Informing the development of tsunami vertical evacuation ...
356
Copyright is owned by the Author of the thesis. Permission is given for a copy to be downloaded by an individual for the purpose of research and private study only. The thesis may not be reproduced elsewhere without the permission of the Author.
-
Upload
khangminh22 -
Category
Documents
-
view
1 -
download
0
Transcript of Informing the development of tsunami vertical evacuation ...

Copyright is owned by the Author of the thesis. Permission is given for a copy to be downloaded by an individual for the purpose of research and private study only. The thesis may not be reproduced elsewhere without the permission of the Author.

Informing the development of tsunamivertical evacuation strategies in New
Zealand
A thesis presented in fulfilment of the requirements for the degree of
Doctor of Philosophyin
Emergency Management
at Massey University, WellingtonNew Zealand
Stuart A. Fraser
2014


ABSTRACT
Tsunami education and evacuation planning promote evacuation to high ground in the event of
tsunami. In some low-lying coastal areas, the distance to safety on high ground or inland of the
hazard zone may exceed the travel distance possible in the time before wave arrival. This is a
particular problem in local-source tsunami with arrival times of less than one hour. Vertical e-
vacuation provides alternative refuge within the inundation zone. Buildings, towers or berms can
provide refuge at elevations above the tsunami flow depth, but must be designed to be effective in
the maximum credible tsunami. The potential benefits and costs of vertical evacuation buildings
were demonstrated during the 2011 Great East Japan earthquake and tsunami, when thousands of
people took refuge in such structures.
The aim of this thesis is to enhance the current theoretical and methodological basis for devel-
opment of vertical evacuation strategies in New Zealand. To achieve this aim, numerical simulation
of local-source tsunami is conducted at Napier, Hawke’s Bay, New Zealand, to establish the max-
imum credible inundation extent, flow depth and arrival times. Interview data describe the use of
vertical evacuation in the 2011 Great East Japan tsunami, and surveys are used to investigate in-
tended evacuation behaviour in a local-source tsunami. Finally, an existing geo-spatial evacuation
analysis method, augmented with temporally-variable exposure and distributed travel speeds, is
used to assess pedestrian evacuation potential in local-source tsunami. The method is demonstrat-
ed in an assessment of the need for vertical evacuation in Napier.
The outputs of the four stages of research enhance the theoretical basis for planning evacua-
tions in local-source tsunami, extends Geographic Information System-based evacuation modelling
methods, and provides empirical advances in tsunami hazard and evacuation planning at Napier.
The proposed methodology is applicable to other locations, thus contributes to tsunami risk reduc-
tion in New Zealand and internationally.


ACKNOWLEDGEMENTS
I would like to thank many people who have provided support and enthusiasm, driven me forward
with this research personally and professionally, and played an important role in making the past
three years so eventful and rewarding.
David Johnston and Graham Leonard have provided countless opportunities for me to learn,
apply my research and expand my horizons; their investment, encouragement and support has been
invaluable. I am grateful to Tiziana Rossetto and Paul Greening for hosting me at University Col-
lege London and advising on the research during that time. William Power and Hannah Brackley
made it possible for me to work within the GNS Science Tectonophysics department, affording
me opportunities to learn from and contribute to ongoing research at GNS Science. Thank you
to Xiaoming Wang for instruction on COMCOT, Christof Mueller for his patient coding advice,
and Tom Wilson for hosting at University of Canterbury. I appreciate the collaboration with many
co-authors during this process, who have helped improve my research skills through constructive
review. Thank you to many colleagues and friends in Wellington and Christchurch, particularly
Carol, Joshua, Tom, Louise, Maureen and Emma.
I would like to acknowledge the support of Lisa Pearse, Craig Goodier and Marcus Hayes-
Jones of Hawke’s Bay CDEM group, who have showed great interest in the application of this
work, sustaining my interest and enthusiasm for the topic. The opportunity to apply this work in
Napier encourages me that this work can contribute to ongoing tsunami risk reduction.
I have been lucky during the course of this research to visit Japan and the US Pacific Northwest
on a number of occasions. Thank you to John Schelling and his colleagues at the State of Wash-
ington Emergency Management Division; the emergency managers with whom I met at the very
beginning of this research; Hitomi Murakami, Ichiro Matsuo and translator Joel Challender, with
whom we collaborated in Japan in October 2011. Thank you to all of my colleagues on the IStructE
Earthquake Engineering Field Investigation Team with whom I visited Japan in June 2011.
Victoria Sword-Daniels has been a constant source of inspiration, support and wise advice.
Thank you for always pushing me further, for initiating our move to New Zealand, and for all of
the adventures and opportunities that have come with it.
This research was supported by New Zealand Ministry of Science and Innovation core geohaz-
ards funding to GNS Science and funding from the Joint Centre for Disaster Research. Additional
funding for fieldwork was provided by Aon Benfield and Washington State Emergency Manage-
ment Division.


CONTENTS
Abstract . . . . . . . . . . . . . . . . . . . . . . . . . . . . . . . . . . . . . . . . . . . iv
Acknowledgements . . . . . . . . . . . . . . . . . . . . . . . . . . . . . . . . . . . . . vii
Contents . . . . . . . . . . . . . . . . . . . . . . . . . . . . . . . . . . . . . . . . . . . xii
List of Figures . . . . . . . . . . . . . . . . . . . . . . . . . . . . . . . . . . . . . . . . xix
List of Tables . . . . . . . . . . . . . . . . . . . . . . . . . . . . . . . . . . . . . . . . xxiv
List of Acronyms . . . . . . . . . . . . . . . . . . . . . . . . . . . . . . . . . . . . . . xxv
1. Introduction . . . . . . . . . . . . . . . . . . . . . . . . . . . . . . . . . . . . . . . 1
1.1 Research aim and objectives . . . . . . . . . . . . . . . . . . . . . . . . . . . . . 6
1.2 Conceptual framework . . . . . . . . . . . . . . . . . . . . . . . . . . . . . . . . 6
1.3 Research methodology . . . . . . . . . . . . . . . . . . . . . . . . . . . . . . . . 11
1.3.1 Objective 1 . . . . . . . . . . . . . . . . . . . . . . . . . . . . . . . . . . 14
1.3.2 Objective 2 . . . . . . . . . . . . . . . . . . . . . . . . . . . . . . . . . . 15
1.3.3 Objective 3 . . . . . . . . . . . . . . . . . . . . . . . . . . . . . . . . . . 17
1.3.4 Objective 4 . . . . . . . . . . . . . . . . . . . . . . . . . . . . . . . . . . 18
1.4 Study area . . . . . . . . . . . . . . . . . . . . . . . . . . . . . . . . . . . . . . . 18
1.5 Thesis structure . . . . . . . . . . . . . . . . . . . . . . . . . . . . . . . . . . . . 22
1.5.1 Literature review . . . . . . . . . . . . . . . . . . . . . . . . . . . . . . . 22
1.5.2 Primary research and discussion . . . . . . . . . . . . . . . . . . . . . . . 22
1.5.3 Appendices — Additional publications and developed code . . . . . . . . 23
2. Tsunami processes and hazard . . . . . . . . . . . . . . . . . . . . . . . . . . . . . . 25
2.1 Tsunami generation . . . . . . . . . . . . . . . . . . . . . . . . . . . . . . . . . . 25
2.1.1 Seismic sources . . . . . . . . . . . . . . . . . . . . . . . . . . . . . . . . 25
2.1.2 Landslide sources . . . . . . . . . . . . . . . . . . . . . . . . . . . . . . . 26
2.1.3 Meteorological forcing, volcanic eruption, and bolide impact . . . . . . . . 27
2.2 Propagation and inundation . . . . . . . . . . . . . . . . . . . . . . . . . . . . . . 27

viii Contents
2.3 Impacts of tsunami . . . . . . . . . . . . . . . . . . . . . . . . . . . . . . . . . . 30
2.3.1 Structural damage . . . . . . . . . . . . . . . . . . . . . . . . . . . . . . 30
2.3.2 Tsunami casualties . . . . . . . . . . . . . . . . . . . . . . . . . . . . . . 31
2.4 Historic tsunami in New Zealand . . . . . . . . . . . . . . . . . . . . . . . . . . . 32
2.4.1 Historic distant-source tsunami . . . . . . . . . . . . . . . . . . . . . . . . 33
2.4.2 Historic regional-source tsunami . . . . . . . . . . . . . . . . . . . . . . . 37
2.4.3 Historic local-source tsunami . . . . . . . . . . . . . . . . . . . . . . . . 37
2.5 Palaeo-tsunami in New Zealand . . . . . . . . . . . . . . . . . . . . . . . . . . . 38
2.6 Tsunami hazard assessment . . . . . . . . . . . . . . . . . . . . . . . . . . . . . . 41
2.7 Summary and link to next chapter . . . . . . . . . . . . . . . . . . . . . . . . . . 43
3. Tsunami risk reduction and preparedness . . . . . . . . . . . . . . . . . . . . . . . . 45
3.1 Land-use planning . . . . . . . . . . . . . . . . . . . . . . . . . . . . . . . . . . 45
3.2 Structural mitigation . . . . . . . . . . . . . . . . . . . . . . . . . . . . . . . . . 49
3.2.1 Coastal defences . . . . . . . . . . . . . . . . . . . . . . . . . . . . . . . 49
3.2.2 Tsunami loading and structural guidelines . . . . . . . . . . . . . . . . . . 51
3.3 Tsunami warnings . . . . . . . . . . . . . . . . . . . . . . . . . . . . . . . . . . . 55
3.3.1 Official warnings . . . . . . . . . . . . . . . . . . . . . . . . . . . . . . . 56
3.3.2 Informal warnings . . . . . . . . . . . . . . . . . . . . . . . . . . . . . . 60
3.3.3 Natural warnings . . . . . . . . . . . . . . . . . . . . . . . . . . . . . . . 61
3.4 Preparedness . . . . . . . . . . . . . . . . . . . . . . . . . . . . . . . . . . . . . 62
3.5 Education . . . . . . . . . . . . . . . . . . . . . . . . . . . . . . . . . . . . . . . 65
3.6 Evacuation planning . . . . . . . . . . . . . . . . . . . . . . . . . . . . . . . . . 67
3.6.1 Evacuation maps . . . . . . . . . . . . . . . . . . . . . . . . . . . . . . . 67
3.6.2 Evacuation signs . . . . . . . . . . . . . . . . . . . . . . . . . . . . . . . 70
3.6.3 Evacuation exercises . . . . . . . . . . . . . . . . . . . . . . . . . . . . . 72
3.6.4 Vertical evacuation . . . . . . . . . . . . . . . . . . . . . . . . . . . . . . 73
3.7 Summary and link to next chapter . . . . . . . . . . . . . . . . . . . . . . . . . . 75
4. Tsunami inundation in Napier, New Zealand, due to local earthquake sources (Paper 1) . 77
4.1 Background to numerical modelling . . . . . . . . . . . . . . . . . . . . . . . . . 77
4.1.1 Tsunami numerical model summary . . . . . . . . . . . . . . . . . . . . . 80
4.2 Abstract . . . . . . . . . . . . . . . . . . . . . . . . . . . . . . . . . . . . . . . . 83
4.3 Introduction . . . . . . . . . . . . . . . . . . . . . . . . . . . . . . . . . . . . . . 84
4.4 Study area . . . . . . . . . . . . . . . . . . . . . . . . . . . . . . . . . . . . . . . 85
4.5 Hikurangi subduction margin . . . . . . . . . . . . . . . . . . . . . . . . . . . . . 87
4.5.1 Tectonic setting and seismic potential . . . . . . . . . . . . . . . . . . . . 87
4.5.2 Evidence of past earthquakes and tsunami . . . . . . . . . . . . . . . . . . 89

Contents ix
4.5.3 Previous tsunami hazard assessment . . . . . . . . . . . . . . . . . . . . . 91
4.6 Methodology . . . . . . . . . . . . . . . . . . . . . . . . . . . . . . . . . . . . . 92
4.6.1 Model setup . . . . . . . . . . . . . . . . . . . . . . . . . . . . . . . . . . 93
4.6.2 Earthquake source mechanisms . . . . . . . . . . . . . . . . . . . . . . . 96
4.7 Results . . . . . . . . . . . . . . . . . . . . . . . . . . . . . . . . . . . . . . . . . 102
4.7.1 Flow depth and inundation extent . . . . . . . . . . . . . . . . . . . . . . 102
4.7.2 Tsunami arrival time and waveforms . . . . . . . . . . . . . . . . . . . . . 107
4.7.3 Structural damage potential . . . . . . . . . . . . . . . . . . . . . . . . . 112
4.8 Conclusions . . . . . . . . . . . . . . . . . . . . . . . . . . . . . . . . . . . . . . 115
4.9 Acknowledgments . . . . . . . . . . . . . . . . . . . . . . . . . . . . . . . . . . 116
4.10 Comparison against rule-based mapping approach . . . . . . . . . . . . . . . . . . 116
4.11 Link to next chapter . . . . . . . . . . . . . . . . . . . . . . . . . . . . . . . . . . 117
5. Tsunami Vertical Evacuation Buildings — Lessons for International Preparedness Follow-
ing the 2011 Great East Japan Tsunami (Paper 2) . . . . . . . . . . . . . . . . . . . . 119
5.1 Abstract . . . . . . . . . . . . . . . . . . . . . . . . . . . . . . . . . . . . . . . . 119
5.2 Introduction . . . . . . . . . . . . . . . . . . . . . . . . . . . . . . . . . . . . . . 120
5.3 Method of investigation . . . . . . . . . . . . . . . . . . . . . . . . . . . . . . . . 120
5.4 Key features of TVEB . . . . . . . . . . . . . . . . . . . . . . . . . . . . . . . . 124
5.4.1 Tsunami-resistant construction . . . . . . . . . . . . . . . . . . . . . . . . 124
5.4.2 Sufficient height of safe storeys . . . . . . . . . . . . . . . . . . . . . . . 126
5.4.3 Building location planning . . . . . . . . . . . . . . . . . . . . . . . . . . 128
5.4.4 Building capacity . . . . . . . . . . . . . . . . . . . . . . . . . . . . . . . 131
5.4.5 Building access . . . . . . . . . . . . . . . . . . . . . . . . . . . . . . . . 131
5.4.6 Fire resistance . . . . . . . . . . . . . . . . . . . . . . . . . . . . . . . . 134
5.4.7 Evacuation signage . . . . . . . . . . . . . . . . . . . . . . . . . . . . . . 134
5.4.8 Building owner agreement . . . . . . . . . . . . . . . . . . . . . . . . . . 135
5.4.9 Community engagement . . . . . . . . . . . . . . . . . . . . . . . . . . . 136
5.4.10 Evacuee welfare in TVEB . . . . . . . . . . . . . . . . . . . . . . . . . . 137
5.5 Conclusions . . . . . . . . . . . . . . . . . . . . . . . . . . . . . . . . . . . . . . 138
5.6 Acknowledgements . . . . . . . . . . . . . . . . . . . . . . . . . . . . . . . . . . 139
5.7 Link to next chapter . . . . . . . . . . . . . . . . . . . . . . . . . . . . . . . . . . 140
6. Intended evacuation behaviour in a local earthquake and tsunami at Napier, New Zealand
(Paper 3) . . . . . . . . . . . . . . . . . . . . . . . . . . . . . . . . . . . . . . . . . 141
6.1 Abstract . . . . . . . . . . . . . . . . . . . . . . . . . . . . . . . . . . . . . . . . 141
6.2 Introduction . . . . . . . . . . . . . . . . . . . . . . . . . . . . . . . . . . . . . . 142
6.3 Evacuation behaviour . . . . . . . . . . . . . . . . . . . . . . . . . . . . . . . . . 143

x Contents
6.3.1 Tsunami warnings and response . . . . . . . . . . . . . . . . . . . . . . . 144
6.3.2 The household / family unit . . . . . . . . . . . . . . . . . . . . . . . . . 147
6.3.3 Pre-evacuation actions and departure time . . . . . . . . . . . . . . . . . . 148
6.3.4 Travel mode and destination . . . . . . . . . . . . . . . . . . . . . . . . . 149
6.3.5 Transient populations . . . . . . . . . . . . . . . . . . . . . . . . . . . . . 150
6.4 Survey method . . . . . . . . . . . . . . . . . . . . . . . . . . . . . . . . . . . . 151
6.4.1 Aims . . . . . . . . . . . . . . . . . . . . . . . . . . . . . . . . . . . . . 151
6.4.2 Survey structure . . . . . . . . . . . . . . . . . . . . . . . . . . . . . . . 152
6.4.3 Sampling method . . . . . . . . . . . . . . . . . . . . . . . . . . . . . . . 153
6.4.4 Study area and demographics . . . . . . . . . . . . . . . . . . . . . . . . 154
6.4.5 Data analysis . . . . . . . . . . . . . . . . . . . . . . . . . . . . . . . . . 156
6.5 Results and discussion . . . . . . . . . . . . . . . . . . . . . . . . . . . . . . . . 160
6.5.1 Hazards information in Napier . . . . . . . . . . . . . . . . . . . . . . . . 160
6.5.2 Tsunami hazard awareness and understanding . . . . . . . . . . . . . . . . 162
6.5.3 Evacuation intentions in a local tsunami . . . . . . . . . . . . . . . . . . . 166
6.6 Vertical evacuation buildings . . . . . . . . . . . . . . . . . . . . . . . . . . . . . 177
6.7 Conclusions . . . . . . . . . . . . . . . . . . . . . . . . . . . . . . . . . . . . . . 180
6.8 Acknowledgements . . . . . . . . . . . . . . . . . . . . . . . . . . . . . . . . . . 183
6.9 Link to next chapter . . . . . . . . . . . . . . . . . . . . . . . . . . . . . . . . . . 183
6.10 Appendix 1: Survey questions . . . . . . . . . . . . . . . . . . . . . . . . . . . . 184
6.11 Appendix 2: Information sheet . . . . . . . . . . . . . . . . . . . . . . . . . . . . 187
7. Variable population exposure and travel speeds in least-cost tsunami evacuation modelling
(Paper 4) . . . . . . . . . . . . . . . . . . . . . . . . . . . . . . . . . . . . . . . . . 189
7.1 Abstract . . . . . . . . . . . . . . . . . . . . . . . . . . . . . . . . . . . . . . . . 190
7.2 Introduction . . . . . . . . . . . . . . . . . . . . . . . . . . . . . . . . . . . . . . 190
7.3 Study area . . . . . . . . . . . . . . . . . . . . . . . . . . . . . . . . . . . . . . . 191
7.4 Methodology: pedestrian evacuation potential . . . . . . . . . . . . . . . . . . . . 194
7.4.1 Anisotropic least-cost path distance analysis . . . . . . . . . . . . . . . . . 194
7.4.2 Time-variable population exposure . . . . . . . . . . . . . . . . . . . . . . 195
7.4.3 Estimation of evacuation time . . . . . . . . . . . . . . . . . . . . . . . . 201
7.5 Results . . . . . . . . . . . . . . . . . . . . . . . . . . . . . . . . . . . . . . . . . 208
7.5.1 Spatio-temporal variation in evacuation demand . . . . . . . . . . . . . . . 208
7.5.2 Evacuation departure time . . . . . . . . . . . . . . . . . . . . . . . . . . 211
7.5.3 Impact of distributed travel speed . . . . . . . . . . . . . . . . . . . . . . 211
7.5.4 Application of running speeds . . . . . . . . . . . . . . . . . . . . . . . . 212
7.6 Conclusions . . . . . . . . . . . . . . . . . . . . . . . . . . . . . . . . . . . . . . 212
7.7 Acknowledgements . . . . . . . . . . . . . . . . . . . . . . . . . . . . . . . . . . 214

Contents xi
7.8 Napier specific results . . . . . . . . . . . . . . . . . . . . . . . . . . . . . . . . . 215
7.9 Link to next chapter . . . . . . . . . . . . . . . . . . . . . . . . . . . . . . . . . . 225
8. Discussion . . . . . . . . . . . . . . . . . . . . . . . . . . . . . . . . . . . . . . . . 227
8.1 Local-source tsunami hazard in New Zealand and the need for vertical evacuation . 227
8.2 Design of vertical evacuation refuges . . . . . . . . . . . . . . . . . . . . . . . . . 228
8.2.1 Structural requirements . . . . . . . . . . . . . . . . . . . . . . . . . . . . 228
8.2.2 Refuge capacity . . . . . . . . . . . . . . . . . . . . . . . . . . . . . . . . 229
8.2.3 Access to safe refuge level . . . . . . . . . . . . . . . . . . . . . . . . . . 230
8.2.4 Evacuation signage . . . . . . . . . . . . . . . . . . . . . . . . . . . . . . 231
8.2.5 Evacuee welfare . . . . . . . . . . . . . . . . . . . . . . . . . . . . . . . 231
8.3 Community participation . . . . . . . . . . . . . . . . . . . . . . . . . . . . . . . 232
8.4 Education . . . . . . . . . . . . . . . . . . . . . . . . . . . . . . . . . . . . . . . 232
8.4.1 Tsunami warning expectations and response . . . . . . . . . . . . . . . . . 232
8.4.2 Evacuation actions . . . . . . . . . . . . . . . . . . . . . . . . . . . . . . 233
8.4.3 Vertical evacuation refuges . . . . . . . . . . . . . . . . . . . . . . . . . . 234
8.5 Evacuation modelling for local-source tsunami . . . . . . . . . . . . . . . . . . . 235
8.6 Dissemination of research findings to date . . . . . . . . . . . . . . . . . . . . . . 236
8.7 Limitations and future work . . . . . . . . . . . . . . . . . . . . . . . . . . . . . 236
8.7.1 Hazard modelling . . . . . . . . . . . . . . . . . . . . . . . . . . . . . . . 236
8.7.2 Evacuation refuges and behaviour . . . . . . . . . . . . . . . . . . . . . . 237
8.7.3 Evacuation modelling . . . . . . . . . . . . . . . . . . . . . . . . . . . . 238
8.8 Conclusions . . . . . . . . . . . . . . . . . . . . . . . . . . . . . . . . . . . . . . 239
9. Bibliography . . . . . . . . . . . . . . . . . . . . . . . . . . . . . . . . . . . . . . . 241
Appendices 281
A. GNS Science report: Scoping study for evaluating the tsunami vulnerability of New Zealand
buildings for use as evacuation structures . . . . . . . . . . . . . . . . . . . . . . . . 283
B. Excerpts from EEFIT report: The MW9.0 Tohoku Earthquake and Tsunami of 11th March
2011 — A Field Report by EEFIT . . . . . . . . . . . . . . . . . . . . . . . . . . . . 285
C. Bulletin of Earthquake Engineering: Tsunami damage to coastal defences and buildings in
the March 11th 2011 MW 9.0 Great East Japan earthquake and tsunami . . . . . . . . . 287
D. GNS Science Report: Tsunami evacuation: Lessons from the Great East Japan earthquake
and tsunami of March 11th 2011 . . . . . . . . . . . . . . . . . . . . . . . . . . . . . 289

xii Contents
E. GNS Science Report: Validation of a GIS-based attenuation rule for indicative tsunami
evacuation zone mapping . . . . . . . . . . . . . . . . . . . . . . . . . . . . . . . . 291
F. Potential ground shaking at Napier . . . . . . . . . . . . . . . . . . . . . . . . . . . . 293
G. Evacuation modelling process charts . . . . . . . . . . . . . . . . . . . . . . . . . . . 301
H. Contribution Statements for co-authored papers . . . . . . . . . . . . . . . . . . . . . 311
I. Publication list . . . . . . . . . . . . . . . . . . . . . . . . . . . . . . . . . . . . . . 321

LIST OF FIGURES
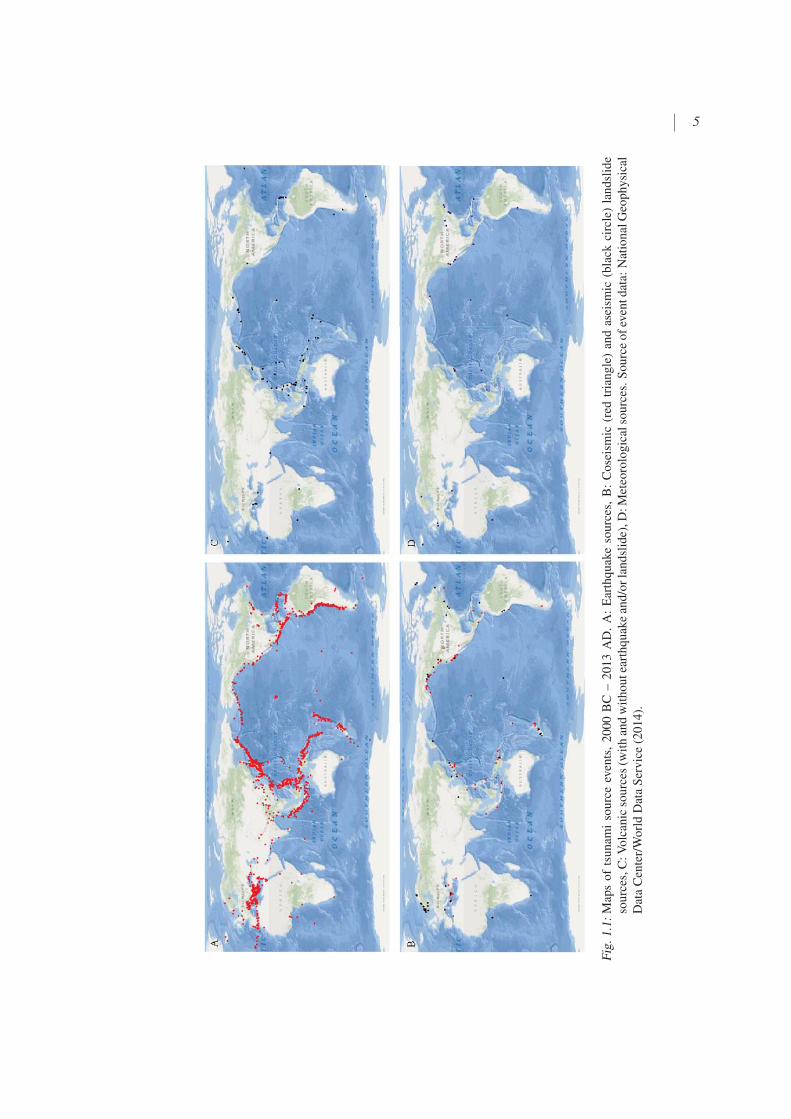
1.1 Maps of tsunami source events, 2000 BC – 2013 AD. A: Earthquake sources, B:
Coseismic (red triangle) and aseismic (black circle) landslide sources, C: Volcanic
sources (with and without earthquake and/or landslide), D: Meteorological sources.
Source of event data: National Geophysical Data Center/World Data Service (2014). 5
1.2 The New Zealand Civil Defence Emergency Management (CDEM) framework (M-
CDEM, 2008b). . . . . . . . . . . . . . . . . . . . . . . . . . . . . . . . . . . . . 7
1.3 Risk management process (Standards New Zealand, 2009). . . . . . . . . . . . . . 8
1.4 An holistic disaster risk reduction framework (Johnston et al., 2014). . . . . . . . . 9
1.5 The research method. . . . . . . . . . . . . . . . . . . . . . . . . . . . . . . . . . 12
1.6 A generic framework for the development of an evacuation plan, after Scheer,
Varela, and Eftychidis (2012). . . . . . . . . . . . . . . . . . . . . . . . . . . . . 12
1.7 A: Study area shown in the national context. B: Napier Territorial Authority in the
Hawkes Bay regional context with numbered locations indicating palaeo-ecological
analysis referred to in-text. The boundary of Napier Territorial Authority is shown
and other locations referred to in-text are also indicated. C: Digital Elevation Mod-
el (DEM) of 10 m horizontal resolution showing topography of Napier Territorial
Authority with labelled unit areas (suburbs), rivers, Napier Port and Hawkes Bay
Airport. . . . . . . . . . . . . . . . . . . . . . . . . . . . . . . . . . . . . . . . . 13
1.8 Oblique aerial photograph looking north towards Napier. The majority of the Ter-
ritorial Authority is visible in this photograph. Photo credit: D Townsend/GNS
Science . . . . . . . . . . . . . . . . . . . . . . . . . . . . . . . . . . . . . . . . 20
1.9 Oblique aerial photograph looking south across Westshore, Napier Port and Bluff
Hill/Hospital Hill. Photo credit: D Townsend/GNS Science . . . . . . . . . . . . . 20
1.10 Oblique aerial photograph looking south-west over Napier Port, Bluff Hill, Ahuriri
and Westshore. Photograph taken in 2001. Source: Hawke’s Bay Regional Council. 21
1.11 Oblique aerial photograph looking southeast across the residential suburbs of Napi-
er. Note the three large tree-lined culverts, crossed by major roads. Photo credit:
D Townsend/GNS Science . . . . . . . . . . . . . . . . . . . . . . . . . . . . . . 21
2.1 Schematic diagram of tsunami wave terminology. . . . . . . . . . . . . . . . . . . 26

xiv List of Figures
2.2 Predicted wave amplitude for two tsunami scenarios in the Pacific Ocean (UN-
ESCO/IOC, 2011). . . . . . . . . . . . . . . . . . . . . . . . . . . . . . . . . . . 29
2.3 The tectonic setting of New Zealand, showing the major subduction and strike-slip
faults at the boundary of the Pacific and Australasian Plates. Slip rates are shown
in red for each of the Hikurangi subduction margin, Alpine Fault and Puysegur
Trench. Source: GNS Science Geological Map of New Zealand, http://data.gns.
cri.nz/geoatlas/text.jsp?Page=1. . . . . . . . . . . . . . . . . . . . . . . . . . . . . 34
2.4 Run-up height from distant and local-source tsunami in the New Zealand historic
record, 1820s to 2013. Flags indicate source location for local-source events, and
general direction of origin for distant-source events. Source: GNS Science, the
original image has been updated to include recent events. . . . . . . . . . . . . . . 35
3.1 Map of locations at which field investigation was conducted. The ria and plains
coastal environments are also highlighted. . . . . . . . . . . . . . . . . . . . . . . 50
3.2 Standard Tsunami signs for New Zealand (MCDEM, 2008c). Signs shown are A:
Tsunami evacuation zone; B: Tsunami evacuation zone with reference to a specific
zone; C: Evacuation route direction (arrow can be turned any direction); D: Vehic-
ular evacuation route; E: Pedestrian evacuation route; F: Vertical evacuation route;
G: Safe location for pedestrian routes; H: Safe location for vertical evacuation; I:
Previous event sign, indicating maximum flow depth in that event. . . . . . . . . . 71
3.3 Examples of the blue lines used in an increasing number of Wellington coastal
communities. a) A blue line at the edge of the maximum inundation zone, credit:
Nick Thompson. b) A directional sign with the distance to the blue line, credit:
RadioNZ. . . . . . . . . . . . . . . . . . . . . . . . . . . . . . . . . . . . . . . . 72
4.1 A: Study area shown in the national context. B: Napier Territorial Authority in the
Hawkes Bay regional context with numbered locations indicating palaeo-ecological
analysis referred to in-text. The boundary of Napier Territorial Authority is shown
and other locations referred to in-text are also indicated. C: 10 m DEM showing
topography of Napier Territorial Authority with labelled unit areas (suburbs), river-
s, Napier Port and Hawkes Bay Airport. Virtual tide gauges quoted in the text are
identified . . . . . . . . . . . . . . . . . . . . . . . . . . . . . . . . . . . . . . . 86
4.2 Map illustrating the shaded bathymetry of the model domain. The main map shows
grid 1 with the plate boundary marked. The inset shows Hawkes Bay and nested
grids 2–4 . . . . . . . . . . . . . . . . . . . . . . . . . . . . . . . . . . . . . . . 88
4.3 Surface roughness values (Mannings coefficients) applied in Napier, based on New
Zealand Landcover Database 2 data (Ministry for the Environment, 2009, LCDB2;) 95

List of Figures xv
4.4 Vertical deformation applied as tsunami generation in COMCOT, with source patch-
es delineated (grey dashed lines). A: Lachlan Fault rupture using simple fault ge-
ometry and 9.0 m slip (MW 7.7); B: Rupture of the plate interface offshore of
Hawkes Bay (MW 8.4); C: Rupture of southern and central Hikurangi subduction
margin (MW 8.8); D: Rupture of the whole Hikurangi subduction margin (MW 9.0).
Vertical scale differs on each image. The background value of approximately ze-
ro deformation is retained to indicate the extent of vertical deformation domain.
Depth contours (km) of the plate interface model (Ansell and Bannister, 1996) are
shown in C . . . . . . . . . . . . . . . . . . . . . . . . . . . . . . . . . . . . . . 97
4.5 Maximum flow depth and inundation extent 1 h after rupture in and around Napier
Territorial Authority due to simulated scenarios. Legend and scale are identical
for each map. A1, A2: Lachlan Fault rupture using simple fault geometry with
9.0 m slip (MW 7.7) at Mean Sea Level (MSL) and Mean High Water (MHW),
respectively; B: Rupture of the plate interface offshore Hawkes Bay (MW 8.4) at
MSL; C: Rupture of southern and central Hikurangi subduction margin (MW 8.8)
at MSL; D1, D2: Rupture of the whole Hikurangi subduction margin (MW 9.0) at
MSL and MHW, respectively . . . . . . . . . . . . . . . . . . . . . . . . . . . . . 105
4.6 Maximum flow depth and inundation extent 1 h after rupture in Napier city due
to simulated scenarios. Legend and scale are identical for each map. A1, A2:
Lachlan Fault rupture using simple fault geometry with 9.0 m slip (MW 7.7) at
MSL and MHW, respectively; B: Rupture of the plate interface offshore Hawkes
Bay (MW 8.4) at MSL; C: Rupture of southern and central Hikurangi subduction
margin (MW 8.8) at MSL; D1, D2: Rupture of the whole Hikurangi subduction
margin (MW 9.0) at MSL and MHW, respectively . . . . . . . . . . . . . . . . . . 106
4.7 Tsunami travel times for the North Island and northern South Island with key urban
centres indicated. Arrival times are shown for waves above the 0.05 m threshold.
Insets show arrival times in Hawkes Bay. A: Lachlan Fault rupture using simple
fault geometry and 9.0 m slip (MW 7.7); B: Rupture of the plate interface offshore
of Hawkes Bay (MW 8.4); C: Rupture of southern and central Hikurangi subduction
margin (MW 8.8); D: Rupture of the whole Hikurangi subduction margin (MW 9.0) 108
4.8 Comparison of simulated wave forms at key offshore and onshore gauges. Water
level (m) is shown for offshore gauge 1, and flow depth (m) is shown for onshore
gauges 2, 3, 4 and 5. Water level is adjusted for coseismic deformation . . . . . . . 109

xvi List of Figures
4.9 Damage potential maps providing comparison between: i. timber frame building
damage levels due to a whole-margin rupture using fragility curves from Japan
2011 (Suppasri et al., 2013a) (A–C) and Chile 2010 (Mas et al., 2012b) (D); ii. RC
building damage levels due to a whole-margin rupture using fragility curves from
Japan 2011 (Suppasri et al., 2013a) (E–G) and American Samoa 2009 (Mas et al.,
2012b) (H); iii. probability of moderate damage to timber frame building due to
each scenario using fragility curves from Japan 2011 (Suppasri et al., 2013a) (A,
I–K) . . . . . . . . . . . . . . . . . . . . . . . . . . . . . . . . . . . . . . . . . . 114
4.10 Probabilistic hazard curve for Napier, showing maximum amplitude of tsunami at
the coast due to all possible tsunami sources (Power, 2013). . . . . . . . . . . . . . 117
4.11 The Geographic Information System (GIS)-calculated attenuation rule based evac-
uation zone for Napier, compared against the simulated inundation zone from a
scenario of a whole margin rupture (MW 9.0). . . . . . . . . . . . . . . . . . . . . 118
5.1 Map and images of Tsunami Vertical Evacuation Buildings (TVEB) in Minami-
Sanriku Town, including numbers of people saved and tsunami inundation marked
in yellow (University of Tokyo, 2011). (A) Matsubara apartment block; (B) Takano-
Kaikan conference venue; (C) Shizugawa Hospital; (D) Fishing Cooperative. . . . 125
5.2 Map and images of nine vertical evacuation buildings in Kesennuma City, includ-
ing numbers of people saved and tsunami inundation marked in yellow (University
of Tokyo, 2011). These comprise office buildings (A, F, G, I); a cannery (B), a
retail building (C), welfare centre (D), a car parking deck (E) and a community
centre (H). . . . . . . . . . . . . . . . . . . . . . . . . . . . . . . . . . . . . . . . 127
5.3 Map and images of vertical evacuation buildings in Kamaishi City and tsunami in-
undation marked in yellow (University of Tokyo, 2011). These are the Kamaishi-
hamacho Post Office and apartment building (A) and government offices (B). . . . 130
5.4 Vertical evacuation signage used in Japan. (A) Sign displayed prominently on the
Kamaishihamacho Post Office, (B) signage on the Matsubara apartment block in
Minami-Sanriku, (C) a sign displayed above an entrance to the Kamaishihamacho
Post Office (Translation: Evacuation building entrance (stairways)). . . . . . . . . 135
6.1 A) Location of Hawke’s Bay on a national scale; B) Location of Napier Territorial
Authority in the context of Hawke’s Bay; C) Napier Territorial Authority boundary
overlain on a Digital Elevation Model (DEM) to illustrate local topography; D)
Map of survey locations and evacuation destinations overlain on the DEM and road
network. Basemap sources: GEBCO, NOAA, National Geographic, DeLorme, and
Esri; OpenStreetMap and contributors, Creative Commons-Share Alike License
(CC-BY-SA). . . . . . . . . . . . . . . . . . . . . . . . . . . . . . . . . . . . . . 155

List of Figures xvii
6.2 Heights of buildings in Napier, assuming that one storey is approximately 3 m in
height. Data source: Napier City Council. . . . . . . . . . . . . . . . . . . . . . . 156
6.3 A) Residents’ approximate home location and their intention to evacuate or remain
at home following ground shaking. Green circles show intention to evacuate, with
evacuation arrows indicating direction to their stated destination (if named during
the survey). Red circles mark intention to not evacuate and a square indicates that
the reason was because they believed themselves to be safe at that location. B) Sur-
vey locations with evacuation direction to respondents’ stated destination (if named
during the survey) or their home if that was their intended destination. Evacuation
arrows which end off the map indicate evacuation to Hastings, Wairoa and Dart-
moor as labelled. Tsunami flow depth and inundation extent generated by Fraser
et al. (2014) for an MW 9.0 rupture of the Hikurangi margin is including on the map
to indicate the worst-case tsunami hazard zone. Basemap source: OpenStreetMap
and contributors, Creative Commons-Share Alike License (CC-BY-SA). . . . . . . 173
7.1 A: Study area topography and locations of suburbs in Napier Territorial Authority.
B: Simulated flow depth due to the maximum credible local-source subduction
earthquake and inundation extent at 60 min after rupture (Fraser et al., 2014). Inset
shows the position of Napier in the national context. C: Meshblock boundaries and
2013 estimate of Usually Resident Population (URP) density for each meshblock
(for clarity, smaller meshblocks are shown without boundaries). URP density is
classified using Natural Breaks (Jenks). . . . . . . . . . . . . . . . . . . . . . . . 193
7.2 Population-time profiles to distribute working-age adults (A, B) and children (C, D)
to home, work/school and unspecified locations. Profiles are shown for a weekday
(A, C) and weekend (B, D). . . . . . . . . . . . . . . . . . . . . . . . . . . . . . . 197
7.3 Population-time profiles to distribute visitors (A), independent elderly (B) and de-
pendent elderly (C) to home or accommodation, and unspecified locations. Profiles
for these groups are the same for weekdays and weekends. . . . . . . . . . . . . . 200

xviii List of Figures
7.4 Evacuation time curves in the range 0–90 min, showing wave arrival time and PV E
values for each curve. ‘d’ refers to a weekday scenario, ‘e’ to a weekend scenario.
The number following ‘d’ or ‘e’ refers to the hour of the day (24 hr clock). A:
Mean PV E and 95% confidence intervals based on 500 simulations for the Febru-
ary weekday 02:00 exposure scenario; B: Diurnal variation in evacuation time for
February weekday and weekend scenarios; C: Seasonal variation in evacuation
time for a weekend 12:00 scenario; D: Comparison of evacuation time curves for
a February 02:00 scenario, with and without evacuation departure time; E: Com-
parison of analysis with distributed travel speeds compared to fixed speeds for a
February 02:00 scenario; and F: The impact of applying a different probabilities
that unimpaired adults and children run to evacuate. . . . . . . . . . . . . . . . . . 203
7.5 Minimum and maximum bounds of evacuation departure time, represented by
Rayleigh functions with μ=7 min and μ=38 min. In each simulation, mean e-
vacuation departure time is sampled from the range 7–38 min, and a new Rayleigh
function generated. Each individual’s evacuation departure time is then sampled
from that curve, which falls in the shaded area. . . . . . . . . . . . . . . . . . . . 204
7.6 Normally-distributed travel speed for each population group based on statistics
presented in Table 7.2. Distributions are derived from the range of travel speeds
identified for different groups in the evacuation literature (Table 7.1). . . . . . . . . 206
7.7 Point density maps showing the density of population with an evacuation time
greater than wave arrival time PV E . Generated using the distributed travel speed
approach, these maps indicate the variation due to diurnal changes in population
distribution. A: Feb weekday 02:00; B: Feb weekday 12:00; C: Feb weekend
12:00; D: Maximum density from all tested exposure scenarios; E: Feb weekday
02:00 with evacuation delay omitted (evacuation travel time only); F: Feb weekday
02:00 using fixed speed of 0.89 ms-1; G: Feb weekday 02:00 using fixed speed of
1.1 ms-1; H: Feb weekday 02:00 using fixed speed of 1.79 ms-1. . . . . . . . . . . 210
7.8 Average total evacuation time (ETt) for the population in Napier, in a February
02:00 exposure scenario. Time data is overlaid on maximum flow depth values,
indicating that the areas of maximum ETt are also those with flow depths >3 m. . 217
7.9 Mean and range of PV E for each suburb in Napier, across all modelled exposure
scenarios. . . . . . . . . . . . . . . . . . . . . . . . . . . . . . . . . . . . . . . . 221
7.10 Top five locations for TVEB in Napier, based on maximum evacuee density across
all scenarios. . . . . . . . . . . . . . . . . . . . . . . . . . . . . . . . . . . . . . 222
7.11 Minimum elevation of vertical evacuation refuge, according to FEMA (2008) guide-
lines and maximum credible flow depth (Fraser et al., 2014). . . . . . . . . . . . . 223
7.12 Potential impact on the February 02:00 evacuation time curve due to implementa-
tion of the two most-optimal TVEB, individually and in combination. . . . . . . . 224

List of Figures xix
8.1 Proposed options for vertical evacuation signs for improved representation of TVE-
B. Symbology is consistent with current signage standards but provides clearer de-
piction of the role of buildings and refuges. Image (b) shows an example of the
sign with additional directional information noting the safe storey or distance to
refuge. . . . . . . . . . . . . . . . . . . . . . . . . . . . . . . . . . . . . . . . . . 231
F.1 United States Geological Survey (USGS) Predefined Vs30 Mapping for New Zealand.
Source: http://earthquake.usgs.gov/hazards/apps/vs30/predefined.php . . . . . . . 296
F.2 Modified Mercalli Intensity (MMI) ShakeMap produced for a MW 9.0 earthquake
finite-source model on the Hikurangi subduction margin, using OpenSHA. Log10(MMI)
= 0.96 corresponds to MMI IX; Log10(MMI) = 0.96 corresponds to MMI VIII . . 297
F.3 USGS ShakeMap estimated MMI for the 2011 Great East Japan earthquake. Source:
http://earthquake.usgs.gov/earthquakes/shakemap/global/shake/c0001xgp/ . . . . . 298
G.1 Model diagram of the model methodology developed in this thesis, which aug-
ments the method of Wood and Schmidtlein (2012, 2013). . . . . . . . . . . . . . 302
G.2 Flow chart indicating the process developed to generate distributed exposure datasets.303
G.3 Flow chart indicating the process developed to generate evacuation compliance rate
(CR). . . . . . . . . . . . . . . . . . . . . . . . . . . . . . . . . . . . . . . . . . 304
G.4 Flow chart indicating the process developed to apply variable travel speeds into
methodology. . . . . . . . . . . . . . . . . . . . . . . . . . . . . . . . . . . . . . 305
G.5 Flow chart indicating the process developed to generate PV E raster. . . . . . . . . 306
G.6 Flow chart indicating the process developed to generate Maximum PV E raster . . . 307
G.7 Flow chart indicating the process developed to develop a raster of safe zones at
vertical evacuation facilities. . . . . . . . . . . . . . . . . . . . . . . . . . . . . . 308
G.8 Flow chart indicating the process developed to develop a revised path distance
raster including vertical evacuation buildings as safe zones. This raster is applied
in further evacuation analyses to assess the impact of different combinations of
TVEB sites. . . . . . . . . . . . . . . . . . . . . . . . . . . . . . . . . . . . . . . 309


LIST OF TABLES
1.1 The 10 most deadly tsunami since the 1980s, based on number of reported fatali-
ties. Total number of deaths for some events differ in the literature, dependent on
whether the number of missing people is included . . . . . . . . . . . . . . . . . . 2
3.1 Proposed classification of evacuation areas (Shibayama et al., 2013). . . . . . . . . 53
3.2 Description of tsunami loads considered by FEMA (2008). . . . . . . . . . . . . . 54
4.1 COMCOT model domain information, showing spatial extent and cell resolution
of model grids in arc seconds and metres, data source and data resolution. . . . . . 93
4.2 List of virtual tide gauges with their location and elevation. . . . . . . . . . . . . . 96
4.3 Scenario fault parameters. *Denotes that the scenario uses variable slip parameters
on multiple source patches, for which this table presents a summary. A range
of slip values, strike and dip angles are given for these events. Full variable slip
parameters are provided on the accompanying CD. . . . . . . . . . . . . . . . . . 100
4.4 Approximate peak flow depth and maximum inundation extent in selected suburbs.
Refer to Fig 4.5 for inundation mapped for all suburbs. Values refer to inundation
at MSL conditions, unless scenario is denoted with *, in which case the first value
refers to inundation under MSL conditions, the second to MHW conditions. Where
no inundation occurred, this is denoted by ‘–’. . . . . . . . . . . . . . . . . . . . . 103
4.5 Key parameters of waveforms at virtual tide gauges. Arrival time is relative to a
threshold of 0.05 m. Height refers to water level for offshore gauge and flow depth
for onshore gauges. The first peak is recorded, and if that peak is negative the first
positive peak is shown in order to demonstrate lag-time of the drawdown and peak
water level. Only data due to maximum slip are shown for scenarios A and B. . . . 110

xxii List of Tables
5.1 Summary of TVEB in locations visited during this research. Field observations
were not made at all buildings listed. A full inventory of known building features
is provided by Fraser et al. (2012a). Not all buildings were available for obser-
vation during field investigations, but data on those buildings has been collected
through interviews. (a) Tsunami data from field surveys [30]; (b) Casualty data at
14th February 2012 [31];(c) Buildings designated as refuge for multiple hazards
evacuation, not specifically as TVEB; (d)Number of people saved is available for
only one TVEB in Ofunato City; (e) Number of people saved at Sendai Interna-
tional Airport is not included. . . . . . . . . . . . . . . . . . . . . . . . . . . . . . 122
5.2 TVEB 24-hour access methods, showing numbers of buildings for each method in
the locations surveyed. Data on external stairs is from field observations. Data on
alternative access methods is from local interviews. Not all TVEB were accessible
for observation during field investigations. (a)Schools in Natori have external stairs
but staff members are also organised to open the building. . . . . . . . . . . . . . . 133
6.1 Residential status of respondents. Residents are classed as those living in Napier
Territorial Authority. Visitors are separated into those from Hawke’s Bay, those
from the rest of New Zealand and those from overseas. Percent values may not
sum to 100% due to rounding. . . . . . . . . . . . . . . . . . . . . . . . . . . . . 157
6.2 Distribution of age group in the survey sample and the Subnational Population Esti-
mates: At 30 June 2012 (SNPE; http://www.stats.govt.nz/browse for stats/population/
estimates and projections/). Age group shows 16–39, while the SPE original data
showed 15–39. SNPE data for ages <15 are omitted from the total. Percent values
may not sum to 100% due to rounding. . . . . . . . . . . . . . . . . . . . . . . . . 157
6.3 Distribution of gender within the survey sample and the 2006 census data for Napi-
er City, excluding people under the age of 15. Source: http://www.stats.govt.
nz/Census/about-2006-census/regional-summary-tables.aspx. Percent values may
not sum to 100% due to rounding. . . . . . . . . . . . . . . . . . . . . . . . . . . 157
6.4 Distribution of ethnicity within the survey sample and the 2006 census data for
Napier City. *For the census, people stating multiple ethnic groups are included in
as many groups as they list, so one person listing their ethnic group as European
and Maori is counted once in each of the separate groups. All ages are includ-
ed in the census totals as the data does not allow exclusion of people under the
age of 16. Source: http://www.stats.govt.nz/Census/about-2006-census/regional-
summary-tables.aspx. Percent values may not sum to 100% due to rounding. . . . 158

List of Tables xxiii
6.5 Distribution of highest level of education within the survey sample. *Trade qual-
ification includes Level 1, 2, 3, 4, Certificates gained post-school; Undergradu-
ate includes Level 5 and 6 Diplomas, Bachelor degree and Level 7 qualifications.
Source: http://www.stats.govt.nz/Census/about-2006-census/regional-summary-tables.
aspx. Percent values may not sum to 100% due to rounding. . . . . . . . . . . . . 158
6.6 Distribution of household income within the survey sample. Household income
statistics are not available at the Territorial Authority or regional level for the 2006
census or more recently. Percent values may not sum to 100% due to rounding. . . 159
6.7 Length of time residents have lived in Napier. Percent values may not sum to 100%
due to rounding. . . . . . . . . . . . . . . . . . . . . . . . . . . . . . . . . . . . . 159
6.8 Percentage of respondents who believed each hazard has the potential to cause
damage or casualties at Napier. . . . . . . . . . . . . . . . . . . . . . . . . . . . . 163
6.9 Cross-tabulation of the percentage of residents and visitors who regard earthquake
and tsunami as hazards in Napier. The table captures presents belief in neither
hazard, both hazards, or one hazard but not the other affecting Napier. . . . . . . . 163
6.10 Respondents’ opinions on whether a tsunami might be possible after long or strong
ground shaking at Napier. . . . . . . . . . . . . . . . . . . . . . . . . . . . . . . . 164
6.11 Percentage of respondents citing potential information sources of tsunami warning.
Respondents were requested to name as many formats as possible. . . . . . . . . . 165
6.12 Percentage of respondents who anticipate tsunami arrival in each timeframe fol-
lowing a natural warning. Respondents were requested to select all categories that
they believed to be applicable — percentage reflects the ‘Yes’ responses in each
timeframe as a percentage of the status group. Only respondents who answered
‘Yes’ to the previous question (Do you believe that a tsunami may be possible after
long or strong ground shaking?) were asked to provide estimates of arrival time. . . 167
6.13 Percentage of respondents who anticipate tsunami arrival in each timeframe fol-
lowing an official warning. Respondents were requested to select all categories
that they believed to be applicable — percentage reflects the ‘Yes’ responses in
each timeframe as a percentage of the status group. . . . . . . . . . . . . . . . . . 167
6.14 Percentages of respondents who would evacuate from the survey location or from
home, split by residential status and gender. These values represent intentions after
prompting in the survey to consider tsunami evacuation. . . . . . . . . . . . . . . . 169
6.15 Influence of level of education on intention to evacuate from the survey location
and from the home. Percentage values refer to the number of respondents quoting
each theme. . . . . . . . . . . . . . . . . . . . . . . . . . . . . . . . . . . . . . . 170
6.16 Percentage of respondents citing intended evacuation actions at the survey location
and the home. Action themes are sorted (descending order) by percentage citing
the action at the survey location. . . . . . . . . . . . . . . . . . . . . . . . . . . . 171

xxiv List of Tables
6.17 Reasons given for non-evacuation of the survey location. *Four of these responses
were given at Clive Square and one at Marewa shops, both of which are located
within the tsunami hazard zone. . . . . . . . . . . . . . . . . . . . . . . . . . . . 172
6.18 Respondents’ reported destinations if intending to evacuate from the survey location.176
6.19 Proportion of residents and visitors with vehicle or pedestrian intended travel modes.
Respondents were able to answer with more than one travel mode, therefore per-
centages may sum to greater than 100%. . . . . . . . . . . . . . . . . . . . . . . . 177
6.20 Percentage of respondents citing different possible safe locations in a tsunami. . . . 179
7.1 Pedestrian travel speeds used in previous evacuation analyses; these speeds are
used in this study to generate travel speed distributions. Sources — 1: FEMA
(2008, P646 pg. 52); 2: Wood and Schmidtlein (2012); 3: Cabinet Office Govern-
ment of Japan (2005); 4: Yagi and Hasemi (2010); 5: Chooramun, Lawrence, and
Galea (2012); 6: Revi and Singh (2006); 7: Knoblauch, Pietrucha, and Nitzburg
(1996); 8: Park et al. (2012a); 9: Liu et al. (2009); 10: Johnstone (2012); 11:
Liu, Hatayama, and Okada (2006); 12: Goto et al. (2012b); 13: Sugimoto et al.
(2003);14: Post et al. (2009); 15: Mas et al. (2012a). . . . . . . . . . . . . . . . . 206
7.2 Travel speed statistics (ms-1) for each travel speed group, compiled from travel
speeds in the citations given in Table 7.1. . . . . . . . . . . . . . . . . . . . . . . 207
7.3 Absolute PV E for each suburb in Napier across modelled exposure scenarios, with
relevant statistics. . . . . . . . . . . . . . . . . . . . . . . . . . . . . . . . . . . . 218
7.4 Population values for each tested exposure scenario. Columns show the number of
people in the safe zone, with sufficient evacuation potential (<38 min), and with
insufficient evacuation potential (≥38 min). . . . . . . . . . . . . . . . . . . . . . 220
7.5 The potential impact of implementing TVEB at the two most optimal locations,
on PV E in a February 02:00 scenario. Percentage change shows the impact of
implementing TVEB on PV E , relative to the situation with no TVEB. . . . . . . . 220
F.1 Estimated rupture duration (s) from a range of rupture length (km) and rupture
velocity (kms-1) values. *Denotes the lower and upper limits of the MW 9.0 earth-
quake applied in Chapter 4 . . . . . . . . . . . . . . . . . . . . . . . . . . . . . . 293
F.2 The New Zealand MMI scale. Source: http://info.geonet.org.nz/display/quake/
Shaking+Intensity. . . . . . . . . . . . . . . . . . . . . . . . . . . . . . . . . . . 299

LIST OF ACRONYMS
ABM Agent Based Model.
ADA Americans with Disabilities Act.
AEP Annual Exceedance Probability.
ANUGA Australian National University-Geoscience Australia.
API Application Programming Interface.
ASCE American Society of Civil Engineers.
BP Years before present.
CAPI Computer-Assisted Personal Interviewing.
CDEM Civil Defence Emergency Management.
COMCOT COrnell Multi-grid COupled Tsunami.
DART Deep-Ocean Assessment and Reporting of Tsunamis.
DEM Digital Elevation Model.
DRR Disaster Risk Reduction.
EEFIT Earthquake Engineering Field Investigation Team.
EQC New Zealand Earthquake Commission.
FEMA Federal Emergency Management Agency.
GIS Geographic Information System.
GPS Global Positioning System.
HFA The Hyogo Framework for Action 2005–2015.

xxvi List of Acronyms
IBC International Building Code.
IL Importance Levels.
ISO International Standards Office.
IStructE UK Institution of Structural Engineers.
JMA Japanese Meteorological Agency.
LCD Least-Cost Distance.
LiDAR Light Detection and Ranging.
MCDEM Ministry of Civil Defence and Emergency Management.
MHW Mean High Water.
MMI Modified Mercalli Intensity.
MOST Method of Splitting Tsunami.
MSL Mean Sea Level.
NIWA National Institute of Water and Atmospheric Research.
NOAA National Oceanic and Atmospheric Administration.
NPO-CeMI Crisis and Environment Management Policy Institute.
NSHM National Seismic Hazard Map.
NTHMP National Tsunami Hazard Mitigation Program.
NWS National Warning System.
NZCPS New Zealand Coastal Policy Statement.
NZTA New Zealand Transport Agency.
PEP Public Education Programme.
PTHA Probabilistic Tsunami Hazard Assessment.
PTWC Pacific Tsunami Warning Center.
PTWS Pacific Tsunami Warning System.

List of Acronyms xxvii
RC Reinforced Concrete.
RiCOM River and Coastal Ocean Model.
RMA Resource Management Act.
SMS short message service.
SRC Steel Reinforced Concrete.
SWE Shallow Water Equations.
TEP Tsunami Expert Panel.
TUNAMI Tohoku University’s Numerical Analysis Model for Investigation of Near-field tsunamis.
TVEB Tsunami Vertical Evacuation Buildings.
URP Usually Resident Population.
US United States.
USD United States Dollars.
USGS United States Geological Survey.
VBA Visual Basic for Applications.
WREMO Wellington Regional Emergency Management Office.
WTPS ‘What’s The Plan Stan?’.


1. INTRODUCTION
Vertical evacuation is a strategy for risk reduction, which can enhance evacuation capacities in
local-source tsunami, floods and storm surges. New Zealand science and emergency manage-
ment communities have begun to consider the application of vertical evacuation strategies to pro-
vide additional evacuation capacity in the case of local-source tsunami due to Hikurangi subduc-
tion zone earthquakes. This thesis presents new inundation modelling of local-source tsunami
in New Zealand and research on vertical evacuation in the 2011 Great East Japan tsunami. It
contributes new data on evacuation behaviour and pedestrian evacuation potential in local-source
tsunami. These distinct research components combine to provide recommendations for the appli-
cation of vertical evacuation in New Zealand. This research is timely, commencing weeks before
the 2011 Great East Japan tsunami, which demonstrated the potentially devastating impacts of
large-magnitude local-source tsunami and provided a unique post-tsunami case study of vertical
evacuation.
Tsunami have the potential to cause massive destruction and a high death toll when they i-
nundate populated coastlines. Over 200,000 people died in the 2004 Indian Ocean tsunami, over
19,000 people died in the 2011 Great East Japan tsunami, and several other tsunami since the 1980s
have each resulted in hundreds to thousands of deaths (Table 1.1). Past events have shown that e-
vacuation of the hazard zone is important for maximising chances of personal survival. Evacuation
is most-often recognised as the horizontal movement of people to safe locations outside the hazard
zone, i.e., further inland or to areas of high ground outside the inland extent of the hazard.
In local-source tsunami there may only be minutes before tsunami arrival in proximal locations,
precluding dissemination of official warnings to the public. For earthquake-generated local-source
tsunami, ground shaking is likely to be felt in coastal areas proximal to the source. When this
shaking is interpreted as a natural warning of tsunami, which often requires public education, it
can trigger evacuation of the exposed population. In tsunami with particularly short arrival times
or in areas with long distances to high ground, the exposed population may not have sufficient
time to travel to safety, even if they evacuate immediately after the earthquake. Vertical evacuation
has been proposed as a solution to enhance evacuation capacity in such situations (Cabinet Office
Government of Japan, 2005; FEMA, 2008, 2009; Okada et al., 2005; Project Safe Haven, 2011a,b).
In vertical evacuation, people seek safety above the tsunami flow within the hazard zone by moving
into multi-storey tsunami-resistant buildings or towers, or to raised areas of natural/artificial high
ground.

2 1. Introduction
Tab. 1.1: The 10 most deadly tsunami since the 1980s, based on number of reported fatalities. Total number
of deaths for some events differ in the literature, dependent on whether the number of missing
people is included
Event DateNo. of
fatalitiesSource
Indian Ocean 26 Dec 2004 226,898
United States Geological Survey
(Earthquakes with 50,000 or MoreDeaths)
Great East Japan 11 Mar 2011 19,000 Suppasri et al. (2013b)
Papua New Guinea 17 July 1998 2,182 Kawata et al. (1999)
Flores, Indonesia 12 Dec 1992 1,712 Yeh et al. (1993)
Java 17 July 2006 802National Geophysical Data
Center/World Data Service (2014)
Mentawai, Sumatra 25 Oct 2010 431National Geophysical Data
Center/World Data Service (2014)
Java 3 June 1994 344 Tsuji et al. (1995)
Okushiri, Japan 12 July 1993 230 Satake and Tanioka (1995)
Samoa 29 Sep 2009 189 Okal et al. (2010)
Nicaragua 2 Sep 1992 168Lander, Whiteside, and Lockridge
(2003)
Maule, Chile 27 Feb 2010 124 Fritz et al. (2011)
Izmit, Turkey 17 Aug 1999 ≥150Lander, Whiteside, and Lockridge
(2003)
Irian Jaya,
Indonesia17 Feb 1996 110
Disaster Prevention Research
Institute (2004)
Sea of Japan, Japan 26 Apr 1983 103Lander, Whiteside, and Lockridge
(2003)
Total 1983-2011 252,443

3
Tsunami science effectively began in Japan following the 1896 Meiji Sanriku tsunami, which
killed 22,000 people (Shuto and Fujima, 2009). Since then, the major advances in this field have
been in response to major events, notably the development of forecasting and ‘comprehensive
countermeasures’ following the 1933 Showa Sanriku tsunami (Shuto and Fujima, 2009). The
distant-source 1960 Chile tsunami provided insight in Japan into the different onshore impacts that
can occur in distant tsunami compared to previous local-source tsunami, for example longer wave
period. This event was the catalyst for development of some of the founding theories of tsuna-
mi science (Kajiura, 1970), and development of structural tsunami defences, including tsunami
breakwaters that were designed using the first instance of numerical modelling for tsunami (Shuto
and Fujima, 2009). Elsewhere, the 1960 tsunami triggered the expansion of the Pacific Tsunami
Warning System (PTWS) to become a Pacific-wide warning system, having been solely focussed
on the United States (US) since its inception. Progression in numerical simulation developed from
proposal of a method for simulating the initial tsunami surface deformation due to an earthquake
(Mansinha and Smylie, 1971b), implementation of shallow water theory (Goto and Ogawa, 1982)
and increasing computational capabilities. With the increased ability to assess tsunami hazard,
risk reduction practices have been continuously developed and have become more widely applied
around the World.
Tsunami are generated when a source event rapidly displaces a sufficiently large volume of
water in a body of water. The most common cause is displacement of the sea bed during sub-
marine earthquakes (1,811 events (72%) of 2,501 contained in the NOAA/NGDC tsunami event
data catalogue; National Geophysical Data Center/World Data Service, 2014). Tsunami can also
occur due to: coseismic (88, 4%) or aseismic (85, 3%) sub-marine or sub-aerial landslides; sub-
marine or sub-aerial volcanic eruptions (146, 6%); meteorological conditions (91, 4%). Thirteen
events (1%) are listed as ‘questionable earthquakes’, two are attributed to ‘astronomical tide’ and
one is attributed to ‘explosion’. The remaining 11% (264 events) are listed as having an unknown
source. The greatest tsunami hazard exists along coastlines that face subduction boundaries, in
Indonesia, the Mediterranean Sea and around the Pacific ‘Ring of Fire’ (Fig 1.1). Global historic
tsunami statistics show that 43% of all offshore earthquakes (>MW5.0, a focal depth shallower than
200 km and a sea depth less than 7 km) in the years 1963-2011 have been tsunamigenic (Suppasri,
Imamura, and Koshimura, 2012). The highest ratio of tsunamigenic earthquakes to all offshore
earthquakes occurs in New Guinea-Solomon (62%), Alaska-Aleutians (59%) Japan (56%), Kurile-
Kamchatka (56%), South America (54%) and New Zealand-Tonga (51%) (Suppasri, Imamura, and
Koshimura, 2012).
Tsunami are commonly categorised in terms of their travel time from source to impact. Local-
source tsunami (also near-field tsunami) are defined in New Zealand as having a source that is
<1 hr of tsunami travel time to the location of interest. Regional-source tsunami have a travel
time of 1–3 hr1 and distant-source tsunami, >3 hr. The same tsunami source may be considered
1 The Solomon Islands is regarded as a regional source, despite having travel time of 4-5 hours

4 1. Introduction
local to one area and regional or distant to other areas, dependent on the location of interest. This
classification is useful for tsunami research and response because: (a) the distance from source
influences the impact of a tsunami, and (b) effective tsunami response is reliant on the time interval
between event generation and arrival of waves at the location of interest. The primary impacts of
tsunami are damage to coastal defences, buildings, infrastructure and lifelines. Tsunami pose a
significant threat to life of anyone who comes into contact with inundation, due to the significant
flow depths and velocities and the entrainment of debris, which can range in size from sand grains
to large debris such as ships.
Historic tsunami (most notably Peru 1868, Gisborne 1947, and Chile 1960) have inundated
coastal areas of New Zealand and demonstrate the potential for casualties and economic damage
from local and distant source events. Additionally, palaeo-tsunami studies provide evidence of
significant (>MW 7.0) tsunamigenic earthquakes at the Hikurangi subduction margin (Cochran et
al., 2005, 2006). The first New Zealand national tsunami hazard and risk reviews were conducted
in 2005 (Berryman, 2005; Webb, 2005). Since then, there has been an increased focus on tsunami
hazard assessment and risk reduction through ongoing tsunami education, installation of warning
sirens and evacuation route planning. Damage and life loss can be mitigated by land-use planning
to minimise development within the tsunami hazard zone, by installing tsunami-resistant coastal
defences, bridges and buildings, and by maximising people’s ability to evacuate the hazard zone
prior to wave arrival. A comprehensive disaster mitigation strategy should comprise all of these
approaches, but implementation of each element is not always suitable or feasible.
While there has been much progress in tsunami risk reduction and readiness in New Zealand
in the last decade, vertical evacuation could enhance tsunami evacuation capabilities in a num-
ber of locations around the country where the distance to high ground would present difficulties
for evacuation during a local-source tsunami. Additionally, vertical evacuation could be used in
regional-source tsunami. The distance of regional-source earthquake from land means that there
may be no natural warning in the form of ground shaking or gentle swaying, but the time re-
quired to process and disseminate official warnings could result in minimal available evacuation
time between a warning and wave arrival. This introductory chapter presents the research aim and
objectives, contextualises the research within the framework of risk management in New Zealand,
outlines the research methodology and describes the structure of the thesis.
5
Fig
.1
.1:
Map
so
fts
un
ami
sou
rce
even
ts,
20
00
BC
–2
01
3A
D.
A:
Ear
thq
uak
eso
urc
es,
B:
Co
seis
mic
(red
tria
ng
le)
and
asei
smic
(bla
ckci
rcle
)la
nd
slid
e
sou
rces
,C:V
olc
anic
sou
rces
(wit
han
dw
ith
ou
tea
rth
qu
ake
and
/or
lan
dsl
ide)
,D:M
eteo
rolo
gic
also
urc
es.
So
urc
eo
fev
entd
ata:
Nat
ion
alG
eop
hy
sica
l
Dat
aC
ente
r/W
orl
dD
ata
Ser
vic
e(2
01
4).

6 1. Introduction
1.1 Research aim and objectives
Recognising the aforementioned New Zealand tsunami hazard, impacts of tsunami and importance
of evacuation, there has been much progress in developing tsunami warnings, evacuation sign-
s, maps and education around the country (Johnston et al., 2014). To address the potential for
difficulty in evacuating certain areas in a local tsunami, New Zealand research and emergency
management communities initiated a scoping study to review international examples of vertical
evacuation and explore the potential for using Tsunami Vertical Evacuation Buildings (TVEB) in
New Zealand (Leonard et al., 2011). The scoping study focussed on structural components of
TVEB and how they would be incorporated into the New Zealand emergency management legisla-
tive framework, building standards and land-use planning. Importantly, the scoping study did not
address the assessment of where vertical evacuation might be a suitable evacuation option, or how
to determine optimal placement of refuges. This thesis seeks to address this knowledge gap and
provide recommendations for the implementation of vertical evacuation in New Zealand. Interna-
tionally, engineers are currently applying the experience of structural damage in Tohoku, Japan,
in the development of new design guidelines for tsunami-resistant buildings (Chock, 2012). These
will provide guidance for development of tsunami-resistant standards within the New Zealand na-
tional building codes, and this thesis does not seek to pre-empt or replicate this engineering work.
The overall aim of this thesis is to enhance the current theoretical and methodological basis for
development of vertical evacuation strategies in New Zealand. The objectives set to achieve this
aim are to:
1. Determine maximum credible inundation extent, flow depth and available evacuation time
due to local-source subduction zone tsunami at a case study location in New Zealand (Chap-
ter 4);
2. Elucidate experiences of vertical evacuation in the March 2011 Great East Japan tsunami to
inform vertical evacuation planning in New Zealand (Chapter 5);
3. Explore intended evacuation behaviours in local-source tsunami in New Zealand, and gather
preliminary research on public perception of vertical evacuation facilities (Chapter 6);
4. Develop a method to assess pedestrian evacuation potential of the exposed population to
inform decision-making on evacuation planning, including vertical evacuation strategies
(Chapter 7).
1.2 Conceptual framework
This research contributes to natural hazards management and risk reduction in New Zealand, which
is conducted within the Civil Defence Emergency Management (CDEM) sector. The 2002 CDEM

1.2. Conceptual framework 7
Act promotes: sustainable management of hazards; encourages communities to reduce risk to
acceptable levels; provides for planning and preparation for civil defence emergencies, and for
response and recovery; requires local authorities to co-ordinate reduction, readiness, response and
recovery activities through regional groups; provides a basis for the integration of national and local
CDEM; and encourages coordination across a wide range of agencies, recognising that civil de-
fence emergencies are multi-agency events (MCDEM, 2008b). The approach prescribed by the Act
is described by four areas of activity: Reduction, Readiness, Response, and Recovery. By inform-
ing the development of evacuation plans, this thesis makes its primary contribution to Readiness,
in that it develops capabilities for public response in advance of a civil defence emergency. CDEM
in New Zealand is led by the Ministry of Civil Defence and Emergency Management (MCDEM)
and the operational structure (Fig 1.2) is determined by the CDEM Act 2002, which requires local
authorities to be part of a regional CDEM group. The 16 CDEM groups in New Zealand must each
have a CDEM Group Plan, which states and provides for the arrangements necessary to manage
hazards and risks affecting that region. The information presented in this thesis is intended to be
of use by CDEM group members (i.e., local authorities) to ascertain the requirement for vertical
evacuation in coastal communities within their jurisdiction. It is expected that the research would
contribute to the development of a national standard on planning and design of vertical evacuation
facilities.
Fig. 1.2: The New Zealand CDEM framework (MCDEM, 2008b).
The CDEM Act 2002 ‘requires that a risk management approach be taken when dealing with
hazards’ (MCDEM, 2008b, p. 5). This is achieved by working to the New Zealand Standard risk
management guidance, which requires anticipation and understanding of risk before evaluation of
whether that risk warrants modification, when judged against risk criteria (Standards New Zealand,
2009, Fig 1.3). Leonard et al. (2008a), and later Johnston et al. (2014) presented the New Zealand

8 1. Introduction
Fig. 1.3: Risk management process (Standards New Zealand, 2009).
Standard risk management process in a hazards context (Fig 1.4). Risk is commonly defined as the
product of hazard and vulnerability (Blaikie et al., 1994). Risk identification is the first phase of
risk assessment and requires that the sources and causes of risk are identified, in addition to poten-
tial areas of impact and consequences (Standards New Zealand, 2009). Hazard is ‘[a] dangerous
phenomenon, substance, human activity or condition that may cause loss of life, injury or other
health impacts, property damage, loss of livelihoods and services, social and economic disruption,
or environmental damage’ (UNISDR, 2009, p.17). Hazard comprises the probability or frequency
of an event occurring, the potential intensity of its damaging parameter (e.g., ground shaking, flow
depth or wind speed), its onset speed and spatial extent (Wisner, Gaillard, and Kelman, 2012).
Hazard frequency is described in terms of exceedance probability: the probability of exceeding a
chosen intensity threshold in any given year. This can be converted into a recurrence interval or
return period by taking the inverse of exceedance probability. Therefore, a 1% Annual Exceedance
Probability (AEP) is the same as an average recurrence interval (or ‘return period’) of 100 yr and
a 1 in 500 yr annual recurrence interval is equivalent to 0.2% AEP. Vulnerability refers to ‘[t]he
characteristics and circumstances of a community, system or asset that make it susceptible to the
damaging effects of a hazard.’ (UNISDR, 2009, p.30). The consequences of a hazard are influ-
enced by vulnerability, which is a product of numerous interacting social, cultural and economic
factors (Wisner, Gaillard, and Kelman, 2012). In engineering terms, vulnerability refers to the
structural damage sustained at a given level of impact (e.g., earthquake magnitude or tsunami flow
depth) in terms of vulnerability or fragility curves.
Risk analysis develops the understanding of the risk and its consequences (Standards New

1.2. Conceptual framework 9
Fig. 1.4: An holistic disaster risk reduction framework (Johnston et al., 2014).

10 1. Introduction
Zealand, 2009). Numerical modelling of past events or stochastic event sets, statistical analysis
or experimental analysis is used to determine the spatio-temporal dimension of the hazard impact.
Vulnerability models translate the impact into consequences, in terms of casualties (killed or in-
jured), damage ratio or monetary loss. Insured loss assessment (‘catastrophe modelling’) is widely
conducted in the reinsurance industry (Grossi and Kunreuther, 2005). Several loss models exist to
assess economic loss and casualties to aid mitigation planning, including the Federal Emergency
Management Agency (FEMA) HAZUS2 model and the GNS/NIWA RiskScape model (Schmidt et
al., 2011). Risk evaluation requires decision-makers to define a set of risk criteria that reflect their
organisation’s or community’s risk appetite or level of acceptable risk. The results of risk analysis
are compared against these criteria to determine what form, if any, of risk treatment is warranted
to reduce the risk (Standards New Zealand, 2009).
Risk management forms an important component of Disaster Risk Reduction (DRR) — the
over-arching ‘concept and practice of reducing disaster risks through systematic efforts to analyse
and reduce the causal factors of disasters’ (UNISDR, 2005, 2009). DRR includes: reduction of
hazard exposure and vulnerability of people and property; sustainable land and environment man-
agement; and improvements in preparedness and early warning capabilities3. Mitigation aims to
reduce the likelihood of a hazardous event occurring, reduce the negative consequences if it does
occur, avoid the risk altogether, or transfer/spread the risk. Risk transfer is primarily achieved
through (re)insurance mechanisms that spread financial risk. It is currently impossible to reduce
the likelihood of tsunami occurrence. Therefore, tsunami mitigation focusses on reduction of neg-
ative consequences by reducing or avoiding exposure to tsunami (through land-use planning and
relocation of assets and population), and reducing vulnerability by improving warning systems
and evacuation infrastructure, installing sea defences, and constructing/strengthening buildings to
tsunami-resistant standards.
In the international DRR context, The Hyogo Framework for Action 2005–2015 (HFA) recog-
nises evacuation in its ‘Priority for Action’ number 5: ‘Strengthen disaster preparedness for effec-
tive response at all levels’ (UNISDR, 2005, p.12):
‘losses can be substantially reduced if authorities, individuals and communities in hazard-prone
areas are well prepared and ready to act and are equipped with the knowledge and capacities for
effective disaster management.’
Key activities under this priority are to:
‘Prepare or review and periodically update disaster preparedness and contingency plans and poli-
cies at all levels, with a particular focus on the most vulnerable areas and groups. Promote regular
disaster preparedness exercises, including evacuation drills, with a view to ensuring rapid and ef-
fective disaster response and access to essential food and non-food relief supplies, as appropriate,
to local needs.’2 http://www.fema.gov/hazus3 http://www.unisdr.org/who-we-are/what-is-drr

1.3. Research methodology 11
Although this research demonstrates implementation of the developed methodology in New Zealand,
and discussion focusses on how vertical evacuation strategies fit into the New Zealand CDEM
framework, the publication of papers within this thesis contribute more widely to international
DRR by developing knowledge of tsunami evacuation strategies and modelling.
1.3 Research methodology
This section summarises the research methodology applied in this thesis. Several distinct methods
are implemented, reflecting the multi-disciplinary nature of research into tsunami evacuation. Be-
cause this thesis comprises several stand-alone papers (see section 1.5), the methodologies are also
outlined in each relevant paper.
Fig 1.5 presents an overview of the research method. As a combined body of work the research
contributes to the early stages of evacuation planning, specifically the first four points of Step 1
in the framework for tsunami evacuation planning (Scheer, Varela, and Eftychidis, 2012, Fig 1.6).
The framework of Scheer, Varela, and Eftychidis, 2012 defines three stages of an evacuation plan:
(1) risk and impact analysis to generate a valid first-iteration of an evacuation strategy; (2) imple-
mentation of the evacuation plan by placement of signage on routes and shelters, dissemination of
the plan / training of the exposed population, and routines for maintaining public awareness and
training; and (3) long-term monitoring and iterative improvements to the plan. This thesis satisfies
the initial stages of evacuation planning, in that it determines the onshore impacts of the maximum
credible local-source tsunami in the study area and assesses the requirement for evacuation facili-
ties within the inundation zone. This thesis is not intended to develop a complete evacuation plan
in isolation. As the risk management, holistic risk reduction and evacuation planning frameworks
all state, effective evacuation planning requires ongoing collaboration, communication and/or con-
sultation between local emergency management and stakeholders including the local community.
The information presented in the thesis informs this collaborative discussion and later stages of
evacuation planning.
Objectives 1, 3 and 4 were applied to a single case study area — Napier Territorial Authority,
in the Hawke’s Bay Region on the east coast of New Zealand’s North Island (Fig 1.7). Napier
was selected as the case study site due to its local subduction zone tsunami hazard and a potential
requirement for vertical evacuation, which was reflected in the involvement of the regional CDEM
group in the earlier TVEB scoping study (Appendix A). Much of Napier is <5 m above sea level,
but there is one large area of high ground (>100 m elevation) close to the city centre and coast.
The ability of the population to reach this high ground in the event of local-source tsunami is, as
yet, untested.

12 1. Introduction
Fig. 1.5: The research method.
Fig. 1.6: A generic framework for the development of an evacuation plan, after Scheer, Varela, and Efty-
chidis (2012).

1.3. Research methodology 13
Fig
.1
.7:
A:
Stu
dy
area
show
nin
the
nat
ion
alco
nte
xt.
B:
Nap
ier
Ter
rito
rial
Au
tho
rity
inth
eH
awkes
Bay
reg
ion
alco
nte
xt
wit
hn
um
ber
edlo
cati
on
sin
dic
atin
g
pal
aeo
-eco
log
ical
anal
ysi
sre
ferr
edto
in-t
ext.
Th
eb
ou
nd
ary
of
Nap
ier
Ter
rito
rial
Au
tho
rity
issh
ow
nan
do
ther
loca
tio
ns
refe
rred
toin
-tex
tar
eal
so
ind
icat
ed.
C:
Dig
ital
Ele
vat
ion
Mo
del
(DE
M)
of
10
mh
ori
zon
tal
reso
luti
on
show
ing
top
og
rap
hy
of
Nap
ier
Ter
rito
rial
Au
tho
rity
wit
hla
bel
led
un
it
area
s(s
ubu
rbs)
,ri
ver
s,N
apie
rP
ort
and
Haw
kes
Bay
Air
po
rt.

14 1. Introduction
1.3.1 Objective 1
Numerical modelling of tsunami is conducted to estimate inundation extent, flow depth and arrival
time for local-source tsunami, to meet Objective 1. These data are required to improve tsunami
hazard assessment for the study area and provide input for Objectives 3 and 4. Previous research
had provided wave heights at coast (Power, Reyners, and Wallace, 2008), estimated the hazard zone
using an initial waveform rather than source rupture so could not provide arrival time (Hawke’s
Bay Civil Defence And Emergency Management, 2011), or was conducted using low-resolution
topography data.
The COrnell Multi-grid COupled Tsunami (COMCOT) numerical tsunami modelling code was
employed to model tsunami generation, propagation and onshore inundation. The model has been
validated against international standard analytical and physical modelling benchmark tests (Liu
et al., 1995a,b; Wang and Liu, 2008) and has been used in previous studies of tsunami affecting
New Zealand and several globally significant tsunami (Baptista et al., 2011; Power et al., 2012,
2013; Wang and Liu, 2006). It was also used in the latest national tsunami hazard review (Power,
2013). COMCOT was selected for use on this basis, and its ability to simulate the tsunami process
from source through to inundation. With future application of the evacuation model in mind, it is
beneficial to initially develop a workflow that is compatible with output from COMCOT, which
is under continued development at GNS Science. A Python Application Programming Interface
(API) is also under development for use with COMCOT, and it is anticipated that the subsequent
evacuation modelling method (Objective 4) will become integrated into the API for coordination
between COMCOT and the RiskScape asset and loss model.
Tsunami generation uses four distributed-slip fault planes located on the Hikurangi subduction
zone. These have been adapted from previously-published source models (Cochran et al., 2005;
Wallace et al., 2009) on the basis of their tsunamigenic potential. One fault plane represents the
maximum credible earthquake, an MW 9.0 whole margin rupture, in order to generate the maxi-
mum credible tsunami inundation zone. Limited source parameter testing (impact of tidal level,
amount of slip) was conducted during the course of this work. Vertical deformation of each source
was modelled using elastic fault dislocation theory (Okada, 1985) to generate the tsunami initial
condition. A detailed DEM was constructed for the study area using Light Detection and Rang-
ing (LiDAR) data and digital bathymetry data. Grid resolution, nested grid boundary location
and time-step size were subject to sensitivity testing in order to optimise the model for boundary
effects, accuracy and computational expense. The simulations provide estimates of wave arrival
time relative to time of earthquake rupture, inundation extent and maximum flow depth for four
local-source tsunami scenarios.

1.3. Research methodology 15
1.3.2 Objective 2
The occurrence of the Great East Japan tsunami on 11 March 2011 provided a unique post-tsunami
case study in which a major local-source tsunami affected a region with established vertical evac-
uation strategies. It was clear that this event would be valuable for informing mitigation strategies
in New Zealand, so two periods of fieldwork were conducted in the affected areas.
The first field investigation was conducted as part of the UK Institution of Structural Engineers
(IStructE) Earthquake Engineering Field Investigation Team (EEFIT), which travelled to Miyagi
and Iwate Prefectures during 27 May – 4 June 2011. The field investigation had broad aims in-
cluding surveys of flow depth, damage to structures, coastal defences and lifelines with respect
to strong ground motion and tsunami (EEFIT, 2011, p. 2–3). The primary objective of the field
investigation, with respect to this research, was to investigate the structural features of vertical
evacuation buildings and the damage they sustained due to tsunami. A field survey methodolo-
gy was adopted, following field investigation guidelines (Dominey-Howes et al., 2012; Hughes
and Lubkowski, 2012). Survey locations were selected on the basis of previously-surveyed flow
depths (Mori and Takahashi, 2012), reported damage levels and contrasting coastal environments.
Multi-storey buildings within the inundated area, including those identified as designated vertical e-
vacuation buildings, were surveyed to record building location, construction type, external features
and damage level. Building location information comprised latitude/longitude coordinates, dis-
tance to coast, elevation, and surrounding land-use. Building construction information comprised:
construction type, number of storeys, plan shape, ground floor type, construction age, occupancy
(regular usage type), ground conditions, and orientation to coast. Building damage information
comprised: a five-level damage scale (Appendix B; EEFIT, 2011); externally visible earthquake
damage; number of storeys inundated; flow depth; and externally visible tsunami damage including
debris strike and scour. An accompanying photograph record was generated for each building. The
surveys were limited to external inspection only, and conducted during broader damage surveys in
Minami-Sanriku Town, Ofunato City, Natori City, Kamaishi City and Kesennuma Town (EEFIT,
2011). Further targetted surveys were conducted in Ishinomaki City and Kesennuma Town in order
to visit areas that could not be visited with the wider EEFIT team. The observations were compiled
and presented qualitatively to provide descriptors for required structural and non-structural features
of TVEB (Chapter 5).
The second period of reconnaissance was conducted during 19–28 October 2011 in collabo-
ration with two Japanese researchers (Mr Ichiro Matsuo, Director Secretary General and senior
researcher, Crisis and Environment Management Policy Institute (NPO-CeMI); and Associate Pro-
fessor Hitomi Murakami, Disaster Mitigation Planning, Yamaguchi University). The primary ob-
jective of this investigation was to conduct an exploratory analysis of the vertical evacuation strat-
egy, evacuation process and planning of TVEB in Miyagi and Iwate Prefectures. Semi-structured
interviews were used to gain insight into: official warning mechanisms; response to official, natu-

16 1. Introduction
ral and informal warnings — including evacuation timing; style and origin of evacuation maps and
education; and vertical evacuation buildings. The questions around vertical evacuation focussed on
clarifying earlier data on their availability and locations, the local design and designation process,
public awareness activities, the number of people using buildings for evacuation on 11 March 2011,
and post-event review of the vertical evacuation strategy. Interview questions were translated into
Japanese by our local collaborators and a professional translator. Semi-structured interviews are
one of the most common methods used in social science research (Kitchin and Tate, 2000) and have
been applied to a wide range of studies (Longhurst, 2003) to gain insight into complex behaviours,
opinions and emotions. The semi-structured interview method was chosen due to the experiential
nature of the data, in order to gather as much descriptive information as possible, and to provide
the flexibility for interviewees to discuss issues, actions and concepts that had not been anticipated
by the researchers, or had been observed in the field after development of the interview questions.
This method also enabled interviewees to describe events in the context of their locality, without
being limited by structured questioning. The interview comprised 21 questions, developed on the
basis of the first field investigation and knowledge of previous research and literature on tsunami
warnings and evacuation.
Seven case study locations (Taro Town, Kamaishi City and Ofunato City in Iwate Prefecture;
Kesennuma City, Minami-Sanriku Town, Ishinomaki City and Natori City in Miyagi Prefecture)
were identified based on identification of TVEB during the earlier EEFIT investigation. The case
study locations comprise contrasting topography (rias and plains), and experienced a range of
impacts and evacuation issues during the tsunami. Interviewees comprised civil protection, emer-
gency management, fire department and police department staff). The relevant interviewees in
each location were identified and recruited by our local collaborators, and were given the interview
questions several days prior to the interview. The two primary interviewers (Fraser and Leonard)
posed questions in English, with simultaneous translation into Japanese by the translator and/or
Prof. Murakami. The translator was briefed in the required technical language prior to translating
and conducting the interviews. Prof. Murakami is an expert in the field and has an excellen-
t professional-level command of the English language. The interviewees provided responses in
Japanese, with simultaneous or near-simultaneous translation into English. Notes were taken by
Fraser and Leonard throughout the interviews, and the full interviews were audio-recorded. During
the interview, any ambiguous or unclear statements or facts were checked with the interviewee.
Following each interview, notes were compared and discussed to collate themes for further
analysis and exploration in any subsequent interviews. The two sets of notes were cross-checked
and any ambiguities were clarified using the audio recordings. Factual statements and emergent
themes from all interviews were collated to develop a descriptive account of warning and evacua-
tion on 11 March 2011, and to form a summary of vertical evacuation in the municipalities inves-
tigated. Findings were published as a GNS Science report (Appendix D) and results pertaining to
vertical evacuation were published as a journal paper, presented in Chapter 5.

1.3. Research methodology 17
1.3.3 Objective 3
To achieve Objective 3 (‘Explore intended evacuation behaviours in local-source tsunami in New
Zealand, and gather preliminary research on public perception of vertical evacuation facilities’),
structured face-to-face interviews were conducted with residents and visitors in Napier. The in-
terviews aimed to collect participants’ intentions (‘stated preferences’) with respect to evacuation
behaviour in local-source tsunami. Development of interview questions was informed by previous
tsunami awareness surveys (Johnston et al., 2003, 2009; Leonard and Wright, 2011) and expecta-
tions of intended behaviour from the published literature. The interview items were structured in
such a way to avoid problems such as fatigue bias and the use of leading questions (Parfitt, 2005).
Questions were collated into sections to collect data on: participant type (resident/visitor); haz-
ard awareness; behavioural intentions in two given tsunami scenarios (ground shaking occurring
when at home or the survey location); opinions on the use of TVEB; and demographic information.
Before explicitly addressing the use of TVEB, participants were given the opportunity to specify
‘buildings’ as a possible destination in order to explore awareness of TVEB as a concept.
Surveys were conducted by two researchers using a convenience sampling method at several
locations in the city. The focus of the survey was to understand people’s intended actions when in
the city at the time of a local-source earthquake, so the study benefited from face-to-face interview-
ing at the location of interest, rather than providing scenarios in written form using a postal survey
to residential addresses. Interviews were carried out throughout the day on a Friday, Saturday and
Sunday at three locations: the city centre shopping area, Westshore beach during surf lifesaving
training, and at Kennedy Road shopping precinct further inland. These locations were selected on
the basis of being at risk and having high levels of day-time foot-traffic.
The interviews comprised closed-response and open-ended questions. Closed-response ques-
tions were used for hazard awareness, participant type and demographic data; Open-ended ques-
tions were employed to record intended behaviour and opinions on TVEB to ensure responses were
not artificially constrained by set options. Questions were piloted by a group of GNS Science sum-
mer students (Currie et al., 2014) during tsunami awareness surveys in Wellington and tested with
GNS Science staff prior to implementation. The interview questions were posed to participants
as written on the interview sheet, with explicit instructions for interviewers to follow (Chapter 6,
Appendix 1). Survey responses were coded and analysed using a semantic-level thematic anal-
ysis approach, reporting the explicit meaning of responses to develop knowledge of evacuation
intentions, without interpreting social or psychological influences on those responses (Braun and
Clarke, 2006). Frequency analysis determined the most-commonly reported behavioural intentions
and cross-tabulation was used to assess awareness and actions in relation to participant type, lo-
cation at the time of event, and demographic variables. Statistical analysis and correlation with
demographics were conducted where the sample size was sufficient to do so.

18 1. Introduction
1.3.4 Objective 4
To address the final objective (‘Develop a method to assess pedestrian evacuation potential of the
exposed population to inform decision-making on evacuation planning, including vertical evacua-
tion strategies’), a Geographic Information System (GIS)-based Least-Cost Distance (LCD) evac-
uation modelling approach is used. An existing least-cost path distance model is augmented with
newly-developed methods to enable modelling of temporally-variable exposure and variability in
pedestrian travel speeds.
The exposure model is developed in Excel Visual Basic for Applications (VBA) using census
data, school rolls and tourist accommodation data. Diurnal activity curves are developed to enable
distribution of exposure to different locations according to time of day, day of week, and month.
The distributed exposure is then used as the basis for evacuation modelling. The benefit of a
temporally-variable exposure model is the potential to simulate evacuation potential for multiple
exposure scenarios (e.g., rush-hour, weekday versus weekend and at different times of year), rather
than the more-typical approach, which is restricted to day-time and night-time scenarios.
Travel speed distributions are developed from a review of travel speeds that have been previously-
used in evacuation modelling. In the evacuation model, each person is assigned a randomly-
sampled travel speed from a distribution based on their demographic group, derived in the exposure
model. The application of travel speed distributions provides an improved representation of vari-
ability in travel speed compared to the typical approach of applying a fixed travel speed to each age
or demographic group. Therefore, the proposed method enhances current assessment of pedestrian
evacuation potential.
The LCD method is developed in Python programming code. The method is demonstrated in an
assessment of pedestrian evacuation potential for the maximum credible tsunami at the case study
location, Napier. Evacuation potential is used to inform the requirement for vertical evacuation
in the city. An additional process is used to identify the optimal locations for vertical evacuation
refuges, if a vertical evacuation strategy was to be developed. Hazard inputs (inundation extent,
flow depth and wave arrival times) are required as input to the evacuation model; these are obtained
from the numerical modelling conducted in Objective 1. The DEM generated to achieve Objective
1 is also applied in this stage.
1.4 Study area
Napier Territorial Authority, in the Hawke’s Bay Region on the east coast of New Zealand’s North
Island has been chosen as the case study area for this research. Napier is a generally low-elevation
coastal area of 106 km2, comprising residential suburbs, commercial and industrial areas and a-
gricultural land including orchards and vineyards. Bluff Hill provides an area of high ground
immediately north of the city centre to maximum elevation over 100 m. Napier Port is the fourth
largest in New Zealand, handling cargo including forestry products and container shipments, with

1.4. Study area 19
storage of timber and containers on site (Port of Napier Limited, 2012). The estimated popula-
tion of Napier in 2013 is 57,800 based on medium growth projections (Statistics New Zealand,
2013a) from the most recent census in 2006 (Statistics New Zealand, 2006). During peak tourist
season (January to March), an average of 2,342 visitors stay in Napier accommodation every night
(Statistics New Zealand, 2012c, 2006–2011 data). Numerous accommodation facilities, schools,
one tertiary education campus, early childhood centres and care homes or retirement villages form
concentrations of people who may be less able to evacuate effectively in a local earthquake and
tsunami due to mobility issues or deficiency in local knowledge.
At the eastern shore of the city there is a steep gravel beach and berm stretching along the
coastline from Bluff Hill in the north to the confluence of the Tutaekuri, Ngaruroro and Clive
Rivers in the south (Fig 1.7). At its northern end, the berm elevation is 7 m above Mean Sea Level
(MSL), reducing to 4 m above MSL at its southern end. Northwest of Bluff Hill the suburbs of
Ahuriri and Westshore are separated by a tidal inlet and small marina. Westshore is situated on a
peninsula elevated 4–6 m above MSL. Bay View is the most northern suburb of Napier, extending
north around the bay. Much of the land around the present Ahuriri Lagoon was previously below
sea level until uplift during the 1931 Hawke’s Bay earthquake and due to artificial drainage in the
years since (Hull, 1986).
The 1931 Hawke’s Bay earthquake destroyed many of the buildings in Napier and triggered
a rebuild in 1930s Art Deco style. The current building stock retains a large number of one- and
two-storey 1930s structures, which are an important factor in the city’s tourism activities. Ninety-
five percent of the building stock in Napier is one or two storeys in height. Ninety-two percent
of structures are of light timber construction, 3% are reinforced concrete shear wall and 3% are
concrete masonry (Cousins, 2009; King and Bell, 2009; King et al., 2008). The remaining 2%
are Brick Masonry, Light Industrial, Reinforced Concrete Moment Resisting Frame, Steel Braced
Frame, Steel Moment Resisting Frame, or Tilt-up Panel construction. The small number of tall
buildings in Napier has implications for tsunami evacuation. The suburban building stock primarily
comprises single-storey family homes or small commercial premises and the only concentration of
taller buildings occurs in the primary retail, tourist and civic area of Nelson Park.
Fig 1.8 shows Napier Territorial Authority from the air, with agricultural land in the south
(foreground) and suburbs to the south of Bluff Hill. The strip of residential properties along the
eastern shore of Napier is visible. Fig 1.9 shows the city from the north, overlooking Westshore,
Ahuriri, the Marina and Ahuriri Lagoon, Napier Port and Bluff Hill. Fig 1.10 shows the Port of
Napier, looking south-west. The moored cruise ship represents additional population exposure,
and shipping containers and logs that provide potential large debris in a tsunami. Behind the Port
are the cliffs and residential suburbs of Bluff Hill. Ahuriri Lagoon is visible behind the residences
of Westshore along the shoreline coastline, and Hawke’s Bay Airport is located at the right-hand
edge (northern edge) of this image. Fig 1.11 shows the main traffic arteries between residential
suburbs, and culverts with crossing locations.

20 1. Introduction
Fig. 1.8: Oblique aerial photograph looking north towards Napier. The majority of the Territorial Authority
is visible in this photograph. Photo credit: D Townsend/GNS Science
Fig. 1.9: Oblique aerial photograph looking south across Westshore, Napier Port and Bluff Hill/Hospital
Hill. Photo credit: D Townsend/GNS Science

1.4. Study area 21
Fig. 1.10: Oblique aerial photograph looking south-west over Napier Port, Bluff Hill, Ahuriri and Westshore.
Photograph taken in 2001. Source: Hawke’s Bay Regional Council.
Fig. 1.11: Oblique aerial photograph looking southeast across the residential suburbs of Napier. Note the
three large tree-lined culverts, crossed by major roads. Photo credit: D Townsend/GNS Science

22 1. Introduction
1.5 Thesis structure
The structure of this thesis has been designed to provide logical progression through the research,
placing the research in the context of tsunami processes, impacts, and mitigation. Chapter 1 has
introduced the aims and objectives of the research, the risk management and CDEM frameworks
in which this research sits and the research methodology. The case study location has also been
introduced.
1.5.1 Literature review
The physical process and impacts of tsunami are described in Chapter 2. The tsunami hazard
in New Zealand (Chapter 2.4) provides greater context to the need for tsunami risk management
in New Zealand by describing the impact of previous tsunami in the historic and palaeo-tsunami
records, and giving an overview of the recently-updated national tsunami hazard assessment (Pow-
er, 2013). Approaches to tsunami risk reduction are reviewed in Chapter 3 to place the role of
vertical evacuation within in the wider framework of risk reduction.
1.5.2 Primary research and discussion
The subsequent four chapters present the primary research conducted during this research, in the
form of published or submitted papers. Chapter 4 discusses in more detail the tsunami hazard from
major earthquakes at the Hikurangi subduction zone and presents the results of deterministic local-
source tsunami inundation simulation at Napier (Objective 1). The results of these simulations are
pre-requisite for subsequent evacuation modelling and provide context to the subsequent discussion
of tsunami risk reduction. The published work is preceded by an overview of tsunami numerical
modelling (Section 4.1).
Chapter 5 focusses on vertical evacuation as a risk reduction strategy, presenting documenta-
tion of TVEB surveys in Tohoku, and experiences of emergency managers in the 2011 Great East
Japan tsunami (Objective 2). Chapter 6 is an investigation of residents’ and visitors’ intended e-
vacuation behaviour in local-source tsunami scenarios at Napier. It includes preliminary research
into people’s views on vertical evacuation buildings (Objective 3). Chapter 7 then presents the de-
velopment and demonstration of a time-variable exposure model in combination with a GIS-based
model of pedestrian evacuation potential to assess the requirement of vertical evacuation for local-
source tsunami (Objective 4). Detailed results on pedestrian evacuation potential in Napier, and
the optimised selection of vertical evacuation locations is presented after the published work, in
Section 7.8. It was decided that these results were too site-specific for publication in an interna-
tional journal, and are intended for subsequent publication as a technical report. Discussion of the
research findings with respect to the aim and objectives is presented in Chapter 8.
Chapters 4 and 5 have been published in international peer-reviewed journals, as Fraser et al.
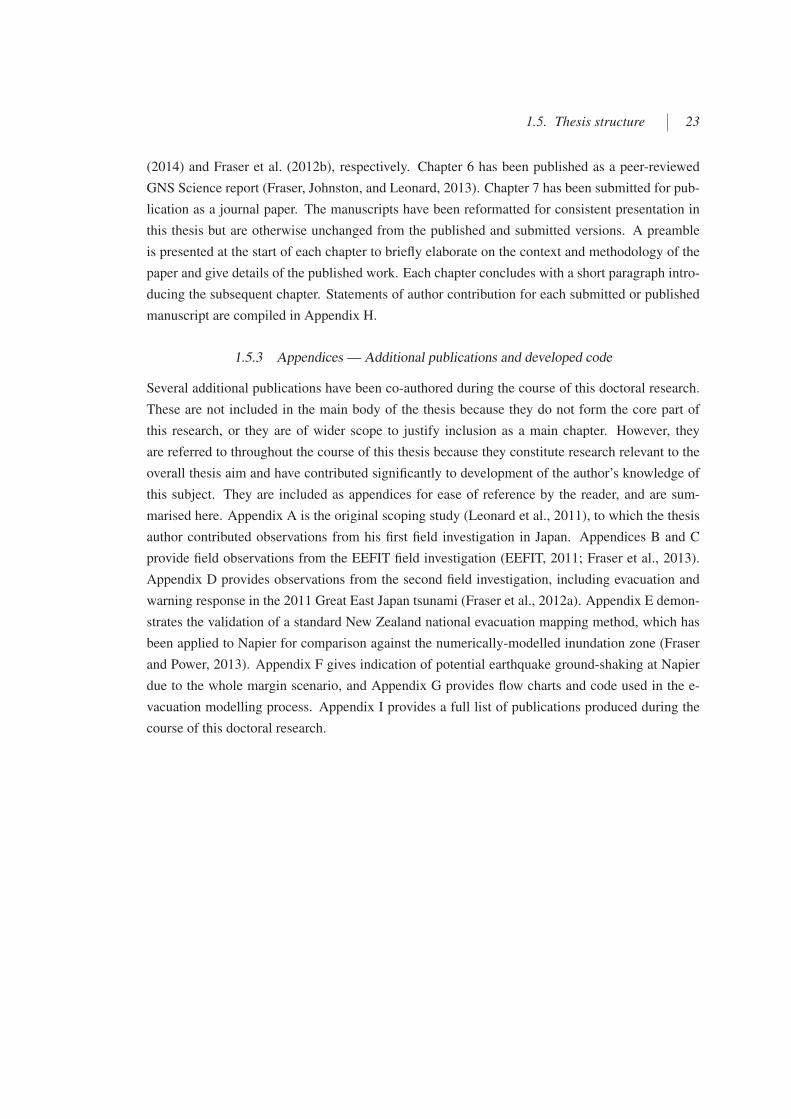
1.5. Thesis structure 23
(2014) and Fraser et al. (2012b), respectively. Chapter 6 has been published as a peer-reviewed
GNS Science report (Fraser, Johnston, and Leonard, 2013). Chapter 7 has been submitted for pub-
lication as a journal paper. The manuscripts have been reformatted for consistent presentation in
this thesis but are otherwise unchanged from the published and submitted versions. A preamble
is presented at the start of each chapter to briefly elaborate on the context and methodology of the
paper and give details of the published work. Each chapter concludes with a short paragraph intro-
ducing the subsequent chapter. Statements of author contribution for each submitted or published
manuscript are compiled in Appendix H.
1.5.3 Appendices — Additional publications and developed code
Several additional publications have been co-authored during the course of this doctoral research.
These are not included in the main body of the thesis because they do not form the core part of
this research, or they are of wider scope to justify inclusion as a main chapter. However, they
are referred to throughout the course of this thesis because they constitute research relevant to the
overall thesis aim and have contributed significantly to development of the author’s knowledge of
this subject. They are included as appendices for ease of reference by the reader, and are sum-
marised here. Appendix A is the original scoping study (Leonard et al., 2011), to which the thesis
author contributed observations from his first field investigation in Japan. Appendices B and C
provide field observations from the EEFIT field investigation (EEFIT, 2011; Fraser et al., 2013).
Appendix D provides observations from the second field investigation, including evacuation and
warning response in the 2011 Great East Japan tsunami (Fraser et al., 2012a). Appendix E demon-
strates the validation of a standard New Zealand national evacuation mapping method, which has
been applied to Napier for comparison against the numerically-modelled inundation zone (Fraser
and Power, 2013). Appendix F gives indication of potential earthquake ground-shaking at Napier
due to the whole margin scenario, and Appendix G provides flow charts and code used in the e-
vacuation modelling process. Appendix I provides a full list of publications produced during the
course of this doctoral research.


2. TSUNAMI PROCESSES AND HAZARD
2.1 Tsunami generation
2.1.1 Seismic sources
The primary cause of tsunami generation is sub-marine seismic sources. The potential for an earth-
quake to be tsunamigenic increases with increased seismic moment (Kanamori, 1972), shallower
focal depth, and greater sea depth at the earthquake location (Suppasri, Imamura, and Koshimura,
2012). An earthquake must generally exceed MW 5.0 to be tsunamigenic (National Geophysi-
cal Data Center/World Data Service, 2014) and although 90% of tsunami are due to the vertical
motion of thrust earthquakes typical of subduction zones, they can also result from strike-slip or
dip-slip mechanisms. Horizontal motion due to shallow-dipping thrust or strike-slip mechanisms
can cause particularly large tsunami when they occur near steep sub-marine slopes (Tanioka and
Satake, 1996b). Tsunamigenic earthquakes are generally <60 km deep (National Geophysical Da-
ta Center/World Data Service, 2014). In the shallowest 30 km, dip-slip events are ineffective (due
to the surface integral of deformation becoming zero) while thrust events are most effective; there
is little difference between the two at greater depths (Okal, 1988). Deep earthquakes can still cause
tsunami despite the reduction in strong motion on the ocean floor, as the relative area affected by
the displacement is increased, meaning a sufficiently large volume of water can be displaced by the
relatively smaller ground motion (Okal, 1988).
Tsunami amplitude (Fig 2.1) is controlled primarily by earthquake magnitude and spatial vari-
ation of slip (Abe, 1979; Geist, 1998; Kajiura, 1981; Okal, 1988). Rupture velocity (Suppasri,
Imamura, and Koshimura, 2010), energy directivity (Okal, 1988), occurrence of co-seismic land-
slides and rupture propagation across multiple rupture segments also affect amplitude. Tsunami
earthquakes are earthquakes with relatively moderate magnitude and slow rupture speed, that cause
tsunami disproportionately larger than their magnitude would suggest (Kanamori, 1972). Tsunami
earthquakes pose problems for evacuation and education on response to natural warnings. Due to
the relatively low magnitude, ground shaking may not be felt at the coastline, or may be dismissed
as too weak to have caused a tsunami. Examples of tsunami earthquakes include the 1896 Mei-
ji Sanriku (Shuto and Fujima, 2009), 1992 Nicaragua (Satake, 1994) and 2010 Mentawai Island
tsunami (Newman et al., 2011).

26 2. Tsunami processes and hazard
Fig. 2.1: Schematic diagram of tsunami wave terminology.
2.1.2 Landslide sources
Landslide-induced tsunami present a risk to many coastlines and enclosed water bodies. Notable
landslide generated tsunami events include 1958 Lituya Bay, and local landslide-induced tsunami
triggered by the 1964 Prince William Sound earthquake, both in Alaska, United States (US). There
have also been multiple events in Norwegian fjords (Lockridge, 1990) and the 1998 Papua New
Guinea tsunami (Synolakis et al., 2002; Tappin, 2001) caused over 2,000 fatalities (Table 1.1).
Slope failure may be triggered by: seismic activity; over-steepening of slopes, decomposition
of gas hydrates or increased saturation; continuous sediment accumulation; or volcanic activity
(Masson et al., 2006). Due to the source mechanism approximating a point source, the resulting
tsunami is significantly more focussed and more dispersive than those generated by ocean floor
displacement in a fault rupture (Glimsdal et al., 2013), therefore they are more restricted in travel
distance and spatial extent of damage. The wave form of a landslide-induced tsunami is one of
a low leading crest with followed by: a trough 2–3 times greater in amplitude than the crest; a
large crest matching the preceding trough; and a series of higher frequency waves (Pelinovsky
and Poplavsky, 1996). The exaggerated N-wave shape results in greater run-up values than in a
comparable seismically-induced event but wave amplitude attenuates rapidly with distant from the
source. Landslide sources are not considered further in this study.

2.2. Propagation and inundation 27
2.1.3 Meteorological forcing, volcanic eruption, and bolide impact
Meteorological tsunami, or meteo-tsunami (Defant, 1961; Nomitsu, 1935) are large amplitude se-
iche oscillations, having similar temporal and spatial scales as typical seismically-forced tsunami,
that are caused by meteorological forcing (Rabinovich and Monserrat, 1998). They are generated
when strong atmospheric disturbances occur over a sea, bay or harbour that has specific resonance
characteristics causing resonance between the atmospheric forcing and the resulting long wave,
or where coastal orientation or configuration promotes amplification of long waves by resonance
(Rabinovich and Monserrat, 1998). Because of the requirement for specific conditions, they are
observed commonly in certain locations, sometimes with damaging wave heights of up to 4 m
(Rabinovich and Monserrat, 1998; Tappin et al., 2013).
Volcanic eruptions present various mechanisms to induce tsunami: seismic tremors, pyroclastic
flows, submarine explosions, caldera collapse, lateral blast, landslide, rock or debris avalanche,
lahar, atmospheric pressure wave and lava (Latter, 1981). Among the most famous volcanically-
generated tsunami are those from the eruption of Santorini (Thera), Crete, in the 2nd millenium BC
(Cita et al., 1984) and Krakatau, Indonesia, in 1883 (Lowe and De Lange, 2000). Several studies
have explored the potential for tsunami generated by flank collapse on volcanic islands in Europe
(e.g., Ward and Day, 2001; Zaniboni et al., 2013).
Bolide impact has been discussed as having the potential to cause massive tsunami, due to the
displacement of water if a bolide (meteorite) of larger than a few hundred metres diameter were to
impact into a water body. This generation mechanism is often quoted in hazard assessments and
general discussions of tsunami generation, however, there little evidence in the literature pointing to
a specific bolide-generated tsunami event. Bryant, Walsh, and Abbott (2007) discuss the potential
cosmogenic source of a mega-tsunami that affected 1500 km of Australian coastline in the 17th
Century, as the dated deposit coincides with Aboriginal legends that appear to describe a comet
strike and tsunami. Goff et al. (2010a) challenged the inferred causal mechanism due to an absence
of evidence for a submarine impact crater and questioned the validity of the data pointing to the
deposit being tsunami-derived. These generating mechanisms are outside the scope of the current
research and are not discussed further in this research.
2.2 Propagation and inundation
The source event determines initial amplitude, directionality and wave-form of the resulting t-
sunami, which is then propagated across the body of water. A seismic thrust or normal faulting
mechanism will commonly result in a tsunami wave that propagates in two directions, with most
energy directed normal to the fault strike. Coastlines proximal to a subduction zone are generally
positioned normal to the strike so receive most of the wave energy and experience the largest wave
amplitude (Fig 2.2). Locations oblique to the strike receive less energy due to this directionality.
The wave will take the form of an N-wave due to differential uplift of the seabed in the seismic

28 2. Tsunami processes and hazard
event (Tadepalli and Synolakis, 1994, 1996). In one direction the wave will be a leading-depression
N-wave and in the other, a leading-elevation N-wave (Tadepalli and Synolakis, 1994). Arrival of a
leading-depression wave causes drawdown at the coast, preceding positive tsunami arrival; leading
elevation waves arrive as a positive wave with no drawdown as warning. This important to ad-
dress in tsunami education and understanding of natural warnings, to ensure that the public doesn’t
expect to see drawdown in all cases.
In the open ocean, tsunami typically have a wavelength (Fig 2.1) of hundreds of kilometres
and amplitude of <1 m. The depth of the ocean (D; average of <4 km) limits the vertical di-
mension of the tsunami. Due to these dimensions, tsunami conform to the long wave theory, with
implications for numerical modelling (Section 4.1). Wave celerity (propagation speed) of tsunami
(c) is calculated using c =√gD, where g is the gravitational constant. Therefore, tsunami can
travel at around 700 kmh-1 in the deep ocean and celerity reduces to tens of kmh-1 in shallow water
on continental shelves, or over undersea ridges. The variation in velocity due to changing water
depth results in wave refraction, which alters the path of wave travel. Waves become focussed
over shallow bathymetry and spread in deep water (Satake, 1988; Woods and Okal, 1987, Fig 2.2).
Divergence and convergence of the tsunami is also affected by the rotation (Coriolis Force) and
curvature of the earth as they travel across the oceans, which influences the path of travel (Fig 2.2)
and resulting wave height at coasts (Shuto, 1991).
Wave energy (and maximum amplitude) is attenuated with distance due to geometrical wave
spreading and frequency dispersion. Dispersion occurs because waves with different frequencies
propagate at slightly different speeds. The result is that tsunami in the far-field appear as multiple
oscillations of different wave period, rather than the original single wave that was generated —
hence the arrival of tsunami as a series of waves over several hours. The natural resonant periods
of coastal topography determines the periods of distant tsunami that are observed at the location
(Rabinovich, 1997, and references therein). Source fault plane dimensions are a key control on dis-
persion. Sources with smaller fault planes causing tsunami with greater dispersion effects (Glims-
dal et al., 2013), thus greater attenuation of wave energy. Dao and Tkalich (2007) demonstrated
that dispersion can significantly reduce maximum tsunami amplitude (by 40%–60%) in deep water
where celerity is greatest.
As tsunami travel into shallower water close to the coast, celerity and wavelength reduce due
to the decreasing water depth and amplitude increases to satisfy the conservation of wave energy
(‘shoaling’; Fig 2.1). The majority of tsunami occur onshore as non-breaking waves (Pelinovsky
and Mazova, 1992). In some cases, however, a wave breaks offshore and forms a turbulent bore,
which results in smaller run-up heights but retains its wave energy and destructive power (Yeh,
1991). The increased effect of bottom friction and turbulence causes energy dissipation and some
energy is reflected off the coastline. Wave energy reflected off the coastline results in construc-
tive and destructive interference as reflected waves interact with incoming waves. Despite this
reduction in energy, the remaining wave energy and celerity is still significant and imparts huge

2.2. Propagation and inundation 29
(a)
Pac
ific
Wav
e2011
Tonga
Tre
nch
scen
ario
.(b
)P
acifi
cW
ave
20
11
Ale
uti
anIs
lan
ds
scen
ario
.
Fig
.2
.2:
Pre
dic
ted
wav
eam
pli
tud
efo
rtw
ots
un
ami
scen
ario
sin
the
Pac
ific
Oce
an(U
NE
SC
O/I
OC
,2
01
1).

30 2. Tsunami processes and hazard
forces in the coastal zone and onshore. Tidal regime at the time of tsunami can be important in
the coastal zone. Dao and Tkalich (2007) demonstrated that an increase of several metres in water
depth (within a typical tidal range) can lead to an increase of up to 100% in maximum amplitude
and earlier wave arrival time.
Local variations in wave height maxima are common due to interactions between the wave and
coastal configuration and relief. Refraction and diffraction occur around coastal features due to
variations in speed and wave height along the wave crest. These effects can result in the greatest
wave amplitude occurring on the lee-side of islands, where waves can diffract around the coast-
line and meet on the lee-side, causing constructive interference and amplified run-up (Liu et al.,
1995b). Within a semi-enclosed structure such as a bay or harbour, reflections, wave-focussing
and resonance can amplify wave heights, leading to higher maximum run-up and greater damage.
Wave focussing can occur due to the geometry of a bay constricting the volume of water as it flows
towards the head of the bay (e.g., Pago Pago Harbour in Samoa 2009 — Didenkulova, 2013; Fritz
et al., 2011; Okal et al., 2010).
2.3 Impacts of tsunami
The immediate impacts of tsunami are casualties and damage to structures, lifelines, infrastructure
and the natural environment. Medium-term impacts include re-location of entire communities,
loss of economic production and the need for extensive debris clearance before an area can be re-
developed. Tsunami cause loss of economic production due to: disruption of agriculture (increased
salinity of soils and sediment deposition); aquaculture and fisheries (loss of port infrastructure,
vessels and ecosystem damage); commerce and industry (power outage, infrastructure damage,
supply chain disruption, damage to retail or production facilities). In the longer-term, continued
economic disruption and disconnection with family, community and culture can affect recovery
(Rodriguez et al., 2006; Rofi, Doocy, and Robinson, 2006).
2.3.1 Structural damage
Tsunami damage to structures such as coastal defences, buildings and bridges have been well-
studied during post-event field investigations since the 1990s and particularly post-2004 (Synolakis
and Bernard, 2006). As a result, causes of damage and building failure modes have been well
characterised. The main causes of damage to buildings are foundation scour, lateral bending failure
of beams, failure of beam-column joints, out-of-plane failure of infill walls and windows, fire,
debris impact (particularly on columns), and overturning (Fraser et al., 2013; Lukkunaprasit et al.,
2008; Reese et al., 2007; Rossetto et al., 2006; Ruangrassamee et al., 2006; Shuto and Matsutomi,
1995; Suppasri et al., 2013b).
The development of tsunami fragility curves (Koshimura, Namegaya, and Yanagisawa, 2009)
has provided further data on the vulnerability of structures to tsunami damage (Reese et al., 2011;

2.3. Impacts of tsunami 31
Suppasri, Koshimura, and Imamura, 2011; Suppasri et al., 2013a,c). Statistical analysis of damage
data from >250,000 buildings surveyed after the 2011 Great East Japan tsunami show that timber
frame buildings perform poorly in tsunami, Reinforced Concrete (RC) structures are most tsunami-
resistant and buildings of more than two storeys are stronger than low-rise buildings (Suppasri et
al., 2013a).
The 2011 Great East Japan tsunami was the first time that damage had been observed to coastal
defences designed to withstand tsunami. Many coastal defences, such as the 10 m high wall at Taro
Town were designed for tsunami, but were overtopped. Concrete blocks that were insufficiently
connected and comprised sand infill were toppled (Fraser et al., 2013). Over 8 km of breakwaters
collapsed (Yagyu, 2011) and although the breakwater at Kamaishi may have reduced inundation
in the town, scour between concrete blocks ultimately caused the breakwater to fail (Kazama,
2011). Concrete block revetments on the coastal plains were overtopped and heavily scoured on
the lee-side, with concrete blocks transported up to 100 m inland (Fraser et al., 2013), showing
the potential for damaged defences to develop into water-borne missiles. The coastal plains also
exhibited buildings that had been damaged by uprooted trees from the coastal defence forest (Fraser
et al., 2013). Appendices B and C present research on tsunami damage in the 2011 Great East Japan
tsunami in more detail.
2.3.2 Tsunami casualties
Commonly reported injuries sustained in tsunami include fractures, crush injuries, abrasions and
lacerations due to debris-strike (Guha-Sapir et al., 2006). Debris can range in size from abrasive
particles of sand and gravel, to large debris such as buildings and marine vessels. The most com-
mon cause of death in tsunami is drowning, which is likely to be influenced by injuries sustained
in the water. Mortality rate due to tsunami is highly variable and dependent on a variety of factors.
Hazard factors influencing mortality are: flow depth and velocity; inundation extent; wave arrival
time after the source event; time of tsunami occurrence; and presence of debris. Important human
factors include: timing and efficacy of official or natural warnings; coastal population density;
cultural, social, economic and demographic vulnerability; preparedness levels; and availability of
evacuation routes and refuges. Activity and location at the time of the event, localised damage
intensity, behaviour during the event, physical and mental condition and even types of clothing can
all influence mortality rate (Nishikiori et al., 2006). Overall mortality rates reported from the 2004
Indian Ocean tsunami were 12.9% in Ampara, eastern Sri Lanka (Nishikiori et al., 2006), 13.9%
in Aceh Barat and Nagan Raya districts, Aceh Province, Indonesia (Rofi, Doocy, and Robinson,
2006) and 5.3–23.6% depending on location in Aceh Jaya district (Doocy et al., 2007). Mortal-
ity rates for individual municipalities in the 2011 Great East Japan tsunami varied from 0.01%
to 8.9% in Iwate Prefecture and 9.8% in Miyagi (National Police Agency of Japan, 2011). Car-
diac arrest and near-drowning respiratory problems (due to inhalation of water) also contribute to

32 2. Tsunami processes and hazard
post-tsunami deaths (Guha-Sapir et al., 2006).
Higher mortality among females than males occurred in the 2004 tsunami, despite their equal
representation in terms of numbers of people affected (Frankenberg et al., 2011; MacDonald, 2005;
Nishikiori et al., 2006). This gender difference was found to apply only to those of working age
(Doocy et al., 2007; Guha-Sapir et al., 2006). Young children and the elderly also exhibited higher
mortality rates than those in middle age groups in Sri Lanka in 2004 (Frankenberg et al., 2011;
Nishikiori et al., 2006), but mortality was more equal between genders. The primary reasons for
age-bias in mortality are mobility and strength. Socio-economic and cultural contexts, gender
roles and daily activities influence a person’s education level, location and likelihood of physical
isolation at the time of tsunami, therefore influence mortality (Neumayer and Plumper, 2007). This
was exemplified in 2004 when the higher female mortality rate was partially explained by women
staying behind to look after children and elderly family, and by women having a lower likelihood
of being able to swim (MacDonald, 2005). Conversely, in some areas male mortality was greater as
males were commonly employed in the fishing industry, and were at sea when the tsunami struck
(MacDonald, 2005).
Various formulae have been proposed for mortality as a function of flow depth, for coastal
floods, river floods and tsunami (Jonkman, Vrijling, and Vrouwenvelder, 2008). Tests of human
stability in flows suggest that ‘people lose stability in relatively low depth-velocity products’ (0.6–
2.0 m2s-1; Jonkman, Vrijling, and Vrouwenvelder, 2008), not accounting for fatigue or the presence
of debris. For flow velocity of 3–4 ms-1, this equates to a depth of 0.2–0.7 m. Estimates of tsunami
flow derived from videos of previous events suggest flow velocity at the water surface can exceed
this. Velocity of 8 ms-1 has been recorded at the coast (Fraser et al., 2013; Rossetto et al., 2006)
and up to 1 km inland (Hayashi and Koshimura, 2013). Fritz et al. (2006) recorded velocities up
to 5 ms-1 more than 3 km inland which suggest instability could occur at even minor flow depths
in much of the inundation zone. These estimates demonstrate the importance of early and efficient
evacuation to avoid contact with tsunami flow.
2.4 Historic tsunami in New Zealand
New Zealand is situated in an active tectonic environment, on the boundary of the Australasian and
Pacific tectonic plates. Offshore of the east coast of the North Island, the Pacific Plate is subducting
beneath the Australasian Plate at the Hikurangi subduction margin (Fig 2.3). At the northern end
of the South Island, plate motion transitions into a strike-slip motion along the Alpine Fault before
reverting to subduction offshore of the South Island at the Puysegur Trench. The entire sub-aerial
and sub-marine landmass of New Zealand is affected by active faulting and volcanic systems relat-
ed to this plate boundary movement, which results in local seismic, volcanic and landslide-induced
tsunami hazard. As a collection of islands, New Zealand is also exposed to tsunami originating at
other major subduction zones in the Pacific Ocean, from the proximal Kermadec and Tonga sub-

2.4. Historic tsunami in New Zealand 33
duction zones, to the distant Peru-Chile Trench. Fig 2.4 illustrates the direction of arrival and year
of occurrence, of previous distant and local-source events. The NOAA-NGDC Tsunami Database
(National Geophysical Data Center/World Data Service, 2014) lists 45 events that caused run-up
in New Zealand between 1845 and 2013, while the New Zealand Historic Tsunami Database1 con-
tains 80 events (with variable reliability) since 1835, at a rate of approximately 4–5 per decade. The
majority of these events caused maximum run-up <2 m, but several events have cause significant
localised run-up >6 m. The most damaging events occurred due to local-source events in 1855,
1931 and 1947, and distant-source events in 1868, 1877 and 1960. These tsunami caused dam-
age to coastal residences and coastal infrastructure but the only confirmed tsunami-related death to
occur in New Zealand occurred during the 1868 Peru event (Richards, 1950).
2.4.1 Historic distant-source tsunami
The most significant distant tsunami to affect New Zealand in the historic record are those generat-
ed offshore of Peru and Chile in 1868, 1877 and 1960. The 1868 MW 9.1 southern Peru earthquake
caused 1–4 m run-up on the North and South Islands of New Zealand and in the Chatham Islands
caused up to 10 m run-up (Hawke’s Bay Herald 27 October 1868, in the New Zealand Historic
Tsunami Database) and inundation extent >6 km (De Lange and Healy, 1986). The only fatality
due to tsunami in New Zealand occurred during this event when the Maori settlement of Tupuangi,
Chatham Island was destroyed (De Lange and Healy, 1986). Run-up of 18 m occurred locally in
Peru during this event indicating that the source event was comparable the 2011 Great East Japan
tsunami. In 1877 a MW 9.0 earthquake in northern Chile caused run-up of 21 m locally and 3.5 m
in New Zealand. In both events there was little damage in New Zealand because the largest waves
arrived within a few hours of low tide. If these events were to occur today, there would likely be
more damage due to the greater amount of coastal development in the worst-affected areas (Great
Barrier Island, Bay of Plenty, Napier, Banks Peninsula and Oamaru).
The 23 May 1960 Chilean tsunami was generated by a MW 9.5 earthquake offshore southern
Chile. Maximum observed run-up was 3–4 m at Banks Peninsula, Gisborne, Chatham Islands and
Napier (New Zealand Historic Tsunami Database). Maximum run-up in Wellington Harbour was
0.75 m (Heath, 1976). The tsunami caused damage to wharves, jetties, boats and houses, primarily
in Napier and Banks Peninsula, resulting in $193,000 of insured damage (2006 values; De Lange
and Healy, 1986; Johnston et al., 2008). Fortunately, the largest waves arrived within a few hours
of low tide, which mitigated further damage and casualties.
The Chile 1960 event was noted for wave energy focussing, which occurred along the East
Pacific Rise onto the east coast of the North Island (Okal, 1988), and by the Chatham Rise onto
Banks Peninsula in the South Island (De Lange and Healy, 2001). This is a prominent feature of
tsunami propagation from South America towards New Zealand, and is a factor in Chile and Peru
1 New Zealand Tsunami Database: Historical and Modern records. Available at http://data.gns.cri.nz/tsunami/

34 2. Tsunami processes and hazard
Fig. 2.3: The tectonic setting of New Zealand, showing the major subduction and strike-slip faults at the
boundary of the Pacific and Australasian Plates. Slip rates are shown in red for each of the Hiku-
rangi subduction margin, Alpine Fault and Puysegur Trench. Source: GNS Science Geological
Map of New Zealand, http://data.gns.cri.nz/geoatlas/text.jsp?Page=1.

2.4. Historic tsunami in New Zealand 35
Fig
.2
.4:
Ru
n-u
ph
eig
ht
fro
md
ista
nt
and
loca
l-so
urc
ets
un
ami
inth
eN
ewZ
eala
nd
his
tori
cre
cord
,1
82
0s
to2
01
3.
Fla
gs
ind
icat
eso
urc
elo
cati
on
for
loca
l-
sou
rce
even
ts,an
dg
ener
ald
irec
tio
no
fo
rig
info
rd
ista
nt-
sou
rce
even
ts.
So
urc
e:G
NS
Sci
ence
,th
eo
rig
inal
imag
eh
asb
een
up
dat
edto
incl
ud
ere
cen
t
even
ts.
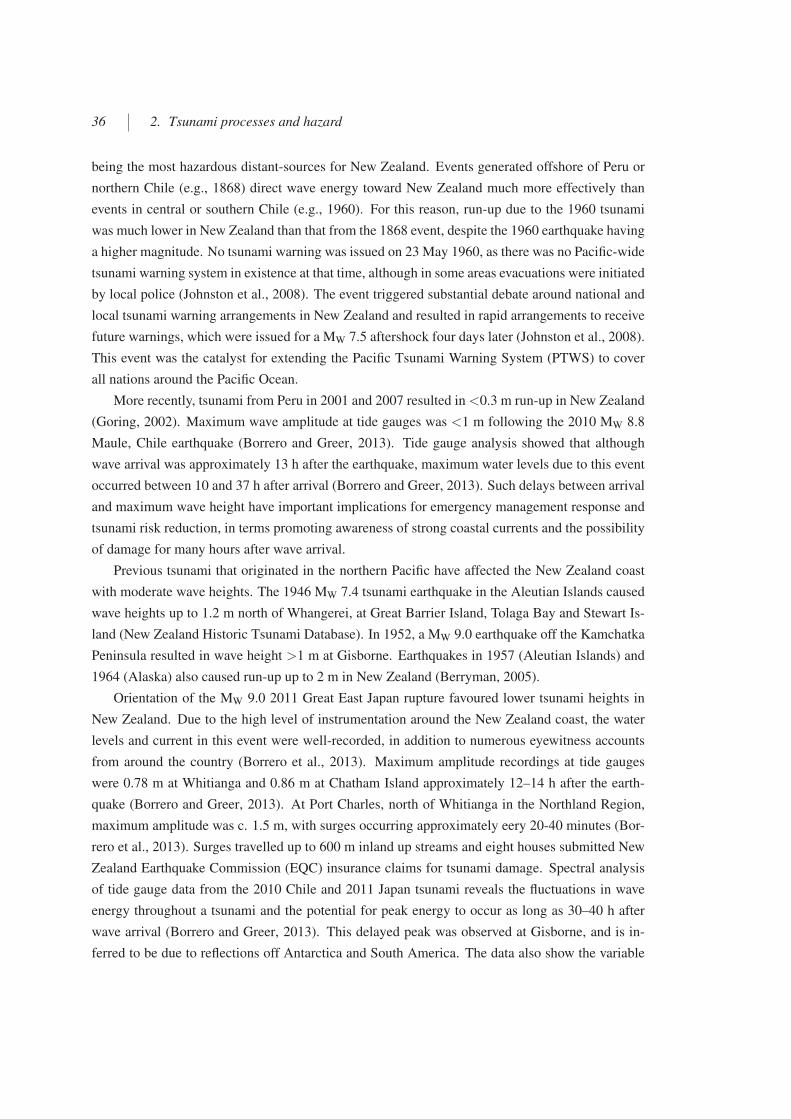
36 2. Tsunami processes and hazard
being the most hazardous distant-sources for New Zealand. Events generated offshore of Peru or
northern Chile (e.g., 1868) direct wave energy toward New Zealand much more effectively than
events in central or southern Chile (e.g., 1960). For this reason, run-up due to the 1960 tsunami
was much lower in New Zealand than that from the 1868 event, despite the 1960 earthquake having
a higher magnitude. No tsunami warning was issued on 23 May 1960, as there was no Pacific-wide
tsunami warning system in existence at that time, although in some areas evacuations were initiated
by local police (Johnston et al., 2008). The event triggered substantial debate around national and
local tsunami warning arrangements in New Zealand and resulted in rapid arrangements to receive
future warnings, which were issued for a MW 7.5 aftershock four days later (Johnston et al., 2008).
This event was the catalyst for extending the Pacific Tsunami Warning System (PTWS) to cover
all nations around the Pacific Ocean.
More recently, tsunami from Peru in 2001 and 2007 resulted in <0.3 m run-up in New Zealand
(Goring, 2002). Maximum wave amplitude at tide gauges was <1 m following the 2010 MW 8.8
Maule, Chile earthquake (Borrero and Greer, 2013). Tide gauge analysis showed that although
wave arrival was approximately 13 h after the earthquake, maximum water levels due to this event
occurred between 10 and 37 h after arrival (Borrero and Greer, 2013). Such delays between arrival
and maximum wave height have important implications for emergency management response and
tsunami risk reduction, in terms promoting awareness of strong coastal currents and the possibility
of damage for many hours after wave arrival.
Previous tsunami that originated in the northern Pacific have affected the New Zealand coast
with moderate wave heights. The 1946 MW 7.4 tsunami earthquake in the Aleutian Islands caused
wave heights up to 1.2 m north of Whangerei, at Great Barrier Island, Tolaga Bay and Stewart Is-
land (New Zealand Historic Tsunami Database). In 1952, a MW 9.0 earthquake off the Kamchatka
Peninsula resulted in wave height >1 m at Gisborne. Earthquakes in 1957 (Aleutian Islands) and
1964 (Alaska) also caused run-up up to 2 m in New Zealand (Berryman, 2005).
Orientation of the MW 9.0 2011 Great East Japan rupture favoured lower tsunami heights in
New Zealand. Due to the high level of instrumentation around the New Zealand coast, the water
levels and current in this event were well-recorded, in addition to numerous eyewitness accounts
from around the country (Borrero et al., 2013). Maximum amplitude recordings at tide gauges
were 0.78 m at Whitianga and 0.86 m at Chatham Island approximately 12–14 h after the earth-
quake (Borrero and Greer, 2013). At Port Charles, north of Whitianga in the Northland Region,
maximum amplitude was c. 1.5 m, with surges occurring approximately eery 20-40 minutes (Bor-
rero et al., 2013). Surges travelled up to 600 m inland up streams and eight houses submitted New
Zealand Earthquake Commission (EQC) insurance claims for tsunami damage. Spectral analysis
of tide gauge data from the 2010 Chile and 2011 Japan tsunami reveals the fluctuations in wave
energy throughout a tsunami and the potential for peak energy to occur as long as 30–40 h after
wave arrival (Borrero and Greer, 2013). This delayed peak was observed at Gisborne, and is in-
ferred to be due to reflections off Antarctica and South America. The data also show the variable

2.4. Historic tsunami in New Zealand 37
regional susceptibility to distant-source tsunami in New Zealand, with Whitianga, Gisborne and
Lyttleton/Sumner subject to enhanced tsunami response in both 2010 Chile and 2011 Japan tsuna-
mi (Borrero and Greer, 2013). Flow currents were recorded at Tauranga Port, where peak tsunami
current speeds reached 2 knots (1.03 ms-1), which is greater than the safe level for large tankers
to manoeuvre through the harbour mouth (Borrero et al., 2013). Maximum flow velocities were
estimated to be 0.5-1 ms-1 at Port Charles (Borrero et al., 2013).
2.4.2 Historic regional-source tsunami
Recent regional tsunami affecting New Zealand include: 1997 MW 7.2 Tonga; 1998 MW 7.0 Papua
New Guinea; 1999 MW 7.5 Vanuatu; 2006 MW 8.0 Tonga; 2007 MW 8.1 Solomon Islands; 2009
MW 8.0 South Pacific; and 2009 MW 7.6 Tonga tsunami (National Geophysical Data Center/World
Data Service, 2014). The most significant of these in New Zealand was the 2009 South Pacific
tsunami, although no onshore damage occurred. Wave arrival occurred after 4 h in the North
Island and 8 h in the South Island, with maximum amplitude of 0.89 m recorded at Chatham Island
(Power, 2013). Maximum amplitude at gauges around the North and South Islands were <0.6
m, occurring as late as 19 h after the earthquake (Power, 2013). Subduction earthquakes on the
Kermadec Trench produced tsunami in 1917, 1976 and 1986.
Regional earthquake sources to the south of New Zealand comprise the Macquarie Ridge and
Hjort Trench, southwest of New Zealand. Strike-slip earthquakes of MW 8.1 occurred at the Mac-
quarie Ridge in 1989 and 1998 (Berryman, 2005) resulting in tsunami of <0.5 m in New Zealand.
Run-up of 0.3 m tsunami also occurred due to an earthquake at this source in 1981 (De Lange and
Fraser, 1999) .
2.4.3 Historic local-source tsunami
Local-source tsunami have resulted in the largest run-up values in New Zealand recorded history.
The most significant occurred on 23 January 1855, when the Wairarapa Fault ruptured, generating
a tsunami with run-up of 3–5 m in Wellington Harbour and >9 m in Palliser Bay to the east of
Wellington (Downes, McSaveney, and Heron, 2000). Wave amplification in Evans Bay resulted
in 5 m waves heights, compared to 2–3 m in the more-sheltered Lambton Harbour (Grapes and
Downes, 1997). The tsunami passed over the Rongotai isthmus several times at a depth of about 1
m, flooding what is now largely residential and commercial development, and the site of Wellington
Airport. The Marlborough coast on the South Island also experienced wave heights of up to 5 m
with a total of 300–500 km of coastline affected with run-up >1 m (Berryman, 2005). The primary
cause of the tsunami is believed to be 6 m of vertical uplift at the south Wellington coast, although
the contribution of earthquake-triggered submarine landslides has not been ruled out (Berryman,
2005). With the earthquake fault located so close to the mainland, initial waves arrived within
minutes at Wellington. Further afield at Otaki and Marlborough arrival time was closer to an hour.

38 2. Tsunami processes and hazard
Despite the significant wave heights, damage was apparently limited to flooding of waterfront
shops in Lambton Harbour, a few houses at Palliser Bay were washed away and a bridge and
houses were damaged along the Hutt River.
The March 1947 MW7.0–7.1 tsunami earthquake, located 50 km east of Gisborne, resulted in
tsunami that affected 120 km of the East Cape coastline. Maximum run-up of 10 m occurred north
of Gisborne at Tatapouri and maximum inundation extent was 800 m (Downes et al., 2000) with
damage to a main road bridge and several houses and the hotel. Wave arrival time was approxi-
mately 30 min after the earthquake. In May 1947 another tsunami earthquake (MW 6.9–7.1 Doser
and Webb, 2003) caused 6 m run-up north of Gisborne and 5 m at Tolaga Bay. These are believed
to have been tsunami earthquakes due to the low maximum Modified Mercalli Intensity (MMI) 4,
and small magnitude relative to the tsunami they caused (Downes, McSaveney, and Heron, 2000).
Bell et al. (2009) and Wang et al. (2009) showed that a rupture at or near a subducting seamoun-
t could have produced a shallow and slow rupture, which in combination with focussing effects
of the seamount bathymetry, could have resulted in the significant run-up. The low intensity felt
onshore poses a particular problem for local tsunami education and evacuation, because the weak
earthquake shaking may be less-likely to be perceived as a natural warning of tsunami (Section
3.3.3).
The 2009 MW 7.8 Dusky Sound, Fiordland earthquake generated a tsunami recorded with
maximum run-up of 2.3 m (Clark et al., 2011), wave arrival of 15–20 min and strong currents that
lasted for 2 h (Prasetya et al., 2011a). Due to the remoteness of the source area, further run-up
observations are limited and there are no records of tsunami damage.
2.5 Palaeo-tsunami in New Zealand
Geological investigations of coastal sediments can identify deposits that may have been emplaced
by tsunami. The location, distribution and dates of palaeo-tsunami deposits can enable the in-
ference of inundation extent and run-up heights, augmenting relatively short historic records and
extending our window of tsunami experience to several thousand years before present. Palaeo-
tsunami research has led to the discovery of previously-unrecognised significant trans-oceanic
events, resulting in significant extensions of regional tsunami catalogues and recognition of the
potential impacts of extreme events (e.g., Atwater, 1987; Atwater et al., 2005b; Minoura et al.,
2001).
Although there have been many recent advances in palaeo-tsunami research, a high degree
of uncertainty exists around the provenance, dating and even correct identification of deposits
as being emplaced by tsunami. Tsunami deposits have been characterised in numerous palaeo-
tsunami studies and immediately after observed tsunami (Chague-Goff, 2010; Chague-Goff et al.,
2000; Dominey-Howes, Humphreys, and Hesse, 2006; Goff, Chague-Goff, and Nichol, 2001; Goff
et al., 2011; Minoura et al., 2001; Sugawara and Goto, 2012; Sugawara et al., 2013):

2.5. Palaeo-tsunami in New Zealand 39
• continuous or discontinuous sheet of silts, sands, clay, gravel or boulders, possibly contain-
ing shell material; sediments fining inland and/or upwards
• marine diatoms, foraminifera or other microscopic marine material
• diluted pollen content
• distinct geochemistry, for example increased concentrations of sodium, sulphur, chlorine,
calcium and magnesium
• occurrence of shells, wood, or other organic material at the top of the deposit
• the stratigraphic position of the deposit overlying organic-rich muds, soils or plant material
(the pre-tsunami surface)
These signatures can be used to distinguish high-energy marine deposits from terrestrially-
derived floodwaters, or sediments that were deposited in low-energy (e.g., estuarine) environments
(Cochran et al., 2005). Deposits are unlikely to display all of the above characteristics and the
potential for mis-identification remains even for deposits that meet several of the characteristics.
Other high-energy processes such as storm waves or storm surge can deposit marine sediments
on land, therefore inland distance of the deposit and its elevation above maximum storm-wave
height are important for distinguishing the magnitude of emplacement event. However, determin-
ing coastal elevation at the time of emplacement is difficult in active tectonic environments that
undergo periodic uplift and subsidence, and inter-seismic sediment compaction. It is unlikely that
complete geographic distribution of a deposit from a single event would be found because there
is high potential for erosion and re-working of deposits in active coastal environments and many
areas of coastline are unsuited to preservation of deposits. Palaeo-tsunami records are biased to-
wards recording large events because the deposited sediment must be of a sufficient volume, height
above sea level, and/or distance inland to be preserved.
The New Zealand palaeo-tsunami database contains 35–40 events (Goff, 2008a; Goff et al.,
2010b). At present, many of the records are equivocal, of variable quality and have only been very
tentatively linked to potential sources. The on-going discovery of new deposits, improved dating
and refinement of the links between deposit and potential sources should enhance this record in
the future. Despite the uncertainty, the more-reliable records in the database provide compelling
evidence of repeated large tsunami prior to short historic and instrumental records in New Zealand.
The publication of such evidence has greatly increased the recognition of the potential for large
tsunami in New Zealand and in particular demonstrate the significant potential for local-source
tsunami on the east coast (Cochran et al., 2005, 2006).
Dating palaeo-tsunami deposits can inform our knowledge on frequency of major tsunami. De-
posits have been dated by ‘bracketing’ radiocarbon dates of organic material above and below the
tsunami sediment (Goff, Chague-Goff, and Nichol, 2001; Nichol et al., 2007) or through use of

40 2. Tsunami processes and hazard
geochemical signatures and sediment accretion rates (Goff and Chague-Goff, 1999). Some of the
published date ranges are well-constrained to tens of years, while the date ranges of other events
are hundreds to thousands of years, representing significant uncertainty in the age. Where possi-
ble, deposition has been correlated with geological events identified from other geomorphological
evidence, cultural information such as oral records (Goff, Nichol, and Kennedy, 2009; King, Goff,
and Skipper, 2007) or geo-archeological data (McFadgen and Goff, 2007). Where geographically-
distributed contemporaneous deposits are have been identified, potential tsunamigenic sources have
been inferred (e.g., Goff et al., 2010b,c) using known historic sources or numerically simulated
events.
The oldest event in the database has been inferred to be 2.15 Ma. There are 186 deposit records
from 250–1685 A.D., and 51 records dated between 1750 Years before present (BP) and 46 ka.
The majority (∼160) of the records pertain to an event or events dated to 1300–1600 A.D. with
widespread geographic distribution and inferred sources (Goff, 2008a). The majority of these de-
posits are identified pebbles or sand overlaying occupation layers; dune re-mobilisation; or erosion
features (Goff, 2008a). Relatively few deposits are identified as tsunami on the basis of marine
diatoms or geochemical signatures. Depending on the location of the deposits, suggested sources
include earthquakes in South/Central America, Tonga-Kermadec earthquakes, and multiple local
faults, most notably on the Hikurangi subduction margin, Cook Strait and Puysegur subduction
zone.
In the Canterbury region, there is evidence of up to seven palaeo-tsunami between 6500 BP
and 1604 A.D.. In each case the source was inferred to be an earthquake known to have occurred
in South/Central America around the same time (Goff and Chague-Goff, 2012). Deposits at Cape
Pattison on the Chatham Islands that pre-date the 1868 Peru tsunami have been inferred to be due
to a Chilean tsunami that occurred in 1604 A.D. (Goff et al., 2010c). Several deposits are inferred
to be due to a Tonga-Kermadec source, including gravel deposits dated to c. 3000 yr BP on Great
Barrier Island, which suggest run-up of >15 m (Nichol, Lian, and Carter, 2003) and sand layers
dated to 2800 yr BP and 6500 yr BP at Kaituna Bay (Goff et al., 2010b). Deposits located in Abel
Tasman National Park and dated to c. 250 A.D. have been inferred to be due to the Taupo volcanic
eruption (Lowe and De Lange, 2000).
The strongest evidence for local-source palaeo-tsunami occurs in Hawke’s Bay, where high-
energy marine deposits have identified (Chague-Goff et al., 2002; Cochran et al., 2005, 2006).
The deposits are contemporaneous with evidence of significant subsidence at c. 7100 yr BP and
5550 yr BP, inferred to be caused by earthquakes on the Hikurangi subduction margin. Additional
sand deposits located in Hawke’s Bay have been dated to 3200 yr BP and 6500 yr BP and are also
inferred as local-source events. Other investigations in this area support the occurrence of several
major subsidence events, therefore large-magnitude local earthquakes, in this region (Hayward et
al., 2006; Hull, 1986, refer to Section 4.5.2). Additional evidence of four possible local palaeo-
tsunami between 260 A.D. and 1670 A.D. occur on the east coast of the North Island in the form of

2.6. Tsunami hazard assessment 41
anomalously young deposits overlaying uplifted marine terraces (Berryman, Ota, and Hull, 1989;
Berryman et al., 2011; Clark et al., 2010). Several sand deposits and submerged vegetation in
the Bay of Plenty have been dated to c. 2,500 yr BP (Bell et al., 2004). No deposits outside the
Bay of Plenty have been dated to the same age, so these are tentatively inferred to be caused by
an earthquake in the Bay of Plenty but revised dating may place them as contemporaneous with
other deposits and suggest a Tonga-Kermadec origin. Further discussion of palaeo-tsunami and the
Hikurangi subduction margin are presented in Section 4.5.2.
2.6 Tsunami hazard assessment
Hazard assessment and its products — primarily inundation and evacuation maps — are funda-
mental to tsunami hazard planning (Gonzalez et al., 2005) and risk reduction. Tsunami hazard
assessment requires a knowledge of potential tsunamigenic sources and simulation of resultant on-
shore flow parameters (Fig 2.1): wave height, run-up height, flow depth, inundation extent, flow
velocity, arrival time, tsunami duration, and resonance effects. Maps of tsunami inundation are
the usual product for communication of tsunami hazard, delineating an area of certain flow depth
on land, the area inundated at a certain event or threshold, or a combination of both. Following
definition of the hazard, risk management strategies can focus on the areas that require mitigation
of the impacts.
The simplest assessment of tsunami hazard where previous events have occurred, is to map
previous maximum run-up and inundation extent, and define the area known to have been affected
as the hazard zone. If additional events occur with impacts at that coastline, an improved picture
of likely inundation can be collated, albeit limited to the historic record. The significant flaws in
this approach were highlighted in the 2011 Great East Japan tsunami. Even in Japan, with a long
history of tsunami observation, inundation due to historic events provides an incomplete catalogue
of possible events and their impacts. The events used to delineate the tsunami hazard zone in Taro
(1896 Meiji and 1933 Showa tsunami), were believed to be the largest events that could affect this
region. Additionally, the 1960 Chile tsunami had been used to demonstrate maximum flow depth
in Ofunato City. However, the 2011 Great East Japan tsunami exceeded flow depth and inundated a
much larger area than the hazard zones, particularly in the Sendai Plains. Many evacuation centres
that had been located outside of the perceived hazard zone were inundated (Fraser et al., 2012a).
The observed events had not captured the largest possible tsunami after all.
Deterministic (scenario-based) or probabilistic tsunami simulation are used to assess tsuna-
mi hazard. In both approaches, ocean displacement at the source and subsequent propagation of
tsunami waves to the coastline are numerically simulated to produce onshore flow parameters. De-
terministic assessments generally use one or more source scenarios as the basis for simulation. The
focus may be on simulating major historic tsunamigenic events, a characteristic earthquake or the
maximum credible earthquake to elucidate subsequent tsunami impacts (e.g., Baptista et al., 2003;

42 2. Tsunami processes and hazard
Roger and Hebert, 2008; Satake, Namegaya, and Yamaki, 2008; Wang and Liu, 2007). The source
event may be determined from wave inversion of instrumental wave records in previous tsunami
(Satake, 1987) or from geological data that describes the source characteristics (e.g., slip deficit,
fault dimensions). If historic events are used as a basis for maximum credible tsunami, then the
potential for under-estimation remains. This is particularly true w
Advances in computing have facilitated the increased use of Probabilistic Tsunami Hazard As-
sessment (PTHA) using statistical approaches such as Monte-Carlo simulation (Geist and Parsons,
2006; Power et al., 2013), logic-trees (Annaka et al., 2007; Burbidge et al., 2008) and Bayesian
statistics (Grezio et al., 2009) to sample uncertain source parameters and create a catalogue of t-
housands of possible source scenarios. Uncertainties are classified as epistemic (knowledge-based,
can be reduced by increasing knowledge) and aleatory (natural variability, cannot be reduced).
Epistemic uncertainty includes quality of bathymetry data, accuracy of computation (Geist and
Parsons, 2006), and overall rate of event occurrence. The primary sources of aleatory uncertainty
are natural variability in seismic slip distribution (Geist and Parsons, 2006) and tidal level at the
time of tsunami arrival (Mofjeld, Foreman, and Ruffman, 1997). At present, PTHA is generally
used to output wave amplitude at shore, or offshore at a certain isobath (e.g., 50 m). Based on the
event frequency and amplitude, selected tsunami can then be simulated through to inundation to
assess onshore impacts. Probabilistic approaches form the basis of reinsurance loss modelling be-
cause they can be effective in simulating low-frequency high-impact events, even though may not
been previously experienced, or are represented by very few events in the relatively short recorded
historical data. This approach allows mapping of probabilistic inundation zones – for example,
delineation of zones with certain maximum wave heights that are assigned a probability of occur-
rence. Probabilistic analysis is therefore required to estimate hazard frequency for structural design
and land-use planning, which require building codes or zoning regulation related to a certain level
of hazard based on a standard probability of occurrence.
Tsunami hazard assessments have been carried out for different regions of New Zealand. Re-
gional and distant-source hazard to Auckland, Waikato and Bay of Plenty have been studied by
Bell et al. (2004), Power et al. (2013) and Lane et al. (2013). The east coast of the North Island
has been studied in relation to local, regional and distant-source tsunami (Power, Downes, and
Stirling, 2007; Power, Reyners, and Wallace, 2008; Power et al., 2012; Wang et al., 2009). Canter-
bury has been the subject of landslide studies (Walters, Goff, and Wang, 2006) in addition to local
and distant-source earthquakes (Lane et al., 2012; Walters, Barnes, and Goff, 2006). Local-source
tsunami impact at Wellington has been studied by Cousins et al. (2007) and Power, Reyners, and
Wallace (2008). Southland has been studied in relation to local tsunami hazard (Downes et al.,
2005), while hazard mapping has been conducted in several locations in Northland (Arnold, Gilli-
brand, and Sykes, 2011; Arnold et al., 2009; Gillibrand, Lane, and Arnold, 2008; Lane et al.,
2007)
The first New Zealand national tsunami hazard review (Berryman, 2005) made probabilistic

2.7. Summary and link to next chapter 43
estimates of wave height and casualties at 19 key urban centres due to distant, regional and local-
source hazard. The 2013 updated national review (Power, 2013) used an updated probabilistic
methodology to provide hazard estimates for every 20 km section of the New Zealand coastline
from local, regional and distant subduction zone and local crustal fault sources. Monte-Carlo
simulation was used to account for uncertainty in source magnitude, the modelling process, and
slip variability. Hazard curves provide maximum tsunami amplitude at the coast (median, 16th
percentile and 84th percentile curves) at return periods up to 1 in 2,500 years. The hazard at each
section was de-aggregated to determine the contribution of sources to the hazard curve.
The 2013 review suggests that there is a 1.0% Annual Exceedance Probability (AEP) (1 in 100
yr average recurrence interval) of 4–6 m amplitude on much of the east coast of the North Island,
Banks Peninsula, Northland and Chatham Islands. There are localised areas which have a 1.0%
AEP of 6–8 m amplitude. The west coast of the North Island and most of the South Island has
1.0% AEP of tsunami with maximum amplitude of 0–4 m. At the 1 in 500 yr average recurrence
interval (0.2% AEP), maximum amplitude is 6–10 m on the east coast of the North Island, Banks
Peninsula, Northland and Chatham Islands. At the 84th percentile of 1 in 500 yr average recurrence
interval, an increased number of coastal sections show maximum amplitude of 10–12 m and Great
Barrier Island, Chatham Island and parts of Northland show maximum amplitude >12 m. There
is 0.2% AEP of 2–6 m amplitude on the west coast, and 6–12 m in Fiordland. At the 1 in 2,500
yr average recurrence interval (0.04% AEP), maximum amplitude is >10 m for Northland, the
east coast of the North Island, Fiordland and Chatham Islands. Elsewhere, maximum amplitude
is in the range 4–12 m. Earthquakes in Peru or northern and central Chile, and on the Hikurangi
subduction margin are the primary source for the 1 in 500 and 1 in 2,500 yr average recurrence
interval hazard on the east coast. The primary hazard contribution for Wellington and the west
coast of North Island are the Hikurangi subduction margin and Wairarapa Fault.
2.7 Summary and link to next chapter
This chapter has given an overview of tsunami processes and impacts, and summarised previous
tsunami that have affected New Zealand in recorded history and earlier. Whilst there has been
relatively little damage and very few casualties due to tsunami in New Zealand, run-up of sev-
eral metres has been recorded and recent hazard assessments demonstrate the potential for wave
heights much higher than those experienced in recent history. The short return periods at which
damaging wave heights can occur, as demonstrated by the recent national hazard review (Power,
2013), puts tsunami risk reduction high on the agenda for coastal communities. The next chapter
discusses tsunami risk reduction activities internationally and in New Zealand, providing context
to the subsequent focus on vertical evacuation.


3. TSUNAMI RISK REDUCTION AND PREPAREDNESS
The previous chapter presented the processes and impacts of tsunami, and established the need for
tsunami risk reduction in New Zealand. This chapter reviews international literature on tsunami
risk reduction strategies and the current approach to risk reduction in New Zealand. While the
focus of this thesis is vertical evacuation, the wider body of risk reduction tools and strategies
are reviewed because, in order to be effective, vertical evacuation must co-exist with and com-
plement these other tools within an holistic risk reduction framework. Two examples of holistic
risk reduction frameworks are given by Johnston et al. (2014, Fig 1.4) and the United States (US)
National Tsunami Hazard Mitigation Program (NTHMP) 2001 (Textbox 3.1). These frameworks
are common in their consideration of risk assessment, land-use planning, appropriate construction,
warning, education, and evacuation planning. However, the NTHMP framework places most em-
phasis on land-use planning and structural mitigation of risk, with five of the Seven Principles for
Planning and Designing for Tsunami Hazards focussed on coastal development issues. In con-
trast, Johnston et al. (2014) explicitly states early warning systems, education and participation,
and exercises as distinct components of the framework. These components are included under the
seventh principle ‘Plan for evacuation’ (NTHMP, 2001). The following sections review the appli-
cation of land-use planning and structural mitigation for tsunami risk reduction, before outlining
the key concepts of warning, preparedness, education, and evacuation.
3.1 Land-use planning
Land-use planning is a policy-based approach to sustainable development of land for human use.
Plans must address conflicting development interests, such as: consumption versus preservation
of natural resources; balanced benefit of property development for private and public use; and
economic development versus preservation of the environmental benefits of an area (Campbell,
1996; Godschalk, 2004). Barriers to effective land-use planning include conflict between different
levels of legislation, prioritisation of issues perceived to be more immediately pertinent than land-
use, and collaboration / coordination between stakeholders and authorities (Glavovic, Saunders,
and Becker, 2010). The high economic and amenity value placed on coastal land for private and
public development (Eisner, 2005), can give rise to the planning conflicts described above, and are
now occurring during the reconstruction process in Tohoku, Japan (EEFIT, 2013; Shibayama et
al., 2013). Disaster losses have been increasing for many years, largely due to increases in wealth

46 3. Tsunami risk reduction and preparedness
and population growth, but also because of encroachment in hazard-prone areas (Changnon et al.,
2000). This is true of many hazards, for example development of floodplains was recognised many
years ago as an issue for flood hazard management (White, 1937). As a result, land-use planning
is now considered an essential tool in sustainable hazard management (Mileti, 1999).
Textbox 3.1 (Principles for Planning & Designing for Tsunami Hazards) NTHMP Prin-ciples for Planning and Designing for Tsunami Hazards
• Know your community’s tsunami risk: hazard, vulnerability, and exposure
• Avoid new development in tsunami run-up areas to minimize future tsunami losses
• Locate and configure new development that occurs in tsunami run-up areas to minimizefuture tsunami losses
• Design and construct new buildings to minimize tsunami damage
• Protect existing development from tsunami losses through redevelopment, retrofit, andland reuse plans and projects
• Take special precautions in locating and designing infrastructure and critical facilitiesto minimize tsunami damage
• Plan for evacuation
NTHMP (2001)
In the natural hazards and Disaster Risk Reduction (DRR) context, land-use planning can help
foster development without creating or exacerbating risk beyond an acceptable level. The ratio-
nale for land-use planning in terms of hazard management is that avoidance of the hazard is better
(and can incur lower costs) than mitigation of the effects through engineered solutions or ‘softer’
means (Bolton et al., 1986). The four principles of land-use planning are defined by Hopkin-
s and Saunders (2008) as: accurate information gathering; avoidance of natural hazards prior to
development; applying a risk-based approach to natural hazards in areas at risk and already devel-
oped; and communication of natural hazards risk in areas at risk and already developed. Methods
of implementing planning controls to avoid or mitigate the effect of hazards are various and can
be regulatory or non-regulatory (Saunders, Prasetya, and Leonard, 2011), should be collaborative
between authorities of different levels (i.e., national, regional, local) and geographic extent (i.e.,
neighbouring councils), and should consider inter-related hazards. Land-use planning tools include
zoning ordinances and development regulations to influence the density, pattern and occupancy us-
age of new developments, with the aim to keep the risk below a defined acceptable level (Eisner,

3.1. Land-use planning 47
2005). For example, the zones of highest risk might be designated as open space, or low-occupancy
building functions to minimise the number of people who are placed at highest risk. High density
residential developments would be restricted to low-risk zones.
The literature discussing land-use planning for tsunami is, to date, relatively sparse with many
discussions of tsunami risk reduction mention land-use planning as a required tool, but not elabo-
rating on how land-use planning can be implemented for tsunami. Tang et al. (2008) found that few
counties on the US Pacific coast had adequately incorporated tsunami risk into hazard management
planning, of which land-use is an important component. The Mitigation and Education Subcom-
mittee of the NTHMP is tasked with promoting ‘the integration of the tsunami hazard and risk
into building codes and land use policy and planning efforts’ (NTHMP, 2013). Glavovic, Saunder-
s, and Becker (2010) highlighted that the emphasis of New Zealand emergency management has
traditionally been on readiness and response and that as a result, hazards (especially tsunami) are
poorly incorporated into land-use planning in New Zealand. Another possible reason that land-
use planning and regulatory tools have traditionally had limited use in tsunami risk mitigation in
New Zealand is the high level of public desire to develop the coastal environment (Garside et al.,
2009). Saunders, Prasetya, and Leonard (2011) addressed this deficiency by proposing a risk-based
method to incorporate tsunami risk into land-use planning. Many areas of tsunami-prone coastlines
have already been developed, so a large part of tsunami land-use planning focusses on reducing
risk or not exacerbating the risk, rather than outright risk avoidance. One of the primary challenges
of land-use planning for tsunami risk reduction are that uncertainties in source parameters and
simulation of the earthquake and tsunami propagate through to any mapped hazard zone. In order
to provide a hazard zone suitable for use in land-use planning, Saunders, Prasetya, and Leonard
(2011) demonstrated a map comprising three zones, representing zones of certain, uncertain, and
no tsunami hazard. Alternatively, maps derived from Probabilistic Tsunami Hazard Assessment
(PTHA) can be presented to show inundation extent for different event probabilities.
Councils in New Zealand are required to consider tsunami in their land-use planning, due to the
inclusion of tsunami in the New Zealand Coastal Policy Statement (NZCPS), under the Resource
Management Act (RMA) (New Zealand Government, 2010). NZCPS Policy 24 requires the i-
dentification of ‘areas in the coastal environment that are potentially affected by coastal hazards
(including tsunami), giving priority to the identification of areas at high risk of being affected’,
including ‘the potential for inundation of the coastal environment, taking into account potential
sources, inundation pathways and overland extent’. With regard to identified hazard areas, NZCPS
Policy 25 requires that any redevelopment or land-use changes that increase the ‘risk of social, envi-
ronmental and economic harm’ from coastal hazards should be avoided and, furthermore, that such
actions that reduce risk or potential harm should be encouraged. Methods cited include ‘managed
retreat by relocation or removal of existing structures’, ‘designing for relocatability or recover-
ability from hazard events’, encouraging ‘the location of infrastructure away from areas of hazard
risk’, discouraging engineered defences with a preference for natural defences, and considering

48 3. Tsunami risk reduction and preparedness
‘the potential effects of tsunami and how to avoid or mitigate them’. The methods cited by NZCPS
are echoed in the NTHMP planning principles (Text Box 3.1). Tsunami evacuation planning has
featured in the proposed development of coastal areas in the Bay of Plenty (Beban et al., 2012), but
earlier development strategies on the east coast (Hastings District Council, 2010) failed to consider
tsunami evacuation, as did proposed land-use regulation changes to allow greater residential use of
what is currently an industrial-use zone in Petone, Lower Hutt (Hutt City Council, 2013).
Specific planning strategies for avoiding new development are given by NTHMP as:
• Designate/acquire tsunami hazard areas for open-space uses
• Restrict development through land-use regulation
• Use infrastructure planning to support land-use planning, by encouraging/discouraging de-
velopment in certain areas
• Adapt other plans/regulations for tsunami use where they have concurrent aims
In areas that have been developed already, site-planning strategies can be applied to new devel-
opments. These include: avoiding inundation areas, slowing water current by increasing friction
in the development parcel, steering tsunami flow away from buildings, and blocking tsunami flow
(NTHMP, 2001). Site planning regulation then becomes closely related to structural design to
achieve tsunami resistance, in terms of open storeys and achieving sufficient height and structural
strength. These methods are now being enacted in the reconstruction of coastal urban areas in
Tohoku, Japan, where planners are advocating the relocation of all residential housing to higher
ground and allowing only industrial facilities close to the coastline, behind seawalls (Government
of Japan Reconstruction Agency, 2013). Between the industrial zone and residential zone, there are
plans to use coastal forests, open-space and infrastructure (road, rail) on raised berms to help slow
or block inundation (e.g., Toyoshima et al., 2012). Critical infrastructure and schools would be lo-
cated further inland. In some areas of the Sendai Plains, large areas of ground are being artificially
raised by 5 m (EEFIT, 2013). In terms of site-planning, public housing structures are to be at least
5–6 storeys in height, with no dwelling space on the ground floor and be designated as Tsunami
Vertical Evacuation Buildings (TVEB) (EEFIT, 2013). Post-event decision-making such as this
can benefit from pre-event land-use planning (Becker et al., 2008), which aims to plan and agree
potential post-disaster land-use changes to enable improvements in community resilience through
appropriate repair, relocation or reconstruction. In post-disaster situations, Glavovic, Saunders,
and Becker (2010) highlighted insurance incentives as a means to influence land-use during re-
development.
With regard to vertical evacuation, land-use planning legislation could be used to oblige de-
velopers to design and construct refuges and designate TVEB in areas of high tsunami hazard
(Leonard et al., 2011). Application of such an approach would be consistent with the site-planning

3.2. Structural mitigation 49
guidance of the NTHMP. There is a legal precedent in New Zealand that ‘applicants seeking re-
source consents for the establishment and operation of public facilities in areas susceptible to nat-
ural hazards should not overlook evacuation planning in their application.’ (Garside et al., 2009).
This was the Environment Court ruling on an application to develop a Marine Education Centre on
the foreshore at Lyall Bay, Wellington. In this particular case, the tsunami hazard was not deemed
sufficient to directly decline the application to develop a public facility, but in failing to consider
appropriate evacuation measures, i.e., plan for access to nearby available high ground above the
maximum elevation at risk from tsunami, the applicants had not reduced the tsunami risk to an ac-
ceptable level. Evacuation is therefore deemed to be a ‘necessary consideration for public safety’
(Garside et al., 2009) in addition to being a statutory obligation of the New Zealand Health and
Safety in Employment Act 1992 (section 6(e)).
3.2 Structural mitigation
3.2.1 Coastal defences
Structural (engineered) defences are commonly constructed for storm waves as part of coastal
management strategies, but are rarely built specifically for tsunami defence. Japan is the only
place in the world to have constructed defences designed to resist tsunami, and the first test of
these under extreme wave conditions was in the 2011 Great East Japan tsunami. Depending on
location, tsunami defences in Japan had been constructed to resist a design wave height equal to
that experienced in the 1896 Meiji or 1933 Showa Sanriku tsunami (Suppasri et al., 2013b). The
2011 tsunami was significantly larger in many areas, thus the tsunami defences were overtopped
and severely damaged or destroyed. Tsunami breakwaters at Kamaishi City and Ofunato City
(Fig 3.1), were subject to scour and significant hydrostatic pressure which caused separation of
their individual concrete blocks and collapse of the breakwater (Kazama, 2011; Port and Airport
Research Institute, 2011). The Kamaishi breakwater was somewhat effective before its collapse,
reducing run-up from >20 m to 10 m, and provided an additional 6 min for evacuation before
inundation of the city (Takahashi et al., 2011). Video footage from Ryoishi (Bombaadi, 2011) also
displays a delay in inundation while the tsunami flow builds up on the seaward side of a substantial
wall; the wall was eventually overtopped and the town destroyed (EEFIT, 2011). Most sea walls on
the coast of the Tohoku region were designed for storm waves, and 190 km (>60%) of these were
damaged or destroyed in the tsunami. The 10 m-high sea walls at Taro Town were designed against
the height of the 1933 Showa Sanriku tsunami, and originally had a convex shape in the seaward-
facing direction, to deflect tsunami around the town. Subsequent development in front of the walls
led to construction of two new walls, forming an ‘X’-shape in plan, and a concave seaward wall
(Fraser et al., 2012a). The concave shape led to focussing of the tsunami wave at the centre of
the wall, which was overtopped and scoured, leading to the movement of poorly connected, poorly
anchored concrete blocks (EEFIT, 2011; Suppasri et al., 2013b). Concrete-armoured revetments

50 3. Tsunami risk reduction and preparedness
Fig. 3.1: Map of locations at which field investigation was conducted. The ria and plains coastal environ-
ments are also highlighted.
with sand infill along the beaches of the Sendai Plains were also overtopped, leading to severe
scour and out-washing of infill on the lee-side of the defence (EEFIT, 2011).
Due to the failure of the substantial tsunami defences, Japanese coastal engineers’ faith in
structural defences to protect developed areas in all tsunami has been re-assessed (Shibayama et
al., 2013). The view now is that defences are considered effective for lower magnitude, higher
frequency events, but that evacuation is vital in the case of the less frequent extreme events. It has
been proposed to have structural defences for protection of property in ‘Level 1’ tsunami, which
are up to 10 m wave height, and soft (non-engineered) measures for life safety, in ‘Level 2’ events –
those above 10 m wave height (Shibayama et al., 2013). In both cases, residents would be expected
to evacuate to evacuation areas, in case of defence failure.
Engineered coastal defences can reduce access to the coast for livelihoods and recreation, and
decrease the aesthetic appeal of a coastline. Shibayama et al. (2013, p.370) postulates that in
Japan, ‘aesthetic considerations are probably secondary to the preservation of not only their lives

3.2. Structural mitigation 51
and livelihoods, but also their way of life’. This viewpoint is contradicted by anecdotal evidence
that there is opposition of some coastal communities to the (re)placement of defences in response
to the Great East Japan tsunami. While substantial defences may also have delayed inundation
and reduced run-up in areas other than Kamaishi City and Ryoishi, these protective defences (im-
portantly, in combination with warnings that underestimated expected tsunami height) provided a
false sense of security and delayed evacuation (Ando et al., 2012; Fraser et al., 2012a; Yun and
Hamada, 2012). They also prevented early visual cues or visual confirmation of tsunami arrival
because the walls often blocked views out to sea; in fact, some witnesses believed that the spray
hitting the seaward side of the wall was fire, not tsunami waves (Fraser et al., 2012a).
3.2.2 Tsunami loading and structural guidelines
Tsunami loading has been the subject of numerical and physical investigation in recent years (e.g.,
Lloyd and Rossetto, 2010; Lukkunaprasit et al., 2008; Palermo and Nistor, 2008; Palermo et al.,
2009; Yeh, 2007). The wealth of structural damage data collected from the 2011 Great East Japan
tsunami are being used by the American Society of Civil Engineers (ASCE) 7 Tsunami Loads and
Effects Subcommittee to generate new tsunami loading guidelines for structures, which would be
implemented in the International Building Code (IBC) post-2020 (Chock, 2012). In the proposed
ASCE 7 code, TVEB would be required to provide immediate occupancy for the maximum credible
tsunami (1 in 2,500 y). Other buildings would be assigned a performance requirement based on
their risk category and height (Chock, 2012).
A review of the Japanese guidelines (Okada et al., 2005) is also underway, with a proposed
reduction in tsunami loading factors. For example, the horizontal tsunami force calculated in Cabi-
net Office Government of Japan (2005) was derived using a co-efficient of 3.0 * water depth, based
on earlier physical modelling. Analysis of structural damage compared to flow depth in Tohoku
showed that this is very conservative, and that the co-efficient could be closer to 1.0 (Nishiyama
et al., 2011). As a conservative procedure, in temporary guidelines, the coefficient was relaxed to
2.0 for buildings that are sheltered by other buildings, and 1.5 for buildings >500 m inland. Further
relaxation of the Japanese guidelines is expected when accurate methodologies for estimating other
tsunami loads have been established (Nishiyama et al., 2011). There is a movement in the Japanese
coastal management community away from reliance on structural mitigation measures in favour of
combined approach with non-structural measures for life safety (Section 3.2.1). Shibayama et al.
(2013) proposed a three-tier classification of evacuation structures (Table 3.1).
Presently, two non-mandatory international structural guidelines for TVEB exist. Federal E-
mergency Management Agency (FEMA) P646 presents the most complete set of guidance in terms
of formulation of forces, and the companion report P646A (FEMA, 2009) presents guidance for
community officials on building planning, design and construction capacity, maintenance, opera-
tion, and funding. FEMA (2008) prescribes methods for calculating multiple tsunami loads (Table

52 3. Tsunami risk reduction and preparedness
3.2) but all loading calculations are based on those included in previous design codes that were
developed for storm surge and riverine flooding (American Society of Civil Engineers, 2006a,b;
City and County of Honolulu, 2000; FEMA, 2005; International Code Council, 2006). As the
best available information, these were used in the development of FEMA (2008) but the guidelines
recognise that tsunami flow characteristics include extreme amplitude fluctuations, flow velocity
and mass of flow than riverine flow. Additionally, tsunami loads are likely to sustain high velocities
and flow depth over longer timescales than riverine or storm surge flood waters, due to their long
wavelength. Loading time histories are not considered in the guidelines, which base design guid-
ance on maximum loads rather than the entire flow time history. Therefore, progressive weakening
may be inadequately accounted for. Although potential combinations of loads are recommended
in the guideline, as is the consideration of the impact of earthquake and subsequent tsunami load-
ing in a local-source, these are not adequately addressed without reproduction of the full loading
time-history accounting for multiple cycles of flow and loading (Park et al., 2012b).
The FEMA (2008) loading guidelines rely on derivation of maximum momentum flux (flow
depth * velocity) at a site, which can be derived from numerical models. Numerical simulation
requires topography data of sufficiently high vertical and horizontal resolution, and resolution of
complex velocity structures onshore, which generally requires simulation to be conducted using a
high-order non-linear model Boussinesq model (Section 4.1). With regards to vertical evacuation,
safe elevation must be defined. Due to uncertainties in numerical modelling, a factor of safety
(1.3 * maximum run-up at the site + 3 m splash-up) is used, but FEMA (2008) also states that
this should never be taken as less than 80% of the values generated using the provided analytical
approximations for maximum momentum flux and maximum flow velocity.
The Japanese government guidelines for designation of building for vertical evacuation are that
they meet adequate construction standards and minimum heights (Cabinet Office Government of
Japan, 2005). The proposed Structural Design Method of Buildings for Tsunami Resistance (Oka-
da et al., 2005) requires buildings to be designed for seismic resistance according to the standard
building code. Subsequently, tsunami loads are estimated and pressure-exposed surfaces and struc-
tural frame are designed accordingly for hydrostatic, hydrodynamic and buoyancy forces based on
maximum flow depth at the site (Okada et al., 2005). Overturning and sliding failure are also cited
in the guidelines as a required analysis. The seismic safety requirement of TVEB in Japan was
achieved by designating buildings constructed to post-1981 seismic standards (Textbox 3.2).
Based on tsunami load analyses, design guidelines and damage observations, several design
concepts have been proposed for tsunami-resistant buildings. The principles defined by FEMA
(2008) are: strong systems with reserve capacity to resist extreme forces; open systems that allow
water to pass through with minimal resistance; ductile systems that resist extreme forces without
failure; and redundant systems that can experience partial failure without progressive collapse.
These include Reinforced Concrete (RC)/steel moment frame and RC shear wall systems. Particu-
lar concepts outlined in FEMA (2008) are: the use of round columns to reduce hydrodynamic force

3.2. Structural mitigation 53
Tab. 3.1: Proposed classification of evacuation areas (Shibayama et al., 2013).
Category Description
A
Hills (higher terrain) that are adjacent to the coast but continue to increase in
elevation for a long distance. Not be isolated low hills, include those that form
part of larger geographical features and have a large hinterland region.
B
Robust buildings that have ≥7 storeys, or small hills that are more than 20 m
in height. Such buildings would generally ensure the safety of anybody taking
shelter in them and could be considered ‘critical lifeline’ structures. This cat-
egory would have the inherent risk of being isolated during the worst tsunami,
but would likely be safe for most events. All new Evacuation Buildings should
be at least Category B.
C
Robust buildings that are >4 storeys high. This category, however, would have
the risk of being overtopped during the worst tsunami events, as described earli-
er. The use of such a category is not recommended, but in areas where Category
B or A do not exist they could be used while better evacuation points are not
available. No new Evacuation Buildings should be built in this category.
compared to square columns; fixing of columns to every storey; orienting shear walls parallel to
flow to minimise hydrostatic loads; designing floor systems for upward forces (uplift, buoyancy),
as well as downward forces (gravity loads); piles that are designed to withstand scour of foundation
around the pile cap; and use of breakaway non-structural walls, designed to fail under loading, thus
reducing hydrostatic loading on the building.
Textbox 3.2 (Key criteria for TVEB in Japan) The key criteria from the 2005 guideline forofficial designation of buildings as tsunami evacuation buildings (Cabinet Office Governmentof Japan, 2005):
• Are of a minimum height according to estimated maximum inundation depth
<1 m depth = 2-storeys or higher required
2 m depth = 3-storeys or higher required
3 m depth = 4-storeys or higher required
• Are RC or steel reinforced concrete composite Steel Reinforced Concrete (SRC) con-struction
• Were constructed after 1981 (the latest significant update of building codes in Japan)

54 3. Tsunami risk reduction and preparedness
Tab. 3.2: Description of tsunami loads considered by FEMA (2008).
Load Description
Hydrostatic
Acts on a wall when the water surface is different levels on either
side. This force will likely be reduced when the ground floor contains
door and window openings that reduce unequal water level inside and
outside the building.
Buoyant forcesThe vertical (upward) equivalent of hydrostatic forces, acting on a
water tight structure.
Hydrodynamic
(drag) forces
Lateral force acting on structural components and the whole struc-
ture, comprising friction forces and pressure forces from the mass of
water flowing through and around the building.
Impulsive forces
Caused by the leading edge of the water surge (i.e., before drag forces
begin to act). Calculated by FEMA (2008) as a factor of the drag
forces.
Debris impact
forces
Vital in the assessment of critical infrastructure, and have been shown
to be important in influencing the level of damage sustained by any
structure in previous events. FEMA (2008) presents several for-
mulations, indicating the current levels of uncertainty around debris
forces.
Debris damming
forces
Caused by the accumulation of waterborne debris, which can enhance
the hydrodynamic force by effectively widening the wall surface.
Uplift forces
Vertical upward force acting on a floor level which is below the water
level but where the building exterior displaces water above that floor
level. It is a combinations of vertical hydrodynamic forces and some
buoyant forces.
Additional gravity
loads
Apply when tsunami water is retained in a building during and after
drawdown, and is dependant on inundation exceeding the elevation
of each floor.
Combination of
loads
Several combinations of loads provided for the whole structure and
individual components. Multiple combinations are provided as not
all loads will act at the same time on the same part of the building.

3.3. Tsunami warnings 55
The New Zealand Building Code, under the Building Act (New Zealand Government, 2004),
requires that all loads likely to be experienced within a building’s lifetime are taken into account in
the design and construction of that building. However, there are currently no New Zealand struc-
tural design standards that account for tsunami loads. The Building Code is a performance-based
code, which prescribes the required performance of buildings under static loads and imposed loads
(wind, snow and ice, and earthquake) at different return period events, for their design lifetime, usu-
ally 50 years (King and Shelton, 2004). Buildings are classified as having one of five Importance
Levels (IL), based on their function and occupancy; this determines the required performance for
that building. At present, the international tsunami loading guidelines discussed above represent
the best options for incorporation of tsunami loads into the Building Code (Leonard et al., 2011).
A TVEB would have to be appropriately designed for tsunami loads so that it could maintain its
critical life-safety function and post-disaster function in the case of the maximum credible tsunami
(the 1 in 2,500 y return period event). As a structure with post-disaster function, TVEBs could
be classed as IL 4. Currently, buildings of IL 4 would be not be required to maintain structural
integrity following a 1 in 2,500 y earthquake, meaning that support and stability for significant
parts and functional continuity may be extensively affected (Uma, 2012). This is clearly insuffi-
cient for buildings in which immediate occupancy is required. Therefore, TVEB would likely have
to be classified as IL 5, which are beyond the scope of the building code and are required to be
designed by special study (King and Shelton, 2004). Additionally, where TVEB were intended
for local-source tsunami, they would be required to withstand the maximum credible earthquake
and retain sufficient capacity to resist failure in subsequent tsunami loading. Leonard et al. (2011)
recommended that a protocol be developed for design of new buildings and assessment of existing
buildings for use as TVEB, and amendments be made to the Building Act to account for design
against tsunami loadings.
3.3 Tsunami warnings
Hazard warnings may be classified as official, informal or natural. All three types play important
and inter-linked roles in ensuring a warning reaches as large a proportion of the exposed population
as possible. Official warnings are those that are disseminated through official, authoritative chan-
nels, typically through an organised, coordinated technological warning system with prescribed
protocols in place before an event; these are important for distant-source tsunami where no natural
warning is available and there is time to detect a tsunami, proceed through the decision-making
process and disseminate the warning. Informal warnings are those passed on through unofficial
channels, including word of mouth, short message service (SMS), email and social media by any-
one who is not in a position of authority to do so. Natural warnings are environmental cues or
natural phenomena that can be recognised as precursory events to the main event; they are most
important for near-field tsunami, when there is little time to activate official warning procedures

56 3. Tsunami risk reduction and preparedness
before wave arrival (Darienzo et al., 2005). There is no linearity to warning dissemination across
the three types, particularly with the ever-increasing sophistication of modern communications and
media. The hazard dynamics, social context and circumstances of the event determine how these
warning types operate together, the extent to which informal warnings play a role, and the media
used in those informal warnings.
3.3.1 Official warnings
Official tsunami warnings alert exposed populations who are too distant from the tsunami source to
feel ground shaking. Such warnings provide official confirmation of received informal warnings or
observed natural warnings. They are generated through a technological (hardware-based) hazard
warning system, defined as ‘a network of interrelated sensors and processes that detect signals of
a possible or imminent dangerous event and provide information [via public notification systems]
that people can use to make protective action decisions before the moment of impact.’ (Leonard,
Johnston, and Gregg, 2013). Tsunami technological warning systems rely on seismometer net-
works to assess earthquake location, magnitude, depth and focal mechanism. The tsunamigenic
potential of the earthquake is assessed by comparing the event parameters against pre-determined
criteria or thresholds to determine the appropriate level of warning, if any, to be issued. This is often
done rapidly with uncertain earthquake parameters, and revised when more data becomes available
to improve accuracy of the assessment. In addition to the seismometer network, networks of o-
cean buoys such as the National Oceanic and Atmospheric Administration (NOAA) Deep-Ocean
Assessment and Reporting of Tsunamis (DART) system (Gonzalez et al., 2005) are used to pro-
vide water pressure and sea-surface time-series data, which can confirm whether a tsunami was
generated or not. Sea-surface time-series data from such buoys facilitate wave inversion (Satake,
1987) to determine the characteristics of the source earthquake and provide site-specific inundation
forecasts (Gica et al., 2008). Coastal sea-level gauges local to the earthquake source are also used
to confirm the occurrence or absence of a tsunami, providing additional warning information for
more distant coastlines.
The initial detection, data validation and decision-making phases of the official warning pro-
cess have time-costs associated with them. Wei et al. (2008) gives an example timeline for Pacific
Tsunami Warning Center (PTWC)/NOAA tsunami forecasts: an information bulletin was given 12
min after the earthquake, based on preliminary magnitude estimates. Thirty-eight min after the
earthquake, the magnitude was revised and warnings/watches issued. Tsunami energy forecasts,
with maps of maximum forecast amplitude became available 46 min after the earthquake. Veri-
fication of an event is necessary to minimise false alarms and maximise accuracy of subsequent
warning messages. Japanese Meteorological Agency (JMA) uses a network of seismometers and
Global Positioning System (GPS) sensors spread across the Japan Trench to rapidly collect more
information on earthquakes that occur there. JMA can produce tsunami warnings only 3 min after

3.3. Tsunami warnings 57
an earthquake using their established earthquake early warning system with similar pre-computed
tsunami scenarios to estimate wave heights and provide a warning based on tsunami height thresh-
olds (Japan Meteorological Agency, 2006).
JMA issue a ‘tsunami advisory’ when expecting tsunami height up to 1 m, ‘tsunami warn-
ing’ when expected height is 1–3 m, and ‘major tsunami warning’ when height is >3 m (Japan
Meteorological Agency, 2013). These thresholds were revised in 2011, following the Great East
Japan tsunami. The previous threshold were 0.5 m, up to 2 m, and >3 m, respectively. In the
‘major’ category additional quantification of tsunami of heights may still be given (5 m, 10 m and
>10 m). However, issuing height thresholds to the public is problematic. In the 2011 Great East
Japan tsunami, inaccurate tsunami wave heights were provided to the public via sirens. These were
gradually upgraded in three stages, by which time the tsunami was arriving at shore. Despite the
changes in thresholds the aim of the warning systems remains the same, and still has the potential
to under-estimate tsunami heights and provide incorrect information to the public.
Ministry of Civil Defence and Emergency Management (MCDEM) aims to assess the tsunami
threat to New Zealand and if appropriate disseminate a national tsunami advisory or warning within
15–30 minutes following receipt of a Pacific Tsunami Warning Center information bulletin, watch
or warning, or a GNS Science earthquake report (MCDEM, 2010a). With advice from GNS Sci-
ence and a Tsunami Expert Panel (TEP) (comprising New Zealand experts from various agencies),
response indicators based on earthquake parameters are used to make a decision on what action
should be taken. This could be: i) no action, ii) an advisory or warning issued through the National
Warning System (NWS), and / or iii) a request for media outlets to broadcast of the advisory or
warning. Following an advisory or warning being issued, further threat assessment is conducted
to provide information on expected arrival times and wave heights. Tsunami source modelling is
carried out by GNS Science and TEP members to provide the earliest possible time of arrival of
the leading wave at 22 pre-designated coastal points. Expected wave amplitude at shore is given
for 43 pre-designated coastal zones. Wave amplitude is assigned to a level of threat: ‘No threat’,
‘Threat to beach, harbours, estuaries and small boats’, ‘Minor land threat’, ‘Moderate land threat’,
‘High land threat’, ‘Severe land threat’. These are communicated by map or table format according
to the warnings categories (Advisory or Warning informing of no threat or a potential threat, and
cancellation messages) set out by MCDEM (2010a).
Tsunami travel time to New Zealand from Chile or Japan is c. 12–15 h and c. 15 h from Alaska.
However, in local-source tsunami there is insufficient time to detect and assess the tsunami threat
then disseminate the warning to the public. There is currently uncertainty around the performance
of the tsunami warning system in regional events that have arrival times of 1–3 h. The MCDEM
response to the 2009 South Pacific tsunami showed that the national tsunami warning was put into
effect 47 min after the earthquake, so there should be sufficient time to issue a warning, but de-
pending on the source location, there could be little subsequent time for widespread dissemination
and evacuation. This issue presents the potential for a ‘tsunami warning blindspot’, in that there is

58 3. Tsunami risk reduction and preparedness
insufficient time to effectively disseminate a warning and trigger an evacuation, but the possibility
exists that there will be no strong ground shaking at the coast to provide natural warnings.
Dissemination of official warnings requires the use of multiple communication channels to en-
sure system redundancy, and to reach as many locations and sections of the population as possible.
Notification technologies include dedicated systems such as alert radios and sirens, and third par-
ty systems such as television and radio broadcasts, SMS messages, email, websites, social media,
power line and telephone messaging (Leonard, Johnston, and Gregg, 2013). Due to the many chan-
nels through which messages can now be disseminated (Textbox 3.3; MCDEM, 2009b), informal
warnings are often distributed through a population simultaneously or prior to official warnings
(Gregg et al., 2007). The key features of an effective warning message are that they: are from an
authoritative source; are specific and certain regarding the event, location and timing; give clear,
accurate instructions; are consistent across messages and notification channels; provide a time-
frame for subsequent messages; and are provided frequently (Lindell and Perry, 1992; Mileti et al.,
2004; Sorensen, 2000).
Tsunami warnings for New Zealand are issued by MCDEM and disseminated through the
NWS. On receipt of notifications via the NWS, local Civil Defence Emergency Management (C-
DEM) groups are responsible for local threat assessment and local public alerting, in accordance
with their response systems. Media are responsible for broadcasting official advisories and warn-
ings if requested through a MCDEM ‘Request for the broadcast of an emergency announcement’.
Official warning dissemination may be carried out using mechanisms that are reliant on third party
hardware or staff, and mechanisms that require dedicated hardware but are controlled by warning
centre staff (MCDEM, 2009b, Textbox 3.3). Additional options that are not yet available in New
Zealand are: Break-in broadcasting; GPS receivers; Mobile-device Broadcasting. Tone-activated
alert radio is currently used in the US (NOAA Weather Radio) and in Japan in limited areas (Fraser
et al., 2012a). All of these alerting options have different monetary costs, effective time-frame,
suitability regarding local terrain, population density and target population, and vulnerabilities to
the hazard event. Multiple alerting systems are required to maximise population coverage and
redundancy.

3.3. Tsunami warnings 59
Textbox 3.3 (Tsunami warning public alerting options) Mechanisms reliant on third partyhardware or staff:Aircraft banners, loudspeakers or sirens; billboards; call-in telephone line; e-mail; marineRadio; mobile PA announcements – NZ Police or Fire Service; pagers; power mains messag-ing; radio and TV broadcasts; route alert (door-to-door); Short Message Service – Point toPoint; landline telephone auto-dialling; telephone trees; tourist advisory radio; websites andwebsite banners.
Mechanisms that require dedicated hardware but are controlled by warning centre staff:Fixed or mobile PA loudspeakers; Flares, explosives; Radio data systems; and Radio (UHF,VHF and HF); Sirens (tone, no voice capability); and Tone-activated alert radio (not currentlyavailable in New Zealand). MCDEM (2009b)
Of all the options in Textbox 3.3, the most high-profile mechanism is sirens. Tsunami sirens
are now present in many coastal communities across the World. Most major urban centres in New
Zealand have some form of siren coverage, but in some locations these act as warning for any
hazard. Previous surveys (Currie et al., 2014; Fraser, Johnston, and Leonard, 2013; Johnston et al.,
2003; Pishief, 2007, GNS unpublished data)1 and media coverage (Worthy, 2013) report public
expectation of and preference for sirens as a tsunami warning in New Zealand.
Sirens are a valuable tool for distant-source tsunami, which allow time for source-event detec-
tion, confirmation of tsunami generation, for warning messages to be formulated and sirens to be
activated. They are less effective in local-source events due to time constrains, and may hinder
evacuation with catastrophic consequences if the public waits for sirens to sound as a signal to
evacuate. In Wellington, almost 90% of respondents believed that a tsunami would follow a siren
warning in <1 h (Currie et al., 2014). This suggests low levels of understanding about the types
of tsunami for which sirens can be effective, and a misplaced reliance on sirens for warning in
local-source tsunami.
Siren technology does not guarantee audibility when they are sounded, particularly for people
indoors and in poor weather conditions such as high wind or heavy rain. This is a point of concern
among the Wellington public respondents (Currie et al., 2014), but many members of the public
still request sirens. Several recent tests of new siren systems have seen mixed success in terms of
operational capability and response from residents in terms of audibility (e.g., Fuatai, 2012; Staff
Reporter, 2012; Twentyman, 2012). There is also a lack of clarity among the public about the
meaning of siren tones, which can be attributed in part to the variety of tones and meanings in use
in different locations (MCDEM, 2013). Data about warnings of past distant-source tsunami raise
1 These unpublished data refers to survey data which, at the time of writing is under analysis. These data will
be published as a GNS Science report in due course. The data can be obtained from [email protected] or
[email protected]. Unless otherwise indicated by a footnote, further references to unpublished data in this chapter
refer to the same data.

60 3. Tsunami risk reduction and preparedness
questions about the efficacy of sirens compared to the other available mechanisms. Following the
2010 Maule, Chile tsunami surveys indicated that very few (0.4%) of people first learned of the
tsunami via sirens. Most people receiving the warning via telephone call (29.7%), face-to-face
(12.3%), or by radio (10.7%) (GNS Science unpublished data). First receipt of the official warning
was dominated by radio (51.7%) and television (21.9%), with sirens cited as the official source by
only 1.2% of respondents.
In Wellington the protocol for warning of a distant tsunami is to use multiple media channels
and mobile sirens, rather than a fixed siren system. Maintenance of tsunami sirens is an ongoing
cost, and in New Zealand this has not been addressed fully. In Tillamook County, Oregon, US, the
low distant-source tsunami hazard, cost of siren maintenance and the non-specific message pro-
vided by sirens have led to the removal of tsunami sirens in favour of specific, targeted messaging
(Tobias, 2012). Several false alarms have occurred with newly installed siren systems due to manu-
al error or technological failure (Couling, 2014; Cuming, 2012; Staff Reporter, 2013; Twentyman,
2012). If fully explained, a false alarm that occurs when a tsunami threat has been detected but
does not materialise (i.e., there is a scientific rationale for the false alarm) can potentially enhance
awareness and understanding of risk information, but technological false alarms are likely to be
detrimental to public response (Mileti and Sorensen, 1990).
3.3.2 Informal warnings
Informal warnings are those disseminated via family, friends, members of the public, general me-
dia or independent self-maintained networks of community members (MCDEM, 2009b). Devel-
opments in social media have enhanced the efficacy of informal warnings. Authorities should
now recognise the potential for informal warnings to be highly effective in terms of speeding up
warning dissemination and reaching some members of the population who may not receive offi-
cial warnings (MCDEM, 2009b), although in the 2010 Chile tsunami the most-common method of
warning receipt was television or radio (see above). Likewise, in Mauritius, television and radio
media dominated warning of the 2004 Indian Ocean tsunami, with <20% of people disseminating
warnings face-to-face or via telephone (Perry, 2007). ‘New technologies’, such as email, social
media and SMS were not used, despite the common use of SMS at the time. The time that people
received warning information, showed that informal warnings only began to be disseminated after
media reports become widely received (Perry, 2007). Social media (Twitter) was used by officials
in Kesennuma (Japan, 2011) to warn of the tsunami (Acar and Muraki, 2011). Although informal
warnings via Twitter were not specifically mentioned in the study by Acar and Muraki (2011), it
was noted that most of the tweets related to warnings, help requests, or reports about environment
and self, suggesting that informal warnings were disseminated via this media. Analysis of Twitter
use in Indonesia as warning of the Great East Japan tsunami reveals dissemination of official warn-
ing to a potential 4 million Twitter users within 10 min of the first official warning being tweeted,

3.3. Tsunami warnings 61
peaking at 9 million users after 2 h (Chatfield and Brajawidagda, 2012). Clearly, social media is
a valuable new tool in warning dissemination, but Perry (2007) notes the concerning potential for
false information.
3.3.3 Natural warnings
Natural warnings include audible cues such as a‘continuous sound like a locomotive’ and ‘thunder-
like’ sounds (Shuto, 1997), tactile cues (ground shaking) and/or visible cues. Visible clues include
drawdown of the water at the coast, exposing the seabed or reefs prior to wave arrival, and other
unusual wave activity such as a wall of water, a rapidly rising tide, large eddies, and frothing
or ‘boiling’ of the sea surface (Gregg et al., 2006). While observation of natural phenomena is
commonly reported after the event (e.g., Borrero et al., 2009; Dengler and Preuss, 2003; Gregg
et al., 2006; Reese et al., 2007), fewer people heed those warnings and evacuate.
In some areas of the world, tsunami have been recognised for generations through experience
and local history, and a culture of hazard awareness and preparedness has developed. Recognition
and understanding of natural warnings of tsunami saved many lives in the Solomon Islands in
2009, despite the tsunami arriving only 3 min after ground shaking ceased (McAdoo, Moore, and
Baumwoll, 2009). A disproportionate number of the immigrant population died compared to the
indigenous population because they did not recognise the tsunami warning (McAdoo, Moore, and
Baumwoll, 2009). A similar cultural knowledge exists in Indonesia, where indigenous knowledge
on the Simeulue Islands helped to save many lives in December 2004 (McAdoo et al., 2006).
Gaillard et al. (2008) demonstrated a) a higher recognition of sea withdrawal and ground shaking
as natural warnings, and b) much higher proportion of evacuation uphill by indigenous Simeulue
people than immigrant Acehnese or Minangkabau people. These events demonstrated the benefits
of immediate evacuation in the context of indigenous knowledge, but the same actions can be
encouraged by public education. In Vanuatu in 1999, timely tsunami education augmented local
knowledge and resulted in evacuation (Walshe and Nunn, 2013).
Where indigenous knowledge is less-pervasive, for example where there has been little or no
experience of tsunami, public education is often the only means of encouraging appropriate action-
s such as immediate evacuation. Tsunami evacuation messaging internationally emphasises the
importance of recognising natural warnings of tsunami and evacuating coastal areas immediately
(e.g., Textbox 3.4).

62 3. Tsunami risk reduction and preparedness
Textbox 3.4 (New Zealand message: Local-source tsunami evacuation actions) A tsuna-mi generated in conjunction with a nearby large earthquake or undersea landslide may notprovide sufficient time to implement official warning procedures. Persons in coastal areaswho:
– experience strong earthquakes (hard to stand up);
– experience weak earthquakes lasting for a minute or more; or
– observe strange sea behaviour such as the sea level suddenly rising and falling, or hearthe sea making loud and unusual noises or roaring like a jet engine
should not wait for an official warning. Instead, let the natural signs be the warning. Theymust take immediate action to evacuate predetermined evacuation zones, or in the absence ofpredetermined evacuation zones, go to high ground or go inland.(MCDEM, 2010a, p.9)
There is significant public confusion around the interpretation of this message, in terms of
what constitutes sufficient strength to cause a tsunami, and data suggest that people have difficulty
accurately perceiving the duration of earthquakes (Dorfstaetter, 2012). Only 37% of respondents to
a tsunami awareness survey in Wellington, New Zealand, recognised that a strong earthquake could
be a precursor to tsunami and only 7% noted that an earthquake would have to be too strong to stand
up in (Currie et al., 2014). Only 8% cited a long earthquake as warning of tsunami. MCDEM and
regional CDEM groups continue to emphasise the important differences in their ability to warn
of local, regional and distant tsunami, and recommend education and self-evacuation as a greater
priority than installation of sirens.
3.4 Preparedness
Preparedness refers to ‘[t]he knowledge and capacities developed by governments, professional re-
sponse and recovery organizations, communities and individuals to effectively anticipate, respond
to, and recover from, the impacts of likely, imminent or current hazard events or conditions’ (U-
NISDR, 2009, p.21). Activities to enhance preparedness encompass: emergency planning; tests
and exercises; communicating plans; and training for organisations and individuals in how to pre-
pare for and respond to disasters (Tierney, 1993). Being prepared also requires having resources in
place to respond to and recover from a disaster, and knowing how to use those resources (Sutton
and Tierney, 2006). Evacuation is an important component of preparedness at the organisational
level in terms of co-ordinating evacuation plans and activities, and at the individual level for hav-
ing members of the community participate in evacuation planning and being aware of appropriate
evacuation actions in a tsunami.

3.4. Preparedness 63
Emergency planning at the organisational level has been defined by a series of principles de-
veloped by Dynes, Quarantelli, and Kreps (1972) and Quarantelli (1982), and further developed
by Quarantelli (1988), Perry and Lindell (2003) and others. These are summarised briefly here.
Emergency planning is a continuous process (Quarantelli, 1982): written plans must be updat-
ed with changing hazard knowledge, land-use changes and development, and available response
resources. Part of the continuous process is testing the plan through exercises and drills, which
provide educational and network-building functions as well as an opportunity to monitor, critically
assess and enhance the plan (Perry and Lindell, 2003). Emergency disaster plans should be distinct
from ‘everyday plans’, due to increased uncertainty, increased magnitude of impacts and required
response, and greater required communication among agencies (Drabek, 1986; Perry and Lindel-
l, 2003; Quarantelli, 1988). Emergency plans should be generic, allowing greater accessibility
and flexibility in their application and enabling application across multiple hazards (Dynes, 1970;
Quarantelli, 1982). Plans should be based on sound knowledge of the hazard, human behaviour
in disasters, and of available resources, to enable planners to make reliable assumptions of likely
events and behaviour in disasters (Quarantelli, 1982). Knowledge of human behaviour enables
planners to accommodate likely behaviours, increasing the efficacy of a plan. Authorities planning
for emergencies should recognise the resilience and resourcefulness of communities and society
and harness that in collaborative planning, rather than a military-style ‘command-and-control’ ap-
proach to managing disasters (Tierney, 1993). This approach should be reflected in preparedness
activities, by engaging communities to take leadership roles in hazard management with support
from authorities to enhance their capabilities.
The New Zealand National CDEM Strategy stresses an all-hazards approach to: increase com-
munity awareness, understanding, and participation in civil defence emergency management; re-
duce the risks from hazards to New Zealand; enhance New Zealand’s capability to manage e-
mergencies and recover from disasters (MCDEM, 2007). A specific goal is to increase commu-
nity awareness, understanding, preparedness and participation in CDEM activities, encouraging
personal responsibility for preparedness, and community-based resilience building. With regard-
s to tsunami, several initiatives have been put in place: public education strategies (MCDEM,
2007, 2012); consistent messaging (MCDEM, 2010b); evacuation planning guidance (MCDEM,
2008d); signage standards (MCDEM, 2008c); and communication/warning systems (MCDEM,
2009b, 2010a). The subsequent sections elaborate on these initiatives after a discussion of individ-
ual preparedness.
Individual preparedness actions comprise such things as collating survival items, structural
strengthening of property, securing contents in the home or business, developing a household e-
mergency plan, gaining survival skills or participating in wider social preparedness actions (Becker
et al., 2012; Sutton and Tierney, 2006). Hazard awareness is ‘the foundation for developing strate-
gies to mitigate a hazard. Without awareness, there is no push to assess the hazard, ascertain risk,
or develop meaningful response or mitigation plans’ (Dengler, 2006, p.53). Awareness refers not

64 3. Tsunami risk reduction and preparedness
only to having knowledge that a hazard exists, but also knowing the factors that lead to the realisa-
tion of that hazard, its impacts and dynamics and actions required to mitigate resulting detrimental
consequences (Coppola, 2011; UNISDR, 2009). Levels of awareness can be raised by educa-
tion or media coverage of events (Connor, 2005; Dengler, 2006). However, high levels of hazard
awareness do not necessarily lead to high levels of individual preparedness (Duval and Mulilis,
1999; Finnis, 2004; Johnston et al., 2005; Lindell and Whitney, 2000; Paton, 2003; Paton et al.,
2008). For example, surveys on the coast of Washington State, US, found that placement of evacu-
ation/warning signs and maps, and distribution of information including via brochures, posters and
school resources reached the majority of the usually-resident population but this did not enhance
respondents’ low to moderate preparedness (Johnston et al., 2005). Low levels of preparedness per-
sist even in areas of high hazard such as California, US (Turner, Nigg, and Helfer Paz., 1986). A
similarly high hazard in Wellington, New Zealand, and several years of sustained education around
hazard awareness and preparedness has had only minor impacts on household preparedness levels,
with around one-quarter to one-third of the population fully prepared (Johnston et al., 2013).
Paton (2003) presented a social-cognitive model of preparedness, which treated preparedness
as a three-phase process comprising motivating factors, intention formation, and transition of in-
tentions into preparedness actions. Risk perception, hazard anxiety and critical awareness are
important motivators of individual preparedness (Paton, 2003) and are linked to risk personalisa-
tion. When personalisation of the risk is low, there is generally a low willingness to prepare; more
frequent experience of disaster can lead to greater personalisation and greater levels of prepared-
ness (Drabek, 1986). However, when previous experience resulted in minor impacts, it can lead
to normalisation bias (Mileti and O’Brien, 1992) or unrealistic optimism bias (Paton, 2003). The
second stage in the social-cognitive model of preparedness is the stage at which individuals for-
m intentions to prepare. Intentions are more likely to be formed if an individual recognises that
preparedness can lead benefit them or mitigate impacts in an emergency (outcome expectancy),
that they believe they have the competence or capability to prepare (self-efficacy) and that they
have the resources to prepare (response efficacy) (Duval and Mulilis, 1999; Lindell and Whitney,
2000; Paton, 2003; Turner, Nigg, and Helfer Paz., 1986). When an intention to prepare has been
formed, the realisation of preparedness actions is affected by: a person’s perceived responsibility
to look after other people; their levels of empowerment to take action; their levels of trust in, or
perceived responsibility of authorities; and their sense of community (Paton, 2003). Societal norms
can also encourage or discourage preparedness depending on the predominant hazard culture, with
people more likely to prepare where such actions are widely encouraged and seen as positive in
society. Paton et al. (2008) also identified community participation, collective efficacy, trust, and
empowerment as important predictors of tsunami preparedness.
These models inform the content and format of community preparedness and education s-
trategies, which seek to enhance preparedness behaviour by countering negative influences in the
social-cognitive model. To be most effective, strategies must address the issues in the above models

3.5. Education 65
to encourage personalisation of the risk, improve levels of outcome expectancy and self-efficacy
by demonstrating the benefits and ease of individual actions (Paton, 2003), and promote commu-
nity engagement, trust and empowerment (Paton et al., 2008). Becker et al. (2012) highlighted
the differences in types of hazard information and their relative impact on preparedness. Passive
information (e.g., leaflets) was found to have the least impact, while interactive information was
good for promoting discussion, enhancing understanding and preparedness. Experiential informa-
tion was found to be the strongest type of information in terms of enhancing hazard beliefs and
understanding of consequences.
For tsunami evacuation, the primary preparedness factors are being able to recognise natu-
ral warning signs of tsunami and an understanding of official warnings, having an emergency
kit for immediate evacuation, preparing and discussing a household plan for evacuation from the
home, work or school (including appropriate routes and rendez-vous points), and practicing e-
vacuation. Community-based evacuation planning, such as the Blue Line Project in Wellington
(Section 3.6.2) seeks to enhance preparedness by encouraging community participation, self- and
collective-efficacy, trust and levels of critical awareness in the community. Similarly community-
focussed processes have been conducted on the US Pacific Northwest coast in the TsunamiReady2
community program and Project Safe Haven (Section 3.6).
3.5 Education
The infrequent nature of most hazards precludes widespread experiential learning, and reliance on
media coverage of natural hazards does not guarantee realistic or proportional representation of
hazards processes or impacts. Therefore, education is necessary for the public to develop accurate
perceptions of hazards (Vitek and Berta, 1982), understand warnings, and learn the appropriate
actions to take (Mileti et al., 2004). Experience from previous tsunami shows that behavioural
response is complicated, with problems such as non-response to official warnings (Johnston et al.,
2008), failure to act on natural warnings (Section 3.3.3), road congestion during evacuation, failure
of warning systems, and returning to evacuated zones too early (Fraser et al., 2012a). Tsunami
hazard education is important for assimilating these lessons into public knowledge and encouraging
appropriate response behaviour.
Media coverage of international tsunami can be important for raising awareness and relay-
ing key education messages, although Becker et al., 2012 notes that media coverage of overseas
disasters can encourage personalisation of risk but can also contribute to fatalism. This can be par-
ticularly true when the media consistently focusses on the worst-affected areas. The 1998 Papua
New Guinea tsunami received unprecedented international coverage and promoted discussions of
the tsunami hazard, especially in the US, Australia, New Zealand and Japan (Dengler and Preuss,
2003). National-scale hazard events can also increase levels of awareness and preparedness can
2 http://www.tsunamiready.noaa.gov/

66 3. Tsunami risk reduction and preparedness
also be significant. In response to the 2010/2011 Canterbury earthquakes, levels of preparedness
among people rose significantly but levels of preparedness in other cities also increased (Colmar
Brunton, 2011; McClure, Johnston, and Henrich, 2011). This can be a short-term effect so ongoing
education remains a key component of risk mitigation (Suganuma, 2006).
Education programmes should be ongoing, with repeated consistent messages in multiple for-
mats to reach different sectors of the population (Mileti et al., 2004). The education message should
provide simple information on the impacts of a hazard, the chance of it occurring and what to do to
reduce the impacts, presented such that the audience can personalise the risk and make their own
conclusion that they need to and are able to prepare (Mileti et al., 2004). There should be support
of further information-seeking and it is important to have subject experts and trusted organisations
involved in the education (Mileti et al., 2004). Education can take many forms, including: me-
dia campaigns; public presentations, workshops, attendance at public events, educational videos,
newsletters brochures, fact sheets, resource guides, guidebooks, childrens’ cartoon books, trivi-
a sheets, games, and evacuation maps (Dengler, 2005; Jonientz-Trisler et al., 2005). Evacuation
maps and signage are considered essential education tools, which raise awareness through their
visibility and can trigger media attention and hazard discussion in the community (Dengler, 2005).
Hazards education in schools is extremely valuable as it can raise awareness and preparedness
not only in the schoolchildren, but also in teachers, parents and the wider community (Johnson,
2011). NTHMP developed tsunami hazard curricula in three US States, and it is now a legal re-
quirement for schools in the inundation zone in Oregon, US to teach tsunami hazard education and
conduct tsunami evacuation drills (Dengler, 2005). Tsunami-specific professional development
courses are offered to teachers and student teachers at Humboldt State University to aid education
in schools (Dengler, 2005). In New Zealand, a national hazards education schools programme
‘What’s The Plan Stan?’ (WTPS)3 is available to schools. Currently, use of WTPS remains re-
gionally variable, due to a lack of awareness of the resource and absence of an strategy based on
required outcomes, and there remains no official requirement for schools to include disaster pre-
paredness education in the curriculum and hold disaster training exercises, such as ‘Drop, Cover
and Hold’ (Johnson, 2011). Tsunami drills are also rare among coastal schools (Johnson, 2011).
Evacuation exercises are particularly important for schools in tsunami hazard zones because ac-
counts from the Great East Japan tsunami showed that schools who were well-practiced in tsunami
evacuation were able to save all of their pupils (Yamori, 2013).
In New Zealand, all-hazards public disaster education is coordinated via the national Public
Education Programme (PEP) (MCDEM, 2012), which comprises: a national media campaign ‘Get
Ready Get Thru’ and supporting resources; WTPS; additional actions by MCDEM to support
or build on these programmes; and actions undertaken by CDEM groups (MCDEM, 2007, p.3).
3 WTPS is a school’s resource developed in parallel with the ‘Get Ready Get Thru’ campaign, intended to engage
school children in a programme of disaster education (MCDEM, 2007). The programme uses various teaching aids and
information including handbooks, interactive activities and online resources to raise awareness and motivate prepared-
ness specifically in school children.

3.6. Evacuation planning 67
The promotion of immediate evacuation in response to natural warnings, which is consistently
in conflict with public pressure on councils to install tsunami sirens (Johnston et al., 2014), is a
challenge for education in New Zealand. Likewise, the low frequency of tsunami and absence
of damaging tsunami in the public memory somewhat relegates the hazard below other hazards
that are higher priorities for coastal communities, e.g., earthquake and coastal erosion (Johnston
et al., 2003). Drawing distinctions between appropriate evacuation actions in local, regional and
distant-source is also a challenge, as research has shown confusion between likely arrival times and
the use of sirens in the respective events (Currie et al., 2014; Dorfstaetter, 2012). Perceptions of
available time for evacuation after a warning siren are often underestimated (Johnston et al., 2003,
GNS unpublished data) due to invalid expectations of siren activation. Ongoing education and
engagement activities such as community discussions of evacuation and sirens, and involvement
of the community in evacuation mapping initiatives can broach these difficulties.
3.6 Evacuation planning
Evacuation planning aims to ensure life safety in a hazard event by guiding people out of the
anticipated hazard area(s) to a safe place. A plan requires public education to deliver consistent,
key messages on correct evacuation actions and familiarise people with evacuation strategies and
information. This includes evacuation maps, signs and periodic exercise, assessment and upgrade
of plans. Evacuation plans must be appropriate for the temporal and spatial scales of the hazard.
Tsunami plans should therefore be available for local-source and distant-source events, as tsunami
have the potential to occur on very different temporal and spatial scales. Primarily, the travel time
of a distant tsunami provides sufficient time for gradual evacuation following an official warning
and time for confirmation, whereas a local tsunami must be treated with the utmost urgency.
3.6.1 Evacuation maps
Evacuation maps are one component of an evacuation plan which should also include signage, pub-
lic education and warnings and contributes to an effective warning system (Leonard et al., 2008b).
Evacuation maps require delineation of hazard zones to represent the maximum possible inunda-
tion extent, multiple scenarios of differing extent, or zones that may show probability of inundation
extent. Locations of key infrastructure such as assembly points or emergency services and location
of concentrated vulnerable populations, e.g., care homes or schools, should be shown (MCDEM,
2008d). Styles of evacuation maps vary internationally in terms of the types of information shown
and how this information is represented, i.e., number of evacuation/hazard zones, symbols, colours,
scale and additional text information. International consistency is unrealistic, but a nationally con-
sistent mapping approach and presentation style is desirable to ensure that people residing in or
visiting a country can interpret the map at any coastal location. There was significant inconsisten-
cy in evacuation maps between administrative authorities in the United States (Kurowski, Hedley,

68 3. Tsunami risk reduction and preparedness
and Clague, 2011; National Research Council, 2011) and Japan (Fraser et al., 2012a) but there has
been a movement recently towards more consistent mapping outputs. The NTHMP Mitigation and
Education Subcommittee (MES) (2011) sets evacuation mapping minimum requirements for all
tsunami evacuation maps produced in the US after January 2012 and existing maps were updated
through 2012 to ensure consistency (J. D. Schelling, personal communication, 9 March 2012).
MCDEM (2008d) provides guidelines for evacuation mapping in New Zealand to be carried
out by local authorities and CDEM groups. It is recognised that resources and capabilities do not
always enable the most detailed evacuation mapping, i.e., using scenario or probabilistic modelling,
in every location. Therefore, four ‘development levels’ are outlined by the National Tsunami
Evacuation Guidelines (MCDEM, 2008d) to enable a minimum (conservative) level of mapping
to be carried out in the first instance, with further complexity added in subsequent generations of
mapping, with the aim to refine the accuracy evacuation zones, but only ever by reducing the zone
size. These development levels are:
1. Simple ‘bathtub’ model: maximum wave height is assigned at the coast, and this level is
projected inland until the water surface intersects the land surface.
2. Rule-based wave height attenuation: maximum wave height is assigned at the coast, and this
level is projected inland using linear height attenuation until the water surface intersects the
land surface. This is recommended by MCDEM to be the minimum recommended level of
development applied in New Zealand, and is the methodology implemented in the current
generation of evacuation maps. It has been used to produce evacuation zones for several
councils in New Zealand and has been validated against surveyed inundation extent in the
2011 Great East Japan tsunami (Appendix E).
3. Computer simulation of wave heights and inundation is conducted separately. PTHA gen-
erates wave height at shore for a catalogue of tsunamigenic earthquakes. De-aggregation is
used to determine the extent to which each source contributes to the tsunami hazard (Power,
2013). Sources that approximate the wave height at particular probability are then simulated
further to estimate flow depth and inundation extent. This method can take into account more
complex features such as variable surface roughness and flow interaction than the Level 2
approach but requires high-resolution elevation data.
4. Zones that envelope all possible inundations from all possible sources, derived from ‘multi-
ple well-tested models’, requiring PTHA analysis from source to inundation.
Level 3 is the minimum approach that provides wave arrival time via full numerical simula-
tion. Therefore, an approach must be used that addresses this data requirement. MCDEM (2008d)
also discusses the recommended content of evacuation maps as part of evacuation plan develop-
ment. Recommendations include the optimum number of evacuation zones as a minimum of two

3.6. Evacuation planning 69
zones and maximum of three zones (Textbox 3.5), as a balance between a) over-simplification
(i.e., mapping only the maximum tsunami), which can lead to over-evacuation in most events and
greater resource requirement; and b) potential public misunderstanding of too many zones. Spatial
coverage of Light Detection and Ranging (LiDAR) can restrict application of higher development
levels, as LiDAR is the optimal dataset with which to produce a Digital Elevation Model (DEM)
of sufficient resolution for accurate simulation of tsunami inundation. In communities that have
insufficient resource to achieve any of these development levels, the recommendation is to assign
the whole community as being within the orange zone, until further research can be carried out (M-
CDEM, 2008d). In cases where future alterations are made to zone boundaries, the components,
colours, and style of the maps will remain unchanged, in order to sustain community awareness
and understanding of the maps.
The publication of evacuation maps in Wellington, New Zealand, is carried out alongside pub-
lic education and collaborative planning for evacuation signage in each community. The roll-out
process for maps requires community engagement and periodic review and amendments to draft
plans, including for placement of evacuation signs. Community involvement benefits the project
because it brings local knowledge to the planning process, and fosters a sense of community partic-
ipation and ownership (Section 3.4; Paton et al., 2008). Community volunteer groups are provided
a base map with evacuation zones shown, and with the assistance of local CDEM staff they devel-
op appropriate evacuation routes and safe locations along with other relevant information such as
street names, key buildings and/or local landmarks to aid understanding of the map. These features,
in addition to roads and rivers, represent the recommended minimum information to present on e-
vacuation maps (MCDEM, 2008d). The guidelines also mention vertical evacuation, stating that
this option should be considered locally where required, and if applied this should be illustrated on
evacuation maps.

70 3. Tsunami risk reduction and preparedness
Textbox 3.5 (Recommended tsunami evacuation zones in New Zealand) Recommended t-sunami evacuation zones to achieve national evacuation mapping consistency in New Zealand(MCDEM, 2008d):
• Red zone: the ‘shore-exclusion’, to be evacuated in all tsunami due to the likelihoodof strong coastal currents. This level of evacuation is expected to be activated severaltimes in a persons lifetime
• Orange zone: to be evacuated in official warnings of most regional and distant tsunami.Official warnings are expected to be available if evacuation of this zone is required
• Yellow zone: this zone accounts for inundation from the maximum credible local tsuna-mi, and is to be evacuated in any local tsunami, which is expected to produce the largesttsunami. The expectation is that evacuation in this case should be prompted by recogni-tion and understanding of natural warning signs or receipt of informal warnings
3.6.2 Evacuation signs
Evacuation routes and destinations require identifiable and understandable signs to direct the public
to safety. A range of sign styles and languages are used internationally, but all employ a tsunami
wave in some form to ensure communication of the key message. Signs can be used to show route
directions, the boundaries of tsunami zones, safe areas and maximum inundation height in previous
events. The New Zealand signage standard has provision for each type of sign in a consistent
format to bring national consistency and to promote greater public understanding and recognition
(MCDEM, 2008c, Fig 3.2).
New Zealand signage uses blue and white colouring, as used in many places around the Pacific,
but this is not globally consistent. Japan uses designs that have been accepted as an International
Standards Office (ISO) international standard (Fraser et al., 2012a). These are consistent with
the Caribbean, but are inconsistent with those in the rest of the Pacific and inconsistent between
municipalities (Fraser et al., 2012a). Signs in Indonesia are red with a blue wave. A notable
difference between signs in Japan and elsewhere, is the use of distance on evacuation signs, such
as the distance to the nearest safe location (Appendix D). Sign placement should be planned during
the community engagement process discussed in Section 3.6.1. In the community of Island Bay in
Wellington, New Zealand, the discussion group proposed that a blue line be painted on the streets
to mark the inland extent of the ‘Yellow zone’ (Wellington Emergency Management Office, 2001,
Fig 3.3). This project, having generated significant national and international interest is now being
implemented in other Wellington communities.

3.6. Evacuation planning 71
Fig. 3.2: Standard Tsunami signs for New Zealand (MCDEM, 2008c). Signs shown are A: Tsunami evac-
uation zone; B: Tsunami evacuation zone with reference to a specific zone; C: Evacuation route
direction (arrow can be turned any direction); D: Vehicular evacuation route; E: Pedestrian evacua-
tion route; F: Vertical evacuation route; G: Safe location for pedestrian routes; H: Safe location for
vertical evacuation; I: Previous event sign, indicating maximum flow depth in that event.

72 3. Tsunami risk reduction and preparedness
(a) (b)
Fig. 3.3: Examples of the blue lines used in an increasing number of Wellington coastal communities. a) A
blue line at the edge of the maximum inundation zone, credit: Nick Thompson. b) A directional
sign with the distance to the blue line, credit: RadioNZ.
3.6.3 Evacuation exercises
Evacuation exercises provide the important ‘testing’ component of emergency planning (Quaran-
telli, 1982; Sutton and Tierney, 2006). The perceived value in evacuation exercises is that frequent,
well-learned emergency practices are likely to increase the probability that in a real emergency
people will respond in an informed manner (Johnston et al., 2011). In the case of schools, those
with ‘well developed and regularly practised emergency preparedness plans in place send a mes-
sage to pupils and caregivers alike that in the case of an emergency, the school is prepared to protect
the safety of the children’ (Johnston et al., 2011). Exercises also provide valuable opportunities
for interactive education and discussion of hazards and appropriate actions and the assessment
and refinement of evacuation plans. However, exercises can be costly, time-consuming and the
cost-benefit ratio in larger communities may make evacuation drills unfeasible (National Research
Council, 2011). Exercises for distant-source scenarios are seen as unnecessary, given the length
of time available to deploy emergency management resources to guide evacuations (National Re-
search Council, 2011).
Fire drills are commonplace in institutional and businesses premises, many US States hold an
annual ShakeOut4 earthquake drill, in which people in low-lying areas of the Pacific States are en-
couraged to also conduct a tsunami evacuation drill. In Japan, tsunami evacuation exercises are an
important component of tsunami preparedness. Local governments hold annual exercises on days
that commemorate past significant tsunami, and drills are also organised by community-groups
and schools, although the majority of participants have been the elderly and children (Ishiwatari
and Arakida, 2011). Some community-groups incorporate vertical evacuation into local business
premises during their drills (Fraser et al., 2012a). Tsunami exercises and education at schools in
4 http://www.shakeout.org/

3.6. Evacuation planning 73
Japan are attributed as the reason for many lives being in the Great East Japan tsunami, including
the so-called ‘Miracles of Kamaishi’ (MSN Sankei News, 2011). The principles of tsunami ten-
denko, taught in some areas of Japan, are: self-reliance, encouraging others to seek refuge, mutual
trust in advance of an event, and reduced feeling of self-reproach among survivors (Yamori, 2013).
A number of limited tsunami evacuation exercises have been conducted and monitored in New
Zealand; these are primarily organised by local CDEM groups (Leonard and Wright, 2011) or by
individual schools. At least one opportunity to combine CDEM tsunami exercise with a school drill
was missed in the Hutt Valley, due to a lack of communication that a drill was planned (Johnson,
2011). A national ShakeOut earthquake drill was conducted in New Zealand in 2012 but inclusion
of tsunami evacuation in the exercise was limited to just 8% of schools (McBride et al., 2013).
3.6.4 Vertical evacuation
As introduced in Chapter 1, vertical evacuation provides safety by evacuation to elevations above
the tsunami flow depth within the hazard zone in tsunami-resistant buildings or towers, or to raised
areas of natural/artificial high ground. As a concept of raising oneself above flood levels, it has
most likely existed for many generations as a basic survival technique. Spontaneous (unplanned)
evacuation to the upper storeys of buildings occurred in the US during the 1960 Chilean tsunami
(Atwater et al., 2005a) and 1961 Hurricane Carla (Ruch, 1984). Vertical evacuation was first ex-
plored by researchers as a planning option in the US in the 1970s and 1980s in hurricane-prone
coastal areas (Ruch, 1984; Salmon, 1984) in response to intensifying coastal development and pop-
ulation density causing increased difficulty of hurricane evacuations. Concerns about practicalities,
ethics and liability issues of vertical evacuation were raised early in this research by Salmon (1984),
who noted that vertical evacuation ‘is resisted by planners who are concerned that its risks are too
high and that partial acceptance of the concept would vitiate compliance with the horizontal com-
ponent’ of evacuation. The issues around liability and responsibility raised by planners in the 1970s
and 1980s are still of concern in current projects.
Vertical evacuation is often-discussed as a recognised strategy for reducing life risk in hurricane
(e.g., Wolshon et al., 2005) and flooding (e.g., Kolen and Helsloot, 2012; Sorensen, 2000). It also
features in tsunami planning guidelines (NTHMP, 2001) and a new European tsunami evacuation
planning framework (Scheer et al., 2011). Coastal hotels are used in Hilo, Hawai’i, US, to evacuate
tourists in tsunami (Staff Reporter, 2011). There are numerous vertical evacuation structures in
Japan, including those in: Aonae, Okushiri Island; Nishiki, Mie Prefecture; Shirahama, Wakayama
Prefecture; and Kaiyo, Tokushima Prefecture (Leonard et al., 2011; Scheer et al., 2011; Velotti et
al., 2013). A combination of pedestrian bridge and tsunami towers have been proposed as solutions
in dense urban environments (Muhari, Imamura, and Koshimura, 2012). Plans for a ‘tsunami
evacuation raised earth park’ are underway in Padang, Sumatra5 and several structures have been
5 http://geohaz.org/projects/sumatra.html

74 3. Tsunami risk reduction and preparedness
constructed in Banda Aceh, Indonesia (Leonard et al., 2011). In New Zealand, vertical evacuation
is defined in Appendix 2 of the MCDEM Guide to the National Plan (MCDEM, 2009a) but it is
not explicitly discussed in the main text of the plan. Additionally, MCDEM (2008c) states that
vertical evacuation options should be considered locally and indicated on evacuation maps with
signage, where this option is implemented. However, there are no further guidelines available on
the development or use of vertical evacuation for tsunami.
Tsunami vertical evacuation was considered in plans to redevelop the City Hall building in
Cannon Beach, Oregon, US. This project exemplifies some of the key issues of vertical evacuation
in terms of structure, risk-reduction context, community participation and funding. Primarily, the
existing site is not large enough to accommodate a ramp of sufficient gradient for wheelchair ac-
cess. Thus, the development does not meet requirements of the Americans with Disabilities Act
(ADA). There was some resistance to the project in the local and scientific communities who be-
lieve that a better strategy for evacuation is to retrofit the main vehicular bridge in and out of town
(Wang, 2009). The project is currently awaiting state or federal funding for construction in order
to progress from the conceptual design stage. Project Safe Haven, a NTHMP-funded multi-agency
project has identified multiple potential vertical evacuation locations on the Washington, US, coast
using a community-participation model to decide on locations and the design of proposed build-
ings, towers or berms (Project Safe Haven, 2011a,b). While planning redevelopment of a school
gymnasium, Ocosta School in Grays Harbor County decided to incorporate the means for vertical
evacuation (Doughton, 2013). This will become the first TVEB in the US.
Several studies have considered the construction or design costs of TVEB, or compared the
cost of a tsunami-resistant building with a non-engineered building. Costs are generally a func-
tion of structure type, required capacity and required structure height (Project Safe Haven, 2011a).
The project costs for several refuges proposed by Project Safe Haven in Grays County and Pacific
Harbor County were in the range United States Dollars (USD) 323,000 for berms with capacity
of <100 people, to >USD 3.3 million for a tower with capacity of 1,700. The ‘cost per evac-
uee’ ratio varied between USD 1,000–6,400 per person, and demonstrates that potential costs vary
significantly according to refuge design, and must be determined on a site-specific basis. It was
estimated that to rebuild Cannon Beach City Hall to provide vertical evacuation refuge and be op-
erational post-earthquake, would cost USD 4 million (double the cost of a wood-frame alternative)
(Wang, 2009). At the same workshop it was noted that when constructing an engineered building,
the additional cost of tsunami-resistance is reduced as a proportion of the building cost, although
no estimates were provided. Mikhaylov and Robertson (2009) estimated that to provide additional
tsunami resistance in a multi-storey RC building, <8% increase in weight of reinforcing steel and
<3% increase in volume of concrete was required. This suggests that costs to modify planned
seismically-engineered buildings for suitability as TVEB could be low, however, this is an area
that should be subject to further research.
Informal discussions were conducted early in this research project with leaders of the Project
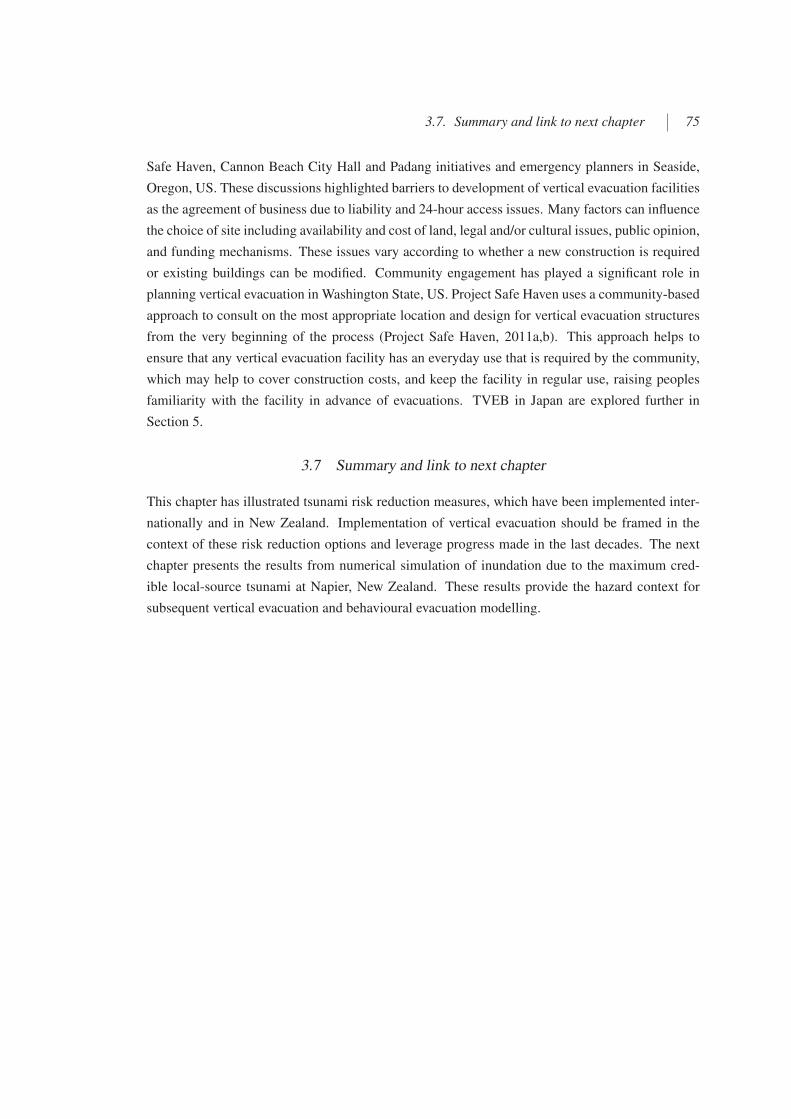
3.7. Summary and link to next chapter 75
Safe Haven, Cannon Beach City Hall and Padang initiatives and emergency planners in Seaside,
Oregon, US. These discussions highlighted barriers to development of vertical evacuation facilities
as the agreement of business due to liability and 24-hour access issues. Many factors can influence
the choice of site including availability and cost of land, legal and/or cultural issues, public opinion,
and funding mechanisms. These issues vary according to whether a new construction is required
or existing buildings can be modified. Community engagement has played a significant role in
planning vertical evacuation in Washington State, US. Project Safe Haven uses a community-based
approach to consult on the most appropriate location and design for vertical evacuation structures
from the very beginning of the process (Project Safe Haven, 2011a,b). This approach helps to
ensure that any vertical evacuation facility has an everyday use that is required by the community,
which may help to cover construction costs, and keep the facility in regular use, raising peoples
familiarity with the facility in advance of evacuations. TVEB in Japan are explored further in
Section 5.
3.7 Summary and link to next chapter
This chapter has illustrated tsunami risk reduction measures, which have been implemented inter-
nationally and in New Zealand. Implementation of vertical evacuation should be framed in the
context of these risk reduction options and leverage progress made in the last decades. The next
chapter presents the results from numerical simulation of inundation due to the maximum cred-
ible local-source tsunami at Napier, New Zealand. These results provide the hazard context for
subsequent vertical evacuation and behavioural evacuation modelling.


4. TSUNAMI INUNDATION IN NAPIER, NEW ZEALAND, DUE TO LOCAL
EARTHQUAKE SOURCES (PAPER 1)
This chapter presents deterministic simulation of local-source tsunami on the east coast of New
Zealand’s North Island. This chapter characterises wave arrival times, flow depth and inundation
extent due to the maximum credible local tsunami scenario. By presenting a new tsunami as-
sessment, and data for subsequent investigations of evacuation behaviour and inform evacuation
simulations, the chapter meets Objective 1. Section 4.1 contextualises the chapter by providing
a general introduction to tsunami numerical modelling, which could not be included in the jour-
nal paper. The majority of this chapter (Sections 4.2–4.9) was originally published as Fraser,
S.A., Power, W.L., Wang, X., Wallace, L., Mueller, C., Johnston, D.M. 2014. Tsunami inundation
in Napier, New Zealand, due to local earthquake sources. Volume 70, Issue 1, 415–445. doi:
10.1007/s11069-013-0820-x. The article is reproduced with kind permission from Springer Sci-
ence and Business Media. With the exception of formatting, the text presented here is unaltered
from the published version. A statement of author contribution is provided in Appendix H.
4.1 Background to numerical modelling
The goal of tsunami numerical modelling is to simulate tsunami generation, propagation and inun-
dation in a numerical domain. This requires accurate representation of seafloor or landslide motion
as the source, transfer of source motion into displacement of the water column, propagation of
waves through the deep ocean and finally inundation on shore. Numerical analyses can be broadly
categorised as deterministic or probabilistic. Deterministic simulations apply one or more scenar-
ios; these may be retrospective analyses of historic events, or assessment of a ‘characteristic’ or
maximum credible earthquake. Such analysis is useful for elucidating the impacts of a given even-
t, but probabilistic analysis is required to generate a full picture of the tsunami hazard including
frequency. Probabilistic analysis is required for defining recurrence intervals of wave heights or
impacts for loss assessment, land-use planning and engineering design standards. The choice of
approach is determined by the goal of an analysis, but also due to practicality and budget, as the
number of simulations involved in probabilistic analyses requires substantially more computational
expense than deterministic analyses. Probabilistic analyses are becoming more commonplace as
advances in computing make it possible to execute thousands of simulations. Still, they are limited
to linear simulation of an offshore tsunami amplitude, for example at the 50 m isobath (Burbidge

78 4. Local tsunami inundation in Napier (Paper 1)
et al., 2008) because non-linear methods remain too computationally intensive to be utilised in
probabilistic frameworks (Power, 2013).
Numerical simulation of tsunami is conducted using a number of available codes; some of
these are summarised in Section 4.1.1 in terms of governing equations, calculation scheme, val-
idation and previous application. The available codes are based on the physics of fluid motion,
described by the non-linear partial differential Navier-Stokes equations. For flow that has a ver-
tical dimension (depth, D) much smaller than the horizontal dimension (wavelength, λ), shallow
water theory applies, which states that vertical acceleration is negligible relative to the horizontal
velocity due to gravitational acceleration. Vertical motion therefore has no impact on pressure dis-
tribution and pressure is considered hydrostatic — a function of depth only. In these situations,
the Navier-Stokes equations can be simplified by averaging the equations over the water depth to
remove the vertical terms and form the Shallow Water Equations (SWE). Shallow water theory is
applicable to tsunami in the deep ocean because the maximum depth of the ocean is generally <4
km and tsunami wavelength can reach hundreds of kilometres, thus, tsunami satisfy the dimension-
al requirements of SWE. The equations of mass conservation and momentum, neglecting vertical
terms are then used to simulate tsunami:
Mass conservation:
∂h
t+
∂(uh)
∂t+
∂(vh)
∂t= 0 (4.1)
Momentum conservation in x-and y-directions:
∂(uh)
∂t+
∂(u2h+ 12gh
2)
∂x+
∂(uvh)
∂y= 0 (4.2)
∂(vh)
∂t+
∂(uvh)
∂x+
∂(v2h+ 12gh
2)
∂y= 0 (4.3)
The advantage of using SWE is their efficiency of use while being able to predict maximum
run-up and the run-up process (Synolakis, 1991). However, their non-dispersive nature means they
are not the most appropriate scheme for replicating waveforms due to some generation mecha-
nisms, over complex bathymetry, or in shoaling/inundation stages. For large seismically-generated
tsunami, frequency dispersion imparts only minor modifications on transoceanic propagation and
for waves with D/λ < 1/20 velocity is independent of wavelength, therefore all waves travel at the
phase velocity and are non-dispersive, so frequency dispersion can be neglected (Glimsdal et al.,
2013). For SWE to be more applicable where D/λ > 1/20, or where distance of travel is sufficient
for dispersion effects to accumulate, numerical dispersion can be applied in the SWE to mimic the
neglected physical dispersion (Imamura, Shuto, and Goto, 1988; Wang, 2008). Fully-dispersive
modelling is required to properly describe wave generation of tsunami generated by landslides or
moderate magnitude earthquakes, which are strongly affected by dispersion (Glimsdal et al., 2013).

4.1. Background to numerical modelling 79
Equations that solve non-linear terms and frequency dispersion, such as the Boussinesq (Grilli et
al., 2007) or the full Navier-Stokes equations, account for vertical flow structure and incorporate
frequency dispersion but incur significant computational expense in doing so. This makes them too
computationally intensive for use in most seismic-tsunami hazard assessments, limiting their prac-
tical utility to small-scale or near-field simulations and simulations where dispersion conditions
demand their use.
In the deep ocean where tsunami amplitude is much smaller that water depth, bottom friction
terms and non-linear convective terms are negligible. Therefore, bottom friction can be ignored
in these deep ocean areas and the SWE can be used in their linear form. As the wave propagates
onto the continental shelf water depth is reduced and tsunami amplitude increases (the ‘shoaling
effect’, Fig 2.1) such that bottom friction effects (Dao and Tkalich, 2007) and nonlinear convective
inertia force become greater, meaning non-linear terms are required (Shuto, 1991). The complexity
is compounded by interactions with physical structures on shore (Charvet et al., 2010). SWE
can be applied in their conservative form, solving for free-surface fluctuation and volume flux,
or non-conservative form, which solve for velocity. The conservative form allows the model to
perform better in situations where the shallow water theory breaks down, such as in areas of steep
bathymetry (Wang and Power, 2011).
The governing equations are discretised and solved on a grid or mesh of individual cells or
elements. Cell size used in analysis must be of a resolution sufficiently fine to resolve the tsunami
wave to prevent decay in the wave profile (Shuto, 1991). Therefore, grid/mesh element size must
reduce as water depth and wavelength decrease. On the other hand, cells with fine resolution carry a
much greater computational expense, due to the increased number of calculations required. A grid
tends to have cells of fixed dimensions within a model domain, while a mesh provides more flexi-
bility to have cells of variable size in a single domain, with the advantage of better representation of
topo/bathymetric features (Tinti, Gavagni, and Piatanesi, 1994). A grid of fixed cell size presents
the problem of insufficient resolution in the onshore region and incurs unnecessary computation
expense in deep ocean areas. To avoid this, some models ‘nest’ multiple grids of decreasing cell-
size inside one another, with the smallest cell-size occurring in shallow or onshore areas. Accurate
simulation of the moving wet/dry boundary is important (Shuto, 1991) to adequately simulate the
cyclical ebb and flow of tsunami water at the shoreline. The moving boundary applied in fixed grid
models is limited to the boundary of elements, so accuracy of the moving boundary is subject to
the grid resolution. Among other schemes, linear extrapolation of water depths across cells can
improve accuracy of the moving boundary (Lynett, Wu, and Liu, 2002).
Simulation can be implemented on Cartesian coordinates, but where trans-oceanic propagation
is being simulated spherical coordinates must be used to represent the impact of Coriolis Force and
curvature of the Earth (Shuto, 1991). These effects alter the path of waves and ultimately affect
wave height at the coast and inundation. One of the primary causes of inaccuracy or uncertainty
in tsunami simulations is the availability of bathymetry/topography data of sufficient resolution to

80 4. Local tsunami inundation in Napier (Paper 1)
adequately simulate the complex and influential interactions between tsunami and bathymetry. For
example, focussing and de-focussing effects of variable ocean depth can impact tsunami ampli-
tude by a factor of three (Okal, 1988). Therefore, it is important that bottom surface features are
accurately represented by using the highest possible resolution bathymetry and topography.
Complexities in modelling and the variation in results from multiple tsunami numerical codes
in analysis of the Indian Ocean tsunami showed a need for code validation (Synolakis et al., 2008).
Synolakis et al. (2008) described a series of analytical, laboratory and field-data benchmark tests
for validating the output of numerical codes. The tests include:
• Analytical — using analytical solutions for linear (solitary and N-wave) and nonlinear wave
evolution on a simple sloping beach, solitary wave on a beach of variable slope, and sub-
aerial landsliding;
• Laboratory — using scaled physical models representing solitary waves on simple and vari-
able beaches, around a conical island and into a three-dimensional cove;
• Field-data — using observed data (tide gauge recordings, measured run-up heights, observed
arrival times and wave direction) to verify the output of a tsunami simulation.
In validation against the benchmark tests, models must satisfy the basic hydrodynamic conditions
of: mass conservation in the face of numerical approximations such as friction factors that stabilise
computations but violate mass conservation principles; and convergence of calculated run-up with
decreasing time-step size (Synolakis et al., 2008). There is also a requirement that models are e-
valuated for scientific use through documentation in peer-reviewed journals and formal evaluation
(Synolakis et al., 2008). These benchmark tests were adopted by the operators of the major tsuna-
mi warning systems to reduce uncertainty in the long-range and operational forecasting required
by such systems (Synolakis et al., 2007). Operational models (i.e., those used by warning cen-
tres in real-time forecasting) must be subject to additional constraints of time (producing run-up
estimates before real-time tsunami arrival) and accuracy (‘how well the computational procedure
represents results of the parent equations’), of which propagation accuracy within 10% and arrival
time accuracy of three minutes is now achievable (Titov et al., 2005).
4.1.1 Tsunami numerical model summary
There are several numerical codes in active development and available for use in tsunami simula-
tion. Some of these are summarised below.
3DD
3DD is a three-dimensional hydrodynamic model used primarily in simulation of inter-tidal zones
such as estuaries. Its robust wetting and drying scheme provides advantages for simulation of inun-
dation over large areas of flat land. The scheme calculates water depth at each cell wall rather than

4.1. Background to numerical modelling 81
at the centre of the cell, as used by most other models. As one or more wall may be wet or dry at
any time) it smooths the transition between cells, reducing the chance of spikes in velocity values
of shallow flow. An effective depth term is also used to prevent instabilities caused by bed fric-
tion. Other characteristics of the model are similar to other models: fully explicit time stepping,
two-dimensional form based on momentum equation and conservation of mass (Prasetya et al.,
2011b), explicit finite difference (Eularian) scheme, roughness length and eddy viscosity included,
nonlinear convection acceleration and coriolis terms, free/no slip of land-sea boundaries, staggered
grid, fully explicit leapfrog scheme. The fully explicit timestepping feature minimises numerical
dispersion, however, this feature requires very small timesteps, which increases the computation-
al expense of running this model. The model has been validated for tsunami using benchmark
problems (Borrero et al., 2007) and other ‘skill score’ tests. 3DD allows the implementation of
Boussinesq terms to simulate depth-dependent breaking and consequent energy loss. This model
has been used by Prasetya et al. (2011b) to reproduce inundation and flow speeds in the 2004 Indi-
an Ocean tsunami, in which they highlighted the importance of flow speeds in determining damage
distribution and disparities in timing and spatial characteristics of return flow compared to onshore
flow. Particularly, return flow was initiated before maximum inundation of prior wave is reached,
is more concentrated than onshore flow and continues 500 m offshore (Prasetya et al., 2011b).
Australian National University-Geoscience Australia (ANUGA)
ANUGA1 is an open source code developed to simulate tsunami as part of the Australian Tsunami
Warning System. The conservative form of SWE are applied in a two-dimensional finite-volume
method on a triangular mesh, with a focus on modelling inundation, therefore the model includes a
wetting-drying function and ability to model hydraulic jumps (Geoscience Australia and the Aus-
tralian National University, 2010; Jakeman et al., 2010), which makes it particularly suitable for
modelling shallow flows around structures, such as in an urban environment. Frictional resistance
is applied using Manning’s formula. As with other two-dimensional models, ANUGA is limit-
ed from representing breaking waves or three-dimensional turbulence. Spherical coordinates are
not supported, therefore large-scale analyses (larger than 6°) cannot be conducted, limiting use
of the model to local and regional studies. Importantly, ANUGA does not allow explicit source
modelling so the initial source must be modelled in another piece of software, and the results of
propagation used as a boundary condition for ANUGA (Jakeman et al., 2010). ANUGA has been
validated against physical modelling of the 1993 Okushiri Island tsunami and applied in simula-
tion of the 2004 Indian Ocean tsunami (Jakeman et al., 2010). At present, ANUGA requires further
refinement in order to satisfy conservation of physical energy, even in smooth, frictionless flows
(Mungkasi and Roberts, 2013).
1 https://anuga.anu.edu.au/

82 4. Local tsunami inundation in Napier (Paper 1)
COrnell Multi-grid COupled Tsunami (COMCOT)
COMCOT enables linear and non-linear modelling of the conservative form of the SWE, in both
Spherical and Cartesian coordinates. The conservative form solves for volume flux rather than
velocity alone, therefore the equations retain validity in the nearshore area, where shallow water
assumptions begin to break down due to the decreasing ratio of water depth to tsunami wavelength.
The conservative form also provides better performance at local scales where bathymetric variation
is significant (Wang and Power, 2011). An explicit leap-frog finite difference method is adopted to
solve both linear and non-linear shallow water equations (Cho, 1995). Initial conditions comprise
instantaneous and transient sea floor disturbance, landslides and initial water surface displacement.
COMCOT has been validated against analytical and experimental benchmark problems (Liu,
Yeh, and Synolakis, 2008; Liu et al., 1995b; Wang and Liu, 2008) and has proven accurate in
re-producing field observations of past events (Gica et al., 2007; Liu, Cho, and Fujima, 1994; Liu
et al., 1995b; Wang and Liu, 2006). In recent years, COMCOT has been used extensively by
GNS Science for tsunami modelling in New Zealand. These studies include inundation modelling
of distant-source and local-source tsunami at Gisborne (Wang et al., 2009), and tsunami hazard
from the Southern New Hebrides and Kermadec subduction margins (Power and Gale, 2011). The
methods applied in these studies provide a guide for the set-up of a suitable model for use in this
study, and indeed, some of the data used in this study was originally developed for these earlier
studies.
Method of Splitting Tsunami (MOST)
MOST was developed by the United States (US) National Oceanic and Atmospheric Administra-
tion (NOAA) for tsunami modelling and real-time forecasting. It solves the nonlinear SWE in
two directions, along-shore and onshore, separately rather than solving in two-directions. This in-
volves splitting the governing equations into two sets — each with one spatial dimension x and y
with a finite-difference method. The model has been validated against standard benchmarks prob-
lems (Liu, Yeh, and Synolakis, 2008). MOST is now used internationally for tsunami inundation
forecast modelling, including the NOAA operational tsunami forecasting system. MOST has pre-
viously been used to simulate at-shore tsunami wave heights for various scenarios on the Hikurangi
subduction zone interface (Power, Reyners, and Wallace, 2008).
River and Coastal Ocean Model (RiCOM)
RiCOM solves non-linear SWE with terms to describe non-hydrostatic forces on a mesh of trian-
gular of quadrilateral elements (Downes et al., 2005; Lane et al., 2011, 2013; Walters, Barnes, and
Goff, 2006). Finite-volume method is used to calculate fluxes through the face of each element.
This permits natural simulation of wetting and drying in intertidal and onshore areas. Free surface

4.2. Abstract 83
displacement is used as initial tsunami condition — time histories of water level and current veloc-
ity (e.g., Lane et al., 2013) or water level corresponding to the a rapid (considered instantaneous)
sea floor rupture (Walters, Barnes, and Goff, 2006). The model enables boundary conditions at the
open sea boundaries to be set to radiate, mimicking the flow of tsunami out of the model domain
without reflection from that boundary. The model has been validated for tsunami benchmark stud-
ies by Walters (2003) and has been applied in several local-source tsunami studies around the New
Zealand coast (Lane et al., 2013; Walters, Barnes, and Goff, 2006; Walters, Goff, and Wang, 2006)
Tohoku University’s Numerical Analysis Model for Investigation of Near-field tsunamis
(TUNAMI)
The TUNAMI code comprises linear and shallow water codes operating on fixed and variable
resolution grids, designed to simulate tsunami in the near-field and far-field (Imamura, Yalciner,
and Ozyurt, 2006). The TUNAMI -N2 (Goto et al., 1997) version uses a leap-frog finite difference
scheme to solve the non-linear SWE. Modifications made by Dao and Tkalich (2007) introduced
dispersion terms and the influence of Coriolis Force and the Earth’s curvature. TUNAMI facilitates
sea surface deformation due to multiple non-simultaneous ruptures, through the Mansinha and
Smylie (1971a) fault model. TUNAMI has been validated against observations of past tsunami
(Dao and Tkalich, 2007) and has been widely applied in simulation of tsunami in multiple regions
(e.g., Mas, Adriano, and Koshimura, 2013; Mas et al., 2012a; Suppasri et al., 2012; Yalciner et al.,
2004; Zahibo et al., 2003).
The rest of this chapter presents the published paper, in which COMCOT is used to simulate
local-source subduction zone tsunami inundation at Napier, Hawke’s Bay, New Zealand.
4.2 Abstract
Deterministic analysis of local tsunami generated by subduction zone earthquakes demonstrates
the potential for extensive inundation and building damage in Napier, New Zealand. We present
the first high-resolution assessments of tsunami inundation in Napier based on full simulation from
tsunami generation to inundation and demonstrate the potential variability of onshore impacts due
to local earthquakes. In the most extreme scenario, rupture of the whole Hikurangi subduction
margin, maximum onshore flow depth exceeds 8.0 m within 200 m of the shore and exceeds 5.0
m in the city centre, with high potential for major damage to buildings. Inundation due to single-
segment or splay fault rupture is relatively limited despite the magnitudes of MW 7.8 and greater.
There is approximately 30 min available for evacuation of the inundation zone following a local
rupture, and inundation could reach a maximum extent of 4 km. The central city is inundated by
up to three waves, and Napier Port could be inundated repeatedly for 12 h. These new data on
potential flow depth, arrival time and flow kinematics provide valuable information for tsunami
education, exposure analysis and evacuation planning.

84 4. Local tsunami inundation in Napier (Paper 1)
4.3 Introduction
The Hikurangi subduction margin is a potential source of ‘large-to-great earthquakes’ (Berryman,
2005) and the local nature of tsunami generated from such an earthquake is of significant concern
to the New Zealand scientific and emergency management communities. New Zealand is also at
risk of tsunami from regional and distant sources and is a member of the Pacific Tsunami Warning
System (PTWS). The Ministry of Civil Defence and Emergency Management (MCDEM) aims
to assess the tsunami threat to New Zealand and if appropriate disseminate a national tsunami
advisory or warning within 15–30 minutes following receipt of a Pacific Tsunami Warning Center
information bulletin, watch or warning, or a GNS Science earthquake report (MCDEM, 2010a).
However, for local tsunami, defined in New Zealand as having travel time of <1 h from source
to the coastal area of interest (MCDEM, 2010a), 15–30 min represents a significant portion of the
time available for evacuation of coastal locations proximal to the source. Education and awareness
of the local tsunami hazard are vital to enable the public to recognise the potential for tsunami
following a local earthquake and act accordingly through immediate self-evacuation.
This paper enhances current knowledge of the local tsunami hazard in Napier, Hawke’s Bay,
by demonstrating potential tsunami inundation due to earthquakes at the Hikurangi subduction
margin. Although the city has not experienced a significant local tsunami in recorded history, there
are sites in Hawke’s Bay that exhibit evidence of past tsunami in the form of high-energy marine
deposits. Damaging local tsunami have been recorded elsewhere on the east coast of the North
Island, most notably two local-source tsunami that affected Gisborne in 1947 (Downes et al., 2000).
We provide the first published assessment of inundation in Napier based on simulation of the full
tsunami process for multiple subduction zone tsunami scenarios. Previous consideration of tsunami
generated by earthquakes on the Hikurangi subduction margin (Berryman, 2005; Power, Reyners,
and Wallace, 2008) is limited to estimation of wave heights at shore with empirically estimated
maximum run-up heights. In order to advance tsunami mitigation and evacuation planning in
coastal communities, accurate estimates of flow depth and inundation extent are now required.
The scenarios applied in this study include the worst-case tsunami for use in community pre-
paredness and tsunami mitigation activities but it is also important to investigate onshore impacts
due to other plausible tsunamigenic earthquakes. The maximum credible earthquake is represented
by a moment magnitude (MW) 9.0 rupture of the whole subduction margin. This is considered as
an upper limit to plausible magnitudes of such a rupture at this margin. We also demonstrate the
potential for inundation due to smaller local ruptures that have been discussed in previous studies,
but have not been used in simulation of onshore inundation. We describe tsunami impacts in terms
of flow depth and structural damage potential, and present wave arrival times to constrain estimates
of time available for evacuation.

4.4. Study area 85
4.4 Study area
Napier Territorial Authority (hereafter, Napier) is a coastal urban centre, identified at substantial
risk of tsunami from previous hazards assessments (Berryman, 2005; Power, Reyners, and Wal-
lace, 2008). There is a need for detailed tsunami hazard assessment to inform the development
of evacuation plans and tsunami education to increase the resilience of individuals and the local
community. Napier has an estimated resident population of 57,800 (Statistics New Zealand, 2013a,
at June 30 2012). The same projections indicate that 10,200 (17.6%) of the population are over
age of 65, which is the demographic group shown by recent experience to be the most vulnerable
to tsunami. In the 2011 Great East Japan tsunami over 65% of deaths in the three worst-affected
prefectures were of people over 60 years of age (Nakasu et al., 2011). Napier covers an area of 106
km2, comprising residential suburbs, commercial and industrial areas and agricultural land includ-
ing orchards and vineyards. Hawke’s Bay Airport, which operates internal passenger and freight
flights and would likely be required to provide access in response to an earthquake and tsunami, is
situated on an area of land between 0.5 m and 1.5 m above mean sea level and 250–1,700 m from
the coast in Bay View. Napier Port is the fourth largest in New Zealand in terms of the number
of containers handled and second largest in the North Island based on export by volume, handling
cargo including forestry products and container shipments (Port of Napier Limited, 2012). Stored
timber and containers on site are a potential source of fire and damaging debris if entrained in
tsunami flow.
The local topography is predominantly low elevation, except for Bluff Hill, which provides an
area of high ground immediately north of the city centre to maximum elevation over 100 m (Fig
4.1). On the eastern shore of the city there is a steep gravel beach and berm stretching along the
coastline south from Bluff Hill to the confluence of the Tutaekuri, Ngaruroro and Clive Rivers.
This berm ranges in elevation above Mean Sea Level (MSL) from 4 m in the south and exceeding
7 m high at its northern end. North-west of Bluff Hill the suburbs of Ahuriri and Westshore are
separated by a tidal inlet and small marina. Westshore is situated on a peninsula elevated 4–6 m
above MSL. Bay View is the most northern suburb of Napier, extending north around the bay.
Much of the land around the present Ahuriri Lagoon and airport was previously below sea level
until uplift during the 1931 Hawke’s Bay earthquake and artificial drainage in the years since
(Hull, 1986). Some of this land remains below MSL. The Hawke’s Bay earthquake destroyed
many buildings in Napier and resulted in major reconstruction in the 1930s Art Deco style. The
1930s building stock is an important factor in the city’s tourism activities. During peak tourist
season (January to March), an average of 2,342 visitors stay in Napier accommodation every night
(Statistics New Zealand, 2012c, 2006–2011 data).
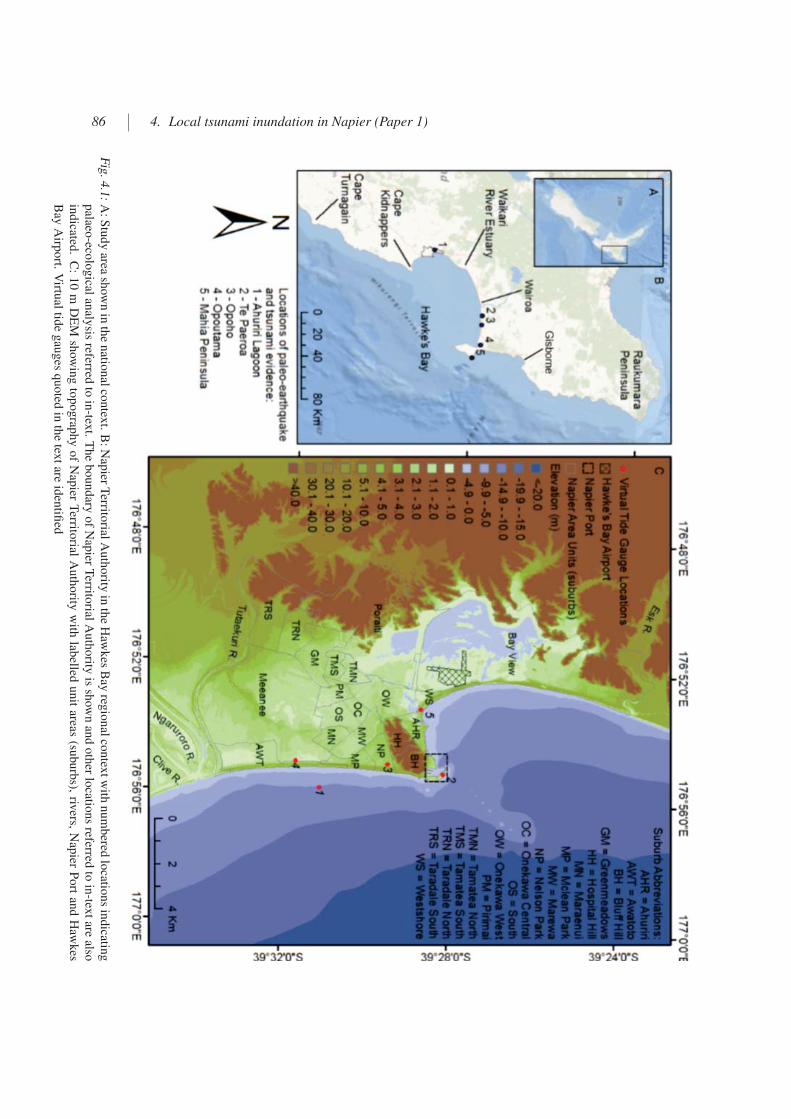
86 4. Local tsunami inundation in Napier (Paper 1)
Fig
.4
.1:
A:
Stu
dy
areash
ow
nin
the
natio
nal
con
text.
B:
Nap
ierT
erritorial
Au
tho
rityin
the
Haw
kes
Bay
regio
nal
con
text
with
nu
mb
eredlo
cation
sin
dicatin
g
palaeo
-ecolo
gical
analy
sisreferred
toin
-text.
Th
eb
ou
nd
aryo
fN
apier
Territo
rialA
uth
ority
issh
ow
nan
do
ther
locatio
ns
referredto
in-tex
tare
also
ind
icated.
C:
10
mD
EM
show
ing
top
og
raph
yo
fN
apier
Territo
rialA
uth
ority
with
labelled
un
itareas
(subu
rbs),
rivers,
Nap
ierP
ort
and
Haw
kes
Bay
Airp
ort.
Virtu
altid
egau
ges
quoted
inth
etex
tare
iden
tified

4.5. Hikurangi subduction margin 87
4.5 Hikurangi subduction margin
4.5.1 Tectonic setting and seismic potential
The Hikurangi Trough is the surface expression of westward subduction of the Pacific plate beneath
the Australian Plate, situated approximately 50–100 km offshore of the East coast of New Zealand’s
North Island (Fig 4.2). The subduction margin continues to the north as the Kermadec Trench and
the southern limit of subduction is located offshore of the northern South Island, where the plate
boundary transitions to strike-slip (Wallace et al., 2012). Moderate subduction thrust earthquakes
(Downes, 2006) and tsunamigenic slow slip earthquakes (Downes et al., 2000) have occurred on
the Hikurangi subduction margin in recorded history (since c. 1840 A.D.), but no subduction thrust
earthquakes greater than MW 7.2 have been recorded.
Ansell and Bannister (1996) initially characterised the subducting slab using micro-earthquake
seismicity and more recent work has provided detailed images of the subduction interface config-
uration (Barker et al., 2009; Henrys et al., 2006). Global Positioning System (GPS) and seismo-
logical observations have been used to define regions of distinctly different subduction interface
behaviour and seismic potential (Wallace et al., 2009). Since early seismological studies of the
Hikurangi subduction margin, it has been suggested that the plate interface below the lower North
Island (Cook Strait to Cape Turnagain) is more likely to produce large subduction thrust events in
comparison to the interface below the upper North Island (North of Mahia Peninsula, Fig 4.1B)
(Reyners, 1998; Wallace et al., 2009). Convergence of the subducting plates is taking place at rates
of around 50–60 mm.yr-1 offshore of the upper North Island, while offshore of the lower North
Island this rate is lower, at 20–25 mm.yr-1 (Wallace et al., 2004).
Below the lower North Island, the plate interface is inter-seismically coupled (coupling coeffi-
cient: 0.8–1.0) to around 40 km deep and 90–180 km wide (Wallace et al., 2009). GPS data reveal
that this part of the plate interface is building up significant elastic strain that will eventually be
released in a large megathrust earthquake (Wallace et al., 2004). Wallace et al. (2009) estimates
the lower North Island segment to be 230 km long and 150–185 km wide, and using Abe’s 1975
fault scaling relationships translates this to a potential event of MW 8.5–8.7 with 8–12 m of slip.
If the current estimated slip rate deficit of 20–25 mm.yr-1 is steady throughout the inter-seismic
period, this results in a proposed return period of 300–625 years (Wallace et al., 2009), although
uncertainty remains around the amount of slip and recurrence interval. It is also possible that this
segment of the interface ruptures in smaller (MW <8.0) earthquakes more frequently.
At the central North Island segment, including offshore Hawke’s Bay, the plate interface cur-
rently exhibits low inter-seismic coupling, and is dominated by aseismic slip and slow slip events
(Wallace and Beavan, 2010; Wallace et al., 2004), suggesting lower potential for ‘stick-slip be-
haviour’, whereby elastic strain accumulates during an inter-seismic period (‘stick’ component;
Scholz, 1998), to be later released in a large earthquake (‘slip’ component). However, we can-
not rule out the possibility of large or great earthquakes at any part of the margin (Wallace et al.,

88 4. Local tsunami inundation in Napier (Paper 1)
Fig
.4
.2:
Map
illustratin
gth
esh
aded
bath
ym
etryo
fth
em
od
eld
om
ain.
Th
em
ainm
apsh
ow
sg
rid1
with
the
plate
bo
un
dary
mark
ed.
Th
ein
setsh
ow
sH
awkes
Bay
and
nested
grid
s2
–4

4.5. Hikurangi subduction margin 89
2009). Despite the shallow inter-seismic coupling extending to only 15 km depth, and the low cou-
pling coefficient, frequent rupture of small patches of the subduction plate occurs and is inferred
to be localised asperities exhibiting stick-slip behaviour, possibly related to subducting seamounts
(Bell et al., 2010). Subducting seamounts have been related to recurrent earthquakes internation-
ally, including earthquakes of around MW 7.0 with 30-year recurrence intervals offshore Tohoku
(Yamanaka and Kikuchi, 2004) and the MW 7.0 Gulf of Nicoya earthquake, Costa Rica (Husen,
Kissling, and Quintero, 2002), and have been related to local seismic coupling in an otherwise
seismically decoupled subduction zone on the Tonga-Kermadec and Izu-Bonin Trenches (Scholz
and Small, 1997).
The plates beneath the upper North Island are less strongly coupled (coupling coefficient: 0.1–
0.2) in a region extending to 15 km depth beneath Hawke’s Bay and the Raukumara Peninsula.
This segment north of Mahia Peninsula is characterised by tectonic erosion and an indented toe,
indicating the impact of seamounts on the subducting plate (Collot et al., 2001; Lewis, Collot, and
Lallemand, 1998; Pedley et al., 2010). It is believed that this segment is particularly suited to pro-
ducing tsunami earthquakes that involve a large amount of rupture close to the trench characterised
by slow rupture velocities, long rupture durations, low local magnitude (ML) compared to moment
magnitude, and larger than expected tsunami compared to the earthquake magnitude (Kanamori,
1972; Pelayo and Wiens, 1992; Tanioka and Satake, 1996a). Two tsunami earthquakes occurred at
the northern Hikurangi subduction margin in March and May 1947 (Downes et al., 2000) and prior
to that in 1880, tentatively suggesting a return period of 70 years for tsunami earthquakes in the
Gisborne region (Power, Reyners, and Wallace, 2008).
In addition to single-segment ruptures, the potential propagation of rupture across multiple
segments must be considered (Power, Reyners, and Wallace, 2008; Wallace et al., 2009). The oc-
currence of multiple-segment rupture at other major subduction zones, for example during the 2011
Great East Japan (Ishii, 2011), 2010 Maule, Chile (Kiser and Ishii, 2011), 2007 Solomon Islands
(Taylor et al., 2008) and 2004 Sumatra (Lay et al., 2005) earthquakes, supports this possibility. Si-
multaneous rupture of the northern and central segment of the margin could result in an earthquake
greater than MW 8.6, assuming 8 m or more of slip, while the expectation of a full margin rupture
is that it would be greater than 650 km long by 100 km wide and MW 8.8 or greater (Wallace
et al., 2009). There also exists the remote possibility of a rupture involving segments on both the
Hikurangi and Kermadec subduction margins (Power et al., 2012) but this extreme scenario is not
investigated in this study.
4.5.2 Evidence of past earthquakes and tsunami
In recorded history, Napier has experienced distant tsunami in 1868 (due to an earthquake in Pe-
ru), flooding of a wharf in 1877 (earthquake, Chile) and 3 m flow depth onshore with damage to
infrastructure, buildings and boats in 1960 (earthquake, Chile) (De Lange and Healy, 1986). The

90 4. Local tsunami inundation in Napier (Paper 1)
tsunami due to the 2010 Chilean earthquake was recorded at Napier with measured peak amplitude
exceeding 1.4 m in Ahuriri Harbour and economic loss of NZD 80,000–100,000 due to closure of
the Port (Hawke’s Bay Regional Council, 2010). Records of tsunami generated within or proximal
to Hawke’s Bay are limited. Most recently, two slow-slip earthquakes at Gisborne in 1947 (26th
March: MW 7.0–7.1 and 17th May: MW 6.9–7.1) caused 10 m and 6 m run-up, respectively, at
the coast around Gisborne (Downes et al., 2000). There is a possible tsunami in 1937 or 1938 that
may have affected Wairoa, recorded by Goff (2008b). In 1931, a sub-aerial landslide close to the
Waikari River was triggered by the Hawke’s Bay earthquake and in turn caused a localised tsunami
with 15 m run-up in the Waikari River Estuary and 3 m at Wairoa (Fraser, 1998). See Fig 4.1B for
locations referred to in this section.
In addition to the limited historic record, palaeo-seismic and palaeo-tsunami data are relied
upon to enhance the record of pre-historic subduction earthquakes and tsunami. Goff (2008b) lists
around ten possible events with deposits found in Hawke’s Bay dated between the 15th Century
and 8,000 calendar years before present (cal. yr BP), and several more that possibly occurred prior
to Maori settlement. The certainty with which we can infer that deposits are due to tsunami varies
significantly, but where a tsunami deposit is synchronous with an episode of sudden subsidence
we can infer that a local earthquake was a possible trigger of the tsunami. Evidence of earthquake
events on the Hikurangi subduction margin exists in the form of repeated sudden-subsidence and
uplift events in Hawke’s Bay. At Ahuriri Lagoon, Hull (1986) identified one or more rapid sub-
sidence events totalling 8 m of subsidence between 1,750 and 3,500 radiocarbon years before
present (14C yr BP) and one event of 1 m subsidence at 500 14C yr BP. This was supported by fur-
ther micro-paleontological analysis at Ahuriri Lagoon by Hayward et al. (2006), who identified six
separate subsidence events within the last 7,200 cal. yr with a recurrence interval of 1,000–1,400
cal. yr and a subsidence range of 0.5–1.8 m in each event. The approximate age of fifteenth-
century tsunami deposits in Hawke’s Bay (Goff, 2008b) coincides with the most recent episode of
(1 m) subsidence in Ahuriri Lagoon (Hayward et al., 2006) suggesting that this represents the most
recent local earthquake and tsunami event for which there is geological evidence.
Cochran et al. (2006) recorded net subsidence of 4 m over the last 7,200 cal. yr at Te Paeroa
Lagoon in northern Hawke’s Bay and of 6 m at Opoho, 10 km to the east. At each site, two episodes
of subsidence have been dated to c. 5,550 and c. 7,100 cal. yr BP suggesting that in each case,
either a single large earthquake caused synchronous vertical deformation at both sites, or that each
site underwent separate incidents of localised subsidence very close together in time. At both sites,
subsidence is synchronous with a high-energy marine deposit of coarse sand and gravel inferred
to be due to tsunami inundation (Chague-Goff et al., 2002; Cochran et al., 2005). This deposit
extends to 2 km inland at Te Paeroa, representing a significant inundation extent. Three lakes, 60
km and 30 km away from the core sites, formed at c. 7,100 cal. yr BP (Page and Trustrum, 1997)
provide further evidence for an earthquake occurring with sufficient intensity to cause co-seismic
landslides (Cochran et al., 2006). There are three other marine-source high-energy deposition units

4.5. Hikurangi subduction margin 91
identified by Cochran et al. (2005) at Opoho and three at nearby Opoutama that may represent
tsunami deposits but have not yet been determined to be synchronous with subsidence events.
In addition to subsidence episodes, investigations of Holocene marine uplifted terraces along
the east coast of the North Island indicate episodes of rapid co-seismic uplift (Berryman, Ota, and
Hull, 1989; Clark et al., 2010), inferred as being due to rupture of local upper plate faults occurring
either in conjunction with or independently of plate interface rupture (Berryman, Ota, and Hull,
1989; Berryman et al., 2011). Berryman et al. (2011) postulate that several anomalously young
dates (with respect to the height of the terrace or age of nearby terraces) obtained for terraces
in the lower North Island are due to tsunami depositing sediments on terraces which had been
uplifted during previous deformation events. In particular, four marine uplift events are believed
to have resulted in localised tsunami deposition along as much as 100 km of the North Island
coast, at 1,463–1,670 AD, 1,282–1,408 AD, 267–449 AD and 270–405 AD. No uplifted terraces
have been recognised as synchronous with the subsidence episodes identified at Opoho and Te
Paeroa, as the respective records overlap by only 500 years, although there is a possibility of
synchronous uplift-subsidence event at c. 5,500 cal. yr BP (Cochran et al., 2006). Dating of
the known uplift episodes has not been carried out to sufficient detail to identify whether any of
the episodes occurred synchronously between sites long distances apart, which would suggest a
significant plate interface rupture (Wallace et al., 2009).
Cochran et al. (2006) used forward elastic-dislocation modelling to demonstrate that the mag-
nitude and distribution of subsidence recorded in northern Hawke’s Bay and uplift of Mahia Penin-
sula could be approximately replicated by several vertical deformation scenarios. They tested sce-
narios of 8 m slip on the plate interface, 8 m slip on the Lachlan Fault and a combination of both.
Replication of the correct uplift-subsidence distribution and amount of subsidence due to rupture of
the Lachlan Fault alone is at the lower limit of that recorded in cores. Although permanent coastal
deformation was replicated for the plate interface rupture with no Lachlan Fault component, uplift
at the Mahia Peninsula is most likely due to a component of upper plate thrusting, rather than iso-
lated rupture of the plate interface, therefore a combined rupture of plate interface and upper plate
faults is favoured as the cause of recorded subsidence-uplift distributions (Cochran et al., 2006).
The scenarios identified by Cochran et al. (2006) inform the choice of scenarios tested in this study.
4.5.3 Previous tsunami hazard assessment
There have been several investigations into likely severity of tsunami generated by an earthquake
on the Hikurangi subduction margin, which have provided estimates of at-shore wave heights. The
first New Zealand National Tsunami Hazard Review (Berryman, 2005) estimated probabilistically
a median wave height of 4.5 m from all sources at Napier/Hastings to be a 1 in 500 year event.
The review estimated that such an event would cause 320 deaths and 2,100 injuries in Napier
and Hastings. Power, Reyners, and Wallace (2008) simulated tsunami generated by 17 rupture

92 4. Local tsunami inundation in Napier (Paper 1)
scenarios on the margin, producing modelled tsunami wave heights at-shore for each scenario.
The largest at-shore wave heights at Napier are in excess of 5 m and are produced by an MW 9.0
rupture of the whole margin and an MW 8.2 simultaneous rupture of the plate interface offshore
Hawke’s Bay and the Lachlan Fault in Hawke’s Bay. Rupture of the lower North Island segment
produced wave heights of up to 3 m at Napier. Maximum wave height at Napier due to rupture
of the segment offshore of the Raukumara Peninsula was 1 m and simulations of the 1947 slow-
slip events resulted in negligible waves at Napier. It has not yet been possible to directly validate
these tsunami inundation scenarios against observed or measured tsunami inundation due to the
absence of well-recorded historical tsunami events at the study area (with the exception of the
1947 Gisborne earthquakes). Therefore, despite evidence supporting the potential for such events,
the results of these scenarios retain a high level of uncertainty. Additionally, RiskScape contained
Lachlan Fault scenarios (King and Bell, 2009), but omitted subduction zone earthquake scenarios.
Utilising detailed topographic data, Hawke’s Bay Regional Council (HBRC) produced tsunami
hazard maps (Hawke’s Bay Civil Defence And Emergency Management, 2011) using an incident
wave of 10 m amplitude relative to high tide, initiated approximately 20 km offshore of Napier
(Craig Goodier, personal communication, April 15th 2013). Results presented here support the
inundation extent of the HBRC hazard maps but, due to the use of an incident wave rather than
an earthquake source mechanism, the HBRC study is unsuitable for estimation of wave arrival
time and does not demonstrate the variability of inundation resulting from different local-source
ruptures.
4.6 Methodology
Tsunami generation, propagation and onshore inundation are modelled using the Cornell Multi-
grid Coupled Tsunami (COMCOT) model. COMCOT solves the conservative form of shallow
water equations SWE in terms of flow velocity and volume flux within an explicit staggered leap-
frog finite difference scheme (Cho, 1995; Liu, Woo, and Cho, 1998; Wang and Power, 2011).
A nested grid configuration is used to maximise both computational efficiency and accuracy by
applying linear SWE in grids 1–3 and non-linear SWE in the onshore grid 4. In the near-shore,
numerical dissipation replicates the energy dissipation of wave breaking, although wave-breaking
cannot be explicitly modelled. A moving boundary scheme tracks the moving shoreline during
non-linear simulation of onshore inundation. The model has been validated in numerous analytical
and physical modelling benchmark tests (Liu et al., 1995a,b; Wang and Liu, 2008), has been used
in previous studies of tsunami affecting New Zealand (e.g., Power et al., 2012, 2013) and several
globally significant tsunami (e.g., Baptista et al., 2011; Wang and Liu, 2006).

4.6. Methodology 93
4.6.1 Model setup
The model comprises four levels of nested grids (Fig 4.2) with maximum grid cell resolution of 15
m in the onshore area of interest (Table 4.1). Although the DEM is at 10 m resolution, significant
computational cost is associated with processing non-linear shallow-water equations at 10 m cell
size. We conducted model sensitivity tests to determine the influence of model grid resolution on
computational expense and congruence of inundation extent in 13 simulations before selecting the
appropriate resolution to apply in the model. Compared to the highest resolution model (7 m in
grid 4, identical resolution in grid 1–3), the model run at 15 m resolution produces <1% difference
in inundation area and inland extent, but requires only 13% of the computational time.
Tab. 4.1: COMCOT model domain information, showing spatial extent and cell resolution of model grids in
arc seconds and metres, data source and data resolution.
Model
grid
number
Long.
extent
(degrees)
Lat. extent
(degrees)
Model grid
resolution
(arc sec)
Model grid
resolution
(m)
Bathymetry /
topography source
and resolution
1166.0 to
186.0
-48.0 to
-33.560 1239–1852
30 arc sec ETOPO1
updated with
GEBCO08/LINZ
charts/CMAP
2176.5 to
177.7
-39.85 to
-38.812 284–370
10 arc sec interpolated
LINZ charts /CMAP
3176.7 to
177.5
-39.75 to
-39.12.4 57–74
10 arc sec LINZ
charts /CMAP
4176.81 to
177.18
-39.66 to
-39.330.48 11–15
10 m DEM Created
for this study –
LiDAR, LINZ
Nautical charts
Grids 1 to 3 are based on worldwide ETOPO1 global relief data (Amante and Eakins, 2009),
General Bathymetric Chart of the Oceans data (GEBCO, 2008), and LINZ (Land Information New
Zealand, 2006) charts at 10 arc seconds (Grids 2 and 3) and 30 arc seconds resolution (Grid 1)
(Table 4.1). In order to achieve high-resolution inundation modelling in grid 4, we developed a
seamless 10 m horizontal resolution digital elevation model (DEM) comprising Light Detection
and Ranging (LiDAR) ground elevation data for onshore topography and interpolated LINZ digital
bathymetric sounding depths. Original sounding depths are available at irregular spacing on the
order of several kilometres distance so we augmented these data by digitising LINZ nautical charts
to provide irregularly-spaced depths at distances on the order of several hundred metres. To pro-
duce a regularly-spaced grid of data for use in COMCOT, all bathymetry and topography data were
interpolated to a 10 m grid using the ArcGIS Topo To Raster algorithm, based on the ANUDEM

94 4. Local tsunami inundation in Napier (Paper 1)
program (Hutchinson, 1989).
Bottom friction, or surface roughness, is an important cause of tsunami flow resistance and
energy dissipation, particularly in shallow water (0–10 m depth) of the near-shore and onshore
areas (e.g., Myers and Baptista, 2001). Onshore, land cover is used to define surface roughness,
commonly in terms of Manning’s coefficient (Arcement and Schneider, 1989). The influence of
surface roughness on inundation extent, flow depth and velocity in high-resolution modelling has
been demonstrated by comparisons between several approaches to implementation of roughness.
Muhari et al. (2011) describes the available approaches as: Topographic Model whereby building
geometry and elevation are incorporated into the DEM; Constant Roughness Model, whereby a uni-
form surface roughness coefficient is applied throughout the study area; and Equivalent Roughness
Model, whereby spatially varying land cover and density of buildings are used to assign variable
roughness coefficient in a model domain. The resolution of our model (15 m), being coarser than
many buildings and streets, precludes accurate representation of buildings in a topographic model,
or application of high roughness coefficients to individual buildings with lower roughness repre-
senting streets between (e.g., Gayer et al., 2010; Kaiser et al., 2011). We apply the Equivalent
Roughness approach, using New Zealand Landcover Database version 2 (LCDB2; Ministry for the
Environment, 2009) to assign a roughness coefficient to each generalised land cover category in
Napier, resulting in variable roughness across the study area (Fig 4.3). Urban landcover is account-
ed for using a single roughness coefficient without the consideration of individual buildings.
We assign urban areas as n = 0.030, arable land as n = 0.019 and woodland as n = 0.026, after
Wang et al. (2009). We consider the urban value appropriate for the low building density in Napier
(10%–30% density in 92% of city meshblocks and maximum building density of 67%). This is a
lower roughness coefficient than those used in other recent studies for medium-density urban areas
(n = 0.059; Kaiser et al. (2011)) and populated areas (n = 0.045; Kotani, Imamura, and Shuto (1998)
in Muhari et al. (2011)). Sensitivity testing was conducted on the roughness values applied to the
Central Business District (CBD) (n =0.030, or n =0.200), as part of the model development process.
It was shown that a high roughness value of n = 0.2 reduced inundation extent by 8 km2 compared
to n = 0.030. The higher n value also reduces inundation extent by upto 50% at a time of 1 hr after
the earthquake. In a study that is being used to focus on evacuation modelling, conservatism in the
resulting inundation extent is desired, hence the low roughness friction implemented. The values
used for arable and woodland areas are also lower than those used elsewhere in the literature for
various types of vegetated and forested land which vary between n = 0.025 and n = 0.26 (Kaiser
et al., 2011; van der Sande, de Jong, and de Roo, 2003). Consistent with the previous studies of
roughness influence, roughness coefficients applied in this study are static through time and do not
account for destruction of buildings in tsunami flow. The sea bed is represented by homogenous
bed friction of n = 0.013 in all grids, although at most water depths in grids 1 to 3 the impact of
friction is negligible.
Five ‘virtual’ tide gauges (Table 4.2) are used to record time-series water level and flow depth

4.6. Methodology 95
Fig. 4.3: Surface roughness values (Mannings coefficients) applied in Napier, based on New Zealand Land-
cover Database 2 data (Ministry for the Environment, 2009, LCDB2;)

96 4. Local tsunami inundation in Napier (Paper 1)
data for the 12 hours of simulated flow at key areas of interest. Gauge 1 is located in the near-
shore area east of Napier and gauges 2–5 are located onshore at the Port, in the eastern city and
at Westshore (Fig 4.1C). These virtual gauges exist only in the model to record simulated flow
time-series.
Tab. 4.2: List of virtual tide gauges with their location and elevation.
Gauge
NumberLocation Long. Lat.
Elevation / depth
relative to MSL (m)
1 Nearshore 176.93 –39.52 –10.4
2 Port 176.92 –39.47 1.8
3 City 176.92 –39.49 3.2
4 City 176.92 –39.53 1.2
5 Westshore 176.89 –39.48 2.63
4.6.2 Earthquake source mechanisms
The earthquake source mechanisms used in this study represent scenarios local to Hawke’s Bay
that are discussed in previous studies as subduction zone earthquakes with the potential to cause
significant at-shore wave heights in Hawke’s Bay or replicate geologically recorded subsidence-
uplift patterns (e.g., Cochran et al., 2006; Power, Reyners, and Wallace, 2008; Wallace et al., 2009).
These scenarios are implemented in COMCOT as instantaneous ruptures using vertical deforma-
tion as an initial surface condition (Fig 4.4). Vertical deformation is modelled using elastic fault
dislocation theory (Okada, 1985) and coseismic deformation is accounted for during inundation
modelling.
Although not considered in this initial investigation of inundation, implementation of dynamic
rupture may affect arrival times and wave heights particularly where rupture length is on the order
of several hundred kilometres (Suppasri, Imamura, and Koshimura, 2010). A mean water depth of
approximately 1,000 m between the Hikurangi Trench and the coast of the North Island gives wave
celerity of approximately 99 m/s using c =√gD (where g is gravitational acceleration and D is
water depth). Applying typical rupture velocities of 1–2.5 km/s to calculate the ratio of rupture
velocity to wave celerity (Suppasri, Imamura, and Koshimura, 2010), the ratio for our study area is
<40. Based on results of testing by Suppasri, Imamura, and Koshimura (2010) this indicates that
dynamic rupture is likely to influence wave height and arrival time at the east coast of the North
Island. Due to the influence of propagation direction and distance from the tsunami source on the
magnitude of this effect, and the rapidly shallowing bathymetry between the Hikurangi Trench and
the coast (water depth = 3,400 m offshore Hawke’s Bay; Fig 4.2), further research expanding this
study is required to constrain the potential influence of dynamic rupture in the context of our study

4.6. Methodology 97
Fig. 4.4: Vertical deformation applied as tsunami generation in COMCOT, with source patches delineated
(grey dashed lines). A: Lachlan Fault rupture using simple fault geometry and 9.0 m slip (MW
7.7); B: Rupture of the plate interface offshore of Hawkes Bay (MW 8.4); C: Rupture of southern
and central Hikurangi subduction margin (MW 8.8); D: Rupture of the whole Hikurangi subduction
margin (MW 9.0). Vertical scale differs on each image. The background value of approximately
zero deformation is retained to indicate the extent of vertical deformation domain. Depth contours
(km) of the plate interface model (Ansell and Bannister, 1996) are shown in C

98 4. Local tsunami inundation in Napier (Paper 1)
area.
Tidal level at the time of tsunami arrival can be an important factor in determining inunda-
tion extent and flow depth. We test the impact of tidal level on inundation in scenarios A and D
by simulating the events at Mean High Water (MHW) (MHW = MSL + 0.75 m) and discussing
the results with reference to the two tidal conditions. There remains significant uncertainty in the
specific fault geometry, magnitude and spatial distribution of slip and temporal development of po-
tential ruptures of the Hikurangi Margin due to the limited current understanding of the Hikurangi
subduction margin. Nevertheless, our application of this range of scenarios provides an extension
of current knowledge of potential inundation due to local earthquake-generated tsunami.
Scenario A: Lachlan Fault rupture using simple fault geometry (MW 7.7)
The Lachlan Fault is an active upper plate splay fault with a west-dipping thrust fault mechanism
and a listric geometry, steepening from a shallow dip of ∼15° at 7–8 km depth to 55–70° in the
upper 1 km, emerging at the sea floor 3–8 km offshore (Barnes, Nicol, and Harrison, 2002). We
use a simplified geometry to represent the Lachlan Fault, applying a uniform dip of 60°. Barnes,
Nicol, and Harrison (2002) identified three segments on the fault with a total length of 80 km,
and acknowledged there may be a fourth segment present. We extend the length of the Lachlan
Fault source to the south, to a conservative length of 139.79 km to account for the possibility of
continuation of Lachlan Fault rupture onto other nearby splay fault structures further along strike
(such as those related to the Cape Kidnappers anticline) as rupture of multiple splay faults beneath
southern Hawke’s Bay could pose a greater danger to Napier than an isolated Lachlan Fault rupture.
Berryman (1993) identified four Holocene uplift events at the nearby Mahia Peninsula, with
a maximum uplift of 4 m and attributed this uplift to movement of the Lachlan Fault. Barnes,
Nicol, and Harrison (2002) projected this uplift across the Lachlan Fault and, based on the ratio
of previous surface deformation to modelled subsurface displacement on nearby faults, estimated
an average dip-slip displacement of 5.0–9.0 m. We define three scenarios of whole-fault rupture
at the upper end of this range with respective uniform dip-slip values of 7.0 m, 8.0m and 9.0 m
(Fig 4.4A; Table 4.3); for the 9.0 m scenario, we simulate for both MSL and Mean High Water
(MHW) conditions. We derive the seismic moment (M0) for each scenario using the relationship
M0 = μSD (where S = average slip (m), D = fault area (m2) and μ = rigidity, assumed in all
scenarios to be 3 ∗ 1010 Pa; Stirling et al. (2012)). The magnitude of each slip scenario is MW
7.7, using MW = (LOG(M0)− 9.1)/1.5 (IASPEI, 2013), which is consistent with estimates that
a rupture of all segments of the Lachlan Fault could generate an event of MW 7.6–8.0. (Barnes,
Nicol, and Harrison, 2002). This level of slip is believed to represent a recurrence interval of
approximately 1,000 years, corresponding to the mean recurrence interval of the four Holocene
uplift events (Berryman, 1993). The most northerly segment of the Lachlan Fault has a recurrence
interval of 615–2,333 yr based on the ratio of surface displacement to surface slip rate 0.30–0.65

4.6. Methodology 99
cm/yr (Barnes, Nicol, and Harrison, 2002).
Scenario B: Rupture of the plate interface offshore Hawke’s Bay (MW 8.2–8.4)
Cochran et al. (2006) showed that rupture of the plate interface offshore Hawke’s Bay is potentially
responsible for past subduction earthquakes and tsunami in Hawke’s Bay and Wallace et al. (2009)
estimate that rupture of the full segment could result in an MW 8.3 event. To test the potential
tsunami inundation from such an event, we apply a non-uniform slip distribution on a model of
plate interface geometry derived from seismicity and seismic reflection data (Ansell and Bannis-
ter, 1996). The source model comprises 14,143 individual slip patches with 195–219° strike and
dip of 5–8° at 3–15 km depth increasing to 10–17° at 15–27 km (see Table 4.3 for summarised
parameters).
We assume slip within the source area of previous slow-slip events at the central Hikurangi
subduction margin, which are located at the down-dip limit of shallow (<10–15 km) inter-seismic
coupling (Wallace and Beavan, 2010). Rupture occurs with an oblique thrust mechanism and
strike-slip component of 1 m. Maximum dip-slip (5.7 m) occurs at a depth of between 3 km and
5 km offshore of Mahia Peninsula where coupling coefficient is >0.5 (Wallace and Beavan, 2010)
and slip rate deficit exceeds 25 mm.yr-1 (Wallace et al., 2012). Slip diminishes with increasing
depth, reducing to zero below the area of slow slip at a depth of 20–27 km. The seismic moment
of each patch sums to a total M0 = 2.80 ∗ 1021 Nm, equivalent to MW 8.2. In order to explore the
impact of increasing slip on inundation, we have applied a linear scaling relationship of 150% and
200% to produce three different magnitude events with an unchanged slip distribution: MW 8.2,
MW 8.3 and MW 8.4 (Table 4.3). Rupture of this segment alone is unlikely to produce an earthquake
of greater than MW 8.3–8.4 due to the size of the segment so MW 8.4 represents an extreme case
of rupture on this fault, and results in maximum subsidence of –0.5 m in the south-east of Napier
(Fig 4.4B).

100 4. Local tsunami inundation in Napier (Paper 1)
Tab
.4
.3:
Sce
nar
iofa
ult
par
amet
ers.
*D
eno
tes
that
the
scen
ario
use
svar
iab
lesl
ipp
aram
eter
so
nm
ult
iple
sou
rce
pat
ches
,fo
rw
hic
hth
ista
ble
pre
sen
tsa
sum
mar
y.A
ran
ge
of
slip
val
ues
,st
rike
and
dip
ang
les
are
giv
enfo
rth
ese
even
ts.
Fu
llvar
iab
lesl
ipp
aram
eter
sar
ep
rov
ided
on
the
acco
mp
any
ing
CD
.
Sce
nar
io
Fo
cal
Pla
ne
Cen
tre
Lo
ng
/
Lat
Fo
cal
Pla
ne
Cen
tre
Dep
th
(km
)
Fo
cal
Pla
ne
Dep
th
Ran
ge
(km
)
Len
gth
(km
)
Wid
th
(km
)
Str
ike
(deg
)
Dip
(deg
)
Rak
e
(deg
)
Max
.
Dip
-sli
p
(m)
Max
.
Str
ike-
slip
(m)
Sei
smic
Mo
men
t
(Nm
)
Mo
men
t
Mag
.
(MW
)
A:
Lac
hla
n
Fau
lt
17
7.7
2,
–3
9.5
36
.25
0.5
–1
2.0
13
9.8
13
.32
18
.56
0.0
90
.0
7.0
0.0
3.9
0E
+2
07
.7
8.0
4.4
6E
+2
07
.7
9.0
5.0
1E
+2
07
.7
*B
:O
ffsh
ore
Haw
ke’
sB
ay
17
7.7
7,
–3
9.6
61
0.6
3.0
–2
6.9
21
3.7
–
25
4.0
12
1.4
–
15
7.3
19
5.3
–
21
9.0
5.0
–1
7.0
62
.9–
90
.0
5.7
1.3
2.8
0E
+2
18
.2
8.5
2.0
4.2
0E
+2
18
.3
11
.42
.65
.60
E+
21
8.4
*C
:S
ou
ther
n
toce
ntr
al
Hik
ura
ng
i
17
6.3
8,
–3
9.8
72
8.6
3.0
–
69
.6
64
3.0
–
73
6.2
18
8.9
–
29
7.5
19
5.3
–
25
6.0
5.0
–
30
.3
11
.3–
90
.02
2.0
13
.62
.27
E+
22
8.8
*D
:W
ho
le
Mar
gin
17
6.3
8,
–3
9.8
72
8.6
3.0
–
69
.6
64
3.0
–
73
6.2
18
8.9
–
29
7.5
19
5.3
–
25
6.0
5.0
–
30
.3
11
.3–
90
.03
3.4
27
.14
.56
E+
22
9.0

4.6. Methodology 101
Scenario C: Rupture of southern and central Hikurangi subduction margin (MW 8.8)
This non-uniform slip scenario represents a combined rupture of the lower North Island segment
from Cook Strait to Cape Turnagain and the central segment from Cape Turnagain to Mahia Penin-
sula. This type of scenario was proposed as a cause of subsidence events recorded in Hawke’s Bay
(Cochran et al., 2006) and the resulting vertical deformation, which is –0.3 to –0.5 m in Napier,
is shown in Fig 4.4C. We apply non-uniform slip distribution on the model of plate interface ge-
ometry of Ansell and Bannister (1996), comprising 38,186 individual patches. The interface has a
strike of 195–220° north of –41.0° S, increasing to 235–255° as subduction becomes more oblique
in the southern North Island and beneath the Cook Strait. Dip angle is shallow (5–14°) between 3
km and 20 km depth, gradually steepening to 30° at 70 km depth (Table 4.3).
Significant dip-slip (15–21 m) is applied in the slow-slip event source area beneath Hawke’s
Bay at depths of 3–10 km where coupling coefficient is 0.5–1.0 (Wallace and Beavan, 2010) and
slip rate deficit is 15–30 mm.yr-1 (Wallace et al., 2012). The lesser amount of slip (9–15 m) applied
in the southern part of the margin represents a recurrence interval of 500 years based on slip deficit
derived from inter-seismic locking patterns from GPS data (Wallace et al., 2012). Slip generally
occurs with an oblique thrust mechanism (rake of 70–90°) but there is a patch of greater strike-slip
component (maximum of 13 m slip) at 30 km depth below the Kapiti coast. Summing all source
patches gives M0 = 2.27 ∗ 1022 Nm, equivalent to MW = 8.8.
Scenario D: Rupture of the whole Hikurangi subduction margin (MW 9.0)
This scenario represents the maximum credible subduction zone earthquake and an upper limit of
magnitude due to rupture of the whole margin. To approximate a worst case scenario, we apply
a non-uniform slip distribution on the same plate interface geometry (Ansell and Bannister, 1996)
detailed above (Table 4.3). Our scenario locates an area of peak dip-slip (20–33 m) offshore the
southern North Island at depths of 3–10 km where slip rate deficit is 20–30 mm.yr-1 (Wallace et al.,
2012), but where the plates are strongly coupled (Wallace and Beavan, 2010) and approximates a
recurrence interval of 1,000 years. This recurrence interval is analogous to those of great earth-
quakes at the Japan Trench, first identified by Minoura et al. (2001). The amount of slip during
the Great East Japan earthquake and tsunami (Simons et al., 2011), the 1,144 year interval since
the last comparable event (Jogan 869 AD) and their similar inundation extents (Goto et al., 2012a;
Sugawara and Goto, 2012; Sugawara et al., 2013), suggests they were generated by a similar style
and magnitude of earthquake.
A moderate amount of slip (generally 2–17 m) is transferred north through the central and
upper North Island segments into the less coupled slow-slip event source areas. This mirrors slip
propagation during the 2011 Great East Japan earthquake, when slip propagated southward into a
slightly less coupled area at the southern end of the rupture (Maercklin et al., 2012). An additional
patch of high slip (20–33 m) is incorporated at depths of 3–10 km at the northern end of the

102 4. Local tsunami inundation in Napier (Paper 1)
margin, to account for higher convergence rates (50–60 mm.yr-1; Wallace et al., 2004). As with
scenario C, slip generally occurs with an oblique thrust mechanism (rake of 70–90°) but there is
an area with a greater strike-slip component (rake 11–30°) of up to 27 m at 30 km depth below the
Kapiti coast due to increasing obliquity of motion down-dip. Summing all source patches gives a
seismic moment of M0 = 4.56 ∗ 1022 Nm, equivalent to MW 9.0. Vertical deformation in Napier
resulting from this slip distribution is between –0.6 m in the south-east of Napier and –0.3 m in the
north-west (Fig 4.4D). This scenario is tested under both MSL and MHW conditions.
4.7 Results
4.7.1 Flow depth and inundation extent
Flow depth and inundation extent define the tsunami hazard from each scenario, determining the
area to be evacuated and providing an important control on the potential for structural damage.
Flow depth is defined as the water surface level relative to ground level at the point of measurement.
In calculating flow depth for each of the scenarios, co-seismic deformation has been included, so
as to represent flow depth above simulated post-earthquake ground elevation. Flow velocity is
also an important control on damage, but the absence of explicit modelling of buildings in this
analysis precludes analysis of accurate flow velocity results in the onshore urban area, and is not
discussed here. The sections below present maximum inundation extent and peak flow depth in
each scenario for the most-commonly inundated suburbs and inundation extents (Table 4.4). There
are local variations in flow depth, which are evident in flow depth maps (Fig 4.5 and 4.6).
Scenario A: Lachlan Fault rupture using simple fault geometry (MW 7.7)
The MW 7.7 Lachlan Fault rupture with uniform slip of 9.0 m under MSL conditions causes maxi-
mum inundation of 1 km and flow depth of 1.0–3.0 m in the 100 m closest to the eastern shore and
3.8 m at the Port (See Fig 4.5A1 for inundation mapped in the whole Territorial Authority and Fig
4.6A1 for inundation mapped in the city centre). When the amount of slip is reduced to 8.0 m, flow
depth does not exceed 2.5 m and maximum inundation is 800 m inland from the eastern shoreline.
For the 7.0 m slip scenario, maximum inundation is 300 m and flow depth does not exceed 1.5 m
except at the Port, where it reaches a maximum of 2.6 m. Simulation of scenario A with 9.0 m slip
at MHW results in more extensive inundation at Westshore and Ahuriri than at MSL (Fig 4.5A2
and 4.6A2). Westshore experiences flow depth up to 1.6 m in some residential areas, generally up
to 0.25 m in Ahuriri and in the eastern city maximum flow depth is generally up to 3.5 m. This
event generates at-shore wave heights of 4–5 m, comparable to a 1 in 500 year to 1 in 1,500 year
tsunami based on the last National Tsunami Hazard Review (Berryman, 2005).

4.7. Results 103
Tab
.4
.4:
Ap
pro
xim
ate
pea
kfl
ow
dep
than
dm
axim
um
inu
nd
atio
nex
ten
tin
sele
cted
subu
rbs.
Ref
erto
Fig
4.5
for
inu
nd
atio
nm
app
edfo
ral
lsu
bu
rbs.
Val
ues
refe
rto
inu
nd
atio
nat
MS
Lco
nd
itio
ns,
un
less
scen
ario
isd
eno
ted
wit
h*
,in
wh
ich
case
the
firs
tval
ue
refe
rsto
inu
nd
atio
nu
nd
erM
SL
con
dit
ion
s,
the
seco
nd
toM
HW
con
dit
ion
s.W
her
en
oin
un
dat
ion
occ
urr
ed,
this
isd
eno
ted
by
‘–’.
Sce
nar
io
Max
imu
m
Inu
nd
atio
n
Ex
ten
t(m
)
Max
imu
mF
low
dep
th(m
)
Nel
son
/
Mcl
ean
Par
k
Nap
ier
Po
rtA
hu
riri
Wes
t-
sho
reB
ayV
iew
Haw
kes
Bay
Air
po
rt
Mar
aen
ui
/M
arew
a
A:
Lac
hla
nF
ault
7m
slip
—
MW
7.7
30
00
.25
2.6
––
––
–
A:
Lac
hla
nF
ault
8m
slip
—
MW
7.7
80
00
.52
.8–
–1
––
A:
Lac
hla
nF
ault
9m
slip
—
MW
7.7
*1
,00
0/
1,3
00
0.8
/1
.03
.8/
4.0
–/
0.2
50
.7/
1.6
2.2
/3
.4–
/<
0.2
50
.8/
1.0
B:
Pla
tein
terf
ace
off
sho
re
Haw
kes
Bay
MW
8.2
10
0–
1.3
––
––
–
B:
Pla
tein
terf
ace
off
sho
re
Haw
kes
Bay
MW
8.3
10
0–
1.7
–0
.6–
––
B:
Pla
tein
terf
ace
off
sho
re
Haw
kes
Bay
MW
8.4
60
00
.25
2.9
12
2.2
0.4
–
C:
So
uth
ern
and
cen
tral
Hik
ura
ng
im
arg
inM
W8
.83
,50
04
.26
.42
3.7
6.5
1.3
1
D:
Wh
ole
Hik
ura
ng
im
arg
in
MW
9.0
*4
,00
0/
5,0
00
4.5
/5
.56
.9/
7.5
6.5
/6
.94
.1/
4.5
7.5
/8
.12
.1/
2.2
2.6
/3
.2

104 4. Local tsunami inundation in Napier (Paper 1)
Scenario B: Rupture of the plate interface offshore Hawke’s Bay (MW 8.2–8.4)
An MW 8.2 plate interface rupture of a single segment offshore Hawke’s Bay is expected to cause
very limited inundation to maximum flow depth of 1.3 m at the Port only. The MW 8.3 scenario
results in additional inundation at Westshore, exceeding 0.6 m in residential areas. At the eastern
shore, there is inundation of the first 100 m on land to a maximum depth of 0.25 m but inundation
does not occur inland of the gravel berm.
The MW 8.4 scenario (Fig 4.5B and 4.6B) causes inundation to 600 m inland in Mclean Park
with maximum flow depth of 1.8 m. Napier Port is inundated to maximum depth of 2.9 m and
the eastern part of the Airport is subject to flow depth up to 0.4 m. Ahuriri, Westshore and the
northern part of Onekawa West experience flow depth up to 1.0 m. This scenario results in at-shore
wave heights of approximately 4–5 m, which corresponds to a tsunami with return period between
1 in 500 years to 1 in 1,000 years (Berryman, 2005). These estimated wave heights compare well
with those generated by Power, Reyners, and Wallace (2008) for an MW 8.7 earthquake on the
same segment. Analysis of inundation due to combined vertical deformation of scenario A and
B suggests that flow depth is similar to that of the Lachlan Fault component alone. Inundation
extent is up to 600 m further inland at Bay View and up to 1 km further inland at Nelson Park with
flow depth generally <0.25 m. Elsewhere, inundation extent is the same as for the Lachlan Fault
component.
Scenario C: Rupture of southern and central Hikurangi subduction margin (MW 8.8)
An MW 8.8 rupture of the southern and central segments of the margin (Fig 4.5C and 4.6C) results
in maximum flow depth exceeding 7.5 m on the eastern side of Bluff Hill, and exceeding 5.0 m
in the first 100 m inland at Nelson Park and Mclean Park. All other areas of Nelson Park and
Mclean Park, and large areas of Maraenui and Marewa, experience flow depth of 1.0–4.0 m. Flow
depth at Ahuriri and Westshore is generally between 1.0 m and 2.0 m but exceeds 3.7 m locally at
Westshore. Maximum flow depth at Napier Port is approximately 6.4 m. Inundation extends over
3 km inland at Bay View with flow depth in residential areas and at the Airport generally up to
1.5 m. This event, with at-shore wave heights of 7–8 m represents a 1 in 2,500 year return period
tsunami (Berryman, 2005) but are greater than those generated by Power, Reyners, and Wallace
(2008), largely due to the additional rupture of the central segment of the margin that is included
in the present study.
Scenario D: Rupture of the whole Hikurangi subduction margin (MW 9.0)
Of the tested scenarios, greatest inundation and flow depth occurs due to the MW 9.0 whole margin
rupture. Inundation extends 4 km inland in the city and over 3 km at Bay View (under MSL
conditions). Areas in the 100 m closest to the eastern shore could expect flow depth exceeding

4.7. Results 105
Fig. 4.5: Maximum flow depth and inundation extent 1 h after rupture in and around Napier Territorial
Authority due to simulated scenarios. Legend and scale are identical for each map. A1, A2:
Lachlan Fault rupture using simple fault geometry with 9.0 m slip (MW 7.7) at MSL and MHW,
respectively; B: Rupture of the plate interface offshore Hawkes Bay (MW 8.4) at MSL; C: Rupture
of southern and central Hikurangi subduction margin (MW 8.8) at MSL; D1, D2: Rupture of the
whole Hikurangi subduction margin (MW 9.0) at MSL and MHW, respectively

106 4. Local tsunami inundation in Napier (Paper 1)
Fig. 4.6: Maximum flow depth and inundation extent 1 h after rupture in Napier city due to simulated sce-
narios. Legend and scale are identical for each map. A1, A2: Lachlan Fault rupture using simple
fault geometry with 9.0 m slip (MW 7.7) at MSL and MHW, respectively; B: Rupture of the plate
interface offshore Hawkes Bay (MW 8.4) at MSL; C: Rupture of southern and central Hikurangi
subduction margin (MW 8.8) at MSL; D1, D2: Rupture of the whole Hikurangi subduction margin
(MW 9.0) at MSL and MHW, respectively

4.7. Results 107
5.5 m in Nelson Park (Fig 4.5D1 and 4.6D1) while elsewhere on the east side of the city between
flow depth is 1.5–4.5 m. Flow depth at Napier Port exceeds 6.0 m, Ahuriri is entirely inundated to
4.5–6.5 m at Westshore flow depth is 1.0–4.1 m. In this scenario, the inland suburbs of Tamatea
North and South are also inundated to a depth of <1.0 m. At Bay View, the majority of residential
areas and the Airport are inundated with flow depth of 1.5–2.0 m.
Simulation of scenario D under MHW conditions increases maximum flow depth generally by
up to 1.0 m. Inundation extent increases to between 4.5 km and 5 km in the city (Fig 4.5D2). The
relative distribution of flow depth remains consistent with simulation inundation at MSL condition-
s. Flow depth in Nelson Park and Mclean Park is generally 2.0–4.0 m (Fig 4.6D2). Marewa and
Maraenui experience flow depth between 1.0 and 3.0 m, and further than 1 km inland, flow depth
is consistently <1.5 m. Maximum flow depth at the Port is 7.5 m and depth consistently exceeds
5.0 m in Ahuriri and 3.0 m in Onekawa West. Flow depth at Westshore is 1.0–4.5 m. Bay View
experiences flow depth of 1.5–2.5 m in the majority of residential areas and 2.2 m at the Airport.
At-shore wave heights due to this event generally exceed 8 m, which is equivalent to 1 in 2,500
year tsunami based on hazard curves generated by Berryman (2005) and of similar order to those
generated by Power, Reyners, and Wallace (2008) for a MW 9.0 whole margin rupture.
4.7.2 Tsunami arrival time and waveforms
Estimated arrival time of the first wave above a given threshold, relative to time of source rupture,
is a key determinant in evacuation planning and public education on the need for immediate self-
evacuation. Effective tsunami warning and evacuation messages should include advice to the effect
‘The first wave may arrive later and may not be the largest. Waves may continue for several hours’
(MCDEM, 2010a, p.43). Analysis of tsunami travel time (Fig 4.7) and time-series data from five
virtual tide gauges (Fig 4.8) reinforces the importance of these messages in Napier and provides
data with which to conduct simulation of urban tsunami evacuation. Arrival time is recorded when
the waveform first exceeds 0.05 m (Table 4.5), and provides approximate arrival time for the area
around each virtual gauge.

108 4. Local tsunami inundation in Napier (Paper 1)
Fig. 4.7: Tsunami travel times for the North Island and northern South Island with key urban centres indi-
cated. Arrival times are shown for waves above the 0.05 m threshold. Insets show arrival times
in Hawkes Bay. A: Lachlan Fault rupture using simple fault geometry and 9.0 m slip (MW 7.7);
B: Rupture of the plate interface offshore of Hawkes Bay (MW 8.4); C: Rupture of southern and
central Hikurangi subduction margin (MW 8.8); D: Rupture of the whole Hikurangi subduction
margin (MW 9.0)

4.7. Results 109
Fig. 4.8: Comparison of simulated wave forms at key offshore and onshore gauges. Water level (m) is shown
for offshore gauge 1, and flow depth (m) is shown for onshore gauges 2, 3, 4 and 5. Water level is
adjusted for coseismic deformation

110 4. Local tsunami inundation in Napier (Paper 1)T
ab.
4.5
:K
eypar
amet
ers
of
wav
eform
sat
vir
tual
tide
gau
ges
.A
rriv
alti
me
isre
lati
ve
toa
thre
shold
of
0.0
5m
.H
eight
refe
rsto
wat
erle
vel
for
off
shore
gau
ge
and
flow
dep
thfo
ronsh
ore
gau
ges
.T
he
firs
tpea
kis
reco
rded
,an
dif
that
pea
kis
neg
ativ
eth
efi
rst
posi
tive
pea
kis
show
nin
ord
erto
dem
onst
rate
lag
-tim
eo
fth
ed
raw
dow
nan
dp
eak
wat
erle
vel
.O
nly
dat
ad
ue
tom
axim
um
slip
are
show
nfo
rsc
enar
ios
Aan
dB
.
Gau
ge
—o
ffsh
ore
Gau
ge
—o
nsh
ore
Sce
nar
ioP
aram
eter
12
34
5
hei
gh
t
(m)
t (min
s)
hei
gh
t
(m)
t (min
s)
hei
gh
t
(m)
t (min
s)
hei
gh
t
(m)
t (min
s)
hei
gh
t
(m)
t (min
s)
Aar
rival
tim
e3
33
83
93
7n
an
firs
tp
eak
33
52
39
0.3
40
0.6
38
n/a
n/a
12
-hr
max
43
92
39
0.3
40
0.6
38
00
12
-hr
min
(off
sho
reo
nly
)–
2.5
11
5
Bar
rival
tim
e4
52
nan
52
58
firs
tp
eak
–0
.42
71
.35
3n
/an
/a0
.45
20
.75
9
firs
t(+
)p
eak
4.5
50
12
-hr
max
4.5
50
1.6
59
00
0.4
52
0.7
59
12
-hr
min
(off
sho
reo
nly
)–
1.8
13
0
Car
rival
tim
e4
49
50
49
55
firs
tp
eak
–0
.52
73
50
1.6
50
1.6
49
1.9
56
firs
t(+
)p
eak
7.4
47
12
-hr
max
7.4
47
3.4
63
1.8
52
2.2
56
1.9
56
12
-hr
min
(off
sho
reo
nly
)–
21
27
Dar
rival
tim
e4
47
49
47
54
firs
tp
eak
–2
.13
83
50
1.7
50
1.8
49
25
5
firs
t(+
)p
eak
8.9
47
12
-hr
max
8.9
47
6.6
63
25
23
17
82
.86
5
12
-hr
min
(off
sho
reo
nly
)–
4.7
14
3

4.7. Results 111
The south and east coasts of the North Island and the northern South Island are at risk of very
short arrival times in the simulated scenarios and Napier is just one of several urban centres at
risk. There is potential for very short arrival times (within 5–10 minutes) at Wellington, Gisborne
and the Marlborough coast from at least one of these scenarios (Fig 4.7). Minimum travel time
to Christchurch from these scenarios is 51–60 minutes. Within Hawke’s Bay, the northern coast
around Wairoa experiences similar arrival times to Napier.
Due to the west-dipping thrust mechanism of scenario A, wave arrival at gauge 1 offshore
Napier is a positive motion occurring at 33 min and water level rapidly increases to 3.0 m at 35
min (Table 4.5). Maximum water level is 4.0 m at this gauge, occurring only 3 min later. Wave
arrival onshore at the Port (gauge 2) occurs 5 min after wave arrival at gauge 1 (38 min after rupture)
in scenario A. Maximum flow depth occurs on the first wave (2.0 m at 39 min). For scenarios B-D,
wave arrival at the Port occurs 47–52 min after rupture with a first peak of 1.3–3.0 m within 3 min
of this time. Maximum water level at the Port is 1.6 m, 3.4 m and 6.6 m, respectively, occurring at
59–63 min in each case.
Maximum flow depth in the city centre (gauge 3) and south-eastern city (gauge 4), albeit lim-
ited to 0.3 m and 0.6 m, respectively, occurs at 38–40 min after rupture in scenario A. Scenarios
B-D cause negative wave arrival at gauge 1 only 4 min after rupture, with peak drawdown of ap-
proximately –0.5 m at 27 min (scenarios B and C) and –2.1 m at 38 min (scenario D). In these
scenarios the first positive peak at gauge 1 occurs at 47–50 min, measuring 4.5 m, 7.4 m and 8.9
m respectively. The lag time between peak drawdown and peak positive wave at gauge 1 is 23
min, 21 min and 9 min, respectively, and there are at least 43 min between nearshore wave arrival
and occurrence of onshore inundation. Therefore, wave arrival and drawdown of the sea provide
additional natural warnings after ground shaking, with some subsequent time to evacuate. Wave
arrival at Westshore (gauge 5) occurs 6–7 min later than at the eastern side of the city. In scenario
B, gauge 5 records maximum flow depth of 0.7 m at 59 min. Scenario C results in peak water level
of 1.9 m at gauge 5 on the first wave at 56 min. Scenario D shows similarly rapid rise of flow depth
to 2.0 m upon wave arrival at 55 min at gauge 5, with peak flow depth of 2.8 m occurring 10 min
later.
Further waves and reflections occur around the coastline for several hours causing significant
fluctuations in water level. Scenario D shows five periods of drawdown greater than –2.0 m over 7
h at gauge 1 and wave heights of 2 m are recorded as much as 12 h after rupture. Minimum water
level (–5.3 m) occurs at 143 min, followed by a further peak water level exceeding 4 m at 175 min.
Despite several later wave arrivals, the high beach and gravel berm at the eastern shore (Fig 4.1C)
provide protection to the city centre. The berm prevents onshore inundation due to most later wave
arrivals, but also mitigates the impact of initial waves of significant height. For example, following
rupture of the whole margin, gauge 1 records a peak water level of 8.3 m on the first wave, which is
mitigated to flow depth of 1–3 m in Nelson Park and Mclean Park, immediately onshore. Despite
the presence of the berm, the largest wave at gauge 4 occurs at 178 min (the third wave arrival),

112 4. Local tsunami inundation in Napier (Paper 1)
which highlights the importance of not returning to the inundation zone after the first wave. A
greater number of waves inundate the more-exposed Westshore Peninsula and the Port, with three
waves greater than 1.0 m affecting the Port in 9 h due to scenario C, and at least nine waves in 9
h due to scenario D with a period of approximate 60 min. Westshore is inundated by five waves
during the 6.5 h following a whole margin rupture. Inundation reaches its maximum extent in
much of the city within 60 min of rupture in scenarios A and B, and reaches close to its full extent
after approximately 70 min in scenarios C and D. The simulations also suggest that standing water
remains for up to 12 min, in some cases exceeding a metre for much of that time, which may have
implications for emergency first responders.
4.7.3 Structural damage potential
An estimated 92% of structures in the study area are of 1–2 storey light timber construction, 3%
are 1–2 storey reinforced concrete shear wall and 3% 1–2 storey concrete masonry (Cousins, 2009;
King and Bell, 2009; King et al., 2008). The high proportion of light timber structures is typical
of the national building stock (Shelton and Beattie, 2011). Onekawa West and Nelson Park have
lower proportion of light timber construction as these suburbs contain a greater proportion of in-
dustrial buildings and commercial buildings respectively. Nelson Park, the main commercial and
civic services area, shows a particularly high proportion of concrete masonry and RC shear wall
construction.
Comparison of simulated flow depth in Napier with a large tsunami fragility dataset from the
Great East Japan tsunami (Ministry of Land Infrastructure Transport and Tourism, 2012; Suppasri
et al., 2013a) and fragility curves derived from the American Samoa 2009 and Chile 2010 tsunami
(Mas et al., 2012b) shows that there is significant potential for structural damage from the simu-
lated scenarios. In the absence of detailed data on tsunami resistance of New Zealand structures
these fragility data provide an approximation of likely damage. We do not consider here the like-
ly damage to structures in Napier due to the initial earthquake. There is likely to be increased
vulnerability of some buildings to tsunami loading due to ground-shaking induced weakening of
structures and the presence of loose debris that may be entrained in the tsunami flow.
Maximum flow depth in our simulations exceed the depth threshold of 2 m, at which damage
to timber frame building stock becomes significant enough to cause collapse, based on the 2011
data and earlier international datasets reviewed by Suppasri et al. (2013a). Fig 4.9 shows the
probability of moderate damage, major damage and collapse of one-storey timber frame buildings
and two-storey reinforced concrete building for scenario D using fragility curves from Suppasri
et al. (2013a) and Mas et al. (2012b). The figure also shows the probability of moderate damage
to timber frame structures in each of the other three simulated scenarios. For both RC and timber
buildings, there is greater than 90% probability of moderate damage (defined as ‘Slight damages
to non-structural components’, ‘Possible to be use[d] after moderate reparation’; Suppasri et al.

4.7. Results 113
(2013a)) in much of the inundated area. Damage potential remains similar for buildings of the
same construction with one or two storeys but probability of collapse is significantly reduced when
a building of a particular construction type is three storeys in height.
Probability of major damage (‘Heavy damages to some walls but no damages in columns’,
‘Possible to be use[d] after major reparations’; Suppasri et al. (2013a)) exceeds 50% for both con-
struction types within 1,000 m of the coastline (which includes many of the commercial, industrial
and civic structures, the Port and Airport) in scenario D and is generally 10–50% further inland.
Probability of collapse (‘Destructive damage to walls (more than half of wall density) and several
columns (bend or destroyed)’, ‘Loss of functionality (system collapse). Non-repairable or great
cost for retrofitting’; Suppasri et al. (2013a)) of timber buildings exceeds 40% within 1,000 m of
the shore and is generally <30% further inland. In contrast, probability of collapse of RC buildings
is <30% for most of the inundated area. Damage potential based on Mas et al. (2012b) is compa-
rable to those of Suppasri et al. (2013a), showing slightly higher probability of collapse for both
construction types. Fig 4.9G–I show the damage potential for one-storey timber frame building for
scenarios A-C for comparison. The limited inundation extent of scenarios A and B precludes the
potential for damage at large distances inland and in scenario A probability of moderate damage
exceeds 60% within 150 m of the shore but rapidly diminishes to <10% further inland. At 150–600
m inland probability of moderate damage in scenario B exceeds 60% locally, and is >80% within
150 m of the shore. Scenario C shows greater inland attenuation of damage potential than scenario
D but there remains a probability of >80% of moderate damage for areas closest to the coast.

114 4. Local tsunami inundation in Napier (Paper 1)
Fig. 4.9: Damage potential maps providing comparison between: i. timber frame building damage levels
due to a whole-margin rupture using fragility curves from Japan 2011 (Suppasri et al., 2013a) (A–
C) and Chile 2010 (Mas et al., 2012b) (D); ii. RC building damage levels due to a whole-margin
rupture using fragility curves from Japan 2011 (Suppasri et al., 2013a) (E–G) and American Samoa
2009 (Mas et al., 2012b) (H); iii. probability of moderate damage to timber frame building due to
each scenario using fragility curves from Japan 2011 (Suppasri et al., 2013a) (A, I–K)

4.8. Conclusions 115
4.8 Conclusions
Deterministic analysis of local tsunami generated by subduction zone earthquake sources prox-
imal to Napier, Hawkes Bay, New Zealand, demonstrates the potential for extensive inundation
with flow depth sufficient to cause major damage to structures. We demonstrate the variability of
inundation in Napier due to different local earthquake scenarios in addition to the maximum cred-
ible earthquake. The scenarios analysed are based on geodetic and geophysical characteristics of
the Hikurangi subduction margin, and geological evidence for significant pre-historic subduction
earthquake and tsunami.
Rupture of multiple segments of the plate interface causes the most extensive inundation, to
4 km inland, and greatest flow depth generally up to 3 m in the city centre, but between 4.5 and
8.0 m in Ahuriri, close to Bluff Hill and at the Port. At the upper limits of their potential magni-
tude range, ruptures of the Lachlan Fault and the plate interface offshore Hawkes Bay also have
the potential to cause onshore inundation with sufficient flow depth to cause moderate damage to
timber frame and reinforced concrete structures. In the lower magnitude ranges of these events,
Napier Port is at risk, but inundation is relatively limited in the rest of the city and extensive dam-
age unlikely. At mean high water, flow depth can increase by the order of 0.5 m and inundation
by several hundreds of metres compared to tsunami occurring when the tide is at mean sea level.
The maximum simulated flow depths result in high probability of moderate to major damage of
timber frame and RC structures in large areas of the city, particularly within 1 km of the coast.
There is low probability that RC buildings would suffer collapse due to the maximum simulated
flow depths, but there remains a moderate probability of the tsunami causing collapse of timber
frame buildings. The results of this analysis are encouraging for the consideration of a vertical
evacuation strategy in Napier, which would likely use RC buildings as refuges, but suggest high
economic losses among residential building stock, high entrainment of debris in the tsunami flow
and a high probability of casualties.
Onshore inundation commences only 37 min after rupture of the Lachlan Fault and at close to
50 min in the other scenarios, suggesting that there is time for evacuation to high ground (Bluff Hill)
if evacuation is started immediately. Distances of up to 4 km to the inland extent of inundation in
scenarios C and D are likely to present significant challenges for large numbers of people to travel
in the time available, and Bluff Hill remains the closest area of land to the city centre that does not
become inundated. Evacuation simulations will provide greater detail on this issue. The occurrence
of multiple waves onshore reinforces the need for education on staying out of the inundation area
until receiving an ‘all clear’ message. Although it would be impossible for those experiencing
ground shaking in Napier and any other coastal areas to determine tsunami potential in real time,
the short arrival times promote the need to consider ground shaking a natural warning of imminent
tsunami. Tsunami earthquakes, during which ground shaking may not be felt onshore, are not
considered amongst these scenarios and future research should investigate the potential impact of

116 4. Local tsunami inundation in Napier (Paper 1)
such events.
The data generated in this study provide dynamic flow input for agent-based evacuation sim-
ulations and provide detailed inundation scenarios from which to analyse tsunami exposure and
casualty potential. Although we provide an enhanced view of the variability of potential inunda-
tion in Napier, several aspects of this work require further research to continue improving tsunami
hazard assessment in Napier. This study does not address the frequency of local tsunami hazard
due to the current absence of data with which to confidently constrain dates of past ruptures and
recurrence intervals of local earthquake sources.
We incorporate co-seismic vertical deformation in this study, but we do not consider the poten-
tial for the gravel berm to be destabilised during ground shaking or tsunami inundation, nor do we
consider earthquake-induced structural damage and liquefaction prior to inundation. These should
be included in future hazard assessments. Probabilistic tsunami hazard analysis incorporating s-
patially and temporally variable slip distribution should be carried out to investigate the impact of
source parameters on inundation. Finally, onshore inundation should be simulated with buildings
modelled explicitly to analyse flow velocities and accurately assess the structural impact of tsunami
loads.
4.9 Acknowledgments
We thank Craig Goodier and Hawkes Bay Regional Council for the provision of LiDAR data, and
Ursula Cochran for early review of the paper. We sincerely thank the three reviewers for providing
detailed comments which helped to improve this article. This research was supported by public
research funding from the Government of New Zealand. Credits for figures using an Esri ArcGIS
basemap layer: GEBCO, NOAA, National Geographic, DeLorme, and Esri (Fig 4.1); Esri, i-cubed,
USDA, USGS, AEX, GeoEye, Getmapping, Aerogrid, IGN, IGP, and the GIS User Community
(Figs. 4.5, 4.6, 4.9); World Shaded Relief, copyright ESRI 2009 (Figs. 4.4, 4.7).
4.10 Comparison of numerical simulation against a rule-based evacuation mapping
approach
To provide pseudo-validation of the maximum credible evacuation zone for Napier based on nu-
merical modelling of a maximum credible tsunami scenario, the maximum credible evacuation
zone has been derived from the attenuation-rule-based methodology developed by Leonard et al.
(2008b), and validated against observations from the 2011 Great East Japan tsunami (Fraser and
Power, 2013, Appendix E). The Digital Elevation Model (DEM) is the same as that discussed in
Section 4.6.1, and river polygons are derived from the DEM and ArcGIS basemap imagery. The
2013 National Tsunami Hazard Review (Power, 2013) estimated the 1 in 2,500 year return period
maximum amplitude at the coast (84% percentile of uncertainty) from all possible sources as 13.4

4.11. Link to next chapter 117
m (Fig 4.10). This gives an estimated maximum potential run-up of 26.8 m, which provides the
input level to the attenuation rule calculations. Tidal level is also included, using a value of 0.75 m,
which represents Mean High Water at Napier (Section 4.6.2). The resulting maximum indicative
evacuation zone for all events is shown in Fig 4.11, and is generally consistent with the output of
numerical modelling (Fig 4.5D2).
4.11 Link to next chapter
This chapter has provided detail on the local-source tsunami hazard at Napier, to establish the
local-source tsunami hazard zone and demonstrate the differences in potential inundation from
different local-source earthquakes. The resulting maximum credible tsunami inundation extent is
subsequently applied in pedestrian evacuation modelling. The next chapter presents features of
vertical evacuation refuges present in Tohoku at the time of the 2011 Great East Japan tsunami,
and observations on the use of these buildings during the 2011 event.
Fig. 4.10: Probabilistic hazard curve for Napier, showing maximum amplitude of tsunami at the coast due
to all possible tsunami sources (Power, 2013).

118 4. Local tsunami inundation in Napier (Paper 1)
Fig. 4.11: The Geographic Information System (GIS)-calculated attenuation rule based evacuation zone for
Napier, compared against the simulated inundation zone from a scenario of a whole margin rup-
ture (MW 9.0).

5. TSUNAMI VERTICAL EVACUATION BUILDINGS — LESSONS FOR
INTERNATIONAL PREPAREDNESS FOLLOWING THE 2011 GREAT EAST JAPAN
TSUNAMI (PAPER 2)
This chapter presents observations of damage to Tsunami Vertical Evacuation Buildings (TVEB)
during the 2011 Great East Japan Tsunami and key features of those buildings for effective evacu-
ation. These observations meet Objective 2 by providing examples of the use of TVEB in a recent
local-source tsunami, and demonstrating potential mechanisms for the planning and operation of
a vertical evacuation strategy in New Zealand. The text was originally published as Fraser, S.,
Leonard, G. S., Murakami, H., and Matsuo, H. 2012. Tsunami Vertical Evacuation Buildings —
Lessons for International Preparedness Following the 2011 Great East Japan Tsunami. Journal
of Disaster Research, Vol.7, Special Issue, August 2012, pp. 446-457. The text is unaltered from
the submitted version. A contribution statement, outlining author contributions to the paper, is
provided in Appendix H.
5.1 Abstract
Tsunami vertical evacuation is an important strategy for enhancing disaster preparedness because
it provides an alternative to evacuation inland or to high ground in areas at risk of local tsunami. A
large number of tsunami vertical evacuation buildings provided safe refuge in the inundation zone
during and immediately after the Great East Japan tsunami on March 11th 2011. This paper dis-
cusses observations of such buildings in connection with themes that arose during semi-structured
interviews with local disaster prevention and emergency services officials in Iwate and Miyagi
Prefectures in October 2011. The implementation of key factors in the development of tsunami
vertical evacuation strategies are assessed with reference to previously published guidelines, en-
abling lessons to be applied in the current and future development of such strategies internationally.
The most important factors for designating tsunami vertical evacuation buildings are that they be
reinforced concrete construction with sufficient height in relation to inundation depth. Also im-
portant to the success of such vertical evacuation strategies are community engagement, building
owner agreement, consistent and clear signage, 24-hour access and evacuee welfare.

120 5. Tsunami Vertical Evacuation Buildings (Paper 2)
5.2 Introduction
Tsunami vertical evacuation strategies are designed to provide safe refuge within a tsunami-inundated
area by offering sufficient elevation above the maximum water level. Safe elevation may be provid-
ed by artificially-raised open ground, by towers designed specifically for evacuation or by buildings
in daily use that can be used for evacuation when required. There is a need for such strategies, par-
ticularly where there is a local tsunami hazard, because many people may not be able to evacuate
inland or to natural high ground (the recommended best option) due to short tsunami arrival times
in the face of long evacuation distances, road congestion or damaged infrastructure.
Japan has led initiatives in vertical evacuation through the establishment of government guide-
lines for the construction and management of TVEB (Cabinet Office Government of Japan, 2005),
although it was noted during this research that such buildings had been designated prior to the
publication of these guidelines, e.g., as early as 1982 in Kesennuma City. Similar guidelines have
since been published in the United States by the Federal Emergency Management Agency (FE-
MA, 2008, 2009), in addition to numerous studies on structural requirements of evacuation struc-
tures with respect to tsunami forces (e.g., Fujima et al., 2009; Lukkunaprasit, Ruangrassamee, and
Thanasisathit, 2009; Lukkunaprasit, Thanasisathit, and Yeh, 2009; Yeh, 2007). Although extreme-
ly important, less research has been carried out on evacuation dynamics inside TVEB (Yagi and
Hasemi, 2010). In addition to structural issues, a vertical evacuation strategy requires the consider-
ation of community engagement, building owner agreement, consistent and clear signage, 24-hour
access and evacuee welfare.
The 2011 Great East Japan tsunami provided the first opportunity to assess a tsunami vertical
evacuation strategy experiencing significant inundation heights in multiple locations. The use of
TVEB (in Japan, called ‘tsunami-hinan’ buildings) effectively mitigated loss of life in the locations
visited during this research. At least 5,428 people took refuge in 37 designated TVEB and in four
of the six locations the average number of people per TVEB exceeded 150 (Table 5.1). This
paper discusses key factors in the success of this strategy through observations made at TVEB and
the outcomes of interviews with local officials, to inform future development of tsunami vertical
evacuation strategies internationally.
5.3 Method of investigation
A field survey was carried out during October 2011 to investigate tsunami vertical evacuation on
March 11th, 2011, in six towns and cities in Iwate and Miyagi Prefectures. Four locations —
Kamaishi City, Ofunato City, Kesennuma City, and Minami-Sanriku Town — are located on a ria
(‘drowned river’) coastline. Two other locations — Ishinomaki and Natori Cities — are located on
flat low-lying coastal plains (Fig 3.1). All of these locations represent densely developed coastal
urban environments less than 20 m above sea level with varying degrees of mixed commercial

5.3. Method of investigation 121
and industrial land-use around a port and dense residential housing further inland (Table 5.1).
The major differentiator between locations is the physical environment and the impact of this on
tsunami height: the ria coastline suffered extreme run-up (Mori et al., 2011) due to amplification
of the tsunami in narrow bays, while lower maximum tsunami height but greater inland extent was
typical on the plains (Table 5.1).
Planned interviews were carried out with officials from municipality government civil pro-
tection, emergency management, fire, and police departments. The aim was to gain knowledge
of TVEB designation, requirements for effective use during evacuation, locations of TVEB, pub-
lic awareness and use of vertical evacuation during the Great East Japan tsunami, and the nature
of any post-event strategy review. Interviews provided insightful comparisons of the strategy in
place on March 11th 2011, regarding recommendations in government guidelines (Cabinet Office
Government of Japan, 2005). Written questions were translated into Japanese and provided to in-
terviewees in advance of interviews, which were carried out in Japanese using a semi-structured
format (Fraser et al., 2012a). Several local residents were also interviewed during field investi-
gations. Simultaneous spoken translation between Japanese and English was provided during all
interviews by the Japanese authors and a professional translator.
Due to the timing of fieldwork seven months after the tsunami, interviews drew upon infor-
mation obtained by local researchers and collated by municipal governments. Observations made
by the authors in the field contribute to the discussion of damage sustained by TVEB and building
features such as signage and access routes. These observations are drawn from the present field
survey and a previous investigation in June 2011 in which the authors participated (EEFIT, 2011;
Fraser et al., 2013).

122 5. Tsunami Vertical Evacuation Buildings (Paper 2)
Tab
.5
.1:
Su
mm
ary
of
TV
EB
inlo
cati
on
sv
isit
edd
uri
ng
this
rese
arch
.F
ield
ob
serv
atio
ns
wer
en
ot
mad
eat
all
bu
ild
ing
sli
sted
.A
full
inven
tory
of
kn
ow
nbu
ild
ing
feat
ure
sis
pro
vid
edb
yF
rase
ret
al.
(20
12
a).
No
tal
lbu
ild
ing
sw
ere
avai
lab
lefo
ro
bse
rvat
ion
du
rin
g
fiel
din
ves
tig
atio
ns,
bu
td
ata
on
tho
sebu
ild
ing
sh
asb
een
coll
ecte
dth
rou
gh
inte
rvie
ws.
(a)
Tsu
nam
id
ata
fro
mfi
eld
surv
eys
[30
];
(b)
Cas
ual
tyd
ata
at1
4th
Feb
ruar
y2
01
2[3
1];
(c)
Bu
ild
ing
sd
esig
nat
edas
refu
ge
for
mu
ltip
leh
azar
ds
evac
uat
ion
,n
ot
spec
ifica
lly
asT
VE
B;
(d)N
um
ber
of
peo
ple
saved
isav
aila
ble
for
on
lyo
ne
TV
EB
inO
fun
ato
Cit
y;
(e)
Nu
mb
ero
fp
eop
lesa
ved
atS
end
ai
Inte
rnat
ion
alA
irp
ort
isn
ot
incl
ud
ed.
Cit
y/
Tow
nK
amai
shi
Cit
yO
fun
ato
Cit
yK
esen
nu
ma
Cit
yM
inam
i-S
anri
ku
Tow
nIs
hin
om
aki
Cit
yN
ato
riC
ity
Env
iro
nm
ent
Ria
sR
ias
Ria
sR
ias
Pla
ins
Pla
ins
Max
.T
sun
ami
Hei
gh
t(a
)3
0.4
0m
31
.99
m2
3.0
0m
20
.54
m2
5.8
4m
12
.96
m
Mea
nT
sun
ami
Hei
gh
t(a
)1
4.3
1m
13
.13
m1
0.5
0m
12
.63
m6
.51
m4
.36
m
Fir
stw
ave
arri
val
tim
eaf
ter
EQ
(a)
28
min
s2
5m
ins
No
tav
aila
ble
No
tav
aila
ble
23
min
s6
3m
ins
Lan
d-u
se
Ind
ust
rial
(po
rt+
stee
lfa
cto
ry)
smal
l
com
mer
cial
+
resi
den
tial
furt
her
inla
nd
Co
mm
erci
al
ind
ust
rial
atp
ort
fro
nt,
resi
den
tial
Lar
gel
yin
du
stri
al
and
com
mer
cial
at
po
rtfr
on
t,
resi
den
tial
furt
her
inla
nd
Res
iden
tial
and
com
mer
cial
Ex
ten
sive
com
mer
cial
+
ind
ust
rial
atp
ort
fro
nt,
resi
den
tial
furt
her
inla
nd
Lar
gel
yre
sid
enti
al
No
.F
atal
itie
s(b
)1
04
74
25
13
68
87
53
73
99
66
Fat
alit
yra
teo
f
area
inu
nd
ated
8%
2%
3%
6%
3%
8%
No
.T
VE
B3
71
64
34
(c)
No
.p
eop
lesa
ved
inT
VE
B5
02
2(d
)2
42
66
94
50
01
73
6(e
)
Aver
age
no
.
peo
ple
saved
in
each
TV
EB
17
22
(d)
15
21
74
16
75
79
(e)
Co
nti
nu
edo
nn
ext
pag
e

5.3. Method of investigation 123
Tab
le5
.1–
con
tin
ued
fro
mp
rev
iou
sp
age
Cit
y/
Tow
nK
amai
shi
Cit
yO
fun
ato
Cit
yK
esen
nu
ma
Cit
yM
inam
i-S
anri
ku
Tow
nIs
hin
om
aki
Cit
yN
ato
riC
ity
No
.bu
ilt
wit
h
TV
EB
inm
ind
00
21
00
TV
EB
Co
nst
ruct
ion
RC
,S
teel
Fra
me
RC
,S
teel
Fra
me
RC
,S
teel
Fra
me
RC
RC
Ste
elF
ram
eR
C
Ran
ge
of
TV
EB
sto
rey
s2
to3
1to
31
to4
2to
41
1
No
.T
VE
Bw
ith
exte
rnal
sig
nag
e2
02
10
0
Ded
icat
edw
elfa
re
reso
urc
es0
02
00
2

124 5. Tsunami Vertical Evacuation Buildings (Paper 2)
5.4 Key features of TVEB
5.4.1 Tsunami-resistant construction
For a building to be officially designated as a TVEB in Japan, it must meet several construction
requirements specified in government guidelines (Cabinet Office Government of Japan, 2005).
These dictate that a building must be of Reinforced Concrete (RC) or composite steel-reinforced
concrete construction and conform to 1981 building code seismic standards, while also being able
to withstand tsunami loading appropriate to the expected inundation depth. The building must
satisfy minimum height requirements according to estimated maximum inundation depth: where
expected maximum inundation depth is less than one metre, the building must be two storeys or
higher; three storeys or higher for less than two metres in depth; and four storeys or higher where
inundation depth of three metres or more is expected. Of TVEB observed during this research,
80% were of RC construction and 20% were steel frame, 31% were three-storey and 34% were
four-storey or greater.
Post-tsunami building damage surveys from Tohoku underline previous field observations (e.g.,
Lukkunaprasit et al., 2008; Rossetto et al., 2006) that RC construction is the most resistant to tsuna-
mi wave loading and debris impact. There were many cases of RC structures failing in Tohoku:
overturning was observed in Onagawa Town (EEFIT, 2011; Fraser et al., 2013) and Otsuchi (Amer-
ican Society of Civil Engineers, 2011) where tsunami height exceeded 16 m. In Minami-Sanriku
Town, scour of foundations caused building collapse and debris strike caused the collapse of upper
storeys of some RC buildings (EEFIT, 2011). Damage to designated TVEB, however, was general-
ly limited to broken glazing, damaged fixtures and fittings, and debris impact to external cladding,
stairwells, railings or balconies, even at flow depths of up to 20 m, as in Minami-Sanriku. No
observed TVEB sustained sufficient earthquake damage to prevent its use during the subsequent
tsunami evacuation.
The extent of foundation scour sustained during the tsunami reportedly resulted in some TVEB
requiring demolition, but these buildings fulfilled their immediate vertical evacuation function. The
Matsubara apartments at the harbour front in Minami-Sanriku (A in Fig 5.1) were scoured at all
corners of the building to at least two metres below previous ground level, exposing numerous
piles that then were submerged by encroaching sea water. The welfare centre and prefectural
government offices in Kesennuma (F and H, Fig 5.2) suffered less extensive scour, but exhibited
scour holes of significant depth at one or two locations at each building (EEFIT, 2011). The
occurrence of significant foundation scour highlights the need for new methods of scour-resistant
design for TVEB, although the buildings in question maintained life-safety in this event and could,
with further detailed investigation, provide good models for future TVEB.
Significant debris strike occurred at Shizugawa Hospital in Minami-Sanriku (C in Fig 5.1),
where the shore-facing side of the buildings exhibited many broken RC columns at third storey
balconies (EEFIT, 2011). An office building at the inner harbour in Kesennuma (A in Fig 5.2)

5.4. Key features of TVEB 125
Fig
.5
.1:
Map
and
imag
eso
fT
VE
Bin
Min
ami-
San
rik
uT
ow
n,
incl
ud
ing
nu
mb
ers
of
peo
ple
saved
and
tsu
nam
iin
un
dat
ion
mar
ked
iny
ello
w(U
niv
ersi
tyo
f
To
ky
o,
20
11
).(A
)M
atsu
bar
aap
artm
ent
blo
ck;
(B)
Tak
ano
-Kai
kan
con
fere
nce
ven
ue;
(C)
Sh
izu
gaw
aH
osp
ital
;(D
)F
ish
ing
Co
op
erat
ive.

126 5. Tsunami Vertical Evacuation Buildings (Paper 2)
sustained debris damage to external stairwells, but the stairwells appeared functional. Although
TVEB generally sustained minor damage due to debris strike, it was not possible to confirm the
type of debris that caused the observed damage. It is therefore not possible in this paper to explicitly
evaluate the resistance of the observed TVEB to debris impact, for example to ascertain the level
of damage in the case of a large ship striking the TVEB.
The performance of steel-frame buildings warrants a brief discussion here to clarify the suit-
ability of steel-frame construction for TVEB. Numerous steel-frame structures remained standing
with extensive removal of external cladding up to the level of inundation (EEFIT, 2011), suggest-
ing that the tsunami flowed ‘through’ the structure once cladding and external walls were washed
away. Despite this, many other steel buildings exhibited bending, buckling, twisting and fracture of
structural columns or joints (Lignos, 2011). It is therefore possible that steel-frame buildings can
provide life safety during tsunami, provided that they are of sufficient height. However, the sub-
stantial damage to cladding and high potential for failure of structural members from wave loading
or debris strike makes them unsuitable for official designation as TVEB.
Observations from this event suggest that construction requirements for designating TVEB
in Japan were sufficient with respect to extreme tsunami wave heights up to 20 m. Government
guidelines (Cabinet Office Government of Japan, 2005) therefore provide suitable guidance for
appropriate construction of TVEB internationally. Of course, Japan benefits from well-developed
seismic codes and this provides a suitable basis for tsunami-resistant construction, which may not
be available in all countries. Detailed structural evaluations will provide more robust analysis of
the tsunami impact than the external investigations possible during this research, and are vital to
inform construction requirements in the future.
5.4.2 Sufficient height of safe storeys
The provision of safe storeys in TVEB — storeys providing refuge above the maximum tsunami
height — is a vital component of a vertical evacuation strategy. Japanese government guidelines
provide graded requirements for TVEB safe storeys (see Section 5.4.1), but on March 11th there
was inundation of storeys considered safe in previous hazard assessments. During interviews, local
officials expressed concern about the current recommended height of TVEB.
In Kesennuma, several TVEB were within one metre of being overtopped when the tsunami
arrived at low tide. The four-storey Wedding Plaza in Ofunato, Shizugawa Hospital (four- and five-
storey buildings) and Matsubara apartments (four storeys) in Minami-Sanriku were all inundated
to the fourth storey, leaving only the roof as a safe refuge. At Shizugawa Hospital, 320 people
survived on the roof and fifth storey of the west building, but it was not possible to move many
immobile patients to a safe storey (The Kahoku Shimpo, 2011). Despite being only two storeys
in height, the fishing co-operative building in Minami-Sanriku (D, Fig 5.1) was designated as a
TVEB through its ownership by a public organisation looking to protect its workers. Fortunately

5.4. Key features of TVEB 127
Fig
.5
.2:
Map
and
imag
eso
fn
ine
ver
tica
lev
acu
atio
nbu
ild
ing
sin
Kes
enn
um
aC
ity,
incl
ud
ing
nu
mb
ers
of
peo
ple
saved
and
tsu
nam
iin
un
dat
ion
mar
ked
in
yel
low
(Un
iver
sity
of
To
ky
o,
20
11
).T
hes
eco
mp
rise
offi
cebu
ild
ing
s(A
,F,
G,
I);
aca
nn
ery
(B),
are
tail
bu
ild
ing
(C),
wel
fare
cen
tre
(D),
aca
r
par
kin
gd
eck
(E)
and
aco
mm
un
ity
cen
tre
(H).

128 5. Tsunami Vertical Evacuation Buildings (Paper 2)
the building was unused on March 11th as people travelled to nearby high ground; flow depth of
around 12 m (twice the building height) occurred at this building.
In light of the examples above, interviewed officials in Kesennuma and Minami-Sanriku sug-
gested that a minimum height of five storeys should be set for future designation of TVEB. Al-
though increasing the height threshold for safe storeys appears an obvious solution, the use of a
single minimum height on a national scale may rule out using suitable buildings of lesser height
in areas where the maximum potential tsunami height has been robustly assessed to be lower. For
example, on the coastal plains where maximum tsunami heights were lower than on the ria coast-
line, many single-storey and two-storey buildings in Natori and Ishinomaki provided safe refuge
on March 11th, indicating the value of low-rise buildings where it is appropriate to the inundation
height. Rather than construct all TVEB to achieve a single ‘safe-storey threshold’ at five storeys,
robust probabilistic hazard assessment and site-specific analyses using maximum credible tsuna-
mi generating earthquakes (especially local-source subduction events) could provide suitable local
thresholds. This approach would allow continued use of current Japanese government guidelines
in areas of lower maximum inundation height and provide greater flexibility in designating TVEB
of fewer storeys.
5.4.3 Building location planning
Government guidelines (Cabinet Office Government of Japan, 2005) encourage planning of TVEB
locations to provide adequate refuge capacity and distribution in areas where it is not possible to
evacuate to high ground. Optimum distribution of buildings can be derived from local population
estimates, evacuation routes and walking speeds (e.g., Goto et al., 2012b; Imamura et al., 2012;
Wood and Schmidtlein, 2012). Where there is reliance on existing buildings in a developed urban
area, the number and distribution of TVEB may be constrained by the availability of suitable
buildings or land on which to build. As a result of this and variable estimated tsunami hazard,
TVEB were distributed very differently in the six locations investigated.
Kesennuma City had 16 officially designated TVEB relatively well distributed across the coastal
areas of the city; nine are in the area shown in Fig 5.2. With the exception of the car park deck over
the fish market (E, Fig 5.2) and the prefectural government office (F, Fig 5.2), which were con-
structed with tsunami vertical evacuation as a planned function, these buildings were all existing
structures that were identified as suitable TVEB because they conformed to government guidelines.
These provided refuge to 2,326 people, although the number of people sheltering in each building
was highly variable. For example, the car park deck in the busy dock area and fish market received
1,000 people and substantial numbers went to other TVEB in areas far from high ground (B, F, G,
and H in Fig 5.2). Buildings closer to high ground received very few people (buildings A and C in
Fig. 2 received zero and five people respectively). It is expected that the variability in number of
people at each TVEB is due to the concentration of population at the time of evacuation, proximity

5.4. Key features of TVEB 129
of the TVEB to high ground, awareness of the TVEB function and variable evacuation response to
natural or official tsunami warnings (Fraser et al., 2012a). However, data on evacuee travel routes
and TVEB choice was not available at the time of this study, so it is not possible here to robustly
determine reasons for the variability.
Minami-Sanriku Town had four official TVEB (Fig 5.1), of which only the Matsubara apart-
ment building was constructed with prior consideration of vertical evacuation functionality. Con-
structed in 2007, this TVEB was intended to provide refuge to large crowds at the adjacent sports
ground. There were initial public concerns about the building being used for tsunami evacuation
due to its port-front location, but the local community was informed that the roof level would
constitute a safe elevation. It was reported during interviews that large numbers of people taking
refuge in TVEB primarily comprised people who were in the building or in the immediate vicinity
at the time of the evacuation warning, suggesting that people did not travel far to TVEB. At Shizu-
gawa Hospital, 69% of the 320 evacuees were hospital staff or patients and at the Takano Kaikan
building, the majority of the 330 people saved were attending a community meeting at the building.
There were only two TVEB in Kamaishi City (Kamaishihamacho Post Office and a government
office, Fig 5.3). Relatively few people (50) took refuge in these buildings during the tsunami,
perhaps owing to the 66.4% rate of immediate evacuation (NPO CeMI, 2011) and access to high
ground within one kilometre of the port and industrial areas. The government office provided
refuge to people who became stuck in vehicles due to traffic congestion. An additional building,
the Hotel Horaikan at nearby Unosumai, was constructed with vertical evacuation in mind (see
Section 5.4.8). Additional TVEB had been planned in the port area of Kamaishi, but they had yet
to be constructed by March 11th.
In locations where minimal tsunami inundation was expected based on previous events and
numerical modelling, there was little planning for vertical evacuation and therefore few designated
TVEB, however, informal vertical evacuation to non-designated buildings was significant in miti-
gating loss of life. Around 500 people sought refuge at three designated buildings in Ishinomaki
City: York Benimaru shopping centre, the Homac hardware centre, and the Hotaru funeral facili-
ty. The local interviewee reported that an additional 50,000 people took refuge in approximately
260 official earthquake and landslide evacuation buildings and other schools, temples, shopping
centres and housing. Informal vertical evacuation also occurred in Kamaishi City and Ofunato
City in cases where buildings suggested by the community did not met official designation criteria
(see Section 5.4.9), but the number of non-designated buildings was not available to quantify this
further.
Four public buildings in Natori City had been specified by the municipality government as gen-
eral hazard evacuation centres (but not specifically TVEB): Yuriage Community Centre, Yuriage
Junior High School, and Yuriage Elementary School. Sendai International Airport at Kitakama
was also an evacuation location. These buildings were not designated as TVEB because they were
located outside of the estimated tsunami hazard zone, but proved effective for vertical evacuation

130 5. Tsunami Vertical Evacuation Buildings (Paper 2)
Fig
.5
.3:
Map
and
imag
eso
fvertical
evacu
ation
bu
ildin
gs
inK
amaish
iC
ityan
dtsu
nam
iin
un
datio
nm
arked
iny
ellow
(Un
iversity
of
To
ky
o,
20
11
).T
hese
areth
eK
amaish
iham
acho
Po
stO
ffice
and
apartm
ent
bu
ildin
g(A
)an
dg
overn
men
to
ffices
(B).

5.4. Key features of TVEB 131
in this event in further examples of informal vertical evacuation.
These observations show that vertical evacuation can be successful where the best possible
distribution of TVEB cannot be achieved, and that informal vertical evacuation saved many addi-
tional lives in areas of low to moderate tsunami height. Planning TVEB in the redevelopment of
tsunami-affected areas in Tohoku is encouraged, but where there are suitable existing buildings,
those buildings should also be used as effectively as possible.
5.4.4 Building capacity
Any building designed as an evacuation refuge must have sufficient capacity for the estimated
number of evacuees. Analysis of potential demand can be carried out using estimates of local
population, evacuation routing, travel speed and distribution of safe refuges, including safe areas
outside of the inundation zone and vertical evacuation structures (Goto et al., 2012b; Imamura
et al., 2012; Wood and Schmidtlein, 2012). Facility capacity also relies on estimates of in-refuge
space required by each evacuee (Cabinet Office Government of Japan, 2005; FEMA, 2008).
Detailed study of building capacity or evacuees’ experience while in the buildings was not
carried out as part of this research. During interviews, however, there were no reported cases of
buildings exceeding capacity on March 11th. The majority of designated buildings were substantial
structures with a requirement for large capacity in their regular function (e.g., schools, apartments),
therefore are more likely to satisfy government guideline capacity requirements (Cabinet Office
Government of Japan, 2005). It was noted in several interviews that even where TVEB existed,
the recommended primary evacuation action was to go to high ground (to exit the tsunami hazard
zone, rather than remain in it). This guidance may also have acted to reduce evacuee demand on
TVEB where they were close to high ground (see Section 5.4.3).
5.4.5 Building access
TVEB must provide access to safe storeys at all times. The type of access (internal or external
stairs, width of entrances) is a key factor in the time required to access the building and move to
safe storeys (Yagi and Hasemi, 2010). External stairs are commonly installed for emergency exit
from buildings in Japan, e.g., in fires or earthquakes, and offer the most efficient way to access
safe storeys of an evacuation building (Yagi and Hasemi, 2010). These stairs may not always lead
directly to the roof, but should enable direct access to safe storeys.
External stair or vehicle ramp access was the most commonly recorded access method at TVEB
investigated, available at nine (33%) of observed TVEB (Table 5.2). Where direct external access
from the ground floor to safe storeys is not available, people may need to gain access by alterna-
tive methods, which are included in government guidelines (Cabinet Office Government of Japan,
2005) and were cited in our interviews (Table 5.2):

132 5. Tsunami Vertical Evacuation Buildings (Paper 2)
• Some private buildings have security personnel present overnight who will open doors for
emergency access, e.g., the Prefectural Office in Kesennuma.
• Due to regular building function it is staffed or has residents present 24 hours a day, e.g.,
Shizugawa Hospital, Hotel Horaikan, the Matsubara apartments, and two other TVEB.
• Representatives of local residents act as key holders to enable access outside of office hours,
e.g., two community representatives living near the government building, Kamaishi; two
Yuriage schools and a community centre, where key holders are informed by telephone that
they need to open the building.
• Building owners agree to the forcible breaking of doors and windows to enable emergency
access, e.g., Kesennuma Junior High School and the National Office in Kesennuma.
The provision of 24-hour access may require installation or retrofitting of adequate stairs and
entrances, or additional investment in structural renovation and staffing requirements. It can also
affect building security and lead to concerns about crime (Yagi and Hasemi, 2010). During our
interviews there were no reports of restricted building access on March 11th, because the tsunami
occurred during at 14:46 (local time) when TVEB were unlocked and occupied. It was acknowl-
edged by several interviewees that access issues may have hindered evacuation if the tsunami had
occurred at night. In Natori City, interviewees noted that although two key holders were trained to
go to each evacuation building in case of night-time evacuation, they had not been trained for this s-
cale or type of evacuation. This highlights the importance of appropriate training and responsibility
on the part of key holders to immediately open TVEB in the event of tsunami.
Allowing evacuees to enter TVEB by force is unlikely to be a suitable solution for build-
ings containing sensitive data, such as public offices or commercial premises. Satisfying access
requirements of TVEB in different communities and with varying regular functions requires di-
alogue among evacuation planners, building owners and the community (see Section 5.4.9) on a
case-by-case basis to define the most appropriate solution for each building and to ensure that the
local community is aware of and trained in the correct access method.

5.4. Key features of TVEB 133
Tab
.5
.2:
TV
EB
24
-ho
ur
acce
ssm
eth
od
s,sh
ow
ing
nu
mb
ers
of
bu
ild
ing
sfo
rea
chm
eth
od
inth
elo
cati
on
ssu
rvey
ed.
Dat
ao
nex
tern
alst
airs
isfr
om
fiel
d
ob
serv
atio
ns.
Dat
ao
nal
tern
ativ
eac
cess
met
ho
ds
isfr
om
loca
lin
terv
iew
s.N
otal
lT
VE
Bw
ere
acce
ssib
lefo
ro
bse
rvat
ion
du
rin
gfi
eld
inves
tig
atio
ns.
(a) S
chools
inN
atori
hav
eex
tern
alst
airs
bu
tst
aff
mem
ber
sar
eal
soorg
anis
edto
open
the
buil
din
g.
Cit
y/
Tow
nK
amai
shi
Cit
y
Ofu
nat
o
Cit
y
Kes
enn
um
a
Cit
y
Min
ami-
San
rik
u
Tow
n
Ish
ino
mak
i
Cit
yN
ato
riC
ity
All
loca
tio
ns
To
tal
no
.o
fT
VE
B3
71
64
34
37
Bu
ild
ing
op
en2
4-h
rs0
12
10
04
Nig
ht-
tim
ere
sid
ents
00
01
00
1
Ex
tern
alst
airs
11
21
22
(a)
9
Lo
cal
key
-ho
lder
s1
00
00
34
Fo
rced
entr
yal
low
ed0
02
00
02
Nig
ht-
tim
ese
curi
tyst
aff
00
10
00
1
No
exte
rnal
stai
rs,
alte
rnat
ive
acce
ss
un
kn
ow
n
11
31
11
8
Acc
ess
met
ho
d
un
kn
ow
n(b
uil
din
gn
ot
ob
serv
ed)
04
60
00
10

134 5. Tsunami Vertical Evacuation Buildings (Paper 2)
5.4.6 Fire resistance
One reason for promoting evacuation to high ground rather than into TVEB is that safety cannot be
guaranteed in the event of large debris strike or fire at such buildings. Fire was a significant issue
during and immediately after this tsunami; many buildings burned and some evacuation centres
narrowly avoided catching fire while occupied by evacuees. In Kesennuma, over 50,000 litres of
oil spilled from ruptured oil tanks and engulfed several areas around TVEB. It was reported that
a government committee had been set up to prevent such spillage from occurring again, and the
fire-proofing of evacuation structures was raised as a consideration for the future design of such
buildings. In Ishinomaki, fire spread within one hour of the earthquake to the Kadonowaki school
building where people had taken refuge, but evacuees were fortunately able to relocate to high
ground nearby before fire spread to the school.
Observations from Tohoku support the need for solutions to minimise the spread of fire and to
prevent fire damage to TVEB, such as fire-retardant cladding and shutters. The potential for fire
damage also led to one interviewee citing the need for emergency communication links in TVEB
in case of urgent need of rescue (see Section 5.4.10).
5.4.7 Evacuation signage
Effective route signage is a key component of tsunami evacuation strategies, for on-going educa-
tion and awareness training as well as for direction in an evacuation (Dengler, 2005). Signage is
required inside a building to show exits and safe routes and to speed up the movement of evacuees
(Yagi and Hasemi, 2010). Signage is also necessary outside a TVEB to highlight the building func-
tion and to show the most appropriate access route to safe floors, particularly for those who may
be unfamiliar with a building and its vicinity, e.g., tourists and emergency responders. There has
been previous recognition of the disparity in tsunami hazard awareness between resident and non-
resident populations (Johnston et al., 2005); it is vital that a vertical evacuation strategy accounts
for both groups, and displaying effective consistent signage is one method of achieving this. This
study did not investigate the use of TVEB specifically by non-resident (transient) populations in
Tohoku because this level of data was not available. Consistent vertical evacuation signage (Fig
5.4) for buildings is recommended in government guidelines (Cabinet Office Government of Japan,
2005) but unfortunately, prior to March 2011, the application of such signage was limited and the
retrofitting of signage for existing buildings was uncommon. Only five buildings were observed
during our field survey to have official signage: the Kamaishihamacho Post Office and Hotel Ho-
raikan in Kamaishi, Matsubara apartments in Minami- Sanriku, the prefectural government office
and the Yoyoi cannery, both in Kesennuma. The high numbers of evacuees taking refuge in desig-
nated buildings despite the absence of signage suggests that awareness of TVEB was high among
people in the area at the time of the tsunami, although further research into evacuee behaviour
should aim to identify any impact that signage may have had on destination of evacuees. In the

5.4. Key features of TVEB 135
meantime, consistent signage should be adopted and applied to all TVEB, including retrofitting of
existing buildings that become designated. Signs should be clearly displayed at the top of each
building and above entrances to clearly indicate the most appropriate access route to upper storeys.
Signage should be nationally consistent with approved standards for style and messaging.
Fig. 5.4: Vertical evacuation signage used in Japan. (A) Sign displayed prominently on the Kamaishi-
hamacho Post Office, (B) signage on the Matsubara apartment block in Minami-Sanriku, (C) a
sign displayed above an entrance to the Kamaishihamacho Post Office (Translation: Evacuation
building entrance (stairways)).
5.4.8 Building owner agreement
The need to gain agreement of building owners to designate their buildings as TVEB is an issue
that has been raised in projects in the United States (Project Safe Haven, 2011a,b), New Zealand
(Leonard et al., 2011) and Japan (Cabinet Office Government of Japan, 2005). During our inter-
views, local officials indicated that owners were generally receptive to the requirement for TVEB
when approached about using their building for vertical evacuation, although some owners had
concerns over the access and responsibility of evacuees.
Disaster prevention officials in Kesennuma found building owners to be extremely cooperative
in the designation of buildings. The owner of the Hotel Horaikan in Kamaishi had proposed that
her building be designated as an alternative to construction of defences that would block beach
access. She had previously seen evacuation to buildings in the 2004 Indian Ocean tsunami and had
built her hotel as a three-storey building so it could be used in tsunami evacuation. The owners
of the Takano Kaikan in Minami-Sanriku (B, Fig 5.1) were described as recognising the corporate
social responsibility of agreeing to use their building for evacuation, and the Minami- Sanriku

136 5. Tsunami Vertical Evacuation Buildings (Paper 2)
fishing cooperative encouraged the designation of its building (D, Fig 5.1) to protect its workers.
There was no disagreement from building owners in Ishinomaki when they were approached by
the city; in this case, it was agreed that the city would pay compensation to building owners in the
event of damage or costs incurred when people evacuate to the property, which follows government
guidelines (Cabinet Office Government of Japan, 2005).
One interviewee reported initial resistance in Ofunato City from building owners approached
about the potential use of their buildings as TVEB. The owners’ concerns focussed on night-time
access and on who would be responsible for evacuees while in the building, but following dis-
cussions with the community the owners agreed to their buildings being used. This suggests that
leveraging community interest and encouraging owners to see the provision of the building as a
benefit to the community was an effective way to gain support of building owners in Japan, and
that a similar approach should be taken in implementing vertical evacuation strategies elsewhere.
5.4.9 Community engagement
The use of workshops in consultation and negotiation for tsunami vertical evacuation strategies is
a key component of Japanese guidelines (Cabinet Office Government of Japan, 2005), and par-
ticipation of local community volunteer disaster prevention groups in building identification and
evacuation mapping were common themes in our interviews. Community engagement to encour-
age ownership and awareness are also important components of tsunami preparedness initiatives
in the United States (Dengler, 2005; Project Safe Haven, 2011a,b) and New Zealand (MCDEM,
2008d).
In Ofunato City, the identification of buildings suitable for vertical evacuation was led by com-
munity groups that approached the municipal government with potential structures for designation.
Some of those structures did not meet official structural requirements, so they did not become of-
ficially designated, yet these buildings were used successfully on March 11th in informal vertical
evacuation (see Section 5.4.3). In Kamaishi, several community-identified structures did not meet
government requirements therefore local authorities did not advise their use during tsunami evacu-
ation. Only the building owners used these buildings on March 11th 2011 and although the lowest
three storeys were damaged, the occupants survived. Community disaster prevention groups in Ke-
sennuma reportedly approached the owners of the Yoyoi cannery in the Hamacho neighbourhood
(B, Fig 5.2) about using it for vertical evacuation, after which it became officially designated.
Engagement with the community after building designation is important for developing and
maintaining awareness of the vertical evacuation strategy, and is a key component of government
guidelines. The Yoyoi cannery had signage at entrances and was used in ongoing training as part of
local biannual evacuation exercises. In contrast, once the use of official buildings in Ishinomaki had
been agreed, the arrangement was broadcast on local news, but their function was not publicised
widely and no signage was applied. In Minami-Sanriku, exercises reportedly involved evacuation

5.4. Key features of TVEB 137
to high ground only, but signs depicting past tsunami heights include directions to TVEB. It is
unclear from the interviews how widespread the incorporation of TVEB into annual evacuation ex-
ercises is elsewhere in Iwate and Miyagi Prefectures, but these observations suggest a high degree
of variability among municipalities.
Community engagement in the development of vertical evacuation strategies should be encour-
aged to foster familiarity with TVEB as part of wider preparedness and evacuation plans. TVEB
should be incorporated into tsunami evacuation drills to enhance the awareness of their availability
and use. Evacuation to high ground should remain the training priority and preferred option, but
the use of TVEB should be practised where conditions are likely to prevent people reaching high
ground during a local tsunami.
5.4.10 Evacuee welfare in TVEB
Evacuees were stranded in some TVEB for up to two days during and following the Great East
Japan tsunami due to standing water and debris blocking building exits. Our interviews examined
the availability of welfare in TVEB, such as the provision of food and water, shelter, warm blankets
and clothing, sanitation, and emergency communication links to disaster prevention officials or
emergency services. It is noted that in Japan, TVEB are considered primary refuges for short-term
use and that welfare provisions for medium- to long-term care are usually provided at secondary
evacuation or welfare centres.
It was reported during interviews that provisions were available at the Prefectural Office in
Kesennuma and at South Kesennuma Elementary School, but these were appropriate for a six-hour
occupancy period only. It had been assumed that after six hours residents would be able to get
to welfare centres. However, evacuees had to remain in these building until March 13th, when
they were rescued after debris had been cleared. Similarly, evacuees at Yuriage Elementary and
Yuriage Junior High schools were required to remain until March 12th, when they had to exit by
walking through standing water. The Junior High School had very limited provisions for evacuees,
and those at the community centre were on the ground level, which became inundated. There
was no emergency communication equipment at either location, although this is recommended in
government guidelines (Cabinet Office Government of Japan, 2005).
In Ofunato, provisions were said to be available at the shopping centre due to the regular
function of the building, but no specific arrangements had been made to provide short-term support
for occupants in the event of a tsunami. As with retail units, apartment buildings are likely to have
some provisions and shelter due to their regular residential use. The official interviewed in Ofunato
highlighted the importance of providing communications links in all refuges to facilitate contact
with emergency services, especially in cases requiring urgent rescue when cell phones or other
radio systems are not functioning, e.g., if threatened by fire or serious illness.
Several interviewees cited cases of people leaving TVEB prematurely and being killed by sub-

138 5. Tsunami Vertical Evacuation Buildings (Paper 2)
sequent tsunami arriving. Although adequate provisions may help reduce the need or urge for
evacuees to leave a refuge earlier than necessary, further work is recommended to assess evacuee
decision-making in this regard. With long-term tsunami preparedness in mind, Sharma and Patt
(2012) show that evacuees’ previous experience in the quality of their stay in an evacuation shelter
positively influenced their response to warnings in future. Therefore, the provision of amenities for
evacuations in the short-term may yield benefits for long-term mitigation.
An important challenge recognised by the official interviewed in Minami-Sanriku and an area
requiring further work is the assessment of adequate resources for a TVEB. It is difficult to say
how many people will use any given building and therefore ensure adequate welfare resources,
although evacuation modelling can help to estimate likely evacuee numbers once the coverage area
of a TVEB is established (Cabinet Office Government of Japan, 2005).
The upper storeys of TVEB should ideally have emergency shelter, food and water sufficient
for several days’ occupancy, given the potential for extended periods of isolation. Communication
links to civil defence or emergency services should also be provided. Such provisions were lack-
ing in TVEB at the locations investigated, but there were no reports of this resulting in deaths at
TVEB. Therefore, availability of short-term welfare should be considered secondary to the struc-
tural requirements for providing life-safety, and the designation of suitable buildings should not be
delayed or prevented because of inadequate welfare provisions.
5.5 Conclusions
Safe refuge was provided by many TVEB during the 2011 Great East Japan tsunami, highlighting
the value of a vertical evacuation strategy in areas at risk of tsunami. These buildings are not a re-
placement for evacuation to high ground, but provide effective alternative options for those unable
to evacuate the inundation zone prior to tsunami arrival. This research presents a reconnaissance-
level view of the implementation of tsunami vertical evacuation guidelines in Japan and the perfor-
mance of TVEB in an extreme event. Observations and interviews have shown that in the locations
visited, there was variable adherence to published tsunami vertical evacuation guidelines and that
there are some aspects in which implementation of the strategy could be improved.
The positive structural performance of TVEB with respect to wave impact, foundation scour
and debris strike in extreme tsunami indicates that construction requirements for designating TVEB
in Japan provide a sound basis for the future development of TVEB in Japan and internationally.
Due to previous underestimation of tsunami hazard in Tohoku, some TVEB were (or were close
to being) overtopped and safe storeys inundated. Future designation of suitable TVEB height for
safe storeys must be based on robust hazard assessment to ensure the height is appropriate to the
estimated local maximum tsunami height. Although TVEB escaped fire damage in this event, the
widespread occurrence of fire and damage, e.g., to a school that had been occupied by evacuees
shows the continuing importance of minimising the spread of fire and preventing fire damage to

5.6. Acknowledgements 139
TVEB.
All of the locations investigated in this work were developed urban areas and the vertical e-
vacuation strategy relied largely on using existing buildings, thereby limiting planners’ ability to
achieve an ideal distribution of TVEB — an issue likely to occur internationally. Experience in
this event shows that this is not, however, a barrier to effective vertical evacuation because loss of
life was mitigated even where the best possible distribution of buildings could not be achieved.
Observations from this work provide several examples of building access methods that should
be considered in the development of TVEB internationally. Although special access plans were
not enacted in this event due to its day-time occurrence, concern was expressed in some interviews
over the efficacy of night-time access preparations. It is therefore important that 24-hour building-
appropriate access and subsequent community evacuation training are given high priority in future
strategy development. The provision of access and responsibility for evacuees represent concerns
for building owners when the use of their buildings as TVEB is considered. In the development
of strategies internationally, this important issue will require engagement between the community
and building owners, which helped to gain agreement of owners in Japan.
Two significant aspects of Japanese government guidelines that were largely absent from ob-
served TVEB were signage and welfare provisions. More effective implementation of external
signage might have helped to minimise loss of life through greater use of TVEB, particularly a-
mong transient populations unfamiliar with local evacuation planning, although further research is
required to confirm this. The majority of TVEB had no dedicated welfare provisions or had provi-
sions suitable only for several hours of building occupancy. Observations from this event show that
potential occupancy period should be considered in terms of days rather than hours, and indicates
a particular need for emergency communications equipment in TVEB.
In Tohoku, the planning of optimal TVEB locations may now be possible during extensive
redevelopment, and greater adherence to existing government guidelines is encouraged. Interna-
tionally, the development of vertical evacuation strategies can benefit by recognising the Japanese
government guidelines and by learning from experiences in the Great East Japan tsunami.
Further study of evacuees’ experiences in identifying, accessing and taking refuge in TVE-
B would enhance the understanding and use of TVEB. Approaches to improving the integration
of TVEB in evacuation exercises and more clearly identifying welfare requirements should be
explored. In addition, detailed structural analyses of specific TVEB and their performance with
respect to tsunami loading, debris strike and foundation scour are expected to enhance structural
resistance against tsunami.
5.6 Acknowledgements
This research was funded by Washington Military Department Emergency Management Division
and supported by New Zealand Ministry of Science and Innovation core geohazards funding to

140 5. Tsunami Vertical Evacuation Buildings (Paper 2)
GNS Science. The authors acknowledge the officials and researchers who were interviewed during
the field survey and thank them for their time and efforts to participate in the interviews. The
authors also acknowledge members of the EEFIT field mission who provided valuable observations
and discussion during and after initial reconnaissance, and thank both reviewers for their thoughtful
review and suggestions, which have improved the manuscript.
5.7 Link to next chapter
This chapter has presented examples of existing vertical evacuation buildings, providing guidance
for design of building, in terms of physical features, logistics and resource issues that should be
considered when designing a vertical strategy in New Zealand. The next chapter (Paper 3) presents
the results of tsunami evacuation behaviour surveys that were conducted at Napier. The results are
intended to inform subsequent evacuation modelling in this thesis, and drive public education to
address outstanding issues in tsunami understanding and evacuation response. The survey collected
some data on perceptions of TVEB in Napier, which are intended to inform TVEB development
strategies.

6. INTENDED EVACUATION BEHAVIOUR IN A LOCAL EARTHQUAKE AND
TSUNAMI AT NAPIER, NEW ZEALAND (PAPER 3)
This chapter presents the results of surveys that explored intended tsunami evacuation behaviour in
Napier, New Zealand. The survey was conducted to inform modelling of evacuation in Chapter 7
and to provide preliminary data on the perception of using Tsunami Vertical Evacuation Buildings
(TVEB), defined as Objective 3. The work was originally published as Fraser, S. A.; Leonard, G.
S.; Johnston, D. M. 2013. Intended evacuation behaviour in a local earthquake and tsunami at
Napier, New Zealand, GNS Science Report 2013/26. 55 p. With the exception of formatting, the
text presented here is unaltered from the published version. A contribution statement, outlining
author contributions to the paper, is provided in Appendix H.
6.1 Abstract
We conducted surveys of 136 residents of and visitors to Napier, Hawke’s Bay, New Zealand, to
understand hazard awareness and intended evacuation behaviour in a hypothetical local earthquake
and tsunami. The results provide a unique investigation of evacuation intentions in the context of
local tsunami hazard in New Zealand. The data support observations from previous surveys and
international literature, and provide new data on intended evacuation destinations, travel mode and
opinions of tsunami vertical evacuation buildings.
There were high levels of recall of hazard information among residents in Napier and although
the results suggest a low level of information provision to visitors by the tourist industry, there
is a high level of tsunami hazard awareness among both groups. There is a reasonably good un-
derstanding of potential tsunami arrival times, but an expectation that official tsunami warnings
will be given via sirens or TV/radio in the case of local tsunami. Intended behaviour suggests
that ground shaking might trigger appropriate earthquake response actions but people may not ex-
tend their actions to include appropriate tsunami evacuation response. Location at the time of the
earthquake and gender influence respondents’ intention to evacuate and their intended travel mode.
A moderate proportion of respondents stated that they would evacuate to high ground and some
respondents identified their home or prominent locations in the city as intended evacuation desti-
nations, despite those locations being within the tsunami hazard zone. Respondents were receptive
to vertical evacuation as an alternative to high ground, but generally consider it a last resort and
expressed concern about structural integrity and sufficient height.

142 6. Intended local tsunami evacuation behaviour (Paper 3)
6.2 Introduction
This study was undertaken to understand hazard awareness and intended tsunami evacuation be-
haviour of residents and visitors in the context of local earthquake and tsunami at Napier, Hawke’s
Bay, New Zealand. Previous research has documented the seismic hazard associated with the Hiku-
rangi subduction margin, 100–150 km offshore of the east coast of the North Island (e.g., Wallace
et al., 2009) and palaeo-earthquake and tsunami in Hawke’s Bay (Cochran et al., 2005, 2006).
Numerical modelling has demonstrated that in the worst-case scenario of a whole margin rupture,
large areas of urban Napier could experience flow depth exceeding 3 m with maximum inundation
extent of 4 km (Fraser et al., 2014). Tsunami wave arrival could occur in as little as 27 minutes
after earthquake rupture. The resident population of 57,800 (Statistics New Zealand, 2013a) and
large numbers of visitors to the city represent high exposure to the local tsunami hazard. We re-
quire improved understanding of tsunami awareness and evacuation intentions to help in designing
community engagement programmes and resources, and efficient evacuation strategies in case of
local tsunami.
Extensive literature on evacuation behaviour provides a basis for tsunami evacuation planning,
but this has been generated largely through the study of U.S. hurricane evacuations and an under-
standing of tsunami evacuation remains limited (Lindell and Prater, 2010). Behavioural models
based on hurricane evacuation data may be applicable to distant tsunami due to the similar avail-
ability of official warnings and lead-time of several hours or more. However, the short lead-time
of local tsunami requires that we investigate behaviour in a different context, where the challenges
of rapidly detecting tsunami and disseminating warnings preclude issuing official warnings ahead
of tsunami arrival. In practice, natural and informal warnings are likely to be the predominant
source of warnings in such a situation. Much of the evacuation behaviour data has been collected
in the United States, which allows us to consider those findings appropriate to New Zealand in
the broad cultural context, as the two countries share a similarly individualistic culture, although
a complicating factor is the use of mandatory evacuation in some states, whereas in New Zealand
evacuation may be advised but is not regulatory.
We conducted 136 face-to-face questionnaire surveys in Napier from Friday 1st March to Sun-
day 3rd March 2013. The survey focussed on assessing respondents’ understanding of tsunami
potential, expected wave arrival time and subsequent evacuation intentions, given a scenario of
long or strong ground shaking at Napier. Intention data or ‘stated preference’ data are able to
provide insight where a type of event occurs infrequently, precluding observation of actual be-
haviour. Context to this research is given by an overview of relevant evacuation decision-making
and behaviour literature (Section 6.3). Description of the survey aims and methodology (Section
6.4) is followed by results and discussion of data analysis (Section 6.5). Data presented here will
inform behavioural assumptions in tsunami evacuation simulations, inform tsunami education, and
provide a focus for future social science research into tsunami evacuation in New Zealand.

6.3. Evacuation behaviour 143
6.3 Evacuation behaviour
We use the term evacuation to mean short-term evacuation undertaken prior to impact with the aim
of minimising losses due to the event, labelled ‘preventative evacuation’ by Perry, Lindell, and
Greene (1981). Evacuation is a complex and dynamic process and evacuation behaviour — the
choices made and protective actions taken in an emergency or crisis — is influenced by situational,
social and cultural contexts, environmental cues and warnings. Personal characteristics are impor-
tant for recognition and interpretation of warnings, personalisation of risk, and decision-making.
Substantial numbers of people choose not to evacuate or are unable to evacuate in disasters. Fac-
tors influencing non-evacuation in previous events may include: low personal risk perception due
to previous experience, lack of belief in the hazard (Lindell and Perry, 1992); a lack of understand-
ing of warnings (Gregg et al., 2006); situational impediments such as mobility issues or separation
from family (Lindell and Perry, 2012); logistical challenges (Lindell, Kang, and Prater, 2011); or
lack of knowledge on available protective options (Burton, Kates, and White, 1978). Previously
studied personal characteristics include age, gender, income, ethnicity, disability, composition of
the household, presence of an adaptive plan, warning factors (source, content, clarity, consistency
of message, number of warnings), risk perception, challenges of evacuation, previous experience
of similar emergencies, and geographic location — all of which have been shown to have some
degree of positive or negative influence on likelihood of evacuation (Dash and Gladwin, 2007, and
references therein). Much of the available data on evacuation behaviour comes from US hurri-
canes (e.g., Lindell, Kang, and Prater, 2011; Lindell and Prater, 2007), undoubtedly owing to the
frequency of hurricanes and ease of access to the study areas. Additional data comes from nuclear
accidents in the United States (e.g., Urbanik, 1994, 2000).
There is limited discussion in the literature of the extent to which rate of evacuation is affected
by receipt of a mandatory or voluntary evacuation order in the United States. Although these are
used for hurricane, tsunami and wildfire, the most-studied is mandatory hurricane evacuation. The
use of mandatory evacuations in hurricanes varies by state, with respect to the use of this term, the
extent to which such an order is enforced, and by which agency (Wolshon et al., 2005). Both types
of order may be issued in the same event to different geographic areas and groups of people, based
on level of hazard and whether they reside in a mobile home or a more substantial construction
(Dash and Morrow, 2001). Mandatory evacuations do not necessarily result in complete compli-
ance, and may even result in lower evacuation than for a voluntary evacuation order during the
same event (Dash and Morrow, 2001). Mesa-Arango et al. (2012) suggests that there is a greater
correlation between stated preferences and actual behaviour when a mandatory evacuation has been
issued, than for voluntary evacuations.
Following the globally significant tsunami of 2004 and 2011 and increased research on tsunami
in the intervening years, tsunami evacuation behaviour has been more extensively studied but re-
mains limited (Dash and Gladwin, 2007; Lindell and Prater, 2010). Several studies have described

144 6. Intended local tsunami evacuation behaviour (Paper 3)
evacuation in the 2011 Great East Japan tsunami including evacuation (or non-evacuation) actions
and timing (Yun and Hamada, 2012), use of vertical evacuation buildings (Fraser et al., 2012b)
and evacuation rates and use of vehicles (Murakami and Kashiwabara, 2011). Mas et al. (2012a)
applied observed behaviours in testing an agent-based model of evacuation against observed evac-
uation rates. Several other international events have resulted in studies of behavioural response to
tsunami (Bird, Chague-Goff, and Gero, 2011; Gregg et al., 2006; McAdoo, Moore, and Baumwoll,
2009; McAdoo et al., 2006; Okumura, Harada, and Kawata, 2011). In New Zealand, Walton and
Lamb (2009) carried out an experimental study of intended post-earthquake travel behaviour and
following the 2007 Gisborne earthquake conducted surveys to investigate actual travel behaviour
(Lamb and Walton, 2011). Several studies of evacuation behaviour have been carried out in the
course of on-going research (Currie et al., 2014; Dorfstaetter, 2012; Stewart et al., 2005) and fol-
lowing distant tsunami events (Rogers, 2010).
Evacuation decision-making factors, such as personal experience, perception of threats and
protective actions, family context, environmental and social cues, have been incorporated pre-
viously into decision theory models to determine their relative importance in taking protective
actions (Lindell and Perry, 2012; Perry, Lindell, and Greene, 1981) and to aid in estimating evac-
uation rates. Agent-based models have also become more commonplace in the study of tsunami
evacuation (Goto et al., 2012b; Johnstone, 2012; Mas, Adriano, and Koshimura, 2013; Mas et al.,
2012a). Agent-based models allow simulation of individual components (agents) within a system,
each with a particular set of characteristics and rules governing their behaviour, the interactions
between multiple agents and interactions between agents and the simulated environment (Crook-
s and Heppenstall, 2012). In the context of tsunami evacuation, agents represent individuals or
family groups, each with a set of characteristics (e.g., physical, experiential) which determine the
likely evacuation actions (and efficacy of those actions) they take in the event of a tsunami in
their environment (modelled roads, buildings etc.). Therefore, prior knowledge about the influence
of personal characteristics and experience on likely behaviours is essential to inform assumption-
s within the model. This behavioural data is something that has been poorly integrated into the
assumptions used in many of these evacuation models (Lindell and Prater, 2007). The following
sections provide background to several key behaviours that are explored in this study, to provide
context to the results and discussion.
6.3.1 Tsunami warnings and response
Environmental cues or natural phenomena have been observed prior to wave arrival in many pre-
vious tsunami. Japanese data from as early as 1896 and 1933 includes accounts of audible cues
such as ‘continuous sound like a locomotive’ and ‘thunder-like’ sounds (Shuto, 1997). In Thailand
the majority of people surveyed following the Indian Ocean tsunami reported seeing or hearing
something unusual in the sea (Gregg et al., 2006). Visible cues can, but do not always, include
6.3. Evacuation behaviour 145
drawdown of the water at the coast, exposing the seabed or reefs prior to wave arrival, and other
unusual wave activity such as a wall of water, a rapidly rising tide, large eddies, and frothing or
‘boiling’ of the sea surface. These phenomena can provide a natural warning of tsunami in the case
of distant, regional and local tsunami as they are due to the mass movement of water occurring
at any distance from the source event. In the case of local tsunami generated by an earthquake,
ground shaking may also provide a natural warning due to the proximity of the epicentre to the
coastline.
Although early earthquake warning systems exist in Japan and are able to provide a tsunami
warning within three minutes (Japan Meteorological Agency, 2013), such technology has flaws
which were exposed in March 2011, primarily the incorrect automatic estimation of wave heights
and mis-communication of subsequent warning messages (Fraser et al., 2012a). Current technolo-
gies allow approximation of earthquake magnitude by the global seismic network almost imme-
diately upon detection of ground shaking. However, the time required to refine source magnitude
and mechanism in order to issue accurate tsunami warnings is too great to be applied effectively in
a local tsunami.
Fixed position, tone-only tsunami siren systems have been installed in several regions of New
Zealand1 and further discussion is underway regarding siren installation (e.g., in Tauranga City)
but such systems have flaws, which are particularly important to consider in the context of short
tsunami arrival times. Aside from the potential for siren systems to fail due to power outages in a
significant local earthquake, and the potential for false alarms2, a major criticism of the warning
provided by sirens (particularly tone-only sirens with no voice message) is that they do not deliver
a specific, detailed message to the surrounding area (Leonard, Saunders, and Johnston, 2007). As
a result, there is a period of time in which the public may hear the siren but not respond until
they are sure of the meaning. In Napier, the council instructs people to listen to local radio for
further information; the tsunami siren system in Auckland gives three different tones for ‘threat of
tsunami’, ‘immediate evacuation’ and ‘threat has passed’ — the public are expected to interpret
these in case of the siren sounding.
In order to make such siren systems effective, they must exist within the framework of an effec-
tive early warning system with, among other components, a public education component required
to enhance awareness and understanding of the system (Leonard et al., 2008a). Even with such a
campaign, understanding of the siren may not be enhanced substantially. A tsunami siren system
has been present in Hawai’i for several decades but Gregg et al. (2007) found that only 13% of the
population understand the meaning of the siren, despite high awareness of sirens and siren tests.
1 Including Napier (http://www.napier.govt.nz/index.php?pid=234), Northland Region (http://www.nrc.govt.
nz/civildefence/tsunami/tsunami-sirens/), Auckland (http://www.aucklandcouncil.govt.nz/en/environmentwaste/
naturalhazardsemergencies/civilDefence/Pages/civil defence and emergency management home.aspx), and
Christchurch (http://www.ccc.govt.nz/homeliving/civildefence/informationondisastershazards/tsunami.aspx)2 In Whitianga, Thames-Coromandel District, several false alarms occurred in 2012 due to accidental triggering by a
cleaner and a flat battery (www.stuff.co.nz/national/7223142/Whitianga-tsunami-siren-gets-unplugged)

146 6. Intended local tsunami evacuation behaviour (Paper 3)
This level of understanding represents a small increase from 5% in 1960 (Lachman, Tatsuoka, and
Bonk, 1961). The complexity of siren systems, requirement for multiple sirens to provide audible
coverage to the entire community at risk (indoors and outdoors, in poor weather conditions includ-
ing high winds and rain which can reduce the audible distance of a siren), and the requirement for
redundancy in the system in case of power failure, result in significant installation and maintenance
costs ranging from tens of thousands to millions of New Zealand Dollars (Leonard, Saunders, and
Johnston, 2007; Leonard et al., 2006).
Hastings District Council (Hawke’s Bay) and Wellington City have mobile sirens, to be driven
in a vehicle around the coastline issuing voice messages in the event of tsunami. Although this
method overcomes the issues of tone-only sirens for distant tsunami, these are not suitable for
local tsunami as they require time to deploy the sirens and personnel to drive into the tsunami
hazard zone to issue the warning. Given the current technological limitations of siren systems for
local tsunami, it is important to understand the general population’s awareness and interpretation
of natural phenomena as warning of tsunami to inform tsunami education, and assumptions of how
people in Napier would respond to a natural tsunami warning and try to improve this response
mode in future.
Evacuation triggered by natural warnings has saved many lives in previous events (McAdoo,
Moore, and Baumwoll, 2009; Yamori, 2013). In some cases, ground shaking has been felt but not
interpreted as a warning of the subsequent tsunami, resulting in delayed or non-evacuation (Greg-
g et al., 2006; Murakami and Kashiwabara, 2011; Yun and Hamada, 2012). The importance of
immediate evacuation is shown in the data from witnesses to the Tohoku 2011 tsunami: 75% of
people who did not evacuate (n = 228) did not survive, whereas 73% of people who evacuated
in less than 20 minutes (n = 461) survived (Yun and Hamada, 2012). A person’s belief that their
current location was safe from tsunami, in part due to previous experience of earthquakes without
subsequent tsunami, was a factor in producing a sense of safety (Yun and Hamada, 2012). Howev-
er, it may also be extremely difficult for people to estimate, based on ground shaking alone, whether
or not the source earthquake is located offshore and is severe enough to pose a tsunami risk. This
is particularly true for long duration, low intensity ‘tsunami earthquakes’ (Kanamori, 1972) which
are capable of causing devastating tsunami with little ground shaking to act as a warning, for ex-
ample Java in 2006 (Reese et al., 2007). Initiation of evacuation in response to ground shaking in
the Canterbury earthquakes was highly dependent on the actions of others rather than demographic
factors or risk perception and hazard knowledge — 76% of people responded in the same way as
neighbours in September 2010 and 98% did during the major aftershocks (Dorfstaetter, 2012). In-
dividuals’ reliance on others’ behaviour was also reported in Japan, with 39.4% of people reported
to have evacuated due to following other people’s direction (Yun and Hamada, 2012).
Significant tsunami inundation has not occurred in New Zealand during recorded history. Con-
sequently, there is little previous experience for coastal populations to draw upon, and previous data
suggests a low evacuation response to natural warnings. Only 7.7% of people in a study of travel

6.3. Evacuation behaviour 147
following an earthquake in Gisborne in 2007 travelled to higher ground to avoid a potential tsuna-
mi (Lamb and Walton, 2011). Following the September 2010 Canterbury earthquake only 21% of
coastal residents evacuated in case of tsunami (Dorfstaetter, 2012). High levels of media coverage
of recent international tsunami events may improve evacuation rates in the future, however, New
Zealand presently largely relies on education to raise tsunami hazard awareness and preparedness
in case of such an event. Tsunami education particularly emphasises the need for immediate evac-
uation in the case of long duration (lasting for a minute or more) or strong earthquakes (hard to
stand up) (MCDEM, 2010a, p. 9, See text box 6.1). The Ministry of Civil Defence and Emergency
Management (MCDEM) message is designed to include the potential for subduction zone events,
tsunami earthquakes and upper plate ruptures — all of which can be tsunamigenic but are likely to
cause a different style and intensity of shaking at a given location:
Textbox 6.1 (MCDEM Evacuation message: Local Source Tsunamis)
Special Consideration — Local Source TsunamisA tsunami generated in conjunction with a nearby large earthquake or undersea landslide maynot provide sufficient time to implement official warning procedures.Persons in coastal areas who:
– experience strong earthquakes (hard to stand up);
– experience weak earthquakes lasting for a minute or more;
– observe strange sea behaviour such as the sea level suddenly rising and falling, or hearthe sea making loud and unusual noises or roaring like a jet engine;
should not wait for an official warning. Instead, let the natural signs be the warning. Theymust take immediate action to evacuate predetermined evacuation zones, or in the absence ofpredetermined evacuation zones, go to high ground or go inland.
6.3.2 The household / family unit
Evacuation behaviour literature has repeatedly cited the importance of the household unit or family
because household members attempt to reunite with, or at least account for, all members before
evacuating together (Drabek, 1996; Lindell and Perry, 1992, 2012; Perry, Lindell, and Greene,
1981). This has been shown to be the case for events with lead-times of several hours to days.
Although there are fewer data for events with a shorter lead-time of less than one hour, there
is anecdotal evidence (Fraser et al., 2012a) and survey data (Yun and Hamada, 2012) from the
2011 Great East Japan tsunami showing that parents travelled to collect children from schools and
some families returned home to collect elderly relatives despite imminent tsunami arrival. Those

148 6. Intended local tsunami evacuation behaviour (Paper 3)
actions resulted in additional deaths as inundation trapped people travelling through unsafe coastal
areas following the earthquake and tsunami warnings. In an experimental investigation of post-
earthquake intentions in New Zealand, Walton and Lamb (2009) found that around half of the
people intending to travel from home or work after an earthquake would travel to reunite with
friends or family. It is anticipated that the same actions could occur in New Zealand during a local
tsunami, and therefore influence evacuation travel mode, routes and time, ultimately influencing
the rate of successful evacuation.
6.3.3 Pre-evacuation actions and departure time
The time at which a person or group begins to evacuate, after receipt of a hazard warning, is
closely associated with reception and understanding of an official, informal or natural warning and
immediate actions taken. This ‘pre-evacuation time’ (Purser, 2010) is the first of the two time
phases in evacuation and has two main behavioural components: recognition, which starts with the
cue or warning and ends with the first response to the alarm; and response, which starts the first
response and ends with person beginning to travel towards an exit or safe location. Response time
can include gathering possessions, helping or warning others, investigating the emergency, and is
affected by key behavioural factors such as alertness, familiarity with surroundings and warnings,
previous experience or training, group interactions, and commitment to on-going activities. Pre-
evacuation time is followed by the travel time, which is the subsequent time taken to reach safety.
The two are additive to produce the overall evacuation time.
The importance of immediate evacuation was highlighted in Section 6.3.1. Yun and Hamada
(2012) reported that the most common pre-evacuation actions taken by people who died in the 2011
Japan tsunami as: helping others (22.4%), finding family or relatives (9.7%) and doing rescue work
(13.9%). Intention surveys in Wellington suggest that over 30% of respondents would evacuate
immediately in case of an earthquake, and 22% would help others (Currie et al., 2014).
The use of stated intentions to estimate approximate evacuation departure times can provide
some insight in the absence of observations of actual evacuation behaviour in real events, but there
is the potential to underestimate departure if we rely on this alone. Mas et al. (2012a) showed that
there was greater correlation between tsunami wave arrival time and actual evacuation departure
time (‘revealed preference’) given in six post-tsunami surveys than there was between ‘stated pref-
erence’ evacuation departure time and a given hypothetical arrival time. To address this issue in
modelling, they implement departure time as a Rayleigh distribution with intended departure time
as a lower bound and tsunami wave arrival as an upper bound. Kang, Lindell, and Prater (2007)
showed that the reliability of people’s estimates of time required to carry out pre-evacuation actions
is determined by the nature of the action, particularly whether it is a usual, repetitive action.

6.3. Evacuation behaviour 149
6.3.4 Travel mode and destination
Travel mode is a key aspect of evacuation planning as it characterises how quickly and at what
density people can travel through a transport network. The evacuation behaviour literature suggests
that private vehicles are the primary travel mode during evacuation (Lindell, 2008; Lindell, Kang,
and Prater, 2011; Perry, Lindell, and Greene, 1981). Lindell (2008) directly relates the proportion
of evacuating households in an area who have access to a private vehicle, to the number of vehicles
involved in an evacuation (for transients this is based on number of hotel rooms, assuming one
vehicle per room). Familiarity with a transport route and expectations of travel time, safety and
convenience influences hurricane evacuation route choice, with evacuees taking the routes that
are most familiar to them (Lindell, Kang, and Prater, 2011). Due to the short lead-time of local
tsunami, traffic congestion in the inundation zone can result in loss of life and the potential for
congestion can be exacerbated by damage and disruption to evacuation routes during the prior
earthquake ground shaking. A study of witness data suggests that 26% of people who died in the
2011 tsunami were caught in traffic jams (Yun and Hamada, 2012).
The assumption that everyone choosing to evacuate will use a vehicle may be appropriate for
long lead-time, long distance evacuations but may not be appropriate in the context of local tsunami
where available travel time and distance are shorter. Having said that, a survey of evacuation
intentions in the Sendai Plains area of Miyagi, Japan, revealed that 80% of those intending to
evacuate inland ahead of a tsunami (n = 215) and 38% of those intending to travel to an evacuation
building (n = 93) would use a car (Suzuki and Imamura, 2005). In 2011, the tsunami warnings
prompted 60% of evacuees to use vehicles in this area, with the level of vehicle use influenced by
high daily use of vehicles (Murakami and Kashiwabara, 2011). Walton and Lamb (2009) reported
that hypothetical travel distance influenced intended travel mode in a survey of post-earthquake
evacuation intentions. The frequency with which people reported intentions to drive a vehicle
increased with increasing distance, and vice versa for intended pedestrian evacuation. Based on
the log-trend of reported frequencies, vehicles were preferred for travelling distances 3.25 km
and over. The distance factor may also contribute to the variation in travel mode according to
destination reported by Suzuki and Imamura (2005).
New Zealand has a high rate of vehicle ownership, which suggests that there is high daily
vehicle use, and therefore there is likely to be a high-use of vehicles during evacuation. This was
borne out by Lamb and Walton (2011) who showed that 95% of trips made immediately following
the 2007 Gisborne earthquake were made by vehicle. Sixty percent of Papamoa residents reported
that their intended evacuation travel mode following a tsunami warning in 2010 had been to drive,
while 25% intended to walk and 8% intended to cycle (Rogers, 2010). Recent education and
media coverage of the 2011 Japan tsunami may have acted to raise awareness of traffic congestion
during tsunami evacuation, therefore reducing the intended levels of vehicle use. A recent survey
in Wellington suggested that over 40% of respondents intend to evacuate on foot (Currie et al.,

150 6. Intended local tsunami evacuation behaviour (Paper 3)
2014). Local topography and urban density are likely factors in the rate of those intending to
walk versus drive as they influence distance to high ground, road layout and network capacity,
local transportation trends and the presence of additional pedestrian-only tracks and trails. For
example, in Hawke’s Bay Region 11% of all journey legs travelled are pedestrian, compared to
18% in Gisborne and 25% in Wellington (Statistics New Zealand, 2013b). In Wellington and
Kapiti urban area 16% of journeys are made by public transport with or without walking, and 11%
are pedestrian journeys (Statistics New Zealand, 2013c). These are higher than the New Zealand
average for urban areas3 (4% and 6%, respectively), therefore, the expectation is that in a daytime
evacuation in Wellington the proportion of the local population having access to a vehicle in the
urban area would be lower than in other areas so a greater proportion would opt to evacuate on
foot.
Recognition that high ground provides safety from tsunami was reported to be very high (90%)
in New Zealand in the 2003 National Coastal Survey (Stewart et al., 2005). We expect that due
to the topography of Napier and the recognition that high ground provides safety, Bluff Hill (as
the closest high ground to the city centre) will be a primary evacuation destination. However, as
already noted in Section 6.3.1 very few people actually went to high ground following the 2007
Gisborne earthquake, so recognition of the appropriate action is not always acted upon.
6.3.5 Transient populations
Transient populations (e.g., tourists, temporary workers), have long been neglected in studies of
evacuation behaviour and warnings (Quarantelli, 1960; Sorensen, Vogt, and Mileti, 1987). This
remains true for vulnerable populations in general, not just transient populations (Drabek, 1994;
Phillips and Morrow, 2007) and has been reported internationally (Becken and Hughey, 2013).
There are complex dynamics in the evacuation of transient populations. The national guidelines
for mass evacuation planning in New Zealand (MCDEM, 2008a) outline some of the perceived
challenges in evacuation of tourists and reasons why they are classified as a vulnerable population,
as: ‘[tourist] numbers are variable and imprecise’; ‘tourists do not know the local area’ ; and ‘they
are likely not to know how to evacuate or where to access help’.
On the other hand, evacuation logistics may be simpler for transient populations than resident
families, as they have fewer possessions or property to protect (Lindell, 2008; Lindell and Prater,
2007). This benefit may be more relevant for slow-onset events rather than rapid-onset events
where there is less focus on property protection than immediate life preservation. Evacuation
intention data from hypothetical tsunami scenarios in Thailand (Charnkol and Tanaboriboon, 2006)
and U.S. hurricane data (Drabek, 1996) suggests that transient populations were likely to evacuate
faster than permanent residents; Charnkol and Tanaboriboon (2006) suggest that this is due to the
3 Includes: Auckland main urban area (MUA), Christchurch MUA, Dunedin MUA, Hamilton Zone, Tauranga MUA
and Wellington (+ Kapiti). Data for Gisborne and Napier are not available at this resolution.

6.4. Survey method 151
reticence of residents to leave their homes.
Direct warning from accommodation staff to guests may expedite the response of visitors
(Drabek, 1996), as occurred in Western Samoa (EEFIT, 2009). This could also apply to con-
firmation of natural warnings in a local tsunami scenario, but this relies on adequate levels of
hazard awareness and prior training of staff, and is likely to be affected by the complex and some-
times conflicted evacuation decision-making of staff (Drabek, 1994). Disparate levels of tsunami
preparedness between residents and visitors were observed in Ocean Shores, Washington, U.S.
(Johnston et al., 2007), and Long Beach, Washington (Johnston et al., 2009) where levels of pre-
paredness and staff training were found to be low despite moderate to high levels of awareness
among residents. There is a concern that a disparity between visitors’ and residents’ awareness
of the tsunami hazard and appropriate response actions could be present in New Zealand coastal
areas. Becker, Paton, and McBride (2013) found that ‘there appears to be little or no outreach when
it comes to educating visitors regarding the risks in Hawke’s Bay Region’ and tourism operators
are not well integrated with Civil Defence and Emergency Management (CDEM) activities in the
Northland Region of New Zealand (Becken and Hughey, 2013).
6.4 Survey method
6.4.1 Aims
The survey was carried out to collect Napier residents’ and visitors’ intended, or ‘stated prefer-
ence’, evacuation behaviour in the context of local tsunami. This data was collected in lieu of
behavioural observations collected during or after a real event, which is the preferred method of
data collection (Lindell and Prater, 2010). ‘Stated preference’ surveys have been used to inform
evacuation assumptions in several recent studies of evacuation behaviour (Mas et al., 2012a; Solıs,
Thomas, and Letson, 2010). Whitehead (2005) demonstrated that intention data have some de-
gree of predictive validity for hurricane evacuation behaviour and Kang, Lindell, and Prater (2007)
demonstrated, for some aspects of behaviour, correlation between expectations and actions actu-
ally taken when an event occurred. There appears to be a greater correlation between intended
and actual evacuation behaviour where there has been prior experience of an event, for behaviour
of a repetitive nature, or for behaviours that are based on a dichotomous choice, i.e., to evacuate
or not to evacuate (Kang, Lindell, and Prater, 2007). Further research is required to strengthen
the validity of this approach, but research to date shows good agreement at the aggregate data level
(proportions citing intended behaviours) (Kang, Lindell, and Prater, 2007), which is the main focus
for this study.
Within our overall aim of enhancing knowledge of tsunami evacuation behaviour in New
Zealand, we explore awareness of the local tsunami hazard and recognition of natural warnings
of tsunami. We establish the range of actions that people intend to take prior to evacuating, in
order to inform modelled pre-evacuation behaviour and calibrate estimates of pre-evacuation time

152 6. Intended local tsunami evacuation behaviour (Paper 3)
for simulation. We investigate intended congregation behaviour of family units to assess the ex-
tent to which this might be observed during a local tsunami in Napier. This can inform education
regarding the dangers of travelling through tsunami hazard zones and facilitate inclusion of such
actions in evacuation simulations and planning initiatives.
We identify preferred travel modes and destinations, hypothesising that these would vary ac-
cording to the location in Napier at which people experience a local earthquake, due to distance
to high ground, proximity of family, and availability of resources. Increased understanding of in-
tended evacuation destinations can inform community engagement and planning for evacuation
routes and emergency response. We include visitors in our survey to investigate comparative levels
of tsunami hazard awareness and differences in intended response actions between residents and
visitors. This represents the first study of visitors’ tsunami evacuation intentions in New Zealand,
and aside from informing evacuation simulations, will help to develop a knowledge base for more
extensive research on this issue. This study does not extend to evacuation behaviour of tourist
industry staff, nor does it investigate interactions between industry staff and guests.
6.4.2 Survey structure
The survey used a combination of closed-response and open-ended questions to capture hazard
awareness and behavioural intention data. Survey questions were piloted by a group of GNS Sci-
ence summer students (Currie et al., 2014) in the Greater Wellington region and tested with a
number of GNS Science staff prior to implementation. The written survey is presented in Section
6.10. Section 6.11 shows a copy of the information sheet that was offered to respondents following
completion of the survey providing further information on the issues raised during the survey.
The survey captured details of the respondent’s status as a resident of Napier, a visitor from the
Hawke’s Bay Region (hereafter, regional visitor), from elsewhere in New Zealand (national visitor)
or from overseas (international visitor) and their recollection of receiving hazards information in
Napier. The key part of the survey was an investigation of respondents’ tsunami hazard awareness,
types of tsunami warning and estimates of arrival times given an official warning or a natural
warning, and intended evacuation behaviour in a local tsunami. To achieve this, two scenarios were
presented — each framed by the experience of long or strong ground shaking, defined as ‘ground
shaking lasting longer than a minute or during which it was hard to stand up’. The first scenario
required that the respondent consider they were undertaking the same activity at the same location
as when the survey was conducted (hereafter, ‘survey location’); the second scenario was for the
respondent being at home (if resident or regional visitor) or at their temporary accommodation in
Napier (if national or international visitor). In each case, respondents were asked to describe their
actions during and after ground shaking. If they failed to mention evacuation, they were prompted
as to whether they would evacuate, and this prompt was noted on the survey. If they stated that they
would not evacuate, the reasons for this were solicited. If evacuation was stated (either prompted or

6.4. Survey method 153
unprompted), we asked how long after the earthquake they would evacuate and what, if anything,
they would do before evacuating. We also asked where they would evacuate to and by what travel
mode.
The survey concluded with an investigation of opinions about using tsunami vertical evacua-
tion buildings. These were open-ended in order to solicit un-prompted responses and act as pilot
questions for later surveys which may focus more closely on this issue. We first asked respondents
to provide all of the types of places they could think they could evacuate to if a tsunami was im-
minent, to see if the concept of evacuation into buildings occurred to them independently. We then
asked how respondents would feel about evacuating into a building in a tsunami, and what might
particularly encourage or discourage them from taking this course of action.
6.4.3 Sampling method
Surveys were conducted by convenience sampling at several locations in Napier from Friday 1st to
Sunday 3rd March 2013 inclusive. Convenience sampling was applied in order to solicit qualitative
responses and data specific to peoples’ actions at the survey locations, which were selected on the
basis of having high levels of day-time foot-traffic. These high-traffic locations are the locations
with high population concentrations during a usual day-time in Napier and are likely to have a
high population exposure during a tsunami occurring in the daytime. As the focus of the survey
was to understand people’s intended actions when in the city at the time of an event, the study
benefited from face-to-face interviewing at the location of interest, rather than providing scenarios
in written form using a postal survey. As a non-probability sample, it is not possible to know the
relationship between our sample and the entire population (Bryman, 2012), therefore this method
precludes extrapolation of data to the entire population and it is not valid to estimate a margin of
error. Despite these limitations, the sample remains useful to gain preliminary understanding of
intended evacuation behaviour, and as a basis to develop a series of subsequent probability-sample
surveys in Napier and elsewhere in New Zealand.
There is a certain amount of self-selection in our sample (the sample only includes those who
frequented the survey locations on the survey days) and systematic exclusion of some sections
of the population who do not frequent the survey locations, for example, due to health or socio-
economic reasons. In order to minimise further bias in the convenience sample we recruited re-
spondents in an unbiased manner by approaching every individual or small group who passed on
the street while we were not actively interviewing a respondent. We did not record the rate of
participation. To ensure our sample was as representative as possible of the people who frequent
the city at different times, we surveyed in several different locations and throughout the day on one
week-day and two weekend days, one of which was a busy market day.
The total number of surveys carried out was 136, comprising 97 residents of Napier Territorial
Authority and 39 visitors (10 regional, 14 national, 15 international). One survey was incomplete

154 6. Intended local tsunami evacuation behaviour (Paper 3)
(only questions 1 to 6 were answered), therefore was used in analysis of hazard awareness, but
excluded from analysis of evacuation intentions. The majority of surveys (78%) were conducted in
the city centre main shopping area on Emerson Street and the surrounding streets. Further surveys
were conducted at Marewa shopping centre (9%), Ahuriri marina (6%) and Westshore Beach (7%)
to investigate intended behavioural responses at different locations (see Figure 6.1).
6.4.4 Study area and demographics
Napier Territorial Authority (hereafter, Napier) is a generally low-elevation coastal area of 106
km2, comprising residential suburbs, commercial and industrial areas and agricultural land includ-
ing orchards and vineyards. Bluff Hill provides an area of high ground immediately north of the
city centre to maximum elevation over 100 m. Napier Port is the fourth largest in New Zealand,
handling cargo including forestry products and container shipments, with storage of timber and
containers on site (Port of Napier Limited, 2012). The estimated population of Napier in 2013
is 57,800 based on medium growth projections from the most recent census in 2006 (Statistics
New Zealand, 2013a). During peak tourist season (January to March), an average of 2,342 visi-
tors stay in Napier accommodation every night (Statistics New Zealand, 2012c, 2006–2011 data).
Numerous accommodation facilities (59), schools (34, plus one tertiary education campus), early
childhood centres (64) and care homes or retirement villages (17) form concentrations of people
who may be less able to evacuate effectively in a local earthquake and tsunami due to mobility
issues or deficiency in local knowledge.
At the eastern shore of the city there is a steep gravel beach and berm stretching along the
coastline south from Bluff Hill, where it is approximately 7 m above Mean Sea Level (MSL) to the
confluence of the Tutaekuri, Ngaruroro and Clive Rivers, where it is 4 m above MSL. Northwest
of Bluff Hill the suburbs of Ahuriri and Westshore are separated by a tidal inlet and small marina.
Westshore is situated on a peninsula elevated 4–6 m above MSL. Bay View is the most northern
suburb of Napier, extending north around the bay. Much of the land around the present Ahuriri
Lagoon was previously below sea level until uplift during the 1931 Hawke’s Bay earthquake and
due to artificial drainage in the years since (Hull, 1986).
The 1931 Hawke’s Bay earthquake destroyed many of the buildings in Napier and triggered
a rebuild in 1930s Art Deco style. The current building stock retains a large number of one- and
two-storey 1930s structures, which are an important factor in the city’s tourism activities. Ninety-
five percent of the building stock in Napier is one or two storeys in height (Fig 6.2). Ninety-two
percent of structures are of light timber construction, 3% are reinforced concrete shear wall and
3% are concrete masonry (Cousins, 2009; King and Bell, 2009; King et al., 2008). The remainder
are Brick Masonry, Light Industrial, Reinforced Concrete Moment Resisting Frame, Steel Braced
Frame, Steel Moment Resisting Frame, or Tilt-up Panel construction. The small number of tall
buildings in Napier has implications for tsunami evacuation. The suburban building stock primarily

6.4. Survey method 155
Fig
.6
.1:
A)
Lo
cati
on
of
Haw
ke’
sB
ayo
na
nat
ion
alsc
ale;
B)
Lo
cati
on
of
Nap
ier
Ter
rito
rial
Au
tho
rity
inth
eco
nte
xt
of
Haw
ke’
sB
ay;
C)
Nap
ier
Ter
rito
rial
Au
tho
rity
bo
un
dar
yover
lain
on
aD
igit
alE
levat
ion
Mo
del
(DE
M)
toil
lust
rate
loca
lto
po
gra
ph
y;
D)
Map
of
surv
eylo
cati
on
san
dev
acu
atio
n
des
tin
atio
ns
over
lain
on
the
DE
Man
dro
adn
etw
ork
.B
asem
apso
urc
es:
GE
BC
O,N
OA
A,N
atio
nal
Geo
gra
ph
ic,D
eLo
rme,
and
Esr
i;O
pen
Str
eetM
ap
and
con
trib
uto
rs,
Cre
ativ
eC
om
mo
ns-
Sh
are
Ali
ke
Lic
ense
(CC
-BY
-SA
).

156 6. Intended local tsunami evacuation behaviour (Paper 3)
comprises single-storey family homes or small commercial premises and the only concentration of
taller buildings occurs in the primary retail, tourist and civic area of Nelson Park.
Fig. 6.2: Heights of buildings in Napier, assuming that one storey is approximately 3 m in height. Data
source: Napier City Council.
We compared the demographics of the resident portion of our sample (71%; Table 6.1) with
that of the estimated 2013 population in Napier. We present the demographics of visitors (29%)
but available visitor statistics do not allow comparison to assess sample bias. Our sample repre-
sents age distribution of the population of Napier very well (Table 6.2), slightly over-represents
females (Table 6.3) and slightly under represents Maori but otherwise represents ethnicity relative-
ly well (Table 6.4). Highest level of education (Table 6.5) significantly under-represents people
with no qualification or a trade qualification and over-represents those with school, undergraduate
or postgraduate qualifications. Neither Territorial Authority nor regional census data is available
for comparison of household income (Table 6.6) and length of time living in Napier (Table 6.7).
6.4.5 Data analysis
We apply a thematic analysis approach to analyse survey responses at a semantic level (Braun and
Clarke, 2006), in that we focus on coding and reporting the explicit meaning of responses to devel-
op knowledge of evacuation intentions, without interpreting social or psychological influences on
those responses. Data were coded manually and analysed using IBM SPSS Statistics version 20.
Our coding is theoretically driven, shaped by previous findings in the evacuation behaviour litera-

6.4. Survey method 157
Tab. 6.1: Residential status of respondents. Residents are classed as those living in Napier Territorial Au-
thority. Visitors are separated into those from Hawke’s Bay, those from the rest of New Zealand
and those from overseas. Percent values may not sum to 100% due to rounding.
Residential status Total (n = 136)
Resident: Napier Territorial Authority 71%
Regional visitor 7%
National visitor 10%
International visitor 11%
Tab. 6.2: Distribution of age group in the survey sample and the Subnational Population Estimates:
At 30 June 2012 (SNPE; http://www.stats.govt.nz/browse for stats/population/estimates and
projections/). Age group shows 16–39, while the SPE original data showed 15–39. SNPE data
for ages <15 are omitted from the total. Percent values may not sum to 100% due to rounding.
Broad Age
Group
Survey
residents (n =
97)
Survey visitors
(n = 39)
Survey total (n= 136)
Napier
subnational
population
estimates (n =
46,100)
16–39* 35% 28% 33% 36%
40–64 44% 46% 45% 41%
65 and over 19% 18% 18% 22%
Not provided 2% 8% 4% n/a
Tab. 6.3: Distribution of gender within the survey sample and the 2006 census data for Napier City, exclud-
ing people under the age of 15.
Source: http://www.stats.govt.nz/Census/about-2006-census/regional-summary-tables.aspx. Per-
cent values may not sum to 100% due to rounding.
GenderResident (n =
97)Visitor (n = 39) Total (n = 136)
Napier 2006
census (n =
43,650)
Male 42% 59% 47% 42%
Female 58% 39% 52% 58%
Not Provided 0% 3% 1% 0%

158 6. Intended local tsunami evacuation behaviour (Paper 3)
Tab. 6.4: Distribution of ethnicity within the survey sample and the 2006 census data for Napier City. *For
the census, people stating multiple ethnic groups are included in as many groups as they list,
so one person listing their ethnic group as European and Maori is counted once in each of the
separate groups. All ages are included in the census totals as the data does not allow exclusion of
people under the age of 16. Source: http://www.stats.govt.nz/Census/about-2006-census/regional-
summary-tables.aspx. Percent values may not sum to 100% due to rounding.
EthnicityResident (n =
97)Visitor n = 39) Total (n = 136)
Napier 2006
census (n =
53,970)
European / NZ
European /
Pakeha
71% 85% 75% 72%
Maori 11% 5% 10% 18%
New Zealander 7% 3% 6% 14%
Asian 2% 5% 3% 3%
European and
Maori3% 0% 2% n/a *
Pacific Islands 1% 0% 1% 3%
Latin
American1% 0% 1% 0%
Other 1% 0% 1% 0%
Not Provided 2% 3% 2% n/a
Tab. 6.5: Distribution of highest level of education within the survey sample. *Trade qualification includes
Level 1, 2, 3, 4, Certificates gained post-school; Undergraduate includes Level 5 and 6 Diplomas,
Bachelor degree and Level 7 qualifications. Source: http://www.stats.govt.nz/Census/about-2006-
census/regional-summary-tables.aspx. Percent values may not sum to 100% due to rounding.
Highest Level
of Education
Resident (n =
97)Visitor (n = 39) Total (n = 136)
Napier 2006
census (n =
43,647)*
None 0% 3% 1% 27%
School 39% 36% 38% 30%
Trade
Qualification10% 5% 9% 15%
Undergraduate 34% 36% 35% 16%
Postgraduate 9% 13% 10% 2%
Other 2% 0% 2% 0%
Not Provided 5% 8% 6% 10%

6.4. Survey method 159
Tab. 6.6: Distribution of household income within the survey sample. Household income statistics are not
available at the Territorial Authority or regional level for the 2006 census or more recently. Percent
values may not sum to 100% due to rounding.
Household Income
(banded)Resident (n = 97) Visitor (n = 39) Total (n = 136)
Benefit 2% 0% 2%
Under $20,000 10% 13% 11%
$20,001–$30,000 7% 8% 7%
$30,001–$50,000 12% 3% 10%
$50,001–$70,000 21% 13% 18%
$70,001–$100,000 9% 10% 10%
Over $100,001 13% 28% 18%
Not Provided 25% 26% 25%
Tab. 6.7: Length of time residents have lived in Napier. Percent values may not sum to 100% due to round-
ing.
Length of residence in Napier Total (n = 97)
Less than 1 year 10%
1 to 5 years 21%
6 to 10 years 10%
11 to 20 years 20%
21 to 30 years 16%
31 to 40 years 8%
Greater than 40 years 16%

160 6. Intended local tsunami evacuation behaviour (Paper 3)
ture, which formed expectations of intended behaviour and informed the development of research
and survey questions. Due to the relatively short responses to each open-ended question we as-
signed codes using the full response rather than an excerpt of the response. We coded responses to
each open-ended question into common themes before reviewing, refining and editing the themes.
In many cases, a response was coded into several themes. Initially, some themes comprised a single
response but after reviewing the themes, these were grouped under ‘Other’. Responses grouped
under ‘Other’ are reported in our results.
We conducted frequency analysis to determine the most commonly reported intentions and
cross-tabulation to assess the correlation of evacuation intentions with demographic variables. S-
tatistical analysis and correlation with demographics have been conducted where the sample size
was sufficient. Analysis of survey responses primarily focussed on the respondents’ gender and
status as resident or visitor. Due to low numbers of respondents of non-European ethnicity, the
influence of ethnicity has not been analysed. Several demographic variables have been grouped
to facilitate analysis of those demographics. These are: Household income (grouped to: under
$30,000, $30,001–$70,000, $70,001–$100,000, >$100,001); Education (School and trade qualifi-
cation, undergraduate and postgraduate); Length of residence (<5 years, 6 to 20 years, 21 to 40
years, >40 years).
6.5 Results and discussion
6.5.1 Hazards information in Napier
Receipt of hazards information in Napier
Public education is a key component of raising awareness of natural hazards, encouraging house-
hold preparation and increasing community resilience. Various channels of information are used,
from information in telephone books and newspapers, community meetings, online and social me-
dia campaigns, and the MCDEM ShakeOut national earthquake exercise. We asked a series of
questions designed to investigate the level to which residents of Napier and visitors to Napier re-
call previously receiving information about natural hazards in Napier. We also enquired as to the
source and format of that information in order to provide feedback to authorities about which types
of information are most commonly received and recalled.
The majority (71%) of the total number of residents in our sample (n = 97) recalled previously
receiving information about natural hazards. This represents good progress since the 2003 Nation-
al Coastal Survey, in which only 30% reported having seen tsunami information (Stewart et al.,
2005). There was no gender influence on receipt of information. Amongst visitors, the propor-
tion of respondents who recalled receiving information was lower (60% for regional visitors, 50%
for national visitors and 47% for international visitors). The difference in receipt of information
between residents and visitors (combined) is statistically significant (p=0.04 at 95% confidence

6.5. Results and discussion 161
interval) using the Fisher Exact test with Freeman-Halton extension, and confirms that visitors are
likely to receive less local hazard information than residents. The visitor sub-samples are too small
to analyse according to visitors’ origin.
There did not appear to be a strong correlation between residents’ receipt of information and
residents’ age or highest level of education. There was some correlation between length of resi-
dency and information receipt, and household income and information receipt. Fifty-three percent
of people resident for five or fewer years recall receiving hazards information; 80% for 6–10 years,
21–30 years and >40 years, 68% for 11–20 years; and 100% for 31–40 years. Sixty percent and
55% of residents in household income categories $50,001–$70,000 and $70,001–$100,000 report-
ed having received information, but for all other categories (three lower, one higher) this proportion
is 75% to 86%. Further analysis of receipt of information among residents revealed no statistical
relationship between receipt of information and age (Fisher Exact Test at 5% significance and 95%
confidence interval: p=0.078), gender (p=0.553), length of residence in Napier (p=0.084), highest
level of education (p=0.420), household income (p=0.873) or ethnic group (p=0.304).
Source of hazard information
The most-quoted source of hazards information among residents who recalled receiving informa-
tion (n = 69) was ‘Civil Defence’ (32%), ‘Council’ (19%) and ‘Radio, TV or media’ (15%). Other
sources quoted were: ‘newspapers’ (n = 3), ‘work’ (2), ‘school’ (2), ‘siren tests or previous warn-
ings’ (2), ‘New Zealand Earthquake Commission (EQC)’ (2), ‘New Zealand ShakeOut’4 (1), and
‘information at the museum or aquarium’ (2). Few visitors who recalled receiving information (n
= 20) were able to elaborate on the source of any previous information they had received, however,
two regional visitors recalled the source as ‘Civil Defence’, one international and one national vis-
itor quoted ‘guidebooks’ and one international visitor received information on their ‘cruise ship’.
Further clarity on the source of information was provided when we asked the question ‘how
was the information provided’. There appears to have been some confusion in these questions be-
tween the use of ‘source’ (intended to mean ‘who provided the information’), and ‘how’ (intended
to mean ‘the format of information received’), which will be revised in further surveys. Of those
residents who recalled receiving information (n = 69), the most common format was ‘TV/Radio’
(45%), ‘newspaper’ (32%), ‘brochures or leaflets’ (17%), through ‘work or school’ (16%) and
‘mail-drop’ (10%). Other formats reported by residents include: ‘informal or conversational’ (n
= 6), ‘telephone book’ (5), ‘siren test or previous warnings’ (4), ‘tourist industry’ including her-
itage signs and publicity of the 1931 earthquake through Art Deco Week5 (4), ‘council website’
4 New Zealand ShakeOut was the first nationwide earthquake drill to take place in any country. The first NZ ShakeOut
took place on 26 September 2012, organised by MCDEM and preceded by a national public information campaign to
encourage individuals, organisations and communities to participate (http://www.shakeout.govt.nz/)5 Art Deco Week takes place in Napier annually in February to celebrate the Art Deco architecture of Napier — a
result of rebuilding after the 1931 earthquake (http://www.artdeconapier.com/)
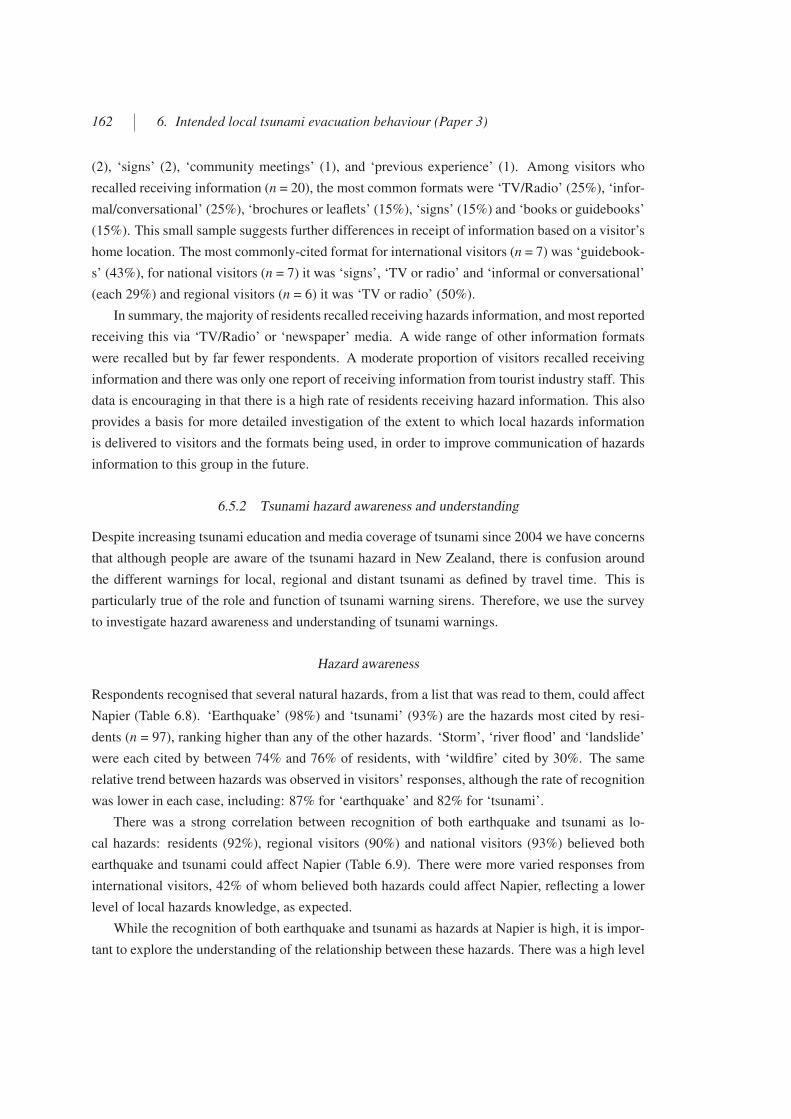
162 6. Intended local tsunami evacuation behaviour (Paper 3)
(2), ‘signs’ (2), ‘community meetings’ (1), and ‘previous experience’ (1). Among visitors who
recalled receiving information (n = 20), the most common formats were ‘TV/Radio’ (25%), ‘infor-
mal/conversational’ (25%), ‘brochures or leaflets’ (15%), ‘signs’ (15%) and ‘books or guidebooks’
(15%). This small sample suggests further differences in receipt of information based on a visitor’s
home location. The most commonly-cited format for international visitors (n = 7) was ‘guidebook-
s’ (43%), for national visitors (n = 7) it was ‘signs’, ‘TV or radio’ and ‘informal or conversational’
(each 29%) and regional visitors (n = 6) it was ‘TV or radio’ (50%).
In summary, the majority of residents recalled receiving hazards information, and most reported
receiving this via ‘TV/Radio’ or ‘newspaper’ media. A wide range of other information formats
were recalled but by far fewer respondents. A moderate proportion of visitors recalled receiving
information and there was only one report of receiving information from tourist industry staff. This
data is encouraging in that there is a high rate of residents receiving hazard information. This also
provides a basis for more detailed investigation of the extent to which local hazards information
is delivered to visitors and the formats being used, in order to improve communication of hazards
information to this group in the future.
6.5.2 Tsunami hazard awareness and understanding
Despite increasing tsunami education and media coverage of tsunami since 2004 we have concerns
that although people are aware of the tsunami hazard in New Zealand, there is confusion around
the different warnings for local, regional and distant tsunami as defined by travel time. This is
particularly true of the role and function of tsunami warning sirens. Therefore, we use the survey
to investigate hazard awareness and understanding of tsunami warnings.
Hazard awareness
Respondents recognised that several natural hazards, from a list that was read to them, could affect
Napier (Table 6.8). ‘Earthquake’ (98%) and ‘tsunami’ (93%) are the hazards most cited by resi-
dents (n = 97), ranking higher than any of the other hazards. ‘Storm’, ‘river flood’ and ‘landslide’
were each cited by between 74% and 76% of residents, with ‘wildfire’ cited by 30%. The same
relative trend between hazards was observed in visitors’ responses, although the rate of recognition
was lower in each case, including: 87% for ‘earthquake’ and 82% for ‘tsunami’.
There was a strong correlation between recognition of both earthquake and tsunami as lo-
cal hazards: residents (92%), regional visitors (90%) and national visitors (93%) believed both
earthquake and tsunami could affect Napier (Table 6.9). There were more varied responses from
international visitors, 42% of whom believed both hazards could affect Napier, reflecting a lower
level of local hazards knowledge, as expected.
While the recognition of both earthquake and tsunami as hazards at Napier is high, it is impor-
tant to explore the understanding of the relationship between these hazards. There was a high level

6.5. Results and discussion 163
Tab. 6.8: Percentage of respondents who believed each hazard has the potential to cause damage or casualties
at Napier.
Status Earthquake Tsunami Landslide Storm Flood WildfireDon’t
know
Resident
(n = 97)98% 93% 75% 74% 76% 30% 0%
Visitor (n= 39)
87% 82% 51% 51% 41% 23% 3%
Total (n =
136)95% 90% 68% 68% 66% 28% 1%
Tab. 6.9: Cross-tabulation of the percentage of residents and visitors who regard earthquake and tsunami as
hazards in Napier. The table captures presents belief in neither hazard, both hazards, or one hazard
but not the other affecting Napier.
Status EarthquakeTsunami
Yes No
Residents (n = 97)Yes 92% 6%
No 1% 1%
Regional Visitors (n = 10)Yes 90% 10%
No 0% 0%
National Visitors (n = 14)Yes 93% 0%
No 7% 0%
International Visitors (n = 15)Yes 47% 27%
No 13% 13%
of recognition that tsunami is possible after experiencing ground shaking in Napier (Table 6.10).
Eighty-eight percent of residents, 95% of regional and national visitors (combined) and 57% of
international visitors said that a tsunami would be possible after ground shaking. Residents’ re-
sponses displayed some difference between males and females, with 95% of females but only 78%
of males believing that a tsunami is possible after ground shaking. The reason for this disparity has
not been explored as it requires a larger sample to allow cross-tabulation across all demographics.
These results suggest that people are aware of the potential for tsunami following a local earth-
quake. However, results of open-ended questions discussed in the following section show that this
does not necessarily translate into understanding that the earthquake is a warning of tsunami.
Understanding of tsunami warnings

164 6. Intended local tsunami evacuation behaviour (Paper 3)
Tab. 6.10: Respondents’ opinions on whether a tsunami might be possible after long or strong ground shak-
ing at Napier.
Status Gender Yes No Don’t Know
Resident
Male (n = 41) 78% 20% 2%
Female (n = 56) 95% 4% 2%
Total (n = 97) 88% 10% 2%
Visitor
Male (n = 22) 82% 5% 14%
Female (n = 14) 79% 14% 7%
Total (n = 36) 81% 8% 11%
Total (n = 133) 86% 10% 5%
Respondents were asked to provide responses to the open-ended question ‘What would warn
you of a potential tsunami in Napier?’ and were prompted to provide as many responses as possi-
ble. Contrary to the well-recognised link between earthquake and tsunami in the previous section,
the percentage of respondents considering ‘earthquake’ (17%) as warning of tsunami is low in
comparison to the percentage of respondents citing ‘sirens’ (67%) and/or ‘TV or radio’ (65%) as a
potential tsunami warning (Table 6.11). This is also true of ‘tidal changes or seeing waves’ (13%)
and there was no mention of unusual sounds from the sea. Fourteen percent of respondents cited
‘public reaction’ or ‘hearing by word of mouth from family or friends’, while 13% would expect
a warning via ‘social media’ or ‘cell-phone’ alerts. A greater proportion of visitors cited natural
warnings than residents (’earthquake’: 23% and 14% respectively; ‘tidal changes or seeing waves’:
15% and 11%) with little variation due to visitors’ home location. Other responses included hearing
from ‘school’, being ‘contacted by work’ and ‘seeing ships moving out of port into deep water’.
These results reaffirm our concern that many people expect to rely on tsunami sirens as a
warning rather than reacting to natural warnings and that there is a disconnect between people’s
high level of hazard knowledge and their warning expectations. Our findings replicate those of
an earlier survey of New Zealand coastal communities following the Chile 2010 tsunami (GNS
Science unpublished data)6, which indicated that:
• Although 60–70% of respondents believed that in a local tsunami, ground shaking or sea
level drawdown or unusual waves would occur, 57% believed that a siren warning is likely
to be given for a local tsunami.
• A siren warning for local tsunami was rated more likely than for regional or distant events,
indicating confusion between technological warning capabilities for different types of tsuna-
6 These unpublished data refers to survey data which, at the time of writing is under analysis. These data will
be published as a GNS Science report in due course. The data can be obtained from [email protected] or
[email protected]. Unless otherwise indicated by a footnote, further references to unpublished data in this chapter
refer to the same data.

6.5. Results and discussion 165
Tab. 6.11: Percentage of respondents citing potential information sources of tsunami warning. Respondents
were requested to name as many formats as possible.
Information FormatResidents (n =
97)
Visitor (n =
39)
Total (n =
136)
Siren 67% 67% 67%
TV / Radio / News 73% 46% 65%
Earthquake 14% 23% 17%
Public reaction / word of mouth /
family / friends12% 18% 14%
Alert (incl. Text / social media /online) 14% 8% 13%
Tidal change / see waves 11% 15% 13%
Civil Defence / council 11% 3% 9%
Other 7% 10% 8%
Emergency Services 3% 8% 4%
Animal response 3% 0% 2%
Don’t know 1% 5% 2%
No response 1% 5% 2%
Other person in authority 0% 5% 1%
mi.
• Sirens were the most-requested improvement to current warning and evacuation procedures,
which supports anecdotal evidence from emergency managers that sirens are seen as the
most important solution by their communities.
During recent surveys in Wellington most respondents reported an expectation that sirens
would provide a tsunami warning but also reported confusion over the signal and efficacy of such
a system (Currie et al., 2014).
Perceived tsunami arrival times
To investigate the perception of potential tsunami arrival times with respect to receipt of an offi-
cial warning and occurrence of a natural warning, we asked respondents which time frames they
thought might apply in each situation. Responses in both cases were skewed towards arrival times
of less than one hour (Table 6.12). Encouragingly, among residents who believe a tsunami could
be possible after ground shaking (n = 85), the most common anticipated time frames for the case
of a natural warning were ‘less than 10 minutes’ (24%), ‘10–30 minutes’ (28%) and ‘30–60 min-

166 6. Intended local tsunami evacuation behaviour (Paper 3)
utes’ (20%). Only 6% of residents believed that following a local earthquake, a tsunami could take
between ‘1–3 hours’ to arrive, and no residents thought it would take ‘longer than 3 hours’. These
data support 2010 survey results, which found that 57% of people in Napier believe that a tsunami
could arrive within 30 minutes if ground shaking was felt at the beach (GNS Science unpublished
data). Previously, the 2003 National Coastal Survey revealed that 45% of respondents believed a
tsunami could follow ground shaking within 30 minutes (Stewart et al., 2005) so this finding is rel-
atively consistent over the last ten years. Simulations of local tsunami at Napier show that tsunami
arrival can occur in as little as 27 minutes after rupture (Fraser et al., 2014), so residents’ estimates
of arrival time after a natural warning were reasonably accurate. There is a more diverse range
of anticipated timeframes from visitors (n = 30), with 7% anticipating arrival after ‘3–10 hours’,
but the most-anticipated timeframe is ‘less than 10 minutes’ (38%), which would likely encourage
immediate evacuation.
In the case of receiving an official warning (Table 6.13), the most common anticipated time-
frames were ‘10–30 minutes’ (19% of all respondents) and ‘30–60 minutes’ (20%). Ten percent
of respondents cited arrival time of ‘3–10 hours’ and 10% cited ‘greater than 10 hours’. The dis-
tribution of responses was similar between residents and regional visitors. A greater proportion of
national visitors tended to underestimate arrival time after an official warning (36% — ‘less than
10 minutes’; 29% — ‘10–30 minutes’; 36% — ‘30–60 minutes’). To some extent this was also true
of international visitors (21% — ‘10–30 minutes’; 29% — ‘30–60 minutes’). These results show
some recognition that there would be a longer interval between an official warning and subsequent
tsunami than there would be between a natural warning and tsunami but there is an underestimation
of the likely time available between an official warning and tsunami arrival. It is encouraging that
responses err on the shorter end of the scale as it is possible, particularly in the case of regional
tsunami, that an official warning could precede a tsunami by timeframes on the order of minutes
rather than hours.
A substantial portion of respondents replied ‘don’t know’ or could not specify a time period
(23% for official warning and 18% for natural warning). Additional comments from respondents
reveal that this was due to an appreciation that arrival time depends on earthquake location. How-
ever, this also reveals that those respondents did not relate the type of warning to the general
earthquake location and therefore make an inference of arrival time on that basis.
6.5.3 Evacuation intentions in a local tsunami
In order to investigate evacuation intentions in a local tsunami scenario, respondents were asked a
series of questions relating to their intended actions during and after a local earthquake. To assess
the influence of location on intended actions, this set of questions was asked first in the context of
them being at the survey location, and then for a situation in which they were at home.

6.5. Results and discussion 167
Tab. 6.12: Percentage of respondents who anticipate tsunami arrival in each timeframe following a natural
warning. Respondents were requested to select all categories that they believed to be applicable
— percentage reflects the ‘Yes’ responses in each timeframe as a percentage of the status group.
Only respondents who answered ‘Yes’ to the previous question (Do you believe that a tsunami
may be possible after long or strong ground shaking?) were asked to provide estimates of arrival
time.
Status<10
min
10-30
min
30 min-
1hr1–3 hrs
3–10
hrs
>10
hrs
Don’t
Know
Resident (n = 85) 24% 28% 20% 6% 0% 0% 18%
Regional visitor (n= 10)
30% 30% 0% 10% 0% 0% 20%
National visitor (n= 12)
58% 17% 33% 8% 0% 0% 8%
International
visitor (n = 8)25% 0% 0% 25% 25% 0% 25%
Total (n = 115) 27% 25% 18% 8% 2% 0% 18%
Tab. 6.13: Percentage of respondents who anticipate tsunami arrival in each timeframe following an official
warning. Respondents were requested to select all categories that they believed to be applicable
— percentage reflects the ‘Yes’ responses in each timeframe as a percentage of the status group.
Status<10
min
10–30
min
30 min-
1hr1–3 hrs
3–10
hrs
>10
hrs
Don’t
Know
Resident (n = 97) 11% 20% 18% 14% 10% 9% 23%
Regional visitor (n= 10)
10% 0% 10% 10% 10% 0% 40%
National visitor (n= 14)
36% 29% 36% 21% 21% 14% 14%
International
visitor (n = 14)7% 21% 29% 7% 0% 14% 21%
Total (n = 135) 13% 19% 20% 14% 10% 10% 23%

168 6. Intended local tsunami evacuation behaviour (Paper 3)
Intention to evacuate or not evacuate
The first question, ‘What would you do after an earthquake that lasted for more than a minute or
during which it was hard to stand up?’ was designed to investigate whether or not tsunami was one
of the respondents’ immediate concerns during an earthquake and what they might do in relation to
that concern. This question solicited open-ended responses, and if respondents made no mention
of evacuation (or non-evacuation) after being prompted for as many action intentions as they could
think of, a prompt (‘Would you evacuate?’) was given. For the case of evacuation from the survey
location, 64% of residents and 57% of visitors required prompting before mentioning evacuation.
When given the situation of evacuation from home, the majority again required prompting (66%
of residents, 55% of visitors). This demonstrates that when provided a scenario of ground shaking,
the majority of respondents do not consider the tsunami risk but focus solely on response to the
earthquake, suggesting that there might be a low rate of evacuation to high ground.
After prompting, the majority of respondents (residents: 85%; regional visitors: 100%; na-
tional visitors: 92%; and international visitors: 67%) reported their intention to evacuate from the
survey location (Table 6.14). The proportion of female residents intending to evacuate the survey
location was higher (89%) than that of male residents (78%) and among visitors there is less d-
ifference (female: 87% versus male: 83%). A smaller proportion intends to evacuate the home
(residents: 57%; regional visitors: 20%; national visitors: 69%; international visitors: 67%). The
low proportion for regional visitors reflects the fact that most of these respondents’ homes are fur-
ther inland than Napier therefore perceived to be safe from tsunami. Male residents are more likely
to evacuate the home (63%) than female residents (52%) but among visitors, females are more
likely to evacuate the home or accommodation (60%) than males (52%). The influence of location
on intention to evacuate demonstrates the existence of a spatial dimension (both topographic ele-
vation and distance to coast) in rate of evacuation in addition to the temporal influence of whether
people are awake or asleep, or facing the prospect of night-time evacuation when a natural warning
occurs.
Given the similar proportions of residents and visitors intending to evacuate, we look at the
impact of further demographics on the total sample. As age increases there is a lower intention
to evacuate the survey location. In each of four age categories covering the range 16–34, over
91% of respondents would evacuate the survey location. In each of five categories between age
40 and 64, the percentage intending to evacuate is between 80% and 93%. For the age group 65
and over, the percentage intending to evacuate is lower, at 68%. The percentage of respondents
who intend to evacuate the home or temporary accommodation is more variable: 62–88% for ages
16–34, 36–77% for ages 40–64 and 48% for age 65 and over.
There is little variation in intention to evacuate with respect to household income category
except for lower intention to evacuate in one middle-income category. In all categories 90–93%
report an intention to evacuate, except for those with a household income of $30,001–$50,000,
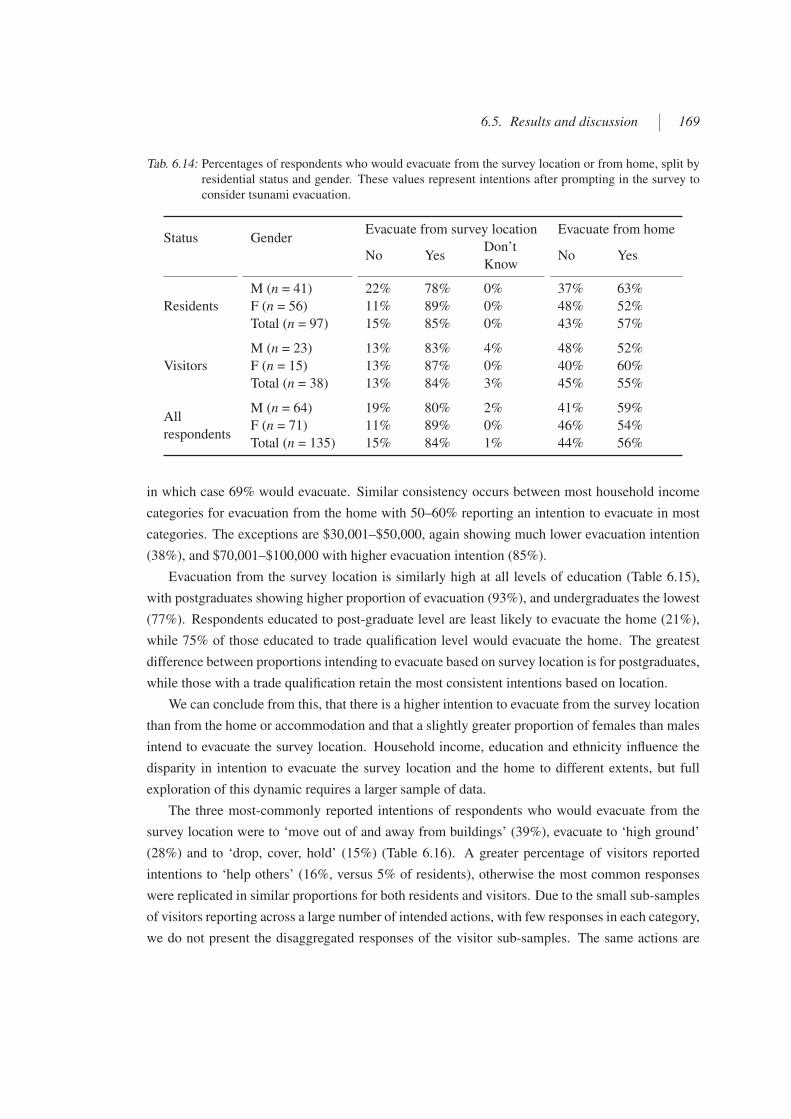
6.5. Results and discussion 169
Tab. 6.14: Percentages of respondents who would evacuate from the survey location or from home, split by
residential status and gender. These values represent intentions after prompting in the survey to
consider tsunami evacuation.
Status GenderEvacuate from survey location Evacuate from home
No YesDon’t
KnowNo Yes
Residents
M (n = 41) 22% 78% 0% 37% 63%
F (n = 56) 11% 89% 0% 48% 52%
Total (n = 97) 15% 85% 0% 43% 57%
Visitors
M (n = 23) 13% 83% 4% 48% 52%
F (n = 15) 13% 87% 0% 40% 60%
Total (n = 38) 13% 84% 3% 45% 55%
All
respondents
M (n = 64) 19% 80% 2% 41% 59%
F (n = 71) 11% 89% 0% 46% 54%
Total (n = 135) 15% 84% 1% 44% 56%
in which case 69% would evacuate. Similar consistency occurs between most household income
categories for evacuation from the home with 50–60% reporting an intention to evacuate in most
categories. The exceptions are $30,001–$50,000, again showing much lower evacuation intention
(38%), and $70,001–$100,000 with higher evacuation intention (85%).
Evacuation from the survey location is similarly high at all levels of education (Table 6.15),
with postgraduates showing higher proportion of evacuation (93%), and undergraduates the lowest
(77%). Respondents educated to post-graduate level are least likely to evacuate the home (21%),
while 75% of those educated to trade qualification level would evacuate the home. The greatest
difference between proportions intending to evacuate based on survey location is for postgraduates,
while those with a trade qualification retain the most consistent intentions based on location.
We can conclude from this, that there is a higher intention to evacuate from the survey location
than from the home or accommodation and that a slightly greater proportion of females than males
intend to evacuate the survey location. Household income, education and ethnicity influence the
disparity in intention to evacuate the survey location and the home to different extents, but full
exploration of this dynamic requires a larger sample of data.
The three most-commonly reported intentions of respondents who would evacuate from the
survey location were to ‘move out of and away from buildings’ (39%), evacuate to ‘high ground’
(28%) and to ‘drop, cover, hold’ (15%) (Table 6.16). A greater percentage of visitors reported
intentions to ‘help others’ (16%, versus 5% of residents), otherwise the most common responses
were replicated in similar proportions for both residents and visitors. Due to the small sub-samples
of visitors reporting across a large number of intended actions, with few responses in each category,
we do not present the disaggregated responses of the visitor sub-samples. The same actions are

170 6. Intended local tsunami evacuation behaviour (Paper 3)
Tab. 6.15: Influence of level of education on intention to evacuate from the survey location and from the
home. Percentage values refer to the number of respondents quoting each theme.
Level of EducationEvacuate from survey location Evacuate from home
No YesDon’t
KnowNo Yes
School (n = 52) 12% 88% 0% 37% 63%
Trade (n = 12) 17% 83% 0% 25% 75%
U/graduate (n = 47) 23% 77% 0% 45% 55%
P/graduate (n = 14) 7% 93% 0% 79% 21%
Not Provided (n = 7) 0% 86% 14% 43% 57%
None (n = 1) 0% 100% 0% 100% 0%
Other (n = 2) 0% 100% 0% 50% 50%
Total (n = 135) 15% 84% 1% 44% 56%
predominant among those respondents who intend to evacuate from home or accommodation (n =
76; Table 6.16), although there is a greater influence of gender on some of these actions: ‘move out
of or away from the building’ (32% of males, 45% of females), ‘drop, cover and hold or equivalent’
(18%, 37%), ‘shelter in a doorway’ (18%, 16%) and / or evacuate to ‘high ground’ (18%, 13%).
Eleven percent of people would ‘seek further information’ and 15% would ‘contact friends or
family’. No visitors discussed intentions to seek guidance from accommodation staff. Intention to
‘evacuate inland’ was reported less frequently than evacuation to high ground — only 3% would
evacuate inland from home and only 10% from the survey location.
The high response rate for moving away from buildings at the survey location is likely due
to the fact that the majority of surveys were conducted in the main shopping streets of Napier,
where shops are primarily two-storey with awnings, thus prompting respondents to consider the
danger of building damage and falling debris. In referring to building collapse and falling debris,
several respondents quoted either direct experience or media coverage of damage due to the 2010–
2011 Christchurch earthquake sequence. These data suggest that response to ground shaking is
focussed primarily on earthquake hazard rather than tsunami hazard and is highly dependent on
evacuee location at the time of ground shaking. This is particularly important for the percentage
of respondents intending to evacuate to high ground. Less than one-third of people who are in the
city, for example, shopping or working, are likely to evacuate to high ground upon experiencing
ground shaking. This percentage drops to less than one-fifth for those who are at home in that
situation. The predominant destination would be to areas of high ground, rather than inland.
Of those people not evacuating the home (n = 59), the most common intended actions are to
‘drop, cover, hold’ (41%) or ‘shelter in a doorway’ (24%) and ‘seek further information’ or ‘contact

6.5. Results and discussion 171
Tab. 6.16: Percentage of respondents citing intended evacuation actions at the survey location and the home.
Action themes are sorted (descending order) by percentage citing the action at the survey location.
Intended actionAt survey location At home
Resident
(n = 82)
Visitor (n= 32)
Total (n= 114)
Resident
(n = 55)
Visitor (n= 21)
Total (n= 76)
Out of or away from
buildings to open space37% 44% 39% 33% 52% 38%
Evacuate to high ground 29% 25% 28% 16% 14% 16%
Drop, cover, hold (or
variation)15% 16% 15% 29% 24% 28%
Evacuate inland 9% 13% 10% 4% 0% 3%
Evacuate (unspecified
destination)7% 9% 8% 7% 0% 5%
Help others 5% 16% 8% 0% 5% 1%
Get emergency supplies /
kit7% 3% 6% 5% 0% 4%
Wait until safe or shaking
has stopped5% 3% 4% 2% 14% 5%
Other 6% 0% 4% 4% 10% 5%
Shelter in doorway 2% 3% 3% 20% 10% 17%
Check on / contact loved
ones4% 0% 3% 15% 0% 11%
Panic 2% 3% 3% 0% 0% 0%
Go home 2% 0% 2% 0% 0% 0%
Seek information 0% 3% 1% 11% 5% 9%
Wait for sirens / warning 1% 0% 1% 2% 0% 1%
Into building 0% 3% 1% 0% 0% 0%
No response 0% 0% 0% 2% 0% 1%
Go to school /
community Centre0% 0% 0% 2% 0% 1%
Stay put 0% 0% 0% 2% 0% 1%
Check property / clear up 0% 0% 0% 0% 5% 1%
Go to upper floor of
building0% 0% 0% 0% 0% 0%

172 6. Intended local tsunami evacuation behaviour (Paper 3)
Tab. 6.17: Reasons given for non-evacuation of the survey location. *Four of these responses were given
at Clive Square and one at Marewa shops, both of which are located within the tsunami hazard
zone.
Respondents’ reasons for non-evacuation of survey location Count
Safe at the survey location * 5
Dangerous to evacuate 4
Don’t know where to go 2
Evacuation is impossible 2
No transport 2
Need to help others 2
No response 2
Never had tsunami here 1
friends or family’ (14%). The most common reasons given for not evacuating from home are be-
cause it is located ‘too far inland’ to be in danger of inundation (12%) or located ‘on high ground’
(20%). Additional common responses were that it was ‘more dangerous to evacuate’ than stay put
(14%), already being in an ‘earthquake safe building’ or ‘feeling safe at home’ (14%), and being
‘unconcerned about tsunami’ (14%). Other themes created from responses include ‘don’t know
what to do’ or ‘don’t know if I need to evacuate’, ‘wait for advice’ and feeling that it is ‘impos-
sible to evacuate’. Mapping respondents’ intentions reveals that although some correctly consider
themselves safe at home, others are in fact located within the tsunami hazard zone according to
numerical simulation of the maximum credible inundation scenario (Fig 6.3A).
Twenty respondents stated they would not evacuate the survey location in case of ground shak-
ing. This is too small a sample to analyse effectively; however, it is worth noting the common
themes into which the responses have been grouped (Table 6.17). These reflect issues which should
be investigated further as they have the potential to contribution to a low evacuation rate if not ad-
dressed through education.
Previous research has highlighted active responses in disasters including information-seeking,
helping others (Rodriguez, Quarantelli, and Dynes, 2006) and the desire to bring the family to-
gether before evacuating in the case of warned events (see Section 6.3.2). In responding to the
initial question, few respondents referenced information-seeking or efforts to bring families to-
gether immediately following ground shaking. When ground shaking is experienced at home, only
11% of respondents reported that they would ‘seek further information’ and 13% of respondents
intend to ‘check on or contact loved ones’, although inherently emotional responses such as these
may be the most sensitive to being misrepresented in stated intention surveys compared to actual
behaviour. For evacuation from the survey location these actions were reported by 1% and 3% re-

6.5. Results and discussion 173
Fig
.6
.3:
A)
Res
iden
ts’
app
rox
imat
eh
om
elo
cati
on
and
thei
rin
ten
tio
nto
evac
uat
eo
rre
mai
nat
ho
me
foll
ow
ing
gro
un
dsh
akin
g.
Gre
enci
rcle
ssh
ow
inte
nti
on
toev
acu
ate,
wit
hev
acu
atio
nar
row
sin
dic
atin
gd
irec
tio
nto
thei
rst
ated
des
tin
atio
n(i
fn
amed
du
rin
gth
esu
rvey
).R
edci
rcle
sm
ark
inte
nti
on
ton
ot
evac
uat
ean
da
squ
are
ind
icat
esth
atth
ere
aso
nw
asb
ecau
seth
eyb
elie
ved
them
selv
esto
be
safe
atth
atlo
cati
on
.B
)S
urv
eylo
cati
on
sw
ith
evac
uat
ion
dir
ecti
on
tore
spo
nd
ents
’st
ated
des
tin
atio
n(i
fn
amed
du
rin
gth
esu
rvey
)o
rth
eir
ho
me
ifth
atw
asth
eir
inte
nd
edd
esti
nat
ion
.E
vac
uat
ion
arro
ws
wh
ich
end
off
the
map
ind
icat
eev
acu
atio
nto
Has
tin
gs,
Wai
roa
and
Dar
tmo
or
asla
bel
led
.T
sun
ami
flow
dep
than
din
un
dat
ion
exte
nt
gen
erat
edb
y
Fra
ser
etal
.(2
01
4)
for
anM
W9
.0ru
ptu
reo
fth
eH
iku
ran
gi
mar
gin
isin
clu
din
go
nth
em
apto
ind
icat
eth
ew
ors
t-ca
sets
un
ami
haz
ard
zon
e.B
asem
ap
sou
rce:
Op
enS
tree
tMap
and
con
trib
uto
rs,
Cre
ativ
eC
om
mo
ns-
Sh
are
Ali
ke
Lic
ense
(CC
-BY
-SA
).

174 6. Intended local tsunami evacuation behaviour (Paper 3)
spectively. With respect to household preparedness, only 5% of respondents reported intentions to
‘get an emergency kit or emergency supplies’ if they experienced ground shaking at home. These
findings are somewhat surprising, but these expected behaviours were referenced more commonly
in subsequent questions and are discussed in the next section.
Pre-evacuation actions and estimated departure time
It is important to gain information on likely pre-evacuation actions that respondents might take
and the delays caused by these actions, given that there is little time available to evacuate. We
anticipated that intended actions will be similar to those described in previous literature (Section
6.3.3). Respondents who indicated their intention to evacuate (from survey location n = 114;
from home or accommodation n = 76) were asked when they would intend to evacuate. For both
scenarios the most common response for both residents and visitors was ‘as soon as possible’ (48%
of respondents at survey location and 55% at home) followed by ‘immediately’ (19% from the
survey location, 9% from home or accommodation). When a specific time was provided regarding
evacuation of the survey location (by 5% of respondents) the stated times were ‘20 seconds’ (n
= 1), ‘5 to 10 minutes’ (n = 2) and ‘10 to 15 minutes’ (n = 3). A specific time was provided by
12% of respondents regarding evacuation of the home, comprising ‘5 to 10 minutes’ (n = 4), ‘20
minutes’ (n = 2) and ‘30 minutes’ (n = 2).
The actions that respondents intend to take before departing include: ‘help others’ (at survey
location: 22%; at home: 4%) or ‘check on, travel to or gather loved ones’ (29%; 23%); ‘get
emergency kit’ (1%; 19%); ‘get / secure property’ (4%, 19%); and ‘nothing’ — i.e., evacuate
immediately without stopping to do anything (34%, 19%). There is little difference between the
proportions of visitors and residents taking each action. Within these results the influence of lo-
cation is apparent. When in public a greater proportion of people intend to help others, while at
home this is cited less often, perhaps because there are likely to be fewer people in immediate
proximity when at home. The proportion of respondents intending to check on, travel to or gather
loved ones is also lower for the home situation, perhaps due to respondents considering that loved
ones will all be together when at home. The other actions apparently influenced by location is the
use of emergency kits and collecting or securing property, which were more frequently reported as
actions taken at home where emergency kits and property are more readily accessible to people. It
is encouraging that people recognise the need to take emergency kits, but the proportion of people
citing kits or supplies is low to moderate.
Regarding pre-evacuation actions at the survey location, 29% of respondents reporting ‘as soon
as possible’ also responded that their departure would be delayed by ‘checking on loved ones’ or
‘travelling to or gathering loved ones’, 25% would delay by ‘helping others’, and 45% would e-
vacuate as soon as possible with no delaying action reported. Therefore, around half of those
reporting ‘as soon as possible’ are likely to experience a delay but this is difficult to quantify with-

6.5. Results and discussion 175
out further data on how long it might take to complete such actions. Further research should link
pre-evacuation actions with respondents’ household composition (i.e., whether there are children
to care for) and collect data on time required for each action. The high number of respondents
citing short intended evacuation start time is encouraging for tsunami education, however, the fact
that these are intentions means they should be treated with caution as they may not correlate well
with actual behaviour (Kang, Lindell, and Prater, 2007; Mas et al., 2012a).
Evacuation destination
The topography of Napier provides few options for evacuating to high ground and the general
expectation is that people evacuating the city centre will go to the nearest area of high ground,
which is Bluff Hill. It is important to understand whether this is in fact the case, and where people
located further from Bluff Hill would intend to go. This will help emergency managers to prepare
primary evacuation routes and anticipate where concentrations of evacuees might relocate to in a
local tsunami event, which has implications for route congestion and emergency response planning.
When asked to provide an evacuation destination if evacuating from the survey location, the
most common intended destinations were ‘Bluff Hill’ (Fig 6.1 and Fig 6.3B — residents: 33%;
regional visitors: 10%; national visitors: 33%; international visitors: 10%) and ‘unspecified high
ground’ (residents: 15%; regional visitors: 20%; national visitors: 33%; international visitors: 0%)
(Table 6.18). It is notable that a very low number of international visitors reported ‘high ground’ as
their intended destination and that 50% gave no response or reported ‘don’t know’. This specific
question about destinations solicited a higher percentage of responses citing high ground than the
more general question about actions following an earthquake (28%, Section 6.5.3). Fifteen percent
of residents would evacuate to ‘home’, and 22% of visitors (origins combined) would evacuate
‘further inland’. Several of those intending to evacuate to their home would still be in the tsunami
hazard zone there, while others would be sufficiently inland towards the Taradale Hills to be safe
(Fig 6.3B). Ten percent of respondents would intend to evacuate to ‘Clive Square’ (Fig 6.1). This
was a focus for evacuation during the 1931 earthquake, but is not currently an official Hawke’s
Bay Civil Defence and Emergency Management assembly point (Marcus Hayes-Jones, personal
communication, 4 April 2013) and is located within the published tsunami hazard zone (Hawke’s
Bay Civil Defence And Emergency Management, 2011).
When considering evacuation from the home, 19% of residents cited ‘unspecified high ground’,
and others named their high ground destinations as: ‘Bluff Hill’ (11%), ‘Sugar Loaf Reserve’ (6%),
and ‘Puketapu Hill’ (6%) (Fig 6.3A). In the visitor sub-samples, 33% of national visitors cited
‘Bluff Hill’, but otherwise ‘high ground’ was not well-cited as a destination, whereas ‘beach’,
‘open areas’ and ‘away from buildings’ were all cited in each sub-sample, although the small sub-
sample precludes drawing further conclusions at this level of detail. In terms of the two major
status groups 11% of residents but no visitors would travel ‘further inland’. Twenty-five percent

176 6. Intended local tsunami evacuation behaviour (Paper 3)
Tab. 6.18: Respondents’ reported destinations if intending to evacuate from the survey location.
Reported
destinations from
the survey location
Resident (n =
82)
Regional
visitor (n =
10)
National
visitor (n =
12)
International
visitor (n =
10)
Unspecified or
other high ground15% 20% 33% 0%
Bluff Hill 33% 10% 33% 10%
Sugarloaf Reserve 1% 0% 0% 0%
Taradale Hills 5% 0% 0% 0%
Unspecified or
other place inland10% 20% 25% 20%
Civil Defence
centre / school4% 0% 0% 0%
Open areas — e.g.,
park5% 0% 8% 10%
Home 15% 20% 8% 0%
Away from
buildings1% 0% 8% 0%
Clive Square 11% 20% 0% 0%
Don’t Know 2% 0% 0% 20%
Other 5% 30% 0% 10%
No response 1% 0% 0% 30%
of residents and 48% of visitors reported their intention to ‘move away from buildings’ or go to an
‘open area’ such as a park, a field or to the end of the driveway, which again suggests a primary
aim of being outside in case of further aftershocks rather than any intention to evacuate in case of
potential tsunami inundation.
Travel mode during evacuation
The preference to evacuate in vehicles for long-distance and long-lead time evacuations has been
discussed, as have variable rates of vehicle use in recent tsunami warnings (Section 6.3.4). To
investigate the intended travel mode at Napier, we asked the open-ended question ‘How would
you travel to your intended destination?’. It is hypothesised that the majority of respondents will
prefer to use their vehicles, on the basis of previous response to earthquake and tsunami in New
Zealand (Lamb and Walton, 2011) and the belief that vehicles are the most commonly used form
of evacuation transport in developed countries due to daily reliance on vehicles (Murakami and

6.6. Vertical evacuation buildings 177
Tab. 6.19: Proportion of residents and visitors with vehicle or pedestrian intended travel modes. Respon-
dents were able to answer with more than one travel mode, therefore percentages may sum to
greater than 100%.
Status and GenderEvacuate from survey location Evacuate from home
n Vehicle Foot n Vehicle Foot
Residents
Male 32 50% 50% 26 73% 31%
Female 50 34% 68% 29 34% 66%
Total 82 40% 61% 55 53% 49%
Visitors
Male 19 47% 53% 12 17% 58%
Female 13 69% 23% 9 33% 67%
Total 32 56% 41% 21 24% 62%
Kashiwabara, 2011).
The most-cited intended travel modes (Table 6.19) for residents evacuating the home (n = 55)
were evacuation in a ‘vehicle’ (53%) and ‘walk or run’ (49%) whereas a greater proportion of
residents evacuating the survey location intend to ‘go on foot’ (61%) than use a ‘vehicle’ (40%). A
greater proportion of female residents intend to walk or run than do male residents when evacuating
the home or survey location. Among visitors, 62% intend to ‘walk or run’ when evacuating the
home and 24% intend to use a ‘vehicle’ and there is little variation between visitor sub-samples.
The majority of regional visitors (60%) and international visitors (70%) would evacuate the survey
location in a ‘vehicle’ but the majority of national visitors (67%) would ‘walk or run’. Only two
respondents offered cycling as a potential means of evacuation.
There is a certain degree of recognition that using a vehicle may not be possible in a post-
earthquake situation — 13% of respondents expressed such concern, although many did so in
the context of their preference to drive, including responses such as ‘Drive — if road weren’t
damaged’, ‘Car if possible’ and ‘Car. If roads bad, run’. Analysis of household income categories
and level of education reveals no consistent influence on intended travel mode.
6.6 Vertical evacuation buildings
The final set of questions in the survey explored respondents’ views and concerns about the use
of tsunami vertical evacuation buildings in Napier. Previous experience in Japan highlights the
value of a vertical evacuation strategy (Fraser et al., 2012b), but also the components required for a
strategy to be successful. A scoping study has previously looked at the potential for using existing
buildings for vertical evacuation in New Zealand (Leonard et al., 2011) and with increased interna-
tional research and development of design guidelines for such facilities (FEMA (2008, 2009) and
forthcoming update by the ASCE 7 Subcommittee on Tsunami Loads and Effects7) it is importan-
7 http://nthmp.tsunami.gov/2012tsuhazworkshop/abstracts/Chock abs.pdf

178 6. Intended local tsunami evacuation behaviour (Paper 3)
t to understand public opinion of such strategies to guide further community engagement on the
topic.
Respondents were first asked to name all of the possible types of places they could think that
might provide safety in a tsunami, with no prompting about vertical evacuation. The overwhelming
majority of respondents (80%) referred in their response to ‘high ground or uphill’ (Table 6.20).
Thirty-eight percent referred to moving ‘inland or away from coast’, while 15% cited buildings as a
safe destination, indicating a relatively low level of consideration of vertical evacuation. Nine per-
cent cited ‘Civil Defence centre or school’ as a safe location, and other interesting but uncommon
responses included ‘away from waterways’ or rivers (2%), ‘tall trees’ (2%) and one responden-
t specifically indicated that they would ‘not evacuate into a building’. The trend in responses is
generally consistent between genders and resident or visitor status. The only group with more re-
spondents citing evacuation to buildings rather than evacuation inland was national visitors, 29% of
whom cited buildings versus 14% who cited going further inland. There is no apparent correlation
in this limited sample between the respondent’s home city and their recognition of buildings as a
safe location, which might suggest familiarity with tall buildings at home and work, but this issue
should be explored further in later surveys.
Of those respondents citing evacuation to the ‘upper storeys or roof of building’ (n = 20),
there were repeated references to building height and strength, demonstrating understanding of the
requisites of a building to be safe in a tsunami. References to height were made by 19 of these
respondents, including three references to evacuation above three storeys and others referring to
the roof, top of the building or use of a tall building. Four respondents referred to the building
being strong, and one cited the need for an open ground floor. Five respondents said they would
use a building as a last resort if they could not reach a hill or go inland.
Next, respondents were given some context to the subsequent questions, by stating ‘In Japan,
many people survived the tsunami by evacuating to the third storey or above in reinforced concrete
buildings. This is an approach that we could consider for New Zealand, and we are interested
in your thoughts on this.’ They were then asked ‘How would you feel about evacuating to the
upper floors of a reinforced concrete building’. The themes that arose in respondents’ views on
evacuation buildings have been grouped into encouraging themes and discouraging themes. Of the
respondents who gave factors that would encourage their use of buildings (n = 35), 40% would
be encouraged if they knew the building was reinforced or if the building was described officially
as safe or reinforced (including signs on the building). Twenty-nine percent were encouraged if
it was the safest option in the available time for evacuation and 14% if there was easy access.
These opinions are in line with the factors considered in official designation of vertical evacuation
facilities in Japan (Cabinet Office Government of Japan, 2005) and identified as important features
of vertical evacuation buildings from their performance in the 2011 Japan tsunami (Fraser et al.,
2012b). Discouraging factors were grouped into themes including: having doubts or being unsure
about safety due to the height or strength of available buildings (43% of respondents); potential to

6.6. Vertical evacuation buildings 179
Tab. 6.20: Percentage of respondents citing different possible safe locations in a tsunami.
Safe Evacuation
Location
Respondent Status – Resident / Visitor
Resident (n= 97)
Regional
Visitor (n =
10)
National
Visitor (n =
14)
International
Visitor (n =
15)
Total (n =
136)
High ground /
uphill83% 80% 93% 53% 80%
Inland / away from
coast39% 70% 14% 33% 38%
Upper storeys /
roof of building13% 10% 29% 13% 15%
CD centre / school 9% 20% 7% 0% 9%
Away from
buildings1% 10% 7% 13% 4%
Open areas – e.g.,
park2% 10% 0% 13% 4%
Tall tree 1% 0% 7% 7% 2%
Home 3% 0% 0% 0% 2%
Away from
waterways2% 0% 7% 0% 2%
Not up building 0% 10% 0% 0% 1%
Don’t Know 0% 0% 0% 7% 1%
Other 4% 0% 0% 20% 5%
No response 2% 0% 7% 0% 2%

180 6. Intended local tsunami evacuation behaviour (Paper 3)
be trapped with no or slow access to safe floors (20%); potential for panic or overcrowding (19%);
and visible building damage or falling debris (14%). Twenty-six percent of people provided factors
that would encourage them to seek safety in a building during a tsunami, 55% gave discouraging
factors and 21% provided no response. There is little difference in the responses of males and
females, except that a high proportion of females provided encouraging or discouraging factors,
rather than a non-committal response. The potential for fire, further earthquakes, being afraid
of heights or worried about hygiene were also given as discouraging factors. Concern about the
availability of supplies in the building was raised by a single respondent. Within these responses,
several respondents reiterated their preference to go to high ground rather than into buildings.
These data demonstrate that many people would consider the visible structural integrity of
the building and the time available to get to the often-preferred option of high ground or inland as
determining factors in their decision to evacuate into a building. It is apparent that a key component
of tsunami evacuation is provision of clear information about which buildings would be safe for
tsunami evacuation use in a post-earthquake situation. The risk of fire and provision of food or
emergency supplies within a building are considered by few respondents, but these components
should also be addressed in any education or evacuation planning that includes a vertical evacuation
component.
6.7 Conclusions
A survey of 136 residents and national and international visitors in Napier was carried out to in-
vestigate hazard awareness and intended evacuation behaviour in a local earthquake and tsunami.
This study provides a unique investigation of evacuation intentions in the context of local tsunami
hazard in New Zealand. The data supports several observations of previous surveys, demonstrating
high levels of tsunami hazard awareness but confusion around warning expectations, and evacua-
tion behaviours cited by respondents are in line with findings in international evacuation behaviour
literature. The survey provides new local data on intended evacuation destinations, travel modes,
and opinions on tsunami vertical evacuation buildings, while demonstrating the existence of demo-
graphic influence on decision-making.
There is a high level of receipt of hazards information among residents in Napier, primarily
via TV, radio and newspaper media. Each group of visitors demonstrated a moderate receipt of
information, and responses suggest a low level of information provision by the tourist industry.
Awareness of earthquake and tsunami hazard in Napier is high, the majority of respondents recog-
nise that tsunami could follow a local earthquake and there is good perception that wave arrival
would occur within one hour after local ground shaking. There is a good level of understanding
that earthquake location influences tsunami wave arrival time. Some respondents appreciate that
following an official warning, wave arrival is likely to be later than following local ground shaking.
However, many respondents believe there will be less than one hour after an official warning until

6.7. Conclusions 181
wave arrival, and while this is possible in a regional tsunami, it is an underestimation of the time
available for evacuation following an official warning of a distant tsunami.
Consistent with previous research findings, we report the high expectation that official tsunami
warnings will be given via sirens or TV/radio in the case of local tsunami. There is relatively low
recognition that ground shaking would provide a natural warning despite education messages to
this effect from Hawke’s Bay CDEM and MCDEM, and visitors reported greater recognition of
natural warnings than residents. Given that respondents recognise the potential for a short arrival
time of tsunami after ground shaking, it appears that this expectation is due to a misunderstanding
of the warning process and current technological capabilities governing the time to warning dis-
semination. This expectation may be a function of the fact that the majority of past events have
been from distant sources, therefore tsunami is associated with official warnings. Further com-
munication of siren functions and importance of the natural warning is required to address these
prevalent expectations.
The intended behavioural responses to an earthquake suggest that in an earthquake ground
shaking might trigger appropriate earthquake response actions but people may not extend their
actions to include appropriate tsunami evacuation response, as most respondents did not consider
tsunami until prompted. Respondents expressed a greater intention to evacuate when they were
at the survey location than they did for an event occurring when they were at home, with similar
proportions of residents and visitors stating an intention to evacuate. There were variations between
genders, with females more likely to evacuate the survey location and males more likely to evacuate
the home. Intention to evacuate the survey location reduces with increasing age. Further research
is required to confirm and explain these trends. Many people reported that if they were at home
at the time of the earthquake, they would evacuate the building (i.e., to open space) but did not
indicate intention to evacuate further (i.e., to high ground). Others would be reluctant to evacuate
the home as they feel that it is safer to remain in place rather than try to evacuate, or that they
are not at risk of tsunami, which is true in some cases but not all. There is a high proportion of
responses recognising the need for evacuation as soon as possible and the range of pre-evacuation
actions are consistent with those previously cited in hurricane evacuation literature. The data did
not permit detailed analysis of evacuation departure times.
Evacuation to high ground is recognised as an appropriate evacuation action, but only a mod-
erate proportion of respondents stated that they would evacuate to high ground. The reported e-
vacuation destinations suggest that in an event, there would be concentrations of evacuees on Bluff
Hill and in the Taradale Hills. Some respondents identified their home as an intended evacuation
destination, despite that location being within the tsunami hazard zone. Reported intentions to use
Clive Square as an evacuation point are of concern, as Clive Square is situated within the tsunami
hazard zone and congregation at that location could result in many deaths. Tsunami hazard maps
available for Napier should be used to ensure that people are aware of whether or not their intended
destination is in the hazard zone when planning for evacuation. Travel mode intentions suggest an
182 6. Intended local tsunami evacuation behaviour (Paper 3)
approximately equal proportion of people evacuating on foot and in a vehicle, which is relatively
in line with travel mode observations from Japan. Travel mode appears to be location-dependent
with a greater proportion of residents using vehicles if they are at home rather than at the survey lo-
cation whereas the opposite is true for visitors. Gender also appears to influence travel mode, with
a greater proportion of female residents than male residents reporting intention to evacuate on foot.
Some respondents recognise that evacuation by vehicle may not be possible in a post-earthquake
situation. Cycling is rarely reported as an intended travel mode, and several respondents reported
a reliance on others for transport.
‘Buildings’ ranked below ‘high ground’ and ‘travelling inland’ as possible safe locations in
a tsunami. Most respondents were concerned about structural integrity and sufficient height of
buildings but many also cited the available time to evacuate to their first choice destination as
factors in deciding to use vertical evacuation. Vertical evacuation is recognised as a potentially
life-saving option if is not possible to reach high ground. Responses indicate the importance of
ensuring that the public has prior knowledge about the safety or designation of buildings, or can
see signage to this effect on the building. There is a common concern that few suitable buildings
exist in Napier.
This survey has a number of limitations that should be addressed in future research, although
it provides a useful base for subsequent surveys, informs evacuation modelling, community en-
gagement on evacuation planning and vertical evacuation, and hazard education of resident and
transient populations. The survey did not attempt to investigate evacuation behaviour within e-
ducational or care-giving facilities or the role of tourist industry staff in evacuations, which are
important groups to study in terms of group evacuation. Household composition and its influence
on evacuation behaviour should be studied more closely in subsequent surveys, and pre-evacuation
actions should be linked more closely with the estimated time required for each action. In order
to investigate the provision of information to visitors in Napier, a more focussed survey of accom-
modation providers and tourism operators should be carried out. We should also explore peoples’
intended actions when they have reached a safe place, specifically with respect to returning to
inundation zone before an ‘all clear’ message.
The fact remains that data presented here are stated intentions given for a hypothetical tsunami
scenario and behaviours are likely to show some differences in an actual event. Although other
researchers have previously shown good agreement between some aspects of expected and actual
behaviour for hurricane evacuation, the comparison of such data for tsunami is limited to evac-
uation departure time and travel mode. Of particular concern is the validity of such data where
there has been little or no experience of a similar event in recent memory, which is the case for
local tsunami in New Zealand. In order to collect a larger, more geographically diverse sample
of evacuation intentions this survey should be refined and administered as a postal survey using
probability sampling in multiple study areas for residents and visitors. We should also develop a
corresponding survey to assess the same behaviours in an actual event, in case of a local tsunami

6.8. Acknowledgements 183
in New Zealand. Consistent collection of data across the two surveys will allow for a comparison
of intended and observed behaviours for further improvement of evacuation planning and testing
of the validity of stated intention data.
6.8 Acknowledgements
We would like to thank Ella Kroch for her efficiency and enthusiasm in conducting surveys for this
study, and Kim Wright, Emma Hudson-Doyle and Maureen Coomer for their review of this report.
We thank Hawke’s Bay Regional Council and Hawke’s Bay Emergency Management Group for
their support of this research and provision of building stock data. This research is supported by
public research funding from the Government of New Zealand.
6.9 Link to next chapter
This chapter has presented survey results that help to anticipate behaviour of the public in local-
source tsunami. These data can be used to refine the behavioural aspects of evacuation models, in
order to improve estimations of evacuation time and improve evacuation planning and response.
The next chapter proposes a method to assess the requirement for vertical evacuation refuges, using
Geographic Information System (GIS)-based evacuation modelling. The methodology augments
current least-cost distance modelling and presents an assessment of pedestrian evacuation potential
in the maximum credible local-source tsunami at Napier. The need for vertical evacuation in Napier
is demonstrated, with preliminary analysis of the optimal locations of refuges.

This survey was implemented face-to-face in the streets of Napier. The questions were delivered verbally and responses recorded by the interviewer. An exclamation ([!]) after a question indicates that the interviewers will prompt the respondent to offer any other responses until those responses are exhausted. Respondents were offered an information sheet following completion of the survey (see Appendix 2). A question code was included on the survey for coding purposes (e.g. [resvis]).
Clipboard Questionnaire: Awareness of hazards and intended response actions
Q1 [resvis] Are you resident in Napier City or visiting? 1 Resident 2 Visitor
Q2 If resident,
a. [reslen] How long have you lived in Napier? _________________________
b. [resloc] What is your home address (or nearest intersection)? ___________________________________
c. [resact] What are you doing here today? 1 Commute/Work 2 Visiting friends/family 3 Leisure activities 4 Other _______________________________________
d. [resinf] Do you recall previously seeing or hearing information about natural hazards in Napier?
1 Yes 2 No 3 Don’t know
e. [resinfsrc] If yes, who was the source of this information? ____________________________________
f. [resinftyp] If yes, how was the information provided? (tick all that apply) 1 TV/Radio broadcast 2 Brochure/Leaflet 3 Mail-drop 4 In phonebook 5 Council website
6 Community meeting 7 Informal/Conversational 8 Other___________________________________________________
Q3 If visiting,
a. [visorg] Where are you visiting from? (city & country) _____________________________________
b. [visact] What is the purpose of your visit? 1 Business 2 Holiday 3 Visiting friends/family 4 Other _________________________________________________________________
c. [visreg] How regularly do you visit Napier? 1 First time 2 Weekly 3 Monthly 4 Annually/less
d. [acctype] What type of accommodation are you staying in? 1 Hotel 2 Motel 3 Backpackers 4 Holiday Park 5 Home of friends/family 6 Holiday Home/Bach 7 Other ______________
e. [hazinfo] Have you seen or heard any information about natural hazards in Napier? 1 Yes 2 No 3 Don’t know
f. [hazinfo] If yes, who was the source of this information? _____________________________________
g. [hazinftyp] If yes, how was the information provided? (tick all that apply) 1 TV/Radio broadcast 2 Brochure/Leaflet 3 Mail-drop 4 In phonebook 5 Council website 6 Community meeting 7 Informal/Conversational 8 Other____________________
Q4 [haznpr] Which of the following hazards do you think could cause damage or casualties in Napier City?
1 Wildfire/Bushfire 2 Earthquake 3 Storm/Cyclone 4 Tsunami 5 Flood 6 Landslide 7 Don’t know 8 Other (please give details): _________________________
184 6. Intended local tsunami evacuation behaviour (Paper 3)
6.10 Appendix 1: Survey questions

Q5 [tsuwrn] What would warn you of a tsunami potentially affecting Napier? [!] _____________________________________________________________________________
Q6 If you were to hear an official tsunami warning (via siren, police, tv, radio),
a. [offarr] How long do you think there would be until the first tsunami waves might arrive at Napier? (tick all that apply)
1 < 10 min 2 10 - 30 min 3 30 min - 1 hr 4 1 - 3 hr 5 3 - 10 hr 6 > 10 hr 7 Don’t know
Q7 If you were to experience ground shaking that lasted for more than a minute or during which it was hard to stand up,
a. [nattsu] Do you think that a tsunami may be possible? 1 Yes 2 No 3 Don’t know
b. [natarr] If Yes, How long do you think there would be until the first tsunami waves might arrive at Napier? (tick all that apply)
1 < 10 min 2 10 - 30 min 3 30 min - 1 hr 4 1 - 3 hr 5 3 - 10 hr 6 > 10 hr 7 Don’t know
State: ‘Two different scenarios will now be presented’:
First, please consider, for what you are doing right now:
Q8 [evcnatactN] What would you do after an earthquake that lasted for more than a minute or during which it was hard to stand up? [!] then prompt: “Would you evacuate?” [Note if prompt required: ] _____________________________________________________________________________
a. [evcnonN] If No, what are your reasons for not evacuating? ___________________________________________________________________________
b. [evcdprtN] If Yes, How long after the earthquake do you think you would begin evacuation? ___________________________________________________________________________
c. [evcdlyN] What would you do, if anything, before evacuating? ___________________________________________________________________________
d. [evcdestN] Where would you evacuate to? [landmark / intersection / suburb / city] ___________________________________________________________________________
e. [evctrvlN] How would you travel to your intended destination? ___________________________________________________________________________
Now please consider, if you were at home (or at your accommodation):
Q8 [evcactH] What would you do after an earthquake that lasted for more than a minute or during which it was hard to stand up? [!] then prompt: “Would you evacuate?” [Note if prompt required: ] _____________________________________________________________________________
a. [evcnonH] If No, what are your reasons for not evacuating? __________________________________________________________________________
b. [evcdprtH] If Yes, How long after the earthquake do you think you would begin evacuation? ___________________________________________________________________________
c. [evcdlyH] What would you do, if anything, before evacuating? ___________________________________________________________________________
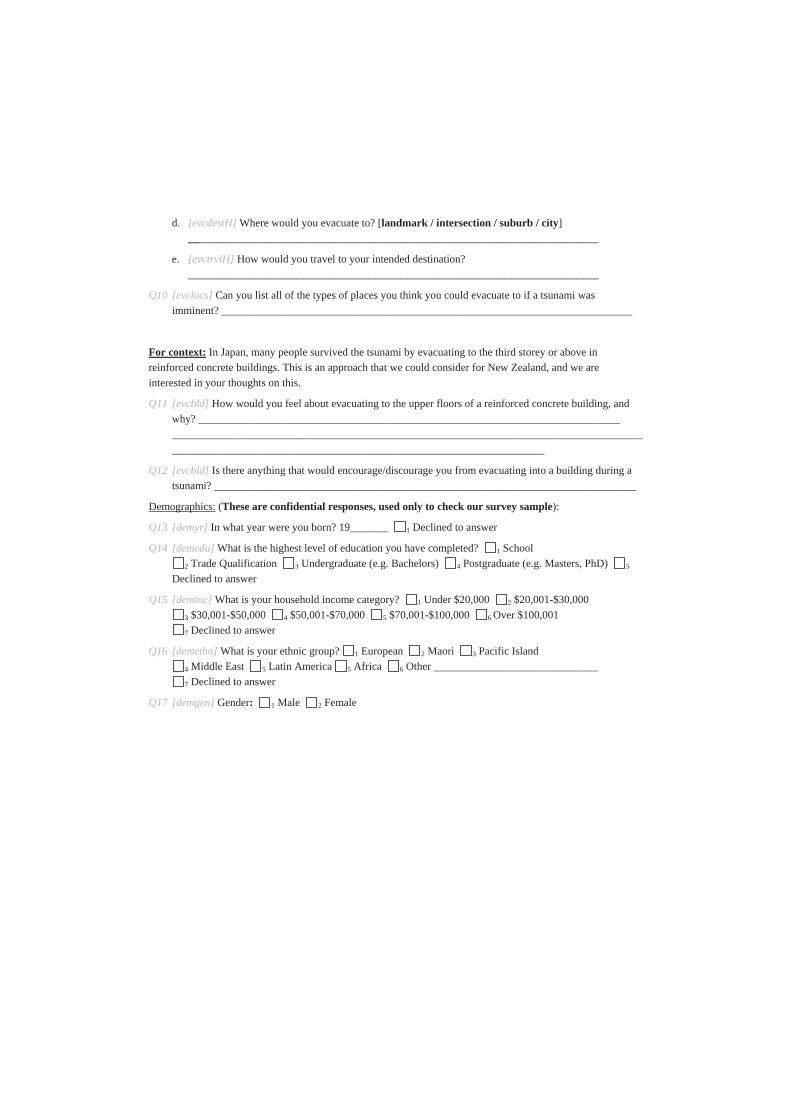
d. [evcdestH] Where would you evacuate to? [landmark / intersection / suburb / city] ___________________________________________________________________________
e. [evctrvlH] How would you travel to your intended destination? ___________________________________________________________________________
Q10 [evclocs] Can you list all of the types of places you think you could evacuate to if a tsunami was imminent? ___________________________________________________________________________
For context: In Japan, many people survived the tsunami by evacuating to the third storey or above in reinforced concrete buildings. This is an approach that we could consider for New Zealand, and we are interested in your thoughts on this.
Q11 [evcbld] How would you feel about evacuating to the upper floors of a reinforced concrete building, and why? _____________________________________________________________________________ __________________________________________________________________________________________________________________________________________________________
Q12 [evcbld] Is there anything that would encourage/discourage you from evacuating into a building during a tsunami? _____________________________________________________________________________
Demographics: (These are confidential responses, used only to check our survey sample):
Q13 [demyr] In what year were you born? 19_______ 1 Declined to answer
Q14 [demedu] What is the highest level of education you have completed? 1 School 2 Trade Qualification 3 Undergraduate (e.g. Bachelors) 4 Postgraduate (e.g. Masters, PhD) 5
Declined to answer
Q15 [deminc] What is your household income category? 1 Under $20,000 2 $20,001-$30,000 3 $30,001-$50,000 4 $50,001-$70,000 5 $70,001-$100,000 6 Over $100,001 7 Declined to answer
Q16 [demethn] What is your ethnic group? 1 European 2 Maori 3 Pacific Island 4 Middle East 5 Latin America 5 Africa 6 Other ______________________________ 7 Declined to answer
Q17 [demgen] Gender: 1 Male 2 Female

Thank you for taking time to complete this survey
GNS Science and Hawke’s Bay Civil Defence and Emergency Management Group are interested in what people know about tsunami
and warnings, to help improve education. This survey is being conducted by a student from Massey University in collaboration with
GNS Science and Hawke’s Bay Civil Defence and Emergency Management Group.
Further information regarding tsunami hazard, warnings and
evacuation in Napier can be found on the Hawke’s Bay Emergency Management Group web pages:
http://www.hbemergency.govt.nz/
Natural warning signs of tsunami are: Strong earthquake shaking; Weak, rolling earthquake shaking of unusually long duration (i.e. a minute or more); Out of ordinary sea behaviour (e.g. unusual and sudden sea level fall or rise); The sea making loud and unusual
noises, especially roaring like a jet engine.
When experiencing any of the above go immediately to high ground or as far inland as possible. Do not wait for an official warning. Let the
natural signs be your warning – the first wave may arrive within minutes. Once away from the water, listen to a radio station for
information from local civil defence about further action you should take. Wait for official all clear before returning.
If you have any questions please contact Stuart Fraser or Graham
Leonard at GNS Science: [email protected] or [email protected] or 04 570 1444
6.11. Appendix 2: Information sheet 187
6.11 Appendix 2: Information sheet


7. VARIABLE POPULATION EXPOSURE AND TRAVEL SPEEDS IN LEAST-COST
TSUNAMI EVACUATION MODELLING (PAPER 4)
This chapter proposes a methodology for assessing the need for vertical evacuation refuges in
a tsunami hazard zone, and demonstrates the use of this methodology in Napier, Hawke’s Bay,
New Zealand. This work draws upon data generated in Chapters 4–6 and achieves Objective 4.
The main parts of this chapter (Sections 7.1 to 7.7) have been published as Natural Hazard and
Earth Systems Science as Fraser, S. A., Wood, N. J., Johnston, D. M., Leonard, G. S., Greening,
P. G., and Rossetto, T. Variable population exposure and distributed travel speeds in least-cost
tsunami evacuation modelling. Natural Hazards and Earth System Sciences, 14(11), 29752991.
doi:10.5194/nhess-14-2975-2014. Section 7.8 provides detailed results for Napier, which were
deemed too site-specific for publication in an international journal. The methodology developed to
achieve variable population exposure and travel speeds is presented in Appendix G. A contribution
statement, outlining author contributions to the paper, is provided in Appendix H.
A Least-Cost Distance (LCD) approach is applied in this study, despite the increasing use of
Agent Based Model (ABM) approaches in tsunami evacuation studies (Goto et al., 2012b; Ima-
mura et al., 2012; Johnstone, 2012; Mas et al., 2012a). ABMs enable simulation of individual
components (agents) within a system, each with a particular set of characteristics and rules govern-
ing their behaviour, the interactions between multiple agents, and interactions between agents and
their environment (Crooks and Heppenstall, 2012). There is great flexibility to conduct theoretical
and empirical studies with ABMs (Manson, Sun, and Bonsal, 2012) and they offer great detail in
their output, however, as a result they are computationally expensive may not be the most effi-
cient way to obtain similar results (O’Sullivan et al., 2012). In the context of tsunami evacuation,
agents represent individuals or family groups, each with a set of characteristics (e.g., physical, ex-
periential) which determine the likely evacuation actions (and efficacy of those actions) they take
in the event of a tsunami in their environment (modelled roads, buildings etc.). Therefore, prior
knowledge about the influence of personal characteristics and experience on likely behaviours is
essential to inform assumptions within the model; this is a level of data that are not available for
local-source tsunami evacuation. As this represents the first study to simulate tsunami evacuation
behaviour based on New Zealand data, and because data on evacuation are insufficient to link to
personal characteristics, it is was decided to use an LCD model to generate an aggregate view of
evacuation. It is the intention to apply ABM in subsequent studies to investigate the influence of
evacuation behaviour on aggregate evacuation outcomes.

190 7. Least-cost tsunami evacuation modelling (Paper 4)
7.1 Abstract
Evacuation of the population from a tsunami hazard zone is vital to reduce life-loss due to inunda-
tion. Geospatial least-cost distance modelling provides one approach to assessing tsunami evacua-
tion potential. Previous models have generally used two static exposure scenarios and fixed travel
speeds to represent population movement. Some analyses have assumed immediate departure or
a common evacuation departure time for all exposed population. Here, a method is proposed to
incorporate time-variable exposure, distributed travel speeds, and uncertain evacuation departure
time into an existing anisotropic least-cost path distance framework. The method is demonstrated
for hypothetical local-source tsunami evacuation in Napier City, Hawke’s Bay, New Zealand. There
is significant diurnal variation in pedestrian evacuation potential at the suburb-level, although the
total number of people unable to evacuate is stable across all scenarios. Whilst some fixed travel
speeds approximate a distributed speed approach, others may overestimate evacuation potential.
The impact of evacuation departure time is a significant contributor to total evacuation time. This
method improves least-cost modelling of evacuation dynamics for evacuation planning, casual-
ty modelling, and development of emergency response training scenarios. However, it requires
detailed exposure data, which may preclude its use in many situations.
7.2 Introduction
Local-source (or near-field) tsunami can cause loss of life due to onshore inundation within min-
utes after a source event. Prompt evacuation of the hazard zone maximises a person’s chance of
surviving tsunami inundation. Well-planned routes and refuges facilitate evacuation by minimising
travel time to safety and maximising the number of people reaching safe refuge. Evacuation mod-
elling is an important tool for estimating exposure to the hazard and the time required to evacuate
the hazard zone.
Least-cost distance (LCD) analysis is an established method for tsunami evacuation modelling
(Gonzalez-Riancho et al., 2013; Graehl and Dengler, 2008; Post et al., 2009; Scheer et al., 2011;
Wood and Schmidtlein, 2012, 2013). LCD analysis is a Geographic Information System (GIS)-
based method that computes the minimum cost of travel (generally expended energy or time) be-
tween specified source and destination cells in a raster domain (i.e., a cell-based grid). Travel speed
values can be applied to the cost distance surface to generate a time surface representing the time to
travel from source to destination. Travel time maps enable emergency managers to visualise spatial
variation in evacuation time (Wood and Schmidtlein, 2012). Comparison of travel time to wave
arrival in tsunami inundation scenarios enables identification of areas that cannot be evacuated be-
fore wave arrival. Combining travel time and population exposure data gives an indication of the
number of people potentially unable to evacuate in the available time, which facilitates planning of
additional evacuation and emergency response solutions.

7.3. Study area 191
In order to simulate evacuation processes at the community scale, a model must represent the
physical environment, spatial extent and timing of the hazard, population exposure, and human be-
haviour with respect to evacuation decisions and timing. To date, LCD models have been tested for
sensitivity to elevation and landcover data (Wood and Schmidtlein, 2012). Wood and Schmidtlein
(2012) concluded that the use of anisotropic path distance provides a more realistic cost distance
estimate than the previous use of isotropic cost distance. Post et al. (2009) applied increased com-
plexity to LCD analysis by including network capacity and evacuee density as modifiers of travel
cost. Three other evacuation factors – population exposure, departure time and travel speed – have
been consistently applied as static values in previous LCD approaches, which may not represent
the potential variability in these factors.
The objective of this paper is to demonstrate a method for introducing variability in population
exposure scenarios, evacuation departure times and travel speeds into an anisotropic, least-cost,
path distance model of pedestrian evacuation potential. The importance of traffic modelling, net-
work capacity issues, evacuee interactions and disruption to evacuation routes due to earthquake
damage are recognised; however, in order to focus on modelling the variability in exposure, de-
parture and travel phases, these aspects have not be incorporated into the demonstrated process.
Population-time profiles are developed to model the distribution of residents and visitors at any
time of day, for a weekday or weekend, in any month of the year. Incorporating distributions to
model departure time and evacuation travel speed better reflects evacuee behaviour in a real-world
evacuation than current GIS-based approaches to mapping evacuation potential. The ability to
model temporally-variable exposure facilitates derivation of hazard exposure, evacuation demands
and optimal evacuation routes and refuges for specific scenarios. Emergency managers can use
multiple exposure scenarios to develop evacuation training exercises, evacuation planning and ca-
sualty estimation.
7.3 Study area
To demonstrate the proposed method, we focus on the coastal community of Napier, Hawke’s Bay,
New Zealand, which faces a significant local-source subduction zone tsunami hazard (Fraser et al.,
2014; Power, 2013). Napier is a coastal city of almost 60 000 people located on largely flat, low-
lying topography (Fig. 7.1a), on the east coast of New Zealand’s North Island. A single numerically
simulated inundation scenario is used to demonstrate the proposed evacuation modelling method.
The scenario is a tsunami generated by the maximum credible MW 9.0 local-source earthquake
on the Hikurangi subduction zone (Fraser et al., 2014). Simulated wave arrival at shore occurs 38
min after rupture and inundation reaches its maximum extent (> 4 km inland) 32 min later. Flow
depths exceed 8 m in the first 100 m onshore and generally up to 3 m further than 1 km inland
(Fig. 7.1b). The simulated maximum credible inundation zone is taken to be the tsunami hazard
zone and is referred to as such in the rest of this paper.

192 7. Least-cost tsunami evacuation modelling (Paper 4)
Bluff Hill (maximum elevation > 100 m) provides the only area of high ground at the coast for
refuge, although other areas of high ground exist further inland of the hazard zone (Fig. 7.1a). The
existing building stock is overwhelmingly 1–2 storey light timber (92 %), with a small proportion
of 1–2 storey reinforced concrete (RC; 3 %) and 1–2 storey concrete masonry (3 %) (Cousins,
2009). Approximately 60 buildings (0.05 %) are three storeys or more in height, 40 % of which are
of RC construction. The second storey may provide sufficient height for safe refuge in inland areas
of the city but this is less likely in the 1 km closest to shore. The probability of moderate to major
structural damage due to tsunami loading in the maximum credible tsunami is greater than 80 %
for RC and greater than 90 % for timber structures in the maximum credible tsunami (Fraser et al.,
2014). Structural assessments are yet to confirm the tsunami-resistance of multi-storey buildings
in the city. Therefore, this study does not include any existing buildings as potential refuges when
considering pedestrian evacuation potential.

7.3. Study area 193
Fig
.7
.1:
A:
Stu
dy
area
top
og
rap
hy
and
loca
tio
ns
of
subu
rbs
inN
apie
rT
erri
tori
alA
uth
ori
ty.
B:
Sim
ula
ted
flow
dep
thd
ue
toth
em
axim
um
cred
ible
loca
l-
sou
rce
sub
du
ctio
nea
rth
qu
ake
and
inu
nd
atio
nex
ten
tat
60
min
afte
rru
ptu
re(F
rase
ret
al.,
20
14
).In
set
show
sth
ep
osi
tio
no
fN
apie
rin
the
nat
ion
al
con
tex
t.C
:M
esh
blo
ckb
ou
nd
arie
san
d2
01
3es
tim
ate
of
Usu
ally
Res
iden
tP
op
ula
tio
n(U
RP
)d
ensi
tyfo
rea
chm
esh
blo
ck(f
or
clar
ity,
smal
ler
mes
hb
lock
sar
esh
ow
nw
ith
ou
tb
ou
nd
arie
s).
UR
Pd
ensi
tyis
clas
sifi
edu
sin
gN
atu
ral
Bre
aks
(Jen
ks)
.

194 7. Least-cost tsunami evacuation modelling (Paper 4)
7.4 Methodology: Least-cost path distance approach to determining pedestrian
evacuation potential
The steps implemented in this methodology are described in this section. First, an anisotropic
least-cost path distance analysis is set up, using physical data and hazard data for a chosen area.
Second, several time-variable population exposure scenarios are created using building locations
and various population statistics. Third, estimates of evacuation departure time and pedestrian
travel speed are combined with the two prior components, to produce an overall view of pedestrian
evacuation potential for the population in question.
7.4.1 Anisotropic least-cost path distance analysis
LCD analysis is conducted in ESRI ArcGIS 10.1 following the anisotropic least-cost path distance
method of Wood and Schmidtlein (2012). Least-cost path distance determines the minimum path
distance from every cell in the hazard zone to the nearest point of safety outside the hazard zone.
The hazard zone and tsunami arrival time are identified by numerical inundation modelling (Fraser
et al., 2014, Fig. 7.1b). Use of arrival time at shore provides a conservative estimate of arrival time
for most locations in the hazard zone because there is additional time before inundation reaches its
maximum inland extent.
The anisotropic approach accounts for the cost associated with direction of travel over sloping
terrain of different surface type. High-resolution ground surface Light Detection and Ranging
(LiDAR) data are used to generate a digital elevation model (DEM) at 2 m horizontal resolution.
Most short-span bridges in Napier are represented in the LiDAR data but manual augmentation is
required to include the deck elevation of longer span bridges. These would otherwise be omitted,
resulting in a road being erroneously intersected by steep terrain, artificially increasing the path
distance value on that route. Tobler’s hiking functions (Tobler, 1993) are used to convert directional
slope (derived from the DEM) into a travel speed cost, interpreting travel in a downhill direction
as a benefit and uphill travel as an additional travel cost.
Land cover data are compiled from aggregated polygon data (Ministry for the Environment,
2009) representing ground surface cover. The aggregated data do not include roads, waterways or
buildings, so additional polygon and polyline data are combined into a single comprehensive land
cover raster. Land cover is represented in the LCD analysis by using a Speed Conservation Value
(SCV), which is a speed-reduction factor representing the ease of travel over that land cover (Wood
and Schmidtlein, 2012). Any cell representing a road is assigned SCV= 1.0 (having no impedance
on travel speed) and any cell representing a water body or building is defined as impassable, to
ensure evacuation routing around these features. Other land cover categories in the study included:
Dirt road (SCV= 0.9091), Light brush (0.8333), Heavy brush (0.6667), Hard sand and Swampy
bog (both 0.5556).

7.4. Methodology: pedestrian evacuation potential 195
7.4.2 Time-variable population exposure
Estimates of population located within a hazard zone (the exposed population) are required to pro-
vide evacuees’ starting locations. Exposure is typically derived directly from census data, which
primarily indicates night-time population distributions. Day-time exposure can be estimated by
augmenting census data with additional information, such as maximum building capacity deter-
mined by floor area (Cousins, 2009), employment records (Wood and Schmidtlein, 2012), or aver-
age rates of schooling, employment and numbers of cars at home (Southworth, 1991). In addition to
the location of residents who are at home or a workplace, exposure models should include those in
institutional facilities, in transit, working outdoors or undertaking leisure activities. Models should
also include visitors and commuting patterns. Previous LCD tsunami evacuation models have
used up to two exposure scenarios or the maximum exposure, derived from a night-time scenario
and a day-time scenario. Random distribution of population has been used to represent exposure
uncertainty in stochastic agent-based simulations (Mas et al., 2012a). Recent progress has been
made in modelling population dynamics by assigning population-time profiles to different types
of locations (Cockings, Martin, and Leung, 2010) and by using transport data in short time-slices
to estimate diurnal changes in spatio-temporal population distribution (Kobayashi, Medina, and
Cova, 2011). However, such time profiles have yet to be applied in tsunami evacuation modelling.
In this study, total night-time population is obtained from 2006 census Usually Resident Pop-
ulation (URP) data at meshblock-resolution and adjusted to 2013 values based on local population
projections (Statistics New Zealand, 2006, 2012a). A meshblock is a New Zealand cadastral en-
tity, generally covering less than 1.0–4.4 km2 in Napier (Fig. 7.1c). Five population groups are
defined on the basis of predominant diurnal activity and age: school/childcare, working-age adult-
s, independent elderly, dependent elderly and visitors. Whilst it is recognised that physical and
intellectual disabilities can affect evacuation decision-making and mobility in evacuation, result-
ing in an increase in required evacuation time, it is not possible to determine the magnitude of
impact of each type of disability registered. By using age to determine mobility impairment, we
have captured the majority of mobility impairment in the population, however, this represents an
important area of further study.
The groups are used in the model to assign exposure locations and travel speed distributions.
Employment data, education rolls and care facility capacities are used to define the proportion of
URP in each population group. These data are site-specific; data relevant to the local area should
be sought for in analyses for other areas.
Population-time profiles are used to define the certain proportion of each group at different
types of location according to the month, day and time of the chosen exposure scenario (Fig. 7.2).
The profiles define three types of location as: home or temporary accommodation (also includes
elderly care facilities), work or school/childcare, and unspecified location to represent people in
transit or outdoors. Time profiles are developed using employment shift patterns (Statistics New

196 7. Least-cost tsunami evacuation modelling (Paper 4)
Zealand, 2006), regional commuting patterns1, US diurnal activity patterns (Klepeis et al., 2001),
and local knowledge of school hours and peak commuting hours. Building locations and occupancy
type are obtained from a regional exposure model developed for the national asset and loss model,
RiskScape (Cousins, 2009). Two population-time profiles are developed for each group, one for
a weekday and one for a weekend, to account for differing diurnal activity on working and non-
working days. To include seasonal distribution of tourists in the exposed population, regional and
local monthly visitor data are converted to an average daily number of visitors for each month.
A description of the development of each population group and the respective population-time
profile follows in Sects.
Twelve exposure scenarios are generated using the time-variable exposure model, then anal-
ysed for evacuation demand. The scenarios comprise: 02:00 weekday, 12:00 weekday and 12:00
weekend, repeated for February, May and November (high-, low- and mid-tourist season, respec-
tively). February weekday 08:00 and 17:00 scenarios, are generated to represent peak commuting
times and January weekend 12:00 to demonstrate peak tourist numbers. This range of scenar-
ios demonstrates the flexibility of the time-variable exposure model and assesses the influence of
changing exposure on evacuation demand.
Exposure distribution – methods applicable to all population groups
The proportion of each population group assigned as being at home is combined into a single “res-
idential population group”. Each meshblock is assigned a residential population for that exposure
scenario, according to the proportional contribution of the meshblock to total URP. The derived
population of each meshblock is then distributed to randomly-selected buildings in that mesh-
block, in a household group of variable size. Household group size is sampled from a weighted
distribution of “number of household occupants”: 36 % of households in Hawke’s Bay comprise
two people, 25 % have one person; 15 % have three people and 13 % have four (Statistics New
Zealand, 2006). Distribution in a group enables a single travel speed to be assigned to the group,
to represent the effect of household evacuation as a group.
To distribute the proportion of each population group assigned to an unspecified location,
a spatially-weighted distribution is developed using a GIS weighted overlay algorithm. In a mixed-
density mixed-use urban area, population distribution is unlikely to be entirely random because
people spend a significant majority of their time in residential buildings (Klepeis et al., 2001;
Leech et al., 2002) and are likely to otherwise congregate around commercial services and com-
munity facilities. Therefore, building density is used as a proxy to determine the locations of
population who are not defined as being at a residence, workplace, school/childcare centre or care-
home. Raster surfaces of (a) commercial-use building density and (b) non-commercial building
1 Source: Statistics New Zealand, customised report and licensed by Statistics NZ for re-use under the Creative
Commons attribution 3.0 New Zealand license
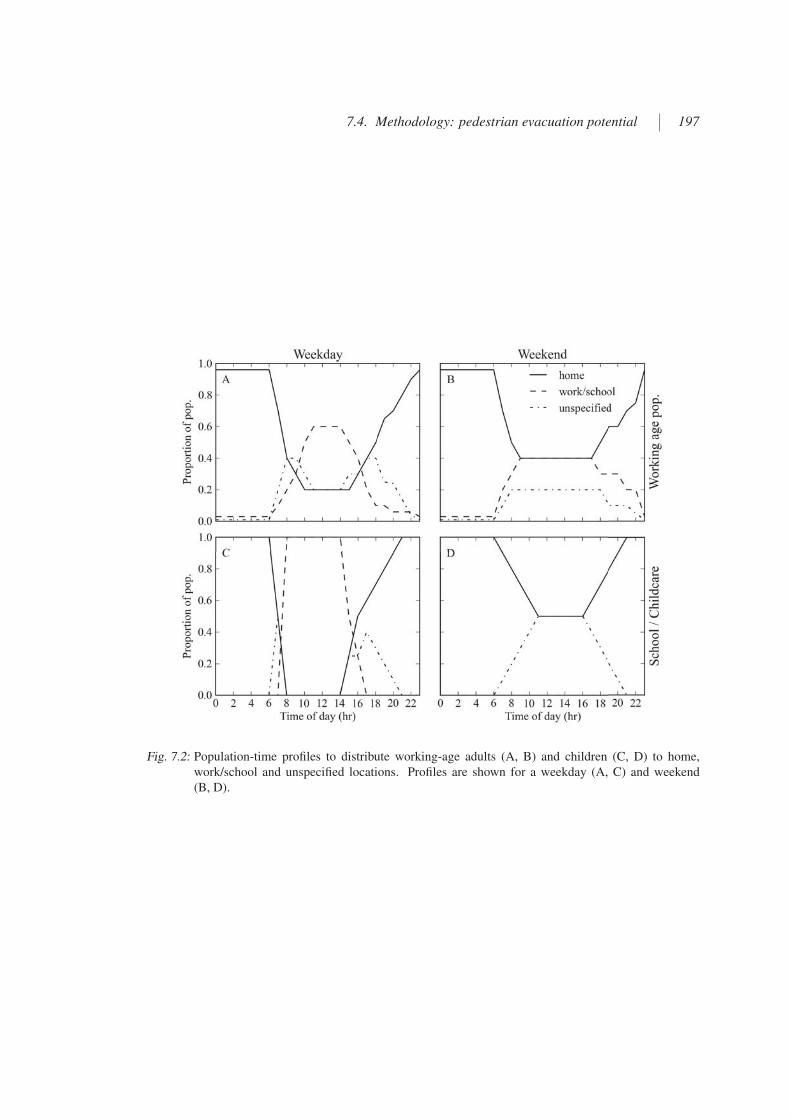
7.4. Methodology: pedestrian evacuation potential 197
Fig. 7.2: Population-time profiles to distribute working-age adults (A, B) and children (C, D) to home,
work/school and unspecified locations. Profiles are shown for a weekday (A, C) and weekend
(B, D).

198 7. Least-cost tsunami evacuation modelling (Paper 4)
density are calculated using the Kernel Point Density tool in ArcGIS 10.1. The two surfaces are
combined using importance-weights of 70 and 30 % respectively, subjectively defined to represent
the relatively greater importance of commercial buildings for congregation of population, then re-
classified to a combined weighting. In the combined raster, highly-weighted cells reflect areas of
highest building density, based on building footprint. The population is then distributed accord-
ing to the weighted surface using a spatial analysis platform (Geospatial Modelling Environment;
Beyer, 2012). This approach ensures that while each individual’s location is random, the model
contains realistic aggregations of population around commercial and public services and facilities
in the city.
Distribution of working-age adults
Population assigned to a workplace is distributed to randomly-selected commercial, industrial, or
community-use buildings until the maximum person-capacity of the building is satisfied. Capacity
is determined using the building floor area (m2) and required floor area per person (Cousins, 2009).
The proportion of this group assigned to residences and to unspecified locations is distributed
according to the method in Sect. 7.4.2. The number of working-age adults (aged 18–65 years) is
derived from census data (Statistics New Zealand, 2012b). All members of this group are assigned
an “adult unimpaired” travel speed.
Employment statistics1 show that approximately 80 % of this group are in employment (Napier
City Council, 2013). Regional employment shift data show that 89 % of working-age adults are
in day-time employment1. Therefore on a weekday, 60 % of working-age adults are assigned
to commercial or industrial buildings between 10:00–16:00, and 20 % to unspecified locations
to represent people working in outdoor locations or in transit while working (Fig. 7.2a). The
remaining 20 % are distributed to randomly-selected residential buildings to represent those at
home during the day (working and non-working population). In the hours 08:00–10:00 and 16:00–
18:00, the proportion of people at unspecified locations peaks to represent commuting between
residences and workplaces. There is no data available to inform the rate of movement of people
at these times, so the population-time profiles curves are developed using expert judgement to
assume movement to residential buildings during this time. Regional commuting data shows a net
reduction of c. 7000 people in the working-age population during weekdays (assumed to be 08:00–
17:00) due to the disparity in numbers of incoming and outgoing commuters. The net balance of
commuters is expected to be much less on weekends, so the effect of commuters is only included
on weekday. The weekend population-time profile assumes, using expert judgement, that 40 % of
working-age adults are at workplaces during the day, with 40 % at home and 20 % at unspecified
locations (Fig. 7.2b). To account for night-shift workers in buildings, 2.5 % of working-age adults
are assigned to workplaces during evening hours and 0.5 % of them are assigned to unspecified
locations. The distribution of people working in evenings (8 %) and overnight (3 %) is based on

7.4. Methodology: pedestrian evacuation potential 199
employment shift data1.
Distribution of children to schools and childcare centres
School rolls are obtained for the 34 schools and one tertiary college in Napier (Ministry of Educa-
tion, 2012a). Attendance rolls for 64 childcare centres are obtained from the Ministry of Education
(2012b). Where published roll data are not available for a centre, the mean attendance roll of all
other centres is applied. The weekday distribution of children places 100 % of children assumed
to be in school or childcare during 08:00–14:00, and at home during 21:00–07:00 (Fig. 7.2c). No
data are available to inform the distribution of children between school or childcare centre, home
and unspecified locations in the intervening hours, so this is subjectively assigned. The combined
school and childcare roll (21 200) is greater than the 2013 adjusted population for age group 2–
18 yr (13 933). The surplus is assumed to be schoolchildren commuting in from other territorial
authorities and they are not included in exposure scenarios between 17:00–07:00.
To account for the total number of people on site, staff numbers are included in the exposure
estimates of childcare facilities using a ratio of one staff member per ten children (Napier Kinder-
gartens, 2012). Staff-to-student ratios are assumed negligible due to the large school population
and lower ratio of staff to schoolchildren. All people distributed to education sites are assigned
child travel speed, due to the expectation that schools will evacuate in class groups, therefore have
reduced speed. Currently, data are not available to elaborate on the effect of group evacuation on
travel speed.
Distribution of dependent and independent elderly
The population at 17 elderly care facilities and retirement villages (1000 people) is defined as
dependent elderly and assigned to the slowest travel speed group (elderly). There are an estimated
10 000 people above 65 years who are considered for this analysis to reside at home, defined in
this model as independent elderly. This group are considered to be more mobile than dependent
elderly, so are assigned to the adult impaired travel speed group.
Both groups are part of the non-working population, assumed based on expert judgement to
be located at home or care facility between 18:00–06:00 (Fig. 7.3a and b). Day-time location is
assumed to be 60 % at home/facility between 10:00–14:00 and 40 % at unspecified locations. The
distribution in the intermediate periods of time (07:00–09:00 and 15:00–17:00) assumes a linear
trend to represent travel patterns between home and unspecified locations.
Distribution of visitors
The daily number and seasonal variation of overnight and day-trip visitors to Napier are derived
from local and regional tourist data (Ministry of Economic Development, 2013a,b; Statistics New
Zealand, 2012a,c). Overnight visitors are distinguished by accommodation type (commercial or

200 7. Least-cost tsunami evacuation modelling (Paper 4)
Fig. 7.3: Population-time profiles to distribute visitors (A), independent elderly (B) and dependent elderly
(C) to home or accommodation, and unspecified locations. Profiles for these groups are the same
for weekdays and weekends.

7.4. Methodology: pedestrian evacuation potential 201
private) and distributed to the appropriate building type in night-time exposure scenarios. Between
23:00–06:00, visitors in private accommodation are distributed in groups of two (mean number
of guests per stay night= 1.67) to randomly-selected residential buildings in Napier (Fig. 7.3c).
Those in commercial accommodation are distributed in groups of two to randomly selected tourist
accommodation (hotel/motel/backpacker/holiday park) according to facility capacity as a propor-
tion of total commercial accommodation capacity. Based on expert judgement, 95 % of visitors are
distributed to unspecified locations between 10:00–18:00 using the spatially-weighted approach,
and 5 % are assumed to be at their accommodation. The estimated number of daytrip visitors is
distributed with the spatially-weighted random distribution for exposure scenarios between 08:00–
20:00.
7.4.3 Estimation of evacuation time
A person’s total evacuation time is represented by a series of discrete time components that include
event detection, warning transmission and reception, evacuation preparation and evacuation travel
(e.g., Gonzalez-Riancho et al., 2013; Post et al., 2009; Purser, 2010; Urbanik et al., 1980). An
evacuation time sequence for an individual or group can be defined as: ETt = EAt+ADt+WDt+
IDt + EPt + TTt where ETt is total evacuation time; EAt is time required to detect an event and
assess the threat; ADt is authorities’ decision-making time for issuing an advisory/warning after
a threat assessment; WDt is warning dissemination time between the decision to issue a warning
and warning receipt by the public; IDt is individual decision-making time on whether to evacuate
or to seek further information; EPt is individual preparation time between an evacuation decision
and initiating movement; and TTt is evacuation travel time that is spent in transit between location
at the time of warning and safe destination. An individual is considered to have the potential to
evacuate successfully if ETt is less than wave arrival time.
In local-source tsunami, short wave arrival times and technological limitations mean that the
detection and warning phases may not be completed fast enough to provide warning with sufficient
time for the subsequent evacuation phases. Instead, tsunami education encourages immediate e-
vacuation on recognition of natural warnings such as earthquake ground shaking or observations of
unusual marine phenomena. Therefore, total evacuation time in the case of local-source tsunami is
a function of the time for individuals to recognise a threat and decide to evacuate (IDt), the time it
takes them to prepare to evacuate (EPt), and their travel time (TTt) so that: ETt = IDt+EPt+TTt.
In this proposed method, evacuation preparation time (Sect. 7.4.3) and travel time (Sect. 7.4.3)
are estimated separately and summed to yield total evacuation time for each individual (ETt). To
account for uncertainty in evacuation time for each exposure scenario, 500 simulations of evacu-
ation time are conducted for each individual in the population to generate mean ETt. From these
500 simulations, the 95 % confidence interval is less than 2 % of the mean population at 20–30 min,
and less than 11 % in the tail of the curve (Fig. 7.4a, which shows the distribution of population for

202 7. Least-cost tsunami evacuation modelling (Paper 4)
ETt in the range 0–90 min). The 95 % confidence interval range based on 1000 simulations is less
than 1–7 %. Five hundred simulations were therefore conducted because they provide comparably
accurate view of the evacuation time curve for a 50 % reduction in computational expense. Individ-
uals whose mean ETt exceeds wave arrival time are subject to further spatial analysis to calculate
the population unable to evacuate the hazard zone before wave arrival (PVE). PVE represents the
demand for additional evacuation capacity, such as vertical evacuation refuges in the hazard zone.
Evacuation departure time (IDt + EPt)
Modelling evacuation departure time is complex and uncertain. Activities in this phase may in-
clude gathering possessions, warning/helping others, confirming warnings, seeking additional in-
formation, and re-uniting or making contact with family before evacuating together (Drabek, 1986;
Lindell and Perry, 1992, 2012). These types of behaviour have been reported in local-source tsuna-
mi (Fraser et al., 2012b; Yun and Hamada, 2012), but literature concerning tsunami evacuation
behaviour remains relatively limited (Dash and Gladwin, 2007; Lindell and Prater, 2010). Quan-
titative data available to constrain tsunami evacuation departure to specific time ranges are limited
to very few studies (Mas et al., 2012a; Suzuki and Imamura, 2005).
Substantial numbers of people choose not to, or are unable to evacuate upon receiving hazard
warnings (Johnston et al., 2005; Lindell, Kang, and Prater, 2011; Lindell and Perry, 1992, 2012),
resulting in compliance rate much less than 100 %. Earthquake ground shaking is often not inter-
preted by people as a tsunami warning (Gregg et al., 2006), therefore not all people evacuate the
hazard zone. Compliance rate is little-studied for local-source tsunami, but may be influenced by
proximity to the shoreline, property ownership, age and preparation of household plans (Charnkol
and Tanaboriboon, 2006; Murakami and Kashiwabara, 2011). Tsunami evacuation intention sur-
veys in our study area suggest relatively high but location-dependent compliance rate based on
a natural warning: 84 % for respondents on the street at the time of an earthquake, 56 % when at
home (Fraser, Johnston, and Leonard, 2013). A spatially-variable compliance rate is supported
in the proposed method but due to the focus on travel speeds in this analysis, compliance rate is
assumed to be 100 %.
Preliminary surveys of intended evacuation behaviour among residents and visitors in Napier
were unable to quantify evacuation decision-making and preparation time but confirmed that peo-
ple’s intended actions would delay evacuation (Fraser, Johnston, and Leonard, 2013). Therefore,
departure time is represented by a time sampled randomly from a Rayleigh distribution. Sigmoid
curves have been previously used to simulate an initially slow rate of increase in the number e-
vacuating, followed by a more rapid rate of evacuation for hurricanes and nuclear accidents (e.g.,
Lindell et al., 2002; Southworth, 1991; Tweedie et al., 1986). Observed departure times in tsunami
events are well-correlated with the Rayleigh function (Imamura et al., 2012; Mas et al., 2012a).
Suzuki and Imamura (2005) estimated that an optimum evacuation curve has a mean value of 7

7.4. Methodology: pedestrian evacuation potential 203
Fig. 7.4: Evacuation time curves in the range 0–90 min, showing wave arrival time and PV E values for each
curve. ‘d’ refers to a weekday scenario, ‘e’ to a weekend scenario. The number following ‘d’ or ‘e’
refers to the hour of the day (24 hr clock). A: Mean PV E and 95% confidence intervals based on 500
simulations for the February weekday 02:00 exposure scenario; B: Diurnal variation in evacuation
time for February weekday and weekend scenarios; C: Seasonal variation in evacuation time for a
weekend 12:00 scenario; D: Comparison of evacuation time curves for a February 02:00 scenario,
with and without evacuation departure time; E: Comparison of analysis with distributed travel
speeds compared to fixed speeds for a February 02:00 scenario; and F: The impact of applying a
different probabilities that unimpaired adults and children run to evacuate.

204 7. Least-cost tsunami evacuation modelling (Paper 4)
min, while Mas et al. (2012a) proposed that a worst-case curve tends towards arrival time, as peo-
ple wait until later to evacuate. Following the approach of Mas et al. (2012a), Rayleigh curves with
mean values of 7 min and 38 min are applied in this analysis as lower and upper bounds potential
evacuation-time curves (Fig. 7.5). For each simulation, a mean departure time value is randomly
selected from the range 7–38 min, to generate a new Rayleigh function that falls in the shaded area
of Fig. 7.5. Every individual or group is then assigned an evacuation departure time sampled from
the corresponding probability density function. Fraser, Johnston, and Leonard (2013) suggested
different intended actions based on gender and location at the time of earthquake, however, in the
absence of quantitative data to inform a relationship between the two, departure time is treated as
independent of any demographic characteristics or situational/spatial context.
Fig. 7.5: Minimum and maximum bounds of evacuation departure time, represented by Rayleigh functions
with μ=7 min and μ=38 min. In each simulation, mean evacuation departure time is sampled
from the range 7–38 min, and a new Rayleigh function generated. Each individual’s evacuation
departure time is then sampled from that curve, which falls in the shaded area.
Evacuation travel time (TTt)
Evacuation travel mode, generally pedestrian or vehicular, determines the speed and density at
which people can travel through a transport network. Travel mode is influenced by distance to
destination (Lamb and Walton, 2011), starting location (Fraser, Johnston, and Leonard, 2013), and

7.4. Methodology: pedestrian evacuation potential 205
local context such as regular transportation modes (Murakami and Kashiwabara, 2011; Okumura,
Harada, and Kawata, 2011). Tsunami education promotes pedestrian evacuation in local-source
tsunami to minimise traffic congestion that can slow evacuation. Previous LCD pedestrian evacu-
ation models have used a single walking speed for all evacuees, or used a different speed for each
of several demographic groups, representing the impact of age and relative mobility (Table 7.1).
Variability in travel speed is included in this study by sampling from a speed distribution that is
developed using previously-published speeds. To assign distributed travel speeds to the modelled
population, walking speeds identified in the literature are grouped into one of five travel speed
groups: Elderly, Child, Adult impaired, Adult unimpaired, and Running (Table 7.1). The five
travel speed groups are based on the categories given in the originating studies. The travel speeds
found in the literature range between 0.21 and 3.83 m s-1. There is a range of 1.92 m s-1 in the
adult unimpaired group, 1.54 m s-1 for children, and 1.09 m s-1 for elderly. These ranges represent
variability in walking speeds that has not been captured by previous studies that apply a fixed speed
to each category.
The mean speed and standard deviation for each travel speed group (Table 7.2) are used to
generate normal distributions of travel speed (Fig. 7.6). For each individual, a new travel speed
is sampled from the corresponding travel speed distribution in each of the 500 simulations. The
inverse of sampled travel speed is multiplied by the least-cost path distance value at the individual’s
location, to calculate travel time to safety (TTt).
Whilst 65 years (the nominal retirement age in New Zealand) is used in this modelling as
a threshold to consider people as non-working, this is arbitrary as a threshold for implementing
slower evacuation speeds. Assigning a very slow travel speed to everyone above 65 years is unwar-
ranted, as deterioration in mobility is gradual and highly variable. Therefore, different minimum-
age thresholds (65, 70, 75, 80 and 85 years) for assigning the elderly travel speed are tested in this
analysis.
The proposed method for allocating travel speeds allows for the definition of a probability that
an unimpaired adult or child will run in the evacuation, reducing their travel time. The probabil-
ity of any child or unimpaired adult running is set to 20 %, 40 %, and 60 % in three tests. For
each child or unimpaired adult in the exposure model, a randomly sampled value between 0–1
determines whether that individual is assigned to the running travel speed group, or to their o-
riginal travel speed group. The proportion of individuals and groups who might run rather than
walk in an evacuation is not empirically known. To minimise this uncertainty when investigating
temporally-variable exposure, running speeds are omitted from the diurnal and seasonal scenarios.
This also makes the travel speed model more conservative. Sensitivity tests are conducted during
this analysis to test the impact of people running on evacuation potential (Sect. 7.5.4).

206 7. Least-cost tsunami evacuation modelling (Paper 4)
Fig. 7.6: Normally-distributed travel speed for each population group based on statistics presented in Table
7.2. Distributions are derived from the range of travel speeds identified for different groups in the
evacuation literature (Table 7.1).
Tab. 7.1: Pedestrian travel speeds used in previous evacuation analyses; these speeds are used in this study
to generate travel speed distributions. Sources — 1: FEMA (2008, P646 pg. 52); 2: Wood and
Schmidtlein (2012); 3: Cabinet Office Government of Japan (2005); 4: Yagi and Hasemi (2010);
5: Chooramun, Lawrence, and Galea (2012); 6: Revi and Singh (2006); 7: Knoblauch, Pietrucha,
and Nitzburg (1996); 8: Park et al. (2012a); 9: Liu et al. (2009); 10: Johnstone (2012); 11: Liu,
Hatayama, and Okada (2006); 12: Goto et al. (2012b); 13: Sugimoto et al. (2003);14: Post et al.
(2009); 15: Mas et al. (2012a).
Source Original descriptionAssigned travel
speed groupms-1 Max. distance
(km) in 38 min
1 Mobility impaired Adult impaired 0.89 2.04
Non mobility impaired Adult unimpaired 1.79 4.08
2Running — fast, moderate,
slowRunning
3.83, 2.68,
1.798.73, 6.11, 4.08
Walking — fast, moderate, slow Adult unimpaired1.52, 1.22,
0.913.47, 2.78, 2.07
Walking — U.S. crosswalk
standardsAdult unimpaired 1.10 2.60
3 Walking: old man alone Elderly 1.30 2.96
Walking: crowd, ‘sighted’ Adult unimpaired 0.88, 1.29 2.01, 2.94
Walking: people with disability Adult impaired 0.91 2.07
Walking up stairs: old man Elderly 0.21 0.48
Continued on next page

7.4. Methodology: pedestrian evacuation potential 207
Table 7.1 – continued from previous page
Source Original descriptionAssigned travel
speed groupms-1 Max. distance
(km) in 38 min
4 Walking (horizontal) Adult unimpaired 1.00 2.28
Walking (up stairs) Adult impaired 0.58 1.32
5 Unimpaired walking speed Adult unimpaired 1.50 3.42
6 Adult mean walking speed Adult unimpaired 1.39 3.17
Older person mean walking
speedElderly 1.11 2.53
Children mean walking speed Child 0.56 1.27
7Younger person (14–64) design
speed, 15th %ileAdult unimpaired 1.22, 1.25 2.78, 2.85
Older person (65+) design
speed, 15th %ileElderly 0.91, 0.97 2.07, 2.21
8 Age 65+ Elderly 1.25 2.86
Age 13–64 Adult unimpaired 1.51 3.44
9 Age 6–17 Child 1.20 2.74
Age 18–69 Adult unimpaired 1.40 3.19
Age 70+ Elderly 1.00 2.28
10 All Adult unimpaired 1.25 3.00
11 Young walking Adult unimpaired 1.10 2.51
Old walking Elderly 0.80 1.82
12 Normal walkers max speed Adult unimpaired 1.50 3.42
Slow walkers max speed Adult impaired 0.75 1.71
13Person: pushing a
perambulator, with a childAdult impaired 1.07, 1.02 2.44, 2.33
Walking elderly person:
independent, groupElderly 0.95, 0.75 2.16, 1.71
14 Age 15–62: Male, female Adult unimpaired 2.80, 2.70 6.38, 6.16
Age <14 Child 2.10 4.79
Age >62 Elderly 0.70 1.60
15 All — Maximum walking speed Adult unimpaired 1.33 3.03
Tab. 7.2: Travel speed statistics (ms-1) for each travel speed group, compiled from travel speeds in the cita-
tions given in Table 7.1.
Adult impaired Adult unimpaired Child Elderly Running
n 7 19 3 11 3
Min 0.58 0.88 0.56 0.21 1.79
Max 1.07 2.80 2.10 1.30 3.83
Mean 0.88 1.46 1.29 0.90 2.77
SD 0.17 0.50 0.78 0.30 1.02

208 7. Least-cost tsunami evacuation modelling (Paper 4)
7.5 Results
The results of this analysis are presented in the form of two products that would be intended
to provide emergency management personnel with the spatio-temporal view of evacuation suc-
cess required for effective evacuation planning. The first product, a set of evacuation time curves
(Fig. 7.4), demonstrates the distribution of the population with evacuation time from zero (no evac-
uation required) to the upper limit of evacuation time. These curves enable emergency managers to
make quick comparisons of the total population unable to evacuate in different scenarios, whether,
facilitating comparison of proposed evacuation routing options, the effect of introducing vertical
evacuation facilities, and comparison of evacuation in different exposure scenarios. They also
enable a rapid assessment of the evacuation potential in inundation scenarios for which tsunami ar-
rival has been estimated, which can provide benefit in actual events rather than planning situations.
The second product, maps showing density of populations who cannot evacuate successfully (e.g.,
Fig. 7.7), demonstrate the spatial density of population who cannot evacuate in time. These maps
can emergency managers to prioritise areas in which to improve evacuation potential and increase
preparedness, but can also provide decision support in real-time, in terms of directing emergency
response personnel to rescue people in an event, ahead of tsunami arrival.
7.5.1 Spatio-temporal variation in evacuation demand
The results reported in this section use consistent assumptions to demonstrate the influence of
exposure changes: 38 min wave arrival time, elderly age threshold of 80 years (Sect. 7.4.2), and
100 % compliance rate.
Total population in each scenario ranges between 92 % of URP for a weekday 17:00 scenario,
and 110 % on a weekend at 12:00. The 17:00 scenario omits non-resident school-children and
resident (outgoing) commuters, who are assumed to be outside the study area at that time. The
weekend 12:00 scenario has a high population because it includes resident commuters and an ad-
ditional 4000 day-trip visitors. There is substantial diurnal variation in exposure distribution on
weekdays. Individual suburbs show population change of −55–150 % when comparing exposure
at 02:00 to exposure at 12:00, as residential population is re-distributed to schools and commer-
cial/industrial areas during the day. Variation between suburbs is also significant when comparing
weekday and weekend exposure (−54–75 %), but seasonal variation in all suburbs is relatively
limited (generally< 11%).
For this case study, there is some diurnal variation in PVE (Fig. 7.4b) but little seasonal variation
(Fig. 7.4c). It is estimated that 15 200–18 800 people (25–30 % of the total population) are unable
to evacuate before wave arrival at 38 min and require additional evacuation options. Highest PVE
occurs on a weekday at 02:00 (29–30 %) and weekend at 12:00 (28–29 %). The weekday 12:00
scenario shows the lowest PVE (25–26 %). Peak commuting scenarios have PVE of 26 % for 08:00
and 29 % for 17:00.

7.5. Results 209
Although absolute PVE shows minor fluctuations (5 % of the total population) between each
exposure scenario, this masks the significant localised variation in PVE at suburb level between ex-
posure scenarios (Fig. 7.7a–c). The darker shades in Fig. 7.7 indicate high concentrations of PVE.
These locations have the greatest requirement for additional evacuation capacity and could poten-
tially have the highest number of casualties or people trapped in a tsunami. The 02:00 scenario
shows a large area of peak PVE density in the residential suburbs, which have high concentrations
of URP at residential locations overnight. PVE on a weekday at 12:00 is strongly influenced by the
large population concentrations at several schools, which show as two distinct areas of peak densi-
ty. Otherwise, the PVE density evident at 02:00 is more evenly distributed in the 12:00 scenario.
Maximum PVE density occurs in a weekday 02:00 scenario (2800 people km-2) and is 33–41 %
lower for all other scenarios. In the weekend 12:00 scenarios, a smaller proportion of the city has
high PVE density (greater than 1500 people km-2) compared to weekday 02:00. However, density
increases along the coastline and commercial-use areas in weekend day-time scenarios, to a mod-
erate PVE density of 200–1000 people km-2. PVE in the top three suburbs (in terms of PVE at 02:00)
decreases in all diurnal comparison scenarios compared to a weekday 02:00. These decreases are
on the order of 29–52 % (1000–1900 people). Conversely, other suburbs show increases of up to
1600 people (500 %).
It is important to represent the local variation in PVE and influence of the weekend/peak-
commute scenarios to inform appropriate siting choices when planning evacuation. Multiple expo-
sure scenarios can be combined into a maximum exposure surface for a single analysis to provide
maximum potential PVE at every location (Fig. 7.7d). Maximum PVE occurs at weekday 02:00 for
seven of the 14 suburbs in the study area. The other 50 % of suburbs experience their maximum
PVE at weekday 08:00 or at weekend 12:00. Therefore, consideration of only the weekday 02:00
and weekday 12:00 scenarios (i.e., night-time and day-time using employment records) would not,
for this study location, accurately represent the maximum PVE.
In addition to changes in PVE distribution, composition of PVE also varies between exposure
scenarios. In a weekday 02:00 scenario at Napier, 91 % of PVE are people located at home, so the
majority of evacuees will be with their household group. At 12:00 on a weekday the distribution is
more diverse, posing different challenges for evacuation and emergency response than a night-time
scenario. Twenty-five percent of the population are at home, 31 % are children at school, 20 % are
people at work, and 21 % are tourists, resident adults and elderly people at unspecified locations.
In these scenarios, evacuation of large groups becomes more prevalent and immediate actions are
likely to include connecting with family and travelling to schools before evacuating. At 12:00 on
a weekend, PVE comprises 47 % at home, 14 % work, and 31 % of people at unspecified location-
s (an equal composition of resident adults, children, and tourists). One of the most-vulnerable
groups, people in elderly care facilities, comprises< 1% of PVE (< 200 people) in each scenario.

210 7. Least-cost tsunami evacuation modelling (Paper 4)
Fig. 7.7: Point density maps showing the density of population with an evacuation time greater than wave
arrival time PV E . Generated using the distributed travel speed approach, these maps indicate
the variation due to diurnal changes in population distribution. A: Feb weekday 02:00; B: Feb
weekday 12:00; C: Feb weekend 12:00; D: Maximum density from all tested exposure scenarios;
E: Feb weekday 02:00 with evacuation delay omitted (evacuation travel time only); F: Feb weekday
02:00 using fixed speed of 0.89 ms-1; G: Feb weekday 02:00 using fixed speed of 1.1 ms-1; H: Feb
weekday 02:00 using fixed speed of 1.79 ms-1.

7.5. Results 211
7.5.2 Evacuation departure time
To demonstrate the importance of including evacuation departure time in evacuation modelling,
analysis was conducted with the decision-making and preparation time phases (IDt + EPt) omit-
ted. When evacuation departure time is omitted, in a February 02:00 scenario, ETt is reduced by
15 min on average, reducing PVE from 30 % of total population to 9 %. This represents a reduc-
tion of 11 800 people who require additional evacuation capacity (Fig. 7.4d and 7.7e). Without
evacuation departure time, > 50% of the population have ETt < 10 min and several suburbs
show no requirement for additional evacuation capacity. This represents a significant possibility
for under-estimating PVE and requirements for additional evacuation capacity, reinforcing the need
to adequately account for the pre-travel phases of evacuation in LCD modelling. Positively, it also
demonstrates the significant reduction in ETt that can be achieved through minimising evacuation
delays.
7.5.3 Impact of distributed travel speed
The impact of simulating evacuation with distributed travel speeds in a LCD framework has been
tested against three fixed travel speeds: 0.89, 1.1 and 1.79 m s-1. These represent fixed speeds
for a mobility impaired adult (FEMA, 2008), unimpaired adult based on US crosswalk standards
(Wood and Schmidtlein, 2012), and an unimpaired adult (FEMA, 2008) (Table 7.1).
The use of fixed speeds can produce comparable results to distributed travel speeds. This
is dependent on the fixed speed corresponding with the mean of travel speed distributions. In
this case study, a fixed speed of 0.89 m s-1 estimates that 37 % of the exposed population cannot
evacuate in time. Simulation with 1.1 m s-1 estimates 33 % and 1.79 m s-1 estimates 23 %. This
compares to 38 % for analysis with distributed travel speeds. This corresponds to a PVE range of
4600 people across the three fixed speed estimates, which is a significant variation in the estimate
of required additional evacuation capacity. The use of 1.1 m s-1 provides a reasonable assumption
to estimate total PVE where travel speed distributions cannot be modelled (Fig. 7.4e). However,
the 1.1 m s-1 fixed speed curve results in a greater number of people with ETt of 38–80 min than
a distributed speed analysis, which contains more people with ETt > 90 min. Therefore, PVE is
more sensitive to changes in evacuation time when a fixed speed of 1.1 m s-1 is used. If this fixed
speed is used to assess the impact of education to reduce evacuation delays, it is likely to show
greater reductions in evacuation demand than analyses with distributed speed. A fixed speed of
0.89 m s-1 provides a conservative estimate of PVE, which is generally desirable for evacuation
planning, but is less suitable for estimating evacuation demand when designing evacuation refuge
capacity and informing investment decisions. A fixed speed of 1.79 m s-1 underestimates PVE
compared to the distributed speed approach.
The application of fixed speeds also affects spatial distribution of PVE, which can influence
casualty estimation and decisions on where to site evacuation refuges. The first locations to be

212 7. Least-cost tsunami evacuation modelling (Paper 4)
affected by altering travel speed are those located closest to the safety zone, because a small change
in travel speed determines whether ETt exceeds wave arrival time or not. Distribution of PVE
density for a fixed speed of 0.89 m s-1 corresponds closely to that of the distributed speed analysis,
although the extent of high density (> 1500 people km-2) is greater than for distributed speeds
(Fig. 7.7f). At 1.1 m s-1, the spatial extent of high density begins to reduce, with no reduction in
peak PVE density (Fig. 7.7g). For 1.79 m s-1 several suburbs are estimated to have no requirement
for additional evacuation capacity (Fig. 7.7h); use of this speed could lead to locations that require
vertical evacuation being overlooked in decision-making processes.
Due to the similarity of mean travel speed in the distributions compiled for elderly and impaired
adults (Fig. 7.6), application of different minimum-age thresholds (65, 70, 75, 80 and 85 years)
for the elderly travel speed causes less than 1 % variation in population unable to evacuate before
wave arrival. In their current form, and for this exposure case study, the two current travel speed
distributions could be combined with minimal impact on results, but in order to demonstrate the
functionality of the proposed method, both curves were retained in this study. In other case studies,
a proportionally larger elderly population, or concentrations of elderly populations in areas with
great travel distances may result in this group having a larger impact. Improved data on evacuation
walking speeds of the elderly, and age-related decline in walking speeds, would enable validation
and adjustment of this threshold if required.
7.5.4 Application of running speeds
The proposed method enables application of faster travel speeds to proportions of unimpaired adult-
s or children, to test the effect on PVE of the probability that people may run to evacuate. In three
different tests, probability of an unimpaired adult or child being assigned a travel speed sampled
from the Running speed distribution (Fig. 7.6) is set to 20, 40 and 60 %. With a 20 % probability
of running, PVE is reduced by 6 %. A 12 % decrease in PVE is achieved with 40 % probability and
17 % reduction with a 60 % probability (Fig. 7.4f). These results show the tangible impact (reduc-
tion in number of casualties) that is possible due to an increase in travel speeds, and demonstrates
the utility of this method in testing the impact of faster evacuation due to education and evacuation
training. This approach could also be used to quantify the potential benefits of increased bicycle
use in evacuations, to determine whether it is worthwhile trying to increase the use of bicycles in
evacuation.
7.6 Conclusions
This study has proposed a method that augments a GIS-based least-cost distance evacuation model,
to account for temporally variable exposure, uncertain departure time and variability in pedestrian
travel speeds. Population-time profiles are developed to provide exposure distributions for several

7.6. Conclusions 213
population groups for any month, day or time. A Rayleigh function is applied to account for uncer-
tain evacuation departure time. A review of pedestrian evacuation models shows that a wide range
of travel speeds have been applied as one or several fixed speeds in previous analyses. It is postu-
lated that this is not representative of natural variability in pedestrian travel speeds of a population.
Previously-used travel speeds are collated into travel speed distributions for different population
groups based on age and relative mobility.
Modelling multiple exposure scenarios facilitates visualisation of the temporal dimension, in
addition to spatial distribution, of evacuation demand. This enables emergency managers and
planners to understand how the time of an event can affect hazard exposure and potential casualties.
Pre-calculated PVE maps and statistics, derived from a large enough range of exposure scenarios,
could assist in: real-time decision-making to expedite emergency response to areas with greatest
PVE; casualty estimation; public education; and evacuation planning. Robust evacuation planning
requires knowledge of maximum potential PVE at any location to ensure that routes and refuges
have sufficient capacity in any event. Whilst this approach displays several benefits, the large
amount of detailed data required to develop a detailed temporally-variable exposure model poses a
significant challenge to its wider application.
In this case study location, PVE varies little due to diurnal changes in exposure, however,
significant temporal variations in PVE are apparent when comparing individual suburbs. A typical
analysis using two-scenarios (day-time/night-time) has the potential to overlook the full range of
diurnal variation in evacuation demand, particularly in areas that have large exposure of transitional
populations at peak commuting times and on weekends. Seasonal variation is found to be less
important for this case study but should not be ruled out for other locations with a higher ratio of
visitors to residents. Maximum potential PVE can be calculated in a single ETt analysis, but the
estimation of maximum exposure should be based on multiple exposure scenarios, including peak
commuting hours and weekends, rather than just two scenarios covering night-time and day-time.
Development of population-time profiles for Napier required several assumptions due to the
limited amount of data on diurnal activity patterns in New Zealand and internationally. There
remains some disparity in diurnal patterns between the population-time profiles developed for this
study and those determined from large samples in the US and Canada. The improvement of diurnal
activity data and temporally-variable exposure datasets would benefit future risk assessments and
evacuation modelling for all hazards. This analysis applied 500 simulations of evacuation time to
a population distribution that was unchanged in each exposure scenario. Future analyses should
aim to use probabilistic exposure distribution in each simulation to better represent uncertainty in
exposure.
Results of evacuation modelling are highly sensitive to the travel speeds applied. The use of
fixed speeds c. 1.1 m s-1 results in PVE that is consistent with distributed speeds, demonstrat-
ing that this fixed-speed assumption can be used as a suitable assumption for aggregate analyses.
However, the slowest speeds used in previous analyses would over-estimate evacuation demand,

214 7. Least-cost tsunami evacuation modelling (Paper 4)
and the fastest would significantly under-estimate demand. There is a requirement to constrain
travel speeds in community-scale evacuations. Collection of travel speed data for a range of demo-
graphic groups in monitored evacuation exercises could improve distributed travel speed models.
This is particularly important for schools and other institutions where group dynamics are likely to
affect evacuation speeds. Evacuation decision-making and travel time are likely to be affected by
physical and intellectual disability (omitted in this analysis), and further research should focus on
the impact of this on evacuation time.
There are currently insufficient data on the time required to conduct preparation activities,
to quantify preparation time according to personal characteristics and situational context. Quan-
tification of departure time according to different preparation activities would benefit evacuation
modelling and planning, and enable validation of Rayleigh functions. It has been demonstrated that
a reduction in departure time can significantly reduce evacuation time and increase the proportion
of the population able to reach safety. It is important that models incorporate departure time, and
that reduction of this phase is a central aim of tsunami education.
Finally, the proposed method provides spatio-temporal variation in evacuation demand for the
maximum credible local-source tsunami in the case study location. This highlights the locations in
which emergency managers should focus on increasing evacuation potential, for example, through
installation of vertical evacuation refuges. While this analysis focusses on pedestrian evacuation
potential, this represents only one part of a robust evacuation plan. Complementary agent-based
evacuation simulation should be used to validate the results of this least cost distance method and
to elaborate on traffic modelling, network capacity issues and evacuee interactions. The potential
disruption to evacuation routes, damage to buildings and infrastructure as a result of earthquake
ground shaking, and the effect of aftershocks on evacuation should be considered in future analyses.
7.7 Acknowledgements
We would like to thank Jim Cousins (GNS Science) for valuable discussion of exposure mod-
els; Megan Harris (Hawke’s Bay Tourism) for provision of tourism data; Lisa Pearse (Hawke’s
Bay Civil Defence Emergency Management Group) and Craig Goodier (Hawke’s Bay Regional
Council) for provision of topography data; Robyn Tuohy (Massey University) for discussion of
age-dependent mobility; and Jeanne Jones (USGS) for providing information on application of
ArcGIS anisotropic least-cost path distance module. We would also like to thank two anonymous
reviewers and Dr Sergio Freire (European Commission Joint Research Centre (JRC)) for their
review comments, which have helped to improve this manuscript. This research was supported
by public research funding from the Government of New Zealand and the US Geological Survey
(USGS) Land Change Science Program. Any use of trade, product, or firm names is for descriptive
purposes only and does not imply endorsement by the US Government.

7.8. Napier specific results 215
7.8 Napier specific results
This section documents the results of LCD evacuation modelling at the suburb-level. Variation
between suburbs was summarised in Section 7.5 but the detailed values were not presented in the
paper. This section does not form part of the paper intended for publication, and is intended instead
for publication as a GNS Science Report for presentation to the regional and local Civil Defence
Emergency Management (CDEM) groups.
Average evacuation times (ETt) for the population in Napier are shown in Fig 7.8. Each
point represents an individual or group of individuals. Points coloured yellow to red have ETt
greater than wave arrival time. Suburbs with the longest evacuation times are northern Westshore,
Maraenui and Awatoto, due to their long path distance to safety. Average ETt in the southern part
of Westshore are in the range of 38–60 min, assuming that the bridges connecting Westshore to
Ahuriri can be crossed by pedestrians following the earthquake. Even with functioning bridges,
this analysis suggest that Westshore requires vertical evacuation to provide safety of its residents,
in flow depths of up to 9 m. If these bridges were damaged such that they could not be used, ETt in
Westshore would increase with the requirement to travel north to the safety zone. Population with
ETt ≥ 38 min are also located in Bay View, Meeanee, Onekawa West, Onekawa Central, Nelson
Park and Mclean Park, while Ahuriri, Tamatea North, Poraiti and Pirimai have much lower ETt.
This is reflected in the PV E values provided in Table 7.3.
Across the whole Territorial Authority, the number of people who do not have the potential to
evacuate in the available time (PV E) is on the order of 15,000–18,000 (25%–30% of total popula-
tion) in any exposure scenario (Fig 7.4b, Table 7.4). The suburbs with highest numbers of people
requiring additional evacuation capacity are Onekawa South, Marewa, Maraenui, and Meeanee
(Fig 7.7; Fig 7.9; Table 7.3). Each of these suburbs have a mean PV E ≥2,000 and a range of
>1,000 across all scenarios.
Diurnal changes in exposure suggests that night-time and weekend 12:00 scenarios, which
maximise the number of day trip visitors, result in the highest PV E , whilst PV E in weekday sce-
narios is around 3,000 lower. Table 7.3 presents absolute PV E for different exposure scenarios for
each suburb. Seasonal variations in tourist numbers has relatively little impact on PV E , with week-
end lunchtime estimates all in the range 17,000–18,000 for January, February, May and November
scenarios.
In order to reduce PV E , evacuation time must be reduced by reducing delay time and / or
travel time. The latter may be achieved by reducing distance to safety or increasing travel speed.
Based on maximum potential PV E density, the five most optimal locations for vertical evacuation
refuges have been identified (Fig 7.10). These locations are indicative only; they are not related
in anyway to physical or built features, such as roads for access or available parcels of land. The
locations are selected using an iterative process described in Fig G.7. The point of highest PV E
density is selected as the optimal location. This location is added to the original safety zone, and a

216 7. Least-cost tsunami evacuation modelling (Paper 4)
new path distance analysis conducted based on the new safety zone. This accounts for evacuation
to the newly-added refuge. Meanwhile, a specified area around the location is removed from the
PV E density data, which are re-analysed to find the new point of maximum density. Thus, the next
most-optimal location is identified and path distance analysed with this refuge included as a point
of safety. Path distance analysis considering the development of multiple refuges can be conducted
by augmenting the safety zone with more than one refuge.
In order of priority, the refuges should be located on the border of Onekawa South and Maraenui,
in south Marewa, in Onekawa Central, in Mclean Park, and in Westshore. According to the maxi-
mum simulated flow depth at the locations identified, the minimum elevation of the refuges should
be ≥3 m for sites 1, 3, and 5 (Fig 7.11), based on the FEMA (2008) guidelines for minimum height
(Section 3.2.2). Sites 2 and 4 would require the refuge to be at a minimum elevation of ≥ 6 m.
Any refuges in Ahuriri, Westshore, northern Onekawa West, the Port, and locations on the eastern
shore would require refuge elevation of ≥ 9 m.
The impact of implementing the top two proposed refuge locations, separately and in combi-
nation, on the evacuation time curve for a February 02:00 scenario is shown in Fig 7.12. Imple-
menting the most optimal refuge has the potential to save 3,800 people, providing a facility of that
capacity is constructed (Table 7.5). A facility at the second-most optimal location could provide
refuge for 2,700 people, and in combination the potential lives saved could equal exceed 5,000.
These values are calculated according to the total number of people located in a radius of 1,200
m, which is the maximum distance that can be covered in the simulated arrival time with a travel
speed equal to the slowest mean distributed travel speed in the analysis (0.88 ms-1). They provide
an indication of the life-saving potential only; the design of structures should endeavour to meet
these estimates when considering the maximum capacity of safe storeys. The PV E estimates given
here are a first attempt to quantify evacuation potential. Refinement of the modelling to include dy-
namic inundation would likely reduce PV E , while the inclusion of non-compliance would increase
PV E .

7.8. Napier specific results 217
Fig. 7.8: Average total evacuation time (ETt) for the population in Napier, in a February 02:00 exposure sce-
nario. Time data is overlaid on maximum flow depth values, indicating that the areas of maximum
ETt are also those with flow depths >3 m.

218 7. Least-cost tsunami evacuation modelling (Paper 4)
Tab
.7
.3:
Ab
solu
tePVE
for
each
subu
rbin
Nap
ier
acro
ssm
od
elle
dex
po
sure
scen
ario
s,w
ith
rele
van
tst
atis
tics
.
Suburb
Jan
-
e12
Feb
-
d2
Feb
-
d1
2
Feb
-
e12
Feb
-
d8
Feb
-
d1
7
Nov
-
d2
Nov
-
d1
2
Nov
-
e12
May
-
d2
May
-
d1
2
May
-
e12
Mea
nS
tDev
On
ekaw
a
So
uth
3,0
09
4,4
70
2,7
49
2,9
08
3,1
87
2,8
06
4,3
32
2,6
90
2,8
85
4,4
14
2,6
68
2,8
83
3,2
50
71
1
Mar
ewa
2,7
27
3,5
58
1,7
65
2,6
26
2,0
74
2,5
25
3,4
48
1,7
46
2,5
94
3,5
26
1,7
57
2,6
31
2,5
81
66
9
Mar
aen
ui
2,4
39
3,6
88
1,7
86
2,3
88
2,0
86
2,3
14
3,6
60
1,7
39
2,3
56
3,6
49
1,7
41
2,3
45
2,5
16
73
9
Mcl
ean
Par
k1
,97
12
,65
72
,55
81
,95
42
,70
21
,74
42
,56
32
,53
51
,92
72
,54
42
,50
01
,86
82
,29
43
62
Mee
anee
2,0
75
32
01
,17
71
,94
91
,13
51
,54
92
93
1,1
30
1,9
17
31
31
,06
21
,79
11
,22
66
55
On
ekaw
a
Cen
tral
96
21
,09
71
,46
59
83
1,4
71
89
21
,03
81
,48
89
74
1,0
95
1,4
79
98
11
,16
02
40
Wes
tsh
ore
1,2
04
1,3
18
84
01
,13
58
98
93
91
,27
38
41
1,1
02
1,2
29
76
81
,08
31
,05
31
89
On
ekaw
a
Wes
t1
,47
61
26
1,1
68
1,4
34
68
88
53
11
01
,47
71
,42
41
20
1,4
29
1,6
87
99
96
00
Bay
Vie
w1
,26
57
97
64
11
,19
77
07
1,0
13
65
56
78
1,1
77
73
86
28
11
67
88
92
53
Nel
son
Par
k7
73
1,1
70
46
27
37
98
67
42
1,0
08
71
67
71
10
69
81
88
38
84
11
90
Aw
ato
to1
,01
23
87
65
79
72
55
97
53
37
85
76
87
03
96
58
08
55
66
62
25
Pir
imai
20
63
39
11
92
41
13
72
67
26
61
40
25
64
04
16
43
24
23
98
9
Tam
atea
No
rth
12
62
49
87
16
08
01
73
14
41
18
16
22
64
79
19
21
53
61
Ah
uri
ri2
63
41
03
13
93
35
21
32
73
52
34
43
11
2
Co
nti
nu
edo
nn
ext
pag
e

7.8. Napier specific results 219
Tab
le7
.3–
con
tin
ued
fro
mp
rev
iou
sp
age
Su
bu
rbJa
n-
e12
Feb
-
d2
Feb
-
d1
2
Feb
-
e12
Feb
-
d8
Feb
-
d1
7
Nov
-
d2
Nov
-
d1
2
Nov
-
e12
May
-
d2
May
-
d1
2
May
-
e12
Mea
nS
tDev
Po
rait
i2
30
10
22
14
29
02
13
80
17
37
18
13
Ho
spit
al
Hil
l0
00
00
00
00
00
00
0
Blu
ffH
ill
10
00
00
00
00
00
00
Tam
atea
So
uth
00
00
00
00
00
00
00
Gre
en-
mea
dow
s0
00
00
00
00
00
00
0
Tar
adal
e
No
rth
00
00
00
00
00
00
00
Tar
adal
e
So
uth
00
00
00
00
00
00
00
To
tal
19
,29
52
0,2
10
15
,49
41
8,7
37
16
,76
31
6,6
32
19
,22
01
5,9
08
18
,48
01
9,7
96
15
,71
31
8,7
26
17
,91
51
,70
0

220 7. Least-cost tsunami evacuation modelling (Paper 4)
Tab. 7.4: Population values for each tested exposure scenario. Columns show the number of people in the
safe zone, with sufficient evacuation potential (<38 min), and with insufficient evacuation potential
(≥38 min).
Scenario Pop. in safe zone <38 min ≥38 min (PV E) Total
Feb d2 25,404 (41%) 17,348 (28%) 18,592 (30%) 61,344 (100%)
Feb d8 30,152 (49%) 15,140 (25%) 15,942 (26%) 61,234 (100%)
Feb d12 30,099 (49%) 16,200 (26%) 15,249 (25%) 61,548 (100%)
Feb d17 23,728 (43%) 15,881 (29%) 15,815 (29%) 55,424 (100%)
Feb e12 28,046 (43%) 19,667 (30%) 18,245 (28%) 65,958 (100%)
Jan e12 28,708 (42%) 20,488 (30%) 18,782 (28%) 67,978 (100%)
May d2 25,152 (42%) 16,536 (28%) 18,173 (30%) 59,861 (100%)
May d12 29,153 (49%) 15,268 (26%) 15,176 (25%) 59,597 (100%)
May e12 26,129 (42%) 18,127 (29%) 17,858 (29%) 62,114 (100%)
Nov d2 25,342 (42%) 17,508 (29%) 17,726 (29%) 60,576 (100%)
Nov d12 29,646 (49%) 15,385 (25%) 15,490 (26%) 60,521 (100%)
Nov e12 27,129 (42%) 18,922 (30%) 17,924 (28%) 63,975 (100%)
Tab. 7.5: The potential impact of implementing TVEB at the two most optimal locations, on PV E in a
February 02:00 scenario. Percentage change shows the impact of implementing TVEB on PV E ,
relative to the situation with no TVEB.
no TVEB TVEB 1 TVEB 2 TVEB 1+2
Safe 25,404 25,461 25,442 25,477
<38 min 17,976 21,762 20,693 23,005
≥38 min (PV E) 17,964 14,120 (-21%) 15,208 (-15%) 12,861 (-28%)
Potential evacuees 3,844 2,756 5,103

7.8. Napier specific results 221
Fig. 7.9: Mean and range of PV E for each suburb in Napier, across all modelled exposure scenarios.

222 7. Least-cost tsunami evacuation modelling (Paper 4)
Fig. 7.10: Top five locations for Tsunami Vertical Evacuation Buildings (TVEB) in Napier, based on maxi-
mum evacuee density across all scenarios.

7.8. Napier specific results 223
Fig. 7.11: Minimum elevation of vertical evacuation refuge, according to FEMA (2008) guidelines and max-
imum credible flow depth (Fraser et al., 2014).

224 7. Least-cost tsunami evacuation modelling (Paper 4)
Fig. 7.12: Potential impact on the February 02:00 evacuation time curve due to implementation of the two
most-optimal TVEB, individually and in combination.

7.9. Link to next chapter 225
7.9 Link to next chapter
This chapter has presented a methodology that combines anisotropic least-cost path distance evacu-
ation modelling with an enhanced view uncertain parameters, namely temporally variable exposure
and distributed travel speeds. The method has been used to identify the optimal locations for TVE-
B in Napier, based on the simulated density of population who may not be able to evacuate the
hazard zone prior to wave arrival in the maximum credible local-source tsunami. The next chapter
presents a synthesis of the work that has been presented in the previous four stand-alone papers
(chapters 4, 5, 6 and 7). Recommendations are made for the development of vertical evacuation
strategies in New Zealand on the basis of work presented in this thesis.


8. DISCUSSION
Evacuation is a ‘necessary consideration for public safety’ (Garside et al., 2009), particularly in
local-source tsunami. This thesis aimed to enhance the theoretical and methodological basis for
development of vertical evacuation strategies in New Zealand. In doing so, it has filled a major
gap in current tsunami risk reduction activities. To achieve the overall research aim, four research
objectives have been addressed:
1. Determine maximum credible inundation extent, flow depth and available evacuation time
due to local-source subduction zone tsunami at a case study location in New Zealand (Chap-
ter 4);
2. Elucidate experiences of vertical evacuation in the March 2011 Great East Japan tsunami to
inform vertical evacuation planning in New Zealand (Chapter 5);
3. Explore intended evacuation behaviours in local-source tsunami in New Zealand, and gather
preliminary research on public perception of vertical evacuation facilities (Chapter 6);
4. Develop a method to assess pedestrian evacuation potential of the exposed population to
inform decision-making on evacuation planning, including vertical evacuation strategies
(Chapter 7).
This discussion chapter synthesises the findings from the four research phases conducted to address
the above objectives. It outlines their contribution to knowledge of local-source tsunami evacua-
tion and makes recommendations for the development of vertical evacuation as a component of
comprehensive tsunami evacuation strategies in New Zealand.
8.1 Local-source tsunami hazard in New Zealand and the need for vertical evacuation
Numerical simulation of four local-source tsunami scenarios has been conducted using the latest
information on seismic potential at the Hikurangi subduction margin, offshore of the east coast of
New Zealand’s North Island (Chapter 4). The simulations show the potential for variable inunda-
tion and arrival times on the order of 30–40 min from such events. Inundation is expected to reach
4–5 km inland at Napier due to the maximum credible event, a MW 9.0 rupture of the whole margin.
Wave arrival at Napier is expected to occur approximately 38 min after earthquake rupture. Flow
depth would be expected to exceed 8 m in areas closest to shore. Comparison of flow depth against
228 8. Discussion
fragility curves from the Great East Japan tsunami demonstrates the potential for major damage
to timber frame buildings and moderate-major damage to Reinforced Concrete (RC) buildings.
The simulated inundation extent is consistent with inundation maps generated independently by
Hawke’s Bay Regional Council (Hawke’s Bay Civil Defence And Emergency Management, 2011)
and the worst-case evacuation zone produced using the New Zealand national standard rule-based
evacuation mapping approach (Section 4.10). The data produced in Chapter 4 were used as the
basis for hypothetical scenarios in the investigation of intended evacuation behaviour (Chapter 6)
and for pedestrian evacuation modelling (Chapter 7).
Preliminary ground shaking intensity mapping and estimates of rupture duration in the maxi-
mum credible scenario suggest intensity of Modified Mercalli Intensity (MMI) 7–10 at Napier and
ground shaking of at least 2 min (Appendix F). This is ‘damaging’ to ‘very damaging’ shaking,
during which people would find it hard to stand up (Table F.2). Therefore the earthquake should
result in sufficient strength and duration of ground shaking to be taken as an unambiguous natural
warning of tsunami, in line with tsunami education in New Zealand. Unfortunately, this research
has suggested that many people would react to the earthquake, but that there may be low levels of
subsequent tsunami evacuation.
The numerical modelling also highlights the relevance of this thesis to tsunami risk reduction in
several other coastal urban areas of New Zealand. Following rupture of the Hikurangi subduction
margin, there is likely to be <60 min available for evacuation of the coastline in the Gisborne,
Wellington, Horizons-Manawatu, and Marlborough regions (Fig 4.7). The national tsunami hazard
review (Power, 2013) indicates significant maximum amplitude at the 1 in 2,500 years return period
(84th percentile) in these regions: Gisborne (14 m), Tauranga (∼9 m), Wellington Harbour (11 m),
and Kaikoura (>10 m). Additionally, there are long distances and limited routes to high ground
from in some of these areas, notably in Tauranga (Papamoa) and Wellington harbour (Petone and
Kilbirnie/Lyall Bay in particular), with the potential to require vertical evacuation. This research
has focussed on a single case study location but the data and proposed methodologies are also
applicable to these locations.
8.2 Design of vertical evacuation refuges
8.2.1 Structural requirements
The Great East Japan tsunami highlighted the potential of vertical evacuation to save many lives
in local-source tsunami. Most Tsunami Vertical Evacuation Buildings (TVEB) fulfilled their des-
ignated evacuation function despite, in some cases, flow depth >10 m inundating several storeys.
However, some TVEB and evacuation sites on high ground were overtopped or inundated, result-
ing in loss of life. The elevation of those sites had been designed on the basis of historic tsunami
inundation, which underestimated the maximum credible inundation. Robust long-term hazard as-
sessment is required to ensure that any evacuation refuge is located at sufficient height to provide

8.2. Design of vertical evacuation refuges 229
safety above the maximum credible flow depth.
Current guidelines provide equations for derivation of tsunami design loads and required refuge
height based on maximum run-up and flow depth. A significant amount of new fragility and tsuna-
mi loading data is being analysed internationally to update approaches to estimation of tsunami
loading (Section 3.2.2). In the United States (US), guidelines are planned for publication in the
2016 edition of the American Society of Civil Engineers (ASCE) 7 Standard, Minimum Design
Loads for Buildings and Other Structures (Chock, 2012). Fire protection and measures to prevent
buildings over-turning are required in the updated guidelines, based on evidence from the Great
East Japan tsunami. The New Zealand emergency management and engineering communities
should be encouraged to assess and adapt, where required, the revised tsunami loading guidelines
for implementation into the New Zealand Building Code.
The calculation of design tsunami loads for implementation of current and forthcoming struc-
tural guidelines requires estimation of flow depth. In order to ensure that adequate tsunami loading
is applied in design, maximum credible flow depth should be obtained by numerical simulation of
low-frequency tsunami scenarios (e.g., 1 in 2,500 year return period), derived from Probabilistic
Tsunami Hazard Assessment (PTHA). The recently-published New Zealand national tsunami haz-
ard review (Power, 2013) provides the ability to select extreme local-source tsunami on the basis
of maximum amplitude at the coast and should be used to define the maximum credible tsunami
at each site to assess flow depth for vertical evacuation design. The experiences related by civil
protection and emergency services staff during our interviews in Japan (Chapter 5) highlight the
importance of considering non-structural aspects of TVEB, some of which have been previous-
ly raised in the limited published literature on vertical evacuation (Section 3.6.4). The following
paragraphs outline the features that must be addressed when developing vertical evacuation refuges.
Although these were explored in the context of TVEB, they are also relevant to the development
of towers and berms too.
8.2.2 Refuge capacity
It is important to estimate the required capacity of each planned refuge to ensure that all evacuees
who go there can access a safe elevation. Chapter 7 proposes a method to select optimal locations
for evacuation refuges based on the density of population requiring additional evacuation options,
and provides an estimate of the required capacity to provide refuge to all people in a radial catch-
ment area. Minimum space requirements for refuge occupants (e.g., FEMA, 2009) should be used
to estimate the floor-space requirements of each refuge. In the design of vertical evacuation strate-
gies, the achievable capacity will determine whether the required capacity can be achieved, within
budget constraints and practical limitations.
Refuge capacity (i.e., over-crowding) was not raised as an issue during our interviews about
evacuation in the Great East Japan tsunami because most people prioritised high ground as a desti-

230 8. Discussion
nation. Evacuation behaviour surveys in Napier suggest that buildings are seen by respondents as a
‘last-resort’ option, suggesting that most people would attempt to travel to high ground rather than
go to buildings. This may reduce the potential for over-crowding of refuges where high-ground
is an option, but the potential for over-crowding cannot be discounted, particularly where there is
clearly no other option. Results of the survey in Napier suggested that concerns about slow access
and over-crowding must be addressed in public education, to ensure that people are not discouraged
from using available refuges when required.
8.2.3 Access to safe refuge level
Access to the safe elevation of a refuge is required at all times for vertical evacuation to be effective.
Various approaches to ensuring 24-hour access to TVEB are proposed following the example of
Japanese facilities (Chapter 5). It is expected that access arrangements (e.g., via external stairs,
staff opening the building, forced entry or community key-holders) would be decided on a case-
by-case basis during the refuge design and designation process, through dialogue with building
owners and local communities. Generally, access to berms would be provided by ramps or stairs.
It would be prudent to ensure redundancy in access options by making provision for more than one
method of access to any refuge.
Planning guidelines should outline all possible options with corresponding legislative frame-
work to facilitate the most suitable option in each case. For example, Section 87 ‘Entry on premis-
es’ of the Civil Defence Emergency Management (CDEM) Act 2002 (New Zealand Government,
2002) may provide some legislative precedent for gaining entry to designated TVEB in the event
of needing to enable people to evacuate vertically (Textbox 8.1). Local-source tsunami evacuation
is likely to occur prior to any declaration of a state of emergency, therefore, current provisions for
forced entry are unsuitable.
Textbox 8.1 (Section 87 ‘Entry on premises’ of the CDEM Act 2002)
If a state of emergency is in force in any area, a Controller or a constable, or any personacting under the authority of a Controller or constable, may enter on, and if necessarybreak into, any premises or place within the area or district in respect of which the state ofemergency is in force if he or she believes on reasonable grounds that the action is necessaryfor—(a) saving life, preventing injury, or rescuing and removing injured or endangered persons; or(b) permitting or facilitating the carrying out of any urgent measure for the relief of sufferingor distress.
New Zealand Government (2002)

8.2. Design of vertical evacuation refuges 231
8.2.4 Evacuation signage
Clear and consistent evacuation signage is required to promote awareness of the existence and loca-
tion of vertical evacuation refuges, and to direct evacuees and emergency responders to the refuge
in an emergency. Signs should be clearly displayed in large format at high elevation, e.g., on mul-
tiple sides at the top of buildings, and above all entrances. At entrances, signs should indicate the
most appropriate access route to upper storeys, as observed at newer TVEB in Japan (Appendix D).
Signage should be consistent with current the New Zealand national tsunami signage standard (M-
CDEM, 2008c), which includes provisions for vertical evacuation. However, the current standard
sign indicates evacuation via stairs (Fig 3.2F) and the sign indicating safe refuge level includes no
symbology (Fig 3.2H). These may be appropriate when referring to external staircases, or hillside
paths such as those common in the hillsides of Wellington, but they do not unambiguously depict
the role of TVEB. To address this issue, it is proposed that additional signage, based on the de-
piction of a building on Japanese signs, be included into the national standard (Fig 8.1). The text
on Fig 8.1b could be replaced with a distance and directional arrow for placement on the street,
directing evacuees to the refuge.
(a) (b)
Fig. 8.1: Proposed options for vertical evacuation signs for improved representation of TVEB. Symbology
is consistent with current signage standards but provides clearer depiction of the role of buildings
and refuges. Image (b) shows an example of the sign with additional directional information noting
the safe storey or distance to refuge.
8.2.5 Evacuee welfare
In any vertical evacuation refuge, there should be provision of shelter, food and water, and commu-
nication links to civil defence and emergency services at the refuge level. Provision of shelter and
supplies is important given the potential for refuges being in use for up to a few days if tsunami

232 8. Discussion
waters subside slowly or if debris prevents egress from the refuge. Communication equipment is
important in case fire threatens a refuge during a tsunami, or if there are medical emergencies a-
mong the evacuees. Adequate provisions may help reduce any need or urge of evacuees to leave the
refuge earlier than it is safe to do so (i.e., before an all-clear message from CDEM). The amount
of provisions should be commensurate with the refuge capacity, and be subject to a plan for main-
taining and refreshing supplies periodically. Duration of refuge occupancy is difficult to estimate,
but evidence from Japan suggests that it is reasonable to expect that a refuge could be occupied for
>24 h, and potentially ≥48 h.
8.3 Community participation
Community engagement has been an important component of designating private buildings as
TVEB in Japan, the positive progress of ‘Project Safe Haven’ in Washington State, US, and the
successful approach taken to evacuation mapping in Wellington, New Zealand. Leveraging com-
munity interest and encouraging owners to see the provision of the facility as a benefit to the com-
munity was effective in Japan for allaying the concerns of building owners, which centred around
liability for evacuees and access issues. These initiatives and the preparedness literature suggest
that development of any vertical evacuation strategy should be strongly community-based to incor-
porate local knowledge and communities’ requirements, to encourage community partnership and
ownership, and to promote discussion and education.
Due to the anticipated investment costs of construction and designation, any refuge is likely to
require a non-emergency use in order to be funded. Project Safe Haven showed that community
workshops can be forums for development ideas to design refuges that meet regular requirements
of the community. This is particularly necessary if the refuge is a public building (Project Safe
Haven, 2011b). Longstanding uncertainty around liability for evacuees using TVEB, and ethics
of vertical evacuation (Ruch et al., 1991) have not been addressed during this research, and these
issues must be fully explored in the future in the preparation of vertical evacuation guidelines.
These are issues that will likely influence whether refuges are incorporated into public or private
developments.
8.4 Education
8.4.1 Tsunami warning expectations and response
Surveys conducted in Napier reveal high awareness levels of tsunami hazard and appropriate ac-
tions to take in tsunami, consistent with previous surveys (Chapter 6). There remains a worrying
level of confusion around the different warning dynamics in local, regional and distant-source
events — namely the common expectation that an official warning will be issued via sirens, tele-
vision or radio in the event of a local-source tsunami. As this is a long-standing problem in New

8.4. Education 233
Zealand, there should be focussed research into the efficacy of currently-used natural warning mes-
sages and an investigation of whether more-effective messages could be developed.
Despite a high awareness of the role of earthquakes in tsunami generation, and of appropriate
tsunami actions, when reporting intentions in a hypothetical local-source tsunami most survey
respondents did not cite tsunami evacuation as an intended action after citing initial responses to
ground shaking (Chapter 6). Earthquake and tsunami education in coastal areas should aim to
promote a combined response in order that people act in response to tsunami in addition to the
earthquake. Education should emphasise the importance of taking proactive evacuation decisions
and the need to base one’s actions on observations of the evolving hazard situation. For instance, a
person’s initial evacuation destination may not remain safe for the duration of the tsunami, therefore
people should be prepared to move to a location further inland or higher, if required.
A bias towards short expected wave arrival times after ground shaking is encouraging, but a
similar bias following official warnings, reported in Napier surveys, is a concern. The latter could
lead to fatalism and a tendency for people to not attempt evacuation. Education should challenge
these beliefs by focussing on improving understanding of warning dynamics, and emphasising that
every step further inland means inundation will be less severe, and chances of survival increase.
8.4.2 Evacuation actions
New data on intended actions during or immediately after a local-source earthquake in New Zealand
are consistent with actions reported in previous studies. Actions such as helping others, checking
on and gathering family, and collecting or securing property are expected to cause delays in tsuna-
mi evacuation, although this study was unable to quantify the delay. Further research should aim
to obtain timing information for intended actions, particularly with respect to situational context
such as being at home or not, or evacuation occurring at night or on in the day. These data should
be collected in contexts consistent with naturally-warned, short lead-time events, in order to be
applicable to local-source tsunami. Identification of intended actions also enables development of
education aiming to reduce evacuation delays. For example, ensuring shared knowledge of school
evacuation plans between school staff, parents and children may mitigate the desire or need for
parents to travel to a school to collect their children, which can endanger the safety of parents
and children. Longitudinal studies should be used to track changes in intended behaviour and the
efficacy of evacuation education messages.
Intended evacuation travel modes in Napier were relatively evenly split between vehicle and
pedestrian evacuation. The surveys revealed an understanding in Napier that road damage may
preclude the use of vehicles for evacuation. Tsunami education should continue to promote the
message that pedestrian evacuation is most desirable. Murakami and Kashiwabara (2011) sug-
gested that chosen travel mode in evacuations is influenced by a person’s regular travel mode in
non-emergency situations. Therefore, an increase in regular ‘everyday’ cycle use could increase

234 8. Discussion
the number of people using a bicycle to evacuate, expediting evacuation without increasing traffic
congestion.
8.4.3 Vertical evacuation refuges
Education highlighting the availability and appropriate use of refuges is an important part of devel-
oping a vertical evacuation strategy. This is particularly true where vertical evacuation is a novel
concept. Education should communicate the tsunami-resistance and design features of refuges, and
their expected performance in events, to counter the reported primary concerns around the strength
and height of a refuge (Section 6.6). The situations in which they are appropriate for use, i.e.,
following the occurrence of a long or strong earthquake, is a key message. The concept of vertical
evacuation and use of refuges should be communicated in conjunction with ongoing education on
tsunami hazard, warning expectations and evacuation actions to ensure its integration into tsunami
evacuation practice and to communicate its role with respect preparedness activities. The initiation
of discussions around vertical evacuation planning is likely to be the focus of media attention, trig-
gering community discussion and interest, with potentially positive benefits for preparedness. The
findings
Education should address concerns about evacuation into buildings such as those raised by
respondents of the Napier surveys (Section 6.6), but also any new concerns that might be raised
through community engagement. It is important that people have a good understanding of the
likely time-frame of tsunami arrival after ground shaking in order to make informed judgements on
the most appropriate destination. Destination choice should be informed through prior education
and encouragement to prepare household/workplace evacuation plans. Education about vertical
evacuation should cover the following points:
• Vertical evacuation refuges offer an alternative to the primary destinations of high-ground /
inland, primarily in local-source tsunami but also regional-source events
• Vertical evacuation refuges do not guarantee safety, due to the risk of debris-strike or fire
• Benefits of vertical evacuation refuges (for non-emergency public-use, but also as encour-
agement for owners to facilitate use as refuge)
• Expectations of occupancy period and instructions to remain in the refuge until an official
‘all-clear’ message
• The welfare that is available at refuges in case of extended occupancy or emergency
• How specific refuges may be accessed for evacuation (particularly required for TVEB). The
incorporation of refuges in evacuation exercises would be a benefit, as long as care is taken
to prioritise evacuation to high ground over the use of vertical evacuation

8.5. Evacuation modelling for local-source tsunami 235
• Structural strength and designation process of refuges
Consistent messaging for broadcast on television and radio should be developed to reiterate
the availability and appropriate use of vertical evacuation refuges. Although it is preferable that
the population has a high-level of evacuation training and pre-event education, broadcast messages
would provide information for people seeking further information prior to evacuation in a local-
source event. This messaging would reiterate the availability of vertical evacuation, but that the
priority destination should be high ground. Once operational, vertical evacuation refuges should
be incorporated into evacuation exercises as an education tool and to foster familiarity with the
concept and refuge itself. Messages advising of vertical evacuation refuges could also be used in
regional-source events.
8.5 Evacuation modelling for local-source tsunami
A method has been proposed to enhance current Geographic Information System (GIS)-based
Least-Cost Distance (LCD) evacuation modelling methods. Temporally-variable population ex-
posure, distributed travel speeds and uncertain evacuation delay time have been incorporated into
assessment of pedestrian evacuation potential (Chapter 7). The additional components improve
representation of variability in evacuation travel speeds in a population and explicitly account for
actions that delay evacuation. The application of temporally-variable exposure is advantageous
because it enables emergency managers to investigate the localised impacts of diurnal, weekly
and seasonal changes in spatial distribution of evacuation demand. This information can be used
to plan emergency response resources, conduct scenario-based casualty estimates, and optimise
evacuation planning by derivation of maximum potential evacuation demand. Using the model,
researchers and emergency managers are able to test different exposure scenarios and alter travel
speed distributions, evacuation delay distributions, and spatially-variable compliance rates. These
can be used to update evacuation estimates to assess the impacts of improved education on intend-
ed evacuation actions, and to set targets for education by ascertaining the reduction in evacuation
time required to achieve certain life-safety targets.
The proposed method utilises commonly available exposure data and generic-format hazard
data that can be generated by most numerical modelling codes, and implements standard GIS pro-
cedures in an open-source coding environment. The common nature of the data format and code
provides potential for the evacuation method to provide a seamless tsunami inundation and evac-
uation modelling work-flow within the current tsunami modelling frameworks. The applicability
of the method to other locations enables assessment of evacuation requirements for proposed and
ongoing coastal development projects and proposed land-use changes in areas of known tsunami
hazard. It could also benefit national asset and loss modelling if incorporated as an evacuation
assessment module into the GNS Science/National Institute of Water and Atmospheric Research
(NIWA) RiskScape software. The exposure model also has utility in national assessment of tsunami

236 8. Discussion
exposure, in conjunction with a proposed national evacuation mapping project, using attenuation
rule-based analysis to establish tsunami evacuation zones for the whole of New Zealand.
The method has been demonstrated in the case of maximum credible local tsunami at Napier.
It has shown the inter-suburb variability in evacuation demand throughout the day, and identified
the areas of maximum potential evacuation demand. In doing so, it has confirmed the requirement
for vertical evacuation in a number of suburbs of Napier, and provides the optimal locations for
implementation of a limited number of refuges, in order to maximise their impact on life safety.
8.6 Dissemination of research findings to date
Research conducted during this doctoral project has been disseminated to practitioners and aca-
demics via peer-reviewed journal papers, GNS Science reports and conference presentations (Ap-
pendix I). Reconnaissance findings from Japan were presented to emergency management person-
nel and a wider audience of academics and practitioners in the United States, at Washington State
Emergency Management Division in December 2011. Observations from Japan were also pre-
sented to catastrophe risk analysts at Aon Benfield, London and members of the UK Institution of
Structural Engineers (IStructE) in London in 2011. The research has also been presented at sev-
eral international conferences: American Geophysical Union 2011, European Geophysical Union
2012, Australasian Natural Hazards Management Conference 2012, and International Tsunami
Symposium 2012. Findings on evacuation behaviour contributed to a distant-source tsunami evac-
uation planning workshop in Wellington, hosted by Wellington Regional Emergency Management
Office (WREMO) and New Zealand Transport Agency (NZTA) in February 2013. The combined
research findings were presented to CDEM and emergency services personnel during an evacuation
planning workshop in Napier in March 2014.
8.7 Limitations and future work
8.7.1 Hazard modelling
Numerical modelling of inundation used deterministic source scenarios with instantaneous rupture
and distributed slip. The maximum credible scenario was developed on the basis of the Great
East Japan rupture pattern (section 4.6.2). While this method was the best available at the onset of
this numerical modelling, it does not capture the potential for progressive rupture of the subduction
margin, or account for uncertainty in slip distribution. Based on the analysis of Suppasri, Imamura,
and Koshimura (2010), incorporating dynamic rupture of the Hikurangi subduction margin is likely
to result in later arrival time and increased maximum amplitude (Section 4.6.2). Future iterations of
this modelling should apply maximum credible source scenarios derived from the PTHA method
used in the 2013 National Tsunami Hazard Review (Power, 2013), which approximates the effect
of variable slip and uncertainties in the modelling approach.

8.7. Limitations and future work 237
Roughness coefficients were used to represent the impact of buildings and landcover on tsuna-
mi flow over land. However, the presence of buildings in the inundation zone channels tsunami
flow through pathways, which can increase flow depth and velocity in narrow channels. In order to
refine tsunami flow parameters in the urban area, high resolution inundation modelling should be
conducted with explicit modelling of buildings and aim to produce onshore flow velocity estimates
for the derivation of tsunami loads.
8.7.2 Evacuation refuges and behaviour
Investigations in Japan yielded qualitative data on the selection, designation and operation of TVE-
B, the number of people saved in each community and observations on the types of damage sus-
tained. Whilst civil protection officials were able to relay evacuation behaviours observed on 11
March 2011, and information about local vertical evacuation strategies, the research did not extend
to direct interviewing of people who had used vertical evacuation buildings. Direct dialogue with
building users may provide further insight than that gained from local officials.
Surveys of intended evacuation behaviour in local-source tsunami should be conducted more
widely in New Zealand and internationally in order make cross-cultural comparisons. These should
aim to quantify evacuation delay time with respect to specific evacuation preparation actions. The
surveys conducted in Napier suggest demographic influence on intended evacuation behaviour,
but consistent surveys should be extend this to a larger sample. The dynamics of group evacuation
should be more thoroughly explored, for example through monitoring tsunami evacuation exercises
in schools. Ultimately, intended and observed evacuation data could be developed into a database
for experimental validation and bench-marking of evacuation models.
Further research should improve understanding of the impact that situational and environmen-
tal factors have on evacuation delay, compliance rate and travel mode and speed. This includes
the impact of evacuation occurring in daylight or at night, in good or poor weather, whether e-
vacuating as a group or alone, and where they are when the earthquake occurs. It is important to
recognise that actual behaviour may differ from stated intentions. Data on intended actions should
be validated against observations of evacuations, such as evacuee accounts of their actions and the
actions of others. Recent progress has been made by including questions on evacuation actions in
recent surveys about the 2010/2011 Canterbury Earthquakes and the 2013 Cook Strait earthquakes.
Validation against data obtained by alternative methods is also desirable, for example the use of
Computer-Assisted Personal Interviewing (CAPI), which is currently being utilised by other re-
searchers to investigate tsunami evacuation behaviour. Intended behaviours should be monitored
in longitudinal studies to assess the effectiveness of education that promotes immediate evacuation
on feeling a long or strong earthquake, and the minimisation of evacuation delay action.
There should be greater focus in future work on mobility impairment due to physical (includ-
ing mobility, visual, and auditory impairments) and intellectual disabilities. Disabilities can affect

238 8. Discussion
evacuation decision making and mobility in evacuation, resulting in an increase in required e-
vacuation time. In addition to the disabled persons’ live being endangered by the difficulties in
evacuation, responders lives are also endangered in the process of helping disabled people to evac-
uate. In the modelling conducted here, it was not possible to determine the magnitude of impact of
each type of disability registered in the census. There has been limited consideration of disabili-
ties in previous evacuation modelling (e.g., Christensen and Sasaki, 2008; Manley and Kim, 2012)
but this can be developed further in the tsunami context, with greater understanding of the needs
and means to evacuate disabled people in a local-source tsunami. In designing vertical evacuation
strategies, evacuation planning should include representation by the disabled community in order
to meet the needs of that community. Refuge location could be optimised to minimise the distance
that disabled people have to travel. With regards to refuge design, particular attention must be paid
to ensuring adequate access and movement within the refuge for disabled occupants.
8.7.3 Evacuation modelling
Although the evacuation model applied here has enhanced existing modelling techniques, there re-
main several limitations in this component of the research. Improved data on evacuation behaviour
(Section 8.7.2) would enable development of more robust evacuation delay curves. Improved da-
ta on diurnal activity patterns would improve the underlying temporally-variable exposure model.
Future evacuation modelling should explicitly account for evacuation of people with disabilities,
as discussed in the previous section.
The current method applied a static, maximum inundation hazard zone, which provides a con-
servative estimate of the available evacuation time. Incorporation of a dynamic representation of
the inundation would account for the time taken for inundation to progress from the shoreline to its
maximum extent (a further 32 min in Napier), which is likely to mitigate current estimates of evacu-
ation time and reduce evacuation demand. Conversely, the modelling does not account for potential
earthquake damage and disruption to road infrastructure. This could slow evacuation, increasing
total evacuation time and estimated evacuation demand. Consideration of non-compliance, i.e.,
people choosing not to evacuate, would increase potential for casualties.
The assessment of evacuation time and evacuation demand should be validated against out-
puts of other GIS-based and Agent Based Model (ABM) approaches. Demographic influences on
behaviour should be explored further in an ABM environment to determine the influence of in-
dividuals’ evacuation dynamics on community-level evacuation success. ABM has an important
role in evacuation modelling, complementing GIS-based approaches by providing greater detail
on individual behaviour and interactions. They are particularly useful for testing the influence of
different behaviours on evacuation potential, and for site-specific analysis in the design of vertical
evacuation refuges.

8.8. Conclusions 239
8.8 Conclusions — Development of national vertical evacuation guidelines
This thesis has made a methodological contribution to evacuation simulation by proposing that
evacuation estimates be based on distributed time components and variable exposure. It has en-
hanced the theoretical basis for evacuation planning by exploring evacuation behaviour specifically
in the context of local-source tsunami and documenting the use of vertical evacuation in a major
local-source tsunami. As stated in Section 1.3, the research contributes to the initial stages of evac-
uation planning, and must be incorporated into a wider framework in order to applied effectively.
To utilise the data presented in this thesis and provide consistent guidance to local authorities on
development of vertical evacuation strategies in New Zealand, it is proposed that a set of national
vertical evacuation guidelines be developed. A nationally-consistent approach to the development
of vertical evacuation strategies would support understanding of the benefits and issues of vertical
evacuation and ensure that the development of vertical evacuation strategies aligns with internation-
al best-practice. Guidelines would support Local Authorities and CDEM Groups in development
of vertical evacuation in conjunction with other evacuation provisions, and provide a single point
of reference for all stake-holders concerned with evacuation planning, research and education.
The guidelines should frame the role of vertical evacuation in the context of existing guidance
and standards for tsunami evacuation (MCDEM, 2008a,d), signage (MCDEM, 2008c), and mes-
saging (MCDEM, 2010a) around earthquake response and local-source tsunami evacuation. The
findings summarised in Sections 8.1–8.5 provide the knowledge base for the guidelines in terms of
local-tsunami evacuation behaviour and required features of refuges. The thesis has used the city of
Napier, New Zealand as a case study for tsunami inundation and evacuation modelling. There are
of course site-specific aspects of this case study that may be distinct from other coastal sites where
vertical evacuation may be considered for implementation. The findings of the studies at Napier
can be generalised for use at other sites and in the development of guidelines, due to the generic
methodologies applied, and the vertical evacuation location planning principles (i.e., use as a sec-
ondary evacuation option) are also applicable elsewhere. Structural guidelines should be based on
forthcoming internationally-developed tsunami loading guidelines and be developed in the context
of New Zealand building legislation. Further work would be required to satisfy the needs of a
national guidelines with regards to ethics and liability for evacuees using vertical evacuation, and
to address funding issues for public buildings, and incentives for development or incorporation of
refuges into private buildings or on private land. Guidelines would also be required to provide
guidance in the context of the Resource Management Act (RMA), New Zealand Coastal Policy
Statement (NZCPS) and land-use planning regulation.


9. Bibliography
Abe, K. (1975). “Reliable estimation of the seismic moment of large earthquakes”. In: Journal of
Physics of the Earth 23, pp. 381–390.
Abe, K. (1979). “Size of great earthquakes of 1837 to 1974 inferred from tsunami data”. In: Journal
of Geophysical Research 84.B4, p. 1561. DOI: 10.1029/JB084iB04p01561.
Acar, A. and Y. Muraki (2011). “Twitter for crisis communication: lessons learned from Japan’s
tsunami disaster”. In: International Journal of Web Based Communities 7.3, pp. 392–402.
Amante, C. and B. W. Eakins (2009). ETOPO1 1 Arc-Minute Global Relief Model: Procedures,
Data Sources and Analysis. NOAA Technical Memorandum NESDIS NGDC-24. NOAA Tech-
nical Memorandum NESDIS NGDC-24. NOAA, p. 19. URL: http://www.ngdc.noaa.gov/mgg/
global/.
American Society of Civil Engineers (2006a). Flood Resistant Design and Construction. ASCE
Standard 24-05. Reston, Virginia: American Society of Civil Engineers.
American Society of Civil Engineers (2006b). Minimum Design Loads for Buildings and Other
Structures. ASCE/SEI Standard 7-05. Reston, Virginia: American Society of Civil Engineers.
American Society of Civil Engineers (2011). Japan Tsunami Reconnaissance Team. Day 3: More
Evidence of Overwhelmed Seawalls. URL: http : / / cms . asce . org / PPLContent . aspx ? id =
12884906357.
Ammon, C. J., T. Lay, H. Kanamori, and M. Cleveland (2011). “A rupture model of the 2011 off
the Pacific coast of Tohoku Earthquake”. In: Earth, Planets and Space 63.7, pp. 693–696. DOI:
10.5047/eps.2011.05.015.
Ando, M., M. Ishida, Y. Nishikawa, C. Mizuki, and Y. Hayashi (2012). “What caused a large num-
ber of fatalities in the Tohoku earthquake?” In: Geophysical Research Abstracts 14, p. 5501.
Annaka, T., K. Satake, T. Sakakiyama, K. Yanagisawa, and N. Shuto (2007). “Logic-tree Approach
for Probabilistic Tsunami Hazard Analysis and its Applications to the Japanese Coasts”. In:
Pure and Applied Geophysics 164.2-3, pp. 577–592. DOI: 10.1007/s00024-006-0174-3.
Ansell, J. and S. Bannister (1996). “Shallow morphology of the subducted Pacific plate along the
Hikurangi margin, New Zealand”. In: Physics of the Earth and Planetary Interiors 93, pp. 3–
20.
Arcement, G. and V. Schneider (1989). Guide for Selecting Manning’s Roughness Coefficients
for Natural Channels and Flood Plains. Water-supply Paper 2339. Denver, CO: United States
Geological Survey, p. 38. URL: http://www.fhwa.dot.gov/bridge/wsp2339.pdf.

242 9. Bibliography
Arnold, J, P Gillibrand, and J Sykes (2011). Northland Regional Council Numerical Modelling of
Tsunami Inundation for Whangarei Harbour and Environs. NIWA Client Report CHC 2010-
133. Report for Northland Regional Council. NIWA, p. 80.
Arnold, J, J Carter, J Dumas, and P Gillibrand (2009). Northland Regional Council Tsunami Mod-
elling Study 3. NIWA Client Report NIWA Client Report: CHC 2009-042. Report for Northland
Regional Council. NIWA, p. 116.
Atwater, B. F. (1987). “Evidence for great holocene earthquakes along the outer coast of washing-
ton state.” In: Science 236.4804, pp. 942–4. DOI: 10.1126/science.236.4804.942.
Atwater, B. F., M. V. Cisternas, J. Bourgeois, W. C. Dudley, J. W. I. Hendley, and P. H. Stauffer
(2005a). Surviving a tsunami–lessons from Chile, Hawaii, and Japan. Circular 1187. U.S. Dept.
of the Interior, U.S. Geological Survey, p. 18. URL: http://pubs.er.usgs.gov/publication/cir1187.
Atwater, B. F., S. Muumi-Rokkaku, K. Satake, Y. Tsuji, K. Ueda, and D. K. Yamaguchi (2005b).
The Orphan Tsunami of 1700. Japanese clues to a parent earthquake in North America. Seattle
WA: University of Washington Press, p. 133.
Baptista, M.-A., J. M. Miranda, F Chierici, N Zitellini, G. Marina, V. Gobetti, R. Sez, and C. Terlec-
chia (2003). “New study of the 1755 earthquake source based on multi-channel seismic survey
data and tsunami modeling”. In: Natural Hazards and Earth System Sciences 3.5, pp. 333–340.
Baptista, M.-A., J. M. Miranda, R Omira, and C Antunes (2011). “Potential inundation of Lisbon
downtown by a 1755-like tsunami”. In: Natural Hazards and Earth System Sciences 11.12,
pp. 3319–3326. DOI: 10.5194/nhess-11-3319-2011.
Barker, D. H. N., R. Sutherland, S. Henrys, and S. Bannister (2009). “Geometry of the Hikurangi
subduction thrust and upper plate, North Island, New Zealand”. In: Geochemistry Geophysics
Geosystems 10.2. DOI: 10.1029/2008GC002153.
Barnes, P. M., A. Nicol, and T. Harrison (2002). “Late Cenozoic evolution and earthquake potential
of an active listric thrust complex above the Hikurangi subduction zone, New Zealand.” In:
Geological Society Of America Bulletin 114.11, pp. 1379–1405.
Beban, J. G., W. J. Cousins, X. Wang, and S. A. Fraser (2012). Modelling the evacuation rates
required to achieve an acceptable level of health and safety risk in Te Tumu from the Variation
to the Southern Kermadec Scenario. Consultancy Report 2012/291. Lower Hutt, New Zealand:
GNS Science, p. 62.
Becken, S. and K. F. Hughey (2013). “Linking tourism into emergency management structures to
enhance disaster risk reduction”. In: Tourism Management 36, pp. 77–85. DOI: 10 . 1016 / j .
tourman.2012.11.006.
Becker, J. S., D. Paton, and S. McBride (2013). Improving community resilience in the Hawke’s
Bay: A review of resilience research, and current public education, communication and re-
silience strategies. Science Report 2012/38. Lower Hutt, New Zealand: GNS Science, p. 72.

Bibliography 243
Becker, J. S., W. Saunders, L. Hopkins, K. Wright, and J. Kerr (2008). Pre-event recovery planning
for land use in New Zealand: An updated methodology. Science Report 2008/11. Lower Hutt,
New Zealand: GNS Science, p. 39.
Becker, J. S., D. Paton, D. M. Johnston, and K. Ronan (2012). “A model of household prepared-
ness for earthquakes: how individuals make meaning of earthquake information and how this
influences preparedness.” In: Natural Hazards 64, pp. 107–137. DOI: DOI10.1007/s11069-
012-0238-x.
Bell, R., X. Wang, W. L. Power, G. L. Downes, and C. Holden (2009). “Hikurangi margin t-
sunami earthquake generated by slip over a subducted seamount”. In: Geological Society of
New Zealand and New Zealand Geophysical Society Joint Annual Conference, Oamaru, 23-27
November 2009, p. 18.
Bell, R. G., J. R. Goff, G. L. Downes, K. R. Berryman, R. A. Walters, C. Chague-Goff, P. M.
Barnes, and I. C. Wright (2004). Tsunami hazard for the Bay of Plenty and eastern Coromandel
Peninsula. Client Report HAM2004-084. Hamilton, New Zealand: National Institute of Water
and Atmospheric Research Ltd, Client Report HAM2004-084, p. 82.
Bell, R., R. Sutherland, D. H. N. Barker, S. Henrys, S. Bannister, L. M. Wallace, and R. J. Beavan
(2010). “Seismic reflection character of the Hikurangi subduction interface, New Zealand, in
the region of repeated Gisborne slow slip events”. In: Geophysical Journal International 180.1,
pp. 34–48. DOI: 10.1111/j.1365-246X.2009.04401.x.
Berryman, K. R. (1993). “Age, height, and deformation of Holocene marine terraces at Mahia
Peninsula, Hikurangi Subduction Margin, New Zealand”. In: Tectonics 12.6, pp. 1347–1364.
DOI: 10.1029/93TC01542.
Berryman, K. R. (2005). Review of Tsunami Hazard and Risk in New Zealand. Client Report
2005/104. Lower Hutt, New Zealand: Institute of Geological & Nuclear Sciences Limited,
p. 139.
Berryman, K. R., Y. Ota, and A. Hull (1989). “Holocene paleoseismicity in the fold and thrust
belt of the Hikurangi subduction zone, eastern North Island, New Zealand”. In: Tectonophysics
163.3-4, pp. 185–195. DOI: 10.1016/0040-1951(89)90256-4.
Berryman, K. R., Y. Ota, T. Miyauchi, A. Hull, K. Clark, K. Ishibashi, N. Iso, and N. Litchfield
(2011). “Holocene Paleoseismic History of Upper-Plate Faults in the Southern Hikurangi Sub-
duction Margin, New Zealand, Deduced from Marine Terrace Records”. In: Bulletin of the
Seismological Society of America 101.5, pp. 2064–2087. DOI: 10.1785/0120100282.
Beyer, H. (2012). Geospatial Modelling Environment (Version 0.7.2.0). URL: http://www.spatialecology.
com/gme.
Bird, D. K., C. Chague-Goff, and A. Gero (2011). “Human Response to Extreme Events: A review
of three post-tsunami disaster case studies”. In: Australian Geographer 42.3, pp. 225–239.
Blaikie, P., T. Cannon, I. Davis, and B. Wisner (1994). At Risk: Natural Hazards, People’s Vulner-
ability and Disasters.

244 9. Bibliography
Bolton, P. A., S. G. Heikkala, M. R. Greene, P. J. May, and M. R. Wolfe (1986). Land use planning
for earthquake hazard mitigation : A handbook for planners. Special Publication 14. Boulder,
CO: Natural Hazards Research and Applications Information Center, p. 133.
Bombaadi (2011). Rare Footage of Tsunami. URL: http://www.youtube.com/watch?v=gzktUwyYWNM.
Borrero, J. C. and S. D. Greer (2013). “Comparison of the 2010 Chile and 2011 Japan Tsunamis
in the Far Field”. In: Pure and Applied Geophysics 170.6-8, pp. 1249–1274. DOI: 10.1007/
s00024-012-0559-4.
Borrero, J. C., C Bosserelle, G Prasetya, and K. P. Black (2007). “Using 3DD to model tsunami
inundation”. In: 18th Australasian Coastal and Ocean Engineering and 11th Australasian Ports
and Harbour conferences, 17-20 July. Melbourne, Australia.
Borrero, J. C., R. Weiss, E. A. Okal, R. Hidayat, D. Arcas, and V. V. Titov (2009). “The tsunami
of 2007 September 12, Bengkulu province, Sumatra, Indonesia: post-tsunami field survey and
numerical modelling”. In: Geophysical Journal International 178.1, pp. 180–194. DOI: 10 .
1111/j.1365-246X.2008.04058.x.
Borrero, J. C., R. Bell, C. Csato, W. P. De Lange, D. Goring, S. Dougal Greer, V. Pickett, and
W. L. Power (2013). “Observations, Effects and Real Time Assessment of the March 11, 2011
Tohoku-oki Tsunami in New Zealand”. In: Pure and Applied Geophysics 170.6-8, pp. 1229–
1248. DOI: 10.1007/s00024-012-0492-6.
Braun, V. and V. Clarke (2006). “Using thematic analysis in psychology”. In: Qualitative Research
in Pyschology 3.2, pp. 77–101. DOI: 10.1191/1478088706qp063oa.
Bryant, E., G. Walsh, and D. Abbott (2007). “Cosmogenic mega-tsunami in the Australia region:
are they supported by Aboriginal and Maori legends?” In: Geological Society, London, Special
Publications 273.1, pp. 203–214. DOI: 10.1144/GSL.SP.2007.273.01.16.
Bryman, A. (2012). Social Research Methods. Fourth Edi. Oxford University Press, p. 766.
Burbidge, D., P. R. Cummins, R. Mleczko, and H. K. Thio (2008). “A Probabilistic Tsunami Haz-
ard Assessment for Western Australia”. In: Pure and Applied Geophysics 165.11-12, pp. 2059–
2088. DOI: 10.1007/s00024-008-0421-x.
Burton, I., R. W. Kates, and G. F. White (1978). The environment as hazard. New York: Oxford
University Press, p. 240.
Cabinet Office Government of Japan (2005). Guideline for Tsunami Evacuation Buildings. Japanese.
Tsunami Evacuation Building Guideline Committee, Government of Japan Cabinet Office.
Tokyo. URL: http://www.bousai.go.jp/jishin/tsunami/hinan/hinanbiru.html.
Campbell, S. (1996). “Green cities, growing cities, just cities? Urban planning and the contra-
dictions of sustainable development”. In: Journal of the American Planning Association 62,
pp. 296–312.
Chague-Goff, C. (2010). “Chemical signatures of palaeotsunamis: A forgotten proxy?” In: Marine
Geology 271.1-2, pp. 67–71. DOI: 10.1016/j.margeo.2010.01.010.

Bibliography 245
Chague-Goff, C., S. Nichol, A. Jenkinson, and H Heijnis (2000). “Signatures of natural catastroph-
ic events and anthropogenic impact in an estuarine environment, New Zealand”. In: Marine
Geology 167.3-4, pp. 285–301. DOI: 10.1016/S0025-3227(00)00035-9.
Chague-Goff, C., S Dawson, J. R. Goff, J Zachariasen, K. R. Berryman, D. L. Garnett, H. M.
Waldron, and D. C. Mildenhall (2002). “A tsunami (ca. 6300 years BP) and other Holocene
environmental changes, northern Hawke’s Bay, New Zealand”. In: Sedimentary Geology 150.1-
2, pp. 89–102.
Changnon, S. A., R. A. Pielke Jr, D. Changnon, R. T. Sylves, and R. Pulwarty (2000). “Human
Factors Explain the Increased Losses from Weather and Climate Extremes”. In: Bulletin of the
American Meteorological Society 81.3, pp. 437–442.
Charnkol, T. and Y. Tanaboriboon (2006). “Evacuee behaviors and factors affecting the tsunami
trip generation model: A case study in Phang-Nga, Thailand”. In: Journal of Advanced Trans-
portation 40.3, pp. 313–330. DOI: 10.1002/atr.5670400306.
Charvet, I., T. Rossetto, W. Allsop, T. O. Lloyd, T. Robinson, and D. I. Robinson (2010). “Advances
in physical modelling of nearshore tsunami waves and their impact using a unique tsunami
generator”. In: Proceedings of the Fourth International Tsunami Symposium / 9th US and 10th
Canadian Conference on Earthquake Engineering. Toronto, Canada, 25-29 July 2010.
Chatfield, A. T. and U. Brajawidagda (2012). “Twitter tsunami early warning network : a social
network analysis of Twitter information flows”. In: ACIS 2012 : Location, location, location
: Proceedings of the 23rd Australasian Conference on Information Systems 2012. Vol. 2012.
Australia: Deakin University, pp. 1–10.
Cho, Y.-S. (1995). “Numerical simulation of tsunami and run-up”. Unpublished thesis. Cornell
University.
Chock, G. (2012). “ASCE 7 and the development of a tsunami building code for the U.S.” In: 14th
U.S.-Japan Workshop on the Improvement of Structural Design and Construction Practices.
Maui, Hawaii, p. 11.
Chooramun, N., P. J. Lawrence, and E. R. Galea (2012). “An agent based evacuation model utilising
hybrid space discretisation”. In: Safety Science 50.8, pp. 1685–1694. DOI: 10.1016/j.ssci.2011.
12.022.
Christensen, K. and Y. Sasaki (2008). “Agent-Based Emergency Evacuation Simulation with In-
dividuals with Disabilities in the Population”. In: Journal of Artificial Societies and Social
Simulation 11.3, p. 9.
Cita, M. B., A Camerlenghi, K. A. Kastens, and F. W. McCoy (1984). “New findings of Bronze Age
homogenites in the Ionian Sea: Geodynamic implications for the Mediterranean”. In: Marine
Geology 55.12, pp. 47–62. DOI: http://dx.doi.org/10.1016/0025-3227(84)90132-4.
City and County of Honolulu (2000). City and County of Honolulu Building Code. Building Code.
Honolulu, Hawaii: Department of Planning and Permitting of Honolulu Hawaii.

246 9. Bibliography
Clark, K., K. R. Berryman, N. Litchfield, U. A. Cochran, and T. Little (2010). “Evaluating the
coastal deformation mechanisms of the Raukumara Peninsula, northern Hikurangi subduction
margin, New Zealand and insights into forearc uplift processes”. In: New Zealand Journal of
Geology and Geophysics 53.4, pp. 341–358. DOI: 10.1080/00288306.2010.520324.
Clark, K., P. L. Johnson, I. Turnbull, and N. Litchfield (2011). “The 2009 Mw7.8 earthquake on
the Puysegur subduction zone produced minimal geological effects around Dusky Sounds, New
Zealand”. In: New Zealand Journal of Geology & Geophysics 54.2, pp. 237–247.
Cochran, U. A., K. R. Berryman, D. C. Mildenhall, B. W. Hayward, and K. Southall (2005). “To-
wards a record of Holocene tsunami and storms for northern Hawke’s Bay, New Zealand”. In:
New Zealand Journal of Geology and Geophysics 48.3, pp. 507–515.
Cochran, U. A., K. R. Berryman, J. Zachariasen, D. Mildenhall, B. W. Hayward, K. Southall, C.
Hollis, P. Barker, L. M. Wallace, B. Alloway, and K. Wilson (2006). “Paleoecological insights
into subduction zone earthquake occurrence, eastern North Island, New Zealand”. In: Geolog-
ical Society of America Bulletin 118.9-10, pp. 1051–1074. DOI: 10.1130/B25761.1.
Cockings, S., D. Martin, and S. Leung (2010). “Population 24/7: building space-time specific pop-
ulation surface models”. In: Proceedings of the GIS Research UK 18th Annual Conference
GISRUK 2010. Ed. by M. M. Haklay, J. Morley, and H. Rahemtulla. London, UK, pp. 41–47.
Collot, J.-Y., K. Lewis, G. Lamarche, and S. Lallemand (2001). “The giant Ruatoria debris avalanche
on the northern Hikurangi margin, New Zealand; results of oblique seamount subduction”. In:
Journal of Geophysical Research, B, Solid Earth and Planets 106.9, pp. 19271–19297.
Colmar Brunton (2011). Ministry of Civil Defence & Emergency Management Campaign Monitor-
ing Research 2011. Campaign Monitoring Research. Colmar Brunton, pp. 1–85.
Connor, D. (2005). Outreach assessment: How to implement an effective tsunami preparedness out-
reach program. Open File Rep. OFR 0-05-10. Portland, Oregon: State of Oregon Department
of Geology and Mineral Industries.
Coppola, D. P. (2011). Introduction to International Disaster Management. 2nd. Burlington, MA,
US: Elsevier Inc., p. 684.
Couling, M. (2014). “Tsunami risk perception and preparedness on the east coast of New Zealand
during the 2009 Samoan Tsunami warning”. In: Natural Hazards 71.1, pp. 973–986. DOI:
10.1007/s11069-013-0945-y.
Cousins, W. J. (2009). RiskScape - development of a default assets model for Hawke’s Bay. Science
Report 2009/50. Lower Hutt, New Zealand: GNS Science, p. 29.
Cousins, W. J., W. L. Power, U. Z. Destegul, and A. B. King (2007). Combined earthquake and
tsunami losses for major earthquakes affecting the Wellington Region. Consultancy Report
2007/280. Lower Hutt, New Zealand: GNS Science, p. 90.
Crooks, A. T. and A. J. Heppenstall (2012). “Introduction to Agent-Based Modelling”. In: Agent-
Based Models of Geographical Systems. Ed. by A. J. Heppenstall, A. T. Crooks, L. M. See, and

Bibliography 247
M. Batty. Dordrecht: Springer Netherlands. Chap. 5, pp. 85–105. DOI: 10.1007/978-90-481-
8927-4. URL: http://www.springerlink.com/index/10.1007/978-90-481-8927-4.
Cuming, A. (2012). Whitianga tsunami siren gets unplugged. URL: www.stuff .co .nz /national /
7223142/Whitianga-tsunami-siren-gets-unplugged.
Currie, C.-S., J. Enjamio, G. D. Orion, C. Hensel, G. S. Leonard, and D. M. Johnston (2014). T-
sunami Awareness and Preparedness in the Greater Wellington Region. Science Report 2014/10.
Lower Hutt, New Zealand: GNS Science, p. 81.
Dao, M. H. and P Tkalich (2007). “Tsunami propagation modelling a sensitivity study”. In: Natu-
ral Hazards and Earth System Science 7, pp. 741–754.
Darienzo, M. E., A. Aya, G. L. Crawford, D. Gibbs, P. M. Whitmore, T. Wilde, and B. S. Yanagi
(2005). “Local Tsunami Warning in the Pacific Coastal United States”. In: Natural Hazards
35.1, pp. 111–119. DOI: 10.1007/s11069-004-2407-z.
Dash, N. and H. Gladwin (2007). “Evacuation Decision Making and Behavioral Responses: Indi-
vidual and Household”. In: Natural Hazards Review 8.3, pp. 69–77.
Dash, N. and B. H. Morrow (2001). “Return delays and evacuation order compliance: the case of
Hurricane Georges and the Florida Keys”. In: Environmental Hazards 2, pp. 119–128.
De Lange, W. P. and R. Fraser (1999). “Overview of Tsunami hazard in New Zealand”. In: Tephra
17, pp. 3–9.
De Lange, W. P. and T. Healy (1986). “New Zealand tsunamis 1840-1982”. In: New Zealand Jour-
nal of Geology and Geophysics 29.1, pp. 115–134.
De Lange, W. P. and T. Healy (2001). “Tsunami Hazard for the Auckland Region and Hauraki
Gulf, New Zealand”. In: Natural Hazards 24, pp. 267–284.
Defant, A. (1961). Physical Oceanography, Vol.2. Oxford, UK: Pergamon Press.
Dengler, L. (2005). “The Role of Education in the National Tsunami Hazard Mitigation Program”.
In: Natural Hazards 35.1, pp. 141–153. DOI: 10.1007/s11069-004-2409-x.
Dengler, L. (2006). “Awareness and Preparedness”. In: Summary Report: Sumatra Earthquakes
and Indian Ocean Tsunamis. Chap. 8, pp. 53–65.
Dengler, L. and J. Preuss (2003). “Mitigation Lessons from the July 17, 1998 Papua New Guinea
Tsunami”. In: Pure and Applied Geophysics 160.10-11, pp. 2001–2031. DOI: 10.1007/s00024-
003-2417-x.
Didenkulova, I. (2013). “Tsunami runup in narrow bays: the case of Samoa 2009 tsunami”. In:
Natural Hazards 65.3, pp. 1629–1636. DOI: 10.1007/s11069-012-0435-7.
Disaster Prevention Research Institute (2004). Report on the survey of Irian Jaya earthquake and
tsunami, Indonesia of 17 February 1996. URL: http://www.drs.dpri.kyoto-u.ac.jp/eqtap/report/
indonesia/field\ survey\ 96\ irian\ jaya/field\ survey\ 96\ irian\ jaya.htm.
Dominey-Howes, D., G. S. Humphreys, and P. P. Hesse (2006). “Tsunami and palaeotsunami
depositional signatures and their potential value in understanding the late-Holocene tsunami
record”. In: The Holocene 16.8, pp. 1095–1107. DOI: 10.1177/0959683606069400.

248 9. Bibliography
Dominey-Howes, D., L. Dengler, P. K. Dunbar, L. S. L. Kong, H. M. Fritz, F. Imamura, B. G. M-
cAdoo, K. Satake, A. C. Yalciner, M. Yamamoto, E. Yulianto, S. Koshimura, and J. C. Borrero
(2012). UNESCO-IOC International Tsunami Survey Team (ITST) Post-Tsunami Survey Field
Guide. 2nd Edition. Paris: UNESCO-IOC, p. 89.
Doocy, S., A. Rofi, C. Moodie, E. Spring, S. Bradley, G. Burnham, and C. Robinson (2007). “T-
sunami mortality in Aceh Province, Indonesia”. In: Bulletin of the World Health Organization
85.2, pp. 273–278. DOI: 10.2471/BLT.06.033308.
Dorfstaetter, M. J. M. (2012). Human Experience and Response to Natural Warning Signs of T-
sunamis: Applications for Risk Management based on Canterbury Earthquakes 2010/11. Un-
published report. Lincoln, New Zealand, pp. 1–10.
Doser, D. I. and T. H. Webb (2003). “Source parameters of large historical (1917-1961) earth-
quakes, North Island, New Zealand”. In: Geophysical Journal International 152.3, pp. 795–
832. DOI: 10.1046/j.1365-246X.2003.01895.x.
Doughton, S. (2013). Grays Harbor County school to build first U.S. vertical- tsunami refuge.
Seattle WA. URL: seattletimes.com/html/localnews/2022051420\ shakeoutxml.html?prmid=
4939.
Downes, G., U. Cochran, L. Wallace, M. Reyners, K. Berryman, R. Walters, and R. Bell (2005).
Understanding local source tsunami: 1820s Southland tsunami. EQC Report EQC04201 Vol.
HAM2005-135. EQC Project 03/490. Hamilton, New Zealand: NIWA and IGNS, p. 92.
Downes, G. L. (2006). “The 1904 Ms6.8 Mw7.0-7.2 Cape Turnagain, New Zealand, earthquake”.
In: Bulletin of the New Zealand Society for Earthquake Engineering 39.4, pp. 182–207.
Downes, G. L., M. McSaveney, and D. Heron (2000). Integrated risk assessment for Wellington C-
ity Council Phase III. Client Report 2000/39. Wellington, New Zealand: Institute of Geological
& Nuclear Sciences Ltd, p. 49.
Downes, G. L., T. H. Webb, M. McSaveney, D. J. Darby, D. Doser, C. Chague-Goff, and A. Barnett
(2000). “The 26 March and 17 May 1947 Gisborne earthquakes and tsunami: implications
for tsunami hazard for the east coast, North Island, New Zealand”. In: Proceedings of the
International Tsunami Workshop Tsunami Risk Assessment Beyond 2000: Theory, Practice
and Plans, pp. 55–67.
Dowrick, D. and D. Rhoades (2005a). “Revised Models for Attenuation of Modified Mercalli In-
tensity in New Zealand Earthquakes”. In: Bulletin of the New Zealand Society for Earthquake
Engineering 38.4, pp. 185–214.
Dowrick, D. and D. Rhoades (2005b). “Risk of Casualties in New Zealand Earthquakes”. In: Bul-
letin of the New Zealand Society for Earthquake Engineering 38.2, pp. 53–72.
Drabek, T. (1986). Human System Responses to Disaster: An inventory of Sociological Findings.
New York: Springer Verlag, p. 509.

Bibliography 249
Drabek, T. (1994). Disaster Evacuation and the Tourist Industry. Boulder, CO: Natural Hazards
Research and Applications Information Center, Institute of Behavioral Science, University of
Colorado, p. 268.
Drabek, T. (1996). Disaster Evacuation Behavior: Tourists and Other Transients. Boulder, CO:
Natural Hazards Research and Applications Information Center, Institute of Behavioral Sci-
ence, University of Colorado.
Duval, T. S. and J.-P. Mulilis (1999). “A Person-Relative-to-Event (PrE) Approach to Negative
Threat Appeals and Earthquake Preparedness: A Field Study”. In: Journal of Applied Social
Psychology 29.3, pp. 495–516. DOI: 10.1111/j.1559-1816.1999.tb01398.x.
Dynes, R. (1970). Organized behavior in disasters. Lexington, Massechusetts: D. C. Heath.
Dynes, R., E. L. Quarantelli, and G. Kreps (1972). A Perspective on Disaster Planning. Columbus,
Ohio: Ohio State University Disaster Research Center.
EEFIT (2009). The South Pacific Islands Earthquake and Tsunami of 29th September 2009 - A
Preliminary Field report by EEFIT. Preliminary Field Report September. London, UK: Earth-
quake Engineering Field Investigation Team, The Institution of Structural Engineers, p. 67.
URL: http://www.istructe.org/resources-centre/technical-topic-areas/eefit/eefit-reports.
EEFIT (2011). The Mw9.0 Tohoku earthquake and tsunami of 11th March 2011 - A field report
by EEFIT. Field Report. London, UK: Earthquake Engineering Field Investigation Team, The
Institution of Structural Engineers, p. 189. URL: http: / /www.istructe.org/resources- centre/
technical-topic-areas/eefit/eefit-reports.
EEFIT (2013). Recovery two years after the 2011 Tohoku Earthquake and Tsunami. A Return
Mission Report by EEFIT. Field Report. London, UK: Earthquake Engineering Field Inves-
tigation Team, The Institution of Structural Engineers, p. 163. URL: http : / / www. istructe .
org/getattachment/resources- centre/technical- topic- areas/eefit/eefit- reports/EEFIT- Japan-
Recovery-Return-Mission-2013-Report-(1).pdf.aspx.
Eisner, R. K. (2005). “Planning for Tsunami: Reducing Future Losses Through Mitigation”. In:
Natural Hazards 35.1, pp. 155–162. DOI: 10.1007/s11069-004-2417-x.
FEMA (2005). Coastal Construction Manual. FEMA P- 55. Washington, D.C.: Federal Emergency
Management Agency.
FEMA (2008). Guidelines for Design of Structures for Vertical Evacuation from Tsunamis. FEMA
Report P646. Redwood City, California: Prepared by the Applied Technology Council for the
Federal Emergency Management Agency, p. 158.
FEMA (2009). Vertical Evacuation from Tsunamis: A Guide for Community Officials. FEMA Re-
port P646A. Redwood City, California: Prepared by the Applied Technology Council for the
Federal Emergency Management Agency, p. 50.
Finnis, K. (2004). Creating a Resilient New Zealand. Report commissioned by the Ministry of
Civil Defence & Emergency Management September. Dunedin, New Zealand: University of
Otago, p. 113.

250 9. Bibliography
Frankenberg, E., T. Gillespie, S. Preston, B. Sikoki, and D. Thomas (2011). “Mortality, The Family
and The Indian Ocean Tsunami”. In: The Economic Journal 121.554, F162–F182. DOI: 10.
1111/j.1468-0297.2011.02446.x.
Fraser, R. (1998). “Historical Tsunami Database for New Zealand”. Unpublished MSc Thesis.
Waikato University, Hamilton.
Fraser, S. A., D. M. Johnston, and G. S. Leonard (2013). Intended evacuation behaviour in a local
earthquake and tsunami at Napier, New Zealand. Science Report 2013/26. Lower Hutt, New
Zealand: GNS Science, p. 55.
Fraser, S. A. and W. L. Power (2013). Validation of a GIS-based attenuation rule for indicative
tsunami evacuation zone mapping. Science Report 2013/02. Lower Hutt, New Zealand: GNS
Science, p. 21.
Fraser, S. A., G. S. Leonard, I. Matsuo, and H. Murakami (2012a). Tsunami Evacuation: Lesson-
s from the Great East Japan earthquake and tsunami of March 11th 2011. Science Report
2012/17. Lower Hutt, New Zealand: GNS Science, p. 89.
Fraser, S. A., G. S. Leonard, H. Murakami, and I. Matsuo (2012b). “Tsunami Vertical Evacua-
tion Buildings — Lessons for International Preparedness Following the 2011 Great East Japan
Tsunami”. In: Journal of Disaster Research 7.7, pp. 446–457.
Fraser, S. A., A. Raby, A. Pomonis, K. Goda, S. C. Chian, J. Macabuag, M. Offord, K. Saito, and P.
Sammonds (2013). “Tsunami damage to coastal defences and buildings in the March 11th 2011
Mw9.0 Great East Japan earthquake and tsunami”. In: Bulletin of Earthquake Engineering
11.1, pp. 205–239. DOI: 10.1007/s10518-012-9348-9.
Fraser, S. A., W. L. Power, X. Wang, L. M. Wallace, C. Mueller, and D. M. Johnston (2014).
“Tsunami inundation in Napier, New Zealand, due to local earthquake sources”. In: Natural
Hazards 70.1, pp. 415–445. DOI: 10.1007/s11069-013-0820-x.
Fritz, H. M., J. C. Borrero, C. E. Synolakis, and J. Yoo (2006). “2004 Indian Ocean tsunami
flow velocity measurements from survivor videos”. In: Geophysical Research Letters 33.24,
p. L24605. DOI: 10.1029/2006GL026784.
Fritz, H. M., C. M. Petroff, P. A. Catalan, R. Cienfuegos, P. Winckler, N. Kalligeris, R. Weiss, S.
E. Barrientos, G. Meneses, C. Valderas-Bermejo, C. Ebeling, A. Papadopoulos, M. Contreras,
R. Almar, J. C. Dominguez, and C. E. Synolakis (2011). “Field Survey of the 27 February
2010 Chile Tsunami”. In: Pure and Applied Geophysics 168.11, pp. 1989–2010. DOI: 10.1007/
s00024-011-0283-5.
Fuatai, T. (2012). “Tsunami siren testing a success for Auckland communities”. In: NZ Herald
April 1.
Fujima, K., F. Achmad, Y. Shigihara, and N. Mizutani (2009). “Estimation of Tsunami Force Act-
ing on Rectangular Structures”. In: Journal of Disaster Research 4.6, pp. 404–409.
Gaillard, J.-C., E. Clave, O. Vibert, J.-C. Denain, Y. Efendi, D. Grancher, C. C. Liamzon, D. R.
Sari, and R. Setiawan (2008). “Ethnic groups’ response to the 26 December 2004 earthquake

Bibliography 251
and tsunami in Aceh, Indonesia”. In: Natural Hazards 47.1, pp. 17–38. DOI: 10.1007/s11069-
007-9193-3.
Garside, R., D. M. Johnston, W. S. A. Saunders, and G. S. Leonard (2009). “Planning for tsunami
evacuations: the case of the Marine Education Centre, Wellington, New Zealand”. In: The
Australian Journal of Emergency Management 24.3, pp. 28–31.
Gayer, G., S. Leschka, I. Nohren, O. Larsen, and H. Gunther (2010). “Tsunami inundation mod-
elling based on detailed roughness maps of densely populated areas”. In: Natural Hazards and
Earth System Science 10.8, pp. 1679–1687. DOI: 10.5194/nhess-10-1679-2010.
GEBCO (2008). The GEBCO 08 Grid. URL: http://www.gebco.net/data\ and\ products/gridded\bathymetry\ data/.
Geist, E. L. (1998). “Local Tsunamis and Earthquake Source Parameters”. In: Advances in Geo-
physics Volume 39 - Tsunamigenic Earthquakes and their Consequences. Ed. by R Dmowska
and B Saltzman. Vol. 39. San Diego: Academic Press, pp. 117–196.
Geist, E. L. and T. O. M. Parsons (2006). “Probabilistic Analysis of Tsunami Hazards”. In: Natural
Hazards 37.3, pp. 277–314. DOI: 10.1007/s11069-005-4646-z.
Geoscience Australia and the Australian National University (2010). ANUGA User Manual. Tech-
nical Manual, p. 111.
Gica, E., M. H. Teng, P. L.-F. Liu, V. V. Titov, and H. Zhou (2007). “Sensitivity Analysis of
Source Parameters for Earthquake- Generated Distant Tsunamis”. In: Journal of Waterway,
Port, Coastal, and Ocean Engineering 133.6, pp. 429–441. DOI: http://dx.doi.org/10.1061/
(ASCE)0733-950X(2007)133:6(429).
Gica, E., M. C. Spillane, V. V. Titov, C. D. Chamberlin, and J. C. Newman (2008). Development of
the forecast propagation database for NOAA’s Short-Term Inundation Forecast for Tsunamis
(SIFT). NOAA Technical Memorandum OAR PMEL-139. Seattle WA: Pacific Marine Envri-
onmental Laboratory, p. 95.
Gillibrand, P, E. Lane, and J Arnold (2008). Northland Regional Council Tsunami Modelling Study
2. NIWA Client Report CHC 2008-115. Report for Northland Regional Council. NIWA, p. 111.
Glavovic, B. C., W. S. A. Saunders, and J. S. Becker (2010). “Land-use planning for natural hazards
in New Zealand: the setting, barriers, burning issues’ and priority actions”. In: Natural Hazards
54.3, pp. 679–706. DOI: 10.1007/s11069-009-9494-9.
Glimsdal, S., G. K. Pedersen, C. B. Harbitz, and F. Lovholt (2013). “Dispersion of tsunamis: does
it really matter?” In: Natural Hazards and Earth System Science 13.6, pp. 1507–1526. DOI:
10.5194/nhess-13-1507-2013.
Godschalk, D. R. (2004). “Land Use Planning Challenges: Coping with Conflicts in Visions of
Sustainable Development and Livable Communities”. In: Journal of the American Planning
Association 70.1, pp. 5–13. DOI: 10.1080/01944360408976334.
Goff, J. R. (2008a). The New Zealand Palaeotsunami Database. NIWA Technical Report 131.
National Institute of Water and Atmospheric research Ltd, p. 24.

252 9. Bibliography
Goff, J. R. (2008b). Tsunami Hazard Assessment for Hawke’s Bay Region. NIWA Client Report
CHC2008-021. Christchurch, New Zealand: National Institute of Water & Atmospheric Re-
search Ltd, p. 42.
Goff, J. R. and C. Chague-Goff (1999). “A Late Holocene record of environmental changes from
coastal wetlands: Abel Tasman National Park, New Zealand”. In: Quaternary International 56,
pp. 39–51.
Goff, J. R. and C. Chague-Goff (2012). “A review of palaeo-tsunamis for the Christchurch region,
New Zealand”. In: Quaternary Science Reviews 57, pp. 136–156. DOI: 10.1016/j.quascirev.
2012.10.004.
Goff, J. R., C. Chague-Goff, and S Nichol (2001). “Palaeotsunami deposits: a New Zealand per-
spective”. In: Sedimentary Geology 143, pp. 1–6.
Goff, J. R., S. Nichol, and D. Kennedy (2009). “Development of a palaeotsunami database for New
Zealand”. In: Natural Hazards 54.2, pp. 193–208. DOI: 10.1007/s11069-009-9461-5.
Goff, J. R., D. Dominey-Howes, C. Chague-Goff, and C. Courtney (2010a). “Analysis of the
Mahuika comet impact tsunami hypothesis”. In: Marine Geology 271.3-4, pp. 292–296. DOI:
10.1016/j.margeo.2010.02.020.
Goff, J. R., S. Pearce, S. L. Nichol, C. Chague-Goff, M. Horrocks, and L. Strotz (2010b). “Multi-
proxy records of regionally-sourced tsunamis, New Zealand”. In: Geomorphology 118.3-4,
pp. 369–382. DOI: 10.1016/j.geomorph.2010.02.005.
Goff, J. R., S. Nichol, C. Chague-Goff, M. Horrocks, B. McFadgen, and M. Cisternas (2010c).
“Predecessor to New Zealand’s largest historic trans-South Pacific tsunami of 1868AD”. In:
Marine Geology 275.1-4, pp. 155–165. DOI: 10.1016/j.margeo.2010.05.006.
Goff, J. R., C. Chague-Goff, S. Nichol, B. E. Jaffe, and D. Dominey-Howes (2011). “Progress in
palaeotsunami research”. In: Sedimentary Geology 243-244, pp. 70–88. DOI: 10.1016/j.sedgeo.
2011.11.002.
Gonzalez, F. I., V. V. Titov, H. O. Mofjeld, A. J. Venturato, R. S. Simmons, R. A. Hansen, R.
Combellick, R. K. Eisner, D. F. Hoirup, B. S. Yanagi, S. Yong, M. E. Darienzo, G. R. Priest, G.
L. Crawford, and T. J. Walsh (2005). “Progress in NTHMP Hazard Assessment”. In: Natural
Hazards 35.1, pp. 89–110. DOI: 10.1007/s11069-004-2406-0.
Gonzalez-Riancho, P., I. Aguirre-Ayerbe, I. Aniel-Quiroga, S. Abad, M. Gonzalez, J. Larreynaga,
F. Gavidia, O. Q. Gutierrez, J. A. Alvarez Gomez, and R. Medina (2013). “Tsunami evacuation
modelling as a tool for risk management: application to the coastal area of El Salvador”. In:
Natural Hazards and Earth System Sciences Discussions 13, pp. 3249–3270. DOI: 10.5194/
nhess-13-3249-2013.
Goring, D. G. (2002). “Response of New Zealand waters to the Peru tsunami of 23 June 2001”. In:
New Zealand Journal of Marine and Freshwater Research 36.1, pp. 225–232. DOI: 10.1080/
00288330.2002.9517081.

Bibliography 253
Goto, C. and Y. Ogawa (1982). Tsunami numerical simulation with leapfrog scheme. Japanese.
Technical Report. Sendai, Japan: Tohoku University, p. 52.
Goto, C., Y. Ogawa, N. Shuto, and F. Imamura (1997). IUGG/IOC Time Project: Numerical Method
of Tsunami Simulation with the Leap-frog Scheme. English. IOC Manuals and Guides 35. Paris,
France: UNESCO.
Goto, K., C. Chague-Goff, J. R. Goff, and B. E. Jaffe (2012a). “The future of tsunami research
following the 2011 Tohoku-oki event”. In: Sedimentary Geology 282, pp. 1–13. DOI: 10.1016/
j.sedgeo.2012.08.003.
Goto, Y., M. Affan, Y. Nurdin, and D. K. Yuliana (2012b). “Tsunami Evacuation Simulation for
Disaster Education and City Planning”. In: Journal of Disaster Research 7.1, pp. 92–101.
Government of Japan Reconstruction Agency (2013). Current Status and Path Toward Reconstruc-
tion. URL: http://www.reconstruction.go.jp/english/130528\ CurrentStatus\ PathToward\FINAL.pdf.
Graehl, N and L. Dengler (2008). “Using a GIS to Model Tsunami Evacuation Times for the
Community of Fairhaven, California”. In: AGU Fall Meeting Abstracts, p. D1324.
Grapes, R. and G. L. Downes (1997). “The 1855 Wairarapa Earthquake, New Zealand, Earthquake
- Analysis of historical Data”. In: Bulletin of the New Zealand Society for Earthquake Engi-
neering 30, pp. 271–368.
Gregg, C. E., B. F. Houghton, D. Paton, R. Lachman, J. Lachman, D. M. Johnston, and S. Wong-
busarakum (2006). “Natural Warning Signs of Tsunamis: Human Sensory Experience and Re-
sponse to the 2004 Great Sumatra Earthquake and Tsunami in Thailand”. In: Earthquake Spec-
tra 22.3, pp. 671–691. DOI: 10.1193/1.2206791.
Gregg, C. E., B. F. Houghton, D. Paton, D. M. Johnston, D. A. Swanson, and B. S. Yanagi (2007).
“Tsunami Warnings: Understanding in Hawaii”. In: Natural Hazards 40.1, pp. 71–87. DOI:
10.1007/s11069-006-0005-y.
Grezio, A., W. Marzocchi, L. Sandri, and P. Gasparini (2009). “A Bayesian procedure for Proba-
bilistic Tsunami Hazard Assessment”. In: Natural Hazards 53.1, pp. 159–174. DOI: 10.1007/
s11069-009-9418-8.
Grilli, S. T., M. Ioualalen, J. Asavanant, F. Shi, J. T. Kirby, and P. Watts (2007). “Source Con-
straints and Model Simulation of the December 26, 2004, Indian Ocean Tsunami”. In: Journal
of Waterway, Port, Coastal, and Ocean Engineering 133.6, pp. 414–428. DOI: 10.1061/(ASCE)
0733-950X(2007)133:6(414).
Grossi, P. and H. Kunreuther (2005). Catastrophe Modeling: A New Approach to Managing Risk.
Springer, p. 252. URL: http://books.google.co.nz/books/about/Catastrophe\ Modeling.html?
id=1vUpiEAghyAC\&pgis=1.
Guha-Sapir, D., L. V. Parry, O Degomme, P. C. Joshi, and J. P. Sulaina Arnold (2006). Risk Factors
for Mortality and Injury: Post-Tsunami Epidemiological Findings from Tamil Nadu. CRED
report April 2006. Brussels, Belgium: Centre for Research on Epidemiology of Disasters, p. 52.

254 9. Bibliography
Hastings District Council (2010). Heretaunga Plain Urban Development Strategy. Strategy Re-
port. Hastings, New Zealand: Hastings District Council, City of Napier, Hawke’s Bay Regional
Council.
Hawke’s Bay Civil Defence And Emergency Management (2011). Latest hazard maps inform t-
sunami preparedness. Napier, New Zealand. URL: http://www.hbemergency.govt.nz/PicsHotel/
HawkesBayCDEM/Brochure/Hazards/TsunamiHazardMaps.pdf.
Hawke’s Bay Regional Council (2010). Chile Tsunami Event Impacts in Hawke’s Bay February
2010. Asset Management Group Technical Report April. Napier, New Zealand: Hawke’s Bay
Regional Council, p. 29.
Hayashi, S. and S. Koshimura (2013). “The 2011 Tohoku Tsunami Flow Velocity Estimation by
the Aerial Video Analysis and Numerical Modeling”. In: Journal of Disaster Research 8.4,
pp. 561–572.
Hayward, B. W., H. R. Grenfell, A. T. Sabaa, R. Carter, U. A. Cochran, J. H. Lipps, P. R. Shane,
and M. S. Morley (2006). “Micropaleontological evidence of large earthquakes in the past
7200 years in southern Hawke’s Bay, New Zealand”. In: Quaternary Science Reviews 25.11-
12, pp. 1186–1207. DOI: 10.1016/j.quascirev.2005.10.013.
Heath, R. A. (1976). “The response of several New Zealand harbours to the 1960 Chilean tsunami”.
In: Bulletin of the Royal Society of New Zealand 15, pp. 71–82.
Henrys, S., M. Reyners, I. Pecher, S. Bannister, Y. Nishimura, and G. Maslen (2006). “Kinking of
the subucting slab by escalator normal faulting beneath the North Island of New Zealand”. In:
Geology 34, pp. 777–780. DOI: 10.1130/G22594.1.
Hopkins, L. and W. S. A. Saunders (2008). Introduction to natural hazards and risk management:
guidance note. URL: http://www.qualityplanning.org.nz/plan-topics/natural-hazards.php.
Hughes, R. and Z. A. Lubkowski (n.d.). The survey of earthquake damaged non-engineered struc-
tures - a field guide by EEFIT. Field Guide.
Hull, A. (1986). “Pre-A.D. 1931 tectonic subsidence of Ahuriri Lagoon, Napier, Hawke’s Bay,
New Zealand.” In: New Zealand Journal of Geology & Geophysics 29.1, pp. 75–82.
Husen, S., E. Kissling, and R. Quintero (2002). “Tomographic evidence for a subducted seamount
beneath the Gulf of Nicoya, Costa Rica: The cause of the 1990 Mw = 7.0 Gulf of Nicoya
earthquake”. In: Geophysical Research Letters 29.8, pp. 74–79. DOI: 10.1029/2001GL014045.
Hutchinson, M. F. (1989). “A new procedure for gridding elevation and stream line data with
automatic removal of spurious pits”. In: Journal of Hydrology 106.3, pp. 211–232. DOI: 10.
1016/0022-1694(89)90073-5.
Hutt City Council (2013). Plan change 29: Proposed zoning change to the western end of Petone -
Petone Mixed Use. URL: http://www.huttcity.govt.nz/district-plan-change-29.
IASPEI (2013). Summary of Magnitude Working Group recommendations on standard procedures
for determining earthquake magnitudes from digital data. Working group report. International

Bibliography 255
Association of Seismology and Physics of the Earth’s Interior, pp. 1–15. URL: http: / /www.
iaspei.org/commissions/CSOI/Summary\ WG\ recommendations\ 20130327.pdf.
Imamura, F., N. Shuto, and C. Goto (1988). “Numerical simulation of the transoceanic propa-
gation of tsunamis”. In: Sixth Congress of the Asian and Pacific Regional Division, Int. Assoc.
Hydraul. Res. Kyoto, Japan.
Imamura, F., A. C. Yalciner, and G. Ozyurt (2006). Tsunami modelling manual. Technical Manual
April, p. 72.
Imamura, F., A. Muhari, E. Mas, M. H. Pradono, J. Post, and M. Sugimoto (2012). “Tsunami Dis-
aster Mitigation by Integrating Comprehensive Countermeasures in Padang City, Indonesia”.
In: Journal of Disaster Research 7.1, pp. 48–64.
International Code Council (2006). International Building Code. Country Club Hills, Illinois.
Ishii, M. (2011). “High-frequency rupture properties of the Mw 9.0 off the Pacific coast of Tohoku
Earthquake”. In: Earth, Planets and Space 63.7, pp. 609–614. DOI: 10.5047/eps.2011.07.009.
Ishiwatari, M. and M. Arakida (2011). Evacuation. Knowledge Note 2-6. Washington DC, United
States: World Bank, pp. 1–16. URL: https://openknowledge.worldbank.com/handle/10986/
16152.
Jakeman, D. J., Nielsen O. M., V. K. Putten, R. Mleczko, D. Burbidge, and N. Horspool (2010).
“Towards spatially distributed quantitative assessment of tsunami inundation models”. In: O-
cean Dynamics 60, pp. 1115–1138.
Japan Meteorological Agency (2006). Tsunami Warning /Advisory and Tsunami Information. URL:
http://www.seisvol.kishou.go.jp/eq/eng/fig/tsunamiinfo.html.
Japan Meteorological Agency (2013). Flow of issuance of information about tsunami and earth-
quake. URL: http://www.seisvol.kishou.go.jp/eq/eng/fig/info.html.
Johnson, V. A. (2011). Disaster Preparedness Education in Schools : Recommendations for New
Zealand and the United States. Ian Axford Fellowship Report. Wellington, New Zealand: Ian
Axford (New Zealand) Fellowships in Public Policy.
Johnston, D. M., G. S. Leonard, R. Bell, C. Stewart, M. Hickman, J. Thomson, J. Kerr, and P.
Glassey (2003). Tabulated Results of the 2003 National Coastal Community Survey. Science
Report 2003/35. Lower Hutt, New Zealand: GNS Science, p. 124.
Johnston, D. M., D. Paton, G. L. Crawford, K. R. Ronan, B. F. Houghton, and P. Borgelt (2005).
“Measuring Tsunami Preparedness in Coastal Washington, United States”. In: Natural Hazards
35.1, pp. 173–184. DOI: 10.1007/s11069-004-2419-8.
Johnston, D. M., J. S. Becker, C. E. Gregg, B. F. Houghton, D. Paton, G. S. Leonard, and R.
Garside (2007). “Developing warning and disaster response capacity in the tourism sector in
coastal Washington, USA”. In: Disaster Prevention and Management 16.2, pp. 210–216. DOI:
10.1108/09653560710739531.
Johnston, D. M., R. Pettersson, G. L. Downes, D. Paton, G. S. Leonard, K. Pishief, and R. G.
Bell (2008). “Developing an effective tsunami warning system: lessons from the 1960 Chile

256 9. Bibliography
earthquake tsunami for New Zealand coastal communities”. In: Kotuitui: New Zealand Journal
of Social Sciences Online 3.2, pp. 105–120. DOI: 10.1080/1177083X.2008.9522436.
Johnston, D. M., J. S. Becker, M. Gowan, G. S. Leonard, and W. S. A. Saunders (2009). Evaluating
warning and disaster response capacity in the tourism sector in Long Beach and Ocean Shores,
Washington, USA. Science Report 2009/10. Lower Hutt, New Zealand: GNS Science.
Johnston, D. M., R. Tarrant, K. Tipler, M. Coomer, S. Pedersen, and R. Garside (2011). “Preparing
schools for future earthquakes in New Zealand: lessons from an evaluation of a Wellington
school exercise”. In: The Australian Journal of Emergency Management 26.1, pp. 24–30.
Johnston, D. M., J. S. Becker, J. McClure, D. Paton, S. McBride, G. S. Leonard, and M. Hughes
(2013). “Community understanding of, and Preparedness for, Earthquake and Tsunami Risk in
Wellington, New Zealand”. In: Cities at Risk: Living with Perils in the 21st Century. Ed. by
H. Joffe, T. Rossetto, and J. Adams. Advances in Natural and Technological Hazards Research
33. Dordrecht: Springer Science + Business Media. Chap. 8, pp. 131–148.
Johnston, D. M., W. S. A. Saunders, G. S. Leonard, J. Beban, K. Wright, and S. A. Fraser (2014).
“History of Tsunami Planning in New Zealand: 1960 to the present”. In: UHPH 14: Land-
scapes and ecologies of urban and planning history, Proceedings of the 12th conference of
the Australasian Urban History / Planning History Group. Ed. by M. Gjerde and E. Petrovic.
Wellington, New Zealand: Australasian Urban History / Planning History Group and Victoria
University of Wellington, pp. 361–372.
Johnstone, W. M. (2012). “Life Safety Modelling Framework and Performance Measures to As-
sess Community Systems: Application to Tsunami Emergency Preparedness and Dam Safety
Management”. PhD thesis. University of British Columbia, p. 341.
Jonientz-Trisler, C., R. S. Simmons, B. S. Yanagi, G. L. Crawford, M. E. Darienzo, R. K. Eisner,
E. Petty, and G. R. Priest (2005). “Planning for Tsunami-Resilient Communities”. In: Natural
Hazards 35.1, pp. 121–139. DOI: 10.1007/s11069-004-2408-y.
Jonkman, S. N., J. K. Vrijling, and A. C. W. M. Vrouwenvelder (2008). “Methods for the estimation
of loss of life due to floods: a literature review and a proposal for a new method”. In: Natural
Hazards 46.3, pp. 353–389. DOI: 10.1007/s11069-008-9227-5.
Kaiser, G., L. Scheele, A. Kortenhaus, F. Lovholt, H. Romer, and S. Leschka (2011). “The influence
of land cover roughness on the results of high resolution tsunami inundation modeling”. In:
Natural Hazards and Earth System Science 11.9, pp. 2521–2540. DOI: 10 .5194/nhess- 11-
2521-2011.
Kajiura, K. (1970). “Tsunami source, energy and directivity of wave radiation”. In: Bulletin of the
Earthquake Research Institute of the University of Tokyo 48, pp. 835–869.
Kajiura, K. (1981). “Tsunami energy in relation to parameters of the earthquake fault model”. In:
Bulletin of the Earthquake Research Institute of the University of Tokyo 56, pp. 415–440.
Kanamori, H. (1972). “Mechanism of Tsunami Earthquakes”. In: Physics of the Earth and Plane-
tary Interiors 6, pp. 346–359.

Bibliography 257
Kang, J. E., M. K. Lindell, and C. S. Prater (2007). “Hurricane Evacuation Expectations and Actual
Behavior in Hurricane Lili”. In: Journal of Applied Social Psychology 37.4, pp. 887–903. DOI:
10.1111/j.1559-1816.2007.00191.x.
Kawata, Y., B. C. Benson, J. C. Borrero, H. L. Davies, W. P. De Lange, F. Imamura, H. Letz, J. Nott,
and C. E. Synolakis (1999). “Tsunami in Papua New Guinea was as intense as first thought”. In:
Eos, Transactions American Geophysical Union 80.9, pp. 101–105. DOI: 10.1029/99EO00065.
Kazama, M. (2011). The 2011 off the Pacific Coast of Tohoku Earthquake After two months. Hong
Kong. URL: http://www.jiban.or.jp/file/file/kazama520e2.pdf.
King, A. B. and R. Bell (2009). Riskscape Project: 2004-008. Consultancy Report 2009/247. Lower
Hutt, New Zealand: GNS Science, p. 153.
King, A. B. and R. Shelton (2004). “New Zealand Advances in Performance-based Seismic De-
sign”. In: 13th World Conference on Earthquake Engineering. 13. Vancouver, BC, Canada,
August 1-6.
King, A. B., W. J. Cousins, D. Heron, I. Matcham, R. Pringle, R. Bell, S. Reese, J. Schmidt,
and R Henderson (2008). “Regional RiskScape: a multi-hazard loss modelling tool”. In: 4th
International i-Rec Conference 2008: building resilience: achieving effective post-disaster re-
construction. Christchurch, New Zealand, p. 11.
King, D. N. T., J. R. Goff, and A. Skipper (2007). “Maori environmental knowledge and natural
hazards in Aotearoa-New Zealand”. In: Journal of the Royal Society of New Zealand 37.2,
pp. 59–73.
Kiser, E. and M. Ishii (2011). “The 2010 Mw 8.8 Chile earthquake: Triggering on multiple seg-
ments and frequency-dependent rupture behavior”. In: Geophysical Research Letters 38.7, p-
p. 1–6. DOI: 10.1029/2011GL047140.
Kitchin, T. and N. Tate (2000). Conducting Research into Human Geography: Theory, Method and
Practice. Harlow: Prentice Hall.
Klepeis, N. E., W. C. Nelson, W. R. Ott, J. P. Robinson, A. M. Tsang, P Switzer, J. V. Behar, S. C.
Hern, and W. H. Engelmann (2001). “The National Human Activity Pattern Survey (NHAPS):
a resource for assessing exposure to environmental pollutants.” In: Journal of exposure analysis
and environmental epidemiology 11.3, pp. 231–52. DOI: 10.1038/sj.jea.7500165.
Knoblauch, R. L., M. T. Pietrucha, and M. Nitzburg (1996). “Field Studies of Pedestrian Walking
Speed and Start-Up Time”. In: Transportation Research Record: Journal of the Transportation
Research Board 1538.1, pp. 27–38. DOI: 10.3141/1538-04.
Kobayashi, T., R. M. Medina, and T. J. Cova (2011). “Visualizing Diurnal Population Change in
Urban Areas for Emergency Management”. In: The Professional Geographer 63.1, pp. 113–
130. DOI: 10.1080/00330124.2010.533565.
Kolen, B and I. Helsloot (2012). “Time needed to evacuate the Netherlands in the event of large-
scale flooding: strategies and consequences”. In: Disasters 36.4, pp. 700–722. DOI: 10.1111/j.
1467-7717.2012.01278.x.

258 9. Bibliography
Koshimura, S., Y. Namegaya, and H. Yanagisawa (2009). “Tsunami Fragility A New Measure to
Identify Tsunami Damage”. In: Journal of Disaster Research 4.6, pp. 479–480.
Kotani, M., F. Imamura, and N. Shuto (1998). “Tsunami run-up simulation and damage estimation
by using geographical information system”. In: Proceedings of Coastal Engineering, JSCE 45,
pp. 356–360.
Kurowski, M. J., N. Hedley, and J. J. Clague (2011). “An assessment of educational tsunami e-
vacuation map designs in Washington and Oregon”. In: Natural Hazards 59.2, pp. 1205–1223.
DOI: 10.1007/s11069-011-9780-1.
Lachman, R., M. Tatsuoka, and W. J. Bonk (1961). “Human Behavior during the Tsunami of May
1960: Research on the Hawaiian disaster explores the consequences of an ambiguous warning
system”. In: Science 133.3462, pp. 1405–1409. DOI: 10.1126/science.133.3462.1405.
Lamb, S. M. and D. K. Walton (2011). “Travel behaviours following the 2007 Gisborne earth-
quake: evidence for the use of simulation in earthquake research”. In: International Journal of
Emergency Management 8.1, p. 42. DOI: 10.1504/IJEM.2011.040397.
Land Information New Zealand (2006). Nautical Chart NZ561 - Approaches to Napier. URL: https:
//data.linz.govt.nz/layer/1282-chart-nz-561-approaches-to-napier/.
Lander, J. F., L. S. Whiteside, and P. A. Lockridge (2003). “Two decades of global tsunamis 1982-
2002”. In: Science of Tsunami Hazards 21.1, pp. 3–88.
Lane, E., R. A. Walters, J Arnold, and H. Roulston (2007). Northland Regional Council Tsuna-
mi Modelling Study 1. NIWA Client Report CHC2007-109. Report for Northland Regional
Council. NIWA, p. 88.
Lane, E., P. Gillibrand, J Arnold, and R. A. Walters (2011). “Tsunami inundation modelling using
RiCOM”. In: Australian Journal of Civil Engineering 9.1, pp. 83–97.
Lane, E., J. Arnold, J. Sykes, and H. Roulston (2012). Modelling coastal inundation in Christchurch
and Kaiapoi from a South American tsunami using topography from after the 2011 February
earthquake. Environment Canterbury Report R12/38. Christchurch, New Zealand: National
Institute of Water & Atmospheric Research Ltd, p. 36.
Lane, E., P Gillibrand, X. Wang, and W. L. Power (2013). “A Probabilistic Tsunami Hazard Study
of the Auckland Region, Part II: Inundation Modelling and Hazard Assessment”. In: Pure and
Applied Geophysics 170.9-10, pp. 1635–1646.
Latter, J. (1981). “Tsunamis of Volcanic Origin: Summary of causes, with particular reference to
Krakatau, 1883.” In: Bulletin Volcanologique 44, pp. 467–490.
Lay, T., H. Kanamori, C. J. Ammon, M. Nettles, S. N. Ward, R. C. Aster, S. L. Beck, S. L. Bilek,
M. R. Brudzinski, R. Butler, H. R. DeShon, G. Ekstrom, K. Satake, and S. Sipkin (2005). “The
great Sumatra-Andaman earthquake of 26 December 2004.” In: Science 308.5725, pp. 1127–
33. DOI: 10.1126/science.1112250.

Bibliography 259
Leech, J. A., W. C. Nelson, R. T. Burnett, S. Aaron, and M. E. Raizenne (2002). “It’s about time: a
comparison of Canadian and American time-activity patterns”. In: Journal of exposure analysis
and environmental epidemiology 12.6, pp. 427–32. DOI: 10.1038/sj.jea.7500244.
Leonard, G. S., D. M. Johnston, and C. E. Gregg (2013). “Warning Systems”. In: Encyclopedia of
Natural Hazards. Ed. by P. T. Bobrowsky. Springer Science+Business Media B.V., p. 1000.
Leonard, G. S., W. S. A. Saunders, and D. M. Johnston (2007). Hazard warning systems for the
Gisborne district: assessment of options. Science Report 2007/042. Lower Hutt, New Zealand:
GNS Science, p. 72.
Leonard, G. S. and K. C. Wright (2011). Evaluation of Get Ready Get Thru The Vines. Science
Report 2011/01. Lower Hutt, New Zealand: GNS Science, p. 22.
Leonard, G. S., D. M. Johnston, W. S. A. Saunders, and D. Paton (2006). Assessment of Auckland
Civil Defence and Emergency Management Group warning system options. Science Report
2006/002. Lower Hutt, New Zealand: GNS Science, p. 79.
Leonard, G. S., D. M. Johnston, D. Paton, A. Christianson, J. S. Becker, and H. Keys (2008a).
“Developing effective warning systems: Ongoing research at Ruapehu volcano, New Zealand”.
In: Journal of Volcanology and Geothermal Research 172.3-4, pp. 199–215. DOI: 10.1016/j.
jvolgeores.2007.12.008.
Leonard, G. S., W. L. Power, B. Lukovic, W. D. Smith, R. Langridge, D. M. Johnston, and G.
L. Downes (2008b). Interim tsunami evacuation planning zone boundary mapping for the
Wellington and Horizons regions defined by a GIS-calculated attenuation rule. Science Re-
port 2008/30. Lower Hutt, New Zealand: GNS Science, p. 22.
Leonard, G. S., N. Evans, G. Prasetya, W. S. A. Saunders, L. Pearse, D. Monastra, and S. A. Fraser
(2011). Scoping study for evaluating the tsunami vulnerability of New Zealand buildings for use
as evacuation structures. Science Report 2011/036. Lower Hutt, New Zealand: GNS Science,
p. 37.
Lewis, K., J.-Y. Collot, and S. Lallemand (1998). “The dammed Hikurangi Trough: A channel-
fed trench blocked by subducting seamounts and their wake avalanches (New Zealand-France
GeodyNZ Project)”. In: Basin research 10.4, pp. 441–468.
Lignos, D. (2011). Effects of the 2011 Tohoku Japan Earthquake on Steel Structures. URL: http:
/ / www . eqclearinghouse . org / 2011 - 03 - 11 - sendai / 2011 / 08 / 03 / eeri - steel - structures -
reconnaissance-group/.
Lindell, M. K. (2008). “EMBLEM2: An empirically based large scale evacuation time estimate
model”. In: Transportation Research Part A: Policy and Practice 42.1, pp. 140–154. DOI: 10.
1016/j.tra.2007.06.014.
Lindell, M. K., J. E. Kang, and C. S. Prater (2011). “The logistics of household hurricane evacua-
tion”. In: Natural Hazards 58.3, pp. 1093–1109. DOI: 10.1007/s11069-011-9715-x.
Lindell, M. K. and R. W. Perry (1992). Behavioral Foundations of Community Emergency Plan-
ning. Washington DC, United States: Hemisphere Publishing Corporation.

260 9. Bibliography
Lindell, M. K. and R. W. Perry (2012). “The protective action decision model: theoretical modi-
fications and additional evidence”. In: Risk analysis: an official publication of the Society for
Risk Analysis 32.4, pp. 616–32. DOI: 10.1111/j.1539-6924.2011.01647.x.
Lindell, M. K. and C. S. Prater (2007). “Critical Behavioral Assumptions in Evacuation Time
Estimate Analysis for Private Vehicles: Examples from Hurricane Research and Planning”. In:
Journal of Urban Planning and Development 133.1, pp. 18–29. DOI: 10.1061/(ASCE)0733-
9488(2007)133:1(18).
Lindell, M. K. and C. S. Prater (2010). “Tsunami Preparedness on the Oregon and Washington
Coast: Recommendations for Research”. In: Natural Hazards Review 11.2, pp. 69–81. DOI:
10.1061/?ASCE?1527-6988?2010?11:2?69?CE.
Lindell, M. K. and D. J. Whitney (2000). “Correlates of Household Seismic Hazard Adjustment
Adoption”. In: Risk Analysis 20.1, pp. 13–26. DOI: 10.1111/0272-4332.00002.
Lindell, M. K., C. S. Prater, R. W. Perry, and J. Y. Wu (2002). EMBLEM: An Empirically Based
Large-Scale Evacuation Time Estimate Model. Report. Hazard Reduction & Recovery Center,
Texas A&M University, p. 23.
Liu, P. L.-F., Y.-S. Cho, and K. Fujima (1994). “Numerical Solutions of three-dimensional run-up
on a circular island”. In: Proceedings of the International Symposium: Waves - Physical and
Numerical Modelling. Canada, pp. 1031–1040.
Liu, P. L.-F., S. B. Woo, and Y.-S. Cho (1998). Computer Programs for Tsunami Propagation and
Inundation. Technical Manual. Ithaca: Cornell univeristy.
Liu, P. L.-F., H. Yeh, and C. E. Synolakis (2008). “Benchmark Problems”. In: Advanced Numerical
Models for Simulating Tsunami Waves and Runup. Ed. by P. L.-F. Liu, H. Yeh, and C. E.
Synolakis. Vol. 10. Advances in Coastal and Ocean Engineering. Singapore: World Scientific
Publishing Co. Pte. Ltd. Chap. 6, pp. 223–230.
Liu, P. L.-F., Y.-S. Cho, S. B. Yoon, and S. N. Seo (1995a). “Numerical simulations of the 1960
Chilean tsunami propagation and inundation at Hilo, Hawaii”. In: Tsunami: Progress in Predic-
tion, Disaster Prevention, and Warning. Ed. by Y Tsuchiya and N. Shuto. Advances in Natural
and Technological Hazards Research. Netherlands: Kluwer Academic Publishers, pp. 99–115.
Liu, P. L.-F., Y.-S. Cho, M. Briggs, U. Kanoglu, and C. E. Synolakis (1995b). “Runup of solitary
waves on a circular island”. In: Journal of Fluid Mechanics 302, pp. 259–285.
Liu, Y., M. Hatayama, and N. Okada (2006). “Development of an Adaptive Evacuation Route
Algorithm under Flood Disaster”. In: Annuals of the Disaster Prevention Research Institute
49B, pp. 189–195.
Liu, Y., N. Okada, D. Shen, and S. Li (2009). “Agent-based Flood Evacuation Simulation of Life-
threatening Conditions Using Vitae System Model”. In: Journal of Natural Disaster Science
31.2, pp. 33–41.
Lloyd, T. O. and T. Rossetto (2010). “New Facility for Physical Modelling of Tsunami Impact on
Buildings”. In: 14th ECEE 2010. Ohrid, 30 August-3 September.

Bibliography 261
Lockridge, P. A. (1990). “Nonseismic Phenomena in the Generation and Augmentation of T-
sunamis”. In: Natural Hazards 3, pp. 403–412.
Longhurst, R. (2003). “Semi-structured interviews and focus groups”. In: Key methods in geogra-
phy. Ed. by N. Clifford, S. French, and G. Valentine. Chap. 8, pp. 117–132.
Lowe, D. and W. P. De Lange (2000). “Volcano-meteorological tsunamis, the c. AD 200 Taupo
eruption (New Zealand) and the possibility of a global tsunami”. In: The Holocene 10.3, p-
p. 401–407. DOI: 10.1191/095968300670392643.
Lukkunaprasit, P., A. Ruangrassamee, and N. Thanasisathit (2009). “Tsunami Loading on Build-
ings with Openings”. In: Science of Tsunami Hazards 28.5, pp. 303–310.
Lukkunaprasit, P., N. Thanasisathit, and H. Yeh (2009). “Experimental Verification of FEMA P646
Tsunami Loading”. In: Journal of Disaster Research 4.6, pp. 410–418.
Lukkunaprasit, P., C Chinnarasri, A. Ruangrassamee, S. Weesakul, and N. Thanasisathit (2008).
“Experimental Investigation of Tsunami Wave Forces on Buildings with Openings”. In: Solu-
tions to Coastal Disasters Congress 2008: Tsunamis Proceedings of the Solutions to Coastal
Disasters Congress 2008, p. 12. DOI: 10.1061/40978(313)8.
Lynett, P. J., T.-R. Wu, and P. L.-F. Liu (2002). “Modeling wave runup with depth-integrated equa-
tions”. In: Coastal Engineering 46.2, pp. 89–107. DOI: 10.1016/S0378-3839(02)00043-1.
MacDonald, R. (2005). “How women were affected by the tsunami: A perspective from Oxfam”.
In: Plos Medicine 2.6, pp. 474–475.
Maercklin, N., G. Festa, S. Colombelli, and A. Zollo (2012). “Twin ruptures grew to build up the
giant 2011 Tohoku, Japan, earthquake”. In: Scientific Reports 2. DOI: 10.1038/srep00709.
Manley, M. and Y. S. Kim (2012). “Modeling emergency evacuation of individuals with disabilities
(exitus): An agent-based public decisision support system”. In: Expert Systems with Applica-
tions 39, pp. 8300–8311.
Mansinha, L. and D. Smylie (1971a). “The displacement fields of inclined faults”. In: Bulletin of
the Seismological Society of America 61.5, pp. 1433–1440.
Mansinha, L. and D. Smylie (1971b). “The displacement of the earthquake fault model”. In: Bul-
letin of the Seismological Society of America 61, pp. 1433–1400.
Manson, S. M., S. Sun, and D. Bonsal (2012). “Agent-Based Modeling and Complexity”. In:
Agent-Based Models of Geographical Systems. Ed. by A. J. Heppenstall, A. T. Crooks, L. M.
See, and M. Batty. Dordrecht: Springer Netherlands. Chap. 7, pp. 125–139. DOI: 10.1007/978-
90-481-8927-4. URL: http://www.springerlink.com/index/10.1007/978-90-481-8927-4.
Mas, E., B. Adriano, and S. Koshimura (2013). “An Integrated Simulation of Tsunami Hazard and
Human Evacuation in La Punta, Peru”. In: Journal of Disaster Research 8.2, pp. 285–295.
Mas, E., A. Suppasri, F. Imamura, and S. Koshimura (2012a). “Agent-based Simulation of the 2011
Great East Japan Earthquake/Tsunami Evacuation: An Integrated Model of Tsunami Inunda-
tion and Evacuation”. In: Journal of Natural Disaster Science 34.1, pp. 41–57.

262 9. Bibliography
Mas, E., S. Koshimura, A. Suppasri, M. Matsuoka, M. Matsuyama, T. Yoshii, C. Jimenez, F. Ya-
mazaki, and F. Imamura (2012b). “Developing Tsunami fragility curves using remote sensing
and survey data of the 2010 Chilean Tsunami in Dichato”. In: Natural Hazards and Earth
System Science 12.8, pp. 2689–2697. DOI: 10.5194/nhess-12-2689-2012.
Masson, D. G., C. B. Harbitz, R. B. Wynn, G Pedersen, and F. Lovholt (2006). “Submarine land-
slides: processes, triggers and hazard prediction.” In: Philosophical transactions. Series A,
Mathematical, physical, and engineering sciences 364.1845, pp. 2009–39. DOI: 10.1098/rsta.
2006.1810.
McAdoo, B. G., A. Moore, and J. Baumwoll (2009). “Indigenous knowledge and the near field
population response during the 2007 Solomon Islands tsunami”. In: Natural Hazards 48.1,
pp. 73–82. DOI: 10.1007/s11069-008-9249-z.
McAdoo, B. G., L. Dengler, V. V. Titov, and G. Prasetya (2006). “Smong: How an Oral History
Saved Thousands on Indonesia’s Simeulue Island during the December 2004 and March 2005
Tsunamis”. In: Earthquake Spectra 22.3, pp. 661–669.
McBride, S., J. S. Becker, M. A. Coomer, K Tipler, and D. M. Johnston (2013). New Zealand
ShakeOut Observation Evaluation Report: A summary of initial findings. Science Report 2013/61.
Lower Hutt, New Zealand: GNS Science, p. 41.
McClure, J., D. M. Johnston, and L. Henrich (2011). Changes in preparedness and earthquake
risk perception: Lessons from the 2010 and 2011 Canterbury earthquakes. Report for EQC.
Wellington, New Zealand: Victoria University of Wellington, GNS Science, pp. 1–40.
MCDEM (2007). The Way Forward: Strategic Framework for the National CDEM Public Educa-
tion Programme 2006 - 2015. National CDEM public education strategy document. Welling-
ton, New Zealand: Ministry of Civil Defence and Emergency Management, p. 28.
MCDEM (2008a). Mass Evacuation Planning. Director’s Guideline 07/08. Wellington, New Zealand:
Ministry of Civil Defence and Emergency Management, p. 86.
MCDEM (2008b). National Civil Defence Emergency Management Strategy 2007. Wellington,
New Zealand.
MCDEM (2008c). National Tsunami Signage Technical Standard for the CDEM Sector. Technical
Standard 01/08. Wellington, New Zealand: Ministry of Civil Defence and Emergency Manage-
ment, p. 20.
MCDEM (2008d). Tsunami Evacuation Zones. Director’s Guideline for Civil Defence Emergency
Management Groups. Director’s Guideline 08/08. Wellington, New Zealand: Ministry of Civil
Defence and Emergency Management, p. 19.
MCDEM (2009a). MCDEM Response to the Tsunami Threat from the 30 September 2009 Samoan
Earthquake. Report on internal review. Report on internal review. Ministry of Civil Defence &
Emergency Management, p. 30.

Bibliography 263
MCDEM (2009b). Public Alerting: Options Assessment - Information for the CDEM sector. IS
10/09. Wellington, New Zealand: Ministry of Civil Defence and Emergency Management,
p. 52.
MCDEM (2010a). Tsunami Advisory and Warning Plan. Supporting Plan [SP01/09] Revised May
2012. Supporting Plan 01/09. Wellington, New Zealand: Ministry of Civil Defence and Emer-
gency Management, p. 64.
MCDEM (2010b). Working from the same page: Consistent Messages for CDEM. MCDEM Guide
June 2010. Wellington, New Zealand: Ministry of Civil Defence and Emergency Management,
p. 233.
MCDEM (2012). National Public Education Programme Summary 2012. Programme Summary.
Wellington, New Zealand: Ministry of Civil Defence and Emergency Management, p. 11.
MCDEM (2013). Presentation on Standard for the use of sirens in tsunami warnings. Wellington,
New Zealand.
McFadgen, B. and J. R. Goff (2007). “Tsunamis in the New Zealand archaeological record”. In:
Sedimentary Geology 200.3-4, pp. 263–274. DOI: 10.1016/j.sedgeo.2007.01.007.
Mesa-Arango, R., S. Hasan, S. V. Ukkusuri, and P. Murray-Tuite (2012). “A Household-Level
Model for Hurricane Evacuation Destination Type Choice Using Hurricane Ivan Data”. In:
Natural Hazards Review 14.1, pp. 11–20. DOI: 10.1061/(ASCE)NH.1527-6996.0000083.
Mikhaylov, Y. and I. N. Robertson (2009). Evaluation of Prototypical Reinforced Concrete Build-
ing Performance When Subjected to Tsunami Loading. Research Report UHM/CEE/09-01.
University of Hawaii College of Engineering.
Mileti, D. S. (1999). Disasters by Design: A Reassessment of natural hazards in the United States.
Washington DC, United States: Joseph Henry Press, p. 363.
Mileti, D. S. and P. W. O’Brien (1992). “Warnings during Disaster: Normalizing Communicated
Risk”. In: Social Problems 39.1, pp. 40–57.
Mileti, D. S. and J. H. Sorensen (1990). Communication of Emergency Public Warnings. Report
prepared for the Federal Emergency Management Agency ORNL-6609. Oak Ridge, Tenn. US.:
Oak Ridge National Laboratory, p. 166.
Mileti, D. S., S. Nathe, P. Gori, M. Greene, and E. Lemersal (2004). Public hazards communica-
tion and education: the state of the art. Boulder, CO: Natural Hazards Center, University of
Colorado, p. 13.
Ministry for the Environment (2009). New Zealand Land Cover Database version 2. URL: http:
//koordinates.com/layer/1072-land-cover-database-version-2-lcdb2/\#.
Ministry of Economic Development (2013a). Domestic Travel Survey Online Database. URL: http:
/ /www.med.govt .nz/sectors- industries/ tourism/tourism- research- data/domestic- tourism/
domestic-travel-survey-online-database.

264 9. Bibliography
Ministry of Economic Development (2013b). International Visitor Survey Online Database. URL:
http: / /www.med.govt .nz/sectors- industries / tourism/tourism- research- data/ international-
visitor-survey/online-database.
Ministry of Education (2012a). Directory of Schools - as at 01/08/2012. Wellington, New Zealand.
URL: http://www.minedu.govt.nz/Parents/AllAges/SchoolSearch.aspx.
Ministry of Education (2012b). Early Childhood Education (ECE) Services Listing (updated at
28 September 2012). Wellington, New Zealand. URL: http://www.minedu.govt.nz/Parents/
AllAges/ECEListing.aspx.
Ministry of Land Infrastructure Transport and Tourism (2012). For summary of the tsunami-affected
urban reconstruction technique research study from the Great East Japan Earthquake. URL:
http: / /www.mlit .go.jp/toshi/ toshi- hukkou- arkaibu.htmlhttp: / /www.mlit .go.jp/common/
000214857.pdfhttp://www.mlit.go.jp/common/000214856.xls.
Minoura, K., F. Imamura, D. Sugawara, Y. Kono, and T. Iwashita (2001). “The 869 Jogan tsunami
deposit and recurrence interval of large-scale tsunami on the Pacific coast of northeast Japan”.
In: Journal of Natural Disaster Science 23.2, pp. 83–88.
Mofjeld, H. O., M. G. G. Foreman, and A. Ruffman (1997). “West Coast tides during Cascadia
Subduction Zone tsunamis”. In: Geophysical Research Letters 24.17, pp. 2215–2218. DOI:
10.1029/97GL02060.
Mori, N. and T. Takahashi (2012). “Nationwide Post Event Survey and Analysis of the 2011 To-
hoku Earthquake Tsunami”. In: Coastal Engineering Journal 54.01, p. 27. DOI: 10 . 1142 /
S0578563412500015.
Mori, N., T. Takahashi, T. Yasuda, and H. Yanagisawa (2011). “Survey of 2011 Tohoku earthquake
tsunami inundation and run-up”. In: Geophysical Research Letters 38.September, pp. 6–11.
DOI: 10.1029/2011GL049210.
MSN Sankei News (2011). “Miracles of Kamaishi as a result of following ’Three principles of
evacuation’. Students all safe thanks to disaster reduction (Translated by SEEDS Asia)”. In:
MSN Sankei News April.
Muhari, A., F. Imamura, and S. Koshimura (2012). “Tsunami-Deck : A new concept of tsunami
vertical evacuation system”. In: Proceedings of Coastal Engineering, JSCE 3, pp. 71–75.
Muhari, A., F. Imamura, S. Koshimura, and J. Post (2011). “Examination of three practical run-
up models for assessing tsunami impact on highly populated areas”. In: Natural Hazards and
Earth System Science 11.12, pp. 3107–3123. DOI: 10.5194/nhess-11-3107-2011.
Mungkasi, S and S. G. Roberts (2013). “Validation of ANUGA hydraulic model using exact
solutions to shallow water wave problems”. In: Journal of Physics: Conference Series 423,
p. 012029. DOI: 10.1088/1742-6596/423/1/012029.
Murakami, H. and K. Kashiwabara (2011). “Travel Means for Tsunami Evacuation in the 2011
Tohoku Pacific Ocean Earthquake - Questionnaire Survey in Natori City”. In Japanese with

Bibliography 265
English abstract. In: Proceedings of the Annual Conference of the Institute of Social Safety
Science. 29, pp. 67–70.
Myers, E. P. and A. M. Baptista (2001). “Analysis of Factors Influencing Simulations of the 1993
Hokkaido Nansei-Oki and 1964 Alaska Tsunamis”. In: Natural Hazards 23, pp. 1–28.
Nakasu, T., K. Takeuchi, S. Tanaka, K. Yoneyama, N. Fujiwara, T. Morita, and J. Sagara (2011).
Meta and Longitudinal Analyses of High Death Rates of Some Particular Municipalities in
GEJET. Beijing, China. URL: http://www.irdrinternational.org/wp-content/uploads/2011/11/
Conference-Booklet\ final.pdfwww.ifi-home.info/111101\ metalongi\ nakasu.pdf.
Napier City Council (2013). Statistics: Employment. URL: http://www.napier.govt.nz/index.php?
pid=506\&mg=7.
Napier Kindergartens (2012). Our Kindergartens. URL: http:/ /www.napierkindergartens.co.nz/
Our+Kindergartens.
National Geophysical Data Center/World Data Service (2014). Global Historical Tsunami Database
at NGDC. DOI: 10.7289/V5PN93H7. URL: http://www.ngdc.noaa.gov/hazard/tsu\ db.shtml.
National Police Agency of Japan (2011). Damage Situation and Police Countermeasures associ-
ated with 2011Tohoku district - off the Pacific Ocean Earthquake, September 6, 2011. URL:
http://www.npa.go.jp/archive/keibi/biki/higaijokyo\ e.pdf.
National Research Council (2011). Tsunami Warning and Preparedness: An Assessment of the U.S.
Tsunami Program and the Nation’s Preparedness Efforts. Washington, D.C., p. 296.
Neumayer, E. and T Plumper (2007). “The gendered nature of natural disasters: The impact of
catastrophic events on the gender gap in life expectancy, 19812002”. In: Annals of the American
Association of Geographers 97.3, pp. 551–566.
New Zealand Government (2002). Civil Defence Emergency Management Act 2002.
New Zealand Government (2004). Building Act 2004. Tech. rep. No 72. Wellington, New Zealand:
Department of Building and Housing-Te Tari Kaupapa Whare, Ministry of Economic Devel-
opment, New Zealand Government, p. 302.
New Zealand Government (2010). New Zealand Coastal Policy Statement 2010. Policy Statement.
Wellington, New Zealand: New Zealand Department of Conservation, p. 30.
Newman, A. V., G. P. Hayes, Y. Wei, and J. Convers (2011). “The 25 October 2010 Mentawai
tsunami earthquake, from real-time discriminants, finite-fault rupture, and tsunami excitation”.
In: Geophysical Research Letters 38.5. DOI: 10.1029/2010GL046498.
Nichol, S. L., O. B. Lian, and C. H. Carter (2003). “Sheet-gravel evidence for a late Holocene
tsunami run-up on beach dunes, Great Barrier Island, New Zealand”. In: Sedimentary Geology
155.1-2, pp. 129–145. DOI: 10.1016/S0037-0738(02)00191-4.
Nichol, S., J. R. Goff, R. Devoy, C. Chague-Goff, B. W. Hayward, and I. James (2007). “Lagoon
subsidence and tsunami on the West Coast of New Zealand”. In: Sedimentary Geology 200.3-4,
pp. 248–262. DOI: 10.1016/j.sedgeo.2007.01.019.

266 9. Bibliography
Nishikiori, N., T. Abe, D. G. M. Costa, S. D. Dharmaratne, O. Kunii, and K. Moji (2006). “Who
died as a result of the tsunami? Risk factors of mortality among internally displaced persons in
Sri Lanka: a retrospective cohort analysis.” In: BMC public health 6, pp. 73–81. DOI: 10.1186/
1471-2458-6-73.
Nishiyama, I., I. Okawa, H. Fukuyama, and Y. Okuda (2011). “Building damage by the 2011 off
the Pacific coast of Tohoku earthquake and following coping activities”. In: 14th U.S.-Japan
Workshop on the Improvement of Structural Design and Construction Practices. Maui, Hawaii,
p. 9.
Nomitsu, T (1935). “A theory of tsunamis and seiches produced by wind and barometric gradient”.
In: Memoirs of the College of Science. Kyoto Imperial University, A 18.4, pp. 201–214.
NPO CeMI (2011). Preliminary Survey of 2011 Tohoku-Pacific Ocean Earthquake and Tsuna-
mi (district Kamaishi district, Natori, Miyagi Prefecture). Japanese. Survey report. Tokyo:
NPO CeMI, pp. 1–22. URL: http : / / www . npo - cemi . com / works / image / 2011touhoku /
110609tsunamisurvey.pdf.
NTHMP (2001). Designing for Tsunamis - Seven Principles for Planning and Designing for T-
sunami Hazards. NTHMP report. National Tsunami Hazard Mitigation Program, p. 60.
NTHMP (2013). National Tsunami Hazard Mitigation Program 2013-2017 Strategic Plan. Strate-
gic Plan report. National Tsunami Hazard Mitigation Program, p. 32.
NTHMP Mitigation and Education Subcommittee (MES) (2011). Guidelines and Best Practices
for Tsunami Evacuation Mapping Guidelines. URL: http://nthmp.tsunami.gov/.
Okada, T., T. Sugano, T. Ishikawa, T. Ohgi, S. Takai, and C. Hamabe (2005). Structural Design
Method of Buildings for Tsunami Resistance (Proposed). English translation of Japanese report,
originally published in The Building Letter, November 2004. The Building Center of Japan,
p. 16.
Okada, Y. (1985). “Surface deformation due to shear and tensile faults in a half-space”. In: Bulletin
of the Seismological Society of America 75.4, pp. 1135–1154.
Okal, E. A. (1988). “Seismic Parameters Controlling Far-Field Tsunami Amplitudes: A Review”.
In: Natural Hazards 1, pp. 67–96.
Okal, E. A., H. M. Fritz, C. E. Synolakis, J. C. Borrero, R. Weiss, P. J. Lynett, V. V. Titov, S.
Foteinis, B. E. Jaffe, P. L.-F. Liu, and I.-C. Chan (2010). “Field Survey of the Samoa Tsunami
of 29 September 2009”. In: Seismological Research Letters 81.4, pp. 577–591. DOI: 10.1785/
gssrl.81.4.577.
Okumura, Y., K. Harada, and Y. Kawata (2011). “Evacuation Behavior in the 29 September 2009
Samoa Islands Region Earthquake Tsunami”. In: Journal of Earthquake and Tsunami 05.03,
pp. 217–229. DOI: 10.1142/S179343111100108X.
O’Sullivan, D., J. Millington, G. Perry, and J. Wainwright (2012). “Agent-Based Models - Because
They’re Worth It?” In: Agent-Based Models of Geographical Systems. Ed. by A. J. Heppenstall,
A. T. Crooks, L. M. See, and M. Batty. Dordrecht: Springer Netherlands. Chap. 6, pp. 109–123.

Bibliography 267
DOI: 10.1007/978-90-481-8927-4. URL: http://www.springerlink.com/index/10.1007/978-90-
481-8927-4.
Page, M. and N. Trustrum (1997). “A late Holocene lake sediment record of the erosion response
to landuse change in a steepland catchment, New Zealand”. In: Zeitschrift fur Geomorphologie
41, pp. 369–392.
Palermo, D. and I. Nistor (2008). “Understanding tsunami risk to structures: A Canadian perspec-
tive”. In: Science of Tsunami Hazards 27.4, pp. 1–11.
Palermo, D., I. Nistor, Y. Nouri, and A. Cornett (2009). “Tsunami loading of near-shoreline struc-
tures: a primer”. In: Canadian Journal of Civil Engineering 36.11, pp. 1804–1815. DOI: 10.
1139/L09-104.
Parfitt, J. (2005). “Questionnaire Design and Sampling”. In: Methods in Human Geography — a
guide for students. Ed. by R. Flowerdew and D. Martin. New York: Routledge.
Park, S., J. W. van de Lindt, R. Gupta, and D. T. Cox (2012a). “Method to determine the locations
of tsunami vertical evacuation shelters”. In: Natural Hazards 63.2, pp. 891–908. DOI: 10.1007/
s11069-012-0196-3.
Park, S., J. W. van de Lindt, D. T. Cox, R. Gupta, and F. Aguiniga (2012b). “Successive Earthquake-
Tsunami Analysis to Develop Collapse Fragilities”. In: Journal of Earthquake Engineering
16.6, pp. 851–863. DOI: 10.1080/13632469.2012.685209.
Paton, D. (2003). “Disaster preparedness: a social-cognitive perspective”. In: Disaster Prevention
and Management 12.3, pp. 210–216. DOI: 10.1108/09653560310480686.
Paton, D., B. F. Houghton, C. E. Gregg, D. A. Gill, L. A. Ritchie, D. McIvor, P. Larin, S. Meinhold,
J Horan, and D. M. Johnston (2008). “Managing tsunami risk in coastal communities: Identi-
fying predictors of preparedness”. In: The Australian Journal of Emergency Management 23.1,
pp. 4–9.
Pedley, K. L., P. M. Barnes, J. R. Pettinga, and K. B. Lewis (2010). “Seafloor structural geomor-
phic evolution of the accretionary frontal wedge in response to seamount subduction, Poverty
Indentation, New Zealand”. In: Marine Geology 270.1, pp. 119–138.
Pelayo, A. M. and D. A. Wiens (1992). “Tsunami earthquakes: Slow thrust-faulting events in the
accretionary wedge”. In: Journal of Geophysical Research: Solid Earth 97.B11, pp. 15321–
15337. DOI: 10.1029/92JB01305.
Pelinovsky, E. N. and R. K. Mazova (1992). “Exact analytical solutions of nonlinear problems of
tsunami wave run-up on slopes with different profiles”. In: Natural Hazards 6.3, pp. 227–249.
DOI: 10.1007/BF00129510.
Pelinovsky, E. and A Poplavsky (1996). “Simplified Model of Tsunami Generation by Submarine
Landslides”. In: Physics and Chemistry of the Earth 21.12, pp. 13–17.
Perry, R. W. and M. K. Lindell (2003). “Preparedness for Emergency Response: Guidelines for the
Emergency Planning Process”. In: Disasters 27.4, pp. 336–350.

268 9. Bibliography
Perry, R. W., M. K. Lindell, and M. R. Greene (1981). Evacuation Planning in Emergency Man-
agement. Toronto, Ontario, Canada: D.C. Heath and Company.
Perry, S. D. (2007). “Tsunami Warning Dissemination in Mauritius”. In: Journal of Applied Com-
munication Research 35.4, pp. 399–417. DOI: 10.1080/00909880701611060.
Phillips, B. D. and B. H. Morrow (2007). “Social Science Research Needs: Focus on Vulnerable
Populations, Forecasting, and Warnings”. In: Natural Hazards Review 8.August, pp. 61–68.
Pishief, K. (2007). “Community Understanding and Preparedness for Tsunami risk in the eastern
North Island, New Zealand”. Unpublished thesis. University of Waikato. URL: researchcommons.
waikato.ac.nz/handle/10289/2393.
Port and Airport Research Institute (2011). Technical Note of Port and Air Port Research Institute,
No. 1231: Urgent Survey for 2011 Great East Japan Earthquake and Tsunami Disaster in
Ports and Coasts Part I (Tsunami). Tech. rep. Port and Air Port Research Institute. URL:
http://www.pari.go.jp/en/files/3653/460607839.pdf.
Port of Napier Limited (2012). Napier Port Annual Report 2012. Annual Report. Napier, New
Zealand: Port of Napier Ltd, p. 84. URL: http://www.napierport.co.nz/media/6474/AnnualReport2012.
pdf.
Post, J., S. Wegscheider, M. Muck, K. Zosseder, R. Kiefl, T. Steinmetz, and G. Strunz (2009).
“Assessment of human immediate response capability related to tsunami threats in Indonesia
at a sub-national scale”. In: Natural Hazards and Earth System Science 9, pp. 1075–1086.
Power, W. L. (2013). Review of Tsunami Hazard in New Zealand (2013 Update). Consultancy
Report 2013/131. Lower Hutt, New Zealand: GNS Science, p. 222.
Power, W. L., G. L. Downes, and M. Stirling (2007). “Estimation of Tsunami Hazard in New
Zealand due to South American Earthquakes”. In: Pure and Applied Geophysics 164.2-3, p-
p. 547–564. DOI: 10.1007/s00024-006-0166-3.
Power, W. L. and N. Gale (2011). “Tsunami Forecasting and Monitoring in New Zealand”. In: Pure
and Applied Geophysics 168.6-7, pp. 1125–1136. DOI: 10.1007/s00024-010-0223-9.
Power, W. L., M. Reyners, and L. M. Wallace (2008). Tsunami hazard posed by earthquakes on the
Hikurangi subduction zone interface. Consultancy Report 2008/40. Lower Hutt, New Zealand:
GNS Science, p. 58.
Power, W. L., L. M. Wallace, X. Wang, and M. Reyners (2012). “Tsunami Hazard posed to New
Zealand by the Kermadec and Southern New Hebrides Subduction Margins: An Assessment
Based on Plate Boundary Kinematics, Interseismic Coupling, and Historical Seismicity”. In:
Pure and Applied Geophysics 169.1-2, pp. 1–36.
Power, W. L., X. Wang, E. Lane, and P. Gillibrand (2013). “A Probabilistic Tsunami Hazard Study
of the Auckland Region, Part I: Propagation Modelling and Tsunami Hazard Assessment at the
Shoreline”. In: Pure and Applied Geophysics 170.9-10, pp. 1621–1634. DOI: 10.1007/s00024-
012-0543-z.

Bibliography 269
Prasetya, G., R. J. Beavan, X. Wang, M. Reyners, W. L. Power, K. Wilson, and B. Lukovic (2011a).
“Evaluation of the 15 July 2009 Fiordland, New Zealand Tsunami in the Source Region”. In:
Pure and Applied Geophysics 168.11, pp. 1973–1987. DOI: 10.1007/s00024-011-0282-6.
Prasetya, G., J. C. Borrero, W. P. De Lange, K. Black, and T. Healy (2011b). “Modeling of inun-
dation dynamics on Banda Aceh, Indonesia during the great Sumatra tsunamis December 26,
2004”. In: Natural Hazards. DOI: 10.1007/s11069-010-9710-7.
Project Safe Haven (2011a). Tsunami vertical evacuation on the Washington coast - Grays Har-
bor County. Project report. Seattle WAshington: College of Built Environments, University of
Washington and the Washington Emergency Management Division, p. 93.
Project Safe Haven (2011b). Tsunami vertical evacuation on the Washington coast - Pacific County.
Project report. Seattle WAshington: College of Built Environments, University of Washington
and the Washington Emergency Management Division, p. 89.
Purser, D. (2010). “Comparisons of Evacuation Efficiency and Pre-travel Activity Times in Re-
sponse to a Sounder and Two Different Voice Alarms Messages”. In: Pedestrian and Evac-
uation Dynamics 2008. Ed. by W. W. F. Klingsch, C. Rogsch, A. Schadschneider, and M.
Schreckenberg. Berlin Heidelberg: Springer-Verlag, pp. 121–134.
Quarantelli, E. L. (1960). Evacuation Behaviour and Problems: Findings and Implications from
the research Literature. Miscellaneous Report 27. Disaster Research Center, The Ohio State
University.
Quarantelli, E. L. (1982). “Ten Research-derived Principles of Disaster Planning”. In: Disaster
Management 2, pp. 23–25.
Quarantelli, E. L. (1988). “Disaster Crisis Management: A Summary of Research Findings”. In:
Journal of Management Studies 25.4, pp. 373–385. DOI: 10.1111/j.1467-6486.1988.tb00043.x.
Rabinovich, A. B. (1997). “Spectral analysis of tsunami waves: Separation of source and topogra-
phy effects”. In: Journal of Geophysical Research C 102, pp. 12663–12676.
Rabinovich, A. B. and S. Monserrat (1998). “Generation of Meteorological Tsunamis (Large Am-
plitude Seiches) Near the Balearic and Kuril Islands”. In: Natural Hazards 18, pp. 27–55.
Reese, S., W. J. Cousins, W. L. Power, N. G. Palmer, I. G. Tejakusuma, and S. Nugrahadi (2007).
“Tsunami vulnerability of buildings and people in South Java field observations after the July
2006 Java tsunami”. In: Natural Hazards and Earth System Science 7.5, pp. 573–589. DOI:
10.5194/nhess-7-573-2007.
Reese, S., B. Bradley, J. Bind, G. Smart, W. L. Power, and J. Sturman (2011). “Empirical build-
ing fragilities from observed damage in the 2009 South Pacific tsunami”. In: Earth-Science
Reviews 107.1-2, pp. 156–173. DOI: 10.1016/j.earscirev.2011.01.009.
Revi, A and A. K. Singh (2006). “Cyclone and Storm Surge, Pedestrian Evacuation and Emergency
Response in India”. In: Pedestrian and Evacuation Dynamics 2006. 1984. Berlin Heidelberg:
Springer-Verlag.

270 9. Bibliography
Reyners, M. (1998). “Plate coupling and the hazard of large subduction thrust earthquakes at the
Hikurangi subduction zone, New Zealand”. In: New Zealand Journal of Geology and Geo-
physics 41.4, pp. 343–354.
Richards, E. (1950). Diary of E. R. Chudleigh 1862-1921, Chatham Islands. Christchurch, New
Zealand: Simpson and Williams Ltd.
Rodriguez, H., E. L. Quarantelli, and R. Dynes (2006). Handbook of Disaster Research. New York:
Springer Science + Business Media B.V., p. 611.
Rodriguez, H., T. Wachtendorf, J. Kendra, and J. Trainor (2006). “A snapshot of the 2004 Indian
Ocean tsunami: societal impacts and consequences”. In: Disaster Prevention and Management
15.1, pp. 163–177. DOI: 10.1108/09653560610654310.
Rofi, A., S. Doocy, and C. Robinson (2006). “Tsunami mortality and displacement in Aceh province,
Indonesia.” In: Disasters 30.3, pp. 340–50. DOI: 10.1111/j.0361-3666.2005.00324.x.
Roger, J. and H. Hebert (2008). “The 1856 Djijelli (Algeria) earthquake and tsunami: source pa-
rameters and implications for tsunami hazard in the Balearic Islands”. In: Natural Hazards and
Earth System Science 8.4, pp. 721–731. DOI: 10.5194/nhess-8-721-2008.
Rogers, E. (2010). Devastation or resilience? A review of tsunami preparedness in Papmoa, Tau-
ranga.
Rossetto, T., N. Peiris, A. Pomonis, S. M. Wilkinson, D. Del Re, R. Koo, and S. Gallocher (2006).
“The Indian Ocean tsunami of December 26, 2004: Observations in Sri Lanka and Thailand”.
In: Natural Hazards 42.1, pp. 105–124. DOI: 10.1007/s11069-006-9064-3.
Ruangrassamee, A., H. Yanagisawa, P. Foytong, P. Lukkunaprasit, S. Koshimura, and F. Imamura
(2006). “Investigation of Tsunami-Induced Damage and Fragility of Buildings in Thailand
after the December 2004 Indian Ocean Tsunami”. In: Earthquake Spectra 22.S3, S377. DOI:
10.1193/1.2208088.
Ruch, C. E. (1984). “Human Response to Vertical Shelters ”An Experimental Note””. In: Interna-
tional Journal of Mass Emergencies and Disasters 2.3, pp. 389–401.
Ruch, C. E., H. C. Miller, M. Haflich, N. M. Farber, P. R. Berke, and N Stubbs (1991). The feasibil-
ity of vertical evacuation: Behavioral, legal, political, and structural considerations. Boulder,
CO, p. 262.
Salmon, J. D. (1984). “Vertical evacuation in hurricanes: An urgent policy problem for coastal
managers”. In: Coastal Zone Management Journal 12.2-3, pp. 287–300.
Satake, K. (1987). “Inversion of Tsunami Waveforms for the Estimation of a Fault Heterogeneity:
Method and Numerical Experiments”. In: Journal of Physics of the Earth 35, pp. 241–254.
Satake, K. (1988). “Effects of bathymetry on tsunami propagation: Application of ray tracing to
tsunamis”. In: Pure and Applied Geophysics 126.1, pp. 27–36. DOI: 10.1007/BF00876912.
Satake, K. (1994). “Mechanism of the 1992 Nicaragua Tsunami Earthquake”. In: Geophysical
Research Letters 21.23, pp. 2519–2522. DOI: 10.1029/94GL02338.

Bibliography 271
Satake, K., Y. Namegaya, and S. Yamaki (2008). “Numerical simulation of the AD 869 Jogan
tsunami in Ishinomaki and Sendai plains”. Japanese. In: Annual Report on Active Fault and
Paleoearthquake Researches 8, pp. 71–89.
Satake, K. and Y. Tanioka (1995). “Tsunami generation of the 1993 Hokkaido Nansei-Oki earth-
quake”. In: Pure and Applied Geophysics 144.3-4, pp. 803–821. DOI: 10.1007/BF00874395.
Saunders, W. S. A., G. Prasetya, and G. S. Leonard (2011). New Zealand’s Next Top Model: In-
tegrating tsunami inundation modelling into land use planning. Miscellanaeous Series Report
34. Lower Hutt, New Zealand: GNS Science, p. 42.
Scheer, S. J., V. Varela, and G. Eftychidis (2012). “A generic framework for tsunami evacuation
planning”. In: Physics and Chemistry of the Earth, Parts A/B/C 49, pp. 79–91. DOI: 10.1016/j.
pce.2011.12.001.
Scheer, S. J., A. Gardi, R. Guillande, G. Eftychidis, V. Varela, B. De Vanssay, and L. Colbeau-Justin
(2011). Handbook of Tsunami Evacuation Planning. SCHEMA Specific Targeted Research
Project 030963. Ispra, Italy: European Commission Joint Research Centre, Institute for the
Protection and Security of the Citizen, p. 54. DOI: 10.2788/34292.
Schmidt, J., I. Matcham, S. Reese, A. B. King, R. G. Bell, R. Henderson, G. Smart, W. J. Cousins,
W. D. Smith, and D. Heron (2011). “Quantitative multi-risk analysis for natural hazards: a
framework for multi-risk modelling”. In: Natural Hazards 58.3, pp. 1169–1192. DOI: 10.1007/
s11069-011-9721-z.
Scholz, C. H. (1998). “Earthquakes and friction laws”. In: Nature 391, pp. 37–42. DOI: 10.1038/
34097.
Scholz, C. H. and C. Small (1997). “The effect of seamount subduction on seismic coupling”. In:
Geology 25.6, pp. 487–490. DOI: 10.1130/0091-7613(1997)025〈0487:TEOSSO〉2.3.CO;2.
Sharma, U. and A. Patt (2012). “Disaster warning response: the effects of different types of per-
sonal experience”. In: Natural Hazards 60.2, pp. 409–423. DOI: 10.1007/s11069-011-0023-2.
Shelton, R. and G. Beattie (2011). Timber Framed Buildings and NZS 3604. Judgeford, New
Zealand. URL: www.timberdesign.org.nz/files/00556RogerShelton.pdf.
Shibayama, T., M. Esteban, I. Nistor, H. Takagi, N. D. Thao, R. Matsumaru, T. Mikami, R. Aranguiz,
R. Jayaratne, and K. Ohira (2013). “Classification of Tsunami and Evacuation Areas”. In: Nat-
ural Hazards 67.2, pp. 365–386. DOI: 10.1007/s11069-013-0567-4.
Shuto, N. (1991). “Numerical Simulation of Tsunamis - Its Present and Near Future”. In: Natural
Hazards 4, pp. 171–191.
Shuto, N. (1997). “A Natural Warning of Tsunami Arrival”. In: Perspectives on Tsunami Hazard
Reduction. Ed. by G. Hebenstreit. Kluwer Academic Publishers, pp. 157–173.
Shuto, N. and K. Fujima (2009). “A short history of tsunami research and countermeasures in
Japan”. In: Proceedings of the Japanese Academy, Series B 85.8, pp. 267–275. DOI: 10.2183/
pjab.85.267.

272 9. Bibliography
Shuto, N. and H. Matsutomi (1995). “Field Survey of the 1993 Hokkaido Nansei-Oki Earthquake
Tsunami”. In: Pure and Applied Geophysics 144.3/4, pp. 649–663.
Simons, M., S. E. Minson, A. Sladen, F. Ortega, J. Jiang, S. E. Owen, L. Meng, J.-P. Ampuero,
S. Wei, R. Chu, D. V. Helmberger, H. Kanamori, E. Hetland, A. W. Moore, and F. H. Webb
(2011). “The 2011 Magnitude 9.0 Tohoku-Oki Earthquake: Mosaicking the Megathrust from
Seconds to Centuries”. In: Science 332.6036, pp. 1421–1425. DOI: 10.1126/science.1206731.
Solıs, D., M. Thomas, and D. Letson (2010). “An empirical evaluation of the determinants of
household hurricane evacuation choice”. In: Journal of Development and Agricultural Eco-
nomics 2.3, pp. 188–196.
Sorensen, J. H. (2000). “Hazard Warning Systems: Review of 20 Years of Progress”. In: Natural
Hazards Review 1.2, pp. 119–125. DOI: 10.1061/(ASCE)1527-6988(2000)1:2(119).
Sorensen, J. H., B. M. Vogt, and D. S. Mileti (1987). Evacuation: An Assessment of Planning and
Research. Research report. Oak Ridge, Tenn. US.: Oak Ridge National Laboratory. Energy
Division., p. 225. URL: http://www.crid.or.cr/digitalizacion/pdf/eng/doc66/doc66.htm.
Southworth, F. (1991). Regional evacuation modelling: a state-of-the-art-review. ORNL/TM 11740.
Centre for Transportation Analysis, Oak Ridge National Laboratory, p. 64.
Staff Reporter (2011). “Tourists, residents in Waikiki were evacuated to upper floors”. In: Honolulu
Star-Advertiser March.
Staff Reporter (2012). “Sirens blasted but council loud on the defensive”. In: Hawke’s Bay Today
February 3.
Staff Reporter (2013). False tsunami alarm wakes Bay of Plenty.
Standards New Zealand (2009). Joint Australian New Zealand International Standard Risk man-
agement: Principles and guidelines. AS/NZS ISO 31000:2009. Superseding AS/NZS 4360:2004.
Statistics New Zealand (2006). 2006 Census Data. URL: http : / / www. stats . govt . nz / Census /
2006CensusHomePage.aspx.
Statistics New Zealand (2012a). Accommodation pivot tables. URL: http : / /www.stats .govt .nz /
browse\ for\ stats/industry\ sectors/accommodation/accommodation-pivot-tables.aspx.
Statistics New Zealand (2012b). Subnational Population Projections: 2006(base)2031 (October
2012 update). URL: http://www.stats.govt.nz/browse\ for\ stats/population/estimates\ and\projections/SubnationalPopulationProjections\ MR0631UpdateOct12.aspx.
Statistics New Zealand (2012c). Territorial Authority (TA) by Total Accommodation: April 2012.
URL: http : / / www. stats . govt . nz / browse \ for \ stats / industry \ sectors / accommodation /
accommodation-pivot-tables.aspx.
Statistics New Zealand (2013a). Estimated resident population, territorial authority areas, at 30
June 2006, 2011, and 2012. URL: http://www.stats.govt.nz/∼/media/Statistics/Browseforstats/
SubnationalPopulationEstimates/HOTPYe30Jun12/snpe-at30jun12-all-tables-prov.xls.

Bibliography 273
Statistics New Zealand (2013b). New Zealand Household Travel Survey: Regional results (3-year
moving average). URL: http : / / nzdotstat . stats . govt . nz / wbos / Index . aspx ? DataSetCode =
TABLECODE7431.
Statistics New Zealand (2013c). New Zealand Household Travel Survey: Travel to work, by main
urban area results (3-year moving average). URL: http://nzdotstat.stats.govt.nz/wbos/Index.
aspx?DataSetCode=TABLECODE7431.
Stewart, C., G. S. Leonard, D. M. Johnston, and T. M. Hume (2005). The 2003 National Coastal
Community Survey: results for Waikato beach communities. Science Report 2005/028. Lower
Hutt, New Zealand: Institute of Geological and Nuclear Sciences Limited, p. 88.
Stirling, M., G. H. McVerry, M. Gerstenberger, N. Litchfield, R. Van Dissen, K. R. Berryman, P.
M. Barnes, L. M. Wallace, P. Villamor, R. Langridge, G. Lamarche, S. Nodder, M. Reyners, B.
Bradley, D. Rhoades, W. Smith, A. Nicol, J. Pettinga, K. Clark, and K. Jacobs (2012). “Nation-
al Seismic Hazard Model for New Zealand: 2010 Update”. In: Bulletin of the Seismological
Society of America 102.4, pp. 1514–1542. DOI: 10.1785/0120110170.
Suganuma, K. (2006). “Recent Trends in Earthquake Disaster Management in Japan”. In: Science
and Technology Trends 19, pp. 91–106.
Sugawara, D. and K. Goto (2012). “Numerical modeling of the 2011 Tohoku-oki tsunami in the
offshore and onshore of Sendai Plain, Japan”. In: Sedimentary Geology 0, pp. –. DOI: 10.1016/
j.sedgeo.2012.08.002.
Sugawara, D., F. Imamura, K. Goto, H. Matsumoto, and K. Minoura (2013). “The 2011 Tohoku-
oki Earthquake Tsunami: Similarities and Differences to the 869 Jogan Tsunami on the Sendai
Plain”. In: Pure and Applied Geophysics 170.5, pp. 831–843. DOI: 10.1007/s00024-012-0460-
1.
Sugimoto, T, H Murakami, Y. Kozuki, and K Nishikawa (2003). “A Human Damage Prediction
Method for Tsunami Disasters Incorporating Evacuation Activities”. In: Natural Hazards 29,
pp. 585–600.
Suppasri, A., F. Imamura, and S. Koshimura (2010). “Effects of the Rupture Velocity of Fault
Motion, Ocean Current and Initial Sea Level on the Transoceanic Propagation of Tsunami”.
In: Coastal Engineering Journal 52.02, pp. 107–132. DOI: 10.1142/S0578563410002142.
Suppasri, A., F. Imamura, and S. Koshimura (2012). “Tsunamigenic Ratio of the Pacific Ocean
earthquakes and a proposal for a Tsunami Index”. In: Natural Hazards and Earth System Sci-
ence 12.1, pp. 175–185. DOI: 10.5194/nhess-12-175-2012.
Suppasri, A., S. Koshimura, and F. Imamura (2011). “Developing tsunami fragility curves based
on the satellite remote sensing and the numerical modeling of the 2004 Indian Ocean tsunami
in Thailand”. In: Natural Hazards and Earth System Science 11.1, pp. 173–189. DOI: 10.5194/
nhess-11-173-2011.

274 9. Bibliography
Suppasri, A., T. Futami, S. Tabuchi, and F. Imamura (2012). “Mapping of historical tsunamis in the
Indian and Southwest Pacific Oceans”. In: International Journal of Disaster Risk Reduction,
pp. 1–10. DOI: 10.1016/j.ijdrr.2012.05.003.
Suppasri, A., E. Mas, I. Charvet, R. Gunasekera, K. Imai, Y. Fukutani, Y. Abe, and F. Imamura
(2013a). “Building damage characteristics based on surveyed data and fragility curves of the
2011 Great East Japan tsunami”. In: Natural Hazards 66.2, pp. 319–341. DOI: 10.1007/s11069-
012-0487-8.
Suppasri, A., N. Shuto, F. Imamura, S. Koshimura, E. Mas, and A. C. Yalciner (2013b). “Lessons
Learned from the 2011 Great East Japan Tsunami: Performance of Tsunami Countermeasures,
Coastal Buildings, and Tsunami Evacuation in Japan”. In: Pure and Applied Geophysics 170.6-
8, p. 1018. DOI: 10.1007/s00024-012-0511-7.
Suppasri, A., A. Muhari, T. Futami, F. Imamura, and N. Shuto (2013c). “Loss functions for small
marine vessels based on survey data and numerical simulation of the 2011 Great East Japan t-
sunami”. In: Journal of Waterway, Port, Coastal, and Ocean Engineering, p. 131017180718008.
DOI: 10.1061/(ASCE)WW.1943-5460.0000244.
Sutton, J. and K. J. Tierney (2006). Disaster Preparedness: Concepts, Guidance, and Research. Re-
port prepared for the Fritz Institute Assessing Disaster Preparedness Conference, Sebastopol,
California. Boulder, CO: Natural Hazards Center Institute of Behavioral Science, University of
Colorado, p. 44.
Suzuki, T. and F. Imamura (2005). “Simulation model of the evacuation from a tsunami in cons-
dieration of the resident consciousness and behaviour”. In: Japan Society for Natural Disaster
Science 23.4, pp. 521–538.
Synolakis, C. E. (1991). “Green’s Law and the Evolution of Solitary Waves”. In: Phys. Fluids.
A3.3, pp. 490–491.
Synolakis, C. E. and E. N. Bernard (2006). “Tsunami science before and beyond Boxing Day
2004”. In: Philosophical Transactions of the Royal Society 364.June, pp. 2231–2265. DOI:
10.1098/rsta.2006.1824.
Synolakis, C. E., J.-P. Bardet, J. C. Borrero, H. L. Davies, E. A. Okal, E. A. Silver, S. Sweet, and D.
R. Tappin (2002). “The slump origin of the 1998 Papua New Guinea Tsunami”. In: Proceedings
of the Royal Society A: Mathematical, Physical and Engineering Sciences 458.2020, pp. 763–
789. DOI: 10.1098/rspa.2001.0915.
Synolakis, C. E., E. N. Bernard, V. V. Titov, U. Kanoglu, and F. I. Gonzalez (2007). Standards, Cri-
teria, and Procedures for NOAA Evaluation of Tsunami Numerical Models. NOAA Technical
Memorandum OAR-PMEL-135. Seattle WA: Pacific Marine Environmental Laboratory.
Synolakis, C. E., E. N. Bernard, V. V. Titov, U. Kanoglu, and F. I. Gonzalez (2008). “Validation
and Verification of Tsunami Numerical Models”. In: Pure and Applied Geophysics 165.11-12,
pp. 2197–2228. DOI: 10.1007/s00024-004-0427-y.

Bibliography 275
Tadepalli, S and C. E. Synolakis (1994). “The run-up of N-waves on sloping beaches”. In: Pro-
ceedings of the Royal Society London A 445, pp. 99–112.
Tadepalli, S and C. E. Synolakis (1996). “Model for the Leading Waves of Tsunamis.” In: Physical
review letters 77.10, pp. 2141–2144.
Takahashi, S., K. Toda, Y. Kikuchi, T. Sugano, Y. Kuriyama, H. Yamazaki, T. Nagao, K.-i. Shi-
mosako, T. Negi, J. Sugeno, T. Tomita, H. Kawai, Y. Nakagawa, A. Nozu, O. Okamoto, K.
Suzuki, Y. Morikawa, T. Arikawa, M. Iwanami, T.-a. Mizutani, E. Kohama, T. Yamaji, K.
Kumagai, D. Tatsumi, M. Washizake, T. Izumiyama, K. Seki, G.-S. Yeom, M. Takenobu, H.
Kashima, M. Banno, Y. Fukunaga, J.-i. Sakunaka, and Y. Watanabe (2011). Urgent Survey for
2011 Great East Japan Earthquake and Tsunami Disaster in Ports and Coasts. Japanese (with
English abstract). Technical Note of The Port and Airport Research Institute No. 1231. Port
and Airport Research Institute, p. 110. URL: http://www.pari.go.jp/files/3642/1049951767.pdf.
Tang, Z., M. K. Lindell, C. S. Prater, and S. D. Brody (2008). “Measuring Tsunami Planning
Capacity on U.S. Pacific Coast”. In: Natural Hazards Review 9.2, pp. 91–100. DOI: 10.1061/
(ASCE)1527-6988(2008)9:2(91).
Tanioka, Y. and K. Satake (1996a). “Fault Parameters of the 1896 Sanriku tsunami earthquake esti-
mated from tsunami numerical modeling”. In: Geophysical Research Letters 23.13, pp. 1549–
1552.
Tanioka, Y. and K. Satake (1996b). “Tsunami generation by horizontal displacement of ocean
bottom”. In: Geophysical Research Letters 23.8, pp. 861–864. DOI: 10.1029/96GL00736.
Tappin, D. R. (2001). “The Sissano, Papua New Guinea tsunami of July 1998-offshore on the
source mechanism”. In: Marine Geology 175, pp. 1–23.
Tappin, D. R., A. Sibley, K. Horsburgh, C. Daubord, D. Cox, and D. Long (2013). “The English
Channel tsunami’ of 27June2011 - a probable meteorological source”. In: Weather 68.6, p-
p. 144–152. DOI: 10.1002/wea.2061.
Taylor, F. W., R. W. Briggs, C. Frohlich, A. Brown, M. Hornbach, A. K. Papabatu, A. J. Meltzner,
and D. Billy (2008). “Rupture across arc segment and plate boundaries in the 1 April 2007
Solomons earthquake”. In: Nature Geoscience 1.4, pp. 253–257. DOI: 10.1038/ngeo159.
The Kahoku Shimpo (2011). Tragedy of Public Shizugawa hospital, Minami-Sanriku. URL: http:
//www.kahoku.co.jp/spe/spe\ sys1071/20110607\ 01.htm.
Tierney, K. J. (1993). Disaster Preparedness and Response: Guidance from the Social Science
Literature. Preliminary Paper 193. Delaware, United States: Disaster Research Center and De-
partment of Sociology, University of Delaware, p. 47.
Tinti, S., I. Gavagni, and A Piatanesi (1994). “A finite-element numerical approach for modeling
tsunamis”. In: Annal of Geophysics 37.5, pp. 1009–1026.
Titov, V. V., F. I. Gonzalez, E. N. Bernard, M. C. Eble, H. O. Mofjeld, J. C. Newman, and A. J.
Venturato (2005). “Real-Time Tsunami Forecasting: Challenges and Solutions”. In: Natural
Hazards 35.1, pp. 35–41. DOI: 10.1007/s11069-004-2403-3.

276 9. Bibliography
Tobias, L. (2012). “Tsunami sirens to go silent in Tillamook County in favor of other warning
systems”. In: The Oregonian October 16.
Tobler, W. (1993). Three presentations on geographical analysis and modelling. Technical Report
93-1. Santa Barbara: National Center for Geographic Information and Analysis, University of
California, p. 24.
Toyoshima, J., T. Kariya, K. Utsumi, and T. Onuki (2012). Reconstruction and town planning of
Ishinomaki. Participatory design day, Tohoku University, Department of Urban Construction.
URL: http:/ /www.slideshare.net/JunichiToyoshima/reconstruction- and- town- planning- of-
ishinomaki.
Tsuji, Y., F. Imamura, H. Matsutomi, C. E. Synolakis, P. Nanang, Jumadi, S. Harada, S. Han, K.
Arai, and B. Cook (1995). “Field survey of the East Java earthquake and tsunami of June 3,
1994”. In: Pure and Applied Geophysics 144.3-4, pp. 839–854. DOI: 10.1007/BF00874397.
Turner, R. H., J. M. Nigg, and D. Helfer Paz. (1986). Waiting for Disaster: Earthquake Watch in
California. Berkeley, CA: University of California Press, p. 446.
Tweedie, S. W., J. R. Rowland, S. J. Walsh, R. P. Rhoten, and P. I. Hagle (1986). “A methodology
for estimating emergency evacuation times”. In: Social Science Journal 23.2, pp. 189–204.
Twentyman, M. (2012). Second false tsunami alarm in Coromandel. URL: www. stuff . co . nz /
national/6928655/Second-false-tsunami-alarm-in-Coromandel.
Uma, S. R. (2012). Achieving acceptable performance levels in the seismic design of buildings.
Science Report 2012/24. Lower Hutt, New Zealand: GNS Science, p. 21.
UNESCO/IOC (2011). Exercise Pacific Wave 11. A Pacific-wide Tsunami Warning and Communi-
cation Exercise, 910 November 2011. IOC Technical Series No. 97.
UNISDR (2005). Hyogo Framework for Action 2005-2015: Building the Resilience of Nations and
Communities to Disasters. Extract from the final report of the World Conference on Disaster
Reduction (A/CONF.206/6. Kobe, Japan: United Nations International Strategy for Disaster
Reduction, p. 25.
UNISDR (2009). UNISDR Terminology on Disaster Risk Reduction. Terminology document. Gene-
va, Switzerland: United Nations International Strategy for Disaster Reduction, p. 30.
United States Geological Survey (n.d.). Earthquakes with 50,000 or More Deaths. URL: http : / /
earthquake.usgs.gov/earthquakes/world/most\ destructive.php.
University of Tokyo (2011). Reaction project for the 2011 off the pacific coast of Tohoku earth-
quake. Data repository, http://stlab.iis.u-tokyo.ac.jp/eq data/index e.html. URL: http://stlab.iis.
u-tokyo.ac.jp/eq\ data/index\ e.html.
Urbanik, T. (1994). “State of the art in evacuation time estimates for nuclear power plants”. In:
International Journal of Mass Emergencies and Disasters 12.3, pp. 327–343.
Urbanik, T. (2000). “Evacuation time estimates for nuclear power plants”. In: Journal of Hazardous
Materials 75.2-3, pp. 165–180.

Bibliography 277
Urbanik, T., A. Desrosiers, M. K. Lindell, and C. Schuller (1980). An Analysis of Techniques for
Estimating Evacuation Times for Emergency Planning Zones. NUREG CR-1745. Washington,
DC.: US Nuclear Regulatory Commission.
Van der Sande, C., S. de Jong, and A. de Roo (2003). “A segmentation and classification approach
of IKONOS-2 imagery for land cover mapping to assist flood risk and flood damage assessmen-
t”. In: International Journal of Applied Earth Observation and Geoinformation 4.3, pp. 217–
229. DOI: 10.1016/S0303-2434(03)00003-5.
Velotti, L., J. E. Trainor, K. Engel, M. Torres, and M. Takumi (2013). “Beyond Vertical Evacuation:
Research Considerations for a Comprehensive Vertical Protection Strategy”. In: International
Journal of Mass Emergencies and Disasters 31.1, pp. 60–77.
Vitek, J. D. and S. M. Berta (1982). “Improving perception of and response to natural hazards: the
need for local education”. In: Journal of Geography 81.6, pp. 225–228.
Wallace, L. M. and R. J. Beavan (2010). “Diverse slow slip behavior at the Hikurangi subduction
margin, New Zealand”. In: Journal of Geophysical Research 115, B12402. DOI: 10 . 1029 /
2010JB007717.
Wallace, L. M., R. J. Beavan, R. McCaffrey, and D. J. Darby (2004). “Subduction zone coupling
and tectonic block rotations in the North Island, New Zealand”. In: Journal of Geophysical
Research 109, B12406. DOI: 10.1029/2004JB003241.
Wallace, L. M., M. Reyners, U. A. Cochran, S. Bannister, P. M. Barnes, K. R. Berryman, G. L.
Downes, D. Eberhart-Phillips, A. Fagereng, S. Ellis, A. Nicol, R. McCaffrey, R. J. Beavan,
S. Henrys, R. Sutherland, D. H. N. Barker, N. Litchfield, J. Townend, R. Robinson, R. Bell,
K. Wilson, and W. L. Power (2009). “Characterizing the seismogenic zone of a major plate
boundary subduction thrust: Hikurangi Margin, New Zealand”. In: Geochemistry Geophysics
Geosystems 10.10, p. 32. DOI: 10.1029/2009GC002610.
Wallace, L. M., P. M. Barnes, R. J. Beavan, R. Van Dissen, N. Litchfield, J. Mountjoy, R. Langridge,
G. Lamarche, and N. Pondard (2012). “The kinematics of a transition from subduction to strike-
slip: An example from the central New Zealand plate boundary”. In: Journal of Geophysical
Research 117, B02405. DOI: 10.1029/2011JB008640.
Walshe, R. A. and P. D. Nunn (2013). “Integration of indigenous knowledge and disaster risk re-
duction: A case study from Baie Martelli, Pentecost Island, Vanuatu”. In: International Journal
of Disaster Risk Science 3.4, pp. 185–194. DOI: 10.1007/s13753-012-0019-x.
Walters, R. A. (2003). “Tsunami runup: model development and testing”. In: Long waves sympo-
sium. Ed. by K. C. Briggs M. AUTh, Thessaloniki, Greece, 2527 Aug, pp. 289–296.
Walters, R. A., P. M. Barnes, and J. R. Goff (2006). “Locally generated tsunami along the Kaikoura
coastal margin: Part 1. Fault ruptures.” In: New Zealand Journal of Marine and Freshwater
Research 40.1, pp. 1–16.
Walters, R. A., J. R. Goff, and K. Wang (2006). “Tsunamigenic Sources in the Bay Of Plenty, New
Zealand”. In: Science of Tsunami Hazards 24.5, pp. 339–357.

278 9. Bibliography
Walton, D. and S. M. Lamb (2009). “An experimental investigation of post-earthquake travel be-
haviours: the effects of severity and initial location”. In: International Journal of Emergency
Management 6.1, pp. 14–32.
Wang, X. (2008). “Numerical modelling of surface and internal waves over shallow and interme-
diate water”. PhD thesis. Cornell University.
Wang, X. and P. L.-F. Liu (2006). “An analysis of 2004 Sumatra earthquake fault plane mechanisms
and Indian Ocean tsunami”. In: Journal of Hydraulic Research 44.2, pp. 147–154.
Wang, X. and P. L.-F. Liu (2007). “Numerical simulation of the 2004 Indian Ocean tsunami -
coastal effects”. In: Journal of Earthquake and Tsunami 1.3, pp. 273–297.
Wang, X. and P. L.-F. Liu (2008). “Numerical Simulation of Tsunami Runup onto a Three-Dimensional
Beach with Shallow Water Equations”. In: Advanced Numerical Models for Simulating Tsuna-
mi Waves and Runup. Ed. by P. L.-F. Liu, H. Yeh, and C. E. Synolakis. Vol. 10. Advances in
Coastal and Ocean Engineering. World Scientific Publishing Co. Pte. Ltd. Chap. 10, pp. 249–
253.
Wang, X. and W. L. Power (2011). COMCOT: A Tsunami Generation Propagation and Run-up
Model. Science Report 2011/43. Lower Hutt, New Zealand: GNS Science, p. 123.
Wang, X., G. Prasetya, W. L. Power, B. Lukovic, H. Brackley, and K. R. Berryman (2009). Gis-
borne District Council Tsunami Inundation Study. Consultancy Report 2009/233. Lower Hutt,
New Zealand: GNS Science, p. 130.
Wang, Y. (2009). Tsunami Evacuation Building Workshop. Open-file report O-10-02. Portland,
Oregon: Oregon Department of Geology and Mineral Industries, p. 241.
Ward, S. N. and S. Day (2001). “Cumbre Vieja VolcanoPotential collapse and tsunami at La
Palma, Canary Islands”. In: Geophysical Research Letters 28.17, p. 3397. DOI: 10 . 1029 /
2001GL013110.
Webb, T. H. (2005). Review of New Zealand’s preparedness tsunami hazard, comparison to risk
and recommendations for treatment. Client Report 2005/162. Lower Hutt, New Zealand: Insti-
tute of Geological and Nuclear Sciences, p. 119.
Wei, Y., E. N. Bernard, L. Tang, R. Weiss, V. V. Titov, C. Moore, M. Spillane, M. Hopkins,
and U. Kanoglu (2008). “Real-time experimental forecast of the Peruvian tsunami of August
2007 for U.S. coastlines”. In: Geophysical Research Letters 35.4, pp. 1–7. DOI: 10 . 1029 /
2007GL032250.
Wellington Emergency Management Office (2001). Tsunami Awareness Project. URL: http://www.
wellington.govt.nz/news/display-item.php?id=4320.
White, G. F. (1937). “Notes on Flood Protection and Land-Use Planning”. In: Journal of the Amer-
ican Institute of Planners 3.3, pp. 57–61. DOI: 10.1080/01944363708978728.
Whitehead, J. C. (2005). “Environmental Risk and Averting Behavior: Predictive Validity of Jointly
Estimated Revealed and Stated Behavior Data”. In: Environmental & Resource Economics
32.3, pp. 301–316. DOI: 10.1007/s10640-005-4679-5.

Bibliography 279
Wisner, B., J.-C. Gaillard, and I. Kelman (2012). Handbook of hazards and disaster risk reduction.
Routledge.
Wolshon, B., E. Urbina, C. Wilmot, and M. Levitan (2005). “Review of Policies and Practices for
Hurricane Evacuation. I: Transportation Planning, Preparedness, and Response”. In: Natural
Hazards Review 6, pp. 129–142.
Wood, N. J. and M. C. Schmidtlein (2012). “Anisotropic path modeling to assess pedestrian-
evacuation potential from Cascadia-related tsunamis in the US Pacific Northwest”. In: Natural
Hazards 62.2, pp. 275–300. DOI: 10.1007/s11069-011-9994-2.
Wood, N. J. and M. C. Schmidtlein (2013). “Community variations in population exposure to near-
field tsunami hazards as a function of pedestrian travel time to safety”. In: Natural Hazards
65.3, pp. 1603–1628. DOI: 10.1007/s11069-012-0434-8.
Woods, M. T. and E. A. Okal (1987). “Effect of variable bathymetry on the amplitude of teleseismic
tsunamis: A ray-tracing experiment”. In: Geophysical Research Letters 14.7, pp. 765–768. DOI:
10.1029/GL014i007p00765.
Worthy, D. (2013). Island needs sirens. URL: www.stuff .co.nz/auckland/local- news/waiheke-
marketplace/8868009/Island-needs-sirens.
Yagi, S. and Y. Hasemi (2010). “Requirements and Verification Methodology for the Design Per-
formance of Tsunami-Hinan Buildings (Temporary Tsunami Refuge Building)”. In: Journal of
Disaster Research 5.5, pp. 591–600.
Yagyu, T. (2011). “Thank you very much for your messages of sympathy regarding the Great East
Japan Earthquake of March 11, 2011 - a message from the secretary of PIANC Japan”. In:
Sailing Ahead (PIANC E-Newsletter), p. 8.
Yalciner, A. C., E. Pelinovsky, T. Talipova, A. Kurkin, A. Kozelkov, and A. Zaitsev (2004). “T-
sunamis in the Black Sea: Comparison of the historical, instrumental, and numerical data”. In:
Journal of Geophysical Research: Oceans 109.C12. DOI: 10.1029/2003JC002113.
Yamanaka, Y. and M. Kikuchi (2004). “Asperity map along the subduction zone in northeastern
Japan inferred from regional seismic data”. In: Journal of Geophysical Research: Solid Earth
109.B7. DOI: 10.1029/2003JB002683.
Yamori, K. (2013). “Revisiting the Concept of Tsunami Tendenko: Tsunami Evacuation Behavior
in the Great East Japan Earthquake”. In: Journal of Disaster Research 8.1, pp. 115–116.
Yeh, H. (1991). “Tsunami bore runup”. In: Natural Hazards 4.2-3, pp. 209–220. DOI: 10.1007/
BF00162788.
Yeh, H. (2007). “Design Tsunami Forces for Onshore Structures”. In: Journal of Disaster Research
2.6, pp. 531–536.
Yeh, H., F. Imamura, C. E. Synolakis, Y. Tsuji, P. L.-F. Liu, and S. Shi (1993). “The Flores Island
Tsunamis”. In: EOS Trans. Am. Geophys Union 74, pp. 369–373.
Yun, N.-Y. and M. Hamada (2012). “Evacuation Behaviors in the 2011 Great East Japan Earth-
quake”. In: Journal of Disaster Research 7.7, pp. 458–467.

280 9. Bibliography
Zahibo, N., E. Pelinovsky, A. C. Yalciner, A. Kurkin, A. Koselkov, and A. Zaitsev (2003). “The
1867Virgin Island tsunami: observations and modeling”. In: Oceanologica Acta 26.5-6, p-
p. 609–621. DOI: 10.1016/S0399-1784(03)00059-8.
Zaniboni, F., G. Pagnoni, S. Tinti, M. Della Seta, P. Fredi, E. Marotta, and G. Orsi (2013). “The
potential failure of Monte Nuovo at Ischia Island (Southern Italy): numerical assessment of a
likely induced tsunami and its effects on a densely inhabited area”. In: Bulletin of Volcanology
75.11, p. 763. DOI: 10.1007/s00445-013-0763-9.

APPENDICES


A. GNS SCIENCE REPORT: SCOPING STUDY FOR EVALUATING THE TSUNAMI
VULNERABILITY OF NEW ZEALAND BUILDINGS FOR USE AS EVACUATION
STRUCTURES
This appendix contains the published report Leonard, G.S., Evans, N., Prasetya, G., Saunders,
W.S.A., Pearse, L., Monastra, D. & Fraser, S.A. (2011). Scoping study for evaluating the tsunami
vulnerability of New Zealand buildings for use as evacuation structures. Science Report 2011/036.
GNS Science, Lower Hutt, New Zealand. p.37. The report is included here for reference due to
repeated references to it in the main text. Fraser contributed several recommendations based on
observations from Japan and the United States to this report.
The report is included as electronic supplementary material on the enclosed CD.


B. EXCERPTS FROM EEFIT REPORT: THE MW9.0 TOHOKU EARTHQUAKE AND
TSUNAMI OF 11TH MARCH 2011 — A FIELD REPORT BY EEFIT
This appendix presents text excerpted from EEFIT, 2011. The MW9.0 Tohoku earthquake and t-
sunami of 11th March 2011 - A field report by EEFIT, with permission of the Earthquake Engineer-
ing Field Investigation Team, UK (www.eefit.org.uk), [Online], http://www.istructe.org/resources-
centre/ technical-topic-areas/eefit/eefit-reports. Two sections of the report are included: 7. Field
observations on tsunami damage to buildings and 10. Tsunami preparedness, warning and evacu-
ation. The text is presented in its original publication format.
The paper is included as electronic supplementary material on the enclosed CD.


C. BULLETIN OF EARTHQUAKE ENGINEERING: TSUNAMI DAMAGE TO
COASTAL DEFENCES AND BUILDINGS IN THE MARCH 11TH 2011 MW 9.0
GREAT EAST JAPAN EARTHQUAKE AND TSUNAMI
This appendix contains the published paper Fraser, S.A., Raby, A., Pomonis, A., Goda, K., Chian,
S.C., Macabuag, J., Offord, M., Saito, K. and Sammonds, P. (2013). Tsunami damage to coastal
defences and buildings in the March 11th 2011 MW9.0 Great East Japan earthquake and tsunami.
Bulletin of Earthquake Engineering. 11 (1). p.pp. 205239. The published work is the result of
significant combined effort on the part of the Earthquake Engineering Field Investigation Team
(EEFIT) team, therefore is not included as a main chapter in this thesis. However, the paper is
included here for reference due to repeated references to it in the main text, and the work conducted
by Fraser during this field investigation played an important role in informing subsequent research
in this thesis.
The paper is included as electronic supplementary material on the enclosed CD.


D. GNS SCIENCE REPORT: TSUNAMI EVACUATION: LESSONS FROM THE
GREAT EAST JAPAN EARTHQUAKE AND TSUNAMI OF MARCH 11TH 2011
This appendix contains the published report Fraser, S.A., Leonard, G.S., Matsuo, I. & Murakami,
H. (2012). Tsunami Evacuation: Lessons from the Great East Japan earthquake and tsunami of
March 11th 2011. Science Report 2012/17. GNS Science, Lower Hutt, New Zealand. p.89. This is
the full report of fieldwork conducted in the Tohoku region of Japan, in October 2011. This report
presents data on tsunami warnings and evacuation additional to that presented in Chapter 5, but is
referred to regularly in-text.
The report is included as electronic supplementary material on the enclosed CD.


E. GNS SCIENCE REPORT: VALIDATION OF A GIS-BASED ATTENUATION
RULE FOR INDICATIVE TSUNAMI EVACUATION ZONE MAPPING
This appendix contains the published report Fraser, S.A. & Power, W.L. (2013). Validation of a GIS-
based attenuation rule for indicative tsunami evacuation zone mapping. Science Report 2013/02.
GNS Science, Lower Hutt, New Zealand. p.21. The report is included here for reference due to
references to the methodology and validation in the main text.
The report is included as electronic supplementary material on the enclosed CD.


F. POTENTIAL GROUND SHAKING AT NAPIER DUE TO A MW 9.0
SUBDUCTION ZONE EARTHQUAKE
Simulation of ground shaking and detailed analysis of earthquake-induced damage in the study
area are outside of the scope of this research project. However, earthquake ground-shaking is
acknowledged in the main text, as being an important factor in evacuation the process. The whole
discussion of immediate evacuation response to natural warnings hinges on the fact that a local-
source tsunamigenic earthquake would impart sufficient ground shaking so as to be too strong to
stand up in, or lasting longer than a minute.
We can obtain a first-order approximation of this using the typical rupture velocity (0.7–2.8
kms-1 Suppasri, Imamura, and Koshimura, 2010) and the rupture length of the slip plane. The
2011 Great East Japan earthquake ruptured with a velocity of 1.5–2.5 kms-1, with rupture duration
of 150-160 s (Ammon et al., 2011).
In Table F.1 we provide a range of rupture length and rupture velocities to show the variation
in estimates. These indicate a rupture duration of at least 2 min 0 s in any of these scenarios,
which was the duration of the 400 km-long rupture of the 2004 Indian Ocean earthquake. We can
therefore be confident that a rupture of this magnitude will be sufficiently long to for people to
recognise the severity of the earthquake as larger than they have experienced previously.
In order to estimate ground shaking intensity, a Modified Mercalli Intensity (MMI) map was
generated for rupture of the subduction zone. This was conducted using the finite source mode of
the open-source software package OpenSHA. In order to test the appropriateness of site parameter
assumptions made in the OpenSHA analysis, mapped isoseismals from two point-source events
were compared using (a) OpenSHA and (b) the isoseismal equation developed from statistics of
Tab. F.1: Estimated rupture duration (s) from a range of rupture length (km) and rupture velocity (kms-1)
values. *Denotes the lower and upper limits of the MW 9.0 earthquake applied in Chapter 4
Rupture
length (km)
Rupture velocity 1.0
kms-1
Rupture velocity 2.0
kms-1
Rupture velocity 2.5
kms-1
300 5 min 0 s 2 min 30 s 2 min 0 s
400 6 min 40 s 3 min 20 s 2 min 40 s
600 10 min 0 s 5 min 0 s 4 min 0 s
640 10 min 40 s 5 min 20 s 4 min 16 s
740 12 min 20 s 6 min 10 s 4 min 56 s

294 F. Potential ground shaking at Napier
New Zealand earthquakes (Dowrick and Rhoades, 2005a).
First, isoseismal distance on the ellipse major-axis for each intensity isoseismal, using values
for the main seismic region of New Zealand (Dowrick and Rhoades, 2005a, Table 6). Isoseismal
distance on the minor axis is given by a separate equation (Dowrick and Rhoades, 2005b, p199).
Isoseismals were plotted for MW 9.0 and MW 8.0 at 2 point-source locations: 2075681.85619 E,
5573458.20855 N; and 1897881.50059 E, 5391424.51115 N (New Zealand Transverse Mercator).
The same point-sources were used to test the congruence with United States Geological Survey
(USGS) Shakemap functions in OpenSHA. Based on the fact that OpenSHA is congruent with
Dowrick for an MW 9.0 point-source, a finite-source model was run using source dimensions from
the National Seismic Hazard Map (NSHM) and the fault trace used in Fraser et al. (2014) — see
framed box, below, for parameters. OpenSHA analysis was tested with different site classifications:
BC, C, D, and CD. Wills Site Classification CD provided the best match, therefore shear velocity
at Napier was assigned as Wills Classification CD (Vs30 equivalent = 270–555ms-1)1, which is
supported by USGS Vs30 mapping (Fig F.1). Testing of the assumed Rake angle between 50–70°,
had no discernable impact on distribution of MMI.
This preliminary analysis suggests that Napier is likely to experience MMI VII-IX for the max-
imum credible local earthquake. This range of estimated intensity is loosely supported by the range
observed in the 2011 Great East Japan earthquake (Fig F.3). At these ‘damaging’ to ‘destructive’
intensities people will experience difficulty standing, and damage would range from ‘damage to
weak buildings’ at MMIVII, to damage to some moderate-strength building and destruction of
many weak buildings (Table F.2).
The subduction zone rupture was approximated in OpenSHA with the following input:
IMR Param List:IMR = ShakeMap (2003); Gaussian Truncation = None; Truncation Level = 2.0; Tectonic
Region = Active Shallow Crust; Component = Average Horizontal; Std Dev Type = Total
IMT = MMI
Region Param List:Min Longitude = 173.0; Max Longitude = 180.0; Min Latitude = -43.0; Max Latitude = -37.0;
Grid Spacing = 0.1; Set Site Params = Apply same site parameter(s) to all locations; Wills
Site Class = BC
1 http://www.opensha.org/glossary-willsSiteClass

295
Custom Eqk Rupture Param List:Rupture Type = Finite source rupture; Magnitude = 9.0; Rake = 90.0;
Set Fault Surface [ Num. of Fault Trace Points = 11 ; Num. of Dips = 1 ;
Fault Latitudes [ Lat-1 = -37.666 ; Lat-2 = -38.38 ; Lat-3 = -38.714 ; Lat-4 = -39.209 ; Lat-5
= -40.227 ; Lat-6 = -40.665 ; Lat-7 = -41.026 ; Lat-8 = -41.302 ; Lat-9 = -41.578 ; Lat-10 =
-41.788 ; Lat-11 = -41.845 ] ;
Fault Longitudes [ Lon-1 = 179.591 ; Lon-2 = 179.163 ; Lon-3 = 178.992 ; Lon-4 = 178.773 ;
Lon-5 = 178.402 ; Lon-6 = 178.097 ; Lon-7 = 177.697 ; Lon-8 = 177.193 ; Lon-9 = 176.584 ;
Lon-10 = 175.765 ; Lon-11 = 175.47 ] ;
Depths [ Depth-1 = 5.0 ; Depth-2 = 24.0 ] ; Dips [ Dip-1 = 9.0 ] ;
Grid Spacing = 1.0 ;
Finite Fault Type = Stirling’s ];
Set Hypocenter Location = false
TimeSpan Param List:No Timespan exists for the selected Rupture
Calculation Param List:Use Approximate Distance = true; Point-Source Correction = false; NSHMP Pt Src. Corr. =
false

296 F. Potential ground shaking at Napier
Fig. F.1: USGS Predefined Vs30 Mapping for New Zealand. Source: http://earthquake.usgs.gov/hazards/
apps/vs30/predefined.php

297
Fig. F.2: MMI ShakeMap produced for a MW 9.0 earthquake finite-source model on the Hikurangi subduc-
tion margin, using OpenSHA. Log10(MMI) = 0.96 corresponds to MMI IX; Log10(MMI) = 0.96
corresponds to MMI VIII

298 F. Potential ground shaking at Napier
Fig. F.3: USGS ShakeMap estimated MMI for the 2011 Great East Japan earthquake. Source: http:
//earthquake.usgs.gov/earthquakes/shakemap/global/shake/c0001xgp/

299
Tab. F.2: The New Zealand MMI scale. Source: http://info.geonet.org.nz/display/quake/Shaking+Intensity.
Intensity Modified Mercalli Level Description
unnoticeable MM 1 - imperceptible Barely sensed only by a very few people.
MM 2 - scarcely feltFelt only by a few people at rest in houses or on
upper floors.
weak MM 3 - weakFelt indoors as a light vibration. Hanging objects
may swing slightly.
light MM 4 - light
Generally noticed indoors, but not outside, as a
moderate vibration or jolt. Light sleepers may be
awakened. Walls may creak, and glassware,
crockery, doors or windows rattle.
moderate MM 5 - moderate
Generally felt outside and by almost everyone
indoors. Most sleepers are awakened and a few
people alarmed. Small objects are shifted or
overturned, and pictures knock against the wall.
Some glassware and crockery may break, and
loosely secured doors may swing open and shut.
strong MM 6 - strong
Felt by all. People and animals are alarmed, and
many run outside. Walking steadily is difficult.
Furniture and appliances may move on smooth
surfaces, and objects fall from walls and shelves.
Glassware and crockery break. Slight
non-structural damage to buildings may occur.
severe MM 7 - damaging
General alarm. People experience difficulty
standing. Furniture and appliances are shifted.
Substantial damage to fragile or unsecured objects.
A few weak buildings are damaged.
MM 8 - heavily damagingAlarm may approach panic. A few buildings are
damaged and some weak buildings are destroyed.
MM 9 - destructiveSome buildings are damaged and many weak
buildings are destroyed.
MM 10 - very destructiveMany buildings are damaged and most weak
buildings are destroyed.
MM 11 - devastatingMost buildings are damaged and many buildings
are destroyed.
MM 12 - completely
devastating
All buildings are damaged and most buildings are
destroyed.


G. EVACUATION MODELLING PROCESS CHARTS
This appendix contains a series of flow charts that outline the exposure and evacuation modelling
process. Figure G.1 demonstrates the original method of Wood and Schmidtlein (2012) and Wood
and Schmidtlein (2013) to the point that it is augmented with the new process developed in the
current research. The subsequent figures show portions of the analysis. Each figure follows on
from the previous, i.e. the output of one process is used as the input in the following process.

302 G. Evacuation modelling process charts
Fig. G.1: Model diagram of the model methodology developed in this thesis, which augments the method
of Wood and Schmidtlein (2012, 2013).

303
Fig. G.2: Flow chart indicating the process developed to generate distributed exposure datasets.

304 G. Evacuation modelling process charts
Fig. G.3: Flow chart indicating the process developed to generate evacuation compliance rate (CR).

305
Fig. G.4: Flow chart indicating the process developed to apply variable travel speeds into methodology.

306 G. Evacuation modelling process charts
Fig. G.5: Flow chart indicating the process developed to generate PV E raster.

307
Fig. G.6: Flow chart indicating the process developed to generate Maximum PV E raster

308 G. Evacuation modelling process charts
Fig. G.7: Flow chart indicating the process developed to develop a raster of safe zones at vertical evacuation
facilities.

309
Fig. G.8: Flow chart indicating the process developed to develop a revised path distance raster including
vertical evacuation buildings as safe zones. This raster is applied in further evacuation analyses to
assess the impact of different combinations of TVEB sites.


H. CONTRIBUTION STATEMENTS FOR CO-AUTHORED PAPERS
In line with Massey University requirements, the following pages contain a statement of author
contribution for each published work presented in the main body and appendices of this thesis.
The statements are presented in the order that the corresponding publication appears in the thesis.

DRC 16
GRS Version 3– 16 September 2011
STATEMENT OF CONTRIBUTION
TO DOCTORAL THESIS CONTAINING PUBLICATIONS
(To appear at the end of each thesis chapter/section/appendix submitted as an article/paper or collected as an appendix at the end of the thesis) We, the candidate and the candidate’s Principal Supervisor, certify that all co-authors have consented to their work being included in the thesis and they have accepted the candidate’s contribution as indicated below in the Statement of Originality. Name of Candidate: Stuart Fraser Name/Title of Principal Supervisor: Prof David Johnston Name of Published Research Output and full reference: Fraser, S.A., Power, W.L., Wang, X., Wallace, L., Mueller, C., Johnston, D.M. 2014. Inundation due to local tsunami at Napier, New Zealand. Natural Hazards. Volume 70, Issue 1, 415--445. doi: 10.1007/s11069-013-0820-x In which Chapter is the Published Work: Chapter 4 Please indicate either:
The percentage of the Published Work that was contributed by the candidate:
and / or
Describe the contribution that the candidate has made to the Published Work:
The candidate designed the research methodology and conducted all numerical analysis that contributed to the published work, with technical advice from X. Wang, W. Power and D. Johnston. Earthquake source models were provided by L. Wallace; the candidate modified these where required and incorporated these into tsunami simulation. The candidate conducted the post-processing using tools developed in collaboration with C. Mueller, and analysis of simulations to develop the published output. The published work was written by the candidate with review and amendments provided by co-authors.
2 April 2014 Candidate’s Signature Date
2 April 2014 Principal Supervisor’s signature Date

DRC 16
GRS Version 3– 16 September 2011
STATEMENT OF CONTRIBUTION
TO DOCTORAL THESIS CONTAINING PUBLICATIONS
(To appear at the end of each thesis chapter/section/appendix submitted as an article/paper or collected as an appendix at the end of the thesis) We, the candidate and the candidate’s Principal Supervisor, certify that all co-authors have consented to their work being included in the thesis and they have accepted the candidate’s contribution as indicated below in the Statement of Originality. Name of Candidate: Stuart Fraser Name/Title of Principal Supervisor: Prof David Johnston Name of Published Research Output and full reference: Fraser, S., Leonard, G. S., Murakami, H., and Matsuo, H. 2012. Tsunami Vertical Evacuation Buildings - Lessons for International Preparedness Following the 2011 Great East Japan Tsunami. Journal of Disaster Research, Vol.7, Special Issue, August 2012, pp. 446-457. In which Chapter is the Published Work: Chapter 5 Please indicate either:
The percentage of the Published Work that was contributed by the candidate:
and / or
Describe the contribution that the candidate has made to the Published Work:
The candidate designed the research methodology based on prior experience in the study area, with guidance from G. Leonard on interviewing strategy. The candidate and G. Leonard jointly conducted interviews and field work in collaboration with H. Murakami and I. Matsuo. The candidate analysed all interview data and wrote the published work, with review provided by all co-authors.
2 April 2014 Candidate’s Signature Date
2 April 2014 Principal Supervisor’s signature Date

DRC 16
GRS Version 3– 16 September 2011
STATEMENT OF CONTRIBUTION
TO DOCTORAL THESIS CONTAINING PUBLICATIONS
(To appear at the end of each thesis chapter/section/appendix submitted as an article/paper or collected as an appendix at the end of the thesis) We, the candidate and the candidate’s Principal Supervisor, certify that all co-authors have consented to their work being included in the thesis and they have accepted the candidate’s contribution as indicated below in the Statement of Originality. Name of Candidate: Stuart Fraser Name/Title of Principal Supervisor: Prof David Johnston Name of Published Research Output and full reference: Fraser, S. A.; Leonard, G.S.; Johnston, D.M. 2013. Intended evacuation behaviour in a local earthquake and tsunami at Napier, New Zealand, GNS Science Report 2013/26. 62p. Lower Hutt, New Zealand. In which Chapter is the Published Work: Chapter 6 Please indicate either:
The percentage of the Published Work that was contributed by the candidate:
and / or
the contribution that the candidate has made to the Published Work:
The candidate designed the research methodology with advice from supervisors. The candidate conducted the field work, all data analysis and wrote the report, which was reviewed by supervisors.
2 April 2014 Candidate’s Signature Date
2 April 2014 Principal Supervisor’s signature Date

DRC 16
GRS Version 3– 16 September 2011
STATEMENT OF CONTRIBUTION
TO DOCTORAL THESIS CONTAINING PUBLICATIONS
(To appear at the end of each thesis chapter/section/appendix submitted as an article/paper or collected as an appendix at the end of the thesis) We, the candidate and the candidate’s Principal Supervisor, certify that all co-authors have consented to their work being included in the thesis and they have accepted the candidate’s contribution as indicated below in the Statement of Originality. Name of Candidate: Stuart Fraser Name/Title of Principal Supervisor: Prof David Johnston Name of Published Research Output and full reference: Fraser, S.A., Wood, N.J., Johnston, D.J., Leonard, G.S., Greening, P. and Rossetto, T.R. Variable population exposure and travel speeds in least-cost tsunami evacuation modelling. Submitted for publication in Natural Hazards and Earth Systems Science. In which Chapter is the Published Work: Chapter 7 Please indicate either:
The percentage of the Published Work that was contributed by the candidate:
and / or
Describe the contribution that the candidate has made to the Published Work: Stuart Fraser (SF) proposed the research aims and developed the extensions to the anisotropic least-cost path distance methodology, which forms the basis for this analysis and was originally developed by N. Wood (NW) and his co-author in a previous paper. SF designed and developed the new exposure model. SF developed the Python code required to action the extensions to NW’s original method, conducted the data analysis, and wrote the manuscript. NW provided technical advice and review, and thorough manuscript review and editing. All other co-authors provided methodological discussion and review of the manuscript. 11 April 2014 Candidate’s Signature Date
11 April 2014 Principal Supervisor’s signature Date

DRC 16
GRS Version 3– 16 September 2011
STATEMENT OF CONTRIBUTION
TO DOCTORAL THESIS CONTAINING PUBLICATIONS
(To appear at the end of each thesis chapter/section/appendix submitted as an article/paper or collected as an appendix at the end of the thesis) We, the candidate and the candidate’s Principal Supervisor, certify that all co-authors have consented to their work being included in the thesis and they have accepted the candidate’s contribution as indicated below in the Statement of Originality. Name of Candidate: Stuart Fraser Name/Title of Principal Supervisor: Prof David Johnston Name of Published Research Output and full reference: Leonard, G. S.; Evans, N.; Prasetya, G.; Saunders, W.S.A.; Pearse, L.; Monastra, D. and Fraser, S. 2011. Scoping study for evaluating the tsunami vulnerability of New Zealand buildings for use as evacuation structures, GNS Science Report 2011/36 39 p. In which Chapter is the Published Work: Appendix A Please indicate either:
The percentage of the Published Work that was contributed by the candidate:
and / or
Describe the contribution that the candidate has made to the Published Work: The candidate contributed observations of tsunami resilient buildings and vertical evacuation projects in Japan and the United States (section 3) and several recommendations (section 6) to the report, based on research in the Great East Japan tsunami and provided review of the report.
11 April 2014 Candidate’s Signature Date
11 April 2014 Principal Supervisor’s signature Date

DRC 16
GRS Version 3– 16 September 2011
STATEMENT OF CONTRIBUTION
TO DOCTORAL THESIS CONTAINING PUBLICATIONS
(To appear at the end of each thesis chapter/section/appendix submitted as an article/paper or collected as an appendix at the end of the thesis) We, the candidate and the candidate’s Principal Supervisor, certify that all co-authors have consented to their work being included in the thesis and they have accepted the candidate’s contribution as indicated below in the Statement of Originality. Name of Candidate: Stuart Fraser Name/Title of Principal Supervisor: Prof David Johnston Name of Published Research Output and full reference: EEFIT, 2011. The Mw9.0 Tohoku earthquake and tsunami of 11th March 2011 - A field report by EEFIT, Earthquake Engineering Field Investigation Team, The Institution of Structural Engineers, London, UK, [Online]. http://www.istructe.org/resources-centre/technical-topic-areas/eefit/eefit-reports. In which Chapter is the Published Work: Appendix B Please indicate either:
The percentage of the Published Work that was contributed by the candidate:
and / or
Describe the contribution that the candidate has made to the Published Work: All authors contributed to field investigation design and planning. All authors conducted field investigation, analysed data and wrote report sections in their own area of interest/expertise. SF compiled and edited the research report. Specifically, Sections 7 and 10 of the report pertain to the research presented in this thesis. All authors contributed to general damage surveys. Stuart Fraser (SF) designed the detailed surveys in Kamaishi City (section 7.2.2, conducted by SF and Joshua Macabuag (JM)) and Kesennuma Town (section 7.2.5, conducted by SF). All authors contributed to Section 7, the majority of which was written by Antonios Pomonis, SF and JM. SF conducted specific surveys of buildings suitable for vertical evacuation and wrote section 10 (‘Tsunami preparedness, warning and evacuation’).
2 April 2014 Candidate’s Signature Date
2 April 2014 Principal Supervisor’s signature Date

DRC 16
GRS Version 3– 16 September 2011
STATEMENT OF CONTRIBUTION
TO DOCTORAL THESIS CONTAINING PUBLICATIONS
(To appear at the end of each thesis chapter/section/appendix submitted as an article/paper or collected as an appendix at the end of the thesis) We, the candidate and the candidate’s Principal Supervisor, certify that all co-authors have consented to their work being included in the thesis and they have accepted the candidate’s contribution as indicated below in the Statement of Originality. Name of Candidate: Stuart Fraser Name/Title of Principal Supervisor: Prof David Johnston Name of Published Research Output and full reference: Stuart A. Fraser, Alison Raby, Antonios Pomonis, Katsuichiro Goda,Siau Chen Chian, Joshua Macabuag, Mark Offord, Keiko Saito, and Peter Sammonds. Tsunami damage to coastal defences and buildings in the March 11th 2011 Mw9.0 Great East Japan earthquake and tsunami. Bulletin of Earthquake Engineering, 11(1):205-239, 2013. In which Chapter is the Published Work: Appendix C Please indicate either:
The percentage of the Published Work that was contributed by the candidate:
and / or
Describe the contribution that the candidate has made to the Published Work: Stuart Fraser (SF) compiled the paper based on the previously-published EEFIT report, with review and editing of the paper by all other authors. All authors contributed to field investigation design and planning. All authors conducted field investigation, data analysis/interpretation and writing of the field report in their respective research areas. Sections 5 and 6 of the paper pertain to the research conducted in this thesis. Stuart Fraser wrote section 5 (‘Vertical evacuation structures’). All authors contributed to the general damage surveys documented in Section 6, which was written based on contributions to the report primarily by Antonios Pomonis, SF and Joshua Macabuag (JM). SF designed the detailed surveys in Kamaishi City (section 6.2, conducted by SF and JM) and Kesennuma Town (section 6.4, conducted by SF).
2 April 2014 Candidate’s Signature Date
2 April 2014 Principal Supervisor’s signature Date

DRC 16
GRS Version 3– 16 September 2011
STATEMENT OF CONTRIBUTION
TO DOCTORAL THESIS CONTAINING PUBLICATIONS
(To appear at the end of each thesis chapter/section/appendix submitted as an article/paper or collected as an appendix at the end of the thesis) We, the candidate and the candidate’s Principal Supervisor, certify that all co-authors have consented to their work being included in the thesis and they have accepted the candidate’s contribution as indicated below in the Statement of Originality. Name of Candidate: Stuart Fraser Name/Title of Principal Supervisor: Prof David Johnston Name of Published Research Output and full reference: Fraser, S., Leonard, G.S., Matsuo, I., Murakami, H. 2012. Tsunami Evacuation: Lessons from the Great East Japan earthquake and tsunami of March 11th 2011. Lower Hutt: GNS Science. GNS Science Report 2012/17. 89p. In which Chapter is the Published Work: Appendix D Please indicate either:
The percentage of the Published Work that was contributed by the candidate:
and / or
Describe the contribution that the candidate has made to the Published Work:
The candidate designed the research methodology based on prior experience in the study area, with guidance from G. Leonard on interviewing strategy. The candidate and G. Leonard jointly conducted interviews and field work in collaboration with H. Murakami and I. Matsuo, who also provided language translation. The candidate analysed all interview data and wrote the published work, with review provided by all co-authors.
2 April 2014 Candidate’s Signature Date
2 April 2014 Principal Supervisor’s signature Date

DRC 16
GRS Version 3– 16 September 2011
STATEMENT OF CONTRIBUTION
TO DOCTORAL THESIS CONTAINING PUBLICATIONS
(To appear at the end of each thesis chapter/section/appendix submitted as an article/paper or collected as an appendix at the end of the thesis) We, the candidate and the candidate’s Principal Supervisor, certify that all co-authors have consented to their work being included in the thesis and they have accepted the candidate’s contribution as indicated below in the Statement of Originality. Name of Candidate: Stuart Fraser Name/Title of Principal Supervisor: Prof David Johnston Name of Published Research Output and full reference: Fraser, S. A. and Power, W. L. 2013. Validation of a GIS-based attenuation rule for indicative tsunami evacuation zone mapping. Lower Hutt: GNS Science. GNS Science Report 2013/02. 17p. In which Chapter is the Published Work: Appendix E Please indicate either:
The percentage of the Published Work that was contributed by the candidate:
and / or
the contribution that the candidate has made to the Published Work:
The candidate applied a previously-developed research methodology to a new study area. The candidate sourced data, developed new digital elevation models, conducted the analysis and wrote the report. W. Power provided technical advice and review.
2 April 2014 Candidate’s Signature Date
2 April 2014 Principal Supervisor’s signature Date

I. PUBLICATIONS AUTHORED DURING THE COURSE OF THIS PHD

JOURNAL PUBLICATIONS
[1] S. A. Fraser, N. J. Wood, D. M. Johnston, G. S. Leonard, P. D. Greening, and
T. Rossetto, “Variable population exposure and distributed travel speeds in
least-cost tsunami evacuation modelling,” Natural Hazards and Earth SystemSciences, vol. 14, no. 11, pp. 2975–2991, Nov. 2014. [Online]. Available:
http://www.nat-hazards-earth-syst-sci.net/14/2975/2014/
[2] S. A. Fraser, W. L. Power, X. Wang, L. M. Wallace, C. Mueller, and D. M.
Johnston, “Tsunami inundation in Napier, New Zealand, due to local earth-
quake sources,” Natural Hazards, vol. 70, no. 1, pp. 415–445, 2014.
[3] S. A. Fraser, G. S. Leonard, H. Murakami, and I. Matsuo, “Tsunami Vertical
Evacuation Buildings — Lessons for International Preparedness Following
the 2011 Great East Japan Tsunami,” Journal of Disaster Research, vol. 7,
no. 7, pp. 446–457, 2012.
[4] S. A. Fraser, A. Raby, A. Pomonis, K. Goda, S. C. Chian, J. Macabuag, M. Of-
ford, K. Saito, and P. Sammonds, “Tsunami damage to coastal defences and
buildings in the March 11th 2011 Mw9.0 Great East Japan earthquake and
tsunami,” Bulletin of Earthquake Engineering, vol. 11, no. 1, pp. 205–239,
2013.
[5] K. Goda, A. Pomonis, S. C. Chian, M. Offord, K. Saito, P. Sammonds, S. A.
Fraser, A. Raby, and J. Macabuag, “Ground motion characteristics and shak-
ing damage of the 11th March 2011 M w9.0 Great East Japan earthquake,”
Bulletin of Earthquake Engineering, vol. 11, no. 1, pp. 141–170, Aug. 2013.
[6] S. Wilkinson, D. Grant, E. Williams, S. Paganoni, S. A. Fraser,
D. Boon, A. Mason, and M. Free, “Observations and implications
of damage from the magnitude Mw 6.3 Christchurch, New Zealand
earthquake of 22 February 2011,” Bulletin of Earthquake Engineer-ing, vol. 11, no. 1, pp. 107–140, Nov. 2013. [Online]. Available:
http://www.springerlink.com/index/10.1007/s10518-012-9384-5

REPORTS
[1] S. A. Fraser, D. M. Johnston, and G. S. Leonard, “Intended evacuation be-
haviour in a local earthquake and tsunami at Napier, New Zealand,” GNS
Science, Lower Hutt, New Zealand, Science Report 2013/26, 2013.
[2] S. A. Fraser and W. L. Power, “Validation of a GIS-based attenuation rule
for indicative tsunami evacuation zone mapping,” GNS Science, Lower Hutt,
New Zealand, Science Report 2013/02, 2013.
[3] S. A. Fraser, G. S. Leonard, I. Matsuo, and H. Murakami, “Tsunami E-
vacuation: Lessons from the Great East Japan earthquake and tsunami of
March 11th 2011,” GNS Science, Lower Hutt, New Zealand, Science Report
2012/17, 2012.
[4] G. S. Leonard, N. Evans, G. Prasetya, W. S. A. Saunders, L. Pearse,
D. Monastra, and S. A. Fraser, “Scoping study for evaluating the tsunami vul-
nerability of New Zealand buildings for use as evacuation structures,” GNS
Science, Lower Hutt, New Zealand, Science Report 2011/036, 2011.
[5] EEFIT, “The Mw9.0 Tohoku earthquake and tsunami of 11th March 2011 -
A field report by EEFIT,” Earthquake Engineering Field Investigation Team,
The Institution of Structural Engineers, London, UK, Field Report, 2011.
[Online]. Available: http://www.istructe.org/resources-centre/technical-topic-
areas/eefit/eefit-reports
[6] J. G. Beban, W. J. Cousins, X. Wang, and S. A. Fraser, “Modelling the evac-
uation rates required to achieve an acceptable level of health and safety risk
in Te Tumu from the Variation to the Southern Kermadec Scenario,” GNS
Science, Lower Hutt, New Zealand, Consultancy Report 2012/291, 2012.
[7] G. S. Leonard, D. M. Johnston, C. E. Gregg, R. Garside, W. S. A. Saunders,
J. S. Becker, and S. A. Fraser, “Evaluation and recommendations for tsunami

and lahar exercises in Washington State,” GNS Science, Lower Hutt, New
Zealand, Science Report 2011/32, 2011.

CONFERENCES
[1] S. A. Fraser, N. J. Wood, D. M. Johnston, and G. S. Leonard, “Simulation of
local tsunami and evacuation of urban areas, informed by population expo-
sure analysis and studies of tsunami evacuation behaviour.” in EGU GeneralAssembly Conference Abstracts, vol. 15, Vienna, Austria, 2013, p. 3635.
[2] S. A. Fraser, “The Role Of Tsunami Vertical Evacuation Buildings In The
2011 Great East Japan Tsunami, and Lessons For New Zealand,” Presentation
at the 6th Annual Australasian Natural Hazards Management Conference, 21-
22 August 2012, Christchurch, New Zealand., 2012.
[3] S. A. Fraser, G. S. Leonard, D. M. Johnston, and P. Greening, “Potential
for using mid to high-rise buildings as vertical evacuation structures in near-
source earthquake and tsunami events,” Poster presented at 5th Annual Aus-
tralasian Natural Hazards Management Conference, 18th to 21st July 2011,
Gold Coast, Australia. Awarded 3rd Prize in Student Poster Award., 2011.
[4] S. A. Fraser, G. S. Leonard, and D. M. Johnston, “Observations of vertical e-
vacuation structures in the 2011 Tohoku earthquake and tsunami,” Poster pre-
sented at 5th Annual Australasian Natural Hazards Management Conference,
July 18-21 2011, Gold Coast, Australia., 2011.
[5] S. A. Fraser, G. S. Leonard, D. M. Johnston, and P. Greening, “Implications
of the 11th March Tohoku tsunami on warning systems and vertical evacua-
tion strategies,” Poster presented at American Geophysical Union Conference,
December 5-9 2011, San Francisco, United States., 2011.
[6] D. M. Johnston, W. S. A. Saunders, G. S. Leonard, J. Beban, K. Wright,
and S. A. Fraser, “History of Tsunami Planning in New Zealand: 1960 to
the present,” in UHPH 14: Landscapes and ecologies of urban and planninghistory, Proceedings of the 12th conference of the Australasian Urban History/ Planning History Group, M. Gjerde and E. Petrovic, Eds. Wellington, New

Zealand: Australasian Urban History / Planning History Group and Victoria
University of Wellington, 2014, pp. 361–372.
[7] D. M. Johnston, S. A. Fraser, G. S. Leonard, W. S. A. Saunders, and
K. Wright, “Developing an effective community response to the next ”Great
East Coast Subduction Zone Earthquake and Tsunami”,” White paper present-
ed at GeoPRISMS - Planning Workshop for the New Zealand Primary Site,
Wellington, New Zealand, April 15-17, 2013, 2013.
[8] G. S. Leonard and S. A. Fraser, “Developing an effective community response
to the next subduction zone earthquake, East Coast, New Zealand,” Confer-
ence workshop convened at 6th Australasian Natural Hazards Management
Conference, August 23 2012, Christchurch, New Zealand., 2012.
[9] C. Mueller, W. L. Power, S. A. Fraser, and X. Wang, “Towards a robust frame-
work for Probabilistic Tsunami Hazard Assessment ( PTHA ) for local and
regional tsunami in New Zealand,” in EGU General Assembly ConferenceAbstracts, vol. 15, Vienna, Austria, 2013, p. 3631.
[10] ——, “Towards a robust framework for Probabilistic Tsunami Hazard As-
sessment (PTHA) for local and mid-range Tsunami in New Zealand,” Ab-
stract presented at Geoscience Society of New Zealand (GSNZ) Annual Con-
ference, November 25-28 2012, Hamilton, New Zealand, 2012.
[11] H. Murakami, S. A. Fraser, G. S. Leonard, and I. Matsuo, “A Field Study on
conditions and Roles of Tsunami Evacuation Buildings in the 2011 Tohoku
Pacific Earthquake and Tsunami.” in Joint Conference Proceedings: 9th Inter-national Conference on Urban Earthquake Engineering / 4th Asia Conferenceon Earthquake Engineering, March 6-8, 2012, Tokyo Institute of Technology.,Tokyo, Japan, 2012.
[12] W. L. Power, C. Mueller, A. Barberopoulou, L. M. Wallace, X. Wang, and
S. A. Fraser, “The New Zealand probabilistic tsunami hazard model (Invit-
ed),” Abstract NH24A-01 presented at 2012 Fall Meeting, AGU, San Francis-
co, Calif., 3-7 Dec, 2012.
[13] K. C. Wright, W. J. Cousins, G. S. Leonard, D. M. Johnston, and S. A.
Fraser, “When engineering isnt enough planning for immediate evacuation in
Wellington Region following major subduction zone earthquakes,” Poster pa-
per #64 presented at 2013 NZSEE Conference, April 26-28 2013, Wellington,
New Zealand., pp. 1–8, 2013.

[14] S. Chian, A. Pomonis, K. Saito, K. Goda, P. Sammonds, A. Raby, M. Offord,
S. A. Fraser, and J. Macabuag, “Post Earthquake Field Investigation of the
Mw9.0 Tohoku Earthquake of 11th March 2011,” in Proceedings of the 15thWorld Conference on Earthquake Engineering, Lisbon, Portugal, 2012.
[15] K. Goda, S. C. Chian, S. A. Fraser, J. Macabuag, M. Offord, A. Pomonis,
A. Raby, K. Saito, and P. Sammonds, “EEFIT field observations and lessons
from the 11th March 2011 Mw9.0 Tohoku earthquake: ground motion and
shaking damage,” in Proceedings of the 15th World Conference on Earth-quake Engineering, Lisbon, Portugal, 2012.