Environmental Interactions in the GFDL Hurricane Model for Hurricane Opal
Upload
khangminh22Category
view
0download
0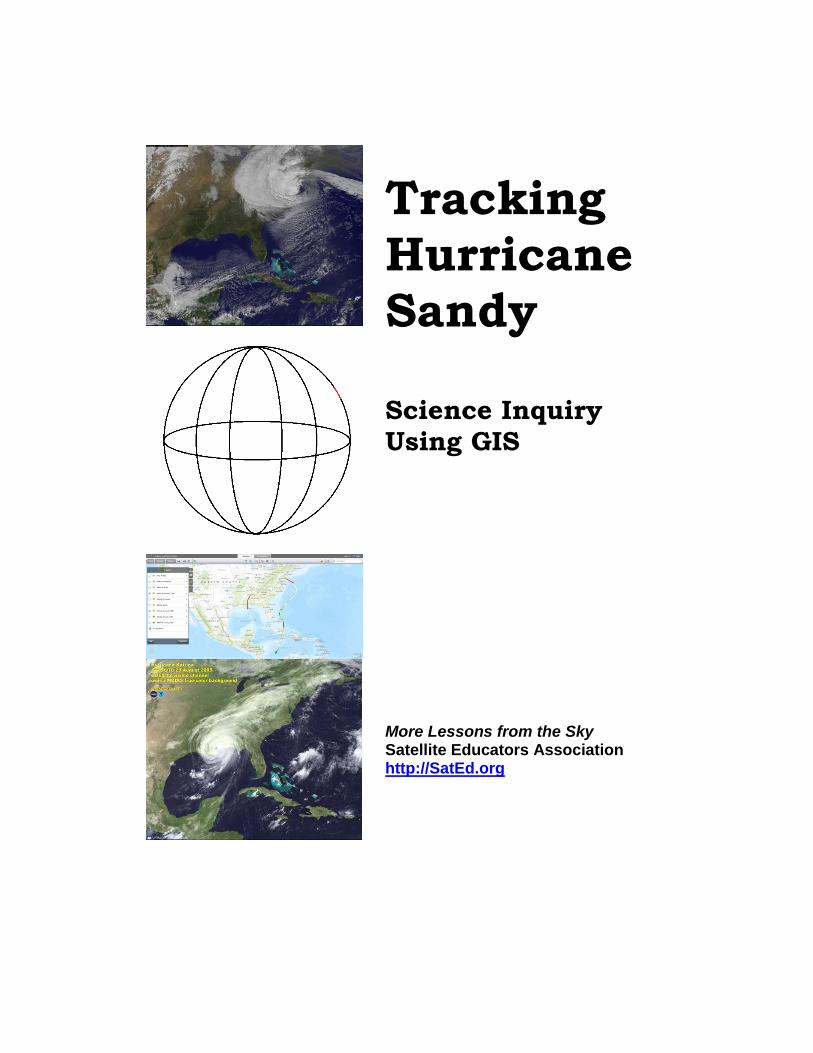
Tracking Hurricane Sandy Science Inquiry Using GIS
More Lessons from the Sky Satellite Educators Association http://SatEd.org
Please see the Acknowledgements section for historical contributions to the development of this lesson plan. This form of “Tracking Hurricane Sandy – Science inquiry Using GIS” was published in October 2013 in “More Lessons from the Sky,” a regular feature of the SEA Newsletter, and archived in the SEA Lesson Plan Library. Both the Newsletter and the Library are freely available on-line from the Satellite Educators Association (SEA) at this address: http://SatEd.org. Content, Internet links, support material available from the online Resources page, were revised and updated in October 2019.
SEA Lesson Plan Library Improvement Program Did you use this lesson plan with students? If so, please share your experience to help us improve the lesson plan for future use. Just click the Feedback link at http://SatEd.org/library/about.htm and complete the short form on-line. Thank you.
.
Teaching Notes
More Lessons from the Sky, © Satellite Educators Association, Inc. Tracking Hurricane Sandy 1
Tracking Hurricane Sandy Science Inquiry Using GIS
Invitation On October 22, 2012, Tropical Depression Eighteen formed in the Caribbean Sea several hundreds of miles east of Nicaragua and north of Panama. Six hours later it became Tropical Storm Sandy. Over the next ten days, Sandy moved northward across the east ends of Jamaica and Cuba, along the Bahamas, then turned northeastward to generally parallel the east coast of the United States. Its sustained wind speeds increased to Hurricane Category 2 levels. The cyclone center consistently remained 200-400 miles offshore of the U.S. until October 29. On that date, Sandy made a left turn, increased
its ground speed until it made landfall in New Jersey, then almost stalled about 100 miles inland. By this time, the storm strength was downgraded to Hurricane Category 1. However, its cloud field covered all the northeast quadrant of continental United States and much of eastern Canada. Called a "superstorm" by the news media, the extent of high winds, rainfall and snowfall for several days was unusually wide. The dollar value of damage in the U.S. alone is second only to that caused by Hurricane Katrina. In this lesson, learners will map the path of a major tropical cyclone in the North Atlantic using NOAA online access tools and ESRI's ArcGIS Online. Then, using ImageJ software, they will analyze the storm viewed from space and apply these methods to other storms to predict impact on human society.
Grade Level: 6-12; adaptable to 4-5
Time Requirement: 1-3 class periods
Prerequisites: None
Relevant Disciplines: Earth Science, Physics
Student Learning Outcomes By the end of this lesson students should be able to do the following:
• Observe severe storm action from space
• Identify weather patterns including cloud types and movement, weather fronts, high and low pressure areas
• Differentiate between sustained wind speed in a hurricane and the speed of the storm; associate each with severity of potential damage
• Use image processing skills to analyze images of the storm as seen by satellite
• Use GIS skills to analyze storm characteristics as seen by satellite
• Apply lesson skills to the prediction of the effects of other tropical cyclones
• Gather, analyze, and interpret environmental data.
• Develop a model based on the evidence and use the model to describe and defend a position related to hurricanes and global climate change.
Teaching Notes
2 Tracking Hurricane Sandy More Lessons from the Sky, © Satellite Educators Association, Inc.
Lesson Description This is a teacher-supported, student-centered, team research and analysis project using Internet available databases, ArcGIS Online for mapping and analysis, and locally installed ImageJ software for analysis. This lesson fosters the use of scientific investigation skills by encouraging learners to ask questions, gather evidence, develop explanations for observed phenomena based on reason and evidence, and communicate their findings to others. The lesson presentation follows the 5E Inquiry approach: Engage, Explore, Explain, Extend, and Evaluate. The Engage phase includes the use of a KWL chart. If desired, the Explore and Explain sections can be completed with a jigsaw cooperative learning strategy. A number of Your Turn activities are suggested for the Extend phase. Formative assessment suggestions are included for Evaluation during and after each phase as well as a summative assessment for the final Evaluation at the end of the lesson. The content of the lesson centers on developing an explanation for the movement and size of Hurricane Sandy, dubbed "Superstorm Sandy" by the media, in October 2012. Sandy seemed to be just one more North Atlantic hurricane until it suddenly turned left to make landfall in New Jersey with a cloud field that covered most of the northeastern quadrant of the United States and a very large part of eastern Canada. To comprehend such behavior, Hurricane Sandy is compared with Hurricane Katrina when it made landfall in New Orleans in August of 2005. Sandy and Katrina are the two most destructive tropical cyclones to strike the United States in the past forty years. Ideally for this lesson, students will be grouped into home teams of four with an Internet-enabled computer for each team. If that is not possible, the teacher can adapt the lesson plan to conform to the needs of the learners and the classroom situation. - Engage Show these NASA video clips to the class:
• Hurricane Sandy movie (0:59 min)
• Hurricane Katrina movie (1:35 min) Both can be downloaded from http://SatEd.org/library/Resources.htm In their home teams, learners compare and contrast the two storms they see in the videos with special attention to the:
1. Size of the storm's cloud field 2. Cyclone's ground speed and how it changes 3. Storm center's direction of movement on the ground and how it changes 4. Visibility of the hurricane eye.
Learners may wish to view the videos several times before answering the question "What
Do We Know?" about the storms in the K column of their KWL charts. Then receive responses from each team to post on a poster-sized KWL chart. Repeat the process adding "What Do We Want to Know?" answers in the W column.
- Evaluation Monitor the progress of each home team as its members make notes of the two video clips and work on their KWL charts. When making the class KWL chart, insuring you receive responses from each home team also serves to check participation and progress.
Teaching Notes
More Lessons from the Sky, © Satellite Educators Association, Inc. Tracking Hurricane Sandy 3
- Explore Leave the KWL poster with two columns complete visible in the room. Divide the home teams into experts and send the experts to their respective expert group meeting areas. Announce that each expert will be reporting back to its home team later and that the report must be no more than 2 minutes long.
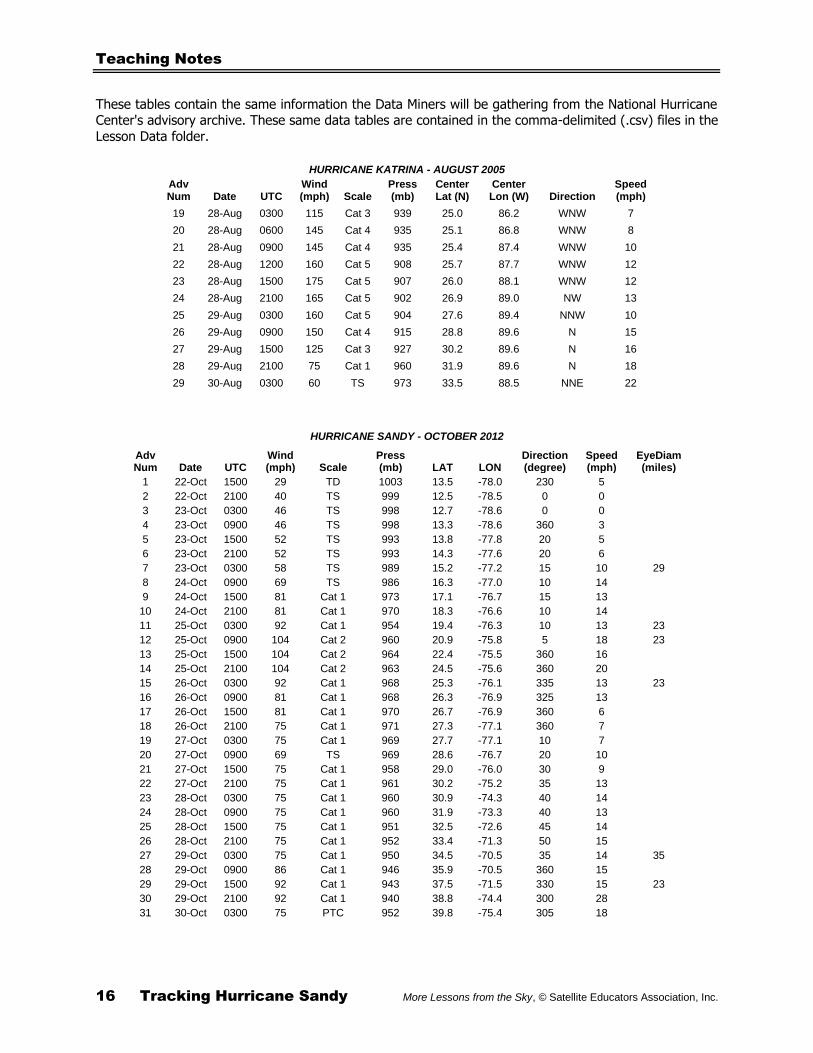
• Expert Group 1: Data Miners will access hurricane advisory archive of the National Hurricane Center to gather information about Hurricanes Katrina and Sandy and complete the data table. The data these learners collect is given in the Hurricane Data tables at the end of these Teaching Notes. The same information is contained in the comma-delimited (.csv) files in the Lesson_Data folder. This group will gather the data from the advisory archive and will use their data tables for reference in their home teams.
• Expert Group 2: Cartographers will import hurricane advisory data into ArcGIS Online to compare the path and characteristics of Hurricane Sandy with those of Hurricane Katrina. These experts will begin working with ArcGIS Online by importing the data from the comma-delimited (.csv) files in the Lesson_Data folder. This is the same data the Data Miners are extracting from the hurricane advisory archives.
• Expert Group 3: Meteorologists, based on their own research, will interpret meteorological events surrounding Hurricane Sandy to determine how they were alike and how they were different from Hurricane Katrina. This research is done entirely online. Each group member should make notes of (not copy) what they find in the online articles.
• Expert Group 4: Analysts will visualize, process, and measure satellite imagery of Hurricane Sandy and Hurricane Katrina using ImageJ to determine the diameter, perimeter, and area of the cloud fields of each storm when it made landfall. The images are Sandy-Landfall-121029-2115.jpg and Katrina-Landfall-050829.jpg found in the Lesson_Data folder.
- Evaluation Monitor the progress of each expert group; adjust time as needed to insure completion of work without going overtime.
- Explain Reform the home teams each of which will be composed now of four experts, where each expert contributes a different piece of the puzzle. Allow each expert to report to her/his home team in a summarized report that is no more than 2 minutes in length. After each expert report, the teams should be given time to digest, discuss, and consider what they have learned related to the KWL chart they worked on earlier. Teams should also be directed to point their web browsers to this URL:
http://bit.ly/1tkevgO This URL will take the learner to a specifically prepared, interactive map in ArcGIS Online called "Tracking Hurricane Sandy." It already contains configured map layers for
Teaching Notes
4 Tracking Hurricane Sandy More Lessons from the Sky, © Satellite Educators Association, Inc.
this lesson. The included attributes are wind speed, scale (category), central air pressure, storm ground path, ground speed, (all from the tables at the end of these Teaching Notes) and extent of the cloud field at landfall for both Hurricane Sandy and Hurricane Katrina (derived from the images in the Lesson_Data folder). Encourage learners to explore the layered data in ArcGIS. Greater understanding comes from manipulating the layers and their attributes when asking questions, conducting experiments, comparing and contrasting features, and interpreting results. After an appropriate discussion time - an amount of time sufficient for each team to agree on a rational, evidence-based explanation for Hurricane Sandy's unusual left turn - have each team complete their KWL charts by answering "What Have We Learned?" in the L column of the chart. As before, follow up by receiving responses from each team to complete the class KWL chart.
- Evaluation Monitor expert reports in the home teams. Time the reports and cut them off at 2 minutes. Especially monitor the follow up discussions to keep them on track and determine the appropriate time to end the discussions and bring the class together for the class KWL chart. Consider carefully the list of learnings on the class KWL chart. Are the listed items on target? Are they sufficient? Are there questions that remain unanswered or need further study?
- Extend This is the place to investigate those unanswered questions needing further study. Home teams or individuals should be directed to pursue several of the Your Turn activities which include opportunity to design their own investigations. - Evaluation Each of the Your Turn activities requires a report either to the teacher, the class, or some other audience. The Your Turn activities provide lesson closure, opportunities to apply concepts and skills learned in this lesson to other storms, and assess the overall advancement of individual learners.
Important Terms Cyclone Hurricane Tropical Depression Eyewall Hurricane Eye Tropical Storm Geosynchronous Landfall Typhoon Gulf Stream "Nor'easter" (northeaster) Universal Time Coordinate
Assessment Suggestions • Participation and teamwork demonstrated in home and expert groups
• Quality of contributions to KWL chart
• Demonstrated skill using ArcGIS Online and ImageJ
• Accuracy of measurements with ImageJ and ArcGIS Online
• Quality and accuracy of individual or team report of Your Turn activities. The Your Turn extension and application activities are the heart of the lesson and provide appropriate summative assessment.
Teaching Notes
More Lessons from the Sky, © Satellite Educators Association, Inc. Tracking Hurricane Sandy 5
Next Generation Science Standards The Next Generation Science Standards sets below are relevant to this lesson. Each set includes a disciplinary core idea (DCI), science and engineering practice (SEP), crosscutting concept (CC), tied together by a performance expectation (PE). Grade 4: Earth and Human Activity - Natural Hazards
PE- 4-ESS3-2 - Generate and compare multiple solutions to reduce the impacts of natural Earth processes on humans.
DCI- 4-ESS3.B - A variety of hazards result from natural processes. Humans cannot eliminate the hazards but can take steps to reduce their impacts.
SEP- Generate and compare multiple solutions to a problem based on how well they meet the criteria and constraints of the design solution.
CC- Engineers improve existing technologies or develop new ones to increase their benefits, to decrease known risks, and to meet societal demand.
Grade 5: Earth's Systems - Earth Materials and Systems
PE- 5-ESS2-1 - Develop a model using an example to describe ways in which the geosphere, biosphere, hydrosphere, and/or atmosphere interact.
DCI- 5-ESS2.A - Earth major systems are the geosphere, the hydrosphere, the atmosphere, and the biosphere. These systems interact in multiple ways to affect Earth's surface materials and processes. The ocean supports a variety of ecosystems and organisms, shapes landforms, and influences climate. Winds and clouds in the atmosphere interact with the landforms to determine patterns of weather.
SEP- Develop a model using an example to describe a scientific principle. CC- A system can be described in terms of its components and their interactions.
Grade 6-8: Earth's Systems - The Roles of Water in Earth's Surface Processes
PE- MS-ESS2-5 - Collect data to provide evidence for how the motions and complex interactions of air masses result in changes in weather conditions.
DCI- MS-ESS2.C - The complex patterns of the changes and the movement of water in the atmosphere, determined by winds, landforms, and ocean temperatures and currents, are major determinants of local weather patterns.
SEP-Collect data to produce data to serve as the basis for evidence to answer scientific questions or test design solutions under a range of conditions.
CC- Cause and effect relationships may be used to predict phenomena in natural systems.
Grade 6-8: Earth and Human Activity: Natural Hazards
PE- MS-ESS3-2 - Analyze and interpret data on natural hazards to forecast catastrophic events and inform the development of techniques to mitigate their
effects. DCI- MS-ESS3.B - Mapping the history of natural hazards in a region, combined with
an understanding of related geologic forces, can help forecast the locations and likelihoods of future events.
SEP-Analyze and interpret data to determine similarities and differences in findings. CC- Graphs, charts, and images can be used to identify patterns of data.
Grade 9-12: Earth's Systems - Weather and Climate
Teaching Notes
6 Tracking Hurricane Sandy More Lessons from the Sky, © Satellite Educators Association, Inc.
PE- HS-ESS2-4 - Use a model to describe how variations in the flow of energy into and out of Earth's systems result in changes in climate.
DCI- HS-ESS2.D - The foundations for Earth's global climate systems is the electromagnetic radiation from the sun, as well as its reflection, absorption, storage, and redistribution among the atmosphere, ocean, and land systems and this energy's re-radiation into space.
SEP-Use a model to provide mechanistic accounts of phenomena. CC- Empirical evidence is required to differentiate between cause and correlation
and make claims about specific causes and effects.
Grade 9-12: Earth and Human Activity - Natural Hazards PE- HS-ESS3-1 - Construct an explanation based on evidence for how the
availability of natural resources, occurrences of natural hazards, and changes in climate have influenced human activity.
DCI- HS-ESS3.B - Natural hazards and other geologic events have shaped the course of human history; they have significantly altered the sizes of human populations and have driven human migrations.
SEP-Construct an explanation based on valid and reliable evidence obtained from a variety of sources (including students' own investigations, models, theories, simulations, peer review) and the assumption that theories and laws that describe the natural world operate today as they did in the past and will continue to do so in the future.
CC- Empirical evidence is required to differentiate between cause and correlation and make claims about specific causes and effects.
Preparation In this 5E Inquiry lesson format, a jigsaw cooperative learning strategy is used in which students are grouped in home teams of 4 and in expert groups. The size of each expert group will be the same as the number of home teams in the class. When the class splits into expert groups, each group will need its own area of the classroom in which to work. Additionally, three of the four expert groups will need Internet-enabled computers. If the groups are too large and computers are available, consider dividing each expert group into smaller groups, each with its own computer. Learners will also need a computer in each home team. The KWL chart can be duplicated and distributed to each home team or each student. The expert tutorials should be duplicated and distributed to each respective expert. The succeeding tutorial can be duplicated and distributed to each home team or each student.
Each computer should have an acceptable browser program such as Mozilla Firefox, Google Chrome, Internet Explorer, Edge, Opera or Safari. Each computer must also have the Lesson_Data folder copied to each local hard drive or other location where each student team has access to it. The Lesson_Data folder downloads as Lesson_Data.zip. The zip file was created using 7-Zip. It can be expanded with 7-zip, later versions of Windows, or Stuffit Expander. The Lesson_Data folder contains these files:
• Katrina-Landfall-050829.jpg
• Sandy-Landfall-121029.jpg
• Katrina-Data.csv
Teaching Notes
More Lessons from the Sky, © Satellite Educators Association, Inc. Tracking Hurricane Sandy 7
• Sandy-Data.csv
• Katrina Advisories.pdf
• Sandy Advisories.pdf
• Photo Credits.txt If student groups have difficulty accessing the hurricane advisories online or if Internet use is limited, the same advisories have been collected together in PDF files in the Lesson_Data folder. The hurricane video clips download in MOV video format. They will play with QuickTime Player and Windows Media Player with updated codecs. The video clips can also be downloaded from http://SatEd.org/library/Resources.htm. ArcGIS Online is a cloud-based, easy to use geographic information system. It is
especially designed for student use. Simply point your browser to this URL and start
working: http://www.arcgis.com/home/index.html. It’s free! (See Cartographers
tutorial in Student Activity for specific directions.)
The use of the Tracking Hurricane Sandy map in ArcGIS Online is strongly recommended. It was prepared especially for this lesson and is available at http://bit.ly/1tkevgO. The teacher is urged to become familiar with this GIS file set before giving the URL to learners. There is no charge to use ArcGIS Online. Maps can be printed, but they cannot be saved without an ESRI global account username and password. Creating an account with ESRI is also free of charge, and it allows you to save maps in your own account space on ESRI's server. Saved maps can also be shared with the public or with specific groups. Directions for creating an account can be found by clicking Sign In on the ArcGIS Online home page. ImageJ is available from https://imagej.nih.gov/ij/ free of charge. Of the several download choices, the easiest to install is the one bundled with Java in either 32- or 64- bit versions. The bundled Java installs automatically and runs only with ImageJ. It does not interfere with any other programs or plug-ins (including Java) already installed on your computer. If you are using Windows Vista or a later version of Windows, it is suggested that you do not install ImageJ in the Program Files folder. Instead install ImageJ in the Documents folder or the root directory of your hard drive or some other folder. When a new program is installed in the Windows Vista or later Program Files folder, new security protocols prevent programs from being altered or rewritten thus effectively preventing ImageJ’s update function from operating.
For those learners selecting the Your Turn activity exploring sea surface temperature, MODIS-Aqua monthly averaged sea surface temperature data maps for October 2012 (Hurricane Sandy), for August 2005 (Hurricane Katrina), and for March of each of those years (non-hurricane season temperatures) are printed at the end of the Student Activity pages. Duplicate and distribute as needed. If desired, the images can be also downloaded from http://SatEd.org/Resources.htm in portable network graphics (PNG) format.
Teaching Notes
8 Tracking Hurricane Sandy More Lessons from the Sky, © Satellite Educators Association, Inc.
These Teaching Notes are provided in .pdf format requiring a pdf reader such as Adobe Reader or equivalent. If needed, Adobe Reader can be downloaded and installed, free of charge, from the web site listed in the Reference section. The Student Activity pages are provided in Microsoft Word document format to allow adaptation to individual student and classroom needs.
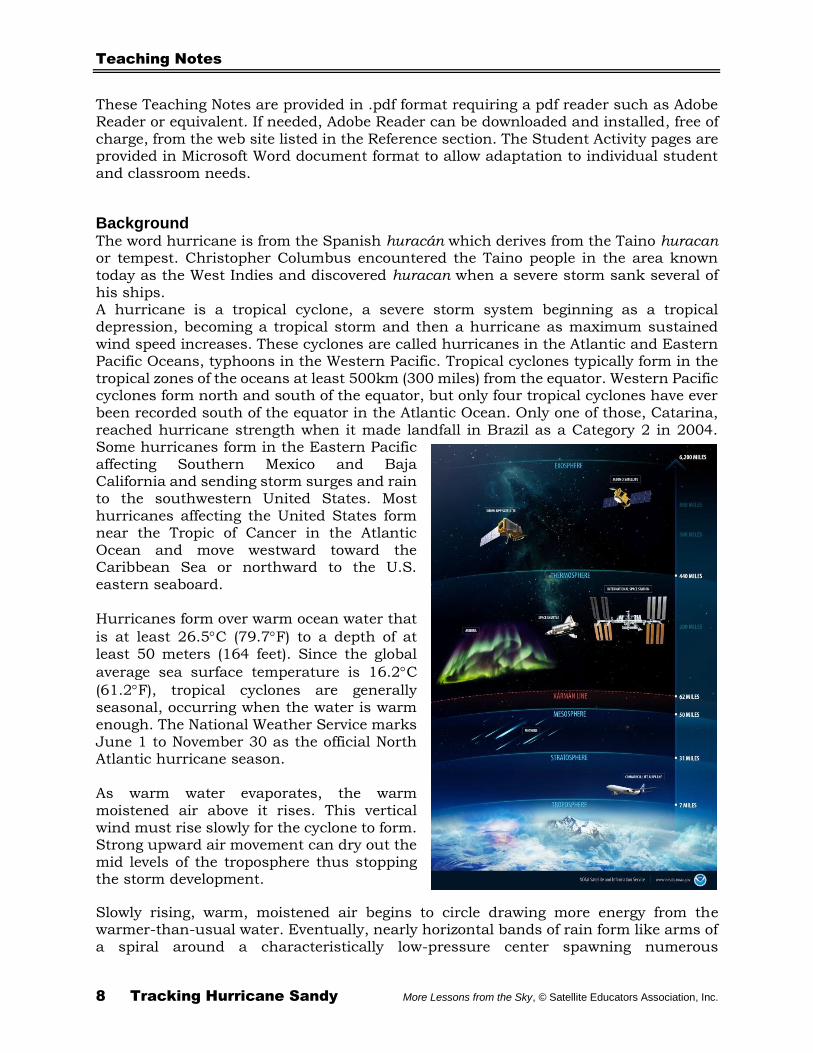
Background The word hurricane is from the Spanish huracán which derives from the Taino huracan or tempest. Christopher Columbus encountered the Taino people in the area known today as the West Indies and discovered huracan when a severe storm sank several of his ships. A hurricane is a tropical cyclone, a severe storm system beginning as a tropical depression, becoming a tropical storm and then a hurricane as maximum sustained
wind speed increases. These cyclones are called hurricanes in the Atlantic and Eastern Pacific Oceans, typhoons in the Western Pacific. Tropical cyclones typically form in the tropical zones of the oceans at least 500km (300 miles) from the equator. Western Pacific cyclones form north and south of the equator, but only four tropical cyclones have ever been recorded south of the equator in the Atlantic Ocean. Only one of those, Catarina, reached hurricane strength when it made landfall in Brazil as a Category 2 in 2004. Some hurricanes form in the Eastern Pacific affecting Southern Mexico and Baja California and sending storm surges and rain to the southwestern United States. Most hurricanes affecting the United States form near the Tropic of Cancer in the Atlantic Ocean and move westward toward the Caribbean Sea or northward to the U.S. eastern seaboard. Hurricanes form over warm ocean water that
is at least 26.5C (79.7F) to a depth of at least 50 meters (164 feet). Since the global
average sea surface temperature is 16.2C
(61.2F), tropical cyclones are generally seasonal, occurring when the water is warm enough. The National Weather Service marks June 1 to November 30 as the official North Atlantic hurricane season. As warm water evaporates, the warm
moistened air above it rises. This vertical wind must rise slowly for the cyclone to form. Strong upward air movement can dry out the mid levels of the troposphere thus stopping the storm development.
Slowly rising, warm, moistened air begins to circle drawing more energy from the warmer-than-usual water. Eventually, nearly horizontal bands of rain form like arms of a spiral around a characteristically low-pressure center spawning numerous
Teaching Notes
More Lessons from the Sky, © Satellite Educators Association, Inc. Tracking Hurricane Sandy 9
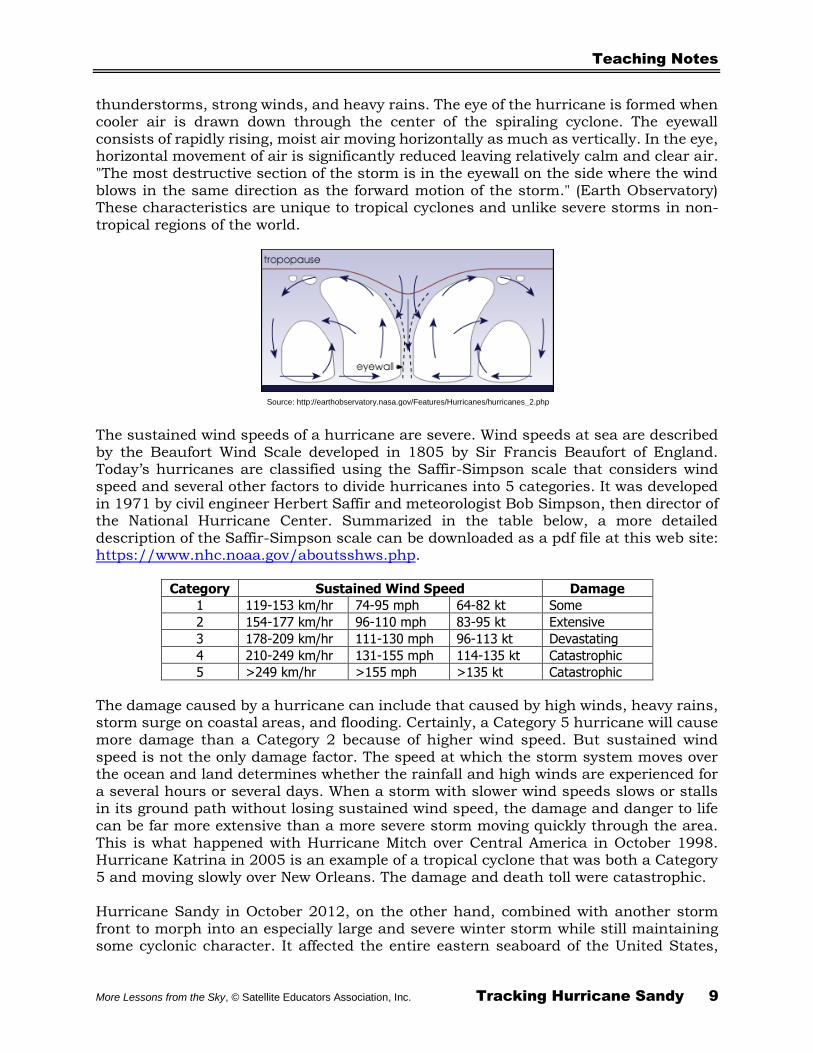
thunderstorms, strong winds, and heavy rains. The eye of the hurricane is formed when cooler air is drawn down through the center of the spiraling cyclone. The eyewall consists of rapidly rising, moist air moving horizontally as much as vertically. In the eye, horizontal movement of air is significantly reduced leaving relatively calm and clear air. "The most destructive section of the storm is in the eyewall on the side where the wind blows in the same direction as the forward motion of the storm." (Earth Observatory) These characteristics are unique to tropical cyclones and unlike severe storms in non-tropical regions of the world.
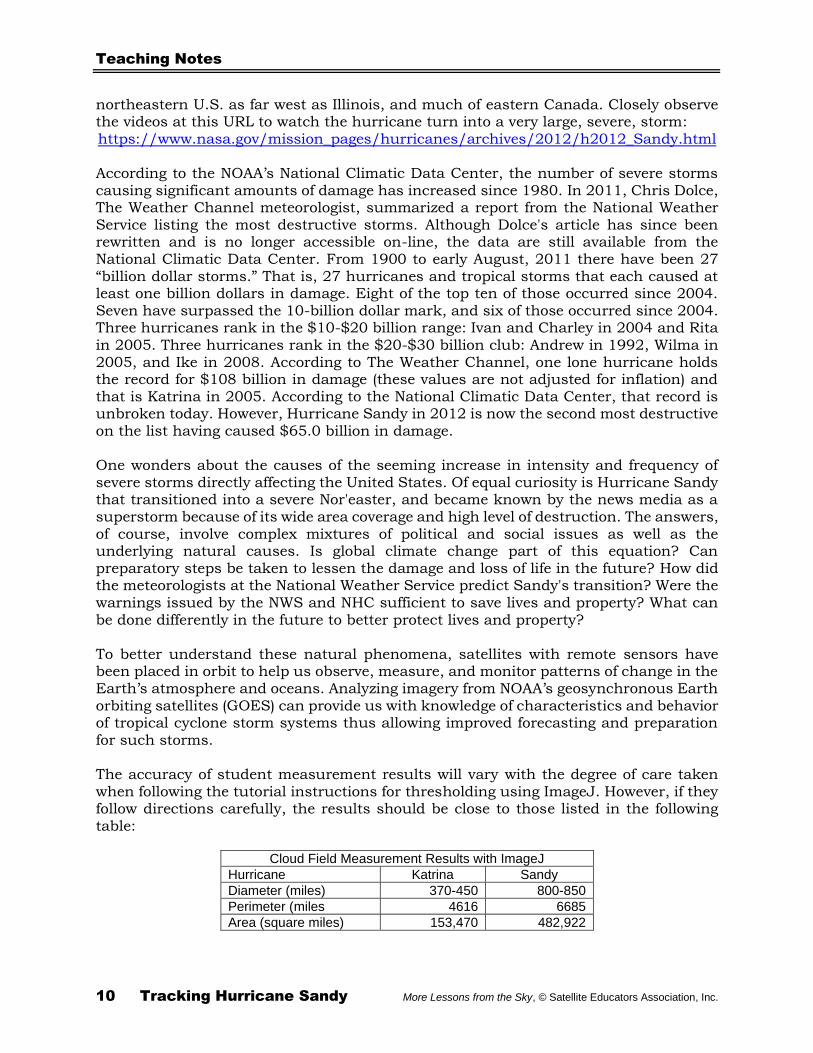
The sustained wind speeds of a hurricane are severe. Wind speeds at sea are described by the Beaufort Wind Scale developed in 1805 by Sir Francis Beaufort of England. Today’s hurricanes are classified using the Saffir-Simpson scale that considers wind speed and several other factors to divide hurricanes into 5 categories. It was developed in 1971 by civil engineer Herbert Saffir and meteorologist Bob Simpson, then director of the National Hurricane Center. Summarized in the table below, a more detailed description of the Saffir-Simpson scale can be downloaded as a pdf file at this web site: https://www.nhc.noaa.gov/aboutsshws.php.
Category Sustained Wind Speed Damage
1 119-153 km/hr 74-95 mph 64-82 kt Some
2 154-177 km/hr 96-110 mph 83-95 kt Extensive
3 178-209 km/hr 111-130 mph 96-113 kt Devastating
4 210-249 km/hr 131-155 mph 114-135 kt Catastrophic
5 >249 km/hr >155 mph >135 kt Catastrophic
The damage caused by a hurricane can include that caused by high winds, heavy rains, storm surge on coastal areas, and flooding. Certainly, a Category 5 hurricane will cause more damage than a Category 2 because of higher wind speed. But sustained wind speed is not the only damage factor. The speed at which the storm system moves over the ocean and land determines whether the rainfall and high winds are experienced for a several hours or several days. When a storm with slower wind speeds slows or stalls in its ground path without losing sustained wind speed, the damage and danger to life can be far more extensive than a more severe storm moving quickly through the area. This is what happened with Hurricane Mitch over Central America in October 1998. Hurricane Katrina in 2005 is an example of a tropical cyclone that was both a Category 5 and moving slowly over New Orleans. The damage and death toll were catastrophic. Hurricane Sandy in October 2012, on the other hand, combined with another storm front to morph into an especially large and severe winter storm while still maintaining some cyclonic character. It affected the entire eastern seaboard of the United States,
Source: http://earthobservatory.nasa.gov/Features/Hurricanes/hurricanes_2.php
Teaching Notes
10 Tracking Hurricane Sandy More Lessons from the Sky, © Satellite Educators Association, Inc.
northeastern U.S. as far west as Illinois, and much of eastern Canada. Closely observe the videos at this URL to watch the hurricane turn into a very large, severe, storm: https://www.nasa.gov/mission_pages/hurricanes/archives/2012/h2012_Sandy.html According to the NOAA’s National Climatic Data Center, the number of severe storms causing significant amounts of damage has increased since 1980. In 2011, Chris Dolce, The Weather Channel meteorologist, summarized a report from the National Weather Service listing the most destructive storms. Although Dolce's article has since been rewritten and is no longer accessible on-line, the data are still available from the National Climatic Data Center. From 1900 to early August, 2011 there have been 27 “billion dollar storms.” That is, 27 hurricanes and tropical storms that each caused at least one billion dollars in damage. Eight of the top ten of those occurred since 2004. Seven have surpassed the 10-billion dollar mark, and six of those occurred since 2004. Three hurricanes rank in the $10-$20 billion range: Ivan and Charley in 2004 and Rita
in 2005. Three hurricanes rank in the $20-$30 billion club: Andrew in 1992, Wilma in 2005, and Ike in 2008. According to The Weather Channel, one lone hurricane holds the record for $108 billion in damage (these values are not adjusted for inflation) and that is Katrina in 2005. According to the National Climatic Data Center, that record is unbroken today. However, Hurricane Sandy in 2012 is now the second most destructive on the list having caused $65.0 billion in damage. One wonders about the causes of the seeming increase in intensity and frequency of severe storms directly affecting the United States. Of equal curiosity is Hurricane Sandy that transitioned into a severe Nor'easter, and became known by the news media as a superstorm because of its wide area coverage and high level of destruction. The answers, of course, involve complex mixtures of political and social issues as well as the underlying natural causes. Is global climate change part of this equation? Can preparatory steps be taken to lessen the damage and loss of life in the future? How did the meteorologists at the National Weather Service predict Sandy's transition? Were the warnings issued by the NWS and NHC sufficient to save lives and property? What can be done differently in the future to better protect lives and property? To better understand these natural phenomena, satellites with remote sensors have been placed in orbit to help us observe, measure, and monitor patterns of change in the Earth’s atmosphere and oceans. Analyzing imagery from NOAA’s geosynchronous Earth orbiting satellites (GOES) can provide us with knowledge of characteristics and behavior of tropical cyclone storm systems thus allowing improved forecasting and preparation for such storms. The accuracy of student measurement results will vary with the degree of care taken when following the tutorial instructions for thresholding using ImageJ. However, if they follow directions carefully, the results should be close to those listed in the following table:
Cloud Field Measurement Results with ImageJ
Hurricane Katrina Sandy
Diameter (miles) 370-450 800-850
Perimeter (miles 4616 6685
Area (square miles) 153,470 482,922
Teaching Notes
More Lessons from the Sky, © Satellite Educators Association, Inc. Tracking Hurricane Sandy 11
Acknowledgements This lesson is a compilation and update of several lesson plans, student tutorials and GIS workshops for teachers developed by the author. These all drew inspiration from a variety of sources including materials developed in the Image Processing For Teaching Project at the Lunar and Planetary Laboratory of the University of Arizona; the Center for Educational Technologies at Wheeling Jesuit University as part of NASA’s Classroom of the Future; “Hurricanes – How Strong Are They?” a lesson plan by Helen Martin published in the Satellite Educators Association's Lessons from the Sky, © 1995 by Amereon, Ltd.; and numerous educational publications from ESRI. The 5E Inquiry strategy is based on Rodger Bybee’s outline in the Biological Science Curriculum Study of the 1960s. The adaptation used here was suggested by Dean Gilbert who was then Science Consultant, Los Angeles County Office of Education. Refer to the comments about ArcGIS Online in the Preparation section above. The sea surface temperature data images are Level 3 maps of derived daytime temperatures from MODIS-Aqua and averaged for the specified month. The maps were generated by GIOVANNI, NASA’s EarthData online access, visualization and analysis tool offered by Goddard Space Flight Center.
All of the layers in the prepared ArcGIS Online map were derived from the National Hurricane Center’s advisory archive. NIH Image was originally written by Wayne Rasband at the National Institute of Health (NIH) for use with medical imaging and research. It has since been placed in the public domain and the newer Java version, ImageJ, is readily available. It is a simple download and installation. The web site contains great documentation and access to many useful and specialized macros. The satellite image of Hurricane Katrina is from a Defense Meteorological Satellite Program (DMSP) satellite. It was color enhanced to highlight storm characteristics and provided to NASA's Earth Science Picture of the Day web site by Mark Connor of the Air Force Weather Agency. The image of Hurricane Sandy is from NOAA's GOES-13 weather satellite. It was processed and posted by NASA's GOES Project. NOAA's National Hurricane Center archives all of its advisories for future reference. These archives are the source of the hurricane data found in the data tables at the end of these Teaching Notes. All GIS data in this lesson were derived from these data tables. Comma-delimited files were created with Microsoft Excel. Shapefiles for use with ArcGIS Online were created with ArcGIS Desktop by the author, compressed with 7-Zip, and
added to the ArcGIS Online map. This lesson arrangement and this edition of Teaching Notes were developed by J.P. Arvedson for the Satellite Educators Association as part of More Lessons from the Sky, published online each month in the Satellite Educators Association Newsletter. More information about this non-profit organization, its annual Satellites & Education Conference connecting teachers with other educators and helpful representatives from government and industry, its international student collaborative environmental research program, and access to its free on-line Newsletter can be found at this address:
Teaching Notes
12 Tracking Hurricane Sandy More Lessons from the Sky, © Satellite Educators Association, Inc.
http://SatEd.org. All More Lessons from the Sky lesson plans are archived in the on-line SEA Lesson Plan Library available at http://SatEd.org. The web site features a description of the library contents, Next Generation Science Standards addressed, several search tools for finding lessons easily, separate resource files for lessons where needed, and the library’s Analysis Toolbox. Please credit all contributors to the lesson plan when downloading, printing, of using this lesson plan or any of its associated support materials.
Resources Note: All of these URLs were current and active as of this writing. If any are unreachable as printed, the use of on-
line search engines such as DuckDuckGo, Ask, Google, or Bing is suggested to find current links.
_____. 7-Zip. Retrieved October 10, 2019 from https://www.7-zip.org/ _____. “Adobe Acrobat Reader DC.” Adobe. Retrieved October 10, 2019 from
https://get.adobe.com/reader/ _____. “Ask an Astrophysicist.” Image the Universe, National Aeronautics and Space
Administration Goddard Space Flight Center. Retrieved October 10, 2019 from https://imagine.gsfc.nasa.gov/ask_astro/index.html _____. “Billion-Dollar Weather and Climate Disasters, National Centers for
Environmental Information, National Oceanic and Atmospheric Administration. Retrieved October 10, 2019 from https://www.ncdc.noaa.gov/billions/
Includes table of events 1980 to present date. _____. Composite MODIS image from Terra showing Hurricane Sandy on October 30, 2012,
Space Science Education Center, University of Wisconsin, Madison. Retrieved October 10, 2019 from
http://ge.ssec.wisc.edu/modis-today/images/terra/true_color/2012_10_30_304/t1.12304.USA_Composite.143.4000m.jpg
_____. “GIOVANNI The Bridge Between Data and Science.” NASA Earth Data, National
Aeronautics and Space Administration. Retrieved October 10, 2019 from https://giovanni.gsfc.nasa.gov/giovanni/
_____. “Global Climate Report - August 2013.” National Centers for Environmental Information, National Oceanic and Atmospheric Administration. Retrieved October 10, 2019 from https://www.ncdc.noaa.gov/sotc/global/201308
_____. “Hurricane Katrina 1445 UTC 29 August 2005 GOES-12 visible channel over a
MODIS true-color background.” GOES Project, National Aeronautics and Space Administration Goddard Space Flight Center. Retrieved October 10, 2019 from http://SatEd.org/library/Resources.htm)
Teaching Notes
More Lessons from the Sky, © Satellite Educators Association, Inc. Tracking Hurricane Sandy 13
_____. “Hurricane Katrina Advisory Archive.” National Hurricane Center, National OOcnic and Atmosperic Administration. Retrieved October 10, 2019 from
https://www.nhc.noaa.gov/archive/2005/KATRINA.shtml? _____. “Hurricane Sandy Advisory Archive.” National Hurricane Center, National Oceanic
and Atmospheric Administration. Retrieved October 10, 2019 from https://www.nhc.noaa.gov/archive/2012/SANDY.shtml? _____. “Hurricane Sandy: the AfterMap.” ESRI Disaster Response Program, ESRI.
Retrieved October 10, 2019from http://disasterresponse.maps.arcgis.com/apps/StorytellingSwipe/index.html?appid=a9b973ea68124e06833385371e9fcc14&webmap=0ff2d0e868524d8fbbbe968bc126792d#
_____. “Hurricanes: The Greatest Storms on Earth.” Earth Observatory, National Aeronautics and Space Administration. Retrieved October 10, 2019 from
https://earthobservatory.nasa.gov/Features/Hurricanes/hurricanes_2.php _____. “Hurricanes Sandy (Atlantic Ocean).” Hurricanes. National Aeronautics and
Space Administration. Retrieved October 10, 2019 from https://www.nasa.gov/mission_pages/hurricanes/archives/2012/h2012_Sandy.h
tml _____. “Katrina Retrospective: 5 Years After the Storm.” Goddard Media Studios,
National Aeronautics and Space Administration Goddard Space Flight Center. Retrieved October 10, 2019 from https://svs.gsfc.nasa.gov/cgi-bin/details.cgi?aid=10633
_____. NOAA GOES 13 full disk animation of Hurricane Sandy. GOES Project, Goddard
Space Flight Center, National Aeronautics and Space Administration. Retrieved October 10, 2019 from https://www.nasa.gov/mp4/701785main_Sandy-TUESDAY.mp4
_____. “Peeling Back the Layers of the Atmosphere.” NESDIS News & Articles, National
Oceanic and Atmospheric Administration. Retrieved October 10, 2019 from https://www.nesdis.noaa.gov/content/peeling-back-layers-atmosphere
_____. “Post-Tropical Cyclone Sandy.” Hurricane and Tropical Cyclones, Weather
Underground. Retrieved October 10, 2019 from https://www.wunderground.com/hurricane/atlantic/2012/Post-Tropical-Cyclone-
Sandy _____. “Lesson Titles/Resources for Lessons.” SEA Lesson Plan Library, Satellite
Educators Association. Retrieved October 10, 2019 from http://SatEd.org/library/Resources.htm
_____. “Saffir-Simpson Hurricane Wind Scale.” National Hurricane Center, National
Oceanic and Atmospheric Administration. Retrieved October 10, 2019 from https://www.nhc.noaa.gov/aboutsshws.php
Teaching Notes
14 Tracking Hurricane Sandy More Lessons from the Sky, © Satellite Educators Association, Inc.
_____. “Sandy After Landfall.” Earth Observatory, National Aeronautics and Space Administration. Retrieved October 10, 2019 from
https://earthobservatory.nasa.gov/images/79565/sandy-after-landfall _____. “Satellite View of Katrina at Landfall.” Earth Science Picture of the Day,
Universities Space Research Association. Retrieved October 10, 2019 from http://epod.usra.edu/blog/2005/09/satellite-view-of-katrina-at-landfall.html
_____. StuffIt Expander for Mac. Retrieved October 10, 2019 from
https://my.smithmicro.com/stuffit-expander-mac.html _____. “Tropical Cyclone Introduction.” JetStream - Online School for Weather, National
Weather Service, National Oceanic and Atmospheric Administration. Retrieved October 10, 2019 from https://www.weather.gov/jetstream/tc
_____. “Winds of Hurricane Katrina.” Earth Observatory, National Aeronautics and
Space Administration. Retrieved October 10, 2019 from https://earthobservatory.nasa.gov/images/6882/winds-of-hurricane-katrina
Arvedson, J.P. “Tracking Hurricanes from Space.” More Lessons from the Sky, Satellite
Educators Association Newsletter, November 2011. Retrieved October 10, 2019 from http://SatEd.org/library/LESSONS/Hurricane_Tracking/Tracking_Hurricanes.pdf
Bybee, Rodger W. The BSCS 5E Instructional Model: Creating Teachable Moments.
Arlington, VA: NSTA Press. 2015. Dolce, Chris. “Superstorm Sandy: A Daily Diary.” The Weather Channel. Retrieved
October 10, 2019 from https://weather.com/news/news/sandy-recap-20121030?pageno=2
Fischetti, Mark. “Sandy versus Katrina, and Irene: Monster Hurricanes by the
Numbers.” Scientific American, October 29, 2012. Retrieved October 10, 2019 from https://www.scientificamerican.com/article/sandy-vs-katrina-and-irene/
Howell, Elizabeth. “Hurricane Sandy was 1-in-700-Year Event.” LiveScience, July 12,
2013. Retrieved October 10, 2019 from https://www.livescience.com/38144-hurricane-sandy-700-year-event.html
National Research Council. A Framework for K-12 Science Education: Practices,
Crosscutting Concepts, and Core Ideas. Washington, DC: The National Academies Press, 2012. Retrieved October 10, 2019 from
https://www.nap.edu/catalog/13165/a-framework-for-k-12-science-education-practices-crosscutting-concepts
National research Council. The Next Generation Science Standards, Next Generation
Science Standards For States, By States.” Washington, DC: The National Academies Press, 2013. Retrieved October 10, 2019 from
https://www.nap.edu/catalog/18290/next-generation-science-standards-for-states-by-states
Teaching Notes
More Lessons from the Sky, © Satellite Educators Association, Inc. Tracking Hurricane Sandy 15
Smith, Adam B., and Katz, Richard W. “U.S. Billion-dollar Weather and Climate Disasters: Data Sources, Trends, Accuracy, and Biases” National Climatic Data Center, National Oceanic and Atmospheric Administration, February 2013. Retrieved October 10, 2019 from
https://www.ncdc.noaa.gov/monitoring-content/billions/docs/smith-and-katz-2013.pdf
Teaching Notes
16 Tracking Hurricane Sandy More Lessons from the Sky, © Satellite Educators Association, Inc.
These tables contain the same information the Data Miners will be gathering from the National Hurricane Center's advisory archive. These same data tables are contained in the comma-delimited (.csv) files in the
Lesson Data folder.
HURRICANE KATRINA - AUGUST 2005
Adv Num Date UTC
Wind (mph) Scale
Press (mb)
Center Lat (N)
Center Lon (W) Direction
Speed (mph)
19 28-Aug 0300 115 Cat 3 939 25.0 86.2 WNW 7
20 28-Aug 0600 145 Cat 4 935 25.1 86.8 WNW 8
21 28-Aug 0900 145 Cat 4 935 25.4 87.4 WNW 10
22 28-Aug 1200 160 Cat 5 908 25.7 87.7 WNW 12
23 28-Aug 1500 175 Cat 5 907 26.0 88.1 WNW 12
24 28-Aug 2100 165 Cat 5 902 26.9 89.0 NW 13
25 29-Aug 0300 160 Cat 5 904 27.6 89.4 NNW 10
26 29-Aug 0900 150 Cat 4 915 28.8 89.6 N 15
27 29-Aug 1500 125 Cat 3 927 30.2 89.6 N 16
28 29-Aug 2100 75 Cat 1 960 31.9 89.6 N 18
29 30-Aug 0300 60 TS 973 33.5 88.5 NNE 22
HURRICANE SANDY - OCTOBER 2012
Adv Num Date UTC
Wind (mph) Scale
Press (mb) LAT LON
Direction (degree)
Speed (mph)
EyeDiam (miles)
1 22-Oct 1500 29 TD 1003 13.5 -78.0 230 5 2 22-Oct 2100 40 TS 999 12.5 -78.5 0 0 3 23-Oct 0300 46 TS 998 12.7 -78.6 0 0 4 23-Oct 0900 46 TS 998 13.3 -78.6 360 3 5 23-Oct 1500 52 TS 993 13.8 -77.8 20 5 6 23-Oct 2100 52 TS 993 14.3 -77.6 20 6 7 23-Oct 0300 58 TS 989 15.2 -77.2 15 10 29
8 24-Oct 0900 69 TS 986 16.3 -77.0 10 14 9 24-Oct 1500 81 Cat 1 973 17.1 -76.7 15 13
10 24-Oct 2100 81 Cat 1 970 18.3 -76.6 10 14 11 25-Oct 0300 92 Cat 1 954 19.4 -76.3 10 13 23
12 25-Oct 0900 104 Cat 2 960 20.9 -75.8 5 18 23
13 25-Oct 1500 104 Cat 2 964 22.4 -75.5 360 16 14 25-Oct 2100 104 Cat 2 963 24.5 -75.6 360 20 15 26-Oct 0300 92 Cat 1 968 25.3 -76.1 335 13 23
16 26-Oct 0900 81 Cat 1 968 26.3 -76.9 325 13 17 26-Oct 1500 81 Cat 1 970 26.7 -76.9 360 6 18 26-Oct 2100 75 Cat 1 971 27.3 -77.1 360 7 19 27-Oct 0300 75 Cat 1 969 27.7 -77.1 10 7 20 27-Oct 0900 69 TS 969 28.6 -76.7 20 10 21 27-Oct 1500 75 Cat 1 958 29.0 -76.0 30 9 22 27-Oct 2100 75 Cat 1 961 30.2 -75.2 35 13 23 28-Oct 0300 75 Cat 1 960 30.9 -74.3 40 14 24 28-Oct 0900 75 Cat 1 960 31.9 -73.3 40 13 25 28-Oct 1500 75 Cat 1 951 32.5 -72.6 45 14 26 28-Oct 2100 75 Cat 1 952 33.4 -71.3 50 15 27 29-Oct 0300 75 Cat 1 950 34.5 -70.5 35 14 35
28 29-Oct 0900 86 Cat 1 946 35.9 -70.5 360 15 29 29-Oct 1500 92 Cat 1 943 37.5 -71.5 330 15 23
30 29-Oct 2100 92 Cat 1 940 38.8 -74.4 300 28 31 30-Oct 0300 75 PTC 952 39.8 -75.4 305 18
Student Activity
More Lessons from the Sky, © Satellite Educators Association, Inc. Tracking Hurricane Sandy 17
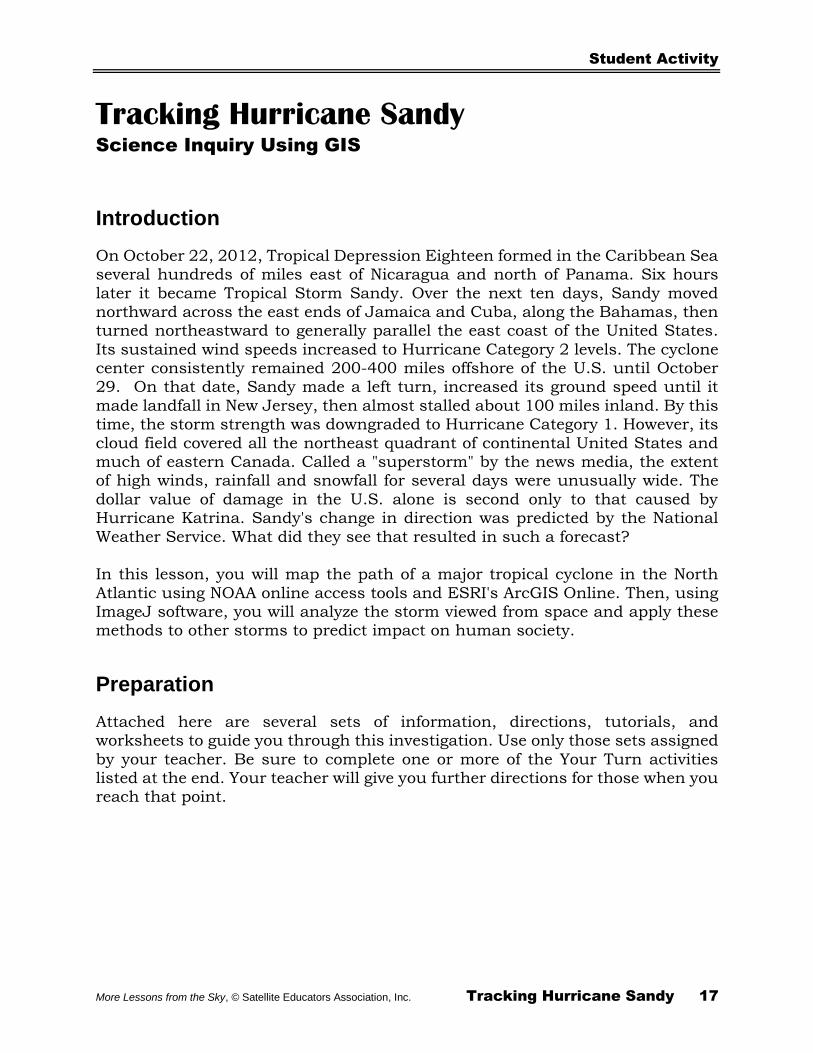
Tracking Hurricane Sandy Science Inquiry Using GIS
Introduction
On October 22, 2012, Tropical Depression Eighteen formed in the Caribbean Sea several hundreds of miles east of Nicaragua and north of Panama. Six hours
later it became Tropical Storm Sandy. Over the next ten days, Sandy moved northward across the east ends of Jamaica and Cuba, along the Bahamas, then turned northeastward to generally parallel the east coast of the United States.
Its sustained wind speeds increased to Hurricane Category 2 levels. The cyclone center consistently remained 200-400 miles offshore of the U.S. until October 29. On that date, Sandy made a left turn, increased its ground speed until it
made landfall in New Jersey, then almost stalled about 100 miles inland. By this time, the storm strength was downgraded to Hurricane Category 1. However, its
cloud field covered all the northeast quadrant of continental United States and much of eastern Canada. Called a "superstorm" by the news media, the extent of high winds, rainfall and snowfall for several days were unusually wide. The
dollar value of damage in the U.S. alone is second only to that caused by Hurricane Katrina. Sandy's change in direction was predicted by the National
Weather Service. What did they see that resulted in such a forecast? In this lesson, you will map the path of a major tropical cyclone in the North
Atlantic using NOAA online access tools and ESRI's ArcGIS Online. Then, using ImageJ software, you will analyze the storm viewed from space and apply these methods to other storms to predict impact on human society.
Preparation
Attached here are several sets of information, directions, tutorials, and worksheets to guide you through this investigation. Use only those sets assigned
by your teacher. Be sure to complete one or more of the Your Turn activities listed at the end. Your teacher will give you further directions for those when you reach that point.
Student Activity
18 Tracking Hurricane Sandy More Lessons from the Sky, © Satellite Educators Association, Inc.
KWL Chart
What I Know What I Want to Know What I Learned
Student Activity
More Lessons from the Sky, © Satellite Educators Association, Inc. Tracking Hurricane Sandy 19
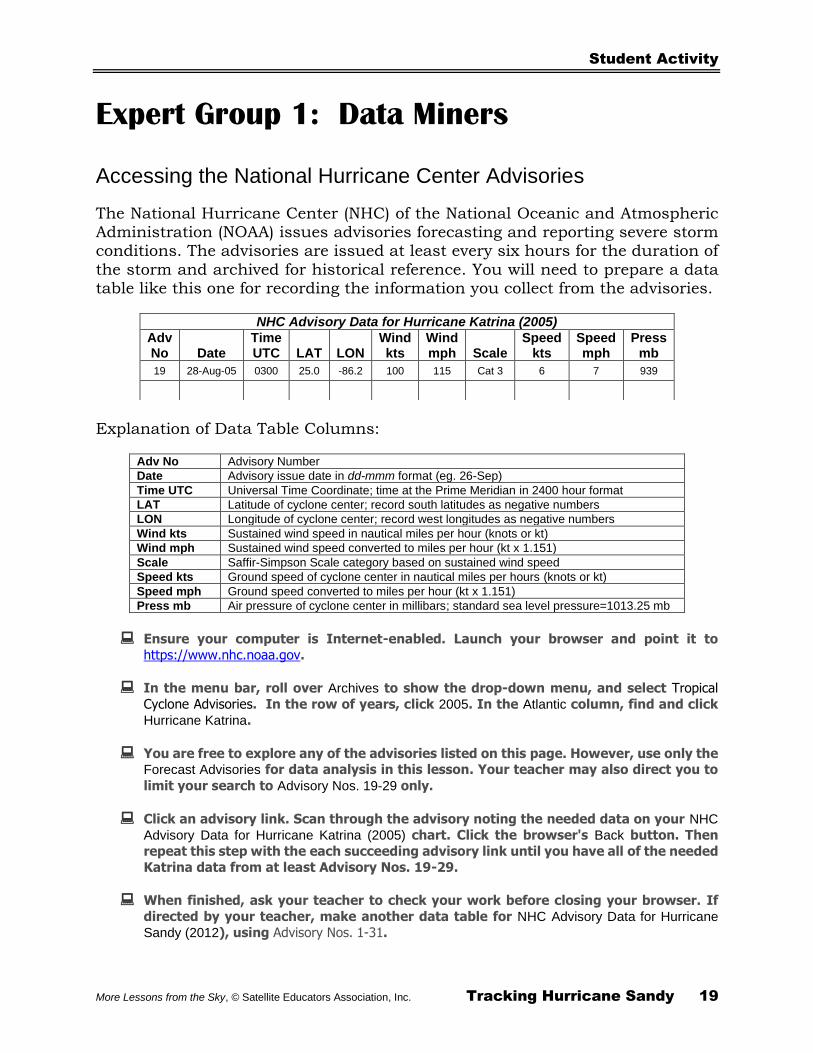
Expert Group 1: Data Miners
Accessing the National Hurricane Center Advisories
The National Hurricane Center (NHC) of the National Oceanic and Atmospheric Administration (NOAA) issues advisories forecasting and reporting severe storm conditions. The advisories are issued at least every six hours for the duration of
the storm and archived for historical reference. You will need to prepare a data table like this one for recording the information you collect from the advisories.
NHC Advisory Data for Hurricane Katrina (2005)
Adv No
Date
Time UTC
LAT
LON
Wind kts
Wind mph
Scale
Speed kts
Speed mph
Press mb
19 28-Aug-05 0300 25.0 -86.2 100 115 Cat 3 6 7 939
Explanation of Data Table Columns:
Adv No Advisory Number
Date Advisory issue date in dd-mmm format (eg. 26-Sep)
Time UTC Universal Time Coordinate; time at the Prime Meridian in 2400 hour format
LAT Latitude of cyclone center; record south latitudes as negative numbers
LON Longitude of cyclone center; record west longitudes as negative numbers
Wind kts Sustained wind speed in nautical miles per hour (knots or kt)
Wind mph Sustained wind speed converted to miles per hour (kt x 1.151)
Scale Saffir-Simpson Scale category based on sustained wind speed
Speed kts Ground speed of cyclone center in nautical miles per hours (knots or kt)
Speed mph Ground speed converted to miles per hour (kt x 1.151)
Press mb Air pressure of cyclone center in millibars; standard sea level pressure=1013.25 mb
Ensure your computer is Internet-enabled. Launch your browser and point it to
https://www.nhc.noaa.gov.
In the menu bar, roll over Archives to show the drop-down menu, and select Tropical
Cyclone Advisories. In the row of years, click 2005. In the Atlantic column, find and click
Hurricane Katrina.
You are free to explore any of the advisories listed on this page. However, use only the Forecast Advisories for data analysis in this lesson. Your teacher may also direct you to
limit your search to Advisory Nos. 19-29 only.
Click an advisory link. Scan through the advisory noting the needed data on your NHC
Advisory Data for Hurricane Katrina (2005) chart. Click the browser's Back button. Then
repeat this step with the each succeeding advisory link until you have all of the needed
Katrina data from at least Advisory Nos. 19-29.
When finished, ask your teacher to check your work before closing your browser. If
directed by your teacher, make another data table for NHC Advisory Data for Hurricane
Sandy (2012), using Advisory Nos. 1-31.
Student Activity
20 Tracking Hurricane Sandy More Lessons from the Sky, © Satellite Educators Association, Inc.
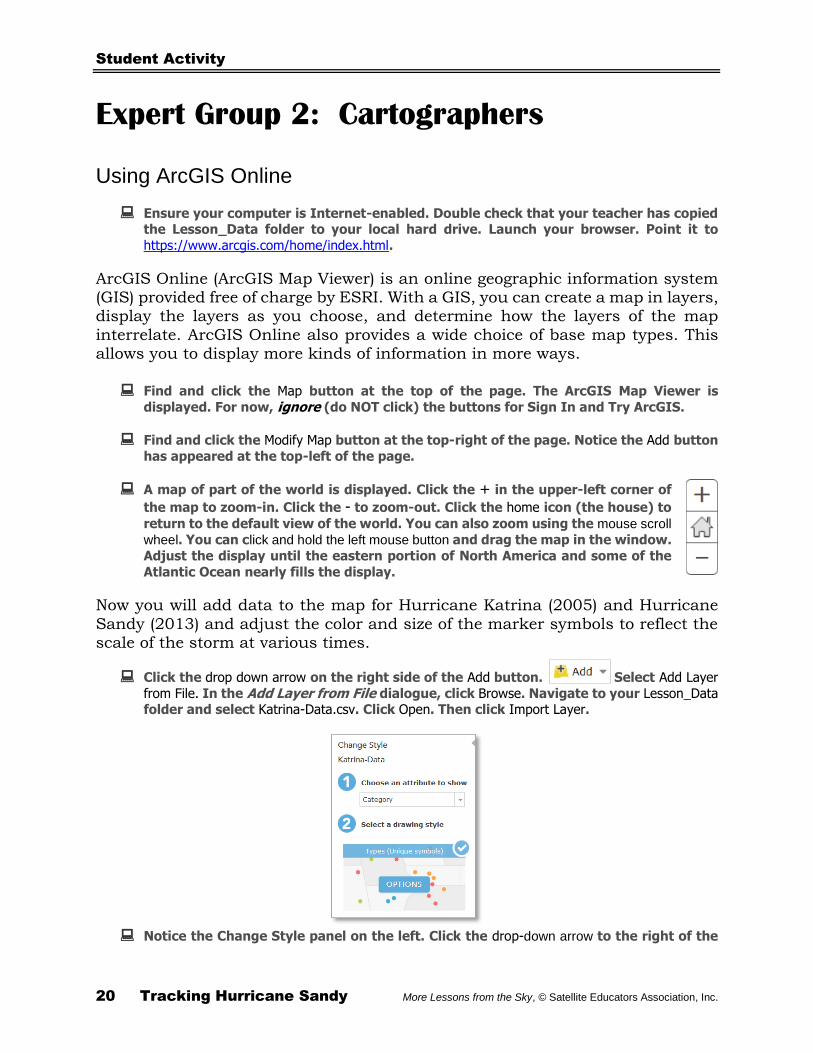
Expert Group 2: Cartographers
Using ArcGIS Online
Ensure your computer is Internet-enabled. Double check that your teacher has copied the Lesson_Data folder to your local hard drive. Launch your browser. Point it to
https://www.arcgis.com/home/index.html.
ArcGIS Online (ArcGIS Map Viewer) is an online geographic information system (GIS) provided free of charge by ESRI. With a GIS, you can create a map in layers, display the layers as you choose, and determine how the layers of the map
interrelate. ArcGIS Online also provides a wide choice of base map types. This allows you to display more kinds of information in more ways.
Find and click the Map button at the top of the page. The ArcGIS Map Viewer is
displayed. For now, ignore (do NOT click) the buttons for Sign In and Try ArcGIS.
Find and click the Modify Map button at the top-right of the page. Notice the Add button
has appeared at the top-left of the page.
A map of part of the world is displayed. Click the + in the upper-left corner of
the map to zoom-in. Click the - to zoom-out. Click the home icon (the house) to
return to the default view of the world. You can also zoom using the mouse scroll
wheel. You can click and hold the left mouse button and drag the map in the window.
Adjust the display until the eastern portion of North America and some of the
Atlantic Ocean nearly fills the display.
Now you will add data to the map for Hurricane Katrina (2005) and Hurricane
Sandy (2013) and adjust the color and size of the marker symbols to reflect the scale of the storm at various times.
Click the drop down arrow on the right side of the Add button. Select Add Layer
from File. In the Add Layer from File dialogue, click Browse. Navigate to your Lesson_Data folder and select Katrina-Data.csv. Click Open. Then click Import Layer.
Notice the Change Style panel on the left. Click the drop-down arrow to the right of the
Student Activity
More Lessons from the Sky, © Satellite Educators Association, Inc. Tracking Hurricane Sandy 21
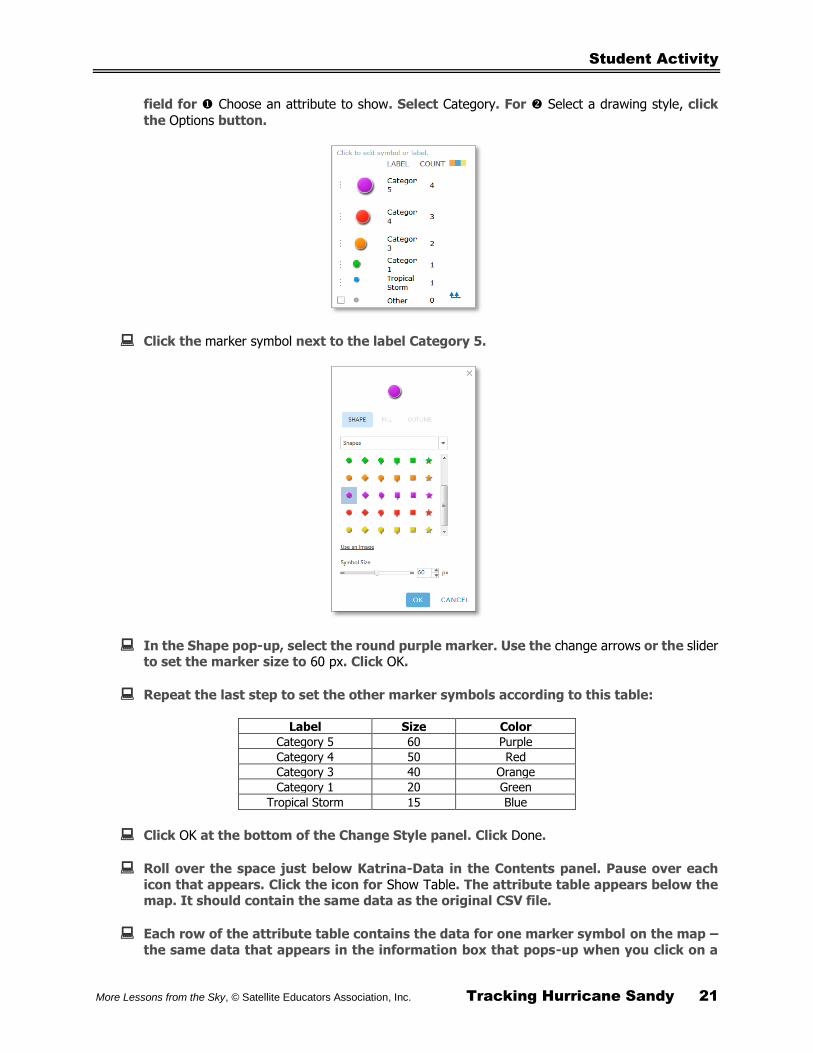
field for Choose an attribute to show. Select Category. For Select a drawing style, click
the Options button.
Click the marker symbol next to the label Category 5.
In the Shape pop-up, select the round purple marker. Use the change arrows or the slider to set the marker size to 60 px. Click OK.
Repeat the last step to set the other marker symbols according to this table:
Label Size Color
Category 5 60 Purple
Category 4 50 Red
Category 3 40 Orange
Category 1 20 Green
Tropical Storm 15 Blue
Click OK at the bottom of the Change Style panel. Click Done.
Roll over the space just below Katrina-Data in the Contents panel. Pause over each
icon that appears. Click the icon for Show Table. The attribute table appears below the map. It should contain the same data as the original CSV file.
Each row of the attribute table contains the data for one marker symbol on the map –
the same data that appears in the information box that pops-up when you click on a
Student Activity
22 Tracking Hurricane Sandy More Lessons from the Sky, © Satellite Educators Association, Inc.
marker symbol on the map. Click any row in the table. Notice that the corresponding marker symbol on the map is highlighted with a cyan colored box. To select multiple
markers, Ctrl-click each additional marker to be highlighted.
To clear the selection(s), click the Table Options icon (just right of the X), and select Clear
Selection.
Close the attribute table by clicking the X in the upper-right corner of the table.
Stop here and check with your teacher. If time permits, click the Add button and follow the above sequence of steps to add another feature layer to the map using Sandy-
Data.csv found in the Lesson_Data folder.
Use the Change Style options to adjust the marker symbols for Hurricane Sandy
according the following table:
Label Size Color
Category 1 28 Green
Tropical Storm 20 Blue
Category 2 36 Yellow
Post Tropical Cyclone 28 Green
Tropical Depression 15 Black
Click OK at the bottom of the Change Style panel. Click Done. Click the Home icon.
Ensure that both feature layers (Sandy-Data and Katrina-Data) are checked in the table of contents.
If the feature layer is not visible on the map, it may be necessary to adjust the visibility range. Setting the visibility range helps the marker symbols appear on
the map in an informative manner.
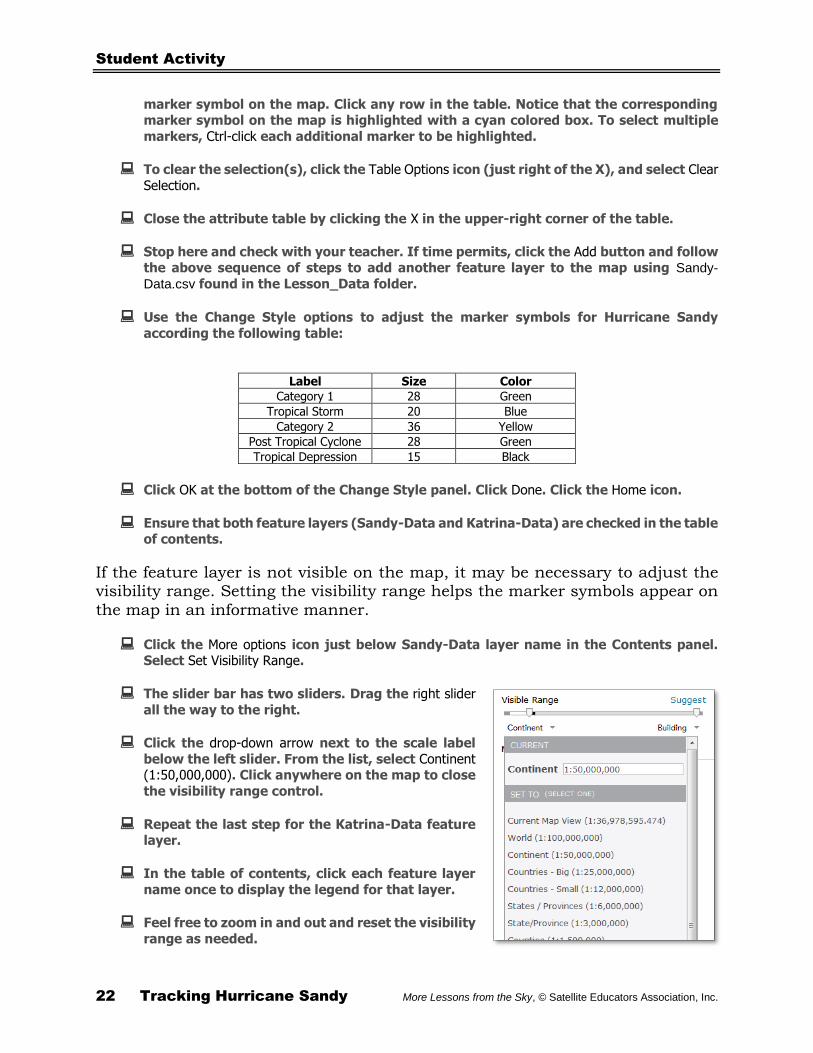
Click the More options icon just below Sandy-Data layer name in the Contents panel. Select Set Visibility Range.
The slider bar has two sliders. Drag the right slider
all the way to the right.
Click the drop-down arrow next to the scale label
below the left slider. From the list, select Continent (1:50,000,000). Click anywhere on the map to close
the visibility range control.
Repeat the last step for the Katrina-Data feature layer.
In the table of contents, click each feature layer
name once to display the legend for that layer.
Feel free to zoom in and out and reset the visibility
range as needed.
Student Activity
More Lessons from the Sky, © Satellite Educators Association, Inc. Tracking Hurricane Sandy 23
Discuss and interpret the resulting map display. You should be able to note: ✓ The direction of each storm's center before and after making landfall ✓ The intensity of each storm - relate the marker color to the legend to interpret
wind speed; click a marker to display its data ✓ The ground speed of each storm - each marker is separated by about 6 hours.
So, greater spacing between markers indicates higher ground speed. ✓ What happens to ground speed and intensity when the storm makes landfall?
Student Activity
24 Tracking Hurricane Sandy More Lessons from the Sky, © Satellite Educators Association, Inc.
Expert Group 3: Meteorologists
Comparing Hurricanes
Ensure your computer is Internet-enabled. Point your browser to this NOAA Web site: https://www.nhc.noaa.gov/aboutsshws.php.
Note wind speeds and characteristics of each level of the Saffir-Simpson Hurricane Winds
Scale. Keep this note for reference throughout the lesson.
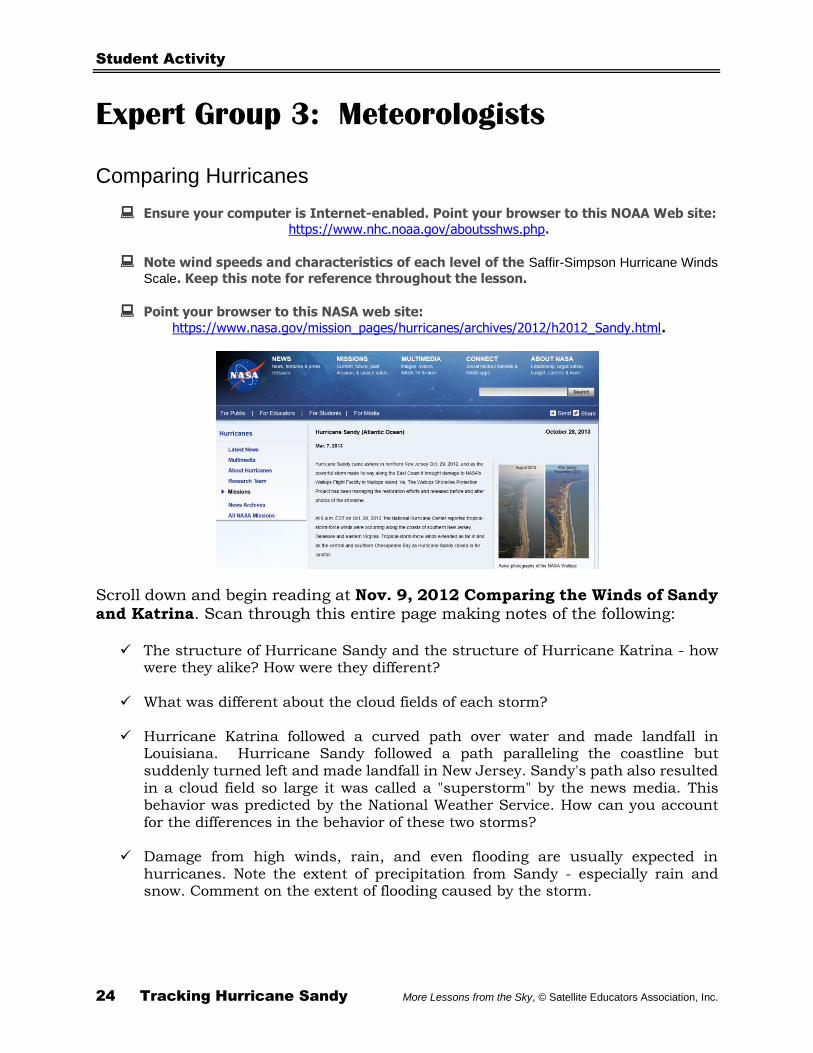
Point your browser to this NASA web site:
https://www.nasa.gov/mission_pages/hurricanes/archives/2012/h2012_Sandy.html.
Scroll down and begin reading at Nov. 9, 2012 Comparing the Winds of Sandy and Katrina. Scan through this entire page making notes of the following:
✓ The structure of Hurricane Sandy and the structure of Hurricane Katrina - how
were they alike? How were they different?
✓ What was different about the cloud fields of each storm?
✓ Hurricane Katrina followed a curved path over water and made landfall in Louisiana. Hurricane Sandy followed a path paralleling the coastline but suddenly turned left and made landfall in New Jersey. Sandy's path also resulted in a cloud field so large it was called a "superstorm" by the news media. This behavior was predicted by the National Weather Service. How can you account for the differences in the behavior of these two storms?
✓ Damage from high winds, rain, and even flooding are usually expected in
hurricanes. Note the extent of precipitation from Sandy - especially rain and snow. Comment on the extent of flooding caused by the storm.
Student Activity
More Lessons from the Sky, © Satellite Educators Association, Inc. Tracking Hurricane Sandy 25
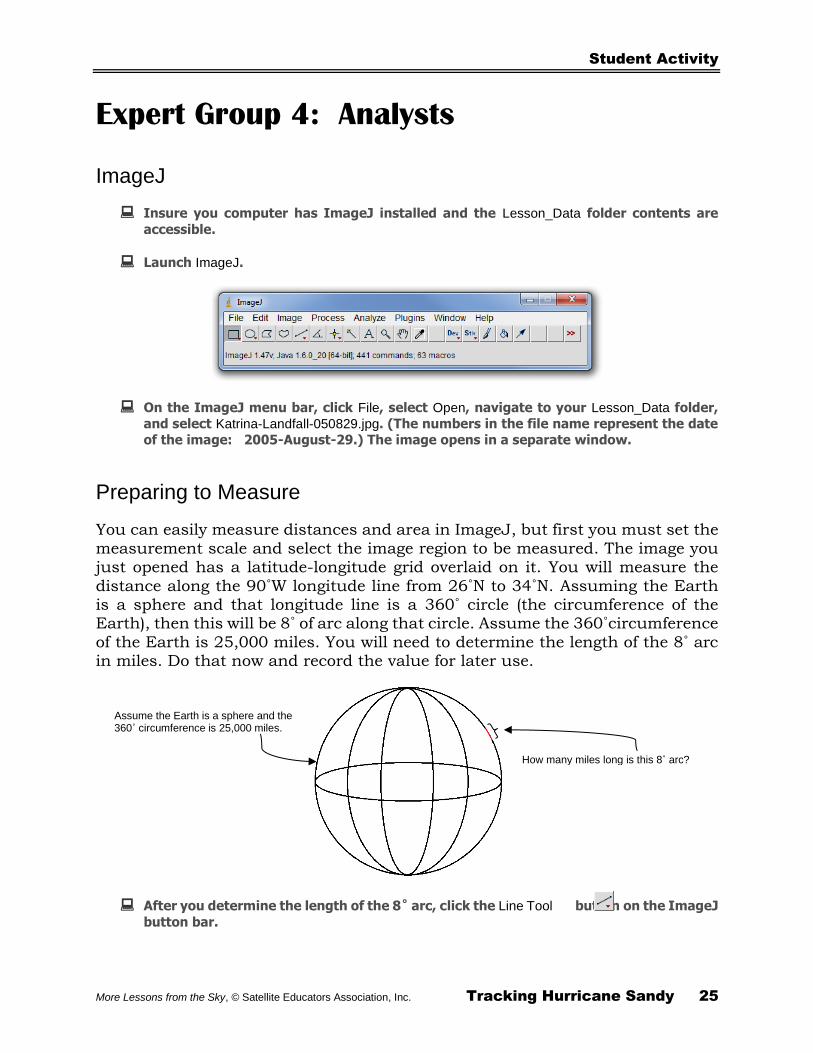
Expert Group 4: Analysts
ImageJ
Insure you computer has ImageJ installed and the Lesson_Data folder contents are
accessible.
Launch ImageJ.
On the ImageJ menu bar, click File, select Open, navigate to your Lesson_Data folder,
and select Katrina-Landfall-050829.jpg. (The numbers in the file name represent the date
of the image: 2005-August-29.) The image opens in a separate window.
Preparing to Measure
You can easily measure distances and area in ImageJ, but first you must set the
measurement scale and select the image region to be measured. The image you just opened has a latitude-longitude grid overlaid on it. You will measure the
distance along the 90˚W longitude line from 26˚N to 34˚N. Assuming the Earth is a sphere and that longitude line is a 360˚ circle (the circumference of the Earth), then this will be 8˚ of arc along that circle. Assume the 360˚circumference
of the Earth is 25,000 miles. You will need to determine the length of the 8˚ arc in miles. Do that now and record the value for later use.
After you determine the length of the 8˚ arc, click the Line Tool button on the ImageJ
button bar.
Assume the Earth is a sphere and the 360˚ circumference is 25,000 miles.
How many miles long is this 8˚ arc?
Student Activity
26 Tracking Hurricane Sandy More Lessons from the Sky, © Satellite Educators Association, Inc.
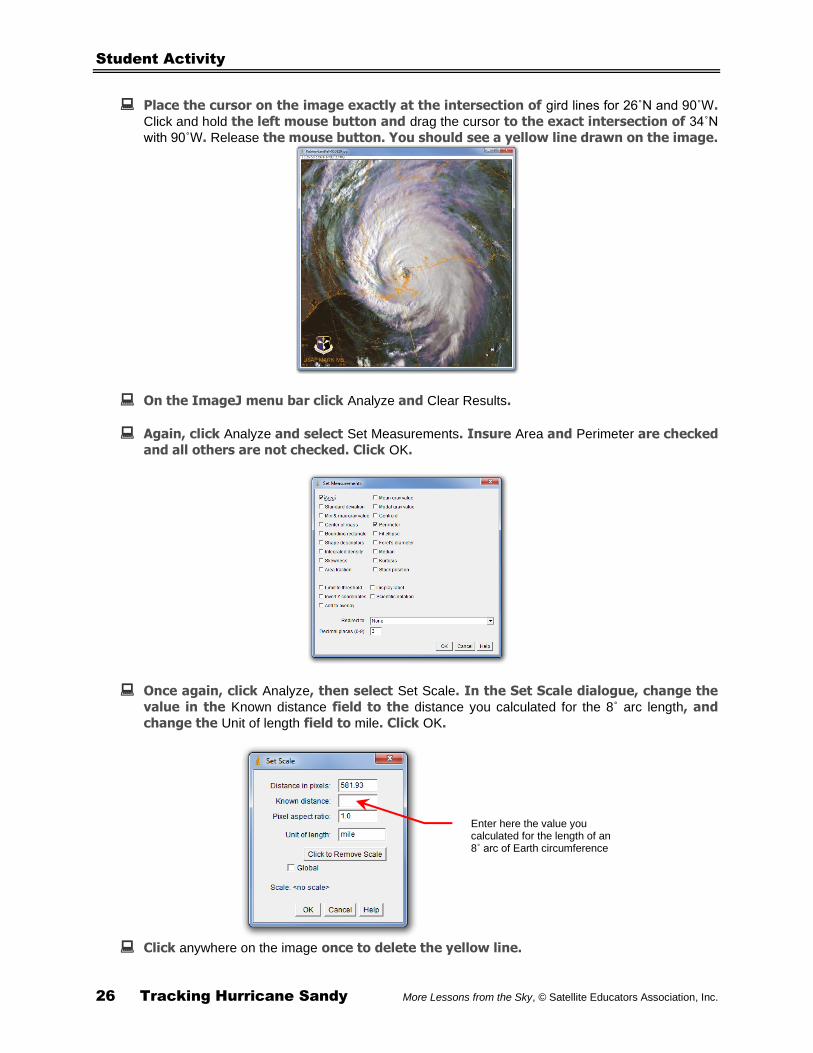
Place the cursor on the image exactly at the intersection of gird lines for 26˚N and 90˚W.
Click and hold the left mouse button and drag the cursor to the exact intersection of 34˚N
with 90˚W. Release the mouse button. You should see a yellow line drawn on the image.
On the ImageJ menu bar click Analyze and Clear Results.
Again, click Analyze and select Set Measurements. Insure Area and Perimeter are checked
and all others are not checked. Click OK.
Once again, click Analyze, then select Set Scale. In the Set Scale dialogue, change the
value in the Known distance field to the distance you calculated for the 8˚ arc length, and
change the Unit of length field to mile. Click OK.
Click anywhere on the image once to delete the yellow line.
Enter here the value you calculated for the length of an 8˚ arc of Earth circumference
Student Activity
More Lessons from the Sky, © Satellite Educators Association, Inc. Tracking Hurricane Sandy 27
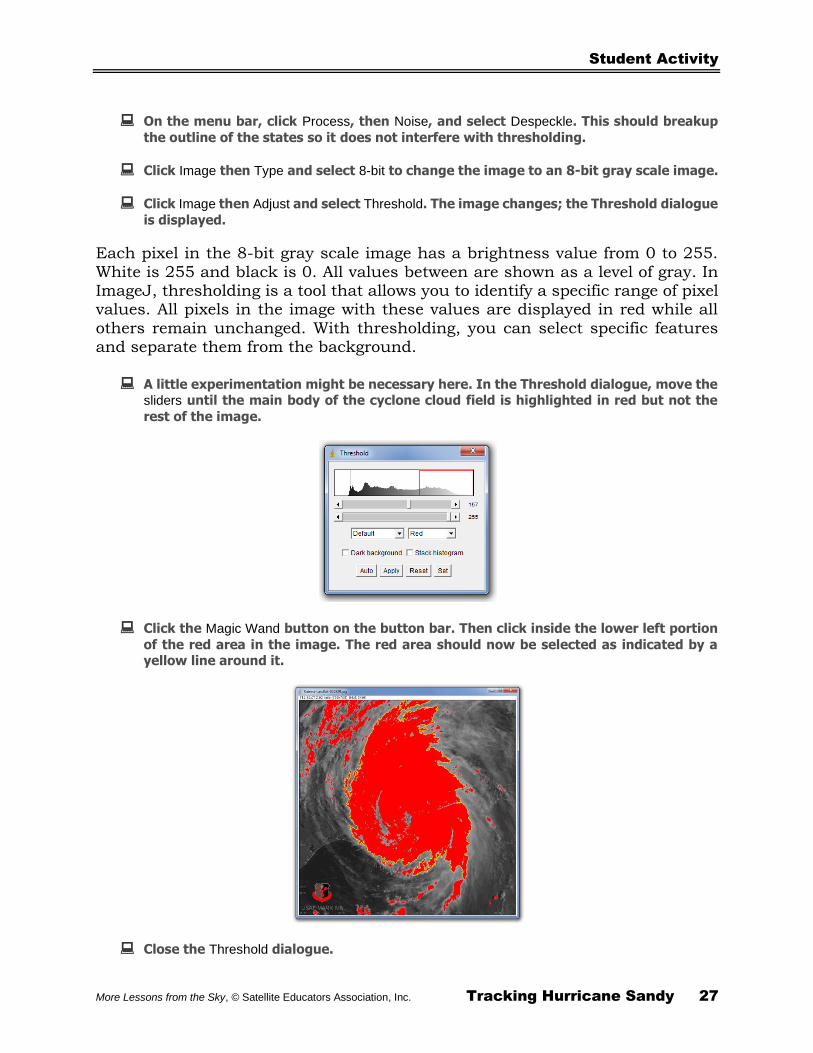
On the menu bar, click Process, then Noise, and select Despeckle. This should breakup
the outline of the states so it does not interfere with thresholding.
Click Image then Type and select 8-bit to change the image to an 8-bit gray scale image.
Click Image then Adjust and select Threshold. The image changes; the Threshold dialogue
is displayed.
Each pixel in the 8-bit gray scale image has a brightness value from 0 to 255.
White is 255 and black is 0. All values between are shown as a level of gray. In ImageJ, thresholding is a tool that allows you to identify a specific range of pixel values. All pixels in the image with these values are displayed in red while all
others remain unchanged. With thresholding, you can select specific features and separate them from the background.
A little experimentation might be necessary here. In the Threshold dialogue, move the sliders until the main body of the cyclone cloud field is highlighted in red but not the
rest of the image.
Click the Magic Wand button on the button bar. Then click inside the lower left portion
of the red area in the image. The red area should now be selected as indicated by a yellow line around it.
Close the Threshold dialogue.
Student Activity
28 Tracking Hurricane Sandy More Lessons from the Sky, © Satellite Educators Association, Inc.
Now, for the actual measurements...
Click Analyze and select Measure. The Results window opens showing the perimeter of
the selected area in miles and the area of the selection in square miles.
Click the Line tool button and click the image once outside of the red area. Now use the
Line tool to draw a line across the red area in a place that seems to be an average width
of the storm cloud field.
Again, click Analyze and measure. On line 2 in the Results window the approximate
average diameter (in miles) of the hurricane cloud field is shown in the Length column. Try measuring the diameter in several different places. Record the average diameter,
perimeter, and area measures for later reference.
In the Results window, click Results and select Clear Results without saving results. Close
the Results window.
Close the image window without saving changes.
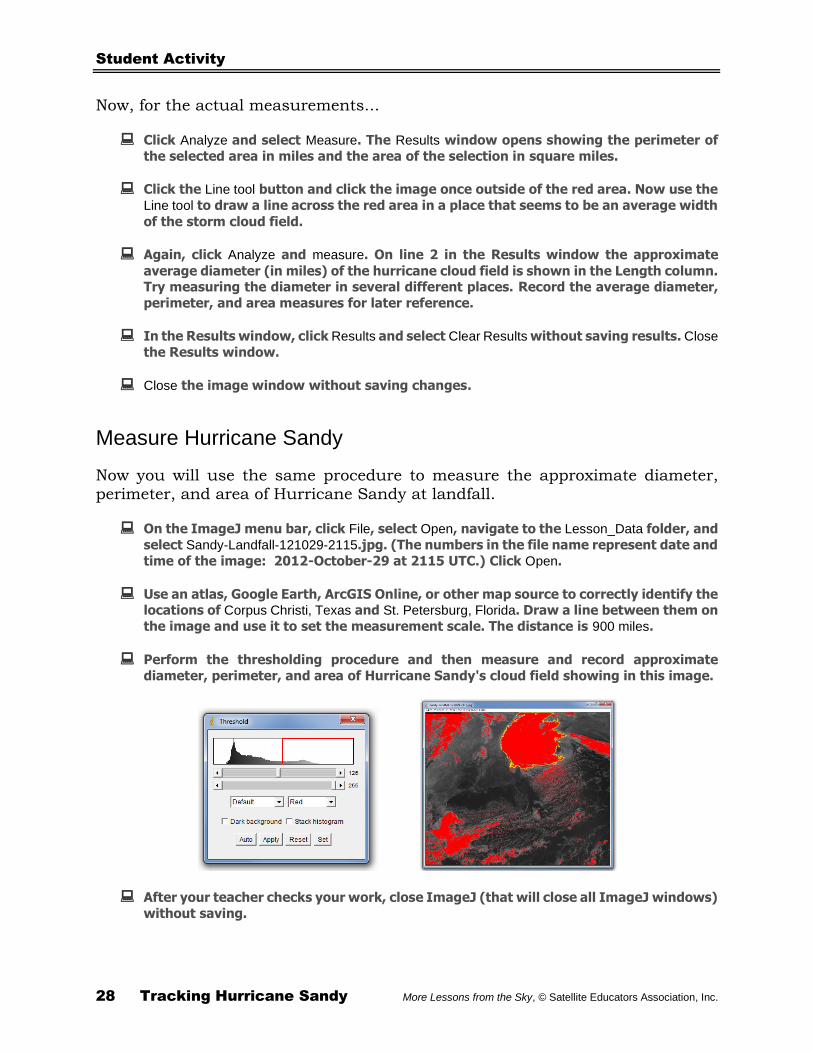
Measure Hurricane Sandy
Now you will use the same procedure to measure the approximate diameter, perimeter, and area of Hurricane Sandy at landfall.
On the ImageJ menu bar, click File, select Open, navigate to the Lesson_Data folder, and
select Sandy-Landfall-121029-2115.jpg. (The numbers in the file name represent date and
time of the image: 2012-October-29 at 2115 UTC.) Click Open.
Use an atlas, Google Earth, ArcGIS Online, or other map source to correctly identify the locations of Corpus Christi, Texas and St. Petersburg, Florida. Draw a line between them on
the image and use it to set the measurement scale. The distance is 900 miles.
Perform the thresholding procedure and then measure and record approximate
diameter, perimeter, and area of Hurricane Sandy's cloud field showing in this image.
After your teacher checks your work, close ImageJ (that will close all ImageJ windows)
without saving.
Student Activity
More Lessons from the Sky, © Satellite Educators Association, Inc. Tracking Hurricane Sandy 29
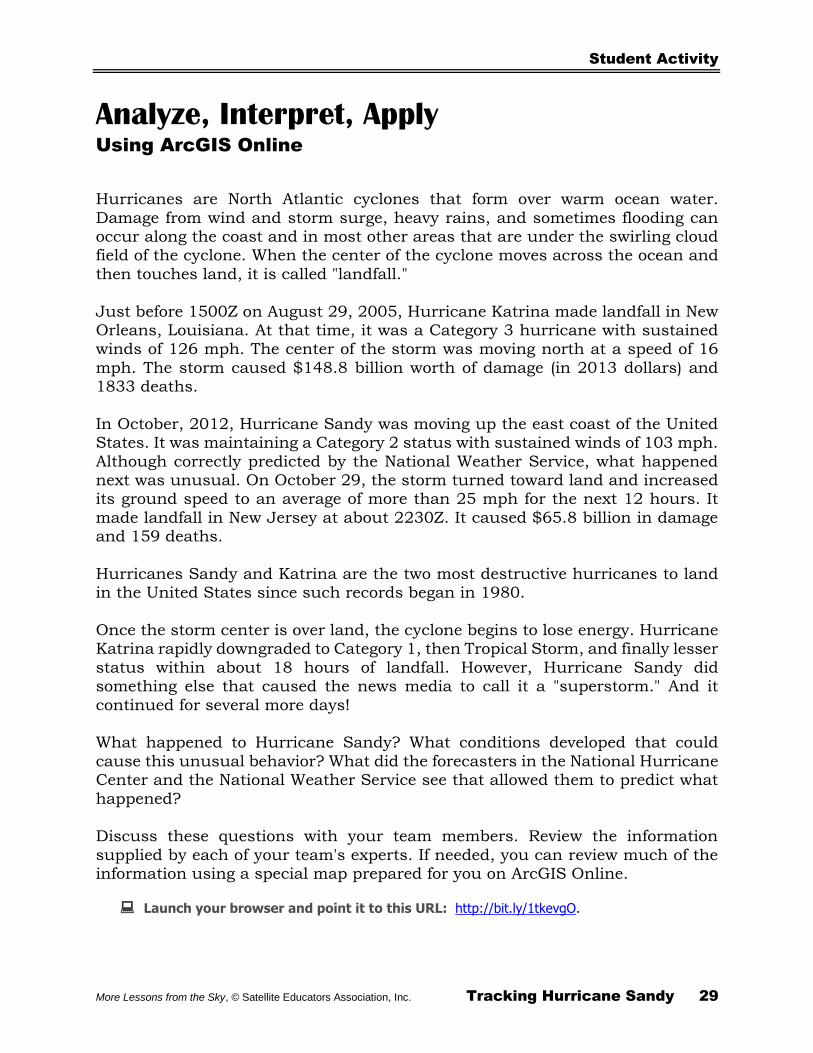
Analyze, Interpret, Apply Using ArcGIS Online
Hurricanes are North Atlantic cyclones that form over warm ocean water.
Damage from wind and storm surge, heavy rains, and sometimes flooding can occur along the coast and in most other areas that are under the swirling cloud field of the cyclone. When the center of the cyclone moves across the ocean and
then touches land, it is called "landfall."
Just before 1500Z on August 29, 2005, Hurricane Katrina made landfall in New Orleans, Louisiana. At that time, it was a Category 3 hurricane with sustained winds of 126 mph. The center of the storm was moving north at a speed of 16
mph. The storm caused $148.8 billion worth of damage (in 2013 dollars) and 1833 deaths.
In October, 2012, Hurricane Sandy was moving up the east coast of the United States. It was maintaining a Category 2 status with sustained winds of 103 mph.
Although correctly predicted by the National Weather Service, what happened next was unusual. On October 29, the storm turned toward land and increased its ground speed to an average of more than 25 mph for the next 12 hours. It
made landfall in New Jersey at about 2230Z. It caused $65.8 billion in damage and 159 deaths.
Hurricanes Sandy and Katrina are the two most destructive hurricanes to land in the United States since such records began in 1980.
Once the storm center is over land, the cyclone begins to lose energy. Hurricane Katrina rapidly downgraded to Category 1, then Tropical Storm, and finally lesser
status within about 18 hours of landfall. However, Hurricane Sandy did something else that caused the news media to call it a "superstorm." And it
continued for several more days! What happened to Hurricane Sandy? What conditions developed that could
cause this unusual behavior? What did the forecasters in the National Hurricane Center and the National Weather Service see that allowed them to predict what
happened? Discuss these questions with your team members. Review the information
supplied by each of your team's experts. If needed, you can review much of the information using a special map prepared for you on ArcGIS Online.
Launch your browser and point it to this URL: http://bit.ly/1tkevgO.
Student Activity
30 Tracking Hurricane Sandy More Lessons from the Sky, © Satellite Educators Association, Inc.
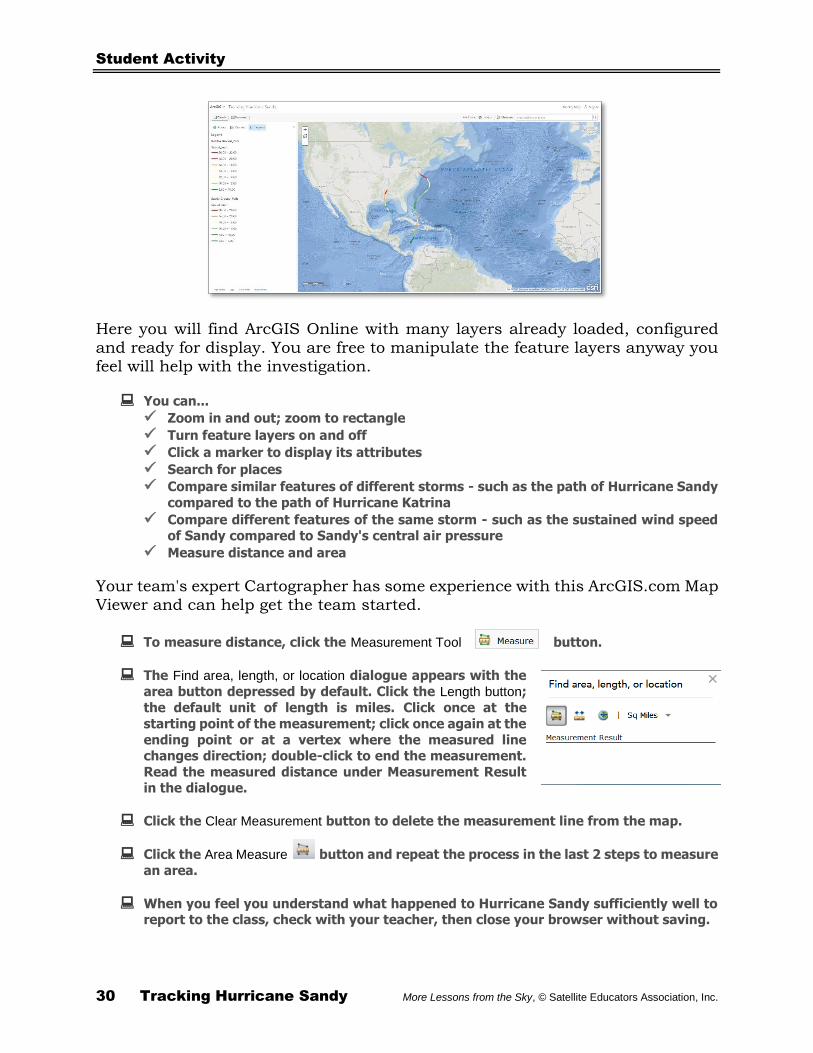
Here you will find ArcGIS Online with many layers already loaded, configured and ready for display. You are free to manipulate the feature layers anyway you feel will help with the investigation.
You can...
✓ Zoom in and out; zoom to rectangle
✓ Turn feature layers on and off
✓ Click a marker to display its attributes
✓ Search for places
✓ Compare similar features of different storms - such as the path of Hurricane Sandy
compared to the path of Hurricane Katrina
✓ Compare different features of the same storm - such as the sustained wind speed of Sandy compared to Sandy's central air pressure
✓ Measure distance and area
Your team's expert Cartographer has some experience with this ArcGIS.com Map Viewer and can help get the team started.
To measure distance, click the Measurement Tool button.
The Find area, length, or location dialogue appears with the
area button depressed by default. Click the Length button;
the default unit of length is miles. Click once at the
starting point of the measurement; click once again at the
ending point or at a vertex where the measured line changes direction; double-click to end the measurement.
Read the measured distance under Measurement Result in the dialogue.
Click the Clear Measurement button to delete the measurement line from the map.
Click the Area Measure button and repeat the process in the last 2 steps to measure
an area.
When you feel you understand what happened to Hurricane Sandy sufficiently well to report to the class, check with your teacher, then close your browser without saving.
Student Activity
More Lessons from the Sky, © Satellite Educators Association, Inc. Tracking Hurricane Sandy 31
YOUR TURN Select and complete one or more of the activities below. Then create and deliver a report of the results. The report must be in a format you have discussed and agreed upon with your teacher. It could be audio-visual in form using presentation software such as PowerPoint; it could be in printed format such as a poster presentation; or it could be in written or oral form similar to a letter, a printed report, or a oral report to the class. In each case, drawing or other artwork or graphics should be included to clarify explanations.
Research and collect photographs of damage caused by Hurricane Sandy. Relate each to an image of the cloud cover from that day as seen in a GOES satellite image. Discuss the effect of the storm on the human population of the affected areas. Suggest and describe several options for lessening the impact of such severe storms on society.
Investigate the forecasted and actual rainfall, snowfall, and flooding resulting from Hurricane Sandy.
We expect every tropical cyclone to bring high winds, heavy rain, and, sometimes, floods. What was unusual about Hurricane Sandy? How did interactions between winds, landforms, ocean temperatures and currents affect the storm's behavior?
Devise a plan to determine the diameter, perimeter, and area of the cloud field and the intensity of other
major hurricanes when they made landfall in the United States. Is there a definite relationship between the size of the cloud field at landfall and the amount of damage caused by the storm? Is this at all related to sea surface temperature and/or land topography? If so, how?
Develop and use a model to describe how hurricanes form and how that formation process is related
to sea surface temperature. In your discussion, emphasize the unique properties of water that contribute to storm development. Use the model to indicate the flow of energy into and out of the storm system. Do hurricanes have the same intensity over land that they do over water? Explain. Why does the National Weather Service call the period from June 1 to November 30 "hurricane season?"
Research major hurricanes making landfall in the United States since 1980. Gather the data in a
comma-delimited text file with columns for Hurricane Name, Landfall Date, Latitude, Longitude. Add these data to the Tracking Hurricane Sandy map in ArcGIS Online. Which geographic areas are most likely to experience a major hurricane this year? What specific conditions are necessary for such a severe storm to develop? Make a prediction about the occurrence of a future hurricane based on the evidence you have gathered so far. Defend your prediction.
Re-examine your KWL chart. Do any questions remain unanswered? Select a question and devise a
plan to investigate a possible answer or design a possible solution. Discuss your plan with your teacher and have it approved before starting work.
Using the data from the Hurricane Sandy advisories, create a X-Y line graph with central air pressure
over time on one line, sustained wind speed on another line, and ground speed on a third line. Compare and contrast the results to develop a position on the relationship between these three storm characteristics. Do the same for Hurricane Katrina. Are you led to the same conclusion by the graphs for both hurricanes? What societal conditions contributed to the overall damage total for each storm? Defend your position in your report.
Student Activity
32 Tracking Hurricane Sandy More Lessons from the Sky, © Satellite Educators Association, Inc.
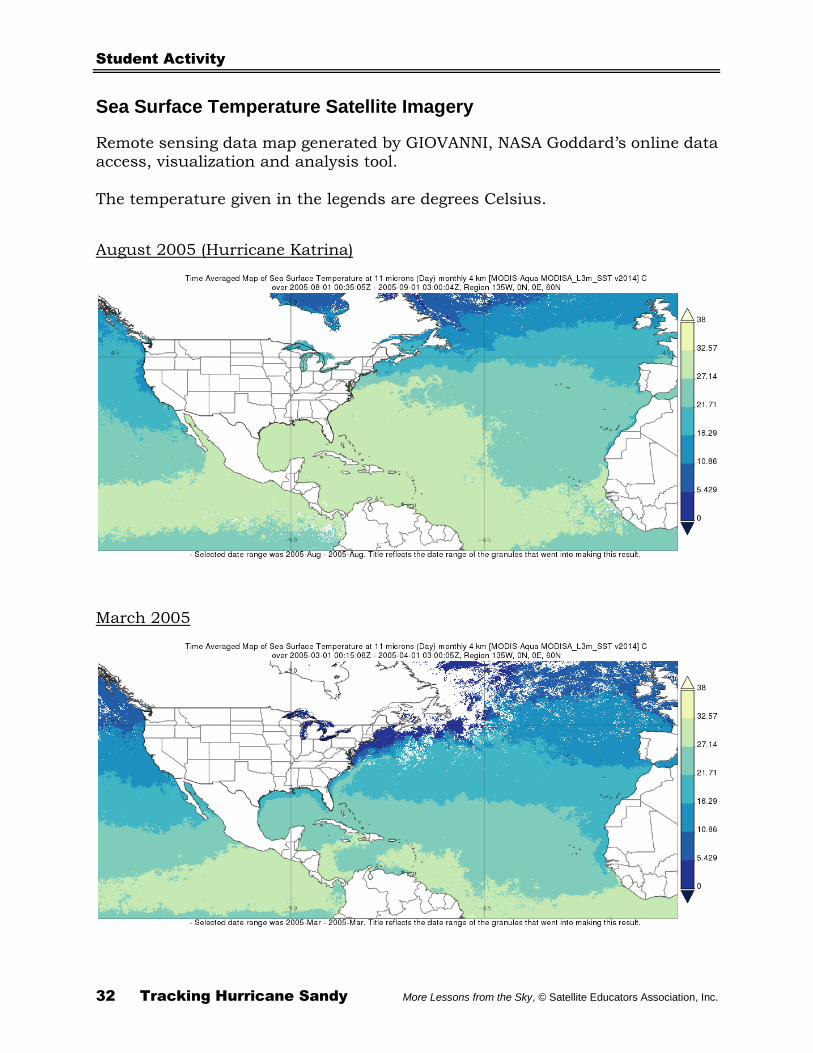
Sea Surface Temperature Satellite Imagery
Remote sensing data map generated by GIOVANNI, NASA Goddard’s online data access, visualization and analysis tool.
The temperature given in the legends are degrees Celsius.
August 2005 (Hurricane Katrina)
March 2005
Student Activity
More Lessons from the Sky, © Satellite Educators Association, Inc. Tracking Hurricane Sandy 33
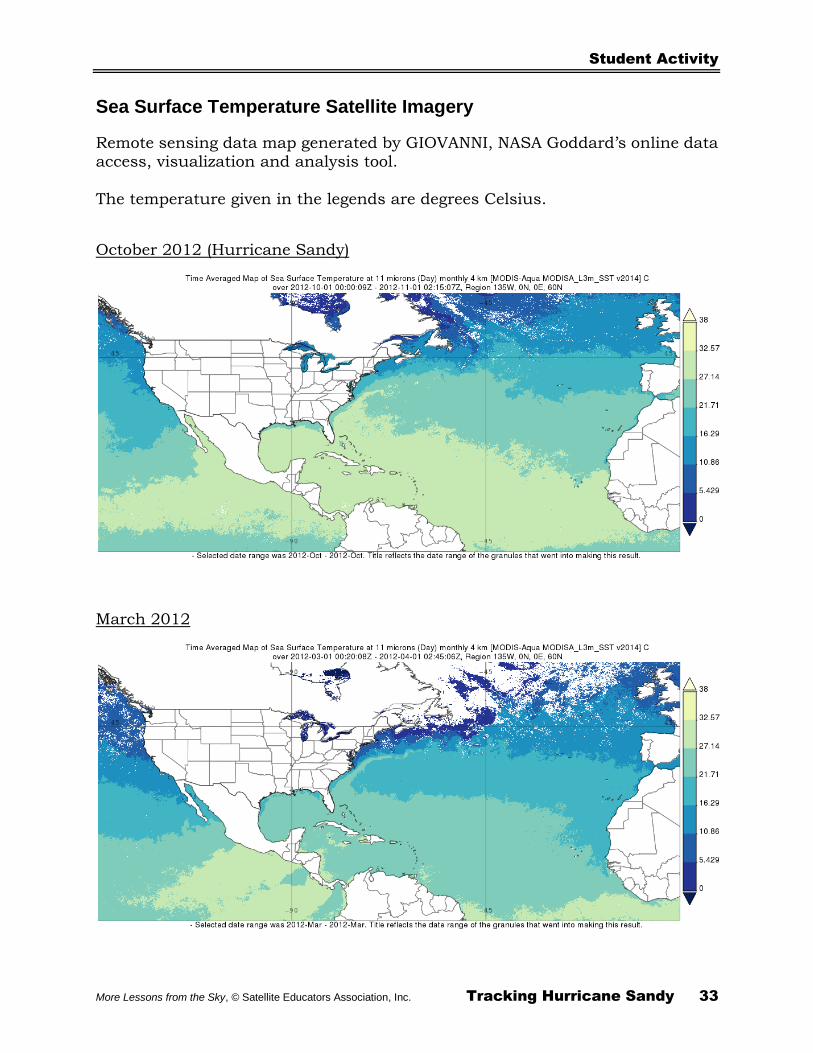
Sea Surface Temperature Satellite Imagery
Remote sensing data map generated by GIOVANNI, NASA Goddard’s online data access, visualization and analysis tool.
The temperature given in the legends are degrees Celsius.
October 2012 (Hurricane Sandy)
March 2012
Copyright © 2022 FDOKUMEN