TROPICAL STORM FRED - National Hurricane Center
56
NATIONAL HURRICANE CENTER TROPICAL CYCLONE REPORT TROPICAL STORM FRED (AL062021) 11–17 August 2021 Robbie Berg National Hurricane Center 19 November 2021 GOES-16 GEOCOLOR VISIBLE SATELLITE IMAGE OF TROPICAL STORM FRED AT 1900 UTC 16 AUGUST 2021, NEAR THE TIME OF LANDFALL ON THE ST. JOSEPH PENINSULA, FLORIDA (IMAGE COURTESY OF NOAA/NESDIS/STAR) Fred affected portions of the Greater Antilles and Florida as a tropical storm, producing strong winds, some storm surge flooding, and heavy rainfall along its path. Fred produced catastrophic flash flooding in the southern Appalachian Mountains as a tropical depression, taking the lives of six people in western North Carolina.
-
Upload
khangminh22 -
Category
Documents
-
view
0 -
download
0
Transcript of TROPICAL STORM FRED - National Hurricane Center
NATIONAL HURRICANE CENTER TROPICAL CYCLONE REPORT
TROPICAL STORM FRED (AL062021) 11–17 August 2021
Robbie Berg National Hurricane Center
19 November 2021
GOES-16 GEOCOLOR VISIBLE SATELLITE IMAGE OF TROPICAL STORM FRED AT 1900 UTC 16 AUGUST 2021, NEAR THE
TIME OF LANDFALL ON THE ST. JOSEPH PENINSULA, FLORIDA (IMAGE COURTESY OF NOAA/NESDIS/STAR)
Fred affected portions of the Greater Antilles and Florida as a tropical storm,
producing strong winds, some storm surge flooding, and heavy rainfall along its path. Fred produced catastrophic flash flooding in the southern Appalachian Mountains as a tropical depression, taking the lives of six people in western North Carolina.

Tropical Storm Fred 2
Table of Contents SYNOPTIC HISTORY ................................................................................................. 3
METEOROLOGICAL STATISTICS ............................................................................ 4 Winds and Pressure .................................................................................................. 5 Storm Surge .............................................................................................................. 6 Rainfall and Flooding ................................................................................................. 7 Tornadoes ................................................................................................................. 8
CASUALTY AND DAMAGE STATISTICS ................................................................. 8
FORECAST AND WARNING CRITIQUE ................................................................... 9
IMPACT-BASED DECISION SUPPORT SERVICES (IDSS) AND PUBLIC COMMUNICATION ..................................................................................... 11
ACKNOWLEDGMENTS ........................................................................................... 11
TABLES .................................................................................................................... 12
FIGURES ................................................................................................................... 43

Tropical Storm Fred 3
Tropical Storm Fred 11–17 AUGUST 2021
SYNOPTIC HISTORY Fred formed from a complex interaction of a series of tropical waves that moved off the west coast of Africa in quick succession on 29 July, 31 July, and 2 August. The combination of these waves caused the development of a broad cyclonic circulation over the eastern and central tropical Atlantic Ocean by 3 August, with the monsoon trough axis stretching from the coast of Mauritania southwestward across the Cabo Verde Islands to French Guiana. The broad circulation moved slowly westward and became stretched out over the ensuing few days, and a distinct cluster of showers and thunderstorms, most likely associated with the middle of the three tropical waves, developed about one thousand miles east of the Windward Islands by 7 August. Showers and thunderstorms gradually consolidated and increased in organization while the system moved quickly toward the west-northwest, and although a well-defined mid-level circulation was noted in satellite imagery, the system did not have a closed surface wind circulation when that feature passed between Dominica and Martinique early on 10 August. The disturbance continued on a west-northwestward path across the northeastern Caribbean Sea on 10 August, and by that evening, the system had developed a well-defined surface center and was producing sustained tropical-storm-force winds. Therefore, a tropical storm is estimated to have formed by 0000 UTC 11 August about 50 n mi south-southeast of Ponce, Puerto Rico. The “best track” chart of the tropical cyclone’s path is given in Fig. 1, with the wind and pressure histories shown in Figs. 2 and 3, respectively. The best track positions and intensities are listed in Table 11.
With an expansive mid-level ridge covering the western Atlantic, Tropical Storm Fred continued moving toward the west-northwest and strengthened slightly while approaching the southern coast of the Dominican Republic. Fred made landfall just west of Santo Domingo near the city of San Cristobal around 1700 UTC 11 August with maximum sustained winds of 40 kt. The cyclone weakened to a tropical depression while moving over Hispaniola for 12 h or so, and it emerged off the north coast of Haiti around 0600 UTC 12 August. Satellite images suggested that Fred’s circulation was significantly disrupted by the rugged terrain of the island, and it is unknown if the depression still possessed a well-defined low-level center when it moved offshore. However, a reconnaissance aircraft was able to locate a center later that morning between the southeastern Bahamas and the northeastern coast of Cuba, and a temporary increase in convection helped Fred re-strengthen to tropical storm intensity by 0000 UTC 13 August about 50 n mi east-northeast of Holguin, Cuba. Fred’s tropical storm status was short lived, however, as strong westerly shear caused the center to move out ahead of the associated
1 A digital record of the complete best track, including wind radii, can be found on line at ftp://ftp.nhc.noaa.gov/atcf. Data for the current year’s storms are located in the btk directory, while previous years’ data are located in the archive directory.

Tropical Storm Fred 4
convection later that morning, and the cyclone made landfall on Cayo Romano, Cuba, along the Jardines del Rey archipelago as a 30-kt tropical depression around 1200 UTC 13 August.
A continuation of moderate-to-strong west-southwesterly shear and land interaction disrupted the cyclone’s circulation further, and Fred degenerated into an open trough by 0000 UTC 14 August over central Cuba. The remnants moved westward over western Cuba, and by late on 14 August, a broad and elongated surface circulation had formed over the southeastern Gulf of Mexico and the extreme northwestern Caribbean Sea. With a mid-level trough positioned over the Gulf of Mexico, Fred’s remnants turned northwestward early on 15 August, and surface winds increased to tropical storm force near the Lower Florida Keys. A new well-defined center then formed by 1200 UTC 15 August, and Fred became a tropical storm for the third time while located about 160 n mi west of Naples, Florida.
Although moderate deep-layer shear persisted over the cyclone, a more favorable shear direction from the southwest and warm waters of 29 to 30°C allowed Fred to strengthen while it moved north-northwestward and then northward over the eastern Gulf of Mexico on 15 and 16 August. Fred reached an estimated peak intensity of 55 kt by 1800 UTC 16 August just before reaching the coast of the Florida Panhandle about 25 n mi southwest of Apalachicola, and it made landfall at that intensity about an hour later on the St. Joseph Peninsula, just northwest of Cape San Blas.
Fred weakened while moving northward over the Florida Panhandle and into Alabama early on 17 August, becoming a tropical depression by 1200 UTC over eastern Alabama. The depression then turned north-northeastward and accelerated over northern Georgia, and by late on 17 August it lost its well-defined center of circulation and organized deep convection. Therefore, it is estimated that Fred became a remnant low by 0000 UTC 18 August over eastern Tennessee, and it moved north-northeastward to northeastward over the central Appalachian Mountains into southwestern Pennsylvania through the remainder of the day. Frontal boundaries then developed in association with the system, and Fred became an extratropical low over central Pennsylvania by 0000 UTC 19 August. The extratropical low turned toward the east-northeast and east as it moved across New York and into New England on 19 August, and it ultimately dissipated near the Massachusetts coast by 1200 UTC 20 August.
METEOROLOGICAL STATISTICS Observations in Fred (Figs. 2 and 3) include subjective satellite-based Dvorak technique intensity estimates from the Tropical Analysis and Forecast Branch (TAFB) and Satellite Analysis Branch (SAB), and objective Advanced Dvorak Technique (ADT) estimates and Satellite Consensus (SATCON) estimates from the Cooperative Institute for Meteorological Satellite Studies/University of Wisconsin-Madison. Observations also include flight-level, stepped frequency microwave radiometer (SFMR), and dropwindsonde observations from nine flights of the 53rd Weather Reconnaissance Squadron of the U.S. Air Force Reserve Command and six flights of the NOAA Aircraft Operations Center (AOC) WP-3D aircraft. Data and imagery from NOAA polar-orbiting satellites including the Advanced Microwave Sounding Unit (AMSU), the NASA Global Precipitation Mission (GPM), the European Space Agency’s Advanced

Tropical Storm Fred 5
Scatterometer (ASCAT), and Defense Meteorological Satellite Program (DMSP) satellites, among others, as well as NOAA WSR-88D Doppler radar data from Eglin Air Force Base (KEVX) and Tallahassee (KTLH), Florida, were also useful in constructing the best track of Fred.
Ship reports of winds of tropical storm force associated with Fred are given in Table 2, and selected surface observations from land stations and data buoys are given in Table 3.
Winds and Pressure Fred’s first relative peak in intensity is estimated to be 40 kt from 1200 UTC 11 August through landfall on the southern coast of the Dominican Republic at 1700 UTC that day based on aircraft data. A NOAA Hurricane Hunter aircraft measured a peak 700-mb flight-level wind of 45 kt at 1225 UTC (which equates to an intensity of about 40 kt). SFMR winds as high as 50 kt were reported, but these measurements were likely influenced by wave shoaling very near Isla Saona along the southeastern coast of the Dominican Republic.
Fred regained tropical storm status for a short time over the waters between the southeastern Bahamas and the northeastern coast of Cuba early on 13 August. An Air Force Reserve Hurricane Hunter aircraft reported peak 925-mb flight-level winds of 41 kt, and several periods of 30- to 35-kt surface winds were measured by the SFMR over the deep waters (more than 1000 meters deep) between Cuba and the Bahama Banks from 0000 to 0300 UTC 13 August. Two separate ASCAT passes also showed winds of 30 to 35 kt over the same area at 0119 and 0147 UTC. However, an ASCAT pass the next morning indicated that Fred had weakened back to a tropical depression by the time it made landfall along the north coast of Cuba around 1200 UTC 13 August.
Even before Fred redeveloped a well-defined center of circulation over the eastern Gulf of Mexico, it was already producing sustained tropical-storm-force winds near the Florida Keys late on 14 August and early on 15 August. During that period, sustained or near-sustained tropical-storm-force winds were measured by NOAA C-MAN stations near Sombrero Key and Sand Key, as well as by WeatherFlow stations at Alligator Reef Light and Smith Shoal Light. Aircraft reconnaissance indicated that a well-defined center formed by 1200 UTC 15 August, making Fred a tropical storm again.
Fred’s estimated peak intensity of 55 kt on 16 August from 1800 UTC through landfall at 1900 UTC on the Florida Panhandle is based on aircraft data and surface observations. An Air Force Reserve Hurricane Hunter aircraft measured a peak 850-mb flight-level wind of 70 kt at 1700 UTC, which equates to an intensity of 55 kt. Several sustained surface wind reports around 55 kt were also received from Franklin County, Florida, to the east of where Fred made landfall.
Fred’s estimated minimum central pressure of 991 mb occurred just before and at the time of landfall in Florida. Several personal weather stations on the St. Joseph Peninsula and in Port St. Joe measured minimum pressures of 991 to 993 mb between 1929 and 2009 UTC as Fred’s center moved overhead. The 991 mb observation also matches the pressure yielded by the Knaff-Zehr-Courtney (KZC) pressure-wind relationship.

Tropical Storm Fred 6
Fred produced tropical-storm-force wind gusts over portions of the United States Virgin Islands and Puerto Rico on 10 and 11 August. Sustained winds just below tropical storm force were reported on St. Croix, Culebra, and on the southwestern side of Puerto Rico near Cabo Rojo, and a gust to 48 kt was reported at Lajas, Puerto Rico. Sustained tropical-storm-force winds likely occurred along the southern coast of the Dominican Republic on 11 August, although the highest reported sustained wind was 30 kt at La Romana. A gust to 52 kt was measured at the Santo Domingo Las Americas International Airport.
Winds increased to tropical storm force near the Florida Keys on 14 August before Fred re-formed as a tropical storm over the southeastern Gulf of Mexico. Several NOAA C-MAN and WeatherFlow marine stations near the islands measured sustained tropical-storm-force winds, with a high of 39 kt reported at Sand Key. A gust to 50 kt was measured by a WeatherFlow station at Smith Shoal Light to the northwest of Key West.
Sustained tropical-storm-force winds occurred over central portions of the Florida Panhandle on 16 August (Fig. 4). Sustained winds of 56 kt (unknown anemometer height) were measured by WeatherSTEM instruments at the St. George Island Bridge and on the Florida State University Panama City campus, and 54 kt was reported at the Franklin County Emergency Operations Center. Near-hurricane-force wind gusts occurred in these areas as well, with 63-kt gusts measured by a WeatherFlow station on St. George Island and at the aforementioned WeatherSTEM sites. Sustained tropical-storm-force winds likely occurred over extreme southwestern portions of Georgia and southeastern portions of Alabama; however, no reports were received from those areas. A wind gust to 45 kt was reported in Alabama at Ft. Rucker, and in Georgia a gust to 40 kt was measured in Bainbridge.
Storm Surge2 The combination of storm surge and tides produced inundation heights of 2 to 4 ft above ground level along the coast of the Florida Panhandle from Port St. Joe to Apalachee Bay. Figure 5 shows maximum water levels measured from National Ocean Service (NOS) tide gauges and United States Geological Survey (USGS) gauges referenced as feet above Mean Higher High Water (MHHW), which is used as a proxy for inundation on normally dry ground along the immediate coastline. The highest measured storm surge was 4.68 ft above normal tide levels at the NOS gauge in Apalachicola, but since this surge occurred about 2 h before low tide, the highest water level measured by the gauge was 3.4 ft MHHW. Nearby, a water level of 2.7 ft MHHW was recorded by a USGS gauge on the Jackson River near Apalachicola, and 2.4 ft MHHW was reported by a gauge at White City along the Gulf Intracoastal Waterway near Port St. Joe.
2 Several terms are used to describe water levels due to a storm. Storm surge is defined as the abnormal rise of water generated by a storm, over and above the predicted astronomical tide, and is expressed in terms of height above normal tide levels. Because storm surge represents the deviation from normal water levels, it is not referenced to a vertical datum. Storm tide is defined as the water level due to the combination of storm surge and the astronomical tide, and is expressed in terms of height above a vertical datum, i.e. the North American Vertical Datum of 1988 (NAVD88) or Mean Lower Low Water (MLLW). Inundation is the total water level that occurs on normally dry ground as a result of the storm tide, and is expressed in terms of height above ground level. At the coast, normally dry land is roughly defined as areas higher than the normal high tide line, or Mean Higher High Water (MHHW).

Tropical Storm Fred 7
Rainfall and Flooding
Heavy rains occurred near Fred’s path across the eastern United States, causing catastrophic flooding in parts of the southern Appalachian Mountains (Figs. 6 and 7a). Rainfall was enhanced along the southeastern-facing slopes of the Blue Ridge Escarpment due to upslope winds, with one round of heavy rains occurring on the morning of 16 August, followed by Fred’s primary rains on 17 August. The highest rainfall totals occurred in North Carolina within and near Pisgah National Forest, where a maximum of 23.41 inches was recorded near Lake Toxaway (Fig. 7b). Totals of more than a foot were measured within Transylvania, Haywood, Jackson, and Henderson Counties. Maximum rainfall totals in neighboring states include 7.87 inches at Canton, Georgia; 7.50 inches near Seneca, South Carolina; and 6.11 inches near Grotto Falls within Great Smoky Mountains National Park in Tennessee.
The heavy rains fell near the headwaters of several rivers within western North Carolina and eastern Tennessee, resulting in major downstream flooding at many locations in the area. A river gauge at the headwaters of the French Broad River near Rosman, North Carolina, recorded 13.38 ft on 16 August, its highest level in almost 30 years. The river at that site rose even higher to major flood stage the next day, reaching its second-highest level on record (14.11 ft) on 17 August (Fig. 8a). On the East Fork of the Pigeon River near Cruso, North Carolina, water levels rose rapidly on the afternoon of 17 August (at one point rising 2.5 ft in only 30 minutes), reaching a record level of 16.03 ft (Fig. 8b), more than 3 ft higher than what occurred during Ivan in 2004. The floodwaters from the East and West Forks of the Pigeon River then merged into the main branch of the Pigeon River, causing river levels near Canton, North Carolina, to reach major flood stage at 19.76 ft on the evening of 17 August (Fig. 8c). In Tennessee, the Pigeon River at Newport reached 16.42 ft on the morning of 18 August, more than 4 ft above major flood stage (Fig. 8d).
Fred produced a narrow swath of 5 to 9 inches of rain along its path across the Florida Panhandle into extreme southeastern Alabama and southwestern Georgia. In Florida, a maximum rainfall total of 8.93 inches was reported in Southport in Bay County. Maximum totals of 6.10 inches and 5.06 inches were measured in Blakely, Georgia, and Columbia, Alabama, respectively. These rains resulted in areas of flash flooding, and Bear Creek in Bay County, Florida, reached moderate flood stage.
Heavy rains and flooding also occurred in parts of New York when Fred moved through as a post-tropical low. An area of 3 inches or more of rain extended from the Finger Lakes region northeastward to the Adirondacks, with a maximum of 7.64 inches reported southwest of Syracuse in the city of Auburn. Major flooding occurred near South Addison, where Tuscarora Creek crested at a record level of 14.36 ft late on 18 August. Several of the Finger Lakes, including Keuka and Canandaigua Lakes, were within a foot or so of flood stage, and outlet gates were opened to reduce lake levels.
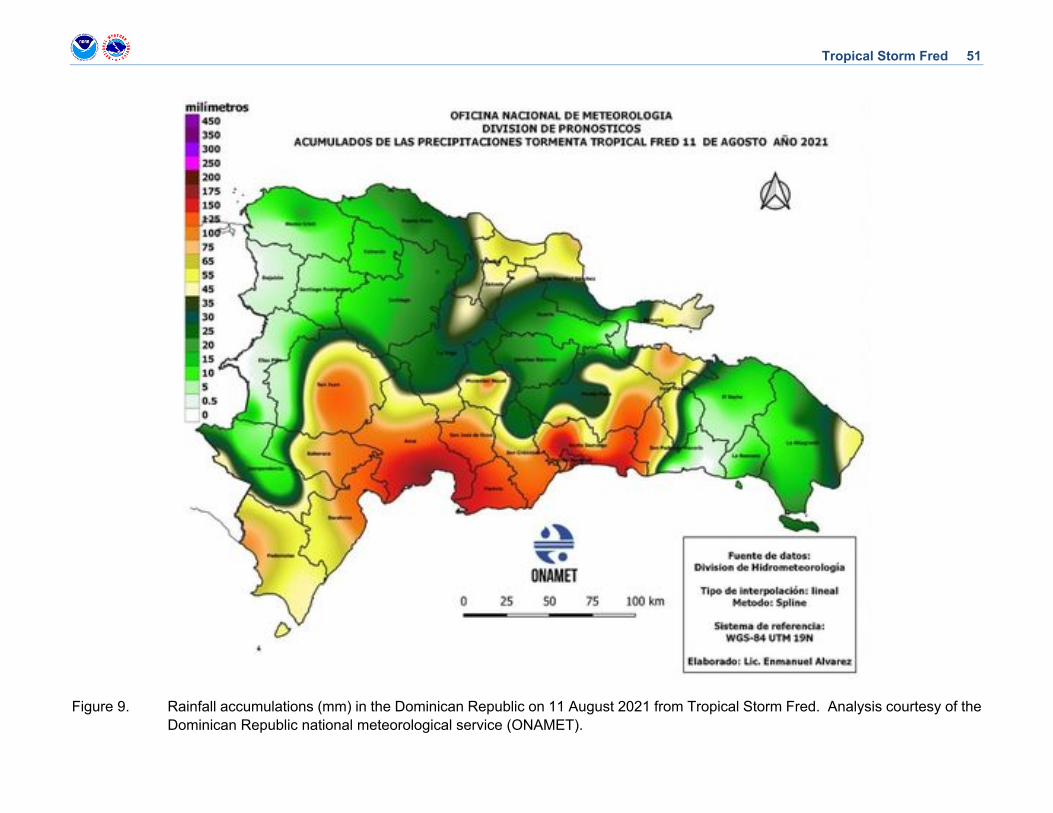
Heavy rains occurred across portions of Cuba, with a maximum of 11.25 inches (285.8 mm) recorded in Hatibonico, Guantánamo. The highest total in the Dominican Republic was 6.76 inches (171.6 mm) in Santo Domingo (Fig. 9); the heavy rains caused widespread flooding across parts of the country, including along Rio Ozama and Rio Isabela in Santo Domingo. Several inches of rainfall occurred in portions of Puerto Rico, with a maximum of 3.34 inches reported near Caguas.

Tropical Storm Fred 8
Tornadoes
There were 20 tornadoes reported on 17 August while Fred was a tropical cyclone: eight in Georgia, nine in South Carolina, and three in North Carolina (Table 4 and Fig. 10). All were rated EF0 or EF1 (on the Enhanced Fujita Scale), were generally short lived, and did not take any lives nor cause significant damage. One particular tornado in Lexington County, South Carolina, had a path length of over 14 miles and a maximum width of 250 yards.
Fred produced an additional 11 tornadoes on 18 and 19 August during its post-tropical phase: one in South Carolina, seven in Pennsylvania, one in New Jersey, and two in Connecticut and Massachusetts combined. All of these tornadoes were also rated EF0 or EF1 and did not cause significant damage or take any lives. The longest-tracked tornado traveled for nearly 9 miles across Montgomery and Bucks Counties, Pennsylvania.
CASUALTY AND DAMAGE STATISTICS Fred is directly responsible for the deaths of six people—all men and women in their 60s, 70s, and 80s—from severe flash flooding that occurred in Cruso, North Carolina. One indirect death occurred near Panama City, Florida, when a man’s car hydroplaned and landed in a ditch.
The NOAA National Centers for Environmental Information (NCEI) estimates that damage from Fred totaled about $1.3 billion in the United States. The worst damage occurred in western North Carolina due to the catastrophic flooding, particularly in Haywood County where 687 homes experienced some level of damage. In the town of Cruso, 225 structures were destroyed along the East Fork of the Pigeon River, and damages totaled $300 million, while the nearby town of Clyde had about $18 million in damage. Three bridges operated by the North Carolina Department of Transportation were completely destroyed, and another 20 were damaged.3 Significant damage also occurred along the Pigeon River in the city of Canton. Portions of Interstate 40 in Haywood County were blocked due to landslides, in addition to other roads across western North Carolina. In Buncombe County, emergency officials reported 97 damaged homes and businesses, with Candler being the hardest-hit area. Damage was also reported in Barnardsville, Swannanoa, Leicester, and Asheville.4
Fred’s winds blew down numerous trees and powerlines across portions of the Florida Panhandle, southeastern Alabama, and southwestern Georgia. Some homes sustained damage due to fallen trees or blown-off shingles. In Florida, minor coastal flooding from storm surge occurred in portions of Wakulla, Franklin, and Gulf Counties, submerging several roads with up to 2 feet of water. In Apalachicola, Water Street and areas around the courthouse flooded, and roads near Eastpoint and Alligator Point were flooded or eroded in some places. Heavy rains
3 Harris, Shelby. Tropical Depression Fred’s sweep over WNC declared federal disaster; FEMA aid coming. Asheville Citizen-Times. 8 September 2021. https://www.citizen-times.com/story/news/2021/09/08/federal-disaster-declared-tropical-storm-fred-western-north-carolina-fema-aid/5773499001/ 4 Brigman, Lauren. FEMA surveys damage from Tropical Storm Fred in several mountain counties. WLOS. 1 September 2021. https://wlos.com/news/local/fema-surveys-damage-from-tropical-storm-fred-in-several-mountain-counties

Tropical Storm Fred 9
caused flooding near Panama City and Southport, and multiple people were rescued from their flooded homes in Lynn Haven.5 An estimated 40,000 customers in the northern part of the state lost power, including about 7,500 in Tallahassee.6
In the Dominican Republic, 40,000 customers lost power, and half a million people were left without water due to flooding shutting down the country’s aqueduct system. In the capital of Santo Domingo, 1,700 people were evacuated, and about a hundred homes were totally or partially damaged.7 The flooding from Fred left 47 communities across the country cut off, damaged or destroyed over 800 homes, and displaced over 4,000 people.8
FORECAST AND WARNING CRITIQUE
The possibility of Fred’s genesis was anticipated well in advance, but the complex weather pattern over the tropical Atlantic Ocean at the time made it difficult to pinpoint which weather disturbance would ultimately develop. Table 5 provides the number of hours in advance of formation with the first NHC Tropical Weather Outlook (TWO) forecast in each likelihood category. A low (<40%) chance of genesis during the next 5 days was first indicated in the TWO 156 h before Fred formed, and chances remained in the low category for about 4 days. The 5-day chance of genesis was raised to the medium (40–60%) category 60 h before formation and to the high (>60%) category 36 h before formation. For the 2-day forecast period, the precursor disturbance was given a low, medium, and high chance of genesis 72, 54, and 36 h before formation, respectively. Since Fred’s precursor disturbance posed a threat of sustained tropical-storm-force winds to land areas in the eastern Caribbean, Potential Tropical Cyclone Advisories were initiated at 2100 UTC 9 August, 27 h before Fred became a tropical cyclone.
A verification of NHC official track forecasts for Fred is given in Table 6a. Because Fred had a 36-h gap as a disturbance while it moved across western Cuba into the southeastern Gulf of Mexico, neither the forecasts made nor forecast times valid between 0000 UTC 14 August and 0600 UTC 15 August are included in this verification. As a result, more track forecasts verified at the 96- and 120-h forecast times than for the 60- and 72-h forecast times. Official forecast track errors were a mixed bag—lower than the mean official errors for the previous 5-year period from 24–48 h and from 96–120 h, but higher at 12 h and 60–72 h. OCD5 errors were lower than their respective 5-year means at all forecast times, suggesting that Fred’s track should have been easier to forecast than usual. However, Fred’s un-forecast dissipation over Cuba caused the
5 Navarro, Adriana. Raging floodwaters surge through states as Fred charges north. AccuWeather. 18 August 2021. https://www.accuweather.com/en/hurricane/raging-flood-waters-surge-through-states-as-fred-charges-north/1001096 6 Burlew, Jeff and Tori Lynn Schneider. ‘A lot of water’ but not a lot of major damage; officials say Fred ‘a good reminder’ to be prepared. Tallahassee Democrat. 16 August 2021. https://www.tallahassee.com/story/news/local/2021/08/16/tropical-storm-fred-updates-track-path-impacts-hurricane-tallahassee-panama-city-leon-tornadoes/8147321002/ 7 Fred leaves the Dominican Republic without electricity and heads toward Cuba. Yucatan Times. 13 August 2021. https://www.theyucatantimes.com/2021/08/fred-leaves-the-dominican-republic-without-electricity-and-heads-toward-cuba/ 8 Fred displaced thousands, cuts off towns. Dominican Today. 13 August 2021. https://dominicantoday.com/dr/local/2021/08/13/fred-displaced-thousands-cuts-off-towns/

Tropical Storm Fred 10
vertically shallow weather system to be steered by lower-level winds and take a track farther west over the Gulf of Mexico than was initially expected. As shown in Fig. 11, the first set of official forecasts up until Fred’s landfall in Cuba had a significant eastward bias over the Gulf of Mexico, likely leading to the poor overall errors from 60–72 h.
A homogeneous comparison of the official track errors with selected guidance models is given in Table 6b and Fig. 12. Due to the homogeneity requirement, the UKMET (EGRI), COAMPS-TC (CTCI), and Florida State Superensemble (FSSE) were not included in the verification. The official track forecasts were competitive with the best-performing models from 12 through 60 h, although the GFS model had notably lower errors, especially at 36 h. The NHC forecasts were less skillful at longer ranges, with several deterministic models and consensus aids having lower errors especially at 72 and 96 h. The ECMWF model continued its recent trend of poor performances, deviating significantly from the main pack of models after 72 h.
A verification of NHC official intensity forecasts for Fred is given in Table 7a. Unlike the official forecast track errors, the official forecast intensity errors were lower than the mean errors for the previous 5-year period at all forecast times. OCD5 errors were also lower than their respective 5-year means at most forecast times, suggesting that Fred’s intensity was easier to forecast than usual. Due to land interaction and the presence of shear for much of Fred’s life, NHC intensity forecasts correctly indicated that Fred would not get any stronger than tropical storm strength.
A homogeneous comparison of the official intensity errors with selected guidance models is given in Table 7b and Fig. 13. The NHC intensity forecasts were quite skillful at most forecast times compared to the intensity models, having the lowest overall errors at 36, 48, 96, and 120 h. The official intensity forecasts were bested by the HMON (HMNI), HWRF (HWFI), and IVDR consensus at 72 h, albeit for only 2 verifying forecasts.
Coastal wind watches and warnings associated with Fred are given in Table 8a. In the United States, a Tropical Storm Watch was first issued for the coast of the Florida Panhandle from the Alabama/Florida border to the Ochlockonee River at 0900 UTC 15 August. At 1500 UTC that day, a Tropical Storm Warning was issued from Navarre to the Wakulla/Jefferson County Line. The warning was extended eastward to the Steinhatchee River at 1500 UTC 16 August. Sustained tropical-storm-force winds are estimated to have first reached the coast within the warning area around 1200 UTC 16 August, indicating that the Tropical Storm Watch provided a lead time of about 27 h and the Tropical Storm Warning provided a lead time of 21 h. These lead times were 21 and 15 h shorter than the respective typical lead times for coastal watches and warnings due to Fred moving faster over the Gulf of Mexico than initially expected. Tropical Storm Watches were also issued for Puerto Rico, the U.S. Virgin Islands, the Florida Keys, and portions of the southwestern coast of Florida, but sustained tropical-storm-force winds were not observed on land in these areas.
Storm surge warnings associated with Fred area given in Table 8b. A Storm Surge Warning was first issued for the coast of the Florida Panhandle from Indian Pass to the Steinhatchee River at 1500 UTC 15 August and was extended eastward to Yankeetown at 2100 UTC 15 August. Storm surge inundation of 3 feet or greater above normally dry ground (which NHC uses as a first-cut threshold for the storm surge watch/warning) occurred within the Storm Surge Warning area, primarily in the Apalachicola area (Fig. 14). Due to large uncertainty

Tropical Storm Fred 11
whether Fred would cause at least 3 ft of inundation, a Storm Surge Watch was not issued, and the Storm Surge Warning was short fused, only providing a lead time of about 21 h before sustained tropical-storm-force winds began along the coast.
IMPACT-BASED DECISION SUPPORT SERVICES (IDSS) AND PUBLIC COMMUNICATION
NHC began communication with emergency managers on 9 August when Fred was designated as a potential tropical cyclone east of the Leeward Islands and continued through Fred’s landfall in Florida on 16 August. This communication included briefings with FEMA Headquarters, FEMA Regions 2 and 4, along with the State of Florida. These decision support briefings were coordinated through the FEMA Hurricane Liaison Team, embedded at the NHC. The Tropical Analysis and Forecast Branch at NHC provided 10 live briefings to the U.S. Coast Guard Districts 7 and 8 on Fred from 9 through 17 August.
NHC conducted several Facebook Live broadcasts for Fred. Key messages on Fred were included in all NHC Tropical Cyclone Discussions, in graphical format on the NHC webpage, and through social media posts from 9 through 17 August.
ACKNOWLEDGMENTS
Data in Table 3 were compiled from Post Tropical Cyclone Reports and Public Information Statements issued by NWS Forecast Offices (WFOs) and reports from the Weather Prediction Center, National Data Buoy Center, NOS Center for Operational Oceanographic Products and Services, United States Geological Survey, and international meteorological services in the Dominican Republic and Cuba.

Tropical Storm Fred 12
Table 1. Best track for Tropical Storm Fred, 11–17 August 2021.
Date/Time (UTC)
Latitude (°N)
Longitude (°W)
Pressure (mb)
Wind Speed (kt)
Stage
09 / 1800 13.9 58.7 1011 30 disturbance
10 / 0000 14.6 60.1 1011 30 "
10 / 0600 15.3 61.6 1011 30 "
10 / 1200 16.0 63.1 1011 30 "
10 / 1800 16.7 64.6 1011 30 "
11 / 0000 17.3 66.1 1009 35 tropical storm
11 / 0600 17.7 67.6 1007 35 "
11 / 1200 18.0 69.0 1005 40 "
11 / 1700 18.4 70.1 1005 40 "
11 / 1800 18.5 70.4 1006 35 "
12 / 0000 19.2 71.7 1009 30 tropical depression
12 / 0600 20.0 72.9 1010 30 "
12 / 1200 20.5 73.9 1010 30 "
12 / 1800 20.9 74.7 1010 30 "
13 / 0000 21.2 75.5 1010 35 tropical storm
13 / 0600 21.6 76.6 1010 35 "
13 / 1200 22.0 77.7 1010 30 tropical depression
13 / 1800 22.3 79.0 1011 30 "
14 / 0000 22.5 80.2 1012 30 disturbance
14 / 0600 22.7 81.3 1012 30 "
14 / 1200 22.9 82.5 1012 30 "
14 / 1800 23.3 83.5 1012 30 "
15 / 0000 24.1 84.1 1011 35 "
15 / 0600 25.0 84.4 1010 35 "
15 / 1200 25.7 84.7 1008 35 tropical storm
15 / 1800 26.4 85.2 1005 40 "

Tropical Storm Fred 13
Date/Time (UTC)
Latitude (°N)
Longitude (°W)
Pressure (mb)
Wind Speed (kt)
Stage
16 / 0000 27.0 85.8 999 50 "
16 / 0600 27.8 85.9 996 50 "
16 / 1200 28.7 85.7 993 50 "
16 / 1800 29.5 85.4 991 55 "
16 / 1900 29.7 85.4 991 55 "
17 / 0000 30.6 85.4 998 45 "
17 / 0600 31.7 85.4 1004 35 "
17 / 1200 32.8 85.2 1006 25 tropical depression
17 / 1800 34.0 84.7 1008 25 "
18 / 0000 35.9 83.6 1009 25 low
18 / 0600 37.7 82.3 1010 20 "
18 / 1200 39.2 81.1 1011 20 "
18 / 1800 40.4 79.7 1013 20 "
19 / 0000 41.2 78.2 1012 20 extratropical
19 / 0600 41.9 76.7 1011 20 "
19 / 1200 42.4 75.1 1011 20 "
19 / 1800 42.7 73.5 1010 25 "
20 / 0000 42.7 72.2 1009 25 "
20 / 0600 42.6 71.0 1008 25 "
20 / 1200 dissipated
16 / 1800 29.5 85.4 991 55 maximum winds and minimum pressure
11 / 1700 18.4 70.1 1005 40 landfall near San
Cristobal, Dominican Republic
13 / 1200 22.0 77.7 1010 30 landfall on Cayo Romano, Cuba
16 / 1900 29.7 85.4 991 55 landfall on St. Joseph
Peninsula, Florida

Tropical Storm Fred 14
Table 2. Selected ship reports with winds of at least 34 kt for Tropical Storm Fred, 11–17 June 2020.
Date/Time (UTC)
Ship call sign
Latitude
(N)
Longitude
(W)
Wind
dir/speed (kt)
Pressure
(mb)
12 / 1900 C6SY3 23.2 74.9 090 / 35 1019.6
15 / 1800 WPAJ 28.0 85.3 080 / 40 1012.8
15 / 2100 WPAJ 27.7 84.8 100 / 36 1010.6
15 / 2200 WPAJ 27.6 84.7 120 / 50 1009.2
15 / 2300 WPAJ 27.6 84.5 110 / 40 1009.1
16 / 0100 WPAJ 27.5 84.1 120 / 40 1008.7
16 / 0300 WPAJ 27.5 83.6 130 / 35 1011.4
16 / 0400 WPAJ 27.6 83.4 120 / 35 1011.8

Tropical Storm Fred 15
Table 3. Selected surface observations for Tropical Storm Fred.
Location
Minimum Sea Level Pressure
Maximum Surface Wind Speed
Storm surge (ft)c
Storm tide (ft)d
Estimated Inundation
(ft)e
Total rain (in) Date/
time (UTC)
Press. (mb)
Date/ time
(UTC)a
Sustained (kt)b
Gust (kt)
U.S. Virgin Islands
National Ocean Service (NOS) Sites
Lime Tree Bay – St. Croix (LTBV3) (17.69N 64.75W)
10/2024 1012.7 10/2100 23 34 0.36 0.5
Lameshur Bay – St. John (LAMV3) (18.32N 64.72W)
10/2012 1013.4 0.60 0.7
Charlotte Amalie – St. Thomas (CHAV3) (18.34N 64.92W)
10/2042 1012.8 10/1312 19 24 0.49 0.7
Weatherflow Sites
Sandy Point NWR – St. Croix (17.68N 64.90W)
10/1922 33 (14 m) 43
Buck Island (18.28N 64.89W) 10/0354 29
(12 m) 38
Puerto Rico
NOS Sites
Esperanza – Vieques Island (ESPP4) (18.09N 65.47W)
10/2054 1012.6 10/2336 28 39 0.43 0.6
Mayaguez (MGZP4) (18.22N 67.16W) 11/0618 1012.1 11/0636 17 23 0.72 0.9
Weatherflow Sites
Isla Culebrita Light (XCUL) (18.31N 65.23W)
10/1718 33 (10 m) 46
Machete - Las Mareas (XMRS) (17.93N 66.16W)
11/0003 30 (10 m) 35
Yabucoa – Yabucoa Tanque de Agua (XYTA) (18.03N 65.84W)
10/1612 27 (25 m) 41
Maunabo – El Cocal Yabucoa (XECY) (18.02N 65.86W)
10/2341 25 (39 m) 35
Quebrada Vueltas - Del Rey Marina (XREY) (18.29N 65.63W)
11/2311 24 (10 m) 36

Tropical Storm Fred 16
Location
Minimum Sea Level Pressure
Maximum Surface Wind Speed
Storm surge (ft)c
Storm tide (ft)d
Estimated Inundation
(ft)e
Total rain (in) Date/
time (UTC)
Press. (mb)
Date/ time
(UTC)a
Sustained (kt)b
Gust (kt)
Citizen Weather Observer Program (CWOP) Sites
Lajas (FW2397) (17.97N 67.04W) 11/0545 32
(11 m) 48
Cabo Rojo (EW7866) (17.93N 67.19W) 11/0545 30
(35 m) 47
Ponce (EW7791) (17.96N 66.62W) 11/0631 25
(12 m) 39
Remote Automatic Weather Station (RAWS) Sites
Cabo Rojo (CRRP4) (17.97N 67.16W) 11/0557 29
(33 m) 44
Hydrometeorological Automated Data System (HADS) Sites
Caguas 8 S (CAIP4) (18.14N 66.05W) 3.43
Yabucoa 2 WNW (YBUP4) (18.06N 65.90W)
2.90
Caguas 6 WSW (CAHP4) (18.20N 66.11W)
2.17
San Lorenzo 6 S (SLMP4) (18.11N 65.94W)
2.11
NWS Cooperative Observer (COOP) Sites
Ensenada 1 W (17.98N 66.91W) 2.07
Dominican Republic
International Civil Aviation Organization (ICAO) Sites
La Romana (MDLR) (18.45N 68.91W) 11/1100 1011.4 11/1100 30 0.56
Santo Domingo – Las Americas (MDSD) (18.43N 69.68W)
11/1500 1012.4 11/1800 16 52 5.89
Santo Domingo (TSDM) (18.43N 69.88W)
11/1800 1009.6 11/1800 16 30 6.76
Punta Cana (MDPC) (18.56N 68.37W) 11/1200 1014.1 11/1500 16 32 1.43
Higuero (MDJB) (18.58N 69.98W) 11/2100 1011.5 11/2100 20 6.13
Barahona (MDBH) (18.25N 71.12W) 11/2100 1009.7 11/1800 12 3.58

Tropical Storm Fred 17
Location
Minimum Sea Level Pressure
Maximum Surface Wind Speed
Storm surge (ft)c
Storm tide (ft)d
Estimated Inundation
(ft)e
Total rain (in) Date/
time (UTC)
Press. (mb)
Date/ time
(UTC)a
Sustained (kt)b
Gust (kt)
Cuba
Guantánamo
Hatibonico 11.25
Baracoa 9.15
Imias 7.67
La Tagua 6.30
Gran Tierra 5.83
Cayamo 5.47
Caimanera 5.39
Bayate 5.28
Derivadora Guanta 4.82
Guantánamo 4.35
Punta Maisí 3.82
Palenque 3.63
Jamal 3.55
Valle de Caujerí 2.21
Granma
Acueducto de Grito de Yara
3.04
Bartolomé Masó 2.87
Pilón 2.76
Las Mercedes 2.46
La Derivadora Bayamo
2.36
Charco Redondo 1.97
Florida
ICAO Sites
Apalachicola (KAAF) (29.73N 85.02W) 16/1930 999.3 16/1930 44 60 4.50
Marianna (KMAI) (30.80N 85.21W) 17/0053 998.8 16/2205 34 48 3.46
Panama City – Bay County (KPFN) (30.20N 85.68W)
16/2109 50

Tropical Storm Fred 18
Location
Minimum Sea Level Pressure
Maximum Surface Wind Speed
Storm surge (ft)c
Storm tide (ft)d
Estimated Inundation
(ft)e
Total rain (in) Date/
time (UTC)
Press. (mb)
Date/ time
(UTC)a
Sustained (kt)b
Gust (kt)
Tallahassee (KTLH) (30.40N 84.35W) 16/2353 1007.1 16/2145 33 40 2.28
Panama City (KECP) (30.36N 85.79W) 16/2053 1002.0 16/2045 31 50
NAS Key West – Boca Chica Field (KNQX) (24.58N 81.68W)
14/0753 1013.9 15/0034 30 43
Marathon (KMTH) (24.73N 81.05W) 14/0753 1014.4 14/2115 25 41
Key West (KEYW) (24.56N 81.76W) 14/0753 1014.1 14/0216 28 39
Quincy (K2J9) (30.60N 84.56W) 16/2315 36
Destin / Ft. Walton Beach (KDTS) (30.40N 86.47W)
16/2153 1007.8 16/2053 19 32
Tyndall AFB (KPAM) (30.07N 85.57W) 6.74
Homestead AFB (KHST) (25.48N 80.37W)
4.11
Coastal-Marine Automated Network (C-MAN) Sites
Tyndall AFB Tower C (SGOF1) (29.41N 84.86W)
16/1900 1002.6 16/1820 48 (35 m, 10 min) 57
Sand Key (SANF1) (24.26N 81.88W) 14/0720 1014.1 15/0219 39
(16 m, 1 min) 41
Sombrero Key (SMKF1) (24.63N 81.11W)
14/2100 34 (6 m, 1 min) 40
Long Key (LONF1) (24.84N 80.86W) 14/2310 1014.1 14/2210 30
(7 m, 1 min) 38
University of South Florida Coastal Ocean Monitoring and Prediction System (COMPS) Sites
Shell Point (SHPF1) (30.06N 84.29W) 16/2142 37
(6 m) 46
National Ocean Service (NOS) Sites
Apalachicola (APCF1) (29.73N 84.98W) 16/1942 1000.8 16/1912 46
(9 m) 53 4.68 3.4
Panama City Beach (PCBF1) (30.21N 85.88W)
16/2036 1002.5 16/2024 32 (17 m) 43 1.67 1.8
Panama City (PACF1) (30.15N 85.67W) 16/2124 31
(10 m) 44 1.60 1.8
Pensacola (PCLF1) (30.40N 87.21W) 16/2224 1009.6 16/2254 11
(10 m) 17 1.91 1.8
Cedar Key (CKYF1) (29.13N 83.03W) 16/2230 1011.2 16/1512 21
(12 m) 26 2.37 1.4

Tropical Storm Fred 19
Location
Minimum Sea Level Pressure
Maximum Surface Wind Speed
Storm surge (ft)c
Storm tide (ft)d
Estimated Inundation
(ft)e
Total rain (in) Date/
time (UTC)
Press. (mb)
Date/ time
(UTC)a
Sustained (kt)b
Gust (kt)
Clearwater Beach (CWBF1) (27.98N 82.83W)
16/2154 1012.2 16/1848 26 (8 m) 33 1.92 1.4
Tampa - East Bay (EBEF1) (27.92N 82.42W)
16/2206 1012.1 1.63 1.4
Old Port Tampa (OPTF1) (27.86N 82.55W)
16/2206 1012.3 16/2012 22 (7 m) 25 1.25 1.4
St. Petersburg (SAPF1) (27.76N 82.63W) 16/2206 1012.6 15/1930 25
(7 m) 34 1.21 1.3
Port Manatee (PMAF1) (27.64N 82.56W) 16/2218 1012.2 1.20 1.3
United States Geological Survey (USGS) Sites
Jackson River near Apalachicola (JRAF1) (29.77N 85.08W)
3.37 2.7
Spring Creek (SBIF1) (30.07N 84.33W) 3.98 2.3
Suwannee River (SUWF1) (29.34N 83.09W)
1.7
Aucilla River at Nutall Rise (NUTF1) (30.11N 83.98W)
3.25 1.4
Econfina River (EFSF1) (30.07N 83.90W)
3.26 1.3
Fenholloway River near Hampton Springs (FRHF1) (30.01N 83.78W)
3.01 1.2
Northwest Florida Water Management District Gauges
White City (SEWF1) (29.88N 85.22W) 2.4
Suwannee River Water Management District Gauges
Steinhatchee (STIF1) (29.67N 83.38W) 3.13 1.5
Weatherflow Sites
St. Andrew Bay (XSTA) (30.13N 85.72W) 16/2102 50
(9 m) 58
St. George Island (XSTG) (29.67N 84.86W)
16/1931 41 (15 m) 63

Tropical Storm Fred 20
Location
Minimum Sea Level Pressure
Maximum Surface Wind Speed
Storm surge (ft)c
Storm tide (ft)d
Estimated Inundation
(ft)e
Total rain (in) Date/
time (UTC)
Press. (mb)
Date/ time
(UTC)a
Sustained (kt)b
Gust (kt)
Apalachee Bay – Panacea Channel (XAPA) (30.01N 84.34W)
16/1954 41 (9 m) 46
Panama City Beach (XPAN) (30.23N 85.88W)
16/2031 31 (15 m) 43
Ft. Walton Beach (XFWB) (30.40N 86.56W)
16/1810 29 (7 m) 41
Smith Shoal Light (XSMS) (24.72N 81.92W)
15/0101 34 (19 m) 50
Alligator Reef Light (XALG) (24.85N 80.62W)
14/2242 33 (8 m) 44
Carysfort Reef Light (XCFL) (25.23N 80.21W)
14/1455 32 (15 m) 45
Other Sites
St. George Island Bridge (29.66N 84.88W)
16/1955 56 63
FSU - Panama City Campus (30.19N 85.72W)
16/2116 56 61 4.41
Franklin County EOC (29.72N 85.03W) 16/1917 54 63
Gulf Coast State College (30.19N 85.73W)
16/2106 50 53 3.73
FSU Coastal and Marine Lab (29.92N 84.51W)
16/1938 43 46 3.91
Bay County Water Treatment Plant (30.21N 85.61W)
16/2152 41 49 4.55
Bay County Sheriff’s Office (30.21N 85.65W)
16/2130 36 42 4.58
Gulf County EOC (29.81N 85.29W) 16/2032 31 44 5.95
Ashford – Usouthal Station (31.20N 85.26W)
16/2351 43
Molinelli Army Heliport (P052C) (31.48N 85.78W)
17/0135 37

Tropical Storm Fred 21
Location
Minimum Sea Level Pressure
Maximum Surface Wind Speed
Storm surge (ft)c
Storm tide (ft)d
Estimated Inundation
(ft)e
Total rain (in) Date/
time (UTC)
Press. (mb)
Date/ time
(UTC)a
Sustained (kt)b
Gust (kt)
Geneva – Usouthal Station (31.06N 85.82W)
17/0051 36
St. Joseph Peninsula (KFLPORTS128) (29.72N 85.39W)
16/1924 990.9
St. Joseph Peninsula (KFLPORTS183) (29.74N 85.40W)
16/1939 992.2
Port St. Joe (KFLPORTS338) (29.86N 85.34W)
16/2004 991.5
Stuart 1.0 ESE (US1FLMT0018) (27.19N 80.23W)
8.00
Sunny Hills 3.3 N (US1FLWS0003) (30.59N 85.58W)
7.42
Youngstown (30.36N 85.44W) 6.94
Eastpoint 1.4 NW (US1FLFR0003) (29.76N 84.89W)
6.61
Salinas Park (29.69N 85.31W) 6.52
Veterans Memorial Park (29.92N 85.38W)
6.23
Washington County EOC (30.63N 85.60W)
5.83
Fountain 3.4 SSE (US1FLBY0015) (30.43N 85.40W)
5.78
Alford 0.6 SSE (US1FLJK0002) (30.69N 85.39W)
5.60
Lynn Haven 1.0 W (US1FLBY0023) (30.24N 85.67W)
5.60
Mexico Beach (29.95N 85.43W) 5.08
CWOP Sites
Southport (AT414) (30.31N 85.61W) 16/2200 55 8.93
Chipley (FW8483) (30.75N 85.59W) 5.26
Alligator Point (FW9222) (29.90N 84.40W)
16/2216 42 4.71

Tropical Storm Fred 22
Location
Minimum Sea Level Pressure
Maximum Surface Wind Speed
Storm surge (ft)c
Storm tide (ft)d
Estimated Inundation
(ft)e
Total rain (in) Date/
time (UTC)
Press. (mb)
Date/ time
(UTC)a
Sustained (kt)b
Gust (kt)
Panacea (FW6414) (29.97N 84.36W) 16/1947 43
COOP Sites
Stuart (27.19N 80.24W) 7.64
RAWS Sites
Brainbridge (TT665) (30.97N 84.63W) 16/2358 37
St. Marks (PRWF1) (30.01N 84.42W) 16/2146 36
Rehobeth (AV619) (31.09N 85.46W) 17/0010 36
Community Collaborative Rain, Hail and Snow Network (CoCoRaHS) Sites
Lynn Haven (FL-BY-19) (30.24N 85.65W)
6.76
Alabama
ICAO Sites
Dothan (KDHN) (31.32N 85.45W) 17/0453 1005.0 17/0105 28 39 3.83
Ft. Rucker / Cairns (KOZR) (31.29N 85.72W)
17/0301 45 3.00
Ft. Rucker – Shell Army Heliport (KSXS) (31.36N 85.85W)
17/0208 41
Hanchey AHP – Ft. Rucker (KHEY) (31.35N 85.65W)
17/0327 39
Florala (K0J4) (31.04N 86.31W) 17/0058 1009.0 16/2217 15 35
NOS Sites
Dauphin Island (DILA1) (30.25N 88.08W) 1.81 1.7
West Fowl River Bridge (WFRA1) (30.38N 88.16W)
1.88 1.6
East Fowl River Bridge (EFRA1) (30.44N 88.11W)
1.71 1.6
Coast Guard Sector Mobile (MCGA1) (30.65N 88.06W)
16/2300 1009.6 15/2006 25 (9 m) 34 1.90 1.6

Tropical Storm Fred 23
Location
Minimum Sea Level Pressure
Maximum Surface Wind Speed
Storm surge (ft)c
Storm tide (ft)d
Estimated Inundation
(ft)e
Total rain (in) Date/
time (UTC)
Press. (mb)
Date/ time
(UTC)a
Sustained (kt)b
Gust (kt)
Weeks Bay, Mobile Bay (WBYA1) (30.42N 87.83W)
1.63 1.6
Bayou La Batre Bridge (BLBA1) (30.41N 88.25W)
2.02 1.6
Dog River Bridge (BYSA1) (30.57N 88.09W)
1.47 1.5
Mobile State Docks (OBLA1) (30.71N 88.04W)
16/2300 1010.0 1.35 1.5
Chickasaw Creek (CIKA1) (30.78N 88.07W)
1.88 1.3
Fort Morgan (FMOA1) (30.23N 88.03W) 16/2236 1010.0 15/1724 28
(38 m) 33
Hydrometeorological Automated Data System (HADS) Sites
Columbia 2 S (COLA1) (31.26N 85.11W) 5.06
Mississippi NOS Sites
Pascagoula NOAA Lab (PNLM6) (30.37N 88.56W)
1.66 1.6
Bay Waveland Yacht Club (WYCM6) (30.33N 89.33W)
1.59 1.5
Louisiana
NOS Sites
Pilot’s Station East (PSTL1) (28.93N 89.41W)
16/2242 1009.2 15/1754 24 (24 m) 29 1.59 1.9
Shell Beach (SHBL1) (29.87N 89.67W) 16/2342 1010.9 16/0654 20
(16 m) 24 1.91 1.8
Port Fourchon (PTFL1) (29.11N 90.20W) 1.11 1.5
New Canal Station (NWCL1) (30.03N 90.11W)
17/0000 1009.9 15/2312 22 (10 m) 25 1.28 1.4
Grand Isle (GISL1) (29.26N 89.96W) 16/2218 1011.0 16/1148 14
(9 m) 18 0.77 1.1

Tropical Storm Fred 24
Location
Minimum Sea Level Pressure
Maximum Surface Wind Speed
Storm surge (ft)c
Storm tide (ft)d
Estimated Inundation
(ft)e
Total rain (in) Date/
time (UTC)
Press. (mb)
Date/ time
(UTC)a
Sustained (kt)b
Gust (kt)
Georgia
ICAO Sites
Bainbridge (KBGE) (30.97N 84.63W) 16/2255 40
Donalsonville (K17J) (31.01N 84.88W) 17/0150 38
HADS Sites
Canton – Etowah River (CNNG1) (34.24N 84.50W)
7.87
Cleveland 5 NNE (STEG1) (34.66N 83.73W)
7.42
Chattahoochee River at Helen (HDCG1) (34.70N 83.73W)
6.63
Suches 4 NW (SCHG1) (34.72N 84.07W) 6.63
Blakely 15 SSW (CEDG1) (31.18N 85.04W)
6.10
Tiger 7 WSW (TIGG1) (34.78N 83.55W) 5.61
Cornelia 6 WNW (DCNG1) (34.54N 83.62W)
5.41
Clayton 10 WSW (NACG1) (34.67N 83.70W)
5.24
Hurst 6 SSW (HRSG1) (34.77N 84.22W) 5.19
COOP Sites
Sautee 3 W (34.66N 83.73W) 7.42
Cornelia (34.52N 83.53W) 6.84
Cleveland (34.59N 83.77W) 6.20
Germany Valley (34.91N 83.46W) 5.51
Clarkesville (34.62N 83.54W) 5.10
RAWS Sites
Clayton 4 NE (TULG1) (34.91N 83.33W) 5.60

Tropical Storm Fred 25
Location
Minimum Sea Level Pressure
Maximum Surface Wind Speed
Storm surge (ft)c
Storm tide (ft)d
Estimated Inundation
(ft)e
Total rain (in) Date/
time (UTC)
Press. (mb)
Date/ time
(UTC)a
Sustained (kt)b
Gust (kt)
Other Sites
Helen 9.5 ENE (US1GAHB0005) (34.77N 83.58W)
6.33
Hiawassee 4.8 SSE (US1GATW0001) (34.89N 83.71W)
6.14
Rabun Gap 2.1 SW (US1GARB0004) (34.94N 83.42W)
6.02
McDonough 7.5 NE (US1GAHY0018) (33.54N 84.07W)
5.85
Baldwin 1.4 ESE (US1GABN0001) (34.48N 83.53W)
5.77
Demorest 6.2 WNW (US1GAHB0007) (34.61N 83.64W)
5.73
Young Harris 3.6 NNW (US1GATW0007) (34.98N 83.84W)
5.41
Tiger 1.9 NW (US1GARB0013) (34.87N 83.46W)
5.37
Cleveland 7.8 NW (US1GAWH0010) (34.67N 83.87W)
5.13
Dillard 3.5 NE (US1GARB0001) (34.99N 83.30W)
5.10
South Carolina
Other Sites
Seneca 2.5 NNW (US1SCOC0053) (34.72N 82.98W)
7.50
West Union 1.9 ESE (US1SCOC0057) (34.75N 83.01W)
7.20
Seneca 4.9 N (US1SCOC0007) (34.76N 82.96W)
6.77
Keowee Key 1.4 WNW (US1SCOC0038) (34.84N 82.94W)
5.70

Tropical Storm Fred 26
Location
Minimum Sea Level Pressure
Maximum Surface Wind Speed
Storm surge (ft)c
Storm tide (ft)d
Estimated Inundation
(ft)e
Total rain (in) Date/
time (UTC)
Press. (mb)
Date/ time
(UTC)a
Sustained (kt)b
Gust (kt)
Longs 2.6 NNW (US1SCHR0116) (33.97N 78.74W)
5.67
Hollywood 5.8 WSW (US1SCCR0162) (32.72N 80.30W)
5.34
Salem 0.8 SW (US1SCOC0078) (34.88N 82.99W)
5.12
Meggett 1.8 W (US1SCCR0032) (32.70N 80.29W)
5.10
Slater-Marietta 6.4 NW (US1SCGV0081) (35.11N 82.56W)
5.03
HADS Sites
Jocassee 8 WNW (JOCS1) (34.98N 83.07W)
6.29
Jocassee 2 ESE (JCSS1) (34.96N 82.92W)
5.17
COOP Sites
Caesars Head (35.11N 82.63W) 5.99
North Carolina
CWOP Sites
Lake Toxaway 3 N (FW4313) (35.18N 82.95W)
23.41
COOP Sites
Mt. Mitchell (35.76N 82.27W) 10.78
Grandfather Mountain Museum (GNFN7) (36.09N 81.84W)
10.53
Rosman (35.14N 82.82W) 6.51
Lake Toxaway 2 SW (35.10N 82.95W) 6.40
North Fork (35.66N 82.34W) 6.36
Highlands (35.06N 83.20W) 5.87

Tropical Storm Fred 27
Location
Minimum Sea Level Pressure
Maximum Surface Wind Speed
Storm surge (ft)c
Storm tide (ft)d
Estimated Inundation
(ft)e
Total rain (in) Date/
time (UTC)
Press. (mb)
Date/ time
(UTC)a
Sustained (kt)b
Gust (kt)
Celo 2 S (35.83N 82.18W) 5.82
Candler 1 W (35.55N 82.70W) 5.66
Banner Elk (36.16N 81.87W) 5.63
Spruce Pine 4 ENE (35.93N 82.00W) 5.60
Beech Mountain (36.19N 81.87W) 5.43
Asheville 8 SSW (35.49N 82.61W) 5.20
East Flat Rock 3 SE (35.25N 82.39W) 5.20
Other Sites
Lake Toxaway 1.7 W (NCTR36) (35.13N 82.96W)
17.73
Sapphire 4.6 SW (NCTR29) (35.06N 83.01W)
14.68
Frying Pan Mountain (FRYI) (35.39N 82.77W)
12.72
Swannanoa 2.7 NNW (NCBC15) (35.64N 82.41W)
10.36
Spruce Pine 6.6 SW (US1NCML0010) (35.84N 82.14W)
10.13
Gerton 0.4 SW (US1NCHN0044) (35.48N 82.35W)
9.10
Swannanoa 0.4 NNE (US1NCBC0126) (35.61N 82.39W)
8.19
Fairview 3.8 ENE (US1NCBC0004) (35.55N 82.34W)
8.09
Old Fort 4.9 SW (US1NCMD0019) (35.58N 82.23W)
7.79
Fairview 2.7 SE (US1NCBC0155) (35.50N 82.37W)
7.65
Jonas Ridge 1.4 S (US1NCBK0013) (35.95N 81.89W)
7.55

Tropical Storm Fred 28
Location
Minimum Sea Level Pressure
Maximum Surface Wind Speed
Storm surge (ft)c
Storm tide (ft)d
Estimated Inundation
(ft)e
Total rain (in) Date/
time (UTC)
Press. (mb)
Date/ time
(UTC)a
Sustained (kt)b
Gust (kt)
Connestee Falls 1 SW (US1NCTR0030) (35.14N 82.74W)
7.48
Bat Cave 1.9 N (US1NCBC0087) (35.48N 82.28W)
7.29
Black Mountain 1.3 NNE (US1NCBC0105) (35.63N 82.32W)
7.09
Blowing Rock 2.2 NE (US1NCWT0010) (36.15N 81.64W)
6.64
Columbus 6.6 NNW (US1NCPK0002) (35.33N 82.26W)
6.64
Foscoe 1.2 WSW (US1NCWT0011) (36.15N 81.79W)
6.61
Chimney Rock 0.3 E (US1NCRT0006) (35.44N 82.25W)
6.39
Flat Rock 1 NE (US1NCHN0053) (35.28N 82.43W)
6.30
Pleasant Gardens 0.8 WSW (US1NCMD0009) (35.69N 82.07W)
6.26
Leicester 0.9 SE (US1NCBC0073) (35.65N 82.68W)
6.23
Highlands 1 W (US1NCMC0037) (35.05N 83.22W)
6.10
Leicester 2 SE (US1NCBC0014) (35.63N 82.68W)
6.09
Hendersonville 1 SSW (US1NCHN0061) (35.31N 82.47W)
5.90
Cedar Mountain 1.9 E (US1NCTR0027) (35.15N 82.61W)
5.89
Maiden 3.6 W (US1NCCT0038) (35.57N 81.27W)
5.85
Saluda 0.5 N (US1NCPK0006) (35.25N 82.35W)
5.77

Tropical Storm Fred 29
Location
Minimum Sea Level Pressure
Maximum Surface Wind Speed
Storm surge (ft)c
Storm tide (ft)d
Estimated Inundation
(ft)e
Total rain (in) Date/
time (UTC)
Press. (mb)
Date/ time
(UTC)a
Sustained (kt)b
Gust (kt)
Candler (US1NCBC0091) (35.55N 82.69W)
5.74
Hendersonville 4.4 NW (US1NCHN0040) (35.36N 82.53W)
5.52
Old Fort 3.6 NW (US1NCMD02008) (35.68N 82.21W)
5.48
Leicester 4.5 SW (US1NCBC0150) (35.62N 82.76W)
5.41
Plumtree 0.5 W (US1NCAV0010) (36.03N 82.02W)
5.33
East Flat Rock 0.5 NNE (US1NCHN0012) (35.29N 82.41W)
5.29
Fairview 1.2 SSE (US1NCBC0151) (35.51N 82.40W)
5.26
Asheville 6.3 NW (US1NCBC0085) (35.64N 82.63W)
5.09
Hendersonville 6.1 SSW (US1NCHN0025) (35.24N 82.50W)
5.08
Hendersonville 3.4 NW (US1NCHN0016) (35.36N 82.50W)
5.07
Union Mills 2.6 ENE (US1NCRT0008) (35.50N 81.92W)
5.05
Saluda 0.7 SW (US1NCPK0030) (35.23N 82.36W)
5.04
Leicester 6.5 WNW (US1NCMS0018) (35.70N 82.80W)
5.02
HADS Sites
Balsam Grove (BSGN7) (35.24N 82.88W)
14.25
Cruso (CRSN7) (35.42N 82.81W) 14.12
Rock Bridge (IRBN7) (35.20N 82.81W) 13.20

Tropical Storm Fred 30
Location
Minimum Sea Level Pressure
Maximum Surface Wind Speed
Storm surge (ft)c
Storm tide (ft)d
Estimated Inundation
(ft)e
Total rain (in) Date/
time (UTC)
Press. (mb)
Date/ time
(UTC)a
Sustained (kt)b
Gust (kt)
Bat Cave (BCVN7) (35.45N 82.29W) 12.85
Wolf Creek (IWCN7) (35.27N 82.97W) 12.09
Tanasee Creek at East Fork Dam (EFKN7) (35.21N 83.00W)
11.27
Cold Creek (ICKN7) (35.23N 82.94W) 10.46
Rosman 2 SW (RSMN7) (35.13N 82.84W)
10.28
Black Mountain 10 NNE (MMTN7) (35.76N 82.27W)
7.80
Swannanoa (BTDN7) (35.64N 82.40W) 7.14
Blantyre (BLAN7) (35.30N 82.62W) 6.90
Boone (BOON7) (36.20N 81.69W) 6.78
Fletcher (FLCN7) (35.43N 82.55W) 6.55
Linville (LNNN7) (36.11N 81.83W) 6.38
Black Mountain 6 NW (BMTN7) (35.66N 82.35W)
6.28
Franklin 11 SW (WLGN7) (35.10N 83.55W)
6.22
Skyland 5 W (SKYN7) (35.50N 82.62W) 5.97
Nantahala 6 WNW (STGN7) (35.34N 83.69W)
5.73
Candler 1 W (CDRN7) (35.52N 82.72W) 5.60
Linville Falls 2 NE (JSRN7) (35.95N 81.90W)
5.50
Murphy 2 NE (MURN7) (35.11N 84.01W) 5.45
Waterville (WATN7) (35.77N 83.10W) 5.34
Granite Falls (GRFN7) (35.87N 81.37W) 5.17

Tropical Storm Fred 31
Location
Minimum Sea Level Pressure
Maximum Surface Wind Speed
Storm surge (ft)c
Storm tide (ft)d
Estimated Inundation
(ft)e
Total rain (in) Date/
time (UTC)
Press. (mb)
Date/ time
(UTC)a
Sustained (kt)b
Gust (kt)
Canton (CTPN7) (35.52N 82.85W) 5.16
Highland (HDSN7) (35.07N 83.22W) 5.15
Canton (CEPN7) (35.46N 82.87W) 5.12
RAWS Sites
Davidson River (DARN7) (35.35N 82.78W)
11.87
Tennessee
HADS Sites
Bryson City 13 N (NFGT1) (35.61N 83.43W)
5.55
Morristown (MRIT1) (36.21N 83.29W) 5.39
COOP Sites
Newfound Gap (35.61N 83.43W) 5.55
Mt. Leconte (35.66N 83.44W) 5.28
Ohio
Other Sites
Glouster 3.6 SW (US1OHAT0009) (39.47N 82.13W)
5.27
Albany 4.1 NW (US1OHAT0006) (39.27N 82.24W)
5.13
Albany 4.5 WNW (US1OHVN0003) (39.25N 82.27W)
5.13

Tropical Storm Fred 32
Location
Minimum Sea Level Pressure
Maximum Surface Wind Speed
Storm surge (ft)c
Storm tide (ft)d
Estimated Inundation
(ft)e
Total rain (in) Date/
time (UTC)
Press. (mb)
Date/ time
(UTC)a
Sustained (kt)b
Gust (kt)
Pennsylvania
Other Sites
Wood 0.1 S (US1PAHN0002) (40.17N 78.14W)
5.74
Carlisle 7.2 SSW (US1PACD0019) (40.11N 77.28W)
5.03
New York
Other Sites
Auburn 8.3 SSE (US1NYCY0008) (42.83N 76.49W)
7.64
Westvale 2.3 SSW (US1NYOG0067) (43.01N 76.22W)
6.99
Liverpool 6.1 NNW (US1NYOG0071) (43.19N 76.25W)
6.58
Cayuga 4 NNE (US1NYCY0014) (42.98N 76.71W)
6.41
Prattsburgh 3.3 NNE (US1NYST0046) (42.57N 77.26W)
6.01
Baldwinsville (US1NYOG0046) (43.20N 76.29W)
5.97
East Ithaca 4.7 E (US1NYTM0018) (42.42N 76.37W)
5.97
Clay 4.6 NW (US1NYOG0012) (43.20N 76.26W)
5.93
Ithaca 6.4 E (US1NYTM0042) (42.43N 76.38W)
5.78
Syracuse 2.7 S (US1NYOG0052) (43.00N 76.14W)
5.57
Skaneateles 9.1 SE (US1NYOG0070) (42.84N 76.32W)
5.56
Oneida 0.4 NW (US1NYMD0022) (43.08N 75.67W)
5.21

Tropical Storm Fred 33
Location
Minimum Sea Level Pressure
Maximum Surface Wind Speed
Storm surge (ft)c
Storm tide (ft)d
Estimated Inundation
(ft)e
Total rain (in) Date/
time (UTC)
Press. (mb)
Date/ time
(UTC)a
Sustained (kt)b
Gust (kt)
COOP Sites
Cayuga Lock No. 1 (42.95N 76.73W) 6.69
Skaneateles (42.95N 76.43W) 6.69
Aurora Research Farm (42.73N 76.66W) 6.00
Whitesville 1 N (42.06N 77.76W) 5.88
Boonville 4 SSW (43.44N 75.37W) 5.74
Baldwinsville (43.15N 76.33W) 5.48
Auburn (42.93N 76.54W) 5.04
Connecticut Other Sites
West Hartford 2.3 NNE (US1CTHR0085) (41.80N 72.74W)
5.14
Offshore
NOAA Buoys Pensacola (42039) (28.79N 86.01W) 16/1300 1002.5 16/1344 49
(4 m, 1 min) 52
West Tampa (42036) (28.50N 84.51W) 16/1130 1006.3 16/0946 45
(4 m, 1 min) 52
East Gulf (42003) (25.93N 85.62W) 15/2240 1007.1 16/0756 23
(3 m, 1 min) 27
a Date/time is for sustained wind when both sustained and gust are listed. b Except as noted, sustained wind averaging periods for C-MAN and land-based reports are 2 min; buoy averaging
periods are 8 min. c Storm surge is water height above normal astronomical tide level. d For most locations, storm tide is water height above the North American Vertical Datum of 1988 (NAVD88). e Estimated inundation is the maximum height of water above ground. For NOS tide gauges, the height of the water
above Mean Higher High Water (MHHW) is used as a proxy for inundation. I Incomplete

Tropical Storm Fred 34
Table 4. Tornadoes documented during Tropical Storm Fred. Rows highlighted in beige denote tornadoes that occurred during Fred’s post-tropical phase.
County Begin
Location End
Location EF
Scale Begin
Date/Time Length (miles)
Width (yards)
Deaths Injuries Damage
Georgia
Sumter 1 ENE
Americus 2 NNE
Americus 1 17/0525 1.24 325 0 0
Meriwether 3 WSW Rocky Mount
2 E Lone Oak
0 17/0834 3.36 150 0 0
Twiggs 2 N District
Path 1 E District
Path 0 17/0947 2.6 150 0 0
Greene 2 N Carey 2 NNE
Greshamville 1 17/1024 5.6 100 0 0
Baldwin and Jones
4 ENE Greenberry Crossroads
4 SW Coopers
0 17/1027 1.86 150 0 0
Madison 3 WNW
Danielsville 3 W Ila 1 17/1220 5.97 150 0 0
Banks 4 E Homer 2 SW
Pinefield Crossroads
1 17/1424 5.7 100 0 0
Rabun 6 E
Mountain City
6 E Mountain
City 0 17/1835 0.02 25 0 0
South Carolina
Anderson 2 NNE Sandy
Springs
2 NNE Sandy
Springs 0 17/1659 0.11 50 0 0
Greenville 1 SSE
Mauldin 1 NW
Mauldin 1 17/1853 2.34 75 0 0
Laurens 4 NE
Fountain Inn
5 NE Fountain Inn
1 17/2218 1.45 75 0 0
Oconee 6 WSW Six
Mile 6 WSW Six
Mile 0 17/1650 0.14 50 0 0

Tropical Storm Fred 35
County Begin
Location End
Location EF
Scale Begin
Date/Time Length (miles)
Width (yards)
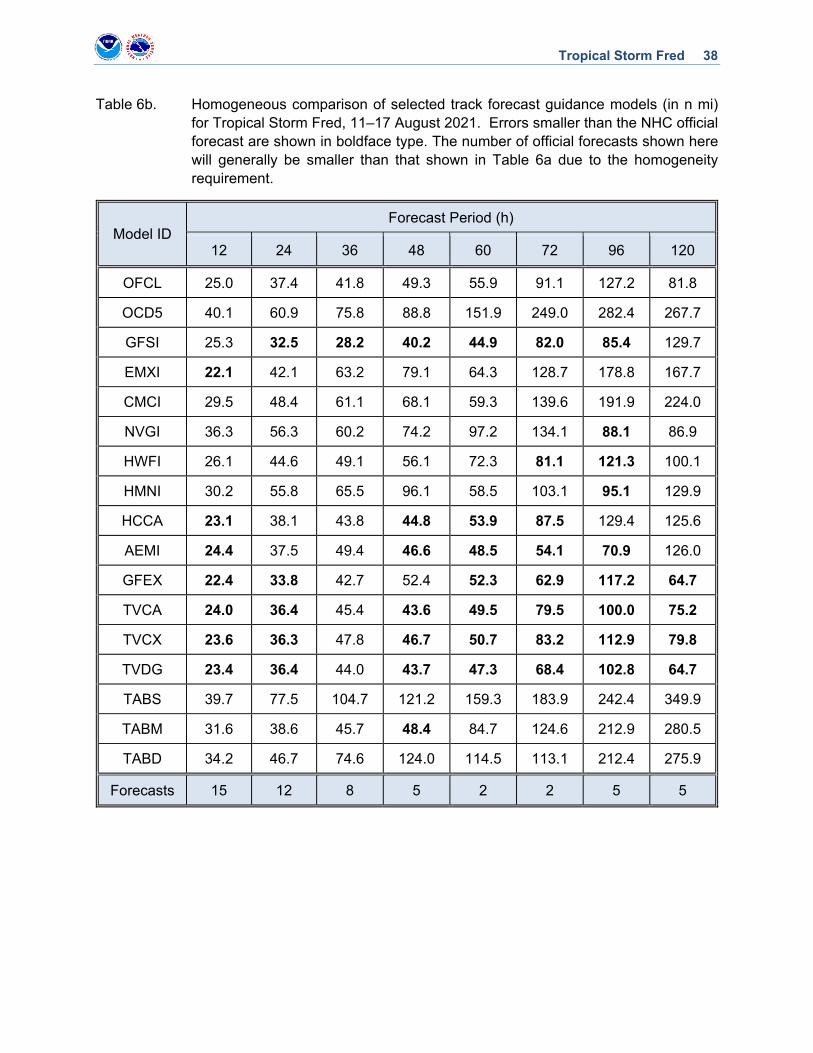
Deaths Injuries Damage
Laurens 3 SE
Fountain Inn
3 SE Fountain Inn
0 17/2207 0.20 30 0 0
Orangeburg 6 NNW
Brookdale 5 NNW
Brookdale 1 17/2140 0.90 50 0 0
Edgefield 4 WNW Murphys Estates
4 WNW Murphys Estates
1 17/1703 1.5 100 0 0
Lexington 3 WNW Summit
3 WSW Chapin
1 17/1931 14.23 250 0 0
Lexington / Saluda
4 N Leesville
8 N Leesville 0 17/1933 4.32 50 0 0
Saluda 5 NNW
Batesburg 5 NNW
Batesburg 0 18/0047 0.11 25 0 0
North Carolina
Iredell / Alexander
3 S Scotts 1 W Stony
Point 1 17/1515 5.12 200 0 0
Wilkes Osbornville Osbornville 0 17/1654 0.75 40 0 0
Wilkes Clingman Clingman 0 17/1711 0.68 75 0 0
Pennsylvania
Schuylkill Valley View Valley View 0 18/1646 75 10 0 0
Snyder Middleburg Middleburg 0 18/2035 0.5 15 0 0
York North
Hopewell Winterstown 0 19/0035 0.6 125 0 0
Dauphin 1.5 SE Halifax
2 E Halifax 1 18/2231 1.5 150 0 0
Adams East Berlin East Berlin 0 18/1916 0.7 75 0 0
Berks Tilden Twp Tilden Twp 1 19/0115 1.10 125 0 0
Montgomery / Bucks
Hatfield Twp
Hilltown Twp 1 19/0425 8.77 140 0 0

Tropical Storm Fred 36
County Begin
Location End
Location EF
Scale Begin
Date/Time Length (miles)
Width (yards)
Deaths Injuries Damage
New Jersey
Morris Rockaway
Twp Rockaway
Twp 0 19/0638 0.91 50 0 0
Connecticut / Massachusetts
Windham CT /
Worcester MA
Thompson CT
Webster MA 0 19/1415 4.7 50 0 0
Worcester MA
Clinton Clinton 0 19/1730 0.5 35 0 0

Tropical Storm Fred 37
Table 5. Number of hours in advance of formation associated with the first NHC Tropical Weather Outlook forecast in the indicated likelihood category. Note that the timings for the “Low” category do not include forecasts of a 0% chance of genesis.
Hours Before Genesis
48-Hour Outlook 120-Hour Outlook
Low (<40%) 72 156
Medium (40%-60%) 54 60
High (>60%) 36 36
Table 6a. NHC official (OFCL) and climatology-persistence skill baseline (OCD5) track forecast errors (n mi) for Tropical Storm Fred, 11–17 August 2021. Mean errors for the previous 5-yr period are shown for comparison. Official errors that are smaller than the 5-yr means are shown in boldface type.
Forecast Period (h)
12 24 36 48 60 72 96 120
OFCL 25.7 34.9 37.7 52.5 88.0 111.8 104.3 85.0
OCD5 38.9 58.7 71.2 76.3 153.8 214.4 226.5 231.0
Forecasts 18 14 10 8 6 6 10 8
OFCL (2016-20) 23.9 36.3 49.1 63.9 79.0 94.1 128.1 169.7
OCD5 (2016-20) 45.1 97.2 157.2 216.7 271.1 325.4 414.4 490.0
Tropical Storm Fred 38
Table 6b. Homogeneous comparison of selected track forecast guidance models (in n mi) for Tropical Storm Fred, 11–17 August 2021. Errors smaller than the NHC official forecast are shown in boldface type. The number of official forecasts shown here will generally be smaller than that shown in Table 6a due to the homogeneity requirement.
Model ID Forecast Period (h)
12 24 36 48 60 72 96 120
OFCL 25.0 37.4 41.8 49.3 55.9 91.1 127.2 81.8
OCD5 40.1 60.9 75.8 88.8 151.9 249.0 282.4 267.7
GFSI 25.3 32.5 28.2 40.2 44.9 82.0 85.4 129.7
EMXI 22.1 42.1 63.2 79.1 64.3 128.7 178.8 167.7
CMCI 29.5 48.4 61.1 68.1 59.3 139.6 191.9 224.0
NVGI 36.3 56.3 60.2 74.2 97.2 134.1 88.1 86.9
HWFI 26.1 44.6 49.1 56.1 72.3 81.1 121.3 100.1
HMNI 30.2 55.8 65.5 96.1 58.5 103.1 95.1 129.9
HCCA 23.1 38.1 43.8 44.8 53.9 87.5 129.4 125.6
AEMI 24.4 37.5 49.4 46.6 48.5 54.1 70.9 126.0
GFEX 22.4 33.8 42.7 52.4 52.3 62.9 117.2 64.7
TVCA 24.0 36.4 45.4 43.6 49.5 79.5 100.0 75.2
TVCX 23.6 36.3 47.8 46.7 50.7 83.2 112.9 79.8
TVDG 23.4 36.4 44.0 43.7 47.3 68.4 102.8 64.7
TABS 39.7 77.5 104.7 121.2 159.3 183.9 242.4 349.9
TABM 31.6 38.6 45.7 48.4 84.7 124.6 212.9 280.5
TABD 34.2 46.7 74.6 124.0 114.5 113.1 212.4 275.9
Forecasts 15 12 8 5 2 2 5 5

Tropical Storm Fred 39
Table 7a. NHC official (OFCL) and climatology-persistence skill baseline (OCD5) intensity forecast errors (kt) for Tropical Storm Fred, 11–17 August 2021. Mean errors for the previous 5-yr period are shown for comparison. Official errors that are smaller than the 5-yr means are shown in boldface type.
Forecast Period (h)
12 24 36 48 60 72 96 120
OFCL 3.3 3.2 2.5 2.5 5.8 7.5 6.0 4.4
OCD5 3.4 6.9 8.1 7.6 9.3 8.8 14.3 11.6
Forecasts 18 14 10 8 6 6 10 8
OFCL (2016-20) 5.4 8.0 9.6 10.9 11.5 12.1 13.3 14.5
OCD5 (2016-20) 7.0 11.0 14.3 16.8 18.3 19.7 21.7 23.0
Table 7b. Homogeneous comparison of selected intensity forecast guidance models (in kt) for Tropical Storm Fred, 11–17 August 2021. Errors smaller than the NHC official forecast are shown in boldface type. The number of official forecasts shown here will generally be smaller than that shown in Table 7a due to the homogeneity requirement.
Model ID Forecast Period (h)
12 24 36 48 60 72 96 120
OFCL 3.2 3.2 2.5 2.1 5.0 7.5 4.2 5.0
OCD5 3.4 6.9 8.1 6.6 9.0 4.5 15.5 13.0
HWFI 4.0 6.1 5.2 6.1 8.3 5.0 12.0 10.6
HMNI 3.5 4.1 3.6 5.1 3.3 4.5 5.2 8.9
DSHP 3.6 3.7 4.8 6.4 7.3 10.5 11.5 10.3
LGEM 3.6 4.1 3.7 3.6 6.7 9.5 11.2 8.3
ICON 3.2 3.6 2.7 3.6 5.3 6.5 8.5 6.0
IVCN 3.4 4.1 2.9 3.4 6.0 9.0 8.2 6.4
IVDR 3.6 4.0 2.9 2.6 5.3 8.5 8.3 7.6
HCCA 2.6 2.7 3.9 3.4 5.0 7.5 7.2 6.7
GFSI 4.5 5.1 5.4 7.3 10.0 23.5 16.8 18.1
EMXI 5.7 6.9 4.8 5.3 8.3 12.0 16.0 22.0
Forecasts 17 14 10 7 3 2 6 7

Tropical Storm Fred 40
Table 8a. Tropical cyclone wind watch and warning summary for Tropical Storm Fred, 11–17 August 2021.
Date/Time (UTC)
Action Location
9 / 2100 Tropical Storm Watch issued Guadeloupe / Martinique
9 / 2100 Tropical Storm Watch issued Dominica
9 / 2100 Tropical Storm Watch issued Puerto Rico and US Virgin Islands
9 / 2100 Tropical Storm Watch issued Dominican Republic entire north coast and south coast from Punta Palenque eastward
9 / 2215 Tropical Storm Watch issued Saba / Sint Eustatius
10 / 0300 Tropical Storm Watch changed to
Tropical Storm Warning Puerto Rico and US Virgin Islands
10 / 0300 Tropical Storm Warning issued Dominican Republic north coast east of
Cabo Frances Viejo and south coast east of Punta Palenque
10 / 0300 Tropical Storm Watch issued Haiti north coast Gonaives eastward
10 / 0900 Tropical Storm Watch issued Turks and Caicos Islands and
Southeastern Bahamas
10 / 1200 Tropical Storm Watch discontinued Dominica
10 / 1500 Tropical Storm Watch discontinued Guadeloupe / Martinique
10 / 1800 Tropical Storm Watch discontinued Saba / Sint Eustatius
11 / 0600 Tropical Storm Warning modified to Dominican Republic entire north coast and south coast from Punta Palenque eastward
11 / 0900 Tropical Storm Warning discontinued Puerto Rico and US Virgin Islands
11 / 1500 Tropical Storm Watch issued Cuban provinces of Ciego de Avila,
Camaguey, Las Tunas, Holguin, Granma, Santiago de Cuba, and Guantanamo
12 / 0000 Tropical Storm Warning discontinued Dominican Republic north coast east of
Cabo Frances Viejo and south coast east of Punta Palenque
12 / 0300 Tropical Storm Warning discontinued Remainder of Dominican Republic
12 / 0900 Tropical Storm Watch discontinued Turks and Caicos Islands
12 / 1500 Tropical Storm Watch discontinued All Haiti

Tropical Storm Fred 41
Date/Time (UTC)
Action Location
12 / 2100 Tropical Storm Watch discontinued Southeastern Bahamas
12 / 2100 Tropical Storm Watch discontinued Cuban provinces of Guantanamo and
Santiago de Cuba
12 / 2100 Tropical Storm Watch issued Florida Keys from Ocean Reef to
Dry Tortugas
12 / 2100 Tropical Storm Watch issued Bonita Beach to Ocean Reef, FL,
including Florida Bay
13 / 0900 Tropical Storm Warning issued Florida Keys from Ocean Reef to
Dry Tortugas, including Florida Bay
13 / 0900 Tropical Storm Watch modified to Ocean Reef to Englewood, FL
13 / 1500 Tropical Storm Watch discontinued Cuban provinces of Las Tunas, Granma,
and Holguin
13 / 1500 Tropical Storm Watch issued Cuban provinces of Sancti Spiritus and Villa
Clara
13 / 2100 Tropical Storm Watch discontinued All Cuban provinces
14 / 0300 Tropical Storm Watch discontinued Ocean Reef to Englewood, FL
14 / 0300 Tropical Storm Warning discontinued Florida Keys from Ocean Reef to the Seven
Mile Bridge, including Florida Bay
14 / 1500 Tropical Storm Warning discontinued All
15 / 0900 Tropical Storm Watch issued AL/FL Border to Ochlockonee River, FL
15 / 1500 Tropical Storm Warning issued Navarre to Wakulla/Jefferson County line, FL
16 / 0300 Tropical Storm Watch discontinued All
16 / 1500 Tropical Storm Warning modified to Navarre to Steinhatchee River, FL
16 / 2100 Tropical Storm Warning discontinued Navarre to Okaloosa/Walton County line, FL
17 / 0300 Tropical Storm Warning discontinued All

Tropical Storm Fred 42
Table 8b. Storm surge watch and warning summary for Tropical Storm Fred, 11–17 August 2021.
Date/Time (UTC)
Action Location
15 / 1500 Storm Surge Warning issued Indian Pass to Steinhatchee River, FL
15 / 2100 Storm Surge Warning modified to Indian Pass to Yankeetown, FL
16 / 0300 Storm Surge Warning discontinued All

Tropical Storm Fred 43
Figure 1. Best track positions for Tropical Storm Fred, 11–17 August 2021. The track over the United States is partially based on analyses from the NOAA Weather Prediction Center.

Tropical Storm Fred 44
Figure 2. Selected wind observations and best track maximum sustained surface wind speed curve for Tropical Storm Fred, 11–17 August 2021. Aircraft observations have been adjusted for elevation using 90%, 80%, and 75% adjustment factors for observations from 700 mb, 850 mb, and 1500 ft, respectively. Advanced Dvorak Technique estimates represent the Current Intensity at the nominal observation time. SATCON intensity estimates are from the Cooperative Institute for Meteorological Satellite Studies. Dashed vertical lines correspond to 0000 UTC, and solid vertical lines correspond to landfalls.

Tropical Storm Fred 45
Figure 3. Selected pressure observations and best track minimum central pressure curve for Tropical Storm Fred, 11–17 August 2021. Advanced Dvorak Technique estimates represent the Current Intensity at the nominal observation time. SATCON intensity estimates are from the Cooperative Institute for Meteorological Satellite Studies. KZC P-W refers to pressure estimates derived using the Knaff-Zehr-Courtney pressure-wind relationship. Dashed vertical lines correspond to 0000 UTC, and solid vertical lines correspond to landfalls.

Tropical Storm Fred 46
Figure 4. Selected peak sustained winds (kt) reported during Tropical Storm Fred on the Florida Panhandle and over the northeastern Gulf of Mexico. An asterisk denotes observations that were elevated more than 20 m above the surface.

Tropical Storm Fred 47
Figure 5. Maximum water levels measured from NOS tide gauges and USGS stream gauges during Tropical Storm Fred. Water levels are referenced as feet above Mean Higher High Water (MHHW), which is used as a proxy for inundation (above ground level) on normally dry ground along the immediate coastline.

Tropical Storm Fred 48
Figure 6. Rainfall accumulations (inches) in the United States from Tropical Storm Fred and its remnants. Rainfall totals depicted in the southern Appalachians only account for the rains directly associated with Fred on 17 August. Image courtesy of Zack Taylor at the NOAA Weather Prediction Center.

Tropical Storm Fred 49
Figure 7. Rainfall accumulations (inches) from Fred and its predecessor rain event (a) across the southern Appalachian Mountains from 8 AM EDT 15 August through 8 AM EDT 18 August and (b) centered on Transylvania County, North Carolina, for the 60-h period ending at midnight 17 August. Images courtesy of the National Weather Service Forecast Office in Greenville/Spartanburg, South Carolina.
(a)
(b)

Tropical Storm Fred 50
Figure 8. River levels measured during Fred from 16 to 18 August on (a) the French Broad River at Rosman, NC, (b) the East Fork of the Pigeon River near Cruso, NC, (c) the Pigeon River near Canton, NC, and (d) the Pigeon River near Newport, TN. The highest dashed blue line in each graph depicts the level of major flooding. Data and images courtesy of the United States Geological Survey.
(a) (b)
(c) (d)
Tropical Storm Fred 51
Figure 9. Rainfall accumulations (mm) in the Dominican Republic on 11 August 2021 from Tropical Storm Fred. Analysis courtesy of the Dominican Republic national meteorological service (ONAMET).

Tropical Storm Fred 52
Figure 10. Locations of tornadoes documented in association with Tropical Storm Fred, during its tropical and post-tropical phases, between 17–19 August 2021.

Tropical Storm Fred 53
Figure 11. NHC 5-day official track forecasts (blue lines) made for Tropical Storm Fred between 0000 UTC 11 August and 1800 UTC 13 August, and between 1200 UTC 15 August and 0600 UTC 17 August, compared against Fred’s actual track (white line with symbols).

Tropical Storm Fred 54
Figure 12. Homogeneous comparison of selected track forecast guidance model errors (in n mi) for Tropical Storm Fred, 11–17 August 2021. Official NHC track errors are denoted by the thick black line.

Tropical Storm Fred 55
Figure 13. Homogeneous comparison of selected intensity forecast guidance model errors (in kt) for Tropical Storm Fred, 11–17 August 2021. Official NHC intensity errors are denoted by the thick black line.

Tropical Storm Fred 56
Figure 14. Maximum water levels measured from tide gauges (circles) during Tropical Storm Fred and areas covered by storm surge warnings (magenta). Water levels are referenced as feet above Mean Higher High Water (MHHW), which is used as a proxy for inundation (above ground level) on normally dry ground along the immediate coastline. Black markers denote water levels less than 3 ft above ground level, and white markers denote water levels 3 ft or higher above ground level.