Hurricane Lili: Educated Evacuation Decision Making
16
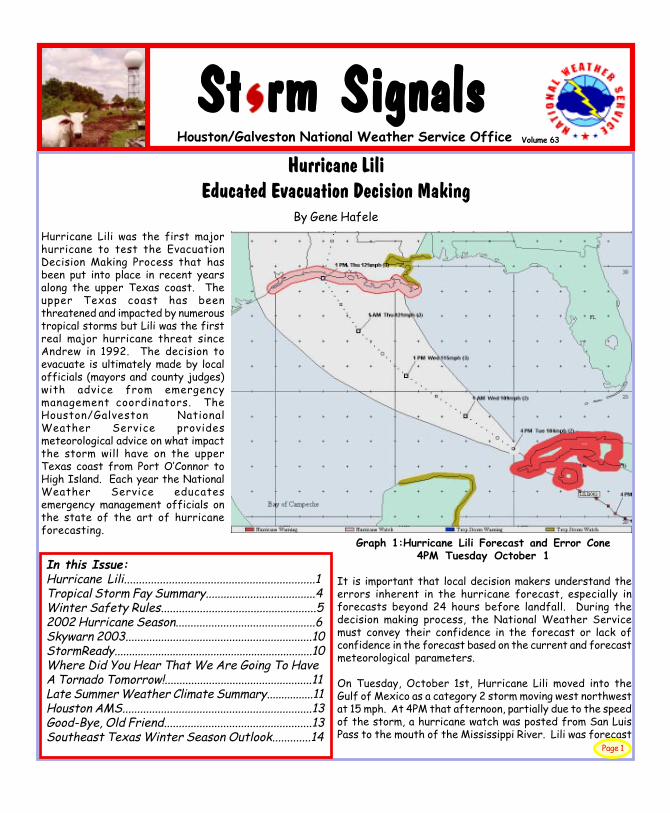
St r St r St r St r St rm Signals m Signals m Signals m Signals m Signals Houston/Galveston National Weather Service Office Volume 63 Hurricane Lili was the first major hurricane to test the Evacuation Decision Making Process that has been put into place in recent years along the upper Texas coast. The upper Texas coast has been threatened and impacted by numerous tropical storms but Lili was the first real major hurricane threat since Andrew in 1992. The decision to evacuate is ultimately made by local officials (mayors and county judges) with advice from emergency management coordinators. The Houston/Galveston National Weather Service provides meteorological advice on what impact the storm will have on the upper Texas coast from Port O’Connor to High Island. Each year the National Weather Service educates emergency management officials on the state of the art of hurricane forecasting. It is important that local decision makers understand the errors inherent in the hurricane forecast, especially in forecasts beyond 24 hours before landfall. During the decision making process, the National Weather Service must convey their confidence in the forecast or lack of confidence in the forecast based on the current and forecast meteorological parameters. On Tuesday, October 1st, Hurricane Lili moved into the Gulf of Mexico as a category 2 storm moving west northwest at 15 mph. At 4PM that afternoon, partially due to the speed of the storm, a hurricane watch was posted from San Luis Pass to the mouth of the Mississippi River. Lili was forecast Hurricane Lili Educated Evacuation Decision Making By Gene Hafele Page 1 In this Issue: Hurricane Lili................................................................1 Tropical Storm Fay Summary.....................................4 Winter Safety Rules....................................................5 2002 Hurricane Season...............................................6 Skywarn 2003...............................................................10 StormReady....................................................................10 Where Did You Hear That We Are Going To Have A Tornado Tomorrow!..................................................11 Late Summer Weather Climate Summary................11 Houston AMS................................................................13 Good-Bye, Old Friend..................................................13 Southeast Texas Winter Season Outlook.............14 Graph 1:Hurricane Lili Forecast and Error Cone 4PM Tuesday October 1
-
Upload
khangminh22 -
Category
Documents
-
view
0 -
download
0
Transcript of Hurricane Lili: Educated Evacuation Decision Making
St rSt rSt rSt rSt rm Signalsm Signalsm Signalsm Signalsm SignalsHouston/Galveston National Weather Service Office Volume 63
Hurricane Lili was the first majorhurricane to test the EvacuationDecision Making Process that hasbeen put into place in recent yearsalong the upper Texas coast. Theupper Texas coast has beenthreatened and impacted by numeroustropical storms but Lili was the firstreal major hurricane threat sinceAndrew in 1992. The decision toevacuate is ultimately made by localofficials (mayors and county judges)with advice from emergencymanagement coordinators. TheHouston/Galveston NationalWeather Service providesmeteorological advice on what impactthe storm will have on the upperTexas coast from Port O’Connor toHigh Island. Each year the NationalWeather Service educatesemergency management officials onthe state of the art of hurricaneforecasting.
It is important that local decision makers understand theerrors inherent in the hurricane forecast, especially inforecasts beyond 24 hours before landfall. During thedecision making process, the National Weather Servicemust convey their confidence in the forecast or lack ofconfidence in the forecast based on the current and forecastmeteorological parameters.
On Tuesday, October 1st, Hurricane Lili moved into theGulf of Mexico as a category 2 storm moving west northwestat 15 mph. At 4PM that afternoon, partially due to the speedof the storm, a hurricane watch was posted from San LuisPass to the mouth of the Mississippi River. Lili was forecast
Hurricane LiliEducated Evacuation Decision Making
By Gene Hafele
Page 1
In this Issue:Hurricane Lili................................................................1Tropical Storm Fay Summary.....................................4Winter Safety Rules....................................................52002 Hurricane Season...............................................6Skywarn 2003...............................................................10StormReady....................................................................10Where Did You Hear That We Are Going To HaveA Tornado Tomorrow!..................................................11Late Summer Weather Climate Summary................11Houston AMS................................................................13Good-Bye, Old Friend..................................................13Southeast Texas Winter Season Outlook.............14
Graph 1:Hurricane Lili Forecast and Error Cone4PM Tuesday October 1
Page 2
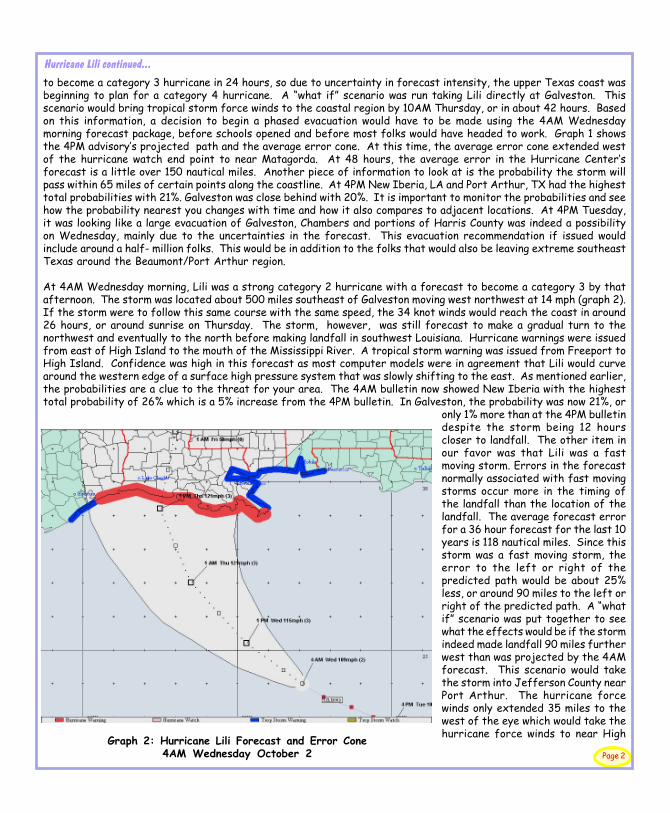
to become a category 3 hurricane in 24 hours, so due to uncertainty in forecast intensity, the upper Texas coast wasbeginning to plan for a category 4 hurricane. A “what if” scenario was run taking Lili directly at Galveston. Thisscenario would bring tropical storm force winds to the coastal region by 10AM Thursday, or in about 42 hours. Basedon this information, a decision to begin a phased evacuation would have to be made using the 4AM Wednesdaymorning forecast package, before schools opened and before most folks would have headed to work. Graph 1 showsthe 4PM advisory’s projected path and the average error cone. At this time, the average error cone extended westof the hurricane watch end point to near Matagorda. At 48 hours, the average error in the Hurricane Center’sforecast is a little over 150 nautical miles. Another piece of information to look at is the probability the storm willpass within 65 miles of certain points along the coastline. At 4PM New Iberia, LA and Port Arthur, TX had the highesttotal probabilities with 21%. Galveston was close behind with 20%. It is important to monitor the probabilities and seehow the probability nearest you changes with time and how it also compares to adjacent locations. At 4PM Tuesday,it was looking like a large evacuation of Galveston, Chambers and portions of Harris County was indeed a possibilityon Wednesday, mainly due to the uncertainties in the forecast. This evacuation recommendation if issued wouldinclude around a half- million folks. This would be in addition to the folks that would also be leaving extreme southeastTexas around the Beaumont/Port Arthur region.
At 4AM Wednesday morning, Lili was a strong category 2 hurricane with a forecast to become a category 3 by thatafternoon. The storm was located about 500 miles southeast of Galveston moving west northwest at 14 mph (graph 2).If the storm were to follow this same course with the same speed, the 34 knot winds would reach the coast in around26 hours, or around sunrise on Thursday. The storm, however, was still forecast to make a gradual turn to thenorthwest and eventually to the north before making landfall in southwest Louisiana. Hurricane warnings were issuedfrom east of High Island to the mouth of the Mississippi River. A tropical storm warning was issued from Freeport toHigh Island. Confidence was high in this forecast as most computer models were in agreement that Lili would curvearound the western edge of a surface high pressure system that was slowly shifting to the east. As mentioned earlier,the probabilities are a clue to the threat for your area. The 4AM bulletin now showed New Iberia with the highesttotal probability of 26% which is a 5% increase from the 4PM bulletin. In Galveston, the probability was now 21%, or
only 1% more than at the 4PM bulletindespite the storm being 12 hourscloser to landfall. The other item inour favor was that Lili was a fastmoving storm. Errors in the forecastnormally associated with fast movingstorms occur more in the timing ofthe landfall than the location of thelandfall. The average forecast errorfor a 36 hour forecast for the last 10years is 118 nautical miles. Since thisstorm was a fast moving storm, theerror to the left or right of thepredicted path would be about 25%less, or around 90 miles to the left orright of the predicted path. A “whatif” scenario was put together to seewhat the effects would be if the stormindeed made landfall 90 miles furtherwest than was projected by the 4AMforecast. This scenario would takethe storm into Jefferson County nearPort Arthur. The hurricane forcewinds only extended 35 miles to thewest of the eye which would take thehurricane force winds to near HighGraph 2: Hurricane Lili Forecast and Error Cone
4AM Wednesday October 2
Hurricane Lili continued...
Page 03
Island in what we felt was a worse case scenario based on the latest meteorological data. Based on this forecast,reasoning and confidence in the forecast, local officials in Chambers, Galveston and Harris Counties decided not torecommend any evacuation at that time. However, further to the east in Jefferson and Orange Counties, the decisionto recommend an evacuation was made since they were still in the forecast margin of error.
Once the decision had been made not to recommend evacuation of Galveston and portions of Harris County, there wasno chance to change that decision later in the day. There would not have been sufficient time left to accomplish a safeand complete evacuation. At 1PM, Lili had rapidly intensified to a Category 4 storm. The forward motion of the stormhowever was now toward the northwest at 15 mph. The gradual turn to the north had begun. At 4PM, Lili had continuedto strengthen and was now a strong Category 4 hurricane with maximum sustained winds near 140 mph. The forecastersat the National Hurricane Center were increasingly more confident that the storm was going to make landfall inLouisiana. The main threat for the Texas coast from High Island west to San Luis Pass would be high tides caused bylarge swells being generated by Lili. At 4PM, emergency management officials in Galveston and Chambers Countywere recommending a voluntary evacuation of the Bolivar Peninsula and low lying areas of Chambers County due to thefact they might be cut off from the mainland by high tides overnight.
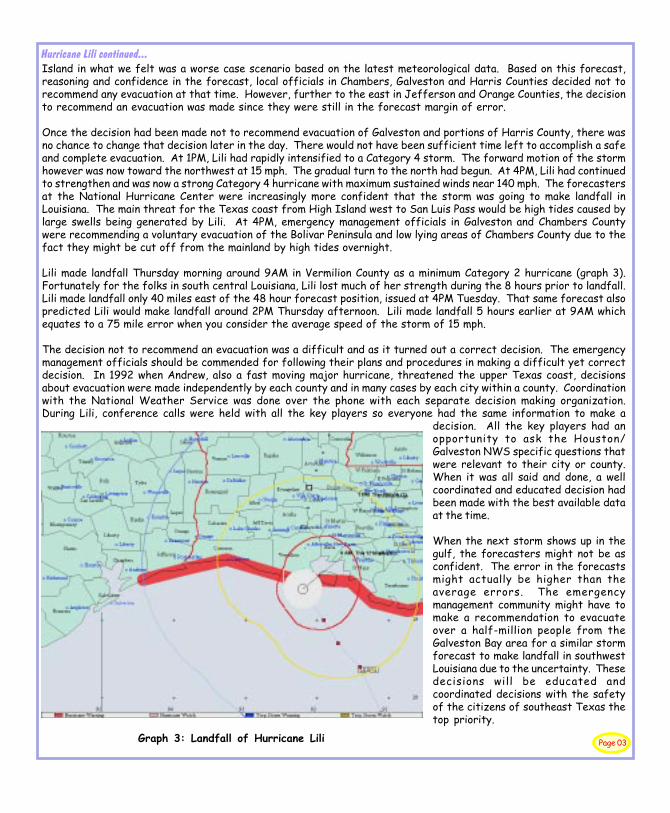
Lili made landfall Thursday morning around 9AM in Vermilion County as a minimum Category 2 hurricane (graph 3).Fortunately for the folks in south central Louisiana, Lili lost much of her strength during the 8 hours prior to landfall.Lili made landfall only 40 miles east of the 48 hour forecast position, issued at 4PM Tuesday. That same forecast alsopredicted Lili would make landfall around 2PM Thursday afternoon. Lili made landfall 5 hours earlier at 9AM whichequates to a 75 mile error when you consider the average speed of the storm of 15 mph.
The decision not to recommend an evacuation was a difficult and as it turned out a correct decision. The emergencymanagement officials should be commended for following their plans and procedures in making a difficult yet correctdecision. In 1992 when Andrew, also a fast moving major hurricane, threatened the upper Texas coast, decisionsabout evacuation were made independently by each county and in many cases by each city within a county. Coordinationwith the National Weather Service was done over the phone with each separate decision making organization.During Lili, conference calls were held with all the key players so everyone had the same information to make a
decision. All the key players had anopportunity to ask the Houston/Galveston NWS specific questions thatwere relevant to their city or county.When it was all said and done, a wellcoordinated and educated decision hadbeen made with the best available dataat the time.
When the next storm shows up in thegulf, the forecasters might not be asconfident. The error in the forecastsmight actually be higher than theaverage errors. The emergencymanagement community might have tomake a recommendation to evacuateover a half-million people from theGalveston Bay area for a similar stormforecast to make landfall in southwestLouisiana due to the uncertainty. Thesedecisions will be educated andcoordinated decisions with the safetyof the citizens of southeast Texas thetop priority.
Hurricane Lili continued...
Graph 3: Landfall of Hurricane Lili
Page 4
Tropical Storm Fay began as an area of disturbed weather associated with a broad low pressure system inthe northwest Gulf of Mexico during the first week of September. On Thursday, September 5th, thisdisturbance became the 6th tropical depression of the 2002 hurricane season with a poorly defined centerlocated approximately 125 miles southeast of Galveston, Texas. That evening just 6 hours after formation,the depression became Tropical Storm Fay as winds strengthened to 40 mph.
Fay remained nearly stationary Thursday night and through most of Friday. However, Fay did manage toslowly strengthen with winds reaching 60 mph late Friday morning (September 6th). On Friday evening, Faybegan to redevelop further west near a cluster of strong thunderstorms. These thunderstorms beganpushing inland along the southeast Texas coastline between San Luis Pass and Palacios around 11 PM CDT.As this cluster of thunderstorms moved inland, it produced extremely heavy rainfall, tornadoes, and strongdamaging wind gusts. The center of Fay moved inland early Saturday morning near Palacios and weakened toa tropical depression by late Saturday morning.
Fortunately, there were no deaths associated with Fay. Three people were injured when a tornado damageda mobile home in eastern Fort Bend county Friday night. The storm produced a total of 5 tornadoes along apath from Freeport in Brazoria county to near Hungerford in Wharton county. The combination of highwinds and tornadoes damaged over 800 homes and close to 100 businesses in Brazoria county. The highestreported wind gust recorded was in the town of Clute in Brazoria county, where an 83 mph wind gust wasrecorded at 120 AM CDT Saturday.
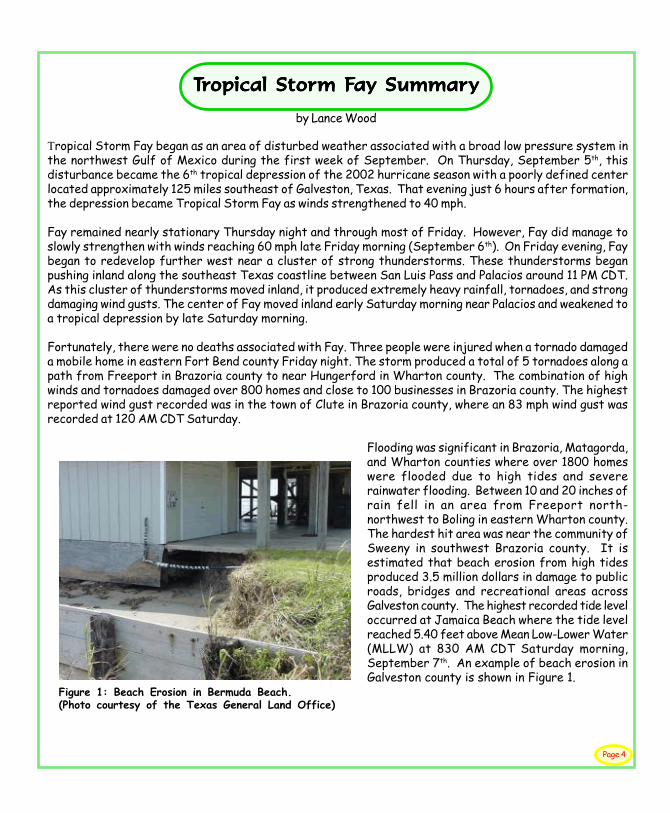
Flooding was significant in Brazoria, Matagorda,and Wharton counties where over 1800 homeswere flooded due to high tides and severerainwater flooding. Between 10 and 20 inches ofrain fell in an area from Freeport north-northwest to Boling in eastern Wharton county.The hardest hit area was near the community ofSweeny in southwest Brazoria county. It isestimated that beach erosion from high tidesproduced 3.5 million dollars in damage to publicroads, bridges and recreational areas acrossGalveston county. The highest recorded tide leveloccurred at Jamaica Beach where the tide levelreached 5.40 feet above Mean Low-Lower Water(MLLW) at 830 AM CDT Saturday morning,September 7th. An example of beach erosion inGalveston county is shown in Figure 1.
TTTTTrrrrropical Storopical Storopical Storopical Storopical Storm Fm Fm Fm Fm Fay Summaray Summaray Summaray Summaray Summaryyyyy
by Lance Wood
Figure 1: Beach Erosion in Bermuda Beach.(Photo courtesy of the Texas General Land Office)

Page 05
Although rare in southeast Texas, winter weather does occasionally occur. January is themonth when snow, sleet, or freezing rain is mostly likely to be observed; yet, winter weatherconditions can occur at anytime during the winter and early spring months. Also, people travel-ing into other parts of the country will likely encounter winter weather harsher than whatoccurs along the upper Texas Gulf coast.
The leading cause of death during winter storms is transportation accidents. Hypothermia and frost bite are otherdangers from very cold winter temperatures. The Houston/Galveston National Weather Service Office would like toreview some important safety information to help you and your family to prepare for winter weather.
• Limit travel during periods of winter weather. Bridges, overpasses, and elevated roadways areespecially vulnerable to ice and snow conditions given the lack of ground insulation under thesestructures.
• Before the onset of winter precipitation, check your supplies and, if necessary, stock up on groceries,gasoline, and other necessities.
• Have flash lights and extra batteries on-hand in case of possible power outages.• Wear layers of protective clothing if you are venturing outside—wind makes the air feel much colder.• Be alert to the signs of hypothermia. These include uncontrollable shivering, memory loss,
disorientation, incoherence, slurred speech, drowsiness, and apparent exhaustion.• If hypothermia signs occur, seek immediate medical attention. If medical attention is not available,
slowly warm the person’s body core first by getting them into dry clothing and wrapping them in awarm blanket covering the head and neck. Giving warm broth and warm food is better than givingbeverages or food that is hot. Alcohol should not be taken.
• Be alert to the signs of frostbite. The most susceptible parts of the body are the extremities such asfingers, toes, ear lobes, or the tip of the nose. If frostbite occurs, seek immediate medicalattention. If it is not available, the affected areas should be warmed slowly.
Concerning travel, make sure your vehicle is prepared for the onset of winter weather. Have a mechanic check thecoolant system and fluid levels, the electrical system and lights, and the heater and defroster. Also, ensure good wintertires are installed. Keep a windshield scraper and small broom available for ice and snow removal. During periods ofwinter weather it is a good idea to maintain at least a half tank of gas. If you must travel, allow extra time to reachyour destination and leave plenty of space between you and other vehicles. Ice- or snow-covered roadways areespecially treacherous and stopping distances are greatly increased.
In the event of a winter storm, it is a good idea to carry a winter storm survival kit in your vehicle. Suggesteditems for the kit for southeast Texas residents include:
• Flashlights with extra batteries• A first aid kit with a pocket knife• Necessary medications• Blankets and an extra set of winter clothes and rain gear• Matches and a candle for heat• A brightly colored cloth to use as a flag• A supply of food and water• A shovel and a small bag of sand for generating traction under wheels• Small tools and booster cables.
Remember, even though harsh winter weather is rare in southeast Texas, it still occasionally occurs. It is veryimportant to stay informed about the possibility of winter weather in your area. This can be done by tuning into NOAAweather radio, commercial radio, or your local television station. If you would like more winter weather information,you can contact the Houston/Galveston National Weather Service Office.
Winter Safety Rules Winter Safety Rules Winter Safety Rules Winter Safety Rules Winter Safety Rules
Page 06
As the 2002 Atlantic Basin hurricane season comes to an end, it is time to take a look back at what has happened thisyear. The 2002 season had twelve named storms, of which four became become hurricanes. In addition, there weretwo tropical depressions that never reached tropical storm strength. Lili was the first U.S. mainland landfallinghurricane since 1999. Eight named storms formed in September - the highest number on record for any month.Perhaps most amazing was the life of Kyle which lasted twenty-two days - the third longest living Atlantic basintropical cyclone on record.
Tropical Storm Arthur was first detected on July 9th in the northeastern Gulf of Mexico as a weak low thatdeveloped along an old frontal zone. The low moved northeastward to the coast of North Carolina by the 14th whereit acquired organized convection and became Tropical Depression One. It strengthened to a 60-mph tropical storm bythe 16th while located several hundred miles south of Nova Scotia and accelerating east-northeastward. Arthurbecame extratropical on the next day while located a few hundred miles south of Newfoundland.
Tropical Storm Bertha peaked as a minimal tropical storm near the northern Gulf coast. It originated from a troughof low pressure that extended from the western Atlantic across Florida into the northern Gulf of Mexico - the sametrough that would eventually spawn Tropical Storm Cristobal. A low pressure area formed in the trough on August 3rd,and this low developed into a tropical depression just east of the mouth of the Mississippi River on the 4th. Thedepression became Tropical Storm Bertha later that day. Bertha moved northwestward over southeastern Louisianaearly on the 5th and weakened to a tropical depression later that day. The depression meandered over southernLouisiana on the 6th, then moved southwestward into the Gulf of Mexico on the 7th. After continuing southwestwardon the 8th, a westward turn brought the depression to the lower Texas coast on the 9th. It dissipated over south Texaslater that day.
Bertha produced tropical storm winds over the coastal waters of Mississippi and southeastern Louisiana. The stormbrought rainfall amounts of 5 to 10 inches to portions of southeastern Louisiana and Southern Mississippi whichproduced minor damage from flooding. Bertha caused one death - a drowning in high surf off the western Floridapanhandle.
Tropical Storm Cristobal was a relatively weak tropical cyclone that meandered in the western Atlantic prior to beingabsorbed into a frontal zone. Cristobal had a non-tropical origin, forming from a trough of low pressure that extendedfrom the northern Gulf of Mexico across Florida into the western North Atlantic Ocean. As this trough spawnedTropical Storm Bertha in the Gulf of Mexico on August 4th, a second area of low pressure was developing near theSouth Carolina coast. This second low moved slowly eastward and gradually became better organized, becoming atropical depression about 175 miles east-southeast of Charleston, South Carolina on the 5th. The depression movedslowly south-southeastward over the next day and a half. A reconnaissance aircraft late on the 6th found that thedepression had strengthened to a tropical storm. On the 7th, Cristobal began a slow eastward motion as it began to feelsome influence of a large mid to upper level trough moving off the U. S. East coast. The peak intensity of 50 mph wasreached early on the 8th. Later that day, Cristobal began a sudden acceleration to the east-northeast, and by late in theday the cyclone had become absorbed within a frontal zone.
Tropical Storm Dolly was the first tropical cyclone of 2002 to develop in the deep tropics. It formed from a tropicalwave about 630 miles southwest of the Cape Verde Islands early on August 29th and its maximum winds reached 60mph on the 30th. Dolly initially moved westward and gradually turned northwest and north over open water and becameabsorbed by a frontal trough on September 5th.
From the National Hurricane Center’sMonthly Tropical Weather Summariesand the National Climatic Data Center
2002 Hurricane Season2002 Hurricane Season2002 Hurricane Season2002 Hurricane Season2002 Hurricane Season
Page 07
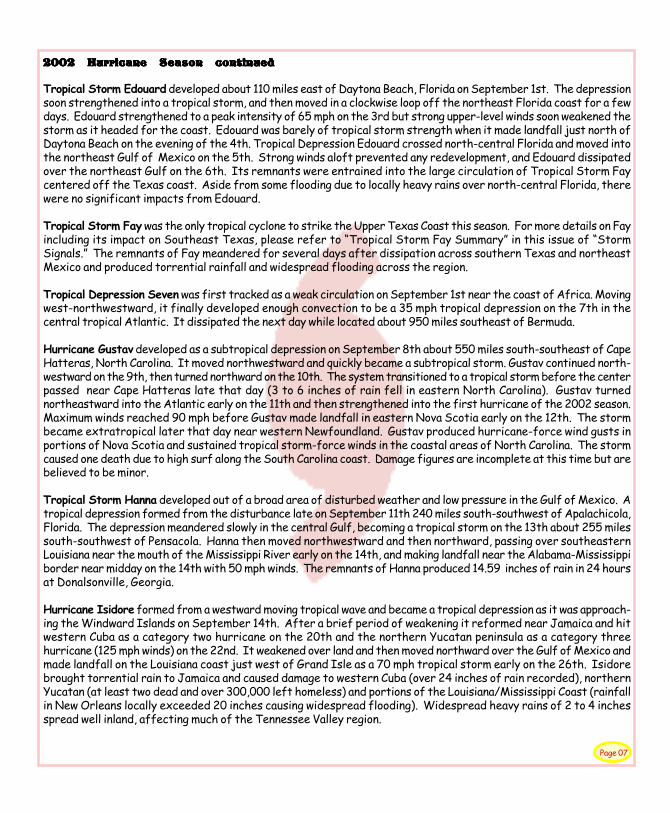
Tropical Storm Edouard developed about 110 miles east of Daytona Beach, Florida on September 1st. The depressionsoon strengthened into a tropical storm, and then moved in a clockwise loop off the northeast Florida coast for a fewdays. Edouard strengthened to a peak intensity of 65 mph on the 3rd but strong upper-level winds soon weakened thestorm as it headed for the coast. Edouard was barely of tropical storm strength when it made landfall just north ofDaytona Beach on the evening of the 4th. Tropical Depression Edouard crossed north-central Florida and moved intothe northeast Gulf of Mexico on the 5th. Strong winds aloft prevented any redevelopment, and Edouard dissipatedover the northeast Gulf on the 6th. Its remnants were entrained into the large circulation of Tropical Storm Faycentered off the Texas coast. Aside from some flooding due to locally heavy rains over north-central Florida, therewere no significant impacts from Edouard.
Tropical Storm Fay was the only tropical cyclone to strike the Upper Texas Coast this season. For more details on Fayincluding its impact on Southeast Texas, please refer to “Tropical Storm Fay Summary” in this issue of “StormSignals.” The remnants of Fay meandered for several days after dissipation across southern Texas and northeastMexico and produced torrential rainfall and widespread flooding across the region.
Tropical Depression Seven was first tracked as a weak circulation on September 1st near the coast of Africa. Movingwest-northwestward, it finally developed enough convection to be a 35 mph tropical depression on the 7th in thecentral tropical Atlantic. It dissipated the next day while located about 950 miles southeast of Bermuda.
Hurricane Gustav developed as a subtropical depression on September 8th about 550 miles south-southeast of CapeHatteras, North Carolina. It moved northwestward and quickly became a subtropical storm. Gustav continued north-westward on the 9th, then turned northward on the 10th. The system transitioned to a tropical storm before the centerpassed near Cape Hatteras late that day (3 to 6 inches of rain fell in eastern North Carolina). Gustav turnednortheastward into the Atlantic early on the 11th and then strengthened into the first hurricane of the 2002 season.Maximum winds reached 90 mph before Gustav made landfall in eastern Nova Scotia early on the 12th. The stormbecame extratropical later that day near western Newfoundland. Gustav produced hurricane-force wind gusts inportions of Nova Scotia and sustained tropical storm-force winds in the coastal areas of North Carolina. The stormcaused one death due to high surf along the South Carolina coast. Damage figures are incomplete at this time but arebelieved to be minor.
Tropical Storm Hanna developed out of a broad area of disturbed weather and low pressure in the Gulf of Mexico. Atropical depression formed from the disturbance late on September 11th 240 miles south-southwest of Apalachicola,Florida. The depression meandered slowly in the central Gulf, becoming a tropical storm on the 13th about 255 milessouth-southwest of Pensacola. Hanna then moved northwestward and then northward, passing over southeasternLouisiana near the mouth of the Mississippi River early on the 14th, and making landfall near the Alabama-Mississippiborder near midday on the 14th with 50 mph winds. The remnants of Hanna produced 14.59 inches of rain in 24 hoursat Donalsonville, Georgia.
Hurricane Isidore formed from a westward moving tropical wave and became a tropical depression as it was approach-ing the Windward Islands on September 14th. After a brief period of weakening it reformed near Jamaica and hitwestern Cuba as a category two hurricane on the 20th and the northern Yucatan peninsula as a category threehurricane (125 mph winds) on the 22nd. It weakened over land and then moved northward over the Gulf of Mexico andmade landfall on the Louisiana coast just west of Grand Isle as a 70 mph tropical storm early on the 26th. Isidorebrought torrential rain to Jamaica and caused damage to western Cuba (over 24 inches of rain recorded), northernYucatan (at least two dead and over 300,000 left homeless) and portions of the Louisiana/Mississippi Coast (rainfallin New Orleans locally exceeded 20 inches causing widespread flooding). Widespread heavy rains of 2 to 4 inchesspread well inland, affecting much of the Tennessee Valley region.
2002 Hurricane Season continued2002 Hurricane Season continued2002 Hurricane Season continued2002 Hurricane Season continued2002 Hurricane Season continued
Page 08
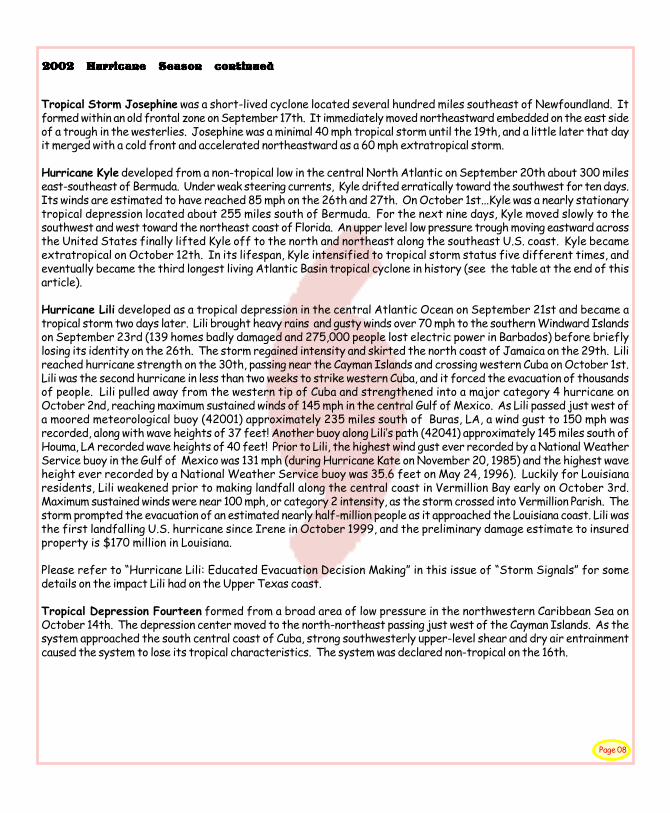
Tropical Storm Josephine was a short-lived cyclone located several hundred miles southeast of Newfoundland. Itformed within an old frontal zone on September 17th. It immediately moved northeastward embedded on the east sideof a trough in the westerlies. Josephine was a minimal 40 mph tropical storm until the 19th, and a little later that dayit merged with a cold front and accelerated northeastward as a 60 mph extratropical storm.
Hurricane Kyle developed from a non-tropical low in the central North Atlantic on September 20th about 300 mileseast-southeast of Bermuda. Under weak steering currents, Kyle drifted erratically toward the southwest for ten days.Its winds are estimated to have reached 85 mph on the 26th and 27th. On October 1st...Kyle was a nearly stationarytropical depression located about 255 miles south of Bermuda. For the next nine days, Kyle moved slowly to thesouthwest and west toward the northeast coast of Florida. An upper level low pressure trough moving eastward acrossthe United States finally lifted Kyle off to the north and northeast along the southeast U.S. coast. Kyle becameextratropical on October 12th. In its lifespan, Kyle intensified to tropical storm status five different times, andeventually became the third longest living Atlantic Basin tropical cyclone in history (see the table at the end of thisarticle).
Hurricane Lili developed as a tropical depression in the central Atlantic Ocean on September 21st and became atropical storm two days later. Lili brought heavy rains and gusty winds over 70 mph to the southern Windward Islandson September 23rd (139 homes badly damaged and 275,000 people lost electric power in Barbados) before brieflylosing its identity on the 26th. The storm regained intensity and skirted the north coast of Jamaica on the 29th. Lilireached hurricane strength on the 30th, passing near the Cayman Islands and crossing western Cuba on October 1st.Lili was the second hurricane in less than two weeks to strike western Cuba, and it forced the evacuation of thousandsof people. Lili pulled away from the western tip of Cuba and strengthened into a major category 4 hurricane onOctober 2nd, reaching maximum sustained winds of 145 mph in the central Gulf of Mexico. As Lili passed just west ofa moored meteorological buoy (42001) approximately 235 miles south of Buras, LA, a wind gust to 150 mph wasrecorded, along with wave heights of 37 feet! Another buoy along Lili’s path (42041) approximately 145 miles south ofHouma, LA recorded wave heights of 40 feet! Prior to Lili, the highest wind gust ever recorded by a National WeatherService buoy in the Gulf of Mexico was 131 mph (during Hurricane Kate on November 20, 1985) and the highest waveheight ever recorded by a National Weather Service buoy was 35.6 feet on May 24, 1996). Luckily for Louisianaresidents, Lili weakened prior to making landfall along the central coast in Vermillion Bay early on October 3rd.Maximum sustained winds were near 100 mph, or category 2 intensity, as the storm crossed into Vermillion Parish. Thestorm prompted the evacuation of an estimated nearly half-million people as it approached the Louisiana coast. Lili wasthe first landfalling U.S. hurricane since Irene in October 1999, and the preliminary damage estimate to insuredproperty is $170 million in Louisiana.
Please refer to “Hurricane Lili: Educated Evacuation Decision Making” in this issue of “Storm Signals” for somedetails on the impact Lili had on the Upper Texas coast.
Tropical Depression Fourteen formed from a broad area of low pressure in the northwestern Caribbean Sea onOctober 14th. The depression center moved to the north-northeast passing just west of the Cayman Islands. As thesystem approached the south central coast of Cuba, strong southwesterly upper-level shear and dry air entrainmentcaused the system to lose its tropical characteristics. The system was declared non-tropical on the 16th.
2002 Hurricane Season continued2002 Hurricane Season continued2002 Hurricane Season continued2002 Hurricane Season continued2002 Hurricane Season continued
Page 09
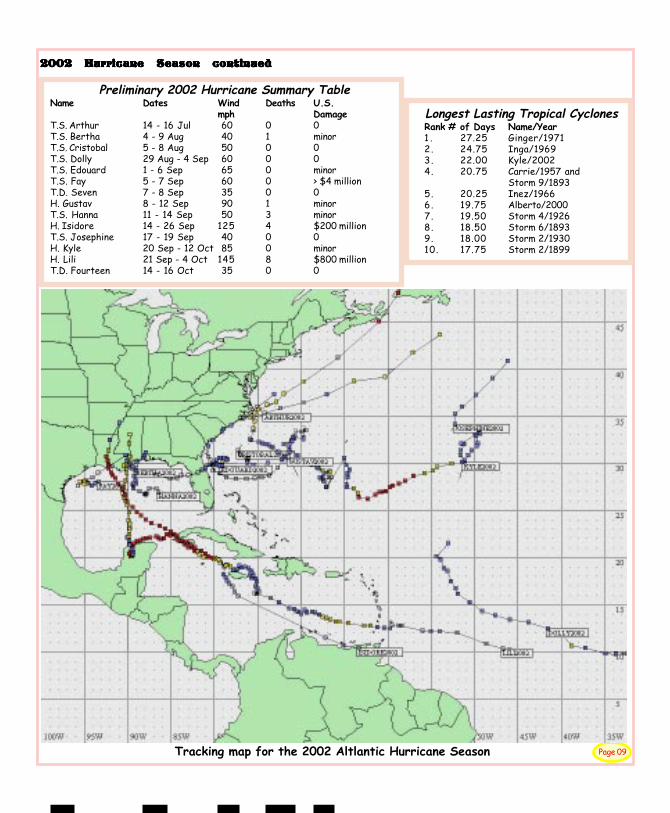
Preliminary 2002 Hurricane Summary TableName Dates Wind Deaths U.S.
mph DamageT.S. Arthur 14 - 16 Jul 60 0 0T.S. Bertha 4 - 9 Aug 40 1 minorT.S. Cristobal 5 - 8 Aug 50 0 0T.S. Dolly 29 Aug - 4 Sep 60 0 0T.S. Edouard 1 - 6 Sep 65 0 minorT.S. Fay 5 - 7 Sep 60 0 > $4 millionT.D. Seven 7 - 8 Sep 35 0 0H. Gustav 8 - 12 Sep 90 1 minorT.S. Hanna 11 - 14 Sep 50 3 minorH. Isidore 14 - 26 Sep 125 4 $200 millionT.S. Josephine 17 - 19 Sep 40 0 0H. Kyle 20 Sep - 12 Oct 85 0 minorH. Lili 21 Sep - 4 Oct 145 8 $800 millionT.D. Fourteen 14 - 16 Oct 35 0 0
Longest Lasting Tropical CyclonesRank # of Days Name/Year1 . 27.25 Ginger/19712. 24.75 Inga/19693. 22.00 Kyle/20024. 20.75 Carrie/1957 and
Storm 9/18935. 20.25 Inez/19666. 19.75 Alberto/20007. 19.50 Storm 4/19268. 18.50 Storm 6/18939. 18.00 Storm 2/193010. 17.75 Storm 2/1899
Tracking map for the 2002 Altlantic Hurricane Season
2002 Hurricane Season continued2002 Hurricane Season continued2002 Hurricane Season continued2002 Hurricane Season continued2002 Hurricane Season continued
Page 10
The Skywarn program was developed by the National Weather Service to train storm spotters to provide specific severeweather event information to the office. With trained storm spotters in the field, meteorologists at the National WeatherService have an eagle-eye view of current weather conditions and how they compare with what appears on radar.Skywarn spotters also enable us to have a severe weather verification program which helps us to improve accuracy onsevere weather warnings.
What is a Skywarn storm spotter?
A storm spotter is a trained volunteer who reports severe weather in his area to local emergency management and lawenforcement officials or the National Weather Service. The reports include hail, high winds, funnel clouds, tornadoes,heavy rainfall, flooding, and wind damage. The storm spotter is not a storm chaser; he usually “spots” close to home orwork. The trained spotter provides eyes in the field and can provide us with severe weather information even at timeswhen the radar data may lack.
How do you become a trained spotter?
Skywarn training classes take place in select southeast Texas counties during the late winter and early spring of eachyear, usually from February to April. The training course is about two hours long, held in the evening, and is open to thegeneral public. At the end of the course, each participant will be given a certificate and a Skywarn emblem for theirvehicle, and information on how to participate in the Skywarn program.
If you are interested in helping the National Weather Service with the valuable cause of severe weather detection, you areencouraged to attend. Even if you attended a course a few years ago, the 2003 course will provide a refresher. Eachyear, the course is updated to account for the changing NWS requirements for severe weather detection, and new stormspotter related material that we have received.
If you are an emergency manager, sheriff, or other public official, and you are interested in scheduling a training class,please contact the Houston/Galveston National Weather Service Office at 281-337-5074.
Starting in December, the NWS Houston/Galveston website at:www.srh.noaa.gov/hgx/severe/skywarn/skywarn03.htm will be updated with more specific information on dates,locations, and times of training classes that will be held in your area.
Skywarn 2003
by Matt Moreland
NWS STORM-READY - Ninety percent of all presidentially declared disasters are weather related,leading to around 500 deaths per year and nearly $14 billion in damage. To help Americans guard againstthe ravages of severe weather, the National Weather Service has designed StormReady, a program aimedat arming America’s communities with the communication and safety skills necessary to save lives andproperty. www.stormready.noaa.gov
When Seconds Count, StormReadyCommunities are Prepared
Page 11
The National Weather Service has begun issuing a Hazardous Weather Outlook. The Hazardous WeatherOutlook is a product that gives a heads up to emergency managers, media, and the general public concerningthe threat of hazardous weather. The Hazardous Weather Outlook will be issued around 7:00 a.m. everymorning summarizing significant weather threats for the following seven days. The product gives a briefdescription of the hazardous weather threats, if any, and when and why these hazards may occur.
Forms of hazardous weather addressed in our Hazardous Weather Outlook include winter weather phenom-enon such as freezing rain, blizzards, heavy snow, severe thunderstorms producing large hail, tornadoes, andflooding rainfall and tropical depressions, tropical storms, and hurricanes. Non-precipitation weather suchas strong winds, fog, extreme heat or cold, and extreme fire dangers will also be addressed in the HazardousWeather Outlook. Marine hazards such as wind induced extreme high or low tides will also be covered in thisproduct.
The Houston/Galveston office began issuing hazardous weather outlooks on a daily basis at the beginning ofOctober. You can hear this product on NOAA Weather Radio or view it on the web at:
www.srh.noaa.gov/data/sat/hwo/sathwohgx.txt
Where Did You Hear That We Are Going To HaveA Tornado Tomorrow!By Kent Prochazka
Rainfall was generally above normal from July through October. Over the last several summers, an upperlevel ridge of high pressure dominated area weather. This feature brought dry conditions and unseasonablyhigh temperatures. This year, the weather patterns shifted somewhat. A split in the upper level highpressure ridge allowed easterly disturbances to push westward around the periphery of the Bermuda highand then slide into Texas. This situation enhanced sea breeze convection and produced higher rainfall totalsacross the region. Strong tropical waves affected the area on July 13-14th and again on August 15th.Tropical Storm Fay moved inland September 6-7th producing another round of heavy rain.
Temperatures across Southeast Texas averaged near normal values. Although average temperatures werenear normal, average high temperatures were actually cooler than normal due to the clouds and above normalrainfall noted above. The clouds which kept daytime temperatures cooler also helped insulate the atmo-sphere at night thus keeping low temperatures above normal. College Station only had two days reach orexceed the century mark while Houston had only one day when the temperature reached the 100 degreethreshold.
LLLLLate Summer Wate Summer Wate Summer Wate Summer Wate Summer WeathereathereathereathereatherClimate SummarClimate SummarClimate SummarClimate SummarClimate Summaryyyyy
By Charles RoeselerBy Charles RoeselerBy Charles RoeselerBy Charles RoeselerBy Charles Roeseler
Page 12
Severe weather was somewhat limited in July and only isolated reports of hail and wind damage werereported. Things changed in August and severe weather occurred at various times of the month. The firstsevere weather occurred on August 3rd. A strong disturbance approached Southeast Texas from the north-east on the 3rd. This feature coupled with afternoon temperatures near 100 degrees triggered widespreadthunderstorms across the area. Tree, powerlines and billboards were blown down by strong winds. Therewere two fatalities on this day, one person was killed by lightning and another person killed when a tree fellon a vehicle. There were also several people injured when high winds overturned a mobile home. On August15th, a large thunderstorm complex developed over the region and remained nearly stationary. Very heavyrain fell over Brazoria, Galveston and Harris counties. The city of Galveston received in excess of 11inches of rain on that day. This is a new 24 hour rainfall record for the day and for the month of August.Other parts of the region received between 5 and 10 inches of rain for the day. Widespread flooding wasreported over much of the region.
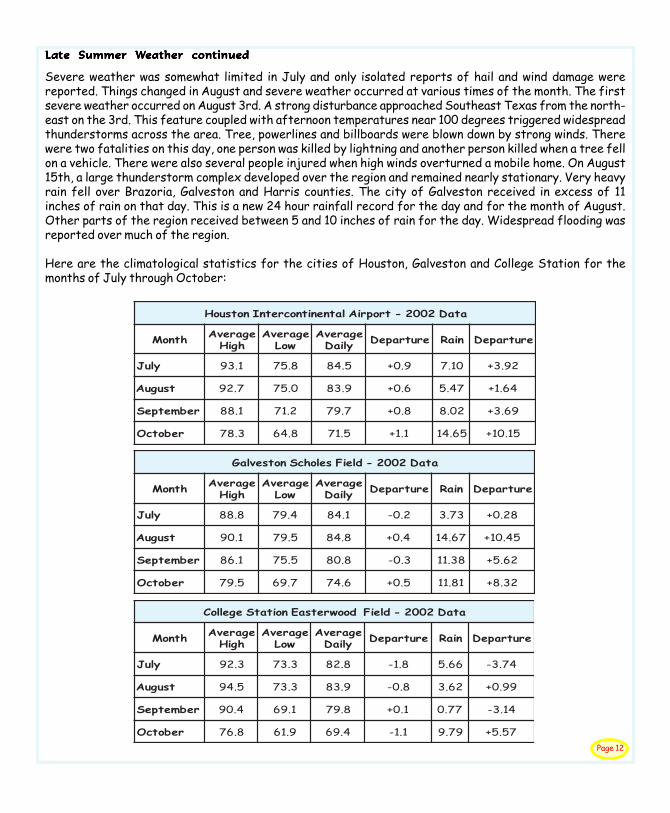
Here are the climatological statistics for the cities of Houston, Galveston and College Station for themonths of July through October:
ataD2002-tropriAlatnenitnocretnInotsuoH
htnoM egarevAhgiH
egarevAwoL
egarevAyliaD erutrapeD niaR erutrapeD
yluJ 1.39 8.57 5.48 9.0+ 01.7 29.3+
tsuguA 7.29 0.57 9.38 6.0+ 74.5 46.1+
rebmetpeS 1.88 2.17 7.97 8.0+ 20.8 96.3+
rebotcO 3.87 8.46 5.17 1.1+ 56.41 51.01+
ataD2002-dleiFselohcSnotsevlaG
htnoM egarevAhgiH
egarevAwoL
egarevAyliaD erutrapeD niaR erutrapeD
yluJ 8.88 4.97 1.48 2.0- 37.3 82.0+
tsuguA 1.09 5.97 8.48 4.0+ 76.41 54.01+
rebmetpeS 1.68 5.57 8.08 3.0- 83.11 26.5+
rebotcO 5.97 7.96 6.47 5.0+ 18.11 23.8+
ataD2002-dleiFdoowretsaEnoitatSegelloC
htnoM egarevAhgiH
egarevAwoL
egarevAyliaD erutrapeD niaR erutrapeD
yluJ 3.29 3.37 8.28 8.1- 66.5 47.3-
tsuguA 5.49 3.37 9.38 8.0- 26.3 99.0+
rebmetpeS 4.09 1.96 8.97 1.0+ 77.0 41.3-
rebotcO 8.67 9.16 4.96 1.1- 97.9 75.5+
LLLLLate Summer Wate Summer Wate Summer Wate Summer Wate Summer Weather continuedeather continuedeather continuedeather continuedeather continued
Page 13
The Houston Local Chapter of the American Meteorological Society is dedicated to the devel-opment and dissemination of the knowledge of meteorology as well as the space and earthsciences. Our members include meteorologists from both the public and private sector, broadcast meteorologist,emergency management officials, amateur radio operators and just plain weather enthusiasts. Each year we try toappeal to our broad member community with wide ranging topics from weather impacts on sailboat racing, discus-sions on lightning safety and global warming, to weather photography taken from the space shuttle. Meetingsnormally take place once a month at a local restaurant at various locations throughout the Houston area.
There are several activities that have become annual events for our chapter such as judging the Houston RegionalScience Fair and traveling to Texas A&M University to present a career fair to members of the TAMSCAMS localstudent chapter. This year among our other activities we will be working closely with the Houston Children’s Museumon a project call Magic School Bus. The Houston Children’s Museum received a grant to develop a Magic School Buson Meteorology that will travel to Children’s Museums across the country. The exhibit will open in late January inHouston and our chapter plans to have some of our members participate in the exhibit.
We have had a great start to the 2002-2003 year. In September Dr. Nielsen-Gammon, from Texas A&M University,made a presentation on his work on the meteorological influence on air quality in Houston. In October, SherWagoner, Research Coordinator, Colorado State University Cooperative Institute for Research In the Atmosphere(C.I.R.A.), spoke on her work dealing with using GPS Meteorology as a Weather Forecasting Tool. In November, wevisited the Air Route Traffic Control Center near Intercontinental Airport to discuss how weather affects theairlines and who provides that weather support. In December, we plan to have an evening out in Galveston. Themeeting will be at the Galveston County Historical Museum where we will hear about “Winters in Galveston”.
We have a web site at www.houstonams.org. Check it out whether you are interested in joining our chapter or justwant to see what events we have planned. Whether you are working in the field of meteorology or you are just aweather buff, everyone is welcome!
Houston AMS
Gene HafelePresident 2002-2003
Good-Bye, Old Friend...Good-Bye, Old Friend...Good-Bye, Old Friend...Good-Bye, Old Friend...Good-Bye, Old Friend...
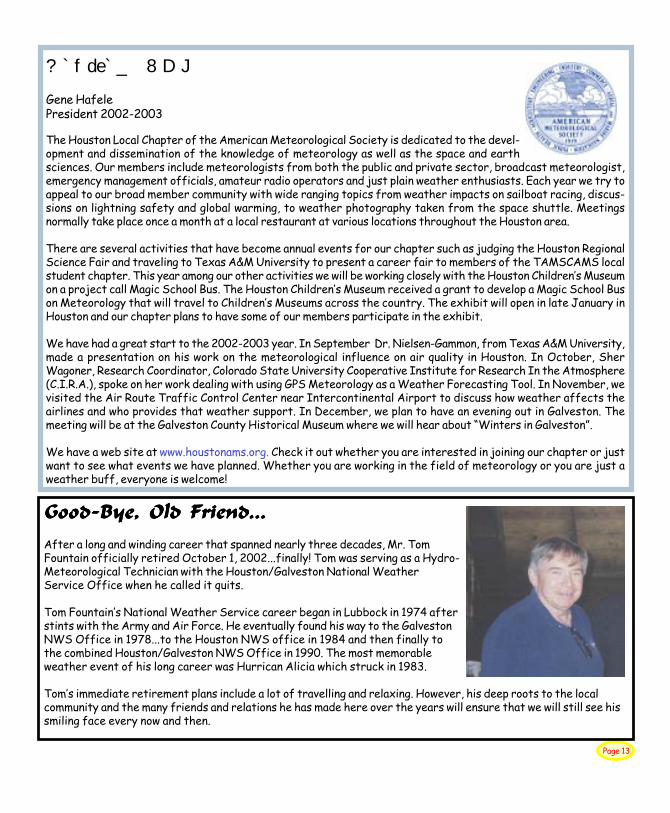
After a long and winding career that spanned nearly three decades, Mr. TomFountain officially retired October 1, 2002...finally! Tom was serving as a Hydro-Meteorological Technician with the Houston/Galveston National WeatherService Office when he called it quits.
Tom Fountain’s National Weather Service career began in Lubbock in 1974 afterstints with the Army and Air Force. He eventually found his way to the GalvestonNWS Office in 1978...to the Houston NWS office in 1984 and then finally tothe combined Houston/Galveston NWS Office in 1990. The most memorableweather event of his long career was Hurrican Alicia which struck in 1983.
Tom’s immediate retirement plans include a lot of travelling and relaxing. However, his deep roots to the localcommunity and the many friends and relations he has made here over the years will ensure that we will still see hissmiling face every now and then.
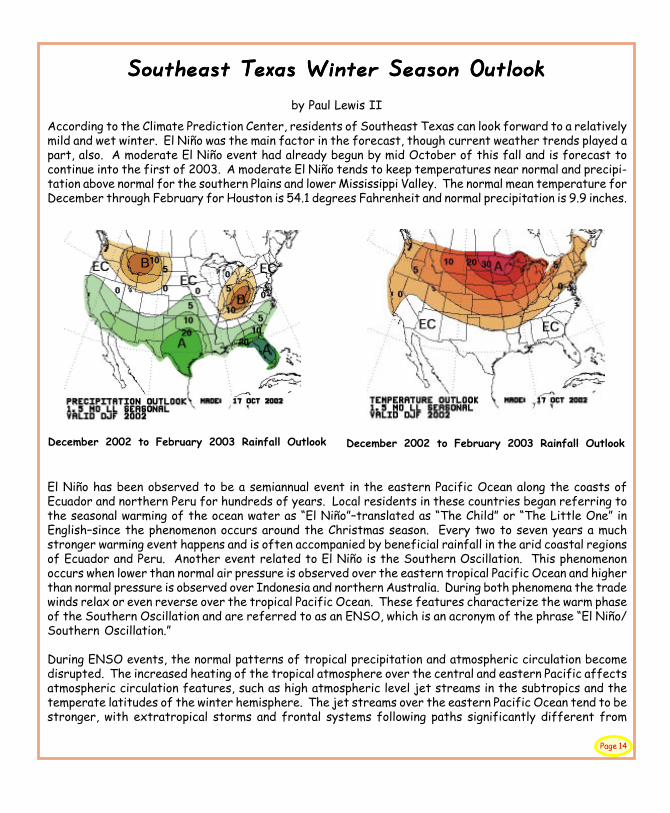
According to the Climate Prediction Center, residents of Southeast Texas can look forward to a relativelymild and wet winter. El Niño was the main factor in the forecast, though current weather trends played apart, also. A moderate El Niño event had already begun by mid October of this fall and is forecast tocontinue into the first of 2003. A moderate El Niño tends to keep temperatures near normal and precipi-tation above normal for the southern Plains and lower Mississippi Valley. The normal mean temperature forDecember through February for Houston is 54.1 degrees Fahrenheit and normal precipitation is 9.9 inches.
El Niño has been observed to be a semiannual event in the eastern Pacific Ocean along the coasts ofEcuador and northern Peru for hundreds of years. Local residents in these countries began referring tothe seasonal warming of the ocean water as “El Niño”–translated as “The Child” or “The Little One” inEnglish–since the phenomenon occurs around the Christmas season. Every two to seven years a muchstronger warming event happens and is often accompanied by beneficial rainfall in the arid coastal regionsof Ecuador and Peru. Another event related to El Niño is the Southern Oscillation. This phenomenonoccurs when lower than normal air pressure is observed over the eastern tropical Pacific Ocean and higherthan normal pressure is observed over Indonesia and northern Australia. During both phenomena the tradewinds relax or even reverse over the tropical Pacific Ocean. These features characterize the warm phaseof the Southern Oscillation and are referred to as an ENSO, which is an acronym of the phrase “El Niño/Southern Oscillation.”
During ENSO events, the normal patterns of tropical precipitation and atmospheric circulation becomedisrupted. The increased heating of the tropical atmosphere over the central and eastern Pacific affectsatmospheric circulation features, such as high atmospheric level jet streams in the subtropics and thetemperate latitudes of the winter hemisphere. The jet streams over the eastern Pacific Ocean tend to bestronger, with extratropical storms and frontal systems following paths significantly different from
December 2002 to February 2003 Rainfall Outlook
Page 14
December 2002 to February 2003 Rainfall Outlook
Southeast TSoutheast TSoutheast TSoutheast TSoutheast Teeeeexxxxxas Was Was Was Was Winininininttttter Season Oer Season Oer Season Oer Season Oer Season Outlutlutlutlutlookookookookookby Paul Lewis II
Southeast TSoutheast TSoutheast TSoutheast TSoutheast Teeeeexxxxxas Was Was Was Was Winininininttttter Season Oer Season Oer Season Oer Season Oer Season Outlutlutlutlutlook conook conook conook conook contttttinuinuinuinuinuededededed
Page 15
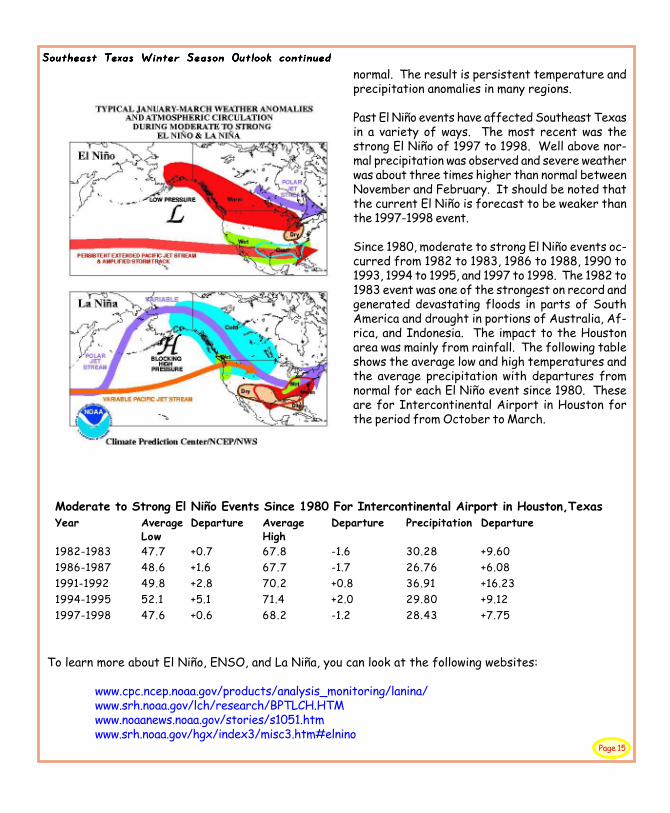
normal. The result is persistent temperature andprecipitation anomalies in many regions.
Past El Niño events have affected Southeast Texasin a variety of ways. The most recent was thestrong El Niño of 1997 to 1998. Well above nor-mal precipitation was observed and severe weatherwas about three times higher than normal betweenNovember and February. It should be noted thatthe current El Niño is forecast to be weaker thanthe 1997-1998 event.
Since 1980, moderate to strong El Niño events oc-curred from 1982 to 1983, 1986 to 1988, 1990 to1993, 1994 to 1995, and 1997 to 1998. The 1982 to1983 event was one of the strongest on record andgenerated devastating floods in parts of SouthAmerica and drought in portions of Australia, Af-rica, and Indonesia. The impact to the Houstonarea was mainly from rainfall. The following tableshows the average low and high temperatures andthe average precipitation with departures fromnormal for each El Niño event since 1980. Theseare for Intercontinental Airport in Houston forthe period from October to March.
Moderate to Strong El Niño Events Since 1980 For Intercontinental Airport in Houston,TexasYear Average Departure Average Departure Precipitation Departure
Low High1982-1983 47.7 +0.7 67.8 -1.6 30.28 +9.601986-1987 48.6 +1.6 67.7 -1.7 26.76 +6.081991-1992 49.8 +2.8 70.2 +0.8 36.91 +16.231994-1995 52.1 +5.1 71.4 +2.0 29.80 +9.121997-1998 47.6 +0.6 68.2 -1.2 28.43 +7.75
To learn more about El Niño, ENSO, and La Niña, you can look at the following websites:
www.cpc.ncep.noaa.gov/products/analysis_monitoring/lanina/www.srh.noaa.gov/lch/research/BPTLCH.HTMwww.noaanews.noaa.gov/stories/s1051.htmwww.srh.noaa.gov/hgx/index3/misc3.htm#elnino
Storm Signals is a Quarterly Publication of theHouston/Galveston
National Weather Service Office
Bill Read - Meteorologist In ChargeGene Hafele - Warning Coordination Meteorologist
Josh Lichter / Kim Mikesell - Editors
Phone: 281-337-5074Fax: 281-337-3798
www.srh.noaa.gov/hgx
Houston/GalvestonNational Weather Service
1620 Gill RoadDickinson, TX 77539