vertical transport evacuation modelling - CORE
437
VERTICAL TRANSPORT EVACUATION MODELLING MICHAEL JON KINSEY A thesis submitted in partial fulfilment of the requirements of the University of Greenwich for the degree of Doctor of Philosophy September 2011
-
Upload
khangminh22 -
Category
Documents
-
view
1 -
download
0
Transcript of vertical transport evacuation modelling - CORE

VERTICAL TRANSPORT
EVACUATION MODELLING
MICHAEL JON KINSEY
A thesis submitted in partial fulfilment of the
requirements of the University of Greenwich
for the degree of Doctor of Philosophy
September 2011

ii
DECLARATION
I, Michael Kinsey, certify that this work has not been accepted in substance for any degree, and
is not concurrently being submitted for any degree other than that of the Doctor of Philosophy
(PhD) being studied at the University of Greenwich. I also declare that this work is the result of
my own investigations except where otherwise identified by references and that I have not
plagiarised the work of others.
Signature
Printed name
Date
Student
...........................................................
Michael Kinsey
....................
First
Supervisor
...........................................................
Prof Edwin Galea
....................
Second
Supervisor
........................................................... Dr Peter Lawrence ....................

iii
ACKNOWLEDGEMENTS
First and foremost I would to thank my supervisors for their guidance and inspiration throughout
the course of this thesis. Specifically I would like to thank Prof Ed Galea for allowing me to
embark on a PhD (again!), his general advice and patience. I would like to thank Dr Peter
Lawrence for his constant support, providing coding assistance for development within
buildingEXODUS, and the 'therapy sessions‟ when things were not going according to plan.
In addition there are a number of other individuals/groups without which it would not have been
possible to complete the presented work, this includes:
- the Engineering and Physical Sciences Research Council (EPSRC) for providing funding for
my PhD candidate position,
- the University of Greenwich Research Ethics Committee for approving the human factors
surveys,
- Roderic Jones and James Daniel of Kingfell Ltd for organising/assisting with the collection
of escalator video footage in the London Underground,
- Dr Jun Chi Ma and Dr Han Xin from the Shanghai Institute of Disaster Prevention and Relief
(Tong Ji University, China) for organising/assisting with the collection of escalator video
footage in the Shanghai Metro,
- my family and friends for providing support and restraining from asking me "when are you
going to get a real job?" too often,
- the 'Lunch Club' (Angus Grandison, John Ewer, Darren Blackshields, Lynn Hulse and
Rachel Day) who provided invaluable guidance and midday humour,
- Aoife Hunt for proof reading various sections of the thesis,
- everyone in the Fire Safety Engineering Group (FSEG) at the University of Greenwich who
has given advice or general support over the course of this work.

iv
PUBLICATION NOTES
The work produced as part of this thesis has been published in various literature including
journals and conference proceedings. The list of these publications along with associated thesis
chapters can be seen in Table 1 below. A copy of the papers can be found in Appendix A7.1.
Table 1: Thesis publication list with associated chapters
# Publications Chapter(s)
1
Kinsey, M.J, Galea, E.R, Lawrence, P.J, (2008), „Modelling
Pedestrian Escalator Behaviour‟, Proceedings of the Pedestrian and
Evacuation Dynamics Conference, pp689-696.
Chapter 7
Chapter 8
2
Kinsey, M.J, Galea, E.R, Lawrence, P.J, (2009), „Investigating the
Use of Elevators for High rise Building Evacuation through
Computer Simulation‟, Proceedings of the Human Behaviour in
Fire Conference, pp85-96.
Chapter 5
Chapter 6
3
Kinsey, M.J, Galea, E.R, Lawrence, P.J, (2009), „Extended Model
of Pedestrian Escalator Behaviour Based on Data Collected within
a Chinese Underground Station‟, Proceedings of the Human
Behaviour in Fire Conference, pp173-182.
Chapter 7
Chapter 8
4
Kinsey, M.J, Galea, E.R, Lawrence, P.J, (2010), „Stairs or Lifts? –
A study of Human Factors associated with Lift/Elevator usage
during Evacuations using an online Survey‟, Proceedings of the
Pedestrian and Evacuation Dynamics Conference.
Chapter 4
5
Kinsey, M.J, Galea, E.R, Lawrence, P.J, (2010), „Human Factors
Associated with the Selection of Lifts/Elevators or Stairs in
Emergency and Normal Usage Conditions‟, Fire Technology, DOI:
10.1007/s10694-010-0176-7.
Chapter 4
6
Kinsey, M.J, Galea, E.R, Lawrence, P.J, (2011), „Investigating
Evacuation Lift Dispatch Strategies using Computer Modelling‟,
Fire and Materials, DOI: 10.1002/fam.1086.
Chapter 5
Chapter 6
v
ABSTRACT
Within any high-rise structure or underground/subway station, occupants often heavily rely on
vertical transport devices (e.g. escalators, lifts, etc) to travel vertically between levels. Typically
such devices provide a faster and more comfortable means to travel than the equivalent stairs.
Such devices also provide an additional means for occupant egress. However, the provision for
utilising such devices in actual buildings for evacuations is rare. Despite a select number of
structures throughout the world allowing the use of vertical transport devices within evacuation
scenarios, little is understood with regards to evacuation vertical transport strategies and to what
extent such strategies may be influenced by associated human factors. This thesis is intended to
address this lack of understanding.
The thesis provides an in depth review of evacuation usage of vertical transport devices in actual
evacuations, their provision in building codes, empirical studies analysing human factors,
representation within simulated environments, and analysis of previously explored operational
strategies. The review provides a broad set of research questions that the thesis is intended to
address. Human factors data associated with vertical transport device usage have been collected
via an online survey and video analysis. The data analysis has instructed the development of the
vertical transport device models and associated agent models within the buildingEXODUS
evacuation software. The models include the representation of device selection, the influence of
local conditions in close proximity to a device, and the influence of wait time upon device
selection. The developed models have been used to demonstrate the influence of different
vertical transport strategies and to what extent such strategies are influenced by human factors.
Finally, the thesis concludes by summarising the increased understanding achieved through the
work presented.

vi
CONTENTS
DECLARATION ..........................................................................................................................II
ACKNOWLEDGEMENTS ....................................................................................................... III
PUBLICATION NOTES ........................................................................................................... IV
ABSTRACT .................................................................................................................................. V
CONTENTS ................................................................................................................................ VI
FIGURES .................................................................................................................................... XI
TABLES ..................................................................................................................................... XV
CHAPTER 1 - INTRODUCTION ............................................................................................... 1
1.1 Introduction ....................................................................................................................... 1
1.2 Research motivations ........................................................................................................ 1
1.3 Research objectives and thesis outline .............................................................................. 4
1.4 Research contributions ...................................................................................................... 9
CHAPTER 2 - LITERATURE REVIEW ................................................................................. 11
2.1 Introduction ..................................................................................................................... 11
2.2 Evacuation lifts ............................................................................................................... 11
2.2.1 Lift usage during evacuations .................................................................................. 12
2.2.2 Evacuation lifts for the general population - codes, standards and guidelines ........ 25
2.2.3 Evacuation lift human factors - empirical and qualitative data ............................... 29
2.2.4 Review of software modelling lifts ......................................................................... 37
2.2.5 Evacuation lift strategies and simulation results ..................................................... 46
2.2.6 Summary .................................................................................................................. 50
2.3 Evacuation escalators ...................................................................................................... 52
2.3.1 Escalator usage during evacuations ......................................................................... 53
2.3.2 Evacuation escalators - codes, standards and guidelines ......................................... 59
2.3.3 Escalator human factors - empirical data ................................................................ 62
2.3.4 Review of software modelling escalators ................................................................ 85
2.3.5 Escalator evacuation strategies and simulation results ............................................ 88
2.3.6 Summary .................................................................................................................. 93
2.4 Concluding remarks ........................................................................................................ 95
CHAPTER 3 - THE BUILDINGEXODUS EVACUATION SOFTWARE ........................... 97
3.1 Introduction ..................................................................................................................... 97

vii
3.2 Model overview .............................................................................................................. 97
3.3 Spatial representation within buildingEXODUS ............................................................ 98
3.4 Occupant behaviour ........................................................................................................ 99
3.5 Current limitations of buildingEXODUS for modelling lifts/escalators ...................... 102
3.6 Concluding remarks ...................................................................................................... 104
CHAPTER 4 - EVACUATION LIFT HUMAN FACTORS ................................................. 105
4.1 Introduction ................................................................................................................... 105
4.2 Survey methodology ..................................................................................................... 105
4.3 Survey description ........................................................................................................ 105
4.4 Limitations of the survey .............................................................................................. 107
4.5 Participant demographic overview ............................................................................... 108
4.6 Results ........................................................................................................................... 110
4.6.1 Circulation ............................................................................................................. 110
4.6.2 Evacuation ............................................................................................................. 114
4.6.3 Demographic break down ...................................................................................... 121
4.6.4 Comparison with other studies .............................................................................. 122
4.7 Concluding remarks ...................................................................................................... 124
CHAPTER 5 - EVACUATION LIFT MODEL ..................................................................... 126
5.1 Introduction ................................................................................................................... 126
5.2 Lift model ..................................................................................................................... 126
5.2.1 Lift shaft ................................................................................................................ 127
5.2.2 Lift car ................................................................................................................... 127
5.2.3 Lift motion controls ............................................................................................... 128
5.2.4 Lift door controls ................................................................................................... 129
5.2.5 Lift kinematics ....................................................................................................... 129
5.3 Agent lift model ............................................................................................................ 131
5.3.1 Lift/Stair choice ..................................................................................................... 134
5.3.2 Lift congestion redirection..................................................................................... 135
5.3.3 Missed lift redirection ............................................................................................ 138
5.3.4 Lift wait location selection .................................................................................... 138
5.3.5 Lift wait time redirection ....................................................................................... 138
5.3.6 Open lift selection .................................................................................................. 139
5.3.7 Stair redirection ..................................................................................................... 139
5.3.8 Additional agent attributes..................................................................................... 140
5.4 Concluding remarks ...................................................................................................... 140
CHAPTER 6 - CASE STUDY: FULL BUILDING LIFT EVACUATION ......................... 142
6.1 Introduction ................................................................................................................... 142

viii
6.2 Geometry ...................................................................................................................... 142
6.3 Lift attributes ................................................................................................................. 143
6.4 Population ..................................................................................................................... 144
6.5 Scenarios ....................................................................................................................... 144
6.6 Results ........................................................................................................................... 146
6.6.1 Simplified Lift Agent Model (SLAM) .................................................................. 146
6.6.2 Advanced Lift Agent Model (ALAM) .................................................................. 152
6.6.3 Comparison of the SLAM and ALAM scenarios .................................................. 159
6.7 Concluding remarks ...................................................................................................... 163
CHAPTER 7 - ESCALATOR HUMAN FACTORS .............................................................. 166
7.1 Introduction ................................................................................................................... 166
7.2 Definitions and methodology ........................................................................................ 166
7.2.1 Escalator/Stair usage.............................................................................................. 167
7.2.2 Walker/Rider usage ............................................................................................... 167
7.2.3 Side usage .............................................................................................................. 167
7.2.4 Walker speeds ........................................................................................................ 168
7.2.5 Flow-rates .............................................................................................................. 169
7.3 Analysis of Spanish data ............................................................................................... 169
7.3.1 Escalator/Stair usage.............................................................................................. 173
7.3.2 Walker/Rider usage ............................................................................................... 174
7.3.3 Side usage .............................................................................................................. 175
7.3.4 Walker speeds ........................................................................................................ 177
7.3.5 Flow-rates .............................................................................................................. 179
7.4 Analysis of Chinese data ............................................................................................... 181
7.4.1 Escalator/Stair usage.............................................................................................. 185
7.4.2 Walker/Rider usage ............................................................................................... 191
7.4.3 Side usage .............................................................................................................. 191
7.4.4 Walker speeds ........................................................................................................ 192
7.4.5 Flow-rates .............................................................................................................. 193
7.5 Analysis of English data ............................................................................................... 194
7.5.1 Escalator/Stair usage.............................................................................................. 199
7.5.2 Walker/Rider usage ............................................................................................... 200
7.5.3 Side usage .............................................................................................................. 202
7.5.4 Walker speeds ........................................................................................................ 205
7.5.5 Flow-rates .............................................................................................................. 207
7.6 Comparison of Spanish, Chinese and English data ...................................................... 210
7.6.1 Escalator/Stair usage.............................................................................................. 213
7.6.2 Walker/Rider usage ............................................................................................... 215
ix
7.6.3 Side usage .............................................................................................................. 215
7.6.4 Walker speeds ........................................................................................................ 216
7.6.5 Flow-rates .............................................................................................................. 217
7.7 Comparison with other studies ..................................................................................... 218
7.7.1 Escalator/Stair usage.............................................................................................. 218
7.7.2 Walker/Rider usage ............................................................................................... 219
7.7.3 Walker speeds ........................................................................................................ 221
7.7.4 Flow-rates .............................................................................................................. 222
7.8 Concluding remarks ...................................................................................................... 223
CHAPTER 8 - EVACUATION ESCALATOR MODEL ...................................................... 226
8.1 Introduction ................................................................................................................... 226
8.2 Physical escalator .......................................................................................................... 226
8.3 Escalator agent model ................................................................................................... 227
8.3.1 Device choice ........................................................................................................ 230
8.3.2 Walker/Rider choice .............................................................................................. 233
8.3.3 Side preference ...................................................................................................... 234
8.3.4 Walker speeds ........................................................................................................ 234
8.3.5 Flow-rates .............................................................................................................. 234
8.4 Concluding remarks ...................................................................................................... 235
CHAPTER 9 - CASE STUDY: UNDERGROUND STATION ESCALATOR
EVACUATION .......................................................................................................................... 237
9.1 Introduction ................................................................................................................... 237
9.2 Geometry ...................................................................................................................... 237
9.3 Population ..................................................................................................................... 240
9.4 Scenarios ....................................................................................................................... 243
9.5 Results ........................................................................................................................... 245
CHAPTER 10 - CONCLUSIONS ............................................................................................ 251
10.1 Future work ............................................................................................................... 256
REFERENCES AND BIBLIOGRAPHY ................................................................................ 261
APPENDIX ................................................................................................................................ 268
A1.1 Online Survey ................................................................................................................. 268
A1.1.1 Participant Consent Form ........................................................................................ 268
A1.1.2 Circulation Section – The Scenarios........................................................................ 269
A1.1.3 Circulation Section – The Questions ....................................................................... 270
A1.1.4 Evacuation Section – The Scenario ......................................................................... 272
A1.1.5 Evacuation Section – The Questions ....................................................................... 272

x
A1.1.6 Person Details Section - The Questions .................................................................. 276
A2.1 Online survey - University of Greenwich Research Ethics Committee Acceptance Letter
................................................................................................................................................. 281
A3.1 Online Survey – Participant cross-demographic analysis .............................................. 282
A3.2 Online Survey – Evacuation questions Q4A-Q4E – demographic analysis ................... 285
Cross-demographic frequencies .............................................................................................. 285
A4.1 Lift Kinematic Derivation Formula ................................................................................ 307
A5.1 Verification Test Results– Lift and Agent Lift Model ................................................... 315
A5.1.1 Verification geometry .............................................................................................. 315
A5.1.2 Verification population ............................................................................................ 316
A5.1.3 Verification lift attributes ........................................................................................ 316
A5.1.4 Verification test – Lift kinematics ........................................................................... 317
A5.1.5 Verification test – Lift motion control verification ................................................. 321
A5.1.6 Verification test – Agent lift/stair choice................................................................. 322
A5.1.7 Verification test – Lift wait area congestion redirection ......................................... 324
A5.1.8 Verification test – Missed lift redirection ................................................................ 326
A5.1.9 Verification test – Lift wait location selection ........................................................ 328
A5.1.10 Verification test – Lift wait time redirection ......................................................... 330
A5.1.11 Verification test – Open lift selection .................................................................... 332
A5.1.12 Verification test – Lift redirection to stairs............................................................ 334
A6.1 Verification Test Results– Agent Escalator Model ........................................................ 336
A6.1.1 Verification geometry .............................................................................................. 336
A6.1.2 Verification population ............................................................................................ 338
A6.1.3 Verification test – device choice.............................................................................. 339
A6.1.4 Verification test – walker/rider choice .................................................................... 344
A6.1.5 Verification test – side preference ........................................................................... 345
A6.1.6 Verification test – side preference ........................................................................... 345
A6.1.7 Verification test – flow-rate ..................................................................................... 346
A7.1 Published papers from thesis .......................................................................................... 348

xi
FIGURES
Figure 1: Average height of the 100 tallest buildings in the world [CTBUH, 2010] ...................... 2
Figure 2: Research objectives and associated thesis chapters ......................................................... 8
Figure 3: Selected Means of egress by floor [Sekizawa, et al., 1999]........................................... 18
Figure 4: Reasons given for evacuation choice for those that used the lifts/stairs to evacuate
[Heyes, 2009] ................................................................................................................................ 24
Figure 5: Percentage of occupants to use the lift by floor level [Heyes and Spearpoint, 2009] ... 32
Figure 6: Percentage of people that will use the lift after waiting time [Heyes and Spearpoint,
2009] .............................................................................................................................................. 34
Figure 7: Percentage of respondents that would take the lift over floor level as a function of
waiting [Heyes and Spearpoint, 2009] .......................................................................................... 35
Figure 8: World Trade Center - WTC1/WTC2 simplified exit and lower level layout ................ 54
Figure 9: World Trade Centre (WTC2) - Photo taken by evacuees of mezzanine/plaza escalators
....................................................................................................................................................... 56
Figure 10: Regression plots for the proportion of escalator users given the travel time differences
between escalator/stair ................................................................................................................... 65
Figure 11: Human ellipse with human buffer zone and escalator tread [Al-Sharif, 1996] ........... 70
Figure 12: Graph showing maximum up flow-rates (for walkers and riders combined) verses
escalator height (rise) [Davis and Dutta, 2002] ............................................................................. 74
Figure 13: Maximum up flow-rate (for walkers and riders separated) verses escalator height
(rise) [Davis and Dutta, 2002] ....................................................................................................... 74
Figure 14: Flow-rate (for walkers, riders and combined) for each station [Davis and Dutta, 2002]
....................................................................................................................................................... 76
Figure 15: Proportion of walkers using up escalators ................................................................... 78
Figure 16: Average walking speed of 39 participants: Single and in a Crowd [Kadokura, et al.,
2009] .............................................................................................................................................. 82
Figure 17: Evacuation Scenarios and fire location [Kadokura, et al., 2009] ................................. 90
Figure 18: Simulation Results - Evacuation Rates [Zhong, et al., 2008] ...................................... 93
Figure 19: buildingEXODUS Conceptual Framework ................................................................. 98
Figure 20: Spatial representation within buildingEXODUS (Nodes, Arcs, Transit nodes, Door) 99
Figure 21: Packed and Staggered occupant behaviour on stairs ................................................. 100
Figure 22: Example of buildingEXODUS implicit lift representation ........................................ 103
Figure 23: Summary of participant demographic information .................................................... 109
Figure 24: Minimum proportion of lift users for a given travel distance (number of floors) in the
up and down direction for the three scenarios ............................................................................. 113

xii
Figure 25: Different Crowd Levels in Lift waiting area .............................................................. 116
Figure 26: Proportion of Participants that would consider using a lift/stair for each floor range if
they were familiar with a building ............................................................................................... 117
Figure 27: Proportion of Participants that would consider using a lift for each floor if they were
familiar with a building ............................................................................................................... 118
Figure 28: Frequency distribution and Cumulative frequency distribution of wait times for each
floor range if participants were familiar with the building .......................................................... 120
Figure 29: Proportion of Participants that would consider using a lift/stair for each floor range if
participants were unfamiliar with a building ............................................................................... 121
Figure 30: Proportion of participants that would consider/used a lift in the down direction for
Heyes‟s Surveys [Heyes, 2009], Hiroshim Motomachi fire [Sekizawa, et al., 1999], CIBSE
Guide D [CIBSE, 2000], the Online Survey –Evacuation/Circulation (base case down) ........... 123
Figure 31: Sample lift model script file ....................................................................................... 126
Figure 32: Transit node lift shaft example................................................................................... 127
Figure 33: Three types of journey a lift can make with respect to jerk, acceleration and maximum
speed [Peters, 1996] ..................................................................................................................... 131
Figure 34: Advanced Agent lift Model - Key Decision Points ................................................... 132
Figure 35: Flow Chart showing key components of the lift agent model and associated chapter
sections ........................................................................................................................................ 134
Figure 36: Sequence of views from buildingEXODUS of high-rise building lift evacuation, (a),
(b) and (c) depicting 3D virtual reality view and (c) depicting two dimensional view ............... 143
Figure 37: Simplified lift agent model simulation results - Average Lift Wait Time (LWT) of
agents who initially start on each floor and use a lift .................................................................. 148
Figure 38: Simplified lift agent model simulation results - Number of people evacuated against
time (sec) for each scenario ......................................................................................................... 148
Figure 40: Advanced lift agent model simulation results - Overall Proportion of agent that used
the stairs, lifts and redirected from the lifts to the stairs due to wait time expiration or congestion
in the lift waiting area .................................................................................................................. 154
Figure 41: Advanced lift agent model simulation results - Proportion of lift agent types according
to floor height .............................................................................................................................. 155
Figure 42: Advanced lift agent model simulation results for each scenario- Number of people
evacuated against time (sec), floor clearance times, and average lift wait time (LWT) of agents
who initially start on each floor and use a lift ............................................................................. 157
Figure 43: Boarding/Alighting time examples ............................................................................ 168

xiii
Figure 44: Spanish Data - The location of the two escalators and camera positions (diagram not
to scale) ........................................................................................................................................ 170
Figure 45: Spanish Data - Escalator (a) and Staircase (b) dimensions ........................................ 171
Figure 46: Spanish Data - Horizontal escalator walker speed frequency distribution (combined
for direction, time period and gender) ......................................................................................... 178
Figure 47: Spanish Data - Rush-hour up: peak flow-rate (highlighted by the red circle) with
corresponding proportion of males/females, walkers/riders, and side usage (highlighted by the
red arrows) ................................................................................................................................... 180
Figure 48: Spanish Data - Rush-hour down: peak flow-rate (highlighted by the red circle) with
corresponding proportion of males/females, walkers/riders, and side usage (highlighted by the
red arrows) ................................................................................................................................... 181
Figure 49: Chinese Data - The location of each camera for each escalator (each escalator/stair
configuration was identical) (diagram not to scale) .................................................................... 183
Figure 50: Chinese Data - Escalator (a) and Staircase (b) dimensions ....................................... 184
Figure 51: Chinese Data - Measured area of where congestion is defined (diagram not to scale)
..................................................................................................................................................... 186
Figure 52: Chinese Data – Rush-hour, platform level: Video screen grab of area where
congestion is defined ................................................................................................................... 187
Figure 53: Chinese Data - Instances of peoples‟ height which cause problems when counting
people in the given area ............................................................................................................... 188
Figure 54: Chinese Data - Different levels of congestion ........................................................... 188
Figure 55: Chinese Data - Horizontal escalator walker speed frequency distribution (combined
gender and time period) ............................................................................................................... 193
Figure 56: Chinese Data - Non-rush hour up: peak flow-rates (highlighted by the red circles)
with corresponding proportion of males/females, walkers/riders, side usage (highlighted by the
red arrows) ................................................................................................................................... 194
Figure 57: English Data - The location of each camera for each escalator/stair (diagram not to
scale) ............................................................................................................................................ 196
Figure 58: English Data - Escalator and Stair dimensions .......................................................... 197
Figure 59: English Data - Horizontal escalator walker speed frequency distribution (combined
for direction and gender) ............................................................................................................. 206
Figure 60: English Data - Day 2, Morning up: peak flow-rate (highlighted by the red circle) with
corresponding proportion of males/females, walkers/riders, side usage, and luggage types
(highlighted by the red arrows) ................................................................................................... 209

xiv
Figure 61: English Data - Day 2, morning, down: peak flow-rate (highlighted by the red circle)
with corresponding proportion of males/females, walkers/riders, side usage, and luggage types
(highlighted by the red arrows) ................................................................................................... 210
Figure 62: Escalator/Stair dimensions for each dataset ............................................................... 211
Figure 63: Proportion of walkers using up escalators by Davis and Dutta [Davis and Dutta, 2002]
..................................................................................................................................................... 220
Figure 64: Escalator transit node within buildingEXODUS [Galea, et al., 2006b] .................... 227
Figure 65: Escalator Agent Model - Key Decision Points: 1- Device Choice, 2- Escalator
behaviour ..................................................................................................................................... 228
Figure 66: Flow chart showing key components of the escalator agent model and associated
chapter sections............................................................................................................................ 229
Figure 67: Escalator and stair transit node group with catchment area displayed (red circles). . 230
Figure 68: Shortest time system diagram .................................................................................... 231
Figure 69: Case study escalator (a) and stair (b) dimensions ...................................................... 238
Figure 70: Hypothetical underground station geometry (ES=Escalator/Stair, S=Stair) .............. 239
Figure 71: Evacuation curves for each scenario .......................................................................... 249
Figure 72: Three types of journey a lift can make with respect to jerk, acceleration and maximum
speed [Peters, 1996] ..................................................................................................................... 308
Figure 73: Lift verification test geometry ................................................................................... 316
Figure 74: Starting location of single agent and lift catchment area agents (Test 4) .................. 325
Figure 75: Verification test geometry - escalator and stair dimensions ...................................... 337
Figure 76: Escalator verification test geometry ........................................................................... 338
Figure 77: Travel time verification - example of initial agent start location and calculated route to
each device .................................................................................................................................. 340
Figure 78: Device selection congestion threshold verification - initial starting location of agents
..................................................................................................................................................... 342

xv
TABLES
Table 1: Thesis publication list with associated chapters ...............................................................iv
Table 2: ICC, 2009 International Building Code, minimum number of exits per storey .............. 27
Table 3: Likely proportion of occupants to use lifts and stairs during normal circulation............ 28
Table 4: Input data required for an BTS simulation [Siikonen, 1997b] ........................................ 41
Table 5: STEPS lift model attributes ............................................................................................. 44
Table 6: Comparison on percentage of occupants evacuated [Wong, et al., 2005] ....................... 47
Table 7: Overall ELVAC simulation results for the 4 GSA Buildings ......................................... 48
Table 8: Fire evacuation collective control versus conventional collective control[Howkins,
2000] .............................................................................................................................................. 50
Table 9: Theoretical escalator handling capacities according to width (ped/min) [CIBSE, 2000]
....................................................................................................................................................... 61
Table 10: Likely proportion of pedestrians to use escalators and lifts [CIBSE, 2000] ................. 62
Table 11: Travel Times, Max Flow-rates Functions by Pedestrian Blocks[Cheung and Lam,
1998] .............................................................................................................................................. 64
Table 12: Regression values for given travel time differences between escalator/stair ................ 65
Table 13: Number of observations, average flow-rate per hour and proportion of stairs users for
each station in each direction [Zeiler, et al., 2010, Knehs, 2010] ................................................. 67
Table 14: Dependence of the percentage of persons ascending as a function of the flow-rate
(persons per second) and of the rate of the counter flow on the stairs [Zeiler, et al., 2010, Knehs,
2010] .............................................................................................................................................. 68
Table 15: Escalator heights, direction, day usage, maximum flow-rates recorded for each
escalator [Al-Sharif, 1996] ............................................................................................................ 69
Table 16: Photographic survey – average escalator boarding times [Fruin, 1971] ....................... 71
Table 17: Escalator flow-rates (30 degree incline) [Strakosch and Caporale, 2010] .................... 71
Table 18: Proportion of Walkers during peak/off peak periods as observed by Andrews and
Boyes [Andrews and Boyes, 1977] ............................................................................................... 77
Table 19: Average Horizontal Walker Speeds (m/s) (not including the escalator speed) ............. 79
Table 20: Overall Average Horizontal Stair Walker Speeds (ms) ................................................ 79
Table 21: Walker speeds by pedestrian blocks [Cheung and Lam, 1998] .................................... 84
Table 22: Horizontal escalator walker speeds by pedestrian blocks [Cheung and Lam, 1998] .... 85
Table 23: Total Evacuation time Calculation Results [Okada, et al., 2009] ................................. 89
Table 24: Number of escalators/stairs available, agents trapped for each case. ............................ 90
Table 25: Simulation Results - Frequency/Proportion of Evacuees against Time ........................ 92
Table 26: buildingEXODUS transit node attribute list ................................................................. 99

xvi
Table 27: Default stair travel speeds by Fruin [Fruin, 1971] used in buildingEXODUS
(maximum recommended values) ............................................................................................... 100
Table 28: Additional situation information provided for each section. ....................................... 110
Table 29: Overall Combined Average Results Irrespective of Time Pressure or Familiarity for
the Base, Queue and Groups cases. ............................................................................................. 111
Table 30: Proportion of participants that stated a reason of a given type whether they are
more/less likely to use a lift in a taller building. ......................................................................... 115
Table 31: Frequency/Proportion of participants that would consider using a lift and cumulative
frequency/proportion of participants who would redirect to use the stairs after encountering a
given crowd density ..................................................................................................................... 119
Table 32: Proportion of surveyed occupants that used lift during actual evacuation incidents .. 122
Table 33: buildingEXODUS lift attributes .................................................................................. 128
Table 34: Calculated probability/proportion that an agent will redirect from a lift if congestion
threshold is met/exceeded for different lift area arrival times and current simulation times
(assuming instant response times) ............................................................................................... 137
Table 35: Agent lift attributes ...................................................................................................... 140
Table 36: Overview of evacuation scenarios ............................................................................... 145
Table 37: Simplified lift agent model simulation results - Summary.......................................... 147
Table 38: Advanced lift agent model simulation results - Summary .......................................... 153
Table 39: Advanced lift agent model simulation results - Average Lift Wait Time (LWT) of all
agents that considered using a lift, lift users and non-lift users (agents who initially chose to use a
lift but then redirected to the stairs) ............................................................................................. 156
Table 40: Comparison of SLAM (S) and ALAM (A) scenario summary results ....................... 160
Table 41: Comparison of SLAM and ALAM - Average Lift Wait Time (LWT) of all lift users
..................................................................................................................................................... 161
Table 42: Spanish Data - Frequency/proportion of participants according to gender, age group,
and time period for the up escalator ............................................................................................ 172
Table 43: Spanish Data - Frequency/proportion of participants according to gender, age group,
and time period for the down escalator ....................................................................................... 173
Table 44: Spanish Data - Breakdown of escalator to stair users in the up and down directions
during rush and non-rush hour periods ........................................................................................ 174
Table 45: Spanish Data - Breakdown of walkers to riders in the up and down directions during
rush and non-rush hour periods ................................................................................................... 175
Table 46: Spanish Data - Breakdown of side preference for escalator users in the up and down
directions during rush and non-rush hour periods ....................................................................... 176

xvii
Table 47: Spanish Data - Average horizontal walker speeds ...................................................... 178
Table 48: Spanish Data – Minimum, average and maximum escalator flow-rates ..................... 179
Table 49: Chinese Data - Analysis performed according to period ............................................ 184
Table 50: Chinese Data - Frequency/proportion of participants according to gender and age
group for the up non-rush hour escalator .................................................................................... 185
Table 51: Chinese Data - Non-congested escalator/stair users ................................................... 190
Table 52: Chinese Data - Congested escalator/stair users ........................................................... 190
Table 53: Chinese Data - Walker/Rider frequencies during rush-hour and non-rush hour periods
..................................................................................................................................................... 191
Table 54: Chinese Data - Side preference for escalator users during the non-rush hour period . 192
Table 55: Chinese Data - Average Horizontal Walker Speeds ................................................... 193
Table 56: English Data -Day 1 frequency/proportion of participants according to gender, age
group, time period and direction ................................................................................................. 198
Table 57: English Data -Day 2 frequency/proportion of participants according to gender, age
group, time period and direction ................................................................................................. 199
Table 58: English Data -Frequencies and proportion of escalator/stair users ............................. 200
Table 59: English Data - Frequencies and proportion of walkers/riders ..................................... 201
Table 60: English Data - Proportion of walkers/riders that used each side on the escalator (Day
1) .................................................................................................................................................. 203
Table 61: English Data - Proportion of walkers/riders that used each side on the escalator (Day
2) .................................................................................................................................................. 204
Table 62: English Data - Proportion of walkers/riders that used each side on the escalator
(Overall)....................................................................................................................................... 204
Table 63: English Data - Average, minimum and maximum horizontal walker speeds on the up
and down escalator during each period on each day according to gender .................................. 207
Table 64: English Data - Minimum, average and maximum flow-rates ..................................... 208
Table 65: Total length of video/real-time footage collected for each dataset ............................. 213
Table 66: Overall proportion of escalator/stair users: Spanish data, Chinese data, English data,
Cheung and Lam's regression prediction (given escalator data) [Cheung and Lam, 1998], Zeiler
et al [Zeiler, et al., 2010] and Knehs [Knehs, 2010] data ............................................................ 219
Table 67: Overall proportion of walkers/riders: Spanish data, English data, and Andrews and
Boyes [Andrews and Boyes, 1977] ............................................................................................. 220
Table 68: Escalator characteristics and average horizontal walker speeds (m/s) - Spanish data,
Chinese data, English data, Okada et al [Okada, et al., 2009], Kadokura et al[Kadokura, et al.,
2009], Cheung and Lam [Cheung and Lam, 1998] ..................................................................... 221

xviii
Table 69: Maximum recorded escalator flow-rates: Spanish data, Chinese data, English data, Al-
Sharif [Al-Sharif, 1996], Davis and Dutta [Davis and Dutta, 2002], and Okada et al [Okada, et
al., 2009] ...................................................................................................................................... 223
Table 70: Device frequency usage............................................................................................... 241
Table 71: Scenario 9, 10 and 11 escalator/stair/exit frequency usage ......................................... 242
Table 72: Overview of evacuation scenarios - Attribute Settings ............................................... 244
Table 73: Average TET, PET, CWT, Platform Clearance Time, Door 1 and 2 Exit times for each
scenario (average of 5 simulations) ............................................................................................. 245
Table 74: Average Proportions/Frequencies of escalator/stair users (per escalator/stair pair) ... 246
Table 75: Participant Demographics - Country and Age Range ................................................. 282
Table 76: Participant Demographics - Country and BMI (Body Mass Index) ............................ 283
Table 77: Participant Demographics - Country and Gender ....................................................... 283
Table 78: Participant Demographics - Age Range and BMI (Body Mass Index) ....................... 284
Table 79: Participant Demographics - Age Range and Gender................................................... 284
Table 80: Participant Demographics - Gender and BMI (Body Mass Index) ............................. 285
Table 81: Participants who would consider using a lift to evacuate according to Country, Gender
and Age group ............................................................................................................................. 287
Table 82: Participants who would consider using a lift to evacuate according to BMI, Gender and
Age group .................................................................................................................................... 288
Table 83: Frequency/Proportion of males/females that would and wouldn't consider using a lift
during an evacuation .................................................................................................................... 289
Table 84: Frequency/Proportion of males/females that would and wouldn't always use a lift
during an evacuation .................................................................................................................... 289
Table 85: Frequency/Proportion of males/females that would and wouldn't be influenced by the
height of the floor they are on when deciding to use a lift during an evacuation ........................ 289
Table 86: Frequency/Proportion of males/females lower and upper limits of how many floors
they would consider travelling within a lift according to gender ................................................ 290
Table 87: Frequency/Proportion of males/females that would and wouldn't be influenced by the
height of the building when deciding to use a lift during an evacuation ..................................... 291
Table 88: Frequency/Proportion of males/females that would and wouldn't be influenced by the
height of the building when deciding to use a lift during an evacuation ..................................... 291
Table 89: Frequency/Proportion of males/females that would and wouldn't consider using a lift if
they were familiar or unfamiliar with a building ......................................................................... 292
Table 90: Frequency/Proportion of participants in each age group that would and wouldn't
consider using a lift during an evacuation ................................................................................... 292

xix
Table 91: Frequency/Proportion of participants in each age group that would and wouldn't
always use a lift during an evacuation ......................................................................................... 293
Table 92: Frequency/Proportion of participants in each age group that would and wouldn't be
influenced by the height of the floor they are on when deciding to use a lift during an evacuation
..................................................................................................................................................... 293
Table 93: Frequency/Proportion of participants lower and upper limits of how many floors they
would consider travelling within a lift according to age range ................................................... 294
Table 94: Frequency/Proportion of participants in each age group that would and wouldn't be
influenced by the height of the building when deciding to use a lift during an evacuation ........ 294
Table 95: Frequency/Proportion of participants in each age group that would and wouldn't be
influenced by the height of the building when deciding to use a lift during an evacuation ........ 295
Table 96: Frequency/Proportion of participants in each age group that would and wouldn't
consider using a lift if they were familiar or unfamiliar with a building ..................................... 296
Table 97: Frequency/Proportion of participants from each country that would and wouldn't
consider using a lift during an evacuation ................................................................................... 297
Table 98: Frequency/Proportion of participants from each country that would and wouldn't
always consider using a lift during an evacuation ....................................................................... 297
Table 99: Frequency/Proportion of participants from each country that would and wouldn't be
influenced by the height of the floor they are on when deciding to use a lift during an evacuation
..................................................................................................................................................... 298
Table 100: Frequency/Proportion of participants lower and upper limits of how many floors they
would consider travelling within a lift according to country....................................................... 299
Table 101: Frequency/Proportion of participants from each country that would and wouldn't be
influenced by the height of the building when deciding to use a lift during an evacuation ........ 299
Table 102: Frequency/Proportion of participants from each country that would and wouldn't be
influenced by the height of the building when deciding to use a lift during an evacuation ........ 300
Table 103: Frequency/Proportion of participants from each country that would and wouldn't
consider using a lift if they were familiar or unfamiliar with a building ..................................... 301
Table 104: Frequency/Proportion of participants according to BMI that would and wouldn't
consider using a lift during an evacuation ................................................................................... 302
Table 105: Frequency/Proportion of participants according to BMI that would and wouldn't
always consider using a lift during an evacuation ....................................................................... 302
Table 106: Frequency/Proportion of participants according to BMI that would and wouldn't be
influenced by the height of the floor they are on when deciding to use a lift during an evacuation
..................................................................................................................................................... 303

xx
Table 107: Frequency/Proportion of participants lower and upper limits of how many floors they
would consider travelling within a lift according to BMI ........................................................... 304
Table 108: Frequency/Proportion of participants according to BMI that would and wouldn't be
influenced by the height of the building when deciding to use a lift during an evacuation ........ 304
Table 109: Frequency/Proportion of participants according to BMI that would and wouldn't be
influenced by the height of the building when deciding to use a lift during an evacuation ........ 305
Table 110: Frequency/Proportion of participants according to BMI that would and wouldn't
consider using a lift if they were familiar or unfamiliar with a building ..................................... 306
Table 111: Key kinematic time points - Condition A: Lift Reaches Maximum Velocity........... 308
Table 112: Key kinematic time points - Condition B: Lift Reaches Maximum Acceleration .... 309
Table 113: Key kinematic time points - Condition C: Lift Does not Reach Maximum
Acceleration ................................................................................................................................. 309
Table 114: Lift verification tests - altered kinematic parameters ................................................ 317
Table 115: Calculated/simulated time lift passes each floor, door opening/closing times, in the
model ........................................................................................................................................... 318
Table 116: Calculated lift travel distances from floor times ....................................................... 319
Table 117: Lift verification motion control verification tests and test results............................. 322
Table 118: Lift/Stair choice verification test – overall proportion of lift users per floor ............ 322
Table 119: Lift/stair choice verification test results - Stated/modelled (over five simulations)
average proportion of lift users per lift group and per floor ........................................................ 324
Table 120: Lift wait area congestion redirection verification test results ................................... 326
Table 121: Missed lift redirection verification test results .......................................................... 328
Table 122: Lift wait location selection verification test results................................................... 330
Table 123: Lift wait time redirection verification test results – standard lift wait time expiration
..................................................................................................................................................... 332
Table 124: Lift wait time redirection verification test results – adjusted lift wait time expiration
due to lift opening ........................................................................................................................ 332
Table 125: Open lift selection verification tests - number of lifts available and lift capacities for
each test ....................................................................................................................................... 333
Table 126: Open lift selection verification tests results .............................................................. 334
Table 127: Lift redirection to stairs verification test results ........................................................ 336
Table 128: Device Selection - Proportional system verification tests results ............................. 339
Table 129: Travel time verification results.................................................................................. 340
Table 130: Wait time verification - initial agent start locations and single agent path calculation
..................................................................................................................................................... 341

xxi
Table 131: Wait time verification results .................................................................................... 341
Table 132: Device selection congestion threshold verification results ....................................... 343
Table 133: Device selection hybrid verification results .............................................................. 344
Table 134: Walker/Rider proportion verification test ................................................................. 344
Table 135: Side preference verification test ................................................................................ 345
Table 136: Walker speed verification test ................................................................................... 346
Table 137: Flow-rate verification test ......................................................................................... 347

1
Chapter 1 - Introduction
1.1 Introduction
This chapter describes the motivations for the research presented in this thesis along with the
subsequent objectives, thesis outline, and contributions to the field in general.
1.2 Research motivations
A „vertical transport device‟ within a building can be defined as any device that transports
occupants vertically from one level to another. For the purpose of this thesis the term refers
specifically to lifts (elevators) and escalators. Whilst both types of device share a number of
common characteristics, the nature in which they are used by occupants, employ different
operational strategies and provide different levels of service varies considerably.
The increased demand for both residential and commercial space, particularly in central urban
areas, coupled with the decreased availability and increased value of land, has caused a
proliferation of high-rise building development throughout the world. The rapid growth of some
previously relatively less developed economies (e.g. China), has been a catalyst for this trend.
This is exemplified in the Council for Tall Building and Urban Habitat's (CTBUH) list of tallest
buildings in the world. In 1950 almost all of the 100 tallest completed buildings in the world
were located in the US [CTBUH, 2010]. However, 60 years later (2010), the US only accounts
for some 28.0% of the 100 tallest completed buildings, with countries such as China (32.0%) and
the United Arabs Emirates (18.0%) accounting for an increasing share of the top 100 tallest
buildings in the world [CTBUH, 2010]. In addition to the geographical spread of high-rise
buildings, the buildings themselves are increasing in height with the average height of the 100
tallest buildings more than doubling between 1930 (160m) to 2010 (350m); representing an
average increase of 2.4m per year (see Figure 1) [CTBUH, 2010].

2
Figure 1: Average height of the 100 tallest buildings in the world [CTBUH, 2010]
This proliferation of high-rise buildings of increasing height throughout the world coupled with
the World Trade Center 911 attacks [Averill, et al., 2005], has cast doubt over the capability of
such buildings to provide adequate simultaneous full building evacuation using stairs alone.
Indeed the introduction of sprinkler systems in high-rise buildings has meant that it is common to
find such buildings are only designed to accommodate phased full/partial building evacuation. In
such structures the respective emergency stairwell widths prescribed are only designed to
accommodate simultaneous evacuation from a select number of floors [Brannigan and Miller-
Hooks, 2007] (i.e. not designed for full simultaneous evacuation). Subsequently, the use of lifts
during evacuations, whilst not a new concept for the transport of disabled occupants and fire
fighter access [British Standards, 2008], has become a serious consideration over the last decade
for the general population [Kinsey, et al., 2011]. Ironically, it is only with the use of lifts and the
vertical transport capacity that they provide in normal circulation that such high-rise buildings
could be designed and built [Barney, 2003]. Several building codes and standards have now
begun to consider and include the provision for lift usage for the general population during
evacuations [ICC, 2009; NFPA, 2009a; NFPA, 2010; British Standards, 2008].
The increased interest in evacuation lifts requires the examination of the potential merits of
evacuation lift strategies and associated human factors. For instance, whether operational
strategies can be designed, the impact on performance, the representation within performance-
based design, and whether people, in reality, will follow the strategies implemented and use lifts
during an emergency. Indeed, current building codes that allow the provision for evacuation lifts
do not mention operational strategies for the use of lifts, merely stating when lifts can be used;
(e.g. prior to a hazard being detected close to a lift system) [ICC, 2009; NFPA, 2009a; NFPA,
2010]. One method for understanding such issues would be to conduct a full building evacuation
of an actual high-rise structure multiple times to assess the impact of different operational
strategies and human factors. However, conducting such trials is highly impractical given the

3
time/cost constraints for the people and companies involved. In addition, simultaneously
evacuating potentially thousands of occupants using the stairs/lifts, even for a drill, is potentially
hazardous. Considering such issues, along with the fact that occupants have traditionally been
instructed for the past 40 years to not use lifts during evacuations, very little evacuation lift
human factors data has been collected. Consequently, very little is understood regarding such
behaviour. This means that if lifts were to be considered for use during an evacuation without
due consideration to associated lift human factors, there could potentially be negative
consequences. For example, building codes may allow the provision for evacuation lifts to
replace the need for additional evacuation stairs (as allowed in certain situations in the ICC, 2009
International Building Code [ICC, 2009]). However, if a disproportionate number of occupants
chose to only use the stair during an evacuation, instead of using the available lifts, then this
could considerably extend an evacuation.
Further to the need to understand associated human factors, there is also a need to understand the
influence of different evacuation lift strategies: identifying how the lift system should be utilised
to maximise benefit during an evacuation. Performing multiple evacuation drills within a real
building utilising different lift strategies to optimise the results is simply not practical for most
high-rise buildings due to the aforementioned costs/reasons. In addition, such drills would not
be possible for buildings still in the design phase. A more efficient, cost effective, faster and
safer method for exploring the influence of different evacuation lift strategies and the influence
of human factors on such strategies is with the use of computational evacuation modelling tools
and techniques. Assuming accurate representation, such methods also provide a means to
forensically explore past evacuation incidents in order to understand and suggest improvements
to training, procedure and operational strategies.
With lift systems themselves being governed by broadly understood laws of physics, modelling
lift movement in simulated environments is relatively straightforward [Peters, 1996]. However,
as previously mentioned, associated human factors are less well understood with representation
within evacuation models either not being possible or very simplistic. At present, with the
scarcity of lift human factors data, such behaviour within evacuation models (where existing)
either require users to explicitly define the behaviour or is based on optimal behaviour with no
empirical basis [Kinsey, et al., 2009a; Kinsey, et al., 2010]. The lack of representation of
empirical-based lift human factors within evacuation models has meant that lift evacuation
simulation results are considered questionable [Kinsey, et al., 2010].

4
Similar to high-rise buildings, there has been an increased spread in popularity of
underground/subway stations throughout the world in urban city centres in the 20th century
[Cudahy, 2004]. The increased usage of cars in such areas and subsequent levels of traffic on the
roads has in turn increased the need for alternate methods of public transport within central urban
areas, further amplified by imposed environmental regulations [Newman and Kenworthy, 1999;
Baum-Snow and Kahn, 2000].
The development and expansion of underground stations, often required to be located deep
underground, has only been possible with the introduction of escalators to transport large
volumes of occupants through such areas [Strakosch and Caporale, 2010]. Underground stations
are therefore already reliant upon on escalators during both circulation and emergency situations.
As with lifts, relatively few studies have attempted to quantify escalator human factors, with a
large number of past studies focusing on establishing capacity rather than use [Al-Sharif, 1996;
Cheung and Lam, 1998; Davis and Dutta, 2002]. Given this, many evacuation models simulate
escalators using a flow model; representing homogenous occupant behaviour on the device
assuming implicit representation of micro-level behaviour. This means that simulation results
using such models are questionable and potentially optimistic [Kinsey, et al., 2009b]. As such
there is a need to quantify and understand human factors associated with escalator usage and
represent such devices more accurately within evacuation models so that conformance to
performance based codes can be reliably demonstrated.
Whilst there are a number potential benefits of using both lifts and escalators during evacuations
for fire fighting services [Barker, 1995; Bukowski, 2005a] and individuals with disabilities
[Barker, 1995; Fox, 1991; Shields, et al., 2009], the focus of the thesis is evacuation device
usage for the general population.
1.3 Research objectives and thesis outline
The objectives of this thesis are to:
Advance the understanding of human factors associated with the use of lifts/escalators
and the influence of associated operational strategies during evacuations.
Measure the potential extent to which human factors may influence such evacuation
lift/escalator strategies.
5
In Chapter 2 of this thesis an extensive review of literature was conducted to identify the current
understanding of lift/escalator usage during evacuations, associated human factors, associated
building codes/standards and current modelling tools to represent lifts/escalators. Based on this
review a number of research questions have been devised:
Lifts
Questions 1: How would occupants behave given that they have the option to use a lift
during an evacuation?
A series of further sub-questions have also been identified:
What proportion of occupants would actually consider using a lift during an evacuation
given they were told that it is safe to do so?
Does this proportion differ between occupants from different countries, of different
gender, BMI and age groups?
Would the proportion of occupants willing to use a lift during an emergency vary
according to floor height?
What level of crowding in lift waiting areas would cause occupants to redirect from the
lift to the stairs during an evacuation?
How long would occupants be prepared to wait to use a lift before redirecting?
How would such levels of crowding and lift wait times vary according to floor height
during an evacuation?
To address these research questions an online survey was conducted. The nature of the survey
and an analysis of the results are presented in Chapter 4.
Question 2: How should human factors associated with evacuation lifts be modelled?
This prompts two sub-questions:
How should lift/stair selection be modelled?
How should lift waiting area behaviour be modelled?

6
The literature reviewed and human factors data collected has been used to help develop a lift
model within the buildingEXODUS software. These research questions are addressed in Chapter
5.
Question 3: To what extent would different lift strategies influence an evacuation?
The development of a lift and agent lift model within an existing evacuation modelling software
allows the extent to which different lift strategies would influence an evacuation to be
investigated. Following from this question, a series of sub-questions need to be answered:
What influence does decreasing the number of lifts available have upon an evacuation?
To what extent is it more efficient to use both lifts and stairs compared to stairs or lifts
alone?
Is it efficient to use sky lobbies as staging areas for evacuations?
Is it efficient to use vertical zoning for evacuations?
How does lift human behaviour influence different lift strategies?
A series of evacuation scenarios using the developed lift and agent lift model have been
performed to address the above research questions. The results from this analysis are presented
in Chapter 6.
Escalators
Question 4: How do occupants behave on escalators during evacuations?
A series of further sub-questions have also been identified:
What proportion of occupants would use an escalator and adjacent stair?
Would these proportions differ according to different levels of congestion at the entrance
to the escalator/stair?
What proportion of escalator users would walk/ride on an escalator?
What proportion of riders/walkers would use each side of an escalator?
What speed would escalator users walk at?
What is the maximum recorded flow-rate for escalators?

7
When such high flow-rates occur are there any determining characteristics of the
escalator users?
Does escalator human factors differ between countries, time period, and direction of
travel? If so, to what extent?
To address these research questions escalator human factors data was collected via analysis of
video footage of occupants using escalators in normal circulation conditions in three different
locations each in a different country. The data collected relates to escalator/stair usage,
walker/rider usage, side usage, walker speeds and flow-rates, along with several other factors.
The analysis of the results has been presented in Chapter 7.
Question 5: How should human factors associated with evacuation escalators be modelled?
This suggests two sub-questions which are required to be answered:
How should escalator/stair selection be modelled?
How should the influence of local conditions be modelled upon escalator/stair selection?
How should behaviour on escalators be modelled?
The literature review and data collection informed the development of the escalator and agent
escalator model within buildingEXODUS. These research questions are addressed in Chapter 8.
Question 6: To what extent would different escalator strategies influence an evacuation?
This prompts a series of sub-questions that are required to be answered:
To what extent would stopping an escalator moving decrease the efficiency of an
evacuation?
What influence does decreasing the number of escalators available have upon an
evacuation?
How does different escalator strategies influence an evacuation?
To what extent does different escalator human factors influence each strategy?

8
A series of evacuation scenarios using the developed escalator and agent escalator model have
been performed to address the above research questions. This work is discussed in Chapter 9.
Based on these research questions, the objectives and the subsequent structure of the thesis can
be seen in Figure 2.
Figure 2: Research objectives and associated thesis chapters

9
1.4 Research contributions
The research presented in this thesis has provided a number of scientific contributions. The
literature review provided an in-depth analysis of actual evacuation incidents that utilised
lift/escalator, associated building codes, evacuation lift/escalator strategies, associated human
factors data and a review of models that can simulate evacuations using lifts/escalators.
Lift/Escalator human factors data has been collected that has provided an increased level of
understanding of how occupants behave on and around such devices. For escalator human
factors, an increased level of understanding has been obtained regarding escalator/stair
selection, flow-rates, walker speeds, walker/rider selection, and side preference selection. Data
was collected from three different countries which allowed a comparison of how escalator
human factors potentially differ between each country. This international study represents one of
the most detailed and broadly scoped collection of escalator human factors to date.
For lift human factors, an increased level of understanding has been obtained through data
collection relating to human factors consideration to use lifts, the influence of floor height,
congestion level redirection, and wait time redirection on the decision to use lifts during
evacuations. The data has been analysed overall and for certain criteria according to
demographic factors. This includes a cross comparison of participants responses from different
countries, BMI (Body Mass Index) groups, age groups, and gender groups. The collected human
factors data is considered to represent some of the key facets that influence occupant behaviour
during an evacuation. This is first time that a broad range of lift human factors has been
collected/quantified using such a demographically diverse sample population. With the current
considerations to use evacuation lifts for the general population in a number of countries, the
international nature of the data means the findings presented are particularly relevant to a
number of countries‟ current needs within the field.
The representation of lifts/escalators and associated human factors has been developed within
an existing evacuation software (buildingEXODUS). Based on published literature, the
lift/escalator human factors represented are the first time that such empirical based processes
have been explicitly represented on a micro-level within an evacuation model. The model has
been used to demonstrate the influence of different lift/escalator strategies and to what extent
these may be influenced by associated human factors. This is the first time that the influence of

10
such a broad variety of human factors has been explicitly represented for such a broad variety of
evacuation lift/escalator strategies.
Findings from the evacuation analysis using the developed lift/escalator model can be applied to
a range of different evacuation scenarios for other structures beyond those explored in this thesis.
Potential benefactors of the research include lift manufacturers, fire safety engineers, building
regulators, model developers or indeed any parties interested in the use of evacuation
lifts/escalators. Further to this, the development of the lift/escalator model will allow future
model users to perform in depth evacuation analysis of both high-rise buildings and underground
stations utilising lifts/escalators. In addition the conceptual representative framework of human
factors described in the thesis could theoretically be used to instruct similar functionality within
other evacuation models.
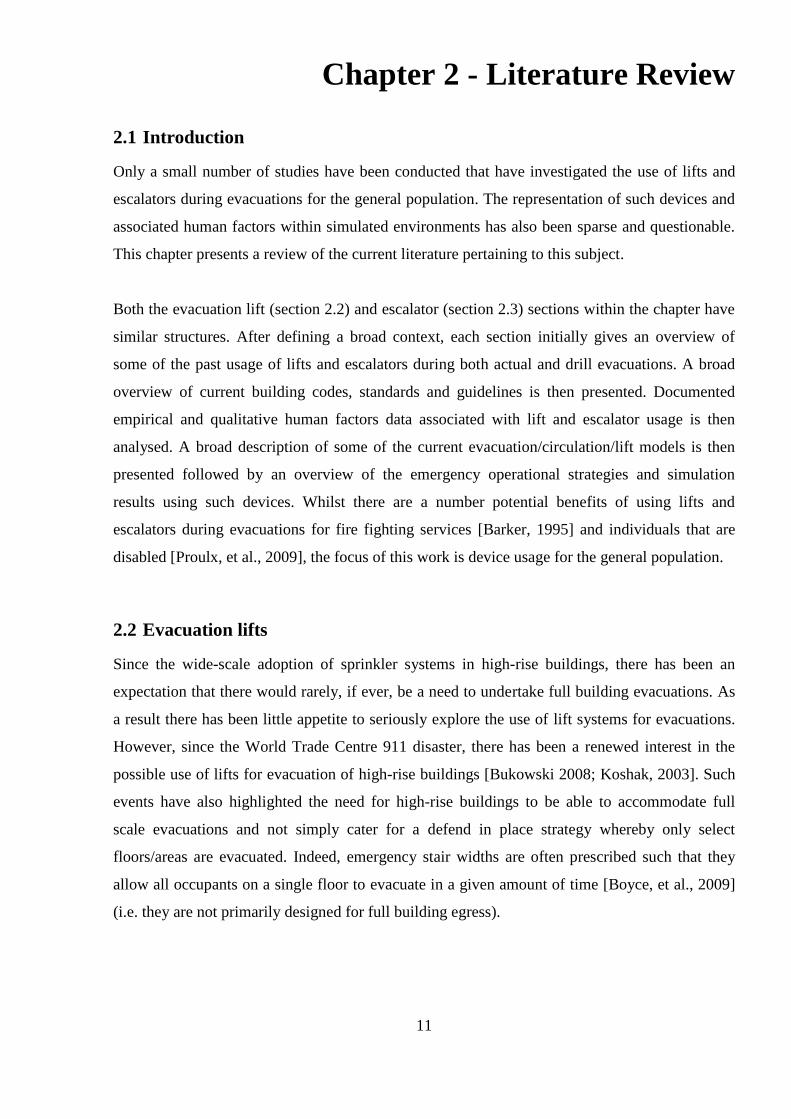
11
Chapter 2 - Literature Review
2.1 Introduction
Only a small number of studies have been conducted that have investigated the use of lifts and
escalators during evacuations for the general population. The representation of such devices and
associated human factors within simulated environments has also been sparse and questionable.
This chapter presents a review of the current literature pertaining to this subject.
Both the evacuation lift (section 2.2) and escalator (section 2.3) sections within the chapter have
similar structures. After defining a broad context, each section initially gives an overview of
some of the past usage of lifts and escalators during both actual and drill evacuations. A broad
overview of current building codes, standards and guidelines is then presented. Documented
empirical and qualitative human factors data associated with lift and escalator usage is then
analysed. A broad description of some of the current evacuation/circulation/lift models is then
presented followed by an overview of the emergency operational strategies and simulation
results using such devices. Whilst there are a number potential benefits of using lifts and
escalators during evacuations for fire fighting services [Barker, 1995] and individuals that are
disabled [Proulx, et al., 2009], the focus of this work is device usage for the general population.
2.2 Evacuation lifts
Since the wide-scale adoption of sprinkler systems in high-rise buildings, there has been an
expectation that there would rarely, if ever, be a need to undertake full building evacuations. As
a result there has been little appetite to seriously explore the use of lift systems for evacuations.
However, since the World Trade Centre 911 disaster, there has been a renewed interest in the
possible use of lifts for evacuation of high-rise buildings [Bukowski 2008; Koshak, 2003]. Such
events have also highlighted the need for high-rise buildings to be able to accommodate full
scale evacuations and not simply cater for a defend in place strategy whereby only select
floors/areas are evacuated. Indeed, emergency stair widths are often prescribed such that they
allow all occupants on a single floor to evacuate in a given amount of time [Boyce, et al., 2009]
(i.e. they are not primarily designed for full building egress).

12
Furthermore, recent computer simulations of high-rise building evacuation suggest that there is a
critical floor population density for a given staircase capacity that effectively limits the height of
high-rise buildings that can be practically evacuated by stairs alone [Galea, et al., 2008].
Despite the increased interest in using lifts for evacuation, very little literature exists regarding
operational and associated human factors. Surprisingly, despite this lack of detailed
understanding, a number of high-rise buildings throughout the world allow for the use of lifts
during both fire and/or non-fire evacuations for the general population (e.g. Burj Khalifa (UAE)
[Evenson and Vanney, 2008], Shanghai World Financial Center (China) [Bukowski, 2008b],
Petronas Towers (Malaysia) [Ariff, 2003], Tapei 101 (China) [Hsiung, et al., 2009], Stratosphere
tower (US) [Bukowski, 2006], Canary Wharf site (UK) [Charters and Fraser-Mitchell, 2009],
Eureka Tower (Australia) [Kuligowski, 2003], etc).
2.2.1 Lift usage during evacuations
In a number of past evacuation situations lifts have been used to good effect to assist in the rapid
egress of high-rise buildings [Averill, et al., 2005; Howkins, 2000; Proulx, et al., 2004; Proulx, et
al., 1995; Sekizawa, et al., 1999]. In addition, there have been a number of evacuation situations
where the use of lifts has resulted in reduced evacuation performance, occupant injury or
occupant fatalities [Averill, et al., 2005; Clark, 1981; NFPA, 1998]. In many of these incidents
lifts were not intended to form part of the evacuation system but were either used by occupants
to egress or occupants were initially located inside them during the initial stages of the
emergency evacuation. This section describes a number of such incidents including both actual
and drill evacuation situations where occupants used lifts. The incidents analysed include the
World Trade Centre 911 evacuation, Cook County Administration Building Fire, Hiroshima
Motomachi Fire, Joelma Building Fire and the MGM Grand Fire. In addition a select number of
smaller actual and drill evacuations are documented where lifts were utilised.
World Trade Center 911Attack
On September 11th 2001 in the US, terrorists hijacked several commercial airplanes with the
intent on flying them into a number of high profile buildings. Two buildings that were hit were
World Trade Center Tower 1 (WTC1, North Tower) and World Trade Centre Tower 2 (WTC2,
South Tower) in New York. Each tower was identical in height (526.3m, 110 floors) and internal
configuration with 99 lifts and an estimated building population of WTC1 and WTC2 of 8,960
and 8,600 respectively at the time of each impact [Averill, et al., 2005]. Lifts serviced a series of

13
'sky lobbies' where occupants could travel to and from via shuttle lifts before using local lifts to
travel to floors between the sky lobbies.
The first airplane struck WTC1 at 8:46:30 AM with an approximate impact zone around floors
93-99. The second airplane struck WTC2 at 9:02:59 AM (approximately 16 minutes and 29
seconds after WTC1) with an approximate impact zone around floors 77-85. Both WTC1 and
WTC2 collapsed around 10:28:22 AM (1 hour, 41 minutes, 52 seconds after impact ) and
9:58:59 AM (1 hour, 11 minutes, 29 seconds after impact ) respectively while occupants were
still attempting to evacuate. NIST estimates that between 1,462-1,533 occupants in WTC1 and
630-701 occupants in WTC2 died (the majority of which were on or above the impact zone) with
around 7,470 and 7,940 occupants in WTC1 and WTC2 surviving respectively [Averill, et al.,
2005].
The NIST report states that in WTC1 there were no operational lifts available for occupants to
use as part of their egress. However, Fahy and Proulx [Fahy and Proulx, 2005] state that out of
the 202 occupants that they interviewed initially in WTC1 who stated their means of egress, 3
used lifts at some point during their evacuation (not including 22 occupants that were trapped
inside lifts). Whilst discrepancies between the exact number of lift users in WTC1 exist it is
evident that very few occupants actually used lifts during the evacuation.
Many occupants who were initially in WTC2 observed the aeroplane impacting WTC1 and
decided to evacuate the building before the 'official' call to evacuate was made. This should be
kept in mind when considering the occupants‟ acceptance to use lifts as they may have thought
that since they have not been told to evacuate or that there was no fire in WTC2, it was still
acceptable to use the lifts to leave the building. Indeed it is mentioned by Galea and Blake
[Galea and Blake, 2004] from accounts mentioned in the mass media that there was some
confusion as to whether it was acceptable to use lifts, as exemplified by the following statements
from two occupant accounts:

14
“Shouldn‟t we be taking the stairs in an emergency like this?” which was replied
by her colleague with, “No! Just get in the elevator! C‟mon!” (Experience 1172) [Galea and
Blake, 2004]
“it was okay to take an elevator as they still had power.” (Experience 1064) [Galea and Blake,
2004]
Other occupants decided that they knew they should not use lifts during an evacuation but due to
the long travel distance decided it was acceptable:
“We got to the 78th floor and Judy said, “Let‟s see if the elevators are working. I‟m
thinking I shouldn‟t be taking an elevator, but I guess the thought of walking
down 78th floors in my high heels was not exactly something I wanted to do.” (Experience 3314)
[Galea and Blake, 2004]
Such reports suggest that even though building occupants are often aware of the common
practice to not use lifts during evacuations, there are circumstances where they will use their own
judgement to decide whether to use lifts or not (i.e. occupants do not merely just do what they
are trained/told to do).
The NIST report estimates that approximately 86% of WTC2 occupants begun evacuating prior
to WTC2 impact, with 18% of WTC2 occupants using a lift for at least part of their evacuation.
From the surveyed occupants, segregating according to floors, occupants were more likely to use
a lift higher up in the building, though the precise proportions are hard to determine due to the
potentially high number of occupants that were not interviewed and the lack of accurate data
regarding the occupancy levels on each floor during the incident.
A number of survivors interviewed, who were physically challenged, were reported to have used
lifts to evacuate due to their physical condition.
Some evidence suggests that, when faced with large queues in lift waiting areas, occupants were
not prepared to wait for lifts to service their floor. For example, there were reports from
survivors who evacuated WTC1 who said:

15
“Let me add too that, at the 44th
floor there was what they call an inter-zone lift bank, we were
led off the stairwell at the 44th
floor and shown to that lift where there are hundreds of people
milling and I looked at that and I turned around to my team and I said „no, I am not waiting for a
elevator in a building on fire. Let‟s go‟ and I walked back to the stairwell and they did too and
then we proceeded down” (WTC1/077/0001 P2, line 22-27) [Galea, et al., 2006a]
“But he looked into the marble-lined lobby, more than half a city block long, and
saw people were standing shoulder to shoulder, waiting for elevators. This is
pointless, he thought.”(Experience 2182) [Galea and Blake, 2004]
The above quotations also highlight that there were quite likely a higher proportion of occupants
that would have considered using a lift to evacuate though were deterred due to congestion in the
lift waiting areas.
The 9/11 Commission Report [Kean and Hamilton, 2004] states that "Many had attempted but
failed to squeeze into packed express elevators" (pp293, reference to WTC2 on the 78th floor
sky lobby) which suggests that occupants may exhibit competitive behaviour when attempting to
board lifts during an evacuation.
Overall the NIST report states that "Elevator usage by occupants played a significant role in
reducing the total loss of life in WTC2 on September 11, 2001" [Averill, et al., 2005] and
exemplifies the potential benefit of using lifts during an evacuation.
In addition to those occupants who escaped using lifts, USA Today [Cauchon and Moore, 2002]
states that at least 200 occupants died in lifts within WTC1 and WTC2. Whilst some occupants
were initially inside lifts at the time of impact and subsequently trapped, a number of them
managed to escape. It is appreciated that it is perhaps not always feasible to prevent such
incidents occurring considering the nature of certain emergencies, though it does highlight that
the lifts can have the potential to considerably inhibit and delay occupant evacuation.
Cook County Administration Building Fire
On October 17th 2003 in the late afternoon the Cook County Administration Building Fire
occurred in Chicago, US. The Cook County Administration Building is 36 floors in height
(144.78m) with 16 lifts (with groups servicing a given range of floors) and two stairwells which
spanned the entire vertical length of the building. Due to the time of the fire there were only

16
around 250 occupants present within the building, many of whom were already leaving or about
to the leave the building (44% of those surveyed). The fire started on the 12th floor of the
building and was discovered at around 4:57PM (on a Friday). Some occupants who were among
the first to initially discover the fire on the 12th floor (prior to the call to evacuate) began
evacuating using the lifts, even though they had already seen the smoke/flames. The official call
to evacuate the entire building was given at 5:05pm (8 minutes after the initial discovery of the
fire) using the P.A system advising occupants to evacuate using the stairs and not the lift. Smoke
entered the emergency stairwells which, combined with the automatic locking of stairwell doors
(from the outside), meant that certain occupants were not able to leave the stairwells on all floors
except on the lobby level. By 6:39PM a report stating the fire was out was made. In total, 6
fatalities occurred on the upper floors (20-24th) and in the stairwell.
Approximately half of the respondents to the survey conducted by Proulx et al [Proulx, et al.,
2004] used lifts to evacuate despite warnings (e.g. signage and the P.A system) and previous
training telling them that they should not use them during a fire. Indeed only 13.3% (56) of
occupants surveyed stated that they understood that they should not use a lift during an
evacuation in the building. Analysis of the survey suggested that those occupants who were still
working were much more likely to use the stairwells with occupants "tending to continue the
activities which they were committed to" [Proulx, et al., 2004] (i.e. those who were already
leaving the building (either about to or already using a lift) were more likely to use a lift during
the evacuation). Of occupants who stated that they attempted to use a lift and stated their
motivations for leaving during the incident, around 50% stated there were leaving for the day,
around 35% stated they perceived fire cues and around 10% felt a threat to their safety. The
average total evacuation time for surveyed lift users was 5.8 mins which was 61.6% (9.3 min)
faster than the average total evacuation time of stair users (15.1mins). Of the occupants that
attempted to use a lift, 3 occupants were unsuccessful in using them but no one became trapped
or died inside them. Findings from the investigation clearly show lifts have provided significant
benefit in reducing total evacuation time.

17
Hiroshima Motomachi High-rise Apartment Fire
On October 28th 1996 in the mid afternoon the Motmochi Apartment Fire occurred in
Hiroshima, Japan [Sekizawa, et al., 1999]. A study group was formed by the JAFSE (Japan
Association for Fire Science and Engineering) to investigate occupant behaviour during the fire.
The primary publication reporting results was by Sekizawa et al [Sekizawa, et al., 1999] where a
survey was conducted of the occupants within the building.
The Motomachi Apartment building is 20 floors in height with four lifts (servicing all floors) and
two emergency stairs (with a skip floor design servicing every even floor by direct access). The
building contained around 3,000 households. Whilst the survey included data from 164
households, the published paper [Sekizawa, et al., 1999] only relates to the 77 respondents who
were at home at the time the fire started. A large proportion (72%) of respondents were elderly
(i.e. ≥60 years old) with there being approximately a quarter of them being male and 17%
disabled.
At around 2:27PM a fire started on the 9th floor of the building which then spread to the top
(20th) floor through the balconies on the outside of the building in less than 20 minutes. The
automatic fire alarm was operated at 2:33PM and the fire was suppressed by 5:02PM. No
fatalities and only two injuries occurred (one firefighter and one occupant).
Of the respondents surveyed, 54% used a lift either in part or for their entire evacuation through
the building. The most common reasons cited for using the lifts related to being more familiar
(44%) and the thought that it was more safe (29%) to use, though it was also mentioned in the
study that few occupants were aware of the evacuation practice to not use lifts during an
evacuation. From Figure 3 it can be seen that as floor height increases the proportion of
occupants that used lifts also approximately increases.

18
Figure 3: Selected Means of egress by floor [Sekizawa, et al., 1999]
Of all the experiences mentioned during the evacuation, only 1% of occupants stated that they
waited for a lift for a long time and only 1% of occupants stated that they could not use a lift due
to the crowd. No mention of what occupants defined as being a „long time‟ waiting for a lift or
what levels of crowding caused them to redirect to the stairs was mentioned.
Joelma Building Fire
On February 1st 1974 in the morning the Joelma Building Fire occurred in San Paulo, Brazil
[Craighead, 2009; Howkins, 2000]. The Joelma Building was 25 floors in height. The building
housed a single staircase which spanned the entire vertical height of the building. Reports
suggest there were at least 4 lifts (each with an operator) which assisted the evacuation. At the
time of the fire there were approximately 756 occupants within the building.
The fire started around 8:50AM on the 12th floor. The fire spread up the single stairwell to floor
15 preventing occupants escaping via the stairs. The fire began to subside around 10:30AM and
was extinguished at around 1:30PM. In total 179 (23.7%) occupants were killed and 300 (39.7%)
injured during the fire. Approximately 300 (39.7%) occupants were reported to have been
evacuated using lifts by 4 operators within lift cars.
MGM Grand Fire
On November 21st 1980 in the morning the MGM Grand Fire occurred in Las Vegas, US [Best
and Demers, 1982; Bryan, 1981; Clark, 1981]. The MGM Grand building is 23 floors in height
with the hotel guest rooms located on floors 3-23 (though the hotel numbering ranges from 5-26
(i.e. there is some contention as to whether the lower levels constitute 2 or 4 floors)). The hotel

19
contained approximately 2,083 guest rooms with the lower floors of the building having a
number of entertainment areas including a casino, arcade, restaurants, etc. At the time of the fire
there were approximately 3,400 guests registered at the hotel in addition to a number of patrons
within the casino. The building contained 6 stairways evenly distributed about the building
which spanned the entire vertical height of the building. In addition there were 16 passenger lifts
and 8 service lifts, which served a given range of floors. The passenger lifts had no enclosed lift
waiting areas whereas the service lifts waiting areas were enclosed.
A fire was discovered on the lower floors of the MGM Grand in the deli between 6:30AM-
7:00AM with the fire department being alerted at 7:15AM. The open plan nature of the lower
floors and the lack of enclosed lift waiting areas meant that significant smoke spread was
reported. This includes smoke spread in all but one of the emergency stairwells and in a number
of lift shafts. Many hotel occupants became cut off due to the smoke in the stairwells and
evacuated to the roof; approximately 300 people were rescued from the roof via helicopter. The
fire was extinguished at approximately 3:00PM (approximately 8 hours after it was initially
discovered). In total 85 occupants died and 600 were injured in various locations throughout the
building.
Of the 85 fatalities, 61 (71.7%) were located in the hotel with almost all of them being located
within close proximity to the lift waiting areas on the respective floors. In total 10 occupants died
inside lifts where they were located around the casino level. At floors 20 and 26, 15 occupants
died in lift waiting areas.
There was no automatic means of returning lifts to the main lobby area (i.e. hall calls could still
be serviced during the fire). Indeed it was reported that some guests boarded lifts during the fire
without being aware of the incident and there was at least a single documented case of a survivor
(who was initially unaware of the fire) using a lift to evacuate.

20
Forest Laneway Fire
On January 6th, 1995 in the early morning in North York, Ontario, Canada the Forest Laneway
Fire occurred [Proulx, et al., 1995]. Survivor accounts from a total of 219 surveyed respondents
from 176 apartments inside the building at the time of the fire were collected. The Forest
Laneway building was a 30 floor apartment block which contained 365 apartments, 2 stairwells
and 4 lifts. At the time of the fire there were an estimated 545 occupants within the building most
of whom were expected to be asleep at that time.
The fire was reported to have started on floor 5 around 5:00AM within an apartment living room.
In total 6 occupants died in the fire whose bodies were all located on the upper floors of the
stairwell. Only 5% (11) of respondents to the survey reported injuries.
In total 162 (74%) respondents used lifts to evacuate with all but a group of five occupants doing
so under the instruction of rescue personnel. There were a number of unsuccessful attempts to
use a lift to evacuate which were typically prevented due to smoke spread. With the exception of
a few respondents, all appeared to know that they should not use a lift during fire evacuations.
Dusseldorf Airport Terminal Fire
On April 11 1996 in the mid-afternoon the Dusseldorf Airport fire occurred in Germany [NFPA,
1998]. The fire started at 3:31PM in the airport at the east end of the arrivals hall with all airport
and external fire fighters arriving at the building by 4:07PM. The fire was under control by
7:20PM (3 hours 49 minutes after the initial report of a problem was made). In total 17
occupants died and 62 were injured. Of the occupants that died, 7 died in a lift when its doors
were opened onto the fire level. These occupants were originally on the roof of the airport car
park before deciding to evacuate using the lift.
Madingley block on the Cambridge Estate, Kingston upon Thames
In mid-July during the late afternoon in 2010 the Madingley block fire occurred in Kingston, UK
[BBC, 2010a; BBC, 2010b]. The Madingley block is a council owned apartment block which has
15 floors with 60 flats housing up to 150 occupants. No details regarding the number of stairs or
lifts were mentioned within any of the literature sources.
The fire started around 4:45PM around the top 4 floors of the building. No fatalities or injuries
were reported. The fire was brought under control by the fire department at around 8:54PM.
Some survivors of the fire reported being forced to use the lifts despite the danger due to the
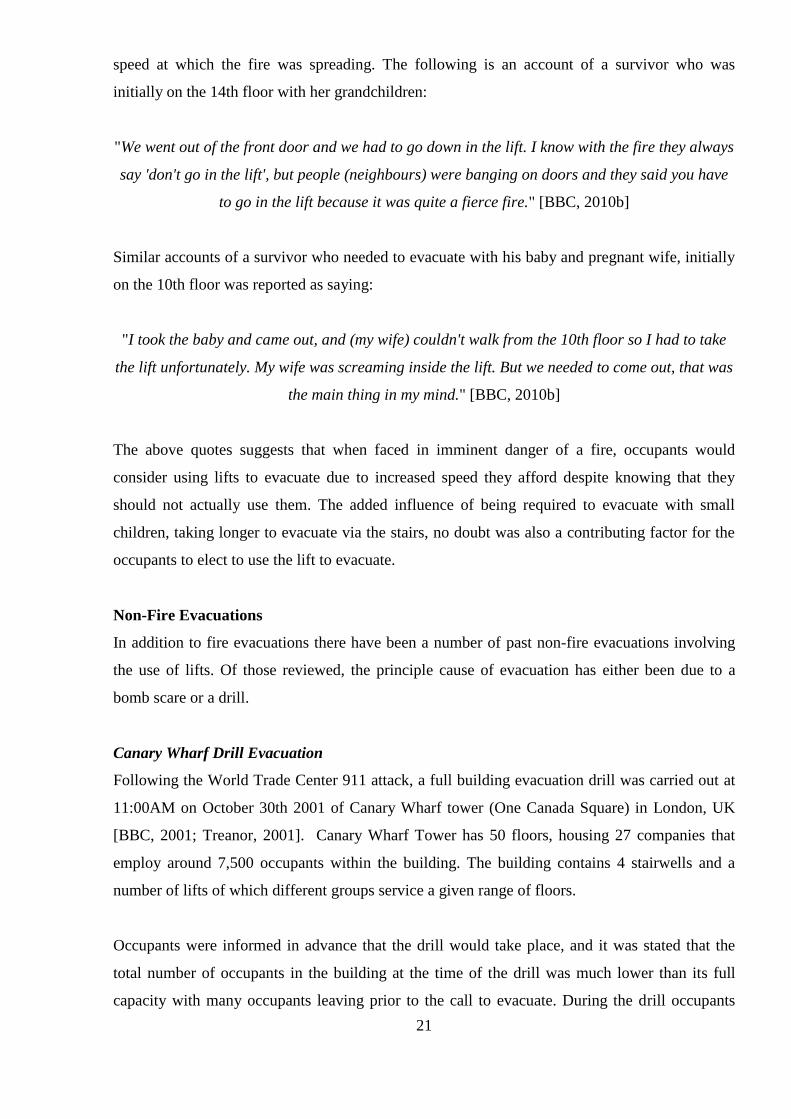
21
speed at which the fire was spreading. The following is an account of a survivor who was
initially on the 14th floor with her grandchildren:
"We went out of the front door and we had to go down in the lift. I know with the fire they always
say 'don't go in the lift', but people (neighbours) were banging on doors and they said you have
to go in the lift because it was quite a fierce fire." [BBC, 2010b]
Similar accounts of a survivor who needed to evacuate with his baby and pregnant wife, initially
on the 10th floor was reported as saying:
"I took the baby and came out, and (my wife) couldn't walk from the 10th floor so I had to take
the lift unfortunately. My wife was screaming inside the lift. But we needed to come out, that was
the main thing in my mind." [BBC, 2010b]
The above quotes suggests that when faced in imminent danger of a fire, occupants would
consider using lifts to evacuate due to increased speed they afford despite knowing that they
should not actually use them. The added influence of being required to evacuate with small
children, taking longer to evacuate via the stairs, no doubt was also a contributing factor for the
occupants to elect to use the lift to evacuate.
Non-Fire Evacuations
In addition to fire evacuations there have been a number of past non-fire evacuations involving
the use of lifts. Of those reviewed, the principle cause of evacuation has either been due to a
bomb scare or a drill.
Canary Wharf Drill Evacuation
Following the World Trade Center 911 attack, a full building evacuation drill was carried out at
11:00AM on October 30th 2001 of Canary Wharf tower (One Canada Square) in London, UK
[BBC, 2001; Treanor, 2001]. Canary Wharf Tower has 50 floors, housing 27 companies that
employ around 7,500 occupants within the building. The building contains 4 stairwells and a
number of lifts of which different groups service a given range of floors.
Occupants were informed in advance that the drill would take place, and it was stated that the
total number of occupants in the building at the time of the drill was much lower than its full
capacity with many occupants leaving prior to the call to evacuate. During the drill occupants

22
were given the choice to use either lifts or stairs. The lifts were placed in a special emergency
mode that was intended to allow the most people to evacuate in as short a time as possible. The
building took approximately 20 minutes to evacuate. Occupants were reported to have said that
previous evacuations of the buildings had taken 45 minutes and that the decreased occupancy
was probably the main reason for the decrease in total evacuation time.
Petronas Towers Bomb Scare/Drill Evacuation
The day after the World Trade Center 911 attack, the Petronas Towers in Kuala Lumpur,
Malaysia was required to fully evacuate both towers due to a bomb alert. This was later followed
by a drill evacuation on another day [Ariff, 2003; Bukowski, 2009; Bukowski, 2010].
The Petronas Towers consists of two towers each having 88 floors (451.9m), 3 stairwells, and 39
lifts using a double-decker design for the main lifts with a sky lobby configuration. The lifts
include a safety feature whereby if one lift becomes trapped, another lift can move along side it
and occupants can transfer between lift cars. The towers are connected via a skybridge between
floors 41-42. The evacuation plans for the towers include a procedure that if a single tower is
required to be fully evacuated then occupants on the upper floors of the evacuation tower can
initially move to the skybridge level via the stairs. Occupants would then move to the adjacent
tower via the skybridge where shuttle lifts could be used to evacuate to the ground floor of the
adjacent tower. Occupants below the skybridge level in the affected building use the stairs to
evacuate to the ground level.
On September 12th a bomb alert prompted a full building evacuation of the Petronas towers. Due
to the uncertainty of which tower the threat related to both towers were evacuated. Occupants on
the floors above the skybridge in both towers attempted to evacuate to the skybridge level where
both groups attempted to cross the skybridge in the opposite direction, creating heavy congestion
and contraflow which subsequently resulted in a 'jam'. As a result the evacuation took a number
of hours to complete. Bukowski [Bukowski, 2010] reports that following this event the local
authorities considered, during a full building evacuation (of both towers) or when the skybridge
is rendered inoperable, the use of shuttle lifts servicing the skylobbies in both towers. Occupants
travel to the nearest sky lobby below them before boarding a lift which shuttles them to the exit
level. A drill was later carried out in October 2002 employing the new strategy and both towers
evacuated in 32 minutes. No further details were found regarding the nature or occupancy levels
of the towers during the drill, however, it should be kept in mind that the main shuttle lifts were
double-decker lifts which would have increased the lift system capacity. As such this is expected

23
to have contributed to further reducing the total evacuation time of the building. The evacuation
drill demonstrates the increased benefit of the combined use of both lifts and stairs during an
evacuation.
Taipei 101 Drill Evacuation
Prior to officially opening Taipei 101 a number of full building evacuation drills were conducted
to explore acceptable evacuation strategies [Bukowski, 2009, 2010; Hsiung, et al., 2009].
Taipei 101 consists of 101 floors (508m in height), contains 2 main stairwells (1.4m in width),
and 61 lifts including double-decker shuttle lifts which service a given range of floors using a
sky lobby configuration. The original full building evacuation procedure was to only use stairs to
evacuate the entire building population.
Prior to the building‟s completion a full building evacuation drill was conducted using stairs only
which took approximately 2 hours 30 minutes to complete. This was considered too long by the
local fire department and the inclusion of lifts into the evacuation procedure was explored. A
further evacuation drill that used lifts in addition to stairs reduced the total evacuation time to
just under one hour (57 minutes), being under half the evacuation time compared to using stairs
alone. Similar to the Pretronas Towers incidents, this demonstrates the increased benefit of the
combined use of both lifts and stairs during an evacuation compared to stairs alone.
Christchurch Bomb Threat Evacuation
On July 30th 2007 a bomb threat was reported on Kilmore Street, Christchurch, New Zealand
and a number of buildings were evacuated. A number of hours later it was determined that there
was no bomb. A survey was conducted by Heyes [Heyes, 2009; Heyes and Spearpoint, 2009]
that asked respondents from two multi-level buildings involved in the evacuation about their
evacuation experience.
The first building was 5 floors in height and had a single lift. The second building was 6 floors in
height and had 2 lifts. Both were office buildings and no details regarding the number of
stairwells were reported. In total 45 respondents surveys were collected (13 from the first
building and 32 from the second building). In the first building respondents were initially located
across 3 floors. In the second building respondents were initially located across 4 floors.

24
Overall 10 (22.2%) respondents used lifts and 35 (77.8%) respondents used stairs to evacuate.
The results presented show that as floor height increases the proportion of occupants that use a
lift to evacuate also approximately increases. However, the low response rate/frequency of
respondents, the low frequency of respondents that used a lift and only coming from a small
number of floors, makes it hard to draw any firm conclusions from the results.
Respondents were also asked about how they felt during the evacuation. Whilst most of the
respondents did not think the threat of the event was very high, their levels of urgency were high.
Overall, respondents who used a lift perceived there to be a higher level of threat to their
personal safety than stair users, however, also had a lower level of urgency to exit the building.
This perhaps suggest that either there is little link between threat and urgency or that something
else was influencing the respondents decision.
Of the reasons given for evacuation choice by lift respondents (see Figure 4), 41% reported using
the lift because they knew it was not a fire event, 17% followed others, 17% reported it was the
easiest means of evacuation, 17% said they knew that the situation was in another building and
8% used lifts to go to other floors to notify others. Of the reasons given for evacuation choice by
stairs respondents, 47% reported because it was part of their evacuation procedure, 30%
followed others, 12 % were afraid of the lift breaking down/being trapped inside the lift, 7% said
the lift was full, 2% said stairs were the most familiar route and 2% thought the stairs was the
quickest route (see Figure 4).
Lift Users Stair Users
Figure 4: Reasons given for evacuation choice for those that used the lifts/stairs to evacuate [Heyes, 2009]
Considering 7% of stair users said the lift was full highlights that a higher proportion of
occupants would have considered using the lift during the evacuation and also that local
conditions in the lift waiting area can cause occupants to redirect to the stairs.

25
Summary of Lift Usage during Evacuations
A number of actual and drill evacuation incidents that have included the use of lifts have been
reviewed. Analysed accounts have shown that occupants will consider using lifts during actual
evacuations even if they have been taught/told not to do so; occupants will not necessarily do
what they are instructed to do. Such accounts suggest that occupants make their own judgments
on whether to use a lift based on local conditions. Occupants have stated that they would not be
prepared to wait in highly congested lift waiting areas or for long periods of time for a lift whilst
evacuating.
2.2.2 Evacuation lifts for the general population - codes, standards and
guidelines
Bukowski [Bukowski, 2009] mentions that the consideration to use lifts during evacuations at a
regulatory level can be traced back to almost 100 years ago in 1914 at an NFPA meeting [NFPA,
1914]. At the meeting it was agreed that suitably fire protected lift systems could provide benefit
to an evacuation, particularly in high buildings. In 1935 the NBS (National Bureau of Standards)
[NBS, 1935] also discussed the potential use of lifts during evacuations. However, in both
meetings the use of lifts during evacuations was discounted due to safety concerns and the lack
of fire protection measures in existing buildings associated with such usage.
Currently, whilst fire protected lifts are considered a viable means for fire fighting services to
fight fire [Barker, 1995] and also assist in the evacuation of disabled occupants [Proulx, et al.,
2009], most standards have yet to accept fire protected lifts as a viable means for the general
population to evacuate during a fire. Building codes and guidelines from both the US and the UK
have been reviewed, including:
International Code Council International Building Code [ICC, 2009],
NFPA 101: Life Safety Code [NFPA, 2009a],
NFPA 130: Standard for Fixed Guideway Transit and Passenger Rail Systems [NFPA,
2010],
NFPA 5000: Building Construction and Safety Code [NFPA, 2009b],
BS9999: Code of practice for fire safety in the design, management and use of buildings
[British Standards, 2008],
Guide D: Transportation systems in buildings [CIBSE, 2000].

26
With certain recent exceptions, building codes typically state that when a fire is detected then
lifts should immediately empty the passengers on the nearest viable floor before moving to the
fire recall floor (often the ground floor) and open the lift doors (commonly referred to as Phase I
Emergency Recall [ASME, 2007]). This allows fire fighting services who enter the building
(within close proximity to the lifts) to determine if any of the lifts have not returned and so
identify if anyone might be trapped inside. If fire fighters need to use a lift (e.g. in order to
rescue occupants or transport equipment) then they can take control of a lift using a key which
overrides the automated Phase I Emergency Recall operation (commonly referred to as Phase II
mode). In both Phase I and Phase II the lifts should not respond to landing calls within the
building.
With the growing usage of performance based codes that state evacuation criteria that can be
achieved in a variety of different ways and the increase in high-rise structures, there is a growing
trend to allow for the provision of fire protected lifts for the general population during
evacuations. Proulx surmises recent progress in the attempts to include lift usage for the general
population during fire evacuations within US building codes below:
"A collaborative effort between ASME, NIST, ICC, NFPA, US Access Board, and the IAFF in
March 2004 resulted in task groups developing technical requirements for occupant and
firefighter use of elevators during fire emergencies [17]. In the 30+ years of work, the
effectiveness of using elevators for reducing overall building evacuation time has been
immediately recognized at every workshop; the focus has been on ensuring that the procedures
and technology are robust enough to maintain or improve the safety record of using stairs
during a fire emergency." [Proulx, et al., 2009]
Indeed the International Code Council (ICC) and National Fire Protection Association (NFPA)
have already begun to allow the use of evacuation lifts for the general population within a
number of their building codes [ICC, 2009; NFPA, 2009a, 2009b, 2010].
The ICC, 2009 International Building Code (Section 1007.4) and NFPA 101 (Annex B) require
lift systems meet a given level of protective safety (i.e. equal to that of fire fighting lifts) and that
fire/smoke is not detected within close proximity to the lift system for them to be used during an
evacuation. If fire/smoke is detected within close proximity to the lift system or any of its
components then Phase I recall will be initiated. In NFPA 101 regardless of a building allowing
the use of such lifts during an evacuation, the same requirements for the number of means of

27
egress, capacity of means of egress and arrangement (e.g. stair provision) is maintained.
However, within the ICC, 2009 International Building Code, if occupant evacuation lifts are
present then buildings over 128m in height are not required to have an additional exit stair (in
addition to the minimum number of exit stairs as stated in Table 2). As such the ICC, 2009
International Building Code allows the capacity of evacuation lifts to substitute that of an
additional stair.
Table 2: ICC, 2009 International Building Code, minimum number of exits per storey
Occupant
Load
(persons per
storey)
Minimum Number of
Exits
(per storey)
1-500 2
501-1,000 3
>1,000 4
Within NFPA 101, in addition to typical buildings, compliant lifts are permitted as secondary
means of escape for certain towers which do not exceed occupancies of 90 persons and are not
used by the general public. In NFPA 5000 (Annex E, for building construction) similar
requirements as those mentioned in NFPA 101 are stated.
NFPA 130: Standard for Fixed Guideway Transit and Passenger Rail Systems [NFPA, 2010]
allows for the use of lifts for the general population providing a similar level of fire safety is
achieved for the lift system as in NFPA 101. Unlike NFPA 101, NFPA 130 further stipulates that
lifts can be used to substitute other forms of egress (e.g. stairs) but cannot account for more than
50% of the total egress capacity providing one lift is assumed to be out of service.
The British Standard BS 9999:2008 Code of Practice for Fire Safety in the Design, Management
and use of Buildings [British Standards, 2008], stipulates that generally lifts should not be used
during an evacuation because "it is possible for the occupants using the lift to become trapped
due to loss of power; it is possible that lifts could discharge occupants onto the floor containing
the fire; people sometimes have to wait for long periods for the lift car to arrive, extending the
escape time" [British Standards, 2008]. However, if lifts provide the same level of safety to that
of a fire fighting lift, then they can be used during an evacuation for the general population with
priority given to occupants who may have problems escaping via other routes. Such evacuation
means would only be considered with a suitable fire risk assessment undertaken. Similarly to
NFPA 101, BS9999 also states that in “a building with automatic sprinklers and significant

28
compartmentation or smoke control, a risk assessment might conclude that a non-evacuation lift
would be useable in the initial stages” [British Standards, 2008].
The Chartered Institute for Building Service Engineers (CIBSE) in the UK produce a document
called Guide D: Transportation systems in buildings [CIBSE, 2000]. The guidelines state
recommendations for the use of escalators and lifts in normal circulation situations in addition to
a variety of human factors associated. Guidance on the proportion of occupants to use stairs
compared to lifts based on collected traffic patterns is also given (see Table 3). The figures
suggest that no occupants would be prepared to walk more than 6 floors using the stairs during
normal circulation conditions. No further information regarding what influence, if any, the height
of a building may have on the proportion stair/lift users is mentioned.
Table 3: Likely proportion of occupants to use lifts and stairs during normal circulation
[CIBSE, 2000]
Floors
Travelled
Down Up
Stairs
(%)
Lift
(%)
Stairs
(%)
Lift
(%)
1 90 10 90 10
2 50 50 80 20
3 20 80 50 50
4 20 80 20 80
5 5 95 5 95
6 0 100 0 100

29
2.2.3 Evacuation lift human factors - empirical and qualitative data
Despite the interest in utilising lifts during evacuations for the general population, little research
has been conducted/published regarding associated human factors. Much of the research into lift
usage during evacuations has been based around making the physical components of the lift
system resilient to hazardous situations [Klote, 1983; Klote and Tamura, 1991; Bukowski,
2005a, 2005b]. Only a small number of past qualitative studies of actual evacuations where lifts
were used have been conducted (see previous sections). Very few have collected
empirical/quantitative data. The following section reviews three studies where data was collected
regarding evacuation lift human factors. The studies reviewed include Levin and Groner‟s air
traffic control tower lift evacuation interviews [Levin and Groner, 1994], Heyes‟s lift evacuation
surveys [Heyes, 2009], and Zmud‟s public Perceptions of high-rise building safety and emergency
evacuation procedures [Zmud, 2007].
Levin and Groner Air Traffic Control Tower Lift Evacuation Interviews
In 1994 Levin and Groner [Levin and Groner, 1994] produced a study of human factors
associated with using lifts to evacuate Federal Aviation Administration (FAA) air traffic control
(ATC) towers in the US. The authors visited 13 ATC towers which were used to examine the
typical architectural designs, interview ATC managers and at least 2 air traffic controllers per
tower. The interviews were intended to gather information on whether occupants would consider
using lifts during a fire evacuation. The authors state that prior to evacuating, air traffic
controllers are required to notify pilots and arrange for other controllers to assume control of
respective aircraft traffic (with estimates for the time taken to complete this task ranging between
1.5-5 minutes). Such pre-evacuation tasks would no doubt potentially increase total evacuation
time and the authors were particularly interested in how this may influence queuing for lifts
during an evacuation.
The typical structure of ATC towers are tall and narrow buildings with a small footprint. As such
they often only have a single lift and single stairway (primarily used for emergencies and when the
lift is non-operational). At the time of the study, the use of lifts during fires was prohibited within
ATC towers which often meant that only a single route of egress was available during fires
(using the stair). Since the survey was conducted the use of lifts as a secondary means of egress
for ATC towers is now accepted in the US [Bukowski, 2005a]. Most of the occupants
interviewed in the study were aware that they should not use lifts during a fire evacuation.

30
The authors state that buildings with only a single lift suffer from complaints regarding lifts not
being operational, forcing occupants to walk up the stairs. Within the interviews of air traffic
controllers the authors state:
"the perceived reliability of elevators has a strong effect on the controllers expressed willingness
to use them during an emergency" [Levin and Groner, 1994]
A number of comments within interviews stated that lifts regularly broke down in ATC towers
and there was a general lack of confidence in lift reliability. A number of air traffic controllers
had reservations about using the lifts during a fire evacuation. Indeed interviewees within the
study expressed a preference to use the stairs instead of the lifts during a fire evacuation due to
not wanting to be reliant on an electrical/mechanical device through fear of becoming trapped.
As such the authors highlight that well maintained lifts during normal operations are likely to
contribute to reducing such reservations for lift usage during fire evacuations.
As ATC towers typically do not simultaneously contain more than 25 occupants [Levin and
Groner, 1994], occupants are not expected to wait very long to use a lift. The authors mention
that the main contributing factors to increased lift wait times are the lift capacity and lift speed.
The study conducted provides valuable insights into evacuation lift human factors, however, the
general applicability of the results to other building/population types (e.g. commercial
(employees), apartments (residents), hospitals (patients), etc), is questionable. Most of these
high-rise buildings would quite likely contain more occupants of different types (e.g. coming
from multiple companies), with no common social hierarchy (e.g. managers in the same
company), having multiple stairwells with a variety of evacuation routes, and a larger building
footprint allowing for a greater degree of horizontal movement.
Heyes's Lift Evacuation Surveys
In 2009, Heyes [Heyes, 2009; Heyes and Spearpoint, 2009], as part of a Master thesis, conducted
a Post-Evacuation Drill Survey, Evacuation Event Simulation Survey, Online Survey and Bomb
Threat Incident survey (previously mentioned) regarding the use of lifts during an evacuation.
Heyes states that due to the inherent limitations with each survey, the "triangularisation
approach" [Heyes and Spearpoint, 2009] of using different surveys allowed overall trends to be
uncovered.

31
The Post-Evacuation Drill Survey was given to students and staff of the University of
Canterbury, New Zealand after evacuating two buildings on campus as part of a drill. None of
the buildings included procedures for the use of lifts during evacuations and participants were
asked about their evacuation experience and if they would consider using lifts if it were
acceptable to do so. In total 91 surveys were completed.
The Evacuation Event Simulation Survey was given to first year engineering students at the
University of Canterbury immediately after a lecture. Participants were presented with a
hypothetical evacuation situation. Pictures were provided as the event happened that was
intended to aid participants in conceptualising the hypothetical situation. Participants were asked
what they would do at different stages of the evacuation with regards to a multi-storey
evacuation. Participants were divided into two groups; "educated" and "uneducated". In the
educated group participants were taught the typical fire safety measures employed in buildings
that use lifts as part of their evacuation. The uneducated group participants were not provided
with this information. Though it was not mentioned it is believed whilst the participants
completed the survey individually, they were located in the same lecture room as other
participants whilst doing the survey (i.e. as a class); the extent to which this may have influenced
the results is uncertain. In total 229 students participated in the survey.
The Online Survey was given to Arup employees in offices within three different
countries/cities: Perth (Australia), San Francisco (US) and Singapore (Republic of Singapore)
(the majority of which were engineers). The survey asked participants to judge how imaginary
characters would behave within a hypothetical evacuation, their understanding of evacuation
procedures in their building, the number of stairs that they would be capable of evacuating down
and what concern they would have for using lift/stairs during an evacuation. In total 138
participants were recorded in Perth (27.5% (38)), San Francisco (43.5% (68)), and Singapore
(31.9% (44)).
In addition to the experimental surveys, Heyes also surveyed evacuees from a bomb-scare in
Christchurch as part of the study which has been reviewed in a previous section.
Across all surveyed locations and occupational groups, the concerns for using lifts during
evacuations were the same with the most common concerns relating to being trapped in a lift,
having to wait a long time, fire/smoke entering the lift and the lift car free falling.

32
The percentage of participants that said they would use a lift for different floor heights in each
survey is presented in Figure 5. As the floor height increases the proportion of participants that
said that they would use a lift also approximately increases.
Figure 5: Percentage of occupants to use the lift by floor level [Heyes and Spearpoint, 2009]
A linear regression was performed to obtain a formula (See Equation 1) to predict the proportion
of lift users given the floor level:
p = 1.14f + 5.3 5≤f≤60 floors
Equation 1
p = Percentage of occupants to use the lift (%)
f = Floor level of the building
A goodness of fit value (R2) of 0.877 was reported which suggests the regression formula to be a
good predictor of the proportion of lift users given a floor level. However, this is surprising
considering the proportion of lift users differ between around 3%-25% (from visual inspection of
the graph). Indeed this difference appears to increase on the higher floors (Floors ≥20, 20%-
25%). It is thought that the linear regression line was constructed and subsequent goodness of fit
value calculated using the average proportion of lift users across all surveys for each floor. If so
this would reduce the influence of the different proportion of lift users for each floor between
surveys and so give an increased R2 value. In addition, only 4 floor heights were tested for the
proportion of lift users in all the surveys (floors 5, 20, 30 and 60). This is also expected to
contribute to a smoothing effect and increase the likelihood of a linear correlation emerging.
Heyes mentions that the increase in lift users may rise more rapidly after floors 60 and that the

33
relationship between the proportion of lift users and floor height may not be linear. Using the
line of best fit suggests that most occupants would use a lift if located above floor 40 within a
building.
Heyes compared the proportion of surveyed lift users against those that used lifts in actual
incidents. The actual fire evacuation incidents using lifts were the World Trade Centre 911
Attack (WTC2), Chicago Cook County Fire and the Hiroshima Motomachi Apartment Fire. As
previously described, each of these fires had unique/different contexts, building
structures/heights, populations and situations. Given such differences it may not have been
appropriate to compare associated lift usage with the survey results.
Heyes states that participants in the Post Evacuation Survey, Online Survey and the Evacuation
Event Simulation Survey were asked questions regarding the length of time they/characters
would wait for a lift during an evacuation. This included:
For the Post Evacuation Survey, participants were asked how long they would be
prepared to wait for a lift before they redirected to the stairs, with participants being
required to state a given time without any options or prompts from multiple time ranges.
For the Evacuation Event Simulation Survey, participants who would consider using a lift
during the hypothetical evacuation were asked whether they would still wait to use a lift
after 5 and 10 minutes.
For the Online Survey, participants were asked how quickly imaginary characters would
take to exit the building using either the lifts or the stairs. For the imaginary characters
that used the lift, this included the time waiting for a lift and time travelling in the lift.
Participants were then asked, out of the imaginary characters who used the lift and stair,
which made the best decision (the stair users or the lift users). A further scenario is
presented where the imaginary characters wait for 5 and 10 minutes for the lift on each
floor and participants were required to say if they thought waiting for each length of time
was the best decision.
Due to the difference between each question (e.g. asking whether it was a good decision for the
participant/imaginary character to wait a given time for a lift) and methodology (e.g.

34
online/lecture based survey), it is uncertain whether the wait times measured in each survey are
semantically identical.
Results show the average proportion of lifts users that would continue to wait for a lift at 0, 300,
600 (for the Event Simulation Survey) seconds for each of the floors in each survey (See Figure
6). As expected in all surveys the proportion of people that would use a lift decreases as wait
time increases.
Figure 6: Percentage of people that will use the lift after waiting time [Heyes and Spearpoint, 2009]
Using the proportion of lift users divided by floor number, the corresponding wait times of
averaged values were plotted for each survey (see Figure 7 below) to allow a line of best fit
along with a subsequent regression formula to be constructed. Heyes states that the responses
from the engineer participants had been removed from the plot in order to obtain a better fit
curve.

35
Figure 7: Percentage of respondents that would take the lift over floor level as a function of waiting [Heyes
and Spearpoint, 2009]
The following equation (see Equation 2) for the line of best fit was produced:
p = (-0.0016t + 1.06).f 5≤f≤60 floors ; 0≤t≤600 seconds
Equation 2
p = percentage of occupants to use the lift (%)
f = Floor level of the building
t = waiting time (s)
As with the previous regression, it is believed that the average values of each time period over all
surveys was calculated to generate the line of best fit which would subsequently increase the
associated R2
value (reported as 0.755). Indeed even without the engineers responses there
appears to be a high degree of variation. Combining the averaged %lift/floor level ratios with the
small number of time bins (three bins) is expected to create a smoothing effect increasing the
likelihood of a linear correlation.
Heyes hypothesizes that participant‟s decision to use a lift or stairs would be influenced by
which device forms part of the fastest and/or safest evacuation route. Results from the Online
Survey and Evacuation Event Simulation showed that participant‟s primary influence was
selecting the device that forms part of their fastest route as opposed to the safest.
Considering different sample populations were used for each survey, it is unclear whether the
differences between overall responses in each survey lay in the different samples or in the more

36
general population. Indeed participants came from a narrow occupational range in each survey
(i.e. mainly students (small age range) and engineers). This makes it hard to determine if and to
what extent the results are generally applicable to a wider population.
Methodological differences exist in how each survey was conducted along with differences
between the format of certain questions/answers (e.g. self reported behaviour of what
participants would do and reported behaviour of what participants think imaginary characters
would do). Comparing responses across surveys may therefore have introduced inconsistencies.
Public Perceptions Of High-Rise Building Safety And Emergency Evacuation Procedures
In 2006 the NFPA commissioned a report by Zmud of NuStats following the World Trade
Centre 911 attacks to investigate the current level of fire safety knowledge of high-rise building
occupants in the US [Zmud, 2007]. In addition, it was intended to find out if attitudes towards
fire safety had changed after of the World Trade Centre 911 attacks. In total 244 occupants from
residential buildings (surveyed across 3 cities in the US: Chicago, New York, and San Francisco)
and 228 occupants from commercial buildings (surveyed across 7 cities in the US: Boston,
Chicago, Detroit, Houston, Los Angeles, Miami, and Philadelphia) were surveyed. Certain
questions in the survey related to lift usage during evacuations.
Overall 73% of residential participants and 80% of commercial participants thought that the use
of lifts during an evacuation was never safe. In residential buildings on average 2% of
participants thought that lifts were "usually safe" and 3% of participants thought lifts were "as
safe as using the exit stairs" during an evacuation. Similarly in commercial buildings 3% of
participants thought that lifts were "usually safe" and 0% of participants thought that lifts were
"as safe as using the exit stairs". It was also reported for the commercial building participants
that just over 10% whose office was located on floor 41 or higher reported that they thought that
using lifts during evacuations was "usually safe". The findings clearly suggest that the majority
of high-rise occupants have reservations about using lifts during evacuations with little
difference being recorded between commercial and residential occupancies.
In addition, several respondents mentioned problems with normal lift usage which made them
consider what may happen to a lift during a fire. As mentioned in the study by Levin and Groner
[Levin and Groner, 1994] of FAA control towers, this highlights that perception of general
reliability of the lift system during normal conditions contributes to occupants‟ perception of the
reliability of using lifts during a fire evacuation.

37
As part of the survey, participants were given a hypothetical evacuation scenario from their
building and a list of possible responses. Less than 5% of participants said that they would use a
lift if it was working. Around a quarter of participants believed that going to the roof was a
possible alternative to using the stairs to evacuate down.
Considering the general reservations about evacuation lift usage by participants the report
concludes that people will need to be retrained in order to generally accept using lifts during fire
evacuations.
Summary of evacuation lift human factors- empirical and qualitative data
A series of studies have been reviewed where human factors data was collected regarding
evacuation lift usage. In all studies participants were asked how they would behave on/around
lifts during an evacuation. In each study participants were recorded as stating that they had
reservations about using a lift during an evacuation. Reliability of using lifts in normal
circulation situations has been mentioned as an influencing factor. It has also been recorded that
as floor height increases the proportion of occupants that would consider using a lift and would
wait for a longer to use a lift also increases. In the studies by Levin and Groner [Levin and
Groner, 1994] and Heyes [Heyes, 2009; Heyes and Spearpoint, 2009], participants were drawn
from narrow demographic groups (e.g. coming from the same occupations) which casts doubt
over the general applicability of the findings from such studies. The scarcity of such studies
highlights the lack of understanding and, considering the regulatory impetus to consider lift
usage, the need to understand associated human factors during evacuations.
2.2.4 Review of software modelling lifts
The first published accounts of lift traffic simulators were in the late 1960's, an example of which
was the lift simulation of the World Trade Center for general circulation scenarios [Browne
1968]. Shortly after lift simulators for evacuation were developed in the 1970's when Bazjanac
developed a computer simulation tool to conduct both partial and full building evacuation
simulations [Bazjanac, 1977]. Since then a variety of numerical and simulation based models
have been developed that can represent lifts during evacuations. These can be broadly
categorised in to two types: dedicated lift models and circulation/evacuation models.

38
The primary purpose of dedicated lift models is typically the control and vertical movement of
lifts about a building. In such models occupant movement is simplified as a product of distance,
occupant speed, flow-rates and arrival rates using numerical calculations. These are typically
used by the lift industry to analyse different lift floor dispatch strategies or the influence of
different occupant traffic patterns for a given lift system to increase circulation efficiency.
A number of circulation/evacuation models also have the capacity to represent lifts. The focus of
such models is based on occupant behaviour (predominantly being agent based); the lift
kinematics, lift control and performance metrics within such models is often less developed
compared to the dedicated lift models. These models are typically used by engineering
companies to simulate occupant behaviour during circulation/evacuation situations in order to
demonstrate adequate structural or procedural design for a building.
Within this section a number of lift models and circulation/evacuation models (that contain lifts)
has been reviewed. A description of each model and associated components specific to the
representation of lifts has been presented.
In 2005 Kuligowski and Peacock produced a review of evacuation models [Kuligowski, 2005]
which stated models that could represent lifts: EVACNET, STEPS, Legion and EvacSim. In
2010 a second edition of the review was published [Kuligowski, 2010] which extended the list of
models that could represent lifts: SimWalk, PEDFLOW, SpaceSensor, Myriad II, MassMotion,
and SGEM. Published details regarding how each model functions is sparse with only a small
number of models publishing details regarding lift functionality. The dedicated lift models
reviewed were ELVAC, ELEVATE and the Building Traffic Simulator (BTS). The
circulation/evacuation models reviewed were STEPS, EvacSim and EVACNET. These were
selected to review based on the availability of published literature regarding the lift components
of the models.
ELVAC
ELVAC is a numerical based model that computes the total evacuation time, lift round trip time,
number of lift trips per floor to evacuate a building using both stairs and lifts. It was developed in
QBASIC by Klote and Alvord in 1992 [Klote and Alvord, 1992b] at NIST, US as part of a
project to explore the use of evacuation lifts for the US General Services Administration (GSA).
The program only has the capability to represent a single group of lifts (a separate simulation for
each group of lifts is required where multiple lift groups exist). The following input parameters
39
that are required by ELVAC are: floor heights, total population on each floor, number of lifts,
max lift speed, lift acceleration speed, lift capacity, lift door type and width, and lift inefficiency
factors. All calculations performed by ELVAC are numerical. Due to the simplified/homogenous
human factors represented in the model the total evacuation time and round trip times are
considered to be "idealized" (though a trip inefficiency factor can be incorporated). The formula
to calculate the total evacuation time by ELVAC can be seen in Equation 3.
tr = ta + to +
.
Equation 3
tr = total evacuation time
trj = total round trip time
m = number of round trips
j = number of lifts
n = the trip inefficiency
ta = lift start up time
to = travel time from the lift to outside
The trip inefficiency component in Equation 3 is included to represent additional and/or
suboptimal lift time components (i.e. time for trips to empty floors and trips to pick up
stragglers). The round trip time for each trip is calculated using the maximum speed and constant
acceleration stated by the user. No representation of user-specified jerk (i.e. change in
acceleration) is represented.
ELEVATE
ELEVATE is a simulation based model developed by Richard Peters at Peters Research, UK
[Peters, 2007, 2002]. This was originally developed in the 1990's in Visual C++. The user
manual for the software is publically accessible online [Peters, 2007], in addition to a number of
published papers regarding its usage. ELEVATE is a dedicated lift model and its primary
purpose is to allow users to explore the influence of different lift floor dispatch strategies and
traffic patterns during normal circulation situations. However, ELEVATE has also been used to
represent evacuation incidents for consultancy; Howkins [Howkins, 2000] replicated the
Hiroshima Motomachi high-rise apartment fire evacuation using stairs/lifts. ELEVATE defines a
buildings structure via an abstract representation of a series of nodes (representing lifts,
escalators and stairs or any vertical means of traversal) connected via arcs about which
occupants move. It is essentially assumed that the main crowd bottlenecks occur around the

40
vertical transfer devices and exits hence the simplification of behaviour representation outside of
these areas (though implicitly representation of other bottlenecks through varying arrival rates to
those devices could be represented).
ELEVATE has a number of required input parameters (with many having default settings):
maximum speed, acceleration rate, jerk, motor start delay, door open/close times, dwell times,
lift capacity (number of person or weight) floors served, single/double deck, shut down time,
restart time, max door reopening time, etc [Peters, 2002]. Further to this a user can specify
different dispatch modes within ELEVATE (e.g. up/down peak modes) in addition to also being
allowed to develop their own floor dispatch algorithms and link them into the software. Vertical
zoning can be represented where lifts only service specific floors and any number of lift groups
can be represented simultaneously. A number of attributes relating to occupants can also be
defined including: passenger mass, loading/unloading times, capacity factor (how full occupants
will load a lift). The occupant model is not an agent based model where each agent moves about
an explicitly defined geometry (as in typical circulation/evacuation model). Instead, occupants‟
arrival at the lift waiting areas are defined via an arrival time distribution. Arrival rates to the lift
waiting areas and stairs can be defined according to default distributions or user-specified arrival
data. In addition to lifts and stairs, escalators can also be represented using a flow-rate model.
When a lift arrives, those at the front of the queue board the lift first. The concept of different
physical wait locations in relation to each lift or occupants influencing each other's behaviour
within the lift waiting area whilst waiting is not explicitly represented. The extent to which this
may influence occupant lift boarding behaviour is unclear.
Adoption of stairs and escalators by occupants are represented by user-specified proportions. A
escalator/stair factor is associated with each floor that defines the proportion of occupants on that
floor which will use the stairs/escalators for travelling a given number of floors. The remaining
occupants will use the lifts from the given floor.
The simplified representation of occupant behaviour and the extent to which occupant behaviour
may influence an evacuation in ELEVATE is limited. Further to this, the behaviour which is
represented is based on empirical data collected in normal circulation situations and not
evacuation scenarios. Such issues highlight the questionable application to assess evacuation
scenarios using such dedicated lift models.

41
Building Traffic Simulator (BTS)
The Building Traffic Simulator (BTS) was originally developed by Siikonen in the 1980's at
KONE, Finland in C++ with a Visual Basic interface [Siikonen, 1993, 1997a, 1997b]. It is a
dedicated lift model and is only available to KONE and its clients (i.e. it is not publically
available). BTS has also been used to model building evacuation scenarios [Hakonen, 2003a,
2003b; Siikonen and Hakonen, 2003; Siikonen, 2007]. BTS defines a building‟s structure via a
series of nodes (representing lifts, escalators and stairs or any vertical means of traversal)
connected via arcs about which occupants move. It essentially assumes that the main bottlenecks
and queues of occupant movement only occur around the vertical transfer devices hence the
simplification of behaviour representation outside of these devices.
BTS has a number of key input parameters (see Table 4). Occupant behaviour on
stairs/escalators is represented using flow to density calculation where the handling capacity of a
stair is stated in Equation 4.
CStair = 0.83 . S . D . W
Equation 4
CStair = Handling capacity of the stair (ped/s)
S = Average walker speed (m/s)
D = Occupant density (ped/m2)
W = Stair width (m)
(where 83% of theoretical actual device handling capacity is used).
Similar to ELEVATE custom lift floor dispatch strategies can be included.
Table 4: Input data required for an BTS simulation [Siikonen, 1997b]
Building Lifts Traffic
Floor height
Number of
floors
Populated
floors
Entrance floors
Number of lifts
Lift sizes
Number of groups
Speeds, acceleration, jerk
Door opening/closing times
Photocell delays
ADO speed and distance
Loading capacity (% of full lift
capacity that is filled (usually 80%))
Passenger
arrival rates
Traffic
Components
Population
distribution
Entrance floor
attractions
Transfer times

42
BTS produces a number of output parameters including occupant lift wait time (time spent
waiting for a lift), occupant ride time (time spent riding in a lift), occupant journey time (sum of
lift wait time and ride time), and overall averages. BTS assumed that lifts, escalators and stairs
are the main bottlenecks in the building.
BTS has the capability to model adults, children and disabled occupants [Susi, et al., 2004]. The
default weight of adult occupants is between 68-80kg each occupying around 0.15-0.22m2 of
floor space inside a lift. Such parameters are defined as the capacity of a lift car is limited by the
combined weight and space of the occupants inside. Occupants have two types of characteristics:
physical and behavioural. Physical characteristics include attributes such as walker speed, lift
transfer time, space demand and ability to use each transport device. Behavioural characteristics
of occupants determine the decisions occupants make and how they move within the simulated
environment e.g. avoiding crowded areas, avoiding walking long distances, etc. Passenger
routing is one such key component of the behavioural part of BTS which determines how an
occupant decides which transportation devices to use in order to get to their chosen destination.
Susi [Susi, et al., 2004] states that by observing transport related behaviour patterns of real
passengers the same behaviour can be represented within BTS. An artificial intelligent
behavioural model is used to represent how occupants behave. Using the model, occupants
exhibit typical occupant behaviour (e.g. avoiding previously visited areas). There are no
predefined routes which occupants take; reacting to the local conditions in selecting which
transport devices best suit their needs.
The occupant model is composed of two key parts: the router and reactor. The router plans the
higher level route within the building using the graph of nodes (transport devices) which
essentially ensures that occupants keep travelling in the right direction to reach a desired target.
A score is given to each route based on the shortest distance algorithm. The reactor assesses each
path based on the individual characteristics of each occupant (e.g. ability to walk long distances),
using a sum of weighted values (weighted values are defined according to the occupant type),
thereby assigning a score to each route. The values produced by the router and reactor are
combined for each route to form a probability distribution from which the occupant has a given
likelihood of choosing a specific route (the decision of which route an occupant uses is chosen at
random from this probability distribution). No details regarding how the weights for the reactor
model have been determined or if they are based on observational data is mentioned. No
published accounts of validation or comparison with an actual traffic were found.

43
When occupants choose to use a lift and arrive in the lift waiting area they can adjust their
decision to use a lift based on wait time and the queues for the lift. When a lift arrives those at
the front of the queue board the lift first. The concept of different physical wait locations in
relation to each lift or occupants influencing each other's behaviour within the lift waiting area
whilst waiting is not explicitly represented.
During the evacuation simulations run by Hakonen [Hakonen, 2003b] if a lift car was not filled
to capacity on a given floor, then it will move to the next floor in the sequence in order to collect
more occupants before taking those occupants to the exit floor. This increases the efficiency of
the lift system in better utilising the available space in each lift during an evacuation.
STEPS
The STEPS (Simulation of Transient Evacuation and Pedestrian movementS)
circulation/evacuation model was originally developed by Hoffmann and Henson [Hoffman and
Henson, 1997] in the 1990s at Mott Macdonald, UK and has since been further developed [Mott,
2003].
STEPS represents floors as continuous planes of discretized space using a Cartesian mesh of a
chosen size (typically based on the size of occupied by a single person). Occupants move about
the plane based on the underlying mesh. Routes through a structure are defined using a series of
checkpoints on a given plane. Occupants interact with the geometry according to their defining
attributes which include free walking speed, awareness, patience, association and pre-movement
time. Occupants‟ fundamental aim is to move through the geometry using the routes defined
according to the shortest time selection method at their free walking speed. STEPS has the
capability to produce a variety of output data at the individual occupant and overall simulation
level.
Lifts in STEPS are defined by a series of attributes which are listed in Table 5. Lift output
parameters include averages of round trip time, interval time, wait time, transit time, highest
return floor, number of stops, and total population transported.
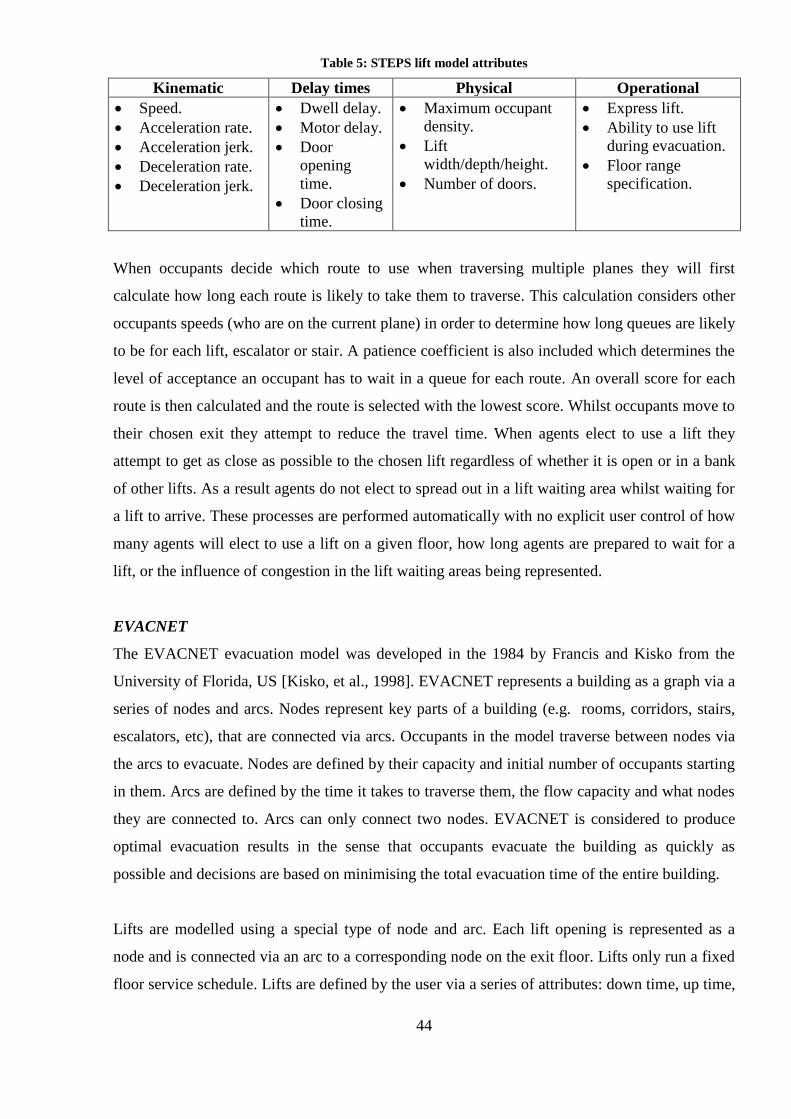
44
Table 5: STEPS lift model attributes
Kinematic Delay times Physical Operational
Speed.
Acceleration rate.
Acceleration jerk.
Deceleration rate.
Deceleration jerk.
Dwell delay.
Motor delay.
Door
opening
time.
Door closing
time.
Maximum occupant
density.
Lift
width/depth/height.
Number of doors.
Express lift.
Ability to use lift
during evacuation.
Floor range
specification.
When occupants decide which route to use when traversing multiple planes they will first
calculate how long each route is likely to take them to traverse. This calculation considers other
occupants speeds (who are on the current plane) in order to determine how long queues are likely
to be for each lift, escalator or stair. A patience coefficient is also included which determines the
level of acceptance an occupant has to wait in a queue for each route. An overall score for each
route is then calculated and the route is selected with the lowest score. Whilst occupants move to
their chosen exit they attempt to reduce the travel time. When agents elect to use a lift they
attempt to get as close as possible to the chosen lift regardless of whether it is open or in a bank
of other lifts. As a result agents do not elect to spread out in a lift waiting area whilst waiting for
a lift to arrive. These processes are performed automatically with no explicit user control of how
many agents will elect to use a lift on a given floor, how long agents are prepared to wait for a
lift, or the influence of congestion in the lift waiting areas being represented.
EVACNET
The EVACNET evacuation model was developed in the 1984 by Francis and Kisko from the
University of Florida, US [Kisko, et al., 1998]. EVACNET represents a building as a graph via a
series of nodes and arcs. Nodes represent key parts of a building (e.g. rooms, corridors, stairs,
escalators, etc), that are connected via arcs. Occupants in the model traverse between nodes via
the arcs to evacuate. Nodes are defined by their capacity and initial number of occupants starting
in them. Arcs are defined by the time it takes to traverse them, the flow capacity and what nodes
they are connected to. Arcs can only connect two nodes. EVACNET is considered to produce
optimal evacuation results in the sense that occupants evacuate the building as quickly as
possible and decisions are based on minimising the total evacuation time of the entire building.
Lifts are modelled using a special type of node and arc. Each lift opening is represented as a
node and is connected via an arc to a corresponding node on the exit floor. Lifts only run a fixed
floor service schedule. Lifts are defined by the user via a series of attributes: down time, up time,

45
time of the first down departure (the time the lift arrives at its first floor), lift capacity, and
priority. Occupants are only carried in the down direction. A user manually specifies the
frequency of occupants that use each lift and no redirection of occupants to stairs is represented.
EvacSim
EVACSIM was developed by Poon at Victoria University, Australia in the 1990's [Poon 1994].
It is described as a discrete event simulation evacuation model. Occupants are defined via a
series of attributes which are grouped into the following categories: occupant response
(perceived level of severity of an incident), physical attributes (e.g. walker speeds, occupied
space), and building knowledge (familiarity with exits and routes).
Flow to density equations are used to model exits and stairs. Queues (for stairs and lifts) are
modelled on a FIFO (First in First Out) principle; they are all linear/single lane. Lifts are
modelled using the following states: Call, Ascend, Load, Wait, Descend, Unload, and Free.
Occupants exit lifts based on a LIFO (Last in first out) principle; occupants exit lifts in a
linear/single lane fashion.
Summary review of software modelling lifts
A series of dedicated lift and evacuation/circulation models have been reviewed. In all models
reviewed no representation of empirical based evacuation lift human factors is represented,
though some contain circulation lift human factors. Occupants evacuating attempt to reduce their
own total evacuation time. Dedicated lift models typically use implicit representation of human
factors. Human factors such as lift waiting area behaviour and the influence that local conditions
may have are typically not represented.
All models reviewed represent the physical, kinematic, and delay time components of a lift
system to varying degrees. The most detailed kinematic components are represented using jerk,
acceleration, and maximum speed values. This allows users to represent the movement of lifts
within a building based on lift manufacturer kinematic specifications. In contrast, certain models
allow users to specify the total lift travel time for a given journey that requires the user to
manually calculate these travel times. Whilst both methods have the ability to represent the
movement of a lift system, the former is considered more flexible as it allows the user to
automatically measure the influence of varying the kinematic attributes of a lift without external
calculations by a model user.

46
2.2.5 Evacuation lift strategies and simulation results
This section addresses literature that describes how lifts could be used during evacuations for the
general population. Typically this is demonstrated through the use lift/evacuation model
simulations and/or analytical methods. In all cases explored the use of both lifts and stairs is
recommended in reducing total evacuation times compared to stairs alone.
Bazjanac [Bazjanac, 1977] states that the total evacuation time of a building using lifts depends
on the number and distribution of people, characteristics of lift system, and the design of the
building, mentioning the smaller the occupant/lift ratio (i.e. more lifts per person) the faster the
evacuation. Bazjanac conducted a series of full building evacuation simulations of a 25 storey
building to assess the effectiveness of using lifts during evacuations. Little detail is mentioned
regarding the simulation software, simulated scenarios, lift model or how occupant behaviour
was represented. In all full building evacuation simulations conducted the buildings were
evacuated in less than 30 minutes using downward collective mode where lifts gave priority to
occupants on the higher floors. All simulations assumed a constant flow of occupants to the lift
lobby and Bazjanac states that the total evacuation time will be considerably extended if this
does not occur. Bazjanac further states that to achieve this, occupants should be well trained and
wardens should be located in lift waiting areas to facilitate the lift boarding process. Bazjanac
mentions that there is little merit in evacuating occupants to other floors compared to evacuating
them to the exit floor.
Around a similar time, Pauls [Pauls, 1977] proposed the concept of using shuttle lifts servicing
sky lobbies combined with stairs to evacuate a building. Pauls suggested that occupants could
initially evacuate to the sky lobbies using stairs and wait for further instructions whilst the best
course of action is decided; drawing comparison to a ship evacuation where occupants muster
before leaving the ship via lifeboats. If the situation requires, occupants could then board the
shuttle lifts from the sky lobbies which would take them to the exit floor. Using numerical
calculations, Pauls states that a 41 floor building containing 5,000 occupants could theoretically
be evacuated in under 30 minutes. This represents around a 50% decrease in total evacuation
time compared to the stairs alone.
In 2005 Wong et al [Wong, et al., 2005] proposed a similar lift evacuation strategy to Pauls with
the use of sky lobbies and shuttle lifts. Wong states that because shuttle lifts only typically have
two openings (on the ground and sky lobby floor) they require minimal additional pressurisation
and water/smoke entry protection measures (for during fires). As such the strategy has a number

47
of cost saving and fire safety protection benefits compared to a standard top-down evacuation
strategy using all lifts. Wong used the STEPS evacuation model to run a series of full building
evacuations in order to determine the potential benefits of using such a strategy compared to
stairs alone.
The hypothetical building used was 100 floors in height with 21,000 occupants. It contained 3
stairwells and 4 refuge floors each serving a maximum of 24 floors. There were 14 shuttle lifts
servicing those refuge floors and the exit level. Occupants were given instant pre-
movement/response times and required to travel down the stairs to the next refuge floor where
they would take the lift to evacuate. STEPS determined the proportion of occupants that would
wait for the lift on the refuge floor based on the queuing time and patience of each occupant. No
details regarding the proportion of lift/stair users initially starting on each floor, the average lift
wait time, or number of occupants that redirected to the stairs after initially choosing the lifts was
mentioned. Wong states that a number of simulation scenarios were run until the last stair user
evacuated at the same/similar time to the last lift user. This was deemed to produce the fastest
total evacuation time. As such the results in Table 6 are considered idealistic.
Table 6: Comparison on percentage of occupants evacuated [Wong, et al., 2005]
Percentage evacuated Stair Lift + stair Difference
25% 26 min 11 min -58%
50% 53 min 25 min -53%
75% 80 min 41 min -49%
90% 96 min 53 min -45%
100% 110 min 70 min -36%
As can be seen, the proportion of time saved using both lifts and stairs almost halves compared
to stair only case for the first 90% of the population evacuated. The final 10% of the population
extended the total evacuation time by 24.3% (17min) towards the end of the evacuation in the
lift+stair scenario. This is due to occupants on the upper floors taking longer to evacuate due to
having to travel further. Overall the lift+stair evacuation reduced the total evacuation time by
36% compared to the stair only scenario.
Klote et al [Klote, et al., 1992] used the ELVAC lift evacuation model to study the feasibly of
using lifts to evacuate 4 General Service Administration (GSA) buildings in the US in the 1990's.
For 3 buildings (Hoffman, White Flint, and General Service Buildings) a series of evacuation
calculations were run where progressively more floors (starting from the top) used lifts and
occupants below used stairs (each stairwell and lift serviced all floors). The study was intended

48
to find the optimal number of upper floors which should use lifts with the remainder of the
building using stairs that would produce the shortest total evacuation time.
The fourth building (Jackson Federal Building) was vertically partitioned into 3 zones (low,
medium and high-rise) with each zone being serviced by 6 lifts. Calculations were run where
different proportions of occupants used the lifts on each floor (with the remaining occupants
using the stairs on each floor). The optimal proportion of lift users was found to be 65% of
occupants on each floor with the remaining 35% using the stairs. This also included, on the low
rise zone, occupants on the top 4 floors all using lifts to evacuate.
A top-down evacuation strategy for lift users was employed in all calculations for all the
buildings. Overall results can be seen in Table 7.
Table 7: Overall ELVAC simulation results for the 4 GSA Buildings
Building Hoffman White Flint
North
Jackson
Federal
General
Services
Number of Floors 13 18 35 7
Number of Lifts 10 4 18 12
Number of Stairwells 4 2 2 6
Number of Occupants 2,990 1,224 2,660 2,174
Stair Only Evacuation Time 15 min 14 min 26 min 7 min
Lift Only Evacuation Time 24 min 29 min 17 min 17 min
Lift+Stair Optimum
Evacuation time 11 min 12 min 13 min 6 min
Approximate %
Time Saved Compared to
Stair Only
20% 15% 50% 10%
Overall results show that higher buildings would benefit considerably from the use of lifts during
an evacuation. Evacuating occupants initially located on the upper floors as a priority was shown
to reduce total evacuation time. In the Jackson Federal building calculations, whilst an optimal
proportion of lift users was determined for each floor, it is questionable whether it is practical or
possible to tell some occupants to evacuate using the lift and others to use the stairs who are
initially located on the same floor.
Results presented from the studies by Pauls and Klote et al are based on analytical calculations
based on the assumption that people behave in the same way with optimum usage of lifts/stairs
assumed/determined. Such homogenous human behaviour and usage of lifts/stairs highlights the
optimal nature of the studies.

49
Galioto et al [Galioto, et al., 2004] developed guidelines for the use of lifts during evacuations; a
series of evacuation calculations were performed to ascertain the influence of using lifts and
stairs compared to stairs alone. The hypothetical building used was 47 floors in height having 2
stairwells and 19 lifts. The lifts were split into 3 groups each serving a different vertical zone:
low-rise (5), medium-rise (6) and high-rise groups (6) (plus one lift servicing all floors in each
zone). The building was populated with 3,300 (approximately 70 occupants per floor). Lifts were
placed in down peak modes thereby employing a top-down evacuation strategy for each zone.
The total time to evacuate the building by stairs alone was calculated (using flow-density
equations) to be 25 minutes. The total time to evacuate the building using lifts only was
calculated to be 23 minutes. Combining both lifts and stairs (assuming an optimum usage
between lifts and stairs) a decrease in total evacuation time to 12 minutes was recorded. This
represents a reduction of total evacuation time in excess of 50% compared to the stair only
scenario.
Howkins [Howkins, 2000] simulated a similar evacuation scenario to that of the Hiroshima
Motomachi apartment fire (mentioned previously). Howkins compared a standard lift collective
control mode and a proposed 'fire collective control' using the ELEVATE lift model. Howkin‟s
'fire collective control‟ method proposes that floors closest to and above the fire floor have
priority to use a lift compared to those floors below the fire floor. The simulation results are
presented in Table 8. Floors above the fire floor (floor 9) are given priority according to how
close they are to the fire so occupants on the floor directly above the fire floor are given priority
to use the lifts first. Occupants two floors above the fire floor are then given priority and so on.
Howkins states that in a conventional collective control system (a down collective mode/top-
down method) occupants closest to the fire floor would have to wait until all occupants on the
floors above evacuated first before having priority.

50
Table 8: Fire evacuation collective control versus conventional collective control[Howkins, 2000]
Fire Collective Control Conventional Collective
Level Lift arrives after (sec) Nominal
Order
Lift arrives after (sec) Nominal
Order
20 226 9 71 1
19 204 8 94 2
18 181 7 116 3
17 159 6 138 4
16 Answered Answered
15 132 5 165 5
14 110 4 187 6
13 88 3 209 7
12 66 2 231 8
11 43 1 254 9
10 No Calls / Fire Floor No Calls / Fire Floor
9 No Calls / Fire Floor No Calls / Fire Floor
8 No Calls / Fire Floor No Calls / Fire Floor
7 289 10 288 10
6 Answered Answered
5 316 11 315 11
4 Answered Answered
3 342 12 342 12
2 Answered Answered
1 No Calls No Calls
Whilst the 'fire collective control‟ method offers immediate benefit to occupants closest above
the fire floor, overall the total evacuation time of the building is identical to the conventional
collective method.
2.2.6 Summary
A review of literature regarding lift usage during actual/drill evacuations, lift evacuation building
codes/standards/guidelines, lift evacuation human factors data, software models that include lifts,
and evacuation lift strategies has been conducted.
Analysis of actual/drill evacuations using lifts has highlighted that lifts can benefit an
evacuation. Despite typical fire safety training of not to use lifts during evacuations many
occupants have demonstrated that they are prepared to consider lift usage during an evacuation
in certain situations (e.g. not considered a fire, not officially been told to evacuate, told to do so
by rescue personnel, in imminent danger). Local conditions in the lift waiting areas (e.g. crowd
levels), have been shown to influence occupants‟ decisions of whether to use a lift or redirect to
the stairs. A number of incidents where occupants have either become trapped or died inside lifts

51
has also been mentioned which serve to exemplify that a degree of risk is associated with lift
usage. In actual evacuations it has been hard to accurately determine the proportion of occupants
that used lifts on each floor due to the uncertainty of each floors total population. Indeed, in all
incidents where the proportion of lift users has been calculated, it has been based on just the
sample population or an estimate. It is therefore difficult in practice to determine the exact
proportion of lift users on each floor in each evacuation. However, results suggest that as floor
height increases the proportion of occupants that would consider using a lift also increases.
There is clear drive in recent times by regulatory bodies to incorporate the provision for lift
usage for the general population during evacuations. This is particularly the case in the US where
a number of guidance/regulatory bodies (e.g. ASME, NFPA, NIST) are coordinating an effort for
the use of lifts during evacuations for the general population. Indeed non-mandatory
requirements in building codes for such provisions are beginning to already appear. In addition, a
number of organisations have developed guidelines using analytical calculations or simulation
results to demonstrate the potential benefits of using lifts during evacuations for the general
population. However, such results appear to neglect the potential impact of associated human
factors.
Despite a number of actual evacuations demonstrating the benefits of lifts and a drive by
regulatory bodies to include them for the general population in building codes, very few studies
have attempted to understand and quantify human factors associated with evacuation lift usage.
It has been shown from the empirical and qualitative studies reviewed that the many occupants
have reservations about using lifts during an evacuation. Indeed collected data suggests most
occupants know that they should not use lifts during evacuations. Results from past studies
suggest that the perception of reliability of lifts during normal circulation appears to influence
occupants‟ acceptance to consider using lifts during an evacuation.
A review of selected dedicated lift and evacuation models has been conducted. Overall, the
evacuation models appear to have greater capacity to represent more detailed/complex human
factors compared to the dedicated lift models. This is due to dedicated lift models typically
simplifying the movement of occupants as flow based analytical calculations and the lack of
explicit modelling of more detailed occupant to occupant interaction that is commonly found in
evacuation models. Despite the representation of evacuation lift human factors in a number of
models no published material regarding such human factors data (empirical or actual) for any
model was found. Indeed the capacity to represent the lift human factors in the models appears to

52
have developed at a faster pace than the understanding of the lift human factors themselves. As
such the representation of evacuation lift human factors in such models is considered to be
questionable.
A number of studies using software based models and/or analytical calculations have
demonstrated how a single lift strategy could potentially influence an evacuation compared to a
stair only evacuation given a hypothetical scenario. A number of evacuation lift strategies were
explored, including:
- Top-down/downward collective evacuation strategy
- Using refuge floors with shuttle lifts
- Priority for floors above and closest to the fire floor
In all cases explored the combined use of lifts and stairs is recommended in order to reduce total
evacuation times by increasing the vertical throughput to the exit level. It appears a common
result in the majority of studies for high-rise buildings, assuming optimum use of lifts and stairs,
that the total evacuation time can be reduced by as much as 50% compared to stairs alone. The
impact of evacuation lift human factors on such results has been neglected in such
studies/models. Indeed the primary purpose of such studies appears to be for the demonstration
of the potential impact of using lifts during an evacuation (i.e. not the potential influence of
associated human factors).
2.3 Evacuation escalators
In certain structures such as deep underground/subway stations, that are well provided for by
escalators for normal pedestrian flows, escalators can provide an attractive and efficient
alternative to long stairs in evacuation situations. Escalators also offer a larger throughput
capacity than a typical single lift for the same number of floors as there is no service wait time
for occupants. The inclusion of escalators has made it possible to build ever deeper underground
stations. Indeed it is common to find underground stations where there is almost no staircases
forming part of the main circulation routes.
Underground stations commonly have a high volume of occupants that simultaneously arrive via
incoming trains and traverse out them within short periods of time in normal circulation. As such
they should in theory be well catered for getting occupants out of the station during evacuations.

53
However, the consideration of how to evacuate such structures has largely neglected the
potential effect of escalator strategies and escalator human factors. The use of escalators during
evacuations has received considerably less attention by comparison to the use of lifts with even
less literature readily available. It is believed that this is contributed to by the common
assumption that human factors on stairs are similar to that on escalators and that optimal
analytical flow calculations for representation of escalator human factors are sufficient for
evacuation analysis.
2.3.1 Escalator usage during evacuations
The majority of literature regarding escalator human factors relate to normal circulation
conditions. The following section reviews literature regarding two actual evacuation incidents:
the World Trade Center 911 attack and the Kings Cross Underground Fire. It is expected that a
number of other actual evacuations have occurred in underground stations that have included the
use of escalators. However, there is a lack of published literature regarding such events and
where it does exists, details regarding escalator usage has not been included or is sparsely
mentioned.
World Trade Center 911 Attack
A description of the events the World Trade Center 911 attack has been given in the lift section
of this review. Further to the description of the WTC1 and WTC2 towers presented in the lift
section, there were two exit levels at the bottom of each tower; mezzanine/plaza level (with an
exit only to one side of each tower) and street/concourse level (exiting below the
mezzanine/plaza level to both sides of each tower) [Averill, et al., 2005].
Whilst there were a number of escalators within both towers, this review focuses on the most
used escalators on the lower levels during the attacks. Occupants evacuating down two of the
three emergency stairs would exit onto the mezzanine/plaza level where they could either exit on
that level or proceed further down to the street/concourse level via an escalator. Those occupants
who did so would then choose to exit on either the street side of the tower or the concourse side.
The concourse side would take them into an underground complex of shops where they could
reach the street level by going up a level via either stairs or escalators. Both towers were
connected via the concourse under the plaza level. The concourse area also connected to an
underground station below where a number of occupants were also required to evacuate the

54
station up to the plaza level. A simplified layout of the levels and exits can be seen in Figure 8
below.
Figure 8: World Trade Center - WTC1/WTC2 simplified exit and lower level layout
It is important to understand the vertical layout of the lower sections of both towers because
during the evacuation debris and bodies were falling from both buildings onto the street and
plaza level. This posed a danger to occupants evacuating the building and potentially influenced
their perception of the severity of the incident. As such it was decided at some point during the
evacuation that occupants should evacuate to the concourse level. This meant that the remaining
occupants who used two of the emergency stairs from either WTC1/WTC2 were required to use
at least one escalator as part of their evacuation route. This included the mezzanine/plaza level
escalator to transfer down to the concourse level and either the stairs or escalators from the
concourse level to traverse up to the street 2 level.
There were two escalators connecting the mezzanine/plaza level to the street/concourse level; in
normal usage one would be moving upwards and the other downwards. Early on during the
evacuation, survivor accounts state that these escalators were moving and being used to evacuate
occupants. An example of which can be seen below from an occupant initially on floor 36 of
WTC2:

55
"Participant: I ended up on the plaza level …. by then people were kind of jostling to
get on the escalator…..…
Interviewer: So, you go to the escalator. Do you have to wait to get on? …
Participant: Yeah… I mean it probably took me you know maybe 30 seconds then to
get on. I remember he kind of held some people so that I could just kind of, kind of get
on.
Interviewer: And was the escalator moving?
Participant: Yeah, yes. Yes." (WTC2/036/0002) [Galea, et al., 2006a]
However, at some stage during the evacuation both escalators were turned off and certain
occupants stated a dislike to walking down static escalators, as highlighted by a survivor who
was initially on floor 55 of WTC2:
“Participant: ….And they kept telling us to ‘Leave, leave, leave!’ And our group was
growing. But… and we walked over to where the escalators were, and we just walked
down the escalators.
Interviewer: Were there lots of people on the escalator?
Participant: It was just a steady flow. It was like you’d walk out of the stairway and
walk down the escalator….
Interviewer: How fast are people moving at this point?
Participant: Just a regular walking pace….
Interviewer: Cos the escalators aren‟t working. So how fast are people… just walking…
Participant: Slower than on the regular stairs, cos escalators suck to walk down. But,
you know, ‘Dunk, dunk, dunk, dunk, dunk, dunk…’“ (WTC2/055/0001) [Galea, et al.,
2006a]
Despite occupants being able to use both escalators, initially, most occupants proceeded to only
use one escalator (the normal downward escalator) before eventually using both, as highlighted
in the quote below of a survivor initially on floor 13 in WTC1:

56
"Participant: …. the only thing I do recall with absolute clarity that was people were
only going down the right hand escalator.
Interviewer: And you said you‟re about to call something out to someone.
Participant: I was about to say ‘hey stupid’, you know, ‘use both of them’ and then
somebody else beat me to it.
Interviewer: How fast were they moving down the escalators?
Participant: I don’t recall them moving too quickly but obviously once they went down
the second one then traffic opened up quite quickly." (WTC1/013/0001) [Galea, et al.,
2006a]
Further evidence to support that only a single escalator was initially being used can be seen in
Figure 9 where photographs of mezzanine/plaza escalator users in WTC2 can be seen.
John Labriola {Unknown evacuee}
Figure 9: World Trade Centre (WTC2) - Photo taken by evacuees of mezzanine/plaza escalators
From Figure 9 it can also be seen that the mezzanine/plaza level escalators were narrow with
only a single lane being able to form on each escalator. This is confirmed in the following
survivor account:
"Interviewer: So when you reached the escalator, was it a case of having to wait?
Participant: Yeah. It really was a small, it was a very narrow… I think it was really
only one person, you could squeeze two, but it was a kind of a one-person-at-a-time
escalator." (WTC1/044/0002) [Galea, et al., 2006a]
Having a narrow escalator width would have decreased the flow-rate onto the escalators. Due to
the escalators being static, forcing all occupants to walk, would have forced increased spacing
between escalator users and further contributed to a decreased flow-rate onto the escalators.

57
In addition to the WTC1 and WTC2 towers, a number of occupants evacuated the underground
station connected to the concourse level of the World Trade Center complex. Despite being an
evacuation, survivor accounts suggest that normal common side preference behaviour was
typically adhered to in the underground station with riders using the right side and walkers using
the left side. This is exemplified in the following account of an occupant initially in the
underground station:
“Participant: I don't remember anybody having a reaction. Now its kind of
hard to have much of a reaction on an escalator. But nobody started to run any more
than… there was… you know there was the code on the escalator you stood to the right
and you walked to the left so the people who were walking continued to walk and the
people on the steps didn't.
Interviewer: That‟s when the officer… that was when the police officer told you to
run for your life?
Participant: He said literally… actually you know I can’t now remember who… at that
point there were… voices were starting to be raised. And I can’t remember if it was a
male or a female officer but he said literally ‘Run, run, run for your life.’”
(WTC0/PATH/0003) [Galea, et al., 2006a]
Kings Cross Station Fire
On November 18th 1987 in the early evening a fire started on an escalator in London's King's
Cross underground station. The escalator was made of wood at that time which contributed to the
fire and smoke spreading more rapidly [Fennel, 1988; Donald and Canter, 1990]. A total of 31
people died in the incident.
King's Cross underground station is built over five levels serving multiple tube lines below
ground and is connected by passageways, staircases and escalators. It is quoted as being one of
the most complex stations in the London Underground [Donald and Canter, 1990]. The Fennel
report [Fennel, 1988] states that at the time of the fire London underground had no evacuation
plan for the station. The ticket hall of the underground station is connected to a main line station.
From the ticket hall level two sets of 3 escalators connect to the passageways that lead to the
underground platforms. One set leads to the Victoria line and the other to the Piccadilly and
Northern line platforms. Occupants can transfer between tube lines via a series of passageways
without having to first travel to the ticket hall level first.

58
Soon after the fire was discovered at around 7:30PM a passenger pressed the emergency stop
button to stop the escalator in question moving (connecting the ticket hall level to the Piccadilly
line platform). A ticket inspector cordoned off the static escalator to prevent occupants from
using it, shortly after local transport police arrived. Travellers were directed away from using the
Piccadilly line escalators to the Victoria line escalators where they could move up to the ticket
hall level. Shortly after an official call to evacuate the entire station was made, all occupants
coming from the platforms were advised to evacuate via the Victoria line escalators through the
ticket hall to the exit/main line station. Fire fighters arrived 13 minutes after the fire had been
noticed. Trains continued to stop at the station where occupants alighted despite calls to stop
trains arriving. As such rescue personnel were required to continue evacuating occupants from
arriving trains.
The top of both the Victoria and Piccadilly line escalators were only a short distance from each
other in the main ticket hall. However, the bottom of both escalators was separated by a much
longer distance of interconnected passageways. Redirecting occupants to evacuate using the
Victoria line escalators from the Piccadilly line escalators severely extended the evacuation route
for those occupants. Despite the considerable extension to the route, occupant evacuation via the
ticket hall placed many in significant danger. This was due to the fire spread travelling up the
Piccadilly line escalator to the ticket hall (i.e. where occupants were alighting the Victoria line
escalator). At around 7:45PM flash-over had occurred in the main ticket hall. Occupants on the
main escalators were quoted as saying "they saw a fellow passenger descend with his clothes and
hair on fire" [Donald and Canter, 1990]. The evacuation route using the 3 Victoria line escalators
was then changed and occupants were diverted to take trains in order to evacuate the station.
Donald and Canter [Donald and Canter, 1990] state that occupants within the station only
changed their normal behaviour (of passing through the station) when they were either instructed
to do so by a figure of authority or "the evidence of their senses was so totally overwhelming that
they knew different, extraordinary action was required for survival" [Donald and Canter, 1990].
Many occupants were unaware of the evolving hazard and/or the severity of the situation. Indeed
those initially using the Victoria line going to the ticket hall would have not likely experienced
any hazard cues until they were near the top of the Victoria line escalator linking to the ticket
hall. As such it is likely that many occupants would have adopted normal circulation behaviour
on those escalators.

59
In addition to the escalator human factors, the study serves to demonstrate how reliant
underground stations have become on the use of escalators during evacuations. The restricted
availability of such devices and associated egress routes is expected to considerably decrease the
levels of safety within such structures.
2.3.2 Evacuation escalators - codes, standards and guidelines
The allowance for the use of escalators during evacuations is varied between building codes and
standards. Indeed some prohibit the use of escalators during evacuations in certain
circumstances. There are many reasons for the restricted use of escalators in emergency
situations. These include
an unexpected shut down during operation possibly causing some escalator users to fall,
pedestrians may become trapped on the escalator (e.g. disabled) because they cannot
physically traverse a static escalator on their own,
moving escalators may be carrying pedestrians to, rather than away from danger.
In situations where escalators have stopped, the uneven riser height for some of the treads (at the
top and bottom of an escalator) increases the likelihood of a miss step resulting in a fall.
Building codes and guidelines from the US and UK have been reviewed with regards to
evacuation escalator usage, including:
International Code Council International Building Code [ICC, 2009],
NFPA 101: Life Safety Code [NFPA, 2009a],
NFPA 130: Standard for Fixed Guideway Transit and Passenger Rail Systems [NFPA,
2010],
NFPA 5000: Building Construction and Safety Code [NFPA, 2009b],
BS9999: Code of practice for fire safety in the design, management and use of buildings
[British Standards, 2008],
The Buildings Regulation 2000 – Approved Document B – Fire Safety [Communities,
2006]
Guide D: Transportation systems in buildings [CIBSE, 2000].

60
The ICC, 2009 International Building Code [ICC, 2009], NFPA 101 [NFPA, 2009a], and NFPA
5000 [NFPA, 2009b] state that escalators should not form part of the required egress capacity of
a building.
The NFPA 130 [NFPA, 2010] allows the use of escalators as part of the egress capacity within
transit stations providing a series of criteria are met. These include:
the escalator is not made of combustible materials,
escalators moving in the direction of egress can carry on moving,
escalators moving in the opposite direction to egress can be stopped both locally and
remotely (including gradual deceleration mechanism),
provide audible or visual signage to communicate to occupants on or near the escalator.
In addition, escalators that are static are allowed to be started in the direction of egress.
Generally, escalators are not permitted to account for more than 50% of the egress capacity of
each level in a transit station. However, escalators are permitted to account for more than 50% of
the egress capacity providing the escalators can be remotely stopped, the respective level has
stair egress access also, and in enclosed stations an exit stair/passageway connects the platforms
to a place of safety. Where escalators are used to calculate the egress capacity of a transit station
at least one escalator shall be assumed to be out of service (chosen according to which escalator
would have the most adverse effect on the egress capacity).
The British Standards BS9999 [British Standards, 2008] stipulate that generally escalators are
not considered a means of egress and that occupants should be discouraged from using them
during an emergency though it is expected that occupants will use them in certain situations.
Escalators should automatically stop moving when a fire alarm is sounded to avoid occupants
being taken to rather than away from a hazardous area. Despite this, BS9999 state a number of
exceptions to this in which escalators can be used during an evacuation. Escalators can be
included as part of the main egress capacity of transit stations providing a fully fire engineered
assessment is carried out. Within shops escalators should include drills where, upon the alarm,
select staff move to either end of the escalators in order to control the use of the escalator and the
people on it.

61
Approved Document B (ADB) [Communities, 2006] echoes what is mentioned in BS9999 in
that escalators should not be consider part of the means of egress though it is expected that
occupants will use escalators if they are free from smoke and heat.
CIBSE Guide D: Transportation systems in buildings [CIBSE, 2000] state recommendations for
the use of escalators and lifts in normal circulation situations in addition to a variety of
associated human factors. Included in the guidelines are theoretical handling capacities
(maximum flow-rates) for escalators with different speeds and widths (see Table 9).
Table 9: Theoretical escalator handling capacities according to width (ped/min) [CIBSE, 2000]
Escalator
Speed
(m/s)
Escalator
Tread Width
1 m 0.8 m 0.6 m
0.5 150 113 75
0.65 195 146 98
0.75 225 169 113
The guide states that actual escalator handling capacities are likely to be half the theoretical
values with the influence of pedestrians leaving tread spacing between each other. On a 0.5m/s
escalator it takes just under a second (0.92s) (depending on the tread depth) for each step to
appear which the guide states is too fast for the majority of pedestrians to continuously board.
The guide recommends that at least two escalators should be placed at each location to handle
both up and down flows with each escalator preferably being parallel to each other. The guide
states that escalator step risers are typically 21cm in height which is larger than the 18cm
maximum recommend step height for stairs. This is why pedestrians typically find walking on
escalators more tiring. The guide states that escalators are usually used by pedestrians to travel a
small number of floors and when occupants decide when to choose to use an escalator or lift then
they will consider travel time, wait time, and walking effort for each device (no justification for
this is mentioned). The guide states the proportion of occupants that would likely use an
escalator and lift for travelling a different number of floors in Table 10. It is worth noting that no
reference of any study or justification for these figures is mentioned or if such figures differ
according to direction of travel.

62
Table 10: Likely proportion of pedestrians to use escalators and lifts [CIBSE, 2000]
Floors
Travelled
Escalator
(%)
Lift
(%)
1 90 10
2 75 25
3 50 50
4 25 75
5 10 90
2.3.3 Escalator human factors - empirical data
The majority of past escalator human factors studies relate to escalator usage during normal
circulation conditions. The evacuation related studies reviewed are all experimental with the
application being stated/used within an evacuation context. In all literature reviewed the
appropriateness and validity of applying the data captured in experimental or normal circulation
conditions within an evacuation context is questionable, though the lack of available alternatives
based on published literature suggests it is required.
A broad review of literature pertaining to empirical escalator human factors data has been
conducted segregating according to escalator/stair choice, escalator flow-rates, proportion of
walkers/riders, walker speeds, and escalator side usage.
Escalator/Stair usage
When pedestrians approach an escalator/stair combination they are required to decide which
device to use in order to traverse the vertical area. Two major studies that focused on
escalator/stair choice based on empirical data were by Cheung and Lam [Cheung and Lam,
1998] and Zeiler et al [Zeiler, et al., 2010]/Knehs [Knehs, 2010], both of which have been
reviewed. In both studies a regression analysis of collected data was conducted in order to
develop a formula to predict the probability that a pedestrian would use an escalator/ stair using
measured attributes (e.g. walker speed, flow-rate, etc).
Route Choices Between Escalator and Stairway in MTR Stations
Cheung and Lam [Cheung and Lam, 1998] recorded the frequency of pedestrians that used
escalators/stairs, travel times, and flow-rates in six stations within the Hong Kong Mass Transit
Railway (MTR) underground system during peak hours in both the up and down direction.
Conditions on the walkways leading to each escalator/stair were also recorded to see how they

63
would influence device selection. This section focuses on escalator/stair selection and the
escalator walker speed data is focused on in the escalator walker speed section.
Using the collected data the authors proposed a model to predict if a pedestrian would use an
escalator or adjacent stair. The authors suggest that pedestrians make the decision to use an
escalator/stair in order to reduce travel time; pedestrians consider expected travel time to and on
each device in their selection.
The developed model comprises of a travel time calculation for each device; considering the
distance to/on each device, and the current flow of pedestrians onto the device (See Equation 5).
Equation 5
t(v) = travel time (s) at flow v
t0 = free flow travel time (s)
v = pedestrian flow (ped/m/min)
c = capacity of pedestrian block (ped/m/min)
B,n = parameters to be estimated
A logit model to predict the probability of a pedestrian using an escalator (Pesc) given a relative
discomfort measure (X) has then been constructed. The authors defined the relative discomfort
measure as the difference between the expected total travel time using the escalator and the stair
(See Equation 6).
Equation 6
X = a + b . (tesc+ tToEsc - (tstair + tToStair))
tesc= time travelling on the escalator
tToEsc = time travelling to the escalator
tstair = time travelling on the stair
tToStair= time travelling to the stair
a,b = parameters to be estimated

64
The data collected within the underground stations was used to estimate the respective
parameters in the model through performing a regression analysis. These parameters along with
the average free flow walker speeds, walker speeds at capacity (maximum flow-rate), and
maximum recorded flow-rates, can be seen in Table 11. The maximum recorded escalator flow-
rates for both the up and down escalators was 120 ped/min, which equates to 2 pedestrians
boarding the escalator every second. The author states such escalator flow-rates are particularly
high and can be partially explained by the smaller physique of oriental pedestrians and the
increased motivation of pedestrians to traverse the area (e.g. commuters, etc).
Table 11: Travel Times, Max Flow-rates Functions by Pedestrian Blocks[Cheung and Lam, 1998]
Facility
Number
Of
Samples
Parameters Free flow
walker
speed
(m/s)
Walking
speed at
capacity
(m/sec)
Max
Flow-rate
(ped/min) R
2
T0 B n
Escalator
Up 611 1.12 0.25 1.07
0.89
[0.88-0.90]
0.73
[0.72-0.75] 120 0.80
Escalator
Down 692 0.95 0.41 1.27
1.05
[1.03-1.07]
0.73
[0.71-0.75] 120 0.78
Stair
Up 696 1.16 1.18 2.08
0.86
[0.84-0.88]
0.43
[0.42-0.44] 70 0.83
Stair
Down 687 1.03 0.63 2.43
0.97
[0.96-0.98]
0.60
[0.59-0.61] 80 0.85
Walkway
to Escalator 709 0.87 2.38 2.28
1.15
[1.09-1.21]
0.31
[0.30-0.32] - 0.86
Walkway
to Stair 712 0.87 2.29 3.44
1.14
[1.11-1.18]
0.32
[0.30-0.33] - 0.83
The logit models used to calculate the probability that a pedestrian will use an escalator (instead
of an adjacent stair) was subsequently constructed for the down and up direction (See Equation 7
and Equation 8).
R
2 = 0.84
Equation 7
R
2 = 0.87
Equation 8
xt = total travel time difference between using the escalator and stair
Using Equation 7 and Equation 8 the predicted proportion of escalator/stair users can be
calculated/plotted (see Table 12 and Figure 10). As expected, the regression shows that
pedestrians travelling in the up direction have a preference to using the escalator more than
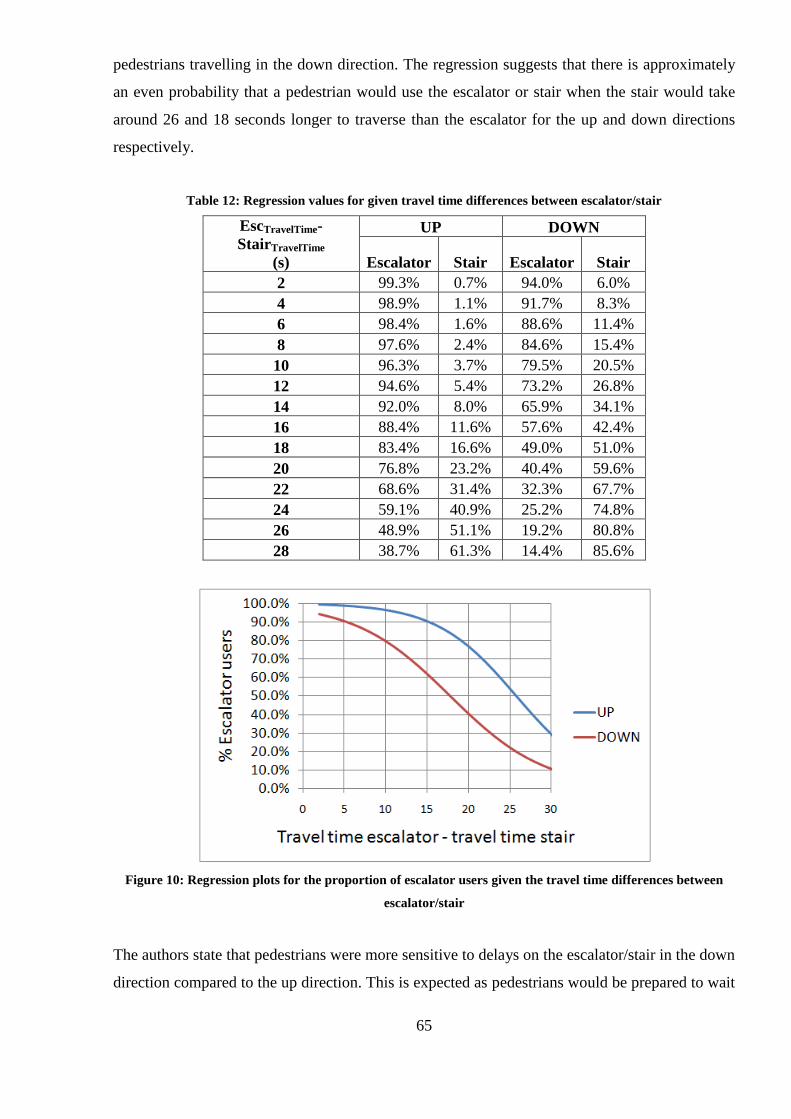
65
pedestrians travelling in the down direction. The regression suggests that there is approximately
an even probability that a pedestrian would use the escalator or stair when the stair would take
around 26 and 18 seconds longer to traverse than the escalator for the up and down directions
respectively.
Table 12: Regression values for given travel time differences between escalator/stair
EscTravelTime-
StairTravelTime
(s)
UP DOWN
Escalator Stair Escalator Stair
2 99.3% 0.7% 94.0% 6.0%
4 98.9% 1.1% 91.7% 8.3%
6 98.4% 1.6% 88.6% 11.4%
8 97.6% 2.4% 84.6% 15.4%
10 96.3% 3.7% 79.5% 20.5%
12 94.6% 5.4% 73.2% 26.8%
14 92.0% 8.0% 65.9% 34.1%
16 88.4% 11.6% 57.6% 42.4%
18 83.4% 16.6% 49.0% 51.0%
20 76.8% 23.2% 40.4% 59.6%
22 68.6% 31.4% 32.3% 67.7%
24 59.1% 40.9% 25.2% 74.8%
26 48.9% 51.1% 19.2% 80.8%
28 38.7% 61.3% 14.4% 85.6%
Figure 10: Regression plots for the proportion of escalator users given the travel time differences between
escalator/stair
The authors state that pedestrians were more sensitive to delays on the escalator/stair in the down
direction compared to the up direction. This is expected as pedestrians would be prepared to wait

66
longer to use an escalator travelling in the up direction due to the increase energy required and
slower speeds afforded by an adjacent stair compared to the down direction. The goodness of fit
values (R2) for Equation 7 and Equation 8 were high which suggests that the difference in travel
times for using the escalator/stairs is a good predictor of escalator/stair usage.
Within the study data was only collected in peak periods and it is uncertain how this would
compare to off peak periods. The assumption that pedestrians are all attempting to minimise their
travel time is considered reasonable and in keeping with the theory of Bounded Rationality as
mentioned by Simon [Simon, 1957] for the majority of pedestrians. However, the extent to
which this occurs is uncertain. Due to the data being collected in a single country it is uncertain
whether the data and subsequent model developed is applicable to other countries, particularly
western countries where pedestrians are typically of a larger build.
Modelling Random Taste Variations on Level Changes in Passenger Route Choice in a Public
Transport Station
Similar to the work by Cheung and Lam [Cheung and Lam, 1998], Zeiler et al [Zeiler, et al.,
2010] and Knehs [Knehs, 2010] recorded the number of escalator/stair users in addition to
associated flow-rates across three different underground complexes in Austria during normal
circulation conditions; locations were referred to as Vienna I, Vienna II and Graz. The height of
each escalator was 3.9m for Vienna I and Vienna II, and 4.8m for Graz. A large number of
pedestrians were counted using the escalators/stairs across each site; 30,235 in the down
direction and 31,630 in the up direction.
In Table 13 the overall aggregated results can be seen including the total average hourly flow-
rate for each location (for both escalators and stairs combined). Here it can be seen that in the
Vienna II location, despite the similar average total flow-rates recorded in both directions, the
proportion of stair users was almost three times as high in the down direction compared to the up
direction. However, in the Graz data the average up flow-rate was approximately twice to that
recorded in the down direction. It is uncertain why each location‟s up and down average flow-
rates followed different trends.

67
Table 13: Number of observations, average flow-rate per hour and proportion of stairs users for each station
in each direction [Zeiler, et al., 2010, Knehs, 2010]
Vienna I Vienna II Graz
Up
Persons N/A 19105 11130
Average flow /hour N/A 1273 505
On Stairs (%) N/A 11.8 21.8
Down
Persons 3722 16741 11167
Average flow /hour 551 1116 501
On Stairs (%) 13.8 32.0 11.0
The aggregated data was separated according to minutes in the data and flow-rates of 10 ped/min
or less were separately analysed. As expected during the periods where less than 10 ped/min
were recorded, lower proportions of stair users were recorded (between 7.6%-11.4%). The
authors derive from this that the results support the conclusion that during low flow-rates that
personal factors are the main influence for device choice.
For the remaining data where higher flow-rates were recorded (>10 ped/min), data points were
plotted of the flow-rates against the proportion of stair users at different times (only Vienna II
plot was presented). In this Vienna II plot, as the flow-rate increases so does the proportion of
stair users, which is expected considering the added width of an adjacent stair compared to the
respective escalators. Data from the Vienna II location shows that there was considerable
variation between the proportion of stair users for each flow-rate measurement, with this
variation decreasing as the flow-rate increases. Again this is expected as the frequency of
pedestrians that pass through the area increases so the surrounding structure begins to become
the restricting factor for the flow-rate.
A regression analysis was performed in order to develop a formula for predicting the proportion
of stair users given the flow-rate. Included within the regression analysis, in addition to the flow-
rate, was the counter flow-rate of pedestrians moving in the opposite direction (see Table 14).

68
Table 14: Dependence of the percentage of persons ascending as a function of the flow-rate (persons per
second) and of the rate of the counter flow on the stairs [Zeiler, et al., 2010, Knehs, 2010]
Vienna I Vienna II Graz
Up
Constant 0.093 0.017 -0.001
Flow-rate -0.096 0.62 0.32
Flow-rate2 0.43 -0.16 -0.05
Counter flow N/A -0.12 0.20
Down
Constant N/A 0.015 -0.001
Flow-rate N/A 0.17 0.39
Flow-rate2 N/A 0.11 -0.30
Counter flow N/A -0.06 0.08
Flow-rates
Whilst the literature regarding escalator human factors is sparse, the majority of previous studies
have focused on escalator flow-rates/handling capacities in normal circulation situations. It is
believed this is due to their ease of use to understand/apply for pedestrians dynamic calculations
and incorporate such figures into simulation models (many models have the capacity to represent
flow based situations). In addition, the most number of pedestrians that can pass through a
vertical area in a given amount of time is of prime interest to transport planners and building
owners as it defines the upper design limit for occupancy levels of a given area/structure. A
selection of five studies have been reviewed which are believed to be representative of the
current understanding regarding escalator flow-rates.
Escalator Handling Capacity: Standards Versus Practice
Al-Sharif [Al-Sharif, 1996] states that the theoretical flow-rate of a 1m wide escalator travelling
at 0.75 m/s is 225 ped/min which assumes two pedestrians per tread and all pedestrians ride.
However, it is widely accepted that this flow-rate is rarely achieved. To demonstrate this and
give justification/determine the maximum flow-rate for a typical escalator in the London
Underground, pedestrians using a series of seven escalators with varying heights in both the up
and down direction were recorded. Pedestrians were counted during 1 minute intervals during
peak flow conditions. Results of the study can be seen in Table 15. Here the highest flow-rate
recorded was 140 ped/min on Escalator C in the down direction. This represents a considerably
lower flow-rate (62.2% (85 ped/min) less) compared to the theoretical maximum flow-rate of
225 ped/min.

69
Table 15: Escalator heights, direction, day usage, maximum flow-rates recorded for each escalator [Al-Sharif,
1996]
Escalator A B C D E F G
Height (m) 14.6 14.6 14.6 7.6 7.6 17.2 17.2
Direction Up Up Down Up Down Up Down
Usage
(ped/day) 27,825 27,825 52,622 22,456 24,910 12,179 17,696
Maximum
recorded
flow-rate
(ped/min)
101 104 140 122 123 86 92
% of
theoretical
maximum
flow-rate
(225
ped/min)
45% 46.2% 62.2% 54.2% 54.7% 38.2% 40.9%
Al-Sharif states that even during peak conditions it was observed that pedestrians do not occupy
every tread. Riders on the right side typically board every other tread and walkers on the left side
typically occupy every third tread (i.e. occupy two treads simultaneously whilst moving plus a
one tread spacing). Al-Sharif states this is due to pedestrians desire to maintain personal space
between themselves and others (termed 'buffer zone'; see Figure 11) which was first proposed by
Fruin [Fruin, 1971]. Indeed Fruin first observed the phenomena of escalator pedestrians leaving
tread spacing's between each other and the impact this had on the theoretical maximum escalator
flow-rates. The buffer zone is defined as an ellipse around the person‟s torso. Since the effective
depth of an escalator tread is typically less than the depth of this buffer zone means escalator
users, unless forced to, typically leave a tread spacing between themselves and the person in
front. In addition, for a 1m wide escalator, though it is stated that two pedestrians can stand on
each tread, considering the buffer zone, it is unlikely that pedestrians will choose to do so in
order to maintain comfort levels. Both of these factors contribute to maximum escalator flow-
rates being reduced.

70
Figure 11: Human ellipse with human buffer zone and escalator tread [Al-Sharif, 1996]
Al-Sharif states that if escalator riders occupy every other tread and escalator walkers occupy
every third tread, then the maximum theoretical flow-rate of an escalator is only 50.0% utilised
on the rider side and 33.33% utilised on the walker side. Assuming an even number of walkers
and riders this translates into a 41.7% (0.5*0.5 + 0.5*0.333) utilisation of the theoretical
maximum flow-rate which translates to 93.8 ped/min (41.7% of 225 ped/min). However this
does not consider that escalator walkers board the escalator quicker than riders so Al-Sharif
proposes a walker factor of 0.7 (i.e. the calculated flow-rate should be increased to 70% of the
maximum flow-rate if walker speeds are included). This increases the maximum flow-rate to 134
ped/min (93.8/0.7) which is similar to the maximum flow-rate (140 ped/min) recorded in the
field studies.
Pedestrian Planning and Design
Fruin [Fruin, 1971] recorded the times pedestrians took to board escalators based on a
photographic survey (i.e. the time it took pedestrians to pass the initial entrance to the section of
the escalator to the time pedestrians placed their first foot on the escalator tread). Fruin argues
that, in addition to having a preferences to reduce physical contact with other escalator users, the
escalator boarding process is a determinant for the pedestrians leaving tread spacings between
each other (and thereby influences escalator flow-rates). Average escalator boarding times from
the study can be seen in Table 16. The results show that a slight increase in escalator boarding
times can be seen when travelling with baggage or travelling during heavy traffic. This would be
expected as carrying baggage or travelling in heavy traffic would reduce walker speed. Also
males were on average observed to board an escalator faster than females which again is as
expected considering male walker speeds are on average faster. No details regarding the
definition of 'heavy'/'light traffic or 'baggage' is mentioned.
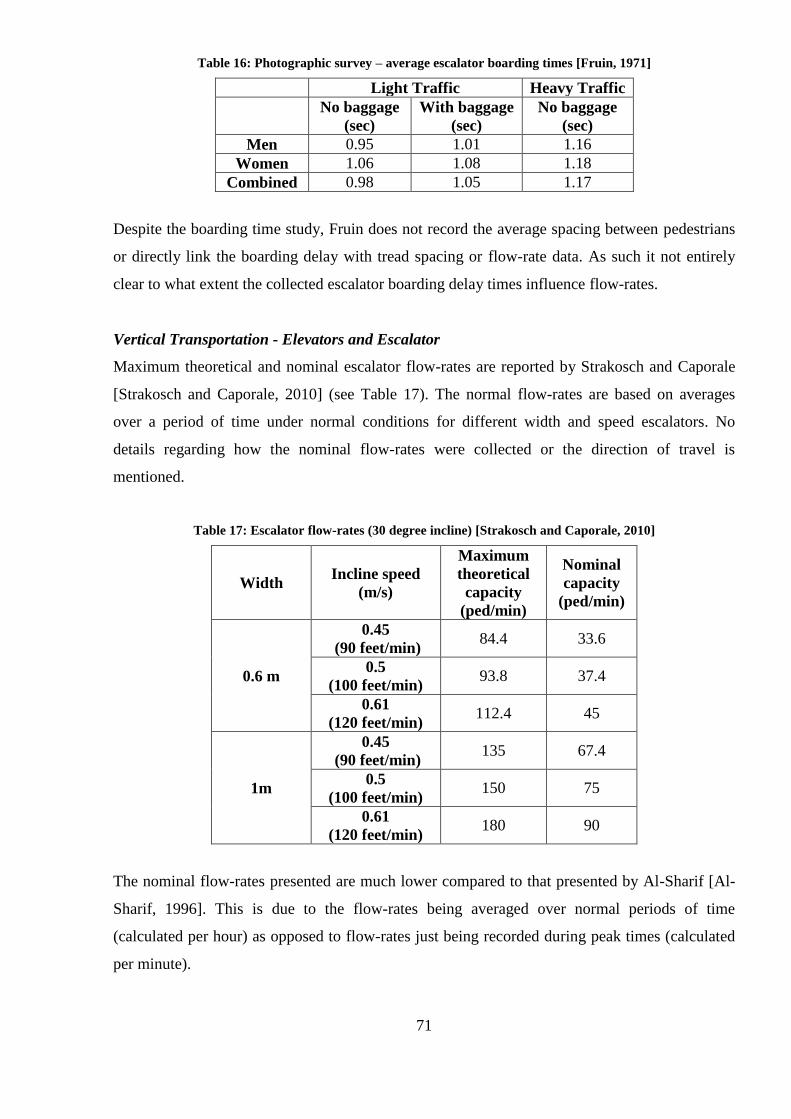
71
Table 16: Photographic survey – average escalator boarding times [Fruin, 1971]
Light Traffic Heavy Traffic
No baggage
(sec)
With baggage
(sec)
No baggage
(sec)
Men 0.95 1.01 1.16
Women 1.06 1.08 1.18
Combined 0.98 1.05 1.17
Despite the boarding time study, Fruin does not record the average spacing between pedestrians
or directly link the boarding delay with tread spacing or flow-rate data. As such it not entirely
clear to what extent the collected escalator boarding delay times influence flow-rates.
Vertical Transportation - Elevators and Escalator
Maximum theoretical and nominal escalator flow-rates are reported by Strakosch and Caporale
[Strakosch and Caporale, 2010] (see Table 17). The normal flow-rates are based on averages
over a period of time under normal conditions for different width and speed escalators. No
details regarding how the nominal flow-rates were collected or the direction of travel is
mentioned.
Table 17: Escalator flow-rates (30 degree incline) [Strakosch and Caporale, 2010]
Width Incline speed
(m/s)
Maximum
theoretical
capacity
(ped/min)
Nominal
capacity
(ped/min)
0.6 m
0.45
(90 feet/min) 84.4 33.6
0.5
(100 feet/min) 93.8 37.4
0.61
(120 feet/min) 112.4 45
1m
0.45
(90 feet/min) 135 67.4
0.5
(100 feet/min) 150 75
0.61
(120 feet/min) 180 90
The nominal flow-rates presented are much lower compared to that presented by Al-Sharif [Al-
Sharif, 1996]. This is due to the flow-rates being averaged over normal periods of time
(calculated per hour) as opposed to flow-rates just being recorded during peak times (calculated
per minute).

72
Estimation of Capacity of Escalators in London Underground
Similar to Al-Sharif [Al-Sharif, 1996], Davis and Dutta [Davis and Dutta, 2002] collected
escalator flow-rates during peak conditions within a number of stations in the London
Underground. The authors mention that the London Underground guidelines use 100 ped/min as
the assumed maximum flow-rate for escalators. The aim of the study was to determine if this was
accurate and determine if escalator height, having two escalators in parallel (double escalator),
escalator approach configuration (intersecting contra-flows from downward traffic) and direction
of travelled influenced this flow-rate.
On average the highest flow-rates were typically recorded on escalators where pedestrians
alighted trains in large batches and large numbers were simultaneously attempting to pass
through a given area. Due to escalator users typically forming separate walker and rider lanes in
most London Underground stations, the flow-rates were recorded for the walker and rider lanes
separately to identify what effect the formation of such lanes had on the flow-rate.
Davis and Dutta state that escalators in the London Underground typically have a tread depth of
0.4m, tread width of 1m and travel at an average speed of 0.72 m/s (43.2 m/min). Using
Equation 9 the maximum escalator flow-rate of the rider lane was calculated to be 54 ped/min
assuming every other tread is occupied.
Cr = Sr . qr
Equation 9
Cr = rider lane flow-rate (ped/min)
Sr = V/D; number of treads passing a point on the escalator each minute
V = 43.2; escalator speed (m/min)
D = 0.4; tread depth (m)
qr = 0.5; proportion of treads occupied
Using Equation 10 the maximum escalator flow-rate for the walker lane was calculated to be 66
ped/min assuming every third tread is occupied (i.e. walkers simultaneously occupy two treads at
a time then leave a one tread spacing).

73
Cw = Sw . qw
Equation 10
Cw = walker lane flow-rate (ped/min)
Sw = (V+U)/D; effective steps per minute
V = 43.2; escalator speed (m/min)
D = 0.4; tread depth (m)
U = 36; average walker speed (m/min)
qw = 0.33; proportion of treads occupied
Combining the walker and rider lane flow-rates calculates the maximum escalator flow-rate to be
120 ped/min. This is 46.7% (105 ped/min) lower than the maximum theoretical flow-rate stated
in CIBSE Guide D of 225 ped/min [CIBSE, 2000]. The maximum flow-rate calculation of Al-
Sharif [Al-Sharif, 1996] who also considered tread spacing calculated 134 ped/min as the
maximum flow-rate. Though this is similar to that of Davis and Dutta, Al-Sharif's calculation
was based on a given proportion of the maximum theoretical flow-rate of 225 ped/min.
The maximum flow-rate (for the walker and rider lanes combined) for each up escalator against
escalator height can be seen in Figure 12. Here it can be seen that the maximum up escalator
flow-rate recorded was 119 ped/min with all flow-rates recorded being above 100 ped/min. This
is similar to the highest flow-rate recorded by Al-Sharif [Al-Sharif, 1996] on an up escalator of
122 ped/min.
Using the walkers and riders flow-rate data combined, a regression analysis using escalator
height as a predictor of flow-rate was performed (see Figure 12). However, visual inspection of
the graph shows there appear to be little correlation between escalator height and overall flow-
rate (highlighted by the low R2 value of 0.43 for the goodness of fit).

74
Figure 12: Graph showing maximum up flow-rates (for walkers and riders combined) verses escalator height
(rise) [Davis and Dutta, 2002]
The walker and rider data was then separated (see Figure 13) and another regression was
performed. Here a stronger correlation between escalator height and flow-rate can be seen. As
the escalator height increases the flow-rate for the riders increases but the flow-rate for the
walkers decreases which reflects the decreased number of pedestrians being prepared to walk up
progressively higher escalators. The increased flow-rate for the riders is explained by people
initially in the walker queue moving over to the rider queue/side of the escalator. The graph also
shows that as escalator height increases the overall flow-rate approximately decreases. This is
due to the number of walkers decreasing so the overall utilisation of each tread also decreases as
the walker lanes are used less.
Figure 13: Maximum up flow-rate (for walkers and riders separated) verses escalator height (rise) [Davis and
Dutta, 2002]
A regression analysis was performed for both the rider and walker flow-rate data separately
analysing whether escalator height, configuration of approach and a double escalator influenced

75
the results. The rider flow-rate data appeared not to be influenced by the escalator approach
configuration or there being a double escalator. However, escalator height did appear to
influence the results; using escalator height as a predictor gave an R2 value of 0.81 using the
following formula (see Equation 11). This shows that the escalator height is a good predictor of
rider lane flow-rates.
Cr = 41.27 + 0.73 . Escheight
Equation 11
For the walker lane flow-rate data, the escalator height, the presence of a double escalator, and
escalator approach configuration (there being a corner of „Type A‟ at the foot of the escalator
mentioned in the report) all influenced the walker lane flow-rate. Using each of these factors as a
predictor in the regression gave a R2 valued of 0.85 using the following formula (see Equation
12).
Cw = 83.49-1.20 . Escheight - (8.058.DoubleEsc)-(6.90.CornerAEsc)
Equation 12
DoubleEsc= represents either 0 or 1 (1 = there are two parallel escalators going in the same
direction from/to the same location, 0 = single escalator).
CornerA= represents either 0 or 1 (1 = the approach to the escalator has the same characteristics
as corner of type A mentioned in the report, 0 = no corner of type A).
Both rider and walker lane regression formula can be combined to give the overall flow-rate
formula for an up escalator (see Equation 13).
Cf = 124.76 - 0.47 . Escheight - (8.058.DoubleEsc)-(6.90.CornerAEsc)
Equation 13
For the down direction, 15 escalators were recorded though only 7 were included in the analysis
as the remaining escalators never appeared to reach peak flow-rates. The overall results are
presented in Figure 14. The highest flow-rate recorded was 132.5 ped/min in the Victoria station.
This is 5.4% (7.5 ped/min) less than the highest flow-rate recorded by Al-Sharif [Al-Sharif,
1996] of 140 ped/min. In all stations the walker lane had a higher flow-rate than that of the rider
lane which is as expected considering walkers move off from the initial escalator tread to allow
the proceeding walkers to board the escalator sooner. Unlike the up escalator no relationship

76
between escalator height, being a double escalator, escalator approach configuration, and flow-
rate was found. Unlike the up direction data this suggests that escalator height was of little or no
influence on the maximum flow-rate on the down escalator data.
Figure 14: Flow-rate (for walkers, riders and combined) for each station [Davis and Dutta, 2002]
Feasibility of upward evacuation by escalator – An experimental study
Okada et al [Okada, et al., 2009] conducted a series of experiments recording the walker speeds
of participants on an upward moving „long‟ escalator (horizontal length of 49.5m) and „short‟
escalator (horizontal length of 12.3m) given a series of different conditions. In total 25
experiments were conducted though only the results of 12 were presented [Okada, et al., 2009],
using 50 participants of which 70.0% (35) were male and 30.0% (15) were female having an
average age of 21 years old all of whom were university students. During the experiments 12
participants wore a special "instant senior" suit which restricted the participants senses and
movement to replicate an elderly person (non instant senior participants are referred to as
'healthy'). Within the experiments the average horizontal walker speeds were recorded in
addition to the average flow-rate. This section focuses on the flow-rate data within the study.
In the study the static escalator maximum flow-rates varied between 60-66ped/min and the
moving escalator maximum flow-rate varied between 90-102 ped/min. As expected the increase
in flow-rate for the moving escalator is relative to the speed of the escalator (i.e. an increase of
0.5 m/s caused a 50% increase in flow-rate). This highlights that increased escalator speed also
increases the flow-rate with participants being taken away from the escalator entrance at an
increased rate. The maximum flow-rate for the moving escalator was 27.1% (38 ped/min) and
23.0% (30.5 ped/min) less than the maximum flow-rates recorded by Al-Sharif [Al-Sharif, 1996]

77
(140 ped/min) and Davis and Dutta [Davis and Dutta, 2002] (132.5 ped/min) respectively. This
is expected considering the escalators in both of these studies were moving approximately 50%
faster. The artificial conditions in which the data was collected with participants having no real
trip purpose and subsequent motivation to traverse the area may have been a contributing factor.
It is also uncertain what influence of all participants being students would have on the flow-rate.
Escalator Walker/Rider usage
Pedestrians that board an escalator, providing they are not blocked by others located in front of
them, have the option to walk, ride or both walk and ride along the escalator. A number of
studies have mentioned that pedestrians walk and ride on escalators, but hardly any mention the
extent to which this occurs. Only two studies were found which present empirical data regarding
escalator walker/rider frequencies/proportions.
Pedestrian movement at Victoria Underground station
Al-Sharif [Al-Sharif, 1996] mentions a study by Andrews and Boyes [Andrews and Boyes,
1977] in 1977 where the proportion of walkers and riders was recorded within a London
Underground station (Victoria) in both the up/down direction and in peak/off peak times (see
Table 18). Here it can be seen that a higher proportion of pedestrians walked when traversing in
the down direction or in the peak period. This suggest that time of day and direction of travel
influence occupants choice to walk or ride on escalators.
Table 18: Proportion of Walkers during peak/off peak periods as observed by Andrews and Boyes [Andrews
and Boyes, 1977]
Peak Off Peak
Walkers Riders Walkers Riders
Up 40% 60% 20% 80%
Down 60% 40% 40% 60%
Estimation of Capacity of Escalators in London Underground
Davis and Dutta [Davis and Dutta, 2002] collected escalator flow-rates within a number of
stations in the London Underground with a variety of different height escalators. As part of this
study the proportion of walkers was presented for the up escalators against escalator height
during peak flow-rate periods (See Figure 15). From visual inspection of the graph the lowest
proportion of walkers appears to be around 43% at Green Park station with the highest appearing
around 62% at Embankment station. A regression analysis using the escalator height as a
predictor gave an R2 value of 0.83 which suggests that escalator height is a good predictor of the

78
proportion of escalator walkers. It should be noted that in the regression two data points were
removed. The Victoria 1 data was removed due to the unusual high number of riders. The
authors stated that the high number of riders was possibly due to counting errors or large
numbers of groups of pedestrians using the escalator. The Embankment 6 data was also removed
due to the high number of riders recorded. The authors state that this was contributed to by the
wide staircase near the escalator (i.e. the staircase attracted walkers away from the escalator),
making it inappropriate to include. No regression formula was presented in the study though the
graph suggests the formula is linear with a negative correlation (i.e. as escalator height increases
the proportion of escalator walkers decrease (as expected)). Due to the proportions of walkers
only being collected during peak flow-rate conditions it is uncertain how generally applicable the
results are to non-peak flow-rate conditions.
Figure 15: Proportion of walkers using up escalators
Escalator walker speeds
Pedestrians who board an escalator and decide to walk, travel at a given walker speed. The
following section presents a review of three empirical studies related to escalator walker speeds.
Feasibility of upward evacuation by escalator – An experimental study
As previously mentioned in the flow-rate section, Okada et al [Okada, et al., 2009] conducted a
series of experimental trials recording escalator walker speeds and flow-rates. This section
focuses on the walker speed data within the study. Walker speeds were recorded for both a short
(5.7m high, 12.3m horizontally long) and long (22.0m high, 49.5m horizontally long) escalator.
The speed of both escalators was 0.5m/s.

79
The walker speed of each participant was recorded for both the short and long escalator and
adjacent stair for the short escalator. In addition, a series of group trials were conducted where
each participant‟s walker speed in the group was recorded. Three different group types were
defined according to the initial starting location of participants at the foot of the escalators/stair:
Group A: participants initially randomly organised in a square,
Group B: formation of two lines with the instant senior participants (those wearing the
suit to mimic an elderly person) staggered on either side, and
Group C: formation of two lines with the instant senior participants spread out on the
right side).
For the long escalator 4 cases were run where walker speeds were recorded for individuals
travelling alone and then also measured when travelling in Group A. This was repeated for both
a moving and static escalator. Walker speeds for Groups B and C were not recorded using the
static long escalator. For the short escalator the following cases were run: stair only (individual
and Group A), and a series of cases running both a static and moving escalator; individual, and
Groups A, B and C. The results are presented in Table 19 and Table 20 below.
Table 19: Average Horizontal Walker Speeds (m/s) (not including the escalator speed)
Escalator Occupants Static/
Individual
Moving/
Individual
Static /
Group
A
Moving/
Group
A
Static /
Group
B
Static /
Group
C
Long
Healthy 0.79 0.76 0.54 0.51 - -
Instant
senior 0.50 0.43 0.47 0.43 - -
Short
Healthy 0.78 0.71 0.54 0.45 0.55 0.68
Instant
senior 0.53 0.43 0.48 0.40 0.51 0.50
Table 20: Overall Average Horizontal Stair Walker Speeds (ms)
Occupants Individual Group
A
Healthy 0.75 0.68
Instant
senior 0.51 0.54
In addition to the average horizontal walker speeds for the entire length of both the long and
short escalator, the average horizontal speed of individual participants at 3 different sections
along the long escalator (whilst static) were recorded. This was done as it was expected that
walker speeds would reduce as participants travelled further along the escalator due to fatigue.

80
However, this was not the case in the results and participants‟ speeds were shown to be
reasonably constant with no considerable difference between walker speeds along different
sections of each escalator. Whilst this may suggest that fatigue is not a strong influencing factor
for escalator walker speeds it should be kept in mind that the participants came from a narrow
demographic group who were likely to be relatively fit/young and who were also not required to
travel a long distance before/after boarding the escalator (unlike typical pedestrians (e.g.
commuters, shoppers, etc)).
The average individual escalator walker speeds (see Table 19) and stair speeds (see Table 20)
appear to be similar for both the healthy and instant senior participants. However, the Group A
average walker speeds for the healthy participants is 25.9% (0.14 m/s) faster compared to the
instant senior participants on the stairs. This may be due to the increased width of the stairs
allowing healthy individuals (typically being faster) to more easily overtake the instant senior
participants compared to the escalator.
Results suggest that the influence of the escalator length and whether the escalator is
moving/static did not have a considerable influence on average escalator walker speeds. The
average walker speed of healthy participants (i.e. those not wearing the instant senior suit) in
Group A is similar to the average walker speed of the individual instant seniors for both the short
and long escalator. This is due to the speed of the group being dictated/strongly influenced by the
slowest individuals which would most likely be the instant senior participants blocking the
healthy individuals.
The average walker speeds in Group B for healthy participants and instant senior individuals
were similar for much the same reason. However, the average walker speeds for Group B were
faster than in Group A. This was due to the two lanes being formed by participants prior to
boarding the escalator, despite the escalator being static. This suggests that when groups
approach an escalator increased speed can be achieved if lanes are formed prior to boarding the
escalator; thereby reducing conflicts and subsequent delays at the escalator entrance. The
average walker speed in Group C was higher for healthy participants due to the instant elderly all
standing to one side thereby allowing the healthy participants to more easily overtake.
Overall static escalator individual walker speeds on the short escalator were similar to the
adjacent stair individual walker speeds. However, group walker speeds were notably slower on
the static escalator compared to the stairs. The authors note that the increased width of the stairs

81
(being over twice as wide) was likely to contribute to this allowing participants to overtake
where possible and so increase the average walker speeds when travelling with other participants
on the stairs.
Considering all participants were students within a narrow demographic group it is uncertain
how generally applicable the results are. The results suggest that elderly individuals walk slower
than non-elderly individuals on escalators. Whilst the author states that the use of the instant
senior suit has been verified to produce accurate results, it is believed this is questionable and
further work with actual elderly participants is probably required to increase confidence in the
walker speed results. Perhaps the most questionable characteristic of the study is the artificial
nature, lack of context and motivation for participants to traverse the escalator.
Study on availability and issues of evacuation using stopped escalators in a subway station
Kadokura et al [Kadokura, et al., 2009] carried out a number of experiments where walker
speeds were recorded of participants traversing up a static escalator and stair on their own and as
part of a group (all participants travelling simultaneously). A total of 39 university students
participated in the study. A single escalator (horizontal length of 27.2m and height of 13.2m) and
stair was used in the trials. Participant escalator walker speeds were recorded at different points
along the escalator.
A graph showing the average individual walker speed and average group/crowd walker speed at
different distances along the escalator can be seen in Figure 16. The average walker speed
measured was calculated using the actual distance participants travelled on the escalator (i.e. not
the horizontal distance).

82
Figure 16: Average walking speed of 39 participants: Single and in a Crowd [Kadokura, et al., 2009]
The average walker speed for individuals along the boarding flat section of the escalator
increased from 1.15 to 1.36 m/s whilst moving towards the incline. The average speed along the
alighting flat section of the escalator was approximately 1.48 m/s. No explanation as to why the
increased walker speed was recorded along the alighting flat section is mentioned by the authors.
However, the decrease in effort/energy required compared to the incline section is likely to be a
contributing factor. The average walker speed along the incline of the escalator remained
approximately constant at 0.8 m/s (horizontal speed 0.7 m/s). The average horizontal walker
speed was between 11.4% (0.08 m/s) and 12.9% (0.09 m/s) less than that recorded for the static
short and long escalators respectively by Okada et al [Okada, et al., 2009].
The average participant walker speeds when travelling in a group on the boarding flat section of
the escalator was slower than that of the equivalent individual walker speeds. This is expected as
the crowd density on the escalator boarding flat section can still remain high, hence restricting
walker speeds at this time. However, the average walker speed increases on the escalator incline.
This is due to each step forcing participants to spread out (decreasing the crowd density) and so
walk at a faster speed.
The average group walker speed along the alighting flat section of the escalator was 1.65 m/s.
The average walker speeds along the incline of the escalator was 0.7 m/s (horizontal speed 0.61
m/s). As with the experiments by Okada et al [Okada, et al., 2009], average group walker speeds
on escalators are expected to be influenced by the slower individuals in the group due to
restricted opportunities to overtake those individuals. Further to this, as mentioned in
experiments by Okada et al [Okada, et al., 2009], the average walker speeds of groups will be

83
influenced by the position of the slower individuals on the escalator (i.e. blocking or requiring
proceeding faster walkers to change sides in order to overtake).
Similar to the study by Okada et al [Okada, et al., 2009], the average walker speeds in both the
individual and group experiments along the incline were observed to exhibit little variation along
the entire length of the escalator. This may be due to the narrow demographic of participants; all
university students and potentially being young/fit individuals so being less likely to experience
fatigue (compared to older less fit individuals).
In addition to the static escalator average crowd walker speeds, stair crowd walker speeds were
also measured for the same height stairs. The average stair walker speed in the group was 0.77
m/s (horizontal speed of 0.68 m/s). This is similar (7.0% (0.07 m/s)) to the average static
escalator walker speed along the incline. This is somewhat surprising considering the stair was
approximately twice the width of the escalator. This would be expected to increase the likelihood
of participants overtaking each other; higher increased walker speeds would be expected on the
stairs. Conversely the small variation between results from the group walker speed experiments
on both the escalator incline and stairs may reflect participant‟s lack of desire to overtake other
participants rather than an imposed condition (i.e. being blocked).
The key findings of the study by Kadokura et al [Kadokura, et al., 2009] are similar to that of
Okada et al [Okada, et al., 2009], in addition to suffering some of the same limitations (i.e.
questionable general applicability (all student participants)), and artificial nature/ lack of real
context/motivation (experimental).

84
Route Choices Between Escalator and Stairway in MTR Stations (walker speeds)
As previously mentioned in the escalator/stair choice section, Cheung and Lam [Cheung and
Lam, 1998] recorded the frequency of pedestrians that used escalators/stairs, travel times, and
flow-rates in six stations within the Hong Kong Mass Transit Railway (MTR) underground
system during peak hours in both the up and down direction. This section reports on the data
presented in the study regarding escalator walker speeds. Overall results are presented in Table
21.
Table 21: Walker speeds by pedestrian blocks [Cheung and Lam, 1998]
Facility
Number
Of
Samples
Free flow
walker
speed
(m/s)
Walking
speed at
capacity
(m/sec)
Escalator Up 611 0.89
[0.88-0.90]
0.73
[0.72-0.75]
Escalator Down 692 1.05
[1.03-1.07]
0.73
[0.71-0.75]
Stair Up 696 0.86
[0.84-0.88]
0.43
[0.42-0.44]
Stair down 687 0.97
[0.96-0.98]
0.60
[0.59-0.61]
Walkway to Escalator 709 1.15
[1.09-1.21]
0.31
[0.30-0.32]
Walkway to Stair 712 1.14
[1.11-1.18]
0.32
[0.30-0.33]
On average, during free-flow conditions, pedestrian escalator walker speeds were 15.2% (0.16
m/s) faster in the down direction compared to the up direction. This is a slightly larger increase
than that observed for the average stair walker speeds (12.8% (0.11 m/s) increase). When the
escalators were crowded to capacity the average walker speed on both the up and down escalator
was approximately the same at 0.73 m/s. This represents a decrease in average walker speed
compared to the free flow conditions between 18.0%-30.5% (0.16m/s - 0.32m/s) for the up and
down escalators respectively.
The authors do not state if the escalator walker speeds were based on the horizontal or incline
travel distance, though compared to other walker speeds in other studies it is thought the speeds
are based on the incline travel distance. If this is correct, converting the average escalator walker
speeds to horizontal walker speeds gives the following horizontal walker speeds seen in Table
22.

85
Table 22: Horizontal escalator walker speeds by pedestrian blocks [Cheung and Lam, 1998]
Facility
Free flow
walker
speed
(m/s)
Walking
speed at
capacity
(m/sec)
Escalator Up 0.77
[0.76-0.78]
0.63
[0.62-0.65]
Escalator
Down
0.91
[0.89-0.93]
0.63
[0.61-0.65]
Escalator side usage
As previously mentioned, when pedestrians board an escalator they either walk, ride or both
walk and ride. To accommodate each type of behaviour, on escalators wide enough to permit,
often separate walker and rider lanes form where those wishing to ride all use one side and
walkers use the opposite side. It has been mentioned that some locations request escalator users
to ride on both sides of the escalator during peak periods in certain circumstances [Davis and
Dutta, 2002].
Based on archived video footage from the 1920's of an escalator in the London Underground,
Malvern [Malvern, 2009] observed riders using the right side of the escalator and postulated they
did so due to the diagonal finish at the start and end of each escalator. This meant that
pedestrians travelling on the left side of the escalator effectively had a longer flat section to
travel on at the end of the escalator and so allowed them more time to better adjust their footing
when alighting. In the London Underground today, as in a number of countries, it is common to
find signage requesting escalator users to "stand on the right side". During off peak periods or
during situations where unfamiliar pedestrians traverse an escalator, common side preference
behaviour may be disrupted though has negligible influence on the overall flow of pedestrians.
As observed by Davis and Dutta [Davis and Dutta, 2002] during peak periods the separation of
walker/rider queues for each side of the escalator can influence boarding flow-rates.
Whilst a number of studies make reference to the existence of separate walker and rider lanes on
escalators no published literature regarding empirical results could be found regarding the extent
to which walkers and riders use each side of escalators.
2.3.4 Review of software modelling escalators
A number of circulation/evacuation models state that they can represent escalators (e.g. Legion,
PEDROUTE/PAXPORT, STEPS, SimPED, etc) [Kuligowski, 2005]. However, little
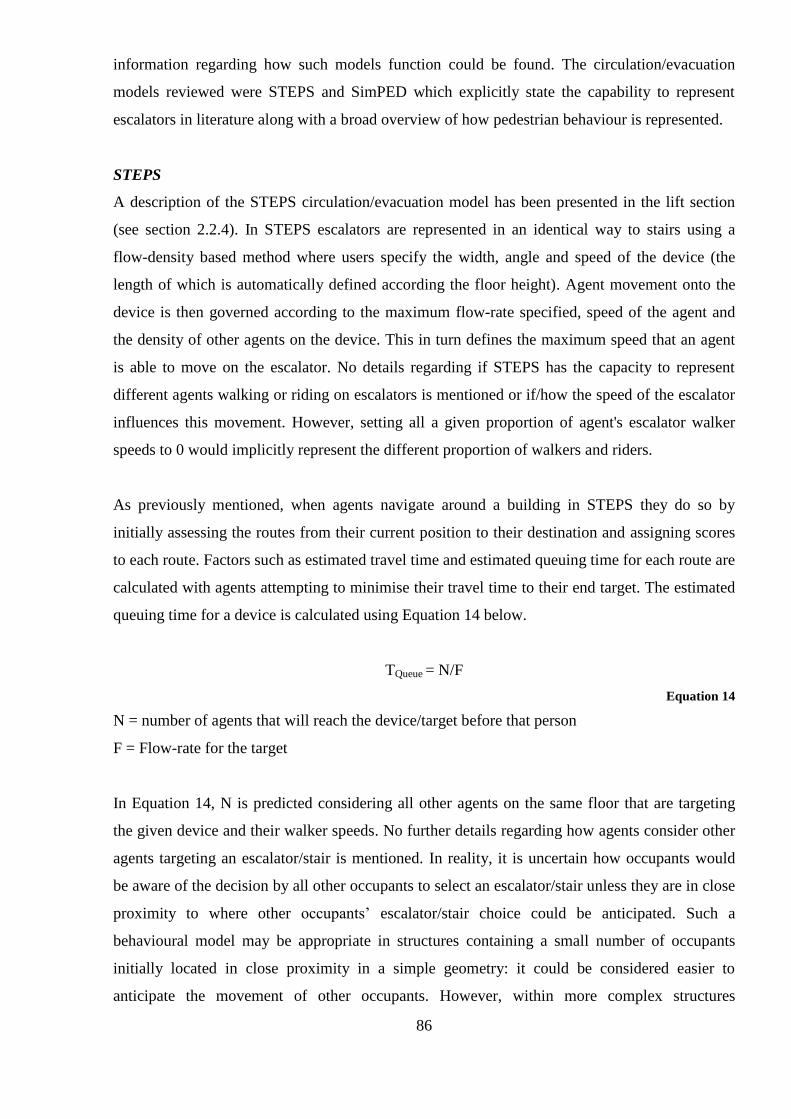
86
information regarding how such models function could be found. The circulation/evacuation
models reviewed were STEPS and SimPED which explicitly state the capability to represent
escalators in literature along with a broad overview of how pedestrian behaviour is represented.
STEPS
A description of the STEPS circulation/evacuation model has been presented in the lift section
(see section 2.2.4). In STEPS escalators are represented in an identical way to stairs using a
flow-density based method where users specify the width, angle and speed of the device (the
length of which is automatically defined according the floor height). Agent movement onto the
device is then governed according to the maximum flow-rate specified, speed of the agent and
the density of other agents on the device. This in turn defines the maximum speed that an agent
is able to move on the escalator. No details regarding if STEPS has the capacity to represent
different agents walking or riding on escalators is mentioned or if/how the speed of the escalator
influences this movement. However, setting all a given proportion of agent's escalator walker
speeds to 0 would implicitly represent the different proportion of walkers and riders.
As previously mentioned, when agents navigate around a building in STEPS they do so by
initially assessing the routes from their current position to their destination and assigning scores
to each route. Factors such as estimated travel time and estimated queuing time for each route are
calculated with agents attempting to minimise their travel time to their end target. The estimated
queuing time for a device is calculated using Equation 14 below.
TQueue = N/F
Equation 14
N = number of agents that will reach the device/target before that person
F = Flow-rate for the target
In Equation 14, N is predicted considering all other agents on the same floor that are targeting
the given device and their walker speeds. No further details regarding how agents consider other
agents targeting an escalator/stair is mentioned. In reality, it is uncertain how occupants would
be aware of the decision by all other occupants to select an escalator/stair unless they are in close
proximity to where other occupants‟ escalator/stair choice could be anticipated. Such a
behavioural model may be appropriate in structures containing a small number of occupants
initially located in close proximity in a simple geometry: it could be considered easier to
anticipate the movement of other occupants. However, within more complex structures

87
containing large numbers of dispersed occupants this is perhaps unrealistic. In such
circumstances, the behavioural model would appear to conflict with the theory of Bounded
Rationality [Simon, 1957] where occupants have a limited amount of information, cognitive
ability and time to process the information.
Further to this, agents can be assigned a patience value on a scale between 0-1. This relates to
how willing an agent is prepared to wait in a queue to use a given device before redirecting to
use an alternative device/route. A patience level of 0.5 is considered unbiased (i.e. the patience
attribute will not influence their device selection). The higher the patience value, the more
patient an agent is assumed to be. The patience value is used to calculate the estimated queuing
time which is then used when agents assign scores to each route. As previously mentioned, the
route score is then used by the agent to decide which route and subsequent device to use.
SimPED
SimPED is a pedestrian modelling software used to represent pedestrians during normal
circulation conditions developed by Daamen [Daamen, 2004]. The model has the capability to
represent escalators. Upon the escalators agents can be modelled as either being walkers or riders
[Daamen, 2002]. The agent movement speed on an escalator is represented as a product of the
agent‟s walker speed, escalator speed and density of other agents on the escalator. A level of
discomfort is also calculated for an escalator according to the crowd density; the more crowded
the escalator the higher the associated levels of discomfort (see Equation 15).
Equation 15
E0 = initial comfort value
N1= number of agents on the escalator
Nmax
= maximum number of agents that can fit on the escalator
When agents approach an escalator/stair combination they select which device to use based on a
combination of the shortest perceived travel time calculation and level of discomfort the agent
expects to encounter on each device. Each device is given a score and the device with the lowest
score is selected by the agent.

88
2.3.5 Escalator evacuation strategies and simulation results
A series of three evacuation simulation studies have been reviewed in the following sections to
demonstrate a variety of different escalator evacuation strategies and simulation results.
Feasibility of upward evacuation by escalator – An experimental study
A description of the experimental escalator trials conducted by Okada et al [Okada, et al., 2009]
has been described in previous sections (see section 2.3.3). In addition to the data collected the
authors also performed an evacuation analysis using empirical calculations (using the data
collected). The analysis was conducted using the plans of an underground station in Tokyo. The
station had 2 parallel platforms (B5 and B7 platform) which were located on the 5th
and 7th
levels
respectively below ground. Escalators and stairs were located at either end of each platform.
Both platforms had an escalator/stair at either end. A fire was also considered in the calculations
at one end of the B7 platform. Agents were required to traverse up a number of escalators/stairs
during the evacuation.
All agents initially on the B7 platform used a single escalator/stair at the opposite end to where
the fire was located. Agents on the B5 platform split evenly between the escalator/stair at either
end of the platform. The stairs adjacent to each escalator were between 1.6m-2.6m wide and all
the escalator tread widths were 1m. The initial population on each platform was 1,300
representing the maximum number of passengers on each train (2,600 agents in total).
Evacuation calculations were conducted using the average escalator walker speeds and flow-
rates mentioned in the previous sections of the literature review. Here the average walker speeds
in groups on a static escalator was 0.47 m/s, on a moving escalator 0.9 m/s, and on a stairway
was 0.54m/s. The flow-rate was 1.0 ped/m/s for the stopped escalator and 1.5 ped/m/s for the
moving escalator. Evacuation pre-movement/response times were 53s on the fire platform (B7)
and 106s on the non-fire platform (B5). Stairs were used in all cases with varying escalator
strategies. A description of each case and results can be seen in Table 23.
89
Table 23: Total Evacuation time Calculation Results [Okada, et al., 2009]
(*All elderly agents use the escalator (other agents use both escalators and stairs))
Case 1 Case 2 Case 3 Case 4 Case 5 Case 6
Stairs X X X X X X
Escalators
Up - Static Moving Moving * Moving Moving
Down - - - - Static
Moving in
Reverse
(up)
Total Evacuation Time 24 min
21sec
19 min
10 sec
16min
59sec
16min
30sec
14min
37sec
13min
16sec
Results show that reversing the direction of a moving escalator (to move in the up direction; case
6) compared to the stair only case reduced the total evacuation time by 45.5% representing the
fastest total evacuation time. Using both stairs and static up escalators (Case 2) reduced the total
evacuation time by 21.3%.
No platform clearance times were presented or details regarding how the evacuation calculations
were performed in the study. It is therefore uncertain as to the level of validity or general
applicability of the results.
Study on availability and issues of evacuation using stopped escalators in a subway station
A description of the experimental escalator trials conducted by Kadokura et al [Kadokura, et al.,
2009] has been described in previous sections (see 2.3.3). In addition to the data collected of
participants using a static escalator the authors also performed evacuation simulations (using the
data collected) of an underground station. During the evacuation simulation a fire was also
modelled on the platform level.
The underground station consisted of three levels with a double-sided platform located on the
lowest level. The platform connected to the upper level via 6 pairs of escalators in 4 different
locations (12 escalators in total) and two stairs at both ends of the platform. All stairs were 2.5m
and all escalators were 1.2m wide. Escalators were assumed to be static during all scenarios. The
platform was initially populated with 1,000 agents who were assigned a horizontal stair walker
speed of 0.5 m/s and a horizontal static escalator walker speed of 0.45m/s (based on results from
the associated experimental study). All agents had instant pre-movement/response times.
The simulated fire on the platform was modelled using the BRI2002 two-layer zone model with
both the fire and smoke represented. The fire characteristics were intended to mimic the fire of

90
the Daegu station fire which occurred in South Korea in 2003 [Kadokura, et al., 2009]. The
representation of the fire in the evacuation simulations meant that the environmental conditions
on the platform became untenable between 2 to 4 minutes after the fire had started. Upon
detection of fire/smoke agents moved away from the affected area. However, the influence of the
fire/smoke on agents‟ walker speeds was not represented. In total 6 evacuation scenarios were
run which can be seen in Figure 17 and Table 24 below.
Figure 17: Evacuation Scenarios and fire location [Kadokura, et al., 2009]
Table 24: Number of escalators/stairs available, agents trapped for each case.
Case 1 Case 2 Case 3 Case 4 Case 5 Case 6
Number of
Stairs
Available
2 2 1 1 1 2
Number of
Escalators
Available
0 4 0 10 6 12
Agents
trapped 562 423 0 0 331 0

91
The study focused on the number of trapped agents (i.e. those agents who encountered untenable
smoke conditions before evacuating) as opposed to the total or platform evacuation time. The
total evacuation time was only stated for Case 3 (422 seconds) and Case 4 (254 seconds). No
agents were trapped in Cases 3, 4 and 6 due to the fire not being close enough to the available
escalator(s)/stair(s). Most agents became trapped in Case 1 where only a single stair was
available and the fire was initially in the middle of the platform (within reasonably close
proximity to the available stairs).
The results suggest that the use of escalators can be very effective for aiding an evacuation,
especially with the restriction of stair usage caused by fire/smoke spread. The authors state that
the introduction of static escalators compared to stairs alone approximately decreased the total
evacuation time by a half. This decrease is perhaps less than expected considering the aggregated
width of the 12 escalators (14.4m) was almost three times the aggregated width of the 2 stairs
(5.0m).
Due to the total and platform evacuation times not being presented along with other simulation
parameters (aside from the number of agents trapped) makes it hard to gauge the full extent to
which escalators provided benefit in each case.
Study of the human evacuation simulation of metro fire safety analysis in China
Zhong et al [Zhong, et al., 2008] performed an evacuation simulation of a Guangzhou
underground station platform for metro line 6 (single platform) in China. Procedures for this
underground station state that during an emergency in locations other than the platform, all
escalators are turned off and can be used as stairs. If there is an emergency on the platform then
up escalators can remain moving and the down escalators can be stopped and reversed in the up
direction.
The station has 4 levels with the lowest being the platform level. The platform has 2 escalators
and 2 stairs connecting to the level above. The emergency was assumed to occur on the platform
so one escalator was made static (used as a stair) and one escalator was kept moving in the up
direction (at a speed of 0.65m/s).
The double-sided platform was 72m in length and was initially populated with 1,300 agents.
Agent escalator walker speeds were set between 0.60-0.67m/s (it is uncertain how these were

92
distributed or whether these were horizontal walker speeds or incline walker speeds). Instant pre-
evacuation/response times were assigned to all agents.
The frequency of agents that evacuated after different periods of time can be seen in Table 25
with evacuation rates presented in Figure 18. The platform took 250 seconds to evacuate with the
overall evacuation rate appearing constant for the majority of the evacuation (see Figure 18); the
evacuation rate for each escalator/stair was also linear. From Figure 18 it can be seen that the last
escalator/stair user alighted at similar times. This suggests that there was no bottleneck or
disproportional usage of escalators/stairs (i.e. the frequency of agents that used each device was
proportional to the throughput capacity each provided). Indeed, from Figure 18 it can be
approximated that 46.2% (600) of agents used the moving escalator, 23.8% (310) of agents used
the static escalator and around 30% (390) of agents used the stairs.
Table 25: Simulation Results - Frequency/Proportion of Evacuees against Time
Time 0s 30s 60s 120s 250s
Frequency
of
Population
Evacuated
0 175 330 654 1300
% of
Population
Evacuated
0% 13.5% 25.4% 50.3% 100.0%

93
Total number of
agents evacuated
Number of agents escaped
from moving Escalator
Number of agents escaped
from static Escalator
Number of agents escaped
from stairs Figure 18: Simulation Results - Evacuation Rates [Zhong, et al., 2008]
Since none of the escalators and stairs were in close proximity to each other there is expected to
be little decision making with regards to device selection (i.e. choosing between escalators and
adjacent stairs considering local crowd conditions). In the study no details regarding how agents
behaved on the moving escalator is mentioned though it is believed that all agents walked.
2.3.6 Summary
A review of literature regarding escalator usage during actual evacuations, escalator evacuation
building codes/standards/guidelines, escalator human factors data, software models that can
represent escalators, and evacuation escalator simulation results has been conducted.
It is understood that escalators were likely to have played a key role in a number of actual
evacuations; however, little literature regarding the extent to which escalators influenced such
evacuations could be found. Indeed it was only due to the severity and nature of the two
incidents reviewed (World Trade Center 911 Attacks and the King Cross Fire) that official
studies and subsequent reports were produced which mentioned escalator usage. In the incidents
analysed for both a high-rise building and an underground station, escalators were shown to have
played a key role during each evacuation. The operational strategies employed have

94
demonstrated using escalators in both the moving and static states during an evacuation. In
structures such as underground stations there is often little alternative other than using escalators
during an evacuation. Within the incidents analysed escalator users were reported to exhibit
typical circulation behaviour whilst using the escalators (e.g. orderly queuing, using only the
normal downward escalator, common side preference behaviour, etc). This behaviour typically
occurred until pedestrians were instructed otherwise or conditions deteriorated to such an extent
that caused them to react differently.
Building codes, standards and guidelines in both the US and the UK have been reviewed. In
most cases moving escalators can be used during an evacuation in a number of circumstances
providing emergency stop provisions are made. However, the guidance differ between the US
and UK with regards to the acceptance of considering moving escalators as primary means of
egress (i.e. whether they are considered contributing to the evacuation capacity). Theoretical
handling capacities of escalators mentioned in guidelines for normal circulation situations are
mentioned to be far greater than actual handling capacities recorded.
All escalator human factors data collected was either collected during experimental or normal
circulation conditions. Whilst it is questionable if such data is appropriate for use in evacuation
situations, the lack of data in actual evacuation conditions suggests it is required. Indeed the
review of escalator usage during actual evacuations suggests it may be appropriate for certain
emergency conditions to consider escalator users adopting normal circulation behaviour in an
evacuation. The majority of data collected in experimental conditions relates to escalator flow-
rates and walker speeds. The collection of walker speed data in experimental conditions, where
participants have no actual motivation or trip purpose, is considered questionable as walker
speeds are expected to be highly influenced by such factors. A number of escalator human
factors studies analysed peak flow-rate/handling capacities. These studies typically conducted
regression analysis using the flow-rate data collected in order to predict the probability that
pedestrians would use an escalator/stair given a certain flow-rate. The analysis of each study
appears to suggest such predictive formulas would only be accurate/appropriate during very
crowded/busy conditions. In all studies very little information was collected regarding the
proportion escalator/stair users, proportion of walkers/riders, or side preference proportions.
Indeed no study was found where a broad variety of such escalator human factors was collected
and analysed in combination.

95
A number of pedestrians/evacuation models have the ability to represent escalators though very
little published literature regarding how such models function or what data the models use for
default settings could be found. The models reviewed typically represent escalators in the same
way as stairs with varied attributes (e.g. flow-rates and pedestrian walker speeds). Behaviour
such as side preference and walker/rider selection are not explicitly considered in most models.
In the models reviewed, device selection (e.g. between escalator/stair), is based on a shortest
travel time calculation with agents electing to use a device which they expect will allow them to
traverse the area the quickest time. It is uncertain if such a selection method is appropriate for all
agents and agents that exhibit suboptimal behaviour appear to not be considered in the models.
A number of studies that conducted evacuation simulations looking at using static and moving
escalators have been reviewed. The evacuation simulation studies reviewed demonstrate the
potential impact of using moving and static escalators in addition to exploring escalator
availability for evacuating a train station/platform. All studies appear to assume that all escalator
users walked on escalators and did not consider agents who would ride in addition to separate
walker/rider lanes forming. Escalator/stair selection by individual agents and the influence of
congestion at the entrance to the escalators/stairs appears to have not been explicitly represented
in the simulation results.
Overall analysis of current literature pertaining to escalator evacuation usage suggests that
escalators can and have provided benefit during emergency situations. However, whilst some
studies have begun to attempt to understand escalator human factors there is still a lack of
understanding regarding escalator human factors (e.g. escalator/stair selection, walker/rider
proportions, common side preference behaviour, etc). Indeed considering no study has looked at
a broad variety of escalator human factors in combination. Further to this, there is a lack of
explicit representation of such behaviour in evacuation/circulation models.
2.4 Concluding remarks
A review of literature regarding evacuation lift and escalator usage has been conducted. Lifts
have been shown to have assisted a number of actual evacuations in a number of different
countries though they were not intended to be used during such incidents. Whilst few accounts
exist of escalator usage during actual evacuations, escalators have also been used in both the
moving and static states to assist evacuations, often forming part of the only viable egress route.

96
The usage of lifts/escalators during evacuations for the general population is either already or
beginning to be accepted in both UK and US building codes, standards and guidelines. Despite
evidence that lifts/escalators have been used to good effect in a number of evacuations there is a
scarcity of data related to associated human factors and to what extent they would influence
operational strategies.
Many evacuation models state that they can represent escalators and a small number have the
capability to represent lifts. Further to this a number of dedicated lift models have also been
shown to be able to represent associated human factors during evacuations in a similar fashion.
Little information about how evacuation models represent such devices or associated human
factors could be found. Of the models reviewed, where a description of how the models represent
lifts/escalator and associated agent behaviour could be found, none appear to represent
empirically based micro-level human factors.
97
Chapter 3 - The buildingEXODUS
Evacuation Software
3.1 Introduction
The purpose of this thesis is to understand human factors associated with lift/escalator usage and
to measure the impact such factors have upon an evacuation. One method to measure the impact
such factors have upon an evacuation using lifts/escalators would be to develop a new
evacuation model to represent lifts/escalators and associated human factors in order to gauge the
effects. However, considering certain evacuation models already exist with a variety of features
that could be used in part to represent lifts/escalators during an evacuation, it would be less time
consuming and more efficient to develop the functionality within an existing evacuation model.
The buildingEXODUS evacuation software has been chosen as a platform to develop the
capabilities to represent lifts/escalators and associated human factors. It is a widely used model
that is familiar to the author and contains a number features that would make lift/escalator
representation convenient to implement. This chapter gives a brief overview of the
buildingEXODUS V4.1 evacuation model including the spatial representation and the agent
behaviour. Current limitations with representing lifts/escalators in addition to the associated
agent behaviour within the buildingEXODUS evacuation software is then discussed.
3.2 Model overview
The buildingEXODUS evacuation software is designed to simulate the evacuation of people
from enclosures. The model has been extensively discussed in literature in the public domain
[Galea, et al., 2006b, Galea, et al., 2008] so will only be broadly reviewed.
The software takes into consideration people-people, people-fire and people-structure
interactions. The software models the trajectory of each individual person as they make their way
out of an enclosure, or are overcome by fire hazards such as heat, smoke and toxic gases. The
software was written in C++ using Object Orientated techniques utilising stochastic rule base
methods to control people's behaviour. Thus, the behaviour and movement of each individual is
determined by a set of heuristics or rules. The software is based on a conceptual framework of five
interacting submodels, the OCCUPANT, MOVEMENT, BEHAVIOUR, TOXICITY and

98
HAZARD submodels (see Figure 19). These submodels operate on a region of space defined by
the GEOMETRY of the enclosure. The software can be used to simulate both evacuation and
circulation scenarios.
Figure 19: buildingEXODUS Conceptual Framework
3.3 Spatial representation within buildingEXODUS
The spatial representation of a structure/area within buildingEXODUS is represented by a two-
dimensional grid of nodes (defining a region of space) that are connected via a series of arcs which
determine the distance between each node. The default node represents a 0.5m x 0.5m square region
of space. Agents traverse through the geometry by moving between nodes via the arcs. There are a
variety of different node types (e.g. free space, exits, internal doors, stairs, obstacles, etc) that allow
users to specify different attributes associated with different spatial regions. Geometries with
multiple floors can be made up of multiple grids of nodes connected by transit nodes that represent
stairs (see Figure 20).

99
Figure 20: Spatial representation within buildingEXODUS (Nodes, Arcs, Transit nodes, Door)
Stair transit nodes are defined via a series of attributes (see Table 26) that influence how agents
behave on the stair during a simulation.
Table 26: buildingEXODUS transit node attribute list
Attribute Description
Direction (degrees) Direction the transit node is facing in relation to the other nodes.
Capacity Maximum number of agents that can simultaneously be on the transit node
at any one time.
Lanes Number of lanes (i.e. number of people that can simultaneously stand side-
by-side on the node).
Flow Direction Direction of travel (bi-direction, up/forward, down/backward).
Drop (m) Vertical travel distance.
Length (m) Horizontal travel distance.
Width(m) Physical width.
Flow-rate (occ/m/m) Maximum number of agents that can board the stair per minute per meter
(used only if flow-rate model is chosen).
Space Required Number of treads that walkers and riders keep between each other for stair
packing or staggered options.
Hand Rail Size (m) Aggregated width of the handrail.
Effective Width (m) Width available for agents to occupy.
Number of Risers Number of risers.
Riser Height (m) Height of each riser.
Tread Depth (m) Depth of each tread.
3.4 Occupant behaviour
The Occupant sub-model within buildingEXODUS allows the nature of the occupant population
to be specified. A simulated population can consist of a range of people with different movement

100
abilities, reflecting age, gender and physical disabilities as well as different levels of knowledge
of the enclosure‟s layout.
Agents within the model are defined via a set of attributes. These attributes can be broadly
categorised into two groups: physical (e.g. gender, weight, height, age, etc), and movement
speeds (e.g. run speed, walk speeds, stair up/down walker speeds, crawl speed, etc). The travel
speed adopted by agents is dependent on the terrain (defined by the node type) being traversed at
any given time. All attributes are configurable by the user and the default attribute values are
based on empirical data from a variety of studies. Specifically relevant for this thesis are the stair
walker speeds. These represent the incline speeds of agents and are based on the work of Fruin
[Fruin, 1971] that is determined by the age and gender of agents (see Table 27).
Table 27: Default stair travel speeds by Fruin [Fruin, 1971] used in buildingEXODUS (maximum
recommended values)
Gender Age (years) Down avg (m/s) Up avg (m/s)
Male <30 1.01 0.67
Female <30 0.755 0.635
Male 30-50 0.86 0.63
Female 30-50 0.665 0.59
Male >50 0.67 0.51
Female >50 0.595 0.485
For transit nodes there are two behavioural regimes that determine the level of spacing agents
keep around themselves: Staggered and Packed (see Figure 21). If the Staggered flag is set then
agents will attempt to use/maintain treads that are not being used by other agents. If the Packed
flag is set then agents will not consider other agents in their tread selection. As previously
mentioned different tread spacing values for both staggered and packed behaviour can be defined
by the user.
Figure 21: Packed and Staggered occupant behaviour on stairs

101
Within the software a number of psychological attributes are also associated within each agent
including drive, patience and response time. The Drive attribute is used to resolve conflicts for
space between competing agents; by default this is determined by the Gender and Age attribute.
The Patience attribute defines how likely an agent will wait in a queue before attempting to seek
an alternative route for reaching a given target. The Response Time attribute represents the time
an agents waits from the beginning of a simulation until the time they begin to either evacuate or
instigate a pre-evacuation task.
On the basis of an agent's individual attributes, the Behaviour sub-model determines the agents‟
response to the current situation, and passes its decision on to the Movement sub-model. The
Behaviour sub-model functions on two levels, Global and Local. Global behaviour involves
implementing an escape strategy that may lead an agent to exit via their nearest serviceable exit
or most familiar exit. The desired global behaviour is set by the user, but may be modified or
overridden through local adaptive agent behaviour (i.e. that the agent‟s rationally assess
congestion levels given the information available, albeit in a crude manner), that includes such
considerations as determining the agent's initial response, conflict resolution, overtaking, etc. In
addition, a number of localized decision-making processes are available to each agent according
to the conditions in which they find themselves and the information available to them. This
includes the ability to customize their egress route according to the levels of congestion at an
internal exit, the environmental conditions and the social relationships within the population.
It is also possible to assign agents with an itinerary of tasks (e.g. visit a pre-defined location) that
must be completed prior to the evacuation. To allow for dynamic paths to be adopted by the
agents these itinerary points can act as redirection nodes instructing the agents to adopt
alternative paths while evacuating or circulating [Gwynne, et al., 1999].
Agents navigate about a geometry based on a potential map; a series of numerical values
assigned to each node for each target (e.g. exits, stairs, etc). Agents who are moving towards a
given target attempt to move to the next node that has the lowest potential value from all the
connecting nodes for a given target. If the node with the lowest potential value is already
occupied by another agent, agents will select to use the node with the next lowest potential.
Failing this they will elect to use a node with an equal potential value to their currently occupied
node. For all targets within a geometry a separate potential map is defined and associated
potential values for every node is calculated. This allows agents to navigate to any given target
within the simulation. For external exits, an overall potential distance map is defined that
102
calculates the potential map for multiple exits and so defines the nearest exit for each agent.
Using this method by default means that agents elect an egress route to an external exit that is
closest to their current location.
During a simulation, if agents that are presented with multiple transit nodes connecting the same
vertical areas (e.g. adjacent stairs), by default they will elect to use a transit node based on which
device forms part of their shortest route to the exit (defined by the potential distance map). This
choice is made irrespective of local conditions. As such currently agent device choice is made
prior to a simulation starting and does not change during the simulation unless the exit/target
selection changes that may potential impact this device selection.
3.5 Current limitations of buildingEXODUS for modelling lifts/escalators
Implicit representation of escalators using a flow-rate system employing transit nodes can
currently be achieved in buildingEXODUS, similar to that of other models (e.g. STEPS).
Certain representation of micro-level escalator human factors is possible within
buildingEXODUS during certain situations using stairs. Escalator/stair selection could be
represented as either explicit device assignment to agents by a user or using a redirection node;
however, agents would not exhibit adaptive behaviour considering local conditions. Movement
speeds could be implicitly represented by agents‟ stair walker speeds being set to an escalator
walker speed plus the speed of the escalator itself. However, if agents were to use both stairs and
escalators (or escalators travelling at different speeds) during the evacuation then this method
would not be appropriate due to the stair speeds including the speed of the escalator. There are a
number of escalator human factors identified in the literature review that could not be explicitly
represented within buildingEXODUS. These include adaptive escalator/stair selection,
walker/rider selection, rider side preference and walker speed data.
Similarly to escalators, no explicit means for representing lifts and associated occupant
behaviour currently exists within buildingEXODUS. Creative means for implicit representation
of using lifts in buildingEXODUS could theoretically be achieved with limited functionality. For
instance, using internal doors being controlled by user-specified opening/closing times and
staging areas (to represent the lifts) is one such method to implicitly represent lifts (See Figure
22). However, this would require a wide breadth of assumptions and require the user to manually
calculate the lift transfer/arrival times for each floor. In a building with a large number of floors
and complex lift dispatch algorithm this would become very challenging. Such a method would
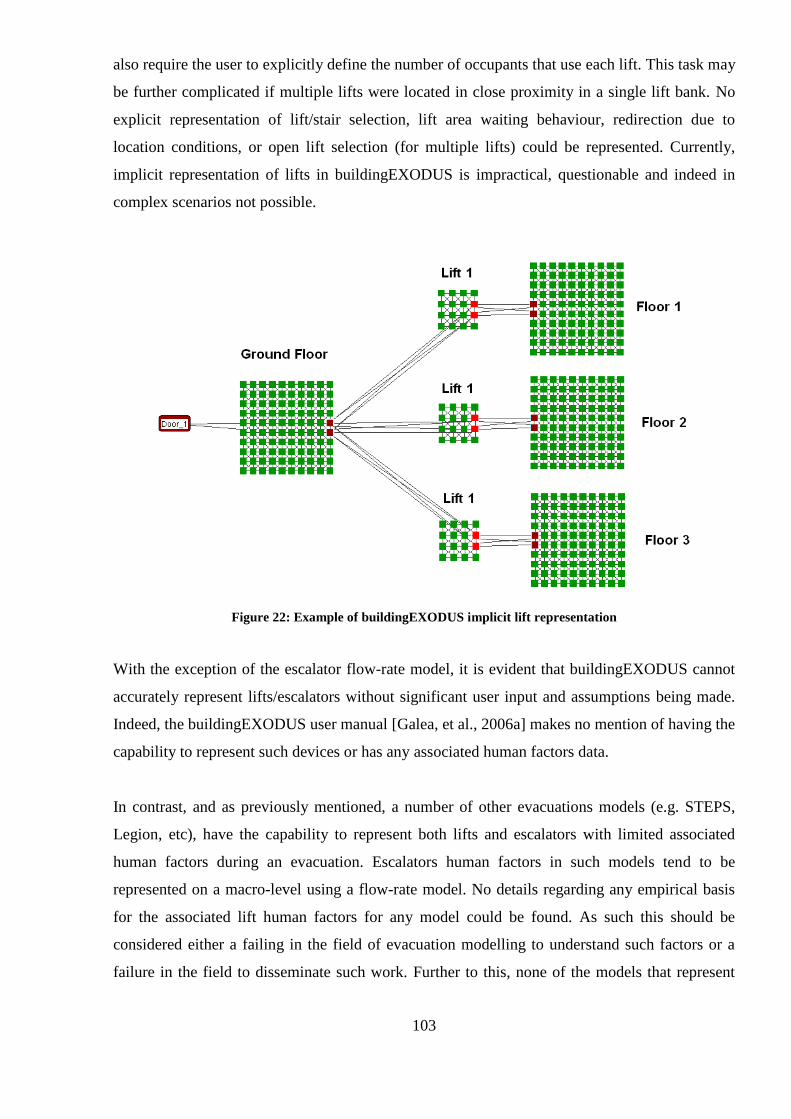
103
also require the user to explicitly define the number of occupants that use each lift. This task may
be further complicated if multiple lifts were located in close proximity in a single lift bank. No
explicit representation of lift/stair selection, lift area waiting behaviour, redirection due to
location conditions, or open lift selection (for multiple lifts) could be represented. Currently,
implicit representation of lifts in buildingEXODUS is impractical, questionable and indeed in
complex scenarios not possible.
Figure 22: Example of buildingEXODUS implicit lift representation
With the exception of the escalator flow-rate model, it is evident that buildingEXODUS cannot
accurately represent lifts/escalators without significant user input and assumptions being made.
Indeed, the buildingEXODUS user manual [Galea, et al., 2006a] makes no mention of having the
capability to represent such devices or has any associated human factors data.
In contrast, and as previously mentioned, a number of other evacuations models (e.g. STEPS,
Legion, etc), have the capability to represent both lifts and escalators with limited associated
human factors during an evacuation. Escalators human factors in such models tend to be
represented on a macro-level using a flow-rate model. No details regarding any empirical basis
for the associated lift human factors for any model could be found. As such this should be
considered either a failing in the field of evacuation modelling to understand such factors or a
failure in the field to disseminate such work. Further to this, none of the models that represent

104
lifts or escalators are open source. As such development within those models is not possible for
third parties.
3.6 Concluding remarks
This chapter has given an overview of the buildingEXODUS evacuation software with specific
focus on factors associated with lifts/escalators and associated human behaviour.
The chapter has highlighted that buildingEXODUS has a number of shortcomings with regards
to lift/escalator representation that are:
1. Limited capability to represent lifts/escalators,
2. Limited or no capability to represent associated human factors without significant manual
intervention by a user,
3. Lack of empirical basis to represent lift/escalator human factors (i.e. device selection, adaptive
behaviour according to crowd levels/wait time, boarding/alighting behaviour, and behaviour on
each device).
Despite these, buildingEXODUS has a number of existing features that would allow such
shortcomings to be addressed in order to represent lifts/escalators and associated human factors.
These include the ability to assign agents itineraries of tasks and the use of transit nodes which
could be extended to represent other vertical transport devices. The source code and
developmental support for buildingEXODUS has also been provided.
The author is only aware of the FDS+Evac evacuation model [Korhonen and Hostikka, 2010]
where the source code is publically available. The associated user guide states that it is only
suitable for mainly horizontal structures (e.g. sports halls, etc) and that inclined structures have
not been validated using the model [Korhonen and Hostikka, 2010]. No explicit method for
assigning agents itineraries is provided in the model. Considering such factors, it was deemed
less favourable to develop a lift/escalator and associated agent models compared to
buildingEXODUS.
The capability of the model to accurately and explicitly represent both lifts and escalators in
addition to associated human factors is considered crucial for users requiring to model structures
that potentially heavily rely on such devices during evacuations (e.g. high-rise buildings,
underground stations, etc).

105
Chapter 4 - Evacuation Lift Human Factors
4.1 Introduction
Several studies have noted potential human factors associated with lift usage during evacuations
[Klote, et al., 1992, Groner and Levin, 1992]. In order to investigate such human factors,
interviews with survivors that used lifts in real evacuations or in evacuation drills has been
carried out [Sekizawa, et al., 1999, Galea, et al., 2006a, Heyes and Spearpoint, 2009].
Furthermore online/paper based surveys have been conducted posing hypothetical evacuation
scenarios where the use of lifts was permitted [Heyes and Spearpoint, 2009]. However, such
studies and associated data are scarce. It can also be limited: only involving participants of a
particular age or cultural group, those with insufficient experience of lift/stair usage, or those
within occupational bias (e.g. participants involved in fire engineering). Subsequently there is a
lack of understanding regarding evacuation lift human factors. To address these issues, an online
survey was developed (see Appendix A1.1). Participants were asked how they would behave
with regards to lift/stair usage given a series of hypothetical situations. This chapter presents the
design of the survey and subsequent analysis of participant responses.
4.2 Survey methodology
Permission was granted by the University of Greenwich Research Ethics Committee to conduct a
publically accessible online survey (see Appendix A2.1). The call for participation to complete
the survey was sent out via several media; website link/leaflet distribution, online forums,
university/company emailing lists, friends/family/colleagues, etc. The results presented relate to
data collected between July 2008 to July 2009. Utilising the Internet promoted a large and
diverse population of participants, however, it also introduced the limitations of an unsupervised
survey. This includes participants misinterpreting or giving incomplete responses to questions.
For clarity, the subsequent data analysis includes the number of participant responses for each
question. False or duplicate participant responses were minimised by recording each
participant‟s computer IP (Internet Protocol) address and time of completion. Despite this no
participants responses were identified as being false or duplicate.
4.3 Survey description
To increase the number and cultural diversity of participants, the survey was made available in
two languages, English and Chinese (Simplified Chinese). In 2009 China possessed six of the

106
world‟s ten tallest buildings [CTBUH, 2010]. Furthermore, cities such as Shanghai and Beijing
have a large number of high-rise residential and office buildings. As such it was deemed
appropriate to have participant responses from such an emerging market for high-rise buildings.
The survey consisted of four sections and required approximately 20 minutes to complete. The
first 3 sections addressed the influence of travel distance, queues and groups within a normal
circulation setting. Each circulation setting was based around a hypothetical scenario. The
scenario description, unless otherwise stated, consisted of the following information:
You are familiar with the layout of the building.
The lifts/stairs are located in the same area.
You are not carrying or wearing anything to restrict your movement.
A lift is not currently on your floor and you do not know how long you will have to
wait for a lift to return.
This description was intended to remove the potential influence of building unfamiliarity,
lifts/stairs being located in different areas, current lift floor and luggage/clothing, upon
participant responses. In each question participants were requested to state the maximum number
of floors they would consider walking on the stairs before redirecting to use the lift. Participants
could respond that they would either always use the lift; always consider using the stairs; or state
the maximum number of floors that they would consider walking on the stairs before choosing to
use a lift.
The fourth section of the survey focused specifically on evacuation usage and informed
participants that it was acceptable to use a lift during the presented scenario. Participants were
then asked a series of questions related to whether they would consider using a lift during an
evacuation. The final questions in the section posed a hypothetical evacuation scenario and asked
participants whether they would be prepared to wait for a lift on progressively higher floors. For
those participants prepared to wait for a lift, additional questions were asked to determine
whether further conditions would influence this decision (e.g. crowding in the lift waiting area
and lift wait time).
The following analysis gives an overview of the normal circulation results before focusing on the
evacuation section as these results are of primary interest.

107
4.4 Limitations of the survey
There are number of inherent limitations with any online survey, in particular those posing
hypothetical situations and asking participants to quantify their behaviour. Such issues include:
Anchoring: It has been stated in a number of psychological studies that "people's ability
to discriminate change in a physical stimulus diminishes as the magnitude of the stimulus
increases" [Fetherstonhaugh, et al., 1997]. Thus, in this survey, questions in which
participants provide responses representing a large number, may be considered less
reliable with anchoring towards certain values (e.g. multiples of 10).
Conceptualisation: In the survey participants are required to predict their decision
making process using hypothetical situations. This gives rise to the question as to
whether their responses would reflect what they would do in the actual situation i.e.
relying on participants‟ ability to accurately predict their own behaviour, and accurately
discriminate between different influences. The more complicated a given hypothetical
scenario the increased likelihood that participant responses will become inconsistent with
what they would actually do due to their inability to accurately conceptualise the
influencing factors. It may also be conjectured that people make such decisions posed in
the survey subconsciously and that asking participants to consciously make such
decisions could potentially influence their answers.
Unsupervised: Since participants performing the survey were not supervised, this gives
rise to the potential for participants misreading, misunderstanding or erroneous answering
questions.
Survey fatigue: Since participants were unsupervised and the survey could take up to 20
minutes to complete, some participants may become tired of doing the survey/questions
part-way through and begin to give any answer in order to answer as few questions as
possible and complete the survey as quickly as possible.
Other influencing factors: The hypothetical situations presented within the survey were
intended to present each participant with as simple situation with as little information to
process in order to more accurately record the potential influence of different factors.

108
There may be a variety of other influencing factors and varying degrees with which these
influence each other which were not captured/tested within the study.
Such survey limitations should be considered when interpreting or applying the results in other
contexts.
4.5 Participant demographic overview
In total, 468 participants either fully or partially completed the survey, of which 424 provided
complete demographic information (e.g. gender, age, height and weight). A summary of
participant demographic information can be seen in Figure 23. There were slightly more male
(60.6% (269)) participants than females (39.4% (175)). Of all participants who provided age data
(N=444), the average age was 35.0 years with just 18-30 years being the largest age group
(44.6%). The average age of male participants was slightly higher (35.9 years) than females
(33.8 years). Considering participants who provided occupational details (N=449) a small
proportion were students (18.9%), were from the fire safety/protection profession (7.6%) or
came from the lift industry (1.6%). The remaining 71.9% of participant occupations were either
classified as coming from other professions or non-specific (e.g. office worker, staff, assistant,
etc).

109
Gender Age Range Occupation
Country BMI Figure 23: Summary of participant demographic information
Of all the participants, 63.5% confirmed that their place of work/study possessed lifts. These
buildings ranged in height between 2 to 78 floors with an average of 10.1 floors. Approximately
15.6% of all participants had at least one lift in their place of residence. These residences varied
in height between 3 to 35 floors with an average of 10.8 floors in height.
Participants came from 23 different countries. However, six countries made up approximately
88.9% of all participants: UK (30.8% (144)), China (25.9% (121)), US (12.8% (60)), Germany
(11.1% (52)), Japan (5.6% (26) and Australia (2.8% (13)). Using the World Health
Organizations classification of body mass indexing (BMI), of all participants who provided
plausible height and weight information (N=445), just over half were classified as normal in
weight (56.4%). Only 6.7% were considered underweight with just under a half being either
overweight (24.7%), obese (11.0%) or morbidly obese (1.1%).
For the initial questions in the evacuation section, an analysis of responses according to gender,
age range, country and BMI has been performed (see Appendix A3.1). The countries with the
most participants were focused upon. A large sample size was required in order to effectively
compare responses between participants from different countries. Therefore, those countries that

110
had greater than 50 participants were used for this comparison (i.e. UK, China, Germany and the
US). Responses from these four countries accounted for 80.6% of all participants in the survey.
4.6 Results
4.6.1 Circulation
The first part of the survey, addressing circulation behaviour, explored issues to do with vertical
travel distance, queue length in the lift waiting area and group behaviour. Three specific
variations of the core scenario, each in separate sections, were presented to the participants: Base
case, Queues, and Groups. The additional situational information relating to the nature of these
various scenarios is presented in Table 28. Given these specific situations, participants were
asked what is the maximum number of floors they would consider travelling on the stairs before
electing to use a lift. Participant responses either stated that they would always consider using
the stairs, never consider using the stairs (always use the lift), or sometimes consider using the
stairs (specifying a finite number of floors they would walk on the stairs). Here, data has been
combined for each scenario. Therefore, the analysis includes multiple data-points for each
participant.
Table 28: Additional situation information provided for each section.
Base case Queues Groups
You are alone in
a lift waiting area
on your floor.
There are a number of
people in the lift
waiting area on your
floor.
You are travelling with a
group of 2-4 people. The people in the group are
all of similar physical ability
and fitness to yourself. The lift waiting area on your
floor is empty.
As previously mentioned, it has been stated in a number of psychological studies that "people's
ability to discriminate change in a physical stimulus diminishes as the magnitude of the stimulus
increases" [Fetherstonhaugh, et al., 1997]. It is postulated that participants who stated that they
would consider walking a finite number of floors that was greater than a given amount could be
inaccurate due to potential inability to conceptualise such a large number of floors. In order to
minimise the effect of participants overestimating the number of floors they would consider
walking on the stairs, responses that stated greater than a given number floors were removed
from the analysis. Between 0.2%-1.3% of respondents stated that they lived or worked in a
building that contained a lift that had greater than 50 floors. It was therefore thought that very
few participants would be familiar with being in a building of such a height, let alone walking

111
down the stairs for that many floors. Consequently participants‟ responses that stated they would
walk a finite number of floors greater than 50 were removed from the analysis. Due to the low
number of participant responses specifying greater than 50 floors in any of the questions
(ranging between 0.0% (0) -1.7% (8) for each question) such responses are considered outliers
and the influence upon the overall analysis is small.
For each question within the circulation section, a Kolmogorov-Sminov test was performed to
test whether the frequency distribution fitted a normal curve. Almost all of the frequency
distributions followed a positively skewed distribution with a number of outliers typically around
multiples of five (participants typically tended towards these numbers when specifying higher
numbers of floors). As such the non-parametric Wilcoxon signed-rank test has been used to
compare participants paired answers (who would sometimes consider using the stairs; specifying
a finite number of floors) in each circulation situation using a 95% confidence interval. An
overall summary of the combined average results for the Base case, Queues and Groups
circulation section can be seen in Table 29.
Table 29: Overall Combined Average Results Irrespective of Time Pressure or Familiarity for the Base,
Queue and Groups cases.
Base Case%
[#]
Queues%
[#]
Groups%
[#]
Up
Always use lift 15.8
[592]
12.7
[474]
23.5
[875]
Always consider
using Stairs
3.7
[138]
4.5
[169]
4.3
[161]
Sometimes consider
using Stairs
80.5
[3008]
82.8
[3091]
72.1
[2682]
Median Stair Travel
(floors) [3.8] [4.0] [3.0]
Mean Stair Travel
(floors) [4.7] [5.0] [4.2]
Total Frequency of
Participant Responses 3738 3734 3718
Down
Always use lift 12.2
[450]
10.6
[392]
19.0
[701]
Always consider
using Stairs
5.6
[208]
7.6
[281]
5.0
[184]
Sometimes consider
using Stairs
82.2
[3036]
81.8
[3027]
76.0
[2799]
Median Stair Travel
(floors) [5.1] [5.3] [4.0]
Mean Stair Travel
(floors) [6.7] [7.0] [5.3]
Total Frequency of
Participant Responses [3694] [3700] [3684]

112
Base case
In the base case, 87.8% of the participants would always or sometimes consider using the stairs
to travel down and 84.2% to travel up. On average, participants that would sometimes consider
walking on the stairs would walk 42.6% (2 floors) further in the down direction than in the up
direction. Significantly more participant responses (67.4% (1928), p<0.05) stated they would
walk further on the stairs in the down direction compared to the up direction. However, 26.6%
(761) of participant responses stated they would not change the number of floors they would
consider walking regardless of travel direction. In addition, 5.9% (170) of participant responses
actually stated they would consider walking further on the stairs in the up direction compared to
the down direction. This highlights that whilst a significant number of participants were recorded
as being prepared to walk further in the down direction than in the up direction, this should not
be assumed to apply to all participants with approximately 1 in 3 of participant responses stating
alternate behaviour.
Queues
When faced with a queue in the lift waiting area, slightly more participants would always or
sometimes consider using the stairs compared to the base case, with 89.4% of participants
always or sometimes considered using the stairs to travel down (compared with 87.8%) and
87.3% to travel up (compared with 84.2%). This represents a slight decrease in attractiveness of
the lift due to the queue in the lift waiting area. On average, the participants that would
sometimes consider walking on the stairs would walk 6.4% (0.3 floors) and 4.5% (0.3 floors)
further in the up and down direction respectively compared with the base case (i.e. no queue in
the lift area). Thus, irrespective of direction of travel, a significant number of participant
responses stated they would walk further on the stairs if a queue was present in the lift waiting
area (32.1% (1826)), p<0.05). However, almost half (49.5% (2813)) of participant responses,
stated that they would not change the number of floors they would consider walking on the stairs
regardless of there being a queue in the lift waiting area. In addition, 18.4% (1044) of participant
responses actually stated they would consider walking fewer floors if there was a queue in the
lift waiting area.
Groups
When travelling in a small group, slightly fewer participants would consider using the stairs than
in the base case: 81.0% of participants always or sometimes consider using the stairs to travel
down (compared with 87.8%) and 76.4% to travel up (compared with 84.2%). This highlights a
decrease in attractiveness of the stair when travelling in groups compared to the queue scenario.

113
On average participants were prepared to walk 5.3 floors down and 4.2 floors up. This represents
a decrease of 20.9% (1.4 floors) and 10.6% (0.5 floors) respectively in the down and up direction
compared to the base case. Irrespective of direction of travel, a significant number of participant
responses stated they would walk further on the stairs if travelling alone than when travelling in
a small group (51.5% (2612), p<0.05). It should also be kept in mind that 30.2% (1531) of
participant responses stated they would not change the number of floors they would consider
walking on the stairs regardless of being in a group. In addition, 18.4% (932) of responses
actually stated they would consider walking more floors on the stairs if travelling within a small
group.
As participants were requested to specify the maximum number of floors they would consider
travelling on the stairs in each question, it is possible to determine the minimum proportion of
expected lift users for a given travel distance (see Figure 24). Irrespective of the direction of
travel or scenario, the majority of participants would not be prepared to walk greater than 5-7
floors on the stairs. Whilst some differences can be seen between each scenario/direction, the
curves begin to converge when the travel distance begins to exceed 10 floors. This reflects the
small number of participants that are prepared to walk greater than this distance on the stairs.
Indeed almost all participants that would sometimes consider using a lift/stairs would elect to use
a lift if required to travel more than 20 floors.
Figure 24: Minimum proportion of lift users for a given travel distance (number of floors) in the up and down
direction for the three scenarios
114
4.6.2 Evacuation
Participants were asked whether they would consider using a lift to evacuate during a
hypothetical emergency. Participants were informed:
They were familiar with the layout of the building.
The lifts (elevator) and stairs were located in the same area.
They were travelling alone and were not carrying or wearing anything that would
restrict their movement.
They have been instructed that it is acceptable to use either a lift or stairs to evacuate
from the building in emergency situations. During an evacuation they are free to
choose to use a lift or stairs.
Of the 467 participants who answered whether they would consider using a lift to evacuate if
familiar with a building, approximately a third (33.0% (154))) said that they would consider
using a lift to evacuate with a significant proportion (67.0% (313)) answering that they would
not (χ²=54.1, p<0.05).
Based on the 98.7% (152) of participants that stated whether they would always use a lift, only a
small proportion (7.2% (11)) stated they would. Of the 139 participants who answered whether
the height of the floor would influence their decision to use a lift, 87.1% (121) replied that the
floor they were on would influence their decision.
Responses suggest that certain participants have reservations about travelling long distances
within lifts during an evacuation. Of the 120 participants who specified the maximum number of
floors they would consider travelling in a lift, 46.7% (56) answered that there was no maximum
number of floors, 22.5% (27) answered 100+ floors, and the remaining 30.8% (37), on average
would travel a maximum of 22.0 floors in a lift. Of the 121 participants who specified the
minimum number of floors they would consider travelling in a lift, 9.9% (12) answered that there
was no minimum number of floors, 0.83% (1) answered 100+, and the remaining 89.3% (108),
on average would travel a minimum of 8.5 floors.
Looking at the number of people who answered whether the height of the building would
influence their decision to use a lift (N=136), almost two thirds (65.4% (89)) said that the height
of the building would influence their decision. Of this group (N=86), 80.2% (69) said that the

115
higher the building the more likely they would be to use a lift. Conversely 19.8% (17) of
participants would be less likely to use a lift if the building was taller. Of the participants that
would be influenced by the height of the building, 77 cited reasons for their choice (see Table
30). The most common reasons cited by participants that answered „the taller the building the
more likely they would be to use a lift‟ was to save travel time, reasons of safety or a
combination of the two. The most common reasons cited by participants that answered „the taller
the building the less likely they would be to use a lift‟ was reasons of safety and considering
people on the upper floors needing to use the lifts as a priority.
Table 30: Proportion of participants that stated a reason of a given type whether they are more/less likely to
use a lift in a taller building.
Reason:
Overall
(%)
[frequency]
Taller
More Likely
(%)
[frequency]
Taller
Less Likely
(%)
[frequency]
Save travel time 42.9
[33]
40.3
[31]
1.3
[1]
Save wait time 2.6
[2]
1.3
[1]
1.3
[1]
Save personal energy 3.9
[3]
2.6
[2]
0.0
[0]
Safety 13.0
[10]
5.2
[4]
6.5
[5]
Anticipate more/less congestion on stairs 3.9
[3]
3.9
[3]
0.0
[0]
Anticipate lift taking long time (stopping many
times or serving other floors)
3.9
[3]
0.0
[0]
3.9
[3]
Consider people on the upper floors 5.2
[4]
0.0
[0]
5.2
[4]
Familiarity 1.3
[1]
1.3
[1]
0.0
[0]
Combinations:
Save travel time + Safety 13.0
[10]
13.0
[10]
0.0
[0]
Save travel time + Save wait time 3.9
[3]
3.9
[3]
0.0
[0]
Save travel time + Anticipate lift taking long time
(stopping many times or serving other floors)
2.6
[2]
0.0
[0]
2.6
[2]
Save energy + Familiarity 1.3
[1]
1.3
[1]
0.0
[0]
Save travel time + Save energy 1.3
[1]
1.3
[1]
0.0
[0]
Save travel time + Anticipate more/less congestion
on Stairs 1.3
[1]
1.3
[1]
0.0
[0]

116
In the proceeding question (Q4F) participants were posed with the following hypothetical
situation:
You are instructed to evacuate from a multi-storey building…
- You are familiar with the layout of the building.
- It is not a drill but you are not in immediate danger.
- You have a choice to use either one of the 4 lifts servicing your floor or the stairs
- Each lift has a capacity of 10 people.
- A lift waiting area on your floor is crowded with people.
Participants were then asked if they would consider using a lift:
a) Given that they were located on progressively higher floors in the building,
b) Given a crowd of a specified density was already waiting for the lift (a
diagrammatic representation of different crowd densities waiting for lifts was
shown to the participants to assist them in selecting the given crowd density (see
Figure 25).
c) Given they were required to wait for a specified time to use a lift.
A: 10 people, 0.13ped/m
2 B: 40 people, 0.5ped/m2 C: 80 people, 1.0ped/m
2
D: 120 people, 1.5ped/m
2 E: 160 people, 2.0ped/m2 F: 200 people, 2.5ped/m
2 Figure 25: Different Crowd Levels in Lift waiting area
In Figure 26 the proportion of participants that would consider using a lift for each floor range
can be seen (floor 1 is assumed to be the ground/exit floor). As the floor height increases the
proportion of participants that would consider using a lift also increases. This proportion of lift
users exponentially increases towards floor range 21-30 then begins to plateau.

117
Figure 26: Proportion of Participants that would consider using a lift/stair for each floor range if
they were familiar with a building
In Figure 27, the mid-points of each floor range with the respective proportion of participants
that would consider using a lift during the evacuation has been plotted. Using the data, a
regression analysis can be used to construct a formula that determines the proportion of lift users
for a given floor (Equation 16).
Y = 0.3207 ln (x) - 0.4403 for 5≤x≤55
Equation 16
Y = proportion of people that would consider using a lift.
X = floor number.
It should be highlighted that this formula is only applicable between floor ranges 5-55 (the lower
and upper mid points of the data). The goodness of fit value (R2) of 0.95 suggests that floor
height is a good predictor of the proportion of occupants that would consider using a lift during
an evacuation.

118
Figure 27: Proportion of Participants that would consider using a lift for each floor if they were familiar with
a building
Within Table 31 the proportion/frequency of participants that would consider using a lift to
evacuate on each floor range can be seen. In addition, the cumulative proportion/frequency of
those participants that would initially consider using a lift, but would choose to redirect to use
the stairs if they encountered a crowd of a given density in the lift waiting area can also be seen.
From the results it can be seen that as the floor height increases, the proportion of participants
that would wait within a crowd of a higher density also approximately increases (see Table 31).
For each floor range this begins to plateau after congestion level E-F (2.0ped/m2-2.5ped/m
2).
This is due to very few participants being prepared to wait in a crowd which is greater than
2.0ped/m2-2.5ped/m
2. A small proportion of participants (7.1%-14.3%) specified that they would
always wait for a lift irrespective of the congestion level.

119
Table 31: Frequency/Proportion of participants that would consider using a lift and cumulative
frequency/proportion of participants who would redirect to use the stairs after encountering a given crowd
density
Floor
Range
Location
Proportion of
Participants
that would
consider
waiting to use
a lift on a
given floor
range
%
[Freq]
Of participants that would initially choose to use a lift, the crowd density in a lift
waiting area that would cause a proportion of those participants to redirect to use the
stairs.
%
[Freq]
YES NO #
Doesn't
Matter
A B C D E F F+
0.13
ped/m2
0.5
ped/m2
1.0
ped/m2
1.5
ped/m2
2.0
ped/m2
2.5
ped/m2
2.5
ped/m2+
2-10 10.4
[14]
89.6
[121] 14
14.3
[2]
21.4
[3]
42.9
[6]
78.6
[11]
85.7
[12]
85.7
[12]
85.7
[12]
85.7
[12]
11-20 32.6
[44]
67.4
[91] 44
11.4
[5]
15.9
[7]
31.8
[14]
59.1
[26]
86.4%
[38]
86.4
[38]
88.6
[39]
88.6
[39]
21-30 63.0
[85]
37.0
[50] 84
7.1
[6]
4.8
[4]
25.0
[21]
63.1
[53]
83.3
[70]
90.5
[76]
92.9
[78]
92.9
[78]
31-40 77.7
[101]
22.3
[29] 99
10.1
[10]
3.0
[3]
19.2
[19]
47.5
[47]
77.8
[77]
86.9
[86]
89.9
[89]
89.9
[89]
41-50 78.5
[102]
21.5
[28] 99
9.1
[9]
3.0
[3]
14.1
[14]
37.4
[37]
65.7
[65]
82.8
[82]
90.9
[90]
90.9
[90]
51-60 80.0
[104]
20.0
[26] 100
11.0
[11]
3.0
[3]
12.0
[12]
32.0
[32]
57.0
[57]
72.0
[72]
84.0
[84]
89.0
[89]
Of participants that would consider using a lift, providing the crowd level did not exceed their
stated 'congestion threshold‟, were asked how long they would be prepared to wait to use a lift.
Participants could either respond that they would wait for as long as it takes for a lift to service
their floor or state a given finite amount of time.
In Figure 28 the frequency and normalised cumulative frequency distribution of wait times for
each floor range can be seen. From Figure 28 (A) in the frequency distribution, it can be seen
that the frequency of lift users that would wait for a lift for „as long as it takes‟ gradually
increases with floor height. It can also be seen that anchoring occurred around multiples of five
on and after 10 minutes (e.g. 10 min, 15 min, 20 min), represented by sharp increases in the
frequency. This potentially suggests participant‟s inability to accurately conceptualise wait times
of 10 minutes or longer within the scenario. From Figure 28(B), it can be seen that as the floor
height increases, the proportion of participants willing to wait a longer amount of time for a lift
also approximately increases.

120
A: Frequency Distribution
B: Cumulative proportion of
participants that would wait for a lift
for each time range
Figure 28: Frequency distribution and Cumulative frequency distribution of wait times for each
floor range if participants were familiar with the building
Participants were asked if they would change any of their previous answers in the evacuation
section if they were unfamiliar with the building. Of the 461 participants who responded,
approximately a fifth (20.4% (94)) answered that they would behave differently if unfamiliar
with the building. From this group, 81.9% (77) would not consider using a lift if they were
familiar with the building, however, would consider using a lift if unfamiliar. This means that
approximately 1 in 2 (49.5% (228)) of all participants would sometimes consider using a lift to
evacuate. This suggests that being unfamiliar with a building increases the likelihood of an
occupant considering using a lift during an evacuation.
Figure 29 shows the proportion of participants that would consider using a lift if they were
unfamiliar with the building for each floor range. The proportion of participants that would
consider using a lift for each floor range is similar to that observed in the familiar situation. This
similarity is due to the large proportion of participants that would consider using a lift if familiar
but would not change their behaviour if unfamiliar (i.e. the familiar responses dominate the
results). Indeed this influenced caused all results for the same questions in the unfamiliar
situation to be almost identical.

121
Figure 29: Proportion of Participants that would consider using a lift/stair for each floor range if
participants were unfamiliar with a building
4.6.3 Demographic break down
Participant responses for the first five questions in the evacuation section of the survey (Q4A-
Q4E) were analysed according to participant demographic groups. The demographic groups
explored include gender, age, country and BMI. The purpose of this was to identify if differences
existed in responses between participant demographic subgroups. The frequency of responses for
certain demographic subgroups became too small (i.e. less than 5) for meaningful statistical
analysis for questions Q4G and Q4F. As such these were not included in the analysis. A
frequency analysis of cross-demographic subgroups was carried out in order to identify any
possible differences between groups (e.g. all males making up a given age range). Results from
the analysis of each question for each demographic group can be found in Appendix A3.2.
The only significant difference between any demographic subgroups was with participant
country. The hypothetical nature of the survey (i.e. not requiring any physical participation), is
thought to have minimised the influence of participant physical characteristics upon the results.
The participant country analysis focused on the top four countries that had the most participant
responses: UK (144), China (121), US (60) and Germany (52). Approximately 1 in 2 participants
(52.5%) from the US and 1 in 3 participants (36.5%) from Germany would consider using a lift
during an evacuation. These decrease for participants coming from both the UK (approx. 1 in 4
(26.4%)) and China (approx. 1 in 5 (21.5%)). A comparison of all countries shows there to be a
significant difference between the frequency of participants that would consider using a lift
during an evacuation (χ2=20.3, p<0.05). This was caused by the higher number of participants

122
coming from Germany and the US that would consider using a lift compared to participants
coming from the UK and China. This suggests that people in the UK and China have more
reservations about sometimes using a lift during an evacuation compared to the US and
Germany.
4.6.4 Comparison with other studies
A comparison of the survey results with the evacuation lift data presented in the literature review
has been carried out. The proportion of surveyed occupants that used lifts during actual
evacuation incidents from the literature review is presented in Table 32. The proportion of lift
users ranged between 18.0%-74.0% and in all cases lifts were not intended to be used during an
evacuation by the general population. From the online survey, irrespective of familiarity,
approximately 1 in 2 participants responded that they would sometimes consider using a lift
during an evacuation. This is within the range presented in the actual evacuation incidents.
However, there were a number of differing characteristics of each incident, including differences
in:
occupant characteristics (e.g. nationality, residents, office workers, elderly),
structural designs/configurations (e.g. hotels, apartments, office blocks),
hazard characteristics (e.g. bomb threat, fire, plane impact).
As a consequence the general applicability of such a comparison with the online survey is
considered limited.
Table 32: Proportion of surveyed occupants that used lift during actual evacuation incidents
Incident
% Occupants that used lifts
(estimated/ of those
surveyed)
World Trade Center 911 Attacks 18.0
Cook County Administration Building Fire 50.0
Hiroshima Motomachi High-rise Apartment Fire 54.0
Joelma Building Fire 39.7
Forest Laneway Fire 74.0
Christchurch Bomb Threat Evacuation 22.2
In almost all actual evacuations incidents where information was provided of occupants
originating from multiple floors, as expected the higher in the building the more likely occupants
were to use a lift. This is identical to that found in the online survey.

123
The proportion of actual/predicted lift users for different floor heights in the studies presented in
the literature reviewed and the online survey can be seen in Figure 30. The CIBSE Guide D
[CIBSE, 2000] and online survey circulation data for the down direction increases more rapidly
compared to other data as floor height increases. This is expected due to the data relating to
normal circulation conditions (i.e. where occupants expect that lift usage is always acceptable
and safe to use). The Hiroshima Motomachi High-rise Apartment Fire [Sekizawa, et al., 1999] data
also increases sharply with floor height which is expected to be largely influenced by the fact that
most occupants were elderly (i.e. physical restrictions of using the stairs encouraged them to use the
lift). The data collected in the surveys by Heyes‟s [Heyes, 2009; Heyes and Spearpoint, 2009]
was plotted using the regression formula mentioned in the literature review. The proportion of
lift users increases linearly at a more gradual rate compared to the other studies. Much of the
survey data from Heyes‟s study was based on hypothetical situations involving imaginary
characters. However, the narrow participant demographic (e.g. many participants were students)
is expected to have contributed to causing a higher acceptance to using the stairs on
progressively higher floors. This is because such participants are expected to have an increased
physical ability compared to studies involving older participants.
Figure 30: Proportion of participants that would consider/used a lift in the down direction for Heyes’s
Surveys [Heyes, 2009], Hiroshim Motomachi fire [Sekizawa, et al., 1999], CIBSE Guide D [CIBSE, 2000], the
Online Survey –Evacuation/Circulation (base case down)
The online survey data curve presented falls between the study by Heyes and the Hiroshima
Motomachi high-rise apartment fire data. This is expected as a broader participant demographic
base was used compared to these studies.

124
The only study in the literature review that considered lift wait time during an evacuation was
the surveys conducted by Heyes. Heyes's study showed that during an evacuation the proportion
of people that would wait for a lift decreased as wait time increased, and that the higher the floor
people were on the longer they would be prepared to wait. This is similar to the findings of the
online survey. Heyes suggests that the relationship between lift wait time and the proportion of
occupants that would wait for a lift is a negative linear correlation (i.e. as wait time increases the
proportion of occupants that choose to wait for a lift linearly decreases). However, the online
survey results suggest the trend to be a negative exponential correlation (i.e. as lift wait time
increases the proportion of occupants that would wait for a lift exponentially decreases).
Heyes also conducted an online survey of employees of an engineering firm located in three
branch offices in different countries: US, Australia and Singapore. Heyes mentions that the
participant responses from each country were similar with little variation being observed.
However, findings from the online survey presented in this thesis suggest there to be a different
level of acceptance to consider using lifts during an evacuation between certain countries. It is
uncertain whether difference with the studies by Heyes were due to differences between each
participant sample, a more general trend, or caused by differences in the study methodologies.
4.7 Concluding remarks
This section has presented an analysis of data collected from participant responses to an online
survey in order to gain an understanding of human factors associated with lift/stair selection in
evacuation scenarios.
Despite being informed that the lifts were a safe and acceptable option, irrespective of
familiarity, only approximately 1 in 2 participants would consider using a lift during an
evacuation. This decreased to approximately 1 in 3 if participants were familiar with the
building: increased familiarity with a building decreases the probability that they would consider
using a lift. This highlights that there is a degree of reluctance by a large number of individuals
to even consider using lifts despite being informed that it is acceptable to do so. Such results
underline the need for extensive training in order to convince occupants that it is indeed safe to
utilise the lifts during an evacuation.
Within the hypothetical building evacuation, as the floor height increases the proportion of
participants that would consider using the lift also increases. Approximately 10% of the

125
population would use a lift even if located below the 10th
floor. The proportion of the population
that would use a lift increases to approximately 80% up to floor 40 and remains at this level even
for higher floors. This suggests that, irrespective of floor height, approximately 20% of the
individuals would not wait to use a lift to evacuate. The majority of participants indicated that
when considering whether to use a lift or stairs, they would consider crowd density and lift wait
time in the lift waiting area. As floor height increases participants tolerance to waiting in a higher
crowd density for longer periods increases. Such results suggest that people adapt their
behaviour according to changing local conditions in the lift waiting area.
From the analysis of demographic factors, whilst trends were noticeable, no significant
differences across the gender, age and BMI demographic groups were found. The lack of
differences between such physical demographic factors may be due to the lack of realism
afforded by the survey (i.e. not requiring physical participation). There were however, significant
differences between the number of participants from certain countries that would consider using
a lift during an evacuation. The results suggest that people in the US and Germany are more
likely to consider using lifts during an evacuation compared to the UK and China. It is suggested
that this may be due to increased general familiarity with high-rise buildings and subsequent lift
systems in the US and Germany compared to the UK and China. These findings suggest that the
proportion of people that would consider using a lift, even though they were informed that it was
safe to do so during an evacuation is not consistent across different countries.

126
Chapter 5 - Evacuation Lift Model
5.1 Introduction
The previous chapter presented data and analysis of human factors associated with lift usage
during evacuations. This chapter presents a lift model along with an agent lift model developed
in buildingEXODUS based on the data collected. The lift model represents the physical
properties, delay times and kinematical features of a lift system. The agent lift model represents
occupants‟ decision to use a lift or redirect to the stairs at various stages during their egress. For
each component of the developed lift and agent lift model a series of verification tests have been
performed and results presented (see Appendix A5.1). This is intended to demonstrate that each
component behaves as expected and produce appropriate results based on input parameters and
simulated conditions.
5.2 Lift model
The following sections describe the lift model within buildingEXODUS representing the lift
shaft, car, motion controls, door controls, and kinematics. The lift motion controls, door controls
and kinematic components can be defined by the user via a script file within buildingEXODUS
(see Figure 31).
Figure 31: Sample lift model script file
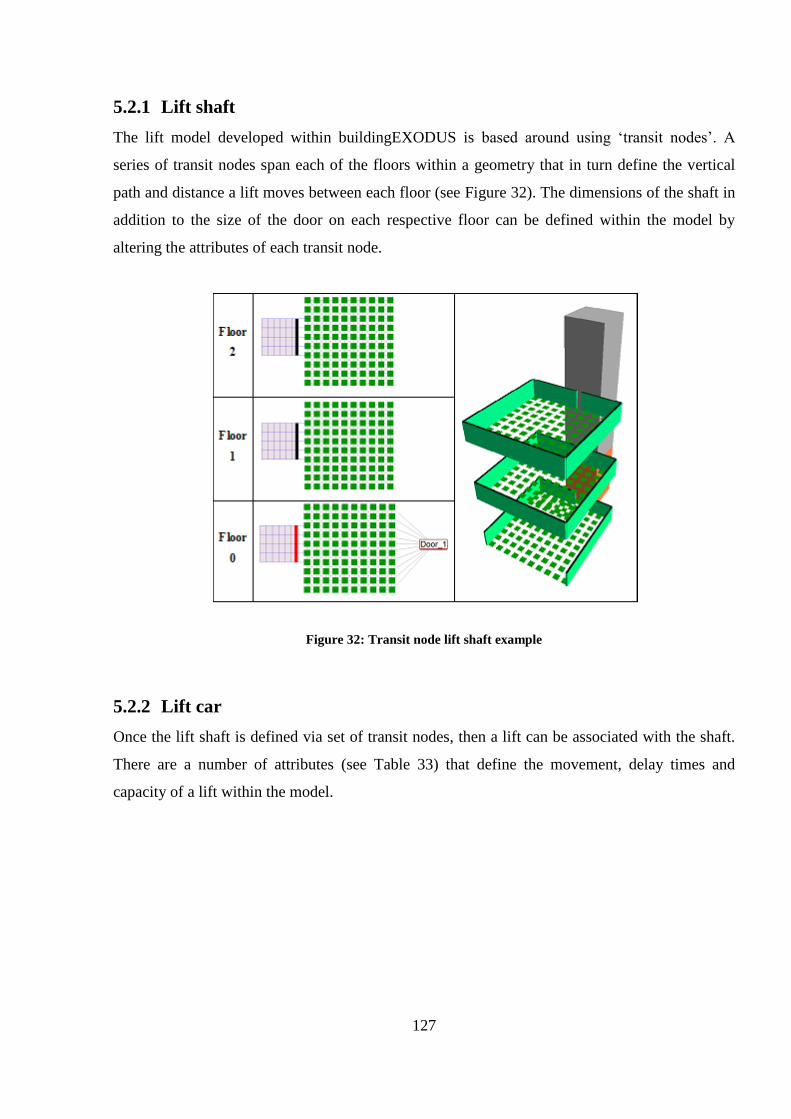
127
5.2.1 Lift shaft
The lift model developed within buildingEXODUS is based around using „transit nodes‟. A
series of transit nodes span each of the floors within a geometry that in turn define the vertical
path and distance a lift moves between each floor (see Figure 32). The dimensions of the shaft in
addition to the size of the door on each respective floor can be defined within the model by
altering the attributes of each transit node.
Figure 32: Transit node lift shaft example
5.2.2 Lift car
Once the lift shaft is defined via set of transit nodes, then a lift can be associated with the shaft.
There are a number of attributes (see Table 33) that define the movement, delay times and
capacity of a lift within the model.

128
Table 33: buildingEXODUS lift attributes
Attribute Description
Maximum speed The maximum rated speed of the lift car (m/s).
Acceleration The constant rate of acceleration of the lift car (m/s²).
Jerk The rate of change in acceleration before and after
constantly accelerating (m/s³).
Start floor The floor the car will start at the beginning of a
simulation.
Door opening time The time it takes a lift door to open.
Door closing time The time it takes a lift door to close.
Dwell time
The duration the car doors will stay open after the car
doors have fully opened to service a given floor
(providing no one enters the lift).
Sensor break adjusted dwell-
delay
The adjusted dwell time after the first occupant enters a
lift car.
Motor delay The time, after a lift‟s doors have closed, before the car
starts to move (i.e. the time it takes the motor to start).
Theoretical capacity The maximum physical number of agents that can enter a
car.
Max % of theoretical capacity The percentage of the „Capacity‟ which the car actually
reaches.
Serve floor sequence A sequence of numbers which represent the series of
floors the car will serve.
Shuttle floor sequence
A sequence of paired numbers which represent a series of
„pick up‟ and „drop off‟ floors the car will shuttle
between.
Exit floors
A list of floor numbers which form the drop off floors for
both Shuttle floor and Serve floor sequence. For both
sequences, if a lift arrives on an exit floor, everyone
currently in the car will exit at the indicated floor.
Start delay The delay time between when a simulation starts and a lift
begins to serve the assigned floor sequence.
5.2.3 Lift motion controls
Within the lift model a mechanism has been developed to control lift cars during a simulation:
the floor dispatching. This mechanism allows users to manually define the sequence of floors a
lift will service from within a script file. This sequence can be defined in two different ways
(floor-sequence or shuttle-floor sequence) along with an exit floor list. Using a floor-sequence, a
user specifies the sequence of floors a lift will service during the simulation. The assigned lift
will serve each of the floors specified in the sequence. Using a shuttle-floor-sequence, a user
specifies a paired-sequence of pick-up/drop-off floors where the lift could pick agents up from
and shuttle them to. This shuttle process would repeat until there where no more agents in the
pick-up floor transit node catchment area. The process is then repeated for the next pick-up/drop-
off floor in the sequence.

129
An optional feature within the model is for the control algorithm to check if agents are waiting in
the next destination floor transit node catchment area. If no agents are waiting then that floor is
removed from the sequence list. This process is repeated at the beginning and end of each lift
journey so that a lift car does not service a floor where no agents are waiting. This increases the
efficiency of the lift system by representing either manual intervention of a lift controller or
automated monitoring system in the lift waiting area to determine if a person is still waiting.
For both floor sequence control methods, the exit floor list defines which floor(s) the agents in
the car will exit the lift. All simulations presented within this thesis use the shuttle-floor
sequence control mechanism. For the shuttle-floor sequence system, using a top-down strategy,
if a lift does not fill to its maximum capacity at a pick-up floor, an optional feature is to then
move the lift to the next pick-up floor to fill up the remaining spaces in the lift car. An
additional optional feature is to keep a lift car's door open whilst it is not filled to capacity whilst
there are still agents targeting the lift bank within the lift waiting area. These features reduce the
amount of redundant shuttle trips a lift makes when it is not full and so increases the efficiency
of the overall evacuation. This assumes that the number of passengers that enter each lift and/or
are present within the lift waiting area is detected either via automated means (e.g.
weight/motion sensors), or manually via a lift operator/emergency staff/occupants inside the lift.
5.2.4 Lift door controls
Once a lift has opened its doors on a floor, the doors will remain open for the specified dwell
time before closing. However, whilst an agent is within a lift waiting area and is targeting one of
the lifts in the lift bank, all open lifts that are not full to capacity will keep their doors open. This
is in anticipation that another agent might board the lift. This assumes that the lift car doors are
kept open either by people already inside the lift or staff controlling the lift. This means that lifts
have an increased chance of being filled to their maximum capacity when collecting agents. If a
lift is filled to its maximum capacity then the lift doors will close after the sensor break dwell
delay expires from the moment the last agent boards the lift.
5.2.5 Lift kinematics
The kinematics of a lift car is defined by its jerk, acceleration and maximum speed. There also
are a number of other factors that influence an actual lift‟s journey such as friction, „wear and

130
tear‟ of machine parts, etc. However, these are not considered within the current lift model. As
such the kinematics of the lift model should be considered “ideal”. Specifying the cars jerk,
acceleration and maximum speed is sufficient to determine the location of a lift at any point
during its journey. The time at which the lift passes each respective floor between its original
location and its destination is determined using a series of formulae.
The first significant work in deriving the formulae for the “ideal lift kinematics” was by Motz
[Motz, 1991] in 1986. In 1996 Peters [Peters, 1996] derived the necessary time-distance
formulae. Given the necessary attributes of a lift, these formulae produce the distance travelled at
a given time in a lift's journey. These formulae have been implemented in a modified form
within buildingEXODUS to provide the model with the time that a lift passes/arrives at each
floor.
With regards to jerk, acceleration and maximum speed, there are three types of journey a lift can
make: A) a lift reaches maximum speed, B) a lift reaches its maximum acceleration (but not
maximum speed), C) a lift fails to reach its maximum acceleration. Figure 33 below shows each
of the three different types of journey that can be made by a lift in terms of the changing values
of jerk, acceleration, velocity and distance travelled, over time. A description of the lift
kinematic formula used within the lift model can be seen in the Appendix A4.1.
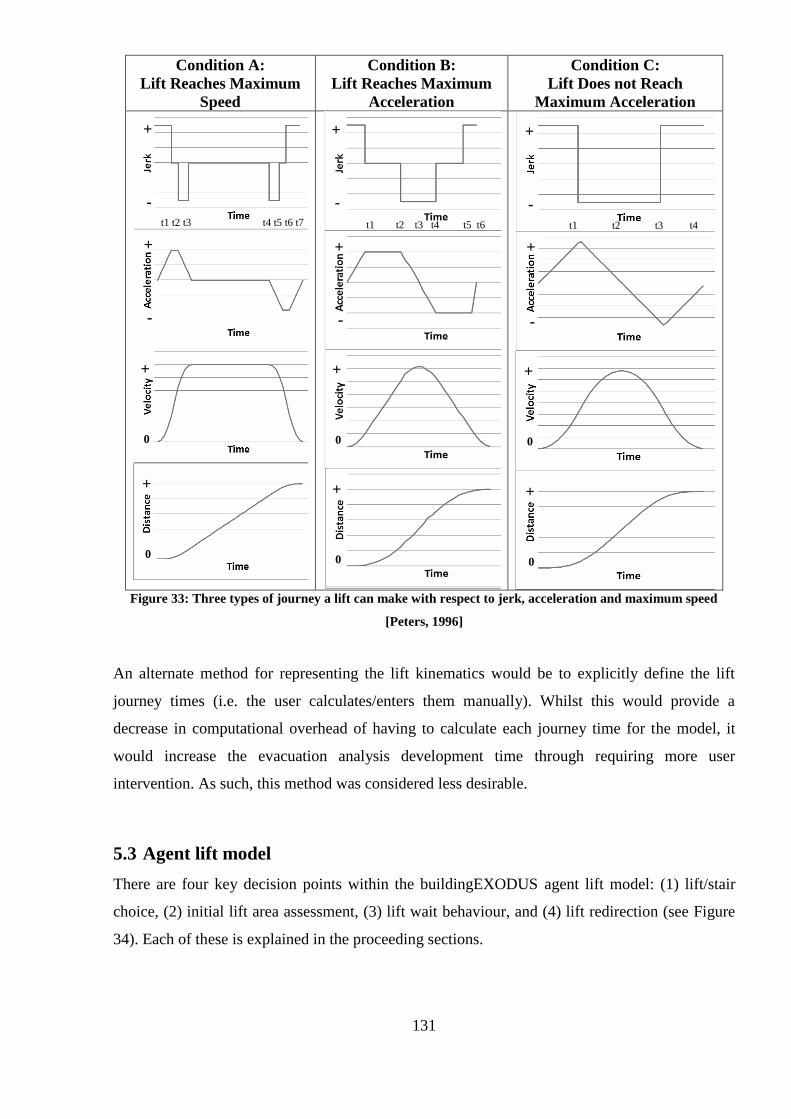
131
Condition A:
Lift Reaches Maximum
Speed
Condition B:
Lift Reaches Maximum
Acceleration
Condition C:
Lift Does not Reach
Maximum Acceleration
Figure 33: Three types of journey a lift can make with respect to jerk, acceleration and maximum speed
[Peters, 1996]
An alternate method for representing the lift kinematics would be to explicitly define the lift
journey times (i.e. the user calculates/enters them manually). Whilst this would provide a
decrease in computational overhead of having to calculate each journey time for the model, it
would increase the evacuation analysis development time through requiring more user
intervention. As such, this method was considered less desirable.
5.3 Agent lift model
There are four key decision points within the buildingEXODUS agent lift model: (1) lift/stair
choice, (2) initial lift area assessment, (3) lift wait behaviour, and (4) lift redirection (see Figure
34). Each of these is explained in the proceeding sections.
t1 t2 t3 t4 t5 t6 t7 t1 t2 t3 t4 t5 t6 t1 t2 t3 t4
+
-
+
-
+
0
+
0
+
0
+
0
+
-
+
-
+
0
+
0
+
-
+
-

132
Figure 34: Advanced Agent lift Model - Key Decision Points
The data included in the model is derived from the evacuation section of the online survey in
question 4F. This represents the responses of participants in the „familiar‟ scenario. The analysis
identified that little difference was recorded between participant responses in the „unfamiliar‟
scenario compared to the familiar scenario (see Chapter 6). In addition, the majority of high-rise
structures are either offices or apartments which contain occupants that are familiar with the
structure. As such it was considered appropriate for representing the majority of high-rise
buildings to use the data from the „familiar‟ scenario.
Despite this, it is possible to alter or use other data within the model should the user require. The
characteristics of how agents interact with the lift system during an evacuation (i.e. the
distributions used for assignment for the lift model) are set according to the agent‟s initial floor.
This is of particular importance when agents are required to traverse the stairs before potentially
using a lift (e.g. a sky lobby scenario). Whilst question 4F in the survey did not pose a sky lobby
scenario, the data can be used for sky lobby cases if it is assumed the distribution of lift users,
distribution of congestion thresholds and lift wait time distributions of initial occupant starting
floor remain the same. Based on the survey data this means that agents on progressively higher
floors above a sky lobby are (a) more likely to use a lift, (b) likely to be more tolerant to higher
1
2 3
4
133
levels of congestion, and (c) are likely to be prepared to wait longer for a lift than those agents
on lower floors above a sky lobby.
In Figure 35 a flow chart can be seen showing the main processes and decisions that agents make
within the agent lift model. These processes were identified from both the literature review and
the online survey results (see Chapter 4) documenting lift human factors.
The agent lift model comprises of a number of key components used to represent occupant
interaction with the lifts available. At the beginning of a simulation, agents are required to decide
if they will use a lift or stairs using the Lift/Stair choice component. The agents that elect to use
a lift, upon entering their chosen lift bank waiting area, assess whether they would be prepared to
wait in the lift waiting area considering the current crowd congestion levels using the Lift
Congestion Redirection component. At this time agents also assess if the lift has already
serviced the agent‟s current floor using the Missed Lift component. Providing the agent has not
missed a lift or redirected due to congestion, they are then required to choose a location to wait
for the lift using the Lift Wait Location component. Whilst within the lift waiting area agents
will decide if they are prepared to wait any longer for a lift to service their current floor before
redirecting to the stairs using the Lift Wait Time component. When a lift within the agent‟s
chosen lift bank opens its doors on the agent‟s floor, the agent decides if they will board the open
lift using the Open Lift component. The agents that initially choose to use a lift but at some stage
redirect to the stairs (e.g. due to congestion), use the Stair Redirection component. A more
detailed explanation of each component of the agent lift model can be found in the proceeding
sections.

134
Figure 35: Flow Chart showing key components of the lift agent model and associated chapter sections
5.3.1 Lift/Stair choice
At the beginning of a simulation agents are assigned to use either a lift/stair based on a
proportional system according to their initial floor. For the scenarios used in this thesis, either all
agents that could use a lift did so, or the proportions of agents for each floor were derived from
the online survey data.

135
Given that an agent has decided to use a lift, there are two possible approaches that the agent can
use in selecting which lift bank they will adopt. These are:
Closest lift bank in service selection (agents select their closest lift bank that is in
service).
Closest serviced lift bank selection with even lift bank usage (agents select their closest
lift bank on a given floor that has not already been adopted by a specified number of
other agents, so ensuring that each lift bank on a given floor is adopted by approximately
the same number of agents).
In addition to these automated approaches, users can explicitly specify which lifts each agent
will use.
Once a simulation has started agents do not change their lift/stair selection or redirect to another
lift/stair after the initial choice is made. Once the agent‟s response time has expired they move
towards the chosen lift bank. Whilst it is appreciated that actual occupants may indeed change
selection to use a lift/stair whilst moving towards their initial choice based on surrounding
environmental and social factors, this requires further investigation for future development.
5.3.2 Lift congestion redirection
When agents who have chosen to use a lift enter a lift catchment area, they are assigned a
congestion threshold. This is randomly selected from a user-defined distribution according to the
floor the agent is on. The default distributions used in the model were derived from the online
survey (see Table 31 and Figure 28). If the overall level of congestion (not including the agent
making the decision) in the lift catchment area reaches or exceeds that congestion threshold it is
assumed that the agent will have a probability that they will either redirect to the stairs or that
they will no longer consider crowd congestion. This check is done only once; the first time the
agent‟s congestion threshold is exceeded. This probability that an agent will redirect due to the
levels of congestion is described in Equation 17.

136
P (RDTC) = LAAT / CST
Equation 17
P(RDTC) = Probability that the agent will redirect due to congestion
LAAT = Lift Area Arrival Time
CST = Current Simulation Time
To demonstrate Equation 17, Table 34 shows the probability of an agent redirecting due to
congestion given their LAAT and CST. Here it can be seen that when an agent is initially located
in a lift waiting area (i.e. LAAT is equal to 0) the probability of redirecting due to congestion is
equal to 0 (agents will not redirect due to congestion). This reflects those agents increased level
of commitment to using the lift and will be not be influenced by congestion. This essentially
represents agents who have already chosen to use a lift prior to the call to evacuate.
For agents that are initially outside of a lift wait area (i.e. LAAT is greater than 0), if the agents‟
congestion threshold is reached or exceeded immediately upon entering the lift wait area (i.e.
LAAT is equal to CST) 100% will redirect to the stairs. This is based on the assumption that
such agents have a decreased level of commitment to using the lift and so are influenced by the
congestion more than agents that have already waited in the lift wait area.
With the exception of agents initially in the lift waiting area (i.e. LAAT is greater than 0), as
agents spend more time in the lift waiting area (i.e. as CST increases), the probability that they
will redirect due to congestion decreases.

137
Table 34: Calculated probability that an agent will redirect from a lift if congestion threshold is met/exceeded
for different lift area arrival times and current simulation times (assuming instant response times)
Current simulation time
(CST) (sec)
Lift area
arrival time
(LAAT)
(sec)
0 5 10 15 20 25 30 35
0 0.0 0.0 0.0 0.0 0.0 0.0 0.0 0.0
5 - 1.0 0.5 0.33% 0.25 0.20 0.17 0.14
10 - 1.0 0.67 0.50 0.40 0.33 0.29
15 - - 1.0 0.75 0.60 0.50 0.43
20 - - - 1.0 0.80 0.67 0.57
25 - - - - 1.0 0.83 0.71
30 - - - - - 1.0 0.86
35 - - - - - - 1.0
Further to this, the later an agent arrives in a lift waiting area (i.e. increased LAAT), the more
likely it is they will redirect due to congestion if their congestion threshold is reached or
exceeded. This is based on the assumption that such agents have a decreased level of
commitment to using a lift due to not arriving in the lift wait area earlier. This means that the
length of time an agent spends in the lift waiting area in addition to the actual time the agent
arrives during the evacuation is considered in the probability. The online survey did not address
levels of commitment as a product of time and the resulting influence upon congestion
redirection. However, the agent lift model assumes that agents that spend longer and arrive
sooner in a lift waiting area have an increased level of commitment to use a lift. This is reflected
in the increased likelihood of being less influenced by the local levels of congestion.
If a lift is open in a lift waiting area, an agent who has chosen to redirect to the stairs due to the
congestion levels can still elect to use a lift whilst in the lift waiting area. This allows agents who
are required to travel through a lift waiting area (i.e. redirecting from the lifts to the stairs) in
order to get to the stairs, to still be able to use a lift if they have the opportunity. This is based on
the assumption that such agents will not walk past a lift that they have the option to board.
Agents who redirect to the stairs are randomly assigned to use each stair. This is done to reduce
the likelihood of any stair being oversubscribed and causing a bottleneck during a scenario.

138
5.3.3 Missed lift redirection
Agents who initially choose to use a lift but arrive in the lift waiting area after the lift has already
serviced the agent‟s floor will redirect to use the stairs. This represents the influence of either
dynamic signage or a communication system informing the agents that the lift has already
serviced their floor and that they should use the stairs instead. This system prevents agents from
waiting for a lift that will not arrive.
5.3.4 Lift wait location selection
No data has been collected or found to exist in current literature with regards to lift wait location
selection in either circulation or evacuation situations. As such the lift wait location selection
method developed within the agent lift model is based on a number of assumptions. Agents who
decide to wait in the lift catchment area (i.e. do not redirect due to congestion), randomly adopt a
location to wait and 'mill' around. The milling process involves agents occasionally randomly
moving about their chosen wait location. A default milling distance is set which ensures that
milling agents will not travel more than the given distance from their wait location. Whilst
milling, agents will not move outside of the lift catchment area.
This regular movement about a chosen wait location helps to ensure that other agents passing
through the lift waiting area (who are not going to use a lift in the local area) do not become
blocked by other agents waiting for a lift. This means that more agents can fit inside the lift wait
area as blocking of new agents entering into the catchment area whilst they move to other
locations is reduced. This also means that agents spread out more uniformly within the lift
waiting area over time. Without such behaviour blockages by other agents at the entrances of a
lift waiting area can occur. This can result in lift boarding delays for agents who have to travel
slightly further (through being blocked) in the lift waiting area.
5.3.5 Lift wait time redirection
Agents who choose to wait to use a lift are assigned a wait time which is randomly selected from
a user-defined wait time distribution. The default distributions used in the model were derived
from the online survey (see Figure 28). The agent‟s wait time starts upon entering the lift
waiting area as agents can choose to use an open lift anytime that they are in the lift waiting area.
This allows agents who might be blocked/delayed by other agents from reaching their assigned

139
wait location to consider this added time whilst waiting for a lift. If they are not assigned to use
an open lift during this wait time, agents will redirect to use the stairs.
If a lift opens whilst agents are waiting, but they do not board (e.g. the lift is full), the agents‟
wait times are increased further by half of their original wait time. The wait time is only
increased once and does not affect agents who would 'wait for as long as it takes'. This is
intended to represent agents willing to wait longer for a lift in anticipation that they will be able
to board a lift soon. This assumption is not based on empirical data. Further investigation is
required to understand the influence of how lifts servicing a floor would affect occupant lift wait
time. If an agent has redirected to use the stairs when a lift opens, and the agent is still in the lift
catchment area, the agent can still choose to board the lift if there is enough space inside.
However, the agent will continue to redirect to the stairs if no space is available (i.e. they will not
wait any longer).
5.3.6 Open lift selection
When a lift door opens in a lift bank, the nearest agents who are waiting in the catchment area
move to use the lift. Only the number of agents that can fit inside the lift (derived from the lift
maximum capacity) attempt to board the lift. As a result there is no competition for lift boarding
and the boarding process is orderly. If multiple lifts open their doors simultaneously at a given
floor, the agents select the nearest open lift that is not oversubscribed. Where the nearest lift and
nearest agents are paired (i.e. an agent is one of the nearest to the lift and the lift is the nearest to
the agent) those agents will choose to use that open lift. Agents who could not board their nearest
lift, will assess if they can board their second nearest lift using the same process, and so on. This
process is repeated until all spaces in all open lifts have been allocated to waiting agents.
5.3.7 Stair redirection
Agents who redirect to the stairs after initially choosing to use a lift are distributed such that each
of the stairs are adopted by approximately an even number of agents. This is done so that any
single stair is not oversubscribed to produce a bottleneck. Within the model it is possible to
disable this behaviour with redirecting agents only following the potential map: the shortest route
to their next exit/target. Typically this would result in agents moving to the stairs that forms part
of this route. No data was collected with regards to stair selection and further investigation is
required regarding this type of behaviour.

140
5.3.8 Additional agent attributes
For all agents who initially choose to use a lift, the time they enter into the lift catchment area
(Lift Wait Start time (LWS)) and the time they either choose to use an open lift or redirect to use
the stairs (Lift Wait End time (LWE)) is recorded. For agents that use a lift, their 'Lift Wait Time'
(LWT) is calculated by subtracting the LWS from the LWE. These additional attributes are
stored for each agent and is included in the output to the main buildingEXODUS results table
within a simulation file.
In addition, all agents have a lift flag status that is used to identify how agents have interacted
with the lift system during a simulation (see Table 35). This can either signify that agents used a
lift during a simulation (Lift User), redirected due to congestion (LCR), redirected due to wait
time expiration (LTW), missed the lift (ML), or did not consider using a lift (N/A).
Table 35: Agent lift attributes
Code Type Lift Catchment Area Wait Time
Start Time End Time
Lift User Lift User Enter catchment area Assigned to use a lift
LCR Redirected due to
congestion Enter catchment area
Decision to redirect
time
LTW Redirected due to wait
time expiration Enter catchment area
Decision to redirect
time
ML Missed lift Enter catchment area Decision to redirect
time
N/A Stair user - -
5.4 Concluding remarks
This chapter has described the development of a lift model and agent lift model within the
buildingEXODUS evacuation software. The lift model represents the movement of a lift car
given a set of kinematic attributes along with various delay times, in addition to a control
mechanism that allows a variety of evacuation floor dispatch strategies to be employed. The
development of the agent lift model was instructed by and uses the empirical data presented in
the previous chapter. The agent lift model represents an occupant‟s initial choice to consider
using a lift, the influence of congestion in the lift wait area and wait time upon an occupant‟s
decision to redirect to the stairs during an evacuation. A number of assumptions have been made
in the agent lift model. These were required to be included in order to represent human factors
where no associated empirical data was collected or available. A number of agent attributes have
also been included within the model to allow analysis of how each agent interacted with the lift

141
system during a simulation. For each component of the lift model and agent lift model the results
from a series of verification tests are presented (see Appendix A5.1) to demonstrate that the
model behaves as intended given a range of input parameters and simulated conditions.

142
Chapter 6 - Case Study: Full Building Lift
Evacuation
6.1 Introduction
A series of full building evacuation scenarios have been performed using the developed lift and
agent lift model presented in the previous chapter. A description of the geometry, lift attributes,
population and scenarios using a variety of evacuation lift strategies is presented followed by the
results. The purpose of the evacuation scenarios is to compare the relative merits of different
evacuation lift strategies and to what extent they may be influenced by associated human factors.
6.2 Geometry
A hypothetical building was developed within buildingEXODUS to perform the evacuation
analysis. The building has 50 floors which is comparable to the current tallest completed
building in the UK (One Canada Square) [CTBUH, 2010], with a floor-to-floor height of 3m (the
total height of the building was 150m in height). CBISE Guide D [CIBSE, 2000] states that, as a
rule of thumb, a building should provide at least one lift for every three floors within a building
to provide excellent service. In addition, the guide also recommends that eight is the maximum
number of lifts that can be presented to occupants within a single lift waiting area to allow
occupants to monitor the arrival of lifts easily. Considering this, the hypothetical building
contains four stairwell cores and four lift banks each having eight lifts, providing approximately
1.56 lifts per three floors (see Figure 36). Such a configuration conforms to the guidance stated
in CIBSE Guide D [CIBSE, 2000].
With the exception of the ground floor all levels in the building have the same layout and
configuration. In certain scenarios specific floors were designated as sky lobbies where agents
from multiple floors move to and wait to use the lifts during the evacuation. In such buildings, it
is common to find that sky lobbies are intended to be refuge areas with sufficient occupant
capacity and fire/smoke/water protective measures in place to protect the enclosed population.
However, the influence of such configuration factors upon evacuation dynamics is considered
beyond the scope of the study. Each stair allowed two agents to stand abreast side-by-side with
agents preferring to stagger their locations (i.e. prefer not to stand side by-side) and maintain at
least one tread spacing between themselves and the agent in front. Each stair is doglegged design

143
where an intermittent landing (1m×3.2m) connects the two legs; each leg being 1.5m in width
and 4.6m in horizontal length allowing a maximum of 16 agents to simultaneously occupy each
leg of the stairs at a time.
Figure 36: Sequence of views from buildingEXODUS of high-rise building lift evacuation, (a), (b) and (c)
depicting 3D virtual reality view and (c) depicting two dimensional view
6.3 Lift attributes
The defining attributes for the lift kinematics and physical characteristics in each scenario were
based on the Chartered Institution for Building Service Engineers (CIBSE) Guide D:
Transportation Systems in buildings [CIBSE, 2000]. Each lift had a maximum capacity of 13
agents, a maximum speed of 6m/s, acceleration rate of 1.2m/s2
and a jerk rate of 1.8m/s3. In
addition, each lift had a door opening time of 0.8s, door closing time of 3.0s, a dwell delay of
3.0s and a motor delay time of 0.5s. Using these parameters approximately 31.5s are required for
a lift to travel from the ground floor to the top floor and fully open its doors. At the beginning of
each simulation each lift started at the ground floor. For each lift simulation not involving stairs,
where lifts serviced multiple floors (i.e. non-sky lobby scenarios), a top–down shuttle evacuation
strategy was employed by each of the lifts. Here all the lifts evacuate the agents on the top floor
first and shuttle them to the ground floor until all people have evacuated that floor. The lifts then
proceed to the floor below this and the process is repeated.

144
6.4 Population
With the exception of the ground floor, there were 160 agents located on each floor (7,840
agents in total). Agents were modelled as non-connected individuals and were not constrained by
groups. The demographics of the agent were assigned according to the default population within
buildingEXODUS, representing a broad cross-section of attributes and capabilities [Galea, et al.,
2006b]. All agents were assumed to react instantly at the beginning of each scenario so response
time is not considered a parameter within the analysis.
6.5 Scenarios
For each scenario, different combinations of lifts and stairs were used to evacuate the entire
building population. In each case, the priority of the lifts was to service the upper floors first,
sequentially working down to the lower floors. Several scenarios examined the use of shuttle
zones and sky lobby arrangements. The full list of scenarios is summarised in Table 36. These
scenarios were selected as many existing high-rise buildings already use shuttle zones and sky
lobbies. As such, the results from the evacuation analysis are intended to be more generally
applicable to both design-phase and existing high-rise buildings.
Lift frequency is varied in some scenarios. This is intended to explore the impact of the number
of lifts on evacuation efficiency and to explore the effect of lift banks being rendered inoperable
during an evacuation (e.g. due to fire, technical fault, etc). For each scenario all lifts initially
started on the ground floor. Due to the hypothetical nature of the building, aside from the
external walls and the lift/stair cores, no furniture or internal obstructions were represented
within each scenario.
In each scenario, agents that initially elected to use the available lifts approximately evenly
distributed among each lift bank. Similarly, of the agents that initially elected to use the stairs,
would approximately evenly distribute between them. This was to minimise the influence of
uneven lift/stair usage. Uneven lift/stair usage would likely decrease the evacuation efficiency of
each scenario. However, the main focus of this study to measure the extent to which different lift
strategies and associated human factors influence an evacuation.

145
Table 36: Overview of evacuation scenarios
Scenario Diagram Description
1
Stairs only
2
8 lifts (1 lift bank)
3
16 lifts (2 lift banks)
4
24 lifts (3 lift banks)
5
32 lifts (4 lift banks)
6
32 lifts, with the lower half of the building (floors 0-25) population
using the stairs and the upper half (26-49) using the lifts to shuttle to the
ground floor.
7
32 lifts, with the lower-half of the building (floors 0-25) population
using the stairs and the upper half (26-49) using the lifts to shuttle to the
middle floor (floor 25) from the agents floor of origin, then continue
their evacuation via the stairs.
8
32 lifts, with the lower-half of the building (floors 0-25) population
using the stairs and the upper half (26-49) initially using the stairs to
walk to a sky lobby on floor 25 where agents would be shuttled via lifts
to the ground floor.
9
32 lifts, 4 shuttle zones - each lift bank servicing a series of 12 floors of
agents, with each zone being evacuated from the top-down of the zone
to the ground floor.
10
32 lifts, 4 shuttle zones + 1 Stair zone - each lift bank servicing a series
of 10 floors of agents, with each zone being evacuated from the top-
down of the zone to the ground floor. Agents below floor 10 only use
the stairs to evacuate.
11
32 lifts, 4 Sky lobbies – there is a sky lobby every 10 floors in the
building (4 sky lobbies in total) with each lift bank servicing one of the
sky lobbies. Agents travel down the stairs to the next sky lobby below
where the lifts shuttle them to the ground floor. Agents below floor 10
only use the stairs to evacuate.

146
6.6 Results
Each of the lift evacuation scenarios was simulated using a simplified version of the Lift Agent
Model (SLAM) and an advanced version of the Lift Agent Model (ALAM). The SLAM assumes
all agents that can use a lift do so during a simulation with no redirection from lift waiting areas.
In these scenarios agents exhibit deterministic and non-adaptive behaviour. The ALAM
incorporates the online survey data mentioned in Chapter 4. To iterate, this includes the
following data for each floor range:
the proportion of occupants that would initially choose to use a lift (see Table 31),
what levels of congestion in the lift waiting area would cause them to redirect to the stairs
(see Table 31),
how long they would be prepared to wait to use a lift (see Figure 28).
The data used in the ALAM scenarios assume that all agents have the capability to use the stairs.
In addition, all occupants would at least consider using a lift given the option and that they are
sufficiently assured/convinced/trained that the lifts are safe to use during an evacuation. During
scenarios using the ALAM agents exhibit probabilistic adaptive behaviour based on the
attributes assigned.
The SLAM evacuation analysis identifies the influence of different lift strategies upon an
evacuation. The ALAM evacuation analysis identifies to what extent each lift strategy is
influenced by human factors. The following sections present results of the evacuation analysis
using both the SLAM and ALAM. A comparison of the scenario results from the two models has
then been performed.
6.6.1 Simplified Lift Agent Model (SLAM)
The results for the various simulations using the SLAM are presented in Table 37.

147
Table 37: Simplified lift agent model simulation results - Summary
Scenario
Number
of
lifts
Evacuation
time of last
lift user
(min)
Evacuation
time of last
stair user
(min)
% Time
saved
(compared
to stairs
only)
Time to
evacuate
top half of
building
(floor
≥26)
Avg
PET
(min)
Avg
LWT
(min)
Time taken to
evacuate proportion
of the population
(min)
25% 50% 75%
1 0 - 35.9 - 20.3 17.6 - 9.3 17.5 25.8
2 8 71.1 - -100.0 41.2 40.8 36.1 24.1 43.0 58.9
3 16 39.1 - -8.9 22.2 22.5 19.5 13.5 23.6 32.3
4 24 29.0 - 19.2 16.2 16.6 15.1 10.0 17.3 23.7
5 32 23.2 - 35.4 12.9 13.3 12.0 8.1 13.9 18.8
6
32 +
half
stairs
top-
down
13.4 18.6 48.2 12.3 8.6 6.2 5.0 8.5 11.9
7
32 +
half
stairs
top
middle
35.4 33.1 1.4 12.3 17.6 4.8 9.3 17.6 25.8
8
32 +
half
stairs,
1 x Sky
Lobby
18.8 18.7 47.6 17.7 9.6 0.0 5.5 9.7 13.8
9
32 + 4
Shuttle
Zones
23.5 - 34.5 22.4 10.2 10.2 5.7 9.9 13.9
10
32 + 4
Shuttle
Zones +
10
Stairs
20.0 7.3 44.3 18.7 8.1 6.8 4.2 7.2 11.7
11
32 +
4 x Sky
Lobbies
18.3 7.3 49.0 17.1 7.2 0.8 3.8 6.4 9.9
The base line comparison for all the cases is the stair only evacuation (scenario 1) as this is
representative of typical evacuation practice where the lifts are not used. This produced a Total
Evacuation Time (TET) of 35.9 min with 20.3 min required to clear the top half of the building.
The average Personal Evacuation Time (PET) for the scenario was 17.6 min. This indicates that
on average, a person required 17.6 min to exit the building. The TET for Scenarios 2 (8 lifts) and
3 (16 lifts) were 71.1 min and 39.1 min respectively, both being longer than the stair only case.
The average Lift Wait Time (LWT) represents the overall average time agents spent waiting for
a lift. The 8 lift scenario (scenario 2) produced the longest LWT of all cases at 36.1 min which
was some 46.0% longer than the 16 lift scenario (Scenario 3). Indeed the longest LWTs were in
Scenarios 2-5. In these scenarios only lifts were used and agents on the lower floors waited the
longest due to the top-down lift strategy employed (see Figure 37).
For Scenarios 2-5 the evacuation rate increased towards the later stages of each evacuation
unlike in the stair only case which decreased towards the later stages of the evacuation (see

148
Figure 38). The increase in evacuation rate was due to the lifts having to travel a shorter distance
towards the end of the evacuation as the remaining agents were located on the lower floors,
given the top-down lift strategy. This can be seen in Figure 39 where the difference between the
floor clearance times in these scenarios decreases on progressively lower floors in the building.
Scenarios 2-6 Scenarios 7-11
Figure 37: Simplified lift agent model simulation results - Average Lift Wait Time (LWT) of agents who
initially start on each floor and use a lift
Figure 38: Simplified lift agent model simulation results - Number of people evacuated against time (sec) for
each scenario

149
Scenarios 1 - 6 Scenarios 7-11
Figure 39: Simplified lift agent model simulation results - Floor Clearance Times for each scenario
It is not until 24 lifts were used (Scenario 4) that the TET decreased in relation to the stair only
case by 19.2% (6.9 min). However, even with 24 lifts the average PET (16.6 min) was still only
marginally less than the stair only case. From Figure 38, it can be seen that the stair only curve
outperformed the 24 lift case for the first 16.3 min (45.4% of the stair evacuation and 56.2% of
the 24 lift case) where some 46.2% (3,620) agents evacuated. However, from Table 37 it can be
seen that the 24 lift case (Scenario 4) cleared the upper half of the building marginally faster
(20.2%) than the stair only case (Scenario 1). Overall the majority of floor clearance times were
only marginally improved compared to those observed in the stair only scenario.
When 32 lifts were used (Scenario 5) a further reduction in TET of 35.4% and reduction of
overall average PET of 24.4% compared with the stair only case was recorded. The use of lifts
provided a substantial benefit to agents initially located in the top half of the building with the
upper half of the building being cleared substantially faster (36.4% (7.4min)) than the stair only
case. Comparing the 8 lift scenario with the other lift only scenarios, it can be seen that there was
an approximate 1.8, 2.5 and 3.1 times reduction in TET for the 16, 24 and 32 lift scenarios
respectively. This suggests that for a given population distribution and number of floors, the
speed up in evacuation performance does not necessarily linearly increase with the number of
lifts used.
In Scenario 6 an evacuation strategy in which the bottom half of the building used the stairs to
evacuate while the top half used 32 lifts to evacuate to the ground was explored. This strategy
produced the second shortest TET of 18.6 min; almost 50% faster than the stair only case. For
the first 9.3 min during the stair only scenario only 25% of all agents evacuated. However,
during the same period of time in Scenario 6, over twice as many agents had evacuated. As is to
be expected, the time to clear the top half of the building was similar to that of Scenario 5 at 12.9
min. In addition, the time to clear each floor was also similar (see Figure 37) but the average

150
PET decreased to 8.6 min. The parallel usage of both the stairs and lift system allowed the lower
floors to be cleared in a shorter amount of time (see Figure 39) compared to Scenarios 2-5. In
this scenario, the last agents out of the building were the stair users, resulting in a decrease in the
evacuation rate towards the very end of the evacuation (see Figure 38). Considering this scenario
only contained half the number of lift users compared Scenario 5, all of which were located in
the top half of the building, it is not surprising that the LWT decreased by almost 50%.
Scenario 7 is similar to Scenario 6, however, instead of agents on the upper floors being taken to
the ground, they were taken to the central floor from where they used the stairs to continue their
evacuation. The TET for this scenario increased to 35.4 min (only marginally faster than the
stair only case) and the average PET, at 17.6 min, is identical to that of the stair only case. It took
approximately the same length of time to evacuate the same proportion of agents throughout the
entire duration of the stair only case. However, we note that the time to clear the upper half of
the building was one of the quickest (along with Scenario 6), requiring only 12.3 min. While the
time to evacuate the entire building was equivalent to the stair only case, using this strategy does
provide one of the quickest ways to clear the upper half of the building. Due to the lifts shuttling
agents a shorter distance to the middle floor instead of the ground floor (as in Scenario 6), a
notable decrease in the average LWT was recorded (22.6% (1.4 min)). It should be kept in mind
that the lifts discharged agents onto the central floor faster than the stairs discharged agents
away. This caused large crowds to form around the stair entrance and eventually began to spill
over into the respective lift waiting areas where agents alighted the lifts. Towards the end of the
upper half of the building's evacuation this caused some agents to be delayed from alighting the
lift due to being blocked by queuing agents for the stairs (see slight tailing off of floor clearance
times for floors 27 and 26 for Scenario 7 in Figure 39). This highlights that when considering
employing such a lift evacuation strategy, the discharge capacities of the lifts and the connecting
stairs should be considered in order to minimise the levels of congestion and possibility of
blocking of alighting lift users.
In Scenario 8 the concept of a sky lobby is introduced. Here the agents in the upper part of the
building were required to descend to the central floor, evenly distributing among each stair, from
where they took a lift to descend to the ground. The agents below the central floor all used the
stairs to evacuate to the ground. As in Scenario 6, the parallel use of the stairs and lifts increased
the vertical throughput, reflected in the decreased floor clearance times (see Figure 39). This is
also reflected in the fact that the evacuation time of the last lift and stair user was approximately
the same. In this case the TET was 18.8 min, some 47.6% faster than the stair only case.
151
However, it required approximately the same period of time (17.7 min) to clear the top half of
the building as agents initially in this part of the building were required to walk down the stairs
to the central floor. The LWT for this scenario was the shortest recorded of all scenarios with the
majority of lift users (initially located above the middle floor) able to board an open lift
immediately after entering the lift waiting areas. This is contributed to by the fact that lifts in the
model will keep their doors open in the lift waiting areas while the lift is not full to capacity and
there is still an agent targeting the lift bank in the lift waiting area. This effectively means that
agents may end up waiting inside a lift until no other agents are targeting the lift bank (i.e. agents
wait inside a lift). The staggered arrival of agents to the lift waiting area (having to initially
travel on the stairs) increased the likelihood of this occurring. As a consequence this meant that
when the large majority of agents arrived in the lift waiting areas on the central floor a lift was
waiting for them already.
In Scenario 9 four shuttle zones were introduced with each group of eight lifts servicing the 12
floors within their allocated zone (the bottom zone had 13 floors). In each zone the lifts serviced
the floors from the top-down. In this case the TET decreased to 23.5 min which is some 34.5%
faster than the stair only case, but slower than Scenario 6, with the last agents to evacuate
coming from the top zone (see Figure 39) where the lifts had a longer journey. Using this
approach required 22.4 min to clear the upper half of the building, some 2.1 min slower than the
stair only case. Clearly this is a very inefficient strategy for clearing the upper half of the
building. In Scenario 10 this concept is extended by making all agents below the 10th
floor use
the stairs rather than the lifts. In this case four shuttle zones were used with each group of eight
lifts servicing 10 floors. While this case represents an improvement over Scenario 9, being
44.3% quicker than the stair only case, the time required to clear the upper half of the building
was only 1.6 min faster than the stair only case. The LWT for Scenario 9 decreased considerably
by a third in Scenario 10. This represents the effects of there being fewer lift users (on the lower
10 floors) and fewer floors in each shuttle zone allowing lifts to service each floor quicker.
In Scenario 11 four sky lobbies were introduced, one on every 10th
floor with each sky lobby
being serviced by eight lifts (a single lift bank). Within each zone, agents descended using stairs,
to a sky lobby where they boarded a lift that took them directly to the ground. Below the 10th
floor, all agents used the stairs to evacuate. This case produced a TET of 18.3 min which is
almost 50% faster than the stair only case. The upper half of the building was cleared in a
marginally shorter amount of time at 17.1 min compared to the stair only scenario. This
scenario produced a comparable TET to Scenario 6 but took 39.0% (4.8 min) longer to clear the

152
upper half of the building (see Table 37). However, the average PET was lower than any other
scenario (7.2 min). From Figure 38 it can be seen that this scenario produced the best evacuation
rate of all the scenarios. The first 75% of agents evacuated some 2 min sooner than the next
quickest scenario (Scenario 6). Indeed in the same time that it took 25% of agents to evacuate in
the stair only case, almost three times as many agents (75%) had already evacuated in Scenario
11. The LWT for this scenario was the second shortest at less than a minute and this was caused
by much the same reason as Scenario 6. Due to the sky lobbies servicing less floors than
Scenario 6, meant that agents on average typically had a shorter distance to travel to a sky lobby.
This meant that the arrival rate of agents to the lift waiting areas was less staggered compared to
Scenario 6, hence the slightly increased average LWT. Lift users initially located on floors closer
to the sky lobbies typically waited longer than those further away (see Figure 37). Results from
this scenario indicate that the introduction of multiple sky lobbies (with the lower levels only
using the stairs) makes it possible to evacuate a greater number of people in the same amount of
time for the majority of the evacuation than in any other scenario examined.
The performance of Scenario 11 could potentially be further improved through the introduction
of local lifts that take agents to the sky lobby rather than use the stairs. It can be seen in Figure
38 that scenarios involving zoning/multiple sky lobbies (Scenarios 9, 10, 11) produce
increasingly inefficient evacuation performance towards the end of the evacuation sequence.
This is because the lifts servicing the zones/sky lobbies on the lower levels are left idle whilst the
lifts servicing the upper levels are still in operation. The performance of such scenarios could
potentially be increased by using the idle lifts from the lower floors to assist in shuttling the
remaining agents on the upper floors/zones to the exit level.
6.6.2 Advanced Lift Agent Model (ALAM)
A summary of results for the various simulations using the Advanced Lift Agent Model (ALAM)
are presented in Table 38. The overall average LWT for all agents that used a lift and those that
initially consider using a lift but redirected to the stairs is presented in Table 39. The proportion
of agents that performed a given action regarding the lift system is presented in Figure 40. This
shows the proportion of agents who:

153
did not consider using a lift (Stair only),
used a lift (Lift User),
initially considered using a lift but redirected due to congestion (Congestion Redirection),
initially considered using a lift but redirected due to lift wait time expiration (Wait time
Redirection).
These proportions are segregated according to agent‟s initial floor in each scenario in Figure 41.
Egress curves, the time it took the last agent to traverse pass through the stairs or board a lift
(floor clearance time) and the average LWT for lift users for each floor can be seen in Figure 42.
Table 38: Advanced lift agent model simulation results - Summary
Scenario Number of
lifts
Evacuation
time of last
lift user
(min)
Evacuation
time of last
stair user
(min)
% Time saved
(compared to
stairs only)
Time to
evacuate top
half of
building
(floor ≥26)
(min)
Avg
PET
(min)
Time taken to
evacuate proportion
of the population
(min)
25% 50% 75%
1 0 - 35.9 - 20.3 17.6 9.3 17.5 25.8
2 8 18.1 32.4 9.7 14.9 14.4 7.4 13.6 21.3
3 16 14.8 31.0 13.6 13.1 13.3 6.4 14.2 20.1
4 24 12.4 29.6 17.5 13.2 12.5 5.7 11.2 19.0
5 32 12.0 29.1 18.9 10.9 12.0 5.2 10.9 18.3
6
32 + half
stairs top-
down
8.9 29.4 18.1 12.9 12.3 5.3 10.8 19.0
7
32 + half
stairs top
middle
35.7 35.7 0.6 22.0 17.6 9.4 17.6 25.9
8
32 + half
stairs,
1 x Sky
Lobby
18.5 24.9 30.6 17.4 10.9 6.1 10.9 15.4
9
32 + 4
Shuttle
Zones
11.7 27.5 23.4 13.3 10.7 4.6 9.2 16.7
10
32 + 4
Shuttle
Zones + 10
Stairs
11.3 26.6 25.9 13.5 10.5 4.6 8.7 16.3
11
32 +
4 x Sky
Lobbies
14.0 24.0 33.1 16.5 8.2 4.4 7.4 11.3
Focusing on the 8 lift scenario (Scenario 2), the last agent to evacuate came from the stairs 14.3
min after the last lift user. From Figure 40 it can be seen that only 13.3% of agents actually used
a lift. Indeed no agents on floor 10 and below used a lift to evacuate (see Figure 41). This
indicates that the lift system was heavily underutilised during the evacuation. This scenario
cleared the top half of the building in 14.7 min representing a 26.6% decrease compared to the
stair only scenario. A majority of lift users were located on the top ten floors of the building (see

154
Figure 41). The majority of agents who initially considered using a lift redirected to the stairs.
Most of these agents (30.3%) were not prepared to wait longer to use a lift, though a small
proportion (7.3%) redirected due to congestion in the lift waiting area (see Figure 40). Those
who did redirect to the stairs waited on average 3.4 min in the lift waiting area. This was almost
half as long as the average time that agents who used a lift waited (6.3 min) (see Table 39).
Agents initially in the upper part of the building were serviced first by the lifts. In the lower part
of the building there were only a small proportion of agents who considered using a lift. This
explains why a lower proportion of agents redirected due to wait time expiration in both the
upper and lower parts of the building (see Figure 41).
Figure 40: Advanced lift agent model simulation results - Overall Proportion of agent that used the stairs,
lifts and redirected from the lifts to the stairs due to wait time expiration or congestion in the lift waiting area

155
Scenario 2 - 8 Lifts Scenario 3 - 16 Lifts
Scenario 4 - 24 Lifts Scenario 5 - 32 Lifts Scenario 6 - 32 + half stairs top-
down
Scenario 7 - 32 + half stairs top
middle
Scenario 8 - 32 + half stairs,1 x Sky
Lobby Scenario 9- 32 + 4 Shuttle Zones
Scenario 10 - 32 + 4 Shuttle Zones +
10 Stairs Scenario 11 - 32 + 4 x Sky Lobbies
Figure 41: Advanced lift agent model simulation results - Proportion of lift agent types according to floor
height
When further lift banks were included (Scenarios 3-5) only a marginal decrease in the time saved
compared to the stair only scenario was recorded. In these scenarios, the decrease in TET ranged
from 9.7%-17.5% compared to the stair only scenario. The time to evacuate the top half of the
building was 26.6%-35.5% (5.4 min-7.2 min) shorter than the stair only scenario. The floor
clearance times and evacuation rates for Scenarios 3-5 were comparable for each scenario (see
Figure 42). Even though the number of available lifts increased in each scenario, the proportion
of agents that used a lift only increased by 17.7%-22.8% (see Figure 40). This suggests that
irrespective of the number of lifts available, using a top-down evacuation strategy for the entire

156
building is not very effective. This is because agents are not prepared to wait long periods of
time for the lift to service the majority of floors. Further to this, as the number of lifts increased,
only a marginal decrease in LWT was recorded (see Table 39). In addition, agents arrived in the
lift waiting areas sooner when more lift banks were used due to the decreased travel distance.
This led to more agents redirecting due to wait time expiration. As expected, due to the top-down
lift strategy, agents initially located on higher floors typically had shorter LWTs (see Figure 42).
Table 39: Advanced lift agent model simulation results - Average Lift Wait Time (LWT) of all agents that
considered using a lift, lift users and non-lift users (agents who initially chose to use a lift but then redirected
to the stairs)
Scenario Number of lifts
Avg
Lift User
LWT
(min)
Avg
Non Lift User
LWT
(min)
Avg
Overall
LWT
(min)
2 8 6.3 3.4 4.2
3 16 4.7 2.8 3.5
4 24 4.1 2.8 3.3
5 32 3.8 2.7 3.2
6 32 + half stairs top-down 3.2 2.1 2.7
7 32 + half stairs top middle 2.9 2.1 2.6
8 32 + half stairs,
1 x Sky Lobby 0.0 0.1 0.0
9 32 + 4 Shuttle
Zones 3.2 2.0 2.7
10 32 + 4 Shuttle
Zones + 10 Stairs 3.2 1.8 2.6
11 32 +
4 x Sky Lobbies 0.5 1.3 0.5
In Scenario 6 all agents initially in the lower half of the building used the stairs to evacuate and
agents in the upper half had the option to use a lift to take them to the ground floor.
Consequently an increased proportion (63.6%) of stair users were recorded compared to Scenario
5 (see Figure 40). The TET for this scenario was comparable to the 32 lift scenario (Scenario 5)
at 29.4 min. In addition, the floor clearance times and evacuation rate were also similar for both
scenarios (see Figure 42). Looking at Figure 41, it can be seen that very few agents in the lower
half of the building used a lift in Scenario 5. As such forcing those agents to use the stairs in
Scenario 6 had little impact on the TET. The time to clear the upper half of the building took 2
min longer in Scenario 6 than in Scenario 5. This reflects the increased crowding on the stairs in
the lower half of the building in Scenario 6. This increased crowding was caused by agents all
directly going to the stairs in the lower half of the building (in Scenario 6). Whereas in Scenario
5, almost a third of agents (28.8%) in the lower half of the building initially went to use a lift
before redirecting to the stairs. This staggered their arrival time to the stairs. A comparable

157
average LWT for lift users was recorded in Scenario 6 (3.2 min) compared to Scenario 5 (3.8
min) (see Table 39). In addition, the average LWT per floor for lift users followed a similar trend
for the upper floors (see Figure 42).
Scenarios 1-6 Scenarios 7-11
Figure 42: Advanced lift agent model simulation results for each scenario- Number of people evacuated
against time (sec), floor clearance times, and average lift wait time (LWT) of agents who initially start on each
floor and use a lift
Similar to Scenario 6, in Scenario 7 agents in the lower half of the building used the stairs to
evacuate with agents in the upper half of the building having the option to use a lift to take them
to the central floor before using the stairs to evacuate. The TET for this scenario was comparable
to the stair only scenario as all agents were required to use the stairs to traverse the lower half of
the building. As in Scenario 6, the impact of restricting lift usage to agents in the top half of the
building had little effect on the proportion of agents that used a lift (see Figure 40). The
increased number of agents entering the stairs on the central floor (from using a lift) restricted
the flow of agents on the stairs coming from the upper floors. This resulted in the time to clear
the upper part of the building taking marginally longer (1.7 min (8.4%)) than the stair only

158
scenario. Due to all agents using the stairs during Scenario 7 meant that the overall evacuation
rate was comparable to the stair only scenario (see Figure 42).
The single sky lobby scenario (Scenario 8) where agents in the top half of the building had the
option to use a lift on the central floor, produced the second quickest evacuation with a decrease
in TET of 30.6% (11 min) compared to the stair only scenario. Despite this, the time to clear the
upper half of the building was only marginally less (2.9min (14.3%)) than the stair only scenario
at 17.4 min. The majority of agents that considered using a lift to evacuate did so (36.8%) with a
small proportion redirecting to the stairs due to congestion (7.5%) or lift wait time expiration
(16.4%) (see Figure 40 and Figure 41). This was caused by the staggered arrival of agents to the
sky lobby as they were required to initially traverse the stairs. This meant that very few agents
experienced high levels of congestion in the lift waiting area. This was further contributed to by
there being four lift banks available on the sky lobby floor about which agents on the floors
above could spread. In addition, due to the lifts only servicing two floors (sky lobby floor and the
ground floor), agents did not have to wait a long time for the lifts (see Table 39). As such this
scenario produced one the shortest average LWTs. Lift users initially located on or near the sky
lobby floor had to wait the longest as they were among the first to arrive in the lift waiting areas
(see Figure 42).
In Scenario 9, four shuttle zones were employed and each agent had the option to use a lift on
their current floor. The TET for this scenario reduced to 26.6 min, some 25.9% faster than the
stair only scenario. It took a similar period of time (13.3 min) to evacuate the top half of the
building compared to the 24 and 16 lift scenarios. However, this strategy was the third quickest
scenario to evacuate 50% of agents before decreasing to the fourth quickest scenario overall (see
Table 38 and Figure 42). This signifies that the initial evacuation efficiency using this strategy is
reasonable but becomes increasingly inefficient towards the end of the evacuation with the last
stair user evacuating some 15.8 min (59.4% longer) than the last lift user. Again this highlights
that the lifts were underutilised towards the end of the evacuation with just over a quarter
(27.7%) of agents using a lift to evacuate with 23.9% redirecting to the stairs (see Figure 40).
From Figure 41 it can be seen that more agents initially located on higher floors within a shuttle
zone used lifts. This was because agents initially located on lower floors within each shuttle zone
had to wait longer for a lift to service their floor and so were more likely to redirect to the stairs
due to wait time expiration. The overall proportion of agents that redirected due to congestion
whilst not being very high (7.5%) was the highest recorded for all scenarios. This was
contributed by the fact that there was only a single lift bank available on each floor which caused

159
the increased levels of congestion in each lift waiting area. Comparable LWTs with Scenario 6
for both the lift users and non-lift users were also recorded.
Scenario 10 extended the concept employed in Scenario 9 by requiring agents on the bottom 10
floors to use the stairs with the remaining floors being partitioned into four shuttle zones. Very
few agents elected to use a lift to evacuate on the bottom 10 floors in Scenario 9 (see Figure 41).
As such forcing them to use the stairs in Scenario 10 was of little consequence to those agents
(see Table 41). However, this did mean that the remaining shuttle zones had fewer floors; only
having 10 instead of 12 floors. Despite this, only a marginal decrease in TET by 3.3% (0.9 min)
(see Table 38) was observed compared to Scenario 9.
The four sky lobby scenario (Scenario 11) produced the shortest TET (24.0 min) of all scenarios,
representing a 33.1% decrease compared to the stair only scenario (see Table 38). Almost all
agents who considered using a lift did so (see Figure 40). The time to evacuate the top half of the
building was only 18.7% (3.8 min) shorter than the stair only case. The overall evacuation
efficiency had more agents evacuated at any point than in any other scenario (see Table 38 and
Figure 42). However, the efficiency decreased considerably towards the end of the evacuation.
As with the SLAM scenarios, this was contributed to by agents being evacuated faster on the
lower sky lobbies due to the decreased lift travel distance. As such those lifts were unused
towards the end of the evacuation. In addition, contraflow occurred on the sky lobby floors
around the stair entrances. In these locations one flow of agents were attempting to enter the sky
lobby (intending to board a lift) whilst others were redirecting to the stairs. Both of these factors
caused a decrease in evacuation efficiency.
In all scenarios, agents using the stairs were the last to evacuate with differences between the last
lift user and stair user evacuation time ranging between 0.1 min (Scenario 7) to 20.5 min
(Scenario 6). This suggests that the lifts were underutilised and that if more agents used the lifts
then further decreases in TET could be achieved.
6.6.3 Comparison of the SLAM and ALAM scenarios
The summary results for each scenario using the SLAM and ALAM have been reproduced in
Table 40.

160
Table 40: Comparison of SLAM (S) and ALAM (A) scenario summary results
Scenario Number of
lifts
Agent
Model
Evacuation
time of last
lift user
(min)
Evacuation
time of last
stair user
(min)
% Time
saved
(compared
to stairs
only)
Time to
evacuate
top half
of
building
(floor
≥26)
Avg
PET
(min)
Time taken to
evacuate proportion
of the population
(min)
25% 50% 75%
1 0 S/A - 35.9 - 20.3 17.6 9.3 17.5 25.8
2 8 A 18.1 32.4 9.7 14.9 14.4 7.4 13.6 21.3
S 71.1 - -100.0 41.2 40.8 24.1 43.0 58.9
3 16 A 14.8 31.0 13.6 13.1 13.3 6.4 14.2 20.1
S 39.1 - -8.9 22.2 22.5 13.5 23.6 32.3
4 24 A 12.4 29.6 17.5 13.2 12.5 5.7 11.2 19.0
S 29.0 - 19.2 16.2 16.6 10.0 17.3 23.7
5 32 A 12.0 29.1 18.9 10.9 12.0 5.2 10.9 18.3
S 23.2 - 35.4 12.9 13.3 8.1 13.9 18.8
6 32 + half stairs
top-down
A 8.9 29.4 18.1 12.9 12.3 5.3 10.8 19.0
S 13.4 18.6 48.2 12.3 8.6 5.0 8.5 11.9
7 32 + half stairs
top middle
A 35.7 35.7 0.6 22.0 17.6 9.4 17.6 25.9
S 35.4 33.1 1.4 12.3 17.6 9.3 17.6 25.8
8 32 + half stairs,
1 x Sky Lobby
A 18.5 24.9 30.6 17.4 10.9 6.1 10.9 15.4
S 18.8 18.7 47.6 17.7 9.6 5.5 9.7 13.8
9 32 + 4 Shuttle
Zones
A 11.7 27.5 23.4 13.3 10.7 4.6 9.2 16.7
S 23.5 - 34.5 22.4 10.2 5.7 9.9 13.9
10
32 + 4 Shuttle
Zones + 10
Stairs
A 11.3 26.6 25.9 13.5 10.5 4.6 8.7 16.3
S 20.0 7.3 44.3 18.7 8.1 4.2 7.2 11.7
11
32 +
4 x Sky
Lobbies
A 14.0 24.0 33.1 16.5 8.2 4.4 7.4 11.3
S 18.3 7.3 49.0 17.1 7.2 3.8 6.4 9.9
The TETs produced by the ALAM were 54.4% (38.7 min) and 20.7% (8.1 min) shorter for
Scenarios 2 and 3 than produced by the SLAM respectively. However, the TETs produced by the
ALAM in Scenarios 4 and 5 were 2.1% (0.6 min) and 25.4% (5.9 min) longer than those
produced by the SLAM respectively. Closer inspection of Scenarios 4 and 5 shows the ALAM to
evacuate the first 75% of agents quicker than the SLAM. The decrease in performance towards
the end of these scenarios using the ALAM was due to the decreased evacuation rate by stair
users. However, the SLAM scenarios increased evacuation efficiency towards the end of the
evacuation due to the shorter distance the lifts were required to travel whilst servicing the lower
floors.
In Scenario 6, there was a 58.1% (10.8 min) increase in the TET using the ALAM compared to
using the SLAM. This increase in TET using the ALAM was caused by agents using the stairs
with the last lift user evacuating some 20.5 min before the last stair user. Closer inspection of the
floor clearance curves shows the top half of the building was cleared in approximately the same

161
length of time using the ALAM and SLAM. However, the time to clear the lower half of the
building in the ALAM took considerably longer. This was because as an increased number of
agents elected to use the stairs from the upper half of the building. Agents that used a lift in the
ALAM scenarios, on average waited almost half the time (48.5% (3.2 min)) for a lift compared
to those agents in the SLAM scenarios (6.2 min) (see Figure 40).
Similar to Scenario 6, Scenario 7 employed lifts to evacuate agents to the central floor of the
building. Results produced by both the ALAM and SLAM were similar in terms of TET,
evacuation rate and proportion of time saved compared to the stair only scenario. However, the
upper half of the building took 44.1% (9.7 min) less time to clear using the SLAM compared to
using the ALAM. This was caused by some agents using the stairs instead of the lift in the upper
part of the building in the ALAM scenarios. Due to agents having the option to redirect from the
lifts in the ALAM, meant the average LWT for lift users was considerably less (1.9 min (39.5%))
compared to the average LWT using the SLAM (see Table 41).
Table 41: Comparison of SLAM and ALAM - Average Lift Wait Time (LWT) of all lift users
Scenario Number of lifts
AVG
Lift User
LWT
(min)
ALAM SLAM
2 8 6.3 36.1
3 16 4.7 19.5
4 24 4.1 15.1
5 32 3.8 12.0
6 32 + half stairs top-
down 3.2 6.2
7 32 + half stairs top
middle 2.9 4.8
8 32 + half stairs,
1 x Sky Lobby 0.0 0.0
9 32 + 4 Shuttle
Zones 3.2 10.2
10 32 + 4 Shuttle
Zones + 10 Stairs 3.2 6.8
11 32 +
4 x Sky Lobbies 0.5 0.8
Results produced by the single sky lobby case (Scenario 8) show the TET to decrease by almost
a quarter (6.1 min (24.5%)) using the SLAM compared to the ALAM. The last lift user in both
models evacuated at approximately the same time with the top half of the building also taking
approximately the same amount of time to evacuate with both models. The evacuation rate
remained almost linear for the majority of the evacuation in both models. However, as with other

162
scenarios, the decreased performance caused by stair users initially on the upper floors of the
building using the ALAM extended this overall evacuation time. The average LWT of lift users
in both models was approximately the same due to very few agents redirecting to the stairs from
the lifts on the sky lobby floor using the ALAM (see Table 41).
Scenario 9 introduced the concept of shuttle zones where each lift bank serviced a given set of
floors or zone. The overall TET for the ALAM was marginally longer (17.0% (4 min)) than the
SLAM. However, the first 50% of agents that evacuated did so in a similar amount of time
(Table 40). The evacuation rate in both models decreased towards the end of the evacuation
though the causes are different for each model. The SLAM inefficiency was caused by the lifts
having to travel further whilst servicing the agents in the top zone. The ALAM inefficiency was
caused by stair users initially located in the upper parts of the building having to travel further.
The time to clear the upper half of the building was 40.6% (9.1 min) shorter using the ALAM
due to both the stairs and lifts being utilised in the upper part of the building. The average LWT
for lift users was 68.6% (7 min) shorter using the ALAM. This is reflective of the decreased
proportion of agents using the lifts (27.7%) and the adaptive behaviour represented (see Table
41).
Similar to Scenario 9, Scenario 10 employed 4 shuttle zones with agents in the bottom 10 floors
being required to use the stairs to evacuate. As previously mentioned, using the ALAM there was
little difference between Scenarios 9 and 10. This was because very few agents elected to use a
lift on the bottom 10 floors. In contrast, using the SLAM a decrease in TET compared to
Scenario 9 was recorded. This was due to each shuttle zone containing less floors and all agents
being forced to use the lifts on those floors. The last agent to evacuate using the SLAM was a
lift user coming from the last floor served (floor 40) in the upper zone. As previously mentioned
in Scenario 9, in both the ALAM and SLAM the evacuation rate decreased towards the end of
the evacuation for different reasons. For the ALAM this was caused by stair users. For the
SLAM this was caused by lift users. The average LWT for lift users in the SLAM scenario was
over twice as long (52.9% (3.6 min)) to that of lift users in the ALAM scenario.
In the final scenario four sky lobbies were used with the bottom 10 floors using the stairs
(Scenario 11). The TET using the SLAM was 23.8% (5.7 min) shorter than using the ALAM.
However, the evacuation rate for the first 75% of agents was similar for both models. In addition,
the time to evacuate the upper half of the building, the average LWT for lift users, and average

163
PET were similar for both models. For both models, Scenario 11 produced the quickest and most
efficient evacuation rate compared to all other scenarios.
With the exception of the 8 and 16 lift scenario (Scenarios 2 and 3), the results show that the
SLAM produced shorter TETs than the ALAM. Using the ALAM, the lifts were underutilised
with the last evacuee in all scenarios coming from the stairs. This imbalance in lift/stair usage
decreased both the TET and the evacuation rate towards the end of each scenario. Such results
highlight the potential inefficiency caused by human factors upon lift evacuation strategies.
Findings also suggest that certain evacuation lift strategies may be less susceptible to
inefficiencies caused by human factors. Results suggest that the combined use of stairs and sky
lobbies/zoning, that stagger the arrival of occupants to the lift waiting areas and/or reduce lift
wait times, produce higher evacuation rates by comparison to top-down strategies.
The comparison of scenarios results using each model has demonstrated that lift human factors
can have a considerable effect upon overall evacuation dynamics. The extent to which this
influence occurs is highly dependent upon the evacuation lift strategy employed. The results
suggest that using lifts can offer potential benefits of speeding up an evacuation by as much as
half assuming non-adaptive occupant behaviour. However, factoring in adaptive occupant
behaviour suggests a decrease by around a third is more realistic. It is proposed that with suitable
orchestration of building occupants (e.g. by fire safety personnel, training, etc), further
reductions in total evacuation times may be possible.
6.7 Concluding remarks
The aim of this chapter was to demonstrate the potential influence of different evacuation lift
strategies and how such strategies may be influenced by human factors. Results pertaining to a
series of full building lift evacuation scenarios employing a variety of evacuation lift strategies
have been presented. Each scenario was run using a Simplified Lift Agent Model (SLAM);
assuming all agents that could use a lift did so, and also using an Advance Lift Agent Model
(ALAM); including lift human factors data collected from the online survey presented in Chapter
4.
Results using the SLAM, suggest that the speed-up in evacuation performance is not necessarily
linear with increasing number of lifts. Using a lift only strategy in which each lift visits each
floor, the total evacuation time can be reduced by 35.4% and the time to clear the top half of the

164
building reduced by 36.4% using 32 lifts compared to a stair only strategy. A more efficient
evacuation strategy involves using lifts in conjunction with stairs. If 32 lifts are used to clear the
top half of the building while the agents in the lower half of the building utilise the stairs, the
building can be emptied 48.2% faster compared to a stair only strategy. The time to empty the
top half of the building is reduced by 39.4% compared to the stair only case. The most efficient
overall strategy (in terms of evacuating the most agents at any given time) involved using all
lifts arranged into four sky lobbies where agents on the lower floors used the stairs. Within
each sky lobby zone agents initially use the stairs to descend to the sky lobby where they board
a lift that takes them directly to the exit level. In this case the building could be evacuated
approximately 50% faster than the stair only case and the upper half of the building could be
emptied 15.8% faster than the stair only case. While the upper half of the building took 39.0%
longer to clear than in the case where the lifts were used to evacuate only the top half of the
building, this case produced the highest egress rate. Due to the lower sky lobby lifts having less
further to travel, meant that those lifts finished evacuating the lower floor agents much sooner
than the upper floor sky lobby lifts. This meant that the efficiency of the evacuation rate during
this scenario decreased towards the end of the evacuation. Once the lower floor sky lobby lifts
have finished servicing their floors, if they were utilised to assist evacuating agents from the
upper floor sky lobbies, this could reduce the influence of this inefficiency.
As shown in the literature review, previous studies have shown that the combination of both lifts
and stairs can reduce total evacuation times by as much as a half compared to stairs alone [Pauls,
1977; Klote, et al., 1992; Wong, et al., 2005; Bukowski, 2010]. This is similar to that found by
the SLAM results employing different evacuation lift strategies combined with stair usage. In the
cases presented in the literature review and the SLAM results, deterministic and non-adaptive
agent behaviour was used. Considering the ALAM results, where agent behaviour was
adaptive and empirically based, suggest that the approximate 50% reduction in evacuation
time with the combined use of stairs and lifts is optimistic. Considering adaptive lift human
factors, the greatest decrease in evacuation time recorded was by approximately a third using
both lifts and stairs compared to the stairs only. Results suggest the human factors can
considerably decrease the efficiency of a lift evacuation and alter underlying evacuation
dynamics. The extent of this influence is dependent on the lift strategy employed. The
predominant cause of the inefficiency was by the underutilisation of the lift system. In the
majority of scenarios using the ALAM, the predominant cause of agents redirecting to the stairs
from the lift was due to wait time expiration. The results suggests that if more occupants would
consider waiting in crowds for longer in the lift waiting area, the efficiency of the evacuation

165
could be improved with more agents using the lifts. Certain lift evacuation strategies have been
shown to be less susceptible to decreases in efficiency due to the simulated human factors.
These include lift evacuation strategies where sky lobbies and shuttle zones were employed
that either disperses the arrival time of agents to the lift waiting areas and/or decrease the
levels of congestion in the lift waiting areas.
The presented evacuation analysis has demonstrated the ability of the developed model to
represent a variety of lift evacuation strategies and associated human factors. This model might
be used as part of an engineering analysis, comparing procedural variants that include lift use.
Based on the analysis presented here, a number of operational and human factors affecting an
evacuation using lifts have been suggested. Further investigation is required to assess the extent
to which the results are generally applicable. Indeed the presented analysis can be used to guide
such future investigation.
166
Chapter 7 - Escalator Human Factors
7.1 Introduction
A number of studies have collected escalator human factors data [Fruin, 1971; Cheung and Lam,
1998; Davis and Dutta, 2002; Okada, et al., 2009; Kadokura, et al., 2009; Zeiler, et al., 2010;
Knehs, 2010]. Typically such studies have focused on individual characteristics of specific
behaviours (e.g. walker speeds, flow-rates, etc). Indeed no studies were found where a variety of
escalator human factors were analysed. As such it is uncertain how different escalator human
factors interact or influence other types of behaviour. It is also uncertain whether such escalator
human factors are unique to the countries where the studies were conducted.
To address these issues, escalator human factors data within three underground stations were
collected. Each station was located in a different country; Spain, China and England. The data
was collected during normal circulation conditions using personal video cameras and existing
CCTV (Closed Circuit Television) systems already in each location. The data has been used to
instruct the development of the evacuation agent escalator model presented in the proceeding
chapter. As mentioned in the literature review, previous studies [Galea, et al., 2006a; Donald and
Canter, 1990] have noted that pedestrians have exhibited typical circulation behaviour on
escalators during actual evacuations. As such it is suggested that escalator human factors are
broadly comparable between circulation and evacuation situations.
The data collected relates to escalator/stair usage, walker/rider usage, side usage, walker speeds
and flow-rates. The chapter presents definitions and methodology of each data item along with a
description and analysis of each dataset. A comparison between each dataset and data presented
in previous studies has also been conducted.
7.2 Definitions and methodology
The following sections describe the methodology of how each data item was collected from the
video footage. All video footage was collected by third party groups/companies under the
guidance of the Fire Safety Engineering Group (FSEG) at the University of Greenwich. The
Spanish footage was collected by Autoritat del Transport Metropolità (ATM) and Ferrocarrils de
la Generalitat de Catalunya (FGC) (located in Barcelona). The Chinese footage was collected by
167
the Shanghai Institute of Disaster Prevention and Relief (SIDPR) at Tong Ji University (located
in Shanghai). The English footage was collected by Kingfell Ltd (located in London).
7.2.1 Escalator/Stair usage
When pedestrians approach a combination of escalators and stairs, they are required to make a
choice as to which device they will use to traverse to the next level. To better understand this
process, the number of pedestrians that used each escalator/stair has been recorded for each of
the datasets collected.
It was relatively simple to count pedestrians using each escalator given their limited capacity (i.e.
the width of each escalator typically only accommodated 2 pedestrians at any one time). For
wide stairways (e.g. in the Chinese dataset), keeping track of each pedestrian during busy periods
became more challenging. This increased the likelihood of counting pedestrians multiple times.
To minimise this inaccuracy, pedestrians were only counted just before they moved out of view
of the camera. Frame by frame analysis of the video footage was also performed in order to
further minimise this inaccuracy. Despite such mitigating techniques, it is accepted that there
may be some error in the counting process.
7.2.2 Walker/Rider usage
When pedestrians board an escalator, they either ride, walk or „ride and walk‟ on the escalator.
The frequencies of pedestrians who rode or walked the entire length of the escalator were
recorded. Pedestrians who walked and rode have not been included in the analysis given that
they were relatively rare (e.g. less than 1.0% were observed). As such it was considered not to be
required to be represented within a simulated environment due to its expected minimal influence.
7.2.3 Side usage
When pedestrians board an escalator, they adopt a side/position of the escalator to use: left, right,
centre or sometimes pedestrians change sides as they move along an escalator. As observed in
previous studies, in certain locations escalator users adopt a „common side preference‟ whereby
walkers and riders use opposite sides of an escalator. The side/position that each escalator users
adopted was recorded.

168
7.2.4 Walker speeds
The walker speeds of the pedestrians that walked the entire length of the escalator and who were
unimpeded were recorded. Here, „unimpeded„ means that no other pedestrians were immediately
in front of the chosen pedestrian (at least approximately 5 steps) for the entire length of the
escalator journey and they did not appear to stop/pause whilst on the escalator.
The walker speed was recorded from the time the walker placed their first foot on an escalator
tread until the time they placed their first foot on the ground when alighting the escalator. In
some circumstances due to restricted visibility the feet of pedestrians could not be seen. Here, an
approximation was carried out based on the upper body position and gait of the pedestrian when
they walked on/off the escalator. For each dataset, examples of pedestrians boarding/alighting
escalators can be seen in Figure 43. Walker speeds were calculated using the horizontal distance
of each escalator less the speed of the escalator (i.e. the horizontal walker speeds of the
pedestrians were recorded).
Boarding Alighting
Sp
ain
Ch
ina
En
gla
nd
Figure 43: Boarding/Alighting time examples

169
7.2.5 Flow-rates
The time at which all escalator users boarded/alighted an escalator was recorded. There are two
types of flow-rates associated with escalator usage. The entry flow-rate represents the number
pedestrians that board an escalator over a period of time. The exit flow-rate represents the
number of pedestrians that alight an escalator over a period of time. With regards to restricted
pedestrian visibility, the same principles apply as with recording walker travel speeds where an
approximation of escalator users boarding/alighting times were made.
The measured flow-rates included all pedestrians who walked or rode the entire length of each
escalator. It should be reiterated that the small number of pedestrians that both walked and rode
on an escalator were not included in the analysis. Since a small number of pedestrians exhibited
this behaviour it is expected to have a very little influence upon the results.
7.3 Analysis of Spanish data
The Spanish data was collected in the Provença station, Barcelona, Spain. The station itself is
located in the very centre of the city and consequently it is used by a large number of people
every day for travelling about the city. The station currently services two tube lines (Line 6 and
Line 7) that run on the same track from East to West of the city. In addition the station is linked
to another station called Diagonal which services a further track, namely Line 3 (though this
station was not analysed in this investigation).
The footage of two separate escalators was collected: an up and down escalator. The CCTV
(Closed Circuit Television) security camera system already in place at the station was used to
capture the video footage. The cameras were located at the top of each escalator, providing for
an elevated, frontal, full-length view of each escalator (see Figure 44). This provided a means to
observe the full-length of each escalator. However, when people traversing the escalator were at
the top, this obstructed the view of the rest of the escalator. This meant the alighting/boarding
times of pedestrians behind the obstructing pedestrians could not be recorded.

170
Figure 44: Spanish Data - The location of the two escalators and camera positions (diagram not to scale)
Each escalator had a horizontal speed of 0.5 m/s and the total length of each escalator was
calculated at 17.0m (horizontal length 15.5m, height 6.29m) (see Figure 45). The up escalator
links the platform level to the lobby level of the underground station. It provides a means for
pedestrians who arrive on incoming trains to traverse to the lobby level. The platform is single
sided with trains only arriving on one side of the platform. Subsequently pedestrians on the
platform level can only approach the escalator/stair from the stair side. The down escalator links
the lobby level to the platform level of the underground station. It provides a means for
pedestrians arriving from outside the station to traverse to the platform level to board incoming
trains. As with the up escalator, pedestrians could only approach the down escalator from the
stair side. The stairs that run parallel with both escalators provide an alternate means to traverse
the vertical area. Each escalator was recorded during a rush-hour and non-rush hour period. One
Up escalator (top) Down escalator (top)

171
camera was used for each escalator (at the top of the escalator) and recorded for 30 minutes each
(the total amount of footage collected was 4 x 30min = 120 min/2 hours).
A: Escalator dimensions B: Stairway dimensions Figure 45: Spanish Data - Escalator (a) and Staircase (b) dimensions
In total, 590 escalator users were recorded using the up escalator: 404 during the rush-hour and
186 during the non-rush hour (see Table 42). In addition, 92 pedestrians using the adjacent stair
were recorded. Irrespective of time period a similar proportion of males and females were
recorded (see Table 42). Pedestrians were categorised according to a given age range based on
appearance. Of all pedestrians, 0.51% (3) appeared to be children (i.e. appeared to be below 12
years old) and 4.58% (27) appeared to be over 60 years old. The remaining 94.92% (560)
appeared to be aged between 12-60 years old (see Table 42).

172
Table 42: Spanish Data - Frequency/proportion of participants according to gender, age group, and time
period for the up escalator
Age Ranges Totals
<12
yrs
%
[Freq]
U60
yrs
%
[Freq]
>60
yrs
%
[Freq]
Gender
Total
%
[Freq]
Period
Total
[Freq]
Rush-
hour
Males 0.5
[1]
44.8
[181]
1.6
[3]
45.8
[185] 404
Females 0.9
[2]
53.0
[214]
1.4
[3]
54.2
[219]
Non-rush
hour
Males 0.0
[0]
41.4
[77]
12.5
[10]
47.3
[88] 186
Females 0.0
[0]
47.3
[88]
10.2
[9]
52.7
[98]
Total 0.5
[3]
94.9
[560]
4.6
[27] 590
In total, 366 escalator users were recorded using the down escalator: 252 during the rush-hour
and 114 during the non-rush hour (see Table 43). In addition, 169 pedestrians using the adjacent
stair were recorded. There were slightly more females than males recorded during both periods
(the rush-hour and non-rush hour) on the down escalator (see Table 43). Of all pedestrians
recorded, 11.2% (41) appeared to be children (i.e. appeared to be below 12 years old) and 3.01%
(11) appeared to be over 60 years old. The remaining 85.8% (560) appeared to be aged between
12-60 years old (see Table 42).

173
Table 43: Spanish Data - Frequency/proportion of participants according to gender, age group, and time
period for the down escalator
Age Ranges Totals
<12
yrs
%
[Freq]
U60
yrs
%
[Freq]
>60
yrs
%
[Freq]
Gender
Total
%
[Freq]
Period
Total
[Freq]
Rush-
hour
Males 9.9
[25]
36.9
[93]
0.0
[0]
46.8
[118] 252
Females 6.4
[16]
45.6
[115]
1.2
[3]
53.2
[134]
Non-rush
hour
Males 0.0
[0]
32.5
[37]
3.5
[4]
36.0
[41] 114
Females 0.0
[0]
60.5
[69]
3.5
[4]
64.0
[73]
Total 11.2
[41]
85.8
[314]
3.0
[11] 366
7.3.1 Escalator/Stair usage
The number of pedestrians that used each escalator and adjacent stair was recorded for both the
up and down direction in both rush-hour and non-rush hour periods (see Table 44).
In total, 535 pedestrians were recorded descending to the lower level using either the down
escalator or adjacent stair. Of these, significantly more (68.4% (366)) were escalator users than
stair users (31.6% (252)) (χ²=20.7, p<0.05). Little difference can be seen between the number of
pedestrians using the escalator/stair during the rush-hour and non-rush hour. (χ²=0.05, p>0.05).
This suggests that that time period has little influence upon escalator/stair usage in the down
direction.
In total, 682 device users were recorded ascending to the higher level using the up escalator or
adjacent stair. As in the down direction significantly more (86.5% (590)) used the escalator than
the stairs (13.4% (92)) (χ²=362.2, p<0.05). Unlike the down direction, significantly more
escalator users (94.4% (186)) were recorded in the non-rush hour compared to the rush-hour
period (χ²=13.9, p<0.05). It is thought that this is influenced by the higher number of pedestrians
simultaneously traversing the area during the rush-hour. This typically resulted in an increased
queue length for the escalator and so a higher proportion of stair users was recorded.

174
Comparing each direction, overall there were significantly more escalator users (86.5% (590) in
the up direction than in the down direction (68.4% (366)) (χ²=57.2, p<0.05). This is expected
considering the further benefit the up escalator provides compared to the down escalator in terms
of increased speed and decreased energy expenditure.
Overall the results suggest that, irrespective of direction of travel, the majority of pedestrians
strongly preferred to use the escalator rather than the stair. However, the escalator is more
favoured in the up direction compared to the down direction.
Table 44: Spanish Data - Breakdown of escalator to stair users in the up and down directions during rush
and non-rush hour periods
Escalator
User
Frequency
%
[Freq]
Stairs
User
Frequency
%
[Freq]
Up
Escalator
Rush-hour 83.3
[404]
16.7
[81]
Non-rush hour 94.4
[186]
5.6
[11]
Total 86.5
[590]
13.5
[92]
Down
Escalator
Rush-hour 68.9
[252]
31.1
[114]
Non-rush hour 67.5
[114]
32.5
[55]
Total 68.4
[366]
31.6
[169]
Overall
Rush-hour 77.1
[656]
22.9
[195]
Non-rush hour 82.0
[300]
18.0
[66]
Total 78.6
[956]
21.4
[261]
7.3.2 Walker/Rider usage
In total, 956 escalator users were recorded either walking or riding for both the up and down
directions during both rush and non-rush hour periods (see Table 45). From these results it can
be seen that irrespective of time of day or direction of travel the most preferred method for
traversing an escalator was by riding (χ²=244.0, p<0.05). No significant difference between the
number of walkers/riders in each period could be found (up (χ²=3.3, p>0.05) or down (χ²=0.0,

175
p>0.05)). Similar to the escalator/stair usage data, this suggests that time of day and subsequent
levels of motivation have little influence upon walker/rider choice.
Significantly more walkers were observed in the up direction compared to down direction
(χ²=45.0, p<0.05). It is suggested this is because pedestrians travelling up were about to leave the
station. Pedestrians travelling on the down escalator only derived benefit to their journey from
walking on the escalator if a train was about to arrive; otherwise they would have to wait after
traversing the escalator. Such results potentially suggest that „post-escalator action‟ influences
escalator walker/rider choice.
Table 45: Spanish Data - Breakdown of walkers to riders in the up and down directions during rush and non-
rush hour periods
Walker
Frequency
%
[Freq]
Rider
Frequency
%
[Freq]
Up Escalator
Rush-hour 29.2
[118]
70.8
[286]
Non-rush
hour
22.0
[41]
78.0
[145]
Total 27.0
[159]
73.0
[431]
Down Escalator
Rush-hour 21.0
[53]
79.0
[199]
Non-rush
hour
21.1
[24]
78.9
[90]
Total 21.0
[77]
79.0
[289]
Overall
Rush-hour 26.1
[171]
73.9
[485]
Non-rush
hour
21.7
[65]
78.3
[235]
Total 24.7
[236]
75.3
[720]
7.3.3 Side usage
In total, 956 escalator users were recorded using different positions for both the up and down
directions during the rush and non-rush hour periods (see Table 46). The data suggest that there
is a clear common side preference for riders to use the right side and walkers to use the left side
of an escalator.

176
Irrespective of direction, a similar proportion of riders used the right side of the escalator in both
the rush-hour (80.0%) and non-rush hour (81.4%) periods (χ²=0.18, p>0.05). During both the
rush-hour periods the side preference of 404 up escalator users was noted, of whom 70.8% (286)
were riders. The majority of these riders (89.5% (256)) adopted the right side. During the non-
rush hour period the side preference of 186 up escalator users were noted, of whom 78.5% (146)
were riders. Of these, 87.7% (128) of the riders adopted the right position. There is no significant
difference between the frequency of riders that used each position in each period on the up
escalator (χ²=0.15, p>0.05).
Table 46: Spanish Data - Breakdown of side preference for escalator users in the up and down directions
during rush and non-rush hour periods
Direction Period Walker/Rider
Left
%
[Freq]
Right
%
[Freq]
Centre
%
[Freq]
Varied
%
[Freq]
Period
Total
%
[Freq]
Total
%
[Freq]
Up
Rush-hour
Walkers 47.5
[56]
30.5
[36]
12.7
[15]
9.3
[11] 68.5
[404]
61.7
[590]
Riders 10.5
[30]
89.5
[256]
0.0
[0]
0.0
[0]
Non-rush hour
Walkers 45.0
[18]
25.0
[10]
7.5
[3]
22.5
[9] 31.5
[186] Riders
11.6
[17]
87.7
[128]
0.7
[1]
0.0
[0]
Total
Walkers 46.8
[74]
29.1
[46]
11.4
[18]
12.7
[20] 590
Riders 10.9
[47]
88.9
[384]
0.2
[1]
0.0
[0]
Down
Rush-hour
Walkers 37.7
[20]
35.8
[19]
11.3
[6]
15.1
[8] 69.6
[252]
38.3
[366]
Riders 26.1
[52]
66.3
[132]
4.0
[8]
3.5
[7]
Non-rush hour
Walkers 33.3
[8]
33.3
[8]
4.2
[1]
29.2
[7] 30.4
[114] Riders
22.2
[20]
71.1
[64]
6.7
[6]
0.0
[0]
Total
Walkers 36.4
[28]
35.1
[27]
9.1
[7]
19.5
[15] 366
Riders 24.9
[72]
67.8
[196]
4.8
[14]
2.4
[7]
Overall
Rush-hour
Walkers 44.4
[76]
32.2
[55]
12.3
[21]
11.1
[19] 68.6
[656]
956
Riders 16.9
[82]
80.0
[388]
1.6
[8]
1.4
[7]
Non-rush hour
Walkers 40.6
[26]
28.1
[18]
6.3
[4]
25.0
[16] 31.4
[300] Riders
15.7
[37]
81.4
[192]
3.0
[7]
0.0
[0]
Overall
Walkers 43.4
[102]
31.1
[73]
10.6
[25]
14.9
[35] 956
Riders 16.5
[119]
80.4
[580]
2.1
[15]
1.0
[7]

177
The majority of escalator riders adopted the right position in both the rush-hour (71.1% (64)) and
non-rush hour (66.3% (132)) periods in the down direction (χ²=0.58, p>0.05). This is similar to
that recorded for the up direction. This suggests that time period has little influence for up
escalator side usage.
During both periods on the down escalator, it can be seen that walkers did not adopt a common
side preference. An even proportion of walkers elected to use both the right and left side of the
escalator. In addition, compared to the up escalator users, a lower proportion of riders were
observed to adopt the common side preference of standing on the right side. The difference in
side usage is perhaps caused by the smaller number of pedestrians simultaneously using the
escalator in the down direction compared to the up direction. In the down direction pedestrian
arrival to the escalator was more sporadic, coming from various locations. In the up direction
pedestrians arrive at the escalator from single trains in higher concentrations. As such, for the
down direction, many walkers and riders may not have felt it was necessary to keep to a certain
side of the escalator as it perhaps did not inconvenience many other escalator users. This
suggests that pedestrian behaviour on escalators may take into consideration the experience of
other escalator users.
7.3.4 Walker speeds
Given that the camera views were occasionally obstructed by escalator users it was not possible
to measure the speeds of all escalator walkers. In total, 52 walker speeds were recorded: 34 in the
up direction and 18 in the down direction. The frequency distribution for all walker speeds can
be seen Figure 46. Analysis of the walker speed frequency distributions, regardless of
segregating according to sub-categories (e.g. direction of travel, time period, etc), showed each
distribution not to be normal (using a Kolmogorov-Smirnov test). As such the non-parametric 2
sample Mann-Whitney U- test was used to determine if there were any significant differences
between walker speeds in each category. The breakdown of average walker speeds is
summarised in Table 47.

178
Figure 46: Spanish Data - Horizontal escalator walker speed frequency distribution (combined for direction,
time period and gender)
Table 47: Spanish Data - Average horizontal walker speeds
Down
(m/s)
Up
(m/s)
Gender Rush-hour Non-rush Overall Rush-hour Non-rush Overall
Average
Males 0.84
[0.72-1.04]
1.30
[1.16-1.51]
1.1
[0.72-1.51]
0.77
[0.51-1.39]
0.83
[0.80-0.86]
0.78
[0.51-1.39]
Females 0.82
[0.68-1.09]
0.74
[0.59-1.00]
0.76
[0.59-1.09]
0.74
[0.50-1.19]
0.69
[0.51-0.83]
0.71
[0.50-1.19]
Overall 0.83
[0.68-1.09]
0.89
[0.59-1.51]
0.86
[0.59-1.51]
0.76
[0.50-1.39]
0.71
[0.51-0.86]
0.74
[0.50-1.39]
Frequency
Males 4 3 7 13 2 15
Females 3 8 11 9 10 19
Overall 7 11 18 22 12 34
On average escalator users walked 16.2% (0.12 m/s) faster in the down direction than in the up
direction, though this did not represent a significant difference (p>0.05). Segregating according
to time period escalator walkers were on average observed to walk 7.2% (0.06 m/s) faster in the
non-rush hour in the down direction and 7.0% (0.05 m/s) faster in the rush hour period in the up
direction. No significant difference was found between walker speeds in the rush-hour and non-
rush hour periods (p>0.05). On average males walked 44.7% (0.34 m/s) and 9.9% (0.07 m/s)
faster in both the down and up direction respectively. Both were significantly faster than females
(p<0.05).

179
7.3.5 Flow-rates
The entry flow-rate was recorded for the down escalator and the exit flow-rate was recorded for
the up escalator. The breakdown of average, maximum and minimum flow-rates is summarised
in Table 48.
Table 48: Spanish Data – Minimum, average and maximum escalator flow-rates
Period Direction
Min
(ped/min)
Avg
(ped/min)
Max
(ped/min)
Rush-hour
flow-rate
Down
(entry) 4.0 9.0 19.0
Up
(exit) 2.0 15.3 41.0
Non-rush
hour flow-
rate
Down
(entry) 1.0 4.5 9.0
Up
(exit) 1.0 6.7 19.0
Overall
Down
(entry) 1.0 6.8 19.0
Up
(exit) 1.0 11.0 41.0
Irrespective of time period, the up escalator flow-rate was on average higher than the down
escalator. This would be expected as more people were typically observed simultaneously
arriving (from underground trains) at any given time on the up escalator. The arrival of
pedestrians to the down escalator was typically more sporadic as they were not all
simultaneously coming from the same location. As such the maximum down escalator flow-rates
are reflective of the dispersed arrival times to the escalator rather than the maximum achievable
flow-rates being imposed by the structural dimensions of the escalator. Indeed the maximum
down escalator flow-rates are considerably lower than that recorded in other studies mentioned
in the literature review. In total, 10 pedestrians were observed to carry items of luggage (e.g.
bags, etc) upon both escalators. The scarcity with which this occurred meant that it is expected to
have little influence upon the recorded escalator flow-rates. As such analysis of escalator flow-
rates according to user luggage has not been included.
The average flow-rate was 128.4% and 50.0% higher for the up and down escalators respectively
in the rush-hour period than in the non-rush hour period. The highest flow-rate recorded was on
the up escalator during the rush-hour at a rate of 41.0 ped/min in the twenty-sixth minute (1560-
1620 seconds) (see Table 48 & Figure 47). During this period there was a high proportion of
riders (95.1%) with the majority of pedestrians using the right side (82.9%). This highlights that

180
the width of the escalator was not being fully utilised even during this period. There were a
slightly higher proportion of females (56.1%) than males (43.9%).
Figure 47: Spanish Data - Rush-hour up: peak flow-rate (highlighted by the red circle) with corresponding
proportion of males/females, walkers/riders, and side usage (highlighted by the red arrows)
The highest entry flow-rate for the down escalator was during the rush-hour period when a flow-
rate of 19 ped/min was recorded in the twenty-eighth minute (see Table 48 & Figure 48). During
this period there were a high proportion of riders (89.5%) with a slightly higher proportion of
participants using the right side than the left (63.2%). A similar proportion of males (52.6%) and
females (47.4%) were recorded.

181
Figure 48: Spanish Data - Rush-hour down: peak flow-rate (highlighted by the red circle) with corresponding
proportion of males/females, walkers/riders, and side usage (highlighted by the red arrows)
Analysis of the highest flow-rate curves suggests that the flow-rates recorded were not physically
constrained by the escalators but determined by the pedestrians themselves with most pedestrians
not using all available space on the escalators (i.e. using both sides and all available treads).
7.4 Analysis of Chinese data
The Chinese video footage was collected in the People‟s Square underground station, Shanghai,
China. The station itself is located in the centre of the city and as such is located near a number
of large office buildings, shopping centres and tourist attractions. Consequently it is used by a
large number of pedestrians every day for travelling about the city. During peak rush-hour
periods high crowd densities on the platform areas can be observed. These can exceed 1.08
ped/m² which represents Fruin‟s Level of Service D, described as “representing only the most
crowded public areas” [Fruin, 1971]. At the time of the data collection the station serviced two
tube lines (Line 1 and Line 2). Within this study, data from two identical escalators was collected
at different times. Both were up escalators identified as Escalator A (recorded during the rush-
hour) and Escalator D (recorded during the non-rush hour). Both escalators linked the same

182
platform level to the above lobby level of Line 1. Local restrictions meant that data collection
from equivalent down escalators was not possible.
Each escalator had an adjacent stair that provided pedestrians with an alternate means of
traversal. The platform is double-sided, which means that trains arrive on both sides of the
platform (going in opposite directions). Subsequently pedestrians on the platform level can
approach the escalator/stair from either the stair or escalator side. This is typically dictated by
which side of the platform a train arrives on. For each escalator, two personal digital video
cameras were used to record the footage. Both of the escalator entrances (on the platform level)
and exits (on the lobby level) were recorded (from different angles for each escalator in order to
assist in obtaining different types of data (see Figure 49)). Each camera recorded footage for 1
hour for each escalator/stair (a total of 2 hours of footage for both escalators/stairs).
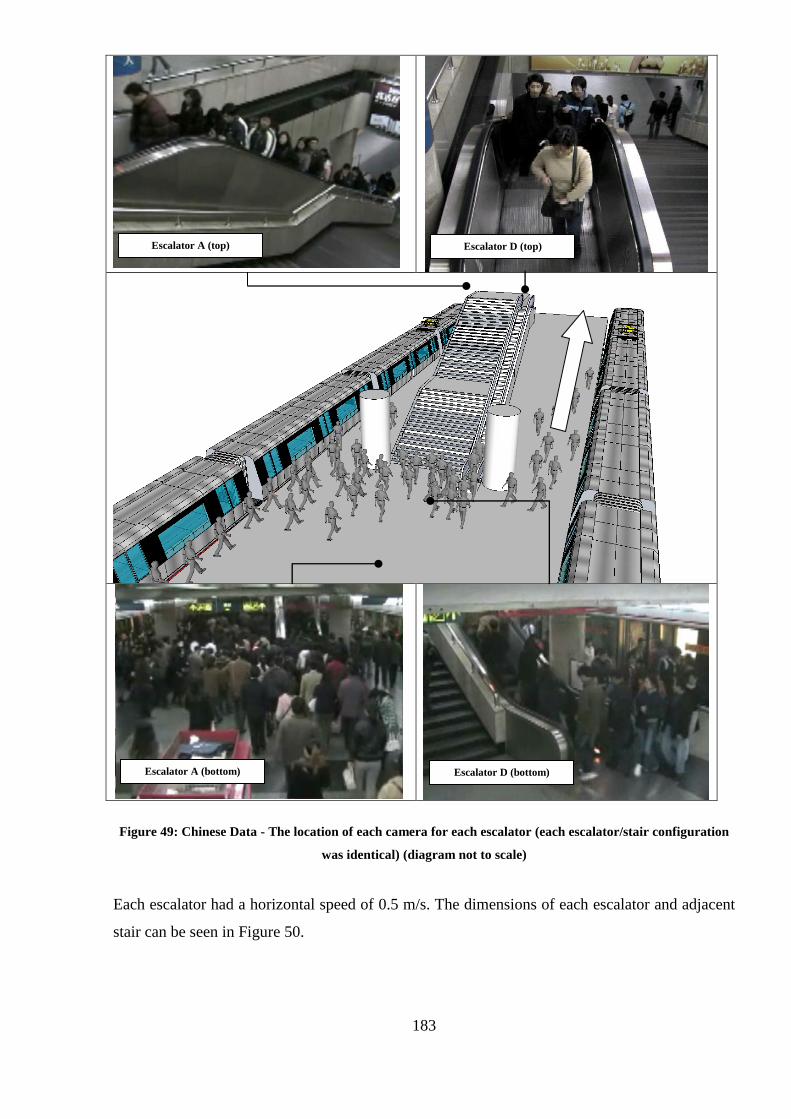
183
Figure 49: Chinese Data - The location of each camera for each escalator (each escalator/stair configuration
was identical) (diagram not to scale)
Each escalator had a horizontal speed of 0.5 m/s. The dimensions of each escalator and adjacent
stair can be seen in Figure 50.
Escalator A (top) Escalator D (top)
Escalator A (bottom) Escalator D (bottom)

184
A: Escalator dimensions B: Stairway dimensions Figure 50: Chinese Data - Escalator (a) and Staircase (b) dimensions
Due to certain camera angles and permission restrictions, it was not possible to collect the same
items of data for each escalator/stair. The breakdown of data collected for each escalator can be
seen in Table 49.
Table 49: Chinese Data - Analysis performed according to period
Escalator A
(Rush-hour)
Escalator D
(Non-rush hour)
Escalator/Stair usage x
Side usage Frequencies
x
Walkers/Rider usage x x
Walker Speeds x x
Flow-rates
x
In total, around 4,787 pedestrians were recorded using each escalator; 2,752 during the rush-hour
(Escalator A) and 2,035 during the non-rush hour (Escalator D). In addition, some 2,451 stair
users during the rush-hour period were also recorded. Due to the camera angles used, data
relating to pedestrian age and gender was not collected during the rush-hour. However,
pedestrian age and gender information was collected during the non-rush hour (see Table 50).
During the non-rush hour a similar proportion of males and females were recorded. A small
proportion of pedestrians appeared to be below 12 years old (3.0%) or older than 60 years old
(2.5%). The remaining 94.4% (1,922) of pedestrians appeared to be aged between 12-60 years
old.

185
Table 50: Chinese Data - Frequency/proportion of participants according to gender and age group for the up
non-rush hour escalator
Age Ranges Totals
<12
yrs
%
[Freq]
U60
yrs
%
[Freq]
O60
yrs
%
[Freq]
Gender
Total
%
[Freq]
Period
Total
[Freq]
Non-rush
hour
Males 3.1
[33]
94.6
[993]
2.3
[24]
51.6
[1050]
2035 Females 2.9
[29]
94.3
[929]
2.7
[27]
48.4
[985]
Overall 3.0
[62]
94.4
[1922]
2.5
[51]
100.0
[2035]
7.4.1 Escalator/Stair usage
Pedestrians arrived at the escalator/stair from arriving trains. It was possible to identify from the
footage when trains arrived/departed on each side of the platform. As such the escalator/stair
usage analysis has been segregated according to train arrival side. This is intended to explore
whether side of approach influences escalator/stair usage. In addition, increases in pedestrian
traffic have been associated with increased stair usage by Zeiler et al [Zeiler, et al., 2010] and
Knehs [Knehs, 2010]. This is because as escalators become oversubscribed more pedestrians
elect to use adjacent stairs. As such the analysis has been further segregated according to batches
of pedestrians from arriving trains: each train arrival was classed as a separate batch. Since each
train had different numbers of pedestrians alighting at any one time, has allowed the influence of
pedestrian traffic upon escalator/stair usage to be measured.
During the non-rush hour period, the camera angles did not offer a full view of the exit or
entrance of the adjacent stair. As such the escalator/stair usage frequencies were only collected
during the rush-hour. There was a wide variation in the number of pedestrians per batch and the
subsequent levels of congestion observed at the foot of the escalator/stair during the rush-hour. It
was therefore deemed necessary to segregate each batch according to the levels of congestion at
the foot of the escalator/stair; defined as either being “congested” or a “non-congested”. Due to
the high levels of congestion within the “congested period”, it was not possible to record
individual pedestrian details. As such during these periods only the number of pedestrians that
used the escalator/stair was collected.
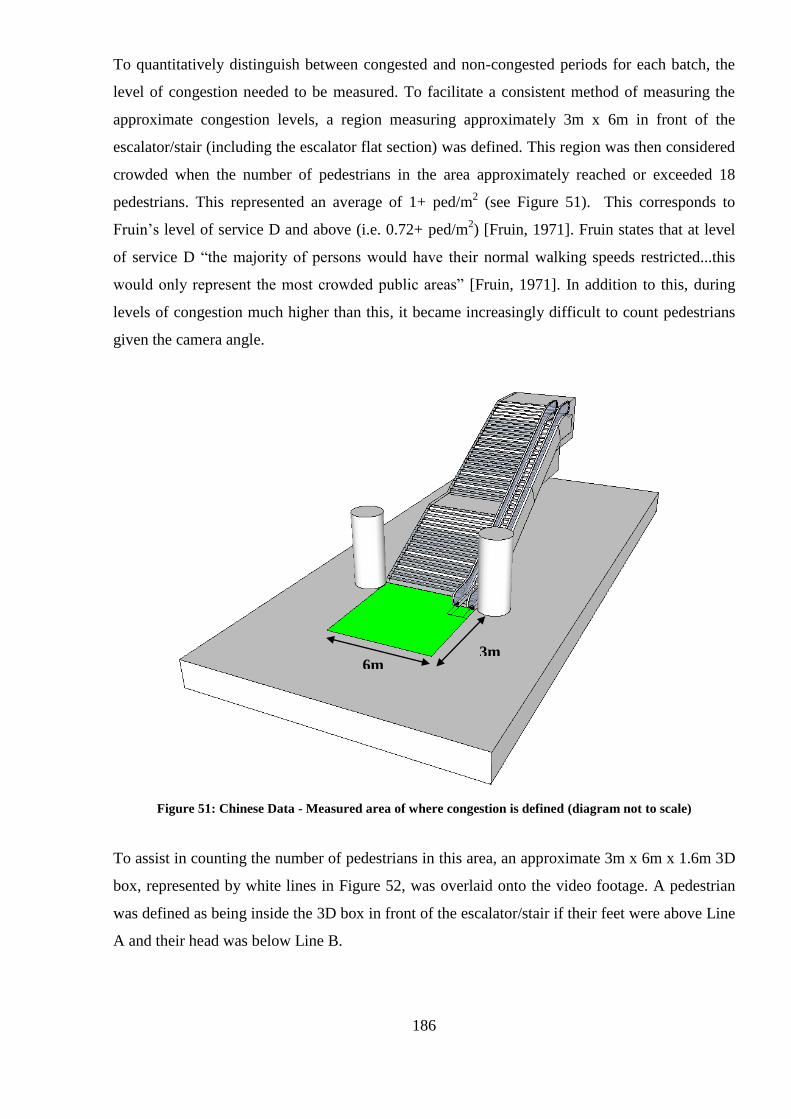
186
To quantitatively distinguish between congested and non-congested periods for each batch, the
level of congestion needed to be measured. To facilitate a consistent method of measuring the
approximate congestion levels, a region measuring approximately 3m x 6m in front of the
escalator/stair (including the escalator flat section) was defined. This region was then considered
crowded when the number of pedestrians in the area approximately reached or exceeded 18
pedestrians. This represented an average of 1+ ped/m2 (see Figure 51). This corresponds to
Fruin‟s level of service D and above (i.e. 0.72+ ped/m2) [Fruin, 1971]. Fruin states that at level
of service D “the majority of persons would have their normal walking speeds restricted...this
would only represent the most crowded public areas” [Fruin, 1971]. In addition to this, during
levels of congestion much higher than this, it became increasingly difficult to count pedestrians
given the camera angle.
Figure 51: Chinese Data - Measured area of where congestion is defined (diagram not to scale)
To assist in counting the number of pedestrians in this area, an approximate 3m x 6m x 1.6m 3D
box, represented by white lines in Figure 52, was overlaid onto the video footage. A pedestrian
was defined as being inside the 3D box in front of the escalator/stair if their feet were above Line
A and their head was below Line B.
18+ People
6m 3m

187
Figure 52: Chinese Data – Rush-hour, platform level: Video screen grab of area where congestion is defined
Using this approach there are two instances relating to extremes of a person's height that can
result in an inaccuracy during the counting process. The first instance occurs with very small
pedestrians: it is possible that a small pedestrian leaves the given area and enters onto the stair
but their head remains below Line B. This would effectively mean that pedestrian would still be
counted as being in the area (see Figure 53, Instance 1). The second instance occurs with very
tall pedestrians present in the area: it is possible that a very tall pedestrian is never counted as
their head moves above Line B before their feet move above Line A. This would effectively
mean they are never counted (see Figure 53, Instance 2). The height a pedestrian would need to
be to fit each instance can be approximated to 1.5m or less for Instance 1 and 2.5m or greater for
Instance 2. Despite the possibility of such instances occurring, neither was observed during the
data collection process.
Line A
Line B
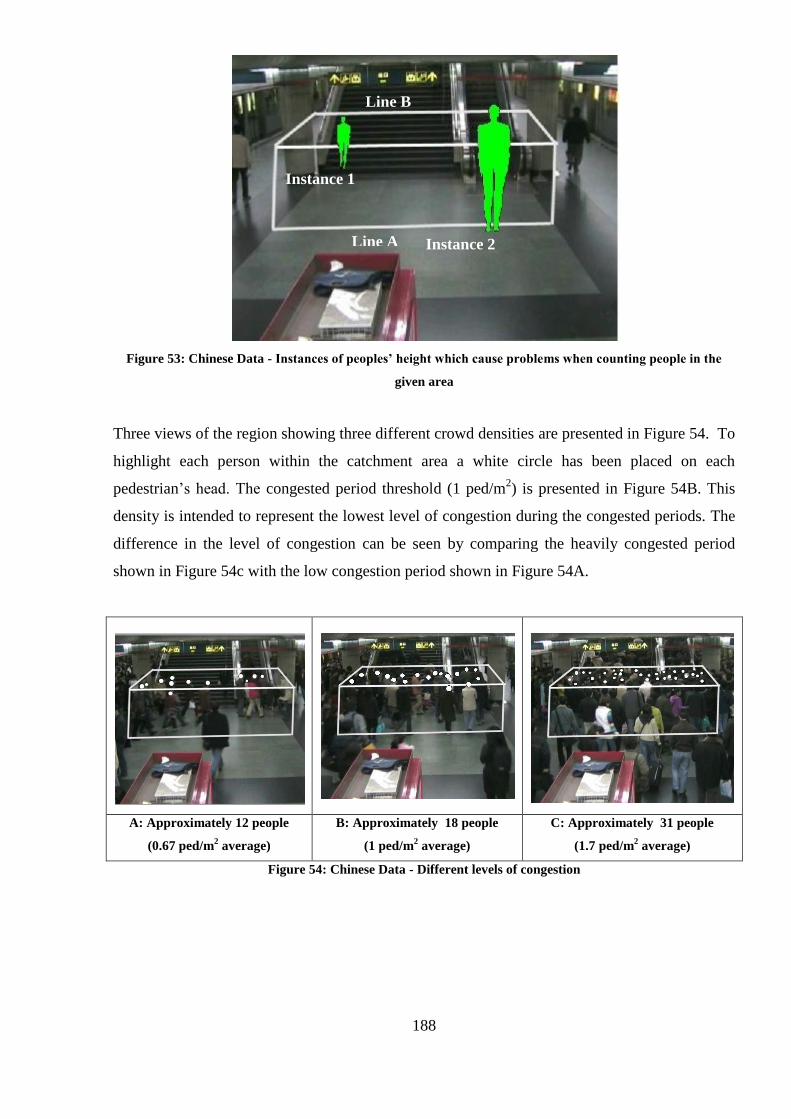
188
Figure 53: Chinese Data - Instances of peoples’ height which cause problems when counting people in the
given area
Three views of the region showing three different crowd densities are presented in Figure 54. To
highlight each person within the catchment area a white circle has been placed on each
pedestrian‟s head. The congested period threshold (1 ped/m2) is presented in Figure 54B. This
density is intended to represent the lowest level of congestion during the congested periods. The
difference in the level of congestion can be seen by comparing the heavily congested period
shown in Figure 54c with the low congestion period shown in Figure 54A.
A: Approximately 12 people
(0.67 ped/m2 average)
B: Approximately 18 people
(1 ped/m2 average)
C: Approximately 31 people
(1.7 ped/m2 average)
Figure 54: Chinese Data - Different levels of congestion
Instance 2
Instance 1
Line B
Line A

189
For the analysis of the congested periods, the number of pedestrians was only recorded when the
levels of congestion reached or exceeded 18 people in the 3m x 6m area. This ensured that all
pedestrians recorded in the batch used either the escalator or stair during a period of sufficient
congestion.
The catchment area where congestion is measured took some time for the specified levels of
congestion to build up once a train had arrived. The first pedestrians to enter the escalator/stair
area were typically the first to leave the train and were also positioned close to the escalator/stair.
Towards the end of each congested period, the levels of congestion gradually decreased as no
new pedestrians entered the area. The last pedestrians to enter the escalator/stair area were
typically the last to leave the train and/or were also positioned furthest away from the
escalator/stair. During both of these periods, despite being part of a congested period, pedestrians
about to traverse the escalator/stair would have made their device choice during a non-congested
period. These pedestrians made their escalator/stair choice when large crowds of other
pedestrians were in front or behind them. As such for consistency with the non-congested data,
these pedestrians were excluded from the analysis.
It should be highlighted that even with such methods to assist the counting process, a number of
factors contributed to potential counting errors. These include human error in counting large
numbers of people, the restricted camera angles provided and pedestrians obstructing views.
Consequently the method of counting provides an approximation of the number of pedestrians in
the area. The extent to which such errors occur is uncertain and requires further investigation.
In total, 4,531 pedestrians were recorded ascending to the upper level using the escalator or the
adjacent stair; 1,182 during non-congested periods (20 train arrivals) and 3,349 during congested
periods (8 train arrivals) (see Table 51). During the non-congested periods 76.7% (907) of all
pedestrians used the escalator (χ²=336.9, p<0.05). Irrespective of which device pedestrians were
initially closest (i.e. train arrival side), the escalator was the preferred device with similar
proportion of escalator users (74.5%-81.7%) recorded in all non-congested periods (χ²=5.8,
p>0.05). This suggests that the side of approach to the escalator/stair does not exert a
considerable influence upon device selection during non-congested periods.

190
Table 51: Chinese Data - Non-congested escalator/stair users
Train
Arrival
Side
Arrival
Frequency
Escalator
User
Frequency
Stair
Users
Frequency
%
Escalator
Users
Escalator 7 532 172 75.6
Stair 9 184 63 74.5
Both
(2 trains) 4 191 40 82.7
Overall 20 907 275 76.7
During the congested periods over twice (64.7% (2,167)) as many pedestrians were observed
compared to the non-congested periods. During these periods, trains were recorded as either
arriving on the stair side or two trains arriving simultaneously on both sides (i.e. no instance of a
single train arriving on the escalator side was observed). Approximately the same proportion of
pedestrians (35.0%-35.1%) were observed using the escalator when trains arrived from either the
stair or both sides simultaneously (χ²=0.001, p>0.05). As with the non-congested periods this
suggests that during congested periods the side of approach has little influence upon
escalator/stair usage.
During the congested periods, crowds formed around the entrance of the escalator/stair, the base
of the stair and along the platform. In these circumstances some pedestrians were likely heavily
influenced by the crowd into using a particular device simply based on proximity and ease of
accessibility to the device. The relative width of the escalator/stair is expected to have some
influence on the proportion of pedestrians using each device during such periods. Given that the
stair is some 3.3 times wider than the escalator, if there were an equal preference to use the stair
and the escalator based on width alone then we would expect the stair to attract around 330%
times as many users. However, we find that the stair attracts some 190% more users. Thus,
while the relative widths of the devices may be influencing pedestrians‟ choice, pedestrians are
also exercising some discretion concerning device usage (e.g. assessing local conditions,
influenced by personal factors, etc).
Table 52: Chinese Data - Congested escalator/stair users
Train
Arrival
Side
Arrival
Frequency
Escalator
User
Frequency
Stair
Users
Frequency
%
Escalator
Users
Stair 3 250 463 35.1
Both
(2 trains)
5 923 1713 35.
Overall 8 1173 2176 35.0
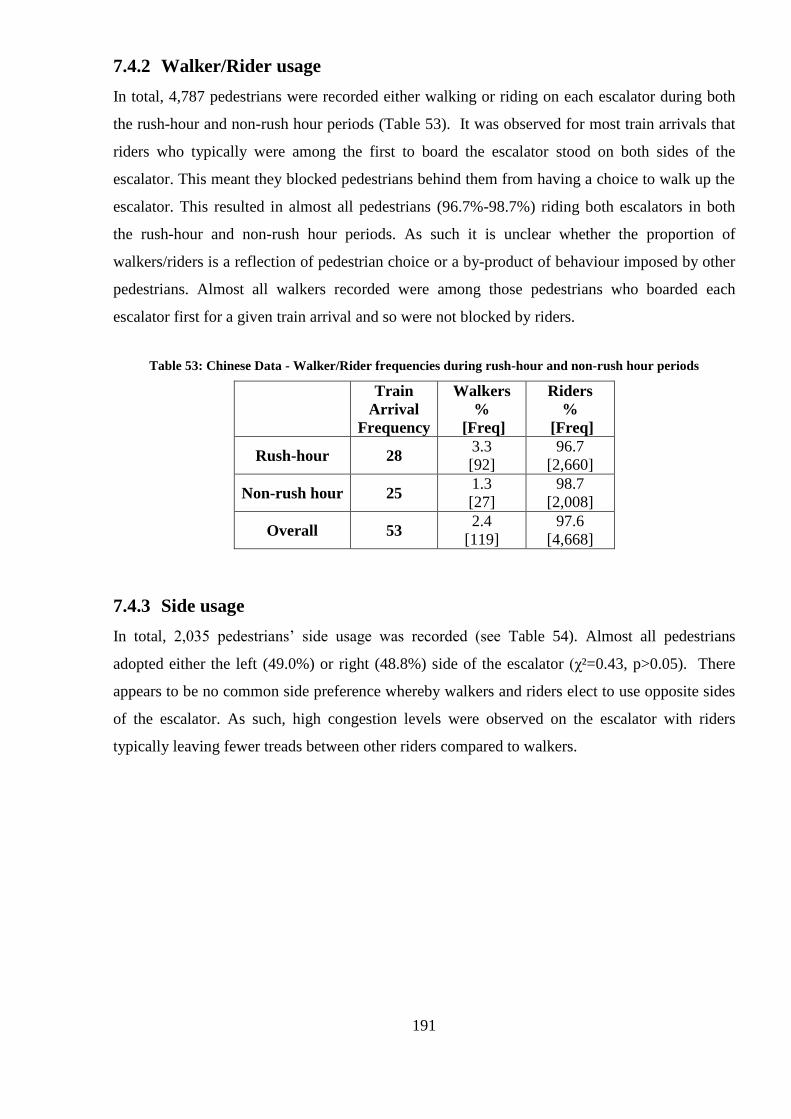
191
7.4.2 Walker/Rider usage
In total, 4,787 pedestrians were recorded either walking or riding on each escalator during both
the rush-hour and non-rush hour periods (Table 53). It was observed for most train arrivals that
riders who typically were among the first to board the escalator stood on both sides of the
escalator. This meant they blocked pedestrians behind them from having a choice to walk up the
escalator. This resulted in almost all pedestrians (96.7%-98.7%) riding both escalators in both
the rush-hour and non-rush hour periods. As such it is unclear whether the proportion of
walkers/riders is a reflection of pedestrian choice or a by-product of behaviour imposed by other
pedestrians. Almost all walkers recorded were among those pedestrians who boarded each
escalator first for a given train arrival and so were not blocked by riders.
Table 53: Chinese Data - Walker/Rider frequencies during rush-hour and non-rush hour periods
Train
Arrival
Frequency
Walkers
%
[Freq]
Riders
%
[Freq]
Rush-hour 28 3.3
[92]
96.7
[2,660]
Non-rush hour 25 1.3
[27]
98.7
[2,008]
Overall 53 2.4
[119]
97.6
[4,668]
7.4.3 Side usage
In total, 2,035 pedestrians‟ side usage was recorded (see Table 54). Almost all pedestrians
adopted either the left (49.0%) or right (48.8%) side of the escalator (χ²=0.43, p>0.05). There
appears to be no common side preference whereby walkers and riders elect to use opposite sides
of the escalator. As such, high congestion levels were observed on the escalator with riders
typically leaving fewer treads between other riders compared to walkers.

192
Table 54: Chinese Data - Side preference for escalator users during the non-rush hour period
Period Walker/Rider
Left
%
[Freq]
Right
%
[Freq]
Centre
%
[Freq]
Varied
%
[Freq]
Total
%
[Freq]
Non-rush
hour
Walkers 33.33
[9]
29.93
[8]
7.41
[2]
29.63
[8]
1.3
[27]
Riders 49.00 [984]
47.61 [956]
3.29 [66]
0.10 [2]
98.7
[2,008]
All 47.37
[993]
48.80
[964]
3.34
[68]
0.49
[10] 2,035
7.4.4 Walker speeds
Given that the camera views were occasionally obstructed by escalator users it was not possible
to measure the speeds of all escalator walkers. In total, 79 escalator walker speeds were
recorded. Over twice as many walker speeds were recorded during the rush-hour (72.2% (57))
than the non-rush hour (27.8% (22)). This is however, expected considering over twice as many
escalator users were recorded in the rush-hour period. Similar proportions of males and females
were recorded in both periods (rush-hour: 57.9% (33) male/42.1% (24) females, non-rush hour:
45.5% (10) males, 54.5% (12) females). Due to most escalator users riding on both sides
resulting in blocking, the walker speeds recorded were typically of those who were among the
first to board the escalator from an arriving train.
The frequency distribution of all walker speeds can be seen in Figure 55. Analysis of the walker
speed frequency distributions, regardless of segregating according to sub-categories (e.g. gender
, time period, etc), showed each distribution not to be normal (using a Kolmogorov-Smirnov
test). As such the non-parametric 2 sample Mann-Whitney U- test was used to determine if there
were any significant differences between walker speeds in each category.

193
Figure 55: Chinese Data - Horizontal escalator walker speed frequency distribution (combined gender and
time period)
The breakdown of average horizontal escalator walker speeds is summarised in Table 55. As
expected, overall walker speeds were significantly faster (34.3% (0.23 m/s)) during the rush-hour
compared to the non-rush hour period (p<0.05).
Males walked significantly faster (8.8%(0.07)) than females (p<0.05). However, this was due to
the greater variation between male and female walker speeds during the non-rush hour period.
Indeed there was no significant difference between the male/female speeds during the rush-hour
(p>0.05). These findings suggest that male and female walker speeds are similar during the rush-
hour. However, whilst both males and females reduce their walker speeds during the non-rush
hour, females do so more than males.
Table 55: Chinese Data - Average Horizontal Walker Speeds
Gender Rush-hour
(m/s) Frequency
Non-rush
(m/s) Frequency Overall Frequency
Average
Males 0.91
[0.69-1.32] 33
0.75
[0.39-0.95] 10
0.87
[0.39-1.32] 43
Females 0.89
[0.59-1.25] 24
0.61
[0.42-0.78] 12
0.80
[0.42-1.25] 36
Overall 0.9
[0.59-1.32] 57
0.67
[0.39-0.95] 22
0.83
[0.39-1.3] 79
7.4.5 Flow-rates
Due to camera viewing restrictions only the exit flow-rate was recorded during the non-rush hour
period in the Chinese data. The flow-rate for each minute can be seen in Figure 56. The highest

194
flow-rate recorded was 102 ped/min in the twenty-first minute (1200-1260 seconds) (see Figure
56 instance „A‟). A similarly high flow-rate of 100ped/min was also recorded in the fifty seventh
minute (3360-3420 seconds) (see Figure 56 instance „B‟). During both of these periods there was
approximately a similar proportion of males (49.0%/52.0%) and females (48.0%/51.0%), with all
pedestrians riding and a similar proportion of pedestrians using both the right (48.0%/49.0%) and
left side (48.0%/49.0%) of the escalator.
Figure 56: Chinese Data - Non-rush hour up: peak flow-rates (highlighted by the red circles) with
corresponding proportion of males/females, walkers/riders, side usage (highlighted by the red arrows)
The flow-rate exceeded 60 ped/min a number of times during the non-rush hour which represents
greater than 1 person exiting the escalator every second. This is reflective of the high crowd
densities observed on the escalator where almost all pedestrians rode the escalator with typically
two pedestrians occupying most escalator treads. The average overall flow-rate was 35ped/min
with a minimum of 1 ped/min recorded in any minute. In total, 13 pedestrians were observed to
carry items of luggage. As with the Spanish data, the scarcity with which this occurred meant
that it is expected to have had little influence upon the recorded escalator flow-rates. As such
analysis of escalator flow-rates according to user luggage has not been included.
7.5 Analysis of English data
The English data was collected in Paddington underground station in London, England. The
station links the underground train network to the mainline national rail services and also forms
A B
A
B
B
B A A

195
part of the Heathrow airport express/connect coach service [Transport, 2010b]. In addition, it
links 4 underground tube lines (Bakerloo, Circle, District, and „Hammersmith & City‟ lines). As
such many commuters and international travellers pass through the station every day. It is
therefore common to find many pedestrians carrying various types of luggage in the station.
The footage of two adjacent escalators and an adjacent stair was collected over a period of two
days. The escalators were moving in opposite directions (see Figure 57). The escalators/stair
linked the ticket hall level of the underground station to the adjoining mainline railway station
platform level.

196
Figure 57: English Data - The location of each camera for each escalator/stair (diagram not to scale)
Each escalator had a vertical drop of 3.65m with a horizontal length of 8.78m and horizontal
speed of 0.5 m/s (see Figure 58). The adjacent three lane stair (separated by two hand rails)
comprised of two flights connected via a single landing.
Up escalator (bottom) Up escalator (top)
Down escalator (bottom) Down escalator (top)

197
A: Escalator dimensions B: Stairway dimensions Figure 58: English Data - Escalator and Stair dimensions
Data was collected via video footage in approximate 20 minute segments during the morning
rush-hour, afternoon non-rush hour and evening rush-hour for both days (2 x 3 x 20 = 120 min of
footage). A technical fault occurred on Day 2 whilst filming the morning rush-hour on the down
escalator. This produced a small time delay of 6.8 minutes in recording. This delay meant the
recording was extended for the same period of time to ensure that a comparable length of footage
was obtained.
In total, 11,019 pedestrians were recorded: 6,123 on the escalators and 4,896 on the stair.
Slightly more males (59.3% (3,629)) were recorded than females (40.7% (2,494)) using each
escalator.
Of all 2,958 escalator users recorded on Day 1, 59.2% (1,752) were males and 40.8% (1,206)
females. Very few escalator users appeared to be under 12 (0.44% (13)) or over 60 years old
(1.7% (51)) (see Table 56). Approximately 22.2% (296) more escalator users were recorded on
the up escalator than on the down escalator. On the up escalator approximately twice as many
pedestrians were recorded during the morning and evening rush-hour compared to the afternoon
non-rush hour period, representing the increased usage during peak times. On the down escalator
there were 36.5% (127) and 46.0% (160) more escalator users recorded in the morning and
evening respectively compared to the afternoon.

198
Table 56: English Data -Day 1 frequency/proportion of participants according to gender, age group, time
period and direction
Age Ranges Totals
<12
yrs
%
[Freq]
U60
yrs
%
[Freq]
>60
yrs
%
[Freq]
Gender
Total
%
[Freq]
Period
Total
%
[Freq]
Day
Total
[Freq]
Up
Morning
Male 0.0
[0]
61.5
[378]
0.2
[1]
61.6
[379] 37.8
[615]
1627
Female 0.0
[0]
37.9
[233]
0.5
[3]
38.4
[236]
Afternoon
Male 0.3
[1]
60.4
[201]
1.5
[5]
62.2
[207] 20.5
[333] Female
0.6
[2]
36.3
[121]
0.9
[3]
37.8
[126]
Evening
Male 0.4
[3]
56.6
[384]
1.2
[8]
58.2
[395] 41.7
[679] Female
0.0
[0]
40.8
[277]
1.0
[7]
41.8
[284]
Down
Morning
Male 0.2
[1]
60.6
[288]
0.6
[3]
61.5
[292] 35.7
[475]
1331
Female 0.2
[1]
38.3
[182]
0.0
[0]
38.5
[183]
Afternoon
Male 1.1
[4]
52.9
[184]
2.6
[9]
56.6
[197] 26.1
[348] Female
0.0
[0]
42.0
[146]
1.4
[5]
43.4
[151]
Evening
Male 0.2
[1]
54.3
[276]
0.6
[3]
55.1
[280] 38.2
[508] Female
0.0
[0]
44.1
[224]
0.8
[4]
44.9
[228]
Total 0.4
[13]
97.8
[2894]
1.72
[51] 2958
Approximately the same number of escalator users were recorded on Day 2 and Day 1 with a
higher proportion of males (59.3%) than females (40.7%) (see Table 57). Considerably more
escalator users (64.4% (771)) were recorded on the up escalator than the down escalator.

199
Table 57: English Data -Day 2 frequency/proportion of participants according to gender, age group, time
period and direction
Age Ranges Totals
<12
yrs
%
[Freq]
U60
yrs
%
[Freq]
>60
yrs
%
[Freq]
Gender
Total
yrs
%
[Freq]
Period Total
yrs
%
[Freq]
Day
Total
[Freq]
Up
Morning
Male 0.3
[3]
58.0
[564]
0.8
[8]
59.2
[575] 49.4
[972]
1968
Female 0.
[2]
40.0
[389]
0.6
[6]
40.8
[397]
Afternoon
Male 0.8
[3]
57.6
[227]
0.8
[3]
59.1
[233] 20.0
[394] Female
0.5
[2]
38.8
[153]
1.5
[6]
40.9
[161]
Evening
Male 0.0
[0]
55.5
[334]
2.5
[15]
58.0
[349] 30.6
[602] Female
0.3
[2]
40.0
[241]
1.7
[10]
42.0
[253]
Down
Morning
Male 0.0
[0]
61.8
[342]
0.7
[4]
62.6
[346] 46.2
[553]
1197
Female 0.0
[0]
36.7
[203]
0.7
[4]
37.4
[207]
Afternoon
Male 0.0
[0]
58.6
[184]
2.5
[8]
61.1
[192] 26.2
[314] Female
0.3
[1]
36.6
[115]
1.9
[6]
38.9
[122]
Evening
Male 0.0
[0]
54.5
[180]
0.6
[2]
55.2
[182] 27.6
[330] Female
0.3
[1]
43.9
[145]
0.6
[2]
44.8
[148]
Total 0.44
[14]
97.2
[3077]
2.34
[74] 3165
7.5.1 Escalator/Stair usage
The frequency/proportion of all escalator/stair users according to day, period, and direction can
be seen in Table 58.
Overall, there were significant differences between the proportion of escalator/stair users in the
up and down direction (χ2= 553.3, p<0.05). In the up direction the escalator was the most used
device (67.0%) (χ2= 620.0, p<0.05). However, in the down direction the stair was the most used
device (55.3%) (χ2= 63.0, p<0.05). This suggests that escalators are more attractive for those
ascending than those descending. This is expected considering the added effort and time required
in travelling in the up direction.

200
Looking at each period, for the up direction significantly more escalator users were recorded
during the morning (χ2=539.1, p<0.05). However, in the down direction there were significantly
more stair users (64.0%) (χ2=63.0, p<0.05). During the afternoon there were significantly more
escalator users irrespective of direction (χ2=105.2, p<0.05). Similarly during the evening period
there were also significantly more escalator users than stair users in both directions (χ2=4.6,
p<0.05). However, this was a weaker correlation than that observed in the other periods. This
suggests that during the evening, whilst the escalator is the most used device, the direction of
travel appears to have less of an influence upon escalator/stair usage compared to the morning
and afternoon periods. Overall, the results highlight that the escalator was the most used device
in all time periods for both directions with the exception of the morning down direction.
Table 58: English Data -Frequencies and proportion of escalator/stair users
Up
%
[Freq]
Down
%
[Freq]
Day 1 Day 2 Overall Day 1 Day 2 Overall
Morning
Stair 28.5
[245]
22.1
[276]
24.7
[521]
64.8
[873]
63.4
[958]
64.0
[1831]
Escalator 71.5
[615]
77.9
[972 ]
75.3
[1587]
35.2
[475]
36.6
[553]
36.0
[1028]
Afternoon
Stair 8.4
[75]
25.2
[133]
22.2
[208]
41.6
[248]
45.6
[263 ]
43.6
[511]
Escalator 81.6
[333]
74.8
[ 394]
77.8
[727]
58.4
[348]
54.4
[314]
56.4
[662]
Evening
Stair 46.3
[586]
43.1
[456]
44.9
[1042]
49.6
[500]
46.2
[283]
48.3
[783]
Escalator 53.7
[679]
56.9
[602]
55.1
[1281]
50.4
[508]
53.8
[330]
51.7
[838]
Overall
Stair 35.8
[906]
30.5
[865]
33.0
[1771]
54.9
[1621]
55.7
[1504]
55.3
[3125]
Escalator 64.2
[1627]
69.5
[1968]
67.0
[3595]
45.1
[1331]
44.3
[1197]
44.7
[2528]
Stair 33.0
[1771]
55.3
[3125]
Escalator 67.0
[3595]
44.7
[2528]
7.5.2 Walker/Rider usage
The frequency and proportion of all escalator walkers/riders according to day, period, and
direction can be seen in Table 59. Of the 6,123 escalator users recorded the majority rode
(74.9%). There was no significant difference between the proportion of walkers/riders between
each day (χ2= 3.787, p>0.05).

201
Table 59: English Data - Frequencies and proportion of walkers/riders
Up
%
[Freq]
Down
%
[Freq]
Day 1 Day 2 Overall Day 1 Day 2 Overall
Morning
Riders 65.5
[403]
64.4
[636]
65.5
[1039]
65.3
[310]
70.3
[389]
68.0
[699]
Walkers 34.5
[212]
34.6
[336]
34.5
[548]
34.7
[165]
29.7
[164]
32.0
[329]
Afternoon
Riders 88.9
[296]
81.2
[320]
84.7
[616]
87.1
[303]
80.9
[254]
84.1
[557]
Walkers 11.1
[37]
18.8
[74]
15.3
[111]
12.9
[45]
19.1
[60]
15.9
[105]
Evening
Riders 78.2
[531]
83.6
[503]
80.7
[1034]
79.7
[405]
71.2
[235]
76.4
[640]
Walkers 21.8
[148]
16.4
[99]
19.3
[247]
20.3
[103]
28.8
[95]
23.6
[198]
Overall
Riders 74.8
[2689]
74.9
[1896]
Walkers 25.2
[906]
25.1
[632]
Riders 74.9
[4585]
Walkers 25.1
[1538]
Overall, significantly more males (29.2%) elected to walk compared to females (19.3%) (χ2=
77.0, p<0.05). There was a significant difference between the number of walker/riders in each
period (χ2= 1.8, p<0.05). Regardless of direction, in the evening periods there were significantly
more walkers (21.0%) than in the afternoon periods (15.6%) (χ2= 16.3, p<0.05). In the morning
periods there were significantly more walkers (33.5%) than in the afternoon (χ2= 147.9, p<0.05)
and evening periods (χ2= 91.404, p<0.05).
Overall there were approximately the same proportion of walkers for both the up (25.2%) and
down (25.1%) directions (χ2=0.03, p>0.05). During the morning periods there were a similar
proportion of walkers for both the up (34.5%) and down escalator (32%) (χ2= 1.8, p>0.05).
Similarly for the afternoon periods there was a comparable proportion of walkers for both the up
(15.3%) and down escalator (15.9%) (χ2= 0.09, p>0.05). However, during the evening
significantly more walkers were observed on the down escalator (23.6%) than on the up escalator
(19.1%) (χ2= 5.8, p<0.05).

202
The results show that time period influences the proportion of walkers/riders. Pedestrians during
the rush-hour periods appear more motivated (reflected in the higher proportion of walkers) than
during the non-rush hour periods. The combination of time period and direction of travel only
appeared to influence the proportion of walkers/riders in the evening. Here significantly more
walkers were recorded in the down direction. It is unclear the reasons for this however, this may
indicate that direction and period influence pedestrians‟ decision to walk/ride on an escalator.
7.5.3 Side usage
The proportion of escalator users according to side preference can be seen in Table 60 (Day 1),
Table 61 (Day 2) and Table 62 (Overall). During both days there was a common side preference
for riders to use the right side and walkers to use the left side of each escalator regardless of
direction, day or period. Indeed a significant number of walkers used the left side (78.2%) and
riders used the right side (88.4%) (χ2= 5,853.6, p<0.05). There was a more significant difference
in the up direction (χ2= 4284.5, p<0.05) (91.6% riders right / 82.9% walkers left) than in the
down direction (χ2= 1699.9, p<0.05) (83.7% riders, right / 71.4% walkers left). This suggests
that those on the up escalator conformed more to the common side preference behaviour than
those on the down escalator. This may be due to more pedestrians typically simultaneously using
the escalator in the up direction. In turn this may have prompted more pedestrians to conform to
either riding on the right side or walking on the left side through not wanting to inconvenience
other escalator users.
Overall the centre (1.3%) and varied (1.6%) positions were adopted by a small proportion of
escalator users over all periods. The majority of escalator users who varied their side whilst on
the escalator were walkers, commonly having to walk around riders whilst traversing the
escalator.
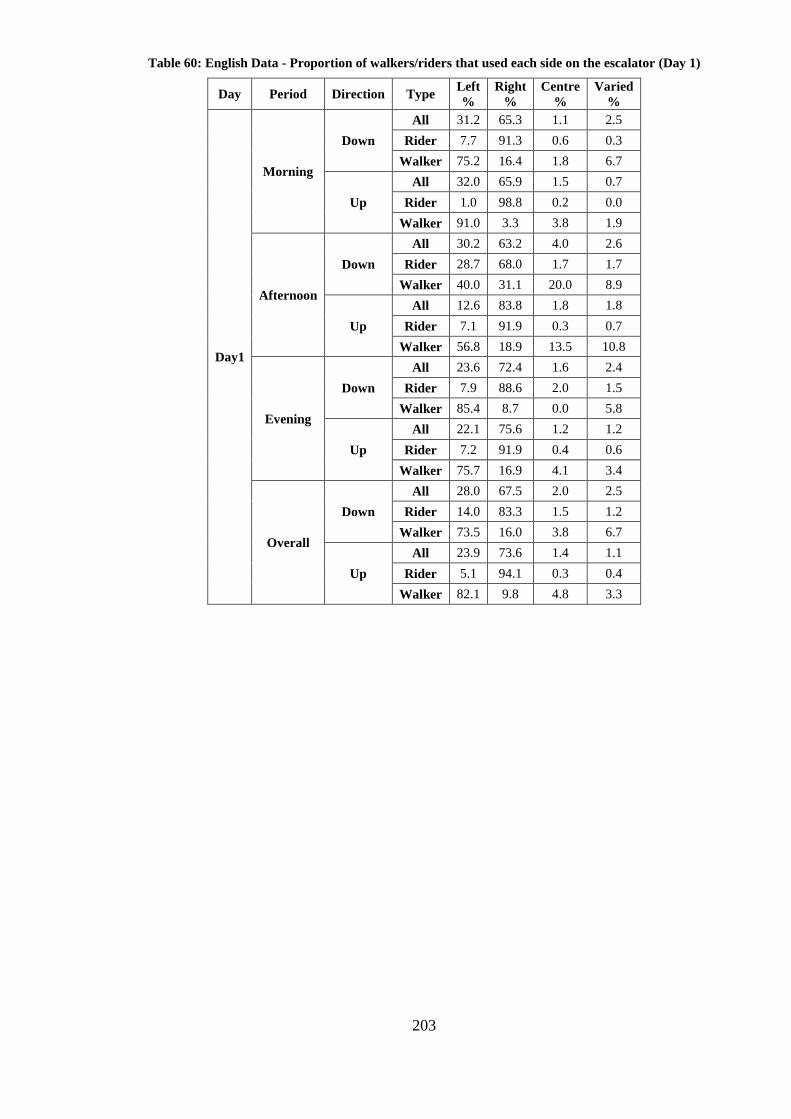
203
Table 60: English Data - Proportion of walkers/riders that used each side on the escalator (Day 1)
Day Period Direction Type Left
%
Right
%
Centre
%
Varied
%
Day1
Morning
Down
All 31.2 65.3 1.1 2.5
Rider 7.7 91.3 0.6 0.3
Walker 75.2 16.4 1.8 6.7
Up
All 32.0 65.9 1.5 0.7
Rider 1.0 98.8 0.2 0.0
Walker 91.0 3.3 3.8 1.9
Afternoon
Down
All 30.2 63.2 4.0 2.6
Rider 28.7 68.0 1.7 1.7
Walker 40.0 31.1 20.0 8.9
Up
All 12.6 83.8 1.8 1.8
Rider 7.1 91.9 0.3 0.7
Walker 56.8 18.9 13.5 10.8
Evening
Down
All 23.6 72.4 1.6 2.4
Rider 7.9 88.6 2.0 1.5
Walker 85.4 8.7 0.0 5.8
Up
All 22.1 75.6 1.2 1.2
Rider 7.2 91.9 0.4 0.6
Walker 75.7 16.9 4.1 3.4
Overall
Down
All 28.0 67.5 2.0 2.5
Rider 14.0 83.3 1.5 1.2
Walker 73.5 16.0 3.8 6.7
Up
All 23.9 73.6 1.4 1.1
Rider 5.1 94.1 0.3 0.4
Walker 82.1 9.8 4.8 3.3

204
Table 61: English Data - Proportion of walkers/riders that used each side on the escalator (Day 2)
Day Period Direction Type Left
%
Right
%
Centre
%
Varied
%
Day2
Morning
Down
All 30.4 66.5 0.2 2.9
Rider 11.1 87.9 0.0 1.0
Walker 76.2 15.9 0.6 7.3
Up
All 36.1 62.7 0.6 0.6
Rider 8.2 91.5 0.0 0.3
Walker 89.0 8.0 1.8 1.2
Afternoon
Down
All 26.4 72.0 0.3 1.3
Rider 18.9 80.3 0.0 0.8
Walker 58.3 36.7 1.7 3.3
Up
All 20.6 77.2 1.0 1.3
Rider 9.1 90.3 0.3 0.3
Walker 70.3 20.3 4.1 5.4
Evening
Down
All 30.3 67.0 1.2 1.5
Rider 16.6 82.1 1.3 0.0
Walker 64.2 29.5 1.1 5.3
Up
All 21.3 75.1 2.3 1.3
Rider 10.7 86.5 2.2 0.6
Walker 74.7 17.2 3.0 5.1
Overall
Down
All 29.3 68.1 0.5 2.1
Rider 14.8 84.2 0.3 0.7
Walker 69.3 23.8 0.9 6.0
Up
All 28.5 69.4 1.2 1.0
Rider 9.3 89.5 0.8 0.4
Walker 83.5 11.6 2.4 2.6
Table 62: English Data - Proportion of walkers/riders that used each side on the escalator (Overall)
Day Period Direction Type Left
%
Right
%
Centre
%
Varied
%
Overall
Down
All 28.6 67.8 1.3 2.3
Rider 14.4 83.7 0.9 0.9
Walker 71.4 19.9 2.4 6.3
Up
All 26.4 71.3 1.3 1.0
Rider 7.4 91.6 0.6 0.4
Walker 82.9 10.8 3.4 2.9
Overall
All 27.3 69.8 1.3 1.6
Rider 10.3 88.4 0.7 0.6
Walker 78.2 14.6 3.0 4.3
Irrespective of direction of travel, significantly more riders used the right side in the rush-hour
(92.3%) compared to the non-rush hour (82.8%) (χ²=57.3, p<0.05).

205
Significantly more escalator users adhered to the common side preference behaviour in the down
direction for the morning period compared to the up direction (χ2=513.4, p<0.05). Similarly,
significantly more escalator users adhered to common side preference behaviour in the up
direction for the evening period compared to the down direction (χ2=563.8, p<0.05). It is
expected that the majority of pedestrians who used the escalators during these periods were
commuters. In the morning period, commuters typically arrived at the station from the mainline
trains so a greater number of down escalator users were observed. In the evening period,
commuters typically arrived at the station on underground trains so a greater number of up
escalator users was observed. During the afternoon periods, fewer pedestrians were observed
simultaneously traversing the escalator. Indeed during these periods a larger variation in the
proportion of walkers/riders using each side can be seen.
As observed in the Spanish data, such results suggest that the likelihood of a pedestrian
conforming to common side preference is influenced by the number of other escalator users.
During periods where many escalator users are present, escalator users may prefer not to
inconvenience other escalator users behind them by blocking them (i.e. riding on the walker
side). During periods where a small number of escalator users are present, adherence to common
side preference has less impact on other escalator users behind them. As such adherence to
common side preference was observed less during periods where less escalator users were
observed.
It should be highlighted that whilst there were no signs on either of these escalators requesting
pedestrians to stand on the right side, there were signs on other escalators in the London
Underground asking pedestrians to "Stand on the right side". Since pedestrians on the up
escalator would have probably traversed at least one escalator with these signs on, these may
have influenced a pedestrian's side choice on the up escalator. The influence of such signage
upon escalator side selection would likely increase the adherence to the common side preference.
7.5.4 Walker speeds
In total, 810 escalator walker speeds were recorded: 52.1% (422) on Day 1 and 47.9% (388) on
Day 2 with 359 on the down escalator and 451 on the up escalator. A large majority of these
were male (70.7% (572)). More walkers were observed in the morning (54.3% (441)) and
evening (32.2% (261)) than in the afternoon (13.4% (108)).

206
The frequency distribution of walker speeds can be seen in Figure 59. Analysis of the walker
speed frequency distributions, regardless of segregating according to sub-categories (e.g.
direction of travel, time period, etc), showed each distribution not to be normal (using a
Kolmogorov-Smirnov test). As such the non-parametric 2 sample Mann-Whitney U- test was
used to determine if there were any significant differences between walker speeds in each
category.
Figure 59: English Data - Horizontal escalator walker speed frequency distribution (combined for direction
and gender)
The average walker speeds according to day, gender, period, and direction can be seen in Table
63. The overall average walker speed of pedestrians on the down and up escalator was 0.82 m/s
and 0.70 m/s respectively. Overall escalator walkers were 17.1% (0.12 m/s) faster on the down
escalator than on the up escalator (p<0.05). Males walked 13.33% (0.10 m/s) and 7.5% (0.05
m/s) faster than females in the down and up direction respectively (p<0.05). Comparison of
overall walkers speeds for both days showed there to be no significant difference between each
day (p>0.05). In addition there was no significant difference between walker speeds between
each period (p>0.05). The results suggest that gender and direction of travel influence escalator
walker speeds; however, time period does not.

207
Table 63: English Data - Average, minimum and maximum horizontal walker speeds on the up and down
escalator during each period on each day according to gender
Direction Period Gender
Day 1 Day 2 Overall
Average
Speed (m/s) Frequency
Average
Speed (m/s) Frequency
Average
Speed
(m/s)
Frequency
Down
Afternoon
Female 0.66
[0.57-0.81] 10
0.73
[0.46-1.09] 12
0.70
[0.46-1.09] 22
Male 0.78
[0.38-1.38] 21
0.82
[0.58-1.34] 21
0.80
[0.38-1.38] 42
Average /Total 0.74
[0.38-1.38] 31
0.79
[0.46-1.34] 33
0.76
[0.38-1.38] 64
Evening
Female 0.82
[0.55-1.44] 19
0.77
[0.52-1.20] 27
0.79
[0.52-1.44] 46
Male 0.87
[0.49-1.46] 45
0.91
[0.47-1.44] 35
0.89
[0.47-1.46] 80
Average /Total 0.86
[0.49-1.46] 64
0.85
[0.47-1.44] 62
0.85
[0.47-1.46] 126
Morning
Female 0.73
[0.40-1.10] 26
0.76
[0.50-0.96] 18
0.74
[0.40-1.10] 44
Male 0.89
[0.48-1.55] 60
0.80
[0.56-1.67] 65
0.84
[0.48-1.67] 125
Average
/Total
0.84
[0.40-1.55] 86
0.79
[0.50-1.67] 83
0.81
[0.40-1.67] 169
Overall
Female 0.75
[0.40-1.44] 55
0.76
[0.46-1.20] 57
0.75
[0.40-1.44] 112
Male 0.86
[0.38-1.55] 126
0.83
[0.47-1.67] 121
0.84
[0.38-1.67] 247
Average/Total 0.83
[0.38-1.55] 181
0.81
[0.46-1.67] 178
0.82
[0.38-1.67] 359
Up
Afternoon
Female 0.63
[0.41-0.79] 6
0.69
[0.57-0.87] 5
0.65
[0.41-0.87] 11
Male 0.67
[0.44-1.09] 19
0.76
[0.48-1.31] 14
0.71
[0.44-1.31] 33
Average/Total 0.66
[0.41-1.09] 25
0.74
[0.48-1.31] 20
0.70
[0.41-1.31] 45
Evening
Female 0.63
[0.45-0.87] 24
0.66
[0.42-0.85] 12
0.64
[0.42-0.87] 36
Male 0.72
[0.41-1.51] 57
0.70
[0.43-1.23] 42
0.71
[0.41-1.51] 99
Average/Total 0.69
[0.41-1.51] 81
0.69
[0.42-1.23] 54
0.69
[0.41-1.51] 135
Morning
Female 0.69
[0.44-0.86] 36
0.69
[0.48-1.02] 43
0.69
[0.44-1.02] 79
Male 0.70
[0.32-1.23] 99
0.74
[0.46-1.20] 94
0.72
[0.32-1.22] 193
Average/Total 0.70
[0.32-1.23] 135
0.72
[0.46-1.20] 137
0.71
[0.32-1.23] 272
Overall
Female 0.66
[0.41-0.87] 66
0.68
[0.42-1.02] 60
0.67
[0.41-1.02] 126
Male 0.70
[0.32-1.51] 175
0.72
[0.43-1.31] 150
0.72
[0.32-1.51] 325
Average/Total 0.69
[0.32-1.51] 241
0.72
[0.42-1.31]
210
0.71
[0.32-1.51] 451
7.5.5 Flow-rates
The entry flow-rate was recorded for all footage collected. With the exception of the afternoon
period on Day 1, the average flow-rate for the up escalator was higher in each period than for the
down escalator (see Table 64). This would be expected as more people were typically observed
simultaneously arriving (from underground trains) at any given time on the up escalator than on

208
the down escalator. As with the Spanish data, these maximum recorded down escalator flow-
rates are thought to be more reflective of the dispersed arrival times to the escalator rather than
the maximum achievable flow-rates.
Table 64: English Data - Minimum, average and maximum flow-rates
Day 1
(ped/min)
Day 2
(ped/min)
Overall
(ped/min)
Period Direction Min Avg Max Min Avg Max Min Avg Max
Morning Down 7.0 23.0 45.0 11.0 28.9 47.0 7.0 26.0 47.0
Up 4.0 29.1 45.0 6.0 37.5 75.0 4.0 33.3 75.0
Afternoon Down 3.0 16.5 36.0 5.0 15.7 29.0 3.0 16.1 36.0
Up 0.0 16.5 30.0 3.0 19.4 38.0 0.0 18.0 38.0
Evening Down 12.0 25.4 39.0 9.0 16.5 28.0 9.0 21.0 39.0
Up 15.0 33.6 47.0 9.0 31.2 46.0 9.0 32.4 47.0
Overall Down 3.0 21.6 45.0 11.0 20.4 47.0 3.0 21.0 47.0
Up 0.0 26.7 47.0 3.0 29.4 75.0 0.0 28.1 75.0
The highest escalator flow-rate recorded was 75 ped/min on the up escalator during the morning
of Day 2 of the eleventh minute (600-660 seconds) (see Table 64 and Figure 60). During this
period pedestrians moving in the up direction were funnelled into using the escalator due to the
adjacent stairs being crowded with pedestrians moving down. As such, pedestrians moving in the
up direction had little choice to use the adjacent stair.
During this peak-flow rate period there were a higher proportion of riders (68%) with
approximately even usage of both the left and right side of the escalator: each side was fully
utilised. A slightly higher proportion of males (62.8%) were also recorded. The majority of
pedestrians (60.7%) carried items of luggage. However, most were small items (i.e. only a
rucksack (26.0%) or only a handbag (20.8%)). As such it is expected that this had little influence
upon the flow-rate.
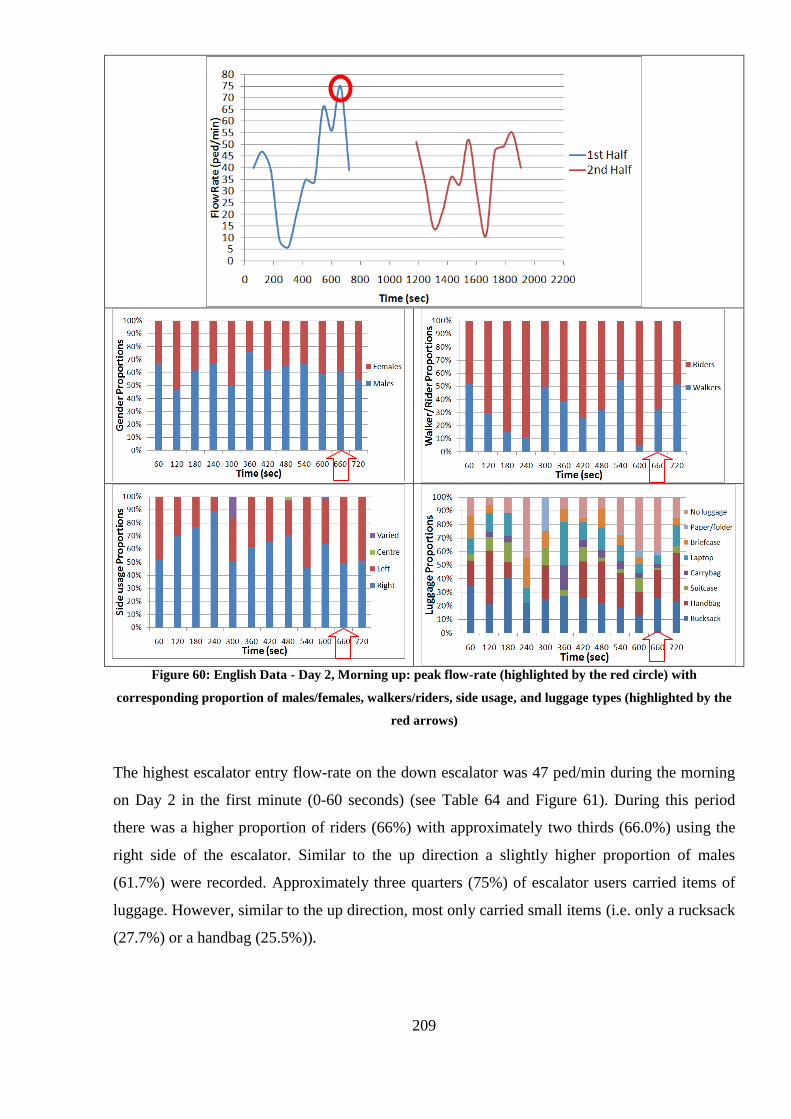
209
Figure 60: English Data - Day 2, Morning up: peak flow-rate (highlighted by the red circle) with
corresponding proportion of males/females, walkers/riders, side usage, and luggage types (highlighted by the
red arrows)
The highest escalator entry flow-rate on the down escalator was 47 ped/min during the morning
on Day 2 in the first minute (0-60 seconds) (see Table 64 and Figure 61). During this period
there was a higher proportion of riders (66%) with approximately two thirds (66.0%) using the
right side of the escalator. Similar to the up direction a slightly higher proportion of males
(61.7%) were recorded. Approximately three quarters (75%) of escalator users carried items of
luggage. However, similar to the up direction, most only carried small items (i.e. only a rucksack
(27.7%) or a handbag (25.5%)).

210
Figure 61: English Data - Day 2, morning, down: peak flow-rate (highlighted by the red circle) with
corresponding proportion of males/females, walkers/riders, side usage, and luggage types (highlighted by the
red arrows)
7.6 Comparison of Spanish, Chinese and English data
This following section compares each of the escalator datasets collected in each country. Though
it is uncertain whether each dataset is representative of typical escalator human factors of each
country, the purpose of such a comparison is to suggest potential cultural differences in escalator
human factors where further investigation maybe of worth. In addition, there may be unidentified
differences between the datasets. These may include situational, location, demographic and
contextual differences. As such further investigation is required to support/refute such findings.

211
The configuration and dimensions of each escalator/stair for each dataset were not identical.
Because it is uncertain what effects such differences have on escalator human factors, a brief
description of the main structural/configuration escalator/stair differences is provided. The
dimensions of each escalator/stair within each dataset is reproduced in Figure 62 for clarity.
Sp
an
ish
Ch
ines
e
En
gli
sh
Figure 62: Escalator/Stair dimensions for each dataset
The Spanish escalators were the longest of all datasets being almost twice the height (6.29m) of
the lowest escalator in the English dataset (3.65m). Despite this the riser height and tread depth,
in addition to the escalator width were approximately the same for all escalators in each dataset.
This increase in height of the Spanish escalator/stair meant the adjacent stair had two landings

212
connecting three flights of stairs compared to a single landing connecting two flights of stairs in
both the Chinese and English stairs. Increased travel distance may influence pedestrian's
escalator/stair choice (e.g. longer travel distances encourage escalator usage). Also this may
cause further fatigue to pedestrians that may influence walker/rider choice and subsequent side
selection.
The adjacent stair to the escalator in the English dataset was partitioned by two handrails
spanning the entire length of the stair and connected landings. The adjacent stairs in both the
Spanish and Chinese datasets did not contain partitioning handrails. In addition, the stairs in the
English dataset were over twice the width (5.40m) compared to the Spanish dataset stairs
(2.30m) and 1.5 times the width of the Chinese dataset stairs. Increased stair width may increase
the proportion of stair users, particularly during peak periods.
The direction of approach for the Spanish escalators was restricted to the left (stair) side for both
the up and down escalators. The Chinese escalators/stairs could be approached from either side
though train arrival side typically dictated the nearest device. The English escalators/stairs could
only be approached from the front in the up direction (there was no side approach) and from any
direction for the down escalator/stair. Pedestrian direction of approach may influence device
selection, especially in crowded situations, with pedestrians potentially electing to use their
closest device.
The English dataset escalator/stair configuration included two escalators moving in opposite
directions with bidirectional flows on the adjacent stairs in between. Both the Spanish and
Chinese dataset escalator/stair configuration included a single escalator and adjacent stair where
bidirectional flows of pedestrians moving in opposite directions was infrequent. Such differences
in pedestrian flows on the stairs may influence pedestrian escalator/stair usage (e.g. increased
pedestrian flows in the opposite direction on the stairs may increase escalator usage).
In both the Spanish and Chinese datasets the escalator/stair connected the train platform to the
above lobby area. This meant that the majority of up escalator/stair users had immediately
alighted an underground train. In the English datasets the escalator/stair connected an
intermediary ticket office level (located above the platform level, at the bottom of the
escalator/stair) and the above lobby level. This meant that the majority of up escalator/stair users
had just alighted an underground train and then used an escalator to get to the ticket hall level
before using the observed escalator. Recent usage of escalators, particularly covering long

213
distances, may influence walker/rider choice and walker speeds due to the potential increased
fatigue.
In all datasets where age and gender were recorded the majority of pedestrians appeared to be
aged between 12-60 years old with approximately even proportions of males and females: no
considerable differences between pedestrians age and gender were found in each dataset.
The total amount of video footage and real-time footage collected for each dataset can be seen in
Table 65. Approximately twice the length of real-time footage was collected in the English
dataset due to being collected over two days compared to the Spanish and Chinese datasets being
collected on a single day. In addition, there appeared to be more pedestrians per train in the
Chinese dataset compared to the Spanish dataset. Subsequently the overall frequency of
pedestrians observed for the Spanish (1,217), Chinese (6,566) and English (6,123) datasets
varied considerably.
Table 65: Total length of video/real-time footage collected for each dataset
Dataset Video footage
(min)
Real time footage
(min)
Spanish 120 120
Chinese 120 120
English 480 240
All of the Chinese dataset was collected for up escalators so comparison of the Chinese dataset
according to direction of travel has not been performed. For both the Spanish and Chinese
datasets, the rush-hour data was collected in the morning. For consistency the English morning
rush-hour period data will be used for comparison instead of the evening rush-hour period data.
Findings from the following analysis assume that each dataset it representative of pedestrians in
each country and that the escalator/stair structural/configuration differences have little or no
influence upon associated human factors.
7.6.1 Escalator/Stair usage
For consistency, the Chinese non-congested rush hour up escalator/stair usage data has been
used to compare with the Spanish and English data with regards to escalator/stair usage. This
was because the high levels of congestion at the entrance to the escalator/stair in the congested
Chinese data was never reached in the Spanish and English escalator/stair data (i.e. there were no

214
incidents when such a higher number of pedestrians simultaneously arrived at the foot of the
escalator/stair).
Overall, more escalator users were recorded than stair users in all datasets for the up direction.
However, a higher proportion of escalator users were recorded in the up direction in the Spanish
data (86.5% (590)) compared to both the Chinese data (76.7% (907)) and English data (67.0%
(3,595)). This represents a significant difference between the number of escalator/stair users in
the up direction for each country (χ²=137.6, p<0.05).
Segregating each period (rush-hour/non-rush hour) in the up direction, in the Spanish data a
significantly higher proportion of escalator users were recorded for the non-rush hour (94.4%
(186)) compared to the rush-hour (83.3% (404)) period (χ²=14.8, p<0.05). Within the English
data in the up direction overall a similar proportion of escalator users were recorded in both the
rush-hour (75.3% (1,587)) and non-rush hour periods (77.8% (727)) (χ²=2.2, p>0.05).
A higher proportion of escalator users were recorded in the down direction in the Spanish data
(68.4% (366)) compared to the English data (44.7% (2,528)) (no down data was collected in the
Chinese dataset). Indeed, in the down direction the majority of pedestrians elected to use the
stairs over the escalator in the English data (55.3% (3,125)). This represents a significant
difference between the proportion of escalator/stair users in the down direction between the
Spanish and English datasets (χ²=110.2, p<0.05).
Segregating each period (rush-hour/non-rush hour) in the down direction, in the Spanish data a
similar proportion of escalator users was recorded in both the rush-hour (68.9% (252)) and non-
rush hour (67.5% (114)) (χ²=0.1, p>0.05). However, within the English data in the down
direction a significantly higher proportion of escalator users were recorded in the non-rush hour
(56.4% (662)) compared to the rush-hour period (36.0% (1,831)) (χ²=143.3, p<0.05).
Results suggest that most pedestrians in all countries would have a preference to use an escalator
(compared to adjacent stair) to travel up. However, the extent of this preference varies between
countries. Findings also suggest that escalator/stair usage in Spain and England is influenced to a
different extent by time period (rush-hour/non-rush hour) and direction of travel. In the down
direction, pedestrians in Spain appear to have a greater preference for using an escalator. In the
up direction, pedestrians in England appear to have greater preference for using an escalator.

215
Further investigation is required to ascertain whether the observed differences are due to the
stated factors (i.e. time period, direction of travel), or by-products of such factors (e.g. higher
levels of congestion during the rush-hour periods).
7.6.2 Walker/Rider usage
As previously mentioned, the Chinese walker/rider usage data perhaps does not accurately
represent the proportion of escalator users who would like to walk on the escalators. This is due
to the observed blocking behaviour with a high proportion of riders typically occupying both
sides of the escalators. It cannot therefore be determined whether the walker/rider behaviour was
a true reflection of pedestrian personal choice or imposed due to other pedestrian behaviour. As
such only the Spanish and English walker/rider frequencies have been compared.
Irrespective of time period there were a similar proportion of walkers in both the Spanish and
English data in both the up (27.0% and 25.2% respectively) and down (21.0% and 25.1%
respectively) directions (χ²=4.3, p>0.05). Little variation in the proportion of walkers during the
rush-hour and non-rush hour periods (21.0%-29.2%) was observed in the Spanish data (χ²=7.8,
p>0.05). However, in the English data significantly more walkers were recorded in the rush-hour
(32.0%-34.5%) compared to the non-rush hour (15.3%-15.9%).
Results suggest that direction of travel does not greatly influence walker/rider usage in both
England and Spain. In Spain the time period also does not appear to influence walker/rider
usage. However, time period does appear to influence walker/rider usage in England where the
proportion of walkers increases considerably during the rush-hour.
7.6.3 Side usage
Due to the blocking behaviour in the Chinese data, it cannot be determined whether the side
usage behaviour was a true reflection of pedestrian personal choice or imposed due to other
pedestrian behaviour. As such only the Spanish and English side usage data have been
compared.
Common side preference behaviour was observed in both the Spanish and English data with a
majority of riders electing to use the right side (80.4% and 88.4% respectively) and walkers
using the left side (43.4% and 78.2% respectively) of the escalators.

216
In both the Spanish and English data a higher proportion of riders adhered to the common side
preference behaviour (using the right side) in the up direction compared to the down direction
(88.9% and 91.6% respectively). This suggests that direction of travel influences escalator side
preference in both Spain and England in a similar way. Pedestrians are more likely adhere to
common side preference when travelling up in both countries.
Within the Spanish data, no significant difference was recorded between the proportion of riders
that used each side during the rush-hour and on-rush hour periods (χ²=0.18, p>0.05). However,
within the English data, overall significantly more riders used the right side during the rush-hour
(92.3%) compared to the non-rush hour (82.8%) (χ²=57.3, p<0.05).
Irrespective of time period, segregating according to direction of travel, a similar proportion of
riders used the right side of the escalator in the up direction in the English data (91.1%-94.3%).
However, in the down direction, significantly more riders (89.4%) used the right side during the
rush-hour compared to the non-rush hour (73.6%).
The results suggest that escalator side usage is not influenced by time period in Spain. However,
in England time period appears to cause more pedestrians to conform to the common side
preference during the rush-hour period. It is postulated that this may be caused by the increased
number of pedestrians simultaneously using the escalators during the rush-hour periods within
the English data compared to the Spanish data.
7.6.4 Walker speeds
Due to each of the walker speed distribution in each dataset not being normally distributed the
non-parametric Mann-Whitney U-test was used to test for significant differences between the
distributions.
On average the Chinese walker speeds were 12.2% (0.09 m/s) and 16.9% (0.12 m/s) faster than
the average Spanish and English walker speeds respectively (p<0.5). This was largely
contributed to by the faster walking speeds during the rush-hour period in the Chinese data
compared to the other datasets.

217
In the up direction, the male Chinese walker speeds (0.87 m/s) were on average 11.5% (0.09
m/s) and 20.8% (0.15 m/s) respectively faster than the male Spanish (0.78 m/s) and English
walker speeds (0.72 m/s) (p<0.05). Similarly, the female Chinese walker speeds (0.80 m/s) were
on average 12.7% (0.09 m/s) and 17.6% (0.12 m/s) respectively faster than the female Spanish
(0.71 m/s) and English walker speeds (0.68 m/s)(p<0.05).
In the up direction, the Chinese rush-hour walker speeds (0.9 m/s) were on average 18.4% (0.14
m/s) and 26.8%(0.19 m/s) respectively faster than the Spanish and English rush-hour walker
speeds (p<0.05).
No significant difference was recorded between the Spanish and English walker speeds in any of
the subgroups (p>0.5). The results suggest that escalator walker speeds are similar in Spain and
England. However, both male and female walker speeds are considerably faster in China for the
up direction.
7.6.5 Flow-rates
The highest flow-rate recorded in all datasets was the up exit flow-rate in the Chinese data where
102 ped/min was recorded. This was 148.8% and 36.0% respectively higher than the highest
flow-rates recorded in the Spanish (41 ped/min, exit) and English (75 ped/min, entry) datasets.
All of the highest flow-rates in each dataset were recorded on the up escalators. As previously
mentioned this was expected as more pedestrians were typically observed simultaneously
arriving (from underground trains) at any given time on the up escalators than on the down
escalator.
The highest flow-rate recorded in all datasets for a down escalator was in the English dataset
where 47 ped/min was recorded. This was 147.4% higher than the Spanish dataset's highest
down flow-rate (19 ped/min). As previously mentioned, none of the down flow-rates are
expected to be representative of the maximal achievable flow-rates. Indeed the down flow-rates
are expected to be reflective of the sporadic arrival of pedestrians to the down escalators rather
than behaviour imposed by the dimensions of the escalators.

218
7.7 Comparison with other studies
This following section compares each of the escalator datasets with escalator data presented in
the literature review. This includes a comparison of the data relating to escalator/stair usage,
walker/rider usage, walker speeds, and escalator flow-rates. As mentioned in the literature
review, no past empirical data regarding escalator side usage could be found. Therefore a
comparison of escalator side usage could not be performed.
7.7.1 Escalator/Stair usage
The regression formula developed by Cheung and Lam [Cheung and Lam, 1998] (reproduced in
Equation 18 and Equation 19 for clarity) can be used to calculate the probability that an
individual pedestrian would use an escalator given the difference between expected travel times
to/on an escalator and adjacent stair.
Equation 18
Equation 19
xt = total travel time difference between using the escalator and stair
Using Equation 18 and Equation 19 the probability of an occupant electing to use an escalator
can be calculated with the average escalator walker speeds collected for each dataset and the
stair/normal walker speeds collected by Fruin [Fruin, 1971] (stair speeds (up; 0.57 m/s,
down;0.77 m/s)/normal walker speed (1.35 m/s)). Using these parameters, irrespective of dataset
or direction used, the regression formulae predicts that almost all pedestrians (95.7%-99.9%)
would elect to use an escalator (see Table 66).
No details regarding escalator height or length were mentioned in the study by Cheung and Lam.
However, it is clear that the small height of the escalators/stairs (3.65m-6.29m) in each dataset
meant that the travel time difference between walking on the escalators/stairs was small (with
„ ‟ being calculated between 1.2s-9.0s for each dataset). As such this resulted in a high
proportion of escalator users when using Cheung and Lam's regression.

219
Table 66: Overall proportion of escalator/stair users: Spanish data, Chinese data, English data, Cheung and
Lam's regression prediction (given escalator data) [Cheung and Lam, 1998], Zeiler et al [Zeiler, et al., 2010]
and Knehs [Knehs, 2010] data
Datasets Up:
% Device Users
Down:
% Device Users
Escalator Stairs Escalator Stairs
Spanish 86.5 13.5 68.4 31.6
Chinese
(non-congested/congested) 76.7 / 35.0 23.3 / 65.0 - -
English 67.0 33.0 44.7 55.3
Cheung and Lam:
Spanish ( =9.0s) 99.9 0.1 98.1 1.9
Cheung and Lam:
Chinese ( =8.5s) 99.9 0.1 - -
Cheung and Lam:
English( =1.2s) 99.6 0.4 95.7 4.3
Zeiler et al and Knehs: Vienna I N/A N/A 86.2 13.8
Zeiler et al and Knehs: Vienna II 88.2 11.8 68.0 32.0
Zeiler et al and Knehs: Graz 78.2 21.8 89.0 11.0
Comparing the overall proportion of escalator users in each dataset to that recorded by Zeiler et
al [Zeiler, et al., 2010] and Knehs [Knehs, 2010] for the up direction, ranged between 67.0%-
88.2% (excluding the Chinese congested periods). In the down direction, with the exception of
the English data, a similar range of values were recorded between 68.0%-89.0%. The English
dataset represents the only instance where the overall proportion of stair users was greater than
the proportion of escalator users.
7.7.2 Walker/Rider usage
As previously mentioned, in the Chinese data almost all escalator users rode adopting both sides
which restricted the option of proceeding escalator users to walk. As such only the Spanish and
English datasets (i.e. where escalator users had a choice to walk/ride), have been compared with
data found in the literature.
From Table 67 it can be seen that the overall proportion of up walkers for the Spanish and
English datasets were comparable to Andrews and Boyes [Andrews and Boyes, 1977] off peak
data, ranging between 20.0%-27.0%. However, in the down direction the proportion of walkers
in each dataset varied considerably (21.0%-60.0%) compared to that recorded by Andrews and
Boyes. A large contribution to this difference was the high proportion of walkers recorded by
Andrews and Boyes in the peak data.

220
Table 67: Overall proportion of walkers/riders: Spanish data, English data, and Andrews and Boyes
[Andrews and Boyes, 1977]
Datasets
Up
%
Down
%
Walkers Riders Walkers Riders
Spanish 27.0 73.0 21.0 79.0
English 25.2 74.8 25.1 74.9
Andrews and Boyes: Peak 40.0 60.0 60.0 40.0
Andrews and Boyes: Off Peak 20.0 80.0 40.0 60.0
Included within the study by Davis and Dutta [Davis and Dutta, 2002] was a graph presenting
the proportion of walkers in the up direction for different escalator heights (see Figure 63).
Though no table of values was presented in the study for the graph, the values can be
approximated. The lowest proportion of walkers was around 43% at Green Park 4 station with
the highest around 62% at Embankment 4 station. This suggests that the proportion of walkers
varies at different locations with a maximum range around 19%. The proportion of walkers for
the Spanish (27.0%) and English (25.2%) datasets for the up direction were considerably lower
than the lowest proportion observed by Davis and Dutta.
Figure 63: Proportion of walkers using up escalators by Davis and Dutta [Davis and Dutta, 2002]
Considering the escalator heights of both the Spanish (6.29m) and the English (3.65m) datasets,
Davis‟s and Dutta‟s linear regression suggests that there would be approximately 60% and 62%
walkers respectively. These estimated proportions of walkers are considerably higher compared
to the observed proportion of walkers in the Spanish (33.0%) and English (36.8%) datasets. It is
expected that this can be partially explained by Davis and Dutta only recording the proportion of
escalator walkers during peak flow-rate conditions. As such, the proportion of walkers is

221
expected to be inflated due to requiring full tread utilisation in order for peak conditions to be
reached (i.e. more walkers using the walker lane). In contrast the proportion of walkers in the
Spanish and English datasets were recorded over longer periods of time including non-peak
conditions. As such this may explain why such differences in the proportion of walkers was
observed.
7.7.3 Walker speeds
Overall average escalator walker speeds from the Spanish, English and Chinese datasets along
with results from studies mentioned in the literature review can be seen in Table 68.
Table 68: Escalator characteristics and average horizontal walker speeds (m/s) - Spanish data, Chinese data,
English data, Okada et al [Okada, et al., 2009], Kadokura et al[Kadokura, et al., 2009], Cheung and Lam
[Cheung and Lam, 1998]
Dataset Escalator
State
Escalator
Speed
(m/s)
Escalator
Height
(m)
Escalator
Horizontal
Length
(m)
Up:
Walker
Speed
(m/s)
Down:
Walker
Speed
(m/s)
Spanish Moving 0.5 6.3 15.5 0.74 0.86
Chinese Moving 0.5 4.8 11.5 0.83 -
English Moving 0.5 3.7 8.8 0.71 0.82
Okada1: Healthy Moving 0.5 5.7 12.3 0.71 -
Okada2: Healthy Static 0.0 5.7 12.3 0.78 -
Okada3: Healthy Moving 0.5 22.0 49.5 0.76 -
Okada4: Healthy Static 0.0 22.0 49.5 0.79 -
Okada5: Instant Senior Moving 0.5 5.7 12.3 0.43 -
Okada6: Instant Senior Static 0.0 5.7 12.3 0.53 -
Okada7: Instant Senior Moving 0.5 22.0 49.5 0.43 -
Okada8: Instant Senior Static 0.0 22.0 49.5 0.50 -
Kadokura: Incline Speed Static 0.0 13.2 27.2 0.70
Cheung and Lam Moving 0.75 - - 0.77 0.91
The escalator heights in each study ranged between 3.7m-22.0m, representing a wide range of
vertical travel distances. With the exception of the study by Okada et al [Okada, et al., 2009]
where participants donned a special suit to mimic an elderly person (instant senior), irrespective
of escalator height or state (being static or moving), all the average walker speeds were similar
ranging between 0.70-0.83 m/s. This suggests that average up escalator walker speeds are
influenced very little by escalator height, motion state or country.
The study by Kadokura et al [Kadokura, et al., 2009] showed that walker speeds on the incline of
an escalator remained approximately constant. This suggests that, irrespective of escalator

222
length, fatigue has little influence upon up walker speeds. The instant senior average walker
speeds collected by Okada et al [Okada, et al., 2009] were all considerably lower (0.43m/s-0.53
m/s) than that recorded in the other trials/studies (0.70m/s-0.83m/s)). This is expected as the
intention of the instant senior was to replicate elderly pedestrians which would likely walk
slower.
The study by Cheung and Lam [Cheung and Lam, 1998] was the only study that recorded down
escalator walker speeds. The average down walker speeds recorded by Cheung and Lam (0.91
m/s) was similar to both the Spanish (0.86 m/s) and English (0.82 m/s) data. Indeed a similar
increase in walker speeds compared to the respective average up walker speeds can also be seen
(15.5%-18.2% faster). As with the up direction, this suggests that there is little variation
between overall average escalator walker speeds in the down direction between different
countries.
7.7.4 Flow-rates
Both CIBSE Guide D [CIBSE, 2000] and Strakosch [Strakosch and Caporale, 2010] state that
for an escalator travelling at 0.5m/s that is 1m wide, the maximum theoretical flow-rate is 150
ped/min (irrespective of direction). This can be calculated using Equation 20.
Ce =
Equation 20
Ce = theoretical maximum flow-rate (ped/min)
K = maximum number of people per tread (ped)
Ev = escalator speed (m/s)
Sd = escalator tread depth (m)
For Equation 20 to reach the maximum theoretical flow-rate it is assumed that 2 people per tread
with tread depth of 0.4 m is used. However, both CIBSE Guide D and Strakosch state that such
theoretical flow-rates are rarely achieved in practice.
The highest flow-rate recorded in the current study was in the Chinese dataset (102.0 ped/min)
which is identical to the maximum flow-rate recorded in the experimental trials by Okada et al
[Okada, et al., 2009] (102.0 ped/m) (see Table 69). All escalator users rode the escalator in the
Chinese data (utilising both sides of the escalator); however, in the trials conducted by Okada et

223
al all escalator users walked. This highlights that different escalator behaviour can result in
identical flow-rates. Both of these studies were predominantly made up of individuals from
Asian demographics. It has been stated in past studies that Asian pedestrians are typically of
smaller physique, require less personal space and are more tolerant to invasion of this space
compared to typical Western pedestrians [Tanaboriboon, 1986]. This may have contributed to
the higher escalator flow-rates in these Asian escalator datasets due to the subsequent increased
crowd density at the entrance to the escalators compared to the Spanish and English datasets.
Table 69: Maximum recorded escalator flow-rates: Spanish data, Chinese data, English data, Al-Sharif [Al-
Sharif, 1996], Davis and Dutta [Davis and Dutta, 2002], and Okada et al [Okada, et al., 2009]
Dataset Speed
(m/s)
Width
(m)
Up
(ped/min)
Down
(ped/min)
Spanish 0.5 1 41.0 19.0
Chinese 0.5 1 102.0 -
English 0.5 1 75.0 47.0
Al-Sharif 0.75 1 122.0 140.0
Davis and Dutta 0.72 1 119.0 132.54
Okada: Static Escalator 0 1 66.0 -
Okada: Moving Escalator 0.5 1 102.0 -
The highest flow-rates recorded in the literature reviewed were by Al-Sharif [Al-Sharif, 1996]
for both the up (122 ped/min) and down (140.0 ped/min) directions. This represent between 2.0-
2.33 pedestrians boarding an escalator every second. These flow-rates were higher for the up and
down direction than all of the datasets in the current study. It should be highlighted that the
speed of the escalators in the study by Al-Sharif were 0.75 m/s: 50% faster than that of the
moving escalators in the other studies. As Equation 20 suggests, increased escalator speed is
likely to contribute to increased escalator flow-rates. This would have allowed boarding
pedestrians to be transported away from the escalator entrance more quickly, so allow
proceeding pedestrians to board sooner.
7.8 Concluding remarks
Human factors data related to escalator usage has been collected in three underground stations
each in a different country. The data and subsequent analysis relate to escalator/stair usage,
walker/rider usage, side usage, walker speeds and flow-rates. The majority of escalator users
across all datasets appeared to be aged between 12-60 years old with very few children or elderly
pedestrians being recorded.

224
Key findings from the analysis are:
There is a clear preference for pedestrians to use an escalator compared to an adjacent
stair. The extent of this preference varies according to country, time period and direction
of travel. As expected, pedestrians have a greater preference for using an escalator in the
up direction than in the down direction. As crowd congestion levels increase along with
subsequent queues for the escalator, the attractiveness of using the escalator decreases.
Irrespective of country or direction of travel, the majority of pedestrians prefer to ride
instead of walk on escalators. The extent to which this occurs can be influenced by time
period, with more pedestrians electing to walk during rush-hour periods. It is suggested
that this reflects increased levels of pedestrian motivation to traverse the area more
quickly due to time restrictions (e.g. getting to work on time). Considering time
restrictions imposed by an evacuation, findings suggest escalator users maybe more
inclined to walk instead of ride during such situations.
In both the Spanish and English datasets escalator users exhibited common side
preference behaviour whereby the majority of riders used the right side and the majority
of walkers used the left side of the escalator. The extent to which escalator users conform
to this common side preference varies according to country. In certain countries,
escalator users typically conform more to the common side preference behaviour in the
up direction during the rush-hour periods. It is suggested that this is due to the increased
number of pedestrians using the escalator during these periods. This suggests that
escalator users exhibit side preference behaviour in relation to other escalator users. In
the Chinese dataset the majority of pedestrians were observed to ride the escalators
evenly on both sides. This prevented other escalator users from walking on the escalators.
Whilst such behaviour inhibits personal walker/rider choice, it does facilitate an
increased flow-rate onto the escalator due to higher crowd densities achieved through
increased tread utilisation.
Overall, escalator users walk faster in the down direction than in the up direction, and
males walk faster than females. Time period has been shown to have little influence upon
escalator walker speeds. The Spanish and English escalator walker speeds were similar.
However, the Chinese walker speeds were significantly faster than both the Spanish and
English walker speeds. Comparisons with data presented in the literature review suggest
that average escalator walker speeds do not vary a great deal between countries or with
escalator height.

225
The highest flow-rate recorded in the up direction was in the Chinese dataset (102
ped/min). This was greater than the highest flow-rates recorded in either the Spanish (41
ped/min) or English (75 ped/min) datasets. All of the maximum flow-rates recorded were
lower than the theoretical maximum flow-rates (150 ped/min) or the maximum recorded
in the literature review (140 ped/min). In all datasets the maximum flow-rates were
recorded for up escalators. This was because they were typically used by more
pedestrians simultaneously attempting to traverse the area.
There were similarities and differences in the Spanish, English and Chinese datasets. However, it
should be kept in mind that there were some differences between the escalator/stair
configurations and dimensions in each dataset. The extent to which this influences escalator
human factors requires further investigation.
The analysis has highlighted the extent to which a variety of escalator human factors occur. It
has also has suggested how certain escalator human factors are influenced by time period,
direction of travel and local conditions. Further to this, potential cultural differences have been
highlighted.

226
Chapter 8 - Evacuation Escalator Model
8.1 Introduction
The previous chapter presented data and subsequent analysis of how pedestrians behave
on/around escalators during normal circulation situations. During a number of evacuations,
evidence suggests that escalator users behave in a similar way as they do in normal circulation
conditions [Galea, et al., 2006a; Donald and Canter, 1990]. Combined with the scarcity of
empirical evacuation escalator human factors data, suggests that the use of escalator circulation
data for the application within an evacuation context is appropriate. The collected data has been
used as a basis to develop an evacuation escalator and agent escalator model within
buildingEXODUS. The escalator model represents the physical properties and movement speed
of an escalator. Components of the agent escalator model relate to escalator human factors
analysed in the previous chapter. These include escalator/stair usage, walker/rider usage, side
usage, walker speeds and flow-rates. The following chapter presents a description of the
developed escalator and agent escalator model. A series of component verification tests have
been performed and results presented (see Appendix A6.1) for the developed escalator and agent
escalator model. This was to demonstrate the model behaves as intended given a series of input
parameters and simulated conditions.
8.2 Physical escalator
The escalator model developed within buildingEXODUS is based around using „transit nodes‟ to
represent escalators. Reiterating what is mentioned in the Chapter 5, a transit node represents a
device that allows agents to move between two areas/levels (e.g. stairway, escalator, lift, etc).
Further to this, transit nodes provide a set of defining attributes unique to each device (e.g. stair,
corridor, etc). This allows users to alter the physical representation of a device within the model.
Such attributes provide a mechanism for a user to alter the agent behaviour associated with a
given transit node.
Using transit nodes the physical dimensions of stairs can already be represented within
buildingEXODUS. These include the number of risers/treads, width, height, horizontal length,
and number of lanes. The existing stair model within buildingEXODUS was extended to
represent the additional physical and kinematic characteristics of an escalator. This includes the

227
speed of an escalator (m/s), direction of movement (up/down) and the level run distance (m) (the
length of the flat sections at the top and bottom of an escalators) (see Figure 64).
Figure 64: Escalator transit node within buildingEXODUS [Galea, et al., 2006b]
8.3 Escalator agent model
There are two key decision points within the developed agent escalator model: (1) device choice
(e.g. escalator/stair selection), (2) escalator behaviour: rider side choice, walker/rider choice, and
walker speed selection (see Figure 65).

228
Figure 65: Escalator Agent Model - Key Decision Points: 1- Device Choice, 2- Escalator behaviour
Based on the key decision points, a flow chart showing the main processes that agents make
within the escalator agent model can be seen in Figure 66. The model comprises of a series of
key components that direct escalator agent behaviour. When an agent enters into a transit node
catchment area and needs to vertically traverse the area, they are required to make a decision
which transit node they will use. This action is performed using the Device choice component of
the escalator agent model. If an agent has selected to use an escalator transit node, they move
towards the escalator. Immediately prior to boarding the escalator, the escalator model checks if
the flow-rate or micro-agent system is being employed for the given escalator. If the flow-rate
system is employed then agents will be assigned a boarding delay time before boarding the
escalator using the Flow-rate component. If the micro-agent system is employed then the agent
will be assigned to be a walker or a rider using the Walker/Rider choice component. Agents that
are assigned to be walkers board the escalator on the nearest available side on the escalator and
walk along the escalator using the Walker speed component. Agents that are assigned to be
riders select which side of the escalator they will ride upon using the Side preference
component; only electing to board the escalator on that side.
The default data included in the agent escalator model for each component is based on the
London datasets presented in the previous chapter. However, it is possible to alter or use other
1
2

229
data within the model. A more detailed explanation of each component of the escalator agent
model can be found in the following sections. The section title and corresponding section
number have been highlighted for each component in Figure 66.
Figure 66: Flow chart showing key components of the escalator agent model and associated chapter sections

230
8.3.1 Device choice
When an escalator and stair link the same two floors, approaching pedestrians are required make
a decision which device they will use. It is suggested that this choice is made within close
proximity to the devices so that pedestrians can judge which device to use based on local
conditions (e.g. congestion levels, etc). To represent this decision making in the escalator agent
model, each transit node within close proximity that links the same levels are clustered together
within a „transit node group‟. Each transit node group has an adjustable user-defined catchment
area at the top and bottom of the transit node group which defines the spatial boundaries where
pedestrians make the decision of which transit node to use within the group (see Figure 67). If
transit nodes are not grouped then agents will elect to use a transit node according to which one
forms part of their shortest path to the given destination.
For agents that have entered a transit node catchment area there are three separate systems that
can determine which transit node they will use in the transit node group (the system employed is
specified by the user). These are the proportion system, the shortest time system, and the hybrid
system.
Figure 67: Escalator and stair transit node group with catchment area displayed (red circles).
Proportional System
The proportion system requires the user to explicitly state the proportion of agents that will use
each device within a transit node group. Using this system, when an agent enters the catchment
area they are assigned a device to use based on the user-specified proportion that are static
throughout a simulation. The user-specified proportions are used within buildingEXODUS to
form boundaries on a scale between 0-1. When agents enter a transit node catchment area a
random number is generated (from a uniform distribution between 0-1). The random number is
then compared with the boundaries in order to determine which transit node the agent will elect

231
to use. After this initial device selection agents do not change their choice. This system is most
appropriate for scenarios where lower levels of crowding occur at the entrance to the
escalator/stair and relies on data that is representative of the type of scenarios being considered.
Such a system allows a user to incorporate collected data regarding the proportion of device
users, as presented in the previous chapter.
Shortest Time System
The shortest time system relies on each individual agent making a decision as to which device to
use based on local conditions. The decision is based on the assumption that the main motivation
of the agent is to reduce their overall travel time whilst traversing through the area.
The shortest time system is a theoretical framework which ensures that agents select the device
which they expect will allow them to traverse the vertical area in the shortest period of time. This
is determined by the agent initially estimating the time it would take to travel to each device
based on the distance from their current position and their speed. In addition, agents take into
consideration the wait time of other agents between them and the device. These combined wait
times are added to the travel time calculation. Further to the travel time to each device, the
expected travel time incurred on each device is also estimated. This considers the travel distance
on the device, device speed (if any), and the agent‟s device walker speed. A summary of the
travel times calculated for the shortest time system can be seen in Figure 68.
Figure 68: Shortest time system diagram

232
The total expected travel time for each device is calculated using Equation 21.
Equation 21
T(D) = total expected travel time (sec)
= distance to device (m)
WS = walker speed on the ground (m/s)
n = number of agents in a straight line path towards the given device
WTi = current wait time of agent i (sec)
= travel distance on the device (m)
= walker speed on the device (m/s)
= device movement speed (m/s)
The agent selects the device within the transit node group that provides the shortest expected
travel time and moves towards the selected device. Whilst in the catchment area and prior to
boarding the desired device, the agent reassesses their device choice and may select another
device based on the shortest time system. This reassessment is performed every 2 seconds prior
to boarding the device. This reassessment delay is intended to minimise agents „rebounding‟
between transit nodes when choosing which device to use (i.e. keep changing their transit node
choice in line with the changing number of agents in front of them). This reassessment time of 2
seconds was derived through sensitivity analysis with minimal rebounding occurring for a single
escalator/stair. For certain other escalator/stair configurations or scenarios a decreased or
increased reassessment time maybe more suitable. Consequently the reassessment time is
configurable by the user within the model.
Using the shortest time system agents adapt their device choice in response to other agent
behaviour. The shortest time system is most appropriate for scenarios involving motivated
pedestrians where high levels of congestion occur at the entrance to the escalator/stair area.
Hybrid System
The hybrid system incorporates both the proportion system and the shortest time system. It
decides which of the two systems to use according to the levels of congestion in the transit node
catchment area. The selection system requires the user to specify a congestion threshold value
for the transit node catchment area. This congestion threshold value can be set between 0-1. It
represents the proportion of nodes in the transit node catchment area that are occupied by agents

233
targeting the transit node group. For example, a congestion threshold value of 0.5 represents 50%
of nodes in the transit node catchment area that are occupied by agents targeting the transit node
group. Using the default 0.5m node/arc representation this represents a congestion density of 2
ped/m2. When the levels of congestion in a catchment area are below the congestion threshold,
agents entering into the catchment area select the device to use based on the proportion system.
When the levels of congestion reach or exceed the congestion threshold, agents select which
device to use based on the shortest time system. This hybrid system allows suboptimal device
selection behaviour to be represented at low levels of congestion and adaptive device selection at
higher levels of congestion. As such the device selection system is appropriate to use when both
low and high levels of congestion are experienced at the entrance to a transit node group over the
course of a simulation.
Within buildingEXODUS all three device selection systems can be accessed through altering the
congestion threshold value set by the user: 0 (shortest time system), 1 (proportional system), 0-1
(hybrid system).
Whilst each dataset in the previous chapter only analyzed pedestrian choice between a single
escalator and adjacent stair, the developed model will allow users to incorporate as many
escalators/stairs as is required.
8.3.2 Walker/Rider choice
Agents that elect to use an escalator, immediately prior to boarding the escalator, are required to
choose whether they will ride or walk on the escalator. This is determined by user-specified
proportions associated with the escalator. The user specifies the proportion of agents that will
walker on the escalator. As with the proportion device selection system, this is then used to form
boundaries on a scale between 0-1 associated with walking/riding. When agents are about to
board an escalator a random number is generated (from a uniform distribution between 0-1). The
random number is then compared with the boundaries to that defined by the user-specified
proportions in order to determine whether the agent will walk or ride on the escalator. Very few
pedestrians were observed to both walk and ride on the escalators in the data (see previous
chapter). As such the model assumes that agents do not alter their decision to be a walker or rider
whilst on the escalator.

234
8.3.3 Side preference
Agents that elect to use an escalator and choose to be a rider are required to decide which side of
the escalator to use. This is defined by user-specified proportions. The remaining agents that
walk on an escalator utilise any available side in order to keep walking and are not constrained
by which side to use in the model. From the data in the previous chapter, few riders typically
used the centre position or varied their position as they traversed the escalator. As such riders in
the model can only opt to use either the left or right side of an escalator. As with the proportion
device selection system, the user-specified proportions are used to form boundaries on a scale
between 0-1 associated with riders using the left/right side. When agents are about to board an
escalator and elect to be a rider, a random number is generated (from a uniform distribution
between 0-1). The random number is then compared with the boundaries to that defined by the
user-specified proportions in order to determine whether the agent will use the left or right side
of the escalator. If an agent is blocked from boarding their chosen side by an agent in front, they
will delay boarding until that side becomes available. This ensures the specified proportion of
riders that use each side of the escalator is maintained.
8.3.4 Walker speeds
Agents that elect to use an escalator and choose to be a walker, will attempt to move along the
length of the escalator at their assigned escalator walker speed for the given direction. This is
represented by calculating the horizontal distance an agent would move along the escalator
considering their horizontal escalator walker speed and the horizontal speed of the escalator for
each time step of the simulation. The agent‟s location on the escalator is then updated each time
step. If a walking agent is blocked by another agent in front then they will attempt to move
around the agent using the opposite side of the escalator. As such the actual speed that agents
walk along an escalator can be restricted by other preceding slower moving agents on the
escalator.
8.3.5 Flow-rates
An alternate method to the previously presented micro-level escalator model is to use the flow-
rate model that sets a capping flow-rate upon agents boarding the escalator. The specified flow-
rate, stated in pedestrians per second, is used to define a minimum delay time between any two
agents boarding the escalator (i.e. a proceeding agent has to wait a minimum amount of time
before they can board the escalator). The calculation for this can be seen in Equation 22 below.

235
Equation 22
= minimum escalator delay time (min)
F = user-specified flow-rate (ped/min)
The flow-rate specified is a capping value to ensure that the number of agents boarding an
escalator over a period of time is not exceeded. Once agents board an escalator they are assigned
a travel speed from a uniform distribution defined by a user specifying a maximum and
minimum value. The time each agent takes to traverse the escalator is then calculated according
to length of the escalator, their assigned walker speed (assigned from the max/min distribution)
and the escalator speed. As such either all agents can be assigned to be riders (all assigned a
walker speed of 0 m/s) or all agents are assigned to be walkers (all assigned a random speed
between the maximum and minimum range specified). No inter-agent or micro-level behaviour
on the escalator (e.g. side preference, etc), blocking, queuing, etc is explicitly represented in the
flow-rate model. After an agent‟s traversal time on the escalator has expired they will alight at
the opposite end of the escalator. The flow-rate model is considered a simplified representation
of escalator human factors with limited implicit representation of such factors. It is considered
appropriate for users who wish to reduce computational overhead (e.g. using large geometries),
only have/require maximum flow-rates to be represented, or wish to compare results with
empirical calculations (that typically use flow-rates).
8.4 Concluding remarks
This chapter has described the developed escalator and agent escalator model within the
buildingEXODUS software. The escalator model represents both the physical and kinematic
features of an escalator. The agent escalator model represents the occupant interaction with an
escalator. Escalator human factors represented include device choice, walker/rider choice, side
preference, and walker speeds. In addition, an escalator flow-rate model has also been
developed. The escalator agent model is controlled via a series of user-specified values that
define how agents in a simulation interact with an escalator. The developed model allows the
escalator human factors data presented in Chapter 7 to be represented. Further to this, the model
allows users to measure how different escalator human factors may influence an evacuation. The
developed model permits users to explicitly represent different micro-level escalator human
factors. Results from Chapter 7 suggest that escalator human factors vary between different

236
countries. The developed model provides a mechanism to explicitly represent such differences.
Results from component verification testing of the model have been presented (see Appendix
A6.1) which show the model to produce expected results based on given input parameters and
simulated conditions.

237
Chapter 9 - Case Study: Underground
Station Escalator Evacuation
9.1 Introduction
A series of evacuation scenarios have been performed using the developed escalator model and
escalator agent model presented in the previous chapter. A description of the geometry, escalator
attributes, population and scenarios is presented followed by the results. The purpose of the
evacuation scenarios is to demonstrate the extent to which different escalator strategies and
escalator human factors influence an evacuation.
9.2 Geometry
The building used for the simulations was a hypothetical underground station. The geometry
consisted of 2 levels. The lower level contained a double-sided platform below ground connected
via 5 escalators, each with adjacent stairs, to a ticket hall level above. The ticket hall level is
where the exits of the station are located. In addition, an emergency stair was positioned at either
end of the platform (see Figure 70). The platform was 18m wide and approximately 140m long.
Each escalator/stair enclosure linking the platform to the ticket level was approximately 7.5m in
width and 15m in length. The total area of the platform was 2,520m2-112.5m
2 = 2,407.5m
2. Each
escalator/stair had identical dimensions to the escalators/stairs observed in the Spanish data (see
Figure 69) with the escalator travelling at 0.5m/s. The Spanish escalator/stair dimensions were
chosen as they were the longest escalator/stairs in all three studies presented in Chapter 7. As
such is expected that escalator human factors would have greater influence for longer vertical
distances.
The emergency stairs located at either end of the platform level had the identical dimensions to
the adjacent stairs to the escalators. However, the emergency stair at the south end of the
platform had a slight variation with the top flight being of a dog legged configuration connecting
to the ticket hall level above.

238
A: Escalator dimensions B: Stairway dimensions Figure 69: Case study escalator (a) and stair (b) dimensions
Each escalator/stair was arranged into transit node groups. Each transit node group had a
catchment area size of 4m from the escalator/stair transit nodes. This was determined as a
suitable size considering the initial level of congestion on the platform. It allowed agents to
change their device selection without being over committed to using a given device considering
the layout of the geometry and the number of agents already on the platform.
The geometry had two exits (Exit 1 and Exit 2) both located on the ticket hall level (see Figure
70). Exit 1 was 18m in width and Exit 2 was 7m in width, both representing an open plan exit
without doors. The maximum travel distance to Exit 1 and 2 was 67.3m and 68.3m respectively
from the platform level.

239
Ticket Hall
Level
Platform
Level
Figure 70: Hypothetical underground station geometry (ES=Escalator/Stair, S=Stair)
18m
200m
18m
140m
ES1
ES2
ES3
ES4
ES5
S2
S1
Exit1
Exit2

240
9.3 Population
Within each scenario agents were modelled as non-connected individuals and were not
constrained by groups. The demographics of the agent were assigned according to the default
population within buildingEXODUS, representing a broad cross-section of attributes and
capabilities [Galea, et al., 2006b].
The NFPA 130 Standard for Fixed Guideway Transit and Passenger Rail Systems 2010 [NFPA,
2010] includes recommendations for maximum occupancy levels within train stations. It states
that the maximum agent load for a train station shall be based on trains simultaneously arriving
at each platform within a station plus the simultaneous arrival of agents entering the station for
each train during peak times. The 1996 Rolling Stock 7 car design (currently used on the Jubilee
line in the London Underground, UK) spans a length of approximately 124 metres which is
similar to the platform length in the hypothetical geometry. Such trains allow a maximum train
capacity of 964 passengers (234 sitting, 730 standing) [Transport, 2010a].
In addition to representing occupants simultaneously arriving on trains at each platform, those
occupants that would already be waiting on each platform was also required to be represented.
The platform waiting occupancy has been proposed to be 50% of the maximum train capacity. In
the given geometry this equates to 2x482=964 agents (for two trains on either side of the
platform). This waiting occupancy frequency is considered to be the upper limit of the
maximum platform occupancy. All occupants initially on the platform level were assumed to be
located on the platform itself and no representation of occupants disembarking trains is
represented. This assumes that escalators/stairs and associated human factors were considered
the main constricting factor upon the platform evacuation. Combined with the maximum
capacity for a train on each platform gives a total platform level occupancy of 2,892 agents. The
total level of occupancy on the platform is considered maximal and meant that on average the
platform effectively had approximately 1.2 ped/m² which corresponds to Fruin's level of service
E described as "Standing in physical contact with others is unavoidable" [Fruin, 1971].
Within each scenario approximately an even number of agents initially on the platform level
elect to use each escalator/stair to traverse to the ticket hall above as part of their egress (see
Table 70). The initial agent starting locations on the platform were specified such that these
frequencies for device usage were achieved with agents using their nearest escalator/stair. This
was to ensure that any single escalator/stair component was not disproportionally oversubscribed
(so extending the evacuation). Though uneven escalator/stair loading would decrease the

241
efficiency of an evacuation the focus on the investigation is how escalator strategies and human
factors influence an evacuation. Approximately 10% (388) of all platform agents were assumed
to use the emergency stairs at either end of the platform. This represents the decreased usage
(compared to the main escalator/stair) due to the expected lack of familiarity with stairs due to
not being used during normal circulation situations.
The ticket hall level above was assumed to be initially occupied by the same number of waiting
agents on a single platform (964). This was intended to represent both entering and exiting
agents to the station. The frequency of agents initially on the ticket level were assigned to use
each exit according to the proportion of the aggregated width each exit provided; with 28.0%
(270) assigned to Exit 1 and 72.0% (694) assigned to Exit 2. As with the escalator/stair
assignment on the platform level, this was to minimise the influence of uneven usage of exits and
the potential decreases in evacuation efficiency caused. Combining the total platform and ticket
level occupancy, the entire occupancy of the station was 3,856 agents.
Table 70: Device frequency usage
Device(s)
% Throughput
Provision for
level
Approximate Agent
Frequency
Usage in each Simulation
ES1 18.0 521
ES2 18.0 521
ES3 18.0 521
ES4 18.0 521
ES5 18.0 520
S1 5.0 144
S2 5.0 144
Platform
Total 2,892
Exit 2 51.2 270+ 1706
(S2+ES3+ES4+ES5) = 1,976
Exit 1 48.8 694 + 1186 (S1+ES1+ES2) =
1,880
Total 100 3,856
The Chinese Design Code for Subway platforms [Planning, 2003] specify an average evacuation
response/pre-movement time of 60 seconds for agents on a transit station. Such specifications
have been typically used to assess upper limit design requirements. With this in mind, agents
within the modelled scenarios were randomly uniformly assigned a response/pre-movement time
range between 0-120 seconds (0-2 minutes) with an average of 60 seconds.

242
For Scenarios 9,10 and 11, where a different number of escalators/stairs were available during
the evacuation, Table 71 shows the agent frequency distribution that were used for each
escalator/stair/exit with approximate even usage of the escalator/stair pairs. When an
escalator/stair is unavailable in a given scenario the agents that would have used the unavailable
escalator/stair were evenly redistributed among the other escalators/stairs.
Table 71: Scenario 9, 10 and 11 escalator/stair/exit frequency usage
Scenario 9 Scenario 10 Scenario 11
Device(s)
% Of
Agent
Usage
Agent
Frequency
Usage
% Of
Agent
Usage
Agent
Frequency
Usage
% Of
Agent
Usage
Agent
Frequency
Usage
ES1 - - - - - -
ES2 22.5 651 30.0 868 45.0 1302
ES3 22.5 651 30.0 868 - -
ES4 22.5 651 30.0 868 45.0 1302
ES5 22.5 651 - - - -
S1 5.0 144 5.0 144 5.0 144
S2 5.0 144 5.0 144 5.0 144
Platform
Total 2,892 2,892 2,892
Exit 2 61.4
270+ 2,097
(S2+ES3+ES4+ES5) =
2,367
55.8
270+1,880
(S2+ES3+ES4)
= 2,150
44.5
270+1,446
(S2+ES4)
= 1,716
Exit 1 38.6
694 + 795
(S1+ES2)
= 1,489
44.2
694 + 1,012
(S1+ES2)
= 1,706
55.5
694
+1,446
(S1+ES2)
= 2,140
Total 100 3,856 100 3,856 100 3,856
Agents were assigned escalator walker speeds derived from the English walker speed
distribution (see Chapter 7). This is with the exception of scenarios where agents did not walk on
the escalators, the escalators were static or where specific walker speed datasets were used. The
English walker speed distributions were used as they were the largest and most complete walker
speed distributions out of the three studies (see Chapter 7). The walker speeds were also
considered appropriate considering the hypothetical station occupancy levels were based around
the English London Underground rolling stock capacities for a specific carriage type. The
walker speed distributions were defined according to gender and direction of travel.
Whilst data pertaining to agent tread spacing on escalators was not collected in the previously
presented studies, Al-Sharif [Al-Sharif, 1996] has stated that escalator users rarely occupy every
available tread. Considering this, the transit node packing option within buildingEXODUS was
employed in each simulation for both escalators and stairs. Using the default settings, this meant

243
that on stairs agents were required to maintain at least a 2 tread spacing between them and any
agent in front of them (i.e. agents can occupy every other tread). For escalators this meant that
riders were required to keep at least a 1 tread spacing and walkers a 3 tread spacing between
them and any agent in front of them (based on observations by Al-Sharif [Al-Sharif, 1996]).
9.4 Scenarios
A series of 14 evacuation scenarios have been performed exploring the influence of different
escalator strategies and escalator human factors upon an evacuation (see Figure 73). In Scenario
2, each escalator was static though agents could still walk up the escalators if they chose to. No
data was collected with regards to static escalator walker speeds in each of the studies. As such
agents assessed whether to use a static escalator based on their stair walker speed. If agents
elected to use the static escalator they would use their stair walker speed to traverse the escalator.
Scenarios 3-8 explored the impact of different human factors upon an evacuation. This included
analysing the influence of the number of escalator/stair users, number of walkers/riders, ride side
usage, and different congestion threshold values. Scenarios 9, 10 and 11 focused on the influence
of escalators/stairs being unavailable. The final three scenarios (Scenarios 12-14) employed the
escalator human factors data analysed within Chapter 7 each relating to a different country. Due
to the escalator model representing two lanes of an escalator, the rider side usage data from each
dataset was normalised to only include the right and left side for these scenarios. Considering the
low proportion of riders that elected to use the centre position or varied their position on the
escalator, this was considered to have little influence upon the results. Whilst congestion level
data at the entrance to each escalator/stair was not collected in the Spanish and English data, a
congestion threshold value (CT) of 1ped/m2
was used in each of these scenarios (i.e. the same as
that used in the Chinese data). This was to allow agents in these scenarios to adapt their
behaviour according to the congestion at the base of the escalator/stair for these scenarios.

244
Table 72: Overview of evacuation scenarios - Attribute Settings
Scenario
Escalator
Motion
(Moving/
Static)
Escalator/Stair
(%)
Walker/Rider
(%)
Rider Side
Usage
(%)
Escalator
Walker
Speeds
(S/C/E)
Congestion
Threshold
(CT)
(ped/m2)
Description
Escalator Stair Walker Rider Left Right
1 - 0 100 - - - - - - Stair only
2 Static - - - - - -
{stair
walker
speeds}
0
Stairs + Static
Escalator (stair-
walker speeds
on escalator)
3 Moving 50 50 0 100 - 100 - - 50/50 Stairs/Esc
+ 100 Riders
(100 Right)
4 Moving - - 100 0 - - English 0 Stairs/Esc +
Shortest time +
100 Walkers
5 Moving - - 0 100 50 50 - 0
Stairs/Esc +
Shortest time +
100 Riders
(50/50)
6 Moving - - 0 100 0 100 - 0
Stairs/Esc +
Shortest time +
100 Riders (100
Right)
7 Moving 50 50 100 0 0 0 English 1
50/50 Stairs/Esc
+ Shortest
time/CT
1ped/m2 + 100
Walkers
8 Moving 50 50 100 0 0 0 English 2
50/50 Stairs/Esc
+ Shortest
time/CT
2ped/m2 + 100
Walkers
9 Moving - - 100 0 - - English 0
Stairs/Esc +
Shortest time +
100 Walkers
+No Stair/Esc
1
10 Moving - - 100 0 - - English 0
Stairs/Esc +
Shortest time +
100 Walkers +
No Stair/Esc
1/5
11 Moving - - 100 0 - - English 0
Stairs/Esc +
Shortest time +
100 Walkers +
No Stair/Esc
1/3/5
12 Moving 83.3 16.7 29.2 70.8 3.5 96.5 Spanish 1
Spanish Data
(up rush-
hour/normalised
side%)
13 Moving 75.6 24.4 3.3 96.7 50.7 49.3 Chinese 1
Chinese Data
(up rush-
hour/normalised
side%)
14 Moving 75.3 24.7 34.5 65.5 5.4 94.6 English 1
English Data
(morning up
rush-
hour/normalised
side %)

245
9.5 Results
A summary of results for each scenario is presented in Table 73 with evacuation curves shown in
Figure 71. The average frequencies/proportions of escalator/stair users are presented in Table 74.
Due to the short times involved in evacuating a relative small structure compared to the high-rise
lift evacuation analysis, results have been presented in seconds rather than minutes.
Table 73: Average TET, PET, CWT, Platform Clearance Time, Door 1 and 2 Exit times for each scenario
(average of 5 simulations)
Scenario
Avg
TET
(sec)
Avg
PET
(sec)
Avg
CWT
(sec)
Platform
Clearance
Time
(sec)
Overall:
% Time
Saved
Compared
to Stairs
Only
Overall:
% Time Saved
Compared to
Stair+Static
Escalator
Platform:
% Time Saved
Compared to
Stairs Only
Platform:
% Time
Saved
Compared
to
Stair+Static
Escalator
1 429.1 67.4 67.6 336.6 - -21.6 - -23.4
2 352.9 66.0 40.5 272.8 17.8 - 19.0 -
3 379.9 66.0 42.7 307.1 11.5 -7.7 8.8 -12.6
4 324.8 67.6 36.3 245.6 24.3 8.0 27.0 10.0
5 338.7 67.3 36.6 268.1 21.1 4.0 20.4 1.7
6 361.3 67.6 40.9 291.3 15.8 -2.4 13.5 -6.8
7 321.3 67.3 32.6 246.7 25.1 9.0 26.7 9.6
8 314.7 67.3 31.5 229.3 26.7 10.8 31.9 15.9
9 367.2 67.2 46.2 269.7 14.4 -4.1 19.9 1.1
10 421.0 66.6 56.9 327.0 1.9 -19.3 2.9 -19.9
11 563.8 73.7 95.7 468.0 -31.4 -59.8 -39.0 -71.6
12 343.4 67.4 36.1 255.6 20.0 2.7 24.1 6.3
13 332.0 67.3 32.4 245.9 22.6 5.9 26.9 9.9
14 336.3 67.4 35.1 254.1 21.6 4.7 24.5 6.9
Scenario 1 represents a situation representative of common practice in an actual evacuation
[British Standards, 2008; Communities, 2006] whereby the escalators are not used and agents
were required to use only the stairs. This scenario produced the second longest Total Evacuation
Time (TET) of 429.1s with the platform taking 336.6s to clear. On average agents spent just over
one minute waiting in congestion with the average Cumulative Wait Time (CWT) being 67.6s.
Another common practice during an evacuation is to turn the escalators off, but allow agents to
walk on the device. If it is assumed that agents elect to use a device based on the shortest time
system (Scenario 2), the TET reduces to 352.9s, a decrease of 17.8% (76.2s). In addition, the
platform clearance time also reduces to 272.8s, a decrease of 19.0% (63.8s). On average
approximately a quarter of agents (26.1%) who made an escalator/stair choice, used an escalator.
This reflects the influence of the increased width of the stairs compared to the static escalator.
In Scenario 3 the escalators were turned on, agents were evenly assigned to use both the
escalators/stairs and all escalator users rode on the right side. During this scenario a small
increase (7.7% (27.0s)) in TET to 379.9s was observed compared to the static escalator case

246
(Scenario 2). If it is now assumed that agents elect to use a device based on the shortest time
system with all escalator users walking (Scenario 4), the TET reduces even further to 324.8s.
This represents a decrease of 24.3% (104.3s) compared to the stair only scenario and was one of
the fastest scenario recorded. Similarly the platform clearance time also decreased by 27.0%
(91s) to 245.6s compared to the stair only scenario. A reduction in average CWT by almost a
half (46.3% (31.3s)) to 36.3s was also recorded compared to the stair only scenario. On average
a higher proportion of agents elected to use the escalator (59.5%) compared to the stairs (40.5%).
An increased overall average flow-rate of agents onto the escalators (87.7 ped/min) was
observed compared to Scenario 3 (68.3 ped/min) where agents were only allowed to board the
right side and ride the escalator.
Table 74: Average Proportions/Frequencies of escalator/stair users (per escalator/stair pair)
Scenario
ES1
%
[Freq]
ES2
%
[Freq]
ES3
%
[Freq]
ES4
%
[Freq]
ES5
%
[Freq]
Overall
Avg.
%
[Freq]
Esc Stair Esc Stair Esc Stair Esc Stair Esc Stair Esc Stair
1 0.0
[0]
100
[521]
0.0
[0]
100
[521]
0.0
[0]
100
[521]
0.0
[0]
100
[521]
0.0
[0]
100
[520]
0.0
[0]
100
[2604]
2 28.4
[147.8]
71.6
[373.2]
27.1
[141]
72.9
[380]
25.3
[131.8]
74.7
[389.2]
23.9
[124.6]
76.1
[396.4]
25.8
[134]
74.2
[386]
26.1
[679.2]
73.9
[1924.8]
3 48.8
[254.2]
51.2
[266.8]
51.7
[269.6]
48.3
[251.4]
51
[265.6]
49
[255.4]
49.7
[258.8]
50.3
[262.2]
49.3
[256.4]
50.7
[263.6]
50.1
[1304.6]
49.9
[1299.4]
4 62.5
[325.6]
37.5
[195.4]
58.1
[302.6]
41.9
[218.4]
58.7
[305.8]
41.3
[215.2]
58.5
[304.8]
41.5
[216.2]
59.7
[310.6]
40.3
[209.4]
59.5
[1549.4]
40.5
[1054.6]
5 57.7
[300.4]
42.3
[220.6]
58.4
[304.2]
41.6
[216.8]
58.4
[304.4]
41.6
[216.6]
58.6
[305.4]
41.4
[215.6]
59.1
[307.2]
40.9
[212.8]
58.4
[1521.6]
41.6
[1082.4]
6 45.1
[235.2]
54.9
[285.8]
50.6
[263.4]
49.4
[257.6]
52.6
[273.8]
47.4
[247.2]
51.4
[267.6]
48.6
[253.4]
52.4
[272.6]
47.6
[247.4]
50.4
[1312.6]
49.6
[1291.4]
7 51.3
[267.2]
48.7
[253.8]
53.9
[280.8]
46.1
[240.2]
47.3
[246.4]
52.7
[274.6]
47.7
[248.6]
52.3
[272.6]
47.9
[249.2]
52.1
[270.8]
49.6
[1292.2]
50.4
[1312]
8 46
[239.6]
54
[281.4]
49.9
[260]
50.1
[261]
45.3
[236.2]
54.7
[284.8]
44.9
[234]
55.1
[287]
46.2
[240.2]
53.8
[279.8]
46.5
[1210]
53.5
[1394]
9 0.0
[0]
0.0
[0]
55.2
[359.4]
44.8
[291.6]
54.4
[354.2]
45.6
[296.8]
52.6
[342.4]
47.4
[308.8]
56
[364.6]
44
[286.4]
54.6
[1420.6]
45.4
[1183.6]
10 0.0
[0]
0.0
[0]
52.8
[458.2]
47.2
[409.8]
52.4
[455.2]
47.6
[412.8]
49.3
[428]
50.7
[440]
0.0
[0]
0.0
[0]
51.5
[1341.4]
48.5
[1262.6]
11 0.0
[0]
0.0
[0]
52.0
[676.6]
48.0
[625.4]
0.0
[0]
0.0
[0]
48.6
[633.2]
51.4
[669]
0.0
[0]
0.0
[0]
50.3
[1309.8]
49.7
[1294.4]
12 41.9
[218.2]
58.1
[302.8]
52
[271]
48
[250]
46.8
[243.8]
53.2
[277.2]
44.3
[231]
55.7
[290.2]
46.5
[241.6]
53.5
[278.4]
46.3
[1205.6]
53.7
[1398.6]
13 51.7
[269.4]
48.3
[251.6]
55
[286.4]
45
[234.6]
52.3
[272.4]
47.7
[248.6]
50.6
[263.6]
49.4
[257.4]
49.8
[259]
50.2
[260.8]
51.9
[1350.8]
48.1
[1253]
14 42.4
[221]
57.6
[300]
51.9
[270.4]
48.1
[250.6]
47.8
[249]
52.2
[272]
44.9
[233.8]
55.1
[287.2]
46.5
[241.8]
53.5
[278.2]
46.7
[1216]
53.3
[1388]
In Scenario 5 all escalator users were assumed to ride with an even number adopting each side.
In this scenario an average decrease in TET of 10.8% (41.2s) and 12.7% (38.9s) in platform
clearance time can be seen compared to when escalator users all rode on the right side (Scenario
3). Compared to when all escalator users walked (Scenario 4), only a slight increase in TET
(5.2% (16.9s)) and platform clearance time (9.2% (22.5s)) was recorded.

247
Scenario 6 is identical to Scenario 3 where all escalator users rode on the right side, except that
agents used the shortest time system for device selection instead of evenly being assigned. A
slight decrease in TET by 4.7% (17.7s) was observed compared to Scenario 3 with a similar
reduction (5.1% (15.8s)) in platform clearance times. Approximately an even number of agents
used each escalator/stair with the average PET/CWT being similar in both scenarios. Indeed each
escalator/stair was adopted by approximately an even number of agents through the use of the
shortest time system (see Table 74) in Scenario 6 which would account for the similarities with
Scenario 3.
Scenario 7 extended Scenario 4 by using the hybrid device selection system. In this scenario a
Congestion Threshold (CT) value of 1ped/m2 was set with even usage of each escalator/stair
imposed before the CT was reached. The scenario produced one of the shortest TETs (321.3s)
and platform clearance times (246.7s). It was comparable to Scenario 4 where all agents used the
shortest time system when choosing to use an escalator/stair. In Scenario 4 approximately an
even number of agents used each escalator/stair. As such assigning an even proportion of agents
to use each device before a given level of congestion was reached in Scenario 7 had little effect.
A similar phenomenon occurred in Scenario 8 where the altered CT of 2ped/m2 had little
influence upon the overall evacuation compared to Scenario 4.
The concept of reducing escalator/stair availability is introduced in Scenario 9. In this scenario
ES1 was unavailable with agents who would have used ES1 evenly using the remaining
escalators/stairs. In addition, the shortest time system was used with all escalator users walking.
Both the TET and platform clearance times were marginally longer by 13.3% (42.4s) and 9.8%
(24.1s) respectively compared to when all escalators/stairs were available (Scenario 4). Scenario
10 extends the escalator/stair unavailability concept to two escalator/stairs (ES1 and ES5) being
unavailable at either end of the platform. Here an average TET of 421.0s and platform clearance
time of 327.0s was recorded which is similar to the time taken to evacuate the station in the stair
only scenario (Scenario 1). Despite this, the evacuation rate was notably higher than the stair
only case for a large proportion of the TET: between approximately 42.8% (180s) - 87.9% (370s)
of the TET (see Figure 71). This was due to the added vertical throughput afforded by the
available escalators and escalator users all walking. The TET from Scenario 10 increased by
29.6% (96.2s) compared to Scenario 4 where all escalators/stairs were available. The final
scenario involving escalator/stair unavailability was Scenario 11 where 3 escalators/stairs were
unavailable. This scenario produced the longest TET of all scenarios at 563.8s, representing a
73.6% (239.0s) increase compared to Scenario 4 where all escalator/stairs were available. In all

248
scenarios involving escalators/stairs being unavailable approximately an even number of agents
used each device. The escalator/stair availability results suggests that there may not be a linear
increase in time with linear decrease of escalators/stairs availability. Escalator human factors
have been shown to impact the extent to which platform clearance times are increased when
escalators/stairs are unavailable.
The final three scenarios (Scenarios 12, 13 and 14) used the escalator human factors data
analysed in Chapter 7. As previously mentioned there are a number of similarities between each
dataset relating to escalator/stair usage (all datasets), rider usage (Spanish and English datasets),
rider side usage (Spanish and English datasets) and walker speeds (Spanish and English
datasets).
Whilst there were significant difference between the Chinese and both the Spanish and English
walker speed distributions, almost all escalator users rode the escalator in the Chinese data. This
meant the impact of the increased walker speeds had little influence upon the overall scenarios
involving those datasets. The most prominent difference with the Chinese dataset scenario
(Scenario 13) compared to both the Spanish (Scenario 12) and English (Scenario 14) dataset
scenarios was the high proportion of riders using both sides of the escalator. In this scenario a
slight decrease in TET of 332.0s was recorded, representing a marginal reduction of 3.3%
(11.4s) and 1.3% (4.3s) respectively compared to the Spanish and English dataset scenarios. The
platform clearance time similarly was marginally reduced by 3.8% (9.7s) and 3.2% (8.2s)
respectively compared to the Spanish and English dataset scenarios. These results suggest that
having separate walker/rider lanes with a decreased proportion of walkers compared to riders
(Spanish/English dataset scenarios) is similar to having most/all escalator users ride using both
sides and not forming separate walker/rider lanes (Chinese dataset scenario). This is exemplified
in Scenario 4 (where all agents walked) and Scenario 5 (where all agents rode on both sides)
where little variation was also observed.

249
Figure 71: Evacuation curves for each scenario
In all scenarios agents initially on the ticket hall level were among the first to evacuate the
station so varying escalator strategies or associated human factors had little influence on those
agents. Consequently the evacuation curves for all scenarios (see Figure 71) are similar for the
first 964 agents in each scenario (i.e. the total ticket hall population). The remaining agents
evacuated from the platform level below so were influenced by the different escalator strategies
and varying human factors.
9.6 Concluding remarks
This chapter has presented the results of a series of evacuation scenarios using the developed
escalator and agent escalator model to explore the potential influence of escalator strategies and
human factors upon an evacuation.
The simulation results have shown that escalator human factors can have a considerable
influence upon a full underground station evacuation. Whilst a variety of escalator human
factors have been explicitly represented and explored within the scenarios, the inter-influencing
nature of certain escalator human factors has been shown to be more dominant than others. This
is exemplified in the final three scenarios (Scenarios 12, 13, 14) that incorporated each dataset.
Whilst significant differences existed between the Chinese datasets and the Spanish/English
datasets, the influence of the high proportion of riders (approximately evenly using both sides of

250
the escalator) in the Chinese dataset scenario negated the influence of the increased Chinese
walker speeds. As a result, little variation was observed between the scenarios that incorporated
each dataset.
The evacuation analysis has demonstrated that even the provision of static escalators can have a
considerable influence upon an evacuation compared to using stairs alone. Furthermore, the
provision of a moving escalator has been shown to decrease overall evacuation times by up to
approximately 25% compared to using stairs alone and around 10% compared to using static
escalators. Results have shown that little decrease in TET was observed when all escalator users
walked compared to if they all rode. As such, urging escalator users to ride on both sides of an
escalator, maximising tread utilisation, may be advantageous during an evacuation
considering the reduced likelihood of escalator users tripping compared to walking. During
scenarios where escalators/stairs were rendered unavailable, as expected, had a considerable
impact upon the evacuation. In those scenarios, increases in TET of up to 59.8% and platform
clearance times of up to 71.6% compared to stairs alone were recorded. Such findings highlight
the severity caused by the unavailability of escalators/stairs (e.g. due to fire/smoke, code
stipulations, etc), and the need to consider additional provision of vertical egress capacity.
The presented evacuation analysis has demonstrated the developed model can represent a variety
of escalator evacuation strategies and associated human factors. This capability could be
employed within an engineering analysis, where the performance of different procedural variants
are compared. Based on the analysis, a number of operational and human factors affecting an
evacuation using escalators have been suggested. Further investigation is required to assess the
extent to which the results are generally applicable. Indeed the presented analysis can be used to
guide such future investigation.

251
Chapter 10 - Conclusions
The objective of this thesis has been to advance understanding of human factors associated with
the use of vertical transport devices (lifts/escalators) and the influence of associated operational
strategies during evacuations. As part of this study the buildingEXODUS evacuation software
has been developed to include the representation of lifts/escalators and associated human factors
during an evacuation. The software was chosen as access to the source code along with
development support was made available. In addition, the software incorporates a number of
existing agent control features that could be utilised in the development of the vertical transport
agent models. Using the developed vertical transport and associated agent models, a series of
evacuation scenarios have been performed. These scenarios explored the influence of different
vertical transport strategies and how human factors influence each strategy.
The main research questions posed in Chapter 1 and general overview of the findings that
address each question in the thesis have been described in the following sections. Such questions
represent the lack of understanding in the field of vertical transport evacuation modelling based
on the literature reviewed.
Question 1: How would occupants behave given that they have the option to use a lift
during an evacuation?
Issues associated with this question were addressed in Chapter 4 where results and analysis from
an online lift survey were presented. The analysis identified that irrespective of familiarity with
a building, approximately half of all participants stated that they would sometimes consider
using a lift during an evacuation. This decreased to approximately a third if participants were
familiar with the building. This suggests that increased familiarity with a building decreases the
likelihood of considering using a lift during an evacuation.
Of participants that would consider using a lift during an evacuation, as expected and
demonstrated by Heyes [Heyes, 2009], results have shown as floor height increases the
proportion of those occupants that would actually choose to use a lift also increases. The
majority of occupants would consider the floor they were initially located on, the levels of
congestion in a lift waiting area, and the amount of time they were waiting for a lift in the
decision to use a lift during an evacuation. In addition, occupants’ tolerance to waiting in more
crowded lift waiting areas for longer periods of time to use a lift also increases with floor

252
height. Results suggest that occupant gender, age, and BMI do not significantly influence
their decision to consider using a lift during an evacuation. However, the country that
occupants are located does appear to be an influencing factor in this decision. Significantly
higher level of acceptance to consider using lifts during evacuations in the US and Germany
compared to the UK and China was recorded.
Question 2: How should human factors associated with evacuation lifts be modelled?
This question has been addressed in Chapter 5 where the development of a lift model and agent
lift model has been presented. The agent lift model developed was based upon data from the
survey presented in Chapter 4. This represents the first time that dedicated evacuation lift human
factors data has been used as a basis for developing an associated agent model within evacuation
software. Verification testing has demonstrated that the lift model and agent lift model behaves
as intended given input parameters and simulated conditions. Whilst this does not confirm the
model predictive capabilities, it does provide a level of confidence in its application to represent
the stated lift/agent behaviour.
Question 3: To what extent would different lift strategies influence an evacuation?
This question has been addressed in Chapter 6 where the developed lift and agent lift model was
used to perform a series of lift evacuation simulations. A series of full building lift evacuation
scenarios utilising different lift strategies were simulated. These were run once where agents
exhibited deterministic and non-adaptive behaviour (Simplified Lift Agent Model (SLAM)) and
once where agents exhibited probabilistic and adaptive behaviour (Advanced Lift
Agent Model (ALAM)). The ALAM employed the survey data presented in Chapter 4 and
represents more realistic behaviour compared to the SLAM. For all lift strategies the inclusion
of this realistic agent behaviour caused a decrease in overall evacuation performance. This was
because the lift system was typically underutilised due to agents not being prepared to wait in
given levels of congestion or for certain periods of time whilst in the lift waiting area.
Analysis of each scenario results show that the most efficient lift evacuation strategies
employed both stairs and lifts, where the building used sky lobbies and lifts shuttled agents to
the ground floor. Using such strategies with non-adaptive agent behaviour, a maximum
reduction in total evacuation time compared to stairs alone of approximately a half was found.
However, using such strategies and adaptive agent behaviour, produced a maximum reduction

253
in total evacuation time of approximately a third. Such strategies were less susceptible to
decreases in efficiency caused by human factors. This was because most agents‟ arrival to the lift
waiting areas was staggered due to initially having to use the stairs. Subsequently this decreased
the overall levels of congestion in the lift waiting areas. Since most high-rise buildings are
vertically partitioned into zones (with different lifts servicing a given range of floors) and/or
include sky lobbies, such strategies have a practical benefit of being able to be employed in most
existing high-rise buildings. Sky lobbies in high-rise buildings are also typically designed as
refuge areas that provide further benefits in terms of fire protection. Using sky lobby lift
strategies also requires little or no input from an operator or automated means of person
detection in the lift waiting areas (e.g. determining if any evacuees are still waiting in a lift
waiting area). This is because the lifts shuttle between the same floors for the entire duration of
the evacuation. Consequently there is no risk of an occupant being left behind and potentially
waiting for a lift that may have already serviced their floor. Further to this, such a strategy could
make use of existing shuttle lifts that are typically housed in blind shafts (i.e. not servicing other
floors between the ground and the sky lobby). This would negate the need for further
pressurisation measures and decrease the likelihood of smoke or fire entering the lift shaft
[Wong and Luo, 2005]. Such findings highlight the need to consider lift strategies and associated
human factors when devising evacuation strategies of high-rise building that heavily rely on lifts.
The results demonstrate that not only can lifts provide general benefit to evacuation
performance, but evacuation lift human factors can influence different lift strategies in
different ways. Such influences should be considered when determining the extent to which lifts
can provide benefit to an evacuation.
Question 4: How do occupants behave on escalators during an evacuation?
This question has been addressed in Chapter 7 where results and analysis of data collection of
human factors associated with escalator usage during normal circulation conditions is presented.
Whilst the data was not collected under emergency or evacuation conditions, based on previous
literature reviewed, evidence suggests that escalator human factors during normal circulation and
evacuation conditions are comparable [Galea, et al., 2006a; Donald and Canter, 1990].
The data analysis has shown that direction of travel (up/down), time period (rush-hour/non rush
hour) and country have varying influences upon escalator human factors. The results suggest that
pedestrian choice to use an escalator/stair is influenced differently by time period and direction
of travel in England and Spain. The escalator was the most popular device choice in the up

254
direction in both countries but the stairs were more popular in the down direction in England (the
influence of direction of travel in the Chinese dataset was not captured). In the Chinese dataset
the influence of high levels of congestion has been shown to considerably influence the
proportion of escalator/stair users. As the levels of congestion increased at the entrance to the
escalator/stair, the proportion of stair users also increased. This is expected to reflect the
increased width and subsequent throughput provided by the wider stair compared to the adjacent
escalator.
Results suggest that escalator walker speeds were similar in England and Spain but, despite
being significantly fewer walkers in China, walker speeds were significantly faster. In the
English and Spanish datasets, there is a common side preference where riders typically use the
right side and walkers use the left side. Conversely, analysis of the Chinese dataset showed the
majority of escalator users to ride on both sides of escalators. Indeed, a number of significant
differences were recorded between escalator human factors compared to both the Spanish and
English datasets. The highest escalator flow-rate recorded was in the Chinese dataset (102
ped/min) though this was less than the maximum flow-rate in the literature reviewed (140.0
ped/min [Al-Sharif, 1996]). The high number of riders approximately evenly using both the left
and right side of the escalator contributed to such high flow-rates being achieved. This
typically meant that each tread of the escalator was fully utilised more of the time compared to
when separate walker/rider lanes formed in the Spanish and English datasets. Indeed the highest
flow-rates occurred in all datasets when the majority of escalator users rode the escalator with a
similar proportion electing to use both the right and left side. The analysis has highlighted that
pedestrians behaviour on escalators is influenced by country, direction of travel, and time period.
Question 5: How should human factors associated with evacuation escalators be modelled?
This question has been addressed in Chapter 8 where the development of an escalator model and
agent escalator model has been presented. The agent escalator model developed was based on the
data presented in Chapter 7. Verification testing has demonstrated the escalator model and agent
escalator model behave as intended given input parameters and simulated conditions. As with the
agent lift model, whilst this does not confirm the model predictive capabilities it does provide a
level of confidence in its application to represent the stated escalator/agent behaviour.

255
Question 6: To what extent would escalator strategies influence an evacuation?
This question has been addressed in Chapter 9 where the developed escalator model and agent
escalator model were used to perform a series of evacuation scenarios. A series of underground
station escalator evacuation scenarios utilising different escalator strategies with varying human
factors were simulated. Results from the simulations have shown that a static escalator can
provide benefit to an evacuation compared to scenarios where only stairs are used. Using moving
escalators was shown to decrease total evacuation time by up to 25% compared to stairs alone
and around 10% compared to using a static escalator. During scenarios that included human
factors data from different countries (see Chapter 7), little variation between each scenario was
observed. This was due to the similarities between datasets from each country and counter
influencing escalator human factors (e.g. blocking behaviour reducing the influence of increased
walker speeds). Similar total evacuation times were recorded in scenarios when all escalator
users walked and in scenarios when all escalators rode on both sides. As such, urging escalator
users to ride on both sides of an escalator, maximising tread utilisation, maybe advantageous
during an evacuation considering the reduced likelihood of escalator users tripping compared
to walking. Overall the simulation results have shown that escalator strategies and human
factors can considerably influence an evacuation. Such findings highlight the need to consider
such factors when devising evacuation strategies of buildings that heavily rely on escalators (e.g.
underground stations).

256
In conclusion, each of the research questions have been addressed within the thesis. As such the
thesis has advanced current understanding and associated technology related to vertical transport
evacuation modelling through:
- Providing greater understanding of human factors associated with vertical transport
device usage during evacuations. This has been achieved through the collection and
extensive analysis of a broad variety of lift/escalator human factors.
- Developing improved empirical based modelling capabilities for simulating occupant
behaviour on and around vertical transport devices during evacuations. This has been
achieved through the model developed within existing evacuation software based on
novel research into lift/escalator human factors.
- Demonstrating the relative merits of using different vertical transport strategies during
evacuations and gauging to what extent human factors influence each strategy. This has
been achieved through a series of original simulated evacuation scenarios and
comparisons with scenarios that include a variety of different associated human factors.
10.1 Future work
All research questions outlined have been addressed. However, invariably the nature of the
subject matter, involving human factors, means the findings support a given hypothesis as
opposed to being absolute. As such further work and evidence to support/refute the existing
findings are required. This section proposes a selection of such future work. The recommended
future work has been segregated into separate sections related to future data collection,
lift/escalator model development, and evacuation scenarios.

257
Future data collection/analysis
The online lift survey and escalator video footage used to collect human factors data both had a
number of limitations (e.g. conceptualisation, being unsupervised, survey fatigue, camera
viewing angles, etc). As such further data should be collected in either experimental and/or
actual evacuations using lifts/escalators to address such limitations. Comparisons of such
evacuation data with the survey and video data would provide a means to suggest the level of
variability and subsequent suitability of applying such data to an evacuation scenario.
The questions in the online lift survey were intended to provide information in an uncomplicated
manner such that participants would not be confused. This was so that participants would be
more likely to make accurate predictions as to how they would behave according to a given
influence (e.g. floor height). It is possible that there are a number of additional aspects that
influence human factors associated with evacuation lift usage. This may include the influence of
training, response/pre-evacuation times, lift waiting behaviour, group dynamics, etc. Further
investigation is required to measure to what extent other influencing human factors associated
with evacuation lift usage might have upon an evacuation.
The online lift survey presented participants with a single decision to use a lift and what
threshold of a given criteria (e.g. wait time) would cause them to redirect to the stairs. Further to
this decision of lift usage, occupants may adapt their behaviour whilst on a stair and possibly
choose to redirect to a lift bank under certain conditions (e.g. waiting in a queue for a long time
on a stair). As such another area of interest would be to identify if and to what extent occupants
adapt their behaviour on stairs given that they have the option to use a lift (i.e. what factors
would cause them to redirect from using the stairs to use a lift).
The video analysis of pedestrians using escalators also had a number of limitations. Each piece
of video footage was collected in normal circulation conditions. Evidence in past literature of
actual evacuations suggests that pedestrians exhibit similar behaviour during evacuations as they
do in normal circulation situations [Galea, et al., 2006a; Donald and Canter, 1990]. However,
further investigation is required to ascertain, if and to what extent escalator human factors may
vary during evacuations.
Local restrictions in each underground station meant that only a limited amount of video footage
could be collected. Coupled with the labour intensive method by which the video footage was

258
analysed, meant that only a limited amount of data could be extrapolated for each item of
footage. Future investigations should perhaps seek to collect data over a longer period of time
with a decreased number of variables, possibly with the use of automated counting tools. This
should allow more data to be collected and general escalator human factors trends to be more
easily identified.
From the video analysis it could not be ascertained whether the observed escalator human factors
were products of habitual behaviour, cultural norms and/or conscious behaviour. One method to
address such issues would be to collect data via a combination of video footage and post
escalator usage participant surveys. These could be used to identify pedestrians‟ motivations and
reasoning for their behaviour.
The video analysis focused on escalator usage within underground stations. Further data
collection involving other types of structure that also heavily rely on escalators (e.g. shopping
centres, airports, etc) would be of interest. This allow a comparisons with the presented study to
identify if escalator users behave in a similar way to that in the observed underground stations.
Future lift/escalator model development
Both the lift survey data and escalator video data were used as a basis for the development of the
agent lift/escalator models. In addition to the empirically based components of each model,
further components were included based on a number of assumptions. Such agent behaviour was
implemented in order to allow agents to be more flexible in adapting to their local conditions.
Experimental/actual escalator evacuation data could be used to provide an empirical basis for
such model components. In addition, such data would also allow for validation of the agent
lift/escalator models. Indeed the limited number of empirical studies analysing evacuation
lift/escalator human factors suggest further data collection is necessary to conduct such model
validation.
A number of additional model components could be added to improve the level of flexibility and
representation of lifts/escalators and associate human factors. For the lift model, the represented
kinematics attributes of a lift are the jerk, acceleration and maximum speed. Using these
attributes the jerk and acceleration are assumed to be the same for the increase towards the
maximum speed and decrease from maximum speed. As mentioned in the literature review, this
is similar to a number of lift modelling simulation tools. However, the acceleration/jerk to and
259
from the maximum speed may potentially vary. An extension to the existing kinematic attributes
would be to allow users to define separate rates of acceleration/jerk to and from the maximum
speed to represent any variation.
The overall kinematics of the lift model are considered “ideal” in the sense that they do not
consider the influence of factors that decrease the efficiency of the lift movement (e.g. friction,
ware of machine parts, etc). Though manufactures include methods to limit the extent to which
they may influence a lift‟s movement, invariably over time they emerge. To represent such
aspects within the lift model, a kinematic inefficiency factor could be included. This could be
represented as a proportion of time increase for a lift journey due to such inefficiencies of the
machine parts. To ascertain what level of inefficiency should be prescribed according to which
lift factor requires further investigation.
The floor dispatch control system in the lift model allows users to explicitly define which floors
and in what order a lift will service during an evacuation. Using the floor sequence method, a lift
will service each floor in the sequence once in the specified order irrespective of occupants
waiting in the lift waiting areas. Using the shuttle floor sequence method, the lift system will
monitor the number of agents waiting in the lift waiting area of the next floor in the sequence to
determine if a lift is still required to service that floor. An extension to these static floor
sequences would be to allow the lift system to dynamically decide which floors to service in
which order based on occupant factors (e.g. floor requests, wait time, number of occupants
waiting, etc). Such dynamic evacuation lift dispatch strategies could be developed as a
programmed module that could plug into the existing lift model. This would in turn allow users
to develop and test their own dynamic evacuation lift dispatch strategies within
buildingEXODUS. This could be used to gauge how existing circulation floor dispatch strategies
may provide benefit during an evacuation scenario.
Future evacuation scenarios
The developed lift/escalator and associated agent models were used to demonstrate the influence
of a variety of different evacuation strategies. In addition, the models were used to identify how
human factors might influence each strategy. For the lift scenarios, all strategies were static in
the sense that once a lift had serviced the floors in its assigned floor sequence, they would stop.
Further development of the model whereby stopped lifts are utilised to service another lift‟s floor
260
sequence could be of interest. This would allow the gauging of how much increased efficiency
could be achieved from utilising stopped lifts.
In all scenarios, full building simultaneous evacuations were explored. However, it is common to
adopt either partial or phased evacuations in certain situations. Exploring the extent to which
different lift strategies and human factors influence both partial and phased evacuations would be
of interest. This would provide particular benefit to large high-rise buildings where such
procedures are more likely.
For the agent lift/escalator model, agents who initially chose to use a lift/escalator only had the
option to maintain their initial choice of lift/escalator bank or redirect to the stairs to evacuate.
Further evacuation scenarios that explore agents moving between other lift/escalator banks may
be of interest to identify if any further improvements or degradations in evacuation efficiency
might arise from such behaviour.
In all of the evacuation lift scenarios a hypothetical 50 storey structure was used and in all of the
evacuation escalator scenarios a hypothetical 2 level underground station was used. To extend
the findings derived from these scenarios, the same scenarios, incorporating the same
lift/escalator strategies and human factors components could be reproduced for structures with
different configurations. This would allow the gauging of how much the findings from the
presented simulations are generally applicable to other structures.
Finally, each lift/escalator evacuation scenario included the option for agents to use either
lifts/stairs or escalators/stairs at a single instance to vertically traversing a given area. In complex
multilevel geometries, occupants may be presented with multiple instances of choosing between
using lifts, escalators and stairs. In such scenarios, complex vertical wayfinding strategies may
be employed by occupants to evacuate a building. The developed lift/escalator model has the
capability to represent the decision of occupants to use lifts, escalators and stairs at various
stages within an evacuation. However, further data collection regarding vertical wayfinding
human factors is required to configure the model and reliably represent such behaviour.

261
References and Bibliography
[Al-Sharif, 1996] Al-Sharif, L., (1996), 'Escalator Handling Capacity: Standards Versus Practice',
Elevator World.
[Andrews and Boyes, 1977] Andrews, J.M., Boyes, J.V.J., (1977), 'Pedestrian movement at Victoria
Underground station', University College London.
[Ariff, 2003] Ariff, A., (2003), 'Review of Evacuation Procedures for Petronas Twin Towers',
Proceedings of the CIB-CTBUH International conference on Tall Buildings'.
[ASME, 2007]
ASME - American Society of Mechanical Engineers (ASME), (2007),
„A17.1/CSA B44 - 2007 Handbook on Safety Code for Elevators and
Escalators‟.
[Averill, et al., 2005]
Averill, J., Mileti, D., Peacock, R., Kuligowski, E., Groner, N., Proulx, G.,
Reneke, P., Nelson, H., (2005), 'Federal Building and Fire Safety Investigation
of the World Trade Center Disaster – Occupant Behavior, Egress and
Emergency Communications', NIST NCSTAR 1-7. US Government Printing
Office, Washington.
[Barker, 1995]
Barker, F., (1995), 'Multi-Purpose Elevators For Persons With Disabilities And
Firefighters In New High-Rise Office Buildings in the US. (with Concepts For
Accessibility And Other Buildings And Locations)' The 2nd Symposium on
Elevators, Fire, and Accessibility, Baltimore, Maryland.
[Barney, 2003] Barney, G., (2003), „Elevator Traffic Handbook: Theory and Practise‟, Spon
Press, Taylor & Francis Group.
[Baum-Snow and Kahn, 2000]
Baum-Snow, N., Kahn, M.E, (2000), „The effects of new public projects to
expand urban rail transit‟, Journal of Public Economics, Vol. 77, Issue 2,
pp241-263.
[Bazjanac, 1977] Bazjanac, V., (1977), 'Simulation of elevator performance in high-rise buildings
under conditions of emergency', Human Response to Tall Buildings', 316-328.
[BBC, 2001]
BBC - British Broadcasting Corporation, (2001), 'Canary Wharf practices terror
drill', Available at: http://news.bbc.co.uk/2/hi/uk_news/1628563.stm,
[Accessed on 22/05/2008].
[BBC, 2010a]
BBC - British Broadcasting Corporation (2010), 'Woman arrested over tower
block fire in London', Available at: http://www.bbc.co.uk/news/10609688,
[Accessed on 12/07/2010].
[BBC, 2010b]
BBC - British Broadcasting Corporation (2010), 'Man saves baby from London
tower block fire', Available at:
http://news.bbc.co.uk/1/hi/england/london/10609647.stm, [Accessed on
20/07/2010].
[Best and Demers, 1982] Best, R., Demers, D., (1982) " Investigation report on the MGM Grand Hotel
Fire – Las Vegas, Nevada, November 21, 1980", Quincy: NFPA.
[Boyce, et al., 2009]
Boyce, B., Purser, D., Shields, J., (2009), „Experimental Studies to Investigate
Merging Behaviour in a Staircase‟, Proceedings of the Human Behaviour in
Fire Conference, pp111-122.
[Brannigan and Miller-Hooks, 2007]
Brannigan, V., Miller-Hooks, E., (2007), 'Phased Evacuation in High-rise
Buildings: Technical and Regulatory Issues' 11th International Conference
Baurecht and Brandshutz (Building Law and Fire Safety).
262
[British Standards, 2008] British Standards Institute, (2008),'BS 9999: Code of practice for fire safety in
the design, management and use of buildings'.
[Brown and Kelly, 1968] Browne, J. J., Kelly, J. J., (1968) 'Simulation of elevator system for world‟s
tallest buildings', Transportation Science, Vol.2, No. 1, pp. 35-56.
[Bryan, 1981]
Bryan, J.L., (1981), „An Examination and Analysis of the Dynamics of the
Human Behaviour in the MGM Grand Hotel, Clark County, Nevada, on
November 21, 1980‟, Quincy: NFPA.
[Bukowski, 2005a]
Bukowski, R., (2005), 'Protected Elevators For Egress And Access During
Fires In Tall Buildings', Workshop on Building Occupant Movement During
Fire Emergencies, pp14-21.
[Bukowski, 2005b] Bukowski, R. W., (2005), 'Is There A Need to Enclose elevator lobbies in tall
buildings?', Building Safety Journal, Vol. 3, No. 4, pp26-31.
[Bukowski, 2006]
Bukowski, R., Fleming, R., Tubbs, J., Marrion, C., Dirksen, J., Duke, C.,
Prince, D., Richardson, L., Beste, D., Stanlaske, D., (2006), 'Elevator controls',
NFPA Journal, Vol. 100, No. 2, pp42-57.
[Bukowski, 2008a] Bukowski, R., (2008), 'Emergency Egress from Ultra Tall Buildings', CTBUH
8th World Congress 2008'.
[Bukowski, 2008b] Bukowski, R., (2008), 'Status of the Use of Elevators in Fires', Fire Protection
Engineering, Issue 23.
[Bukowski, 2009]
Bukowski, R. W., (2009), 'Emergency Egress From Buildings Part 1: History
and Current Regulations for Egress System Design Part 2: New Thinking on
Egress From Buildings', NIST Technical Note 1623, NIST TN1623.
[Bukowski, 2010] Bukowski, R. W., (2010) „Applications of Elevators for Occupant Egress in
Fires‟, Fire Protection Engineering, Issue 38.
[Cauchon and Moore, 2002] Cauchon, D., Moore, M. T., (2002), 'Elevators were disaster within disaster',
USA Today.
[Charters and Fraser-Mitchell, 2009]
Charters, D., Fraser-Mitchell, J., (2009), 'Guidance on the emergency use of
lifts or escalators for evacuation and fire and rescue service operations BD
2466', Technical report, Department for Communities and Local Government.
[Cheung and Lam, 1998]
Cheung, C., Lam, W., (1998), 'Pedestrian Route Choices Between Escalator
and Stairway in MTR Stations', Journal of Transportation Engineering,. Vol.
124, No. 3, pp227-285.
[CIBSE, 2000] CIBSE - Chartered Institute of Building Service Engineers, (2000), 'Guide D:
Transportation systems in buildings', Technical report.
[Clark, 1981] Clark County Fire Department, (1981), „Clark County Fire Department, MGM
Report., Clark County Fire Department, Las Vegas, May 19, 1980‟.
[Communities, 2006]
Communities and Local Government., (2006), 'The Buildings Regulations 2000
– Approved Document B – Fire Safety – Volume 2 – Buildings other than
dwelling houses', Technical report.
[Craighead, 2009] Craighead, G., (2009),‟High-Rise Security and Fire Life Safety 3rd edition‟,
Butterworth-Heinemann.
[CTBUH, 2010] CTBUH - Council on Tall Buildings and Urban Habitat, (2010), Accessed at:
http://www.ctbuh.org, [Accessed on 20/10/2010].

263
[Cudahy, 2004] Cudahy, B., (2004), „A Century of Subways: Celebrating 100 years of New
York‟s Underground Railways‟, Fordham University Press, ISBN:0823222934.
[Daamen, 2002] Daamen, W., (2002), 'SimPed: A Pedestrian Simulation Tool for Large
Pedestrian Areas', Proceedings EuroSIW.
[Daamen, 2004] Daamen, W., (2004), 'Modelling Passenger Flows in Public Transport
Facilities', PhD Thesis , Delf University Press.
[Davis and Dutta, 2002]
Davis, P., Dutta, G., (2002), 'Estimation of Capacity of Escalators in London
Underground', No 2002-11-01, IIMA Working Papers from Indian Institute of
Management Ahmedabad, Research and Publication Department.
[Donald and Canter, 1990]
Donald, D., Canter, D., (1990), 'Behavioural aspects of the King‟s Cross
disaster'. In: D. Canter, Editor, „Fires and Human Behaviour‟, David Fulton,
London, pp15–30.
[Evenson and Vanney, 2008] Evenson, J. M., Vanney, A. F., (2008), 'Burj Dubai: Life Safety and Crisis
Response Planning Enhancements', CTBUH 8th World Congress.
[Fahy and Proulx, 2005] Fahy, R., Proulx, G. (2005), 'Analysis Of Published Accounts Of The World
Trade Center Evacuation', NIST NCSTAR 1-7A.
[Fennel, 1988] Fennel, D., (1988), 'Investigation into the King's Cross Underground Fire',
Technical report, Her Majesty‟s Stationary Office.
[Fetherstonhaugh, et al., 1997]
Fetherstonhaugh, D., Slovic, P., Johnson, S., Friedrich, J., (1997), 'Insensitivity
to the Value of Human Life: A Study of Psychophysical Numbing', Journal of
Risk and Uncertainty, Vol. 14, pp 283–300.
[Fox, 1991]
Fox, C., (1991), 'Handicapped use of elevators', American Society of
Mechanical Engineers, Council of American Building Officials and National
Fire Protection Association. Proceeding of Elevators and Fire Conference.
[Fruin, 1971] Fruin, J.J, (1971), „Pedestrian Planning and Design‟, Metropolitan Association
of Urban Designers and Environmental Planners.
[Galea and Blake, 2004]
Galea, E.R., Blake, S., (2004), 'Collection and Analysis of Human Behaviour
Data appearing in the mass media relating to the evacuation of The World
Trade Centre Towers of 11 September 2001', Technical report, Building
Disaster Assessment Ground (BDAG), Office of the Deputy Prime Minister.
[Galea, et al., 2006a]
Galea, E.R., Shields, J., Canter D., Boyce, K., Day, R., Hulse, L, Siddiqui A.,
Summerfield, L., Marselle, M., Greenall, P., (2006), ‟Methodologies employed
in the Collection, Retrieval and Storage of Human Factors Information Derived
from First Hand Accounts of Survivors of the WTC Disaster of 11 September
2001‟, Journal of Applied Fire Science, Vol 15, Number 4, pp253-276.
[Galea, et al., 2006b]
Galea, E.R., Lawrence, P.J., Gwynne, S., Filippidis, L., Blackshields, D.,
Cooney, D., (2006) „BuildingEXODUS v 4.06 user guide and technical
manual‟, Fire Safety Engineering Group, University of Greenwich.
[Galea, et al., 2008]
Galea, E.R, Sharp, G., Lawrence, P.J., Holden, R., (2008), „Approximating the
Evacuation of the World Trade Center North Tower using Computer
Simulation‟, Journal of Fire Protection Engineering, Vol 18, Issue 2, pp85-115.
[Galioto, et al., 2004]
Galioto,C. , Heller, J., Fletcher, M.S., Spiewak, B., Meyers, R., Barlund, K.,
Jong, .J.D., Edgett, S., Kinnaman, S., Siikonen, M., Solomon, R., Harper, J.,
Adams, W., Freidenfelds, L,. (2004), 'Emergency Evacuation Elevator Systems
Guideline', Technical report, Council for Tall Buildings and Urban Habitat
(CTBUH).
264
[Groner and Levin, 1992]
Groner, N., Levin, B., (1992), 'Human Factors Considerations in the Potential
for Using Elevators in Building Emergency Evacuation Plans', NIST GCR 94-
656.
[Gwynne, et al., 1999]
Gwynne, S., Galea, E.R., Lawrence, P.J., (1999), “Adaptive Decision-
making in buildingEXODUS in response to exit congestion”.,
Proceedings of the 6th International Symposium IAFSS, ISBN: 0925
223 255, Poitiers France, Ed:M.Curtat, pp 1041-1052.
[Hakonen, 2003a]
Hakonen, H., (2003), 'Simulation of Building Traffic and Evacuation by
Elevators', PhD thesis, Helsinki University of Technology, Department of
Engineering Physics and Mathematics Systems Analysis Laboratory.
[Hakonen, 2003b] Hakonen, H., Susi, T., Siikonen, M., (2003), 'Evacuation Simulation Of Tall
Buildings', Proceedings of the Council on Tall Buildings and Urban Habitat.
[Heyes, 2009]
Heyes, E., (2009), 'Human Behaviour Considerations in the Use of Lifts for
Evacuation from High-rise Commercial Buildings', Master‟s thesis, University
of Canterbury, Department of Civil Engineering.
[Heyes and Spearpoint, 2009]
Heyes, E., Spearpoint, M., (2009), 'Lifts for evacuation – Human behaviour
considerations', Proceedings of the Human Behaviour in Fire Conference,
pp73-84.
[Hoffman and Henson, 1997]
Hoffmann, N.A, Henson, D.A., (1997) 'Simulating Transient Evacuation and
Pedestrian Movements in Stations', International Conference on Mass Transit
Management.
[Howkins, 2000] Howkins, R., (2000), 'In the Event of Fire - Use Elevators' Proceedings of
ELEVCON 2000, Elevator Technology 10, pp11-21.
[Hsiung, et al., 2009]
Hsiung, K.-H., Chien, S.-W., Huang, P.-T., Tseng, C.-H., (2009), 'A study on
high-rise building fire evacuation strategies for Taipei 101 Financial Centre'
Proceedings of the Human Behaviour in Fire Conference, pp51-60.
[ICC, 2009] ICC - International Code Council, (2009) '2009 International Building Code'.
[Kadokura, et al., 2009]
Kadokura, H., Sekizawa, A., Takahashi, W., (2009), 'Study on availability and
issues of evacuation using stopped escalators in a subway station' Human
Behaviour in Fire', pp183-194.
[Kean and Hamilton, 2004]
Kean, T.H, Hamilton, L., (2004), „The 9/11 Commission Report: Final Report
of the National Commission on Terrorist Attacks Upon the United States‟,
United States Government Printing Office, ISBN 0-16-072304-3.
[Kinsey, et al., 2008]
Kinsey, M.J, Galea, E.R, Lawrence, P.J., (2008), „Modelling Pedestrian
Escalator Behaviour‟, Proceedings of the Pedestrians and Evacuation Dynamics
(PED) Conference, pp689-696.
[Kinsey, et al., 2009a]
Kinsey, M.J, Galea, E.R, Lawrence, P.J., (2009), „Investigating the Use of
Elevators for High-rise Building Evacuation through Computer Simulation‟,
Proceedings of the Human Behaviour in Fire Conference, pp85-96.
[Kinsey, et al., 2009b]
Kinsey, M.J, Galea, E.R, Lawrence, P.J, (2009), „Extended Model of Pedestrian
Escalator Behaviour Based on Data Collected within a Chinese Underground
Station‟, Proceedings of the Human Behaviour in Fire Conference, pp173-182.
[Kinsey, et al., 2010]
Kinsey, M.J, Galea, E.R, Lawrence, P.J, (2010) „Human Factors Associated
with the Selection of Lifts/Elevators or Stairs in Emergency and Normal Usage
Conditions‟, Fire Technology, DOI: 10.1007/s10694-010-0176-7.

265
[Kinsey, et al., 2011]
Kinsey, M.J, Galea, E.R, Lawrence, P.J, (2011) „Investigating Evacuation Lift
Dispatch Strategies using Computer Modelling‟, Fire and Materials,
DOI: 10.1002/fam.1086.
[Kisko, et al., 1998] Kisko, T.M, Francis, R.L, Nobel, C.R, (1998), 'EVACNET4 User's Guide
version 10/29/98', University of Florida.
[Klote, 1983]
Klote, J., (1983), 'Elevators as a Means Of Fire Escape', American Society of
Heating Refrigerating and Air Conditioning Engineers Transactions, Vol. 89,
No. 2, pp1-16,. NBSIR 82-2507.
[Klote and Tamura, 1991]
Klote, J. H., Tamura, G. T., (1991), 'Smoke control systems for elevator fire
evacuation' American Society of Mechanical Engineers, Council of American
Building Officials and National Fire Protection Association. Elevators and Fire,
pp83-94.
[Klote, et al., 1992]
Klote, J. H., Alvord, D. M., Levin, B. M., Groner, N. E., (1992), 'Feasibility
and Design Considerations of Emergency Evacuation by Elevators', National
Institute of standards, and Technology, Gaithersburg, MD NISTIR 4870, 126.
[Klote and Alvord, 1992b]
Klote, J.H, Alvord, D.M., (1992), „Routine for Analysis of the People
Movement Time for Elevator Evacuation‟, National Institute of Standards,
NISTIR 4730.
[Knehs, 2010] Knehs, C., (2010), „Untersuchung und Modellierung des Routenverhaltens von
Fußgängern in Bahnhöfen‟, Master Thesis, TU Wien.
[Korhonen and Hostikka, 2010] Korhonen, T., Hostikka, S., (2010), “Fire Dynamics Simulator with Evacuation:
FDS+Evac, Thecnical Reference (FDS 5.50, Evac 2.2.1)”, VTT
[Koshak, 2003] Koshak, J., (2003), 'Elevator Evacuation in Emergency Situations', ASME
International.
[Kuligowski, 2003]
Kuligowski, E., (2003), 'Elevators for Occupant Evacuation And Fire
Department Access' Proceedings of the CIB-CTBUH International Conference
on Tall Buildings.
[Kuligowski, 2005] Kuligowski, E. D, Peacock, R. D., (2005), 'Review of Building Evacuation
Models', NIST Technical Note 1471.
[Kuligowski, 2010] Kuligowski, E. D, Peacock, R. D., Hoskins, B.L., (2010), 'Review of Building
Evacuation Models, 2nd
Edition', NIST Technical Note 1680.
[Levin and Groner, 1994]
Levin, B., Groner, N., (1994), 'Human Factors Considerations for the potential
use of elevators for fire evacuation of FAA Air Traffic Control Towers', NIST
Technical Note, NIST-GCR-94-656.
[Malvern, 2009]
Malvern, J., (2009), „Mystery over Tube escalator etiquette cleared up by
restored film‟, The Times, Accessed at:
http://entertainment.timesonline.co.uk/tol/arts_and_entertainment/film/london_
film_festival/article6883065.ece, [Accessed on 22/10/2009].
[Mott, 2003] Mott Macdonald, (2003), „STEPS Simulation of Transient Evacuation and
Pedestrian movementS) User Manual‟, (Unpublished).
[Motz, 1991]
Motz, H., (1991), 'On the ideal Kinematics of lifts‟ (republished in English),
(First published in „Foedern und Heben‟ Vol. 26 (1976), No. 1 in German),
Elevatori, pp41-46.
[NBS, 1935] NBS - National Bureau of Standards, (1935), 'Design and Construction of
Building Exits', Miscellaneous Publication M151, Washington DC.

266
[Newman and Kenworthy, 1999] Newman, P., Kenworthy, J.R., (1999) „Sustainability and cities: overcoming
automobile dependence‟, Island Press.
[NFPA, 1914] NFPA – National Fire Protection Association, (1914), „Proceedings of the 18th
Annual Meeting‟, Boston, MA.
[NFPA, 1998]
NFPA – National Fire Protection Association, (1998) „Fire Investigation
Summary – Dusseldorf Airport Terminal Fire. Dusseldorf, Germany; April 11,
1996‟, Quincy, MA.
[NFPA, 2009a] NFPA – National Fire Protection Association, (2009), 'NFPA 101: Life Safety
Code 2009', Technical report.
[NFPA, 2009b] NFPA – National Fire Protection Association, (2009), 'NFPA 5000: Building
Construction and Safety Code', Technical report.
[NFPA, 2010] NFPA – National Fire Protection Association, (2010), "NFPA 130: Standard
for Fixed Guideway Transit and Passenger Rail Systems‟, Technical Report.
[Okada, et al., 2009]
Okada, N., Hasemi, Y., Moriyama, S., Hirakawa, K., Takemori, K., Hebiishi,
T., Lu, Y. (2009), 'Feasibility of upward evacuation by escalator – An
experimental study', Proceedings of Human Behaviour in Fire Conference,
pp161-172.
[Pauls, 1977]
Pauls, J., (1977), 'Management and movement of building occupants in
emergencies' Proceedings of Second Conference on Designing to Survive
Severe Hazards, pp103-130.
[Peters, 1996]
Peters, R.D., (1996), 'Ideal Lift Kinematics: Derivation of Formulae for the
Equations of Motion of a Lift', International Journal of Elevator Engineering 1,
pp60-71.
[Peters, 2002]
Peters, RD.., (2002) 'Current Technology and Future Developments in Elevator
Simulation' Technical Note, International Journal of Elevator Engineers, Vol. 4
No. 2.
[Peters, 2007] Peters, R.D., (2007) 'ELEVATE User Manual, Version 7.0', Peters Research,
(Unpublished).
[Planning, 2003] Planning Press of China, (2003),‟Code for Design of Subway. GB 50157-
2003‟.
[Proulx, et al., 1995]
Proulx, G., Pineau, J., Latour, J. C., Stewart, L., (1995), 'Study of the
Occupants' Behaviour During the 2 Forest Laneway Fire in North York,
Ontario, January 6, I995', Internal Report: IRC-IR-705.
[Proulx, et al., 2004]
Proulx, G., Reid, I., Cavan, N., (2004)., 'Human behavior study – Cook County
Administration Building Fire October 17, 2003 Chicago Illinois', Research
Report No. 181. National Research Council Canada, Ottawa.
[Proulx, et al., 2009]
Proulx, G., Johnson, P., Heyes, E., Hedman, G., Averill, J., Pauls, J., McColl,
D., (2009), 'The use of elevators for egress: Discussion Panel', Proceedings of
Human Behaviour in Fire Conference, pp97-110.
[Sekizawa, et al., 1999]
Sekizawa, A., Ebihara, M.E., Notake, H., Kubota, K. , Nakano, M., Ohmiya,
Y., Kaneko, H. , (1999), 'Occupants' Behaviour in Response to the High-rise
apartments Fire in Hiroshima City', Proceedings of Human Behaviour in Fire,
pp297-303.
[Shields, et al., 2009]
Shields, T.J, Boyce, K.E, McConnell, N., (2009), „The behaviour and
evacuation experiences of WTC 9/11 evacuees with self-designated mobility
impairments‟, Fire Safety Journal, Vol. 44, Issue 6, pp881-893.

267
[Siikonen, 1993] Siikonen, M., (1993), 'Elevator Traffic Simulation', SIMULATION, Vol. 61
Issue. 4, pp257-267.
[Siikonen, 1997a] Siikonen, M., (1997), 'Customer Service In An Elevator System During Up-
Peak', Transport Research Board, Vol. 31, Issue 2, pp127-139.
[Siikonen, 1997b]
Siikonen, M., (1997), 'Planning and Control Models for Elevators in High-Rise
Buildings', PhD thesis, Helsinki University of Technology, Systems Analysis
Laboratory.
[Siikonen and Hakonen, 2003] Siikonen, M., Hakonen, H., (2003), 'Efficient Evacuation Methods In Tall
Buildings', Elevator World, July, pp78-83.
[Siikonen, 2007] Siikonen, M., (2007), 'Evacuation with Elevators - Current Activities', ELA
Conference on Fire and Evacuation.
[Simon, 1957]
Simon, H., (1957), “A Behavioral Model of Rational Choice”, in Models of
Man, Social and Rational: Mathematical Essays on Rational Human Behavior
in a Social Setting. New York: Wiley
[Strakosch and Caporale, 2010] Strakosch, G., Caporale, R.S, (2010), 'The Vertical Transportation Handbook,
The Third Edition', John Wiley & Sons Inc.
[Susi, et al., 2004] Susi, T., Sorsa, J., Siikonen, M., (2004), 'Passenger Behaviour In Elevator
Simulation', Proceedings of ELEVCON 14.
[Tanaboriboon, 1986]
Tanaboriboon, Y., Hwa, S., Chor, C., (1986), 'Pedestrian Characteristics Study
in Singapore', Journal of Transportation and Engineering, Vol. 112, Issue 3,
pp229-235.
[Transport, 2010a]
Transport for London (TFL), (2010), „1996 Rolling Stock‟, Accessed at:
http://www.tfl.gov.uk/corporate/modesoftransport/londonunderground/rollingst
ock/1630.aspx, [Accessed on 18/08/2010].
[Transport, 2010b]
Transport for London (TFL), (2010), „Key facts‟, Accessed at:
http://www.tfl.gov.uk/corporate/modesoftransport/londonunderground/1608.asp
x, [Accessed on 18/08/2010]
[Treanor, 2001]
Treanor, J., (2001), '50-floor Canary Wharf tower evacuated', The Guardian ,
Accessed at: http://www.guardian.co.uk/uk/2001/oct/31/afghanistan.terrorism,
[Accessed on 22/10/2010]
[Wong, et al., 2005]
Wong, K., Hui, M., Guo, D., Luo, M., (2005), 'A Refined Concept on
Emergency Evacuation by Lifts', Proceedings of the Eighth International
Symposium on Fire Safety Science, pp599-610.
[Wong and Luo, 2005]
Wong, K.H., Luo, M., (2005), 'The Application of New Technology in
Quantifying the Effectiveness of Lift Evacuation' Proceeding of Fire Australia
2005.
[Zeiler, et al., 2010]
Zeiler I, Rudloff, C., Bauer, D., (2010), 'Modelling Random Taste Variations
on Level Changes in Passenger Route Choice in a Public Transport Station',
Proceedings of the Pedestrian and Evacuation Dynamics Conference (PED)
2010.
[Zhong, et al., 2008]
Zhong, M., Shi, C., Tu, X., Fu, T., He, L., (2008), „Study of the human
evacuation simulation of metro fire safety analysis in China‟, Journal of Loss
Prevention in the Process Industries, Vol. 21, Issue 3, pp287-298.
[Zmud, 2007]
Zmud, M., (2007), 'Public Perceptions of High-rise Building Safety and
Emergency Evacuation Procedures Research Project', The Fire Protection
Research Foundation, Massachusetts, USA.

268
Appendix
A1.1 Online Survey
A summary of the questions posed in the on-line survey is presented in this Appendix, the full
survey can be found at http://fseg.gre.ac.uk/elevator/. Presented in Appendix A1.1-A1.6 is the full
text of each of the participant consent form, hypothetical scenarios posed in the section dealing
with circulation and the questions posed for each of the scenarios.
A1.1.1 Participant Consent Form
Participant Information Sheet
Thank you for agreeing to participate in this study. This study is being conducted by the
University of Greenwich and your participation in this study is helping to improve evacuation
safety.
THE QUESTIONNAIRE:
As part of this study, you will be asked to fill out a questionnaire.
While you are under no obligation to answer any of the questions we would appreciate if you
could provide an answer to all of the questions.
If you have any problems in completing the questionnaire please ask the research assistant
and they will explain the question.
There are no right or wrong answers.
The entire process should take about 10 minutes of your time.
YOUR ANSWERS:
The answers you provide to the questionnaire will be analysed and the data stored.
We will keep the data for research purposes and some of the analysed data may be published
and shown in public fora.
Your name and any unique identifying personal details will not be associated with your
questionnaire.
The questions have been designed to collect information which will help us in our
understanding of human behaviour during normal and evacuation scenarios.
RIGHT TO WITHDRAW:
The public survey in which you are about to participate involves simple questions and
answers and should present no difficulties to you.

269
However, if at any time you wish to withdraw from the questionnaire, please inform the
member of staff and you will be free to leave, no reasons need to be provided.
CONFIDENTIALITY:
We request that you do not discuss the detailed nature of the questionnaire with any one
likely to participate in the survey.
For further information about this survey please contact:
Prof Edwin Galea (Research Director) Michael Kinsey (PhD Student)
University of Greenwich, University of Greenwich,
Fire Safety Engineering Group, Fire Safety Engineering Group,
Room 355, Queen Mary Building, Room 264, Queen Mary Building,
30 Park Row, 30 Park Row,
Greenwich, London SE10 9LS, Greenwich, London SE10 9LS,
http://fseg.gre.ac.uk
Tel: 0208 331 8730 Tel: 0208 331 8447
Email: [email protected] Email: [email protected]
A1.1.2 Circulation Section – The Scenarios
1. Base Case
Situation:
You are in a multi-storey building and....
You are familiar with the layout of the building.
The lifts/elevators and stairs are located in the same area.
You are travelling alone and are not carrying or wearing anything which
would restrict your movement.
You are alone in the lift/elevator lobby.
The lift/elevator is not currently on your floor and you do not know
how long you will have to wait for the lift/elevator to return.

270
2.Queues
Situation:
You are in a multi-storey building and....
You are familiar with the layout of the building.
The lifts/elevator and stairs are located in the same area.
You are travelling alone and are not carrying or wearing anything which
would restrict your movement.
There are a number of people in the lift/elevator lobby.
The lift/elevator is not currently on your floor and you do not know
how long you will have to wait for the lift/elevator to return.
3.Groups
Situation:
You are in a multi-storey building and....
You are familiar with the layout of the building.
The lifts/elevator and stairs are located in the same area.
You are travelling with a group of 2-4 people.
The people in the group are all of similar physical ability and fitness
to yourself.
The lift/elevator lobby is empty.
The lift/elevator is not currently on your floor and you do not know how
long you will have to wait for the lift/elevator to return.
A1.1.3 Circulation Section – The Questions
a) You need to travel UP a number of floors.
For each situation identified below, please state the maximum number of floors you
would consider taking the STAIRS to travel UP (state „-‟ if you would always use the
stairs and 0 if you would always use the lift/elevator).

271
You are on a ....
(a) leisure activity
with no time
pressure.
(b) leisure activity
with some time
pressure.
(c) business
activity with no
time pressure.
(d) business
activity with some
time pressure.
I would use the
stairs if I had to
travel UP...
__________
floors
__________
floors
__________
floors
__________
floors
b) If you were unfamiliar with the building but all the other conditions were the same,
would you change your answers to the above questions?
YES NO
If YES, how many floors would you now travel:
(a) _______floors (b) _______floors (c) _______floors (d) _______floors
c) You need to travel DOWN a number of floors.
For each situation identified below, please state the maximum number of floors you
would consider taking the STAIRS to travel DOWN (state „-‟ if you would always use
the stairs and 0 if you would always use the lift/elevator).
You are on a ....
(a) leisure activity
with no time
pressure.
(b) leisure activity
with some time
pressure.
(c) business
activity with no
time pressure.
(d) business
activity with some
time pressure.
I would use the
stairs if I had to
travel DOWN...
__________
floors
__________
floors
__________
floors
__________
floors
d) If you were unfamiliar with the building but all the other conditions were the same,
would you change your answers to the above questions?
YES NO
If YES, how many floors would you now travel:
(a) _______floors (b) _______floors (c) _______floors (d) _______floors

272
A1.3 Evacuation Section – The main scenario (and variations) and associated questions
A1.1.4 Evacuation Section – The Scenario
Situation:
You are in a multi-storey building and....
You are familiar with the layout of the building.
The lifts/elevator and stairs are located in the same area.
You are travelling alone and are not carrying or wearing anything which
would restrict your movement.
You have been instructed that it is acceptable to use either the
lifts/elevators or stairs to evacuate from your building in emergency
situations. During an evacuation you are free to choose to use with the
lifts/elevators or stairs.
A1.1.5 Evacuation Section – The Questions
a) Would you consider using the lift/elevator to evacuate?
YES NO
If YES go to 4b. If NO go to 4g.
b) Would you always use the lift/elevator to evacuate in preference to the stairs?
YES NO
If YES go to 4g. If NO go to 4c.
c) Would the height of the floor you were on influence your decision?
YES NO
If YES go to 4d. If NO go to 4e.
d) What is the maximum AND minimum number of floors you would consider
travelling in a lift/elevator to an exit floor?

273
- The maximum number of floors I would consider travelling in a lift would be
_______ floors (state „-„ if there is no maximum).
- The minimum number of floors I would consider travelling in a lift would be
_______ floors (state „-„ if there is no minimum).
e) Irrespective of the floor your are on (i.e. regardless of how far you need to vertically
travel), would the height of the building influence your decision?
YES NO
If YES, select which statement is most appropriate:
The higher the building, the more likely I would want to use the lift/elevator.
The higher the building, the less likely I would want to use the lift/elevator.
Please explain your answer:
________________________________________________________________________
________________________________________________________________________
________________________________________________________________________
________________________________________________________________________
________________________________________________________________________
f) You are instructed to evacuate from a multi-storey building…
- It is an emergency but you are not in immediate danger.
- You have a choice to use either one of 4 lifts/elevators servicing your floor OR the
stairs.
- Each lift/elevator has a capacity of 10 people.
- The lift/elevator lobby is crowded with people.
In the table below please indicate if you would wait to use a lift/elevator given that
you are located in each of the indicated floor regions. If you would consider waiting

274
to use a lift/elevator for a given floor region, please fill in the remaining two
columns.
You are
located
between
floors...
Due to the crowd
you will have to
wait to use the
lift/elevator, are
you prepared to
wait to use the
lift/elevator?
If YES…
Based on the Crowd level key, select the crowd level that
would deter you from waiting for the lift/elevator.
If YES….
Given that the
crowd is below the
indicated
size/density, what
is the maximum
time that you
would consider
waiting for the
lift/elevator before
using the stairs?
2-10 YES NO <A A-B B-C C-D
D-E E-F >F Crowd size doesn‟t matter
11-20 YES NO <A A-B B-C C-D
D-E E-F >F Crowd size doesn‟t matter
21-30 YES NO <A A-B B-C C-D
D-E E-F >F Crowd size doesn‟t matter
31-40 YES NO <A A-B B-C C-D
D-E E-F >F Crowd size doesn‟t matter
41-50 YES NO <A A-B B-C C-D
D-E E-F >F Crowd size doesn‟t matter
51-60 YES NO <A A-B B-C C-D
D-E E-F >F Crowd size doesn‟t matter

275
Crowd level Key:
g) Would you change your above answer(s) if you were UNFAMILIAR with the
building BUT knew that it was OK to use the lifts to evacuate?
YES NO If NO go to 5.
If YES, please complete the table below as if you were UNFAMILIAR with the building:
You are instructed to evacuate from a multi-storey building…
- It is an emergency but you are not in immediate danger.
- You have a choice to use either one of 4 lifts/elevators servicing your floor OR the
stairs.
- Each lift/elevator has a capacity of 10 people.
- The lift/elevator lobby is crowded with people.

276
You are
located
between
floors...
Due to the
crowd you
will have to
wait to use the
lift/elevator,
are you
prepared to
wait to use the
lift/elevator?
If YES…
Based on the Crowd level key, select the crowd level that
would deter you from waiting for the lift/elevator.
If YES….
Given that the
crowd is below
the indicated
size/density, what
is the maximum
time that you
would consider
waiting for the
lift/elevator
before using the
stairs?
2-10 YES NO <A A-B B-C C-D
D-E E-F >F Crowd size doesn‟t matter
11-20 YES NO <A A-B B-C C-D
D-E E-F >F Crowd size doesn‟t matter
21-30 YES NO <A A-B B-C C-D
D-E E-F >F Crowd size doesn‟t matter
31-40 YES NO <A A-B B-C C-D
D-E E-F >F Crowd size doesn‟t matter
41-50 YES NO <A A-B B-C C-D
D-E E-F >F Crowd size doesn‟t matter
51-60 YES NO <A A-B B-C C-D
D-E E-F >F Crowd size doesn‟t matter
A1.1.6 Person Details Section - The Questions
a) What is your Gender?
MALE FEMALE
b) What is your date of birth?
MONTH DAY YEAR
c) Approximately how much do you weigh? (select a value AND select one of the metrics)
VALUE METRIC
d) Approximately how tall are you? (select a value AND select one of the metrics)
VALUE METRIC
e) Usually, how many days a week do you engage in greater than 30 minutes of moderate
exercise?
SELECTdays a week.

277
If you selected more than '0' days a week, please tick which moderate activity you take part in:
Walking Tennis Football / Soccer
Cycling Aerobics Rugby / American Football
Jogging Gym Cricket/Baseball
Swimming Badminton Hockey
Other. Please Specify:
f) Do you smoke?
YES NO
If YES, how many cigarettes a day do you usually smoke?
SELECTcigarettes a day.
g) Do you have any physical conditions which would inhibit you participating in physical
exercise? E.g. pregnant, asthma.
YES NO
If YES, please specify:
h) Do you have any physical/psychological condition which would influence your choice to
use a lift/elevator? E.g. claustrophobia, vertigo, wheelchair bound, etc
YES NO
If YES, please specify:
Place of Work/Study & Occupation
i)What is your occupation?

278
j) Does your place of work/study have a lift/elevator(s)?
YES NO
If YES....
- How many floors does the building have? SELECTfloors.
- What floor do you most commonly work/study on? SELECT
- Do you usually use the lift/elevator to travel to that
floor? YES NO
- Approximately how many times a day, in your place of
work/study, do you use the lift/elevator to go UP ? SELECT
times a day.
- Approximately how many times a day, in your place of
work/study, do you use the lift/elevator to go DOWN ? SELECT
times a day.
- Do you use the stairs in your place of work/study? YES NO
If YES...
How many times a day do
you use the stairs?
How many floors do you usually travel on the
stairs?
Travelling UP SELECTtimes a day. between
SELECTand
SELECTfloors
Travelling
DOWN SELECT
times a day. between SELECT
and SELECT
floors
Place of Residence
k)Does your place of residence have a lift/elevator(s)?
YES NO
If YES....
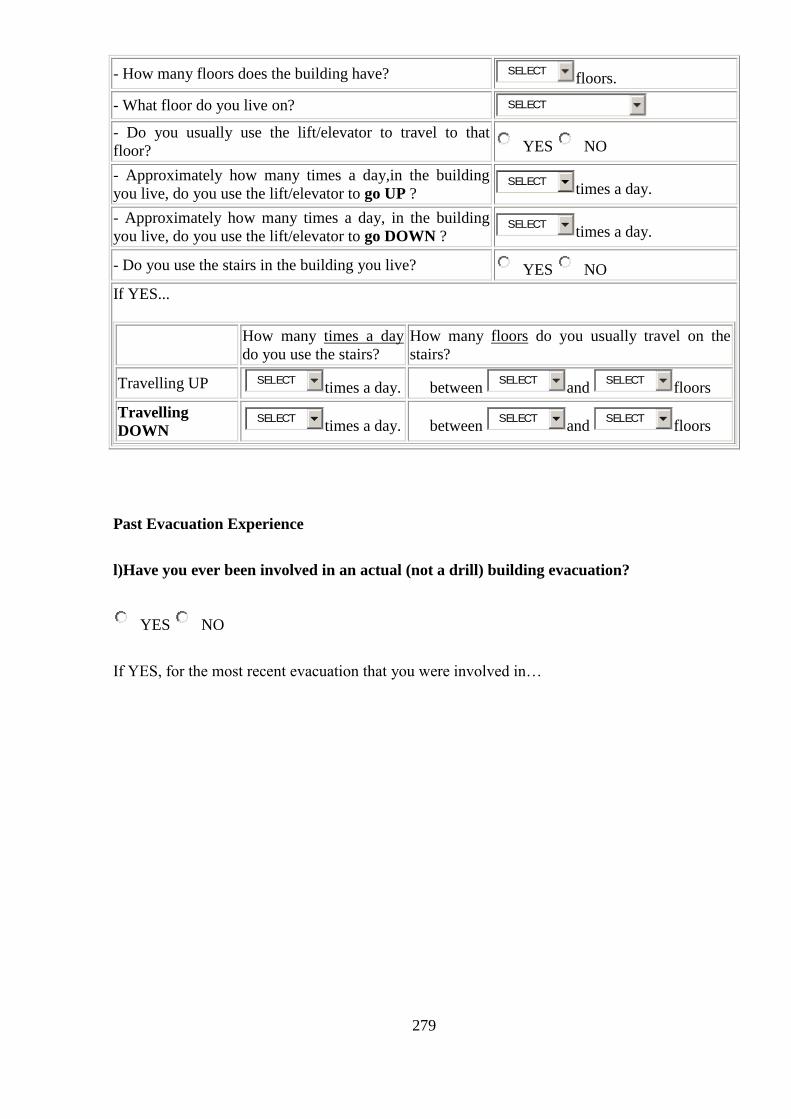
279
- How many floors does the building have? SELECTfloors.
- What floor do you live on? SELECT
- Do you usually use the lift/elevator to travel to that
floor? YES NO
- Approximately how many times a day,in the building
you live, do you use the lift/elevator to go UP ? SELECT
times a day.
- Approximately how many times a day, in the building
you live, do you use the lift/elevator to go DOWN ? SELECT
times a day.
- Do you use the stairs in the building you live? YES NO
If YES...
How many times a day
do you use the stairs?
How many floors do you usually travel on the
stairs?
Travelling UP SELECTtimes a day. between
SELECTand
SELECTfloors
Travelling
DOWN SELECT
times a day. between SELECT
and SELECT
floors
Past Evacuation Experience
l)Have you ever been involved in an actual (not a drill) building evacuation?
YES NO
If YES, for the most recent evacuation that you were involved in…
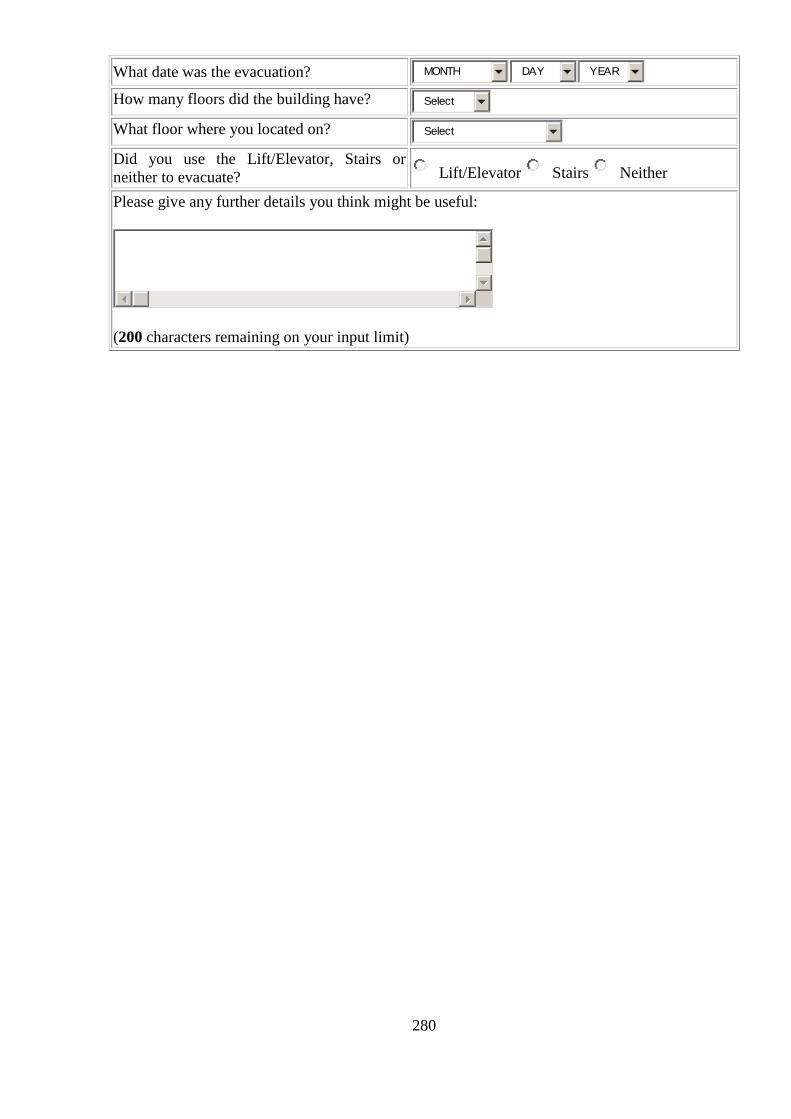
280
What date was the evacuation? MONTH DAY YEAR
How many floors did the building have? Select
What floor where you located on? Select
Did you use the Lift/Elevator, Stairs or
neither to evacuate? Lift/Elevator Stairs Neither
Please give any further details you think might be useful:
(200 characters remaining on your input limit)

281
A2.1 Online survey - University of Greenwich Research Ethics Committee
Acceptance Letter

282
A3.1 Online Survey – Participant cross-demographic analysis
Country + Age
In Table 75, for participants that provided their country and age information, a frequency break
down of participant's country location and age range can be seen. It can be seen that the majority
of participants in the UK and China were aged between 18-40. Of participants from China there
were significantly more aged between 18-30 (χ²=140.3, p<0.05) than any other age range and
only 2.6% of participants from China were over the age of 40. Participants from Germany and
the US came from a more evenly distributed age range; there was no significant differences
between the frequency of participants in each age range (Germany: χ²=4.5, p>0.05 and US:
χ²=3.7, p>0.05).
Table 75: Participant Demographics - Country and Age Range
Country
Age Range
%
[Freq]
18-30 31-40 41-50 50+
UK 39.9
[55]
26.8
[37]
15.2
[21]
18.1
[25]
China 68.7
[79]
28.7
[33]
2.6
[3]
0.0
[0]
Germany 38.6
[17]
18.2
[8]
20.5
[9]
22.7
[10]
US 14.0
[8]
28.1
[16]
28.1
[16]
29.8
[17]
Country + BMI
In Table 76, for participants that provided their country and height/weight information, a
frequency break down of participant's country location and BMI category can be seen. With the
exception of participants in the UK, the majority of participants were considered normal in
weight in each country. Approximately half of all participants from the UK (50.0%) and the US
(44.7%) were considered either overweight or obese.

283
Table 76: Participant Demographics - Country and BMI (Body Mass Index)
Country
BMI Category
%
[Freq]
Underweight Normal
weight Overweight Obese
UK 8.2
[11]
41.8
[56]
34.3
[46]
15.7
[21]
China 10.3
[12]
69.2
[81]
15.4
[18]
5.1
[6]
Germany 2.0
[1]
62.0
[31]
28.0
[14]
8.0
[4]
US 1.8
[1]
53.6
[30]
21.4
[12]
23.2
[13]
Country + Gender
In Table 77, for participants that provided their country and gender information, a frequency
break down of participant's country location and gender can be seen. Both the UK and Germany
had approximately even numbers of males and females. However significantly more males than
females were recorded in both China (χ²=7.9, p<0.05) and the US (χ²=4.3, p<0.05) accounting
for over 60% of participants from each country.
Table 77: Participant Demographics - Country and Gender
Country
Gender
%
[Freq]
Male Female
UK 54.9
[79]
45.1
[65]
China 62.8
[76]
37.2
[45]
Germany 46.2
[24]
53.8
[28]
US 63.3
[38]
36.7
[22]
Age + BMI
In Table 78, for participants that provided their age and height/weight information, a frequency
break down of participant's country location and BMI can be seen.. With the exception of the
50+ age range, the majority of participants in each age range were normal weight. In the 50+ age
range 61.0% of participants were either overweight or obese. As the age ranges increase the
proportion of participants that were either overweight or obese also increases. This is perhaps
reflective of the increased sedentary lifestyles of older participants.

284
Table 78: Participant Demographics - Age Range and BMI (Body Mass Index)
Age
Range
BMI Category
%
[Freq]
Underweight Normal
weight Overweight Obese
18-30 12.6
[24]
66.0
[126]
14.7
[28]
6.8
[13]
31-40 4.4
[5]
53.5
[61]
29.8
[34]
12.3
[14]
41-50 0.0
[0]
53.3
[32]
35.0
[21]
11.7
[7]
50+ 0.0
[0]
39.0
[23]
32.2
[19]
28.8
[17]
Age + Gender
In Table 79, for participants that provided their age and gender information, a frequency break
down of participant's age and gender can be seen. The 18-30 age range was the only age group
where a similar proportion of males and females were recorded. In the remaining age groups a
significant (p<0.05) higher number of males was recorded, with over 60.0% males being
recorded in those age groups.
Table 79: Participant Demographics - Age Range and Gender
Age
Range
Gender
%
[Freq]
Male Female
18-30 55.6
[110]
44.4
[88]
31-40 63.6
[75]
36.4
[43]
41-50 61.8
[42]
38.2
[26]
50+ 70.0
[42]
30.0
[18]
BMI + Gender
In Table 80, for participants that provided their gender and height/weight information, a
frequency break down of participant's gender and BMI can be seen. A slightly higher proportion
of females than males were consider normal in weight. Almost twice the proportion of
overweight male participants were recorded compared to females. Almost four times the

285
proportion of underweight females were recorded compared to males. A similar proportion of
both males and females were considered overweight.
Table 80: Participant Demographics - Gender and BMI (Body Mass Index)
Gender
BMI Category
%
[Freq]
Underweight Normal
weight Overweight Obese
Male 3.3
[9]
53.6
[147]
30.3
[83]
12.8
[35]
Female 12.3
[21]
60.8
[104]
15.8
[27]
11.1
[19]
A3.2 Online Survey – Evacuation questions Q4A-Q4E – demographic analysis
Where categorical frequency data has been compared between demographic subgroups a Chi
Square test has been used to test for significant difference between each group and associated χ²
and p-values have been stated. In certain instances where the cell frequencies have been below 5
or a two by two table has been used, then a Yates‟ Chi Square test has been used to correct
potential anomalies caused by such data in the standard Chi Square calculation.
Certain questions required participants to state the minimum and maximum number of floors that
they would consider travelling within a lift during an evacuation. Collating the values for the
participant responses for all of these questions in each demographic subgroups showed the
responses to not be normally distributed. For questions where there were only two demographic
subgroups (e.g. male/female), the non parametric Mann-Whitney test was used to identify
significant differences between those demographic subgroups (used for two unpaired groups).
For questions that involved more than two demographic subgroups the non-parametric Kruskal-
Wallis significance test was employed (used for three or more unpaired groups).
Cross-demographic frequencies
In Table 78 and Table 79 the frequency of participants in each demographic group that answered
Q4A of the online survey can be seen.
More males were recorded than females in each country with the proportion of males ranging
between 57.9%-69.2%. The largest subgroup were males aged between 18-30 in both the UK
(26.3% (10)) and China (38.5% (10)), with the largest subgroup in the US being males aged

286
between 41-50 (63.6% (7)). The largest subgroup from Germany were males who did not specify
their age (26.3% (5)). Indeed with the exception of the US, the majority of participants from each
country were aged below 40 years of age. The majority of participants from the US (61.3% (19))
were above 40 years of age. Approximately 65.4% (17) of Chinese participants were aged
between 18-30 which is well above the overall average of 40.3% (62) of participants across all
countries within the 18-30 age range. Focusing on the BMI subgroups in Table 82, all
underweight participants were aged between 18-30. Over half participants (51.3% (39)) who
were normal weight were aged between 18-30 with the majority (64.5% (49)) being males. There
was an even spread of participants across each age range among the obese group though the
large majority of them (80.0% (32)) were males.
Varying frequencies of participants in each demographic have been shown to exists across
demographic subgroups. Such differences between subgroups may influence the demographic
group analysis and so should be considered in the following comparison.

287
Table 81: Participants who would consider using a lift to evacuate according to Country, Gender and Age
group
Age Range
Country Gender 18-30 31-40 41-50 50+ Unspecified TOTAL
Gender
UK
Male 10 5 2 5 0 22
Female 5 3 4 3 1 16
Unspecified 0 0 0 0 0 0
TOTAL 15 8 6 8 1 38
China
Male 10 4 2 0 2 18
Female 7 1 0 0 0 8
Unspecified 0 0 0 0 0 0
TOTAL 17 5 2 0 2 26
US
Male 4 4 7 5 0 20
Female 1 2 2 5 1 11
Unspecified 0 0 0 0 0 0
TOTAL 5 6 9 10 1 31
Germany
Male 3 0 1 2 5 11
Female 2 3 2 1 0 8
Unspecified 0 0 0 0 0 0
TOTAL 5 3 3 3 5 19
Other
Male 16 10 5 1 0 32
Female 4 1 3 0 0 8
Unspecified 0 0 0 0 0 0
TOTAL 20 11 8 1 0 40
TOTAL
Male 43 23 17 13 7 103
Female 19 10 11 9 2 51
Unspecified 0 0 0 0 0 0
TOTAL 62 33 28 22 9 154

288
Table 82: Participants who would consider using a lift to evacuate according to BMI, Gender and Age group
Age Range
BMI Gender 18-30 31-40 41-50 50+ Unspecified TOTAL
Gender
Underweight
Male 3 0 0 0 0 3
Female 4 0 0 0 0 4
Unspecified 0 0 0 0 0 0
TOTAL 7 0 0 0 0 7
Normal
weight
Male 27 10 4 5 3 49
Female 12 5 6 3 1 27
Unspecified 0 0 0 0 0 0
TOTAL 39 15 10 8 4 76
Overweight
Male 9 8 9 4 2 32
Female 1 3 2 1 1 8
Unspecified 0 0 0 0 0 0
TOTAL 10 11 11 5 3 40
Obese
Male 3 4 2 4 1 14
Female 2 1 2 4 0 9
Unspecified 0 0 0 0 0 0
TOTAL 5 5 4 8 1 23
TOTAL
Male 43 23 17 13 7 103
Female 19 10 11 9 2 51
Unspecified 0 0 0 0 0 0
TOTAL 62 33 28 22 9 154
Results – Gender
Of all participants that answered whether they would consider using the lift during an evacuation
and specified their gender (N=467); 60.8% (284) were males and 39.2% (183) were females. Of
these participants, a higher proportion of males (36.3% (103)) would consider using a lift during
an evacuation than females (27.9% (51)) (see Table 83). Whilst this suggests that females are
more likely to have reservations about using a lift during an evacuation, this does not represent a
significant difference between each gender (Yates‟-χ²=3.2, p>0.05).

289
Table 83: Frequency/Proportion of males/females that would and wouldn't consider using a lift during an
evacuation
Gender
%
[Freq]
All
Participants
%
[Freq] Would you consider using a lift
during an evacuation? Males Females
YES 36.3
[103]
27.9
[51]
33.0
[154]
NO 63.7
[181]
72.1
[132]
67.0
[313]
A small proportion of both males (8.8% (9)) and females (4.0% (2)) would always consider
using the lift during the evacuation (Yates‟-χ²=0.6, p>0.05) (see Table 84).
Table 84: Frequency/Proportion of males/females that would and wouldn't always use a lift during an
evacuation
Gender
%
[Freq]
All
Participants
%
[Freq] Would you ALWAYS
use a lift during an evacuation? Males Females
YES 8.8
[9]
4.0
[2]
7.2
[11]
NO 91.2
[93]
96.0
[48]
92.8
[141]
With regards to lift/stair choice during an evacuation, a large majority of both males (89.1%
(82)) and females (83.0% (39)) stated that they would be influenced by what floor they were on
in a building when deciding to use a lift during an evacuation (Yates‟-χ²=0.6, p>0.05) (see Table
85).
Table 85: Frequency/Proportion of males/females that would and wouldn't be influenced by the height of the
floor they are on when deciding to use a lift during an evacuation
Gender
%
[Freq]
All
Participants
%
[Freq] Would the height of the floor you
were on influence your decision? Males Females
YES 89.1
[82]
83.0
[39]
87.1
[121]
NO 10.9
[10]
17.0
[8]
12.9
[18]

290
The frequency/proportion of both males and females who specified the minimum and maximum
number of floors they would consider travelling within a lift during an evacuation can be seen in
Table 86. Of the males who specified a minimum number of floors they would consider
travelling in a lift (N=82), 90.2% (74) specified that on average they would travel a minimum of
8.7 floors in a lift. Similarly, with female participants (N=39), 87.1% (34) specified that on
average they would travel a minimum of 7.7 floors in a lift. Overall, there was no significant
difference (p>0.05) between the minimum number of floors males and females would consider
travelling in a lift during an evacuation.
Of the males who specified a maximum number of floors they would consider travelling in a lift
(N=81), approximately a half (50.6% (41)) answered that there was no maximum number of
floors. The remaining half approximately were evenly split between stating 100+ floors (25.9%
(21)) or specifying on average they would travel a maximum of 20.3 floors (23.5% (19)). For
female participants (N=39), a lower proportion (38.5% (15)) answered that there was no
maximum number of floors, specified 100+ floors (15.4% (6)). Almost a half of females (46.2%
(18)) specified on average they would travel a maximum of 23.7 floors in a lift. This represents a
16.7% (3.4 floors) increase compared to the males. However, of participants that specified a
finite maximum number of floors, there was no overall significant difference between male and
female participants (p>0.05).
Table 86: Frequency/Proportion of males/females lower and upper limits of how many floors they would
consider travelling within a lift according to gender
Lower Limit Upper Limit
Gender % No
Minimum % 100+
%
Number
Avg.
(floors)
% No
Maximum % 100+
%
Number
Avg.
(floors)
Males 8.5
[7]
1.2
[1]
90.2
[74] 8.7
50.6
[41]
25.9
[21]
23.5
[19] 20.3
Females 12.8
[5]
0.0
[0]
87.1
[34] 7.7
38.5
[15]
15.4
[6]
46.2
[18] 23.7
All
Participants
9.9
[12]
0.83
[1]
89.3
[108] 8.5
46.7
[56]
22.5
[27] 30.8[37] 22.0
Whilst a higher proportion of female (75.6% (34)) compared to male (60.4% (55)) participants
would be influenced by the height of the building when considering to use a lift during an
evacuation, this did not represent a significant difference (Yates‟-χ²=2.4, p>0.05) (see Table 87).
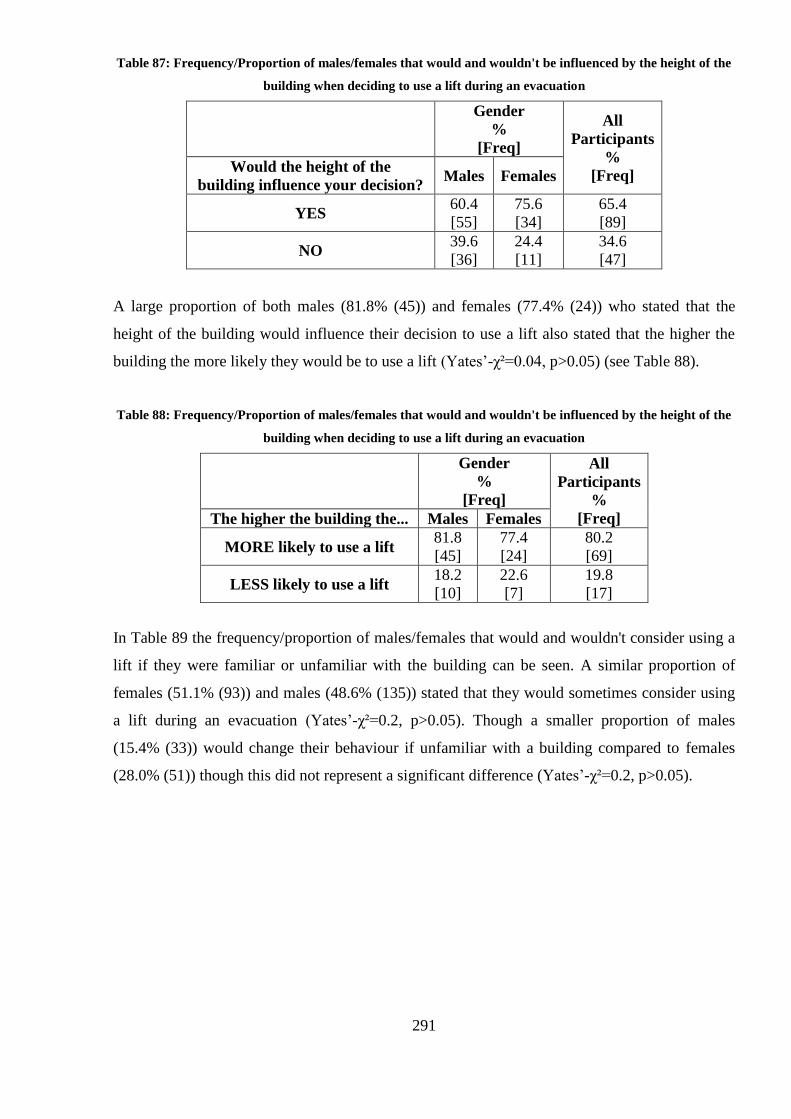
291
Table 87: Frequency/Proportion of males/females that would and wouldn't be influenced by the height of the
building when deciding to use a lift during an evacuation
Gender
%
[Freq]
All
Participants
%
[Freq] Would the height of the
building influence your decision? Males Females
YES 60.4
[55]
75.6
[34]
65.4
[89]
NO 39.6
[36]
24.4
[11]
34.6
[47]
A large proportion of both males (81.8% (45)) and females (77.4% (24)) who stated that the
height of the building would influence their decision to use a lift also stated that the higher the
building the more likely they would be to use a lift (Yates‟-χ²=0.04, p>0.05) (see Table 88).
Table 88: Frequency/Proportion of males/females that would and wouldn't be influenced by the height of the
building when deciding to use a lift during an evacuation
Gender
%
[Freq]
All
Participants
%
[Freq] The higher the building the... Males Females
MORE likely to use a lift 81.8
[45]
77.4
[24]
80.2
[69]
LESS likely to use a lift 18.2
[10]
22.6
[7]
19.8
[17]
In Table 89 the frequency/proportion of males/females that would and wouldn't consider using a
lift if they were familiar or unfamiliar with the building can be seen. A similar proportion of
females (51.1% (93)) and males (48.6% (135)) stated that they would sometimes consider using
a lift during an evacuation (Yates‟-χ²=0.2, p>0.05). Though a smaller proportion of males
(15.4% (33)) would change their behaviour if unfamiliar with a building compared to females
(28.0% (51)) though this did not represent a significant difference (Yates‟-χ²=0.2, p>0.05).

292
Table 89: Frequency/Proportion of males/females that would and wouldn't consider using a lift if they were
familiar or unfamiliar with a building
Would you consider using the
lift/lift to evacuate? (if you were
familiar)
%
[Freq]
Would
sometimes
consider using
a lift to
evacuate
%
[Freq] YES NO
Would you
change
your above
answer(s) if
you were
unfamiliar
with the
building?
Male
YES 3.2
[9]
12.2
[34] 48.6
[135] NO
33.1
[92]
51.4
[143]
Female
YES 4.4
[8]
23.6
[43] 51.1
[93] NO
23.1
[42]
48.9
[89]
All
Participants
YES 3.7
[17]
16.7
[77] 49.6
[228] NO
29.1
[134]
50.4
[232]
Results - Age
Of all participants that answered whether they would consider using the lift during an evacuation
and specified their age (N=444); 44.6% (198) were aged 18-30, 26.6% (118) were aged 31-40,
15.3% (68) were aged 41-50, and 13.5% (60) were over 50 years old.
The proportion of participants within each age group that would consider using the lift during an
evacuation (see Table 90) does not differ very much between each age group (28.0%-41.2%)
(χ²=4.0, p>0.05). This suggests that people's age does not have a great influence upon their
decision to consider using a lift during an evacuation.
Table 90: Frequency/Proportion of participants in each age group that would and wouldn't consider using a
lift during an evacuation
Age Range
%
[Freq]
All
Participants
%
[Freq] Would you consider using a
lift during an evacuation? 18-30 31-40 41-50 50+
YES 31.3
[62]
28.0
[33]
41.2
[28]
36.7
[22]
33.0
[154]
NO 68.7
[136]
72.0
[85]
58.8
[40]
63.3
[38]
67.0
[313]
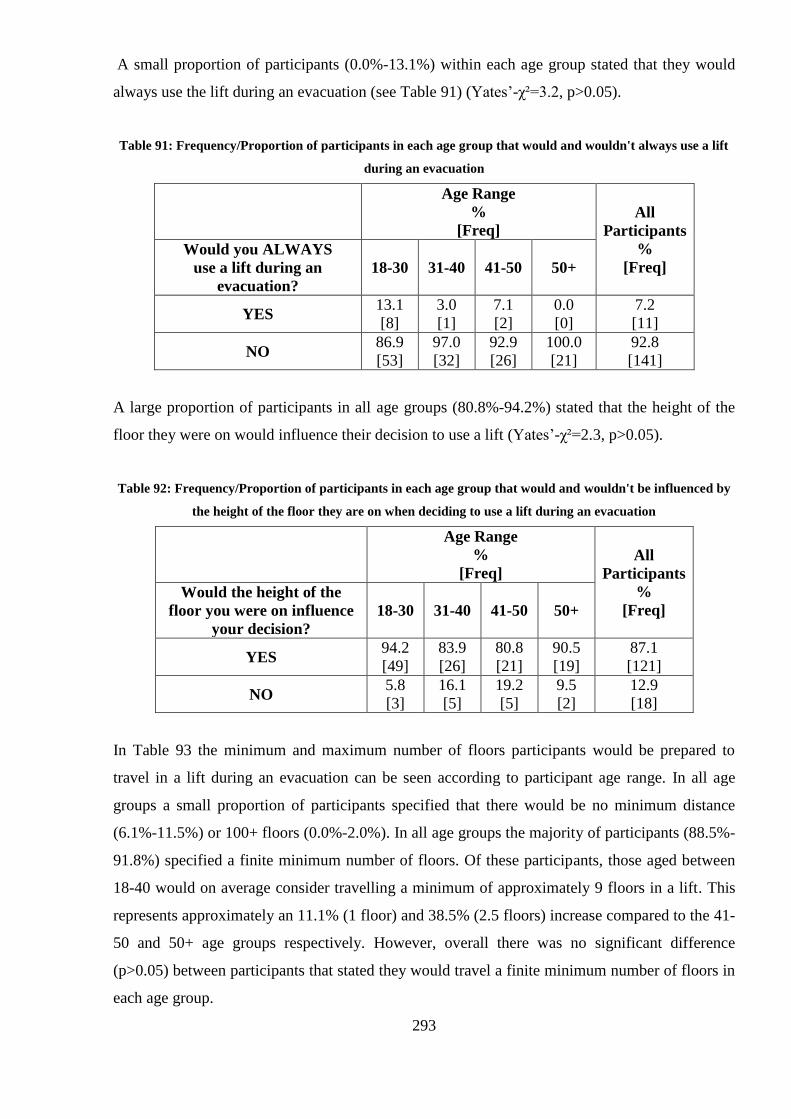
293
A small proportion of participants (0.0%-13.1%) within each age group stated that they would
always use the lift during an evacuation (see Table 91) (Yates‟-χ²=3.2, p>0.05).
Table 91: Frequency/Proportion of participants in each age group that would and wouldn't always use a lift
during an evacuation
Age Range
%
[Freq]
All
Participants
%
[Freq]
Would you ALWAYS
use a lift during an
evacuation?
18-30 31-40 41-50 50+
YES 13.1
[8]
3.0
[1]
7.1
[2]
0.0
[0]
7.2
[11]
NO 86.9
[53]
97.0
[32]
92.9
[26]
100.0
[21]
92.8
[141]
A large proportion of participants in all age groups (80.8%-94.2%) stated that the height of the
floor they were on would influence their decision to use a lift (Yates‟-χ²=2.3, p>0.05).
Table 92: Frequency/Proportion of participants in each age group that would and wouldn't be influenced by
the height of the floor they are on when deciding to use a lift during an evacuation
Age Range
%
[Freq]
All
Participants
%
[Freq]
Would the height of the
floor you were on influence
your decision?
18-30 31-40 41-50 50+
YES 94.2
[49]
83.9
[26]
80.8
[21]
90.5
[19]
87.1
[121]
NO 5.8
[3]
16.1
[5]
19.2
[5]
9.5
[2]
12.9
[18]
In Table 93 the minimum and maximum number of floors participants would be prepared to
travel in a lift during an evacuation can be seen according to participant age range. In all age
groups a small proportion of participants specified that there would be no minimum distance
(6.1%-11.5%) or 100+ floors (0.0%-2.0%). In all age groups the majority of participants (88.5%-
91.8%) specified a finite minimum number of floors. Of these participants, those aged between
18-40 would on average consider travelling a minimum of approximately 9 floors in a lift. This
represents approximately an 11.1% (1 floor) and 38.5% (2.5 floors) increase compared to the 41-
50 and 50+ age groups respectively. However, overall there was no significant difference
(p>0.05) between participants that stated they would travel a finite minimum number of floors in
each age group.
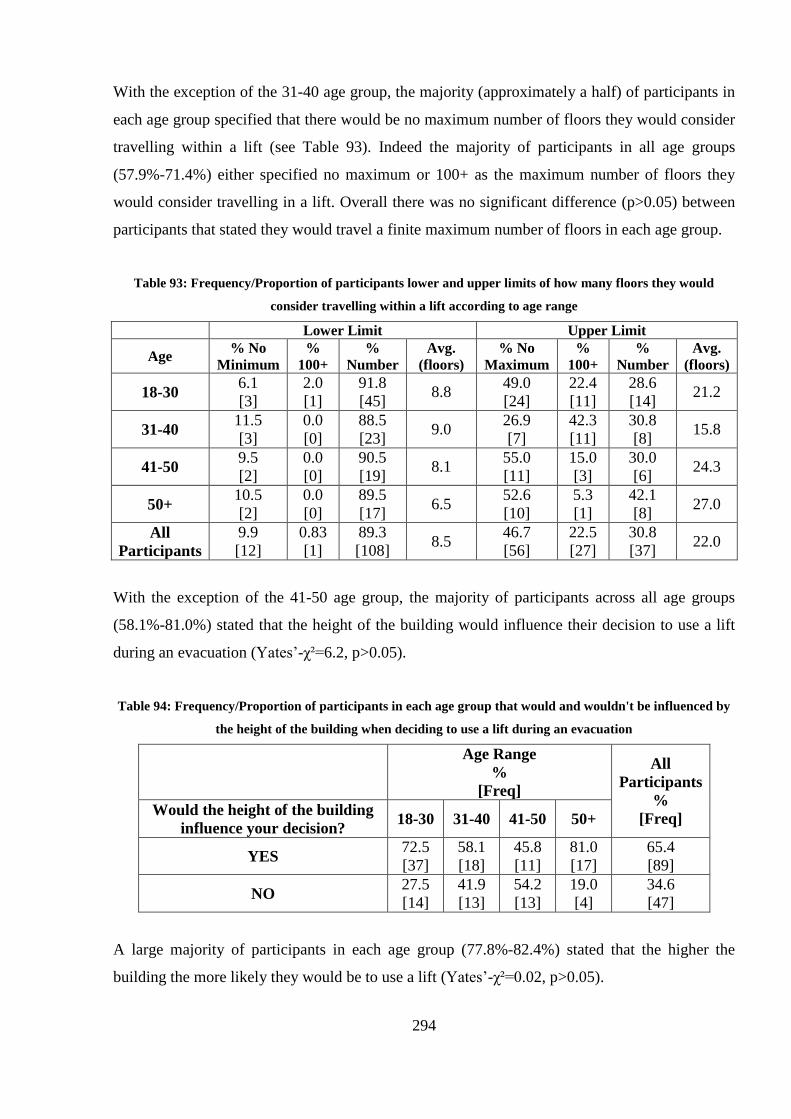
294
With the exception of the 31-40 age group, the majority (approximately a half) of participants in
each age group specified that there would be no maximum number of floors they would consider
travelling within a lift (see Table 93). Indeed the majority of participants in all age groups
(57.9%-71.4%) either specified no maximum or 100+ as the maximum number of floors they
would consider travelling in a lift. Overall there was no significant difference (p>0.05) between
participants that stated they would travel a finite maximum number of floors in each age group.
Table 93: Frequency/Proportion of participants lower and upper limits of how many floors they would
consider travelling within a lift according to age range
Lower Limit Upper Limit
Age % No
Minimum
%
100+
%
Number
Avg.
(floors)
% No
Maximum
%
100+
%
Number
Avg.
(floors)
18-30 6.1
[3]
2.0
[1]
91.8
[45] 8.8
49.0
[24]
22.4
[11]
28.6
[14] 21.2
31-40 11.5
[3]
0.0
[0]
88.5
[23] 9.0
26.9
[7]
42.3
[11]
30.8
[8] 15.8
41-50 9.5
[2]
0.0
[0]
90.5
[19] 8.1
55.0
[11]
15.0
[3]
30.0
[6] 24.3
50+ 10.5
[2]
0.0
[0]
89.5
[17] 6.5
52.6
[10]
5.3
[1]
42.1
[8] 27.0
All
Participants
9.9
[12]
0.83
[1]
89.3
[108] 8.5
46.7
[56]
22.5
[27]
30.8
[37] 22.0
With the exception of the 41-50 age group, the majority of participants across all age groups
(58.1%-81.0%) stated that the height of the building would influence their decision to use a lift
during an evacuation (Yates‟-χ²=6.2, p>0.05).
Table 94: Frequency/Proportion of participants in each age group that would and wouldn't be influenced by
the height of the building when deciding to use a lift during an evacuation
Age Range
%
[Freq]
All
Participants
%
[Freq] Would the height of the building
influence your decision? 18-30 31-40 41-50 50+
YES 72.5
[37]
58.1
[18]
45.8
[11]
81.0
[17]
65.4
[89]
NO 27.5
[14]
41.9
[13]
54.2
[13]
19.0
[4]
34.6
[47]
A large majority of participants in each age group (77.8%-82.4%) stated that the higher the
building the more likely they would be to use a lift (Yates‟-χ²=0.02, p>0.05).
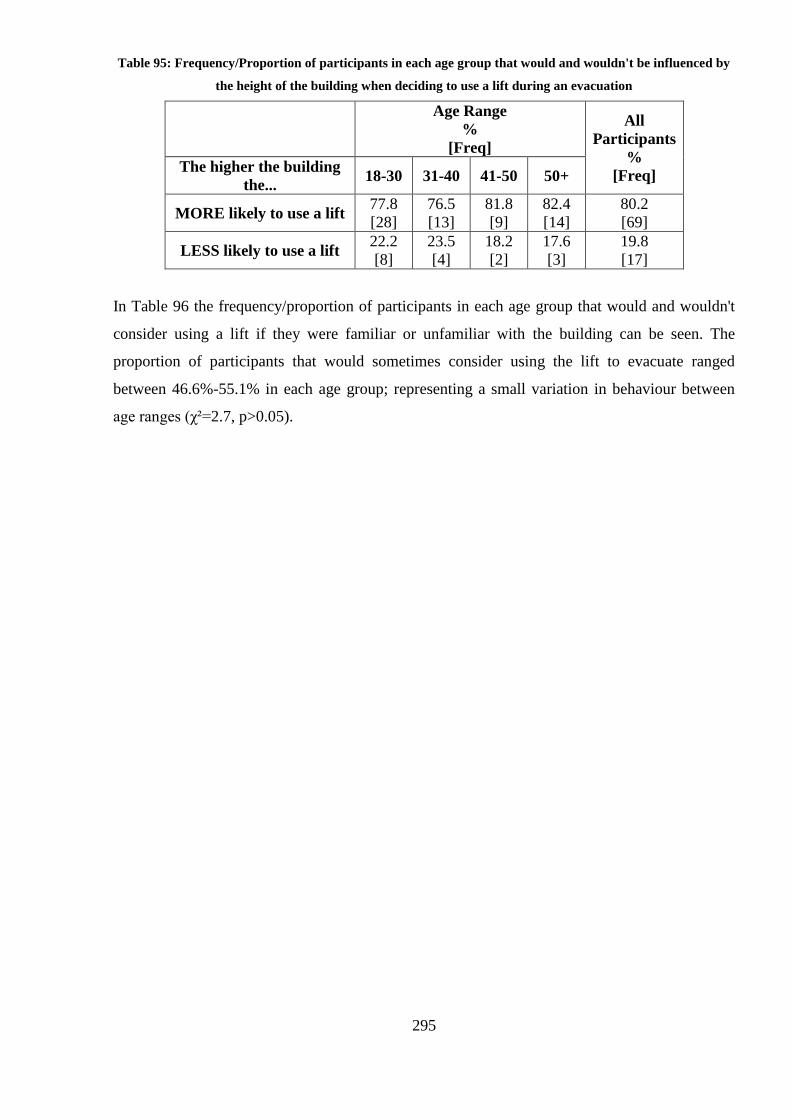
295
Table 95: Frequency/Proportion of participants in each age group that would and wouldn't be influenced by
the height of the building when deciding to use a lift during an evacuation
Age Range
%
[Freq]
All
Participants
%
[Freq] The higher the building
the... 18-30 31-40 41-50 50+
MORE likely to use a lift 77.8
[28]
76.5
[13]
81.8
[9]
82.4
[14]
80.2
[69]
LESS likely to use a lift 22.2
[8]
23.5
[4]
18.2
[2]
17.6
[3]
19.8
[17]
In Table 96 the frequency/proportion of participants in each age group that would and wouldn't
consider using a lift if they were familiar or unfamiliar with the building can be seen. The
proportion of participants that would sometimes consider using the lift to evacuate ranged
between 46.6%-55.1% in each age group; representing a small variation in behaviour between
age ranges (χ²=2.7, p>0.05).

296
Table 96: Frequency/Proportion of participants in each age group that would and wouldn't consider using a
lift if they were familiar or unfamiliar with a building
Would you consider using the
lift/lift to evacuate? (if you were
familiar)
%
[Freq]
Would
sometimes
consider using
a lift to
evacuate
%
[Freq] YES NO
Would you
change
your above
answer(s) if
you were
unfamiliar
with the
building?
18-30
YES 2.3
[5]
26.6
[57] 55.1
[118] NO
26.2
[56]
44.9
[96]
31-40
YES 1.7
[2]
19.0
[22] 46.6
[54] NO
25.9
[30]
53.4
[62]
41-50
YES 8.8
[6]
10.3
[7] 51.5
[35] NO
32.4
[22]
48.5
[33]
50+
YES 3.4
[2]
11.9
[7] 47.5
[28] NO
32.2
[19]
52.5
[31]
All
Participants
YES 3.7
[17]
16.7
[77] 49.6
[228] NO
29.1
[134]
50.4
[232]
Results - Country
Participant responses were broken down according to which country each participant came from.
The analysis focused on the top four countries which had the most participant responses: UK
(144), China(121), US(60) and Germany(52). Each of these countries had more than 50
participants completing the survey.
The proportion of participants that would consider using a lift during an evacuation can be seen
according to country in Table 97. Approximately 1 in 2 participants (52.5%) from the US and 1
in 3 participants (36.5%) from Germany would consider using a lift during an evacuation. These
decrease for participants coming from both the UK (approx. 1 in 4 (26.4%)) and China (approx.
1 in 5 (21.5%)). Comparing all countries shows there to be a significant difference between the
frequency of participants that would consider using a lift during an evacuation (χ2=20.3, p<0.05).
This significant difference is indeed caused by the higher number of participants that would

297
consider using a lift coming from Germany and the US compared to participants coming from
the UK and China.
Table 97: Frequency/Proportion of participants from each country that would and wouldn't consider using a
lift during an evacuation
Country
%
[Freq]
All
Participants
%
[Freq] Would you consider using a
lift during an evacuation? UK China US Germany
YES 26.4
[38]
21.5
[26]
52.5
[31]
36.5
[19]
33.0
[154]
NO 73.6
[106]
78.5
[95]
47.5
[28]
63.5
[33]
67.0
[313]
Of participants who specified their location country and whether they would always use a lift
during an evacuation (N=112) see Table 98, the proportion of participants from each country that
would always use the lift during an evacuation (see Table 98) was very small. Only a few
participants from the UK and China stated that they would always use a lift (i.e. the two
countries with the largest number of participants). Overall there was a significant difference
between the frequency of participants that would always consider using a lift during an
evacuation between countries (Yates‟-χ²=13.4, p<0.05), however, this was caused by the higher
number of participants from China stating that they would always use a lift compared to the
other countries.
Table 98: Frequency/Proportion of participants from each country that would and wouldn't always consider
using a lift during an evacuation
Country
%
[Freq]
All
Participants
%
[Freq]
Would you ALWAYS
use a lift during an
evacuation?
UK China US Germany
YES 5.3
[2]
28.0
[7]
0.0
[0]
0.0
[0]
7.2
[11]
NO 94.7
[36]
72.0
[18]
100.0
[30]
100.0
[19]
92.8
[141]
Of participants who specified their location country and whether the height of the floor they were
on would influence their decision to use a lift during an evacuation (N=101), a large proportion
of participants from each country would be influenced by the height of the floor they were on

298
during an evacuation (see Table 99). This ranged between 76.7%-100.0% and does not
represents a significant difference between each country (Yates‟-χ2=6.9, p>0.05).
Table 99: Frequency/Proportion of participants from each country that would and wouldn't be influenced by
the height of the floor they are on when deciding to use a lift during an evacuation
Country
%
[Freq]
All
Participants
%
[Freq]
Would the height of the
floor you were on
influence your decision?
UK China US Germany
YES 100.0
[36]
87.5
[14]
76.7
[23]
78.9
[15]
87.1
[121]
NO 0.0
[0]
12.5
[2]
23.3
[7]
21.1
[4]
12.9
[18]
In Table 100 the minimum and maximum number of floors participants would be prepared to
travel in a lift during an evacuation can be seen according to participant country. A small
proportion of participants in each country stated that there was no minimum number of floors
they would consider travelling within a lift (6.7%-16.7%). A large majority of participants in all
countries (83.3%-93.3%) would only consider using a lift to travel on average approximately 7
to 9 floors or more. Of participants that specified a finite minimum number of floors, there was
no overall significant difference between each country (p>0.05).
The majority of participants (57.2-80.0%) across all countries specified they would either be
prepared to travel 100+ floors or that there was no maximum number of floors they would
consider travelling in a lift during an evacuation. The remaining participants specified a finite
maximum number of floors they were prepared to travel within a lift, ranging between 15.1-49.0
floors. Those participants from Germany who stated a finite number of floors would consider
travelling approximately at least double the number of floors in a lift compared to the respective
participants from the other countries. However, it should be kept in mind that only three
participants from Germany specified a finite maximum number of floors they would consider
travelling within a lift. Of participants that specified a finite maximum number of floors, there
was no overall significant difference between each country (p>0.05).

299
Table 100: Frequency/Proportion of participants lower and upper limits of how many floors they would
consider travelling within a lift according to country
Lower Limit Upper Limit
Country % No
Minimum
%
100+
%
Number
Avg.
(floors)
% No
Maximum
%
100+
%
Number
Avg.
(floors)
UK 16.7
[6]
0.0
[0]
83.3
[30] 7.6
50.0
[18]
16.7
[6]
33.3
[12] 19.6
China 7.1
[1]
7.1
[1]
85.7
[12] 7.2
28.6
[4]
28.6
[4]
42.9
[6] 26.2
US 8.7
[2]
0.0
[0]
91.3
[21] 9.1
43.5
[10]
21.7
[5]
34.8
[8] 15.1
Germany 6.7
[1]
0.0
[0]
93.3
[14] 7.9
60.0
[9]
20.0
[3]
20.0
[3] 49.0
All
Participants
9.9
[12]
0.83
[1]
89.3
[108] 8.5
46.7
[56]
22.5
[27]
30.8
[37] 22.0
Of all participants who specified their country and responded whether the height of the building
would influence their decision to use a lift during an evacuation (N=98), the majority of
participants across all countries stated that the height of the building would influence their
decision to use a lift during an evacuation. Whilst it can be seen that less participants from the
US and Germany would be influenced by the height of the building compared to both China and
the UK, there was no overall significant difference between each country (χ2=1.8, p>0.05).
Table 101: Frequency/Proportion of participants from each country that would and wouldn't be influenced
by the height of the building when deciding to use a lift during an evacuation
Country
%
[Freq]
All
Participants
%
[Freq]
Would the height of the
building influence your
decision?
UK China US Germany
YES 71.4
[25]
80.0
[12]
63.3
[19]
61.1
[11]
65.4
[89]
NO 28.6
[10]
20.0
[3]
36.7
[11]
38.9
[7]
34.6
[47]
For all participants who specified the location country and specified if the height of the building
would influence their decision to use a lift (N=64), the majority stated that the higher the
building the more likely they would be to use a lift, ranging from 61.1%-100.0%. All participants
in China stated that the higher the building the more likely they would be to use a lift whereas in
the US, some 38.9% less participants stated they would be more likely to use a lift in a higher
building. Despite this no significant difference between each country was recorded (Yates‟-
χ2=4.5, p>0.05).

300
Table 102: Frequency/Proportion of participants from each country that would and wouldn't be influenced
by the height of the building when deciding to use a lift during an evacuation
Country
%
[Freq]
All
Participants
%
[Freq] The higher the
building the... UK China US Germany
MORE likely to use a
lift
83.3
[20]
100.0
[11]
61.1
[11]
81.8
[9]
80.2
[69]
LESS likely to use a
lift
16.7
[4]
0.0
[0]
38.9
[7]
18.2
[2]
19.8
[17]
In Table 103 the frequency/proportion of participant in each country that would and wouldn't
consider using a lift if they were familiar or unfamiliar with a building can be seen. Participants
from the UK were recorded as the least likely to sometimes consider using a lift to evacuate with
some 35.7% (51) of all participants from the UK stating that they would sometimes use a lift to
evacuate. In contrast, participants from Germany and the US were the most likely to sometimes
consider using a lift to evacuate with some 61.5% (32) and 58.6% (34) of all participants from
Germany and the US respectively stating that they would sometimes consider using a lift to
evacuate. These represent a significant difference between the number of participants that would
sometimes consider using a lift and never consider using a lift between each country (χ2=15.1,
p<0.05). This significant difference is due entirely to the low proportion of participants from the
UK that would sometimes considering using a lift during an evacuation compared to the other
countries (there was no significant difference between the remaining countries). This suggests
that more people in the UK have reservations about sometimes using a lift during an evacuation
compared to the other countries.

301
Table 103: Frequency/Proportion of participants from each country that would and wouldn't consider using
a lift if they were familiar or unfamiliar with a building
Would you consider using the
lift/lift to evacuate? (if you were
familiar)
%
[Freq]
Would
sometimes
consider using
a lift to
evacuate
%
[Freq] YES NO
Would you
change
your above
answer(s) if
you were
unfamiliar
with the
building?
UK
YES 2.8
[4]
9.8
[14] 35.7
[51] NO
23.1
[33]
64.3
[92]
China
YES 3.4
[4]
27.6
[32] 49.1
[57] NO
18.1
[21]
50.9
[59]
US
YES 1.7
[1]
6.9
[4] 58.6
[34] NO
50.0
[29]
41.4
[24]
Germany
YES 7.7
[4]
25.0
[13] 61.5
[32] NO
28.8
[15]
38.5
[20]
All
Participants
YES 3.7
[17]
16.7
[77] 49.6
[228] NO
29.1
[134]
50.4
[232]
Results - BMI (Body Mass Index)
Of participants that provided height and weight information and answered whether they would
consider using a lift during an evacuation (N=445) see Table 97, it can be seen that as
participants BMI increases the proportion of them that would consider using the lift also
increases with a 19.3% difference between the participants in the Underweight and the Obese
group. This may be due to participants with higher BMIs having less physical
ability/desire/speed to traverse the stairs during an evacuation. Despite this there was no
significant difference between each BMI category (χ²=4.9, p>0.05).

302
Table 104: Frequency/Proportion of participants according to BMI that would and wouldn't consider using a
lift during an evacuation
BMI
%
[Freq]
All
Participants
%
[Freq] Would you consider using a
lift during an evacuation?
Under
weight
Normal
weight
Over
weight Obese
YES 23.3
[7]
30.3
[76]
36.4
[40]
42.6
[23]
33.0
[154]
NO 76.7
[23]
69.7
[175]
63.6
[70]
57.4
[31]
67.0
[313]
Of participants that provided height and weight information and answered if they would always
use a lift during an evacuation (N=144) see Table 105, the proportion that would always use a
lift was very small. No underweight or obese participants responded that they would always use
a lift. Whilst a slightly higher proportion of overweight participants responded that they would
always use a lift (4.6%) compared to the normal weight participants, this was not significantly
different between BMI groups (Yates‟-χ²=1.7, p>0.05).
Table 105: Frequency/Proportion of participants according to BMI that would and wouldn't always consider
using a lift during an evacuation
BMI
%
[Freq]
All
Participants
%
[Freq]
Would you ALWAYS
use a lift during an
evacuation?
Under
weight
Normal
weight
Over
weight Obese
YES 0.0
[0]
7.9
[6]
12.5
[5]
0.0
[0]
7.2
[11]
NO 100.0
[6]
92.1
[70]
87.5
[35]
100.0
[22]
92.8
[141]
Of participants that provided height and weight information and answered if their decision would
be influenced by the height of the floor they were on (N=131) see Table 106, a large proportion
of participants in each BMI group would be influenced by the height of the floor they were on
during an evacuation. However, there appears to be no significant difference between each BMI
(Yates‟-χ²=1.4, p>0.05).

303
Table 106: Frequency/Proportion of participants according to BMI that would and wouldn't be influenced by
the height of the floor they are on when deciding to use a lift during an evacuation
BMI
%
[Freq]
All
Participants
%
[Freq]
Would the height of the
floor you were on
influence your decision?
Under
weight
Normal
weight
Over
weight Obese
YES 83.3
[5]
89.7
[61]
88.6
[31]
77.3
[17]
87.1
[121]
NO 16.7
[1]
10.3
[7]
11.4
[4]
22.7
[5]
12.9
[18]
In Table 107 the minimum and maximum number of floors participants would be prepared to
travel in a lift during an evacuation can be seen according to participant BMI. A small number of
participants in each BMI group stated that there was no minimum number of floors they would
consider travelling within a lift during an evacuation (1-12 participants). A large majority of
participants in all BMI groups (60.0%-91.8%) would only consider using a lift to travel on
average 6.3 to 8.6 floors; participants across all BMI groups would be prepared to walk a similar
minimum number of floors. Of participants that specified a finite minimum number of floors,
there was no overall significant difference between each BMI group (p>0.05).
With the exception of the underweight group, the majority of participants (64.7%-83.3%) across
all BMI groups specified they would either be prepared to travel 100+ floors or that there was no
maximum number of floors they would consider travelling in a lift during an evacuation. The
remaining participants specified a finite maximum number of floors they were prepared to travel
within a lift, ranging between an average of 18.2-44.4 floors. Of those participants in both the
Underweight and Normal weight category specified an average maximum number of floors
which was under half the maximum number of floors (18.2-20.0 floors) to those participants in
the Overweight category (44.4 floors). However participants who specified a finite maximum
number of floors in the Obese category specified considerably less floors (24.8 floors). Of
participants that specified a finite maximum number of floors, there was no overall significant
difference between each BMI group (p>0.05).

304
Table 107: Frequency/Proportion of participants lower and upper limits of how many floors they would
consider travelling within a lift according to BMI
Lower Limit Upper Limit
BMI % No
Minimum
%
100+
%
Number
Avg.
(floors)
% No
Maximum
%
100+
%
Number
Avg.
(floors)
Under
weight
20.0
[1]
20.0
[1]
60.0
[3] 6.3
20.0
[1]
20.0
[1]
60.0
[3] 20.0
Normal
weight
8.2
[5]
0.0
[0]
91.8
[56] 8.6
45.9
[28]
21.3
[13]
32.8
[20] 18.2
Over
weight
12.9
[4]
0.0
[0]
87.1
[27] 8.3
53.3
[16]
30.0
[9]
16.7
[5] 44.4
Obese 11.8
[2]
0.0
[0]
88.2
[15] 7.8
41.2
[7]
23.5
[4]
35.3
[6] 24.8
All
Participants
9.9
[12]
0.83
[1]
89.3
[108] 8.5
46.7
[56]
22.5
[27]
30.8
[37] 22.0
Of participants that provided height and weight information and responded whether the height of
the building would influence their decision to use a lift during an evacuation (N=84), as the BMI
increases in each group the proportion of participants that responded that they would be
influenced by the height of the building decreases. With the exception of the Obese group the
majority of participants in each BMI group responded that they would be influenced by the
height of the building.
Whilst there was no significant difference between the proportion of participants in each BMI
group that would be influenced by the height of the building (Yates‟-χ²=4.6, p>0.05) this results
perhaps suggest that participants with higher BMIs are less concerned about other occupants
using a lift or delayed lift travel times during an evacuation in higher buildings.
Table 108: Frequency/Proportion of participants according to BMI that would and wouldn't be influenced by
the height of the building when deciding to use a lift during an evacuation
BMI
%
[Freq]
All
Participants
%
[Freq]
Would the height of the
building influence your
decision?
Under
weight
Normal
weight
Over
weight Obese
YES 100.0
[5]
68.7
[46]
67.6
[23]
45.5
[10]
65.4
[89]
NO 0.0
[0]
31.3
[21]
32.4
[11]
54.5
[12]
34.6
[47]
For all participants who specified their location country and specified that the height of the
building would influence their decision to use a lift (N=64), the majority stated that the higher

305
the building the more likely they would be to use a lift, ranging from 55.6%-100.0%. A smaller
proportion of participants in the Obese group (55.6%) specified that the higher the building the
more likely they would be to use a lift during an evacuation than the other BMI groups though
overall there was no significant difference between BMI groups (Yates‟-χ²=2.4, p>0.05).
Table 109: Frequency/Proportion of participants according to BMI that would and wouldn't be influenced by
the height of the building when deciding to use a lift during an evacuation
BMI
%
[Freq]
All
Participants
%
[Freq] The higher the
building the...
Under
weight
Normal
weight
Over
weight Obese
MORE likely to use a
lift
100.0
[5]
77.8
[35]
86.4
[19]
55.6
[5]
80.2
[69]
LESS likely to use a
lift
0.0
[0]
22.2
[10]
13.6
[3]
44.4
[4]
19.8
[17]
In Table 110 the frequency/proportion of participant in each BMI group that would and wouldn't
consider using a lift if they were familiar or unfamiliar with a building can be seen. Irrespective
of BMI group, around half of all participants (44.0%-53.7%) in each BMI group would
sometimes consider using a lift to evacuate with being no significant difference between each
BMI group (χ²=2.1, p>0.05).

306
Table 110: Frequency/Proportion of participants according to BMI that would and wouldn't consider using a
lift if they were familiar or unfamiliar with a building
Would you consider using the
lift/lift to evacuate? (if you were
familiar)
%
[Freq]
Would
sometimes
consider using
a lift to
evacuate
%
[Freq] YES NO
Would you
change
your above
answer(s) if
you were
unfamiliar
with the
building?
Under
Weight
YES 13.9
[4]
27.6
[8] 48.3
[14] NO
6.9
[2]
51.7
[15]
Normal
Weight
YES 2.8
[7]
21.1
[52] 51.4
[127] NO
27.5
[68]
48.6
[120]
Over
Weight
YES 3.7
[4]
8.3
[9] 44.0
[48] NO
32.1
[35]
56.0
[61]
Obese
YES 1.9
[1]
11.1
[6] 53.7
[29] NO
40.7
[22]
46.3
[25]
All
Participants
YES 3.7
[17]
16.7
[77] 49.6
[228] NO
29.1
[134]
50.4
[232]

307
A4.1 Lift Kinematic Derivation Formula
As mentioned in the main text, with regards to jerk, acceleration and maximum speed, there are
three types of journey a lift can make: A) a lift reaches maximum speed, B) a lift reaches its
maximum acceleration (but not maximum speed), C) a lift fails to reach its maximum
acceleration (see Figure 72). In each journey type there are a series of key kinematic time points
when a kinematic variable changes (e.g. t1, t2, t3, t4, etc) (see Figure 72, Table 111, Table 112,
Table 113). These time points are used to determine which formula to use to calculate the time a
lift arrives/passes a given floor.
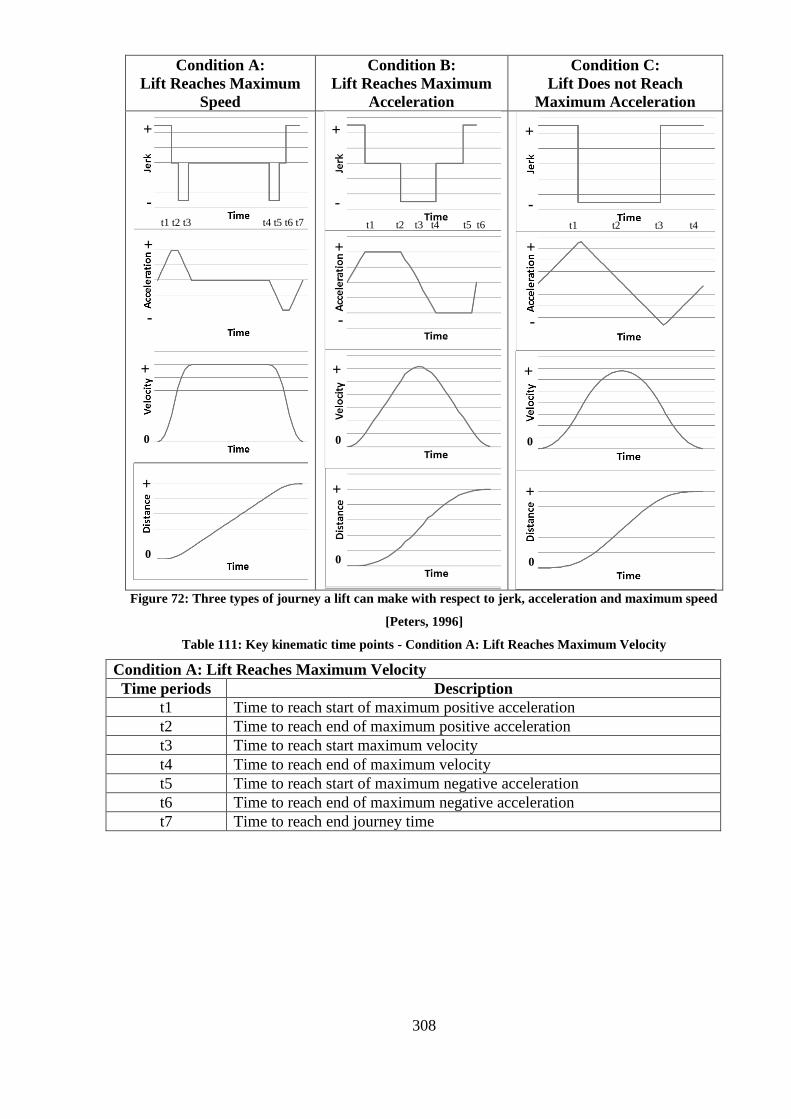
308
Condition A:
Lift Reaches Maximum
Speed
Condition B:
Lift Reaches Maximum
Acceleration
Condition C:
Lift Does not Reach
Maximum Acceleration
Figure 72: Three types of journey a lift can make with respect to jerk, acceleration and maximum speed
[Peters, 1996]
Table 111: Key kinematic time points - Condition A: Lift Reaches Maximum Velocity
Condition A: Lift Reaches Maximum Velocity
Time periods Description
t1 Time to reach start of maximum positive acceleration
t2 Time to reach end of maximum positive acceleration
t3 Time to reach start maximum velocity
t4 Time to reach end of maximum velocity
t5 Time to reach start of maximum negative acceleration
t6 Time to reach end of maximum negative acceleration
t7 Time to reach end journey time
t1 t2 t3 t4 t5 t6 t7 t1 t2 t3 t4 t5 t6 t1 t2 t3 t4
+
-
+
-
+
0
+
0
+
0
+
0
+
-
+
-
+
0
+
0
+
-
+
-

309
Table 112: Key kinematic time points - Condition B: Lift Reaches Maximum Acceleration
Condition B: Lift Reaches Maximum Acceleration
Time periods Description
t1 Time to reach start of maximum positive acceleration
t2 Time to reach end of maximum positive acceleration
t3 Time to reach maximum velocity (in this journey)
t4 Time to reach start of maximum negative acceleration
t5 Time to reach end of maximum negative acceleration
t6 Time to reach end journey time
Table 113: Key kinematic time points - Condition C: Lift Does not Reach Maximum Acceleration
Condition C: Lift Does not Reach Maximum Acceleration
Time periods Description
t1 Time to reach end of positive jerk / start of negative jerk / maximum
positive acceleration (in this journey)
t2 Time to reach maximum velocity (in this journey)
t3 Time to reach end of negative jerk / start of positive jerk / maximum
negative acceleration (in this journey)
t4 Time to reach end journey time
The lift motion formulae derived by Peters [Peters, 1996] specified the distance a lift would
travel after a given length of time, treating distance on a continuous scale. However, the lift
system within buildingEXODUS treats distance on discretized scale (i.e. the distance between
each lift opening on each floor is fixed and is only implicitly represented within the animation).
As such the formulae derived by Peter's were rearranged such that given the lift kinematic
attributes and distance travelled would determine the time a lift would pass each floor between
the start floor and the destination floor the specified location. This allows the animation of a lift
moving vertically passing each floor to be represented.
The following formula describe the kinematic component of the lift model to represent the
animation of a lift moving between floors on a given journey. The rearranged formula were
derived by Peters[Peters, 1996]. Where rearranging the formula derived by Peters[Peters, 1996]
was not possible (due to the high order), a binary search algorithm was used to iteratively search
for the floor time stamp for a given distance using the respective transition time markers for
that part of the journey as the initial boundaries for the search space (i.e. 0-t1, t1-t2, t2-t3, t3-t4,
t4-t5, t5-t6, t6-t7) for each journey type. The following pseudo code describes how the time
stamp for such a formula is searched for:

310
Formula Key:
The following formulae, originally derived by Peters, specify the derived transition time markers
(i.e. 0-t1, t1-t2, t2-t3, t3-t4, t4-t5, t5-t6, t6-t7) for each of the three types of lift journey along
with methods for calculating the time stamp for a given distance used within the lift model in
buildingEXODUS.
d Lifts overall journey
distance
v Maximum
velocity
d(t) Distance travelled at time
„t‟.
a Maximum acceleration j Maximum Jerk
searchTime =
searchDistance = 0.0
toleranceLevel = 0.0001 {how accurate the iterative approximation needs to be}
upperBoundary =
lowerBoundary =
f(x) = {function used to determine the distance travelled at a given time}
while (d(t) - searchDistance < toleranceLevel)
{
searchDistance = f(x)
if ( searchDistance>d(t))
{
upperBoundary=searchTime
searchTime=lowerBoundary + ((searchTime-lowerBoundary)/2);
}else{
lowerBoundary=searchTime
searchTime=lowerBoundary + ((upperboundary -searchTime)/2);
}
}
searchTime

311
Condition A: Lift Reaches Maximum Velocity
1. Condition to check lift reaches maximum velocity
2. Time Period Formula
3. Time Stamp Formula for floors between each time period
The distance between the next lift floor and the initial start lift floor (d) is passed to the following
rearranged equations which then provide the necessary distances travelled for each interval (i.e.
using t1, t2, t3, etc determine d1, d2, d3, etc). Once these distances are calculated for each time
interval it is then determined which interval the next floor is part of using the distance travelled
(d). That intervals formula is then used to calculate the time at which the lift will arrive at the
next floor. This time is then used to display the lift at the given time for the next floor in the
simulation. This process is then repeated for the next floors in the sequence so providing the
location and subsequent animation of the lift vertically moving through the geometry.
Time Period Time Stamp Formula/Method
Rearranged to:
Was solved using
to give:
{iteratively search for solution}
searchDistance =

312
Condition B: Lift Reaches Maximum Acceleration (but not Maximum Velocity)
1. Condition to check Lift Reaches Maximum Acceleration (but not maximum velocity)
2. Time Period Formula
Rearranged to:
{iteratively search for solution}
{iteratively search for solution}
{iteratively search for solution}
+

313
3. Time Stamp Formula for floors between each period
Time Period Time Stamp Formula/Method
Rearranged to:
Was solved using
to give:
{iteratively search for solution}
searchDistance =
{iteratively search for solution}
searchDistance =
Was solved using
to give:
{iteratively search for solution}

314
Condition C: Lift Does not Reach Maximum Acceleration
1. Condition to check Lift Reaches Maximum Acceleration (but not maximum velocity)
2. Time Period Formula
3. Time Stamp Formula for floors between each period
Time Period Time Stamp Formula/Method
Rearranged to:
{iteratively search for solution}
searchDistance =
{iteratively search for solution}
searchDistance =
{iteratively search for solution}
searchDistance =

315
A5.1 Verification Test Results– Lift and Agent Lift Model
For each component of the developed lift and agent lift model a series of verification tests have
been performed and results presented. This is intended to demonstrate that each component
behaves as expected and produce appropriate results based on input parameters and simulated
conditions. The geometry and population used in each test have been described in the following
sections with results and a description of each test presented accordingly for each component of
the lift and agent lift model in the respective sections of the chapter.
A5.1.1 Verification geometry
The verification test geometry has 10 floors with a floor to floor height of 3m (the total height of
the building was 30m in height), with four stairwell cores, each stair being 1m wide, and four lift
banks each containing eight lifts (see Figure 73) (not all lifts and stairs are used for all
verification tests). With the exception of the ground floor all levels in the building have the
same layout and configuration. Each stair allowed two agents to stand abreast side-by-side with
occupants preferring to stagger their locations (i.e. prefer not to stand side-by-side) and maintain
at least one tread spacing between themselves and the agent in front. Each stair is doglegged
design where an intermittent landing (1m x 3.2m) connects the two legs; each leg being 1.5m in
width and 4.6m in horizontal length allowing a maximum of 16 agents to simultaneously occupy
each leg of the stairs at a time. Within the building all of the lifts have the capacity to service all
floors. Due to the hypothetical nature of the building, aside from the external walls and the
stair/lift cores, no furniture or internal obstructions were represented within the building
geometry. A graphical view of the geometry can be seen in Figure 73 below. At the beginning of
each simulation the lift doors are closed and immediately start moving at the start of a
simulation.

316
3D Geometry View 2D Geometry View Figure 73: Lift verification test geometry
A5.1.2 Verification population
For the lift verification tests no agents were required to be represented. However,
buildingEXODUS requires at least a single agent in order to run a simulation. As such whilst a
single agent has been used in the lift verification tests the agent behaviour will not influence the
lift verification tests. The population used in all of the agent lift verification tests were generated
from the standard buildingEXODUS population. The frequency of agents used in each test was
different and has been specified in the respective sections within the chapter.
A5.1.3 Verification lift attributes
The delay times associated with a lift journey have been set to the following times, as defined by
CBISE Guide D:
- Motor delay = 0.5s
- Dwell delay = 3.0s
- Door opening time=0.8s
- Door closing time= 3.0s
In buildingEXODUS each delay time is combined with the lift kinematics time calculations
(determining the movement of the lift) to determine the time at which a lift passes given floors
on its journey. As such these have been combined within the lift verification tests. The kinematic
attributes of the lifts used have been stated within each the respective section.
Lift Group 1 Lift Group 2
Lift Group 3 Lift Group 4

317
A5.1.4 Verification test – Lift kinematics
A series of 14 lift movement/delay time verification tests were conducted to demonstrate the
kinematics of the lift model behaves as expected given a series of input parameters. All tests
involved a single journey of a single lift travelling from floor 0 to floor 9 (27 meters) each using
different kinematic parameters (maximum speed, acceleration and jerk) (see Figure 73) of a lift
and recorded the movement/event times within the model. Each test was intended to demonstrate
the lift model representing each of the three types of lift journey (see Figure 33), with tests 1-4
only altering the maximum speed, tests 5-8 only altering the acceleration, and tests 9-14 only
altering the jerk. These movement/event times were then input into the equations derived by
Peters [Peters, 1996] (which the lift model rearranged equations were based on) to demonstrate
the times calculated in the equations correlate with the distance travelled and the expected event
times in the model. Each test was involved one simulation as no random seed variables are used
in the lift mode (i.e. no variation would be produced from multiple simulations).
Table 114: Lift verification tests - altered kinematic parameters
Test Journey
Type
Max Speed (m/s)
Acceleration (m/s
2)
Jerk (m/s
3)
1 A 4 1.2 1.8
2 A 5.3 1.2 1.8
3 B 5.31 1.2 1.8
4 B 6 1.2 1.8
5 B 7 1.2 1.8
6 B 7 3.52 1.8
7 C 7 3.53 1.8
8 C 7 4 1.8
9 A 7 3 2
10 A 7 3 1.97
11 B 7 3 1.96
12 B 7 3 1.42
13 C 7 3 1.41
14 C 7 3 1.3
In Table 115 the calculated and the modelled time the lift passes each floor in the model (which
includes the motor delay at the beginning of each journey), the time the lift door opens and the
time the lift door closes (after the given dwell delay and door closing time) for a single journey
can be seen. Events in buildingEXODUS are governed by the simulation clock which increments
every 0.17 sec (0.166666∙ sec) for the lift model. This introduces a small margin of error when
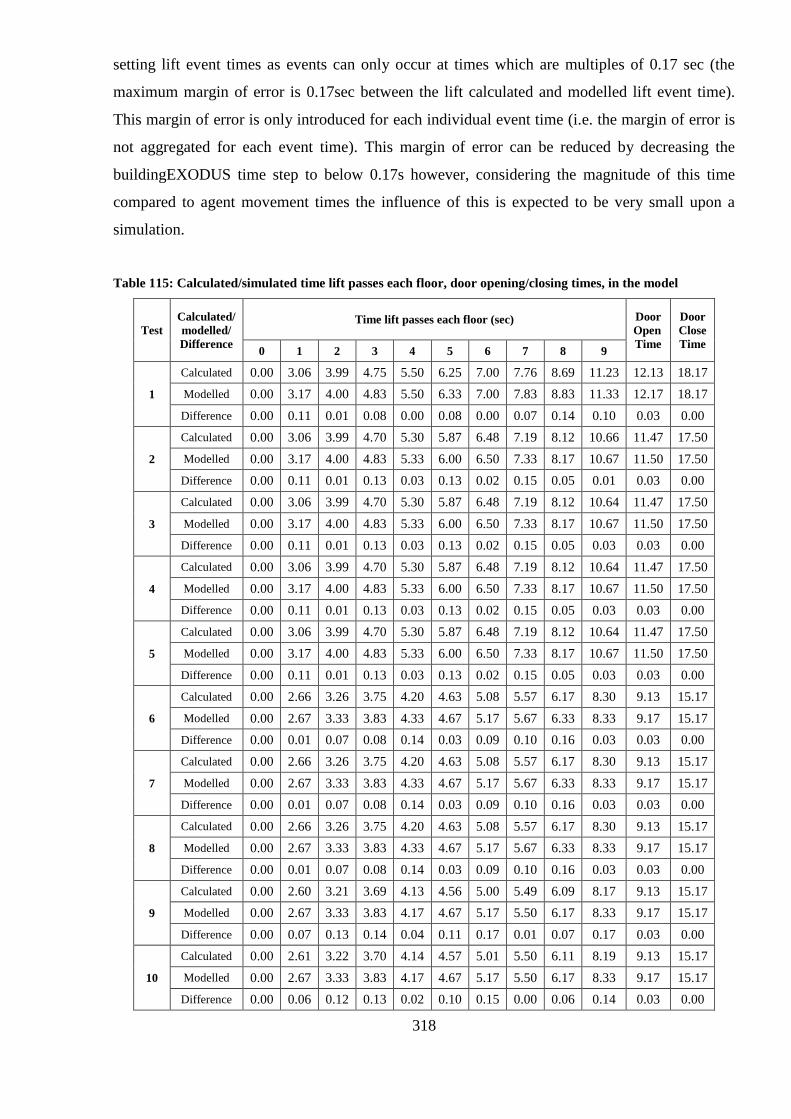
318
setting lift event times as events can only occur at times which are multiples of 0.17 sec (the
maximum margin of error is 0.17sec between the lift calculated and modelled lift event time).
This margin of error is only introduced for each individual event time (i.e. the margin of error is
not aggregated for each event time). This margin of error can be reduced by decreasing the
buildingEXODUS time step to below 0.17s however, considering the magnitude of this time
compared to agent movement times the influence of this is expected to be very small upon a
simulation.
Table 115: Calculated/simulated time lift passes each floor, door opening/closing times, in the model
Test
Calculated/
modelled/
Difference
Time lift passes each floor (sec) Door
Open
Time
Door
Close
Time 0 1 2 3 4 5 6 7 8 9
1
Calculated 0.00 3.06 3.99 4.75 5.50 6.25 7.00 7.76 8.69 11.23 12.13 18.17
Modelled 0.00 3.17 4.00 4.83 5.50 6.33 7.00 7.83 8.83 11.33 12.17 18.17
Difference 0.00 0.11 0.01 0.08 0.00 0.08 0.00 0.07 0.14 0.10 0.03 0.00
2
Calculated 0.00 3.06 3.99 4.70 5.30 5.87 6.48 7.19 8.12 10.66 11.47 17.50
Modelled 0.00 3.17 4.00 4.83 5.33 6.00 6.50 7.33 8.17 10.67 11.50 17.50
Difference 0.00 0.11 0.01 0.13 0.03 0.13 0.02 0.15 0.05 0.01 0.03 0.00
3
Calculated 0.00 3.06 3.99 4.70 5.30 5.87 6.48 7.19 8.12 10.64 11.47 17.50
Modelled 0.00 3.17 4.00 4.83 5.33 6.00 6.50 7.33 8.17 10.67 11.50 17.50
Difference 0.00 0.11 0.01 0.13 0.03 0.13 0.02 0.15 0.05 0.03 0.03 0.00
4
Calculated 0.00 3.06 3.99 4.70 5.30 5.87 6.48 7.19 8.12 10.64 11.47 17.50
Modelled 0.00 3.17 4.00 4.83 5.33 6.00 6.50 7.33 8.17 10.67 11.50 17.50
Difference 0.00 0.11 0.01 0.13 0.03 0.13 0.02 0.15 0.05 0.03 0.03 0.00
5
Calculated 0.00 3.06 3.99 4.70 5.30 5.87 6.48 7.19 8.12 10.64 11.47 17.50
Modelled 0.00 3.17 4.00 4.83 5.33 6.00 6.50 7.33 8.17 10.67 11.50 17.50
Difference 0.00 0.11 0.01 0.13 0.03 0.13 0.02 0.15 0.05 0.03 0.03 0.00
6
Calculated 0.00 2.66 3.26 3.75 4.20 4.63 5.08 5.57 6.17 8.30 9.13 15.17
Modelled 0.00 2.67 3.33 3.83 4.33 4.67 5.17 5.67 6.33 8.33 9.17 15.17
Difference 0.00 0.01 0.07 0.08 0.14 0.03 0.09 0.10 0.16 0.03 0.03 0.00
7
Calculated 0.00 2.66 3.26 3.75 4.20 4.63 5.08 5.57 6.17 8.30 9.13 15.17
Modelled 0.00 2.67 3.33 3.83 4.33 4.67 5.17 5.67 6.33 8.33 9.17 15.17
Difference 0.00 0.01 0.07 0.08 0.14 0.03 0.09 0.10 0.16 0.03 0.03 0.00
8
Calculated 0.00 2.66 3.26 3.75 4.20 4.63 5.08 5.57 6.17 8.30 9.13 15.17
Modelled 0.00 2.67 3.33 3.83 4.33 4.67 5.17 5.67 6.33 8.33 9.17 15.17
Difference 0.00 0.01 0.07 0.08 0.14 0.03 0.09 0.10 0.16 0.03 0.03 0.00
9
Calculated 0.00 2.60 3.21 3.69 4.13 4.56 5.00 5.49 6.09 8.17 9.13 15.17
Modelled 0.00 2.67 3.33 3.83 4.17 4.67 5.17 5.50 6.17 8.33 9.17 15.17
Difference 0.00 0.07 0.13 0.14 0.04 0.11 0.17 0.01 0.07 0.17 0.03 0.00
10
Calculated 0.00 2.61 3.22 3.70 4.14 4.57 5.01 5.50 6.11 8.19 9.13 15.17
Modelled 0.00 2.67 3.33 3.83 4.17 4.67 5.17 5.50 6.17 8.33 9.17 15.17
Difference 0.00 0.06 0.12 0.13 0.02 0.10 0.15 0.00 0.06 0.14 0.03 0.00

319
11
Calculated 0.00 2.61 3.22 3.70 4.15 4.58 5.02 5.50 6.11 8.20 9.13 15.17
Modelled 0.00 2.67 3.33 3.83 4.17 4.67 5.17 5.67 6.17 8.33 9.17 15.17
Difference 0.00 0.06 0.11 0.13 0.02 0.09 0.15 0.16 0.05 0.13 0.03 0.00
12
Calculated 0.00 2.83 3.49 4.02 4.50 4.97 5.46 5.99 6.64 8.94 9.80 15.83
Modelled 0.00 2.83 3.50 4.17 4.67 5.00 5.50 6.00 6.67 9.00 9.83 15.83
Difference 0.00 0.00 0.01 0.15 0.17 0.03 0.04 0.01 0.03 0.06 0.03 0.00
13
Calculated 0.00 2.84 3.49 4.03 4.51 4.98 5.47 6.00 6.66 8.89 9.80 15.83
Modelled 0.00 3.00 3.50 4.17 4.67 5.00 5.50 6.00 6.67 9.00 9.83 15.83
Difference 0.00 0.16 0.01 0.14 0.16 0.02 0.03 0.00 0.01 0.11 0.03 0.00
14
Calculated 0.00 2.90 3.58 4.12 4.62 5.11 5.60 6.15 6.82 9.12 9.97 16.00
Modelled 0.00 3.00 3.67 4.17 4.67 5.17 5.67 6.17 6.83 9.17 10.00 16.00
Difference 0.00 0.10 0.09 0.04 0.05 0.06 0.06 0.02 0.01 0.04 0.03 0.00
To verify that the above lift event times are as expected for each floor, the motor delay time (0.5
sec)was subtracted from each of the above calculated/modelled floor times then used to calculate
the travel distance a lift would have travelled using the formulae derived by Peters [Peters, 1996]
(see previous section) (see Table 116). As can be seen in Table 116, using the calculated travel
times the exact distance travelled by the lift for each floor on the lift journey is produced for each
test with a slight difference (0.0m-1.07m) in the modelled distance due to the time discretisation
within buildingEXODUS.
Table 116: Calculated lift travel distances from floor times
Test
Calculated/
modelled/
Difference
Calculated lift travel distance using above travel times and Richards formula (m)
0 1 2 3 4 5 6 7 8 9
1
Calculated 0.00 3.00 6.00 9.00 12.00 15.00 18.00 21.00 24.00 27.00
Modelled 0.00 3.29 6.04 9.33 12.00 15.33 18.00 21.27 24.37 27.00
Difference 0.00 0.29 0.04 0.33 0.00 0.33 0.00 0.27 0.37 0.00
2
Calculated 0.00 3.00 6.00 9.00 12.00 15.00 18.00 21.00 24.00 27.00
Modelled 0.00 3.29 6.04 9.62 12.15 15.66 18.11 21.54 24.13 27.00
Difference 0.00 0.29 0.04 0.62 0.15 0.66 0.11 0.54 0.13 0.00
3
Calculated 0.00 3.00 6.00 9.00 12.00 15.00 18.00 21.00 24.00 27.00
Modelled 0.00 3.29 6.04 9.62 12.15 15.66 18.11 21.54 24.13 27.00
Difference 0.00 0.29 0.04 0.62 0.15 0.66 0.11 0.54 0.13 0.00
4
Calculated 0.00 3.00 6.00 9.00 12.00 15.00 18.00 21.00 24.00 27.00
Modelled 0.00 3.29 6.04 9.62 12.15 15.66 18.11 21.54 24.13 27.00
Difference 0.00 0.29 0.04 0.62 0.15 0.66 0.11 0.54 0.13 0.00
5
Calculated 0.00 3.00 6.00 9.00 12.00 15.00 18.00 21.00 24.00 27.00
Modelled 0.00 3.29 6.04 9.62 12.15 15.66 18.11 21.54 24.13 27.00
Difference 0.00 0.29 0.04 0.62 0.15 0.66 0.11 0.54 0.13 0.00
6 Calculated 0.00 3.00 6.00 9.00 12.00 15.00 18.00 21.00 24.00 27.00

320
Modelled 0.00 3.05 6.42 9.55 12.94 15.23 18.56 21.54 24.61 27.00
Difference 0.00 0.04 0.42 0.55 0.94 0.23 0.56 0.54 0.61 0.00
7
Calculated 0.00 3.00 6.00 9.00 12.00 15.00 18.00 21.00 24.00 27.00
Modelled 0.00 3.05 6.42 9.55 12.94 15.23 18.56 21.54 24.61 27.00
Difference 0.00 0.05 0.42 0.55 0.94 0.23 0.56 0.54 0.61 0.00
8
Calculated 0.00 3.00 6.00 9.00 12.00 15.00 18.00 21.00 24.00 27.00
Modelled 0.00 3.05 6.42 9.55 12.94 15.23 18.56 21.54 24.61 27.00
Difference 0.00 0.05 0.42 0.55 0.94 0.23 0.56 0.54 0.61 0.00
9
Calculated 0.00 3.00 6.00 9.00 12.00 15.00 18.00 21.00 24.00 27.00
Modelled 0.00 3.29 6.75 9.96 12.25 15.74 19.07 21.09 24.28 27.00
Difference 0.00 0.29 0.75 0.96 0.25 0.74 1.07 0.09 0.28 0.00
10
Calculated 0.00 3.00 6.00 9.00 12.00 15.00 18.00 21.00 24.00 27.00
Modelled 0.00 3.25 6.69 9.88 12.17 15.66 19.00 21.01 24.23 27.00
Difference 0.00 0.25 0.69 0.88 0.17 0.66 1.00 0.01 0.23 0.00
11
Calculated 0.00 3.00 6.00 9.00 12.00 15.00 18.00 21.00 24.00 27.00
Modelled 0.00 3.24 6.67 9.86 12.14 15.63 18.96 21.90 24.21 27.00
Difference 0.00 0.24 0.67 0.86 0.14 0.63 0.96 0.90 0.21 0.00
12
Calculated 0.00 3.00 6.00 9.00 12.00 15.00 18.00 21.00 24.00 27.00
Modelled 0.00 3.00 6.07 9.91 13.05 15.17 18.26 21.07 24.10 27.00
Difference 0.00 0.00 0.07 0.91 1.05 0.17 0.26 0.07 0.10 0.00
13
Calculated 0.00 3.00 6.00 9.00 12.00 15.00 18.00 21.00 24.00 27.00
Modelled 0.00 3.65 6.03 9.86 12.99 15.11 18.19 21.00 24.04 27.00
Difference 0.00 0.65 0.03 0.86 0.99 0.11 0.19 0.00 0.04 0.00
14
Calculated 0.00 3.00 6.00 9.00 12.00 15.00 18.00 21.00 24.00 27.00
Modelled 0.00 3.37 6.47 9.26 12.28 15.37 18.36 21.08 24.03 27.00
Difference 0.00 0.37 0.47 0.26 0.28 0.37 0.36 0.08 0.03 0.00
In addition to the floor travel times, the lift door opening/closing and dwell times within each test
were recorded to verify attributes were being correctly modelled. In each test the lift door
opening times were set to 0.8 sec. As can be seen in Table 115 the difference between the
modelled lift arrival time for floor 9 (the time the door opening time is calculated from) and the
calculated door opening time in each test is exactly 0.8 sec. The difference between the modelled
floor 9 arrival time and modelled door opening time was 0.83 sec for each test with the
difference of 0.03 sec due to the buildingEXODUS time step discretisation. Once the lift door is
opened in each test it will stay open for the dwell time plus the door closing time before the
animation of the door actually closes in the modelled. The dwell time (3.0 sec) and closing door
time (3.0 sec) combined sum to 6.0 sec. As can be seen in Table 115 the difference between the
all the modelled door opening and the modelled door closing times in each test is 6.0 sec exactly.
Due to the combined time being a multiple of 0.17sec (0.166666∙ sec) meant that the difference
time is represented exactly.

321
Results from the lift movement/delay times verification tests have shown the developed lift
model to behaves as intended given the input parameters used and the time step used within
buildingEXODUS.
A5.1.5 Verification test – Lift motion control verification
As previously mentioned the lift motion control floor sequence system within buildingEXODUS
is used to control the floors a lift will service during a simulation. The two methods for a user to
specify the lift floor sequence within the model are the floor sequence system and the shuttle
floor sequence system. A series of 8 verification tests have been performed to demonstrate the
model behaves as expected given a series of input parameters.
With exception of tests 7 and 8, all tests involved 26 agents (twice the capacity of a lift) located
next to lift bank 1 on floors 7, 8, 9. A single lift (Lift 1) within lift group 1 was used for all tests.
All agents were assigned to use the lift if the lift serviced their starting floor with agents assigned
to use the stairs if they do not use the lift. Of the agents they were assigned to use a lift, their
individual attributes were set such that no agent would redirect from the lift.
The lift attributes were set as follows:
- Max Speed = 4 m/s
- Acceleration 1.2 m/s2
- Jerk = 1.8 m/s3
- Motor delay = 0.5s
- Dwell delay = 3.0s
- Door opening time=0.8s
- Door closing time= 3.0s
Results from the lift motion control verification tests are presented in Table 117. The first three
tests (Test 1-3) show the floor sequence control system to serve different floors. Tests 4-6 show
the shuttle floor sequence control system to serve the same floor sequence as Tests 1-3 with the
floor sequence control sequence. Tests 7 used the floor sequence control system and is identical
to Test 3 however, 20 agents were present on each floor instead of 26. Due to the floor sequence
control system being used in this test meant that the lift explicitly followed the stated floor
sequence specified irrespective of the lift being full to capacity on the upper floors. As such the
last journey for each floors agents involved the lift moving to the ground floor and was not full

322
to capacity. Test 8 used the shuttle floor sequence control system and is identical to Test 6
however, 20 agents were present on each floor instead of 26. Due to the shuttle floor sequence
control system being used in this test meant that the lift shuttle between floor pairs in the
sequence. If a lift is not filled to capacity and no other agents are waiting in the lift catchment
area for the current floor, the lift will move directly to the next floor pair in the sequence (i.e. not
having to travel to the ground floor being partially full to empty). This difference in the modelled
floor sequence compared to Test 7 can be seen in the fourth lift journey where the lift moves
directly from floor 9 to floor 8 without moving to the ground floor. The results from the lift
motion control verification tests have shown the model to behave as intended given a series of
input parameters.
Table 117: Lift verification motion control verification tests and test results
Test System Stated Floor
Sequence
Modelled Floor
Sequence in
buildingEXODUS
1 Floor sequence 9,0,9,0 9,0,9,0
2 Floor sequence 9,0,9,0,8,0,8,0 9,0,9,0,8,0,8,0
3 Floor sequence 9,0,9,0,8,0,8,0,7,0,7,0 9,0,9,0,8,0,8,0,7,0,7,0
4 Shuttle floor 9,0 9,0,9,0
5 Shuttle floor 9,0,8,0 9,0,9,0,8,0,8,0
6 Shuttle floor 9,0,8,0,7,0 9,0,9,0,8,0,8,0,7,0,7,0
7 Floor sequence
(20 agents per floor) 9,0,9,0,8,0,8,0,7,0,7,0 9,0,9,0,8,0,8,0,7,0,7,0
8 Shuttle floor
(20 agents per floor) 9,0,8,0,7,0 9,0,9,8,0,8,0,8,7,0,7,0
A5.1.6 Verification test – Agent lift/stair choice
A series of 5 verification tests were conducted to demonstrate the agent lift assignment model
behaves as expected given a series of user-specified proportions for each floor (see Table 118).
Table 118: Lift/Stair choice verification test – overall proportion of lift users per floor
Test Floor
0 1 2 3 4 5 6 7 8 9
1 0% 0% 0% 0% 0% 0% 0% 0% 0% 0%
2 0% 100% 100% 100% 100% 100% 100% 100% 100% 100%
3 0% 50% 50% 50% 50% 50% 50% 50% 50% 50%
4 0% 10% 20% 30% 40% 50% 60% 70% 80% 90%
5 0% 0% 0% 0% 0% 20% 40% 60% 80% 90%

323
All tests involved all 4 lift banks (32 lifts) servicing all floors evacuating the building in a top-
down evacuation strategy. All lifts had the following attributes assigned:
- Shuttle floor sequence: 9,0,8,0,7,0,6,0,5,0,4,0,3,0,2,0,1,0
- Max Speed = 4 m/s
- Acceleration 1.2 m/s2
- Jerk = 1.8 m/s3
- Motor delay = 0.5s
- Dwell delay = 3.0s
- Door opening time=0.8s
- Door closing time= 3.0s
Note that the kinematic attributes of the lifts are no consequence to the verification results
however, the shuttle floor sequence is required to service all floors in order to give all agents the
option to use either the stairs or the lift during each verification test. With the exception of the
ground floor there were 100 agents distributed on each floor (900 agents in total). Each
verification test involved assigning a different probability of a agents using a lift based on the
floor they were initially located on. In addition to the overall proportion of lift users on each
floor, agents should approximately evenly distribute between each lift bank on the respective
floors. The difference between the stated and modelled proportion of lift users was calculated
according to each floor and for each lift bank on each floor. For each test, the average proportion
of lift users per floor and per lift bank over a series of 5 simulations was taken due to a random
seed variable being used in the lift/stair choice algorithm. The results are presented in Table 119.
The range of differences between the stated and modelled proportion of lift users for a given
floor for each verification test ranged between 0.0%-3.2% for the overall proportions and 0.0%-
3.7% for each given lift group. These differences between the stated and the modelled proportion
of lift users overall and per lift group represent an acceptable level of variation. The results from
the lift choice verification tests have shown the model to behave as intended given a series of
input parameters.

324
Table 119: Lift/stair choice verification test results - Stated/modelled (over five simulations) average
proportion of lift users per lift group and per floor
Test
Floor 1
Overall
2
Overall
3
Overall Lift
Group 1 2 3 4 1 2 3 4 1 2 3 4
1
Stated 0.0 0.0 0.0 0.0 0.0 0.0 0.0 0.0 0.0 0.0 0.0 0.0 0.0 0.0 0.0
Modelled 0.0 0.0 0.0 0.0 0.0 0.0 0.0 0.0 0.0 0.0 0.0 0.0 0.0 0.0 0.0
Difference 0.0 0.0 0.0 0.0 0.0 0.0 0.0 0.0 0.0 0.0 0.0 0.0 0.0 0.0 0.0
2
Stated 25.0 25.0 25.0 25.0 100.0 25.0 25.0 25.0 25.0 100.0 25.0 25.0 25.0 25.0 100.0
Modelled 25.0 25.0 25.0 25.0 100.0 25.0 25.0 25.0 25.0 100.0 25.0 25.0 25.0 25.0 100.0
Difference 0.0 0.0 0.0 0.0 0.0 0.0 0.0 0.0 0.0 0.0 0.0 0.0 0.0 0.0 0.0
3
Stated 12.5 12.5 12.5 12.5 50.0 12.5 12.5 12.5 12.5 50 12.5 12.5 12.5 12.5 50.0
Modelled 10.2 13 12 12.6 47.8 8.8 13 12.2 13 47.0 9.2 12.6 12.2 13 47.0
Difference 2.3 0.5 0.5 0.1 2.2 3.7 0.5 0.3 0.5 3.0 3.3 0.1 0.3 0.5 3.0
4
Stated 2.5 2.5 2.5 2.5 10.0 5.0 5.0 5.0 5.0 20.0 7.5 7.5 7.5 7.5 30.0
Modelled 2.8 2.8 3.0 3.2 11.8 4.4 5.0 4.2 5.0 18.6 6.6 8.0 8.0 8.0 30.6
Difference 0.3 0.3 0.5 0.7 1.8 0.6 0.0 0.8 0.0 1.4 0.9 0.5 0.5 0.5 0.6
5
Stated 0.0 0.0 0.0 0.0 0.0 0.0 0.0 0.0 0.0 0.0 0.0 0.0 0.0 0.0 0.0
Modelled 0.0 0.0 0.0 0.0 0.0 0.0 0.0 0.0 0.0 0.0 0.0 0.0 0.0 0.0 0.0
Difference 0.0 0.0 0.0 0.0 0.0 0.0 0.0 0.0 0.0 0.0 0.0 0.0 0.0 0.0 0.0
Test
Floor 4
Overall
5
Overall
6
Overall Lift
Group 1 2 3 4 1 2 3 4 1 2 3 4
1
Stated 0.0 0.0 0.0 0.0 0.0 0.0 0.0 0.0 0.0 0.0 0.0 0.0 0.0 0.0 0.0
Modelled 0.0 0.0 0.0 0.0 0.0 0.0 0.0 0.0 0.0 0.0 0.0 0.0 0.0 0.0 0.0
Difference 0.0 0.0 0.0 0.0 0.0 0.0 0.0 0.0 0.0 0.0 0.0 0.0 0.0 0.0 0.0
2
Stated 25.0 25.0 25.0 25.0 100.0 25.0 25.0 25.0 25.0 100.0 25.0 25.0 25.0 25.0 100.0
Modelled 25.0 25.0 25.0 25.0 100.0 25.0 25.0 25.0 25.0 100.0 25.0 25.0 25.0 25.0 100.0
Difference 0.0 0.0 0.0 0.0 0.0 0.0 0.0 0.0 0.0 0.0 0.0 0.0 0.0 0.0 0.0
3
Stated 12.5 12.5 12.5 12.5 50.0 12.5 12.5 12.5 12.5 50.0 12.5 12.5 12.5 12.5 50.0
Modelled 11.2 13 10.4 13 47.6 11.6 13 13 13 50.6 12.4 13 13 13 51.4
Difference 1.3 0.5 2.1 0.5 2.4 0.9 0.5 0.5 0.5 0.6 0.1 0.5 0.5 0.5 1.4
4
Stated 10.0 10.0 10.0 10.0 40.0 12.5 12.5 12.5 12.5 50.0 15.0 15.0 15.0 15.0 60.0
Modelled 9.0 9.8 10.0 10.0 38.8 12.4 13.0 12.6 13.0 51.0 13.6 16.0 14.8 16.0 60.4
Difference 1.0 0.2 0.0 0.0 1.2 0.1 0.5 0.1 0.5 1.0 1.4 1.0 0.2 1.0 0.4
5
Stated 0.0 0.0 0.0 0.0 0.0 5.0 5.0 5.0 5.0 20.0 10.0 10.0 10.0 10.0 40.0
Modelled 0.0 0.0 0.0 0.0 0.0 4.8 5.0 4.8 5.0 19.6 8.4 10.0 9.2 10.0 37.6
Difference 0.0 0.0 0.0 0.0 0.0 0.2 0.0 0.2 0.0 0.4 1.6 0.0 0.8 0.0 2.4
Test
Floor 7
Overall
8
Overall
9
Overall Lift
Group 1 2 3 4 1 2 3 4 1 2 3 4
1
Stated 0.0 0.0 0.0 0.0 0.0 0.0 0.0 0.0 0.0 0.0 0.0 0.0 0.0 0.0 0.0
Modelled 0.0 0.0 0.0 0.0 0.0 0.0 0.0 0.0 0.0 0.0 0.0 0.0 0.0 0.0 0.0
Difference 0.0 0.0 0.0 0.0 0.0 0.0 0.0 0.0 0.0 0.0 0.0 0.0 0.0 0.0 0.0
2
Stated 25.0 25.0 25.0 25.0 100.0 25.0 25.0 25.0 25.0 100.0 25.0 25.0 25.0 25.0 100.0
Modelled 25.0 25.0 25.0 25.0 100.0 25.0 25.0 25.0 25.0 100.0 25.0 25.0 25.0 25.0 100.0
Difference 0.0 0.0 0.0 0.0 0.0 0.0 0.0 0.0 0.0 0.0 0.0 0.0 0.0 0.0 0.0
3
Stated 12.5 12.5 12.5 12.5 50.0 12.5 12.5 12.5 12.5 50.0 12.5 12.5 12.5 12.5 50.0
Modelled 10.4 12 12.4 12 46.8 12.2 13 11.8 12.8 49.8 13 13 13 13 52.0
Difference 2.1 0.5 0.1 0.5 3.2 0.3 0.5 0.7 0.3 0.2 0.5 0.5 0.5 0.5 2.0
4
Stated 17.5 17.5 17.5 17.5 70.0 20.0 20.0 20.0 20.0 80.0 22.5 22.5 22.5 22.5 90.0
Modelled 17.2 18.0 18.0 18.0 71.2 19.6 20.0 19.8 20.0 79.4 22.0 23.0 22.8 23.0 90.8
Difference 0.3 0.5 0.5 0.5 1.2 0.4 0.0 0.2 0.0 0.6 0.5 0.5 0.3 0.5 0.8
5
Stated 15.0 15.0 15.0 15.0 60.0 20.0 20.0 20.0 20.0 80.0 25.0 25.0 25.0 25.0 100.0
Modelled 15.0 14.6 16.0 16.0 61.6 19.6 20.0 19.8 20.0 79.4 25.0 25.0 25.0 25.0 100.0
Difference 0.0 0.4 1.0 1.0 1.6 0.4 0.0 0.2 0.0 0.6 0.0 0.0 0.0 0.0 0.0
A5.1.7 Verification test – Lift wait area congestion redirection
A series of 11 verification tests were conducted to demonstrate the agent lift wait area congestion
redirection model behaves as expected given a variety of different congestion thresholds

325
assigned to a single agent and a variety of different levels of congestion (number of agents) in a
lift waiting area.
All tests involved a single bank of lifts (Lift group 1) only servicing the top floor (9) evacuating
the building in a top-down evacuation strategy. All lifts had the following attributes assigned:
- Shuttle floor sequence: 9,0
- Max Speed = 4 m/s
- Acceleration 1.2 m/s2
- Jerk = 1.8 m/s3
- Motor delay = 0.5s
- Dwell delay = 3.0s
- Door opening time=0.8s
- Door closing time= 3.0s
- Start delay time = 120.0s
Note that the kinematic attributes of the lifts are no consequence to the verification results
however, the shuttle floor sequence is required to service the upper floor in order to give all
agents the option to use the lifts in lift group 1 during each verification test. In addition all lift
group 1 lifts were assigned a start delay of 120 s in order to ensure that each verification test
could be completed prior to the lifts servicing the upper floor. In all tests agents were only
located on floor 9 in the lift group 1 catchment area, and a single agent was located outside of the
catchment area (see Figure 74 as an example). The lift group 1 catchment area was set to 3m for
each lift which formed the lift waiting area of 185 nodes (92.5 m2 area).
Figure 74: Starting location of single agent and lift catchment area agents (Test 4)

326
All agents in each test were assigned a lift wait time set to 9999 (i.e. they would not redirect due
to wait time expiration) and a congestion threshold of 5.0 ped/m (i.e. they would not redirect due
congestion). For each test the single agent initially outside the lift catchment area was assigned a
different congestion threshold value with each test involving a different number of agents
initially in the lift catchment area representing different levels of congestion (see Table 120). The
number of agents in the lift waiting area in each test was set based on the boundaries of the
single agent‟s congestion threshold to demonstrate the single agent correctly decided to redirect
or maintain waiting for the lifts according to the congestion threshold assigned. Since no other
agent entered into the lift catchment area after the single agent the congestion redirection
probability was always set to 1 if the agents congestion threshold was reached or exceeded in
each test (i.e. the single agent would always redirect if the congestion threshold was reached or
exceeded).
As can be seen from the verification test results in Table 120, the correct device selection was
made by the single agent according to the levels of congestion and the assigned congestion
threshold for the single agent as made. The results have shown the model to behave as intended
given a series of input parameters and simulated conditions.
Table 120: Lift wait area congestion redirection verification test results
Test Number of
people in lift
catchment area
Level of congestion in lift
catchment are (ped/m
2)
Single agent
congestion threshold assigned (ped/m
2)
Device
Selection
1 170 3.842 4 Lift
2 154 3.480 3.5 Lift
3 155 3.503 3.5 Stair
4 132 2.983 3 Lift
5 133 3.006 3 Stair
6 88 1.989 2 Lift
7 89 2.011 2 Stair
8 44 0.994 1 Lift
9 45 1.017 1 Stair
10 0 0.000 0 Stair
A5.1.8 Verification test – Missed lift redirection
A series of 6 verification tests were conducted to demonstrate the missed lift redirection model
behaves as expected given a variety of different lift catchment area arrival times. All tests

327
involved a single lift (within Lift group 1) only servicing floor 9 evacuating the building in a top-
down evacuation strategy. The lift had the following attributes assigned:
- Shuttle floor sequence: 9,0
- Max Speed = 4 m/s
- Acceleration 1.2 m/s2
- Jerk = 1.8 m/s3
- Motor delay = 0.5s
- Dwell delay = 3.0s
- Door opening time=0.8s
- Door closing time= 3.0s
All tests involved a single agent initially located on floor 9 immediately outside Lift Group 1
catchment area. The agent was assigned to use the only available lift with a lift wait time set to
9999 (i.e. they would not redirect due to wait time expiration) and a congestion threshold of 5.0
ped/m (i.e. they would not redirect due congestion). For each test the agent was assigned
different response times so that they arrived in the lift catchment area at different times. The
kinematics/delay times of the lift determine the arrival/leave time on floor 9. Combined with the
agent response/travel time determine if the agent will arrive in the lift catchment area before,
during or after the lift services the agent‟s floor. This in turn determines if an agent will redirect
from the lift to the stairs due to arriving in the lift catchment area too late.
As can be seen from the verification test results in Table 121, the agent correctly chose to
maintain targeting the lift when they arrived in the lift catchment area before or whilst the lift
was servicing their floor. The agent correctly chose to redirect to the stairs during tests when
they arrived in the lift catchment area after the lift had closed the doors (i.e. already serviced the
floor). The results have shown the model to behave as intended given a series of input
parameters and simulated conditions.
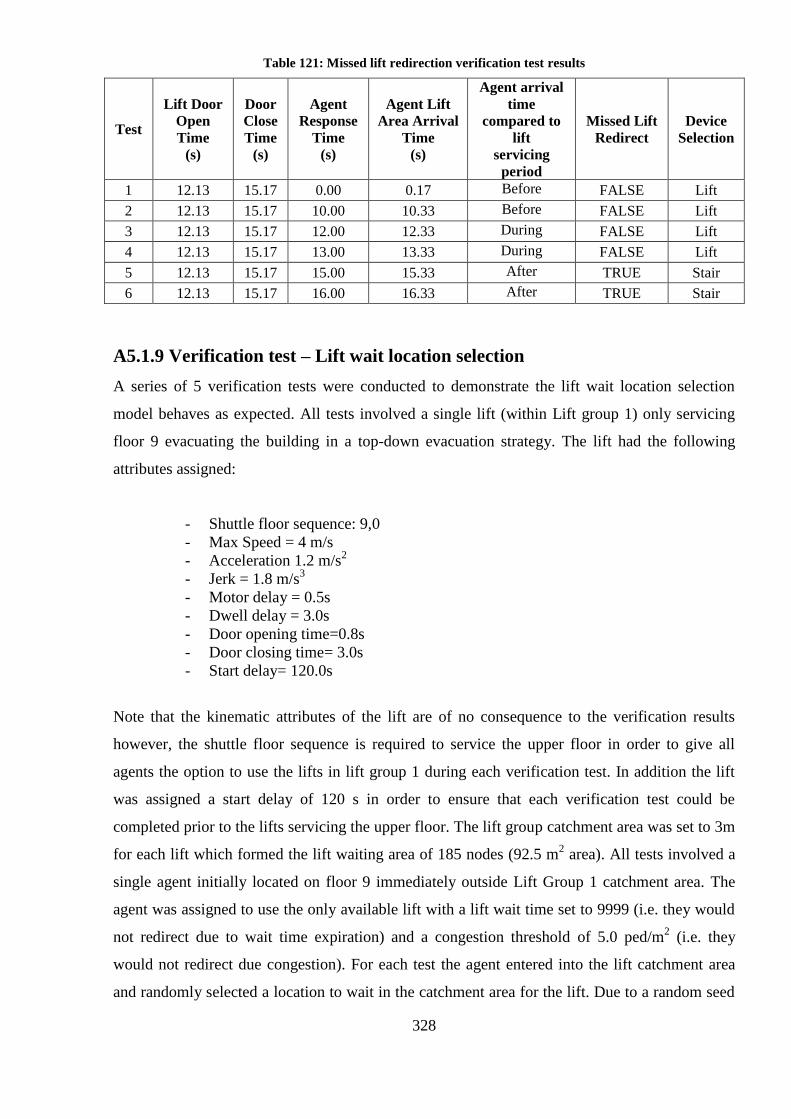
328
Table 121: Missed lift redirection verification test results
Test
Lift Door Open Time
(s)
Door Close Time
(s)
Agent Response
Time (s)
Agent Lift Area Arrival
Time (s)
Agent arrival
time
compared to lift
servicing period
Missed Lift Redirect
Device Selection
1 12.13 15.17 0.00 0.17 Before FALSE Lift
2 12.13 15.17 10.00 10.33 Before FALSE Lift
3 12.13 15.17 12.00 12.33 During FALSE Lift
4 12.13 15.17 13.00 13.33 During FALSE Lift
5 12.13 15.17 15.00 15.33 After TRUE Stair
6 12.13 15.17 16.00 16.33 After TRUE Stair
A5.1.9 Verification test – Lift wait location selection
A series of 5 verification tests were conducted to demonstrate the lift wait location selection
model behaves as expected. All tests involved a single lift (within Lift group 1) only servicing
floor 9 evacuating the building in a top-down evacuation strategy. The lift had the following
attributes assigned:
- Shuttle floor sequence: 9,0
- Max Speed = 4 m/s
- Acceleration 1.2 m/s2
- Jerk = 1.8 m/s3
- Motor delay = 0.5s
- Dwell delay = 3.0s
- Door opening time=0.8s
- Door closing time= 3.0s
- Start delay= 120.0s
Note that the kinematic attributes of the lift are of no consequence to the verification results
however, the shuttle floor sequence is required to service the upper floor in order to give all
agents the option to use the lifts in lift group 1 during each verification test. In addition the lift
was assigned a start delay of 120 s in order to ensure that each verification test could be
completed prior to the lifts servicing the upper floor. The lift group catchment area was set to 3m
for each lift which formed the lift waiting area of 185 nodes (92.5 m2 area). All tests involved a
single agent initially located on floor 9 immediately outside Lift Group 1 catchment area. The
agent was assigned to use the only available lift with a lift wait time set to 9999 (i.e. they would
not redirect due to wait time expiration) and a congestion threshold of 5.0 ped/m2 (i.e. they
would not redirect due congestion). For each test the agent entered into the lift catchment area
and randomly selected a location to wait in the catchment area for the lift. Due to a random seed

329
variable being used to determine the wait location in the catchment area 5 verification tests were
run in order to demonstrate a range of wait locations being selected.
The verification test results in Table 122 show the agent in each test to choose a different wait
location in the lift waiting area when they entered the lift catchment area, move to the chosen
wait location, then mill around the wait location once reached. The results have shown the model
to behave as intended given the simulated conditions.

330
Table 122: Lift wait location selection verification test results
Test
Agent Enters
Catchment Area
(choose wait location)
Agent
arrives at wait
location
Agent location
after 30 seconds
(after milling)
1
2
3
4
5
A5.1.10 Verification test – Lift wait time redirection
A series of 10 verification tests were conducted to demonstrate the lift wait time redirection
model behaves as expected. The tests were segregated in to two parts to tests the standard wait

331
time redirection component and test the adjusted wait time redirection component due to a lift
opening. All tests involved a single lift (within Lift group 1) only servicing floor 9 evacuating
the building in a top-down evacuation strategy. The lift had the following attributes assigned:
- Shuttle floor sequence: 9,0
- Max Speed = 4 m/s
- Acceleration 1.2 m/s2
- Jerk = 1.8 m/s3
- Motor delay = 0.5s
- Dwell delay = 3.0s
- Door opening time=0.8s
- Door closing time= 3.0s
- Capacity=1
For the standard wait time expiration tests a lift start delay of 120s was also included to ensure
that the lift did not service any floor prior to agent‟s lift wait time expiring. For the adjusted wait
time expiration tests there was no start delay as the test required the lift to service the upper floor
at least once prior to agents redirecting due to wait time expiration. For both sets of tests the
shuttle floor sequence is required to service the upper floor in order to give all agents the option
to use the lifts in lift group 1 during each verification test. The lift group catchment area was set
to 3m for each lift which formed the lift waiting area of 185 nodes (92.5 m2 area).
The standard lift wait time expiration verification tests involved a single agent initially located
on floor 9 immediately outside Lift Group 1 catchment area. The agent was assigned to use the
only available lift with a congestion threshold of 5.0 ped/m2 meaning they would not redirect due
congestion. For each test the agent was assigned a different lift wait times upon entering the lift
catchment area, the agent would wait for the assigned length of time in the lift catchment area
before redirecting to the stairs. The adjusted lift wait time expiration verification tests were
similar however, involved two agents immediately outside the lift catchment area. Since the lift
used in each test can only hold one agent, the lift would service floor 9 where a single agent
would board the lift, the remaining agent would then increment their lift wait time by 50%. The
agent lift wait times were defined such that the waiting agent would always redirect prior to the
lift servicing floor 9 in each test. These tests are intended to demonstrate that of agents waiting
for a lift that experience a lift opening but unable to board the lift, would increase their lift wait
time by 50%.
The verification test results in Table 123 for the standard lift wait time expiration model show
the agent in each test to redirect to the stairs after waiting for the assigned lift wait time after
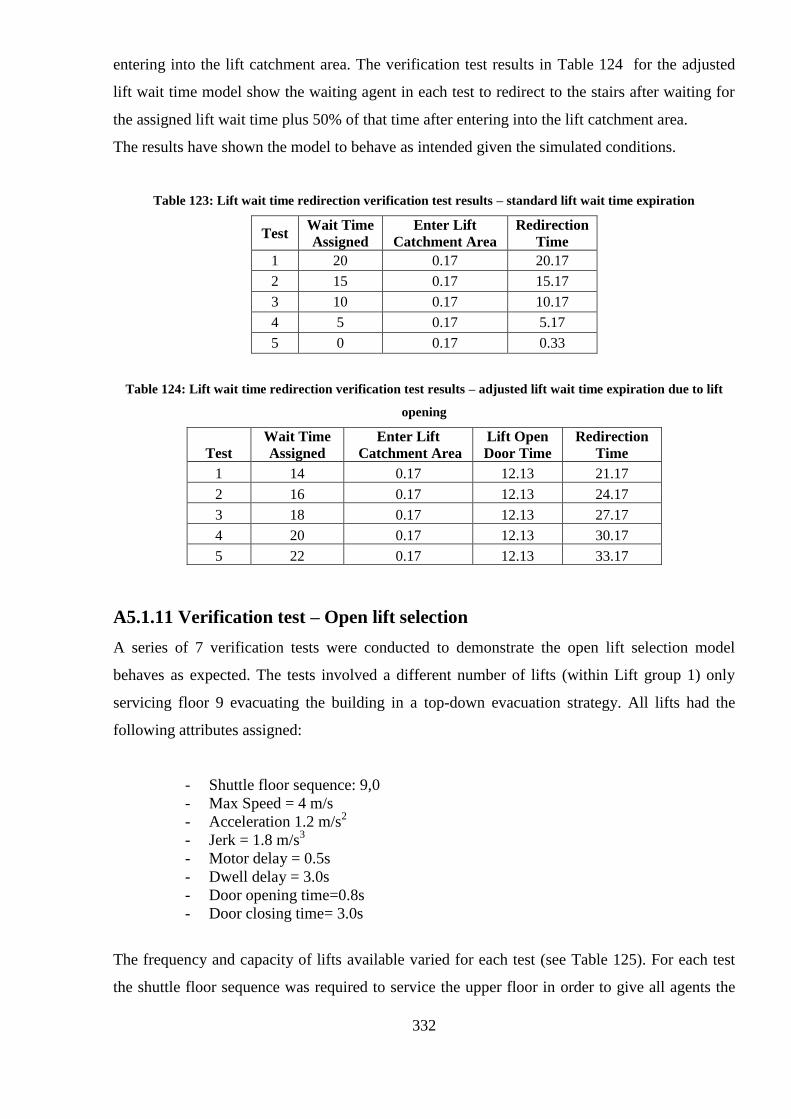
332
entering into the lift catchment area. The verification test results in Table 124 for the adjusted
lift wait time model show the waiting agent in each test to redirect to the stairs after waiting for
the assigned lift wait time plus 50% of that time after entering into the lift catchment area.
The results have shown the model to behave as intended given the simulated conditions.
Table 123: Lift wait time redirection verification test results – standard lift wait time expiration
Test Wait Time Assigned
Enter Lift Catchment Area
Redirection Time
1 20 0.17 20.17
2 15 0.17 15.17
3 10 0.17 10.17
4 5 0.17 5.17
5 0 0.17 0.33
Table 124: Lift wait time redirection verification test results – adjusted lift wait time expiration due to lift
opening
Test Wait Time Assigned
Enter Lift Catchment Area
Lift Open Door Time
Redirection Time
1 14 0.17 12.13 21.17
2 16 0.17 12.13 24.17
3 18 0.17 12.13 27.17
4 20 0.17 12.13 30.17
5 22 0.17 12.13 33.17
A5.1.11 Verification test – Open lift selection
A series of 7 verification tests were conducted to demonstrate the open lift selection model
behaves as expected. The tests involved a different number of lifts (within Lift group 1) only
servicing floor 9 evacuating the building in a top-down evacuation strategy. All lifts had the
following attributes assigned:
- Shuttle floor sequence: 9,0
- Max Speed = 4 m/s
- Acceleration 1.2 m/s2
- Jerk = 1.8 m/s3
- Motor delay = 0.5s
- Dwell delay = 3.0s
- Door opening time=0.8s
- Door closing time= 3.0s
The frequency and capacity of lifts available varied for each test (see Table 125). For each test
the shuttle floor sequence was required to service the upper floor in order to give all agents the

333
option to use the available lifts in lift group 1 during each verification test. Where multiple lifts
were used in a test, all lifts arrive at floor 9 at the same time. The lift group catchment area was
set to 3m for each lift which formed the lift waiting area of 185 nodes (92.5 m2 area).
Table 125: Open lift selection verification tests - number of lifts available and lift capacities for each test
Test Lifts
available
Capacity of
each lift
(persons)
1 1 1
2 2 1
3 2 5
4 2 5
5 2 5
6 4 1
7 8 2
The open lift selection verification tests involved a different number of agents initially located
inside the Lift Group 1 catchment area. All agents in each test were assigned a lift wait time set
to 9999 (i.e. they would not redirect due to wait time expiration) and a congestion threshold of
5.0 ped/m (i.e. they would not redirect due congestion). The lift wait location was manually set
for all agents to their initially starting location within the lift catchment area and milling was
disabled (i.e. agents would wait in their start location instead of mill about a chosen location).
This was done to maintain a fixed distance from the functioning lifts in each test. Each agent
was assigned a given colour according to which lift they should use during each test in order to
more clearly demonstrate which agent‟s should use which lift bank according to their initial
starting location. The tests are intended to demonstrate that agents initially closer to an open lift
will have priority in selecting to use it over those further away, with agents only electing to use a
lift that they know they can board (i.e. has not been elected to be used by more agents than can
fit inside the lift).
The verification test results in Table 126 shows the initial starting location of each agent and the
lift used by each agent (the agents colour allows their initial location and lift selected to be
identified). Each test demonstrates each agent to elect to use their closest available lift which
they know they can board. The results have shown the model to behave as intended given the
simulated conditions.

334
Table 126: Open lift selection verification tests results
Test Initial agent
lift wait locations
Lift used by
agent(s) Test
Initial agent
lift wait locations
Lift used by
agent(s)
1
2
3
4
5
6
7
A5.1.12 Verification test – Lift redirection to stairs
A series of 13 verification tests were conducted to demonstrate the lift redirection to stairs model
behaves as expected. A different number of lift banks were used in each test and all lifts had the
following attributes assigned:

335
- Shuttle floor sequence: 9,0
- Max Speed = 4 m/s
- Acceleration 1.2 m/s2
- Jerk = 1.8 m/s3
- Motor delay = 0.5s
- Dwell delay = 3.0s
- Door opening time=0.8s
- Door closing time= 3.0s
- Start delay = 120s
Note that the kinematic attributes of the lift are of no consequence to the verification results
however, the shuttle floor sequence is required to service the upper floor in order to give all
agents the option to use the lifts in lift group 1 during each verification test. In addition the lift
was assigned a start delay of 120 s in order to ensure that lifts did not service any floor prior to
agent‟s redirecting or passing through to the stairs from each of the available lift banks. Each lift
group catchment area was set to 3m for each lift which formed the lift waiting area of 185 nodes
(92.5 m2 area) for each lift group. All tests involved 100 agents initially located on floor 9 with
25 agents immediately outside each of the 4 lift group‟s catchment area. Each agent was
assigned to use their closest available lift group and was manually assigned a congestion
threshold of -1.0f which ensured that all agents would redirect to the stairs from each lift
catchment area due to congestion (i.e. even if no other agents were inside each lift catchment
area agents would still redirect).
Each test that involved multiple stairs was run twice; once using the even redirect stair model
(i.e. where agents are randomly assigned to evenly redirect to each of the available stairs) and
once using the potential map to direct agents to their nearest stair. This was to demonstrate the
difference between stair usage for each method of redirection. In the first seven tests (tests 1-7)
agents were initially assigned to evenly use 4 lift banks and a different number of stairs were
made available for them to redirect to. In the final six tests (tests 8-13) a different number of lift
banks were made available and agents approximately evenly distributed between each lift bank
before redirecting to the stairs.
Due to a random seed variable being used to determine which stair agent‟s redirected to when
using the even redirect stair model 5 verification tests were run for each test in order to represent
the average spread of agents that used each available stair.

336
The verification test results in Table 127 demonstrate that when agents redirect to the stairs using
only the potential map, agents use their closest stair to redirect to which can cause uneven usage
of the stairs (tests 4,7,9,13). The test also demonstrates that when the agents redirect to the stairs
using the even redirect stair model, irrespective of the number stairs available or the initial
distribution of agents assigned to each lift bank, approximately an even number of agents will
redirect to each stair. The results have shown the model to behave as intended given the
simulated conditions.
Table 127: Lift redirection to stairs verification test results
Test Number
of lifts
Number
of Stairs
Available
Average number/proportion of
agents using each stair Even
usage on Stair 1
Stair 2
Stair 3
Stair 4
1 4 4 24.2 24.8 25.8 25.2 On
2 4 4 25.0 25.0 25.0 25.0 Off
3 4 3 - 34.2 34.2 31.6 On
4 4 3 - 50.0 25.0 25.0 Off
5 4 2 - - 47.0 53.0 On
6 4 2 - - 50.0 50.0 Off
7 4 1 - - 100.0 0.0 Off
8 1 4 23.2 30.0 24.0 22.8 On
9 1 4 100.0 0.0 0.0 0.0 Off
10 2 4 25.8 21.6 26.2 26.4 On
11 2 4 50.0 50.0 0.0 0.0 Off
12 3 4 22.8 24.0 26.2 27.0 On
13 3 4 32.0 34.0 34.0 0.0 Off
A6.1 Verification Test Results– Agent Escalator Model
A series of component verification tests have been performed and results presented for the
escalator agent model to demonstrate that each component behaves as expected and produce
appropriate results based on input parameters. The geometry and population used in each test
have been described in the following sections with results and a description of each test
presented accordingly for each component of the escalator agent model.
A6.1.1 Verification geometry
The geometry used in each verification test consisted of a two level structure connected via an
escalator and stair (Figure 75 and Figure 76).

337
A: Escalator dimensions B: Stairway dimensions Figure 75: Verification test geometry - escalator and stair dimensions
The escalator and stair transit node within buildingEXODUS were added to a transit node group
with a combined catchment area of 135 nodes/33.75 m2 at the base of the escalator/stair on the
lower level.

338
Figure 76: Escalator verification test geometry
For the verification tests agents were initially located on the lower level and were required to
travel to the upper level via either the escalator or stairs. the lower level was split into four zones;
A,B,C, D, each being 10m x 10m where agents will have different start locations in certain tests.
A6.1.2 Verification population
The population used in all the verification tests were generated from the standard
buildingEXODUS population with walker speed, escalator up speeds and up walker speed values
set to 1 m/s in order to more easily determine expected behaviour that uses such agent
characteristics (though for the walker speed verification tests the walker speeds have been
altered accordingly). The frequency of agents used in each test was different in each test and has
been specified in the respective sections.

339
A6.1.3 Verification test – device choice
A6.1.3. 1Verification test – device choice – proportional system
The transit node proportional system which allows a users to state the probability that an agent
will use each device within a transit node group. This device selection system has been verified
by prescribing a given proportion of device users for the escalator/stair and measuring the
difference between these values and the average recorded proportion of agents that used each
device over a series of 5 simulations (see Table 128). An average of multiple simulations was
used due to the proportional device selection system using incorporating randomly generated
values to determine which device to use. The results demonstrates that the proportional system
behaves as intended with between a 0.0%-3.2% difference between prescribed and observed
values. This difference is caused by the random uniform distribution spread and is considered
acceptable.
Table 128: Device Selection - Proportional system verification tests results
Test
Number
Values Set
Frequency /
Proportion
Average Values
Recorded
Frequency /
Proportion
Difference
between values
Escalator Stairs Escalator Stairs Escalator Stairs
1 0.0% 100.0% 0.0% 100.0% 0.0% 0.0%
2 25.0% 75.0% 26.0% 74.0% 1.0% 1.0%
3 50.0% 50.0% 47.4% 52.6% 2.6% 2.6%
4 75.0% 25.0% 78.2% 21.8% 3.2% 3.2%
5 100.0% 100.0% 100.0% 0.0% 0.0% 0.0%
A6.1.3. 2 Verification test – device choice – shortest travel time
The shortest travel time device selection system contains a two subcomponents which are used
by agents to select a device within a transit node group: the travel time calculation (where agents
calculate the expected movement time to traverse to and on each device) and the wait time
calculation(where agents consider how long they are expected to wait for each given device
based on the wait time of other agents targeting each device). Verification tests for both of these
components have been carried out.

340
Travel Time Verification
The travel time verification tests involved a single agent initially placed at various location
(within region 'D') each being different distances from the escalator/stair within the transit node
catchment area. The agent was assigned a walker speed of 1m/s, a horizontal escalator walker
speed of 1m/s and a stair walker speed of 1m/s.
Figure 77: Travel time verification - example of initial agent start location and calculated route to each device
The travel time to and on each device was calculated manually and compared with the expected
travel time within the model based the initial starting location of the agent. Results from the
verification tests in Table 129 show correct calculated travel times along with the correct
respective device selection within the model using the shortest time system.
Table 129: Travel time verification results
Test
Calculated: Travel distance
(m) to...
EXODUS: Total Travel time (s) to…
EXODUS: Total Travel time (s) on…
EXODUS: TOTAL Travel time (s)
Calculated: TOTAL
Travel time (s)
Device Selected
Stair Esc Stair Esc Stair Esc Stair Esc Stair Esc
1 4.47 10.08 4.47 10.08 6.53 5.33 11.00 15.41 11.00 15.41 Stair
2 4.29 6.61 4.29 6.61 6.53 5.33 10.82 11.94 10.82 11.94 Stair
3 4.30 4.62 4.30 4.62 6.53 5.33 10.83 9.95 10.83 9.95 Escalator
4 5.59 4.00 5.59 4.00 6.53 5.33 12.12 9.33 12.12 9.33 Escalator
5 6.76 4.58 6.76 4.58 6.53 5.33 13.29 9.91 13.29 9.91 Escalator
Wait Time Verification
The wait time verification tests involved 3 agents initially located in region 'D' all initially within
the transit node catchment area. A single agent was initially located a given distance from the
escalator/stair (4.79m from escalator and 6.38m from the stair ); it is this agent who's expected
travel wait time was being recorded and used for the verification tests. The remaining two agents

341
stood directly in front of the escalator (blocking it) targeting the escalator with their wait counter
artificially set to different times for each test and a response time of 5 seconds (this is slightly
over the time it takes the single agent to travel to the escalator). The two agents in front of the
escalator were intended to represent the influence of a queue. This meant that the wait time
calculation of the single agent should include the wait time of one of the agents directly in front
of the escalator when determining which device to select.
Initial start locations of agent and blocking
agents
Path calculation (with nodes of the
expected route highlighted) Table 130: Wait time verification - initial agent start locations and single agent path calculation
For each verification test the wait time of the blocking agents in front of the escalator was
gradually incremented so increasing the expected wait time to use the escalator. The results
presented in Table 131 show that as the expected wait time increases for the escalator the total
travel time to use the escalator also increases. When the expected total travel time for the
escalator exceeds the expected total travel time for the stairs the single agent elects to use the
stairs. The results show the model to calculate the correct total travel time using the adjusted wait
time considering the two agents in front of the escalator.
Table 131: Wait time verification results
Test EXODUS:
Total Travel time
(s) to…
EXODUS: Total Travel time
(s) on…
Wait Time of agents
in front (s)…
Calculated: TOTAL
Travel time (s) Device
Selected Stair Esc Stair Esc Stair Esc Stair Esc
1 6.38 4.79 6.53 5.33 0.00 0.00 12.91 10.12 Escalator
2 6.38 4.79 6.53 5.33 0.00 1.00 12.91 11.12 Escalator
3 6.38 4.79 6.53 5.33 0.00 2.00 12.91 12.12 Escalator
4 6.38 4.79 6.53 5.33 0.00 3.00 12.91 13.12 Stair
5 6.38 4.79 6.53 5.33 0.00 4.00 12.91 14.12 Stair

342
A6.1.3. 3 Verification test – device choice – congestion threshold
The device selection congestion threshold verification tests involved a group of 35 agents
waiting in the transit node catchment area (in section 'D') and a single agent initially located in
section 'B' outside the catchment area (see Figure 78). The group of agents in the catchment area
had responses times of 30 seconds and were manually assigned to use the stairs (giving the
single agent enough time to traverse to and on the stairs/escalator before the group responded).
Those agents were positioned in the catchment area such that they did not block the path of the
single agent, however, are intended to represent the crowd of people attempting to use either the
escalator or stair (filling approximately 25.9%/1.0 ped/m2 of the transit node catchment area)
The single agent initially in section 'B' had an instant response time and started moving at the
start of the simulation. Upon entry to the catchment area by an agent the device selection method
is defined by the congestion threshold value; with the proportional system being adopted prior to
the congestion threshold being reached, and the shortest time system used when the congestion
threshold is reached or exceeded.
Figure 78: Device selection congestion threshold verification - initial starting location of agents
The transit node group catchment area contained 135 nodes (33.75 m2) at the base on the
escalator/stair. The proportion of users assigned to use the escalator prior to the congestion
threshold being met was 100% (i.e. prior to the congestion threshold being met all agents should
elect to use the escalator). Each of the verification tests involved a different congestion threshold
to test if the single agent used the correct device selection method and the correct device was
selected.
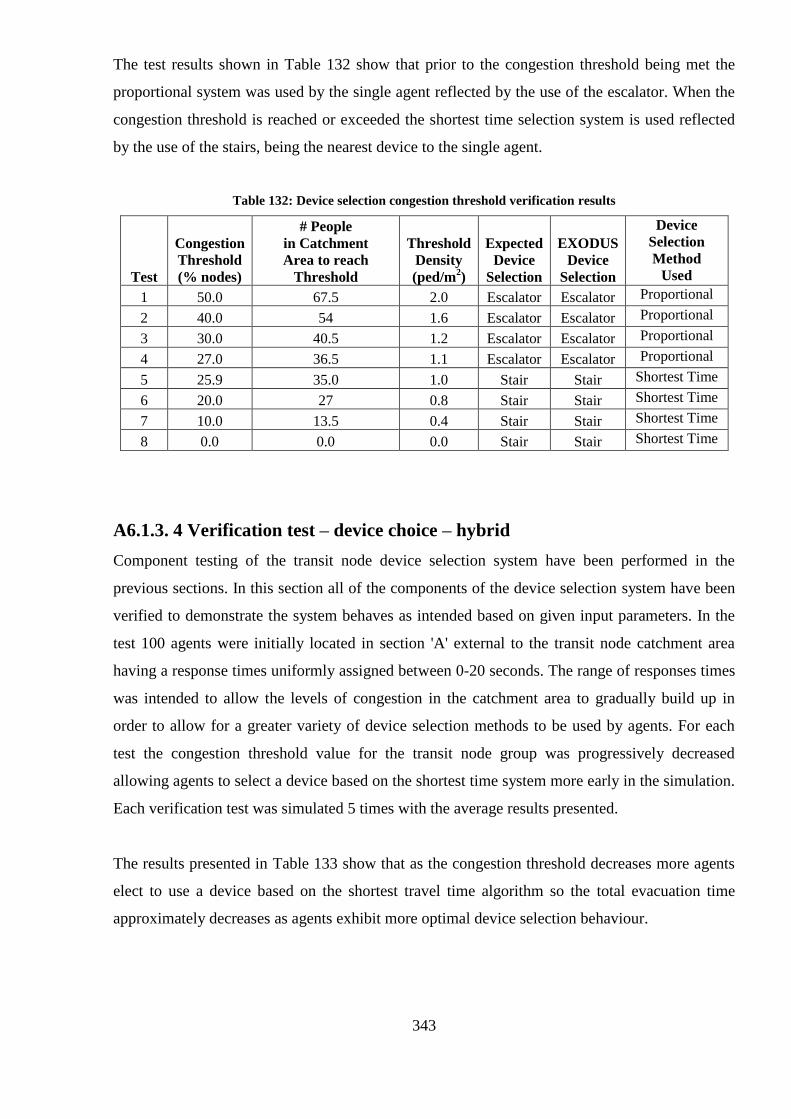
343
The test results shown in Table 132 show that prior to the congestion threshold being met the
proportional system was used by the single agent reflected by the use of the escalator. When the
congestion threshold is reached or exceeded the shortest time selection system is used reflected
by the use of the stairs, being the nearest device to the single agent.
Table 132: Device selection congestion threshold verification results
Test
Congestion Threshold (% nodes)
# People in Catchment Area to reach
Threshold
Threshold Density (ped/m
2)
Expected Device
Selection
EXODUS
Device Selection
Device Selection
Method Used
1 50.0 67.5 2.0 Escalator Escalator Proportional
2 40.0 54 1.6 Escalator Escalator Proportional
3 30.0 40.5 1.2 Escalator Escalator Proportional
4 27.0 36.5 1.1 Escalator Escalator Proportional
5 25.9 35.0 1.0 Stair Stair Shortest Time
6 20.0 27 0.8 Stair Stair Shortest Time
7 10.0 13.5 0.4 Stair Stair Shortest Time
8 0.0 0.0 0.0 Stair Stair Shortest Time
A6.1.3. 4 Verification test – device choice – hybrid
Component testing of the transit node device selection system have been performed in the
previous sections. In this section all of the components of the device selection system have been
verified to demonstrate the system behaves as intended based on given input parameters. In the
test 100 agents were initially located in section 'A' external to the transit node catchment area
having a response times uniformly assigned between 0-20 seconds. The range of responses times
was intended to allow the levels of congestion in the catchment area to gradually build up in
order to allow for a greater variety of device selection methods to be used by agents. For each
test the congestion threshold value for the transit node group was progressively decreased
allowing agents to select a device based on the shortest time system more early in the simulation.
Each verification test was simulated 5 times with the average results presented.
The results presented in Table 133 show that as the congestion threshold decreases more agents
elect to use a device based on the shortest travel time algorithm so the total evacuation time
approximately decreases as agents exhibit more optimal device selection behaviour.

344
Table 133: Device selection hybrid verification results
Test Congestion Threshold (% nodes)
# People in
Catchment Area to
reach
Threshold
Threshold Density (ped/m
2)
AVG. Stair
Users (#/%)
AVG. Escalator
Users (#/%)
TET (s)
1 50.0 67.5 2.0 3.6 96.4 109.8 2 40.0 54.0 1.6 26.2 73.8 93.0 3 30.0 40.5 1.2 44.8 55.2 80.0 4 20.0 27.0 0.8 53.8 46.2 73.8 5 10.0 13.5 0.4 60.4 39.6 67.6 6 0.0 0.0 0.0 64.8 35.2 66.0
A6.1.4 Verification test – walker/rider choice
The walker/rider choice verification tests involved a group of 100 agents from the standard
EXODUS population with instant response times initially located in section 'A' of the geometry.
The proportional device selection system was used for the transit node group to assign 100% of
agents to use the escalator during the simulations (i.e. all agents would use the escalator). Each
test progressively increased the proportion of agent's that should walk on the escalator and
subsequently decrease the proportion of agents that should ride on the escalator. Each test was
run 5 times in order to produce an average of the multiple simulations due to the walker/rider
selection system incorporating random values to determine which device to use. Results
presented in Table 134 show the difference between the defined and recorded proportion of
agents that walked and rode in each test within EXODUS, ranging between 0-3.0%. These
differences represent an acceptable degree of variation considering the implementation method
incorporating a random uniform distribution element.
Table 134: Walker/Rider proportion verification test
Test Defined EXODUS Difference
% Walkers %Riders % Walkers %Riders % Walkers %Riders
1 0.0 100.0 0.0 100.0 0.0 0.0
2 20.0 80.0 18.0 81.0 2.0 1.0
3 40.0 60.0 42.6 57.0 2.6 3.0
4 60.0 40.0 62.0 38.0 2.0 2.0
5 80.0 20.0 80.6 19.4 0.6 0.6
6 100.0 0.0 100.0 0.0 0.0 0.0

345
A6.1.5 Verification test – side preference
The side preference verification tests involved a group of 100 agents from the standard
EXODUS population with instant response times initially located in section 'A' of the geometry.
The proportional device selection system was used for the transit node group to assign 100% of
agents to use the escalator with 100% of agents assigned to ride on the escalator during the
simulations (i.e. all agents would use the escalator and be influenced by the side proportions).
Each test progressively increased the proportion of agent's that should use the left side of the
escalator and subsequently decrease the proportion of agents that should walk on the escalator.
Each test was run 5 times in order to produce an average of the multiple simulations due to the
side preference system incorporating random values to determine which side the agent would
use. Results presented in Table 135 show the difference between the defined and recorded
proportion of agents that used each side of the escalator in each test within EXODUS, ranging
between 0-3.6%. These differences represent an acceptable degree of variation considering the
implementation method incorporating a random uniform distribution element.
Table 135: Side preference verification test
Test Defined EXODUS Difference
% Left %Right % Left %Right % Left %Right
1 0.0 100.0 0.0 100.0 0.0 0.0
2 20.0 80.0 21.8 78.2 1.8 1.8
3 40.0 60.0 36.4 63.6 3.6 3.6
4 60.0 40.0 60.2 39.8 0.2 0.2
5 80.0 20.0 79.4 20.6 0.6 0.6
6 100.0 0.0 100.0 0.0 0.0 0.0
A6.1.6 Verification test – side preference
The walker speed verification tests involved a single agent with an instant response time initially
located in section „A‟ of the geometry. The proportional device selection system was used for the
transit node group to assign 100% of agents to use the escalator with 100% of agents assigned to
walk on the escalator during the simulations. Each verification test progressively increased the
escalator up walker speed of the agent with the escalator boarding and alighting being recorded
in each test to demonstrate that the agent movement speed was being correctly represented.
Results presented in Table 136 show the difference between the calculated and recorded
escalator travel time in each test within EXODUS, with there being a 0.0% difference between
the EOXDUS travel time and the calculated travel time in all tests.

346
Table 136: Walker speed verification test
Test
Defined
Walker
Speed
(m/s)
Escalator
Speed
(m/s)
Hoz
Dist
(m)
Board
Time
(s)
Alight
Time
(s)
Recorded
Speed
(m/s)
EXODUS
Time
(s)
Calculated
Time
(s)
% Time
Difference
1 0 0.50 8.00 12.25 28.25 0.00 16.00 16.00 0.0
2 0.2 0.50 8.00 12.25 23.68 0.20 11.43 11.43 0.0
3 0.4 0.50 8.00 12.25 21.14 0.40 8.89 8.89 0.0
4 0.6 0.50 8.00 12.25 19.52 0.60 7.27 7.27 0.0
5 0.8 0.50 8.00 12.25 18.4 0.80 6.15 6.15 0.0
6 1 0.50 8.00 12.25 17.58 1.00 5.33 5.33 0.0
7 1.2 0.50 8.00 12.25 16.96 1.20 4.71 4.71 0.0
8 1.4 0.50 8.00 12.25 16.46 1.40 4.21 4.21 0.0
9 1.6 0.50 8.00 12.25 16.06 1.60 3.81 3.81 0.0
A6.1.7 Verification test – flow-rate
The flow-rate verification tests involved a group of 100 agents from the standard EXODUS
population with instant response times initially located in section 'A' of the geometry. The
proportional device selection system was used for the transit node group to assign 100% of
agents to use the escalator. The escalator transit node was set to represent agent behaviour using
the flow-rate model with each verification test having progressively higher capping flow-rates
set. The horizontal escalator agent walker speeds were defined in the flow-rate model as all
being 0.5m/s which meant that all agents effectively rode on the escalator. This was intended to
ensure that agents did not traverse the escalator before the next agent boarded. Results presented
in Table 137 show the difference between the defined and recorded proportion of agents that
used each side of the escalator in each test within EXODUS, ranging between 0-0.8% for flow-
rates 6.0-90.0 ped/min. For tests 6 and 7 involving 2.0 and 2.5 ped/min the main inhibiting factor
of occupant flow onto the escalator was occupant walker speeds on the ground and escalator
resulting in a larger variation between the prescribed and recorded flow-rate in EXODUS. To
highlight this these tests were run again (tests 8 and 9) with agents assigned fast walk speeds of
4m/s and horizontal escalator walker speeds of 2m/s (for demonstration purposes). Including
tests 8 and 9 the difference between the prescribed and simulated average flow-rates vary
between 0.0-2.6%. These differences represent an acceptable degree of variation considering the
flow-rate model is based on a restriction principle and is largely dependent on the agent
behaviour at the entrance to the escalator.

347
Table 137: Flow-rate verification test
Test
Defined Flow-rate
Min Delay
Time
Between
occ (s)
EXODUS Flow-rate
%
Difference ped/sec ped/min
Average Flow-rate (ped/min)
1 0.1 6.0 10.0 6.1 1.6%
2 0.5 30.0 2.0 30.3 1.0%
3 0.7 40.0 1.5 40.4 1.0%
4 1.0 60.0 1.0 60.6 1.0%
5 1.5 90.0 0.7 89.3 0.8%
6 2.0 120.0 0.5 100.8 16.0%
7 2.5 150.0 0.4 105.0 30.0%
8 2.0 120.0 0.5 121.2 1.0%
9 2.5 150.0 0.4 154.0 2.6%

348
A7.1 Published papers from thesis

349

350

351

352

353

354

355

356

357

358

359

360

361

362
363

364

365

366

367

368

369

370

371

372

373

374

375

376

377

378

379

380
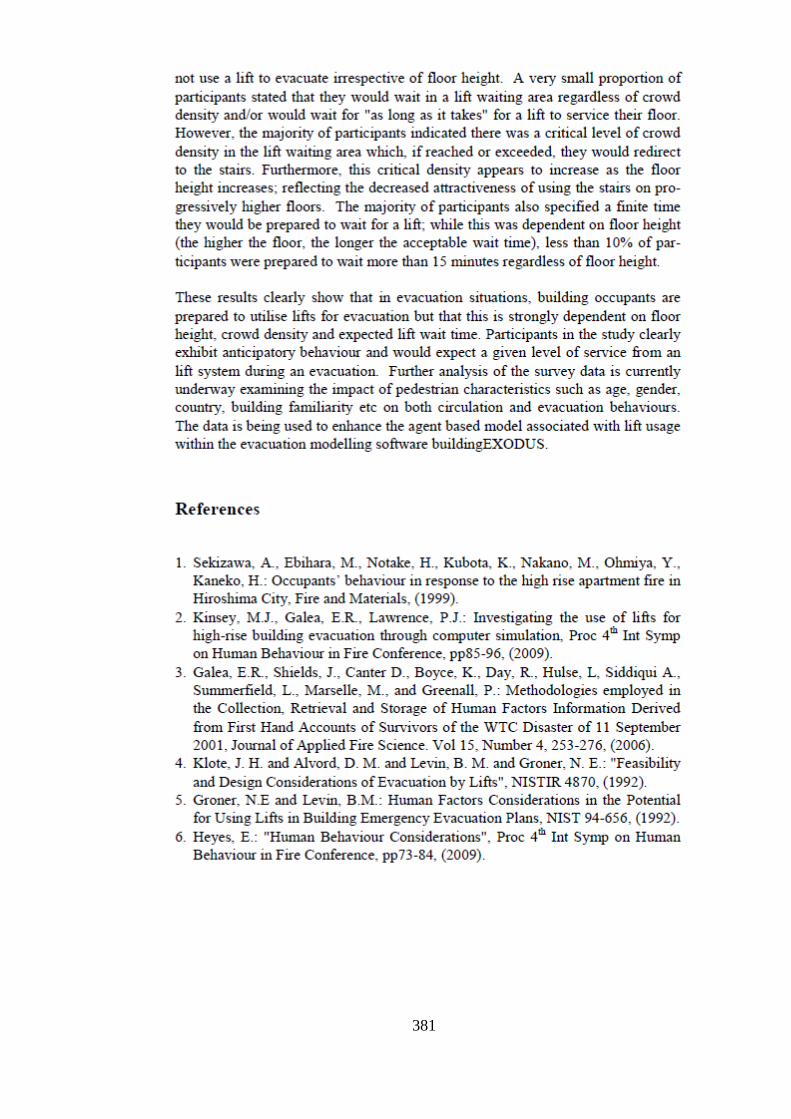
381
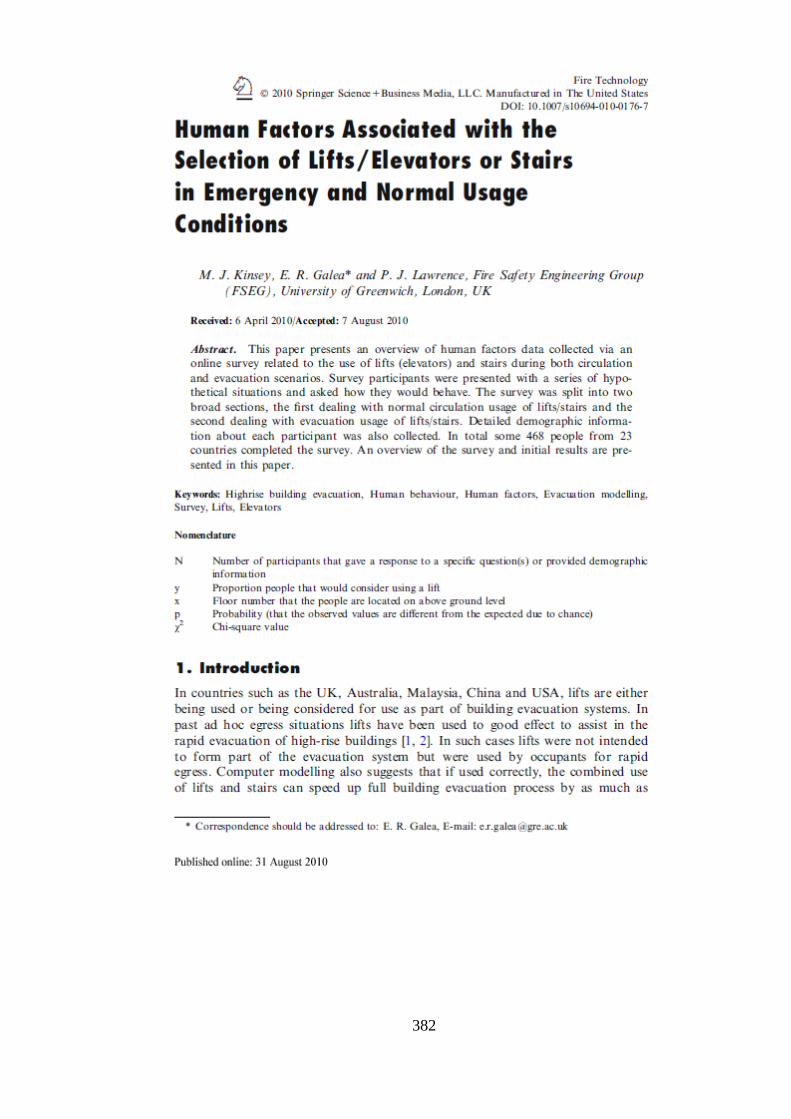
382

383

384

385

386

387
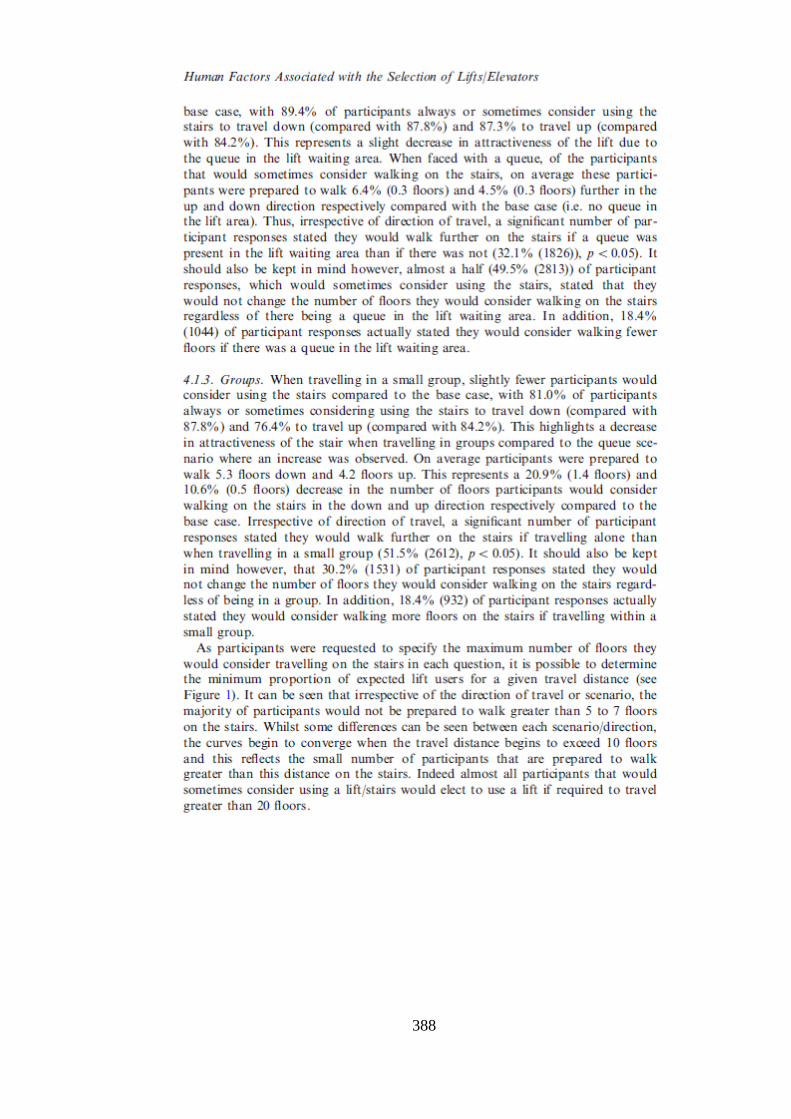
388

389

390
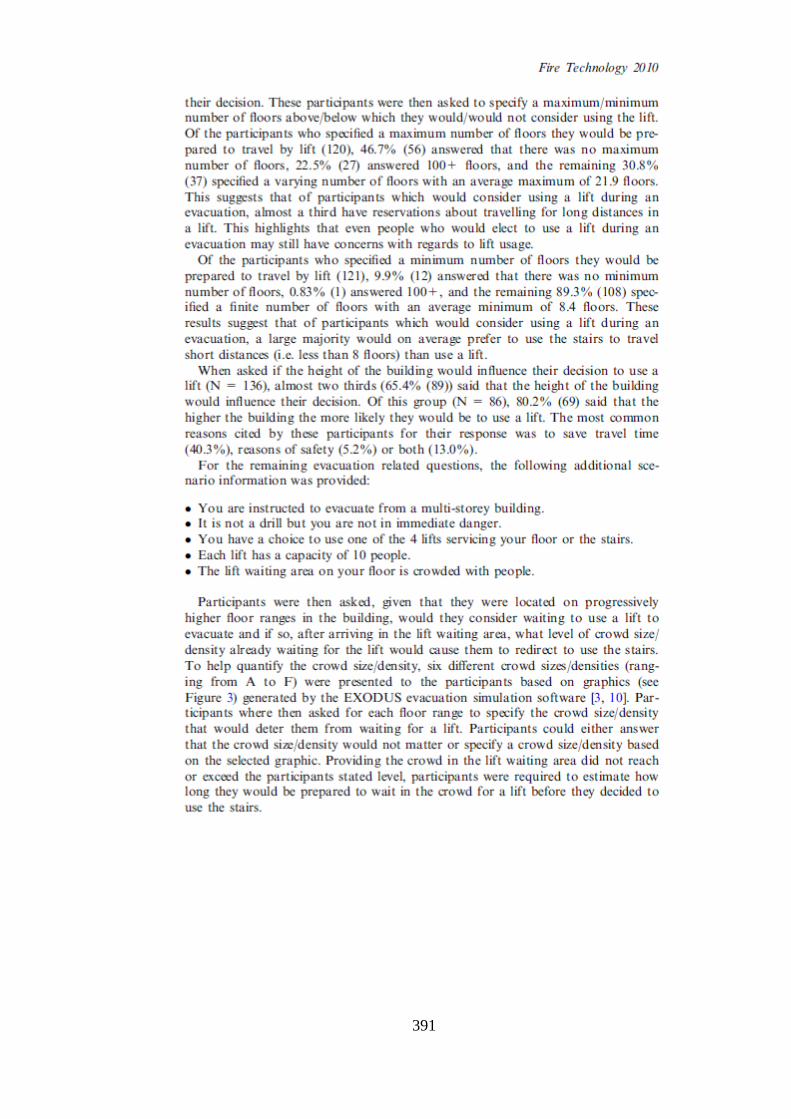
391

392
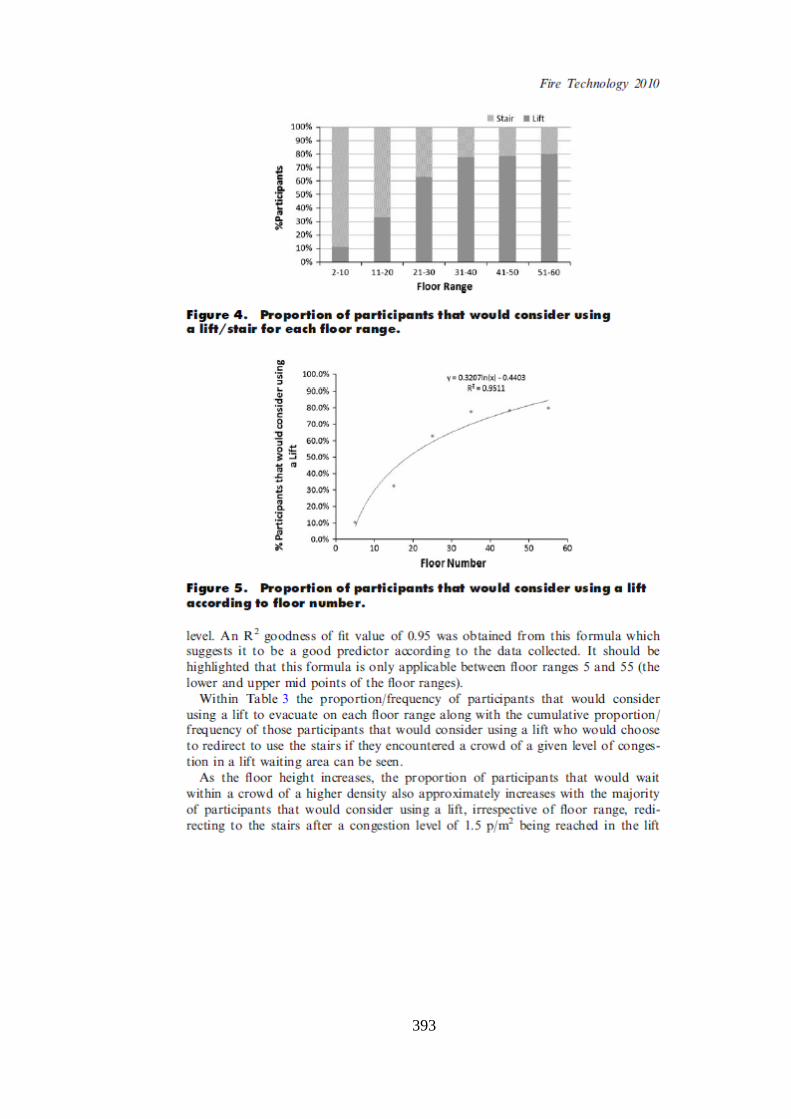
393

394
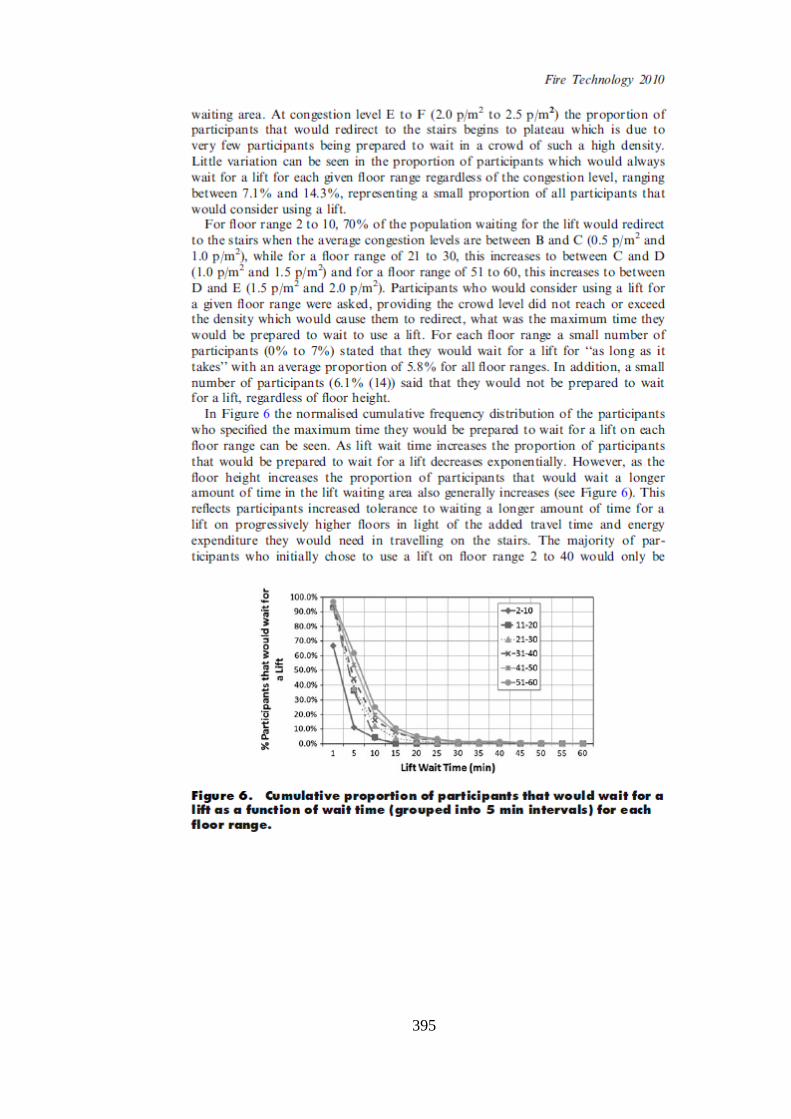
395

396

397

398

399

400

401

402

403

404

405

406

407
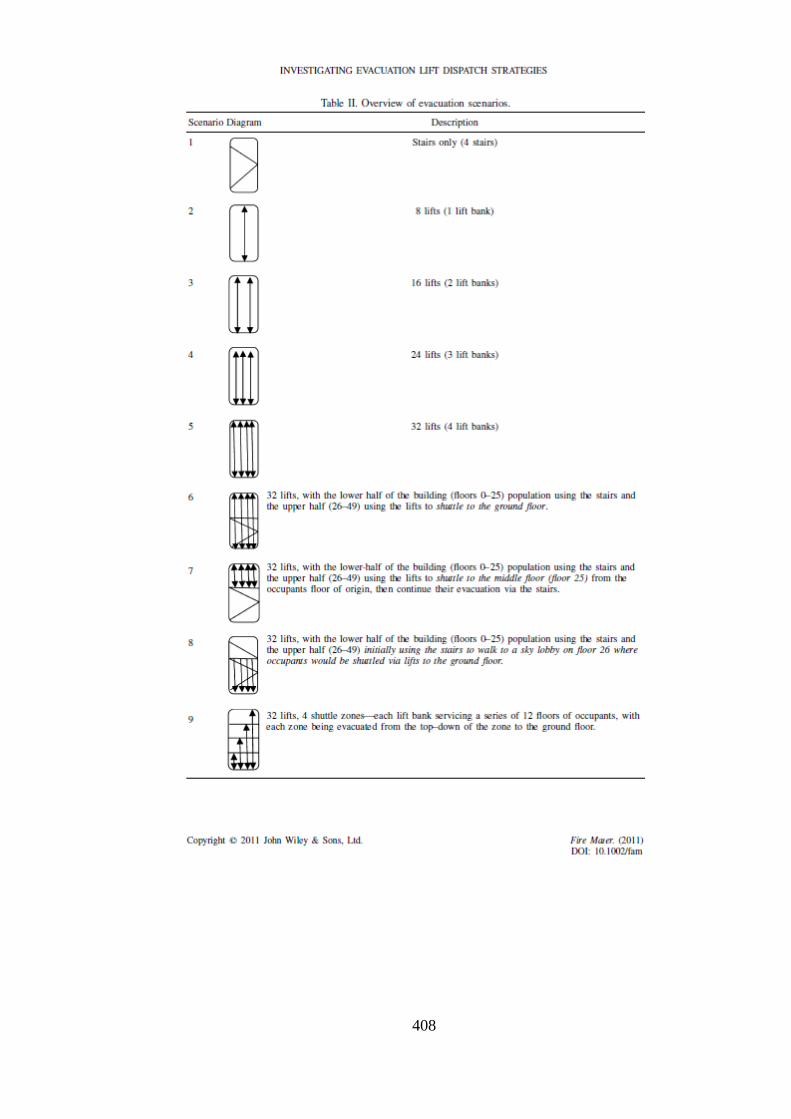
408
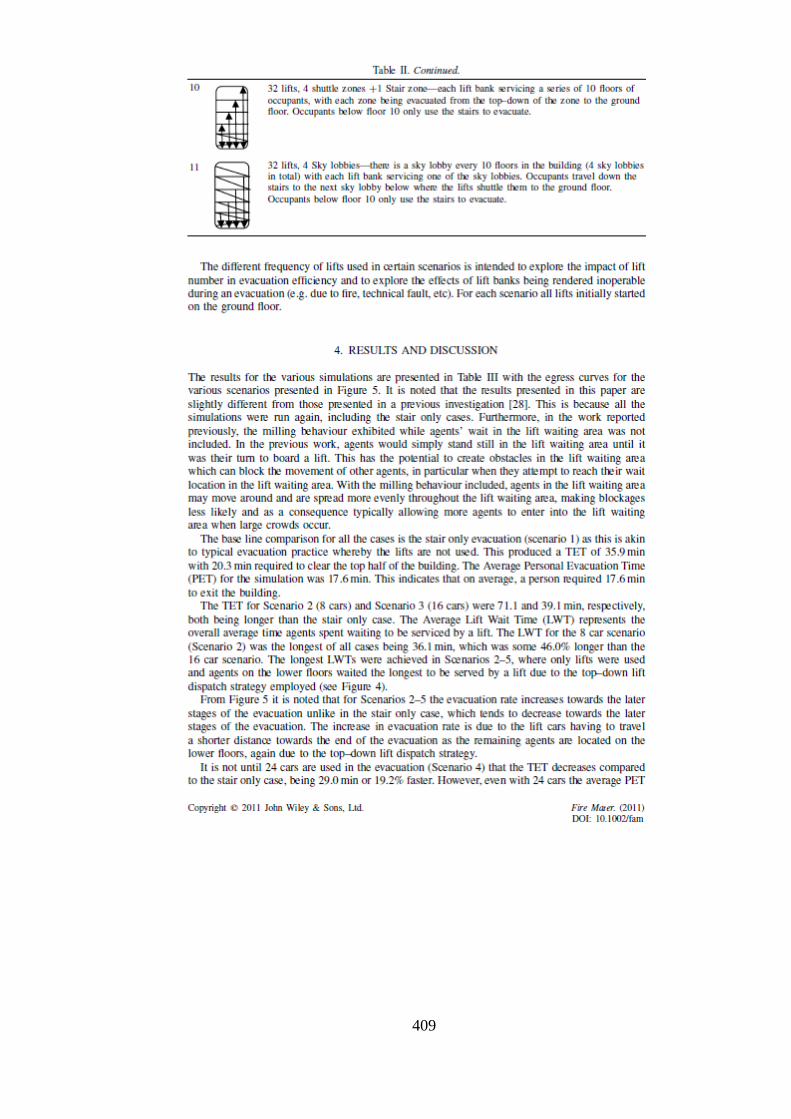
409

410

411

412

413

414

415
416