Compressor Surge Mitigation in Turbocharged Spark-Ignition ...
Upload
khangminh22Category
view
0download
0
Fin
al
Re
po
rt
Final Report - Ike Dike Concept for
Reducing Hurricane Storm Surge in the
Houston-Galveston Region
Jac
kso
n S
tate
Un
ive
rsit
y
Bruce A. Ebersole, Thomas C. Massey, Jeffrey A. Melby,
Norberto C. Nadal-Caraballo, Donald L. Hendon, Thomas W.
Richardson, Robert W. Whalin
April 2018

Jackson State University 1
Contents
1 Overview ......................................................................................................................................................... 6
2 Storm Surge Model Validation for Hurricane Ike ............................................................................................ 11
Introduction ...................................................................................................................................... 11
Computed Maximum Water Surface Elevations for Hurricane Ike ....................................................... 13
Comparison with High Water Marks .................................................................................................. 14
High Water Marks from Gage Measurements of Water Surface Elevation .............................................. 15
Visually Estimated High Water Marks ................................................................................................... 19
3 Texas Coast Historic Hurricanes .................................................................................................................... 24
Intensity of Historic Hurricanes .......................................................................................................... 24
The September 1900 Galveston Hurricane ........................................................................................ 25
Hurricane Carla ................................................................................................................................ 31
Hurricane Ike .................................................................................................................................... 34
4 The “Bracketing” Set of Hypothetical Synthetic Storms ................................................................................. 35
5 Hurricane Surge Generation on the Open Coast – Causative Factors ........................................................... 41
What Causes a Storm Surge? ........................................................................................................... 41
Wind .................................................................................................................................................. 41
Atmospheric Pressure ......................................................................................................................... 42
Waves ................................................................................................................................................ 42 Storm Surge along the Texas Coast .................................................................................................. 44
Surge Forerunner................................................................................................................................ 44
Surge Generation by the Core Winds ................................................................................................... 54
6 Hurricane Surge Generation within Galveston Bay – Causative Factors ....................................................... 58
Introduction ...................................................................................................................................... 58
Existing Conditions ........................................................................................................................... 59
Surge Generation in Galveston Bay - With the Ike-Dike Concept........................................................ 68
7 Influence of Storm Track on Surge Development .......................................................................................... 79
Introduction ...................................................................................................................................... 79
Forerunner Surge Development as a Function of Storm Track ........................................................... 80
Development of Surge within the Bays Due to Forerunner Propagation and Winds ............................. 92
Galveston Bay Storm Surge Response to the Hurricane’s Core Winds ............................................ 106
8 Reduction in Flooding Achieved with the Ike Dike – Initial Assessment ....................................................... 123
Introduction ................................................................................................................................... 123
The Long Dike or Levee Effect ....................................................................................................... 124
Hurricanes of Varying Intensity - The Direct-Hit Set ......................................................................... 125
Major Hurricanes Approaching from the South ................................................................................ 134
Major Hurricanes Approaching from the South-Southeast ............................................................... 143

Jackson State University 2
Major Hurricanes Approaching from the Southeast ......................................................................... 154
9 Placing Hurricane-Induced Water Levels in a Probabilistic Context............................................................. 161
Introduction ................................................................................................................................... 161
Approach for Statistical Analysis of Water Surface Elevation ........................................................... 162
Joint Probability Analysis .................................................................................................................. 163
Joint Probability Method ................................................................................................................... 163
Joint Probability Method with Optimal Sampling ................................................................................. 166
JPM-OS-BQ Implementation for the Present Study ............................................................................ 167
Probability Distributions of Tropical Storm Parameters ....................................................................... 176
Estimation of Errors and Other Secondary Terms .............................................................................. 177
Summary of Differences in JPM-OS Studies for the Houston-Galveston Region .................................. 181 Existing Condition Water Surface Elevation Statistics ..................................................................... 182
Probabilistic Context for Hurricane Ike’s Maximum Water Surface Elevations .................................. 190
The Proxy Storm Concept .............................................................................................................. 191
Identification and Selection of Proxy Storms ................................................................................... 193
10-yr Proxy Storm ............................................................................................................................ 196
100-yr Proxy Storm .......................................................................................................................... 198
500-yr Proxy Storm .......................................................................................................................... 200
10 Storm Surge Simulations with an Extended Ike Dike ....................................... 203
Introduction ............................................................................................................................... 203
Effect of the Extended Ike Dike for Hurricane Ike ............................................................... 205
Effect of the Extended Ike Dike for the 10-yr Proxy Storm .................................................... 209
Effect of the Extended Ike Dike for the 100-yr Proxy Storm.................................................. 212
Effect of the Extended Ike Dike for the 500-yr Proxy Storm.................................................. 216
11 Influence of Sea Level on Storm Surge ....................................................................... 221
Recent Historic Changes in Sea Level for the Region ......................................................... 221
Effects of Sea Level Rise on Storm Surge and Wave Processes ...................................... 224
Past Relevant Work by ARCADIS (2011) .............................................................................. 227
Storm Surge for Present and Future Sea Level Scenarios ................................................. 228
Hurricane Ike Peak Surge for Present and Future Sea Levels .............................................. 231
Storm 535 (10-yr Proxy Storm) Peak Surge for Present and Future Sea Levels ................ 239
Storm 033 (100-yr Proxy Storm) Peak Surge for Present and Future Sea Levels .............. 247
Storm 036 (500-yr Proxy Storm): With and Without Sea Level Rise .................................... 255
12 Exposure to Inundation, Residual Flood Risk, and Implications
for Secondary Lines of Defense ........................................................................................ 265
Introduction ............................................................................................................................... 265
Galveston Island........................................................................................................................ 269
City of Galveston.......................................................................................................................... 269
Galveston Island (central portion) ............................................................................................. 275
Galveston Island (western end) ................................................................................................. 278 Bolivar Peninsula ...................................................................................................................... 281
Bolivar Peninsula (western end) ................................................................................................ 281

Jackson State University 3
Bolivar Peninsula (central portion)............................................................................................ 284
Bolivar Peninsula (eastern end) ................................................................................................ 286 Galveston Bay ............................................................................................................................ 288
Texas City (south)/La Marque/Bayou Vista .............................................................................. 288
San Leon/Texas City (north)/Bacliff/Dickinson ....................................................................... 295
Clear Lake/Bayport/La Porte .................................................................................................... 301 Houston Ship Channel .............................................................................................................. 306
Upper Houston Ship Channel (eastern portion) ....................................................................... 306
Upper Houston Ship Channel (western portion) ...................................................................... 310
13 Examination of Alternate Ike Dike Configurations .............................................. 314
Introduction ............................................................................................................................... 314
Alignment 1a – A Modification of the Extended Ike Dike .................................................. 315
Alternate Alignment 1b – Alignment 1a with Lowered Gate Elevations ..........................317
Alternate Alignment 2 .............................................................................................................. 319
Alternate Alignment 3 .............................................................................................................. 320
Storm Surge Simulations Made for the Alternate Dike Alignments................................. 322
Peak Surge Maps for Each Dike Alignment/Storm Simulation ............................................. 322
Extraction of Peak Storm Surge Values for Analysis .............................................................. 331 Comparison of Two Different Alignments for an Eastern Termination Section. ............. 332
Surge Reduction in the Houston-Galveston Region with and without an Eastern
Termination Section ................................................................................................................. 337
Analysis of Peak Surge Elevations ............................................................................................ 337
Analysis of Water Surface Elevation Time Series.................................................................... 339 Storm Surge Reduction Benefits of a Western Termination Section ............................... 347
Analysis of Temporal Changes in Water Surface Elevation and Velocity ............................. 350 Influence of Lowered Gate Elevations on Interior Surge Levels ........................................ 356
14 Water Level Considerations for Operating the Ike Dike Storm
Surge Gates ...................................................................................................................................... 358
Introduction ............................................................................................................................... 358
Processes that Influence Antecedent Water Levels............................................................ 359
Mean Sea Level ........................................................................................................................... 360
Astronomical Tide........................................................................................................................ 362
Wind-Driven Surge Forerunner .................................................................................................. 365
Volume Mode Forerunner ........................................................................................................... 367 Wind-Driven Forerunner - Proxy Storms and Hurricane Ike ............................................... 368
10-yr Proxy Storm........................................................................................................................ 368
100-yr Proxy Storm ..................................................................................................................... 372
500-yr Proxy Storm ..................................................................................................................... 374
Simulated Hurricane Ike ............................................................................................................. 376
Observations of Forerunner Propagation into Galveston Bay during Hurricane Ike ........... 379 Volume Mode Forerunner – Modeling and Analysis Approach ......................................... 384
Selection of the Storm Set ......................................................................................................... 384
Isolation of the Volume Mode Oscillation................................................................................. 387 Volume Mode Forerunner - Generation Mechanism ........................................................... 389
Jackson State University 4
Water Fluxes Into/Out of the Gulf of Mexico ........................................................................... 389
Water Surface Elevation and Velocity Patterns Associated with the Moving
Hurricane ...................................................................................................................................... 393
Water Surface Elevation Changes Induced by the Volume Oscillation................................. 397
Examination of the Shallow Water Anomaly – Far-Field Influence of the Wind-
Driven Forerunner........................................................................................................................ 403
Propagation of the Volume Mode Forerunner into Galveston Bay ........................................ 412 Volume Mode Forerunner – Dependence upon Hurricane Characteristics ..................... 413
Influence of Storm Track and Forward Speed ......................................................................... 413
Quantitative Analysis of Volume Oscillation Characteristics ................................................. 422
Discrepancy with the Volume Oscillation Amplitudes Found by Bunpapong et al
(1985) ........................................................................................................................................... 425
Influence of Storm Intensity ....................................................................................................... 426
Influence of Storm Size............................................................................................................... 427 Influence of Forward Speed on the Wind-Driven Forerunner and Peak Surge
Development ............................................................................................................................. 429
Selection of a Storm Set for Analysis ....................................................................................... 429
The Analysis Approach................................................................................................................ 429
Central Yucatan Storm 01 (6-kt Forward Speed) .................................................................... 432
Central Yucatan Storm 02 (12-kt Forward Speed) .................................................................. 437
Central Yucatan Storm 03 (18-kt Forward Speed) .................................................................. 443
Evolution of the Wind-Driven Forerunner and Interaction with the Hurricane’s Core
Winds ............................................................................................................................................ 449 Summary .................................................................................................................................... 460
15 Nearshore Wave and Water Level Conditions to Consider in
Design of the Ike Dike .............................................................................................................. 465
Introduction ............................................................................................................................... 465
Water Surface Elevation .......................................................................................................... 467
Significant Wave Height .......................................................................................................... 468
Peak Wave Period .................................................................................................................... 470
Mean Wave Period .................................................................................................................... 471
16 Summary of Key Results, Findings, and Recommendations ....................... 473
Regional Storm Surge Dynamics ........................................................................................... 473
Generation of the Open Coast Storm Surge ............................................................................. 473
Surge Generation within Galveston Bay ................................................................................... 473
Influence of Storm Track on Surge Development ................................................................... 474
Dependence of Peak Surge on Hurricane Intensity ................................................................ 476
Dependence of Peak Surge on Storm Track ............................................................................ 477 Putting Storm Surge in the Context of Probability .............................................................. 478
Storm Surge Reduction Achieved with the Ike Dike Concept: Results from
Original Bracketing Set of Storms and Initial Modeling Approach ................................... 480
Storm Surge Reduction Achieved with the Ike Dike Concept: Results from the
Refined Modeling Approach with the Extended Ike Dike ................................................... 481
Reduction in Peak Storm Surge Values .................................................................................... 481
Residual Risk with the Ike Dike in Place.................................................................................. 487

Jackson State University 5
Consideration of Secondary Lines of Defense and Recommendations........................... 489
City of Galveston.......................................................................................................................... 489
Galveston Island and Bolivar Peninsula ................................................................................... 492
Bayou Vista and Hitchcock areas .............................................................................................. 492
San Leon, Texas City (north), Bacliff and Dickinson areas ..................................................... 492
Clear Lake, Bayport and La Porte areas................................................................................... 493
Upper Houston Ship Channel ..................................................................................................... 494 Examination of Alternate Ike Dike Configurations .............................................................. 494
The Different Configurations ...................................................................................................... 495
Storms That Were Simulated ..................................................................................................... 497
Merits of an Eastern Termination Section ................................................................................ 497
Merits of a Western Termination Section................................................................................. 498
Influence of Lowered Gates at the Passes ............................................................................... 499 Water Level Considerations for Operating the Ike Dike Storm Surge Gates .................. 500
Wave Conditions to Consider in Designing the Ike Dike .................................................... 504
17 References ........................................................................................................................................ 506
Appendix A: Inundation Maps for the Simulated Hurricane Ike and the 100-yr and 500-yr Proxy Storms ............ 513
Appendix B: Water Surface Elevations at Selected Locations for Different Ike Dike Alignments .......................... 547
Jackson State University 6
1 Overview
A consortium of universities and other partners, led by Texas A&M
University at Galveston, is investigating the feasibility of a coastal barrier
to greatly reduce hurricane-induced coastal flooding in the
Houston/Galveston region. In 2008 Hurricane Ike produced considerable
storm surge and damage in the area, raising awareness of the flooding
threat to the region posed by hurricanes. Had Ike tracked and made
landfall 20 to 40 miles farther to the southwest, storm surge in the
Houston/Galveston region would have been much more devastating. In
support of the feasibility study and as members of the study team, Jackson
State University and the U.S. Army Engineer Research and Development
Center’s Coastal and Hydraulics Laboratory (ERDC) are collaborating to
quantify the reduction in flooding that can be expected with a long coastal
dike and gate system. This protective measure, called the Ike Dike
concept, has been proposed and advanced by the Texas A&M University at
Galveston (Merrell 2012). This report presents results from the initial
assessment of the Ike Dike’s flood mitigation benefits.
Utilizing the latest state-of-the-science coupled computer models for
hurricane winds, pressures, waves and storm surge, the study compares
inundation due to hurricane surge for existing conditions with reduced
inundation achieved by a proposed 17 foot high Ike Dike that stretches
from Freeport in the west to Sea Pines State Park in the east (at Sabine
Pass), which would provide risk-reduction to the entire Galveston Bay area
during a severe hurricane. The models were first set up and applied as
part of the Federal Emergency Management Agency’s (FEMA) Region VI
Risk MAP study to update coastal flood risk maps for the Texas coast, then
adapted and modified for use in the present feasibility study (USACE
2011). These are the same models that have been developed and applied
by the U.S. Army Corps of Engineers in their recent assessments of coastal
flood risk done for FEMA, the Nuclear Regulatory Commission, and in
their internal design of flood-risk-reduction measures, including measures
constructed in the New Orleans area.
Initial results documented in this report were derived from a total of 50
hypothetical synthetic hurricane simulations. Twenty-five different
hurricanes were simulated for both the existing conditions reflecting a
post-Ike (2008) condition and the with-Ike-Dike condition. Twenty-one
of the storms involved a very intense, rare, but possible storm having a

Jackson State University 7
900-mb central pressure. Each of those 21 storms had a different path,
characterized by one of three general approach directions (south, south-
southeast, and southeast). The other 4 storms had varying intensities,
central pressures of 900 mb, 930 mb, 960 mb, 975 mb, but were all on a
“direct- hit” path approaching from the south-southeast. The direct-hit
path involved landfall at the City of Galveston and a storm track along the
western shoreline of Galveston Bay.
These 25 storms were chosen as a “bracketing set.” They represent a small
subset of storms considered in the FEMA Region VI Risk MAP project
(USACE 2011). The bracketing set was intended to achieve the following
objectives: understanding exactly how hurricane storm surge is generated
in the region and in different locations within the region for both the
existing and with-dike conditions; quantify how high the storm surge can
reach for this severe rare hurricane intensity (900 mb central pressure) in
those key areas that have the greatest potential for damage and losses;
characterize how the peak surge varies from location to location
throughout the region for a particular storm and how storm track
influences both the surge development process and peak surge. The
“direct-hit” storms were selected to provide insights into how storm surge
varied as a function of intensity, primarily. The effectiveness of the Ike
Dike in reducing storm surge was examined for all storms.
Results from the “direct-hit” storms were used to assess the reduction in
damages/losses associated with the Ike Dike. This economic analysis work
is being done by the economics team as part of the feasibility study, work
that also is being led by Texas A&M University at Galveston.
Flooding associated with Hurricane Ike and three “proxy” storms was
examined. The work included validation of the storm surge modeling
approach for Hurricane Ike was performed using available measured
water level data including high water marks acquired by the Harris County
Flood Control District.
The three proxy storms were selected from among the set of hypothetical
storms that were simulated as part of the FEMA Risk MAP study. The
proxy storms best approximate peak water surface elevations at a set of
locations, that lie along the heavily populated and industrialized western
side of the bay, that are associated with the statistical 10-yr, 100-yr and
500-yr average recurrence intervals at these same locations. Examination
of proxy storms provides an initial probabilistic assessment of economic
Jackson State University 8
damages and losses. The proxy storm approach was adopted as balance
between level of effort, technical rigor, and resources available to perform
the work (time and funding).
The influence of sea level rise on storm surge and economic
damages/losses was examined for the three proxy storms and Hurricane
Ike. A projected contribution to global sea level rise of 1.5 feet over the
next 50 years was adopted for this sensitivity study. The subsidence
contribution to relative sea level rise, which can have significant local
variation, was neglected in this preliminary analysis. The effects of sea
level rise was investigated for both existing and with-dike conditions.
A rigorous assessment of flood risk, and the risk of damage/loss with the
Ike Dike in place, requires simulation of a much larger set of storms,
characterization of the flooding and economic damage/loss for each storm,
and estimation of the probability of occurrence of each storm that is
simulated. Despite the valuable insights gained from work involving a
relatively small set of hypothetical hurricanes, Hurricane Ike, and proxy
storms, it does not thoroughly consider the probability, or likelihood, that
a particular hurricane will occur (and the spatial variability in flooding and
damages/losses it causes). As such, the work described in this report
serves a precursor to a more rigorous effort to characterize the probability
of flooding for existing conditions and conditions reflecting the dike in
place. Such and effort must involve a much larger set of hypothetical
synthetic storms (on the order of 200) having a wider range of
characteristics such as intensity, track, forward speed and radius-to-
maximum winds.
The 17-ft Ike Dike is extremely effective in reducing the peak storm surge
around the entire perimeter of the Texas City levee and in the upper
reaches of the Houston Ship Channel for all the storms that were
considered, including Hurricane Ike and the 100-yr and 500-yr proxy
storms. Without the Ike Dike in place these hurricanes produce extremely
large storm surges and widespread inundation in key areas (as much as
22.5 ft at the Texas City levee and 25 ft in the upper Houston Ship
Channel). For the many areas in the upper ship channel that are home to
petro-chemical facilities, as well as the Texas City industrial area, the
magnitude of the surge suppression achieved with the Ike Dike is sufficient
to reduce the risk of inundation in nearly all of the highly industrialized
areas to a very low probability of occurrence. This is a major benefit of
the 17-ft Ike Dike; i.e., just how well it protects the vast majority of the

Jackson State University 9
highly industrialized areas from inundation for even very rare hurricane
events, like the 500-yr proxy storm, including those with the future sea
level scenario.
Even with the Ike Dike in place and despite the high degree of surge
reduction it provides, for the higher surge levels generated by the 100-yr
and 500-yr proxy storms inundation still occurs in the lower-lying
residential areas, particularly for the higher sea level. An analysis of
exposure to inundation, residual flood risk, and possibilities for secondary
lines of defense are discussed in the report text. The intent of these
additional risk-reduction measures is to reduce the residual flood risk that
exists in certain areas, even with the 17-ft Ike Dike in place.
The report initially examines the storm surge reduction benefits of the
originally envisoned Ike Dike concept, which started at Freeport, ended at
Sabine Pass, and which followed the coastline. The report also examines a
number of other possible alternate configurations for the Ike Dike,
including shorter versions that provide less surge reduction. One of the
other alignments examined is quite similar to the coastal spine
recommended by the Gulf Coast Protection and Restoration District
(GCCPRD) that extends from the western end of Galveston Island to High
Island. The merits of adding eastern and western termination dike
sections to the alignment recommended by the GCCPRD are examined, as
is the influence of adopting lower crest elevations for storm surge gates at
Bolivar Roads and San Luis Passes.
Early closure of the storm surge gates at both San Luis and Bolivar Roads
Passes is a critical operational feature of the Ike Dike concept. The amount
of water within Galveston and West Bays at the time of gate closure
influences the peak surge elevation that will be generated by local
hurricane force winds that still act on the bays after the gates are closed.
A higher antecedent water level in the bays leads to a higher peak surge
within the bays, and thus a greater residual flood risk The following
contributors influence the antecedent water level: long-term and seasonal
and long-term mean sea level, astronomical tide, wind-driven surge
forerunner, and volume mode forerunner. The wind-driven forerunner
can cause an increase in water level at Galveston of as much as several
feet, one or two days before landfall. Importantly, the wind-driven
forerunner that is generated at the coast readily propagates through the
passes and open storm surge gates into the bays, with little or no
attenuation. Therefore, wind-driven forerunner surge directly increases
Jackson State University 10
residual flood risk inside the bays. The report examines the implications of
the various water level contributors on operation of storm surge gates that
are built as part of the Ike Dike concept.
Design of the land barrier and navigational/environmental sections of the
gate systems, both of which will be constructed as part of the Ike Dike
concept, will require nearshore wave information. All components will
need to be resilient to overflow and overtopping, which means they will
experience minimal damage and no loss of functionality in the event the
hydraulic design conditions are exceeded and the Ike Dike is overtopped,
even with overflow. There is always some risk of this happening. The
report provides preliminary information on the nearshore wave conditions
that are generated by severe hurricanes.
Jackson State University 11
2 Storm Surge Model Validation
for Hurricane Ike
Introduction
The modeling reflected in this report used state-of-the-science coupled
computer models for hurricane winds and pressures, waves and storm
surge. These are the same models that have been developed and applied
by the U.S. Army Corps of Engineers (USACE) to design flood-risk-
reduction measures, including measures constructed in the New Orleans
area following Hurricane Katrina. The models also were used by the
USACE in recent assessments of coastal flooding risk that have been
performed for FEMA and the Nuclear Regulatory Commission. The
models are run as a coupled modeling system using the USACE Coastal
STORM Modeling System (CSTORM-MS). The system is comprised of the
following:
a) a tropical cyclone Planetary Boundary Layer (PBL) model, Cardone
et al. (1992), Cardone et al. (1994), Thompson and Cardone (1996),
Cardone and Cox (2009),
b) a deep water wave model, WAM, WAMDII Group (1988), Komen et
al. (1994), Gunther (2005), Smith et al. (2010),
c) a shallow water wave model, STWAVE, Smith et al. (2001), Smith
(2007), Smith et al. (2010), Massey et al. (2011), and,
d) a storm surge model, ADCIRC, Luettich et al. (1992), Westerink et
al. (1992), Blain et al. (1994), Dietrich et al. (2010a and 2010b).
The models were set up and applied to the north Texas coast as part of the
FEMA Risk MAP project to update coastal flood risk maps for the entire
Texas coast, then adapted and modified for use in the present feasibility
study.
One change was made to the wave modeling approach that was originally
adopted in the Risk MAP study. In the Risk Map study, the regional north
Texas shallow water wave model domain that included the Houston-
Galveston region was first simulated with the half-plane version of
STWAVE. The half-plane wave model then provided boundary conditions

Jackson State University 12
to a nested wave model within Galveston Bay which was run with the full-
plane version of STWAVE. The half-plane version of STWAVE only
considers waves approaching the coast in a 180-degree window relative to
the coastline, which is a reasonable approximation for the open coast of
Texas. In the full-plane model waves can approach from a full 360-degree
window, which is required to accurately simulate wave conditions around
the periphery of a fully- or semi-enclosed bay, like Galveston Bay. For this
feasibility study, in light of computational efficiency advancements made
to the CSTORM-MS modeling system, the wave modeling was improved
by simulating shallow water waves for the full north Texas regional
domain using the full-plane version of STWAVE.
Storm surge simulations of several extreme 900-mb storms included in
the original bracketing set of storms, using the original FEMA Risk Map
study grid mesh, became numerically unstable. To stabilize the
simulations, global slope limiting was applied to all of the bracketing set of
storms, for all time steps, to produce the original bracketing set results.
In an effort to reduce the error associated with applying slope limiting
globally, on the entire computational domain, a more localized procedure
for applying slope limiting was sought and developed. A polygon was
created which encompassed the very shallow nearshore open Gulf region
(shallower than approximately 10 m water depth), from Sabine Pass to the
south of Texas; and it extended inland to the landward side of the natural
dune system, encompassing the jetty systems at the passes, and extending
into the throats of the passes. These were the areas where model
instabilities tended to develop for several of the most extreme hurricanes
in the bracketing set. The application of slope limiting was geographically
restricted to those areas within the polygon. A trigger also was applied to
restrict application of slope limiting to those time steps when the water
surface slope exceeded a threshold value.
One other change was made to the model set-up that was applied in the
original bracketing set of storm simulations. The bottom friction
coefficient on the Louisiana and Texas continental shelves was reduced to
enable a better simulation of the wind-driven hurricane surge forerunner
that can occur along the Texas shelf for approaching hurricanes. The
reduced bottom friction enabled higher along-shelf water velocities to
develop under wind forcing, which in turn produced a greater Coriolis-
driven Ekman setup at the coast, i.e. the surge forerunner. Bottom friction
on the continental shelf was reduced to levels that were quite similar to

Jackson State University 13
those used in the FEMA study; and the level of accuracy of forerunner
simulation achieved with this revised modeling procedure is quite similar
to that achieved in the original FEMA study.
The change in wave modeling approach, while improving the quality of the
wave computations, was not expected to significantly alter the computed
storm surge. To verify this, and as a check of the revised coupled modeling
system’s capability to replicate the accuracy of results obtained in the
original FEMA Risk Map study, the modeling system was rerun for
Hurricane Ike. The re-validation also provided a check on the
performance of and influence of the polygon-based application of slope
limiting.
Extensive verification of the coupled models was performed in the original
Risk MAP study for several historic hurricanes, including Ike. Verification
included comparisons between ADCIRC results and high water marks
collected by different agencies as well as comparisons between water
surface elevation hydrographs computed using ADCIRC and hydrographs
measured by the U.S. Geological Survey (USGS), see East et al (2009), by
the National Oceanic and Atmospheric Administration (NOAA), by the
Texas Coast Ocean Observing Network (TCOON) and by Kennedy et al
(2010, 2011).
At present, the economic analysis of damage/losses prevented by the Ike
Dike concept relies solely on maximum water surface elevations (still-
water elevations) that are simulated with the ADCIRC storm surge model.
In light of this fact, the re-evaluation of model accuracy for Hurricane Ike
only considered a comparison of computed and measured high water
marks.
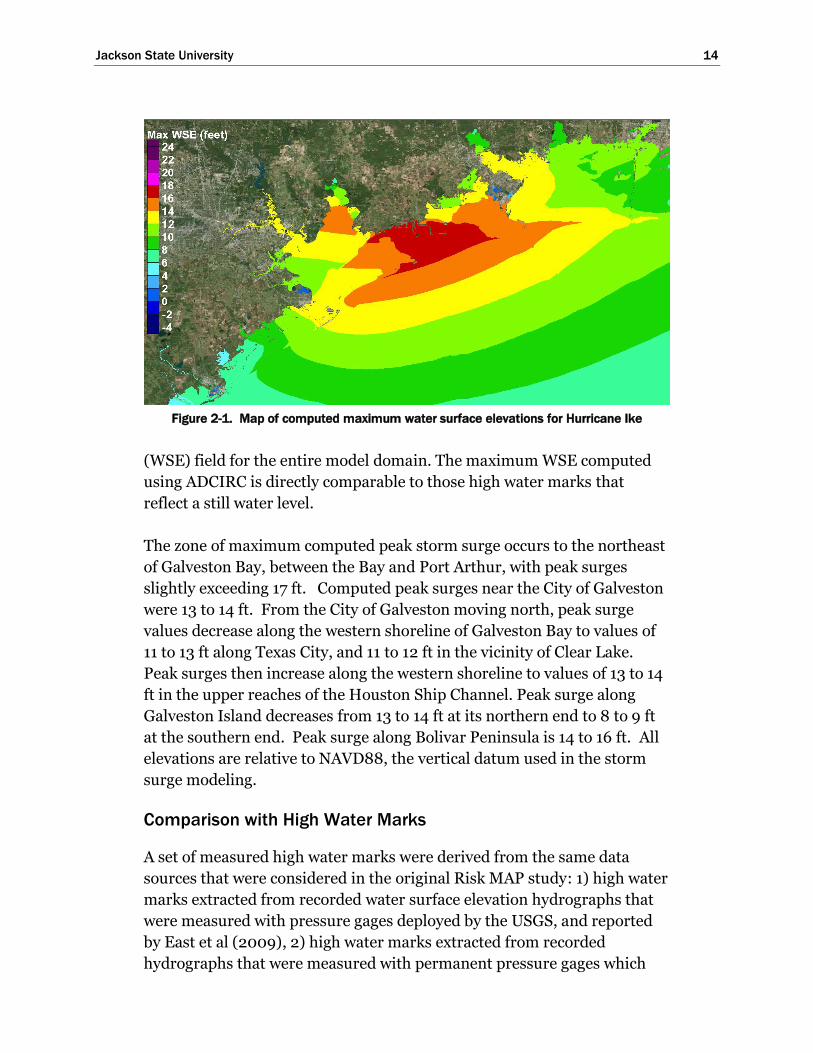
Computed Maximum Water Surface Elevations for Hurricane Ike
The maximum water surface elevation field (in feet) computed for
Hurricane Ike using the ADCIRC model, with the modified modeling
procedure, is shown in Figure 2-1. At each computational node of the
ADCIRC grid mesh, the maximum water surface elevation is recorded as
the simulation progresses and saved to an output file. At the conclusion of
the simulation, the maximum elevation file reflects the maximum water
surface elevation reached at each and every grid node in the active model
domain, regardless of when the maximum occurred during the simulation.
Figure 2-1 graphically displays the maximum water surface elevation
Jackson State University 14
Figure 2-1. Map of computed maximum water surface elevations for Hurricane Ike
(WSE) field for the entire model domain. The maximum WSE computed
using ADCIRC is directly comparable to those high water marks that
reflect a still water level.
The zone of maximum computed peak storm surge occurs to the northeast
of Galveston Bay, between the Bay and Port Arthur, with peak surges
slightly exceeding 17 ft. Computed peak surges near the City of Galveston
were 13 to 14 ft. From the City of Galveston moving north, peak surge
values decrease along the western shoreline of Galveston Bay to values of
11 to 13 ft along Texas City, and 11 to 12 ft in the vicinity of Clear Lake.
Peak surges then increase along the western shoreline to values of 13 to 14
ft in the upper reaches of the Houston Ship Channel. Peak surge along
Galveston Island decreases from 13 to 14 ft at its northern end to 8 to 9 ft
at the southern end. Peak surge along Bolivar Peninsula is 14 to 16 ft. All
elevations are relative to NAVD88, the vertical datum used in the storm
surge modeling.
Comparison with High Water Marks
A set of measured high water marks were derived from the same data
sources that were considered in the original Risk MAP study: 1) high water
marks extracted from recorded water surface elevation hydrographs that
were measured with pressure gages deployed by the USGS, and reported
by East et al (2009), 2) high water marks extracted from recorded
hydrographs that were measured with permanent pressure gages which

Jackson State University 15
are maintained by TCOON and NOAA, and reported on the NOAA Tides
and Currents web site, 3) high water marks estimated from graphical plots
of water surface elevation hydrographs that were measured with gages
deployed by Kennedy et al (2011) ; and 4) a set of visually identified high
water marks taken from FEMA’s Texas Hurricane Ike Rapid Response
Coastal High Water Mark Collection (2008) effort. Even though these
same data sets were included in the original Risk Map model validation
work, the exact data set which was adopted for each of the various data
sources might be slightly different than the data set used here due, for
example, to different decisions on which data were included/excluded
from the analysis for various reasons.
An additional set of high water marks that were acquired within Galveston
Bay by the Harris County Flood Control District (HCFCD), immediately
following Hurricane Ike, that were not considered in the original Risk Map
study, were considered in this re-evaluation. These data were acquired via
personal communication with Mr. Steven Fitzgerald, Chief Engineer with
HCFCD.
Only visually identified high water marks that reflect still-water elevations
were considered in the analysis. These are the only types of high water
marks that are appropriate for direct comparison with water surface
elevations computed with ADCIRC. Only high water marks that were
rated by the collectors as being of good or excellent quality were retained
in the analysis. High water marks that were acquired at locations which
did not fall within the computational grid mesh or were located a
significant distance away from the inundated parts of the model domain
were excluded from the analysis.
High Water Marks from Gage Measurements of Water Surface Elevation
High water marks from NOAA/TCOON maintained pressure gages were
extracted by first displaying the water surface elevation hydrograph within
the NOAA tides and currents web site
(http://tidesandcurrents.noaa.gov/stations.html?type=Water+Levels),
scrolling the cursor over the water surface elevation hydrograph to the
time of maximum elevation and reading the maximum value directly from
the screen.
The high water marks from gages deployed by the USGS were derived
from hydrographs comprised of measured pressures every minute that
Jackson State University 16
were subsequently converted to water surface elevation. See East et al
(2009) for details of the data processing. Time series at perhaps a third of
the locations showed data-point-to-data-point variability in water surface
elevation due to the influence of short-period wind waves that were
reflected in the pressure measurements. The degree of wave-induced
variability varied for different gages.
The type of modeling being done here to simulate storm surge does not
compute water surface elevation changes on time scales of seconds and
fractions of a second, which occur for short-period wind waves. Instead a
“mean”, in the time sense, or much more slowly varying water surface
elevation (often called the still water level) is computed by the ADCIRC
model.
In an attempt to filter out these higher-frequency fluctuations, or “noise,”
from the measured data and develop an estimate of the still water level
that is consistent with the water surface elevation, or storm surge, being
computed with the models, a 20-min average was computed at
approximately the time of maximum water level. The 20-min average
value was used as the measured high water mark for that location.
The quality of the measured hydrographs was good, and high water marks
derived from the measured hydrographs are considered to be the most
accurate data which are available, more so than high water marks that are
not based on measured data but rather reflect some other type of marking
left behind by the elevated surge and waves such as the FEMA and HCFCD
high water marks.
USGS/NOAA/TCOON gage-based high water marks from Matagorda,
Brazoria, Galveston, Harris, Chambers, and Jefferson counties in Texas,
and Cameron parish in Louisiana, were considered in the analysis. All
high water marks that were located within the model domain were
retained in the analysis; whereas, other marks that fell outside the model
domain or fell outside the region of simulated inundation were not
considered in the analysis.
The locations of 41 USGS gages, whose data were retained in the analysis,
are shown as yellow dots in Figure 2-2. Locations of the 6 NOAA-TCOON
gages are shown as magenta dots, and locations of the 5 Kennedy et al

Jackson State University 17
Figure 2-2. Locations of USGS (yellow), NOAA/TCOON (magenta) and Kennedy (purple)
gages.
gages are shown with purple dots. The Kennedy et al gages were deployed
along the open coast, in relatively shallow water, at fairly regular
alongshore spacing; although, data from the gage located closest to the
City of Galveston were not available.. The NOAA/TCOON gages were
mostly deployed within the bay systems, except for a single gage along the
open coast at Galveston Pleasure Pier.
This set of gage-derived high water marks reflects a broad regional
coverage, centered about the Houston-Galveston area which is of prime
interest. Comparisons between surge model maximum water surface
elevations and this measured data set best illustrates model accuracy for
the entire region, with gages distributed rather uniformly throughout the
region.
A scatter plot of the comparison between maximum water surface
elevations computed with the ADCIRC model and gage-derived high water
marks for each of the 52 gages is shown in Figure 2-3. A 45-degree dashed
line also is shown in the figure. If there is perfect agreement between
measurements and model results, then all points would fall on the dashed
line. The distance away from the dashed line indicates the magnitude of
error reflected in the model results.

Jackson State University 18
Figure 2-3. Scatter plot of measured and modeled maximum water surface elevations for
all hydrograph-derived high water marks.
Average error and average absolute error were computed for all pairs of
modeled and measured values, for each gage location. Average error was
computed by subtracting the measured water surface elevation from the
modeled elevation, and then taking an average. An average error of 0.47 ft
was computed using model-measurement data pairs for the 52 gage
locations. The positive average value indicates a slight positive bias, i.e.,
the model results are slightly higher than the measured values. Average
absolute error provides a measure of the average magnitude of the
difference between measured and modeled values, without regard for
whether the modeled value is greater than or less than the measured value.
The average absolute error for the entire data set was 0.81 ft. This error
measure provides an overall estimate of model skill and accuracy in
making peak storm surge estimates as part of the feasibility study, using
the current model setup.

Jackson State University 19
The scatter plot also reveals the slight high bias in the modeled high water
marks, i.e. on average, modeled high water marks slightly exceed
measured values. The modeled/measured high water mark differences
and the bias evident in Figure 2-3 for the Houston-Galveston region are
quite similar to the results for Hurricane Ike shown in the original FEMA
Risk MAP study.
Visually Estimated High Water Marks
The locations of 69 high water marks acquired by FEMA following
Hurricane Ike are shown as light blue dots in Figure 2-4. These data also
are reasonably well distributed, regionally, to both the northeast and
southwest of the Houston-Galveston region. Marks acquired to the
northeast of Galveston Bay appear to have been mostly acquired along the
inland edge of inundation caused by the hurricane. Coverage is not as
uniformly distributed as was coverage of the gage-derived high water
marks.
A scatter plot of the comparison between ADCIRC results and 69 FEMA
high water marks is shown in Figure 2-5. The plot shows trends that are
similar to those seen for the gage-derived high water marks. The average
error for this data set was 0.44, and average absolute error was 0.98 ft;
both results were similar to results for the previous data set.
Figure 2-4. Locations of FEMA high water marks.

Jackson State University 20
Figure 2-5. Scatter plot of measured and modeled maximum water surface elevations for
the FEMA high water marks.
The set of HCFCD high water marks were not included in the validation
one as part of the original Risk MAP study. They are included in the
nalysis reported here because they were all acquired within Galveston Bay,
particularly in areas along the western side of the bay and in the upper
reaches of the Houston Ship Channel that are of great interest in the
economic analysis facet of the feasibility study.
The locations of 69 high water marks acquired by HCFCD are shown as
green dots in Figure 2-6. These data were nearly exclusively acquired in
the northwest portion of Galveston Bay and the vicinity of the upper reach
of the Houston Ship Channel, i.e., in a much smaller area relative to that
reflected in the other data sets.

Jackson State University 21
Figure 2-6. Locations of HCFCD high water marks.
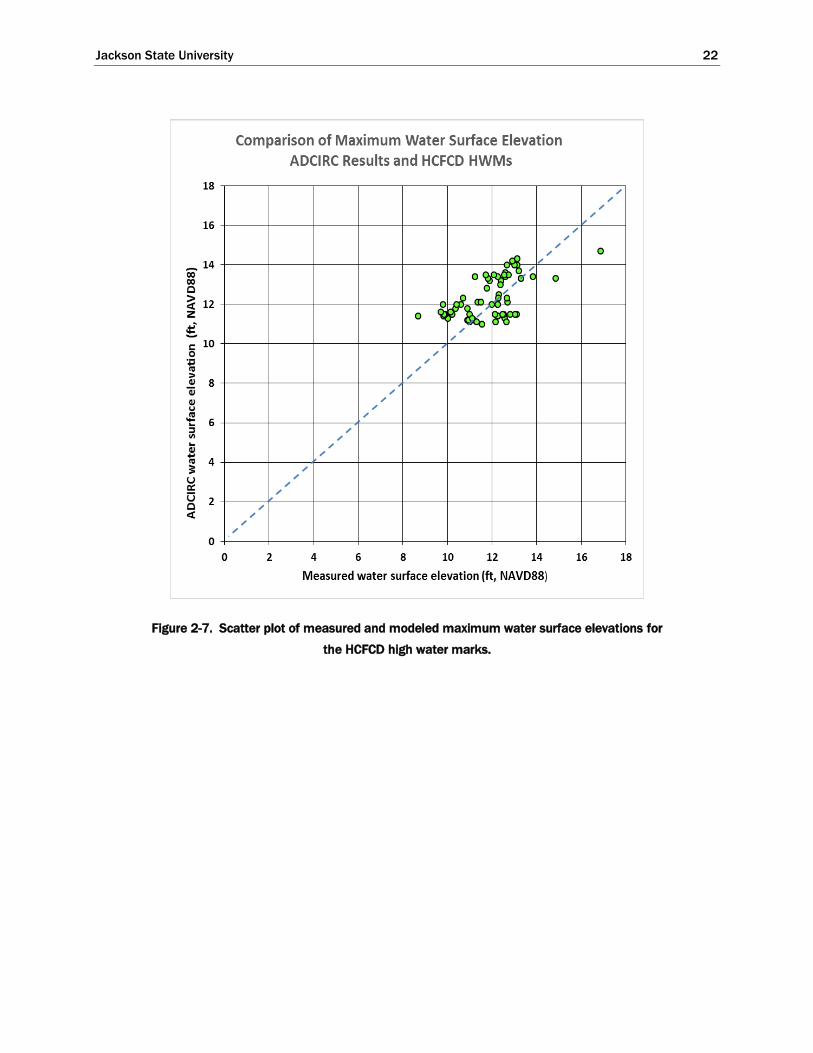
A scatter plot of the comparison between ADCIRC results and the 69
HCFCD high water marks is shown in Figure 2-7. The plot shows trends
that are similar to those seen for the gage-derived and FEMA high water
marks. The average and average absolute errors computed for this data set
are 0.42 ft and 1.00 ft, very similar to the values obtained for the other two
data sets. The small positive bias of the model results seen in the gage-
derived data comparisons and in the FEMA high water mark comparisons
also are evident for the HCFCD data set.
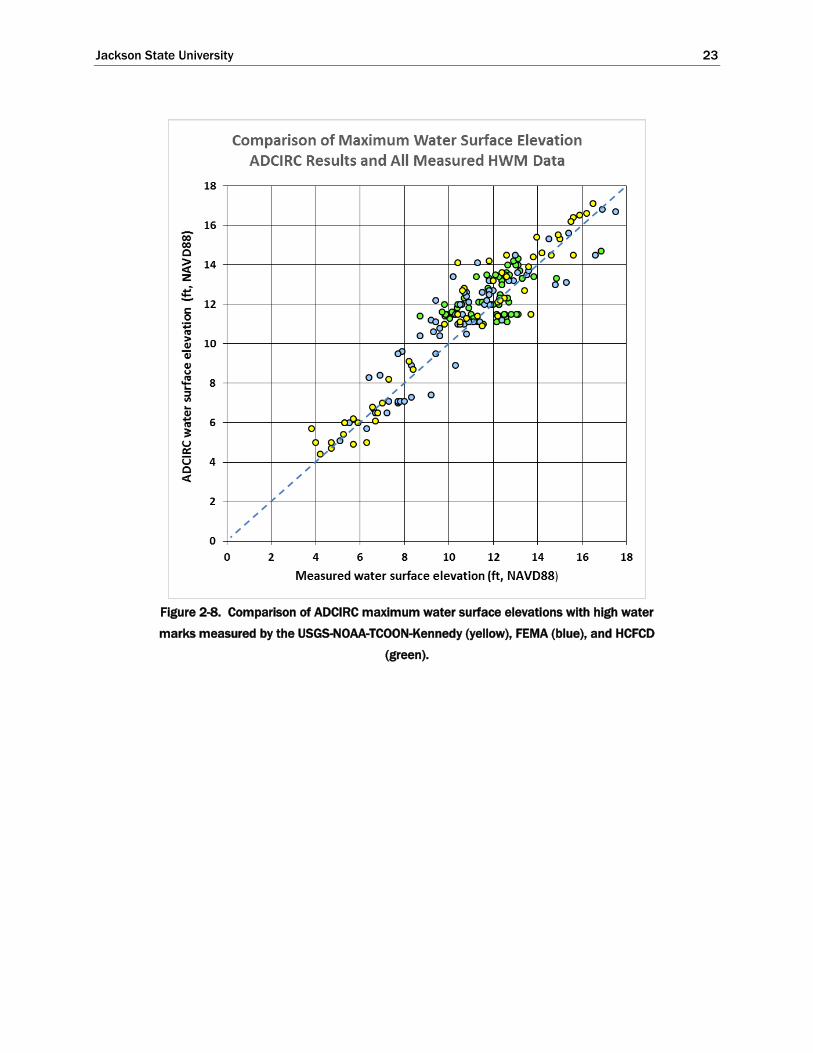
Figure 2-8 shows a scatter plot for all the high water mark data sets,
combined in a single plot. Not surprisingly, the same consistent trends
that are evident for the individual data sets also are evident for the
composite data set. The average and average absolute error computed for
this entire set of 179 model-measurement data pairs is 0.44 ft and 0.98 ft,
respectively.
The slight high bias of the model results is clearly seen in the figure as
well. Results shown in Figure 2-8 indicate that the current modeling
approach yields maximum water surface elevation results for Hurricane
Ike that are very similar to those produced in the Risk MAP study. As a
percentage of the peak storm surge of 11-14 feet that was generated by Ike
along the western side of Galveston Bay and into the upper reaches of the
Houston Ship Channel, the average absolute error reflects an error of 7 to
9%.
Jackson State University 22
Figure 2-7. Scatter plot of measured and modeled maximum water surface elevations for
the HCFCD high water marks.
Jackson State University 23
Figure 2-8. Comparison of ADCIRC maximum water surface elevations with high water
marks measured by the USGS-NOAA-TCOON-Kennedy (yellow), FEMA (blue), and HCFCD
(green).

Jackson State University 24
3 Texas Coast Historic Hurricanes
Intensity of Historic Hurricanes
The National Weather Service (Roth) documented historic hurricanes that
have impacted the Texas coast. Based on this work, Figure 1 shows the
occurrence of Category 3, 4 and 5 hurricanes (the most severe hurricanes)
from 1870 through 2010, as indicated by their central pressures (in mb).
The National Weather Service defines hurricane categories based on
maximum wind speed. However, central pressure is highly correlated to
maximum wind speed, so central pressure also is a reasonably good
indicator of hurricane intensity. The lower the central pressure the more
intense is the hurricane, generally speaking. Hurricane central pressure is
used here as the measure of hurricane intensity, for illustrative purposes
and to compare the intensity of different historic and synthetic storms.
Figure 3-1. Occurrence of severe hurricanes along the Texas coast from the historic record.
Twenty-one hurricanes having intensities of Category 3, 4 or 5 occurred
during this 140-year span, roughly once every 7 years on average. These
storms generally have central pressures of 960 mb or less. Roth’s work
indicates that central pressure information for the hurricanes first became
available in the 1870’s. For three of the of Category 3 storms, central
pressure information was not available. So, to still include these storms in

Jackson State University 25
the figure a central pressure of 960 mb was assumed for illustrative
purposes.
The historical record shows 7 storms having a central pressure of 935 mb
or less during this time span. The occurrence of a storm of this intensity
was not uniformly distributed during the 140 years.
The September 1900 Galveston Hurricane
The track and intensity characteristics for the 1900 Galveston Hurricane,
based on information contained in the NOAA Hurdat2 data base, are
shown in Table 3-1. Column 1 of the table shows the year, date and time
(referenced to GMT) of each set of observations; columns 2 and 3 show
the position of the eye of the hurricane, in latitude and longitude, along its
path, or track; column 4 shows the maximum sustained 1-minute wind
speed; column 5 shows a conversion of this 1-min wind speed to metric
units; column 6 shows a conversion of the metric 1-min wind speed to a
10-min wind speed; and column 7 shows the observed central pressure in
the eye. Few pressure observations were available for this storm.
The Galveston Hurricane of 1900 had a central pressure of 936 mb at
landfall; the minimum central pressure is unknown. So in terms of
intensity, the Texas coast has experienced a storm of this, or greater,
intensity on a number of occasions during this 140-year period. Because
of its notoriety, and fact that its intensity, while extreme, is not rare, the
Galveston Hurricane of 1900 was thought to be a reasonable severe
hurricane with which to examine the feasibility of the Ike Dike. The NOAA
Digital Coast site reports the maximum wind speed for this hurricane to be
125 kts, a Category 4 hurricane.
Figure 3-2, generated using the NOAA Digital Coast web site, shows the
track of the 1900 Galveston Hurricane among the tracks of 15 other severe
historic hurricanes of Categories 3, 4 and 5. The storm tracked to the
southwest of Galveston and landfall occurred to the southwest of
Galveston, but this track caused the maximum wind band on the right
hand side of the storm to directly impact Galveston. A number of severe
historical hurricanes have tracked to the southwest of Galveston Bay.

Jackson State University 26
Table 3-1. Galveston Hurricane of 1900, Track and Intensity Characteristics
Mo/Day/Yr/Hr (GMT)
Lat (deg)
Lon (deg)
Wmax (kt)
Max sust.
Wmax (m/sec)
Max sust.
Wmax1 (m/sec) 10-min
Cp (mb) obs
1900/09/05/0:00 22N 79.5W 35 18.0 16.0 X
1900/09/05/6:00 22.4N 80.1W 35 18.0 16.0 X
1900/09/05/12:000
23N 80.7W 45 23.1 20.6 X
1900/09/05/18:0000
23.5N 81.5W 55 28.2 25.2 X
1900/09/06/0:00 24.1N 82.3W 60 30.8 27.5 X
1900/09/06/6:00 24.8N 83.2W 65 33.3 29.8 X
1900/09/06/12:00 25.5N 84.1W 75 38.5 34.4 X
1900/09/06/18:00 26.1N 85.2W 85 43.6 38.9 974
1900/09/07/0:00 26.5N 86.2W 95 48.7 43.5 X
1900/09/07/6:00 26.8N 87.4W 105 53.9 48.1 X
1900/09/07/12:00 27N 88.7W 115 59.0 52.7 X
1900/09/07/18:00 27.2N 89.7W 125 64.1 57.3 X
1900/09/08/ 0:00 27.4N 90.6W 125 64.1 57.3 X
1900/09/08/6:00 27.6N 91.5W 125 64.1 57.3 X
1900/09/08/12:00 27.8N 92.4W 125 64.1 57.3 X
1900/09/08/18:00 28.2N 93.5W 120 61.6 55.0 X
1900/09/09/0:00 28.9N 94.7W 120 61.6 55.0 936
1900/09/09/2:002 29.1N 95.1W 120 61.6 55.0 936
1900/09/09/6:00 29.8N 95.9W 90 46.2 41.2 X
1900/09/09/12:00 31N 96.9W 65 33.3 29.8 X
1900/09/09/18:00 32.2N 97.6W 50 25.7 22.9 X
1900/09/10/0:00 33.4N 97.8W 45 23.1 20.6 X 1 factor of 0.88 used to convert max sustained wind speed to 10-min wind speed 2 time of landfall
For the present study, the original plan was to simulate the 1900
Galveston Hurricane on its original track. A Planetary Boundary Layer
(PBL) model representation of the storm winds and pressures, with best
available information on hurricane parameters and track, was to be used
to develop the wind and pressure fields required as input to the storm
surge modeling.
However, in light of the lack of available central pressure data prior to
landfall, through time, uncertainty in the radius to maximum winds value
that was identified in a search for information, and relative lack of any
other information for characterizing the spatial structure of the wind fields
as the storm approached and crossed the continental shelf, the primary

Jackson State University 27
Figure 3-2. Track Galveston Hurricane, among other Category 3, 4 and 5 storms.
storm surge generation zone, a decision was made not to simulate this
storm, and instead, compare it to other storms in the FEMA storm set.
Figure 3-3 compares the track for the 1900 Galveston Hurricane and the
storm track considered in the FEMA Risk Map study that most closely
matches the original the track. The FEMA storm track that is shown is
named TXN SE Track 3b. The tracks are similar over the continental shelf,
the primary storm surge generation zone. The track general track
orientation and landfall location are quite similar; with landfall near San
Luis Pass.
Table 3-3 compares various storm characteristics for the 1900 Galveston
Hurricane with those for three FEMA Risk Map study storms, Storm 128,
Storm 147, and Storm 158, which were all simulated for track TXN SE
Track 3b. Column 2 shows that Storm 128 was a 900-mb storm, in terms
of minimum central pressure, and Storms 158 and 147 were 930-mb
storms. Based on minimum central pressure alone, Storm 128 would be
expected to produce grater storm surge than the others, including the
1900 Galveston Hurricane. The first column compares the peak maximum
wind speed (10-min wind speed), at any position along the track, and
column 3 compares the maximum wind speed (10-min speed) at landfall.

Jackson State University 28
Figure 3-3. Track of the 1900 Galveston Hurricane (yellow symbols) and the closest track
from the FEMA storm set (red symbols).
Table 3-2. Comparison of Storm Characteristics, 1900 Galveston
Hurricane and Similar storms from the FEMA storm set.
Storm
Peak Wmax
(m/sec) 10-min
Minimum Cp (mb)
Wmax at landfall (m/sec) 10-min
Cp at landfall
(mb)
Rmax (nm)
Forward speed (kts)
1900 Galveston Hurricane
56.4 ? 54.2 936 14 10 to 13
FEMA Storm 128 62.9 900 53.2 912 17.7-25.7 11
FEMA Storm 158 60.6 930 51.0 942 17.7-25.7 17
FEMA Storm 147 52.9 930 42.4 942 17.7-25.7 6
In terms of maximum wind speeds, Storms 128 and 158 are higher the
1900 Galveston Hurricane; the maximum wind speeds for Storm 147 are
less than those for the 1900 Galveston Hurricane. The greater maximum
wind speeds for Storms 128 and 158 would tend to produce larger storm
surge than for the 1900 Galveston Hurricane. The maximum wind speed
at landfall is also is an important factor in defining the open coast storm
surge, because winds are most effective in generating storm surge in
Jackson State University 29
shallower water. At landfall, the maximum wind speeds for Storms 128
and 158 are both slightly less than the value for the 1900 Galveston
Hurricanes; the maximum wind speed for Storm 147 is much less than that
for the 1900 Galveston Hurricane. In terms of maximum wind speed,
storm 158 seems like it would produce open coast storm surge that is most
similar to the 1900 Hurricane compared to the other two storms. The
central pressure at landfall for Storm 158 is slightly higher (i.e. less
intense) than that for the 1900 Hurricane; the central pressure for Storm
128 is much lower (i.e., more intense) than that for the 1900 Hurricane. In
terms of the intensity parameters, central pressure and maximum wind
speed; Storm 128 is expected to produce a greater storm surge than the
1900 Galveston Hurricane; Storm 158 is expected to produce a surge that
is similar to the 1900 Hurricane; and Storm 147 is expected to produce less
storm surge than the 1900 Hurricane.
The single radius-to-maximum–winds value for the 1900 Hurricane (14 n
mi) is less than the values for Storms 128, 158 and 147 (17.7 to 25.7 n mi).
Also, the track for the three FEMA storms was displaced a few miles to the
northeast compared to the 1900 Hurricane track. Both the larger radius-
to-maximum winds and the displacement in track would suggest that the
zone of maximum surge will be displaced further to the north for the three
FEMA storms, compared to the location of maximum surge for the 1900
Galveston Hurricane. In general, larger Rmax values also tend to produce
larger open coast storms surges than smaller Rmax values.
The forward speed for the 1900 Galveston Hurricane is similar to that for
Storm 128; but quite different from the forward speeds for Storms 158 and
147. In light of the work by Bunpapong and Reid (1985) for the Galveston
area, the higher forward speed of Storm 158 is expected to increase the
storm surge relative to the storm surge for a slower moving storm like
Storm 147.
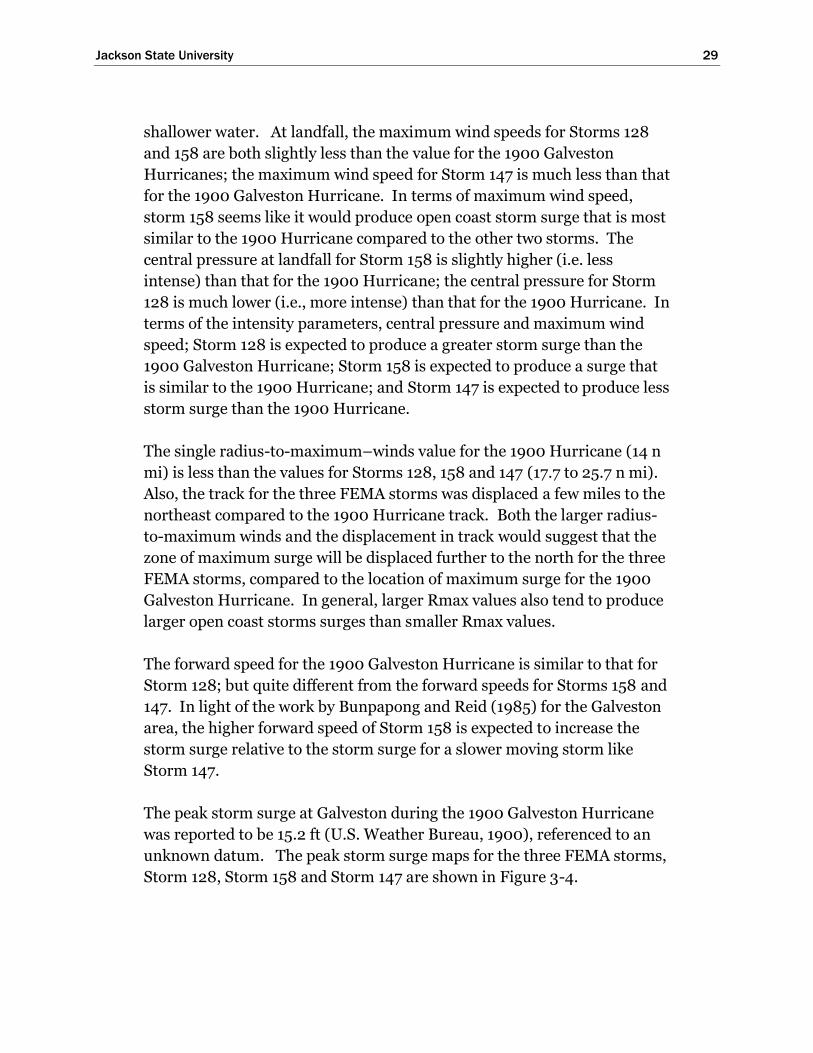
The peak storm surge at Galveston during the 1900 Galveston Hurricane
was reported to be 15.2 ft (U.S. Weather Bureau, 1900), referenced to an
unknown datum. The peak storm surge maps for the three FEMA storms,
Storm 128, Storm 158 and Storm 147 are shown in Figure 3-4.

Jackson State University 30
Figure 3-4. Maximum water surface elevation map for Storms 128 (upper), 158 (middle)
and 147 (lower).

Jackson State University 31
The zone of maximum storm surge for Storm 128 lies along Bolivar
Peninsula, reaching a maximum value of 16 to 17 ft NAVD88. For Storm
158, the zone of peak surge also lies along the southern end of Bolivar
Peninsula, with a maximum of just over 14 ft NAVD88. For Storm 147, the
zone of peak surge also lies along the southern end of Bolivar Peninsula,
with a maximum of just over 12 ft NAVD88. For reasons discussed earlier,
the zone of maximum surge for the three FEMA storms is displaced
further to the northeast than what would have been expected for the 1900
Galveston Hurricane. For the 1900 Hurricane, the zone of maximum
surge would probably have been closer to the City of Galveston.
These peak storm surge results are consistent with the earlier discussion
comparing intensity and the other parameters. The peak storm surge for
Storm 128 (16 to 17 ft) was expected to be greater than the maximum
observed during the 1900 Galveston Hurricane (approximately 15 ft),
primarily because of its greater intensity offshore, similar intensity at
landfall, and larger Rmax. The peak surge for Storm 158 (14 ft) was
expected to be most similar to the 1900 Hurricane (15 ft) because of its
slightly higher intensity offshore and slightly lower intensity at landfall.
The maximum for Storm 147 (12 ft) was expected to be less than the
observed value for the 1900 Hurricane (15ft) because of its lower intensity
offshore and much lower intensity at landfall.
These results suggest that the modeling is producing results consistent
with those that were observed during the 1900 Galveston Hurricane, for
storms having similar tracks and intensity characteristics.
Hurricane Carla
Another more recent severe hurricane from the historic record is
Hurricane Carla, in 1961. Figure 3-5 shows the track of Hurricane Carla.
Hurricane Carla had a minimum central pressure of 931 mb and
maximum wind speed of 155 kts. Hurricane Carla was a Category 5 storm
offshore, with Category 5 strength winds occurring over the continental
shelf, the zone where coastal storm surge and waves are effectively
generated by the wind. The time during which Hurricane Carla reached
Category 5 intensity is shown as the blue portion of the track in Figure 3-5.
As it approached landfall, its intensity decreased to Category 4 strength.
Storm parameters, as a function of time, for Hurricane Carla are shown in
Table 3-3.

Jackson State University 32
Figure 3-5. Track of the Hurricane Carla in 1961, among other Category 3, 4 and 5 storms.
The track of Hurricane Alicia (1983) is shown in Figure 3-6, along with the
track of Carla. The track of Alicia is nearly parallel t0 the track of Carla, at
least over the continental shelf where storm surge is primarily created.
Figure 3-6. Tracks of Hurricanes Carla (1961) and Alicia (1983). Alicia is highlighted.

Jackson State University 33
Hurricane Carla was considered in the storm surge model validation
conducted as part of the FEMA Risk MAP study of flood risk remapping
for the Texas coast (FEMA 2011).
Table 3-3. Hurricane Carla (1961) Track and Intensity Characteristics
Mo/Day/Yr/Hr (GMT)
Lat (deg)
Lon (deg)
Wmax (kt) Max sust.
Wmax (m/sec)
Max sust.
Wmax1 (m/sec) 10-min
Cp (mb) obs
1961/09/05/12:00 16.3N 82.7W 40 20.5 18.1 997
1961/09/05/18:00 16.9N 83.1W 45 23.1 20.3 993
1961/09/06/0:00 17.4N 83.6W 50 25.7 22.6 990
1961/09/06/6:00 18.1N 84.3W 55 28.2 24.8 987
1961/09/06/12:00 18.8N 85.1W 65 33.3 29.3 984
1961/09/06/18:00 19.1N 85.6W 70 35.9 31.6 981
1961/09/07/0:00 19.5N 85.9W 75 38.5 33.9 978
1961/09/07/6:00 20.2N 86.0W 80 41.0 36.1 975
1961/09/07/12:00 20.9N 86.0W 85 43.6 38.4 973
1961/09/07/18:00 21.7N 86.3W 95 48.7 42.9 970
1961/09/08/0:00 22.3N 87.3W 100 51.3 45.1 968
1961/09/08/6:00 22.8N 87.8W 105 53.9 47.4 966
1961/09/08/12:00 23.1N 88.3W 110 56.4 49.7 965
1961/09/08/18:00 23.4N 89.2W 110 56.4 49.7 962
1961/09/09/0:00 23.7N 89.8W 110 56.4 49.7 959
1961/09/09/6:00 24.0N 90.2W 110 56.4 49.7 956
1961/09/09/12:00 24.6N 91.0W 110 56.4 49.7 953
1961/09/09/18:00 24.9N 91.8W 110 56.4 49.7 948
1961/09/10/0:00 25.6N 92.6W 110 56.4 49.7 944
1961/09/10/6:00 26.1N 93.3W 115 59.0 51.9 940
1961/09/10/12:00 26.3N 93.9W 120 61.6 54.2 937
1961/09/10/18:00 26.7N 94.5W 130 66.7 58.7 936
1961/09/11/0:00 27.0N 95.0W 140 71.8 63.2 936
1961/09/11/6:00 27.2N 95.7W 150 77.0 67.7 936
1961/09/11/12:00 27.6N 96.2W 145 74.4 65.5 935
1961/09/11/18:002
2 222
28.0N 96.4W 125 64.1 56.4 931
1961/09/12/0:00 28.6N 96.8W 100 51.3 45.1 940
1961/09/12/6:00 29.5N 97.2W 80 41.0 36.1 955
1961/09/12/12:002 30.5N 97.4W 60 30.8 27.1 975
1961/09/12/18:00 31.8N 97.4W 45 23.1 20.3 979
1961/09/13/0:00 32.8N 97.2W 40 20.5 18.1 980
1961/09/13/6:00 33.5N 97.0W 35 18.0 15.8 X 1 factor of 0.88 used to convert max sustained wind speed to 10-min wind speed 2 time of landfall occurred at approximately 20:00 GMT on 09/11/1900

Jackson State University 34
Hurricane Ike
Hurricane Ike (2008) was considered in the feasibility study. Hurricane
Ike is the most recent major hurricane to strike the Texas coast, most
people remember it and relate to it. The track for Hurricane Ike is shown
in Figure 3-7, among other Category 2 storms in the NOAA Digital Coast
data base.
Hurricane Ike was only a Category 2 intensity hurricane (central pressure
of 950 mb and a maximum wind speed of 95 kts) as it made landfall and
tracked up the center of Galveston Bay. Its maximum winds were around
95 kts for the entire transit across the continental shelf. However its large
size was a strong contributor to the high coastal storm surge that was
generated. Storm size and intensity are the two most important factors in
dictating the magnitude of the open coast storm surge. Hurricane Ike was
considered in the storm surge model validation conducted as part of the
FEMA flood risk remapping study, so the highest quality wind fields
available for the storm will be used.
Hereafter in this document, the 1900 Galveston Hurricane, Hurricane
Carla, and Hurricane Ike will be referred to as “historic” storms or
hurricanes, in contrast with hypothetical synthetic hurricanes.
Figure 3-7. Track of the Hurricane Ike in 2008, among other Category 2 storms.
Jackson State University 35
4 The “Bracketing” Set of
Hypothetical Synthetic Storms
Initially, a set of 25 hypothetical synthetic hurricanes was simulated. The
set includes 21 storms, each on a unique storm track, or trajectory,
selected from among those tracks that were considered in the original
FEMA Risk MAP studies (FEMA 2011) to update flood insurance rate
maps for the Texas and Louisiana coasts. The trajectories at which these
storms approach the coast can be divided into three categories.
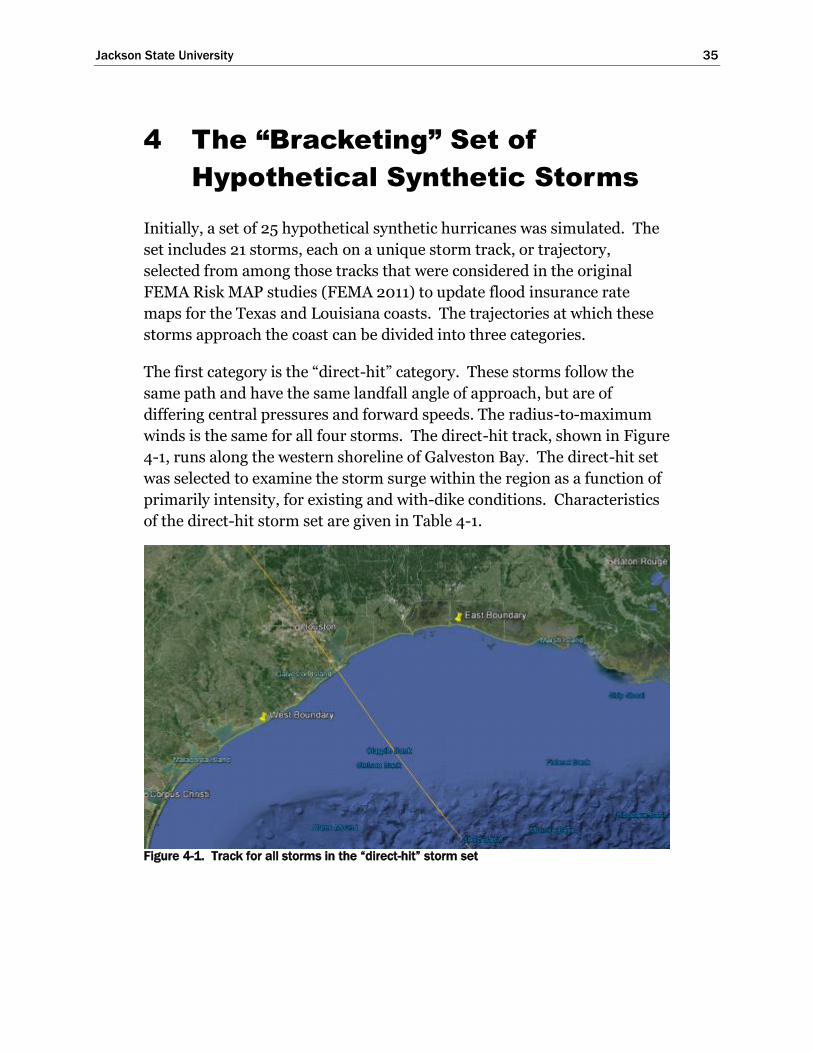
The first category is the “direct-hit” category. These storms follow the
same path and have the same landfall angle of approach, but are of
differing central pressures and forward speeds. The radius-to-maximum
winds is the same for all four storms. The direct-hit track, shown in Figure
4-1, runs along the western shoreline of Galveston Bay. The direct-hit set
was selected to examine the storm surge within the region as a function of
primarily intensity, for existing and with-dike conditions. Characteristics
of the direct-hit storm set are given in Table 4-1.
Figure 4-1. Track for all storms in the “direct-hit” storm set

Jackson State University 36
Table 4-1. Characteristics of the direct-hit set.
Storm ID Landfall Heading CP Vf Rmax
Lat Lon (deg) (mb) (kn) (nmi)
TEX_FEMA_RUN122.TROP 29.27 -94.84 -35 900 11 17.7
TEX_FEMA_RUN155.TROP 29.27 -94.84 -35 930 17 17.7
TEX_FEMA_RUN121.TROP 29.27 -94.84 -35 960 11 17.7
TEX_FEMA_RUN561.TROP* 29.27 -94.84 -35 975 11 17.7
The second category consists of 12 synthetic storms making landfall at
varying locations on Texas’ northeastern coast, shown in Figure 4-2.
Known as the North Texas set or the TX-12, three originate in the northern
Gulf of Mexico off the western coast of Florida, five originate outside the
Gulf of Mexico and enter the Gulf of Mexico through the Yucatan Straits
between Mexico and Cuba, and the final four originate in the southwestern
Gulf of Mexico. The storms all have an identical central pressure of 900
mb, but differ in other parameters, such as the forward speed, radius-to-
maximum-winds, and angle (heading) at which the storm makes landfall
varying from -41° to 11°. Characteristics of the 12 storms in the North
Texas set are given in Table 4-2.
The third and final category of synthetic hurricanes consists of 9 storms
making landfall in the vicinity of the north Texas and western Louisiana
coast (shown in Figure 4-3). Known as the West Louisiana set or the LA-9,
three originate off the coast of southern Florida near the Florida Strait,
four originate outside the Gulf and enter the Gulf through the Yucatan
Straits between Mexico and Cuba, and two originate in the south central
Gulf of Mexico and head west, then take a sharp turn in the northern
direction. Like the second category, the North Texas set, these storms all
have the same central pressure of 900 mb with other parameters, such as
the angle at which the storm makes landfall, varying from -57° to 11°.
Characteristics of the 9 storms in the West Louisiana set are given in Table
4-3.

Jackson State University 37
Figure 4-2. Tracks for the 12 storms from the North Texas set
Table 4-2. Characteristics of the 12-storm North Texas set.
Storm ID Landfall Heading CP Vf Rmax
Lat Lon (deg) (mb) (kn) (nmi)
TEX_FEMA_RUN027.TROP 28.75 -95.65 -41 900 11 21.8
TEX_FEMA_RUN036.TROP 29.09 -95.09 -37 900 11 21.8
TEX_FEMA_RUN045.TROP 29.46 -94.61 -35 900 11 21.8
TEX_FEMA_RUN057.TROP 28.89 -95.40 -64 900 11 18.4
TEX_FEMA_RUN061.TROP 29.35 -94.72 -64 900 11 18.4
TEX_FEMA_RUN077.TROP 28.96 -95.28 6 900 11 18.4
TEX_FEMA_RUN081.TROP 29.51 -94.50 11 900 11 18.4
TEX_FEMA_RUN128.TROP 29.16 -95.01 -63 900 11 17.7
TEX_FEMA_RUN134.TROP 28.76 -95.64 3 900 11 17.7
TEX_FEMA_RUN136.TROP 29.23 -94.90 8 900 17 17.7
TEX_FEMA_RUN142.TROP 28.91 -95.36 -37 900 6 17.7

Jackson State University 38
TEX_FEMA_RUN144.TROP 29.27 -94.84 -37 900 6 17.7
Figure 4-3. Tracks for the 9 storms from the West Louisiana set
Table 4-3. Characteristics of the 9-storm West Louisiana set.
Storm ID Landfall Heading CP Vf Rmax
Lat Lon (deg) (mb) (kn) (nmi)
JPM_FEMA_RUN209.TROP 29.59 -94.29 -35 900 11 21.8
JPM_FEMA_RUN218.TROP 29.71 -93.69 -28 900 11 21.8
JPM_FEMA_RUN249.TROP 29.56 -94.37 -57 900 11 18.4
JPM_FEMA_RUN253.TROP 29.72 -93.63 -53 900 11 18.4
JPM_FEMA_RUN269.TROP 29.61 -94.22 11 900 11 18.4
JPM_FEMA_RUN326.TROP 29.68 -94.04 -57 900 11 17.7
JPM_FEMA_RUN332.TROP 29.72 -93.67 11 900 11 17.7
JPM_FEMA_RUN338.TROP 29.67 -94.05 -30 900 6 17.7
JPM_FEMA_RUN340.TROP 29.76 -93.39 -26 900 6 17.7

Jackson State University 39
The twelve storms comprising the North Texas set are shown with pink
tracks in Figure 4-4; the nine storms comprising the West Louisiana set
are shown with green tracks in Figure 4-4. The spacing between tracks, at
landfall, is approximately 20 miles. Figure 4-4 shows the storm
numbering scheme that is used throughout this report. The storm
numbers are also indicated in the storm ID, which is the first column of
Tables 4-1, 4-2 and 4-3.
Most of the storms in the bracketing set have central pressures of 900 mb.
The hurricane wind and pressure model using in this feasibility study
simulates a decrease in storm intensity and an increase in the radius to
maximum winds just before landfall (a process call storm filling). This
filling process has been observed for severe storms. As a result of storm
filling, the central pressure at landfall for these 900-mb storms rages from
approximately 910 mb to 920 mb. These are severe hurricanes, all having
maximum wind speeds of about 125 kts, or of Category 4 intensity on the
Saffir-Simpson wind intensity scale. Central pressure is highly correlated
to maximum wind speed. In terms of intensity, these storms are generally
more severe than those that have occurred along the Texas coast over the
Figure 4-4. Storm tracks for the Texas set (in pink) and the Louisiana set (in green).

Jackson State University 40
past 140 years (see Figure 1), with the notable exception of Hurricane
Carla in 1961, which reached Category 5 as it moved across the continental
shelf then weakened to Category 4 intensity at landfall.

Jackson State University 41
5 Hurricane Surge Generation on
the Open Coast – Causative
Factors
What Causes a Storm Surge?
Hurricanes are intense storms that originate in tropical waters and derive
their energy from warm water. They weaken in intensity when the heat
source is diminished or removed, which occurs when the storm passes
over cooler water or when winds are blowing over land. Hurricanes also
can be weakened by vertical wind shear. Hurricanes are low-pressure
systems, in which winds spin counterclockwise (in the northern
hemisphere) around the storm’s center, or eye. A hurricane’s intensity is
measured by its maximum wind speed and central pressure; the two are
strongly correlated. Hurricane intensity, size, path, and speed of
movement all change with time during any particular event. Hurricane
characteristics can vary widely from storm to storm.
Storm surge is defined here as an anomalous increase in the water level
associated with a coastal storm. Storm surge is a long wave that is
primarily forced by wind and to a lesser degree by spatial gradients in
atmospheric pressure and momentum fluxes associated with waves,
particularly in the surf zone.
The modeling being used in this feasibility study to simulate the
development of storm surge treats each of these contributions to storm
surge, as described below.
Wind
Wind exerts a shear stress on the water surface, which acts to push water
in the direction of the wind. Shear stress is a nonlinear function of the
wind speed, i.e., it is related to wind speed raised to the second or third
power, depending on the formulation of wind drag coefficient used to
calculate surface stress for different wind speeds. For example, an
increase in wind speed by a factor of 2 will increase the surface shear stress
by a factor of 4 to 8. The contribution to storm surge caused by wind
stress is called wind set-up.

Jackson State University 42
Wind is most effective in creating a set-up (increase) in the water level
when it blows over shallow water because, in the balance of momentum,
the effective wind stress is inversely proportional to water depth.
Therefore storm surge is mostly generated on the continental shelf, in the
shallow nearshore coastal region and in shallow bays and estuaries. Wind
is much less effective in creating wind set-up in deep water. The
magnitude of wind set-up depends on the fetch, or the distance over which
a wind blows, in addition to the duration or persistence of winds.
Atmospheric Pressure
An elevated water surface dome is created under the center of a low
pressure storm system, which contributes to the storm surge.
Atmospheric pressure is the weight of air above the water. In regions of
high pressure (at the storm periphery), the force pushing down on the
water is greater than the force over regions of low pressure (storm center).
This horizontal gradient in atmospheric pressure forces water to move
from regions of higher pressure toward regions of lower pressure. Water is
forced toward the eye of the hurricane, which creates the dome of water.
The amplitude of this contribution to storm surge is dependent upon the
magnitude of the difference between the peripheral and central pressures;
but it can be as much as several feet for a major hurricane. This pattern of
water movement is not static; instead, it moves with the translating
hurricane.
Waves
Storm winds also result in the generation of energetic short-period waves,
which at elevated water levels can pose a significant coastal flood hazard
and cause structural damage. Similar to the generation of wind set-up,
storm wave characteristics (height, period, and direction) are strongly
influenced by wind speed and direction, fetch, and the persistence of wind
from a particular direction. Higher wind speed, greater fetch distance and
longer duration generally lead to greater wave energy (higher wave height)
and longer wave periods. However, unlike storm surge, waves are very
effectively generated in deep water and the most energetic waves are
usually found in deeper water. Waves generated by a hurricane propagate
outward away from the storm in all directions. Along the open coast,
severe hurricanes typically generate significant wave heights of 15 to 30 ft,
with typical peak wave periods of 10 to 15 sec. In more sheltered areas,
storm wave heights and wave periods are generally smaller.

Jackson State University 43
As obliquely incident wind waves propagate into shallow water their
propagation speed slows, they begin to “feel” the bottom, turn and seek to
align themselves in such a way that wave crests approach in a direction
increasingly more parallel to the shoreline. In the absence of wind energy
input this refraction process generally causes a decrease in wave height,
although complex irregular bathymetry can create patterns of locally
increased and decreased wave height. Some wave energy is dissipated due
to bottom friction and white-capping. But generally during hurricanes,
strong onshore winds continue to act as an energy source offsetting energy
losses associated with these other processes.
As waves propagate into even more shallow water, they shoal, steepen and
eventually break, dissipating energy much more strongly. In response to
this depth-induced dissipation, significant wave height decreases. In the
inner surf zone, despite the presence of high winds, wave energy becomes
saturated and the local significant wave height is generally limited to
values of 0.4 to 0.6 times the local water depth. Wave height can be
smaller if wind input is reduced and energy is dissipated by vegetation or
diminished in some other way due to sheltering or disruption of wave
propagation by buildings, other landscape features, or by debris.
Wave transformation and breaking is strongly dependent upon the local
water depth. If the storm surge significantly changes the local water
depth, wave transformation and breaking processes will be altered
accordingly. Increases in water depth associated with increases in storm
surge generally enable greater wave energy (height) to be present locally.
As waves break on a beach in very shallow water, wave heights decrease
and the flux of wave momentum in the onshore direction is reduced. This
change in wave momentum is balanced by an increase in the mean water
level, a contribution to the storm surge called wave setup. Wave setup is
usually treated in engineering analysis as a “mean” (in time) quantity that
varies every half hour or hour as the incident wave conditions change.
The magnitude of wave setup is greatest right at the shoreline, and the
maximum value is roughly 10 to 20% of the incident significant wave
height at the seaward edge of the surf zone, i.e., the breaking wave height.
For example, incident waves having a significant height of 20 ft can force a
maximum wave setup at the shoreline of 2 to 4 ft. Wave setup produces an
additional increase in the storm surge elevation, which in turn exacerbates

Jackson State University 44
wave runup on beaches and structures and increases the potential for
inundation and subsequent propagation of waves over inundated terrain.
Storm Surge along the Texas Coast
In addition to atmospheric pressure and wave effects, storm surge along
the north Texas coast is strongly influenced by two wind-forced
contributors. One is the development of a wind-driven surge forerunner,
an Ekman wave that develops as along-shore moving water on the
continental shelf forced by the hurricane’s peripheral winds which is then
directed onshore by the Coriolis force even while the storm is well
offshore. The second contributor is the direct effect of the highest winds in
the core of the hurricane as it crosses the continental shelf and approaches
landfall, pushing the shelf waters toward the coast and into the bay.
Within Galveston Bay, storm surge is highly dependent upon infilling that
occurs due to surge propagation over the low barrier islands and through
the passes linking the Gulf of Mexico to Galveston Bay and West Bay, and
by local wind-set up. For the bracketing set of 25 storms, the maximum
simulated water surface elevation was 25 ft NAVD88 in the upper reaches
of the Houston Ship Channel. Peak surge can vary significantly within
Galveston Bay, depending on storm track and location.
Surge Forerunner
In a broad sense, a hurricane forerunner is a rise in the water surface
elevation at the coast when the eye of the hurricane is far offshore in very
deep water, and which is not directly attributable to the strong core winds
closer to the eye of the storm. Several contributors to the forerunner have
been identified, including the hurricane’s far-field winds as well as other
wave dynamics associated with the fact the Gulf of Mexico is a nearly
enclosed basin, but forced by the flux of water through the Florida Straits
and the Yucatan Straits. The Coriolis force, which acts on moving water
and is associated with the rotation of the earth, is a critical factor in
development of the forerunner.
Ekman Wave Formation
Kennedy et al (2011) described and documented well what appears to be
the most significant contribution to the forerunner, or mechanism driving
the forerunner, along the northwest Texas Gulf coast. They identified the
forerunner during Hurricane Ike through measurements, and verified it
using modeling and analysis. This mechanism is the development of a

Jackson State University 45
wind-driven surge forerunner, an Ekman wave, that develops as along-
shore moving water on the continental shelf forced by the hurricane’s
peripheral winds, then directed onshore by the Coriolis force (to the right
in the northern hemisphere) even while the storm is well offshore.
Kennedy et al (2011) found that this contribution to the water surface
elevation steadily increased over a period of several days before Ike’s
landfall and reached approximately 6 feet in amplitude.
Figure 5-1, from Kennedy et al (2011), shows the measured water surface
elevation during Hurricane Ike which was recorded at a gage located on
the open coast, in shallow water, just east of Bolivar Peninsula. Measured
water surface elevations are shown in black, results of a storm surge model
simulation with the Coriolis force turned on are shown in red, and results
from a model simulation without Coriolis forcing are shown in blue.
Measured data show a steady rise in water level beginning 2 days prior to
landfall, when the storm was located in the deep water region of the Gulf.
The forerunner gradually increased to an elevation of approximately 6 ft (2
meters) at a time 12 hours prior to landfall, after which the core winds of
the storm began to dominate the surge response along the coast. Without
Coriolis forcing included in the model, the forerunner could not be
simulated at all.
Figure 5-1. Water surface elevation measurements made during Hurricane Ike that show
the wind-driven forerunner, from Kennedy et al (2011)

Jackson State University 46
The work of Kennedy et al (2011) showed the importance of the wide
continental shelf off the Louisiana-Texas coast in development of the
Ekman wave, forced initially by the wind, which then propagates along the
shelf to the south as a free wave once the wind forcing subsides. Because
of the generation mechanism involved, the counterclockwise rotation of
winds about the hurricane eye, and the wide continental shelf along the
Louisiana and north Texas coasts, conditions are generally favorable to
force a significant forerunner for all major hurricanes that approach the
coast along the northwest Gulf of Mexico.
Figure 5-2 shows the Gulf of Mexico bathymetry, where the shallower
depths on the shelf are shown as the color-shaded contours. The shallow
areas with colored contours reflect the location and varying width of the
continental shelf around the periphery of the Gulf. The very deep portion
of the Gulf, beyond the continental shelf, is indicated by the monochrome
maroon colored area. As stated previously, winds are only important in
generating a storm surge on the shelf and in adjacent shallow coastal and
bay waters. The extensive shelf situated along the northwestern Gulf coast
is a critical factor in the development of the forerunner, and storm surge in
general, in the Houston-Galveston region.
Figure 5-2. Bottom surface elevation in the Gulf of Mexico

Jackson State University 47
Volume Mode Oscillation
In a study funded by the U.S. Army Corps of Engineers, Bunpapong et al
(1985) identified other contributors to the forerunner in the Gulf of
Mexico, arising from physical processes other than far-field winds blowing
along the shelf. For the Texas coast near Galveston, they found one
mechanism in particular to be more significant than several others they
identified.
Using model simulations and measured water surface elevation data from
tide measurement stations located around the periphery of the Gulf, for
Hurricanes Carla (1961) and Allen (1980), they showed that as a hurricane
enters the Gulf of Mexico, an in-phase difference in the magnitude of the
volume of water entering/leaving the Florida and Yucatan Straits (both in
or both out), a volume mode or Helmholtz type of oscillation is excited
throughout the entire Gulf. For this mode of oscillation, the water surface
of the entire Gulf rises and falls in phase, with a nearly uniform amplitude
throughout the Gulf. The flux of water through the Straits is driven by both
wind and the atmospheric pressure gradient associated with the storm,
with the latter forcing water from regions of high atmospheric pressure
toward the low-pressure center of the hurricane. They found that the
effect of wind-driven transport was the most important.
Bunpapong et al (1985) found that for hurricanes, having a central
pressure deficit of 80 mb and a radius to maximum winds of 16 n mi,
which entered the Gulf through the Yucatan Straits on a straight track
resulting in landfall on the Texas coast, a forerunner was generated at
Galveston that had an amplitude of approximately 0.7 ft. A hurricane with
an 80-mb pressure deficit is akin to a hurricane having a central pressure
of approximately 930 mb and a far-field pressure of 1010 mb. They found
that for larger storms, having the same pressure drop of 80 mb but radius
to maximum winds of 32 n mi, the amplitude of the volume mode
oscillation doubled to 1.3 ft. For pressure drops of 40 mb and 120 mb, and
the larger radius to maximum winds of 32 n mi, they found amplitudes of
0.7 and 2 ft, respectively. They found that the hurricane path and
evolution play important roles in dictating the amplitude of the
forerunner.
A significant forerunner was not always generated; the amplitude
depended on storm track, intensity and size. They showed that for
hurricanes of lesser intensity when entering the Gulf through the Florida

Jackson State University 48
Straits, and for hurricanes originating within the Gulf, the amplitude of
this volume mode along the Texas coast was less than when an intense
storm enters through the Yucatan Straits.
For this particular contribution to the forerunner, the timing between this
volume mode oscillation and the primary wind induced surge generated at
the coast determines whether or not this mode oscillation contributes to
the peak surge or detracts from it. This will depend upon the relative
timing of the two contributors, which is strongly influenced by the
hurricane’s forward speed. Bunpapong et al (1985) found that increasing
forward speed produced a significant increase in peak open coast surge
along the Texas coast, but that different forward speeds had little effect on
the amplitude of the volume model oscillation.
The follow-on work plan proposes to further examine the effect of this
forerunner mechanism on peak surge in the Houston-Galveston region,
confirming the maximum amplitude of this mechanism for intense storms
that enter the Gulf, examining sensitivity of the amplitude to location of
entry into the Gulf (which influences the Strait fluxes driven by the wind),
the prevalence of this phenomenon, the likelihood that it can be an
additive effect to the open coast surge, and the influence of forward speed
on peak surge.
An Example of Forerunner Development: Direct-hit Storm 122
The model simulation for Storm 122, a direct-hit storm having central
pressure of 900 mb at its most intense stage, a forward speed of 11 kts, and
a radius to maximum winds of 17.7 n mi, is used to illustrate development
of the hurricane surge forerunner. This storm originated outside the Gulf
and entered through the Yucatan Straits, at its northernmost point.
However, its central pressure as it entered the Gulf through the Yucatan
Straits was not very intense, only 980 mb with a far field pressure of 1013
mb; i.e., a pressure deficit of only 33 mb.
The modeling of surge being done in this feasibility study should be able to
simulate the volume mode oscillation identified by Bunpapong et al
(1985). Both the wind and atmospheric pressure gradient forcing are
being simulated in the storm surge modeling and water flux through both
Straits is being well simulated since the surge model’s open water
boundaries are located in the middle of the Atlantic Ocean. Because Storm
122 is not very intense as it enters the Gulf, and because the wind-driven
water flux is directed out of one Strait and into the other as a result of its

Jackson State University 49
entry location, the amplitude of the volume mode contribution to the
forerunner is expected to be small for this storm, on the order of a few
tenths of a foot at most, based on the results of Bunpapong et al (1985).
Figure 5-3 shows the simulated Gulf-wide field of water surface elevation
and wind vectors for Storm 122 just before its entry into the Gulf, almost 3
days before making landfall at Galveston. At this point in time the central
pressure of the storm is 980 mb. The initial water surface elevation for
this simulation is about 0.9 ft NAVD88, or approximately 0.4 ft above
mean sea level to account for steric increases in Gulf water levels during
the summertime hurricane season. The very small circular light blue area
just south of Cuba reflects a small dome of water beneath the eye of the
hurricane that is forced by atmospheric pressure gradients which push
water toward the storm center.
Figure 5-4 shows the water surface elevation and wind vectors for Storm
122, about a day later, 2 days prior to landfall. At this point in time the
storm’s central pressure is 942 mb. The counterclockwise rotation of wind
vectors about the eye of the storm is quite evident. The dome of water
under the eye of the storm has grown, having a maximum water surface
elevation of more than 3 ft NAVD88, 2 to 2.5 feet above mean sea level.
The dome is following the eye of the storm as it transits across the Gulf
toward the Texas coast.
Figure 5-3. Water surface elevation and wind vectors in the Gulf of Mexico nearly 3 days
before landfall for Storm 122 (direct-hit track, 900 mb)

Jackson State University 50
Also evident are increasing water surface elevation along sections of the
Gulf coast where the winds are blowing along the continental shelf, the
shelf is widest, and a Kelvin wave is being forced. The figure clearly shows
the development of this wind driven contribution to the forerunner, along
the Louisiana-Texas coast; it’s also evident along other regions of the Gulf
having a wider continental shelf where winds blow along the coast. Along
the north Texas coast, the increase in water surface elevation is
approximately 1 ft. Also note the near uniform increase in water surface
elevation through the Gulf, compared with the elevation in the previous
figure. This appears to be associated with the volume model of oscillation,
forced by entry of the storm into the Gulf about a day earlier.
Figure 5-4. Water surface elevation and wind vectors in the Gulf of Mexico 2 days before
landfall for Storm 122 (direct-hit track, 900 mb)
It should be noted that in these idealized synthetic hurricane simulations
the hurricane is the only meteorological system in the Gulf; there are no
other weather systems. So winds throughout the Gulf are only influenced
by the hurricane and its forward speed as calculated by the planetary
boundary layer wind model being used in the simulations. Along the
northern Gulf coastline, winds blow along the coast from the east due to
the counterclockwise wind circulation about the eye and its forward speed.
Figure 5-5 shows the water surface elevation and wind vectors for Storm
122, one day prior to landfall. The dome of water under the eye of the
storm has grown as the storm intensifies to its minimum central pressure

Jackson State University 51
of 900 mb. The maximum water surface elevation within this dome is
greater than 4 ft NAVD88, 3 to 3.5 feet above mean sea level. Along the
north Texas coast, due to the wind-driven forerunner, the increase in
water surface elevation is approximately 1.5 to 2 ft above mean sea level.
Figure 5-5. Water surface elevation and wind vectors in the Gulf of Mexico one day before
landfall for Storm 122 (direct-hit track, 900 mb)
Figure 5-6 shows the water surface elevation and wind vectors for Storm
122, 12 hours after landfall. The hurricane has moved inland, the wind
forcing is diminished and changed in direction, yet the water surface
remains elevated along many coastal areas where the shelf is wide. This
observation is consistent with the finding of Kennedy et al (2011) that the
Kelvin wave becomes a free wave, moving along the shelf, after the wind
forcing diminishes.
Figure 5-7 shows the water surface elevation and wind vectors for Storm
122, one day after landfall. The hurricane has moved well inland, and the
wind forcing has decreased further. Evidence of the forerunner along the
coast where the shelf is widest persists.
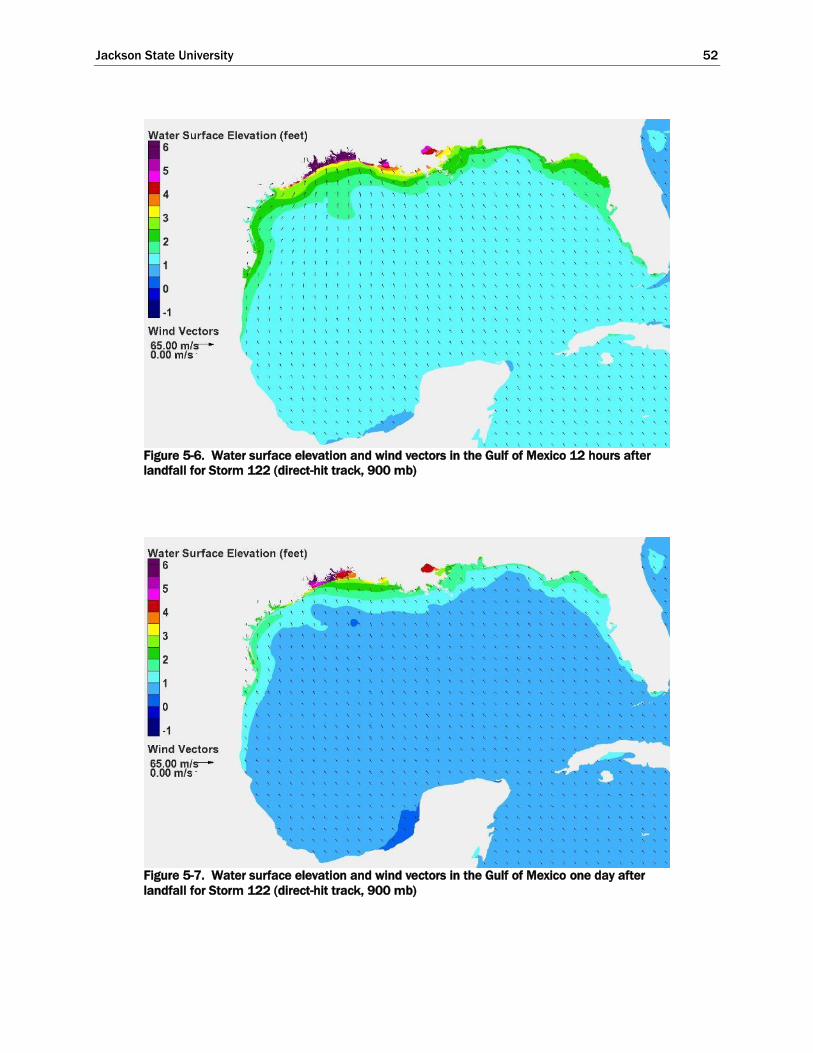
Jackson State University 52
Figure 5-6. Water surface elevation and wind vectors in the Gulf of Mexico 12 hours after
landfall for Storm 122 (direct-hit track, 900 mb)
Figure 5-7. Water surface elevation and wind vectors in the Gulf of Mexico one day after
landfall for Storm 122 (direct-hit track, 900 mb)

Jackson State University 53
Comparing Figure 5-7 with Figure 5-6, snap-shots in time separated by 12
hours, a nearly uniform change in water surface elevation throughout the
entire Gulf is evident. The entire Gulf water surface has decreased during
this 12-hour period of time. Comparing Figure 12 prior to the hurricane
entering the Gulf, with Figure 13 reflecting conditions a day later, a
uniform increase in water surface elevation Gulf-wide also is evident. The
color changes suggest an increase and decrease of about the same
magnitude. This type of change is consistent with the volume mode, or
Helmholtz, type of oscillation identified by Bunpapong et al (1985).
To further illustrate the development of the forerunner, Figure 5-8 shows
the temporal variation of water surface elevation through time, during the
first 60 hours of the simulation, at three locations: the open coast at
Galveston (Pleasure Pier), inside Galveston Bay near the Clear Lake area
along the western shoreline, and well into the Houston Ship Channel. The
figure shows a slow steady increase in water surface elevation associated
with the wind-driven Ekman wave, an increase of about 2 ft during the
first 2 days, then nearly another foot of rise over the next 10 hours. The
rate at which the surge builds noticeably increases at hour 50 as the storm
winds over the continental shelf increase. Landfall occurs at hour 70. Also
evident is the penetration of the forerunner into Galveston Bay for this
storm. Elevations are higher inside the Bay due to an additional
contribution of wind setup, where winds from the northeast set up the
western side of the Bay by an additional 0.5 ft.
Figure 5-8. Temporal variation of water surface elevation showing forerunner development.
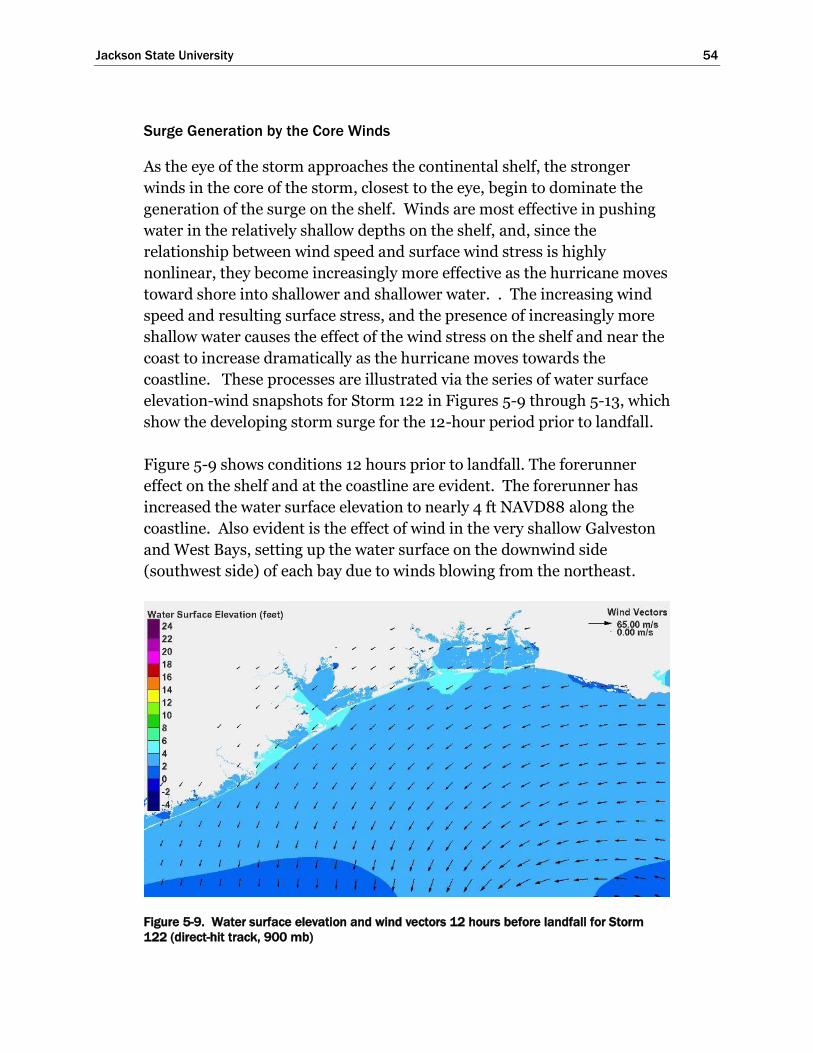
Jackson State University 54
Surge Generation by the Core Winds
As the eye of the storm approaches the continental shelf, the stronger
winds in the core of the storm, closest to the eye, begin to dominate the
generation of the surge on the shelf. Winds are most effective in pushing
water in the relatively shallow depths on the shelf, and, since the
relationship between wind speed and surface wind stress is highly
nonlinear, they become increasingly more effective as the hurricane moves
toward shore into shallower and shallower water. . The increasing wind
speed and resulting surface stress, and the presence of increasingly more
shallow water causes the effect of the wind stress on the shelf and near the
coast to increase dramatically as the hurricane moves towards the
coastline. These processes are illustrated via the series of water surface
elevation-wind snapshots for Storm 122 in Figures 5-9 through 5-13, which
show the developing storm surge for the 12-hour period prior to landfall.
Figure 5-9 shows conditions 12 hours prior to landfall. The forerunner
effect on the shelf and at the coastline are evident. The forerunner has
increased the water surface elevation to nearly 4 ft NAVD88 along the
coastline. Also evident is the effect of wind in the very shallow Galveston
and West Bays, setting up the water surface on the downwind side
(southwest side) of each bay due to winds blowing from the northeast.
Figure 5-9. Water surface elevation and wind vectors 12 hours before landfall for Storm
122 (direct-hit track, 900 mb)

Jackson State University 55
Figure 5-10 shows conditions 3 hours later, at a time 9 hours prior to
landfall at Galveston. The eye of the hurricane is clearly visible, as
evidenced by the counterclockwise wind circulation around the eye. The
dome of water beneath the eye which is forced by the atmospheric
pressure gradients is visible. Also evident is the increase in surge in the
right front quadrant of the storm (viewed relative to the direction of storm
advance). This is the zone where the surface winds have their maximum
speed and greatest surge building capacity. Surge is building farther out
on the shelf due to the higher core winds and decreasing water depth. The
wind-driven surge on the shelf associated with the core winds is beginning
to merge with the surge that has been forced as a forerunner closer to the
shore.
Figure 5-10. Water surface elevation and wind vectors 9 hours before landfall for Storm
122 (direct-hit track, 900 mb)
Figure 5-11 shows conditions 3 hours later at a time 6 hours before
landfall. As the core winds move into increasingly more shallow water,
surge on the shelf is increasing. The surge generated by the core winds is
merging with the forerunner surge.
The same pattern of surge evolution is shown in Figure 5-12, three hours
later, at a time 3 hours prior to landfall. The surge associated with the
core winds and the forerunner have now merged. The core winds are
producing waves, and have been even when the storm center was in deep
water. The wave setup created by breaking waves is also contributing to
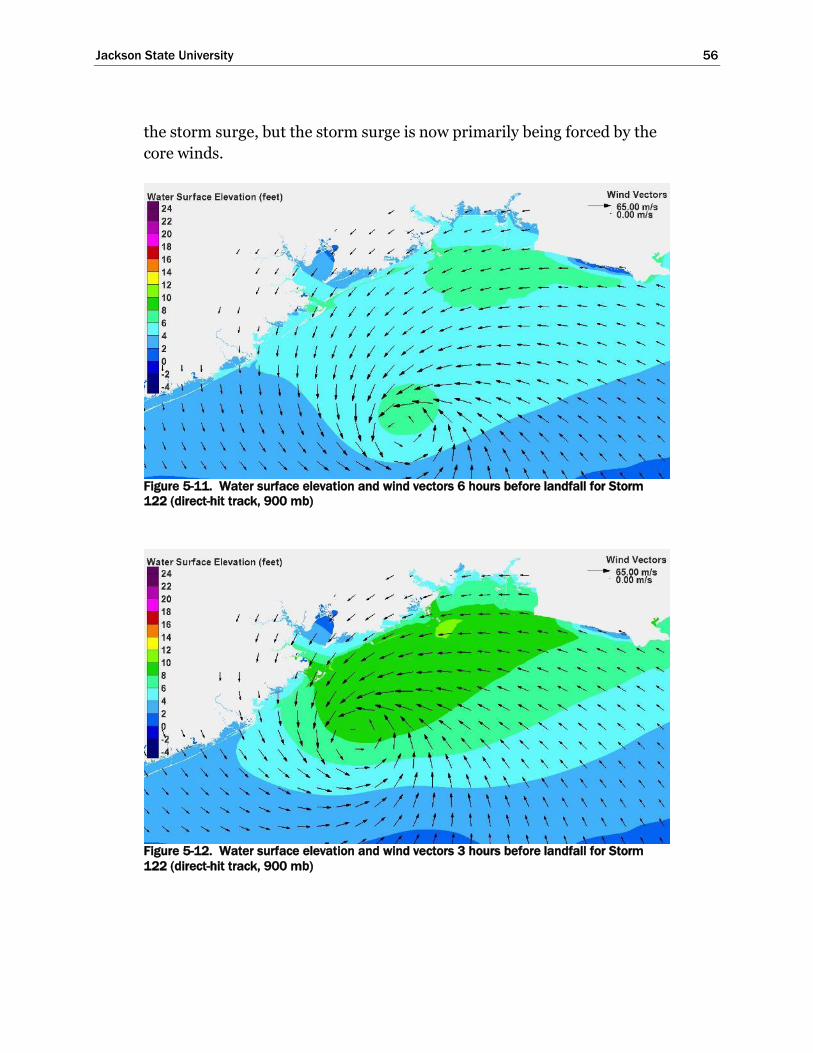
Jackson State University 56
the storm surge, but the storm surge is now primarily being forced by the
core winds.
Figure 5-11. Water surface elevation and wind vectors 6 hours before landfall for Storm
122 (direct-hit track, 900 mb)
Figure 5-12. Water surface elevation and wind vectors 3 hours before landfall for Storm
122 (direct-hit track, 900 mb)

Jackson State University 57
Figure 5-13 shows conditions at landfall. The surge at the coast has
rapidly increased to levels in excess of 18 ft along Bolivar Peninsula. The
onshore-directed winds have pushed the water that was accumulating on
the shelf up against the coastline, with even greater force and effectiveness
because of the very shallow water depths.
The focus of this chapter was the development of storm surge on the open
coast. The following chapter will focus on surge development within
Galveston Bay.
Figure 5-13. Water surface elevation and wind vectors at landfall for Storm 122 (direct-hit
track, 900 mb)

Jackson State University 58
6 Hurricane Surge Generation
within Galveston Bay –
Causative Factors
Introduction
In a semi-enclosed shallow water body like Galveston Bay (having an
average water depth of approximately 10 ft), water levels will respond to
both a filling action and a tilting of the water surface. Lake Pontchartrain
near New Orleans, which also is semi-enclosed and has a water depth
similar to Galveston Bay, responded to Hurricane Katrina with both filling
and tilting of the water surface as the storm’s eye moved through the
region.
Filling arises from several sources. Filling occurs in response to water
surface elevation differences (or head differences) between the ocean and
bay at each of the passes that connect the two water bodies. Filling also
occurs in response to overflow of adjacent barrier islands during extreme
surge levels. Head differences are primarily caused by the surge
forerunner and increased ocean surge associated with arrival of the
storm’s core winds. The tilting of the water surface within the bay occurs
in response to local wind speed and direction, with a setup in water surface
on the downwind side of the bay and possibly a set-down in water surface
on the upwind side.
There is feedback between filling and tilting of the water surface, and the
interactions are complex. Set-down is reduced within the bay if the filling
rate is large enough to fill the area where wind is acting to set down the
water surface. Also, the wind-induced tilting of the water surface within
the bay can influence the head difference between ocean and bay, thereby
affecting flow through the inlets, which in turn influences the filling rate.
The greater the head difference, the faster the rate of filling. The
magnitude of the water surface slope within the bay, i.e. the degree of
tilting, is dependent upon the amount of filling. The greater the water
depth in the bay, the less is the water surface slope induced by a certain
wind speed. Filling acts to increase water surface elevations throughout
the bay system, which reduces the degree of tilting of the water surface.
The tilting of the water surface within the bay responds rather quickly to
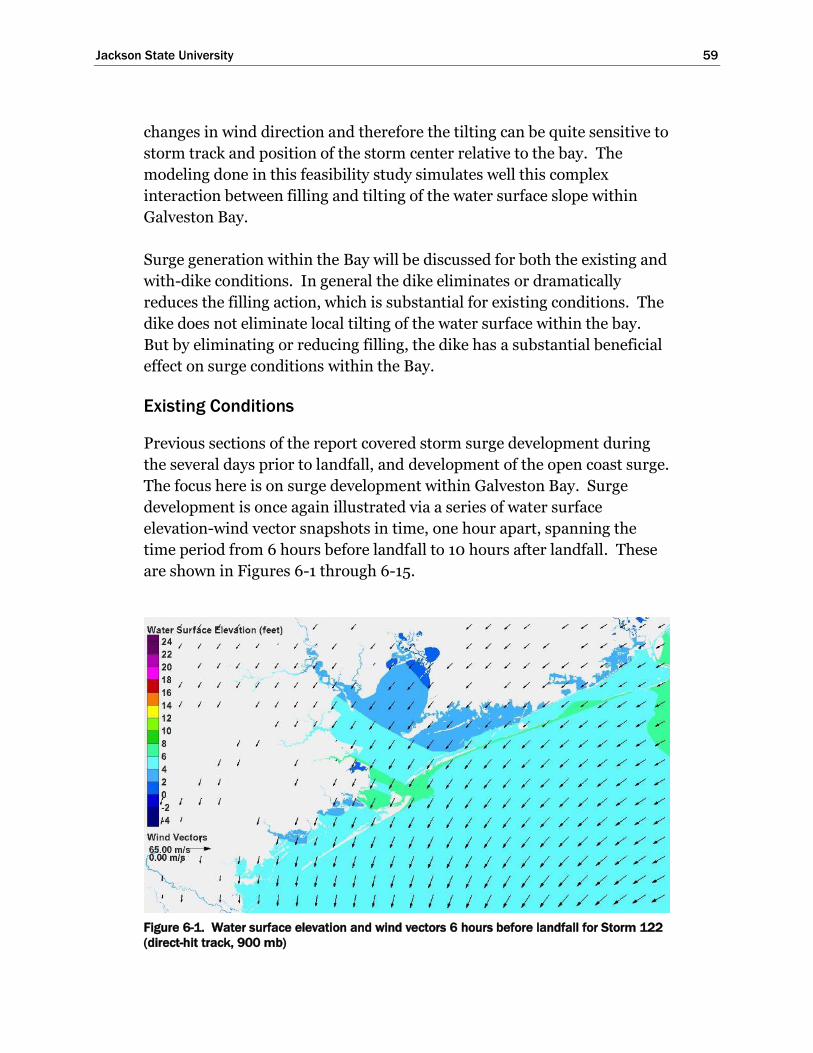
Jackson State University 59
changes in wind direction and therefore the tilting can be quite sensitive to
storm track and position of the storm center relative to the bay. The
modeling done in this feasibility study simulates well this complex
interaction between filling and tilting of the water surface slope within
Galveston Bay.
Surge generation within the Bay will be discussed for both the existing and
with-dike conditions. In general the dike eliminates or dramatically
reduces the filling action, which is substantial for existing conditions. The
dike does not eliminate local tilting of the water surface within the bay.
But by eliminating or reducing filling, the dike has a substantial beneficial
effect on surge conditions within the Bay.
Existing Conditions
Previous sections of the report covered storm surge development during
the several days prior to landfall, and development of the open coast surge.
The focus here is on surge development within Galveston Bay. Surge
development is once again illustrated via a series of water surface
elevation-wind vector snapshots in time, one hour apart, spanning the
time period from 6 hours before landfall to 10 hours after landfall. These
are shown in Figures 6-1 through 6-15.
Figure 6-1. Water surface elevation and wind vectors 6 hours before landfall for Storm 122
(direct-hit track, 900 mb)

Jackson State University 60
Figures 6-1 through 6-3 show the water surface slope within the bay, or
tilt, increasing as the storm moves closer and wind speeds increase. Wind
sets up the water surface in the southwest corner of the bay. Filling of the
bay through the passes by the forerunner has raised the water surface
throughout the entire bay. Flow over the low barrier islands has begun.
Figure 6-2. Water surface elevation and wind vectors 3 hours before landfall for Storm 122
(direct-hit track, 900 mb)
Figure 6-3. Water surface elevation and wind 2 hours before landfall for Storm 122 (direct-
hit track, 900 mb)

Jackson State University 61
In Figures 6-4 and 6-5, near landfall, filling due to barrier island overflow
continues. The open coast surge of 18 ft has overwhelmed Bolivar
Peninsula; surge of 8 to 14 ft has overwhelmed most of Galveston Island.
Once overtopped, barrier island overflow is the predominant source of bay
filling. Local wind setup continues, building surge at Texas City and
Galveston.
Figure 6-4. Water surface elevation and wind vectors 1 hour before landfall for Storm 122
(direct-hit track, 900 mb)

Jackson State University 62
Figure 6-5. Water surface elevation and wind vectors at landfall for Storm 122 (direct-hit
track, 900 mb)
The water surface slope within the Bay is changing. Figures 6-6 through
6-7 show the shifting wind pattern. In a matter of hours, winds have
quickly shifted from the northeast, then from the east, then the southeast,
then from the south. Winds are blowing onshore, strongly driving the
water farther inland, toward the northwest inside the bay. Surge is 13 to 15
feet along the western shoreline of the Bay and at Galveston.
Figure 6-6. Water surface elevation and wind vectors 1 hour after landfall for Storm 122
(direct-hit track, 900 mb)

Jackson State University 63
Figure 6-7. Water surface elevation and wind vectors 2 hours after landfall for Storm 122
(direct-hit track, 900 mb)
Figures 6-8 and 6-9 show the surge 3 to 4 hours after landfall. The eye is
moving through the Houston area. Winds from the south persist, pushing
water that has accumulated within the Bay to the north. Surge is building
in the upper reaches of Galveston Bay and the Houston Ship Channel.
Surge is already subsiding at the coast and lower parts of the Bay.
Figure 6-8. Water surface elevation and wind vectors 3 hours after landfall for Storm 122
(direct-hit track, 900 mb)
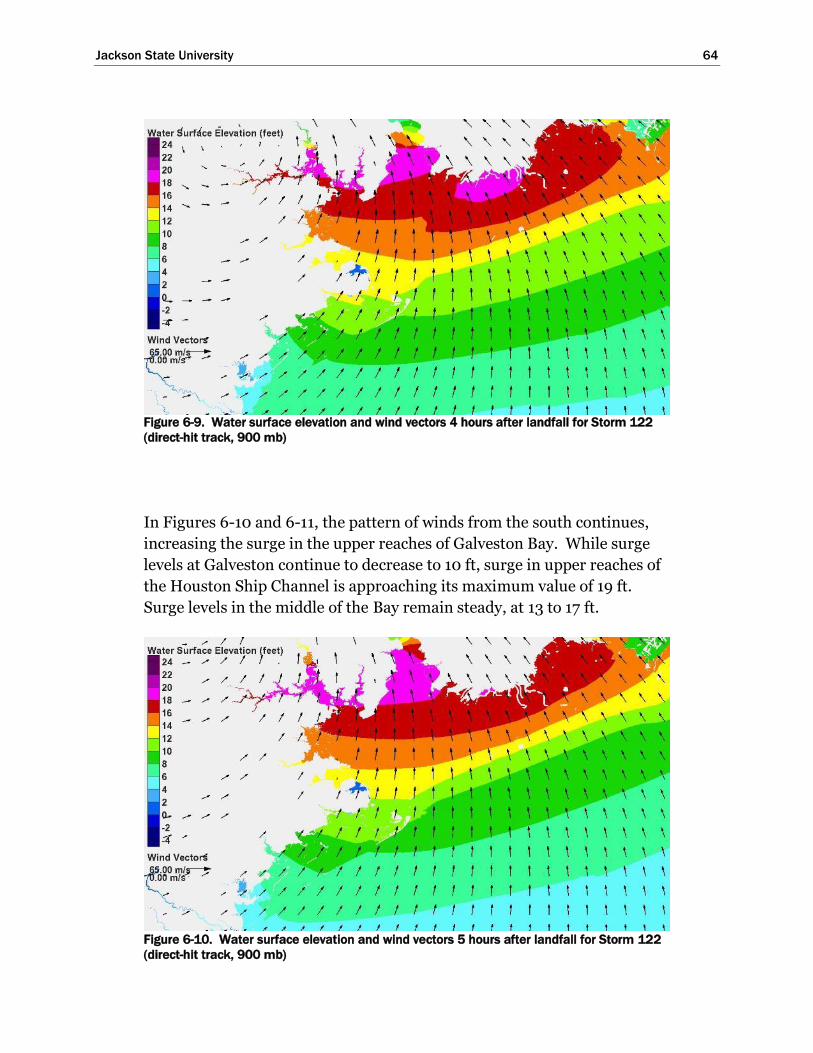
Jackson State University 64
Figure 6-9. Water surface elevation and wind vectors 4 hours after landfall for Storm 122
(direct-hit track, 900 mb)
In Figures 6-10 and 6-11, the pattern of winds from the south continues,
increasing the surge in the upper reaches of Galveston Bay. While surge
levels at Galveston continue to decrease to 10 ft, surge in upper reaches of
the Houston Ship Channel is approaching its maximum value of 19 ft.
Surge levels in the middle of the Bay remain steady, at 13 to 17 ft.
Figure 6-10. Water surface elevation and wind vectors 5 hours after landfall for Storm 122
(direct-hit track, 900 mb)

Jackson State University 65
Figure 6-11. Water surface elevation and wind vectors 6 hours after landfall for Storm 122
(direct-hit track, 900 mb)
Figures 6-12 and 6-13 show the storm surge field 7 and 8 hours after
landfall, respectively. Surges in the upper reaches of the Houston Ship
Channel have reached their peak and are beginning to subside. Winds
remain from the south but they are diminishing in strength. Surge within
the whole Houston-Galveston area is beginning to recede back over the
barrier islands and through the passes. Surge along the western bay is 11
to 15 ft.

Jackson State University 66
Figure 6-12. Water surface elevation and wind vectors 7 hours after landfall for Storm 122
(direct-hit track, 900 mb)
Figure 6-13. Water surface elevation and wind vectors 8 hours after landfall for Storm 122
(direct-hit track, 900 mb)
Continued recession of the surge is shown in Figures 6-14 and 6-15, 9 and
10 hours after landfall, respectively. Surges in the upper Bay and Houston
Ship Channel still exceed 14 ft. Surge along the west shoreline of the Bay
are 9 to 14 ft. Surge levels along the open coast have receded to 5 ft,
facilitating flow of water from the Bay back to the Gulf.

Jackson State University 67
Figure 6-14. Water surface elevation and wind vectors 9 hours after landfall for Storm 122
(direct-hit track, 900 mb)
Figure 6-15. Water surface elevation and wind vectors 10 hours after landfall for Storm 122
(direct-hit track, 900 mb)
Figure 6-16 shows the temporal variation of storm surge at five locations:
Galveston (Pleasure Pier) on the open coast, the Bay side of the City of
Galveston, just north of Texas City along the western Bay shoreline, the
Clear Lake area along the Bay shoreline, and in the upper reach of the
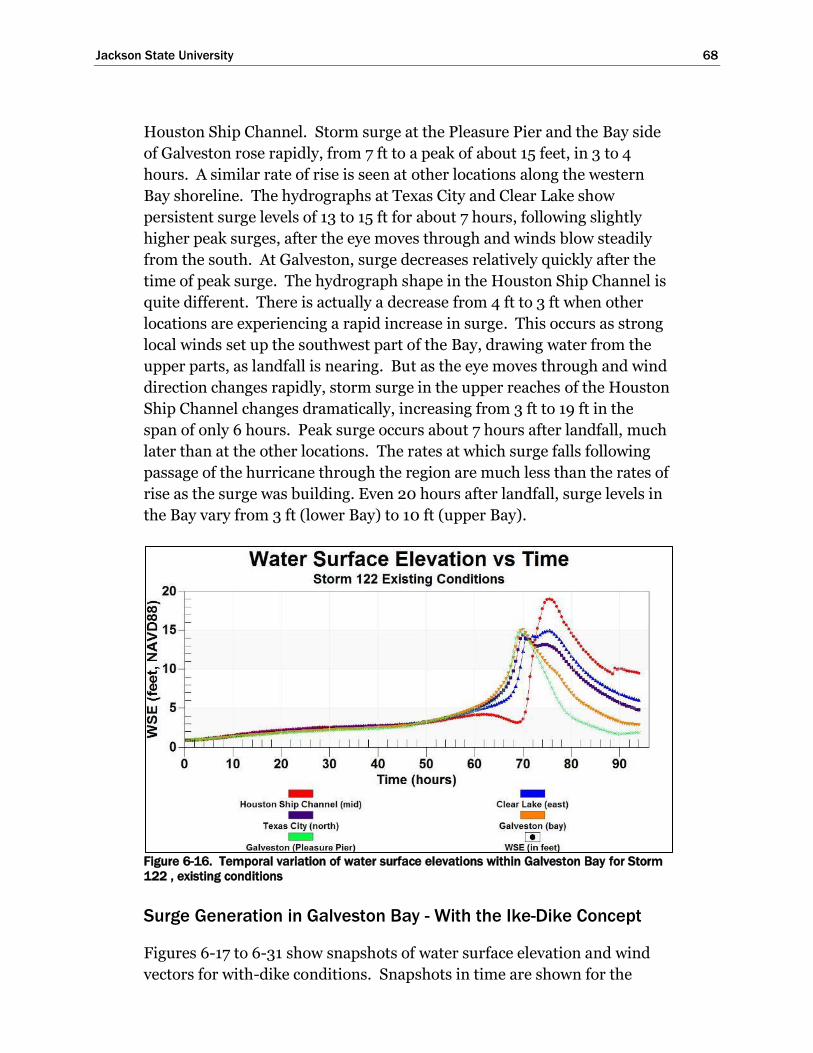
Jackson State University 68
Houston Ship Channel. Storm surge at the Pleasure Pier and the Bay side
of Galveston rose rapidly, from 7 ft to a peak of about 15 feet, in 3 to 4
hours. A similar rate of rise is seen at other locations along the western
Bay shoreline. The hydrographs at Texas City and Clear Lake show
persistent surge levels of 13 to 15 ft for about 7 hours, following slightly
higher peak surges, after the eye moves through and winds blow steadily
from the south. At Galveston, surge decreases relatively quickly after the
time of peak surge. The hydrograph shape in the Houston Ship Channel is
quite different. There is actually a decrease from 4 ft to 3 ft when other
locations are experiencing a rapid increase in surge. This occurs as strong
local winds set up the southwest part of the Bay, drawing water from the
upper parts, as landfall is nearing. But as the eye moves through and wind
direction changes rapidly, storm surge in the upper reaches of the Houston
Ship Channel changes dramatically, increasing from 3 ft to 19 ft in the
span of only 6 hours. Peak surge occurs about 7 hours after landfall, much
later than at the other locations. The rates at which surge falls following
passage of the hurricane through the region are much less than the rates of
rise as the surge was building. Even 20 hours after landfall, surge levels in
the Bay vary from 3 ft (lower Bay) to 10 ft (upper Bay).
Figure 6-16. Temporal variation of water surface elevations within Galveston Bay for Storm
122 , existing conditions
Surge Generation in Galveston Bay - With the Ike-Dike Concept
Figures 6-17 to 6-31 show snapshots of water surface elevation and wind
vectors for with-dike conditions. Snapshots in time are shown for the

Jackson State University 69
same times prior to, at, and after landfall as were shown in the previous
section. In general, the dike greatly reduces or eliminates flow over the
barrier islands, resulting in a significant reduction in storm surge within
the Bay. Barrier island overflow is the dominant contributor to filling
within the Bay for the existing condition. Some major storms overtop the
dike that is being considered at present, but that volume is considerably
less than the volume that can flow over the low barrier islands. The dike
does not alter wind fields within the Bay, however, so tilting of the water
surface by the wind within the Bay is not affected very much by the
presence of the dike.
Figure 6-17 shows conditions within the Bay 6 hours before landfall.
Persistent winds from the northeast set up the southwest corners of
Galveston and West Bays, as they have been doing prior to this time. In
the absence of a source of water to raise the Bay’s water level, the
northeast corner is being set down by the wind, i.e., negative water surface
elevations. Water is being pushed from Galveston Bay into West Bay,
subject to constrictions that impede the water from doing so.
Figure 6-17. Water surface elevation and wind vectors 6 hours before landfall for Storm
122 (direct-hit track, 900 mb)
Figures 6-18 and 6-19 show the storm approaching and wind speeds
within the Bay increasing. The increase in speed increases the water
surface slope, or tilt, within the Bays forcing water from the northeast

Jackson State University 70
parts of Galveston Bay to the southwest part and then into West Bay. The
tilting action is drawing water out of the upper reaches of the Houston
Ship Channel.
Figure 6-18. Water surface elevation and wind vectors 3 hours before landfall for Storm
122 (direct-hit track, 900 mb)
Figure 6-19. Water surface elevation and wind vectors 2 hours before landfall for Storm
122 (direct-hit track, 900 mb)
Figures 6-20 and 6-21 show conditions near landfall. The tilting action is
exacerbated by the higher wind speeds in the Bay. The surge at the

Jackson State University 71
southwest corner of Galveston Bay reaches 8 to 9 ft, some 7 ft less than for
existing conditions. The dike is being overtopped along Galveston Bay.
Figure 6-20. Water surface elevation and wind vectors 1 hour before landfall for Storm 122
(direct-hit track, 900 mb)
Figure 6-21. Water surface elevation and wind vectors at landfall for Storm 122 (direct-hit
track, 900 mb)

Jackson State University 72
Figures 6-22 and 6-23 show conditions just after landfall. Overflow
continues along Bolivar Peninsula; no overflow is occurring along
Galveston Island. Winds are shifting rapidly, and water is being driven to
the northern parts of the Bay and into the upper reaches of the Houston
Ship Channel. Surge on the Bay side of Galveston has reached its peak of 8
to 10 ft.
Figure 6-22. Water surface elevation and wind vectors 1 hour after landfall for Storm 122
(direct-hit track, 900 mb)
Figure 6-23. Water surface elevation and wind vectors 2 hours after landfall for Storm 122
(direct-hit track, 900 mb)
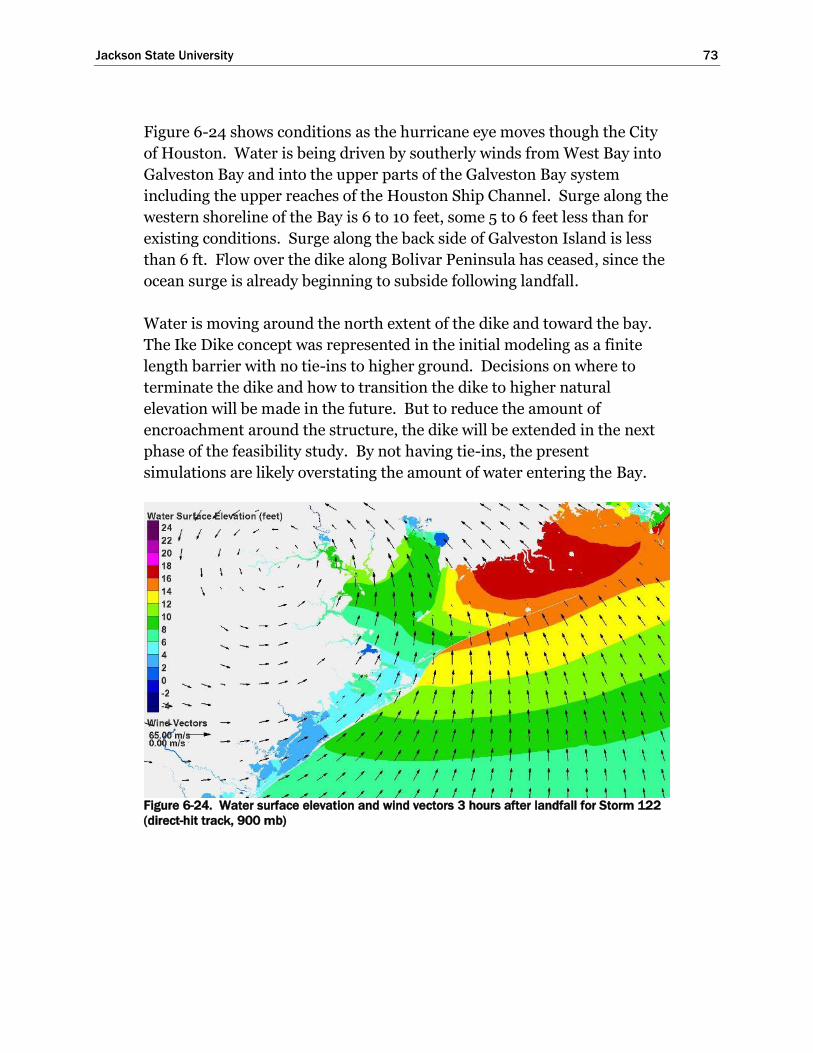
Jackson State University 73
Figure 6-24 shows conditions as the hurricane eye moves though the City
of Houston. Water is being driven by southerly winds from West Bay into
Galveston Bay and into the upper parts of the Galveston Bay system
including the upper reaches of the Houston Ship Channel. Surge along the
western shoreline of the Bay is 6 to 10 feet, some 5 to 6 feet less than for
existing conditions. Surge along the back side of Galveston Island is less
than 6 ft. Flow over the dike along Bolivar Peninsula has ceased, since the
ocean surge is already beginning to subside following landfall.
Water is moving around the north extent of the dike and toward the bay.
The Ike Dike concept was represented in the initial modeling as a finite
length barrier with no tie-ins to higher ground. Decisions on where to
terminate the dike and how to transition the dike to higher natural
elevation will be made in the future. But to reduce the amount of
encroachment around the structure, the dike will be extended in the next
phase of the feasibility study. By not having tie-ins, the present
simulations are likely overstating the amount of water entering the Bay.
Figure 6-24. Water surface elevation and wind vectors 3 hours after landfall for Storm 122
(direct-hit track, 900 mb)

Jackson State University 74
Figures 6-25 and 6-26, 4 and 5 hours after landfall, respectively, show
persistent winds from the south as the hurricane moves out of the region.
Surge has reached its maximum in the upper Houston Ship Channel,
nearly 13 ft, some 6 feet less than for existing conditions. Surges along the
western shoreline of Galveston Bay also have peaked but are stationary.
Figure 6-25. Water surface elevation and wind vectors 4 hours after landfall for Storm 122
(direct-hit track, 900 mb)
Figure 6-26. Water surface elevation and wind vectors 5 hours after landfall for Storm 122
(direct-hit track, 900 mb)

Jackson State University 75
Figures 6-27 through 6-31 show persistent surge levels along the western
shoreline of the Bay, and decreasing surge in the upper Houston Ship
Channel. Water that encroached around the northern extent of the dike is
moving into the Bay and acting to fill it. This is an artifact of not having
tie-ins of the dike to higher ground.
Figure 6-27. Water surface elevation and wind vectors 6 hours after landfall for Storm 122
(direct-hit track, 900 mb)

Jackson State University 76
Figure 6-28. Water surface elevation and wind vectors 7 hours after landfall for Storm 122
(direct-hit track, 900 mb)
Figure 6-29. Water surface elevation and wind vectors 8 hours after landfall for Storm 122
(direct-hit track, 900 mb)
Figure 6-30. Water surface elevation and wind vectors 9 hours after landfall for Storm 122
(direct-hit track, 900 mb)
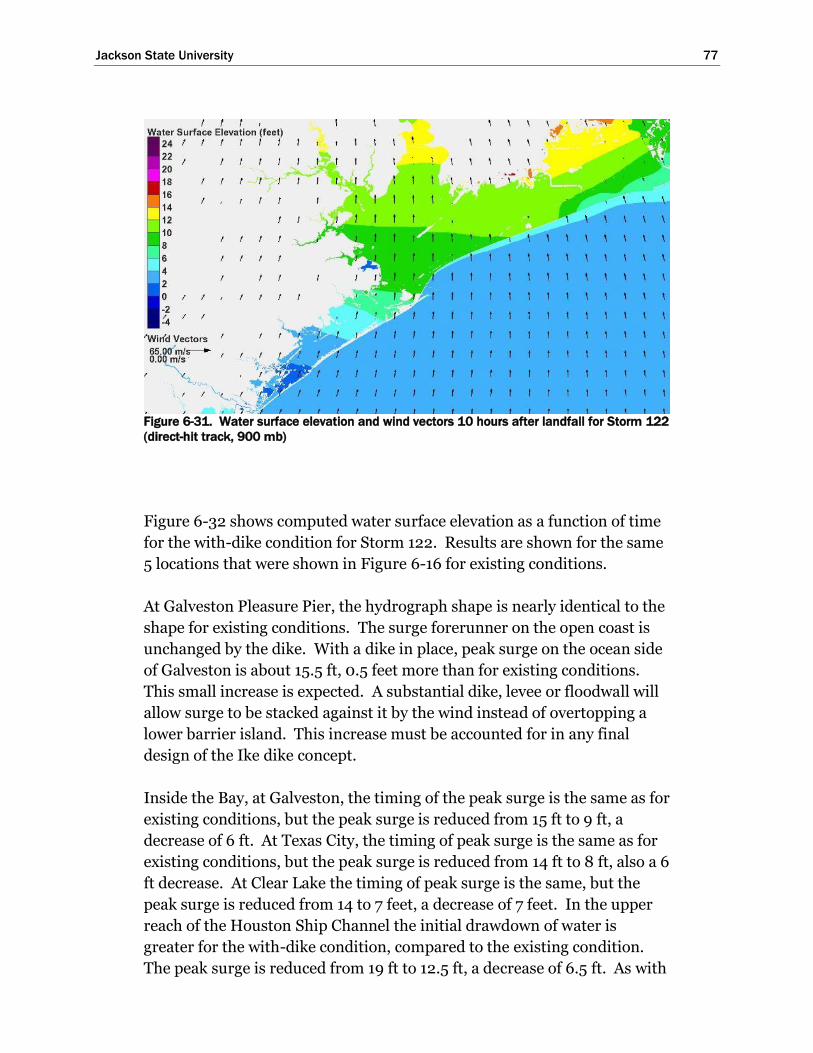
Jackson State University 77
Figure 6-31. Water surface elevation and wind vectors 10 hours after landfall for Storm 122
(direct-hit track, 900 mb)
Figure 6-32 shows computed water surface elevation as a function of time
for the with-dike condition for Storm 122. Results are shown for the same
5 locations that were shown in Figure 6-16 for existing conditions.
At Galveston Pleasure Pier, the hydrograph shape is nearly identical to the
shape for existing conditions. The surge forerunner on the open coast is
unchanged by the dike. With a dike in place, peak surge on the ocean side
of Galveston is about 15.5 ft, 0.5 feet more than for existing conditions.
This small increase is expected. A substantial dike, levee or floodwall will
allow surge to be stacked against it by the wind instead of overtopping a
lower barrier island. This increase must be accounted for in any final
design of the Ike dike concept.
Inside the Bay, at Galveston, the timing of the peak surge is the same as for
existing conditions, but the peak surge is reduced from 15 ft to 9 ft, a
decrease of 6 ft. At Texas City, the timing of peak surge is the same as for
existing conditions, but the peak surge is reduced from 14 ft to 8 ft, also a 6
ft decrease. At Clear Lake the timing of peak surge is the same, but the
peak surge is reduced from 14 to 7 feet, a decrease of 7 feet. In the upper
reach of the Houston Ship Channel the initial drawdown of water is
greater for the with-dike condition, compared to the existing condition.
The peak surge is reduced from 19 ft to 12.5 ft, a decrease of 6.5 ft. As with

Jackson State University 78
the existing condition, the rate of rise in surge in the upper Houston Ship
Channel is rapid, increasing from -2 ft to +13 ft, a change of 15 ft, in only 2
to 3 hours. The timing of peak surge is the same.
The elevated water levels evident late in the hydrograph are primarily an
artifact due to encroachment of the surge around the north end of the dike,
allowing a large amount of water to enter the bay. The dike, as it’s initially
represented and implemented in the modeling, holds the water inside the
Bay. In actuality the dike would be built with lateral terminations, or tie-
ins to higher ground, that would prevent or substantially reduce surge
encroachment around the end of the dike. Gates would be built in the
passes and opened following passage of the storm to allow water to leave
the Bay and return to the ocean.
Figure 6-32. Temporal variation of water surface elevations within Galveston Bay for Storm
122, with-dike condition

Jackson State University 79
7 Influence of Storm Track on
Surge Development
Introduction
The influence of hurricane track on storm surge development was
examined by comparing surge generation for a single severe hurricane
approaching from each of three different approach directions: from the
south, from the south-southeast, and from the southeast. First, the
development of the surge forerunner was examined as a function of track,
then development of the surge associated with arrival of the storm’s
stronger core winds was examined.
For the forerunner analysis, three storms were selected from the
bracketing set that had the same values of minimum central pressure,
forward speed, and radius to maximum winds. Central pressure and
radius to maximum winds are generally considered to be the two most
important parameters that determine open coast surge amplitude and
peak surge for a particular coastal setting like the north Texas coast.
Bunpapong et al (1985) found that forward speed was important for this
region. One storm was selected from each of the three track groups
represented in the bracketing set; the three were chosen to have as similar
a landfall location as possible, subject to the constraint of having the same
hurricane parameters. The three storms selected were Storms 134, 122
(extensively described previously in this report) and 128. The forerunner
analysis considered the time period when the hurricane was well offshore
and the forerunner surge was building, up until a time that is 12 hours
before landfall.
Development of the storm surge associated with arrival of the core winds,
as a function of storm track, also was examined for each of the three
approach directions. For this analysis, three storms were selected that had
approximately the same landfall location, the same minimum central
pressure and the same radius to maximum winds. The storms selected for
this analysis were Storms 136, 122 and 128. Storm 136 has a different
forward speed compared to the others; however, the landfall location for
storm 136 is approximately 50 miles north of the landfall location for
Storm 134 and closer to the landfall location of the other two. The three
chosen storms make landfall along the upper half of Galveston Island.
Jackson State University 80
Forerunner Surge Development as a Function of Storm Track
Storms 134 (south), 122 (south-southeast) and 128 (southeast) were
compared to examine forerunner development. Each has a minimum
central pressure of 900 mb, a radius-to-maximum-winds of 17.7 n mi, and
a forward speed of 11 kts, and the same value of the Holland B parameter,
1.27, which controls the radial distribution of wind speed. The paths
through the Gulf for storms in each of the three directional groupings were
shown in Figure 7, and their individual paths in the Houston-Galveston
Region were shown in Figure 9.
Storm 128 originates within the Gulf, in deep water, west of the Florida
peninsula. From its time of origin, the storm immediately begins to move
across the Gulf until it makes landfall just south of Bolivar Roads 45 hrs
after its initiation. The storm had an initial central pressure of 980 mb,
and it begins to intensify immediately after its origin. Its central pressure
decreases rapidly to 960 mb after 3 hours, decreases to 930 mb during the
next 9 hrs, and then decreases to its minimum of 900 mb during the
following 9 hours. The storm maintains its minimum central pressure
until just before landfall, 24 hours later, when storm filling occurs the
storm weakens and central pressure increases.
Storm 122 originates just outside the Gulf, south of Cuba, and it enters the
Gulf near the northern limit of the Yucatan Straits. Its central pressure at
the time of origin is 980 mb. It starts moving on its track for 8 hrs while
maintaining the initial central pressure of 980 mb, before it begins to
intensify. Once intensification begins, the central pressure decreases to
960 mb over the next 7 hours, decreases to 930 mb over the ensuing 12
hrs, and decreases to its minimum pressure of 900 mb during the
following 12 hrs. The storm maintains its minimum central pressure until
just before landfall, 31 hours later.
Storm 134 originates on land near the Yucatan peninsula, with an initial
central pressure of 980 mb. For 28 hrs the hurricane remains stationary
with a central pressure of 980 mb. For the next 18 hours, while the storm
moves to the north, the central pressure remains at 980 mb. Then the
storm begins to intensify over the next 5 hours, with the central pressure
decreasing to 960 mb. During the next 6 hours the central pressure
decreases to 930 mb, and then 7 hours later decreases to its minimum
central pressure of 900 mb. The storm maintains its minimum pressure
until just before landfall, 31 hours later.

Jackson State University 81
From the time all three storms commence movement along their
respective tracks, Storm 122 is in motion for 70 hours and it has the
longest path to landfall. Storm 134 has a slightly shorter path, compared
to Storm 122, and it is in motion for 67 hours. Storm 128 takes the
shortest path to landfall, and it is in motion for 45 hours. Prior to landfall,
the durations for which each storm has a central pressure of 900 mb are:
31 hours for Storm 122, 31 hours for Storm 134, and 24 hours for Storm
128.
Figures 7-1 through 7-5 show snap-shots in time of water surface elevation
and wind vectors at different times prior to landfall. The snap-shots are
used to illustrate position of the storm and the evolution of the surge
forerunner. Forerunner amplitudes cited in the following discussion are
estimated visually from the graphical images. Computed time series of
water surface elevation, which characterize the forerunner amplitude more
accurately, are presented and discussed later.
Figure 7-1 shows results for Storms 134 and 122 60 hrs prior to each
storm’s landfall. Results are not shown for Storm 128, since its time of
origin was later and there is no snap-shot for this storm 60 hrs before
landfall. Storm 134 is just beginning its movement into the Gulf, and it is
undergoing intensification. Storm 128 has recently entered the Gulf and
also is experiencing intensification.
For both storms, the wind-induced surge forerunner has already started to
develop along the Louisiana and north Texas coasts. The magnitude of the
forerunner surge along the Louisiana and north Texas coasts is similar.
Near Galveston, the water surface elevation is approaching between 1 and
1.5 ft NAVD88 for both storms. The NAVD88 datum is the vertical datum
used for all references to water surface elevation; for the rest of this
chapter, the datum will be omitted from water surface elevation
references. Since the initial water surface elevation for all the hypothetical
storm simulations is 0.9 ft (about 0.4 ft above mean sea level), the
amplitude of the forerunner, relative to mean sea level, is between 0.1 and
0.6 ft.
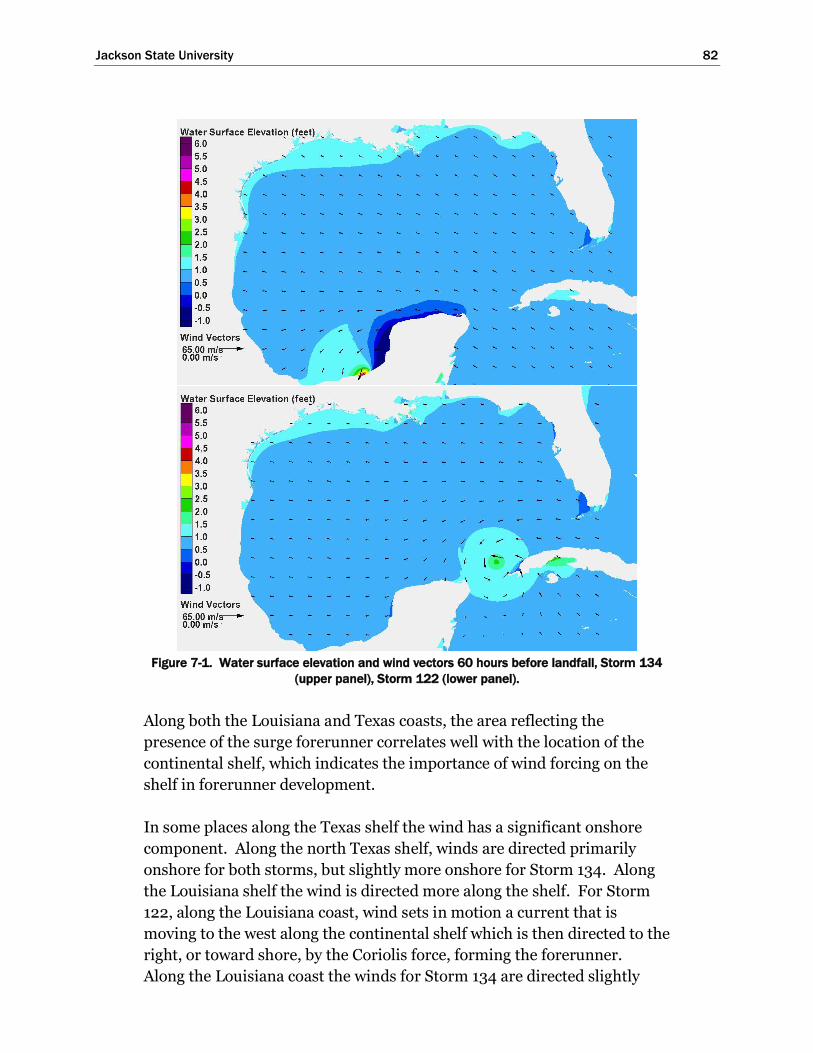
Jackson State University 82
Figure 7-1. Water surface elevation and wind vectors 60 hours before landfall, Storm 134
(upper panel), Storm 122 (lower panel).
Along both the Louisiana and Texas coasts, the area reflecting the
presence of the surge forerunner correlates well with the location of the
continental shelf, which indicates the importance of wind forcing on the
shelf in forerunner development.
In some places along the Texas shelf the wind has a significant onshore
component. Along the north Texas shelf, winds are directed primarily
onshore for both storms, but slightly more onshore for Storm 134. Along
the Louisiana shelf the wind is directed more along the shelf. For Storm
122, along the Louisiana coast, wind sets in motion a current that is
moving to the west along the continental shelf which is then directed to the
right, or toward shore, by the Coriolis force, forming the forerunner.
Along the Louisiana coast the winds for Storm 134 are directed slightly

Jackson State University 83
more onshore than they are for Storm 122, but they also have an
alongshore component. Onshore-directed winds of the same speed are
more effective in building the surge at the coast than are along-shore
directed winds of the same speed. However, the alongshore blowing winds
also set in motion a movement of water along the shelf from Louisiana
toward Texas which eventually increases the amount of water on the Texas
shelf that can be blown toward shore by the core winds of the hurricane.
Far-field winds that blow directly onshore would not tend to produce this
alongshore moving water. The amplitude of the surge forerunner along
the Texas coast is slightly larger for Storm 134 compared to Storm 122
because the winds are directed more onshore and because the alongshore
moving water on the shelf has not yet moved from Louisiana toward
Texas.
It is worth noting that in these simulations there is only one contributor to
winds in the Gulf, the hurricane itself, as simulated by the PBL model
which is an idealized wind model. In real situations, other weather
systems would be present and influence winds in the Gulf and on the shelf
as the hurricane either forms within the Gulf or enters the Gulf. These
other weather systems, and how they interact with an approaching
hurricane, will influence winds over the shelf (both speed and direction);
and therefore, they can influence development of the forerunner.
Generation of the forerunner by wind along the Louisiana and Texas
continental shelves will be strongly influenced by the local wind conditions
on these two shelves.
Figure 7-2 shows snap-shots for all three storms 48 hrs prior to landfall for
Storms 134 and 122. The snap shot for Storm 128 is actually taken slightly
later, 45 hours prior to landfall; it has just originated in the Gulf. All three
storms are intensifying at this stage in time. Storm 122 is the most intense
of the three, so its far field winds along the Texas and Louisiana coasts are
slightly greater. Winds along the Louisiana and Texas coasts are directed
more onshore for storm 134 compared to Storm 122. Wind is pushing
water along the coast, from Louisiana toward Texas, for both storms. The
amplitude of the surge forerunner along the north Texas coast, above the
initial mean water surface elevation used in the modeling, is similar for
Storm 122 compared to Storm 134, approximately 1 ft, but seemingly
slightly larger for storm 122. For Storm 128, which is the least intense
storm of the three at this time, the forerunner surge along the Louisiana
and Texas coasts is quite small.

Jackson State University 84
Figure 7-2. Water surface elevation and wind vectors 48/45 hours before landfall, Storm
134 (upper panel), Storm 122 (middle panel), Storm 128 (lower panel).

Jackson State University 85
The snap-shot for Storm 122 shows evidence of the volume-mode
contribution to the forerunner investigated by Bunpapong et al (1985); the
entire water surface within the Gulf is elevated for this storm, which was
not evident in results for the other two storms. Because they do not pass
through the ports leading to the Gulf, the volume mode contribution to the
forerunner for Storms 134 and 128 is expected to be less than the volume
model oscillation for Storm 122. Because Storm 122 is relatively weak
when it enters the Gulf, its volume model oscillation is expected to be
small.
Figure 7-3 shows snap-shots for all three storms 36 hrs prior to landfall for
each storm. Storm 122 is the most intense of the three at this stage as well;
Storm 128 is the least intense. The amount of water building beneath the
eye of the storm is a measure of storm intensity. The bulge of water under
the eye develops because of atmospheric pressure gradients. The lower the
central pressure in the eye the larger the spatial pressure gradients that act
to pus water toward the eye from all directions. Of the three storms the
bulge for Storm 122 is greatest, indicating its greater intensity (i.e., its
lower central pressure). None of the storms has yet reached its minimum
central pressure (or strongest winds).
Intensity affects the magnitude of the simulated far field winds as well as
the core winds. Winds for Storms 122 and 128 continue to be directed
more parallel to shore along the north Texas and Louisiana coasts,
pushing water along the shelf and toward the coastline by the Coriolis
force. Winds for Storm 134 are directed much more onshore, directly
pushing water up against the coastline. Both alongshore winds/water
movement (because of the Coriolis force) and onshore winds/water
movement act to increase the water surface elevation at the coast
At the time shown in Figure 7-3, Storm 122 has the largest surge
forerunner. The forerunner amplitude for Storm 134 is only slightly less
and the forerunner for Storm 128 is the smallest but is developing. The
forerunner amplitude near the Galveston region is between 1 and 1.5 ft for
Storms 122 and 134. Even though Storm 122 is more intense and has been
since its inception, creating stronger winds along the shelves, the onshore
directed far field winds of Storm 134 still produces a significant
forerunner.
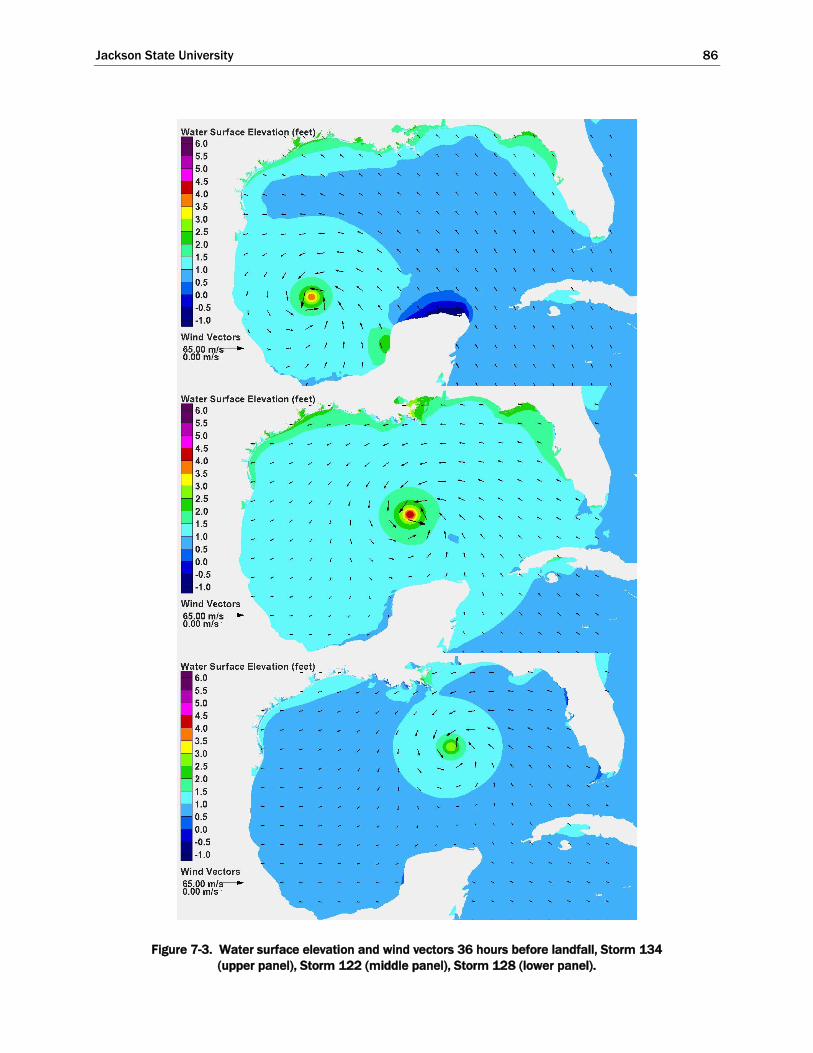
Jackson State University 86
Figure 7-3. Water surface elevation and wind vectors 36 hours before landfall, Storm 134
(upper panel), Storm 122 (middle panel), Storm 128 (lower panel).
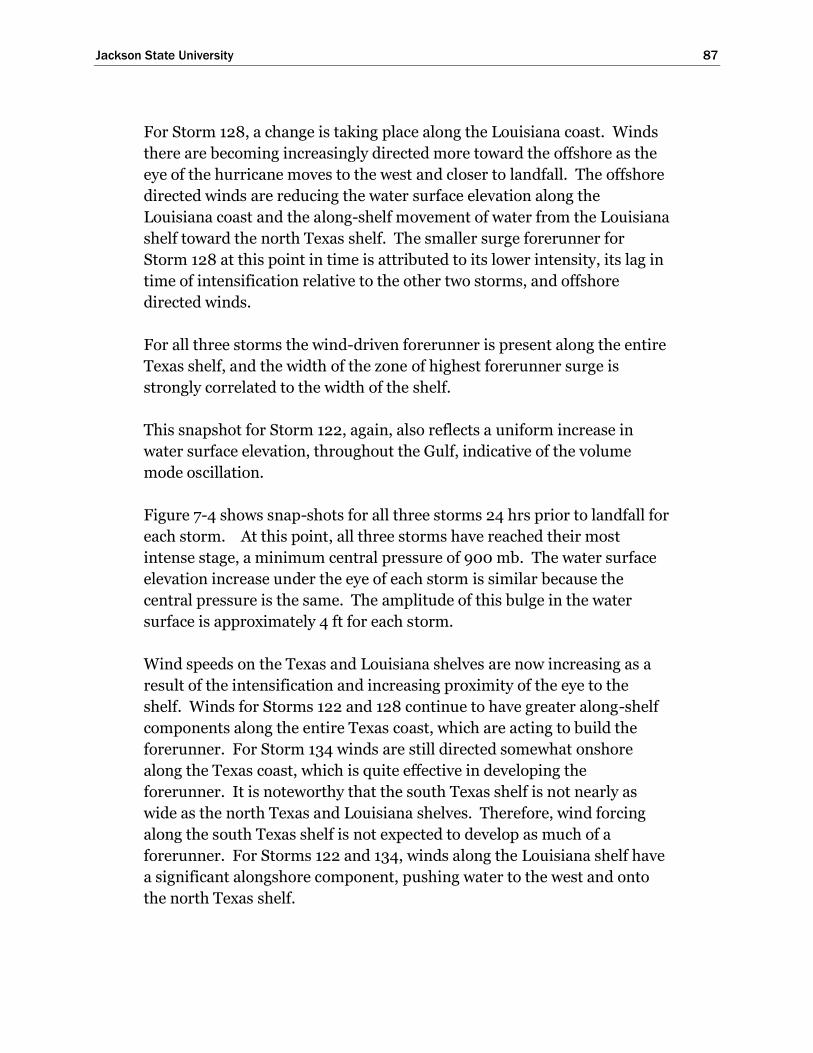
Jackson State University 87
For Storm 128, a change is taking place along the Louisiana coast. Winds
there are becoming increasingly directed more toward the offshore as the
eye of the hurricane moves to the west and closer to landfall. The offshore
directed winds are reducing the water surface elevation along the
Louisiana coast and the along-shelf movement of water from the Louisiana
shelf toward the north Texas shelf. The smaller surge forerunner for
Storm 128 at this point in time is attributed to its lower intensity, its lag in
time of intensification relative to the other two storms, and offshore
directed winds.
For all three storms the wind-driven forerunner is present along the entire
Texas shelf, and the width of the zone of highest forerunner surge is
strongly correlated to the width of the shelf.
This snapshot for Storm 122, again, also reflects a uniform increase in
water surface elevation, throughout the Gulf, indicative of the volume
mode oscillation.
Figure 7-4 shows snap-shots for all three storms 24 hrs prior to landfall for
each storm. At this point, all three storms have reached their most
intense stage, a minimum central pressure of 900 mb. The water surface
elevation increase under the eye of each storm is similar because the
central pressure is the same. The amplitude of this bulge in the water
surface is approximately 4 ft for each storm.
Wind speeds on the Texas and Louisiana shelves are now increasing as a
result of the intensification and increasing proximity of the eye to the
shelf. Winds for Storms 122 and 128 continue to have greater along-shelf
components along the entire Texas coast, which are acting to build the
forerunner. For Storm 134 winds are still directed somewhat onshore
along the Texas coast, which is quite effective in developing the
forerunner. It is noteworthy that the south Texas shelf is not nearly as
wide as the north Texas and Louisiana shelves. Therefore, wind forcing
along the south Texas shelf is not expected to develop as much of a
forerunner. For Storms 122 and 134, winds along the Louisiana shelf have
a significant alongshore component, pushing water to the west and onto
the north Texas shelf.
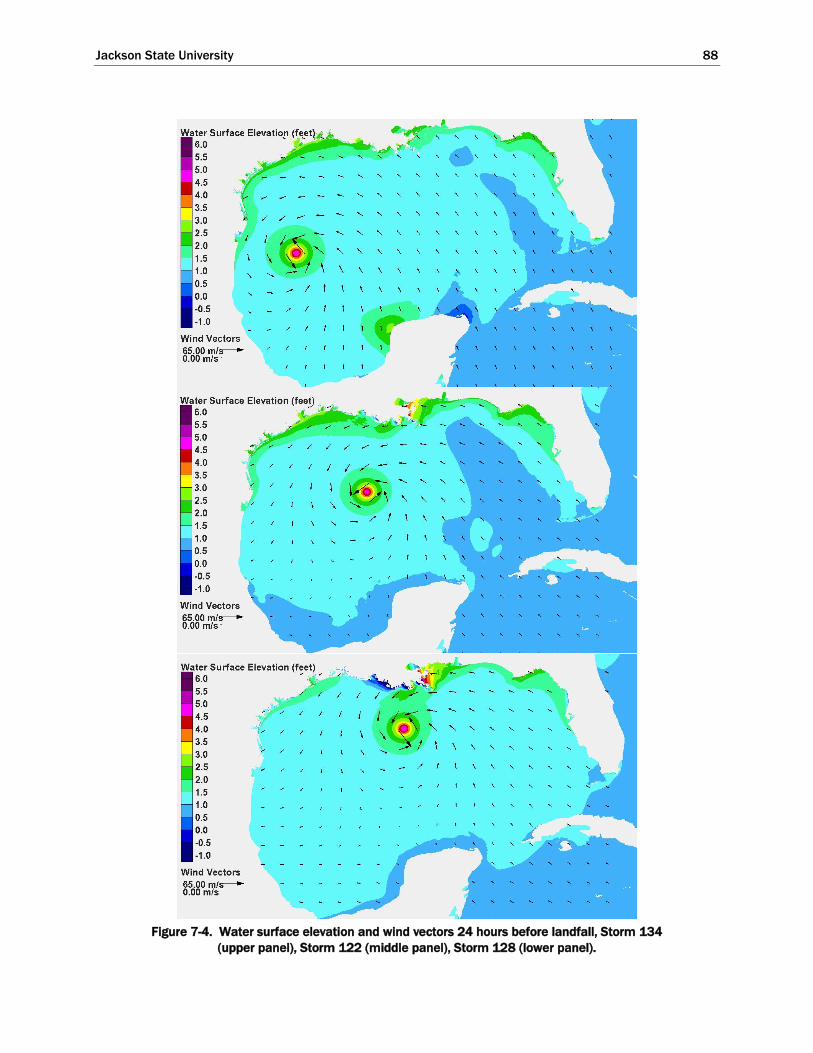
Jackson State University 88
Figure 7-4. Water surface elevation and wind vectors 24 hours before landfall, Storm 134
(upper panel), Storm 122 (middle panel), Storm 128 (lower panel).

Jackson State University 89
For Storm 128, winds are becoming stronger over the Louisiana shelf and
continue to be directed toward the offshore as the eye of the hurricane
moves to the west. Storm 128 winds are directed along the Texas shelf.
Since both onshore and alongshore winds act to develop the forerunner on
the Texas coast, all three storms are having this effect.
The closer proximity of Storm 134 to the south Texas coast, and the higher
winds over the Texas shelf, is resulting in a larger forerunner there
compared to the other storms. Storm 122 has the largest surge forerunner
along the Louisiana coast. Both Storms 122 and 134 have generated a
forerunner having a similar amplitude along the north Texas coast. The
forerunner for Storm 134 is only slightly less in these areas. The
forerunner amplitude near Galveston is between 1.5 and 2.0 ft for Storms
122 and 134.
The forerunner amplitude at the north Texas coast is smallest for Storm
128, approaching 1 ft. The offshore directed winds for Storm 128 are
setting down the water surface (negative water surface elevations) in
places along the Louisiana coast. Compared to Storms 122 and 134, the
wind pattern for Storm 128 significantly reduces the amount of water that
moves along the Louisiana and Texas shelves, which in turn reduces the
amplitude of the surge forerunner along the north Texas coast by reducing
the along-shelf movement of water from the Louisiana shelf toward the
Texas shelf.
For all three storms the wind-driven forerunner is present along the entire
Texas shelf, and the width of the zone of highest forerunner surge
continues to be strongly correlated to the width of the shelf. The close
proximity of Storm 134 to the south Texas coast means the surge
forerunner is most pronounced there due to the higher alongshore and
onshore winds.
Figure 7-5 shows snap-shots for all three storms 12 hrs prior to landfall for
each storm. All three storms are at their most intense state in terms of
central pressure and wind speeds.
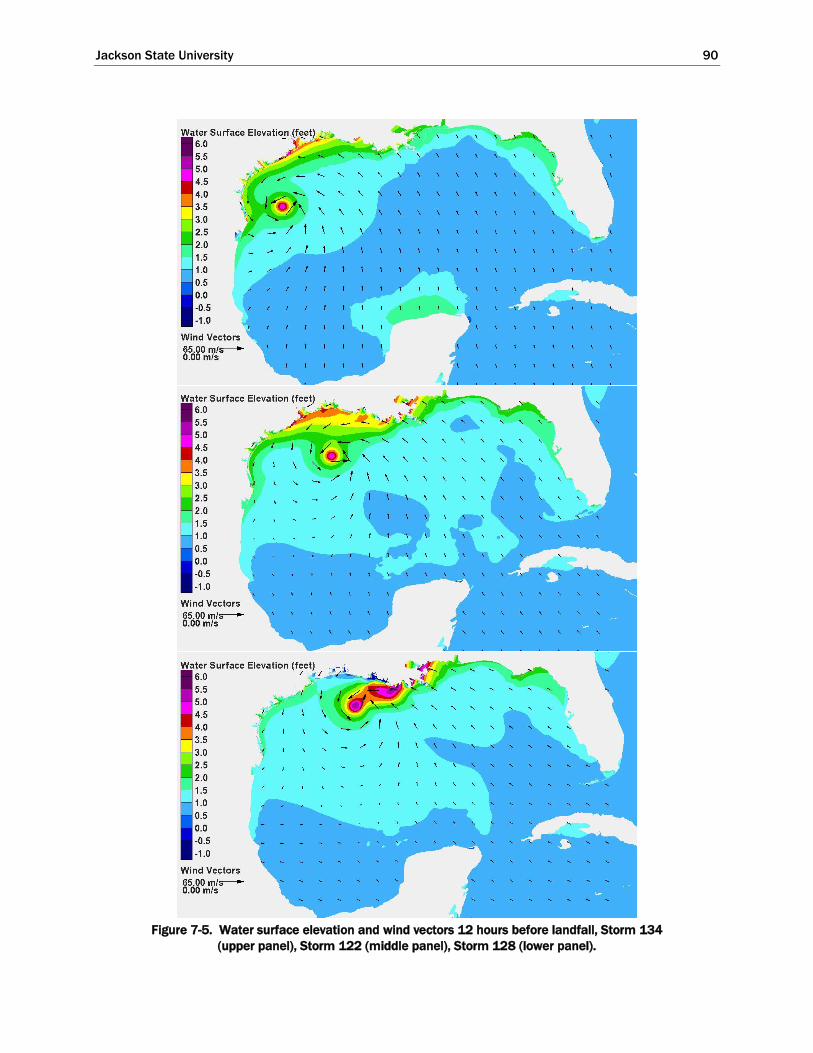
Jackson State University 90
Figure 7-5. Water surface elevation and wind vectors 12 hours before landfall, Storm 134
(upper panel), Storm 122 (middle panel), Storm 128 (lower panel).
Jackson State University 91
At this point, with the eyes closer to landfall, wind directions along the
north Texas coast are becoming different for each storm. For Storm 134,
winds are directed more onshore, winds for Storm 122 are directed more
alongshore, and winds for Storm 128 are directed more offshore.
Forerunner amplitude is increasing for Storms 134 and 122 along the
Louisiana and Texas coasts. Storm 122 has the largest surge forerunner
along the open coast, with considerable water being pushed from the
Louisiana shelf onto the Texas shelf. The forerunner amplitude near
Galveston is between 2.5 and 3.0 ft for Storms 122 and 134. For Storm
122, the along-shelf movement of water from Louisiana to Texas is greatest
and contributes to the higher forerunner surge along the north Texas
coast. Storms 122 and 134, and to a lesser degree Storm 128, are creating a
forerunner surge along the south Texas coast driven by the alongshore
movement of water and the Coriolis force. Again, because of the close
proximity of Storm 134 to the south Texas coast and the resulting higher
wind speeds, the surge forerunner there is most pronounced.
The forerunner amplitude for Storm 128 has reached its maximum near
Galveston and is beginning to decrease due to the pattern of offshore-
directed winds as the eye approaches. As Storm 128 moves closer to the
Houston-Galveston region, the offshore-directed winds begin to decrease
the forerunner surge along the north Texas coast. That trend will continue
until the core winds arrive on the shelf and increase the storm surge.
The surge response along the open north Texas coast is beginning to
change from forerunner dominance (caused by far field winds) to
dominance of the hurricane’s core winds. The close proximity of the eye
of Storm 122 to the shelf is beginning to force a much greater surge
response on the Louisiana shelf, pushing a considerable amount of water
toward the north Texas shelf. The eye from Storm 134 is farther from the
wider Louisiana and north Texas shelves, but the onshore directed winds
continue to build the forerunner. For Storm 128, winds along the north
Texas shelf are directed offshore, decreasing forerunner development.
At 12 hours prior to landfall, the eyes of the three hurricanes are still in
deep water but about to enter onto the continental shelf. Storm 128 is
closest, and strong winds are beginning to force a much greater surge
response on the Louisiana shelf.

Jackson State University 92
Development of Surge within the Bays Due to Forerunner
Propagation and Winds
Discussion now shifts to forerunner propagation through the passes that
connect the Gulf with the bays, and how surge response within the bays
develops as a function of bay filling associated with forerunner penetration
and local wind conditions. As was the case for the open coast, bay surge
response is strongly influenced by storm track because of the dependence
of wind direction on track. Figures 7-6 through 7-9 show the surge
forerunner response and wind conditions in the immediate Houston-
Galveston region for the same three storms (Storms 134, 122 and 128),
zooming in on the bays and nearshore coastal region. The figures show
snap-shots of water surface elevation (as color-filled contours) and wind
(as vectors) at times 48/45, 36, 24 and 12 hrs prior to landfall (45 for
Storm 128 which originated later than the others).
The snap-shots in Figure 7-6 are 48/45 hrs prior to landfall. Water
surface elevation along the open coast at the entrance to Galveston Bay is
between 1.5 and 2 ft for Storms 134 and 122, and a negligible amount for
Storm 128. Elevations inside both Galveston and West Bays are similar to
those in the Gulf, suggesting effective penetration of the forerunner into
both bays at this time. For Storm 134, winds are blowing approximately
onshore from the southeast, and for Storm 122 winds are blowing from
slightly south of east. Inside the bay, local winds are setting up the water
surface from southeast to northwest for Storm 134 and from east to west
for Storm 122, creating a tilt to the water surface in both cases. In
response to the local wind, water moves within the bays such that water
surface elevation contours are generally perpendicular to the wind
direction. A sloping water surface is evident having an increase from one
side of the bay to the other in the wind direction of approximately 1 ft.

Jackson State University 93
Figure 7-6. Water surface elevation and wind vectors 48/45 hours before landfall, Storm
134 (upper panel), Storm 122 (middle panel), Storm 128 (lower panel).

Jackson State University 94
A point at the center of Galveston Bay is reasonably indicative of the Bay’s
overall water surface elevation in that it removes the effect of the tilting
water surface. The water surface elevation in the middle of the bay is
between 1.5 and 2 ft for Storm 134 and nearly 2 ft for Storm 122, indicating
that the surge forerunner has effectively propagated into the bay and
raised the entire water level through this filling action. The forerunner
amplitude within the Bay is slightly greater for Storm 122, compared to
Storm 134. The local wind imposes a tilt to the water surface (setting it up
on downwind side and setting it down on the upwind side) that is
superimposed on the raised water level.
For Storm 134 in particular, winds blowing from the southeast tend to set
up the water surface along the open coast and the northwest part of
Galveston Bay and set down the water surface along the southeast side of
the Bay. This pattern of water surface elevation, for this wind direction,
will create a water surface elevation gradient, or head difference, across
the entrance pass at Bolivar Roads which will enhance propagation of the
forerunner into the Bay, i.e., it will enhance filling of the Bay. The same
process can occur at San Luis Pass.
F0r Storm 128, winds are still quite small within the Bay, so tilting of the
water surface is evident in Figure 7-6. The degree of tilting is a function of
the local wind speed within the Bay.
Figure 7-7 shows results for all three storms 36 hrs prior to landfall.
Within the Bay, winds for Storms 134 and 122 are still from different
directions. Wind direction for each storm is similar to what it was 12
hours earlier, so the general patterns of water surface tilting remain the
same as the previous snap-shot, although the magnitude is slightly greater.
For Storm 134, the open coast water surface elevation is a slightly greater
than 2 ft. The elevation in the middle of the bay appears to be about the
same or slightly higher. As discussed for the previous snap-shots,
southeasterly winds which are directed onshore give a “boost” to filling by
setting down the lower part of the Bay, which increases the head difference
across the pass.
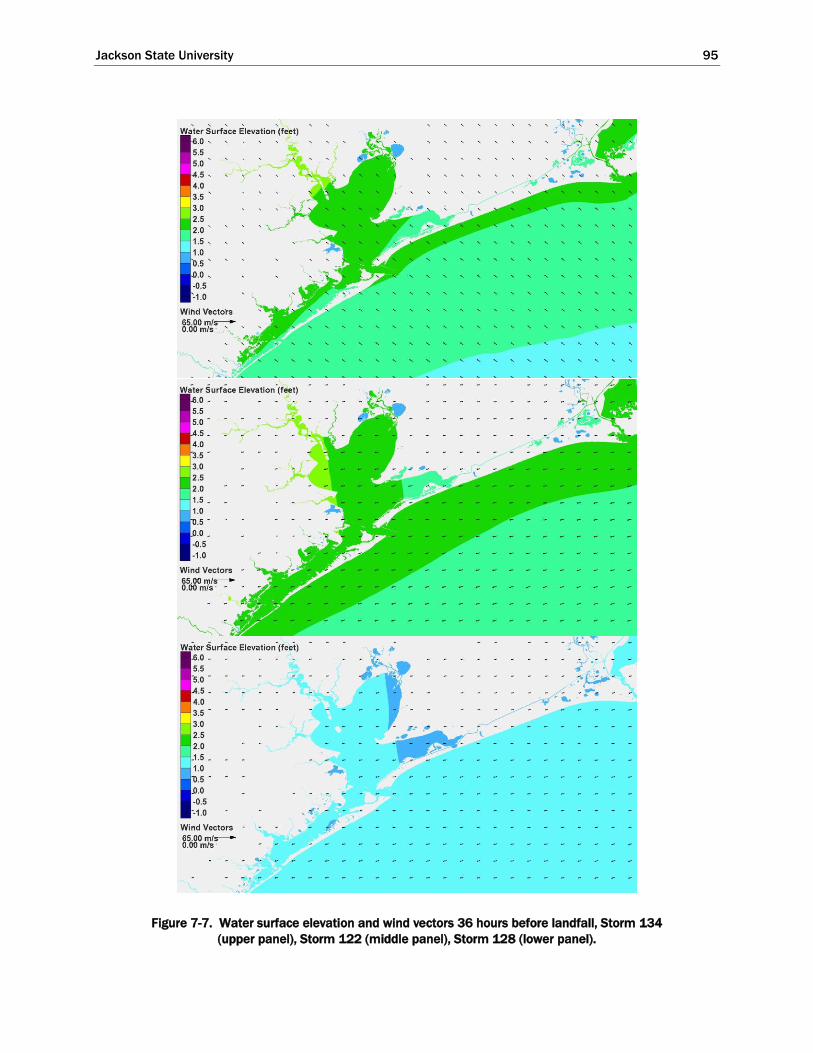
Jackson State University 95
Figure 7-7. Water surface elevation and wind vectors 36 hours before landfall, Storm 134
(upper panel), Storm 122 (middle panel), Storm 128 (lower panel).

Jackson State University 96
For Storm 122, the open coast water surface elevation at the entrance to
the Bay is greater than for Storm 134, closer to 2.5 ft. The water surface in
the middle of the Bay appears to be about the same for Storm 122, about
2.5 ft. The wind direction for Storm 122, winds from the east, does not
produce the same degree of enhanced filling as Storm 134. Winds from
the east tend to set up the western side of the Bay. Since Bolivar Roads is
situated closer to the west side of Galveston Bay, a higher wind setup there
reduces the head difference across Bolivar Roads pass, which in turn
reduces the filling rate. If the wind were blowing from the north the wind
setup on the south side of the Bay would be maximized, the head
difference across the pass would be minimized, and the filling rate through
the pass would be minimized.
For Storm 128, winds are also from the east, similar to Storm 122, and the
pattern of water surface tilt is similar. The higher winds for Storm 122
create a greater degree of tilt within the Bay. At this time before landfall,
Storms 122 and 134 have a greater intensity, i.e., higher wind speeds, than
Storm 128. The forerunner amplitude on the open coast is lower for Storm
128, so the degree of filling within the Bay is expected to be less.
Figure 7-8 shows results for each of the three storms 24 hrs prior to
landfall. The storms are closer to the coast so winds within the Bay are
stronger. Storm 128 has just reached its minimum central pressure of 900
mb, while the other two storms have been at their minimum central
pressure for 7 hours. Wind speeds in the Bay for the three storms are
similar and are shifting in the counterclockwise direction. For Storm 134,
winds are now blowing from the east-southeast; winds for Storm 122 are
blowing from the east-northeast; and winds for Storm 128 are blowing
from the northeast.
For all three storms, in response to the change in wind direction, the
pattern of water surface tilt has also changed. In each case, the contours of
constant water surface elevation within the Bay remain nearly
perpendicular to the wind direction. Water is moving within the bay in
response to the wind to create the water surface elevation gradient, or tilt.

Jackson State University 97
Figure 7-8. Water surface elevation and wind vectors 24 hours before landfall, Storm 134
(upper panel), Storm 122 (middle panel), Storm 128 (lower panel).

Jackson State University 98
It is important to note that wind effectively establishes the water surface
tilt throughout Galveston Bay, projecting the same tilting pattern into the
upper reaches of the Houston Ship Channel and into other estuaries. This
is the case for all three storms, and is seen in the water surface elevation
fields for all three.
The amplitude of the forerunner on the open coast is slightly greater for
Storm 122 than for Storm 134. The amplitude of the forerunner at the
coast for Storm 128 is 0.5 to 0.75 ft lower than for the other storms. The
water surface elevation in the middle of the Bay is still greatest for Storm
134, slightly more than the elevation for Storm 122. Storms approaching
from the south tend to increase propagation of the forerunner surge into
the Bay compared to tracks from the south-southeast and southeast.
The magnitude of the water surface tilt (the difference between water
surface elevations on opposite sides of the bay in the direction of the wind)
is similar for Storms 122 and 134, approximately 1.5 ft. However, the
water surface elevations are higher for Storm 134, compared to Storm 122,
because of the higher degree of Bay filling. The magnitude of the tilt for
Storm 128 is about 1 ft across the Bay, which is larger than the previous
snap-shot.
These snap-shots also illustrate a feature in the water surface slope within
West Bay that is worth noting. West Bay has been filling, just as Galveston
Bay has been filling, due to the open coast forerunner surge driving the
filling action. At this point, winds in West Bay have a significant easterly
component, more so for Storms 122 and 128, and less so but still present
for Storm 134. This easterly wind component is acting to set up the west
end of West Bay. It is also acting to enhance water movement from
Galveston Bay into West Bay, particularly for Storms 122 and 128, where
winds are blowing in the direction of the long axis. For all three storms,
there is some indication that the water surface elevation on the Bay side of
San Luis Pass is nearly the same or greater than the water surface
elevation on the Gulf side. Once the water surface elevation is greater on
the Bay side, water will actually start to flow back toward the Gulf through
San Luis Pass. This flow reversal might have implications for design and
operation of any gate at San Luis pass that is a structural component of the
Ike Dike concept.

Jackson State University 99
Figure 7-9 shows snapshots 12 hrs prior to landfall. At this point all three
storms have been at their most intense stage for 12 hrs for Storm 128 and
approximately 18 hrs for the other two storms. Winds are continuing to
shift direction with a counterclockwise rotation; winds are now blowing
from the east, northeast, and north-northeast for Storms 134, 122 and 128,
respectively.
The water surface in Galveston Bay responds predictably to the shift in
winds, moving quickly to establish contours of constant water surface
perpendicular to the wind direction. Wind speed is increasing as is the
magnitude of water surface slope in response to the higher winds.
The magnitude of the water surface tilt from one side of the bay to the
other, in the direction of the wind, is approximately 2 ft for Storms 134
and 122. The tilt for Storm 128 is now nearly the same as it is for the other
two storms, approximately 2 ft, because winds within the Bay are quite
similar for all three storms. For Storm 128, the northeast-most portion of
Galveston Bay (in Trinity Bay) is set down by the wind. The water surface
elevation here is approaching 0 ft NAVD88 which is about 0.5 ft below
mean tide level.
The degree of Bay filling, as estimated by the water surface elevation in the
middle of the Bay, is between 3.5 and 4 ft for Storm 134, approximately 3.5
for Storm 122, and between 1 and 1.5 ft for Storm 128. For Storm 128,
winds were blowing from the northeast 12 hrs earlier and are now blowing
from the north-northeast. Recall from the previous report section that this
wind direction is decreasing the amplitude of the surge forerunner along
the open coast. This trend is seen in the lower panel of Figure 7-9. Winds
from northerly directions set up the lower, or southern, portion of
Galveston Bay. The decreased open coast water surface elevation and the
higher elevation on the Bay side at Bolivar Roads due to wind setup both
act together to reduce filling of the Bay by reducing the head difference
across Bolivar Roads. These processes are key factors in reducing
forerunner penetration into Galveston Bay for storms that approach from
the southeast or from more easterly directions.

Jackson State University 100
Figure 7-9. Water surface elevation and wind vectors 12 hours before landfall, Storm 134
(upper panel), Storm 122 (middle panel), Storm 128 (lower panel).

Jackson State University 101
For all three storms, in response to the wind direction, the pattern of water
surface tilt in the coupled system is forcing water from Galveston Bay into
West Bay, and wind is setting up the west end of West Bay. The mean
water surface in West Bay is as high, or higher, than it is in Galveston Bay,
particularly for Storm 128. For all three storms, the water surface
elevation on the Bay side of San Luis Pass is higher than the elevation on
the Gulf side, causing water to flow toward the Gulf through the Pass.
To further support this surge forerunner analysis and to provide more
quantitative information on water surface elevations and forerunner
amplitude, water surface elevation time series were generated for all three
storms at the six locations shown in Figure 7-10. The six locations are: 1)
the open Gulf coast at Galveston Pleasure Pier, 2) the bay side of the City
of Galveston where West Bay meets Galveston Bay, which is also indicative
of the bay side of Bolivar Roads, 3) Texas City, 4) the entrance of the tidal
channel that leads to the Clear Lake area, 5) the upper Houston Ship
Channel, and 6) a point in the middle of Galveston Bay called Trinity Bay
(central). Trinity Bay is the large embayment on the northeast side of
Galveston Bay.
Figure 7-10. Locations of hydrographs considered in the analysis of forerunner development
as a function of storm track.
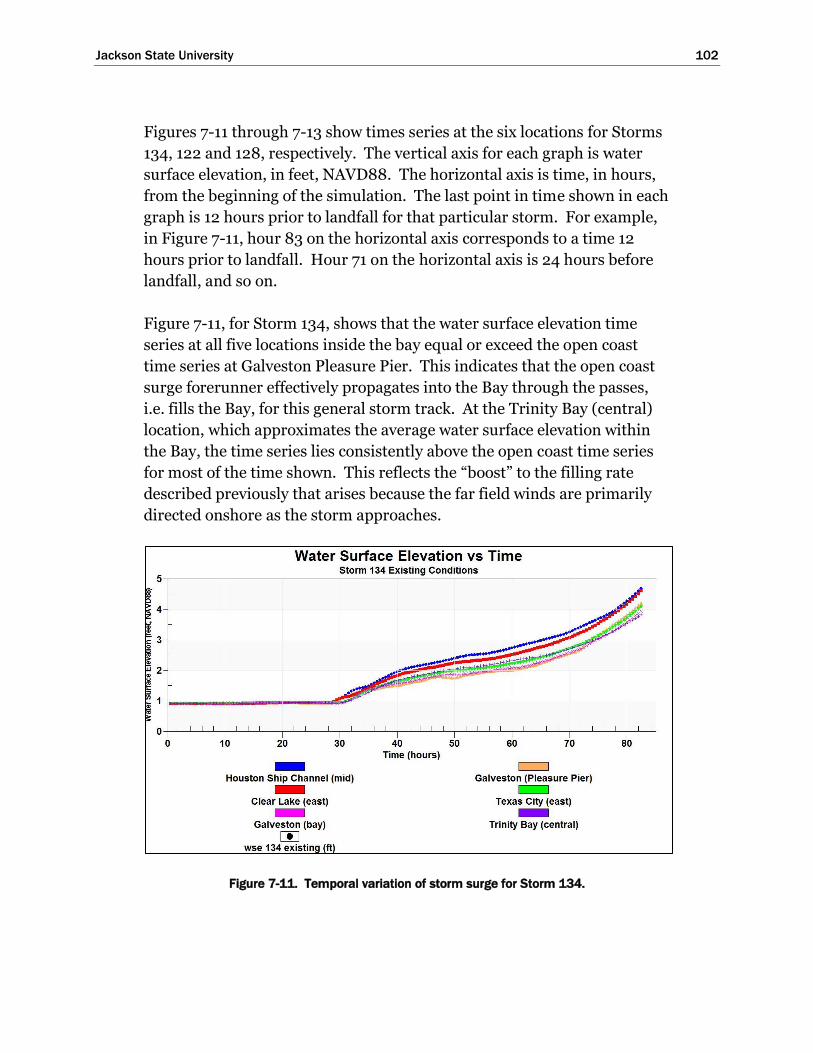
Jackson State University 102
Figures 7-11 through 7-13 show times series at the six locations for Storms
134, 122 and 128, respectively. The vertical axis for each graph is water
surface elevation, in feet, NAVD88. The horizontal axis is time, in hours,
from the beginning of the simulation. The last point in time shown in each
graph is 12 hours prior to landfall for that particular storm. For example,
in Figure 7-11, hour 83 on the horizontal axis corresponds to a time 12
hours prior to landfall. Hour 71 on the horizontal axis is 24 hours before
landfall, and so on.
Figure 7-11, for Storm 134, shows that the water surface elevation time
series at all five locations inside the bay equal or exceed the open coast
time series at Galveston Pleasure Pier. This indicates that the open coast
surge forerunner effectively propagates into the Bay through the passes,
i.e. fills the Bay, for this general storm track. At the Trinity Bay (central)
location, which approximates the average water surface elevation within
the Bay, the time series lies consistently above the open coast time series
for most of the time shown. This reflects the “boost” to the filling rate
described previously that arises because the far field winds are primarily
directed onshore as the storm approaches.
Figure 7-11. Temporal variation of storm surge for Storm 134.

Jackson State University 103
Twelve hours prior to landfall, the open coast surge forerunner at
Galveston Pleasure Pier has an amplitude of nearly 3.5 ft relative to mean
sea level, which corresponds to the water surface elevation of nearly 4 ft
NAVD88 seen at the end of the time series. This amplitude is nearly
identical to that in the middle of the bay at Trinity Bay (central). At 24
hours prior to landfall, the open coast forerunner has a smaller amplitude
of 2.1 ft, while the amplitude in the middle of the bay is about 0.2 ft higher,
2.3 ft.
Within the Bay, both the filling action and tilting action caused by local
wind contribute to the water surface elevations. Higher water surface
elevations are evident for locations in the upper parts of the Bay (including
the upper Houston Ship Channel and Clear Lake), with the highest being
in the upper reaches of the Channel. Lower water surface elevations are
seen for locations in the lower parts of the Bay (bay side of Galveston and
Texas City). This pattern is consistent with winds blowing from the
southeast, which occurred during much of the forerunner development
period of time.
Figure 7-12, for Storm 122, shows similar trends. The water surface
elevation time series at all five locations inside the Bay equal or exceed the
open coast time series at Galveston Pleasure Pier. For Storm 122 the open
coast surge forerunner also effectively propagates into the Bay through the
passes. For this and other storms on this general track, effective
propagation of the forerunner into the Bay is expected.
Within the Bay, both the filling action and tilting action caused by local
wind contribute to the water surface elevations. Higher water surface
elevations are evident for locations in the northwestern parts of the Bay
(including the upper Houston Ship Channel and Clear Lake), with those
two locations having nearly the same water surface elevations for much of
the forerunner development period. Compared to Storm 134, there is less
variation in the time series along the western side of the Bay. This
tendency is due to the prevalence of easterly winds, which tend to set up
the western side of the Bay where most of the monitoring locations are
situated.

Jackson State University 104
Figure 7-12. Temporal variation of storm surge for Storm 122.
In the middle of the Bay, the Trinity Bay (central) time series is very
similar to the open coast time series at Galveston Pleasure Pier. Storms on
this track do not appear to produce the “boost” in forerunner propagation
into the Bay that was observed for Storm 134.
For Storm 122, twelve hours prior to landfall, the open coast surge
forerunner at Galveston Pleasure Pier has an amplitude of 3.9 ft relative to
mean sea level (elevation of 4.4 ft NAVD88). This amplitude is
approximately 0.9 ft higher than the forerunner amplitude at Trinity Bay
(central). At 24 hours prior to landfall, the open coast forerunner has a
smaller amplitude of 2.1 ft, while the amplitude in the middle of the bay is
about 0.1 ft lower, 2 ft.
Figure 7-13, for Storm 128, shows very different trends in forerunner
propagation into the bay and evolution compared to Storms 134 and 122.
All the time series for Storm 128 show an initial build-up of the surge
forerunner, as did the other two storms. However, the trend of increasing
forerunner amplitude changes to a trend of decreasing amplitude about 20
hours prior to landfall. The exact time of change is a function of the
storm’s forward speed. As the storm on this track moves closer to shore,
winds begin to shift to northerly directions, diminishing the surge
forerunner amplitude and pushing water way from the coast.

Jackson State University 105
Figure 7-13. Temporal variation of storm surge for Storm 128.
For Storm 128 the forerunner amplitude on the open coast is greater than
the amplitude in the middle of the Bay for the entire duration of the storm.
This indicates a reduced capacity of the forerunner to penetrate into the
Bay through the passes. This behavior is caused by the easterly winds
(early) and northeasterly winds (later) which tend to set up the western
side of the Bay (early) and southwesterly side (later), where most of the
monitoring locations are situated. For this storm there is also much less
variation in the time series along the western side of the Bay, due to the
same prevailing wind directions. In the latter stages of forerunner
development, when winds are blowing more out of the north, water is
pulled from the upper reaches of that part of the Bay system.
Twelve hours prior to landfall, the open coast surge forerunner at
Galveston Pleasure Pier has an amplitude of 1.2 ft relative to mean sea
level. This amplitude is approximately 0.6 ft higher than the forerunner
amplitude at Trinity Bay (central) at the same time. At 24 hours prior to
landfall, the open coast forerunner has a higher amplitude of 1.4 ft, while
the amplitude in the middle of the bay is about a 0.2 ft lower, 1.2 ft.
Jackson State University 106
Galveston Bay Storm Surge Response to the Hurricane’s Core
Winds
For these three storms, until 12 hours prior to landfall, the surge
forerunner dictates surge development along both the open coast and
within Galveston and West Bays. As the storms move onto the continental
shelf the storm’s core winds, i.e., those winds closer to the eye particularly
on the right hand side where wind speeds are generally highest, begin to
dominate the surge development process. The temporal rate of change in
water surface elevation begins to increase; because, as the eye moves into
shallower water, winds become increasingly more effective in pushing
water. The effective surface wind stress in the water momentum balance is
inversely related to water depth. Therefore, for the same wind speed, the
effective wind stress is less in deeper water and greater in shallower water;
and it is greatest in the very shallow water of the nearshore coastal zone
and in the shallow bays.
Figures 7-14 through 7-22 show snap-shots in time for three storms from
the bracketing set. Storm 136 approaches from the south, Storm 122
approaches from the south-southeast, and Storm 128 approaches from the
southeast. Storm 136 was selected to represent storms approaching from
the south, instead of Storm 134 which was selected previously, because the
landfall location for storm 136 is closer to the landfall locations of the
other two storms. All three storms have the same minimum central
pressure (900 mb) and the same radius to maximum winds (17.7 n mi).
Storm 136 has a faster forward speed, 17 kts. Forward speeds for the
other two storms are 11 kts.
The snaps-shots show the water surface elevation field as filled color
contours and the wind field as black vectors, for the immediate Houston-
Galveston region. Note the change in water surface elevation scale for this
series of figures, compared to that used in the previous discussion of the
forerunner. A color bar scale that ranges from -4 to +24 ft is used in this
report section. Each figure contains three images. The top panels show
results for Storm 136, results for Storm 122 are shown in the middle panel,
and results for Storm 128 are shown in the bottom panel. Each figure
reflects a different point in time as the hurricane approaches the coast,
makes landfall, and then moves out of the Houston-Galveston region. This
analysis advances the progression in time from the point where it ended in
the previous report section, 12 hours before landfall. The first figure shows
results 6 hours prior to landfall and the last figure shows results 9 hours

Jackson State University 107
after landfall. The time increments between snap-shots are variable; they
are concentrated on times around landfall.
Figure 7-14 shows results 6 hrs prior to landfall. Wind speeds are
increasing as the eye moves closer to shore. For each of the storms, wind
directions are similar to what they were 6 hrs earlier; but they continue to
shift, rotating in the counterclockwise direction. At this point, in
Galveston Bay, winds for Storm 136 are blowing from the east-northeast,
winds for Storm 122 are blowing from the northeast, and winds for Storm
128 are blowing from the north-northeast.
For all three storms the higher wind speeds are creating a larger gradient,
or tilting, in the water surface. For Storm 136 the region of highest surge
within Galveston Bay is along the western shoreline, and the zone of
highest surge extends into the upper reaches of the Houston Ship Channel.
In West Bay the east-northeasterly winds set up the western side of the bay
and push water from Galveston Bay into West Bay. For the other two
storms, the zone of highest surge is at the southwest corner along the bay
side of the City of Galveston. This water surface pattern also acts to push
water from Galveston Bay into West Bay. For Storms 136 and 122, local
winds having a significant northerly component and they set down the
water surface in the upper reaches of the Channel. For all three storms,
the northeast part of Galveston Bay is being set down by the wind.
Figure 7-15 shows snap shots 3 hrs prior to landfall. The eye of the
hurricane is beginning to enter the image for all three storms. The
curvature of the wind field about the eye, associated with the
counterclockwise wind circulation in a hurricane, is evident for all three
storms. For Storm 136 (upper panel), winds in Galveston Bay are still
blowing from the east-northeast, which is producing the highest surges
within Galveston Bay along its western shoreline. Along this side of the
Bay, easterly winds are forcing a higher surge into the western reaches of
the Clear Lake and Dickinson areas, where wind is pushing water up into
the channels and estuaries, establishing the same water surface gradient
that is evident throughout the rest of the Bay. Increasing wind speeds
within the Bay are increasing the magnitude of the water surface elevation
gradient.
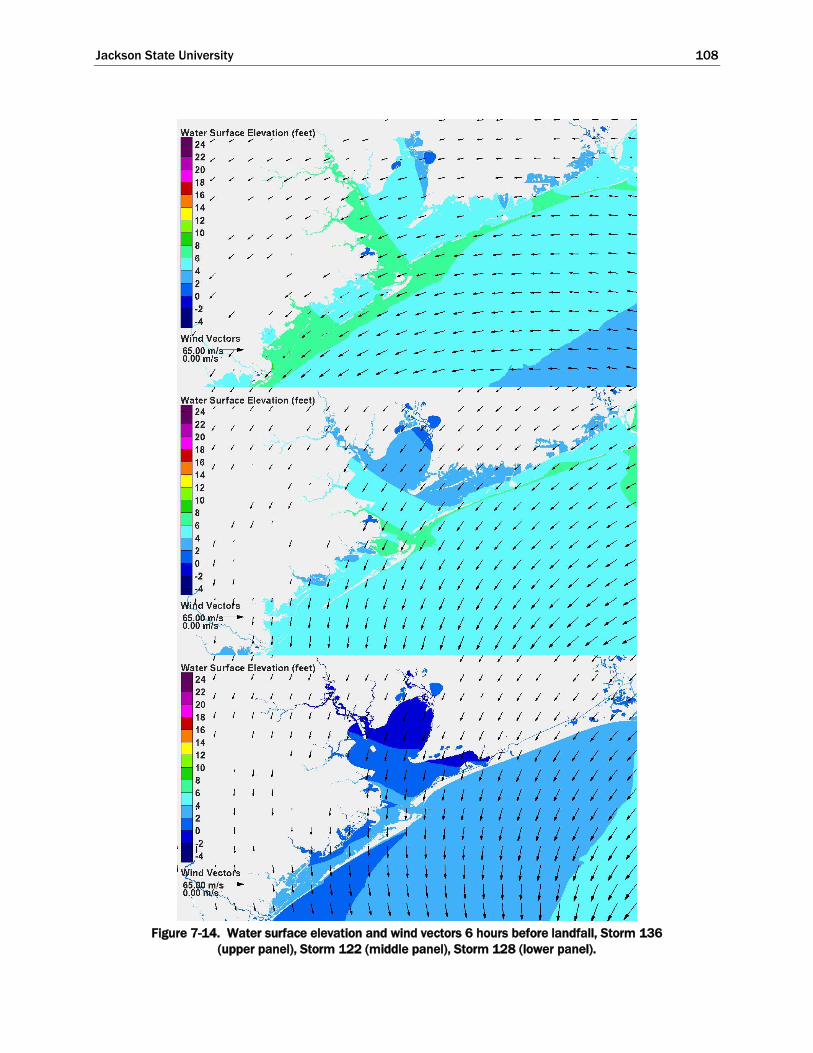
Jackson State University 108
Figure 7-14. Water surface elevation and wind vectors 6 hours before landfall, Storm 136
(upper panel), Storm 122 (middle panel), Storm 128 (lower panel).
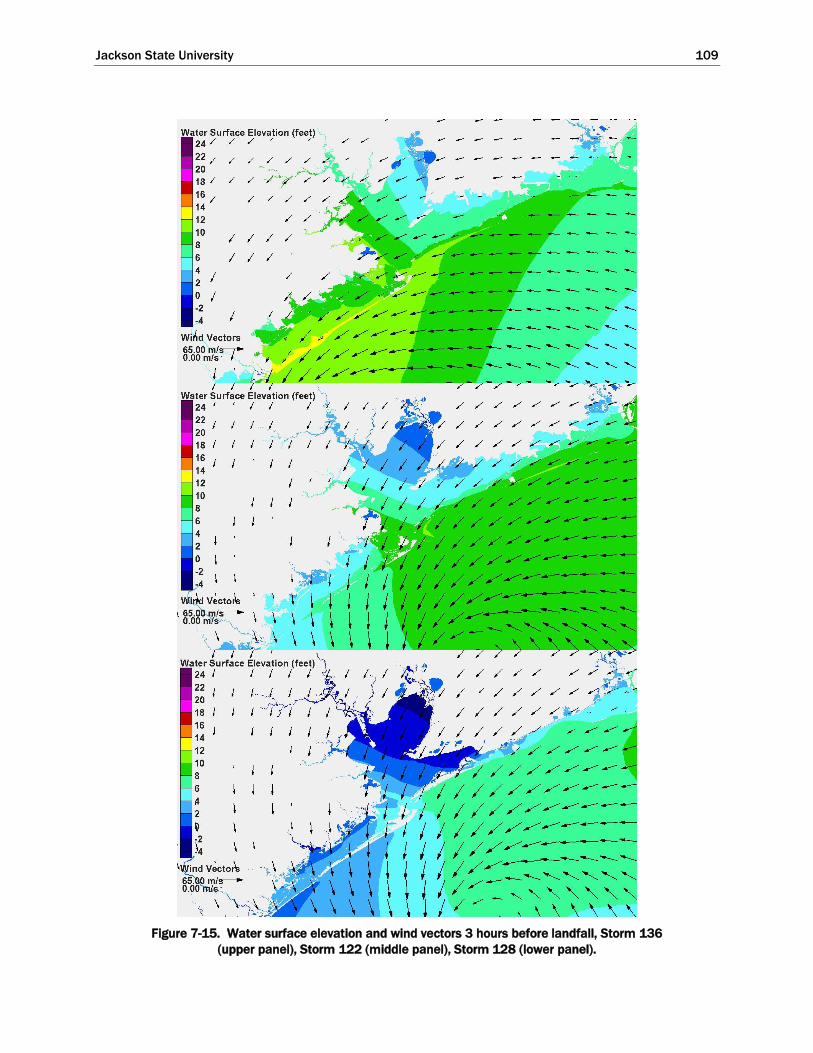
Jackson State University 109
Figure 7-15. Water surface elevation and wind vectors 3 hours before landfall, Storm 136
(upper panel), Storm 122 (middle panel), Storm 128 (lower panel).
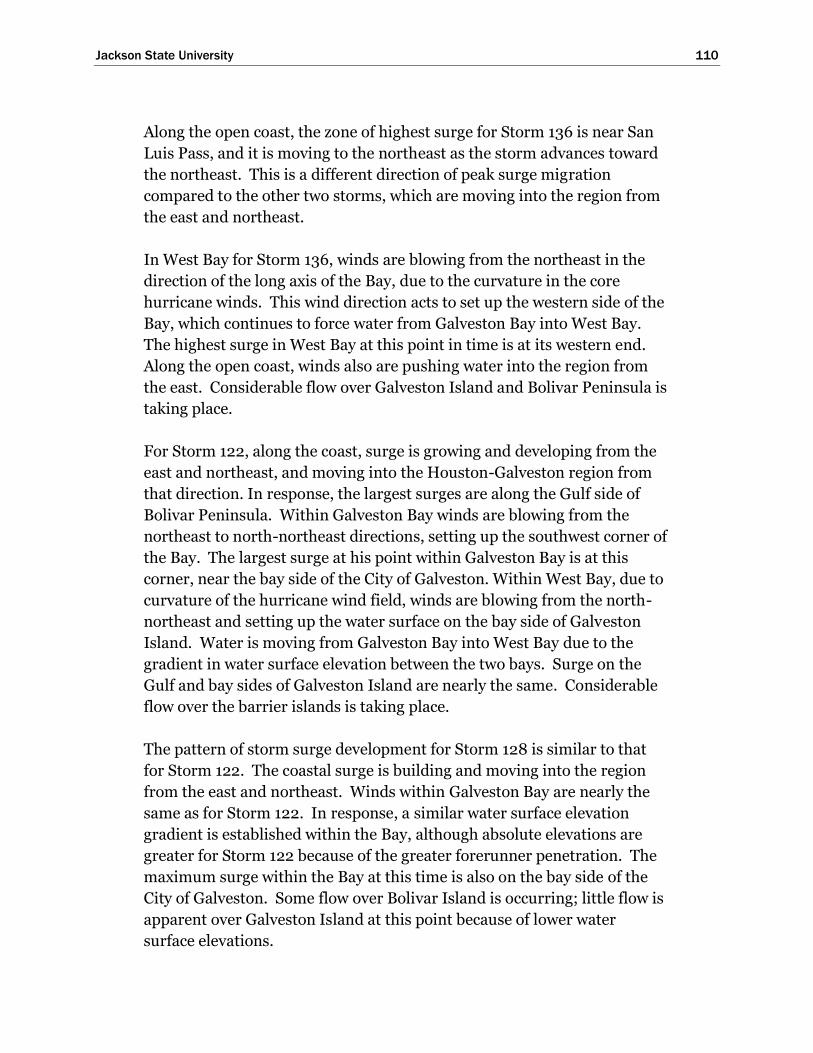
Jackson State University 110
Along the open coast, the zone of highest surge for Storm 136 is near San
Luis Pass, and it is moving to the northeast as the storm advances toward
the northeast. This is a different direction of peak surge migration
compared to the other two storms, which are moving into the region from
the east and northeast.
In West Bay for Storm 136, winds are blowing from the northeast in the
direction of the long axis of the Bay, due to the curvature in the core
hurricane winds. This wind direction acts to set up the western side of the
Bay, which continues to force water from Galveston Bay into West Bay.
The highest surge in West Bay at this point in time is at its western end.
Along the open coast, winds also are pushing water into the region from
the east. Considerable flow over Galveston Island and Bolivar Peninsula is
taking place.
For Storm 122, along the coast, surge is growing and developing from the
east and northeast, and moving into the Houston-Galveston region from
that direction. In response, the largest surges are along the Gulf side of
Bolivar Peninsula. Within Galveston Bay winds are blowing from the
northeast to north-northeast directions, setting up the southwest corner of
the Bay. The largest surge at his point within Galveston Bay is at this
corner, near the bay side of the City of Galveston. Within West Bay, due to
curvature of the hurricane wind field, winds are blowing from the north-
northeast and setting up the water surface on the bay side of Galveston
Island. Water is moving from Galveston Bay into West Bay due to the
gradient in water surface elevation between the two bays. Surge on the
Gulf and bay sides of Galveston Island are nearly the same. Considerable
flow over the barrier islands is taking place.
The pattern of storm surge development for Storm 128 is similar to that
for Storm 122. The coastal surge is building and moving into the region
from the east and northeast. Winds within Galveston Bay are nearly the
same as for Storm 122. In response, a similar water surface elevation
gradient is established within the Bay, although absolute elevations are
greater for Storm 122 because of the greater forerunner penetration. The
maximum surge within the Bay at this time is also on the bay side of the
City of Galveston. Some flow over Bolivar Island is occurring; little flow is
apparent over Galveston Island at this point because of lower water
surface elevations.
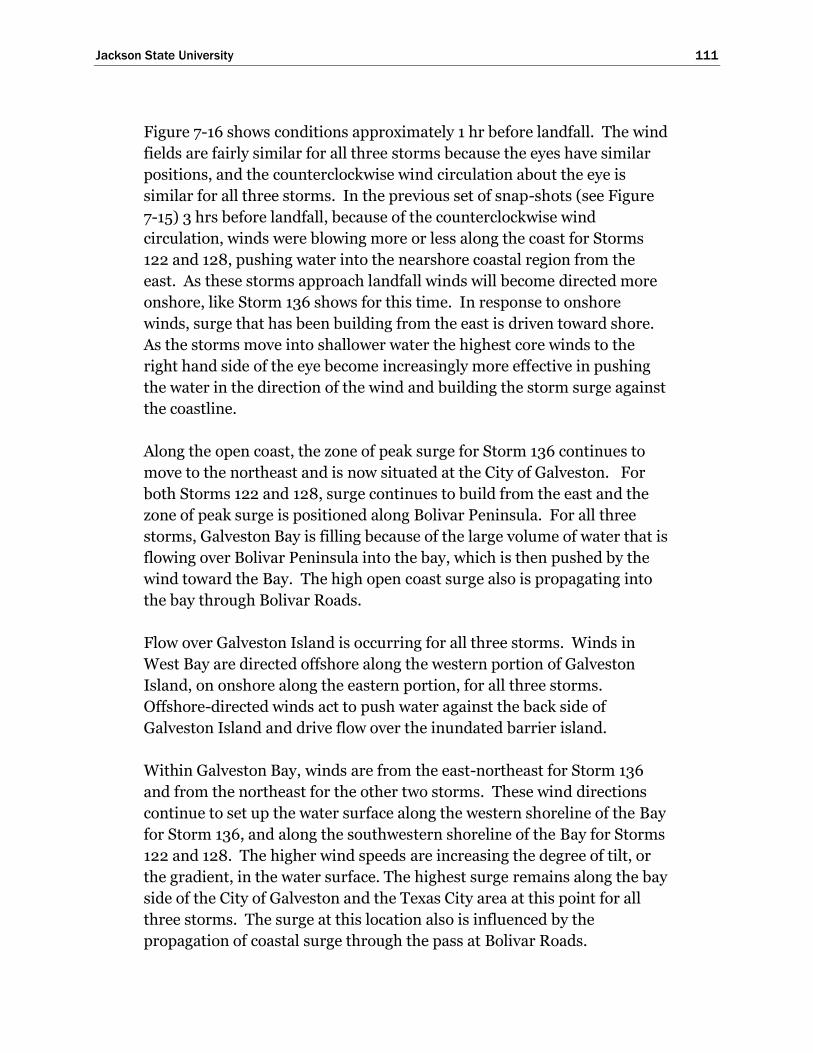
Jackson State University 111
Figure 7-16 shows conditions approximately 1 hr before landfall. The wind
fields are fairly similar for all three storms because the eyes have similar
positions, and the counterclockwise wind circulation about the eye is
similar for all three storms. In the previous set of snap-shots (see Figure
7-15) 3 hrs before landfall, because of the counterclockwise wind
circulation, winds were blowing more or less along the coast for Storms
122 and 128, pushing water into the nearshore coastal region from the
east. As these storms approach landfall winds will become directed more
onshore, like Storm 136 shows for this time. In response to onshore
winds, surge that has been building from the east is driven toward shore.
As the storms move into shallower water the highest core winds to the
right hand side of the eye become increasingly more effective in pushing
the water in the direction of the wind and building the storm surge against
the coastline.
Along the open coast, the zone of peak surge for Storm 136 continues to
move to the northeast and is now situated at the City of Galveston. For
both Storms 122 and 128, surge continues to build from the east and the
zone of peak surge is positioned along Bolivar Peninsula. For all three
storms, Galveston Bay is filling because of the large volume of water that is
flowing over Bolivar Peninsula into the bay, which is then pushed by the
wind toward the Bay. The high open coast surge also is propagating into
the bay through Bolivar Roads.
Flow over Galveston Island is occurring for all three storms. Winds in
West Bay are directed offshore along the western portion of Galveston
Island, on onshore along the eastern portion, for all three storms.
Offshore-directed winds act to push water against the back side of
Galveston Island and drive flow over the inundated barrier island.
Within Galveston Bay, winds are from the east-northeast for Storm 136
and from the northeast for the other two storms. These wind directions
continue to set up the water surface along the western shoreline of the Bay
for Storm 136, and along the southwestern shoreline of the Bay for Storms
122 and 128. The higher wind speeds are increasing the degree of tilt, or
the gradient, in the water surface. The highest surge remains along the bay
side of the City of Galveston and the Texas City area at this point for all
three storms. The surge at this location also is influenced by the
propagation of coastal surge through the pass at Bolivar Roads.

Jackson State University 112
Figure 7-16. Water surface elevation and wind vectors 1 hour before landfall, Storm 136
(upper panel), Storm 122 (middle panel), Storm 128 (lower panel).

Jackson State University 113
Figure 7-17 shows the storm surge and wind fields at landfall. Winds are
directed onshore to the east of the eye for all three storms. For Storm 136,
the zone of peak surge continues to move toward the northeast and is now
situated at the western end of Bolivar Peninsula. For Storms 122 and 128,
the zones of peak surge persist along Bolivar Peninsula. Winds to the east
of the eye continue to push surge over Bolivar Peninsula and into the Bay.
Winds in West Bay are directed offshore along those parts of the island to
the left, or west, of the eye. The offshore-directed winds continue to stack
water against the Bay side of Galveston Island and push water over the
inundated island.
At this time, wind conditions within the Bay are quite similar for all three
storms, blowing from the east, and forcing a similar water surface tilt.
Differences in absolute elevation between storms are due to different
forerunner penetration and differing amounts of filling by flow over the
barrier islands. Winds in the Bay are shifting rapidly, and the water
surface elevation field responds quickly to the wind shift. Water is moving
rapidly to establish the primary momentum balance between wind shear
stress and water surface slope.
Figure 7-18 shows conditions 1 hr after landfall. The eyes of the storms are
moving inland; as they do so, winds are rapidly shifting within Galveston
and West Bays. The curvature in wind fields produces considerable
variation in wind direction for all the storms, but less so for Storm 128
since its eye is the farthest away from the Bay. With the eye being farther
away, the curvature of the wind fields in the Bay is less. For all three
storms, water that has been pushed into Galveston Bay is now starting to
be driven to the north and northwest sides. Water also is filling the
northeast parts of the Bay that previously had been p set down by the
wind. In West Bay the winds are shifting rapidly, blowing from the
northwest for Storms 136 and 122. For Storm 128, winds are now blowing
from the south in the eastern portion of the Bay, setting up the north side.
The water surface is responding quickly to the shifts in wind conditions in
these shallow bays.
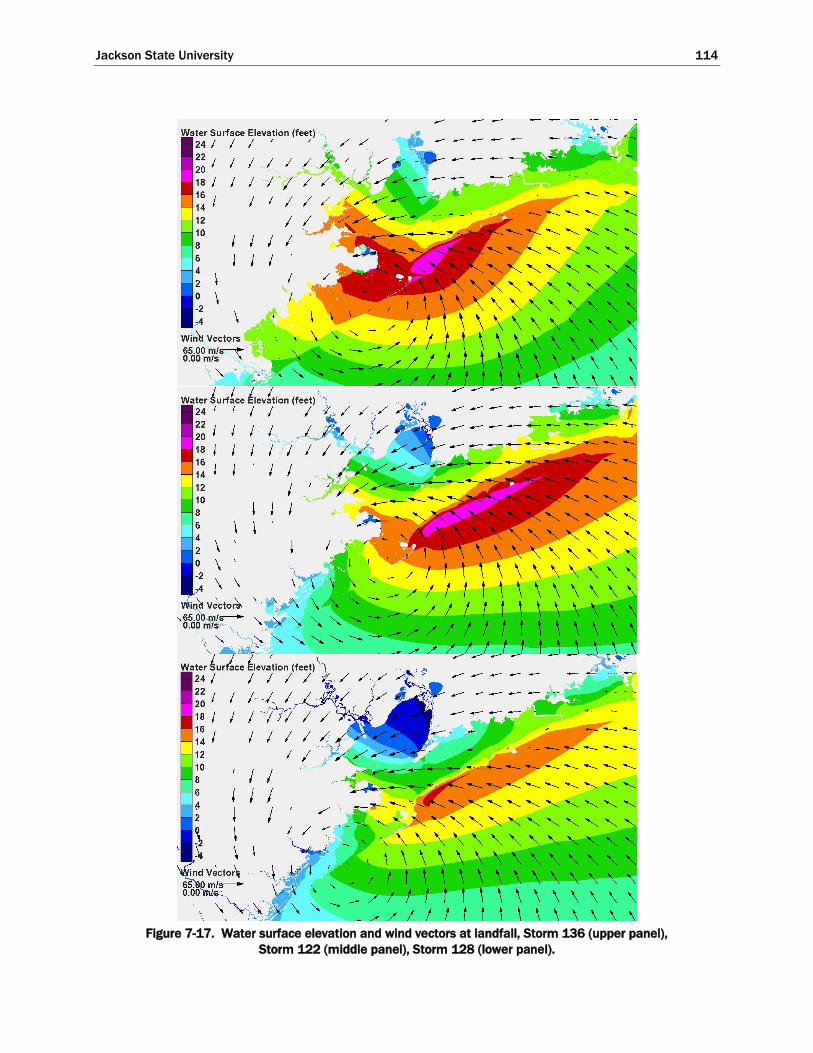
Jackson State University 114
Figure 7-17. Water surface elevation and wind vectors at landfall, Storm 136 (upper panel),
Storm 122 (middle panel), Storm 128 (lower panel).

Jackson State University 115
Figure 7-18. Water surface elevation and wind vectors 1 hour after landfall, Storm 136
(upper panel), Storm 122 (middle panel), Storm 128 (lower panel).

Jackson State University 116
Along the open coast, the zone of highest surge for Storm 136 continues to
move to the northeast and is situated along the middle and eastern
portions of Bolivar Peninsula. For Storms 122 and 128, the zone of highest
surge persists along Bolivar Peninsula. The onshore winds along Bolivar
Peninsula, for all three storms, continue to build surge against the
coastline and push water across the inundated barrier island.
Figure 7-19 shows water surface elevation and wind fields 2 hrs after
landfall. Along the open coast, persistent onshore winds for all three
storms push water against the coast, across the inundated Bolivar
Peninsula, and then into Galveston Bay.
For Storm 136, the eye of the storm is positioned directly over Galveston
Bay and moving toward the north. Winds throughout the Bay are quite
variable in direction, with no persistent direction, and are characterized by
relatively lower wind speeds because of the presence of the eye. In
response, water surface elevations throughout much of the Bay are
somewhat uniform at this time. The northeast part of the Bay continues to
fill. In West Bay winds are blowing from the west and west- northwest,
setting up the eastern side.
The eye for Storm 122 is moving along the western shoreline of Galveston
Bay toward the north-northwest, and is positioned near the northwest
corner at this time. Winds in Galveston Bay are generally blowing to the
north, pushing water toward the north. Winds in West Bay are blowing
from west and southwest, depending on location within the Bay, and are
setting up the eastern.
The eye of Storm 128 made landfall farthest to the west of the three
storms. It is moving toward the northwest, and this movement is
increasing its distance from the Bay. Winds within Galveston Bay are all
directed to the northwest, pushing water in that direction and setting up
the northwest corner. The northeast corner also is filling due to water
surface elevation gradients that force water from areas of high surge to
areas of lower surge. Winds in West Bay are blowing from the south,
setting up the north side and pushing water inland. Water is being pushed
across the inundated Galveston Island toward the north.

Jackson State University 117
Figure 7-19. Water surface elevation and wind vectors 2 hours after landfall, Storm 136
(upper panel), Storm 122 (middle panel), Storm 128 (lower panel).

Jackson State University 118
Figure 7-20 shows conditions 3 hrs after landfall. Along the open coast,
persistent onshore winds for all three storms continue to push water
against the coast and across the inundated Bolivar Peninsula. For Storms
122 and 128, the water being pushed across Bolivar Peninsula continues to
flow into Galveston Bay, toward the north for Storm 122 and toward the
northwest for Storm 128. However, the eye of Storm 136 has moved north
of Galveston Bay, and strong winds on the back side of the eye are now
directed toward the east. Those winds push water toward the east side of
Galveston Bay.
Figure 7-21 shows winds and water surface elevation fields 6 hours after
landfall. Along the open coast winds have an onshore component for all
three storms, but more so for Storms 122 and 128 than for Storm 136.
Winds for Storm 136 are blowing more from the southwest. Within
Galveston Bay, winds for Storm 136 are from the west-southwest
throughout the region. Winds for Storms 122 and 128 are from the south
and south-southeast, respectively, throughout the region. As the eye of the
storm moves farther away, the winds become more uniform in direction
because the degree of curvature of the wind fields lessens with distance
away from the eye.
The open coast storm surge is subsiding for all three storms, most rapidly
for Storm 136. For this storm and at this time, the water surface elevation
is higher in Galveston Bay than along the open coast; and in response,
water is flowing from the Bay back to the Gulf. This same process is
occurring in West Bay, where water is flowing back over Galveston Island
toward the Gulf. For Storms 122 and 128, the response along the barrier
islands is quite different. Southerly winds continue to push water toward
the coast, across the inundated Bolivar Peninsula and Galveston Island,
and into Galveston Bay and West Bay, respectively.
Different water surface responses also are occurring within the Bays. For
Storm 136 winds in Galveston Bay are directed toward the east. In
response, the water surface is set up on the east side of the Bay and set
down along the western shoreline. Westerly winds in West Bay set up the
east end and set down the west end. For Storm 122, persistent southerly
winds continue to push water that has accumulated in Galveston Bay to
the north, setting up the water surface in the northern parts of the system
and pushing water into the channels and estuaries. The persistent
southerly wind is establishing a large south-to- north water surface
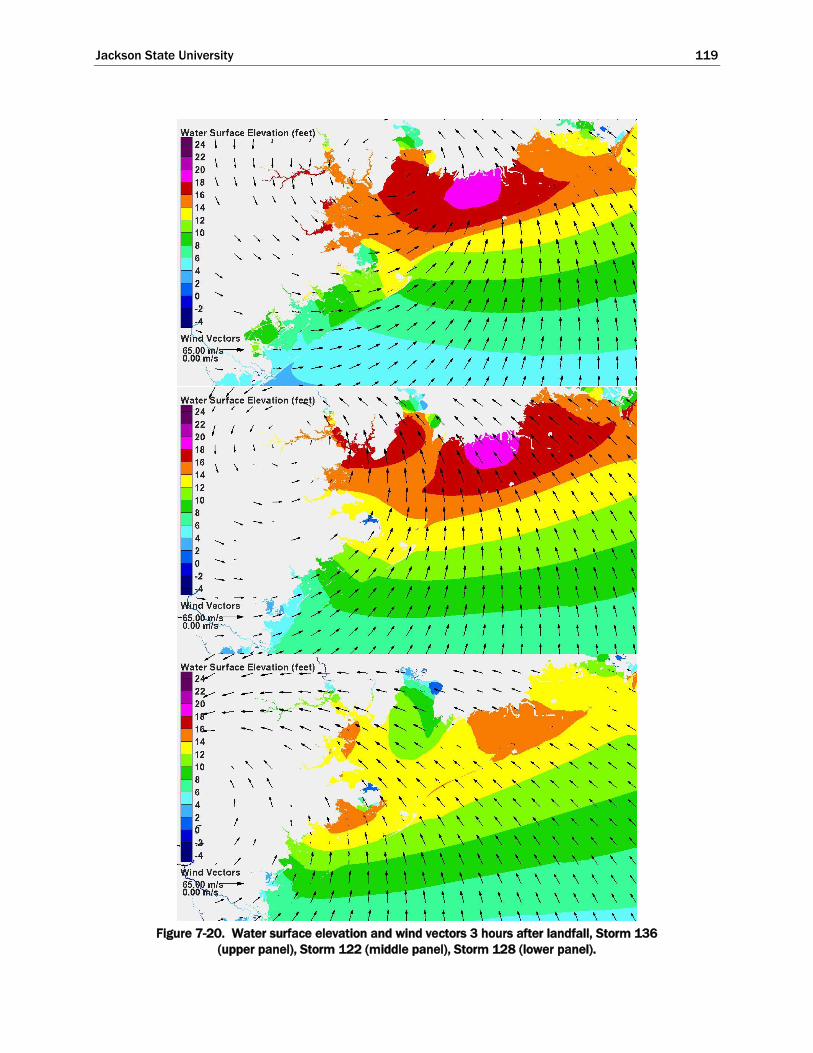
Jackson State University 119
Figure 7-20. Water surface elevation and wind vectors 3 hours after landfall, Storm 136
(upper panel), Storm 122 (middle panel), Storm 128 (lower panel).

Jackson State University 120
Figure 7-21. Water surface elevation and wind vectors 6 hours after landfall, Storm 136
(upper panel), Storm 122 (middle panel), Storm 128 (lower panel).

Jackson State University 121
gradient throughout the Bay. In West Bay, southeasterly winds set up the
northeast corner.
The surge development process within the Bay at this time is similar for
Storm 128, compared to Storm 122. Uniform winds from the south-
southeast set up the north-northwest parts of the Bay, pushing water in
that direction and into channels and estuaries, and establishing a
persistent water surface gradient throughout the Bay. In West Bay
southerly winds set up the north side and push water inland.
Figure 7-22 shows conditions 9 hours after landfall. At this time the storm
eyes have moved well away from the Houston-Galveston region and winds
are rather uniform in direction throughout the region for each storm.
Wind directions for each storm are quite similar to what they were 3 hrs
earlier. Wind speeds are decreasing for each storm as the eye moves
farther away from the region.
Within the Bays, surges have reached their maximum values and are
decreasing. However, even 9 hours after landfall, high surges persist
throughout the system and in particular the northern parts of the system.
For all three storms, the open coast storm surge is subsiding, water is
draining from the Bays and flowing back to the Gulf. This draining takes
place much more slowly than the filling did. As water surface elevations
decrease to values lower than crest elevations of the degraded barrier
islands, draining will be restricted to flow through passes and any breach
channels that formed on the eroded barrier islands during the storm.

Jackson State University 122
Figure 7-22. Water surface elevation and wind vectors 9 hours after landfall, Storm 136
(upper panel), Storm 122 (middle panel), Storm 128 (lower panel).

Jackson State University 123
8 Reduction in Flooding Achieved
with the Ike Dike – Initial
Assessment
Introduction
Reduction in flooding achieved by the Ike Dike concept was initially
examined by comparing maximum water surface elevation maps for
existing conditions with maximum water surface elevation maps for with-
dike conditions. The maximum water surface elevation maps were
computed for each storm in the following way: at every grid node of the
computational mesh used in the storm surge modeling, the maximum
water surface elevation is recorded, regardless of when it occurred during
the hurricane simulation. The water surface elevation maxima at every
grid mesh node are then used to develop the maximum water surface
elevation map. A difference map was computed by subtracting the with-
dike map from the existing condition map for each storm. All water
surface elevations are relative to the NAVD88 vertical datum, which is
about 0.5 ft below the mean sea level tidal datum.
For each storm a figure is provided which shows three maps, one for
existing conditions (top panel), one for with-dike conditions (middle
panel), and the difference map (bottom panel). The water surface
elevation color bar scale used for each map is shown in each panel. The
same scale is used throughout this chapter. Following the figure showing
the maps, storm surge information for existing conditions, with-dike
conditions, and the difference, is shown in tabular and descriptive form for
each of 9 locations in the Houston-Galveston region: Galveston (Gulf
side), Galveston (Bay side), rest of Galveston Island west of the City of
Galveston, Bolivar Peninsula, the Texas City area, Clear Lake area, Bayport
Area, and the upper reaches of the Houston Ship Channel. The tables help
quantify reduction in surge achieved with the dike. The reduction is
generally not uniform throughout the Houston-Galveston region for a
particular storm, and the reductions at each location vary from storm to
storm.
Storms are divided into four groupings, and results provided below are
grouped in the same way. The first group is the direct-hit set of four

Jackson State University 124
storms, all on the same track, with varying intensity (900 mb, 930 mb,
960 mb and 975 mb). The other groupings are based on storm track, one
group for each of the three main approach directions, south, south-
southeast and southeast. All storms in the three track groups were 900
mb storms. The storms in each grouping have the same heading but they
differ in their landfall location.
Landfall location has great influence on the storm surge that is
experienced in the Houston-Galveston region. Storms that make landfall
at a distance of one radius-to-maximum-winds to the west of Bolivar
Roads tend to produce the largest storm surge in the most economically
sensitive areas. For the storms simulated here, one radius-to-maximum-
winds distance to the west of Bolivar Roads is approximately at San Luis
Pass. So the storm(s) in each track grouping that make(s) landfall nearest
San Luis Pass tends to produce the largest storm surge in the Houston-
Galveston region for that group of storm tracks.
As the landfall location moves east of Bolivar Roads, the maximum surge
will be located well to the east of Galveston Bay. For these storms, as the
distance between landfall position and Bolivar Roads increases, the region
of maximum surge will occur farther and farther way from the Houston–
Galveston region and storm surge within the region will decrease. This
trend is evident in the results shown below. Storms in the West Louisiana
set tended to make landfall well to the east of Galveston Bay, and the
surges they generated in the area of interest tended to be much less than
surge generated by the storms in the North Texas set. Therefore this
report will only show results for the North Texas set.
The Long Dike or Levee Effect
When a long coastal dike, seawall or levee is constructed to reduce the risk
of storm flooding, it can result in a local increase of storm surge compared
to surge that would have occurred at that same location had the dike or
other structure not been present. The structure provides a barrier for the
wind-driven water to stack up against, and it restricts the ability of the
water to move elsewhere away from the structure. This increase in surge
occurs for the Ike Dike concept and is seen in the results that follow.
Surge is generally increased by amounts of up to 1.5 ft for the 900 mb
storms that have been simulated. The maximum increase tends to occur
where the storm surge is greatest. If flow over the dike commences, as it
does for a number of the storms, this will tend to mask the amount of the

Jackson State University 125
increased surge had the dike been higher and prevented overflow from
occurring. This effect and the surge increase must be recognized and
factored into the design of the risk reduction measure.
Hurricanes of Varying Intensity - The Direct-Hit Set
Results for the direct-hit set of four storms illustrate the benefits of the Ike
Dike concept in reducing storm surge for hurricanes of varying intensity.
The four storms have the same track, shown in Figure 8-1, but different
central pressures: Storm 122 (900 mb), Storm 155 (930 mb), Storm 121
(960 mb) and Storm 561 (975 mb).
Figure 8-1. Direct-hit group of hurricanes approaching from the southeast (storms 122 (900
mb), 155 (930 mb), 121 (960 mb), 561 (975 mb))

Jackson State University 126
Figure 8-2. Maximum water surface elevation maps for Storm 122 (900 mb). Existing
conditions (top); With-dike conditions (middle); Difference in maximum water surface
elevation (bottom)

Jackson State University 127
Table 8-1. Summary of Maximum Storm Surge Conditions for Storm 122.
Location Existing Condition With-Dike Condition Changes
Galveston
(Gulf side)
13.5 to 16.5 ft 14 to 17.5 ft The dike causes surge by 0.5 to 1 ft in front of the seawall. Overtopping and overflow expected.
Galveston
(Bay side)
14 to 16 ft 8.5 to 11 ft Reduction of 5.5 ft to 6 ft
Rest of
Galveston
Island
7 to 14 ft, increasing from west to east
6.5 to 8.5 ft Reductions of 0 ft in the west to 5.5 ft in the east.
Bolivar
Peninsula
18 to 18.5 ft 14 to 17 ft 0 to 2 ft. Overflow and overtopping along most/all of the dike. No significant change
Texas City
area
11 to 15 ft 8.5 to 9.5 ft Reduction of 4.5 to 5.5 ft
Clear Lake
Area
15 to 15.5 ft 9.5 to 10.5 ft Reduction of 5 to 5.5 ft
Bayport
Area
15.5 to 16.5 ft 10.5 to 11.5 ft Reduction of 5.5 to 6 ft
Upper
reaches of
Houston
Ship
Channel
19 to 20 ft 13 to 14 ft Reduction of 6 to 7 ft

Jackson State University 128
Figure 8-3 Maximum water surface elevation maps for storm 155 (930 mb). Existing
conditions (top); With-dike conditions (middle); Difference in maximum water surface
elevation (bottom)

Jackson State University 129
Table 8-2. Summary of Maximum Storm Surge Conditions for Storm 155.
Location Existing Condition With-Dike Condition Changes
Galveston
(Gulf side)
11 to 15 ft increasing from west to east
12 to 16 ft Increase of 1 ft. Increase in overtopping is expected.
Galveston
(Bay side)
11 to 14 ft increasing from west to east
4 to 5.5 ft Reduction of 7 to 10 ft
Rest of
Galveston
Island
7 to 11 ft, increasing from west to east
4 to 4.5 ft Reductions of 2 ft in the west to 6 ft in the east.
Bolivar
Peninsula
16 to 17 ft 10 to 16 ft 0 to 4 ft. Presence of the dike increases surge in front of dike by 1 ft. Overflow along most/all of the dike
Texas City
area
11.5 to 12.5 ft 4 to 5 ft Reduction of 7 to 8 ft
Clear Lake
Area
13 ft 4 to 5 ft Reduction of 7.5 to 8.5 ft
Bayport
Area
13.5 ft 5 to 5.5 ft Reduction of 8 to 8.5 ft
Upper
reaches of
Houston
Ship
Channel
15 ft 7 ft Reduction of 8 ft

Jackson State University 130
Figure 8-4. Maximum water surface elevation maps for storm 121 (960 mb). Existing
conditions (top); With-dike conditions (middle); Difference in maximum water surface
elevation (bottom)

Jackson State University 131
Table 8-3. Summary of Maximum Storm Surge Conditions for Storm 121.
Location Existing Condition With-Dike Condition Changes
Galveston
(Gulf side)
7.5 to 10.5 ft 8 to 10.5 ft Increase of 0 to 0.5 ft. No significant change.
Galveston
(Bay side)
8.5 to 10.5 ft 2.5 to 3 ft Reduction of 6 to 8 ft
Rest of
Galveston
Island
5 to 8 ft, increasing from west to east
3 to 4 ft Reductions of 1 ft in the west to 5 ft in the east.
Bolivar
Peninsula
11 to 11.5 ft 2 to 2.5 ft Presence of the dike increases surge by 1 ft on ocean side. Reduction in bay of 9 ft
Texas City
area
8.5 to 11 ft 2 to 4 ft Reduction of 6 to 7 ft
Clear Lake
Area
10 ft 3 to 4 ft Reduction of 7 ft
Bayport
Area
10 to 10.5 ft 3 to 4 ft Reduction of 7 to 7.5 ft
Upper
reaches of
Houston
Ship
Channel
12 to 12.5 ft 3 to 4 ft Reduction of 8 to 9 ft

Jackson State University 132
Figure 8-5. Maximum water surface elevation maps for storm 561 (975 mb). Existing
conditions (top); With-dike conditions (middle); Difference in maximum water surface
elevation (bottom)
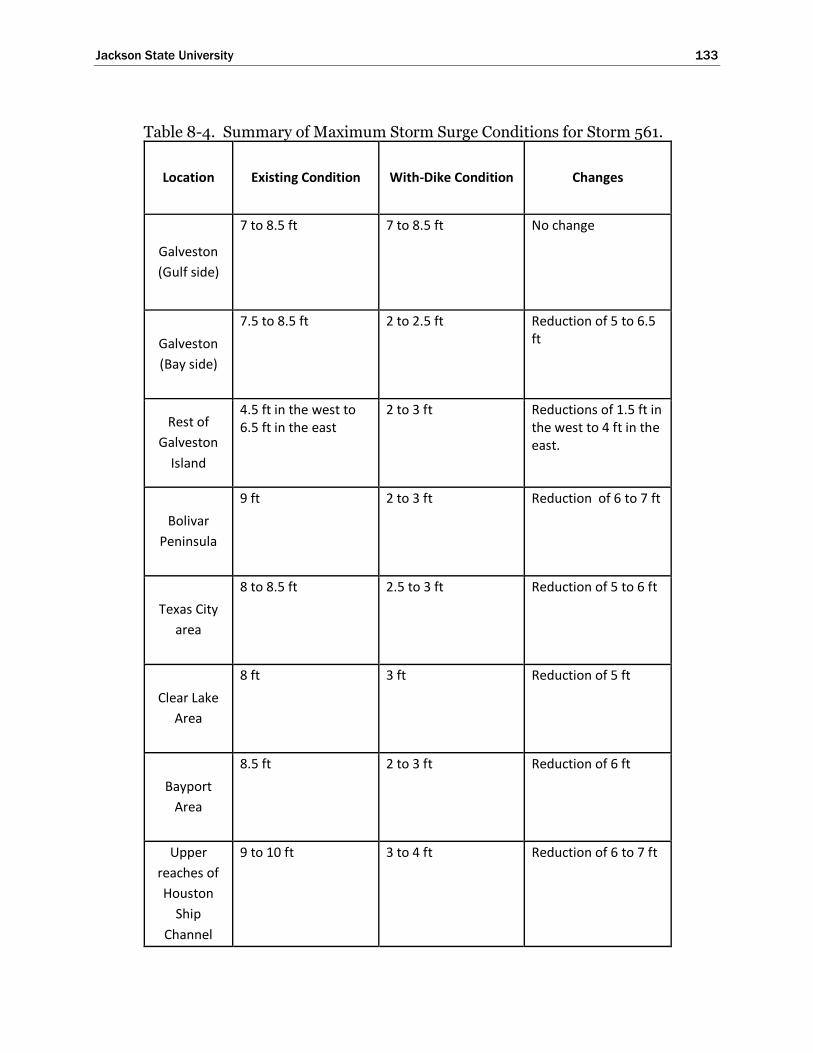
Jackson State University 133
Table 8-4. Summary of Maximum Storm Surge Conditions for Storm 561.
Location Existing Condition With-Dike Condition Changes
Galveston
(Gulf side)
7 to 8.5 ft 7 to 8.5 ft No change
Galveston
(Bay side)
7.5 to 8.5 ft 2 to 2.5 ft Reduction of 5 to 6.5 ft
Rest of
Galveston
Island
4.5 ft in the west to 6.5 ft in the east
2 to 3 ft Reductions of 1.5 ft in the west to 4 ft in the east.
Bolivar
Peninsula
9 ft 2 to 3 ft Reduction of 6 to 7 ft
Texas City
area
8 to 8.5 ft 2.5 to 3 ft Reduction of 5 to 6 ft
Clear Lake
Area
8 ft 3 ft Reduction of 5 ft
Bayport
Area
8.5 ft 2 to 3 ft Reduction of 6 ft
Upper
reaches of
Houston
Ship
Channel
9 to 10 ft 3 to 4 ft Reduction of 6 to 7 ft
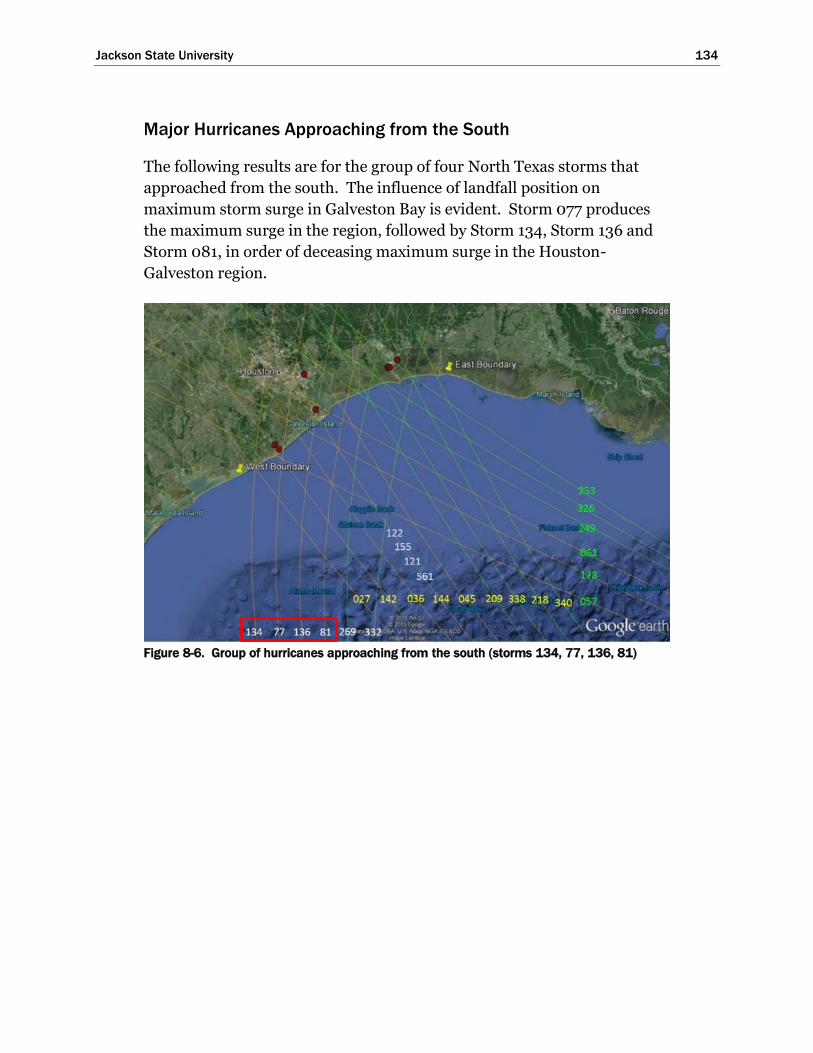
Jackson State University 134
Major Hurricanes Approaching from the South
The following results are for the group of four North Texas storms that
approached from the south. The influence of landfall position on
maximum storm surge in Galveston Bay is evident. Storm 077 produces
the maximum surge in the region, followed by Storm 134, Storm 136 and
Storm 081, in order of deceasing maximum surge in the Houston-
Galveston region.
Figure 8-6. Group of hurricanes approaching from the south (storms 134, 77, 136, 81)
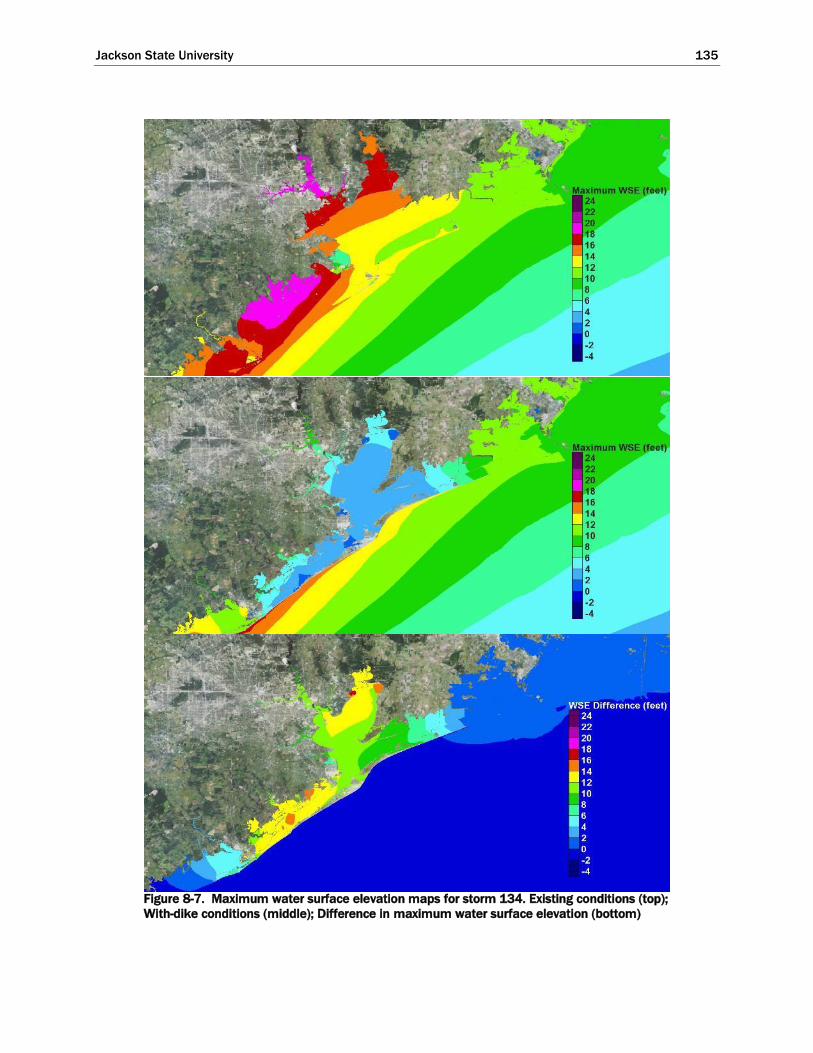
Jackson State University 135
Figure 8-7. Maximum water surface elevation maps for storm 134. Existing conditions (top);
With-dike conditions (middle); Difference in maximum water surface elevation (bottom)

Jackson State University 136
Table 8-5. Summary of Maximum Storm Surge Conditions for Storm 134.
Location Existing Condition With-Dike Condition Changes
Galveston
(Gulf side)
13 to 14 ft 13 to 14 ft No change
Galveston
(Bay side)
13 ft 2 to 3 ft Reduction of 11 ft
Rest of
Galveston
Island
14 to 16 ft 2 to 4.5ft Reductions of 12 to 14 ft
Bolivar
Peninsula
12 to 13 ft 3 to 4 ft Reduction of 8 to 10 ft
Texas City
area
13 to 16.5 ft 2.5 to 3 ft Reduction of 12 ft. Prevented interior flooding.
Clear Lake
Area
15 to 16.5 ft 4 to 5 ft Reduction of 11 to 12 ft
Bayport
Area
17 to 18 ft 4 to 5 ft Reduction of 12 ft
Upper
reaches of
Houston
Ship
Channel
19 to 20 ft 8 to 9 ft Reduction of 11 to 12 ft

Jackson State University 137
Figure 8-8. Maximum water surface elevation maps for storm 077. Existing conditions (top);
With-dike conditions (middle); Difference in maximum water surface elevation (bottom)

Jackson State University 138
Table 8-6. Summary of Maximum Storm Surge Conditions for Storm 077
Location Existing Condition With-Dike Condition Changes
Galveston
(Gulf side)
16 ft 16 to 16.5 ft 0 to 0.5 ft increase. Increase in overtopping expected.
Galveston
(Bay side)
16 ft 6 to 10 ft Reduction of 6 to 10 ft
Rest of
Galveston
Island
16.5 to 17 ft 10 to 16 ft Overtopping/overflow of the dike. Reduction of 4 to 6 ft.
Bolivar
Peninsula
13 to 16 ft 6 to 8 ft Reduction of 6 to 9 ft
Texas City
area
16 to 22 ft 7 to 13 ft Reduction of 8 to 11 ft. Prevented interior flooding.
Clear Lake
Area
17 to 19 ft 7 ft Reduction of 10 to 12 ft
Bayport
Area
19 ft 7 ft Reduction of 12 to 12.5 ft
Upper
reaches of
Houston
Ship
Channel
21 to 22 ft 9 to 10 ft Reduction of 11 to 12 ft

Jackson State University 139
Figure 8-9. Maximum water surface elevation maps for storm 136. Existing conditions (top);
With-dike conditions (middle); Difference in maximum water surface elevation (bottom)

Jackson State University 140
Table 8-7. Summary of Maximum Storm Surge Conditions for Storm 136
Location Existing Condition With-Dike Condition Changes
Galveston
(Gulf side)
18 ft 18 to 19.5 ft 0 to 1.5 ft increase. Increase in overtopping and overflow is expected.
Galveston
(Bay side)
18 ft 12 ft Reduction of 6 ft
Rest of
Galveston
Island
12 to 17 ft, increasing from west to east
5 to 10 ft Some overtopping and overflow of the dike. Reduction of 7 to10 ft.
Bolivar
Peninsula
16 to 19 ft 12 to 17 ft Overtopping/overflow of the dike. Reduction of 3 to 4 ft
Texas City
area
18 to 19 ft 9 to 10 ft Reduction of 8 to 9 ft. Significantly reduced interior flooding.
Clear Lake
Area
17 ft 7.5 to 9 ft Reduction of 8 to 9 ft
Bayport
Area
18 ft 10 ft Reduction of 8 to 9 ft
Upper
reaches of
Houston
Ship
Channel
17 to 18 ft 10 ft Reduction of 7 to 8 ft

Jackson State University 141
Figure 8-10. Maximum water surface elevation maps for storm 081. Existing conditions
(top); With-dike conditions (middle); Difference in maximum water surface elevation
(bottom)

Jackson State University 142
Table 8-8. Summary of Maximum Storm Surge Conditions for Storm 081
Location Existing Condition With-Dike Condition Changes
Galveston
(Gulf side)
13 to 16 ft 13 to 16 ft No change
Galveston
(Bay side)
14 to 16 ft 8 ft Reduction of 6 to 8 ft
Rest of
Galveston
Island
8 to 13 ft, increasing from west to east
5 to 6 ft Reduction of 3 to 7 ft.
Bolivar
Peninsula
17 to 19 ft 12 to 18 ft Overtopping/overflow of the dike. Reduction of 1 to 4 ft
Texas City
area
11 to 16 ft 6 to 8 ft Reduction of 7 to 10 ft.
Clear Lake
Area
12 to 14 ft 5 to 6 ft Reduction of 6.5 to 8.5 ft
Bayport
Area
11 ft 5 to 6 ft Reduction of 5 to 6 ft
Upper
reaches of
Houston
Ship
Channel
7 to 8 ft 4 to 5 ft Reduction of 3 ft

Jackson State University 143
Major Hurricanes Approaching from the South-Southeast
The following results are for the group of five North Texas storms that
approach from the south-southeast. The influence of landfall position on
maximum storm surge in Galveston Bay is again evident. Storms making
landfall to the west of Bolivar Roads tended to produce larger surges in the
region than storms making landfall very close to, or to the east of, Bolivar
Roads. Storm 036 produces the maximum surge in the region, followed by
Storm 027, Storm 142, Storm 144 and Storm 045, in order of decreasing
maximum surge. Based solely on track, with other storm parameters
being the same, Storm 142 would be expected to produce a larger surge in
the region compared to Storm 027. Storms 027 and 142 have different
radii to maximum winds. The radius for Storm 027 is 21.8 n mi; the
radius for Storm 142 is 17.7 n mi. The forward speed for Storm 027 is 11
kts, whereas for storm 142 it is slower, 6 kts. Intensity and storm size are
the two factors that tend to influence peak surge the most. Bunpapong et
al (1985) also found that forward speed is important along the Texas coast;
the faster the forward speed the greater the peak surge. The larger radius
to maximum winds and the faster forward speed combine to create the
larger surge for Storm 027 compared to the surge for Storm 142 which
makes landfall closer to Bolivar Roads.
Figure 8-11. Group of hurricanes approaching from the south-southeast (storms 027, 142,
036, 144, 045)

Jackson State University 144
Figure 8-12. Maximum water surface elevation maps for storm 027. Existing conditions
(top); With-dike conditions (middle); Difference in maximum water surface elevation
(bottom)
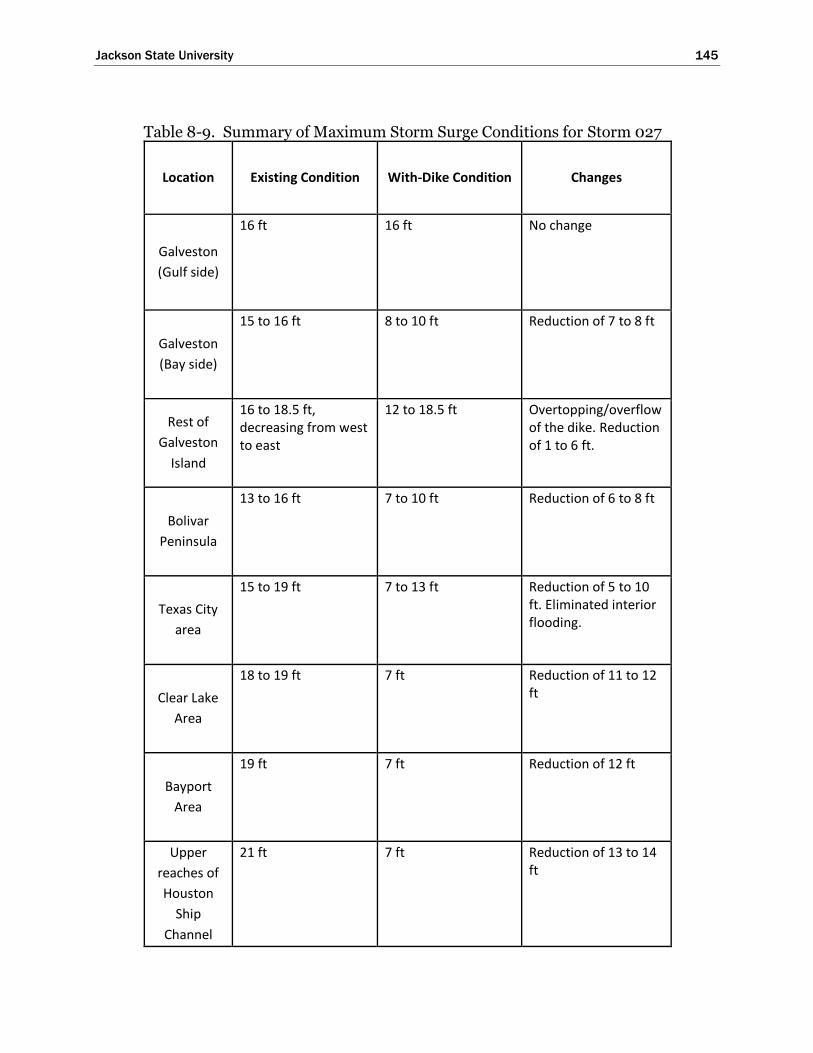
Jackson State University 145
Table 8-9. Summary of Maximum Storm Surge Conditions for Storm 027
Location Existing Condition With-Dike Condition Changes
Galveston
(Gulf side)
16 ft 16 ft No change
Galveston
(Bay side)
15 to 16 ft 8 to 10 ft Reduction of 7 to 8 ft
Rest of
Galveston
Island
16 to 18.5 ft, decreasing from west to east
12 to 18.5 ft Overtopping/overflow of the dike. Reduction of 1 to 6 ft.
Bolivar
Peninsula
13 to 16 ft 7 to 10 ft Reduction of 6 to 8 ft
Texas City
area
15 to 19 ft 7 to 13 ft Reduction of 5 to 10 ft. Eliminated interior flooding.
Clear Lake
Area
18 to 19 ft 7 ft Reduction of 11 to 12 ft
Bayport
Area
19 ft 7 ft Reduction of 12 ft
Upper
reaches of
Houston
Ship
Channel
21 ft 7 ft Reduction of 13 to 14 ft

Jackson State University 146
Figure 8-13. Maximum water surface elevation maps for storm 142. Existing conditions
(top); With-dike conditions (middle); Difference in maximum water surface elevation
(bottom)

Jackson State University 147
Table 8-10. Summary of Maximum Storm Surge Conditions for Storm 142
Location Existing Condition With-Dike Condition Changes
Galveston
(Gulf side)
14 ft 14 ft No change
Galveston
(Bay side)
13 to 14 ft 3 ft Reduction of 10 to 11 ft
Rest of
Galveston
Island
14 ft 3 to 6 ft Reduction of 10 to 12 ft.
Bolivar
Peninsula
11 to 13 ft 3 to 8 ft Reduction of 5 to 10 ft
Texas City
area
15.5 to 17.5 ft 4 to 5 ft Reduction of 11 to 12 ft. Eliminated interior flooding.
Clear Lake
Area
18 to 19 ft 6 ft Reduction of 12 to 13 ft
Bayport
Area
19 ft 5ft Reduction of 13 to 14 ft
Upper
reaches of
Houston
Ship
Channel
20-21 ft 7 ft Reduction of 13 to 14 ft

Jackson State University 148
Figure 8-14. Maximum water surface elevation maps for storm 036. Existing conditions
(top); With-dike conditions (middle); Difference in maximum water surface elevation
(bottom)
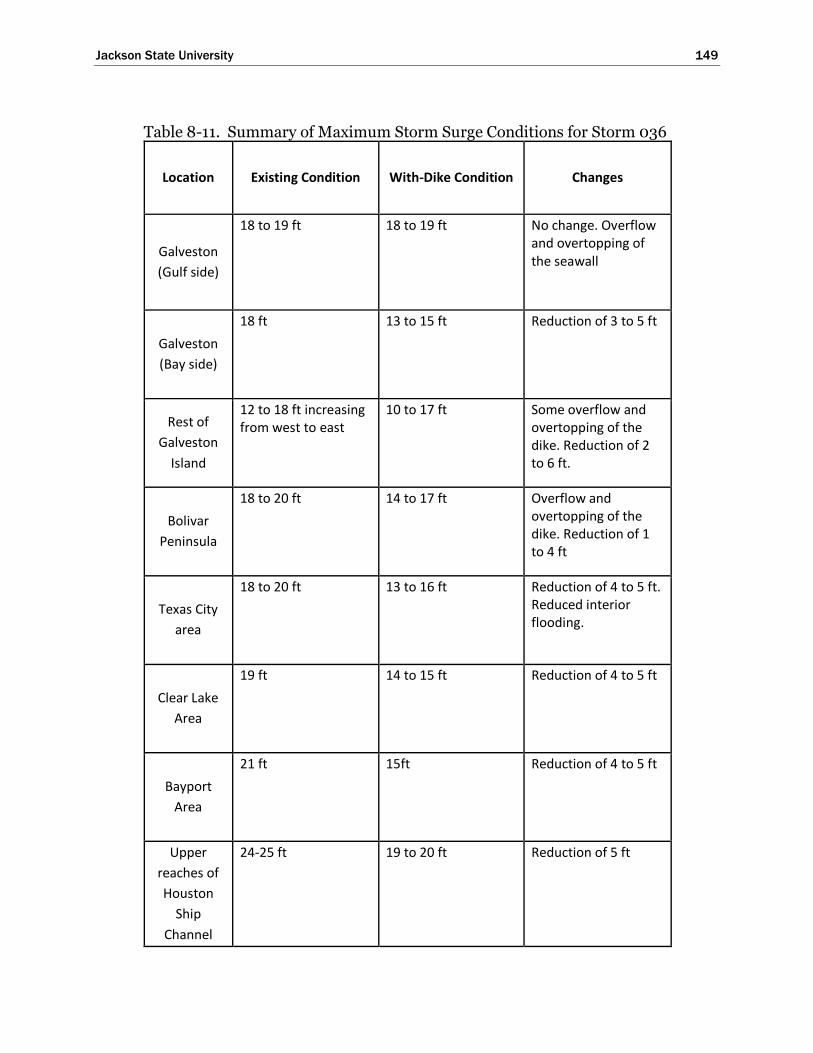
Jackson State University 149
Table 8-11. Summary of Maximum Storm Surge Conditions for Storm 036
Location Existing Condition With-Dike Condition Changes
Galveston
(Gulf side)
18 to 19 ft 18 to 19 ft No change. Overflow and overtopping of the seawall
Galveston
(Bay side)
18 ft 13 to 15 ft Reduction of 3 to 5 ft
Rest of
Galveston
Island
12 to 18 ft increasing from west to east
10 to 17 ft Some overflow and overtopping of the dike. Reduction of 2 to 6 ft.
Bolivar
Peninsula
18 to 20 ft 14 to 17 ft Overflow and overtopping of the dike. Reduction of 1 to 4 ft
Texas City
area
18 to 20 ft 13 to 16 ft Reduction of 4 to 5 ft. Reduced interior flooding.
Clear Lake
Area
19 ft 14 to 15 ft Reduction of 4 to 5 ft
Bayport
Area
21 ft 15ft Reduction of 4 to 5 ft
Upper
reaches of
Houston
Ship
Channel
24-25 ft 19 to 20 ft Reduction of 5 ft
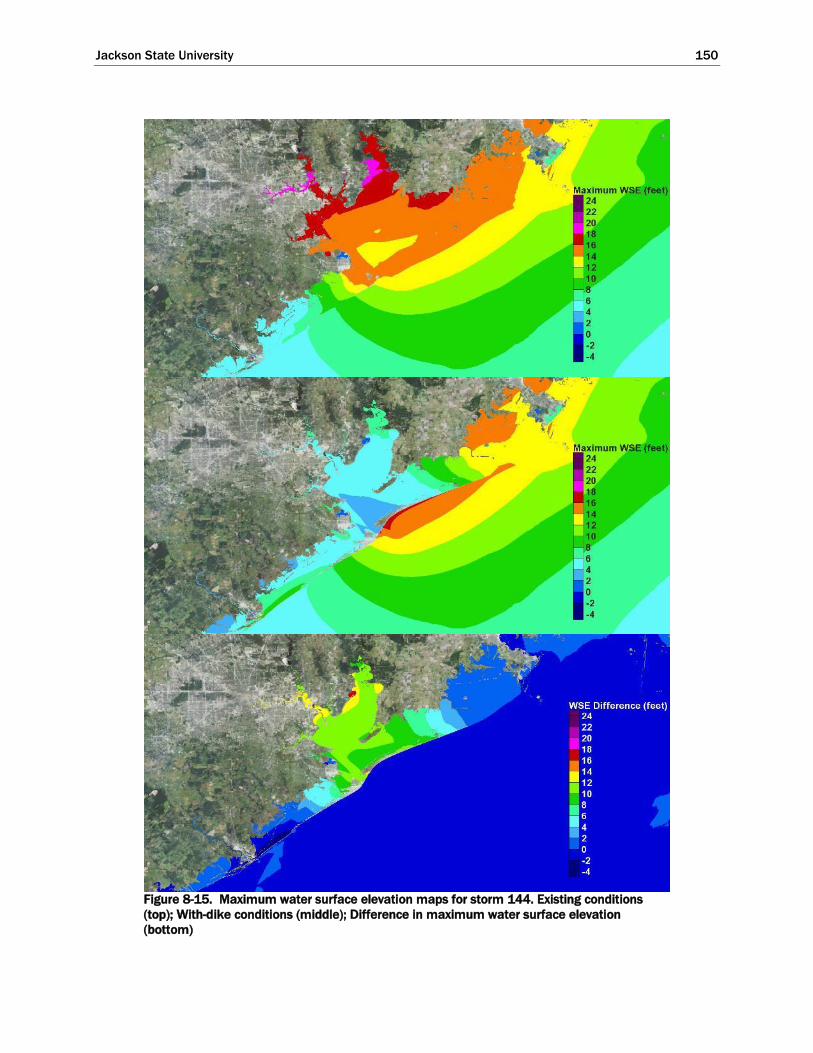
Jackson State University 150
Figure 8-15. Maximum water surface elevation maps for storm 144. Existing conditions
(top); With-dike conditions (middle); Difference in maximum water surface elevation
(bottom)
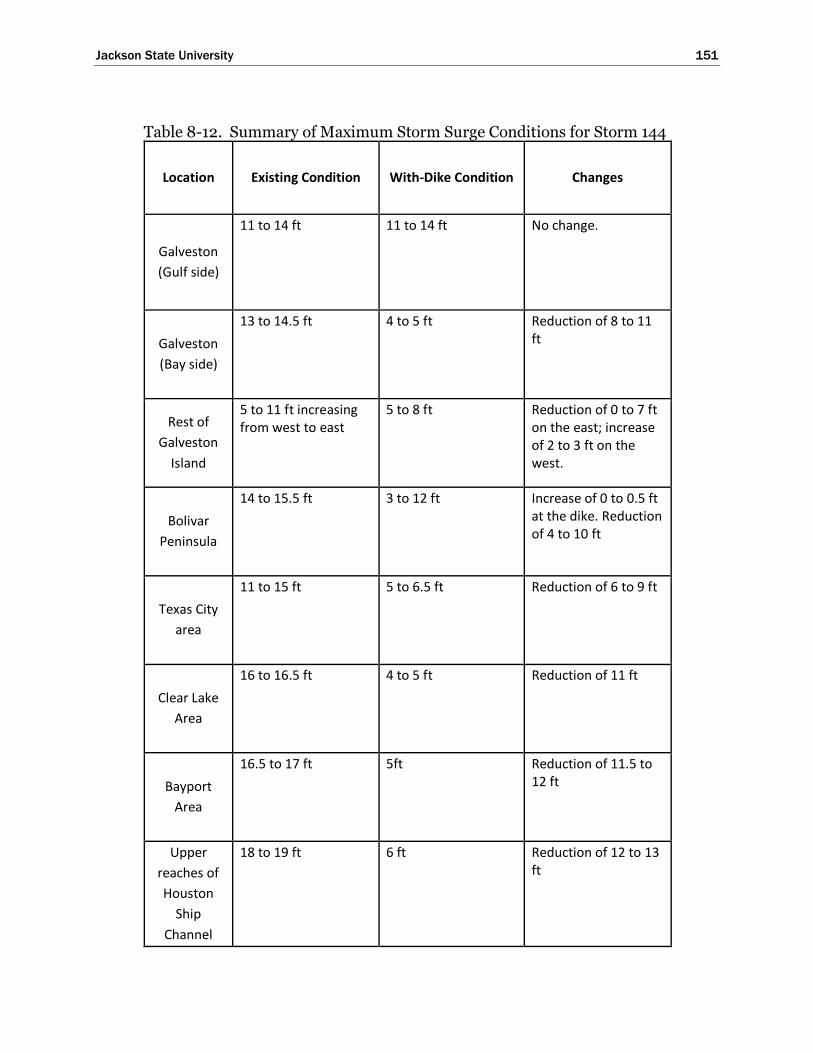
Jackson State University 151
Table 8-12. Summary of Maximum Storm Surge Conditions for Storm 144
Location Existing Condition With-Dike Condition Changes
Galveston
(Gulf side)
11 to 14 ft 11 to 14 ft No change.
Galveston
(Bay side)
13 to 14.5 ft 4 to 5 ft Reduction of 8 to 11 ft
Rest of
Galveston
Island
5 to 11 ft increasing from west to east
5 to 8 ft Reduction of 0 to 7 ft on the east; increase of 2 to 3 ft on the west.
Bolivar
Peninsula
14 to 15.5 ft 3 to 12 ft Increase of 0 to 0.5 ft at the dike. Reduction of 4 to 10 ft
Texas City
area
11 to 15 ft 5 to 6.5 ft Reduction of 6 to 9 ft
Clear Lake
Area
16 to 16.5 ft 4 to 5 ft Reduction of 11 ft
Bayport
Area
16.5 to 17 ft 5ft Reduction of 11.5 to 12 ft
Upper
reaches of
Houston
Ship
Channel
18 to 19 ft 6 ft Reduction of 12 to 13 ft

Jackson State University 152
Figure 8-16. Maximum water surface elevation maps for storm 045. Existing conditions
(top); With-dike conditions (middle); Difference in maximum water surface elevation
(bottom)

Jackson State University 153
Table 8-13. Summary of Maximum Storm Surge Conditions for Storm 045
Location Existing Condition With-Dike Condition Changes
Galveston
(Gulf side)
9 to 12 ft 9 to 12 ft No change.
Galveston
(Bay side)
11 to 12 ft 5 to 7 ft Reduction of 5 to 6 ft
Rest of
Galveston
Island
5 to 8 ft increasing from west to east
5 to 6 ft Reduction of 0 to 4 ft on the east. Increase of 0 to 1 ft on the west.
Bolivar
Peninsula
13 to 18.5 ft 4 to 18.5 ft Increase of 0.5 to 1 ft at the dike. Overflow and overtopping of the dike. Reduction of 0 to 7 ft
Texas City
area
8 to 11 ft 4 ft Reduction of 4 to 7 ft
Clear Lake
Area
9 ft 4 ft Reduction of 5.5 ft
Bayport
Area
10.5 ft 4.5 ft Reduction of 6 ft
Upper
reaches of
Houston
Ship
Channel
11 to 11.5 ft 5 ft Reduction of 6 to 6.5 ft

Jackson State University 154
Major Hurricanes Approaching from the Southeast
The following results are for the group of three North Texas storms that
approach from the southeast. Storm 057 produces the greater surge in the
region, followed closely by Storm 128 and Storm 061, in order of
decreasing maximum surges. The peak surges for Storms 057 and 128 are
similar. Storm 057 makes landfall to the west of San Luis Pass, Storm 128
to the east of San Luis Pass, both approximately equidistant from the pass.
Storm 061 makes landfall at Bolivar Roads. Storm 057 has a radius to
maximum winds that is lightly larger (18.4 n mi) than the radius for Storm
128 (17.7 n mi), which contribute to its slightly greater surge in the Bay.
Figure 8-17. Group of hurricanes approaching from the southeast (storms 057, 128, 061)

Jackson State University 155
Figure 8-18. Maximum water surface elevation maps for storm 057. Existing conditions
(top); With-dike conditions (middle); Difference in maximum water surface elevation
(bottom)
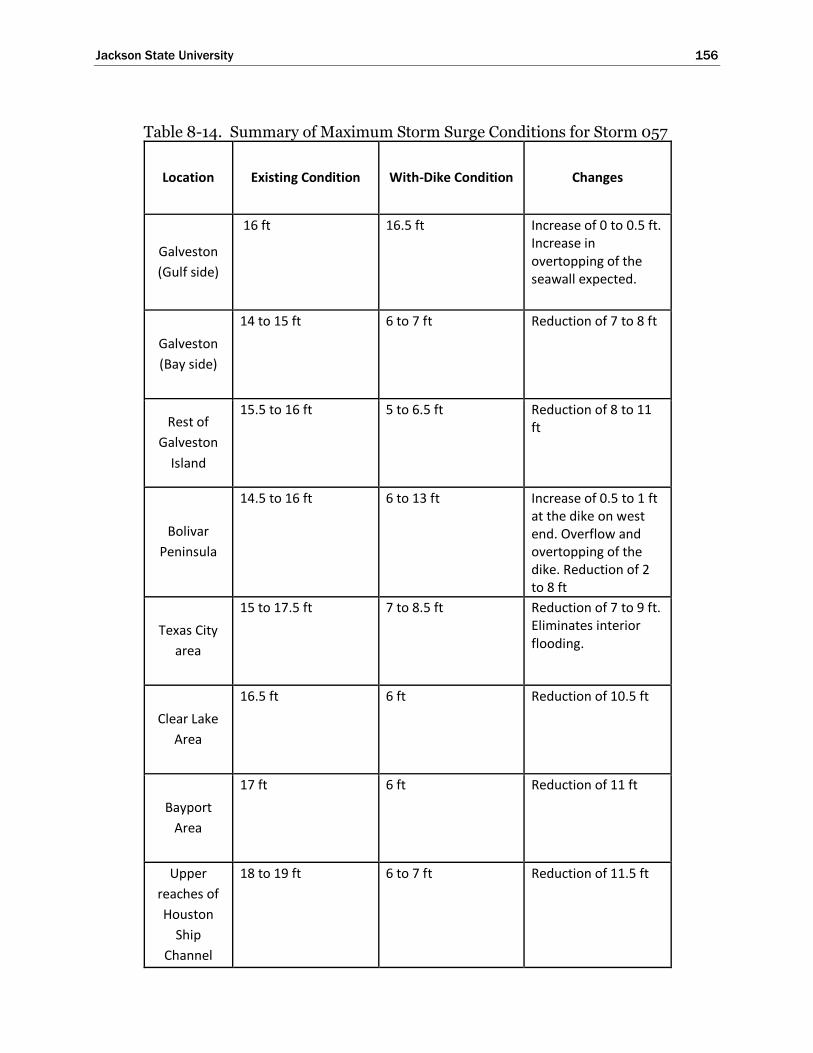
Jackson State University 156
Table 8-14. Summary of Maximum Storm Surge Conditions for Storm 057
Location Existing Condition With-Dike Condition Changes
Galveston
(Gulf side)
16 ft 16.5 ft Increase of 0 to 0.5 ft. Increase in overtopping of the seawall expected.
Galveston
(Bay side)
14 to 15 ft 6 to 7 ft Reduction of 7 to 8 ft
Rest of
Galveston
Island
15.5 to 16 ft 5 to 6.5 ft Reduction of 8 to 11 ft
Bolivar
Peninsula
14.5 to 16 ft 6 to 13 ft Increase of 0.5 to 1 ft at the dike on west end. Overflow and overtopping of the dike. Reduction of 2 to 8 ft
Texas City
area
15 to 17.5 ft 7 to 8.5 ft Reduction of 7 to 9 ft. Eliminates interior flooding.
Clear Lake
Area
16.5 ft 6 ft Reduction of 10.5 ft
Bayport
Area
17 ft 6 ft Reduction of 11 ft
Upper
reaches of
Houston
Ship
Channel
18 to 19 ft 6 to 7 ft Reduction of 11.5 ft

Jackson State University 157
Figure 8-19. Maximum water surface elevation maps for storm 128. Existing conditions
(top); With-dike conditions (middle); Difference in maximum water surface elevation
(bottom)

Jackson State University 158
Table 8-15. Summary of Maximum Storm Surge Conditions for Storm 128
Location Existing Condition With-Dike Condition Changes
Galveston
(Gulf side)
14 to 14.5 ft 14 to 16.5 ft Increase of 0 to 2 ft. Increase in overtopping of the seawall expected.
Galveston
(Bay side)
13.5 to 14 ft 7 to 12 ft Reduction of 4 to 7 ft
Rest of
Galveston
Island
8 to 13.5 ft, increasing from west to east
6 to 7 ft Reduction of 1 to 7 ft
Bolivar
Peninsula
15 to 16.5 ft 6 to 13 ft Increase of 1 ft at the dike. Overflow and overtopping of the dike. Reduction of 2 to 10 ft
Texas City
area
13 to 15.5 ft 7 to 9 ft Reduction of 6 to 7 ft. Eliminates interior flooding.
Clear Lake
Area
15 to 16 ft 7 to 7.5 ft Reduction of 7.5 to 8 ft
Bayport
Area
16 ft 7 ft Reduction of 8 ft
Upper
reaches of
Houston
Ship
Channel
18 to 19 ft 10 to 11 ft Reduction of 8 ft

Jackson State University 159
Figure 8-20. Maximum water surface elevation maps for storm 061. Existing conditions
(top); With-dike conditions (middle); Difference in maximum water surface elevation
(bottom)

Jackson State University 160
Table 8-16. Summary of Maximum Storm Surge Conditions for Storm 061
Location Existing Condition With-Dike Condition Changes
Galveston
(Gulf side)
8 to 11 ft 9 to 12 ft Increase of 1 ft
Galveston
(Bay side)
8 to 10 ft 6 to 7 ft Reduction of 2 to 4 ft
Rest of
Galveston
Island
4 to 7 ft 4 to 7 ft Increase of 0 to 0.5 ft
Bolivar
Peninsula
14 to 16 ft 3 to 10 ft Reduction of 4 to 9 ft
Texas City
area
8.5 to 9.5 ft 6 to 7 ft Reduction of 2 to 4 ft
Clear Lake
Area
10 to 11 ft 3 ft Reduction of 7 to 8 ft
Bayport
Area
11 to 11.5 ft 3 ft Reduction of 8 to 8.5 ft
Upper
reaches of
Houston
Ship
Channel
14 ft 6 ft Reduction of 8 ft

Jackson State University 161
9 Placing Hurricane-Induced
Water Levels in a Probabilistic
Context
Introduction
The 25-storm bracketing set of tropical cyclones (TCs) was mostly
comprised of very severe hurricanes having extremely low minimum
central pressures of 900 mb and different land-falling tracks. Hurricanes
that have a central pressure of 900 mb and make landfall in the Houston-
Galveston region, like many of the bracketing set of storms, are
exceedingly rare events. The Houston-Galveston region has not
experienced a 900-mb hurricane in the most recent 140 years; however,
the possibility exists that such a severe hurricane can directly impact the
region. The probability of peak storm surge produced by such an
occurrence is of great interest, with and without the proposed Ike Dike.
A few less intense storms also were considered in the bracketing storm set,
having minimum central pressures of 930-, 960-, and 975-mb, all on a
single direct-hit track. The 1900 Galveston Hurricane had a central
pressure of 936 mb at landfall. Hurricane Ike had a central pressure of
950 mb at landfall. Both of these storms directly and adversely impacted
the Houston-Galveston area. The probabilities of peak surge that
produced these types of less intense, but more likely, events also is of great
interest.
The Ike Dike concept reduced storm surge throughout Galveston Bay for
all the bracketing-set TCs, including the very severe 900-mb storms. The
dike showed considerable reduction in storm surge for the 930-mb storms
and even more reduction for the less intense 960 and 975-mb storms, all
of which have a much greater probability of occurrence compared to 900-
mb storms. However, several of the 900-mb TCs, and the 930-mb direct
hit storm, produced very high storm surge which overtopped the proposed
Ike Dike at various locations. These extreme storms still produced
substantial surge and inundation within Galveston Bay as a result of both
overtopping and the effect of strong winds within the Bay. It is important
to determine the frequency of occurrence of water levels for these types of
rare TCs as well as the more likely storms. A full probabilistic approach is

Jackson State University 162
essential for accurately determining the risk of both flooding and
damage/losses associated with TCs for the existing condition and for
determining the reduction in risk associated with the Ike Dike concept.
An initial approach, which is informative, relatively simple and much less
resource intensive than a full probabilistic approach, was taken to gain
insight on the inundation and damage/losses prevented by the dike in a
probabilistic context. Although simple and not rigorous from a probability
and statistics perspective, it sheds some initial light for TCs that produce
water levels having certain frequencies of occurrence. This approach is
based on the idea of a proxy storm, in which a single storm is selected to
best represent a certain annual exceedance probability (AEP), or
alternatively the average recurrence interval (ARI), water surface elevation
throughout the corridor of greatest potential economic damage/loss. This
corridor encompasses the City of Galveston, follows the western shoreline
of Galveston Bay including Texas City and the Clear Lake area, and
extends into the upper reaches of the Houston Ship Channel. The process
for selecting proxy storms and results from the proxy storm analysis are
presented later in this chapter.
A final approach will involve simulation of a large set of TCs for both
existing conditions and with Ike Dike conditions, to assess risk of flooding
and economic damages, without and with the proposed project.
Approach for Statistical Analysis of Water Surface Elevation
To provide a basis for proxy storm selection and to fully and accurately
characterize the probability of extreme water surface elevations for
existing conditions, a full joint probability analysis was conducted by the
U.S. Army Engineer Research and Development Center (ERDC) using
joint probability methods. The analysis produced water surface elevation
statistics for a set of points, or save locations, in the Houston-Galveston
region, including the key corridor for potential economic damage and
losses, for existing conditions. The approach used by the ERDC differs
slightly, in some aspects, from the approach used in the FEMA Region VI
Risk Map study of the Texas coast (FEMA 2011). Differences in the joint
probability analyses are noted later in this chapter.

Jackson State University 163
Joint Probability Analysis
To quantify and estimate probabilities of hurricane-induced water levels, a
probabilistic model of TCs was first built based on the historical storm
climatology; and then the model was used to determine the probability of
previously simulated synthetic tropical cyclones. For the present study, a
new Joint Probability Analysis (JPA) was applied which takes advantage
of more rigorous methods recently developed by the ERDC, which were
applied to a recent study of the coastal storm hazard for the northeast
United States, the North Atlantic Coast Comprehensive Study (Nadal-
Caraballo, et al. 2015).
The present JPA model was built based on the historical storm climatology
of tropical cyclones developed in the FEMA Region VI Risk MAP study
(FEMA 2011). It also utilized high fidelity hydrodynamic modeling of TCs
which was done as part of the Risk MAP study (FEMA 2011), in which the
wind, pressure, surge and waves were modeled for each cyclone. The Risk
MAP study included specification and modeling of 223 tropical cyclones
for the northern Texas region, comprised of 152 high-intensity cyclones
and 71 low-intensity cyclones. All hydrodynamic responses were
stochastic because storms are random in both recurrence and intensity.
The statistical analysis of the storm surge responses of the 223 simulated
TCs produced response statistics including average recurrence interval
(ARI) water surface elevations. In addition, epistemic uncertainty was
quantified and represented as confidence limits.
Joint Probability Method
Statistical analysis of water level response resulting from TCs in most
cases suffers from a lack of historical observations, which results in a small
sample size. Moreover, some of the characteristics of the TCs that impact a
particular area may make it necessary to consider them as belonging to
different populations, further reducing the sample sizes. Storm intensity
has been identified as such a characteristic (Resio et al., 2007) since
intense TCs tend to behave differently from weak ones.
The Joint Probability Method (JPM) overcomes this problem by focusing
on the forcing instead of the response. In broad terms, TCs are defined by
a number of forcing parameters which are used to generate the
corresponding wind and pressure fields required for the simulation of
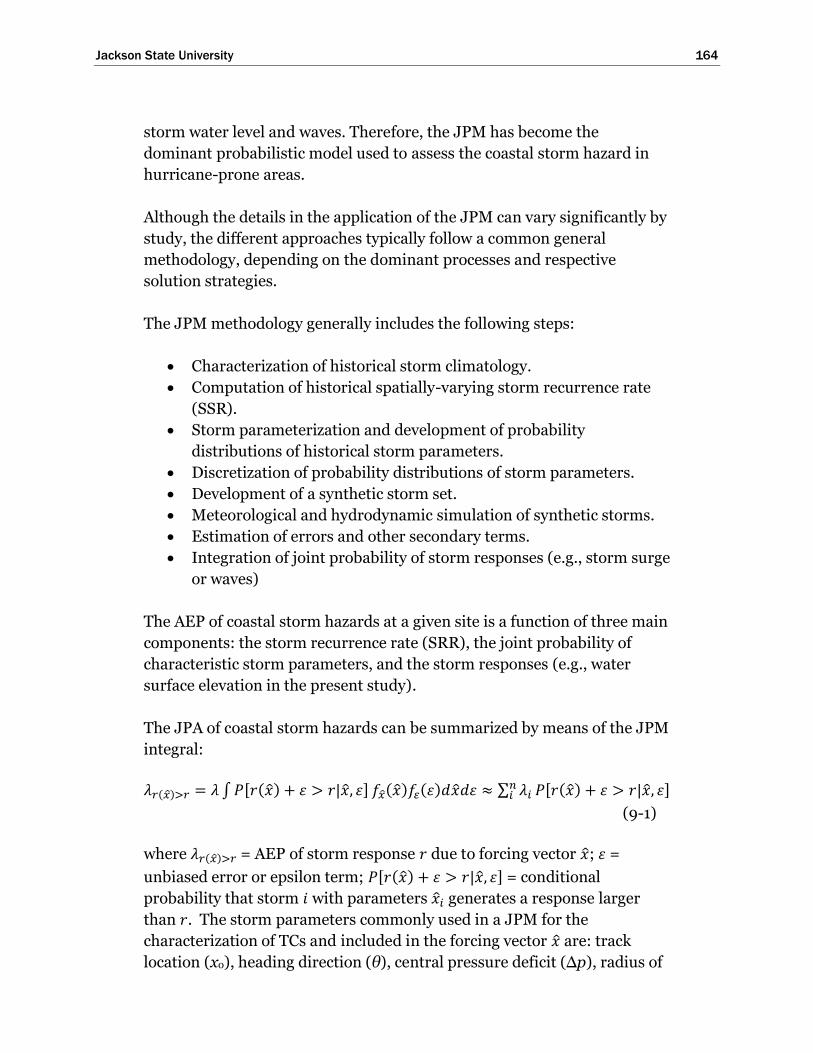
Jackson State University 164
storm water level and waves. Therefore, the JPM has become the
dominant probabilistic model used to assess the coastal storm hazard in
hurricane-prone areas.
Although the details in the application of the JPM can vary significantly by
study, the different approaches typically follow a common general
methodology, depending on the dominant processes and respective
solution strategies.
The JPM methodology generally includes the following steps:
Characterization of historical storm climatology.
Computation of historical spatially-varying storm recurrence rate
(SSR).
Storm parameterization and development of probability
distributions of historical storm parameters.
Discretization of probability distributions of storm parameters.
Development of a synthetic storm set.
Meteorological and hydrodynamic simulation of synthetic storms.
Estimation of errors and other secondary terms.
Integration of joint probability of storm responses (e.g., storm surge
or waves)
The AEP of coastal storm hazards at a given site is a function of three main
components: the storm recurrence rate (SRR), the joint probability of
characteristic storm parameters, and the storm responses (e.g., water
surface elevation in the present study).
The JPA of coastal storm hazards can be summarized by means of the JPM
integral:
𝜆𝑟(𝑥)>𝑟 = 𝜆 ∫ 𝑃[𝑟(�̂�) + 𝜀 > 𝑟|�̂�, 𝜀] 𝑓𝑥(�̂�)𝑓𝜀(𝜀)𝑑�̂�𝑑𝜀 ≈ ∑ 𝜆𝑖𝑛𝑖 𝑃[𝑟(�̂�) + 𝜀 > 𝑟|�̂�, 𝜀]
(9-1)
where 𝜆𝑟(𝑥)>𝑟 = AEP of storm response 𝑟 due to forcing vector �̂�; 𝜀 =
unbiased error or epsilon term; 𝑃[𝑟(�̂�) + 𝜀 > 𝑟|�̂�, 𝜀] = conditional
probability that storm 𝑖 with parameters �̂�𝑖 generates a response larger
than 𝑟. The storm parameters commonly used in a JPM for the
characterization of TCs and included in the forcing vector �̂� are: track
location (xo), heading direction (θ), central pressure deficit (Δp), radius of

Jackson State University 165
maximum winds (Rmax), and translational speed (Vt). Secondary
parameters may include: epsilon, or error, term (𝜀); Holland 𝐵 , which
characterizes the peakedness or radial shape of the wind field; and
astronomical tide.
In order to develop the set of synthetic storms, each parameter is treated
as a correlated random variable and either a marginal or a conditional
probability density function (PDF) is sought for each parameter based on
the TCs observed in the historical record. The probability distributions are
then discretized and the corresponding weights are assigned to the range
of discrete values. Synthetic storms are developed as possible
combinations of samples from the marginal or conditional distributions.
Each synthetic storm must consist of a physically- and meteorologically-
realistic combination of the aforementioned parameters. The
parameterized TCs are used as inputs to the PBL wind/pressure model.
This model is used as part of the JPM methodology to estimate the time-
histories of the wind and pressure fields that drive high-fidelity storm
surge and wave numerical hydrodynamic models such as ADCIRC and
WAM/STWAVE, respectively.
A central issue surrounding application of the JPM is the number of storm
parameters required to adequately represent TCs and their forcing. In
current practice, it has been shown that the five parameters listed above
are sufficient to characterize TCs and their wind and pressure fields for the
purpose of quantifying coastal storm hazards. Sources of epistemic
uncertainty often accounted for in the JPM include:
1. Hydrodynamic modeling errors potentially arising from unresolved
physical processes, inadequate grid resolution, and bathymetry
inaccuracy.
2. Meteorological modeling errors due to use of idealized wind and
pressure fields, and wind variations not captured by the PBL model.
3. Track variations not captured in the synthetic storm set.
4. Random variations in the peakedness of the wind fields represented by
the Holland B parameter.
The AEP of a particular storm hazard is computed by integration of
Equation (9-1). Epistemic uncertainty is quantified and incorporated in
the JPM as confidence limits (e.g., 84%, 90%, 95%, and 98% are
considered in the present study).

Jackson State University 166
Joint Probability Method with Optimal Sampling
Although the JPM approach has been implemented since the 1970s, recent
advancements in sampling techniques and the development of the JPM
with Optimal Sampling (JPM-OS) have made it possible to reduce the
necessary number of synthetic storms, more efficiently characterizing the
parameter and probability spaces. The main accomplishment of these new
developments was the reduction in number of storms required for
populating the parameter space, from thousands, or even tens of
thousands, down to hundreds of storms. This reduction was accomplished
by optimizing the sampling of the storm parameters (Resio et al. 2007;
Toro 2008; Vickery and Blanton 2008).
Different implementations of the JPM-OS methodology emerged as a
result of several studies done in the aftermath of Hurricane Katrina after
2005, which led to the proliferation of surge hazard studies that brought
further improvements to the JPM. Different approaches include the JPM-
OS by Bayesian Quadrature (JPM-OS-BQ), the JPM with augmented
sampling by means of Response Surface (JPM-OS-RS), and other JPM
applications that use hybrid optimal sampling techniques.
Of particular importance was the work done by the Interagency
Performance Evaluation Taskforce (IPET 2009) in which JPM-OS
methods were developed for the statistical analysis of water level extremes
to evaluate the performance of the Southeast Louisiana hurricane surge
reduction system. This study provided the basic framework for the storm
surge and modeling approaches used in later works, including the Texas
Risk MAP study (FEMA 2011). This effort, led by a team of USACE, FEMA,
NOAA, and private sector and academic researchers, was documented in
the IPET (2009) report.
Regional studies conducted after Hurricane Katrina that stood out
included the Louisiana Coastal Protection and Restoration (LACPR)
(USACE 2009a), the Mississippi Coastal Improvements Program (MSCIP)
(USACE 2009b), the Mississippi Coastal Analysis Project (FEMA 2008a)
and the Risk MAP Study for the Coastal Counties in Texas (FEMA 2011).
The JPM-OS-RS approach was applied in the Texas Risk MAP study
(FEMA 2011).
The JPM-OS-BQ was adopted as part of FEMA’s National Flood Insurance
Program Risk MAP program best practices, as documented in the
Jackson State University 167
Operating Guidance No. 8-12 (FEMA 2012). The JPM-OS-BQ approach
was adopted for the present analysis.
JPM-OS-BQ Implementation for the Present Study
Tropical Cyclone Data Sources
The first step in implementing a JPA is characterization of the historical
storm climatology, TCs in this case. Characterization requires
identification of a TC data source and selection of a period of record for
which the analysis will be performed.
For TC s, the main data source was HURDAT2 (Landsea and Franklin,
2013). HURDAT2 is a product of NOAA’s National Hurricane Center
(NOAA-NHC) and consists of the reanalysis of all historical TCs recorded
in the North Atlantic basin (i.e., North Atlantic Ocean, Gulf of Mexico, and
the Caribbean Sea) from 1851 to the present. This same basic data source
was used in the Texas Risk MAP study (FEMA 2011).
The JPA performed in this study focused on TCs with ∆p ≥ 28 hPa. The ∆p
were computed as the difference between a far-field atmospheric pressure
of 1,013 hPa and central pressure (cp). TCs of this intensity are expected to
be classified, on average, as category 1 hurricanes based on the Saffir-
Simpson hurricane wind scale (SSHWS), but generally fall within the
tropical storm to category 2 range.
Period of Record
Prior to the selection of historical TCs, the specific period of record to be
used for the JPA must be defined. The SRR and the marginal distributions
of storm parameters are sensitive to the historical record length. The
1940s decade marked the dawn of modern aircraft reconnaissance
missions to measure hurricane parameters, resulting in much more
reliable estimates of storm characteristics, including frequency and
intensity.
Prior to 1944, the main data sources were land stations and ship reports
(Jarvinen et al. 1984). During this period it was typical for relatively weak
storms to go undetected and for the intensity of strong storms to be
underestimated. After 1944 and as a consequence of World War II, aerial
reconnaissance led to increased data collection incidence and

Jackson State University 168
measurement accuracy, including storm position, track, wind speed and
pressure. The use of satellite imagery was introduced during the 1964
hurricane season (Neumann et al., 1985) and was considered one of the
major advances in TC tracking (Jarvinen et al., 1984).
The high frequency of unsampled TCs prior to the 1940s has been well
documented. Mann et al. (2007) estimated an undercount in the pre-
aircraft reconnaissance era (1870–1943) ranging from 0.5 to 2.0 TC/yr,
with a mean of 1.2 TC/yr. Landsea et al. (2010) discussed that the increase
in reported TCs during the 1940s and until about 1960 had been
interpreted as a result of climate change. This increase, however, is likely
to be a consequence of improved observing and recording of short-lived
TCs coinciding with the advent of aircraft reconnaissance and satellite
imagery.
Worley et al. (2005) identified spikes in the number of unrecorded
moderate to long-lived TCs during the 1910s and 1940s as due to reduced
ship observations during World War I and World War II, respectively.
Vecchi and Knutson (2011), after adjusting HURDAT data for unrecorded
TCs, concluded that the mid-twentieth century was a high activity period
that extended from the 1940s to the 1960s.
In recent flood hazard studies where the JPM-OS methodology has been
used, the period of record that was considered started in the early 1940s
(FEMA 2008a, 2012; Resio et al., 2007). For the present study, the period
of record was 1940-2013. For the Texas Risk Map study (FEMA 2011), the
period of record considered was 1940-2007.
Computation of Spatially-Varying Storm Recurrence Rate
A second step in conducting a JPA is computation of the historical
spatially-varying storm recurrence rate (SSR) for the area of interest.
Calculation of the SRR requires sampling of historic TC occurrences for
the region. The computation method adopted in the present study is
different from that used in the Texas Risk MAP study (FEMA 2011), and
slightly different rates are calculated.
Efficient storm sampling from the historical record and statistical
computation of the SRR can be achieved using several different
approaches. In recent studies some of the approaches used to compute the
spatial variation of SRR have included: area-crossing, line-crossing,
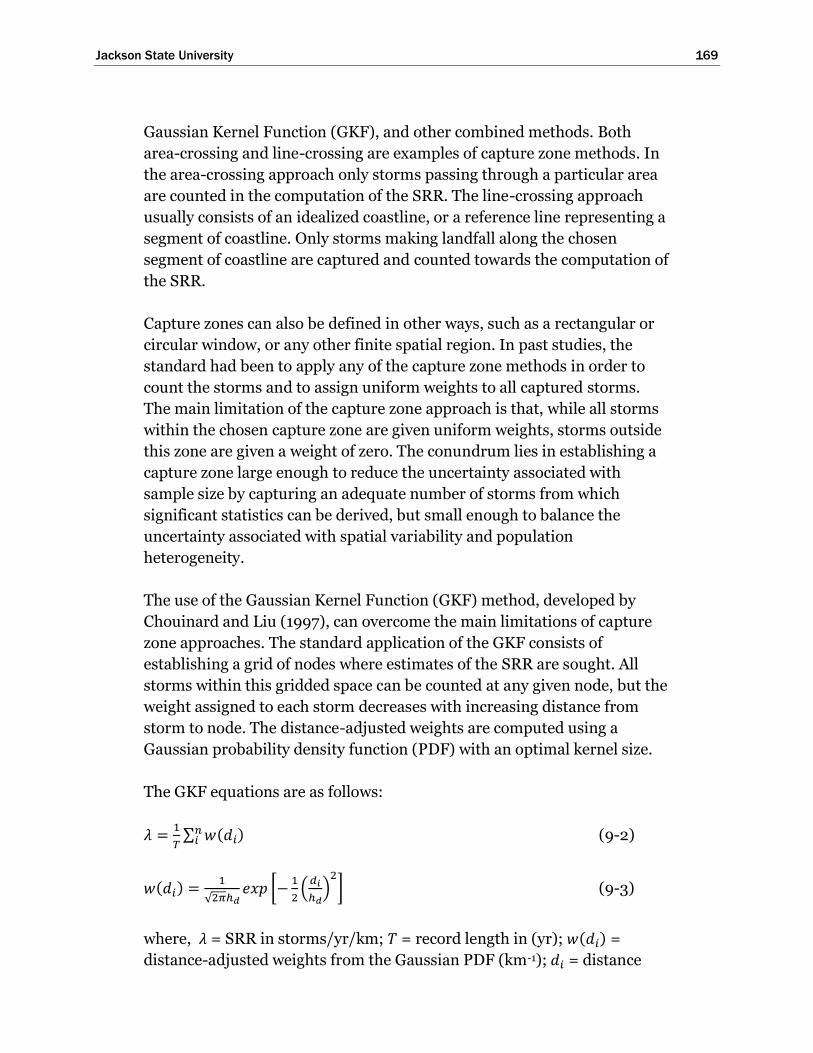
Jackson State University 169
Gaussian Kernel Function (GKF), and other combined methods. Both
area-crossing and line-crossing are examples of capture zone methods. In
the area-crossing approach only storms passing through a particular area
are counted in the computation of the SRR. The line-crossing approach
usually consists of an idealized coastline, or a reference line representing a
segment of coastline. Only storms making landfall along the chosen
segment of coastline are captured and counted towards the computation of
the SRR.
Capture zones can also be defined in other ways, such as a rectangular or
circular window, or any other finite spatial region. In past studies, the
standard had been to apply any of the capture zone methods in order to
count the storms and to assign uniform weights to all captured storms.
The main limitation of the capture zone approach is that, while all storms
within the chosen capture zone are given uniform weights, storms outside
this zone are given a weight of zero. The conundrum lies in establishing a
capture zone large enough to reduce the uncertainty associated with
sample size by capturing an adequate number of storms from which
significant statistics can be derived, but small enough to balance the
uncertainty associated with spatial variability and population
heterogeneity.
The use of the Gaussian Kernel Function (GKF) method, developed by
Chouinard and Liu (1997), can overcome the main limitations of capture
zone approaches. The standard application of the GKF consists of
establishing a grid of nodes where estimates of the SRR are sought. All
storms within this gridded space can be counted at any given node, but the
weight assigned to each storm decreases with increasing distance from
storm to node. The distance-adjusted weights are computed using a
Gaussian probability density function (PDF) with an optimal kernel size.
The GKF equations are as follows:
𝜆 =1
𝑇∑ 𝑤(𝑑𝑖)
𝑛𝑖 (9-2)
𝑤(𝑑𝑖) =1
√2𝜋ℎ𝑑𝑒𝑥𝑝 [−
1
2(
𝑑𝑖
ℎ𝑑)
2] (9-3)
where, 𝜆 = SRR in storms/yr/km; 𝑇 = record length in (yr); 𝑤(𝑑𝑖) =
distance-adjusted weights from the Gaussian PDF (km-1); 𝑑𝑖 = distance
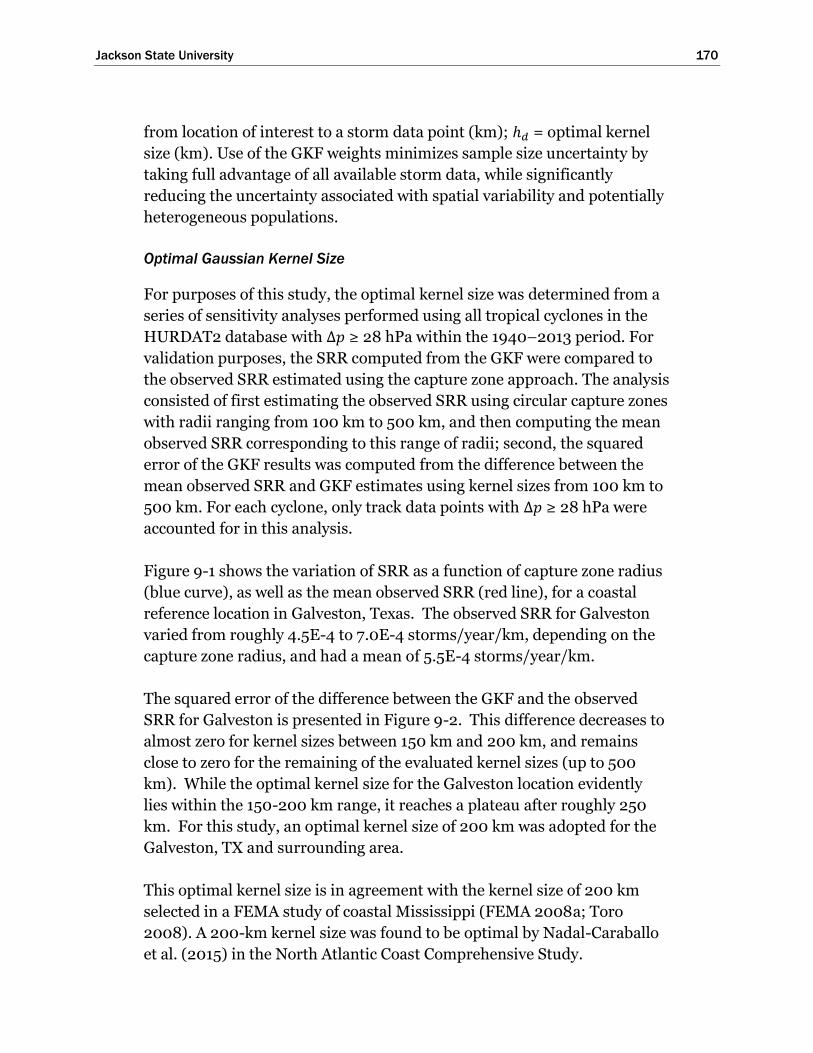
Jackson State University 170
from location of interest to a storm data point (km); ℎ𝑑 = optimal kernel
size (km). Use of the GKF weights minimizes sample size uncertainty by
taking full advantage of all available storm data, while significantly
reducing the uncertainty associated with spatial variability and potentially
heterogeneous populations.
Optimal Gaussian Kernel Size
For purposes of this study, the optimal kernel size was determined from a
series of sensitivity analyses performed using all tropical cyclones in the
HURDAT2 database with Δ𝑝 ≥ 28 hPa within the 1940–2013 period. For
validation purposes, the SRR computed from the GKF were compared to
the observed SRR estimated using the capture zone approach. The analysis
consisted of first estimating the observed SRR using circular capture zones
with radii ranging from 100 km to 500 km, and then computing the mean
observed SRR corresponding to this range of radii; second, the squared
error of the GKF results was computed from the difference between the
mean observed SRR and GKF estimates using kernel sizes from 100 km to
500 km. For each cyclone, only track data points with Δ𝑝 ≥ 28 hPa were
accounted for in this analysis.
Figure 9-1 shows the variation of SRR as a function of capture zone radius
(blue curve), as well as the mean observed SRR (red line), for a coastal
reference location in Galveston, Texas. The observed SRR for Galveston
varied from roughly 4.5E-4 to 7.0E-4 storms/year/km, depending on the
capture zone radius, and had a mean of 5.5E-4 storms/year/km.
The squared error of the difference between the GKF and the observed
SRR for Galveston is presented in Figure 9-2. This difference decreases to
almost zero for kernel sizes between 150 km and 200 km, and remains
close to zero for the remaining of the evaluated kernel sizes (up to 500
km). While the optimal kernel size for the Galveston location evidently
lies within the 150-200 km range, it reaches a plateau after roughly 250
km. For this study, an optimal kernel size of 200 km was adopted for the
Galveston, TX and surrounding area.
This optimal kernel size is in agreement with the kernel size of 200 km
selected in a FEMA study of coastal Mississippi (FEMA 2008a; Toro
2008). A 200-km kernel size was found to be optimal by Nadal-Caraballo
et al. (2015) in the North Atlantic Coast Comprehensive Study.

Jackson State University 171
The weights computed using the GKF with a kernel size of 200 km are
illustrated in Figure 9-3. These weights are shown relative to the weight of
a storm track point located right on the coastal reference line (CRL), (𝑑𝑖 =
0 km), or
Relative weight =𝑤(𝑑𝑖)
𝑤(𝑑𝑖=0) (9-3)
Data from such a storm track point would have a relative weight of 1.0,
whereas, a track point located at a distance 200 km away from the CRL
would have a relative weight of 0.6. The weights decrease as distance from
the CRL increases, based on the Gaussian pdf, until becoming negligible.
The relative weight of track points located at 600 km and 850 km from the
CRL, for example, will have relative weights of roughly 1.0E-2 and 1.0E-4,
respectively.
For the present study, further analyses were performed to determine the
SRR corresponding to both high intensity (Δ𝑝 ≥ 48 hPa) and low intensity
(28 hPa ≤ Δ𝑝 < 48 hPa) storms for the 1940-2013 period. The SRR of high
intensity storms computed for locations in the Galveston region varied
from 1.6E-4 to 2.2E-4 storms/year/km. For low intensity storms in the
same area, the computed SRR ranges from 4.2E-4 to 5.1E-4
storms/year/km.
Figure 9-1. Observed SRR for Galveston, Texas.

Jackson State University 172
Figure 9-2. Comparison of GKF SRR vs. Mean Observed SRR for Galveston, Texas.
Figure 9-3. Relative weight of storm parameters as a function of distance from CRL.
0.0
0.1
0.2
0.3
0.4
0.5
0.6
0.7
0.8
0.9
1.0
0 100 200 300 400 500 600 700 800 900 1000
Rel
ativ
e W
eigh
t
Distance from Coastal Reference Location (km)
Gaussian Kernel Size = 200 km

Jackson State University 173
The GKF SRR results corresponding to high intensity storms (Δ𝑝 ≥ 48
hPa) in the entire Atlantic basin for the 1940–2013 period are shown in
Figure 9-4. SRR of low intensity storms (28 hPa ≤ Δ𝑝 < 48 hPa) for the
same period are presented in Figure 9-5. The Δ𝑝 values were determined
based on a far-field pressure of 1,013 hPa. The SRR depicted in these
figures is SRR200km, with units of storms/yr, and represents the annual
chance of a TC passing within 200 km.
Estimates of SRR from Other Studies
For comparison purposes, the SRR of high intensity storms in previous
FEMA studies (Resio et al., 2007; FEMA, 2009a, 2009b; FEMA, 2011) for
the Galveston area have been determined to be around 0.02
storms/year/deg, or roughly 2.0E-4 storms/year/km.
The SRR analyses in the present study were performed using the standard
GKF method developed by Chouinard and Liu (1997) with an optimal
kernel size of 200 km. However, in the Resio et al. (2007) work, the SRR
was estimated using a hybrid method which employed a line-crossing
approach to sample only landfalling storms, then using GKF weights with
kernel size of 250 km for the actual computation of SRR. Figure 9-6 shows
the coastal reference line that was used. The Resio et al. (2007) results are
shown in Figure 9-7 with units of storms/year/deg.
In FEMA (2008a) and Toro 92008), another hybrid method was used that
included a rectangular window capture zone. The results, which were
based on a kernel size of 160 km, are illustrated in Figure 9-8 with units
also in storms/year/deg.
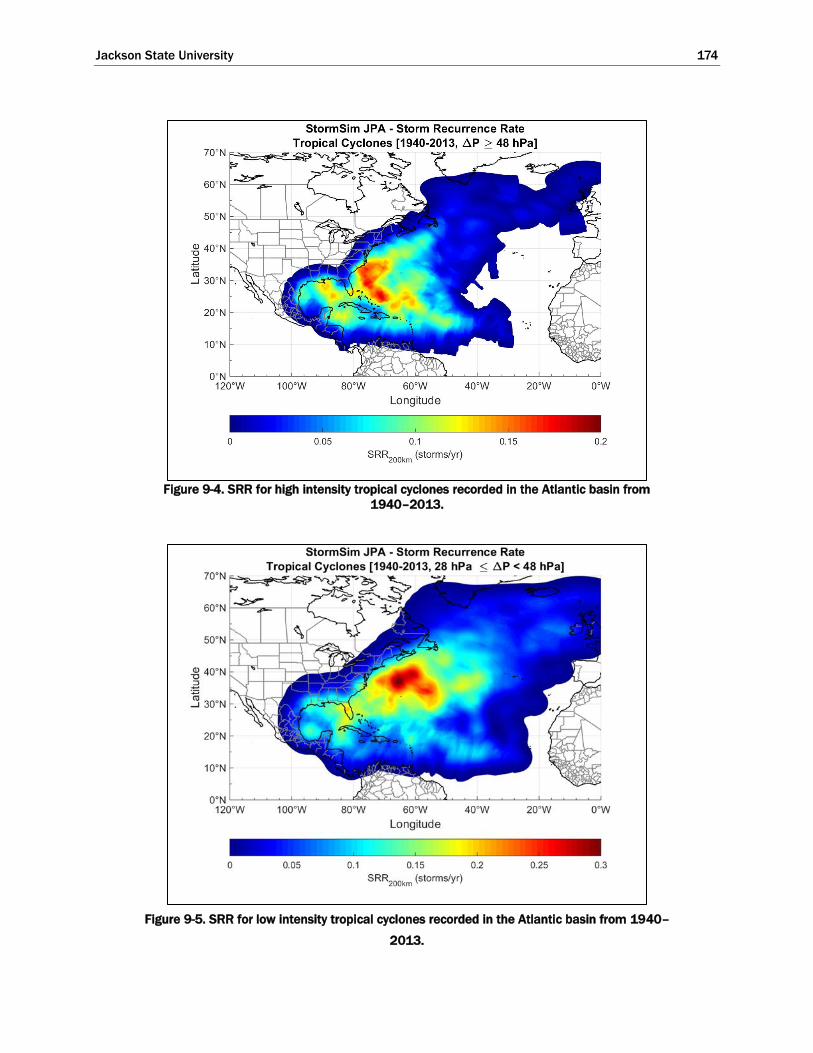
Jackson State University 174
Figure 9-4. SRR for high intensity tropical cyclones recorded in the Atlantic basin from
1940–2013.
Figure 9-5. SRR for low intensity tropical cyclones recorded in the Atlantic basin from 1940–
2013.
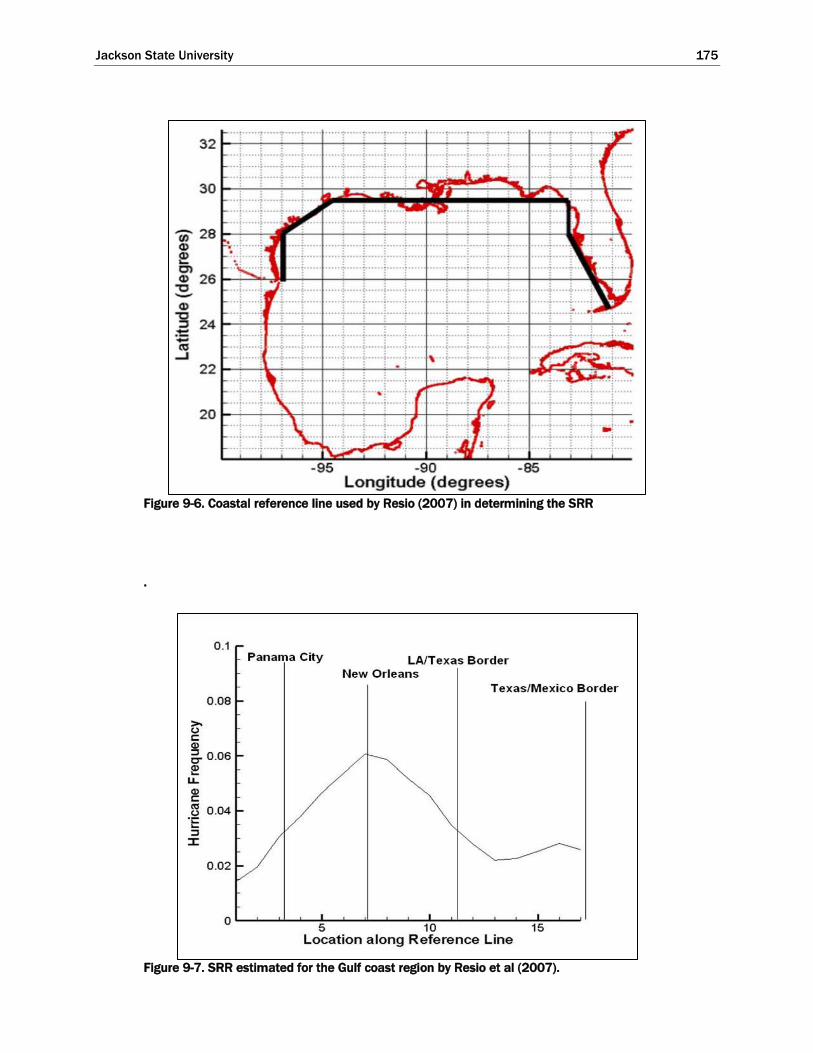
Jackson State University 175
Figure 9-6. Coastal reference line used by Resio (2007) in determining the SRR
.
Figure 9-7. SRR estimated for the Gulf coast region by Resio et al (2007).

Jackson State University 176
Figure 9-8. SRR computed from GKF for the Gulf of Mexico in FEMA (2008a).
Probability Distributions of Tropical Storm Parameters
In general, the next steps in conducting a JPA are: storm parameterization
and development of probability distributions of historical TC parameters,
discretization of probability distributions of TC parameters, and
development of a synthetic storm set. The storm set adopted for use in
the present study is the same storm set that was developed for the FEMA
Risk MAP study of the Texas Coast (FEMA 2011). Compared to the
method used in the Texas Risk MAP study (FEMA 2011), the present study
adopted a different approach for discretizing probability distribution of
storm parameters and optimizing the discrete weights assigned to each TC
parameter combination.
Most recent FEMA studies of hurricane-prone coastal areas have been
based on some implementation of JPM-OS methodology for sampling
distributions of TC parameters. The two most well established JPM-OS
methods are the JPM-OS Response Surface approach (Resio et al., 2007)
and the JPM-OS Bayesian Quadrature approach (Toro et al., 2010). The
Response Surface approach (JPM-OS-RS) has been used in studies

Jackson State University 177
throughout the Gulf Coast, including Louisiana (IPET 2009) and Texas
(FEMA 2011). The Bayesian Quadrature Approach (JPM-OS-BQ) has been
used in areas of the Gulf Coast region such as Mississippi (FEMA 2008a).
The focus of the JPM-OS-RS is to augment the storm sampling by
interpolating intermediate parameter values from response surfaces. The
interpolated values have been shown to introduce additional uncertainty
in water surface elevations with root-mean-square deviation on the order
of 0.70 m (CPRA 2013). The added uncertainty is seldom quantified in
these studies. The JPM-OS-RS also requires expert judgment for the
selection of the storm parameters and associated discrete weights.
The JPM-OS-BQ approach employs a quadrature scheme that selects the
optimal storm parameters and assigns the appropriate discrete weights.
The JPM-OS-BQ was adopted as part of FEMA’s Risk MAP program best
practices, as documented in the Operating Guidance No. 8-12 (FEMA
2012). In the present study, the Bayesian Quadrature (Diaconis 1988;
O’Hagan 1991; Minka 2000; Toro 2008, Toro et al., 2008) algorithm was
used to optimize the discrete weights assigned to each parameter
combination corresponding to the synthetic storm set developed as part of
the Texas Risk MAP study (FEMA 2011).
Estimation of Errors and Other Secondary Terms
The error or epsilon (𝜀) term that is considered in the JPM integral
(Equation 9-1) is a combination of multiple epsilons that are considered to
be probabilistically independent and aggregated accordingly. Following is
a list of epsilons that have been estimated and accounted for in recent
JPM-OS studies:
1) Errors in hydrodynamic modeling and grids associated with
epistemic uncertainty.
2) Errors in meteorological modeling associated with simplified PBL
winds.
3) Random variations in the Holland 𝐵 parameter.
4) Storm track variations not captured in synthetic storm set.
5) Random astronomical tide phase.

Jackson State University 178
The uncertainty associated with each epsilon is assumed to be unbiased
and normally distributed. This allows the epsilons to be represented as
standard deviations and their effects to be combined additively. The total
uncertainty associated with the combined epsilon (𝜎𝜀) is computed as the
square root of the sum of the squares of the standard deviations of each
individual epsilon (𝜎𝑖):
𝜎𝜀 = √∑ (𝜎𝑖2)𝑛
𝑖 (9-4)
where 𝜎𝜀 is the total standard deviation of errors and 𝜎𝑖 is the standard
deviation of error 𝑖.
Errors in Hydrodynamic Modeling
The epsilon related to hydrodynamic modeling errors, 𝜎ℎ𝑦𝑑, has been
estimated in substantially different ways in recent FEMA studies. For example, in FEMA (2008), 𝜎ℎ𝑦𝑑 was computed as follows:
𝜎ℎ𝑦𝑑 = √𝜎𝑐𝑎𝑙2 − 𝜎𝑚𝑒𝑎𝑠
2 (9-5)
where 𝜎𝑐𝑎𝑙 = calibration error; 𝜎𝑚𝑒𝑎𝑠 = measurement error. The calibration
error was estimated as the standard deviation of the difference between
simulated and measured storm surge elevations. The measurement error
was estimated as a standard deviation representing the variability in high
water marks. The epsilons 𝜎𝑐𝑎𝑙 and 𝜎𝑚𝑒𝑎𝑠 were estimated to be 0.46 m and 0.40 m, respectively, resulting in 𝜎ℎ𝑦𝑑 = 0.23 m. Other studies (Resio et al.
2007; FEMA 2011) have estimated 𝜎ℎ𝑦𝑑 for the Louisiana-Mississippi coast
to be in the range of 0.53–0.76 m. This same range for 𝜎ℎ𝑦𝑑, 0.53– 0.76 m
(mean of 0.645 m), was adopted in the present study.
Errors in Meteorological Modeling
The epsilon associated with errors in meteorological modeling, 𝜎𝑚𝑒𝑡, is
estimated from the variability in water levels when comparing levels
simulated using best winds to those simulated with PBL winds. The wind
and pressure fields derived from “best winds” employs techniques that
combine inputs from a variety of meteorological sources. In Resio et al.
(2007) and FEMA (2011) values of 𝜎𝑚𝑒𝑡 are not explicitly provided. However, it is stated that the range of 𝜎ℎ𝑦𝑑+𝑚𝑒𝑡 for the Louisiana-
Mississippi coast is estimated to be 0.61–1.07 m. In FEMA (2008a), 𝜎𝑚𝑒𝑡

Jackson State University 179
for coastal Mississippi was estimated at 0.36 m. For the present study,
values of 0.07 to 0.30 (mean of 0.185 m) were adopted, the same as values
adopted in FEMA (2011).
In the Texas Risk MAP study (FEMA 2011), regional biases were evident in
comparisons that were made between maximum water surface elevation
results from historic storms run using handcrafted Oceanweather “best
winds” and runs using a PBL-model representation of the same historic
storms. The same bias correction adopted by FEMA (2011) for the region
encompassing Galveston Bay was applied in the present study.
Variations in Holland B Parameter
Regarding the epsilon associated with random variations in the Holland 𝐵
parameter, 𝜎𝐵, the storm surge elevation has been found to vary almost
linearly with changes in the Holland 𝐵 parameter. The epsilon 𝜎𝐵 is
typically assumed to be in the range of 10–20% of the storm surge (Resio
et al. 2007). More recent studies have adopted 𝜎𝐵 = 0.15 × storm surge
elevation FEMA (2008a, 2011). This same epsilon term was adopted in
the present study, 𝜎𝐵 = 0.15 × storm surge elevation.
Storm Track Variations
The epsilon related to storm track variations not accounted for in the
synthetic storm set, 𝜎𝑡𝑟𝑎𝑐𝑘, was estimated to be 0.20% of the wave setup
contribution to the storm surge elevation (Resio 2007; FEMA 2011). The
wave setup is estimated to be roughly 15–30% of the storm surge (Resio
2007; FEMA 2011). Other FEMA (2008a) studies have not explicitly
accounted for 𝜎𝑡𝑟𝑎𝑐𝑘.
Errors due to track variation were excluded from the present study. The
way it was computed in FEMA (2011) resulted in a fairly insignificant
magnitude.
Random Astronomical Tide Phase
There are locations where the magnitude of the astronomical tide is small
enough that it can be treated as an uncertainty associated with the total
water level response. This has been the approach followed for the Gulf of
Mexico (e.g., FEMA 2008a, FEMA 2011). In cases where the tide
amplitude is relatively small compared to the storm surge, the purpose of

Jackson State University 180
this uncertainty is to capture the aleatory variability arising from the fact
that the arrival of a TC can occur at any tide phase. This uncertainty is
sometimes computed as the standard deviation of the predicted tide at any
given location. FEMA (2008a) estimated the uncertainty associated with
the astronomical tide to be 0.20 m for coastal Mississippi. In FEMA
(2014), the adopted approach differed and consisted of simulating each
storm with a random tide phase.
In the present study, the maximum surge values for each of the 223 FEMA
North Texas storms, which were each modeled on a mean sea level with
wave effects but without astronomical tides, was linearly superimposed
with 96 random tide values. The tide values were obtained from NOAA
gage 8771450
(http://tidesandcurrents.noaa.gov/stationhome.html?id=8771450). The
period of record considered for the tide was ‘1904 Jan 01’ to ‘2013 Dec 31’.
Only tide values corresponding to hurricane season months (June-
November) were used. This approach followed that taken in the North
Atlantic Coast Comprehensive Study, NACCS, (Nadal-Caraballo et al.,
2015)
Summary of Estimated Errors
The values of the error terms used in the present study along with the
previous JPM-OS studies for Mississippi (FEMA 2008a), Texas (FEMA
2011), New York/New Jersey (FEMA 2014) and the NACCS, (Nadal-
Caraballo et al., 2015) are listed in Table 9-2.
Table 9-2. Comparison of uncertainty estimates in JPM studies.
Uncertainty
Present
Study
FEMA
2008a
(m)
FEMA
2011
(m)
FEMA
2014
(m)
NACCS
(m)
Hydrodynamic
modeling
0.53 to
0.76 0.23
0.53 to
0.76 0.39 0.48
Meteorological
modeling
0.07 to
0.30 0.36
0.07 to
0.30 0.54 0.38
Storm track
variation n/a n/a
0.20* ×
wave
setup
n/a 0.25
Holland B
0.15* x
surge
elevation
0.15* ×
surge
elevation
0.15* ×
surge
elevation
n/a
0.15* ×
surge
elevation
Astronomical
tide variable 0.20 0.20 n/a variable
*Factor on storm surge elevation is dimensionless.

Jackson State University 181
Summary of Differences in JPM-OS Studies for the Houston-Galveston Region
For the present study, the JPM of hurricane parameters was recomputed
and the probabilities of each of the previously modeled storms were
recomputed in order to take advantage of new, more rigorous methods
recently developed by the ERDC. The joint probability of coastal storm
hazards was performed following a methodology similar to that described
in FEMA (2011), but using a revised probabilistic model based on Bayesian
Quadrature techniques (FEMA 2012). A re-analysis of the joint probability
statistics was done using the new probabilistic model, which also
incorporates additional data from tropical cyclones that have affected the
Gulf of Mexico coast since 2007, including Hurricane Isaac in 2012. As
part of the present study, storm recurrence rates, storm parameter
statistics, and the probabilities of extreme water levels were recomputed.
The main differences between the FEMA (2011) JPM effort and the
present JPM study are the following:
1) Period of record – FEMA (2011) considered the period of record 1940-
2007. The present study considered the period 1940-2013.
2) Storm population – FEMA (2011) only considered landfalling
hurricanes. The present study accounted for bypassing tropical storms as
well.
3) Storm Recurrence Rate (SRR) – FEMA (2011) used a hybrid approach
consisting of land-crossing sampling of storms and GKF weights to
compute the SRR. The present study used a standard GKF approach that
accounted for all tropical cyclones in the NOAA-HURDAT historical
record within a given range of intensity and a limited time period (e.g.
1940–2013).
4) Storm frequency – FEMA (2011) estimated frequency of landfalling
hurricanes at 1-degree increments of longitude starting at latitude 29.5.
For the present study, all statistics including SRR were individually
computed at 200 locations along the Gulf of Mexico U.S. coastline, for
increased spatial coherence and fidelity.
5) Discretization method for storm parameters– The discretization
method employed in FEMA (2011) and the weights used for the discrete
storm parameter values were based on expert judgment. In the present

Jackson State University 182
study, the weights were assigned to the synthetic storm set which was
developed as part of FEMA (2011) in an optimal manner based on the
Bayesian Quadrature algorithm.
6) Optimal kernel size – FEMA (2011) settled on a kernel size of 333 km.
The present study used a kernel size of 200 km.
7) Epsilon terms – The epsilons used in the present study, shown in Table
9-2, were based on the knowledge gathered from previous FEMA (2008a,
2011) studies and from the USACE NACCS study. Differences in epsilon
values between the present study and FEMA (2011) are noted in the table.
Existing Condition Water Surface Elevation Statistics
Based on the JPA approach described above and the maximum water
surface elevation fields computed for each of the 223 North Texas storms
that were simulated by FEMA (2011), water surface elevation statistics
(WSE) were computed for a series of 43 locations that are shown in Figure
9-9 and in Table 9-3. These statistics represent existing conditions.
Estimates of WSE having average recurrence intervals of 10, 20, 50, 100,
200, 500 and 1,000 years are shown for the mean value (Table 9-4) and
for the upper value associated with the following confidence limits (CL),
84%, 90%, 95% and 98%, which are shown in Tables 9-5, 9-6 , 9-7 and 9-
8, respectively. At a given location, compared to the mean values, WSE
values for successively greater confidence intervals are increasingly higher.
As seen in Tables 9-4 through 9-8, some general spatial patterns are
evident in the WSE associated with each ARI. Along the open Gulf coast,
WSE for a particular ARI are similar in magnitude along both Galveston
Island and Bolivar Peninsula, with values being slightly greater along
Bolivar Peninsula compared to those along Galveston Island. WSE on the
bay sides of both Galveston Island and Bolivar Peninsula are slightly less
than WSE on the open Gulf sides of both barriers.
Along the western shoreline of Galveston Bay, WSE for a particular ARI
generally increases from the City of Galveston northward toward the upper
reaches of the Houston Ship Channel; and along most of the western Bay
shoreline they are higher than WSE along the open Gulf coast. The highest
WSE values occur in the upper reaches of the Ship Channel for any
particular ARI. This overall trend for increasing WSE along the western
Bay shoreline is due to the predominance of onshore-directed core winds
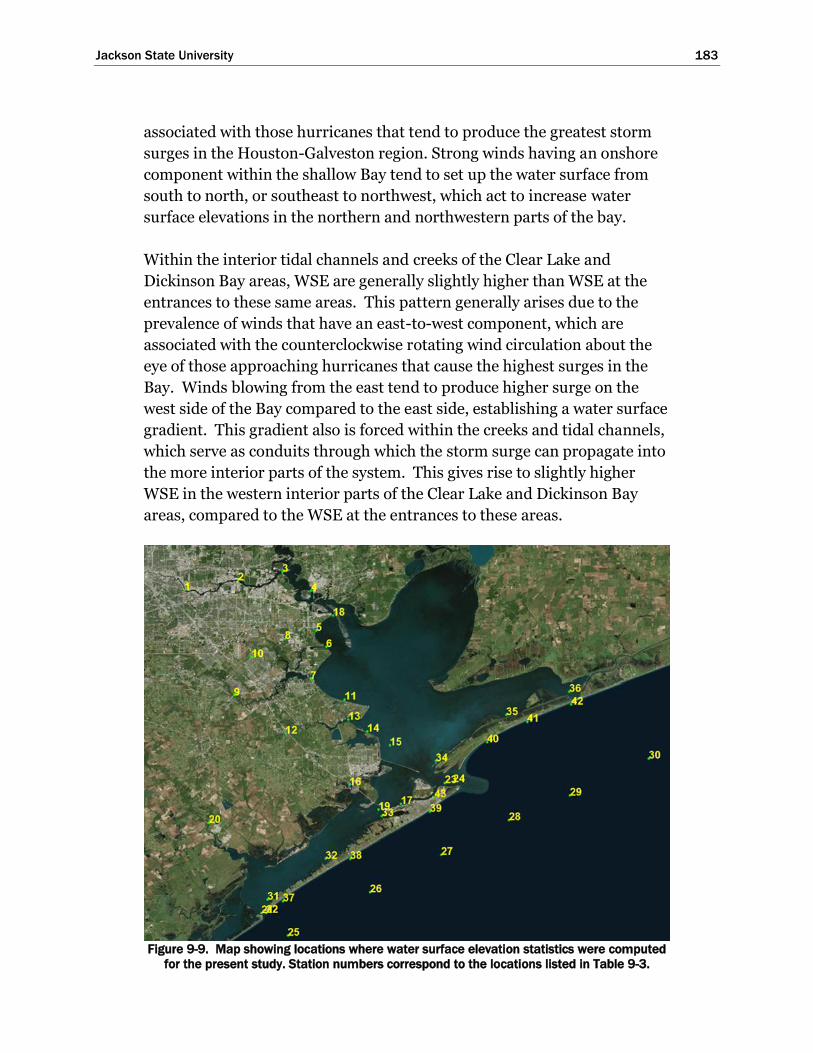
Jackson State University 183
associated with those hurricanes that tend to produce the greatest storm
surges in the Houston-Galveston region. Strong winds having an onshore
component within the shallow Bay tend to set up the water surface from
south to north, or southeast to northwest, which act to increase water
surface elevations in the northern and northwestern parts of the bay.
Within the interior tidal channels and creeks of the Clear Lake and
Dickinson Bay areas, WSE are generally slightly higher than WSE at the
entrances to these same areas. This pattern generally arises due to the
prevalence of winds that have an east-to-west component, which are
associated with the counterclockwise rotating wind circulation about the
eye of those approaching hurricanes that cause the highest surges in the
Bay. Winds blowing from the east tend to produce higher surge on the
west side of the Bay compared to the east side, establishing a water surface
gradient. This gradient also is forced within the creeks and tidal channels,
which serve as conduits through which the storm surge can propagate into
the more interior parts of the system. This gives rise to slightly higher
WSE in the western interior parts of the Clear Lake and Dickinson Bay
areas, compared to the WSE at the entrances to these areas.
Figure 9-9. Map showing locations where water surface elevation statistics were computed
for the present study. Station numbers correspond to the locations listed in Table 9-3.
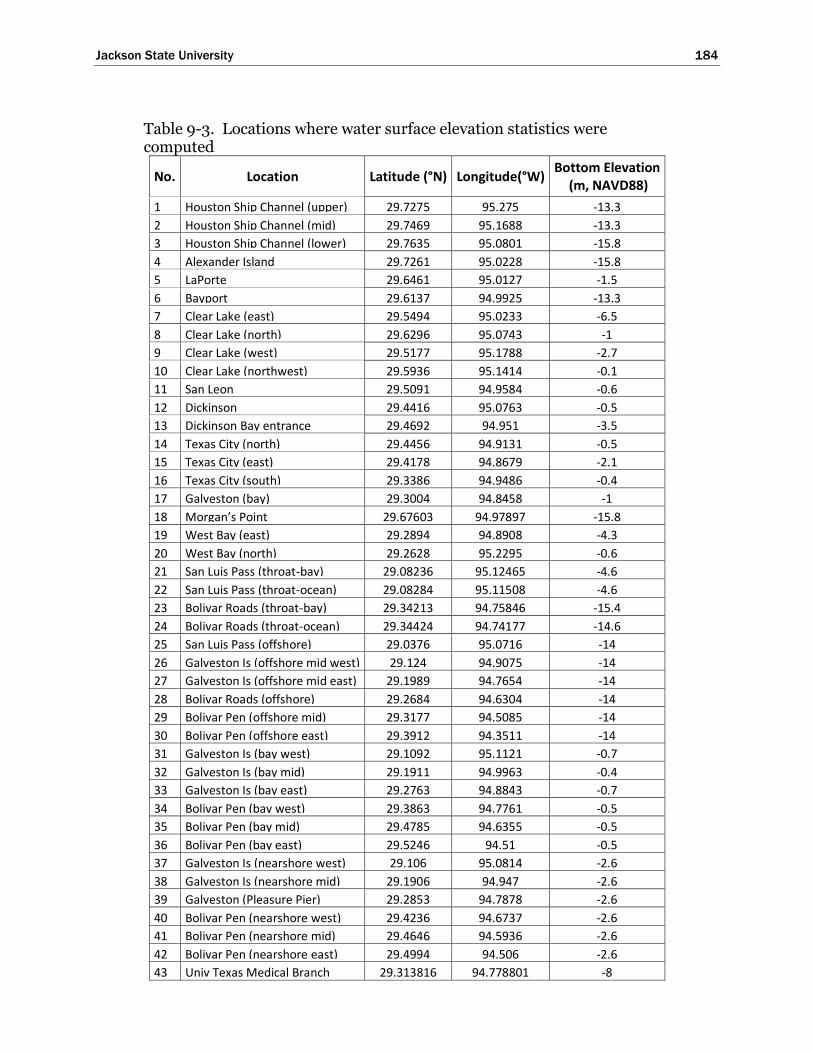
Jackson State University 184
Table 9-3. Locations where water surface elevation statistics were computed
No. Location Latitude (°N) Longitude(°W) Bottom Elevation
(m, NAVD88)
1 Houston Ship Channel (upper) 29.7275 95.275 -13.3
2 Houston Ship Channel (mid) 29.7469 95.1688 -13.3
3 Houston Ship Channel (lower) 29.7635 95.0801 -15.8
4 Alexander Island 29.7261 95.0228 -15.8
5 LaPorte 29.6461 95.0127 -1.5
6 Bayport 29.6137 94.9925 -13.3
7 Clear Lake (east) 29.5494 95.0233 -6.5
8 Clear Lake (north) 29.6296 95.0743 -1
9 Clear Lake (west) 29.5177 95.1788 -2.7
10 Clear Lake (northwest) 29.5936 95.1414 -0.1
11 San Leon 29.5091 94.9584 -0.6
12 Dickinson 29.4416 95.0763 -0.5
13 Dickinson Bay entrance 29.4692 94.951 -3.5
14 Texas City (north) 29.4456 94.9131 -0.5
15 Texas City (east) 29.4178 94.8679 -2.1
16 Texas City (south) 29.3386 94.9486 -0.4
17 Galveston (bay) 29.3004 94.8458 -1
18 Morgan’s Point 29.67603 94.97897 -15.8
19 West Bay (east) 29.2894 94.8908 -4.3
20 West Bay (north) 29.2628 95.2295 -0.6
21 San Luis Pass (throat-bay) 29.08236 95.12465 -4.6
22 San Luis Pass (throat-ocean) 29.08284 95.11508 -4.6
23 Bolivar Roads (throat-bay) 29.34213 94.75846 -15.4
24 Bolivar Roads (throat-ocean) 29.34424 94.74177 -14.6
25 San Luis Pass (offshore) 29.0376 95.0716 -14
26 Galveston Is (offshore mid west) 29.124 94.9075 -14
27 Galveston Is (offshore mid east) 29.1989 94.7654 -14
28 Bolivar Roads (offshore) 29.2684 94.6304 -14
29 Bolivar Pen (offshore mid) 29.3177 94.5085 -14
30 Bolivar Pen (offshore east) 29.3912 94.3511 -14
31 Galveston Is (bay west) 29.1092 95.1121 -0.7
32 Galveston Is (bay mid) 29.1911 94.9963 -0.4
33 Galveston Is (bay east) 29.2763 94.8843 -0.7
34 Bolivar Pen (bay west) 29.3863 94.7761 -0.5
35 Bolivar Pen (bay mid) 29.4785 94.6355 -0.5
36 Bolivar Pen (bay east) 29.5246 94.51 -0.5
37 Galveston Is (nearshore west) 29.106 95.0814 -2.6
38 Galveston Is (nearshore mid) 29.1906 94.947 -2.6
39 Galveston (Pleasure Pier) 29.2853 94.7878 -2.6
40 Bolivar Pen (nearshore west) 29.4236 94.6737 -2.6
41 Bolivar Pen (nearshore mid) 29.4646 94.5936 -2.6
42 Bolivar Pen (nearshore east) 29.4994 94.506 -2.6
43 Univ Texas Medical Branch 29.313816 94.778801 -8

Jackson State University 185
Table 9-4. Average Recurrence Interval WSEs, Mean.
Location
Average Recurrence Interval in years (mean WSE in ft, NAVD88)
10 20 50 100 200 500 1,000 1 Houston Ship Channel (upper) 7.0 9.5 12.8 15.2 17.4 19.8 21.3 2 Houston Ship Channel (mid) 6.6 9.0 12.2 14.5 16.5 18.6 20.1 3 Houston Ship Channel (lower) 6.3 8.6 11.7 13.9 15.8 17.9 19.3 4 Alexander Island 6.0 8.2 11.0 13.1 14.8 16.8 18.2 5 LaPorte 6.0 8.1 10.6 12.6 14.3 16.2 17.4 6 Bayport 5.8 7.8 10.1 12.0 13.7 15.6 16.8 7 Clear Lake (east) 5.9 7.9 10.1 11.9 13.6 15.7 16.9 8 Clear Lake (north) 6.4 8.6 11.3 13.3 15.1 16.8 17.9 9 Clear Lake (west) 6.6 8.8 11.3 13.4 15.4 17.6 18.9 10 Clear Lake (northwest) 6.6 8.8 11.5 13.6 15.6 17.7 18.9 11 San Leon 5.4 7.2 9.2 10.8 12.4 14.3 15.5 12 Dickinson 6.9 9.2 11.6 13.3 14.9 16.6 17.6 13 Dickinson Bay entrance 5.8 7.7 10.0 11.7 13.4 15.3 16.5 14 Texas City (north) 5.3 7.1 9.1 10.8 12.4 14.2 15.3 15 Texas City (east) 4.9 6.7 8.8 10.5 12.0 13.8 14.9 16 Texas City (south) 4.4 6.3 8.8 10.9 12.8 15.2 16.8 17 Galveston (bay) 4.8 6.6 8.7 10.5 12.1 14.0 15.1 18 Morgan’s Point 5.7 7.8 10.3 12.3 14.0 15.8 17.1 19 West Bay (east) 4.4 6.1 8.1 9.8 11.4 13.2 14.3 20 West Bay (north) 5.3 7.8 10.3 12.5 14.8 17.2 18.7 21 San Luis Pass (throat-bay) 4.3 5.9 8.2 10.0 11.5 13.2 14.6 22 San Luis Pass (throat-ocean) 4.3 6.0 8.4 10.2 11.7 13.4 14.9 23 Bolivar Roads (throat-bay) 4.6 6.5 9.2 10.9 12.4 14.2 15.6 24 Bolivar Roads (throat-ocean) 4.6 6.5 9.3 11.0 12.5 14.4 15.8 25 San Luis Pass (offshore) 4.0 5.6 8.0 9.6 11.0 12.7 14.1 26 Galveston Is (offshore mid west) 4.0 5.8 8.3 9.8 11.2 13.0 14.5 27 Galveston Is (offshore mid east) 3.8 5.4 7.9 9.4 10.7 12.6 14.2 28 Bolivar Roads (offshore) 3.9 5.7 8.4 9.9 11.2 13.0 14.6 29 Bolivar Pen (offshore mid) 3.8 5.6 8.2 9.7 11.1 12.8 14.3 30 Bolivar Pen (offshore east) 3.6 5.3 8.0 9.5 10.9 12.9 14.3 31 Galveston Is (bay west) 3.9 5.1 7.0 8.8 10.4 12.1 13.4 32 Galveston Is (bay mid) 3.8 5.0 7.0 8.8 10.5 12.2 13.3 33 Galveston Is (bay east) 4.2 5.8 7.7 9.5 11.1 12.9 14.0 34 Bolivar Pen (bay west) 4.3 6.0 8.3 9.9 11.3 13.1 14.2 35 Bolivar Pen (bay mid) 2.8 4.2 6.0 7.6 9.0 10.6 11.7 36 Bolivar Pen (bay east) 2.5 4.0 6.2 8.0 9.5 11.4 12.8 37 Galveston Is (nearshore west) 4.4 6.2 8.8 10.6 12.1 14.0 15.4 38 Galveston Is (nearshore mid) 4.4 6.4 9.2 10.9 12.4 14.4 15.9 39 Galveston (Pleasure Pier) 4.4 6.2 8.9 10.6 12.1 14.1 15.9 40 Bolivar Pen (nearshore west) 4.9 7.1 10.2 12.2 13.8 15.7 17.4 41 Bolivar Pen (nearshore mid) 4.6 6.8 9.9 11.7 13.3 15.3 16.9 42 Bolivar Pen (nearshore east) 4.5 6.6 9.7 11.6 13.1 15.1 16.7 43 Univ Texas Medical Branch 4.6 6.5 9.0 10.7 12.3 14.0 15.2

Jackson State University 186
Table 9-5. Average Recurrence Interval WSEs, 84% Confidence Limit.
Location
Average Recurrence Interval in years (84% CL WSE in ft, NAVD88)
10 20 50 100 200 500 1,000 1 Houston Ship Channel (upper) 9.2 11.7 15.0 17.4 19.6 22.0 23.5 2 Houston Ship Channel (mid) 8.8 11.2 14.4 16.7 18.7 20.8 22.3 3 Houston Ship Channel (lower) 8.5 10.8 13.9 16.1 18.0 20.1 21.5 4 Alexander Island 8.2 10.4 13.2 15.3 17.0 19.0 20.4 5 LaPorte 8.2 10.2 12.8 14.8 16.5 18.4 19.6 6 Bayport 8.0 10.0 12.3 14.2 15.9 17.8 19.0 7 Clear Lake (east) 8.1 10.1 12.3 14.1 15.8 17.9 19.1 8 Clear Lake (north) 8.5 10.8 13.4 15.5 17.3 19.0 20.1 9 Clear Lake (west) 8.8 11.0 13.5 15.6 17.6 19.8 21.1 10 Clear Lake (northwest) 8.8 11.0 13.7 15.8 17.8 19.9 21.1 11 San Leon 7.6 9.4 11.4 13.0 14.6 16.5 17.7 12 Dickinson 9.1 11.4 13.8 15.5 17.1 18.8 19.8 13 Dickinson Bay entrance 8.0 9.9 12.2 13.9 15.6 17.5 18.7 14 Texas City (north) 7.5 9.2 11.3 13.0 14.6 16.4 17.5 15 Texas City (east) 7.1 8.9 11.0 12.7 14.2 16.0 17.1 16 Texas City (south) 6.6 8.5 11.0 13.1 15.0 17.4 19.0 17 Galveston (bay) 6.9 8.8 10.9 12.7 14.3 16.2 17.3 18 Morgan’s Point 7.9 10.0 12.5 14.5 16.2 18.0 19.3 19 West Bay (east) 6.6 8.3 10.3 12.0 13.6 15.4 16.5 20 West Bay (north) 7.5 10.0 12.5 14.7 17.0 19.4 20.9 21 San Luis Pass (throat-bay) 6.5 8.1 10.4 12.2 13.7 15.4 16.8 22 San Luis Pass (throat-ocean) 6.5 8.2 10.6 12.4 13.9 15.6 17.1 23 Bolivar Roads (throat-bay) 6.8 8.7 11.4 13.1 14.6 16.4 17.8 24 Bolivar Roads (throat-ocean) 6.8 8.7 11.5 13.2 14.7 16.6 18.0 25 San Luis Pass (offshore) 6.2 7.8 10.2 11.8 13.2 14.9 16.3 26 Galveston Is (offshore mid west) 6.2 8.0 10.5 12.0 13.4 15.2 16.7 27 Galveston Is (offshore mid east) 6.0 7.6 10.1 11.6 12.9 14.8 16.4 28 Bolivar Roads (offshore) 6.1 7.9 10.6 12.1 13.4 15.2 16.8 29 Bolivar Pen (offshore mid) 6.0 7.8 10.4 11.9 13.3 15.0 16.5 30 Bolivar Pen (offshore east) 5.8 7.5 10.2 11.7 13.1 15.1 16.5 31 Galveston Is (bay west) 6.1 7.3 9.2 11.0 12.6 14.3 15.6 32 Galveston Is (bay mid) 6.0 7.2 9.2 11.0 12.7 14.4 15.5 33 Galveston Is (bay east) 6.4 8.0 9.9 11.7 13.3 15.1 16.2 34 Bolivar Pen (bay west) 6.5 8.2 10.5 12.1 13.5 15.3 16.4 35 Bolivar Pen (bay mid) 5.0 6.4 8.2 9.8 11.2 12.8 13.9 36 Bolivar Pen (bay east) 4.7 6.2 8.4 10.2 11.7 13.6 15.0 37 Galveston Is (nearshore west) 6.6 8.4 11.0 12.8 14.3 16.2 17.6 38 Galveston Is (nearshore mid) 6.6 8.6 11.4 13.1 14.6 16.6 18.1 39 Galveston (Pleasure Pier) 6.6 8.4 11.1 12.8 14.3 16.3 18.1 40 Bolivar Pen (nearshore west) 7.1 9.3 12.4 14.4 16.0 17.9 19.6 41 Bolivar Pen (nearshore mid) 6.8 9.0 12.1 13.9 15.5 17.5 19.1 42 Bolivar Pen (nearshore east) 6.7 8.7 11.9 13.8 15.3 17.3 18.9 43 Univ Texas Medical Branch 6.8 8.7 11.2 12.9 14.5 16.2 17.4

Jackson State University 187
Table 9-6. Average Recurrence Interval WSEs, 90% Confidence Limit.
Location
Average Recurrence Interval in years (90% CL WSE in ft, NAVD88)
10 20 50 100 200 500 1,000 1 Houston Ship Channel (upper) 9.8 12.3 15.6 18.0 20.3 22.6 24.2 2 Houston Ship Channel (mid) 9.4 11.9 15.1 17.3 19.3 21.5 22.9 3 Houston Ship Channel (lower) 9.1 11.5 14.5 16.7 18.6 20.7 22.2 4 Alexander Island 8.8 11.0 13.9 15.9 17.7 19.6 21.0 5 LaPorte 8.8 10.9 13.4 15.4 17.2 19.1 20.2 6 Bayport 8.6 10.6 12.9 14.8 16.6 18.4 19.6 7 Clear Lake (east) 8.7 10.7 12.9 14.7 16.5 18.5 19.7 8 Clear Lake (north) 9.2 11.4 14.1 16.1 17.9 19.6 20.7 9 Clear Lake (west) 9.4 11.6 14.1 16.2 18.2 20.4 21.7 10 Clear Lake (northwest) 9.4 11.7 14.3 16.5 18.5 20.5 21.7 11 San Leon 8.3 10.0 12.0 13.6 15.3 17.1 18.3 12 Dickinson 9.7 12.0 14.4 16.1 17.7 19.4 20.5 13 Dickinson Bay entrance 8.6 10.5 12.8 14.5 16.2 18.1 19.3 14 Texas City (north) 8.1 9.9 11.9 13.6 15.2 17.0 18.1 15 Texas City (east) 7.7 9.5 11.6 13.3 14.8 16.6 17.8 16 Texas City (south) 7.2 9.2 11.6 13.7 15.6 18.0 19.6 17 Galveston (bay) 7.6 9.4 11.5 13.3 15.0 16.8 17.9 18 Morgan’s Point 8.6 10.6 13.2 15.1 16.8 18.7 19.9 19 West Bay (east) 7.3 8.9 10.9 12.6 14.3 16.0 17.1 20 West Bay (north) 8.1 10.6 13.1 15.3 17.6 20.0 21.5 21 San Luis Pass (throat-bay) 7.1 8.7 11.1 12.8 14.3 16.0 17.4 22 San Luis Pass (throat-ocean) 7.1 8.8 11.3 13.0 14.5 16.3 17.7 23 Bolivar Roads (throat-bay) 7.4 9.3 12.0 13.7 15.2 17.1 18.4 24 Bolivar Roads (throat-ocean) 7.4 9.3 12.1 13.8 15.3 17.2 18.6 25 San Luis Pass (offshore) 6.8 8.4 10.8 12.4 13.8 15.5 16.9 26 Galveston Is (offshore mid west) 6.8 8.6 11.1 12.6 14.0 15.9 17.3 27 Galveston Is (offshore mid east) 6.6 8.2 10.7 12.2 13.6 15.4 17.0 28 Bolivar Roads (offshore) 6.7 8.5 11.2 12.7 14.0 15.8 17.4 29 Bolivar Pen (offshore mid) 6.6 8.4 11.0 12.6 13.9 15.7 17.1 30 Bolivar Pen (offshore east) 6.4 8.1 10.8 12.4 13.8 15.7 17.2 31 Galveston Is (bay west) 6.8 8.0 9.8 11.6 13.2 14.9 16.2 32 Galveston Is (bay mid) 6.6 7.8 9.8 11.7 13.3 15.0 16.1 33 Galveston Is (bay east) 7.0 8.6 10.6 12.3 13.9 15.7 16.8 34 Bolivar Pen (bay west) 7.1 8.9 11.2 12.7 14.2 15.9 17.0 35 Bolivar Pen (bay mid) 5.6 7.0 8.8 10.4 11.9 13.4 14.5 36 Bolivar Pen (bay east) 5.3 6.8 9.0 10.8 12.3 14.2 15.6 37 Galveston Is (nearshore west) 7.2 9.0 11.6 13.4 14.9 16.8 18.2 38 Galveston Is (nearshore mid) 7.2 9.2 12.0 13.7 15.2 17.2 18.8 39 Galveston (Pleasure Pier) 7.2 9.0 11.7 13.5 14.9 17.0 18.7 40 Bolivar Pen (nearshore west) 7.7 9.9 13.1 15.0 16.6 18.6 20.3 41 Bolivar Pen (nearshore mid) 7.4 9.6 12.7 14.5 16.1 18.1 19.7 42 Bolivar Pen (nearshore east) 7.3 9.4 12.5 14.4 15.9 17.9 19.5 43 Univ Texas Medical Branch 7.4 9.3 11.8 13.5 15.1 16.9 18.0

Jackson State University 188
Table 9-7. Average Recurrence Interval WSEs, 95% Confidence Limit.
Location
Average Recurrence Interval in years (95% CL WSE in ft, NAVD88)
10 20 50 100 200 500 1,000 1 Houston Ship Channel (upper) 10.6 13.1 16.4 18.8 21.0 23.4 25.0 2 Houston Ship Channel (mid) 10.2 12.7 15.9 18.1 20.1 22.3 23.7 3 Houston Ship Channel (lower) 9.9 12.3 15.3 17.5 19.4 21.5 23.0 4 Alexander Island 9.6 11.8 14.6 16.7 18.5 20.4 21.8 5 LaPorte 9.6 11.7 14.2 16.2 18.0 19.8 21.0 6 Bayport 9.4 11.4 13.7 15.6 17.4 19.2 20.4 7 Clear Lake (east) 9.5 11.5 13.7 15.5 17.3 19.3 20.5 8 Clear Lake (north) 10.0 12.2 14.9 16.9 18.7 20.4 21.5 9 Clear Lake (west) 10.2 12.4 14.9 17.0 19.0 21.2 22.5 10 Clear Lake (northwest) 10.2 12.5 15.1 17.3 19.3 21.3 22.5 11 San Leon 9.1 10.8 12.8 14.4 16.0 17.9 19.1 12 Dickinson 10.5 12.8 15.2 16.9 18.5 20.2 21.3 13 Dickinson Bay entrance 9.4 11.3 13.6 15.3 17.0 18.9 20.1 14 Texas City (north) 8.9 10.7 12.7 14.4 16.0 17.8 18.9 15 Texas City (east) 8.5 10.3 12.4 14.1 15.6 17.4 18.6 16 Texas City (south) 8.0 10.0 12.4 14.5 16.4 18.8 20.4 17 Galveston (bay) 8.4 10.2 12.3 14.1 15.8 17.6 18.7 18 Morgan’s Point 9.4 11.4 14.0 15.9 17.6 19.5 20.7 19 West Bay (east) 8.1 9.7 11.7 13.4 15.1 16.8 17.9 20 West Bay (north) 8.9 11.4 13.9 16.1 18.4 20.8 22.3 21 San Luis Pass (throat-bay) 7.9 9.5 11.8 13.6 15.1 16.8 18.2 22 San Luis Pass (throat-ocean) 7.9 9.6 12.1 13.8 15.3 17.1 18.5 23 Bolivar Roads (throat-bay) 8.2 10.1 12.8 14.5 16.0 17.9 19.2 24 Bolivar Roads (throat-ocean) 8.2 10.1 12.9 14.6 16.1 18.0 19.4 25 San Luis Pass (offshore) 7.6 9.2 11.6 13.2 14.6 16.3 17.7 26 Galveston Is (offshore mid west) 7.6 9.4 11.9 13.4 14.8 16.6 18.1 27 Galveston Is (offshore mid east) 7.4 9.0 11.5 13.0 14.4 16.2 17.8 28 Bolivar Roads (offshore) 7.5 9.3 12.0 13.5 14.8 16.6 18.2 29 Bolivar Pen (offshore mid) 7.4 9.2 11.8 13.4 14.7 16.5 17.9 30 Bolivar Pen (offshore east) 7.2 8.9 11.6 13.1 14.6 16.5 18.0 31 Galveston Is (bay west) 7.6 8.8 10.6 12.4 14.0 15.7 17.0 32 Galveston Is (bay mid) 7.4 8.6 10.6 12.5 14.1 15.8 16.9 33 Galveston Is (bay east) 7.8 9.4 11.4 13.1 14.7 16.5 17.6 34 Bolivar Pen (bay west) 7.9 9.6 11.9 13.5 14.9 16.7 17.8 35 Bolivar Pen (bay mid) 6.4 7.8 9.6 11.2 12.7 14.2 15.3 36 Bolivar Pen (bay east) 6.1 7.6 9.8 11.6 13.1 15.0 16.4 37 Galveston Is (nearshore west) 8.0 9.8 12.4 14.2 15.7 17.6 19.0 38 Galveston Is (nearshore mid) 8.0 10.0 12.8 14.5 16.0 18.0 19.5 39 Galveston (Pleasure Pier) 8.0 9.8 12.5 14.3 15.7 17.8 19.5 40 Bolivar Pen (nearshore west) 8.5 10.7 13.9 15.8 17.4 19.4 21.1 41 Bolivar Pen (nearshore mid) 8.2 10.4 13.5 15.3 16.9 18.9 20.5 42 Bolivar Pen (nearshore east) 8.1 10.2 13.3 15.2 16.7 18.7 20.3 43 Univ Texas Medical Branch 8.2 10.1 12.6 14.3 15.9 17.7 18.8

Jackson State University 189
Table 9-8. Average Recurrence Interval WSEs, 98% Confidence Limit.
Location
Average Recurrence Interval in years (98% CL WSE in ft, NAVD88)
10 20 50 100 200 500 1,000 1 Houston Ship Channel (upper) 11.4 13.9 17.2 19.6 21.8 24.2 25.7 2 Houston Ship Channel (mid) 11.0 13.4 16.6 18.9 20.9 23.0 24.5 3 Houston Ship Channel (lower) 10.7 13.0 16.1 18.3 20.2 22.3 23.7 4 Alexander Island 10.4 12.6 15.4 17.5 19.2 21.2 22.6 5 LaPorte 10.4 12.4 15.0 17.0 18.7 20.6 21.8 6 Bayport 10.2 12.2 14.5 16.4 18.1 20.0 21.2 7 Clear Lake (east) 10.3 12.3 14.5 16.3 18.0 20.1 21.3 8 Clear Lake (north) 10.7 13.0 15.6 17.7 19.4 21.2 22.3 9 Clear Lake (west) 11.0 13.2 15.7 17.8 19.8 22.0 23.3 10 Clear Lake (northwest) 11.0 13.2 15.9 18.0 20.0 22.1 23.3 11 San Leon 9.8 11.6 13.6 15.2 16.8 18.7 19.9 12 Dickinson 11.3 13.6 16.0 17.7 19.3 21.0 22.0 13 Dickinson Bay entrance 10.2 12.1 14.4 16.1 17.8 19.7 20.9 14 Texas City (north) 9.7 11.4 13.5 15.2 16.8 18.6 19.7 15 Texas City (east) 9.3 11.1 13.2 14.9 16.4 18.2 19.3 16 Texas City (south) 8.8 10.7 13.2 15.3 17.2 19.6 21.2 17 Galveston (bay) 9.1 11.0 13.1 14.9 16.5 18.4 19.5 18 Morgan’s Point 10.1 12.1 14.7 16.7 18.4 20.2 21.5 19 West Bay (east) 8.8 10.5 12.5 14.2 15.8 17.6 18.7 20 West Bay (north) 9.7 12.2 14.7 16.9 19.2 21.6 23.1 21 San Luis Pass (throat-bay) 8.7 10.3 12.6 14.4 15.9 17.6 19.0 22 San Luis Pass (throat-ocean) 8.7 10.4 12.8 14.6 16.1 17.8 19.3 23 Bolivar Roads (throat-bay) 9.0 10.9 13.6 15.3 16.8 18.6 20.0 24 Bolivar Roads (throat-ocean) 9.0 10.9 13.6 15.4 16.9 18.8 20.2 25 San Luis Pass (offshore) 8.4 10.0 12.4 14.0 15.4 17.1 18.5 26 Galveston Is (offshore mid west) 8.4 10.2 12.7 14.2 15.6 17.4 18.9 27 Galveston Is (offshore mid east) 8.2 9.8 12.3 13.8 15.1 17.0 18.6 28 Bolivar Roads (offshore) 8.3 10.1 12.8 14.3 15.6 17.4 19.0 29 Bolivar Pen (offshore mid) 8.2 10.0 12.6 14.1 15.5 17.2 18.7 30 Bolivar Pen (offshore east) 8.0 9.7 12.4 13.9 15.3 17.3 18.7 31 Galveston Is (bay west) 8.3 9.5 11.4 13.2 14.8 16.5 17.8 32 Galveston Is (bay mid) 8.2 9.4 11.4 13.2 14.9 16.5 17.7 33 Galveston Is (bay east) 8.6 10.2 12.1 13.9 15.5 17.3 18.4 34 Bolivar Pen (bay west) 8.7 10.4 12.7 14.3 15.7 17.5 18.6 35 Bolivar Pen (bay mid) 7.2 8.6 10.4 12.0 13.4 15.0 16.1 36 Bolivar Pen (bay east) 6.9 8.4 10.6 12.4 13.9 15.8 17.2 37 Galveston Is (nearshore west) 8.8 10.6 13.2 15.0 16.5 18.4 19.8 38 Galveston Is (nearshore mid) 8.8 10.8 13.6 15.3 16.8 18.8 20.3 39 Galveston (Pleasure Pier) 8.8 10.6 13.3 15.0 16.5 18.5 20.3 40 Bolivar Pen (nearshore west) 9.3 11.5 14.6 16.6 18.1 20.1 21.8 41 Bolivar Pen (nearshore mid) 9.0 11.2 14.3 16.1 17.7 19.7 21.3 42 Bolivar Pen (nearshore east) 8.9 10.9 14.1 16.0 17.5 19.5 21.1 43 Univ Texas Medical Branch 9.0 10.9 13.4 15.1 16.6 18.4 19.6
Jackson State University 190
Probabilistic Context for Hurricane Ike’s Maximum Water Surface
Elevations
Within the Houston-Galveston region, the geographic corridor having the
greatest potential for substantial flood-induced economic damages/losses
runs from the City of Galveston, northward along the western shoreline of
Galveston Bay, and into the upper reaches of the Houston Ship Channel.
Table 9-4 showed expected values for the various ARI water surface
elevations. Using these values, the maximum water surface elevations
observed during Hurricane Ike can be placed in a probabilistic context,
within this corridor having the greatest potential for economic losses that
runs along the western shoreline of Galveston Bay an into the upper
reaches of the Houston Ship Channel.
At Galveston Pleasure Pier, on the Gulf side, the maximum water surface
elevation observed during Ike was 10.6 ft NAVD88. This value is equal to
the 100-yr ARI value at this location (10.6 ft) from Table 9-4, i.e., this
value has a 1% chance of occurring each and every year. On the bay side of
Galveston, the observed maximum water surface elevation reached 10.7 ft,
which is also approximately equal to the 100-yr ARI value at this location
(10.5 ft).
In the vicinity north of Texas City, near the entrance to Dickinson Bay, and
at San Leon, the maximum water surface elevation was slightly higher,
approximately 11 ft (11.3 ft was recorded at the Eagle Point gage, and 10.8
ft near San Leon). These values are also approximately equal to the 100-yr
ARI values in this vicinity (10.8 ft north of Texas City and at San Leon, and
11.7 ft at the entrance to Dickinson Bay).
At the entrance to Clear Lake and in the vicinity of Morgan’s Point,
maximum water surface elevations during Ike were slightly higher, 12 to
12.5 ft, NAVD88. These are roughly equal to the expected 100-yr ARI
values at the entrance to Clear Lake (11.9 ft) and Morgan’s Point (12.3 ft).
In the upper reaches of the Houston Ship Channel, maximum water
surface elevations during Ike were higher, approximately 13 to nearly 15 ft,
increasing slightly from east to west along the channel. Within the
economic corridor, the water surface elevations reached their highest
values along this section of the Ship Channel during Ike. The 100-yr ARI
values also increase in this section of the channel, from east to west,

Jackson State University 191
ranging from 13.9 ft in the east to 15.2 ft in the west. Conditions during
Ike were similar to the expected 100-yr ARI values in the upper reaches of
the ship channel.
Throughout this economic corridor, the maximum water surface
elevations experienced during Ike were approximately equal to the
expected 100-yr ARI values. These conditions have a 1% chance of
occurring each and every year.
The Proxy Storm Concept
This economic corridor is generally oriented in a shore-perpendicular
direction relative to the open Gulf shorelines of Galveston Island and
Bolivar Peninsula. The corridor is relatively narrow in alongshore extent
compared to the entire Galveston Bay region.
Because of the corridor’s location and orientation, extreme WSEs that can
severely impact this area, such as those associated with the 100-yr and
500-yr ARIs, are expected to be principally dictated by the most severe
hurricanes which make landfall within a particular stretch of coast. That
coastal landfall zone extends from near Bolivar Roads pass (like the
“direct-hit” track for some of the bracketing set storms) to a point that is
20 to 30 nm southwest of the pass (like storms 128 and 036 from the
bracketing set). The extreme water surface elevation fields associated with
the 100-yr and 500-yr ARIs are expected to have a general pattern of
variability that is dictated in large part by the extreme bracketing set
storms that approach from the south-southeast or southeast directions
and make landfall in this critical zone. Tracks from the south-southeast
and southeast also are the most common tracks for severe storms that
have impacted the Texas coast, historically.
A field of 100-yr WSE (in feet) is shown in Figure 9-10. The figure is based
upon the FEMA (2011) JPA approach. To generate this figure, 100-yr ARI
WSEs were computed at each node of the storm surge model, color-coded
based upon magnitude, and plotted at each model grid node. Elevations
shown in Figure 9-10 are draft results from the FEMA (2011) study; and
they are considered to be draft results until finalized by FEMA. The “still”
WSE in Figure 9-10 only reflect the contributions of storm surge, tide and
other sources of uncertainty. It is important to note that these elevations
are not FEMA Base Flood Elevations (BFEs); they do not include the

Jackson State University 192
effects of wind wave crests on top of the “still” water surface. The different
color contour bands reflect 1-ft changes in WSE.
Figure 9-10. Field of water surface elevations (in feet) reflecting the 100-yr average
recurrence interval, based on the draft FEMA (2011) results.
Table 9-9 shows the FEMA (2011) “still” WSEs at a few discrete locations
within the key economic corridor for both the 100-yr and 500-yr ARIs.
These locations are shown as green dots in Figure 9-10. The locations are
listed in geographical order, starting with the upper reaches of the
Houston Ship Channel, moving toward the south, and ending at the open
Gulf coast at Galveston Pleasure Pier.
A sloping water elevation surface, with values increasing from southeast to
northwest, is evident in the tabular results for both the 100-yr and 500-yr
ARIs. The same pattern also is clearly evident in the graphical results for
the 100-yr ARI shown in Figure 9-10; as reflected by the WSE color
contours in the Bay which are roughly parallel to the open Gulf shoreline.
The sloping surface is evident in the Bay proper, the upper reaches of the
Houston Ship Channel, and along the western shoreline of the Bay. This
WSE pattern is quite similar to that seen for some of the bracketing set

Jackson State University 193
Table 9-9. 100-yr and 500-yr average recurrence interval “still” water
surface elevations at selected locations based upon the JPA approach and
North Texas storm simulations from FEMA (2011).
100-yr ARI WSE (ft)
WSE
WSE (ft)
500-yr ARI WSE (ft)
WSE (ft)
Location Latitude (N) Longitude (W)
Houston Ship Channel (Upper)
29° 44' 52'' 95° 17' 12'' 18.1 22.7
Houston Ship Channel (Middle)– Harris County Toll Authority
29° 44' 20'' 95° 09' 14'' 16.7 21.2
Houston Ship Channel (Lower) - Burnet Bay
29° 45' 44'' 95° 04' 48'' 15.9 20.5
Alexander Island 29° 43' 35'' 95° 01' 15'' 14.9 19.2
La Porte 29° 38' 46'' 95° 00' 42'' 14.1 18.1
Bayport 29° 37' 14'' 94° 59' 55'' 13.6 17.4
Clear Lake (Seabrook) 29° 32' 59'' 95° 01' 24'' 13.4 16.8
Texas City levee (north) 29° 27' 35'' 94° 56' 24'' 12.6 16.1
Texas City levee (east) 29° 23' 24'' 94° 53' 00'' 12.4 16.2
Galveston (bay side) 29° 18' 10'' 94° 49' 44'' 11.8 14.8
Galveston (ocean side)
- Pleasure Pier
29° 17' 07'' 94° 47' 16'' 13.1 17.7
storms that approach from the southeast and south-southeast directions
and make landfall just to the southwest of the City of Galveston.
Because of the similarity between the ARI WSE pattern and the maximum
WSE pattern for individual storms, it was anticipated that there might be a
“proxy” storm from among the 223-storm FEMA set, one of the synthetic
hypothetical hurricanes that were simulated, which produced a WSE field
that was quite similar to the WSE field corresponding to a particular ARI
WSE field throughout the key economic corridor. If so, then a with-dike
storm simulation could be made for this same FEMA storm and then
compared to the FEMA storm that was run for existing conditions as part
of the FEMA (2011) study. In this way, without-dike and with-dike results
could be compared to assess the effectiveness of the dike in reducing
damages/losses for a storm that produces WSEs that have a particular ARI
throughout the economic corridor. Based on this preliminary analysis
using the FEMA (2011) results, the proxy storm concept seemed to have
merit, as a first step to placing water surface elevations and economic
damages/losses in a probabilistic context.
Identification and Selection of Proxy Storms
Using the existing condition water surface elevation statistics computed as
part of the present study and presented earlier in this chapter, proxy

Jackson State University 194
storms were defined for the 10-yr, 100-yr and 500-yr ARI WSE. With-dike
simulations were made for each proxy storm, then the without-dike and
with-dike maximum WSE fields were provided to the study economics
team for analysis. The following approach, described for the 10-yr ARI
proxy storm, was used to identify and select the three proxy storms.
First, based on the statistical analysis results shown in Table 9-8 for the
90% CL WSE values, the 10-yr ARI WSE was identified at each of the
eighteen locations within the corridor of high economic value that are
shown in Figure 9-11 and listed in Table 9-10. Second, individual storms
from the 223-storm FEMA set were examined as potential proxies, based
on their track and other hurricane parameters, and on their maximum
WSE fields. Third, for each candidate proxy storm, the maximum WSE for
that storm was extracted for each of the locations used to make the
selection. Fourth, differences and absolute differences were computed
between the ARI WSE and the storm-specific WSE at each of the eighteen
locations, and average differences were computed for the entire set of
locations. Fifth, the proxy storm was selected as the storm that minimized
the average differences between it and the ARI WSE values, and
minimized any bias.
Figure 9-11. Locations of water surface elevations used to identify and select proxy storms.
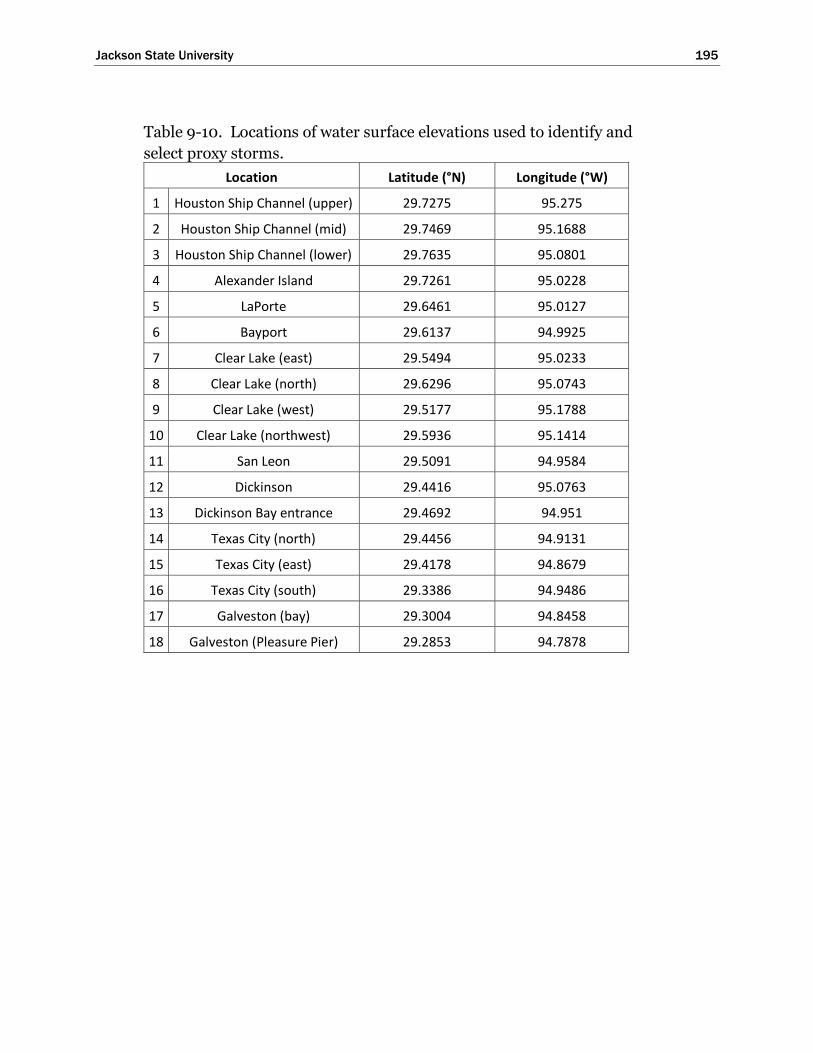
Jackson State University 195
Table 9-10. Locations of water surface elevations used to identify and
select proxy storms.
Location Latitude (°N) Longitude (°W)
1 Houston Ship Channel (upper) 29.7275 95.275
2 Houston Ship Channel (mid) 29.7469 95.1688
3 Houston Ship Channel (lower) 29.7635 95.0801
4 Alexander Island 29.7261 95.0228
5 LaPorte 29.6461 95.0127
6 Bayport 29.6137 94.9925
7 Clear Lake (east) 29.5494 95.0233
8 Clear Lake (north) 29.6296 95.0743
9 Clear Lake (west) 29.5177 95.1788
10 Clear Lake (northwest) 29.5936 95.1414
11 San Leon 29.5091 94.9584
12 Dickinson 29.4416 95.0763
13 Dickinson Bay entrance 29.4692 94.951
14 Texas City (north) 29.4456 94.9131
15 Texas City (east) 29.4178 94.8679
16 Texas City (south) 29.3386 94.9486
17 Galveston (bay) 29.3004 94.8458
18 Galveston (Pleasure Pier) 29.2853 94.7878

Jackson State University 196
10-yr Proxy Storm
Storm 535 from the original FEMA set was selected to be the 10-yr proxy
storm. Storm 535 is a 975-mb storm that approaches from the southeast
(TXN Fan set, Track 4, in FEMA storm set jargon) and makes landfall near
San Luis Pass. It has the following characteristics:
Minimum central pressure - 975 mb
Central pressure at landfall - 987 mb
Maximum wind speed - 35 m/sec (68 kts)
Max wind speed at landfall - 26 m/sec (50 kts)
Radius to maximum winds - varies from 17.7 to 25.7 n mi
Variable Holland B parameter
Forward speed of 6 kts
The maximum wind speed and wind speed at landfall cited for each of the
three proxy storms reflect 30-min average winds at a 10-m elevation.
Results for the 10-yr proxy storm are shown in Table 9-11. Some added
precision was retained in the analyses done to identify and select proxy
storms, and it is reflected in Table 9-11 and in subsequent tables in this
section. However, the added precision is not indicative of overall accuracy
of the computed WSEs; the computed WSE are no more accurate than
tenths of a foot, at best. In the “Difference” column, green numbers
indicate locations where the actual storm maximum WSE exceeded the
ARI WSE value; red numbers indicate where the actual storm WSE was
less than the ARI WSE value.
In Table 9-11, WSE differences for Storm 535 show a very small negative
bias of approximately 0.1 ft; the average absolute difference is about 0.4 ft.
The average absolute difference reflects an “error” of about 4% to 6%, in
light of the 10-yr ARI WSE range of 7.2 to 9.8 ft.

Jackson State University 197
Table 9-11. Water surface elevations for the 10-yr proxy storm, Storm 535.
10-yr Proxy Storm Water Surface Elevations
10-yr WSE 90% CL
(ft)
Storm 535
WSE (ft)
Difference (ft)
Absolute Difference
(ft)
1 Houston Ship Channel (upper) 9.78 10.53 0.75 0.75
2 Houston Ship Channel (mid) 9.42 10.04 0.62 0.62
3 Houston Ship Channel (lower) 9.12 9.61 0.49 0.49
4 Alexander Island 8.86 9.06 0.20 0.20
5 LaPorte 8.83 8.79 -0.03 0.03
6 Bayport 8.63 8.37 -0.26 0.26
7 Clear Lake (east) 8.73 8.50 -0.23 0.23
8 Clear Lake (north) 9.15 9.38 0.23 0.23
9 Clear Lake (west) 9.42 9.48 0.07 0.07
10 Clear Lake (northwest) 9.38 9.65 0.26 0.26
11 San Leon 8.27 7.64 -0.62 0.62
12 Dickinson 9.68 9.55 -0.13 0.13
13 Dickinson Bay entrance 8.63 8.14 -0.49 0.49
14 Texas City (north) 8.10 7.38 -0.72 0.72
15 Texas City (east) 7.74 6.92 -0.82 0.82
16 Texas City (south) 7.19 7.45 0.26 0.26
17 Galveston (bay) 7.58 6.76 -0.82 0.82
18 Galveston (Pleasure Pier) 7.19 6.50 -0.69 0.69
Average 8.65 8.54 -0.108 0.428
Figure 9-12 shows the maximum WSE field for Storm 525. The WSE
pattern is very similar to the pattern shown in Figure 9-10, with highest
surges in the northwest part of Galveston Bay and the upper reaches of the
Houston Ship Channel.

Jackson State University 198
Figure 9-12. Maximum water surface elevation field for Storm 535, from FEMA (2011), the
10-yr proxy storm.
100-yr Proxy Storm
Storm 033 from the original FEMA set was selected to be the 100-yr proxy
storm. Storm 033 is a 930-mb storm that approaches from the southeast
(also has the TXN Fan set, Track 4) and makes landfall near San Luis
Pass. It has the following characteristics:
Minimum central pressure - 930 mb
Central pressure at landfall - 948 mb
Maximum wind speed - 51 m/sec (100 kts)
Max wind speed at landfall - 40 m/sec (78 kts)
Radius to maximum winds - varies from 25.8 to 37.4 n mi
Variable Holland B parameter
Forward speed of 11 kts
Results for the 100-yr proxy storm are shown in Table 9-12. WSE
differences for Storm 033 show no significant bias, overall; however, there
are small regional biases, with Storm 033 WSEs being higher than the
100-yr ARI values in the northern and southern portions of the corridor
and Storm 033 WSEs being lower than the ARI WSEs in the central
portion of the corridor in the Clear Lake and Dickinson Bay areas. The
overall average absolute difference is about 0.9 ft. The average absolute
difference reflects an “error” of about 5% to 7%, in light of the 100-yr ARI
WSE range of 13.3 to 18.1 ft.
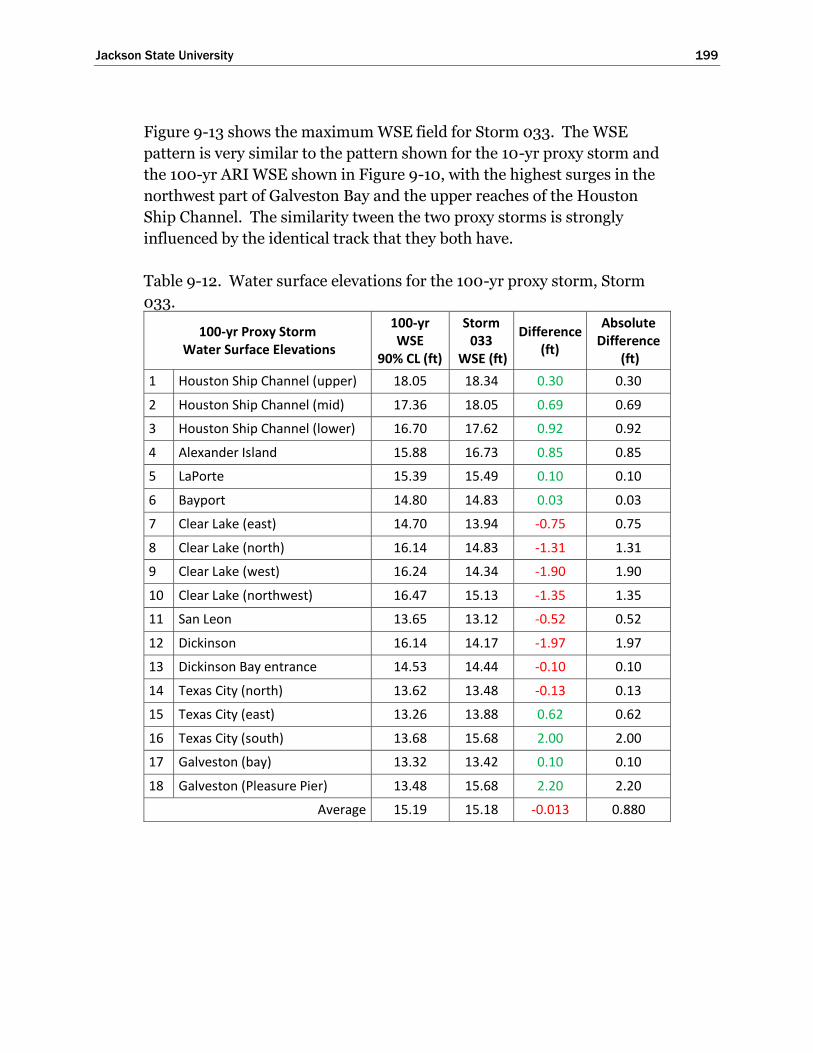
Jackson State University 199
Figure 9-13 shows the maximum WSE field for Storm 033. The WSE
pattern is very similar to the pattern shown for the 10-yr proxy storm and
the 100-yr ARI WSE shown in Figure 9-10, with the highest surges in the
northwest part of Galveston Bay and the upper reaches of the Houston
Ship Channel. The similarity tween the two proxy storms is strongly
influenced by the identical track that they both have.
Table 9-12. Water surface elevations for the 100-yr proxy storm, Storm
033.
100-yr Proxy Storm Water Surface Elevations
100-yr WSE
90% CL (ft)
Storm 033
WSE (ft)
Difference (ft)
Absolute Difference
(ft)
1 Houston Ship Channel (upper) 18.05 18.34 0.30 0.30
2 Houston Ship Channel (mid) 17.36 18.05 0.69 0.69
3 Houston Ship Channel (lower) 16.70 17.62 0.92 0.92
4 Alexander Island 15.88 16.73 0.85 0.85
5 LaPorte 15.39 15.49 0.10 0.10
6 Bayport 14.80 14.83 0.03 0.03
7 Clear Lake (east) 14.70 13.94 -0.75 0.75
8 Clear Lake (north) 16.14 14.83 -1.31 1.31
9 Clear Lake (west) 16.24 14.34 -1.90 1.90
10 Clear Lake (northwest) 16.47 15.13 -1.35 1.35
11 San Leon 13.65 13.12 -0.52 0.52
12 Dickinson 16.14 14.17 -1.97 1.97
13 Dickinson Bay entrance 14.53 14.44 -0.10 0.10
14 Texas City (north) 13.62 13.48 -0.13 0.13
15 Texas City (east) 13.26 13.88 0.62 0.62
16 Texas City (south) 13.68 15.68 2.00 2.00
17 Galveston (bay) 13.32 13.42 0.10 0.10
18 Galveston (Pleasure Pier) 13.48 15.68 2.20 2.20
Average 15.19 15.18 -0.013 0.880

Jackson State University 200
Figure 9-13. Maximum water surface elevation field for Storm 033, from FEMA (2011), the
100-yr proxy storm.
500-yr Proxy Storm
Storm 036 from the original FEMA set was selected to be the 500-yr proxy
storm. Storm 036 is a 900-mb storm that approaches from the southeast
(it also has the TXN Fan set, Track 4) and makes landfall near San Luis
Pass. It has the following characteristics:
Minimum central pressure - 900 mb
Central pressure at landfall - 916 mb
Maximum wind speed – 58 m/sec (112 kts)
Max wind speed at landfall - 48 m/sec (93 kts)
Radius to maximum winds - varies from 21.8 to 31.6 n mi
Variable Holland B parameter
Forward speed of 11 kts
Results for the 500-yr proxy storm are shown in Table 9-13. WSE
differences for Storm 036 show a negative bias of approximately 1 ft,
overall, with Storm 036 WSEs being lower than the 500-yr ARI values at
most locations. In the Clear Lake and Dickson Bay areas, Storm 036
maximum WSEs are 1 to 4 ft lower than the 500-yr ARI values. Storm 036
produces the largest storm surges in Galveston Bay, among all the 223
FEMA (2011) storms. The overall average absolute difference is about 1.3
ft. The average absolute difference reflects an “error” of about 6% to 8%,
in light of the 500-yr ARI WSE range of 16.6 to 22.6 ft.
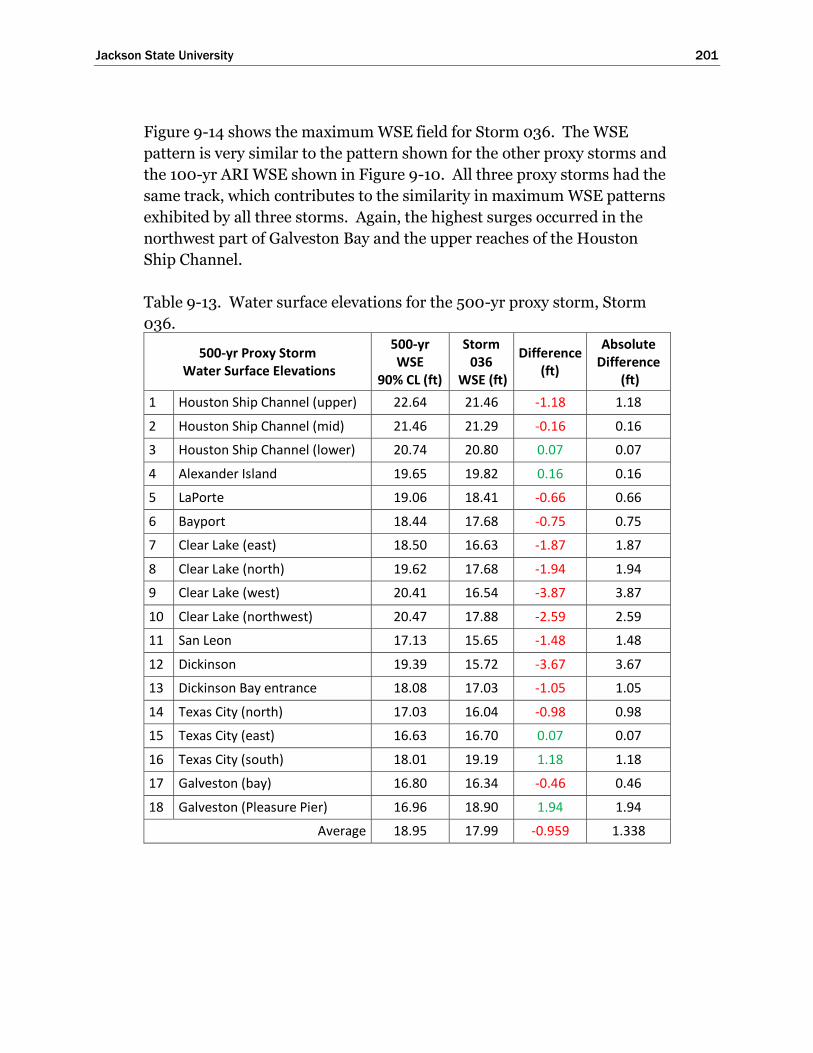
Jackson State University 201
Figure 9-14 shows the maximum WSE field for Storm 036. The WSE
pattern is very similar to the pattern shown for the other proxy storms and
the 100-yr ARI WSE shown in Figure 9-10. All three proxy storms had the
same track, which contributes to the similarity in maximum WSE patterns
exhibited by all three storms. Again, the highest surges occurred in the
northwest part of Galveston Bay and the upper reaches of the Houston
Ship Channel.
Table 9-13. Water surface elevations for the 500-yr proxy storm, Storm
036.
500-yr Proxy Storm Water Surface Elevations
500-yr WSE
90% CL (ft)
Storm 036
WSE (ft)
Difference (ft)
Absolute Difference
(ft)
1 Houston Ship Channel (upper) 22.64 21.46 -1.18 1.18
2 Houston Ship Channel (mid) 21.46 21.29 -0.16 0.16
3 Houston Ship Channel (lower) 20.74 20.80 0.07 0.07
4 Alexander Island 19.65 19.82 0.16 0.16
5 LaPorte 19.06 18.41 -0.66 0.66
6 Bayport 18.44 17.68 -0.75 0.75
7 Clear Lake (east) 18.50 16.63 -1.87 1.87
8 Clear Lake (north) 19.62 17.68 -1.94 1.94
9 Clear Lake (west) 20.41 16.54 -3.87 3.87
10 Clear Lake (northwest) 20.47 17.88 -2.59 2.59
11 San Leon 17.13 15.65 -1.48 1.48
12 Dickinson 19.39 15.72 -3.67 3.67
13 Dickinson Bay entrance 18.08 17.03 -1.05 1.05
14 Texas City (north) 17.03 16.04 -0.98 0.98
15 Texas City (east) 16.63 16.70 0.07 0.07
16 Texas City (south) 18.01 19.19 1.18 1.18
17 Galveston (bay) 16.80 16.34 -0.46 0.46
18 Galveston (Pleasure Pier) 16.96 18.90 1.94 1.94
Average 18.95 17.99 -0.959 1.338
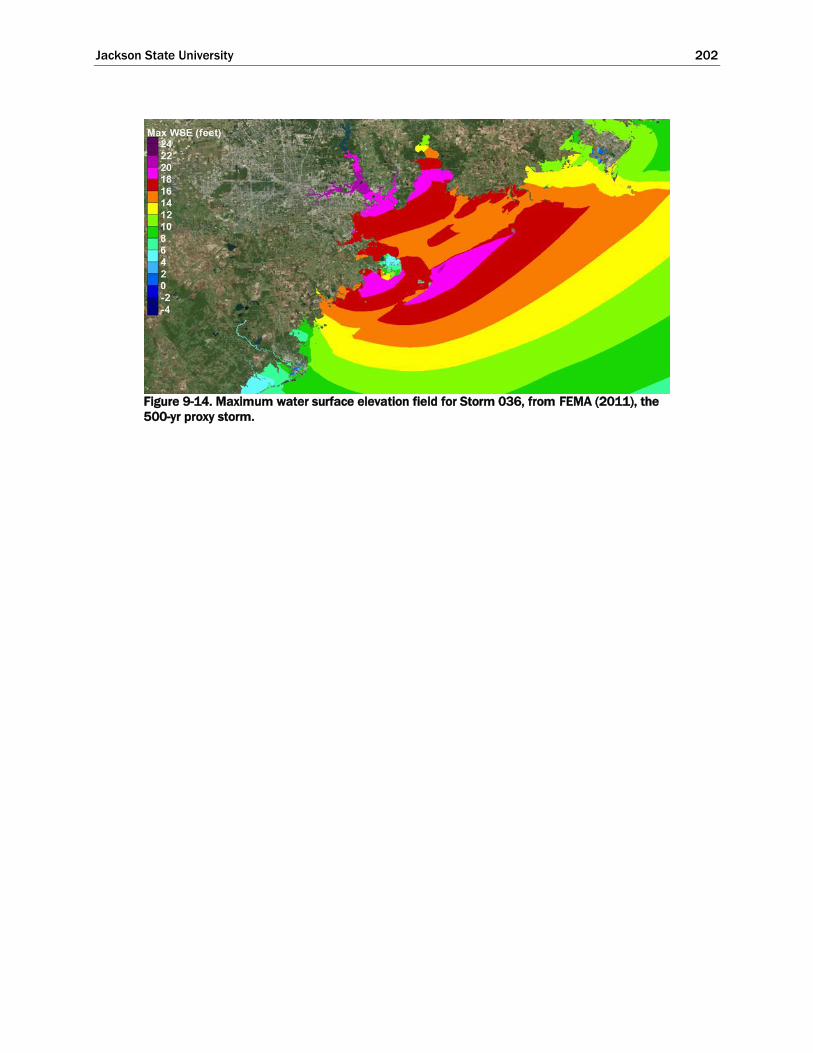
Jackson State University 202
Figure 9-14. Maximum water surface elevation field for Storm 036, from FEMA (2011), the
500-yr proxy storm.
Jackson State University 203
10 Storm Surge Simulations with
an Extended Ike Dike
Introduction
The conceptual Ike Dike, as implemented in the original bracketing set of
simulations, ended near High Island, close to the northeast end of Bolivar
Peninsula. A plan for terminating the dike into higher natural ground, or
to some other man-made feature such as an elevated roadway or levee, had
not been formulated yet, so the ends of the dike were not transitioned into
higher ground in the original model setup.
For some of the severe hurricanes in the bracketing set, model results
indicated that a significant amount of water flowed around the northeast
end of the unterminated dike. This flanking flow significantly increased
storm surge levels within Galveston Bay. These increased water levels
were judged to be not indicative of levels that would occur for a dike
having an effective termination scheme. To minimize or effectively
eliminate the influence of flanking, the with-dike model setup was revised
to extend the dike toward the northeast, all the way to Sabine Pass. The
southern terminus of the dike, which is located just south of Freeport, was
not altered.
In the original modeling approach, the dike was treated as a three-
dimensional topographic feature, which led to computational stability
issues during some overflow conditions. In addition to these types of
instabilities, for a few of the most extreme storms, other instabilities
occurred within the open-coast nearshore region near Galveston Bay and
within the passes leading to the bays. These instabilities were mitigated in
the original modeling approach through the global use of a computational
slope-limiting stabilization scheme. The use of slope-limiting created a
few undesirable effects in certain areas of the model domain.
To minimize these adverse effects, two other changes were made to the
modeling approach. One, the geographical area in which slope-limiting is
applied was greatly reduced to a much more localized nearshore region
that extends from Sabine Pass to Freeport. The polygon in which slope
limiting is applied also extends a short distance into the Bolivar Roads and
San Luis passes, covering the areas where instabilities tended to occur.

Jackson State University 204
Second, the manner in which the dike was treated in the model set-up was
revised. Instead of treating the dike as a three-dimensional topographic
feature, the dike is treated as a single, long, continuous, weir section, an
“infinitely thin” barrier. The change to a weir representation was done to
promote model stability, avoiding the supercritical flows that would occur
on the back side of the three-dimensional dike. The change to a weir
representation also allows changes to dike crest elevation to be made with
minimal effort. The weir representation allows the dike to be overtopped
when the water surface elevation on one side of the dike exceeds the dike’s
crest elevation. When overtopping occurs, flow over the dike is computed
using a standard weir formula.
These dike modifications required changes to both the storm surge and
wave model grid meshes, as well as changes to how the dike alignment was
represented within both meshes. The extended dike is a single long,
continuous weir section, with no breaks, extending from south of Freeport
all the way to Sabine Pass, cutting across all the passes. The dike has a
uniform crest elevation of 17 ft NAVD88 along its entire length (the same
crest elevation as was used in the original bracketing set of simulations).
The seaward-most long green line in Figure 10-1 shows the extended dike
alignment.
Figure 10-1. Alignment of the extended conceptual Ike Dike (from south of Freeport to
Sabine Pass).
Jackson State University 205
Storm surge results using the model set-up with the extended dike are
expected to better represent surge conditions within Galveston Bay for a
dike having an effective termination scheme. The dike extension greatly
reduces the contribution of flanking to water surface elevations within the
Bay.
There are other geographic features in the model domain, which also are
represented as weir sections. One example is the Texas City levee. The
other green lines shown in Figure 10-1 represent such features, and they
are part of both the existing condition and the with-extended-dike model
grid meshes.
Using the revised modeling approach, the 10-yr, 100-yr and 500-yr proxy
storms defined in Chapter 9, and Hurricane Ike, were all simulated with
the extended dike, in order to further examine the effectiveness of the
conceptual coastal Ike Dike in reducing storm surge levels within the bays.
For the three proxy storms, results from the original FEMA study (2011)
were used to represent the existing, without-dike, water surface elevation
conditions. Existing conditions for Hurricane Ike were simulated using
the current modeling approach; and results presented here for Ike are the
same as those presented in the model validation chapter, Chapter 2.
Maximum water surface elevation results for all simulations were provided
to the economics team for further analysis of damages and losses.
Effect of the Extended Ike Dike for Hurricane Ike
Figures 10-2 and 10-3 show the maximum water surface elevation field (in
feet), as color-shaded contours, for existing conditions and with-extended-
dike conditions, respectively. The figures graphically show the maximum
elevation at every storm surge model grid node, without regard to when
the maximum occurred during the simulation. In light of the fact that
Hurricane Ike is such a recent major hurricane, and the experience was a
memorable one, the results for Ike serve as an informative and effective
benchmark with which to evaluate results from the existing-condition and
with-dike simulations of the proxy storms, particularly the 100-yr and
500-yr storms. Therefore, results for Ike are presented first in this
chapter.

Jackson State University 206
Figure 10-2. Maximum water surface elevation field for Hurricane Ike, existing without-dike
conditions.
Figure 10-3. Maximum water surface elevation field for Hurricane Ike, extended-dike
conditions.

Jackson State University 207
For the existing condition simulation (Figure 10-2), Ike produced rather
large maximum water surface elevation values along the north Texas
coastline with the overall maximum storm surge (approximately 16.5 ft)
occurring between Bolivar Peninsula and Sabine Pass. A peak storm surge
of approximately 12 to 13.5 ft was simulated along the Gulf side of the City
of Galveston, less than the 17-ft crest elevation of the Galveston Seawall.
Similar peak surges were simulated for the bay side of the City of
Galveston. Along the rest of Galveston Island, Gulf-side peak surge
decreased from 12 ft in the east to 8 ft at the western end, near San Luis
Pass. Along Bolivar Peninsula, Gulf-side peak surge reached 16 ft at the
eastern end, with a slightly lower peak surge value of 14 ft at the western
end, adjacent to Bolivar Roads pass.
Within Galveston Bay for existing conditions, the peak surge reached
approximately 12.5 ft along the south side of Texas City. Along the north
side of Texas City, peak surges reached approximately 11.5 to 12 ft. No
overflow of the levee surrounding Texas City was simulated. From San
Leon northward, peak surge along the western shoreline of Galveston Bay
increased from south to north, from 11.5 ft to about 12.5 ft at the northern
parts of the main part of Galveston Bay, near Bayport. Into the upper
reaches of the Houston Ship Channel, peak surges increased slightly, to
levels reaching 13 to nearly 14 ft.
A visual comparison of Figures 10-2 and 10-3 clearly shows that the
extended conceptual Ike Dike produces a considerable reduction in storm
surge throughout the entire bay system for Hurricane Ike. The coastal
dike very effectively prevents the storm surge from entering the bay
systems via flow over the barrier islands and through the passes. The
magnitude of reductions in peak surge levels are quantified below.
Note that Bolivar Roads and San Luis passes are closed from the very
beginning of the with-dike simulations. This modeling assumption will
slightly understate the amount of hurricane surge forerunner that
penetrates into the bays prior to gate closure. An understatement of
approximately 1 to 2.5 ft is expected for major hurricanes. The
development of the forerunner surge during the early stages of severe
hurricanes that move into and through the Gulf of Mexico was discussed in
Chapters 5 and 6. Future work should examine the influence that the
timing of gate closure has on forerunner propagation into Galveston Bay
and its influence on peak surge levels inside the Bay.
Jackson State University 208
Along the Gulf side of the City of Galveston, as well as along Galveston
Island and Bolivar Peninsula, the with-dike storm surge is increased
slightly compared to the existing condition simulations as a result of the
‘long-dike effect’. The amount of increase for Hurricane Ike is 0.5 to 1 ft,
resulting in peak surge levels along the Gulf side of Galveston of 13 to 14 ft.
A very long impermeable coastal dike that is built to retard surge
penetration will locally increase the surge by a small amount on the open
coast side of the dike (usually by amounts of up to 2 ft for extreme storms).
The long dike effect is essentially this: the presence of the barrier serves as
an obstacle to the wind-driven surge; the barrier represents something for
the wind-driven surge to pile up against, which would not occur if the dike
were not present. The dike will dramatically reduce the surge for a much
larger region behind the barrier by drastically curtailing the storm
propagation over/past the dike. The “long dike effect” needs to be
recognized and actions to mitigate the effect should be considered.
With the extended dike in place, along the bay side of the City of
Galveston, the peak surges were reduced by amounts ranging from 7.5 ft to
9.5 ft. Between the City of Galveston and Texas City, the peak surge only
reaches 4 to 5 ft, a reduction of 7.5 to 8 ft. In this region note that there is
an area of locally higher surge between Galveston and Texas City (the
lightest blue region seen in Figure 10-3). This area of higher maximum
surge is a common feature for severe hurricanes that approach from the
southeast and make landfall in the region. This storm surge feature is due
to the counterclockwise rotating wind fields about the hurricane’s eye
which act to build surge in the southwest corner of Galveston Bay prior to
landfall. As shown more clearly later in this chapter for the more severe
proxy storms, the prevalence of this feature suggests that a bayside
levee/wall for the city of Galveston, effectively creating a ring around the
city, should be considered as a secondary line of defense along with the
primary coastal dike.
The extended dike significantly lowered peak surges around Texas City, by
approximately 8 ft. At most locations along the western shoreline of
Galveston Bay and into the Clear Lake and Dickinson areas, peak surges
are generally 8 to 9 ft less than for existing conditions. Peak surges in the
upper reaches of the Houston Ship Channel are even more significantly
reduced, by amounts of 10 to 11 ft.
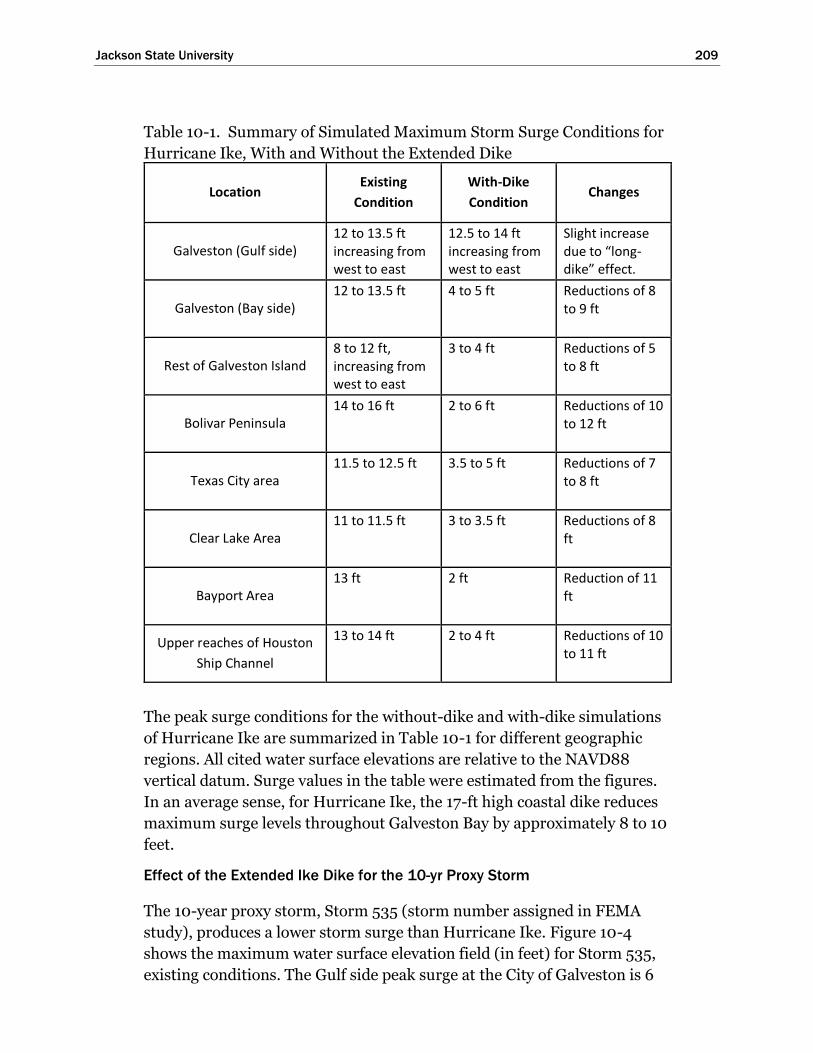
Jackson State University 209
Table 10-1. Summary of Simulated Maximum Storm Surge Conditions for
Hurricane Ike, With and Without the Extended Dike
Location Existing
Condition
With-Dike
Condition Changes
Galveston (Gulf side) 12 to 13.5 ft increasing from west to east
12.5 to 14 ft increasing from west to east
Slight increase due to “long-dike” effect.
Galveston (Bay side) 12 to 13.5 ft 4 to 5 ft Reductions of 8
to 9 ft
Rest of Galveston Island 8 to 12 ft, increasing from west to east
3 to 4 ft Reductions of 5 to 8 ft
Bolivar Peninsula 14 to 16 ft 2 to 6 ft Reductions of 10
to 12 ft
Texas City area 11.5 to 12.5 ft 3.5 to 5 ft Reductions of 7
to 8 ft
Clear Lake Area 11 to 11.5 ft 3 to 3.5 ft Reductions of 8
ft
Bayport Area 13 ft 2 ft Reduction of 11
ft
Upper reaches of Houston
Ship Channel
13 to 14 ft 2 to 4 ft Reductions of 10 to 11 ft
The peak surge conditions for the without-dike and with-dike simulations
of Hurricane Ike are summarized in Table 10-1 for different geographic
regions. All cited water surface elevations are relative to the NAVD88
vertical datum. Surge values in the table were estimated from the figures.
In an average sense, for Hurricane Ike, the 17-ft high coastal dike reduces
maximum surge levels throughout Galveston Bay by approximately 8 to 10
feet.
Effect of the Extended Ike Dike for the 10-yr Proxy Storm
The 10-year proxy storm, Storm 535 (storm number assigned in FEMA
study), produces a lower storm surge than Hurricane Ike. Figure 10-4
shows the maximum water surface elevation field (in feet) for Storm 535,
existing conditions. The Gulf side peak surge at the City of Galveston is 6

Jackson State University 210
to 7 ft for this less intense storm. Along the bay side of Galveston, peak
surges were 6 to 7 ft. Along the western shoreline of Galveston Bay, peak
surges range from 6.5 feet at Texas City to 8.5 at Bayport, increasing to 9.5
to 11 feet in the upper reaches of the Houston Ship Channel.
Figure 10-5 shows the maximum water surface elevation field (in feet) for
Storm 535 and the with-extended-dike conditions. The Gulf-side peak
surge at the City of Galveston (less than 7 ft) is only slightly higher for the
with-dike condition, compared to the existing condition, due to the long
dike effect. In general, the less intense the storm, the lower the increase in
peak storm surge associated with the long-dike effect. On the bay side of
Galveston, peak surges with the dike in place were only 1.5 to 2.5 ft.
Throughout Galveston Bay, the extended coastal dike reduced peak surges
to levels less than 6 ft, even in the upper reaches of the Houston Ship
Channel where the surge reached its maximum values of 9.5 to 11 ft for
existing conditions.
The extended dike reduces peak surges within Galveston Bay by amounts
of 4 to 5 ft throughout Galveston and West Bays, significantly reducing the
risk of flooding to all areas behind the dike. High winds that circulate in a
counterclockwise rotation about the storm eye at landfall near San Luis
Pass set up an east-to-west water surface gradient within the bay, the
channels leading to the Dickinson area and into Clear Lake, and in the
upper reaches of the Houston Ship Channel. In these channelized areas on
the western side of Galveston Bay, peak water levels reach their highest
values. The general pattern of maximum water surface elevation within
Galveston Bay is nearly the same for without- and with-dike conditions.
However, the dike effectively eliminates propagation of surge through the
passes and over the barrier islands, significantly reducing the volume of
water that enters the bays which would otherwise act to raise surge levels
within the bays, as seen for the existing conditions.

Jackson State University 211
Figure 10-4 Maximum water surface elevation field for the 10-yr proxy storm, from FEMA
(2011), representing the existing without-dike conditions.
Figure 10-5. Maximum water surface elevation field for the 10-yr proxy storm, extended-dike
conditions.
Table 10-2 summarizes the same peak surge results in tabular form for
several important regions of the study area as well as the changes
attributed to the presence of the dike, for the 10-year proxy storm. Values
listed in the table were visually estimated from the color-shaded contour
maps.

Jackson State University 212
Table 10-2. Summary of Maximum Storm Surge Conditions for Storm
535, the 10-yr Proxy Storm, With and Without the Extended Dike
Location Existing
Condition
With-Dike
Condition Changes
Galveston (Gulf side) 6 to 7 ft increasing from west to east
6 to 7 ft increasing from west to east
Slight increase due to “long-dike” effect.
Galveston (Bay side) 6 to 7 ft 1.5 to 2.5 ft Reductions of 4
to 5 ft
Rest of Galveston Island 5 to 6.5 ft, increasing from west to east
1.5 to 2.5 ft Reductions of 4 to 5 ft
Bolivar Peninsula 5.5 to 7 ft Less than 2 ft Reductions of 4
to 5 ft
Texas City area 6.5 to 8 ft 2.5 to 4 ft Reductions of 4
to 4.5 ft
Clear Lake Area 8 to 9.5 ft 4 to 5.5 ft Reductions of 4
to 4.5 ft
Bayport Area 8.5 ft 4 ft Reduction of 4.5
ft
Upper reaches of Houston
Ship Channel
9.5 to 11 ft 5 to 6 ft Reduction of 4.5 to 5 ft
Effect of the Extended Ike Dike for the 100-yr Proxy Storm
The computed maximum water surface elevation fields for the without-
dike and the with-dike conditions, for the 100-yr proxy storm, Storm 033,
are shown in Figures 10-6 and 10-7, respectively.
For the existing conditions, a peak storm surge of approximately 14.5 to 16
ft was simulated along the Gulf side of the City of Galveston, increasing
from west to east. At this location, the peak surge is approximately 2 ft
higher than the peak surge that was computed for Hurricane Ike.
Significant wave induced overtopping of the seawall, but no steady
overflow, would be expected at this surge level, since levels are below the
seawall crest elevation of 17 ft. Peak surges along the rest of Galveston

Jackson State University 213
Figure 10-6. Maximum water surface elevation field for the 100-yr proxy storm, from FEMA
(2011), representing the existing without-dike conditions.
Figure 10-7. Maximum water surface elevation field for the 100-yr proxy storm, extended-
dike conditions.
Island were 10 to 14.5 ft, also increasing from west to east along the island.
Peak surges of 15 to 17 ft were computed along the open coast of Bolivar
Peninsula, with the highest peak surge at the western end, decreasing
toward the east end of the peninsula.
In general, the zone of maximum open-coast surge is located where the
maximum onshore-directed hurricane winds occur at landfall. All three
proxy storms make landfall at San Luis pass, each following the same
track; and all three have similar radii-to-maximum-winds as they
approach landfall. The location of maximum onshore-directed winds is
roughly positioned at one radius-to-maximum winds distance to the
Jackson State University 214
northeast of the landfall location. Therefore, the zone of maximum surge
in roughly location between Bolivar Roads Pass and western Bolivar
Peninsula, in light of differences in the radii-to-maximum winds for the
three storms as they approach landfall.
For existing conditions within Galveston Bay, from the bay side of the City
of Galveston to the north side of Texas City and near San Leon, the peak
surge ranged from 14 to 15 ft. From San Leon northward, along the
western shoreline of Galveston Bay, peak surge increased from 14 ft to 16
ft near Bayport. Peak surges increased further into the upper reaches of
the Houston Ship Channel, approaching maximum values of 19 to 20 ft.
Figure 10-7 shows the maximum water surface elevation field for with-dike
conditions. Comparing Figures 10-7 and 10-6, the extended dike produces
substantial reductions in peak storm surge levels throughout the interior
bay system, in both Galveston and West Bays. The coastal dike prevents a
considerable amount of storm surge from entering the bay systems via
flow over the barrier islands and through the passes. As was evident for
the 10-yr proxy storm, hurricane force winds within the bay still generate a
significant east-to-west water surface elevation gradient within the bay, as
a result of the counterclockwise rotating wind fields around the eye, as the
storm makes landfall. These gradients result in locally higher peak surge
levels along the western sides of both bays, but they are significantly less
than levels without the dike in place.
Along the Gulf sides of the City of Galveston as well as along Galveston
Island and Bolivar Peninsula, the storm surge is increased slightly as a
result of the ‘long-dike effect,’ to maximum values of 17 to 19 ft. This
increase results in greater overtopping and steady flow over the Galveston
Seawall as is evident in Figure 10-7; the same occurs along the western
side of Bolivar Peninsula. For this more intense hurricane, the long-dike
effect increases on the open coast side of the dike by 1 to 2 ft. These results
suggest that raising of the Galveston Seawall should be considered as an
element of the coastal dike, to mitigate the long-dike effect on the existing
seawall and provide enhanced risk reduction for the City of Galveston for
storms of this intensity and greater.
With the extended dike, along the bay side of the City of Galveston, the
peak surges were reduced by amounts ranging from 4 to 5 ft. Between the
City of Galveston and Texas City, the peak surge reaches 7 to 10 ft, a
Jackson State University 215
reduction of 6 to 7 ft. As was seen for Hurricane Ike, this area of locally
higher surge between Galveston and Texas City is a common feature for
hurricanes from the southeast. The prevalence for this feature suggests
that a bayside levee for the city of Galveston, effectively creating a ring
levee, wall or dike around the city, should be considered as a secondary
line of defense along with the coastal dike.
The extended dike greatly reduces the amount of inundation along the
western shoreline of Galveston Bay, for the 100-yr proxy storm. The
extended dike significantly lowered peak surges around Texas City, by
amounts of 6 to 8 ft, in such a way as to reduce overtopping and flow over
the protective dike surrounding Texas City on its southern side, compared
to the without-dike case. With the dike in place, in most places along the
western shoreline of Galveston Bay, peak surges are generally in the 6 to 8
ft range, much less than the 14 to 16 ft surges that occur here without the
dike in place. Also note that peak surges with the dike in place are 3 to 5 ft
lower than was experienced during Hurricane Ike (10 to 12 ft) in these
same areas.
As noted for the other storms considered thus far in this chapter,
computed surges for the with-dike conditions are slightly higher,
approaching 11 ft, in some of the isolated areas of the interior back
channels of Dickinson Bay, compared to surges in the bay proper. This is
due to the strong winds from the east at landfall which force east-to-west
water surface gradients in the channels leading to Dickinson and into
Clear Lake. In light of these gradients, which are a prevalent feature for
severe hurricanes that approach from the southeast, secondary lines of
defense should be considered within these channels. Secondary lines of
defense might be raised topography or roadways, or smaller gates in
conjunction with raised topography or roadways, which can provide
additional flood risk reduction, if cost-effective.
Peak surges in the upper reaches of the Houston Ship Channel are
significantly reduced as a result of the extended dike, to levels less than 12
ft; an 8-ft reduction in peak surge in this area. Peak surge elevations with
the dike in place are less than peak surge elevations that were experienced
in these same areas during Hurricane Ike.
The peak surge conditions for the without-dike and with-dike simulations are summarized in Table 10-3 for different geographic regions.

Jackson State University 216
Table 10-3. Summary of Maximum Storm Surge Conditions for Storm
033, the 100-yr Proxy Storm, With and Without the Extended Dike
Location Existing
Condition
With-Dike
Condition Changes
Galveston (Gulf side) 14.5 to 16 ft increasing from west to east
16 to 18 ft increasing from west to east
1 to 2 ft increase due to “long-dike” effect.
Galveston (Bay side) 13.5 to 14 ft 8 to 10 ft Reductions of 4
to 5 ft
Rest of Galveston Island 11 to 14.5 ft, increasing from west to east
4 to 5 ft Reductions of 7.5 to 9.5 ft
Bolivar Peninsula 15 to 16.5 ft 4 to 9 ft Reductions of
7.5 to 11 ft
Texas City area 14 to 16 ft 6 to 10 ft Reductions of 6
to 8 ft
Clear Lake Area 14 to 15 ft 7 to 9 ft Reductions of 6
to 7 ft
Bayport Area 16 ft 7.5 ft Reductions of
8.5 ft
Upper reaches of Houston
Ship Channel
17.5 to 20 ft 10 to 12 ft Reductions of 7.5 to 8 ft
Effect of the Extended Ike Dike for the 500-yr Proxy Storm
Figures 10-8 and 10-9 show the computed maximum water surface
elevation fields for the existing and with-dike conditions, respectively, for
the 500-yr proxy storm, Storm 036. For existing conditions (Figure 10-8),
a peak storm surge of approximately 19 ft was generated along the Gulf
side of the City of Galveston, higher than the 17-ft crest elevation of the
Galveston Seawall. Substantial overflow of the seawall occurs at this surge
level, along with widespread inundation of the City of Galveston. Along
the rest of Galveston Island, Gulf-side peak surge increased from 14 ft in
the west to 19 ft in the east. Gulf-side peak surge approached 19 to 20 ft
along the western end of Bolivar Peninsula, decreasing to 18 ft at the
eastern end.
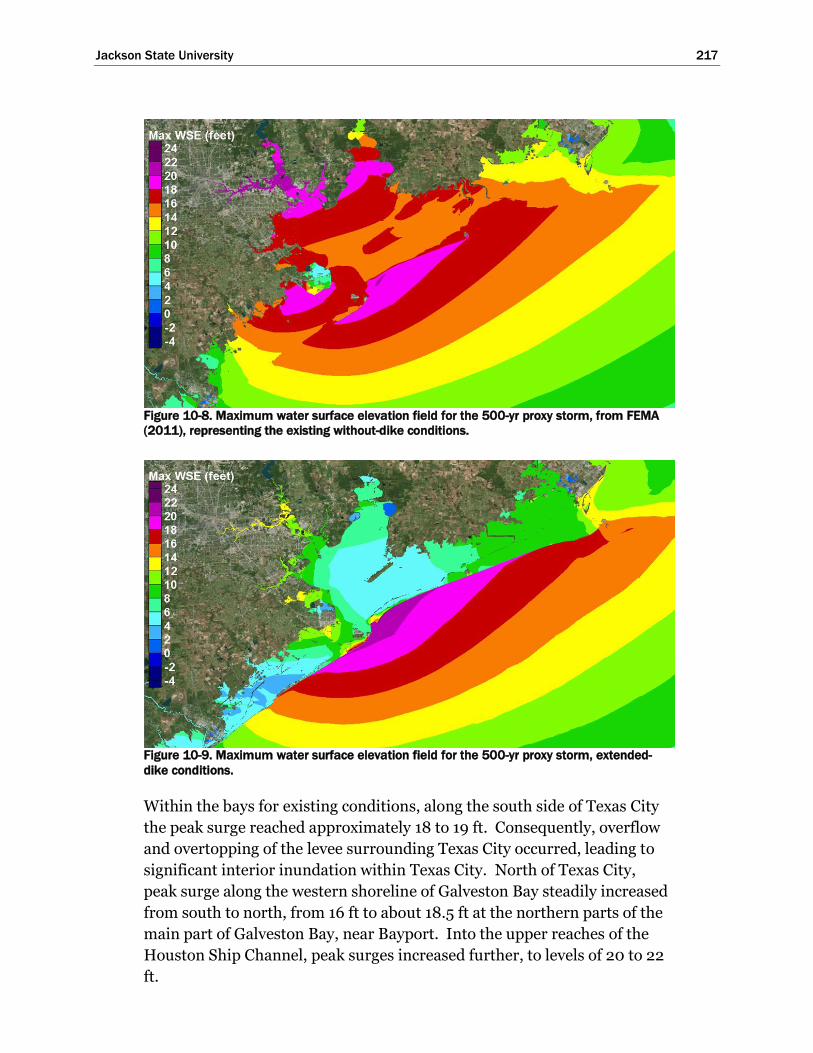
Jackson State University 217
Figure 10-8. Maximum water surface elevation field for the 500-yr proxy storm, from FEMA
(2011), representing the existing without-dike conditions.
Figure 10-9. Maximum water surface elevation field for the 500-yr proxy storm, extended-
dike conditions.
Within the bays for existing conditions, along the south side of Texas City
the peak surge reached approximately 18 to 19 ft. Consequently, overflow
and overtopping of the levee surrounding Texas City occurred, leading to
significant interior inundation within Texas City. North of Texas City,
peak surge along the western shoreline of Galveston Bay steadily increased
from south to north, from 16 ft to about 18.5 ft at the northern parts of the
main part of Galveston Bay, near Bayport. Into the upper reaches of the
Houston Ship Channel, peak surges increased further, to levels of 20 to 22
ft.

Jackson State University 218
Even with the extended dike, some flanking flow is evident around the
northeast end of the dike for Storm 036. This storm also produces steady
flow over the extended dike along the eastern half of Galveston Island,
over the Galveston Seawall, and over the entire length of Bolivar
Peninsula, albeit for a rather short duration. This overflow contributes to
elevated surge levels with the bays.
Even with this overflow of the coastal dike, compared to Figure 10-8,
Figure 10-9 shows that the extended dike produces a considerable
reduction in storm surge throughout the entire bay system for the 500-yr
proxy storm. As was the case for the 100-yr storm, the coastal dike
prevents a considerable amount of storm surge from entering the bay
systems via flow over the barrier islands and through the passes. As was
seen for the 100-yr proxy storm, hurricane force winds within the bay still
generate a significant east-to-west water surface elevation gradient within
the bay, as a result of the counterclockwise rotating wind fields around the
eye, as the storm makes landfall. These gradients result in locally higher
peak surge levels along the western sides of both bays; but peak surge
levels are significantly less than peak levels without the dike in place. For
the 500-yr proxy storm, the pattern of peak surge within the bays is quite
similar to the pattern seen for the 100-yr proxy storm (compare Figures
10-9 and 10-7).
Along the Gulf side of the City of Galveston as well as along Galveston
Island and Bolivar Peninsula, the storm surge is increased slightly, by
amounts ranging from 1 to 2 ft, as a result of the ‘long-dike effect,’ to peak
surge levels of approximately 21 ft at the City of Galveston and western
Bolivar Peninsula.
The magnitude of the surge at Galveston for existing conditions, 19 ft,
which exceeds the crest elevation of the Galveston seawall (17 ft), and the
peak surge level of 21 ft for the with-dike conditions, both suggest that
raising of the Galveston Seawall on the Gulf side should be considered as
an element of the coastal Ike Dike concept, to mitigate the long-dike effect
and provide enhanced flood risk reduction for the City of Galveston.
Along the bay side of the City of Galveston, peak surges are reduced from
values of 15.5 to 16.5 to values of 12 to 13 ft, reductions of 3 to 4 ft. The
relatively small reductions here are due to the considerable amount of flow
over the Galveston Seawall and subsequent inundation of the City of
Jackson State University 219
Galveston, and to the locally higher surge that is created in the southwest
corner of Galveston Bay, between Texas City and the City of Galveston. As
noted previously for the 100-yr proxy storm, this area of locally higher
surge between Galveston and Texas City is a common feature for
hurricanes that approach from the southeast along this type of storm
track. The occurrence of the locally elevated surge zone for Hurricane Ike
and both the 1oo-yr and 500-yr proxy storms suggests that a bayside levee
for the city of Galveston should be considered as a possible feature of the
Ike Dike concept, a secondary line of defense. Raising the existing seawall
and establishing bay-side protection would create in effect a ring
levee/dike/wall around the city. The Gulf-side of the ring levee would be
higher than the adjacent sections of the coastal spine. The crest elevation
of the bayside portion of the ring dike would need to be optimized through
further investigation.
Along the western shoreline of Galveston Bay, peak water surface elevation
approached 13 ft in some of the isolated areas of the interior back channels
of Dickinson Bay, but peak elevations generally ranged from 10 to 12 ft
throughout most of the area. Simulated peak surges in the upper reaches
of the Houston Ship Channel for the with-extended dike case are reduced
to levels less than 14 ft, roughly an 8-ft reduction in peak surge in this area
compared to existing conditions. In general throughout Galveston Bay,
for the 500-yr proxy storm, peak surge levels with the Ike Dike concept in
place are quite similar to, or slightly less than, peak surge levels that were
experienced during Hurricane Ike. The Hurricane Ike experience is a
reasonably good overall indicator of the flooding and inundation that
would be expected along the western shoreline of Galveston Bay and into
the upper reaches of the Houston Ship Channel for the 500-yr proxy
storm, with the coastal spine in place as the only flood risk reduction
feature, without any secondary lines of defense.
The Ike Dike concept significantly reduced steady flow over the protective
levee/dike surrounding Texas City, greatly reducing the depth of
inundation for a large portion of Texas City that was inundated by this
storm without the coastal dike in place. It appears that even with the
coastal dike in place, the 500-yr proxy storm might cause some flow over
the Texas City levee. Therefore raising of the Texas City Levee, perhaps
only locally, should be examined as an improvement to this flood risk
reduction measure, which becomes a secondary line of defense with the
coastal dike in place. It could be that with additional forerunner

Jackson State University 220
penetration, under a realistic gate closure scenario, more flow over the
Texas City Levee would have been simulated for this storm.
Along most of the eastern shoreline of Galveston Bay, the presence of the
dike reduces peak surge levels to elevations of 6 to 8 ft NAVD88.
The peak surge conditions for the without-dike and with-dike simulations
are summarized in Table 10-4 for different geographic regions.
Table 10-4. Summary of Maximum Storm Surge Conditions for Storm
036, the 500-yr Proxy Storm, With and Without the Extended Dike
Location Existing
Condition
With-Dike
Condition Changes
Galveston (Gulf side) 18 to 20 ft increasing from west to east
20 to 21 ft increasing from west to east
1 to 2 ft increase due to the “long-dike” effect.
Galveston (Bay side) 15.5 to 16.5 ft 12 to 13 ft Reductions of 3
to 4 ft
Rest of Galveston Island 13 to 16 ft, increasing from west to east
4 to 10 ft Reductions of 6 to 9 ft
Bolivar Peninsula 18 to 20 ft 4 to 13 ft Reductions of 7
to 12 ft
Texas City area 16 to 19 ft 8 to 12 ft Reductions of 7
to 8 ft
Clear Lake Area 17 to 18 ft 9 to 12 ft Reductions of 6
to 8 ft
Bayport Area 19 ft 10 ft Reductions of 9
ft
Upper reaches of Houston
Ship Channel
20 to 22 ft 12 to 14 ft Reductions of 8 ft

Jackson State University 221
11 Influence of Sea Level on Storm
Surge
Recent Historic Changes in Sea Level for the Region
Figures 11.1 and 11.2, taken from the NOAA Tides and Currents web site,
show the mean sea level changes that have been observed at Galveston.
These observations are based on measured water surface elevation data
from NOAA tide gages (see https://tidesandcurrents.noaa.gov/sltrends/).
Figure 11.1 shows the monthly means based on data from the Galveston
Pleasure Pier, which is located on the open Gulf side of the city. Figure 11.2
shows the temporal variation of monthly mean sea level at Galveston Pier
21, which is located on the bay side of the City of Galveston. The average
annual mean sea level trends at the Pleasure Pier and Pier 21 are similar,
6.62 mm/yr and 6.34 mm/yr, respectively (which correspond to rates of
0.02172 ft/yr and 0.02080 ft/yr, respectively).
As part of this feasibility study, the sensitivity of peak storm surge values
to changes in mean sea level was investigated for the Houston-Galveston
region. Sensitivity was examined for both the existing condition and for
the with-extended-dike condition. A single future sea level scenario was
considered in all with-sea-level-rise simulations. Simulations also
involved four storms, Hurricane Ike and each of the three proxy storms
(10-yr, 100-yr and 500-yr).
Figure 11-1. Mean sea level trend at Galveston Pleasure Pier, Texas.
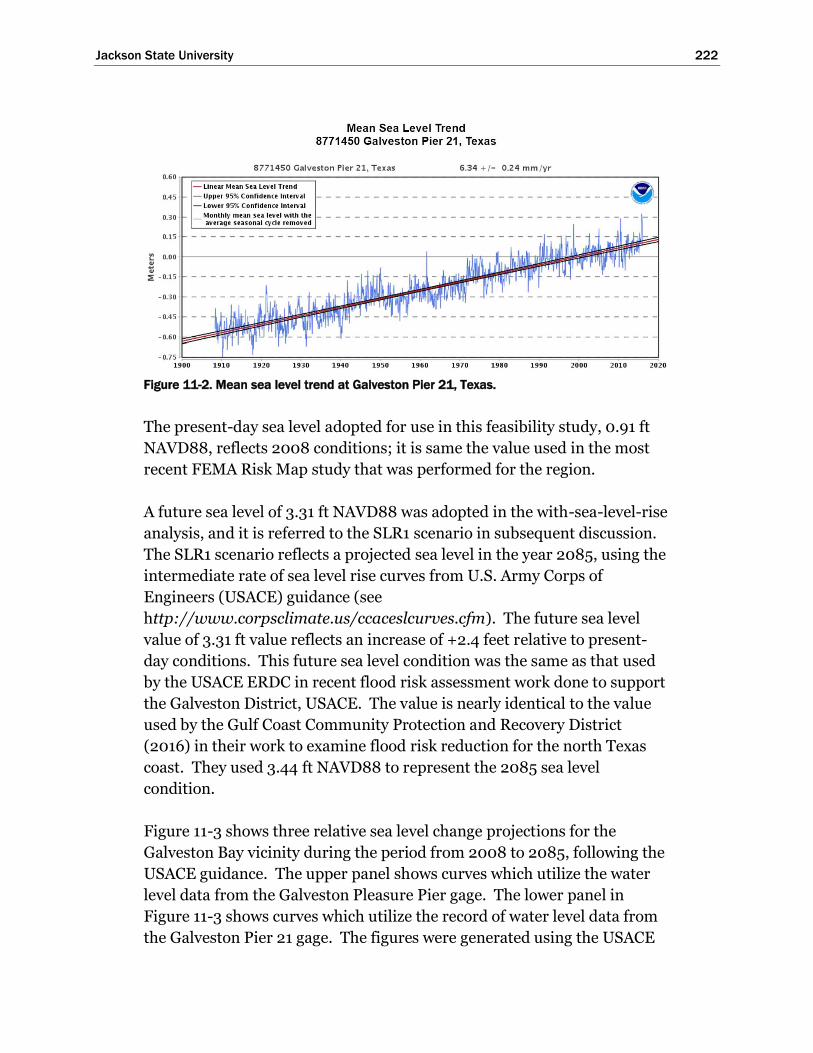
Jackson State University 222
Figure 11-2. Mean sea level trend at Galveston Pier 21, Texas.
The present-day sea level adopted for use in this feasibility study, 0.91 ft
NAVD88, reflects 2008 conditions; it is same the value used in the most
recent FEMA Risk Map study that was performed for the region.
A future sea level of 3.31 ft NAVD88 was adopted in the with-sea-level-rise
analysis, and it is referred to the SLR1 scenario in subsequent discussion.
The SLR1 scenario reflects a projected sea level in the year 2085, using the
intermediate rate of sea level rise curves from U.S. Army Corps of
Engineers (USACE) guidance (see
http://www.corpsclimate.us/ccaceslcurves.cfm). The future sea level
value of 3.31 ft value reflects an increase of +2.4 feet relative to present-
day conditions. This future sea level condition was the same as that used
by the USACE ERDC in recent flood risk assessment work done to support
the Galveston District, USACE. The value is nearly identical to the value
used by the Gulf Coast Community Protection and Recovery District
(2016) in their work to examine flood risk reduction for the north Texas
coast. They used 3.44 ft NAVD88 to represent the 2085 sea level
condition.
Figure 11-3 shows three relative sea level change projections for the
Galveston Bay vicinity during the period from 2008 to 2085, following the
USACE guidance. The upper panel shows curves which utilize the water
level data from the Galveston Pleasure Pier gage. The lower panel in
Figure 11-3 shows curves which utilize the record of water level data from
the Galveston Pier 21 gage. The figures were generated using the USACE

Jackson State University 223
Figure 11-3. Sea level change scenarios for Galveston Bay and vicinity, following USACE
guidance (upper panel– based on Galveston Pier 21 gage data; lower panel – based on
Galveston Pleasure Pier gage data)

Jackson State University 224
sea level change curve calculator:
http://www.corpsclimate.us/ccaceslcurves.cfm.
The “USACE Low” curves in Figure 11-3, reflect a projection of the historic
rate of sea level rise into the future, i.e., a projection of the average rates
that are shown in Figures 11-1 and 11-2. The “USACE Int” curves in Figure
11-3, which were adopted for this feasibility study, represent an
accelerated rate of sea level rise, compared to the recent historic rate. For
the year 2085, projection of the historic rate (the “USACE Low” curve)
yields a sea level of approximately 1.6 ft, which is 0.8 ft less than the 2.4 ft
calculated using the “USACE Int” curve.
A sea level rise of 1.6 ft to 2.4 ft reflects a significant change in the
Houston-Galveston region, one that is important to consider in assessing
and reducing flood risk for the region in general, and in the design of the
Ike Dike concept, in particular. This magnitude of sea level increase
represents a 20 t0 30% increase in the average, present-day water depth in
Galveston Bay.
Effects of Sea Level Rise on Storm Surge and Wave Processes
A rising sea level will lead to greater water depths, which in turn can
influence the generation of storm surge and waves. Increases in water
depth affect the storm surge and nearshore wave conditions in different
ways; they tend to reduce both the effective surface wind stress and reduce
the effective bottom shear stress. The former leads to less pushing force
on the water; the latter tends to make it easier for the forcing to push the
water. Both the reduction in effective wind stress and bottom shear stress
exert influence on the storm surge response along the north Texas coast.
A sea level rise that increases water depths will act to slightly reduce the
effective surface wind stress in the open Gulf shelf areas near the coast,
where winds are most effective in generating storm surge. In terms of the
two-dimensional horizontal water momentum balance, the wind stress is
divided by the water depth, so the deeper the water the less the effective
wind stress is that acts to push the entire water column beneath the
surface. The less the effective wind stress, the less the water surface
gradient, the less the storm surge amplitude at the upwind side of the
basin. So a wind blowing over deeper water will result in a slightly smaller
water surface gradient than the same wind blowing over shallower water.
A smaller forced water surface gradient leads to a smaller peak surge, in a
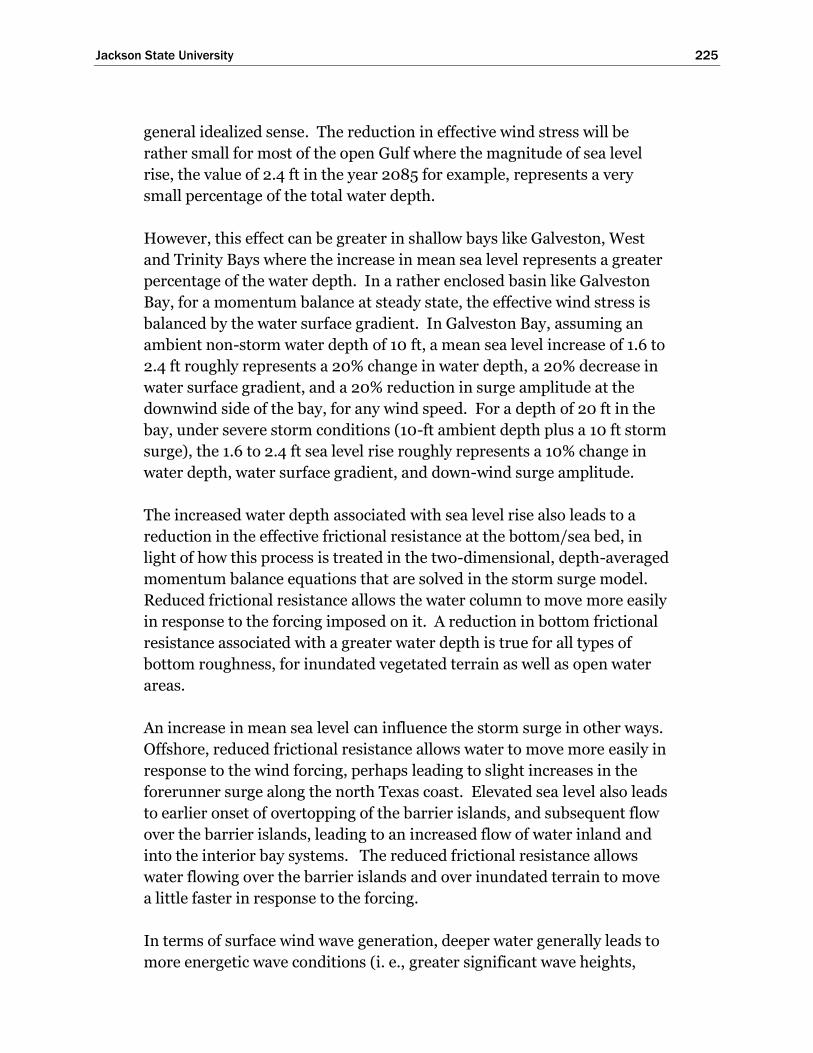
Jackson State University 225
general idealized sense. The reduction in effective wind stress will be
rather small for most of the open Gulf where the magnitude of sea level
rise, the value of 2.4 ft in the year 2085 for example, represents a very
small percentage of the total water depth.
However, this effect can be greater in shallow bays like Galveston, West
and Trinity Bays where the increase in mean sea level represents a greater
percentage of the water depth. In a rather enclosed basin like Galveston
Bay, for a momentum balance at steady state, the effective wind stress is
balanced by the water surface gradient. In Galveston Bay, assuming an
ambient non-storm water depth of 10 ft, a mean sea level increase of 1.6 to
2.4 ft roughly represents a 20% change in water depth, a 20% decrease in
water surface gradient, and a 20% reduction in surge amplitude at the
downwind side of the bay, for any wind speed. For a depth of 20 ft in the
bay, under severe storm conditions (10-ft ambient depth plus a 10 ft storm
surge), the 1.6 to 2.4 ft sea level rise roughly represents a 10% change in
water depth, water surface gradient, and down-wind surge amplitude.
The increased water depth associated with sea level rise also leads to a
reduction in the effective frictional resistance at the bottom/sea bed, in
light of how this process is treated in the two-dimensional, depth-averaged
momentum balance equations that are solved in the storm surge model.
Reduced frictional resistance allows the water column to move more easily
in response to the forcing imposed on it. A reduction in bottom frictional
resistance associated with a greater water depth is true for all types of
bottom roughness, for inundated vegetated terrain as well as open water
areas.
An increase in mean sea level can influence the storm surge in other ways.
Offshore, reduced frictional resistance allows water to move more easily in
response to the wind forcing, perhaps leading to slight increases in the
forerunner surge along the north Texas coast. Elevated sea level also leads
to earlier onset of overtopping of the barrier islands, and subsequent flow
over the barrier islands, leading to an increased flow of water inland and
into the interior bay systems. The reduced frictional resistance allows
water flowing over the barrier islands and over inundated terrain to move
a little faster in response to the forcing.
In terms of surface wind wave generation, deeper water generally leads to
more energetic wave conditions (i. e., greater significant wave heights,

Jackson State University 226
with an increase in peak spectral wave period). As a percentage, these
changes are expected to be greater in shallow bays like Galveston Bay
where the sea level rise represents a much greater change to the water
depth, percentage-wise, than in the open Gulf.
Changes in water depth associated with a sea level increase also influence
wave conditions in shallow water. In very shallow water, where wave
breaking processes are dominant, significant wave height is roughly
proportional to the local water depth. Therefore, a 10% or 20% increase in
local water depth due to an increase in sea level, such as in Galveston Bay,
can lead to a 10% or 20% increase in local significant wave height,
respectively. Increases in local wave height can increase the erosive
potential of the waves, increase wave forces on structures, and increase the
potential for wave run-up and overtopping of dunes, dikes and other man-
made or natural flood risk reduction measures.
Sea level rise also can influence the storm surge in other ways, on time
scales that are much longer than the hurricane event time scale. As mean
sea level increases, the beach and dune system along Bolivar Peninsula
and Galveston Island might become more fragile, degrading with time. As
sea level rises, the frequency of dune overtopping and overwash, and dune
erosion, will increase. If the dunes and beach system are not maintained,
the dune crest elevation will probably be lowered on an increasingly more
frequent basis. As the dunes degrade, overtopping and overwash will
begin to occur during storms of lesser intensity. Without dune
maintenance, natural dune building processes associated with wind-blown
sand will probably not be able to keep pace with the ever increasing
occurrences of overtopping, overwash, and lowering of the crest elevation.
The dune degradation process is likely to accelerate in the absence of
beach and dune maintenance.
Dune degradation also will probably lead to increased probability of
significant breaches forming in the barrier island during hurricanes. As
stated earlier, sea level rise by itself will lead to earlier onset of barrier
island overflow during storms, leading to more water flowing into the
interior bays, contributing to interior flooding. This process is exacerbated
by dune degradation.

Jackson State University 227
It is important to note that the Ike Dike coastal spine concept greatly
reduces the likelihood of barrier island degradation leading to breaching.
It provides integrity to the barrier island.
Changes in the interior bays and wetlands also are expected as a result of
sea level rise; which can then, in turn, influence the storm surge. Rising
sea level is expected to alter the landscape in the following ways: changes
to the type, health and/or density of vegetation due to increased frequency
of inundation, permanency of inundation, and changes to the salinity
regime; conversion of upland terrain to marshland; conversion of
marshland to 0pen water bottom conditions; and, shoreline erosion and
changes to sedimentation patterns. Changes to the vegetation canopy also
can change the surface roughness that can influence the effective wind
stress.
Degradation or loss of vegetation can reduce the frictional resistance of the
landscape and allow storm surge to propagate more easily into inland
areas, and promote development of storm surge in those areas. For
approaching hurricanes that produce high surges and coastal inundation,
considerable volumes of water can move across the vegetated barrier
islands and wetlands northeast of Galveston Bay, and then into Galveston
Bay for certain storms.
Conversion of the landscape to open water, as a result of vegetation loss or
erosion, increases wind fetches. Greater fetches can in turn expose ever-
expanding open-water areas to the effects of storm surge and more
energetic wave conditions. These changes in surge and wave conditions
can lead to greater marsh and wetland degradation and/or exacerbate
erosion. Loss of vegetation also can reduce the wave energy dissipation
benefits of a vegetated landscape when it does become inundated.
Past Relevant Work by ARCADIS (2011)
In support of The Nature Conservancy, ARCADIS (2011) performed an
assessment of future landscape changes in the Jefferson County and
Galveston Bay areas of north Texas; and they examined the influence of
those changes on hurricane storm surge. ARCADIS examined the effects
of Hurricane Ike for present-day mean sea level and two future mean sea
levels: a sea level of 2.0 ft NAVD88 in the year 2050 and a sea level of 3.9
ft NAVD88 in the year 2100. (For comparison purposes, the present study
is considering a sea level of 3.3 ft NAVD88 in the year 2085.) Their work

Jackson State University 228
considered some of the anticipated landscape changes mentioned above:
changes to the vegetation canopy which can alter surface wind stress,
changes to vegetation that can change the bottom frictional resistance, and
increased water depths which tend to reduce frictional resistance in
general. ARCADIS (2011) developed two future modified landscapes,
which they projected, for the years 2050 and 2100. The modified future
landscapes were used to alter the storm surge model input, and Hurricane
Ike was simulated for the present landscape scenario (2004) and each of
the landscape/sea level scenarios (2050 and 2100).
In general, ARCADIS (2011) showed that the increase in sea level and the
corresponding landscape changes both acted to reduce the influence of
bottom friction which, in turn, led to greater storm surge penetration and
greater storm surge peak amplitude in the inundated areas. They found
that for Hurricane Ike, in some areas the peak storm surge increases were
much greater than the increase in mean sea level alone, a nonlinear
response, with storm surge amplification factors approaching a value of 3
(i.e., increases in peak surge elevations that were 3 times the increase in
mean sea level). An amplification factor of 2 indicates an increase in peak
surge that is twice the magnitude of the increase in mean sea level. The
greatest nonlinear increases were seen for Jefferson County, which is
northeast of the Houston-Galveston region, and in the northern end of
Trinity Bay, which is in the northeast part of Galveston Bay.
This nonlinear response was not nearly as strong in other areas. For
example, along the western shoreline of Galveston Bay, which is an area of
great potential for flood damage, they found that the non-linear effect was
generally less than in other areas. Amplification factors ranged from 1.0
near the City of Galveston to 1.5 or 1.6 near Morgan’s Point, for the year
2o50 case. For the 2100 case, amplification factors ranged from 1.0 near
the City of Galveston to 1.4 near Morgan’s Point. They found that
amplification factors were generally less for the higher mean sea level.
ARCADIS (2011) only considered Hurricane Ike in their analysis, and they
noted that the effects of reduced frictional resistance might be less for
Hurricane Ike than for other storms that are smaller and/or had faster
forward speeds.
Storm Surge for Present and Future Sea Level Scenarios
Simulations were conducted as part of this feasibility study to further
examine the influence of rising mean sea level on storm surge. The

Jackson State University 229
simulations also were done t0 support an assessment of damages/losses
prevented by the Ike Dike concept for a future sea level condition. The
analysis presented here does not consider any changes to the landscape, as
was done by ARCADIS (2011), some of which would be expected for a
future sea level increase of this magnitude (1.6 to 2.4 ft). Instead, a static
landscape was assumed: the present-day landscape, as it was treated in the
most recent FEMA Risk Map study. As will be discussed and shown
below, the assumption of a static landscape is quite reasonable as a first
step to examine the effect of a future elevated sea level on storm surge in
the Houston-Galveston region.
The static landscape assumption captures the key factors influencing the
effect of sea level rise on storm surge in the areas of greatest interest in the
Houston-Galveston region: Galveston Island, Bolivar Peninsula, western
shoreline of Galveston Bay, and the upper reaches of the Houston Ship
Channel. Surge generated in the open Gulf and in Galveston/West Bays is
primarily generated by wind blowing over the open water areas, including
all areas that are inundated prior to the storm’s arrival by the sea level rise.
Surge in the interior bays is controlled by the flow of water through Bolivar
Roads into the bays, and by water flowing over the barrier islands once
they become inundated, a process which occurs earlier in the storm as a
result of sea level rise. Changes in water depth in these open water areas is
the most important factor in determining the effect of sea level rise on
storm surge in the Houston-Galveston region, and those effects are
represented in the modeling performed with the static landscape
representation. Changes in storm surge attributable to future changes in
the landscape vegetation that might occur due to a sea level rise on the
order of 2 ft are expected to be of secondary importance in generation of
storm surge along the western shoreline of Galveston Bay. The work by
ARCADIS (2011) seemed to indicate this as well, for this area.
Using peak water surface elevation fields from surge model simulations for
both present-day and future sea level scenarios, a peak surge amplification
factor was calculated in the same manner as was done by ARCADIS (2011).
The amplification factor was computed for each grid node in the surge
model domain as the difference between the maximum water surface
elevation for the future SLR1 sea level scenario (a 2.4-ft sea level rise) and
the maximum water surface elevation field for the present-day sea level
scenario. To normalize the factor, the elevation difference was then
divided by 2.4 ft. Therefore, at a particular location, an amplification

Jackson State University 230
factor of 1.0 means that the peak surge response is linear, i.e., the
maximum water surface elevation for the SLR1 sea level scenario is exactly
2.4 ft higher than the maximum water surface elevation for the present-
day sea level scenario.
Amplification factors other than 1.0 indicate that there is a nonlinear
response in peak storm surge at that location. For example, if the
maximum water surface elevation at a location for the SLR1 scenario was
4.8 ft greater than the maximum water surface elevation for the present-
day sea level scenario, the amplification factor would be 2.0.
Amplification factors greater than 1.0 indicate locations where the
increases in maximum water surface elevation, between the two sea level
scenarios, are greater than 2.4 ft. If the maximum water surface elevation
for SLR1 was only 1.8 ft greater than the maximum water surface elevation
for present day sea level, then the amplification factor would be 0.75.
Amplification factors less than 1.0 indicate locations where increases in
maximum water surface elevation, between the two sea level scenarios, are
less than 2.4 ft.
A series of simulations were made for Hurricane Ike and for the three
proxy storms (10-yr, 100-yr and 500-yr); for both the present day sea level
scenario (2008) and the SLR1 future sea level scenario (2085, which is 2.4
ft higher than present day sea level); for both the no-dike and with-
extended dike conditions. The maximum water surface elevation fields for
pairs of simulations, for SLR1 and present-day sea levels, were compared.
The sequence of figures shown below for each storm have the following
order:
1) maximum water surface elevation field for no-dike conditions, with
the present day (2008) sea level scenario
2) maximum water surface elevation field for no-dike conditions,
with the SLR1 scenario
3) difference in maximum water surface elevation fields for the SLR1
and present-day sea level scenarios, for no-dike conditions (SLR1
minus present-day elevations)
4) peak surge amplification factor for no-dike conditions

Jackson State University 231
5) maximum water surface elevation field for with-extended-dike
conditions, with the present day (2008) sea level scenario
6) maximum water surface elevation field for with-extended-dike
conditions, with the SLR1 scenario
7) difference in maximum water surface elevation fields for the SLR1
and present-day sea level scenarios, for with-extended-dike
conditions (SLR1 minus present-day elevations)
8) peak surge amplification factor for with-extended-dike conditions
Hurricane Ike Peak Surge for Present and Future Sea Levels
The No-dike condition
The group of four figures for Hurricane Ike, no-dike conditions, is shown
in Figures 11-4 through 11-7. Figures 11-4 and 11-5 show the maximum
water surface elevation fields for the two sea level scenarios, and Figure 11-
6 shows the difference between the two. Figure 11-7 shows the
amplification factor field. Valuable information about the response of
storm surge to rising sea level can be gained by examining the
amplification factor fields.
Areas in Figure 11-7 that are colored in white reflect those regions where
the increase in storm surge between present-day sea level and the future
sea level is approximately equal to the 2.4-ft increase in sea level. This is
the linear response that would generally be expected for the deeper coastal
waters in the open Gulf. The white areas appear to occur offshore, in the
nearshore region that is further removed from the maximum storm surge
zone, and in those areas where there is a transition in color from blue to
yellow.
In the open Gulf coastal region north of Bolivar Roads, much of the shaded
area is blue. This area coincides with the zone of highest peak surge, as
seen in Figures 11-4 and 11-5. Amplification factors of 0.85 to 0.95 suggest
that the peak surge values in this blue region for the future sea level
scenario are 0.1 to 0.4 ft less than values for present-day sea level scenario,
a fairly small difference.
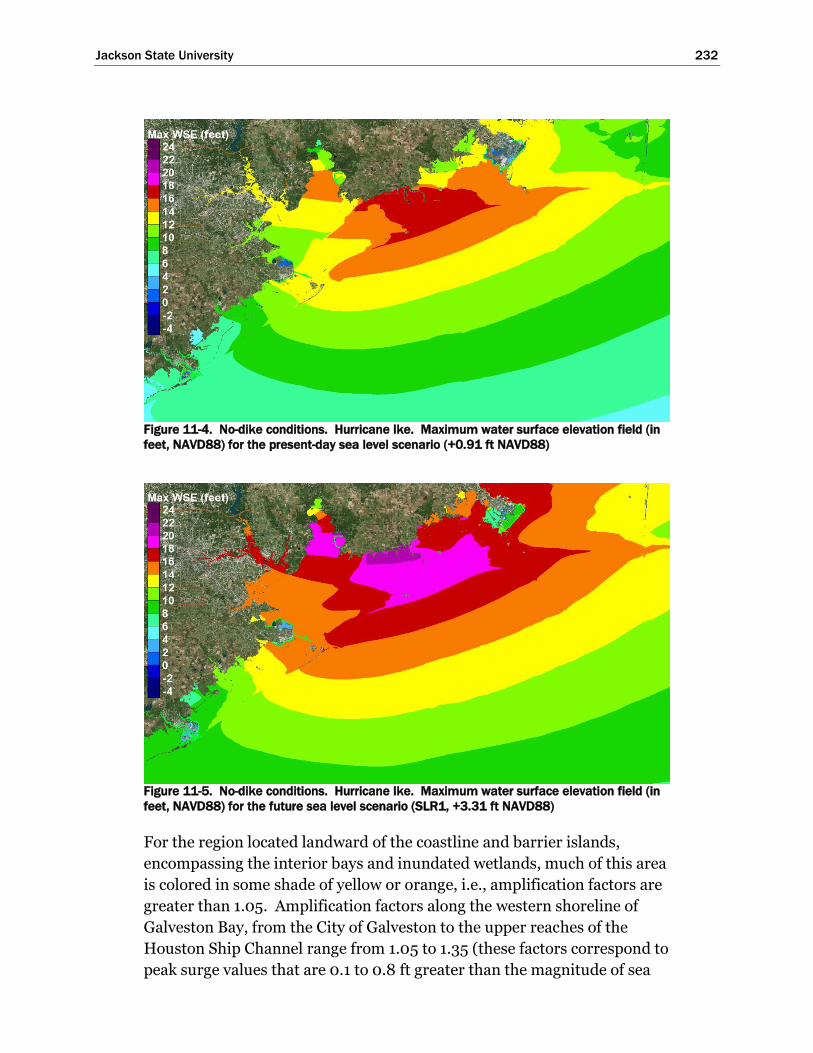
Jackson State University 232
Figure 11-4. No-dike conditions. Hurricane Ike. Maximum water surface elevation field (in
feet, NAVD88) for the present-day sea level scenario (+0.91 ft NAVD88)
Figure 11-5. No-dike conditions. Hurricane Ike. Maximum water surface elevation field (in
feet, NAVD88) for the future sea level scenario (SLR1, +3.31 ft NAVD88)
For the region located landward of the coastline and barrier islands,
encompassing the interior bays and inundated wetlands, much of this area
is colored in some shade of yellow or orange, i.e., amplification factors are
greater than 1.05. Amplification factors along the western shoreline of
Galveston Bay, from the City of Galveston to the upper reaches of the
Houston Ship Channel range from 1.05 to 1.35 (these factors correspond to
peak surge values that are 0.1 to 0.8 ft greater than the magnitude of sea

Jackson State University 233
level increase, 2.4 ft). The nonlinear surge response associated with sea
level rise exacerbates flooding in the key areas where flood risk reduction
is desired.
Figure 11-6. No-dike conditions. Hurricane Ike. Change in maximum water surface
elevation (wse) fields. Maximum wse for the SLR1 future sea level scenario minus the
maximum wse for the present-day sea level scenario.
Figure 11-7. No-dike conditions. Hurricane Ike. Peak surge amplification factor.
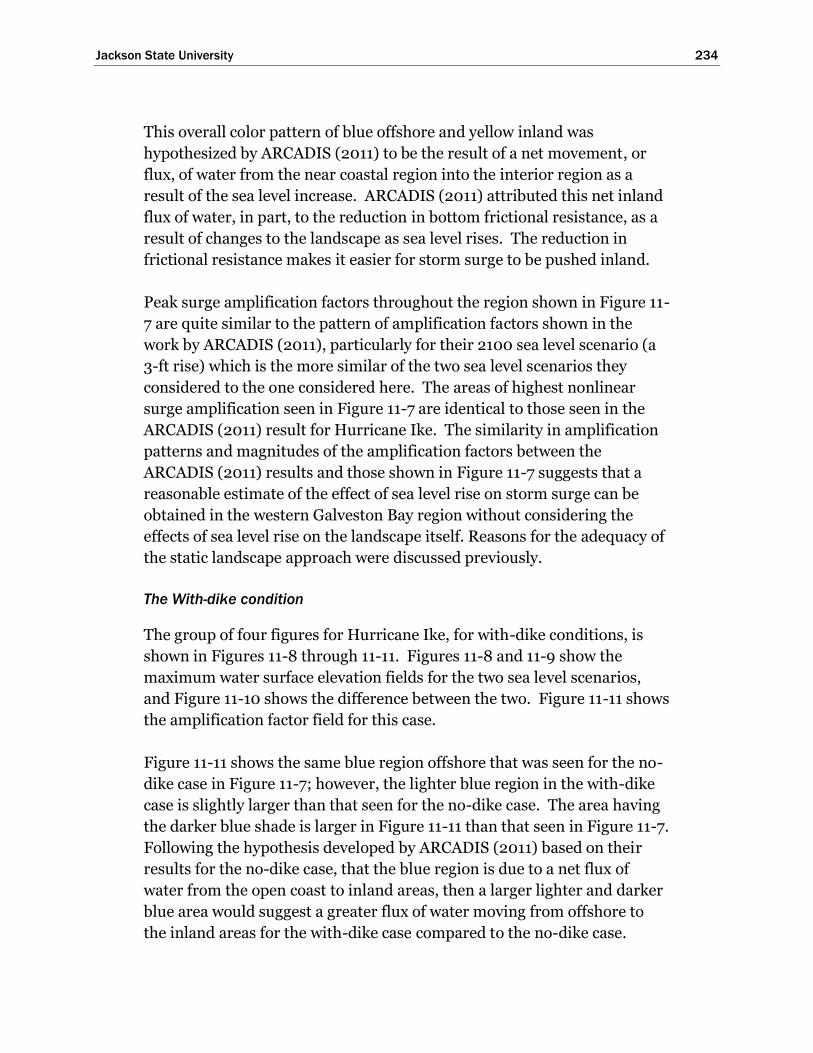
Jackson State University 234
This overall color pattern of blue offshore and yellow inland was
hypothesized by ARCADIS (2011) to be the result of a net movement, or
flux, of water from the near coastal region into the interior region as a
result of the sea level increase. ARCADIS (2011) attributed this net inland
flux of water, in part, to the reduction in bottom frictional resistance, as a
result of changes to the landscape as sea level rises. The reduction in
frictional resistance makes it easier for storm surge to be pushed inland.
Peak surge amplification factors throughout the region shown in Figure 11-
7 are quite similar to the pattern of amplification factors shown in the
work by ARCADIS (2011), particularly for their 2100 sea level scenario (a
3-ft rise) which is the more similar of the two sea level scenarios they
considered to the one considered here. The areas of highest nonlinear
surge amplification seen in Figure 11-7 are identical to those seen in the
ARCADIS (2011) result for Hurricane Ike. The similarity in amplification
patterns and magnitudes of the amplification factors between the
ARCADIS (2011) results and those shown in Figure 11-7 suggests that a
reasonable estimate of the effect of sea level rise on storm surge can be
obtained in the western Galveston Bay region without considering the
effects of sea level rise on the landscape itself. Reasons for the adequacy of
the static landscape approach were discussed previously.
The With-dike condition
The group of four figures for Hurricane Ike, for with-dike conditions, is
shown in Figures 11-8 through 11-11. Figures 11-8 and 11-9 show the
maximum water surface elevation fields for the two sea level scenarios,
and Figure 11-10 shows the difference between the two. Figure 11-11 shows
the amplification factor field for this case.
Figure 11-11 shows the same blue region offshore that was seen for the no-
dike case in Figure 11-7; however, the lighter blue region in the with-dike
case is slightly larger than that seen for the no-dike case. The area having
the darker blue shade is larger in Figure 11-11 than that seen in Figure 11-7.
Following the hypothesis developed by ARCADIS (2011) based on their
results for the no-dike case, that the blue region is due to a net flux of
water from the open coast to inland areas, then a larger lighter and darker
blue area would suggest a greater flux of water moving from offshore to
the inland areas for the with-dike case compared to the no-dike case.
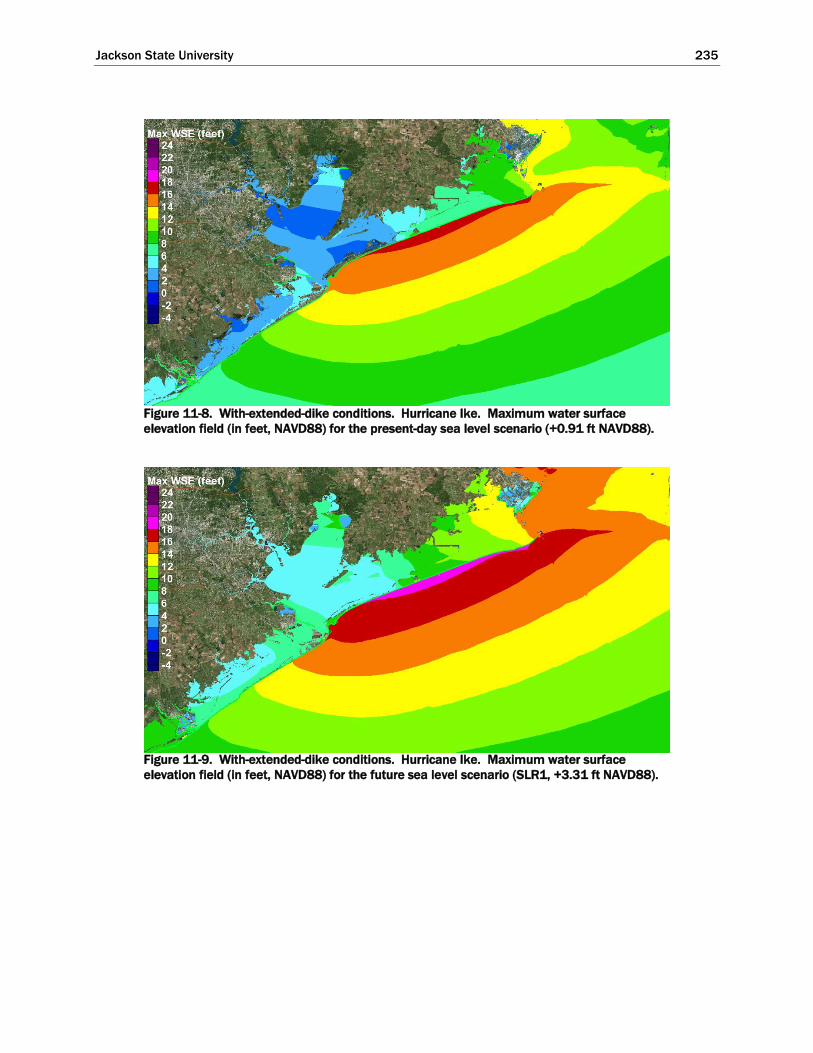
Jackson State University 235
Figure 11-8. With-extended-dike conditions. Hurricane Ike. Maximum water surface
elevation field (in feet, NAVD88) for the present-day sea level scenario (+0.91 ft NAVD88).
Figure 11-9. With-extended-dike conditions. Hurricane Ike. Maximum water surface
elevation field (in feet, NAVD88) for the future sea level scenario (SLR1, +3.31 ft NAVD88).

Jackson State University 236
Figure 11-10. With-extended-dike conditions. Hurricane Ike. Change in maximum water
surface elevation (wse) fields. Maximum wse for the SLR1 future sea level scenario minus
the maximum wse for the present-day sea level scenario.
Figure 11-11. With-extended-dike conditions. Hurricane Ike. Peak surge amplification
factor.
However the presence of the dike must drastically limit this flux of water
from offshore to the inland areas. This result suggests that the blue-
shaded region offshore, having amplification factors less than 0.95, is not
primarily due to a net inland flux of water.
It seems more likely that the blue region offshore is primarily due to a
reduction in the effective wind stress. As sea level increases, the water
depth increases, which in turn leads to slight reduction in effective wind
Jackson State University 237
stress. A wind stress decrease would manifest itself in the blue region, due
to a lower shear stress piling water against the coastline or against the dike
in this case. There is another factor that leads to increased water depth
seaward of the dike. With the dike in place, the long-dike effect leads to
greater surges on the Gulf side of the dike, which also contribute to a
greater water depth. The long-dike effect appears to be the primary
contributor to the larger dark blue region shown in Figure 11-11, compared
to size of the darker blue region seen in Figure 11-7.
Figure 11-11 shows widespread occurrence of amplification factors greater
than 1.0 in areas landward of the dike. What is the source of water that
leads to these amplification factors, with the dike in place? The coastal
surge, including enhancement of the surge due to the long-dike effect,
leads to overflow of the dike, which would be one source. Also, the open
coast surge for Ike leads to a strong gradient in water surface elevation at
the northeast terminus of the dike. The track of Ike, which crossed Bolivar
Peninsula, leads to an open coast surge of 16 ft or more at Sabine Pass.
Note that although the dike extends to Sabine Pass, it is not terminated
into higher ground elevation. So the large water surface elevation gradient
at the eastern end of the dike, drives water toward the west, on the
landward side of the dike. Prior to the time of peak surge, the combination
of the sea level increase and the large surge forerunner that occurred
during Ike also likely contribute to the flanking flow around the eastern
terminus of the dike. Water that flanks the dike moves over a less
frictionally resistant, inundated, landscape and into Galveston Bay, and,
from there, into West Bay and Trinity Bay. These two sources of water,
flow over the dike and flanking flow, are apparently enough to offset any
effect of reduced wind stress in the bays.
The relative magnitude of both sources of water is unknown. Figure 11-9
suggests that flanking flows are the dominant source, in light of the
following: the expanse of the inundated area behind the dike and the
gentle slope of the water surface elevation gradient, together with the
limited time during the storm (a few hours at most), only near the time of
peak surge, that flow over the dike would occur. The duration of flow over
the dike is expected to be much less than the duration of flanking flow; and
therefore the volume of the overflow source is expected to be much less
than the volume of flanking source. A well-terminated dike, tied into
ground having an elevation comparable to that of the dike crest, would
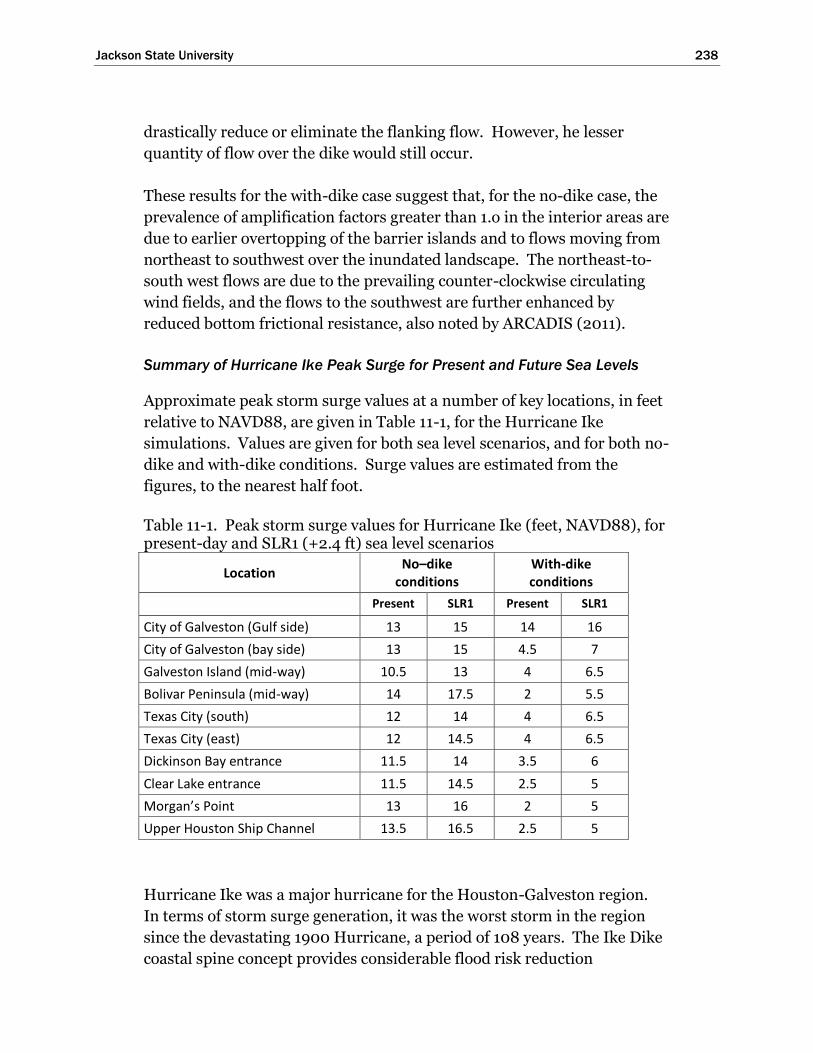
Jackson State University 238
drastically reduce or eliminate the flanking flow. However, he lesser
quantity of flow over the dike would still occur.
These results for the with-dike case suggest that, for the no-dike case, the
prevalence of amplification factors greater than 1.o in the interior areas are
due to earlier overtopping of the barrier islands and to flows moving from
northeast to southwest over the inundated landscape. The northeast-to-
south west flows are due to the prevailing counter-clockwise circulating
wind fields, and the flows to the southwest are further enhanced by
reduced bottom frictional resistance, also noted by ARCADIS (2011).
Summary of Hurricane Ike Peak Surge for Present and Future Sea Levels
Approximate peak storm surge values at a number of key locations, in feet
relative to NAVD88, are given in Table 11-1, for the Hurricane Ike
simulations. Values are given for both sea level scenarios, and for both no-
dike and with-dike conditions. Surge values are estimated from the
figures, to the nearest half foot.
Table 11-1. Peak storm surge values for Hurricane Ike (feet, NAVD88), for present-day and SLR1 (+2.4 ft) sea level scenarios
Location No–dike
conditions With-dike conditions
Present SLR1 Present SLR1
City of Galveston (Gulf side) 13 15 14 16
City of Galveston (bay side) 13 15 4.5 7
Galveston Island (mid-way) 10.5 13 4 6.5
Bolivar Peninsula (mid-way) 14 17.5 2 5.5
Texas City (south) 12 14 4 6.5
Texas City (east) 12 14.5 4 6.5
Dickinson Bay entrance 11.5 14 3.5 6
Clear Lake entrance 11.5 14.5 2.5 5
Morgan’s Point 13 16 2 5
Upper Houston Ship Channel 13.5 16.5 2.5 5
Hurricane Ike was a major hurricane for the Houston-Galveston region.
In terms of storm surge generation, it was the worst storm in the region
since the devastating 1900 Hurricane, a period of 108 years. The Ike Dike
coastal spine concept provides considerable flood risk reduction
Jackson State University 239
throughout the region, for both present-day and the future sea level rise
scenario. Considering those locations in Table 11-2 that are inland of the
dike, the average surge suppression for the present-day sea level is 9 ft
(average peak surge of 12 ft without the dike; 3 ft with the dike), and for
the future sea level the average surge suppression is 9 ft (average peak
surge of 15 ft without the dike; 6 ft with the dike). These are substantial
reductions. Even with the 2.4-ft sea level rise which will, in general,
increase the risk of flooding, the presence of the dike greatly reduces
coastal flooding for a storm of this magnitude to relatively low levels. A
significant attribute of the coastal spine concept is that it provides surge
suppression and flood risk reduction benefits for the entire region that is
lies behind it.
Storm 535 (10-yr Proxy Storm) Peak Surge for Present and Future Sea Levels
The No-dike condition
The group of four figures for Storm 535, for no-dike conditions, is shown
in Figures 11-12 through 11-15. Figures 11-12 and 11-13 show the maximum
water surface elevation fields for the two sea level scenarios, and Figure 11-
14 shows the difference between the two. Figure 11-15 shows the peak
surge amplification factor field for this case, which facilitates examination
of any nonlinear surge response to rising sea level.
Figure 11-15 shows a light blue-shaded region offshore, which is
characterized by peak surge amplification factors that are less than 1.0,
similar to that seen for Hurricane Ike. Compared to Ike, the center of the
light blue region is displaced to the southwest. In terms of its alongshore
extent, the most pronounced blue region is centered near Bolivar Roads.
This location corresponds to the zone of maximum surge, as seen in
Figures 11-12 and 11-13. Storm 535, and the other proxy storms, make
landfall approximately at the south end of Galveston Island, near San Luis
Pass, which places the zone of maximum winds approximately at Bolivar
Roads. The zone of maximum surge occurs where the zone of maximum
winds occurs. Both the presence of the light blue region, with
amplification factors between 0.85 and 0.95, and its location, which is well
correlated with the position of the zone of maximum winds, reinforce the
thought that this feature is attributed to the reduction in the effective wind
stress associated with elevated mean sea level. The expanse of the light
blue region is smaller for this storm than it was for Hurricane Ike.

Jackson State University 240
Figure 11-12. No-dike conditions. Storm 535 (10-yr proxy). Maximum water surface
elevation field (in feet, NAVD88) for the present-day sea level scenario (+0.91 ft NAVD88)
Figure 11-13. No-dike conditions. Storm 535 (10-yr proxy). Maximum water surface
elevation field (in feet, NAVD88) for the future sea level scenario (SLR1, +3.31 ft NAVD88)

Jackson State University 241
Figure 11-14. No-dike conditions. Storm 535 (10-yr proxy). Change in maximum water
surface elevation (wse) fields. Maximum wse for the SLR1 future sea level scenario minus
the maximum wse for the present-day sea level scenario.
Figure 11-15. No-dike conditions. Storm 535 (10-yr proxy). Peak surge amplification factor.
This is attributed to the lower wind speeds for this storm, which produce
smaller water surface elevation gradients and lower peak surges.
The areas where amplification factors are much greater than 1.0, the
darker yellow and orange shaded regions, are primarily confined to the
inundated wetland areas north and northeast of Bolivar Peninsula,
including the easternmost parts of Galveston Bay. The peak surges at the

Jackson State University 242
coast for this storm are significantly less than those for Hurricane Ike, so
there is much less water flow over the barrier islands. The effect of
reduced bottom friction on these flows is also less significant, in terms of
enhancing water movement over the islands and into Galveston Bay.
Wind speeds are less for this storm, as well, compared to Ike, which
creates a slower northeast-to-southwest movement of water through the
inundated wetlands. Reduced speeds of alongshore moving water
diminishes the enhancement of flow arising from a reduced effective
bottom shear stress. These factors appear to result in less water moving
into Galveston Bay from the northeast through the inundated wetlands.
Along the western shoreline of Galveston Bay, from the City of Galveston
extending all the way to the north along the bay shoreline and into the
upper reaches of the Houston Ship Channel, amplification factors are less
than or equal to 1.0 (light blue areas). Factors are significantly less than
1.0 in a number of areas, shown in darker blue. For this storm track,
which all the proxy storms follow, winds will be blowing from northeast to
southwest as the hurricane approaches landfall, acting to set down the
water surface on the eastern side of Galveston Bay and setting up the water
surface on the western side of the bay. After landfall, winds will begin to
shift and blow toward the north, driving surge into the upper reaches of
the ship channel and the northern part of the bay. Amplification factors
less than 1.0 along the western bay shoreline and in the northern
periphery of the bay and ship channel reflect the reduction in effective
wind stress arising from greater water depths in the bay, which are
associated with the sea level increase. As discussed previously, the
reduced effective wind stress is expected to be greater in the shallow bays
than along the open coast. The prevalence of this amplification factor
pattern attributed to reduced effective wind stress is not masked by the
movement of water into the bay from the northeast and over the barrier
islands, as it appeared to be for Hurricane Ike.
The With-dike condition
The group of four figures for with-dike conditions, for Storm 535, are
shown in Figures 11-16 through 11-19. Figures 11-16 and 11-17 show the
maximum water surface elevation fields for the two sea level scenarios,
and Figure 11-18 shows the difference between the two. Figure 11-19
shows the amplification factor field for this case.
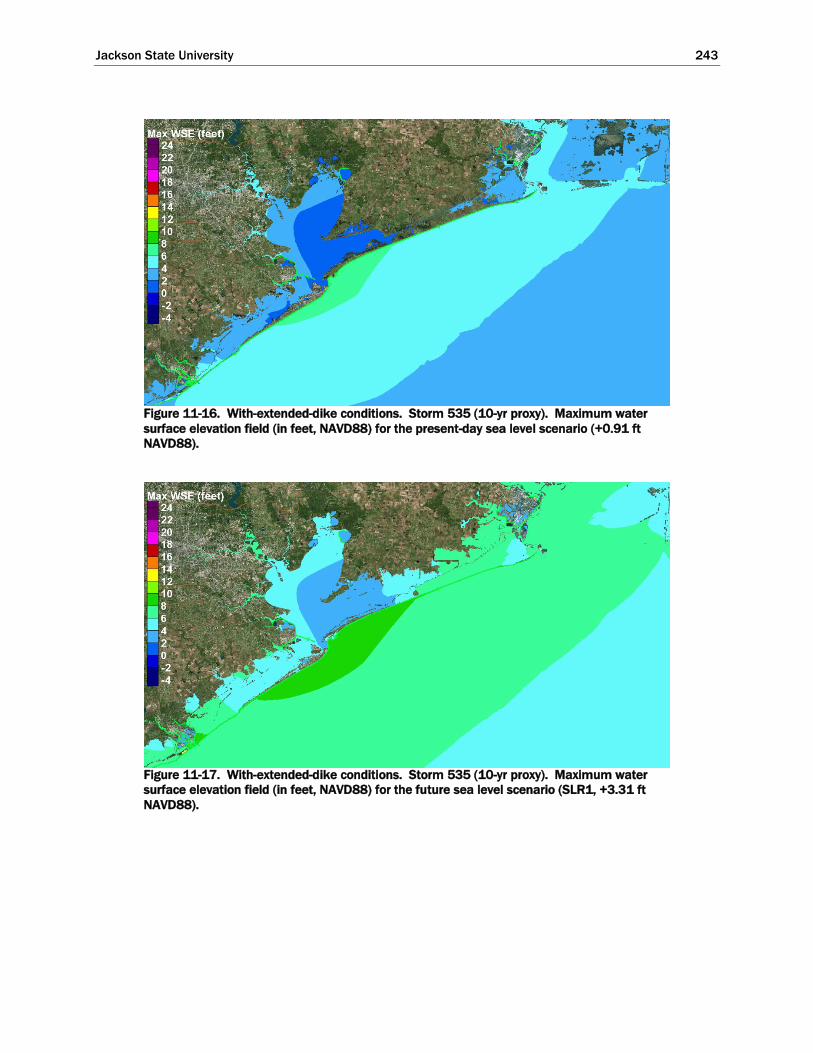
Jackson State University 243
Figure 11-16. With-extended-dike conditions. Storm 535 (10-yr proxy). Maximum water
surface elevation field (in feet, NAVD88) for the present-day sea level scenario (+0.91 ft
NAVD88).
Figure 11-17. With-extended-dike conditions. Storm 535 (10-yr proxy). Maximum water
surface elevation field (in feet, NAVD88) for the future sea level scenario (SLR1, +3.31 ft
NAVD88).
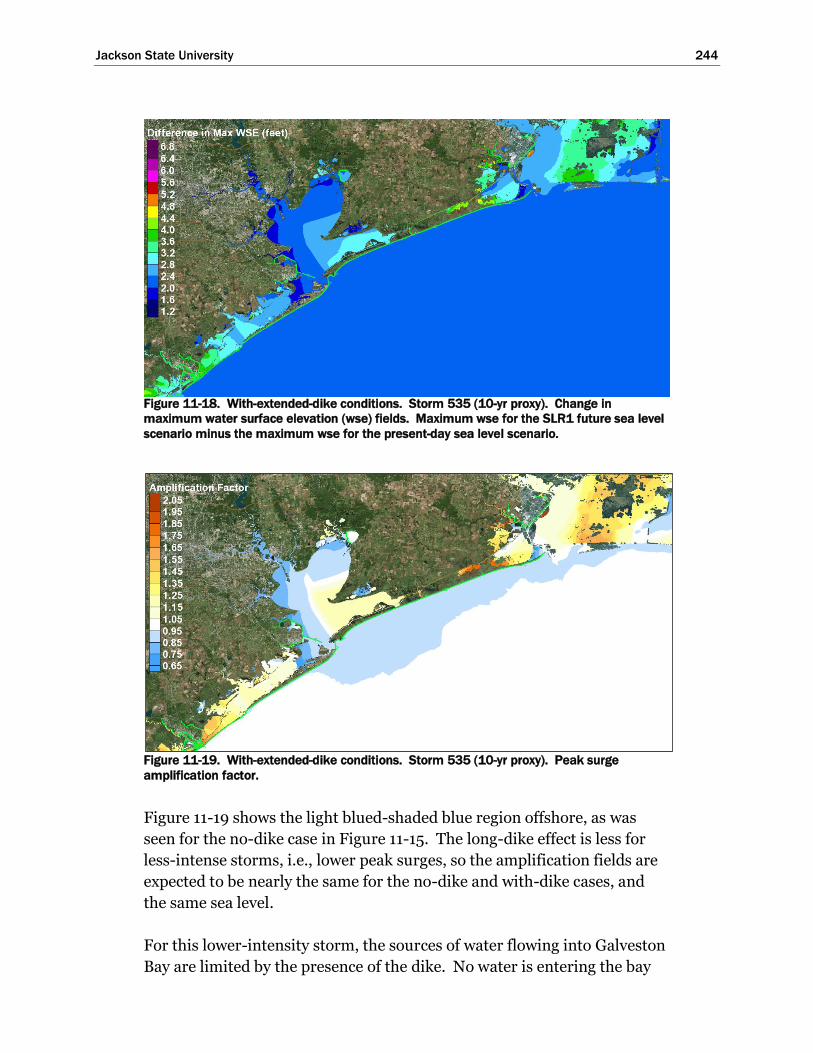
Jackson State University 244
Figure 11-18. With-extended-dike conditions. Storm 535 (10-yr proxy). Change in
maximum water surface elevation (wse) fields. Maximum wse for the SLR1 future sea level
scenario minus the maximum wse for the present-day sea level scenario.
Figure 11-19. With-extended-dike conditions. Storm 535 (10-yr proxy). Peak surge
amplification factor.
Figure 11-19 shows the light blued-shaded blue region offshore, as was
seen for the no-dike case in Figure 11-15. The long-dike effect is less for
less-intense storms, i.e., lower peak surges, so the amplification fields are
expected to be nearly the same for the no-dike and with-dike cases, and
the same sea level.
For this lower-intensity storm, the sources of water flowing into Galveston
Bay are limited by the presence of the dike. No water is entering the bay

Jackson State University 245
system by flowing over the coastal dike, for either the present-day sea level
scenario or the future sea level scenario. The only water being introduced
into Galveston Bay for the present-day sea level is through the intercostal
waterway, driven by the elevated storm surge that exists at the
northeastern end of the unterminated coastal dike. There is no large
expanse of inundated wetlands behind the dike as there was for Hurricane
Ike (see Figure 11-16).
However, for the future sea level scenario (Figure 11-17), there is much
more flanking taking place around the northeast end of the dike, and
subsequently more movement of water toward the southwest on the inland
side of the dike. More water is entering Galveston Bay for the future sea
level scenario, compared to the present-day sea level scenario.
Peak surge amplification factors in West Bay are generally greater than
1.0; and, they are much greater than 1.0 in the western end of West Bay.
Since there is no flow over the dike, this highly nonlinear surge response at
the west end is attributed to water moving through the inundated wetlands
behind the dike, due to flanking of its northeast and flow through the
Inter-coastal Waterway. For the future sea level scenario, the reduced
effective bottom shear stress enhances water movement to the southwest,
and it leads to much greater accumulation of that water in the west end of
West Bay, compared to the present-day sea level scenario. This area is the
farthest downwind area in the combined Galveston-West Bay system for
the prevailing wind direction that exists prior to landfall; i.e., winds from
the northeast. Water introduced into Galveston Bay tends to move in that
direction under the influence of the prevailing winds. However, note that
an effective dike termination scheme on its northeast end, tying the dike
into a higher ground elevation, would effectively eliminate these flanking
flows.
In Galveston Bay the pattern of the amplification factors clearly shows the
signature of reduced effective surface wind stress, first apparent on the
western side of the bay, which is the downwind side for the prevailing
wind direction prior to landfall. The signature also is apparent in the
northern parts of the bay, which is the downwind side for the prevailing
winds after landfall.
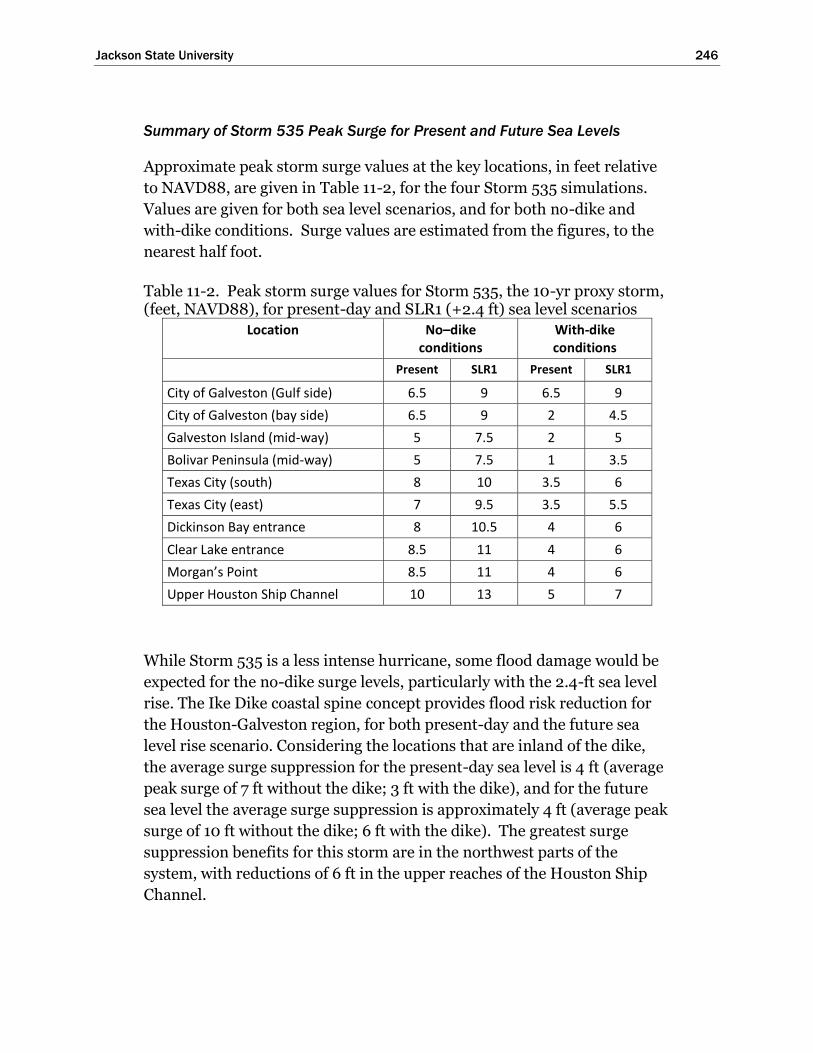
Jackson State University 246
Summary of Storm 535 Peak Surge for Present and Future Sea Levels
Approximate peak storm surge values at the key locations, in feet relative
to NAVD88, are given in Table 11-2, for the four Storm 535 simulations.
Values are given for both sea level scenarios, and for both no-dike and
with-dike conditions. Surge values are estimated from the figures, to the
nearest half foot.
Table 11-2. Peak storm surge values for Storm 535, the 10-yr proxy storm, (feet, NAVD88), for present-day and SLR1 (+2.4 ft) sea level scenarios
Location No–dike conditions
With-dike conditions
Present SLR1 Present SLR1
City of Galveston (Gulf side) 6.5 9 6.5 9
City of Galveston (bay side) 6.5 9 2 4.5
Galveston Island (mid-way) 5 7.5 2 5
Bolivar Peninsula (mid-way) 5 7.5 1 3.5
Texas City (south) 8 10 3.5 6
Texas City (east) 7 9.5 3.5 5.5
Dickinson Bay entrance 8 10.5 4 6
Clear Lake entrance 8.5 11 4 6
Morgan’s Point 8.5 11 4 6
Upper Houston Ship Channel 10 13 5 7
While Storm 535 is a less intense hurricane, some flood damage would be
expected for the no-dike surge levels, particularly with the 2.4-ft sea level
rise. The Ike Dike coastal spine concept provides flood risk reduction for
the Houston-Galveston region, for both present-day and the future sea
level rise scenario. Considering the locations that are inland of the dike,
the average surge suppression for the present-day sea level is 4 ft (average
peak surge of 7 ft without the dike; 3 ft with the dike), and for the future
sea level the average surge suppression is approximately 4 ft (average peak
surge of 10 ft without the dike; 6 ft with the dike). The greatest surge
suppression benefits for this storm are in the northwest parts of the
system, with reductions of 6 ft in the upper reaches of the Houston Ship
Channel.

Jackson State University 247
Storm 033 (100-yr Proxy Storm) Peak Surge for Present and Future Sea
Levels
The No-dike condition
The group of four figures for Storm 033, the 100-yr proxy storm, no-dike
conditions, is shown in Figures 11-20 through 11-23. Figures 11-20 and 11-
21 show the maximum water surface elevation fields for the two sea level
scenarios, and Figure 11-22 shows the difference between the two. Figure
11-23 shows the amplification factor field.
The amplification factor field for Storm 033 is quite similar to that for
Hurricane Ike (compare Figures 11-23 and 11-7). In the open Gulf, much
of the shaded are is light blue, which is caused by the reduction in effective
wind stress resulting in a slightly less open coast storm surge. For the
region that is located landward of the coastline and barrier islands,
encompassing the interior bays and inundated wetlands, much of this area
is colored in some shade of yellow or orange, i.e., amplification factors are
greater than 1.05. Amplification factors along the western shoreline of
Galveston Bay, from the City of Galveston to the upper reaches of the
Houston Ship Channel range from 1.05 to 1.45. There are a few areas
northeast of Galveston Bay and in Trinity Bay where amplifications factors
are approaching 2.0 (darker orange) or are greater than 2.0 (red), as was
the case for Hurricane Ike (see Figure 11-7). These occur in the same
places, and are strikingly similar to, areas having high amplification
factors for Ike.
The close match in peak surge amplification factors between Storm 033
and Hurricane Ike suggests that the same processes are at work, in a
similar manner, for both hurricanes. The large area having amplification
factors greater than 1.05 indicates that the elevated sea level is causing
more water to enter the interior bay systems and the interior wetlands,
than occurs for the present day sea level. The increase in water in inland
areas is attributed to the following processes: 1) earlier onset of flow over
the barrier islands, enhanced by the reduction in effective bottom shear
stress associated with deeper water; and 2) north-east to southwest
movement of water in the inundated wetlands, which is also enhanced by
the reduction in effective bottom shear stress associated with greater
depths of inundation. The northeast-southwest movement of water arises
due to the prevailing winds from the northeast that are characteristic of
the counterclockwise rotating wind fields around the hurricane’s eye, prior

Jackson State University 248
to landfall. The maximum storm surge values along the coastline for
Storm 033, 16 to 17 ft, are similar to those computed for Hurricane Ike,
which lends some support to the similarity in surge amplification patterns.
Figure 11-20. No-dike conditions. Storm 033 (100-yr proxy). Maximum water surface
elevation field (in feet, NAVD88) for the present-day sea level scenario (+0.91 ft NAVD88)
Figure 11-21. No-dike conditions. Storm 033 (100-yr proxy). Maximum water surface
elevation field (in feet, NAVD88) for the future sea level scenario (SLR1, +3.31 ft NAVD88)

Jackson State University 249
Figure 11-22. No-dike conditions. Storm 033 (100-yr proxy). Change in maximum water
surface elevation (wse) fields. Maximum wse for the SLR1 future sea level scenario minus
the maximum wse for the present-day sea level scenario.
Figure 11-23. No-dike conditions. Storm 033 (100-yr proxy). Peak surge amplification
factor.
The With-dike condition
The group of four figures for Storm 033, for with-dike conditions, is shown
in Figures 11-24 through 11-27. Figures 11-24 and 11-25 show the
maximum water surface elevation fields for the two sea level scenarios,
and Figure 11-26 shows the difference between the two. Figure 11-27
shows the amplification factor field for this case.

Jackson State University 250
Figure 11-24. With-extended-dike conditions. Storm 033 (100-yr proxy). Maximum water
surface elevation field (in feet, NAVD88) for the present-day sea level scenario (+0.91 ft
NAVD88).
Figure 11-25. With-extended-dike conditions. Storm 033 (100-yr proxy). Maximum water
surface elevation field (in feet, NAVD88) for the future sea level scenario (SLR1, +3.31 ft
NAVD88).

Jackson State University 251
Figure 11-26. With-extended-dike conditions. Storm 033 (100-yr proxy). Change in
maximum water surface elevation (wse) fields. Maximum wse for the SLR1 future sea level
scenario minus the maximum wse for the present-day sea level scenario.
Figure 11-27. With-extended-dike conditions. Storm 033 (100-yr proxy). Peak surge
amplification factor.
With the dike in place, in the open Gulf, the surge amplification factor field
for Storm 033 is similar to Hurricane Ike (compare Figures 11-27 and 11-
11). The shaded blue areas for Storm 033 are shifted to the southwest
compared to the shaded areas for Ike. The shift is due to the difference in
storm track for the two hurricanes. The track for Storm 033 is shifted 30
to 35 miles to the southwest compared to the track for Ike.
Jackson State University 252
Inside the dike, surge amplification in areas to the northeast of Galveston
Bay is similar to amplification for Hurricane Ike in the same areas.
Excluding the surge amplification within Galveston Bay, the area to the
northeast of Galveston Bay appears to have slightly higher surge
amplification for Storm 033, compared to Ike. However, including the
surge amplification within Galveston Bay, the amount of surge
enhancement is higher for Ike. A higher volume of water in this area for
Ike is attributed to higher surge at the northeast end of the dike, compared
to Storm 033, driving more flanking flow.
In West Bay, the surge amplification is slightly greater for Storm 033,
particularly at the westernmost end of the bay. This is attributed to the
slightly higher peak surge in the vicinity of Bolivar Roads for Storm 033
compared to the peak surge in this same area for Hurricane Ike, and
resulting higher volume of flow over the dike which occurs there for Storm
033. The amount of overflow at Bolivar Roads is much greater than any
amount that might be occurring for Hurricane Ike at this location. The
volume of water that flows over the dike in this area is pushed to the west
into West Bay by the prevailing winds prior to, and at, landfall. The water
ends up at the western end of the bay.
Within Galveston Bay, the amplification factor field for Storm 033 is
different from Hurricane Ike. The field for Storm 033 is more similar to
that for Storm 535. This is attributed the difference in track and wind
fields between Ike and the proxy storms. There is a difference in water
volume associated with flanking flow (greater for Ike). Eventually, that
water moves first to the southwest through the inundated interior area and
then to the north, ending up in the north part of Galveston Bay and Trinity
Bay after the storm moves through and winds are predominantly from the
southwest and south.
Amplification factors along the western shoreline of Galveston Bay show
the signature of a reduced effective shear stress, as was seen for Storm 535
(see Figure 11-19). In Galveston Bay, the presence of the dike greatly
reduces, and eliminates in most places, the nonlinear surge amplification
that occurs for the no-dike conditions in Galveston Bay, by eliminating
earlier flow over the barrier islands, and reducing the flow that moves s
flanking flow from the northeast into Galveston Bay through the
inundated wetlands. With the dike in place the peak surge amplification
field along the western shoreline of the Bay is dominated by the reduction

Jackson State University 253
in effective wind shear stress. This includes the bay side of the City of
Galveston, which experiences amplification factors 0f 0.65 to 0.95. Surge
amplification factors less than 1.0 along the western shoreline of Galveston
Bay for these “worse-case” track proxy storms is a nuanced benefit
associated with the coastal spine concept.
Risk-reduction schemes and measures taken solely inside the bay, without
the coastal spine, are subject to the nonlinear surge amplification
(amplification factors greater than 1.0) evident for Hurricane Ike and
Storm 033, no-dike conditions. These are associated with the earlier onset
of barrier island overflow, and flow to the southwest through the
inundated wetlands that are enhanced by the reduced effective bottom
shear stress.
Summary of Storm 033 Peak Surge for Present and Future Sea Levels
Approximate peak storm surge values at a number of key locations along
the western shoreline of Galveston Bay, along Galveston Island, and along
Bolivar Peninsula, are given in Table 11-3, in feet relative to NAVD88, for
the four Storm 033 simulations. Values are given for both sea level
scenarios, and for both no-dike and with-dike conditions. Surge values are
estimated from the figures above, to the nearest half foot.
Table 11-3. Peak storm surge values for Storm 033, the 100-yr proxy storm, (feet, NAVD88), for present-day and SLR1 (+2.4 ft) sea level scenarios
Location No–dike conditions
With-dike conditions
Present SLR1 Present SLR1
City of Galveston (Gulf side) 16 18 18 20
City of Galveston (bay side) 14 18 6.5 10
Galveston Island (mid-way) 13 15 4 7
Bolivar Peninsula (mid-way) 16 18.5 10 10
Texas City (south) 16.5 19 8 10.5
Texas City (east) 15 17.5 7 9.5
Dickinson Bay entrance 14.5 17.5 8 10
Clear Lake entrance 15 18.5 8 10
Morgan’s Point 17 20 7.5 10
Upper Houston Ship Channel 18.5 21.5 10 12.5
Jackson State University 254
In terms of storm intensity, Storm 033, the 100-yr proxy storm, is a major
hurricane for the Houston-Galveston region, which also follows a “worst-
case” track for generating storm surge along the western shoreline of
Galveston Bay. The central pressure of Storm 033 at landfall was 948 mb
(minimum pressure offshore of 930 mb), and the maximum wind speed at
landfall was 78 kt (100 kt offshore).
For the no-dike case, and present sea level, the average peak surge is 16 ft
for the region represented by the nine locations listed in Table 11-3 that
are inland of the dike. This reflects a very damaging storm surge having
an average value higher than peak surge conditions observed during
Hurricane Ike. For the no-dike case, future sea level scenario, the average
peak surge for the entire region is 18 ft. For the with-dike case, present sea
level, the average peak surge for the nine locations is 9 ft. For the with-
dike case and future sea level, the average peak surge is 10 ft.
Calculating surge suppression as the difference between the averages of
peak surge for no-dike and with-dike conditions, the surge suppression for
the present-day sea level is 7 ft; and for the future sea level, it is 8 ft. These
are substantial reductions in peak surge achieved by the coastal spine
concept. Even with the 2.4-ft sea level rise, which will in general increase
the risk of flooding, the presence of the dike greatly reduces coastal
flooding for a severe storm of this intensity and track. As was the case for
Storm 535, on the same worst-case track, the greatest surge suppression
occurs in the northern parts of the bay, into the upper reaches of the
Houston Ship Channel.
For a storm of this intensity and track, there are areas that remain exposed
to flood damage. For the present-day sea level, the City of Galveston
seawall would be significantly overtopped, with steady overflow. For this
reason, raising of the seawall should be considered as part of the Ike Dike
coastal spine concept. To prevent steady overflow for Storm 033, the
seawall would have to be raised to accomodate a peak surge level of about
20 ft, NAVD88, with additional elevation of several more feet that would
be required to reduce wave-induced overtopping to acceptable levels.
The City of Galveston also can be subjected to flooding from the bay side.
Because of its location at the southwest corner of Galveston Bay, and in
light of prevailing surge dynamics that occur within the bay for severe
hurricanes approaching on a track similar to the Storm 033 path,

Jackson State University 255
significant bay-side flooding would be expected, even if the seawall is
raised. As a secondary line of defense for the city, construction of flood
risk reduction measures along the bay side should be considered,
effectively ringing the city. Assuming the seawall is raised to effectively
reduce Gulf-side overtopping to acceptable values, to greatly reduce the
risk of flooding from the bay side for this particular storm, the elevation of
bay-side risk reduction measures would need to be approximately 12 ft,
perhaps plus a few additional feet to reduce the wave-induced overtopping
to acceptable amounts and to accommodate a future sea level increase.
With the coastal spine in place, with a crest elevation of 17 ft, and for the
present sea level scenario, peak surge levels for Storm 033 were much less
than levels experienced during Hurricane Ike, in all areas along the
western shoreline of Galveston Bay. With the dike in place, for the future
sea level, peak surge levels along the western Galveston Bay shoreline were
still less than the hurricane surge experienced during Hurricane Ike, for
most locations, perhaps with a few local exceptions.
Secondary lines of defense should be considered for other areas along the
western shoreline of the Bay, to further reduce the risk of flooding to
acceptable levels. The cost-effectiveness of all secondary lines of defense
would need to be examined further. Locations and alignments of possible
secondary lines of defense are examined further in the next chapter.
Storm 036 (500-yr Proxy Storm): With and Without Sea Level Rise
The No-dike condition
The group of four figures for Storm 036, the 500-yr proxy storm, no-dike
conditions, is shown in Figures 11-28 through 11-31. Figures 11-28 and 11-
29 show the maximum water surface elevation fields for the two sea level
scenarios, and Figure 11-30 shows the difference between the two. Figure
11-31 shows the amplification factor field.
The amplification factor field for Storm 036 (the 500-yr proxy), which
compares peak surge values for the two sea level scenarios, is quite similar
to that for Storm 033 (the 100-yr proxy). Compare Figures 11-31 and 11-
23. This suggests that similar processes are at work for the future sea
level, compared to present-day sea level, for both storms, and that the
spatial variability in those processes is similar for both storms.

Jackson State University 256
Figure 11-28. No-dike conditions. Storm 036 (500-yr proxy). Maximum water surface
elevation field (in feet, NAVD88) for the present-day sea level scenario (+0.91 ft NAVD88)
Figure 11-29. No-dike conditions. Storm 036 (500-yr proxy). Maximum water surface
elevation field (in feet, NAVD88) for the future sea level scenario (SLR1, +3.31 ft NAVD88)

Jackson State University 257
Figure 11-30. No-dike conditions. Storm 036 (500-yr proxy). Change in maximum water
surface elevation (wse) fields. Maximum wse for the SLR1 future sea level scenario minus
the maximum wse for the present-day sea level scenario.
Figure 11-31. No-dike conditions. Storm 036 (500-yr proxy). Peak surge amplification
factor.
Both storms follow the same track and they primarily differ in their
intensity. Storm 036 is the more intense storm.
There are some small differences in the peak surge amplification fields for
Storms 036 and 033. In the open Gulf, much of the shaded area is light
blue, as was the case for Storm 033. The area in light blue in Figure 11-31
for Storm 036 is slightly larger than the light blue area for Storm 033

Jackson State University 258
(Figure 11-23). For Storm 036 there is an area of darker blue along the
coastline that is not present for Storm 033. The differences in blue-shaded
areas for the two storms are attributed to higher wind speeds and greater
water surface elevation gradients for Storm 036, compared to Storm 033,
which lead to larger reductions in water surface gradient due to greater
water depths. The greater water depths are associated with the sea level
increase and the greater surge levels associated with Storm 036.
Much of the region located landward of the coastline and barrier islands,
encompassing the interior bays and inundated wetlands, is colored in
some shades of yellow or orange, as was the case for Storm 033. Yellow
and orange areas indicate regions where the peak surge amplification
factors exceed 1.05. The pattern of amplification factors in Galveston and
West Bays is quite similar for Storms 036 and 033. However, in general
peak surge amplification factors are slightly less in Galveston and West
Bays for Storm 036, compared to Storm 033. That was also the case for the
open Gulf areas. The overall decrease in amplification factors in these
inland areas also is attributed to greater surge amplitude and consequently
slightly greater water depths for Storm 036 which, in turn, leads to a
greater reduction in effective wind stress. The wind stress reduction
diminishes slightly the effect of an earlier onset of flow and increased
magnitude of flow over the barrier islands as well as water moving
alongshore in inundated areas, enhanced by reduced effective bottom
shear stress, that occur in the inland areas. The blue shaded regions in
West Bay north of Galveston Island also are an indication of the
importance of the role of reduced wind stress, associated with greater
water depth, in this part of the system.
The red-shaded area inside the Texas City levee system (see Figure 11-31)
is a result of the much greater inundation depth in this area for Storm 036,
for the future sea level scenario, compared the depth of inundation for the
present-day sea level scenario. For both the present-day and future sea
level scenarios, inundation inside the Texas City levee is substantial for
Storm 036.
The With-dike condition
The group of four figures for Storm 036, for with-dike conditions, is shown
in Figures 11-32 through 11-35. Figures 11-32 and 11-33 show the
maximum water surface elevation fields for the two sea level scenarios,
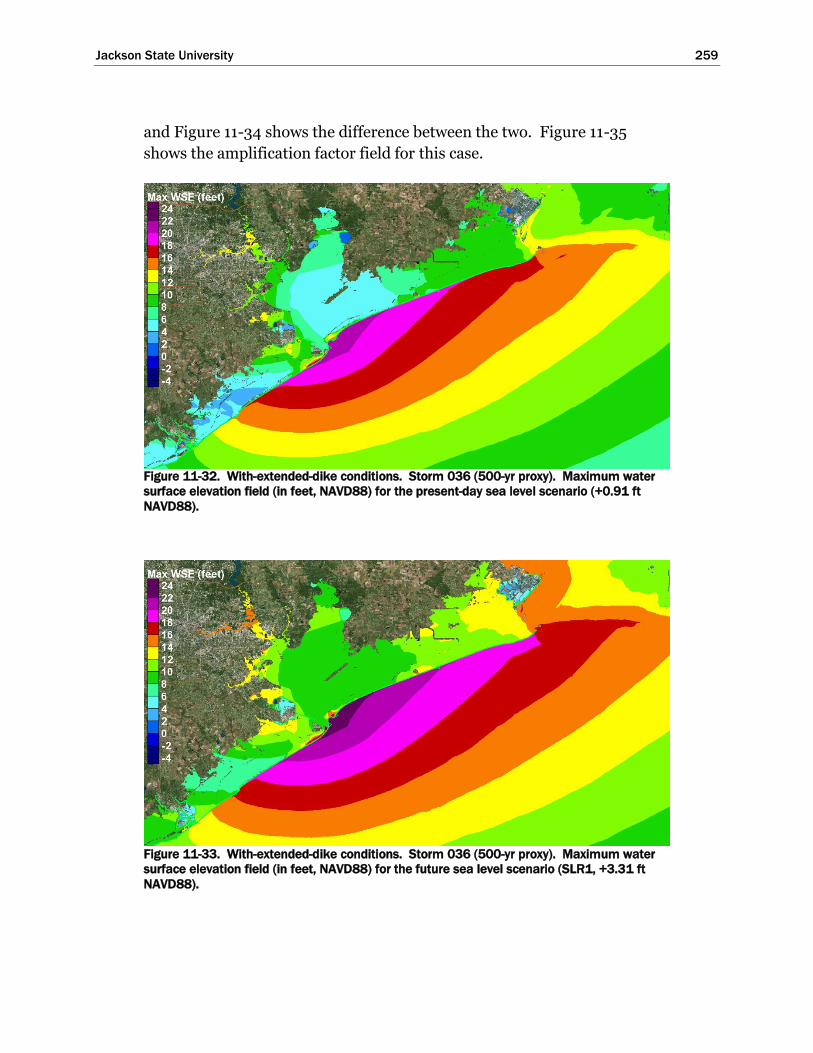
Jackson State University 259
and Figure 11-34 shows the difference between the two. Figure 11-35
shows the amplification factor field for this case.
Figure 11-32. With-extended-dike conditions. Storm 036 (500-yr proxy). Maximum water
surface elevation field (in feet, NAVD88) for the present-day sea level scenario (+0.91 ft
NAVD88).
Figure 11-33. With-extended-dike conditions. Storm 036 (500-yr proxy). Maximum water
surface elevation field (in feet, NAVD88) for the future sea level scenario (SLR1, +3.31 ft
NAVD88).
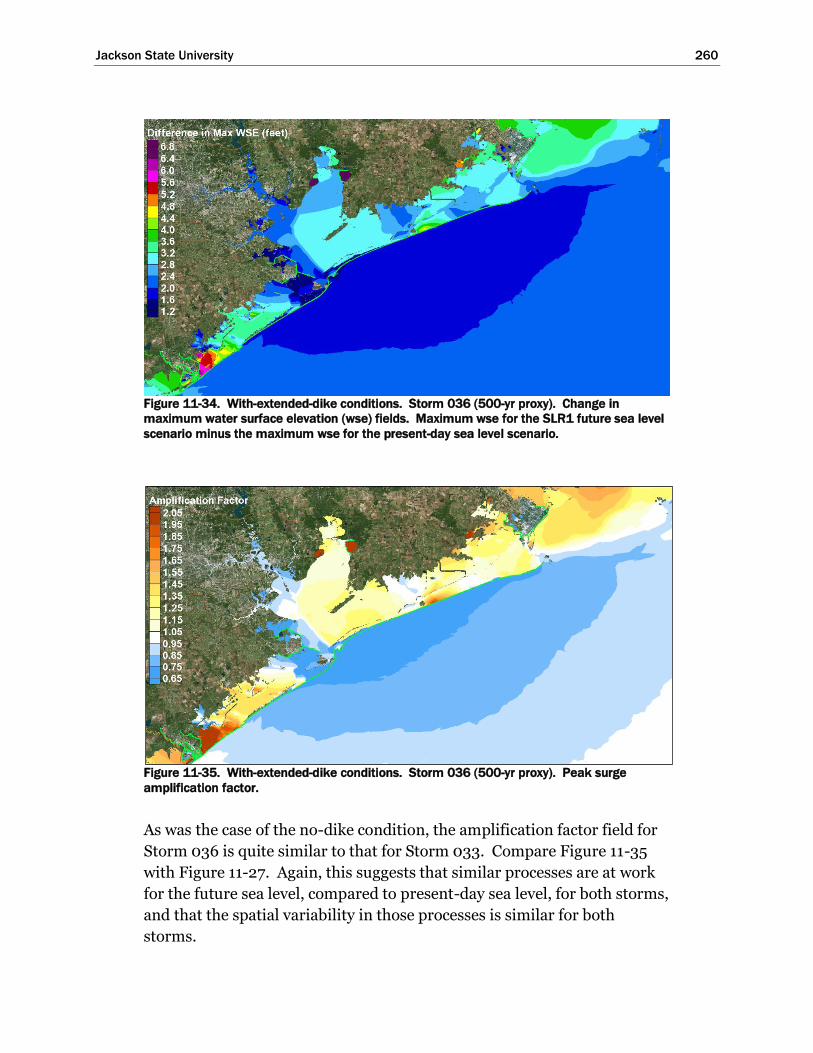
Jackson State University 260
Figure 11-34. With-extended-dike conditions. Storm 036 (500-yr proxy). Change in
maximum water surface elevation (wse) fields. Maximum wse for the SLR1 future sea level
scenario minus the maximum wse for the present-day sea level scenario.
Figure 11-35. With-extended-dike conditions. Storm 036 (500-yr proxy). Peak surge
amplification factor.
As was the case of the no-dike condition, the amplification factor field for
Storm 036 is quite similar to that for Storm 033. Compare Figure 11-35
with Figure 11-27. Again, this suggests that similar processes are at work
for the future sea level, compared to present-day sea level, for both storms,
and that the spatial variability in those processes is similar for both
storms.

Jackson State University 261
There are some small differences in the peak surge amplification fields for
Storms 036 and 033. In the open Gulf, the blue shaded area for Storm
036 is larger than the light blue area for Storm 033. For Storm 036 there
are larger and darker blue areas compared to those seen for Storm 033.
The differences in blue-shaded areas for the two storms are attributed to
higher wind speeds for Storm 036, compared to Storm 033, which lead to
larger open-Gulf water surface elevation gradients, which in turn lead to a
larger reduction in water surface gradient associated with greater water
depth due to sea level increase and the greater surge levels associated with
Storm 036. For Storm 036, as was the case for Storm 033, the blue shaded
areas are caused by the reduction in effective wind stress resulting
associated with greater water depths that arise because of greater storm
surge and increased sea level.
For the region that is located landward of coastal spine dike, including
interior bays and inundated wetlands, much of this area is colored in some
shades of yellow or orange, as was the case for Storm 033. The patterns of
amplification factors in Galveston and West Bays are quite similar for
Storms 036 and 033.
In general, peak surge amplification factors are slightly greater in eastern
Galveston Bay and in West Bay for Storm 036, compared to Storm 033.
This is attributed to the greater volume of water that flows over the dike at
peak surge levels for Storm 036. For both sea levels, more water flows
over the coastal spine for Storm 036, compared to Storm 033. The greater
sea level exacerbates flow over the dike, and the higher surge levels for
Storm 036 also exacerbate flow over the dike. The peak surge
amplification at the west end of West Bay is due to flow over the dike along
Galveston Island, and perhaps by flow over the dike along Bolivar
Peninsula, which is pushed to the west by prevailing winds. The increased
flow over the dike along Bolivar Peninsula might contribute to higher
amplification factors in eastern Galveston Bay, compared to Storm 033, or
it might be due to enhanced flanking flow for Storm 036 arising from the
higher surge levels at the northeastern terminus of the coastal spine. An
effectively terminated coastal spine on its northeast end (tied into higher
ground elevation) should significantly reduce the amount of flanking flow
that moves into Galveston Bay from the northeast.
Amplification factors along the western shoreline of Galveston Bay show
the signature of a reduced effective wind shear stress, as was seen for the
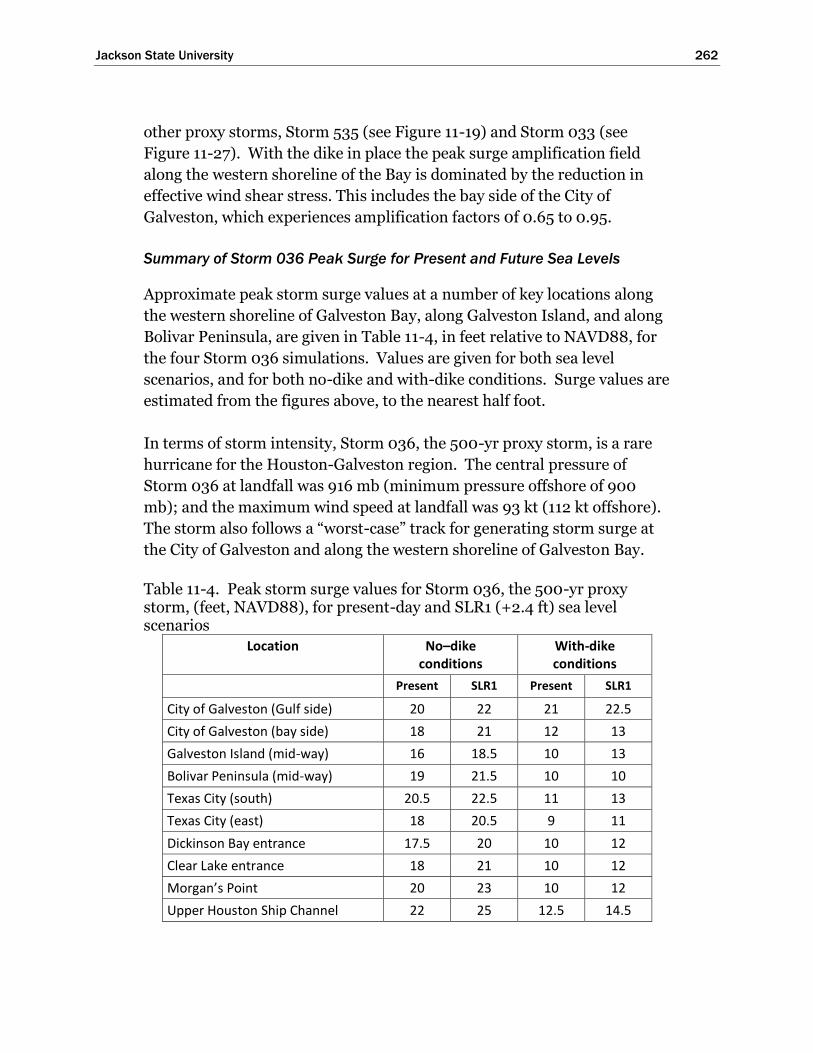
Jackson State University 262
other proxy storms, Storm 535 (see Figure 11-19) and Storm 033 (see
Figure 11-27). With the dike in place the peak surge amplification field
along the western shoreline of the Bay is dominated by the reduction in
effective wind shear stress. This includes the bay side of the City of
Galveston, which experiences amplification factors 0f 0.65 to 0.95.
Summary of Storm 036 Peak Surge for Present and Future Sea Levels
Approximate peak storm surge values at a number of key locations along
the western shoreline of Galveston Bay, along Galveston Island, and along
Bolivar Peninsula, are given in Table 11-4, in feet relative to NAVD88, for
the four Storm 036 simulations. Values are given for both sea level
scenarios, and for both no-dike and with-dike conditions. Surge values are
estimated from the figures above, to the nearest half foot.
In terms of storm intensity, Storm 036, the 500-yr proxy storm, is a rare
hurricane for the Houston-Galveston region. The central pressure of
Storm 036 at landfall was 916 mb (minimum pressure offshore of 900
mb); and the maximum wind speed at landfall was 93 kt (112 kt offshore).
The storm also follows a “worst-case” track for generating storm surge at
the City of Galveston and along the western shoreline of Galveston Bay.
Table 11-4. Peak storm surge values for Storm 036, the 500-yr proxy storm, (feet, NAVD88), for present-day and SLR1 (+2.4 ft) sea level scenarios
Location No–dike conditions
With-dike conditions
Present SLR1 Present SLR1
City of Galveston (Gulf side) 20 22 21 22.5
City of Galveston (bay side) 18 21 12 13
Galveston Island (mid-way) 16 18.5 10 13
Bolivar Peninsula (mid-way) 19 21.5 10 10
Texas City (south) 20.5 22.5 11 13
Texas City (east) 18 20.5 9 11
Dickinson Bay entrance 17.5 20 10 12
Clear Lake entrance 18 21 10 12
Morgan’s Point 20 23 10 12
Upper Houston Ship Channel 22 25 12.5 14.5

Jackson State University 263
For the no-dike case, and for the present-day sea level, the average peak
surge is 19 ft for the region represented by the nine locations listed in
Table 11-4 that are inland of the dike. This large average surge amplitude
reflects a devastating hurricane for the entire Houston-Galveston region,
where peak surges are approximately 5 to 8 ft higher than peak surges
experienced during Hurricane Ike. For the no-dike case, future sea level
scenario, the average peak surge for the entire region is 21 ft. For this sea
level scenario, peak surges would be 7.5 to 10.5 ft higher than those
experienced during Hurricane Ike.
For the with-dike case, and for present sea level, the average peak surge
for the nine locations is 11 ft. This value is approximately a foot less than
the values experienced during Hurricane Ike in Galveston Bay for the same
areas. For the with-dike case and future sea level, the average peak surge
is 12 ft, which is similar to, or slightly greater than, average peak surges
experienced within the Bay during Hurricane Ike. This is a useful
benchmark for the value of the coastal spine.
Calculating surge suppression as the difference between the averages of
peak surge for no-dike and with-dike conditions, the average surge
suppression value for the present-day sea level is 8 ft; and for the future
sea level, it is 9 ft. These are substantial reductions in peak surge achieved
by the coastal spine concept. As was the case for the other proxy storms,
the greatest surge suppression occurs in the northern parts of the bay, into
the upper reaches of the Houston Ship Channel, where suppression values
range from 9 to 10 ft for both sea level scenarios.
For a storm of this intensity and track, even with the 17-ft coastal spine
dike in place, Galveston Island and Bolivar Peninsula will experience
substantial flooding and damage. For a surge level of 20 ft (present-day
sea level) or 22 ft (the future sea level scenario) the City of Galveston
seawall would be significantly overtopped, with steady overflow of several
feet over the seawall, flooding the city. For present-day sea level, along the
eastern half of Galveston Island, steady flow over the Dike would be
experienced, as it would be for the entirety of Bolivar Peninsula. For the
future sea level scenario, there would be steady flow over most or all of
Galveston Island, in addition to all of Bolivar Peninsula. A higher coastal
dike should be considered if risk reduction is desired along Galveston
Island and Bolivar Peninsula, for a storm of this magnitude. Other
measures also should be considered, including raising of the Galveston

Jackson State University 264
seawall and construction of a ring dike/wall system around the entire City
of Galveston to provide adequate reduction of risk for flooding from the
bay-side.
The 17-ft coastal spine provides much greater risk reduction for the rest of
the western shoreline of Galveston Bay, although some areas would still
experience flooding and damage. With the 17-ft coastal spine in place, and
for the present-day sea level, peak surge levels for Storm 036 were
approximately a foot less than levels experienced during Hurricane Ike, all
along the western shoreline of Galveston Bay and into the upper reaches of
the Houston Ship Channel. For the future sea level, with the dike in place,
peak surge levels along the western Galveston Bay shoreline and upper
reaches of the Houston Ship Channel were comparable to peak surge levels
experienced with the dike. Additional risk reduction measures; i.e.,
secondary lines of defense, should be considered for areas on the western
side of Galveston Bay, and in the upper reaches of the Houston Ship
Channel that were severely impacted by Hurricane Ike. For this storm,
and for present sea level, the coastal spine limits peak surges to levels than
would not result in steady flow over the levee surrounding Texas City. For
the future sea level, limited flow over the Texas City levee appears to occur
in some areas. For added risk reduction for a storm of this magnitude,
raising of the levee surrounding Texas City, in some local areas, should be
considered.
To achieve additional flood risk reduction for a storm of this magnitude,
the aforementioned secondary lines of defense should be considered to
further reduce the risk of flooding to acceptable levels. Locations and
alignments of possible secondary lines of defense are examined further in
the next chapter.
Jackson State University 265
12 Exposure to Inundation,
Residual Flood Risk, and
Implications for Secondary
Lines of Defense
Introduction
Comparisons of the no-dike and with-dike simulations of Hurricane Ike,
and the 100-yr and 500-yr proxy storms, all showed substantial surge
suppression benefits associated with the Ike Dike concept. The primary
function of the dike is preventing a massive amount of water from entering
Galveston Bay over the inundated barrier islands. Averaged along the
western shoreline of Galveston Bay, reductions in peak surge range from 7
to 9 ft for these three severe hurricanes, depending on the locations
included in the averaging. Slightly greater-than-average surge
suppression is achieved in the upper reaches of the Houston Ship Channel.
However, even with the Ike Dike in place, winds during very severe
hurricanes can produce a significant storm surge internally, within the
bay, along its western shoreline. With the 17-ft Ike Dike in place, and for
the present-day and future sea level scenarios, peak surge values along the
western shoreline of Galveston Bay ranged from 2 to 7 ft (Hurricane Ike),
8 to 13 ft (100-yr proxy storm) and 10 to 15 ft (500-yr proxy storm). Peak
surges of this magnitude can inundate the lower-lying areas within
Galveston and West Bays, resulting in some level of residual flood risk.
Flow over the Ike Dike, which occurs for the 100-yr and 500-yr proxy
storms, also can lead to inundation of the areas that lie directly behind the
dike, as the overtopping water flows downslope. The amount of residual
risk varies with location.
The 100-yr and 500-yr proxy storms, and Hurricane Ike, were considered
in an assessment of residual risk and of possible measures, secondary lines
of defense, which can be taken to further reduce flood risk. All three of
these hurricanes represent severe hurricanes that produce significant
storm surge inside Galveston Bay.

Jackson State University 266
To place residual risk information that is discussed below in a probabilistic
context, the encounter probability for a 100-yr water level is
approximately 25% over the next 30 years. This means that there is a 25%
chance that the 100-yr water level (or something greater) will be
encountered during the next 30 years. The encounter probability for a
100-yr water level sometime during the next 50 years is approximately
40%. For the 500-yr water level, the encounter probability is
approximately 6% over the next 30 years and approximately 10% over the
next 50 years.
Possible additional risk-reduction measures which can be implemented,
supplementing the Ike Dike, are discussed in this chapter. Secondary lines
are proposed in light of several persistent features of the storm surge
dynamics that have been observed within the Galveston Bay system.
Possible measures include: 1) raising the Galveston seawall in light of past
and future relative sea level increases and of slightly increased surge levels
at Galveston as a result of the long-dike effect associated with the Ike Dike,
with possible lateral extensions to prevent flanking of the seawall if
adjacent areas of the Ike Dike are lower, 2) measures taken on the bay side
of Galveston to reduce the risk of flooding from the bay side, 3) use of ring
dikes/levees/walls, or elevated roadways or walkways, and 4) elevating the
first floor of individual structures. It is unclear how extensively the
National Flood Insurance Program maps of flood risk will lead to raising of
the first floor elevation of structures throughout the region. This measure
seems to be the most suitable and feasible for a number of the lowest-lying
areas, in order to reduce residual risk.
One other risk reduction measure that has been proposed is a surge
barrier/gate system, the “Centennial Gate”, located in the northwest
corner of Galveston Bay, leading to the upper reaches of the Houston Ship
Channel. With the 17-ft Ike Dike in place, if the future mean sea level
exceeds the +2.4 ft considered here as the future scenario, and if there is
significant hurricane surge forerunner penetration into Galveston Bay
before the Bolivar Roads surge barrier gate is closed, peak surge levels in
the Upper Ship Channel for the 500-yr proxy storm could exceed those
experienced during Hurricane Ike by several feet or more. Under these
conditions, if the flood risk for many of the industrial areas that lie along
the upper ship channel is unacceptable, a “Centennial Gate” gate could be
considered as a secondary line of defense.
Jackson State University 267
To facilitate examination of flood risk, residual risk, and possible
secondary lines of defense, a set of inundation maps was generated for a
number of sub-regions in the Houston-Galveston area that have the
greatest potential for flood damages/losses. The sub-regions are located
on Galveston Island, Bolivar Peninsula, and along the Galveston Bay
shoreline. The examination is documented below, by geographic location;
first for three sub-regions comprising both Galveston Island and Bolivar
Peninsula, then for three sub-regions encompassing the western shoreline
of Galveston Bay, and finally for two regions encompassing the upper
reaches of the Houston Ship Channel.
Inundation maps were generated using the peak storm surge fields (model
output) and the topographic elevation field used as input to the storm
surge model. Maps were generated for the three most severe hurricanes;
Hurricane Ike and the 100-yr and 500-yr proxy storms, for both present-
day and future sea level scenarios, and for both no-dike and with-dike
conditions. Maps were not generated for the 10-yr proxy storm
simulations. The Ike Dike is very effective in reducing inundation to
negligible levels throughout the Houston-Galveston region for less intense
hurricanes like the 10-yr proxy storm. The full set of maps is provided in
Appendix A. Selected maps from the appendix are presented in the
sections below to facilitate discussion. Inundation for each of the three
storms, in each of the following geographic sub-regions, and proposed
secondary lines of defense, is discussed below in individual sections, in
this order:
Galveston Island
City of Galveston
Galveston Island (central portion)
Galveston Island (western end)
Bolivar Peninsula
Bolivar Peninsula (western end)
Bolivar Peninsula (central portion)
Bolivar Peninsula (eastern end)
Galveston Bay
Texas City (south)/La Marque/Bayou Vista
San Leon/Texas City (north)/Bacliff/Dickinson

Jackson State University 268
Clear Lake area/Bayport area/La Porte
Houston Ship Channel
Upper Houston Ship Channel (eastern portion)
Upper Houston Ship Channel (western portion)
Figure 12-1 shows the locations of a number of places along the western
shoreline of Galveston Bay that are referenced in the discussion
throughout this chapter and in Chapter 14. The section in Chapter 14
titled “Surge and Inundation Suppression Achieved with the Ike Dike
Concept: Results from the Refined Modeling Approach and the Extended
Dike” contains a much shorter summary of the key points from this
chapter.
Figure 12-1. Location map for the western shoreline of Galveston Bay.

Jackson State University 269
Galveston Island
City of Galveston
At the Pleasure Pier on the gulf side of Galveston, the 100-yr and 500-yr
average recurrence interval (ARI) water levels are 13.5 ft and 17.0 ft
NAVD88, respectively (the 90% confidence limit values). These
probabilistic values were computed for existing conditions, i.e., present-
day sea level with no Ike Dike in place, using the methodology that was
described in Chapter 9.
Simulated peak surge levels at the Pleasure Pier for Hurricane Ike and the
100-yr and 500-yr proxy storms are approximately 13 ft, 16 ft and 20 ft,
respectively, for the same set of existing conditions. To place these storm
surge values in a probabilistic context, the Hurricane Ike simulation
resulted in peak surge levels that were most similar to the 100-yr water
levels at this same location. The computed peak surge of 13 ft for
Hurricane Ike is slightly less than the 100-yr value, by 0.5 ft. The 100-yr
proxy storm resulted in a simulated peak surge value of 16 ft at this
location, which is 2.5 ft higher than the 100-yr and 1.0 ft less than the 500-
yr ARI water levels, respectively.
Due to the long-dike effect, on the gulf side, the Ike Dike increases the
peak storm surge compared to peak surge for existing conditions. For the
Hurricane Ike simulations, the magnitude of the long dike effect is 1 ft for
both sea level scenarios. With the Ike Dike in place, and for present day
sea level, the simulated peak surge level at the Pleasure Pier for Hurricane
Ike is 14 ft, 1 ft higher than the existing condition peak surge of 13 ft. For
the future sea level scenario; the peak surge is 16 ft; also 1 ft higher than
the 15 ft peak surge for existing conditions.
With the Ike Dike in place, for the present-day sea level, the Hurricane Ike
simulation produced no steady flow over the Galveston seawall , while the
proxy storms did produce overflow. For the future sea level scenario, all
three of the hurricanes produced steady flow over the seawall. For the
Hurricane Ike simulation, overflow occurred at a single location near the
northeast end of the original seawall; whereas, both the 100-yr and 500-yr
proxy storms caused widespread flow over the seawall along most or all of
its length.

Jackson State University 270
The steady flow over the wall for the Hurricane Ike simulation, for the
future sea level, prompted a closer look at why this occurred. The peak
surge level of 16 ft was presumably less than the 17-ft crest elevation of the
seawall. For the with-Ike Dike case, the actual topographic elevations
along the Galveston seawall for the existing conditions case were retained
in the modeling. The actual elevations vary along the length of the seawall,
but they are close to 17 ft along most of its length. For the rest of the Ike
Dike implementation, elevations of the extended dike were set to exactly 17
ft NAVD88. At this one location, the existing Galveston seawall appears to
be approximately two feet lower than 17 ft NAVD88 elevation. This
apparent low point in the sea wall is discussed further below.
Figures A.1 through A.3 in Appendix A show inundation patterns for the
City of Galveston, for the simulations of Hurricane Ike and the 100-yr and
500-yr proxy storms. Figure 12-2, inundation for the Hurricane Ike
simulation and present-day sea level, shows that the Galveston seawall
effectively reduces inundation to a few isolated low-lying areas around the
periphery of the city. For the future sea level scenario, shown in Figure 12-
3, the Hurricane Ike simulation results in much more widespread
inundation, including a large swath in the downtown area having a high
density of structures. The flooding originates from both the bay side and
from the single area on the gulf side that was identified above.
Figure 12-4 shows topographic elevations in this region from the storm
surge model. Displayed elevations are in feet relative to the NAVD88
vertical datum. The negative sign listed in the figure’s scale simply
indicates elevations that lie above the vertical datum. The bay side of the
City of Galveston is characterized by relatively low elevations, less than 6 ft
in places. Comparison of the inundation patterns for the two Hurricane
Ike simulations with the topographic elevation map suggests that peak
surge elevations along the bay side were approximately 4.5 to 5 ft for
present-day sea level and 7 to 7.5 ft for the future sea level scenario. The
peak storm surge maps for the two simulations confirm this; see Figures
11-8 and 11-9.
The two areas that appear to be the sources for the widespread inundation
in the downtown area shown in Figure 12-3 are circled in Figure 12-4. The
inundated area downtown is characterized by the rather extensive low-
lying region having elevations of 5 to 7 ft. Water that flows downslope
from the gulf-side source accumulates in this lower lying area, as does the

Jackson State University 271
water that enters from the bay side. Raising topographic elevations in
these two areas would achieve a more consistent level of flood protection
in the City of Galveston for the Hurricane Ike simulation, for the future sea
level scenario.
Figure 12-2. Inundated areas in the City of Galveston, Hurricane Ike simulation, with-dike
condition, present-day sea level.
Figure 12-3. Inundated areas in the City of Galveston, Hurricane Ike simulation, with-dike
condition, future sea level scenario which is 2.4 feet higher than present-day sea level.

Jackson State University 272
Figure 12-4. Topographic elevations in the City of Galveston, in feet relative to the NAVD88
vertical datum. Negative values indicate elevations that lie above the vertical datum.
As stated earlier, the circled area on the Galveston seawall has model
elevations that are approximately 2 ft lower than 17 ft NAVD88.
Elevations in this local area should be examined further to make sure the
model topography is accurate. If model elevations are correct, and they
are several feet lower than 17 ft NAVD88, this area of the seawall
constitutes a weak link in the primary line of defense, a deficiency that
should be corrected as part of the Ike Dike implementation. Other model
elevations along the seawall show more consistent elevations near 17 ft.
Actual elevations from a high resolution data source should be examined
to identify any other possible areas where elevations are significantly lower
than 17 ft.
At the source for flooding from the bay side, these low elevations that are
less than 6 ft also appear to constitute a vulnerability that should be
addressed. Raising elevations to 8 ft in this area, and in all areas where
elevations lower than 8 ft can lead to inundation within the city, should be
considered as a secondary line of defense measure. This would seem to
provide a consistent elevation for ringing the city against bay-side
inundation. This could be achieved by raising a road surface, building a
small wall along the side of a road, raising a median between lanes of
traffic, or via a wall incorporated into a raised pedestrian walkway.
The extensive elongated area of low-lying elevations in the down town area
would tend to accumulate flood water that flows down slope from other
sources. Another facet of addressing inundation in this area that should
Jackson State University 273
be considered is a pump station(s) for evacuating accumulating water, and
then discharging it back into the bay.
If a higher level of flood risk reduction is desired for the City of Galveston,
more extensive risk reduction measures will need to be constructed.
Measures would have to include raising the Galveston seawall and
construction of much more extensive bay-side measures to raise the bay-
side flood defense perimeter to the desired elevation, ringing the city.
Pump stations or a structure(s) to facilitate gravity-driven drainage would
have to be built to evacuate any water that accumulates inside the ring due
to steady overflow and/or wave overtopping in the event that the system is
overtopped.
Since construction of the Galveston seawall in the early 1900’s, the risk of
inundation to the City of Galveston has been increasing because of the rise
in relative mean sea level that has occurred (assuming the probabilities of
hurricanes are the same, then and now). Based on the long record of
measured water level data at Galveston (see Chapter 11, Figures 11.1 and
11.2), the observed change in relative mean sea level at Galveston has been
approximately 2 ft over the past 100 years. This relative rise in sea level
has increased the risk of flooding to the City of Galveston both from the
gulf and the bay sides as is evident from the Hurricane Ike and proxy
storm simulations. In light of past sea level rise and a projected rise in the
future sea level, and in light of the long-dike effect, raising of the seawall
should be considered. To achieve the same level of flood risk that existed
when the sea wall was originally built, the seawall should probably be
raised by 5 to 6 ft, to a uniform crest elevation of 22 to 23 ft NAVD88.
This increase reflects 2 ft of historic relative sea level rise, 2 ft due to the
long-dike effect, and 1 to 2 ft of future sea level rise. There might be public
opposition to raising the seawall to this elevation, or to raising it at all.
If the Galveston seawall is raised above the crest elevation of the adjacent
sections of the Ike Dike, the need for lateral transition sections should be
examined and implemented where necessary at the ends of the seawall.
Transitions should minimize any negative effect of flanking around the
terminal ends of the raised sea wall on the desired level of flood risk within
the city.

Jackson State University 274
For the 100-yr proxy storm, peak surge on the bay side of Galveston
reached approximately 8 ft (see Figure 11-24) for present-day sea level and
10 to 11 ft (see Figure 11-25) for the future sea level scenario. To
accommodate peak surge levels along the bay side for the future sea level
scenario of +2.4 ft, the crest elevation of a bay-side ring levee/wall system
would need to be approximately 11 ft NAVD88. For risk reduction
measures of this elevation, a much more extensive dike/levee/wall system
would have to be built to ring the city. This secondary line of defense
should be explored further.
Several possible alignments for a more extensive ring dike/levee/wall
system are shown in Figure 12-5. The layouts that are shown attempt to
maximize use of existing roads, and raising of those roads. Utilization of
existing roadways and rights of way, and other public lands such as around
the airport, would appear to be among the less costly and less
controversial alternatives. One of the alignments encompasses the airport
within the ring and would require a gate to support recreational vessels.
Certainly, other alignments are possible. Each of them would have
different benefits/negatives, costs and pros/cons.
Figure 12-5. Possible alignments for a more extensive dike/levee/wall system that rings
the City of Galveston.
There is considerable complexity in integrating a continuous system of
levees/dikes, walls, and gates (all having the desired crest elevation, for
example, 11 ft NAVD88) to provide risk reduction to the Port of Galveston
infrastructure. Complexities involve constructing a system among the
many docks, slips, rail lines, roads, buildings, etc., as well as disruption to
operation of the port, during and possibly after construction. Other ring

Jackson State University 275
alignments that fully encompass the Port would require construction of
deep draft navigation gates, integrated into an open-water wall system.
These can be built, but they will be very costly.
There are other issues related to construction of the more extensive ring
and its integration into other parts of the city, such as the possible need for
multiple pump stations or structures to facilitate gravity-driven drainage
to remove water that could accumulate inside the fully ringed polder in the
event of significant overflow/overtopping, and other gates needed to
provide vehicle and rail access. All would need to be examined as part of
the conceptual and detailed design of a bay-side dike/wall system that
fully rings the city.
The Gulf Coast Community Protection and Recovery District (2016) study
has proposed such a ring dike, although their proposed alignment follows
one of the existing roadways and excludes the Port of Galveston. Options
for a ring that includes the Port should be examined as well.
Galveston Island (central portion)
Figures A.4 through A.6 in Appendix A show inundation patterns for the
simulations of the same three storms for the central portion of Galveston
Island. The central portion roughly represents the central third of the
barrier island. The 17-ft Ike Dike is very effective in reducing the risk of
flooding, as illustrated by the Hurricane Ike simulations. However, even
with the dike in place certain areas in this region remain susceptible to
flooding from the bay side. The potential for bay-side flooding is dictated
by surge levels within West Bay and by the low-lying barrier island
topography.
Barrier islands on the upper Texas coast are generally characterized by low
topography. They tend to have higher elevations (with or without small
dunes) on the gulf side of the island. From the higher gulf side, elevations
tend to steadily decrease with increasing proximity to the bay shoreline.
The elevation data for the central portion of Galveston Island are shown in
Figure 12-6. Examination of the data shows this general pattern of sloping
topography from gulf side to bay side. Topographic elevations along the
bay shoreline are about 3 ft NAVD88 and they are 7 to 8 ft along much of
the gulf side of the island. The very low-lying topography on the bay side
of the island strongly contributes to the risk of flooding in these areas,
even with the Ike Dike in place.
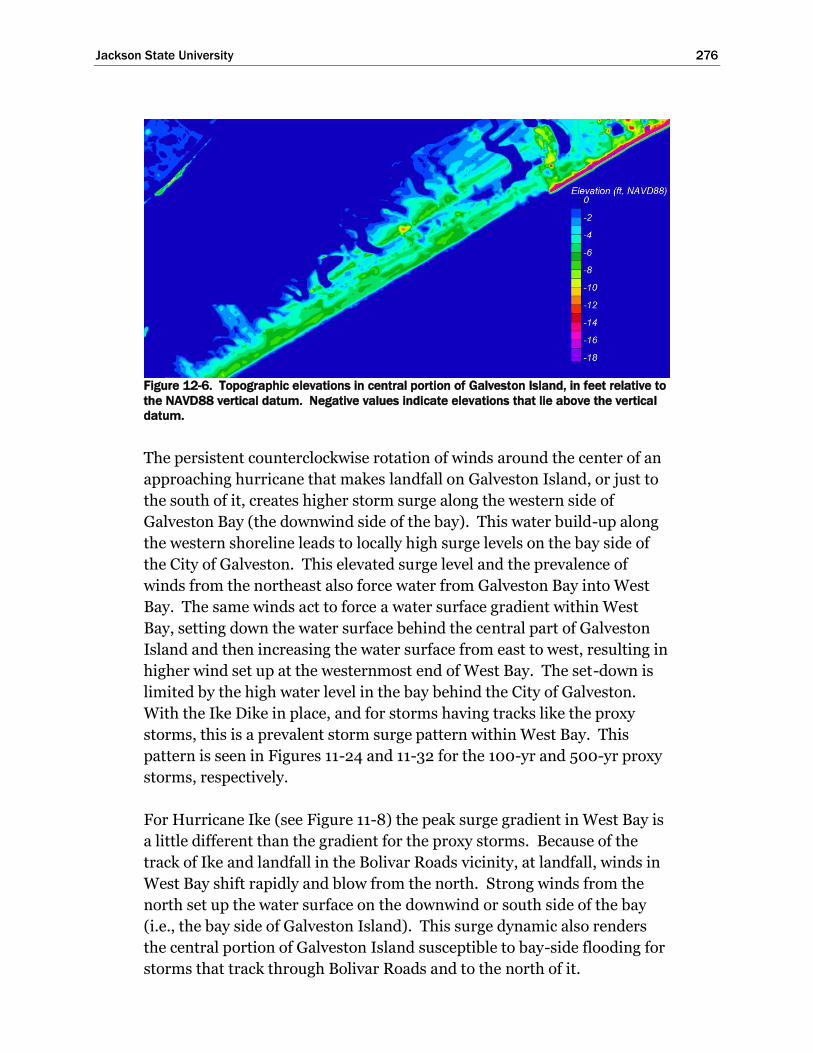
Jackson State University 276
Figure 12-6. Topographic elevations in central portion of Galveston Island, in feet relative to
the NAVD88 vertical datum. Negative values indicate elevations that lie above the vertical
datum.
The persistent counterclockwise rotation of winds around the center of an
approaching hurricane that makes landfall on Galveston Island, or just to
the south of it, creates higher storm surge along the western side of
Galveston Bay (the downwind side of the bay). This water build-up along
the western shoreline leads to locally high surge levels on the bay side of
the City of Galveston. This elevated surge level and the prevalence of
winds from the northeast also force water from Galveston Bay into West
Bay. The same winds act to force a water surface gradient within West
Bay, setting down the water surface behind the central part of Galveston
Island and then increasing the water surface from east to west, resulting in
higher wind set up at the westernmost end of West Bay. The set-down is
limited by the high water level in the bay behind the City of Galveston.
With the Ike Dike in place, and for storms having tracks like the proxy
storms, this is a prevalent storm surge pattern within West Bay. This
pattern is seen in Figures 11-24 and 11-32 for the 100-yr and 500-yr proxy
storms, respectively.
For Hurricane Ike (see Figure 11-8) the peak surge gradient in West Bay is
a little different than the gradient for the proxy storms. Because of the
track of Ike and landfall in the Bolivar Roads vicinity, at landfall, winds in
West Bay shift rapidly and blow from the north. Strong winds from the
north set up the water surface on the downwind or south side of the bay
(i.e., the bay side of Galveston Island). This surge dynamic also renders
the central portion of Galveston Island susceptible to bay-side flooding for
storms that track through Bolivar Roads and to the north of it.

Jackson State University 277
Figure 12-7 illustrates bay-side flooding in the central portion of Galveston
Island for the Hurricane Ike simulation with the Ike Dike in place and
present-day sea level. Of the three storms, only the Hurricane Ike
simulations do not lead to steady flow over the Ike Dike in this region, so
the influence of bay-side flooding is most apparent for this simulation.
Peak storm surge along the bay side of the island for this simulation is only
about 4 ft NAVD88. But in light of the low-lying terrain, inundation of
some residential areas occurs, in particular those that are located in the
lower-lying areas closest to the bay.
Figure 12-7. Inundated areas for the Hurricane Ike simulation, with-dike condition, present-
day sea level, for the central portion of Galveston Island.
For the future sea level scenario, which is 2.4 ft higher than present sea
level, all three storms produce nearly complete inundation of this portion
of the barrier island, due either due to flooding from the gulf side or from
the bay side. Because of the very low topography, inundation is
particularly sensitive to an increase in mean sea level.
One measure that can be taken to reduce the risk of flooding from the bay
side on Galveston Island, as well as in other low-lying areas, is raising the
first floor elevation of individual structures. This measure also can be
effective in reducing the risk of flooding associated with flow over the Ike
Dike. In the event the crest elevation of the dike is exceeded by the gulf-
side surge, the water surface in West Bay will be much lower than the open
gulf surge level. Consequently, water flowing over the dike will move
rapidly down-slope over the barrier island toward the bay side. The water
surface transitions from the higher open gulf side surge level to the lower

Jackson State University 278
water level in West Bay, with much of the transition occurring over a
relatively short distance on the bay side of the Ike Dike. Elevating
structures to a first floor elevation of 10 to 12 ft NAVD88 would
significantly reduce the risk of flooding on the bay side of the 17-ft Ike
Dike, even for the future sea level scenario.
Another measure, or secondary line of defense, that can be implemented
to reduce flood risk on this portion of the low-lying barrier island is
construction of ring dikes or levees around concentrations of structures,
perhaps integrated with an access road on top. A ring levee with crest
elevation of 10 to 12 ft NAVD88 would significantly reduce the risk of
flooding. As is the case with any ring levee/dike that has a residual risk of
being overtopped and then having that water trapped within the confines
of the ring, a pump station(s) or other structures that would be required to
evacuate any accumulating water. A gate or gates might also be required
to provide vehicular access to the residential area surrounded by the
dike/levee. The benefits and costs of any such secondary lines of defense
would need to be examined. Residents are often opposed to such
structural measures because they block the view.
Galveston Island (western end)
Figures A.7 through A.9 in Appendix A show inundation patterns for the
simulations of Hurricane Ike and the 100-yr and 500-yr proxy storms,
respectively, for the western end of Galveston Island. The western end
roughly represents the western third of the barrier island.
As was the case for the central portion of the island, the 17-ft Ike Dike is
very effective in reducing the risk of flooding from the gulf side, as
evidenced by the simulations for Hurricane Ike. However, the low-lying
areas in this region also remain susceptible to flooding from the bay side.
Figure 12-8 shows the topography for this portion of the barrier island.
The range of elevations and patterns of elevation change from the gulf side
to the bay side are similar to those found in the central portion of the
island. The barrier island is narrower on its western end.

Jackson State University 279
Figure 12-8. Topographic elevations at the western end of Galveston Island, in feet relative
to the NAVD88 vertical datum. Negative values indicate elevations that lie above the
vertical datum.
Figures 12-9 and 12-10 illustrate inundation in this region for the
Hurricane Ike simulation (Figure 12-9) and the 100-yr proxy storm
simulation (Figure 12-10), with the 17-ft Ike Dike in place and present-day
sea level. Both simulations do not lead to steady flow over the Ike Dike in
this region, so the influence of bay-side flooding is most apparent. Peak
storm surge for Hurricane Ike is about 4 ft NAVD88 along the bay side of
the island, and for the 100-yr proxy storm the peak surge is slightly less.
Recall that for Hurricane Ike after landfall, winds set up the southern part
of the bay all along the back side of Galveston Island. This leads to slightly
higher peak surges for Hurricane Ike in this area, compared to those for
the 100-yr proxy storm.
The residential areas that experience inundation for these two storms tend
to be those located in the lower-lying areas closest to the bay shoreline.
Differences between the two figures illustrate how sensitive inundation
from the bay side is to small changes in the peak surge level. The bay sides
of barrier islands generally have very gentle slopes, which makes the area
of inundation quite sensitive to peak surge elevation.
As was found to be the case for the central portion of Galveston Island, for
the future sea level scenario all three storms produce nearly complete
inundation of this portion of the barrier island.
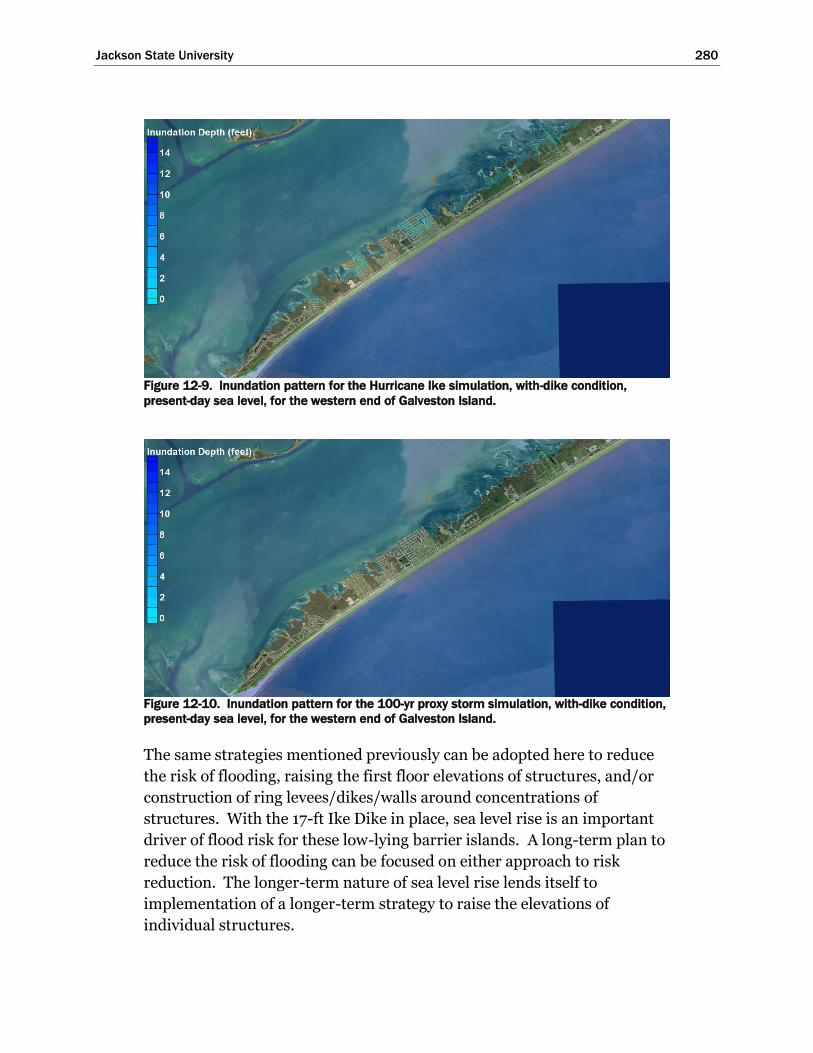
Jackson State University 280
Figure 12-9. Inundation pattern for the Hurricane Ike simulation, with-dike condition,
present-day sea level, for the western end of Galveston Island.
Figure 12-10. Inundation pattern for the 100-yr proxy storm simulation, with-dike condition,
present-day sea level, for the western end of Galveston Island.
The same strategies mentioned previously can be adopted here to reduce
the risk of flooding, raising the first floor elevations of structures, and/or
construction of ring levees/dikes/walls around concentrations of
structures. With the 17-ft Ike Dike in place, sea level rise is an important
driver of flood risk for these low-lying barrier islands. A long-term plan to
reduce the risk of flooding can be focused on either approach to risk
reduction. The longer-term nature of sea level rise lends itself to
implementation of a longer-term strategy to raise the elevations of
individual structures.

Jackson State University 281
Bolivar Peninsula
Bolivar Peninsula (western end)
In some ways, the potential for flooding on Bolivar Peninsula is similar to
that on Galveston Island, but, in one important way it differs. Figures A.10
through A.12 in Appendix A show inundation patterns for the three
storms, for the western end of Bolivar Peninsula. The western end roughly
represents the western third of the peninsula.
As was the case for Galveston Island, the 17-ft Ike Dike is very effective in
reducing the risk of flooding from the gulf side. However, as was the case
for Galveston Island, even with the dike in place most of this region
remains susceptible to flooding from the bay side because of the low-lying
topography, particularly for the future sea level scenario. For Bolivar
peninsula, the potential for bay-side flooding with the dike in place is
dictated by surge levels within southern Galveston Bay and by the low-
lying topography on the peninsula. Figure 12-11 shows the topography on
the western end of Bolivar Peninsula. The topography is quite similar to
that found on Galveston Island, with higher elevations on the gulf side and
lower elevations on the bay side.
Figure 12-11. Topographic elevations at the western end of Bolivar Peninsula, in feet
relative to the NAVD88 vertical datum. Negative values indicate elevations that lie above
the vertical datum.

Jackson State University 282
However, even though the topography is similar to Galveston Island, the
prevailing storm surge patterns within southern Galveston Bay are quite
different from those in West Bay for storms like Hurricane Ike and both
proxy storms. In general, this difference reduces the potential for flooding
from the bay side on Bolivar Peninsula compared to that for Galveston
Island for these three storms and for those that make landfall on
Galveston Island.
The persistent counterclockwise rotation of winds around the center of an
approaching hurricane creates higher surge levels along the western
shoreline of Galveston Bay. With the Ike Dike in place, the storm surge
build-up on the western side of the bay is accompanied by a pronounced
set-down of the water surface on the eastern side of the bay, which is the
part adjacent to Bolivar Peninsula. This water surface gradient, and the
set-down behind Bolivar Peninsula, are nicely illustrated in Figures 6-17
through 6-20 for another very severe hurricane that makes landfall in in
this vicinity, a “direct-hit” storm that was examined earlier in this study.
The signature of this east-west water surface elevation gradient is evident
along the western side of Galveston Bay in the peak storm surge map
shown in Figure 11-8 (a Hurricane Ike simulation). It is more evident in
Figures 11-24 and 11-32, which show the peak surge maps for the 100-yr
and 500-yr proxy storms respectively. The set-down in water surface
elevation behind Bolivar Peninsula, which occurs before and during the
time when the open coast storm surge is at its peak, reduces the potential
for bay-side flooding on Bolivar Peninsula.
Even though the Ike Dike extends to Sabine Pass, some flanking flow is
occurring for each of these three storms. This is evidenced by the gradient
in peak surge within the inundated coastal areas east of Galveston Bay that
is seen in each of the figures cited above. The flanking flow tends to
reduce the amount of the set-down on the eastern side of the bay;
however, the amount of flanking flow is relatively small for this longer,
extended configuration of the Ike Dike.
Once the hurricane moves out of the region, and the water surface
elevation within the bays levels out after the strong wind forcing has
ceased, some bay-side flooding can occur due to the added volume of
water that entered the bay, either through Bolivar Roads pass before the
surge barrier gates were closed, or via flow over the dike during the peak of

Jackson State University 283
the storm surge or flanking flow around the eastern terminus of the Ike
Dike. The peak storm surge maps in Figures 11-8, 11-24, and 11-32
actually mask the amount of the set-down on the eastern side of the bay
during the storm, because the peak surge within Galveston Bay behind
Bolivar Peninsula occurs after the strong wind forcing has ceased and the
water levels within the bays equilibrate.
Figure 12-12 illustrates the bay-side flooding on the western end of Bolivar
Peninsula for the Hurricane Ike simulation, with the Ike Dike in place and
for the present-day sea level. Of the three storms, only the Hurricane Ike
simulation for present day sea level does not lead to appreciable steady
flow over the Ike Dike, so the influence of bay-side flooding is most
apparent for this simulation. The peak storm surge in the bay for this
simulation is less than 2 ft NAVD88 in this region; and it is associated with
the equilibrated water levels within the bay. In this model simulation, in
which the surge barrier gate is effectively closed at the beginning of the
simulation, this peak surge level is indicative of the amount of water that
enters the bay due to flanking and flow over the dike in other areas.
None of the residential areas at the western end of Bolivar Peninsula
experienced inundation for the Ike simulation at present sea level, despite
the low topographic elevations that characterize most the Peninsula.
Figure 12-12. Inundation pattern for the Hurricane Ike simulation, with-dike condition,
present-day sea level, for the western end of Bolivar Peninsula.

Jackson State University 284
For the future sea level scenario, which is 2.4 ft higher than present sea
level, all three storms produce nearly complete inundation of this portion
of the barrier island as well as peak surge levels that exceed the 17-ft Ike
Dike throughout this geographic region. Inundation is caused by steady
flow over the dike and then down slope over the terrain toward the bay.
The three storms examined here have the distinct surge dynamic of setting
down the water surface on the east side of the bay during the event,
following by rising water levels as the volume of the water inside the bay
equilibrates. A complete assessment of the risk of bay-side flooding on
Bolivar Peninsula also must consider other types of storms that have
significant surge generating potential in this region. The assessment
should consider storms that make landfall to the west of the peninsula,
where strong north-to-south blowing winds just prior to landfall, at
landfall, and shortly after landfall, blowing over the long north-to-south
fetch of Galveston Bay, will set up the south side of Galveston Bay. This
wind set-up can cause inundation on the bay side of Bolivar Peninsula,
particularly for an elevated future mean sea level. However, the farther a
hurricane tracks to the west the lower the potential for flow over the Ike
Dike in the Galveston Bay area, and the lower the magnitude of any
flanking flow at Sabine Pass.
The same strategies mentioned previously for Galveston Island can be
adopted here to reduce the risk of flooding from the gulf and bay sides:
raising the first floor elevations of structures, and/or construction of ring
levees/dikes/walls around concentrations of structures.
Bolivar Peninsula (central portion)
Figures A.13 through A.15 in Appendix A show inundation patterns for the
simulations of Hurricane Ike and the 100-yr and 500-yr proxy storms,
respectively, for the central portion of Bolivar Peninsula.
Figure 12-13 shows the topography on the central portion of Bolivar
Peninsula. Rollover Pass, which connects the gulf to the bay, is evident on
the right side of the figure near the legend. As part of the Ike Dike
concept, a gate will be required at Rollover Pass if navigation and water
exchange is to be maintained. The peninsula narrows considerably from
west to east in this sub-region; and the highest elevations on the peninsula
also decrease from west to east. Maximum elevations at the western side
of this sub-region are quite low, less than 5 ft NAVD88.
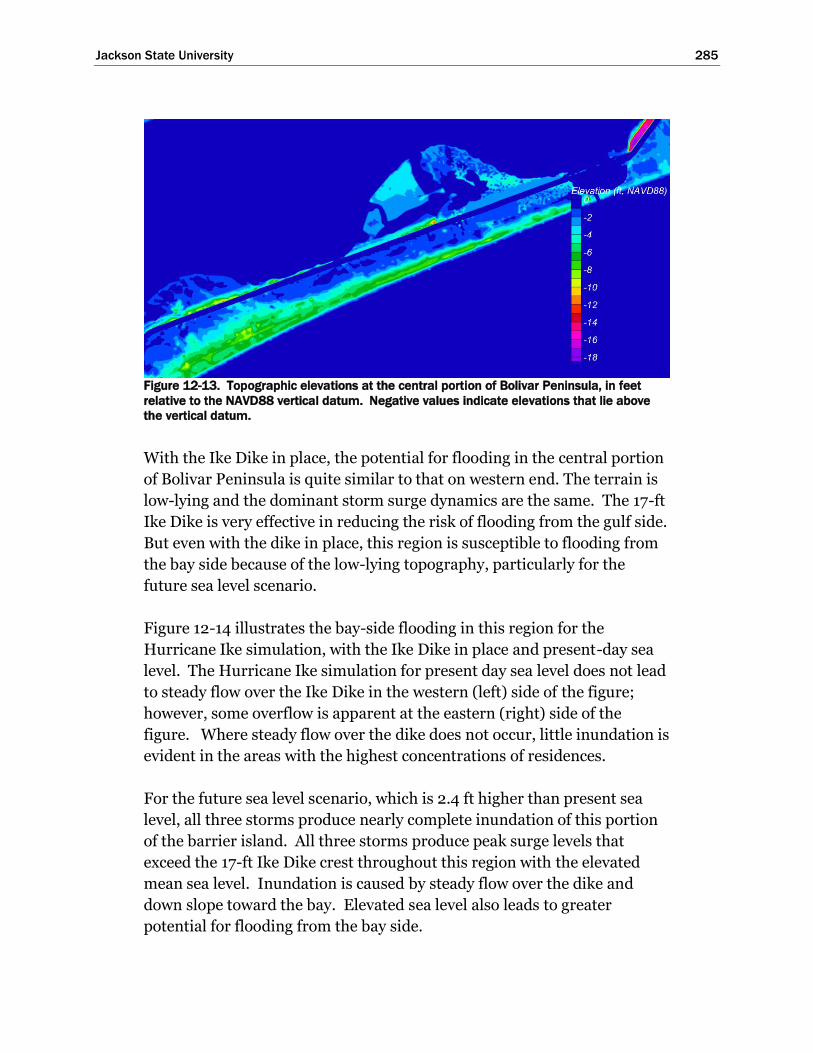
Jackson State University 285
Figure 12-13. Topographic elevations at the central portion of Bolivar Peninsula, in feet
relative to the NAVD88 vertical datum. Negative values indicate elevations that lie above
the vertical datum.
With the Ike Dike in place, the potential for flooding in the central portion
of Bolivar Peninsula is quite similar to that on western end. The terrain is
low-lying and the dominant storm surge dynamics are the same. The 17-ft
Ike Dike is very effective in reducing the risk of flooding from the gulf side.
But even with the dike in place, this region is susceptible to flooding from
the bay side because of the low-lying topography, particularly for the
future sea level scenario.
Figure 12-14 illustrates the bay-side flooding in this region for the
Hurricane Ike simulation, with the Ike Dike in place and present-day sea
level. The Hurricane Ike simulation for present day sea level does not lead
to steady flow over the Ike Dike in the western (left) side of the figure;
however, some overflow is apparent at the eastern (right) side of the
figure. Where steady flow over the dike does not occur, little inundation is
evident in the areas with the highest concentrations of residences.
For the future sea level scenario, which is 2.4 ft higher than present sea
level, all three storms produce nearly complete inundation of this portion
of the barrier island. All three storms produce peak surge levels that
exceed the 17-ft Ike Dike crest throughout this region with the elevated
mean sea level. Inundation is caused by steady flow over the dike and
down slope toward the bay. Elevated sea level also leads to greater
potential for flooding from the bay side.

Jackson State University 286
Figure 12-14. Inundation pattern for the Hurricane Ike simulation, with-dike condition,
present-day sea level, for the central portion of Bolivar Peninsula.
The observations and recommendations regarding measures to reduce the
risk of flooding here are the same as those made for the western end of the
island.
Bolivar Peninsula (eastern end)
Figures A.16 through A.18 in Appendix A show inundation patterns for the
simulations of Hurricane Ike and the 100-yr and 500-yr proxy storms,
respectively, for the eastern end of Bolivar Peninsula.
Figure 12-15 shows the topography in this sub-region, which is similar to
that found in eastern side of the central sub-region. The peninsula is quite
narrow and the highest portions on the gulf side have low maximum
elevations. The exception is at High Island, the area of very high
topographic elevations clearly seen on the right side of the figure. There
are far fewer residences in this sub-region, compared to the others.
With the Ike Dike in place, the potential for flooding in the eastern end of
Bolivar Peninsula is quite similar to that elsewhere on the peninsula. The
terrain is low-lying and the dominant storm surge dynamics are the same.
The 17-ft Ike Dike is very effective in reducing the risk of flooding from the
gulf side.
Even with the Ike Dike in place, this region is susceptible to flooding from
the bay side because of the low-lying topography, particularly for the
future sea level scenario.

Jackson State University 287
Figure 12-15. Topographic elevations at the eastern end of Bolivar Peninsula, in feet
relative to the NAVD88 vertical datum. Negative values indicate elevations that lie above
the vertical datum.
Figure 12-16 illustrates the bay-side flooding in this region with the Ike
Dike in place, for the Hurricane Ike simulation and present-day sea level.
The Hurricane Ike simulation for present day sea level leads to steady flow
over the Ike Dike in most places, as do the proxy storms.
The observations and recommendations regarding measures to reduce the
risk of flooding here are the same as those made for the rest of Bolivar
Peninsula.
Figure 12-16. Inundation pattern for the Hurricane Ike simulation, with-dike condition,
present-day sea level, for the eastern end of Bolivar Peninsula.
.

Jackson State University 288
Galveston Bay
Texas City (south)/La Marque/Bayou Vista
Figures A.19 through A.21 in Appendix A show inundation maps for the
sub-region that encompasses the Texas City (south), La Marque,
Hitchcock and Bayou Vista areas, all of which are located along the
western shoreline of Galveston Bay, across the bay from and north of the
City of Galveston. Maps are shown for the simulations of Hurricane Ike
and the 100-yr and 500-yr proxy storms.
Texas City/La Marque
Figures 12-17 and 12-18 show the inundated areas for the 100-yr proxy
storm and the future sea level scenario, for both the existing, no-dike,
condition (Figure 12-17) and for the with-Ike Dike condition (Figure 12-
18). The Texas City industrial area and La Marque, which is seen in the
upper right corner of both figures, are surrounded by the Texas City levee,
which is shown with a thin green line. The Texas City levee has a crest
elevation that ranges from 19 to 23 feet.
These two figures provide an indication of the Ike Dike’s flood risk
reduction benefits in this sub-region. Without the Ike Dike in place, the
area inside the levee is subjected to widespread inundation for the 100-yr
proxy storm and the future sea level scenario (see Figure 12-17). For these
conditions the peak storm surge level on the east side of the Texas City
levee is 17.5 ft. On the southwest side of the levee the peak surge level is 19
ft.
The extremely high surge level on the southwest side of the levee,
approximately 19 ft, is the source of inundation inside the polder. The
western terminus of the levee is flanked in this simulation. This flanking
flow appears to be the primary source of water causing inundation inside
the polder, although there might be some steady flow over the levee as
well. The western terminus of the levee is circled in Figure 12-19, which is
a map of the surge model’s topographic elevations in this sub-region.

Jackson State University 289
Figure 12-17. Inundation pattern for the 100-yr proxy storm simulation in the Texas City
(south)/La Marque/Bayou Vista area, no-dike condition, future sea level scenario..
Figure 12-18. Inundation pattern for the 100-yr proxy storm simulation in the Texas City
(south)/La Marque/Bayou Vista area, with-dike condition, future sea level scenario.
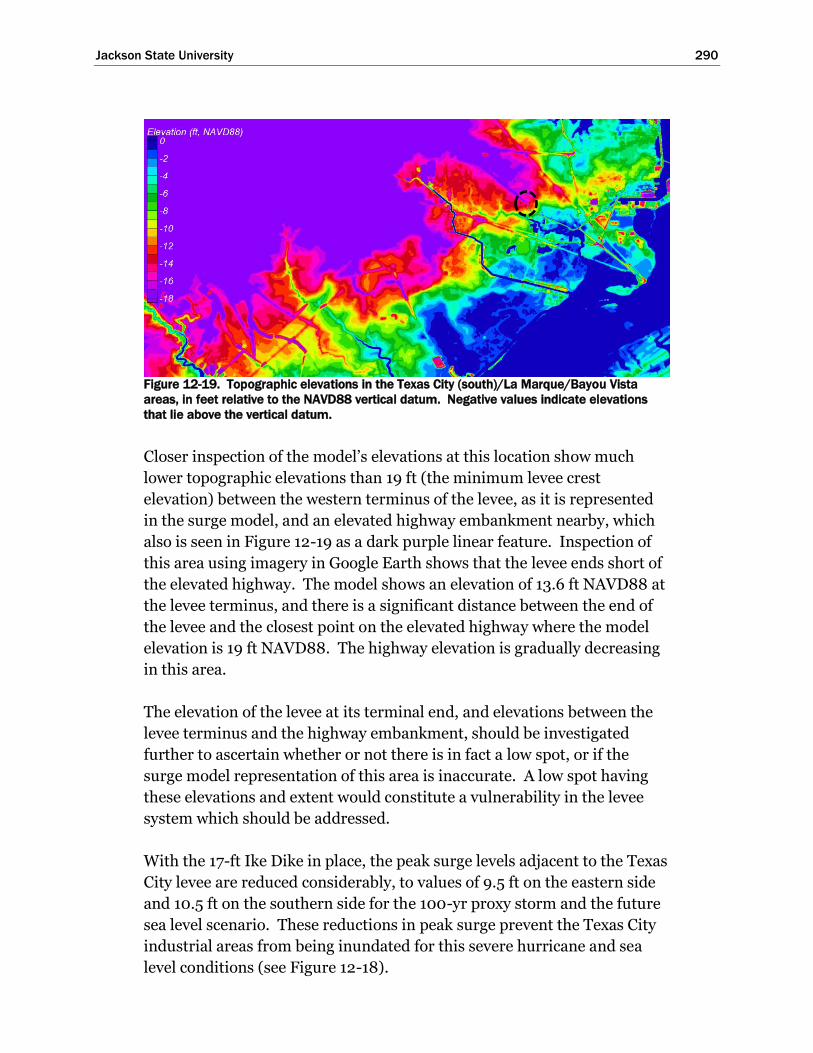
Jackson State University 290
Figure 12-19. Topographic elevations in the Texas City (south)/La Marque/Bayou Vista
areas, in feet relative to the NAVD88 vertical datum. Negative values indicate elevations
that lie above the vertical datum.
Closer inspection of the model’s elevations at this location show much
lower topographic elevations than 19 ft (the minimum levee crest
elevation) between the western terminus of the levee, as it is represented
in the surge model, and an elevated highway embankment nearby, which
also is seen in Figure 12-19 as a dark purple linear feature. Inspection of
this area using imagery in Google Earth shows that the levee ends short of
the elevated highway. The model shows an elevation of 13.6 ft NAVD88 at
the levee terminus, and there is a significant distance between the end of
the levee and the closest point on the elevated highway where the model
elevation is 19 ft NAVD88. The highway elevation is gradually decreasing
in this area.
The elevation of the levee at its terminal end, and elevations between the
levee terminus and the highway embankment, should be investigated
further to ascertain whether or not there is in fact a low spot, or if the
surge model representation of this area is inaccurate. A low spot having
these elevations and extent would constitute a vulnerability in the levee
system which should be addressed.
With the 17-ft Ike Dike in place, the peak surge levels adjacent to the Texas
City levee are reduced considerably, to values of 9.5 ft on the eastern side
and 10.5 ft on the southern side for the 100-yr proxy storm and the future
sea level scenario. These reductions in peak surge prevent the Texas City
industrial areas from being inundated for this severe hurricane and sea
level conditions (see Figure 12-18).

Jackson State University 291
Figures 12-20 and 12-21 show the inundated areas for the 500-yr proxy
storm and the future sea level scenario, for both the existing condition
(Figure 12-20) and the with-Ike Dike condition (Figure 12-21).
Figure 12-20. Inundation pattern for the 500-yr proxy storm simulation in the Texas City
(south)/La Marque/Bayou Vista area, no-dike condition and the future sea level scenario.
Figure 12-21. Inundation pattern for the 500-yr proxy storm simulation in the Texas City
(south)/La Marque/Bayou Vista area, with-dike condition and the future sea scenario.
For the existing condition (without the Ike Dike), for the 500-yr proxy
storm simulation with the future sea level the peak surge on the east side
of the Texas City levee is 20.5 ft, and on the southwest side of the levee it is
22.5 ft. Again, the extremely high surge levels on the south and southwest
sides of the levee appear to be the source of the inundation inside the
levee. There is extensive flanking of the levee system on the southwest
side as well as steady flow over the crest of the levee. This hurricane, at
Jackson State University 292
this sea level, completely fills the polder inside the levee ring with peak
water levels that exceed 14 ft NAVD88.
For the same 500-yr proxy storm, but at the present-day sea level,
widespread inundation inside the levee occurs as well. The depth and
extent of inundation lie between those for the 100-yr and 500-yr proxy
storms at the future sea level.
The 17-ft Ike Dike prevents inundation via steady overflow or flanking
inside the Texas City levee for the 100-yr proxy storm and the future sea
level scenario, and for all the 500-yr proxy storm simulations. These
storm conditions reflect severe and rare hurricanes at elevated sea levels.
In Figures 12-18 and 12-21, the few isolated areas inside the levee that do
seem to indicate some inundation are actually low lying or water areas that
are raised by the +2.4 ft in sea level and become deeper water areas in the
model at the beginning of the simulation. These areas do not reflect
increases due to flow over the levee or to flanking flow around the
southwest terminus of the levee.
With the Ike Dike in place, the existing Texas City levee becomes a very
substantial secondary line of defense. Together, these two risk reduction
measures greatly reduce the risk of inundation within the Texas City
industrial area, reducing the possibility to extremely low probabilities as
evidenced by the positive results for the 500-yr proxy storm and the future
sea level scenario. With the dike in place, the potential vulnerability at the
southwest terminus of the Texas City levee does not lead to any inundation
inside the levee for any of the storms that were simulated.
With the Ike Dike in place, peak surge levels on the eastern side of the
levee are 9 and 11 ft for the 500-yr proxy storms simulations, for the
present-day and future sea level scenarios, respectively. The east-facing
side of the levee is where wave conditions will be greatest for these storms
because of the strong winds from the east and the available wind fetch
within Galveston Bay to the east of the levee. These peak surge levels are
roughly equal to or less than the peak surge levels that were experienced
during Hurricane Ike at this location. On the south side of the levee,
where wave conditions are expected to be lower than on the east side, peak
surge levels for the two with-dike, 500-yr proxy storms simulations were
11 and 13 feet for the two sea level scenarios, which are also similar to the
surge levels that were experienced during Hurricane Ike. Wave

Jackson State University 293
overtopping of the Texas City levee for the 500-yr proxy storm and the
future sea level scenario is expected to be comparable to or less than the
magnitude of wave overtopping that was experienced during Hurricane
Ike in 2008.
Bayou Vista and Hitchcock areas
The Bayou Vista and Hitchcock areas are more susceptible to inundation.
Bayou Vista, which is a small community in a very low-lying area, is
located just to the southwest of, and adjacent to the southern tip of, the
Texas City levee. Hitchcock lies to the west and southwest of the Texas
City levee, and to the west of Bayou Vista. There are two other
communities in very low-lying areas south of Bayou Vista, Tiki Island and
Harborwalk. See Figure 12-1 for the exact locations of these communities.
With the Ike Dike in place, peak storm surge values in the Bayou Vista
area, for Hurricane Ike, the two proxy storms, and for both sea level
scenarios, are summarized as follows. For the Hurricane Ike simulation,
with the Ike Dike in place, peak surge levels at Bayou Vista are 4 ft and 6.5
ft for the present-day and future sea levels, respectively. For the 100-yr
proxy storms, the corresponding peak surges for the two sea levels are 8 ft
and 10.5 ft. For the 500-yr proxy storms, the corresponding peak surges
are 11 ft and 13 ft.
As seen in Figures 12-17 and 12-18 for the 100-yr proxy storm, and Figures
12-20 and 12-21 for the 500-yr proxy storms (both for the future sea level),
the Ike Dike provides a considerable reduction in the extent and depth of
inundation for the southeastern Hitchcock area. However, the lowest-
lying areas remain inundated, even with the Ike Dike in place. The Bayou
Vista area and the other low-lying communities are inundated for all the
100-yr and 500-yr proxy storm simulations.
For the Hurricane Ike simulation for present-day sea level with the Ike
Dike in place, storm surge levels are sufficiently reduced to prevent
inundation in the Tiki Island and Harborwalk communities, and in some
parts of the Bayou Vista community. The potential for wave overtopping is
not considered in this analysis The Ike Dike is very effective in preventing
inundation within the Hitchcock area for the Hurricane Ike simulation and
present-day sea level.
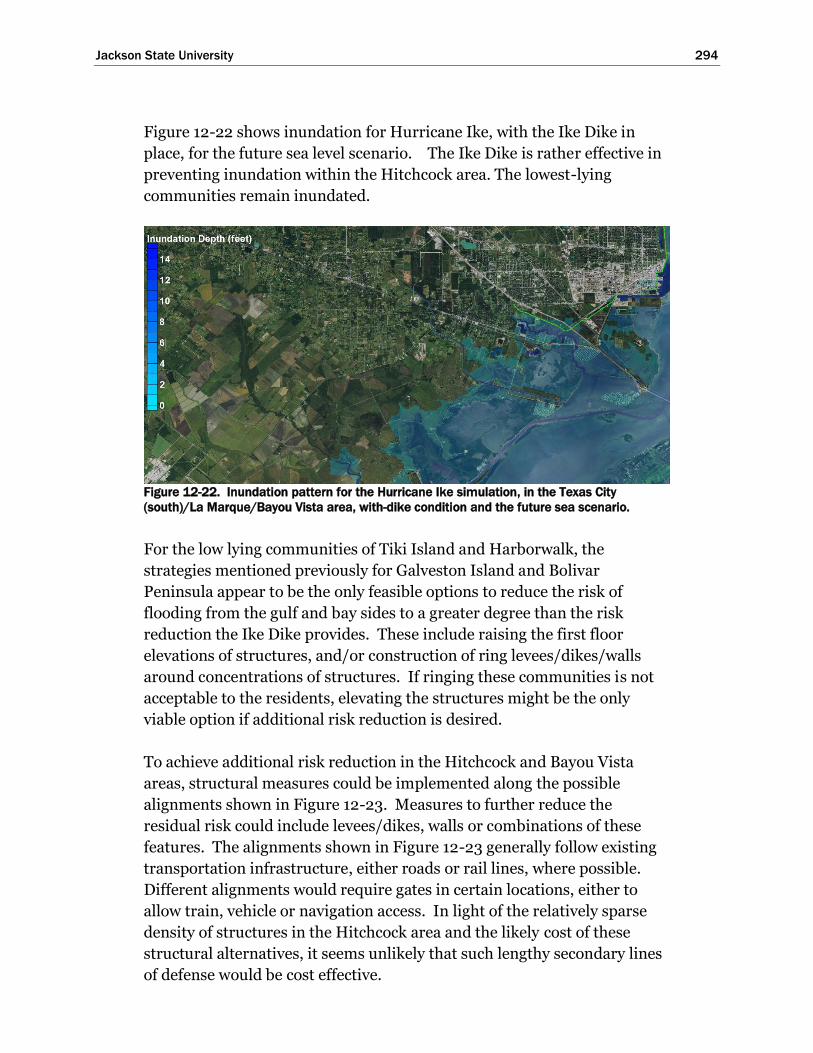
Jackson State University 294
Figure 12-22 shows inundation for Hurricane Ike, with the Ike Dike in
place, for the future sea level scenario. The Ike Dike is rather effective in
preventing inundation within the Hitchcock area. The lowest-lying
communities remain inundated.
Figure 12-22. Inundation pattern for the Hurricane Ike simulation, in the Texas City
(south)/La Marque/Bayou Vista area, with-dike condition and the future sea scenario.
For the low lying communities of Tiki Island and Harborwalk, the
strategies mentioned previously for Galveston Island and Bolivar
Peninsula appear to be the only feasible options to reduce the risk of
flooding from the gulf and bay sides to a greater degree than the risk
reduction the Ike Dike provides. These include raising the first floor
elevations of structures, and/or construction of ring levees/dikes/walls
around concentrations of structures. If ringing these communities is not
acceptable to the residents, elevating the structures might be the only
viable option if additional risk reduction is desired.
To achieve additional risk reduction in the Hitchcock and Bayou Vista
areas, structural measures could be implemented along the possible
alignments shown in Figure 12-23. Measures to further reduce the
residual risk could include levees/dikes, walls or combinations of these
features. The alignments shown in Figure 12-23 generally follow existing
transportation infrastructure, either roads or rail lines, where possible.
Different alignments would require gates in certain locations, either to
allow train, vehicle or navigation access. In light of the relatively sparse
density of structures in the Hitchcock area and the likely cost of these
structural alternatives, it seems unlikely that such lengthy secondary lines
of defense would be cost effective.
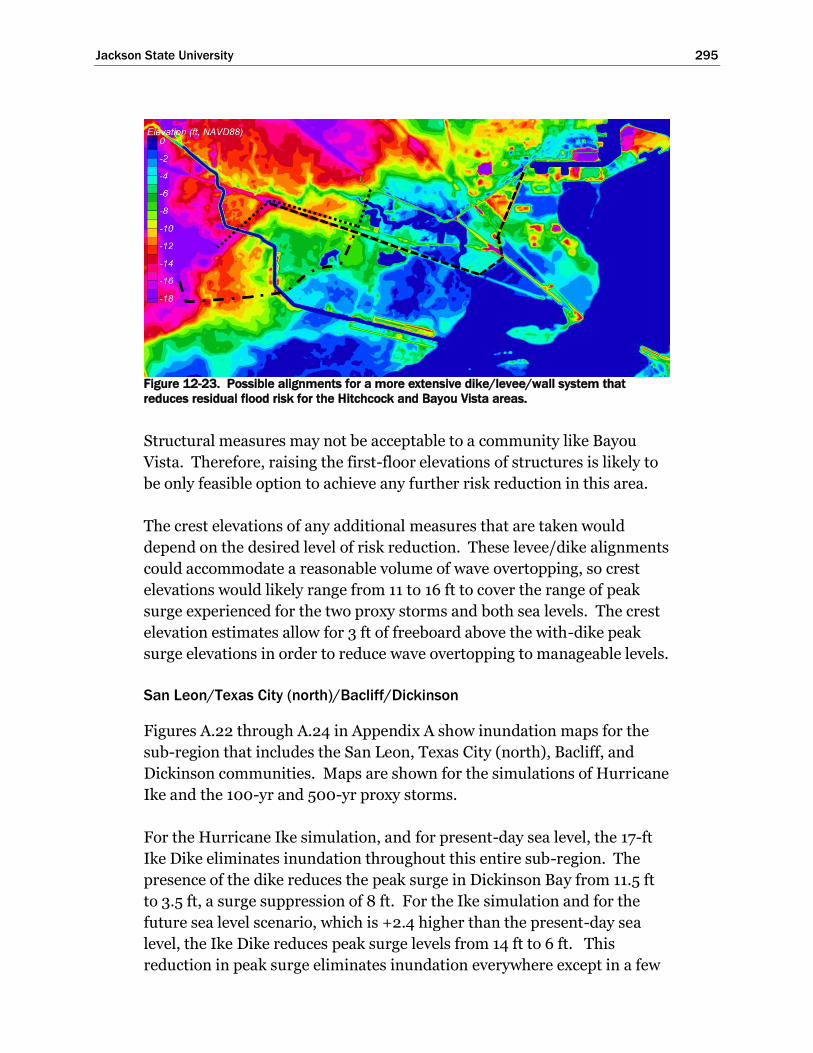
Jackson State University 295
Figure 12-23. Possible alignments for a more extensive dike/levee/wall system that
reduces residual flood risk for the Hitchcock and Bayou Vista areas.
Structural measures may not be acceptable to a community like Bayou
Vista. Therefore, raising the first-floor elevations of structures is likely to
be only feasible option to achieve any further risk reduction in this area.
The crest elevations of any additional measures that are taken would
depend on the desired level of risk reduction. These levee/dike alignments
could accommodate a reasonable volume of wave overtopping, so crest
elevations would likely range from 11 to 16 ft to cover the range of peak
surge experienced for the two proxy storms and both sea levels. The crest
elevation estimates allow for 3 ft of freeboard above the with-dike peak
surge elevations in order to reduce wave overtopping to manageable levels.
San Leon/Texas City (north)/Bacliff/Dickinson
Figures A.22 through A.24 in Appendix A show inundation maps for the
sub-region that includes the San Leon, Texas City (north), Bacliff, and
Dickinson communities. Maps are shown for the simulations of Hurricane
Ike and the 100-yr and 500-yr proxy storms.
For the Hurricane Ike simulation, and for present-day sea level, the 17-ft
Ike Dike eliminates inundation throughout this entire sub-region. The
presence of the dike reduces the peak surge in Dickinson Bay from 11.5 ft
to 3.5 ft, a surge suppression of 8 ft. For the Ike simulation and for the
future sea level scenario, which is +2.4 higher than the present-day sea
level, the Ike Dike reduces peak surge levels from 14 ft to 6 ft. This
reduction in peak surge eliminates inundation everywhere except in a few
Jackson State University 296
of the lowest-lying areas along the Dickinson Bay shoreline, including the
lowest-lying parts of San Leon, and areas immediately adjacent to the
Dickinson and Gum Bayous. The lowest-lying part of San Leon is
subjected to flooding from the Dickinson Bay side for this storm and the
future sea level scenario. See Figure 12-1 for a map showing these
locations.
Without the Ike Dike, for the more severe 100-yr and 500-yr proxy storms,
and for both sea level scenarios, this sub-region is subjected to widespread
inundation, particularly for the future sea level scenario. With the 17-ft
Ike Dike in place, because of surge suppression, there are substantial
widespread reductions in the area that is inundated. However, some low-
lying areas are still inundated even with the dike in place. For example,
for the 100-yr proxy storm and present-day sea level, the presence of the
dike reduces the peak surge in Dickinson Bay area from 14.5 ft to 8 ft. For
the future sea level scenario, the dike reduces peak surge levels from 17.5 ft
to 10 ft for this same storm. On average, surge suppression achieved with
the Ike Dike is 7 ft in this sub-region.
For the 100-yr proxy storm and present-day sea level, the Ike Dike greatly
reduces the amount of flooding in the Dickinson area. As was the case for
the Hurricane Ike simulation, only the lowest-lying areas along Dickinson
and Gum Bayous experience inundation for these conditions, although the
extent of inundation for this hurricane is slightly greater than for
Hurricane Ike. For the future sea level scenario, inundation in the
Dickinson area is greatly reduced. Inundation in the low-lying areas
around along Dickinson and Gum Bayous is a little more widespread for
the higher sea level conditions compared to that for the present-day sea
level.
Without the dike, inundation in the Bacliff area is extensive for the 100-yr
proxy storm and both sea levels. With the Ike Dike, flooding in the Bacliff
area is eliminated.
The most vulnerable area is the area around Dickinson Bay, including the
San Leon community. Inundation occurs in San Leon for the 100-yr proxy
storm and both sea levels; flooding occurs from both the Dickinson Bay
and Galveston Bay sides.

Jackson State University 297
For the 500-yr proxy storm, and present-day sea level, the presence of the
dike reduces peak surge in the Dickinson Bay area from 17.5 ft to 10 ft. For
the future sea level scenario, the Ike Dike reduces peak surge levels from
20 ft to 12 ft. On average surge suppression is 7 to 8 ft.
The Ike Dike greatly reduces the amount of flooding that is experienced in
the Dickinson area for the 500-yr proxy storm and both sea level
scenarios. However, even with the Ike Dike in place, several areas around
Dickinson are inundated for this storm. The areas that remain inundated
in Dickinson for this storm and both sea levels are the same as the areas
that remain inundated for the 100-yr proxy storm and the future sea level,
although they are expanded for the 500-yr proxy storm.
For the 500-yr proxy storm and both sea levels, flooding in the Bacliff area
is eliminated by the Ike Dike.
The low-lying San Leon area is inundated from both the Dickinson Bay
and Galveston Bay sides for the 500-yr proxy storm and both sea levels.
To graphically illustrate these some of these observations and more
precisely identify the areas having the highest residual risk with the Ike
Dike in place, Figure 12-24 shows the widespread inundation that occurs
for the no-dike condition, for the 100-yr proxy storm and the future sea
level scenario. The sub-region is completely inundated including much of
the Dickinson area. Inundation for the 500-yr proxy storm and the future
sea level is slightly more widespread than that shown in Figure 12-24.
Figures 12-25 and 12-26 show the inundated areas for the 100-yr and 500-
yr proxy storms, respectively, with the Ike Dike in place, and for the future
sea level scenario. The Ike Dike reduces the risk of flooding in the Bacliff
area to a very low probability of occurrence. However, even with the dike
in place, the Dickinson and San Leon communities have residual risk.
These two figures indicate the size of the areas in Dickinson that have the
greatest residual risk of flooding, and they show how the extent of
inundation in these areas varies between the two proxy storms.

Jackson State University 298
Figure 12-24. Inundation pattern for the 100-yr proxy storm simulation in the San
Leon/Texas City (north)/Bacliff/Dickinson area, no-dike condition and the future sea level
scenario.
Figure 12-25. Inundation pattern for the 100-yr proxy storm simulation in the San
Leon/Texas City (north)/Bacliff/Dickinson area, with-dike condition and the future sea level
scenario.
The figures also indicate those areas around the Dickinson Bay shoreline,
including San Leon, that have the greatest residual risk. The residual risk
is much higher around Dickinson Bay because of the very low-lying
terrain. Figure 12-27 shows the topographic elevations in this sub-region.
Much of San Leon is situated on topography having elevations less than 8
ft NAVD88.

Jackson State University 299
Figure 12-26. Inundation pattern for the 500-yr proxy storm simulation in the San
Leon/Texas City (north)/Bacliff/Dickinson area, with-dike condition and the future sea level
scenario.
Figure 12-27. Topographic elevations in the San Leon/Texas City (north)/Bacliff/Dickinson
areas, in feet relative to the NAVD88 vertical datum, and possible secondary lines of
defense.
There are several possible secondary lines of defense that can lessen the
residual flood risk in this sub-region. The inundation maps and elevation
map can be used to assess possible secondary lines of defense that could be
implemented now or in the future as sea level rises to further reduce the
flood risk in these areas.
One measure that can reduce residual risk to part of the Dickinson area
involves a short section of levee or wall and a small gate to enable
navigation when the gate is not closed, at the location indicated as “Line 1”
in Figure 12-27. This secondary line of defense is tied into an existing
Jackson State University 300
elevated railroad bed where the rail line crosses the Dickinson Bayou. This
site is located just to the east of where Highway 3 crosses the bayou. The
rail line was selected as the site because it has an existing elevation of
nearly 18 ft NAVD88. This secondary measure could reduce the residual
risk to the low-lying floodplain area of Dickinson, which lies just to the
east of the rail line, to a very low probability. The water that inundates
this part of Dickinson enters the flood plain via the Dickinson Bayou.
A second possibility that could reduce residual risk for a much larger area,
including the entire Dickinson area, is a levee/dike/wall along Highway
146. This secondary line of defense is shown as “Line B” in Figure 12-27.
This alignment also would require a gate at the entrance to Clear Lake. It
would be incorporated into sections of the existing highway infrastructure.
The Gulf Coast Community Protection and Recovery District (2016) also
considered and proposed such a measure along this highway as a primary
line of defense for the western shoreline of Galveston Bay. As a secondary
line of defense, the levee/dike/wall/gate system would be much lower in
elevation, much shorter in length, and much less substantial in cross
section than a primary line of defense.
Neither of the secondary defense lines, A nor B, reduces the residual flood
risk for areas located to the east of them, including the community of San
Leon. Any significant flood risk reduction for San Leon must be achieved
with measures that address flooding from both the Galveston Bay and
Dickinson Bay sides of the peninsula. Inspection of the San Leon area in
Google Earth reveals an area that is characterized by an abundance of long
private docks along the east-, south- and west-facing shorelines of the San
Leon peninsula, and a small dock facility and embayment on the
Dickinson Bay side.
A number of approaches to reduce residual flood risk in this area are
possible. Most likely, raising the elevations of structures as part of a long-
term community plan is the only feasible approach. Construction of risk
reduction measures along the periphery of the peninsula, across the open
water leading to Dickinson Bay, and tying into the Texas City levee can be
done; however, it seems problematic for a number of reasons, including
real estate and rights-of way issues, public acceptability, and cost.
Jackson State University 301
Construction of a levee/dike/wall would either require removal of the
docks, construction seaward of the docks, or construction landward of
them, perhaps by elevating existing roads that are set back from the coast
line. There is a shore-parallel road on the side of the peninsula facing
Galveston Bay, but not along the south-facing shoreline. A possible
alignment for such a structural approach is indicated as “Line C” in Figure
12-27, although the actual alignment would likely have to be much more
irregular than this to integrate it into existing roads. The alignment shown
would tie into the Texas City levee and it would require construction of a
substantial navigation gate in open water.
Each of the alignments, Lines A, B or C, will differ in complexity of
implementation, costs, benefits, and other pros and cons. A structure on
Line C appears to be a complex and expensive alternative to implement,
and the least likely. An analysis of costs, benefits, and other factors would
need to be done to examine the feasibility of any of these risk reduction
measures.
The crest elevations of any of these measures would depend on the desired
level of risk reduction. Crest elevations would likely range from 11 to 14
feet for lines A and B, and 14 to 16 ft for Line C, for the future sea level
scenario. These elevations allow for freeboard above the with-dike peak
surge elevations in order to reduce any wave overtopping to manageable
levels. Approximate amounts of freeboard that are included here in the
elevation estimates are: 1 ft of freeboard at Line A, 2 ft at Line B and 4 ft of
freeboard at Line C.
Clear Lake/Bayport/La Porte
Figures A.25 through A.27 in Appendix A show inundation maps for the
sub-region that includes the Clear Lake, Bayport and La Porte areas. Maps
are shown for the simulations of Hurricane Ike and the 100-yr and 500-yr
proxy storms.
For the Hurricane Ike simulation, and for present-day sea level, the 17-ft
Ike Dike eliminates inundation throughout this entire sub-region. The
presence of the dike reduces the peak surge at the entrance to Clear Lake
from 11.5 ft to 2.5 ft, a surge suppression of 9 ft; and at Morgan’s Point the
peak surge is reduced from 13 ft to 2 ft, a surge suppression of 11 ft. For
the Ike simulation and for the future sea level scenario, which is +2.4
higher than the present-day sea level, the Ike Dike reduces peak surge

Jackson State University 302
levels from 14.5 ft to 5 ft at the entrance to Clear Lake, and from 16 ft to 5
ft at Morgan’s Point. Surge suppression was 9.5 ft to 11 ft for the future sea
level scenario. This considerable reduction in peak surge eliminates
inundation nearly everywhere in this sub-region, except in a few of the
lowest-lying areas at the entrance to Clear Lake at Seabrook and Clear
Lake Shores and along Nassau Bay.
Without the Ike Dike in place, for both the 100-yr and 500-yr proxy
storms, and for both sea level scenarios, this sub-region is subjected to
widespread inundation, particularly for the future sea level scenario.
Figure 12-28 shows the extent of inundation for the 100-yr proxy storm
and the future sea level scenario, without the Ike Dike in place. The NASA
facility adjacent to Nassau Bay is inundated. Bayport is inundated as are
all the communities along the western shoreline of Galveston Bay, La
Porte, Morgan’s Point, Shoreacres, Clear Lake Shores, Seabrook and
Kemah. Inundation for the 500-yr proxy storm and the future sea level is
even more widespread.
Figures 12-29 and 12-30 show the inundated areas for the 100-yr and 500-
yr proxy storms, respectively, and the future sea level scenario, for the
with-dike condition. With the 17-ft Ike Dike in place, there are substantial
widespread reductions in the area inundated. However, some low-lying
areas are still inundated, and most of them that have a higher density of
structures are located closer to the Galveston Bay shoreline. These lower-
lying areas have the greatest residual risk of flooding with the Ike Dike in
place
Flooding in the vicinity of the NASA facility, at Morgan’s Point, and at
LaPorte is eliminated. At Bayport flooding is nearly eliminated for the
present-day sea level, but there is some inundation in the southern part of
Bayport for the future sea level scenario. Also, with the dike in place,
inundation remains in those areas that are close to the entrance to Clear
Lake, in the Clear Lake Shores, Seabroook and Kemah areas, for both sea
levels. These are areas having higher residual risk.

Jackson State University 303
Figure 12-28. Inundation pattern for the 100-yr proxy storm simulation in Clear
Lake/Bayport/La Porte areas, no-dike condition and the future sea level scenario.
Figure 12-29. Inundation pattern for the 100-yr proxy storm simulation in Clear
Lake/Bayport/La Porte areas, with-dike condition and the future sea level scenario.

Jackson State University 304
Figure 12-30. Inundation pattern for the 500-yr proxy storm simulation in Clear
Lake/Bayport/La Porte areas, with-dike condition and the future sea level scenario.
For the 500-yr proxy storm and the future sea level, these same areas are
inundated with the Ike Dike in place. In addition to these areas, other
low-lying areas adjacent to the Clear Lake shoreline also are inundated,
including areas on the periphery of the NASA facility in Nassau Bay (see
Figure 12-30). The southern part of La Porte is inundated for this storm
and the future sea level scenario. However, inundation at Morgan’s Point
is eliminated by the Ike Dike even for the 500-yr proxy storm and the
future sea level.
To reduce the residual risk in this sub-region, there are several possible
measures that can be taken. The alignments of possible measures are
shown in Figure 12-31, which also shows the topographic elevations in the
sub-region.
One possible measure involves a levee/dike/wall system that is built along
Highway 146, which could be incorporated into the existing highway
infrastructure. The Gulf Coast Community Protection and Recovery
District (2016) also considered and proposed such a measure along this
highway as a primary line of defense. As a secondary line of defense, the
levee/dike/wall/gate system would be much lower in elevation, much
shorter in length, and much less substantial in cross section. This option

Jackson State University 305
would also require a gate to facilitate navigation at the entrance to Clear
Lake. The two sections that comprise this secondary line of defense are
shown as “Line A” in Figure 12-31.
Figure 12-31. Topographic elevations in the Clear Lake/Bayport/La Porte areas, in feet
relative to the NAVD88 vertical datum, and possible secondary lines of defense.
The upper section of the secondary line of defense, Line A, could be
replaced by another measure along an alignment indicated as “Line B” in
Figure 12-31. This potential line of defense is positioned along another
smaller road, South Broadway Street, which also runs north to south
through most of LaPorte. This alignment would reduce flood risk for a
greater area. However, the narrowness of the available footprint and
rights of way for this road, and the need for many gates or other means to
provide access to side streets on either side of it, probably preclude this
alignment as being a viable alternative. The larger dimensions of the
Highway 146 footprint and rights of way probably make it the better
alternative.
The only other apparent option which would provide the greatest risk
reduction for the broadest area would be a secondary line of defense right
at the Galveston Bay shoreline, taking the alignment shown in Figure 12-31
Jackson State University 306
as “Line C”. However, judging from the built environment and the many
docks along the bay shoreline, there might be public opposition to
construction of any structural measures at the coast.
The other option is to raise the elevations of individual structures as part
of a long-term strategy to do so in the most vulnerable areas.
Each of the possible alignments for a secondary line of defense will differ
in ease of implementation, costs, benefits, real estate and rights of ways
issues, and other pros and cons. An analysis of costs, benefits, and other
factors, would need to be done to examine the feasibility of any of these
levee/dike/wall/gate system alternatives.
The crest elevations of any of these measures depends on the desired level
of risk reduction. Crest elevations would likely range from 13 to 16 feet for
any measures taken along Line A. These elevations allow for freeboard
above the with-dike peak surge elevations in order to reduce any wave
overtopping to manageable levels. Approximate amounts of freeboard
that are included here are 2 to 4 ft.
Houston Ship Channel
Upper Houston Ship Channel (eastern portion)
Figures A.28 through A.30 in Appendix A show inundation maps for this
sub-region that includes the eastern half of the upper reaches of the
Houston Ship Channel. Maps are shown for the simulations of Hurricane
Ike and the 100-yr and 500-yr proxy storms.
For both of the Hurricane Ike simulations, the presence of the 17-ft Ike
Dike reduces the peak surge from 13.5 ft to 2.5 ft for the present-day sea
level; and, for the future sea level scenario, the peak surge is reduced from
16.5 ft to 5 ft. On average, the surge suppression for the Hurricane Ike
simulations is approximately 11 ft. This substantial reduction in peak
surge eliminates inundation nearly everywhere in this sub-region for all
but isolated extremely low-lying areas.
For the 100-yr proxy storm, the 17-ft Ike Dike reduces peak surge from
18.5 ft to 10 ft for the present-day sea level and from 21.5 ft to 12 ft for the
future sea level scenario. On average, the surge suppression for the 100-yr
proxy storm is approximately 9 ft for these two sea levels.

Jackson State University 307
Figures 12-32 and 12-33 show the inundated areas for the 100-yr proxy
storm and the future sea level scenario, for both the no-dike and with-dike
simulations respectively.
For the no-dike case (see Figure 12-32), there is significant inundation to
many industrial sites. At peak surge levels of 21.5 ft for this case, extensive
economic damage is expected. In addition to economic losses, inundation
creates the potential for significant environmental damage. This is a
heavily industrialized area, having many petro-chemical facilities.
Figure 12-32. Inundation pattern for the 100-yr proxy storm simulation in the eastern
portion of the upper Houston Ship Channel, no-dike condition and the future sea level
scenario.
Figure 12-33. Inundation pattern for the 100-yr proxy storm simulation in the eastern
portion of the upper Houston Ship Channel, with-dike condition and the future sea level
scenario.

Jackson State University 308
Inspection of Google Earth imagery shows that many areas of the sub-
region are heavily populated with storage tanks. Ecological impacts could
result from petro-chemical spills associated with storage facilities and/or
tanks that are damaged as a result of inundation by the storm surge and
accompanying wave energy/forces.
With the 17-ft Ike Dike in place, there are substantial reductions in the
areas that are inundated (see Figure 12-33). However, inundation still
occurs in a few of the lowest-lying areas, although the depth of inundation
in these areas is greatly reduced by the dike. Elevations for the sub-region
are shown in Figure 12-34 (note the change in elevation scale used in the
figure, compared to all previous elevation figures). A few of the industrial
facilities are located in low-lying areas where topographic elevations are
less than 9 ft above NAVD88.
Figure 12-34. Topographic elevations in the eastern portion of the upper Houston Ship
Channel, in feet relative to the NAVD88 vertical datum.
For the 500-yr proxy storm, the 17-ft Ike Dike reduces the peak surge from
22 ft to 12.5 ft for the present-day sea level and from 25 ft to 14.5 ft for the
future sea level scenario. On average, the surge suppression for the 500-yr
proxy storm is approximately 10 ft for these two cases.
Figures 12-35 and 12-36 show the inundated areas for the 500-yr proxy
storm and the future sea level scenario, for both the no-dike and with-dike
simulations respectively.
For the no-dike case (Figure 12-35), because of the 25-ft peak storm surge,
there is much more widespread inundation and deeper depths of

Jackson State University 309
inundation in industrial areas throughout the sub-region than for the 100-
yr proxy storm and future sea level. As seen in Figure 12-36, the Ike Dike
greatly reduces the extent of inundation for this event. Where inundation
still occurs, depths are greatly reduced, by approximately 10 ft, which is
the amount of surge suppression.
Figure 12-35. Inundation pattern for the 500-yr proxy storm simulation in the eastern
portion of the upper Houston Ship Channel, no-dike condition and the future sea level
scenario.
Figure 12-36. Inundation pattern for the 500-yr proxy storm simulation in the eastern
portion of the upper Houston Ship Channel, with-dike condition and the future sea level
scenario.

Jackson State University 310
In areas having undesirable residual risk, levees/dikes/walls built to ring
individual facilities can reduce it to the desired level. In light of the peak
surge levels for the 100-yr and 500-yr proxy storms, and both sea level
scenarios, the elevations of such features would probably need to be in the
range of 11 to 16 ft, depending on the desired level of risk reduction and
exposure of the site/levee to wave action.
Upper Houston Ship Channel (western portion)
Figures A.31 through A.33 in Appendix A show inundation maps for this
sub-region that comprises much of the western half of the upper reaches of
the Houston Ship Channel. Maps are shown for the simulations of
Hurricane Ike and the 100-yr and 500-yr proxy storms.
The storm surge conditions in this part of the upper ship channel are
nearly the same as those in the eastern portion of the upper ship channel,
for both no-dike and with-dike conditions and for both sea level scenarios.
Figures 12-37 and 12-38 show the inundated areas for the 100-yr proxy
storm and the future sea level scenario, for both the no-dike and with-dike
simulations respectively. Figures 12-39 and 12-40 show the inundated
areas for the 500-yr proxy storm and the future sea level scenario, for both
the no-dike and with-dike simulations respectively.
Observations and conclusions regarding the extent and depths of
inundation for the western portion of the upper reaches of the Houston
Ship Channel are the same as those for the eastern portion. With the 17-ft
Ike Dike in place, there are substantial reductions in the areas that are
inundated and inundation depths are reduced by amounts roughly equal
to the average surge suppression values. However, inundation still occurs
in a few of the lowest-lying areas with the dike in place, although the depth
of inundation in these areas is greatly reduced. Elevations for the western
sub-region are shown in Figure 12-41.

Jackson State University 311
Figure 12-37. Inundation pattern for the 100-yr proxy storm simulation in the western
portion of the upper Houston Ship Channel, no-dike condition and the future sea level
scenario.
Figure 12-38. Inundation pattern for the 100-yr proxy storm simulation in the western
portion of the upper Houston Ship Channel, with-dike condition and the future sea level
scenario.

Jackson State University 312
Figure 12-39. Inundation pattern for the 500-yr proxy storm simulation in the western
portion of the upper Houston Ship Channel, no-dike condition and the future sea level
scenario.
Figure 12-40. Inundation pattern for the 500-yr proxy storm simulation in the western
portion of the upper Houston Ship Channel, with-dike condition and the future sea level
scenario.
The 17-ft Ike Dike is extremely effective in suppressing the peak storm
surge amplitude in the upper Houston Ship Channel reaches of Galveston
Bay for severe hurricanes that would otherwise produce very large and
damaging storm surges in this region. As is the case for the Texas City
industrial area, the magnitude of the surge suppression achieved with the
Ike Dike is sufficient to reduce the risk of inundation to a very low
probability in most of these highly industrialized areas. This is a major
advantage for this regional approach to flood risk reduction.

Jackson State University 313
Figure 12-41. Topographic elevations in the western portion of the upper Houston Ship
Channel, in feet relative to the NAVD88 vertical datum.
The “Centennial Gate” option was originally proposed by the Rice
University SSPEED Center as a stand-alone surge suppression measure to
prevent storm surge penetration into the upper reaches of the Houston
Ship Channel. The 500-yr proxy storm, for existing conditions and the
future sea level scenario, produces peak surges that reach nearly 25 ft in
this area. With the coastal spine in place, peak surge levels that are
generated in the upper ship channel (14 to 15 ft) would be about 1 ft higher
than those experienced during Hurricane Ike. Except for very low-lying
areas, the Ike Dike seems to be quite effective in suppressing surge levels
in the upper ship channel area, probably precluding the need for a
“Centennial Gate” as a risk reduction measure for this region. If sea level
is expected to be much higher than the future sea level of +2.4 ft, or if Ike
Dike gate operations enable more of the hurricane surge forerunner to
penetrate into Galveston Bay prior to gate closure, perhaps adding several
feet of water to the system, the need for such a gate can be revisited.

Jackson State University 314
13 Examination of Alternate Ike
Dike Configurations
Introduction
The original set of storm simulations that were made to examine benefits
of the Ike Dike concept involved a long dike that followed the shoreline,
began just south of Freeport, TX, and ended just to the east of High Island,
TX. The original dike alignment followed the long continuous green line
that is shown in Figure 13-1, which follows the coastline. The eastern
terminus of the original dike is shown by the blue star in Figure 13-1; the
location of High Island is shown by the yellow star. The dike included gate
systems at both San Luis Pass and Bolivar Roads in order to provide a
single continuous line of defense. Results from those initial simulations
were discussed in Chapter 8; and, they suggested that flanking around the
eastern terminus of the dike lead to significant increases in peak storm
surge levels of several feet throughout Galveston Bay.
Figure 13-1. Alignment of the original and extended conceptual Ike Dikes.
Sabine Pass
High Island
Freeport
San Luis Pass
Bolivar Roads

Jackson State University 315
To reduce the adverse effects of flanking, the original alignment was
extended further to the east, all the way to Sabine Pass, TX. The extended
dike alignment is shown in Figure 13-1, as the full extent of the green line
that follows the shoreline. Near Sabine Pass the dike alignment veered
slightly inland and followed an historic sand dune line.
An analysis of reductions in peak storm surge achieved with the extended
dike was the subject of Chapters 10 through 12. This chapter presents
results for several alternate Ike Dike configurations that have been
identified or proposed by others.
Alignment 1a – A Modification of the Extended Ike Dike
Dutch partners in the Ike Dike investigation identified several other
possible alignments for a long coastal spine. Each of them involved tying
the dike into higher ground elevations at alternate locations on both its
eastern and western ends (Van Berchem et al., 2016).
On the eastern end, in addition to the coastal alignment shown in Figure
13-1 that extended all the way to Sabine Pass, they identified an inland
option. That option, the State Highway 124 option (referred to here as SH
124), left the coast and turned inland at High Island and then followed SH
124 north to Winnie, TX. This alignment for the eastern termination
section of the dike is shown in Figure 13-2. The inland alignment is
significantly shorter, and therefore potentially less costly, than the
extended dike alignment; although, a gate system at the Intercoastal water
waterway just north of High Island would probably be required, which
increases the cost. The SH 124 alignment for the eastern section that is
modeled assumes that a gate system is in place.
On the western end, van Berchem et al. (2016) identified two options. One
option, the Bluewater Highway alignment, is similar to the extended dike
alignment that has been previously modeled in this study. This option
began at the western end of Galveston Island, crossed San Luis Pass with a
gate system, followed or paralleled the Bluewater Highway south of the
pass, and ended at Texas City where it tied in to the existing levees there.
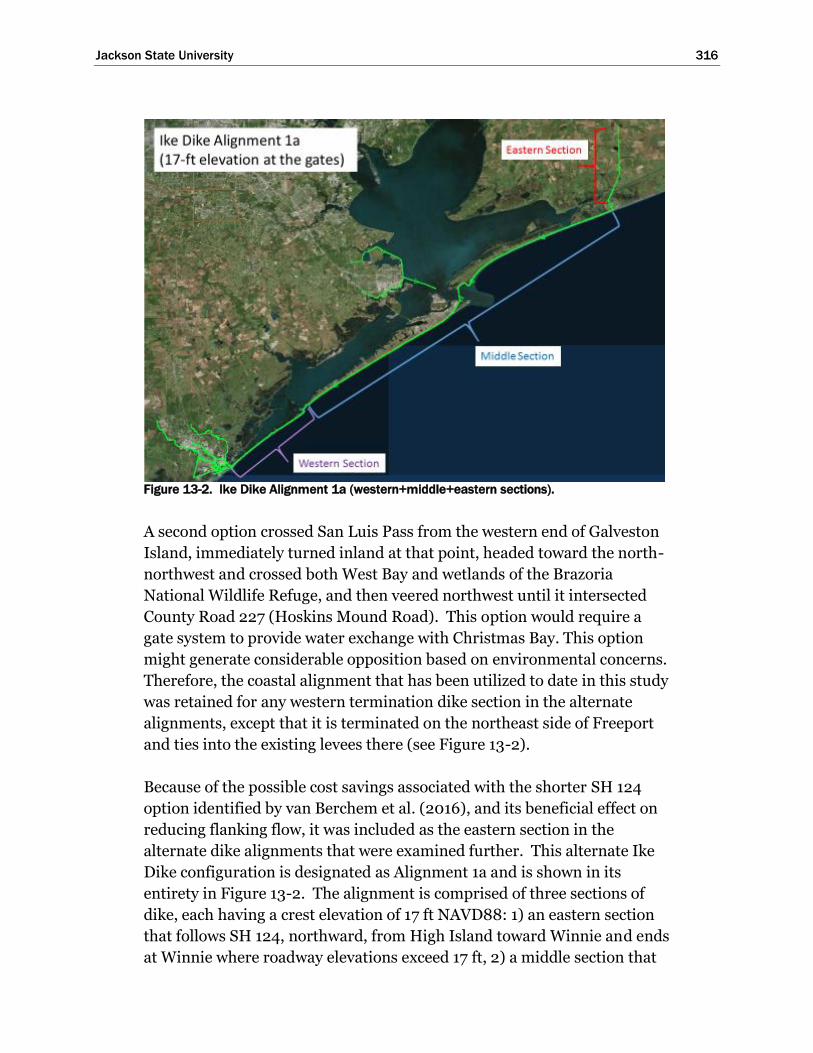
Jackson State University 316
Figure 13-2. Ike Dike Alignment 1a (western+middle+eastern sections).
A second option crossed San Luis Pass from the western end of Galveston
Island, immediately turned inland at that point, headed toward the north-
northwest and crossed both West Bay and wetlands of the Brazoria
National Wildlife Refuge, and then veered northwest until it intersected
County Road 227 (Hoskins Mound Road). This option would require a
gate system to provide water exchange with Christmas Bay. This option
might generate considerable opposition based on environmental concerns.
Therefore, the coastal alignment that has been utilized to date in this study
was retained for any western termination dike section in the alternate
alignments, except that it is terminated on the northeast side of Freeport
and ties into the existing levees there (see Figure 13-2).
Because of the possible cost savings associated with the shorter SH 124
option identified by van Berchem et al. (2016), and its beneficial effect on
reducing flanking flow, it was included as the eastern section in the
alternate dike alignments that were examined further. This alternate Ike
Dike configuration is designated as Alignment 1a and is shown in its
entirety in Figure 13-2. The alignment is comprised of three sections of
dike, each having a crest elevation of 17 ft NAVD88: 1) an eastern section
that follows SH 124, northward, from High Island toward Winnie and ends
at Winnie where roadway elevations exceed 17 ft, 2) a middle section that

Jackson State University 317
extends from High Island to the western end of Galveston Island, and
includes a gate system at Bolivar Roads, and 3) a western section that
extends the dike across San Luis Pass (includes a gate system there),
follows the shoreline, ends at Freeport, and ties into the existing levee
system there. The alignment of the western section parallels the Bluewater
Highway option identified by van Berchem et al. (2016). A 17-ft NAVD88
crest elevation was used for all dike sections and the gate systems in
Bolivar Roads and San Luis Passes, in Alignment 1a.
Alternate Alignment 1b – Alignment 1a with Lowered Gate
Elevations
Preliminary design analyses was performed by the Dutch study partners
for gate systems at both Bolivar Roads and San Luis Pass (see Jonkman et
al., 2015). They designed both a navigational gate section and an
environmental gate section at each pass. The navigational sections enable
safe navigation, and the environmental sections allow increased water
exchange between the Gulf and the interior bays when the gate systems are
open. Both navigation and environmental sections are to be fully closed
during a hurricane surge event.
Table 13-1 shows the lengths of, and crest elevations of, the navigation and
environmental gate sections at both passes, as specified by Jonkman et al.
(2015). As part of the gate system in San Luis Pass, some of the shallower
portions of the pass would be permanently closed with a section of dike.
This closure section extended for a length of 2624 ft (800 m), and had a
crest elevation of 17 ft (5.2 m), as does the rest of the 17-ft Ike Dike.
Table 13-1. Summary of Lengths and Crest Elevations for the Navigation
and Environmental Gate Sections (from Jonkman et al. (2015))
Gate Location
Navigation
Section
Length
(meters, feet)
Navigation
Section
Elevation
(meters, feet)
Environmental
Section
Length
(meters, feet)
Environmental
Section
Elevation
(meters, feet)
Bolivar Roads 200, 656 3.0, 9.8 2800, 9184 4.2, 13.8
San Luis Pass 50, 164 3.0, 9.8 150, 492 4.2, 13.8

Jackson State University 318
Crest elevations for both gate sections, at both passes, were designed to
allow significant wave overtopping and even steady overflow during more
intense hurricane events. Lower gate crest elevations were selected in
order to reduce construction costs. The volume of water that enters the
bays as a result of wave overtopping only, which can occur while the still
water level is below the gate crest elevation, is expected to be much less
than the volume associated with steady flow over the gates. When it
occurs, steady flow will only last for up to several hours before and after
the time of peak surge. It was expected that the amount of steady flow
over the lower gates would not lead to a significant increase in storm surge
levels within the bays, because of the large water storage capacity of
Galveston and West Bays relative to the volume of overtopping and
overflow.
To quantify the influence of steady overflow on surge levels within the bay,
particularly at the City of Galveston which is immediately adjacent to the
Bolivar Roads gate system and which is vulnerable to flooding from the
bay side, an alternate dike configuration was considered in the analysis.
Alignment 1b was developed, in which the 17-ft crest elevation of the dike
in Alignment 1a was lowered to the elevations shown in Table 13-1, at the
locations of both gate systems. The lower gate elevations were represented
in the grid mesh used in the storm surge modeling by changing grid node
and element elevations at the approximate positions of the gates and
approximately for the lengths shown in the table.
At the Bolivar Roads navigation gate, Jonkman et al. (2015) also discuss
the possibility of leaving a gap between the bottom of the gate and the sea
floor or scour blanket. Such an opening would allow water leakage into
the bays during the entire storm duration following gate closure, including
the time while the wind-driven surge forerunner is building a day or more
in advance of the hurricane’s arrival, as well as during the time pf peak
surge as the storm makes landfall. This source of leakage is not considered
in the surge modeling done here for dike Alignment 1b or in any of the
alternate alignments; however, its influence on surge levels within the bay
should be examined if the final design calls for a gap beneath the
navigation gate.

Jackson State University 319
Alternate Alignment 2
The Gulf Coast Community Protection and Recovery District (2016a and
2016b), GCCPRD, recently completed its own storm surge suppression
study to investigate measures for reducing hurricane flood risk for the
north Texas coast. For their central region, which encompassed
Chambers, Harris and Galveston counties, the GCCPRD’s final
recommendation included a coastal spine, or dike, along with several other
localized risk reduction measures inside the bay, including a ring dike for
the City of Galveston. The coastal spine recommended by the GCCPRD
extended from the western end of Galveston Island, across Bolivar Pass,
and ended at High Island. A gate system was included at Bolivar Roads.
The GCCPRD coastal spine ended at the western end of Galveston Island,
with no gate system at San Luis Pass. The recommended coastal spine was
situated inland, parallel to existing highways on both Galveston Island and
Bolivar Peninsula, and not at the shoreline as it is treated in the
alignments considered here. The GCCPRD coastal spine had higher dike
crest elevations that ranged from 18 to 21 ft.
The portion of the GCCPRD coastal spine that lies along Bolivar Peninsula
and ends at High Island is shorter than the Ike Dike alignment that was
originally considered as part of this feasibility study and shorter than the
extended dike that was most recently considered. The limited eastward
extent of the GCCPRD dike raised questions regarding the role of flanking
flow on storm surge elevations in Galveston Bay, as well as the trade-offs
between dike cost and flood risk that might be associated with omission of
an eastern termination section, like those shown in Figures 13-1 and 13-2.
To examine these questions, an Alignment 2 for the Ike Dike concept was
developed and analyzed. Alignment 2 is shown in Figure 13-3, and it
involves a 17-ft NAVD88 dike that extends from the western end of
Galveston Island, across Bolivar Roads, and ends at High Island just like
the GCCPRD plan. Unlike the GCCPRD dike, Alignment 2 follows the
shoreline. Alignment 2 is nearly identical in length/extent compared to
the coastal spine recommended by the GCCPRD, although the crest
elevations and details of the alignment differ. Alignment 2 represents the
middle section, only, of the alignments shown in Figures 13-1 and 13-2,
without any eastern or western termination sections.

Jackson State University 320
Figure 13-3. Ike Dike Alignment 2 (middle section only).
The GCCPRD plan terminates at the western end of Galveston Island, and
it avoids the cost of both a gate complex at San Luis Pass and a coastal
spine segment that runs from San Luis Pass south to Freeport.
Consideration of an Alignment 2 also enables an analysis of the trade-offs
between changes in dike length and changes in storm surge reduction that
are associated with omission of both eastern and western termination
sections like those shown in Figures 13-1 and 13-2.
Alternate Alignment 3
Termination of the coastal spine at the western end of Galveston Island
with no gate system at San Luis Pass, as recommended by the GCCPRD,
enables propagation of the hurricane surge forerunner into West Bay; and,
it precludes any means for operationally controlling the forerunner’s
influence on surge levels within West Bay prior to gate closure or timing
gate closure to coincide with low tide stage in the bays. Termination of the
dike at this location also significantly increases peak storm surge levels
within West Bay; it enables propagation of the peak storm surge through
San Luis Pass as well as flow over the barrier island south of the pass once
it becomes inundated.
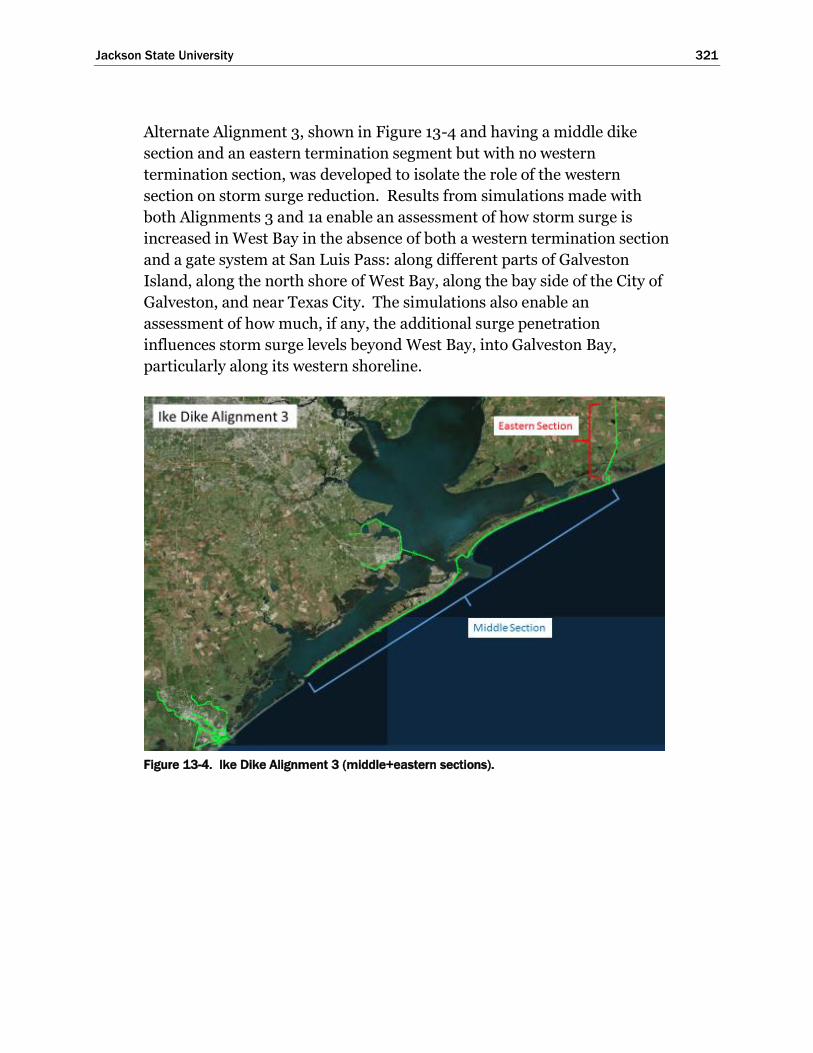
Jackson State University 321
Alternate Alignment 3, shown in Figure 13-4 and having a middle dike
section and an eastern termination segment but with no western
termination section, was developed to isolate the role of the western
section on storm surge reduction. Results from simulations made with
both Alignments 3 and 1a enable an assessment of how storm surge is
increased in West Bay in the absence of both a western termination section
and a gate system at San Luis Pass: along different parts of Galveston
Island, along the north shore of West Bay, along the bay side of the City of
Galveston, and near Texas City. The simulations also enable an
assessment of how much, if any, the additional surge penetration
influences storm surge levels beyond West Bay, into Galveston Bay,
particularly along its western shoreline.
Figure 13-4. Ike Dike Alignment 3 (middle+eastern sections).

Jackson State University 322
Storm Surge Simulations Made for the Alternate Dike Alignments
Four storm surge simulations were made for each of the four alternate
dike alignments, Alignments 1a, 1b, 2 and 3. All simulations for alternate
dike alignments were made for the future sea level scenario, which is 2.4 ft
higher than present sea level (i.e., a future sea level of 3.31 ft, NAVD88).
This future sea level scenario is the same SLR1 scenario that was
considered previously in the extended Ike Dike analysis discussed in
Chapters 10 through 12. For each dike alignment, simulations were made
for the 10-yr, 100-year, and 500-yr proxy storms and for Hurricane Ike,
using the same improved modeling approach that was adopted for the
extended Ike Dike simulations. Peak storm surge results for each of these
simulations were provided to the economics team for further analysis.
It is important to note that each of the three proxy storms makes landfall
at San Luis Pass, and all three are of a size (i.e., radius to maximum winds)
that produces maximum coastal surges near Bolivar Roads and along the
western shoreline of Galveston Bay. Each proxy storm produces lesser
peak storm surges at San Luis Pass, the location of landfall. These three
storms were selected to best replicate probabilistic ARI storm surge values
at the City of Galveston and along the western side of Galveston Bay, not at
San Luis Pass or elsewhere, such as at High Island. These three proxy
storms are probably not the storms that produce the 10-yr, 100-yr, and
500-yr ARI storm surge values at San Luis Pass. The increase in storm
surge and flood risk within West Bay, which arises in the absence of the
western dike section, will be understated by the sole use of these three
proxy storms.
Hurricane Ike made landfall near Bolivar Roads and generated its peak
surge further to the east, in the vicinity of High Island. Results for the
Hurricane Ike simulations shed insight concerning how much additional
flanking occurs when the maximum surge occurs in the vicinity of the
eastern termination section, compared to flanking associated with the
three proxy storms where the peak coastal surge near High Island is less
than the maximum surge in the vicinity of Bolivar Roads.
Peak Surge Maps for Each Dike Alignment/Storm Simulation
Figures 13-5 through 13-8 show maximum water surface elevation maps
(in feet, NAVD88) for the 10-yr proxy storm (Storm 535) and all four
alignments, 1a, 1b, 2 and 3, respectively: 1a (western + middle + eastern

Jackson State University 323
sections with 17-ft gate elevations), 1b (western + middle + eastern
sections with lower gate elevations), 2 (middle section only) and 3 (middle
+ eastern sections), in that order. Figures 13-9 through 13-12 show
maximum water surface elevation maps for the 100-yr proxy storm (Storm
033) and all four alignments. Figures 13-13 through 13-16 show maximum
water surface elevation maps for the 500-yr proxy storm (Storm 036) and
all four alignments. Figures 13-17 through 13-20 show maximum water
surface elevation maps for Hurricane Ike and all four alignments.
Figure 13-5. Dike alignment 1a (western+middle+eastern sections). Storm 535 (10-yr
proxy). Maximum water surface elevation field (in feet, NAVD88) for the future sea level
scenario (SLR1, +3.31 ft NAVD88).
Figure 13-6. Dike alignment 1b (western+middle+eastern sections with lowered gate
elevations). Storm 535 (10-yr proxy). Maximum water surface elevation field (in feet,
NAVD88) for the future sea level scenario (SLR1, +3.31 ft NAVD88).
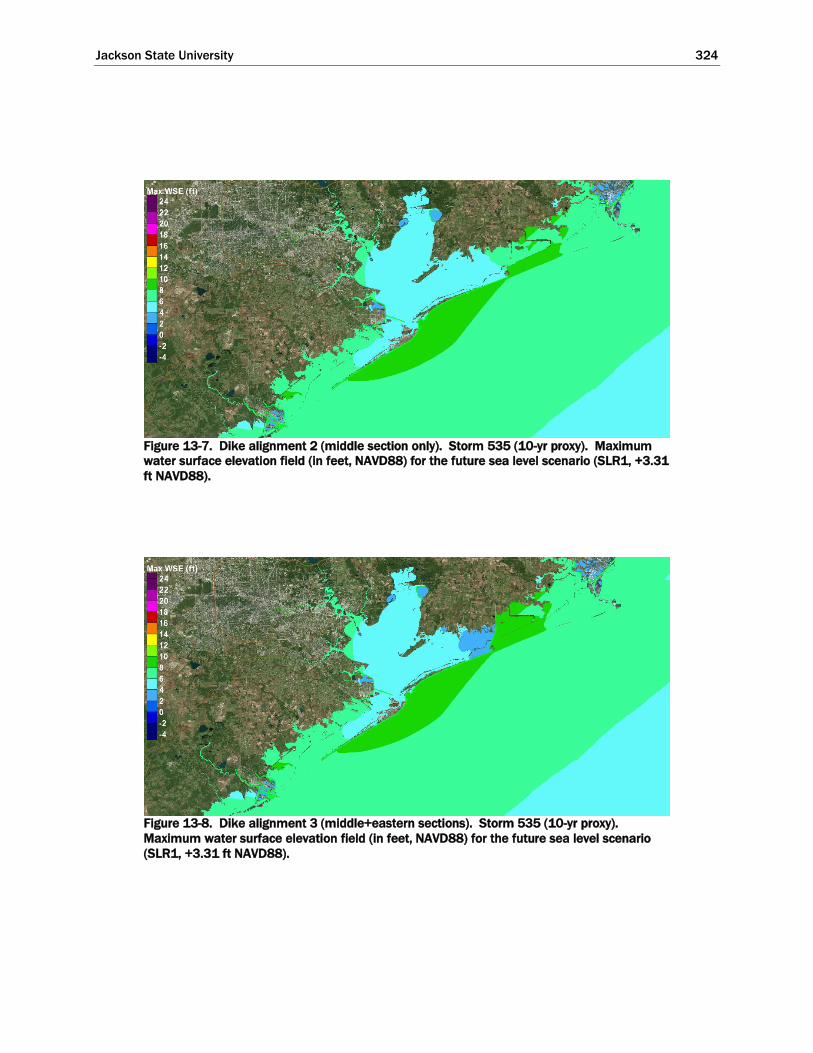
Jackson State University 324
Figure 13-7. Dike alignment 2 (middle section only). Storm 535 (10-yr proxy). Maximum
water surface elevation field (in feet, NAVD88) for the future sea level scenario (SLR1, +3.31
ft NAVD88).
Figure 13-8. Dike alignment 3 (middle+eastern sections). Storm 535 (10-yr proxy).
Maximum water surface elevation field (in feet, NAVD88) for the future sea level scenario
(SLR1, +3.31 ft NAVD88).

Jackson State University 325
Figure 13-9. Dike alignment 1a (western+middle+eastern sections). Storm 033 (100-yr
proxy). Maximum water surface elevation field (in feet, NAVD88) for the future sea level
scenario (SLR1, +3.31 ft NAVD88).
Figure 13-10. Dike alignment 1b (western+middle+eastern sections with lowered gate
elevations). Storm 033 (100-yr proxy). Maximum water surface elevation field (in feet,
NAVD88) for the future sea level scenario (SLR1, +3.31 ft NAVD88).

Jackson State University 326
Figure 13-11. Dike alignment 2 (middle section only). Storm 033 (100-yr proxy). Maximum
water surface elevation field (in feet, NAVD88) for the future sea level scenario (SLR1, +3.31
ft NAVD88).
Figure 13-12. Dike alignment 3 (middle+eastern sections). Storm 033 (100-yr proxy).
Maximum water surface elevation field (in feet, NAVD88) for the future sea level scenario
(SLR1, +3.31 ft NAVD88).
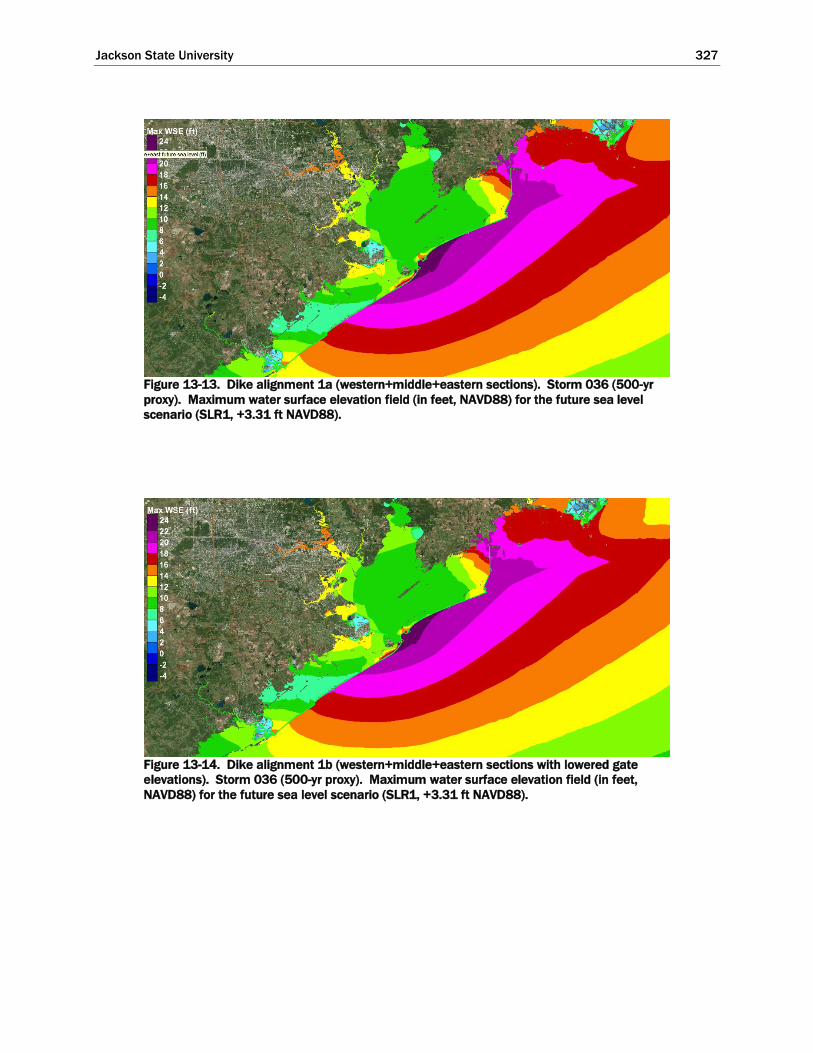
Jackson State University 327
Figure 13-13. Dike alignment 1a (western+middle+eastern sections). Storm 036 (500-yr
proxy). Maximum water surface elevation field (in feet, NAVD88) for the future sea level
scenario (SLR1, +3.31 ft NAVD88).
Figure 13-14. Dike alignment 1b (western+middle+eastern sections with lowered gate
elevations). Storm 036 (500-yr proxy). Maximum water surface elevation field (in feet,
NAVD88) for the future sea level scenario (SLR1, +3.31 ft NAVD88).

Jackson State University 328
Figure 13-15. Dike alignment 2 (middle section only). Storm 036 (500-yr proxy). Maximum
water surface elevation field (in feet, NAVD88) for the future sea level scenario (SLR1, +3.31
ft NAVD88).
Figure 13-16. Dike alignment 3 (middle+eastern sections). Storm 036 (500-yr proxy).
Maximum water surface elevation field (in feet, NAVD88) for the future sea level scenario
(SLR1, +3.31 ft NAVD88).
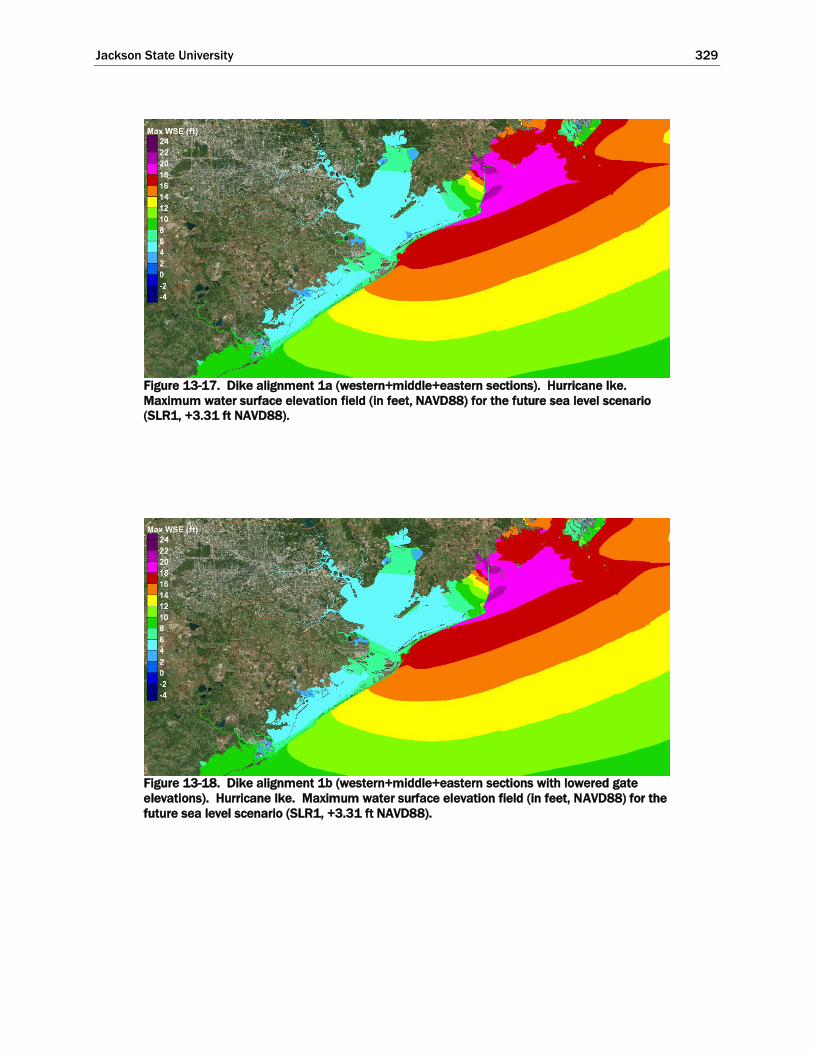
Jackson State University 329
Figure 13-17. Dike alignment 1a (western+middle+eastern sections). Hurricane Ike.
Maximum water surface elevation field (in feet, NAVD88) for the future sea level scenario
(SLR1, +3.31 ft NAVD88).
Figure 13-18. Dike alignment 1b (western+middle+eastern sections with lowered gate
elevations). Hurricane Ike. Maximum water surface elevation field (in feet, NAVD88) for the
future sea level scenario (SLR1, +3.31 ft NAVD88).

Jackson State University 330
Figure 13-19. Dike alignment 2 (middle section only). Hurricane Ike. Maximum water
surface elevation field (in feet, NAVD88) for the future sea level scenario (SLR1, +3.31 ft
NAVD88).
Figure 13-20. Dike alignment 3 (middle+eastern sections). Hurricane Ike. Maximum water
surface elevation field (in feet, NAVD88) for the future sea level scenario (SLR1, +3.31 ft
NAVD88).

Jackson State University 331
Extraction of Peak Storm Surge Values for Analysis
Quantitative examination of the differences in peak surge for the various
alternate dike alignments was facilitated by extracting values from each
peak storm surge field that was used to create a peak surge map, at a series
of points. The locations of the points are shown in Figure 13-21, and the
latitude/longitude coordinates of each are listed in Appendix B. Peak
surge values at each location, for each of the four alignments, and for each
of the four storms, also are provided in Appendix B. All simulations reflect
use of the future sea level scenario, SLR1.
Values from the peak surge maps associated with the extended dike
alignment which terminates at Sabine Pass and which was extensively
discussed in Chapters 10 through 12, also are given in Appendix B for the
same locations, same storms, and the same future sea level scenario.
Figure 13-21. Locations for extracted peak storm surge values and water surface elevation
times series.

Jackson State University 332
Comparison of Two Different Alignments for an Eastern
Termination Section.
The extended Ike Dike has been the focus of the study thus far; and its
eastern portion followed the shoreline along Bolivar Peninsula and it
followed the shoreline, or nearly so, all the way to its termination at Sabine
Pass. Alignment 1a reflects a modification to the extended dike. The
following changes are based on work done by van Berchem et al. (2016): 1)
the dike is shortened on its eastern end, 2) reoriented at High Island to
have a mostly north-south alignment that follows state highway SH 124
north of High Island, and 3) ends at Winnie, TX. Both alignments for the
eastern portion, the coastal alignment in the original extended dike and
Alignment 1a, were primarily designed to minimize flanking during the
storm and the subsequent entry of water into Galveston Bay.
Examination of the peak storm surge maps and location-specific values
extracted from the maps reveals both similarities and differences between
the two alignments. Peak surge maps for the extended dike alignment
were presented and discussed in Chapter 11. Comparison of the with-dike
maps with maps for the no-dike condition is informative as well. The no-
dike maps also were presented in Chapter 11.
For the 10-yr proxy storm, Storm 535 run at the future sea level SLR1, a
comparison of the peak surge maps for both Alignment 1a (Figure 13-5)
and the extended dike (Figure 11-17) illustrates both the similarities and
differences. Inside the dike, peak surge throughout most of Galveston Bay
including its western shoreline, throughout West Bay and its adjacent
shorelines, and along much of Bolivar Peninsula, differences in peak surge
between the two different eastern alignments are very small, 0.1 ft or less.
Peak surge values for Alignment 1a are consistently slightly less than those
for the extended dike. Alignment 1a is slightly more effective than the
extended dike in reducing flanking. Some differences are evident in the
immediate vicinity of the eastern dike sections. Here, peak surge maps
show that termination of the dike at Sabine Pass allows a few more feet of
peak surge due to flanking, compared to Alignment 1a. Alignment 1a is
tied into higher ground, is a complete barrier with no gaps, and no flow
over the 17-ft dike occurs for this storm, so flanking is completely
eliminated by this alignment and for this storm. The extended dike allows
some flanking flow into Galveston Bay through the Intercoastal Waterway
and over inundated low lying terrain if the surge is high enough at Sabine
Pass to cause inundation to occur, as is the case for this storm.

Jackson State University 333
Comparison of the peak surge maps for Alignment 1a (see Figure 13-5) and
the no-dike condition (see Figure 11-13) shows that there is a slightly
higher peak surge value, an amplification, outside the eastern section of
Alignment 1a compared to the peak surge at the same location without any
dike in place. This small amplification is a local effect that is constrained
to the immediate vicinity just outside the dike; and it extends along the
entire eastern section of Alignment 1a, from Winnie all the way to High
Island. The effect of amplification does not extend very far eastward and
definitely not to Port Arthur. The reason for the local amplification in
peak surge is the following. The counterclockwise rotating wind field of
hurricanes that approach from the southeast pushes water, which has
inundated the low lying terrain, against the eastern dike section of
Alignment 1a. This process causes a storm surge build-up against the
eastern dike section that would not, otherwise, occur without the presence
of the dike. This is the same “long-dike” effect that was discussed
previously for the open coast along Galveston Island and Bolivar
Peninsula, in which the storm surge right at and along the dike is
increased by the presence of the long coastal dike itself.
Examination of the peak surge results for Alignment 1a suggests that a
modification to the eastern section in Alignment 1a should be considered
at its northern terminus, if this general alignment is adopted. The change
involves realigning the dike in such a way that it departs from highway SH
124, rings the eastern side of Winnie, and ties into Highway 73. Such an
alignment provides improved storm surge reduction to those parts of
Winnie that lie east of SH 124, and it can best address the local influence
of surge amplification on Winnie.
For the much more severe 100-yr proxy storm (Storm 033), inside the
dike, peak surges for Alignment 1a (Figure 13-9) also are generally slightly
less than those for the extended dike (Figure 11-25). Results in Appendix
B quantify the differences. Throughout both Galveston and West Bays,
peak surges for Alignment 1a are generally 0.1 or 0.2 ft less than those for
the extended dike. In light of the relatively small differences between the
two eastern section alignments, it is clear that both alignments are
similarly effective in reducing the peak storm surge in all of the
aforementioned areas inside the dike for this severe hurricane.

Jackson State University 334
Compare peak surge maps in Figure 13-9 (Alignment 1a) with Figure 11-21
(existing, no-dike conditions for Storm 033). Again, surge amplification
outside the eastern dike section of Alignment 1a is evident for this storm.
Having the eastern termination section for Alignment 1a located inland
allows a greater surge to develop along the outside of the dike due to
hurricane force winds acting on very shallow water over inundated terrain.
As was the case for the 10-yr proxy storm, the amplification effect is seen
only in the immediate vicinity of the eastern dike section; the effect does
not extend to Port Arthur.
Greater peak surges are evident inside the eastern section of Alignment 1a
for the 100-yr proxy storm, compared to those for the 10-yr proxy storm.
The higher open coastal surge for the 100-yr proxy storm and its
amplification due to the eastern dike section result in a peak surge of
approximately 18 ft along the outside of the dike. This magnitude of surge
causes steady flow over the dike, and the resulting overflow substantially
increases peak surge levels just inside the dike throughout the region from
Winnie to High Island. In this region, peak surges for Alignment 1a (see
Figure 13-9) are generally greater than they are for the extended dike
alignment (see Figure 11-25).
For the 100-yr proxy storm, the extended dike alignment that ends at
Sabine Pass provides substantial and widespread storm surge reduction
between Winnie and Port Arthur, in the geographical area that lies east of
the position of the Alignment 1a eastern section. Reductions in peak surge
of 3 to 8 ft are evident from the peak surge maps. The eastern section of
Alignment 1a provides no surge reduction benefits in this same region; as
this region lies outside the dike.
Peak surge results for Storm 036, the 500-yr proxy storm, are similar to
those seen for the 100-yr proxy, Storm 033. For Storm 036, compare
Figure 13-13 (Alignment 1a) with Figure 11-33 (extended dike), and
compare Figure 13-13 with Figure 11-29 (existing, no-dike conditions).
Inside the dike, along most of Bolivar Peninsula, along the western
shoreline of Galveston Bay, at the City of Galveston, and throughout West
Bay, differences between the two eastern section alignments in these areas
are quite small for this proxy storm as well, 0.1 to 0.2 ft in most places.
Again, peak surges for Alignment 1a are slightly less than those for the
extended dike. For this very severe and rare hurricane, both eastern
section alignments are similarly effective in reducing the peak storm surge

Jackson State University 335
in all of the key areas that lie inside the dike. Alignment 1a is slightly more
effective.
The amplification effect east of the Alignment 1a eastern dike section from
High Island to Winnie is less evident for this storm. Steady overflow of the
eastern section occurs for both the 100-yr and 500-yr proxy storms.
However, the peak surge for Storm 036 is several feet higher than the
elevation of the dike. The long-dike effect is less pronounced once surge
levels exceed the crest elevation of the dike and overflow predominates.
Results and findings for Hurricane Ike, are similar to those for the 100-yr
and 500-yr proxy storms, but there are some noticeable differences as
well. Compare Figure 13-17 (Alignment 1a) with Figure 11-9 (extended
dike) and compare Figure 13-17 with Figure 11-5 (existing no-dike
conditions for Hurricane Ike). As was seen for the proxy storms, inside
the dike throughout most of Galveston and West Bays, peak surges for
Alignment 1a are generally less than those for the extended dike. The
magnitude of these differences in peak surge are slightly greater for Ike
than they are for the 100-yr and 500-yr proxy storms. In the bays, peak
storm surge levels for Alignment 1a are mostly 0.5 to 1 ft less than peak
surges for the extended dike alignment. However, also note that the peak
surges for Hurricane Ike within Galveston and West Bays, for either
alignment of the eastern dike section, are only 4 to 7 ft, and they are not so
problematic from a flooding perspective.
This greater differences seen for Ike (0.5 to 1 ft) compared to the proxy
storms (less than 0.2 ft) suggest that flanking flow was a greater for
Hurricane Ike than it was for the proxy storms. Results also show that
Alignment 1a is more effective than the extended dike in
eliminating/reducing the increased flanking flow.
The greater flanking flow is attributed to one or more of the following
factors. The Hurricane Ike surge forerunner had a longer duration and
higher amplitude than the forerunner for the proxy storms, which is
expected to cause greater flanking flow and lead to flanking earlier in the
storm for the extended dike alignment. Hurricane Ike also included the
astronomical tide which may have exacerbated flanking during the
forerunner development stage and possibly later. Also, the zone of peak
surge for Ike was located closer to the eastern end of the extended dike
than was the case for the proxy storms. The landfall location for Ike was at

Jackson State University 336
Bolivar Roads; whereas, for the proxy storms, landfall occurred further
south at San Luis Pass. Also, the peak surge for Ike in the vicinity of
Sabine Pass to Port Arthur, which drives the flanking for the extended
dike, was significantly higher for Ike compared to peak surge at the same
location for the 100-yr proxy storm and slightly more than the 500-yr
proxy storm.
As is the case for the 100-yr and 500-yr proxy storms, peaks surge results
for Hurricane Ike show that for the region just inside the eastern section of
Alignment 1a, peak surges for Alignment 1a generally exceed those for the
extended dike alignment. For Alignment 1a, Ike created very high surges
just outside the eastern dike section, surge amplification occurred, and
overflow of the eastern section occured. The steady flow over the eastern
dike section of Alignment 1a leads to the increased peak surge levels just
inside the dike, throughout the region from Winnie to High Island.
For Hurricane Ike, as was the case for the proxy storms, the peak surge
maps indicate that the extended dike alignment that ends at Sabine Pass
provides substantial storm surge reduction between Winnie and Port
Arthur. Reductions of 3 to 10 ft in peak surge values occurred in this
region, increasing from west to east, compared to peak surges for
Alignment 1a.
Both alignments are quite effective at preventing significant increases to
peak surge levels as a result of flanking flow. A cost-benefit analysis done
for the two eastern section alignments should consider not only the cost of
each alignment and the resulting peak surges in the Houston-Galveston
area, but also the reduction in storm surge that is achieved in the region
from Bolivar Peninsula to Port Arthur, as well as any other potential
benefits. For example, the longer and presumably more expensive coastal
alignment of the extended Ike Dike provides greater flood risk reduction
benefits to the Port Arthur area, and it can provide protection for and
longer-term stability for the coastal highway in this region.

Jackson State University 337
Surge Reduction in the Houston-Galveston Region with and
without an Eastern Termination Section
Analysis of Peak Surge Elevations
The previous section compared two different alignments for an eastern
termination section. Both alignments produced similar reductions in peak
storm surge throughout the immediate Houston-Galveston region, with
Alignment 1a being just slightly more effective in reducing peak surge in
the key areas along the western shoreline of Galveston Bay.
In this report section, the merits of having any eastern termination
section at all are evaluated in terms of the magnitude of peak storm surge
reduction for the immediate Houston-Galveston region, in those areas
having the greatest potential for damage/loss along the western shoreline
of Galveston Bay. The analysis does not consider surge reduction benefits
that are accrued east of Galveston Bay.
Neither the eastern portion of the extended Ike dike nor the eastern
termination section that is included in dike Alignments 1a, 1b and 3
appears to produce the widespread significant reduction in peak surge that
was initially anticipated. The initial assessment was based on an
examination of results from the first bracketing set of storm surge
simulations that were made in this study, which involved an Ike Dike
which ended just to the east of High Island. Those initial results were
discussed in Chapter 8. The perceived importance of flanking flow around
the eastern end of the dike on peak surge levels along the western
shoreline of Galveston Bay, and into the upper reaches of the Houston
Ship Channel, was apparently overstated in that modeling. The first set of
simulations utilized a global slope limiting approach to stabilizing the
storm surge simulations, which tended to overestimate the peak storm
surge within some parts of the bays and in some inundated areas by as
much as several feet.
A comparison of peak surge results for Alignments 2 (middle section only)
and 3 (middle+eastern sections), from more recent simulations made
using the current, improved model set-up, provides a more reliable and
definitive assessment of the storm surge reduction value of an eastern
termination section. Qualitative inspection of the peak surge maps for
Alignments 2 and 3 illustrates the influence of the eastern termination
section on peak surge levels in key areas. Compare Figures 13-7 and 13-8

Jackson State University 338
for the 10-yr proxy storm; compare Figures 13-11 and 13-12 for the 100-yr
proxy storm; compare Figures 13-15 and 13-16 for the 500-yr proxy storm;
and compare Figures 13-19 and 13-20 for Hurricane Ike. Also refer to
tabular peak surge results provided in Appendix B for both alignments.
For the 10-yr, 100-yr, and the 500-yr proxy storms, the eastern
termination section only reduces peak surges by very small amounts, 0.2 ft
or less at most locations along the western shoreline of Galveston Bay,
including the City of Galveston and in the upper reaches of the Houston
Ship Channel. For all three proxy storms, the eastern termination section
has a negligible influence on peak surge values within West Bay. The peak
surge reduction benefit of the eastern termination section is greater on
eastern Bolivar Peninsula, where reductions in peak surge range from 0.1
to 0.6 ft for the 10-yr proxy storm, are approximately 0.8 ft for the 100-y
proxy storm, and 0.6 ft for the 500-yr proxy storm.
Surge reduction achieved with the eastern termination section is greater
for Hurricane Ike, compared to that achieved for the three proxy storms.
With the eastern termination section, peaks surges along the western
shoreline of Galveston Bay are decreased by amounts of up to 1 ft north of
San Leon and by a few tenths of a foot at locations south of Dickinson Bay.
In West Bay, as was the case for the proxy storms, peak surges are
effectively unaltered by the presence of the eastern dike section. Along the
eastern end of Bolivar Peninsula, the eastern dike section reduces peak
surges more significantly, by as much as 2.3 ft.
It is important to note that for Hurricane Ike, peak surges along the
western shoreline of Galveston Bay are only approximately 7 ft with only
the middle dike section in place (Alignment 2). Even this surge level, and
without the 1-ft reduction due to the eastern section, is not so problematic
in terms of flood damage and economic losses, for most of the Houston-
Galveston region.
The cost of, and the regional and local flood risk reduction benefits
associated with, constructing an eastern dike section should be examined
for additional storms to confirm the findings for the proxy storms and
Hurricane Ike. In light of the relatively small reductions in peak surge that
accrue with the eastern termination section for the severe storms
examined here, an eastern section that extends beyond High Island might
not be cost-effective as a means for reducing flood risk in the Houston-

Jackson State University 339
Galveston area. The coastal spine option proposed by the GCCPRD ended
at High Island.
Analysis of Water Surface Elevation Time Series
An explanation follows for why the reductions in peak storm surge along
the western side of Galveston Bay, which result from inclusion of an
eastern termination section, are relatively small. To support this analysis
graphs showing the variation in water surface elevation as a function of
time were created for five locations indicated with red dots in Figure 13-21,
for both the 100-yr proxy storm and Hurricane Ike. The five locations are:
1) Bayport, located along the western shoreline of Galveston Bay toward
the northern part of the bay, 2) on the bay side of the City of Galveston, 3)
San Luis Pass on the open gulf side of the pass, 4) Galveston Is (bay west)
which is located just inside San Luis Pass along the western end of
Galveston Island, and 5) Bolivar Peninsula (bay east) which is located in
Galveston Bay on the eastern end of Bolivar Peninsula. This discussion
only focusses on results at Bayport, City of Galveston and Bolivar
Peninsula, which are most relevant to this topic.
Figure 13-22 shows water surface elevations for Storm 033, the 100-yr
proxy storm, and the future sea level scenario, SLR1. There are three
panels in Figure 13-22, one each for Alignment 2 which is comprised of a
middle dike section only (top panel), Alignment 3 which is comprised of
middle + eastern dike sections (middle panel ) and Alignment 1a which is
comprised of western + middle + eastern dike sections (bottom panel).
The analysis here only focusses on the top and middle panels of the figure,
to illustrate the effect of the eastern termination section.
For the 100-yr proxy storm, as it approaches the Texas coast from the
southeast, the winds are steadily blowing from the northeast, due to the
counterclockwise wind circulation around the hurricane’s eye. This wind
direction persists right up to the time of landfall. This prevailing wind
direction acts to force a set up (an increase) in the water surface on the
western side of Galveston Bay as evidenced at Bayport (red curves in
Figure 13-22) and at the City of Galveston (black curves). Concurrently,
the same winds are acting to set down (decrease) the water surface along
the eastern side of the bay including the area adjacent to eastern Bolivar
Peninsula (green curves). Water is being pushed by the wind from the east
side of Galveston Bay to the west side. This pattern of developing set

Jackson State University 340
Figure 13-22. Water surface elevation times series for Storm 033, future sea level scenario
SLR1, and different Ike Dike alignments. Top panel (Alignment 2). Middle panel (Alignment
3). Bottom panel (Alignment 1a).

Jackson State University 341
up/set down is clearly seen prior to hour 65 in Figure 13-22. The set-
up/set-down begins slowly for the first 40 hours, and then it occurs at a
faster rate as the hurricane approaches landfall and winds within the bay
grow stronger between hours 40 and 65. Hour 65 is just a few hours
before landfall.
The peak storm surge along the western shoreline of Galveston Bay occurs
around hour 70, first at the City of Galveston and then a short time later at
Bayport, as shown in the red and black curves, respectively. Surge peaks
around hour 70 at both locations are the result of local wind set-up that is
forced by the hurricane’s core winds acting directly on water within the
bay. The peak surge at both locations is only slightly lower with the
eastern termination section in place; compare the red and black curves in
the top and middle panels of Figure 13-22 at the time of peak surge. The
difference is due to flanking that occurs without the eastern section. In
terms of peak surge levels, the effects of flanking are quite small at
Bayport, the City of Galveston and along the rest of the western bay
shoreline. Differences are 0.2 ft or less. The amount of flanking flow is
neither great enough, nor does it occur early enough, to significantly raise
peak surge levels along the western shoreline of the bay.
The influence of flanking is most clearly evident in water surface elevation
differences at the bay side of Bolivar Roads (differences in the green curves
between top and middle panels), beginning around hour 50. Flanking that
occurs without the eastern section results in less set-down on the eastern
side of the bay. Water entering Galveston Bay due to flanking is in part
offsetting the set down of the water surface by the wind.
After the eye of the storm passes through Galveston Bay, wind speeds
rapidly decrease, and the water surface elevation throughout the bay
equilibrates or “levels out” in the absence of strong wind forcing. This is
evident in Figure 13-22 at the end of the simulation, after hour 90. The
water surface elevation curves at Bayport, the City of Galveston, and at
eastern Bolivar Peninsula are all approaching a similar value, the
equilibrated level. This level is established by the amount of water volume
that enters the bays due to flanking and flow over the dike that occurs
during the storm.
As this leveling out process occurs, the peak surge along the bay side of
Bolivar Peninsula, an area that was set down by the wind for most of the

Jackson State University 342
storm, is finally realized. The time of peak surge along Bolivar Peninsula
occurs close to hour 90, some 20 hours later than the time of peak surge
along the western shoreline of Galveston Bay which occurred at around
hour 70.
For the 100-yr proxy storm the added influx of water into the bay due to
flanking does not significantly contribute to the peak surge magnitude
along the western side of Galveston Bay that was forced much earlier by
the wind; but it does contribute to peak surges throughout much of the
rest of the bay particularly in areas where the bay was set down by the
peak winds. The difference in the “leveled out” water surface, with and
without the eastern termination section, which is approximately 0.5 ft, is
indicative of the additional volume of water that entered the bay due to the
flanking which occurs without an eastern dike section.
The same general findings were observed for the even more severe, and
rarer still, 500-yr proxy storm. For both of these proxy storms, which are
the highest surge producing events among the four storms examined, the
peak surges along the western shoreline of Galveston Bay are primarily
dictated by the strong forcing associated with the peak winds that occur
within the bay around the time of landfall. Peak surges are only minimally
influenced by flanking so the eastern dike section, which effectively
reduces flanking, has minimal influence on them.
A second similarly formatted figure, Figure 13-23, shows water surface
elevation time series for Hurricane Ike and the future sea level scenario,
SLR1. Ike was a storm that had its maximum surge zone near High Island,
and it had a high peak surge there, approximately 18 to 20 ft. It provides
an opportunity to the influence of the eastern dike section in reducing
surge levels within the bay for an event having a higher potential for
flanking than the 100-yr proxy storm.
The influence of flanking, and the greater amount of flanking that occurs
for Ike, are evident by comparing the green curves in the top and middle
panels of Figure 13-23. In the middle panel of Figure 13-23, which reflects
the dike configuration with the eastern termination section in place,
beginning at hour 1035 the water surface set-down in eastern Galveston
Bay becomes evident as the core hurricane winds approach and then act
directly on the bay. Compare the green curves in the top and middle
panels of Figure 13-23 between hours 1035 and 1050. The same

Jackson State University 343
Figure 13-23. Water surface elevation times series for Hurricane Ike, future sea level
scenario SLR1, and different Ike Dike alignments. Top panel (Alignment 2). Middle panel
(Alignment 3). Bottom panel (Alignment 1a).
Jackson State University 344
development of wind set down is not seen in the top panel, which reflects
the absence of an eastern section; the amount of wind set-down on the
eastern side of Galveston Bay is much less than for the case with the
eastern dike section, by about 2 ft, due to the higher volume of flanking
flow. The larger influx of water into Galveston bay associated with
flanking mostly offsets any decrease in water surface elevation due to wind
set-down.
The difference in the “leveled out” water surface elevation at the end of the
water surface elevation time series graphs after hour 1070 also is
indicative of the amount of flanking. The difference in equilibrated water
level between Alignments 2 and 3 for Ike is approximately 1 ft, which is
larger than it was for the 100-yr proxy storm. This is further evidence of an
increased amount of flanking flow that occurred for Ike, which is reduced
by the eastern termination section.
For Ike, the main driver of the peak storm surge experienced in different
parts of Galveston Bay is somewhat different than it was for the 100-yr
proxy storm. For the 100-yr proxy, peak surge at both Bayport and
Galveston was driven by the strongest winds acting on the bay at landfall.
For Ike, the surge values that occur at Bayport and Galveston at around
hour 1050, which are forced by the locally high winds that occur with
landfall are only minimally influenced by the flanking that occurs.
Differences in surge level at this time are only several tenths of a foot for
the two alignments. This finding is similar to that seen for the 100-yr
proxy storm. The flanking that has occurred prior to hour 1050 is
apparently not early enough and not great enough to significantly
influence the peak surge associated with the strongest winds acting within
the bay. The presence of an eastern dike section has little influence on the
initial wind driven peak surges that occur at this time.
At Galveston the surge value at hour 1050 is the peak surge for the entire
event; however, at Bayport, the peak surge for the entire event is
associated with the leveling out of the bay in the latter stages of the storm
(at around hour 1070). This occurs some 20 hours after landfall and after
the storm had moved through the region. See the red curves in Figure 13-
23, both upper and middle panels, where the event peak surge at Bayport
occurs after hour 1065. An explanation for the different behavior follows.

Jackson State University 345
For Hurricane Ike, because it made landfall at Bolivar Roads, peak winds
in Galveston Bay were directed more to the south than were the peak
winds for the 100-yr proxy storm. For this more southerly wind direction
Bayport was not located at the downwind side of the bay as it was for
Storm 033. The amount of wind set-up that occurred there at around
hour 1050 was relatively small. The City of Galveston, which is located at
the southwest corner of Galveston Bay, was situated at the down-wind side
of the bay for Ike just as it was for the 100-yr proxy. At Galveston, the
peak surge is driven by the local wind forcing, for both storms.
Also note that for the 100-yr proxy storm, local winds within the bay drove
the storm surge into the upper reaches of the Houston Ship channel
shortly after landfall forcing high surges there. No such process occurred
for Hurricane Ike, because of the different landfall location and different
wind field patterns within the bay after landfall. After the eye of the storm
moved through, the bay, winds from the west were prevalent.
For Ike, without the eastern termination section, the peak surge at the
eastern end of Bolivar Peninsula does not occur very late in the storm and
it is not associated with the leveling out of the bay water surface after the
storm has moved through. Instead, the peak surge is more strongly forced
by the flanking that occurs both before and near the time of peak surge
and by the prevailing winds from the west after the storm moves inland
which sets up the water surface on the east side of the bay. See the green
curve in the top panel of Figure 13-23, where the peak surge occurs at
about hour 1055.
But even Hurricane Ike, which had high potential for flanking on the
eastern side, did not produce surge levels for Alignment 2 that would
cause significant loss/damage in key areas of Galveston Bay along its
western shoreline and into the Upper Houston Ship Channel. Peak surges
in these areas were approximately 7 ft for Alignment 2. The eastern dike
section included in Alignment 3 reduced these surges by as much as a foot,
but they were already at relatively low dmage-causing levels.
A central question is: for Alignment 2, are there storms that produce
inundation-causing surge levels in the key areas of Galveston Bay, like the
100-yr and 500-yr proxy storms, that also generate high flanking such that
the presence of an eastern termination section (Alignment 3) reduces the
peak surges by significant amounts, not just one or two tenths of foot? A

Jackson State University 346
related question is: are there extreme storms that produce enough flanking
flow with flanking early enough such that flanking has a strong influence
on the magnitude of the wind-driven peak surges.
Storms that produce the most flanking flow for Alignment 2 would tend to
have their maximum surge zone at High Island, and have very high peak
surge levels there, like Hurricane Ike. Hurricane forward speed and the
duration of high surge levels could also play a role in influencing the
volume of flanking flow. Storms that have their peak surge at High Island
would tend to have their maximum wind band at the same location, and
not along the western shoreline of Galveston Bay, which is some 30 miles
away. Also, wind directionality for severe storms that make landfall more
to the east, like Ike, might not be conducive to generating high peak surges
all along the western Galveston Bay shoreline and into the upper Houston
Ship Channel.
It appears as though the highest surge producing storms and the most
damaging storms for the western shoreline of Galveston Bay and the upper
Houston Ship Channel are those having the following characteristics: 1) an
approach from the southeast, 2) a landfall location that is south of Bolivar
Roads, and 3) highest winds located right at Galveston and along the
western bay shoreline. These conditions lead to a maximum set-up along
the entire west side of the Bay and then a push of the water up into the
upper Houston Ship Channel after landfall and strong winds are directed
to the north. It is not surprising that the storms that best matched the
extreme 100-yr and 500-yr surge levels all along the western bay shoreline
and into the upper reaches of the Houston Ship Channel are storms like
that had these characteristics, the selected proxy storms.
Extreme storms for which flanking might play a greater role than was seen
for the 100-yr and 500-yr proxy storms, might be slower moving versions
of these same severity/size of storms. Both Storms 033 and 036 have 11-kt
forward speeds. Perhaps, storms with same the intensity but larger size
could also produce more flanking flow. These two storms were fairly large
given their intensity. The radius-to-maximum-winds for Storms 033 and
036 were 26/37 nm and 22/32 nm, respectively. The first number is the
radius offshore and the second number is the radius at landfall; the latter
reflects the storm filling process near landfall. Storms having a larger
radius-to-maximum-winds would have to make landfall further to the
south in order to have the maximum wind bands at Galveston. Storms

Jackson State University 347
with very high intensities are less likely to also have large radii-to-
maximum winds.
It would be informative to examine other storms that produce high surge
values for the west shoreline of Galveston Bay, like the 100-yr and 500-yr
statistical surge values, that also might have flanking flows that are higher
than those for the 100-yr and 500-yr proxy storms, if such storms are
realistic. Candidates might be other storms that were considered as
possible 100-yr or 500-yr proxy storms. These would be simulated with
and without the eastern dike section in place (Alignments 3 and 2), to see
if they also show the same dominance of the local wind in generating the
peak surge and a minimal reduction in peak surge achieved with the
eastern termination section in place. The other storms examined might
include slower moving storms that might lead to higher flanking volumes
prior to landfall as well as larger storms that have maximum winds at
Bolivar Roads and higher surges at High Island.
Storm Surge Reduction Benefits of a Western Termination
Section
Without a gate system at San Luis Pass, which is an important feature of
the western termination section, as long as the water level on the open
coast is higher than the water level inside the pass, then the water surface
gradient across the pass forces water to flow into West Bay. If the water
level is higher in West Bay than it is in Galveston Bay, water will flow into
Galveston Bay from West Bay. This flow in turn increases water levels
inside Galveston Bay. Consequently, the hurricane forerunner surge can
propagate through San Luis Pass and into West Bay, and then perhaps into
Galveston Bay, a process that can begin a day or more before the hurricane
makes landfall. The same process occurs during development of the peak
surge, following the forerunner stage, as the open coast water level
continues to rise with the arrival of the hurricane’s core winds over the
continental shelf. The absence of a gate system at San Luis Pass allows the
peak storm surge to propagate into West Bay as well. Without the land
barrier portion of the western termination section, once the open coast
surge level exceeds the elevation of the barrier island along the Bluewater
Highway, additional water flows into West Bay.
The prevailing wind pattern that develops within the bays for approaching
hurricanes can reduce the amount of water which flows through San Luis
Pass and into the bays. For hurricanes that approach from the southeast,

Jackson State University 348
the most common direction, the wind-induced water surface elevation
setup tends to occur along the western side of Galveston Bay, in response
to winds that blow from the east or northeast. These same winds can set
up the western end of West Bay, adjacent to San Luis Pass. This prevailing
wind pattern occurs due to the counterclockwise rotating wind fields
associated with the hurricane. Wind setup on the western end of West Bay
tends to reduce the water surface elevation difference between the open
coast and West Bay, thereby reducing flow into the bay. As wind setup
develops on the west side of Galveston Bay, flow from West Bay into
Galveston Bay is reduced.
Because West Bay is hydraulically connected to Galveston Bay, there is
potential for the forerunner and peak storm surge to propagate from West
Bay into Galveston Bay, a process that depends upon the wind forcing that
is acting in both bays and the open coast water levels. The Texas City Dike
and the man-made peninsulas on the north and south sides of West Bay,
upon which the I-45 highway is built, influence the hydraulic connectivity
between West and Galveston Bays. These features retard, but do not
eliminate, the movement of water from one bay to the other.
A comparison of peak storm surge results for Alignments 1a and 3 enables
assessment of the surge reduction benefits of the western termination
section. Alignment 1a is comprised of the western + middle + eastern dike
sections; whereas, Alignment 3 is comprised of the middle section plus the
eastern section, but with no western section. Compare peak surge maps
for Alignments 1a and 3 for the 10-yr proxy storm (compare Figures 13-5
and 13-8), the 100-yr proxy storm (compare Figures 13-9 and 13-12), the
500-yr proxy storm (compare Figures 13-13 and 13-16), and Hurricane Ike
(compare Figures 13-17 and 13-20). The tabulated peak surge values that
are listed in Appendix B, and the water surface elevation time series shown
in Figures 13-22 and 13-23 (the middle and bottom panels), provide
valuable insights as well. The middle panel in both figures shows results
for Alignment 3 (no western section), and the bottom panel shows results
for Alignment 1a (with the western section).
Qualitatively, for all four storms, the peak storm surge maps with and
without a western termination section show that the most significant
differences are in West Bay; along Galveston Island west of the City of
Galveston, and along the northern shoreline of West Bay west of Texas
City. For all four storms, the storm surge significantly penetrates into

Jackson State University 349
West Bay without the western termination section in place. Within
Galveston Bay, along its western shoreline including the City of Galveston,
peak surge levels also are reduced with the western termination section in
place. The peak storm surge maps suggest that the western termination
section has a much greater positive influence in the Houston-Galveston
region than does the eastern termination section. The western section
results in greater surge reductions, over a wider geographic area, in areas
having higher potential for damage and economic losses.
The tabular peak surge data that are listed in Appendix B enable a more
quantitative assessment of the magnitude of storm surge reduction that is
achieved with the western termination section. On Galveston Island, the
benefit of the western section decreases from west to east, from San Luis
Pass toward the City of Galveston. In terms of reduction in peak surge, for
the 10-yr proxy storm, peak surge in West Bay is reduced by 1.9 ft, 1.2 ft,
and 0.9 ft at the western, middle, and eastern ends of Galveston Island,
respectively, and by 0.8 ft at the bay side of the City of Galveston near the
University of Texas Medical Branch. For the 100-yr proxy storm, the
reductions in peak surge at the same four locations are 5.9 ft, 4.9 ft, 0.8 ft
and 0.3 ft, respectively. For the 500-yr proxy storm, the reductions at the
same four locations are 6.7 ft, 5.7 ft, 1.3 ft and 0.3 ft, respectively; and for
Hurricane Ike, the reductions at the same locations are 4.3 ft, 3.3 ft, 2.3 ft
and 1.3 ft, respectively. Reductions in peak surge achieved with the
western section are largest near San Luis Pass and smaller with increasing
distance from the pass.
Peak surges also are reduced along the northern shoreline of West Bay
with the western termination section. As was the case along Galveston
Island, the reductions in surge lessen in magnitude from west to east. For
example, near the Amoco Chemicals Reservoir (designated as the West
Bay (north) location) which is north of San Luis Pass, peak surges are
reduced by 1.7 ft, 5.5 ft, 6.3 ft, and 5.4 ft for the 10-yr, 100-yr, 500-yr proxy
storms and Hurricane Ike, respectively. Much further to the east, near
Bayou Vista which is immediately south of Texas City at the east end of
West Bay (designated as the West Bay (east) location), peak surges are
reduced by 1.1 ft, 2.3 ft, 2.4 ft, and 3.2 ft for the 10-yr, 100-yr and 500-yr
proxy storms, and Hurricane Ike, respectively.
In general, the western termination section has a much greater benefit in
reducing surge along the western and central parts of Galveston Island, in

Jackson State University 350
those areas that lie to the west of the City of Galveston. This is primarily
due to the presence of the I-45 highway peninsulas that reduce the
movement of water, past them, to the west. Flow to the west is mostly
constrained to the open water gap between the two man-made peninsulas,
which retards surge penetration past this point. Surge penetration past
this point is not prevented; it is just reduced.
For Hurricane Ike, the western termination section has a greater positive
influence at the City of Galveston, compared to any of the 3 proxy storms,
even the more intense 100-yr and 500-yr proxy storms. In the absence of
the western section, the storm surge penetrates into this area more
effectively for Hurricane Ike than for any of the proxy storms.
Interestingly, and perhaps counterintuitively, the absence of a western
termination section leads to a larger increase in peak surge at the City of
Galveston for the 10-yr proxy storm than for the more intense 100-yr and
500-yr proxy storms. In fact, while the two most intense proxy storms
lead to the greatest increases in peak surges in eastern and central West
Bay, the increase in peak surge at the City of Galveston is the least for
these two storms, even less than the 10-yr proxy storm and Hurricane Ike.
Reasons for these differences are discussed later in this section.
Within Galveston Bay, the western termination section has a beneficial
effect by reducing peak surges along the western shoreline of the bay and
into the upper reaches of the Houston Ship Channel. The western section
reduces peak surge levels along the western Galveston Bay shoreline by
amounts of 0.5 to 0.8 ft for the 10-yr proxy storm. The magnitude of the
peak surge reduction is fairly uniform along this long stretch of shoreline.
Peaks surge is reduced by smaller amounts for the 100-yr proxy storm, 0.1
to 0.5 ft, and by even smaller amounts of 0.1 to 0.3 ft for the 500-yr proxy
storm. For Hurricane Ike, the benefits of the western termination section
are greater than they are for the proxy storms; reductions in peak surge
range from 1.1 to 2.1 ft along the western shoreline of Galveston Bay.
North of Clear Lake and into the upper reaches of the Houston Ship
Channel, reductions in peak surge are approximately 2 ft; south of Clear
Lake reductions are closer to 1 ft.
Analysis of Temporal Changes in Water Surface Elevation and Velocity
Results indicate that, without the western termination section, there is
much greater surge penetration past the City of Galveston and into
Galveston Bay for Hurricane Ike than there is for any of the three proxy

Jackson State University 351
storms. Results also suggest that surge penetration into Galveston Bay is
greater for the 10-yr proxy storm than it is for the more intense 100-yr and
500-yr proxy storms, which produce greater open coast surges at San Luis
Pass. Examination of the water surface elevation time series graphs in
Figures 13-22 (the 100-yr proxy storm) and 13-23 (Hurricane Ike) sheds
additional insight on why this is the case, as does consideration of the
winds and water velocities for each of these storms. In both figures, the
middle panel shows the time series for Alignment 3 (no western
termination section) and the bottom panel shows time series for
Alignment 1a (having the western section).
In Figure 13-22 (middle panel), which is for the 100-yr proxy storm and a
middle dike section only with no western termination section, the close
similarity of the orange curve (outside San Luis Pass) and the blue curve
(inside the pass) for the hours between 0 and 40 shows that the surge
forerunner propagates through San Luis Pass with only a small amount of
attenuation. During this 40-hour period of time, the water surface
elevation increases by about 1 ft inside San Luis Pass. At the City of
Galveston (black curve) which is located at the eastern end of West Bay,
the water surface increases by only a few tenths of a foot during this same
period of time.
Inspection of the water velocity fields as a function of time for the 100-yr
proxy storm revealed that that prior to hour 36, the forerunner surge that
was developing on the open coast forced water into West Bay through San
Luis Pass, and then that water moved toward the east within West Bay,
past the City of Galveston primarily via the deeper channel that serves the
Port of Galveston, and then into Galveston Bay. The peninsulas which are
part of I-45 slowed the movement of water from West Bay to the east
toward Galveston and Galveston Bay, but did not prevent it.
At around hour 37 or 38, the winds within Galveston Bay increased to a
speed that was sufficient to set up the western side of Galveston Bay in
such a way that water began to reverse direction and flow from Galveston
Bay past the City of Galveston and into West Bay through gap between the
I-45 peninsulas. At this point in time, propagation of the forerunner from
West Bay into Galveston Bay ceased.
After hour 38 the surge forerunner and then, eventually, the peak surge
continued to propagate through San Luis Pass and into West Bay as the

Jackson State University 352
coastal surge level increased and remained above the water level inside the
bay. The wind setup on the western side of Galveston Bay grew as the
hurricane approached landfall and winds became stronger; and in
response, flow continued from Galveston Bay into West Bay. The
convergence of flow into West Bay, through San Luis Pass and from
Galveston Bay, lead to increases in storm surge levels in West Bay. This
pattern of surge development continued until after landfall.
Following landfall, as the storm moved inland, winds shifted to blow from
the west, then the southwest and them from the south; and as the shift in
wind direction occurred, and water began to be pushed from West Bay
back into Galveston Bay as the south end of Galveston Bay was set down
and the northern side of Galveston Bay was set up by the wind, pushing
water into the upper Houston Ship Channel.
For Alignments 1a and 3, peak surge values at Galveston and Bayport, and
at other locations along the western shoreline of Galveston Bay, differ by
about 0.2 to 0.4 ft for this storm. Values for Alignment 3, without the
western section, slightly exceed those for Alignment 1a, with the western
section in place. This amount is comparable to and consistent with the
magnitude of forerunner propagation that had developed at Galveston and
Bayport prior to hour 36, a few tenths of a foot.
For the 10-yr proxy storm, examination of the velocity and water surface
elevation fields as function of time showed that propagation of the
forerunner surge into West Bay, past the City of Galveston, and into
Galveston Bay lasted for 10 hours longer than it did for the 100-yr proxy
storm. The longer duration occurred because it took longer for the winds
in Galveston Bay to increase to the point that enough wind set-up
developed on the west side of the bay such that the flow direction was
reversed and propagation of the forerunner surge from West Bay into
Galveston Bay ceased. By the time forerunner propagation ceased, more
water had entered Galveston Bay than entered during the 100-yr proxy
storm. Peak surge values at Galveston and Bayport, and at other locations
along the western shoreline of Galveston Bay, differ by about 0.7 to 0.9 ft
for the 10-yr proxy storm. These amounts are greater than those for the
100-yr and 500-yr proxy storms. Again, values for Alignment 3 without
the western section slightly exceeded those for Alignment 1a, with the
western section in place.

Jackson State University 353
For Hurricane Ike (Figure 13-23), the forerunner development period was
prior to hour 1040. At about hour 1040, the center of the hurricane
entered the continental shelf region off Texas. The Hurricane Ike
simulation was made with the astronomical tide; whereas, the proxy storm
simulations were made with no astronomical tide. The effects of the tide
are evident in the water surface elevation time series shown in the figure.
During this time, the top panel (Alignment 3 with no western termination
section) shows that the forerunner is slightly attenuated by San Luis Pass,
as was the case for the 100-yr proxy storm. The magnitude of the
forerunner + tide amplitude at hour 1040 outside the pass is
approximately 5.2 ft. The 3.3 ft future sea level value was subtracted from
the water surface elevation to arrive at this value for the amplitude.
Because the Ike simulation also includes the astronomical tide, estimates
of the surge forerunner are approximate. Just inside the pass, the
forerunner + tide amplitude is about 4.5 ft. The small decrease in
forerunner + tide amplitude reflects the attenuation through the pass.
Analysis of the water velocity and water surface elevation fields as a
function of time for Hurricane Ike indicated a strong net movement of
water into West Bay, and then from West Bay into Galveston Bay. This
occurred despite periodic fluctuations associated with the ebbing and
flooding of the astronomical tide. Prior to hour 1040, propagation of the
forerunner surge into West Bay and into Galveston Bay continued pretty
much unabated; however, propagation was somewhat reduced by the I-45
peninsulas and by the Texas City Dike. During this entire time, winds in
Galveston Bay had directions and magnitudes that were not sufficient to
cause a cessation in propagation of the forerunner into Galveston Bay. For
this reason, Hurricane Ike produced greater forerunner propagation into
Galveston Bay that did the proxy storms.
Figure 13-24 shows an example of the water surface elevation and velocity
fields that are associated with propagation of the surge forerunner surge
into Galveston Bay. The fields are for Hurricane Ike. The figure shows a
snap-shot in time at hour 1040. The following important features are
labeled: a) propagation of the forerunner and building coastal surge
through San Luis Pass and over the inundated barrier island south of the
pass, b) propagation eastward within West Bay, c) flow through the gap
between the I-45 peninsulas, d) eastward flow through the navigation

Jackson State University 354
channel at the Port of Galveston, e) flow around the east end of the Texas
City Dike and into Galveston Bay.
Figure 13-24. Illustration of surge forerunner propagation into West Bay, and from West Bay
into Galveston Bay for Hurricane Ike, Alignment 3, and the future sea level scenario SLR1.
An estimate of the amplitude of the forerunner that has propagated into
West Bay, past the I-45 peninsulas and Texas City Dike, and into
Galveston Bay can be made by examining differences between the water
surface elevation time series curves for Bayport (red curve) and Galveston
(black curve) displayed in the middle and bottom panels in Figure 13-23.
The bottom panel reflects a western termination section in place so neither
tide nor forerunner can propagate into West Bay via San Luis Pass. At
hour 1040 the approximate differences are 1.1 ft for Galveston and 1 ft for
Bayport. At the time of peak surge for each location, the approximate
differences are 1.1 ft for Galveston and 1.2 ft for Bayport. For Ike, the
amount of forerunner penetration into both West Bay and Galveston Bay
appears to be between 1 and 1.2 ft, which is larger than that for any of the
proxy storms.
The western termination section has much greater regional surge
reduction benefits than the eastern termination section, particularly along
western and central Galveston Island and along the northern shoreline of
West Bay west of Texas City. Without the western termination section, the
hurricane surge forerunner can propagate into West Bay, with relatively
Jackson State University 355
little attenuation. The peninsulas of I-45 and, to a lesser degree, the Texas
City Dike retard surge propagation in a fairly significant way; however the
forerunner propagation into Galveston Bay can reach 1 ft or slightly more
for a substantial open coast forerunner like that which occurred during
Hurricane Ike and wind conditions within Galveston Bay that are
favorable for forerunner penetration into Galveston Bay (weak winds
and/or wind directions that not blowing from the east or northeast).
Without the western termination section, the peak surge associated with
the hurricane’s core winds can also propagate rather efficiently into West
Bay and lead to significant increases in peak surge throughout the bay,
particularly west of the I-45 peninsulas.
An analysis should be performed to examine the cost of the western dike
section, either a gate at San Luis Pass alone or in concert with a land
barrier along the Blue Water Highway, and the flood risk benefits that
accrue from it in both West Bay and Galveston Bay. The land barrier along
the Bluewater Highway might simply involve raising the elevation of the
highway to an elevation less than the 17 ft Ike Dike, and armoring it to be
able to withstand overtopping.
In such an analysis though, it is important to note the following. The 100-
yr proxy storm, Storm 033, was selected to best match the 100-yr ARI
water levels at Galveston and along the western shoreline of Galveston
Bay, not at San Luis Pass. At San Luis Pass, Storm 033 produces peak
surge levels that are less than the 100-yr ARI water levels at this location.
The damages prevented along Galveston Island and elsewhere in West Bay
by the western termination section would be greater for a hurricane that
produces the 100-yr ARI water surface elevation at San Luis Pass,
compared to damages prevented by the event that produces the 100-yr
ARI water level at Galveston. Analysis should consider additional storms
that best replicate the 10-yr, 100-yr and 500-yr statistical surge levels at
San Luis Pass.
Another factor that supports inclusion of the western termination section
in the Ike Dike concept, particularly a gate at San Luis Pass, is the ability
to not only prevent the forerunner and peak surge form entering West Bay,
but also as a means for controlling the water level inside the bays at the
time when the surge gates are closed. It might be advantageous to try and
use the timing of gate closure as a means to minimize the amount of water

Jackson State University 356
in the bays, in advance of an approaching hurricane. Such an operational
procedure might dictate closing the gates when low astronomical tide
creates a minimum water surface inside the bays. Having gates at both
San Luis Pass and Bolivar Roads could achieve this operational objective
fully; a gate system only at Bolivar Roads can only do this partially. A
desire to control the water level inside the bays might become increasingly
more important as mean sea level rises.
Influence of Lowered Gate Elevations on Interior Surge Levels
Alignment 1b has the same footprint as Alignment 1a. However, dike crest
elevations in Alignment 1b are lowered from 17 ft NAVD88 to elevations
that correspond to preliminary design elevations for the navigation (9.8 ft
NAVD88) and environmental (13.8 ft NAVD88) gate systems at both
Bolivar Roads and San Luis Passes. Both alignments 1a and 1b have
western, middle and eastern dike sections.
By comparing results for Alignments 1b and 1a, it is evident that the effect
of lower gate elevations on peak surge levels behind the dike is relatively
small; the lower gate elevations lead to slightly higher storm surge
levels. Among the three proxy storms, the greatest increases in peak surge
occur for Storm 036, the 500-yr proxy storm, which produces the highest
open coast storm surges and therefore produces the greatest magnitude
and duration of flow over the gates. There is some spatial variability in the
peak surge increases within the bays. For Storm 036, the greatest increase
in peak surge is 0.5 ft immediately behind the gates at Bolivar Roads pass.
With increasing distance away from the gates the amount of the increase
in peak surge lessens. For example, the magnitude of the increase in the
vicinity of the University of Texas Medical Branch is slightly less, 0.4 ft;
and the increase is reduced further to 0.3 ft on the bay side of the western
end of the City of Galveston. Elsewhere in West Bay increases range from
0.1 to 0.3 ft. Along the western shoreline of Galveston Bay and into the
upper reaches of the Houston Ship Channel, increases of peak surge for
Alignment 1b are no more than 0.3 ft, and less than that value in many
locations.
For Storm 033, the 100-yr proxy storm, which is the only other proxy
storm that produces significant flow over the gates, the greatest increase
is, again, immediately behind the gates at Bolivar Roads Pass. The
magnitude of the increase at this location is 0.2 ft. In the vicinity of the
University of Texas Medical Branch the increase is slightly higher, 0.3 ft;
Jackson State University 357
and the increase is 0.2 ft on the bay side of the western end of the City of
Galveston. Elsewhere in West Bay, increases were 0.1 to 0.2 ft. Along the
west shoreline of Galveston Bay and into the upper reaches of the Houston
Ship Channel, increases are 0.2 ft or less.
For less intense hurricane events, like the 10-yr proxy storm which
produces little or no overtopping or no steady flow over the gates, there
are no significant increases to peak storm surge levels behind the dike
associated with the lowered gate crest elevations.
These increases in peak surge level, which are relatively small even for the
most intense hurricanes, will require a small increase in design elevation
for any secondary lines of defense within the bays, such as a ring
levee/wall system along the bay side of the City of Galveston.
Jackson State University 358
14 Water Level Considerations for
Operating the Ike Dike Storm
Surge Gates
Introduction
Model simulations discussed in previous chapters showed that the Ike
Dike concept significantly reduced peak storm surge levels within
Galveston and West Bays for severe hurricanes. The land portions of the
coastal spine reduced surge in the bays by greatly diminishing the flow of
water over the low-lying barrier islands. Gate systems, at Bolivar Roads
and San Luis Passes, reduced storm surge by restricting flow into the bays
through the passes. Flow was reduced in both the early stages of surge
build-up, i.e., during the forerunner stage of surge development when the
storm was far offshore in the Gulf of Mexico, as well as during the latter
stages as the storm approached the coast and made landfall during which
time the core winds forced much higher surge levels.
However, even with the dike in place and the gates closed, significant
storm surge can be locally generated within the bays by hurricane-force
winds. This facet of surge generation arises due to the bays’ large size and
its shallow depth. Strong winds acting internally within the bays push
water from the upwind side of the bay toward the down-wind side,
stacking water against the down-wind shoreline and elevating local surge
levels there. The amount of water within the bays at the time of gate
closure influences the peak surge elevation. A higher antecedent water
level leads to a higher peak surge.
All storm surge simulations made thus far have necessarily assumed (due
to a surge model limitation) that the surge gates are closed at the outset of
the simulation, and that no surge forerunner has propagated into the bays
through the passes for the duration of the simulation. In reality, some
degree of forerunner propagation into the bays is expected prior to the
time of gate closure; and the actual time of gate closure will dictate the
water level that exists inside Galveston and West Bays.

Jackson State University 359
From the perspective of operating the storm surge gates in a way that
minimizes peak storm surge inside the bays, it is desirable to minimize the
amount of water within the bays at the time of gate closure. This chapter
focusses solely on minimization of the antecedent water level within the
bays at the time gates are closed, in order to minimize interior surge levels.
Other factors that might influence the timing of gate closure, such as
operational constraints associated with the gates themselves, navigation
safety, or throughput of vessel traffic in anticipation of an approaching
hurricane, are not considered here.
Processes that Influence Antecedent Water Levels
A number of physical processes contribute to longer-term changes in
water surface elevation along the Texas coast, all of which can influence
the antecedent water level conditions that exist inside the bays at any
particular time during hurricane season. Month-to-month changes in the
monthly mean sea level along the Texas coast, and in Galveston and West
Bays, are caused by seasonal variation in the thermal expansion of surface
waters in the Gulf of Mexico. Such changes also are influenced by the
seasonally-varying prevailing winds and atmospheric pressure patterns in
the Gulf, and by seasonal changes in riverine runoff amounts that enter
the bays. In addition to seasonal and Gulf-scale changes in mean sea level,
there are annual changes in mean sea level arising from some of the same
physical phenomena occurring at global spatial scales, and at annual and
decadal time scales.
Other tidal and meteorological processes vary over shorter time scales and
they influence antecedent water levels in the bays as well. One such
process is the astronomical tide. Astronomical tides within the Gulf of
Mexico are forced by net water fluxes through the Yucatan and Florida
Straits which connect the Gulf with other larger adjacent water bodies and
by the gravitational pull of the moon and sun on the Gulf’s waters. Other
physical processes that influence the antecedent water level are the wind-
driven forerunner and the volume mode forerunner, both of which are
associated with the presence of a hurricane. Both types of forerunners
were introduced in Chapter 5.
These different contributors to antecedent water levels are discussed
further, below.

Jackson State University 360
Mean Sea Level
All of the with-dike storm simulations assumed that the storm surge gates
at both Bolivar Roads and San Luis Passes were closed at the beginning of
the simulation. Therefore, in essence, the antecedent water level within
the bays at the time of gate closure, was equal to the initial water surface
elevation value that was adopted for the simulation. The antecedent water
level was set to either 0.91 ft NAVD88 for present sea level or 3.31 ft
NAVD88 for the future sea level scenario.
The present-day sea level includes a current estimate of long-term mean
sea level at Galveston Pleasure Pier, 0.5o ft (0.152 m) NAVD88 plus an
additional amount of 0.41 ft (0.125 m). This added amount represents a
seasonal mean sea level adjustment that reflects the late summer portion
of the hurricane season, the time when the most intense hurricanes that
influenced the Texas Coast have tended to occur, historically. The long-
term mean sea level value was extracted from the following NOAA web site
(https://tidesandcurrents.noaa.gov/datums.html?id=8771510).
Figure 14-1 shows the average monthly mean sea level for the Galveston
Pier 21 gage, which is located on the bay side at the Port of Galveston. The
graph is based on data from the following NOAA web site,
(https://tidesandcurrents.noaa.gov/sltrends/seasonal.htm;jsessionid=86
0DD03CDCFEE25287DB39611EA5E206?stnid=8771510).
Figure 14-1. Computed average monthly mean sea level at Galveston Pier 21, Texas.

Jackson State University 361
Data from the Pier 21 NOAA gage was selected for display in lieu of data
from the open-coast Galveston Pleasure Pier gage because of the former’s
very long data record and continuous availability of data through to the
present. Available overlapping data for both the Galveston Pier 21 bay site
and the Galveston Pleasure Pier open coastal site show little difference in
the average monthly mean sea level between the bay and the open Gulf.
Note that the vertical scale in Figure 14-1 is displayed in metric units
(meters), not in feet. The seasonal mean sea level adjustment value of 0.41
ft, which we have adopted, is equivalent to a metric value of 0.125 m.
There is year-to-year variability in the monthly mean sea level values.
Figure 14-1 displayed the average monthly means and “error” bars that
reflect its annual variability. Figure 14-2, also displayed in metric units,
shows the inter-annual variability in monthly mean sea level at Galveston
Pier 21, since 1990. The figure is taken from the NOAA web site,
https://tidesandcurrents.noaa.gov/sltrends/residual1980.htm;jsessionid=
192977B0714E944FE6463E112A1B5477?stnid=8771450). Note, that to
produce this figure, both the average seasonal cycle and a linear trend
were removed. Removal of the linear trend is intended to remove the
effects of long-term mean sea level change. The figure shows how the
monthly mean sea level can vary from year to year, in addition to the
seasonal cycle.
Figure 14-2. Inter-annual variability in monthly mean sea level at Galveston Pier 21, Texas.

Jackson State University 362
Variability about the average monthly mean sea level can reach 0.2 m
(0.66 ft) or more, which is greater than the highest average mean values in
September and October shown in Figure 14-1. Also, of particular note is
the unusually high and persistent variability in monthly mean sea level
that was computed for 2016. Monthly, seasonal, and annual-scale changes
in mean sea level strongly influence the antecedent water levels with
Galveston and West Bays, at the time of hurricane occurrence. Gate
operations will have no influence on these levels.
Astronomical Tide
Other processes can change antecedent water levels within the bays as
well, on shorter time scales, such as periodic motions associated with the
astronomical tide which oscillate with periods of approximately 12 or 24
hours.
Typical Tide Conditions at Galveston
Figures 14-3 and 14-4 are examples of the predicted astronomical tide at
the Galveston Pleasure Pier, on the open coast, for two months in the
middle of the peak hurricane season, August 2017 and September 2017,
respectively. The figures were generated using the NOAA Tides and
Currents web site (https://tidesandcurrents.noaa.gov). Each figure shows
a 1-month record of the predicted astronomical tide, not the actual
measured tide.
Figure 14-3. Predicted astronomical tide at Galveston Pleasure Pier, Texas, for August
2017.

Jackson State University 363
Figure 14-4. Predicted astronomical tide at Galveston Pleasure Pier, Texas, for September
2017.
The tide along the north Texas coast is considered to be a mixed tide;
sometimes having one high and one low tide per day (called a diurnal tidal
variation) and sometimes having two high and two low tides per day
(called a semidiurnal variation). The diurnal variation is prevalent during
times when the water surface elevation fluctuations from high tide to low
tide (called the tide range) are greatest. The diurnal variation is prevalent
for most of the month, about 75% of the time. The semi-diurnal variation
is most prevalent during times when elevation fluctuations from high tide
to low tide (tide range) are smallest, about 25% of the time.
Roughly, two full cycles of water surface elevation fluctuations are evident
in each figure, with each cycle spanning approximately 14.5 days. Within
each 14.5-day cycle, the daily highest water level values are modulated, i.e.,
daily maxima gradually increase from a smaller value to a greater value
and then they get smaller again. The daily low water values are modulated
in the same way. This general pattern repeats itself from month to month,
throughout the year. The times of highest maximum elevation (and lowest
minimum elevation) are called spring tide conditions; and, the times of
lowest maximum elevation and highest minimum elevation are called neap
tide conditions. The two 14.5-day cycles, each of which is called a spring-
neap cycle, make up a lunar month, which is approximately 29 days in
length. Each calendar month has about two spring-neap cycles; and that
behavior is seen in Figures 14-3 and 14-4.
Jackson State University 364
Tide Differences at Galveston – Open Gulf vs Galveston Bay
Bolivar Roads Pass naturally attenuates the tidal elevations, and the tide
range, by about 30%. Based on NOAA data, in the open Gulf at Galveston
Pleasure Pier the mean tidal range and the tidal range at spring tide is 1.46
and 2.04 ft, respectively; whereas, just inside the pass at Galveston Pier 21
the mean range and the range at spring tide is 1.02 and 1.41 ft,
respectively. Tide range data were extracted from the NOAA web site:
https://tidesandcurrents.noaa.gov/stations.html?type=Datums. The
temporal characteristics of the tidal fluctuations in the bay and in the open
Gulf are quite similar, except for the reduced tidal amplitude in the bay.
The surge gate structures that are built as part of the Ike Dike concept are
expected to further attenuate the tide through the passes. The permanent
superstructure that is built to support the retractable storm surge gates at
both Bolivar Roads and San Luis Passes will permanently decrease the
cross-sectional area at both passes, which will likely lead to further
attenuation of the tide through the gate systems at the passes. Actual
reductions of the antecedent water level within the bays that can be
achieved by closing the surge gates at low tide will be determined by the
natural attenuation that occurs at the passes and by additional attenuation
that occurs with the surge gate systems in place. The exact amount of
flood risk reduction that is achieved by closing the gates at low tide is
unknown at present. The amount of flood risk reduction achieved by
closing the gates at low tide can be quantified via modeling.
An Example of Measured Tide Fluctuations
A previous section described the unusually high monthly mean sea levels
during 2016. Figure 14-5 shows the predicted astronomical tide (blue
curve) and the actual measured water surface elevation (green curve) at
Galveston Pier 21 during September 2016. The differences between
measured and predicted tides clearly show the potential for higher-than-
normal seasonal sea levels, relative to predicted astronomical tide values.
The also show daily variations in the difference between the predicted and
measured tide, due to other physical processes that are not storm related.

Jackson State University 365
Figure 14-5. Predicted astronomical tide and measured water surface elevation at
Galveston Pier 21, Texas, for September 2016.
While the mean sea level which is present during the time of hurricane
occurrence cannot be controlled, the time of gate closure can be. The
graph reinforces the benefit of closing the gates at low astronomical tide in
order to minimize antecedent water levels within the interior bays and
thereby minimize flood risk. Conversely, closing the gates at high tide
increases the flood risk.
Wind-Driven Surge Forerunner
All hurricanes that traverse the Gulf of Mexico, and eventually approach
the north Texas coast, will generate a significant wind-driven surge
forerunner. Model results presented in Chapters 5 and 7 showed this for
very intense hurricanes that approach the Houston-Galveston region from
the east-southeast, southeast and south-southeast directions. The
magnitude of the forerunner surge was greatest for storms having a
southeast or south-southeast track and it was significantly less for an east-
southeast track.
The counterclockwise circulating winds about the eye of a hurricane tend
to force water movement along the continental shelf regions of the
northern Gulf. An Ekman set-up, i.e the wind-driven surge forerunner, is
forced at the coast; and it is created by water moving along the shelf,
which is turned to the right in the northern hemisphere by the Coriolis
force, and stacked against the coastline. The forerunner surge propagates
westward along the Louisiana shelf and then southward along the Texas
shelf. The forerunner surge seems to readily propagate into the bays via
Jackson State University 366
the passes, relatively un-attenuated, as it did for Hurricane Ike.
Propagation of the forerunner through the passes and into the bays is
expected until the time when the surge gates are closed.
Water surface elevation changes associated with the forerunner surge
generation process were discussed in Chapters 5 and 7. As described in
those chapters, the wind-driven forerunner will cause the water surface
elevation on the open coast and within the bays to gradually and steadily
increase with time, a process which can start days before the hurricane
makes landfall. As time progresses and the hurricane approaches and
moves across the continental shelf off the coast of Texas, the rate of water
level rise associated with the forerunner increases. Therefore, from the
perspective of minimizing the antecedent water level within the bays due
to the wind-driven forerunner surge, the earlier the storm surge gates are
closed at both passes the better.
Recent work by Liu and Irish (2017) examined the wind-driven forerunner
surge elevation along the north Texas coast for a number of synthetic land-
falling hurricanes of varying intensity and size. They used a coupled wave
and storm surge modeling approach that was quite similar to that applied
in this study. Storm intensity was defined by the pressure deficit, i.e., the
difference between far-field pressure and minimum central pressure.
Storm size was characterized by the radius-to-maximum-winds. A single
storm track from the southeast was considered, having a landfall location
at the western limit of the City of Galveston.
Forerunner surge results were presented for a location that was positioned
on the coast approximately half way between High Island and Sabine Pass.
These results, shown in Figure 14-6, are considered to be generally
applicable and representative of the entire Houston-Galveston region. The
left hand panel of Figure 14-6 shows the forerunner surge elevation above
normal, i.e., above the mean sea level, at a time 12 hours before landfall.
The right hand panel shows the time of arrival for a 1-m (3.3-ft) forerunner
surge level in hours before landfall. The forerunner surge elevations
shown in Figure 14-6 are significant, ranging from 0.6 m (2 ft) to twice
that value, 1.2 m (4 ft), for the set of storms that were considered.

Jackson State University 367
Figure 14-6. From Liu and Irish (2017). Left panel: Surge elevation above normal level (in
m) 12 hours before landfall, as a function of pressure deficit and storm radius to maximum
wind. Right panel: Time of arrival for a 1-m flood elevation (above normal level) in hours
before storm landfall, as a function of pressure deficit and storm radius to maximum wind.
Forerunner surge is a significant contributor to flood risk in the Houston-
Galveston region. Closing the gates as early as possible and practical
minimizes propagation of the forerunner surge into the bays and
minimizes flood risk for all areas inside the gates. Results presented in
Chapters 5 and 7 suggest that closing the surge gates 24 hours prior to
landfall would reduce, by an additional 50 to 60%, the forerunner surges
that occur at 12 hours prior to landfall.
Surge forerunners for the 3 proxy storms and Hurricane Ike are presented
and discussed in a later section of this chapter.
Volume Mode Forerunner
The volume mode oscillation that was investigated and identified by
Bunpapong et al (1985), which was briefly described in Chapter 5,
suggested that this phenomenon could produce oscillatory water surface
fluctuations having an amplitude of up to 2 ft along the Texas coast (for
major hurricanes having a pressure deficit of 120 mb), and having a period
of oscillation of 28 to 30 hours. Such water level changes are comparable
in magnitude to those associated with the astronomical tide and with the
wind-driven forerunner; and as such, changes of this magnitude will have
implications for storm surge gate operations and closure. This
phenomenon has not been widely studied; and, it has been neglected in all
coastal flood risk engineering studies of which the authors are aware.
Therefore this phenomenon was examined more closely as part of the
present study, to ascertain its importance in surge gate operations. This
phenomenon is examined and discussed in much greater detail later in
this chapter.
Jackson State University 368
Wind-Driven Forerunner - Proxy Storms and Hurricane Ike
The wind-driven surge forerunner is one of the most important
phenomena that affects surge gate operations because it persistently and
steadily increases the water surface elevation with time as a hurricane
moves through the Gulf and approaches the Texas coast. This
phenomenon leads to a steady rise in water surface elevation within
Galveston Bay, and thus it leads to a steady increase in flood risk. The
potential magnitude of elevation change associated with the wind-driven
forerunner is higher than that for the astronomical tide or the volume
mode forerunner.
Development of the wind-driven surge forerunner for the 10-yr, 100-yr
and 500-yr proxy storms, and Hurricane Ike is examined below. Results
for the proxy storms shed some light on the roles of forward speed, storm
intensity, and storm size on wind-driven forerunner characteristics.
Results for Ike, both as it was simulated with the model and as it was
measured during the actual event, are presented and discussed.
10-yr Proxy Storm
Figure 14-7 shows the temporal variation in water surface elevation at the
Galveston Pleasure Pier, an open-coast location, and at three locations
inside Galveston Bay: 1) Clear lake (east) which is located at the entrance
to Clear Lake, 2) Alexander Island which is located at the northern end of
Galveston Bay adjacent to the Houston Ship Channel, and 3) Houston Ship
Channel (upper) which is located at the uppermost end of the ship channel
near central Houston. The format of the graph in Figure 14-7, specifically
the choice for vertical scale, is intended to focus on the development of the
wind-driven surge forerunner, not the peak surge.
The 10-yr proxy storm is a relatively weak hurricane. It has a minimum
central pressure of 975 mb, a maximum surface wind speed of 68 kts,
which reflects Category 1 hurricane on the Saffir-Simpson wind scale, a
radius-to-maximum-winds of 18 nm which increases to 22 nm as the
storm approaches landfall, a typical storm size, and a rather slow constant
forward speed of 6 kts.

Jackson State University 369
Figure 14-7. Water surface elevation changes with time associated with the wind-driven
forerunner surge, both inside and outside Galveston Bay, for the 10-yr proxy storm.
Simulation time is shown on the horizontal axis in Figure 14-7, and several
key times during the hurricane’s transit in the Gulf are noted here. The
eye of this hurricane enters the Gulf at hour 10 of the simulation. Upon
entry the idealized wind fields, which are nearly circular about the eye for
this synthetic storm and which blow in the counterclockwise direction
about the eye, begin to generate far field east-to-west blowing winds all
along the northern continental shelf regions of the Gulf. The along-shelf
winds begin to force an along-shelf movement of water which, in turn,
generates a small Ekman set at the shoreline, i.e. the wind-driven surge
forerunner. As the storm gets closer to the Texas coast, wind speeds on
the shelf increase, forcing an increase in speed of the along-shelf moving
water, which in turn leads to a greater Ekman set-up.
At hour 58.5, which is 72 hours (3 days) prior to landfall, the eye of the
hurricane is still positioned well beyond the edge of the continental slope
off the Texas Coast. The water surface elevation at this time, at the
Galveston Pleasure Pier, is 1.5 ft NAVD88, which is 0.6 ft above the
approximate mean sea level value of 0.9 ft. Following entry, during the
first two days of the hurricane’s transit through the very deep-water parts
of the central Gulf, a wind-driven forerunner surge of 0.6 ft already has
been generated at the coast in the Houston-Galveston region by this slow-
moving storm. During the entire time leading up to this point, the wind-
driven forerunner has effectively propagated into all parts of Galveston
Bay, with very little attenuation.
Jackson State University 370
At hour 82.5, which is 48 hrs (2 days) prior to landfall, the water surface
elevation has reached 1.9 ft. The eye crosses the outer edge of the
continental slope off the Texas coast a short time later, at hour 85.5 of the
simulation. During the previous 24 hours, the magnitude of wind-driven
forerunner surge at Galveston increased by 0.4 ft, from 0.6 to 1.0 ft.
Importantly, the rate at which the water surface elevation rises, i.e., the
slope of the curve in the figure, is increasing at this time, as the storm
approaches the Texas coast. As the eye approaches the continental slope
off the Texas coast, the rate of water level rise associated with the
forerunner begins to accelerate.
At hour 106.5, which is 24 hours before landfall, the eye has moved up the
continental slope and is approaching the edge of the continental slope.
The eye crosses the edge of the continental shelf, off the Texas coast, at
hour 110, and it moves into the increasingly more shallow water. The rate
at which the water surface elevation is rising due to the surge forerunner
continues to accelerate, as evidenced by the changing slope of the curves
seen in the figure. The rate of rise is increasing as stronger winds move
onto the shallower shelf regions in advance of the approaching eye,
enhancing alongshore movement of water and formation of the Ekman
setup. During the previous 24 hours, the water surface elevation at
Galveston has risen by 0.9 ft, from 1.9 ft to an elevation of 2.8 ft NAVD88.
The magnitude of the forerunner surge at this time is 1.9 ft, relative to the
mean sea level. Even for this relatively weak hurricane, 24 hours (1 day)
before landfall, the wind driven forerunner has increased local water levels
by roughly 2 ft. During this entire period of time, up to this point, the
wind-driven forerunner has effectively propagated into all parts of
Galveston Bay, with very little attenuation.
At hour 118.5, which is 12 hours before landfall, the water surface at the
Galveston Pleasure Pier is 4.4 ft NAVD88, which is 3.5 ft above mean sea
level. The water level rose by another 1.6 ft during the previous 12 hours
alone, at an accelerating rate.
The simulated forerunner surge magnitude for the proxy storm can be
roughly compared to the elevation suggested by the work of Liu and Irish
(2017). The 10-yr proxy storm has a central pressure deficit of 38 mb (the
difference between the far-field pressure of 1013 mb and the central
pressure is 975 mb). For this pressure deficit and a radius-to-maximum-
winds value of 18 nm (33 km) for most of its duration, results from the
Jackson State University 371
work by Liu and Irish (2017), which are shown in Figure 14-6, suggest a
forerunner surge value of between 0.6 and 0.7 m (2.0 and 2.3 ft) at a time
that is 12 hours before landfall. The value of 3.5 ft from the present study
is significantly higher than the value suggested by the work of Liu and
Irish (2017).
It is possible that the slow-moving nature of the 10-yr proxy storm leads to
a higher wind-driven forerunner surge at Galveston than does a faster
moving storm having all other characteristics the same. There is some
evidence that this might be the case, based upon results shown in the
volume-mode forerunner analysis section that is presented and discussed
later in this chapter. Liu and Irish (2017) did not examine the influence of
forward speed on forerunner magnitude. All the storms that they
considered and simulated had the same forward speed, 11 kts, which is
nearly twice as fast as the speed of the 10-yr proxy storm, 6 kts. A
difference in their model set-up compared to that used in the present
study, such as the treatment of bottom friction, might also contribute to
the difference in estimated surge forerunner magnitude.
Forerunner surge results for the 10-year proxy storm show the importance
of early closure in operating the storm surge gates, which are an integral
component of the Ike Dike concept. First, the wind-driven forerunner is
not appreciably attenuated as it propagates through the passes and into
the bays. There are only small differences between the water surface
elevation at the open coast Galveston Pleasure Pier site and at locations
throughout the bay, including even the upper reaches of the Houston Ship
Channel. This observation is true for the entire forerunner surge
development period prior to hour 118.5, which is 12 hours prior to landfall.
Second, for this storm, decisions to close the storm surge gates at 72 hrs,
48 hrs, 24 hrs, and 12 hrs prior landfall, would result in forerunner surge
magnitudes within Galveston Bay approximately of 0.6, 1.0, 1.9 and 3.5 ft,
respectively, relative to mean sea level, at the time of gate closure. Any
delay in closing the gates can lead to an increase in flood risk within the
bay; so the sooner gates are closed the better. The potential increase in
flood risk within the bay, that is associated with penetration of the wind-
driven forerunner surge into the bay prior to gate closure, can be mitigated
to a degree through an earlier gate closure and/or timing of gate closure to
coincide with a time of low astronomical tide.

Jackson State University 372
100-yr Proxy Storm
Figure 14-8 shows the variation in water surface elevation with time for
the 100-yr proxy storm, at the same four locations that are shown in
Figure 14-7. The 100-yr proxy is an intense hurricane, having a minimum
central pressure of 930 mb, a maximum surface wind speed of 100 kts,
which is a Category 3 hurricane on the Saffir-Simpson wind scale. The
storm has a radius-to-maximum-winds of nearly 26 nm which increases to
37 nm as the storm approaches landfall, which is a rather large value; and
it has a constant forward speed of 11 kts, which is an average value.
Compared to the 10-yr proxy storm, the 100-yr proxy storm is more
intense, larger, and it moves at nearly twice the forward speed, so it spends
much less time transiting the Gulf of Mexico.
The eye of the 100-yr proxy storm was located just inside the Gulf at the
beginning of the simulation, i.e., at hour zero. It began its initial spin-up
from rest and began its transit, all while inside the Gulf. The start-up
time, hour zero, corresponds to a time that is approximately 72 hours (3
days) prior to landfall.
At hour 22, which is 48 hours (2 days) prior to landfall, the eye of the
hurricane is still in very deep water and well seaward of the edge of the
continental slope off the Texas Coast. The water surface elevation at this
time, at the Galveston Pleasure Pier, is 2.0 ft NAVD88, which is 1.1 ft
Figure 14-8. Water surface elevation changes with time associated with the wind-driven
forerunner surge, both inside and outside Galveston Bay, for the 100-yr proxy storm.

Jackson State University 373
above the approximate mean sea level value of 0.9 ft. Early development
the wind-driven forerunner is rapid for this storm, reflected by the
increase of 1.1 ft in the first 24 hours. Because the hurricane is more
intense, stronger winds develop quickly over the continental shelf regions,
leading to earlier formation of higher Ekman set-up at the coast.
At hour 46 of the simulation, the eye of the storm is positioned at the
seaward edge of the continental slope. At his time, which is 24 hrs (1 day)
prior to landfall, the water surface elevation at Galveston Pleasure Pier is
2.7 ft NAVD88, which reflects a forerunner surge magnitude of 1.8 ft
relative to mean sea level. During the previous 24 hours, the wind-driven
forerunner surge magnitude at Galveston increased by 0.7 ft, from 1.1 ft to
1.8 ft. The rate of water surface rise at Galveston is greater during the first
24 hours (1.1 ft) compared to the second 24 hours (0.7 ft). At first glance
this seems counterintuitive. The anomaly is likely related to the storm’s
origin inside the Gulf and its rapid spin-up from zero intensity to full
intensity over a relatively short time while it is already inside the Gulf.
After hour 30, the rates of water level rise appear to be more like those
seen for the 10-yr proxy storm, having a persistent acceleration in the rate
of rise.
At hour 58, which is 12 hours before landfall, the eye has moved up the
continental slope; and it is positioned at the edge of the continental shelf
at hour 59. During the previous 12 hours, the water surface elevation at
Galveston rose from 2.7 ft to 4.8 ft NAVD88, an increase of 2.1 ft in only 12
hours. The water surface elevation of 4.8 ft reflects a 3.9-ft forerunner
surge magnitude, relative to mean sea level. The rate at which the water
surface elevation is rising due to the surge forerunner is accelerating, as
seen in the figure.
The simulated forerunner surge for the 100-yr proxy storm also can be
compared to the forerunner surge magnitude that is based upon the work
of Liu and Irish (2017). For the 100-yr storm, which has a central pressure
deficit of 83 mb and a radius-to-maximum-winds value of 26 nm (48 km)
for most of its duration, results from the work by Liu and Irish (2017),
which are shown in Figure 14-6, suggest a forerunner surge magnitude of
approximately 1.05 m (3.4 ft). The value of 3.9 ft from the present study is
only slightly higher. Note that the forward speed of the 100-yr proxy
storm, 11 kts, is the same as the speeds of all storms considered by Liu and

Jackson State University 374
Irish (2017). This suggests that the larger discrepancy seen for the 10-yr
proxy storm might be due, at least in part, to its slower forward speed.
Forerunner surge results for the much more intense 100-year proxy storm
also show the importance of early storm surge gate closure. As was the
case for the 10-yr proxy storm, during the forerunner development period
prior to hour 46, there are small differences between the water surface
elevation at the open coast Galveston Pleasure Pier site and all locations
throughout the bays, showing propagation of the forerunner into the bay
with little attenuation. Some of that difference is due to the effect of
stronger prevailing winds within Galveston Bay which act to set up the
western side of the bay. For the 100-yr proxy storm, decisions to close the
storm surge gates at 48 hrs, 24 hrs, and 12 hrs prior landfall, would result
in forerunner surge magnitudes within Galveston Bay approximately of
1.1, 1.8 and 3.9 ft, respectively, relative to mean sea level, at the time of
gate closure. For an intense storm such as this one, closing the gates at
least 24 hrs before landfall seems to be absolutely necessary, as does
timing of closure to coincide with low astronomical tide.
500-yr Proxy Storm
Figure 14-9 shows the variation in water surface elevation with time for
the very intense 500-yr proxy storm, at all four locations. The 500-yr
proxy storm has a minimum central pressure of 900 mb, a maximum
surface wind speed of 112 kts, which is right on the borderline between a
Category 3 and 4 hurricane on the Saffir-Simpson wind scale. The storm
has a radius-to-maximum-winds of nearly 22 nm which increases to 32
nm as the storm approaches landfall, a rather large value; and it has a
constant forward speed of 11 kts which is an average value. Compared to
the 100-yr proxy storm, the 500-yr proxy storm is more intense, not quite
as large but still rather large, and it moves at the same forward speed, 11
kts.
Like the 100-yr proxy storm, the eye of the 500-yr proxy storm was located
just inside the Gulf at the beginning of the simulation, i.e., at hour zero. It
began its initial spin-up from rest and began its transit, all while inside the
Gulf. The start-up time, hour zero, corresponds to a time that is
approximately 72 hours (3 days) prior to landfall.

Jackson State University 375
Figure 14-9. Water surface elevation changes with time associated with the wind-driven
forerunner surge, both inside and outside Galveston Bay, for the 500-yr proxy storm.
For the first 46 hours of the simulation, the time which is 24 hrs (1 day)
prior to landfall, the water surface elevation at Galveston Pleasure Pier is
essentially the same for the 500-yr proxy storm as it was for the 100-yr
proxy storm. Despite the higher intensity for the 500-yr proxy storm, its
smaller size apparently offsets the intensity difference in the development
of the surge forerunner. Both storms produce water surface elevations of
2.0 and 2.7 ft NAVD88 at hours 22 and 46 of the simulation, respectively,
which are 48 and 24 hours prior to landfall, respectively. Forerunner
surge magnitudes are 1.1 and 1.8 ft at these same two times.
At hour 58, which is 12 hours before landfall, the hurricane eye has moved
up the continental slope. It is positioned right at the edge of the
continental shelf at hour 59. During the previous 12 hours, the wind
forerunner surge at Galveston rose from 2.7 ft to 4.9 ft NAVD88, an
increase of 2.2 ft in only 12 hours. This elevation is slightly higher than the
elevation for the 100-yr proxy storm, suggesting that the intensity
difference is prevailing over the influence of a smaller size. This makes
sense because the core winds are now moving onto the shelf. The eventual
peak surge at Galveston Pleasure Pier for the 500-yr proxy storm, which is
dictated by the winds on the shelf, is several feet higher for the 500-yr
proxy storm than peak surge for the 100-y proxy storm. The water surface
elevation of 4.9 ft for the 500-y proxy storm, 12 hours before landfall,
reflects a 4.0-ft forerunner surge magnitude relative to mean sea level. As
Jackson State University 376
was the case for the other proxy storms, the rate at which the water surface
elevation is rising due to the surge forerunner is accelerating.
The simulated forerunner surge elevation for the 500-yr proxy storm also
can be compared to the elevation suggested by the work of Liu and Irish
(2017). For the 500-yr storm, which has a central pressure deficit of 113
mb and a radius-to-maximum-winds value of 22 nm (41 km) for most of
its duration, results from the work by Liu and Irish (2017), which are
shown in Figure 14-6, suggest a forerunner surge value of approximately
1.07 m (3.5 ft). The value of 4.0 ft from the present study is only slightly
higher. The slightly higher value for the 500-yr proxy storm compared to
the 100-yr proxy storm, as computed in this study, is quite consistent with
the results of Lie and Irish (2017) which also show a same small difference,
despite the large intensity difference.
As was the case for the 100-yr proxy storm, closure of the storm surge
gates at least 24 hrs before landfall seems to be absolutely necessary, as
does timing of the closure to coincide with low astronomical tide.
Simulated Hurricane Ike
Figure 14-10 shows the variation in water surface elevation with time for
Hurricane Ike, as simulated by the storm surge model. Hurricane Ike had
the following characteristics: 1) a minimum central pressure of between
968 and 946 mb as it transited the Gulf, having a value of about 950 mb
for much of time while in the Gulf; a maximum surface wind speed that
varied between 70 and 95 kts, a value of between 85 to 95 kts during most
of its time in the Gulf, which corresponds to a Category 2 hurricane on the
Saffir-Simpson wind scale; 2) an unusually large size, having considerable
asymmetry in the wind field, with a large area of hurricane force winds on
its right hand side, and having a radius-to-maximum-winds that varied
from 26 nm to 72 nm; 3) a variable forward speed of 7 to 11 kts, 7 kts when
it entered the Gulf and gradually increasing to 11 kts as the storm transited
the shelf and approached landfall.
The hurricane’s transit through the Gulf lasted 81 hours; starting at hour
971 of the simulation when it first entered the Gulf and ending at hour
1051 when it made landfall. The hurricane’s eye crossed the seaward edge
of the continental slope off the Texas shelf at hour 1024.5 and it crossed
the seaward edge of the continental shelf at hour 1038.

Jackson State University 377
Figure 14-10. Water surface elevation changes with time associated with the wind-driven
forerunner surge, both inside and outside Galveston Bay, for Hurricane Ike.
The Hurricane Ike storm surge simulation included the astronomical tide,
unlike the proxy storm simulations which did not. The predominant
diurnal tidal oscillations, having a period of 24 hours, are quite evident in
Figure 14-10. The tide range was rather large when the hurricane
occurred, a range of 2 to 2.5 ft.
Aside from the tidal fluctuations, a slow steady rise in water surface
elevation is evident, which is caused by the wind-driven forerunner. As
was the case for the proxy storms, the rate of water level rise due to the
forerunner begins to rapidly accelerate once the eye approaches the
seaward edge of the continental slope. In the case of Hurricane Ike that
point in time occurs about 27 hours before landfall, at around hour 1024 of
the simulation. At this point in time the water surface elevation appears to
be about 2.4 ft NAVD88, about 1.5 ft above the mean sea level value of 0.9
ft NAVD88.
For the 24 hours before the eye reaches the continental slope, the
acceleration in water level rise is quite evident, and it begins at around
hour 1000. This time is approximately 48 hours before landfall (actual
landfall is at hour 1051). The early acceleration in water level rise
associated with the forerunner is attributed to the large asymmetric size of
Ike, which produced higher winds on the Louisiana-Texas shelf, earlier in
the storm, than would otherwise be expected for a smaller sized storm.

Jackson State University 378
By the time the storm reaches the seaward edge of the continental shelf, at
hour 1038, the wind-driven forerunner surge has reached a much higher
elevation of approximately 5.7 ft NAVD88, 4.8 ft above mean sea level.
This time corresponds approximately to a time that is 12 hours before
landfall. The highest surge level associated with the forerunner is
approximately 6.6 ft NAVD88, 5.7 ft above sea level, which occurs around
hour 1040 or slightly later. The storm surge due to the hurricane’s core
winds occurs after this time, as the eye moves further onto the shelf and
wind directions change from being directed alongshore to being directed
onshore.
The simulated forerunner surge elevation for Hurricane Ike can be roughly
compared to the elevation suggested by the work of Liu and Irish (2017).
Assuming a representative central pressure deficit value of 60 mb, and a
radius-to-maximum-winds value of 50 nm (92 km), a middle value based
on quite variable observations of the observed radius-to-maximum winds,
results from the work by Liu and Irish (2017) suggest a forerunner surge
value of approximately 1.25 m (4.1 ft). The value of 4.8 ft from the present
study is slightly higher, but similar.
Closure of the storm surge gates at the low astronomical tide event which
occurs at hour 996 of the simulation, which is 55 hours (more than 2 days)
prior to landfall, would have occurred when the water surface elevation at
Galveston Pleasure Pier was 0.5 ft NAVD88, which is below the mean sea
level value of 0.9 ft. Closure at around this time would minimize flood risk
in Galveston Bay, by minimizing the water level inside the bay, which is
about 1 ft NAVD88, nearly equal to mean sea level, at this same time.
Note that at this time, the eye of Ike would have still been in the deep-
water central region of the Gulf, when there would have been considerable
uncertainty in its actual landfall location and time.
Closure of the gate 24 hours later, at hour 1020 of the simulation which
corresponds to the next low tide event, would have occurred when the
water surface elevation at Galveston Pleasure Pier was 1.8 ft NAVD88, 1.3
ft higher than the elevation at the previous low tide. The 24-hr delay in
closure would lead to an increase in flood risk within the bays, by enabling
the surge forerunner to grow and propagate relatively un-attenuated into
the bays. This analysis does not consider the influence of the surge gate
infrastructure that is built at Bolivar Roads, or at San Luis Pass, on tidal
propagation into the bays. Any lag in time or change in tide characteristics

Jackson State University 379
can in turn influence when gate closure achieves the desired minimum
water surface elevation inside the bays. A lag in time between low tide on
the open coast and low tide in Galveston Bay of approximately 5 hours is
evident in Figure 14-10 without any surge gate system in place.
Observations of Forerunner Propagation into Galveston Bay during Hurricane
Ike
Propagation of the wind-driven surge forerunner into Galveston Bay
during Hurricane Ike was investigated using water surface elevation
measurements that were made during the storm. Results from the
Hurricane Ike model simulation suggested that there was little attenuation
of the wind-driven forerunner through the passes and into the bays.
Measured data were used to confirm the model results. The measured
data also provide an opportunity to evaluate model accuracy in predicting
the wind-driven forerunner for this hurricane event, which produced a
very large forerunner surge.
Measured data, that were acquired and archived by NOAA, were examined
for the seven locations shown in Figure 14-11. The choice of stations
enables assessment of the propagation of the forerunner, and any
attenuation it might undergo, as it enters Galveston Bay through Bolivar
Roads, propagates within the Bay and then into the upper reaches of the
Houston Ship Channel.
Figure 14-11. Stations where measured water surface elevation data were used to assess
forerunner propagation into Galveston Bay during Hurricane Ike.

Jackson State University 380
The series of Figures 14-12a through 14-12g show the time variation in
water surface elevation at each of the seven gage sites. These graphs were
generated using the NOAA Tides and Currents web site. The figures are
shown in the order in which the forerunner propagates into the bay,
starting with the Galveston Pleasure Pier site on the open coast, then the
City of Galveston inside of Bolivar Roads, several sites along the western
side of Galveston Bay from south to north, and eventually ending with the
Manchester Houston site in the upper reaches of the Houston Ship
Channel.
In all graphs, the predicted astronomical tide is shown as a blue curve.
Measured water surface elevation data are either shown in green or red,
green for verified data, red for preliminary data that have not been
verified. Water surface elevation is displayed in feet, relative to mean sea
level (MSL), which is the long term mean sea level for the gage site. Note,
that the vertical elevation scales vary for some of the figures. In all graphs,
the deviation between the measured water surface elevation (either
verified or preliminary) and the predicted tide reflects some combination
of the magnitude of the wind-driven forerunner as the hurricane transits
the Gulf and the vertical offset between the seasonal mean sea level that
was present at the time of the storm in September of 2008 and the long-
term mean sea level at that gage site.
Figure 14-12a. Measured water surface elevation during Hurricane Ike, at the Galveston
Pleasure Pier gaging station.
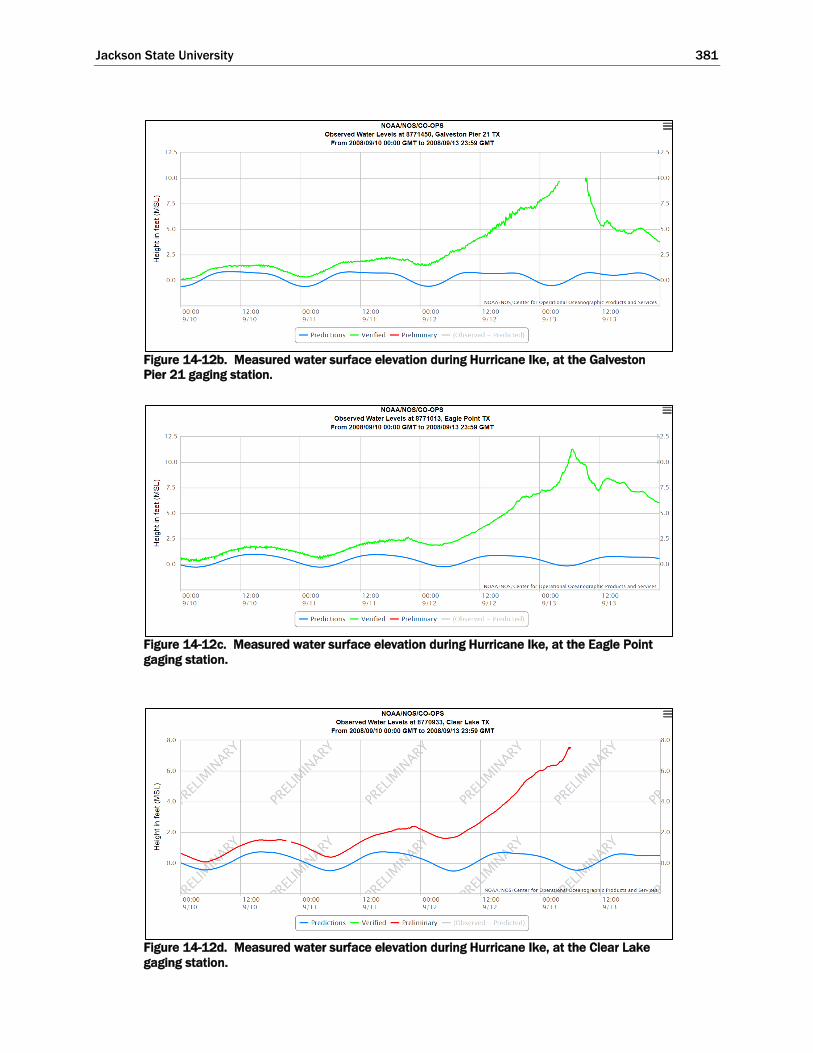
Jackson State University 381
Figure 14-12b. Measured water surface elevation during Hurricane Ike, at the Galveston
Pier 21 gaging station.
Figure 14-12c. Measured water surface elevation during Hurricane Ike, at the Eagle Point
gaging station.
Figure 14-12d. Measured water surface elevation during Hurricane Ike, at the Clear Lake
gaging station.
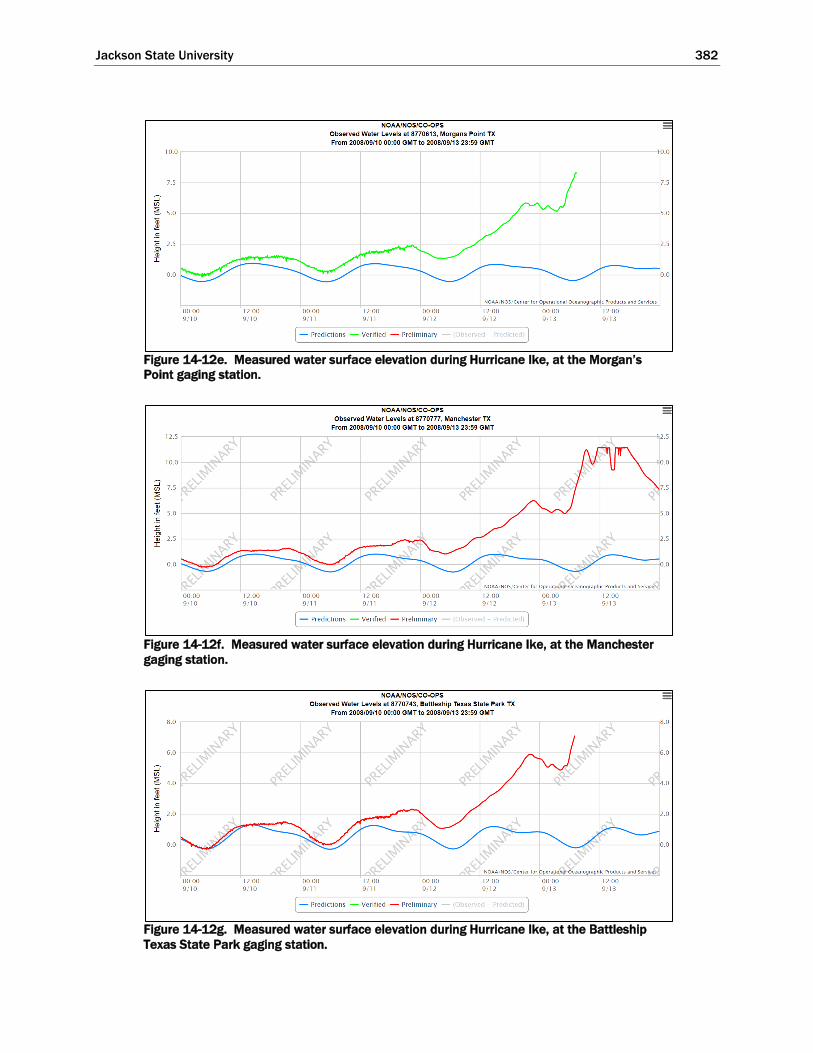
Jackson State University 382
Figure 14-12e. Measured water surface elevation during Hurricane Ike, at the Morgan’s
Point gaging station.
Figure 14-12f. Measured water surface elevation during Hurricane Ike, at the Manchester
gaging station.
Figure 14-12g. Measured water surface elevation during Hurricane Ike, at the Battleship
Texas State Park gaging station.

Jackson State University 383
All graphs display the measured water surface elevation for the same
period of time, September 10-13, 2008. In each graph, time is displayed
on the horizontal axis relative to Greenwich Mean Time (GMT), which is
ahead of Central Daylight Time, CDT, by 5 hours. For example, the eye of
Hurricane Ike crossed the Texas coast at approximately 2:10 am CDT on
the morning of September 13, which corresponds to 7:10 am GMT.
Hurricane Ike passed over Cuba and entered the Gulf of Mexico at 4:00
pm CDT on September 9, which is 9:00 pm GMT on that same day.
The deviation in water surface elevation at hour 00 on September 10, just
hours after the hurricane’s eye entered the Gulf, is consistent for the first
six gage locations, and it measures about 0.5 ft. The lack of a deviation at
the Battleship Park gage (Figure 14-12g) is likely due to some type of a
vertical datum issue. There is no physical explanation why the deviation at
this gage location should differ significantly from the deviation at the other
gages.
Both qualitatively and quantitatively, both the measured water surface
elevation time series and the deviation between measured water surface
elevation and predicted tide are quite similar at all of the gage sites. At
hour 00 GMT on September 11, which is around the time of low
astronomical tide and about 51 hours before landfall, the deviation is
consistent for all the gages), approximately 0.6 to 0.7 ft (accounting for the
datum discrepancy at the Battleship Park site). At hour 00 GMT on
September 12, which is around the next time of low astronomical tide and
about 27 hours before landfall, the deviation is again quite consistent for
all the gages, approximately 2 ft. During the previous 24-hr period, the
surge forerunner magnitude increased by 1.3 to 1.4 ft, nearly the same
increase as the simulated value (1.3 ft) that was discussed in the previous
report section.
The maximum water surface elevation associated with the wind driven
forerunner ranges from about 6.0 to 7.2 ft MSL at all seven gage sites. The
model results for Hurricane Ike indicate a maximum value of the
forerunner surge to be 6.5 ft NAVD88 at the Galveston Pleasure Pier site,
which after adjusting to a consistent vertical datum is about 6 ft relative to
the long term mean sea level, or approximately 1 ft less that the measured
maximum elevation value at the same site.

Jackson State University 384
Approximate maximum elevation values associated with the wind-driven
forerunner and tide, at each of the seven gage sites, are: 7.2, 7.2, 6.5, 6.0,
6.2, 6.3, 6.3 ft MSL. Values were estimated from the graphs. The
consistency of peak values at all seven sites indicates that the wind-driven
forerunner surge is relatively un-attenuated by the Bolivar Roads Pass or
during its propagation through Galveston Bay and into the upper reaches
of the Houston Ship channel. Values generally tend to decrease in the
direction of forerunner propagation into and then through the bay. The
peak values are also influenced to a degree by the local wind set-up that
occurs in response to local winds within the bay, which likely influences
some of the variability in peak values from site to site.
The measured forerunner peak at Galveston Pleasure Pier occurs at a time
that is about 13 hours before landfall. The time lag between the times of
maximum forerunner surge and landfall is very similar to the value of
about 10 or 11 hours that is seen in in the model results for Hurricane Ike.
At other locations, the measured time lag ranges from 7 to 12 hours.
Volume Mode Forerunner – Modeling and Analysis Approach
Selection of the Storm Set
An initial set of model simulations was defined to first confirm the
occurrence of the volume mode oscillation, or volume mode forerunner,
identified by Bunpapong et al (1985), and then to examine its dependency
on different hurricane characteristics. Results from the simulations were
used to examine the volume mode oscillation’s generation mechanism and
general properties. They also were used to examine the dependency of the
oscillation’s characteristics, such as its period and amplitude, as a function
of the hurricane’s track, intensity, size and forward speed. Bunpapong et
al (1985) examined the same types of dependencies and results from the
present study are compared/contrasted to those from their study.
Four different tracks were developed to represent movement of a
hurricane into the Gulf of Mexico, through either the Florida Straits or the
Yucatan Straits, thereby triggering the volume mode oscillation. The tracks
reflect paths of storms that are expected to have less dissipation in
strength caused by interference with adjacent land masses, which is
expected for those hurricanes that enter the Gulf in an intense state, such
as Category 3, 4 and 5 storms on the Saffir-Simpson intensity scale. The
four tracks considered in the present study are shown in Figure 14-13.
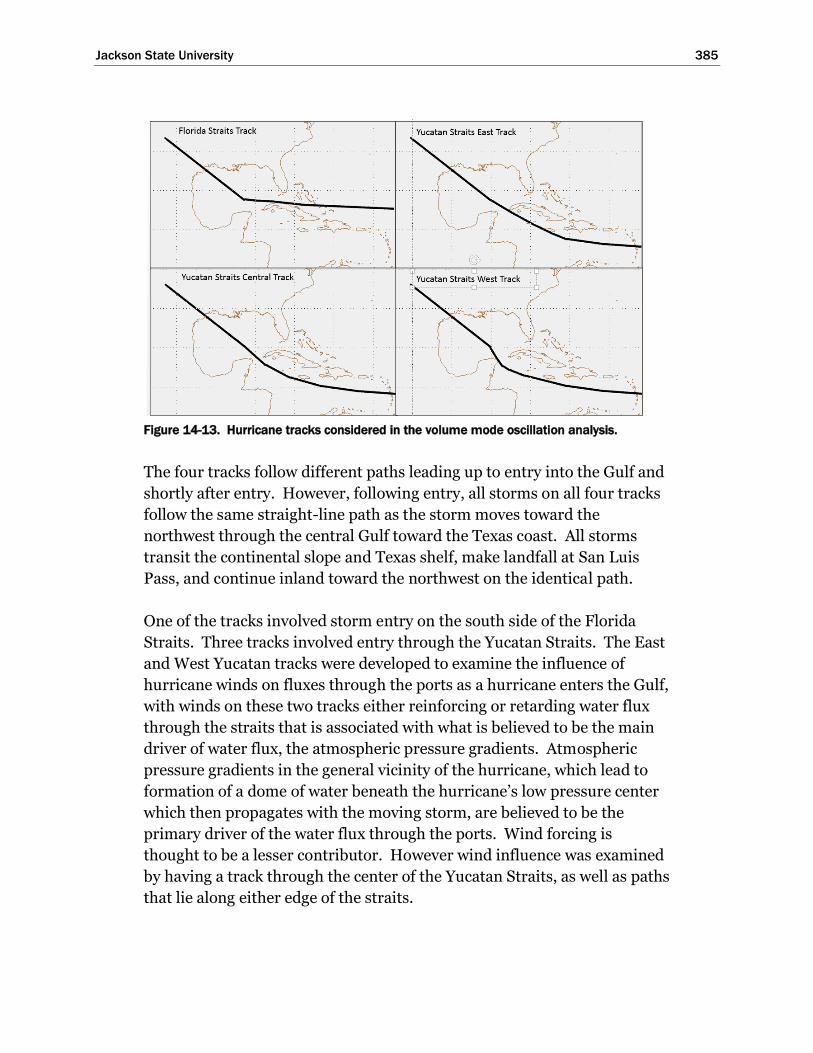
Jackson State University 385
Figure 14-13. Hurricane tracks considered in the volume mode oscillation analysis.
The four tracks follow different paths leading up to entry into the Gulf and
shortly after entry. However, following entry, all storms on all four tracks
follow the same straight-line path as the storm moves toward the
northwest through the central Gulf toward the Texas coast. All storms
transit the continental slope and Texas shelf, make landfall at San Luis
Pass, and continue inland toward the northwest on the identical path.
One of the tracks involved storm entry on the south side of the Florida
Straits. Three tracks involved entry through the Yucatan Straits. The East
and West Yucatan tracks were developed to examine the influence of
hurricane winds on fluxes through the ports as a hurricane enters the Gulf,
with winds on these two tracks either reinforcing or retarding water flux
through the straits that is associated with what is believed to be the main
driver of water flux, the atmospheric pressure gradients. Atmospheric
pressure gradients in the general vicinity of the hurricane, which lead to
formation of a dome of water beneath the hurricane’s low pressure center
which then propagates with the moving storm, are believed to be the
primary driver of the water flux through the ports. Wind forcing is
thought to be a lesser contributor. However wind influence was examined
by having a track through the center of the Yucatan Straits, as well as paths
that lie along either edge of the straits.

Jackson State University 386
The full set of storms that were simulated are shown in Table 14-1. Storms
are grouped by track.
Table 14-1. Storm Set Adopted for the Volume Oscillation Forerunner
Analysis
Storm Track/Identifier Name
Central
Pressure
(mb)
Forward
Speed
(kts)
Radius-to-
Maximum-
Winds
(nm)
Yucatan Straits - Central Track
Central Yucatan Track Storm01 930 6 18
Central Yucatan Track Storm02 930 12 18
Central Yucatan Track Storm03 930 18 18
Central Yucatan Track Storm04 930 12 10
Central Yucatan Track Storm05 930 12 30
Central Yucatan Track Storm06 900 12 18
Yucatan Straits – East Track
Eastern Yucatan Track Storm01 930 6 18
Eastern Yucatan Track Storm02 930 12 18
Eastern Yucatan Track Storm03 930 18 18
Yucatan Straits – West Track
Western Yucatan Track Storm01 930 6 18
Western Yucatan Track Storm02 930 12 18
Western Yucatan Track Storm03 930 18 18
Florida Straits
Florida Track Storm01 930 6 18
Florida Track Storm02 930 12 18
Florida Track Storm03 930 18 18
Florida Track Storm04 930 12 10
Florida Track Storm05 930 12 30
Florida Track Storm06 900 12 18

Jackson State University 387
Six storms were simulated for the Central Yucatan track. The first three
storms, 01, 02 and 03, were selected in order to examine the influence of
storm forward speed on forerunner development. Forward speeds of 6, 12
and 18 kts, reflecting a typical range for Gulf of Mexico hurricanes, were
adopted for this purpose; with storm intensity (reflected by the minimum
central pressure) and storm size (reflected by the radius-to-maximum-
winds) held constant for all three storms. Storm 02 (radius- to-maximum-
winds value of 18 nm) and Storms 04 and 05 (radius to maximum winds
values of 10 and 30 nm, respectively) were defined t0 examine the
influence of storm size on volume mode forerunner development, with
intensity and forward speed held constant. Size values that were
considered also reflect a reasonable range for Gulf hurricanes. Storm 06
(minimum central pressure of 900 mb) was defined to compare with
Storm 02 (minimum central pressure of 930 mb to assess the influence of
storm intensity on the volume oscillation characteristics. Both values
reflect very intense hurricanes. The same set of six storms was simulated
for the Florida Straits track to examine the same dependencies.
Only three storms were simulated for both the east and west Yucatan
Straits tracks. They were defined to only examine the influence of forward
speed.
For all simulations shown in Table 14-1, the peripheral surface
atmospheric pressure was set to 1013 mb. Therefore, for the 930-mb
storms, the maximum central pressure deficit, the difference between the
minimum central pressure and the far-field pressure was 83 mb; and for
the 900-mb storms, the pressure deficit was 113 mb. The storms
considered by Bunpapong et al (1985) in their analysis of hypothetical
hurricanes mostly had a constant pressure maximum pressure deficit of
80 mb. For all storms simulated in the present study, the Holland B
parameter which controls the radial variation of pressure field was set to a
constant, typical value of 1.27.
Isolation of the Volume Mode Oscillation
To isolate the volume mode forerunner from the wind-driven forerunner,
the following modeling procedure was adopted. Some iteration was
required to arrive at a satisfactory procedure. Once the storm entered the
Gulf at full intensity either via the Yucatan or Florida Straits it was allowed
to advance some distance into the Gulf, also at full intensity, in order to
fully trigger the volume oscillation. Then, storm intensity was steadily

Jackson State University 388
decreased by increasing the storm’s central pressure until it was nearly
equal to the peripheral pressure. The intensity decay occurred rather
rapidly, over a duration of about 24 hours, and the intensity decay process
ended while the storm center was still situated in the deep waters of the
Gulf of Mexico. Concurrently, as the central pressure increased, wind
speed was steadily decreased in magnitude to small values in both the
storm’s core and in the far field. Note that the hurricane wind model only
allowed the central pressure to be raised to a value that was slightly less
than the ambient far-field pressure value, but not exactly equal to it. This
limitation had some bearing on the modeling approach.
The small wind speed values that resulted along the Texas and Louisiana
shelves due to the small residual pressure difference in the hurricane wind
model still generated a small wind-driven forerunner along the Texas coast
which obfuscated the water surface elevation changes induced by the
volume oscillation forerunner. To further eliminate the effect of wind and
surface atmospheric pressure along the Louisiana and Texas shelves, a
spatial mask was applied over these two shelf regions. Within the entire
masking region, wind speeds were set to zero and atmospheric pressure
was set to the far field value of 1013 mb. The wind/pressure masking was
applied throughout the entire simulation duration.
Color-shaded contours in Figure 14-14 shows the maximum wind speed
field for Storm 02 on the Central Yucatan track. The figure depicts
maximum wind speed at each node of the storm surge model grid mesh,
for the entire simulation, regardless of when the maximum wind speed
occurred during the simulation. Core winds of the hurricane, having the
highest wind speeds while at full intensity, are reflected by the yellow and
orange colors. The yellow/orange trace reflects storm movement through
the straits and into the Gulf while at full intensity. The region of intensity
decay is evident in the central Gulf area where maximum wind speeds
transition from yellow to orange to green to light blue in color, in the
direction of storm advance along the storm track. The Florida Straits
storms began their intensity decay slightly to the northwest of where the
Yucatan Straits storms began their intensity decay.

Jackson State University 389
Figure 14-14. Maximum wind surface fields, including implementation of wind masking, for
Central Yucatan Storm 02.
The wind/pressure masking region is shown by the darkest blue region in
Figure 14-14, which lies along the Louisiana and Texas continental shelves
and slopes, where wind speeds are set to zero and atmospheric pressures
are set to ambient pressure throughout the entire storm simulation. The
masking region begins just seaward of the outer edge of the continental
slope and extends inland to the interior storm surge model boundary. The
same masking region was applied for all storms.
Volume Mode Forerunner - Generation Mechanism
Water Fluxes Into/Out of the Gulf of Mexico
Analysis of Storm 01 on the Central Yucatan Track was performed to
confirm the generation mechanism for the volume mode forerunner that
was identified by Bunpapong et al (1985). This particular storm was
similar to one of the hypothetical storms that they examined, HUR3,
which had a track through the Yucatan Straits, landfall on the Texas coast,
a maximum pressure deficit of 80 mb, a radius to maximum winds of 16
nm and a forward speed of 8 kt.
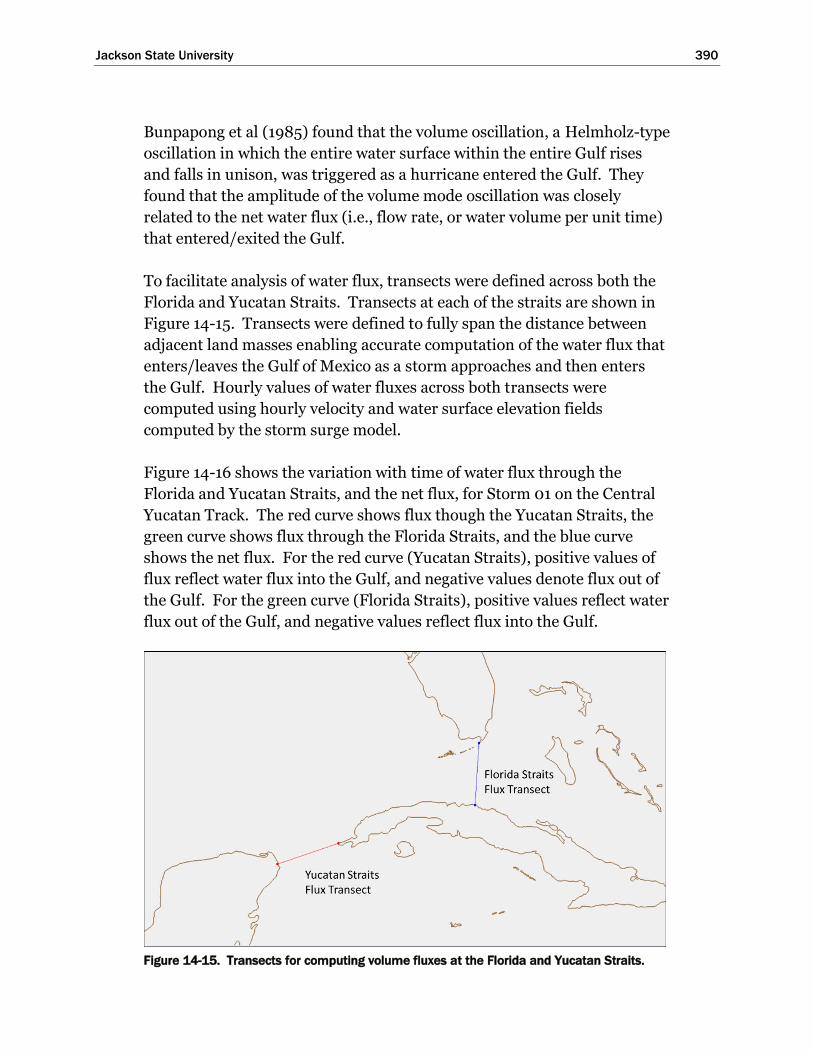
Jackson State University 390
Bunpapong et al (1985) found that the volume oscillation, a Helmholz-type
oscillation in which the entire water surface within the entire Gulf rises
and falls in unison, was triggered as a hurricane entered the Gulf. They
found that the amplitude of the volume mode oscillation was closely
related to the net water flux (i.e., flow rate, or water volume per unit time)
that entered/exited the Gulf.
To facilitate analysis of water flux, transects were defined across both the
Florida and Yucatan Straits. Transects at each of the straits are shown in
Figure 14-15. Transects were defined to fully span the distance between
adjacent land masses enabling accurate computation of the water flux that
enters/leaves the Gulf of Mexico as a storm approaches and then enters
the Gulf. Hourly values of water fluxes across both transects were
computed using hourly velocity and water surface elevation fields
computed by the storm surge model.
Figure 14-16 shows the variation with time of water flux through the
Florida and Yucatan Straits, and the net flux, for Storm 01 on the Central
Yucatan Track. The red curve shows flux though the Yucatan Straits, the
green curve shows flux through the Florida Straits, and the blue curve
shows the net flux. For the red curve (Yucatan Straits), positive values of
flux reflect water flux into the Gulf, and negative values denote flux out of
the Gulf. For the green curve (Florida Straits), positive values reflect water
flux out of the Gulf, and negative values reflect flux into the Gulf.
Figure 14-15. Transects for computing volume fluxes at the Florida and Yucatan Straits.

Jackson State University 391
Figure 14-16. Fluxes through the Florida and Yucatan Straits, and the net flux into/out of
the Gulf, for Storm 01 on the Central Yucatan track.
For the blue curve, the net water flux curve, positive values reflect net flux
into the Gulf; whereas, negative values reflect net flux out of the Gulf. The
horizontal axis in Figure 14-16 displays the hours of simulation time. The
figure shows fluxes for most of the storm duration, excluding only the first
72 hours when the storm is situated far away from the Gulf.
The flux time series in Figure 14-16 display several notable features. One,
the most obvious, is the cyclical nature of all three flux values. All three
flux graphs display cyclical changes; and all three flux signals have a nearly
constant period of oscillation. The eye of the hurricane passes through the
Yucatan Straits, i.e., the eye crosses the flux transect and enters the Gulf,
at hour 258. Prior to hour 240, all three flux graphs show regular
oscillations, and for all three graphs the period of oscillation is
approximately 29 to 32 hrs. After hour 300, when the hurricane is well
into the Gulf, all three flux graphs again show regular oscillations, and for
all three graphs the period of oscillation is approximately 33 to 35 hrs.
Bunpapong et al (1985) found the period of the volume oscillation to be
similar but slightly less, ranging from 28 to 30 hours, for tracks that also
involved storm entry through the Yucatan Straits and landfall along the
Texas coast.
A second feature that is evident in Figure 14-16 is the difference in
amplitude of the flux oscillations before storm entry into the Gulf and
those after storm entry. Prior to hour 258, the time of entry, the
amplitude of the oscillatory variations in the flux is noticeably smaller than
the amplitude of flux oscillation after entry. It appears as though the
initial spin-up of the hurricane at the beginning of the model simulation
excited a small volume oscillation, presumably an artifact from starting
Jackson State University 392
the model at rest, initially. The flux oscillation triggered by hurricane
entry into the Gulf, after hour 258, has a much greater amplitude (several
times larger) than the initial oscillation.
A third feature is that both prior to and after entry the amplitude of
oscillation is steadily damped, presumably due to bottom friction
influence. However, in both cases damping takes place rather slowly
during the six days both before and after entry. Bunpapong et al (1985)
also found that the volume oscillation was damped with time.
Examination of the water fluxes leading up and during storm entry sheds
light on the triggering of the volume oscillation. Beginning at around hour
180, and continuing through to the time of entry at hour 258 (a time span
of approximately 3 days), water flux through the Yucatan Straits is
peristently being drawn out of the Gulf toward the low pressure eye of the
hurricane as the storm approaches the Gulf, but with some slight
oscillation presumably due to the initial model start-up. During this same
period of time, water flux through the Florida Straits begins to enter the
Gulf on a persistent basis, presumably due to water in the southeastern
Gulf being drawn out through the Yucatan Straits, and also with some
oscillation from the initial model start-up. During this same time period,
the net flux entering/leaving the Gulf is oscillating about a small positive
mean value (i.e. net flux into the Gulf). Shortly before entry, at around
hour 250, the water flux continues to enter the Gulf though the Florida
Straits; however, flux at the Yucatan Straits begins to change direction and
enter the Gulf. Right around the time of entry, hour 258, the net flux into
the Gulf reaches a local (in time) maximum value.
Shortly after entry, net flux through the Florida Straits begins to
peristently leave the Gulf, presumably due to water surface elevation
gradients associated with arrival of the hurricane eye into the Gulf along
with its underlying dome of water. A larger-amplitude oscillation in the
net flux commences through the Yucatan Straits, with a smaller oscillatory
flux through the Florida Straits, as the volume oscillation is triggered
following storm entry.
Jackson State University 393
Water Surface Elevation and Velocity Patterns Associated with the Moving
Hurricane
Figures 14-17 through 14-19 shed additional light on the dynamics that
cause the observed trends in water flux through the straits. Each of the
three figures represents a snap-shot taken at a different time in the
simulation. Each figure has two panels: the top panel shows the water
surface elevation field at one snap-shot in time; and the lower panel shows
the velocity field in black vectors and the flux per unit width (depth-
averaged current speed multiplied by the total water depth) field at the
same time. The two flux transects are shown in both panels as thin black
line segments.
Figure 14-17 shows model results for hour 220, which is 38 hours before
the time of storm entry into the Gulf. At hour 220, flux is persistently
directed into the Gulf through the Florida Straits and directed out of the
Gulf though the Yucatan Straits (also see Figure 14-16). The upper panel,
which reflects the water surface elevation field displayed as color shaded
contours, clearly shows the circular dome of water beneath the eye of the
hurricane, with the orange color denoting the highest water surface
elevations.
The dome is formed by water that has been drawn there from surrounding
areas by gradients in atmospheric pressure, which is called the inverted
barometer effect. Water is steadily being drawn toward the eye as the
hurricane moves along its path. At this time in the simulation, water is
being pulled out of the Gulf through the Yucatan Straits toward the eye in
response to the atmospheric pressure gradients which tend to drive this
direction of water movement. In response to the athmospheric and water
surafce gradients that develop inside the Gulf, water is being drawn into
the Gulf through the Florida Straits. The eye of the hurricane is close
enough to the straits to force this predominant flux pattern at both straits.
The flux pattern at both straits is illustrated in the lower panel of Figure
14-17. The lower panels show depth-averaged velocity vectors, indicating
the direction of water movment and water flux, as black arrows. The
magnitude of flux per unit width is shown as color shaded contours.

Jackson State University 394
Figure 14-17. Water surface elevation field (top panel) and velocity vectors/flux per unit
width field (bottom panel) for Storm 01 on the Central Yucatan track at hour 220.
Figure 14-18 shows conditions at hour 258, the time when the eye is at the
Yucatan Straits and entering the Gulf. The position of the eye is reflected
by the position of the dome of water beneath it, as seen in the top panel.
Again, as seen in the bottom panel, water flux is being drawn into the Gulf
through the Florida Straits, and it is being drawn toward the eye of the
hurricane. The flux pattern at the Yucatan Straits is complex, with flux
directed both into and out of the Gulf on opposite sides of the eye and on
opposite sides of the flux transect. The opposing flux contributions are
beginning to negate each other, and flux is transitioning from being

Jackson State University 395
directed out of the Gulf to flux being directed into the Gulf, as water is
being drawn toward the moving eye. A highly complex pattern of flux per
unit width is seen in the wake of the hurricane, a complexity also seen by
Bunpapong et al (1985).
Figure 14-18. Water surface elevation field (top panel) and velocity vectors/flux per unit
width field (bottom panel) for Storm 01 on the Central Yucatan track at hour 258.

Jackson State University 396
Figure 14-19 shows conditions at hour 271, 13 hours after the hurricane eye
entered the Gulf. Entry has triggered the volume oscillation. At this time,
the net flux, which is directed into the Gulf, has already reached its
greatest value and is beginning to decrease (see the blue curve in Figure
14-16).
Also at this time, flux through the Florida Straits is starting to change
direction in response to the volume oscillation that has been excited and
by the water surface elevation gradients that arise from the fact that the
dome of water is now situated inside the Gulf.
Figure 14-19. Water surface elevation field (top panel) and velocity vectors/flux per unit
width field (bottom panel) for Storm 01 on the Central Yucatan track at hour 271.
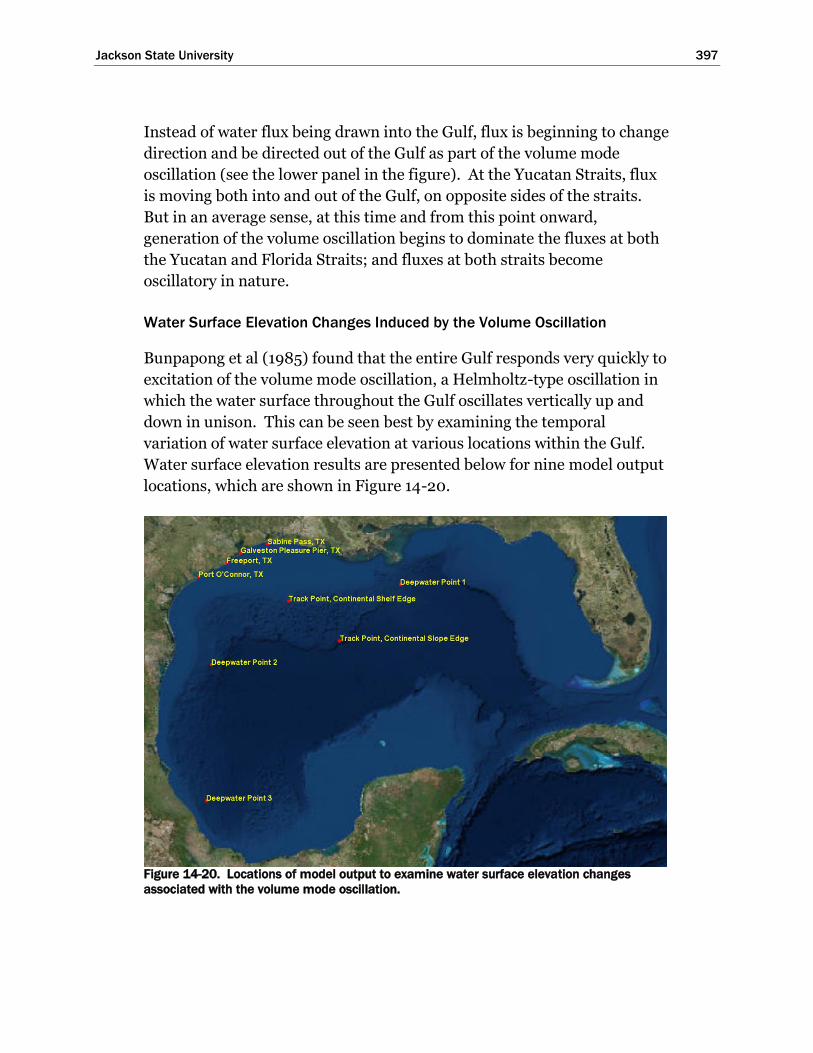
Jackson State University 397
Instead of water flux being drawn into the Gulf, flux is beginning to change
direction and be directed out of the Gulf as part of the volume mode
oscillation (see the lower panel in the figure). At the Yucatan Straits, flux
is moving both into and out of the Gulf, on opposite sides of the straits.
But in an average sense, at this time and from this point onward,
generation of the volume oscillation begins to dominate the fluxes at both
the Yucatan and Florida Straits; and fluxes at both straits become
oscillatory in nature.
Water Surface Elevation Changes Induced by the Volume Oscillation
Bunpapong et al (1985) found that the entire Gulf responds very quickly to
excitation of the volume mode oscillation, a Helmholtz-type oscillation in
which the water surface throughout the Gulf oscillates vertically up and
down in unison. This can be seen best by examining the temporal
variation of water surface elevation at various locations within the Gulf.
Water surface elevation results are presented below for nine model output
locations, which are shown in Figure 14-20.
Figure 14-20. Locations of model output to examine water surface elevation changes
associated with the volume mode oscillation.

Jackson State University 398
All of the observation points shown in Figure 14-20 are located within the
wind/pressure masking region that was applied to the western Gulf (see
Figure 14-14). Inside the masking region there are no hurricane-related
atmospheric pressure gradients, and there are no non-zero wind speeds,
both of which would tend to induce changes in the water surface elevation.
Therefore, selecting output locations within the masking region should
help isolate the influence of the volume mode oscillation.
Volume Oscillation at Deep Water Locations
Five of the nine output points shown in Figure 14-20 are located in deep
water. Four are in very deep water, with corresponding water depths of
several thousand meters; and all of them they are situated either over the
continental slope or near its seaward edge. The fifth deep-water point lies
at the edge of the continental shelf directly off the Texas coast. Both of the
deep-water points titled “Track Points” lie on that portion of the storm
track that was common to all the simulated storms as they transited the
continental slope and shelf and eventually made landfall at San Luis Pass.
Figure 14-15 shows the water surface elevation as a function of time for all
five deep-water output locations. Results confirm the presence of the
volume mode oscillation and the Helmholz-type nature of the oscillation,
in which the surface of the entire Gulf oscillates up and down in unison.
Figure 14-15. Water surface elevation as a function of time for the five deep-water output
locations, for Storm 01 Central Yucatan Track.

Jackson State University 399
The points, which are widely spread throughout the entire western Gulf,
all show the same cyclical elevation variation, with no significant phase or
amplitude difference from location to location. The Helmholz mode
oscillation throughout the Gulf is apparent before storm entry at hour 258
of the simulation, presumably caused by the initial start-up. The volume
oscillation is more pronounced after entry. The average period of
elevation oscillations following storm entry, is between 33 and 34 hrs,
which is slightly greater than the periods found by Bunpapong et al (1985),
which were 28 to 30 hr.
The first peak in the elevation oscillation following storm entry occurs at
hour 280, 22 hours after the time of entry. This lag time is similar to the
value of 24 hrs found by Bunpapong et al (1985) for a storm they
examined, HUR3, which had a similar intensity, size and forward speed,
also entered through the Yucatan Straits, and also made landfall on the
Texas coast. They observed some dependence of the lag time on forward
speed, based on their full set of simulations.
Storm 01 on the Central Yucatan track, with its constant forward speed
and on the specified track, would make landfall approximately 114 hours
after entering, i.e., landfall at hour 372. As seen in Figure 14-15, hour 372
corresponds to the time of an elevation trough following the third peak.
Several elevation oscillations occur while the storm transits the Gulf. Of
course, any deviations from the specified track, or changes in forward
speed, after the storm enters the Gulf would influence the timing of the
oscillation peaks/troughs with the time of landfall.
The elevation anomaly that is associated with the first peak following
storm entry is noticeably higher than subsequent oscillation peaks. Each
of the storm simulations comprising the initial storm set was made using
present-day mean sea level as the initial water level in the surge model.
Present-day sea level corresponds to a water surface elevation of 0.91 ft
NAVD88. The elevation of the first peak, relative to this “mean” level, is
approximately 0.2 ft. Subsequent peaks had smaller maximum elevation
values, approximately 0.1 ft, relative to mean sea level.
Jackson State University 400
Confirmation for the Volume Oscillation’s Generation Mechanism
To further confirm the causation mechanism for the volume mode
oscillation, a calculation was made to examine the relationship between
net flux into/out of the Gulf and water surface elevation changes inside the
Gulf. First, the computed change in net water flux entering/leaving the
Gulf through both transects was computed at 1-hr time increments, using
hourly values of computed water flux passing both transects. Second, the
net water flux value at each hourly time increment was divided by the
surface area of the entire Gulf of Mexico (that area which is contained
inside of the transects), and then multiplied by the time increment of one
hour, to calculate hourly values of the change in water surface elevation
based solely upon the change in net water flux. Third, beginning with the
initial water surface elevation value for the simulation, the change in water
surface elevation at each hourly increment was added to the elevation at
the previous time increment to compute an updated water surface
elevation. This calculation was repeated for each hourly time increment,
for the entire simulation duration. In other words, a time series of water
surface elevation was computed based solely upon the net water flux
entering/leaving the Gulf and the assumption that the water surface
elevation within the Gulf rose and fell in unison in response to changes in
the net water flux, i.e., simple conservation of water mass within the Gulf.
The water surface elevation time series computed based on flux through
the transects was then compared to the simulated water surface elevation
time series at the deep-water point on the edge of the continental shelf off
the Texas coast (see its location in Figure 14-14). The comparison was
done to see if the water surface elevation changes inside and throughout
the Gulf (at all the deep water points shown in Figure 14-15) could be
explained simply by the conservation of water mass that enters/leaves the
Gulf through the Florida and Yucatan Straits. Figure 14-16 shows the
results of this comparison. Note that water surface elevation is graphed in
metric, not English, units.
The similarity in both sets of results shows, and confirms, that the volume
mode oscillation is directly related to the net water flux that enters/leaves
the Gulf. Much of the computed water surface elevation change signal can
be explained simply by the net water flux through the transects, the
principle of conservation of water mass within the Gulf, and the
assumption that the water surface of the Gulf moves up and down in
unison in response to changes in the net flux.

Jackson State University 401
Figure 14-16. Comparison of water surface elevation response computed using net water
flux and conservation of mass with the simulated free surface elevation response inside the
Gulf.
The higher simulated elevation at around hour 275, seen in both Figures
14-16 and 14-15, that is associated with the first cycle of the volume
oscillation is consistent with the higher elevation computed based on the
net water flux entering the Gulf. The difference between the two curves at
this time is attributed to the additional role of atmospheric pressure
gradients that draw water from surrounding areas, through both transects,
toward they eye, and the proximity of the eye near the transects at this
time of the simulation (recall that storm entry into the Gulf occurred at
hour 258). The agreement between simulated water surface elevation and
elevation computed using only the net flux is particularly close for all prior
and subsequent cycles of the volume oscillation, when the hurricane eye is
further away from the transects.
Volume Oscillation at Shallow Water Locations
Four of the nine model output locations shown in Figure 14-14 are located
along the north Texas coast in very shallow water, just seaward of several
entrances to bays that are situated along the Texas coast. One of the
output locations is the Galveston Pleasure Pier, near Bolivar Roads; and it
is representative of open coast conditions in the Houston-Galveston
region. Other coastal points are located either north or south of the
Houston-Galveston area, Sabine Pass (north), Freeport (south), and Port
O’Connor (south). Figure 14-17 shows the water surface elevation as a
function of time for these four output locations. Results for the deep-
water point at the edge of the Texas continental shelf (the red curve) are
shown as well, for reference.

Jackson State University 402
Figure 14-17. Water surface elevation as a function of time for the four shallow water
output locations, for Storm 01 Central Yucatan Track.
Following entry of the hurricane into the Gulf, peak elevation values at the
shallow water locations are consistently greater than values in deep water.
There appears to be somewhat of an elevation offset, deviation or anomaly,
between the oscillations in deep water and those in shallow water at the
coastline. Deviations between shallow and deep water points are greatest
for the second and third peaks, less for the first and fourth peaks and less
for the fifth and sixth peaks. Recall that eye would have made landfall,
aside from wind and pressure masking, at around hour 372. These results
suggest that a longer-period oscillation or some other shallow water
dynamic might be present, in addition to the 33 to 34-hr volume mode
oscillation.
The water surface elevations corresponding to the first three peaks of the
oscillation are of comparable magnitude, approximately 0.25 ft above the
mean sea level. The third peak is the highest, albeit by a small amount
compared to the previous two. The amplitudes of the peaks, relative to the
mean sea level, appear to decay with time after hour 350. Bunpapong et
al (1985) also observed a slow decay in the amplitude of the volume
oscillation.
The maximum elevation anomaly at the shallow water sites, 0.25 ft, is
significantly smaller than the 0.7 ft volume oscillation amplitude value in
shallow water found by Bunpapong et al (1985) for the similar storm,

Jackson State University 403
HUR3. A possible reason for the discrepancy in magnitude of the volume
oscillation is discussed later in this chapter.
Examination of the Shallow Water Anomaly – Far-Field Influence of the Wind-
Driven Forerunner
An explanation for the vertical elevation offset in shallow water, i.e., the
elevation anomaly that exists along with the pure volume oscillation, was
examined further. The magnitude of the elevation anomaly is small;
however, an understanding of its generation is worthwhile because it is
related to the same physical processes that lead to a wind-driven surge
forerunner. An analysis was done utilizing a series of snap shots, in time,
of the water surface elevation field for the entire Gulf of Mexico. The first
few snap shots shown below reflect conditions prior to and at the time of
storm entry into the Gulf. Subsequent snap-shots show water surface
elevation fields at times which correspond to the water surface elevation
peak and trough for each of the first four cycles of the volume oscillation.
Figure 14-18 shows the water surface elevation field that exists 48 hours
prior to the time of storm entry into the Gulf. The snap-shot corresponds
to hour 210 of the simulation in Figure 14-17. The figure clearly shows the
dome of water beneath the eye of the hurricane, which sits southeast of the
Yucatan Straits. Within the Gulf, the water surface is rather uniform in
elevation, which is consistent with the small Helmholtz oscillation that
existed prior to storm entry, an artifact of the initial model spin-up. There
are no significant elevation anomalies evident on the continental shelf off
the Texas coast or on any other continental shelf region in the Gulf.
Figure 14-19 shows the water surface elevation field 24 hours prior to the
time of storm entry into the Gulf. The snap-shot corresponds to hour 234.
Again, the figure shows the dome of water beneath the eye of the
hurricane, which has now moved closer to the Yucatan Straits transect.
Within the Gulf, the water surface field is rather uniform in elevation
except for the emergence of a small elevation anomaly along the Florida,
Alabama and Mississippi continental shelves. There are no significant
elevation anomalies evident along the Texas shelf or any other continental
shelf region in the western Gulf.

Jackson State University 404
Figure 14-18. Water surface elevation field at hour 210, 48 hours before storm entry, for
Storm 01 on the Central Yucatan Track.
Figure 14-19. Water surface elevation field at hour 234, 24 hours before storm entry, for
Storm 01 on the Central Yucatan Track.
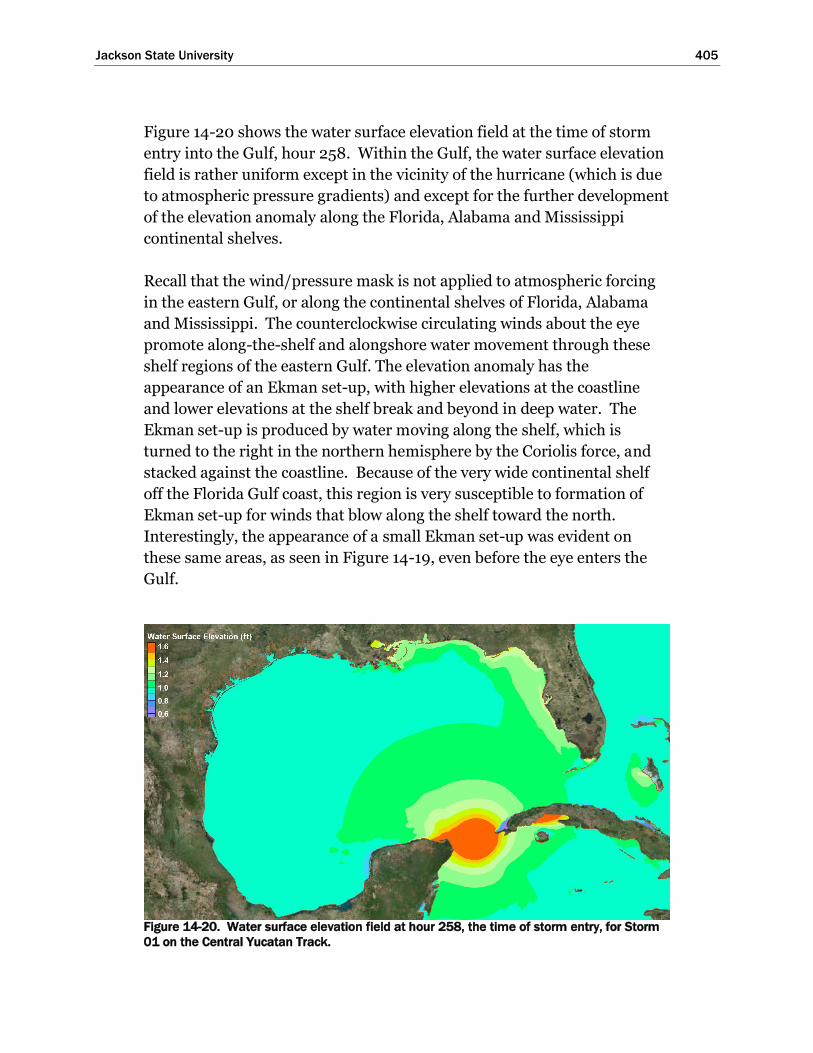
Jackson State University 405
Figure 14-20 shows the water surface elevation field at the time of storm
entry into the Gulf, hour 258. Within the Gulf, the water surface elevation
field is rather uniform except in the vicinity of the hurricane (which is due
to atmospheric pressure gradients) and except for the further development
of the elevation anomaly along the Florida, Alabama and Mississippi
continental shelves.
Recall that the wind/pressure mask is not applied to atmospheric forcing
in the eastern Gulf, or along the continental shelves of Florida, Alabama
and Mississippi. The counterclockwise circulating winds about the eye
promote along-the-shelf and alongshore water movement through these
shelf regions of the eastern Gulf. The elevation anomaly has the
appearance of an Ekman set-up, with higher elevations at the coastline
and lower elevations at the shelf break and beyond in deep water. The
Ekman set-up is produced by water moving along the shelf, which is
turned to the right in the northern hemisphere by the Coriolis force, and
stacked against the coastline. Because of the very wide continental shelf
off the Florida Gulf coast, this region is very susceptible to formation of
Ekman set-up for winds that blow along the shelf toward the north.
Interestingly, the appearance of a small Ekman set-up was evident on
these same areas, as seen in Figure 14-19, even before the eye enters the
Gulf.
Figure 14-20. Water surface elevation field at hour 258, the time of storm entry, for Storm
01 on the Central Yucatan Track.

Jackson State University 406
In addition to causing an Ekman set-up, water moving northward along
the Florida shelf will stack up in Apalachee Bay, Florida, which lies east of
Apalachicola. Water movement along the northern Gulf shelf adjacent to
Alabama and Mississippi will stack up against the Mississippi River Bird’s
Foot delta, resulting in accumulation within Lake Pontchartrain. Each of
these processes, and their influence on water and water surface elevation,
are evident in the figure.
In Figure 14-20 there also is evidence of water movement around the
Bird’s Foot delta toward the west; however, there is no noticeable
elevation anomaly along the Louisiana or Texas shelves at this point in
time.
Figure 14-21 shows the water surface elevation field at hour 278 of the
simulation, which corresponds to the peak elevation that is associated with
the first volume oscillation. The intensity of the storm is still near full
strength, so the dome of water beneath the low pressure center is still
present as is wind forcing along the shelf regions of the eastern Gulf.
Intensity decay is just beginning. Within the Gulf, further development of
the elevation anomaly along the Florida, Alabama and Mississippi
continental shelves is evident. The elevation anomaly continues to have
the appearance of an Ekman set-up, with higher elevations at the coastline
and lower elevations at the shelf break. Clear evidence persists for water
Figure 14-21. Water surface elevation field at hour 278, the time of the first elevation peak,
for Storm 01 on the Central Yucatan Track.

Jackson State University 407
moving northward along the Florida shelf and stacking up in Apalachee
Bay, as well as water movement along the northern Gulf shelf adjacent to
Alabama and Mississippi and stacking of that water against the Mississippi
River Bird’s Foot delta with accumulation in in Lake Pontchartrain and
Lake Borgne. There is also evidence of water movement around the Bird’s
Foot delta toward the west, the first appearance of the elevation anomaly
in shallow water on both the Louisiana and north Texas shelves.
Figure 14-22 shows the water surface elevation field at hour 301 of the
simulation, the time of the elevation trough which is associated with the
first volume oscillation. The intensity of the storm has diminished
significantly by this time, and only remnants of the dome of water beneath
the eye are evident in the center of the Gulf. Forcing of the Ekman setup
along the Florida, Alabama and Mississippi continental shelves by the
wind has decreased.
The elevation anomaly along the shelf regions of the northern Gulf
continues to exhibit the appearance of an Ekman set-up, which is confined
to the continental shelf. Wind and pressure forcing along the Louisiana
and Texas shelves has been zeroed out since the beginning of the
simulation. However, a shallow water elevation anomaly is evident along
the Louisiana and Texas shelves. This is evidence for propagation of the
Figure 14-22. Water surface elevation field at hour 301, the time of the first elevation
trough, for Storm 01 on the Central Yucatan Track.

Jackson State University 408
Ekman set-up as a free wave toward the west along both the Louisiana and
north Texas shelves. The Ekman set-up that was forced on the shelf
regions of the eastern Gulf, propagates as a free wave from east to west,
along the shelf once forcing is diminished or ceases. The magnitude of the
Ekman setup is clearly decreasing in the eastern half of the Gulf due to
cessation of the wind forcing. Also, there is emerging evidence of a
southward movement of the Ekman set-up wave, as a free wave, along the
narrower south Texas shelf, as the elevation anomaly increases in this
region.
Throughout the rest of the Gulf, the water surface elevation is rather
uniform as is expected for a pure Helmholtz oscillation.
Figures 14-23 and 14-24 show Gulf-wide water surface elevation fields at
the times of both peak and trough, respectively, which are associated with
the second volume oscillation. During both of these times there is no
longer any wind forcing of the Ekman set-up; it is propagating as a free
wave in the counterclockwise direction along the continental shelf regions
of the northern Gulf. The elevation anomaly associated with the
propagation of this free wave continues to be constrained to the
continental shelf. Water surface elevations throughout the rest of the Gulf
are rather uniform during both snap-shots, consistent with the Helmholtz
mode of oscillation.
The magnitude of the elevation anomaly has decreased significantly along
the Florida shelf as the Ekman setup wave propagates out of this region.
The magnitude of the anomaly also is decreasing along the Alabama and
Mississippi shelves, east of the Bird’s Foot delta, for the same reason.
West of the delta, the elevation anomaly persists along the Louisiana and
Texas shelves. There is more evidence of southward propagation of the
free wave along the southernmost Texas shelf, in the form of an increasing
magnitude of the elevation anomaly there. In prior snap-shots, the
elevation anomaly had not appeared this far south.
Figures 14-25 and 14-26 show the water surface elevation field at times
corresponding to the elevation peak and trough, respectively, which are
associated with the third volume oscillation. The trends that were
observed during the second volume oscillation continue. The magnitude

Jackson State University 409
Figure 14-23. Water surface elevation field at hour 318, the time of the second elevation
peak, for Storm 01 on the Central Yucatan Track.
Figure 14-24. Water surface elevation field at hour 334, the time of the second elevation
trough, for Storm 01 on the Central Yucatan Track.
of the elevation anomaly continues to decrease everywhere along the
eastern and northern Gulf shelves east of the Bird’s Foot delta. The
anomaly persists along the Louisiana and Texas shelves; and the
southward propagation of the free wave along the southern Texas shelf
continues as evidenced by an increasing magnitude and southern extent of
the elevation anomaly there.
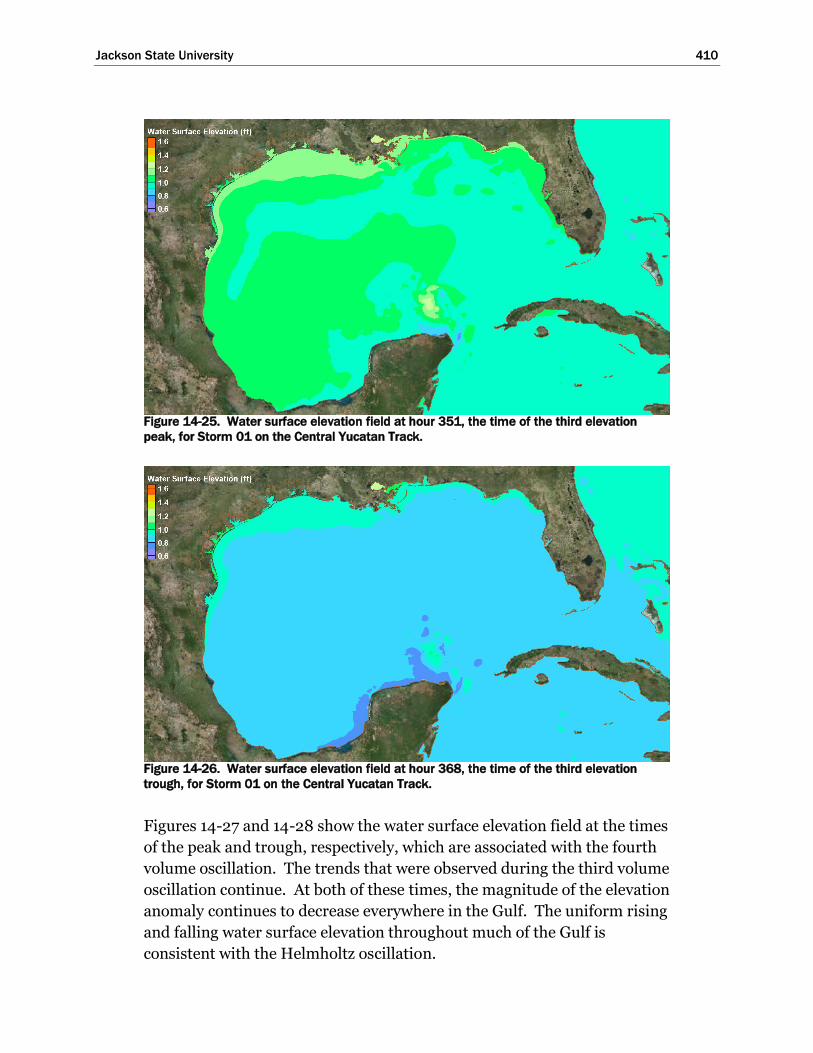
Jackson State University 410
Figure 14-25. Water surface elevation field at hour 351, the time of the third elevation
peak, for Storm 01 on the Central Yucatan Track.
Figure 14-26. Water surface elevation field at hour 368, the time of the third elevation
trough, for Storm 01 on the Central Yucatan Track.
Figures 14-27 and 14-28 show the water surface elevation field at the times
of the peak and trough, respectively, which are associated with the fourth
volume oscillation. The trends that were observed during the third volume
oscillation continue. At both of these times, the magnitude of the elevation
anomaly continues to decrease everywhere in the Gulf. The uniform rising
and falling water surface elevation throughout much of the Gulf is
consistent with the Helmholtz oscillation.

Jackson State University 411
Figure 14-27. Water surface elevation field at hour 385, the time of the fourth elevation
peak, for Storm 01 on the Central Yucatan Track.
Figure 14-28. Water surface elevation field at hour 403, the time of the fourth elevation
trough, for Storm 01 on the Central Yucatan Track.
The time series graph in Figure 14-17 also shows the decreasing amplitude
of the elevation anomaly later in the simulation and the persistence of the
volume oscillation, i.e., uniformity in water surface elevation through the
Gulf, in the latter stages of the simulation.
It is very important to remember that the residual elevation anomaly
which is evident at the shallow water output locations shown in Figure 14-
17 is an artifact of the inability of the current modeling approach to fully

Jackson State University 412
isolate the volume oscillation in shallow water throughout the entire Gulf.
Steps were taken to eliminate the effects of wind-driven Ekman set-up
along the Texas and Louisiana shelves, with partial success.
It is also important to recognize that the residual elevation anomaly does
not in any way reflect the full contribution of the wind-driven Ekman set-
up that would be expected along the Louisiana and Texas shelves had the
storm intensity not been decayed or had the wind and pressure forcing not
been zeroed out in the western Gulf of Mexico. The analysis above shows
the importance of the Ekman set-up throughout the northern Gulf, first as
a forced wave, and then its potential to propagate as a free wave along the
northern Gulf shelf, around the Bird’s Foot Delta and into the Louisiana
and Texas shelf regions. As discussed previously, this dynamic appears to
be a potential contributor to the wind-driven forerunner surge that is
experienced at the Texas coast for slow-moving hurricanes.
Propagation of the Volume Mode Forerunner into Galveston Bay
Figure 14-29 shows time series of water surface elevation at three locations
within Galveston Bay, along with the time series at the open-coast
Galveston Pleasure Pier location. The three in-bay locations are: 1) the
City of Galveston; 2) Morgan’s Point which lies at the northern edge of
Galveston Bay, along the Houston Ship Channel; and, 3) the Houston Ship
Channel (upper) location which is situated at the uppermost end of the
Figure 14-29. Water surface elevation as a function of time for three locations in Galveston
Bay and the Galveston Pleasure Pier on the open Gulf, for Storm 01 Central Yucatan Track.

Jackson State University 413
ship channel. Considered together, the results illustrate how the volume
mode forerunner readily penetrates into the bay from the open Gulf,
through Bolivar Roads pass. This behavior is quite similar to that seen for
the wind-driven forerunner.
For the volume mode oscillation, the water surface elevation variation with
time inside the bay is quite similar to that seen at the open coast. The
volume oscillation is not attenuated as it propagates through the Bolivar
Roads Pass and into Galveston Bay. In fact, for the volume mode
oscillation, the amplitude increases slightly as the oscillation propagates
up the ship channel, as evident in the higher elevation highs and lower
elevation lows at all three locations. Amplitude is greatest in the upper
ship channel, albeit by a small amount.
Close inspection of Figure 14-29 also shows that there is a small phase lag
between the oscillation at the open coast and inside the bay. The phase lag
increases slightly as the oscillation propagates into the bay and then up the
Houston Ship Channel. The greatest phase lag between the open coast and
locations inside they bay occurs at the upper end of the ship channel, a lag
time of a few hours. The phase lag is similar to that seen for the Hurricane
Ike wind-driven forerunner surge. Both phenomena seem to propagate
into the bay and up the ship channel as long shallow-water wave, whose
propagation speed is related to the local water depth and its propagation
path.
Volume Mode Forerunner – Dependence upon Hurricane
Characteristics
Influence of Storm Track and Forward Speed
To further examine the general behavior of the volume mode oscillation,
its characteristics, and its dependence on hurricane characteristics, the
dependence on storm track and forward speed was investigated first.
Behavior of the volume oscillation is examined primarily in terms of the
changes in water surface elevation with time.

Jackson State University 414
Storms Having the Slowest Forward Speed
Figure 14-30 shows the computed change in water surface elevation, with
time, at the Galveston Pleasure Pier location in shallow water. Results in
the figure are shown for four storms, each of which has the same intensity,
size and forward speed; each has a minimum central pressure of 930 mb, a
radius-to-maximum-winds of 18 nm (the middle of the three values that
were considered), and a forward speed of 6 kt (the slowest of the three
forward speeds that were considered). Each storm takes one of the four
different tracks that were considered, three that enter through the Yucatan
Straits (Eastern Yucatan Storm 01, Central Yucatan Storm 01, and
Western Yucatan Storm 01) and one that enters through the Florida Straits
(Florida Storm 01). Results for the three Yucatan storms are discussed
here, results for the Florida storm in the next section.
For the three storms that enter the Gulf through the Yucatan Straits, the
water surface elevation time series are similar. Following entry into the
Gulf at around hour 255 to 260, volume oscillations are prevalent for all
three storms; and for each storm, the volume oscillations have similar
periods of approximately 30 to 35 hours.
Figure 14-30. Dependence of the volume mode oscillation on storm track for the slowest
moving storms (6-kt forward speed).

Jackson State University 415
The initial volume oscillation that occurs at around hour 275 is most
pronounced for the Eastern Yucatan track storm, slightly less so for the
central Yucatan track storm, and least pronounced for the Western
Yucatan track storm. This is probably due to the fact that as the hurricane
approaches and enters the Gulf on the east side of the Yucatan Straits, the
counterclockwise circulating hurricane winds tend to push water out of the
Gulf, in the same direction as the water which is drawn out of the Gulf
toward the low pressure center, reinforcing each other. The opposite
would be true for the western Yucatan track, with winds tending to push
water into the Gulf as the storm enters, in opposition to water being drawn
out of the Gulf toward the eye. For the Central Yucatan track, winds on
one side of the eye are pushing water into the Gulf, and on the opposite
side they act to push water out of the Gulf, partially offsetting each other.
Subsequent volume oscillations for the storms on all three Yucatan tracks
have more similar amplitudes. During subsequent oscillations, the eye is
positioned well inside the Gulf and moving away from the Yucatan Straits.
As the three simulations progress in time, the eye is located in a similar or
the same position for all three tracks. This reinforces the notion that the
large differences in the first peak are primarily due to the differences in
position of the eye at the time of storm entry into the Gulf. It is unlikely
that a gate system at Bolivar Roads would close during the first volume
oscillation when differences are greatest. Closure is more likely during
later oscillations when differences are much smaller.
For all three Yucatan tracks, the volume oscillations appear to be super-
imposed on another, longer-period elevation oscillation such that the first
three oscillation cycles between hours 260 and 370 are generally offset by
higher positive elevation values. As shown and discussed in the previous
section on Central Yucatan Track Storm 01, this residual elevation
anomaly is due to the Ekman set-up, first manifested as a forced wave
along the Florida, Alabama, Mississippi shelves, then as a free wave that
eventually propagates along the Louisiana and Texas shelves.
The maximum magnitude of this elevation anomaly is greatest for the east
Yucatan track, which makes sense. The hurricane eye on the eastern
Yucatan track is closer to the Florida Shelf than the eye on the other two
tracks, which leads to slightly higher winds on the Florida shelf and a
slightly higher magnitude of Ekman set-up. The eye is farthest from the

Jackson State University 416
Florida shelf for the western Yucatan track, leading to a slightly smaller
elevation anomaly for this track.
The amplitudes of the volume oscillation for all three storms are quite
small, about 0.1 ft or less. The maximum magnitude of the elevation
anomaly that is present, in addition to the volume oscillation, is of
comparable or greater magnitude, 0.1 to 0.2 ft above mean sea level.
Water Surface Elevation Anomaly in Shallow Water for Florida Storm 01
The elevation time series for the storm that enters the Gulf through the
Florida Straits (Florida Track Storm 01 shown as the black curve in Figure
14-30) exhibits a very different behavior compared to that for the three
storms that enter through the Yucatan Straits. The Florida Storm 01
enters the Gulf through the Florida Straits at hour 196, and there are
several small oscillations that appear following entry between hours 200
and 275 of the simulation. These appear to be volume mode oscillations;
they also have periods of approximately 30 to 35 hours. However,
beginning at around hour 275, the appearance of periodic oscillations is
obscured by a much more pronounced and larger water surface elevation
anomaly. The water surface elevation reaches a much higher maximum
value, approximately 1.35 ft at around hour 335, which is nearly 0.5 ft
above the mean sea level value. This maximum elevation value is
significantly higher than the local maximum elevation values that are
associated with individual 30- to 35-hour volume oscillation cycles for
storms that entered through the Yucatan Straits. In the Florida Track
Storm 01 time series there is some evidence of an oscillatory signal after
the very pronounced rise/fall in elevation.
It appears that the elevation time series for Florida Track Storm 01 is
much more dominated by the residual Ekman set-up than the time series
for those hurricanes that enter through the Yucatan Straits. As pointed
out previously, this elevation anomaly does not in any way reflect the full
magnitude of Ekman set-up that would be expected at Galveston for any of
these storms. However, examination of how the residual anomaly
develops and how it varies with different storm tracks sheds additional
insights into the generation and propagation of the Ekman set-up as a
forced and free wave.

Jackson State University 417
The development of Ekman setup along the Florida, Alabama and
Mississippi continental shelves is expected to be larger for Florida Storm
01 because of its closer proximity to these shelf regions than storm which
enter through the Yucatan Straits. Prior analysis of the far-field influence
of the Ekman setup for Central Yucatan Storm 01 utilized snap-shots of
the water surface elevation fields in the entire Gulf. To examine the
Ekman set-up generation process in the eastern Gulf and its propagation
along the northern Gulf continental shelves for Florida Storm 01, time
series of water surface elevation at a number of shallow-water coastal
locations around the Gulf of Mexico periphery were graphed and
examined. These locations are shown in Figure 14-31.
Figure 14-31. Locations for analyzing water surface elevation time series around the Gulf of
Mexico periphery for Florida storm 01.
Figure 14-32 shows the water surface elevation time series at each of these
shallow-water coastal locations for the Florida Storm 01. Along the
western Florida coast, as the hurricane approaches and then enters the
Gulf through the Florida Straits, winds along the west Florida shelf are
directed offshore, such that the water surface elevation at the coast is set
down, i.e., lowered, by the wind. This behavior is evident by the steady
decrease in water surface elevation at the three Florida sites between the
hours of 150 and 225. Entry of the storm into the Gulf occurred at hour
196. The greatest magnitude of water surface elevation set-down is at
Naples which is closest to the eye of the hurricane and nearest the stronger
wind speeds. The smallest set- down occurs at Apalachicola which is

Jackson State University 418
Figure 14-32. Water surface elevation time series for Florida Track Storm 01 at locations
around the periphery of the Gulf of Mexico.
farthest from the eye of the hurricane and where winds are relatively
weaker.
Once the hurricane has entered and has moved toward the interior of the
Gulf, some 30 hours later, winds along the west Florida shelf begin to have
more of an alongshore wind component, blowing from south to north.
These winds push water northward along the Florida shelf, and that
moving water is turned toward the right by the Coriolis force, stacking it
up against the western coastline of Florida, i.e., formation of the Ekman
set-up.
Figure 14-32 shows that the Ekman set-up moves as a forced wave
northward along the Florida shelf, as evidenced by the lagged (in time)
water surface elevation peaks which occur first at Naples (hour 235), then
at St. Petersburg (hour 245), then at Apalachicola (hour 260). The
maximum value of the elevation anomaly that is associated with the
Ekman setup increases from south to north; and the greatest elevation
associated with the forced wave that moves along the Florida continental
shelf occurs at Apalachicola, which is the most removed from the location
of the hurricane eye. The peak elevation at Apalachicola reaches a value of
about 1.6 ft above mean sea level.

Jackson State University 419
The forced shelf wave then continues to move eastward along the northern
Gulf shelf as a forced wave, then as a free wave as the storm intensity is
decreased significantly. This movement is clearly evidenced by the lagged
elevation peak at Dauphin Island, AL, which occurs at around hour 275,
and then the occurrences of the elevation peak at Grand Isle, LA, which is
located west of the Mississippi River Bird’s Foot at hour 305.
Propagation of the Ekman set-up as a free wave along the Louisiana shelf
and then down the Texas shelf is seen in the arrival of the peak elevation at
Galveston Pleasure Pier at hour 335. Peaks in the water surface elevation
time series at Port O’Connor (hour 340) and Port Isabel (sometime
between hours 350 and 370), TX, and Tampico, Mexico (hour 410), also
show that the shelf wave continues to propagate as a free wave along the
entire relatively narrow southern Texas and Mexico continental shelves
despite no local wind or pressure forcing. This same propagation path was
shown for the Central Yucatan storm 01 in a previous section.
The increasingly smaller amplitude of the lagged peaks at these locations
as the Ekman set-up wave advances can be seen in the water surface
elevation signals, reflecting dissipation of the wave. As the amplitude of
the wind-driven Ekman setup wave decreases, the influence of the volume
oscillations become more noticeable in the elevation time series, as seen at
all the Texas locations.
For this slow moving storm, having a constant forward speed of 6 kt, the
arrival time of the residual elevation anomaly at Galveston indicates that
the Ekman setup wave propagates at a speed that is fast enough to arrive
at Galveston prior to the time of hurricane landfall at San Luis Pass.
Florida Storm 01 entered the Gulf, crossing the Florida Straits transect, at
hour 196 of the simulation. At its constant forward speed, a hurricane on
this track would have made landfall at San Luis Pass at hour 347. The
peak water surface elevation at Naples, FL, occurs at around hour 235 of
the simulation; and at Galveston it occurred at around hour 335, 100
hours (roughly 4 days) later. Assuming an approximate travel distance
from Naples to Galveston of 900 nm along a path near the coastline, or
750 nm along a path that is parallel to the coastline but positioned roughly
midway between the outer continental shelf edge and the coastline, a
propagation speed for this shelf wave between these two locations can be
estimated, 7.5 to 9 kt (3.8 to 4.6 m/sec). Using the 105-hr time lag
between the water surface elevation anomaly peaks at Grand Isle, LA and

Jackson State University 420
Tampico, Mexico, and using the same methodology for computing path
length (750 and 720 nm), propagation speeds of 6.9 to 7.1 kt (3.5 to 3.7
m/sec) are estimated for the speed of the shelf wave between these two
locations. Kennedy et al (2011) found that the Hurricane Ike wind-driven
forerunner, which was forced by the same type of mechanism, propagated
along the Texas coast as a dissipative free wave with a propagation speed
of 5 to 6 m/sec.
Storms Having Faster Forward Speeds
Figure 14-30 compared volume oscillations at Galveston Pleasure Pier for
storms having the same size and intensity characteristic on each of the
four tracks, all of them having the slowest forward speed of 6 kt. Figures
14-33 and 14-34 show the volume oscillations for the same storms on the
four tracks, all having a forward speed of 12 kt (Figure 14-33) and 18 kt
(Figure 14- 34), respectively. Results are shown at Galveston Pleasure
Pier.
Figure 14-33. Dependence of the volume mode oscillation on storm track for storms having
a 12-kt forward speed, on all four tracks.
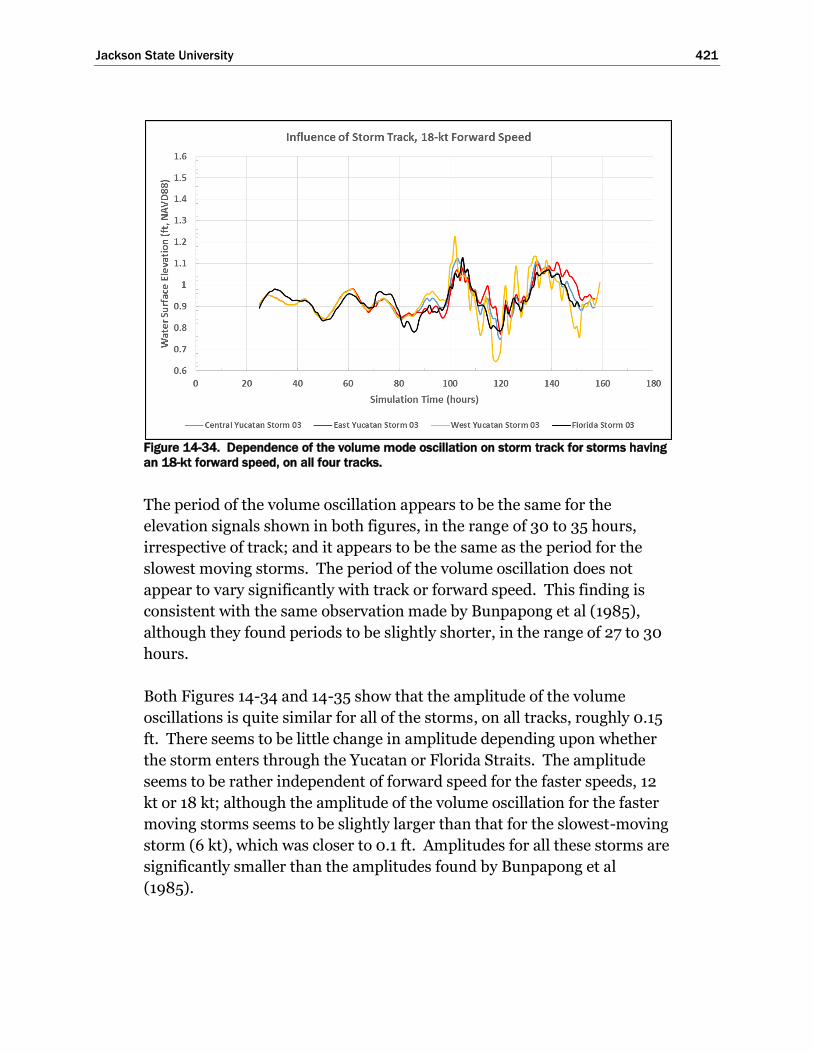
Jackson State University 421
Figure 14-34. Dependence of the volume mode oscillation on storm track for storms having
an 18-kt forward speed, on all four tracks.
The period of the volume oscillation appears to be the same for the
elevation signals shown in both figures, in the range of 30 to 35 hours,
irrespective of track; and it appears to be the same as the period for the
slowest moving storms. The period of the volume oscillation does not
appear to vary significantly with track or forward speed. This finding is
consistent with the same observation made by Bunpapong et al (1985),
although they found periods to be slightly shorter, in the range of 27 to 30
hours.
Both Figures 14-34 and 14-35 show that the amplitude of the volume
oscillations is quite similar for all of the storms, on all tracks, roughly 0.15
ft. There seems to be little change in amplitude depending upon whether
the storm enters through the Yucatan or Florida Straits. The amplitude
seems to be rather independent of forward speed for the faster speeds, 12
kt or 18 kt; although the amplitude of the volume oscillation for the faster
moving storms seems to be slightly larger than that for the slowest-moving
storm (6 kt), which was closer to 0.1 ft. Amplitudes for all these storms are
significantly smaller than the amplitudes found by Bunpapong et al
(1985).

Jackson State University 422
The influence of the residual elevation anomaly associated with the Ekman
set-up wave is similar for storms on all four tracks, for the 12-kt forward
speed. For the 18-kt forward speed, the same observation is made.
However, it appears as though the residual anomaly that is generated in
the eastern Gulf shelves is a function of forward speed, with less anomaly
occurring at Galveston for faster storms. A faster moving storm is
apparently less effective in generating Ekman set on the eastern Gulf shelf
regions and/or the storms having forward speeds of 12 and 18 kt “outpace”
the speed at which the residual Ekman set-up wave propagates along the
shelf.
Quantitative Analysis of Volume Oscillation Characteristics
In addition to a qualitative analysis of volume oscillation characteristics,
which was based primarily upon graphs of water surface elevation time
series, a quantitative analysis of the time series at the Galveston Pleasure
Pier also was undertaken. The analysis involved calculation of various
volume oscillation parameters using model-generated time series data.
The results of that analysis, which was performed for each storm, are
presented in Table 14-2. All results are shown for the Galveston pleasure
Pier model output location.
The first column in Table 14-2 lists the different hurricanes that were
simulated, grouped by track. Table 14-1 listed the forward speed,
intensity, and radius-to-maximum-winds for each storm. The second
column in Table 14-2 lists only the storm’s forward speed. The third
column lists the “lag time to first peak,” which is defined as the difference
between the time when the storm enters the Gulf and the time of
occurrence of the water surface elevation peak that is associated with the
first volume oscillation following entry into the Gulf. The fourth column
lists the “lag time to first trough,” which is defined in a similar way to the
previous quantity, but involving the time of occurrence of the first trough.
The fifth column is the average period of the volume oscillation for that
storm. Average period was computed based upon the time differences
between successive peaks and between successive troughs, for as many full
volume oscillation cycles as were available. All the individual period
values were then used to compute an arithmetic mean value. The average
amplitude value listed in column six was computed in a similar way as the
previous quantity. Differences in elevation between successive peaks and
troughs were used to compute amplitude values for each of the full volume
oscillations. All the individual amplitude values were then used to
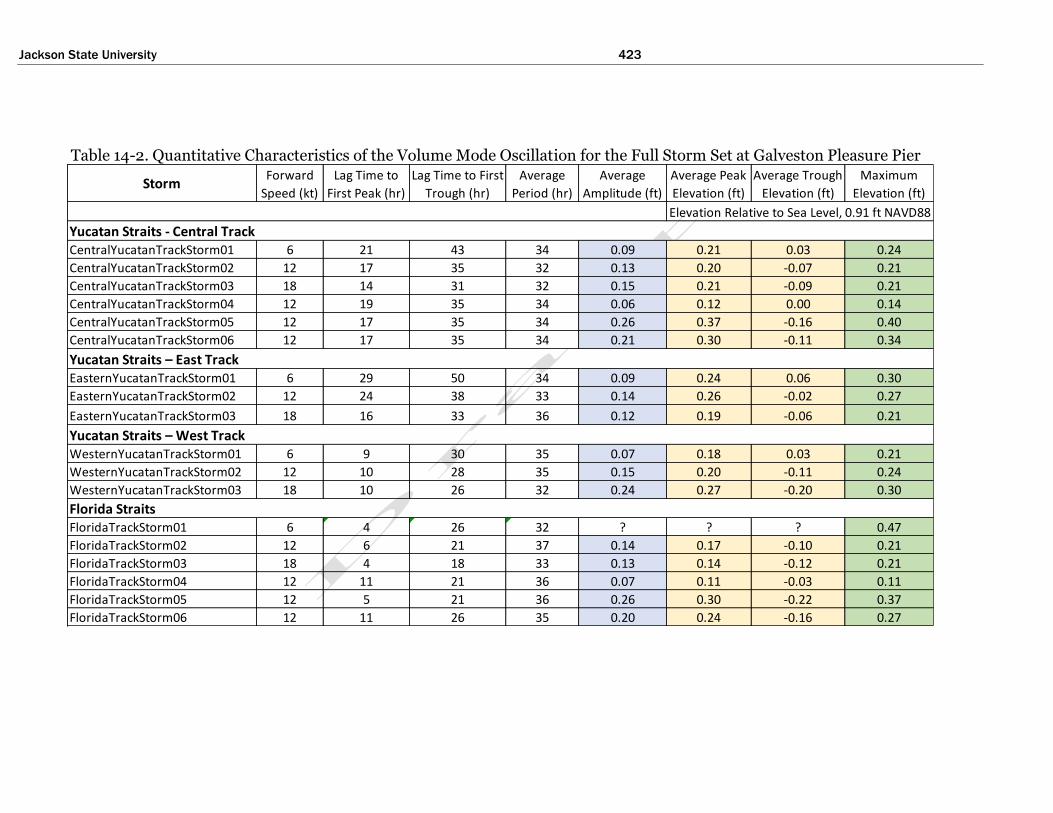
Jackson State University 423
Table 14-2. Quantitative Characteristics of the Volume Mode Oscillation for the Full Storm Set at Galveston Pleasure Pier
CentralYucatanTrackStorm01 6 21 43 34 0.09 0.21 0.03 0.24
CentralYucatanTrackStorm02 12 17 35 32 0.13 0.20 -0.07 0.21
CentralYucatanTrackStorm03 18 14 31 32 0.15 0.21 -0.09 0.21
CentralYucatanTrackStorm04 12 19 35 34 0.06 0.12 0.00 0.14
CentralYucatanTrackStorm05 12 17 35 34 0.26 0.37 -0.16 0.40
CentralYucatanTrackStorm06 12 17 35 34 0.21 0.30 -0.11 0.34
EasternYucatanTrackStorm01 6 29 50 34 0.09 0.24 0.06 0.30
EasternYucatanTrackStorm02 12 24 38 33 0.14 0.26 -0.02 0.27
EasternYucatanTrackStorm03 18 16 33 36 0.12 0.19 -0.06 0.21
WesternYucatanTrackStorm01 6 9 30 35 0.07 0.18 0.03 0.21
WesternYucatanTrackStorm02 12 10 28 35 0.15 0.20 -0.11 0.24
WesternYucatanTrackStorm03 18 10 26 32 0.24 0.27 -0.20 0.30
FloridaTrackStorm01 6 4 26 32 ? ? ? 0.47
FloridaTrackStorm02 12 6 21 37 0.14 0.17 -0.10 0.21
FloridaTrackStorm03 18 4 18 33 0.13 0.14 -0.12 0.21
FloridaTrackStorm04 12 11 21 36 0.07 0.11 -0.03 0.11
FloridaTrackStorm05 12 5 21 36 0.26 0.30 -0.22 0.37
FloridaTrackStorm06 12 11 26 35 0.20 0.24 -0.16 0.27
Maximum
Elevation (ft)
Florida Straits
Forward
Speed (kt)
Lag Time to
First Peak (hr)
Lag Time to First
Trough (hr)Storm
Yucatan Straits - Central Track
Yucatan Straits – East Track
Yucatan Straits – West Track
Elevation Relative to Sea Level, 0.91 ft NAVD88
Average
Period (hr)
Average
Amplitude (ft)
Average Peak
Elevation (ft)
Average Trough
Elevation (ft)
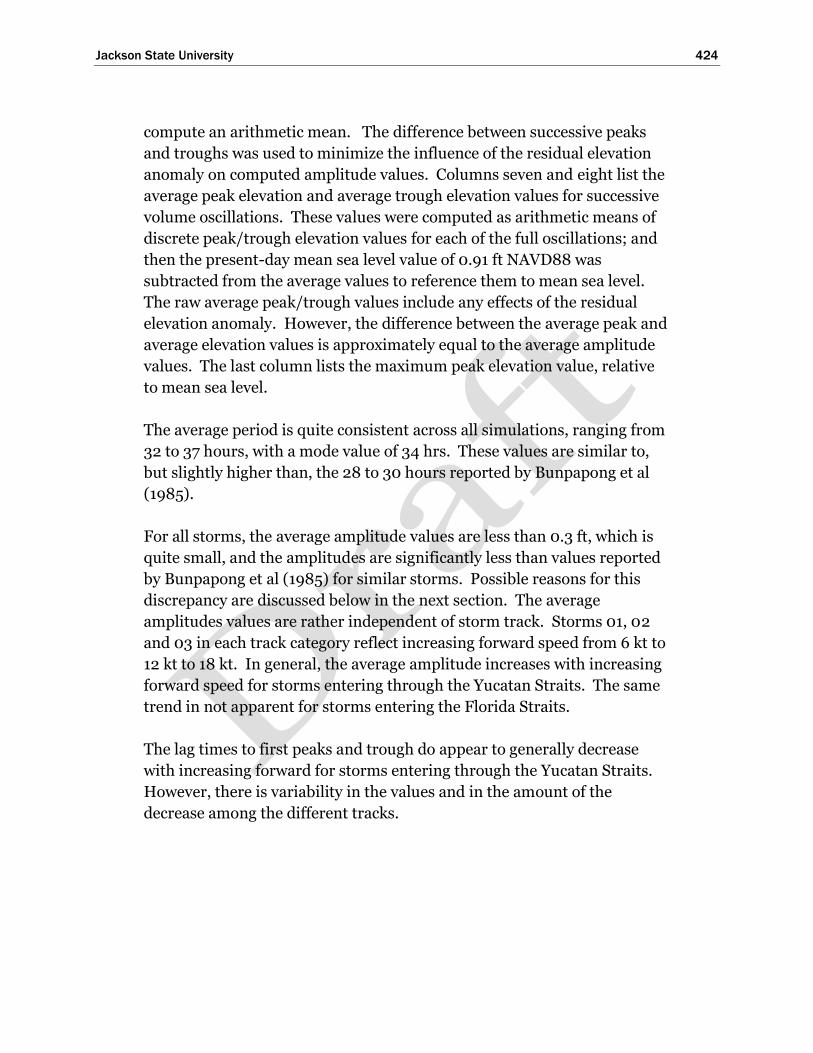
Jackson State University 424
compute an arithmetic mean. The difference between successive peaks
and troughs was used to minimize the influence of the residual elevation
anomaly on computed amplitude values. Columns seven and eight list the
average peak elevation and average trough elevation values for successive
volume oscillations. These values were computed as arithmetic means of
discrete peak/trough elevation values for each of the full oscillations; and
then the present-day mean sea level value of 0.91 ft NAVD88 was
subtracted from the average values to reference them to mean sea level.
The raw average peak/trough values include any effects of the residual
elevation anomaly. However, the difference between the average peak and
average elevation values is approximately equal to the average amplitude
values. The last column lists the maximum peak elevation value, relative
to mean sea level.
The average period is quite consistent across all simulations, ranging from
32 to 37 hours, with a mode value of 34 hrs. These values are similar to,
but slightly higher than, the 28 to 30 hours reported by Bunpapong et al
(1985).
For all storms, the average amplitude values are less than 0.3 ft, which is
quite small, and the amplitudes are significantly less than values reported
by Bunpapong et al (1985) for similar storms. Possible reasons for this
discrepancy are discussed below in the next section. The average
amplitudes values are rather independent of storm track. Storms 01, 02
and 03 in each track category reflect increasing forward speed from 6 kt to
12 kt to 18 kt. In general, the average amplitude increases with increasing
forward speed for storms entering through the Yucatan Straits. The same
trend in not apparent for storms entering the Florida Straits.
The lag times to first peaks and trough do appear to generally decrease
with increasing forward for storms entering through the Yucatan Straits.
However, there is variability in the values and in the amount of the
decrease among the different tracks.

Jackson State University 425
Discrepancy with the Volume Oscillation Amplitudes Found by Bunpapong et
al (1985)
Reasons for the aforementioned discrepancy in amplitude values for the
volume oscillation between the present study and the work of Bunpapong
et al (1985) are uncertain. However, one contributing factor is probably
the close proximity of the open water model boundaries to the Gulf of
Mexico, in the modeling done by Bunpapong et al. (1985). One of their
open-water model boundaries was located right where the Florida Straits
transect is located in the present study. Another open-water boundary
condition was located not too far from the Yucatan Straits near the
Cayman Islands in the Caribbean Sea. Model boundary conditions are, by
their very nature, approximations to the full set of equations conservation
of water mass and momentum. There are inherent errors in any and all
approximations. Error in the open-water boundary conditions might have
translated into error in the computed water flux through the Florida
Straits, and perhaps to a lesser degree the Yucatan Straits, which in turn
might have contributed to error in the net flux that enters/leaves the Gulf,
and subsequently resulted in error in the computed volume oscillation.
The amplitude of the volume oscillation is critically dependent upon
accurate calculation of the fluxes through both straits. A boundary located
right at the Florida Straits is not ideal.
The storm surge model used in the present study has its eastern open
water boundary located very far away from the Gulf of Mexico; it is located
in the middle of the Atlantic Ocean. The model has been shown to predict
well the astronomical tides, storm surge, and the combination of the two,
in the Gulf of Mexico. Accurate simulation of the tides in the Gulf of
Mexico requires accurate simulation of the water flux through both straits
that lead to/from the Gulf. It is believed that the present modeling is
much more accurate in computing fluxes through the straits in part
because of its open-water boundary location. The modeling done by
Bunpapong et al (1985) was not verified for astronomical tides in their
report.
The choice of boundary locations made by Bunpapong et al (1985) seems
reasonable for a study done at that time. Substantially more
computational resources would have been required to extend the model
boundaries to a location far-removed from the Gulf using the rectangular
structured grid mesh modeling approach which was applied. Such an

Jackson State University 426
option was probably not an option for them, and they most likely made the
only choice that was feasible for them at the time.
Influence of Storm Intensity
Storms having different minimum central pressures of 930 and 900 mb,
but having all other characteristics the same, were run for both the Central
Yucatan and Florida tracks. Dependence of the volume oscillation on
storm intensity was examined using results from these pairs of
simulations. Figures 14-35 and 14-36 show differences in the volume
oscillation for both tracks, the Central Yucatan and the Florida tracks,
respectively. Both sets of results show a clear dependence of the
amplitude of the oscillation on storm intensity. The same observation was
made by Bunpapong et al (1985). The increases in amplitude with
increasing intensity (i.e. decreasing minimum central pressure) are
quantified in Table 14-2, comparing Storms 02 and 06 for these two
tracks. Even the average amplitudes for the most severe 900-mb storms,
0.2 ft, are quite small.
Figure 14-35. Dependence of the volume mode oscillation on storm intensity for storms on
the Central Yucatan track.
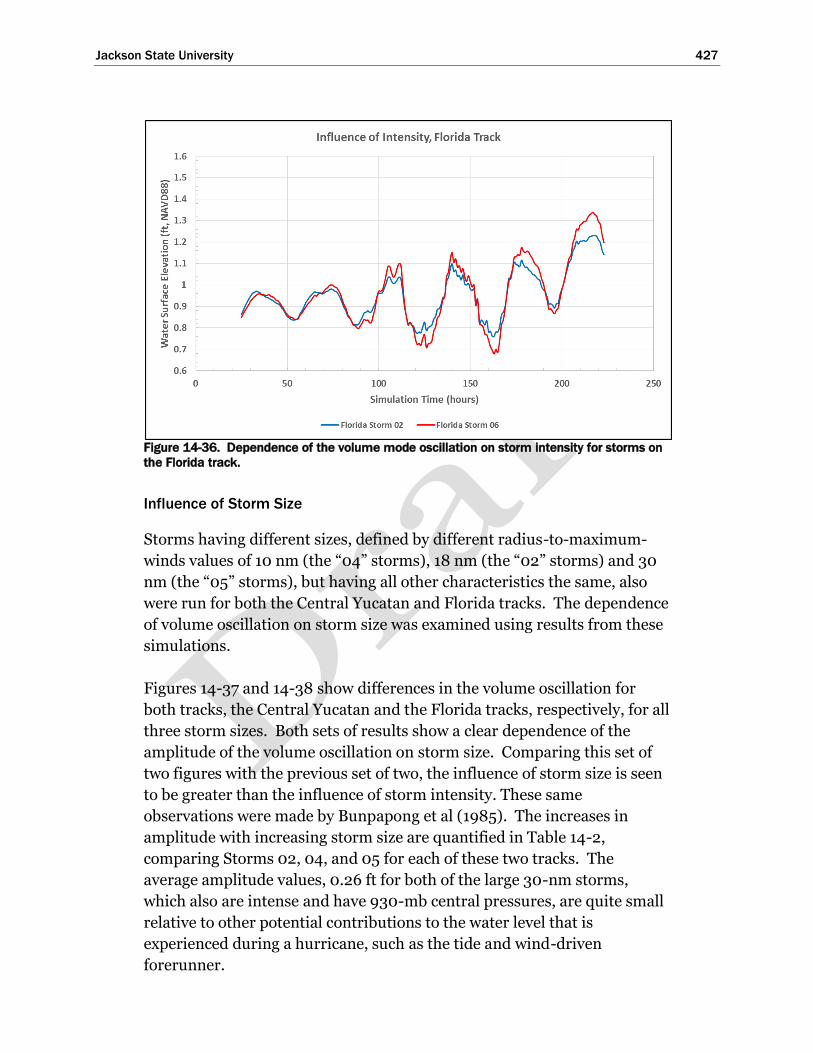
Jackson State University 427
Figure 14-36. Dependence of the volume mode oscillation on storm intensity for storms on
the Florida track.
Influence of Storm Size
Storms having different sizes, defined by different radius-to-maximum-
winds values of 10 nm (the “04” storms), 18 nm (the “02” storms) and 30
nm (the “05” storms), but having all other characteristics the same, also
were run for both the Central Yucatan and Florida tracks. The dependence
of volume oscillation on storm size was examined using results from these
simulations.
Figures 14-37 and 14-38 show differences in the volume oscillation for
both tracks, the Central Yucatan and the Florida tracks, respectively, for all
three storm sizes. Both sets of results show a clear dependence of the
amplitude of the volume oscillation on storm size. Comparing this set of
two figures with the previous set of two, the influence of storm size is seen
to be greater than the influence of storm intensity. These same
observations were made by Bunpapong et al (1985). The increases in
amplitude with increasing storm size are quantified in Table 14-2,
comparing Storms 02, 04, and 05 for each of these two tracks. The
average amplitude values, 0.26 ft for both of the large 30-nm storms,
which also are intense and have 930-mb central pressures, are quite small
relative to other potential contributions to the water level that is
experienced during a hurricane, such as the tide and wind-driven
forerunner.

Jackson State University 428
Figure 14-37. Dependence of the volume mode oscillation on storm size for storms on the
Central Yucatan track.
Figure 14-38. Dependence of the volume mode oscillation on storm size for storms on the
Florida track.

Jackson State University 429
Influence of Forward Speed on the Wind-Driven Forerunner and
Peak Surge Development
Selection of a Storm Set for Analysis
Results from analyses of the volume mode forerunner suggested that the
amplitude of the wind-driven forerunner might be sensitive to a
hurricane’s forward speed. Liu and Irish (2017) did not investigate the
dependency of wind-driven forerunner amplitude on forward speed, only
dependencies on size and intensity. In light of the importance of the wind-
driven forerunner on antecedent water level inside Galveston and West
Bays, and consequently the importance to Ike Dike storm surge gate
operations, the dependence of forerunner and peak surge development on
forward speed was investigated further.
Storms 01, 02 and 03 (see Table 14-1) on the Central Yucatan track (see
Figure 14-13), which were considered in the volume mode forerunner
analysis, were re-simulated to focus on wind-driven forerunner surge and
peak surge development, and the interaction between the two. Unlike the
simulations that were made to try and isolate the volume mode
forerunner, the new simulations were made with no intensity decay after
the hurricane entered the Gulf and with no application of the
wind/pressure mask that zeroed out the wind speeds over the western Gulf
shelf. The peak intensity for each hurricane was maintained during the
entire transit through the Gulf, before, during and after landfall. All three
storms followed the same track, which had landfall occurring near San
Luis Pass. All three had the same intensity and size, a minimum central
pressure of 930 mb and a radius-to-maximum winds of 18 nm. The three
storms differed only in their forward speed; speeds of 6, 12 and 18 kts for
Central Yucatan Storms 01, 02 and 03, respectively. All three storms were
simulated with a seasonal/long-term mean sea level value of 0.9 ft
NAVD88.
The Analysis Approach
The temporal variation of water surface elevation was examined first, at
the five locations shown in Figure 14-39, to identify differences
attributable to varying forward speed. The observation point at Galveston
Pleasure Pier was selected to characterize the forerunner and peak surge
on the open coast. The location at the City of Galveston, on the bay side,
was selected to examine propagation of the forerunner and peak surge

Jackson State University 430
Figure 14-39. Locations for examining variation of water surface elevation with time, to
assess influence of hurricane forward speed.
through Bolivar Roads pass and into Galveston Bay, and any attenuation
in forerunner amplitude that might occur through the pass. The other
three in-bay locations, entrance to Clear Lake, close proximity to
Alexander Island and the upper Houston Ship Channel, were selected to
examine forerunner and peak surge propagation into the rest of Galveston
Bay, into areas with potential for high economic losses due to flooding.
Some of the figures in these sections show the temporal variation of the
water surface elevation for Central Yucatan Storms 01, 02 and 03,
respectively. In these figures, water surface elevation is graphed on the
vertical axis, and simulation time (in terms of elapsed real time) is
graphed on the horizontal axis. Each figure displays results for all five
locations. In each figure, water level results are displayed for a 60-hour
window of time, beginning approximately 48 hours prior to landfall and
ending roughly 12 hours after landfall.
The spatial characteristics of the water surface elevation field, and its
dependency on forward speed, were examined as well. Figures showing
snap shots of the water surface elevation field throughout the region at the
time of landfall were used to assess storm surge levels along the inner shelf
on the open coast, and within the bay. Other figures show water surface
elevation profiles, which depict the spatial variation of water surface
elevation at a snap-shot in time, along two transects. The two transects

Jackson State University 431
considered here are shown in Figure 14-40. One is located inside
Galveston Bay. It is oriented to be roughly parallel to the wind direction
within the bay around the time of landfall, when winds set up the western
side of Galveston Bay and set down the eastern side of the bay. The other
transect is located on the open coast, in the inner shelf region. It is
oriented to lie in the cross-shelf direction, parallel to the track heading,
which is also shown in the figure. In these figures, water surface elevation
is graphed on the vertical axis and distance measured along a transect is
graphed on the horizontal axis. Distance is measured starting at the
easternmost end of the in-bay transect, and from the offshoremost end of
the open coast transect. Both the elevation snap shots and profile graphs
were used to assess the degree of bay infilling due in large part to
forerunner propagation into the bay, and how the amount of bay infilling
varied with forward speed.
Other figures show maps of water surface elevation maxima, like those
shown often in previous chapters. Maximum water surface elevation,
throughout the region are shown, regardless of when the maxima occurred
during the storm simulation.
Figure 14-40. Locations for profiles for examining spatial variation of water surface
elevation at a snap=shot in time, to assess influence of hurricane forward speed.

Jackson State University 432
Results for each storm are discussed in separate sections below. However,
a summary of observations is presented here, which are generally to be
expected for severe hurricanes that approach from the southeast and make
landfall in the vicinity of Freeport to Galveston Island. Results show that
forward speed has a significant influence on the following aspects of storm
surge: 1) development and amplitude of the wind-driven forerunner surge
along the open coast and inside Galveston Bay, 2) the magnitude of the
peak surge experienced inside Galveston Bay, 3) the duration of high surge
conditions both at the open coast and inside the bay, and 4) the difference
between the open coast peak surge and peak surge experienced within the
bay. On the other hand, results show that forward speed has less of an
influence on peak surge at the open coast, even though it has great
influence on peak surge inside the bay. The causative surge dynamics that
lead to these observations are discussed in subsequent sections.
Central Yucatan Storm 01 (6-kt Forward Speed)
Figure 14-41 shows graphs of time series of water surface elevation for
Central Yucatan Storm 01 which is the slowest moving storm of the three.
Development of a substantial wind-driven forerunner is evident prior to
landfall. This storm makes landfall at hour 372 of the simulation.
Figure 14-41. Temporal variation of water surface elevation for Central Yucatan Storm 01
(6-kt forward speed).

Jackson State University 433
Several days before landfall, the amplitude of the forerunner begins to
steadily grow, with a slowly accelerating rate of rise in elevation. The eye
of this hurricane reached the outer edge of the continental slope off the
Texas coast at hour 326, 48 hours before landfall. At this time the water
surface elevation at the open-coast Galveston Pleasure Pier location was
1.9 ft NAVD88, which corresponds to a wind-driven forerunner surge
amplitude of 1.0 ft relative to the mean sea level adopted for the
simulations. The water surface elevation is the same at all four locations
inside the bay; and the in-bay elevation is equal to the open-coast
elevation. The forerunner effectively propagates into Galveston Bay,
relatively un-attenuated, for this slow-moving storm.
As the eye reaches the outer edge of the continental shelf, 22 hours later at
hour 348 of the simulation, the water surface elevation at the open coast
has increased to 3.6 ft NAVD88 (a forerunner amplitude increase from 1.0
ft to 2.7 ft). Likewise, the water surface elevation has increased
throughout the bay, with values at the four in-bay locations being nearly
the same as that on the open coast or slightly less, i.e., values ranging from
3.o to 3.6 ft NAVD88. The variability in water surface elevation inside the
bay is greater at this particular time due to the increasing influence of local
wind. Winds are acting on the water inside the very shallow Galveston Bay
to set up or set down different parts of the bay, depending on wind
direction. Wind speeds are increasing as the storm moves closer to shore,
and the degree of variability in water surface elevation inside the bay
increases accordingly.
At hour 360 of the simulation, the eye is midway across the Texas shelf, 12
hours before landfall. At this time, the water surface elevation at the coast
is 6.1 ft NAVD88, which corresponds to a forerunner amplitude elevation
of 5.2 ft. At other locations inside the bay, elevations range from 4.4 to 6.1
ft. Variability inside the bay increases as the wind speed increases.
Figure 14-42 shows the water surface elevation field at landfall for Storm
01, which occurs at hour 372 of the simulation. The location of the in-bay
and open-coast transects also are shown in the figure. The surge elevation
at the open coast Galveston Pleasure Pier site is 9.2 ft NAVD88. Surge
elevations inside the bay are equal to or greater than this value: 9.2 ft at
Galveston (bay side), 13.6 ft at Clear Lake, 10.4 ft in the vicinity of
Alexander Island, and 10.8 ft in the upper Houston Ship Channel.
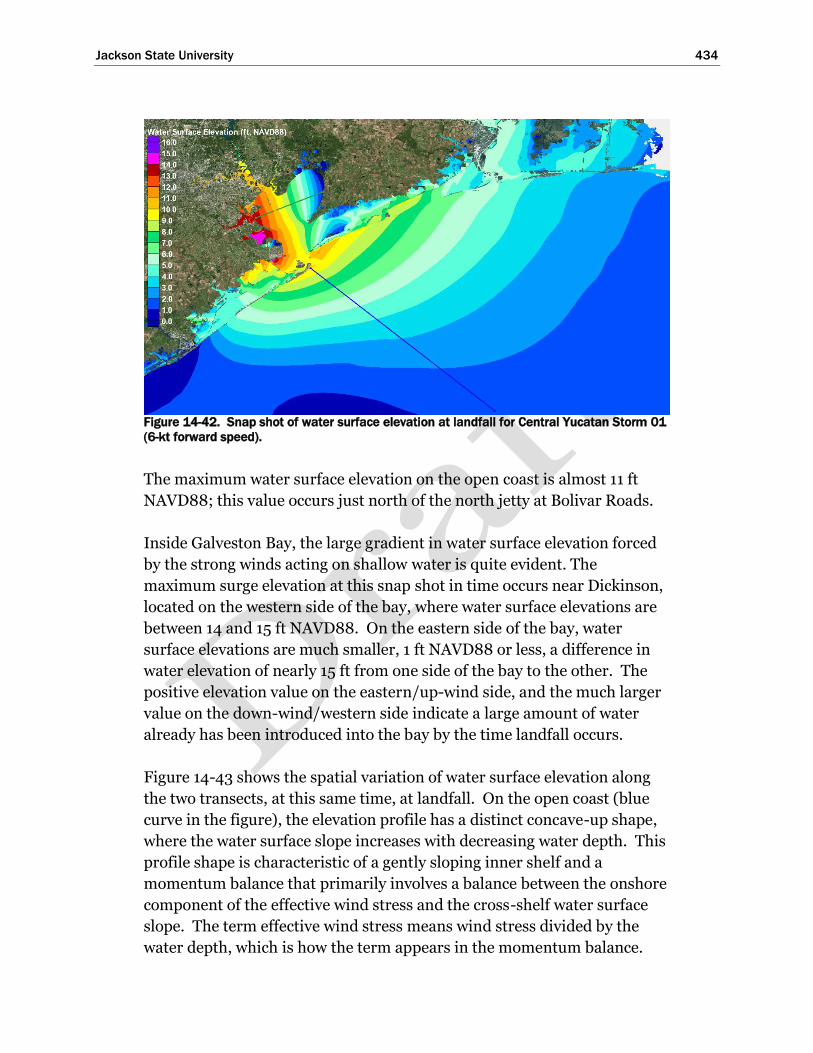
Jackson State University 434
Figure 14-42. Snap shot of water surface elevation at landfall for Central Yucatan Storm 01
(6-kt forward speed).
The maximum water surface elevation on the open coast is almost 11 ft
NAVD88; this value occurs just north of the north jetty at Bolivar Roads.
Inside Galveston Bay, the large gradient in water surface elevation forced
by the strong winds acting on shallow water is quite evident. The
maximum surge elevation at this snap shot in time occurs near Dickinson,
located on the western side of the bay, where water surface elevations are
between 14 and 15 ft NAVD88. On the eastern side of the bay, water
surface elevations are much smaller, 1 ft NAVD88 or less, a difference in
water elevation of nearly 15 ft from one side of the bay to the other. The
positive elevation value on the eastern/up-wind side, and the much larger
value on the down-wind/western side indicate a large amount of water
already has been introduced into the bay by the time landfall occurs.
Figure 14-43 shows the spatial variation of water surface elevation along
the two transects, at this same time, at landfall. On the open coast (blue
curve in the figure), the elevation profile has a distinct concave-up shape,
where the water surface slope increases with decreasing water depth. This
profile shape is characteristic of a gently sloping inner shelf and a
momentum balance that primarily involves a balance between the onshore
component of the effective wind stress and the cross-shelf water surface
slope. The term effective wind stress means wind stress divided by the
water depth, which is how the term appears in the momentum balance.

Jackson State University 435
Figure 14-43. Water surface elevation profiles at landfall for the in-bay and open-coast
transects, for Central Yucatan Storm 01 (6-kt forward speed).
The water surface elevation at the seaward terminus of the open-coast
transect is approximately 1.5 ft NAVD88, a value that is influenced by both
the wind conditions and the amount of water on the inner shelf. The latter
is influenced by the forerunner surge. Water surface elevation at the
coastline is about 10 ft NAVD88. The difference between elevations at the
inshore and offshore ends of the open-coast transect is approximately 8.5
ft.
The shape of the water surface elevation profile inside the bay (green
curve) is quite different from that on the open coast, having a nearly linear
variation with distance but with a slightly concave-down shape. This
shape is expected in light of the rather uniform bottom surface elevation of
the bay and the predominant momentum balance between the across-bay
directed effective wind stress and the water surface slope in the same
direction. The slight downward concavity in shape is due to the large
degree of tilt in the water surface (set up on the western side and set down
on the eastern side), which leads to a greater water depth on the western
side. The greater water depth leads to a reduction in effective wind stress
on the western side of the bay, which in turn leads to a smaller water
surface slope. This is in contrast to the eastern side where the water depth
is less, so the effective wind stress is greater, and therefore the water
surface slope is greater.

Jackson State University 436
Figures 14-42 and 14-43 indicate that for this slow moving storm, at the
time of landfall, roughly 7 additional feet of water has been added
throughout Galveston Bay. The additional water is mostly due to early
wind-driven forerunner surge propagation through the passes, augmented
and in part by more recent flow over the barrier islands as the open coast
surge elevation exceeds the land elevation on the barrier islands.
Figure 14-44 shows the peak water surface elevation map for Storm 01.
Note the elevation scale is different from the scale used in Figure 14-42, in
order to cover the maximum values encountered during the entire event,
which exceed 21 ft NAVD88 near Houston. At all five locations, peak
elevations experienced during the storm are higher than the elevations
that were present at the time of landfall. Peak elevations on the open coast
at the Pleasure Pier location (10.6 ft NAVD88) and at the bayside of
Galveston (10.6 ft NAVD88) each occurred two hours before landfall.
After landfall, winds shift rapidly and begin to push all the water that
resides in Galveston Bay toward the north, and up the Houston Ship
Channel where the maximum surge elevations occur. This changing wind
pattern leads to even higher peak surge values at Clear Lake (14.6 ft
NAVD88, 2 hours after landfall, an increase of 1.0 ft from the value here at
landfall), at Alexander Island (16.1 ft NAVD88, 5 hours after landfall, an
increase of 5.7 ft from the value here at landfall), and in the Upper
Figure 14-44. Peak water surface elevation field for Central Yucatan Storm 01 (6-kt forward
speed).

Jackson State University 437
Houston Ship Channel (20.5 ft NAVD88, 6 hours after landfall, an
increase of 9.7 ft from the value here at landfall).
The maximum surge at the Upper Houston Ship Channel location (20.5 ft)
is nearly 10 ft higher than the maximum surge elevation at the open coast.
This very large elevation difference is due to the large amount of water that
accumulated inside the bay before landfall, and the effectiveness of
hurricane force winds in moving that water around within the bay, tilting
the water surface, by setting up the water surface along the downwind side
of the bay and setting it down on the upwind side of the bay. The central
benefit of the Ike Dike is to substantially reduce the amount of water that
enters the bay, which can then be moved about by strong winds.
Central Yucatan Storm 02 (12-kt Forward Speed)
Figure 14-45 shows results for Central Yucatan Storm 02 which has a
forward speed of 12 kt, twice as fast as the speed of Storm 01. Storm 02
makes landfall at hour 188 of the simulation. As was the case with Storm
01, several days before landfall the amplitude of the forerunner begins to
grow. However, the faster-moving storm leads to a forerunner growth rate
that is slower than the rate for Storm 01; and therefore, the amplitude of
the wind-driven forerunner surge along the Texas coast is less for the
faster moving storm.
Figure 14-45. Temporal variation of water surface elevation for Central Yucatan Storm 02
(12-kt forward speed).

Jackson State University 438
The eye of Storm 02 reaches the outer edge of the continental slope at
hour 165, 23 hours before landfall. At this time the water surface elevation
at the Galveston Pleasure Pier location is 1.4 ft NAVD88, which
corresponds to a forerunner amplitude of 0.5 ft. Results for this storm
also show that the forerunner effectively propagates into Galveston Bay,
un-attenuated. The in-bay water surface elevations are nearly the same at
all four locations, 1.4 to 1.5 ft NAVD88, and all are roughly equal to the
elevation on the open coast.
As the eye reaches the outer edge of the continental shelf 11 hours later (at
simulation hour 176), the water surface elevation at the open coast
increases to 2.3 ft NAVD88 (corresponds to a forerunner amplitude of 1.4
ft). Likewise, elevations increase throughout the bay, with values ranging
from 0.9 to 1.5 ft NAVD88 at the four in-bay locations. The elevations for
Storm 02 are significantly less than elevations for the slower moving
Storm 01, when the eye of both storms is at this same position.
Differences in water surface elevation between the two storms are 1.2 to
1.3 ft both at the open coast location and all four locations within the bay.
At hour 182 of the simulation, the eye is midway across the Texas shelf;
and the time is 6 hours before landfall. At this time, the water surface
elevation at the open coast is 3.4 ft NAVD88 (corresponding to a
forerunner amplitude of 2.5 ft). At locations inside the bay, water surface
elevations are variable and range from 2.0 to 4.1 ft NAVD88. The
increasing variability in these elevations reflects the influence of
increasingly stronger local winds acting inside the bay. At all five
locations, the elevations for Storm 02 are significantly less than elevations
for the slower moving Storm 01, when the eye of both storms is at this
same mid-shelf position. Differences between storms are 2.7 ft at the open
coast and 2.0 to 2.5 ft within the bay; and, the magnitude of the
differences is growing. The open coast forerunner amplitude is about half
of what it was for the slowest moving Storm 01, when its eye also was
situated at the mid-shelf position (2.5 ft versus 5.2 ft).
Figure 14-46 shows the water surface elevation field at landfall for Storm
02, at hour 188 of the simulation, along with the in-bay and open-coast
transects. The surge elevation at the open coast Galveston Pleasure Pier
site is 11.6 ft NAVD88. The surge elevation at each location inside the bay
is less than this value: 9.3 ft at Galveston (bay), 10.4 ft at Clear Lake, only
4.8 ft at Alexander Island and 4.6 ft in the upper reaches of the Houston
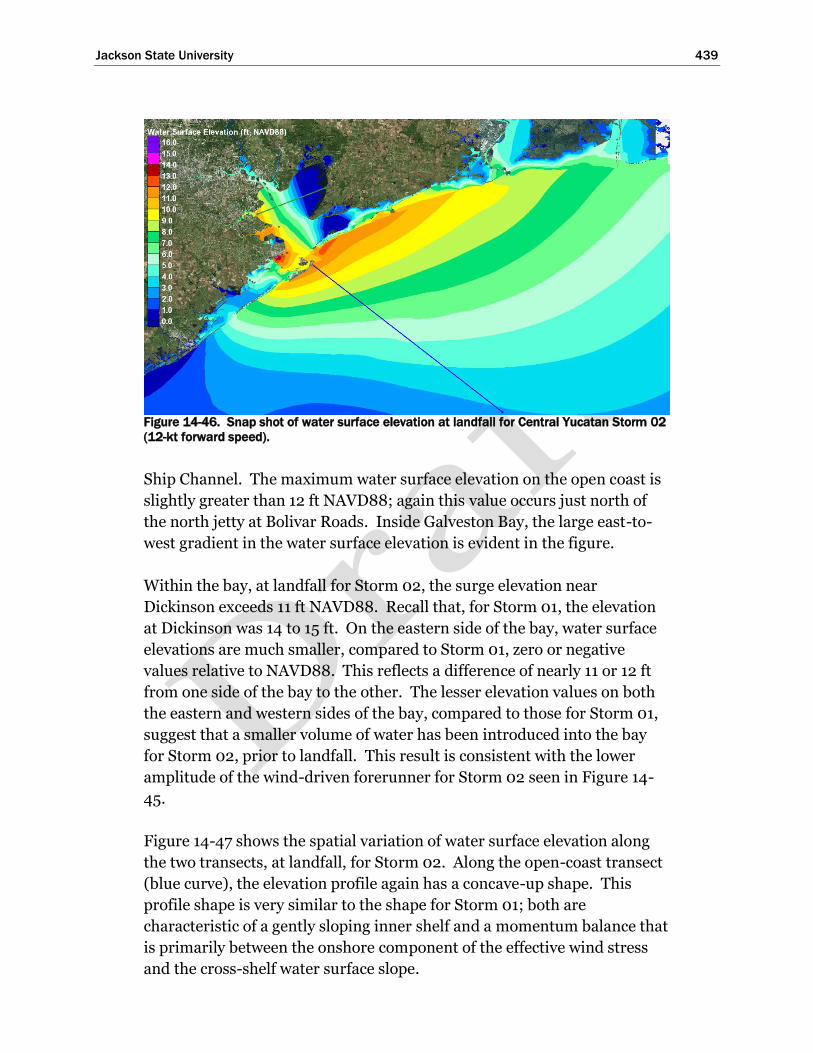
Jackson State University 439
Figure 14-46. Snap shot of water surface elevation at landfall for Central Yucatan Storm 02
(12-kt forward speed).
Ship Channel. The maximum water surface elevation on the open coast is
slightly greater than 12 ft NAVD88; again this value occurs just north of
the north jetty at Bolivar Roads. Inside Galveston Bay, the large east-to-
west gradient in the water surface elevation is evident in the figure.
Within the bay, at landfall for Storm 02, the surge elevation near
Dickinson exceeds 11 ft NAVD88. Recall that, for Storm 01, the elevation
at Dickinson was 14 to 15 ft. On the eastern side of the bay, water surface
elevations are much smaller, compared to Storm 01, zero or negative
values relative to NAVD88. This reflects a difference of nearly 11 or 12 ft
from one side of the bay to the other. The lesser elevation values on both
the eastern and western sides of the bay, compared to those for Storm 01,
suggest that a smaller volume of water has been introduced into the bay
for Storm 02, prior to landfall. This result is consistent with the lower
amplitude of the wind-driven forerunner for Storm 02 seen in Figure 14-
45.
Figure 14-47 shows the spatial variation of water surface elevation along
the two transects, at landfall, for Storm 02. Along the open-coast transect
(blue curve), the elevation profile again has a concave-up shape. This
profile shape is very similar to the shape for Storm 01; both are
characteristic of a gently sloping inner shelf and a momentum balance that
is primarily between the onshore component of the effective wind stress
and the cross-shelf water surface slope.

Jackson State University 440
Figure 14-47. Water surface elevation profiles at landfall for the in-bay and open-coast
transects, for Central Yucatan Storm 02 (12-kt forward speed).
The water surface elevation at the seaward terminus of the open-coast
transect is approximately 3 ft NAVD88. This value is larger than the
comparable value for Storm 01, indicating that there is more water on the
inner shelf for Storm 02 than there was for Storm 01. A comparison of
Figure 14-46 with 14-42, in the offshore area shown in both figures,
confirms that this is the case.
The amount of water on the inner shelf is influenced by the wind-driven
forerunner. The forerunner surge amplitude at the coast was less for
Storm 02 than for Storm 01; however, offshore, the amplitude of the
forerunner surge is greater for Storm 02 than for Storm 01. Therefore it
seems that the forerunner evolution with time and the timing between
forerunner development and landfall of the eye must influence the amount
of water on the shelf in some way. This dynamic is examined and
discussed later. The water surface elevation at the inshore end of the
open-coast transect is about 12 ft NAVD88 for Storm 02; and the
difference between elevations at the inshore and offshore ends of the
open-coast transect is approximately 9 ft, nearly the same as it was for
Storm 01.

Jackson State University 441
The similarity for Storms 01 and 02, both in terms of profile shape and in
elevation difference between the offshore and inshore ends of the open-
coast transect, can be explained. The wind field over the shelf at this eye
position is the same for both storms. The total water depths across the
inner shelf are essentially the same for both storms, because small
differences in water surface elevation between storms have little influence
on total water depth along the transect (the total water depth influences
the effective wind stress). Assuming steady state conditions on a long
straight coastline/shelf, the cross-shelf shape of the water surface
elevation profile is strongly influenced by a momentum balance between
the effective onshore directed effective wind stress and the water surface
slope. Since the effective wind stress along the transect is the essentially
the same for both storms, the water surface slope along the transect also
should be the same. This is why their shapes are quite similar. Deviations
from a long straight coastline/shelf assumption and the unsteadiness in a
moving hurricane cause small differences in the shapes of the elevation
profiles. Even though the profile slopes are quite similar same, the profile
for Storm 02 is shifted vertically upward compared to Storm 01 due to the
presence of the additional water on the inner shelf for Storm 02.
Again, for Storm 02, the shape of the water surface elevation profile inside
the bay (green curve) is quite different from the shape along the open-
coast transect; and its shape is a bit different than the in-bay profile shape
for Storm 01. For Storm 02, along thewestern side of the bay, there is a
nearly linear variation in water surface elevation with distance along the
transect. In contrast, the slope of the profile is much greater on the
eastern side, and concave downward. This occurs because of the very
shallow water on the eastern side which leads to a much greater effective
wind stress and a much greater water surface slope.
Figures 14-46 and 14-47 indicate that for this faster moving storm, at the
time of landfall, roughly 4 additional feet of water had been added
throughout Galveston Bay. The additional water is primarily due to early
wind-driven forerunner surge propagation through the passes. Because of
the lower forerunner surge amplitude in general for Storm 02, the onset of
flow over the barrier island would have commenced later than it did for
Storm 01, lessening the contribution of barrier island overflow to the
accumulation of water inside the bay.

Jackson State University 442
Figure 14-48 shows the peak water surface elevation surge map for Storm
02. The peak elevation on the open coast is greater for Storm 02 than
Storm 01; however, in the bay the peak elevations at all four locations are
significantly less than those for Storm 01. Peak elevations on the open
coast at the Pleasure Pier location (11.6 ft NAVD88) occurred at the time of
landfall. At the bay side of Galveston the maximum (9.8 ft NAVD88)
occurred one hour before landfall. As was the case for Storm 01, after
landfall, winds shift rapidly and begin to push all the water that resides in
Galveston Bay toward the north, and up the Houston Ship Channel where
the maximum surge elevations occur. This changing wind pattern leads to
the following peak surge values at Clear Lake (11.1 ft NAVD88, 1 hour after
landfall, an increase of 0.7 ft from the value here at landfall), at Alexander
Island (11.9 ft NAVD88, 4 hours after landfall, an increase of 7.1 ft from
the value here at landfall), and in the Upper Houston Ship Channel (15.1 ft
NAVD88, 4 hours after landfall, an increase of 10.5 ft from the value here
at landfall). The maximum surge at the Upper Houston Ship Channel
location (15.1 ft) is 3.5 ft higher than the maximum surge elevation at the
open coast. This difference is much less than the difference for Storm 01,
and the smaller difference is due to the smaller amount of water that had
entered the bay prior to landfall; which was subsequently push to the
north as winds shifted after landfall.
Figure 14-48. Peak water surface elevation field for Central Yucatan Storm 02 (12-kt
forward speed).

Jackson State University 443
Central Yucatan Storm 03 (18-kt Forward Speed)
Figure 14-49 shows the water surface elevation time series for Central
Yucatan Storm 03, which moves 50% faster than Storm 02 and three times
as fast as Storm 01. Storm 03 has a forward speed of 18 kt. This storm
makes landfall at hour 126 of the simulation. While the storm is transiting
through the Gulf, but prior to reaching the outer edge of the continental
slope, the amplitude of the wind forerunner for this storm is less than the
amplitude for the slowest moving Storm 01; however, the amplitude is
about the same as the amplitude for the slower moving Storm 02.
The eye of Storm 03 reached the outer edge of the continental slope at
hour 111, 15 hours before landfall. At this time the water surface elevation
at the Galveston Pleasure Pier location was 1.4 ft NAVD88, which
corresponds to a wind forerunner amplitude of 0.5 ft, the same value seen
for Storm 02 for the same position of the hurricane eye. Results again
show that the forerunner effectively propagates into Galveston Bay, un-
attenuated; water surface elevations are nearly the same at all four in-bay
locations, and all are nearly equal to the elevation value at the open coast,
1.4 ft NAVD88.
Figure 14-49. Temporal variation of water surface elevation for Central Yucatan Storm 03
(18-kt forward speed).

Jackson State University 444
As the eye reaches the outer edge of the continental shelf eight hours later
(at simulation hour 119), the water surface elevation value at the open
coast has increased only slightly, from 1.4 to 1.5 ft NAVD88
(corresponding to a forerunner amplitude increase from 0.5 to 0.6 ft).
Likewise, the forerunner amplitude has increased throughout the Bay, but
only slightly, with water surface elevations values ranging from 1.3 to 1.9 ft
NAVD88 at the four in-bay locations. The rate at which the forerunner
amplitude is increasing is quite small, less than the rate for Storm 02 and
much less than the rate for Storm 01.
This hurricane is moving very quickly across the shelf, and at hour 122 of
the simulation, the eye is midway across the Texas shelf. At hour 122, just
4 hours away from landfall, the water surface elevation at the open coast,
the Galveston Pleasure Pier site, is still nearly the same as it was 11 hours
earlier crossing the edge of the continental slope. For this eye position, the
water surface elevation at the Pleasure Pier is 2.0 ft less than it was for the
slower moving Storm 02, and 4.7 ft less than it was for the slowest moving
storm, Storm 01. For locations inside the bay, water surface elevations are
generally higher than they are at the open coast site, ranging from 1.2 to
2.3 ft NAVD88. The variability in these elevations reflects the influence of
local winds.
Figure 14-50 shows the water surface elevation field for Storm 03, at the
time of landfall, which occurs at hour 126 of the simulation. At this time,
the surge elevation at the open coast Galveston Pleasure Pier site is 9.0 ft
NAVD88. The surge elevation at each location inside the bay at landfall is
less than the open coast value, as was the case for Storm 02: 6.7 ft at
Galveston (bay), 4.9 ft at Clear Lake, only 0.2 ft at Alexander Island, and
only 1.2 ft in the upper reaches of the Houston Ship Channel. The
maximum water surface elevation on the open coast is slightly greater than
9 ft NAVD88. As was the case for the other two storms, the maximum
value occurs just north of the north jetty at Bolivar Roads.
Inside Galveston Bay, the large east-to-west gradient in the water surface
elevation is evident. However, for Storm 093, the surge elevation near
Dickinson is only between 6 and 7 ft NAVD88. This elevation value is
much less than the 14 to 15 ft value for the 6-kt Storm 01 and 11 to 12 ft for
the 12-kt Storm 02. On the eastern side of the bay, water surface
elevations have negative values. The easternmost parts of the bay are

Jackson State University 445
Figure 14-50. Snap shot of water surface elevation at landfall for Central Yucatan Storm 03
(18-kt forward speed).
blown dry by the strong winds. The lower elevation values on the western
side of the bay, compared to those for Storms 01 and 02, even though the
winds are the same at landfall, suggest that there is much less water inside
Galveston Bay for storm 03 that can be moved about by the wind, just 4
hours before landfall. This result is consistent with the observed lower
amplitude of the wind-driven forerunner for Storm 03, compared to the
slower-moving storms, and the storm moved across the Texas shelf.
Figure 14-51 shows the spatial variation of water surface elevation along
both the open-coast and in-bay transects, at landfall, for Storm 03. Along
the open-coast transect (blue curve), the elevation profile again has the
same concave-up shape as seen for Storms 01 and 02, where the water
surface slope increases with decreasing water depth. The profile shape is
very similar to the shapes for Storms 01 and 02.
Water surface elevation at the seaward terminus of the open-coast transect
is approximately 2 ft NAVD88. This value is approximately 0.5 ft larger
than the value for Storm 01, and 1 ft smaller than the comparable value for
Storm 03, indicating that there is more/less water on the inner shelf for
this storm than for Storms 01 and 02, respectively. A comparison of
Figure 14-50 with Figures 14-42 and 14-46, in the offshore area, confirms
that this is the case. Again, it seems that the forerunner evolution with
time and the timing between forerunner development and the core wind

Jackson State University 446
Figure 14-51. Water surface elevation profiles at landfall for the in-bay and open-coast
transects, for Central Yucatan Storm 03 (18-kt forward speed).
field at landfall must influence the amount of water that is resident on the
shelf at the time of landfall.
The water surface elevation at the inshore end of the open-coast transect is
about 9 ft NAVD88 for Storm 03; and the difference between elevations at
the inshore and offshore ends of the open-coast transect is approximately
7 ft, somewhat less than it was for Storms 01 and 02. The very fast
forward speed of Storm 03 appears to influence the temporal development
of the open coast storm surge on the inner shelf, seemingly reducing the
peak surge at the coast. It is possible that the water on the inner shelf does
not respond as quickly or fully to the imposed wind stress field for this
very fast-moving storm, i.e. steady state is least achieved for Storm 03.
Again, for Storm 03, the shape of the water surface elevation profile inside
the bay (green curve in figure 14-51) is quite different from the shape along
the open-coast transect. The in-bay profile shape for Storm 03 is similar
to the in-bay profile shape for Storm 02. For Storm 03, along the western
side of the bay, there is a nearly linear variation in water surface elevation
with distance along the transect. In contrast, the slope of the profile is
greater on the easternmost side, and concave downward. This is the same
behavior that was seen for Storm 02, and it occurs because of the very
shallow water on the eastern side which leads to a much greater effective
wind stress, and therefore a greater water surface slope. The small “glitch”

Jackson State University 447
in the water surface elevation graph for the in-bay transect arises from
wind-induced set-up/set-down on opposite sides of a dredged material
placement island that is situated along the Houston Ship Channel in this
area. There is much less water inside the bay at landfall for Storm 03.
Water surface elevations are so small that the dredged material island is
not inundated by this storm at this time in the simulation.
Figures 14-49, 14-50 and 14-51 indicate that for this very fast-moving
storm, only approximately 1.5 additional feet of water had been added
throughout Galveston Bay at the time of landfall. The additional water is
due to early wind-driven forerunner propagation through the passes,
albeit for a very small forerunner surge. Because of the very small
forerunner amplitude for Storm 03, the onset of flow over the barrier
island would have commenced later than it did even for Storm 02,
minimizing any contribution of barrier island overflow to the
accumulation of water inside the bay before the open coast surge levels
quickly rose to their peak values. This occurred very rapidly because there
was no gradual water surface elevation build-up because the forerunner
was so small.
Figure 14-52 shows the peak water surface elevation map for Storm 03.
The peak elevation on the open coast is less for Storm 03 than for Storms
02 and 01. The same is true for peak surge elevations throughout
Galveston Bay. Peak elevation on the open coast at the Pleasure Pier
location (10.1 ft NAVD88) occurred one hour after the time of landfall
supporting the notion that the water on the inner shelf responds more
slowly to the faster moving storm. At the bay side of Galveston the
maximum (7.7 ft NAVD88) also occurred one hour after landfall. As was
the case for Storms 01 and 02, after landfall, winds shift rapidly and begin
to push all the water that resides in Galveston Bay toward the north, and
up the Houston Ship Channel. This changing wind pattern leads to the
following peak surge values at Clear Lake (8.3 ft NAVD88, 1 hour after
landfall, an increase of 3.4 ft from the value here at landfall), at Alexander
Island (7.9 ft NAVD88, 4 hours after landfall, an increase of 7.7 ft from the
value here at landfall), and in the Upper Houston Ship Channel (9.6 ft
NAVD88, 4 hours after landfall, an increase of 8.4 ft from the value here at
landfall).

Jackson State University 448
Figure 14-52. Peak water surface elevation field for Central Yucatan Storm 03 (18-kt
forward speed).
The maximum surge value on the open coast at the Galveston Pleasure
pier location was the least for Storm 03 (10.1 ft BAVD88) among the three
storms (maximums for Storms 01 and 02 were 10.6 and 11.1 ft,
respectively). At the open coast peak surge appears to have only a small
sensitivity to forward speed. No clear trend in the open coast maxima was
evident in terms of dependency on forward speed. The greatest open coast
surge occurred for the 12-kt forward speed, with lesser values for the 6-
and 18-kt storms. Reasons for the observed dependency of maximum
surge level on forward speed is examined in the following section.
Peak surge values inside Galveston bay for the 18-kt Storm 03 are
considerably less than those inside the Bay for the slower moving 12- and
6-kt storms. Even though the peak surge elevations at the open coast were
quite similar for the three storms, peak surge values in the upper Houston
Ship Channel were quite dissimilar, 20.5 ft, 15.1 ft and 9.6 ft NAVD88 for
the same three storms, Storms 01, 02 and 03, respectively. The same
trend is seen for all the in-bay locations: Alexander Island (16.1, 11.9, 7.9 ft
for Storms 01, 02 and 03), Clear Lake (14.6, 11.1, 8.3 ft for Storms 01, 02
and 03) and the bay side of Galveston (10.6 ft, 9.8 ft, 7.7 ft for Storms 01,
02 and 03). This is a direct result of the much lower forerunner surge
amplitudes that occur for the faster moving storms, which leads to much
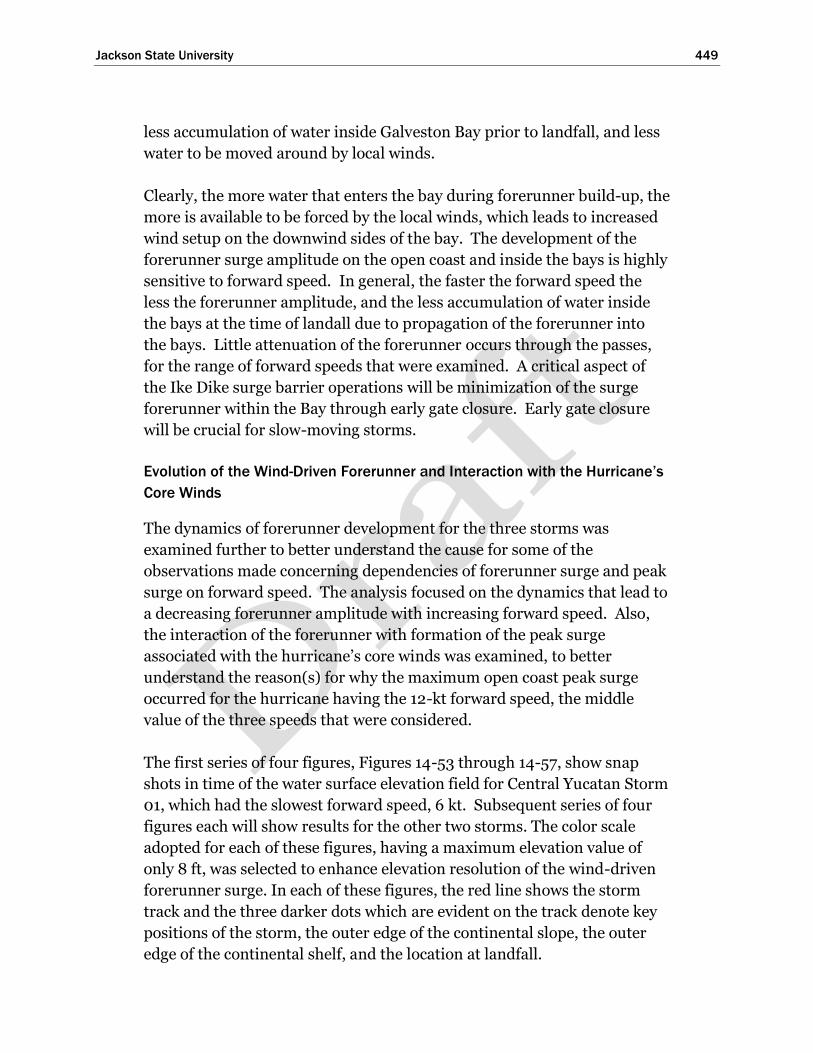
Jackson State University 449
less accumulation of water inside Galveston Bay prior to landfall, and less
water to be moved around by local winds.
Clearly, the more water that enters the bay during forerunner build-up, the
more is available to be forced by the local winds, which leads to increased
wind setup on the downwind sides of the bay. The development of the
forerunner surge amplitude on the open coast and inside the bays is highly
sensitive to forward speed. In general, the faster the forward speed the
less the forerunner amplitude, and the less accumulation of water inside
the bays at the time of landall due to propagation of the forerunner into
the bays. Little attenuation of the forerunner occurs through the passes,
for the range of forward speeds that were examined. A critical aspect of
the Ike Dike surge barrier operations will be minimization of the surge
forerunner within the Bay through early gate closure. Early gate closure
will be crucial for slow-moving storms.
Evolution of the Wind-Driven Forerunner and Interaction with the Hurricane’s
Core Winds
The dynamics of forerunner development for the three storms was
examined further to better understand the cause for some of the
observations made concerning dependencies of forerunner surge and peak
surge on forward speed. The analysis focused on the dynamics that lead to
a decreasing forerunner amplitude with increasing forward speed. Also,
the interaction of the forerunner with formation of the peak surge
associated with the hurricane’s core winds was examined, to better
understand the reason(s) for why the maximum open coast peak surge
occurred for the hurricane having the 12-kt forward speed, the middle
value of the three speeds that were considered.
The first series of four figures, Figures 14-53 through 14-57, show snap
shots in time of the water surface elevation field for Central Yucatan Storm
01, which had the slowest forward speed, 6 kt. Subsequent series of four
figures each will show results for the other two storms. The color scale
adopted for each of these figures, having a maximum elevation value of
only 8 ft, was selected to enhance elevation resolution of the wind-driven
forerunner surge. In each of these figures, the red line shows the storm
track and the three darker dots which are evident on the track denote key
positions of the storm, the outer edge of the continental slope, the outer
edge of the continental shelf, and the location at landfall.

Jackson State University 450
The first snap shot, Figure 14-53, shows Storm 01, the slowest moving
storm of the three, when its eye is positioned at the outer edge of the
continental slope. This position is denoted by the most offshore dark dot
that is identifiable on the storm track. The location of the hurricane eye is
readily identified by the circular dome of water, the region of raised water
surface elevation, which is located directly beneath the eye and centered
on the most offshore dot. The dome of water under the eye is due to
atmospheric pressure gradients that force water from the periphery of the
storm (regions of higher atmospheric pressure) toward the center (the
region of lowest atmospheric pressure).
The wind-driven forerunner along the Louisiana and north Texas shelves
is quite evident by the lighter blue color contour in this region. Water
surface elevations are between 1.5 and 2.0 ft NAVD88 in this region. Even
along the south Texas shelf there is evidence of the wind-driven
forerunner, i.e., the region having water surface elevations between 1 and
1.5 ft that follows the shelf. The presence of the wind-driven forerunner
surge this far south along the Texas coast is consistent with results from
the volume mode forerunner analysis for this same slow-moving storm,
that were presented earlier in this chapter. Slow moving severe hurricanes
that approach from the southeast appear to be quite effective in generating
a significant wind-driven forerunner along the entire Texas coast.
Figure 14-53. Water surface elevation map to depict the wind-driven forerunner surge on
the Louisiana-Texas shelf for Central Yucatan Storm 01, when the hurricane eye is
positioned at the outer edge of the continental slope.
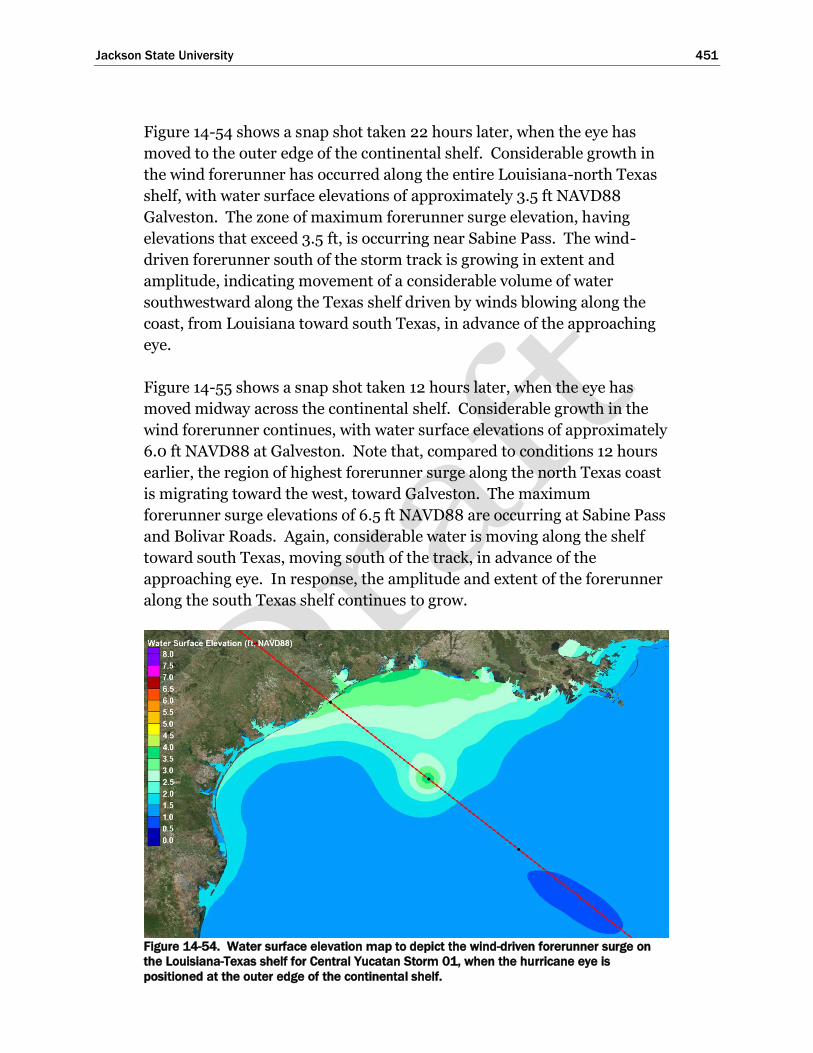
Jackson State University 451
Figure 14-54 shows a snap shot taken 22 hours later, when the eye has
moved to the outer edge of the continental shelf. Considerable growth in
the wind forerunner has occurred along the entire Louisiana-north Texas
shelf, with water surface elevations of approximately 3.5 ft NAVD88
Galveston. The zone of maximum forerunner surge elevation, having
elevations that exceed 3.5 ft, is occurring near Sabine Pass. The wind-
driven forerunner south of the storm track is growing in extent and
amplitude, indicating movement of a considerable volume of water
southwestward along the Texas shelf driven by winds blowing along the
coast, from Louisiana toward south Texas, in advance of the approaching
eye.
Figure 14-55 shows a snap shot taken 12 hours later, when the eye has
moved midway across the continental shelf. Considerable growth in the
wind forerunner continues, with water surface elevations of approximately
6.0 ft NAVD88 at Galveston. Note that, compared to conditions 12 hours
earlier, the region of highest forerunner surge along the north Texas coast
is migrating toward the west, toward Galveston. The maximum
forerunner surge elevations of 6.5 ft NAVD88 are occurring at Sabine Pass
and Bolivar Roads. Again, considerable water is moving along the shelf
toward south Texas, moving south of the track, in advance of the
approaching eye. In response, the amplitude and extent of the forerunner
along the south Texas shelf continues to grow.
Figure 14-54. Water surface elevation map to depict the wind-driven forerunner surge on
the Louisiana-Texas shelf for Central Yucatan Storm 01, when the hurricane eye is
positioned at the outer edge of the continental shelf.
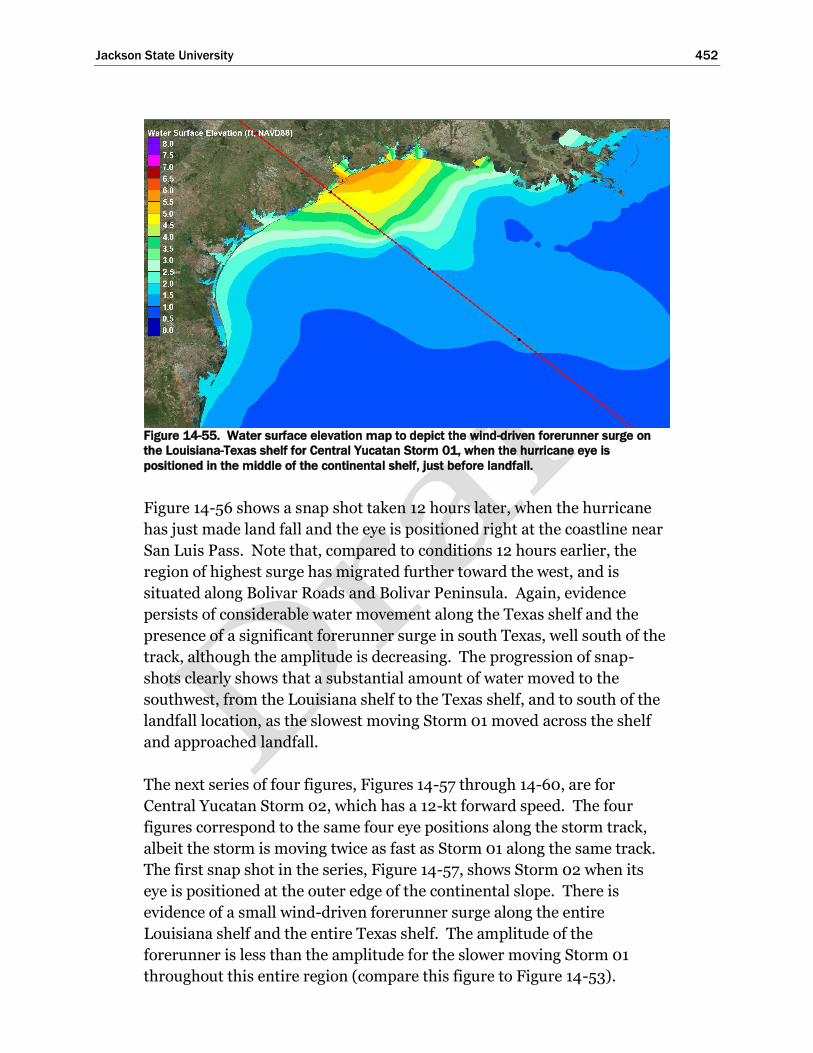
Jackson State University 452
Figure 14-55. Water surface elevation map to depict the wind-driven forerunner surge on
the Louisiana-Texas shelf for Central Yucatan Storm 01, when the hurricane eye is
positioned in the middle of the continental shelf, just before landfall.
Figure 14-56 shows a snap shot taken 12 hours later, when the hurricane
has just made land fall and the eye is positioned right at the coastline near
San Luis Pass. Note that, compared to conditions 12 hours earlier, the
region of highest surge has migrated further toward the west, and is
situated along Bolivar Roads and Bolivar Peninsula. Again, evidence
persists of considerable water movement along the Texas shelf and the
presence of a significant forerunner surge in south Texas, well south of the
track, although the amplitude is decreasing. The progression of snap-
shots clearly shows that a substantial amount of water moved to the
southwest, from the Louisiana shelf to the Texas shelf, and to south of the
landfall location, as the slowest moving Storm 01 moved across the shelf
and approached landfall.
The next series of four figures, Figures 14-57 through 14-60, are for
Central Yucatan Storm 02, which has a 12-kt forward speed. The four
figures correspond to the same four eye positions along the storm track,
albeit the storm is moving twice as fast as Storm 01 along the same track.
The first snap shot in the series, Figure 14-57, shows Storm 02 when its
eye is positioned at the outer edge of the continental slope. There is
evidence of a small wind-driven forerunner surge along the entire
Louisiana shelf and the entire Texas shelf. The amplitude of the
forerunner is less than the amplitude for the slower moving Storm 01
throughout this entire region (compare this figure to Figure 14-53).
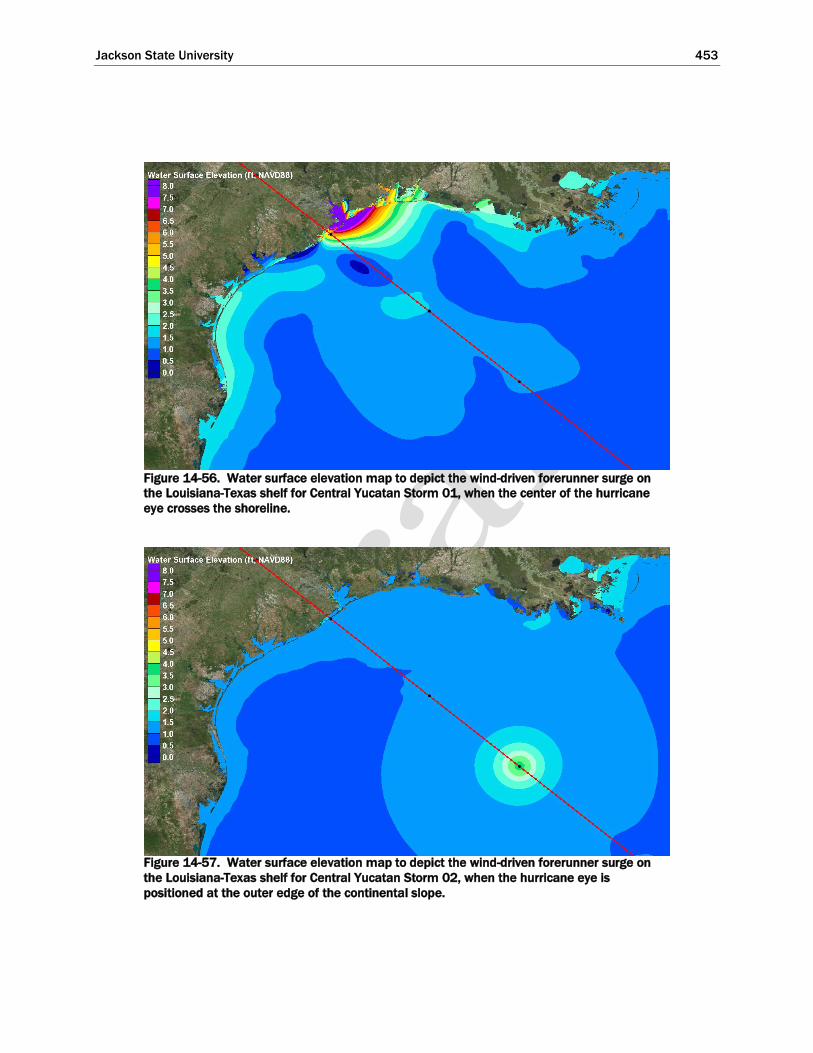
Jackson State University 453
Figure 14-56. Water surface elevation map to depict the wind-driven forerunner surge on
the Louisiana-Texas shelf for Central Yucatan Storm 01, when the center of the hurricane
eye crosses the shoreline.
Figure 14-57. Water surface elevation map to depict the wind-driven forerunner surge on
the Louisiana-Texas shelf for Central Yucatan Storm 02, when the hurricane eye is
positioned at the outer edge of the continental slope.
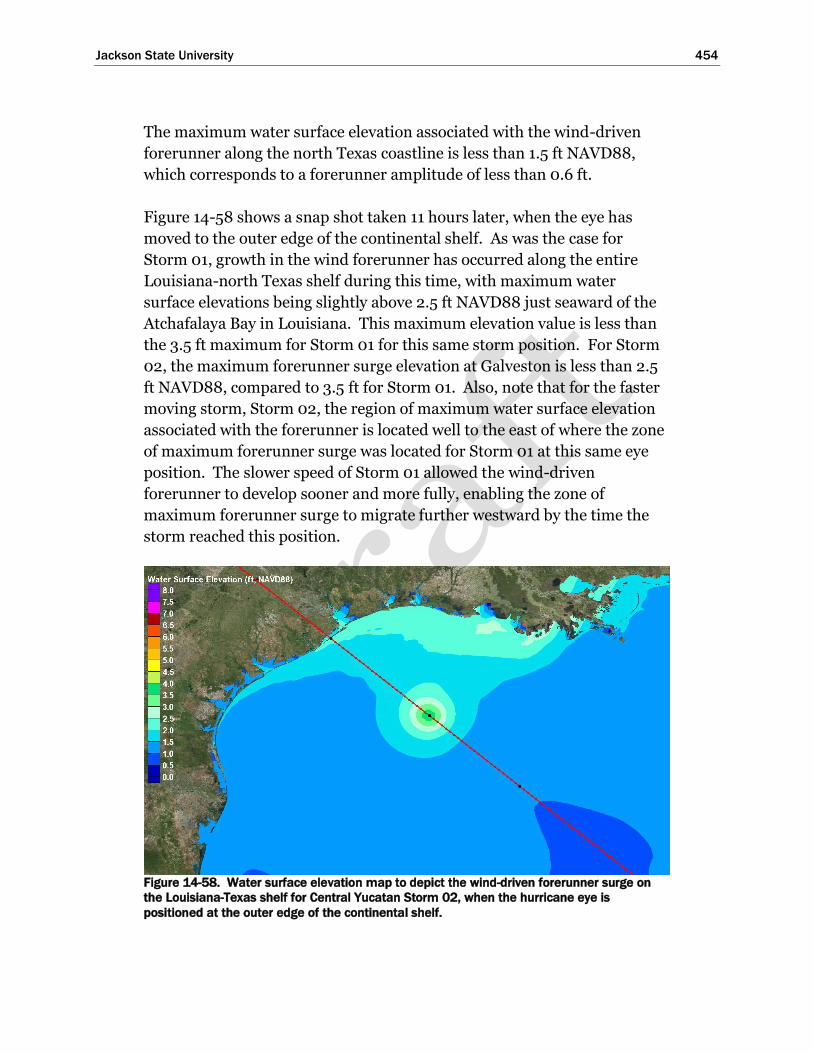
Jackson State University 454
The maximum water surface elevation associated with the wind-driven
forerunner along the north Texas coastline is less than 1.5 ft NAVD88,
which corresponds to a forerunner amplitude of less than 0.6 ft.
Figure 14-58 shows a snap shot taken 11 hours later, when the eye has
moved to the outer edge of the continental shelf. As was the case for
Storm 01, growth in the wind forerunner has occurred along the entire
Louisiana-north Texas shelf during this time, with maximum water
surface elevations being slightly above 2.5 ft NAVD88 just seaward of the
Atchafalaya Bay in Louisiana. This maximum elevation value is less than
the 3.5 ft maximum for Storm 01 for this same storm position. For Storm
02, the maximum forerunner surge elevation at Galveston is less than 2.5
ft NAVD88, compared to 3.5 ft for Storm 01. Also, note that for the faster
moving storm, Storm 02, the region of maximum water surface elevation
associated with the forerunner is located well to the east of where the zone
of maximum forerunner surge was located for Storm 01 at this same eye
position. The slower speed of Storm 01 allowed the wind-driven
forerunner to develop sooner and more fully, enabling the zone of
maximum forerunner surge to migrate further westward by the time the
storm reached this position.
Figure 14-58. Water surface elevation map to depict the wind-driven forerunner surge on
the Louisiana-Texas shelf for Central Yucatan Storm 02, when the hurricane eye is
positioned at the outer edge of the continental shelf.
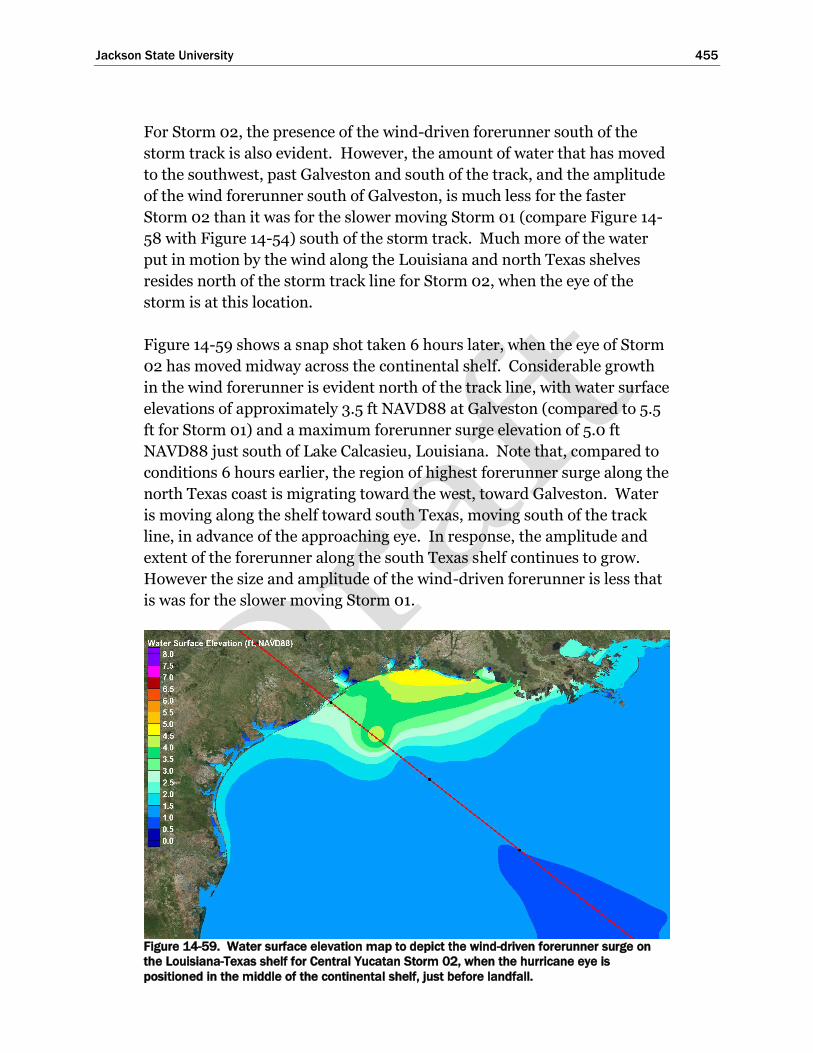
Jackson State University 455
For Storm 02, the presence of the wind-driven forerunner south of the
storm track is also evident. However, the amount of water that has moved
to the southwest, past Galveston and south of the track, and the amplitude
of the wind forerunner south of Galveston, is much less for the faster
Storm 02 than it was for the slower moving Storm 01 (compare Figure 14-
58 with Figure 14-54) south of the storm track. Much more of the water
put in motion by the wind along the Louisiana and north Texas shelves
resides north of the storm track line for Storm 02, when the eye of the
storm is at this location.
Figure 14-59 shows a snap shot taken 6 hours later, when the eye of Storm
02 has moved midway across the continental shelf. Considerable growth
in the wind forerunner is evident north of the track line, with water surface
elevations of approximately 3.5 ft NAVD88 at Galveston (compared to 5.5
ft for Storm 01) and a maximum forerunner surge elevation of 5.0 ft
NAVD88 just south of Lake Calcasieu, Louisiana. Note that, compared to
conditions 6 hours earlier, the region of highest forerunner surge along the
north Texas coast is migrating toward the west, toward Galveston. Water
is moving along the shelf toward south Texas, moving south of the track
line, in advance of the approaching eye. In response, the amplitude and
extent of the forerunner along the south Texas shelf continues to grow.
However the size and amplitude of the wind-driven forerunner is less that
is was for the slower moving Storm 01.
Figure 14-59. Water surface elevation map to depict the wind-driven forerunner surge on
the Louisiana-Texas shelf for Central Yucatan Storm 02, when the hurricane eye is
positioned in the middle of the continental shelf, just before landfall.

Jackson State University 456
Figure 14-60 shows a snap shot taken 6 hours later, the time of landfall.
Compared to conditions 6 hours earlier, the region of highest surge has
translated further toward the west, and is situated along the Bolivar Roads
and Bolivar Peninsula area. Again, evidence persists of water movement
in the southwest direction along the Texas shelf and the presence of a
forerunner surge along the south Texas shelf, although the amplitude is
decreasing. The progression of snap-shots shows some movement of
water to the southwest, moving from the Louisiana shelf to the Texas shelf
and to south of the track line, as was seen for the slower Storm 01;
however much less southwesterly movement occurred for Storm 02.
Interestingly, for Storm 02, even though the forerunner surge amplitude
was generally smaller than for Storm 01, along the open coast the surge
elevation is higher in the maximum surge zone north of the track line, and
the extent of the highest surge zone is greater for Storm 02, compared to
Storm 01 (compare Figures 14-56 and 14-60). Apparently, the timing of
the westward alongshore migration of the maximum surge forerunner
zone and the arrival of the hurricane eye and its core winds is somewhat
synchronous for the faster 12-kt Storm 02, producing slightly larger open
coast surge elevations at the time of landfall (11.6 ft NAVD88) compared to
those for Storm 01 (9.2 ft NAVD88). For the slower moving Storm 01, a
substantial forerunner surge propagated westward and then to the
southwest, past the Galveston Bay region, and well in advance of the
Figure 14-60. Water surface elevation map to depict the wind-driven forerunner surge on
the Louisiana-Texas shelf for Central Yucatan Storm 02, when the center of the hurricane
eye crosses the shoreline.

Jackson State University 457
arriving hurricane core winds, apparently slightly lessening the peak surge
elevation that occurred at the time of landfall for Storm 01.
The last series of four figures, Figures 14-61 through 14-64, are for Central
Yucatan Storm 03, the fastest moving of the three storms, which has an
18-kt forward speed. The four figures correspond to the same four eye
positions along the storm track. Note that Storm 03 moves three times as
fast as Storm 01, and 50% faster than Storm 02, along the same track.
The first snap shot, Figure 14-61, shows Storm 03 when its eye is
positioned at the outer edge of the continental slope. The water surface
elevations in the Houston-Galveston region for this storm are quite similar
to those observed for Storm 02. The maximum water surface elevation
associated with the wind-driven forerunner along the north Texas
coastline is less than 1.5 ft NAVD88. At Galveston Pleasure Pier, the water
surface elevation is 1.4 ft NAVD88, which corresponds to a forerunner
amplitude of 0.5 ft.
Figure 14-61. Water surface elevation map to depict the wind-driven forerunner surge on
the Louisiana-Texas shelf for Central Yucatan Storm 03, when the hurricane eye is
positioned at the outer edge of the continental slope.

Jackson State University 458
Figure 14-62 shows a snap shot taken 8 hours later, when the hurricane’s
eye has moved to the outer edge of the continental shelf. Unlike the other
two slower-moving storms, no significant forerunner is evident along the
westernmost Louisiana coast. The highest forerunner surge, where water
surface elevations are 2.5 ft NAVD88, is developing along the Louisiana
coast but much further to the east, east of the Atchafalaya Bay in the
vicinity of the Mississippi River Bird’s Foot delta. Also there is some
evidence of a slowly growing, but still a very small, forerunner surge along
the Texas coast near Galveston Island. At Galveston Pleasure Pier, the
water surface elevation is 1.5 ft NAVD88, slightly higher than 8 hours
earlier, and much less than forerunner surge at the same location for
Storms 01 and 02, 3.6 ft and 2.3 ft, respectively, for the same eye position.
Compared to Storms 01 and 02, the development of the forerunner surge
for this fast-moving storm is occurring much later and it is much less
developed in terms of its amplitude.
Figure 14-63 shows a snap shot taken 3 hours later, when the eye of Storm
03 has moved midway across the continental shelf. Growth in the wind-
driven forerunner surge is evident further to the east along the Louisiana
coast, with water surface elevations reaching between 3 and 3.5 ft
NAVD88. There is still no appreciable forerunner surge at Galveston
Pleasure Pier, where the water surface elevation remains nearly constant
Figure 14-62. Water surface elevation map to depict the wind-driven forerunner surge on
the Louisiana-Texas shelf for Central Yucatan Storm 03, when the hurricane eye is
positioned at the outer edge of the continental shelf.
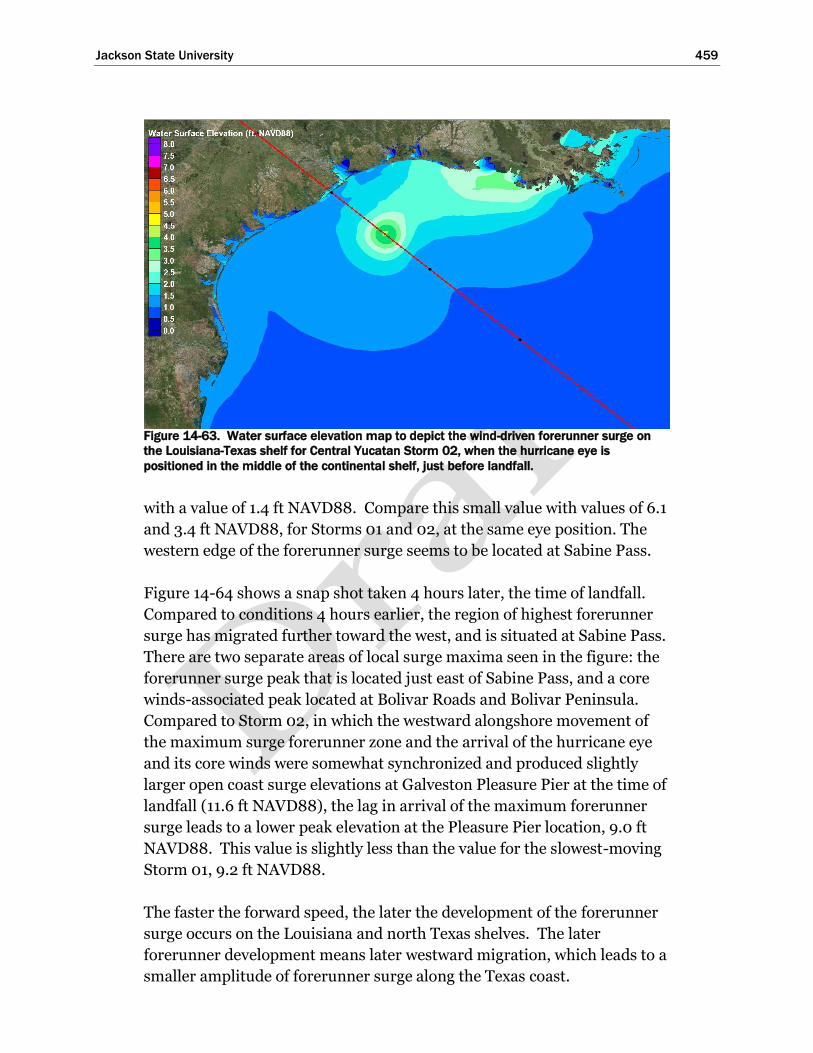
Jackson State University 459
Figure 14-63. Water surface elevation map to depict the wind-driven forerunner surge on
the Louisiana-Texas shelf for Central Yucatan Storm 02, when the hurricane eye is
positioned in the middle of the continental shelf, just before landfall.
with a value of 1.4 ft NAVD88. Compare this small value with values of 6.1
and 3.4 ft NAVD88, for Storms 01 and 02, at the same eye position. The
western edge of the forerunner surge seems to be located at Sabine Pass.
Figure 14-64 shows a snap shot taken 4 hours later, the time of landfall.
Compared to conditions 4 hours earlier, the region of highest forerunner
surge has migrated further toward the west, and is situated at Sabine Pass.
There are two separate areas of local surge maxima seen in the figure: the
forerunner surge peak that is located just east of Sabine Pass, and a core
winds-associated peak located at Bolivar Roads and Bolivar Peninsula.
Compared to Storm 02, in which the westward alongshore movement of
the maximum surge forerunner zone and the arrival of the hurricane eye
and its core winds were somewhat synchronized and produced slightly
larger open coast surge elevations at Galveston Pleasure Pier at the time of
landfall (11.6 ft NAVD88), the lag in arrival of the maximum forerunner
surge leads to a lower peak elevation at the Pleasure Pier location, 9.0 ft
NAVD88. This value is slightly less than the value for the slowest-moving
Storm 01, 9.2 ft NAVD88.
The faster the forward speed, the later the development of the forerunner
surge occurs on the Louisiana and north Texas shelves. The later
forerunner development means later westward migration, which leads to a
smaller amplitude of forerunner surge along the Texas coast.

Jackson State University 460
Figure 14-64. Water surface elevation map to depict the wind-driven forerunner surge on
the Louisiana-Texas shelf for Central Yucatan Storm 03, when the center of the hurricane
eye crosses the shoreline.
The forward speed of 12 knots (Storm 02) seems to enhance the storm
surge at Galveston, due to apparent convergence of the development and
westward migration of the wind-driven forerunner along the Louisiana
and north Texas shelves and the arrival of high surge zone that is
associated with the arrival of the hurricane’s core winds on the inner shelf.
This convergence leads to much more water on the inner shelf and higher
peak surge levels at the shoreline. For the slowest moving storm (6-kt
forward speed, Storm 01), the development of the forerunner surge and its
westward migration occurred much sooner and much of the forerunner
surge propagated south of the Houston-Galveston region before the core
winds arrived at the inner shelf, slightly lessening the peak surge at
Galveston. For the fastest moving storm (18-kt forward speed, Storm 03),
the surge forerunner was latest in development and westward migration,
and the peak forerunner surge arrived later than the high surge zone
associated with the core winds. This lag in time between the two surge
features also lessened the peak surge at Galveston, compared to the 12-kt
storm, Storm 02.
Summary
Early closure of the storm surge gates at both San Luis and Bolivar Roads
Passes is a critical operational feature of the Ike Dike concept. The amount
of water within Galveston and West Bays at the time of gate closure

Jackson State University 461
influences the peak surge elevation that will be generated by local
hurricane force winds that still act on the bays after the gates are closed.
A higher antecedent water level in the bays leads to a higher peak surge
within the bays, and thus a greater residual flood risk The following
contributors influence the antecedent water level: long-term and seasonal
and long-term mean sea level, astronomical tide, wind-driven surge
forerunner, and volume mode forerunner.
The long-term relative mean sea level has been slowly rising in the
Houston-Galveston region. There are seasonal changes in mean sea level
that occur in the Gulf of Mexico. Late summer hurricanes (in September
and October) are expected to be accompanied by seasonal mean sea levels
that are 0.4 to 0.5 ft higher, on average, than the long-term mean sea level.
The actual sea level at the time a hurricane occurs can be even higher than
the monthly mean values. Such was the case in September 2016 when
seasonal sea levels were unusually high, approximately 1 ft above the long-
term mean sea level. Hurricanes that occur earlier the season (June, July
and August) will most likely be accompanied by a seasonal mean sea level
is not significantly different from long-term mean. The seasonal sea level
will be the same inside the bay as outside, unless local precipitation raises
levels significantly inside the bays.
The astronomical tide, which produces oscillatory changes in water level,
can lessen the impacts of higher antecedent water levels caused by the
seasonal mean sea level and the wind-driven forerunner. This can be
achieved by closing the surge gates at a time of low tide. The time of
occurrence of the hurricane within the 14-day spring-neap tidal cycle, and
the tide range at that time, influences the potential benefits of closing the
gates at low tide. At spring tide conditions, when the tide range is greatest
(2.5 to 3 ft), unusually low tides that occur every 24 hours provide an
opportunity to significantly lessen the residual flood risk inside the bays.
At neap tide, when the tide range is smallest (0.5 to 1.5 ft), low tides are
not as low and there is less opportunity to offset the elevated water levels
associated with mean sea level and the wind-driven forerunner. During
neap tide conditions, lows are experienced every 12 hours, which might be
a small benefit in deciding when to close gates.
Generation of the wind-driven forerunner can begin once the eye of a
hurricane enters the Gulf. The forerunner is forced by winds that blow
along the continental shelf regions of the northern Gulf, pushing water

Jackson State University 462
along the shelf, which is then turned to the “right” and stacked against the
shoreline by the Coriolis force, an Ekman set-up. The wind-driven
forerunner is manifested as a persistent steady rise in water level at the
coast; and, the rate of rise accelerates as the hurricane gets closer to the
continental slope and shelf off the Texas coast. The magnitude of the wind
forerunner is dependent upon the storm’s size, intensity and forward
speed. The more intense and larger the hurricane, the greater the rate of
water level rise during the forerunner build-up. Slower moving storms
have the potential to produce a greater forerunner surge than faster
moving storms.
The wind-driven forerunner can cause an increase in water level at
Galveston of as much as several feet, one or two days before landfall.
Importantly, the wind-driven forerunner that is generated at the coast
readily propagates through the passes and open storm surge gates into the
bays, with little or no attenuation. Therefore, wind-driven forerunner
surge directly increases residual flood risk inside the bays.
The development of the wind-driven forerunner amplitude both on the
open coast and inside the bays is highly sensitive to forward speed for
hurricanes that approach from the southeast. In general, the slower the
forward speed the greater the wind-driven forerunner amplitude at
Galveston and the greater accumulation of water inside the bays at the
time of landfall. Because little to no attenuation of the forerunner
amplitude occurs as it propagates from the open coast through the passes
and into the bays, propagation of the forerunner into the bays exerts a
major influence on peak surge levels inside the bay caused by high in-bay
winds moving the water around within the bay. For example, for a severe
930-mb hurricane, without any surge gates in place, a threefold decrease
in forward speed, from 18 kt to 6 kt, led to a two fold increase in peak
surge in the upper reaches of the Houston Ship Channel (from 10 to 20 ft).
A critical aspect of the Ike Dike surge barrier operation will be
minimization of the surge forerunner within the Bay through early gate
closure. Early gate closure will be particularly crucial for slow-moving
storms. Peak surge at the open coast is much less sensitive to forward
speed.

Jackson State University 463
The wind-driven forerunner is much more important than the volume
mode forerunner, which can be excited when a severe hurricane enters the
Gulf. The amplitude of the volume mode forerunner is only a few tenths of
a foot for even the largest and most intense hurricanes.
The volume mode forerunner is oscillatory by nature, with a rather
predictable period of 32 to 36 hours. As with the astronomical tide, the
predictability of its period provides some potential for exploitation in
terms of timing gate closure. The amplitude of the volume-mode
forerunner is relatively small, so the benefits of exploiting this mode of
forerunner are limited.
Hurricane Ike serves as a useful example for examining these different
physical processes that influence the antecedent water level, and how they
might influence timing of gate closure. The figure below is a reproduction
of Figure 14-12b, which was presented earlier in the chapter. The figure
shows the measured water surface elevation during Ike at Galveston Pier
21 (in green), which lies inside they bay at the Port of Galveston, along
with the predicted astronomical tide (in blue). Water surface elevation is
displayed in feet, relative to mean sea level (MSL), which is the long term
mean sea level for the gage site. Ike’s landfall occurred at around hour
0700 GMT on September 13, shown by the red vertical line in the figure.
The initial offset in elevation between the green and blue curves at hour
00:00 on September 10, more than 3 days before landfall, reflects about
0.5 ft of seasonal mean sea level increase above the long-term mean sea
level and possibly a small contribution due to the wind-driven forerunner
Figure 14-12b. Measured water surface elevation during Hurricane Ike, at the Galveston
Pier 21 gaging station.

Jackson State University 464
surge while the hurricane was beginning to transit the Gulf. Ike entered
the Gulf a few hours before 00:00 on September 10. During the
subsequent two days, September 10 and 11, an overall trend for increasing
water level due to the wind-driven forerunner is evident, at an accelerating
rate of rise, as are oscillations due to the astronomical tide.
Assuming a time of gate closure that is 12 hours before landfall, i.e., at
hour 19:00 on September 12, an antecedent water level of between 6 and 7
ft would likely be present inside Galveston Bay at the time of closure. This
very high antecedent level would considerably increase flood risk inside
the bay, by unacceptable levels, even with the Ike Dike in place. Closing
the gates at the time of low tide which occurred at around hour 03:00 on
September 12 (28 hours before landfall) would have resulted in a much
lower antecedent water level in the bay, approximately 1.0 to 1.5 ft, which
would reduce the residual flood risk inside the bays, compared to the later
closure time. Closing the gates even earlier, at the preceding low tide,
which occurred at around hour 02:00 on September 11 (53 hours before
landfall), while the hurricane was in the Gulf but well seaward of the Texas
coast, the antecedent water level inside the bays would have been lower
still, approximately equal to the long-term mean sea level value with little
to no effect of the seasonal mean and wind-driven forerunner.
Very early closure of the surge gates prevents any precipitation run-off
into the bays from leaving the bays, so this might also be an operational
issue that needs to be considered as well.
A reliable hurricane surge forecasting model that accurately does the
following: simulates the tide and forerunner surge, treats the influence of
the surge gate infrastructure on long wave propagation into the bays while
the gates are in the open position, treats closure of the gates during the
storm’s approach, and treats flow of water over closed gates, would be a
very useful predictive tool. The tool could be applied to provide guidance
for decision-making concerning the optimal time for closure of the surge
gates. Inclusion of rainfall during the approaching storm into the model
simulation, and subsequent simulation of water run-off into the bays could
improve such a forecast capability.

Jackson State University 465
15 Nearshore Wave and Water
Level Conditions to Consider in
Design of the Ike Dike
Introduction
Design of the land barrier and navigational/environmental sections of the
gate systems, both of which will be constructed as part of the Ike Dike
concept, will require nearshore wave information. Components of the dike
might include some of the following: I-walls, T-walls, dike/levee sections,
sand dunes and/or beach nourishment, overtopping and scour protection,
a retractable gate at the passes, and perhaps another type of structural
barrier to serve as the “environmental section” of the gate system at each
of the passes. Wave forces on structures, and wave run-up, overtopping,
and overflow, are all dictated by the local wave height, period and water
depth conditions, among other parameters.
All components will need to be resilient to overflow and overtopping,
which means they will experience minimal damage and no loss of
functionality in the event the hydraulic design conditions are exceeded and
the Ike Dike is overtopped. There is always some risk of this happening.
Therefore, it is informative to examine the characteristics of extreme
nearshore waves and water levels that the Ike Dike might be subjected to.
In this chapter, significant wave height, peak and mean wave period, and
water surface elevation from the simulation of Storm 036, the 500-yr
proxy storm, are presented with the extended dike in place.
Wave and water level conditions are presented for the four locations
shown in Figure 15-1. The geographical location and the sea bed elevation
at each location (from the model grid mesh) are shown in Table 15-1.
Conditions at these four locations are believed to be reasonably
representative of conditions that would be experienced along the length of
the proposed Ike Dike for a very intense hurricane like Storm 036. Three
of the locations, central Galveston Island, Galveston Pleasure Pier and
central Bolivar Peninsula, reflect open-coast, shallow-water locations. The
fourth location, Bolivar Roads, was selected to illustrate the wave
conditions at the approximate location of the proposed gate system at this

Jackson State University 466
pass. The Bolivar Roads location is situated within the inlet throat and is
more sheltered than the three open coast sites.
Figure 15-1. Water level and wave model output locations for Storm 036, the 500-yr proxy
storm.
Table 15-1. Water level and wave condition output locations for Storm
036, the 500-yr proxy storm.
Latitude (deg N) Longitude (deg W)
Bottom Elevation (ft, NAVD88)
Bolivar Roads 29.34424 94.74177 -47.9
Galveston Pleasure Pier 29.2853 94.7878 -8.5
Central Bolivar Peninsula 29.4646 94.5936 -8.5
Central Galveston Island 29.1906 94.947 -8.5
Incident hurricane waves that are generated in deeper water undergo a
series of complex transformations before reaching the site of the proposed
retractable gate at Bolivar Roads. To reach this location, waves must first
propagate over and be refracted by the irregular bathymetry of the ebb
tidal shoals at the Bolivar Roads entrance. Then the waves must
propagate over the pair of long jetties that stabilize the entrance channel.
Both jetties will be submerged for most of the storm duration. Incoming
waves will be “tripped” by the jetties and break due to the shallow water
depth over the jetty crests, thereby limiting the amount of energy
Jackson State University 467
contained in the waves as they penetrate into the throat. Then the
incoming waves will be refracted, diffracted and broken by the complex
bathymetry within the throat of the pass. Generally, waves at the location
of the Bolivar Roads gate will be less energetic than the waves offshore.
The following hydraulic design parameters are shown below in a series of
four figures, one figure for each parameter: a) water surface elevation
relative to the NAVD88 vertical datum (the same datum listed for the
bottom elevations in Table 15-1, which can be used together to compute
the total water depth); b) energy-based significant wave height, c) peak
spectral wave period, and d) mean spectral wave period. Figure 15-2
shows the water surface elevation as a function of time throughout the
peak of the storm. Results are shown for times beginning 23 hours prior
to landfall and ending 23 hours after landfall. Figures 15-3, 15-4, and 15-5
show the significant wave height, peak wave period, and mean wave
period, each as a function of time for the same period of time. Each figure
shows results at all four of the locations listed in Table 13-1.
Water Surface Elevation
Twenty-three hours prior to landfall, the eye of the hurricane is still in the
deep water portions of the Gulf of Mexico, well seaward of the edge of the
continental shelf. At this point in time, the water surface elevation at all
four locations is nearly the same, slightly less than 3 ft NAVD88. This
water level reflects an increase of about 2 ft compared to the ambient sea
level of 0.9 ft that was adopted for the storm simulations. This 2-ft
increase is due to the wind-driven hurricane surge forerunner that
develops on the continental shelf, the dynamics of which were discussed in
Chapters 5 and 6. The rise in water surface associated with forerunner
development is increasing at a rate of about 0.16 ft/hr, before the eye of
the hurricane reaches the edge of the continental shelf.
The eye of the hurricane crosses the edge of the shelf 10 hrs before
landfall. At this time the forerunner amplitude reaches an elevation
slightly greater than 5 ft. Once the eye crosses the edge of the continental
shelf and hurricane-strength winds begin to blow over the shallow shelf,
the rate of water level rise begins to accelerate until the time of landfall,
reaching several feet of rise per hour.

Jackson State University 468
Figure 15-2. Temporal variation of water surface elevation for Storm 036, the 500-yr proxy
storm.
At landfall, the storm surge at Bolivar Roads, Galveston Pleasure Pier, and
the center of Bolivar Peninsula reaches its peak value of between 20 and
22 ft NAVD88. The peak surge at the center of Galveston Island is a little
less, 18.5 ft, and it occurs about 1 hour prior to landfall. The onshore-
directed winds at landfall are slightly stronger at the three locations with
the higher peak surge. At the time of peak storm surge, the water depth at
the three open coast locations is about 27 to 30 ft. After landfall as the eye
moves inland, the water level falls rather rapidly at all four locations. The
rate of water level decrease is quite similar to the rate at which water levels
increased prior to landfall.
Significant Wave Height
The temporal evolution of the energy-based significant wave height, shown
in Figure 15-3, is quite similar to that of the water surface elevation: a slow
rate of increase initially, until the eye crosses the edge of the shelf, then a
much faster rate of increase as the eye moves across the shelf and makes
landfall. Both the growth of waves and the increase in storm surge levels
are dominantly forced by the wind. The rate of decrease in wave height
following landfall also is similar to the rate of rise prior to landfall, as is the
case for the water level.

Jackson State University 469
Figure 15-3. Temporal variation of significant wave height for Storm 036, the 500-yr proxy
storm.
For the three open coast locations, the maximum energy-based significant
wave height is approximately 16 ft at Galveston Pleasure Pier and Central
Bolivar Peninsula, and 15 ft at Central Galveston Island. The maximum
wave height value is approximately 55% (roughly half) of the water depth
at the time of peak surge (29 ft for Galveston Pleasure Pie and Central
Bolivar Peninsula, and 27 ft at Central Galveston Island) at all three open-
coast sites, suggesting that the energy level contained in the waves is
saturated due to wave breaking; i.e., wave height is limited by wave
breaking to be a percentage of the local water depth.
The maximum significant wave height in the throat of Bolivar Roads,
slightly less than 10 ft, is less than the wave height at the open coast
locations, 15 to 16 ft. This lower maximum wave height is consistent with
the wave transformation dynamics described earlier. It also suggests that
significant wave height at this location might be strongly controlled by the
depth of water over the jetties and not the local water depth (which is
approximately 70 ft at the time of peak surge). Assuming an elevation of 4
ft NAVD88 for the crest of the jetties, and a maximum water surface
elevation of 21.5 ft NAVD88, the water depth over the jetties is about 17.5
ft. Therefore, a 10-ft maximum wave height reflects 57% of the water
Jackson State University 470
depth. This percentage also suggests a depth-limited, saturated wave-
energy condition in the throat of Bolivar Roads, limited by the water depth
over the submerged jetties at the peak of the storm.
Looking at two other times near the peak of the storm, one that is 2 hours
before landfall (wave height of 7 ft and water depth over the jetties of 13.5
ft) and another 2 hours after landfall (wave height of 7.5 ft and water depth
over the jetties of 14 ft), the ratios of significant wave height to water depth
at these two times are 0.52 and 0.54, respectively (percentages of 52% and
54%). The ratios of wave height to water depth over the jetties for these
two other times near landfall also suggest a controlling influence of the
submerged jetties on wave conditions at the site of the proposed gate in
Bolivar Roads, near the peak of the storm.
Peak Wave Period
The temporal evolution of the peak wave period is shown in Figure 15-4.
Peak wave period is the period (inverse of the frequency) associated with
the most energetic band in the calculated tw0-dimensional (frequency-
direction) energy spectrum.
Prior to the hurricane eye reaching the edge of the continental shelf at
hour 10 before landfall, wave conditions at the three open-coast sites are
dominated by long-period (16-sec) 6- to 8-ft swell waves that were
generated offshore and arrive well before the hurricane’s core winds. The
peak wave period at the more sheltered Bolivar Roads site is dominated by
locally-generated short-period (4 to 5 sec) 1 to 3-ft wind seas. The energy
associated with the longer-period swell waves that are generated well
offshore is much less effective in penetrating past the complex ebb shoal
bathymetry and jetty systems compared to the shorter period wind seas,
which are primarily locally generated.
As the hurricane eye crosses the edge of the continental shelf and locally
generated waves associated with the core winds begin to dominate, the
peak period at the open-coast sites begins to down-shift. At landfall, peak
periods are approximately 12 sec at the three open-coast sites. The peak
period at Bolivar Roads increases to 12 sec, as the elevated storm surge
levels allow longer-period waves generated on the shelf to penetrate into
the inlet throat. Peak wave periods at storm landfall are between 12 and 13
sec.

Jackson State University 471
Following landfall the peak periods continue to downshift to periods
approaching 8 sec at the open-coast sites 3 to 6 sec in the inlet throat once
surge levels have subsided.
Figure 15-4. Temporal variation of peak wave period for Storm 036, the 500-yr proxy storm.
Mean Wave Period
The temporal evolution of the mean wave period is shown in Figure 15-5.
Mean wave period is computed as an energy-weighted average for the
entire two-dimensional energy spectrum. Generally, mean wave periods
are smaller than peak wave periods.
The general pattern of temporal variation for the mean period is similar to
that for the peak period. While the hurricane eye is offshore, well beyond
the shelf, open-coast mean wave periods are 14 to 15 sec. Mean wave
periods within the throat are 4.5 to 6 secs during this same period of time.
As the eye crosses the continental shelf break and continues toward
landfall, mean wave period also downshifts from 14 to 15 sec to values of
10 to 11 sec at landfall for the open coast sites. However, as was the case
for peak period, mean wave periods at the Bolivar Roads site increase from
5 sec to 8 to 9 sec during the same time span.

Jackson State University 472
Following landfall, mean wave periods at the open-coast sites continue to
steadily downshift from 10 to 11 sec to periods of approximately 7 sec.
Mean periods at the Bolívar Roads site steadily decrease from 9 sec to 5
sec as the surge levels subside. This pattern of decreasing mean wave
period after landfall is quite similar to the pattern seen for the peak period.
Figure 15-5. Temporal variation of mean wave period for Storm 036, the 500-yr proxy storm.

Jackson State University 473
16 Summary of Key Results,
Findings, and Recommendations
Regional Storm Surge Dynamics
Generation of the Open Coast Storm Surge
Hurricane storm surge along the north Texas coast is primarily influenced
by two contributors. One is the development of a wind-driven surge
forerunner, an Ekman wave, which is forced on the Louisiana-Texas
continental shelf. The forerunner is created by water moving along the
shelf that is forced by the hurricane’s peripheral winds. This alongshore
moving water is then directed onshore by the Coriolis force that is
associated with the earth’s rotation. The counterclockwise rotating wind
circulation about the hurricane’s eye creates winds directed to the west
along the Louisiana shelf and to the southwest along the Texas shelf as a
hurricane approaches the Houston-Galveston region from the southeast
and south-southeast, which are the most prevalent directions of approach.
The curvature of the counterclockwise circulating wind fields for these
storms matches well the curvature of the Louisiana/Texas continental
shelf, which enhances forerunner development for storms that take these
types of tracks.
Forerunner development begins while the storm is well offshore in the
deep waters of the Gulf. The forerunner is manifested as a slowly rising
water surface elevation at the coast which can propagate into West bay and
Galveston Bay through the passes. The increase in water surface elevation
associated with the forerunner can reach 6 ft, as was observed by Kennedy
et al (2011) during Hurricane Ike (2008).
The second contributor to the storm surge is the direct effect of the highest
winds in the core of the hurricane as it crosses the continental shelf. These
strong winds push the water that has accumulated on the shelf toward the
coast. The largest open coast surge computed for the 22 major hurricanes
simulated thus far (those having a very low central pressure of 900 mb)
was 18 to 19 ft at Galveston Pleasure Pier.
Surge Generation within Galveston Bay
Within Galveston Bay, storm surge is highly dependent upon filling that
occurs from several sources. The most significant source is surge
Jackson State University 474
propagation over Galveston Island and Bolivar Peninsula as these barrier
islands become inundated by the coastal surge. A second source is surge
propagation through Bolivar Roads and San Luis Pass, tidal passes which
connect the Gulf to the Bays. A third contributor is the local wind-set up
due to strong winds within the Bays themselves, which create a gradient or
tilt to the water surface inside the bay. The tilting action is in the
direction of the wind, i.e., higher water surface elevation on the downwind
side, lower water surface on the upwind side.
Within Galveston Bay the largest surge computed for the major hurricanes
simulated thus far was 18 to 20 ft on the bay side of Galveston, 18 to 20 ft
in the Texas City area, 19 ft in the Clear Lake area, 21 ft in the Bayport area
and 24 to 25 feet in the upper reaches of the Houston Ship Channel.
Influence of Storm Track on Surge Development
Three storms were selected to examine the influence of track on
development of the storm surge. Each storm had a different track and
landfall location, but they all had the same minimum central pressure,
forward speed and size (radius-to-maximum-winds). Tracks from the
south, south-southeast, and southeast were considered.
Far-field winds for the hurricane that approached from the south were
directed onshore during the forerunner development period. These
onshore winds were the primary contributor to formation of a significant
open-coast surge forerunner. Because the winds were directed onshore,
they were very effective in generating the forerunner surge. Movement of
water along both the wide Louisiana continental shelf and the narrower
north Texas shelf was a lesser contributor to the forerunner development
for this storm track.
For the storm that approached from the south-southeast, the alongshore
movement of water along the Louisiana and north Texas shelves was much
stronger. This movement of water is then turned to the right or toward
shore by the Coriolis force to raise the water level at the coast. This
process was the primary contributor to the significant forerunner that also
developed for this storm track.
For the storm that approached from the southeast, the alongshore
movement of water was the primary contributor to forerunner
development as well. However, as the storm approached the edge of the
shelf, the core winds were directed more offshore along the Louisiana

Jackson State University 475
coast. These offshore winds reduced the alongshore movement of water
from the Louisiana shelf toward the north Texas shelf, thereby reducing
the forerunner amplitude.
These same three storms were used to examine the influence of storm
track on surge development by the hurricane’s core winds. Core winds are
those nearest the eye, particularly on the right hand side of the storm
where the wind speeds are typically highest. Whereas the storm’s far field
winds dominate the forerunner development process, the storm’s core
winds begin to dominate surge development once the storm moves onto
the continental shelf. Each of the three storms had the same minimum
central pressure and radius-to-maximum-winds, but their tracks differed.
The storm from the south had a higher forward speed than the other two.
All three storms made landfall at a different location along Galveston
Island.
With storm parameters being the same, or nearly so, and for these
particular landfall locations for each storm, the hurricane that approached
from the south generated a maximum storm surge zone that first
developed at the City of Galveston. The zone then migrated northeast to
Bolivar Peninsula as the storm approached and made landfall. For the
other two storms which approached from the south-southeast and
southeast directions, storm surge built up from the east and northeast.
For both storms, maximum surge zones developed along Bolivar Peninsula
and persisted at that location through the time of landfall.
Peak surge along the open coast was greatest for the storm which
approached from the south-southeast. This storm developed a significant
forerunner as a result of considerable movement of water from the
Louisiana shelf to the north Texas shelf. This large accumulated volume of
water was then driven ashore by the core winds. Peak surge for the storm
from the south was less, since this storm did not have the same volume of
water moving along the Louisiana shelf and onto the north Texas shelf.
The storm from the southeast produced the least amount of open coast
surge. This occurred primarily because of the offshore directed winds
along the Louisiana coast as the storm moved onto the shelf, which
reduced the forerunner and drew down the surge before it increased with
arrival of the core winds at landfall. The significant role of offshore winds
did not occur for storms on either the south or south-southeast tracks.

Jackson State University 476
Within Galveston Bay, at landfall, all three storms produced maximum
surges at the southwest corner of the Bay, on the bay side of the City of
Galveston. This high surge at the southwest corner forced water from
Galveston Bay into West Bay, and prevailing winds set up the western side
of West Bay.
For all three storms wind directions shifted rapidly for the few hours after
landfall, first pushing water toward the western shoreline of Galveston Bay
and then toward the northern shoreline. After landfall, the storm from the
south transited through the center of Galveston Bay. This movement
created times of relatively lower wind speeds within the Bay, as the
hurricane’s eye was positioned over the Bay. Wind directions near the eye
changed very rapidly with passage of the eye. Coupled with the lower wind
speeds, the lack of a persistent wind direction resulted in no formation of a
substantial water surface elevation gradient within the bay as the storm
center moved through, which might have augmented filling of the Bay.
For all three storms, significant filling of Galveston and West Bays
occurred due to forerunner penetration through the passes and by flow
over the barrier islands. When the storm from the south did move away
from the Bay, winds from the west persisted and set up the east side of
Galveston and West Bays.
The eye of the storm that approached from the south-southeast direction
transited along the western side of Galveston Bay; and the eye for the
storm from the southeast passed well to the west of the Bay. For both
storms, once the eye moved away from the Bay, persistent winds from the
south formed a substantial water surface gradient within the Bay, which
was superimposed on the significant filling of the Bay. This substantial
south-to-north gradient was established by persistent winds from the
south, which pushed water into the northern parts of the system.
Dependence of Peak Surge on Hurricane Intensity
A “direct-hit” set of four storms was simulated, each having a different
central pressure (900 mb, 930 mb, 960 mb and 975 mb), but all followed
the same track. Each of them approached from the south-southeast, made
landfall at the City of Galveston, and subsequently moved inland along the
western shoreline of Galveston Bay. The range of open coast surge levels
in the maximum surge zone at Galveston, listed by storm having the
greatest to least intensity, were 13.5 to 16.5 ft, 11 ft to 15 ft, 7.5 to 10.5 ft,
and 7 to 8.5 ft, respectively. In the Texas City area, peak surges for the

Jackson State University 477
four storms were 11 to 15 ft, 11.5 to 12.5 ft, 8.5 to 11 ft, and 8 to 8.5 ft,
respectively. In the Clear Lake and Bayport areas, peak surges were 15 to
16.5 ft, 13 to 13.5 ft, 10 to 10.5 ft, and 8 to 8.5 ft, respectively, for the four
storms. In the upper reaches of the Houston Ship Channel, peak surges
were 19 to 20 ft, 15 ft, 12 to 12.5 ft, and 9 to 10 ft, respectively.
Results confirm that peak surge is strongly influenced by storm intensity;
i.e., the greater the intensity (i.e., the lower the central pressure) the
greater the peak surge. Central pressure is positively correlated with
maximum wind speed, wind speed is nonlinearly related to surface wind
stress, and wind stress is linearly related to water surface slope and storm
surge.
Within Galveston Bay, along the western shoreline, peak surges tended to
increase from the south to north, and then into the Houston Ship Channel
where surge levels tended to be the highest for each storm. The
counterclockwise wind circulation tended to force water into the upper
reaches of the Houston Ship Channel.
Dependence of Peak Surge on Storm Track
The 21 major hurricanes (those having a 900-mb central pressure) that
were originally simulated as part of the bracketing set of storms,
approached the Houston-Galveston region from one of three general
directions: from the south, the south-southeast and the southeast. All of
the storms in each directional grouping had a unique track and a different
landfall location; the tracks within each grouping were parallel with one
other. Tracks for each of the storms in the group, and thus landfall
locations, were separated by about 20 miles. For each of the three
different groupings, results suggest that hurricanes which make landfall in
the zone that extends from San Luis Pass to a location 20 miles west of the
pass will produce the greatest peak surges in the Houston-Galveston
region, assuming all other hurricane parameters are the same and they
only differ by track. Storms that made landfall at Bolivar Roads or to the
east of Bolivar Roads tended not to generate nearly as high peak surges
within the Bay. For these hurricanes, the farther the landfall positon was
from Bolivar Roads, the more peak surges in the Bay decreased
significantly.

Jackson State University 478
Putting Storm Surge in the Context of Probability
Prior to the eventual simulation of a much larger set of hypothetical
hurricanes, a small set of hurricanes was identified and selected to support
analysis of the Ike Dike concept (three proxy storms, which are described
below, and Hurricane Ike). To provide a basis for proxy storm selection
and to fully and accurately characterize the probability of extreme water
surface elevations for existing conditions, a full joint probability analysis
was conducted by the U.S. Army Engineer Research and Development
Center (ERDC) using joint probability methods. The analysis produced
water surface elevation statistics for a set of locations in the Houston-
Galveston region throughout the key corridor for potential economic
damage and losses that lies along the western side of Galveston Bay. The
approach used by the ERDC differs slightly, in some aspects, from the
approach used in the FEMA Region VI Risk MAP study of the Texas coast
(FEMA 2011). However, the FEMA (2011) storm surge archive was used as
the underlying peak storm surge data source for the statistical analysis.
Based on the ERDC analysis, Table 15-1 summarizes several extreme water
level statistics for the following key locations: the upper reaches of the
Houston Ship Channel, Morgan’s Point, the entrance to Clear Lake, the
east side of Texas City, bay side of the City of Galveston, and the Gulf side
of the City of Galveston. For each location, the mean, or expected value, of
water surface elevations corresponding to the 100-yr and 500-yr ARIs
(Average Recurrence Intervals) are shown. These ARI values correspond
to water levels having a 1% and 0.2% chance of occurring each and every
year, respectively. The water surface elevations listed in Table 16-1
account for the astronomical tide, wave contributions to the still water
level, and a number of sources of uncertainty arising from various sources.
Table 16-1. Water Surface Elevation Statistics for Select Key Locations
Location
Extreme Water Surface Elevations (ft, NAVD88)
100-yr ARI
mean
100-yr ARI
90%CL
100-yr ARI
95%CL
500-yr ARI
mean
500-yr ARI
90C%CL
500-yr ARI
95%CL Houston Ship Chan (upper) (upper)
15.2 18.0 18.8 19.8 22.6 23.4 Morgan’s Point 12.3 15.1 15.9 15.8 18.7 19.5 Clear Lake Entrance 11.9 14.7 15.5 15.7 18.5 19.3 Texas City (east side) 10.5 13.3 14.1 13.8 16.6 17.4 Galveston (bay side) 10.5 13.3 14.1 14.0 16.8 17.6 Galveston (Gulf side) 10.6 13.5 14.3 14.1 17.0 17.8

Jackson State University 479
In addition to expected values, water levels for the 100-yr and 500-yr ARIs
also shown for two different confidence levels, 90% and 95% (the 90%CL
and 95%CL values, respectively). We recommend that the 90%CL ARI
values be adopted for use in the feasibility assessment of the Ike Dike
concept, since they provide a much higher level of confidence than use of
the mean, or expected values. Values in the table show that, at all locations
for both the 100-yr and 500-yr ARIs, the 90%CL values are about 3 ft
higher than the expected values; and the 95%CL values are about 3.5 ft
higher than the expected values.
For comparison purposes, Hurricane Ike produced maximum water
surface elevations of 10.5 to 12 ft NAVD88 for much of the main portion of
Galveston Bay and at the City of Galveston. In the upper reaches of the
Houston Ship Channel Ike produced maximum water surface elevations of
13 to 15 ft NAVD88.
A crest elevation of 17 ft NAVD88 for the conceptual Ike Dike, which is
approximately equal to the present crest elevation of the Galveston
Seawall, corresponds to a 500-yr ARI water surface elevation at a 90%
confidence level at the Galveston Pleasure Pier.
Strong similarity was observed between the ARI water surface elevation
pattern within Galveston Bay and the maximum water surface elevation
pattern in the Bay for individual severe storms that made landfall near San
Luis Pass, or just to the south of the pass. Because of this similarity, it was
thought that “proxy” storms could be identified from among the 223-
storm FEMA (2011) set, such that one of the synthetic hypothetical
hurricanes simulated in the FEMA study (2011) would produce a water
surface elevation field that was quite similar to the field corresponding to a
particular ARI water surface elevation field throughout the key economic
corridor within the Bay. Based on this preliminary analysis using the
FEMA (2011) results, the proxy storm concept seemed to have merit as a
first step to placing water surface elevations and economic damages/losses
in a probabilistic context. Proxy storms were identified for 10-yr, 100-yr,
and 500-yr ARI water surface elevations. The proxy storms enable
reductions in inundation, attributable to the Ike Dike, to be placed in a
probabilistic context prior to simulating a large set of hurricanes and
performing a more rigorous statistical analysis on that much larger set of
results.

Jackson State University 480
Storm Surge Reduction Achieved with the Ike Dike Concept:
Results from Original Bracketing Set of Storms and Initial
Modeling Approach
The primary benefit of the 17-ft Ike Dike concept is to greatly reduce, or
eliminate in some case, the sources of bay filling, with the greatest source
being flow over the barrier islands. The dike eliminates, or nearly so, a
major contributor to the storm surge and subsequent flooding within
Galveston Bay. Reduction of storm surge in the bay also can lead to a
reduction in the amount of wave energy generated within the bay by
reducing the water depth.
The dike also acts to eliminate or reduce storm surge and wave attack
along the coastal barrier islands, preventing surge and waves from
damaging buildings and infrastructure that lie behind the dike. Damages
are reduced or prevented as long as the dike is not overtopped or subjected
to steady overflow. If overtopping and overflow occurs, damages and
losses behind the dike can accrue on the barrier islands. Barrier islands
also can flood from the backside, the bay side. By reducing surge levels in
Galveston Bay, the Ike Dike can reduce flooding of the barrier islands from
the bay side.
Based on an analysis of modeled water surface elevations for the original
bracketing set of storms (25 storm simulations made for both without- and
with-dike conditions), which were run with the initial surge and wave
model set up and modeling approach, significant flood reduction benefits
accrue throughout the region because of the Ike Dike. For the direct-hit
set of four storms, having central pressures of 900, 930, 960 and 975 mb,
the Ike Dike concept reduced storm surge within Galveston Bay by these
approximate amounts: 4.5 to 7 ft, 7 to 10 ft, 6 to 9 ft, 5 to 7 ft, respectively.
The dike limited storm surge levels within the Bay to 4 to 7 ft for the 930-
mb storm, 2 to 4 ft for the 960-mb storms, and 2 to 4 ft for the 975-mb
storm. This indicates that the Ike Dike concept will have considerable
storm surge and flooding reduction benefits for all storms, particularly for
the most frequently occurring, less intense, hurricanes.
The dike significantly reduced storm surge in Galveston Bay for the rare
but possible 900-mb storm, by 4.5 to 7 ft, and the 930-mb storm by 7 to 10
ft, so considerable flood reduction benefits will accrue for many locations
within the region even for major storms. However, the 900- and 930-mb
direct-hit storms did produce flow over the dike in some areas, extensively
Jackson State University 481
in places, which would result in flood damage along the barrier islands in
these areas. Overtopping and overflow occurred for some of the other 900-
mb storms that produced substantial open coast storm surge which
exceeded the crest height of the dike. As long as the dike is resilient and
maintains its integrity while being overtopping (without or with overflow),
it would reduce damages even in these overtopping and overflow
situations, compared to the existing condition.
For all the 900-mb storms, the Ike Dike significantly reduces storm surge
throughout Galveston Bay and the Houston Ship Channel, by amounts of
up to 14 ft, depending on storm track. Reductions achieved with the dike
were most often in the 6 ft to 12 ft range, which are significant reductions
that will lead to significantly less damage/losses.
Storm Surge Reduction Achieved with the Ike Dike Concept:
Results from the Refined Modeling Approach with the Extended
Ike Dike
Reduction in Peak Storm Surge Values
Hurricane Ike and the 10-yr, 100-yr, and 500-yr proxy storms were
simulated for existing conditions and with- extended Ike Dike conditions.
The extended dike ends at Sabine Pass, whereas the original dike in the
bracketing set simulations ended in the vicinity of the northeast end of
Bolivar Peninsula, just to the east of High Island, TX. For the extended
dike, a crest elevation of 17-ft NAVD88 was used except for the Galveston
seawall, where actual elevations were used. Simulations used an improved
model setup. Model validation for Hurricane Ike, using the revised
modeling approach, is presented in Chapter 2.
Simulations were made for present-day sea level and a future sea level
scenario, which is called SLR1. The SLR1 sea level is +2.4 higher than
present-day sea level. Based on a comparison of the current modeling
approach with past Hurricane Ike modeling done by ARCADIS (2011) in
support of the Nature Conservancy, the current modeling approach
captures the dominant influences of sea level change on those storm surge
processes that most dictate peak storm surge values along the western
shoreline of Galveston Bay. The effects of sea level change on landscape
vegetation are less important than the change sea level has on water
depths in the shallow coastal and bay areas.

Jackson State University 482
Detailed results and discussion for results from this set of simulations, for
the four-storm set, present and future sea level, are presented in Chapters
11 and 12. Results were provided to the economics team. The following
four tables summarize peak storm surge results from these simulations. Table 16-2. Peak storm surge values for Hurricane Ike (feet, NAVD88), for the present-day and SLR1 (+2.4 ft) sea level scenarios
Location No–dike
conditions With-dike conditions
Present SLR1 Present SLR1
City of Galveston (Gulf side) 13 15 14 16
City of Galveston (bay side) 13 15 4.5 7
Galveston Island (mid-way) 10.5 13 4 6.5
Bolivar Peninsula (mid-way) 14 17.5 2 5.5
Texas City (south) 12 14 4 6.5
Texas City (east) 12 14.5 4 6.5
Dickinson Bay entrance 11.5 14 3.5 6
Clear Lake entrance 11.5 14.5 2.5 5
Morgan’s Point 13 16 2 5
Upper Houston Ship Channel 13.5 16.5 2.5 5
Table 16-3. Peak storm surge values for Storm 535, the 10-yr proxy storm, (feet, NAVD88), for present-day and SLR1 (+2.4 ft) sea level scenarios.
Location No–dike conditions
With-dike conditions
Present SLR1 Present SLR1
City of Galveston (Gulf side) 6.5 9 6.5 9
City of Galveston (bay side) 6.5 9 2 4.5
Galveston Island (mid-way) 5 7.5 2 5
Bolivar Peninsula (mid-way) 5 7.5 1 3.5
Texas City (south) 8 10 3.5 6
Texas City (east) 7 9.5 3.5 5.5
Dickinson Bay entrance 8 10.5 4 6
Clear Lake entrance 8.5 11 4 6
Morgan’s Point 8.5 11 4 6
Upper Houston Ship Channel 10 13 5 7
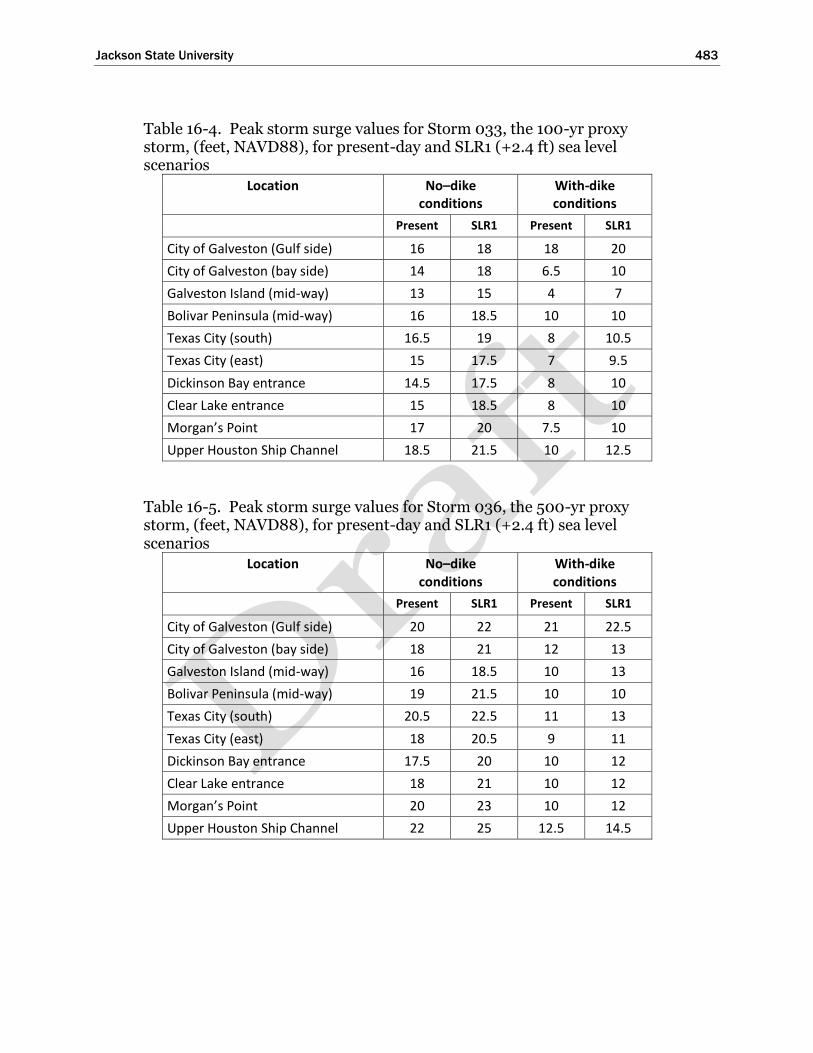
Jackson State University 483
Table 16-4. Peak storm surge values for Storm 033, the 100-yr proxy storm, (feet, NAVD88), for present-day and SLR1 (+2.4 ft) sea level scenarios
Location No–dike conditions
With-dike conditions
Present SLR1 Present SLR1
City of Galveston (Gulf side) 16 18 18 20
City of Galveston (bay side) 14 18 6.5 10
Galveston Island (mid-way) 13 15 4 7
Bolivar Peninsula (mid-way) 16 18.5 10 10
Texas City (south) 16.5 19 8 10.5
Texas City (east) 15 17.5 7 9.5
Dickinson Bay entrance 14.5 17.5 8 10
Clear Lake entrance 15 18.5 8 10
Morgan’s Point 17 20 7.5 10
Upper Houston Ship Channel 18.5 21.5 10 12.5
Table 16-5. Peak storm surge values for Storm 036, the 500-yr proxy storm, (feet, NAVD88), for present-day and SLR1 (+2.4 ft) sea level scenarios
Location No–dike conditions
With-dike conditions
Present SLR1 Present SLR1
City of Galveston (Gulf side) 20 22 21 22.5
City of Galveston (bay side) 18 21 12 13
Galveston Island (mid-way) 16 18.5 10 13
Bolivar Peninsula (mid-way) 19 21.5 10 10
Texas City (south) 20.5 22.5 11 13
Texas City (east) 18 20.5 9 11
Dickinson Bay entrance 17.5 20 10 12
Clear Lake entrance 18 21 10 12
Morgan’s Point 20 23 10 12
Upper Houston Ship Channel 22 25 12.5 14.5

Jackson State University 484
Using only the approximate peak surge values that are listed in these
tables, which were visually estimated from peak surge maps presented in
Chapter 11, the following average values of surge reduction are achieved
with the 17-ft Ike Dike: 10-yr proxy storm (4 ft), Hurricane Ike (9 ft), 100-
yr proxy storm (8 ft), 500-yr proxy storm (9 ft). Surge reduction tends to
be a little higher in the upper reaches of the Houston Ship Channel.
Average surge reduction values for both sea levels are quite similar, so they
are averaged to arrive at the reduction values cited above for each
hurricane.
The primary strength of the Ike Dike concept is the regional scope of flood
risk reduction benefits that the coastal spine provides to all areas that lie
behind it. The 17-ft Ike Dike reduces the peak storm surge within
Galveston Bay, for major surge-producing storm events, by 8 to 9 ft, on
average. The areas of focus in this study are Galveston Island, Bolivar
Peninsula, the western shoreline of Galveston Bay, and the upper reaches
of the Houston Ship Channel. All of these key areas in the Houston-
Galveston region, which presently are at risk of experiencing substantial
flood-induced damages/losses, would receive significant risk reduction
benefits. No areas are omitted from receiving benefits. This is true
regardless of whether the area is primarily residential or primarily
industrial, this is true without regard for the economic value of individual
properties, structures or residences that receive the risk reduction
benefits.
For the Hurricane Ike simulation, for present-day sea level, the Ike Dike
eliminates flooding and inundation of residential and industrial areas
nearly everywhere in the Houston Galveston region, except in some of the
lowest-lying areas. Those areas that are inundated for the Ike simulation
with the dike in place include some locations on central and western
Galveston Island that are closest to the bay shoreline, as well as areas in
and around Bayou Vista which is located just to the south of the Texas City
levee. For hurricanes that produce less storm surge than Hurricane Ike,
including the 10-yr proxy storm and less intense hurricanes like it, the
possibility of inundation will be greatly reduced or even eliminated even in
these most vulnerable areas. The value of the Ike Dike in eliminating
flooding during most hurricanes, for present-day sea level, should not be
understated.
Jackson State University 485
Flooding in the lowest-lying areas is particularly sensitive to the
antecedent water level in Galveston and West Bays, so it will be sensitive
to the amount of water that enters Galveston Bay prior to closure of the
flood gates at Bolivar Roads and San Luis Pass, and it will be sensitive to
sea level. Rising sea level increases flood risk throughout the Houston-
Galveston region.
For the Hurricane Ike simulation, for the future sea level scenario, which
is +2.4 ft above present-day sea level, the Ike Dike provided widespread
surge reduction and great reductions in the depth and extent of inundation
throughout the region, particularly along the western shoreline of
Galveston Bay.
In light of the sensitivity of flooding to sea level in lower-lying areas, quite
a few more areas were inundated for Hurricane Ike at the higher future sea
level, even with the Ike Dike in place. The communities along the western
shoreline of Galveston Bay that experienced inundation for this hurricane
event/sea level scenario included the following: most areas on central and
western Galveston Island except those located on the highest topography,
Bayou Vista and the surrounding area, the Tiki Island and Harborwalk
communities, the lowest-lying parts of San Leon, Seabrook and Clear Lake
Shores near the entrance to Clear Lake, and isolated low-lying areas along
the Nassau Bay shoreline. See Figure 12-1 for a map that shows these
locations. A few of the lowest-lying industrialized areas in the upper
reaches of the Houston Ship Channel also experienced inundation for this
storm/sea level. All along Bolivar Peninsula, the peak surge flowed over
the Ike Dike for the Hurricane Ike simulation and the future sea level,
subjecting areas immediately behind the dike to inundation. Parts of the
City of Galveston are inundated for the Ike simulation with the future sea
level. At present, and even with the Ike Dike in place, the City of Galveston
is vulnerable to flooding from the bay side, although the risk of flooding
from the bay side is far less than it is for existing no-dike conditions.
The inundation analysis revealed what might be a vulnerability along the
Galveston seawall, near its northern end. There is a relatively small area
(see Figure 12-3) where, according to the model topography, the maximum
elevation along the seawall is 14 to 15 ft, NAVD88, which is 2 to 3 ft lower
than the 17 ft NAVD88 elevation that exists along the rest of the seawall.
In addition to flooding from the bay side, this apparent low spot is a source
of inundation within the City of Galveston for the Hurricane Ike
Jackson State University 486
simulation at the higher future sea level. If this area is, in fact, lower by
this amount, the vulnerability should be addressed. Because of the much
greater risk to the City of Galveston from flooding along the bay side for
existing conditions, this vulnerability is less important that it would be
with the Ike Dike in place. The vulnerability should be addressed and
eliminated as part of Ike Dike implementation.
For the no-dike conditions, and for the 100-yr and 500-yr proxy storms,
peak surges generated by these two severe hurricanes cause widespread
inundation, and undoubtedly great damages and losses, throughout the
entire region for both sea-level scenarios. In light of its high surge
reduction value, the Ike Dike greatly reduces the extent and depth of
inundation in the heavily residential areas along the western shoreline of
Galveston Bay and in all of the heavily industrialized areas, except for a
few areas, for both proxy storms and for both present and future sea-level
scenarios.
The inundation analysis also revealed a possible flooding vulnerability at
the southwestern terminus of the Texas City levee (see Figure 12-18). The
minimum elevation of the Texas City levee is 19 ft. At the southwest
terminus of the levee, the surge model elevations at the end of the levee
are between 13 and 14 ft NAVD88, which is 5 to 6 feet lower than the
minimum levee elevation. There is a considerable distance between the
end of the levee and the nearest location on an adjacent elevated highway
embankment that is at an elevation of 19 ft NAVD88. Examination of this
area in Google Earth also suggests that the levee ends well short of the
elevated highway. Flooding through this low spot contributes to
inundation inside the Texas City levee for some of the simulations, raising
the flood risk to La Marque and Texas City. With the Ike Dike in place,
because of the substantial surge reduction it provides, no flow occurred
through this low spot in any of the simulations. However if this area is, in
fact, lower by this amount, the vulnerability should be addressed. Any
weak links in the risk reduction system can compromise its effectiveness.
The 17-ft Ike Dike is extremely effective in reducing the peak storm surge
around the entire perimeter of the Texas City levee and in the upper
reaches of the Houston Ship Channel, for the 100-yr and 500-yr proxy
storms. Without the Ike Dike these hurricanes produce extremely large
storm surges and widespread inundation in these areas (as much as 22.5 ft
at the Texas City levee and 25 ft in the upper Houston Ship Channel). For

Jackson State University 487
the many areas in the upper ship channel that are home to petro-chemical
facilities, as well as the Texas City industrial area, the magnitude of the
surge suppression achieved with the Ike Dike is sufficient to reduce the
risk of inundation in nearly all of the highly industrialized areas to a very
low probability of occurrence. This is a major benefit of the 17-ft Ike Dike;
i.e., just how well it protects the vast majority of the highly industrialized
areas from inundation for even very rare hurricane events, like the 500-yr
proxy storm, including those with the future sea level scenario.
Even with the Dike in place and despite the high degree of surge reduction
it provides, for the higher surge levels generated by the 100-yr and 500-yr
proxy storms inundation still occurs in the lower-lying residential areas,
particularly for the higher sea level.
With the extended Ike Dike in place, for the 100-yr proxy storm and the
higher future sea level, peak surges along the western shoreline of
Galveston Bay range from 7 to 8 ft for present-day sea level, and from 9.5
to 10.5 ft for the future sea level scenario. Peak surge values for both sea
level scenarios are less than peak surge levels that were observed during
Hurricane Ike in 2008; so the extent and depth of flooding and inundation
for the 100-yr proxy storm and either sea level would be significantly less
than what was experienced during Ike.
With the extended Ike Dike in place, even for the very rare 500-yr proxy
storm at the higher sea level, peak surges along the western shoreline of
Galveston Bay range from 9 to 11 ft, for present-day sea level, to 11 to 13 ft
for the future sea level. These values are comparable to or less than the
peak surge levels during Hurricane Ike in 2008, so inundation is expected
to be comparable to or less than what occurred during Ike.
Residual Risk with the Ike Dike in Place
The following discussion provides some idea of the level of residual risk to
residential and industrial areas along the western shoreline of Galveston
Bay with the 17-ft Ike Dike. The assessment of residual risk considers peak
surge conditions for the severe 100-yr and 500-yr proxy storms, with the
Ike Dike concept in place.

Jackson State University 488
For Present Sea Level Conditions
With the extended Ike Dike in place, the following communities along the
western shoreline of Galveston Bay still experience inundation for the 100-
yr proxy storm and the present sea level scenario: all the communities just
south of the Texas City levee in the vicinity of and including Bayou Vista
and the southeast fringes of Hitchcock, most of San Leon, the lowest-lying
areas along the Dickinson Bayou and isolated areas in eastern Dickinson
adjacent to Gum Bayou, isolated areas in southern Bayport, the lower-
lying areas in communities at the entrance to Clear Lake (Seabrook,
Kemah, Clear Lake Shores), a few isolated areas around the periphery of
Nassau Bay, and isolated industrial facilities in the upper reaches of the
Houston Ship Channel.
With the Ike Dike, for the 500-yr proxy storm and present-day sea level,
the following areas experience inundation that did not experience
inundation for the 100-yr proxy storm for either sea level: a few more
areas in southeast Hitchcock a few more areas in central and eastern
Dickinson a few more areas in the communities around the entrance to
Clear Lake a few more areas around Shoreacres and in southern Bayport,
and more areas around the periphery of Nassau Bay.
For Future Sea Level Conditions
With the Ike Dike, the following communities along the western shoreline
of Galveston Bay experience inundation for the 100-yr proxy storm and
the future sea level scenario: all the communities just south of the Texas
City levee in the vicinity of and including Bayou Vista and the southeast
fringes of Hitchcock, nearly all of San Leon, lower-lying areas along the
Dickinson Bayou, including more areas in western Dickinson (adjacent to
Gum Bayou) and in central Dickinson (between I-45 and Highway 3),
southern Bayport, southern Shoreacres and sections of Highway 146 near
Shoreacres, communities near the entrance to Clear Lake (southern
Seabrook including the coastal areas along the Galveston Bay shoreline,
Kemah, Clear Lake Shores), more areas around the periphery of Nassau
Bay, and a few more isolated facilities in the upper reaches of the Houston
Ship Channel.
Jackson State University 489
With the Ike Dike, for the 500-yr proxy storm and the future sea level
scenario, the following areas experience inundation that did not
experience it for the 100-yr proxy storm, for either sea level: a few more
areas in southeast Hitchcock, a few more areas in central and eastern
Dickinson, much of the Seabrook, Kemah, Clear Lake Shores areas, much
of the coastal region northeast of Seabrook, a few more areas in southern
Bayport, all of Shoreacres, new areas southern La Porte, and nearly all
areas that lie along the Clear Lake and Taylor Lake shorelines, including
the El Lago area and areas immediately adjacent to the NASA facility.
To place this residual risk information in a probabilistic context, the
encounter probability for a 100-yr water level is approximately 25% over
the next 30 years. This means that there is 25% chance that the 100-yr
water level (or something greater) will be encountered during the next 30
years. The encounter probability for a 100-yr water level sometime during
the next 50 years is approximately 40%. For the 500-yr water level, the
encounter probability is approximately 6% over the next 30 years and
approximately 10% over the next 50 years.
Consideration of Secondary Lines of Defense and
Recommendations
An analysis of exposure to inundation, residual flood risk, and possibilities
for secondary lines of defense are discussed in greater detail in Chapter 12.
The results of this analysis are summarized here. The intent of these
additional risk-reduction measures is to reduce the residual flood risk that
exists in each of these areas, even with the 17-ft Ike Dike in place.
City of Galveston
The City of Galveston is at risk of flooding from both the Gulf and bay
sides. Certain hurricanes, Hurricane Ike was an example, can generate a
peak surge on the Gulf side that is significantly lower than the elevation of
the Galveston Seawall, but still produce significant flooding in the city due
to high peak storm surge along the bay side. Surge simulations done to
date suggest that, in a relative sense and at the present time, Galveston is
more vulnerable to flooding from the bay side than it is from the Gulf side.
Since construction of the Galveston Seawall in the early 1900’s, there has
been an increase in relative mean sea level in the Galveston area. The
Jackson State University 490
increase in sea level has increased the risk of flooding along both the bay
and Gulf sides of the city.
Further reduction in the risk of flooding is recommended for the City of
Galveston. It can be achieved by raising the Galveston Seawall and by
building a ring dike/wall system around the bay side of the city, with a
proper transition from the much higher elevation at the Galveston Seawall
to a lower dike/wall elevation on the bay side. Elevations for the Seawall
and the ring dike/wall should be designed to create a consistent level of
flood risk around the periphery of the City.
Ring Dike
The Ike Dike concept will greatly reduce the risk of bay-side flooding, but a
significant residual risk remains for parts of the City because of the low
land elevations along the bay shoreline, which are less than 6 ft NAVD88
in places. Raising elevations, where necessary, to a minimum of 8 or 9 ft in
the lowest-lying areas, should be considered as a secondary line of defense
measure to implement as a facet of the Ike Dike concept. Building a ring
dike/wall in these areas, to a crest elevation of approximately 8 or 9 ft,
helps create a more consistent level of risk associated with flooding due to
storm surge from the Gulf side and from the bay side, for the present sea
level.
If the Galveston Seawall also is raised to reduce the risk of flooding from
the Gulf side, a measure that is discussed in the next section, then to
achieve a consistent degree of flood risk on both the Gulf and bay sides,
measures also would need to include construction of a more extensive and
higher bay-side ring dike/wall. For a Seawall crest elevation of 22 or 23 ft,
the design elevation for a ring dike/wall on the bay side would probably
need to be approximately 11 ft, and perhaps more, depending on the
magnitude of wave overtopping that is allowable.
If a ring dike is built to keep the water out of the City, pumping stations or
other measures will probably be required to evacuate any water that does
accumulate in the lower areas due to steady overflow and/or wave
overtopping of the Seawall and/or the ring dike/wall on the bay side.

Jackson State University 491
Raising the Galveston Seawall
Raising the Galveston Seawall is recommended for the following reasons.
First, in light of the nearly two feet of relative sea level rise that has
apparently occurred since the original Galveston Seawall was constructed,
the current seawall elevation of 17 ft does not provide the same level of risk
reduction that the seawall provided when it was originally constructed. A
2-ft increase in seawall elevation would compensate for the increase in sea
level that has already occurred. With any additional future sea level rise,
the existing seawall will provide even less risk reduction. The future sea
level scenario of +2.4 ft suggests that the increase in seawall elevation
should be 4.4 ft to maintain the level of risk reduction that was reflected in
the original sea wall design (i.e., to an elevation of approximately 21.5 ft
NAVD88). The present-day 100-yr, 200-yr and 500-yr 90% CL Average
Recurrence Interval (ARI) water surface elevations at the Galveston
Pleasure Pier have been computed to be 13.5, 14.9 and 17.0 ft NAVD88,
respectively, as part of this study. Linearly adding 2.4 ft of future sea level
rise to each ARI elevation, these same three statistical water level values
become 15.9 ft, 17.3, and 19.4 ft, respectively. Second, the long-dike effect
that will occur with construction of the Ike Dike will act to raise the ARI
water levels, perhaps by a foot or so for these extreme values (i.e., further
increases in ARI elevations to values of roughly 17, 18.5, and 19.5 ft,
respectively, are expected). A value of 17 ft, the current seawall elevation,
lies somewhere closer to the expected 100-yr ARI value for the SLR1 future
sea level scenario, with the Ike Dike in place. The City of Galveston should
have a lower risk of flooding than is provided by a seawall that has a crest
elevation that corresponds to the 100-yr ARI value. Third, note that these
ARI water surface elevation values are “still water” levels, which do not
account for any short wave overtopping. Considerable wave overtopping
would be expected for peak storm surges of these magnitudes. Adding 3 to
4 ft of freeboard to reduce the effects of wave overtopping, raises the
desired seawall elevations to something in the range of 22 to 23 feet for the
200-yr and 500-yr ARI water levels. It is estimated that during Hurricane
Ike, there was about 4 ft of freeboard on the Gulf side of the Galveston
Seawall, in the light of the 13 ft peak surge that was simulated for this
hurricane. The volume of wave overtopping at the Seawall which occurred
during Hurricane Ike provides some indication of the volume that can be
expected for this amount of freeboard above the peak surge level. The
elevation of the Galveston Seawall should be raised to 22 or 23 ft or to the
maximum value that is supported by the City of Galveston.

Jackson State University 492
Galveston Island and Bolivar Peninsula
One measure that can be taken is raising the first floor elevation of
individual structures. Elevating structures to a first floor elevation of 10 to
12 ft NAVD88 would significantly reduce the risk of flooding on the bay
side of the 17-ft Ike Dike, even for the future sea level scenario. This is
undoubtedly much lower than what would be required to comply with the
FEMA risk maps for existing conditions.
Another measure that can be implemented is construction of a ring dike or
levee around concentrations of structures, perhaps integrated with an
access road on top of the levee. A ring levee with crest elevation of 10 to 12
ft NAVD88 would significantly reduce the risk of flooding. A pump
station(s) might be required to evacuate any accumulating water inside the
ring levee. A gate or gates might also be required to provide vehicular
access. Residents are often opposed to such structural measures, because
they block the view.
Bayou Vista and Hitchcock areas
In the Hitchcock and Bayou Vista areas, a levee/wall system could be
constructed along one of several possible alignments shown in Figure 12-
23. The crest elevations of this secondary line of defense would likely
range from 11 to 16 ft to cover the range of peak surge experienced for the
two most severe proxy storms and both sea levels. However, in light of the
relatively sparse density of structures in the Hitchcock area, and the
probable cost of these structural alternatives, it seems unlikely that such
lengthy secondary lines of defense would be cost effective. Ringing the
Bayou Vista area with a levee system may not be acceptable to the
community.
For the low lying communities of Tiki Island, and Harborwalk, the only
feasible option is likely raising the first floor elevations of structures.
Ringing these communities with a levee system might not be acceptable to
the communities.
San Leon, Texas City (north), Bacliff and Dickinson areas
There are several possible secondary lines of defense that can lessen the
residual flood risk to a varying number of areas. Alignments of possible
measures are shown in Figure 12-27.

Jackson State University 493
One measure that can reduce residual risk to part of central Dickinson, the
area between I-45 and Highway 3, involves a short section of levee or wall
and a small gate to enable navigation on Dickinson Bayou. The measure
could be constructed at a location just to the east of where Highway 3
crosses the bayou. It would have a crest elevation of about 11 to 14 ft, and
would be tied into the existing rail line embankment.
A second possible measure that reduces residual risk for a much larger
area, including the entire Dickinson area, is a levee/dike/wall constructed
along Highway 146. It could be incorporated into sections of the existing
highway infrastructure. Its crest elevation would also be 11 to 14 ft. This
measure would require a gate at the entrance to Clear Lake to enable
navigation.
Neither of the first two measures provides additional risk reduction to San
Leon. Most likely, raising the elevations of structures as part of a long-
term community plan is the only feasible approach for reducing residual
risk at San Leon. Construction of risk reduction measures along the
coastal periphery of the San Leon peninsula, across the open water leading
to Dickinson Bay, and tying in to the Texas City Levee can be done, but it
seems problematic for a number of reasons and would probably be
prohibitively costly.
Clear Lake, Bayport and La Porte areas
Only one of several possible measures appears viable to reduce the
residual risk in these areas. Alignments of this and other possible
measures are shown in Figure 12-31.
The most viable measure involves a levee or wall system built along
Highway 146, in two sections, which could be incorporated into the
existing highway infrastructure. This option would also require a gate to
facilitate navigation at the entrance to Clear Lake. The crest elevation of
this measure would likely range from 13 to 16 feet. It is recommended that
these two sections of a secondary line of defense be examined to assess
their cost/benefits, and their potential for inclusion as a component of the
Ike Dike implementation.
The only other option would be a secondary line of defense right at the
Galveston Bay shoreline. However, judging from the built environment
and the many docks along the bay shoreline, there would likely be
Jackson State University 494
considerable opposition to construction of any structural measures at the
coast.
Another option is to raise the elevations of individual structures as part of
a long-term strategy to do so in the most vulnerable areas.
Upper Houston Ship Channel
In areas having undesirable residual risk, levees or walls built to ring
individual facilities, or groups of facilities, can reduce the risk of flooding
to the desired level. In light of the peak surge levels for the 100-yr and
500-yr proxy storms, and both sea level scenarios, the elevations of such
features would probably need to be in the range of 11 to 16 ft, depending
on the desired level of risk reduction and exposure of the site/levee to
wave action.
The “Centennial Gate” was originally proposed by the Rice University
SSPEED Center as a stand-alone surge suppression measure to prevent
storm surge penetration into the upper reaches of the Houston Ship
Channel. The 500-yr proxy storm, for existing no-dike conditions, and for
the future sea level scenario, produces peak surges that reach nearly 25 ft
in this area. With the Ike Dike in place, peak surge levels that are
generated in the upper ship channel (14 to 15 ft) would be about 1 ft higher
than those experienced during Hurricane Ike. Except for very low-lying
areas, the Ike Dike seems to be quite effective in suppressing surge levels
in the upper ship channel area, probably precluding the need for a
“Centennial Gate” as a risk reduction measure for this region, at least for
the present time.
If future sea level looks like it might exceed the 2.4 ft value that is
considered in scenario SLR1, it would be worthwhile to re-examine the
need for a gate at this location as a means for reducing flood risk in the
upper reaches of the Houston Ship Channel to acceptable levels.
Examination of Alternate Ike Dike Configurations
Chapters 10 through 12 examined the storm surge reduction benefits of the
extended Ike Dike, which started at Freeport, ended at Sabine Pass, and
which followed the coastline. Chapter 13 examines a number of other
possible alternate configurations for the Ike Dike, including shorter
versions that provide less surge reduction. One of the other alignments

Jackson State University 495
examined, Alignment 2, is quite similar to the coastal spine recommended
by the GCCPRD that extends from the western end of Galveston Island to
High Island. The mertis of adding eastern and western termination dike
sections to the alignment recommended by the GCCPRD are examined in
Chapter 13, as is the influence of adopting lower crest elevations for storm
surge gates at Bolivar Roads and San Luis Pass.
The Different Configurations
The original set of storm surge simulations that were made to examine
benefits of the Ike Dike concept involved a long dike that followed the
shoreline, began just south of Freeport, TX, and ended just to the east of
High Island, TX. Those results suggested that undesirable flanking
occurred around the eastern end of the dike. To reduce the adverse effects
of flanking, the original alignment was extended further to the east, all the
way to Sabine Pass, TX. This alignment is referred to as the extended Ike
Dike, and it is shown in Figure 13-1. The extended Ike Dike alignment is
the subject of Chapters 10 through 12.
A variation of the extended Ike Dike was also examined. Dutch partners in
the Ike Dike investigation identified several other possible alignments for
a long coastal spine. Each alignment involved tying the dike into higher
ground elevations at different locations on both its eastern and western
ends (Van Berchem et al., 2016).
On the eastern end, one alternate alignment, the State Highway 124
option, or SH124, left the coast and turned inland at High Island and then
followed SH124 north to Winnie, TX, instead of following the coast to
Sabine Pass (see Figure 13-2). This alignment was adopted for further
study in light of the fact that it is shorter and potentially less costly than a
coastal alignment that extended to Sabine Pass.
On the western end, van Berchem et al. (2016) identified two options. One
option, the Bluewater Highway alignment, is similar to the extended dike
alignment that has been previously modeled in this study. A second
option crossed San Luis Pass from the western end of Galveston Island,
immediately turned inland at that point, headed toward the north-
northwest and crossed both West Bay and wetlands of the Brazoria
National Wildlife Refuge, and then veered northwest until it intersected
County Road 227 (Hoskins Mound Road). This inland alignment might
generate considerable opposition based on environmental concerns.

Jackson State University 496
Therefore, the coastal alignment that has been utilized to date in the
extended Ike Dike was retained, except that the western dike section is
now terminated on the northeast side of Freeport and ties into the existing
levees there. An Alignment 1a was developed that included a middle dike
section that extended from San Luis Pass to High Island, along with the
SH124 eastern section alignment and the coastal western section that ends
at Freeport. Alignment 1a in shown in Figure 13-2. This alignment
represents a slightly different version of the extended Ike Dike shown in
Figure 13-1.
Preliminary design analyses were performed by the Dutch study partners
for gate systems at both Bolivar Roads and San Luis Pass (see Jonkman et
al., 2015). They designed both a navigational gate section and an
environmental gate section at each pass. Lower gate crest elevations were
selected in order to reduce construction costs. To quantify the influence of
steady overflow on surge levels within the bay, particularly at the City of
Galveston which is immediately adjacent to the Bolivar Roads gate system
and which is vulnerable to flooding from the bay side, an alternate dike
configuration was considered in the analysis. Alignment 1b was
developed, in which the 17-ft crest elevation of the dike in Alignment 1a
was lowered to the elevations shown in Table 13-1, at the locations of both
gate systems.
The Gulf Coast Community Protection and Recovery District (2016a and
2016b), GCCPRD, recently completed its own storm surge suppression
study to investigate measures for reducing hurricane flood risk for the
north Texas coast. The coastal spine recommended by the GCCPRD
extended from the western end of Galveston Island, across Bolivar Pass,
and ended at High Island. An Alignment 2 was developed that closely
resembles the coastal spine alignment recommended by the GCCPRD; it
extended from the western end of Galveston Island, across Bolivar Pass,
and ended at High Island. A gate system was included at Bolivar Roads.
Alignment 2, shown n Figure 13-3, represents the middle section, only, of
the alignments shown in Figures 13-1 and 13-2, without any eastern or
western termination sections.
An Alignment 3 was developed that was comprised of Alignment 2 plus the
SH124 eastern termination section. This alignment had no western
termination section. Alternate Alignment 3, shown in Figure 13-4, was
developed to isolate the role of the western section on storm surge

Jackson State University 497
reduction and it was intended to facilitate examination of the
merits/consequences of having/not having a western termination section.
Storms That Were Simulated
Four storm surge simulations were made for each of the four alternate
dike alignments, Alignments 1a, 1b, 2 and 3. All simulations were made
for the future sea level scenario, which is 2.4 ft higher than present sea
level (i.e., a future sea level of 3.31 ft, NAVD88). This future sea level
scenario is the same SLR1 scenario that was considered previously in the
extended Ike Dike analysis discussed in Chapters 10 through 12. For each
dike alignment, simulations were made for the 10-yr, 100-year, and 500-yr
proxy storms and for Hurricane Ike, using the same improved modeling
approach that was adopted for the extended Ike Dike simulations. Peak
storm surge results for each of these simulations were provided to the
economics team for further analysis. Results from these simulations are
discussed in Chapter 13. Results are presented graphically within the
report text and in tabular form in Appendix B.
Merits of an Eastern Termination Section
Results suggest that an eastern termination section might not be cost
effective in terms of flood risk reduction benefits to the
Houston/Galveston region. This is the case for both of the two eastern
section alignments, the SH 124 inland alignment and the coastal
alignment that extends to Sabine Pass. In the Houston/Galveston region,
the eastern termination section primarily benefits Bolivar Peninsula,
where the potential for flood risk reduction benefits is much lower. An
eastern termination section is of relatively little benefit in reducing peak
surge at the City of Galveston, along the western shoreline of Galveston
Bay and the upper reaches of the Houston Ship Channel in the Houston-
Galveston region, areas that have a much greater potential for
damage/loss. The storm surge dynamics that lead to this result are
discussed in Chapter 13.
Having no eastern termination section probably means tying the Ike Dike
into higher elevation on the south side of High Island. This is the
termination location in the coastal spine plan recommended by the
GCCPRD.

Jackson State University 498
If an eastern section is adopted, costs and benefits should be considered
both within and outside the Houston/Galveston region. For example, a
coastal alignment for an eastern section which extends all the way to
Sabine Pass provides flood risk reduction benefits to the Winnie-to-Port
Arthur area which have not been considered heretofore. It can also
provide protection to and stability to a coastal highway in the area.
However those benefits should be accounted for in a complete cost/benefit
analysis of an extended Ike Dike alignment. Additionally there are some
negative consequences associated with the inland SH124 alignment, which
causes local increases in peak surge just outside the dike, due to the “long
dike effect.”
The original modeling approach and the initial Ike Dike simulations made
with it suggested that flanking around the eastern end of the Ike Dike,
which ended just east of High Island was problematic and that the dike
should be extended further to the east. Subsequent simulations made with
the improved modeling approach for the alternate Ike Dike configurations,
showed that the original results were misleading and that flanking around
the east side of the dike was not as great as first thought. Results indicate
that termination of the Ike Dike at High Island, as recommended by the
GCCPRD, does not significantly affect peak surge levels throughout
Galveston and West Bays, except along Bolivar Peninsula.
Merits of a Western Termination Section
Termination of the coastal spine at the western end of Galveston Island
with no gate system at San Luis Pass, as recommended by the GCCPRD,
enables propagation of the hurricane surge forerunner into West Bay.
Without a western termination section the hurricane forerunner surge can
propagate through San Luis Pass and into West Bay, and then into
Galveston Bay under certain wind and water level conditions, a process
that can begin a day or more before the hurricane makes landfall.
The absence of a western termination section, which includes a gate
system at San Luis Pass, allows the peak storm surge associated with a
hurricane’s core winds to propagate into West Bay as well. Therefore
termination of the coastal spine at the western end of Galveston Island
significantly increases peak storm surge levels within West Bay because it
enables propagation of the peak storm surge through San Luis Pass as well
as flow over the barrier island south of the pass once it becomes
inundated.
Jackson State University 499
The peak storm surge results suggest that the western termination section
has a much greater positive influence in the Houston-Galveston region
than does an eastern termination section, particularly along western and
central parts of Galveston Island and along the northern shoreline of West
Bay west of Texas City. The western dike section results in greater surge
reductions, over a wider geographic area, in areas having higher potential
for damage and economic losses than does an eastern termination section.
Another factor that might support inclusion of the western termination
section in the Ike Dike concept is the ability to not only prevent the
forerunner and peak surge from entering West Bay, but also as a means for
controlling the water level inside the bays at the time when the surge gates
are closed. It might be advantageous to use the timing of gate closure as a
means to minimize the amount of water in the bays, in advance of an
approaching hurricane. Such an operational procedure might dictate
closing the gates when low astronomical tide creates a minimum water
surface inside the bays. Having gates at both San Luis Pass and Bolivar
Roads could achieve this operational objective fully; a gate system only at
Bolivar Roads can only do this partially. A desire to operationally control
the water level inside the bays at the time of gate closure might become
increasingly more important as mean sea level rises.
Also, with rising sea level, salinity within West and Galveston Bays is
expected to gradually increase, due to the added volume of salt water from
the open Gulf that is introduced into the bays. The added volume will be
significant in light of the shallowness of the bays. Gate systems at both
Bolivar Roads and San Luis Pass might provide an opportunity for
managing the salinity within the bays in a beneficial way in an era of rising
sea level, by reducing tidal exchange and increasing the residence time for
freshwater that is introduced into the bays by the rivers. Operation of the
gate systems might provide an opportunity to mitigate, to some degree,
negative consequences of a more saline bay system. If there are
environmental benefits for having a gate system at San Luis Pass, this
would also support inclusion of a western termination section in the Ike
Dike concept. Any potential for environmental benefits associated with
gate systems at both passes should be explored further.
Influence of Lowered Gates at the Passes
By comparing results for Alignments 1b and 1a, it is evident that the effect
of lower gate elevations on peak surge levels behind the dike is relatively
Jackson State University 500
small even for the more severe hurricanes. Lower gate elevations lead to
slightly higher storm surge levels for the severe hurricanes that were
simulated. For less intense hurricane events like the 10-yr proxy storm,
which produces little or no overtopping or steady flow over the gates, there
are no significant increases to peak storm surge levels behind the dike
associated with the lowered gate crest elevations.
These increases in peak surge level, which are relatively small even for the
most intense hurricanes, will require a small increase in design elevation
for any secondary lines of defense within the bays, such as a ring
levee/wall system along the bay side of the City of Galveston.
Water Level Considerations for Operating the Ike Dike Storm
Surge Gates
Early closure of the storm surge gates at both San Luis and Bolivar Roads
Passes is a critical operational feature of the Ike Dike concept. The amount
of water within Galveston and West Bays at the time of gate closure
influences the peak surge elevation that will be generated by local
hurricane force winds that still act on the bays after the gates are closed.
A higher antecedent water level in the bays leads to a higher peak surge
within the bays, and thus a greater residual flood risk The following
contributors influence the antecedent water level: long-term and seasonal
and long-term mean sea level, astronomical tide, wind-driven surge
forerunner, and volume mode forerunner.
The long-term relative mean sea level has been slowly rising in the
Houston-Galveston region. There are seasonal changes in mean sea level
that occur in the Gulf of Mexico. Late summer hurricanes (in September
and October) are expected to be accompanied by seasonal mean sea levels
that are 0.4 to 0.5 ft higher, on average, than the long-term mean sea level.
The actual sea level at the time a hurricane occurs can be even higher than
the monthly mean values. Such was the case in September 2016 when
seasonal sea levels were unusually high, approximately 1 ft above the long-
term mean sea level. Hurricanes that occur earlier the season (June, July
and August) will most likely be accompanied by a seasonal mean sea level
is not significantly different from long-term mean. The seasonal sea level
will be the same inside the bay as outside, unless local precipitation raises
levels significantly inside the bays.

Jackson State University 501
The astronomical tide, which produces oscillatory changes in water level,
can lessen the impacts of higher antecedent water levels caused by the
seasonal mean sea level and the wind-driven forerunner. This can be
achieved by closing the surge gates at a time of low tide. The time of
occurrence of the hurricane within the 14-day spring-neap tidal cycle, and
the tide range at that time, influences the potential benefits of closing the
gates at low tide. At spring tide conditions, when the tide range is greatest
(2.5 to 3 ft), unusually low tides that occur every 24 hours provide an
opportunity to significantly lessen the residual flood risk inside the bays.
At neap tide, when the tide range is smallest (0.5 to 1.5 ft), low tides are
not as low and there is less opportunity to offset the elevated water levels
associated with mean sea level and the wind-driven forerunner. During
neap tide conditions, lows are experienced every 12 hours, which might be
a small benefit in deciding when to close gates.
Generation of the wind-driven forerunner can begin once the eye of a
hurricane enters the Gulf. The forerunner is forced by winds that blow
along the continental shelf regions of the northern Gulf, pushing water
along the shelf, which is then turned to the “right” and stacked against the
shoreline by the Coriolis force, an Ekman set-up. The wind-driven
forerunner is manifested as a persistent steady rise in water level at the
coast; and, the rate of rise accelerates as the hurricane gets closer to the
continental slope and shelf off the Texas coast. The magnitude of the wind
forerunner is dependent upon the storm’s size, intensity and forward
speed. The more intense and larger the hurricane, the greater the rate of
water level rise during the forerunner build-up. Slower moving storms
have the potential to produce a greater forerunner surge than faster
moving storms.
The wind-driven forerunner can cause an increase in water level at
Galveston of as much as several feet, one or two days before landfall.
Importantly, the wind-driven forerunner that is generated at the coast
readily propagates through the passes and open storm surge gates into the
bays, with little or no attenuation. Therefore, wind-driven forerunner
surge directly increases residual flood risk inside the bays.
The development of the wind-driven forerunner amplitude both on the
open coast and inside the bays is highly sensitive to forward speed for
hurricanes that approach from the southeast. In general, the slower the
forward speed the greater the wind-driven forerunner amplitude at

Jackson State University 502
Galveston and the greater accumulation of water inside the bays at the
time of landfall. Because little to no attenuation of the forerunner
amplitude occurs as it propagates from the open coast through the passes
and into the bays, propagation of the forerunner into the bays exerts a
major influence on peak surge levels inside the bay caused by high in-bay
winds moving the water around within the bay. For example, for a severe
930-mb hurricane, without any surge gates in place, a threefold decrease
in forward speed, from 18 kt to 6 kt, led to a two fold increase in peak
surge in the upper reaches of the Houston Ship Channel (from 10 to 20 ft).
A critical aspect of the Ike Dike surge barrier operation will be
minimization of the surge forerunner within the Bay through early gate
closure. Early gate closure will be particularly crucial for slow-moving
storms. Peak surge at the open coast is much less sensitive to forward
speed.
The wind-driven forerunner is much more important than the volume
mode forerunner, which can be excited when a severe hurricane enters the
Gulf. The amplitude of the volume mode forerunner is only a few tenths of
a foot for even the largest and most intense hurricanes.
The volume mode forerunner is oscillatory by nature, with a rather
predictable period of 32 to 36 hours. As with the astronomical tide, the
predictability of its period provides some potential for exploitation in
terms of timing gate closure. The amplitude of the volume-mode
forerunner is relatively small, so the benefits of exploiting this mode of
forerunner are limited.
Hurricane Ike serves as a useful example for examining these different
physical processes that influence the antecedent water level, and how they
might influence timing of gate closure. The figure below is a reproduction
of Figure 14-12b, which was presented earlier in the chapter. The figure
shows the measured water surface elevation during Ike at Galveston Pier
21 (in green), which lies inside they bay at the Port of Galveston, along
with the predicted astronomical tide (in blue). Water surface elevation is
displayed in feet, relative to mean sea level (MSL), which is the long term
mean sea level for the gage site. Ike’s landfall occurred at around hour
0700 GMT on September 13, shown by the red vertical line in the figure.

Jackson State University 503
Figure 14-12b. Measured water surface elevation during Hurricane Ike, at the Galveston
Pier 21 gaging station.
The initial offset in elevation between the green and blue curves at hour
00:00 on September 10, more than 3 days before landfall, reflects about
0.5 ft of seasonal mean sea level increase above the long-term mean sea
level and possibly a small contribution due to the wind-driven forerunner
surge while the hurricane was beginning to transit the Gulf. Ike entered
the Gulf a few hours before 00:00 on September 10. During the
subsequent two days, September 10 and 11, an overall trend for increasing
water level due to the wind-driven forerunner is evident, at an accelerating
rate of rise, as are oscillations due to the astronomical tide.
Assuming a time of gate closure that is 12 hours before landfall, i.e., at
hour 19:00 on September 12, an antecedent water level of between 6 and 7
ft would likely be present inside Galveston Bay at the time of closure. This
very high antecedent level would considerably increase flood risk inside
the bay, by unacceptable levels, even with the Ike Dike in place. Closing
the gates at the time of low tide which occurred at around hour 03:00 on
September 12 (28 hours before landfall) would have resulted in a much
lower antecedent water level in the bay, approximately 1.0 to 1.5 ft, which
would reduce the residual flood risk inside the bays, compared to the later
closure time. Closing the gates even earlier, at the preceding low tide,
which occurred at around hour 02:00 on September 11 (53 hours before
landfall), while the hurricane was in the Gulf but well seaward of the Texas
coast, the antecedent water level inside the bays would have been lower
still, approximately equal to the long-term mean sea level value with little
to no effect of the seasonal mean and wind-driven forerunner.

Jackson State University 504
Very early closure of the surge gates prevents any precipitation run-off
into the bays from leaving the bays, so this might also be an operational
issue that needs to be considered as well.
A reliable hurricane surge forecasting model that accurately does the
following: simulates the tide and forerunner surge, treats the influence of
the surge gate infrastructure on long wave propagation into the bays while
the gates are in the open position, treats closure of the gates during the
storm’s approach, and treats flow of water over closed gates, would be a
very useful predictive tool. The tool could be applied to provide guidance
for decision-making concerning the optimal time for closure of the surge
gates. Inclusion of rainfall during the approaching storm into the model
simulation, and subsequent simulation of water run-off into the bays could
improve such a forecast capability.
Wave Conditions to Consider in Designing the Ike Dike
Design of the land barrier and navigational/environmental sections of the
gate systems, both of which will be constructed as part of the Ike Dike
concept, will require nearshore wave information. All components will
need to be resilient to overflow and overtopping, which means they will
experience minimal damage and no loss of functionality in the event the
hydraulic design conditions are exceeded and the Ike Dike is overtopped,
even with overflow. There is always some risk of this happening.
Wave model results for the 500-yr proxy storm provide a reasonable
estimate of the nearshore wave conditions that the Ike Dike will need to
withstand, even though overtopped. Undoubtedly, armoring of the Ike
Dike will be required to provide the necessary level of resilience.
Wave and water level conditions at the Galveston Pleasure Pier location
are representative of open-Gulf, nearshore wave conditions, which the
land barrier sections of the Ike Dike will have to withstand. Conditions for
a location in the throat of Bolivar Roads Pass are more representative of
those which the gate systems will have to withstand. The throat is more
“sheltered” than the open gulf area by the entrance jetties, even when they
are submerged, so wave conditions are expected to be lower there.
For the 500-yr proxy storm and present-day sea level, the following wave
and water level conditions were calculated:
Jackson State University 505
Pleasure Pier: significant wave height of 16 ft in a water depth of 29 ft,
which includes a storm surge elevation of 20.5 ft NAVD88. The peak and
mean wave periods at the time of landfall were 13 sec and 10 sec,
respectively.
Bolivar Roads Pass: significant wave height of 10 ft in a water depth of 70
ft, which includes a storm surge elevation of 21.5 ft NAVD88. The peak
and mean wave periods at the time of landfall were 12 sec and 8.5 sec,
respectively.
The time of landfall corresponds well to the times of peak storm surge and
the time of maximum wave conditions at both of these locations.

Jackson State University 506
17 References
ARCADIS, 2011, “ADCIRC Based Storm Surge Analysis of Sea Level Rise in
the Galveston Bay and Jefferson County Area in Texas,” November 28,
2011, prepared for The Nature Conservancy, 49 pp.
Blain, C.A., J.J. Westerink, R.A. Luettich, Jr. and N.W. Scheffner, 1994,
ADCIRC: an advanced three-dimensional circulation model for shelves
coasts and estuaries, report 4: hurricane storm surge modeling using large
domains, Dredging Research Program Technical Report, DRP-92-6, U. S.
Army Engineers Waterways Experiment Station.
Bunpapong, M., Reid, R.O., and Whitaker, R.E., “An Investigation of
Hurricane-Induced Forerunner Surge in the Gulf of Mexico,” Technical
Report CERC-85-5, Coastal Engineering Research Center, U.S. Army
Corps of Engineers, September 1985.
Bunpapong, M., Reid, R.O., and Whitaker, R.E., “An Investigation of
Hurricane-Induced Forerunner Surge in the Gulf of Mexico,” Technical
Report CERC-85-5, Coastal Engineering Research Center, U.S. Army
Corps of Engineers, September 1985.
Cardone, V. J., C.V. Greenwood, and J. A. Greenwood. 1992. Unified
program for the specification of tropical cyclone boundary layer winds
over surfaces of specified roughness. Contract Rep. CERC 92-1. Vicksburg,
MS: U.S. Army Corps of Engineers Waterways Experiment Station.
Cardone, V.J., A.T. Cox, J.A. Greenwood, and E.F. Thompson. 1994.
Upgrade of tropical cyclone surface wind field model. Misc. Paper CERC-
94-14, Vicksburg, MS: U.S. Army Corps of Engineers Waterways
Experiment Station.
Cardone, V.J. and A.T. Cox. 2009. Tropical cyclone wind field forcing for
surge models: critical issues and sensitivities. Nat Hazards 51: 29–47.
Chouinard, L.M. and C. Liu. 1997. Model for Recurrence Rate of
Hurricanes in Gulf of Mexico. Journal of Waterway, Port, Coastal and
Ocean Engineering 123(3): 113-119.

Jackson State University 507
Coastal Protection and Restoration Authority (CPRA). 2013. Greater New
Orleans Flood Protection System Notice of Completion – Design
Assessment by Non-Federal Sponsor. Bell City, LA: Lonnie G. Harper &
Associates.
Diaconis, P. (1988). Bayesian numerical analysis. Statistical Decision
Theory and Related Topics IV.
Dietrich, J.C., S. Bunya, J.J. Westerink, B.A. Ebersole, J.M. Smith, J.H.
Atkinson, R. Jensen, D.T. Resio, R.A. Luettich, C. Dawson, V.J. Cardone,
A.T. Cox, M.D. Powell, H.J. Westerink, H.J. Roberts. 2010a. A High-
Resolution Coupled Riverine Flow, Tide, Wind, Wind Wave and Storm
Surge Model for Southern Louisiana and Mississippi: Part II – Synoptic
Description and Analysis of Hurricanes Katrina and Rita. Monthly
Weather Review, Volume 138, 378-404.
Dietrich, J.C., S. Bunya, J.J. Westerink, B.A. Ebersole, J.M. Smith, J.H.
Atkinson, R. Jensen, D.T. Resio, R.A. Luettich, C. Dawson, V.J. Cardone,
A.T. Cox, M.D. Powell, H.J. Westerink, H.J. Roberts. 2010b. A High-
Resolution Coupled Riverine Flow, Tide, Wind, Wind Wave and Storm
Surge Model for Southern Louisiana and Mississippi: Part II – Synoptic
Description and Analysis of Hurricanes Katrina and Rita. Monthly
Weather Review, Volume 138, 378-404.
East, J.W., Turco, M.J., and Mason, Jr., R.R., “Monitoring Inland Storm
Surge and Flooding from Hurricane Ike in Texas and Louisiana, “ Open
File Report 2008-1365, March 2009.
Federal Emergency Management Agency (FEMA). 2008a. Mississippi
coastal analysis project. Final Report: HMTAP Task Order 18, prepared for
the Federal Emergency Management Agency, Department of Homeland
Security. Gaithersburg, MD: URS Group, Inc.
Federal Emergency Management Agency (FEMA). 2008b. Hurricane Ike
in Texas and Louisiana, High Water Marks, FEMA Mitigation Assessment
Team Report (October 2008).
Federal Emergency Management Agency (FEMA). 2011. Flood Insurance
Study: Coastal Counties, Texas: Scoping and Data Review. Denton, TX:
Federal Emergency Management Agency, Region 6 (draft, in review).
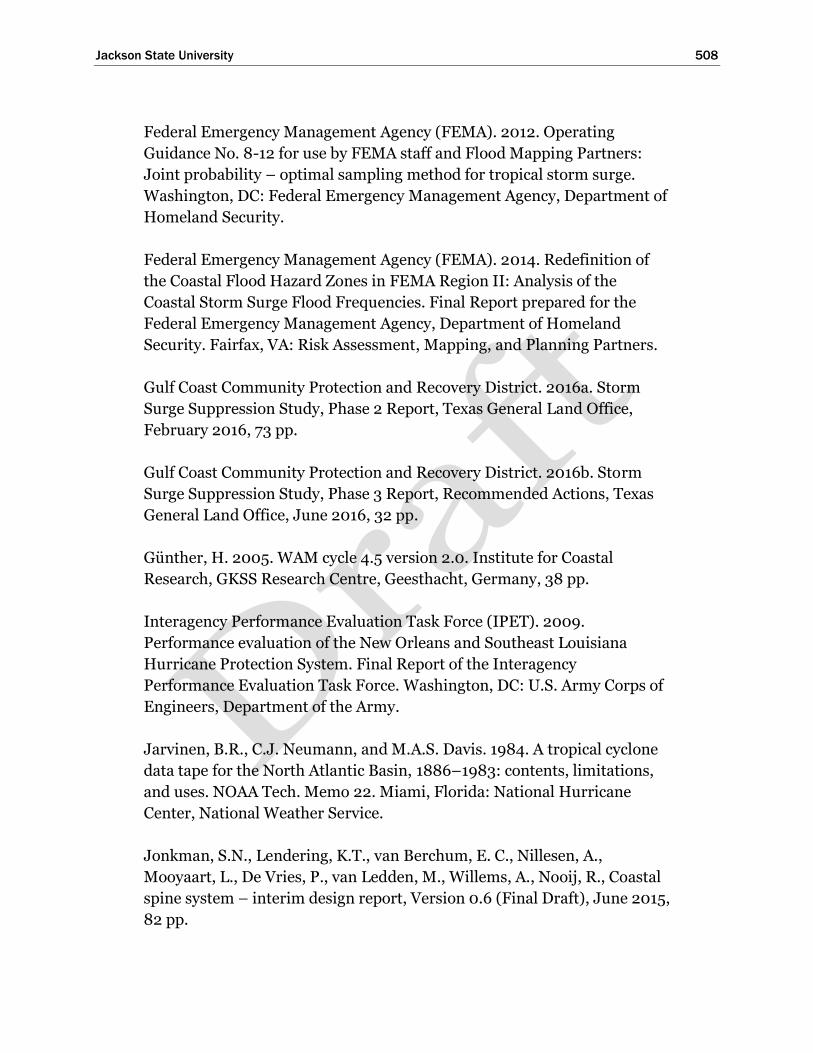
Jackson State University 508
Federal Emergency Management Agency (FEMA). 2012. Operating
Guidance No. 8-12 for use by FEMA staff and Flood Mapping Partners:
Joint probability – optimal sampling method for tropical storm surge.
Washington, DC: Federal Emergency Management Agency, Department of
Homeland Security.
Federal Emergency Management Agency (FEMA). 2014. Redefinition of
the Coastal Flood Hazard Zones in FEMA Region II: Analysis of the
Coastal Storm Surge Flood Frequencies. Final Report prepared for the
Federal Emergency Management Agency, Department of Homeland
Security. Fairfax, VA: Risk Assessment, Mapping, and Planning Partners.
Gulf Coast Community Protection and Recovery District. 2016a. Storm
Surge Suppression Study, Phase 2 Report, Texas General Land Office,
February 2016, 73 pp.
Gulf Coast Community Protection and Recovery District. 2016b. Storm
Surge Suppression Study, Phase 3 Report, Recommended Actions, Texas
General Land Office, June 2016, 32 pp.
Günther, H. 2005. WAM cycle 4.5 version 2.0. Institute for Coastal
Research, GKSS Research Centre, Geesthacht, Germany, 38 pp.
Interagency Performance Evaluation Task Force (IPET). 2009.
Performance evaluation of the New Orleans and Southeast Louisiana
Hurricane Protection System. Final Report of the Interagency
Performance Evaluation Task Force. Washington, DC: U.S. Army Corps of
Engineers, Department of the Army.
Jarvinen, B.R., C.J. Neumann, and M.A.S. Davis. 1984. A tropical cyclone
data tape for the North Atlantic Basin, 1886–1983: contents, limitations,
and uses. NOAA Tech. Memo 22. Miami, Florida: National Hurricane
Center, National Weather Service.
Jonkman, S.N., Lendering, K.T., van Berchum, E. C., Nillesen, A.,
Mooyaart, L., De Vries, P., van Ledden, M., Willems, A., Nooij, R., Coastal
spine system – interim design report, Version 0.6 (Final Draft), June 2015,
82 pp.

Jackson State University 509
Kennedy, A.B., Gravois, U., Zachry, B., Luettich, R., Whipple, T. Weaver,
R., Reynolds, Fleming, J. Chen, Q., and Avissar, R. (2010). “Rapidly
installed temporary gauging for waves and surge, and application to
Hurricane Gustav”, Continental Shelf Research 30, 1743-1752.
Kennedy, A.B., Gravois, U., Zachry, B.C., Westerink, J.J., Hope, M.E.,
Dietrich, J.C., Powell, M.D., Cox, A.T., Luettich, R.L., and Dean, R.G.
(2011). “Origin of the Hurricane Ike forerunner surge”, Geophys. Res.
Lett., L08805, doi:10.1029/2011GL047090.
Komen, G. J., L. Cavaleri, M. Donelan, K. Hasselmann, S. Hasselmann,
and P.A.E.M. Janssen. 1994. Dynamics and modelling of ocean waves.
Cambridge, UK: Cambridge University Press, 560 pages.
Landsea, C.W., G.A. Vecchi, L.Bengtsson, and T.R. Knutson. 2010. Impact
of Duration Thresholds on Atlantic Tropical Cyclone Counts. Journal of
Climate 23 (10): 2508–19.
Landsea, C.W. and J.L. Franklin. 2013. Atlantic hurricane database
uncertainty and presentation of a new database format. Monthly Weather
Review 141(10): 3576–3592.
Liu, Y. and Irish, J.L. 2017. Predicting tropical cyclone forerunner surge.
Proceedings of Coastal Dynamics 2017. Pg 47-51.
Luettich, R.A., Jr., J.J. Westerink, and N.W. Scheffner, 1992, ADCIRC: an
advanced three-dimensional circulation model for shelves coasts and
estuaries, report 1: theory and methodology of ADCIRC-2DDI and
ADCIRC-3DL, Dredging Research Program Technical Report DRP-92-6,
U.S. Army Engineers Waterways Experiment Station.
Mann, M.E., T.A. Sabbatelli, and U. Neu. 2007. Evidence for a Modest
Undercount Bias in Early Historical Atlantic Tropical Cyclone Counts.
Geophysical Research Letters 34(22): L22707.
Massey, T.C., Anderson, M.E., Smith, J.M., Gomez, J., and Jones, R., 2011.
STWAVE: Steady-State Spectral Wave Model User’s Manual for STWAVE.
Version 6.0. ERDC/CHL SR-11-1, U.S. Army Engineer Research and
Development Center.

Jackson State University 510
Minka, T. P. (2000) Deriving quadrature rules from Gaussian processes.
Technical Report, Statistics Department, Carnegie Mellon University.
Nadal-Caraballo, N.C., Melby, J.A., Gonzalez, V.M., and Cox, A.T., 2015.
North Atlantic Coast Comprehensive Study (NACCS), Coastal Storm
Hazards from Virginia to Maine, ERDC/CHL TR-15-5, U.S. Army Engineer
Research and Development Center. (draft, under review)
National Oceanic and Atmospheric Administration (NOAA), Tides and
Currents web site,
http://tidesandcurrents.noaa.gov/stations.html?type=Water+Levels
Neumann, C.J., G.W. Cry, E.L. Caso, and B.R. Jarvinen. 1985. Tropical
Cyclones of the North Atlantic Ocean, 1871-1980. Asheville, NC: National
Climatic Center.
O'Hagan, A. (1991). Bayes-Hermite quadrature. Journal of Statistical
Planning and Inference, No. 29.
Resio, D.T., S.J. Boc, L. Borgman, V. Cardone, A.T. Cox, W.R. Dally, R.G.
Dean, D. Divoky, E. Hirsh, J.L. Irish, D. Levinson, A. Niedoroda, M.D.
Powell, J.J. Ratcliff, V. Stutts, J. Suhada, G.R. Toro, and P.J. Vickery.
2007. White Paper on estimating hurricane inundation probabilities.
Consulting Report prepared by USACE for FEMA. Vicksburg, MS: U.S.
Army Engineer Research and Development Center.
Smith, J. M., A. R. Sherlock, and D. T. Resio. 2001. STWAVE: Steady-state
spectral wave model user’s manual for STWAVE, Version 3.0. ERDC/CHL
SR-01-1. Vicksburg, MS. U.S. Army Engineer Research and Development
Center.
Smith, J.M. 2007. Full-plane STWAVE with bottom friction: II. Model
overview. CHETN-I-75. U.S. Army Engineer Research and Development
Center.
Smith, J.M., Jensen, R.E., Kennedy, A.B., Dietrich, J.C., and Westerink,
J.J. Waves in Wetlands: Hurricane Gustav. Proceedings of the 32nd
Conference on Coastal Engineering. 2010.

Jackson State University 511
Texas Coastal Ocean Observation Network (TCOON) web site,
http://www.cbi.tamucc.edu/TCOON/
Thompson, E. F., and V. J. Cardone. 1996. Practical modeling of hurricane
surface wind fields. ASCE J. of Waterway, Port, Coastal and Ocean
Engineering, 122(4): 195-205.
Toro, G.R. 2008. Joint probability analysis of hurricane flood hazards for
Mississippi – Final URS Group Report in support of the FEMA-HMTAP
flood study of the State of Mississippi. Boulder CO: Risk Engineering.
Toro, G.R., D.T. Resio, D.D., A.W. Niedoroda, and C. Reed. 2010. Efficient
joint-probability methods for hurricane surge frequency analysis. Ocean
Engineering 37(1): 125–34.
U.S. Army Corps of Engineers (USACE). 2009a. Louisiana Coastal
Protection and Restoration (LACPR). Final Technical Report. New
Orleans, LA: New Orleans District, Mississippi Valley Division, USACE.
U.S. Army Corps of Engineers (USACE). 2009b. Mississippi Coastal
Improvements Program (MSCIP), Hancock, Harrison, and Jackson
Counties, Mississippi. Mobile, AL: Mobile District, South Atlantic
Division, USACE.
U.S. Weather Bureau. Monthly Weather Review, September 1900, Vol.
XXXVIII, No. 9.
Van Berchem, E.C., de Vries, P.A.L., de Kort, R.P.J. Galveston Bay Area
land Barrier preliminary design, Draft version 0.9, February 2016. 66 pp.
Vecchi, G.A. and T.R. Knutson. 2011. Estimating Annual Numbers of
Atlantic Hurricanes Missing from the HURDAT Database (1878–1965)
Using Ship Track Density. Journal of Climate 24(6): 1736–1746.
Vickery, P.J., and B.O. Blanton. 2008. North Carolina coastal flood
analysis system hurricane parameter development. Technical Report TR-
08-06. Chapel Hill, NC: RENCI Renaissance Computing Institute.
WAMDI Group, 1988. The WAM Model - A Third Generation Ocean Wave
Prediction Model. Journal of Physical Oceanography, 18, 1775-1810

Jackson State University 512
Westerink, J.J., R.A. Luettich, A.M. Baptista, N.W. Scheffner and P.
Farrar, 1992, Tide and storm surge predictions using finite element model,
ASCE Journal of Hydraulic Engineering, 118(10):1373-1390.
Worley, S.J., S.D. Woodruff, R.W. Reynolds, S.J. Lubker, and N. Lott.
2005. ICOADS Release 2.1 Data and Products. Journal of Climatology
25:823-842.

Jackson State University 513
Appendix A: Inundation Maps for
the Simulated Hurricane Ike and
the 100-yr and 500-yr Proxy
Storms

Jackson State University 514
A.1 Galveston Island (City of Galveston)
Simulated Hurricane Ike
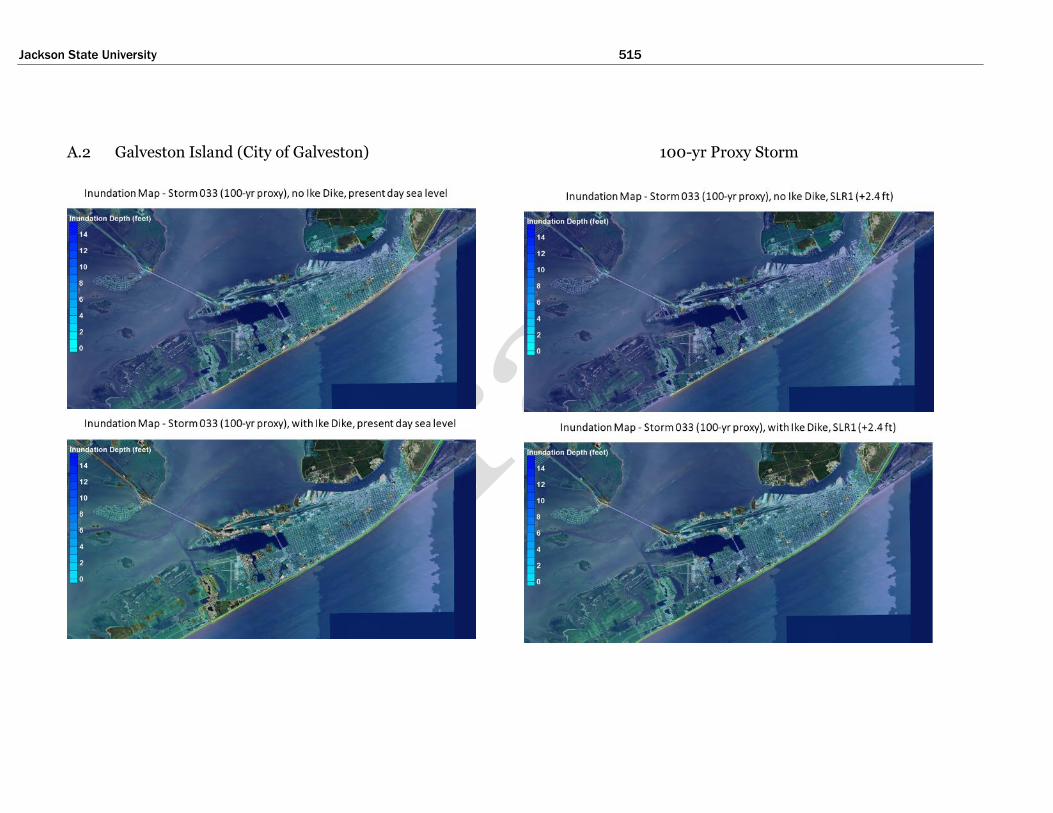
Jackson State University 515
A.2 Galveston Island (City of Galveston)
100-yr Proxy Storm

Jackson State University 516
A.3 Galveston Island (City of Galveston)
500-yr Proxy Storm

Jackson State University 517
A.4 Galveston Island (central portion)
Simulated Hurricane Ike

Jackson State University 518
A.5 Galveston Island (central portion)
100-yr Proxy Storm

Jackson State University 519
A.6 Galveston Island (central portion)
500-yr Proxy Storm
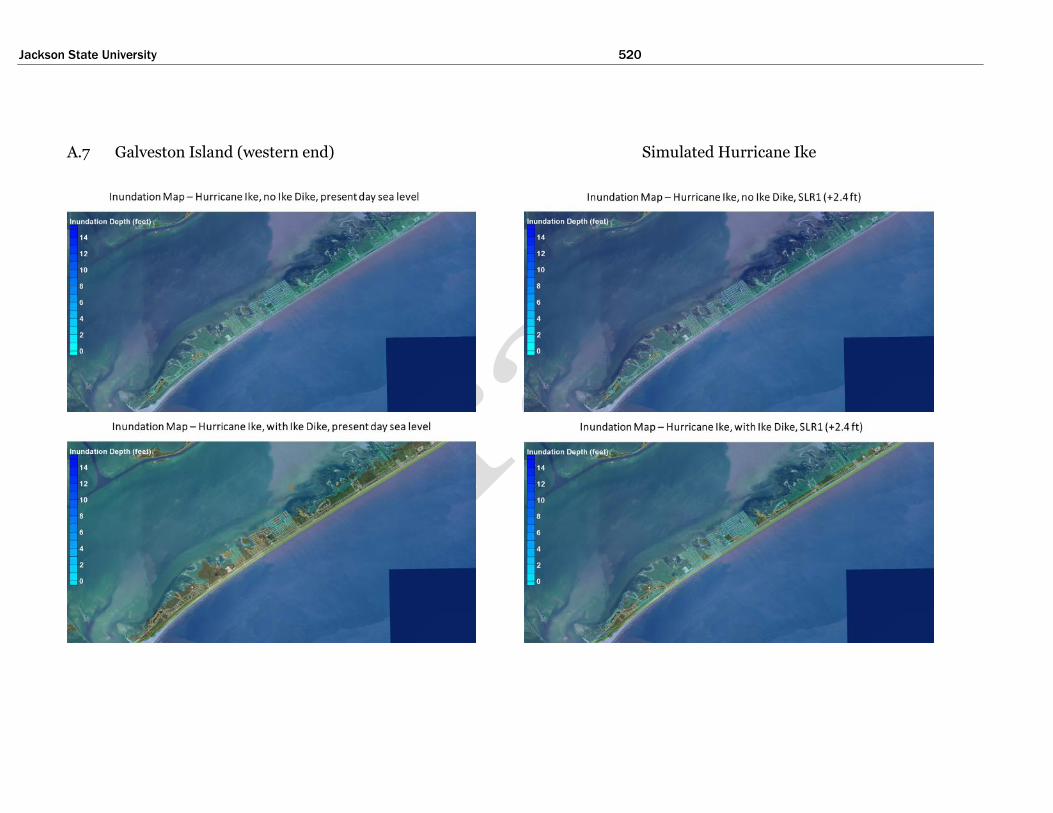
Jackson State University 520
A.7 Galveston Island (western end)
Simulated Hurricane Ike

Jackson State University 521
A.8 Galveston Island (western end)
100-yr Proxy Storm

Jackson State University 522
A.9 Galveston Island (western end)
500-yr Proxy Storm

Jackson State University 523
A.10 Bolivar Peninsula (western end)
Simulated Hurricane Ike
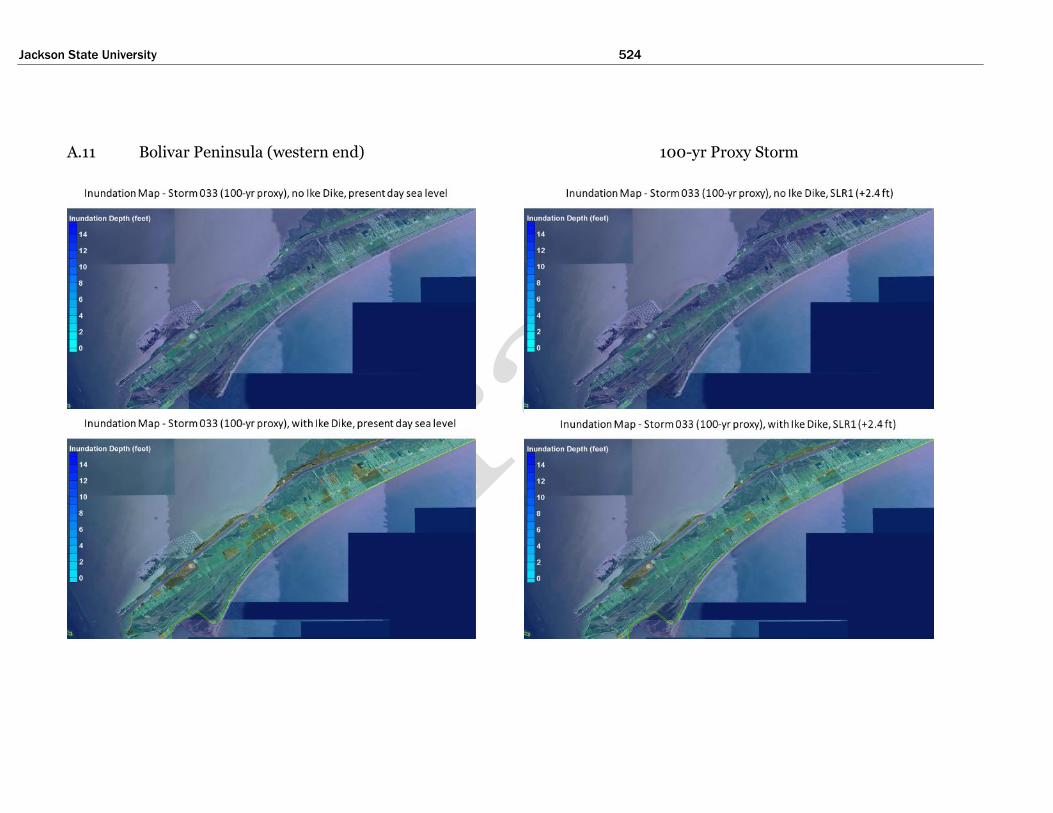
Jackson State University 524
A.11 Bolivar Peninsula (western end)
100-yr Proxy Storm
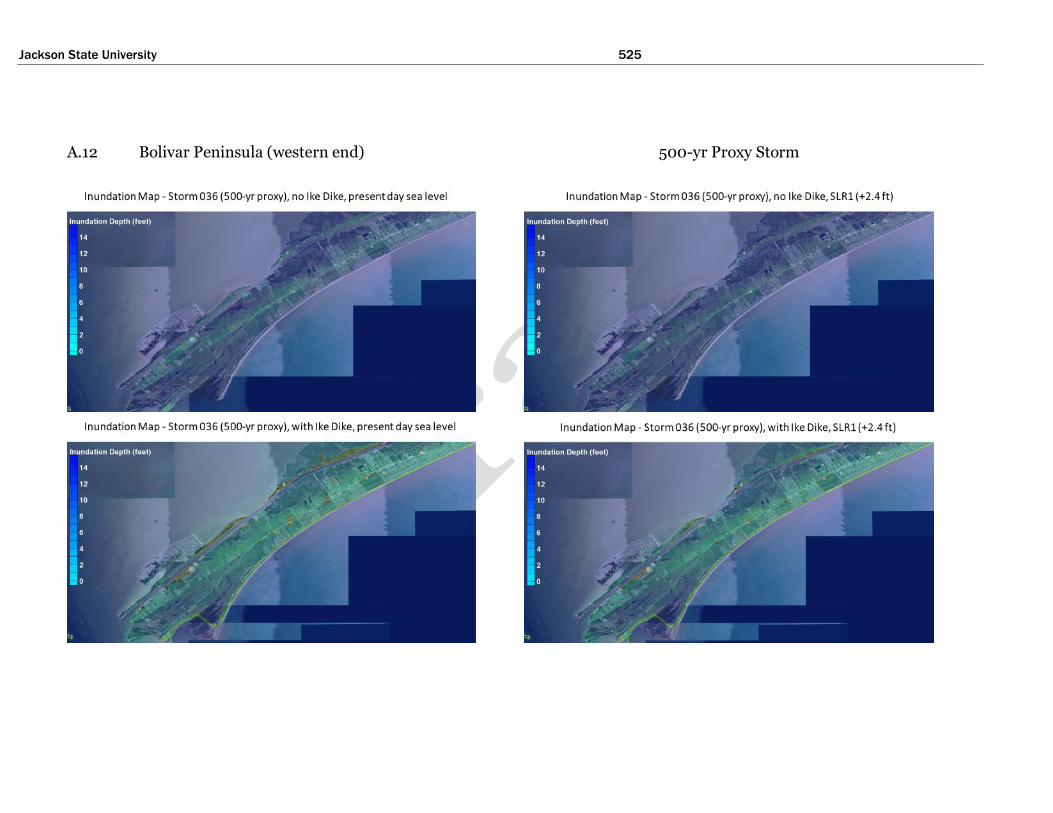
Jackson State University 525
A.12 Bolivar Peninsula (western end)
500-yr Proxy Storm

Jackson State University 526
A.13 Bolivar Peninsula (central portion)
Simulated Hurricane Ike

Jackson State University 527
A.14 Bolivar Peninsula (central portion)
100-yr Proxy Storm

Jackson State University 528
A.15 Bolivar Peninsula (central portion)
500-yr Proxy Storm

Jackson State University 529
A.16 Bolivar Peninsula (eastern end)
Simulated Hurricane Ike

Jackson State University 530
A.17 Bolivar Peninsula (eastern end)
100-yr Proxy Storm
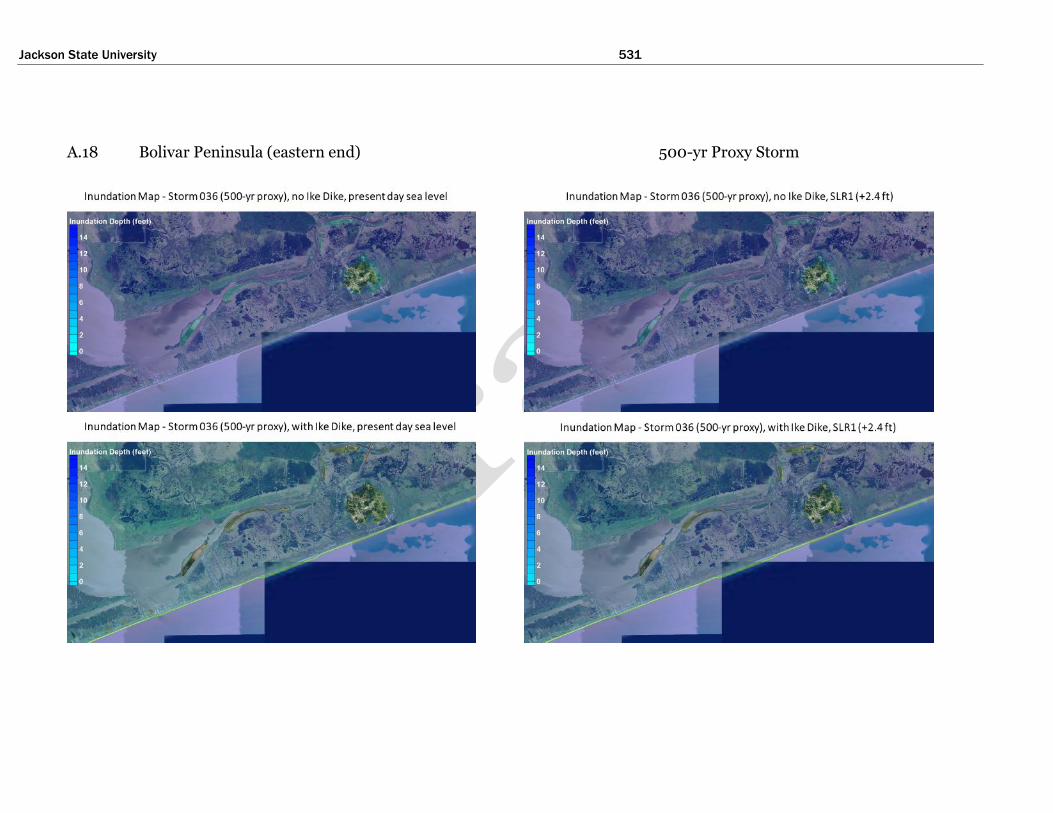
Jackson State University 531
A.18 Bolivar Peninsula (eastern end)
500-yr Proxy Storm

Jackson State University 532
A.19 Texas City (south), La Marque, Bayou Vista
Simulated Hurricane Ike
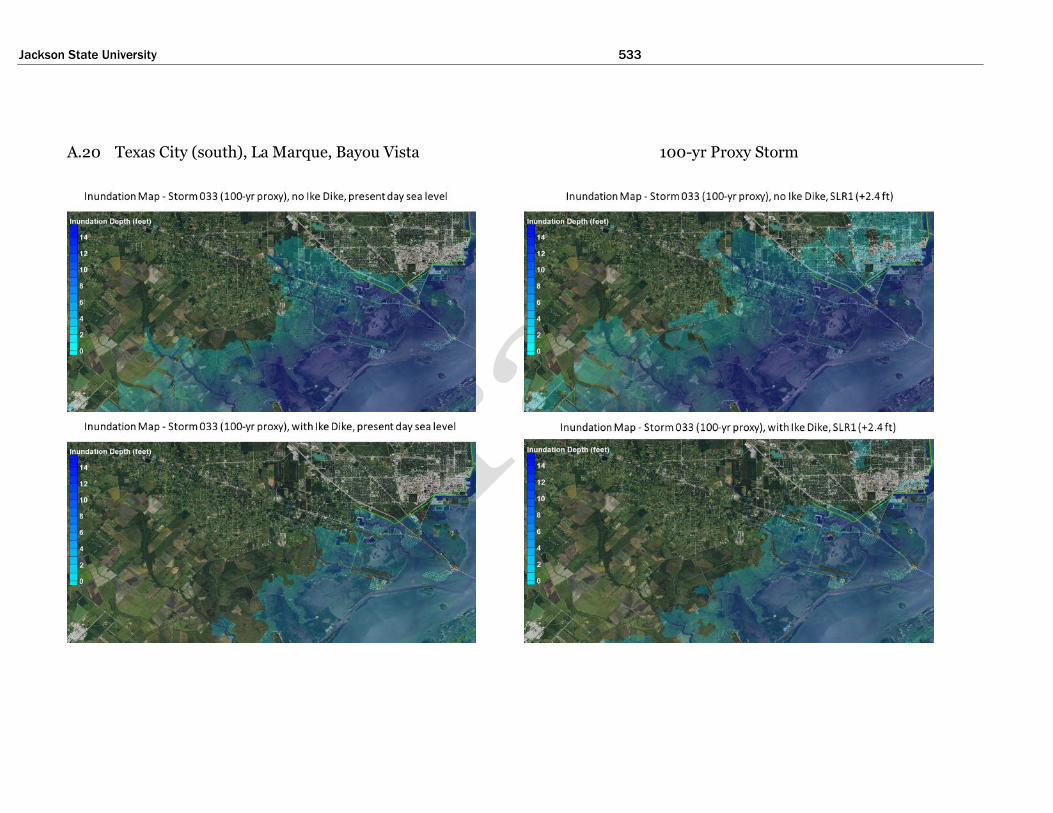
Jackson State University 533
A.20 Texas City (south), La Marque, Bayou Vista
100-yr Proxy Storm

Jackson State University 534
A21. Texas City (south), La Marque, Bayou Vista
500-yr Proxy Storm

Jackson State University 535
A.22 San Leon, Texas City (north), Bacliff, Dickinson
Simulated Hurricane Ike
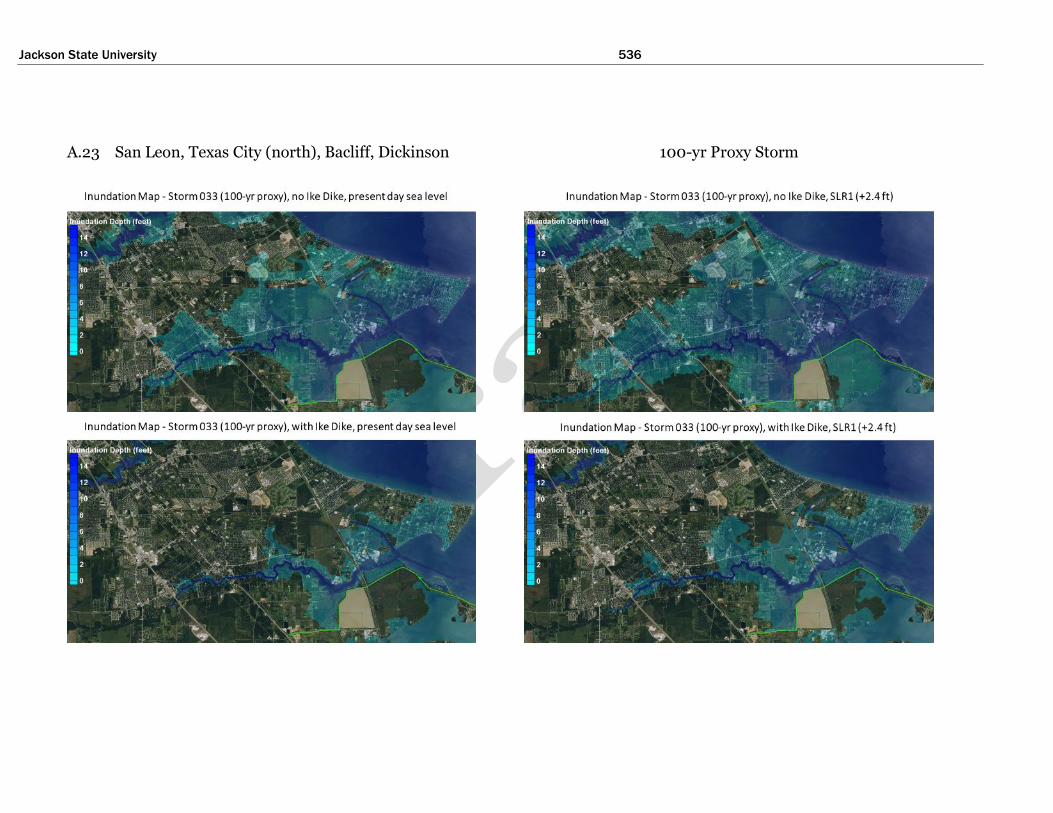
Jackson State University 536
A.23 San Leon, Texas City (north), Bacliff, Dickinson
100-yr Proxy Storm

Jackson State University 537
A.24 San Leon, Texas City (north), Bacliff, Dickinson
500-yr Proxy Storm
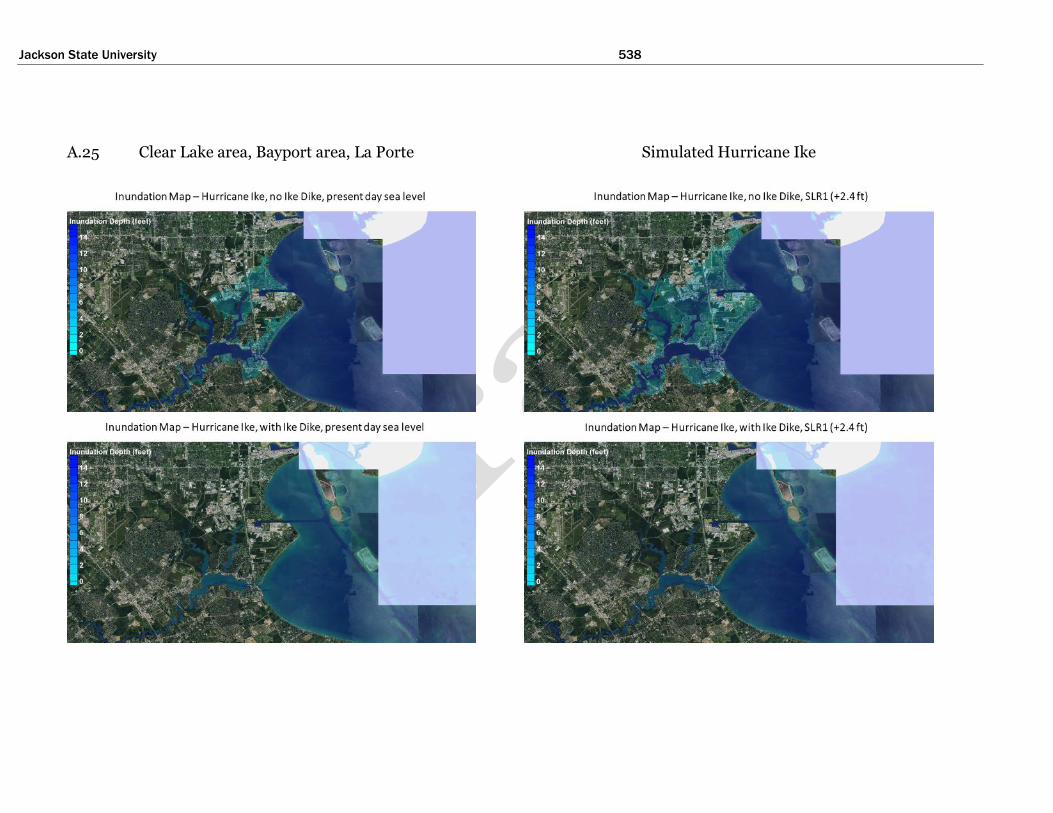
Jackson State University 538
A.25 Clear Lake area, Bayport area, La Porte
Simulated Hurricane Ike

Jackson State University 539
A.26 Clear Lake area, Bayport area, La Porte
100-yr Proxy Storm

Jackson State University 540
A.27 Clear Lake area, Bayport area, La Porte
500-yr Proxy Storm

Jackson State University 541
A.28 Upper Houston Ship Channel (eastern portion)
Simulated Hurricane Ike

Jackson State University 542
A.29 Upper Houston Ship Channel (eastern portion)
100-yr Proxy Storm

Jackson State University 543
A.30 Upper Houston Ship Channel (eastern portion)
500-yr Proxy Storm
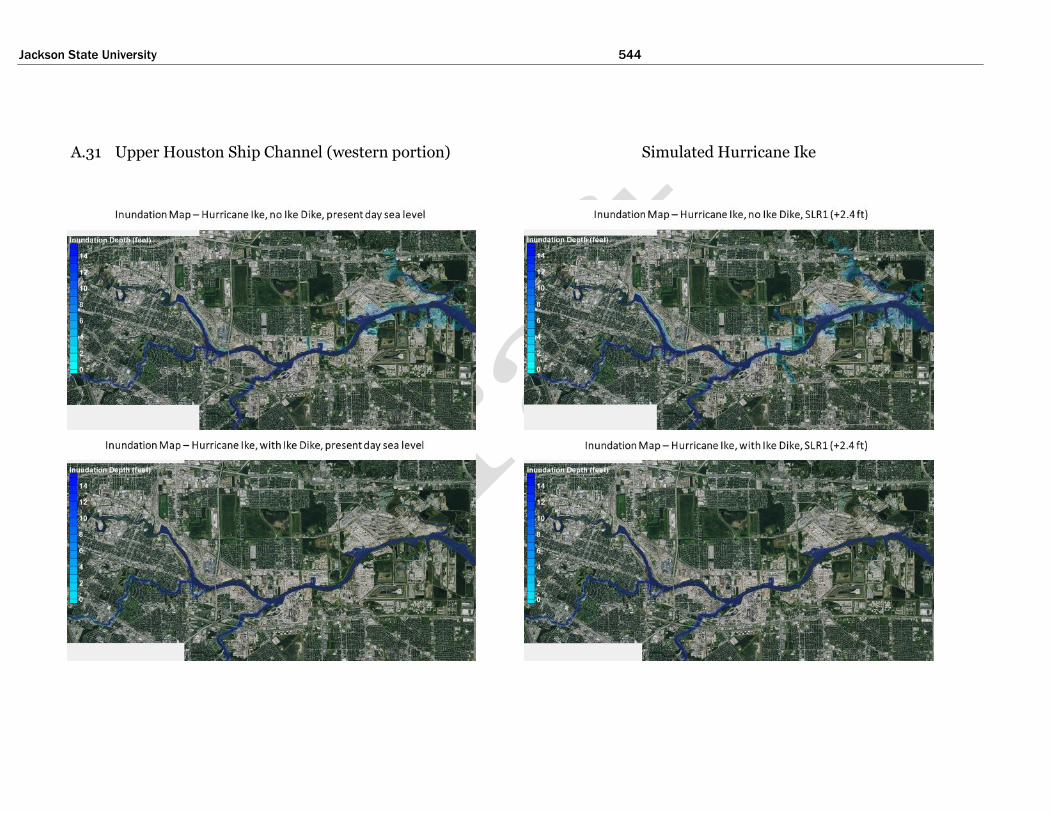
Jackson State University 544
A.31 Upper Houston Ship Channel (western portion)
Simulated Hurricane Ike

Jackson State University 545
A.32 Upper Houston Ship Channel (western portion)
100-yr Proxy Storm
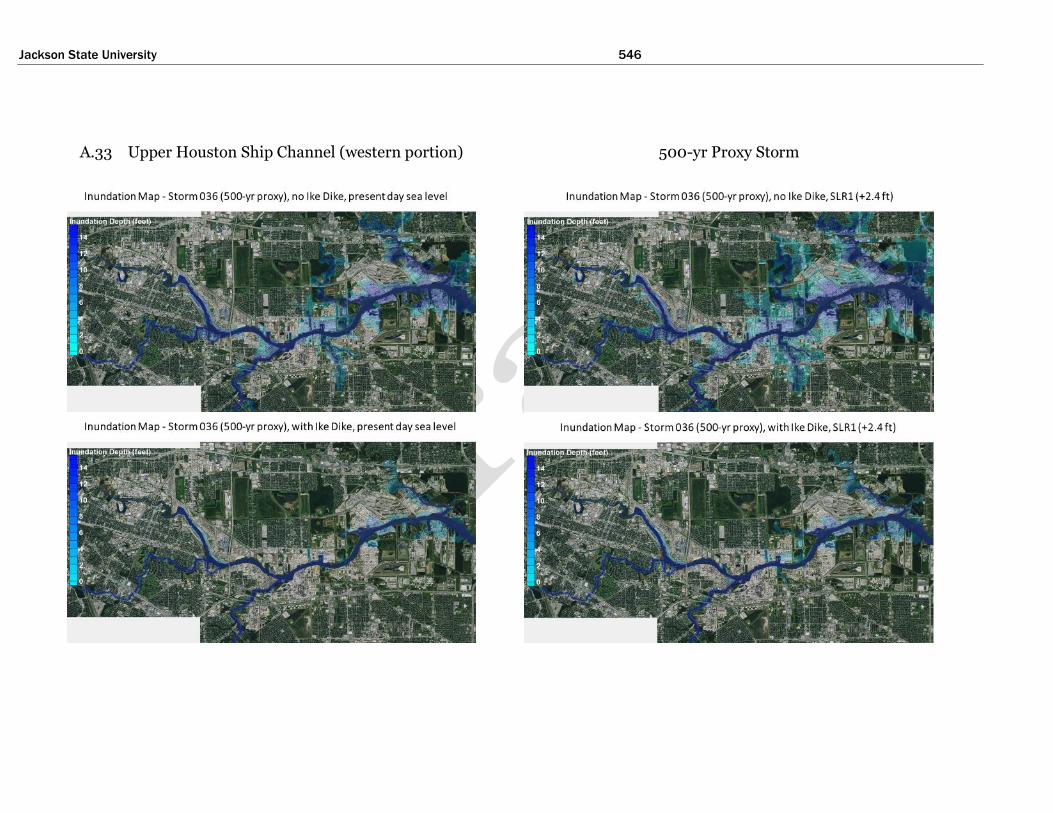
Jackson State University 546
A.33 Upper Houston Ship Channel (western portion)
500-yr Proxy Storm

Jackson State University 547
Appendix B: Water Surface
Elevations at Selected Locations for
Different Ike Dike Alignments
The tables in Appendix B show maximum water surface elevations, in feet NAVD88, for five different configurations of the Ike Dike concept at a series of locations in the Houston/Galveston region. Results reflect simulations made for the three proxy storms and Hurricane Ike. Each simulation was made for the future sea level scenario, SLR1, which is 2.4 ft above present-day sea level. Each column in the tables shows water surface elevation values for a particular dike configuration. The different configurations are identified using the following labels:
middle only – Alignment 2 (middle section only, dike that extends from the western end of Galveston Island to High Island) middle + east – Alignment 3 (middle + eastern sections, dike that extends from the western end of Galveston Island to High Island, then continues northward to Winnie) extended – extended Ike Dike (middle + eastern + western sections, dike that extends from Freeport to Sabine Pass) west+mid+east – Alignment 1a (middle + eastern + western sections, dike that extends from Freeport to High Island, then continues northward to Winnie) lowered gates – Alignment 1b (same as Alignment 1a except gate crest elevations are lowered for the navigation gate sections at Bolivar Roads and San Luis Pass)
The crest elevation of all dike sections is 17 ft NAVD88 unless noted in Chapter 13 for Alignment 1b.
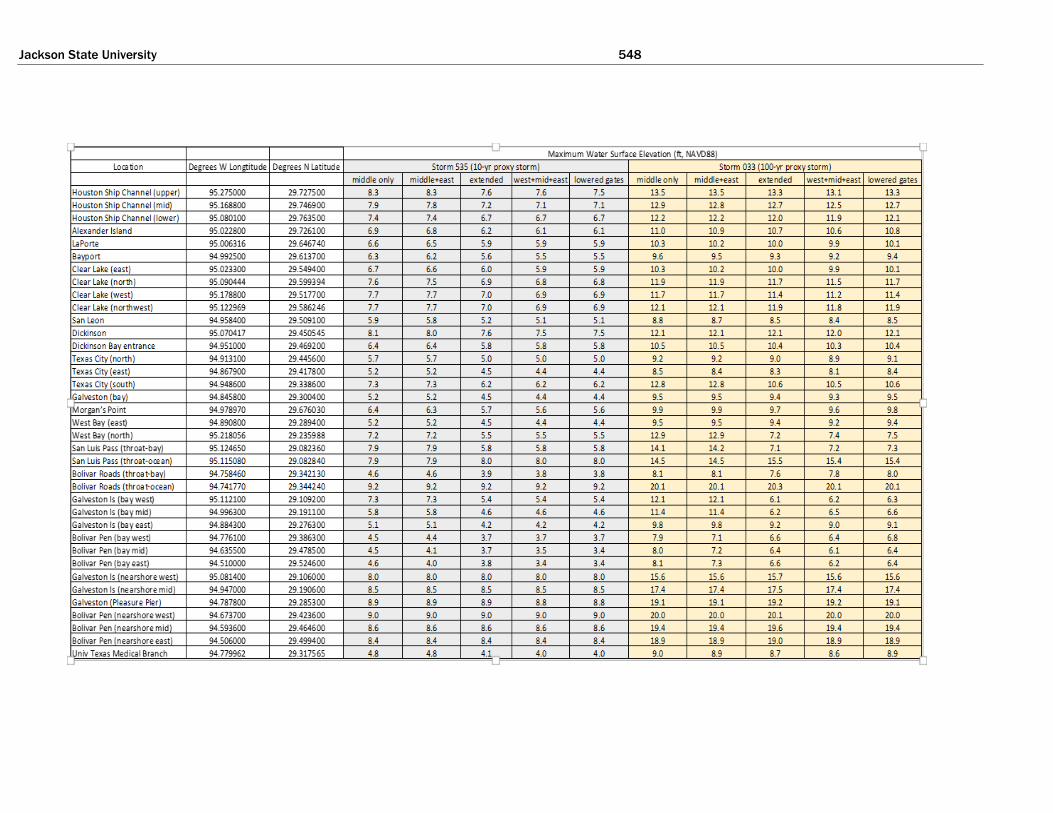
Jackson State University 548

Jackson State University 549
Location Degrees W Longtitude Degrees N Latitude
middle only middle+east extended west+mid+east lowered gates middle only middle+east extended west+mid+east lowered gates
Houston Ship Channel (upper) 95.275000 29.727500 15.9 15.9 15.8 15.6 15.8 7.2 6.3 5 4.2 4.6
Houston Ship Channel (mid) 95.168800 29.746900 15.3 15.2 15.1 14.9 15.2 7.2 6.3 5 4.2 4.4
Houston Ship Channel (lower) 95.080100 29.763500 14.5 14.4 14.3 14.1 14.4 7.2 6.3 5 4.3 4.6
Alexander Island 95.022800 29.726100 13.0 12.9 12.8 12.6 12.9 7.2 6.2 5 4.2 4.5
LaPorte 95.006316 29.646740 12.2 12.1 12.0 11.9 12.1 7.1 6.1 4.9 4.1 4.3
Bayport 94.992500 29.613700 11.3 11.2 11.1 10.9 11.2 7.0 6.1 4.9 4.1 4.3
Clear Lake (east) 95.023300 29.549400 12.1 12.1 11.9 11.8 11.9 7.0 6 5.1 4.6 4.8
Clear Lake (north) 95.090444 29.599394 13.9 13.9 13.7 13.6 13.7 7.0 6.1 4.8 4.2 4.3
Clear Lake (west) 95.178800 29.517700 13.8 13.7 13.5 13.4 13.5 7.0 6 5.1 4.7 4.8
Clear Lake (northwest) 95.122969 29.586246 14.2 14.1 14.0 13.9 14.0 7.0 6.1 4.8 4.3 4.4
San Leon 94.958400 29.509100 10.3 10.2 10.0 9.9 10.1 6.9 6.2 5.5 5.1 5.3
Dickinson 95.070417 29.450545 13.4 13.4 13.3 13.3 13.3 7.0 6.9 6.4 5.8 6.1
Dickinson Bay entrance 94.951000 29.469200 12.4 12.3 12.3 12.1 12.3 6.9 6.7 6.3 5.6 5.9
Texas City (north) 94.913100 29.445600 10.8 10.7 10.6 10.5 10.7 7.0 6.9 6.3 5.8 6
Texas City (east) 94.867900 29.417800 9.9 9.9 9.9 9.7 10.0 7.0 6.9 6.5 5.8 6.1
Texas City (south) 94.948600 29.338600 15.4 15.4 13.1 13.0 13.2 10.3 10.2 7.8 7 7.2
Galveston (bay) 94.845800 29.300400 11.0 11.0 11.0 10.8 11.1 7.7 7.5 7 6.3 6.7
Morgan’s Point 94.978970 29.676030 11.8 11.7 11.6 11.5 11.7 7.1 6.2 4.9 4.1 4.4
West Bay (east) 94.890800 29.289400 12.1 12.0 11.1 10.9 11.2 7.9 7.8 6.5 5.9 6.2
West Bay (north) 95.218056 29.235988 14.7 14.7 8.2 8.4 8.6 9.3 9.3 4.5 3.9 3.9
San Luis Pass (throat-bay) 95.124650 29.082360 16.0 16.0 7.6 7.8 8.0 10.9 11 7.1 6.3 6.3
San Luis Pass (throat-ocean) 95.115080 29.082840 16.5 16.5 17.7 17.6 17.5 11.2 11.2 11.6 11.5 11.5
Bolivar Roads (throat-bay) 94.758460 29.342130 9.7 9.1 8.8 8.5 9.0 7.2 7.5 7.1 6.3 6.3
Bolivar Roads (throat-ocean) 94.741770 29.344240 23.1 23.2 23.3 23.2 23.1 17.0 17 17.1 17 17
Galveston Is (bay west) 95.112100 29.109200 13.6 13.6 7.2 6.9 7.1 10.0 10 6.3 5.7 5.7
Galveston Is (bay mid) 94.996300 29.191100 13.4 13.4 7.6 7.7 8.0 9.2 9.2 6.4 5.9 5.9
Galveston Is (bay east) 94.884300 29.276300 12.1 12.1 10.9 10.8 10.9 8.3 8.2 6.5 5.9 6.1
Bolivar Pen (bay west) 94.776100 29.386300 9.7 9.1 8.1 8.1 8.3 6.8 6.7 6.3 5.6 5.9
Bolivar Pen (bay mid) 94.635500 29.478500 9.8 9.2 8.2 8.2 8.4 6.9 6 4.9 4.1 4.3
Bolivar Pen (bay east) 94.510000 29.524600 9.9 9.3 8.4 8.3 8.5 8.6 6.3 5.5 5.2 5.3
Galveston Is (nearshore west) 95.081400 29.106000 17.8 17.9 18.1 18.0 17.9 11.6 11.6 11.8 11.7 11.7
Galveston Is (nearshore mid) 94.947000 29.190600 20.2 20.2 20.4 20.2 20.2 13.3 13.3 13.4 13.4 13.3
Galveston (Pleasure Pier) 94.787800 29.285300 22.2 22.2 22.3 22.2 22.2 15.4 15.4 15.5 15.4 15.4
Bolivar Pen (nearshore west) 94.673700 29.423600 23.0 23.0 23.1 23.0 23.0 17.5 17.5 17.6 17.5 17.5
Bolivar Pen (nearshore mid) 94.593600 29.464600 22.2 22.3 22.4 22.3 22.3 18.0 18 18.1 17.9 17.9
Bolivar Pen (nearshore east) 94.506000 29.499400 21.5 21.6 21.7 21.6 21.6 18.2 18.3 18.5 18.3 18.3
Univ Texas Medical Branch 94.779962 29.317565 10.0 10.0 10.0 9.7 10.1 7.3 7.5 7.5 6.2 6.5
Maximum Water Surface Elevation (ft, NAVD88)
Storm 036 (500-yr proxy storm) Hurricane Ike

Jackson State University 1
Copyright © 2022 FDOKUMEN