
DRAFT TUBE SURGE RESEARCH FOREWORD In ...
205
DRAFT TUBE SURGE RESEARCH FOREWORD In November 1966 a meeting was called by the Chief Engineer of the Bureau to discuss problems which might arise by increasing the specific speed for the Grand,Coulee Third Powerplant turbines above normal Bureau practice. This meeting led to several others in which the problems of draft tube surging and mechanical vibrations were con- sidered. The conclusion of the series of meetings was that mechanical vibrations presented no particular concerns. However, the problem of draft tube surging was not resolved. To attack the surge problem a two-phase research program was initiated. The first phase consisted of meetings with a Board of Consultants to review and aid in the establishment of research goals. The second phase of the program was to conduct model and analytic investigations to: a. Study the fundar,Lental hydrodynamics b. Determine the variables controlling the surge c. Study mechanisms to control surging d. Determine characteristic parameters to be used in correlating model and prototype data The.Board of Consultants was convened in February 1968. It consisted of Dr. J. W. Daily, Dr. Hunter Rouse, and Mr. Ray Quick. After pre- sentations of the Bureau's concerns, library studies of surging, and analysis of model and prototype data, the Board concurred with the second phase research program. The reports and papers in this compilation are the direct result of the draft tube research program. The first three purposes of the program have been rather thoroughly investigated. Although the basic correlat- ing parameters in part d of the program have been established, some discrepancies still exist between the model and prototype characteris- tics. The causes of these discrepancies are presently being investigated.
-
Upload
khangminh22 -
Category
Documents
-
view
0 -
download
0
Transcript of DRAFT TUBE SURGE RESEARCH FOREWORD In ...

DRAFT TUBE SURGE RESEARCH
FOREWORD
In November 1966 a meeting was called by the Chief Engineer of the Bureau to discuss problems which might arise by increasing the specific speed for the Grand,Coulee Third Powerplant turbines above normal Bureau practice. This meeting led to several others in which the problems of draft tube surging and mechanical vibrations were con-sidered. The conclusion of the series of meetings was that mechanical vibrations presented no particular concerns. However, the problem of draft tube surging was not resolved.
To attack the surge problem a two-phase research program was initiated. The first phase consisted of meetings with a Board of Consultants to review and aid in the establishment of research goals. The second phase of the program was to conduct model and analytic investigations to:
a. Study the fundar,Lental hydrodynamics
b. Determine the variables controlling the surge
c. Study mechanisms to control surging
d. Determine characteristic parameters to be used in correlating model and prototype data
The.Board of Consultants was convened in February 1968. It consisted of Dr. J. W. Daily, Dr. Hunter Rouse, and Mr. Ray Quick. After pre-sentations of the Bureau's concerns, library studies of surging, and analysis of model and prototype data, the Board concurred with the second phase research program.
The reports and papers in this compilation are the direct result of the draft tube research program. The first three purposes of the program have been rather thoroughly investigated. Although the basic correlat-ing parameters in part d of the program have been established, some discrepancies still exist between the model and prototype characteris-tics. The causes of these discrepancies are presently being investigated.

T. FALVEY4 Dr - Ing.
REC-OCE-69-5
Dr. J. J. Cassidy Division of Research Office of Chief Engineer Bureau of Reclamation
October 1969

REC-OCE-69-5 Report No. HYD-591
EXPERIMENTAL STUDY AND ANALYSIS
OF DRAFT-TUBE SURGING
by
Dr. J. J. Cassidy
October 1969
HYDRAULICS BRANCH DIVISION OF RESEARCH
UNITED STATES DEPARTMENT OF THE INTERIOR * BUREAU OF RECLAMATION
Office of Chief Engineer . Denver, Colorado

ACKNOWLEDGEMENTS
This study was conducted while the writer (Professor of Civil Engineering, University of Missouri, Columbia, Missouri) was a Ford Foundation Engineer Resident with the Hydraulics Branch, Division of Research. Design of experimental equipment was performed primarily by Dr. H. T. Falvey. Mr. U. J. Palde collected a portion of the data while Mr. W. M. Batts performed the photography. Turbine performance data and advice relative to hydraulic machinery were furnished by Mr. C. G. Bates and Mr. G. H. Johnson, Hydraulic Machinery Branch, Division of Design. The manuscript was reviewed critically by Dr. H. T. Falvey. Head, Hydraulics Research Section. The entire project was under the direction of Mr. H. M. Martin, Hydraulics Branch Chief.

CONTENTS
Page
Abstract.................. ............................... ii Nomenclature ............... ............................... iv Purpose................................................... 1 Conclusions ................................................ 1 Applications................ ............................... . 1 ntroductior. ............................................... . 1 Equipment................................................. 2 Analysis.................................................. 3 Experimental Procedure ........................................ . 4
The Onset of Surging ........................................ . 4 Frequency and Amplitude of Surging ............................... . 4 TubesStudied ............. ............................... . 4 Flow Visualization .. ........................................ . 4
Discussion of Results ........... ............................... . 4 Influence of Viscosity . .. ..................................... . 4 Nature of the Onset of Surging .... ............................... . 4 Frequency and Pressure Characteristics .......................... .... . 5
Application to. Hydraulic Turbines .. ................................ . 6 Analysis.................. ............................... 6 Effect of Tailwater ......................................... . 7
Model-Prototype Similitude . ............................... ...... . 8
Figures
Effect of Rotation on Flow Pattern .............. ................... . 1 Experimental Apparatus ......... ... ........................... . 2 Schematic Diagram of Apparatus .... ... ........................... . 3 SmokeGenerator ............ ............................... . 4 Photographs of Flow Patterns ....... ............................. . 5 Photographs of Flow Patterns ...... .............................. . 6 Draft Tubes and Flow Patterns ................................... . 7 Critical Values of E2D(pQ2 ....... .. ..... ........................ . 8 Velocity and Pressure Traces Photographed on the Oscilloscope ................ . 9 Frequency Parameter as a Function of Reynolds Number for Straight Tubes ......... . 10 Pressure Parameter as a Function of Reynolds Number for Straight Tubes ..... .. ... . 11 Frequency Parameter as a Function of Reynolds Number for the Fontenelle Draft Tube . . . 12 Frequency Parameter for all Tubes as a Function of Momentum Parameter .......... . 13 Pressure Parameter for all Tubes as a Function of Momentum Parameter ........... . 14 Velocity Diagrams for a Turbine Runner .............................. . 15 Operating Characteristics for Fontenelle Model Turbine ..................... . 16 Efficiency Hill-Hoover Replacement-Runner Model Data . ................... . 17 Hoover Model Data—Frequency, Momentum, a .......................... . 18 Hoover Replacement-Runner Model Data, Pressure Parameter Versus Momentum
Parameter for Various Values of a ............... ................. . 19 Schematic Diagram of Velocity Vectors on Wicket Gates and the Runner ........... . 20

ABSTRACT
Draft-tube surge experiments were conducted with models of draft tubes, using air as the fluid. The occurrence, frequency, and amplitude of surges were correlated with flow and draft-tube geometry variables. Studies show that surges arise when angular momentum reaches a critical value relative to linear momentum. Surge frequency and peak-to-peak pressures are independent of viscous effects for Reynolds numbers above 80,000, and are correlated with a dimensionless momentum parameter for a particular draft-tube shape. A criterion is given for predicting the surging threshold. Results of the study are applied to analysis of draft-tube surging in the Fontenelle and Hoover replacement turbines.
DESCRIPTORS—/ `draft tubes/ *turbines/ *hydroelectric plants/ hydraulic machinery/ fluid mechanics/ dimensional analysis/ *surges/ air/ unsteady flow/ pressure/ laboratory tests/ model tests/ fluid flow/ non-uniform flow IDENTIFIERS—/ fluid dynamics/ hydraulic resonance

Where approximate or nominal English units- are used to express a value --or range of values, the converted metric units in parentheses are also approximate or nominal. Where precise English units are used, the converted metric units are expressed as equally significant values. A table of conversion factors—BRITISH TO METRIC UNITS OF MEASUREMENT—is provided at the end of this report.

NOMENCLATURE
Unless otherwise noted, all dimensions are in the foot-pound-second (meter-kilogram-second) system.
A = area
B = height of wicket gates
D = diameter of draft-tube throat
DR = runner diameter at midpoint of wicket gates
H = net head across turbine
HB = atmospheric pressure head minus vapor pressure head
HS= static draft head on turbine (negative for turbines set above tailwater)
L = length of draft tube
P = power
oP = peak-to-peak value of pressure surge
Q = discharge
R = Reynolds number = WD/v
V = velocity
W = Q/A = average axial velocity
f = frequency
fn = natural frequency
g = acceleration due to gravity
n = rotation speed (rev/sec)
r = coordinate in radial direction
u = velocity component in radial direction
v = velocity component in peripheral direction
w = velocity component in axial direction
z = coordinate in axial direction
12 = rate of flow of angular momentum
-f =specific weight
_ irDn ¢ 60
= peripheral speed coefficient; also, a function
iv

a = angle between a radial line and velocity vector
6 = coordinate angle in cylindrical coordinate system
p = kinematic viscosity of fluid
7r = 3.1416
p = fluid density
a = (HB - HS)/H = turbine cavitation number
w = angular velocity (rad/sec)

PURPOSE
The analysis and experimental investigation were conducted in order to gain an understanding of draft-tube surging and to correlate occurrence, frequency, and amplitude of draft-tube surges with flow and geometric variables involved in turbine and draft-tube flow.
CONCLUSIONS
1. Draft-tube surges are a stable unsteady form of flow arising when the rate of flow of angular momentum reaches a critical value relative to the rate of flow of linear momentum. The dimensionless momentum parameter 2D/p Q2 has a critical value above which surging exists.
2. Frequency and peak-to-peak values of draft-tube pressure surges are independent of viscous effects for Reynolds numbers above approximately 80,000. Prototype Reynolds numbers greatly exceed 80,000.
3. Dimensionless parameters for peak-to-peak pressures and frequency of draft-tube surging can be correlated with a dimensionless momentum parameter for a particular draft-tube geometry.
APPLICATIONS
The results of this study can be applied to the analysis of flow through turbine draft tubes, or conceivably, to flow through pump intakes. The surge frequency and amplitude predicted by similitude yield reasonable prototype values. If the analysis for turbines is fully developed, designers could conceivably predict in advance operational conditions at which surging would occur for a particular unit. However, it would be highly desirable to correlate the results of this study with the frequency, amplitude, and threshold of surging observed in a carefully planned prototype observation, one in which discharge, head, gate, plant sigma, and turbine geometry as well as surge characteristics are observed or known.
INTRODUCTION
Draft-tube surges have been observed in hydroelectric plants using Francis-type turbines apparently since the
time these units first went into operation.' Effects of surges have been observed as power swings or general noise and vibration. In most cases powerplant operators rapidly learn where the "rough" areas of operation are and avoid operation in those regions. In some cases vertical vanes are spaced around the periphery of the draft-tube entrances in an attempt to modify or eliminate the swirl in the flow and thus reduce the severity of, or eliminate, surging. Air is also frequently admitted below the runner to "smooth out" operation.
The phenomenon of surging is known to be due to rotation of flow passing through the draft tube. Pictures of the helical vortex thus generated have been taken by Wigle2 and Hosoi3 to mention only two. However, very little in the way of quantitative information, useful to the engineer, is currently available beyond the equation proposed by Rheingansl for the expected frequency of the surge:
f= 3.6
f is the surge frequency in cycles per second and n is the turbine rotational speed in revolutions per second.
Purely axial flow through a straight tube is stable once the transition to a fully turbulent flow takes place. If some rotation is superimposed on this flow, however, the flow pattern makes a drastic change from that of the purely axial flow 4 The axial velocity decreases on the centerline and increases near the wall. The peripheral component of velocity also increases near the wall. Figure (1) shows a typical velocity distribution in axial and axial-with-rotation flows. If the discharge is kept constant and the rotational velocity of the flow is increased, a radical change in flow pattern occurs. A reversal in flow takes place at the tube axis and a stagnation point is developed on the centerline. On the centerline, flow is toward the stagnation point from both the upstream and downstream directions. The development of reversed flow along the axis of the tube has been referred to as vortex breakdown.6
Basic investigation of this vortex breakdown first occurred not as a result of interest on the part of turbine users or manufacturers, but rather as the result
I Rheingans, W. J., "Power Swings in Hydroelectric Power Plants," Trans. ASME, Vol. 62, 1940. 2 Wigle, D. A., et al, "Hydraulic Model Studies for Turbines at Grand Coulee Powerplant," U.S. Bureau of Reclamation, Hydraulic Laboratory Report, HYD-198, Denver, Colorado, 1946. 3Hosoi, Y., "Experimental Investigations of Pressure Surge in Draft Tubes of Francis Water Turbines," Hitachi
Review, V. 14, No. 12, 1965. 4 Kreith, F. and 0. K. Sonju, "The Decay of a Turbulent Swirl in a Pipe," JOURNAL OF FLUID MECHANICS,
Vol. 22, Part 2, 1965. 6 Benjamin, T. B., "Theory of the Vortex Breakdown Phenomenon," JOURNAL OF FLUID MECHANICS, Vol.
14, 1962.

of observations made by people interested in acousticss and the "breakdown" observed on the vortices forming above delta wings on high-speed modern airplanes.6
The analytical study by Benjamin indicated that the "breakdown" was actually a transition from one stable regime of flow to another. He showed that prior to the breakdown an axisymmetric standing wave could not exist in the flow while the breakdown produced a flow which could support such a wave. Benjamin used the well-understood hydraulic jump as an analogy to what occurred in the vortex breakdown.
Quantitative information on the occurrence of vortex breakdown was apparently first obtained by Squire? in an analytical study. According to Squire's theory, breakdown occurred when the maximum swirl angle (the angle whose tangent is v/w - See Figure 1) was 520 or greater.
Harvey$ in an experimental study using air flowing through a straight tube measured a maximum swirl angle of 510 using smoke injected in the flow just upstream from the breakdown.
If, after breakdown has occurred, the rotational velocity of the fluid is further increased, the flow downstream from the point of transition forms a precessing helical vortex. It is the precession of this vortex which produces the pressure surge. This aspect of the phenomenon, which is the most important to the engineer, has received very little basic investigation.
Chanaud9 studied both the steady and unsteady part of the transition. He found that the Strouhal number fD/W (D is tube diameter and W is the average axial velocity) of the precessing vortex depended upon the tube length to diameter ratio L/D and the axial Reynolds number of the flow. Unfortunately, Chanaud's data regarding rotation are in error because he assumed that the flow moving through a revolving tube was set into rigid body motion equivalent to that of the pipe. However, qualitatively his results are of considerable interest. He found that the transition to helical-spiral (surging) flow took place more readily at larger Reynolds numbers. For Reynolds numbers below 250 unsteady flow could not be produced in the tube regardless of the degree of rotation imparted to the fluid.
Quantitative information regarding both the onset of surging and the characteristics of frequency and amplitude of the resultant surge would be of considerable value to the engineer concerned with design and selection of hydraulic machinery. This study was designed to produce both qualitative information on the nature of surges in contemporary turbine draft tubes, and to obtain quantitative information on occurrence and characteristics of surge frequency and amplitude.
EQUIPMENT
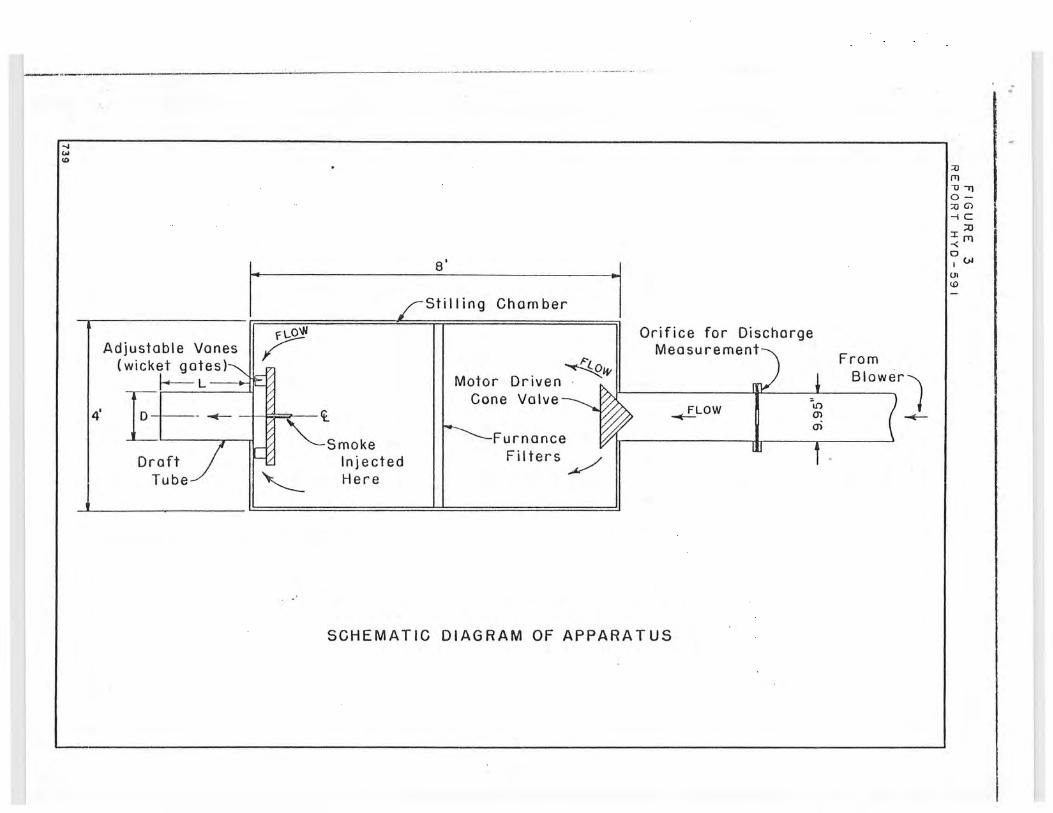
For the sake of convenience, it was decided to conduct the experiments with air as the fluid. medium. The apparatus is shown in photographs in Figure 2 and schematically in Figure 3. Because a study involving a model of the Fontenelle draft tube and spiral case had been previously conducted, many of the details of the experimental apparatus were actually scale models of corresponding Fontennelle components' o
Because the phenomena is quite complex at best, it was highly desirable, at least for this initial study, to simplify the geometry as much as possible. Hence, no turbine runner was to be installed in the draft tube. Rotation was introduced as the flow passed through inclined vanes in the radial approach to the draft tube. Radial inclination of these vanes was readily adjusted by a control extending outside the stilling chamber. With this control the angle between the gates and a radial line could be set at any value between 00 and 52.50. At 00 the gates are fully open and no rotation is imparted to the flow.
Discharge was controlled by the motor-driven cone valve at the entrance to the stilling chamber and computed from the differential pressure across the orifice in the supply line. The supply line leading from the fan to the stilling chamber had a 9.952-inch inside diameter and the orifice diameter was 4.801 inches. Pressure differential across the orifice was measured using a calibrated 2.5 psig Statham pressure cell.
Piezometers (1/16 inch in diameter) were installed in the draft tubes for the measurement of peak-to-peak pressures of the surges. A 2.5 psig Statham pressure cell was used as a transducer for the pressure surges. After amplification, the signal from the pressure cell was displayed on an oscilloscope equipped with a variable
s Chenaud, R. C., "Experiments Concerning the Vortex Whistle," JOURNAL OF THE ACOUSTICAL SOCIETY OF AMERICA, Vol. 35, No. 7, 1963. 7 Squire, H. B., "Analysis of the Vortex Breakdown Phenomenon, Part I," Aero, Dept., Imperial College, Rep. No. 102, 1960. B Harvey, J. K., "Some Observations of the Vortex Breakdown Phenomenon," JOURNAL OF FLUID MECHANICS, Vol. 14, 1962. 9 Chenaud, R. C., "Observations of Oscillatory Motion in Certain Swirling Flows," JOURNAL OF FLUID MECHANICS, Vol. 21, 1965. 10 Falvey, H. T., "Hydraulic Model Studies of the Fontenelle Powerplant Draft Tube and Tailrace," Report No. Hyd-571, U.S. Bureau of Reclamation, Denver, Colorado, August 1967.
2

persistence screen. With the variable persistence feature it was possible to retain as many traces as desired and then store the result as a permanent image. When stored, the resultant image was static and could be scrutinized for frequency and peak-to-peak value.
The peak-to-peak value oP of the pressure produced at a particular point by the surge can be assumed to be a function of the same variables as the frequency. Thus,
AP = 02 (p, v, D, L, Q, 2) (4)
Taps were also mounted on the draft tubes so that velocity measurements could be made using a hot-film anemometer. The signal from the anemometer could also be displayed on the oscilloscope. Calibration of the hot-film was accomplished by placing the probe in an air jet, the velocity of which had been measured using a stagnation tube and a differential manometer.
ANALYSIS
In order to be able to utilize the results of this study in an actual hydraulic-turbine application, it was necessary to generalize the results in a basic fashion. Complete analytical solution to the problem of draft-tube surging would naturally provide the necessary generalization. However, such a solution seems as yet to be unattainable. An experimental study was therefore indicated.
When faced with the need to generalize experimental results, dimensional analysis can be very useful if the phenomenon is at least partially understood.
In this case, the assumption was made that the frequency of the surge is a function of only the fluid density p, the fluid viscosity v, the draft tube diameter D and Length L, the discharge Q, and the rate of flow of angular momentum Q. Thus,
f =q5 (p, v, D, L, Q, E2) (2)
Application of standard techniques of dimensional analysis to Equation (2) produces
fD3 (
OD ~ SZ~ (3) pQ2 ' D Dv
as one possible set of dimensionless parameters. The frequency parameter is actually a form of Strouhal number written in terms of discharge rather than mean velocity. The first parameter on the right of Equation (3) is a dimensionless ratio of angular-momentum flux to linear-momentum flux. If the discharge is held constant and angular-momentum flux is increased for a particular tube the magnitude of the momentum parameter is increased. The last parameter on the right of Equation (3) is simply the Reynolds number and will be represented as R = WD/v throughout the remainder of this report.
or in one possible combination of dimensionless terms
3 L R) (5) ~2D = 0
3 (.pQ p
Two things should be noted at this point. First, the role of draft-tube shape cannot be incorporated in this type of analysis and data plotted according to Equations (3) and (5) will produce different results for each tube shape tested. Second, the parameter 2D/pQ2 is obviously a gross parameter quite in contrast to the local swirl angle tan leas used by previous analysts and experimenters. Because of its gross feature, this momentum parameter is easily utilized, but in utilizing it, the assumption must be made that regardless of the manner in which angular momentum is introduced into the flow the resulting flow pattern will be the same as long as S2D/pQ2 is constant.
With the exception of 2 all variables in Equations (3) and (5) could be measured directly with the experimental equipment. The flux of angular momentum was computed from the geometry of the inlet to the draft tube as follows:
From the gate diagram (see Figure 20) 21r
Q fVo Cos adA=rVoBr Cos ado
J o where B is the height of the wicket gates.
Also, 2a
92 = p rVo cos a (rVo sin a)dA = opVo2Br2 cos a sin a d e
Assuming that Vo, B, and r are constant with respect to p
Q= V cos a 21rrB
O = pVo2 cos a sin a 21r r2B
Thus,
pQ2 2D tw a (6) irB
Hence, the momentum parameter is a function of only the gate opening, draft-tube inlet diameter, and height of gates.
3

EXPERIMENTAL PROCEDURE
A. THE ONSET OF SURGING
A qualitative and quantitative description of the transition from steady uniformly-swirling flow to unsteady surging flow was obtained by two separate experimental methods. At average velocities below 5 fps (1.64 m/s) smoke was injected on the centerline of the tube at the upstream cover. The gate angle--and thus QD/pQ2 --at which the transition took place was recorded. Because the longitudinal location of the
transition point moved upstream as 2D/pQ2 was increased, two critical values of the momentum parameter were recorded: (1) When the transition occurred just within the tube exit; and (2) when surging occurred throughout the tube.
A hot-film anemometer was used to detect transition to surging at high average flow velocities. A cylindrical hot-film probe was positioned at thee-centerline near the tube exit. Flow was established with no rotation. Then S2D/pQ2 was gradually increased (by closing the wicket gates). The value of S2D/pQ2 at which a reversal in velocity was noted at the centerline was recorded as the critical value. At these large velocities, transition appeared to progress rapidly upstream. Two critical values were not observed since flow seemed to become unsteady throughout the entire tube almost simultaneously.
B. FREQUENCY AND AMPLITUDE OF SURGING
Two separate 'measurements were made of surge frequency. Using the previously described pressure cell to detect pressure surging and cylindrical hot-film probe to detect velocity near the piezometer, traces of velocity and pressure were displayed simultaneously on the dual-beam oscilloscope. Figure (9) is a picture of two traces thus made. Approximately 50 traces of both velocity and pressure were retained for the photograph in Figure (9) through use of the persistence feature of the oscilloscope screen.
Peak-to-peak pressures were obtained by measuring the peak-to-peak voltage of the oscilloscope display and relating this to the calibrated output of the pressure cell and its associated amplifier.
Experimental procedure was the same for each tube. A particular gate angle was set with maximum obtainable discharge (approximately 10 ft3/sec-- 0.283 m3/sec). The discharge was then successively decreased in small
increments by closing the cone valve. Frequency and peak-to-peak pressures were measured and recorded for each discharge.
C. TUBES STUDIED
Straight tubes studied included two different diameters-6.13 inches (15.56 cm), 3.44 inches (8.76 cm)--with lengths giving rise to L/D ratios ranging from 1.63 to 7.20. In addition, a model of the Fontenelle draft tube with a throat diameter of 6.13 inches (15.26 cm) and a straight cone having the same expansion ratio, throat diameter, and centerline length as the draft tube were also studied. All tubes were formed from transparent plexiglass in order to facilitate flow visualization. The draft tube can be seen in Figure (2) and the remaining tubes studied are shown in Figure
(7).
D. FLOW VISUALIZATION
Smoke was chosen as the most desirable agent for obtaining flow visualization for this particular study. After some experimentation, pipe tobacco proved to produce the least objectionable of the varieties of smoke which were dense enough to provide good visualization. The smoke generator developed for this study is shown schematically in Figure (4).
DISCUSSION OF RESULTS
A. INFLUENCE OF VISCOSITY
Figures 10, 11, and 12 show dimensionless frequency and pressure plotted against Reynolds number for straight pipes and the Fontenelle draft tube. The frequency and pressure parameters are both seen to be essentially constant for Reynolds numbers beyond 80,000. Since a prototype hydraulic turbine would have a Reynolds number well above this (for Fontenelle design conditions R = 18,600,000) viscosity does not seem to be an important variable in surging of hydraulic turbines.
B. NATURE OF THE ONSET OF SURGING
As pointed out in the introduction, most investigators have utilized the magnitude of the swirl angle as the predictor of the onset of vortex breakdown. In each case observed here the breakdown began at the center of the pipe. Invariably the maximum swirl angle is found at some distance away from the centerline. In fact Harvey8 found it to occur quite near the
4

boundary. Thus, it would seem that it is not the swirl angle itself which is important, but rather the combined rotational and axial gross characteristics.
The maximum swirl angle, like the onset of surging itself, is more likely a dependent quantity governed by the particular combination of angular-momentum flux, discharge, and draft-tube diameter. However, this assumes that regardless of how angular momemtum is introduced into the draft tube only one unique flow pattern will develop for each value of 2D/pQ2 In this study, angular momentum was introduced in only one manner--the wicket gates--and, hence, that assumption was not verified or disproved. However, sharp-edged and bell-mouth entrances were used on the 0.286-foot-diameter tube. Equal-length tubes were found to have the same dimensionless frequency and pressure characteristics regardless of entrance condition.
The onset of surging took place in an interesting chain of events. Figure (5a) shows the flow pattern during steady rotating flow. As the wicket gates were closed, increasing the angular-momentum flux in the tube, a zone of reverse flow eventually formed in the jet downstream from the tube. Further increase in 2D/pQ2 served to move the zone of reversed flow into the tube and upstream along the centerline. Figure (5b) shows the more or less spherical pattern marking the stagnation point which occurs at the upstream end of the reversed-flow zone. Downstream from the spherical pattern the helical-spiral vortex can be seen in Figure (5b). Further closure of the wicket gates moved the centerline stagnation point to the upstream limit of the tube and produced a helical-spiral vortex throughout the length of the tube as shown in Figure (6a). Diffusion of the smoke by turbulence made it impossible to visualize the flow pattern near the downstream end once surging was established throughout the tube.
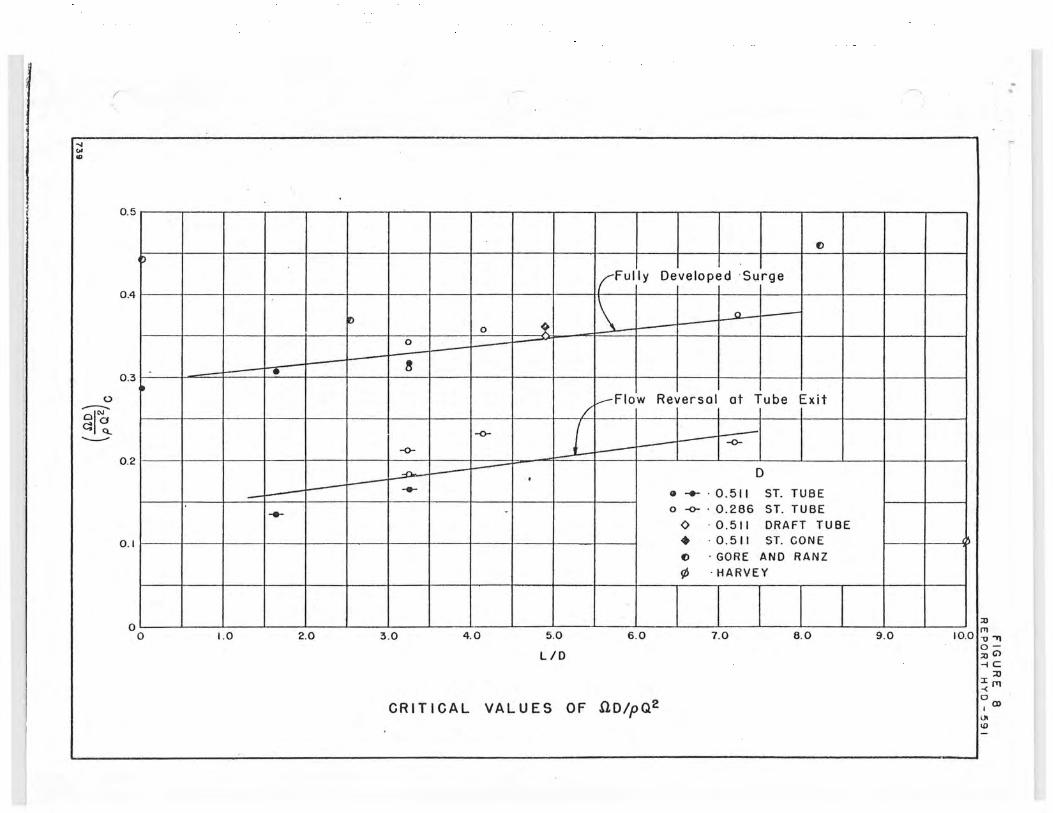
Two critical values of 2D/pQ2 were recorded for each tube, one for the value at which reversal occurred at the downstream end of the tube and one corresponding to fully developed surging throughout the tube. For the case of the jet (LID = 0) there was only one critical value. The spiral vortex observed for the jet is shown in Figure 6(b) while Figure (7b) shows the spiral vortex for fully developed surging in the Fontenelle model draft tube. In the curved draft tube the onset of surging was first observed near the elbow and although smoke patterns never revealed a spiral vortex
downstream from the elbow, measurements there did
reveal that pressure surging did occur throughout. The
critical values of 2D/pQ2 are shown in Figure (8)
along with values obtained by Gore and Ranzl' and Harveya . For these comparative values it was necessary to assume an axial-velocity distribution in order to
compute `?D/pQ2 since both investigations used swirl
angle as the critical parameter. Figure (8) indicates that
longer _ube lengths produce greater stability against
surging.
Figure 8 also indicates that the bend in the draft tube
does not influence the breakdown threshold. The
divergent cone tested (see Figure 7) had the same
expansion rate and same centerline length as the draft
tube, but was not bent or deformed. Using centerline
length and entrance diameter the L/D ratio of the draft
tube and the cone were both 4.77. Expansion of the
tube appears to make the flow only slightly less stable
against breakdown. The effect of expansion appears
reasonable because the local value of 2D/pQ2 increases
as D increases while 2,p, and Q must remain constant.
Smoke visualization of the helical vortex showed a
much more distinct, well defined spiral for both the
draft tube and the cone than for the straight tubes (see
Figure 7). However, the vortex could not pass through
the draft tube bend and was always broken up and
diffused at the bend.
C. FREQUENCY AND PRESSURE CHARACTERISTICS
Dimensionless characteristics of pressure and frequency are shown respectively in Figures 13 and 14 in
composite for all tubes tested. The values shown were
ail computed from runs made at Reynolds numbers
well beyond 80,000 and therefore do not reflect
viscous effects. All experimental points are at values of
2D/pQ2 above the critical because the pressure-surge
signal was difficult to filter out of turbulent noise at
low surge amplitudes.
As can be seen, both amplitude and frequency of the
surge become smaller as the pipe is made longer, all
other variables being held constant. Although pressure
variation along the tube was not recorded, it was
"Gore, Gore, R. W., and W. E. Ranz, "8ackflows in Rotating Fluids Moving Axially Through Expanding Cross-Sections," AIChE JOURNAL, January 1964.
5

observed that the frequency of the surge was constant
all along the tube. However the peak-to-peak value of
the pressure surge varied along the length of the tube
being greatest near the exit of the tube and lowest at
the inlet end.
When surging occurred within the exit tube, a pressure
fluctuation of equal frequency was observed upstream
from the wicket gates inside the stilling chamber. In
most cases the amplitude of this upstream pressure
fluctuation was at least a factor of five smaller than
that observed at the draft tube throat. However, when
the surge frequency was near the natural frequency of
the system, the amplitude of the pressure fluctuation within the box increased significantly. Natural
frequencies of the system (stilling chamber and exit
tube) were determined by two different methods. The
first method, suggested by Rayleigh, involved observing
the frequency of the fluctuations produced by blowing
compressed air across the exit opening of the draft
tube.12 In the second method, a loud speaker was
driven at successively different frequencies and the
pressure response of the system was observed.
The following table shows the natural frequencies of
the system as they were determined experimentally.
The natural frequencies were substantially different
from the frequency of the surge for nearly all recorded
measurements. Therefore, it is improbable that the
natural frequency had any effect upon the measured
surge amplitude or frequency.
TUBE DESCRIPTION NATURAL FREQUENCY OF SYSTEM
D L/D fn
(ft.) (cps)
0.511 3.26 230 0.511 1.63 230
0.511 0 8
0.286 7.20 250
Using the hot-film anemometer to monitor velocity
near the tube wall provided a verification that the
pressure surge was indeed produced by the precessing
helical vortex. Figure 9 shows that the velocity near
the piezometer and the pressure signal have the same
frequency. (This is an important feature because it
clearly shows the connection between the pressure
surge and the vortex.)
APPLICATION TO
HYDRAULIC TURBINES
The experimental results of this study can be used to
investigate the surging potential of hydraulic turbines.
Since the parameter 2D;pQ2 indicates the probability
of surging as well as the resulting frequency and
pressure-fluctuation amplitude, analysis of a turbine
must be directed toward the determination of this
parameter.
A. ANALYSIS
In flow through a hydraulic-turbine runner, angular
momentum is imparted to the flow as it passes through
the wicket gates. As the flow then passes through the
turbine runner an exchange of angular momentum is
made between the flow and the runner resulting in a
net torque on the runner. The torque is equal to the
change in the rate of flow of angular momentum
produced as the flow passes from the inlet to the outlet
of the runner. Figure 15 is a simplified schematic
diagram for flow through a runner. The equation for
the torque on the runner is
T = 21-02 (7)
where E21-02 is the rate of change of angular
momentum occurring between points 1 and 2,
respectively, the entrance to and exit from the runner.
Power delivered by the runner is equal to torque
multiplied by w the angular velocity of the runner.
Thus,
w= S21—SZ2 (8)
Multiplication of both sides of Equation (8) by D/pQ2
and subsequent rearrangement yields
22D_ 21D — PD (91
pQ2 pQ p_wQ72
12 Rayleigh, Lord, 'Theory of Sound," Dover Press, 1963.
[:f

which by incorporation of Equation (6) can be written
as
SZ " = D tan at PD (10) Q 2n B pwQ2
The left side of Equation (10) is the momentum
parameter of Equations (3) and (5) for the draft tube.
On the right side of Equation (10) the first term is the
momentum parameter for the flow entering the runner
and can be determined if the inlet geometry of the
turbine is known. The second term can be determined
if the performance characteristics of the turbine are
known.
Equation (10) can be used to determine the operating
conditions under which the momentum parameter
122 D/p Q 2 for the draft tube exceeds the critical
value as given in Figure 8. If load and discharge on the
turbine are such that flow leaves the runner with no
swirl then 122 will be zero, as will 122D/pQ2, and no
surging could occur. The sketch in Figure (20) shows
the velocity diagram for flow from the discharge side
of a runner blade. The absolute velocity V2 is
determined by the two components: the runner
velocity r2w and Vr the velocity of the water relative
to the blade. The runner velocity r2w is constant on a
speed-regulated unit. However, any change in Q
produces a change in Vr. If Q is decreased Vr decreases
and V2 develops a peripheral component in the
direction of turbine rotation. If Q is increased, Vr
increases and V2 develops a peripheral component in
the direction opposite to turbine rotation. The change
in Vr can be caused by either a change in gate opening
or a change in head. If swirl occurs in the direction of the runner, % in Equation (10), and hence 122D/pQ2
as well, will be positive. For swirl in the direction
opposite to the runner, the sign of E22D/pQ2 will be
negative. Surging is independent of swirl direction and,
thus, it is the absolute value of 122D/pQ2 which is of
importance.
Equation (10) was used to analyze model-performance data for the Fontenelle and Hoover-replacement
runners. Figure (16) shows the OD/pQ2 and efficiency
characteristics for the Fontenelle model as a function
of standard unit parameters. For operation within the
12D/pQ2 = 0.4 contour surging should not be expected.
However, operation outside of that contour should
produce surging. Note that the region of maximum
efficiency lies within the smooth operation region, but
that rough operation could conceivably occur at a
discharge only slightly larger than that realized at
maximum efficiency (assuming constant head).
Contours of large 2D/pQ2 will indicate regions of
relatively high frequency and pressure-fluctuation amplitude.
Upward and to the left of the dashed line in Figure
(16) the flow in the draft tube whirls in the same
direction as the runner while below and to the right of
the line the whirl is opposite to the runner. Power
swings observed on the Fontenelle prototype are
plotted on Figure (16) in megawatts. Because the
interaction between turbine and power system is not
known, little can be said about the power swings
except that they are in general agreement with
predicted regions of surging.
Analysis of the Hoover model data produced the plot
of characteristics shown in Figure (17). Again a region
of surge-free operation is predicted. The manufacturer
of the Hoover model did not provide as large a range of
performance data as was available for the Fontenelle
model. However, the water leaving the wicket gates
does not necessarily leave tangent to the gate.
Experience with the Hoover data showed that the
method used in determining 2, D/pQ2 for use in
Equation (9) needs further investigation. Using D tan a1/27rB may produce an 02D/pQ2 which is incorrect.
B. EFFECT OF TAILWATER
In prototype plants it has been noted that increasing
tailwater depth generally results in stronger pressure
surges while decreasing the depth seems to alleviate the
surging. In the air model such a phenomenon could not
be observed because an increase in pressure at the
outlet end would simply increase the pressure
throughout the system and decrease the discharge for a
given gate opening. This, according to the results of
this study summarized in Figures (13) and (14), would
not change 12D/pQ2 and would, hence, not change the
frequency or pressure parameter.
7

One must conclude, therefore, that the tailwater effect is a condition involving two-phase flow, If the tailwater depth is reduced the pressure in the draft tube is
reduced and water vapor may be created and fill the
core or air may be drawn in through existing aeration
devices and then may replace the core of the vortex in
the draft tube. At high tailwater cavitation may be
eliminated and because of increased draft-tube pressure
air may not be drawn into the draft tube. Under these
conditions the core will fill with water and the surge is
dynamically similar to the air model observed in this
study. Air injection is known to alleviate surging which
agrees with the above reasoning. 12 The air or
vapor-filled core has been observed by many
investigators. z, 3, 1 z With the vortex core filled with air or vapor the mass of fluid oscillating in the draft tube
is reduced and thus one would expect the pressure
amplitudes to be reduced even though the surge
frequency may possibly remain the same.
Figure (18) shows a dimensionless plot of surge frequency parameter versus 2D/pQ2 for various values of Q for the Hoover model (u is the cavitation number for the turbine).
Figure (19) shows a corresponding plot of the pressure
parameter. The plots indicate that both frequency and pressure decrease as Q is decreased. At v = 0.30 the
frequency parameters and pressure parameters are in
reasonable agreement with those of this study for
corresponding values of 2D/pQ2.
MODEL-PROTOTYPE SIMILITUDE
(aD~2D L __ L p02 M =(
_ D) C D)M D)P (11)
For viscous similarity all that is required is that the
Reynolds number of the prototype be at least equal to
80,000.
If the similitude relationships of Equations (11) are satisfied it follows from Equations (3) and (5) that
CQ3M(Q~ 7~ 17)m ( E23)P (12)
Thus, the prototype surge amplitude will be
APP = APM / I pM~
3 IM~ (13)
P \
Using the first of the similitude relations in Equation
(11)
~P K. p (APD3j PD ]M,tp) p (14)
similarly, the prototype surge frequency will be
fP = fm (D
2Dm 3 QPP Qn (15)
If information on the model is known in terms of
2D/pQ2 Equations (14) and (15) can be used to
determine frequency and magnitude of pressure surging
for the prototype. Predicted pressure may, however, be
altered by plant a and by possible resonance in the system.
( Example) Equations (3) and (5) express functionally the
relationships of interest in applying the experimental For Fontenelle turbine and draft tube results of this study to a prototype turbine draft tube.
3 f Q 01 (P~ D R (3)
APD3 = 02~pQ2, ~, R) (5)
Using subscripts of M and P to represent model and
prototype, respectively, the conditions of dynamic and
geometric similitude are
Dp = 10.00' (3.048 m), pp = 1.94 slugs/ft3 (1.0 gm/cm3)
Picking a point on Figure (16) where nD/pQ2 = 1.00,
Q/DA -V'H- =11.75 and rDR n/60-/_2gH = 0.80
Then, because DRP=7.416' (2.2606 m) and np=150
rpm, HP = 83' (25.2 m) and QP = 880 cfs (24.9
M3/sec).
8

From Figures (1 3) and (1 4) we obtain
r = 0.88 and f M 3) 4.5 /M Q l l
Thus, fD3)
,6 fP ) = P 0.881000) — 0.78 cps
APP — (~SPD
3~M (PQ /~V ~ D )p
= 4.5 (1.00) 1.94 (880)2 = 695 psf = 11.1 ft (3.38 m) water (10)4
The rotational speed for Fontenelle is 150 rpm, Rheingans Equation (1) predicts a frequency of 0.63 cps. Thus, the predicted results above appear reasonable.
1'1

FIGURE I REPORT HYD - 591
W
r
D Z
i ,
(a) PURELY AXIAL TURBULENT FLOW
r
W
~Z reer\ D oi?
i
(b) AXIAL FLOW WITH ROTATION
EFFECT OF ROTATION ON FLOW PATTERN
739

Figure 2 Report HYD-591
A. Overall view from downstream end. Photo PX-D-64111.
B. View of outlet with model of Fontenelle draft tube mounted. Photo PX-D-64112.
DRAFT—TUBE SURGE STUDY Experimental Apparatus
J W
8'
Stilling Chamber
F~ow Orifice for Discharge Adjustable Vanes Measurement
(wicket gates)—,, From
~~--~ Motor Driven Blower
Cone Valve =~ 4' ID — - •E— — ~~ 0) —F
Smoke Furnance
Draft Injected Filters
Tube ~~_ Here
SCHEMATIC DIAGRAM OF APPARATUS
Cn W

FIGURE 4 REPORT HYO - 591
To Draft Tube
Plastic Lid Needle
Valve
Copper -~~— Tube
Rubber Stopper 7Compressed Air Supply
~~ I -in. Steel Pipe
` Large Can
Tobacco 1~
Water
SMOKE GENERATOR
739
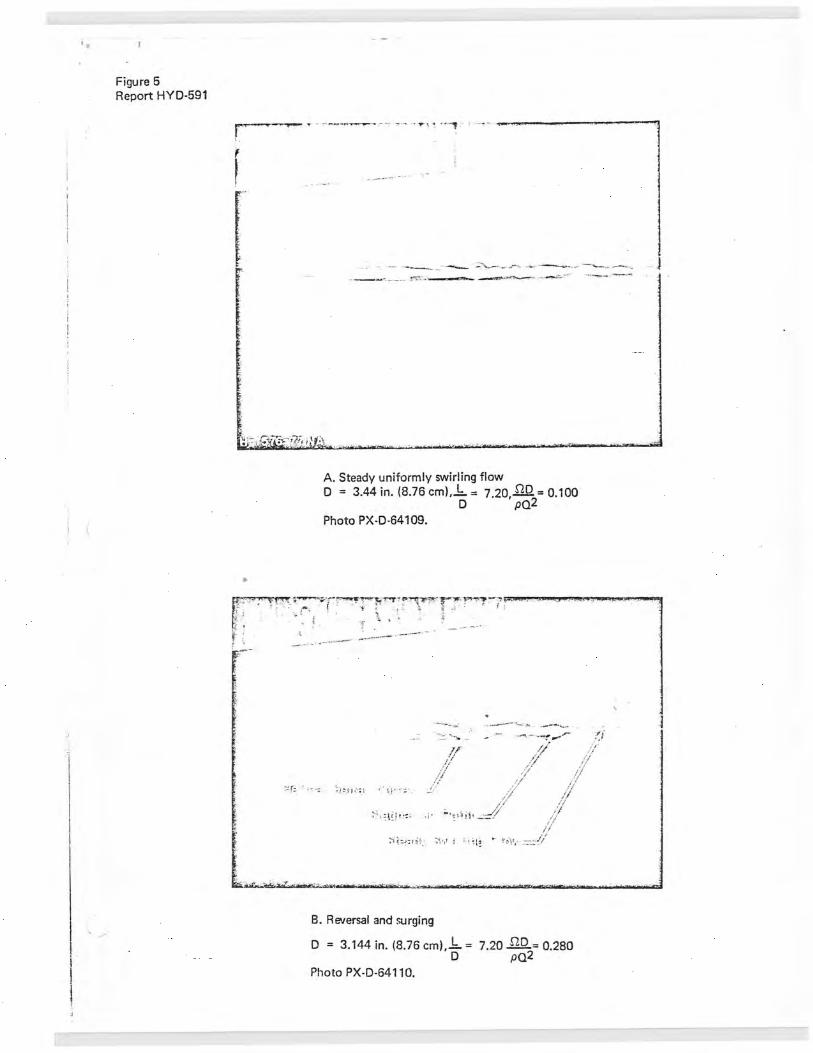
Figure 5 Report HYD-591
A. Steady uniformly swirling flow D = 3.44 in. (8.76 cm), .L = 7.20,E = 0.100
D pQ2 Photo PX-0-64109.
B. Reversal and surging
D = 3.144 in. (8.76 cm), -L = 7.20 2D = 0.280 D pQ2
Photo PX-D-64110.

i
Figure 6 siugiq Report HYD-5AIfl
A. Fully established surging
D = 6.13 in. (15.56 cm), I = 3.26, nD = 0.354 D pQ2
Photo PX-D-64107
orsJ
B. Surging in an open jet
D = 6.13 in. 0 5. 56 cm), _L = 0.0, OD = 0.300 D pQ
Photo PX-D-64108.
DRAFT-TUBE SURGE STUDY Photographs of Flow Patterns

Figure 7 Report HYD-591
A. Draft tubes that were tested. Photo PX-D-64105.
B. Fully established surging in the model of the Fontenelle Draft Tube.
D = 6.13 in. (15.56 cm), p = 4.77, = 0.400 A 2
Photo PX-D-64106.
DRAFT--TUBE SURGE STUDY Draft Tubes and Flow Patterns
w e
0.5
0.4
0.3
U QIN
c:G Q
0.2
0.1
0 1.0 2.0 3.0 4.0 5.0 6.0 7.0 8.0 9.0 10.0
L/D
CRITICAL VALUES OF Sty/pat
O
Fully Developed Surge
-- o
a
Flow Reversal at Tube Exit
-6-
D
0.511 ST. TUBE o -o- 0.286 ST. TUBE -o-
O 0.511 DRAFT TUBE 0 0.511 ST. CONE O -GORE AND RANZ
~ -HARVEY
0
a~
=m
r

rep reolHYD51
.% a § ! % ►\f x
. ,
%»w# may/
~ 22\ \ ®
Velocity (upper) and pressure Qoe traces photographed o the oscilloscope
D=61a in. QE5cmR~= to, ~ =1.000
POoRXe44l04,
DRAFT-TUBE SU RGE STUDY

Fo
L;
S, 0
30
0A
1 0
0.E
b b E n,
1.00 0 0
+ + -4- 0.92
-4 0 0.77
CIC4 co
x
x— _x X— -x 0.69 0,3
. . .... .... 1 0 3
Os 0.58
Co
D
13 x + x 0 V
x x
x q.2 I A 0.6 9.8 1.0 x ly 2
0 1 1 6 1.8
x •
R ~ 10-5 c x 0 0 0
+ 49 0
FREJUENgY PARAMETE S k FUNCT LIDO EB ff-,ORcl T FtA GHf TUBES A A ON q~F R Ds r1li mq
2 6 c ~n) 1163 1 1+
t-0

C) c m m

J W D
1.2
olcl o.a w
0.6
0.4
0 0.2 0.4 0.6 0.8 1.0 1.2 1.4 1.6 1.8
R x I0 5
FREQUENCY PARAMETER AS A FUNCTION OF REYNOLDS NUMBER FOR THE FONTENELLE DRAFT TUBE
D = 0.5' (15.26 cm) L / D = 4.77
SZ D
P Q2
• I .0 8 + 0.971 0 0.872 1.0 x 0.781 ❑ 0.705
• • • • • • •
+
x x x ❑ ❑ ❑
C,
x x x xx x x
0
—~x x x -x x

S (FIGURE 1 3 n - EFORT HYD - 591
I~
ca C
bi D
W
]I: W 5 W
S I©
W T -I
I~ O -d
_7 In tt W
n1-1 C
~ds I N L0 O
U S
N W
0 v
_ tL O _
O O tt
C8 5
W D
D
W
s D
D
.3 .4 0.5 0.6 0.7 0.8 0.9 1.0 I.1 S y no W o "Q2 C
W FREQUENCY PARAMETER FOR ALL TUBES AS A FUNCTION
-~ OF THE MOMENTUM PARAMETER 1
739
L/D D X 7.21 0.286' (8.76cm) SHARP-EDGED ENTRANCE, ST. TUBE • 4.12 0.286' (8.76cm) SHARP-EDGED ENTRANCE, ST. TUBE ~ 3.34 0.286 (8.76cm) SHARP-EDGED ENTRANCE, ST. TUBE 0 3.26 0.51 1' (15.26cm) SHARP-EDGED ENTRANCE, ST. TUBE + 0 + 1.63 0.51 I' (15.26cm) SHARP-EDGED ENTRANCE, ST. TUBE p 0 7.21 0.286' i 8.76 cm) BELL-MOUTH ENTRANCE, ST. TUBE + + ` a 4,12 0.286' (8.76cm) BELL-MOUTH ENTRANCE, ST. TUBE °
+ r 3.34 0.286' 18.76cm) BELL-MOUTH ENTRANCE, ST. TUBE A 4.77 0.511' (15.26cm) STRAIGHT CONE ° r 4.77 0.51 I' (15.26cm) DRAFT TUBE
t
0 0
+ + 0
o
t +p o
0
+fib
~ +o
~ a
~. x J~ a
•p a A 't
!4~ •x Gx Y
40 Xa
.m n a►• •~ x
x ~ ••• .axx o a a • X on a ; 0
o G D 0
M ti
IL A
\x kYl k 1 xa t t s
t}
s ~ t
X o
O

FIGURE 14 REPORT HYO-591
II
10
9
e
7
6
a.l d 4
5
4
3
2
1
0 0.3 0.4 0.5 0.6 0.7 0.8 0.9 1.0 1.1
a0 PQz
PRESSURE PARAMETER FOR ALL TUBES AS A FUNCTION OF MOMENTUM PARAMETER
739
L/D D , X 7.21 0.286 (8.76cm)' SHARP-EDGED ENTRANCE, ST. TUBE • 4.12 0.286 (8.76cm) SHARP-EDGED ENTRANCE, ST. TUBE ° 3.34 0.286' (8.76cm) SHARP-EGGED ENTRANCE, ST. TUBE 0 3.26 0.51 I' (15.26cm) SHARP-EDGED ENTRANCE, ST. TUBE
0 7.21 0.286 (8.76 cm) BELL-MOUTH ENTRANCE, ST. TUBE + 1.63 0.51 1'
lk
(15.26 cm) SHARP-EDGED ENTRANCE, ST. TUBE
♦ 4.12 0.286 (8.76cm) BELL-MOUTH ENTRANCE, ST. TUBE ■ 3.34 0.286 (8.76cm) BELL-MOUTH ENTRANCE, ST. TUBE
4.77 0.51 1' (15.26 cm) STRAIGHT CONE f 4.77 0.51 (15.26 cm) DRAFT TUBE
} } } °
t 0 + o o °
A x
1'OCR 3
+ o ~ R
o f f f R f
~ }Goo f f t o f
f f o /
1 } } ~ ¢ f f
+O + ° f
t° ~} AO f
apO■ f 08 ■ •' ff ■ • ♦ fx
80 A. •on ~ °: 8 N
~ • xnx x I
On 11 x d° xx°
o •♦ ° . ♦~ xc
•~ X ■■ • XX ■ X

FIGURE 15 REPORT HYD- 591
VELOCITY DIAGRAMS FOR A TURBINE RUNNER
739

w aD
1 .5
1.0
N
k o z
0.5
1.0 2.0 3.0 4.0
Q
DR VrH
OPERATING CHARACTERISTICS FOR FONTENELLE MODEL TURBINE
p Q2 1.0 0.7 0.6 0.5
3.0
1.3
1.6 / 0.4
2.5
~
10.0 8.0 6.0
30 '
1 1 '
S0 ' f
60 ~, i 1
g0 t SWIRL 30
I
g5 SWIRL
50 }.
~
0.15 MW , - 4MW 0.3 g7
MW 0.05 MW g0 ,• • /
60 cD 0.4
0.5
w
85
d ~I
I ~ 60
30 40 ~
0.6
60 60 100 120
GATE OPENING (%) nPl/2 N s =
H 5~4 = 60

V , W f0
1.0
0.9
0.8
o rn ~ N
I< o CD
0.7
0.1 0.2- 0.3 0.4 0.5 0.6 0.7 0.8 0.9
Q
DR V
EFFICIENCY HILL - HOOVER REPLACEMENT RUNNER - MODEL DATA
n P I/2 Ng = = 28
H5/
4
S1 D P Q2
I.O 0.8 0.6 0.4
i
i 0.40
~
0.60 I SID
/ 94 P Q2
93 0.80
,,--0.90
~ I.00 0.6 91
g0
47.0 58.8 64.7 70.6 82.5 94.0 100.0
0.5 GATE OPENING (%1

V
0 1.5
1.0
0 cl a-
0.5
0 0 1.0 2,0 3.0 4.0
nD p Q2
HOOVER MODEL DATA — FREQUENCY, MOMENTUM, 0'
N22'
15
III
09 • 6 "
32 25
X13 23e
e32 26 e22
30 13 e 33 022
e30 31 0 25 32 26~ i 9
" 6 "
0• ~O
15 • 10 p6 0 ~
•11 •
12 06
,Ig 009 e10
10~ s10 '09 07
06 09 07 •09 06

6
5
4
2
0 0
.30
.30 31 31 15. •
09.
.
.32,
• 25
I~ •32
II •25 32. • •05
•12 10• 12•
33 •
26 • 2
no P a2
.15
.09
.11
10 • .01
.22
13 .22 •
.09
.01 I~ •23 •07 23• •06
3
HOOVER REPLACEMENT RUNNER MODEL DATA, PRESSURE PARAMETER VERSUS MOMENTUM PARAMETER FOR VARIOUS VALUES OF~
4
::0 fTI -0,, o::0 C> -iC
:0
~fTI 0 I
01"° IO

FIGURE 20 REPORT HYD- 591
s
a. FLOW LEAVING WICKET GATES
v2 positive swir
v2 no swirl
normal
r = normal
v2 negative swirl ~ ~~ yr > normal
b. FLOW AT EXIT FROM TURBINE RUNNER
FLOW THROUGH A TURBINE
739

7.1750 (3-67) Bure.0 of Ree l.m.tlon
CONVERSION FACTORS-- BRITISH TO METRIC UNITS OF MEASUREMENT
The following conversion factors adopted by the Bureau of Reclamation are those published by the American Society for Testing and Materials (ASTM Metric Practice Guide, January 1964) except that additional factors (*) commonly used in the Bureau have been added. Further discussion of definitions of quantities and units is given on pages 10-11 of the ASTM Metric Practice Guide.
The metric units and conversion factors adopted by the ASTM are based on the "International System of Units" (designated SI for Systeme International d'Unites), fixed by the International Committee for Weights and Measures; this system is also known as the Giorgi or MKSA (meter-kilogram (mass)-second-ampere) system. This system has been adopted by the International Organization for Standardization in ISO Recommendation R-31.
The metric technical unit of force is the kilogram-force; this is the force which, when applied to a body having a mass of 1 kq, gives it an acceleration of 9. 80565 m/sec/sec, the standard acceleration of free fall toward the earth's center for sea level at 45 deg latitude. The metric unit of force in SI units is the newton (N), which is defined as that force which, when applied to a body having a mass of 1 kg, gives it an acceleration of 1 m/sec/sec. These units must be distinguished from the (inconstant) local weight of a body having a mass of 1 kq; that is, the weight of a body is that force with which a body is attracted to the earth and is equal to the mass of a body multiplied by the acceleration due to gravity. However, because it is general practice to use "pound" rather than the technically correct term "pound-force," the term "kilogram" (or derived mass unit) has been used in this guide instead of "kilogram-force" in expressing the conversion factors for forces. The newton unit of force will find increasing use, and is essential in SI units.
Table I
UANTITIES AND UNITS OF SPACE
Multiply By To obtain
LENGTH
Mil . . . . . . . . . . . . . 25.4 (exactly). . . . . . . . Micron Inches . . . . . . . . . . . 25.4 (exactly). . . . . . . . Millimeters
. . . . . . . . . . . 2.54 (exactly)*. . . . . . . Centimeters Feet . . . . . . . . . . . . 30.48 (exactly) . . . . . Centimeters
0.3048 (exactly)*. . . . Meters 0.0003048 (exactly)* . . . . Kilometers
Yards . . . . . . . 0. 9144 (exactly) . . . . Meters Miles (statute). . . . . . . . 1,609.344 (exacfly)* .. . . . . Meters
1.609344 (exactly) . Kilometers
AREA
Square inches . . . . . . . . Square feet . . . . . . . . .
6.4516 (exactly) . . . . . . 929.03* . . . . . . . .
Square centimeters Square centimeters
. . . . . . . 0.092903 . . . . . . . . Square meters Square yards . . . . . . . . Acres . . . . .
0.836127 . . . . . . . . . 0.40469* . . . . . . . . .
Square meters Hectares
. . . . . . . 4,046.9* . . . . . . . . Square meters . . . . . . 0.0040469* . . . . . . . . Square kilometers
Square miles . 2.58999. . Square kilometers
VOLUME
Cubic inches . . . . . . . . 16.3871 . . . . . . . Cubic centimeters Cubic feet. . . . . . . . . . 0.0283168. . . . . . . . Cubic meters Cubic yards. 0.764555. . Cubic meters
CAPACITY
Fluid ounces (U.S.) 29.5737 . . . . . . . . . . Cubic centimeters . . . . 29.5729. . . . . . . . . Milliliters
Liquid pints (U. S. 0.473179 . . . . . . . . . Cubic decimeters . 0.473166 . . . . . . . . . Liters
quarts (U.S.) . . . 946.358* . . . . . . . . Cubic centimeters 0.946331*. . . . . . . . Liters
Gallons (U.S.). 3,785.43* . . . . . . . . . Cubic centimeters 3.78543. . . . . . . . Cubic decimeters
. 3.78533. . . . . . . Liters . 0.00378543*. . . . . . Cubic meters
Gailoas {U: if.) 4.54609 . . . . . . . . . Cubic decimeters 4.54596 . . . . . . . . . Liters
Cubic feet. . . 28.3160 . . . . . . . . . . Liters Cubic yards. 764.55* . . . . . . . . . . Liters Acre-feet. . 1,233.5* . . . . . . . . . . . Cubic meters
.1,233.500* Liters

Table II
QUANTITIES AND UNITS OF MECHANICS
Multiply By To obtain
Grains (1/7, COO lb) . . . . . . . . . 64.79891 (exactly) . . . . . Milligrams Troy ounces (480 grains). . . . . . . 31.1035. . . . . . . . . . Grams Ounces (avip). . . . . . . . . . . . 28.3495 . Grams Pounds (avapp). . . . . . . . . 0.45359237 (exactly). Kilograms Short tons (2, 000 lb) . . . . . . . . . 907.185 . . . . . . . . Kilograms
. . . 0.907185. . . . . . . . . . Metric tons Lora tons (2,240 lb): 1,018.05. . Kilograms
Pounds per square inch . . . . . . . 0.070307. . . . . . . . . . Kiloyrams per square centimeter . 0.680478. Newtons per square centimeter
Pounds per square foot 4.88243. Kilograms per square meter 47.8803. . Newtons persnuare meter
MASS/VOLUME (DENSITY)
Ounces per cubic inch . . . . . . . . 1.72999 . . . . . . . . . . Grams per cubic centimeter Pounds per cubic fool . . . . . . . . 16.0185 . . . . . . Kilograms per cubic meter
. . . . . . . . C.0160186 . . . . . . . . . Grams per cubic centimeter
MASS/CAPACITY
Ounces per gallon (U.S.) . . . . . . 7.4893 . . . . . . . . . . . Grams per liter Ounces per gallon (U. K.) . . . . . . 6.2362. . . . . . . . . . Grams per IIter Pounds per gallon (U.S.) . . . . . . 119.629 . . . . . . . . . . . Grams per liter
BENDING MOMENT OR TORQUE
Inch-pounds . . . . . . . . . . . . 0.011621. . . . . Meter-kilograms . I. 12985 x 106. . . . . . Centimeter-dynes
Foot-pounds . . . . . . . . . . . , 0.138265. Meter-kilograms 1.35562 x 10⁷. Centimeter-dynes
Foct-pounds per Inch . . . . 5.4431. . . . . . . . . . . Centimeter-kilograms per centimeter
Feet per second. . . . . . . . . . . 30.48 (exactly). . . . . . Centimeters per second 0.3048 (exactly)* . . . . . Meters per second
Feet per year. 0. 965873 x 10-6* . , , , , Centimeters per second Hiles per hour . . . . . . . . . . 1.609344 (exactly). . . . . . Kilometers per hour
. . . . . . . . . . . 0.44711 (eractIv) . . . . . . Meters oer second
ACCELERATION*
Feet per seccnd2 . 0.3048* . Meters per second
FLOW
Cubic feet per second (second- feet) 0.028317* . . . . . . . . Cubic meters per second
Cubic feet per minute 0.4710 Liters per second Gallons (0.S.) per minute . ' 0.06309 . Liters per second
FORCE*
Pounds . . . . . . . . . . . . . . 0.453602* . . . . . . Kilograms . . . . . 4.4482*
4. 4482 x 10-6* Newtons Dynes
Multiply By To obtain
WORK AND ENERGY*
British thermal units (Btu) . . . . 0. 252* . . . Kilogram calories 1,066.08 Joules
Btu per pound. . . . . . . . . . . . 2.32d (exactly) . . . . . . . Joules per gram Foot-pounds 1.36582*. . Joules
Horsepower . . . . . . . . . . . . 745.700. . . . . . . . . . Watts Btu per hour . . . . . . . 0.293071 . . . . . . . . . . Watts Foot-pounds per second 1.35582. . Watts
HEAT TRANSFER
Btu in. /hr fl2 deg F (k, thermal conductivity) . . . . . . . 1.442 . . . . . . . . . . .
0.12.40. . . . . . . Milltsatts/cm deg C Kg cal/hr in deg C
Btu ft/hr ft2 de gg F . . . . Btu/hr ft2 de qq F (C, thermal
1.4880* . . . . . . Kg cal m/hr in deg C
conductance) . . . . . . . . . . . 4.682 ...... . . . . xgl~~1th
/m~aedgeg C
Deg F hr ft2/Btu (R, thermal C resistance) . . . . . 1.761 Deg C cm2/milliwatt
Btu/lb deg F (c, heat capacity) . . . . . . . . . .
4.1868 1.000* . . . . . . . . .
J/gg deg C Bt~/1b deg F
0.2581 Cal(gram deg C
Ft (thermal diffusivity) /hr . . . . 0.09290*.
Ctp'/sec M4/hr
WATER VAPOR TRANSMISSION
Grains/hr ft2 (water vapor lransmisslon) . . . . . . . . . . . 16.7 . . . . . . . . . . Grams/24 br m2
Perms (permeance) . . . . . . 0.659 . . . . . . . . . I . Metric perms
Table 11I
OTHER QUANTITIES AND UNITS
Multiply By To obtain
Cubic feet per square foot per day (seepage) . . . 304.8* . . . . . . . . . . . liters per square meter per oay
Pound-seconds per square foot (viscosity) . . . . . . 4.8824*. . . . . . . . . . Kilogram second per square meter
Square feel per second (viscosity). . . 0.092903*. . . . . . . . . Square meters per seconi Fahrenheit degrees (change)*. . . Volts per mil. . . . . .
5/9 exactly . . . . . . . . 0.03937. . . . . . . . . .
Celsius or Kevin degrees (change)* Kilajolls per millimeter
Lumens per square foot (foot- 10.784. . . . . . . . . candles) . . . . . . . .
Ohm-clrcular mils per fool . . . . . 0.001882 . . . . . . . . . Lumens per square peter Ohm-square millimeters per meter
Millicuries per cubic foot . . . . . . 35.3147* . . . . . . . . . Millicurles per cubic meter Milliamps per square foot . . . . . . 10.7639* . . . . . . . . . Milliamps per square meter Gallons per square yard . . . . . . 4.627219* . . . . Liters per square meter Pounds oer inch. . . . . . . . . . .0.17868*. . . . . Kilograms Der centimeter
GPO 855-412

ABSTRACT
Draft-tube surge experiments were conducted with models of draft tubes, using air as the fluid. The occurrence, frequency, and amplitude of surges were correlated with flow and draft-tube geometry variables. Studies show that surges arise when angular momentum reaches a critical value relative to linear momentum. Surge frequency and peak-to-peak pressures are independent of viscous effects for Reynolds numbers above 80,000, and are correlated with a dimensionless momentum parameter for a particular draft-tube shape. A criterion is given for predicting the surging threshold. Results of the study are applied to analysis of draft-tube surging in the Fontenelle and Hoover replacement turbines.

Hyd-591 Cassidy, J. J. EXPERIMENTAL STUDY AND ANALYSIS OF DRAFT-TUBE SURGING Bur Reclam Lab Rep Hyd-591, Hydraul Br, May 1969. Bureau of Reclamation, Denver, 9 p, 20 fig, 3 tab, 13 ref
DESCRIPTORS—/ "draft tubes/ "turbines/ "hydroelectric plants/ hydraulic machinery/ fluid mechanics/ dimensional analysis/ "surges/ air/ unsteady flow/ pressure/ laboratory tests/ model tests/ fluid flow/ non-uniform flow IDENTIFIERS—/ fluid dynamics/ hydraulic resonance
Hyd-591 Cassidy, J. J. EXPERIMENTAL STUDY AND ANALYSIS OF DRAFT-TUBE SURGING Bur Reciam Lab Rep Hyd-591, Hydraul Br, May 1969. Bureau of Reclamation, Denver, 9 p, 20 fig, 3 tab, 13 ref
DESCRIPTORS—/ "draft tubes/ "turbines/ "hydroelectric plants/ hydraulic machinery/ fluid mechanics/ dimensional analysis/ 'surges/ air/ unsteady flow/ pressure/ laboratory tests/ model tests/ fluid flow/ non-uniform flow IDENTIFIERS—/ fluid dynamics/ hydraulic resonance
Hyd-591 Cassidy, J. J. EXPERIMENTAL STUDY AND ANALYSIS OF DRAFT-TUBE SURGING Bur Reclam Lab Rep Hyd-591, Hydraul Br, May 1969. Bureau of Reclamation, Denver, 9 p, 20 fig, 3 tab, 13 ref
DESCRIPTORS—/ "draft tubes/ "turbines/ hydroelectric plants/ hydraulic machinery/ fluid mechanics/ dimensional analysis/ surges/ air/ unsteady flow/ pressure/ laboratory tests/ model tests/ fluid flow/ non-uniform flow IDENTIFIERS—/ fluid dynamics/ hydraulic resonance

J
. .. _. z r,


hEN.Tl'f T. FALVEY, Dr - Ing.
n ~' parts
for Sect10 c Machin,%Dfry- n ffo r i;,diraull l Y
av Equipmerft and itation
i Z.,
C7~ rE. ques ~a Rach L U U.Y is iquies. Section nivil.a.d.1-111ne5s Hydraul.
EquipemEllirnts (EL Cavitation
Svenska Centralkommitt6n f6r Internationella lngenjdrskongresser
c/o Vattenfall, S-162 87 VAllingby, Sweden

SYMPOSIUM 1970 E -
STOCKHOLM 1
FREQUENCY AND AMPLITUDE OF PRESSURE SURGES GENERATED
BY SWIRLING FLOW
H. T. Falvey U. S. Bureau of Denver, Colorado Head,Hydraulic Research Section Reclamation USA
J. J. Cassidy University of Columbia, Missouri Professor of Civil Engineering Missouri USA
SYNOPSIS Th—is paper reports on the investigation of swirling flow through tubes. Fre-
quencies and amplitudes of pressure surges produced by the swirling flow were
measured and found to be essentially independent of viscous effects for Reynolds
numbers larger than 1x10⁵. Dimensionless frequency and pressure parameters as
well as the onset of surging were correlated with the parameter QO/pQ2 where n and Q are respectively the fluxes of angular momentum and volume through the tube, D
is the tube diameter and p is the fluid density. Relative length and shape of the
tube were also found to be important.
The results of the study were used to analyze a particular draft tube for -
potential surging. Using performance data obtained from the model of the turbine
and draft tube, a region of surge-free operation was outlined on the efficiency
hill for the unit. Comparison was made between measured power swings and the
predicted pressure fluctuations in the draft tube.
RESUME ` Cette communication a trait a une recherche sur un courant tourbillonnaire passant daps des tubes. Les frequences et les amplitudes des surpressions creees
par le courant tourbillonnaire ont ete mesurees et trouvees essentiellement
independantes des effets de viscosite pour des nombres de Reynolds superieurs a 1x10⁵. Des parameters sans dimension lies a la frequence et a la pression et l'etablissement de la surpressions ont ete relie's au parametre 110/pq2 ou n et Q sont respectivement les flux du moment angulaire et du volume dans le tube, D le
diametee du tube et p is densite du fluide. On a trouve que la longueur relative
et la forme du tube sont egalement importantes.
On a utilise les resultats de cette etude pour analyser l'etablissement de la
surpressions dans une conduite d'ecoulement particuliere. En utilisant les donnees
de fonctionnement obtenues a partier d'un modele de turbine et de conduite
d'ecoulement, on a trouve un domaine de marche sans surpressions sur le diagramme
de rendement de l'unite. On a compare les resultats des mesures des amplitudes de
puissance et ceux des calculs des fluctuations de pression dans la conduite
d'ecoulement.
1 S 1
m

INTRODUCTION.
Draft-tube surging has been recognized as a problem in the operation of
hydro-power plants for several decades [1]. History shows that the attack on
draft-tube surging has been one of alleviation rather than prevention. New units
are placed in operation and if objectionable surging occurs within the operating
range various types of remedial action are attempted or, if possible, operation
is not permitted in the critical range. However, because of automation of the
generating systems, plants are frequently required to operate over a wide range
of turbine gate openings. Remedial measures including air admission to the draft
tube or the placement of fins in the draft-tube throat are only occasionally
successful. If it were possible to predict the possibility of surging prior to
installation and operation of a unit, considerable advantage could be realized.
It appears to be generally accepted that draft-tube surging arises as a
result of rotation remaining in the water as it leaves the turbine runner and
enters the draft tube [2]. Moreover, the phenomenon is complicated by many fac-
tors including vaporization of the water, geometry of the turbine and draft tube,
and the dynamic characteristics of the penstock and electrical network. Swirling
flow has been investigated analytically and experimentally by several people in
the field of fluid mechanics [3,4,5,6]. These studies have shown that when a
fluid flows in a swirling fashion (axial flow with superimposed rotation) the is
resulting flow pattern depends upon the relative amount of rotation in the fluid.
If the flux of angular momentum entering the tube is sufficiently large as com-
pared to the flux of linear momentum, a,reversal in flow direction occurs along
the centerline of the tube [3]. For large Reynolds numbers the flow becomes
unsteady forming a helical vortex with the reversed flow occurring along the
spiral core of the vortex [7]. This phenomenon is known as "vortex breakdown" in ►̀ °~
the fluid mechanics literature and as draft-tube surging in the hydraulic-machin-
ery literature [8].
This paper describes a study initiated in order to investigate the character-
istics of swirling flow in tubes and to correlate these characteristics with the
occurrence and nature of draft-tube surging.
THE BASIC STUDY
Because of the excessive number of variables which could be involved it
was not only desirable but necessary to simplify the experimental model as much
as possible. Air was used as the working fluid in order to eliminate the possible
effects of a two-phase flow. No turbine runner was installed in order to simplify
geometry. Instead the air entered the tube (Figure 1) radially through wicket-
gate type vanes. It was possible to accurately determine the amount of swirl
imparted to the flow as it entered the tube. The angle between the vanes and a
radial line could be set at any angle between Q' and 82°. At 00 the vanes were
2 E t
1

a
L
Flow Wicket Gate or Inlet Vane
Smoke Injecter Here, Flow _ D
-enter Line
u 11
Stilling Chamber .
FIGURE 1 EXPER!MENTAL APPARATUS SHOWING STRAIGHT TUBE
FIGURE 2 DEFINITION SKETCH OF INLET FLOW TO TUBE OR RUNNER
3 E t

radial and no rotation was applied to the flow (Figure 2). Overall configuration
of the apparatus is shown in Figure 1 and is described in more detail by Cassidy
[7]. Clear plastic was used in construction to facilitate flow visualization '
with smoke. Pressures at points on the tube wall were measured using pressure
cells and a root-mean-square meter. Frequencies of the unsteady pressure were
determined using an oscilloscope with a retentive screen.
Flow through three types of tubes was studied:
1) circular tubes of uniform diameter; 2) a model of a draft tube used in
Fontenelle Dam; 3) an expanding cone having the same length-to-area relation-
ship as the draft tube.
ANALYSIS
It was assumed that, for a particular draft-tube shape, the root-mean-square '
amplitude GP and frequency f of the unsteady pressure surge are both'functions of s
the fluid density p and viscosity v, draft-tube diameter D and length L, discharge
Q. and flux of angular momentum 0. Standard techniques of dimensional analysis
yield the following functional relationships
P 92 — 1 l pO2 ' p
Q RD
~ p~lR) (2) O
wherelR is the Reynolds number 4Q/aDv.
The angular momentum flux Q entering the tube was computed as (see Figure 2)
n =P QR V. sin a (3) -..
in which Q - SBNVo. The variables S, a, Vo, and R are defined in Figure (2);
N is the number of vanes around the inlet; and B is the dimension of the vanes
perpendicular to the plane of Figure 2. The momentum parameter contained in
Equations (1) and (2) is then computed as
nD _ DRsinor (4) pqz - BNS
and is seen to be a function of geometry only for the particular inlet conditions
of this study. In all experiments the momentum parameter n0/pQ2was calculated
according to Equation (4).,
4 1 1

I
N
a.) Steady Swirling Flow, no b.) Stagnation Point at the c.) Fully Developed Surging, surging, D-3.46 inches, Centerline With Surging fID/pQ2-0.454, D-6.13 inches, L/D=7.15, f10/pQ2.0.150 downstream D=3.6 inches, L/D-3.26.
L/D-7.15, M/pQ -0.330
Figure 3. SWIRLING FLOW IN STRAIGHT TUBES
i
•
dW
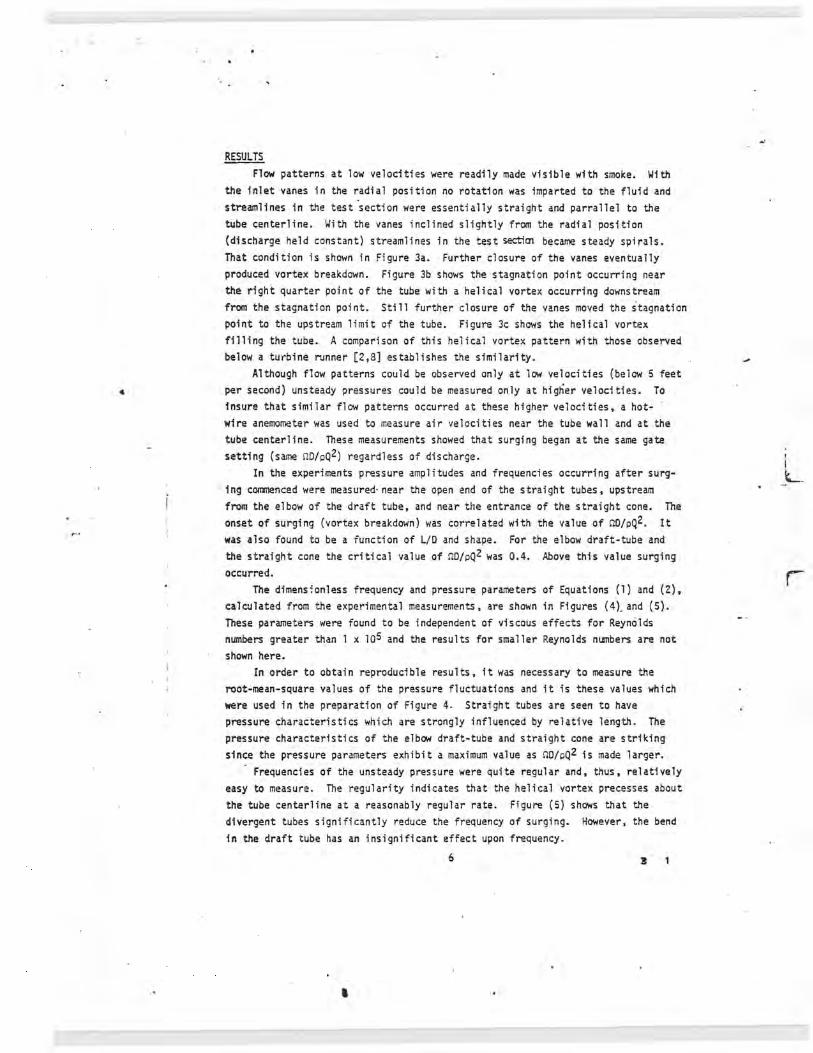
RESULTS
Flow patterns at low velocities were readily made visible with smoke. With
the inlet vanes in the radial position no rotation was imparted to the fluid and
streamlines in the test section were essentially straight and parrallel to the
tube centerline. With the vanes inclined slightly from the radial position
(discharge held constant) streamlines in the test section became steady spirals.
That condition is shown in Figure 3a. Further closure of the vanes eventually
produced vortex breakdown. Figure 3b shows the stagnation point occurring near
the right quarter point of the tube with a helical vortex occurring downstream
from the stagnation point. Still further closure of the vanes moved the stagnation
point to the upstream limit of the tube. Figure 3c shows the helical vortex
filling the tube. A comparison of this helical vortex pattern with those observed
below a turbine runner [2,8] establishes the similarity.
Although flow patterns could be observed only at low velocities (below 5 feet
4 per second) unsteady pressures could be measured only at higher velocities. To
insure that similar flow patterns occurred at these higher velocities, a hot-
wire anemometer was used to measure air velocities near the tube wall and at the
tube centerline. These measurements showed that surging began at the same gate
setting (same 00/pQ2) regardless of discharge.
In the experiments pressure amplitudes and frequencies occurring after surg-
ing commenced were measured near the open end of the straight tubes, upstream
y from the elbow of the draft tube, and near the entrance of the straight cone. The
onset of surging (vortex breakdown) was correlated with the value of n0/pQ2. It
was also found to be a function of L/D and shape. For the elbow draft-tube and
the straight cone the critical value of nD/pQ2 was 0.4. Above this value surging
occurred.
The dimensionless frequency and pressure parameters of Equations (1) and (2),
calculated from the experimental measurements, are shown in Figures (4)_and (5).
These parameters were found to be independent of viscous effects for Reynolds
numbers greater than 1 x 10⁵ and the results for smaller Reynolds numbers are not
shown here.
In order to obtain reproducible results, it was necessary to measure the
root-mean-square values of the pressure fluctuations and it is these values which
were used in the preparation of Figure 4. Straight tubes are seen to have
pressure characteristics which are strongly influenced by relative length. The
pressure characteristics of the elbow draft-tube and straight cone are striking
since the pressure parameters exhibit a maximum value as n0/pQ2 is made larger.
Frequencies of the unsteady pressure were quite regular and, thus, relatively
easy to measure. The regularity indicates that the helical vortex precesses about
the tube centerline at a reasonably regular rate. Figure (5) shows that the
divergent tubes significantly reduce the frequency of surging. However, the bend
in the draft tube has an insignificant effect upon frequency.
6 E 1
4

A
+ + +
Symbols Defined +{ + Y
in Figure 5 +{ tCylinders-
x
+ ' x Con¢ + APD4 z t x , PQz =1.29[1.-1 .108 {PQZ
1.0 x e • x
D4 x x p x x
P • x ''- xElbow Draft Tub¢
xxxepc4 l n sl xx P Q
O 0 10 n D 2.0 3.0
Pc;L Fig, 4-PRESSURE PARAMETERS FOR SURGING
x x +
x { 2.0 x ;
x + X +
x + x +
f D1 X ,c + 0
x ~" .• mac .
Qo••••o.•• •
+'+ p~D L/ D • .521 ft. (15.9 cm ) 4, 8 Elbow Draff Tube
•aka •.503ft.(15.3cm) 4.84Truncafed Cone +511 ft (15.6 cm) 3.26 Circular Cylinder x .511 ft. 05.6cre) 1.63 Circular Cylinder
01 1All Tubes Have Sharp edged Entrances
0 1.0 R D 2.0 3.0 i
Fig 5-FREQUENCY PARAMETERS FOR SURGING
7 E 1
2.01
M

ANALYSIS OF DRAFT-TUBE SURGING IN A TURBINE
Occurrence and severity of draft-tube surging in a given hydraulic turbine
and associated draft tube can be predicted using the experimental results of this
study. To do this it is necessary to be able to compute the parameter f20/pQ2 of
the flow as it leaves the turbine runner and enters the draft tube.
Analysis of Turbine
Horsepower P imparted to the turbine runner by water flowing through it is
given by the classic expression
P - 60 ~n, 'n Z~~sso (5) where n is the rotational speed of the turbine in revolutions per minute, and
(91 - n2) is the rate of change in angular momentum occurring in the flow as it
passes through the runner. Subscripts 1 and 2 refer to the entrance and exit
sides of the runner respectively. Multiplying both sides of Equation (5) by
550 D/npQ2 and using Equation (4) yields
fl.z D _ DRainar _ SSo pi D (6) P(,- 5N 2-.,-29 Dz
where (0. Pll, Qll, and 02 are respectively the specific speed, power, discharge
and runner diameter and are defined in Figure 6 and n2D/pQ2 is the momentum para-
meter associated with the flow leaving the turbine runner and entering the draft
tube. The first term on the right of Equation (6) is the momentum parameter
associated with the flow leaving the wicket gates and entering the turbine and
can be evaluated if the wicket-gate geometry is known. The second terra on the
right of Equation (6) can be evaluated if the performance characteristics and
geometry of the turbine are known.
Specific Application
Equation (6) was used to analyze the hydraulic turbine at Fontenelle Dam
[9]. The efficiency hill for the turbine, as determined from model tests, is
shown in Figure 6. Any point on this efficiency hill yields a particular value
Of n2D/pQ2 and, thus, areas of potential surging--where 22D/pQ2 exceeds 0.4--can
be determined. Figure 7 shows the regions in which surging can be expected and
also shows a line representing operating conditions for which flow leaving the
turbine and entering the draft tube has zero swirl. To the left of this line flow
in the draft tube swirls opposite to the turbine rotation while to the right
swirl is with the runner. The point of maximum efficiency falls on the line of
zero swirl for this unit although this is not apparently true of all units.
Figure (4) predicts that for the elbow draft tube a maximum pressure ampli-
tude occurs at 020/pQ2 = 1.30. The line on which surging would produce this
maximum pressure amplitude is also shown on Figure 7. A parabolic curve was fit-
ted to the pressure data for the elbow draft tube. This parabolic expression
(shown in Figure 4)was used in conjunctionwith Equaticn(6)to calculate relativevalues
s s t
A
i

2.0 } F
4
09
0
80'g=%Efficie 760
so 4 30 2
~to Runaway Speed
P D= Hs'=
t
0 N S = r gg'0 Psi = 63
0 1.0 TD:n 2.0 =60
FIGURE 6 EFFICIENCY HILL FOR FONTENELLE TURBINE
2.0
CS
`c
17 900
h̀
o I.0 Zero Swirl—, r ~ _ Runaway
a' / Speed
Maximum Surge Amplitude
0' O 1.0 T D
, n 2.0
60'f29 FIGURE 7 PREDICTED SURGING FOR FONTENELLE TURBINE
9 E 1

(AP/PgH where H is net head on the unit) of pressure amplitudes for the Fontenelle
unit. The results of this computation are shown on Figure 8 along with relative
power swings actually measured at the plant. Excellent agreement is shown for
the wicket gate opening at which maximum surging occurred. Numerical agreement
of the % power swing and % pressure fluctuation was not expected because the
dynamics of the mechanical and electrical system are necessarily involved in
determining the power swing arising as a result of the pressure surging which is
the driving force. The lack of agreement occurring at each side of Figure 8 may
also be due to the use of Equation (4). Analysis of other units indicated that
this expression may not give an entirely accurate estimate of the momentum para-
meter for all gate openings usually because the exact geometry of the wicket gate
assembly is not accurately known.
CONCLUSIONS '
A particular hydraulic turbine can be analyzed for possible surging within
the desired range of operation by the method presented herein. Dimensionless
frequencies and root-mean-square amplitudes of unsteady pressures measured herein
are directly convertible to prototype conditions by similitude considerations.
However, they can be expected to predict prototype conditions only for the "hard-
core" vortex condition. For low-tailwater conditions, for which the vortex core
becomes unwatered, a two-phase flow occurs and pressure surges are usually some-
what milder.
r ACKNOWLEDGEMENTS
Mr. U. J. Palde of the Hydraulics Branch, U.S. Bureau of Reclamation, took
much of the data and carefully refined the experimental methods and equipment
used.
REFERENCES
1.) Rheingans, W.J., "Power Swings in Hydroelectric Power Plants," Transactions,
American Society of Mechanical Engineers, Vol. 62, 1940.
2.) Hosoi, Y., "Experimental Investigations of Pressure Surge in Draft Tubes of
Francis Water Turbines," Hitachi Review, Volume 14, Number 12, 1965.
3.) Harvey, J.K., "Some Observation of the Breakdown Phenomenon," Journal of
Fluid Mechanics, Vol. 14, 1962.
4.) Chanaud, R.C., "Observations of Oscillatory Motion in Certain Swirling Flows,
Journal of Fluid Mechanics, Vol. 21, 1965.
5.) Benjamin, T.B., "Theory of the Vortex Breakdown Phenomenon," Journal of
Fluid Mechanics, Vol. 14, 1962.
6.) Squire, H.B., "Analysis of the Vortex Breakdown Phenomenon, Part I," Aero
Department, Imperial College, Report Number 102, 1960.
10 E 1
2

Rated Output=11.9 Mega-watts ~1~Predicted % Pressure Fluctuation
Q2.0 4 Net Head = 100 Feet
z ,Measured % Power .,-1.5 3 , Swing-
Peak to Peak 0 o
c + \ + `
ii 1.0 ° 2 s
~ a \ ~ m
c .3 +
~
0.5 I \
o / a
a 0 0 + 0 20 40 60
% Wicket Gate Opening
FIGURE 8 PREDICTED AND MEASURED SURGING EFFECTS
it


kEINIR f T. FALV L jl Dr r Ing.
J. Fluid Mech. (1970), vol. 41, part 4, pp. 727-736 727 Printed in Great Britain
Observations of unsteady flow arising after vortex breakdown
By JOHN J. CASSIDY University of Missouri, Columbia, Missouri
AND HENRY T. FALVEY U.S. Bureau of Reclamation, Denver, Colorado
(Received 11 July 1969)
In rotating flow moving axially through a straight tube, a helical vortex will be generated if the angular momentum flux is sufficiently large relative to the flux of linear momentum. This paper describes an experimental study of the occur-rence, frequency and peak-to-peak amplitude of the wall pressure generated by this vortex. The experimental results are displayed in dimensionless form in terms of a Reynolds number, a momentum parameter and tube geometry.
Introduction In recent years considerable attention has been focused on the transformation
in flow pattern which can occur in a swirling flow. A swirling flow is defined as one undergoing simultaneous axial and vortex motions. The vortex is said to be `broken down.' when reverse flow occurs along the axis. Squire (1960) studied this occurrence analytically and deduced that breakdown would occur when the local swirl angle (tan-'v/w) exceeds 52.5°. In the swirl ratio w and v are the local axial and transverse velocity components. Harvey (1962) obtained experi-mental results agreeing with Squire's analysis. Benjamin (1962, 1967) deduced that the breakdown was in actuality a transformation to a conjugate flow pattern capable of sustaining an axisymmetric standing wave. Fraenkel (1967) and Scheer (1963) have enlarged upon Benjamin's analysis.
As long as the Reynolds number is very low the flow appears to remain steady after the transition. However, as the Reynolds number is increased, the alternate flow pattern takes the form of a helical vortex precessing about the tube centre-line. This unsteady state of flow has been witnessed in the breakdown of the vortex formed by flow over a delta-wing airplane and since much earlier times in the flow through turbine draft tubes. Batchelor (1967) refers to this pheno-menon as `bursting' of the vortex.
Chanaud (1965) studied both the steady and unsteady aspects of conjugate rotating flows experimentally and outlined, on a graph of swirl ratio versus Reynolds number, regions in which the particular patterns of flow would occur.
In this study observations and measurements were made on the unsteady vortex flow developing at high axial Reynolds numbers in straight tubes.
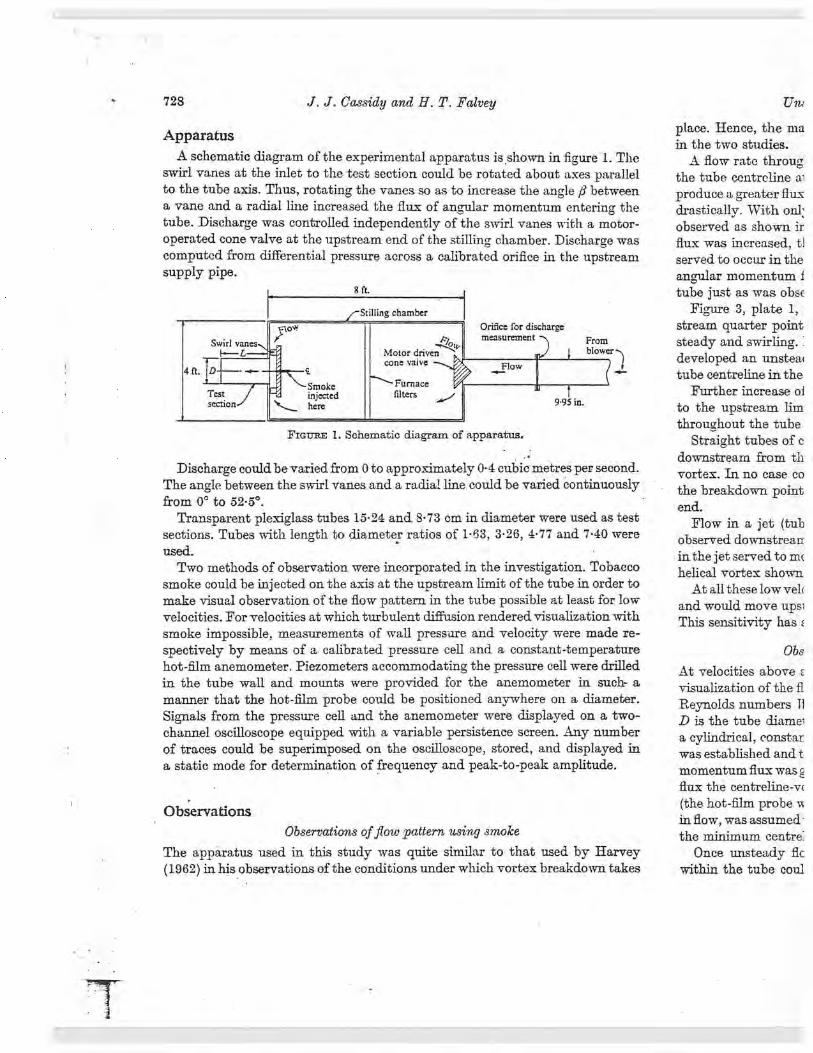
728 J. J. Cassidy and H. T. Falvey Un,
Apparatus place. Hence, the ma in the two studies.
A schematic diagram of the experimental apparatus is shown in figure 1. The A flow rate throng swirl vanes at the inlet to the test section could be rotated about axes parallel the tube centreline al to the tube axis. Thus, rotating the vanes so as to increase the angle / between produce a greater flux a vane and a radial Iine increased the flux of angular momentum entering the drastically. With onh tube. Discharge was controlled independently of the swirl vanes with a motor- observed as shown ir operated cone valve at the upstream end of the stilling chamber. Discharge was flux was increased, t] computed from differential pressure across a calibrated orifice in the upstream served to occur in the supply pipe. angular momentum f
8 ft. tube just as was obse Stilling chamber Figure 3, plate 1,
Flow Orifice forsurement
discharge stream quarter point mea
Swirl vanes-_ .,tea From steady and swirling. I--L Motor driven blower
cone valve developed an unstew
ZJ Flow
I" 4 a- '- r-- tube centreline in the T Smoke Furnace Test injected filters Further increase of
1 9.95 in. section here to the upstream lim If throughout the tube
FIGURE 1. Schematic diagram of apparatus. Straight tubes of c downstream from th
Discharge could be varied from 0 to approximately 0.4 cubic metres per second. vortex. In no case co The angle between the swirl vanes and a radial line could be varied continuously the breakdown point from 0° to 52.5°. end.
Transparent plexiglass tubes 15.24 and 8.73 em in diameter were used as test Flow in a jet (tub sections. Tubes with length to diameter ratios of 1.63, 3.26, 4.77 and 7.40 were observed downstream used. in the jet served to me
Two methods of observation were incorporated in the investigation. Tobacco helical vortex shown smoke could be injected on the axis at the upstream limit of the tube in order to At all these low velt make visual observation of the flow pattern in the tube possible at least for low and would move upsl velocities. For velocities at which turbulent diffusion rendered visualization with This sensitivity has, smoke impossible, measurements of wall pressure and velocity were made re- spectively by means of a calibrated pressure cell and a constant-temperature Obs hot-film anemometer. Piezometers accommodating the pressure cell were drilled At velocities above t in the tube wall and mounts were provided for the anemometer in such a visualization of the fl manner that the hot-film probe could be positioned anywhere on a diameter. Revnolds numbers 11 Signals from the pressure cell and the anemometer were displayed on a two- D is the tube diamei channel oscilloscope equipped with a variable persistence screen. Any number a cylindrical, constax of traces could be superimposed on the oscilloscope, stored, and displayed in was established and t a static mode for determination of frequency and peak-to-peak amplitude. momentum flux was g
flux the centreline-v(
Observations (the hot-film probe v inflow, was assumed
Observations of glow pattern using smoke the minimum centre: The apparatus used in this study was quite similar to that used by Harvey Once unsteady flt (1962) in his observations of the conditions under which vortex breakdown takes within the tube cool

L Unsteady flow arising after vortex breakdown 729
place. Hence, the manner of visual observation utilized was also quite similar in the two studies.
shown in figure 1. The A flow rate through the tube was established and smoke was introduced on ed about axes parallel the tube centreline at the upstream limit. As the swirl vanes were adjusted to 3e the angle /3 between produce a greater flux of angular momentum, the flow pattern was seen to change omentum entering the drastically. With only a low angular-momentum flux, steady swirling flow was .1 vanes with a motor- observed as shown in figure 2, plate 1. Eventually as the angular momentum camber. Discharge was flux was increased, the discharge being held constant, a flow reversal was ob- )rifice in the upstream served to occur in the jet downstream from the tube exit. Further increase in the
angular momentum flux forced the reversed-flow beginning upstream into the tube just as was observed by Harvey (1962).
Figure 3, plate 1, shows the point of breakdown at approximately the up- for discharge stream quarter point of the tube. Upstream of the point of breakdown flow is
cement From steady and swirling. Downstream from the breakdown the flow is seen to have
tow
blower developed an unsteady helical vortex. The helical vortex precesses about the tube centreline in the same direction as the rotation imparted by the swirl vanes.
i Further increase of the angular momentum flux moved the breakdown point 9.95 in. to the upstream limit of the tube and produced a precessing helical vortex
throughout the tube as is shown in figure 4, plate 1. "S' Straight tubes of constant diameter all produced similar flow patterns. Flow
downstream from the breakdown point always produced a precessing helical metres per second.
)e
vortex. In no case could the flow be forced to remain steady downstream from >e va: continuously the breakdown point without decreasing the tube diameter at the downstream
end. Teter were used as test Flow in a jet (tube length L = 0) was also observed. Breakdown was first :6, 4.77 and 7.40 were observed downstream from the opening. Increasing the angular momentum flux
in the jet served to move the breakdown point upstream producing the precessing nvestigation. Tobacco helical vortex shown in fig 5, plate 2. of the tube in order to At all these low velocities the breakdown was quite sensitive to any disturbance )s
ure
~ssible least for low and would move upstream rapidly if any type of probe were placed in the flow. alization with ;red visualization This sensitivity has also been noted by previous investigators.
,locity were made re- constant-temperature Observations of unsteady Pressure and velocity .ssure cell were drilled At velocities above approximately 6 feet per second turbulent diffusion made .emometer in such a visualization of the flow pattern impossible. Observations of breakdown at axial where on a diameter. Reynolds numbers IVDIv greater than 10,000 (IV is the average axial velocity, displayed on a two- D is the tube diameter and v is the fluid viscosity) were made by positioning screen. Any number a cylindrical, constant-temperature, hot-film probe at the tube axis. A flow rate
red, and displayed in was established and the signal from the anemometer was observed as the angular -peak amplitude. momentum flux was gradually increased. With increase of the angular momentum
flux the centreline-velocity decreased, reached a minimum, and then increased (the hot-film probe was not directionally sensitive). The breakdown, or reversal in flow, was assumed to have taken place at the swirl-gate setting which produced
'e the minimum centreline-velocity. ;hat used by Harvey Once unsteady flow occurred measurements of mean velocity or pressure rtex breakdown takes within the tube could no longer be made because of the time-Rrise directional

730 J. J. Cassidy and H. T. Falvey UM
change in local velocities produced by the precessing helical vortex. The fre-quency and peak-to-peak values of the wall pressure near the tube exit were observed by displaying the amplified pressure-cell signal on the oscilloscope. In order to verify that the unsteady pressure was indeed produced by a pre-cessing helical vortex such as was observed with smoke at lower axial Reynolds numbers, the hot-film probe was positioned inside the tube near the piezometer at which the pressure was being observed. Signals from the hot-film anemometer and the pressure cell were displayed simultaneously on the oscilloscope. Figure 6, plate 2, shows the simultaneous traces obtained for one unsteady condition. The velocity and pressure are seen to have the same frequency. A slight phase difference existed because pressure and velocity were not measured at exactly the same point.
The sensitivity of the flow pattern to disturbances observed at low velocities did not seem to exist at the high velocities at which velocity and pressure measurements were made. Positioning the j inch diameter hot-film probe en-tirely across the diameter of the tube did not cause a measurable difference in either the frequency or magnitude of the unsteady wall pressure. However, the frequency of the unsteady pressure was substantially increased when the exit was partially blocked with a flat plate.
Analysis of the results Unsteady pressures
Vortex breakdown was correlated with flow variables in terms of the local swirl angle by Squire (1960) and Harvey (1962). Because the unsteady aspects of flow were of primary interest in this study the local swirl angle of the flow could not be used. Once the helical vortex existed throughout the tube, no quantitative measurements could be made within. Thus, it was necessary to develop a gross parameter descriptive of the relative rotational and axial characteristics of the flow for use in correlating the experimental results.
~ L
Sz Y S} S1
v u ~
w r /
D — 4 - ---+ B ,
Y FIGurE 7. Co-ordinate system and control volume.
The desired parameters were formulated through consideration of the mo- CD mentum equation (for a fluid of zero viscosity) for an axis oriented parallel to the mean flow (see figure 7).
av av 1 v av av uv ap rpat +rpCu ar + r a9
+rw az + r = aB' (1)
Integration of (1) continuity equation, ;
d f rpvdV +fS
/ P
Choosing the contrc in figure 7 makes it p
d f rpvdV—Wt P The second integra
Since this integral wa symbol Q and used a from all variables tra
(PQ
z D3
Q) d
dt v ry c
where Q is the volum The dimensionless 1
tube length LID, wei quency and pressure Reynolds number, sh pendent of viscosity I for a particular value
1.6
1.4
1.2 d
Q 1.0
0.8
0.6
-4
0 0.2 0•~
FIGURE 8. Frequency
In figure 9 values c which viscous effects a similar plot for whi

Unsteady flow arising after vortex breakdown 731
ielical vortex. The fre-.ear the tube exit were ial on the oscilloscope.
:ed produced by a pre-
it lower axial Reynolds ibe near the piezometer e hot-film anemometer
.e oscilloscope. Figure 6, unsteady condition. The luency. A slight phase of measured at exactly
served at low velocities velocity and pressure
eter hot-film probe en-aeasurable difference in pressure. However, the nereased when the exit
_ terms of the local swirl he unsteady aspects of
1 angle of the flow could fie tube, no quantitative 3sary to develop a gross Al characteristics of the
S,
r
+ Z
'IV volume.
)nsideration of the mo-s.s oriented parallel to
— ap (1) ao'
Integration of (1) over an arbitrary control volume, incorporation of the continuity equation, and use of Gauss's theorem yields
r dt f
vrpvdY+ f prv(uan+vrae+w'z )ds+
fV puvdV=—
J aOdV. (2)
S V
Choosing the control volume V as the tube of length L and diameter D shown in figure 7pmakes it possible to modify (2) to r
d J rpvdV— J prvwds+J
prvwds+J
P'rvdV =—~ apdV. (3) V sl s, v v TO
The second integral in (3) is the flux of angular momentum into the tube. Since this integral was an independent variable in this study, it was given the symbol Q and used as a reference quantity. Forming dimensionless quantities from all variables transforms (3) to
(2) ry dV —1 + T} it Ir' rwv ds +f,~,
Uv dV}f =~ Q Wt v P-D/ t J s, 1 —
(POD) a
fT;EPdV,; ao
where Q is the volume rate of flow and f is frequency. The dimensionless parameters fD3JQ, Po D3/ n, S2D/pQ2, along with the relative
tube length LID, were then utilized to correlate the experimental data on fre-quency and pressure. Figure 8, a plot of fD3/Q versus the average-velocity Reynolds number, shows that frequency of the flow is indeed essentially inde-pendent of viscosity for large Reynolds numbers but tends to become constant for a particular value of S)..D/pQ 2.
1.6
1.4 0.92
1.2 0.77
A 1.0
0.8
0.6 0 0.2 0.4 0.6 0.8 1.0 1.2 1.4 1.6 1.8
R x 10-5
FIarM 8. Frequency parameter as a function of Reynolds number for straight tubes.
In figure 0 values of fD31Q have been plotted against QD/pQ2 for the range in which viscous effects are not important as shown in figure S. Figure 10 shows a similar plot for which the pressure parameter of (2) is the dependent variable.

1.5
1.4
1.3
1.2
0.9
0.8
0.7
0.6
Unste
Dimensionless frequer increasing S?D1pQ2. B( the tube exit. Aleasm points farther upstrea any point on the tub( the upstream directioi chamber was noted. ' with a frequency equa amplitude that was d
7
5
G 4
A 4
3
2
1
0 1 1 0.3 0.4 C
FIGURE 1
The unsteady wall a solid cylinder inside large transient forces
Figure 11 displays the noted. Two values ar( the helical vortex fille
732
1.6•
J. J. Cassidy and H. T. Falvey
0
°
e e
+ 0
e
+e e
e
+ ~ b
a~
4
"A
x
i:•x° a ~
.z° 0
di 0.•• zandn°
0 e
o° .
0.3 0.4 0.5 0.6 0.7 0.8 0.9 1.0 1.1 nDIPQ$
FIGURE 9. Frequency as a function of momentum parameter. Straight tube. D
Symbol LID ft. cm X 7.21 0.286 8.76
4.12 0.286 8.76 ❑ 3.34 0.286 8-76 Sharp-edged entrance Q 3.26 0.511 15.26 + 1.63 0.511 15.26 A 7.21 0.286 8.76 A 4.12 0.286 8.76 Bell-mouth entrance ■ 3.34 0.286 8.76

Unsteady flow arising after vortex breakdown 733
Dimensionless frequencies and pressures are both seen to increase rapidly with increasing nD/pQ2. Both frequencies and amplitudes were measured quite near the tube exit. Measurements were made of frequency and pressures at other points farther upstream in the tube. Frequencies were found to be the same at any point on the tube wall but pressure amplitudes were found to decrease in the upstream direction. Communication of the unsteady pressures to the stilling chamber was noted. This unsteady pressure in the stilling chamber occurred with a frequency equal to that of the unsteady pressure in the tube, but with an amplitude that was always reduced by at least a factor of five.
7
6
5
2
0 0.3
°
+
+ °
°
0.9 1.0 1.1
v + + . e
e
+#° °
+t¢
° +
+°
+°
a• 4 c Q ~.
X a d. X.x ' x
• ~' XX
s.
0.4 0.5 0.6 0.7 0.8 0.9 1.0 1.1
QDlpQ2
FiavxE 10. Pressure as a function of momentum parameter. Straight tube. Same symbols as figure 9.
G 4
A
4 3
meter. Straight tube. The unsteady wall pressure was found to be completely eliminated by placing a solid cylinder inside the tube forming an annular flow passage. However, rather large transient forces were required to hold the cylinder centred.
sharp-edged entrance Vortex breakdown
Figure 11 displays the critical values of QD/pQ2 at which vortex breakdown was noted. Two values are plotted for each tube. The lower points are those for which -
Bell-ir h entrant© the helical vortex filled the tube. At high Reynolds numbers breakdown appeared

mathematical solutior that a reversal of axia flow. However, at no solution, Batchelor a: upstream. The measm rotation was approxin uniform. With rotatic tube centreline, and 1 and assumed conditio
Smo Injec
734 J. J. Cassidy and H. T. Falvey Uns.
to take place simultaneously throughout the tube and no lower critical value of 0-D/pQ2 was noted.
Critical values of S2D/pQ2 were computed from the results of Harvey (1962) and Gore & Ranz (1964). In order to make the computation it was necessary to assume that flow ahead of the breakdown rotated with rigid-body motion. Bearing this assumption in mind, agreement appears to be reasonable.
EMENNN. +. developed surge
■■■■■N. i MINMEN Flow reversal at tube exit
ME■■■■N 0=00ME
1.0 2.0 3.0 4.0 5.0 6.0 7.0 8.0 9.0 10.0
LID
FiGuRE 11. Critical values of the momentum parameter. Straight tube, D: 0.511; O, —o—, 0.286. C Gore & Ran Harvey.
Observations were made of vortex breakdown in flow through a tube in which the diameter was abruptly reduced from 15.24 em to 8.73 cm. The down-stream tube, 50•S cm long and 8.73 cm in diameter, was bolted to the upstream section, 25.4 em long and 15.24 cm in diameter as shown in figure 12. Three separate modes of breakdown were observed in this tube using smoke for visual observation of the flow pattern:
1. At QD/pQ2 = 0.189 (D = 15.24 cm) breakdown occurred in the larger tube but a reversion to swirling flow without a reversed-flow core occurred as the flow contracted to enter the 8.73 em tube. No breakdown occurred in the smaller tube.
2. Between QD/pQ2 = 0.492 and 0.575 (D = 15.24 cm) steady reversed flow persisted along the axis of both tubes. Smoke patterns formed during this phase of flow were striking. Although rotation was in the same direction throughout both tubes, the upstream flow near the tube axis produced spiral patterns having a pitch opposite to those produced by the outer flow moving downstream.
3. At QD/pQ2 = 0.830 (D = 15.24 cm) reversed flow occurred in the larger tube. The flow reverted to steady swirling flow without reversal upon passing through the contraction, and breakdown occurred downstream in the smaller tube. Photographs of the resulting flow patterns are shown in figure 13, plate 3.
Careful observations were made of the flow patterns produced in both tubes as the angular momentum flux entering the tubes was steadily increased. The
Conclusions 1. The unsteady p
the axis of the tube. 2. Frequency and.
breakdown are indep 3. Breakdown and
arising after breakdo-momentum paramete

Unsteady flow arising after vortex breakdown 735
i no lower critical value
results of Harvey (1962) atation it was necessary with rigid-body motion. :o be reasonable.
8.0 . 9.0 10.0
fight tube, D: •, f, 0.511; rvev.
flow through a tube in n. to 8.73 cm. The down-s bolted to the upstream own in figure 12. Three )e using smoke for visual
curred in the larger tube core occurred as the flow arced in the smaller tube. m) steady reversed flow Formed during this phase me direction throughout ed spiral patterns having noving downstream. r occurred in the larger at reversal upon passing w-nstream in the smaller own in figure 13, plate 3. produced in both tubes
s steadily increased. The
mathematical solution for swirling flow presented by Batchelor (1967) predicts that a reversal of axial velocity should occur near the boundary in contracting flow. However, at no time was any reversal noted except on the axis. In his solution, Batchelor assumed a uniform axial velocity and rigid-body rotation upstream. The measurements made here indicated that prior to breakdown the rotation was approximately rigid-body, but that the axial velocity is not nearly uniform. With rotation the axial velocity always appeared to be low along the tube centreline, and high near the boundaries. This difference between actual and assumed conditions is apparently of some importance.
Swirl vanes
Both a rounded and a square-edged entrance were used with each tube observed
1524 cm Flow 8.73 cm
Smoke injector
25.4 cm _ I _ 50.8 cm
FiaunE 12. Arrangement of flow inlet.
Conclusions
1. The unsteady pressures are produced by a helical vortex precessing about ub the axis of the te.
2. Frequency and amplitude of unsteady wall pressures produced after vortex breakdown are independent of viscous effects for high Reynolds numbers.
3. Breakdown and the frequency and amplitude of the unsteady wall pressure arising after breakdown can be correlated in dimensionless form with the gross momentum parameter DD/pQ2.

I
736 J. J. Cassidy and H. T. Falvey
REFERENCES
BATCHELOR, G. K. 1967 An Introduction to Fluid Dynamics. Cambridge University Press.
BErraAHnN, T. B. 1962 Theory of the vortex breakdown phenomenon. J. Fluid Mech. 14, 593.
BENJAmix, T. B. 1967 Some developments in the theory of vortex breakdown. J. Fluid Mech. 28, 65.
CHA.NAuD, R. C. 1965 Observations of oscillatory motion in certain swirling flows. J. Fluid Mech. 21, 111.
FRAEN%EL, L. E. 1967 On Benjamin's theory of conjugate vortex flows. J. Fluid !Mech. 28, 85.
GORE, R. W. & RANz, W. E. 1964 Backflows in rotating fluids moving axially through expanding cross sections. Am. Inst. Chem. Engrs J. 10; 83.
HARvEY, J. K. 1962 Some observations of the vortex breakdown phenomenon. J. Fluid Mech. 14, 585.
SCHEER, A. F. 1968 On the nature of conjugate vortex flows. J. Fluid Mech. 33, 625. SQumE, H. B. 1960 Analysis of the vortex breakdown phenomenon, Part I. Aero. Dept.,
Imp. Coll. Rep. no. 102.
/r,urxu.J ('f Eland• ,heck
FIGURE 2. Steadv s, Q = 0.005"
FIGURE 3. Breakdovm ai Q = 0.003Z
FIGIIRF 4. Helical Q = 0.0167
C;ASSIDY AND FALVEY
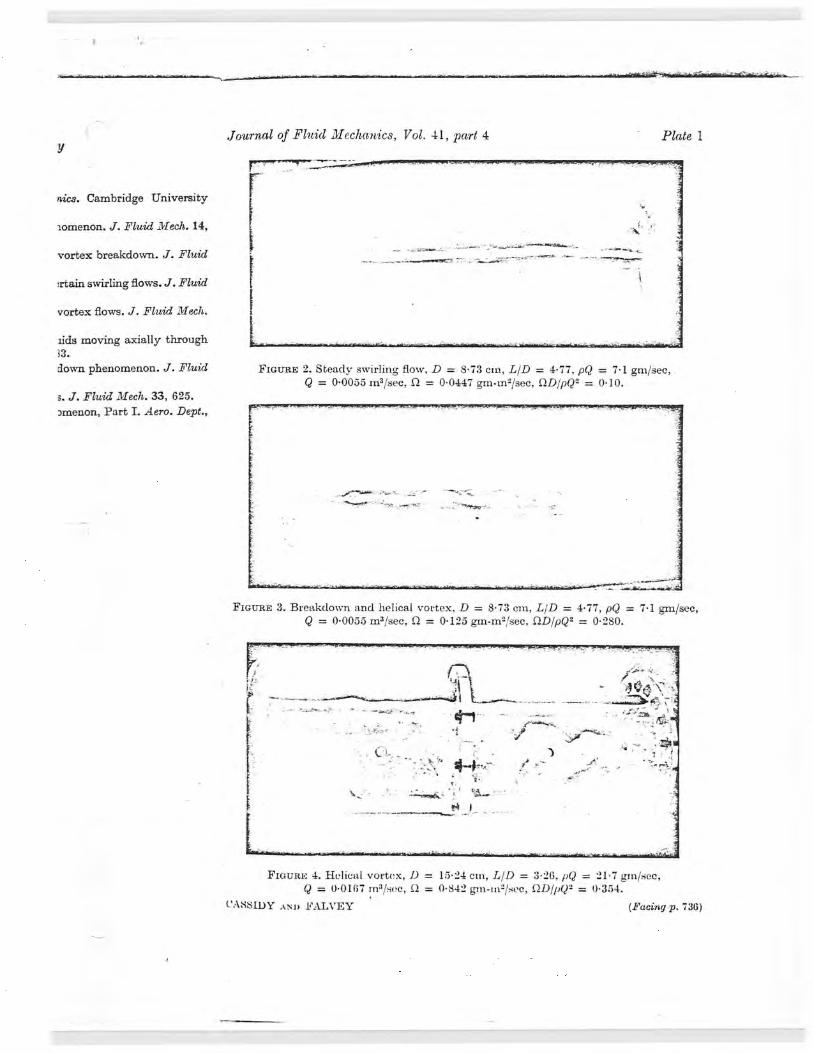
Journal of Fluid Mechanics, Vol. 41, part 4 Plate 1 Y
FiGuxE 2. Steady swirling flow, D = 8.73 cin, LID = 4.77, pQ = 7.1 gm/sec, Q = 0.0055 m3/sec, S2 = 0.0447 gm-ur/sec, S2D/pQ2 = 0.10.
FiGuxE 3. Breakdown and helical vortex, D = 8.73 cin, LID = 4.77, pQ = 7.1 gm/sec, Q = 0.0055 m3/sec, f2 = 0.123 gm-m3/sec, QD/pQ2 = 0.280.
FIGURE 4. Helical vortex, D = 15-24 cin, LID = 3•26, pQ = 21.7 gin/sec, Q = 0.0167 7n3/sec, S2 = 0.842 gin-in'-'/sec, S2D/pQ2 = 0.354.
CASSIDY ANN) FALVEY (Facing p. 736)
nits. Cambridge University
iomenon. J. Fluid Alech. 14,
vortex breakdown. J. Fluid
,rtain swirling flows. J. Fluid
vortex flows. J. Fluid Mech.
rids moving axially through 33. down phenomenon. J. Fluid
s. J. Fluid Mech. 33, 625.
3menon, Part I. Aero. Dept.,

f
Journal of Fluid Mechanic~, Vol. 41, part 4 Plate 2 Joluvtal of Fluid .11
Ficua.E 5. Flow in a swirling jet, LID = 0, pQ = 21.7 gm/sec, Q = 0.0167 m3/sec, Q = 0.714 gm-m$/see, QD/pQ2 = 0.300.
~~.: r tom; ~ `~.- ~ ~ • l ~ Y "..:
.;:
L t
t,
~''• t • } 1
Sri-- j ~ - .a ~, .
_
FIGURE 6. Oscilloscope traces of velocity (upper trace) and pressure. FiGURu 13. Flow throe flow in the small tube. axis of the large tube k
CASSIDY AND FALVEY CASSIDY AND FALVE'

Q = 21.7 gm/sec, 2D/pQ2 = 0.300.
(u)
(b)
Plate 2 Journal of Fluid Mechanics, Vol. 41, part 4 Plate 3
-rte.•-~-:- _ .. ... _ . . -
y
(c)
trace) aId pre4sure.
FicURE 13. Flow through a contraction. (a) Breakdown in the large tube, steady swirling flow in the small tube. (b) Reversed flow throughout both tubes. (c) 134werse flow on the axis of the large tube with a second breakdown in the suialler tube.
CASSIDY AND FALVLY


REC-ERC-71-42 H. T. Falvey Code 1532
H. T. Falvey
Engineering and Research Center
Bureau of Reclamation
December 1971

MS-230 (8-70) Bureau of Reclamation TECHNICAL REPORT STANDARD TITLE PAGE
1. REPORT NO. 2, GOVERNMENT ACCES94" NO. 3. RECIPIENT'S CATALOG NO. REC-ERC-71-42
4. TITLE AND SUBTITLE 5. REPORT DATE
Dec 71 Draft Tube Surges—A Review of Present 6. PERFORMING ORGANIZATION CODE Knowledge and an Annotated Bibliography
7. AUTHOR(S) 8. PERFORMING ORGANIZATION REPORT NO.
H. T. Falvey REC-ERC-71-42
9. PERFORMING ORGANIZATION NAME AND ADDRESS 10. WORK UNIT NO.
Engineering and Research Center 11. CONTRACT OR GRANT NO.
Bureau of Reclamation Denver, Colorado 80225
13. TYPE OF REPORT AND PERIOD COVERED
12. SPONSORING AGENCY NAME AND ADDRESS
Same 14. SPONSORING AGENCY CODE
15. SUPPLEMENTARY NOTES
16. ABSTRACT
A literature survey and a review of material related to draft tube surges is presented. The literature survey consists of an annotated bibliography of 68 articles published between 1910 and 1970. The review is restricted to three major areas: experiments with elementary models, expeFimE is with model and prototype turbines, and field expedients to reduce surging. Velocity distributions and surge frequencies are given special attention in the first two areas. Present knowledge is sufficient for predicting the order of magnitude of draft tube surge frequencies and relative surge amplitudes. Additional studies are needed to refine prediction methods and to extend their scope to include pumps and pump-turbines. Model testing at full prototype heads is apparently not required to investigate draft tube surging. Has 68 references.
17. KEY WORDS AND DOCUMENT ANALYSIS
a. DESCRIPTORS-- / *draft tubes/ * turbines/ *surges/ *hydroelectric powerplants/ hydraulic machinery/ fluid mechanics/ unsteady flow/ laboratory tests/ model tests/ fluid flow/ non-uniform flow/ vortices/ bibliographies/ annotations/ velocity distribution/ amplitude/ air admission/ frequency
b. IDENTIFIERS-- /hydrodynamic stability
c. COSATI Field/Group 13G
18. DISTRIBUTION STATEMENT 19. SECURITY CLASS 21, NO. OF PAGE
Available from the National Technical Information Service, Operations (THIS REPORT)
UNCLASSIFIED 25 Division, Springfield, Virginia 22151,
20. SECURITY CLASS 22. PRICE (THIS PAGE)
UNCLASSIFIED $3.00

REC-ERC-71-42
DRAFT TUBE SURGES
A Review of Present Knowledge and an
Annotated Bibliography
by
H. T. Falvey
December 1971 '
Hydraulics Branch Division of General Research Engineering and Research Center Denver, Co~orado
UNITED STATES DEPARTMENT OF THE INTERIOR * BUREAU OF RECLAMATION Rogers C. B. Morton Ellis L. Armstrong
Secretary Commissioner

CONTENTS
Applications . . . . . . . . . . . . . . Introduction . . . . . . . . . . . . . . Experimental Observations With Simplified Models
General Velocity Distribution Surge Frequencies Mathematical Description of the Swirling Flow
Observations With Model and Prototype Turbines
General Velocity Distributions Surge Frequencies
Field Expedients to Reduce Surging
Air Admission Fins and Flow Splitters Extensions to Runner Cone Coaxial Hollow Cyl inder
Symbols Used in the Text Conversion Factors Alphabetical Listing of Authors Bibliography of Vortex Action in Closed Conduits and Draft Tube Surging
Figure
1 2 3 4 5 6 7
LIST OF FIGURES
Spiral vortex in a cylindrical tube . . . . . . . Flow regimes with swirling flow in divergent conduits Circumferential velocity distribution in a conduit Definition sketch of turbine nomenclature Fins and flow splitters Extensions to runner cone Coaxial hollow cylinder
.... <¥4 -: t.i!if .
Page
1 2 3 3
4
4 4 5
6
6 7 9 9
11 12 13 14
2 5 7 8 9
10
8-4 • - -. t .
! l )

APPLICATIONS
The results of this study are encouraging. Sufficient knowledge is presently available to permit the analytic prediction of draft tube surge frequencies and relative amplitudes knowing the wicket gate geometry and turbine characteristics. Additional studies are needed to refine existing surge prediction methods and to extend their scope to include pumps and pump-turbines. Testing models at the full prototype head does not appear to be necessary to investigate surge characteristics of a turbine. The quantities presented in the s~ction "Field Expedients to Reduce Surging" represent observations of specific installations. The absolute value of these quantities will undoubtedly vary from installation to installation. However, the order of magnitude of the quantities can probably be used for estimations.
INTRODUCTION
Draft tube surge is the term applied to a hydrodynamic instability which forms in draft tubes containing swirling flow. The instability is present in almost every reaction-type installation when the unit is not operating near maximum efficiency. It has also been observed with Kaplan-type (propeller) runners.
Flow visulization studies with model turbines have shown that the instability or surging is intimately connected with the presence of a corkscrew or spiral-shaped vortex which rotates around the axis of the conduit, Figure 1. The surging exists with the vortex core filled with air, water, or water vapor. However, when the vortex core is filled with air or water vapor, the amplitude of the surges is reduced. A vortex core which forms coaxially with the conduit produces no surges. Apparently, the spiral vortex represents a flow configuration conducive to self-excited oscillations.
,, In hydroelectric plants, tht surges are responsible for many undesirable operating characteristics which may occur individually or in combination. These undesirable characteristics are: noise, vibrations, variations in power output, vertical movement of the runner and shaft, and pressure puls.itions in the penstock. The existence of so many different adverse characteristics of the draft tube surge, as wall as inconsistencies in the character of the surge between apparently identical units, has led to much confusion in analyzing the problem.
This report presents a compilation and analysis of known facts and observations about the draft tube surges in an effort to explain some of the
Figure 1. Spiral vortex in a cylindrical tube. Flow is from
right to left.
inconsistencies. In addition, an annotated bibliography is included to provide the reader with additional sources of information.
In conducting the library study, any material pertaining to rotational flow in a conduit was gathered. Although the sources were often very remote from the field of. hydraulic machinery, their inclusion in the bibliography adds insight into the nature of the problem.
EXPERI1\IENTAL OBSERVATIONS WITH SIMPLIFIED iVIODELS
General
In a normal Francis-type turbine installation, the analysis of the flow beneath the runner is made extremely complex by the effects of the bend in the draft tube, the conical diffuser section of the draft tube, and the velocity distribution imparted by the runner itself. Some authors have suggested that the flow distribution in the spiral case or distributor may also be a significant parameter. In view of the multitude of factors to be considered, investigations with simplified models is clearly indicated. With a simplified model, the effect of each factor can be investigated separately and its contribution to surging evaluated.
Tests of simplified models were made with either water or air flow in cylindrical, convergent, and divergent pipe sections. Swirl was imparted through rotation of upstream pipe sections, spiral chambers, vanes, and rotating perforated disks placed perpendicular to the
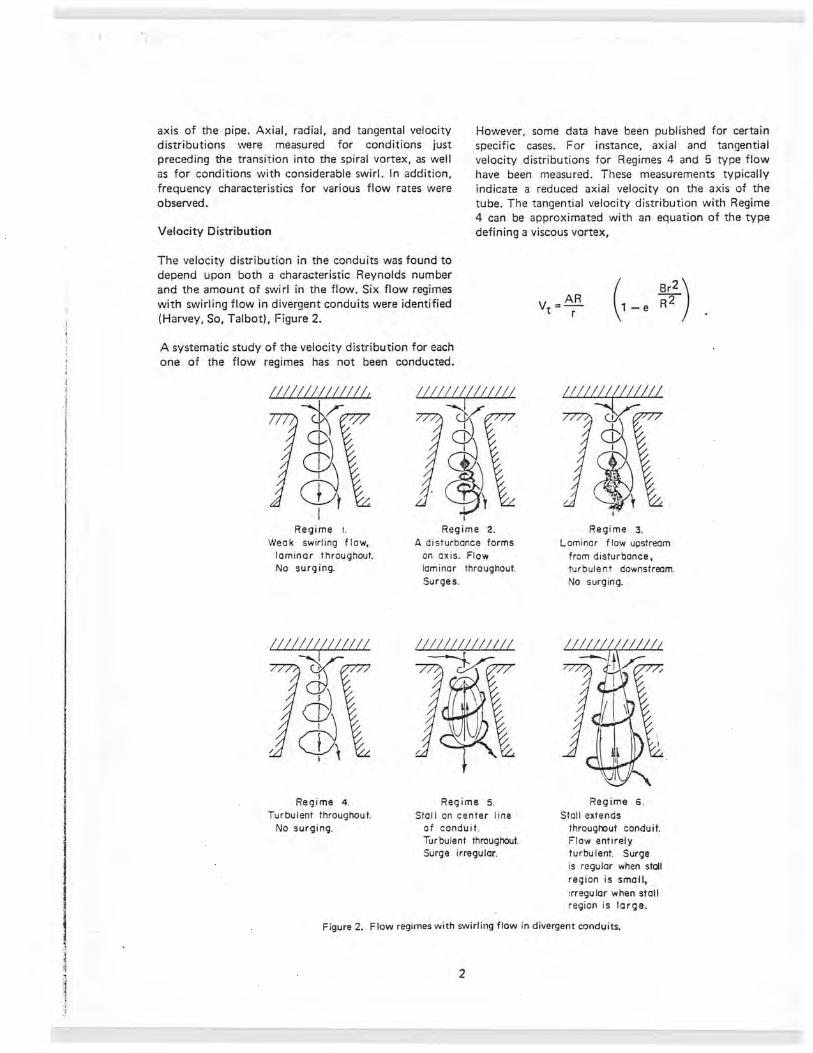
l l I I
l I I I I I
I
axis of the pipe. Axial, radial, and tangental velocity distributions were measured for conditions just preceding the transition into the spiral vortex, as well as for conditions with considerable swirl. In addition, frequency characteristics for various flow rates were observed.
Velocity Distribution
However, some data have been published for certain specific cases. For instance, axial and tangential ve locity distributions for Regimes 4 and 5 type flow have been measured. These measurements typically indicate a reduced axial velocity on the axis of the tube. The tangential velocity distribution with Regime 4 can be approximated with an equation of the type defining a viscous vortex,
The velocity distribution in the conduits was found to depend upon both a characteristic Reynolds number and the amount of swirl in the flow. Six flow regimes with swirling flow in divergent conduits were identified (Harvey, So, Talbot), Figure 2.
A systematic study of the velocity distribution for each one of the flow regimes has not been conducted.
/!llll!l!!lllt't
1( ¢) cu
I Regime I.
Weak swirling flow, laminar throughout. No surging.
llllll~!IIIIII ~ c9 28 cp,
Regime 4.
Turbulent throughout. No surging.
llllllfU!II!
. t I
Regime 2. A di sturbonce forms
on axis. Flow laminar throughout. Surges .
Regime 5. Stal I on center I ine
of conduit . Tur bu lent throughout. Surge irregular.
V _AR
t - r ( Br2)
1-e R2
Regime 3. Laminar flow upstream
from disturbance, turbulent downstream. No surging.
Regime 6 . Stall extends
througl"out conduit. Flow entirely turbulent. Surge is regular when stall region is small, ;rregu lor when stall region i s large.
Figure 2. Flow regimes with swirling flow in divergent conduits.
2

. .
Tests were also made with air in straight cylindrical conduits (Harvey). A series of vanes were used to induce spiral flow. The swirl angle upstream from the disturbance was measured directly with a stream of smoke. The author indicated that the flow was laminar upstream from the disturbance and turbulent downstream which is indicative of Regime 3 type flow . However, upstream flow conditions at which the tests were conducted give a Reynolds number of about 9 x ,o3 and thus indicate the inception of Regime 5 type flow. Tests have shown that moderate rotation or swirl has a dampening effect upon turbulence which could explain the laminar appeara_nce of the flow even though it is in the turbulent range (i.e. , Reynolds numbers greater than about 2 x 1 o3). A viscous vortex equation could not be made to fit the swirl angle measurements exactly . This lack of fit is probably caused by a nonuniform axial velocity distribution across the cross section.
The rope-like vortex which precesses around the cell of reversed flow with Regime 5 or 6 type flows produces
In one empirical method, an interpretation or explanation of the pressure fluctuations is made on rational grounds. Then an equation, containing constants to be determined experimentally, is writ.ten to describe the phenomenon . For instance, it has been assumed that the vibrations are produced by pertubations of the velocity and density of the fluid in the tube (Michelson, Vonnegut). This assumption leads to an expression for the frequency of the form
A Vs f=--
7TD
, /2 (1)
The approach leads to the conclusion that high speed and motion in more than one dimension are necessary for the generation of the surge (Michelson). Although the explanation seems plausible, velocity measurements in air and water have shown that surging can exist even though the flow is everywhere definitely subsonic.
periodic variations in the velocity measurements. In Another method for obtaining an empirical equation general , the manner in which the various investigators for the surging flow is to write the governing analyzed these velocity fluctuations at a point to differential equations in dimensionless form. This obtain a single mean velocity value was not indicated in . .. . . , results in a set of dimensionless parameters which can their publications. · _be· used to correlate the experimental data. The
,urge Frequencies
The frequency of the oscillations was found to vary inversely as the diameter of the tube and inversely as the length of the tube. The amplitude of the fluctuation was lower with conically divergent tubes than with cylindrical tubes. In all the tests, the relationship between discharge and frequency was very linear for a given tube and inlet swirl condition. This concept has been used by at least one manufacturer in a flow-metering device.
Mathematical Description of the Swirling Flow
Many attempts have been made to describe the swirling flow in cylindrical and divergent tubes mathematically . Almost without exception, the basic assumptions restrict the classes of solutions to rotationally symmetric flow. This means that any disturbances which are predicted will be symmetrical and will appear on the axis of the conduit. Prediction of a spiral-shaped vortex is automatically eliminated by the basic assumptions. In general, it is not possible to make the necessary assumptions about the flow , a priori, which permits a description of the spiral vortex. However, it is possible to obtain analytic descriptions ,f the spiraling flow empirically.
3
.• 5 . . ... o .. -. ¥. _ . . .c
: approach teads to equations of the form
f D'3 ~"' ADD +B
Q po2 (2)
where A and B are empirically determined constants (Cassidy, Falvey) . This method implies that gross ~low parameters are sufficient to describe the surge phenomenon with swirling flow. In general, good correlations have been obtained with this approach even when using such widely different density fluids as air and water.
Instead of studying fully surging flow, some investigators have tried to define the conditions at which a disturbance will form with swirling flow . These attempts have led to the conclusion that the disturbance is a finite transition between two states of flow (Benjamin).
Analytic studies indicate that the disturbance will occur when the ratio of the rotational velocity component to the axial component is greater than about 1.0 (Squire). The critical breakdown point can also be described by the empirical expression mentioned above. Expressed in terms of the gross parameters, the disturbance will occur in a straight pipe when
wwt ac;; .u ~. ~ .- 24 :;; _ 41hCJ & G _ 43 ... Mi&J _ &.A!r. za. AJL>-t

' ( 1 · ;t:w:t - · ·· · ciizt•il" tit "<WRM::ir** ~w em~· · · Y>s· ·- ~ · '"t "" ·1 u t;;;":teF it · ? ·· h-iHE · ' fint'Mt0
r.,. :ts
rm L o.oos O + 0.11 (3)
The empirical methods mentioned above could be eliminated if the upstream and downstream boundary conditions could be accurately described. One attempt was made to approximate these conditions through an iterative procedure using the simplified equations of motion (Gore, Ranz). Through this procedure a flow field was obtained which has some of the important features of the observed flow.
OBSERVATIONS WITH MODEL AND PROTOTYPE TURBINES
General
Often the use of hydraulic models to predict prototype performance is questioned. In some cases, these doubts are justified, especially when the flow · phenor:nena under study have not been carefully defined. Some of the authors conducted model-prototype comparisons and indicate areas in which model tests can be beneficial.
For instance, it has been demonstrated that with turbulent vortices neither the velocity distribution nor the circulation are functions of viscosity if the flow is turbulent and fully developed (Hoffman and Joubert) . Thus, one would expect flow patterns, velocity distributions, and pressure fluctuations in the model and prototype to be related through an Euler number relationship. These considerations have been verified in experiments which showed close agreement between the size of the vortex core underneath model and prototype runners, as well as damage areas to be expected from cavitation (Girand).
Attempts to correlate penstock frequencies and amplitudes have, on the other hand, been rather unsuccessful. The reason for these discrepancies is apparent if the entire power generating system is considered as a vibrating system having several degrees of freedom with each capable of resonance being driven by some forcing function . The forcing function which drives the system is created by pressure fluctuations in the draft tube. The frequency and amplitude of these fluctuations can be obtained from a hydraulic model study. The degrees of freedom or parts of the system which could resonate include the penstock, other generators connected to the same penstock, the surge tank, the turbine generator unit and connecting shafts, the regulating system, and the
4
electrical power network. Obviously, this multitude of factors cannot be accurately simulated in the hydraulic model. Therefore, correlation of amplitudes and frequencies in the penstock between model and prototype measurements · would be fortuitous. However, this does not imply that data from the model study cannot be used to predict prototype penstock pressure fluctuations. Existing analytical methods based on impedance concepts have proven highly successful in predicting penstock frequency and amplitudes created by periodic pressure or discharge fluctations (Streeter, Zolotov).
A model can thus be expected to accurately represent velocity distributions, forcing frequencies, and amplitudes in the prototype draft tube. The appearance of cavitation and areas which can be expected to sustain cavitation damage can also be predicted on the basis of model experiments. The model data can then be used in a mathematical description of the system to determine power swings and penstock pressure fluctuations in the prototype.
The scaling laws to convert model frequencies and amplitudes to prototype values are
(4)
for frequency, and
(5)
for amplitude.
Velocity Distributions
The type of flow observed during periods of large pressure surges is described by most experimenters as being typical of Regime 5 or 6 type flow, Figure 2. Without surging, a Regime 4 type flow is observed in the model. These regimes are modified to some extent by the pressure in the draft tube. For high tailwater levels, the vortex core remains solid. With lower tailwater levels, the pressure in the center of the vortex core decreases until at some critical value of tailwater the pressure in the vortex core reaches the vapor pressure of the water and a hollow vortex core results. If air is admitted to the draft tube, a hollow core can be achieved at pressures greater than the vapor pressure of water.
A distinction was made between hollow and solid vortex cores. The hollow vortex was called "soft" and the solid vortex "hard" (Vuskovic and Velensek). This terminology was developed during observations of

' '
pressure fluctuations in the draft tube. With a solid core the intensity of the pulsations was severe. By admitting air or dropping the tailwater level to form water vapor in the vortex core, the intensity of the pulsations decreased or softened. The use of this terminology is unfortunate. Recent tests have.revealed that air admission or decreasing the tailwater level can make the intensity of the pulsations increase in some cases (Ulith).
The velocity distribution in the throat of the draft tube is a function of the runner speed, distributor proportions, discharge, and the shape of the runner blades. Until recently, velocity distributions were obtained from simplified theories involving runner speed (i.e., assuming ru = constant) or from model tests. With the advent of the computer, better methods for computing the three-dimensional velocity distribution have been developed (Jansen). These have reduced the need for a comprehensive model test program. With the mathematical model, various parameters can be examined and a final design developed. The final design can then be verified by a model study . These methods, although a tremendous improvement over previous computational methods, still are inadequate since the effect of velocity distributions produced in the draft tube are not considered.
:xperiments with models thus seem to be the only reliable. method of determining velocity distributions in the draft tube. Some velocity distributions for typical units have been measured with a vapor-filled vortex core and with a solid vortex core (Dziallas, Yamazaki). In both cases, a positive, nonzero value of peripheral velocity was measured over the entire cross section. These results are clearly incorrect since the peripheral velocity must be zero somewhere in the cross section. For fl ow which rotates both clockwise and counterclockwise in the cross section, there must be an odd number of points on the diameter of the section having zero peripheral velocity . However, the experiments of one investigator are particularly noteworthy (Mollenkopf) . Through the use of a hot fi Im probe, he was . able to obtain velocity measurements in the draft tube which represent essentially a "snapshot" of the instantaneous distribution. The circumferential velocity distribution computed from Mol lenkopf's work differs significiantly from the distribution of a potential vortex in a cylinder, Figure 3.
Surge Frequencies
The earliest prediction of the surge frequencies was in 1940 (Rheingans). The well known relationship is
.,,
5
Derived from Mollenkopf {67 ), Figures 14 and 1S, Plane m: Rotat ional Speed of Vortex around tube about r.e rev / sec.
a. Measured distribution.
\Jortex Strength K :: .211 M'l sec. Rotational Speed of Vortex around Tube = 1. s re" I sec.
b. Theoretical distribution resulting from irrotational flow
around a vortex.
Figure 3. Circumferential velocity distribution in a
conduit.
Q. 4 ;::.:e.; ,)tt R<l 4 $ . .#

~ 1Jd'7Xrtt s \ ;. >Ciz - - -:ncrcr,. eat:¥ ' · 5 · · -· a ? e ·- · ii bt" 1ln " w ·«tr±:
- _/
f = n/60 3.6 (6)
This equation is based on observations of existing plants and represents the surge frequency when the greatest pressure fluctuations occur. Other investigators have argued that the constant in the denominator should be something closer to 4.0. However, the exact magnitude of the constant is somewhat immaterial since the equation is empirical with no firm theoretical basis.
The next major attempt to develop a mathematical model for predicting the surge frequency utilized the concept of a rotational vortex moving in an irrotational vortex field (Hosoi). The equation which was developed had the form of the Rheingans equation . It was
Model tests indicated Va/R varied between 0.7 and 0.8. Unfortunately, velocity distribution studies have not substantiated the velocity field assumptions made in this method.
The most recent attempts to predict the surge frequency utilize gross flow parameters (Falvey, Cassidy, 1970). For a given draft tube size, the surge frequency is given by
,. ; (as•:, + 03) 111 The parameter (DO/pQ2) can be computed for a particular turbine from the following expression
no = DR si n a
pQ2 BNS
550p 11 D (8)
The first term on the right of the equal sign is a function of the wicket gate geometry. The second term represents the turbine runner characteristics. The dimensionless ratio thus takes both the wicket gate geometry and the turbine runner characteristics into account when predicting the surge frequency. The effect of draft tube geometry on the constants in Equation 7 has not been established.
FIELD EXPEDIENTS TO REDUCE SURGING
Air Admission
The most frequently mentioned means to reduce the amplitude of the surging is the admission of air into the
6
::ntttc .. . rr I ri¥&1~
runner or draft tube. With low tailwater levels, the pressure below the runner is less than atmospheric. In this case, suitable venting is all that is required to supply air to the vortex. On the other hand high tailwater levels require the use of an air compressor to force the air into the draft tube. Since the most severe pulsations can occur with the high tailwater levels, provision for the admission of air may be costly.
Both the location and the manner of air injection are important. For instance, air admitted to the inlet side of a turbine runner eliminated pressure pulsations for all gate _openings less than 72 percent of optimum gage (Konig, Whippen) . Normally, however, air is admitted to the lower side of the runner. Many air admission schemes have been used . They include air admission through extensions of the turbine shaft, through pipes or especially formed streamlined shapes, oriented across the draft tube, and behind the runner band (Dziallas), Figure 4. For axial flow runners the most effective location for air injection is through holes in the runner cone ( lsaev) . Recent studies indicate the most effective aeration location with high specific speed Francis-type runners is injection of compressed air into the annular chamber between the wicket gates and the runner (Ulith) . Other injection locations have been used successful ly. Even injection from the draft tube wall or from behind the runner band can reduce the surge amplitude. The migration of the air to the vortex core in these cases is due to recirculation of water in the draft tube.
The quantities of air needed to reduce surging are normally expressed in terms of the ratio of the volumetric airflow at standard temperature and pressure to the turbine discharge at full load point with rated head. Using this definition, the air quantities needed for maximum surge attenuation with injection through the runner cone in low specific speed units are in ,the range 1 to 2 percent. Whereas, with air injection into the space between the wicket gates and the runner only 0.05 to 0.10 percent air is needed with high specific speed units (Ulith).
The location at which the air is admitted has a sign ificant effect on the efficiency of the unit. For instance, admission of air either upstream from the runner or through deflecting surfaces of the head cover result in loss of efficiency. Air admission between the runner and the wicket gates may result in slight increases in efficiency. Whereas, air admission through the runner cone has, in some cases, led to a 0.5 to 1.0 percent increase in efficiency (lsaev). In these cases, the gain in efficiency with air admission through the cone may be attributed to improved flow conditions in the draft tube as a result of air filling the reversed flow region.

Turbine runner shaft
Runner blade
Turbine Runner Profile High Specific Speed
(Ns=63)
Draft lube
Stay vanes
Spiral case
Figure 4. Definition sketch of turbine nomenclature.
Air admission may not always lead to decreased surge amplitudes. The reduction in surge amplitude has been found to be dependent on sigma (or tailwater level) (Ulith). In fact, for sigma values larger than about 0.3 to 0.4, air admission may increase the surge amplitude. An upper limit for the quantity of air which could be admitted advantageously was also noted ( lsaev). For instance, during part load operation with a Kaplan turbine, the maximum reduction in surge amplitude was observed with 0.5 percent air. Increasing the airflow quantity to 3 or 4 percent increased the surges at the inlet to the elbow. Under motoring conditions 2 percent air resulted in the largest surge reduction. Increasing air quantities above 2 percent led to larger surges.
The necessity of providing for compressed air with high tailwater levels may or may not be a disadvantage. Frequently air is available at the plant in sufficient quantities and at adequate pressure to provide the required air admission. If air is admitted at the runner cone, the maximum pressure required is about equal to the submergence of the runner below the tailwater. With high-speed runners, air injection at the periphery of the head cover requires an air pressure of about 40 to 50 percent of the head . Admission in the spiral case would require a pressure approximately equal to the
7
head on the unit. One side benefit of air admission upstream from the runner is protection of the runner from cavitation damage. It should be stressed, however, that compressed air, while it may be available for surge suppression, requires energy and equipment for its production.
Fins and Flow Splitters
Since the instability or surging is caused by the rotation of the flow in the draft tube, a logical way to eliminate the pulsations would be to eliminate or reduce the swirl. One means to reduce the swirl is to place fins parallel with the axis of the runner either on the walls on the draft tube or on the runner cone. The fins are usually a half a throat diameter long and extend about 0.1 to 0.2 throat diameters into the flow. Between two and eight fins are used.
If the fins extend far enough into the flow to touch each other, they are known as flow splitters, Figure 5. Normally, the flow splitters consist of three fins or vanes, although a greater number have been used.
The orientation, number of fins or elements of a flow splitter, and height of the fins or flow splitter are significant parameters in obtaining a maximum

I I I ! j
! l I
I l l i J ~ J
i
-I i l 1 ! ' I
·i
i l l l
I I l
I I
I l I
. \
IP,. .;;>
' ·,
9
. • I t . . G '
·j\ . J" .;) . ,; '--!°'A_"><~J ' / , _,, : --. t:·o\ :-.:~ /' i ~ -t;::) • . . , __ ),. _ _____ ....1 ..._ ~ '- ., .. ,~ • ;I
('1',,. ""'"' •:r ~--;. "'-' Ji :v" . . . \ \. ·, .. ,, ~ ' \
THROAT DIAMETER
j,.: ...,. ;r \ •
I ,. : '·
. J
~.;l 10 . t! -~ /fl~ ' .P \ DRAFT TUBE
'$; '
f . r.
Figure 5. F ' ins and flow splitters.
8
-~ -.. '" . ' .,.~ . ~/-, . .,,......-- --:: :-
;• ./
FLOW SPLITIERS
._· -~ /
:' f : -.;,. . ~- .I.
. : :.
/ ·/
.. " /
. ..

reduction in the swirl. No specific guidelines can be given as to height or orientation of the fins since these · parameters depend upon the height of the diffusor cone in the draft tube. However, tests indicate that the flow splitter should be pl.ace as high as possible in the draft tube cone for maximum effectiveness (Falvey) .
The disadvantages of fins and flow splitters are a loss in efficiency, a necessity to guard the appurtenances from cavitation damage, high-frequency noise, and structural problems involved in installing them . Because of these disadvantages the use of fins is normally restricted to small units.
Extensions to Runner Cone ·
Another approach used in reducing the draft tube surges is to fill the reverse flow region on the axis of the draft tube with a solid body of rotation. The body can either be fixed by attaching it to the draft tube wall, as in the Moody spreading cone, or rotat ing by attaching it to the runner cone (Scheidenhelm's discussion of Allen). Their earliest use was on the Merrimack River in Massachusetts around the years 1860 to 1910, Figure 6. The basis for this concept comes from observations with rectilinear flow where areas of reverse flow are prevented from forming .
. Elimination of the reverse flow areas reduces the unsteadiness by streamlining the overall flow. lndiscriminant use of this principle is not recommec,ded. One unpublished report described a low specific speed runner which stopped surging when the Hydraucone broke off 4 feet below the runner.
There are at least two disaq.yantages to using extension of the runner cone (Dzial~, Kovalev) . These are the large lateral forces on the extension and the unfavorable velocity head recovery in the draft tube . These disadvantages limit this type of surge suppressor to relatively low specific speed un its. In addition to these disadvantages, the diameter of the extension would have to be adjustable for optimum results since the diameter of the reverse flow area varies between 0.2 to 0.8 of the draft tube diameter.
Coaxial Hollow Cylinder
Model tests indicate that a hollow cyl inder, which resembles a barrel with the ends cut out, placed concentrically in the draft tube will reduce the amplitude of the pressure surges and slightly increase efficiency (Vuskovic, Lecher), Figure 7. Significantly higher frequencies were also observed. In the zone of ma xi mum surges, the frequencies corresponded roughly with t he turbine's rotational speed. The ·design of these devices must be accomplished by model
.1. .• ; . ' - ·- ._ ... Cf . CC!- S!,414W.V~ ··•·· .
9
". . -· . " .r
. . :1··_· ·· . .. ...:.-- . --,.-'--:::,... ____ __. __ ...._ __ _ . 0 : . - . . . . .· , .. . . . . . . . . . . . . "'·.
__ _ ti!
a. Moody spreading cone.
Configurotian used at Washington Mills
Lawrence Risden Wheel
1881 on Merrimock River
b. Rotating extension.
Figure 6. Extensions to runner cone.
- '¥$) . • . • ~-*' ?, ¥¥ - . ,, _z::;: ... _ - . . rwt-

·; i l I I
I l i
·1 I
: i .i (
. ---~-~--~-----------------------------------------------~
testing since it was noted that small form changes alter the performance considerably. The largest red!.!ction in the pressure pulsations amounted to 70 percent.
The major disadvantage of the coaxial hollow cylinder is providing enough strength in the supports to keep
the cylinder centered. The cylinder must also be made rigid enough to keep it fro m deforming. To minimize losses in efficiency, the supports should be designed so they thet do not cause a significant restriction to the flow.
Figure 7. Coaxial hollow cylinder.
10

f
9 n p r r a A,B, D D2 H L N NS p
Q R S. Va Vs Vt .6.p a p ¢
n
Subscripts 1 2 m p
SYMBOLS USED IN THE TEXT
frequency, hz acceleration of gravity rotational speed of runner, rpm pressure radius from centerline of tube radius of rotational vortex core constants draft tube diameter minimum clear diameter of runner net available head across turbine length of .tube number of wicket gates specific speed power generated by turbine, horsepower discharge draft tube radius minimum clear space between wicket gates local axial velocity sonic velocity local tangential velocity pressure fluctuation angle between velocity vector and radial density
ratio of rotational speed of runner to maximum velocity for a given head (spouting velocity)
angula, momeotum a / 2 .,2 p V, V 1 d,
upstream downstream model prototype
0
11

CONVERSION FACTORS
In the English system of measurements, all turbine quantities are referred to unit dimensions which are:
length , 1 foot discharge, 1 cubic foot per second horsepower, 550 foot-pounds per second
In the metric system, the unit quantities are:
length, 1 meter discharge, 1 cubic meter per second horsepower, 75 kilogram-meters per second
Due to these differences, the unit characteristics of a turbine are not always the same in the metric and English systems. The following table gives the equivalents to aid the reader in referring the quantities mentioned in the articles to his own frame of reference.
12
Quantity
phi
specific speed
Definition
¢
n p1 /2 N =--
. s H5/4
specific discharge 011
Q
0 2 H 1/2 2
p specific power p11 - ---
- 0 2 H3/2 2
unit speed nD
Multiply English units by these fa·ctors to obtain
metric units
1.0
4.45
0.552
64.9
0.552

ALPHABETICAL LISTING OF AUTHORS
Allen 35 Kuchemann 3 Barkov 62 . Kulonen 10 Baumann 63 Labrow 36 Benjamin 7, 11 Lasenko 56 Betchov tt 20 Lecher 63 Cassidy 17, 65,66 Michelson 5 Chanaud 8,26, 30 Mockmore 39 Danilov 52 Mollenkopf 67 Deriaz 44 Murakami 24 Dobratz 1 Raabe 67 Dziallas 50 Ranz 9,28 Falvey 17,58,66 Rheingans 40 Fraenkel 12 Ruud 49 Gibson 36 Sharamkov 54,61 Giraud 55 So 34 Gore 9,28 Sole 48 Granger 16,33 Solomon 2 Harvey 25 Sonju 19, 31 Heim 37 Squire 6 Hoffman 18,27 Streeter 21 - . .. Hornsby 38 Struna 48 Hosoi 53 Talbot 13,22 Howard 14 Tajiri 39 lsaev 45 Turner 15,32 lvanova 68 Ulith 64 Jansen 59 Velensek 57 Joubert 18,27 Vonnegut 23 Kelvin 4 Vuskovic 57 Kito 43 Whippen 60 Klabukov 68 White 29 Kliuikov 47 Wigle 41 Kolychev 56 Winter 35 Konig 60 Wylie 21 Kovalev 46 Yamazaki 42 Kreith 19,31 Zolotov 68
13
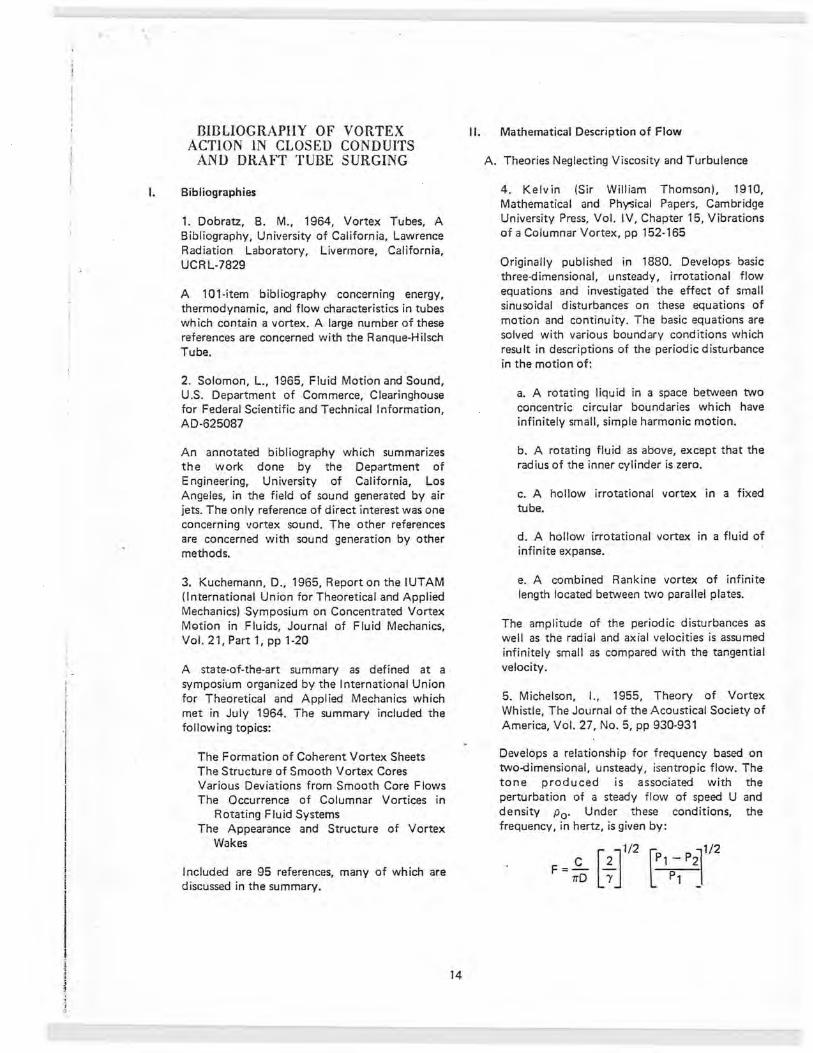
I I
.I I I
I
I I I
I
' •
I.
IllI3LIOGRAPIIY OF VORTEX ACTION IN CLOSED CONDUITS
AND DRAFT TUBE SURGING
Bibliographies
1. Dobratz, B. M., 1964, Vortex Tubes, A Bibliography, University of California, Lawrence Radiation Laboratory, Livermore, California, UCRL-7829
A 101 -item bibliography concerning energy, thermodynamic, and flow characteristics in tubes which contain a vortex. A large number of these references are concerned with the Ranque-Hilsch Tube.
2. Solomon, L., 1965, Fluid Motion and Sound, U.S. Department of Commerce, Clearinghouse for Federal Scientific and Technical Information, AD-625087
An annotated bibliography which .summarizes the work done by the Department of Engineering, University of California, Los Angeles, in the field of sound generated by air jets. The only reference of direct interest was one concerning vortex sound. The other references are concerned with sound generation by other methods. ·
3. Kuchemann, D., 1965, Report on the IUTAM (International Union for Theoretical and Applied Mechanics) Symposium on Concentrated Vortex MGtion in Fluids, Journal of Fluid Mechanics, Vol. 21, Part 1, pp 1-20
A state-of-the-art summary as defined at a · symposium organized by the International Union
for Theoretical and Applied Mechanics which met in July 1964. The summary included the following topics:
The Formation of Coherent Vortex Sheets The Structure of Smooth Vortex Cores Various Deviations from Smooth Core Flows The Occurrence of Columnar Vortices in
Rotating Fluid Systems The Appearance and Structure of Vortex
Wakes
Included are 95 references, many of which are discussed in the summary.
14
11. Mathematical Description of Flow
A. Theories Neglecting Viscosity and Turbulence
4. Kelvin (Sir William Thomson), 1910, Mathematical and Physical Papers, Cambridge University Press, Vol. IV, Chapter 15, Vibrations of a Columnar Vortex, pp 152-165
Originally published in 1880. Develops basic three-dimensional, unsteady, irrotational flow equations and investigated the effect of small sinusoidal disturbances· on these equations of motion and continuity . The basic equations are solved with various boundary conditions which result in descriptions of the periodic disturbance in the motion of:
a. A rotating liquid in a space between two concentric circular boundaries which have infinitely small, simple harmonic motion.
b. A rotating fluid as above, except that the radius of the inner cylinder is zero.
c. A hollow irrotational vortex in a fixed tube.
d. A hollow irrotational vortex in a fluid of infinite expanse.
e. A combined Rankine vortex of infinite length located between two parallel plates.
The amplitude of the periodic disturbances as well as the radial and axial velocities is assumed infinitely small as compared with the tangential velocity.
5. Michelson, I., 1955, Theory of Vortex Whistle, The Journal of the Acoustical Society of America, Vol. 27, No. 5, pp 930-931
Develops a relationship for frequency based on two-dimensional, unsteady, isentropic flow. The tone produced is associated with the perturbation of a steady flow of speed U and density p0 . Under these conditions, the frequency, in hertz, is given by:

where C = speed of sound
'Y = 5/3 for monatomic gasses
'Y 7 /5 for diatomic gasses D = diameter of tube p reservoir and exit pressures
6. Squire, H. B., 1960, Analysis of Vortex Breakdown Phenomenon, Part 1, Aero Department, Imperial College, Report No. 102
The theory of standing waves on a cylindrical vortex is developed and applied to three cases of swirl. These cases are:
( 1) forced and free vortex
for r,;;;; 1
for r ;;;i: 1
(2) a viscous vortex
(3) a specially constructed distrih11tin.,
2 2 Va
V =-t t
In every case, a uniform axial velocity distribution is assumed. The solutions predict a vortex breakdown when
1.0 ,;;;; vt;va,;;;; 1.20
7. Benjamin, ·T. B., 1962, Theory of the Vortex Breakdown Phenomenon, Journal of Fluid Mechanics, Vol. 14, pp 493-629
Development of a theory which predicts two states of flow in a vortex . The theory is based on a stationary axisymmetric perturbation of the stream function. The form of the perturbation is a standing wave, i.µ = ¢ (Y) sin (X + v). The two states of flow correspond to conditions before and after the perturbation. In the derivations, radial components of velocity are not considered. This theory was developed to explain the abrupt change in structure which sometimes occurs in swirling flow, especially in the leading-edge vortex formed above sweptback lifting surfaces.
8. Chanaud, R . C., 1963, Experiments Concerning the Vortex Whistle, Journal of the
15
Acoustical Society of America, Vol. 35, No. 7, pp 953-960
Two-dimensional equations of rotation in a plane perpendicular to the tube axis were used to describe the flow. To these equations, nonaxisymmetric disturbances were applied to obtain a set of perturbed differential equations. The complete solution of these equations was not determined.
9. Gore, R. W. and Ranz, W. E., 1964, Backflows in Rotating Fluids Moving Axially through Expanding Crop Sections, American Institute of Chemical Engin ___ ; Journal, Vol. 10, No. 1, pp 84-88
The axially symmetric equations for rotational flows were simplified through dimensional analysis. An axial inlet velocity distribution was assumed and substituted into the equations. Through an iterative procedure, a flow field is obtained which has some of the important features of the observed flow.
10. Kulonen, G. A. and Kulonen, L. A., 1966, On the Calculation of Axisymmetric Vortex Flo~ of an Ideal Incompressible Fluid in Curvilinear Channels, Leningrad Universitet, Vestn i k, Seriya Matematiki, Mekhaniki Astronomii, No. 1, pp 145-153
The equations of continuity and momentum are reduced to a single nonlinear partial differential equation which is solved for a 90° bend through successive approximations.
11 . Benjamin, T. B., 1967, Some Developments in the Theory of Vortex Breakdown, Journal of Fluid Mechanics, Vol. 28, Part 1, pp 65-84
A .further development of Reference 7. The requirement of infinitesimal perturbations is relaxed and the theory is expanded to include a change from cylindrical flow to one in wh.ich a finite standing wave exists.
12. Fraenkel, L. E., 1967, On Benjamin's Theory of Conjugate Vortex Flows, Journal of Fluid Mechanics, Vol. 28, Part 1, pp 85-96
A substantiation of Benjamin's theory (References 7 and 11) from a mathematicians point of view. The conclusions of Benjamin are found through a method which does not require the calculus of variations.

I I I
! . I
i I t i ·t l I I ! I
l i
t l j
' • I,
l '
l !
' ..
B. Theories Including Viscosity but Neglecting Turbulence
13. 'Talbot, L., 1954, Annular Swirling Pipe Flow, Journal of Applied Mechanics, Vol. 21, pp 1-7
The problem of rotationally symmetric steady swirl superimposed on Poiseuille flow in a round pipe was solved through numerical analysis. The solution was obtained through consideration of the momentum-integral method which is analogous to that used in boundary layer analysis. The results are not exact but are in the correct order of magnitude.
14. Howard, L. N., 1963, Fundamentals .of the Theory of Rotating Fluids, Journal of Applied Mechanics, Transactions of the ASME, December, pp 481-485
An ex po sitory survey of some of the mathematical models which have been used in the theory of rotat ing fluids. The examples are restricted to geophysical fluid dynamics.
15. Turner, J. S., 1966, The Constraints Imposed on Tornadolike Vortices by the Top and Bottom Boundary Conditions, Journal of Fluid Mechanics, Vol. 25, Part 2, pp 377-400
Steady, incompressible, axisymmetric flow in a region remote from solid boundaries was assumes. The equations are solved by assuming an expression for the stream function. Boundary layer conditions which are responsible for the up and down flows in the vortex are examined . The results are in good agreement with experimental measurements.
16. Granger, R., 1966, Steady Three-dimensional Vortex Flow, Journal of Fluid Mechanics, Vol. 25, Part 3, pp 557-576
Exact differential equations of motion are developed in terms of the circulation and the stream function for steady axisymmetric flow. The equations are solved through the use of a power series prov ided the vorticity distribution along the ax is of rotation is known. Solutions are restricted to small perturbations.
17. Cassidy, J . J. and Falvey, H. T., 1970, Observations of Unsteady Flow Arising After Vortex Breakdown , Journal of Fluid Mechanics, Vol. 41, Part 4, pp 727-736
16
In rotating flow moving axially through a straight tube, a helical vortex will be generated if the angular momentum flux is sufficiently large relative to the flux of linear momentum. This paper describes an experimental study of the occurrence, frequency and peak-to-peak amplitude of the wall pressure generated by this vortex. The experimental results are displayed in dimensionless form in terms of a Reynolds number, a momentum parameter and tube geometry.
C. Theories Including Viscosity and Turbulence
18. Hoffman, E. R. and Joubert, P. N., 1963, Turbulent Line Vortices, Journal of Fluid Mechanics, Vol. 16, Part 3, pp 395-411
Axisymmetric, steady-state flow is assumed . Various phenomenalistic considerations of the turbulent shear stresses are used to develop velocity profiles. This, in conjunction with dimensional analysis, leads to an empirical description of the flow which is subst.intiated with experiments.
19. Kreith, F. and Sonju, 0 . K., 1965, The Decay of a Turbulent Swirl in a Pipe, Journal of Fluid Mechanics, Vol. 22, Part 2, pp 257-271
Steady, incompressible, axisymmetric flow in a pipe was considered. The resulting equations were solved through the use of perturbation theory . The theoretical swirl velocity agreed well with experimental measurements at distances of less than 20 diameters but deviated further downstream.
D. Miscellaneous Mathematical Considerations
20. Betchov, R., 1965, On the Curvature and Torsion of an Isolated Vortex Filament, Journal of Fluid Mechanics, Vol. 22, Part 3, pp 471-479
The flow equations for a very thin, curved vortex filament in an inviscid fluid are considered. The elementary solution of a helical vortex filament is shown to be unstable.
21. Streeter, V. L. and Wylie, E. B., 1967, Hydraulic Transients, McGraw-Hill
A textbook describing various analytical methods to compute water-hammer waves in conduits and surge tanks. An impedance computational procedure for conduits is described which

permits a rapid examination of the system for resonance.
111. Experimental Observations with Elementary Models
22. Talbot, see Reference 13
Tests were made in a 1.25-inch inside-diameter plastic pipe with Reynolds numbers between 135 and 3,240. Swirl was induced by a rotating section 25 diameters long. The transition between stable swirl and unstable swirl was presented on a graph. For Reynolds numbers less than 1,800, a nonperiodic sinuous motion was the instability observed at the breakdown between stable and unstable flow. For Reynolds numbers in excess of 2,500, a spatially periodic disturbance was observed. Measurements of the swirl decay rate are presented.
23. Vonnegut, B., 1954, A Vortex Whistle, Journal of the Acoustical Society of America, Vol. 26, No. 1, pp 18-20
Tests were conducted with both air and water. In both cases, an audible sound was obtained as the spiraling flow left the cylindrical tube. From the experimental results, the following equation was derived to predict the frequency of the outlet sound:
where F frequency, in hz a = a constant less than 1 which
accounts for frictional losses in the cylinder
v = velocity of sound in ft/sec D = diameter of the tube, in ft P1 = inle·, pressure, in psi P2 = exit pressure, in psi
Results indicate that the frequency varies inversely as the length of the cylinder. In addition, the sound intensity dropped significantly with a conically diverging tube.
24. Murakami, M., 1961, Vibration of Water-Turbine Draft Tubes, Transactions ASME, Vol. 83, No. 1, pp 36-42
Experiments were performed on straight, conically diverging, conically converging, and elbow-type draft tubes. The inlet swirl was
17
imparted by a set of stationary guide vanes placed at the turbine location. A theory is presented which essentially duplicates the classical development describing the motion of a line vortex within an irrotional flow field. A method is presented to estimate the size of the vortex core at the top of the draft tube. The deviations between the idealized mathematical description of flow and the true flow are reconciled through empirically determined values. The author concludes that through the use of his equations one can compute the frequency and force of the draft tube surges given the draft tube dimensions, the turbine runner dimensions, and the load conditions on the turbine.
25. Harvey, J. K., 1962, Some Observations of the Vortex Breakdown Phenomenon, Journal of Fluid Mechanics, Vol. 14, pp 585-594
Experiments were made with spiraling flow in a cylindrical tube. Tests indicated that a change in the flow state was observed when the ratio of the tangential velocity to the axial velocity was 1.21 at a point within the flow stream. The length to diameter ratio of the tube was 13.71 and the Reynolds number was about 9.7 x 10³. The rotation of the fluid was induced through 18 swirl vanes located in a plenum chamber at the pipe entrance.
26. Chanaud, see Reference 8
Experiments were performed with both air and water in cylindrical and flared tubes. The rotation was imparted through a single nozzle which discharged tangentially into a large cylinder that was connected to a smaller diameter test section. The range of Reynolds numbers tested was 5 x 10³ to 1. 7 x 10⁴ with water and 7 x 10³ to 8.6 x 10⁴ with air. Length to diameter ratios of 1.35, 2. 70, 5.40, 10.8, and 21.6 were investigated. Investigations of the sound field in a plane passing through the axis of the tube reveal a dipole-type pressure level distribution. The pressure levels of signals measured at diametrically opposite locations near the tube exist were 180° out of phase.
27. Hoffman, see Reference 18
Tests were made with air in which the vortex was generated by a wing which spanned a wind tunnel vertically . The lower half of the wing was mounted at an angle of incidence equal and

opposite to that of the upper half. It was found that for a turbulent line vortex rotating in the absence qf constraining walls that the circulation of the vortex is proportional to the logarithm of the radius.
28. Gore, see Reference 9
Swirl was generated by passing air through a rotating perforated plate which was mounted perpendicular to the axis of the supply pipe. A critical value of the swirl ratio WR / V was noted for which the flow oscillated between forward flow and backflow. The critical swirl ratio was found to be independent of Reynolds numbers for 20<Re<60,000 but that it depended on the geometry of the apparatus. With the plate flush with the end of the tube, the critical swirl ratio was 1.36. With the plate recessed 1 foot into a 0.4-foot-diameter tube the critical swirl ratio was 1.15.
29. White, A., 1964, Flow of a Fluid in an Axially Rotating Pipe, The Journal ot°Mechanical Engineering Science, the Institution of Mechanical Engineers, England, Vol. 6, No. 1, pp 47-54
The investigation studied the effect of rotation on turbu lent and laminar flows by observing the pressure loss in a pipe. The pipe was 3/8-inch-diameter bore. Swirl was imparted through three different lengths of rotating pipe which were 69, 109, and 232 pipe diameters long. The range of Reynolds numbers varied between 1,000 and 30,000. The results indicate that the pressure drop decreases with rotation of the fluid when the flow is laminar. For Reynolds numbers greater than 8,000, the reduction in the friction factor was found to be primarily a function of a modified Rossby number (WD/V).
30. Chanaud, R. C., 1965, Observations of Oscillatory Motion in Certain Swirling Flows, Journal of Fluid Mechanics, Vol. 21, Part 1, pp 111-127
Experiments were conducted with both air and water with a cylindrical tube 0.5 inch in diameter and lengths which gave an LID range of 1.35 to 21.6. In addition, tubes with conical expansions and contractions were investigated. The range of Reynolds numbers was from 130 to 7,000. Swirl was produced with a single tangential inlet, four tangential inlets, a set of stationary swirl blades, and a rotating section 30 pipe diameters long.
18
The author notes that the terms in the equations of motion are all of such magnitude that it appears no important simplifications can be made to solve the problem analytically.
31. Kreith, see Reference 9
Swirl was generated with one of two twisted tapes having dimensionless pitch ratios of 9 and 15. The test section was constructed from 1-inch inside-diameter plastic pipe 100 inches long_ Data were obtained in the range of axial Reynolds numbers from 18,000 to 61,000. The swirl decay rate as determined experimentally agrees rather well with that predicted theoretically.
32. Turner, see Reference 15
The experiments were performed in a 15- and a 22-cm-diameter cylinder. The water depth was 30 cm. Swirl was generated by rotating the cylinder and a "convecticn" region was established within the fluid by bubbling air up through the center of the vortex. The end of the air supply tube was placed 10 cm below the surface. This was provided with a hole to allow the air to escape. With the rigid lid, large oscillations in the vertical velocity were noted and the "waves passed up the center much as they would along a loose helical spring stretched · from top to bottom of the tank."
33. Granger, see Reference 16
The experiments were conducted in a tank 4 feet high and 23 inches in diameter. Swirl was induced through a series of tangential inlets distributed over the entire surface of the cylindrical tank. The flow was recirculated and left the tank through a hole in the bottom surface of the tank. A free water surface condition existed at the top of the tank. Tests were made at circulation rates (f = 2rrr2W) between 5.5 in.2/sec and 17 in.2/sec. Large amplitude precessional oscillations were observed at the lower rate and air entered the vortex core at the upper rate. Dimensionless curves are presented which give the variation of vorticity and axial velocity along the vortex axis, the radial variation of vorticity and axial velocity, and the axial variations of the core radius.
34. So, K. S. , 1967, Vortex Phenomena in a Conical Diffuser, American Institute of Aeronautics and Astronautics Journal, Vol. 5, No. 6, June, pp 1072-1078

The study resulted in defining five flow regimes representing three types of vortex flow and two types of transitional phenomena. The vortex flow types were ( 1) laminar, one cell; (2) turbulent, one cell; and (3) turbulent, two cell. For one-cell flow, the fluid spirals inward toward the axis of rotation at points near a solid boundary which is perpendicular to the axis. At points far from the boundary, the flow is aw9y from the boundary outward along the axis. With two-cell flow, the fluid moves toward the boundary at small distances from the axis and awa){ from the boundary at large distances from the ax is. The two transitional flow types are: ( 1) a laminar vortex breakdown phenomena and (2) the occurrence of a two-celled vortex within the diffuser and a one-celled vortex downstream. The experiments were made with air in a 6° diffuser having a throat diameter of 3.5 inches and a length of about 24 inches.
IV. Model and Prototype Tests with Draft Tubes and Turbines
35. Allen, C. M. and Winter, I. A., 1924, Comparative Tests on Experimental Draft-tubes, Trans ASCE, Vol. 87, pp 893-970
Model tests were conducted with a variety of draft tube shapes. Surging was observed to be the least severe with the most efficient draft tube. No quantitative results of surging amplitude or frequency were given.
36. Gibson, A. H. and Labrow, S., 1926, The Efficiency of Regain in Straight and Bent Draught-Tubes, the Institution of Civil Engineers, Selected Engineering Papers, No. 34
A theory is presented which indicated" that the efficiency with curved draft :ubes may be less than with straight draft tubes when swirl is present.
37. Heim, R., 1929, An Investigation of the Thoma Counterflow Brake, Mitteilungen des Hydraulischen lnstitut der Technischen Hochschule Munchen, Heft 3. Translated in 1935 by the American Society of Mechanical Engineers and entitled Transactions of the Munich Hydraulic Institute, Bulletin 3, pp 13-28
The brake consisted of a spiral vortex chamber connected to a long pipe or "draft tube," The resistance to flow through the chamber was greatest when flow entered the chamber through
19
the long pipe. With flow leaving through the Jong pipe, a spiral vortex was observed for certain flow rates. This vortex was not eliminated when the pipe was arranged so that it discharged vertically upwards. Periodic oscillations were also observed for certain pressure ranges.
38. Hornsby, G. J ., 1935, Hydraulic Model Studies for the Design of Draft Tubes for the Wheeler Dam, TVA, U.S. Bureau of Reclamation, Hydraulic Laboratory Report No. Hyd-35, Denver, Colorado
Swirl was induced in a model draft tube by 20 vanes set at angles of o0 , 15°, 30°, and 45° to the radial. An attempt was made to prevent air from being admitted to the draft tube. Ten draft tube configurations were tested (including alterations). All configurations had either one or two dividing piers. The performance of the draft tubes was evaluated on the basis of discharge coefficients. The results included pressure measurements along the top of the elbow and each draft tube conduit or barrel, as well as pressure measurements along the bottom of the elbow. Water profiles in the tailrace w~re also included. A poor velocity distributi.on at the exit of -the draft tube was noted for 0
large ·angles of swirl. Under some conditions all of the flow was concerned in one barrel.
39. Mockmore, C. A . , 1938, Flow Characteristics in Elbow Draft-tubes, . Trans ASCE, Vol. 103, pp 402-464, 39 Item bibliography
Swirl at the draft tube inlet caused pulsations with all models tested . However, one particular bend had the most severe pulsations when the angle of whirl at the entrance was about 45°. The frequency was about 4.0 hz. A region of backflow was noted in the draft tube cone, but in none of the experiments did the backflow region extend halfway around the bend. The whirl was induced by a series of vanes and the flow made visible by the admission of air.
40. Rheingans, W. J., 1940, Power Swings in Hydroelectric Power Plants, Trans ASME, Vol. 62, pp 171-184
A classic in the field of draft tube surging. The paper deals with the characteristics of the surges, their relation to power swings, the elimination of surges in the field, and design considerations which will prevent draft tube surges from

producing excessive power swings. Some of the important facts determined by the author are as follows:
a. Power swings always occur over a narrow range of gate openings.
b. The frequency of the draft tube surge is given by
where w
f
rotational speed of the turbine in rpm frequency of the draft tube surge or power swing in hertz.
c. In some cases, the addition of fins to the draft tube walls or the admission of air on the axis of the draft tube has reduced surging. However, these methods frequently result in reduced !,!fficiencies.
41. Wigle, D. A., et al, 1946, Hydraulic Model Studies for Turbines at Grand Coulee Powerplant, U.S. Bureau of Reclamation, Hydraulic Laboratory Report No. Hyd-198, Denver, Colorado
Tests were made with a model turbine runner and with three draft tube designs. The draft tube studies included measurement of flow distribution at the draft tube exit in the 6 and 1/2-inch-diameter draft tube throat with the optimum gate opening; observations of draft tube surging under various operating conditions; and the effect of splitter vanes in the draft tube throat and on the runner cone. The velocity tranverses in the throat of the draft tube indicated zero velocity on the axis. In addition, velocity concentrations were found in the right and left draft tube barrels at the optimum gate opening. The draft tube surging phenomenon was recorded on movie film. No quantitative measurements were indicated. Five equally spaced radial fins 2 inches long were placed in the draft tube throat. These were not effective in straightening the vortex filaments. Fins placed on the runner fairwater cone were not effective in straightening the vortex filaments and they also reduced the efficiency and peak horsepower. A set of three equally spaced radial vanes in the draft tube throat which had a hub connecting them to the fairwater was effective in
20
straightening the vortex filaments. The most effective orientation of the fins to reduce surging was one in which one fin pointed downstream in the direction of flow from the draft tube. These splitters were about 1 and 1/2 to 2 inches long.
42. Yamazaki, T . and Tajiri, S., 1954, Experimental Research on Cavitation of Francis Turbine and Flow Conditions below the Runner, Hitachi Review, Vol. 5, pp 17-26
Measurements of whirl velocity, axial velocity, efficiency, and cavitation potential of two model Francis runners were performed. The velocity measurements, which were potentially the most valuable part of the paper, are either in error or the whirl velocity was not accurately defined. The authors indicate a finite value of the whirl velocity on the axis of symmetry, when in fact it must be zero at that location.
43. Kito, F., 1959, The Vibration of Penstocks, Water Power, Vol. 11, pp 379-385, 392
A description of resonance in penstocks in which the vibrations are due to deformations of the penstock out of a circular shape. A method for computing the response of a penstock is presented. Prototype tests illustrate the method when the cause of the vibrations is surging in the draft tube. Methods to eliminate this type of resonance through stiffener rings are indicated.
44. Deriaz, P., 1960, A contribution to the Understanding of Flow in Draft Tubes of Francis Turbines, International Association for Hydraulic Research, Hydraulic Machinery and Equipment Symposium, Nice, France
The author classifies and explains the- types of flow observed in draft tubes under various operating conditions. Pulsations of the flowing water were observed even when no water vapor core was present. If the ratio of pressure pulses per minute to revolutions per minute is in the range 3 to 6, the presence of a single rope vortex can be assumed. Specific speed apparently does not have an important influence on this ratio. The author concludes that the only way to truly remedy draft tube instabilities is by using variable pitch blades.
45. lsaev, I. M., 1961, Nluanie sposoba vpuska vozdukha na pulsatziiu davleniia b otsasivaiushchei trube modeli osevoi gidroturbing (Influence of a Method of Air Admission on

Pressure Surges in Draft Tube Models of Axial Hydro-Turbines). Gidroma shine stroenie Trudy LPI, No. 215, Moscow and Leningrad, pp 58-68, USBR Working Translation No. 756
This paper describes hydraulic model tests of the effects of air admission on pressure surges in axial hydraulic turbines. The reduction or grnwth in surge amplitude and the change in unit efficiency were investigated for several locations of air admission and varying quantities of air. The particular study described was for a Kaplan turbine. It was concluded that the most effective method was introduction of air through the flow deflecting part of the cone. Surge amplitudes were reduced by up to 45 percent and efficiency of the unit increased 0.5 to 1.0 percent. (Author's summary.)
46. Kovalev, N. N., 1961, Gidroturbiny. Konstruktsii i voprosy proektirovaniya ( H yd roturbines, Design and Construction), Mashgiz Gosudarstvennoe Nauchno-Teknischeskoe lzdatel stvo Mashinostroitel'noi Literatury, Moskva-Leningrad, Translated from Russian and published for U.S. Department of the Interior by the Israel Program for Scientific Translations
An excellent summary of all facets of turbine design and construction. Indicates that extensions to runner hub decrease pressure fluctuations and increase efficiency. However, the danger of damaging the runner by hydraulic forces increases as the hub is made longer.
47. Kliuikov, N. T., 1963, Nekotoyre resultaty isnytanii modelei radial' no-osevykh gidroturbin (Some results of model tests on Francis Hydraulic Turbines), Energomashinostroenie, No. 4, pp 35-37
Surging was observed in four model turbines for operating speeds outside of the range 1.06 Nopt to 0.78 Nopt, where Nopt is the speed at maximum efficiency. The author indicates that the water entering the draft tube can obtain a rotation motion due to unequal flow distributions in the spiral case.
48. Struna, A. and Sole, L., 1963, L'I ntroduction de I' Air dans le D iffuseur (Admission of Air into the Draft Tube). IAH R 10th Congress, London, Vol. 4, pp 179-185, USBR Translation No. 736
21
The paper describes flow conditions in the runner and the formation of a vortex core at part loads. Methods, both of minimizing the effects of part load pulsations and of eliminating. them, are given. The authors suggest a method of air admission which involves separate systems for admitting air to the draft tube center and to the periphery . An empirical formula is given which has been proved by experience. Further suggestions are given based on operating experience at hydroelectric power stations.
49. Ruud, F. 0., 1964, Hydraulic Turbine Setting Criteria, ASME Paper No. 64-WA/FE-10
Presents a number of case histories taken from Bureau of Reclamation experience where cavitation damage and surging have occurred.
50. Dziallas, R. R., 1964, Francisturbinen bei Teil-und Uberlast (Francis Turbines with Partialand Over Loads). VOi Berichte, No. 75, pp 53-64
A report of model tests in which the velocity distribution efficiency curves and pressure fluctuations are given. The figures present conditions which could be expected to occur in a typical unit. Various schemes to dampen the oscillations caused by the vortex are presented and their disadvantages discussed.
51. Anon., 1964, Wheeler Project Vibration Studies, Units 9-11, Tennessee Valley Authority, Report No. 3-494, Norris, Tennessee
A report of prototype vibration and pressure measurements on a fixed blade, axial flow turbine generator unit. Initial measurements on the unmodified unit revealed shaft vibrations whose energy was concentrated in the 9- to 10-cycle per revolution range. This corresponded approximately to the calculated natural frequency of the rotating mass. The cause of these vibrations was apparently a 0.4-cycle per revolution excitation by the draft tube vortex. The runner was modified by adding five guide vanes to the inner head cover and by slightly altering the shape of the leading edges of the blades. These modifications introduced a 4-cycle per revolution pressure variation ahead of the runner with only a minor change in the draft tube vortex motion.
52. Danilov, A. E., 1965, Pul'satsii davleniia v protochnoi chasti bloka agragatov Bratskoi GES

;
.! i l
! i
1 l
J I I
I I
I !
l I I l
I
npinonizhennykh (puskovykh) naporakh i sviazannye crnm1 nestatsionapnye iavleniia (Surges in the Water Passage of the Unit Blocks of Bratsk Powerplant at Low Heads and the Transient Phenomena Connected with Them), Tr. Koordinats., Soveschanii po gidrotekhn, No. 22, pp 201-209
A report of surging in the Bratsk turbines when operated at a head of 55 to 57 m. The design head is 96 m. The surging was practically eliminated by the addition of air through the turbine shaft. However, with air the efficiency of the units was lowered around 1.5 percent.
53. Hosoi, Y., 1965, Experimental Investigations of Pressure Surge in Draft Tubes of Francis Water Turbines, Hitachi Review, Vol. 14, No. 12
Experimental investigations were made with model turbines and the results analyzed with a simplified mathematical model of the flow condition:;. Under these conditions the draft tube surge frequency was shown to be a function of the discharge, speed, and unit head. The surge amplitude was roughly proportional to the product ot. the angular velocity and the discharge with a constant head. Through manipulation of the simplified mathematical model, the author shows that the surge frequency at· which the maximum surge amplitude is present can be given by
1 N1 F =-(r /R) 2 -
2 a 60
or
f::::::: (...!.to_!_) ~ 3 4 60
for typical installations. This agrees with the empirically determ ined equation of Rheingans.
54. Shramkov, K. A., 1965, Periodicheskaia pul'satsiia davleniia v radial' no-osevykh gidroturbinakh (Periodic Pressure Surges in Francis Hydraulic Turbines), Gidrotekhnicheskoe Stroitel' stvo, No. 7, pp 34-37, U.S. Bureau of
22
Reclamation Translation No. 629, Denver, Colorado
,The author identifies two types of pressure surges, one in the spiral case and one in the draft tube. The spiral case surge is that one which has a frequency nearly the same as the rotational speed of the unit. Th is surge is associated with flow between .the heud cover and the runner. The second type of surge is caused by rotational flow in the draft tube. For loads between 40 to 85 percent, the surge in the draft tube is transmitted from the pier to the spiral case and penstock. The frequency was found to be a function of rotational speed of the unit ( Rheingans formula) and independent of head and tailrace elevation. The draft tube pressure variations were 180° out of phase with the penstock fluctuations.
55. Giraud, H., 1966, Etude detaillee de la comparaison entre essais industriels et modele daus quelques cas bien defin is (Detailed Study of Prototype and Model Test Comparisons for a Few Specific Cases), La Houille Blanche, No. 3, pp 299-311
Close agreement was found between model and prototype observations of the size of the vortex underneath the runners. The size of vortex was determined with a probe in the prototype and photographically in the model. The model predicted the prototype output to within plus and minus 1 percent of the maximum output. The author shows the usefulness of models in cavitation studies.
56. Kolychev, V. A. and Lasenko, V. E., 1966, lssledovanie potoka v radial' no-osevoi gidroturbine (Investigation of Flow in Francis Hydraulic Turbines), lzvestiya Vysshikh Vchebnykh Zavedenii (Moskeva) Energetika, No. 2, pp 89-96
The position of the wicket gates relative to the draft tube throat was found to have a significant effect on the velocity distribution in the draft tube. The nonuniformity of the distribution of both the axial and the circumferential components increases as the ratio Do/Di is changed from 1.8 to 1.16. Do is the distance from the centerline of the unit to the axis of the guide vanes and Di is the smallest radius to the inside of the lower wearing ring of the runner.
57. Vuskovic', I. and Velensek, B., 1966, Runner Outlet Vortex Core and I ts Influence on

(' Pulsations in Francis and Propeller Turbine Draft Tube, Symposium on Vibrations in Hydraulic Pumps and Turbines, Institution of Mechanical Engineers, Manchester, England
The authors identify two states of flow in the vortex core. If the pressure within the core is higher than the vapor pressure of water, the core contains only water and is called "hard." Conversely, a "soft" core contains water vapor and exists when the core pressure is less than the vapor pressure of water. The most intense pressure pulsations occur with a hard core. The model tests allege to completely confirm the tests of Dziallas. Ribs mounted in the conical diffuser section of the draft tube and guide vanes below the runner were both found to reduce the efficiency of the unit. A coaxial cylindrical diffuser was found to reduce the pressure surges without an adverse effect on the efficiency. In addition, a significant increase in the frequency of the surges was noted. The diffuser diameter was one-half the draft tube throat diameter.
58. Falvey, H., 1967, Hydraulic Model Studies of the Fontenelle Powerplant Draft Tube and Tailrace, USSR Report No. Hyd-571, Denver, Colorado
Hydraulic model studies of the draft tube. at Fontenelle Powerplant show that erosive flow concentrations in the tailrace can be reduced through the use of either a tri-vane flow splitter in the draft tube throat or baffle walls in the draft tube flow passages when water is passed through the facility with the turbine runner removed. The effect of flow splitter length, orientation, and vertical position in reducing flow concentrations is indicated. Baffle dimensions and distances above draft tube invert, as well as forces on the baffles are given.
59. Jansen, W., 1967, Flow Analysis in Francis Water Turbines, Trc;1ns ASME, Engr for Power, Vol. 89, Ser A, No. 3
A method is given to compute the velocity distribution in the flow passage between turbine blades through the use of analytical methods. By using certain simplifying assumptions, the velocity distribution on the pressure side and suction side of the blades is obtained. The method includes three-dimensional effects and also allows computation at off-design performance of the runner.
23
60. Konig, H. B. and Whippen, W. G., 1967, Vibration Problems at Conowingo, Water Power, July, pp 259-260
This report is a description of a severe vibration problem in a turbine unit. The vibrations cracked. welds in the draft tube liner and caused extremely noisy operation. The pulsations were eliminated for all gate openings less than best gate (72 percent) by admitting air to the inlet side of the runner blade. Above 73 percent opening another kind of roughness was present which could not be alleviated by air admission to the inlet side of the blades. The specific speed of this unit was higher than that of any other fixed blade turbine installed by the bidder.
61. Shramkov, K. A., 1967, Gidravlicheskii rezonaus v vodovodakh GES {Hydraulic Resonance in the Conduits of Hydroelectric Powerplants), G idrotekhn icheskoe Stroitel 'stvo, No. 2, pp 12-16, U.S. Bureau of Reclamation Translation No. 689, Denver, Colorado
A discussion of investigations made in field units. The frequencies observed in the field were in the range predicted by resonance computations of the penstock based on a simplified theory. The amplitude of the pressure pulsations was found to increase as the submergence of the unit increased.
62. Barkov, N. K., 1968, Vpusk vozdukha i aeratsiia potoka v gidroturbinakh {Air Admission and Flow Aeration in Hydroturbines), Electricheskie Stantsii No. 8, pp 26-29, USSR Working Translation No. 635
Various methods of atmospheric and compressed air admission in hydraulic turbines are briefly described. Presently, atmospheric air is used successfully in hydraulic turbines for { 1) filling in the breaks in flow continuity, (2) preventing
• erratic conditions and dangerous vibration during periods of abnormal flow whirling in the draft tube, and (3) stabilizing flow for partial loading and off-design head operation. Compressed air injection is accomplished by several techniques and practical devices. Compressed air is used to reduce erosive wear in hydraulic turbines due to cavitation. Research shows that air in flow cavities significantly lowers the rate of cavitation damage. It also appears to be highly effective in controlling pressure surging beyond the turbine runner. Further study of air injection is required

,,--... (
to improve the reliability and operation of contemporary hydromachines.
63. Lecher, W. and Baumann, K., 1968, Francis Turbines at Part-Load with High Back Pressure, Paper 84, I AHR Symposium, Lausanne, Switzerland
All Francis turbines show at part-load operation a rotating instability. Thereby, large pressure pulsations in the tailrace system can arise especially with high back pressure and a long ta ii race tunnel without surge tank. This phenomenon was observed to a. pronounced extent on the Francis turbines of a large pumped storage plant. The influence of different parameters, runner cap forms and of air supply at different places and in different quantities was investigated. With model tests, the conditions of the full-size plant were well reproduced. The investigation of many alternatives led to a solution by which, besides the great reduction of the pulsations, a considerable efficiency increase was obtained. These results were also proved by measurements taken on the prototype. (Author's summary.)
!54. Ulith, P., 1968, A Contribution to Influencing the Part-Load Behavior of Francis Turbines by Aeration and a-Value, Paper No. B 1, IAH R Symposium, Lausanne, Switzerland
The amplitude of the pressure fluctuation measured at the draft tube wall is used as a characteristic mangitude to assess turbine draft tube flow. This magnitude depends on the variation of the pressure distr ibution in the draft tube cross section and, as a result, on the discharge, the a-value and the airflow. The method of aeration above the vaneless space between guide wheel [wicket gate, sic] and runner is described. The test results obtained on a ns = 308 [metric, sic] model turbine are indicated. (Author's summary.)
65. Cassidy, J. J., 1969, Experimental Study and Analysis of Draft-Tube Surging, Report No. REC-OCE-69-5, U.S. Bureau of Reclamation, Denver, Colorado
Draft tube surge experiments were conducted with models of draft tubes, using air as the fluid. The occurrence, frequency, and amplitude of surges were correlated with flow and draft tube geometry variables. Studies show that surges arise when angular momentum reaches a critical value
24
relative to linear momentum. Surge frequency and peak-to-peak pressures are independent of viscous effects for Reynolds numbers above 80,000 and are correlated with a dimensionless momentum parameter for a particular draft tube shape. A criterion is given for predicting the surging threshold. Results of the study are app lied to analysis of draft tube surging in the Fontenelle and the model of the Hoover replacement runners.
66. Falvey, H. T. and Cassidy, J. J ., 1970, Frequency and Amplitude of Pressure Surges Generated by Swirling Flow, IAHR Symposium, Stockholm, Sweden, Transactions, Part 1, Paper E1
Reports on the investigation of swirling flow through straight tubes, conical d iffusors, and elbow draft tubes. Frequencies and amplitudes of pressure surges produced by the swirling flow were measured and found to be essentially independent of viscous effects for Reynolds numbers larger than 1 x 10⁵. Dimensionless frequency and pressure parameters as well as the onset of surging were correlated with the parameter S°2D/pQ2 where n and Q ¥e, respectively, the fluxes of angular momentum and volume through the tube, D is the tube diameter and p is the flu id density. Relative · length and shape of the tube were also found to be important.
The results of the study were used to analyze a particular draft tube for potential surging. Using performance data obtained from the model of the turbine and draft tube, a region of surge-free operation was outlined on the efficiency hill for the unit. Comparison was made between measured power swings and the predicted pressure fluctuations in the draft tube.
67. Mollenkopf, G. and Raabe, J., 1970, Measurements. of Velocity and Pressure in the Draft Tube of a Francis Turbine, IAHR Symposium, Stockholm, Sweden, Transactions, Part 1, Paper 83
Measurements were made in a draft tube with a hot film probe which defined the instantaneous velocity vector. A Francis model turbine was used whose metric specific speed was 295 rpm. The measurements were made in the presence of a strong spiral vortex at two part-load cond itions. The results also indicated that surge frequency

,~' \
\ '--
and amplitude could be predicted from scaling laws for a model head range of 2 to 9 meters.
68. Zolotov, L. A., Klabukov, V. M., and lvariova, G. A., 1970, Flow Dynamic Characteristics Downstream of Hydraulic Turbine Runner and Their Influence on Conditions of Turbine Un its Regulation, IAH R Symposium, Stockholm, Sweden, Transaction, Part 1, Paper 82
Discharge and pressure fluctuations in the draft tube were observed. At partial loads the
25
discharge fluctuations reach plus and minus 10 percent of the rated discharge capacity. Whereas, at optimum capacity, the fluctuations are only plus and minus 1 percent. The influence of the discharge fluctuations on pressure fluctuations in the penstock were studied by water-hammer equations. The shape of the pressure wave in the penstock was found to be strongly dependent upon the time at which the draft tube disturbance occurred in the wicket gate closing cycle.

7-1750 (J-71) lureau of Reclamotlot1
CONVERSlON FACTORS-nRITISII TO METRIC UNITS OF MEASUREMENT
The following conversion facto rs adopted by the Bureau of Reclamation are those published by the American Society for Testing and Materials (ASTM Metric Practice Guide, E 380-68) except that additional factors (•) commonly used in the Bureau have been added. Further discussion of definitions of quantities and units is given in the ASTM Metric Practice Guide.
The metric units and conversion factors adopted by the ASTM are based on the "'International System of Units" (designated SI for Systeme International· d'Unites) , fixed by the International Committee for Weights and Measures; this system is also known as the Giorgi or MKSA (meter-kilogram (mass)-second-ampere) system. This system has been adopted by the International Organization for Standardization in ISO Recommendation R-31.
The metric technical unit of force is the kilogram-force; this is the force which, when applied to a body having a mass of 1 kg, gives it an acceleration of 9.80665 m/sec/sec, the standard acceleration of free fall toward the earth's center for sea level at 45 deg latitude. The metric unit of fo rce in SI units is the newton (N ), which is defined as that force which, when applied to a body having a mass of 1 kg, gives it an acceleration of 1 m/sec/s~c. These units must be distinguished from the (inconstant) local weight of a body having a mass of 1 kg, that is, the weight of a body is that force with which a body is attracted to the earth and is equal to the mass of a body multiplied by the acceleration due to gravity. However, because it is general practice to use "pound" rather than the technically correct term " pound-force," the term "kilogram" (or derived mass unit) has been used in this gu ide instead of "kilogram-force" in expressing the conversion factors for forces. The newton unit of force will find increasing use, and is essential in SI units.
Where approximate or nominal English units are used to express a value or range of values, the converted metric units in parentheses are also approximate or nominal. Where precise English units are used, the converted metric units are expressed as equally significant values.
Multiply
Mil ..... ..•. . Inches Inches Feet Feet . Feet . Yards Miles (statute) Miles . .... .
Square inches Square feet . Square feet . Square· yards Acres .. Acres . . . . . Acres .. .. . Square miles
Cubic inches Cubic feet . Cubic yards . .. . . .
Fluid ounces (U.S.) Fluid ounces (U.S.) Liquid pints (U.S.) Liquid pints (U.S.) Quarts (U .S.) Quarts (U.S.) Gallons (U.S .) Gallons (U.S.) Gallons (U.S.) Gallons (U.S.) Gallons (U.K.) Gallons (U.K.) Cubic feet . Cubic yards Acr&-feet Acr&-feet
Table I
QUANTITIES AND UNITS OF SPACE
By
LENGTH
25.4 (exactly) 25.4 (exactly)
2.54 (exactly)• . 30.48 (exactly)
0.3048 (exactly)• 0.0003048 (exactly)• 0.9144 (exactly) .
1,609.344 (exactly)• . 1.609344 (exactly)
AREA
6.4516 (exactly) •929.03 ...
0.092903 0.836127
•0.40459 . 0 4,046.9 . .. .
'0.0040469 2.58999 .
VOLUME
16.3871 .. 0.0283168 . 0.764555
CAPACITY
29.5737 .. 29.5729 . .
0.4731 79 0.473166
'946.358 . . '0.946331
0 3,785.43 ... 3.78543 . 3.78533 .
• 0.00378543 . 4.54609 4.54596
28.3160 . '764.55
'1,233.5 • 1,233,500 . .
To obtain
.. . Micron Millimeters
Centimeters Centimeters . . Meters Kilometers . . Meters . . Meters Kilometers
Square centimeters Square centimeters
Square meters . .. Square meters ... .. . Hectares . . . Square meters
Square k ilometers Square kilometers
Cubic centimeters Cubic meters
. . . . . . Cubic meters
Cubic centimeters Milliliters
. Cubic decimeters Liters
Cubic centimeters Liters
Cubic centimeters Cubic decimeters
Liters . . Cubic meters Cubic decimeters
Liters Liters Liters
. Cubic meters Liters

,.,.,.;,--..:,._I __ ,. _______ ._,.,. _ ___ .._, ___ ., _____________ · ---------•~- ·-----~~--- - -·----------·
Table II
QUANTITIES ANO UNITS OF MECHANICS
Multiply By To obtain
MASS
Grains 0/7,000 lbl . . 64 .79891 lexactlyl ..... , .... , .. , . , . , , . , . . . Milligrams Troy ounces (480 grains! . . . . . . 31 . 1035 . . . , . . .. . , . . . , , . Grams Ounces (avdp) 28.3495 ........... , . . . . . . • . . . . . . . • . Grams Pounds (avdp! ... . .. ... . , . 0.45359237 (exactly) ... , . .. , . .... , . , . . , . . . Kilogram, Short tons 12,000 lh) 907.185 ......... , .. .. . , . , . . Kilograms Short tons 12 ,000 lb) 0 .907185 . , .. .. , . .. . . •. . . . , . . . Metric tons Long tons (2 ,240 lbl ._._._._. _. _._. __ 1,c...0_1_6._05 __ . _. _._._._._. _. _._._._._. _. _. _._._._ ._ . c_' _. _._._._._. _. _._._._K_i_lo_:g_ra_m_s_
---------------~F~O~RCE/ARE~A--------------------
Pounds per square inch Pounds per square inch Pounds per square foot Pounds per square foot
Ounces per cubic: inch Pounds per cubic foot Pounds pN cubic foot ... . . . . . Tons (long) per cubic yard ... . .
o ~J nces per gallon (U.S.) Ollnces per gallon (U.K.) Potonds per gallon (U .S.) Pounds per gallon (U.K.)
Inch-pounds .. . ... . .. .• .. lnch·pounds ... ... . . . Foot-pounds . . _ . .. . . .... . Foot -pounds . . .. ... • . .. . Foot-pounds per inch ... . .• .• Ounce·inches ...
Fee t per second ... • ....• . . Feet per second ... ... ... . . Feet per year .. . . . • . .. .... Miles per hour ....... ... . . Miles per hour ..... .. . .. . .
Feet per second2 .... .. . .•..
Cubic feet per second ( second· feet) . . . _ .
Cubic fee t per minute . Gallons (U .S.) per minute . . , , . .
Pound, Pound, Pound,
0.070307 .. . . , . .... ..•. , . Kilograms per square centimeter 0.689476 . ...........•. ... Newtons per square centimeter 4.88243 . . . . . . . . • . . . . • . . . . . . Ki lograms per square meter
47 .e803 ...... ... . . ..• .... .. . Newtons per square meter
MASS/VOLUME (DENSITY)
1.72999 . . . .. .. .. . .. . 16.0185 ... . .. .. , ... . 0 .0160105 ... . . .•. , .. ... , ... 1.32894 . ....... .. . . .• .. ...
MASS/CAPACITY
Grams per cubic centimeter Kilograms per cubic meter
Grams per cubic cen timeter Grams per cul.lie centimeter
7.4893 . . . .. . . .•. . .. , . .... .. . Grams per li1er Grams per liter Grams per liter Grams per liter
6.23 62 , . . , .. .. , .... , . ... • ....•... 119.829 ..... ... . . . .
99 .779 . ... . . .. . . . .
BENDING MOMENT OR TORQUE
0.011521 . ....... , . , . . , ...• , . . Meter-kilograms 1.12985 x 10⁶ . .. • , . . . . • . • . . • . . . . . Centimeier-dynes 0.138255 . . . . . . . . . . . . . . . . . . . . . . . . . Me ter-kilograms 1.35582 x 10⁷ . . . . • . . . . . . . . Centimeter-dynes 5.4431 , . . . . . . • . . . . . Centimeter-kilograms pe.- centimeter
72.008 Gram-centimeters
VELOCI TY
30.48 (exactly} . ... , . . . . • . . . . • . . . Centimeters per second 0.3048 (e>eactly) • . , . . . . • • . . . . . . . . . . . Meters per second
·o .965873 x 10- 6 . .. ..•.... , . . . Centimeters per second 1.609344 (~xactly) . . . . . . . . . . Kilometers per hour 0.44704 (exacllyl . . . • . . . . . . Meters per second
ACCELERATION "
•o.3048 •....• . ...... . . .. .... . ... Meters per second2
FLOW
•o.028317 ....... •.. ..•....• . . . Cubic meters per second 0.4719 .. •. ••. • •. •. . . .. ....... Liters per second 0 .06309 , , . • , . .. • . •... , . , . . . .. , , , . Liters per second
FORCE"
"0.453592 , , • . , , . , , .. . • . . . , ... , , . . . . . . . Kilogram, • 4.4482 .. , , . , , • , ....... .• , . • , , •• , , , , . . New ion, • 4 .4482 x 105 . .... , .• .. , . . . . • . . . . . . . . . . . Oynos
Multiply
British thermal units (Btu) .. • .. British thermal units (Btu) . .• . . Btu per pound ..... . . . .•.. Foot-pournls . . .......... .
Table II-Continued
By To obtain
WORK ANO ENERGY"
•o.252 .. . . . . . . .... ... . ... , . .. .... Kilogram calo ries 1,055.06 .. .... . . ..•... .• .. , . • . . . . . . . . . . . . . Joules
2.326 (exactly) . , , , , . , ... . ... , .... , , .. Joules per gram '1.35582 ............. . .. .. . , , . . . , . . . . . . . . Joules
POWER
Horsepower . . . . . . . . . . . . . . 745. 700 ..... . . • ...... . ... . •.. .. ... . . . . ... Wans Btu per hour ... .. .. , . . . . . 0 .293071 .. . ... . .. . . , •.... .. .•. • . , .. • .. . . Wans Foot-poundspe __ r_s_ec_o_n_d _______ 1_.3_5_5_8_2_._ ._ . _. _· _._._._ ._ . _. _. _._._._. _. _. _._._._._. _. _. _·_·_·_·_· _. _· _._w_at_t_s
Btu in ./hr tt2 degree F (k, thermal conducti'llity) . .
Btu in.flu It 2 degree F (k, thermal conducli'llity)
Btu ft / hr ft 2 degree F . Btu/hr tt2 degree F (C,
thermal concluctance) Btu/ hr 112 deg,ce F (C,
thermal conductance) Degree F hr 1t2/ Btu (R,
ther mal resistance) Btu/ lb degree F (c, heat capacity) . Btu/lb degree F . ...... . . Ft2/hr (thormal diffusivity) . . Ft2 /hr (thermal d iffusivity) , .
HEAT TRANSFER
1.442 ......... . ..•. , .. .. ... . Milliwans/cm degree C
0. 1240 . • . .. . , .... •....... Kg cal/hr m deg,ee C '1.4880 .. .. .. , . . . . • . . . . • . . . . Kg calm/ hr m2 degree C
0.568 , ..... , ... . , . , ...•.... , Milliwatu/cm2 deg,ee C
4.882 .. , . ... . . .... , . . .• , . . . . . Kg cal/hr m2 degree C
. 1.761 .. . .. , . , . •. . , . . . ... • ... Oeg-ee C cm2/milliwatt 4 .1868 ..... . , , . , . , ........ ... ...... Jig degree C
'1.000 . . . . . . . • . . . . . . . . . . . . . . . . . . Cal/gram deg,ee C 0 .2581 . . .. .. , .. .. , . ...•..... , . . . . . . . . cm2 / sec
'0.09290 ......... , . . ... , . . . . . . . . . M2/hr
----- ------~WATER VAPOR TRANSMISSION
16. 7 .. . .. . . , ..•• • . ... , . . • . . . . . . . . Grams/ 24 hr m2 Grains/hr 112 (water vapor)
trammission) , . ... . . .. . . . Perms (permeance) .. ... - .. . 0.659 . . • . . . . . . . . . . . . • . . . . . . . . . . . . . Metric perms Perm-inches {permeability) .... . 1.67 .... . .•. . .. • .•. .. . •.. . . . Metric perm<entimeter,
Table Ill
OTHER QUANTITIES ANO UNITS
Multiply
Cubic feet per square foot per day (seepage) Pound-seconds per square foot tviw:ositv) . .. . . . Square feet per second (viscosity) ... .... .. . Fahrenheit degrees (change)• ..... ... , ..•. Volts per mil ...... , .. . .. ..•. ... . . . Lumens per square foot (foot-candles) . ..•... . Ohm-circular mils per foot , ........ •. .. . Millicuries per cubic foot • ...... .. .. . , .. Milliamps per square foot . . •..•....•.. . , ~all9ns per square yard . . .. . . • .... . . , .. Pound, per Inch , , ...... ..... ..•...• .
By To obtain
•304_9 .. .. .• , . .. . lilers per ~uare meter per day •4 .8824 . . . , '. . , Kilo~am second per square meter •o.092903 . . . . . . . . . . . Square meters per second !i/9 exac llv . • . . Celsius or Kelvin degrees !change}• 0.03937 . . . . . . . . . . . . Kiiovol ts per millimeter
10.764 . . _ . , . . . . . . . . Lumens per squ are meter 0.001662 . .. ... Ohm-square millimeters per meter
•35_3147 •••.• . .• • _ . Millicuries per cubic meter • 10.7639 . . . . . . . . . . . Milliamps per square meter '4 .527219 .. , , .. , . . , . . Liters per square meter •o.17858 . . . . . . . . . . . Kilograms per centimeter
GPO 83Q• C26
., I

,
......................................................................................................................................................................
ABSTRACT
A literature survey and a review of material related to draft tube' surges is presented. The literature survey consists of an annotated bibliography of 68 articles published between 1910 and 1970. The review is restricted to three major areas : experiments with elementary models, experiments with model and prototype turbines, and field expedients to reduce surging. Velocity distributions and surge frequencies are given special attention in the first two areas . Present knowledge is sufficient for predicting the order of magnitude of draft tube surge frequencies and relative surge amplitudes . Additional studies are needed to refine prediction methods and to extend their scope to include pumps and pump-turbines . Model testing at full prototype heads is apparently not required to investigate draft tube surging . Has 68 references .
ABSTRACT
A literature survey and a review of material related to draft tube surges is presented. The literature survey consists of an annotated bibliography of 68 articles published between 1910 and 1970. The review is restricted to three major areas : experiments with elementary models, experiments with model and prototype turbines, and field expedients to reduce surging. Velocity distributions and surge frequencies are given special attention in the first two areas. Present knowledge is sufficient for predicting the order of magnitude of draft tube surge frequencies and relative surge amplitudes . Additional studies are needed to refine prediction methods and to extend their scope to include pumps and pump-turbines . Model testing at full prototype heads is apparently not required to inve; tigate draft tube surging . Has 68 references .
. . . . . . . . . . . . . . . . . . . . . . . . . . . . . . . . . . . . . . . . . . . . . . . . . . . . . . . . . . . . . . . . . . . . . . . . . . . . . . . . . . . . . . . . . . . . . . . . . . . . . . . . . . . . . . . . . . . . . . . . . . . . . . . . . . . . . . . . . . . . . . . . . . . . . . . . . . . . . . . . . . . . . . . . .
ABSTRACT
A literature survey and a review of material related to draft tube surges is presented. The literature survey consists of an annotated bibliography of 68 articles published between 1910 and 1970. The review is restricted to three major areas : experiments with elementary models, experiments with model and prototype turbines, and field expedients to reduce surging. Velocity distributions and surge frequencies are given special attention in the first two areas. Present knowledge is sufficient for predicting the order of magnitude of draft tube surge frequ encies and relative surge amplitudes. Additional studies are needed to refine prediction methods and to ex tend their scope to include pumps and pump-turbines . Model testing at full prototype heads is apparently not required to investigate draft tube surging. Has 68 references.
ABSTRACT
A literature survey and a review of material related to draft tube surges is presented. The literature survey consists of an annotated bibliography of 68 articles published between 1910 and 1970. The review is restricted to three major areas: experiments with elementary models, experiments with model and prototype turbines, and field expedients to reduce surging. Velocity distributions and surge frequencies are given special attention in the first two areas . Present knowledge is sufficient for predicting the order of magnitude of draft tube surge · frequencies and relative surge amplitudes . Addit ional studies are needed to refine prediction methods and to extend their scope to include pumps and pump-turbines . Model testing at full prototype heads is apparently not required to investigate draft tube surging. Has 68 references.
--- ···~- -----· . - ...... ' --·- -·-. . .,,,_, .... , ..... -······-· .. ,-- ..... --........ .. _ .. ..... ~.,- ... --... ··•· ... · ·-.. •·•• ..... •"---·-· .... _.,. .. .....,. ,_ ..... _~~· ... - ·.,__..,.,._ ... __ _

REC-ERC-71-42 Falvey, HT DRAFT TUBE SURGES-A REVIEW OF PRESENT KNOWLEDGE AND AN ANNOTATED BIBLIOGRAPHY Bur Reclam Rep REC-ERC-71 -42, Div Gen Res, Dec 1971. Bureau of Reclamation, Denver, 25 p, 7 fig, 68 ref
DESCRIPTORS-/ 0 draft tubes/ •turbines/ •surges/ 0 hydroelectric powerplants/ hydraulic machinery/ fluid mechanics/ unsteady flow/ laboratory tests/ model tests/ fluid flow/ non-un iform flow/ vortices/ bibliographies/ annotations/ velocity distribution/ amplitude/ air admission/ frequency IDENTIFIERS-/ hydrodynamic stability
REC-ERC-71-42 Falvey, HT DRAFT TUBE SURGES-A REVIEW OF PRESENT KNOWLEDGE AND AN ANNOTATED BIBLIOGRAPHY Bur Reclam Rep REC-ERC-71 -42, Div Gen Res, Dec 1971 . Bureau of Reclamation, Denver, 25 p, 7 fig, 68 ref
DESCRIPTORS- / 0 draft tubes/ ·turbines/ ·surges/ 0 hydroelectric powerplants/ hydraulic machinery/ fluid mechanics/ unsteady flow/ laboratory tests/ model tests/ fluid flow/ non-uniform flow/ vortices/ bibliographies/ annotations/ velocity distribution/ amplitude/ air admission/ frequency IDENTIFIERS-/ hydrodynamic stability
REC-ERC-71-42 Falvey, HT DRAFT TUBE SURGES- A REVIEW OF PRESENT KNOWLEDGE AND AN ANNOTATED BIBLIOGRAPHY Bur Reclam Rep REC-ERC-71 -42, Div Gen Res, Dec 1971. Bureau of Reclamation, Denver, 25 p, 7 fig, 68 ref
DE,SCRIPTORS-/ 0 draft tubes/ •turbines/ ·surges/ 0 hydroelectric powerplants/ hydraulic machinery/ fluid mechanics/ unsteady flow/ laboratory tests/ model tests/ fluid flow/ non-uniform flow/ vortices/ bibliographies/ annotations/ velocity distribution/ amplitude/ air admission/ frequency IDENTIFIERS-/ hydrodynamic stability
REC-ERC-71-42 Falvey, HT DRAFT TUBE SURGES-A REVIEW OF PRESENT KNOWLEDGE AND AN ANNOTATED BIBLIOGRAPHY Bur Reclam Rep REC-ERC-71-42, Div Gen Res, Dec 1971 . Bureau of Reclamation, Denver , 25 p, 7 fig, 68 ref
DESCRIPTORS-/ 0 draft tubes/ •turbines/ ·surges/ 0 hydroelectric powerplants/ hydraulic machinery/ fluid mechanics/ unsteady flow/ laboratory tests/ model tests/ fluid flow/ non-uniform flow/ vortices/ bibliographies/ annotations/ velocity distribution/ ampli tude/ air admission/ frequency IDENTIFIERS-/ hydrodynamic stability


•'(' c:6 - .; .~,.: ;,,,ir,4' ri • ...,
--
REC-ERC-72-24
( ... ;;...
,: - ~,, -~· .
Uldis J. Palde
Engineering and Research Center
Bureau of Reclamation
July 1972
H.E~?.i T. FALVEY, Dr. Inc.

MS-230 (8-70) Bureau ,of Reclamation TECHNICAL REPORT STANDARD TITLE PAGE
1. REPORT NO . r· wCVtRW.U:HT ACC£$£.!OM t(d:. --· ,;;.~~:,1~ 3. RECIPIENT'S CATALOG NO.
REC-ERC-72-24 :,~':, .· <{:i~·~:!.?-;_~:~~r~:~~;·:~::~~~fff;~;it Jffi.~ .. 4, TITLE AND SUBTITLE s. REPORT DATE
Influence of Draft Tube Shape on Surging Jul 72
Characteristics of Reaction Turbines 6. PERFORMING ORGANIZATION CODE
7. AUTHOR(S) e. PERFORMING ORGANIZATION REPORT NO.
Uldis J. Palde REC-ERC-72-24 ..
9. PERFORMING ORGANIZAT ION NAME AND ADDRESS 10. WORK UNIT NO.
Engineering and Research Center Bureau of Reclamation 11. CONTRACT OR GRANT NO.
Denver, Colorado 80225 13. TYPE OF REPORT AND PERIOD
COVERED 12. SPONSORING AGENCY NAME AND ADDRESS
14. SPOt.SORING AGENCY CODE
15 . SUPPLEMENTARY NOTES
16. ABSTRACT
Laboratory experiments, using a simplified air model, were conducted to obtain the correlation between draft tube shape and the draft tube surge characteristics-the range of occurrence, frequencies, and pressure amplitudes of the surges. Dimensionless parameters were used to compare results. The draft tube shape was found to have significant influence on the surging characteristics. Surge measurements obtained from two hydraulic turbine model studies are also compared using the dimensionless parameters. Hydraulic and air model studies of the same draft tube produced satisfactory correlation. The information presented can be used to predict the surge characteristics of prototype and model turbines, or as an aid in draft tube design where surge reduction or resonance minimization are considered as design criteria. Examples are included to illustrate application of the laboratory results.
-
17. KEY WORDS AND OOCUM!:NT ANALYSIS
a. DESCRIPTORS-- I "draft tubes/ turbines/ "surges/ "hydroelectric powerplants/ hydraulic machinery/ fluid mechanics/ dimensional analysis/ model tests/ fluid flow/ pressure/ frequency/ "shape/ resonance/ test results/ hydraulic design/ "reaction turbines/ hydraulic turbines/ noise (sound)/ hydraulic models/ vibration/ wicket gates/ hydraulic similitude
b. IDENTIFIERS-- I hydraulic pressure tests/ Fontenelle Dam, Wyo/ Grand Coulee Powerplant, Wash/ water pressure tests
c. COSATI Field/Group 13G \ 18. DISTRIBUTION STATEMENT 19 . SECURITY CLASS 21. NO. OF PAGE5
Available from the National Technical Information Service. Operations (THIS REPORT)
UNCLASSIFIED 29 Division, Springfield, Virginia 22151.
20. SECURITY CLASS 22 . PRICE
I (THIS PAGE)
UNCLASSIFIED

' •
REC-ERC-72-24
INFLUENCE OF DRAFT TUBE SHAPE
ON SURGING CHARACTERISTICS OF REACTION TURBINES
by
Uldis J. Palde
July 1972
Hydraulics Branch Division of General Research Engineering and Research Center Denver, Colorado
UNITED STATES DEPARTMENT OF THE INTERIOR Rogers C. B. Morton Secretary
* BUREAU OF RECLAMATION Ellis L. Armstrong Commissioner

ACKNOWLEDGMENT
The study was conducted under the supervision of Dr. Henry T. Falvey, Head, Hydraulics Research Section, whose advice, encouragement, and patience is greatly appreciated. Appreciation is also expressed to Dr. Jack C. Cassidy (presently Head of the Civil Engineering Department, University of Missouri at Columbia) who patiently introduced the author to the draft tube surge phenomenon and its measurement in the laboratory. The help of Robert H. Kuemmich in resolving instrumentation problems is also appreciated. The entire research project was under the direction of William E. Wagner, Hydraulics Branch Chief, Engineering and Research Center, Denver.

I • - --
Notation Conclusions Applications Introduction Analysis Laboratory Model Laboratory Procedure Draft Tube Shapes Studied Results . . . . . . Surge Measurements on Turbine Models
CONTENTS
Air Model and Hydraul ic Turbine Model Comparison Application to Turbines References Appendix . . . . .
Page
ii
1 1 2 3 4 4 5 7 7
23-26 27
-•

NOTATION
B = height of wicket gates
D2 = runner diameter at minimum opening
D3 , D = diameter of draft tube throat
f = frequency (hz)
g = acceleration due to gravity
H = net head across turbine
L = length of draft tube
N = number of wicket gates
n = rotational speed (rev/min)
n1 I = unit speed
P = power
P1 1 = specific power
p' = pressure surge amplitude fluctuation from mean
Q = discharge
Q11 = specific discharge
R = radial distance to center of flow through wicket gates
S = width of opening between wicket gates
T = torque
V = axial velocity
a = radial inclination of flow through wicket gates
= ratio of maximum runner rotational velocity to the spouting velocity
v = kinematic viscosity
tr = 3.1416
P = fluid density
S = turbine cavitation number
E2 = flux of moment of momentum
W = angular velocity (rad/sec)
01. 02, 03, 04 = functions
R = Reynolds number
Subscripts
M = model
P = prototype
CONCLUSIONS
1. An air model of the type described in this report can successfully be used to determine the surging characteristics of hydraulic turbine draft tubes. The equipment need have no more mechanical components than the minimum required to precisely introduce, control, and measure swirling flow at the draft tube
in let.
2. The shape of the draft tube has a significant influence on the surging characteristics—the range of surging, the frequency band of the surges, and the amplitude of the resulting pressure pulsations.
3. The throat geometry generally has more influence on the surging characteristics than the shape of the remaining downstream portion of the draft tube.
4. The degree of divergence of a draft tube is the most significant geometric feature affecting surging characteristics. Bends and relative length have lesser influence.
5. Surging can be minimized by using an equivalent draft tube expansion angle of about 150 through the whole length of the draft tube, and possibly eliminated
entirely with greater angles.
6. The use of straight cylinder sections (any L/D) or constant diameter elbows in or near the draft tube throat will increase the range of surging and generally increase the frequency and amplitude of the surges.
7. The possibility of resonance with known natural frequencies of other features of the hydroelectric plant can be checked with fair accuracy using the results
presented, if the turbine performance characteristics and wicket gate geometry are known. Resonance can be avoided by proper choice of geometric components
in the draft tube design.
APPLICATIONS
The results presented in this report can be used to predict with fair accuracy the range of occurrence, frequencies, and pressure amplitudes of draft tube
surges in prototype or model turbines. The draft tube shape and performance characteristics of the turbine must be known. The results can be used in draft tube design to help minimize the inevitable surging that will occur over some portion of the operating range of the turbine. Examples of dimensionless parameter
evaluation are included to encourage the generalized comparison of surge measurement data obtained from prototype and model turbines.
INTRODUCTION
Draft tube surges have created problems in hydroelectric powerplants using reaction turbines for several decades.' *
Draft tube surges generally occur over a range of gate positions above or below best efficiency. The most common adverse effects of the surges are noticeable
vibration and pounding noise in the powerplant. More serious manifestations, such as periodic variations in power output (power swings), vertical movement of the runner and shaft, and penstock pressure pulsations
and vibration have often been attributed to draft tube surges.
For many years, there was considerable speculation and disagreement about the cause of draft tube surges. It is now generally accepted that the draft tube surge is a hydrodynamic instability which occurs in the draft tube as the result of rotation remaining in the fluid as it leaves the turbine runner and enters the draft tube throat. The hydrodynamic instability produces spiralling vortex flow in the draft tube, which has been referred to in the literature as "vortex breakdown."
Bureau of Reclamation powerplants have not been an
exception to the draft tube surge problem. As a first step in -finding a solution to the problem, a concentrated research effort was directed toward
determining the basic nature and cause of draft tube surges. A bibliography of literature pertaining to draft tube surges and swirling flow in tubes was collected. An analysis and experimental investigation was conducted to gain an understanding of draft tube surging and to correlate occurrence, frequency, and amplitude of the surges with flow and geometric variables related to the flow through the turbine and draft tube. The experimental investigation was reported in a USBR report by Cassidy while the review of existing knowledge and an annotated bibliography was compiled in another USBR report by Falvey.' Specific aspects of the studies were also presented in two papers by Cassidy and Falvey. 3,4
Cassidy noted that the dimensionless parameters used to correlate the occurrence, frequency, and amplitude of the surges were also functions of the draft tube shape. The results indicated that a thorough
*Numbers indicate references at end of report.

investigation of this aspect would be of great value in understanding the surge phenomenon, in predicting frequencies, and in applying measures to reduce or
eliminate the surges. The experimental work presented in this report is a continuation and expansion of Cassidy's studies. The same experimental equipment
and analysis were used. However, all results are from
original data obtained subsequent to Cassidy's studies.
This report contains sufficient analysis and description of experimental equipment and procedure to provide an ample background for the analysis and application of experimental results. For a more thorough
discussion of the analysis and description of the experimental equipment, the reader should refer to reference,2 while background information on problems arising from draft tube surges and attempts to solve them can be obtained from reference.'
ANALYSIS
Dimensionless parameters were derived by Falvey and Cassidy to help generalize experimental results of surging flow in a draft tube. It was assumed that for a particular draft tube shape, the frequency f and root-mean-square (rms) amplitude
VA M- of the surge are both functions of the density p and the viscosity v of the fluid, the diameter D3 and length L of
the draft tube, the discharge Q, and the flux of the moment of momentum (angular momentum)2. Dimensional analysis yielded the following functional relationships:
pressure parameter
D3 (P )2 = C~D2 L R) PQ PQ D3
and frequency parameter
fD3 aD3 L R Q = 02 PQ2 'D3
Where R is the Reynolds number 4Q/7rD3 v. The ratio E2D3 /PQ2 is referred to as the momentum parameter and is a ratio of angular momentum flux to linear momentum flux. The momentum parameter is, in effect, a useful measure of the amount of swirl in the flow. In applying it to the experimental study, the
assumption was made that regardless of the manner in which angular momentum is introduced into the flow, the resulting surging characteristics will be the same for
a particular value of QD3 /PQ2 . The frequency
parameter is a form on the Strouhal number fD3 /V (V
is the axial velocity), written in terms of discharge.
Based on his initial experimentation with a simplified
model using air as the fluid, Cassidy concluded that:
1. For a given draft tube shape there is a critical
value of nD3 /PQ2 above which surging flow exists.
2. The frequency and pressure parameters can be correlated with the momentum parameter for a
given draft tube shape.
3. Frequency and rms pressure values of the surging flow are independent of viscous effects for
Reynolds numbers above approximately 80,000 (prototype Reynolds numbers greatly exceed
80,000).
The momentum parameter QD3 /PQ2 can be computed
for a turbine if the runner diameter, wicket gate
geometry, and the performance characteristics are known. If we start with the basic expression for power,
P= wT (1)
where w is the angular velocity and T is torque, and
substitute
T = n, — 922 (2)
where 21 — S22 is the rate of change of moment of
momentum of the flow as it passes through the runner, we obtain
P w = S2, — 22 (3)
Multiplying Equation (3) by D3 /p Q2 and rearranging
terms,
22 D3 = a' D3 PD3 (4) PQ2 PQ2 PwQ2
The left side of Equation (4) is the momentum parameter associated with the flow at the draft tube throat. The first term on the right of the same equation is the momentum parameter of the flow leaving the
wicket gates and entering the turbine runner and can
be computed by
2

21 D3 _ D3 R sins
Ply BNS (5)
Equation (5) shows that E21 D3 /pQ2 is entirely a function of wicket gate geometric variables (defined in Figure 1), and the draft tube throat diameter.
8- Geoth of gate \ N- no of gates
which can be evaluated for prototype or model turbines from data (in English units) normally obtained during performance tests.
LABORATORY MODEL
Laboratory experiments were conducted with air as the fluid and a model (Figure 2) utilizing some of the components of a model turbine which had been used in a prior hydraulic model study. The spiral case, stay vanes, and runner were removed. The wicket gates remained and served to produce swirl in the flow as it passed from a symmetrical pressure chamber into the draft tube (Figure 3). Radial inclination of the gates could be set at any angle between 00 (radial) and 820 (closed) to introduce varying amount of swirl in the flow.
Figure 1. Definition sketch of flow leaving wicket gates and entering turbine runner.
The second term of Equation (4) can be computed from performance characteristics of the turbine, using the equation
PD3 550 P11 D3 (6)
PwQz 2V-2—g p Qi 1 0 D-2 y.a
Where q5 is the ratio of maximum runner rotational velocity to the spouting velocity (the computed velocity obtained from a velocity head equal to the net head), or
_ aD3n (7)
60vf2g—H
P11 is the specific power, or
P P11 _ Dz H
3/2 (8) 2
and 011 is specific discharge, or
%1 DZ al/z
(9)
Combining Equations (4), (5), and (6), we obtain
n2 D3 _ D3 R sina _ 550 P1 ! D3 (10)
,o a2 BNS 2~P Q21 ¢ Dz
Figure 2. Laboratory air model and instruments. Photo PX-0-67575
SECTIONAL PLAN SECTION THROUGH
WICKET GATES
Figure 3. Schematic of laboratory air model.
3

The momentum parameter of the flow entering the draft tube could be determined in the simplified laboratory model with far less effort than would be required in a complete turbine model. Without the turbine runner, the momentum parameter at the draft tube throat is equal to that existing in the flow leaving the wicket gates. Equation (5) could therefore be used to compute the momentum parameter of the flow entering the draft tube:
22 D3 _ _ Q, D3 D3 R slna
p~ pQ BNS
The computation of the pressure and frequency parameters required the measurement of discharge and
the frequency and rms pressure of the draft tube surges. The rate of discharge was controlled at the
wicket gate openings and varied along with the gate opening area with changes in the gate setting. The discharge was measured by a differential orifice located
in the inlet pipe to the pressure box. Pressure differential across the orifice was measured with a pressure cell and conditioned by and recorded on one channel of a dual channel recorder-amplifier.
The plastic draft tubes being tested had piezometer taps at several locations along the walls. A pressure cell with a short piece of flexible tubing could be attached to the piezometers for dynamic pressure pickup. The signal was conditioned by the second channel of the recorder-amplifier and fed through a band-pass filter to an oscilloscope and rms meter. Frequencies of the periodic pressure pulsations were determined on the retentive screen of the oscilloscope. The instrumentation is shown in Figure 2.
LABORATORY PROCEDURE
The values of R, S, and a, defined in Figure 1, vary with the gate position. These quantities were carefully measured or graphically determined for numerous gate
angle settings, and tables for use in computations were prepared from smoothed curves of R, S, and a versus gate angle. The value of the momentum parameter for a particular gate setting could then be readily computed using Equation (5).
For a particular draft tube, the range of gate settings for which surging flow could be detected was first noted, as well as the approximate maximum and
minimum frequencies in that range. If the frequency band was not too great, the high- and low-pass circuits
on the band-pass filter were set somewhat outside this band. Occasionally the frequencies varied greatly and
the band pass was set to include most of the frequencies encountered, and later adjusted as required.
For a particular gate setting, a given draft tube surges at the same frequency throughout the entire tube (with a few notable exceptions). The amplitude, however, varies with location along the tube wall. Data were generally taken at a location where amplitude was maximum, since the frequency was best defined at that location.
For some tubes, data were obtained at several locations to determine the variation of amplitude with respect to
location. For one draft tube, data were also obtained at several locations without feeding the signal through the band-pass filter, for comparison of rms pressures with
the filtered signal results.
A run consisted of frequency and rms pressure measurements (along with discharge orifice pressure
differential) taken at the same piezometer at numerous gate settings in the range of surging. The data, along
with amplifier attenuation factors, air density, and descriptive information were recorded on data sheets suitable for ADP card keypunch use. The dimensionless parameters and other flow variables were then
determined by computer. During the computer run, frequency and pressure parameter versus momentum parameter curves could be plotted on an online cathode-ray tube (CRT) and photographed on 35mm microfilm for later copying and convenient storage. The CRT plotting routine was designed so that any six frequency or pressure parameter curves, each with a different symbol, could be plotted on the same figure (microfilm frame) by simply specifying the desired run numbers for each figure. The graphs used in Figures 4 through 18 (following Results section) are computer generated.
DRAFT TUBE SHAPES STUDIED
Cassidy2 determined that the draft tube shape definitely has an effect on the range of surging and on the frequency and rms pressure on the pulsations. His testing was limited to one model draft tube, an irregularly expanding cone, and several cylinders of varying diameter and length. From the results, it was not possible to extrapolate what shapes could eliminate or at least reduce the surging.
A systematic study to correlate the geometric shape components found in typical draft tubes with the surging characteristics was undertaken. A few of the shapes tested were actual models of draft tubes with
4

.nor modifications. The greater majority, however, were simple geometrical shapes or combinations thereof, consisting of straight circular cylinders, truncated diverging cones, and circular cross-section elbows. The diameter, length, and angle of divergence were varied. Tests were repeated on all of the tubes which had already been tested by Cassidy to provide a reliable base of comparison, since measurement instrument calibration discrepancies were discovered later.
Data were eventually obtained for about 75 distinct draft tube shapes (see Figure 1 in the Appendix). Only a fraction are included in the comparison of results which follow. The results that have been included generally reflect how different shapes or minor modifications have significant influence on the surging
characteristics; they also show that some significant features, changes, or modifications have very minor, if any, influence. Many of these results were contrary to what might be expected or is presently assumed in draft tube design.
A minor limitation on the shapes that could be tested
was imposed by the model itself. The downstream face of the pressure chamber had a thickness of 1.93 inches (4.9 centimeter (cm)) (see Figure 3), in which a
rmanent circular opening of 6.13 inches (15.6 cm) in
-.jameter was provided for the outflow. Although the size of this opening could not be increased, it could be decreased. Or the shape could be changed (with the inevitable reduction of inlet diameter) by positioning a
machined plastic insert of the required dimensions in the opening. Many of the tubes tested had inlet diameters of approximately 6 inches (15 cm).
The results presented by Cassidy and much of the data obtained initially in this study were taken on 6-inch-diameter draft tubes, attached to the outer face of the pressure box. Consideration was not given to the short circular cylinder as a geometrical component upstream of the shape being tested. Subsequently, it was discovered that the upstream cylindrical section had significant influence on the surging characteristics. Much of the data for this condition was thus obtained unintentionally. But the data proved to be of value, as reflected in some of the included comparisons of results.
RESULTS
The presented results should be considered largely for their qualitative comparisons. The onset of surging was
only seldom discernable as a well-defined break in the ow regime, and was therefore usually subject to the
investigator's interpretation. Rms pressure values were repeatable from day to day only within about a 10 percent variation. The values were also influenced by the frequency band pass used and somewhat by the presence of the short length of flexible tubing between the piezometer and pressure cell (producing a fairly constant amplification of about 13 percent). Pressure parameter curves should therefore be used primarily to indicate trends and the order of magnitude of the surges.
Frequencies in most cases could be precisely determined and were closely repeatable from day to day for the same draft tube and gate setting. The values of the resulting frequency parameter can therefore be used in a quantitative sense.
The results are presented as plots of the dimensionless parameters in Figures 4 through 18 (starting with page 8). In most cases, the surging characteristics of several shapes are compared in the same figure. Scaled schematic drawings (with only significant dimensions shown) of the shapes being compared are included in each figure. The symbol used for a tube in the parameter plots has been indicated on each draft tube at the location where the surges were measured. The run number has also been indicated adjacent to the symbol. Approximate distances along the tubes can be scaled. The range of surging is defined by the range of the momentum over which data points are plotted.
Figure 4 shows the surging characteristics of three draft tubes. The throats of both variations of the Fontenelle draft tube were modified from the actual prototype geometry. The Grand Coulee pump-turbine draft tube is geometrically similar to the prototype. Its cross section is circular for the entire length.
For all three draft tubes the frequency and pressure parameters initially increase with an increase of the momentum parameter. This was typical of all tubes tested. For some tubes, the pressure parameter continues increasing monotonously, while for others one or more peaks occur.
Most tubes surge over a finite range of momentum parameter, as is the case with the two variations of the Fontenelle draft tube. Others, like the Grand Coulee
pump-turbine draft tube, surge continuously up to the point of complete wicket gate closure, where the
momentum parameter approaches infinity. In the Grand Coulee pump-turbine draft tube, the maximum amplitudes occur near the end of the elbow, on the
right side, where the amplitudes are much higher than at the start of the elbow (compare Runs 188 and 175, Figure 4). Although the pressure parameter generally
attains the highest value at large values of momentum parameter (>2), the maximum value of the pressure pulsation amplitude itself usually occurs at a
momentum parameter value near 1, at the first peak of the pressure parameter.
A slight variation of the Fontenelle throat geometry produces significant changes in the surge parameter values but does not change the range of surging. Removal of the piers and progressively sections of the downstream end of the draft tube has little effect on the surge parameters. A short tube including only the first 300 of the elbow has only slightly different characteristics than the entire draft tube (see Figure 5).
Simple sections of truncated 150 cones surge over a smaller range of momentum parameter and display
lower frequencies and amplitudes than the draft tubes (see Figure 6). The frequencies measured from the cones were far less well defined than those from any other shape. Different inlet diameters and L/D ratios have only slight effect on the dimensionless surge
parameters. Figure 6 also verifies the validity of the dimensional analysis as related to geometric similarity.
Somewhat varying surging characteristics are displayed by 7.50 cones with variation of cone L/D (Figure 7).
The longest and shortest tubes display surging ranges and frequency and pressure parameter curves quite
similar to those of the Fontenelle draft tube. The surging range of the cone with L/D = 2.32, however, is far greater than the ranges of the other cones. The pressure parameter also increases continuously to higher values than for the other cones. It should be noted that a 7.50 cone with L/D -- 2.0 is used downstream of the constant-diameter elbow in the Grand Coulee pump-turbine draft tube.
Straight cylindrical tubes display surging characteristics quite different from those of expanding cones (see F i gure 8). Short sections (L/D <1) produce high-frequency curves, while longer sections have two distinct frequencies—the higher being exactly double
the lower. In a tube having an L/D of 0.96 the lower frequency predominates up to a momentum parameter value of about 2.0, while beyond this point only the higher frequency is apparent (Runs 109 and 110). Several o-cher intermediate lengths between L/D = 0.96 and L/D = 3.58 were tested. The tubes all had surge characteristics similar to the tube with L/D = 3.58. It should be noted that both high- and low-frequency parameter curves of all cylinders show considerably higher values than those of draft tubes with expanding sections.
Adding a bellmouth entrance section to a long, straight cylinder does not alter the surging characteristics up to a momentum parameter value of about 2.0 (see Figure
9). The Reynolds number falls below 80,000 at momentum parameter values above about 1.8, and only results below this value should be considered. The
bellmouth entrance possibly affects the distribution of the angular momentum at the entrance to the cylindrical section, but apparently does not change the total flux. The results tend to support the assumption that the manner of introduction of angular momentum
is not significant.
Figure 10 illustrates the effect of adding short circular
cylinders to the upstream end of a long 7.50 cone. The
frequency and the range of surging are increased
significantly as the length of cylinder is increased. Similar results were noted with the shorter 7.50 cones.
Adding circular cylinder sections upstream of a 150 cone has an even more pronounced effect on the singe characteristics (see Figure 11). A long cylinder has only slightly more influence than a short cylinder. Adding a cylinder to the downstream end of a long cone has no effect on the frequency, but does decrease the surge amplitude at higher momentum parameter values
(Figure 11, Run 123).
The surge amplitude decreases with respect to distance from the inlet in an expanding cone, but generally increases in a long cylinder (Figure 12).
A 1000 elbow produces lower frequencies than a cylinder of the same length (Figure 13). The range of surging is also reduced. In elbows of different lengths the highest pressure fluctuations were measured near the outlet. The fluctuations were always higher at the inside of the bend than at the outside, both in
constant-diameter elbows and expanding cross-section elbows of draft tubes.
Substitution of a straight cylinder of equal length for
the elbow in the Grand Coulee pump-turbine draft tube does not alter the frequency parameter values to a great extent (see Figure 14). An interesting phenomenon in the straight tube is the presence of a second frequency equal to about two-thirds of the predominant one. The predominant frequency parameter curve varies only slightly from the frequency parameter curve of the elbow draft tube. The maximum amplitude is typically higher in the elbow to be.
In addition to the frequency and pressure parameter
curves for the above two draft tubes, parameter plots of their geometric components have been included in Figure 15 for comparison. The frequency parameter curve of the 7.50 cone is almost identical to those of
the draft tubes. The frequencies of all the other

. vidual components, however, are higher than the two complete draft tubes. While generally the most upstream components have the most influence, in this case just the opposite is true. A similar comparison is presented in Figure 16, where the influence of straight cylinder sections inserted between cone sections is illustrated.
Two lengths of 300 expanding cones were also tested. No periodic pressure fluctuations could be detected with the instruments and measuring techniques used in the other tests.
It was pointed 'out earlier that the amplitude of the surge varies with location along the tube wall. In simple symmetrical shapes the variance occurs in a fairly regular fashion (Figure 12). In an elbow of constant diameter the generalization can be made that pressure pulsation amplitude is highest near the outlet and higher at the inside than at the outside of the bend. In a more complex shape such as the Grand Coulee pump-turbine draft tube the amplitude variation is not as easily predictable throughout the total range of surging.
Rms values of pressure pulsation were obtained for the entire range of surging at about 30 locations in the
-and Coulee pump-turbine. The resulting pressure parameter curves at five cross sections (four curves
at section quarter points for each section) are shown in Figure 17. The results provide sufficient information to
obtain directly or interpolate the pressure parameter
value at any location on the draft tube walls. The maximum value of the pressure pulsation amplitude itself in most cases occurs at the first peak of the pressure parameter curve, near a momentum parameter value of 1. Pressure parameter plots for the downstream portions of the exit cone have not been shown because the pressure pulsations vary in a fashion typical of expanding cones, i.e., decreasing downstream.
All recorded pressure amplitudes were influenced by the frequency filter band through which the amplified
pressure transducer signal was passed before it reached the rms meter. The filtered rms value was always lower than what would have been measured without a band-pass filter. Some comparative data for four different locations in the Grand Coulee pump-turbine draft tube are shown in Figure 18. The unfiltered pressure parameter in most cases is not more than 20 percent higher than the filtered value.
SURGE MEASUREMENTS ON TURBINE MODELS
Recently the contracts for two different turbines for Bureau of Reclamation projects included requirements for pressure pulsation measurements during model tests. The manufacturers furnished the Bureau complete operating data and draft tube pressure pulsation oscillograms and magnetic recording tapes.
From these data, it was possible to compute the dimensionless parameters. The frequency parameter results for these turbines, the Grand Coulee Third Powerplant turbine model, and the Grand Coulee
Pumping Plant pump-turbine model are shown in Figure 19.
A shorter range of surging is produced by the turbine draft tube and its frequency parameter curve is lower. The difference in the surging characteristics can be
attributed to the different shapes of the two draft tubes. The turbine draft tube area expands throughout the elbow for a distance of about 2.5 L/D, with an equivalent area cone expansion angle between 110 and 130. Then there is a slight gradual decrease in area in the vicinity of the piers. The long, initial expanding section is sufficient, however, to produce surging characteristics typical of an equivalent area expanding cone. The frequency parameter curve is very similar to the one produced by the Fontenelle draft tube with conical throat (see Figure 4). The pump-turbine draft tube has a short, expanding initial section followed by a 1000 constant-diameter elbow (centerline L/D = 2). The constant-diameter elbow near the entrance tends to extend the range of surging and produces higher frequencies, as was demonstrated by the air model tests (Figure 4).
AIR MODEL AND HYDRAULIC TURBINE MODEL COMPARISON
The Grand Coulee pump-turbine draft tube surge characteristics were determined both from the
manufacturer's hydraulic scale model (1:9.5 scale) data and the laboratory air model (1:17.8 scale) data. The
two tests were performed completely independently of each other. Coordination during the tests was not
possible since the manufacturer's tests had been
completed and reported when the air model tests were performed. The air model testing on this draft tube was part of the regular testing program, and therefore
established procedures were used to obtain the data.

ELEVATION ola
U Z w
a Lu o: u-
♦ •• s e o e 3
Be p13 0
'o 2
5.25" Q 12.25
6.13 2
175 188 .- O
,OOO
• •w_
a
GRAND COULEE P/T DRAFT TUBE W
ui s.13" Cylindrical Throat 6.24" < '
Q a w
62 0 LU
0 0
3
A
2
cD MOMENTUM PARAMETER
AQ`
3
9 ♦
e e ♦ o 0 00 0
♦ 9 e
o ~ ♦ e ~ 0 D
o ♦ e
a e a ° a
S2D MOMENTUM PARAMETER QZ
PLAN P FONTENELLE TURBINE DRAFT TUBE
Figure 4. Surging characteristics of three model draft tubes.
8

/D = 2.44
~aNQ
Q W I- w
Q
Q a w t< Cn LU w a
o~ 0
L f D = 3.66
62
0 6.13'
6.24
Q 63
(W/O piers)
2
MOMENTUM PARAMETER SZD PQ2
} U Z w
O w cc LL
j
0-6724 L / D = I.13
64 2
ELEVATION
n
v 2
SZD MOMENTUM PARAMETER
PQZ
PLAN
Figure 5. Effect of pier elimination and draft tube shortening on surging characteristics of Fontenelle draft tube.
E

o- 0 0
o e eo oe
o e e
W ~d
z
E
98
0 Ln LO L/D = 1,46
97
A
L/D=2.58 Ln
0
QD MOMENTUM PARAMETER pQ_
130
~L/D=2.58
129
0 i4-
- L/D =4.32
MOMENTUM PARAMETER Q P
Figure 6. Surging characteristics of 150 truncated cones.
UK

ova 3
166
L/D=4.45 u~i ~
cc w H w
Q ct 2 Q c } U z w
a , w LL
a a
e
a
e
e
e
a
p p0
2 3 4
2D MOMENTUM PARAMETER —
pp p~ e a e e e e e a
~YyY
2 3 s S2D
MOMENTUM PARAMETER P02
Figure 7. Surging characteristics of 7.50 cones.
168 O Q 3 0
o: w
0 w 2 L/D=1.26
a w
N t w CL
167
A
0
L/D = 2.32 LO
HE

4
w
Lu w cc CL.
} U z w
d~ W LL
4
a 0
0 0
0
0
D x.
x
e
0 ~ x ° e
~ e
* e e x e
Y
xxe ♦ ++
x ++++
i z s •
S2D MOMENTUM PARAMETER Q7
P
+ a
o e e + o o e
+ o ae A
. e
o e +eee X
x oOSQO
0 + o + x
+ x
+ ++
x 2
■ Y
~x
1 2 3 A
S2D MOMENTUM PARAMETER Q2
P
a.
107
O
L 1 D = 0.31 lD
ioa D
E L/D = 0.64
1 109 I10
oa L/D = 0.96
I~
99 103
X+
L/D =3.58 (J]
Figure 8. Surging characteristics of circular cylinders.
12

4
O
O Iq Ki
• •~
a ~ Q~
0
cc w H w
Q 2 tt Q a w 0: Z) 0 0 w Cr CL
MOMENTUM PARAMETER p(az
o
0 0
a
4 s e
et a
119
in O
c0 Ki
3
Cr w
wLu
Q ¢ 2 a CL
r U Z w
O I w LL
0
0 0 0
0 0
e e e e
0
Q e e
t
3
t
3 u.~ MOMENTUM PARAMETER z
pa
Figure 9. Influence of a bellmouth entrance on the surging characteristics of long, straight cylinders.
13

m W 1-- W 1
Q cc Q a w LO 0 m w cc CL
CIO
o: w I— W
CL
o: Q
v z w D d w x LL
0
2
0 0
♦
ea ° a • • a
0
ae~OOA o
00 a
a A
e0♦ eo o°
~o A 0
2
(-.A MOMENTUM PARAMETER 2
Pa
166
0
n 0 m ~
LO ti
165
A _f f 0
ca 6
210
E 0 1n
cD Ih
e ♦°
aaa
A a s
sa o 0 p Q O p a o0 0
a e
A °ee
oo
e^eo 0
0 1
QA MOMENTUM PARAMETER 2
PQ
Figure 10. Influence of short, circular cylinders at the throat of a long 7.50 cone.
14
2

E2o MOMENTUM PARAMETER z
Pn
r 00. '3
OQ 0 V
0 1 z
128
0 0 ° rri rn
123
a _ O O 0 rn Ln v - -
rh cD
Cr w
Lu
w
Q 2 Q a
a ,
e e ~ ~
e
e 0 0
e
0~
u
0
peo
a
130
O
2
° N_
N l CL N
7 0, n
w LU w ~
122 a w
D rn U)
~ wi $ "'
20 MOMENTUM PARAMETER
PQZ
Figure 11. Surging characteristics of 15° cones in combination with circular cylinders.
15

W Ir
N w cc CL
2 4
(t ) 3
0
o= w
w 2
a ¢ a w tr ~ t W N w oc CL
00 0 0
4
~I d 3
D: W
w J
Q 2 2 Q d
} U Z w
2 di p t
W LL
~0 p~0
o °► A
0 e ~~
o o e
►e o
o Q .
►
e g e
o o
X X x
~e0oX
X X X
G
•
•_ T • -~ •7
I
0~ 0~
00 soW
Q~
iii:! •-~ t1 I!!. n
0
S2o MOMENTUM PARAMETER QZ
P
7879808182 O A Oox
cD cD
4
e o 0
e a
0 °
0 0 o °
a e 0 o ~ a e
e °
► e °
0 o
o e ° °eo 0
A o
Q
c 0
d 0
0
00 t 2 3
M MOMENTUM PARAMETER PQ2
102 101 100 99
0 8 4 a
M
cD
Figure 12. Variation of surge amplitude with respect to distance from inlet.
IN

L/D = 2.28
IINQ N 131 132 °3
W H W 2
M ~
a
L/D = 2.28 W C, 0 co W cc a
A
alo
Cr W
LU
rn
/~po Q 2 142 143
{ z
T U Z W D
W 0:
L/D=2.28 LL
x
x e
x p
e o
o
0 a
e ao x e e
a
off+
13
a o xae e
0 oejx
YY
13 m
1 2 7 A
S1D MOMENTUM PARAMETER
p x I
~ x x
o x
x
0 x x + o
0
x~
x +
+ o
o
x'~ + o e
a4+ 0 A
eAg e 0
8
2 3
2D MOMENTUM PARAMETER
PQ
Figure 13. E Ffect of bends on surging characteristics.
17

e
0
1 o e
A e
0 000 0
o o e
e
e e
o e e ee e
e e e AAA
o e e A
t 2 3 4
M MOMENTUM PARAMETER Z
PQ
-- 1
N
'a N_
0 QQ 3
5.25 F w
12.250 Q 2
6.13 ¢ Q
LU
145 o W
00 0 ~'_ LU Q 1
\ a
L/D = 5.30
146
4
0 V) 0
N N M IA Q I d Ui (V ti 3
s w N
L/D = 5.30 Lu 2 G 2 Q a } U z w D 1 0 w s LL
0 0
e
e e
e o 0
o '
AA 0 e8e a ee A 9 e e
1 2 3 4
MOMENTUM PARAMETER PQ2
Figure 14. Effect on surging characteristics of replacement of Grand Coulee pump-turbine draft tube elbow with a straight cylinder of equal length.
18

4
Q N
4 3 Q O
x W H W 'Z 2 a x a CL w x to 1 U) W x CL
4
cc W F' w
a
a 2
a
} U Z W
a w x LL
145 ,° 07
- TU O
~°a_ _ 1
146
A
0 LO LO o N N — LO
u7 N cD
144
0
0
N CV
131
Lo
a
(D
+ + +
+
+ Q Q a ~
x A X~ +
x x° +
x o x
e
A e
o + o e s o + o e
Q
~4ar a ee e
e e 44 44
e e e e
e 1 z 3 4
S?A MOMENTUM PARAMETER POZ
a
a a
~
x x
x x x + b
~~eeea x
x +o + o
+
~ ` ~e
eeee e e e e
ae
l Z S 4
2D MOMENTUM PARAMETER Z
PQ
Figure 15. Comparison of surging characteristics of two draft tubes and their geometric components.
19

158 159
F-I X 0
0 -n ~ K) o N N tO —6
w w
2 a
} U Z W
O t W
LL
a
9
e e
e e + # a x +
x x p 0
a Q +
++ +
o 0 + ~
t 2 3 <
SZD MOMENTUM PARAMETER PQ.
150
0
_ o _ Ln to LC) N (D
~a r •_ 4. 3
147 °
0 Cc W H w 2 2 a
N O d
N L W to
~ t uj w 2 CL
208
+~ o
(D ca
148
- o N N
0 0
o e
e °
o + 4e
0 ° ° + +
+
y l u k+ ■
f +
1 Z 3 4
MOMENTUM PARAMETER Q2 P
Figure 16. Comparison of surging characteristics of cone and cylinder combinations.
20

A
INa ?L S c
tr w H W 2
Q Q Q a w Cr I D
In W cc CL
I
1 n ,
rl 0
tl n !
t
1 I t r
t1 F
F
ti fII
4It~qU6~ I F
F F
0 0 0
I~ a O Q
o s
Lu W I— W
2 Q Ir Q CL W ~ I Cn 1n to w Cr CL
a 0 i 2 S a
. M MOMENTUM PARAMETER
PO d. L/D = 2.84 from entrance.
1-~
Iry7. Q
O 3
tL w H w ¢ 2
Q a. u
to w T CL
a
0 a 1 2 i
A b. L/D = 93 from entrance.
I
1
c
F t ,
I F
o
I
~c A Q
Q o
R t
irtt ,P, F
a
Q N
O 3
w
Lu
w
2
Ir Q n. W ti U) U) 1n w tr CL
:0
A
I_ a
a s
Ir W H W ~ 2 Q
a W
~ 1 y w CL CL
a
C
F
0
0
F
6 t n n r l
1 2 S a
a. L/D - 48 from entrance.
F r:
r
c 1
1
I
F tl
1 c
C add it.~ot
;FIR~ a 1 2 S a
G L/D = 1.50 from entrance.
.1
I
r:
1111 r
6 b b b6
0 r
r
1 2 3 a GRAND COULEE P/ T DRAFT TUBE
MOMENTUM PARAMETER 92D P02
e. L/D = 3.22 from entrance.
Figure 17. Pressure parameter variation with respect to location in the Grand Coulee pump-turbine draft tube. Plotted4etter symbols used to define location: O = outside of bend; I = inside of bend; N = near side; F = far side. Coordinates are defined by center of symbol. Indicated distance from entrance is along centerline.
21

Q. N
C 3
tt W H W ¢ 2 Ir ¢ CL W
tr U)
LU t w
rz a
4
00 1 2 3 A
b. LID = 1.89 from entrance, pressures on inside of bend.
0 a
0
a
s
o ° ge
4Y
a •
d
r
1r w Lu w 2 ¢ 2 ¢ a w
L 1 w 1r CL
a-
Q.
O 3
tY W F- LU
¢ t
2 t a w
W LU w 1 CL CL
s
INa N O e ~ S
Q W Lu w
Q 2 ¢ a w tr
w 1 w CL
1 z 3 •
MOMENTUM PARAMETER 2 Aa
c. LID = 2.84 from entrance pressures on far side.
0
o °
40o
o
p e a a e
° e
1 2 3 • 2D
MOMENTUM PARAMETER Pn Z
d. LID - 3.22 from entrance pressures on far side.
I o t 2 3
a. LID = 0.48 from entrance pressures on near side.
4
e
e
0
o ° 0 oa o a
oa aoo 0 o e
A.
0 e
a
0 e
0
0 a
o a
CAW
a e
a e ~a of oa
ss
0 0
(2) No frequency filter
A Filter band pass = 60 to 160 hz
501
a C
GRAND COULEE P/ T DRAFT TUBE
Figure 18. Comparison of filtered and unfiltered pressure parameter values for the Grand Coulee pump-turbine draft tube.
22

~o
0 0
A A A
9 g
A A gay cP"'
O GRANO COULEE TNIRO PP 9-
NVOR. MOOEL 7UReINE A CRANO COULEE PUMP PLANT
NTOR MOOEL PUMP -TURF.
MOMENTUM PARAMETER, ,OS
0 U.5 8 R AIR MODEL
NTDRAULIC MOCEL I O
B82O.43 ma +0.16
4.8.019
A am ob a el o. rp8 v a
ggp
A 0
MOMENTUM PARAMETER, ,OS
Figure 19. Comparison of frequency parameter for Grand Coulee Third Powerplant turbine and Grand Coulee Pumping Plant pump-turbine hydraulic models.
Pressure pulsation data were obtained at approximately the same location, near the draft tube inlet, in both tests. Results of the two tests are shown in Figure 20. The frequency parameter comparison is quite satisfactory. Pressure parameter values do not compare nearly as well. Since powerplant cavitation factor, S, is a function of the vapor pressure of water, the air model could not be used to explore the effects of S on pressure amplitude. The best comparison is obtained (as it should) from the hydraulic model tests with the highest value of S (S = 0.43). Taking into account the ,rying test equipment and techniques used in the two
,gists, the overall comparison of results is quite encouraging.
The favorable comparison of results of the air model with the turbine model verifies a major assumption
made in applying the results of the dimensional analysis to experimental studies. That is, that regardless of the manner in which angular momentum is introduced into the flow, the resulting dimensionless surging characteristics in geometrically similar draft tubes will be the same for a particular value of S21D 3 /pQ2 . This says nothing about the accuracy of determining the correct value of 2D3 /pQ2 . Computing the momentum parameter for a complex flow such as that passing through the runner is subject to many uncertainties, and simplifying assumptions obviously must be made. The methods used to determine the value of the momentum parameter in the two studies are not as exact as could be desired, and possibly can be improved in future experiments and analyses.
The greatest improvement in increasing the accuracy of computing the momentum parameter would be a more accurate determination of the angular momentum of the flow through the wicket gates. Presently this is done by means of a graphical analysis of the flow ,irection. Measurements of wicket gate flow performed
.1 hydraulic models would furnish valuable
A 0
AO A ~~ o
A O
O U.5 8 R. AIR MCOEL
A NTDRdULIC MODEL PUMP-TUR91NE
MOMENTUM PARAMETER,
Figure 20. Comparison of frequency and pressure parameters for Grand Coulee pump-turbine draft tube computed from air model and hydraulic scale model pump-turbine.
information. Conceivably the flow through two adjacent gates also varies with respect to location, caused by unsymmetrical flow from the spiral case. To obtain accurate values of the momentum parameter of
the flow leaving the wicket gates, a complete circumferential integration may have to be performed at several gate settings.
Accurate measurer(ient of discharge is also important in computing the momentum parameter of turbines. A discharge measurement error of 2 percent can cause
errors of about plus or minus 0.06 to plus or minus 0.11 in the computed value of the momentum parameter. The corresponding relative error can
approach 20 percent at the lower end of the momentum parameter surging range.
APPLICATION TO TURBINES
The air model tests and the two hydraulic turbine model tests conclusively demonstrate that for a given draft tube shape and at sufficiently high Reynolds numbers, there is correlation between the momentum parameter and the frequency and pressure parameters:
23

3
fQ =03 \Pa 3/
D3 Zp )2 = ~a / SlDZ / PQ l pQ
a-
The momentum parameter for a turbine can be
computed from Equation (10):
n2 D3 D3 R sing 550 Pt , D3 (10)
PQ2 BNS 2 2g P Qi t 0 D2
92 .60 .12
.91 .3o to
90 40 09
which requires a knowledge of the wicket gate geometry and turbine performance characteristic
1 30 oa
An example follows for the evaluation of Equation (10) for the Grand Coulee Pumping Plant pump-turbine Units 7 and S. 04
To determine the values of the wicket gate geometric variables, two adjacent wicket gates are laid out (using o= a scale template) on a drawing at several gate positions from closed to full open, as in Figure 1. At each gate setting, the values of R and S are obtained by scaling. 0 ( I The flow direction is assumed to be normal to the o to zo 30 40
smallest opening between the gates, S. The angle a is ° N WICKET GATE ANGLE (FROM CLOSED)
then measured between the flow direction and a radial line through the center of the opening. Values of R, S, Figure 21. Wicket gate geometric characteristics for
and a can then be plotted as functions of gate angle (or Grand Coulee Pumping Plant pump-turbine (.Units P/G-7
and P/G-8) 1:9.5 scale hydraulic model studies. some other defined base, such as percent of full gate) and a smooth curve constructed for each variable The second term of Equation (10) evaluates the
(Figure 21). Since the number of wicket gates N, their amount the momentum parameter is changed as the
height B, and the draft tube diameter D3 are constant flow passes through the runner. Performance data
and known, the quantity D3 R sing/BNS can easily be obtained on the model (or prototype) turbine are
computed for any gate setting. The result is the value sufficient to compute this term. All the necessary data
of momentum parameter of the flow as it enters the required to compute the momentum parameter are
turbine runner. tabulated in Table 1 for two test points.
Table 1
Run
No.
Gate position
from closed Gate characteristics Turbine performance data
R S a H Q P n ft ft ° ft cfs hp rpm
30 30.0 0.809 0.1148 46.6 112.8 16.48 147.1 775 69 11.8 10.828 0.0492 60.2 i 134.5 9.48 103.1 1,285
Constants
D2
ft
D3
ft
B
ft
N g
ft/sect
P
lb-sec 2/fta
0.984 0.984 0.1967 20 32.2 1.94
24

or Run 30, using Equations (8), (9), and (7)
P 147.1
P11 _ D2 H3/' (.984)' (112.8)3/2 - 0.127
Q 16.48 QI I
D2 H'/2 (.984)2 (112.8) t /2 - 1.603
7rD3n 3.14(.984)(775) = 0.468
60 2gH = 60 2(32.2)(112.8)
The first term of Equation (10)
D3 R sing _ (.984)(.809)(sin 46.6)
BNS (.1967) (20)(.1148) = 1.28
and the second term of Equation (10)
550 PII D3
2N/ -2g P Q1I 0 D2
550(.127)(.984) = 1.86
2(8.025) (1.94) (1.603)' (.469) ( .984)
or
Similarly, for Run 69
S2D3 pQ2 = 1.27
Here the swirl of the draft tube flow is in the same direction as the runner rotation.
Figure 22 shows the oscillograms of the pressure pulsations. The frequency of the draft tube surge is indicated on each recording. Corresponding values of the frequency parameter are tabulated in Table 2.
The pressure pulsation rms amplitude was obtained from isolines of pressure fluctuation expressed as percent of total head, drawn on a Ql I versus n1 I (n1 I
= nD2 /H l/2 ) plot. The values, as well as the resulting values of the pressure parameter, are given in Table 2.
The frequency and pressure parameter values determined above can be used to predict the surge frequency and pressure amplitude for the homologous prototype turbine having a geometrically similar draft tube. For the same value of the momentum parameter in model and prototype, i.e., when
2D nD PQ'/m - \ PQ'lp
Table 2
EM3 1.28 - 1.86 = -0.58
PQ2
The minus sign indicates that the swirl direction of the flow entering the draft tube is opposite the rotation of the runner.
Run f D3 Q fD3 (P' )= D~ (p ))
No. hz ft cfs Q psf PQ2
30 8.8 0.984 16.48 0.51 176 0.31 69 9.4 0.984 9.48 0.94 142 0.77
-- Run No. 30 -- ---- Run No. 69
f=8.8 Hz --- - -
f = 9.4 Hz
--- ----- ----- ---- ------j -sec
- --- ---
6, v V .L V w l/ to Lr L/ L,. L, 6, V Le 1.
Figure 22. Oscillograms of pressure pulsations in Grand Coulee pump-turbine hydraulic model draft tube throat.
25

(where the subscripts m and p represent model and prototype, respectively) it follows that
3 3
(f Q)m \fQ3 /P
and
C
D3 (P~)2 ~
/
_ / D3 (P~)2
PQ2 m t\ PQ2 P
The prototype frequency then can be determined from
3 ( s (11) fP
fD _ Q >P
Q m (D3
and the prototype pressure pulsation rms amplitude from
C (P )2)P = (D3 PQ2p )2)m CPDQ
/p (12)
The frequency and pressure amplitude of the prototype surge for Run 69 (5 = 0.19) are computed below. The prototype draft tube diameter, D3 is given as 9.35 feet. Prototype discharge can be computed by using Equation (9), where D2 in this case equals D3 . Prototype net head can be computed from the definition n11 = nD2 /H'/2 . The value of nt I for Run 69 is given as 109.1 in the model test results. The prototype unit will be operated at 200 rpm, and therefore the corresponding H for Run 69 is 294 feet. Then from Equation (9)
QP = Q1 1 D2 H' /2
Qp = (.844)(9.35)2 (293)'/2
Qp = 1263 cfs
Using Equation (11)
fp = (.94) (1,263) (9.35)3
fp = 1.45 hz
Using Equation (12)
1.94 (1,263)2 ( (p')2 p = (.77) (9.35)4 = 312 Ib/ft2
( (p")2) P = 5.0 ft water
The above values appear reasonable, but can be verified only after the units are installed, and prototype performance and draft tube surge data obtained.
It is not necessary to use specific model test points to compute prototype frequencies and pressure amplitudes. The characteristic frequency and pressure parameter curves for a particular draft tube can be established using a simplified model or any turbine—prototype or model. For the specific unit in
question, sufficient data must be available to compute the momentum parameter (using Equation (10)) for the particular operating point where frequency and amplitude are to be computed. The corresponding
values of the frequency and pressure parameters are
obtained from the surge characteristic curves. The frequency and pressure amplitude are then computed as in the above example. Some other method of determining prototype discharge may be used.
REFERENCES
1. Falvey, H. T., "Draft Tube Surges—A Review of Present Knowledge and an Annotated Bibliography,"
Report No. REC-ERC-71-42, U.S. Bureau of Reclamation, Denver, Colorado, December 1971
2. Cassidy, J. J., "Experimental Study and Analysis of Draft-Tube Surging," Report No. REC-OCE-69-5, U.S. Bureau of Reclamation, Denver, Colorado, October
1969
3. Cassidy, J. J., and Falvey, H. T., "Observations of Unsteady Flow Arising After Vortex Breakdown," Journal of Fluid Mechanics, Vol. 41, Part 4, pp
727-736, 1970
4. Falvey, H. T. and Cassidy, J. J., "Frequency and Amplitude of Pressure Surges Generated by Swirling Flow," Transactions of Symposium Stockholm 1970, International Association for Hydraulic Research, Part
1, Paper E1, Stockholm, Sweden, 1970
5. Rheingans, W. J., "Power Swings in Hydroelectric Power Plants," Transactions, American Society of Mechanical Engineers, Vol. 62, pp 171-184, 1940
26

APPENDIX
DRAFT TUBE SHAPES TESTED WITH THE AIR NIODEL
27

f . N.i.- Alw r. AN.N•
. , a
•~ ~ . Nf l.1 WIA.q COAL[[ NT p1ATT TUE[
i
LJ IIIJJJJ~~~Jf,l
11 ~ Vr
yyeltrf (fl Sl
N F. NI IM
17! N.I.
'-so
Npr 1.f1..f7_TS- •,• 1!7 NF 01
it
i
~—
Lr
d e
Ir7p w .l u u .n
EENCAAL NOT[[ ' F 3 A iNar1 Ibrl 4M ord. n .
pll.mrl fr N«afro. rAnr pTfflw. ~ ranar"n AaM r e.l.wA the
Mpt•nl n,merrltl rtprcrnl Ib mmWr A t~rtled m n«abv
MAKaf11 IM rnu111 b n.l rw bre 1e.• nt w
I—
of noM err d .ar M M tnnwr e d Ynrnlb • iywnr n
• ~.. N! flaridf lar h91' Irryumti L F II.Mi tar b. IM7."
ELEVATMN [L[VATION
FLAN /LAN
FONTEMELLE DRAFT TUBE
iii • r Tolal L • 27.84" °N~ImN 1i3 Tool L/D•9.30
nir:luN nI II!
Ifa u7 N5 u7 f1.rn.tN
ra
Elbow LLr12.05`%. u! uo
r lu
L • 11.69
FILTER BAND PASS 60 TO 160 N2
L•5.25' tats• Total L•2784' t0D': Total L/D•5.30 ♦p to .
to
7.Y. toT+ twr: 707. tou I
. t
Elbow LL • 12.05 L • 11 69' J
NO FREQUENCY FILTER i
Fqur. 2. Louftona WdN Onnd C-W ►umpirtE /tan, pump. turbirN draft tub. whm wrp d.ta wen obtalmd rdtn the .0 Irrod.l.
Fi"m 1. Draft tuba h". la which tarp data w.r. tfbUlNNd with M! All rf,-W.

7-1750 (3-71) B,.- al R-1-ti-
CONVERSION FACTORS-BRITISH TO METRIC UNITS OF MEASURE6IENT
The following conversion factors adopted by the Bureau of Reclamation are those published by the American Society for Testing and Materials (ASTM Metric Practice Guide, E 380-68) except that additional factors (') commonly used in the Bureau have been added. Further discussion of definitions of quantities and units is given in the ASTM Metric Practice Guide.
The metric units and conversion factors adopted by the ASTM are based on the "International System of Units" (designated SI for Systeme International d'Unites), fixed by the International Committee for Weights and Measures; this system is also known as the Giorgi or MKSA (meter-kilogram (mass)-second-ampere) system. This system has been adopted by the International Organization for Standardization in ISO Recommendation R-31.
The metric technical unit of force is the kilogram-force; this is the force which, when applied to a body having a mass of 1 kg, gives it an acceleration of 9.80665 m/sec/sec, the standard acceleration of free fail toward the earth's center for sea level at 45 deg latitude. The metric unit of force in SI units is the newton (N), which is defined as that force which, when applied to a body having a mass of 1 kg, gives it an acceleration of 1 m/sec/sec. These units must be distinguished from the (inconstant) local weight of a body having a mass of 1 kg, that is, the weight of a body is that force with which a body is attracted to the earth and is equal to the mass of a body multiplied by the acceleration due to gravity. However, because it is general practice to use "pound" rather than the technically correct term "pound-force," the term "kilogram" (or derived mass unit) has been used in this guide instead of "kilogram-force" in expressing the conversion factors for forces. The newton unit of force will find increasing use, and is essential in SI units.
Where approximate or nominal English units are used to express a value or range of values, the converted metric units in parentheses are also approximate or nominal. Where precise English units are used, the converted metric units are expressed as equally significant values.
Table I
QUANTITIES AND UNITS OF SPACE
Multiply By To obtain
Mil ................. 25.4 (exactly) ........ ............ Micron Inches ............... 25.4 (exactly) ... .... ... Millimeters Inches ............... 2.54 (exactly)' .................. Centimeters Feet ................ 30.48 (exactly) .................. Centimeters Feet ................ 0.3048 (exactly)' ................... Meters Feet ................ 0.0003048 (exactly)' .............. Kilometers Yards ........ ..... .. 0.9144 (exactly) . .. .. ... ......... .. . Meters Miles (statute) .......... 1,609.344 (exactly)' .................... Meters Miles ................ 1.609344 (exactly) ......... ..... Kilometers
Square inches .......... . Square feet ........... . Square feet ........... . Square yards .......... . Acres ................ Acres ................ Acres ................ Square miles .......... .
6.4516 (exactly) .. ... ... .. ... Square centimeters '929.03 .................... Square centimeters
0.092903 .................... Square meters 0.836127 .................... Square meters 0.40469 ........................ Hectares
'4,046.9 ........................ Square meters '0.0040469 ................ Square kilometers 2.58999 .................. Square kilometers
Cubic inches .......... . Cubic feet ............ . Cubic yards ........... .
Fluid ounces (U.S.) ...... . Fluid ounces (U.S.) ...... . Liquid pints (U.S.) ....... . Liquid pints (U.S.) ....... . Quarts (U.S.) .......... . Quarts (U.S.) .......... . Gallons (U.S.) .......... . Gallons (U.S.) .......... . Gallons (U.S.) .......... . Gallons (U.S.) .......... . Gallons (U.K.) ......... . Gallons (U.K.) ......... . Cubic feet ............ . Cubic yards ........... . Acre-feet ............. Acre-feet .............
16.3871 ................... Cubic centimeters 0.0283168 ................... Cubic meters 0.764555 .................... Cubic meters
CAPACITY "
29.5737 ................... Cubic centimeters ' 29.5729 ........................ Milliliters 0.473179 .................. Cubic decimeters 0.473166 .... . ............. ... Liters
'946.358 ................... Cubic centimeters '0.946331 ........................ Liters
'3,785.43 .................... Cubic centimeters 3.78543 ................... Cubic decimeters 3.78533 ......................... Liters
'0.00378543 ................... Cubic meters 4.54609 ................... Cubic decimeters 4.54596 ......................... Liters
28.3160 .......................... Liters '764.55 ........................... Liters
'1,233.5 ........................ Cubic meters '1,233,500 ............................. Liters

Table 11
QUANTITIES AND UNITS OF MECHANICS
Multiply By To obtain
Grains (1/7,00016) ...... 64.79891 (exactly) ........................ Milligrams Troy ounces (480 grains) ...... 31.1035 ................................ Grams Ounces (avrlp) ............ 28.3495 .............................. . Grams Pounds (avdp) ............ 0.45359237 (exactly) ... . ...... Kilograms Short tons (2,000 Ib) ........ 907.185 ............................ Kilograms Short tons (2,000 lb) ........ 0.907185 ............................ Metric tons Long tons 12,240 lb) ........ 1,016.05 ................................ Kilograms
Pounds per square Inch ....... 0.070307 ................ Kilograms per square centimeter Pounds per square inch ....... 0.689476 ................. Newtons per square centimeter Pounds per square foot ....... 4.88243 .................... Kilograms per square meter Pounds per square foot ....... 47.8803 ..................... Newtons per square meter
MASS/VOLUME (DENSITY)
Ounces per cubic inch ........ 1.72999 .................... Grams per cubic centimeter Pounds per cubic foot ........ 16.0185 .................. Kilograms per cubic meter Pounds per cubic foot ........ 0.0160185 .................. Grams per cubic centimeter Tons (long) par cubic yard ..... 1.32894 .................... Grams per cubic centimeter
MASS/CAPACITY
Ounces per gallon (U.S.) ...... 7.4893 ........................... Grams per liter Ounces per gallon (U.K.) ...... 6.2361 ........................... Grams per liter Pounds per gallon (U.S.) ...... 119.029 ............................ Grams per liter Pounds per gallon (U.K.) ...... 99.779 ............................ Grams per liter
BENDING MOMENT OR TORQUE
Inch-pounds ............. 0.011521 ......................... Meter kilograms Inch-pounds ............. 1.12985 x 10⁶ ...................... Centimeter-dynes Foot-pounds ............. 0.138255 ..................... Meter kilograms Foot pounds ............. 1.35582 x 10⁷ ...................... Centimeter-dynes Foot-pounds per Inch ........ 5.4431 .............. Centimeter-kifograms per centimeter Ounce inches ............. 72.008 .......................... Gram-centimeters
Feet per second ........... 30.40 (exactly) ................ Centimeters per second Feet per second ........... 0.3048 (exactly)' ................... Meters per second Feet per year ............. '0.965873 x 10⁻⁶ ......... ..... Centimeters per second Miles per hour ............ 1.609344 (exactly) ... ..... Kilometers per hour Miles per hour ............ 0.44704 (exactly) ................... Meters per second
Feet per second2 ........... '0.3048 ......................... Meters per second2
Cubic feet per second (second-feet) ............ '0.028317 ..................... Cubic meters per second
Cubic feet per minute . I ...... 0.4719 .......................... Liters per second Gallons (U.S.1 par minute ...... 0.06309 .......................... Liters per second
FORCE'
Pounds ................ '0.453592 ............................. Kilograms Pounds '4.4482 ........................... Newtons P-nds ................ '4.4402 x 10~ ......... I ....... I ......... Dynes
Table II-Continued
Multiply By To obtain
WORK AND ENERGY'
British thermal units (Btu) ..... '0.252 ...................... .. Kilogram calories British thermal units (Btu) ..... 1,055.06 ................... 1 ............ , , Joules Btu per pound ............ 2.326 (exactly) ....................... Joules per gram Foot-pounds ............. '1.35582 ......................... ... Joules
POWER
Horsepower .............. 745.700 .................................. Watts 13 t per hour ............. 0.293071 ................................ Watts Foot-pounds per second ...... 1.35582 ................................. Watts
HEAT TRANSFER
Btu in./hr h2degree F (k, thermal conductivity) ....... 1.442 ....................... Milliwatts/cm degree C
Btu in./hr ft2 degree F (k, thermal conductivity) ....... 0.1240 ........................ Kg cal/hr m degree C
Btu ft/hr ft2 degree F ........ ' 1.4880 ..................... Kg cal m/hr m2 degree C Btu/hr ft2 degree F (C,
thermal conductance) ....... 0.568 ....................... Mflliwatts/cm2 degree C Btu/hr f12 degree F (C,
thermal conductance) ....... 4.882 ........................ Kg cal/hr m2 degree C Degree F hr ft2/Btu (R,
thermal resistance) ... 1.767 ...................... Degree C cm2/milliwatt Btu/Ib degree F (c, heat capacity) 4.1868 ............................. .Yg degree C Btu/Ib degree F ........... ' 1.000 .......................... Cal/gram degree C Ft2/hr (thermal diffusivity) .... 0.2581 ............................... Cm2/sec Ft2/hr (thermal diffusivity) .... '0.09290 ................................ M2/hr
WATER VAPOR TRANSMISSION
Grains/hr ft2 (water vapor) ttensmissionl ............ 16.7 ............... . ............. Grams/24 hr m2
Perms (permeance) ......... 0.659 ............................. Metric perms Perm-inches (permeability) ..... 1.67 ........................ Metric perm-centimeters
Table III
OTHER QUANTITIES AND UNITS
Multiply By To obtain
Cubic feet per square foot per day (seepage) .... '304.8 ....... . Liters per square meter per day Pound-seconds per square foot (viscosity) ...... '4.8824 ....... Kilogram second per square meter Square feet per second (viscosity) .......... '0.092903 ........... Square meters per second Fahrenheit degrees (change)' ............. 5/9 exactly .... Celsius or Kelvin degrees (change)' Volts per mil ...................... 0.03937 ........ ... Kilovolts per millimeter Lumens per square foot (foot-candiesl ........ 10.764 ............. lumens per square meter Ohm-circular mils per foot .............. 0.001662 ...... Ohm-square millimeters per meter Millicurles per cubic foot ............... '35.3147 ........... Millicuries per cubic meter Milllamps per square foot ............... ' 10.7639 ...... .... Mllliamps per square meter Gallons per square yard ................ '4.527219 ............ Liters per square meter Pounds per Inch ..................... '0.17858 ........... Kilograms per centimeter
GPO 875. 188

•/ ............................................................................... .................................................................................•
ABSTRACT ABSTRACT
Laboratory experiments, using a simplified air model, were conducted to obtain the correlation Laboratory experiments, using a simplified air model, were conducted to obtain the correlation between draft tube shape and the draft tube surge characteristics—the range of occurrence, between draft tube shape and the draft tube surge characteristics—the range of occurrence, frequencies, and pressure amplitudes of the surges. Dimensionless parameters were used to frequencies, and pressure amplitudes of the surges. Dimensionless parameters were used to compare results. The draft tube shape was found to have significant influence on the surging compare results. The draft tube shape was found to have significant influence on the surging characteristics. Surge measurements obtained from two hydraulic turbine model studies are also characteristics. Surge measurements obtained from two hydraulic turbine model studies are also compared using the dimensionless parameters. Hydraulic and air model studies of the same compared using the dimensionless parameters. Hydraulic and air model studies of the same draft tube produced satisfactory correlation. The Information presented can be used to predict draft tube produced satisfactory correlation. The information presented can be used to predict the surge characteristics of prototype and model turbines, or as an aid in draft tube design the surge characteristics of prototype and model turbines, or as an aid in draft tube design where surge reduction or resonance minimization are considered as design criteria. Examples are where surge reduction or resonance minimization are considered as design criteria. Examples are included to illustrate application of the laboratory results.
................................................................................. .....................................................................................
included to illustrate application of the laboratory results.
ABSTRACT ABSTRACT
Laboratory experiments, using a simplified air model, were conducted to obtain the correlation Laboratory experiments, using a simplified air model, were conducted to obtain the correlation between draft tube shape and the draft tube surge characteristics—the range of occurrence, between draft tube shape and the draft tube surge characteristics—the range of occurrence, frequencies, and pressure amplitudes of the surges. Dimensionless parameters were used to frequencies, and pressure amplitudes of the surges.. Dimensionless parameters were used to compare results. The draft tube shape was found to have significant influence on the surging compare results. The draft tube shape was found to have significant influence on the surging characteristics. Surge measurements obtained from two hydraulic turbine model studies are also characteristics. Surge measurements obtained from two hydraulic turbine model studies are also compared using the dimensionless parameters. Hydraulic and air model studies of the same compared using the dimensionless parameters. Hydraulic and air model studies of the same draft tube produced satisfactory correlation. The information presented can be used to predict draft tube produced satisfactory correlation. The information presented can be used to predict the surge characteristics of prototype and model turbines, or as an aid in draft tube design the surge characteristics of prototype and model turbines, or as an aid in draft tube design where surge reduction or resonance minimization are considered as design criteria. Examples are where surge reduction or resonance minimization are considered as design criteria. Examples are included to illustrate application of the laboratory results. included to illustrate application of the laboratory results.

REC-ERC-72.24 Palde, U J INFLUENCE OF DRAFT TUBE SHAPE ON SURGING CHARACTERISTICS OF REACTION TURBINES Bur Reclam Rep REC-ERC-72-24, Div Gen Res, September 1972. Bureau of Reclamation, Denver, 29 p, 22 fig, 2 tab, 5 ref, append
DESCRIPTORS—/ 'draft tubes/ turbines/ 'surges/ 'hydroelectric powerplants/ hydraulic machinery/ fluid mechanics/ dimensional analysis/ model tests/ fluid flow/ pressure/ frequency/ 'shape/ resonance/ test results/ hydraulic design/ 'reaction turbines/ hydraulic turbines/ noise (sound)/ hydraulic models/ vibration/ wicket gates/ hydraulic similitude IDENTIFIERS—/ hydraulic pressure tests/ Fontenelle Dam, Wyo/ Grand Coulee Powerplant, Wash/ water pressure tests
REC-ERC-72-24 Palde, U J INFLUENCE OF DRAFT TUBE SHAPE ON SURGING CHARACTERISTICS OF REACTION TURBINES Bur Reclam Rep REC-ERC-72-24, Div Gen Res, September 1972. Bureau of Reclamation, Denver, 29 p, 22 fig, 2 tab, 5 ref, append
DESCRIPTORS—/ "draft tubes/ turbines/ "surges/ "hydroelectric powerplants/ hydraulic machinery/ fluid mechanics/ dimensional analysis/ model tests/ fluid flow/ pressure/ frequency/ 'shape/ resonance/ test results/ hydraulic design/ 'reaction turbines/ hydraulic turbines/ noise (sound)/ hydraulic models/ vibration/ wicket gates/ hydraulic similitude IDENTIFIERS—/ hydraulic pressure tests/ Fontenelle Dam, Wyo/ Grand Coulee Powerplant, Wash/ water pressure tests
REC-ERC-72.24 Pelde, U J INFLUENCE OF DRAFT TUBE SHAPE ON SURGING CHARACTERISTICS OF REACTION TURBINES Bur Reclam Rep REC-ERC-72-24, Div Gen Res, September 1972. Bureau of Reclamation, Denver, 29 p, 22 fig, 2 tab, 5 ref, append
DESCRIPTORS—/ 'draft tubes/ turbines/ 'surges/ 'hydroelectric powerplants/ hydraulic machinery/ fluid mechanics/ dimensional analysis/ model tests/ fluid flow/ pressure/ frequency/ 'shape/ resonance/ test results/ hydraulic design/ 'reaction turbines/ hydraulic turbines/ noise (sound)/ hydraulic models/ vibration/ wicket gates/ hydraulic similitude IDENTIFIERS—/ hydraulic pressure tests/ Fontenelle Dam, Wyo/ Grand Coulee Powerplant, Wash/ water pressure tests
REC-ERC-72-24 Pelde, U J INFLUENCE OF DRAFT TUBE SHAPE ON SURGING CHARACTERISTICS OF REACTION TURBINES Bur Reclam Rep REC-ERC-72-24, Div Gen Res, September 1972. Bureau of Reclamation, Denver, 29 p, 22 fig, 2 tab, 5 ref, append
DESCRIPTORS—/ 'draft tubes/ turbines/ "surges/ 'hydroelectric powerplants/ hydraulic machinery/ fluid mechanics/ dimensional analysis/ model tests/ fluid flow/ pressure/ frequency/ 'shape/ resonance/ test results/ hydraulic design/ 'reaction turbines/ hydraulic turbines/ noise (sound)/ hydraulic models/ vibration/ wicket gates/ hydraulic similitude IDENTIFIERS—/ hydraulic pressure tests/ Fontenelle Dam, Wyo/ Grand Coulee Powerplant, Wash/ water pressure tests


ZII
T. SYMPOSIUM.197
MCDEL AND PROTOTYPE TURMINE DRFLFT TUBE SURGE
ANALYSIS BY THE SGTIRL 2d0M.r 71M =OD
United States Denver, Colorado
Bureau of Reclamation_ USA
Uldis J. Palde
Hydraulic Engineer
SYNOPSIS
Turbine draft tube surges result from excessive swirl in the flow entering the
draft tube. A quantitative measure of the swirl is obtained"by computing the
dimensionless "momentum parameter" of the swirl, M 1pe (where a is the flux
of angular momentum, D3 is the draft tube inlet diameter, p is the fluid density,
and Q is the discharge). Turbine model study results show that surging occurs
only at operating points where the momentum parameter is greater than a critical
value for the particular draft tube. The method is used to identify surge-free
and surging areas on model and prototype turbine performance diagrams. A pre-
diction of the surging range and frequencies is compared to measurements subse-
quently obtained on the prototype.
Les ondes de surpression dans lfaspirate r de la turbine proviennent d1un
tourbillonnement excessif du courant y penetrant. Une mesure quantitative de ce
tourbillon peut etre obtenue en faisant intervenir le "parametre du moment" de
ce dernier OD3/pe (ou a est 1e flux du moment angulaire, D3 - le diam6tre a
11admission du conduit, p - la densite du fluide, et Q - la decharge). Les
resultats de 11 etude d1 un modele de turbine montrent que les ondes de surpression
n1apparaissent qu'en certains points, la ou le parametre du moment est plus
grand qu'une certain valeur critique pour ce genre de conduit. La methode est
utilisee pour determiner les zones avec et sans ondes de surpression d'apres les
diagrammes de fonctionnerent d1 un modele et d1 un prototype. W estimation de
11importance et de la frequence des ondes de surpression est alors ccmparee aux
resultats obtenus ensuite sur le prototype.
3

INTRODUCTION
Turbine draft tube surges arise as a result of excessive swirl remaining in the
flaw leaving the runner and entering the draft tube. Cassidy and Falvey [1] pro-
posed that a dimensionless "momentum parameter,"
IID2
P@
where n - angular momentum (moment of momentum per second) D3 = draft tube inlet diameter
0 = fluid density
Q - discharge
could be used as a measure of the amount of swirl in the flow. The momentum
parameter reflects the ratio of angular to linear momentum of the swirling flaw.
Thus, when there is no net angular momentum in the flow, the momentum parameter
equals zero. Experiments indicated that for a particular draft tube shape,
periodic pressure pulsations occur only above a critical nD3/PQ2 value, and that
frequencies and amplitudes, expressed in dimensionless form, were unique functions
of the momentum parameter.
Cassidy and Falvey showed that the pressure pulsations are initiated simultaneously
with the occurrence of the flow phenomenon known as "vortex breakdown." After
vortex breakdown has taken place, the flow is characterized by a spiraling
(helical) vortex and reverse flow along the axis. The spiraling vortex produces
periodic, high-intensity pressure fluctuations in the tube. Evaluation of the
momentum parameter for the swirl in the flow leaving a Francis turbine runner was
first presented by Falvey and Cassidy [2] in 1970. The effect of the draft tube
shape on surge frequencies and amplitudes was thoroughly investigated and reported
by Palde [3]. All experimental work in connection with the above studies was per-
formed at the Bureau of Reclamation laboratories on a special model where the
swirl could be easily controlled and measured, using air as the fluid.
=M OF ANALYSIS AND MTM.TION
The evaluation of the momentum parameter for the flow entering a turbine draft tube
consists of computing the dimensionless momentum flux introduced by the wicket
gates and subtracting the amount of momentum flux converted to torque by the
runner,

i PQ2 s \ PQ2 /x. a. - \ PQ2
fID D R sin a where 3 = s (2)
Pe W.G. BNS
and 1 // a
- PD,
(3 ) ~2
r 2
pl
The symbols used in Equation (2) are defined in Figure 1.
In Equation (3),
P - turbine power output
p = density of water
= angular velocity of the turbine
Q - discharge through the turbine
The direction of flow through the gates is defined to be perpendicular to the mini-
mum space between the tail of a gate and the body of the adjacent downstream gate.
R, oz and S are evaluated for several gate positions using a graphical gate layout,
and the results can be used to construct the curves shown in Figure 2a. The entire
term D.Rsinot BNS can be evaluated for each gate opening, resulting in a single
wicket gate momentum parameter curve shown in Figure 2b. The shape of the curve is
a function of the particular wicket gate shape and layout.
Inspection of Equations (1), (2), and (3) reflects the advantage of employing the
momentum parameter method to define the amount of swirl in the flow. The momentum
parameter can be computed if the wicket gate layout and shape are known, and the
performance characteristics of the turbine are available. The procedure is much
simpler than direct measurement on a model of the entire velocity vector distribu-
tion in the flow entering the draft tube. The method, however, does not always
yield accurate results. Much of the inaccuracy is thought to be due to the over-
simplification inherent in the graphical method of determining the angular momentum
of the flow through the wicket gates. Laboratory studies of flow through the
wicket gates are being planned to determine how the accuracy of the momentum
parameter method could be improved.

B - depth of gate \ I N= no. of gates
Figure 1. Definition sketch of flow leaving wicket gates and entering turbine runner.
d4 80 .16
.63 TO .14
,82 60 .12
.81 s0 t0
.S0 40 .08
.10
2
J J ' 00 10 20 30 40 00 t0 20 30 40
o H
WICKET GATE ANGLE, DEGREES WICKET GATE ANGLE, DEGREES (FROM CLOSED POSITION) 'FROM CLOSED POSITION)
a. Variation of R, a, and S with b. Wicket gate momentum parameter wicket gate angle. as function of gate angle.
Figure 2. Wicket gate geometric characteristics for Grand Coulee Pumping Plant puntp turbines (Units 7 and 8).
T
s
6

L TURBINE MODEL STUDIES
The Bureau of Reclamation recently installed a high head model turbine test stand
at its Estes Powerplant in Colorado. A 40.333 scale model (9" throat diameter) of
the Francis turbines for the first three 60o NET units of Grand Coulee Third Power-
plant was initially installed in the stand. Dominion Engineering Works of Montreal
designed the turbine and built the model. The primary emphasis during the initial
tests performed during 1973 was on draft tube surge investigations.
Data were obtained to evaluate performance characteristics using an automatic data
acquisition and computation system. Draft tube pressures were measured at two
locations in the throat by means of piezometers and pressure transducers. The
pressure output signal was recorded by an oscillograph. The signal was also moni-
tored on a retentive-screen oscilloscope, allowing for convenient determination of
surge frequencies. Amplitude of pressure fluctuations was monitored on a root-
mean-square meter.
For each model turbine test point the combination of Equations (1), (2), and (3)
was used to compute the momentum parameter:
fE11 = Rsina - PD
pQ2 BNS ~2 (4)
The dimensionless frequency parameter
fD3 3 Q
and the dimensionless pressure parameter
~—
Pe
as well as the root-mean-square pressure (~ as percent of net test head, were
also computed for each run.
Range of Surging in Model
Although the model could be tested under the prototype range of net heads of 67
meters to 108 meters, most of the tests were performed at lower than prototype
heads. The speed coefficient
7cD n
~ Z
(5) a 60 f2gA
-5- III 3

where DZ = runner throat diameter
n = rotational speed in RPM, and
H = net head across turbine
was used as the independent test point variable. From the test results it was
verified that at a given opening and a particular value of 02 the same value of
M3/ pie is computed by Equation (4) for any combination of rotational speed and head yielding the given ¢2 value. In other woxds, the momentum parameter is a
function of the gate opening and ~2. The characteristic momentum parameter contours
(plotted, for instance, on a specific power, P11, vs 02 diagram) can therefore be obtained Pram tests at any head. The range of surging is then defined by the
M3lpe contour above which surging occurs for the particular draft tube being used.
Figure 3, plotted from the results of the Grand Coulee model draft tube surge tests,
illustrates the above principle. The critical momentum parameter value in the
model was observed to varf between about 0.31 and 0.34, depending on gate opening
and the cavitation factor, sigma. A critical momentum parameter value of 0.33 has
been used in Figure 3 to delineate the periodic surge area.
Range of Surging in Prototype
Equation (4) can be applied to the prototype in the same manner. The wicket gate
momentum parameter curve derived from Equation (2) is the same for the model and the
prototype, since it depends entirely on geometry. The first term on the right of
Equation (4) is therefore.already known for all gate openings. The second term is
evaluated from prototype quantities stepped up from model data. Instead of present-
ing the predicted prototype draft tube surges for the Grand Coulee 600 had turbines,
a prediction (using the same method) for the Grand Coulee Pumping Plant Pump-
Turbines, for which comparative data from actual prototype operation are available,
is presented later in the paper.
Effect of Draft Tube Vortex Core on Surging
A visible vortex core below the turbine runner at certain gate openings and operat-
ing conditions is commonly accepted as somehow related to the occurrence of draft
tube surging. The association is valid only in this respect: If a hollow vortex
core is present, its instability and draft tube surging are one and the same occur-
rence. This fact offers no information, however, about the operating points at
which surging will occur.
Observations of flow in the draft tube over a wide range of test conditions dis-
closed that a hollow vortex core in the flow below the runner was neither necessary
now sufficient for draft tube surging to occur. Rather, the model studies indi-
cated that the intensity of swirl (as measured by the value of the momentum
T

.19
12
.18
II .17
Z 34°
.16 ~ ~- 30°
510 02.95)
456 (11.58)
385 (9.78)
co W x U Z
.325 (8.26) z M
a .296 (7.53) o
W
a
.266 (6.77) w Y U 3
.222 (5.64)
.192 (4.88)
3 0.6 0.7 0.8 0.9 1.0
SPEF-D COEFFICIENT,
bo z~u, GRAND COULEE THIRD POWER PLANT UNITS 19,
C.20, 21
DEW 9" MODEL TURBINE
Figure 3. Range of surging as determined from model tests of the Gran
Coulee Third Powerplant 600 mw turbines (model scale 1:40.333).
10 v
_ = vi IS
N 0 a 250
F- LU
9
W CD w•14
W
021°
13 0 190
cr W 8 z
s
0 CL o
CL 3.12 W
J 17°
U ~ cD z — 7 U Uj CL
—
a .10
W 140
(JY cn
6 .09
H
12*
3
.08-
5 10°
.07-
4- .06 8°
05

1
f - ?,11 (p,)2 m 0.8% of H s
a. Irregular pressure pulsations. 02 - .80 8 = .12' nD = .27, R ? P@
F }
b. Surging at critical swirl.
f - 7.8 Hz, % (P1 )2 = 0.7% of H
ID2 = .83, s = .12, "D - .33, a >_ .34 P@
3
1
f=12 0 R (P')2 =21d ofH
t
c. Surging at high tailwater. 02 = .93, 8 = .26, nDQ - .58, Rs
.52 P 2
~ 2 2 f = 13.0 Hz, (P ) = .5p of H s
d. Surging at low tailwater. o2 = .93, S - .10, Q2 .. .59, Q - .54
Figure 4. Photos of draft tube wall pressure fluctuation traces displayed on a retentive oscilloscope screen, and corresponding flow conditions. Wicket gates at 17°, or approximately 45% of rated output gate.
- 8 - III 3

O
parameter) was clearly the governing factor for the occurrence of surging.
Figure 4 illustrates some relationships between the vortex core and surging.
Figure 4b, shows a hollow vortex core which appears to be vertical. However, the
vortex does in fact deflect toward the wall (tlTis becoming a spiraling vortex)
farther downstream in the draft tube, producing low amplitude pressure pulsations
! throughout the tube. At lower momentum parameter values (between about 0.10 and I j 0.20) a vertical hollow core exists at some gate openings and sufficiently low
tailwater values. The overall swirl is not high enough, however, to deflect the
vortex core, and thus surging does not occur. The condition shown in Figure 4c.,
with higher swirl, produces high amplitude surging without the presence of a hollow
vortex core. Figure 4d. shows flow conditions with the same amount of swirl as in
4c., but with lower tailwater producing a highly visible, spiraling hollow vortex
core. The above operating points have been marked on the model hill curves,
Figure 3, with letters on the plot corresponding to letters designating the photos
in Figure 4.
PROT'dI'YPE SURGE APIALYSIS
The swirl momentum method was used to predict the surging characteristics of the
Grand Coulee Pumping Plant Pump-Turbines, Units 7 and 8. Performance and draft
tube surge test data from a homologous model were available from the model test
report of the manufacturer, NOHAB of Tro7lh9ttan, Sweden. Additional surging
characteristic data for the particular draft tube shape were obtained with the
Bureau of Reclamation simplified air model. The relationships between the
A
8
A
A
A AA N
0 U.S.S.R. AIR MODEL A HYDRAULIC MODEL
PUMP-TURBINE
O /no, 1 2 3 I ~2 \P C Ja
MOMENTUM PARAMETER, p D3 PQ2
Figure 5. Frequency parameter curve for the Grand Coulee Pump-Turbine
draft tube computed from two independent model tests.
ZM III 3
L

mementum and frequency parameters determined from the two tests are shown in
Figure 5. The critical momentum parameter value was found to be between about
0.4 and 0.5, but a value of 0.40 has been used in this application.
Method of Computation from Model Data
The value of the momentum parameter for each point of computation was determined
Pram Figure 2b. In the second term P and Q were obtained from expected prototype
quantities given in the NOHAB model test report. The computed value of the
momentum parameter for each point was entered in Figure 5 to obtain the value of
the frequency parameter, fD3/Q, from which the frequency was determined. Figure 6
shows the results of the surging prediction. Surging is expected to occur over
the dark shaded areas,where the value of the momentum parameter is greater than
0.10 (absolute value). Intermittent periodic and/or irregular high amplitude
pressure pulsations can be expected to occur between contours of about 0.25 and
0.40 (absolute value), the light shaded areas in the figure.
WICKET (from /
GATE ANGLE closed position)
Max.
C!I A3_1
SWIRL = f n
PQZ
CO
Field test XII5%. Generator voting
points
Min. 1 ,_^- ( ( Rating
/yam a h i ~o oo~oo % OPEN
5 10 15 20 25 30 35 40 45 50 55 60 65 70 75
POWER OUTPUT, -WATTS
GRAND COULEE PUMPING PLANT UNITS P/T-7 AND P/T-8
Figure 6. Expected turbine performance and predicted draft tube surge
range and frequencies for the Grand Coulee Pump-Turbines.
-10- III 3
115
110
105
tfi
h 100 Uj
0 95 a W 2
90 W z
85
80
75 0

Prototype Field Tests
Draft tube surge test data were obtained at several gate settings over the entire
operating range, at a gross head of about 87 meters (286 feet). The test points
are shown as circles on the plot of Figure 6. The predictions and results of the
field tests are compared in the table below.
RUN
NO
GATES
% DEGREES SURGE
PREDICTED
I FREQ.(HZ)
MEASURED
SURGE FREQ.(HZ)
1 14 5.2 YES 7 NO — 2 20 7.4 YES 1.10 YES .70 3 30 11.3 YES 1.07 YES 1.30 4 40 15.1 YES .85 YES 1.47 5 50 18.8 NO — YES 1.14 6 60 22.6 NO — NO — 7 70 26.4 NO — NO — 8 80 30.1 NO — NO — 9 90 33.9 INTERM. 1.25 NO — 10 100 37.7 INTERM. 1.50 NO —
The measured range of surging at about 87 meters net head extends to slightly
higher gate openings than the predicted range. Measured frequencies are higher
than those predicted (by as much as 75 percent at 40 percent gate) over most of
the surging range. It should be noted that for this turbine (n = 200 rpm) the
well-known Rheingans [4] formula, f = n/(60 x 3.6), predicts a surge frequency of 0.93 Hz. The above comparison may therefore be considered good in relation to the available knowledge of surge frequency prediction.
IMPROMMr-'S PIEEDED ITT-THE M=0D
The above example is the first known instance where predicted surge computations
using the swirl momentum method were checked in the field. The comparison indi-
cates that the method needs improvement. This has been confirmed by recent conpu-
tations for model turbines also, where the surging range predicted by application
of Equation (4) did not agree with observations in the model.
The most likely cause for the disagreement can be attributed to the evaluation of
Equation (2), i.e., the curve in Figure 2b. On examining the definition sketch in
Figure 1 it is evident that the effective values of R and a (and possibly S) could
be considerably diff:!rent than those obtained from the simplified graphical
analysis, which does not take into account the influence of upstream conditions.
9 -11- III 3

Stay vanes could certainly influence the flow direction. Circulation arising from
flow through the spiral case could also influence the angular momentum of the flow.
A correct evaluation of the wicket gate momentum parameter curve is absolutely
necessary for usefulness of the momentum parameter method. Experimental or improved
analytical methods could be employed to achieve the desired accuracy. A study to
better define the flow through the wicket gates is presently in progress at the
Bureau of Reclamation.
The effect of an improved momentum parameter curve can be applied qualitatively to
the surge prediction for the case of the Grand Coulee Pump-Turbines. A momentum
parameter carve (Figure 2b) giving values only about 0.25 to 0.30 higher in the
vicinity of 50-rercent gate would have produced a prediction agreeing much more
closely with the field :measurements. The range of surging would cover the field
test point at 50-percent gate, as it should. The predicted frequencies would be
about 20 percent higher. Also, the computed zero swirl line shown in Figure
would fall to the right of the efficiency contour peaks, as it probably should.
FUTURE APPLICATIONS
The swirl momentum method can be improved to produce better predictions of proto-
t;,rpe,surgir4-,, . Even with present limitations, the method can be used to evaluate
proposed changes in turbine design directed toward increasing the surge-free
operating range of Francis turbines. Equation (4) relates turbine dimensions or
quantities affecting the value of the momentum parameter, i.e., the amount of
swirl. Continued investigations may disclose how flow passages may be shaped to
reduce the swirl in common turbine operating areas, thus increasing the surge-
free operating range.
CONCLUSION
The swirl momentum rethod is a useful tool for the analysis and prediction of
surging characteristics of prototype Francis turbines. The accuracy of the
method must be improved, however, before it can be applied with full confidence
for prototype predictions.
-12- 111 3

ACKNO6T=G1MM4T
Appreciation is expressed to Fred Ruud, Bureau of Reclamation, for his special
effort in obtaining the field data needed for the comparison of the Grarxi Coulee
Punp-Turbine surging characteristics. The data were obtained on Unit 7 during
acceptance tests in November 1973. i I
~
1. Cassidy, J. J. and Falvey, H. T., "Observations of Unsteady Flow Arising
after Vortex Breakdown," Journal of Fluid Mechanics, Vol. 41, Part 4, pp 727-736,
1970
2. Falvey, H. T. and Cassidy, J. J., "Frequency and Amplitude of Pressure Surges
Generated by Swirling Flow," Transactions of Symposium, Stockholm, 1970, IAHR,
Pert 1, Paper El, Stockholm, Sweden, 1970
3. Palde, J. J., "Influence of Draft Tube Shape on Surging Characteristics of
Reaction Turbines," Report REC-ERC-72-24, U.S. Bureau of Reclamation, Denver,
Colorado, USA, 1972
4. Rheingans, W. J., "Posner Swings in Hydroelectric Power Plants," Transactions,
American Society of Mechanical Engineers, Vol. 62, pp 171-184, 1940.
-13- III 3
j~


.' ~.-'• ...
~-: , __
_: - .'·
'·
·. r . . . . ~ .
. ~-. _., _ .. . . . ~~
.. . f j --,
·. ,;
' }
' ! '
!AHR -HENRY. T. F .AL 'VEY.
t
f t t t i I
I f
t 8THSYMPOSIUM BE .
SECTION FOR HYDRAULIC
MACHINERY EQUIPMENT
AND CAVITATION
6-9 SEPTEMBER 1976 ------------ LENINGRAD, USSR
\
i t t
f ! 1· , .
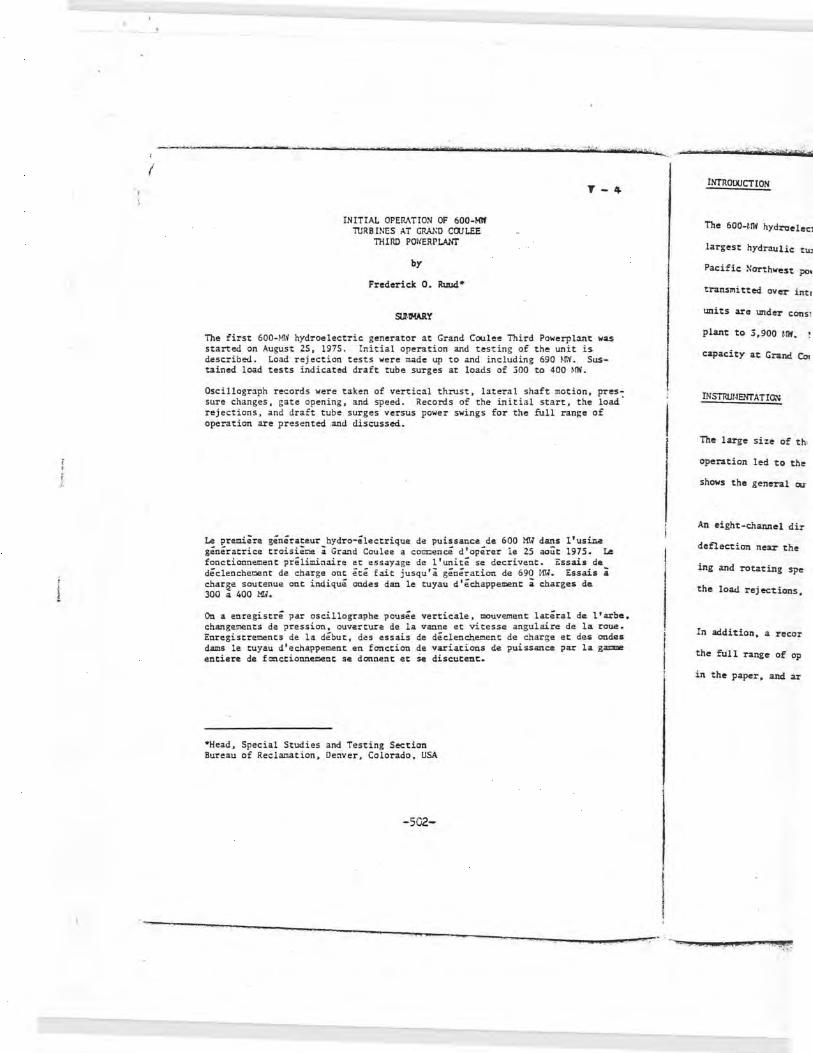
•
I
':it- · attd d£e··zy r·m
INITIAL OPERATION OF 600-Mlf TI.IRBIN1'S AT GRA/,D CCULEE.
Tii!RD POl~ERPLANT
by
Frederick O. Ruud•
SUMMARY
, .. ,
T-4
The first 600-Mli hydroelectric generator at Grand Coulee Third Powerplant was started on August 25, 1975. Initial operation and testing of the unit is described. Load rejection tests were made up to and including 690 ~n1. Sustained load tests indicated draft tube surges at loads of 300 to 400 ~IW.
Oscillograph records were taken of vertical thrust, lat era 1 shaft motion, pres-: sure changes, gate opening, and speed. Records of the initial start, the load rejections, and draft tube surges versus power swings for the full range of operation are presented .and discussed.
Le ~re.mi.ere generateur hydro-electrique de puissance de 600 MW dans l'usi~a generatrice troisiex:,e a Gra.~d Coulee a comcence d 1 operer ie 25 aout 1975, Le fonctionnement preliminaire et essayage de l'unite se decrivent, Essais de decleochecent de charge ant ete fait jusqu'a generation de 690 t-lW. Essais a charge soutenue ant indique ondes dan le tuyau d'echappement a charges de 300 a 400 M!J.
On a eoregistre par oscillagraphe pousee verticale, mouvement lateral de l'arbe. changements depression, ouverture de la vanne et vitesse angulaire de la roue. Enregistrements de la debut, des essais de declenchement de charge et de.s ondes dams le tuyau d'echappement en fonctian de variations de puissance par la ga?IIIII! entiere de f::mctiannement se donnent et se discutent.-
•Head, Special Studies and Testing Section Bureau of Reclamation, Denver, Colorado, USA
-502-
l
I I
i
.....
INTRODUCTION
The 600-f.fW hydrtielec:1
largest hydraulic tu,
Pacific Northwest po,
transmitted over int,
units are under cons1
plant to 3,900 f.fW.
capacity at Granc! Co,
INSTRU!,JENTA TION
The large si:z:e of th,
operation led to the
shows the general au-
An eight-channel dir
deflection near the
ing and rotating spe
the load rejections,
In addition, a recor
the full range of op
in the paper, and ar
. c ?· 4,»: > ,uc U'9!f-:

..
-··a . a&l-.· t· e
T-4
Third Powerplant was g of the unit is uding 690 ~n1. Sus,· 300 to 400 ~n~.
~l shaft motion, pres~ iitial start, the load : the full range of
600 Ml· s l 'usina · le 25 ...,t.it 1975 . Le crivent. Essais de de 690 HW. Essais a ment a charges de
·ement lateral de l' arbe. ,e angulaire de la roue. : de charge et des ondes ·, puissance par la gacne
· t5, ....:. , ...
IITTRO!JUCTION
The 600-t.n~ hydroelectric units at Grand Coulee Third Powerplant are presently t_he
largest hydraulic turbines in existence. These units provide peaking power to the
Pacific Xorthwest power grid. Energy surplus to local needs in the Northwest is
transmitted over intertie lines to the Southwest during sumr:ier moqths. Additional
units are under construction to bring the installed capacity of the Third ;>ower
plant to 3,900 /.fW. 1-lore units are presently planned to bring the total installed
capacity at Grand Coulee to approximately 10,000 MW.
INSTnLJI-IENTAT ION
The large size of these units and the need for infonnation regarding their initial
operation led to the decision to measure certain important para.meters. Figure 1
shows the general outline of the shaft and the shaft deflection gage locations.
An eight-channel direct-writing oscillograph was used to record thrust, shaft
deflection near the guide bearings, penstock and draft tube pressures, gate open
ing and rotating speed. These records were taken during the initial start and
the load rejections, as well as during normal operations.
In addition, a record of draft tube surges versus power output was obtained for
the full range of operation. Photographs of these original records are included
in the paper, and are marked with appropriate infonnation.
-503-
~---=~----..... ---- ----·· -----·- --- -
I , _ I
1
r I.

UPPER GUIDE BE A RI NG :-.._--!==+=1,
TURBINE GUIDE BEARING
254cm o.o. ,oo· o. o. 84" I. 0 . 213cm 1.0.
I
'
244cm ao. 96"' 0.0. 70", 1.0.
178cm 1.0.
- d ,-
FIGURE l, LOCATION OF SHAFT DEFLECTION GAGES.
-504-
• -· e · · ·r · i
I I I I I
I l
I I I
. id - , -..1t ti¥
I:-/ITIAL SiAA11JP
The first operatic
os cillograph rea>r
are typical of t.'ie
Upon starting, the
sure. As the gate,
to vibrate in the I
ment of the shaft,
bearing.
The vertical thru.n
The apparent natura
seen to be abo~ 7
A timing trace mark
The lateral shaft :,,
mately 0.012 inch ( I
0.004 inch (O.l m=)
guide bearing. The
an apparent 0. 005-it
main shaft.
On September 4, 1975
load rejection tests
L,0 4: , .PS

3-
~EfLECTION GAGES.
.. _;c_,. .. ' lf& 444# S7 ?2 ¢ "
INITIAL STARTIJP
The first operation of the 600-~fl1 unit was on August 25, l97S. Figure 2 shows the
oscillograph record of the initial start. Certain phenomena shown on this record
are typical of the transient operation of hydroelectri c units.
Upon starting, the gates were opened rapidly to about 12 percent followed by reclo
sure. As the gates open to admit substantial flow to the turbine, the shaft begins
to vibrate in the horizontal and vertical directions. The maximum horizontal move
ment of the shaft was about 0.046 inch (1.2 mr.,) at the lower generator guide
bearing.
The vertical thrust varies from 2,500 tons (22.24 ~IN) to 4,500 tons (40.03 MN).
The apparent natural frequency of vertical oscillation of the rotating parts is
seen to be about 7 Hz. Downsurge in the penstock was about 25 psi (0.172 MPa).
A timing trace marking l-second intervals is at the bottor., of each record.
The lateral shaft movements on this and subsequent runs ultimately became approxi
mately 0.012 inch (0.3 mm) peak-to-peak at the upper generator guide bearing,
0.004 inch (O.l mm) at the lower guide, and 0.004 inch (O.l 11Jtt) at the turbine
guide bearing. The larger runout at the upper guide was considered to be due to
an apparent 0.005-inch (0.13-mm) misalinement of the auxiliary shaft above the
main shaft.
On September 4, 1975, following preliminary tests anJ equipment adjustments, the
load rejection tests began. The 150-~IW test was conducted without incident. The
-sos-
I
'---
···-·--···~--- ·· 4 . g -
--·---·--· - ""': ~-----. _ ,.. ___ _
i.
1: 1 •
i i I
r L
l '

·,
" .. ::, ... "' ., .., ::, ... ...
..c:: ... - <.,
"' C,
. ~ ., c:: c:: .., .. r-:,.
e;: E: E:
"' "' "' .. " .. ... !; !:; -::: ., ~~: ~~: -" "' 3.c: :I-<: 3.c: c,<.> c,'-' ~.s c::,c:: .; ., "' l:::l .S - "'- c::,~ --s -- c::,- -- - -- ~~~ .,
"' ~ .., c::, c:, c::, c:, "' ..
<::i ""' <:l
-506-
CO M d •
u <.:>
,,,·
!:: z ::::,
~ < I-V')
_, ... < .. !:: ... "'- :;; ..,
..,; "-'
"' ::::,
::: u..
·:;~ ~ C>.c::,
1==>~ c::, ~ ~S! ; .·
~ .. ,._.,_ ~~ - ....
"' . c:: .<: u . C ..... ·-
"' C .,_ "' C"l . .., C
- " ~S: "'"' . .., .... ..,._ • • I- -~
"' 0 C. 0 00 •C
"'"'
penstock pressure ·
cent and the thrus,
runouts were essen1
Upon building up l,
surges at a gate o,
dieted by model Stl.l
mately 337 ft (103
(55.2 kPa) cocmence
increased severely.
except for the ecce
outs incre1sed an a
ing, 0.010 inch (0 •.
(0.35 r:un) at the tu:
500 tons (4.45 IN) ,
Figure 3 shows the c
Various systems of a
the draft tube surge
partially effective
of the shaft were un,
One may note that th ,
,the unit to oscillat,
lated for some time •
., Vi Ji . -*· _,,..

Mrri .•
u "' .,;
!: z ~
~ "" < !-"' ..,
..,,, < .. !: .. Cl..
"" z
,_;
"' "" ~ ~ ""
/.
dno' .•• _ ,....... ___ ............. _ ........... .....-~---------
~ " ,_ C.
~= _.,. N
• c ~ II
.5.-"' e C.
V'I OV'I ..... e . ,., ~~ V'IOO . .... ..,. ..,._ • • !- ·~
"' 0 C. 0 00 •e
V'IN
penstock pressure rise was 18 psi (0.124 11Pa), the speed increase was about S per
cent and the. thrust load was momentarily reduced by SOO tons (4.45 lt'I). Bearing
runouts were essentially unchanged.
Upon building up load fer the 300-1-IW rejection, the unit began to show draft tube
surges at a gate opening of 34 percent. Reference l describes the surging pre
dicted by model studies of this unit. The gross head at this time was approxi
mately 337 ft (103 m), The output was about 310 I-fit when surges of about 8 psi
(SS.2 kPa) commenced in the draft tube. Simultaneously, the shaft runouts
increased severely. Prior to surging, the runouts were about 0.003 inch (0.08 mr.i)
except for the eccentricity of the stub shaft. During surging, the shaft run
outs increased an additional 0.010 inch (0.25 ~) at the upper i:uide bear-
ing, 0.010 inch (0.2S mm) at the lower 3enerator guide bearing and 0.014 inch
(0.3S cm) at the turbine guide bearing. Vertical thrust variations of up to
500 tons (4.45 lt'I) were noted in synchronism with the draft tube surges •
Figure 3 shows the onset of surging, and the record of the events discussed .
Various systems of admitting compressed air were used in an attempt. to reduce
the draft tube surges. Adding cornpressed air to the center of the runner was
partially effective in reducing the pressure surges. However, the movements
of the shaft were unchanged.
One may note that the periodic draft tube pressure surges c:iused the shaft of
.the unit to oscillate at the same frequency. This phenomenon had been postu
lated for some time. These tests were the first instance where we have obtained
-507..:.
L.......
Xi! · az. .as X .. . 4 . .JtJf.f ... ,... u ---------··
i i • i l . i--~
l I I I i
I I I I
r

•
-droie:rrii" :,
' !)own
5000 Tons
t IJownstfeam 0.050 inches
t t
Downstream 0.050 rches
" ±t:o?i 'If
Vertical Thrust
Shaft Motton of 1/pper Genera.tor Guide 8ea.ri,,g
Turb ine Guide t + ])ownstrea.m
0.050 inches . t 2,00psi
100 psi +35psi
0 -/5 p3i
50%
0 150%
100%
50%
Penstocl< Pressure
Jira.ft Tube Pressure
Ca.te Opening
Sud
FIGURE 3. ONSl;T or- SURGING AT 300 ~n~. UNIT 19, GC III.
5,000 Ts 44.S MN, 0.050 inch s 1.27 mm 200 psi = l.38 11Pa, 35 psi s 0.24 !IPa
-508-
em ;.-friri :tittrio
prototype records of
is believed the shaft
turbine runner. Thu
units at Grand Coulee
occurrence on all uni·
Because the shaft 1:1ot .
might increase as hii;I
would increase at 400
amount of surging in :
air being periodicall,
Pressure variations ir
runouts were less tha,
without special preca,
Since the unit was su1
However, it was decid,
erating speed and red,
of the unit. Upon 30(
and the speed rise 1r.1s
slight increase in thz
2,500 tons (22.2 MN) t
static amount of 2 , 800
normal values of less
Figure 4 shows the osc
41 -., _

,erator Guide Beari,,g
~ra.tur Guide Bea.rinq
. UNIT 19, GC II I.
·.s 1.27 mm .24 MPa
pY'Ototype records of shaft movements directly caused by draft tube surges. It
is believed the shaft deflection was caused by pressure unbalance beneath the
turbine runner. This effect has been subsequently verified on the other smaller
units at Grand Coulee. However, the phenomenon is believed to be a ~eneral
occurrence on all units having draft tube surges.
Because the shaft motion was substantial, concern i,as expressed that the motion
might increase as higher loads were attained. Model data had indicated the surging
would increase at 400 1-fli. However, as the generator output reached 400 MW, the
amount of surging in the draft tube was reduced. This was ·due to atmospheric
air being periodically drawn into the draft tube throu~h the center of t he runner.
Pressure variations in the draft tube decreased to about S psi (34.S kPa) and shaft
runouts were less than 0.005 inch (0.13 mm). The unit was subsequently operated
without special precautions in the draft tube surge range of gate openings.
Since the unit was surging at 300 ~nq, load rejection could have caused concern.
However, it was decided to J'TOCeed with the 300-~M load rejection since accel
erating speed and reduced wicket gate opening would lead to improved stability
of the unit. Upon 300-MW rejection, the pressure rise was 18 psi (0.124 ~!Pa)
and the speed rise was 11 percent. As the gates began to close, there was a
slight increase in thrust to 3,500 tons (31 . l HN) followed by a decrease to
2,500 tons (22.2 MN) thrust. Subsequently, the thrust returned to the steady
static amount of 2,800 tons (24.9 MN). The shaft runouts returned to previous
normal values of less than 0.005 inch (0.13 1m1) without abnormal incident.
Figure 4 shows the oscillographic record of the 300-IM load rejection.
-509-
:.:"9}§#.¥,j#!A·.,-~.t#\JU4j@l P.k-.. ~· .! ;eq .. -- s M . @ >IS ...
• • I
,' I ·I
( I
' r !
i I· 1· i
~
! I !

c:: -3 ..
~
., . ' y ti'
-5IO-
· - -·mmdr'c
!: z ::,
z g t; "' .., "' c:: C < s !
I 0 0 ,.,
"' "' c:: ::,
~ ...
_.., N
C .<: u • C -~-"' 0 Q.
"' 0"1 .,., 0 ... z C. :.:::c:: "'ao . ,., "' ..--• • I--;: 0 Q. 0 00 •O
1/'lN
;-- ";· 111 +&th .. y.
On Septer.iber 7, lo.:a.d r ,
ancr.,alies of operation
were extremely satisfa
(0.13 mm) for steady-s
sient operation.
Figures Sand 6 show t
load rejections. One
indicate t he quality o
required no balancing
The transient vibratio
acceptable levels for
for shaft vibration du
POh'ER Sl'II~S
Much concern has been
variations in power OtJ
versus power output •
rejecting 600 ~l:f.
The surging starts in
power output until a 1
relatively rapidly and
----=-------,,--.,....--..._...,,,------.,.....,.,--....,..,.,,._..,..,......,.----..,...,---------.... _,·_-.,-, ____ 4"')"'1-"',-"'.A-"'.S'""!9!!)!111J2!1, 5111'¢!1!f¥11'f!ll_"4k!'!CI;~

c..; t;)
~
t: z ::,
,; ;: ... u "' .., u.l c:: Q .. < .. g
! I
0 0
"' .,. w c:: ::, ~ ...
~ "' ... C.
N::;: _.,. N
• 0 "' " • " -·-"' 0 "' "' OU'I . ,.., 0
. "' zc.. ::
"'"" .,.., .... .... -n • ...... ..
0 "' 0 00 •O
u,N
·- - - - - -----· - -
On September 7, load rejections of 450, 600, and 690 !-IW were made . Nci serious
anomalies of operation were observed in these load rejections. Shaft runouts
were extremely satisfactory during this operation, being less than 0.005 inch
(0.13 rana) for steady-state operation and well within a norrial range for tran
sient operation.
Figures S and 6 show the original oscil lograph records of the 600-~M and 690-1-nt
load rejections. One may note that the shaft runouts prior to load rejection
indicate the quality of operation of the unit under constant load . The unit
required no balancing weights, and operated very well at all loaded conditions.
The transient vibrations during startup and load rejections were well within
acceptable levels for units of this size and speed. Reference 2 gives criteria
for shaft vibration during transient operations.
PO\'/ER SWINGS
Much concern has been expressed over the relation of draft tube pressure surges to
variations in power output. Figure 7 shows a record of the draf~ tube pressures
versus power output. This was taken during the period of load buildup prior to
rejecting 600 ~IW.
The surging starts in the vicinity of 300 ~n~, but does not apparently affect
power output until a load of 350 MW is reached. However, the load changes
relatively rapidly and the surges take a few seconds to build up.
-sn-
§SE. pl. ¢ - - Q , .5 S_ MV . .~,@ ·. AA - ~ •. I.~- -
I I I
( I
....

' Down
5000 Tons
t t Downstream
0.050 tnches
i t t
Downstream 0.050 inches
t t t
Downstream o.oso rches
200 psi
TOO psi. JS psi
0
- fSpsi 100%
Verttcal Thrust
Shaft Motion of Upper Generator Gu id.e Bea.ring
Shaft Motion of lower Genera.tor Guide Bea.rtnq
Sha.ft Motion of Turbine Guide Bear i ng
Penslocl< Pressure
I) raft Tu.be Pressure
Gate Opentnq
Speed
f/.0% I I 111 1111111 I I I II I 1111111111111 I I I I 111111111111 [ [ [ I [ 11 i [ [ I 11 [ [ [ 111 i [I'
FIGURE S. 600-MW LOAD REJECTION, UNIT 19, r,e III.
S, 000 T • 44. S MN, 0 . 050 inch • l. 27 nm 200 psi• 1.38 MPa, 35 psi• 0.24 MPa
-5I2-
l)ou,n
5000 Ton.r
t t Downstream
0.050 inches ,"W'{, '.i' t 1 t
Downstream 0.050 inches
' t t --Downstream
/J.050 inches \IVWV\N\
~ ZOOp.ri
100 psi JS psi
0 . -1spst
100"/.
0 -
1'+0%
.!111111111 1
FICURE
5, 2(
-~ ... ___ ..,_ --·"""""0.:rAA!l"P ___ NP111¥!'!1!'!'".'1!!?.'ll"

~ /- ?,. Wtt:riWb rt r¥ : Ml ·ti,,., ..
rrrrator Gui.de 8 ea.ring
enera.tor Guide Bea.rinq
:u.id.e Bta.rinq
ure
.,.essure
Openlnq
eed
.J t 11 11 I 11 11 JI !I I II f I J ti II I I I
: 19, r.c III.
·.27 lllll
, MPa
Wert ical Thrust
!)own
5000 Tan.s ________ j1....r .. -----. ...... --... --.,,..,------------.. ....
t t !Jownstream
0.050 inches
~
t t
Shaft Motion of Uppe.~ Generator Guide Bea.r,nq
Shaft ."'oti.an of lower Generator Guide Bea.rrnq
Downslrea.m 0.050 inches ~~~"'"'""' I - ., ,,,,,;,WtN,W,,,,,."'1'N,Vy,,-.~
~ . I
Shaft Motwn of Turbine Guide 8ea.rimr
200psi
100 psi J5psi
0 -IS psi
100%
0 1'+0%
Penstock Pressure
!Jraft Tube Pres.111.re
Ga.le Openinq:
Speed
•• .......... F
11 I II IJ I! II I t II I II I II If I 11 1 II J I I! I II ti I It II t i, I I !I 11 11 I I I 1 1 t 11 11 1 r, 1 I
FIGURE 6. 690-~IW LOAD REJECTION, UNIT 19, GC III.
5,000 T • 44.5 ~IN. 0.050 inch : 1.27 mm 200 psi • 1.38 MPa, 35 psi = 0.24 f1Pa
-513-
~ ...,,'l't"A~\,..,Z.,..,. _ _ ,.,..,_,.3 www• ___ , .. _ ,,.. . .... , "'· ,rr-,,c:cr·-,_-,.,,•-A@ii•. "'t®,.••- 1!',.?4!"'!.'"'- "F.1"-E"""!'l.¥4"1'-""!-."*,...., ___ ·""'·,-.-.----~--...-~...,-.-
._,.,...,.,,,____.- -- __________ .. --·
......
j·
i i i i t . r : ; ·.
l t
i ! ! '
I i i !
t

-- ·-----·- """"'""'"" _ _. ..... ___ .... ___________ ~----------------------
j:
"' "' 0 ...
0 ! <:: " ·~
r-c:.. "' "!Z "" <a ~
_.,. N
~ • 0 .s::.
~ U II
" ........ i= "' 0 =-I- "' :;. 0"1 . .,, o< 0 0 ... "' ~~
f >
"la:>
"' . .,, <; ..,. z ..,._ ~ • II
I- ... o< "' "' 0 c:. 5 0
'\ 00
C. •O "IN
...: w o< :::,
::: ... ..,
3:: ~ :; ...
<:::, <:::,
"" ..... .. I .. .. ""'" 3 l ::,._ ., l ~ ~ ... .. ., ....... .. .. .... c:::o"-
-SI4-
While the suri:es r ,
persist as long as
SSO f1W load. Thes,
the Ulli t.
cm1cwsroxs
The 600-IIW hydrocl,
very we 11. The sha
~ithin acceptable 1
speed rise on load
The occurrence of d
predicted values fo
the surges were pre
were fdund to occur
vent normal operati
AC I<NOWI.EGBIENTS
Westinghouse Electr
generators. Bingha
this project.
Many persons of botl
tions to the initia:
were in charge of t l

•
ili,ia-iliiiiili;--............... ~-.-.. ............... ---..__..;......-----~---..... ~-·-~--------·--
V,
~ 0 ..
_..,. N
n • 0
.<: u" = -· .. "' 0 c:.
U"l OU"l . .., 0
. "' ~~
"'"' . .., ..... ..,._ 11 II
1,- ...
"' 0 c:. 0 00
•O U"JN
While the surges reduce to about 5 psi (34.5 kPa) near 400 r.nt, power swinis
persist as long as any surge is present. Figure 7 shows sor.ie power variation at
550 MW load. These are relatively small and cause no concern durinr. operation of
the uPit.
CONCWSIONS
The 600-r!W hydroelectric units at the Grand Coulee. Third l'owerplant operate
very well. The shaft vibration levels during startup and operation arc well
within acceptable limits for units of this size and speed. The head rise and
speed rise on load rejection are quite acceptable.
The occurrence of draft tube surges was expected, and generally a~rees with
predicted values for this unit. Synchronous shaft oscillations resulting from
the surges were_previously observed on the model tests of this unit . These
were found to occur in the prototype in the' predicted range, but do not pre
vent normal operation of the unit .
ACKNOWLEGEMENTS
Westinghouse Electric Company, Pittsburgh, Pennsylva~ia, furnished the electric
generators. Bingham-Willamette of Portland, Oregon, supplied the turbines for
this project.
Many persons of both companies and their subcontractors made important contribu
tions to the initial startup of these units. Bureau of Reclamation engineers
were in charge of the initial testing and operation of the units.
-SIS-
1"'-44')-41"'!"'-.... _,,,,., ........ .. ,... ..... ,...- - i-- ·..,,,...,...., ___ .... ,,..,. ............ ..,._ .... ________ ..,.., .... ..,.,--~--.,....,-.. ...
L

t'
(
(
'
l j
1 I
i
I !
I \.
----=---------------.... --........ -................... ...,_ ..... _,oioii,;_ .... ___ ,....ioi . .,·..:_· . ..,..:...· :ra rf I
REFERt'.\'CtS
1. Palde, Uldis J., ·~· lodel and f'rototype Turbine llraft Tuhe Surge Anal ysis by the
Swirl ttor.ientur.t ~-lethod", 7th !AIIR Syr,posium on llydraul ic flachinery, Vienna
.~stria, October 1974
2. Ruud, Frederick 0., "Proposed Vibration Criteria for Transient Operation of
llydroelectric Units", 2nd International .JS~!E Symposium on Fluid ~!achinery and
Fluidics, Tokyo, September 1972
-5I6- ~ I
~ •
..... •.-;-$,, i~t-
. ,._ ·_~·~·- '
Subject I.
I-1. A. ~ • .A.be:
O.G.Vini:
L.L.Doll
I.S.She:
I-2. K.Petril
I-3. J .Klein. F • .Strobl
D.Enzenl
I-4. W. V. Neai
I-5. E.Krame:
R.Bord.m1
I-6. L • .Arosi1
ll.Roal1&·
I-7, J.Seyde:
r-s. R • .l.tl& eh;
K.Holla: B • .Barp.
f-'. , ;. MS@!-.~

)
<
.:{ . . tti C'td -· . t · ·-' t :t 1 f r· ' ' I ? ··ec ·· • e *' I I m Y I " . t I
1 il.SCE - IAHR/ AIHR - ASfV!E
l J
. ·: '!
t JOINT I SYMPOSIUM !
: on ·t t t
i :i .1
1 i
1 FLUID l MACHINERY
; I '.. i I .1 ,· .
June 12 - 14, 1978 ~ 1
J: I 1 Colorado .I State
' '" '\•!
--
0 r? ivers it y :::c r t Co l i:m . Co forac!o, US;\
HENRY T. FALVF.'ii DI : Inr.1,
~~~~~=;,~!l"! ...... .., ,~.'.l :~ ~../ ,:.:;,~·~ ~ Ll.i~ J.;:..;.;.:.. u ::.:~ ~
~ ':"'~'1' t' ~..-.., r ,,.'7./1 \J'·~~~~::..~'-.J1i/ J.~ I
POL YPHASE FLOW TRANSIENTS PRESSURE RECOVERY DEVICES INTAKE STRUCTURES COOLING WATER SYSTEMS
~-:- "!"!'. 4A$!1¥:111!1!. 1!'.1)•:Ctll!!_ { ... .4.'""'"""-¥A""'- -~--' ,.""~a""",9""''·""!•.a:~ . . !"!'~I•. _.."ll!;y:p_.,>!l!L~J c""'·'"""t<""'-'*..,lQC!ll'!' .. '!'1!. ¥1!!"'. Zall!_ #~!10""_,...41111144.,.,,W-AO!li'!P,... ,.. __ ,,..,..,A _ _......,,. _____ _

ecttic
Charles, K. E. , antially y Life Stages nt and Impinge-
,rst, T. J., :ems for ·oposed Power :ional Workshop ,bruary 1976.
,d Fish Protec~ournal of EE6,
+::ic ..
PENSTOCK INTAKE VORTEX AND RELATED TIJRBINE OPERATION MODEL STIJDIES
ABSTRACT
R. B. Dexter, Research Hydraulic Engineer (Retired) E. R. Zeigler, Hydraulic Engineer
Bureau of Reclamation, E&R Center Post Office Box 25007, Denver, Colorado 80225 USA
A literature search indicated Froude number modeling of intake vortices with a large model scale may produce inadequate results. Therefore larger than Froude number model discharges were used to intensify vortex action in a 1:120 scale model. The model study showed the intake trashracks inhibited vortex action, and airentraining vortices could be suppressed by rafts. The literature search did not yield informaticn to define intake vortex conditions that would be unacceptable for turbine operation. General information indicated that air-entraining vortices are to be av.aided. A reaction-type model turbine was operated at prototype head to investigate the effect of vortex entrained air upon draft tube pressure surges and turbine runner deflections. Airflow in the model turbine for short periods did not result in untenable pressure surges or runner deflections. However, the airflow did create operational conditions comparable to rough operation in the periodic draft tube pressure surge range and this operation can be tolerated fa~ only a limited time.
Une qu!te de la litterature a indiquee la possibilite d'obtenir les resultats insuffisants quand on fait un mod~le des tourbillons 4 une prise d'eau avec une grande echelle de nombre Froude. Done, debits plus grand que le debit par le Froude echelle etaient utilise d'intensifier !'action du tourbillon dans un 1:125 mod~le. L'essais du mod~le a indique que le grille de la prise d'eau a inhibe !'action du tourbillon et les tourbillons qu' aspirent l'air pourraient supprime par les radeaux. La qu!te de la litterature ne rend pas les renseignements concernant les conditions mauvaises pour !'operation de la turbine avec un tourbillon i la prise d'eau. Done, en generale les tourbillons qu' aspirent l ' air doivent ~tre evite. Une turbine de la reaction etait opere sur une charge qui a correspondu avec la charge en nature d'etuder l'effet d'un tourbillon avec l'air sur les fluctuations dans l'asoirateur et sur les deviations de la roue de la turbine. L'e~oulement d'air clans la turbine pour lll!e court duree ne produit pas les grandes variations ou in la pression ou en la deviation de la ·roue. Done, l'ecoulement a produit les conditions de !'operation comparable de la zone de !'operation mauvaise qu ' est cause par le tourbillon dan l'aspirateur et on peut tolere cette operation pour une duree tr~s limitee.
425
,.. r

I t f
!J_ f l I
I I l l f f
! ! I !
aa ,.,. f1 ,zn - a· , . - ) E2 r t ~ "¥sift . )'. ' R"'fitse· ·w+·£$trt -' ' rtts r ~s,r 'wt #,-JC o · .J·:1M?t:t '"·« ehtn# .J~,..;;e ·&fmts rn?t: rJ'Xi '
INTRODUCTION
During the active design stages of the Grand Coulee Third Powerplant, two hydraulic model studies were made : [l]* a study of the powerplant forebay channel and tailrace and [2] a study of the entrance, transition, and penstock bends. Vortices of an intermittent nature were noted in the forebay during both studies. Thus, a more intensive vortex study [3] was made with the existing 1:120 scale model.
A literature search was made concerning vortex effect upon turbines and vortex modeling. No information was found defining at what point vortex conditions were unacceptable; but air-entraining vortices were reported detrimental to hydraulic machinery operation. Thus tests were made with an air-entraining vortex at the penstock intake of a 1:40.33 model of the Grand Coulee Third Powerplant turbines with the model operating at prototype head.
MODELING INTAKE VORTICES
Hydraulic modeling of vortices is a problem because of the lack of similitude between model and prototype. The Froude, Weber, and Reynolds numbers should be used in dealing with the question of similitude [4]. However, an accurate relationship among these three numbers when applied to vortex modeling is not known. If using only Froude scaling, a vortex may be scarcely detectable in the model, but a very awesome occurrence in the prototype [S]. In another study [6], a prototype had air-entraining vortices which the Froude scaled model did not have, and a vortex modeling technique was developed which somewhat overcame the deficiency of Froude number modeling. This technique was designated the Equal Velocity Method because for some tests the model penstock velocity was equal to that of the prototype.
The Equal Velocity Method involves many model tests with different water depths and penstock velocities. For each test condition, vortex observations are made, and data points plotted on a graph similar to that of figure 1. A boundary l i ne or envelope curve is drawn between the air-entraining and non-air-entraining data points. At water surface elevations below the curve, there is a danger of air-entraining vortices forming i n the prototype. In study (7], effects of corrective measures were shown ·on the graph, figure 2.
Study [6] commented about a shape characteristic of the boundary curves:
"The shape of the boundary curve varies with the circumstances, but in general the curves have one limb tending to become asymptotic to a constant velocity and another limb tending to become asymptotic to a constant depth."
* Numbers in brackets designat~ references listed at the end of this paper.
------- .. - ·-·---~ --~~~---
426
_.. ... ~---~------~-,.....,-~-----~-- ~ ~
Al ab
Th stant d for vor vertica. tor. A attaini1 becomes and sen: preventE
The greater the prot testing. cal powe of the b prototyp unknown for vort intense vortex i : vide an 1
TiiE INTAI
Loe. Powerplar. Insomuch vortex st the foreb stock vel penstock discharge 0.0057 m3
In this p charge pa. number di:
!nit: entrainini ces could elevation . Vortex se\ predominar stream frc For three the last d dle unit. intensify forebay da greatest i vortex-pro

1_d Coulee Thi rd le: [l]* a study ~d f2J a study of Ort:1ces of an ri~g both studies. W~th the existing
~ex effect upon ;:: fou~d defining at rut air-entraining tachinery opera-g_ vortex at the OUlee Third Power>!pe head.
ecause of the he Froude, Weber, 11 the question lip among these it known. If • detectable in rtotype [SJ. In ·ortices which modeU-~ techicieru ,f ted the Equal tstock velocity
·ests with difch test condiplotted on a or envelope !:!'-entraining :urve, there ~ prototype. 1wn ·on the
: of the
circumtending .nether epth."
1e end of
I I ! !
I i
I I
Also, "The transition between the two regions is more abrupt in some cases than in others . "
Thus, the vertical (constant velocity) and horizontal (consta.nt depth) limbs of the boundary curve were important indicators for vortex action in the model. For lower model velocities, the vertical limb shows velocity as a very criti cal and sensitive factor. Air-entraining vortices will form in the model only after attaining some minimum threshold velocity. Thereafter, the vortex becomes insensitive to velocity and the water depth is the critical and sensitive factor . Relatively small increases in water depth prevented formation of air-entraining vortices.
Therefore, it appears that a model penstock velocity which is greater than the Froude scale velocity, but considerably less than the prototype penstock velocity, may be sufficient for vortex model testing. In model study (7) of intake vortices at a hydroelectrical powerplant, the model scale was 1:200, and the horizontal limb of the boundary curve was attained before reaching the one-third prototype velocity. Both studies (6) and (7) suggest that an unknown measure of safety occurs by using the Equal Velocity Method for vortex modeling since the model vortex conditions may be more intense than those occurring in the prototype. Therefore, if the vortex is prevented in the model, the solut i on is believed to provide an unknown degree of safety in the prototype.
niE INTAKE MODEL S11JDY
Location and flow geometry concerning the Grand Coulee Third Powerplant intakes is shown in figure 3 and the model in figure 4. Insomuch as possible, the Equal Velocity Method was used for the vortex studies. However, because of model head difference between the forebay and tailrace water surface elevations, the model penstock velocities were limited to about one-third of the prototype penstock velocity. Tests were made with multiple Froude number discharges for one prototype unit. Thus, a model discharge of 0.0057 m3/s corresponded to an 878-m3/s prototype unit discharge. In this paper the designation lQ refers to one Froude number discharge passing through each operating unit, 2Q for two Froude number discharges, and 3Q for three Froude number discharges.
Initial tests -were made without model trashracks, and airentraining vortices occurred intermittently , figure S. The vortices could not be submerged by the maximum reservoir water surface elevation, and thus the boundary curves had no horizontal limbs. Vortex severity increased with the number of operating units. The predominant vortex action was at the first operating unit downstream from the juncture of the Grand Coulee and Forebay Dams • For three unit operation, there was diminished vortex action at the last downstream unit and infrequent vortex action at the middle unit. A vortex would form 12 to 30 min front of an intake, intensify while traveling toward the intake, then move along .the forebay dam, and dissipate, fi gure 6. Vortex severity was the greatest in the region immediately in front of the intake. This vortex-prone region was very susceptible to vortex formation and
427
L

i. r. r ;, i, J
l I I I
I ' l \ I !
! i
i ! ' r l I
!
Ill
.... .,,.. ....
.-------•""*=-••.., .... ,,..,.,..._ ____ .,g"'r"'s"'1••ilia·lillilttililfiliiiiili"t.:l1111itat1aiii.~iiihlilt 111eliiiirii··,:;;;· .. , .,, .. ,s...,.~.ii1ioltw;·.;;y..._- .a,n;:.·1.·na,;1..,·~w;,;;··,.;·-,;;;·-_.e .. .,· tmliili·· •:nae:-· .- -.... ..,,..,,?~~ ~ .~ .· ei """ en· ·:e-. t,e
\
continuation of a developed vortex. Also, in some cases model discharge influenced whether or not the vortex moved upstream or downstream along the forebay dam, figure 7. Thus, the equal velocity method of vortex modeling may distort location of vortex action.
Model trashracks were constructed which simulated the prototype trashrack shape and calculated head loss. The trashracks were 41 m high, a 14-m radius semicircular shape, and at the furthest point extended 7 m out from the headwall. There were no air-entraining vortices and the vortex severity was considerably reduced by the trashracks, figure 8. Previously, without trashracks, a vortex with a continuous air core entered the intake. The trashrack occupied and restrained a portion of the vortexprone region from contributing to vortex action. Also, the front of the trashrack provided resistance to t!1e rotating water as the vortex approached, and the vortex dissipated upon reaching the trashrack, figure 9.
The juncture of Grand Coulee Dam and Forebay Dam forms a sharp corner where a flow separation occurred, producing eddies that traveled to the intakes. Corner modifications were made and a guidewall aligned the flow with the forebay channel, figure 10. The surface currents approached the intakes less directly, reducing vortex action, especially for the no trashrack test condition. Vortices occurred slightly downstream from the first unit and, being closer to the dam, more readily dissipated , figure 11. Thus, it was concluded that flow separation from the dam corner contributed to vortex formation, but was not the sole cause of the problem. Also, it was believed that the model produced proportionally larger flow separation than the prototype. More waterflow tended to enter the forebay channel at a right angle because of area limitation of the model reservoir (arrow, fig. 4).
Vortex suppression rafts were tested. Various rafts were tried - floating, submerged, different total areas, depth, and grid spacing - and all were successful. The raft was effective in preventing objectionable vortices when positioned near the center of the vortex formation area. Also, the raft was effective when positioned where the traveling vortices had their most severe development. Vortices would form beyond the raft and dissipate when passing beneath the raft.
Although the rafts were effective, there was some question because of the uncertainty that the intermittent vortices could be on the verge of dissipating. Therefore, a strong and steady vortex was generated in the model. With the stable and persistent vortex, the uncertainty was removed, the rafts definitely suppressed the vortex. However, swirl still remained beneath the raft and entered the intake, figure 12. In the event the hydraulic model did not simulate severe enough vortices, dissipation of the more severe generated vortex was believed to provide a measure of safety in the raft tests.
430
. --· . _ ...... ., .... ~~"""''
-.;~~-~·-- --·----...-.-----...----~ ...... --~
. ?}~?~·\-~::[~ .. .., __ ._
. ~---·_-..,-::
-~~ ~·
\:t.~_:: . c.~ : ·-·
~}~~:~:·'.~ Figure 8.
and 20 o:
Figure 9. 20, and

.1l some cases model ex moved upstream or Thus. the equal
rt location of vortex
simulated the protoll~ The trashracks tape, and at the fur.l . There were no ty was considerably sly, without trashtered the intake. on of the vortex-Jn. Also , the front lt:ating water as the ipon reaching the
·bay Dam forms a producing eddies
tions were made and channel, figure 10. rs directly, reducrack test condition first unit and ·
ld, figure 11. 'Thus, dam corner contri-. cause of the produc 0
~ propor-ype • :e water-i ght augle because "• fig . 4).
lous rafts were !as, depth and 't was eff;cti ve oned near the cen·t was effective their most severe
t and dissipate
• some question vortices could 'Ong and steady ·l e and persistent finitely sup-d' beneath the vent the hydrau,,. dissipation of Jrovide a measure
l I I i
I l
I i I ;
i I ' l I i I
I ! I I i I
I I l
i I
I I
I I I i
Forebay Dam i
-----Lines indicating general direction of vortex travel IQ--
20 ----3.0---
j ':~;e I Oown1tr1am -
pr111nt and region of init i al vortu f ormation
Figure 7. - Varying locat i on of vortex action with respect to discharge .
Figure 8. - Vortex action with and without trashracks . Units 19 and 20 operating 3Q each, reservoir elevation 393 m.
r:~7~t~.;_~_ ... ..;·-,··._' :J I; i . . ~" -. • .•
i · \ . 1.. .. --i ' ~"- ~ ~ . ~-~-~\ ,1
~ ';y.,;,;l~ .. i \
!·A i. -4 .. .::. . \ .. J
Figure 9. - Dissipation of vortex on the trashracks. Units 19, 20, and 21 operating 3-l/2Q each, and reservoir elevation 393 m.
431
~ - -"! =--_.._ ..., __ .,,_,-... ,., _ __ .,_,.,.,,. __ ,, .. ..., __ ,_,.._ ... ..,,..,_.,..,_.,._ '<'"··'"'.,4'"'·...,,=:~·"'•*-""''*'"'· .. ' '"'*"'· ..,._.,.pe,_...,._...,..,._,_ ____ ~-.----·----
l
r

~ .
I ' l t f
I ' l [ r t
;-,, l /; .. , • ., zt't·
: .. ,'·•
Figure 10. - Flow conditions of the corner with and without the guidewall.
Unit 19
) \
13uidewall
Figure 11. - Corner effect upon vortex action.
.;{; :·:t:: r-:;~'.;:~_.;,ifi.'.".%t~-§1-~·; · ,··: ;/ ·-. ,
-, -;, -_ .
i
Figure 12. - The generated vortex without and with a raft.
432
R, clusiv, weTe i.J in thii tionabJ making measur~ info= vortex taken c Prototy of each the uni
TI-IE INT
Th recogni inadequ the pre, velocit. time it model t , vortice: more se, Coulee '. no repoi above tl erably vortex c
PASSAGE
The Grand Cc uncertai using a turbines prototyp test fac the turb draft tu draft tu were ins measurem, plied ab, intentioi tank to 1
installei model tu: head of l

(
~ -:~;~;~~!~;:::l~::~1\ 2-~· ·
~ ;· _;,:~ " ~ t' . .....
~:~.:.-~~;~ . -i----; -·
~-... ... JO>\.~ L~~.;l~). ner with and without the
M.i.tll ;uidawall
.,.,all
n vort action.
hout and with a raft.
Results of the model vortex tests were not considered conclusive for recommending modifications to the design. These tests were interpreted as indicating a danger of vortex formation, and in this event, the model tests showed rafts would suppress objectionable vortex action. The designers requested information for making a preliminary raft design. Model tests were reviewed, rough measurements made of rotational velocities; and design guideline information given for raft dimensions, forebay area of appreciable vortex occurrence, and flow velocities. Also, the precaution was taken of alerting project forces about a possible vortex problem. Prototype observations were to be made at the initial operation of each I.Ulit. If vortices of questionable strength formed, then the I.Ulit could immediately be shut down.
TiiE INTAKE MODEL VORTEX REPRESENTATION
The lack of vortex similitude with the 1:120 scale model was recognized and the Equal Velocity Method used to protect against inadequacy of Froude number vortex modeling. However, there was the predicament of not obtaining the full range of model penstock velocities required by the Equal Velocity Method. Thus, at the time it was unknown whether a degree of safety was provided by the model tests. Although with trashracks there were no air-entraining vortices, there was some concern whether vortex conditions might be more severe in the prototype. To date, three units of the Grand Coulee Third Powerplant have been installed , have operated, and no reports have been received of vortices in the forebay channel above the intakes. Evidently, model penstock velocities, considerably less than required by the Equal Velocity Method, produced vortex action more severe than that which occurs at the prototype.
PASSAGE OF AIR TiiROUGH A MODEL TURBINE
The possibility of air-entraining vortices occurring at the Grand Coulee Third Powerplant Penstock Intake, along with the uncertainty of their effect upon the turbines, resulted in studies using a model turbine. A 1:40.33 scale model of the 600-megawatt turbines was furnished as part of the contract for the first three prototype turbines of the Grand Coulee Powerplant installation. A test facility was in operation in which the waterway, including the turbine, was modeled from the penstock intake structure to the draft tube outlet. Pressure transducers were installed in the draft tube throat and proximity sensors (electronic micrometers) were installed to face the lower band.of the turbine runner for measurement of runner deflections. Compressed air could be supplied above the water surface in the headwater tank to maintain an intentionally created vortex. Rate of airflow into the headwater tank to maintain the vortex was metered. The test facility was installed at Estes Powerplant, Estes Park, Colorado, where the model turbine could be operated at or near the prototype rated head of 87 meters.
433
~ ,#VfrP.t&-k )5 ¥ ...,. V bl f . % .I . 3.! . P \ · ~ I . PA«n.
i i
l
r

' .. ~.
l (
It 'l .. ;r,.
ij. l_.
i
i l'
' 5'
l I i f • ~
I
!'.-
tfi4 ftt b' " · ·ttccti't:tW:tiMd· ·rt "ff rrir ·&?6KMS ··.f lff ftM ......... )~~ _... · -c ~b r b- ¥t .• ..
A series of tests was made to investigate the effect of airentraining vortices upon draft tube throat pressure surges and runner deflection. Compressed air was fed into the headwater tank and an air-entraining vortex existed over the penstock intake, until the supply of a limited volume air compressor receiver was exhausted. Control tests were made without an air-entraining vortex. Photographic recordings of transducer output images of draft tube pressure surges and runner deflections were made for a range of turbine operational parameters.
Figure 13 shows comparisons of draft tube surge pressure and runner deflection amplitudes and frequencies without and with entrained air. When the turbine was operating near peak efficiency and at minimum draft tube pressure surge amplitudes, figure 13A, vortex entrained air increased pressure surge and runner deflection amplitudes, as shown by figure 13B. Note that the sensitivity of the draft tube throat pressure surge trace of figure l3B is one-fifth the sensitivity of the corresponding trace of figure 13A.
13A. No airflow, smooth operation, near peak efficiency.
Top: Draft tube throat pressure. Vert scale, 1 div= 0.12 m Horiz scale, l div= 0.1 sec
Bottom: Runner deflection. Vert scale, 1 div= 6 x 10⁻³ mm
13B. Same operation as above with airflow.
Top: Draft tube throat pressure. Vert scale, l div= 0.60 m Horiz scale, l div= 0.1 sec
Bottom: Runner deflection. Vert scale, l div= 6 x 10⁻³ mm
Figure 13. - Comparison of model turbine draft tube throat pressure surges and runner deflections without and with vortex entrained airflow.
434
A effici, range. at red1 range . amplit1
Tai
Effici, (peri:er
91.0!
90.6j
86.6~
1 Near before 2 Off p before 3 Reduc vortex.
Co deflect that VO
runner ciency . tion. tube pr small i runner
Th surges near ma tube su icantly
A gation type tu alent t.
.,..., - :ov-·"w';~<('- .- ~-~,.,.-n"'_'~'""---=....,..,,.,.. ,.,.......,._,.. .. <", 1,,""""""'· ""· ·""· - ~--"""'"''"''"""'"'· "· "'· ...., .. 4_;;_"'· _..,_, ....... _u,-_. """"· 91!1! .. "!!.¥~.-""-·"'.J".{!"~0-. - -. ~·GSf#-}Zjl ~. ~

f
\ if · ' re • · r i'S >+tr«Y
(
:feet of air;urges and 1eadwater tank :k intake, receiver was ntraining vormages of draft e for a range
, pressure and : and with peak effi
litudes, figcge and runner ~ that the trace of fig
onding trace
, smooth oper-Lk efficiency· throat pressure.
iiv =· , 2 m div ~ .l sec
deflection. div= 6 x 10- 3 mm
ition as above
e throat pressure. div= 0.60 m
1 div= O.l sec deflection. div: 6 x 10- 3 mm
Jbe throat preswith vortex
\
I i ! I
I I ;
' ""'-25§.
A test was performed with the turbine operating near peak efficiency but in the intermittent draft tube pressure surge range . A third and final test was made with the turbine operating at reduced efficiency in the periodic draft tube pressure surge range. Changes of draft tube pressure surge and runner deflection amplitudes due to vortex entrained air are summarized in table l.
Table 1. - Changes of draft tube surge pressure and runner defZection ampZitudes due t o vorte= entrained air
Airflow to Draft tube Runner Efficiency waterflow surge amp. deflect. (Eercent) (Eercent) (m water) (mm) Remarks
91.05 0. 0 . 3 0. No vortex, fig. 13A1
2.8 3.0 .008 Constant vortex, fig . l3B
90.67 0. 0.5 o. No vortex2
3.1 0.9 0. Constant vortex
86.62 o. 4.6 .006 No vortex 3
3.3±.3 4: 6 .006 Vari able vortex 2.4±.4 7.6 .006 Intermittent
vortex
I Near peak efficiency , negligible draft tube pressure surges before vortex. 2 Off peak efficiency, intermittent draft tube pressure surges before vortex. 3 Reduced efficiency, periodic draft tube pressure surges before vortex.
Comparison of draft tube pressure surge amplitudes and runner deflection values in the first and second lines of table 1 reveal that vortex entrained air created signi ficant pressure surges and runner deflection when the turbine was operat i ng near peak ef fi ciency. The largest runner defl ection occurred for this situation. When the machine was operating in the intermittent draft tube pressure surge range the passage of air created a relatively small increase in pressure surge amplitude without i ncrease of runner deflection.
The last three lines of table 1 show that draft tube pressure surges reached maximum amplitudes and runner de f lection values were near maximum when the machine was operating in the periodic draft tube surge range. Air supplied by an intermittent vorte.x significantly increased pressure surge amplitudes .
A significant conclusion may be made from the model investigation about passage of vortex entrained air through a reactiontype turbine. The conclusion is that the passage of air is equivalent to operation of the machine in the periodic draft tube
435
£A .b·.""*~· C 4:W .. SUJ41, ;;zg s:;;. ?#S4W ·. Z "I 5 .c,; 4-!?.- -·•. •
i t t k..
r

•
( -~---~--------·---------------------..... -. .... .-..:.. ..... -------., . ..:-
pressure surge range. If a reaction-type turbine was operating in the periodic pressure surge range , when an intermittent vortex entrained air, then the pressure surges would be amplified and operation of the machine would be very rough. A turbine would normally be operated at or near peak efficiency and should vortex entrained air pass through, the resultant pressure surges and unbalanced transverse load acting on the runner would be comparable to operation in the periodic draft tube pressure surge range. This phenomenon would not create immediate serious consequences but action should be taken immediately to eliminate the airentraining vortex at the penstock intake. This action would require a decrease of turbine discharge. If this decrease resulted in turbine operation in an untenable draft tube surge range then the unit would have to be shut down.
REFERENCES
[l] King, D. L., "Hydraulic Model Studies for Grand Coulee Third Powerplant Forebay and Tailrace Channels," Bureau of Reclamation Report REC-ERC-73-2, February 1973.
(2] Rhone, T. J., "Hydraulic Model Studies for the Penstocks for Grand Coulee Third Powerplant," Bureau of Reclamation Report REC-ERC-74-12, August 1974.
[3] Zeigler , E. R., "Hydraulic Medel Vortex Study - Grand Coulee Third Powerplant," Bureau of Reclamation Report REC-ERC-76-2.
[ 4] Berge, J . P .. , "Study of Vortex Formation and Other Types of Abnormal Flow in an Enclosure With or Without Open Surface," La Houille Blanche , Vol. 21, No. 1, pp. 13-40, 1966, Bureau of Reclamation Translation No. 665, October 1967.
[5] Angel in, S. and Larsen, P., Discussion - "Factors Influencing Flow in Large Conduits," Journal of the Hydraulic Division, ASCE, Vol. 92, No. HY4, pp. 201- 202, July 1966.
[6] Denny, D. F., and Young, G. A., The Prevention of Vortices and Swirl at Intakes, Transactions, 7th Meeting of International Association for Hydraulic Research, Seventh Congress of IAHR, Publication C.1, Lisbon, 1975.
(7] Linford, A., "Application of Models to Hydraulic Engineering," Water and Water Engineering, Vol. 69, No. 829, pp. 105-110, March 1965.
436
. .. , _,. ,_ ·-- . ., ·- ~ .. ,_,. ... , ........ - ·--·------··---·-- -------~
Re Eng. Mgr. Managing Asst. Chi Mgr. Nucl,
ABSTRACT
The occur: pump sump: due to vil ing the ~ Unit 1 Emt
· perfectin~ tection fa der _emergE A hydrauli 180°F and permitted able dimen ducted usi screen blo No vortex trapped un, entraining in a horiz, developmen· eliminated
~ La pr~sencE ables dans quer des pe son des vi1: evaluer le Farley (Ref teurs) et p protege non admission d Un modele h pouvant att nal a penni nombres ill ete pratiqui pour differ, diverses pr, tourbillon 1
que la masst tend a prove aient obstri. eur de la c, d'une cage ! pennis de s1


J ~:)~ - ·.~
-, • ~· 't
;. : . ... .. ·, -~-- !~
·-... "! . . ; \ .-·-, ~-
...... . -,
r ~ - ;;• ,
. . : .. , . .,, _
· ,, I: 1. : } . t --:
; ._;-~- -- ... -:' ~- .
{ i
i I
l .1 f
ASCE - IAHR/ AIHR - ASME
JOINT SYMPOSIUM -on • "II I
aer-1crn . ~-~ .l.
and operation of FLUID MACHINERY
June 12 - 14,
- \-0::,; 1978 <:""t,~
Colorado . ~,:. State Univers i ty
L,~
Fort Col i ins , .- ,- Colorado, USA
POL YPHASE FLOW TRANSIENTS PRESSURE RECOVERY DEVICES INTAKE STRUCTURES COOLING WATER SYSTEMS
I •
l

J
ciA?f;ifhiirff'"'BiM:c-.::k:..:,_.:...-,· zi::l> +:tt:ci l · itt'ii Nik· de; a, ·, n w
I
narures
0.. 0
that (20) can
I 1totyt. ;; is .. µsis
r.23.
,port,
: (1977),
,,. p.171.
11. m4.
\
ABSTRACT
STUDIES OF A METHOD TO PREVENT DRAFT TUBE SURGE IN PUMP-TURBINES
*
* Thomas A. Seybert
* Walter S. Gearhart
** Henry T. Falvey
APPLIED RESEARCH LABORATORY The Pennsylvania State University
Post Office Box 30 State College, PA 16801
** Bureau of Reclamation Post Office Box 25007
Denver, Colorado 80225
This paper describes a method of preventing draft tube surge in pump-turbines by injecting some high energy fluid from the spiral casing into the draft tube counter to the direction of the swirl. An air flow facility was used to simulate the flow in the draft tube. The study investigated the effectiveness of various nozzle geometries in reducing draft tube surge over a range of swirl parameters. The results of these tests provide design criteria for selecting injection nozzle configuration. The minimum ratio of bypass flow to draft tube flow to prevent draft tube surge for various swirl parameters was determined. The loss in efficiency associated with bypassing fluid into the draft tubes is evaluated for the Grand Coulee Third turbines.
Cet essai decrit une methode d'empecher les ondes de pression dans des tubes d'aspiration des pompes-turbines par !'injection d'une partie du fluid de la bache spirale dans l'aspirateur centre la direction de la rotation. Un modele experimental, que uciliser l'air pour le fluid, etait employe de si.muler l'ecoulement dans l'aspirateur. L'etude a examine l'efficaciti des divers giometriei de la buse en reduisant les ondes depression pour un rang des parametres de la rotation. Les resultats des essais fournissent le dessin critere pour le choix de la configuration de la buse. Le rapport minimal entre l'ecoulement diverti et l'icoulement dans l'aspirateur etait determine enfin d'eli.miner les ondes depression pour les divers parametres de la rotation. La perte du rendemenc a cause de la diversion du fluid dans l'aspirateur est evalue pour les Grand Coulee Third turbines.
15;1.
> _;_, .. z:, _ . €4

./
1 i
l ' l ,, l
J
_i
-- , 1
w · -5 t · f ' .
NOMENCLATURE
S momentum parameter
rl flux of moment of momentum
D diameter of draft tube
D' diameter of injection nozzle
p mass density
Q flowrate
ri radius of trailing edge of wicket gates-
Vei circumferential velocity of wicket gate exit
VeT circumferential velocity in draft tube throat
VAT axial velocity in draft tube throat
QB bypass discharge
QT turbine discharge
Tl efficiency
H head
~ total area of injection nozzles
~ area of draft tube throat
y density
g
p
gravitational constant
power
, cc ·-· :.,
a fluid flow angle at trailing edge of wicket gates
f frequency of surge condition
~ rms value of surge condition
Note: all dimensions are in SI units.
INTRODUCTION
The occurrence of draft tube surge in hydroelectric turbines has received- considerable attention during the past decade as
152
evidenced by bibliography
The gen, is related t , the disch.arg an unstable pulsations d may cause se and vertical
Real.izi with th.e amo obvious solu
Stra.igh been suggest losses or st has, in some tions. Appe cylinder to the intensit majority of excessive er induce exce.!
A METHOD TO
A meth, off design • machine whe1 efficiency : the draft t, is operatin: negative sv.
"The me a series of immediately arrangement fluid in th discharge f separate ro of injectin An arrangem positive or will be dir spiral casi activated o the flow tc dischargin2

J
rbines 18
evidenced by reference (1] which is a review and annotated bibliography on the subject.
The general consensus is that the origin of draft tube surge is related to the amount of angular momentum or swirl left in the discharge flow from the turbine. The swirl gives rise to an unstable flow pattern in the draft tube which causes pressure pulsations described as draft tube surge. The draft tube surge may cause severe noise and vibration, variation in power output and vertical movement of runner and shaft.
Realizing that the onset of draft tube surge is associated with the amount of swirl present in the discharge flow, the obvious solution would consist of eliminating the swirl.
Straightening vanes and fins located in the draft tube have been suggested and tried but have resulted in either efficiency losses or structural and cavitation damage. Injection of air has, in some cases, reduced the magnitude of the pressure pulsations. Appendages attached in the draft tube such as a hollow cylinder to contain the vortex core or solid fairings to reduce the intensity of the vortex have met with limited success. The majority of the methods that have been attempted cause either excessive energy losses, result in cavitation damage, or · induce excessive structural vibrations.
A METHOD TO PREVENT DRAFT TUBE SURGE
A method that reduces the rotation in the draft tube flow at off design conditions and does not effect the efficiency of the machine when it is operating at or near its point of best efficiency is necessary. It must not consist of appendages in the draft tube or impair the performance of the machine when it is operating as a pump. The elimination of either positive or negative swirl should be provided.
"The method that is considered in this . paper consists of a series of flush mounted nozzles located in the draft tube imixiediately downstream of the turbine rotor. A schematic of the arrangement is shown in Figure (1). The nozzles will inject fluid in the draft tube counter to the peripheral motion of the discharge flow. Although not indicated in the figure, two separate rows of nozzles could be provided with one row capable of injecting fluid in a direction opposite to that of the other. An arrangement such as this would permit the reduction of either positive or negative swirl. It is envisioned that the nozzles will be directly .connected to the high pressure fluid in the spiral casing or penstock. An appropriate system of valving, activated on the basis of wicket gate opening, would control the flow to the nozzles and could control the number of nozzles discharging.
153
1 •• ..-·---.._ "'Mi:"'.t"'~'!llflll!:.1",1:?~···:!"!;~~"". ·"'9°"~ .. ~!'!_..~l'".~/r'!':;;..... "'!s!!l!_( l!1!.~!$!1!.4~,¥111Zl!l!.,l!!;-s¥~!4M.'-!.All!'. ,µo!19!!1, 1!!!)411!!. il!!,f!'r~*l'IJ,1!!1Jj!ll:.;!lli.@i,_ !ll!Ull!!ll!.kftd!!!, ~§~%!!1111illl. 11!4!111!1. !". 'll'lll!!'. l!!I.Z!'!Sl"!l,Al!!!,, 4!!!21'!!1.Al!l. !11A'-". !1>"'""""'4"'··--"'·"'""''""";;"";"'z;;111. "'·"'""· -"""'lt....,. z_...,.. ______ _._...

/'
.. ~
. -... ';.,_ · ,.. --.~ -.. ~,;,;;'Hri:'4#1..;htt:r::h ·frnStftfiSfttz@ft'Si~ 'P WrlftiiectWtf''~# ·' :&¥ n·u
CI RCUMFERENTIAl MANIFOLD
SECTION A· A THRU SWIRL NOZZLE TYPICAL 3 PLACES EQUALLY SPACED
Figure 1 - Schematic of Proposed Means of Preventing Draft Tube Surge
An alternate arrangement to that shown in Figure (1) would consist of swirl nozzles individually connected to the spiral casing by separate piping and valving.
The nozzles shall be flush mounted on the wall of the draft tube and thereby provide a minimum flow disturbance when the swirl nozzles are inactive. Their presence should not cause any loss in efficiency or cavitation resistance of the machine when they are inactive. Of primary importance is an evaluation of the amount of fluid that must be drawn from the high pressure side of the turbine and discharged into the draft tube. The bypassing of such fluid represents an energy loss that for purposes of analysis, will be considered as totally unrecoverable. On this basis, the swirl in the draft tube must be reduced to some specified value with a minimum rate of injected fluid if the described technique is to be successful, An engineering estimate of the ratio of bypassed flow to flow through the turbine can be obtained on the basis of momentum consideration.
The momentum or swirl parameter describing the ratio of angular to axial momentum flux in the draft tube is defined in [2]. Figure (2) illustrates the nomenclature and stations considered where,
154
(1)
l i i i i • J
!
f I i
I
A-
Figur,
The consei between the wic quantity VA n draft tube. T n of tangential ~ represented by averaged quant:i would occur at the draft tube.
and substituted
It is propc momentum flux tt opening to that periodic draft t the angular mome injected fluid i S, which is less is predicted to
If the crit in the draft tub through the swir flow and velocit:

(
Draft Tube
·e (1) would .he spiral
of the draft when the ct cause any achine when uation of pressure
be. The at for unrecoverable. educed to fluid if
ineering gh the sideration.
ratio of defined in ations
\.
(1)
__..., . ... ,.,,.t+_.· , ... ·ct .. - -t-,aa,,..,..,, ___ _. .. ••·--,:... ..... _____ ..... ...,....., ____ .._,.;..__...,.....,.__.._ ...... .._..,....,._ ........ _._,).-;;:,...,,;. .v.-~·;
WICXIT GATES
SECTION A·A
Figure 2 - Schematic of Flow Leaving Wicket Gates
The conservation of angular momentum is assumed constant between the wicket gate exit and the draft tube throat. The quantity VAT represents a mass averaged axial velocity in the draft tube. The assumption is made that the radial distribution of tangential velocity at a given section in the draft tube is represented by a potential vortex. On this basis the mass averaged quantity VeT, at a _g_iven section of the draft tube, would occur at the diameter D associated with the mean area of the draft tube. This can be expressed algebraically as:
and substituted in (1) to give
It is proposed to reduce the ratio of angular to axial momentum flux that exists in the draft tube at any given gate opening to that level which exists prior to the occurrence of periodic draft tube surge. This level would be attained when the angular momentum of the draft tube flow and that of the injected fluid is summed to give a resultant swirl parameter, S, which is less than that at which periodic draft tube surge is predicted to occur, s*.
* If the critical swirl paramter S is not to be exceeded, in the draft tube, the amount of fluid that must be injected through the swirl nozzles can be evaluated. The quantities of flow and velocity associated with the critical swirl parameter
155
(2)
(3)
' ..

...
shall be noted by an asterisk. The quantity of bleed fluid required to obtain the critical swirl parameters* in the draft tube can be determined by equating the difference between the angular momentum from the turbine discharge QT Ver and that of the bypass fluid QB /:fgH to the angular momentum at the critical condition Q; V~T· Thus,
(QT VeT)
* * (QT VAT)
QB /2gH
* * (QT VAT) * 2.22 S (4)
and Equation (4) can be rearranged to provide a ratio of bypass flow to draft tube flow in terms of the swirl parameters (S) and cs*) as
* 2.22 VAT
(5)
The decrease in' efficiency (6n) of the turbine due to bleeding bypass fluid to the swirl nozzles assuming that none of the bypass fluid energy is recovered is:
Q Lin• (lOO)(QB)
T (6)
If Equation (5) is considered for a given (S), the numerator is essentially constant, independent of turbine head. This is based on the assumption, for cavitation purposes, that the velocity at the design condition in the draft tube throat for conventional turbine installations has some upper limit. The ratio of QB/Qr specified by (5) decreases as some reciprocal function as head is increased. On this basis, Equation (6) indicates the decrease in efficiency, due to bleeding bypass fluid to the swirl nozzles, will be less in a high head turbine than in a low head turbine.
TEST APPARATUS
Investigations for this paper were conducted in an air flow facility as shown in Figure (3). Similar studies conducted in [2] and [3] have shown that the use of air as a working fluid has been quite successful in characterizing the swirl parameter in draft tube flow and predicting the occurrance of draft tube surge. The main air supply was provided by a variable speed
156
*
M£T!]!ING
~·2t= A.OW FROM VARIABLESPEED BLOWER
STILi.iNG CHAMBER/ I.it CUBE!
II C
INJECTION - C R.UID (.
Fig
centr.ifugal blo" ment. The meter chamber where sc the stilling ch: draft tube radi, angle between tl angle between o· It can be shown reduces to K(t. and Cl is the av data across the probe were used settings. This parameter as a by an auxiliatJ arrangement enl section locate< injection flui , flow) Gr, coul• valve on the a· provided three circumferentia Nozzle geometr pointed out th sum of the thr the nozzle te: draft tube (L/ all along the could be repl:
·-~-------· ..-,;-,---"---..~ .. ~, -.. ·"",!!l!l."!!,lll!'I. Zll'l""ZQl!J!IIJ!l\1!!!11.-fillll!. ,.:-,

d fluid a the ace between 3T and that it the
(WICKET GATES) INJECTION FLOW SCREENS \ ENTRANCE TO
MANIFOLD
LOCATION OF PRESSURE %TERIN aD ORIFICE
I
~
1I '~~ T RAPICK
V ERSINGUP
, /D = 4.40
ORIFICE I TRAVERSING, L/0 = 440
FLOW FROM VIEW A-A
VARIABLE- CYLINDRICAL SPEED BLOWER DRAFT TUBE
NOZZLE LID =4.56 TEST SECTION
INJECTION STI LL ING CHAMBER MANIFOLD (IR CUBE) r ,, of bypass ers (S)
METERING Kr LOORIFICE ~
INJECTION FLUID
(5) A-A
Figure 3 - Schematic of Air Flow Facility
(4)
ae to bleeding if the bypass
(6)
e numerator This is the
oat for t. The procal n (6) bypass d turbine
L air flow icted in ;. fluid iarameter :ft tube speed
centrifugal blower and was measured by an orifice meter arrange-ment. The metered air flow was diffused as it entered a stilling chamber where screens were used to reduce flow turbulence across the stilling chamber flow field. The air entered a cylindrical draft tube radially through wicket gate type swirl vanes. The angle between the vanes and a radial line could be set at any angle between 0° (radial position) and 82.5° (closed position). It can be shown that the dimensionless momentum parameter 2D/pQ2 reduces to K(tan a) for this test facility, where K = constant and a is the average flow angle leaving the wicket gates. Traverse data across the trailing edge of the wicket gates using a prism probe were used to determine flow angles for various wicket gate settings. This data was used to develop a relation for swirl parameter as a function of gate setting. Injection fluid provided by an auxiliary air supply and measured by an orifice meter arrangement entered the manifold of the injection nozzle test section located just below the wicket gates. Any ratio of injection fluid flow, QB to fluid flow through the gates (turbine flow) QT, could be provided by the proper setting of a butterfly valve on the auxiliary air supply blower. The nozzle test section provided three points of fluid injection equally spaced in a circumferential plane perpendicular to the draft tube centerline. Nozzle geometries tested are shown in Table I. It should be pointed out that in Table I, AN, nozzle area, was defined as the sum of the three separate nozzle areas. After passing through the nozzle test section, the air flow entered the cylindrical draft tube (L/D=4.56). Pressure taps and probe holes were located all along the length of the tube. The cylindrical draft tube could be replaced with an elbow type (Fontenelle) draft tube.
I&&

6.
-20
-30 Id81
-40
-50
-60
•70 0 10
DISCUSSION OF
The effect geometries were in reducing the draft tube. Al as recommended compressible of the reduction it is shown by Figt and the frequent is increased. T at a QB/QT of 16 this condition o
The angle o studied with resl swirl in the drat gated, these beir, The nozzle geomet Table I, and the parameter of 0.8 that, up to the 4. amplitude is indel of the curves in to completely elin of QB/QT required,
Table 1
NOZZLE SHAPES TESTED
THROAT OF NOZZLE
~L~
1q: MD
D 3 INJECTION NOZZLES INTO DRAFT TUBE
Nozzle Number
Injection Angle, 0
Idegl
Nozzle Area, AN
(Sgin.)
AIN T
11hl L1t"!
1 30 1.500 5.09 8.0
2 0.750 2.54 4.0
3 I 0.375 1.27 0.5
4 + L 125 3.84 1.5
5 0 0.750 2.54 1.0
15 30
1 1 45 • 6 30 0.188 0.64 4.0 7 0.750 2.54 0.25
8 0.610 2.04 circle
9 1.325 4.48 circle
10 0.375 1.27 1.0
11 4.0 12 0.25 13 1.50 5.04 1.0 14 4.0
15 0.25
The unsteady pressure produced by the swirling flow in the draft tube was monitored at the last pressure tap (L/D=4.40) on the draft tube by a dynamically calibrated differential pressure transducer. The pressure signal was sent to a Spectral-Dynamics real time analyzer in conjunction with an ensemble averager from which the frequency, f, of the surging condition could be established.
Figure (4) shows typical data received from the analyzer. The root mean square value, >2, of the surging condition was p read from an RMS meter after the signal was passed through a line filter with a characteristic 48 dB per octave roll-off. The band pass of the filter was set at 20 Hz to 120 Hz for all tests. The frequency of all observed pressure surges was between 35 and 70 Hz. Directly across from the pressure pickup tap used on the draft tube was a probe hole used for flow field measure-ments. A prism probe was used to obtain total pressure, static pressure and fluid flow angle as a function of radial distance across the draft tube for various flow conditions. The basic parameters used in this study to describe the surging condition were the dimensionless groups suggested by [5], namely pressure parameter (D4 Y7=2 /pQ2) and frequency parameter (fD3/Q).
0' =0.5 in. D' =0.75 in.
\ _- 158

-10
•20
-30 (d81
40
-50
-60
-TO
INJECTION
S = L.18 CONDITION
8 Q8i0T (1.1
41
14
Ve 16 ( SURGE ELIMINATED Y
0 10 20 30 40 50 60 A] du w iw
FREQUENCY (Hz)
Figure 4 - Spectral Analysis of Surge
DISCUSSION OF EXPERIMENTAL RESULTS
The effect of various fluid injection angles and nozzle geometries were investigated on the basis of their effectiveness in reducing the unsteady pressure amplitude measured in the draft tube. All tests were at a Reynolds Numbers above 80,000 as recommended in [3] and at velocities low enough to prevent
in the compressible effects. A typical spectral analysis indicating
40) on the reduction in the amplitude of the unsteady surge pressure
1ressure is shown by Figure (4). It is apparent that both the amplitude ignamics and the frequency of the surge are reduced as the ratio of QB/QT
;er from is increased. The spectral analysis indicates no pressure peaks _ at a QB/QT Of 16% indicating that surge has been eliminated at
this condition of fluid injection.
yzer. The angle of fluid injection as defined in Table I was - was studied with respect to its effect on reducing surge for a given h a a swirl in the draft tube. Four angles of injection were investi- ff. gated, these being 0', 15', 30' and 45' as defined by Table I. r, all The nozzle geometry used in these tests was #5, described in between Table I, and the results are shown in Figure (5) for a swirl ap used parameter of 0.8 and 1.18. The most significant result being asure- that, up to the 45' angle tested, the reduction of surge pressure static amplitude is independent of injection angle. The lower end points Lance j of the curves in Figure (5) represent that ratio of QB/QT required laic to completely eliminate surge and it is evident that the quantity iition of QB/QT required, is equal for the four injection angles tested. assure
159

SYMBOL 0 (deg)
Q 0 a 15 0 30 O 45
5=L 18
5=0.80
(r
LO
c o 0.8
0.6
IL W
W 0.4
a
I ~ Id
U 0.0 0.10 0.15
Q8IQT
Figure 5 — Comparison of Nozzle Angle of Injection
An injection angle of 30° was selected for the tests to investigate the effect of the length to width ratio of the injection nozzle as well as the ratio of the area of the injection nozzles to the draft tube throat area. The ratio QB/QT is plotted against the surge pressure parameter for a series of nozzle geometries at the swirl parameters in Figure (6). The lower extremity of each curve represents a condition where surge is eliminated and thereby indicates the ratio of QB/QT required to eliminate surge for a given AN/AT ratio. Figure (6) illustrates that for a given ratio of QB/QT, the reduction in the surge pressure amplitude is greater as AN/AT decreases. This results directly from the fact that to inject a given ratio of QB/QT into the draft tube the head and hence the velocity must increase as AN/AT decreases. Since the momentum of the injected fluid increases as the square of the spouting velocity from the nozzles, smaller ratios of QB/QT are required to eliminate surge as the head on the turbine increases.
Table I lists the various nozzle geometries tested and defines their characteristic dimensions. The rather surprising result being that for the various L/W nozzles tested, no measurable difference was observed in the ratio of QB/QT required to eliminate surge at a given AN/AT. This result suggests that the choice of a nozzle geometry to obtain a given AN/AT would consist of selecting that geometry which would give the least hydraulic losses and permit the easiest fabrication. On this basis, a cylindrical nozzle which would be elliptical at its intersection with the barrel of the draft tube would seem appropriate.
0.2
Figu
the draft tangentia tube were
i by means of a prise the
vee local static locity distribute
meters of 0.24, agures 0.4
represents s a setting corresp
1.0
i 0.8 r
0.6 1
Y
~/r SURGE Y w ELIMINATED
0.4 8Y FLUID INJECTION d 0.24 S =0.80
a ~
0.2
0
0 0.5 1.0
Ve/VAi
Figure 7 - al
0.10
QBIQT 0
160
r

SYMBOL
i
I ANIATI%1 L(W
G 1.21 1.0 0 2.04 circle 0 2.55 1.0 0 3.82 L 5 O 4.48 circle
\ 0 5.D9 1.0
S. 1.18
S =0.90
L
L
0.
L I
m 1s 2n 0 5 10 1'
FLOW RATIO, Q8/QT f%I FLOW RATIO, 0810T I%I
Figure 6 - Comparison of Nozzle Geometries
The tangential and axial velocity components of the flow in the draft tube were measured at a station indicated on Figure (3) by means of a prism probe which provided a time averaged reading of the local static, total pressure and flow angularity. The velocity distributions are shown by Figure (7) for swirl para-meters of 0.24, 0.41, 0.80 and 1.18. The dashed line in these figures represents similar traverse data having the wicket gates at a setting corresponding to a swirl of 0.8 but with fluid
tion
is to :he
ltio rr a "igure Aition o of o. the &N/AT inject fence
the 'QT are tcreases.
LY
0.8
0, 8
0.80 \?.
SURGE ELIMINATED BY FLUID INJECTION S =0.80 — ¢
nd rising
required s that auld Bast :his .ts
0.6
rlrw
0.4
0.2
_ d 0.41
SURGE i —ELIMINATED
BY FL UIO \40.2 — INJECTION S S=0.80`,'
S=1 ' IS 0.80
X0.41
0.24/
V@/VAT VA(VAT
Figure 7 - Axial and Tangential Velocity Distribution
161

t
injected to eliminate surge. It is evident that the reversal of axial flow at the axis of rotation is eliminated and considerable swirl has been removed from the flow when fluid is injected.
Without injection, the outer portion of the flow approaches a free vortex or constant angular momentum distribution with solid body rotation near the center. The peripheral velocity distribution downstream of a turbine runner may deviate from that indicated in Figure (7). The effect of such variation has not } been investigated in the present studies but deserves future consideration.
- ss i
QB
COMPARISON OF TEST RESULTS WITH PREDICTIONS Qi
a r The ratio of bleed flow to turbine flow was previously derived
in Equation (5), assuming ideal momentum transfer between the injected and draft tube flow. On the basis of the preceding
'~ experimental data, it is possible to derive an empirical relation that applies to pump—turbines. The bypass flow can be expressed as
z QB = K1 (2gH)1/2 AN (6)
where K1 is a nozzle coefficient and assumed equal to 0.9. The flow through the turbine can be written as
_ 1 P QT n Hy (7) Figure
for S=1.18 The ratio of bypass flow to turbine flow is then
P H3/2 (8) QB/QT = 39,100 n
The results of experimental data indicating, for a given AN/AT, for 5=0.80.
that ratio of QB/QT required to eliminate surge at two swirl Consic
parameters are shown in Figure (8). A curve fitting of this substitutit
data indicates a relation
QB/QT - 0.719 (AN/AT)'.401 (9)
162

(6)
0.9. The
(7)
(8)
ven AN AT, o swirl of this
0
8
6
.z
i '0 C=CIRCLE
A % o S=0.80
F S = 1.18 r ;
g r r r r
/ r / r
6
0 1 z s 4 a AN/AT M
Figure 8 - Injected Flow Required to Eliminate Surge for Cylindrical Draft Tube
for S=1.18 and,
QB/0T = 0.473 (A,,/AT)0.366 (10)
for S=0.80.
Considering a swirl parameter of 1.18, it is possible by substituting (9) in (8) to obtain a relation for QB/QT of,
reversal of i considerable rjected.
sr approaches 4on with { velocity
'Ite from that 2n has not j
future
riously derived peen the .-eceding _cal relation re expressed

In similar fashion, the substitution of (10) in (8) provides a relation of QB/QT for a swirl parameter of 0.8,
QB/QT = j (12)
1460 (n P )0.578 x0.867
An elbow-type draft tube was also evaluated to indicate the influence of draft tube shape. The draft tube tested was similar to the Fontenelle configuration described in [3]. The data and equations relating AN/AT to QB/QT required to eliminate surge for this draft tube is shown in Figure (9). By applying the same analysis as indicated for the cylindrical draft tube, the ratio of bypass flow to turbine flow for the elbow-type draft tube
24
22
OB — M QT
16
QB AN AN 2 /
OT AT AT~ °//
i311
j
o /
FONTENELLE
/ ORAFT TUBE
a 5=0.80
0 5=L18 i
2 / O 0.1026 ,36.82
QT AT
Z 3 4
ANIAT (S)
Figure 9 - Injected Flow Required to Eliminate Surge for Elbow Draft Tube
was calculated. Using performance, geometrical data and a speed coefficient of ~=0.8 for the model of the Grand Coulee Third Power Plant Units given in [4], the bypass flow rates were determined for a cylindrical, and an elbow-type draft tube, Table II.
Predicte Ideal (Eq. (5)
Predicte Empirica
The compar of Qg/QT r, is about 2 momentum t: between the availabilit other exist similar est the specifj
It she (12) in con required, f 0.8 or 1.18
SUMMARY AND
Experii surge by in. existing sw:
As the surge frequf in magnitudE
The usE indicates nc in reducing angles up to reducing sur selected pri of fabricati
Empiric area of the required for
164

(8) provides a Table II
GRAND COULEE THIRD POWER PLANT BYPASS RATES
' (12) S=0.8 S=1.18
Predicted Ideal QB/QT=6.35% QB/QT=5.622
:U indicate the ! (Eq. (5)) ;ted was Similar E
The data andd Predicted QB/QT 10.3% QB/QT=13.9% (cylindrical)
inate surge Empirically QB/QT=11.5% QB/QT=13.0% (elbow) 'lying the same
)e, the ratio 'raft tube
The comparison indicates that the empirically derived quantity of Qg/QT required to eliminate surge at a swirl parameter of-1.18 is about 2.5 times greater than that predicted assuming an ideal momentum transfer. At the lower swirl parameter, the difference between the estimated values of QB/QT is not as great. The availability of performance characteristics and geometries of other existing or new turbine installations would permit making similar estimates of the required QB/QT to eliminate surge at the specified values of swirl parameter.
It should be emphasized that solution of Equation (11) and (12) in conjunction with Figure (9) also specifies the AN/AT required, for a given turbine, to eliminate surge at a swirl of 0.8 or 1.18.
SUMHARY AND RECOMMENDATIONS
Experimental studies with respect to eliminating draft tube surge by injecting fluid into the draft tube counter to the existing swirl resulted in the following observations.
As the ratio of injected fluid QB/QT is increased, both the surge frequency and the amplitude of the surge pressure decreases in magnitude.
The use of various nozzles geometries with a fixed AN/AT indicates no measurable change in the effectiveness of the nozzle in reducing or eliminating the surge. Similarly, nozzle injection angles up to 45° show no difference in their effectiveness in reducing surge. On this basis the nozzle geometry would be selected primarily on the basis of hydraulic efficiency and ease of fabrication.
Empirical data is presented which permits estimating the area of the injection nozzles and the quantity of bleed fluid required for turbines of specified performance characteristics.
for
a speed Eird e e,
165

At a given swirl parameter, the quantity, Q /Q required to eliminate surge decreases as higher head turbines or lower
specific speed machines are considered.
Further investigations are required to gather data indicating I the influence of draft tube shape on the effectiveness of fluid injection in reducing draft tube surge.
The hydrodynamic effects such as cavitation arising from the interaction of the draft tube flow with the high velocity injection jets should be experimentally investigated.
ACKNOWLEDGMENT
The E This work was performed at The Applied Research Laboratory in plane-v
of The Pennsylvania State University and sponsored by the United as the wor States Department of the Interior, Bureau of Reclamation of Denver, Steadiness Colorado as part of the Bureau's Pumped Storage Research Activities ( di be d direC under their Energy Research and Development Program. j Quantitati
i indicates a geometri
REFERENCES
[1] Falvey, H. T., "Draft Tube Surges--A Review of Present Knowledge and an Annotated Bibliography," Report No. i REC-ERC-71-42, U. S. Bureau of Reclamation, Denver, Operatingoperattinng Colorado, December 1971. } flow stabil
(2] Cassidy, J. J., "Experimental Study and Analysis of Draft- f most all pr diffuser
Tube Surging," Report No. REC-OCE-69-5, U. S. Bureau of i pe I flow behavi
Reclamation, Denver, Colorado, October 1969. d systemati ferredto a
[3] Palde, U. J., "Influence of Draft Tube Shape on Surging diffus
Characteristics of Reaction Turbines," Report REC-ERC-72-24, { tfluctua y
U. S. Bureau of Reclamation, Denver. Colorado, USA, 1972. unsteadines (28), and t, [4] Palde, U. J., "Model and Prototype Turbine Draft Tube increase as
Surge Analysis by the Swirl Momentum Method," IAHR and their studio AIRH Symposium, 1974. t iZation purf
? variations i [5] Falvey, H. T. and Cassidy, J. J., "Frequency and Amplitude formance s cri of Pressure Surges Generated by Swirling Flow," Transactions numbers.
of Symposium Stockholm 1970, International Association for Hydraulic Research, Part 1, Paper E1, Stockholm, Sweden,
The 1970.
pre # to high Reyn
fluid. Resu Pressure rec
i fusers are r and a synthe:
! pressure recc presented anc
166
I


![Predgovor [Foreword].](https://static.fdokumen.com/doc/165x107/63333df9ce61be0ae50e8cf4/predgovor-foreword-1681982858.jpg)