![Predgovor [Foreword].](https://static.fdokumen.com/doc/165x107/63333df9ce61be0ae50e8cf4/predgovor-foreword-1681982858.jpg)
Foreword - Pakistan Centre for Philanthropy
44
-
Upload
khangminh22 -
Category
Documents
-
view
0 -
download
0
Transcript of Foreword - Pakistan Centre for Philanthropy


CORPORATE PHILANTHROPY SURVEY | 2016
Page i
Foreword This annual review of Corporate Philanthropy seeks to extend the comprehension of corporate giving in Pakistan. This report features patterns of giving, best practices and strategic policy considerations that could create a more enabling environment for corporate giving. On this journey, we have seen an unwavering increase in the volume of corporate philanthropy, an extension in the scope of philanthropic activities, and a steady shaping of Corporate Social Responsibility (CSR) in Pakistan. We hope to see continuing progress in this regard in the years to come.
Pakistani companies have great potential to do social good and are increasingly seen as key players in tackling some of society’s challenges of poverty and low human development. Businesses are now actively feeding into the realization of Sustainable Development Goals (SDGs) and are expected to play a prominent role in future. This report covers giving by three types of companies in Pakistan namely; Public Listed Companies (PLCs), Public Unlisted Companies (PUCs) and Private Limited Companies (PvLCs). This study also provides insight into Pakistan’s biggest companies and how they deploy their corporate philanthropy. For many, these entities are considered role models which set an example for the broader business community.
We, at Pakistan Centre for Philanthropy (PCP) believe that philanthropy is a powerful tool for driving sustainability. Our research on corporate philanthropy aims to create an evidence-based debate to ensure that philanthropy becomes an ever increasing part of our social consciousness and dialogue. This report highlights the current state of corporate philanthropy, assessing what corporations in Pakistan are actually doing in contrast to the public’s perception. The results highlight a gap between the two and call for businesses to adopt a greater sense of social purpose, an increased emphasis on impact measurement, and more transparency in reporting of all charitable and philanthropic activities.
This year, philanthropic donations of PLCs have reached to the highest ever level of PKR 7.31 billion marginally higher than previous year’s figure of PKR 6.97 billion. The trend shows continuous interest and commitment of the corporate sector in Pakistan towards social causes. In the case of our sample PUCs (474) and PvLCs (360), it is inspiring to see their total CSR contributions of PKR 2.2 billion, implying for the
presence of an instrumental potential resource if harnessed effectively.
The findings of study would be useful in deepening awareness about corporate philanthropy and in presenting an action agenda for PCP, for the government, and other stakeholders who are engaged with social development initiatives. PCP also hopes that findings of this survey report will facilitate the government, civil society organizations, and businesses to make informed decisions to further enhance the volume and effectiveness of philanthropy in Pakistan.
Mr. Zaffar A. Khan, S.I. Chairman, Board of Directors, Pakistan Centre for Philanthropy (PCP)
CORPORATE PHILANTHROPY SURVEY | 2016
Page ii
Acknowledgements This 13th volume on corporate philanthropy is the latest addition to the Centre’s annually published survey of giving by the business sector in Pakistan. Besides quantifying the volume of philanthropy in usual pattern, the current survey also presents in-depth analysis of some of the qualitative aspects which strengthened our belief that indigenous philanthropy is a significant source of social development, if effectively channelized.
This report in your hand is a product of deep and extensive effort and commitment of many individuals. Since 2015, the research team has gone an extra mile to gather information on two new segments of the corporate universe in Pakistan, i.e., Public Unlisted and Private Limited Companies. This year they have also included findings from one-on-one interviews with top giving companies to provide a qualitative background to the numbers.
The successful completion of this survey on corporate philanthropy owes acknowledgment to the collective efforts of those individuals without whose contribution PCP would not have been able to bring out this report. First of all, PCP owes its gratitude to Mr. Zaffar A. Khan, Chairman PCP, for his unwavering support, guidance and perceptive input. PCP also owes its appreciation to Dr. Attiya Inayatullah, Chair of the Research Committee, and the entire Board of Directors for their assiduous support.
The financial data contained in this report was largely obtained from Securities and Exchange Commission of Pakistan (SECP). We owe special thanks to Ms. Sumaira Siddique, Additional Director of Corporatization and Compliance Department, who provided unconditional cooperation, especially in the case of data collection on Public Unlisted and Private Limited Companies.
We also owe gratitude to all those Companies who attended our calls, responded and provided the requisite data on their philanthropic activities. Special thanks are due to those companies who kindly granted us time for interviews. This part of the process is integral as good information forms the foundation of our work. We look forward to their cooperation in the ensuing years as well.
My special thanks to Narmeen Adeel, Manager Research for her dedicated help and oversight in finalizing the report. I am grateful to the entire research team; Mr. Muhammad Ashraf (Senior Program Officer), Mr. Muhammad Ali (Program Officer), Mr. Ali Jadoon (Junior Program Officer) and Mr. Saad Khan (Research Associate) for their meticulous work and contribution to this report. Finally, I would like to thank the entire PCP team for working together to achieve this success.
The Centre is thankful to all stakeholders who have utilized the successive volumes of the corporate philanthropy surveys and appreciate this endeavor. We hope that our readers find this volume informative and insightful. As always, we deeply appreciate any suggestions and comments for the improvement of this survey.
Shazia Amjad Executive Director Pakistan Centre for Philanthropy (PCP)
CORPORATE PHILANTHROPY SURVEY | 2016
Page iii
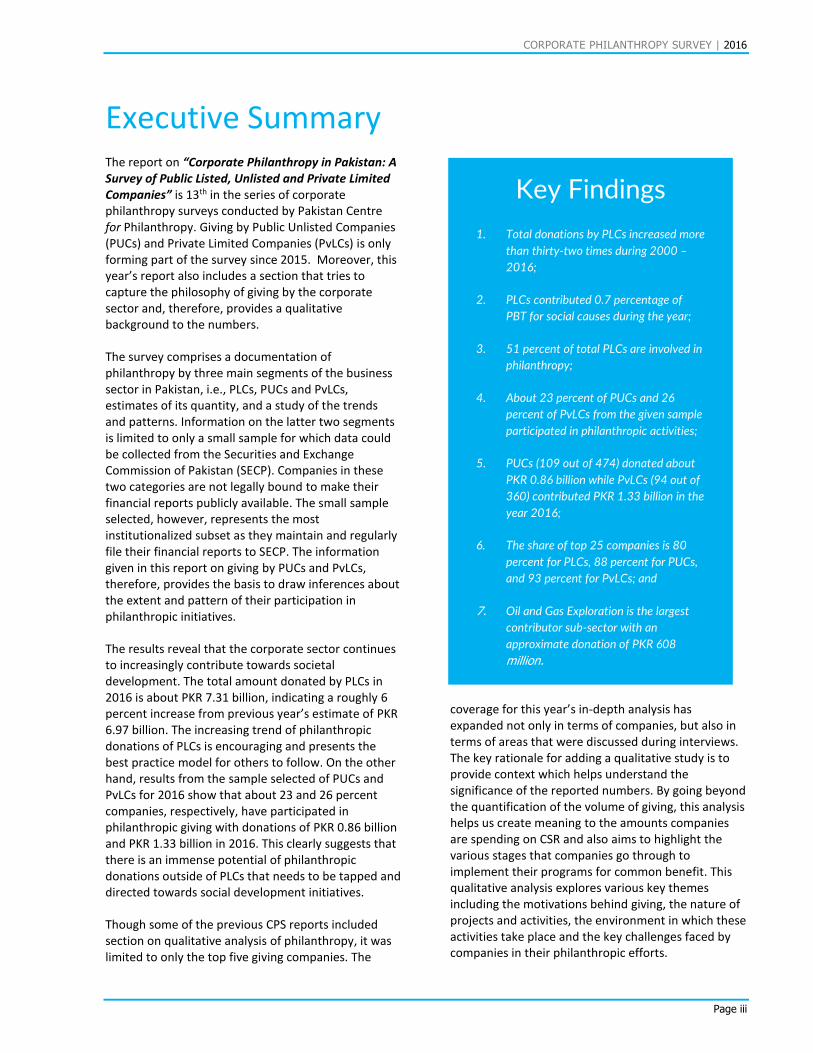
Executive Summary The report on “Corporate Philanthropy in Pakistan: A Survey of Public Listed, Unlisted and Private Limited Companies” is 13th in the series of corporate philanthropy surveys conducted by Pakistan Centre for Philanthropy. Giving by Public Unlisted Companies (PUCs) and Private Limited Companies (PvLCs) is only forming part of the survey since 2015. Moreover, this year’s report also includes a section that tries to capture the philosophy of giving by the corporate sector and, therefore, provides a qualitative background to the numbers.
The survey comprises a documentation of philanthropy by three main segments of the business sector in Pakistan, i.e., PLCs, PUCs and PvLCs, estimates of its quantity, and a study of the trends and patterns. Information on the latter two segments is limited to only a small sample for which data could be collected from the Securities and Exchange Commission of Pakistan (SECP). Companies in these two categories are not legally bound to make their financial reports publicly available. The small sample selected, however, represents the most institutionalized subset as they maintain and regularly file their financial reports to SECP. The information given in this report on giving by PUCs and PvLCs, therefore, provides the basis to draw inferences about the extent and pattern of their participation in philanthropic initiatives.
The results reveal that the corporate sector continues to increasingly contribute towards societal development. The total amount donated by PLCs in 2016 is about PKR 7.31 billion, indicating a roughly 6 percent increase from previous year’s estimate of PKR 6.97 billion. The increasing trend of philanthropic donations of PLCs is encouraging and presents the best practice model for others to follow. On the other hand, results from the sample selected of PUCs and PvLCs for 2016 show that about 23 and 26 percent companies, respectively, have participated in philanthropic giving with donations of PKR 0.86 billion and PKR 1.33 billion in 2016. This clearly suggests that there is an immense potential of philanthropic donations outside of PLCs that needs to be tapped and directed towards social development initiatives.
Though some of the previous CPS reports included section on qualitative analysis of philanthropy, it was limited to only the top five giving companies. The
coverage for this year’s in-depth analysis has expanded not only in terms of companies, but also in terms of areas that were discussed during interviews. The key rationale for adding a qualitative study is to provide context which helps understand the significance of the reported numbers. By going beyond the quantification of the volume of giving, this analysis helps us create meaning to the amounts companies are spending on CSR and also aims to highlight the various stages that companies go through to implement their programs for common benefit. This qualitative analysis explores various key themes including the motivations behind giving, the nature of projects and activities, the environment in which these activities take place and the key challenges faced by companies in their philanthropic efforts.
Key Findings
1. Total donations by PLCs increased more
than thirty-two times during 2000 –
2016;
2. PLCs contributed 0.7 percentage of
PBT for social causes during the year;
3. 51 percent of total PLCs are involved in
philanthropy;
4. About 23 percent of PUCs and 26
percent of PvLCs from the given sample
participated in philanthropic activities;
5. PUCs (109 out of 474) donated about
PKR 0.86 billion while PvLCs (94 out of
360) contributed PKR 1.33 billion in the
year 2016;
6. The share of top 25 companies is 80
percent for PLCs, 88 percent for PUCs,
and 93 percent for PvLCs; and
7. Oil and Gas Exploration is the largest
contributor sub-sector with an
approximate donation of PKR 608
million.

CORPORATE PHILANTHROPY SURVEY | 2016
Page iv
It is envisioned that qualitative analysis of the report would further enhance the understanding of the discourse on corporate giving as well as shed light on the behavior and motivation of top giving companies. The section would be of great value for all stakeholders including the government, corporate
sector, and civil society organizations in terms of providing first-hand knowledge on the contribution of the corporate sector towards social development and in identifying the ways to augment its impact on the society at large
Figure 1: Donations by PLCs over the years
0.23 0.34 0.65
2.33 2.24
3.27
4.11
5.86
7.31
2000 2002 2004 2006 2008 2010 2012 2014 2016
PK
R b
illio
n

CORPORATE PHILANTHROPY SURVEY | 2016
Page v
Contents Foreword ............................................................................................................................................................................. i Acknowledgements ............................................................................................................................................................ ii Executive Summary ........................................................................................................................................................... iii List of Tables ...................................................................................................................................................................... vi List of Figures ..................................................................................................................................................................... vi Acronyms ........................................................................................................................................................................... vi
The Context ......................................................................................................................................................................... 1 Corporate Philanthropy and Corporate Social Responsibility .................................................................................. 1 Corporate Philanthropy/CSR and Sustainable Development Goals (SDGs) ............................................................. 3 CSR in Pakistan ......................................................................................................................................................... 4 Corporate Philanthropy: The Rationale ................................................................................................................ 5 Scope and Methodology .......................................................................................................................................... 5 Data Collection and Analysis .................................................................................................................................... 6 Limitations................................................................................................................................................................ 6
Giving in Numbers - PLCs .................................................................................................................................................... 9 Number of PLCs ........................................................................................................................................................ 9 PLCs Involved in Giving............................................................................................................................................. 9 Donations by PLCs – In Absolute Volume and as a Percentage of PBT .................................................................... 9 Actual Donations vs. if Taken as 1 Percent of PBT ................................................................................................. 10 Giving Trend – Contributions by Top 25 vs. others ................................................................................................ 11 Individual Ranking .................................................................................................................................................. 11 Giving by Sub-sectors ............................................................................................................................................. 12
Giving in Numbers – PUCS and PvLCs ............................................................................................................................... 17 Prevalence of Philanthropic Giving ........................................................................................................................ 17 Individual Ranking .................................................................................................................................................. 17 Pattern of Giving – Total, by Top 25 and Top 5 ...................................................................................................... 19
Going Beyond Numbers: Qualitative Analysis of Top Giving Companies ......................................................................... 23 Rationale ................................................................................................................................................................ 23 Areas of Research .................................................................................................................................................. 23
Strategic Community Investment ................................................................................................................ 23 Aligning CSR with Long-term Development and the Sustainable Development Goals ............................... 24 Motivations for being Socially Responsible ................................................................................................. 24 Change in Annual Donations ....................................................................................................................... 24 Spending by Thematic Areas ....................................................................................................................... 25 In-kind Giving Practices ............................................................................................................................... 25 Areas of Operation ...................................................................................................................................... 25 Preferred Channel for Giving ....................................................................................................................... 26 Organizational Structures for CSR ............................................................................................................... 27 Internal and External CSR Regulations ........................................................................................................ 27 Tax Benefits ................................................................................................................................................. 28 Challenges in Giving .................................................................................................................................... 28 Creating an Enabling Environment for CSR ................................................................................................. 28
Conclusion ........................................................................................................................................................................ 29
CORPORATE PHILANTHROPY SURVEY | 2016
Page vi
List of Tables Table 1: Composition of the corporate sector in Pakistan ............................................................................................ 5 Table 2: Number of PLCs, PUCs, PvLCs .......................................................................................................................... 6 Table 3: Number of PLCs (2000 - 2016) ......................................................................................................................... 9 Table 4: Number and percentage of PLCs involved in giving (2000 – 2016) ................................................................. 9 Table 5: Philanthropy as a volume and as a percentage of PBT (2000 - 2016) ............................................................. 9 Table 6: Percentage share of Top 25 Giving PLCs vs. others: 2000 –16 ...................................................................... 11 Table 7: Top 25 PLCs by volume of donations – 2016 (PKR million) ........................................................................... 11 Table 8: Top 25 PLCs by volume of donations as percentage of PBT – 2016 (PKR million) ......................................... 12 Table 9: Giving by sub-sectors – 2016 (PKR million) ................................................................................................. 13 Table 10: Top 25 PUCs by volume of donation – 2016 (PKR million) .......................................................................... 17 Table 11: Top 25 PvLCs by volume of donation – 2016 (PKR million) ...................................................................... 18 Table 12: Top 25 PUCs by volume of donations as percentage of PBT donation-2016(PKR million) .......................... 18 Table 13: Top 25 PvLCs by volume of donations as percentage of PBT – 2016 (PKR million) ................................... 19 Table 14: Total donations, by top 25 and by top 5 ..................................................................................................... 19
List of Figures Figure 1: Donations by PLCs over the years ................................................................................................................. iv Figure 2: Actual giving vs. 1 percent of PBT ................................................................................................................ 10 Figure 3: Percentage of PUCs and PvLCs involved in giving ........................................................................................ 17 Figure 4: Motivations for giving .................................................................................................................................. 24 Figure 5: Reason of Change in Annual Donation ......................................................................................................... 25 Figure 6: Thematic areas preferred by companies ...................................................................................................... 25 Figure 7: Preferred channels for giving ....................................................................................................................... 26 Figure 8: Reasons of Preference of Companies........................................................................................................... 26 Figure 9: Percent distribution of tax knowledge and getting rebate .......................................................................... 28 Figure 10: Provision of enabling environment from Government side....................................................................... 28
Acronyms BoD Board of Directors Co. Company CP Corporate Philanthropy CPS Corporate Philanthropy Survey CSR Corporate Social Responsibility PCP Pakistan Centre for Philanthropy PKR Pakistani Rupee PLC Public Listed Company PSX Pakistan Stock Exchange PUC Public Unlisted Company PvLC Private Limited Company SBP State Bank of Pakistan SECP Securities and Exchange Commission of Pakistan

CORPORATE PHILANTHROPY SURVEY | 2016
Page 7
THE CONTEXT

CORPORATE PHILANTHROPY SURVEY | 2016
Page 8
CORPORATE PHILANTHROPY SURVEY | 2016
Page 1
The Context During the last many years, there has been a rise in the interest and belief that philanthropy has an important role to play in addressing human challenges and strengthening civil society. Over the course of time, the understanding has evolved, the strategies have expanded; earlier, philanthropic activities were mostly confined to affluent individuals of the world’s wealthiest countries. But now it is happening all around the globe; according to a recently launched report, around 98 percent of population in Pakistan is involved in philanthropy in one way or the other.1 The importance of philanthropy is accentuated by the fact that governments in recent years have gradually cut back their roles in provision of public goods and services. Such changes have redefined the roles and responsibilities between the state, commercial marketplace and civil society; the former adopting more of laissez-faire role while the latter emerging as providers of social services. It was this realization and recognition of the potential role that philanthropy can play that led to the formation of Pakistan Centre for Philanthropy (PCP). Among other goals of creating PCP, one was to create broad based understanding about philanthropy and to bridge the knowledge gap through conducting evidence based research in the country. This understanding and knowledge creation was ultimately aimed at increasing the volume of giving and enhancing its efficiency.
In pursuance of its mandate, PCP has ventured into various areas of research related to giving over the past years. The areas explored so far include an assessment of the enabling environment for CSOs in the country, giving by family foundations, individual giving in the Punjab province, individual giving in the Sindh province, individual indigenous giving in Pakistan and finally, survey of corporate philanthropy in Pakistan. In fact, the study of corporate philanthropy has been a feature study of PCP since the year 2005. Given the importance of the corporate sector in terms of possessing huge resources, both financial and human as well as technical skills that add to its potential to play a role in the overall progress of the economy, these surveys have endeavored to bring out not only the volume of philanthropy of the companies but have also tried to highlight the trends and patterns of it. Moreover, PCP has been holding
1 Pakistan Centre for Philanthropy (2015). The state of individual philanthropy in Pakistan. 2 http://www.triplepundit.com/2012/08/philanthropy-csr-social-responsibility-of-business/
annual corporate philanthropy awards ceremonies where companies with good performance are appreciated, recognized and their services are duly acknowledged through awards. The idea of these awards is to encourage the good-doers and to motivate others to follow suit.
Corporate Philanthropy and Corporate Social Responsibility Quite often, corporate philanthropy (CP) is mistaken for corporate social responsibility (CSR) but that is not the case.2 The confusion is more widespread in countries including Pakistan, where the literature on the subject is yet to see due recognition and acceptance in academia. In fact, both are related in the sense that CP is a slice of the bigger pie which is CSR. CP is a company’s way of giving back to its community -- local, regional, national or international -- through financial donations and non-cash contributions such as time, expertise and tangible goods like computers, medicine, food and textbooks. CSR, on the other hand, covers a much wider area; besides those mentioned under CP, CSR cares for the environment where the company operates, the consumers who use its products, human rights, supply-chain sustainability and transparency for the greater good of the world at large.3 Given the fact that CP constitutes one of the many facets of CSR, we will try to understand what CSR means and how it has evolved to the present-day position.
CSR, as a matter of fact, lacks a unanimous definition; it has been defined differently at different times. However, despite these differences in defining the span and scope, the one point agenda where all agree is; corporations are not only responsible to safeguard the interests of their shareholders but also of the stakeholders that include the environment, buyers, suppliers, employees, etc. Given below are two of such definitions that are both comprehensive and comprehensible.
“Incorporation and integration of socio-environmental concerns into their commercial
3 http://smallbusiness.chron.com/difference-between-corporate-philanthropy-corporate-social-responsibility-65129.html

CORPORATE PHILANTHROPY SURVEY | 2016
Page 2
undertakings with the aim of strengthening better relationship with different stakeholders of the business concern.”4
“CSR is the behavioral response of any business that, besides the attainment of its economic goals, also contributes in improving the quality of life at the workplace, benefits local communities and the society in its totality.”5
CSR has transformed into a buzz word over time and in today’s world, it essentially represents the philosophy of relationship between business sector and the society. Its basis can be traced back to the two principles that Andrew Carnegie, founder of the US steel, believed to be necessary for capitalism to work; firstly, the charity principle which states that the “have nots” should be assisted by the fortunate members of the society. This assistance can be rendered in a variety of ways, either directly or indirectly, through institutions such as churches, settlements, houses and other community groups. The second principle is the stewardship principle which considers business people as stewards or caretakers of the society. They hold their money ‘in trust’ for the society which means this can be used for any purpose the society deems legitimate.6
There has been an unending discussion on whether the activities purported under CSR are voluntary or mandatory. Various authors have tried to draw a line and delineate the distinction. Carroll differentiated four types of social responsibilities, e.g., economic, legal, ethical, and discretionary. The adapted version of his conceptualization is given in the following:7
Hierarchy of Corporate Social Responsibility8
4 Definition by the European Commission. 5 Lord Holme and Richard Watts, (2007), "Making Good Business Sense" The World Business Council for Sustainable Development. Available at: http://www.mallenbaker.net/csr/definition.php 6 R. E. Freeman & L. Jeanne, (1991). Corporate Social Responsibility: A Critical Approach. Business Horizons 7 J. Dima (2007). The Case for Strategic Corporate Social Responsibility in Developing Countries. Business and Society Review 112:1 1–27.
Economic responsibility, according to Carroll entails, for examples, providing a return on investment to owners and shareholders, creating jobs, fair pay for workers, promoting technological advancement, etc. Legal responsibility, on the other hand, comprises of expectations of legal compliance and playing by the rules and regulations. In this case society expects business to fulfill its economic agenda remaining within the requirements set forth by the legal system of the society or country.
Ethical CSR is morally mandatory and goes beyond economic and legal obligations to its responsibility to do ‘good’ and to avoid ‘social harm.9 Ethical responsibilities encompass activities that have been codified into law and include activities such as respecting people, avoiding social harm, and preventing social injury. The last category, discretionary responsibilities entail all activities that a business is bound to do by neither legal imposition nor by societal expectations rather by its widest scope of discretionary judgement and choice. Here the firm decides what specific activities to perform or philanthropic contributions to make that aim at the belief that business and society are intertwined, and as such, have to support each other.
Prof. Michael Porter presents a similar kind of mapping, however, he thinks in terms of three phases of CSR that have evolved over time.10 According to him, businesses’ first response to societal need was ‘philanthropy’. But with the passage of time corporations learned that philanthropy is not enough and they have to adopt a more holistic approach. As a result, a new approach called CSR came into being that included activities other than philanthropy, e.g., compliance with community standards, citizenship activities. In other words, he described three phases of CSR: philanthropy, basic CSR, and strategic CSR.
This description of different phases of CSR fares well with the description presented earlier that philanthropy is a component of a bigger pie which is CSR. As with CSR, corporate philanthropy is also an umbrella term that encompasses a number of
9 M. Ramon (2010). International Corporate Social Responsibility: The Role of Corporations in the Economic Order of the 21st Century. Kluwer Law International, the Netherlands. 10 See: https://quizlet.com/41319156/philantrophy-and-csr-models-flash-cards/
Economic
Ethical
Legal
Discretionary
CORPORATE PHILANTHROPY SURVEY | 2016
Page 3
different values, interests, mindsets and alternative approaches.11
In its original, altruistic meaning—phil-anthropos—philanthropy describes voluntary, active, non-reciprocal efforts (financial, organizational, human resources, etc.) by an entity with the sole purpose of benefiting human beings, or fulfilling an unmet social need, regardless of any specific ‘return on investment’ for the donor.
Corporate Philanthropy/CSR and Sustainable Development Goals (SDGs) The Sustainable Development Goals (SDGs) are a universal call to implement actions to end poverty, protect the planet, and ensure peace and prosperity by 2030. The SDGs, which include 17 Goals and 169 associated targets, define the post-2015 development agenda and build on the achievements of the Millennium Development Goals (MDGs) to lead toward a path of economic development, social inclusion and environmental sustainability. Thus, it incorporates some new areas such as climate change, economic inequality, innovation, sustainable consumption, peace and justice, among other priorities. The goals are interconnected – often the key to success on one will involve tackling issues more commonly associated with another. The SDGs implementations are adopting inclusive approach where government partners with other sectors i.e. philanthropy, business, academia, civil society organization (CSO), and media. The SDGs work in the spirit of partnership and pragmatism to make the right choices to improve life in a sustainable way.
Did the private business sector play any role in the achievement of MDGs, and if so, how it can contribute in getting the new goals, i.e., SDGs, is a question to ponder upon. Interestingly, the potential role of the private sector in achieving any of the global goals did not come up in discussions until when the UN started reviewing the MDGs in 2012. It was at this point when it was observed that many targets, for example, that have to do with employment, environment and the delivery of key services could not be achieved without
11 L. M. Klaus & S. Karin. Corporate Responsibility and Corporate Philanthropy Available at: https://www.google.com/search?q=Corporate+Responsibility+and+Corporate+Philanthropy+Klaus+M.+Leisinger
involvement of the private sector. It was further recognized that the relationship between inclusive and sustainable industrial development (ISID) on the one hand, and long-term economic, social and environmental goals on the other, remains undeniable. 12
Unlike MDGs where the role of the private business sector was largely bypassed, in the case of SDGs it was accepted in the initial stage. In the Addis Ababa Action Agenda which was an outcome of the Third International Conference on Financing for Development it was stated, “Private business activity, investment and innovation are major drivers of productivity, inclusive economic growth and job creation. We call on all businesses to apply their creativity and innovation to solving sustainable development challenges. We invite them to engage as partners in the development process, to invest in areas critical to sustainable development, and to shift to more sustainable consumption and production patterns”13. Furthermore, the agenda proposed a fostering of dynamic and well-functioning business sector, while protecting labour rights, environmental and health standards in accordance with relevant international standards and agreements which serve as the Guiding Principles on Business and Human Rights and the labour standards of ILO. It also welcomed the growing number of businesses that embrace a core business model that takes into account the environmental, social and governance impacts of their activities, and urged the rest to do so as well.
The subject of philanthropy has emerged as a unique and powerful notion in the 2030 Agenda for sustainable development. It offers complementary approaches, partnerships and types of funding to bridge the gap between the three sectors of development, especially civil society organizations (CSOs). Hence, philanthropy as a financing modality can prove to be an effective means to improve financial sustainability of CSOs enabling the sector to flourish and enhance its development impact. In this backdrop, philanthropic giving is marked under SDG 17 to act as a player to bridge the gap between public and private sectors to help achieve the SDGs. The first 10 goals including an agenda to improve health,
12 Li Yong, Director General UNIDO, in Foreword to Series of Dialogues on Means of Implementation of the Post-2015 Development Agenda Engaging with the Private Sector in the Post-2015 Agenda Consolidated Report on 2014 Consultations. 13 Available at: http://www.un.org/ga/search/view_doc.asp?symbol=A/CONF.227/L.1

CORPORATE PHILANTHROPY SURVEY | 2016
Page 4
education, gender inequality, and environmental conditions – factors that are all conducive to reducing poverty and hunger, are especially important in the light of SDG 17. Given the importance of philanthropy towards the achievement of SDGs various forums have popped up at global level. SDG Philanthropy Platform is one such example of a body that aims at helping philanthropy engage in the global development agenda through informing and catalyzing collaboration, fostering a close partnership between those working in the philanthropy sector along with bringing together CSOs, foundations and philanthropists to create new partnerships that will have greater and more sustainable impact on people’s lives. CSR in Pakistan In Pakistan, the concept of CSR is not very old. Although individuals have long been involved in giving and philanthropy, the importance of CSR and its allied practices were widely highlighted for the first time when the issue of child labor in football industry hit the international headlines.14 Ensuing uproar by the international media and the resultant embargo on imports of some of the Pakistani products compelled the manufacturers and exporters to give heed to various standards that come under CSR.
While CSR has become a touchstone of corporate trust and a predictor of business in the west and other developed countries, in Pakistan, on the other hand it is still a buzzword for most of the organizations and individuals. This trend has gotten momentum during the last many years but in the process of attaining the internationally accepted norms of CSR, businesses are either misunderstanding the true philosophy of CSR or simply ignoring it. Multinationals in Pakistan are ahead of this wave, due to their international linkages and are actually adopting the standards followed in their head-offices in developed countries.15 The concept, however, is still vague for majority of the people in the sector, most of them still regard it as typical philanthropy, some of them see it as basic CSR, and even fewer position their CSR strategically. Even though companies are not very clear of what CSR actually means, they have been contributing generously for causes related to social development.
14 See Yunis, M. S., Durrani, L., Khan, A. (2017). Corporate Social Responsibility (CSR) in Pakistan: A Critique of the Literature and Future Research Agenda. Business & Economic review, 9.1. 15 Waheed, A. (2005). Evaluation of the State of Corporate Social Responsibility in Pakistan and a Strategy for Implementation.
Giving by PLCs that form less than 1 percent of the entire corporate universe of the country has increased 32 times since the year 2000.
While the numbers are telling of good things happening they never depict the picture in totality. There are still a lot of unanswered questions, for example, who is giving to whom and why, whether there has been any impact and of what kind, etc. Questions such as these, among many others, need to be answered in order to present a more holistic sketch of the CSR programs in the country. Given below is a broad categorization of the types of CSR programs practiced in Pakistan which would help in shedding light on motivations behind charitable spending by companies.16
Political CSR A company’s CSR, in this type, is aligned with a political agenda. Spending by public sector organizations falls in this category. In this case the CSR spending is neither based on any assessment of people’s needs nor does it follows any corporate strategy. Globally Aligned CSR Strategy This type of CSR strategy is usually adopted by multinational companies (MNCs). MNCs have their head offices in developed countries where they are well aware of the businesses’ needs as well as the social value of CSR. Policies are formulated in the head office and then the subsidiaries in various countries follow suit. Externally Imposed CSR There are many organizations formed by the government that are supposed to safeguard the interests of the general public, e.g., Securities and Exchange Commission (SECP), Oil & Gas Regulatory Authority (OGRA). These institutions have the backing of the government and all the businesses are bound to follow the laws, rules and regulations formulated by them.
16 Fariduddin, S. CSR trends and types in Pakistan. Available at: https://www.academia.edu/6652308/CSR_Trends_and_Types_in_Pakistan
CORPORATE PHILANTHROPY SURVEY | 2016
Page 5
Philanthropic and Responsive CSR This kind of CSR follows the ‘do good’ principle instead of following a well-defined objective. Companies set a budget to be spent on as-requested basis. Donations by corporations to SKMCH, LRBT, etc., fall under this category.
Corporate Philanthropy: The Rationale Government, civil society and business sector are the three building blocks for the development of a state. Development theorists and practitioners not only recognize the importance of each of the individual members but also place responsibilities on them according to their niches as critical partners. Creating synergy and partnership between the said three sectors of the society is what PCP has adopted as an important component of its mandate.
Business sector plays a vital role in the progress of any society, be it in the economic front or the social front. The positive role played by corporations for the common societal benefit, though there are still nay-sayers, is not only accepted in today’s globalized environment but also vigorously promoted. The notion that a business thrives in a thriving society is understandable to everyone. The evolution has led corporations believe that by contributing towards the overall wellbeing of the society they not only act on their social responsibility but can also reap economic benefits. This relatively new phenomenon of simultaneously reaping both social and economic benefits is named as strategic philanthropy or strategic CSR. Among many other economic benefits of CSR, one is employee retention. According to a research by Cone Millennial Cause group, 80 percent of a sample of 1,800, 13-25 year olds wanted to work for a company that cares about how it impacts and contributes to society. More than half said they would refuse to work for an irresponsible corporation.17
Cognizant of this important role played by the corporate sector of the country, PCP has been collecting data on their contribution, primarily financial one, over the last more than one and a half
17 M, Jeanne. The Future Of Work: Corporate Social Responsibility Attracts Top Talent. Available at: https://www.forbes.com/sites/jeannemeister/2012/06/07/the-future-of-work-corporate-social-responsiblity-attracts-top-talent
decade. By publishing philanthropic contributions of the business community, PCP aims at not only highlighting this good deed but also motivating those companies which have not adopted CSR so far. Secondly, through CPS, the Centre tries to fill the dearth of documented data about corporate sector’s involvement in social development of the country.
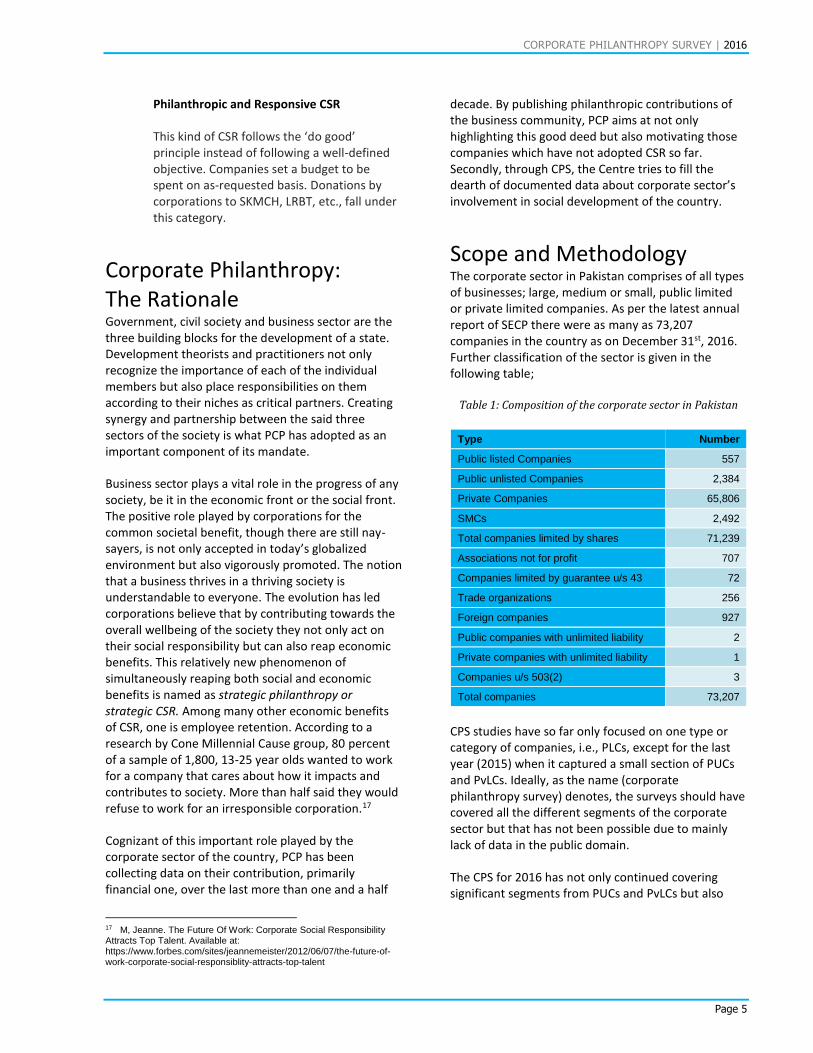
Scope and Methodology The corporate sector in Pakistan comprises of all types of businesses; large, medium or small, public limited or private limited companies. As per the latest annual report of SECP there were as many as 73,207 companies in the country as on December 31st, 2016. Further classification of the sector is given in the following table;
Table 1: Composition of the corporate sector in Pakistan
CPS studies have so far only focused on one type or category of companies, i.e., PLCs, except for the last year (2015) when it captured a small section of PUCs and PvLCs. Ideally, as the name (corporate philanthropy survey) denotes, the surveys should have covered all the different segments of the corporate sector but that has not been possible due to mainly lack of data in the public domain.
The CPS for 2016 has not only continued covering significant segments from PUCs and PvLCs but also
Type Number
Public listed Companies 557
Public unlisted Companies 2,384
Private Companies 65,806
SMCs 2,492
Total companies limited by shares 71,239
Associations not for profit 707
Companies limited by guarantee u/s 43 72
Trade organizations 256
Foreign companies 927
Public companies with unlimited liability 2
Private companies with unlimited liability 1
Companies u/s 503(2) 3
Total companies 73,207
CORPORATE PHILANTHROPY SURVEY | 2016
Page 6
expanded its scope from another angle. Hitherto, the report has been dealing only with numbers for the most part. However, this year it goes beyond the annual reports and the numbers and a section has been added that explores the qualitative side of CSR. This shall provide much needed context to our findings and will provide an overview of how the concept of philanthropy is understood and implemented within corporations.
Data Collection and Analysis
SECP has remained the main source of data on PLCs in the past though libraries of the State Bank of Pakistan and Pakistan Stock Exchange (PSX) formerly known as Karachi Stock Exchange were also consulted occasionally. This year, however, the process has changed a bit; most of the annual reports of PLCs were downloaded from their websites. SECP was consulted only in cases where annual reports could not be found on their respective websites.
In the case of PUCs and PvLCs, SECP is the sole reservoir of annual reports and the same has been resorted to for data collection this year. The total universe of PUCs operating in Pakistan is 2,384 in number. However, till 30th April, data of only 474 companies had been submitted to SECP and was accessible for the surveyors. Similarly, out of a universe of 65,806 PvLCs only 1995 submitted their annual financial statements to SECP for year 2016. Given that a very short time was allowed by SECP data was collected of only those companies whose paid-up capital was PKR 100 million or above. Hence, only 360 companies were included in the sample. The number of PLCs, PUCs and PvLCs that the current study covers is given in the table below;
Table 2: Number of PLCs, PUCs, PvLCs
Company Number
PLCs 557
PUCs 474
PvLCs 360
Source: SECP Annual Report, 2016
Information about sales, gross profit, net profit, CSR/philanthropy were extracted from relevant sections of the annual reports. This information was then recorded in worksheets to summarize them for
further analysis. Tables, charts, and graphs were used to highlight the giving volume, trends and the patterns. Giving numbers were compared to those of the preceding year and the base year which helped in highlighting patterns in giving behaviors.
For the qualitative research, we reached out to the top 25 PLCs, the top 5 PUCs, and the top 5 PvLCs. The top givers were selected for interview for two reasons; firstly, they are responsible for most of the CSR contributions (top 25 PLCs made 82 percent of total philanthropy), and secondly, it was not possible to include all the companies given the time and cost constraints. Of these companies, we were able to actually interview some 18 companies including 15 PLCs, 1 PUCs, 2 PvLC and this formed the final sample for the qualitative analysis.
Limitations Just like any other research/survey report, CPS 2016 comes with a set of limitations that must be considered by the readers.
Firstly, as stated earlier, the survey covers only a small component of the overall corporate sector. PLCs, all covered in this report, constitute less than 1 percent of the entire corporate sector. On the other hand only 20 percent of PUCs are surveyed while just 0.5 percent of the PvLCs are included in the current edition of CPS. Having said that, it must also be noted that the survey covers philanthropy by the most evolved and vibrant segment of the business community and the companies most active with their CSR programs.
Secondly, the study reports on CSR/philanthropy by companies measured in terms of cash allocation. Philanthropy consists of any giving that happens in terms of cash, kind, and time. Companies might be doing philanthropy in the form of kind or time volunteerism but they do not report on it anywhere in their reports.
Finally, financial statements tell us only about CSR budgets but what they don’t tell us about is that on which and what type of projects that money is spent on, thereby, limiting the possibility of knowing the impact of spending on the community.
CORPORATE PHILANTHROPY SURVEY | 2016
Page 7

CORPORATE PHILANTHROPY SURVEY | 2016
Page 8
CORPORATE PHILANTHROPY SURVEY | 2016
Page 9
Giving in Numbers - PLCs
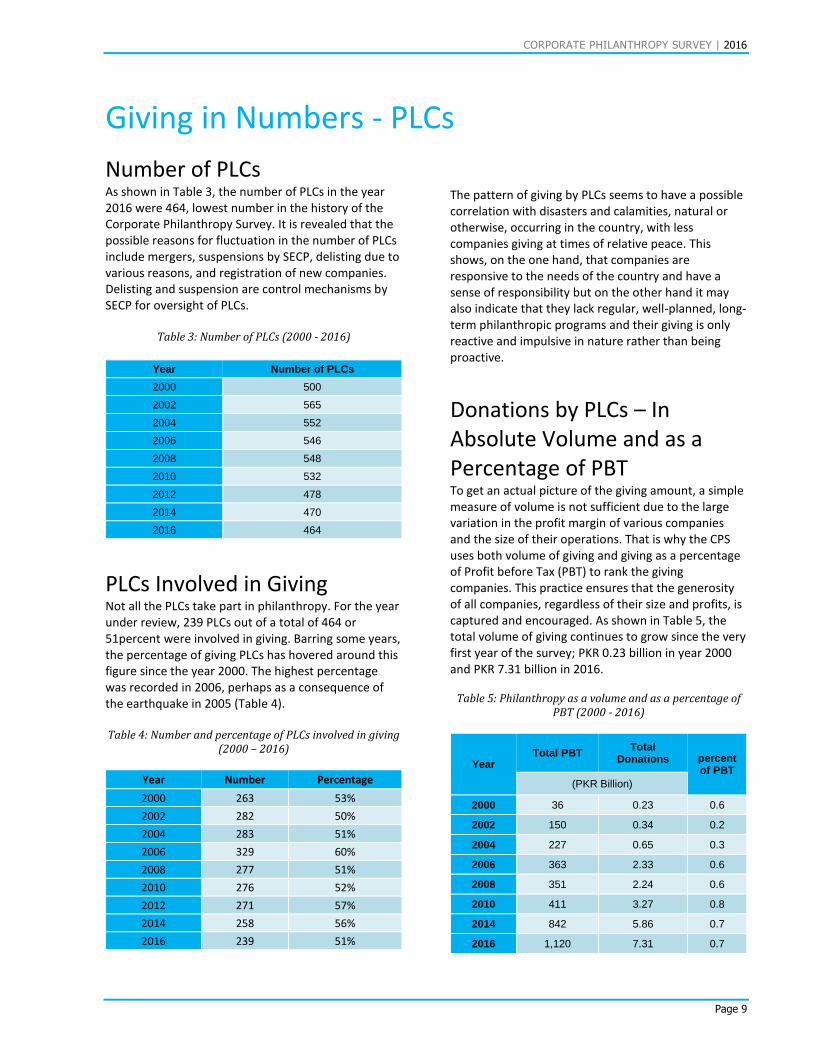
Number of PLCs As shown in Table 3, the number of PLCs in the year 2016 were 464, lowest number in the history of the Corporate Philanthropy Survey. It is revealed that the possible reasons for fluctuation in the number of PLCs include mergers, suspensions by SECP, delisting due to various reasons, and registration of new companies. Delisting and suspension are control mechanisms by SECP for oversight of PLCs.
Table 3: Number of PLCs (2000 - 2016)
Year Number of PLCs
2000 500
2002 565
2004 552
2006 546
2008 548
2010 532
2012 478
2014 470
2016 464
PLCs Involved in Giving Not all the PLCs take part in philanthropy. For the year under review, 239 PLCs out of a total of 464 or 51percent were involved in giving. Barring some years, the percentage of giving PLCs has hovered around this figure since the year 2000. The highest percentage was recorded in 2006, perhaps as a consequence of the earthquake in 2005 (Table 4). Table 4: Number and percentage of PLCs involved in giving
(2000 – 2016)
Year Number Percentage
2000 263 53%
2002 282 50%
2004 283 51%
2006 329 60%
2008 277 51%
2010 276 52%
2012 271 57%
2014 258 56%
2016 239 51%
The pattern of giving by PLCs seems to have a possible correlation with disasters and calamities, natural or otherwise, occurring in the country, with less companies giving at times of relative peace. This shows, on the one hand, that companies are responsive to the needs of the country and have a sense of responsibility but on the other hand it may also indicate that they lack regular, well-planned, long-term philanthropic programs and their giving is only reactive and impulsive in nature rather than being proactive.
Donations by PLCs – In Absolute Volume and as a Percentage of PBT To get an actual picture of the giving amount, a simple measure of volume is not sufficient due to the large variation in the profit margin of various companies and the size of their operations. That is why the CPS uses both volume of giving and giving as a percentage of Profit before Tax (PBT) to rank the giving companies. This practice ensures that the generosity of all companies, regardless of their size and profits, is captured and encouraged. As shown in Table 5, the total volume of giving continues to grow since the very first year of the survey; PKR 0.23 billion in year 2000 and PKR 7.31 billion in 2016.
Table 5: Philanthropy as a volume and as a percentage of
PBT (2000 - 2016)
Year Total PBT
Total Donations percent
of PBT
(PKR Billion)
2000 36 0.23 0.6
2002 150 0.34 0.2
2004 227 0.65 0.3
2006 363 2.33 0.6
2008 351 2.24 0.6
2010 411 3.27 0.8
2014 842 5.86 0.7
2016 1,120 7.31 0.7

CORPORATE PHILANTHROPY SURVEY | 2016
Page 10
Though the volume has seen a steady increase, its corresponding percentage of PBT has remained more or less the same. Barring dips in 2002 and 2004, the percentage has remained stagnant in the range of 0.6 percent - 0.8 percent. Despite advocacy and endeavors to increase awareness about CSR, the percentage has never touched the 1percent of PBT which is propagated as to be the international best practice.
The increase in volume seems to be a function of increase in absolute profits (not considering inflation) as can be seen from the increasing amount of annual total PBT. It may also be interesting to note that giving has not shown a decrease in all these years despite economic slumps, political turmoil, energy crisis, law and order challenges, and other issues faced by the corporate sector.
Actual Donations vs. if Taken as 1 Percent of PBT There is a global tendency to demand, by CSR advocates and social activists, that companies set
18An interview with Mark Benioff (2000).New Frontiers in Doing Good. LEADERS, 34, 2.
aside 1percent of PBT, 1percent of equities, and 1 percent of employee time for philanthropic endeavors.18 An excellent example of this spirit is set in India, which created a law that all companies above a certain limit of revenue will commit not one but two percent of their PBT to philanthropy. One might argue, that the need for corporate philanthropy is much higher in developing countries like India and Pakistan compared to more developed economies. To present a picture of potential gains from such a law or practice, Figure 2 shows the projected volume of giving if all giving companies had committed 1 percent of their profits for all survey years. The actual volume is also shown for an easy comparison. The gap between actual giving and potential giving started out small but after some fluctuations, has been increasing steadily. As can be seen, the potential volume for the year 2016 was PKR 11.2 billion compared to the actual giving of PKR 7.31 billion. The difference of PKR 3.9 billion is the amount that could have been added to total philanthropy if all the giving companies had donated at least 1percent of their PBT.
Figure 2: Actual giving vs. 1percent of PBT
0.23 0.34 0.65
2.33 2.24
3.27
4.11
5.86
7.31
0.36
1.50
2.27
3.63 3.51
4.11
5.93
8.42
11.24
-
2.00
4.00
6.00
8.00
10.00
12.00
2000 2002 2004 2006 2008 2010 2012 2014 2016
PK
R b
illio
n
Actual as 1%
CORPORATE PHILANTHROPY SURVEY | 2016
Page 11
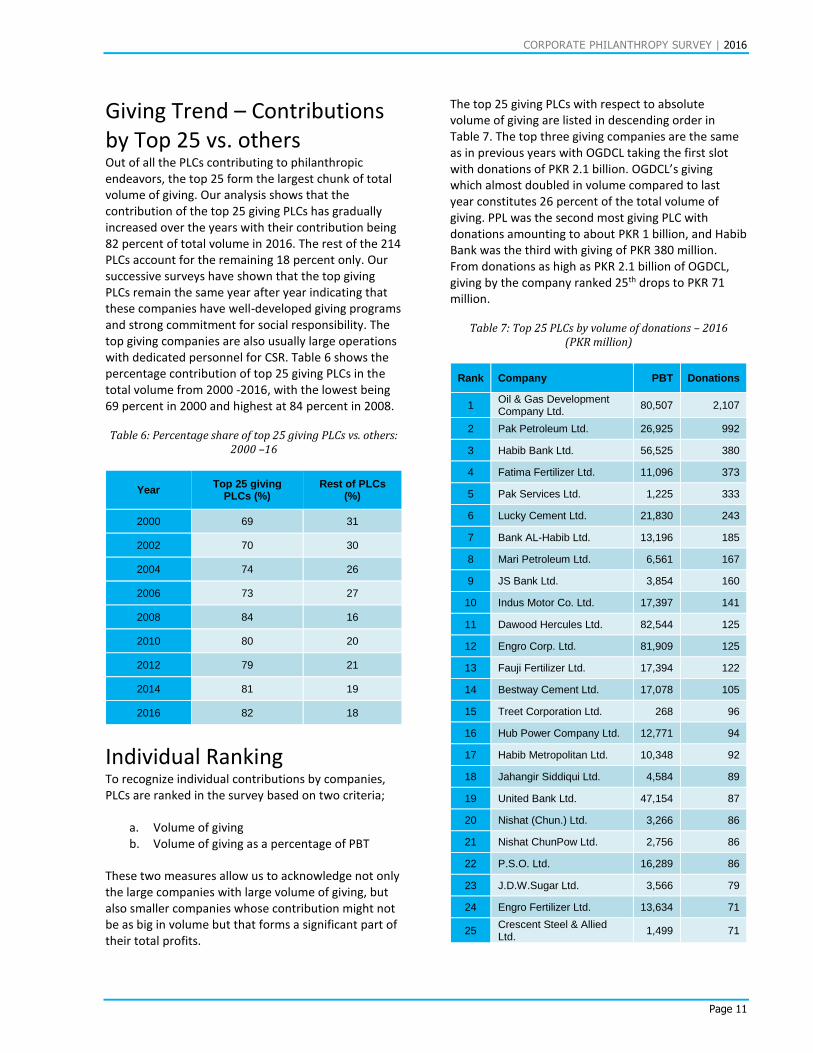
Giving Trend – Contributions by Top 25 vs. others Out of all the PLCs contributing to philanthropic endeavors, the top 25 form the largest chunk of total volume of giving. Our analysis shows that the contribution of the top 25 giving PLCs has gradually increased over the years with their contribution being 82 percent of total volume in 2016. The rest of the 214 PLCs account for the remaining 18 percent only. Our successive surveys have shown that the top giving PLCs remain the same year after year indicating that these companies have well-developed giving programs and strong commitment for social responsibility. The top giving companies are also usually large operations with dedicated personnel for CSR. Table 6 shows the percentage contribution of top 25 giving PLCs in the total volume from 2000 -2016, with the lowest being 69 percent in 2000 and highest at 84 percent in 2008.
Table 6: Percentage share of top 25 giving PLCs vs. others:
2000 –16
Year Top 25 giving
PLCs (%) Rest of PLCs
(%)
2000 69 31
2002 70 30
2004 74 26
2006 73 27
2008 84 16
2010 80 20
2012 79 21
2014 81 19
2016 82 18
Individual Ranking To recognize individual contributions by companies, PLCs are ranked in the survey based on two criteria;
a. Volume of giving b. Volume of giving as a percentage of PBT
These two measures allow us to acknowledge not only the large companies with large volume of giving, but also smaller companies whose contribution might not be as big in volume but that forms a significant part of their total profits.
The top 25 giving PLCs with respect to absolute volume of giving are listed in descending order in Table 7. The top three giving companies are the same as in previous years with OGDCL taking the first slot with donations of PKR 2.1 billion. OGDCL’s giving which almost doubled in volume compared to last year constitutes 26 percent of the total volume of giving. PPL was the second most giving PLC with donations amounting to about PKR 1 billion, and Habib Bank was the third with giving of PKR 380 million. From donations as high as PKR 2.1 billion of OGDCL, giving by the company ranked 25th drops to PKR 71 million.
Table 7: Top 25 PLCs by volume of donations – 2016
(PKR million)
Rank Company PBT Donations
1 Oil & Gas Development Company Ltd.
80,507 2,107
2 Pak Petroleum Ltd. 26,925 992
3 Habib Bank Ltd. 56,525 380
4 Fatima Fertilizer Ltd. 11,096 373
5 Pak Services Ltd. 1,225 333
6 Lucky Cement Ltd. 21,830 243
7 Bank AL-Habib Ltd. 13,196 185
8 Mari Petroleum Ltd. 6,561 167
9 JS Bank Ltd. 3,854 160
10 Indus Motor Co. Ltd. 17,397 141
11 Dawood Hercules Ltd. 82,544 125
12 Engro Corp. Ltd. 81,909 125
13 Fauji Fertilizer Ltd. 17,394 122
14 Bestway Cement Ltd. 17,078 105
15 Treet Corporation Ltd. 268 96
16 Hub Power Company Ltd. 12,771 94
17 Habib Metropolitan Ltd. 10,348 92
18 Jahangir Siddiqui Ltd. 4,584 89
19 United Bank Ltd. 47,154 87
20 Nishat (Chun.) Ltd. 3,266 86
21 Nishat ChunPow Ltd. 2,756 86
22 P.S.O. Ltd. 16,289 86
23 J.D.W.Sugar Ltd. 3,566 79
24 Engro Fertilizer Ltd. 13,634 71
25 Crescent Steel & Allied Ltd.
1,499 71
CORPORATE PHILANTHROPY SURVEY | 2016
Page 12
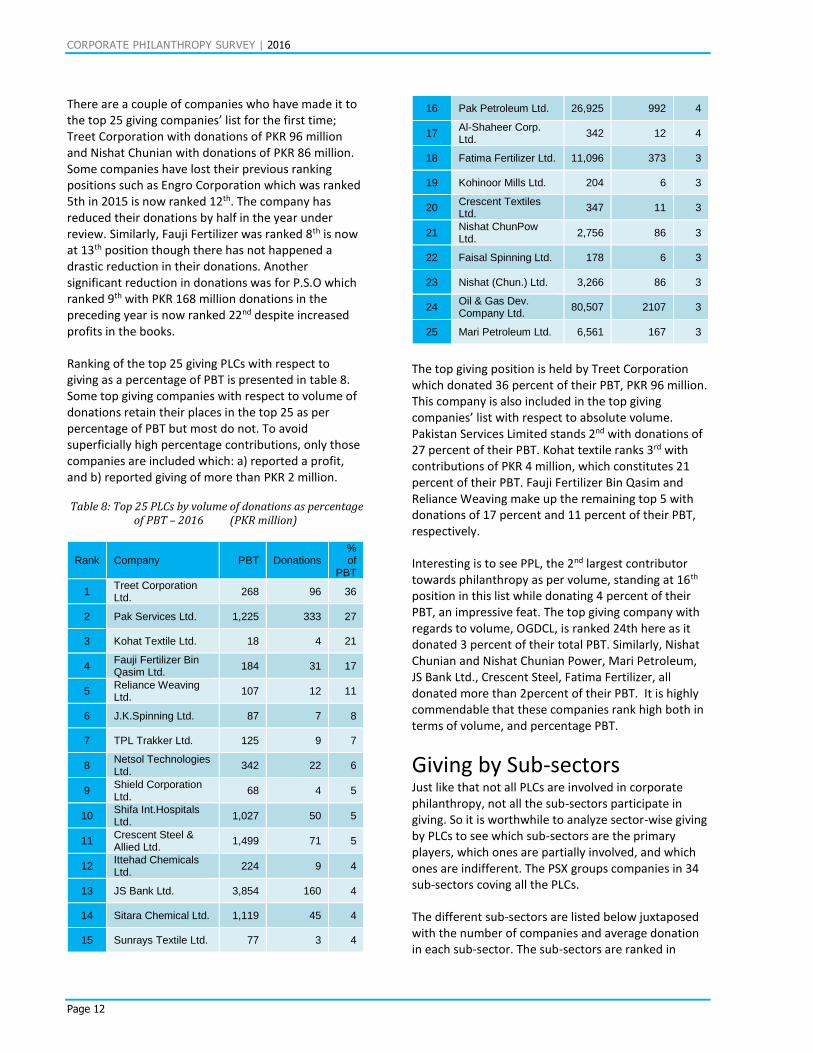
There are a couple of companies who have made it to the top 25 giving companies’ list for the first time; Treet Corporation with donations of PKR 96 million and Nishat Chunian with donations of PKR 86 million. Some companies have lost their previous ranking positions such as Engro Corporation which was ranked 5th in 2015 is now ranked 12th. The company has reduced their donations by half in the year under review. Similarly, Fauji Fertilizer was ranked 8th is now at 13th position though there has not happened a drastic reduction in their donations. Another significant reduction in donations was for P.S.O which ranked 9th with PKR 168 million donations in the preceding year is now ranked 22nd despite increased profits in the books.
Ranking of the top 25 giving PLCs with respect to giving as a percentage of PBT is presented in table 8. Some top giving companies with respect to volume of donations retain their places in the top 25 as per percentage of PBT but most do not. To avoid superficially high percentage contributions, only those companies are included which: a) reported a profit, and b) reported giving of more than PKR 2 million.
Table 8: Top 25 PLCs by volume of donations as percentage
of PBT – 2016 (PKR million)
Rank Company PBT Donations % of
PBT
1 Treet Corporation Ltd.
268 96 36
2 Pak Services Ltd. 1,225 333 27
3 Kohat Textile Ltd. 18 4 21
4 Fauji Fertilizer Bin Qasim Ltd.
184 31 17
5 Reliance Weaving Ltd.
107 12 11
6 J.K.Spinning Ltd. 87 7 8
7 TPL Trakker Ltd. 125 9 7
8 Netsol Technologies Ltd.
342 22 6
9 Shield Corporation Ltd.
68 4 5
10 Shifa Int.Hospitals Ltd.
1,027 50 5
11 Crescent Steel & Allied Ltd.
1,499 71 5
12 Ittehad Chemicals Ltd.
224 9 4
13 JS Bank Ltd. 3,854 160 4
14 Sitara Chemical Ltd. 1,119 45 4
15 Sunrays Textile Ltd. 77 3 4
16 Pak Petroleum Ltd. 26,925 992 4
17 Al-Shaheer Corp. Ltd.
342 12 4
18 Fatima Fertilizer Ltd. 11,096 373 3
19 Kohinoor Mills Ltd. 204 6 3
20 Crescent Textiles Ltd.
347 11 3
21 Nishat ChunPow Ltd.
2,756 86 3
22 Faisal Spinning Ltd. 178 6 3
23 Nishat (Chun.) Ltd. 3,266 86 3
24 Oil & Gas Dev. Company Ltd.
80,507 2107 3
25 Mari Petroleum Ltd. 6,561 167 3
The top giving position is held by Treet Corporation which donated 36 percent of their PBT, PKR 96 million. This company is also included in the top giving companies’ list with respect to absolute volume. Pakistan Services Limited stands 2nd with donations of 27 percent of their PBT. Kohat textile ranks 3rd with contributions of PKR 4 million, which constitutes 21 percent of their PBT. Fauji Fertilizer Bin Qasim and Reliance Weaving make up the remaining top 5 with donations of 17 percent and 11 percent of their PBT, respectively.
Interesting is to see PPL, the 2nd largest contributor towards philanthropy as per volume, standing at 16th position in this list while donating 4 percent of their PBT, an impressive feat. The top giving company with regards to volume, OGDCL, is ranked 24th here as it donated 3 percent of their total PBT. Similarly, Nishat Chunian and Nishat Chunian Power, Mari Petroleum, JS Bank Ltd., Crescent Steel, Fatima Fertilizer, all donated more than 2percent of their PBT. It is highly commendable that these companies rank high both in terms of volume, and percentage PBT.
Giving by Sub-sectors Just like that not all PLCs are involved in corporate philanthropy, not all the sub-sectors participate in giving. So it is worthwhile to analyze sector-wise giving by PLCs to see which sub-sectors are the primary players, which ones are partially involved, and which ones are indifferent. The PSX groups companies in 34 sub-sectors coving all the PLCs.
The different sub-sectors are listed below juxtaposed with the number of companies and average donation in each sub-sector. The sub-sectors are ranked in
CORPORATE PHILANTHROPY SURVEY | 2016
Page 13
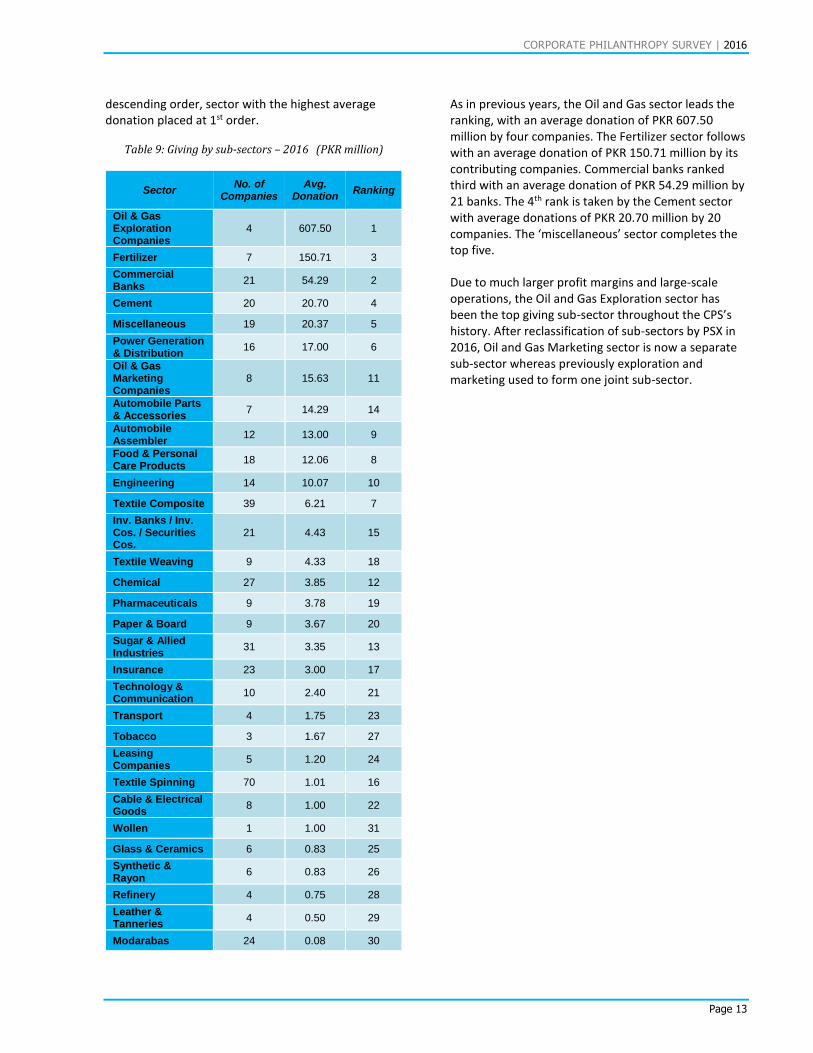
descending order, sector with the highest average donation placed at 1st order.
Table 9: Giving by sub-sectors – 2016 (PKR million)
Sector No. of
Companies Avg.
Donation Ranking
Oil & Gas Exploration Companies
4 607.50 1
Fertilizer 7 150.71 3
Commercial Banks
21 54.29 2
Cement 20 20.70 4
Miscellaneous 19 20.37 5
Power Generation & Distribution
16 17.00 6
Oil & Gas Marketing Companies
8 15.63 11
Automobile Parts & Accessories
7 14.29 14
Automobile Assembler
12 13.00 9
Food & Personal Care Products
18 12.06 8
Engineering 14 10.07 10
Textile Composite 39 6.21 7
Inv. Banks / Inv. Cos. / Securities Cos.
21 4.43 15
Textile Weaving 9 4.33 18
Chemical 27 3.85 12
Pharmaceuticals 9 3.78 19
Paper & Board 9 3.67 20
Sugar & Allied Industries
31 3.35 13
Insurance 23 3.00 17
Technology & Communication
10 2.40 21
Transport 4 1.75 23
Tobacco 3 1.67 27
Leasing Companies
5 1.20 24
Textile Spinning 70 1.01 16
Cable & Electrical Goods
8 1.00 22
Wollen 1 1.00 31
Glass & Ceramics 6 0.83 25
Synthetic & Rayon
6 0.83 26
Refinery 4 0.75 28
Leather & Tanneries
4 0.50 29
Modarabas 24 0.08 30
As in previous years, the Oil and Gas sector leads the ranking, with an average donation of PKR 607.50 million by four companies. The Fertilizer sector follows with an average donation of PKR 150.71 million by its contributing companies. Commercial banks ranked third with an average donation of PKR 54.29 million by 21 banks. The 4th rank is taken by the Cement sector with average donations of PKR 20.70 million by 20 companies. The ‘miscellaneous’ sector completes the top five.
Due to much larger profit margins and large-scale operations, the Oil and Gas Exploration sector has been the top giving sub-sector throughout the CPS’s history. After reclassification of sub-sectors by PSX in 2016, Oil and Gas Marketing sector is now a separate sub-sector whereas previously exploration and marketing used to form one joint sub-sector.

CORPORATE PHILANTHROPY SURVEY | 2016
Page 14
"If you're in the luckiest 1 percent of humanity, you owe it to the rest of humanity to think about the other 99 percent". Warren Buffett
CORPORATE PHILANTHROPY SURVEY | 2016
Page 15

CORPORATE PHILANTHROPY SURVEY | 2016
Page 16
CORPORATE PHILANTHROPY SURVEY | 2016
Page 17
Giving in Numbers – PUCS and PvLCs Prevalence of Philanthropic Giving Though the number of PUCs and PvLCs is growing the number of giving companies has not seen a corresponding increase. It is understandable that PUCs and PvLCs are smaller in size and have limited revenues and resources but there are some admirable examples of philanthropic giving amongst them. Compared to PLCs, giving by PUCs and PvLCs is erratic and patterns are not easily observable.
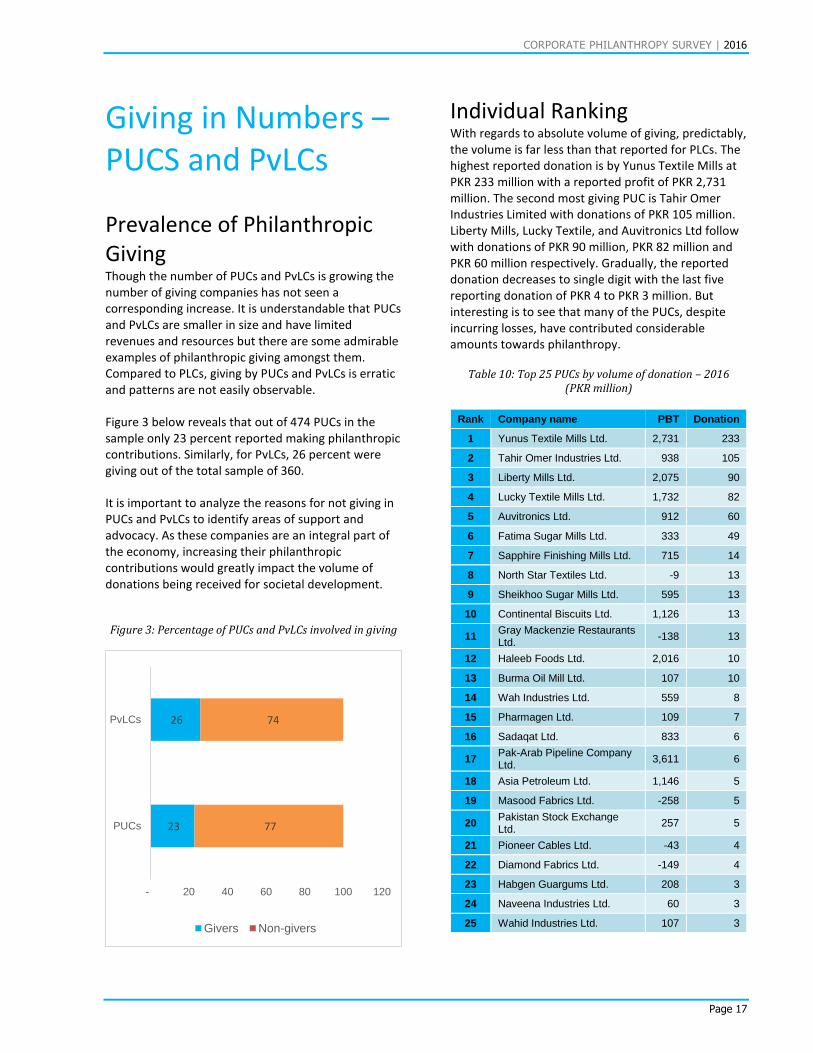
Figure 3 below reveals that out of 474 PUCs in the sample only 23 percent reported making philanthropic contributions. Similarly, for PvLCs, 26 percent were giving out of the total sample of 360.
It is important to analyze the reasons for not giving in PUCs and PvLCs to identify areas of support and advocacy. As these companies are an integral part of the economy, increasing their philanthropic contributions would greatly impact the volume of donations being received for societal development.
Figure 3: Percentage of PUCs and PvLCs involved in giving
Individual Ranking With regards to absolute volume of giving, predictably, the volume is far less than that reported for PLCs. The highest reported donation is by Yunus Textile Mills at PKR 233 million with a reported profit of PKR 2,731 million. The second most giving PUC is Tahir Omer Industries Limited with donations of PKR 105 million. Liberty Mills, Lucky Textile, and Auvitronics Ltd follow with donations of PKR 90 million, PKR 82 million and PKR 60 million respectively. Gradually, the reported donation decreases to single digit with the last five reporting donation of PKR 4 to PKR 3 million. But interesting is to see that many of the PUCs, despite incurring losses, have contributed considerable amounts towards philanthropy.
Table 10: Top 25 PUCs by volume of donation – 2016
(PKR million)
Rank Company name PBT Donation
1 Yunus Textile Mills Ltd. 2,731 233
2 Tahir Omer Industries Ltd. 938 105
3 Liberty Mills Ltd. 2,075 90
4 Lucky Textile Mills Ltd. 1,732 82
5 Auvitronics Ltd. 912 60
6 Fatima Sugar Mills Ltd. 333 49
7 Sapphire Finishing Mills Ltd. 715 14
8 North Star Textiles Ltd. -9 13
9 Sheikhoo Sugar Mills Ltd. 595 13
10 Continental Biscuits Ltd. 1,126 13
11 Gray Mackenzie Restaurants Ltd.
-138 13
12 Haleeb Foods Ltd. 2,016 10
13 Burma Oil Mill Ltd. 107 10
14 Wah Industries Ltd. 559 8
15 Pharmagen Ltd. 109 7
16 Sadaqat Ltd. 833 6
17 Pak-Arab Pipeline Company Ltd.
3,611 6
18 Asia Petroleum Ltd. 1,146 5
19 Masood Fabrics Ltd. -258 5
20 Pakistan Stock Exchange Ltd.
257 5
21 Pioneer Cables Ltd. -43 4
22 Diamond Fabrics Ltd. -149 4
23 Habgen Guargums Ltd. 208 3
24 Naveena Industries Ltd. 60 3
25 Wahid Industries Ltd. 107 3
23
26
77
74
- 20 40 60 80 100 120
PUCs
PvLCs
Givers Non-givers
CORPORATE PHILANTHROPY SURVEY | 2016
Page 18
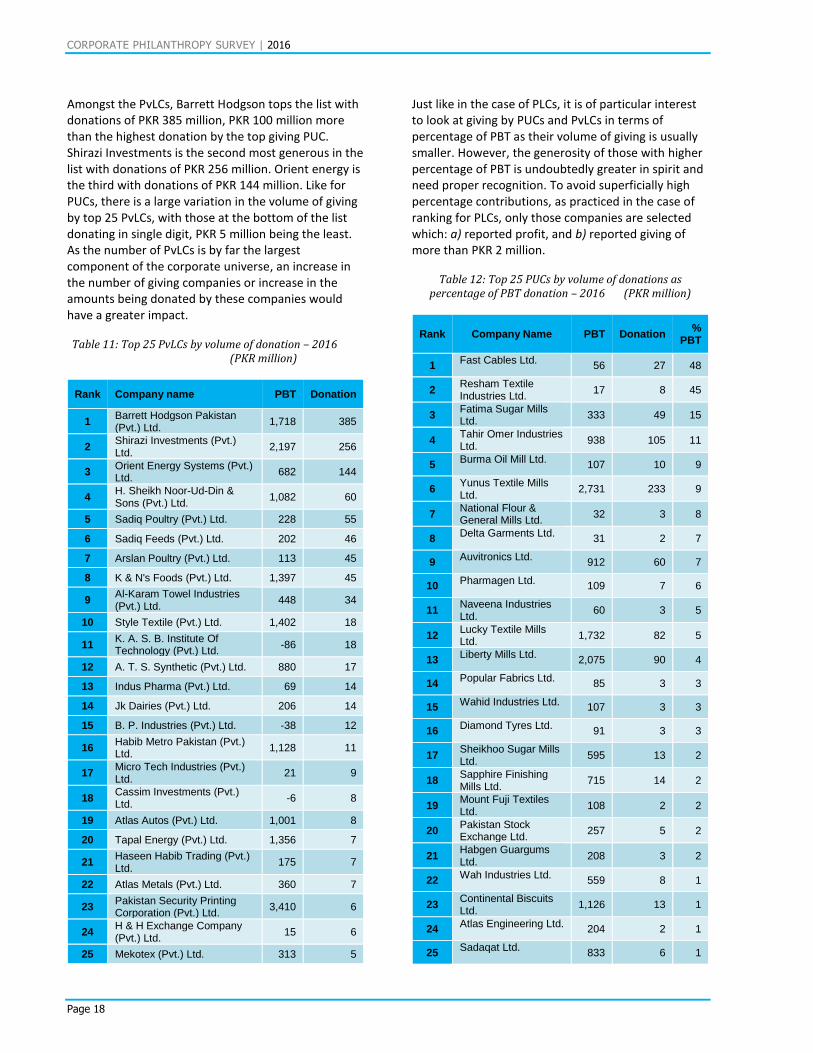
Amongst the PvLCs, Barrett Hodgson tops the list with donations of PKR 385 million, PKR 100 million more than the highest donation by the top giving PUC. Shirazi Investments is the second most generous in the list with donations of PKR 256 million. Orient energy is the third with donations of PKR 144 million. Like for PUCs, there is a large variation in the volume of giving by top 25 PvLCs, with those at the bottom of the list donating in single digit, PKR 5 million being the least. As the number of PvLCs is by far the largest component of the corporate universe, an increase in the number of giving companies or increase in the amounts being donated by these companies would have a greater impact.
Table 11: Top 25 PvLCs by volume of donation – 2016
(PKR million)
Rank Company name PBT Donation
1 Barrett Hodgson Pakistan (Pvt.) Ltd.
1,718 385
2 Shirazi Investments (Pvt.) Ltd.
2,197 256
3 Orient Energy Systems (Pvt.) Ltd.
682 144
4 H. Sheikh Noor-Ud-Din & Sons (Pvt.) Ltd.
1,082 60
5 Sadiq Poultry (Pvt.) Ltd. 228 55
6 Sadiq Feeds (Pvt.) Ltd. 202 46
7 Arslan Poultry (Pvt.) Ltd. 113 45
8 K & N's Foods (Pvt.) Ltd. 1,397 45
9 Al-Karam Towel Industries (Pvt.) Ltd.
448 34
10 Style Textile (Pvt.) Ltd. 1,402 18
11 K. A. S. B. Institute Of Technology (Pvt.) Ltd.
-86 18
12 A. T. S. Synthetic (Pvt.) Ltd. 880 17
13 Indus Pharma (Pvt.) Ltd. 69 14
14 Jk Dairies (Pvt.) Ltd. 206 14
15 B. P. Industries (Pvt.) Ltd. -38 12
16 Habib Metro Pakistan (Pvt.) Ltd.
1,128 11
17 Micro Tech Industries (Pvt.) Ltd.
21 9
18 Cassim Investments (Pvt.) Ltd.
-6 8
19 Atlas Autos (Pvt.) Ltd. 1,001 8
20 Tapal Energy (Pvt.) Ltd. 1,356 7
21 Haseen Habib Trading (Pvt.) Ltd.
175 7
22 Atlas Metals (Pvt.) Ltd. 360 7
23 Pakistan Security Printing Corporation (Pvt.) Ltd.
3,410 6
24 H & H Exchange Company (Pvt.) Ltd.
15 6
25 Mekotex (Pvt.) Ltd. 313 5
Just like in the case of PLCs, it is of particular interest to look at giving by PUCs and PvLCs in terms of percentage of PBT as their volume of giving is usually smaller. However, the generosity of those with higher percentage of PBT is undoubtedly greater in spirit and need proper recognition. To avoid superficially high percentage contributions, as practiced in the case of ranking for PLCs, only those companies are selected which: a) reported profit, and b) reported giving of more than PKR 2 million.
Table 12: Top 25 PUCs by volume of donations as
percentage of PBT donation – 2016 (PKR million)
Rank Company Name PBT Donation %
PBT
1 Fast Cables Ltd.
56 27 48
2 Resham Textile Industries Ltd.
17 8 45
3 Fatima Sugar Mills Ltd.
333 49 15
4 Tahir Omer Industries Ltd.
938 105 11
5 Burma Oil Mill Ltd.
107 10 9
6 Yunus Textile Mills Ltd.
2,731 233 9
7 National Flour & General Mills Ltd.
32 3 8
8 Delta Garments Ltd.
31 2 7
9 Auvitronics Ltd.
912 60 7
10 Pharmagen Ltd.
109 7 6
11 Naveena Industries Ltd.
60 3 5
12 Lucky Textile Mills Ltd.
1,732 82 5
13 Liberty Mills Ltd.
2,075 90 4
14 Popular Fabrics Ltd.
85 3 3
15 Wahid Industries Ltd.
107 3 3
16 Diamond Tyres Ltd.
91 3 3
17 Sheikhoo Sugar Mills Ltd.
595 13 2
18 Sapphire Finishing Mills Ltd.
715 14 2
19 Mount Fuji Textiles Ltd.
108 2 2
20 Pakistan Stock Exchange Ltd.
257 5 2
21 Habgen Guargums Ltd.
208 3 2
22 Wah Industries Ltd.
559 8 1
23 Continental Biscuits Ltd.
1,126 13 1
24 Atlas Engineering Ltd.
204 2 1
25 Sadaqat Ltd.
833 6 1
CORPORATE PHILANTHROPY SURVEY | 2016
Page 19
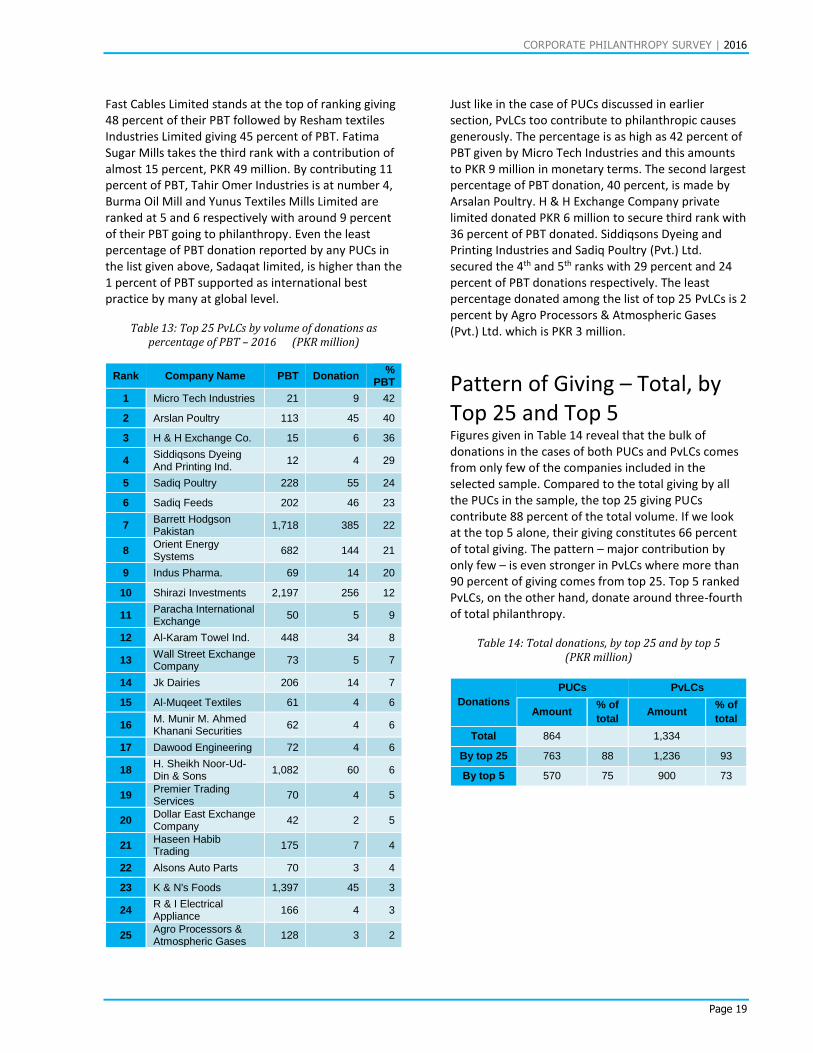
Fast Cables Limited stands at the top of ranking giving 48 percent of their PBT followed by Resham textiles Industries Limited giving 45 percent of PBT. Fatima Sugar Mills takes the third rank with a contribution of almost 15 percent, PKR 49 million. By contributing 11 percent of PBT, Tahir Omer Industries is at number 4, Burma Oil Mill and Yunus Textiles Mills Limited are ranked at 5 and 6 respectively with around 9 percent of their PBT going to philanthropy. Even the least percentage of PBT donation reported by any PUCs in the list given above, Sadaqat limited, is higher than the 1 percent of PBT supported as international best practice by many at global level.
Table 13: Top 25 PvLCs by volume of donations as
percentage of PBT – 2016 (PKR million)
Rank Company Name PBT Donation %
PBT
1 Micro Tech Industries 21 9 42
2 Arslan Poultry 113 45 40
3 H & H Exchange Co. 15 6 36
4 Siddiqsons Dyeing And Printing Ind.
12 4 29
5 Sadiq Poultry 228 55 24
6 Sadiq Feeds 202 46 23
7 Barrett Hodgson Pakistan
1,718 385 22
8 Orient Energy Systems
682 144 21
9 Indus Pharma. 69 14 20
10 Shirazi Investments 2,197 256 12
11 Paracha International Exchange
50 5 9
12 Al-Karam Towel Ind. 448 34 8
13 Wall Street Exchange Company
73 5 7
14 Jk Dairies 206 14 7
15 Al-Muqeet Textiles 61 4 6
16 M. Munir M. Ahmed Khanani Securities
62 4 6
17 Dawood Engineering 72 4 6
18 H. Sheikh Noor-Ud-Din & Sons
1,082 60 6
19 Premier Trading Services
70 4 5
20 Dollar East Exchange Company
42 2 5
21 Haseen Habib Trading
175 7 4
22 Alsons Auto Parts 70 3 4
23 K & N's Foods 1,397 45 3
24 R & I Electrical Appliance
166 4 3
25 Agro Processors & Atmospheric Gases
128 3 2
Just like in the case of PUCs discussed in earlier section, PvLCs too contribute to philanthropic causes generously. The percentage is as high as 42 percent of PBT given by Micro Tech Industries and this amounts to PKR 9 million in monetary terms. The second largest percentage of PBT donation, 40 percent, is made by Arsalan Poultry. H & H Exchange Company private limited donated PKR 6 million to secure third rank with 36 percent of PBT donated. Siddiqsons Dyeing and Printing Industries and Sadiq Poultry (Pvt.) Ltd. secured the 4th and 5th ranks with 29 percent and 24 percent of PBT donations respectively. The least percentage donated among the list of top 25 PvLCs is 2 percent by Agro Processors & Atmospheric Gases (Pvt.) Ltd. which is PKR 3 million.
Pattern of Giving – Total, by Top 25 and Top 5 Figures given in Table 14 reveal that the bulk of donations in the cases of both PUCs and PvLCs comes from only few of the companies included in the selected sample. Compared to the total giving by all the PUCs in the sample, the top 25 giving PUCs contribute 88 percent of the total volume. If we look at the top 5 alone, their giving constitutes 66 percent of total giving. The pattern – major contribution by only few – is even stronger in PvLCs where more than 90 percent of giving comes from top 25. Top 5 ranked PvLCs, on the other hand, donate around three-fourth of total philanthropy.
Table 14: Total donations, by top 25 and by top 5
(PKR million)
Donations
PUCs PvLCs
Amount % of
total Amount
% of
total
Total 864 1,334
By top 25 763 88 1,236 93
By top 5 570 75 900 73

CORPORATE PHILANTHROPY SURVEY | 2016
Page 20
"My religion is humanitarianism, which is the basis of every religion in the world". Abdul Sattar Edhi
CORPORATE PHILANTHROPY SURVEY | 2016
Page 21

CORPORATE PHILANTHROPY SURVEY | 2016
Page 22
CORPORATE PHILANTHROPY SURVEY | 2016
Page 23
Going Beyond Numbers: Qualitative Analysis of Top Giving Companies
Rationale Corporate philanthropy surveys by PCP have focused on the numbers of giving barring some of the years when qualitative analysis was conducted that covered the top 5 giving PLCs. In this year’s CPS the qualitative part is expanded to include in-depth analysis of giving practices by top 25 companies in PLCs, 5 in PUCs, and 5 in PvLCs.
The key rationale for this section is to provide context which helps understand the significance of the reported numbers. By going beyond the quantification of the volume of giving, this analysis helps us create meaning for the amount of CSR various companies are doing and also aims to understand the various stages that companies go through to implement CSR. The subsequent section explores various key themes including the motivations behind CSR, the nature of projects and activities, the environment in which these activities take place and the key challenges faced by companies in their philanthropic efforts.
Areas of Research The following areas were explored during the qualitative survey;
1) Strategic Community Investment
2) Aligning CSR with SDGs
3) Motivations for being Socially Responsible
4) Change in Annual Donations
5) Spending in Various Thematic Areas
6) In-Kind Giving Practices
7) Areas of Operation
8) Preferred Channel for Giving
9) Organizational Structures for CSR
10) Internal and External CSR Regulations
19 “Human Development Reports.” | Human Development Reports,
UNDP, hdr.undp.org/en/countries/profiles/PAK.
11) Tax Benefits
12) Challenges in Giving
13) Creating an Enabling Environment for CSR
Strategic Community Investment According to the UNDP’s Global 2016 Human Development Report, Pakistan ranks at 147 out of 188 countries, below both Iraq and Palestine, in terms of the Human Development Index.19 In Pakistan, systems are underdeveloped and poverty is daunting. Therefore, when it comes to social service delivery, the private sector is often regarded as a key player. This type of expectation on people’s behalf was repeatedly expressed in our interviews. The discussions with HUBCO and Engro, for example, reinforced the idea that strategic community investments as a way of uplifting social environment are extremely important. In fact, when asked whether the CSR can lead to concrete social development, 72 percent of our respondents believed that corporate philanthropy has a massive influence on communities at grassroots levels. On the other hand, there is also a realization on the private sector’s part that this level of expectation puts them on a slippery slope. They cannot possibly replace or entirely make up for the shortcomings of the government and the public sector. Nor should there be such an expectation because ultimately all companies are driven by profits; profit margins expand or shrink depending on the market forces thus making prolonged commitments such as ensuring education and health, quite difficult. In fact, sustainable philanthropy came up as a focal concern in some of our discussions. Arguably, successful businesses create an overarching economic impact providing value to the society and uplifting its condition. Such long-term transitions are far more desirable than short bursts of philanthropic contributions which only seek to provide temporary relief.
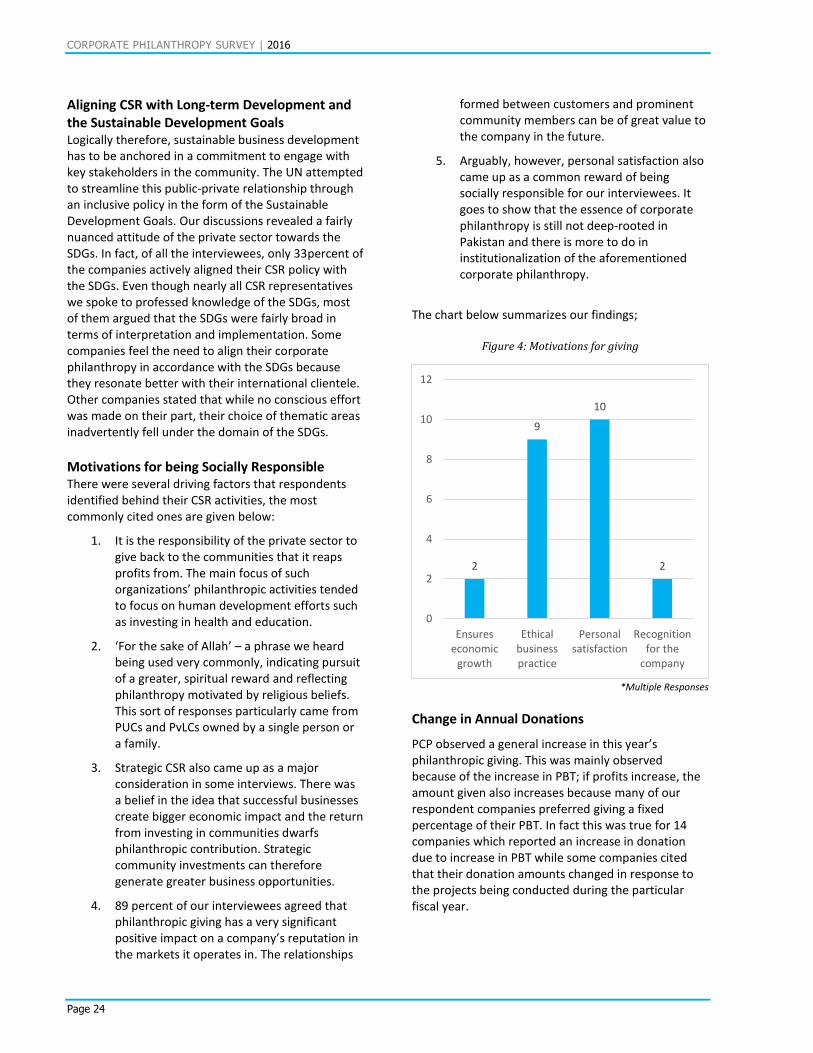
CORPORATE PHILANTHROPY SURVEY | 2016
Page 24
Aligning CSR with Long-term Development and the Sustainable Development Goals Logically therefore, sustainable business development has to be anchored in a commitment to engage with key stakeholders in the community. The UN attempted to streamline this public-private relationship through an inclusive policy in the form of the Sustainable Development Goals. Our discussions revealed a fairly nuanced attitude of the private sector towards the SDGs. In fact, of all the interviewees, only 33percent of the companies actively aligned their CSR policy with the SDGs. Even though nearly all CSR representatives we spoke to professed knowledge of the SDGs, most of them argued that the SDGs were fairly broad in terms of interpretation and implementation. Some companies feel the need to align their corporate philanthropy in accordance with the SDGs because they resonate better with their international clientele. Other companies stated that while no conscious effort was made on their part, their choice of thematic areas inadvertently fell under the domain of the SDGs.
Motivations for being Socially Responsible There were several driving factors that respondents identified behind their CSR activities, the most commonly cited ones are given below:
1. It is the responsibility of the private sector to give back to the communities that it reaps profits from. The main focus of such organizations’ philanthropic activities tended to focus on human development efforts such as investing in health and education.
2. ‘For the sake of Allah’ – a phrase we heard being used very commonly, indicating pursuit of a greater, spiritual reward and reflecting philanthropy motivated by religious beliefs. This sort of responses particularly came from PUCs and PvLCs owned by a single person or a family.
3. Strategic CSR also came up as a major consideration in some interviews. There was a belief in the idea that successful businesses create bigger economic impact and the return from investing in communities dwarfs philanthropic contribution. Strategic community investments can therefore generate greater business opportunities.
4. 89 percent of our interviewees agreed that philanthropic giving has a very significant positive impact on a company’s reputation in the markets it operates in. The relationships
formed between customers and prominent community members can be of great value to the company in the future.
5. Arguably, however, personal satisfaction also came up as a common reward of being socially responsible for our interviewees. It goes to show that the essence of corporate philanthropy is still not deep-rooted in Pakistan and there is more to do in institutionalization of the aforementioned corporate philanthropy.
The chart below summarizes our findings;
Figure 4: Motivations for giving
*Multiple Responses
Change in Annual Donations
PCP observed a general increase in this year’s philanthropic giving. This was mainly observed because of the increase in PBT; if profits increase, the amount given also increases because many of our respondent companies preferred giving a fixed percentage of their PBT. In fact this was true for 14 companies which reported an increase in donation due to increase in PBT while some companies cited that their donation amounts changed in response to the projects being conducted during the particular fiscal year.
2
9
10
2
0
2
4
6
8
10
12
Ensureseconomic
growth
Ethicalbusinesspractice
Personalsatisfaction
Recognitionfor the
company
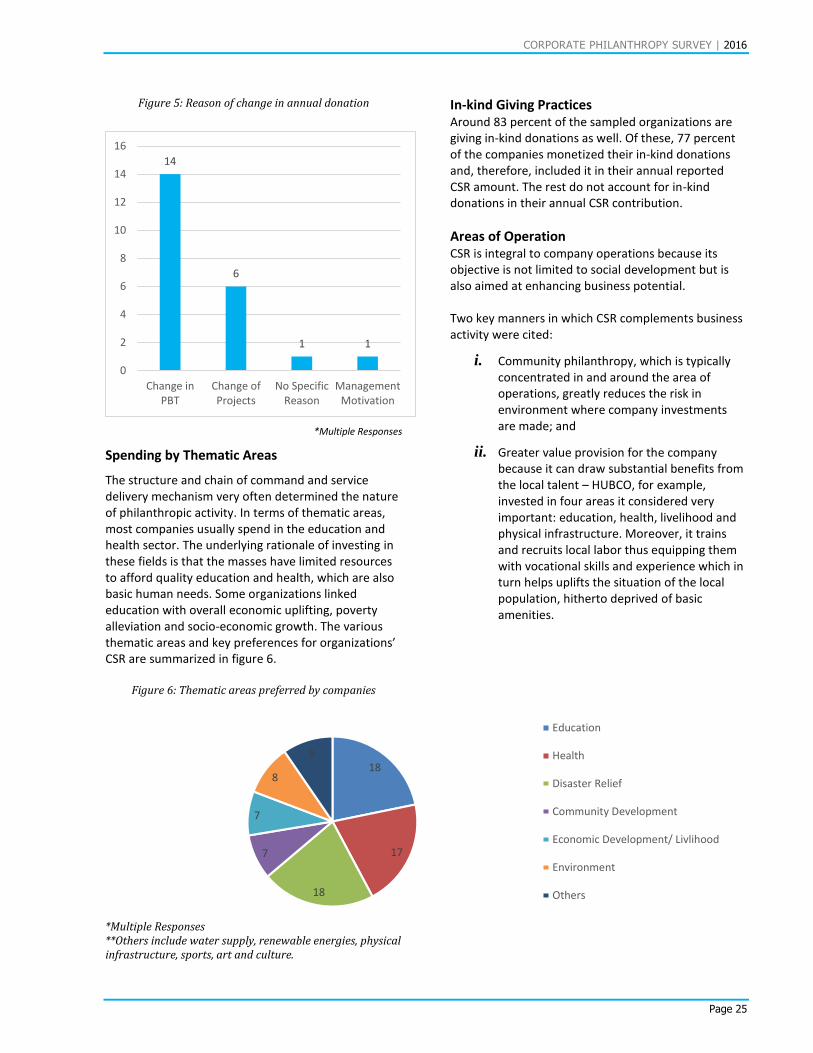
CORPORATE PHILANTHROPY SURVEY | 2016
Page 25
Figure 5: Reason of change in annual donation
*Multiple Responses
Spending by Thematic Areas
The structure and chain of command and service delivery mechanism very often determined the nature of philanthropic activity. In terms of thematic areas, most companies usually spend in the education and health sector. The underlying rationale of investing in these fields is that the masses have limited resources to afford quality education and health, which are also basic human needs. Some organizations linked education with overall economic uplifting, poverty alleviation and socio-economic growth. The various thematic areas and key preferences for organizations’ CSR are summarized in figure 6.
Figure 6: Thematic areas preferred by companies
*Multiple Responses **Others include water supply, renewable energies, physical infrastructure, sports, art and culture.
In-kind Giving Practices Around 83 percent of the sampled organizations are giving in-kind donations as well. Of these, 77 percent of the companies monetized their in-kind donations and, therefore, included it in their annual reported CSR amount. The rest do not account for in-kind donations in their annual CSR contribution.
Areas of Operation CSR is integral to company operations because its objective is not limited to social development but is also aimed at enhancing business potential. Two key manners in which CSR complements business activity were cited:
i. Community philanthropy, which is typically concentrated in and around the area of operations, greatly reduces the risk in environment where company investments are made; and
ii. Greater value provision for the company because it can draw substantial benefits from the local talent – HUBCO, for example, invested in four areas it considered very important: education, health, livelihood and physical infrastructure. Moreover, it trains and recruits local labor thus equipping them with vocational skills and experience which in turn helps uplifts the situation of the local population, hitherto deprived of basic amenities.
14
6
1 1
0
2
4
6
8
10
12
14
16
Change inPBT
Change ofProjects
No SpecificReason
ManagementMotivation
18
17
18
7
7
8
8
Education
Health
Disaster Relief
Community Development
Economic Development/ Livlihood
Environment
Others
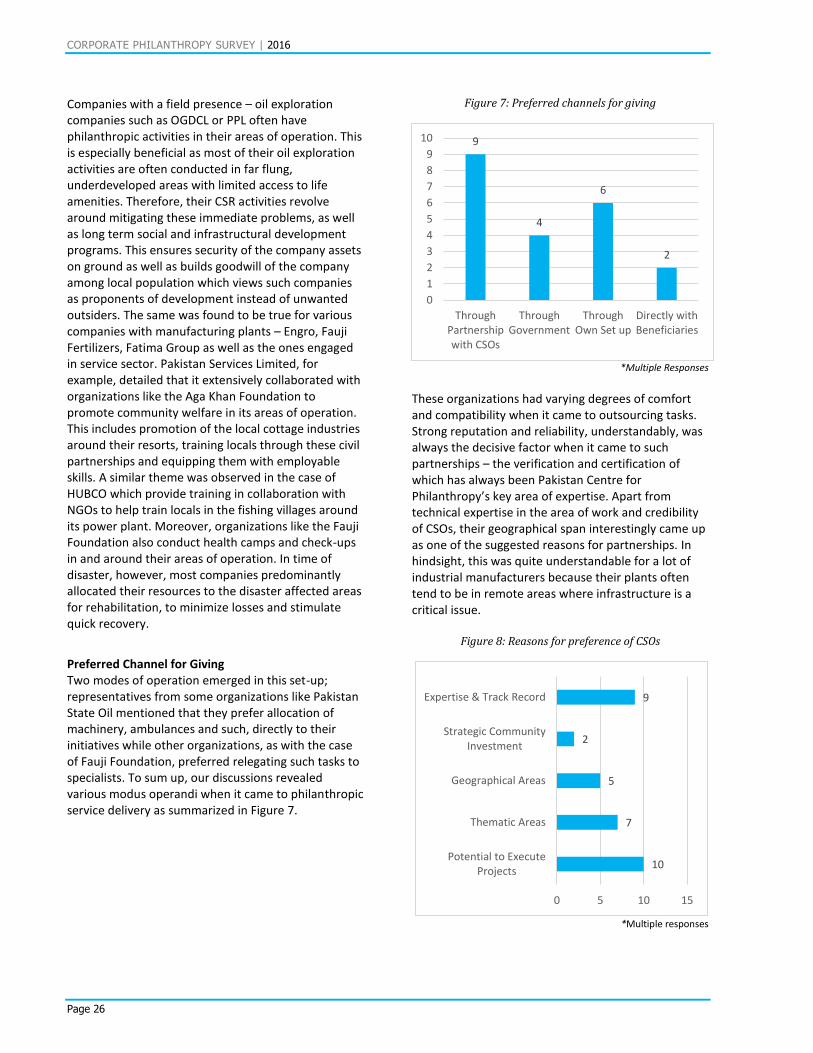
CORPORATE PHILANTHROPY SURVEY | 2016
Page 26
Companies with a field presence – oil exploration companies such as OGDCL or PPL often have philanthropic activities in their areas of operation. This is especially beneficial as most of their oil exploration activities are often conducted in far flung, underdeveloped areas with limited access to life amenities. Therefore, their CSR activities revolve around mitigating these immediate problems, as well as long term social and infrastructural development programs. This ensures security of the company assets on ground as well as builds goodwill of the company among local population which views such companies as proponents of development instead of unwanted outsiders. The same was found to be true for various companies with manufacturing plants – Engro, Fauji Fertilizers, Fatima Group as well as the ones engaged in service sector. Pakistan Services Limited, for example, detailed that it extensively collaborated with organizations like the Aga Khan Foundation to promote community welfare in its areas of operation. This includes promotion of the local cottage industries around their resorts, training locals through these civil partnerships and equipping them with employable skills. A similar theme was observed in the case of HUBCO which provide training in collaboration with NGOs to help train locals in the fishing villages around its power plant. Moreover, organizations like the Fauji Foundation also conduct health camps and check-ups in and around their areas of operation. In time of disaster, however, most companies predominantly allocated their resources to the disaster affected areas for rehabilitation, to minimize losses and stimulate quick recovery.
Preferred Channel for Giving Two modes of operation emerged in this set-up; representatives from some organizations like Pakistan State Oil mentioned that they prefer allocation of machinery, ambulances and such, directly to their initiatives while other organizations, as with the case of Fauji Foundation, preferred relegating such tasks to specialists. To sum up, our discussions revealed various modus operandi when it came to philanthropic service delivery as summarized in Figure 7.
Figure 7: Preferred channels for giving
*Multiple Responses
These organizations had varying degrees of comfort and compatibility when it came to outsourcing tasks. Strong reputation and reliability, understandably, was always the decisive factor when it came to such partnerships – the verification and certification of which has always been Pakistan Centre for Philanthropy’s key area of expertise. Apart from technical expertise in the area of work and credibility of CSOs, their geographical span interestingly came up as one of the suggested reasons for partnerships. In hindsight, this was quite understandable for a lot of industrial manufacturers because their plants often tend to be in remote areas where infrastructure is a critical issue.
Figure 8: Reasons for preference of CSOs
*Multiple responses
9
4
6
2
0
1
2
3
4
5
6
7
8
9
10
ThroughPartnershipwith CSOs
ThroughGovernment
ThroughOwn Set up
Directly withBeneficiaries
10
7
5
2
9
0 5 10 15
Potential to ExecuteProjects
Thematic Areas
Geographical Areas
Strategic CommunityInvestment
Expertise & Track Record
CORPORATE PHILANTHROPY SURVEY | 2016
Page 27
Organizational Structures for CSR
Different companies have different organizational structures in place to overlook their CSR programs. Ranging from having dedicated CSR departments, to voluntary committees and autonomous foundations, each company has identified the modality that works best for them. Most companies with dedicated CSR departments tended to be multinationals and large public listed companies: Fatima Group, Dawood Hercules, etc. It is noteworthy that while these companies had a dedicated CSR department, others had different kinds of arrangements; Pakistan State Oil, for example, had a CSR committee which comprised of employees volunteering to serve on the committee in addition to their designated jobs. Some companies conducted their CSR set-ups through foundations which operated autonomously. Notable examples include the Habib and Engro Foundations functioning under the umbrella of Habib Bank Limited and Engro Group respectively. By examining the way these companies had structured their philanthropic efforts, we can deduce a number of observations:
i. Foundations are, by their very nature, subservient to corporate strategy. For many such foundations, a repositioning of programs and policies happens once the company starts to expand in different directions. For that purpose, their operative span and scope of work is always in the process of being pruned in order to be aligned with corporate goals.
ii. Private limited companies, often run by a circle of family members or a closely-knit group, tend to keep the operations of their philanthropy programs closely regulated. Due to the smaller scale of their activities, there is a greater likelihood that these organizations operate at a more intimate level.
iii. Larger publicly traded companies quite often tend to blur the boundaries between CSR and marketing. This is possible because of three major reasons; greater influence owing to larger market shares, highly structured corporate philanthropy guidelines and proactive marketing departments. Corporate social responsibility, therefore, is also perceived as a major driving force for sustained brand equity in markets like Pakistan.
Internal and External CSR Regulations For some companies, apart from the internal regulations, their structure played a very important role in determining the nature of their philanthropic activity. Internal guidelines in a lot of cases, however, were not available in writing per se. In some companies, this role was taken up either by the board or a committee, as with Pakistan State Oil, which articulated major talking points for CSR – including resource allocation and disbursement of funds to appropriate channels. All of our respondent companies have certain board level responsibilities. These not only included approved funds but also the decision as to where to spend the amount allocated for CSR. Some board members also actively monitor progress reports on the action taken by the relevant CSR teams which shows that companies have growing interest on community development. Few companies have authorized the sole discretion of CSR allocations to boards and others have two or three layers of approval which means the higher amount of specific project will go further for approval while the amount under certain category will be approved at Managerial levels. Moreover, the survey highlighted the role that high-powered board members hold within companies with large philanthropic portfolios. The individual role of the CEOs was also highlighted in some cases as with Haji Sheikh Noor-ud-Din & Sons Pvt. Limited. Therefore, internal guidelines both formal and informal, help shape the corporate philanthropy landscape in Pakistan. When speaking to CSR representatives, there appeared to be a general consensus that at least 1percent of profits before taxes should be channeled towards CSR programs. All of our respondent organizations mentioned that they have internal guidelines, policies, SOPs, manuals regarding CSR. These guidelines range from outlines to thorough policies and direction manuals. However, when discussing external regulations, 9 of the 18 companies mentioned they were not subjected to any external guidelines or regulations. Meanwhile the rest of the companies cited various external frameworks that they used to guide their CSR activities. Specifically, oil companies are following the mandatory “Petroleum Concession Agreement” which mandates allocation of a certain amount of exploration, production or PBT for social welfare of the community. Other companies follow voluntary international guidelines of CSR such as ISO 26000 which is the recognized International Standard for CSR.
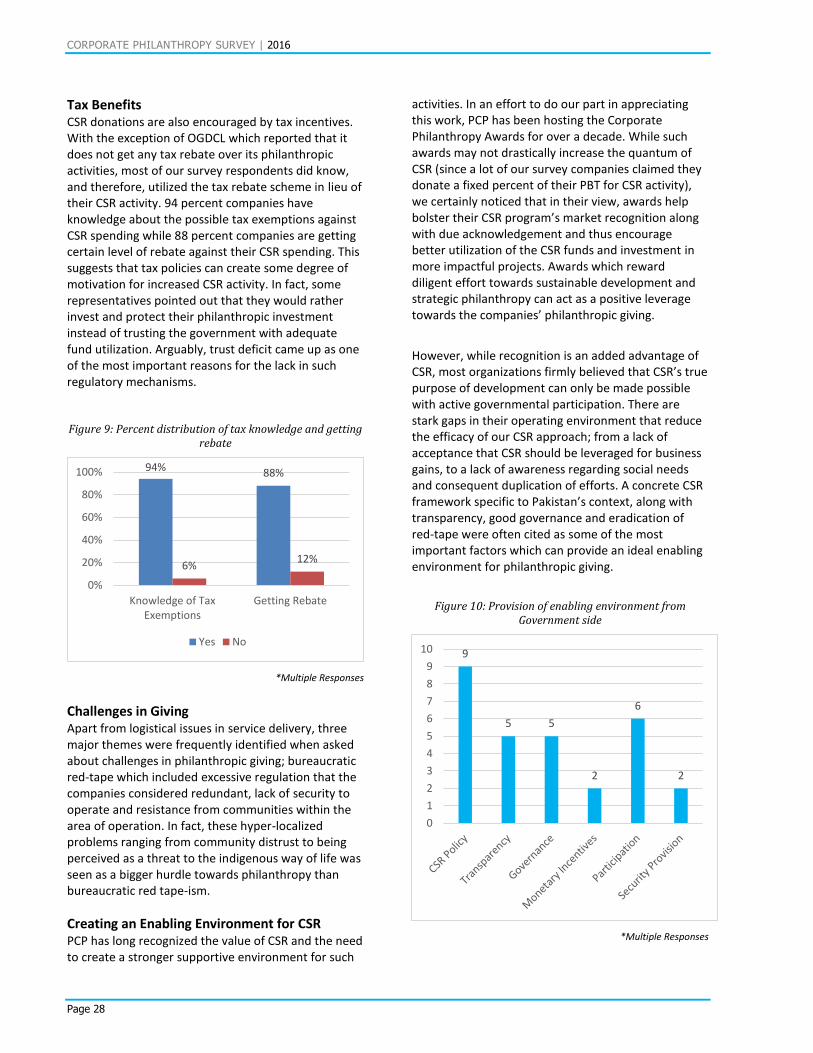
CORPORATE PHILANTHROPY SURVEY | 2016
Page 28
Tax Benefits CSR donations are also encouraged by tax incentives. With the exception of OGDCL which reported that it does not get any tax rebate over its philanthropic activities, most of our survey respondents did know, and therefore, utilized the tax rebate scheme in lieu of their CSR activity. 94 percent companies have knowledge about the possible tax exemptions against CSR spending while 88 percent companies are getting certain level of rebate against their CSR spending. This suggests that tax policies can create some degree of motivation for increased CSR activity. In fact, some representatives pointed out that they would rather invest and protect their philanthropic investment instead of trusting the government with adequate fund utilization. Arguably, trust deficit came up as one of the most important reasons for the lack in such regulatory mechanisms.
Figure 9: Percent distribution of tax knowledge and getting rebate
*Multiple Responses
Challenges in Giving Apart from logistical issues in service delivery, three major themes were frequently identified when asked about challenges in philanthropic giving; bureaucratic red-tape which included excessive regulation that the companies considered redundant, lack of security to operate and resistance from communities within the area of operation. In fact, these hyper-localized problems ranging from community distrust to being perceived as a threat to the indigenous way of life was seen as a bigger hurdle towards philanthropy than bureaucratic red tape-ism.
Creating an Enabling Environment for CSR PCP has long recognized the value of CSR and the need to create a stronger supportive environment for such
activities. In an effort to do our part in appreciating this work, PCP has been hosting the Corporate Philanthropy Awards for over a decade. While such awards may not drastically increase the quantum of CSR (since a lot of our survey companies claimed they donate a fixed percent of their PBT for CSR activity), we certainly noticed that in their view, awards help bolster their CSR program’s market recognition along with due acknowledgement and thus encourage better utilization of the CSR funds and investment in more impactful projects. Awards which reward diligent effort towards sustainable development and strategic philanthropy can act as a positive leverage towards the companies’ philanthropic giving.
However, while recognition is an added advantage of CSR, most organizations firmly believed that CSR’s true purpose of development can only be made possible with active governmental participation. There are stark gaps in their operating environment that reduce the efficacy of our CSR approach; from a lack of acceptance that CSR should be leveraged for business gains, to a lack of awareness regarding social needs and consequent duplication of efforts. A concrete CSR framework specific to Pakistan’s context, along with transparency, good governance and eradication of red-tape were often cited as some of the most important factors which can provide an ideal enabling environment for philanthropic giving.
Figure 10: Provision of enabling environment from
Government side
*Multiple Responses
94% 88%
6%12%
0%
20%
40%
60%
80%
100%
Knowledge of TaxExemptions
Getting Rebate
Yes No9
5 5
2
6
2
0
1
2
3
4
5
6
7
8
9
10
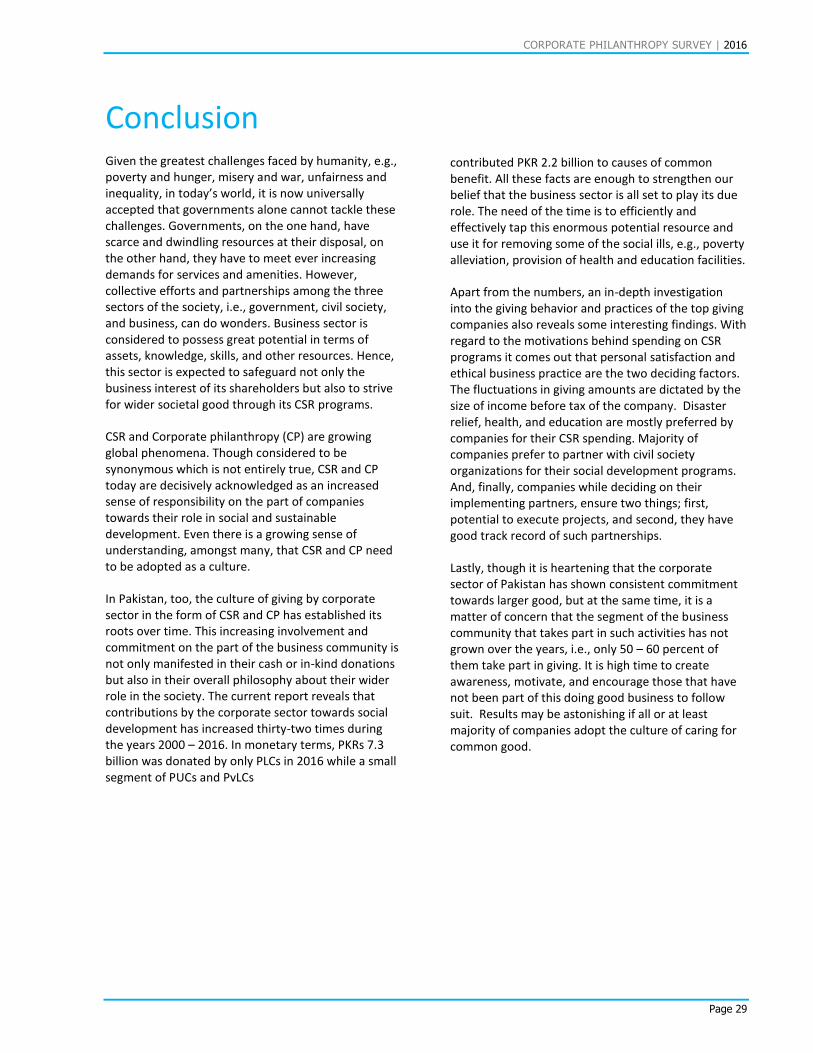
CORPORATE PHILANTHROPY SURVEY | 2016
Page 29
Conclusion
Given the greatest challenges faced by humanity, e.g., poverty and hunger, misery and war, unfairness and inequality, in today’s world, it is now universally accepted that governments alone cannot tackle these challenges. Governments, on the one hand, have scarce and dwindling resources at their disposal, on the other hand, they have to meet ever increasing demands for services and amenities. However, collective efforts and partnerships among the three sectors of the society, i.e., government, civil society, and business, can do wonders. Business sector is considered to possess great potential in terms of assets, knowledge, skills, and other resources. Hence, this sector is expected to safeguard not only the business interest of its shareholders but also to strive for wider societal good through its CSR programs.
CSR and Corporate philanthropy (CP) are growing global phenomena. Though considered to be synonymous which is not entirely true, CSR and CP today are decisively acknowledged as an increased sense of responsibility on the part of companies towards their role in social and sustainable development. Even there is a growing sense of understanding, amongst many, that CSR and CP need to be adopted as a culture.
In Pakistan, too, the culture of giving by corporate sector in the form of CSR and CP has established its roots over time. This increasing involvement and commitment on the part of the business community is not only manifested in their cash or in-kind donations but also in their overall philosophy about their wider role in the society. The current report reveals that contributions by the corporate sector towards social development has increased thirty-two times during the years 2000 – 2016. In monetary terms, PKRs 7.3 billion was donated by only PLCs in 2016 while a small segment of PUCs and PvLCs
contributed PKR 2.2 billion to causes of common benefit. All these facts are enough to strengthen our belief that the business sector is all set to play its due role. The need of the time is to efficiently and effectively tap this enormous potential resource and use it for removing some of the social ills, e.g., poverty alleviation, provision of health and education facilities.
Apart from the numbers, an in-depth investigation into the giving behavior and practices of the top giving companies also reveals some interesting findings. With regard to the motivations behind spending on CSR programs it comes out that personal satisfaction and ethical business practice are the two deciding factors. The fluctuations in giving amounts are dictated by the size of income before tax of the company. Disaster relief, health, and education are mostly preferred by companies for their CSR spending. Majority of companies prefer to partner with civil society organizations for their social development programs. And, finally, companies while deciding on their implementing partners, ensure two things; first, potential to execute projects, and second, they have good track record of such partnerships.
Lastly, though it is heartening that the corporate sector of Pakistan has shown consistent commitment towards larger good, but at the same time, it is a matter of concern that the segment of the business community that takes part in such activities has not grown over the years, i.e., only 50 – 60 percent of them take part in giving. It is high time to create awareness, motivate, and encourage those that have not been part of this doing good business to follow suit. Results may be astonishing if all or at least majority of companies adopt the culture of caring for common good.

CORPORATE PHILANTHROPY SURVEY | 2016
Page 30
PCP’s Board of Directors Mr. Zaffar A. Khan, S.I. Chairperson, PCP Board of Directors Mr. Mueen Afzal, H.I. Former Secretary General, Finance & Economic Affairs, Government of Pakistan Syed Hyder Ali, Managing Director and CEO, Packages Limited, Lahore Mr. Arif Habib, President, Arif Habib Securities Limited Dr. Attiya Inayatullah, Former Federal Minister for Women Development, Special Education, Social Welfare and Population Welfare Dr. S. Sohail H. Naqvi, Vice Chancellor, Lahore University of Management Sciences Ms. Khawar Mumtaz, Chairperson, National Commission on the Status of Women, Govt. of Pakistan Mr. Sohail G. Khoja, Representative, Aga Khan University
Mr. Abdul Wajid Rana, Member, Federal Public Service Commission of Pakistan Mr. Ahsan M. Saleem, Chief Executive, Crescent Steel & Allied Products Mr. Omar Yaqoob Sheikh, Chairman/Managing Director, Shell Pakistan Ltd. Mr. Badaruddin F. Vellani, Chairman of Board, Aga Khan Foundation (Pakistan). Mr. Osman Waheed, President, Ferozesons Laboratories Limited. Mr. Iqbal Walji, Chairperson, National Committee, AKFP. Mr. Arshad Zuberi, Chief Executive and Editor, Daily Business Recorder. The Centre is led by Ms. Shazia Maqsood Amjad, Executive Director and Ex-officio member of the BoD.


Pakistan Centre for Philanthropy
1st Floor, RDF Centre, 31 Mauve Area, G-9/1, Islamabad.pcp.org.pk