Future and current sea dike reliability analysis under severe ...
73
Future and current sea dike reliability analysis under severe storms in Shanghai Pudong New District Bingjing Lu
-
Upload
khangminh22 -
Category
Documents
-
view
2 -
download
0
Transcript of Future and current sea dike reliability analysis under severe ...
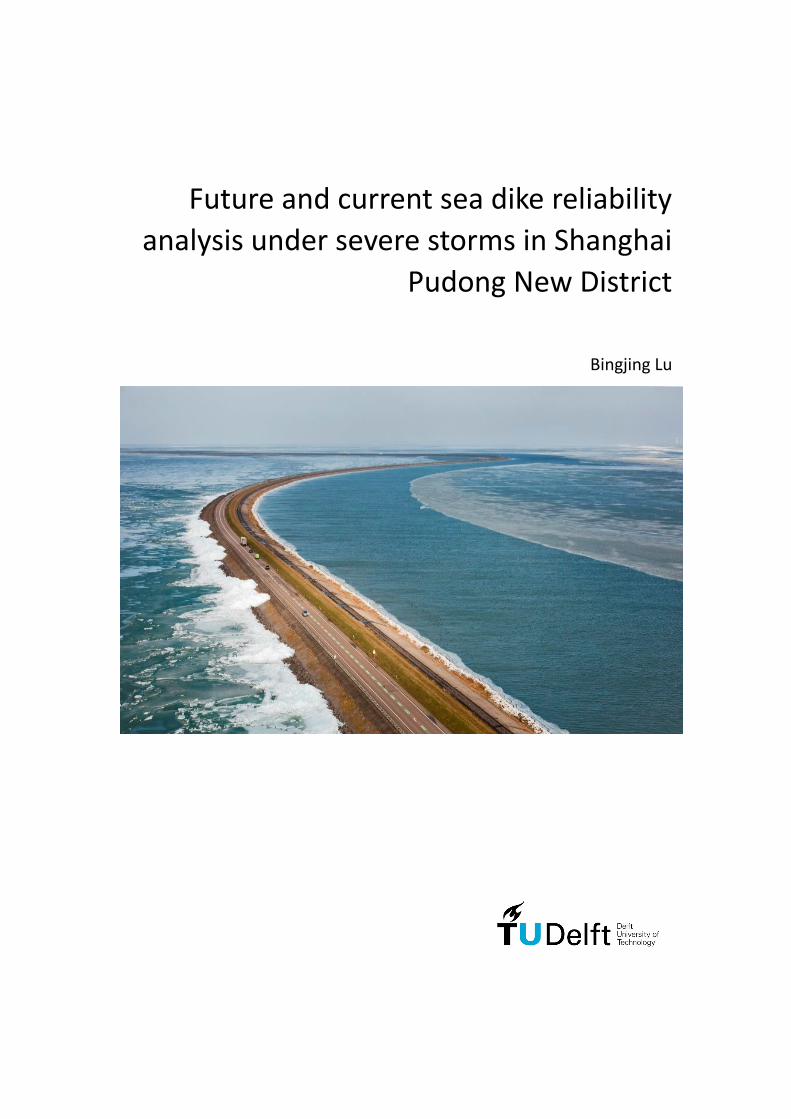
Future and current sea dike reliability
analysis under severe storms in Shanghai
Pudong New District
Bingjing Lu


Future and current sea dike reliability analysis under
severe storms in Shanghai Pudong New District
MASTER OF SCIENCE THESIS
For the degree of Master of Science in Hydraulic Engineering at Delft
University of Technology
Name: Bingjing Lu
Student number: 4769791
Thesis committee: Prof. dr. ir. M. Matthijs Kok, TU Delft
Dr. ir. R.C. Robert Lanzafame, TU Delft
Dr. Q. Ke, TU Delft
Faculty of Civil Engineering and Geosciences (CEG) · Delft University of Technology
I
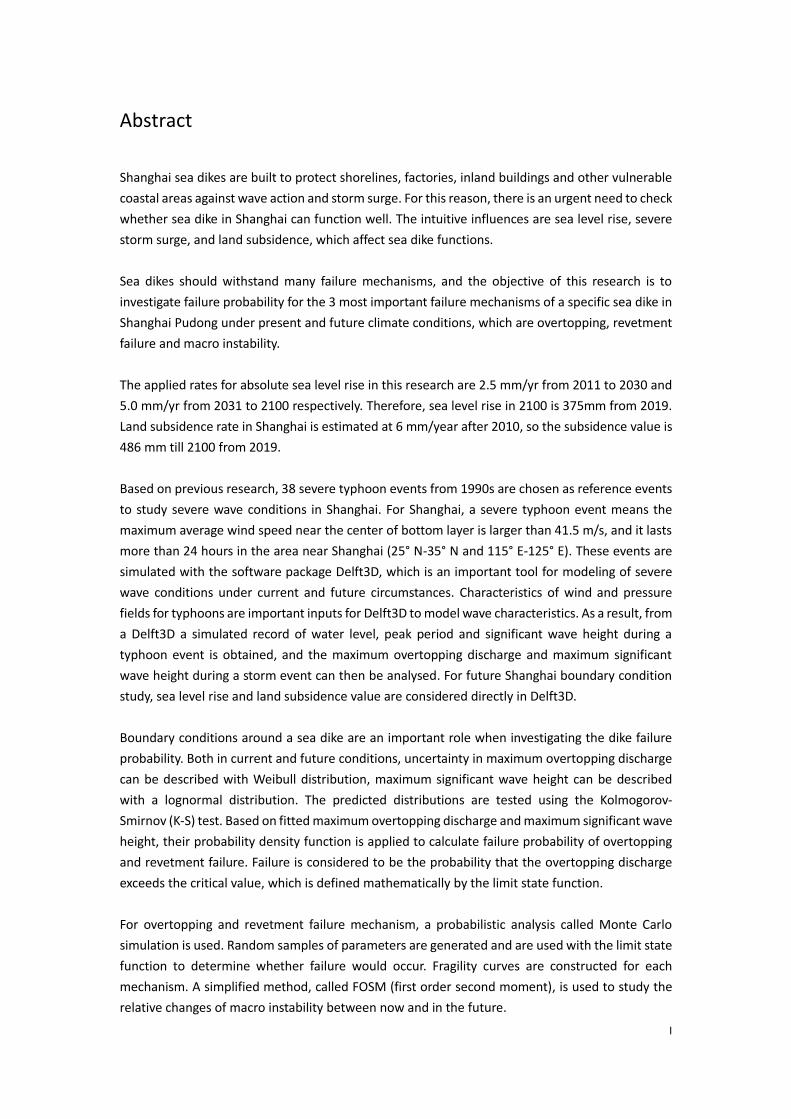
Abstract
Shanghai sea dikes are built to protect shorelines, factories, inland buildings and other vulnerable
coastal areas against wave action and storm surge. For this reason, there is an urgent need to check
whether sea dike in Shanghai can function well. The intuitive influences are sea level rise, severe
storm surge, and land subsidence, which affect sea dike functions.
Sea dikes should withstand many failure mechanisms, and the objective of this research is to
investigate failure probability for the 3 most important failure mechanisms of a specific sea dike in
Shanghai Pudong under present and future climate conditions, which are overtopping, revetment
failure and macro instability.
The applied rates for absolute sea level rise in this research are 2.5 mm/yr from 2011 to 2030 and
5.0 mm/yr from 2031 to 2100 respectively. Therefore, sea level rise in 2100 is 375mm from 2019.
Land subsidence rate in Shanghai is estimated at 6 mm/year after 2010, so the subsidence value is
486 mm till 2100 from 2019.
Based on previous research, 38 severe typhoon events from 1990s are chosen as reference events
to study severe wave conditions in Shanghai. For Shanghai, a severe typhoon event means the
maximum average wind speed near the center of bottom layer is larger than 41.5 m/s, and it lasts
more than 24 hours in the area near Shanghai (25° N-35° N and 115° E-125° E). These events are
simulated with the software package Delft3D, which is an important tool for modeling of severe
wave conditions under current and future circumstances. Characteristics of wind and pressure
fields for typhoons are important inputs for Delft3D to model wave characteristics. As a result, from
a Delft3D a simulated record of water level, peak period and significant wave height during a
typhoon event is obtained, and the maximum overtopping discharge and maximum significant
wave height during a storm event can then be analysed. For future Shanghai boundary condition
study, sea level rise and land subsidence value are considered directly in Delft3D.
Boundary conditions around a sea dike are an important role when investigating the dike failure
probability. Both in current and future conditions, uncertainty in maximum overtopping discharge
can be described with Weibull distribution, maximum significant wave height can be described
with a lognormal distribution. The predicted distributions are tested using the Kolmogorov-
Smirnov (K-S) test. Based on fitted maximum overtopping discharge and maximum significant wave
height, their probability density function is applied to calculate failure probability of overtopping
and revetment failure. Failure is considered to be the probability that the overtopping discharge
exceeds the critical value, which is defined mathematically by the limit state function.
For overtopping and revetment failure mechanism, a probabilistic analysis called Monte Carlo
simulation is used. Random samples of parameters are generated and are used with the limit state
function to determine whether failure would occur. Fragility curves are constructed for each
mechanism. A simplified method, called FOSM (first order second moment), is used to study the
relative changes of macro instability between now and in the future.

II
Although not all failure mechanisms for the Pudong sea dike are taken into account, this study
proves that the lower bound of Shanghai sea dike failure probability is 0.31 per year in the
condition of severe storm events in the year 2100. However, under current conditions, the lower
bound of failure probability of Pudong sea dike is 0.23 per year. In terms of these three main failure
mechanisms, revetment and overtopping mechanisms contribute more to Pudong sea dike failure.
III
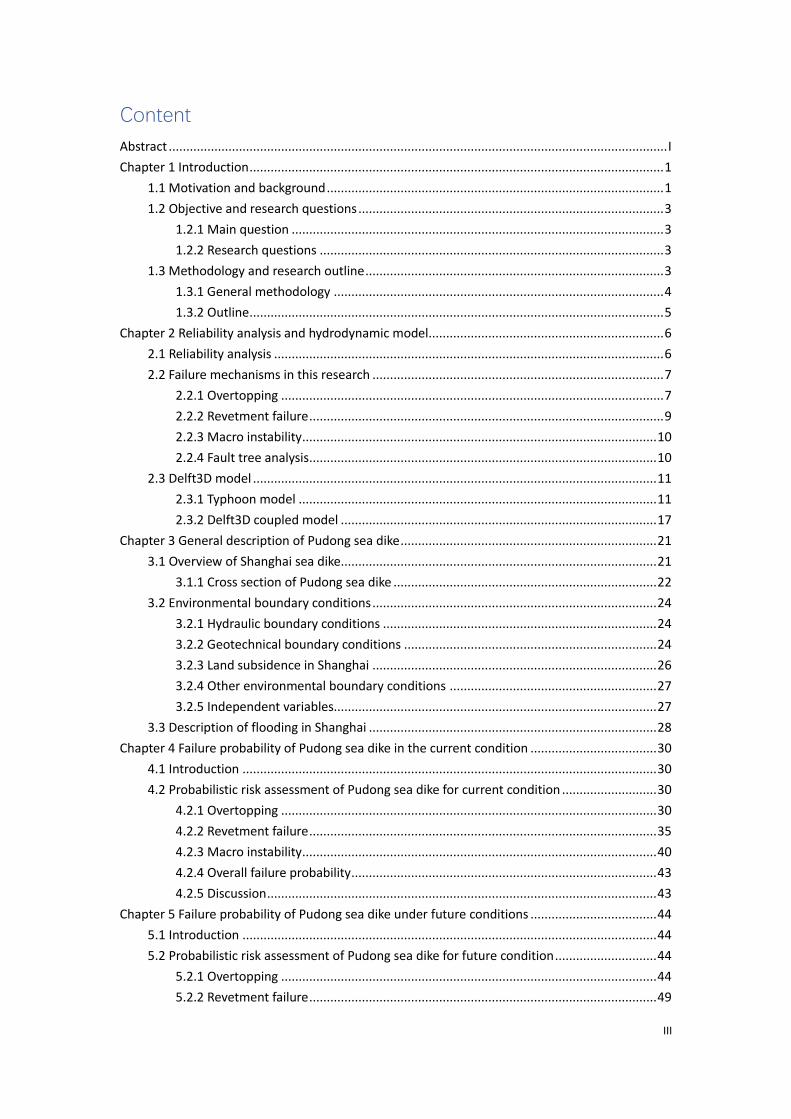
Content
Abstract .............................................................................................................................................. I
Chapter 1 Introduction ...................................................................................................................... 1
1.1 Motivation and background ................................................................................................ 1
1.2 Objective and research questions ....................................................................................... 3
1.2.1 Main question .......................................................................................................... 3
1.2.2 Research questions .................................................................................................. 3
1.3 Methodology and research outline ..................................................................................... 3
1.3.1 General methodology .............................................................................................. 4
1.3.2 Outline ...................................................................................................................... 5
Chapter 2 Reliability analysis and hydrodynamic model ................................................................... 6
2.1 Reliability analysis ............................................................................................................... 6
2.2 Failure mechanisms in this research ................................................................................... 7
2.2.1 Overtopping ............................................................................................................. 7
2.2.2 Revetment failure ..................................................................................................... 9
2.2.3 Macro instability ..................................................................................................... 10
2.2.4 Fault tree analysis ................................................................................................... 10
2.3 Delft3D model ................................................................................................................... 11
2.3.1 Typhoon model ...................................................................................................... 11
2.3.2 Delft3D coupled model .......................................................................................... 17
Chapter 3 General description of Pudong sea dike ......................................................................... 21
3.1 Overview of Shanghai sea dike.......................................................................................... 21
3.1.1 Cross section of Pudong sea dike ........................................................................... 22
3.2 Environmental boundary conditions ................................................................................. 24
3.2.1 Hydraulic boundary conditions .............................................................................. 24
3.2.2 Geotechnical boundary conditions ........................................................................ 24
3.2.3 Land subsidence in Shanghai ................................................................................. 26
3.2.4 Other environmental boundary conditions ........................................................... 27
3.2.5 Independent variables............................................................................................ 27
3.3 Description of flooding in Shanghai .................................................................................. 28
Chapter 4 Failure probability of Pudong sea dike in the current condition .................................... 30
4.1 Introduction ...................................................................................................................... 30
4.2 Probabilistic risk assessment of Pudong sea dike for current condition ........................... 30
4.2.1 Overtopping ........................................................................................................... 30
4.2.2 Revetment failure ................................................................................................... 35
4.2.3 Macro instability ..................................................................................................... 40
4.2.4 Overall failure probability ....................................................................................... 43
4.2.5 Discussion ............................................................................................................... 43
Chapter 5 Failure probability of Pudong sea dike under future conditions .................................... 44
5.1 Introduction ...................................................................................................................... 44
5.2 Probabilistic risk assessment of Pudong sea dike for future condition ............................. 44
5.2.1 Overtopping ........................................................................................................... 44
5.2.2 Revetment failure ................................................................................................... 49

IV
5.2.3 Macro instability ..................................................................................................... 53
5.2.4 Overall failure probability ....................................................................................... 55
5.2.5 Discussion ............................................................................................................... 55
Chapter 6 Conclusions and recommendations ............................................................................... 56
6.1 Conclusions ....................................................................................................................... 56
6.2 Recommendations ............................................................................................................ 57
Reference ........................................................................................................................................ 59
Appendix A ...................................................................................................................................... 62
Appendix B ...................................................................................................................................... 66
1
Chapter 1 Introduction
1.1 Motivation and background
Shanghai is a Chinese coastal city with an elevation of 3-4m (Wusong datum) at 30.42’N - 31.48’ N
and 120°52’E-122°12’E located on the Yangtze Estuary of China’s east coast, with the Yangtze River
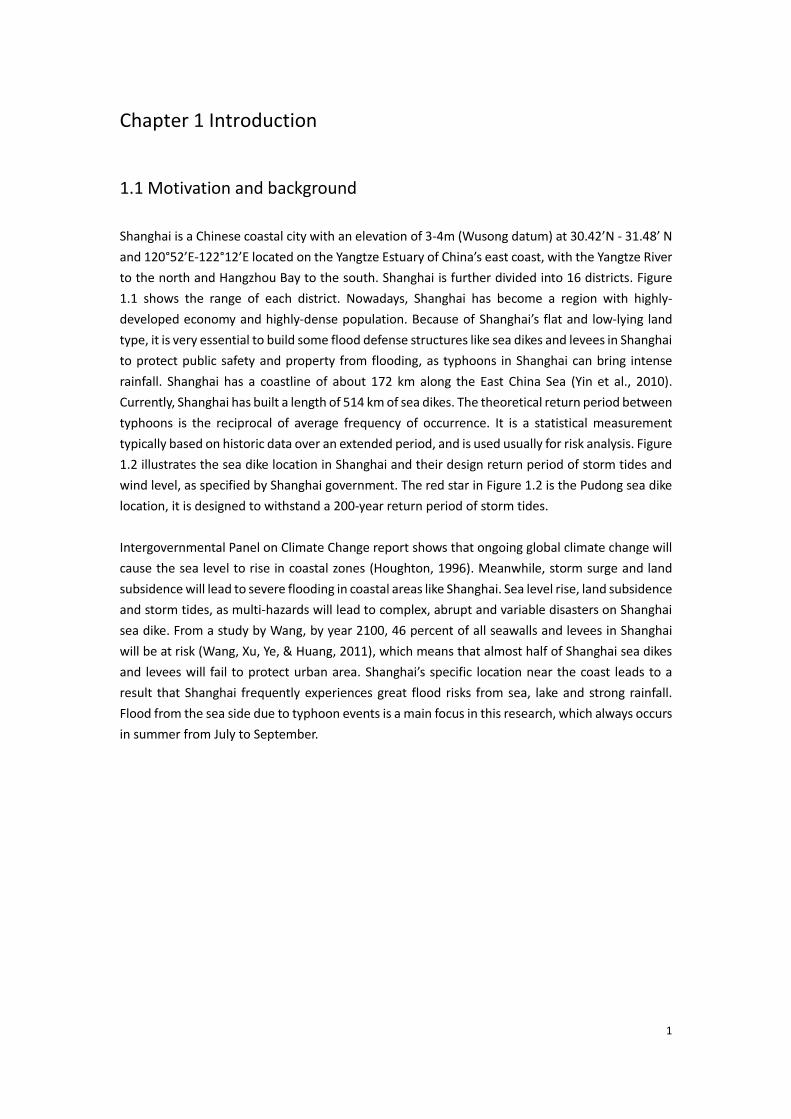
to the north and Hangzhou Bay to the south. Shanghai is further divided into 16 districts. Figure
1.1 shows the range of each district. Nowadays, Shanghai has become a region with highly-
developed economy and highly-dense population. Because of Shanghai’s flat and low-lying land
type, it is very essential to build some flood defense structures like sea dikes and levees in Shanghai
to protect public safety and property from flooding, as typhoons in Shanghai can bring intense
rainfall. Shanghai has a coastline of about 172 km along the East China Sea (Yin et al., 2010).
Currently, Shanghai has built a length of 514 km of sea dikes. The theoretical return period between
typhoons is the reciprocal of average frequency of occurrence. It is a statistical measurement
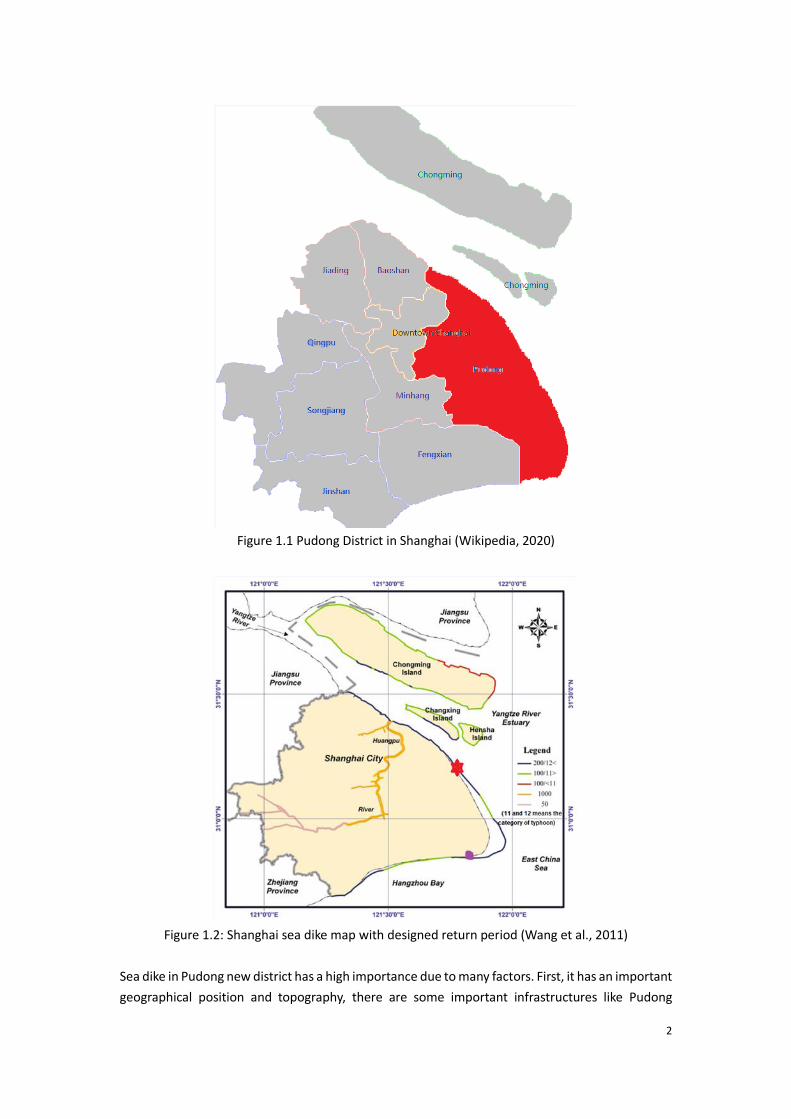
typically based on historic data over an extended period, and is used usually for risk analysis. Figure
1.2 illustrates the sea dike location in Shanghai and their design return period of storm tides and
wind level, as specified by Shanghai government. The red star in Figure 1.2 is the Pudong sea dike
location, it is designed to withstand a 200-year return period of storm tides.
Intergovernmental Panel on Climate Change report shows that ongoing global climate change will
cause the sea level to rise in coastal zones (Houghton, 1996). Meanwhile, storm surge and land
subsidence will lead to severe flooding in coastal areas like Shanghai. Sea level rise, land subsidence
and storm tides, as multi-hazards will lead to complex, abrupt and variable disasters on Shanghai
sea dike. From a study by Wang, by year 2100, 46 percent of all seawalls and levees in Shanghai
will be at risk (Wang, Xu, Ye, & Huang, 2011), which means that almost half of Shanghai sea dikes
and levees will fail to protect urban area. Shanghai’s specific location near the coast leads to a
result that Shanghai frequently experiences great flood risks from sea, lake and strong rainfall.
Flood from the sea side due to typhoon events is a main focus in this research, which always occurs
in summer from July to September.
2
Figure 1.1 Pudong District in Shanghai (Wikipedia, 2020)
Figure 1.2: Shanghai sea dike map with designed return period (Wang et al., 2011)
Sea dike in Pudong new district has a high importance due to many factors. First, it has an important
geographical position and topography, there are some important infrastructures like Pudong
Figure 1.1: Pudong District in Shanghai
3
International airport, Waigaoqiao port, Lvbo water park, Disneyland, etc. Second, Pudong New
District houses 1.4 million people in a 1210 km2 area, which is very densely populated (Damoah-
Afari, Ding, Lu, Li, & Omura, 2010). In 2008, sea dike in Pudong new district is 55.30 km in length
(CHEN & QI, 2010). Pudong sea dike failure will lead to huge economic losses. Therefore, a major
concern for Shanghai government now is in the near future, whether the current Shanghai Pudong
sea dike can comply with safety criteria, so it is important to calculate failure probability of
Shanghai sea dike in 2100 year and take some defense measures to protect Shanghai future.
1.2 Objective and research questions
1.2.1 Main question
The objective of this thesis is:
To evaluate the effect of sea level rise and land subsidence on the reliability of Shanghai Pudong
sea dikes during storm events under current and future conditions.
1.2.2 Research questions
The main research question can be split up into several sub-questions:
1. How to determine the most important hydraulic boundary conditions (significant wave height,
water level and peak period) in Pudong New District?
2. What are representative distributions of maximum overtopping discharge and significant wave
height to conduct reliability analysis in Pudong New District for current and future conditions?
3. What is the failure probability of Pudong sea dike for each 3 main failure mechanisms and how
does it change for the future condition if sea level rise and land subsidence are considered?
1.3 Methodology and research outline
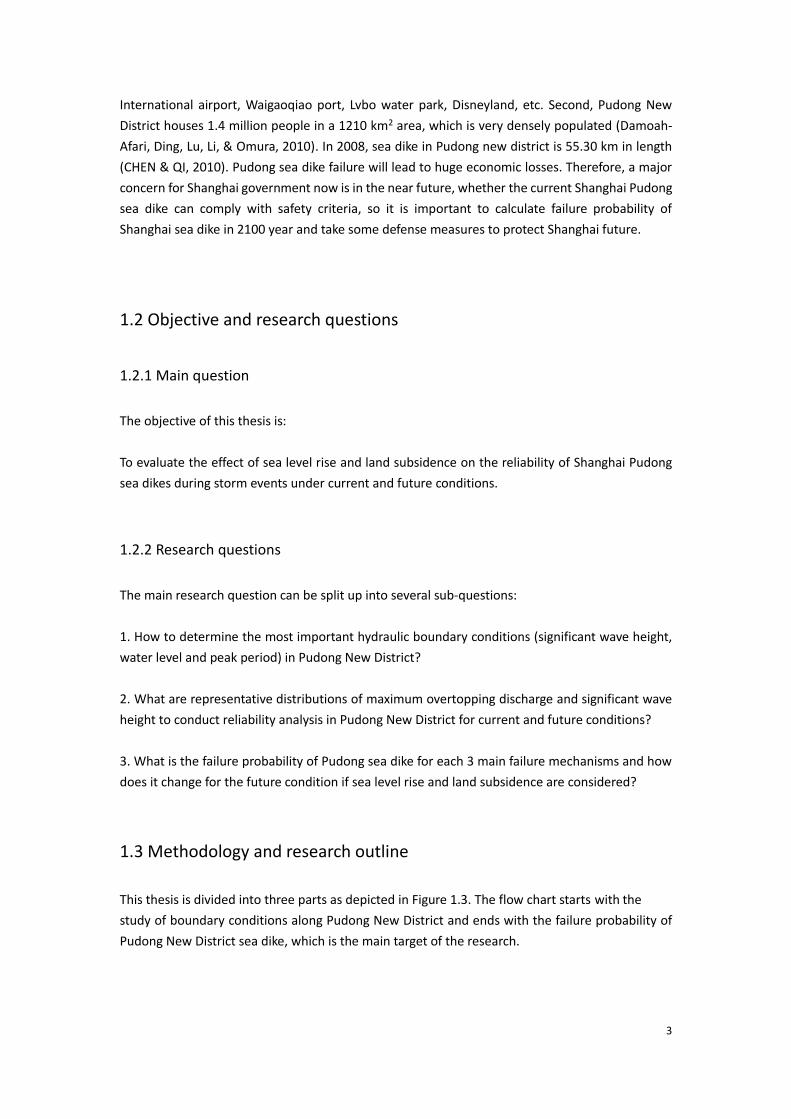
This thesis is divided into three parts as depicted in Figure 1.3. The flow chart starts with the
study of boundary conditions along Pudong New District and ends with the failure probability of
Pudong New District sea dike, which is the main target of the research.
4
Figure 1.3: Flow chart of this thesis and links to other sub-projects (SP)
1.3.1 General methodology
• General method to calculate failure probability
To study the failure probability of Pudong sea dike, limit state functions of main failure mechanisms
should be determined first.
For overtopping, fitting the maximum overtopping discharge from historical severe storm events
to form a probability distribution, For revetment failure, significant wave height is the only variable
in the limit state function, more insight in the prediction of Hs distribution is necessary, Then using
the probability density function plot of estimated distribution and critical overtopping
discharge/critical significant wave height can help investigate the failure probability of failure mode.
In terms of the macro instability, First Order Second Moment (FOSM) provides a way to assess the
failure probability. It evaluates the performance function by using the first order Taylor series
expansion of the limit state function (LSF) at the mean value.
• Model for boundary conditions
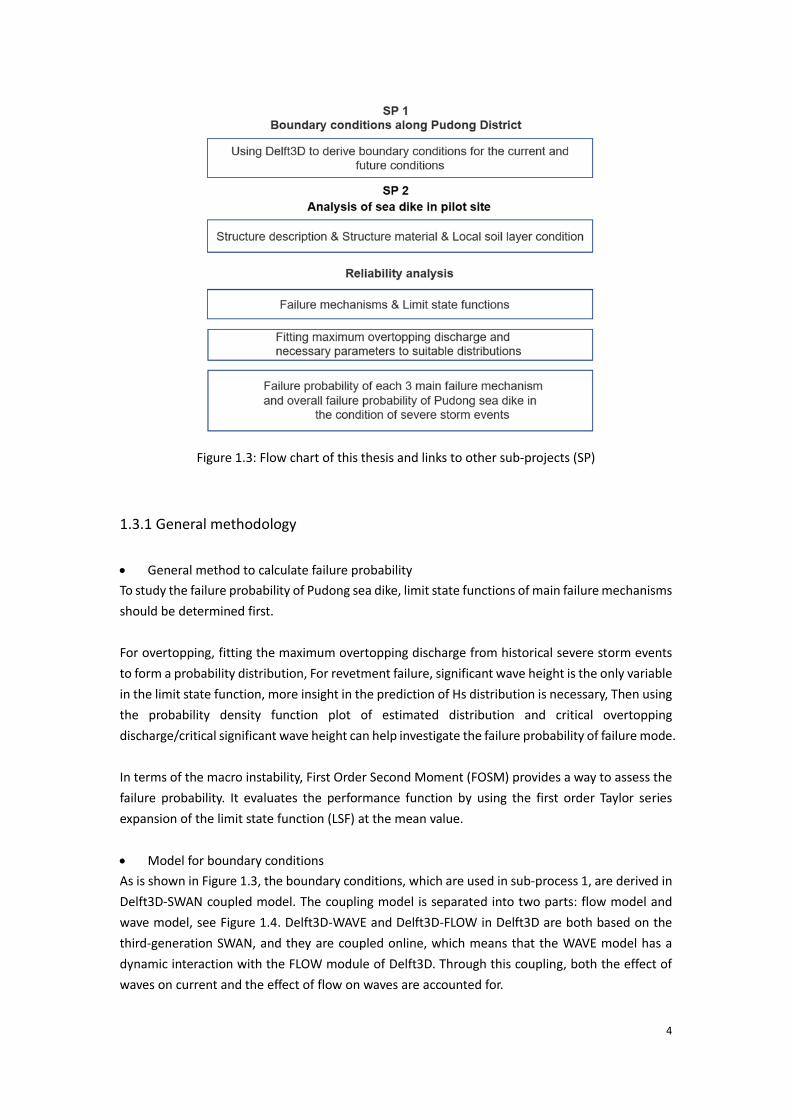
As is shown in Figure 1.3, the boundary conditions, which are used in sub-process 1, are derived in
Delft3D-SWAN coupled model. The coupling model is separated into two parts: flow model and
wave model, see Figure 1.4. Delft3D-WAVE and Delft3D-FLOW in Delft3D are both based on the
third-generation SWAN, and they are coupled online, which means that the WAVE model has a
dynamic interaction with the FLOW module of Delft3D. Through this coupling, both the effect of
waves on current and the effect of flow on waves are accounted for.

5
Delft3D-FLOW is a multi-dimensional (2D or 3D) hydrodynamic simulation program which
calculates non-steady flow and transport phenomena that result from tidal and meteorological
forcing on a rectilinear or a curvilinear, boundary fitted grid. Study area grids, bathymetry, tidal
level and wind conditions including wind tracks, pressure fields are important inputs in Delft3D-
FLOW model. The water level can be read from the model results.
Delft3D-WAVE model gives wave parameters, and the input of wind information, study area grid
and bathymetry are the same as that in the Delft3D-FLOW model.
Figure 1.4: Delft-3D coupling model description
• Main failure mode analysis
There are many failure mechanisms encountered in daily life for dikes. This thesis will look into
most likely failure mode overtopping, revetment failure and macro instability in detail. From the
output of Delft3D coupling model and Pudong sea dike dimension, reliability analysis of each main
failure mechanism can be done. The overall reliability analysis can then be analyzed using fault tree.
1.3.2 Outline
The research consists of 6 chapters that are organized as follows:
Chapter 1: Introduction, statement and motivation of the thesis topic.
Chapter 2: Reliability framework for the calculations that will be performed in this research. and
methodology of model set-up.
Chapter 3: Background knowledge to this study. Pudong sea dike information is summarized.
Chapter 4: Boundary conditions for Pudong sea dike and reliability analysis in current situation.
Chapter 5: Boundary conditions for Pudong sea dike and reliability analysis in future situation
considering sea level rise and land subsidence.
Chapter 6: General conclusions and the answer to the research questions.
6
Chapter 2 Reliability analysis and hydrodynamic model
The reliability of the designed structure has to be determined to check if the structure meets the
design requirements. To check the reliability of the total structure the reliability of all the different
components should be examined. In this section the reliability of a single element is treated to
discuss the different calculation methods. In the following sections these reliability methods are
explained in detail and an example is given to illustrate the possibilities
2.1 Reliability analysis
When the strength of Pudong sea dike or a certain section of it no longer fulfills its design criteria,
failure occurs. A failure mechanism is the way in which a failure occurs, in this research, it means
overtopping, revetment failure and macro instability. It is important for us to do a reliability analysis
to calculate the probability of Pudong sea dike in the situation in which it performs its required
function adequately for a specified period of time under stated conditions as defined by the limit
state. As defined by the limit state, it is possible to define a reliability functions by using limit states,
the general form of which can be written as:
𝑍 = 𝑅 − 𝑆 (2.1.1)
Where R indicates resistance variable and S indicates the load effect on the sea dike. Failure
mechanism happens when the load is larger than the resistance (R>S), at this time, the limit state
has a negative value.
Another way to describe the reliability of Pudong sea dike is using the reliability index β. The failure
probability and the reliability index are related as 𝑃𝑓 = 𝜙(−𝛽) , 𝜙 is the cumulative standard
normal distribution.
This can also be expressed in factor of safety (FoS) Equation (2.1.2), if the FoS is smaller than 1 the
mechanism is not safe and it can lead to initial failure.
𝐹𝑜𝑆 =𝑅
𝑆 (2.1.2)
𝑍 = 𝐹𝑜𝑆 − 1 (2.1.3)
The reliability is often expressed as the probability of proper function i.e. the probability P(Z>0).
This can be expressed in terms of the probability of failure (Pf).
𝑃(𝑍 ≥ 0) = 1 − 𝑃𝑓 (2.1.4)
The probability of failure is defined as follows:
𝑃𝑓 = 𝑃(𝑍 < 0) = 𝑃(𝑆 > 𝑅) = ∫ 𝑓(𝑥)𝑑𝑥 𝑓𝑜𝑟 𝑡 > 0∞
𝑡 (2.1.5)
7
where:
t: allowable critical load value.
2.2 Failure mechanisms in this research
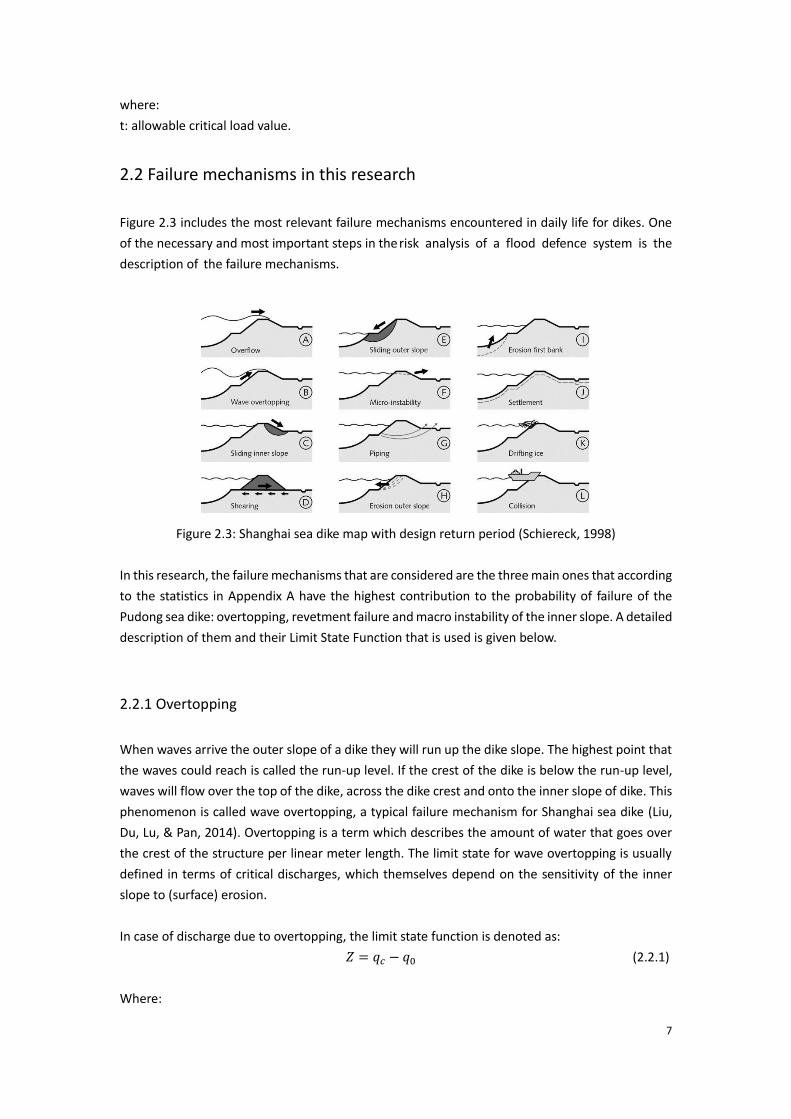
Figure 2.3 includes the most relevant failure mechanisms encountered in daily life for dikes. One
of the necessary and most important steps in the risk analysis of a flood defence system is the
description of the failure mechanisms.
Figure 2.3: Shanghai sea dike map with design return period (Schiereck, 1998)
In this research, the failure mechanisms that are considered are the three main ones that according
to the statistics in Appendix A have the highest contribution to the probability of failure of the
Pudong sea dike: overtopping, revetment failure and macro instability of the inner slope. A detailed
description of them and their Limit State Function that is used is given below.
2.2.1 Overtopping
When waves arrive the outer slope of a dike they will run up the dike slope. The highest point that
the waves could reach is called the run-up level. If the crest of the dike is below the run-up level,
waves will flow over the top of the dike, across the dike crest and onto the inner slope of dike. This
phenomenon is called wave overtopping, a typical failure mechanism for Shanghai sea dike (Liu,
Du, Lu, & Pan, 2014). Overtopping is a term which describes the amount of water that goes over
the crest of the structure per linear meter length. The limit state for wave overtopping is usually
defined in terms of critical discharges, which themselves depend on the sensitivity of the inner
slope to (surface) erosion.
In case of discharge due to overtopping, the limit state function is denoted as:
𝑍 = 𝑞𝑐 − 𝑞0 (2.2.1)
Where:
8
qc: Critical discharge expressing the limit discharge for which damage of the inner slope occurs.
q0: Actual occurring overtopping discharge due to the hydraulic boundary conditions.
Every method has its own range of application. This research uses the Chinese overtopping formula.
Chinese Guideline of Dike Design gives an overtopping discharge q0 (m3/m/s) formula(C.
government, 2014):
𝑞0 = 0.07𝐻𝐶
′
𝐻𝑚0 exp (0.5 −𝑏1
2𝐻𝑚0) 𝐵𝐾𝐴
𝐻𝑚02
𝑇𝑝[
0.3
√𝑚+ 𝑡ℎ (
𝑑
𝐻𝑚𝑜− 2.8)
2] 𝑙𝑛√
𝑔𝑇𝑝2𝑚
2𝜋𝐻𝑚0 (2.2.2)
Where:
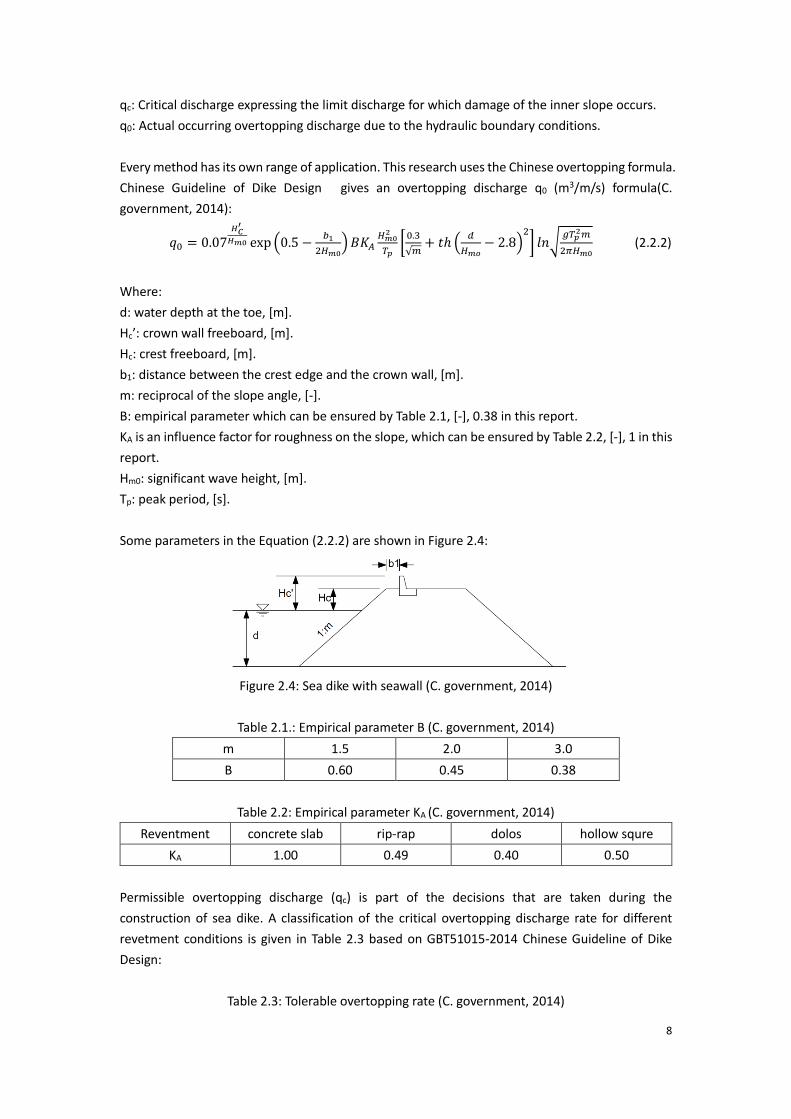
d: water depth at the toe, [m].
Hc’: crown wall freeboard, [m].
Hc: crest freeboard, [m].
b1: distance between the crest edge and the crown wall, [m].
m: reciprocal of the slope angle, [-].
B: empirical parameter which can be ensured by Table 2.1, [-], 0.38 in this report.
KA is an influence factor for roughness on the slope, which can be ensured by Table 2.2, [-], 1 in this
report.
Hm0: significant wave height, [m].
Tp: peak period, [s].
Some parameters in the Equation (2.2.2) are shown in Figure 2.4:
Figure 2.4: Sea dike with seawall (C. government, 2014)
Table 2.1.: Empirical parameter B (C. government, 2014)
m 1.5 2.0 3.0
B 0.60 0.45 0.38
Table 2.2: Empirical parameter KA (C. government, 2014)
Reventment concrete slab rip-rap dolos hollow squre
KA 1.00 0.49 0.40 0.50
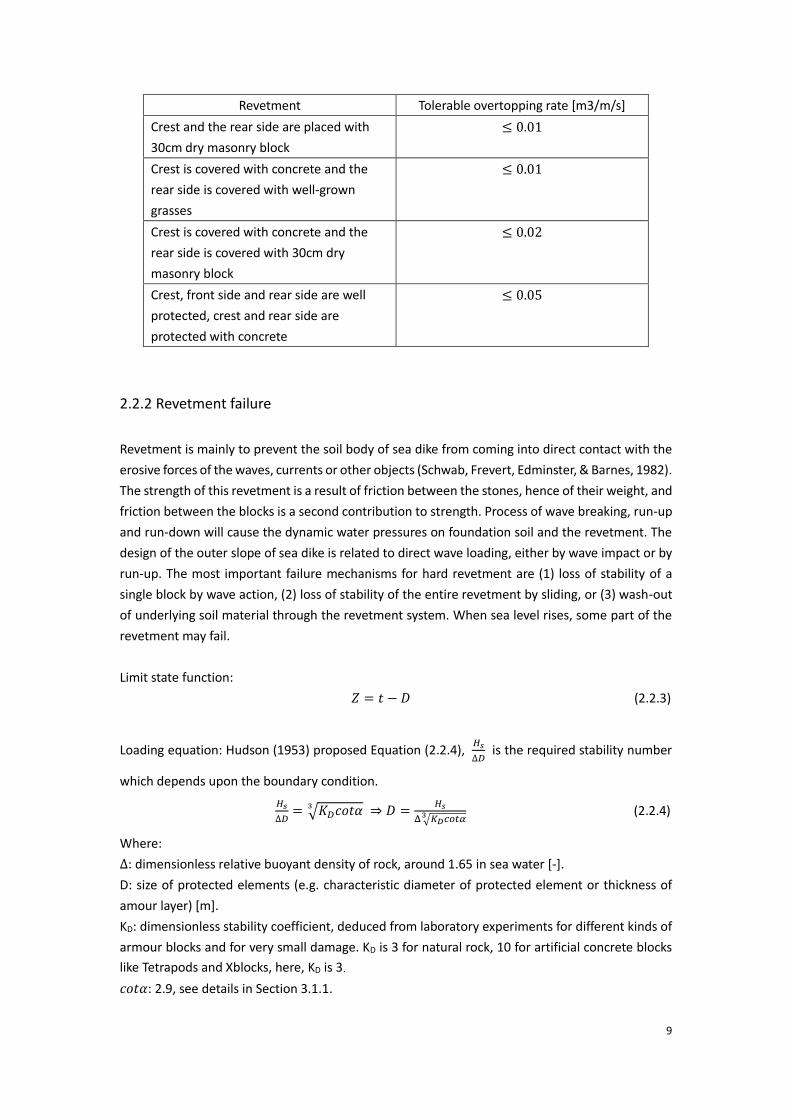
Permissible overtopping discharge (qc) is part of the decisions that are taken during the
construction of sea dike. A classification of the critical overtopping discharge rate for different
revetment conditions is given in Table 2.3 based on GBT51015-2014 Chinese Guideline of Dike
Design:
Table 2.3: Tolerable overtopping rate (C. government, 2014)
9
Revetment Tolerable overtopping rate [m3/m/s]
Crest and the rear side are placed with
30cm dry masonry block
≤ 0.01
Crest is covered with concrete and the
rear side is covered with well-grown
grasses
≤ 0.01
Crest is covered with concrete and the
rear side is covered with 30cm dry
masonry block
≤ 0.02
Crest, front side and rear side are well
protected, crest and rear side are
protected with concrete
≤ 0.05
2.2.2 Revetment failure
Revetment is mainly to prevent the soil body of sea dike from coming into direct contact with the
erosive forces of the waves, currents or other objects (Schwab, Frevert, Edminster, & Barnes, 1982).
The strength of this revetment is a result of friction between the stones, hence of their weight, and
friction between the blocks is a second contribution to strength. Process of wave breaking, run-up
and run-down will cause the dynamic water pressures on foundation soil and the revetment. The
design of the outer slope of sea dike is related to direct wave loading, either by wave impact or by
run-up. The most important failure mechanisms for hard revetment are (1) loss of stability of a
single block by wave action, (2) loss of stability of the entire revetment by sliding, or (3) wash-out
of underlying soil material through the revetment system. When sea level rises, some part of the
revetment may fail.
Limit state function:
𝑍 = 𝑡 − 𝐷 (2.2.3)
Loading equation: Hudson (1953) proposed Equation (2.2.4), 𝐻𝑠
∆𝐷 is the required stability number
which depends upon the boundary condition.
𝐻𝑠
∆𝐷= √𝐾𝐷𝑐𝑜𝑡𝛼3 ⇒ 𝐷 =
𝐻𝑠
Δ √𝐾𝐷𝑐𝑜𝑡𝛼3 (2.2.4)
Where:
Δ: dimensionless relative buoyant density of rock, around 1.65 in sea water [-].
D: size of protected elements (e.g. characteristic diameter of protected element or thickness of
amour layer) [m].
KD: dimensionless stability coefficient, deduced from laboratory experiments for different kinds of
armour blocks and for very small damage. KD is 3 for natural rock, 10 for artificial concrete blocks
like Tetrapods and Xblocks, here, KD is 3.
𝑐𝑜𝑡𝛼: 2.9, see details in Section 3.1.1.
10
Pudong sea dike revetment thickness is around 0.4m in the construction design plot, i.e. t value is
0.3 m. This can help yield a critical Hs value as 1.02 m using equation 2.2.4. The limit state function
can be written in the form of:
Z = 1.02 −𝐻𝑠
Δ √𝐾𝐷𝑐𝑜𝑡𝛼3 (2.2.5)
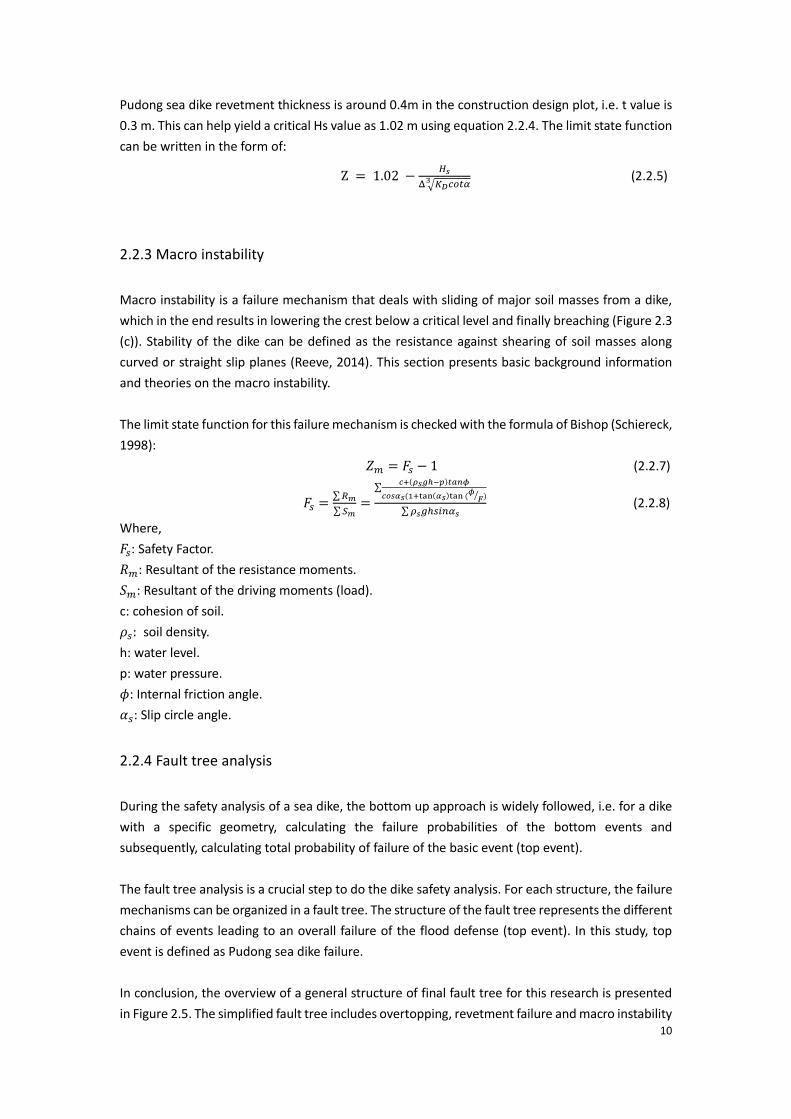
2.2.3 Macro instability
Macro instability is a failure mechanism that deals with sliding of major soil masses from a dike,
which in the end results in lowering the crest below a critical level and finally breaching (Figure 2.3
(c)). Stability of the dike can be defined as the resistance against shearing of soil masses along
curved or straight slip planes (Reeve, 2014). This section presents basic background information
and theories on the macro instability.
The limit state function for this failure mechanism is checked with the formula of Bishop (Schiereck,
1998):
𝑍𝑚 = 𝐹𝑠 − 1 (2.2.7)
𝐹𝑠 =∑ 𝑅𝑚
∑ 𝑆𝑚=
∑𝑐+(𝜌𝑠𝑔ℎ−𝑝)𝑡𝑎𝑛𝜙
𝑐𝑜𝑠𝛼𝑠(1+tan(𝛼𝑠)tan (𝜙
𝐹⁄ )
∑ 𝜌𝑠𝑔ℎ𝑠𝑖𝑛𝛼𝑠 (2.2.8)
Where,
𝐹𝑠: Safety Factor.
𝑅𝑚: Resultant of the resistance moments.
𝑆𝑚: Resultant of the driving moments (load).
c: cohesion of soil.
𝜌𝑠: soil density.
h: water level.
p: water pressure.
𝜙: Internal friction angle.
𝛼𝑠: Slip circle angle.
2.2.4 Fault tree analysis
During the safety analysis of a sea dike, the bottom up approach is widely followed, i.e. for a dike
with a specific geometry, calculating the failure probabilities of the bottom events and
subsequently, calculating total probability of failure of the basic event (top event).
The fault tree analysis is a crucial step to do the dike safety analysis. For each structure, the failure
mechanisms can be organized in a fault tree. The structure of the fault tree represents the different
chains of events leading to an overall failure of the flood defense (top event). In this study, top
event is defined as Pudong sea dike failure.
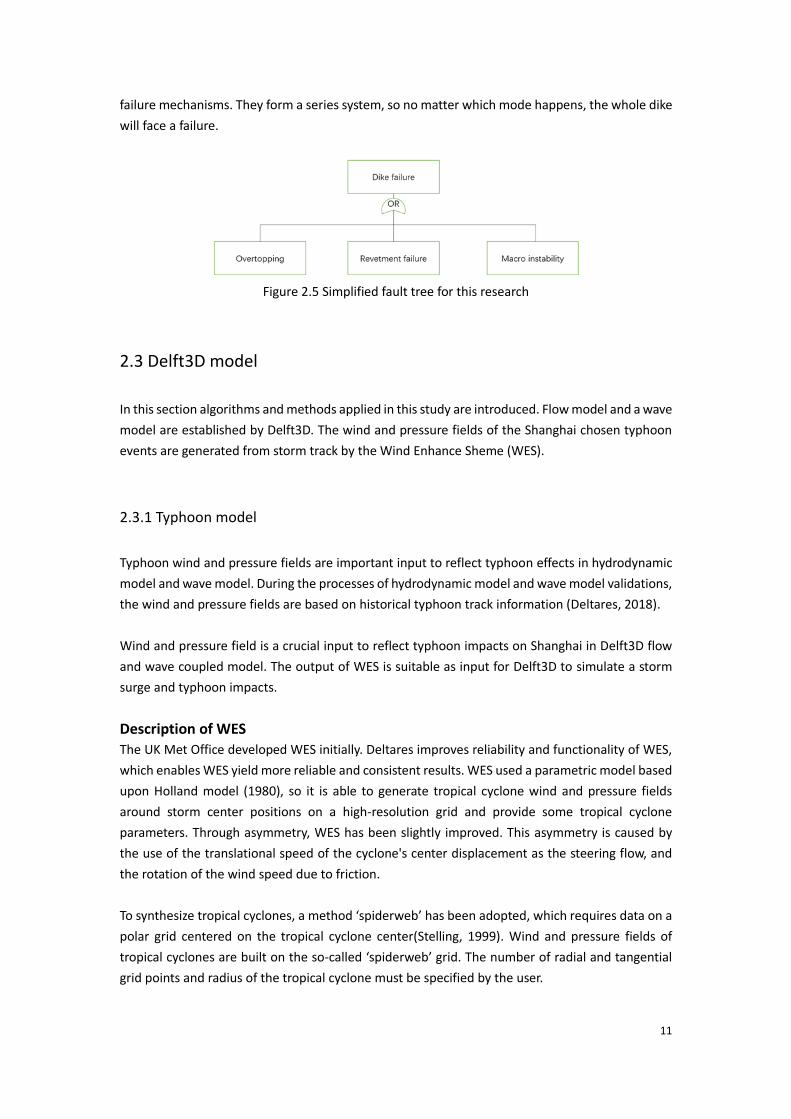
In conclusion, the overview of a general structure of final fault tree for this research is presented
in Figure 2.5. The simplified fault tree includes overtopping, revetment failure and macro instability
11
failure mechanisms. They form a series system, so no matter which mode happens, the whole dike
will face a failure.
Figure 2.5 Simplified fault tree for this research
2.3 Delft3D model
In this section algorithms and methods applied in this study are introduced. Flow model and a wave
model are established by Delft3D. The wind and pressure fields of the Shanghai chosen typhoon
events are generated from storm track by the Wind Enhance Sheme (WES).
2.3.1 Typhoon model
Typhoon wind and pressure fields are important input to reflect typhoon effects in hydrodynamic
model and wave model. During the processes of hydrodynamic model and wave model validations,
the wind and pressure fields are based on historical typhoon track information (Deltares, 2018).
Wind and pressure field is a crucial input to reflect typhoon impacts on Shanghai in Delft3D flow
and wave coupled model. The output of WES is suitable as input for Delft3D to simulate a storm
surge and typhoon impacts.
Description of WES
The UK Met Office developed WES initially. Deltares improves reliability and functionality of WES,
which enables WES yield more reliable and consistent results. WES used a parametric model based
upon Holland model (1980), so it is able to generate tropical cyclone wind and pressure fields
around storm center positions on a high-resolution grid and provide some tropical cyclone
parameters. Through asymmetry, WES has been slightly improved. This asymmetry is caused by
the use of the translational speed of the cyclone's center displacement as the steering flow, and
the rotation of the wind speed due to friction.
To synthesize tropical cyclones, a method ‘spiderweb’ has been adopted, which requires data on a
polar grid centered on the tropical cyclone center(Stelling, 1999). Wind and pressure fields of
tropical cyclones are built on the so-called ‘spiderweb’ grid. The number of radial and tangential
grid points and radius of the tropical cyclone must be specified by the user.

12
Description of Holland model
From Delft3D WES user manual, following Holland (1980) the geostrophic wind speed Vg at radius
r is expressed as:
𝑉𝑔(𝑟) = √𝐴𝐵𝑝𝑑𝑟𝑜𝑝exp (−
𝐴
𝑟𝐵)
𝜌𝑟𝐵 +𝑟2𝑓2
4−
𝑟𝑓
2 (2.3.1)
Where,
r: Distance from the center of the cyclone (nmi).
f: Coriolis parameter (1/s).
𝜌: Air density (assumed to be constant equal to 1.10 kg∙m−3),
pdrop = pn − pc
pn: Ambient pressure (In this model, the average pressure over the model domain is used).
pc: Central pressure.
A: Scaling parameter. It defines relation of the pressure or wind profile relative to the origin.
B: Scaling parameter. It determines profile shape.
In the maximum wind area, the Coriolis force is small compared to the pressure gradient and
centrifugal force, so the air is in a rotational equilibrium state. The cyclostrophic wind Vc at a
distance r in this region is calculated as:
𝑉𝑐(𝑟) = √𝐴𝐵(𝑝𝑑𝑟𝑜𝑝) exp (−𝐴
𝑟𝐵) /𝜌𝑟𝐵 (2.3.2)
By setting 𝑑𝑉𝑐
𝑑𝑟= 0, maximum wind radius (Rw) can be given as:
𝑅𝑤 = 𝐴1/𝐵 (2.3.3)
The Rw is independent of the relative values of ambient pressure and central pressure. It is defined
by the physically parameters A and B. Substituting Equation (2.3.3) into Equation (2.3.2) comes out
an expression for the maximum wind speed:
𝑉𝑚𝑎𝑥 = √𝐵𝑝𝑑𝑟𝑜𝑝
𝜌𝑒 (2.3.4)
Where,
e: Base for a logarithm (approximately equal to 2.71828).
Parameters A and B can be defined as functions of measurable quantities as follows:
𝐴 = 𝑅𝑤𝐵 (2.3.5)
𝐵 =𝜌𝑒𝑉𝑚𝑎𝑥
2
𝑝𝑑𝑟𝑜𝑝 (2.3.6)
Drop of center pressure is defined as:
𝑃𝑑𝑟𝑜𝑝 =𝜌𝑒𝑉𝑚𝑎𝑥
2
𝐵 (2.3.7)
By substitution, Vg can be expressed as:
𝑉𝑔(𝑟) = √𝑅𝑤
𝑟
𝐵𝑉𝑚𝑎𝑥
2 exp (1 − (𝑅𝑤
𝑟)
𝐵+ 𝑟2𝑓2/4 −
𝑟𝑓
2 (2.3.8)
13
Equations above can be applied to geostrophic wind. Before deriving A and B, the wind speed and
pressure values are now scaled according to their geostrophic values.
Approach in WES
Equation (2.3.8) synthesises cyclonic winds assuming that parameters A and B are known. However,
in real cases they are usually not directly available. The method used in this research to compute
the wind and pressure fields in WES can be described as:
Method 1: Vmax, pdrop are known
Rw=25km. Refer to the third method, Equations (2.3.5), (2.3.6) and (2.3.8) are used to get wind and
pressure fields.
Vmax, Pdrop are the three essential elements for method decision in WES. Joint Typhoon Warning
Center (JTWC) and IBTrACS gives Vmax. Pdrop can be calculated by Pdrop = Pn − Pc (ambient pressure
Pn=1015 hpa and center pressure Pc is given). IBTrACS gives the longest radius of 50 kt winds or
greater as well as the shortest radius of 50 kt winds or greater, R50 takes the average. Method 1 can
also be applied only using Vmax and Pdrop. By using method 1, WES helps model wind velocity and
direction.
Typhoon description
A typhoon is a kind of tropical cyclone that develops between 180° and 100°E in the Northern
Hemisphere. This region is referred to as the Northwestern Pacific Basin, and is the most active
tropical cyclone basin on Earth. A tropical cyclone (TC) is an intense circular storm which originates
over warm tropical oceans where it draws the energy to warm tropical oceans. In the system center,
the pressure is low and weather is usually calm and no cloud. A tropical cyclone brings very violent
winds, torrential rain, high waves. Accompanying strong winds are torrential rains and a
devastating phenomenon known as the storm surge, an abnormal rise of the sea surface generated
by a storm. Therefore, cyclones always cause a serious hazard for coastal areas all over the world.
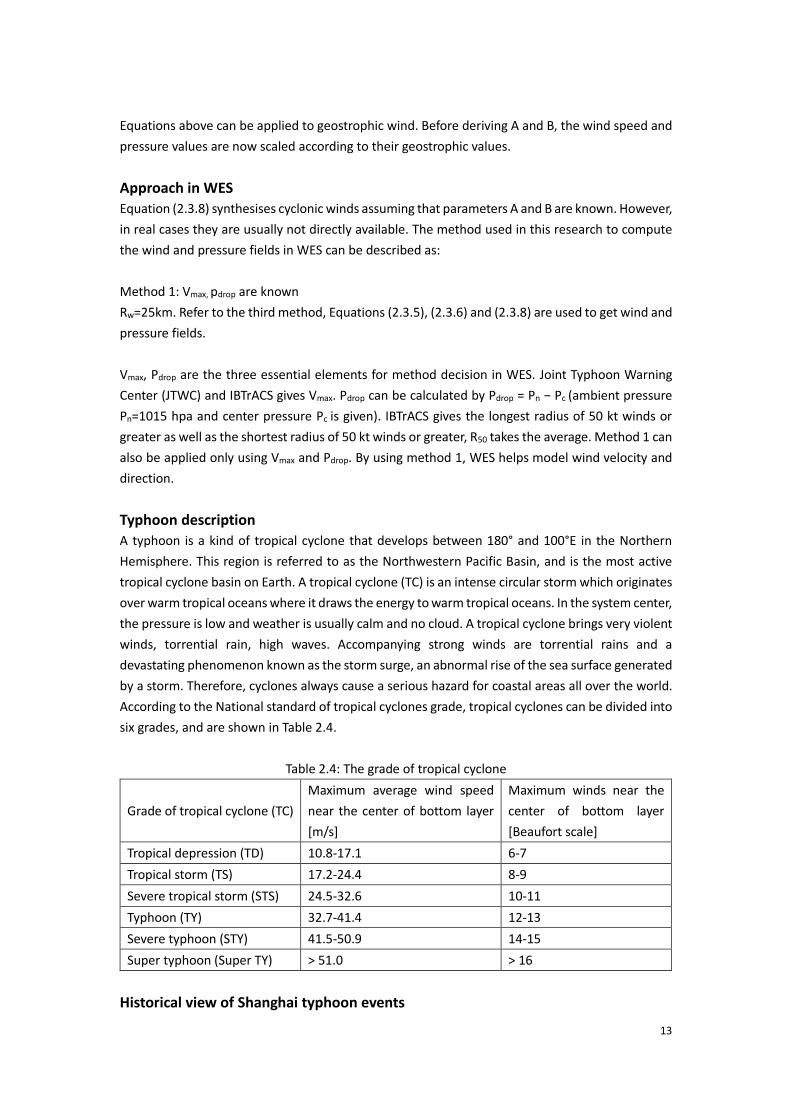
According to the National standard of tropical cyclones grade, tropical cyclones can be divided into
six grades, and are shown in Table 2.4.
Table 2.4: The grade of tropical cyclone
Grade of tropical cyclone (TC)
Maximum average wind speed
near the center of bottom layer
[m/s]
Maximum winds near the
center of bottom layer
[Beaufort scale]
Tropical depression (TD) 10.8-17.1 6-7
Tropical storm (TS) 17.2-24.4 8-9
Severe tropical storm (STS) 24.5-32.6 10-11
Typhoon (TY) 32.7-41.4 12-13
Severe typhoon (STY) 41.5-50.9 14-15
Super typhoon (Super TY) > 51.0 > 16
Historical view of Shanghai typhoon events
14
Shanghai is very vulnerable to tropical cyclones and flood in the history, because it is a low-lying
area and exposed to powerful typhoons and the land is subsiding as sea levels rise. Based on some
historical records, floods in Shanghai is mainly caused by the high storm surge and high discharge
from the East China Sea or Yangtze River.
Recently, several destructive typhoons attacked Shanghai, and data listed in Table 2.5 are all
collected at the Huangpu Park Gauge Station (Administration, 2020).
In 2012, when typhoon Haikui came, more than 3.2 million residents were affected and 2,900
houses were flattened. About 220 roads and 770 electric lines were destroyed. Typhoon Haikui
forced Shanghai to raise its highest-level alert as a wake.
In terms of typhoon Fitow, the level of risk from the precipitation and wind combined could rank
in the top 15% among all TCs that have impacted the Shanghai area since 1949 (Yu et al., 2014).
This typhoon killed 12 people in China, and left 11.4 billion dollars in damage.
Table 2.5. Recent Flood Caused by Typhoon in Shanghai
Year Date Typhoon name
1997 16.Aug Winnie
2000 31.Aug Papain
2000 14.Sep Sangmei
2005 06.Aug Matsa
2012 08.Aug Haiku
2011 07.Aug Muifa
2013 10.Oct Fitow
2019 12.Aug Krosa
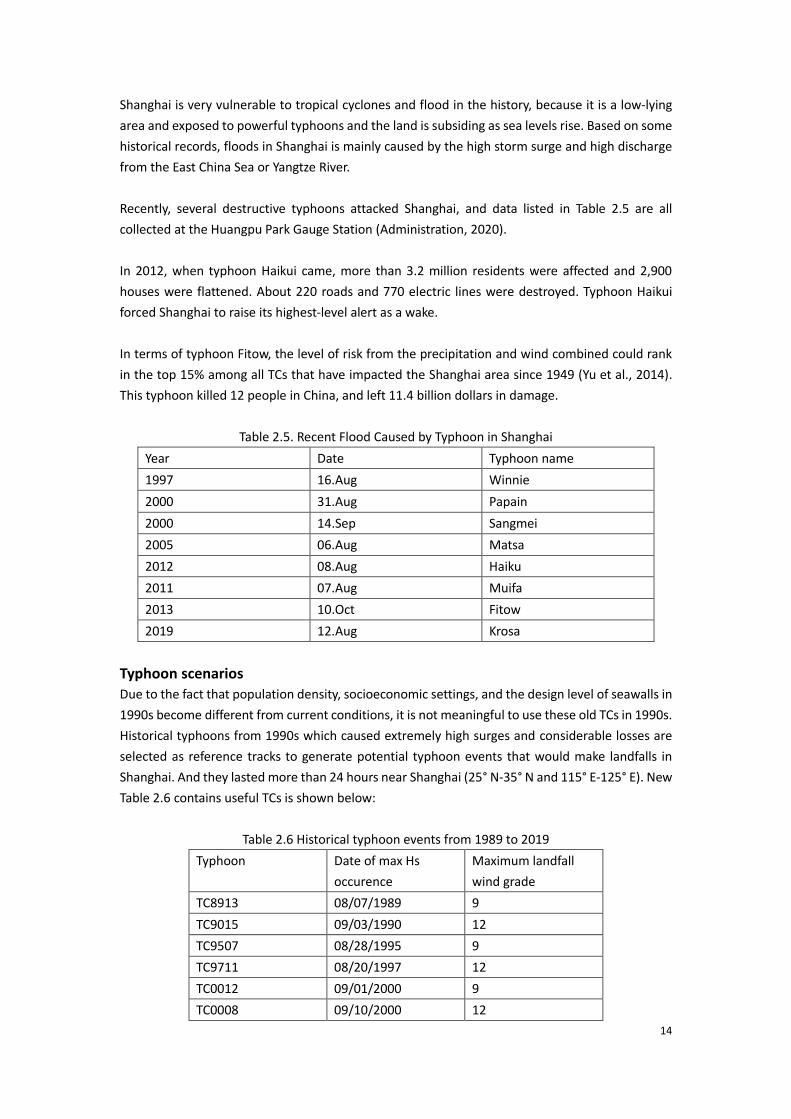
Typhoon scenarios
Due to the fact that population density, socioeconomic settings, and the design level of seawalls in
1990s become different from current conditions, it is not meaningful to use these old TCs in 1990s.
Historical typhoons from 1990s which caused extremely high surges and considerable losses are
selected as reference tracks to generate potential typhoon events that would make landfalls in
Shanghai. And they lasted more than 24 hours near Shanghai (25° N-35° N and 115° E-125° E). New
Table 2.6 contains useful TCs is shown below:
Table 2.6 Historical typhoon events from 1989 to 2019
Typhoon Date of max Hs
occurence
Maximum landfall
wind grade
TC8913 08/07/1989 9
TC9015 09/03/1990 12
TC9507 08/28/1995 9
TC9711 08/20/1997 12
TC0012 09/01/2000 9
TC0008 09/10/2000 12
15
TC0014 09/16/2000 12
TC0102 06/21/2001 10
TC0205 07/06/2002 10
TC0407 07/03/2004 9
TC0414 08/12/2004 12
TC0509 08/09/2005 12
TC0515 09/13/2005 10
TC0713 09/18/2007 10
TC0808 08/09/2008 11
TC0813 09/15/2008 12
TC0908 08/08/2009 11
TC1009 09/04/2010 12
TC1105 06/25/2011 12
TC1109 08/09/2011 13
TC1210 08/02/2012 11
TC1211 08/08/2012 10
TC1215 08/24/2012 9
TC1323 08/08/2013 11
TC1316 09/01/2013 10
TC1412 08/01/2014 9
TC1416 09/23/2014 10
TC1509 07/10/2015 11
TC1510 07/11/2015 12
TC1617 09/22/2016 10
TC1622 10/14/2016 11
TC1710 07/28/2017 9
TC1718 09/17/2017 11
TC1810 07/22/2018 10
TC1818 08/16/2018 10
TC1825 09/27/2018 12
TC1909 08/08/2019 10
TC1918 10/01/2019 9
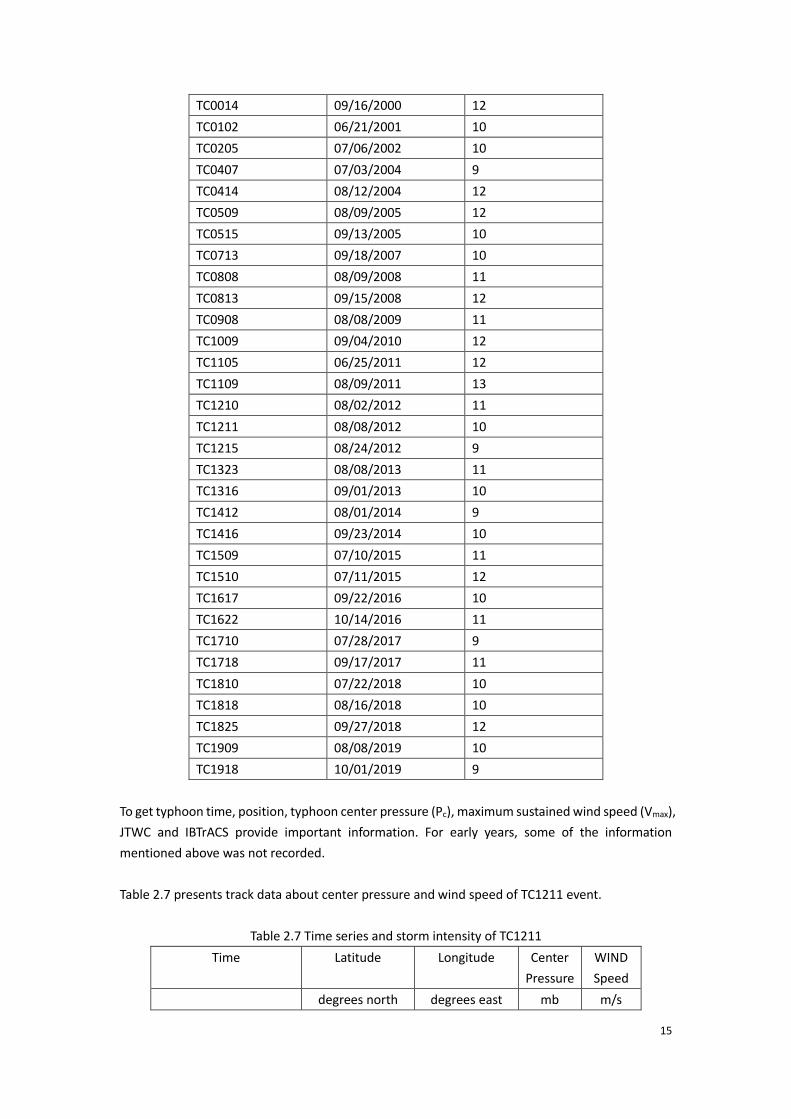
To get typhoon time, position, typhoon center pressure (Pc), maximum sustained wind speed (Vmax),
JTWC and IBTrACS provide important information. For early years, some of the information
mentioned above was not recorded.
Table 2.7 presents track data about center pressure and wind speed of TC1211 event.
Table 2.7 Time series and storm intensity of TC1211
Time Latitude Longitude Center
Pressure
WIND
Speed
degrees north degrees east mb m/s
16
2012/8/7 12:00:00 29.47 122.95 950 34.66
15:00:00 29.61 122.62 952 37.51
18:00:00 29.85 122.25 955 39.41
21:00:00 29.91 121.83 962 41.02
2012/8/8 0:00 30.38 121.38 970 41.95
3:00:00 30.74 120.90 972 42.03
6:00:00 30.88 120.40 975 43.69
9:00:00 31.27 119.89 978 40.15
12:00:00 31.4 119.4 982 41.12
15:00:00 31.52 118.95 985 38.55
18:00:00 31.59 118.55 988 34.38
21:00:00 31.63 118.20 988 33.41
2012/8/9 0:00 31.67 117.93 991 29.31
3:00:00 31.71 117.69 991 27.5
6:00:00 31.72 117.53 992 23.13
9:00:00 31.73 117.41 992 20.56
12:00:00 31.73 117.34 993 15.42
15:00:00 31.7 117.24 993 13.90
18:00:00 31.68 117.14 994 12.85
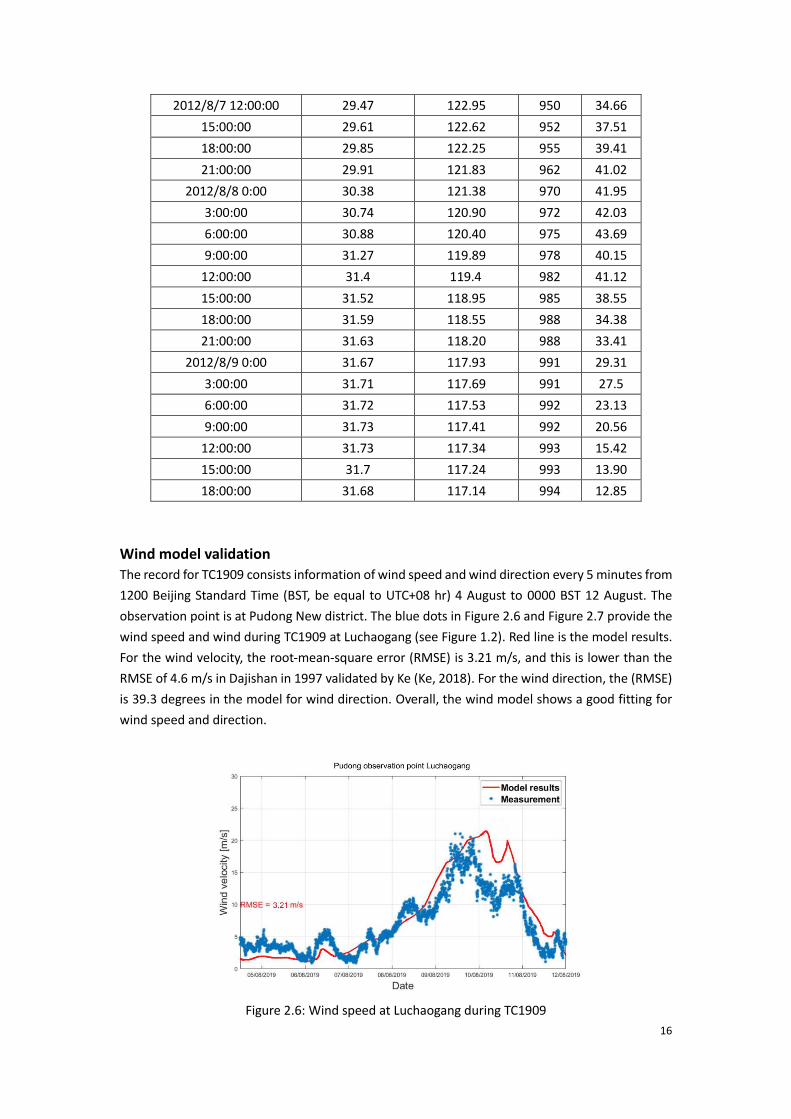
Wind model validation
The record for TC1909 consists information of wind speed and wind direction every 5 minutes from
1200 Beijing Standard Time (BST, be equal to UTC+08 hr) 4 August to 0000 BST 12 August. The
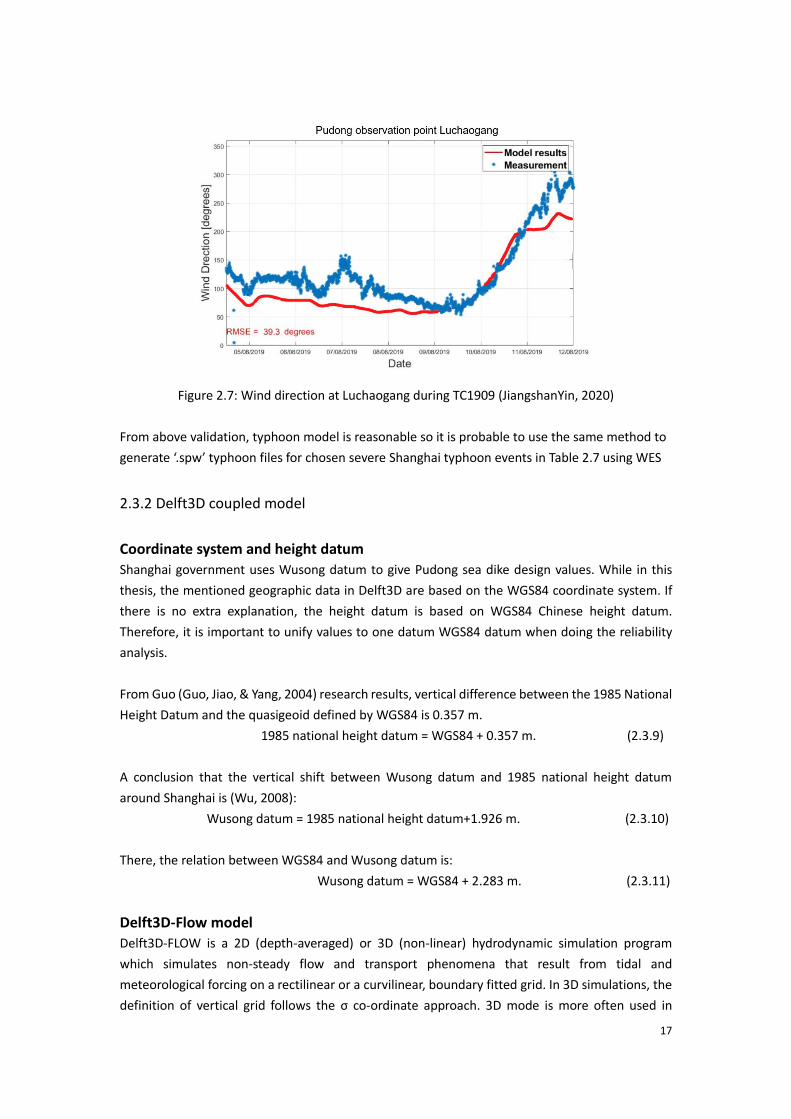
observation point is at Pudong New district. The blue dots in Figure 2.6 and Figure 2.7 provide the
wind speed and wind during TC1909 at Luchaogang (see Figure 1.2). Red line is the model results.
For the wind velocity, the root-mean-square error (RMSE) is 3.21 m/s, and this is lower than the
RMSE of 4.6 m/s in Dajishan in 1997 validated by Ke (Ke, 2018). For the wind direction, the (RMSE)
is 39.3 degrees in the model for wind direction. Overall, the wind model shows a good fitting for
wind speed and direction.
Figure 2.6: Wind speed at Luchaogang during TC1909
17
Figure 2.7: Wind direction at Luchaogang during TC1909 (JiangshanYin, 2020)
From above validation, typhoon model is reasonable so it is probable to use the same method to
generate ‘.spw’ typhoon files for chosen severe Shanghai typhoon events in Table 2.7 using WES
2.3.2 Delft3D coupled model
Coordinate system and height datum
Shanghai government uses Wusong datum to give Pudong sea dike design values. While in this
thesis, the mentioned geographic data in Delft3D are based on the WGS84 coordinate system. If
there is no extra explanation, the height datum is based on WGS84 Chinese height datum.
Therefore, it is important to unify values to one datum WGS84 datum when doing the reliability
analysis.
From Guo (Guo, Jiao, & Yang, 2004) research results, vertical difference between the 1985 National
Height Datum and the quasigeoid defined by WGS84 is 0.357 m.
1985 national height datum = WGS84 + 0.357 m. (2.3.9)
A conclusion that the vertical shift between Wusong datum and 1985 national height datum
around Shanghai is (Wu, 2008):
Wusong datum = 1985 national height datum+1.926 m. (2.3.10)
There, the relation between WGS84 and Wusong datum is:
Wusong datum = WGS84 + 2.283 m. (2.3.11)
Delft3D-Flow model
Delft3D-FLOW is a 2D (depth-averaged) or 3D (non-linear) hydrodynamic simulation program
which simulates non-steady flow and transport phenomena that result from tidal and
meteorological forcing on a rectilinear or a curvilinear, boundary fitted grid. In 3D simulations, the
definition of vertical grid follows the σ co-ordinate approach. 3D mode is more often used in
18
transport problems where the horizontal flow field shows significant variation in the vertical
direction. Delft3D-FLOW is able to run in 2D mode, which corresponds to solving the depth-
averaged equations. For the interaction between waves and currents the flow module may be
coupled with the short-waves model Delft3D-WAVE.
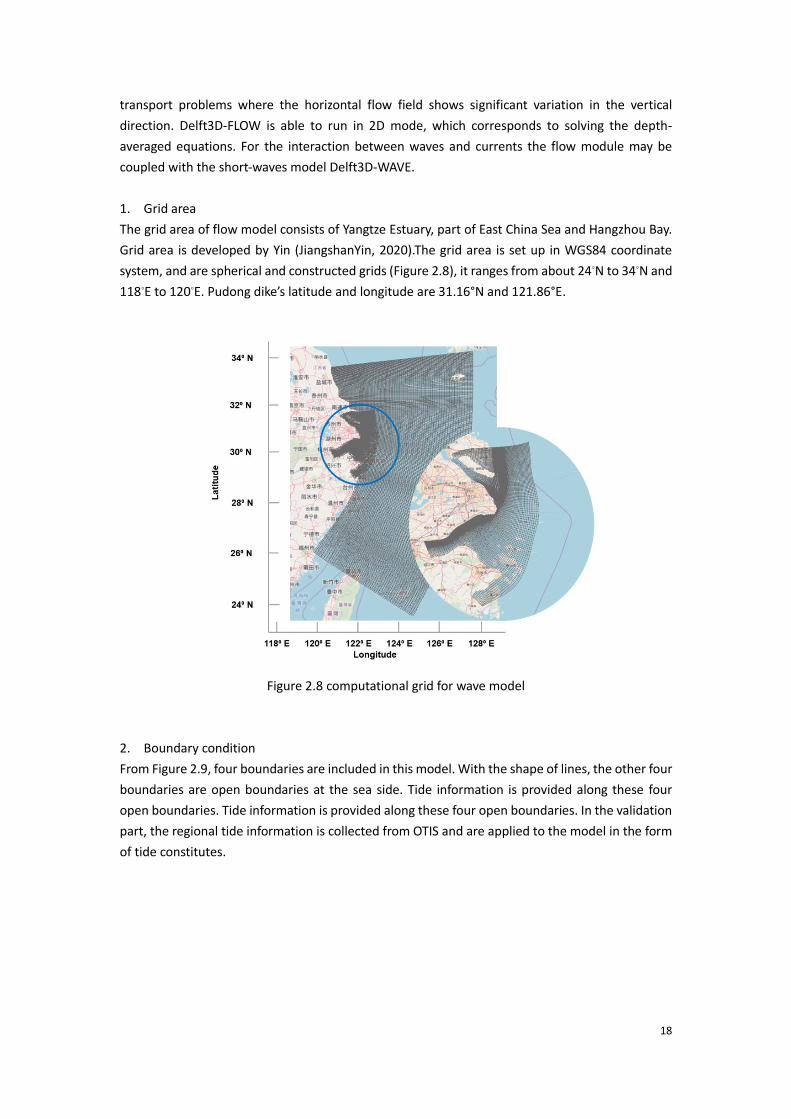
1. Grid area
The grid area of flow model consists of Yangtze Estuary, part of East China Sea and Hangzhou Bay.
Grid area is developed by Yin (JiangshanYin, 2020).The grid area is set up in WGS84 coordinate
system, and are spherical and constructed grids (Figure 2.8), it ranges from about 24◦N to 34◦N and
118◦E to 120◦E. Pudong dike’s latitude and longitude are 31.16°N and 121.86°E.
Figure 2.8 computational grid for wave model
2. Boundary condition
From Figure 2.9, four boundaries are included in this model. With the shape of lines, the other four
boundaries are open boundaries at the sea side. Tide information is provided along these four
open boundaries. Tide information is provided along these four open boundaries. In the validation
part, the regional tide information is collected from OTIS and are applied to the model in the form
of tide constitutes.
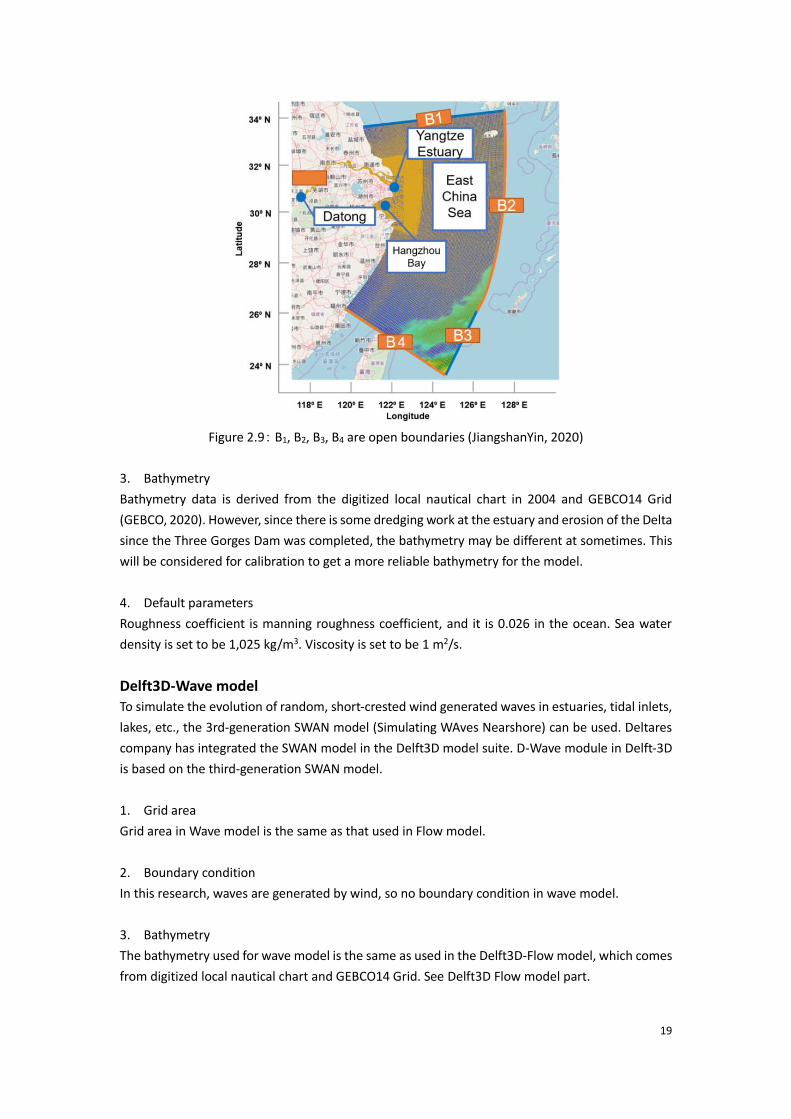
19
Figure 2.9: B1, B2, B3, B4 are open boundaries (JiangshanYin, 2020)
3. Bathymetry
Bathymetry data is derived from the digitized local nautical chart in 2004 and GEBCO14 Grid
(GEBCO, 2020). However, since there is some dredging work at the estuary and erosion of the Delta
since the Three Gorges Dam was completed, the bathymetry may be different at sometimes. This
will be considered for calibration to get a more reliable bathymetry for the model.
4. Default parameters
Roughness coefficient is manning roughness coefficient, and it is 0.026 in the ocean. Sea water
density is set to be 1,025 kg/m3. Viscosity is set to be 1 m2/s.
Delft3D-Wave model
To simulate the evolution of random, short-crested wind generated waves in estuaries, tidal inlets,
lakes, etc., the 3rd-generation SWAN model (Simulating WAves Nearshore) can be used. Deltares
company has integrated the SWAN model in the Delft3D model suite. D-Wave module in Delft-3D
is based on the third-generation SWAN model.
1. Grid area
Grid area in Wave model is the same as that used in Flow model.
2. Boundary condition
In this research, waves are generated by wind, so no boundary condition in wave model.
3. Bathymetry
The bathymetry used for wave model is the same as used in the Delft3D-Flow model, which comes
from digitized local nautical chart and GEBCO14 Grid. See Delft3D Flow model part.
20
4. Wind
Wind file used in Delft3D is in a form of ‘.spw’ file, which was given in detail in typhoon model
section.
5. Default parameters
The gravity is 9.81 m/s2. The water density is 1.025 kg/m3. There are some other parameters,
default values in the model are used.
Online coupling
Delft3D-Flow and Delft3D-Wave can be online coupled if choosing online Delft3D-WAVE. If Delft3D-
Flow model runs online with Delft3D-Wave, and wind is active in the Delft3D-Flow simulation, this
wind can be used in the Delft3D-Wave simulation. The subsidence 486 mm is applied to a 2km
band along the Shanghai shore in Delft3D model grid elevation and sea level rise 375 mm in 2100
has been included in bathymetry in Delft3D. It is a way to approximate the influence of land
subsidence.
21
Chapter 3 General description of Pudong sea dike
This chapter can be divided into two sections. First section gives basic knowledge and description
of a typical Pudong sea dike. Different kinds of sea dike failure modes are introduced and most
likely failure modes for Pudong sea dike will be picked out to study. The second section discusses
important boundary conditions of Pudong sea dike.
3.1 Overview of Shanghai sea dike
People in Shanghai have had to protect themselves against the dangers of water, they used some
hydraulic methods like building sea dikes. The sea embankments have important function: protect
Shanghai highly developed industrial and agricultural areas, as well as the most densely populated
industrial and mining enterprises or important transportation hubs and other important facilities.
The sea dike failure could lead to immeasurable damage, and it is necessary to study how the dike
perform in current and future conditions.
Shanghai sea dikes have two main structural forms: slope-type earth-rock dam dike and slope-type
earth-rock dam compound dike; Dike body is mainly made up of pipe and bag ridges filled with
mud (Qi, 2010). Protection structure on the sea dike outer slope is composed of fence board or
artificial block, including torsion king body and torsion worker body.
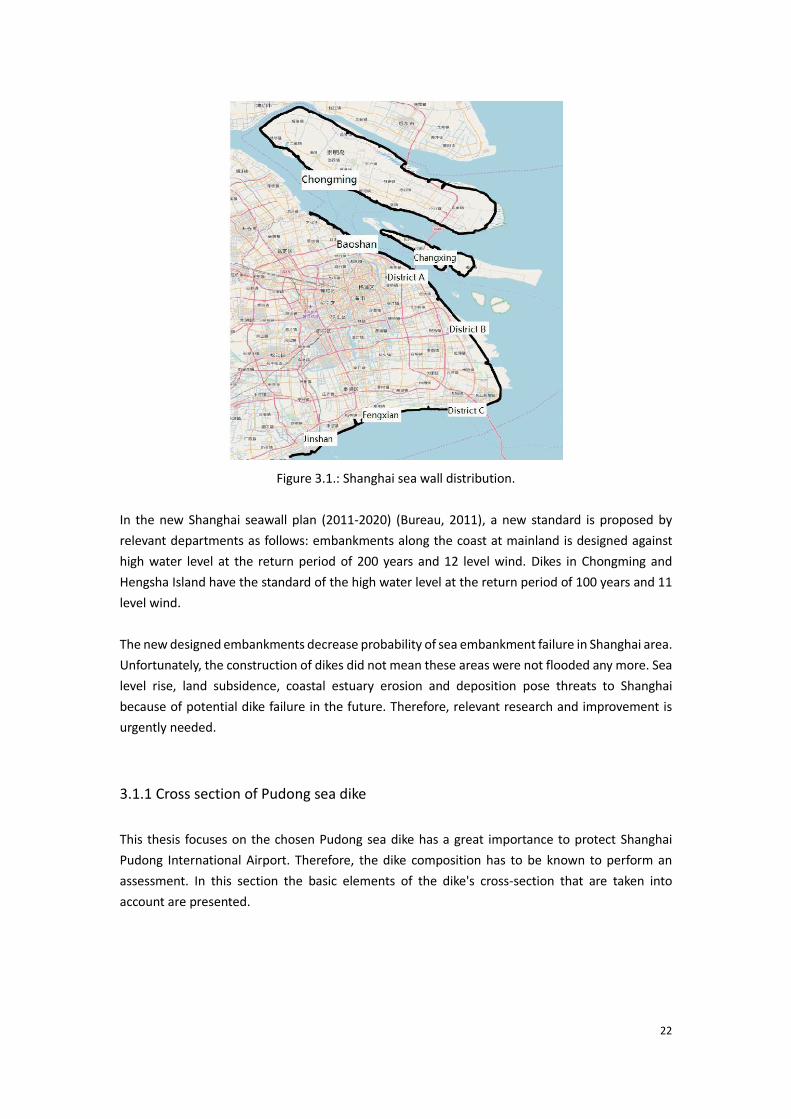
Shanghai government agreed to abolish Shanghai’s Nanhui district and merged its this area into
Shanghai’s Pudong new district in 2009. To make a clear explanation, sea dikes in Pudong new
district are divided into three parts. In Figure 3.1, district A, B, C are all Pudong New District (ZHANG,
ZHU, LI, LIU, & Resources, 2008). This research focuses on the sea dike in District B, which protects
Pudong international airport.
22
Figure 3.1.: Shanghai sea wall distribution.
In the new Shanghai seawall plan (2011-2020) (Bureau, 2011), a new standard is proposed by
relevant departments as follows: embankments along the coast at mainland is designed against
high water level at the return period of 200 years and 12 level wind. Dikes in Chongming and
Hengsha Island have the standard of the high water level at the return period of 100 years and 11
level wind.
The new designed embankments decrease probability of sea embankment failure in Shanghai area.
Unfortunately, the construction of dikes did not mean these areas were not flooded any more. Sea
level rise, land subsidence, coastal estuary erosion and deposition pose threats to Shanghai
because of potential dike failure in the future. Therefore, relevant research and improvement is
urgently needed.
3.1.1 Cross section of Pudong sea dike
This thesis focuses on the chosen Pudong sea dike has a great importance to protect Shanghai
Pudong International Airport. Therefore, the dike composition has to be known to perform an
assessment. In this section the basic elements of the dike's cross-section that are taken into
account are presented.
23
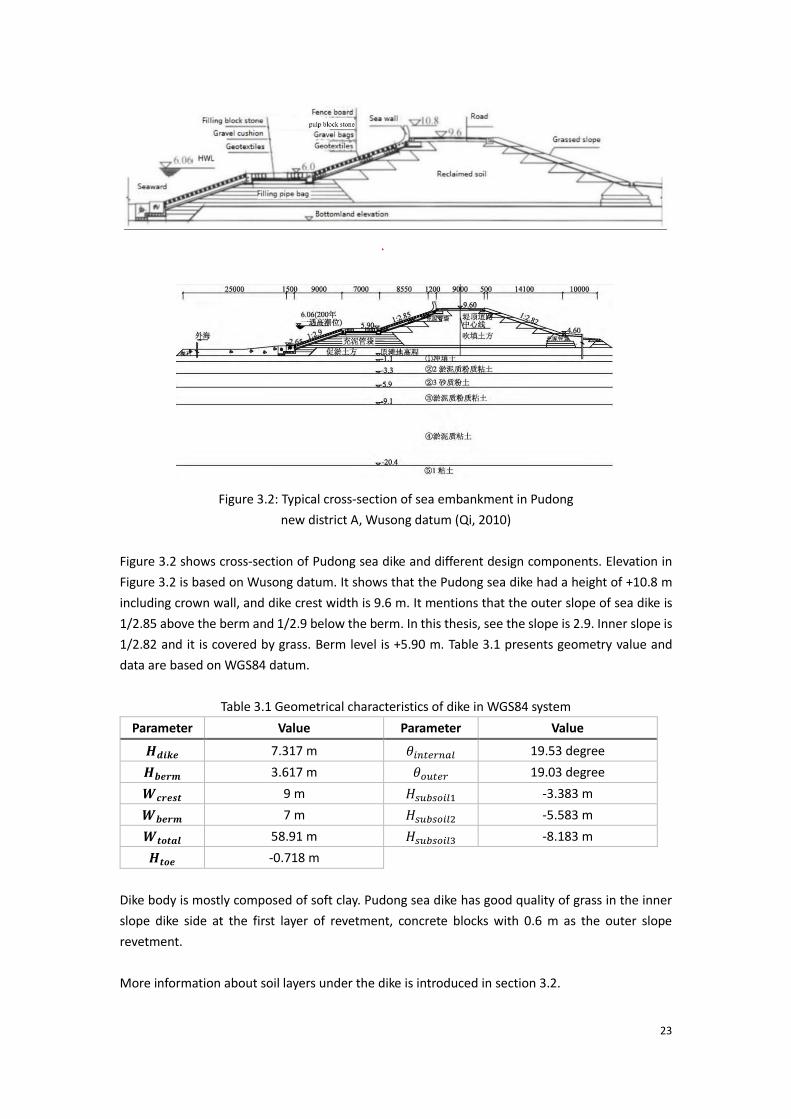
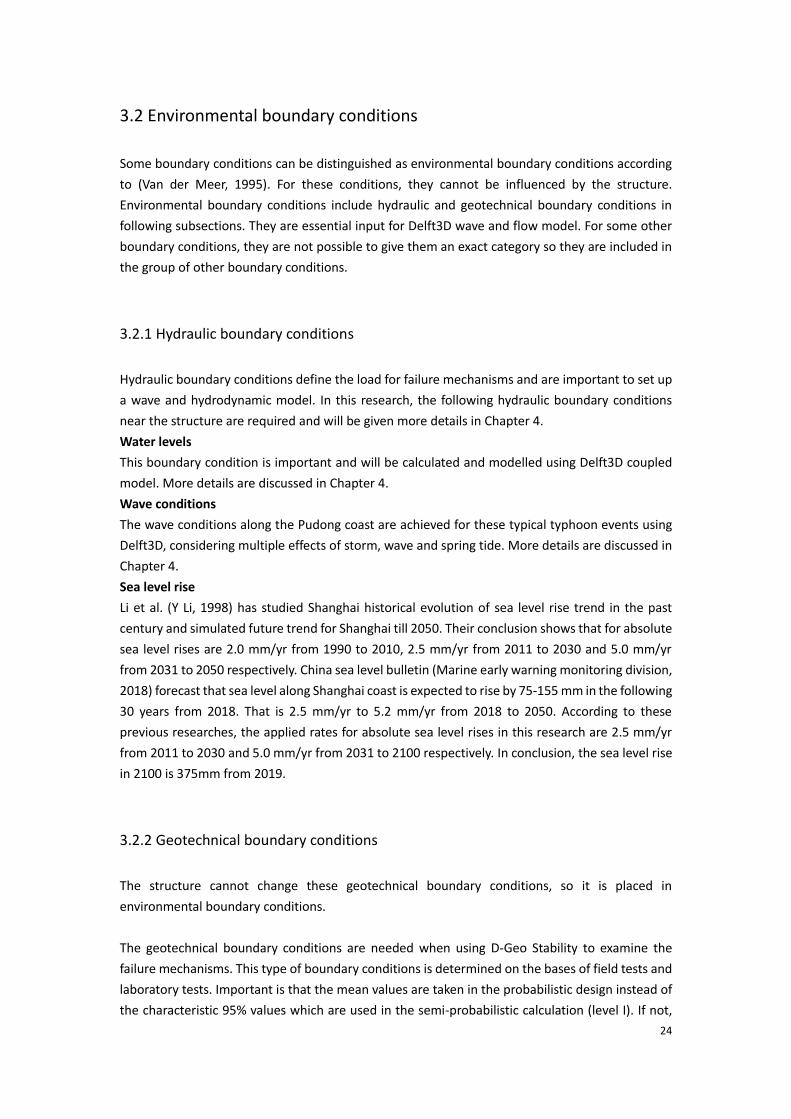
Figure 3.2: Typical cross-section of sea embankment in Pudong
new district A, Wusong datum (Qi, 2010)
Figure 3.2 shows cross-section of Pudong sea dike and different design components. Elevation in
Figure 3.2 is based on Wusong datum. It shows that the Pudong sea dike had a height of +10.8 m
including crown wall, and dike crest width is 9.6 m. It mentions that the outer slope of sea dike is
1/2.85 above the berm and 1/2.9 below the berm. In this thesis, see the slope is 2.9. Inner slope is
1/2.82 and it is covered by grass. Berm level is +5.90 m. Table 3.1 presents geometry value and
data are based on WGS84 datum.
Table 3.1 Geometrical characteristics of dike in WGS84 system
Parameter Value Parameter Value
𝑯𝒅𝒊𝒌𝒆 7.317 m 𝜃𝑖𝑛𝑡𝑒𝑟𝑛𝑎𝑙 19.53 degree
𝑯𝒃𝒆𝒓𝒎 3.617 m 𝜃𝑜𝑢𝑡𝑒𝑟 19.03 degree
𝑾𝒄𝒓𝒆𝒔𝒕 9 m 𝐻𝑠𝑢𝑏𝑠𝑜𝑖𝑙1 -3.383 m
𝑾𝒃𝒆𝒓𝒎 7 m 𝐻𝑠𝑢𝑏𝑠𝑜𝑖𝑙2 -5.583 m
𝑾𝒕𝒐𝒕𝒂𝒍 58.91 m 𝐻𝑠𝑢𝑏𝑠𝑜𝑖𝑙3 -8.183 m
𝑯𝒕𝒐𝒆 -0.718 m
Dike body is mostly composed of soft clay. Pudong sea dike has good quality of grass in the inner
slope dike side at the first layer of revetment, concrete blocks with 0.6 m as the outer slope
revetment.
More information about soil layers under the dike is introduced in section 3.2.
24
3.2 Environmental boundary conditions
Some boundary conditions can be distinguished as environmental boundary conditions according
to (Van der Meer, 1995). For these conditions, they cannot be influenced by the structure.
Environmental boundary conditions include hydraulic and geotechnical boundary conditions in
following subsections. They are essential input for Delft3D wave and flow model. For some other
boundary conditions, they are not possible to give them an exact category so they are included in
the group of other boundary conditions.
3.2.1 Hydraulic boundary conditions
Hydraulic boundary conditions define the load for failure mechanisms and are important to set up
a wave and hydrodynamic model. In this research, the following hydraulic boundary conditions
near the structure are required and will be given more details in Chapter 4.
Water levels
This boundary condition is important and will be calculated and modelled using Delft3D coupled
model. More details are discussed in Chapter 4.
Wave conditions
The wave conditions along the Pudong coast are achieved for these typical typhoon events using
Delft3D, considering multiple effects of storm, wave and spring tide. More details are discussed in
Chapter 4.
Sea level rise
Li et al. (Y Li, 1998) has studied Shanghai historical evolution of sea level rise trend in the past
century and simulated future trend for Shanghai till 2050. Their conclusion shows that for absolute
sea level rises are 2.0 mm/yr from 1990 to 2010, 2.5 mm/yr from 2011 to 2030 and 5.0 mm/yr
from 2031 to 2050 respectively. China sea level bulletin (Marine early warning monitoring division,
2018) forecast that sea level along Shanghai coast is expected to rise by 75-155 mm in the following
30 years from 2018. That is 2.5 mm/yr to 5.2 mm/yr from 2018 to 2050. According to these
previous researches, the applied rates for absolute sea level rises in this research are 2.5 mm/yr
from 2011 to 2030 and 5.0 mm/yr from 2031 to 2100 respectively. In conclusion, the sea level rise
in 2100 is 375mm from 2019.
3.2.2 Geotechnical boundary conditions
The structure cannot change these geotechnical boundary conditions, so it is placed in
environmental boundary conditions.
The geotechnical boundary conditions are needed when using D-Geo Stability to examine the
failure mechanisms. This type of boundary conditions is determined on the bases of field tests and
laboratory tests. Important is that the mean values are taken in the probabilistic design instead of
the characteristic 95% values which are used in the semi-probabilistic calculation (level I). If not,
25
this results in an overestimation of the probability of failure.
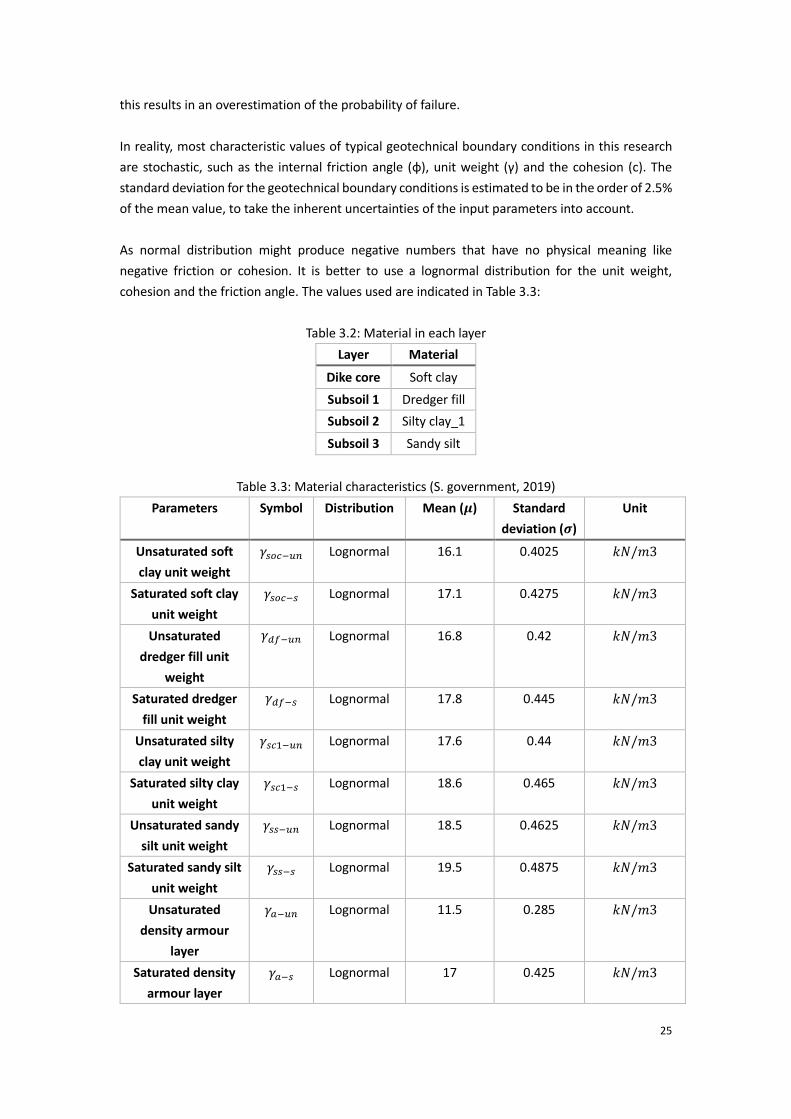
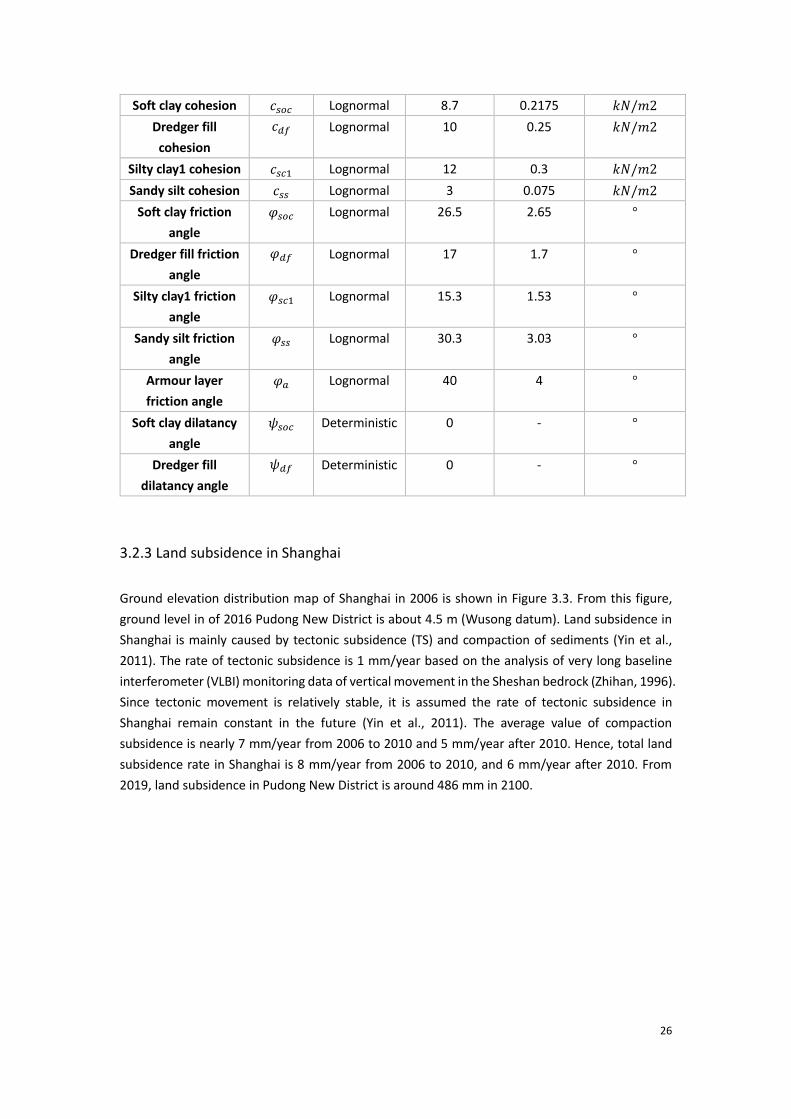
In reality, most characteristic values of typical geotechnical boundary conditions in this research
are stochastic, such as the internal friction angle (φ), unit weight (γ) and the cohesion (c). The
standard deviation for the geotechnical boundary conditions is estimated to be in the order of 2.5%
of the mean value, to take the inherent uncertainties of the input parameters into account.
As normal distribution might produce negative numbers that have no physical meaning like
negative friction or cohesion. It is better to use a lognormal distribution for the unit weight,
cohesion and the friction angle. The values used are indicated in Table 3.3:
Table 3.2: Material in each layer
Layer Material
Dike core Soft clay
Subsoil 1 Dredger fill
Subsoil 2 Silty clay_1
Subsoil 3 Sandy silt
Table 3.3: Material characteristics (S. government, 2019)
Parameters Symbol Distribution Mean (𝝁) Standard
deviation (𝝈)
Unit
Unsaturated soft
clay unit weight
𝛾𝑠𝑜𝑐−𝑢𝑛 Lognormal 16.1 0.4025 𝑘𝑁/𝑚3
Saturated soft clay
unit weight
𝛾𝑠𝑜𝑐−𝑠 Lognormal 17.1 0.4275 𝑘𝑁/𝑚3
Unsaturated
dredger fill unit
weight
𝛾𝑑𝑓−𝑢𝑛 Lognormal 16.8 0.42 𝑘𝑁/𝑚3
Saturated dredger
fill unit weight
𝛾𝑑𝑓−𝑠 Lognormal 17.8 0.445 𝑘𝑁/𝑚3
Unsaturated silty
clay unit weight
𝛾𝑠𝑐1−𝑢𝑛 Lognormal 17.6 0.44 𝑘𝑁/𝑚3
Saturated silty clay
unit weight
𝛾𝑠𝑐1−𝑠 Lognormal 18.6 0.465 𝑘𝑁/𝑚3
Unsaturated sandy
silt unit weight
𝛾𝑠𝑠−𝑢𝑛 Lognormal 18.5 0.4625 𝑘𝑁/𝑚3
Saturated sandy silt
unit weight
𝛾𝑠𝑠−𝑠 Lognormal 19.5 0.4875 𝑘𝑁/𝑚3
Unsaturated
density armour
layer
𝛾𝑎−𝑢𝑛 Lognormal 11.5 0.285 𝑘𝑁/𝑚3
Saturated density
armour layer
𝛾𝑎−𝑠 Lognormal 17 0.425 𝑘𝑁/𝑚3
26
Soft clay cohesion 𝑐𝑠𝑜𝑐 Lognormal 8.7 0.2175 𝑘𝑁/𝑚2
Dredger fill
cohesion
𝑐𝑑𝑓 Lognormal 10 0.25 𝑘𝑁/𝑚2
Silty clay1 cohesion 𝑐𝑠𝑐1 Lognormal 12 0.3 𝑘𝑁/𝑚2
Sandy silt cohesion 𝑐𝑠𝑠 Lognormal 3 0.075 𝑘𝑁/𝑚2
Soft clay friction
angle
𝜑𝑠𝑜𝑐 Lognormal 26.5 2.65 °
Dredger fill friction
angle
𝜑𝑑𝑓 Lognormal 17 1.7 °
Silty clay1 friction
angle
𝜑𝑠𝑐1 Lognormal 15.3 1.53 °
Sandy silt friction
angle
𝜑𝑠𝑠 Lognormal 30.3 3.03 °
Armour layer
friction angle
𝜑𝑎 Lognormal 40 4 °
Soft clay dilatancy
angle
𝜓𝑠𝑜𝑐 Deterministic 0 - °
Dredger fill
dilatancy angle
𝜓𝑑𝑓 Deterministic 0 - °
3.2.3 Land subsidence in Shanghai
Ground elevation distribution map of Shanghai in 2006 is shown in Figure 3.3. From this figure,
ground level in of 2016 Pudong New District is about 4.5 m (Wusong datum). Land subsidence in
Shanghai is mainly caused by tectonic subsidence (TS) and compaction of sediments (Yin et al.,
2011). The rate of tectonic subsidence is 1 mm/year based on the analysis of very long baseline
interferometer (VLBI) monitoring data of vertical movement in the Sheshan bedrock (Zhihan, 1996).
Since tectonic movement is relatively stable, it is assumed the rate of tectonic subsidence in
Shanghai remain constant in the future (Yin et al., 2011). The average value of compaction
subsidence is nearly 7 mm/year from 2006 to 2010 and 5 mm/year after 2010. Hence, total land
subsidence rate in Shanghai is 8 mm/year from 2006 to 2010, and 6 mm/year after 2010. From
2019, land subsidence in Pudong New District is around 486 mm in 2100.

27
Figure 3.3: Ground elevation distribution map of Shanghai
in 2006, Wusong datum (HM, 2013)
3.2.4 Other environmental boundary conditions
Besides the hydraulic and geotechnical boundary conditions, other boundary conditions are
required depending on the failure mechanisms. For example, loads exerted on the dike due to ice,
ship collision. These boundary conditions are not important for Pudong sea dike, although they
may exert large forces on the structure. In this research, no other boundary conditions are present
except for hydraulic and geotechnical ones.
3.2.5 Independent variables
In addition to the described boundary conditions in the above chapters following variables are also
placed in boundary conditions. To be precise, the gravitational acceleration and water density can
be described as independent variables. They often have a deterministic value, so in the
28
probabilistic design method these variables either are deterministic or have a very small deviation
(almost can be neglected). Gravitational acceleration (g) is 9.81 kg/m3, and water density 𝜌𝑤 is
1.025 m/s2
.
3.3 Description of flooding in Shanghai
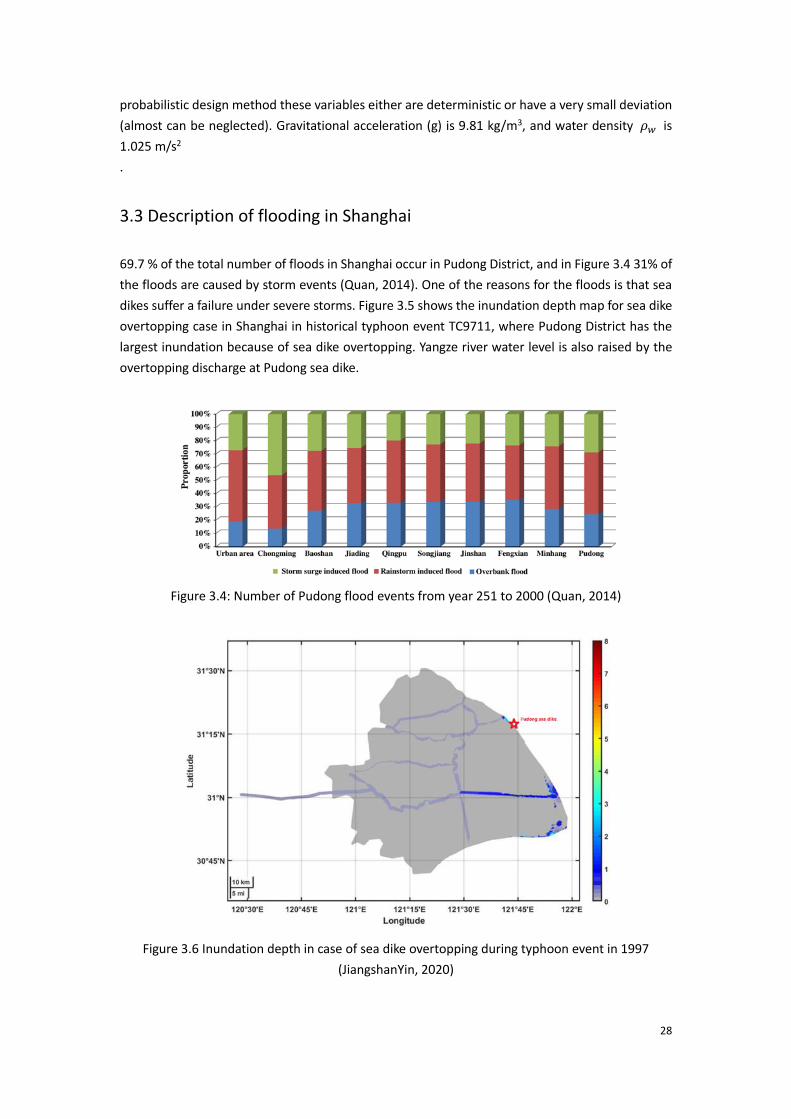
69.7 % of the total number of floods in Shanghai occur in Pudong District, and in Figure 3.4 31% of
the floods are caused by storm events (Quan, 2014). One of the reasons for the floods is that sea
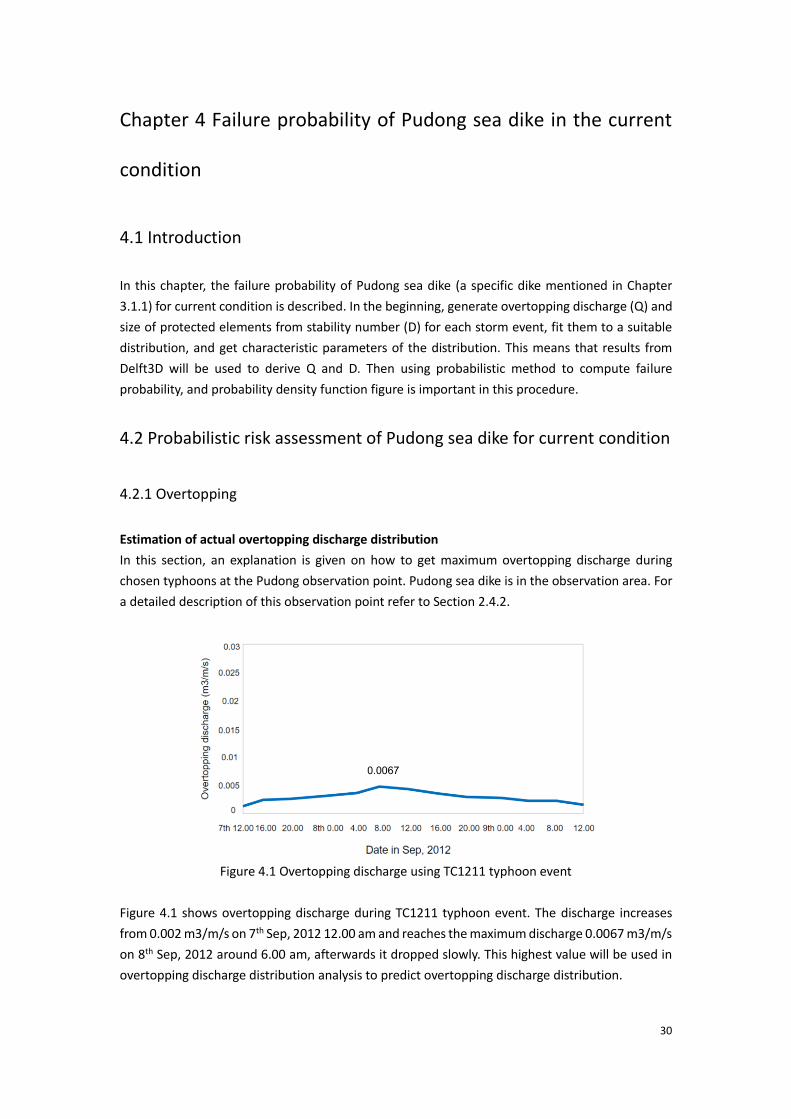
dikes suffer a failure under severe storms. Figure 3.5 shows the inundation depth map for sea dike
overtopping case in Shanghai in historical typhoon event TC9711, where Pudong District has the
largest inundation because of sea dike overtopping. Yangze river water level is also raised by the
overtopping discharge at Pudong sea dike.
Figure 3.4: Number of Pudong flood events from year 251 to 2000 (Quan, 2014)
Figure 3.6 Inundation depth in case of sea dike overtopping during typhoon event in 1997
(JiangshanYin, 2020)

29
Based on Du’s work, because of historical storms, flooding has occurred in Shanghai due to
overtopping discharge over the Pudong sea dike 12 times between years 1949 and 2009 (Du, Chen,
& Van Rompaey, 2015), approximately once every 5 years on average. Take TC9711 as an example,
the inundation depth near Pudong sea dike because of overtopping failure is around 3 m (Figure
3.6), which has caused more than 50 deaths in Pudong (Baiduwenku, 2015). Thus, overtopping
caused by historical severe storms plays an important role in sea dike failure.
30
Chapter 4 Failure probability of Pudong sea dike in the current
condition
4.1 Introduction
In this chapter, the failure probability of Pudong sea dike (a specific dike mentioned in Chapter
3.1.1) for current condition is described. In the beginning, generate overtopping discharge (Q) and
size of protected elements from stability number (D) for each storm event, fit them to a suitable
distribution, and get characteristic parameters of the distribution. This means that results from
Delft3D will be used to derive Q and D. Then using probabilistic method to compute failure
probability, and probability density function figure is important in this procedure.
4.2 Probabilistic risk assessment of Pudong sea dike for current condition
4.2.1 Overtopping
Estimation of actual overtopping discharge distribution
In this section, an explanation is given on how to get maximum overtopping discharge during
chosen typhoons at the Pudong observation point. Pudong sea dike is in the observation area. For
a detailed description of this observation point refer to Section 2.4.2.
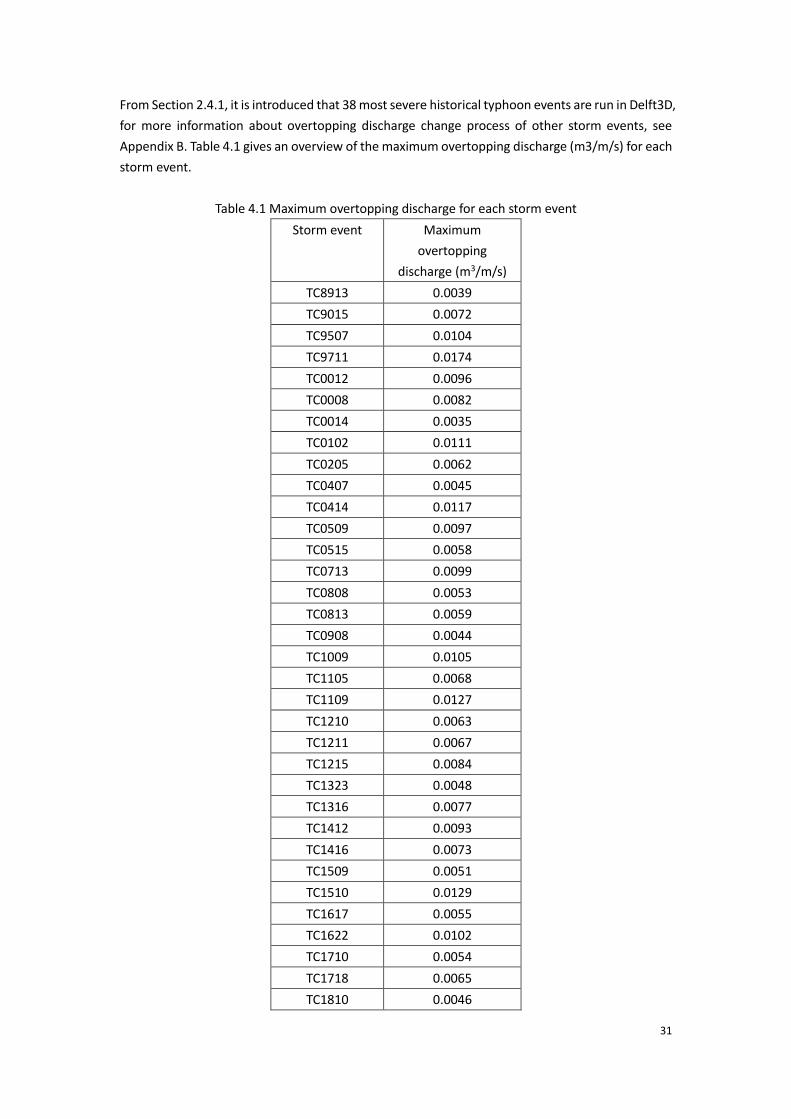
Figure 4.1 Overtopping discharge using TC1211 typhoon event
Figure 4.1 shows overtopping discharge during TC1211 typhoon event. The discharge increases
from 0.002 m3/m/s on 7th Sep, 2012 12.00 am and reaches the maximum discharge 0.0067 m3/m/s
on 8th Sep, 2012 around 6.00 am, afterwards it dropped slowly. This highest value will be used in
overtopping discharge distribution analysis to predict overtopping discharge distribution.
31
From Section 2.4.1, it is introduced that 38 most severe historical typhoon events are run in Delft3D,
for more information about overtopping discharge change process of other storm events, see
Appendix B. Table 4.1 gives an overview of the maximum overtopping discharge (m3/m/s) for each
storm event.
Table 4.1 Maximum overtopping discharge for each storm event
Storm event Maximum
overtopping
discharge (m3/m/s)
TC8913 0.0039
TC9015 0.0072
TC9507 0.0104
TC9711 0.0174
TC0012 0.0096
TC0008 0.0082
TC0014 0.0035
TC0102 0.0111
TC0205 0.0062
TC0407 0.0045
TC0414 0.0117
TC0509 0.0097
TC0515 0.0058
TC0713 0.0099
TC0808 0.0053
TC0813 0.0059
TC0908 0.0044
TC1009 0.0105
TC1105 0.0068
TC1109 0.0127
TC1210 0.0063
TC1211 0.0067
TC1215 0.0084
TC1323 0.0048
TC1316 0.0077
TC1412 0.0093
TC1416 0.0073
TC1509 0.0051
TC1510 0.0129
TC1617 0.0055
TC1622 0.0102
TC1710 0.0054
TC1718 0.0065
TC1810 0.0046
32
TC1818 0.0068
TC1825 0.0107
TC1909 0.0157
TC1918 0.0137
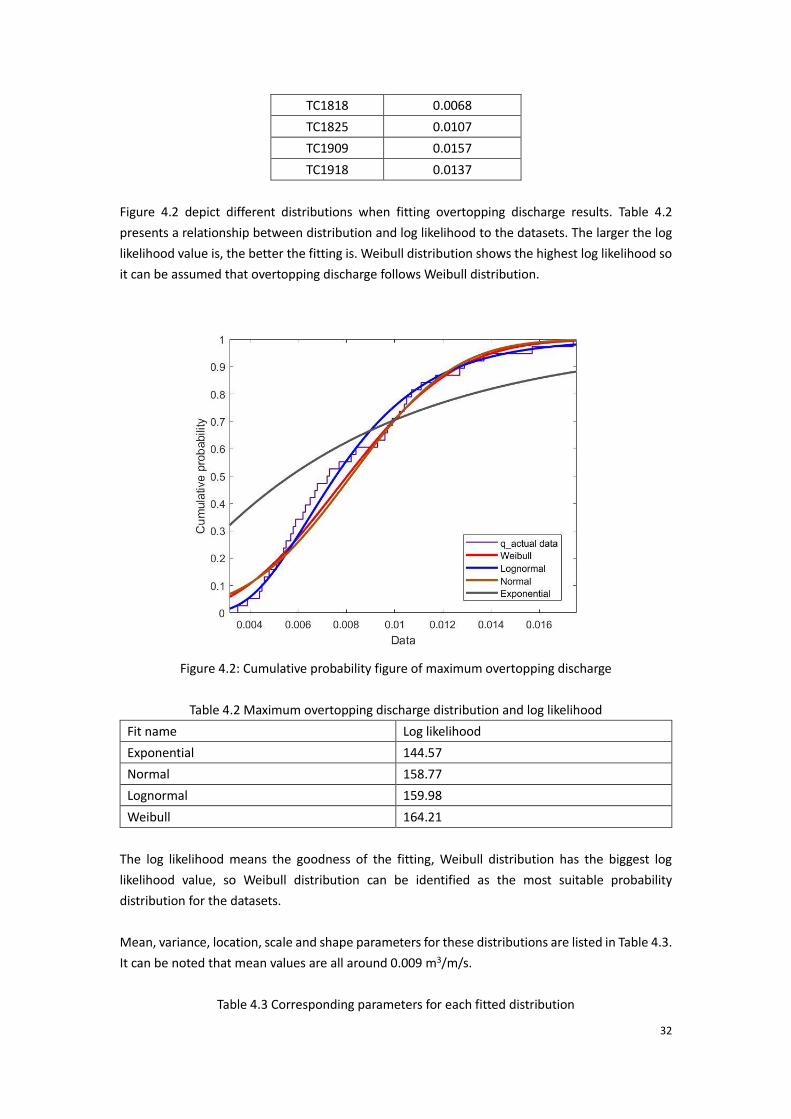
Figure 4.2 depict different distributions when fitting overtopping discharge results. Table 4.2
presents a relationship between distribution and log likelihood to the datasets. The larger the log
likelihood value is, the better the fitting is. Weibull distribution shows the highest log likelihood so
it can be assumed that overtopping discharge follows Weibull distribution.
Figure 4.2: Cumulative probability figure of maximum overtopping discharge
Table 4.2 Maximum overtopping discharge distribution and log likelihood
Fit name Log likelihood
Exponential 144.57
Normal 158.77
Lognormal 159.98
Weibull 164.21
The log likelihood means the goodness of the fitting, Weibull distribution has the biggest log
likelihood value, so Weibull distribution can be identified as the most suitable probability
distribution for the datasets.
Mean, variance, location, scale and shape parameters for these distributions are listed in Table 4.3.
It can be noted that mean values are all around 0.009 m3/m/s.
Table 4.3 Corresponding parameters for each fitted distribution
33
Distribution Mean Variance Location parameter
(for Lognormal distribution
is log location parameter,
for Weibull distribution is
shape parameter)
Scale parameter
(for Lognormal distribution is
log scale parameter)
Exponential 0.0082 6.70e-05 - -
Normal 0.0081 1.44e-05 0.0082 0.0034
Lognormal 0.0082 1.19e-05 -4.8845 0.4036
Weibull 0.0082 1.14e-05 2.618 0.3164
To verify the distribution for the datasets are accurate, Kolmogorov-Smirnov (K-S) test is applied to
compare a reference probability distribution with the datasets. More details for K-S test (P=value
D-value) are written in Appendix B. For a K-S test, the distribution should be fully specified. Only
when the location, scale, and shape parameters of the distribution are determined, the critical
region of the K-S test is valid.
The D-value statistic is the absolute max distance (supremum) between the CDFs of the two
samples. The closer this number is to 0 the more likely it is that the two samples were drawn from
the same distribution.
P-value is the probability of observing a test statistic as extreme as, or more extreme than, the
observed value under the null hypothesis. Small values of p-value cast doubt on the validity of the
null hypothesis. Null hypothesis that the two samples were drawn from the same distribution will
be rejected if the p-value is less than significance level (5%).
P value in K-S tests for Weibull distribution in Table 4.4 is larger than others, and D-value is the
smallest which can verify that Weibull distribution is more valid to express overtopping discharge.
Table 4.4 K-S Tests at 5% Significance Level for each fitted
distributions with corresponding parameters
Distribution P value D value
Exponential 0.0185 0.1430
Normal 0.5722 0.1417
Lognormal 0.7563 0.1287
Weibull 0.9036 0.0734
For Weibull distribution the equation of the PDF and CDF is as follows:
(4.2.1)
(4.2.2)
34
The scale parameter '𝑎' is equal to the slope of the line in a probability plot. The shape parameter
‘𝑏' is always larger than zero.
The mean and standard deviation value of Weibull distribution are related to '𝑎 ' and ‘𝑏 '. The
equation for the mean value and standard deviation value are written as:
𝜇 = 𝑎Γ(1 +𝑛
𝑏) (4.2.3)
𝜎2 = 𝑎2[Γ (1 +2
𝑏) − (Γ (1 +
1
𝑏))
2
) (4.2.4)
where,
Γ: gamma function;
The details of the scale parameter, the shape parameter, mean value and standard variation of the
distribution are computed when fitting the datasets to Weibull distribution. Table 4.5 is an
overview of characteristic values of Weibull distribution.
Table 4.5 Weibull distribution parameters
Symbol Value
Scale parameter a 0.009
Shape parameter b 2.618
Mean value mu/μ 0.008
Standard deviation sigma/σ 0.0034
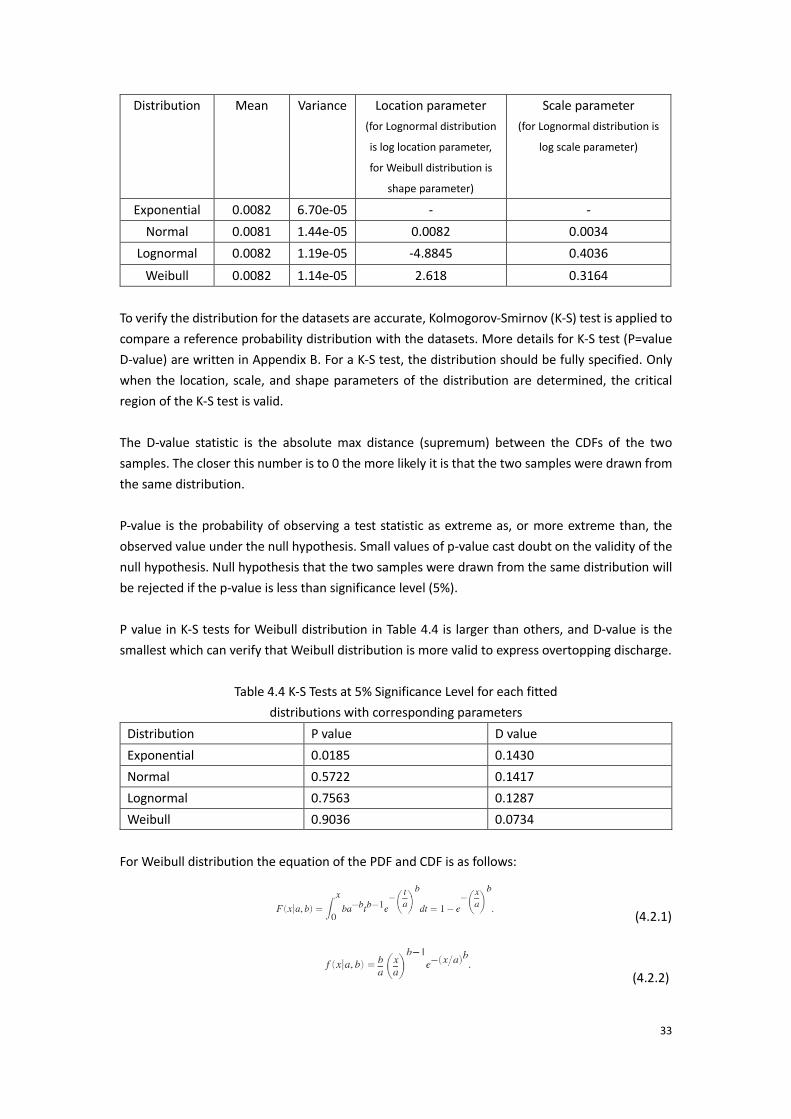
A relationship between maximum overtopping discharge from 38 storm events and their Weibull
probability density function is given below, which predicts the dataset fitting performance. From
the figure, it is obvious that maximum overtopping discharge calculated from 38 storm events are
on the Weibull PDF line.
35
Figure 4.3 Overtopping discharge Weibull PDF plot and
maximum overtopping discharge from chosen storm events
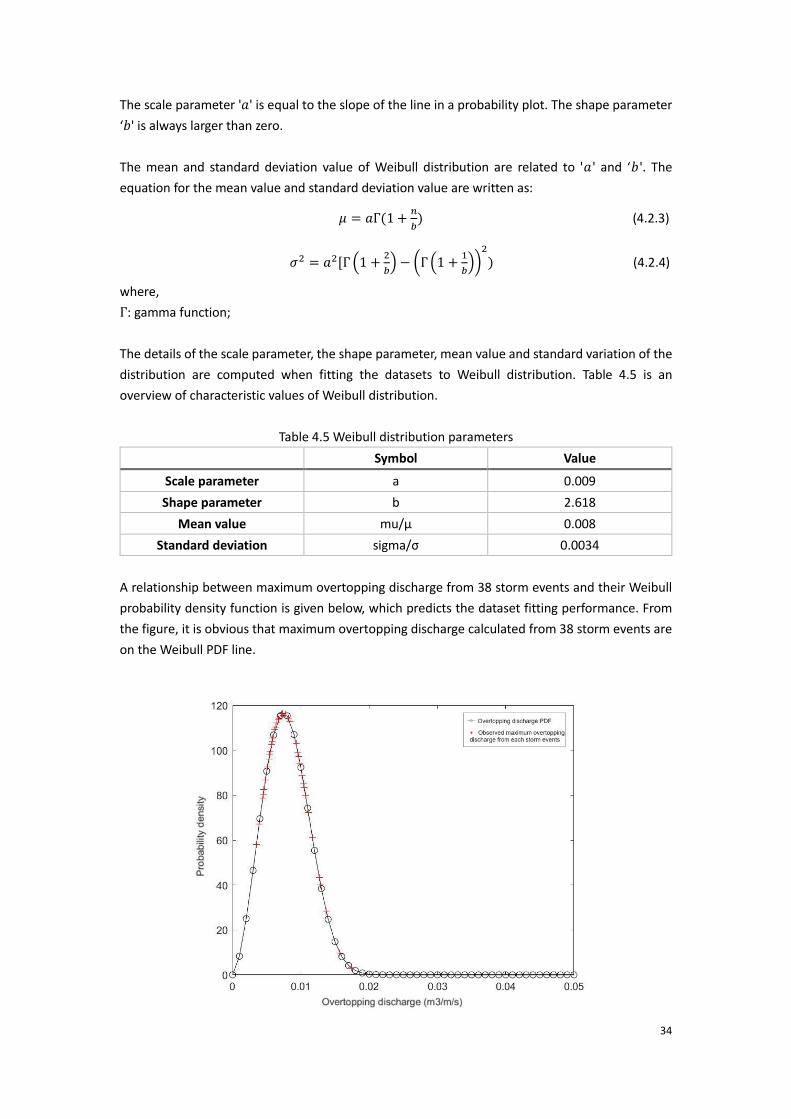
Overtopping failure probability in current condition
Section 2.2.1 gives the critical overtopping discharge for Pudong sea dike.
Figure 4.4 Overtopping failure probability in the condition of
Weibull distributed overtopping discharge
As described in equation 2.1.5 and equation 2.2.1, overtopping failure probability can be computed
using:
𝑃𝑓 = 𝑃(𝑍 < 0) = ∫ (𝑞𝑐 − 𝑞)𝑑𝑞 ∞
𝑞𝑐 (4.2.5)
Where,
Pf: probability that the dike will fail because of overtopping within the interval [qc, ∞] , which
means the area to the right of the green line;
qc: critical overtopping discharge, 0.01 m3/m/s as described in paragraph 2.2.1;
q: actual overtopping discharge, m3/m/s;
Integration yields overtopping failure probability for current condition 0.17.
4.2.2 Revetment failure
Estimation of maximum significant wave height distribution
Equation 2.2.4 is the limit state function of revetment failure. Significant wave height (Hs) is the
only variable in the equation, so a detailed statistical analysis of the modelled wave data is
investigated to reveal the characteristics of Hs for Pudong sea dike test site.
36
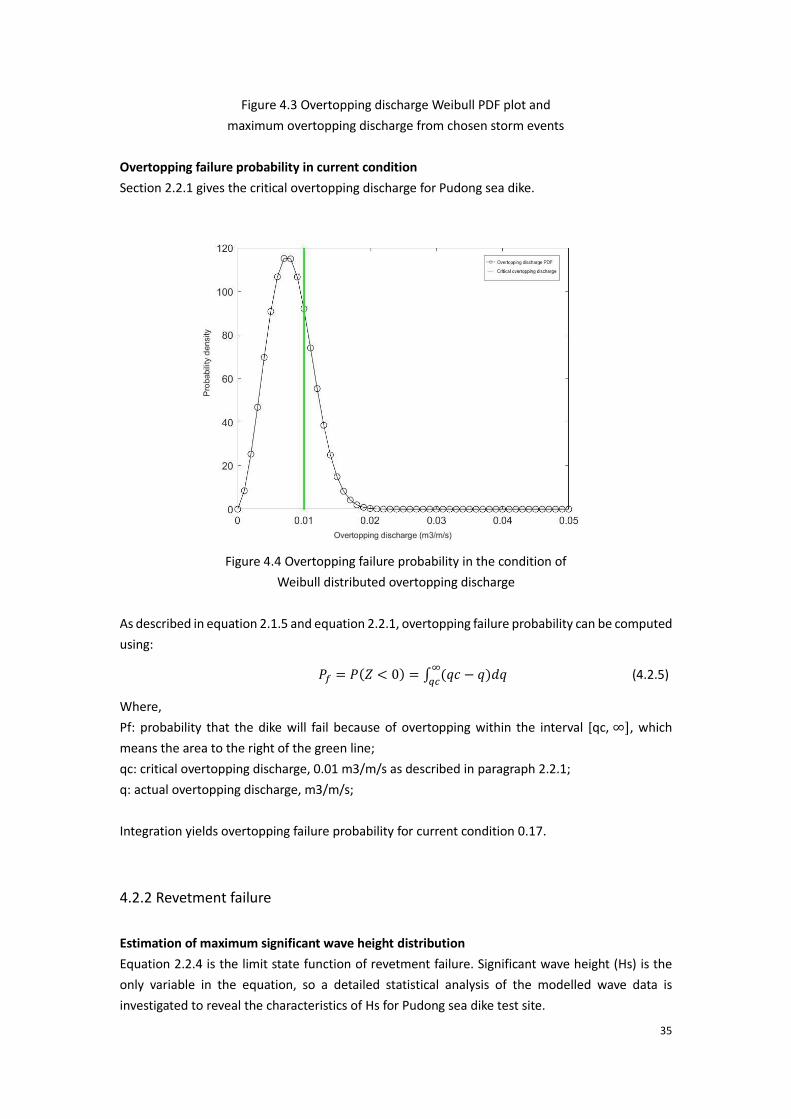
Figure 4.5 Significant wave height for current condition
using TC1211 typhoon event
Significant wave height during TC1211 typhoon event. is clearly shown in Figure 4.5. The Hs value
on 7th Sep, 2012 12.00 am is lowest, below 0.6 m. Then it went up until 8th Sep, 2012 around 4.00
am, and the maximum Hs is 1.13 m. It dropped since the peak. This highest Hs value in TC1211
event will be used to study maximum Hs distribution.
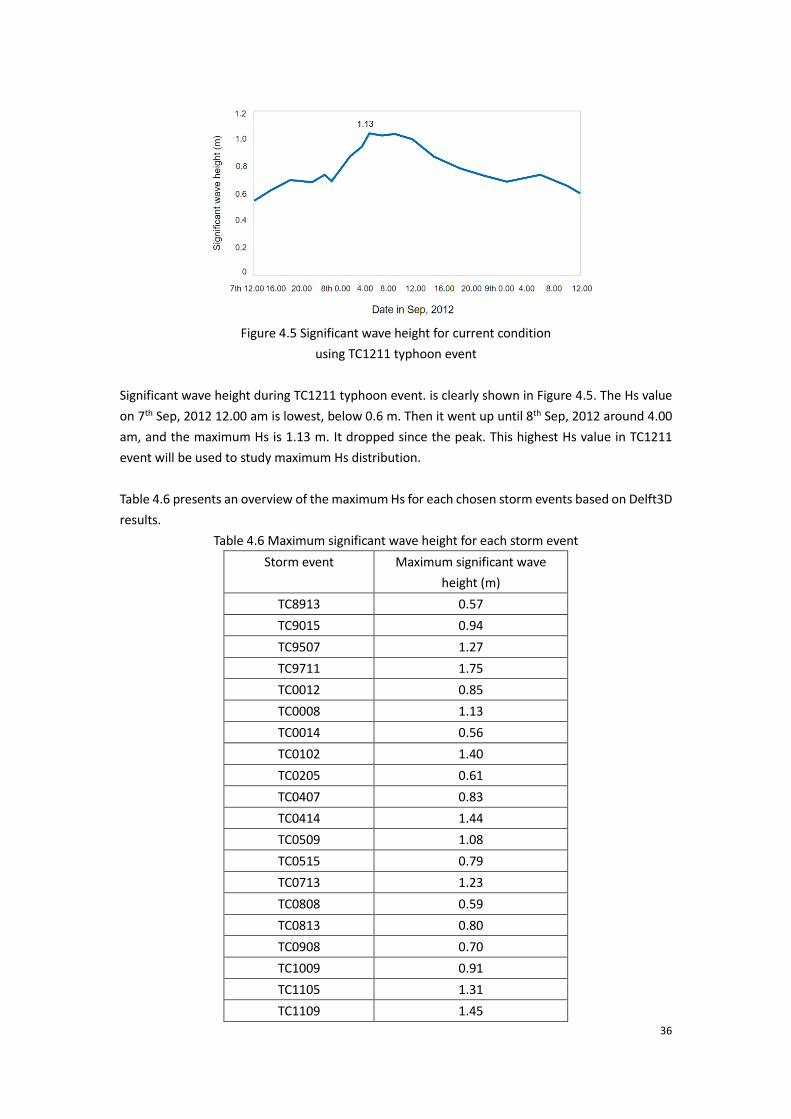
Table 4.6 presents an overview of the maximum Hs for each chosen storm events based on Delft3D
results.
Table 4.6 Maximum significant wave height for each storm event
Storm event Maximum significant wave
height (m)
TC8913 0.57
TC9015 0.94
TC9507 1.27
TC9711 1.75
TC0012 0.85
TC0008 1.13
TC0014 0.56
TC0102 1.40
TC0205 0.61
TC0407 0.83
TC0414 1.44
TC0509 1.08
TC0515 0.79
TC0713 1.23
TC0808 0.59
TC0813 0.80
TC0908 0.70
TC1009 0.91
TC1105 1.31
TC1109 1.45
37
TC1210 1.10
TC1211 1.39
TC1215 0.68
TC1323 0.69
TC1316 0.97
TC1412 1.08
TC1416 1.54
TC1509 1.03
TC1510 0.95
TC1617 0.74
TC1622 1.24
TC1710 0.71
TC1718 0.87
TC1810 0.89
TC1818 0.62
TC1825 0.78
TC1909 1.72
TC1918 1.61
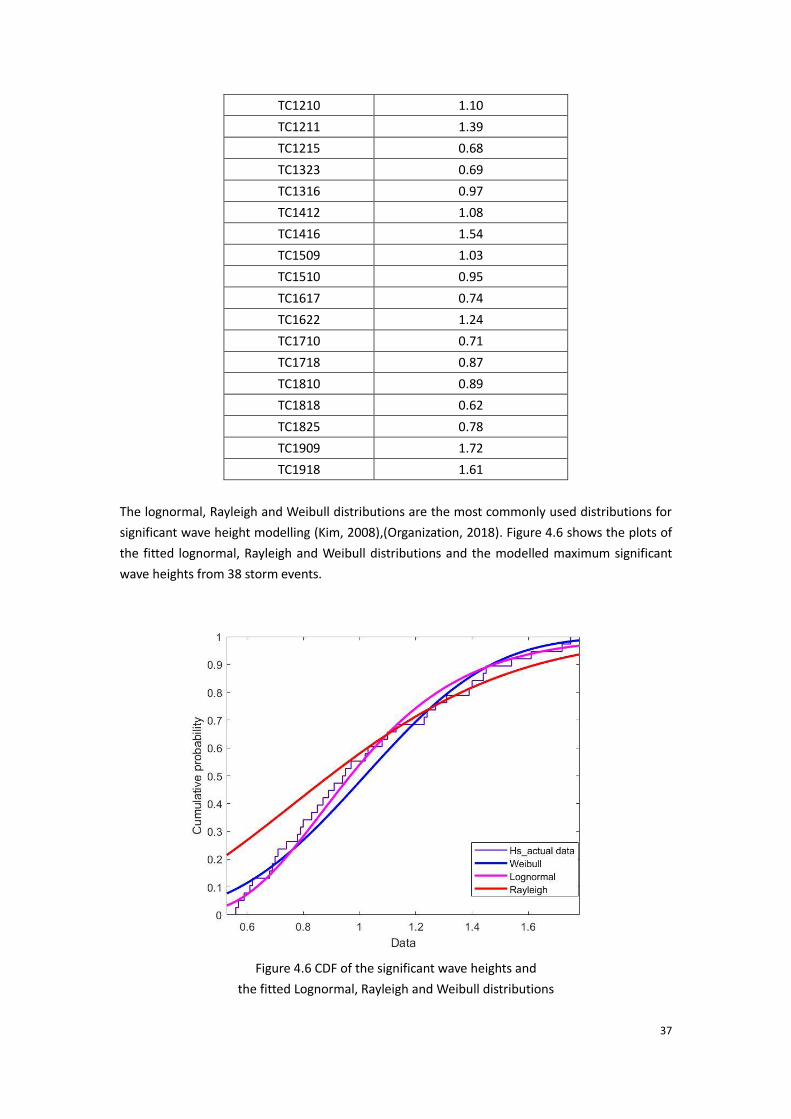
The lognormal, Rayleigh and Weibull distributions are the most commonly used distributions for
significant wave height modelling (Kim, 2008),(Organization, 2018). Figure 4.6 shows the plots of
the fitted lognormal, Rayleigh and Weibull distributions and the modelled maximum significant
wave heights from 38 storm events.
Figure 4.6 CDF of the significant wave heights and
the fitted Lognormal, Rayleigh and Weibull distributions
38
Significant wave height Hs is the average height of the highest one-third of the waves, as measured
from the trough to the crest of the waves. It can be seen that significant wave heights over 2 m
rarely occur for Pudong sea dike.
Table 4.7 Maximum significant wave height distribution and log likelihood
Fit name Log likelihood
Rayleigh -18.32
Weibull -11.98
Lognormal -10.00
The bigger the log likelihood, the better the maximum significant wave height related probability
distribution is. As the log likelihood value -10.00 is the biggest one, which can help readers assume
the fit of the Lognormal distribution to the data performs better than other chosen distributions.
Based on the results in Table 4.8, we can see characteristic parameters for Rayleigh, Weibull,
Lognormal distribution.
Table 4.8 Corresponding parameters for each fitted distribution
Distribution Mean Variance Location parameter
(for Lognormal distribution is log
location parameter, for Weibull
distribution is shape parameter)
Scale parameter
(for Lognormal
distribution is log scale
parameter)
Rayleigh 0.951 0.247 - 0.759
Weibull 1.022 0.117 3.283 1.139
Lognormal 1.021 0.119 -0.033 0.330
The K-S statistical test is used to measure the goodness of fit for the fitted distribution to the
maximum Hs as well. The results from the K-S test and the corresponding P value and D value for
each fitted distribution are compared in Table 4.9.
Table 4.9 K-S Tests at 5% Significance Level for each fitted
distributions with corresponding parameters
Distribution P value D value
Rayleigh 0.4221 0.2383
Weibull 0.7386 01068
Lognormal 0.9388 0.0826
The P-value 0.9388 and D value 0.0826 in Table 4.9 indicates a quite good fit for Hs prediction. The
goodness of fit assessed with the K-S test from the Lognormal model to the measured maximum
Hs data is impressively good.
Lognormal distribution is proposed to describe the behavior of the maximum Hs for each chosen
storm event and it shows an impressive goodness of fit to Hs data.
39
The mathematical description of the lognormal distribution is expressed as follows:
𝐹𝑥(𝑥) = 0.5 + 0.5erf (𝑙𝑛𝑥−𝜇
√2𝜎) (4.2.6)
𝑓𝑥(𝑥) =1
𝑥𝜎√2𝜋exp (−
(𝑙𝑛𝑥−𝜇)2
2𝜎2 ) (4.2.7)
𝜇: mean of logarithmic values
𝜎: standard deviation of logarithmic values
The following equations introduce how to express 𝜇 and 𝜎 in terms of mean value and variance:
𝜇 = ln (𝐸(𝑥)2
√𝑉𝑎𝑟(𝑥)+𝐸(𝑥)2) (4.2.8)
𝜎2 = ln (𝑉𝑎𝑟(𝑥)
𝐸(𝑥)2 + 1) (4.2.9)
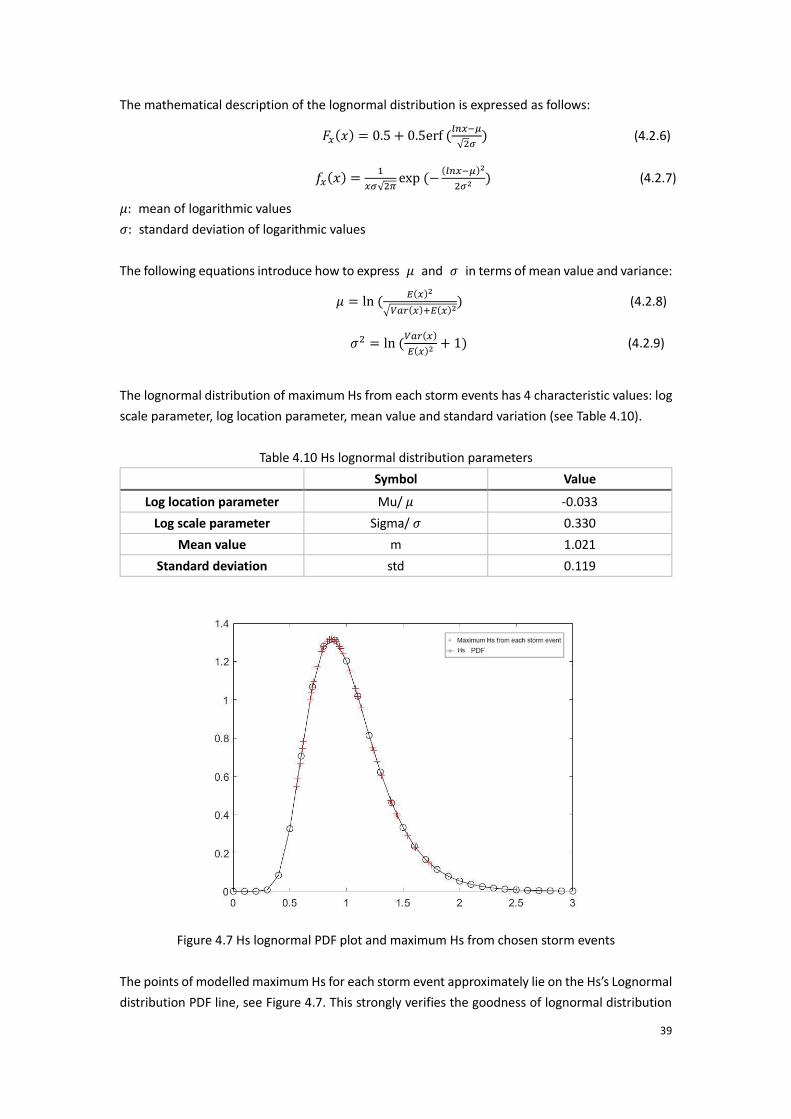
The lognormal distribution of maximum Hs from each storm events has 4 characteristic values: log
scale parameter, log location parameter, mean value and standard variation (see Table 4.10).
Table 4.10 Hs lognormal distribution parameters
Symbol Value
Log location parameter Mu/ 𝜇 -0.033
Log scale parameter Sigma/ 𝜎 0.330
Mean value m 1.021
Standard deviation std 0.119
Figure 4.7 Hs lognormal PDF plot and maximum Hs from chosen storm events
The points of modelled maximum Hs for each storm event approximately lie on the Hs’s Lognormal
distribution PDF line, see Figure 4.7. This strongly verifies the goodness of lognormal distribution
40
fitting.
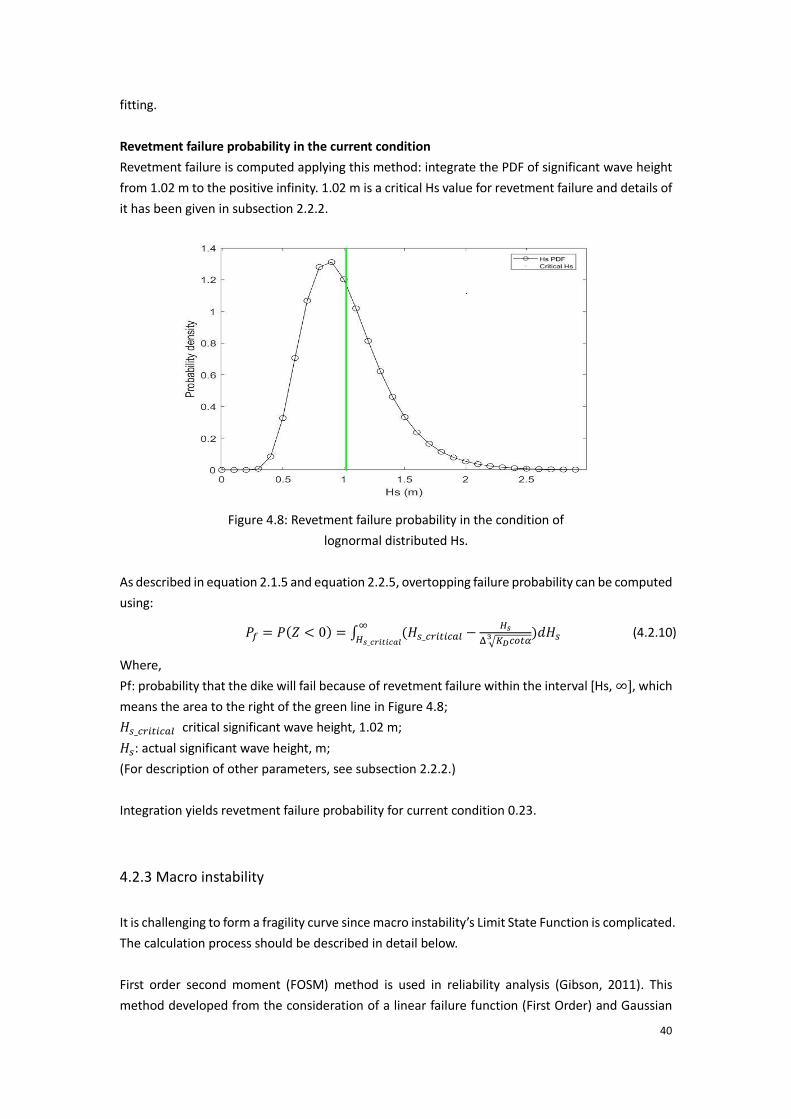
Revetment failure probability in the current condition
Revetment failure is computed applying this method: integrate the PDF of significant wave height
from 1.02 m to the positive infinity. 1.02 m is a critical Hs value for revetment failure and details of
it has been given in subsection 2.2.2.
Figure 4.8: Revetment failure probability in the condition of
lognormal distributed Hs.
As described in equation 2.1.5 and equation 2.2.5, overtopping failure probability can be computed
using:
𝑃𝑓 = 𝑃(𝑍 < 0) = ∫ (𝐻𝑠_𝑐𝑟𝑖𝑡𝑖𝑐𝑎𝑙 −𝐻𝑠
Δ √𝐾𝐷𝑐𝑜𝑡𝛼3 )𝑑𝐻𝑠 ∞
𝐻𝑠_𝑐𝑟𝑖𝑡𝑖𝑐𝑎𝑙 (4.2.10)
Where,
Pf: probability that the dike will fail because of revetment failure within the interval [Hs, ∞], which
means the area to the right of the green line in Figure 4.8;
𝐻𝑠_𝑐𝑟𝑖𝑡𝑖𝑐𝑎𝑙 critical significant wave height, 1.02 m;
𝐻𝑠: actual significant wave height, m;
(For description of other parameters, see subsection 2.2.2.)
Integration yields revetment failure probability for current condition 0.23.
4.2.3 Macro instability
It is challenging to form a fragility curve since macro instability’s Limit State Function is complicated.
The calculation process should be described in detail below.
First order second moment (FOSM) method is used in reliability analysis (Gibson, 2011). This
method developed from the consideration of a linear failure function (First Order) and Gaussian
41
processes (represented by their first two statistical moments).
The Taylor series expansion for a multi variables function f(xi) retaining only the linear components
is shown in Equations 4.2.11 and 4.2.12:
(4.2.11)
(4.2.12)
Equations 4.2.13 and 4.2.14 help compute the expected value of y and the variance of y:
(4.2.13)
(4.2.14)
Equations 4.2.13 and 4.2.14 require the evaluation of the derivative of the target function y with
respect to the variables. This can be estimated using Equation 4.2.15:
(4.2.15)
When using FOSM method to evaluate FoS, it requires 2N+1 steps. In some cases where target
function is not known the evaluation is done via numerical analyses, this imply that it will be
required 2N+1 analyses; for example, slope stability analysis using limit equilibrium methods and
considering material properties as variables will require several analyses to evaluate Equation
4.2.15.
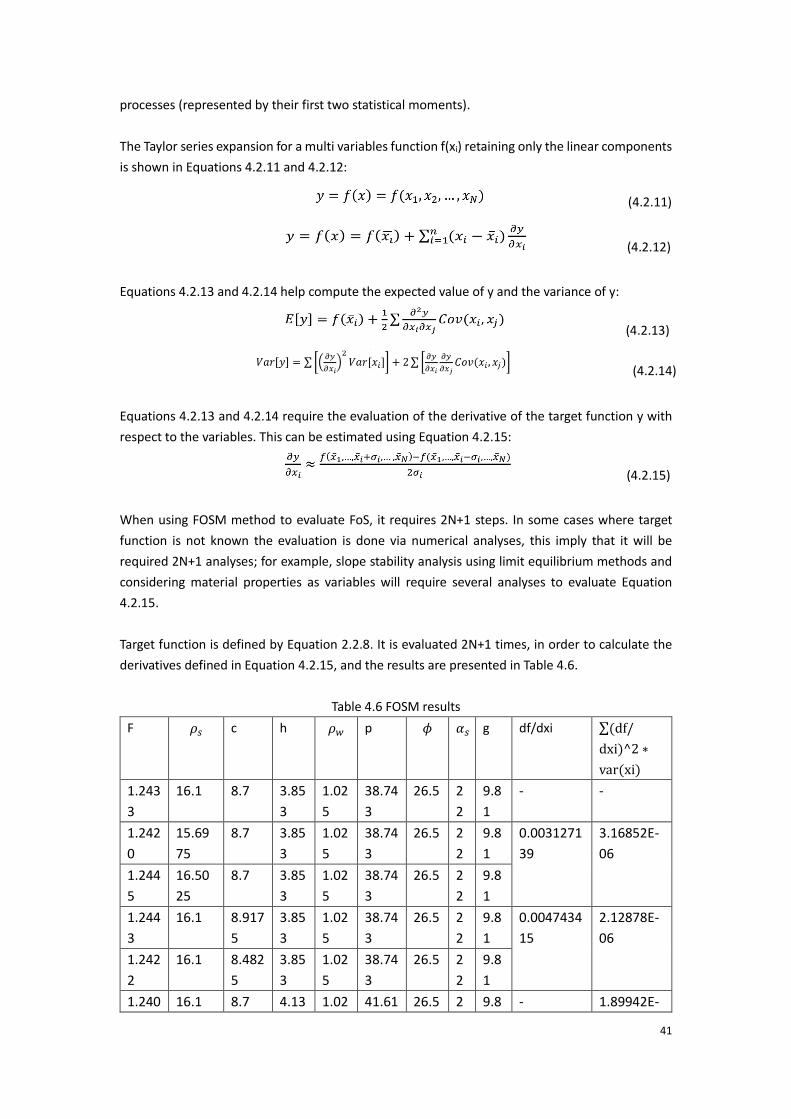
Target function is defined by Equation 2.2.8. It is evaluated 2N+1 times, in order to calculate the
derivatives defined in Equation 4.2.15, and the results are presented in Table 4.6.
Table 4.6 FOSM results
F 𝜌𝑠 c h 𝜌𝑤 p 𝜙 𝛼𝑠 g df/dxi ∑(df/
dxi)^2 ∗
var(xi)
1.243
3
16.1 8.7 3.85
3
1.02
5
38.74
3
26.5 2
2
9.8
1
- -
1.242
0
15.69
75
8.7 3.85
3
1.02
5
38.74
3
26.5 2
2
9.8
1
0.0031271
39
3.16852E-
06
1.244
5
16.50
25
8.7 3.85
3
1.02
5
38.74
3
26.5 2
2
9.8
1
1.244
3
16.1 8.917
5
3.85
3
1.02
5
38.74
3
26.5 2
2
9.8
1
0.0047434
15
2.12878E-
06
1.242
2
16.1 8.482
5
3.85
3
1.02
5
38.74
3
26.5 2
2
9.8
1
1.240 16.1 8.7 4.13 1.02 41.61 26.5 2 9.8 - 1.89942E-
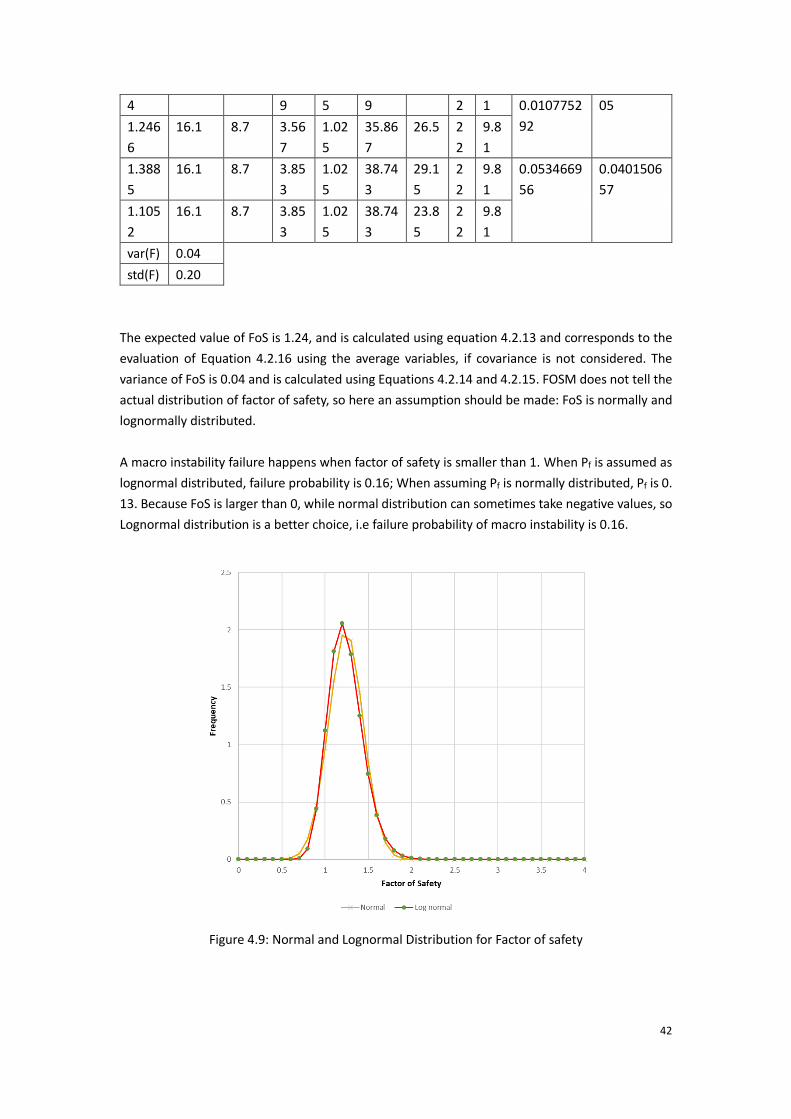
42
4 9 5 9 2 1 0.0107752
92
05
1.246
6
16.1 8.7 3.56
7
1.02
5
35.86
7
26.5 2
2
9.8
1
1.388
5
16.1 8.7 3.85
3
1.02
5
38.74
3
29.1
5
2
2
9.8
1
0.0534669
56
0.0401506
57
1.105
2
16.1 8.7 3.85
3
1.02
5
38.74
3
23.8
5
2
2
9.8
1
var(F) 0.04
std(F) 0.20
The expected value of FoS is 1.24, and is calculated using equation 4.2.13 and corresponds to the
evaluation of Equation 4.2.16 using the average variables, if covariance is not considered. The
variance of FoS is 0.04 and is calculated using Equations 4.2.14 and 4.2.15. FOSM does not tell the
actual distribution of factor of safety, so here an assumption should be made: FoS is normally and
lognormally distributed.
A macro instability failure happens when factor of safety is smaller than 1. When Pf is assumed as
lognormal distributed, failure probability is 0.16; When assuming Pf is normally distributed, Pf is 0.
13. Because FoS is larger than 0, while normal distribution can sometimes take negative values, so
Lognormal distribution is a better choice, i.e failure probability of macro instability is 0.16.
Figure 4.9: Normal and Lognormal Distribution for Factor of safety
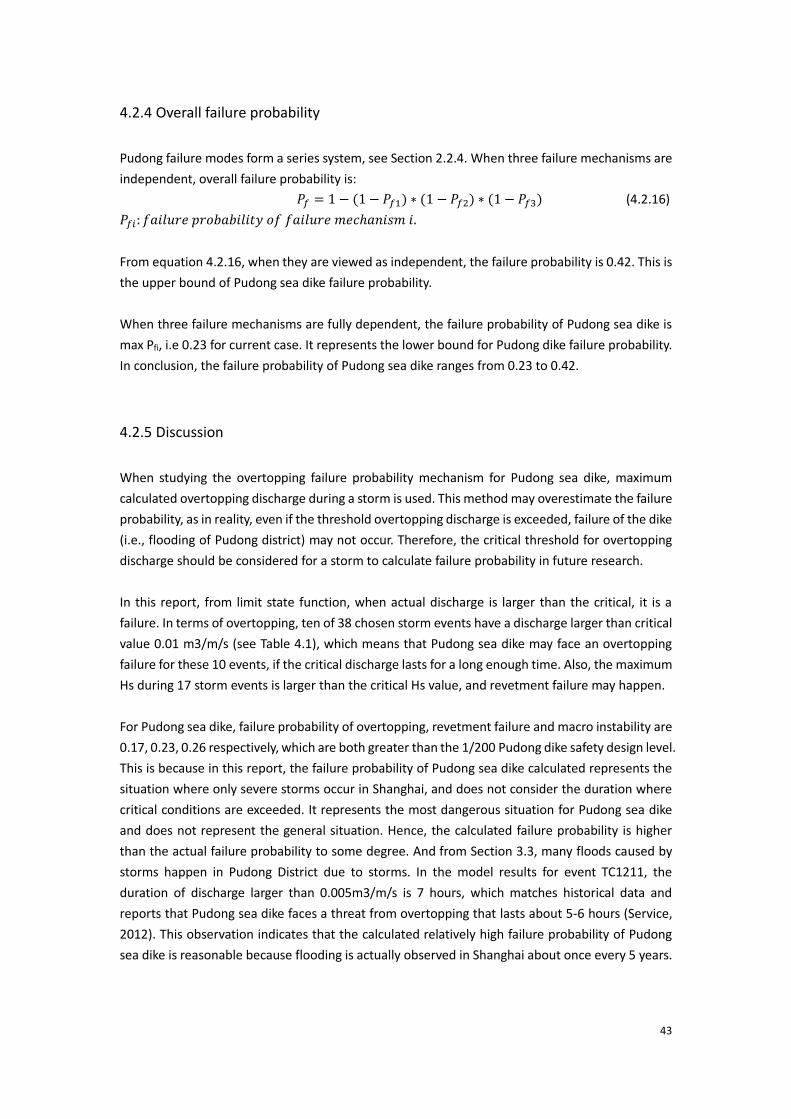
43
4.2.4 Overall failure probability
Pudong failure modes form a series system, see Section 2.2.4. When three failure mechanisms are
independent, overall failure probability is:
𝑃𝑓 = 1 − (1 − 𝑃𝑓1) ∗ (1 − 𝑃𝑓2) ∗ (1 − 𝑃𝑓3) (4.2.16)
𝑃𝑓𝑖: 𝑓𝑎𝑖𝑙𝑢𝑟𝑒 𝑝𝑟𝑜𝑏𝑎𝑏𝑖𝑙𝑖𝑡𝑦 𝑜𝑓 𝑓𝑎𝑖𝑙𝑢𝑟𝑒 𝑚𝑒𝑐ℎ𝑎𝑛𝑖𝑠𝑚 𝑖.
From equation 4.2.16, when they are viewed as independent, the failure probability is 0.42. This is
the upper bound of Pudong sea dike failure probability.
When three failure mechanisms are fully dependent, the failure probability of Pudong sea dike is
max Pfi, i.e 0.23 for current case. It represents the lower bound for Pudong dike failure probability.
In conclusion, the failure probability of Pudong sea dike ranges from 0.23 to 0.42.
4.2.5 Discussion
When studying the overtopping failure probability mechanism for Pudong sea dike, maximum
calculated overtopping discharge during a storm is used. This method may overestimate the failure
probability, as in reality, even if the threshold overtopping discharge is exceeded, failure of the dike
(i.e., flooding of Pudong district) may not occur. Therefore, the critical threshold for overtopping
discharge should be considered for a storm to calculate failure probability in future research.
In this report, from limit state function, when actual discharge is larger than the critical, it is a
failure. In terms of overtopping, ten of 38 chosen storm events have a discharge larger than critical
value 0.01 m3/m/s (see Table 4.1), which means that Pudong sea dike may face an overtopping
failure for these 10 events, if the critical discharge lasts for a long enough time. Also, the maximum
Hs during 17 storm events is larger than the critical Hs value, and revetment failure may happen.
For Pudong sea dike, failure probability of overtopping, revetment failure and macro instability are
0.17, 0.23, 0.26 respectively, which are both greater than the 1/200 Pudong dike safety design level.
This is because in this report, the failure probability of Pudong sea dike calculated represents the
situation where only severe storms occur in Shanghai, and does not consider the duration where
critical conditions are exceeded. It represents the most dangerous situation for Pudong sea dike
and does not represent the general situation. Hence, the calculated failure probability is higher
than the actual failure probability to some degree. And from Section 3.3, many floods caused by
storms happen in Pudong District due to storms. In the model results for event TC1211, the
duration of discharge larger than 0.005m3/m/s is 7 hours, which matches historical data and
reports that Pudong sea dike faces a threat from overtopping that lasts about 5-6 hours (Service,
2012). This observation indicates that the calculated relatively high failure probability of Pudong
sea dike is reasonable because flooding is actually observed in Shanghai about once every 5 years.
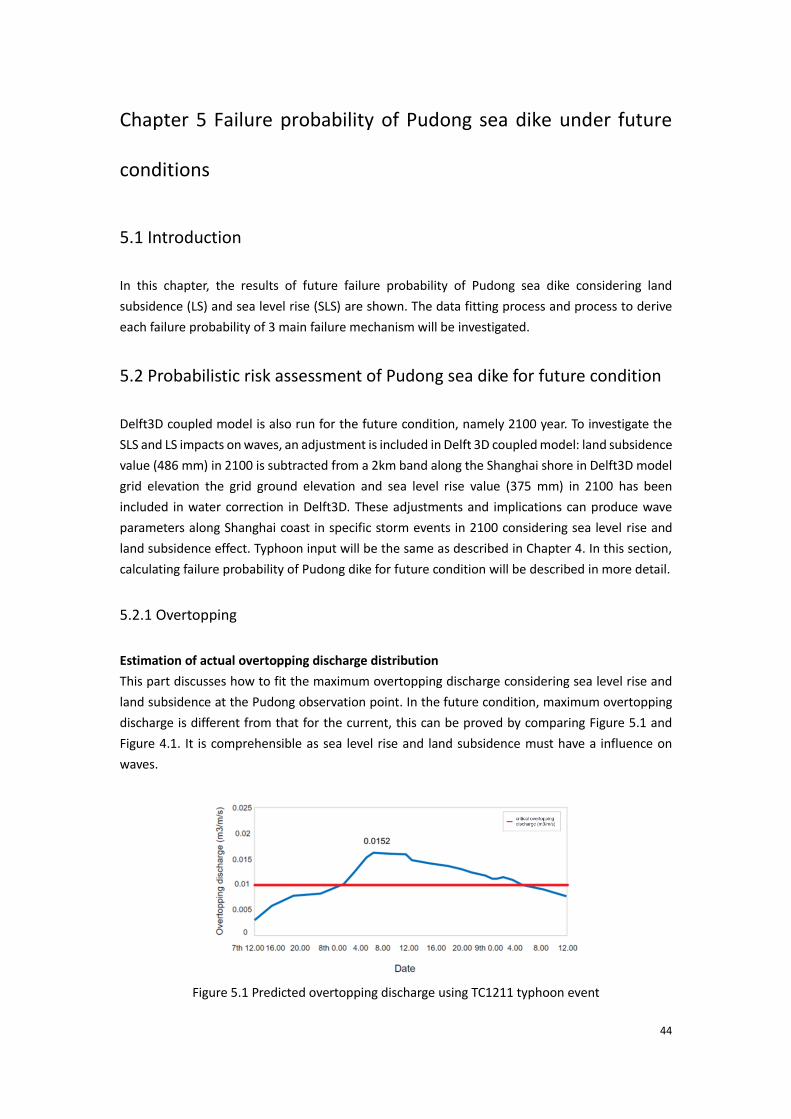
44
Chapter 5 Failure probability of Pudong sea dike under future
conditions
5.1 Introduction
In this chapter, the results of future failure probability of Pudong sea dike considering land
subsidence (LS) and sea level rise (SLS) are shown. The data fitting process and process to derive
each failure probability of 3 main failure mechanism will be investigated.
5.2 Probabilistic risk assessment of Pudong sea dike for future condition
Delft3D coupled model is also run for the future condition, namely 2100 year. To investigate the
SLS and LS impacts on waves, an adjustment is included in Delft 3D coupled model: land subsidence
value (486 mm) in 2100 is subtracted from a 2km band along the Shanghai shore in Delft3D model
grid elevation the grid ground elevation and sea level rise value (375 mm) in 2100 has been
included in water correction in Delft3D. These adjustments and implications can produce wave
parameters along Shanghai coast in specific storm events in 2100 considering sea level rise and
land subsidence effect. Typhoon input will be the same as described in Chapter 4. In this section,
calculating failure probability of Pudong dike for future condition will be described in more detail.
5.2.1 Overtopping
Estimation of actual overtopping discharge distribution
This part discusses how to fit the maximum overtopping discharge considering sea level rise and
land subsidence at the Pudong observation point. In the future condition, maximum overtopping
discharge is different from that for the current, this can be proved by comparing Figure 5.1 and
Figure 4.1. It is comprehensible as sea level rise and land subsidence must have a influence on
waves.
Figure 5.1 Predicted overtopping discharge using TC1211 typhoon event
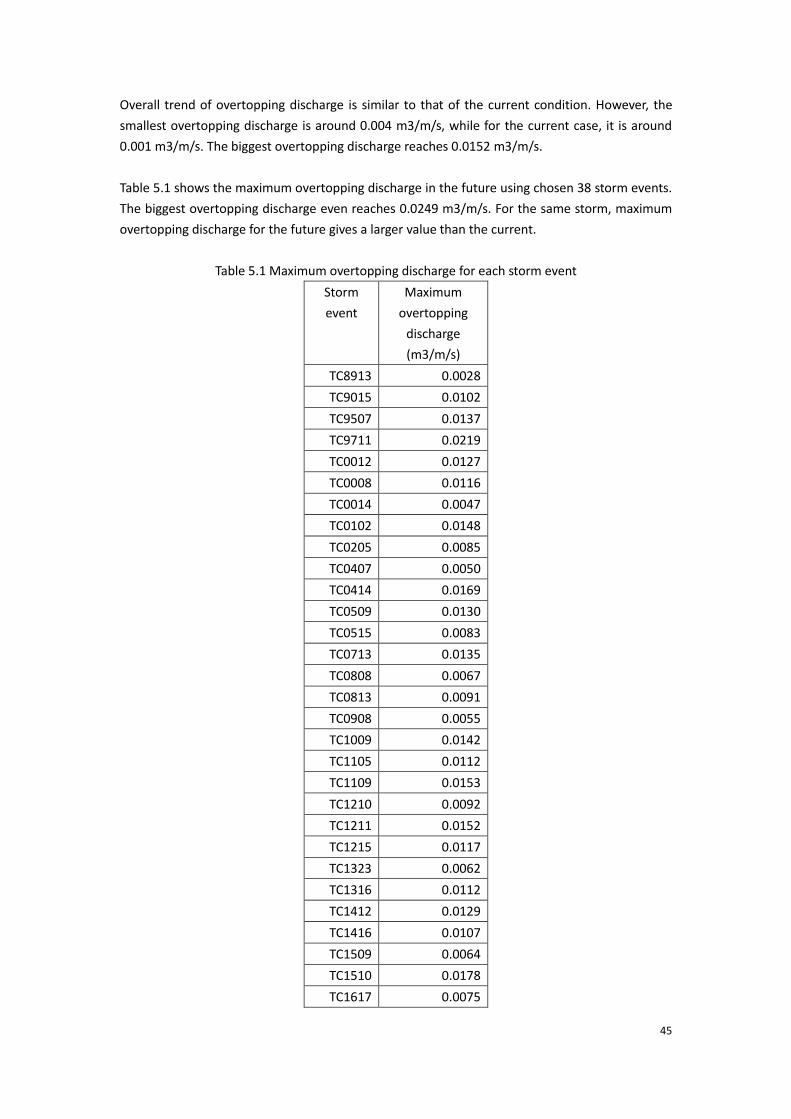
45
Overall trend of overtopping discharge is similar to that of the current condition. However, the
smallest overtopping discharge is around 0.004 m3/m/s, while for the current case, it is around
0.001 m3/m/s. The biggest overtopping discharge reaches 0.0152 m3/m/s.
Table 5.1 shows the maximum overtopping discharge in the future using chosen 38 storm events.
The biggest overtopping discharge even reaches 0.0249 m3/m/s. For the same storm, maximum
overtopping discharge for the future gives a larger value than the current.
Table 5.1 Maximum overtopping discharge for each storm event
Storm
event
Maximum
overtopping
discharge
(m3/m/s)
TC8913 0.0028
TC9015 0.0102
TC9507 0.0137
TC9711 0.0219
TC0012 0.0127
TC0008 0.0116
TC0014 0.0047
TC0102 0.0148
TC0205 0.0085
TC0407 0.0050
TC0414 0.0169
TC0509 0.0130
TC0515 0.0083
TC0713 0.0135
TC0808 0.0067
TC0813 0.0091
TC0908 0.0055
TC1009 0.0142
TC1105 0.0112
TC1109 0.0153
TC1210 0.0092
TC1211 0.0152
TC1215 0.0117
TC1323 0.0062
TC1316 0.0112
TC1412 0.0129
TC1416 0.0107
TC1509 0.0064
TC1510 0.0178
TC1617 0.0075

46
TC1622 0.0132
TC1710 0.0070
TC1718 0.0096
TC1810 0.0057
TC1818 0.0098
TC1825 0.0079
TC1909 0.0200
TC1918 0.0195
Probability density function (PDF) and cumulative density function (CDF) plots gives visualized
distribution of maximum overtopping discharge from 38 storm events. Figure 5.2 gives CDF plots
of Normal, Lognormal, Weibull, Exponential distributions when fitting them the dataset.
Exponential distribution cannot fit data that well, because the CDF line of it fails to match the most
CDF of overtopping discharge (see Figure 5.2). Weibull distribution performs well. The goodness of
fit will be shown in Table 5.2 by log likelihood.
Figure 5.2: Cumulative probability figure of maximum overtopping discharge
Table 5.2 Maximum overtopping discharge distribution and log likelihood
Fit name Log likelihood
Exponential 133.38
Normal 149.76
Lognormal 150.53
Weibull 152.36
In the future condition, Weibull distribution still has the biggest log likelihood value (see Table 5.2),
and this will be certified by applying a KS test.
In Table 5.3 all the input variables are listed for the Exponential, Normal, Lognormal, Weibull which
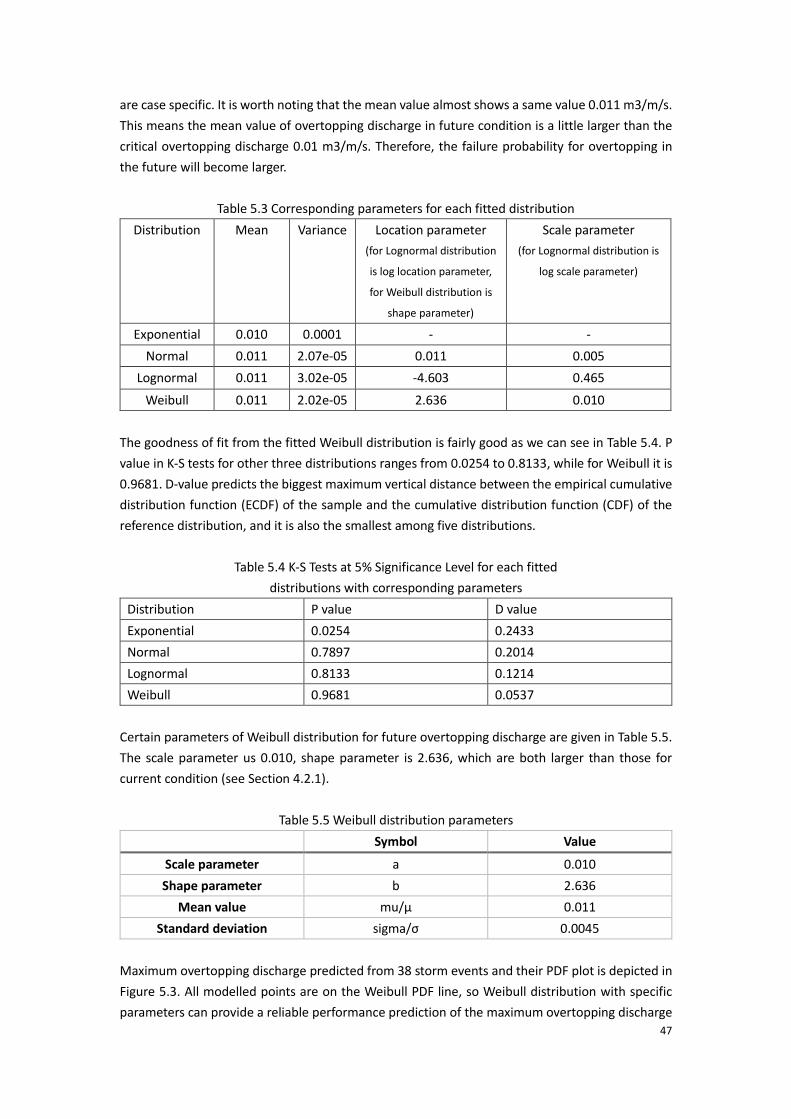
47
are case specific. It is worth noting that the mean value almost shows a same value 0.011 m3/m/s.
This means the mean value of overtopping discharge in future condition is a little larger than the
critical overtopping discharge 0.01 m3/m/s. Therefore, the failure probability for overtopping in
the future will become larger.
Table 5.3 Corresponding parameters for each fitted distribution
Distribution Mean Variance Location parameter
(for Lognormal distribution
is log location parameter,
for Weibull distribution is
shape parameter)
Scale parameter
(for Lognormal distribution is
log scale parameter)
Exponential 0.010 0.0001 - -
Normal 0.011 2.07e-05 0.011 0.005
Lognormal 0.011 3.02e-05 -4.603 0.465
Weibull 0.011 2.02e-05 2.636 0.010
The goodness of fit from the fitted Weibull distribution is fairly good as we can see in Table 5.4. P
value in K-S tests for other three distributions ranges from 0.0254 to 0.8133, while for Weibull it is
0.9681. D-value predicts the biggest maximum vertical distance between the empirical cumulative
distribution function (ECDF) of the sample and the cumulative distribution function (CDF) of the
reference distribution, and it is also the smallest among five distributions.
Table 5.4 K-S Tests at 5% Significance Level for each fitted
distributions with corresponding parameters
Distribution P value D value
Exponential 0.0254 0.2433
Normal 0.7897 0.2014
Lognormal 0.8133 0.1214
Weibull 0.9681 0.0537
Certain parameters of Weibull distribution for future overtopping discharge are given in Table 5.5.
The scale parameter us 0.010, shape parameter is 2.636, which are both larger than those for
current condition (see Section 4.2.1).
Table 5.5 Weibull distribution parameters
Symbol Value
Scale parameter a 0.010
Shape parameter b 2.636
Mean value mu/μ 0.011
Standard deviation sigma/σ 0.0045
Maximum overtopping discharge predicted from 38 storm events and their PDF plot is depicted in
Figure 5.3. All modelled points are on the Weibull PDF line, so Weibull distribution with specific
parameters can provide a reliable performance prediction of the maximum overtopping discharge
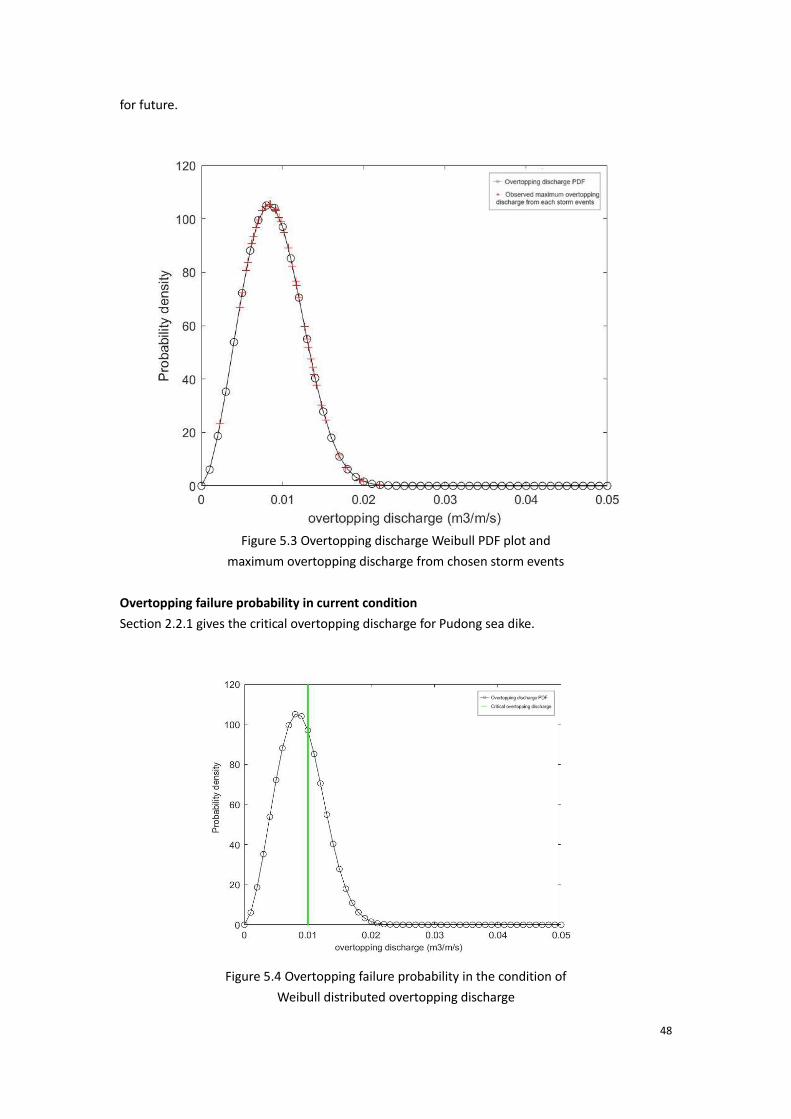
48
for future.
Figure 5.3 Overtopping discharge Weibull PDF plot and
maximum overtopping discharge from chosen storm events
Overtopping failure probability in current condition
Section 2.2.1 gives the critical overtopping discharge for Pudong sea dike.
Figure 5.4 Overtopping failure probability in the condition of
Weibull distributed overtopping discharge
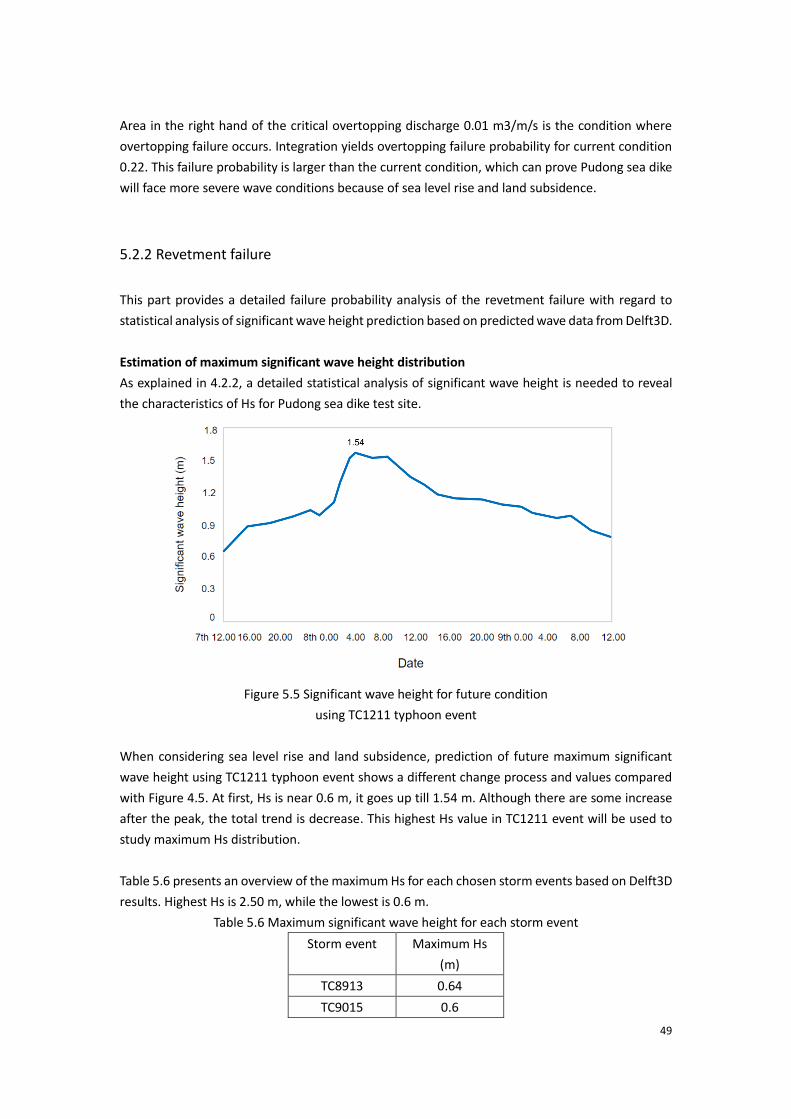
49
Area in the right hand of the critical overtopping discharge 0.01 m3/m/s is the condition where
overtopping failure occurs. Integration yields overtopping failure probability for current condition
0.22. This failure probability is larger than the current condition, which can prove Pudong sea dike
will face more severe wave conditions because of sea level rise and land subsidence.
5.2.2 Revetment failure
This part provides a detailed failure probability analysis of the revetment failure with regard to
statistical analysis of significant wave height prediction based on predicted wave data from Delft3D.
Estimation of maximum significant wave height distribution
As explained in 4.2.2, a detailed statistical analysis of significant wave height is needed to reveal
the characteristics of Hs for Pudong sea dike test site.
Figure 5.5 Significant wave height for future condition
using TC1211 typhoon event
When considering sea level rise and land subsidence, prediction of future maximum significant
wave height using TC1211 typhoon event shows a different change process and values compared
with Figure 4.5. At first, Hs is near 0.6 m, it goes up till 1.54 m. Although there are some increase
after the peak, the total trend is decrease. This highest Hs value in TC1211 event will be used to
study maximum Hs distribution.
Table 5.6 presents an overview of the maximum Hs for each chosen storm events based on Delft3D
results. Highest Hs is 2.50 m, while the lowest is 0.6 m.
Table 5.6 Maximum significant wave height for each storm event
Storm event Maximum Hs
(m)
TC8913 0.64
TC9015 0.6
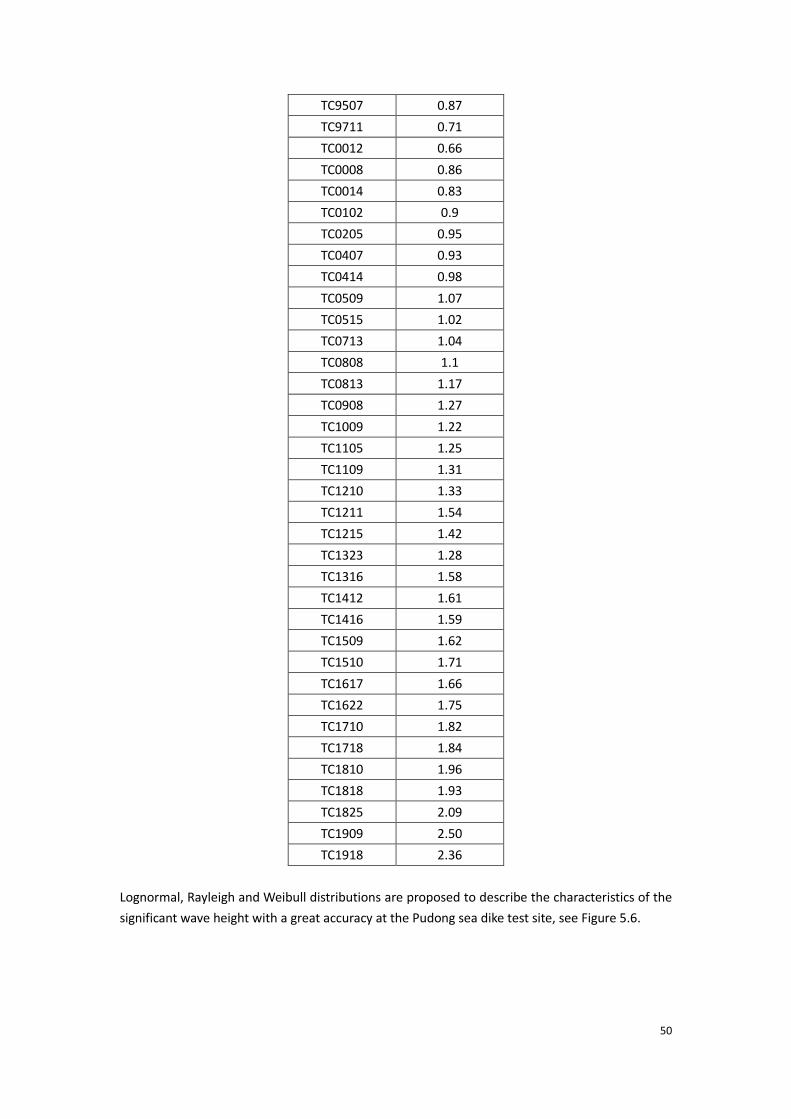
50
TC9507 0.87
TC9711 0.71
TC0012 0.66
TC0008 0.86
TC0014 0.83
TC0102 0.9
TC0205 0.95
TC0407 0.93
TC0414 0.98
TC0509 1.07
TC0515 1.02
TC0713 1.04
TC0808 1.1
TC0813 1.17
TC0908 1.27
TC1009 1.22
TC1105 1.25
TC1109 1.31
TC1210 1.33
TC1211 1.54
TC1215 1.42
TC1323 1.28
TC1316 1.58
TC1412 1.61
TC1416 1.59
TC1509 1.62
TC1510 1.71
TC1617 1.66
TC1622 1.75
TC1710 1.82
TC1718 1.84
TC1810 1.96
TC1818 1.93
TC1825 2.09
TC1909 2.50
TC1918 2.36
Lognormal, Rayleigh and Weibull distributions are proposed to describe the characteristics of the
significant wave height with a great accuracy at the Pudong sea dike test site, see Figure 5.6.
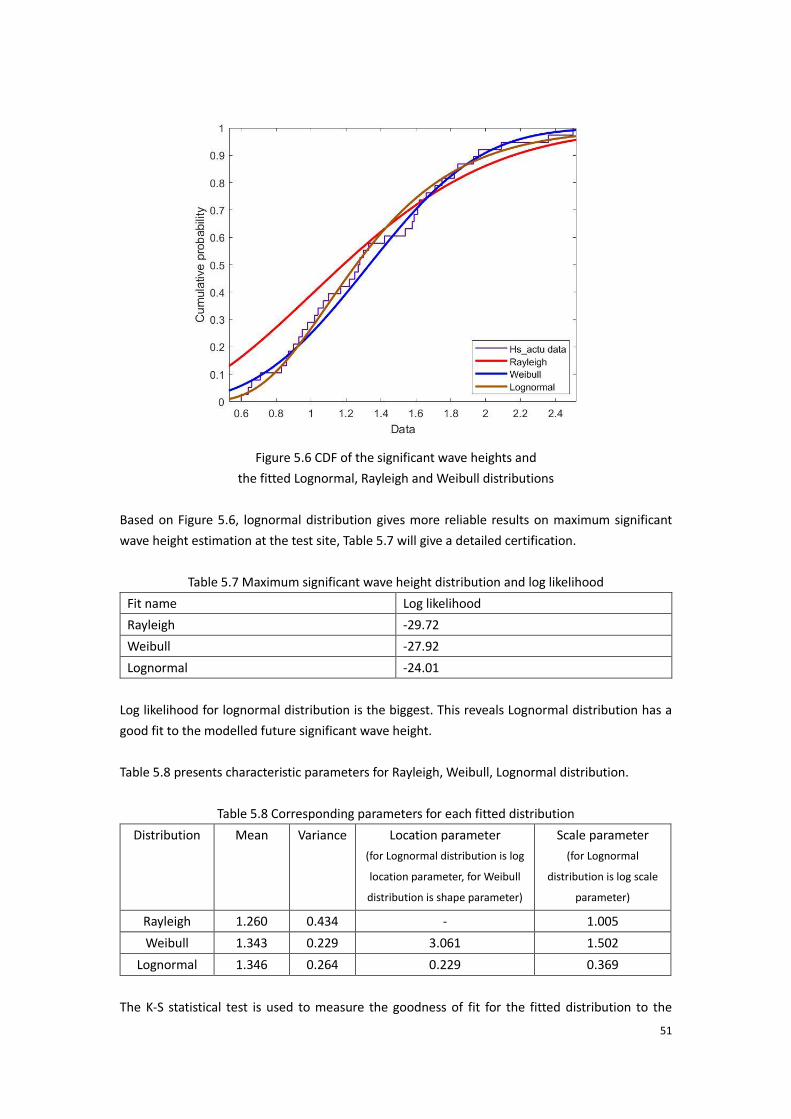
51
Figure 5.6 CDF of the significant wave heights and
the fitted Lognormal, Rayleigh and Weibull distributions
Based on Figure 5.6, lognormal distribution gives more reliable results on maximum significant
wave height estimation at the test site, Table 5.7 will give a detailed certification.
Table 5.7 Maximum significant wave height distribution and log likelihood
Fit name Log likelihood
Rayleigh -29.72
Weibull -27.92
Lognormal -24.01
Log likelihood for lognormal distribution is the biggest. This reveals Lognormal distribution has a
good fit to the modelled future significant wave height.
Table 5.8 presents characteristic parameters for Rayleigh, Weibull, Lognormal distribution.
Table 5.8 Corresponding parameters for each fitted distribution
Distribution Mean Variance Location parameter
(for Lognormal distribution is log
location parameter, for Weibull
distribution is shape parameter)
Scale parameter
(for Lognormal
distribution is log scale
parameter)
Rayleigh 1.260 0.434 - 1.005
Weibull 1.343 0.229 3.061 1.502
Lognormal 1.346 0.264 0.229 0.369
The K-S statistical test is used to measure the goodness of fit for the fitted distribution to the

52
maximum Hs as well. Important parameters P value and D value for each fitted distribution are
given in Table 5.9.
Table 5.9 K-S Tests at 5% Significance Level for each fitted
distributions with corresponding parameters
Distribution P value D value
Rayleigh 0.1354 0.1837
Weibull 0.7929 0.1034
Lognormal 0.9475 0.0809
The P-value 0.9475 and D value 0.0809 for Lognormal distribution presented in Table 5.9 has an
advantage for fitting a general measured wave data with very good fitness. For future condition,
Lognormal distribution shows applicability for predicting future behavior of the maximum Hs data.
The lognormal distribution of maximum Hs from each storm events has 4 characteristic values: log
scale parameter, log location parameter, mean value and standard variation (see Table 5.10).
Table 5.10 Hs lognormal distribution parameters
Symbol Value
Log location parameter Mu/ 𝜇 0.229
Log scale parameter Sigma/ 𝜎 0.369
Mean value m 1.346
Standard deviation std 0.264
Figure 5.7 Hs lognormal PDF plot and maximum Hs from chosen storm events
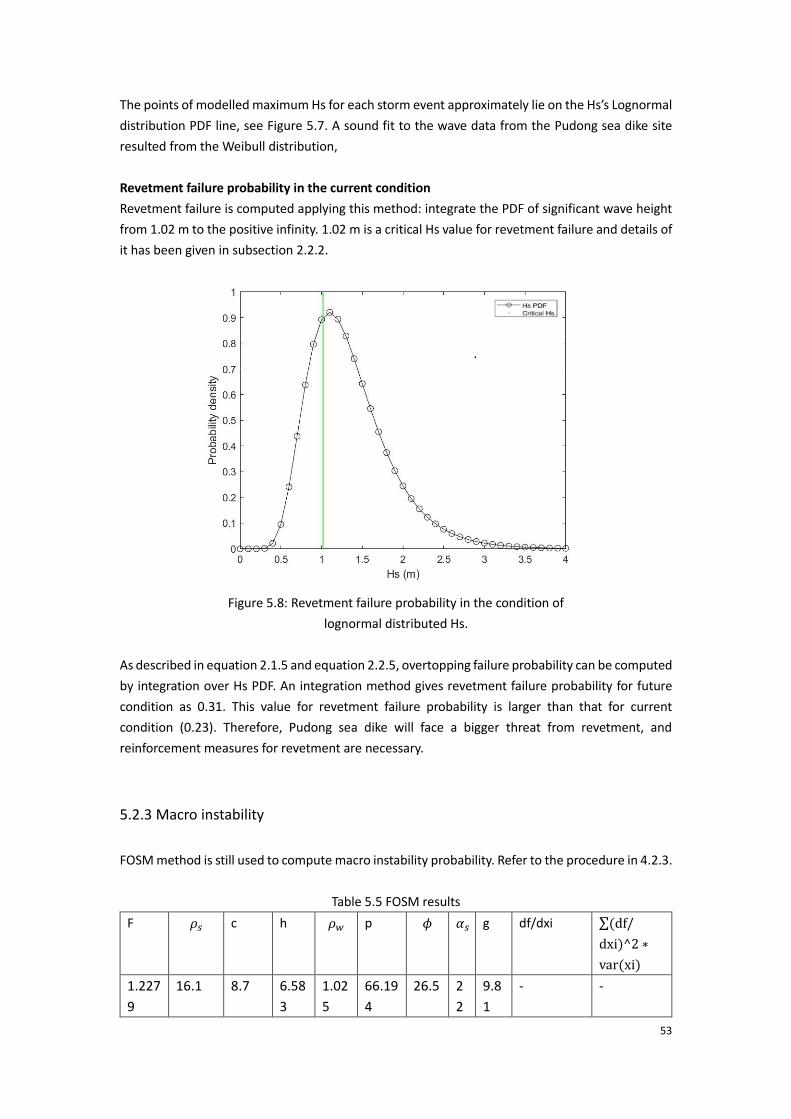
53
The points of modelled maximum Hs for each storm event approximately lie on the Hs’s Lognormal
distribution PDF line, see Figure 5.7. A sound fit to the wave data from the Pudong sea dike site
resulted from the Weibull distribution,
Revetment failure probability in the current condition
Revetment failure is computed applying this method: integrate the PDF of significant wave height
from 1.02 m to the positive infinity. 1.02 m is a critical Hs value for revetment failure and details of
it has been given in subsection 2.2.2.
Figure 5.8: Revetment failure probability in the condition of
lognormal distributed Hs.
As described in equation 2.1.5 and equation 2.2.5, overtopping failure probability can be computed
by integration over Hs PDF. An integration method gives revetment failure probability for future
condition as 0.31. This value for revetment failure probability is larger than that for current
condition (0.23). Therefore, Pudong sea dike will face a bigger threat from revetment, and
reinforcement measures for revetment are necessary.
5.2.3 Macro instability
FOSM method is still used to compute macro instability probability. Refer to the procedure in 4.2.3.
Table 5.5 FOSM results
F 𝜌𝑠 c h 𝜌𝑤 p 𝜙 𝛼𝑠 g df/dxi ∑(df/
dxi)^2 ∗
var(xi)
1.227
9
16.1 8.7 6.58
3
1.02
5
66.19
4
26.5 2
2
9.8
1
- -
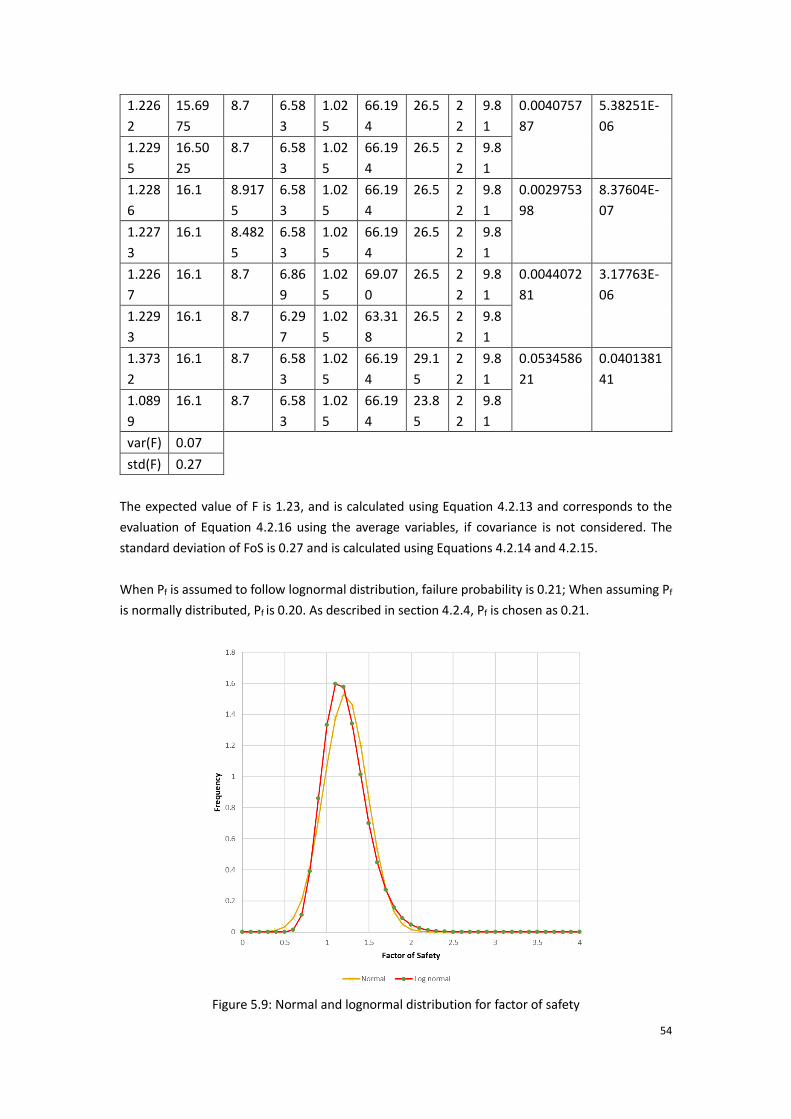
54
1.226
2
15.69
75
8.7 6.58
3
1.02
5
66.19
4
26.5 2
2
9.8
1
0.0040757
87
5.38251E-
06
1.229
5
16.50
25
8.7 6.58
3
1.02
5
66.19
4
26.5 2
2
9.8
1
1.228
6
16.1 8.917
5
6.58
3
1.02
5
66.19
4
26.5 2
2
9.8
1
0.0029753
98
8.37604E-
07
1.227
3
16.1 8.482
5
6.58
3
1.02
5
66.19
4
26.5 2
2
9.8
1
1.226
7
16.1 8.7 6.86
9
1.02
5
69.07
0
26.5 2
2
9.8
1
0.0044072
81
3.17763E-
06
1.229
3
16.1 8.7 6.29
7
1.02
5
63.31
8
26.5 2
2
9.8
1
1.373
2
16.1 8.7 6.58
3
1.02
5
66.19
4
29.1
5
2
2
9.8
1
0.0534586
21
0.0401381
41
1.089
9
16.1 8.7 6.58
3
1.02
5
66.19
4
23.8
5
2
2
9.8
1
var(F) 0.07
std(F) 0.27
The expected value of F is 1.23, and is calculated using Equation 4.2.13 and corresponds to the
evaluation of Equation 4.2.16 using the average variables, if covariance is not considered. The
standard deviation of FoS is 0.27 and is calculated using Equations 4.2.14 and 4.2.15.
When Pf is assumed to follow lognormal distribution, failure probability is 0.21; When assuming Pf
is normally distributed, Pf is 0.20. As described in section 4.2.4, Pf is chosen as 0.21.
Figure 5.9: Normal and lognormal distribution for factor of safety
55
5.2.4 Overall failure probability
As the fault tree for Pudong sea dike failure is a series system (Section 2.2.4), the overall failure
probability is calculated from equation 4.2.16 when the failure modes are independent. Therefore,
The upper bound overall failure probability in the condition of severe storms is 0.5. When three
failure mechanisms are fully dependent, the failure probability of Pudong sea dike is max Pfi, i.e
0.31 for future case. It represents the lower bound for Pudong dike failure probability. In conclusion,
the failure probability of Pudong sea dike ranges from 0.31 to 0.52.
5.2.5 Discussion
In this chapter, the decision has been made to predict the failure probability of Pudong sea dike in
future year 2100 and the results show that it will increase relative to the present condition.
However, in this prediction procedure, there are some limitations which are discussed below:
When concluding the relative influence of sea level rise and land subsidence on Pudong sea dike
failure probability, only the combined effect of them is considered. Future research can apply sea
level rise and land subsidence separately in Delft3D model to investigate the relative influence of
sea level rise and land subsidence on Pudong sea dike failure. Therefore, future hydrodynamic
boundary conditions affected by sea level rise and by land subsidence can be derived separately,
compare them with the current case to study the relative influence and see which factor plays a
more important role in Pudong sea dike safety. More land subsidence and sea level rise scenarios
can be included in future study, this can result in a more reliable result as this report only consider
one scenario.
In Delft3D grid model, land subsidence is applied to 2km band along the Shanghai shore in Delft3D
model grid elevation, and neglects the settlement under Shanghai, where pumping often occurs.
This simplification leads to a less accurate determination of boundary conditions, and if land
subsidence is also added to Shanghai elevation grid in future, more conservative results are
expected.
In terms of overtopping and revetment failure mode, the duration of flows greater than the critical
value is not taken into account, which is an important factor in determining whether or not flooding
actually occurs. If the conditions are severe but lasts only a short time, the dike can still function
and buildings or people behind the dike remain safe. For this reason, the effect of duration of peak
conditions should be included in future research.
As only the maximum calculated overtopping discharge for each storm is used and only severe
storms were considered to predict future Pudong sea dike failure probability, the calculated value
is probably higher than the true value. Future researches can take mild typhoon events into
account to calculate the overall failure probability more accurately.
56
Chapter 6 Conclusions and recommendations
6.1 Conclusions
To achieve the research objective, 38 Shanghai historical storms from 1989 to 2019 are modeled
in Delft3D to create probability density distributions for significant wave height, peak period and
water level variables. These variables are used in reliability analysis of three main failure
mechanisms to evaluate probability of failure. In this work, failure probability is defined as the
probability when overtopping discharge larger than the threshold discharge. This is close to the
flooding probability because if discharge occurs in Shanghai for a long time, the area behind the
sea dike is flooded. Since 38 storms from a thirty-year period are used, this is on average at least
one dangerous storm per year that can cause flooding. Due to the observation that flooding has
historically occurred in Shanghai approximately once every 5 years, the calculated failure
probability for current situation of 0.23 to 0.42 has the correct order of magnitude.
In condition of severe storms, Shanghai Pudong sea dikes have a higher failure probability when
sea level rise and land subsidence are considered. The following conclusions can be made based
on the results of analyses in this report:
1. How to determine the most important hydraulic boundary conditions in Pudong New District?
Build a Delft3D coupled model which include grid area, wind and pressure fields conditions of
storms and bathymetry. The process Online Delft3D-WAVE is selected to couple a Delft3D-FLOW
computation directly with a Delft3D-WAVE computation. Delft3D WAVE model gives Delft3D FLOW
model wave conditions and Delft3D FLOW model gives Delft3D WAVE model flow information.
From the interaction, essential boundary conditions like peak period, water level and significant
wave height can be derived for each storm event. For the future year 2100 boundary conditions
along Shanghai coast, sea level rise value is added to the bathymetry and land subsidence is added
to 2km band along the Shanghai shore in Delft3D model grid elevation.
2. What are the representative distributions of maximum overtopping discharge and significant
wave height to do reliability analysis in Pudong New District for current and future conditions?
In the current case, maximum overtopping discharge for Pudong sea dike follows Weibull
distribution with scale parameter 0.009 m3/m/s shape parameter 2.618 m3/m/s and mean value
is 0.008 m3/m/s, in 2100 year, the parameters become larger, they grow to be 0.010, 2.636 and
0.011 respectively. Significant wave height in current matches Lognormal distribution, absolute
value of log location parameter is 0.033 m, log scale parameter is 0.33 m and mean value is 1.021
m. For future case, although the fitted distribution is the same but log location parameter is 0.229
m, log scale is 0.369 m and mean value is 1.346 m.
3. What is the failure probability of Pudong sea dike for each 3 main failure mechanisms and
57
how does it change for the future condition if consider sea level rise and land subsidence?
In current case, overtopping probability of Pudong sea dike is 0.17 and it increases to 0.22 in 2100
yr. Failure probability of revetment failure is 0.23 in current and 0.31 in future. Macro instability
has a failure probability of 0.16 in current while 0.21 in 2100 yr. Failure probability increases when
considering sea level rise and land subsidence. The failure probability for current is from 0.23 to
0.42, and the range increases to 0.31-0.52 for future. Overall, Pudong sea dike in the future is more
likely to experience overtopping, revetment failure and land subsidence compared with events in
current climate condition.
Based on the discussion and results above, this study considers 38 historical severe storm events
to derive Pudong sea dike failure probability. For future situation, sea level rise and land subsidence
are considered. However, only one sea level rise and land subsidence scenario and only historical
severe storm events are performed, so the result has its limitations. It is recommended that this
should be further investigated by including more scenarios and more mild typhoon events. Due to
the decision to only consider maximum overtopping discharge during each most severe storm
event, the failure probability is overestimated. Including duration of overtopping discharge for each
chosen storm event is a meaningful direction for further research as illustrated in Section 4.2.5. If
the critical discharge lasts for a very short time, sea dike can still function well, since this report
assumes that any load greater than the threshold results in a failure. Precisely defining the meaning
of sea dike failure, and acceptable threshold values, could be further examined and this is a good
topic for the next study.
This research provides users a good insight in the governing failure behavior for each failure
mechanism. Overtopping, revetment failure and macro instability prove to be the dominant failure
mechanism. The results can be used as a starting point for improving the reliability of Shanghai sea
dikes over the coming century.
6.2 Recommendations
Pudong sea dike has a higher failure probability in the future because of sea level rise and land
subsidence. As concluded the calculation of the failure probability is computed by integrating on
the probability density function of the maximum overtopping discharge and significant wave height.
For macro instability, FOSM method is used. In this research, the concerned mechanisms are in a
series system, and the situation where failure of a mechanism induces failure of another
mechanism is not taken into account with this method. Further research is required to investigate
possible situation where this type of physical correlation could occur between failure mechanism.
Pudong sea dike faces revetment failure, overtopping, and macro instability most. For further
research, other failure mechanisms should be investigated to calculate failure probability of the
sea dike. Possible failure mechanisms which should be investigated can be failure of the crest
element, berm stability or more case specific such as ice loads and ship collisions. Boundary
conditions have a large influence on the failure probability of the sea dike. This research picks up
38 extreme typhoon events to give Pudong boundary conditions and uses them to forecast Pudong

58
sea dike safety in current and future situation. Also, based on my calculations and data achieved in
this report, the correlation of coefficient between main failure modes I have not looked into and
deserved further study.
This research provides failure probability analysis for Shanghai Pudong sea dike considering sea
level rise and land subsidence in future condition and current condition. The results give strong
support for further Pudong sea dike risk assessment and is a reference for Shanghai Pudong sea
dike construction.
59
Reference
Administration, C. M. (2020). Recent Flood Caused by Typhoon in Shanghai. Retrieved from
www.tcdata.typhoon.org.cn
Bureau, S. W. R. (2011). Planning of Shanghai sea embankments (2011-2020) (in Chinese).
Baiduwenku.(2015). Catastrophic flood of 9711 storm event. Retrieved from
https://baike.baidu.com/item/1998%E7%89%B9%E5%A4%A7%E6%B4%AA%E6%B0%B4#6
CHEN, F., & QI, D.-m. J. J. o. M. S. (2010). Study on the present defensive capability of the coastal levees
in Shanghai [J]. 1.
Damoah-Afari, P., Ding, X.-l., Lu, Z., Li, Z., & Omura, M. (2010). Magnitude and extent of six years of land
subsidence in Shanghai revealed by JERS-1 SAR China data: InTech.
Deltares. (2018). Delft3D User Manual Retrieved from https://oss.deltares.nl/web/delft3d/manuals
Du, S., Gu, H., Wen, J., Chen, K., & Van Rompaey, A. J. W. (2015). Detecting flood variations in Shanghai
over 1949–2009 with Mann-Kendall tests and a newspaper-based database. 7(5), 1808-1824.
GEBCO. (2020). Bathymetry data sets for the world’s oceans. Retrieved from https://www.gebco.net/
Gibson, W. J. A. G. (2011). Probabilistic methods for slope analysis and design. 46(3), 29.
government, C. (2014). GBT51015-2014 Chinese Guideline of Dike Design (in Chinese).
government, S. (2019). Shanghai soil characteristics. Retrieved from
https://wenku.baidu.com/view/75e344848762caaedd33d46b.html
Grimaldi, S., Vezza, P., Angeluccetti, I., Coviello, V., & Kô, A. M. K. (2015). Designing and building gabion
check dams in Burkina Faso. In Engineering Geology for Society and Territory-Volume 3 (pp.
529-533): Springer.
Guo, H., Jiao, W., & Yang, Y. J. A. G. e. C. S. (2004). The systematic difference and its distribution between
the 1985 national height datum and the global quasigeoid. 33(2), 100-104.
HM, W. (2013). The risk assessment system and risk management of land subsidence in Shanghai.
Retrieved from Shanghai University:
Houghton, E. (1996). Climate change 1995: The science of climate change: contribution of working group
I to the second assessment report of the Intergovernmental Panel on Climate Change (Vol. 2):
Cambridge University Press.
60
JiangshanYin. (2020). Simulation of flooding due to embankment breaches by Delft3D Flexible Mesh:
Case study of coastal area in Shanghai.
Ke, Q. (2018). Preliminary results on storm surge modelling by a numerical model – delft 3d fm. Draft
version.
Kim, C. H. (2008). Nonlinear waves and offshore structures (Vol. 27): World scientific.
Liu, X., Du, X., Lu, Y., & Pan, L. (2014). An investigation on excessive storm surge impacts on typical
seawall in Shanghai. Paper presented at the The Eleventh ISOPE Pacific/Asia Offshore
Mechanics Symposium.
Marine early warning monitoring division, . (2018). China sea level bulletin 2018 (in Chinese): Ministry
of Natural Resources.
Organization, W. M. (2018). Guide to Wave Analysis and Forecasting.
Pullen, T., Allsop, N., Bruce, T., Kortenhaus, A., Schüttrumpf, H., & Van der Meer, J. J. A. p. a. s. v. o. D. K.
(2007). EurOtop, European overtopping manual-wave overtopping of sea defences and related
structures: assessment manual.
Qi, F. C. a. D. (2010). Investigation and analysis on the current situation of seawall protection capability
in shanghai (in chinese). Journal of Marine Sciences, 72–79.
Quan, R. J. E. e. s. (2014). Risk assessment of flood disaster in Shanghai based on spatial–temporal
characteristics analysis from 251 to 2000. 72(11), 4627-4638.
Reeve, D. (2014). Risk and reliability: coastal and hydraulic engineering: CRC Press.
Schiereck, G. J. J. T.-E. r. (1998). Fundamentals on water defences.
Schwab, G. O., Frevert, R. K., Edminster, T. W., & Barnes, K. K. J. S. S. (1982). Soil and water conservation
engineering. 134(2), 146.
Service, S. M. (2012). TC1211 typhoon effects on Pudong sea dike.
Stelling, G. S. (1999). Internal note on Cyclone modelling. Delft Hydraulics.
Van der Meer, J. W. (1995). Conceptual design of rubble mound breakwaters. In Advances In Coastal
And Ocean Engineering: (Volume 1) (pp. 221-315): World Scientific.
Wang, J., Xu, S., Ye, M., & Huang, J. J. I. J. o. D. R. S. (2011). The MIKE model application to overtopping
risk assessment of seawalls and levees in Shanghai. 2(4), 32-42.
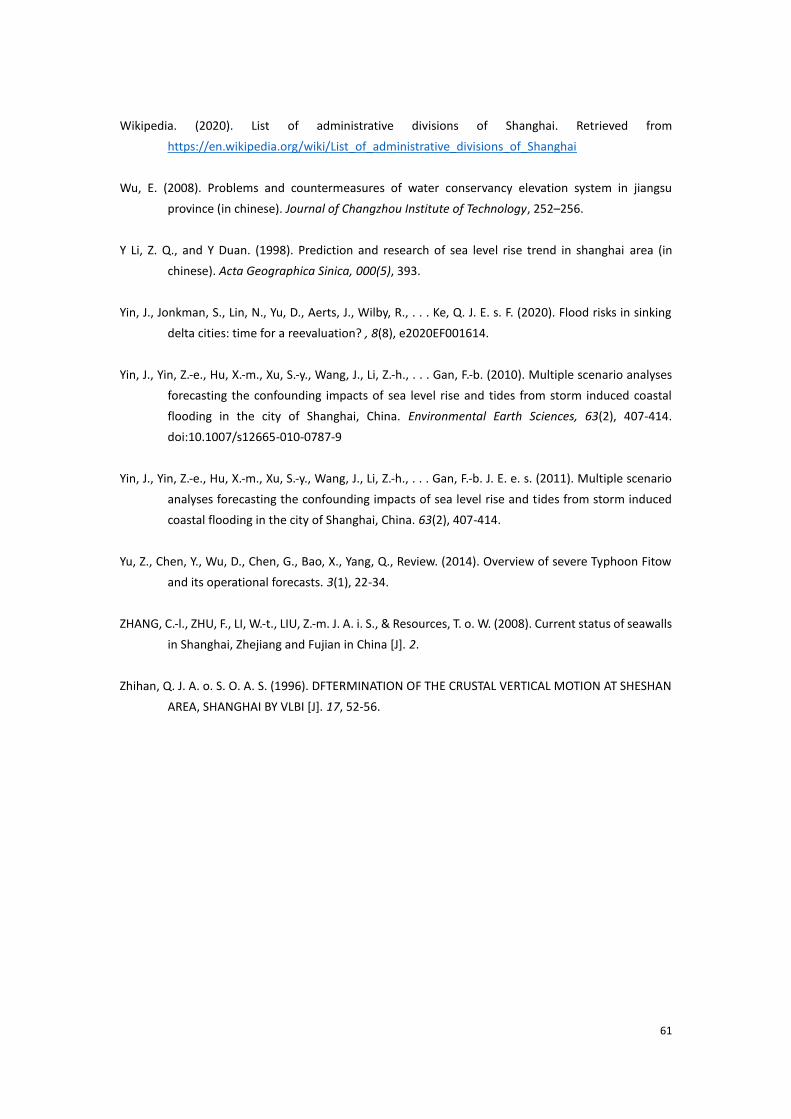
61
Wikipedia. (2020). List of administrative divisions of Shanghai. Retrieved from
https://en.wikipedia.org/wiki/List_of_administrative_divisions_of_Shanghai
Wu, E. (2008). Problems and countermeasures of water conservancy elevation system in jiangsu
province (in chinese). Journal of Changzhou Institute of Technology, 252–256.
Y Li, Z. Q., and Y Duan. (1998). Prediction and research of sea level rise trend in shanghai area (in
chinese). Acta Geographica Sinica, 000(5), 393.
Yin, J., Jonkman, S., Lin, N., Yu, D., Aerts, J., Wilby, R., . . . Ke, Q. J. E. s. F. (2020). Flood risks in sinking
delta cities: time for a reevaluation? , 8(8), e2020EF001614.
Yin, J., Yin, Z.-e., Hu, X.-m., Xu, S.-y., Wang, J., Li, Z.-h., . . . Gan, F.-b. (2010). Multiple scenario analyses
forecasting the confounding impacts of sea level rise and tides from storm induced coastal
flooding in the city of Shanghai, China. Environmental Earth Sciences, 63(2), 407-414.
doi:10.1007/s12665-010-0787-9
Yin, J., Yin, Z.-e., Hu, X.-m., Xu, S.-y., Wang, J., Li, Z.-h., . . . Gan, F.-b. J. E. e. s. (2011). Multiple scenario
analyses forecasting the confounding impacts of sea level rise and tides from storm induced
coastal flooding in the city of Shanghai, China. 63(2), 407-414.
Yu, Z., Chen, Y., Wu, D., Chen, G., Bao, X., Yang, Q., Review. (2014). Overview of severe Typhoon Fitow
and its operational forecasts. 3(1), 22-34.
ZHANG, C.-l., ZHU, F., LI, W.-t., LIU, Z.-m. J. A. i. S., & Resources, T. o. W. (2008). Current status of seawalls
in Shanghai, Zhejiang and Fujian in China [J]. 2.
Zhihan, Q. J. A. o. S. O. A. S. (1996). DFTERMINATION OF THE CRUSTAL VERTICAL MOTION AT SHESHAN
AREA, SHANGHAI BY VLBI [J]. 17, 52-56.

62
Appendix A
A deterministic probabilistic method is applied to calculate the reliability of Pudong sea dike. By
applying this approach, the most severe failure mechanism will be chosen to further investigation.
1. Revetment failure mechanism
For revetment stability, use formulae 2.2.4:
𝐷 =𝐻𝑠
Δ √𝐾𝐷𝑐𝑜𝑡𝛼3
For significant wave height Hs near Pudong sea dike, a deterministic value 1.5 m from Figure A.1 is
chosen (Yin et al., 2020). Equation 2.2.4 results in a revetment thickness of 0.44 m, while in reality,
the revetment thickness is designed as 0.3 m (Figure A.2). Revetment failure should be looked in
detail in thesis.
Figure A.1 Significant wave heights along the coast
with 100-year return period under current condition (Yin et al., 2020)
Figure A.2 Materials of Pudong sea dike (Shanghai Pudong dike design)
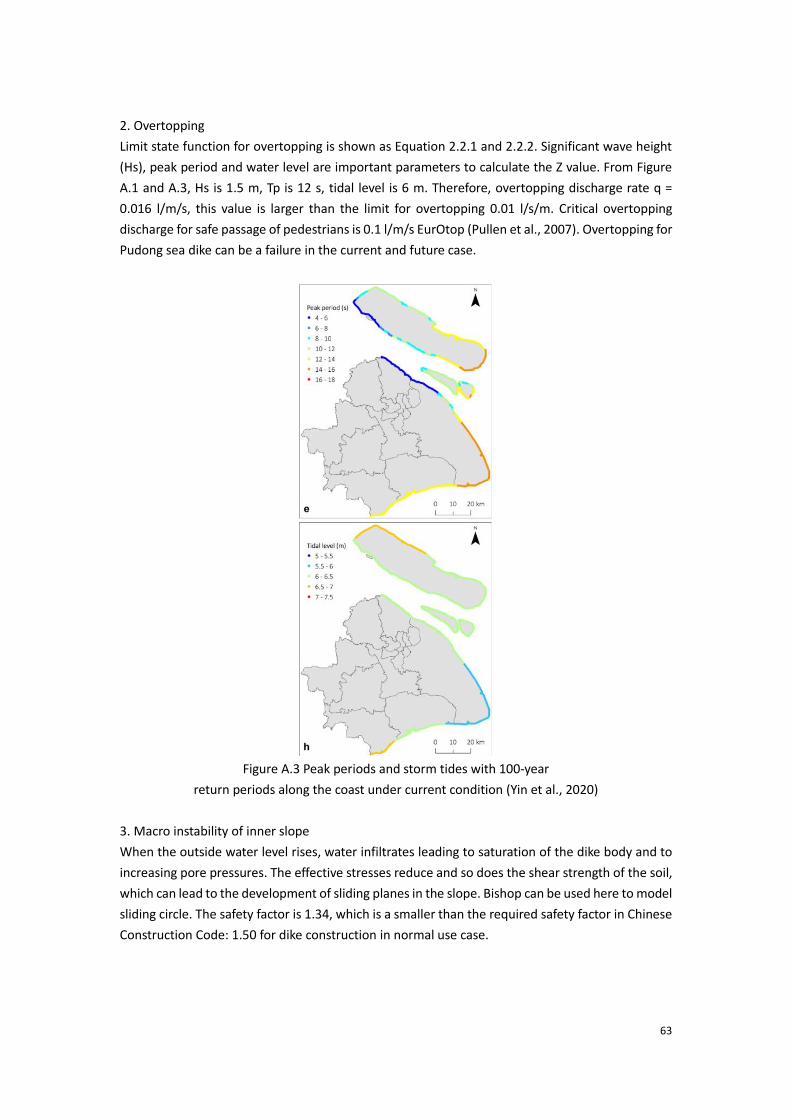
63
2. Overtopping
Limit state function for overtopping is shown as Equation 2.2.1 and 2.2.2. Significant wave height
(Hs), peak period and water level are important parameters to calculate the Z value. From Figure
A.1 and A.3, Hs is 1.5 m, Tp is 12 s, tidal level is 6 m. Therefore, overtopping discharge rate q =
0.016 l/m/s, this value is larger than the limit for overtopping 0.01 l/s/m. Critical overtopping
discharge for safe passage of pedestrians is 0.1 l/m/s EurOtop (Pullen et al., 2007). Overtopping for
Pudong sea dike can be a failure in the current and future case.
Figure A.3 Peak periods and storm tides with 100-year
return periods along the coast under current condition (Yin et al., 2020)
3. Macro instability of inner slope
When the outside water level rises, water infiltrates leading to saturation of the dike body and to
increasing pore pressures. The effective stresses reduce and so does the shear strength of the soil,
which can lead to the development of sliding planes in the slope. Bishop can be used here to model
sliding circle. The safety factor is 1.34, which is a smaller than the required safety factor in Chinese
Construction Code: 1.50 for dike construction in normal use case.
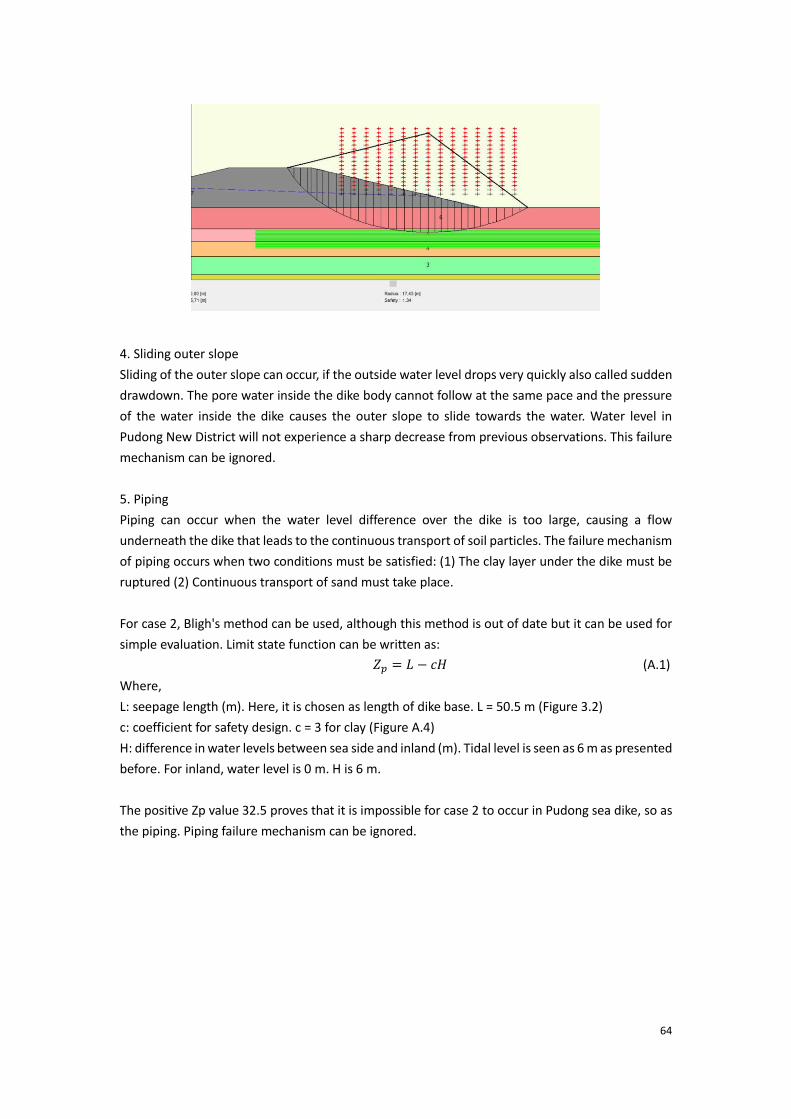
64
4. Sliding outer slope
Sliding of the outer slope can occur, if the outside water level drops very quickly also called sudden
drawdown. The pore water inside the dike body cannot follow at the same pace and the pressure
of the water inside the dike causes the outer slope to slide towards the water. Water level in
Pudong New District will not experience a sharp decrease from previous observations. This failure
mechanism can be ignored.
5. Piping
Piping can occur when the water level difference over the dike is too large, causing a flow
underneath the dike that leads to the continuous transport of soil particles. The failure mechanism
of piping occurs when two conditions must be satisfied: (1) The clay layer under the dike must be
ruptured (2) Continuous transport of sand must take place.
For case 2, Bligh's method can be used, although this method is out of date but it can be used for
simple evaluation. Limit state function can be written as:
𝑍𝑝 = 𝐿 − 𝑐𝐻 (A.1)
Where,
L: seepage length (m). Here, it is chosen as length of dike base. L = 50.5 m (Figure 3.2)
c: coefficient for safety design. c = 3 for clay (Figure A.4)
H: difference in water levels between sea side and inland (m). Tidal level is seen as 6 m as presented
before. For inland, water level is 0 m. H is 6 m.
The positive Zp value 32.5 proves that it is impossible for case 2 to occur in Pudong sea dike, so as
the piping. Piping failure mechanism can be ignored.
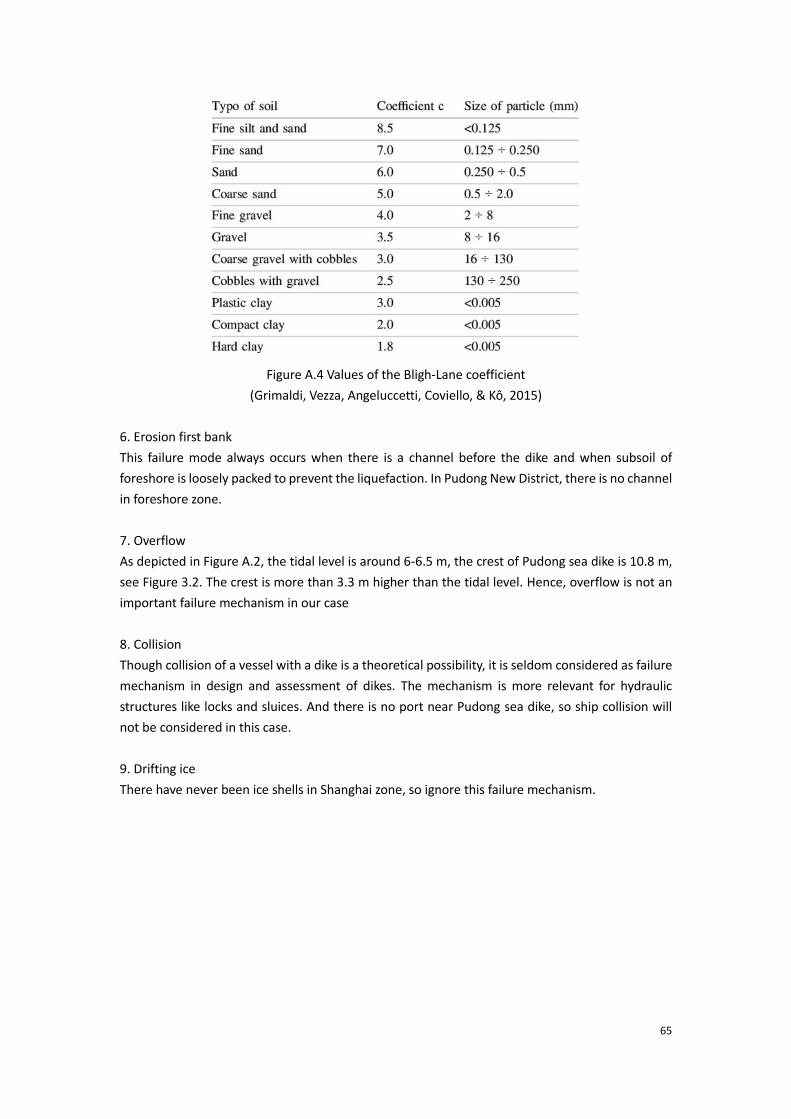
65
Figure A.4 Values of the Bligh-Lane coefficient
(Grimaldi, Vezza, Angeluccetti, Coviello, & Kô, 2015)
6. Erosion first bank
This failure mode always occurs when there is a channel before the dike and when subsoil of
foreshore is loosely packed to prevent the liquefaction. In Pudong New District, there is no channel
in foreshore zone.
7. Overflow
As depicted in Figure A.2, the tidal level is around 6-6.5 m, the crest of Pudong sea dike is 10.8 m,
see Figure 3.2. The crest is more than 3.3 m higher than the tidal level. Hence, overflow is not an
important failure mechanism in our case
8. Collision
Though collision of a vessel with a dike is a theoretical possibility, it is seldom considered as failure
mechanism in design and assessment of dikes. The mechanism is more relevant for hydraulic
structures like locks and sluices. And there is no port near Pudong sea dike, so ship collision will
not be considered in this case.
9. Drifting ice
There have never been ice shells in Shanghai zone, so ignore this failure mechanism.
66
Appendix B
In statistics, the Kolmogorov–Smirnov test (K–S test or KS test) is a nonparametric test of the
equality of continuous (or discontinuous), one-dimensional probability distributions that can
be used to compare a sample with a reference probability distribution (one-sample K–S test)
The K-S statistic D-value for a given cumulative distribution function F(x) is expressed as:
D = suplFn(x)-F(x)|
where,
ksstst: K-S test statistic;
Fn(x): empirical cumulative distribution function;
F(x): cumulative distribution function of the hypothesized distribution.
sup: supremum of the set of distances
If the sample comes from distribution F(x), then D-value converges to 0.
p-value of the K-S test, returned as a scalar value in the range [0,1]. p-value is the probability
of observing a test statistic as extreme as, or more extreme than, the observed value under
the null hypothesis. Small values of p cast doubt on the validity of the null hypothesis.