
Numerical study of the storm-induced circulation on the Scotian Shelf during Hurricane Juan using a...
22
Numerical study of the storm-induced circulation on the Scotian Shelf during Hurricane Juan using a nested-grid ocean model Jinyu Sheng * , Xiaoming Zhai, Richard J. Greatbatch Department of Oceanography, Dalhousie University, Halifax, NS, Canada B3H 4J1 Received 24 August 2004; received in revised form 21 March 2005; accepted 27 July 2005 Available online 23 August 2006 Abstract A nested-grid ocean circulation modelling system is used to assess the upper ocean response of the Scotian Shelf and adjacent slope to Hurricane Juan in September 2003. The nested-grid system consists of a fine-grid inner model covering the Scotian Shelf/slope and a coarse-grid outer model covering the northwest Atlantic Ocean. The model-calculated upper ocean response to Hurricane Juan is characterized by large divergent surface currents forced by the local wind forcing under the storm, and intense near-inertial currents in the wake of the storm. The sea surface temperature (SST) cooling produced by the model is biased to the right of the storm track and agrees well with a satellite-derived analysis. Over the deep water, off the Scotian Shelf, some of the near-inertial energy input by the storm is advected eastward by the Gulf Stream away from the storm track. The hurricane also generates shelf waves that propagate equatorward with the coastline on their right. In comparison with the outer model results, the inner model captures more meso-scale structures, greater SST cooling and stronger near-inertial currents in the study region. Ó 2006 Elsevier Ltd. All rights reserved. Keywords: Storm-induced circulation; Nested-grid model; Scotian Shelf; Inertial currents; Surface cooling; Shelf waves; Geostrophic advection 1. Introduction The main purpose of this study is to examine the upper ocean response of the Scotian Shelf (SS) and adja- cent slope to a moving storm using a three-dimensional ocean circulation model. We are motivated by the fact that the shelf circulation and temperature/salinity distributions on the SS and slope are frequently affected by winter storms and occasionally by hurricanes. There is, however, a lack of previous studies on storm-induced currents and temperature/salinity changes on the SS, an issue of concern in view of the recent upsurge in industrial activities (e.g., offshore oil and gas, and aquaculture). 0079-6611/$ - see front matter Ó 2006 Elsevier Ltd. All rights reserved. doi:10.1016/j.pocean.2005.07.007 * Corresponding author. Tel.: +1 902 494 2718; fax: +1 902 494 2885. E-mail address: [email protected] (J. Sheng). Progress in Oceanography 70 (2006) 233–254 Progress in Oceanography www.elsevier.com/locate/pocean
-
Upload
independent -
Category
Documents
-
view
2 -
download
0
Transcript of Numerical study of the storm-induced circulation on the Scotian Shelf during Hurricane Juan using a...

Progress in Oceanography 70 (2006) 233–254
Progress inOceanography
www.elsevier.com/locate/pocean
Numerical study of the storm-induced circulationon the Scotian Shelf during Hurricane Juan using
a nested-grid ocean model
Jinyu Sheng *, Xiaoming Zhai, Richard J. Greatbatch
Department of Oceanography, Dalhousie University, Halifax, NS, Canada B3H 4J1
Received 24 August 2004; received in revised form 21 March 2005; accepted 27 July 2005Available online 23 August 2006
Abstract
A nested-grid ocean circulation modelling system is used to assess the upper ocean response of the Scotian Shelf andadjacent slope to Hurricane Juan in September 2003. The nested-grid system consists of a fine-grid inner model coveringthe Scotian Shelf/slope and a coarse-grid outer model covering the northwest Atlantic Ocean. The model-calculated upperocean response to Hurricane Juan is characterized by large divergent surface currents forced by the local wind forcingunder the storm, and intense near-inertial currents in the wake of the storm. The sea surface temperature (SST) coolingproduced by the model is biased to the right of the storm track and agrees well with a satellite-derived analysis. Overthe deep water, off the Scotian Shelf, some of the near-inertial energy input by the storm is advected eastward by the GulfStream away from the storm track. The hurricane also generates shelf waves that propagate equatorward with the coastlineon their right. In comparison with the outer model results, the inner model captures more meso-scale structures, greaterSST cooling and stronger near-inertial currents in the study region.� 2006 Elsevier Ltd. All rights reserved.
Keywords: Storm-induced circulation; Nested-grid model; Scotian Shelf; Inertial currents; Surface cooling; Shelf waves; Geostrophicadvection
1. Introduction
The main purpose of this study is to examine the upper ocean response of the Scotian Shelf (SS) and adja-cent slope to a moving storm using a three-dimensional ocean circulation model. We are motivated by the factthat the shelf circulation and temperature/salinity distributions on the SS and slope are frequently affected bywinter storms and occasionally by hurricanes. There is, however, a lack of previous studies on storm-inducedcurrents and temperature/salinity changes on the SS, an issue of concern in view of the recent upsurge inindustrial activities (e.g., offshore oil and gas, and aquaculture).
0079-6611/$ - see front matter � 2006 Elsevier Ltd. All rights reserved.
doi:10.1016/j.pocean.2005.07.007
* Corresponding author. Tel.: +1 902 494 2718; fax: +1 902 494 2885.E-mail address: [email protected] (J. Sheng).

234 J. Sheng et al. / Progress in Oceanography 70 (2006) 233–254
Hurricane Juan is chosen for the analysis in this study. This storm began as a tropical depression located atabout 470 km southeast of Bermuda at 12:00 ADT (all times in this study are in Atlantic daylight time(ADT)), September 25, 2003. It intensified as it moved northwestward and became a tropical storm about6 h later. The storm turned northward at 06:00, September 28 (Fig. 1), and made landfall on the south coastof Nova Scotia near Halifax at 00:10 am, September 29 as a category-2 hurricane (on the Saffir-Simpson Hur-ricane Scale), with maximum sustained winds of 158 km h�1 and gusts to over 185 km h�1 (Levinson andWaple, 2004). Hurricane Juan was the most damaging storm to hit Nova Scotia in more than a century leadingto the loss of several lives, millions of uprooted trees, and property damage worth at least $100 million.
Hurricane Juan also generated significant temperature changes in the upper ocean in the vicinity of thestorm track. Fig. 2 shows the observed change in sea surface temperature (SST) from September 27 to October1, 2003 estimated from satellite remote sensing SST data. There was systematic SST cooling centered about60 km to the right side of the storm track (when facing in the direction taken by the storm) all the way fromthe deep water off the Scotian Shelf to the Gulf of St. Lawrence. The maximum SST cooling due to HurricaneJuan was about �3 �C over the central Scotian Shelf and adjacent slope (Fig. 2). On each side of the SST coldwake, there was a strip of SST warming associated with the storm. The changes in thermal structure producedby the storm had the potential to significantly affect the environmental habitat and biological productivity inthe region.
The upper ocean response to wind stress and pressure forcing associated with a moving storm has beeninvestigated in the past. Leipper (1967) discussed the observed upper ocean condition in the Gulf of Mexico
Fig. 1. Storm track of Hurricane Juan compiled by the National Hurricane Center (Courtesy of Chris Fogarty of the MeteorologicalService of Canada).

Fig. 2. The change in sea surface temperature (SST) associated with Hurricane Juan estimated from satellite remote sensing SST data onSeptember 27 and October 1, 2003 (Courtesy of Chris Fogarty of the Meteorological Service of Canada). The track taken by the eye of thestorm is also shown.
J. Sheng et al. / Progress in Oceanography 70 (2006) 233–254 235
during Hurricane Hilda in September 1964. Geisler (1970) investigated the linear dynamics of the oceanresponse to a moving storm but did not consider the mixed layer effect. Chang and Anthes (1978) combinedthe mixed layer effect and dynamics in a one active layer model. Price (1981) embedded a mixed layer model ina multilayer three-dimensional numerical model. Greatbatch (1983) used a 1 1
2-layer ocean model to investigate
the nonlinear dynamics of the response. Brink (1989) discussed observations of the response of thermoclinecurrents to Hurricane Gloria in September 1985 in the western subtropical Atlantic Ocean, and Dickeyet al. (1998) examined the observed upper ocean response to Hurricane Felix in August 1995. These studiesdemonstrate, using models or/and observations, that the upper ocean response to a moving storm is charac-terized by a cold wake behind the storm, and inertial oscillations that are most energetic to the right of thestorm track. The SST cooling is also biased to the right of the storm track and strongly dependent on the hur-ricane translation speed, with greater cooling for a slower moving storm (see Price, 1981 and Greatbatch,1985).

236 J. Sheng et al. / Progress in Oceanography 70 (2006) 233–254
When a storm moves from deep water to a continental shelf, additional physical processes are at workdue to the existence of highly varying bottom topography and coastline. One of the additional processesis the generation of continental shelf waves by the storm. Shelf waves can introduce significant transient cur-rents and surface elevation variations in the coastal ocean (Csanady, 1982). Martinsen et al. (1979) examinedthe importance of barotropic shelf waves during storm events along the western coast of Norway. Gordonand Huthnance (1987) studied storm-driven continental shelf waves over the Scottish Continental Shelf andpresented a model for the generation of shelf waves in the region. In a numerical study of the response of anidealized ocean to a travelling storm, Slørdal et al. (1994) found that both standing and propagating wavesare excited by a moving storm. Tang et al. (1998) investigated the barotropic response of the Labrador andNewfoundland Shelves to a moving storm using a linear barotropic ocean model with realistic coastline andtopography. They found that the low-mode barotropic shelf waves are prevalent due to resonance motionexcited by the tropical cyclone forcing. Zhai (2004) used a numerical model to study the response of astep-shelf to a moving storm and found a significant shelf wave response. He showed that the dispersion rela-tion for the storm-induced shelf waves agrees well with the analytic solution derived by Niiler and Mysak(1971).
Since there were no direct measurements of currents, temperature and salinity in the vicinity of the stormtrack during Hurricane Juan, a numerical ocean circulation model becomes a very useful tool to examine thedetailed storm-induced circulation on the SS and slope as well as the remote influences caused by HurricaneJuan (e.g., shelf waves, energy spreading). In this paper, we use a two-way nested-grid ocean circulation mod-elling system developed by Zhai et al. (2004a) in a process-oriented study to assess the upper ocean response toHurricane Juan. The nested system consists of a fine-resolution inner model for the Scotian Shelf/slope and acoarse-resolution outer model for the northwest Atlantic Ocean. The newly developed two-way nesting tech-nique based on the smoothed semi-prognostic method (Zhai et al., 2004a; Sheng et al., 2005) is used toexchange information between the inner and outer models over the subregion where the two models overlap.
The arrangement of this paper is as follows. Section 2 briefly reviews the ocean circulation model and thetwo-way nesting technique. Model results of the upper ocean response to Hurricane Juan are presented in Sec-tion 3. Section 4 is a summary and discussion.
2. Ocean circulation model and nesting technique
2.1. Ocean circulation model and setup
The ocean circulation model used in this study is a primitive equation z-level ocean circulation modelknown as CANDIE (Sheng et al., 1998). CANDIE has been applied to various modelling problems on theshelf, and most recently, to the western Caribbean Sea by Sheng and Tang (2003, 2004), Lunenburg Bay ofNova Scotia by Sheng and Wang (2004), and the Scotian Shelf by Zhai et al. (2004a).
The nested-grid modelling system has a fine-resolution inner model embedded interactively inside a coarse-resolution outer model (Fig. 3). The fine-resolution inner model covers the Scotian Shelf/slope between 54�Wand 66�W and between 39�N and 47�N, with a horizontal resolution of one eleventh degree in longitude(about 7 km). The coarse-resolution outer model is the northwest Atlantic Ocean model developed by Shenget al. (2001), which covers the area between 30�W and 76�W and between 35�N and 66�N, with a horizontalresolution of one-third degree in longitude (about 25 km on the SS). There are 31 unevenly spaced z-levels inboth the outer and inner models with the centers of each level located, respectively, at 5, 16, 29, 44, 61, 80, 102,128, 157, 191, 229, 273, 324, 383, 450, 527, 615, 717, 833, 967, 1121, 1297, 1500, 1733, 2000, 2307, 2659, 3063,3528, 4061, and 4673 m, among which the z-levels below the local ocean bottom are inactive as expected. Themodel parameters and setup are the same as in Sheng et al. (2001), unless otherwise stated. It should be noted,however, that the vertical mixing scheme used in this study includes entrainment at the base of the surfacemixed layer due to the shear instability based on a bulk Richardson number formulation suggested by Priceet al. (1986) (see the Appendix for details), which is essential for generating realistic spatial patterns of SSTcooling due to a moving storm. In addition, the subgrid-scale mixing parameterization scheme of Smagorinsky(1963) is used for the horizontal eddy viscosity and diffusivity with the Prandtl number set to 0.1 (note that thisis resolution dependent and hence leads to different levels of mixing in the inner and outer models, see also

Fig. 3. Bathymetric features within (a) the outer model domain of the Northwest Atlantic Ocean and (b) the inner model domain of theScotian Shelf/slope. Abbreviations are used for the Labrador Sea (LS), Newfoundland Basin (NB), Grand Banks (GB), Flemish Cap (FC),Flemish Pass (FP), Avalon Channel (AC), Gulf of St. Lawrence (GSL), Cabot Strait (CS), Gulf of Maine (GOM), and Cape Cod (CC).The area marked by dashed lines in (b) is chosen to present model results.
J. Sheng et al. / Progress in Oceanography 70 (2006) 233–254 237

238 J. Sheng et al. / Progress in Oceanography 70 (2006) 233–254
Sheng et al., 2005). The model also uses fourth-order numerics (Dietrich, 1997; Sheng, 2002) and Thuburn’sflux limiter to discretize the nonlinear advection terms (Thuburn, 1996).
The model boundary conditions for the nested system are specified as follows. At lateral closed boundariesof the inner and outer models, the normal flow, tangential stress of the horizontal velocities and horizontalfluxes of potential temperature and salinity are set to zero (i.e., free-slip conditions). The free-slip lateral closedboundary condition is commonly used in coarse-resolution numerical simulations in which viscous boundarylayers near lateral closed boundaries are not fully resolved. Along model open boundaries, the normal flow,potential temperature and salinity fields are specified using the adaptive open boundary condition (Marches-iello et al., 2001), which first uses an explicit Orlanski radiation condition (Orlanski, 1976) to determinewhether the open boundary is passive (outward propagation) or active (inward propagation). If the openboundary is passive, the model prognostic variables are radiated outward to allow perturbations generatedinside the model domain to propagate outward through the open boundary as freely as possible. If the openboundary is active, the model prognostic variables at the open boundary are restored to input boundary fields.For the inner model, the input boundary fields are restored (with a restoring time scale of 2 days) toward thehorizontal velocities and temperature/salinity fields produced by the outer model after interpolation onto thefine grid. For the outer model, the input boundary fields are the monthly mean climatology of temperature/salinity from Geshelin et al. (1999), and depth-mean normal flow taken from the diagnostic calculation ofGreatbatch et al. (1991), and the restoring time scale is 15 days.
2.2. Two-way nesting technique
The two-way nesting technique based on the smoothed semi-prognostic (SSP) method used in this studyexchanges information between the inner and outer models over the subregion where the two model gridsoverlap (see Greatbatch et al., 2004 for a review of the SSP method). This new two-way nesting techniqueis discussed in detail in Sheng et al. (2005) and was used earlier by Zhai et al. (2004a) and Sheng and Tang(2004). To implement the new two-way nesting technique, the first step is to interpolate the outer model vari-ables onto the fine grid over the overlapping subregion. The interpolated fields are then used to provide theboundary conditions for the inner model. Second, the interpolated outer model density is used to adjustthe hydrostatic equation of the inner model based on the smoothed semi-prognostic method:
opinner
oz¼ �gqinner � gð1� biÞhq̂outer � qinneri ðfor the inner modelÞ; ð1Þ
where pinner is the pressure variable carried by the inner model, qinner is the inner model density, q̂outer is theouter model density computed from the outer model potential temperature and salinity fields after interpola-tion to the fine grid, and bi is a linear combination coefficient with a value between 0 and 1, and Æ æ is a spatialfilter operator. For the application in this paper, the filtering is carried out over 16 inner model grid pointscorresponding to a smoothing scale of 112 km. As discussed in Greatbatch et al. (2004) (see also Shenget al., 2001), this procedure is equivalent to adjusting the momentum balance in the inner model based onthe difference in density between the inner and outer models. This can be demonstrated by decomposingthe pressure variable pinner carried by the inner model into two parts:
pinner ¼ p�inner þ p̂inner: ð2Þ
Here p�inner is the physical pressure and satisfiesop�inner
oz¼ �gqinner ð3Þ
with p�inner ¼ q0gginner at the sea surface, where ginner is the upwards displacement of the sea surface from a ref-erence level. p̂inner is a correction term satisfying
op̂inner
oz¼ �gð1� biÞhq̂outer � qinneri ð4Þ
with p̂inner ¼ 0 at the sea surface. Using (1), the horizontal momentum equations of the inner model can berewritten as:

J. Sheng et al. / Progress in Oceanography 70 (2006) 233–254 239
o~uot¼ � 1
q0
rp�inner �1
q0
rp̂inner þ � � � ð5Þ
where~u is the horizontal velocity vector for the inner model and $ is the horizontal gradient operator. There-fore, the new nesting technique based on the smoothed semi-prognostic method is equivalent to adding aninteraction term ð� 1
q0rp̂innerÞ to the model horizontal momentum equations. The filtering operator in (1) en-
sures that the interaction term is applied to the inner model only on large spatial scales (larger than thesmoothing scale), leaving the small scales associated with the fine grid unconstrained.
In the same way, the inner model density in the overlapping subregion is interpolated back onto the coarsegrid of the outer model. The hydrostatic equation of the outer model is then adjusted in the same overlappingsubregion based on
opouter
oz¼ �gqouter � gð1� boÞhq̂inner � qouteri ðfor the outer modelÞ; ð6Þ
where pouter is the pressure variable carried by the outer model, q̂inner is the inner model density calculated fromthe inner model potential temperature and salinity fields after interpolation to the coarse grid, and bo is a lin-ear combination coefficient with a value between 0 and 1, and Æ æ is a spatial filter (usually different from thatused in (1)). For the present application, this second spatial filter is not applied.
The above two-way interaction is applied once per day in this study. For simplicity, bi and bo are set to be0.5. To reduce the model drift, the semi-prognostic method, as described in Sheng et al. (2001), is also used toassimilate climatological density into the outer model. Zhai et al. (2004a) demonstrated that two-way nestingusing the smoothed semi-prognostic method outperforms conventional one-way nesting, bringing the modeloutput much closer to the observations (Fratantoni, 2001) (in conventional one-way nesting, the outer modelprovides boundary conditions for the inner model, but there is no constraint on the interior of the inner model,and no feedback from the inner model to the outer model). They also showed that the spatial filtering operatorin (1) is effective in releasing the small scales associated with the inner model grid and helps in reducing themodel bias. For more detailed discussion of the nesting technique, the reader is referred to Sheng et al. (2005).
2.3. Wind stress representation of the storm
Our main purpose in this study is to understand the physical processes that characterize the shelf responseto Hurricane Juan, rather than a realistic simulation. We therefore follow Chang and Anthes (1978) and use asimple, Rankine vortex to represent the wind stress associated with the hurricane:
s ¼ smax �r=rmin; 0 6 r 6 rmin;
ðrmax � rÞ=ðrmax � rminÞ; rmin 6 r 6 rmax;
0; r P rmax;
8><>: ð7Þ
where s is the amplitude of the tangential wind stress with respect to the storm center (the radial component isset to zero), and r is the radial distance from the center. In this study, we set rmin = 30 km, rmax = 300 km, andsmax = 3 N m�2 to represent approximately the structure and intensity of Hurricane Juan. The realistic stormtrack and translation speed of Hurricane Juan compiled by the National Hurricane Center is used to simulatethe moving storm (Fig. 1). The typical translation speed of Hurricane Juan over the SS and slope is about15 m s�1. The surface buoyancy forcing due to the storm is not considered and has been shown elsewhere(e.g., Price, 1981) to be small in its effect.
2.4. Model experiments
We conducted two numerical experiments to assess the upper ocean response of the SS and slope to Hur-ricane Juan. In the first experiment (CLIM), the nested-grid system is initialized with the January mean tem-perature and salinity from Geshelin et al. (1999) and forced by the monthly mean wind stress and surface heatflux from da Silva et al. (1994), the latter using the method of Barnier et al. (1995). The model sea surfacesalinity is restored to the monthly mean climatology on a time scale of 15 days. The nested system in exper-

240 J. Sheng et al. / Progress in Oceanography 70 (2006) 233–254
iment CLIM is integrated for two years and the model results of the second model year are discussed in thispaper. In the second experiment (CLIM + STORM), the nested-grid system is initialized and forced in thesame way as in the first experiment for the first 628 days from January 1 to September 28 of the second modelyear (assuming 360 days for each model year). After day 628 (i.e., September 28 of the second model year), thewind forcing associated with Hurricane Juan described in (7) is superimposed on the climatological wind forc-ing to drive the nested system in experiment CLIM + STORM.
3. Model results
3.1. Large-scale circulation forced by climatological forcing
We first examine the large-scale circulation and potential temperature and salinity distributions producedby the nested-grid modelling system in experiment CLIM. The outer model results in this experiment areessentially the same as the single domain model results discussed in detail in Sheng et al. (2001), except forsome small differences in meso-scale features over the SS and slope, due mainly to the two-way interactionof the inner and outer models. In comparison with satellite remote sensing SST data during the first half ofAugust 1999, the outer model generates reasonably well the large-scale distribution of the SST in August overthe northwest Atlantic Ocean (Fig. 4). Both the remote sensing data and model results demonstrate that theSST in August is relatively cold over the Labrador Shelf and along the continental slope from Labrador Sea tothe southern tip of the Grand Banks. The observed and calculated SST is relatively warmer in the deep wateroff the Grand Banks and Scotian Shelf in association with the Gulf Stream and the North Atlantic Current.Caution should be taken, however, when comparing the calculated SST with the remote sensing data shown inFig. 4. The model-calculated SST shown in Fig. 4a is produced by the model using monthly mean climatolog-ical forcing, while the remote sensing SST data in Fig. 4b are the composite of the SST observed during thefirst half of August 1999.
Fig. 4. Left panel shows the sea surface temperature (SST) on day 585 (i.e., August 15 of the second model year) produced by the outermodel, and right panel shows the satellite remote sensing SST data composite over the northwest Atlantic Ocean during the first half ofAugust 1999 (Courtesy of the Biological Oceanography Division of the Bedford Institute of Oceanography). The thin and thick whitecontour lines in the left panel represent 500-m and 200-m isobaths, respectively. The model-calculated SST over the region marked bydotted lines in the left panel is compared to the remote sensing SST data composite in the right panel.

J. Sheng et al. / Progress in Oceanography 70 (2006) 233–254 241
The large-scale surface circulation produced by the outer model (Fig. 4a) is in general agreement withobservations (e.g., Loder et al., 1998). Along the shelf breaks of the Labrador and Newfoundland Shelves,there is a narrow southeastward jet known as the offshore branch of the Labrador Current (Fig. 4a). On reach-ing the northern flank of the Grand Banks, the offshore branch of the Labrador Current splits into three parts:a coastal branch that flows through the Avalon Channel, a middle branch that flows through Flemish Pass tothe south, and an eastern branch that passes around the seaward flank of Flemish Cap. The middle branchand part of the eastern branch merge over the eastern flank of the Grand Banks and form a narrow equator-ward jet along the shelf breaks of the Grand Banks and the Scotian Shelf. The outer model also reproducesreasonably well the general flow patterns of the Gulf Stream and North Atlantic Current offshore from thecontinental slopes of the Grand Banks and the Scotian Shelf.
To assess the performance of the nested-grid system in reproducing the general circulation in the studyregion, we calculated the annual mean near-surface (16 m) currents from the second year model results andcompared them with the time-mean currents inferred from the observed trajectories of near-surface driftersby Fratantoni (2001) over the SS and slope (Fig. 5, see also Zhai et al., 2004a). The near-surface currents pro-duced by the inner and outer models agree reasonably well with the observed currents. There are two south-westward jets on the Scotian Shelf, with an inshore jet flowing along the coast (known as the Scotian Current)and an offshore jet flowing along the outer shelf (known as the shelf-break jet). In the slope water region off thesouthwestern SS, there is an intense eastward flow as part of the model Gulf Stream. This eastward jet splitsinto two branches at about 62�W, with the main branch flowing southeastward into the deep water and theweak branch flowing northeastward between the main branch and the shelf-break jet in the slope water region.Both these branches are a feature of the observations (Loder et al., 1998; Pickart et al., 1999).
3.2. Storm-induced circulation during Hurricane Juan
Model results in experiment CLIM + STORM generate the total ocean response to the combination of thespecified wind stress associated with Hurricane Juan and the climatological monthly mean forcing. To exam-ine the ocean circulation induced directly by Hurricane Juan, we calculate the difference of the model currentsand temperature between the two experiments CLIM + STORM and CLIM and use these difference fields torepresent the storm-induced ocean response produced by the model.
Fig. 5. Annual mean near-surface (15 m) currents (solid black arrows) and temperature produced by (a) the outer and (b) inner models ofthe nested-grid system. The observed currents (open red arrows) are the gridded time-mean near-surface currents during the 1990s inferredfrom trajectories of 15 m-drogued satellite-tracked drifters by Fratantoni (2001) on a 1� grid. Contour intervals are 1 �C.

242 J. Sheng et al. / Progress in Oceanography 70 (2006) 233–254
Fig. 6a shows the storm-induced surface currents and temperature produced by the model at 06:00 (ADT),September 28, at which time the center of Hurricane Juan was located over deep water. The storm-inducedcurrent and temperature changes on the SS and slope are negligible, indicating that the upper ocean circula-tion of this region has not yet been affected by the storm at this time. In comparison, the storm-induced upperocean response over deep water is characterized by strong outward (or divergent) surface currents forced bythe local wind stress under the storm and significant SST cooling (Fig. 6a). At later times (Fig. 6) we can seeintense inertial currents to the right of the storm track behind the storm, consistent with previous studies(Chang and Anthes, 1978; Price, 1981; Greatbatch, 1983). Based on the model results in Fig. 6c, we estimatethe typical along-track wavelength of the calculated inertial currents behind the storm to be about 900 km,which is comparable with the inertial wavelength estimated from 2pUf�1, where f is the Coriolis parameterand U is the translational speed, which is about 15 m s�1 for Hurricane Juan. The typical period of the inertialoscillations produced by the model is about 18 h, which is also consistent with the calculation of the inertialperiod of about 17–18.7 h for the study region.
The rightward bias of the intense inertial currents behind the storm can be explained as follows (Chang andAnthes, 1978). First, and most importantly, there is a more efficient energy transfer from the storm to theocean on the right side of the storm track than that on the left side of the storm track. This is because, asthe storm passes by, the wind stress veers anticyclonically at a fixed point on the right side of the storm track,while the wind stress veers cyclonically on the left side of the storm track. The Coriolis force (on the northhemisphere) turns the ocean currents in the same direction as the wind stress on the right side of the stormtrack, leading to an efficient transfer of energy from the storm to the ocean currents. By contrast, on the left
Fig. 6. Changes of sea surface temperature (SST) and surface currents (arrows) associated with Hurricane Juan at different times producedby the outer model. Contour intervals are 0.4 �C. The black dashed line represents the storm track and the solid diamond symbol showsthe center of the storm.

J. Sheng et al. / Progress in Oceanography 70 (2006) 233–254 243
side of the storm track, the ocean currents are turned in the opposite direction to the wind stress, resulting inweak currents. Second, the water parcels on the right side of the storm are accelerated by the wind forcing fora longer time than those on the left side of the storm (Greatbatch, 1983). The net result is that the inertialcurrents on the right side are much stronger than those on the left side of the storm track (Price, 1981).The rightward bias of the inertial currents behind the storm leads to a smaller Richardson number at the baseof the surface mixed layer and hence stronger entrainment and mixing on the right side of the storm track,which, in turn (Price, 1981), is mainly responsible for the rightward bias of SST cooling (more discussion isgiven in the Appendix).
Hurricane Juan reached the offshore areas of the southwestern Scotian Shelf around 16:36, September 28(Fig. 6b) and made landfall at 00:10 on September 29 (Fig. 1). The model-calculated response of the SS andslope to the storm is initially very similar to that over deep water (e.g., Fig. 6a). At later times, due to the com-plicated bottom topography, coastline and large-scale background circulation in the region, the upper oceanresponse has its own unique features (Fig. 6c and d). One of the important features in Fig. 6c and d is theoccurrence of several localized maxima of SST cooling of about �2.5 �C over the slope water region, whichdiffers significantly from the continuous strip of SST cooling expected in a horizontally homogeneous oceanenvironment (Chang and Anthes, 1978; Price, 1981; Greatbatch, 1983; see also Fig. 15 of the Appendix). Thedetailed SST cooling over the slope water region is associated mainly with the interaction of the storm-inducedcirculation with the varying bottom topography (Fig. 3) and the large variations of temperature stratificationin the upper ocean over the region (e.g., the reduced cooling near 40�N where the storm crosses the GulfStream).
To further examine the storm-induced circulation on the Scotian Shelf/slope, we examine the surface cur-rent and temperature differences produced by the inner model (Fig. 7). Before the storm reaches the shelfbreak, the ocean response produced by the inner model is confined over the deep water, with strong outwardsurface currents under the storm and a cold wake with intense inertial currents behind the storm (Fig. 7a andb) as before. When the storm reaches the shelf break (Fig. 7b), a marked strip of warm water (DSST is about0.5 �C) occurs in front of the cold wake due to horizontal advection of warm surface water from the vicinity ofthe Gulf Stream. After the storm makes landfall, the cold wake reaches its maximum (close to �3 �C) at theshelf break at about 60–70 km to the right of the storm track (Fig. 7c and d). The strip of warm surface wateris pushed to both sides of the cold wake. The amplitude and pattern of the SST cooling on the SS and slopegenerated by the inner model compare well to the observed change in SST during the storm shown in Fig. 2
Fig. 7. Changes of sea surface temperature and surface currents associated with Hurricane Juan produced by the inner model over theregion marked by dashed lines in Fig. 3b. Otherwise as in Fig. 6.
244 J. Sheng et al. / Progress in Oceanography 70 (2006) 233–254
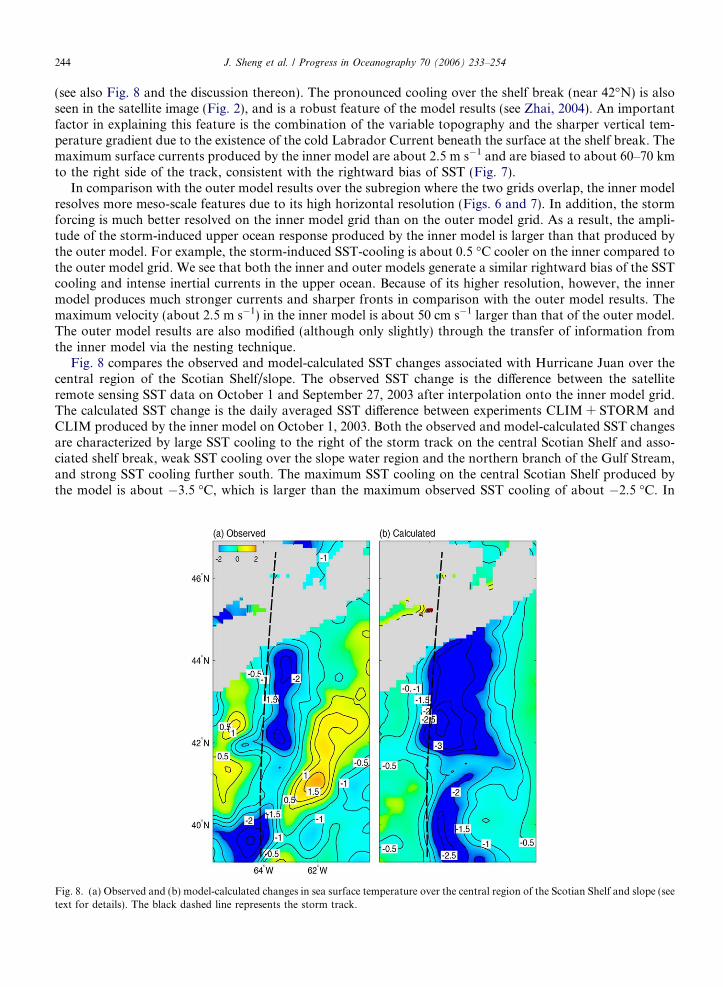
(see also Fig. 8 and the discussion thereon). The pronounced cooling over the shelf break (near 42�N) is alsoseen in the satellite image (Fig. 2), and is a robust feature of the model results (see Zhai, 2004). An importantfactor in explaining this feature is the combination of the variable topography and the sharper vertical tem-perature gradient due to the existence of the cold Labrador Current beneath the surface at the shelf break. Themaximum surface currents produced by the inner model are about 2.5 m s�1 and are biased to about 60–70 kmto the right side of the track, consistent with the rightward bias of SST (Fig. 7).
In comparison with the outer model results over the subregion where the two grids overlap, the inner modelresolves more meso-scale features due to its high horizontal resolution (Figs. 6 and 7). In addition, the stormforcing is much better resolved on the inner model grid than on the outer model grid. As a result, the ampli-tude of the storm-induced upper ocean response produced by the inner model is larger than that produced bythe outer model. For example, the storm-induced SST-cooling is about 0.5 �C cooler on the inner compared tothe outer model grid. We see that both the inner and outer models generate a similar rightward bias of the SSTcooling and intense inertial currents in the upper ocean. Because of its higher resolution, however, the innermodel produces much stronger currents and sharper fronts in comparison with the outer model results. Themaximum velocity (about 2.5 m s�1) in the inner model is about 50 cm s�1 larger than that of the outer model.The outer model results are also modified (although only slightly) through the transfer of information fromthe inner model via the nesting technique.
Fig. 8 compares the observed and model-calculated SST changes associated with Hurricane Juan over thecentral region of the Scotian Shelf/slope. The observed SST change is the difference between the satelliteremote sensing SST data on October 1 and September 27, 2003 after interpolation onto the inner model grid.The calculated SST change is the daily averaged SST difference between experiments CLIM + STORM andCLIM produced by the inner model on October 1, 2003. Both the observed and model-calculated SST changesare characterized by large SST cooling to the right of the storm track on the central Scotian Shelf and asso-ciated shelf break, weak SST cooling over the slope water region and the northern branch of the Gulf Stream,and strong SST cooling further south. The maximum SST cooling on the central Scotian Shelf produced bythe model is about �3.5 �C, which is larger than the maximum observed SST cooling of about �2.5 �C. In
Fig. 8. (a) Observed and (b) model-calculated changes in sea surface temperature over the central region of the Scotian Shelf and slope (seetext for details). The black dashed line represents the storm track.

J. Sheng et al. / Progress in Oceanography 70 (2006) 233–254 245
comparison with the observed SST change, the model-calculated SST cooling is too broad on the central Sco-tian Shelf, and the region of strong cooling in the south is too far to the right of the storm track. The mostlikely explanation for the former is that the Rankine vortex used to specify the wind stress associated with thestorm extends the region of high wind stress too far out from the storm track. In addition, the observed stripsof surface warming on both sides of the cold wake in the slope water region are not well-captured by the model(although they can be seen in Fig. 7), perhaps also because of the Rankine vortex used to specify the windstress. All of these model deficiencies indicate that while the present modelling system has some basic skill,more research remains to be done in order to simulate the details of the upper ocean response to HurricaneJuan (including the specification of a realistic ocean state, representative of late September 2003, prior to thestorm).
The other important circulation feature produced by the nested system is the generation and propagation ofbarotropic shelf waves during Hurricane Juan. Fig. 9 shows time series from the outer model of the storm-induced surface currents at point 1, located near the coast of Cape Cod and far from the storm track of Hur-ricane Juan. Although the local storm wind forcing associated with Hurricane Juan is negligible at point 1, thestorm-induced horizontal currents at this point have significant oscillations during the first 10 days after thestorm and decay with time afterwards. The typical amplitude of the horizontal currents at point 1 is about10 cm s�1 during the first 5 days, with a typical period of about 28 h, which falls in the range of typical periodsfor low-mode barotropic shelf waves (Niiler and Mysak, 1971). For an idealized step-wise shelf with uniformshelf width (L) and uniform water depths on the shelf (Hs) and in the deep water (Hd), the periods of baro-tropic shelf waves are given by 2pf�1[Hs + Hd coth(2pL/l)]/(Hd � Hs), where l is the wavelength (LeBlond andMysak, 1978). For a step-wise mid-latitude shelf with Hs = 100 m, Hd = 4000 m, L = 100 km andf = 10�4 s�1, the periods of low-mode barotropic shelf waves with wavelengths between 700 and 1000 kmare in the range of 25.5–32.5 h (Zhai, 2004).
Fig. 10 shows the temporal and spatial evolution of storm-induced horizontal currents along a line of pointson the shelf several grid points away from the coast. There are distinct inertial oscillations near the storm trackwith a period of about 18 h. In the region westward of the storm track, there are slopes in the time-space
Fig. 9. Left panel: part of the outer model domain showing the storm track of Hurricane Juan (dashed line) and point 1 indicated by thecircle. Upper right panel: time series of storm-induced horizontal currents at point 1 located near the coast of Cape Cod. Lower rightpanel: spectrum of storm-induced horizontal currents at point 1. The outer model results along the zonal transect marked by the dot-dashed line are presented in Fig. 14.

Fig. 10. Temporal and spatial evolution of the horizontal velocity components (in units of cm s�1) at points on the shelf near the coast inthe outer model. The dot-dashed line represents the position where the center of Juan hits the coast.
246 J. Sheng et al. / Progress in Oceanography 70 (2006) 233–254
domain, indicating the propagation of the shelf waves. The phase speed of the shelf waves is estimated fromthe slopes of the contours in Fig. 10 to be roughly 15 m s�1.
The shelf waves excited by the storm can also be examined in terms of the storm-induced sea surface ele-vation anomaly defined as the difference in sea surface elevation between experiments CLIM + STORM andCLIM. It should be noted that the sea surface elevation is not calculated directly by the nested modelling sys-tem since it is based on the rigid-lid version of CANDIE. Sea surface elevation can be diagnosed, however,from the model-calculated sea surface pressure using g = ps/q0g, where ps is the sea surface pressure producedby the rigid-lid ocean circulation model, q0 is the reference density and g is the gravitational acceleration. (Wenote in passing that external Kelvin waves are filtered out in our numerical simulations due to the use of therigid-lid approximation in the model.) The diagnosed surface elevation anomaly presented in Fig. 11a shows apositive sea surface elevation anomaly extending from the Bay of Fundy to the continental shelf off LongIsland at 14:12 September 30 ADT. This positive anomaly (i.e., peak of the shelf waves) propagates southwardand arrives at the continental shelf off New Jersey at 02:12 October 1 (Fig. 11a–f). After the positive anomalyleft the Gulf of Maine, a negative anomaly enters the eastern Gulf of Maine from the western Scotian Shelf atabout 19:00 September 30 (Fig. 11c). The center of this negative anomaly reaches the continental shelf offCape Cod at about 04:36 October 1 (Fig. 11g) and Atlantic City at about 12:00 on the same day (not shown).The amplitude of these waves is characterized by a gradual decay from the coast to the shelf-break, but due tothe scattering by the rough bottom topography and coastline, these shelf waves are not in such a regular pat-tern as seen in an idealized step-wise shelf model set-up (Zhai, 2004).
Other interesting features in Fig. 11 are two wave trains of sea surface elevation anomalies, with a negativeanomaly train along the storm track and a positive anomaly train at about 200 km to the east of the stormtrack (there is also a third, weaker positive anomaly train to the left of the storm track). These anomaly trainsarise from the change in steric height due to the net Ekman divergence (convergence) along (either side) of thestorm track, with upwelling (downwelling) leading to negative (positive) sea surface elevation anomalies.(There is also a signature due to the vertical pumping driven by the horizontal convergence/divergence ofthe near-inertial velocities in the surface layer (Greatbatch, 1983).) Along the negative train, there are threeseparate negative anomalies at 14:12 September 30 ADT (Fig. 11a), with the largest anomaly over deep water,

Fig. 11. Temporal evolution of the sea surface elevation (SSE, Dg) calculated from sea surface pressure produced by the outer model afterHurricane Juan made landfall. The SSE response is the SSE difference between the model results in experiments CLIM + STORM andCLIM. Contour intervals are 1 cm. The black dashed line represents the storm track.
J. Sheng et al. / Progress in Oceanography 70 (2006) 233–254 247
an intermediate anomaly at the shelf break and the smallest anomaly at the coast. At later times, the interme-diate anomaly propagates northward and generates a shelf wave as it impinges on the coast (Fig. 11b–d andg–i). At later times again (starting at 02:12 ADT), the large negative anomaly over deep water spawns a newintermediate negative anomaly that propagates northward and the process repeats itself. Similarly, a largepositive anomaly stands over deep water to the east of the negative anomaly and spawns the smaller-size posi-tive anomalies that propagate northward and generate shelf waves as they reach the coast (Fig. 11e and f).
As evident from Fig. 11, the storm-induced continental shelf waves are associated with sea level variationsof several centimeters along the coast of the western Scotian Shelf and Gulf of Maine. To determine whethertide gauges in the region detected these subtidal sea level variations, we computed (adjusted) subtidal sea leveltime series from hourly sea level observations at three coastal locations: Halifax, Yarmouth and Saint John(Fig. 3) by eliminating the inverse barometer effect and tides. Fig. 12a–c shows the subtidal sea level time seriesfrom Julian day 269 to 276. The subtidal sea level time series for Halifax reaches a maximum value of about110 cm at the beginning of day 271, due to the direct influence of Hurricane Juan. On the same day, the sub-tidal sea level time series at the other two locations (Fig. 12b and c) also reach maximum values of about15 cm, but lagged by about 2.5 h at Yarmouth and about 3 h at Saint John compared to Halifax. Afterday 271, the subtidal sea level time series at Yarmouth and Saint John have some noticeable variations at fre-quencies of about 0.85–0.95 cycles per day (Fig. 12d), or periods of 25–28 h (the same as found in the model).The subtidal sea level time series at Yarmouth and Saint John are strongly correlated during the periodbetween Julian day 271.2 and 275, with a correlation coefficient of about 0.8 at a time lag of about 2 h

Fig. 12. Subtidal sea level time series (solid) derived from hourly tide gauge measurements and model-computed coastal sea level (dotted)at (a) Halifax, (b) Yarmouth and (c) Saint John; and (d) power density functions calculated from the sub-tidal sea level time series at thethree locations during the period between Julian days 271 and 275 marked by shaded boxes in (a–c). Hurricane Juan made landfall at thebeginning of Julian day 271 (September 29), 2003.
248 J. Sheng et al. / Progress in Oceanography 70 (2006) 233–254
(Yarmouth leading). The observed subtidal sea levels at Yarmouth and Halifax are also correlated during thesame period, but with a smaller correlation coefficient of about 0.5 at a time lag of about 1 h (Halifax leading).Therefore, the subtidal sea level observations at the three locations, particularly at Yarmouth and Saint John,provide evidence of equatorward propagation of shelf waves with typical periods of 25–28 h.
We also compare the coastal sea level diagnosed from the model-calculated surface pressure with theobserved subtidal sea levels at the three locations (Fig. 12a–c). The model sea level time series at Halifaxunderestimates significantly the observed peak in subtidal sea level associated with the landfall of HurricaneJuan. This is not surprising since the ocean circulation model used here employs the rigid lid approximation,and is not valid for producing the storm surge associated with a fast-moving storm system such as HurricaneJuan. (Realistic simulations of the storm surge due to Hurricane Juan are presently underway using a

J. Sheng et al. / Progress in Oceanography 70 (2006) 233–254 249
two-dimensional barotropic model; D. Mercer, Personal Communication, 2006.) Despite the obvious discrep-ancies, the modelled coastal sea level time series show similar low-frequency variations, with similar ampli-tudes of variation, as the observed time series at both Yarmouth and Saint John during the first few daysfollowing landfall, lending support to the existence of the shelf wave response to the hurricane.
The other interesting phenomenon produced by the nested system (Zhai et al., 2004b) is the onset of inertialoscillations after more than 10 days at locations along the pathway of the Gulf Stream far from the stormtrack, where there is also no local storm forcing. There are two competing hypotheses concerning the mech-anism for this phenomenon: linear wave dispersion of inertial-gravity waves from the storm track (e.g., Gill,1984) or advective processes. Zhai et al. (2004b) have demonstrated the importance of geostrophic advectionfor carrying the near-inertial energy to regions remote from the storm track by using a diagnostic model run inwhich the baroclinic dispersion of inertial-gravity waves is excluded.
In order to extract energy at the near-inertial frequency, a bandpass filter centered at the local (41�N) iner-tial frequency is used. The kinetic energy of the surface currents, given by (u2 + v2)/2 (where u and v are thestorm-induced horizontal velocity components) is computed after the bandpass filter is applied. The near-iner-tial energy is initially biased to the right of the storm track at day 6, due to the rightward bias in the storm-generated currents (e.g., Price, 1981) (Fig. 13a). The near-inertial energy is then advected gradually by the GulfStream to the east at the latitude around 41�N (Fig. 13b–d). The near-inertial energy decays as it is advectedhorizontally, due to dissipation and the vertical propagation of the energy. The time scale of the horizontaladvection is consistent with the velocity scale for the Gulf Stream in the model. The shelf-break jet also advectsthe near-inertial energy to the southwest along the shelf-break as seen in Fig. 14.
The near-inertial energy generated by the storm is initially confined in the surface mixed layer. It graduallypropagates downward in the following ten days mainly on the right side of the storm track, where there existsa larger energy source in the surface mixed layer (Fig. 14a–c). The vertical propagation of the near-inertial
Fig. 13. Temporal evolution of the near-inertial energy at the sea surface in the outer model (unit: cm2 s�2). The dashed line represents thestorm track. The 20, 100, 500 and 1000 contours are drawn. Dotted lines are 500 m isobaths.

Fig. 14. Vertical transect (marked by the dot-dashed line in Fig. 9) showing the temporal evolution of the near-inertial energy in the outermodel (unit: cm2 s�2) in the upper 400 m. The dashed line shows where the hurricane center intersects the transect. The same contours aredrawn as in Fig. 13.
250 J. Sheng et al. / Progress in Oceanography 70 (2006) 233–254
energy can be interpreted using the concept of modal interference and separation as described in Gill (1984)and Zervakis and Levine (1995). The total near-inertial energy decreases with time due to dissipation and onlya small amount is left on day 18.
4. Summary and discussion
We conducted a process-oriented study on the upper ocean response of the Scotian Shelf/slope to Hurri-cane Juan using a nested-grid ocean circulation model developed by Zhai et al. (2004a). The nested systemconsists of a fine-grid inner model covering the Scotian Shelf and adjacent slope, and a coarse-grid outermodel covering the northwest Atlantic Ocean. The newly developed two-way nesting technique based onthe smoothed semi-prognostic method (Zhai et al., 2004a; Sheng et al., 2005) is used to exchange informationbetween the outer and inner models over the common subregion where the two grids overlap. In comparisonwith the coarse-grid outer model, the inner model generates a stronger response, sharper fronts, and moremeso-scale structures due to its higher horizontal resolution and better resolution of the storm forcing onthe fine model grid.
The nested-grid modelling system yields a reasonable upper ocean response to Hurricane Juan. Before thestorm reaches the Scotian Shelf, the model-calculated upper ocean response over the deep water is character-ized by strong divergent currents forced directly by the local wind forcing under the storm, a rightward bias ofSST cooling, and intense inertial oscillations behind the storm. The amplitude and distribution of the coldwake produced by the model compare reasonably well with the observed change in SST estimated from satel-lite remote sensing SST data before and after the storm. After Hurricane Juan moves onto the shelf, continen-tal shelf waves are excited and propagate with the coast on their right. These waves can easily be seen in the sea

J. Sheng et al. / Progress in Oceanography 70 (2006) 233–254 251
surface elevation field computed from the model, and in the temporal and spatial evolution of the horizontalcurrents. The phase speed of the shelf waves estimated from the model results is about 15 m s�1. The otherinteresting phenomenon produced by the model is that the inertial oscillations are gradually advected east-ward in the ocean interior by the model Gulf Stream. The advective mechanism for dispersing the inertialenergy could be important for understanding mixing in the ocean as argued by Zhai et al. (2004b).
Acknowledgments
We thank Alan Davies, William Perrie, and Jim Chuang for useful discussions. We are grateful to ChrisFogarty of the Meteorological Service of Canada (MSC) for providing us the realistic storm track and satelliteremote sensing data of SST, and Scott Tomlinson of the Marine Environmental Data Service for providing uswith the tide gauge data. Comments from two anonymous reviewers and Sang-Ki Lee were very helpful whenrevising the manuscript. This project is supported by funding from CFCAS. R.J.G. and J.S. are also supportedby NSERC, MARTEC (a Halifax based company), and the MSC through the NSERC/MARTEC/MSCIndustrial Research Chair in ‘‘Regional Ocean Modelling and Prediction’’.
Appendix. The vertical mixing scheme
The vertical eddy viscosity and diffusivity coefficients in the ocean surface mixed layer (SML) are param-eterized in terms of a scale velocity. For the wind-driven SML, the scale velocity is usually assumed to be eitherthe wind stress friction velocity, u* (e.g., Chang and Anthes, 1978 and Greatbatch, 1985), or DV (e.g., Priceet al., 1978), which is the magnitude of the mean velocity difference across the base of the SML. Parameter-izing mixing in terms of u* implicitly assumes that breaking waves at the surface are responsible for the tur-bulence that erodes the base of the SML, whereas a parameterization based on DV assumes that the importantturbulence is generated by shear instability at the base of the mixed layer itself. Linden (1975) argued that therate of entrainment across a density interface, produced by a stirring grid, should not be related directly to thevelocity of the stirrer (corresponding to breaking waves at the surface), but to the turbulent velocity at theinterface. This is because the mechanical energy density decays with depth, and a smaller fraction of the energyinput is available for mixing when the layer is deep and the interface further from the energy source (Thomp-son and Turner, 1975). Price et al. (1978) argued that DV is a better scale velocity by simulating observed oce-anic cases of ML deepening. As is shown later, the choice of DV, rather than u*, plays a key role in producingthe rightward bias of the upper ocean response to a moving hurricane.
In Price’s layered model (Price, 1981), the rate of entrainment at the base of the SML ðdhdt Þmix is given by
1
DVdhdt
� �mix
¼ 5� 10�4R�4v ðRv 6 1Þ;
0 ðRv > 1Þ;
(ðA1Þ
where Rv is a bulk Richardson number, defined as
Rv ¼ gDqh=q0ðDV Þ2; ðA2Þ
where Dq is the density difference across the base of the SML and DV is the corresponding difference of thebulk velocity. Since the storm-induced currents are usually stronger to the right of the storm track than to theleft, (A1) and (A2) imply more entrainment on the right side of the storm track than the left. Price (1981) sug-gested that this mechanism is responsible for the bias to the right of the track of the sea surface temperatureresponse.The default vertical mixing scheme used in CANDIE is Csanady’s (1982) formula for the vertical eddy vis-cosity in the SML, which depends on u* rather than DV, and Large et al.’s formula (1994) for vertical mixingin the interior of the ocean, with the vertical eddy diffusivity set to be equal to the vertical eddy viscosity. Tosimulate the ocean response to a moving storm, we modify the default mixing scheme based on the suggestionof Price et al. (1986). First of all, the SML thickness is diagnosed from the vertical temperature distribution ofthe water column. Beginning from the top z-level, the scheme searches for the first level k at which the tem-perature exceeds that at the level below by a prescribed value (0.4 �C in this study). The scheme then sets the

252 J. Sheng et al. / Progress in Oceanography 70 (2006) 233–254
mixed layer depth to be at the base of level k. Within the SML, a very large vertical mixing coefficient is usedso that currents and temperature in the SML are essentially vertically homogeneous. At the base of the SML,the eddy mixing coefficient is dependent on a bulk Richardson number as defined by (A2). A smaller bulkRichardson number corresponds to larger vertical mixing at the base of the SML and hence more cold wateris entrained into the SML. The parameterization is
Fig. 15storm(b) verstorm
m=mM ¼1; Rv < 0;
0:2R�2v ; Rv P 0;
�ðA3Þ
where m is the vertical eddy viscosity/diffusivity coefficient at the base of the mixed layer, Rv is the bulk Rich-ardson number and mM = 104 cm2 s�1.
Below the SML, the vertical mixing is parameterized as a function of the gradient Richardson number Rg
(the ratio of local buoyancy to vertical shear forcing, i.e., Rg = N2/((ozU)2 + (ozV)2)) as suggested by Largeet al. (1994). Their parameterization can be written as
m=m0 ¼1; Rg < 0;
½1� ðRg=R0Þ2�3; 0 < Rg < R0;
0; Rg P R0;
8><>: ðA4Þ
where m is the vertical eddy viscosity/diffusivity coefficient, m0 = 50 cm2 s�1 and R0 = 0.7. This scheme results ina rapid increase of the vertical mixing coefficient as Rg decreases below the threshold value of R0.
To identify the relative importance of vertical mixing and upwelling in lowering the SST (see Greatbatch,1985), we ran two model experiments using an idealized model set-up, one with the advection (horizontal andvertical) terms in the model temperature equation switched off, and one with these terms included. Since mostof the SST change is captured by the case with the advection terms suppressed, it follows that vertical mixingplays a dominate role in the SST change including the rightward bias (Fig. 15). It should be noted that if the
. Sea surface cooling (DSST in units of �C) at the mid-latitude of the Northern Hemisphere associated with the passage of a movingproduced by the ocean model in an idealized model setup with: (a) vertical mixing and advection in the model temperature equation;tical mixing only. The symbol ‘‘·’’ denotes the position of the storm center at the time of the snapshot. The dotted line represents thetrack.

J. Sheng et al. / Progress in Oceanography 70 (2006) 233–254 253
vertical mixing is parameterized in terms of u*, since the wind stress forcing used here is symmetric about thestorm track, the corresponding SST response in the case without advection is also symmetric about the stormtrack. The fact this is not the case in Fig. 15 demonstrates the importance of using the velocity scale DV toparameterize the vertical mixing used in the model, as in Price (1981).
References
Barnier, B., Siefridt, L., Marchesiello, P., 1995. Thermal forcing for a global ocean circulation model using a three-year climatology forECMWF analyses. Journal of Marine Systems 6, 363–380.
Brink, K.H., 1989. Observations of the response of thermocline currents to a hurricane. Journal of Physical Oceanography 19, 1017–1022.Chang, S.W., Anthes, R.A., 1978. Numerical simulations of the ocean’s nonlinear baroclinic response to translating hurricanes. Journal of
Physical Oceanography 8, 468–480.Csanady, G.T., 1982. Circulation in the Coastal Ocean. Reidel Publishing Company, Dordrecht, Holland, 279pp..Dietrich, D.E., 1997. Application of a modified Arakawa ‘a’ grid ocean model having reduced numerical dispersion to the Gulf of Mexico
circulation. Dynamics of Atmospheres and Oceans 27, 201–217.Dickey, T. et al., 1998. Upper-ocean temperature response to hurricane Felix as measured by Bermuda tested mooring. Monthly Weather
Reviews 126, 1195–1201.Fratantoni, D.F., 2001. North Atlantic surface circulation during the 1990s observed with satellite-tracked drifters. Journal of
Geophysical Research 106, 22067–22093.Geisler, J.E., 1970. Linear theory of the response of a two-layer ocean to a moving hurricane. Geophysical Fluid Dynamics 1, 249–272.Geshelin, Y., Sheng, J., Greatbatch, R.J., 1999. Monthly mean climatologies of temperature and salinity in the western North Atlantic.
Canadian Data Report of Hydrography and Ocean Sciences 153, 62.Gill, A.E., 1984. On the behaviour of internal waves in the wake of storms. Journal of Physical Oceanography 14, 1129–1151.Gordon, R.L., Huthnance, J.M., 1987. Storm-driven continental shelf waves over the Scottish continental shelf. Continental Shelf
Research 7, 1015–1048.Greatbatch, R.J., 1983. On the response of the ocean to a moving storm: the nonlinear dynamics. Journal of Physical Oceanography 13,
357–367.Greatbatch, R.J., 1985. On the role played by upwelling of water in lowering sea surface temperatures during the passage of a storm.
Journal of Geophysical Research 90, 11751–11755.Greatbatch, R.J., Fanning, A.F., Goulding, A.D., Levitus, S., 1991. A diagnosis of interpentadal circulation changes in the North
Atlantic. Journal of Geophysical Research 96, 22009–22023.Greatbatch, R.J., Sheng, J., Eden, C., Tang, L., Zhai, X., Zhao, J., 2004. The semi-prognostic method. Continental Shelf Research 24,
2149–2169.Large, W.G., McWilliams, J.C., Doney, S.C., 1994. Oceanic vertical mixing: a review and a model with a nonlocal boundary layer
parameterization. Reviews of Geophysics 32, 363–403.Levinson, D.H., Waple, A.M., 2004. State of the climate in 2003. Bulletin of the American Meteorological Society 85, s1–s72. doi:10.1175/
BAMS-85-6-Levinso.LeBlond, P.H., Mysak, L.A., 1978. Waves in the Ocean. Elsevier North-Holland Inc., New York, 602pp..Linden, P.F., 1975. The deepening of a mixed layer in a stratified layer. Journal of Fluid Mechanics 71, 385–406.Leipper, D.F., 1967. Observed ocean conditions and hurricane Hilda. Journal of the Atmospheric Sciences 24, 182–196.Loder, J., Petrie, B., Gawarkiewicz, G., 1998. The coastal ocean off northeastern north America: a large-scale view. The Sea 11, 105–133.Marchesiello, P., McWilliams, J.C., Shchepetkin, A., 2001. Open boundary conditions for long-term integration of regional oceanic
models. Ocean Modelling 3, 1–20.Martinsen, E.A., Gjevik, B., Roed, L.P., 1979. A numerical model for long barotropic waves and storm surges along the western coast of
Norway. Journal of Physical Oceanography 9, 1126–1138.Niiler, P.P., Mysak, L.A., 1971. Barotropic waves along an eastern continental shelf. Geophysical Fluid Dynamics 2, 273–288.Orlanski, I., 1976. A simple boundary condition for unbounded hyperbolic flows. Journal of Computational Physics 21, 251–269.Pickart, R.S., McKee, T.K., Torres, D.J., Harrington, S.A., 1999. Mean structure and interannual variability of the slopewater system
south of Newfoundland. Journal of Physical Oceanography 29, 2541–2558.Price, J.F., 1981. Upper ocean response to a hurricane. Journal of Physical Oceanography 11, 153–175.Price, J.F., Mooers, C.N.K., Van Leer, J.C., 1978. Observation and simulation of storm-induced mixed-layer deepening. Journal of
Physical Oceanography 8, 582–599.Price, J.F., Weller, R.A., Pinkel, R., 1986. Diurnal cycling: observations and models of the upper ocean response to diurnal heating,
cooling, and wind mixing. Journal of Geophysical Research 91, 8411–8427.Sheng, J., 2002. Circulation and drift pathways in the northwest Atlantic Ocean. In: Spaulding, M.L. (Ed.), Estuarine and Coastal
Modeling, Proceedings of the 7th International Conference, pp. 364–383.Sheng, J., Tang, L., 2003. A numerical study of circulation in the western Caribbean Sea. Journal of Physical Oceanography 33, 2049–2069.Sheng, J., Tang, L., 2004. A two-way nested-grid ocean-circulation model for the Meso-American Barrier Reef System. Ocean Dynamics
54, 232–242.Sheng, J., Wang, L., 2004. Numerical study of tidal circulation and nonlinear dynamics in Lunenburg Bay, Nova Scotia. Journal of
Geophysical Research 109, C10018. doi:10.1029/2004JC002404.

254 J. Sheng et al. / Progress in Oceanography 70 (2006) 233–254
Sheng, J., Greatbatch, R.J., Wright, D.G., 2001. Improving the utility of ocean circulation models through adjustment of the momentumbalance. Journal of Geophysical Research 106, 16711–16728.
Sheng, J., Greatbatch, R.J., Zhai, X., Tang, L., 2005. A new two-way nesting technique for ocean modelling based on the smoothed semi-prognostic method. Ocean Dynamics 55, 162–177. doi:10.1007/s10236-005-0005-6.
Sheng, J., Wright, D.G., Greatbatch, R.J., Dietrich, D.E., 1998. CANDIE: A new version of the DieCAST ocean circulation model.Journal of Atmospheric and Oceanographic Technology 15, 1414–1432.
da Silva, A.M., Young, C.C., Levitus, S., 1994. Atlas of surface marine data 1994, vol. 3, Anomalies of heat and momentum fluxes. NOAAAtlas NESDIS 8, NOAA, Washington, DC, 413pp.
Slørdal, L.H., Martinsen, E.A., Blumberg, A.F., 1994. Modelling the response of an idealized coastal ocean to a traveling storm and toflow over bottom topography. Journal of Physical Oceanography 24, 1689–1705.
Smagorinsky, J., 1963. General circulation experiments with the primitive equation. I. The basic experiment. Monthly Weather Review 21,99–165.
Tang, C.L., Gui, Q., Detracey, B.M., 1998. Barotropic response of the Labrador/Newfoundland shelf to a moving storm. Journal ofPhysical Oceanography 28, 1152–1172.
Thompson, S.M., Turner, J.S., 1975. Mixing across an interface due to turbulence generated by an oscillating grid. Journal of FluidMechanics 67, 349–367.
Thuburn, J., 1996. Multidimensional flux-limited advection schemes. Journal of Computational Physics 123, 74–83.Zervakis, V., Levine, M.D., 1995. Near-inertial energy propagation from the mixed-layer: theoretical consideration. Journal of Physical
Oceanography 25, 2872–2889.Zhai, X., 2004. Studying storm-induced circulation on the Scotian Shelf and slope using a two-way nested-grid model. M.Sc. Thesis,
Department of Oceanography, Dalhousie University, Halifax, Canada, unpublished.Zhai, X., Sheng, J., Greatbatch, R.J., 2004a. A new two-way nested-grid ocean modeling technique applied to the Scotian Shelf and slope.
In: Spaulding, M.L. (Ed.), Estuarine and Coastal Modeling: Proceedings of the 8th International Conference, pp. 342–357.Zhai, X., Greatbatch, R.J., Sheng, J., 2004b. Advective spreading of storm-induced inertial oscillations in a model of the northwest
Atlantic Ocean. Geophysical Research Letter 31, L14315. doi:10.1029/2004GL020084.