AEROSPACE FACTS AND FIGURES
134
TL 501 oA818 I uJ7f\Jl, COl:.AC9 l tD0:>2B 044[ C4( L20 42B Ull2Co: Cltt(A l tt3 0o 2u 034Cu6, )2122 8 0003CLh AEROSPACE FACTS AND FIGURES 1971/72 1971 "'" 72 OSPACE INDUSTRIES ASSOCIATION OF AMERICA, INC. -=-- ___)
-
Upload
khangminh22 -
Category
Documents
-
view
0 -
download
0
Transcript of AEROSPACE FACTS AND FIGURES

TL 501 oA818 I
uJ7f\Jl, COl:.AC9 l
tD0:>2B 044[ C4( L20 42B Ull2Co: ~ uG82B Cltt(A l tt3 0o 2u 034Cu6, )2122 8 0003CLh
AEROSPACE FACTS AND FIGURES
1971/72
1971"'"72 OSPACE INDUSTRIES ASSOCIATION OF AMERICA, INC. -=--___)

COMPILED BY THE OFFICE OF PUBLIC AFFAIRS
Vice President for Public Affairs • Carlyle H. Jones
Editor • Gerald J. McAllister
Statistician • Sally H. Bath
Consultant • Rudolf Modley
Art Director • James J. Fisner
PUBLISHED BY
Aviation Week & Space Technology
A MCGRAW·Hill JI'UBLICATION
330 West 42nd Street
New York, N. Y. 10036
Library of Congress Card 46-25007 ~·~·Aerospace Industries Association, Inc., 1971
$3.95 Per Copy

FOREWORD
Major areas of activities in the aerospace industry continued their predicted decline during 1970.
However, sales volume in 1970 was the fourth largest in the industry's history and there are firm indications that the downward curve will be reversed.
Basic economic measurements of the industry in 1970 include: • Sales in 1970 dropped to $24.8 billion compared with $26.1 bil
lion in 1969 with most of the decline in sales of military aircraft and space vehicles.
• Average employment fell from 1,354,000 persons in 1969 to 1,159,000 in 1970, and the decline has continued into 1971. Nevertheless, the aerospace industry remained the nation's largest manufacturing em-
ployer. • Erosion continued in aerospace profits (as a percentage of sales
after taxes) with 2.0 percent reported in 1970 compared with 3.1 percent in 1969. The 1970 aerospace profit ratio compares with 4.0 percent for all manufacturing industries.
• Backlog of the industry dropped approximately $3.5 billion in 1970 from $28.3 billion reported at the end of 1969.
• Aerospace exports were a major factor in maintaining the nation's precarious balance of trade dur~n.g 1970. For the seventh consecutive year, aerospace exports increased, nsmg from $3.1 billion in 1969 to a new record of $3.4 billion. The past year also marked the fourteenth consecutive year that aerospace exports have exceeded $1 billion.
The firm indications of an upturn in aerospace activities include:
2

• Space sales for 1970, which dropped from $4.3 billion in 1969 to $3 .6 billion in 1970, were largely due to the virtual completion of the hardware phase of the Apollo program. However, the space shuttle program, a major step forward in economic space exploration, and the E arth resources program for unmanned satellites, are moving ahead.
• Nonaerospace sales, which remained virtually the same over the 1969-70 period , <:fre expected to increase as the advanced technology generated by the aerospace industry enters an application phase to domestic and social problems. The industry is already heavily involved in transportation hardware work for the Urban Mass Transportation Administration. The b roadening development of a marketplace fo r aerospace technology in socio-economic fields appears promising.
• Obligational authority for aerospace products fro m two major customers-DoD and NASA-are estimated to increase $ 1 billion in Fiscal Year 1972 (compared with FY 1971) to a total of approximately $18 billion.
This 1971 / 72 edition of Aerospace Facts and Figures represents an effort by the Aerospace Industries Association to furnish an insight into the basic economics of the industry. The industry's record in such fields as research, development , test and evaluation and production of its diverse products is reported.
This nineteenth edition is aimed at serving as a standard reference work for administrators and managers in Government and industry, writers and editors, legislators and analysts and students.
K ARL G. HARR, JR .
President Aerospace Industries Association
3

CONTENTS
PACE
5 AEROSPACE SUMMARY
23 AIRCRAFT PRODUCTION
43 MISSILE PROGRAMS
51 SPACE PROGRAMS
64 RESEARCH AND DEVELOPMENT
70 FOREIGN TRADE
85 MANPOWER
96 FINANCE
105 AIR TRANSPORTATION
124 GLOSSARY
127 INDEX
4

0
Aerospace Summary
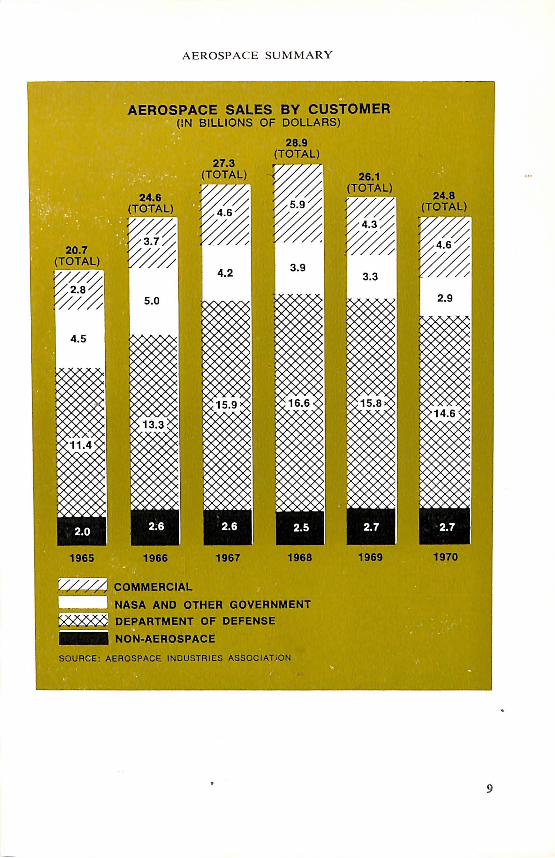
Sales of the aerospace industry continued the predicted decline in 1970, dropping to approximately $24.8 billion compared with $26.1 billion in 1969. A sales peak of $29 billion was achieved in 1968.
Bulk of the sales decline was in aircraft and space vehicle sales. Missile sales in 1970 registered an increase of about $300 million over 1969.
Sales to the Department of Defense declined more than $1 billion while sales to the National Aeronautics and Space Administration dropped $350 million. Non-government sales gained approximately $235 million over 1969 and non-aerospace remained at the same level.
Backlog of the industry dropped to $24.8 billion in 1970 from $28.3 billion in 1969. This is a decline of approximately $6 billion from the peak backlog of nearly $31 billion. ,The backlog reported for 1970 breaks
5

AEROSPACE FACTS AND FIGURES, 1971 / 72
down to $13.1 billion in U.S. Government orders and $ 11.7 billion in other orders, principally civil aircraft.
Aerospace expenditures by the D epartment of D efense are estimated at $13.9 billion for Fiscal Year 1972 which compares with approximately $14 billion in FY 1971.
Obligational authority for aerospace products and services for both DoD and NASA for FY 1972 are estimated at nearly $18 billion, an increase of $1 billion over the FY 1971 estimate.
Average employment for the aerospace industry during 1970 was down to 1,159,000 workers compared with 1,354,000 in the previous year. Average employment in all manufacturing industries for 1970 was 19,-393,000 compared with 20,169,000 in 1969.
Exports continued to be a bright spot in the aerospace business picture. A new high of $3.4 billion in exports was reached during 1970. This compares with $3.1 billion in 1969 and marks the fourteenth year that exports have exceeded $1 billion.
6
AEROSPACE SALES (IN BILLIONS OF DOLLARS)
15.0 ~------~~---------L--------~~~------~~------~ 1965 1966 1967 1968 1969 1970
SOURC E: AEROSPACE INDUSTRIES ASSOC IATION

I
Year
Ending Decem-ber 31
1960 1961 1962 1963 1964
1965 1966 1967 1968 1969 1970
r Revised
AEROSPACE SUMMARY
AEROSPACE SALES AND THE NATIONAL EcoNOMY Calendar Years 1960 to Date (Dollar Figures in Billions)
I AEROSPACE SALES AS
SALES OF PERCENT OF
Total
Gross Manu-National Manufac- Durable Aero- factur- Dur-Product turing Goods space GNP ing In- able
Industries Industry Industry dustries Goods
$503.7 $368.7 $189.5 $17.3 3.4 4.7 9.1 520.1 370.7 186.5 18.0 3.5 4.9 9.7 560.3 397.4 205.2 19.2 3.4 4.8 9.4 590.5 420.4 219.0 20.1 3.4 4.8 9.2 632.4 448.0 235.6 20.6 3.3 4.6 8.7
684.9 492.0 266.6 20.7 3.0 4.2 7.8 747.6 538.5 295.6 24.6 3.3 4.6 8.3 793.5 548.5 299.7 27.3 3.4 5.0 9.1 865.0' 603.7 331.0 29.0' 3.4 4.8 8.8 931.4' 655.6 363.7 26.1' 2.8 4.0 7.2 976.5 665.7 361.7 I 24.8 2.5 3.7 "6.9 • I
NOTE: The AlA estimate of Aerospace Industry sales is arrived at by adding 1. DoD expenditures for "procurement" of aircraft and missiles, 2. DoD ex_penditures for research, development, test and evaluation for aircraft, missiles, and astronautics, 3. NASA expenditures for research and development, 4. AEC expenditures for sj)ace propulsion systems and space electric power development, 5. Net sales to customers other than U.S. Government by approximately 55 aerospace companies (adjusted to eliminate duplication by subcontracting) and 6. Non-aerospace sales reported by the approximately 55 aerospace companies reporting to the Bureau of the Census.
Source: Manufacturing and Durable Goods Industries; Department of Commerce, Bureau of the Census, "Manufacturers' Shipments, Inventories, and Orders, Series M-3" (Monthly). Gross National Product; Department of Commerce, "Survey of Current Businl!!'s," (Monthly). Aerospace: Aerospace Industries Association estimates, based on latest available information.
During 1969, the International Air Transport Association reported that there were 3,999 aircraft in operation on "World civil airlines, and 75 percent of them were manufactured in the U.S.
The profits of the aerospace industry (as a percentage of sales after taxes) continued to decline. In 1970, the percentage was 2.0 compared with 3.1 in 1969. The profit percentage for all manufacturing corporations, measured by the same formula, was 4.0 percent in 1970.
7

-
8
AEROSPACE FACTS AND FIGURES, 1971/72
EsTIMATim SALES OF THE AEROSPACE INDUSTRY, BY CusTOl\11-:R (Millions of Dollars)
Calendar Years 1948 to Date
I I I
Aerospace Products and Services Non-
Year aerospace Ending TOTAL I Government Products
December SALES Non- and 31 govern- Services
Department NASA ment of Defense and
I Other
1948 $ 1,493 $ 1,182 - s 177 $ 134 1949 2,232 1,802 - 230 200 1950 3,116 2,598 - 238 280 1951 6,264 5,353 - 347 564 1952 10,130 8,568 - 650 912
1953 12,459 10,604 i - 734 1,121 1954 12,807 10,832 - 822 1,153 1955 12,411 10,508 - 786 1,117 1956 13,946 11,525 - 1,166 1,255 1957 15,858 12,833 - 1,598 1,427
1958 16,065 13,246 $ 1 1,372 1,446 1959 16,640 13,171 130 1,841 1,498 1960 17,326 13,196 I 363 2,208 1,559 1961 17,997 13,871 630 1,876 1,620 1962 19,162 14,331 1,334 1,772 1,725
1963 20,134 14,191 2,628 1,485 1,830 1964 I 20,594 13,218 3,635 2,020 1,721 1965 20,670 11,396 4,490 2,816 1,968 1966 24,610 13,284 5,026 3,663 2,637 1967 27,267 15,855 4,201 4,632 2,579
1968T 28,959 16,573 3,920 I 5,917 I 2,549 1969T 26,126 15,771 3,314
I 4,342
I
2,699 1970
I 24,848 I 14,642 2,952 4,578 2,676
I r Revised. NoTS: For explanation of "Aerospace Sales" aPe "Note" on page 7. Source: Aero•pace Industries Association estimates. based on latPSt available information.
A EROSPAC E SU M M A RY
AEROSPACE SALES BY CUSTOMER (IN BILLIONS OF DOLLARS)
28.9 (TOTAL)
SOURCE: AEROSPACE INDUSTRIES ASSOCIAT ON
9

AEROSPACE FACTS AND FIGURES, 1971/72
ESTIMATED SALES OF THE AEROSPACE INDUSTRY, BY PRODUCT GROUP Calendar Years 1948 to Date
(Millions of Dollars)
Year Product Group Ending TOTAL
December SALES 31 Space Non-
Aircraft Missiles Vehicles aerospace
1948 $ 1,493 $ 1,359 - - $ 134 1949 2,232 2,032 - - 200 1950 3,116 2,731 $ 105 - I 280 1951 6,264 5,067 633 - I 564 1952 10,130 8,442 776 -
I 912
1953 12,459 10,420 918 - 1,121 1954 12,807 10,460 1,194 - 1,153 1955 12,411 9,781 1,513 - I ,117 1956 13,946 10,485 2,206 - 1,255 1957 15,858 11,398 3,033 - 1,427
1958 16,065 10,582 4,036 $ 1 1,446 1959 16,640 9,714 5,042 386 1,498 1960 17,326 9,126 5,762 878 1,559 1961 17,997 8,847 6,266 1,264 1,620 1962 19,162 8,944 6,311 2,182 1,725
1963 20,134 8,527 6,003 3,774 1,830 1964 20,594 8,911 5,242 4,720 1,721 1965 20,670 9,747 3,626 5,329 1,968 1966 24,610 11,951 4,053 5,969 2,637 1967 27,267 14,981 4,417 5,290 2,579
1968r 28,959 16,578 4,719 5,113 2,549 1969r
I 26,126 14,097 5,058 4,272 2,699
1970 24,848 13,232 5,375 3,565 2,676 I
'Revised NoTE: For explanation of "Aerospace Sales" sec "Note" on page 7. Source: Aerospace Industries Association estimates, based on latest available information.
10

As of De- GRAND
c ember ToTAL 31
1960 12,496 1961 13,922 1962 13,138 1963 13,904 1964 15,188
1965 20,385 1966 27,547 1967 29,339 1968 30,749 1969 28,298
1970 24,770
AEROSPACE SUMMARY
BACKLOG OF MAJOR AERoSPACE CoMPANIEs, By PRODUCT GROUP
1960 to Date (Millions of Dollars)
Mis- I Aircraft and siles & Other
ToTAL Engines Snace Aerospace Incl.
u.s. u.s. Propul- u.s. I Govt. Other Govt. Other sion Govt. Other
N.A. N.A. 5,357 2,379 N.A. N.A. N.A. 11,018 2,904 5,056 2,136 3,836 1,391 390 10,572 2,566 4,900 1,672 4,056 992 488 10,950 2,954 4,924 1,887 4,646 837 458 11,651 3,537 5,282 2,515 4,556 913 492
13,731 6,654 6,107 5,281 5,480 1,294 562 15,711 11,836 8, 761 9, 718 4,510 1,588 904 17,750 12,972 20,628" ii, 704 1,712 917 16,343 14,406 8,150 12,409 5,083 1,851 983 14,302 13,996 7,090 12,098 4,337
I 2,002 880
13,080 11,690 6,022 9,676 4,491 2,031 789
NoiJ-aero-space
4,760 1,113 1,030 1,152 1,430
1,661 2,066 1,761 2,273 1,891
1,761
"Of this amount, sales of aircraft to the U.S. Government are $7,071 million; to other customers are $9,306 million. Total engine sales are $4,251 million.
NOTE: Based of!: reports from about 55 aerospace companies. N.A.-Not available. Source: Bureau of the Census, "Current Industrial Reports," Series MQ37D {Quarterly).
SALES oF MAJOR AEROSPACE CoMPANIES, BY PRODUCT GROUP
1960 to Date (Millions of Dollars)
Mis-Year Aircraft and sile.'l &
ending GRAND ToTAL Engines Space De- ToTAL
cember u.s. 31 Govt.
1960 $10,977 N.A. 1961 14,948 $11,766 1962 15,972 12,552 1963 16,407 13,203 1964 16,686 12,815
1965 17,016 12,535 1966 20,227 14,530 1967 23,444 16,334 1968 25,592 16,635 1969• 24,648 16,560
1970 24,976 16,596
r Re\'ised. N.A.-Not available.
Incl. u.s. Pr?pul-
Other Govt. Other s1on
N.A. $4,246 $2,183 N.A. $3,182 3,967 1,888 $5,187 3,420 4,128 1,772 6,078 3,204 4,158 1,459 6,904 3,871 4,568 1,863 6,381
4,481 4,525 2,532 5,819 5,697 5,458 3,267 6,241 7,110 7,141 4,753 6,0:14 8,957 7,411 6,439 6,076 8,088 7,161 5,t03 5,660
8,380 7,654 5,890 5,486
Other Aerospace
u.s. I Govt. 1 Other
N.A. N.A. $1,824 $ 852
1,791 762 1,611 682 1,418 735
1,413 759 1,755 869 1,914 1,002 2,077 1,040 2,539 986
2,349 921
I Non-aero-space
$4,568 1,230 1,441 1,593 1,721
1,968 2,637 2,580 2,549 2,699
2,676
Source: Bureau of _the Census, "Current Industrial Reports, Series l\IQ37D", {Quarterly). Based on information from about ~5 aerospace compani'lll. Includes some duplication because of subcontracting be-tween aerospace compan1e.s. •
11

AEROSPACE FACTS AN D F IGU RES, 197 1/72
AEROSPACE EMPLOYMENT (ANNUAL AVERAGE)
1 ,500 ~------··--------~------~--------rt-------~---~~---
E- Estimated
SOURCE: AEROS PACE INDUSTRIES ASSOC IATI ON
·· - I .. 1 .
- - 1 L
·-:-j .. -- - - -· · ---L - - -. ·:. ~, .. . ·- .. -·

AEROSPACE SUMMARY
EMPLOY:MEXT rx ALL ).1ANUFACTURIXG, DunABLI-: Goons, AXD AIO:ROSPACI·: !NDUSTRH;S
Calendar Years 1960 to Date (Thousands of Employees)
• 13

AEROSPACE FACTS AND FIGURES, 1971i72
ESTIMATED EMPLOYMENT AND PAYROLL IN THE AEROSPACE INDUSTRY Calendar Years 1959 to Date
I I Aerospace as Annual Average Percent
Aerospace Employment Aerospace Payroll of Total
I
I Year Manu-Ending I factur- Manu-Decem- Produc-
I Produc- ing factur-
ber 31 Sal a- tion Sala- tion Em- ing TOTAL I ried ,Worker TOTAL ried Worker ploy- Pay-(Thousands of Employees) (Millions of Dollars) ment roll
1959 1.128 I 455 673 $7,427 $3,692 $3,735 6.8% 8.5% 1960 1,074 467 607 7,317 3,835 3,482 6.1 8.2 1961 1,096 499 597 7,809 4,257 3,552 6.7 8.7 1962 1,177 558 619 8,889 5,045 3,844 7.0 9.2 1963 1,174 594 580 9,102 5,421 3,681 6.9 9.0
1964 1,117 565 552 8,897 5,326 3,571 6.5 8.3 1965 1,133 562 571 9,502 5,429 4,073 6.3 8.2 1966 1,298 612 686 11,394 6,220 5,174 6.8 I 8.!)
1967 1,392 645 747 12,659 6,860 i 5,779 7.2 9.4 1968 1,418 664 754 I 13,748 7,728 6,020 7.2 9.5 I 1969 1,354 1 657 697 14,150 8,189 5,961 6.7 9.0 1970 1,159 581 578 12,834 I 7,666 5,16816.0 8.1
I
Sources· Manufacturing Employment: Bureau of Labor Statistics, "Employment and Earnings" (Month! ) Man~facturing Payroll: Bureau of Employment Security-Office of Business Economics estimates. Xerospace Employment and Payroll: Aerospace Industries Association Estimates, based on latest .avail-able information.
14

AEROSPACE SUMMARY
U.S. ExPORTS AND ExPORTS OF AEROSPACE PRODUCTS
Calendar Years 1912 to Date (Millions of Dollars)
ToTAL Year Exports
Ending of U.S. December l\'lerchan-
31 dise
1912 $ 2,170.3 1915-18 22,176.7 1922 3,765.1 1929 5,157.1 1931 2,378.0
1939 3,123.3 1944 14,161./f 1948 12,523 1950 10,142 1951 14,879
1952 15,049 1954 14,981 1957 20,671 1958 17,745 1959 17 ,451'
1960 20,375r 1961 20,754 1962 20,431 1963 23,062 1964 26,156
1965 27,135 1966 29,884 1967 31,142 1968 34,199 1969r 37,332
1970 42,662
a Less than 0.005 percent. r Revised.
li I
TOTAL
$ 0.1 31.5 0.5 9.1 4.9
117.8 2,818.2
154 242 301
603 619
1,028 1 ,316' 1,059r
1,726 1,653 1,923 1,627 1,608
1,618 1,673 2,248 2,994 3,138
3,400
N.A.-Not available. · ·
II
I
I I
I
E f t\. xpor s o . erospace p d t ro uc s
C'i vii
Military Trans- Other ports
N.A. N.A. N.A. N.A. N.A. N.A. N.A. N.A. N.A. N.A. N.A. N.A. N.A. N.A. N.A.
N.A. N.A. I
N.A. N.A. N.A. N.A.
$ 37 $117 40 202 13 288
18 585 93 526
179 849 147 $ 456 s 713 108 394 557
480 609 637 263 615 773 259 651 1,013 191 541 895 211 553 844
' 353 501 764 421 614 638 611 769 868
1,200 1,089 705 947 1,080 1,111
1,295 1,213 892
I Percent of
I Total 1 u.s.
Exports
a
0.14 a
0.18 0.2
3.8 19.9 1.2 2.4 2.0
4.0 4.1 5.0 7.4 6.3
I 8.5 8.0 9.4 7.1 6.1
I 6.0 5.6 7.2 8.8 8.4
8.0
NoTE: Several changes ha\·e been made in this series ~ver the years so that data for years after 1957 are not strictly comparable with earlier years.
Sources: Bureau of the Census "U.S. Exports, Schedule B Commodity and Country", Report FT 410 (Monthly). Bureau of the Census, "Highlights of U.S. Export and Import Trade" Report FT 990 (Monthly).
15
Year
- ----1957 1958 1959 1960 1961
1962 1963 1964 1965 1966
1967 1968 1969 1970
AEROSPACE F ACTS AND FIGURES, 197 1/72
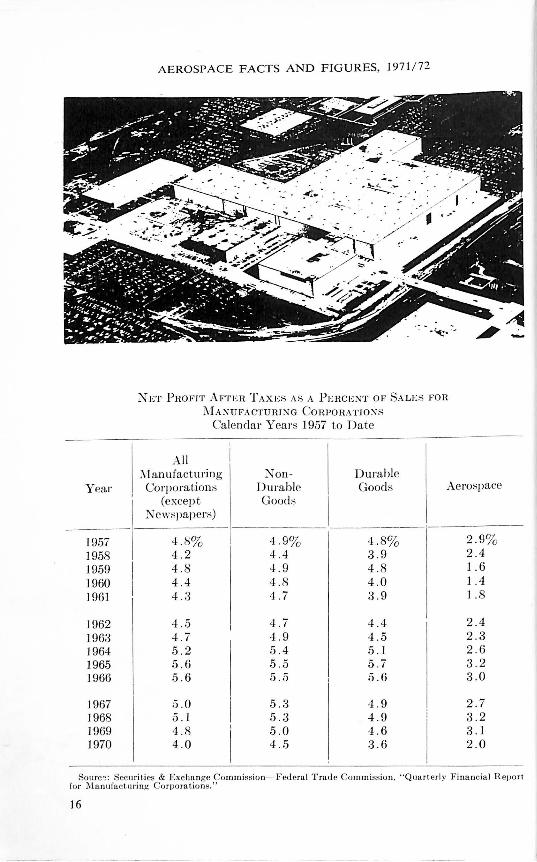
NET Pnorrr AFTEH TAx~-:,; A S .-1. P~-:nc~-::-.;T or S.-\ LI·:s ron .;VIA!'\UFACTUHJXG ConPORATJoxs
Calendar Years 1957 to Date
All Manufacturing Non- Durable Corporation,; Dmable Good:; Aerospace
(except Good:; Newspapers)
--- -----------------------4. 8% 4.9% 4.8% 2.9% 4 .2 4.4 3.9 2.4 4 .8 4.9 4.8 1.6 4.4 4.8 4 .0 1.4 4 .3 4.7 3.9 1.8
4.5 4.7 4.4 2.4 4.7 4.9 4.5 2.3 5.2 5.4 5.1 2.6 5.6 5 .5 5.7 3 .2 5.6 5.5 5.6 3.0
5.0 5 .3 4.9 2 .7 .5 .1 5.3 4 .9 3.2 4 .8 5.0 4 .6 3 .1 4.0 4.5 3.6 2 .0
Sourc'! : Securi Lies & Exchange Commission- Federa l Trad e Commission, "Quart erly Financia l H.eport for l\1 anu fac t.uring C orpora tions."
16

Year Ending June 30
1948 1949 1950 1951 1952
1953 1954 1955 1956 1957
1958 1959 1960 1961 1962
1963 1964 1965 1966 1967
1968• 1969• 1970 1971E 1972E
AEROSPACE SUMMARY
FEDERAL OUTLAYS FOR SELECTED FuNCTIONS Al\"D FOR AEROSPACE PRODUCTS Al\'1) SERVICES
Fiscal Years, 1948 to Date
Federal Outlays (Millions of Dollars)
Total Total National NASA AEROSPACE Defense AimosPACE Products
and Services
$11,983 N.A. s 891 13,988 N.A. 1,474 13,009 N.A. 2,130 22,444 N.A. 2,878 45,963 N.A. 6,075
''" 50,442 s 79 9,204 46,986 90 11' 194 40,695 74 10,470 40,723 71 10,544 43,368 76 12,506
44,234 89 13,160 46,483 145 13,330 45,691 401 13,269 47,494 744 13,866 51' 103 1,257 15,295
52,755 2,552 16,214 54,181 4,171 17,940 50,163 5,093 15,697 57,718 5,933 17,771 70,095 5,426 20,193
80,516 4,724 21,353 81,240 4,251 20,472 80,295 3,753 18,747 76,443 3,369 17,270 77,512 3,152 16,875
AEROSPACE as Percent
of Total
National Defense
and NASA
7.4% 10.5 16.4 12.8 13.2
18.2 23.8 25.7 25.8 28.8
29.7 28.6 28.8 28.7 29.2
29.3 30.7 28.4 27.9 26.7
25.1 23.9 22.3 21.6 20.9
NoTE: "National Defense" includes the military budget of the Department of Defense and Atomic Energy Commission. "NASA Aerospace" includes research and development activities and administrative operations and construction of facilities of NASA. NASA construction is not included in "Total Aerospace Products and Services."
N.A.-Not available. •Revised. EEstimate. • Source: "The Budget of the United States Government" (Annually).
17

AEROSPACE FACTS AND FTGURES, 1971 / 72
D E P:\RTME :'\T O F DE FE :'\ . ' E
T OTAL E xPEX DITUR ES B Y A PPROPR IATI OX G n ou P
Fiscal Years, 1964 to Da te (:VIillions of Dolla rs)
Year E nding .June 30
T OTAL . .... . . . . . .
PROCUR EM E ST ... . . • . • .
A IRCRA FT . . ... . . .. . . .. ... • . . . . ..
IVIrssrLES . . . ... . . . . .
Shi ps . ............ . ........ . .. . Combat Vehicles, Weapons & Torpedoe.~ . . . Ordnance, Vehicles, & Related Equipment . . . E lectronics and Communica tions .. . Other procurement ...... .. ... . . ... ... . .. .
R ESEARCH, DEVE LO PMEXT, Tr·:ST A XD EVA LU.-I.TIO X ..
A IRCRAFT ....
M ISSILES.
A ST RO!\'A UTf CS . . . . . . . ..... .... ....... .
Other . ......... . . ... . . .. . . . . . . . .. . . . . . .. ... . l\IIILITA R Y ASS ISTAX CE . . .. . . ...... . . . .. . .
A IRCRA f 'T AS U :\IrSSILI-:S .. . .. . ... . ..... . . .... . .
Other . . . . . . . . . . . . .. . . .. . .Mili ta ry Construction.. . . .... . . . Fa mily Housing . . . . . . . . . . . ..... ... .. . Civil Defen.-e. . . . . . .. ... . . . . .. .. .. . M ili tary Personnel. . . . . . . . . . . . . . . . . .. . . . . . . .
Active F orces. . . .... .. . . .. . Reserve Forces.. . . . .... . . . Retired Pay. . . . .. . . . . . . . . . . . . . . ... . . . .. .
Operations and iVIain tenance . . . Other ....
18
.,
1964' 1965'
$50 ,786 $47,098
15,351 11 ,839 6, 053 5,200 3, 577 2 ,096 2, 078 l ' 7 13
a a
I ,597 1, 041 I ,264 897
782 893 7 ,021 6, 236
939 1,017 2 ,352 1 ' 901 I , 284 921 2 ,446 2,397 1, 485 1 '229
218 358 l '267 871 I , 026 1,007
580 6 19 107 93
14, 195 14 ,771 12, 3 12 12 ,662
674 725 I ,209 1, 384
II , 932 12, 349 (9ll) (I, 045)

AEROSPACE SUMMARY
DJ·:PART!\11'::-<T m· DJ-:FJ-:xsJ·:
ToTAL ExPJ·:XJ.>ITURJ-:s BY APPROPRIATION GROUP-Continued Fiscal Y ea1·s, 1964 to Date
(Millions of Dollars)
Y ca1· Ending J unc 30 ---·--·-----·------------------------
1966' -----S55, 181 -----
14,339 6,635 2,069 1,479
a
1,642 983
1,531 6,259
976 1,801
930 2,552
968 299 669
1,334 647 86
16,753 14,407
755 1,591
I4, 710 85
t-: l~stimate. r Revised.
1967'
$68,315
19,012 8,411 1,930 1,398
a ,., 3,881 1,284 2,108 7,160 1,048 2,502
983 2,627
873 182b 691
1,536 482 100
I9,787 17,055
902 1,830
I9,000 365
1968' -
$78,027
23,283 9,462 2,2I9 I,356
738 5,709 I,595 2,204 7,747 1,367 2,488 1,221 2,671
601 97b
I 504
1,28I 495 108
21,954 I8,988
871
I
2,095 20,578 1,980 I
'
1969' 1970' 1971E 1972E
$78,666 $77,880 $74,500 $76,000
23,988 21,585 18,447 17,936 9,177 7,948 6,603 6,167 2,509 2,9I2 3,036 3,348 I,949 2,066 1,993 2,268
a 647 460 4I3 6,590 4,973 3,686 3,I97 I,409 I, I82 I ,040 917 2,354 1,857 1,629 I,626 7,459 7,166 7,281 7,504 1,031 I,239 1, 708 1,975 2,410 2,196 2, II5 1 '787 1,I59 753 489 489 2,859 2,978 2,969 3,253
686 609 1,205 I, 110 57b 68 88 96
629 541 I, 117 I ,OI4 1,389 I, 168 I,200 I,523
572 6I4 629 726 87 80 74 77
23,828 25,880 25,092 23,849 20,478 21,977 20,5I6 18,870
907 1,054 1,182 1,235 2,443 2,849 3,394 I 3,744
22,285 21,609 20,380
I 20,23,1
(1,628) (831)' 192 3,041
a Amount included in entry for "Ordnance, Vr.hicles & Related Equipment." 6 Aerospace Industries Association estimate hased on deliveries of aircraft and missiles to the Air l•'orce
and Navy. NoTE: Data in parentheses are minus figures. While the categories printed in capital letters are pri
marily "aerospace" categories, others such as "Operations and Maintenance" and "Electronics and Communications" contain substantial parts attributable to aerospace activities. The term "procurement." is used in the federal budget as applying primarily to "major hard goods." Contract procurement actions eomprise other procurement pro~~trams, such as servic'ifj, fuels and hibricants, etc.
Sources: Department of Defense.
19

Year Ending .J une 30
1960 1961 1962 1963 1964
J965r 1966 1967 1968' 1969
1970' 1971E 1972E
r Revised .
DEPARnmNT oF DEFE:\'SC
AEROSPACe ExPE:l\DI TURE S
F iscal Years 1960 to Date (Millions of Dollars)
I Procu rem en t· DOD
Aerospace Expenditures :\ [ilitary :\Ii li tar.' ·
Fu nction" .-\.!'sistancea
S13,013 s 9,299 $511 13,379 8,870 419 14,359 9,842 367 14 ,302 10,126 445 14,423 ' 9, 630 218
11 ,493 7 ,296 358 12,710 8,704 299 15,056 10,341 182 16 ,854 i 11,681 97 16, .333 11' 686 57
15,116 10,860 68 14 ,039
I 9, 639 88
13,862 0,515 96
Rc=-carch , De,·elopmen t,
Te:; t, and E\·a luation
S3 , 203 ~ . 090 4, 150 3, 731 ~ . 57;)
3,839 3,707 ~ . 533 5,076 ~.GOO
-! , 18R -! , 312
I -!,25 1
E Estimate. a Data on lVlili ta ry Assistance are based on d eliveries of ai rcraft and n1 issil es to A ir Force and Navy.
or on Budget Pla n data . These data are not includ ed in most other tables on Department of Defense expenditures in this book.
Sources : Department of Defense. 11F:\D" R epo rts DeparLment of Defense, "i\ I ili tu ry Assi:-:. ta rH·e Fuels" (Annual ly) ; "The Budget of th e United States Government" (.-\nn ua ll y) .
I Year
Ending June 30
1962 1963 1964
i 1965 1966
1967 1968 1969" 1970"
I 197P: ! I
1972 1';
I ~ E st imaLe.
NEW 0BLIG ·\TIONAL AUTHORITY FOR AEROSPACE PRODUCTS ANO SERVICJ.:S
F ISCA !J YE.~RS 1962 TO DATE (Millions of Dollars)
DEP .-\RTME NT ()f' DEFEi\SJ.:
ToT.\L I
Total Ai rcraft; Missiles
-----
$14,874 $13,077 s 6,591 s 5,604 s 17,738 14,112 6,499 6,415 19,059 14,013 6,649 6, 107 17,632 12 ,464 7,025 4,550 20' 178 15,083 10,463 ' 3,541
21 '191 16,329 10 ,737 4,650 21,034 16,581 10,641 4,897 18,350 14 ,528 7,593 5,863 17,945 14,082 8,005 5,439 16 ,984 13,715 7 ,823 5 ,425
17 ,942 14,671 8,389 I 5 ,783 ! I I
a Exclud es trans fers fro m stock funds .
I NAS:\
Aslro-nal!t ics
882 s 1,797 1 ' 198 3,626 1 ,257 I 5,046
889 5, 168 1 ,079 i 5 ,095
!)42 4,8G2 1 ,043 4,453 1 ,072 3,822
638 3,863 4G7 3,269
4!)9 I
3,271
Source: Department of Defense, J>ress Package, Ja nuary 29, 1971, Reports "F :\ D" 0-17. 0 ·18, Feb ruary 2, 1970, a nd earli er r eports. N .~ SA Budget Press ConferPrwe, .January 28, l!l71.
20

AEROSPACE SUMMARY
A c T I VE lVliLIT.\H Y Fonc E s O F T HI; U N I TED ST,\ TES
1964 and 1970 to Date
Actua l E s tima ted
De:scrip l iou
lVIilitary pcr:sonnel (in thousands) : Army .. ......... . . .... . .... .. . Na vy .. . . .. . . . . . . . . ... . . .. . . . . .. . Marine Corps . .. . . . . .... . . ... . .. . Air Force . . . . . . . . . . . . . . . .
ToT.\ L, Department of Defense .. .Selected milit a ry forces:
.Strategic forces : In tercontinental ba lli:sLic mi:ssiles :
r--Iinuteman . . . . . . . .... . Ti ta n II ... ... . .
Polaris-Poseidon i\li ::;siles . . . . .. . . .Stra tegic bombers (AAI J . ... . . .. . Manned fighter interceptor
squadrons . . ... . . Army air defen se firing b:Ltleries .
G eneral purpose forces : Army division:; . . . . . . . . . . Marine Corps division:; . ... . .. .. . Air Force wings . . . , • .... . .. . . . . . . . Nav_v n,ttn ck \\'ing::; .. . ........ . . . Marine Corps wings ... . Attack & a.ntisubnm rine carrier::; . . . N uclear attack submarine~ .. . . . .. . E ::;co rL ships .... .. .. .. .. . Amphibious Hs:sault :ships ... . .. .. . . Airlift. n.nd Senlif t forces :
Aircraft squadron:; : C-5A .. ... . . . . C-133, C-141, C-11 8, C-1 24,
C-1 30, C-135. Troopships, ca rgo :ships, and
tankers.. . . .. . . . . ..... . . . .
June 30,
I June 30,
1964 1970
972 1 , 322 667 693 190 260 856 791
---- -2 , 685 3 , 066
600 1' 000 54 54
336 656 1, 277 516
40 14 107 40
16!·3i 17J-5 3 3
22 23 15 13 3 3
24 19 19 46
265 231 139 99
- 1
32 17
100 113
Source : D epa rLmcnt o f Defense, OASD (CompLroll e r), January 29, 1971.
June 30, June 30, 1971 1972
1,107 942 623 604 212 206 757 753
--- -- - - ---2, 699 2,505
1 , 000 1, 000 54 54
656 656 552 510
11 11 21 21
13% 13)3 3 3
21 21 12 11 3 3
18 16 53 56
226 227 82 76
2 4
15 13
105 98
21

---AEROSPACE FACTS AND FIGUR ES, 1971/72
.\IHCH.uvr 1:-1 OrEHATIOX ON WoRLD C IVIL AmLIX I·:s, I\uMBt:R .\XD l'En CE X'l'AGE
.\ I A:'>iUFACTUREV IX THE Ul\' JTJ::!) STATES
Calendar Years 1958 to Da te
I I ::\umber Percent
Year Ending ToTAL .i\Ianufactured Manufactureu December 31 .·\mCRAFT in the in the
1:-1 0PERATI O!\' United Sta tes United States - ---
1958 3,402 2,819 82 .9% 1959 3,479 2,868 82.4 1960 3,376 2 ' 7(:i(j 81.9 1961 3,319 2,542 76 .6 1962 3, 162 ~,345 74 .2
1963 3,086 2,2(i(j 73.4 1964 3,137 2,317 73.9 1965 3,461 2, 548 73 .6 1966 3 ,541 2,55(i 72.2 1967 3, 725 2, 735 73.4
1968 3,903 2,890 74. 0 1969 3, 999 :~, 030 75 .S
NoTE: Based on reports by members of the In ternat io nal Air Transport :\ s~oc ia ti o n . Exclud Ps U.S .S .H .. a nd China.
Sot rrce : f n ternaticl flf\ 1 Ai r T ra nsport Associa tion.
22

0
Aircraft Production
Aircraft production in the United States dropped sharply in 1970 for the second consecutive year-from an estimated 16,997 airplanes in 1969 to an estimated 10,758, a decline of 37 percent.
Commercial air transport production fell from 514 in 1969 to 311 in 1970, a drop of 40 percent.
In general aviation there was a similar decline-from 12,456 units to 7 ,283, or almost 42 percent.
Even production of commercial helicopters, which had risen slightly from 1968 to 1969, dropped 10 percent-from 534 aircraft to 482. (As was the case in 1969, no figures were available on 1970 production of military helicopters.)
Combined aircraft sales actually rose-from $12.8 billion in 1969 to
23

AEROSPACE FACTS AND F IGURES, 1971/72
.\JHCHA~vr IN 0PJ::HATIO:'\' ON \VORLD CIVIL AmLIXES, 1\uMBI::R .-1:\D PJ·: nCE :\'fAGE: !'ILANUFACTURED Di THI' U;.;JTJ;D STATES
Calendar Years 1958 to Date
::\umber Percent Year Ending TOTAL Manufactured Manufactured December 31 AIRCRAFT in the in the
I:\' OPERATIO N United States Un ited States ---~-
1958 3,402 2,819 82.9% 1959 3,479 2,868 82.4 1960 3,376 2,76G 81.9 1961 3,319 2,542 76.6 1962 3, 162 ~,3-!5 74.2
1963 3,086 2,2GU 73.4 1964 3,137 2,317 73.9 1965 3,461 2,548 73.6 1966 3,541 2,556 72.2 1967 3,725 2,735 73 .4
1968 3,903 2, 890 7-1. 0 1969 3,999 :) ,030 75 .8
NoTE : Based on repo rts by memb ers o f Lh e In ternatio na l :\ir Transpo rt Assoc iation. F.x e lud Ps U.S.S. H .. a nd C hina .
So urce: In ternationa l Air Transport Associat io n.
22

--------
•
0
Aircraft Production
Aircraft production in the United States dropped sharply in 1970 for the second consecutive year-from an estimated 16,997 airplanes in 1969 to an estimated 10,758, a decline of 37 percent.
Commercial air transport production fell from 514 in 1969 to 311 in 1970, a drop of 40 percent.
In general aviation there was a similar decline-from 12,456 units to 7,283, or almost 42 percent.
Even production of commercial helicopters, which had risen slightly from 1968 to 1969, dropped 10 percent-from 534 aircraft to 482. (As was the case in 1969, no figures were available on 1970 production of military helicopters.)
Combined aircraft sales actually rose-from $12.8 billion in 1969 to
23

$13 .5 billion in 1970, or more than 5 percent. Military aircraft sales rose by nearly $500 million, and commercial sales by nearly $200 million, the latter mainly because of sales of the wide-bodied 7 4 7 jet transport.
The backlog of total aircraft orders declined substantially, however, froni $19.2 billion in 1969 to $15 .7 billion in 1970, or about 18 percent. More than $2.4 billion of the decline was caused by reductions in commercial orders, while military orders fell off by slightly more than $1 billion.
Year Ending December 31
1909 1910 1911 1912 1913
1914 1915 1916 1917 1918
1919 1920 1921 1922 1923
1924 1925 1926 1927 1928
1929 1930 1931 1932 1933
1934 1935 1936 1937 1938
24
U. S. AIRCRAFT PRODUCTION
Calendar Years 1909 to Date (Number of Aircraft)
TOTAL Mili tary
N.A. 1 N.A. -N.A. 11
45 16 43 14
49 15 178 26 411 142
2,148 2,013 14,020 13,991
780 682 328 256 437 389 263 226 743 687
377 317 789 447
1,186 532 1,995 621 4,346 1,219
6,193 677 3,437 747 2,800 812 1,396 593 1,324 466
1,615 437 1,710 459 3,010 1,141 3,773 949 3,623 1,800
(Continued on next page)
Civi l
N.A. N.A. N.A.
29 29
34 152 269 135
29
98 72 48 37 56
60 342 654
1,374 3,127
5,516 2,690 1,988
803 858
1,178 1 '251 1,869 2,824 1,823

Year Ending December 31
1939 1940 1941 1942 1943
1944 1945 1946 1947 1948
1949. 1950 1951 1952 1953
1954 1955 1956 1957 1958
1959 1960 1961 1962 1963
1964 1965 1966 1967 1968
1969E
I 1970E
AIRCRAFT PRODUCriON
AIRCRAFT PRODUCTION
1909 TO DATE (cont'd) (Number of Aircraft)
TOTAL Military
5,856 2,195 12,813 6,028 26,289 19,445 47,675 47,675 85,433 85,433
95,272 95,272 48,912 46,865 36,418 1,417 17,739 2,122 9,838 2,536
6,137 2,592 6,200
I 2,680
7,532 5,055 10,640 7,131 13,112 8,978
11,478 8,089 11,484 6,664 12,408 5,203 11,943 5,198 10,938 4,078
11,076 2,834 10,237 2,056 9,054 1,582 9,308 1,975
10,125 1,970
12,492 2,439 15,349 2,806 19,886 3,609 19,141 4,481 19,376 4,400
16,997E
I 3,800E
10,758E 2,900E
I
I
I NoTm: 1950 to date excludes aircraft produc~ for the Military Assistance PrograiDe BEstimate. N.A.-Not available.
Civil
3,661 6,785 6,844
--
-2,047
35,001 15,617 7,302
3,545 3,520 2,477 3,509 4,134
3,389 4,820 7,205 6,745 6,860
8,242 8,181 7,472 7,333 8,155
10,053 12,543 16,277 14,660 14,976
13,197 7,858
Sources: Aerospace Industries Association, "Aerospace Facts and Figures" (Annually), Department of Commerce, Bureau of the Census, "Current Industrial Reports, Series M37G" (Monthly). Department of Defense.
25

AEROSPACE FACTS AND FIGURES, 1971/72
AIR:CRAFT SALES AND BACKLOG, REPORTED BY MAJOR MA:-1UFACTURERS OF Col\lPL~~TI~ AIRCRAFT, AIRCRAFT ENGINEs, PROPELLERs, AND PARTs
Calendar Years 1948 to Date
(Millions of Dollars)
'Revised. a Three quarters only. NoTE: 1948 to 1960 based on reports from about 48 companies-all companies known to be engaged in
the manufacture of complete aircraft, aircraft engines, and aircraft propellers. After 1960, based on reports from about 55 aerospace companies.
Source: Bureau of the Census, "Current Industrial Reports," Series l\IQ37D (Quarterly).
l

-
AIRCRAFT PRODUCTION
AmcR,\FT SALES IIY MAJOR J.\ll.o~.NUFAcTURERS OF CoMPLETE AIRCRAFT, AIRCRAFT ENGINES, AND pARTS Calendar Years 1948 to Date
(Millions of D.>llars)
Aircraft Aircraft Engines Year Total End- -ing
I Dec. 'faTAL u.s. Other 31 Gov't
19486 s 1,061 $ 884 I $ 177 1949 1,668 1,438 230 1950 2,116 1,878 238 1951 2,872 2,525 347 1952 5,654 5,004 650
1953 7,760 7,026 734 1954 7,471 6,649 822 1955 7,231 6,445 786 1956 7,689 6,523 1 '166 1957 9,482 7,884 1,598
1958 8,661 7,289 1,372 1959 7,236 5,395 1,841 1960 6,429 4,246 2,183 1961 I 5,855 3,967 1,888 1962 5,900 4,128 1,772
1963 5,617 4,158 I 1,459 1964 6,431 4,568 1,863 1965 7,057 4,525 2,532 1966 8,725 5,458 3,267 1967 11,894 7,141 4,753
1968 13,850
I 7,411 6,439
1969• 12,764 7,161 5,603 1970 13,544
I 7,654 I 5,890
" Includes Aircraft Propellers and Parts. 6 Total for the last 3 quarters of 1948 only. r Revised.
I
I
& Parts" & Parts
' u.s. Other u.s. Other
Gov't Gov't
s 662 $ 134 $ 222 $ 43 977 183 461 47
1,317 174 561 64 1,746 247 779 100 3,564 481 1,440 169
'
4,837 545 2,189 189 4,777 632 1,872 190 4,717 581 1,728 205 4,805 849 1,718 I 317 5,747 1,208 2,137 390
5,431 1,051 1,858 321 4,127 1,433 ' 1,268 408 3,333 1,766 913 417 2,946 1,455 1,021 433 2,998 1,389 1,130 383
2,986 1,055 1,172 404 3,502 1,409 1,066 454 3,393 1,950 1,132 582 4,086'. 2,544 1,372 723 5,345 3,737 1,796 I ,016
5,697 5,188 1,714 1,251 5,382 4,517 1,779 1,086 5,676 4,683 1,978 1,207
NoTE: 1948 to 1960 based on reports from about 48 companies-all companies known to be engaged in the manufacture of complete aircraft, aircraft engines and aircraft propellers. After 1960. based on reports from about 51? aerospace companies. Includes some duplication because of subcontracting between aeroapace compa.mes.
Source: Bureau of the Census, "Current Industria.! Reports, Series MQ37D" (Quarterly).
27

AEROSPACE FACTS AND FIGURES, 1971/72
AIRCRAFT B .\CKLOG OF ORDERS Rc:PORTED HY i\1 .\JUU M .\ NU FACTunc:ns OF C uM!'LC:TJ::
D ec. 31 : I I
TuT.\L
----1948 s 2,!)83 1949 2,853 1950 4,717 1951 11,898 1952 16 ,692
1953 15 , 928 1954 13,755 1955 13,864 1956 16,000 1957 12,363
1958 10,182 1959' 8,121 1960 7,736 1961 7, 192 1962 6, 572
1963 6,811 1964 7, 797 1965' 11,388 1966 18,479 1967 20,628
1968 20,559 1969' 19,188 1970 15,698
AIRCH,\FT, A IHCRAFT ENG I NES AND PARTS 1948 to Date
(Millions of Dolla rs)
Tota l Aircraft & Parts"
u.s. u.s. Govern- Othe r Govern- Other
ment men t
s 2,817 s 166 s 2,058 s 139 2,708 145 1,998 106 4,287 430 2,888 359
10,899 999 7,549 818 15,626 1, 066 10,634 886
14,984 944 11 ' 031 I 791 12,835 920 10,029 797 11,553 2,311 8,823 1,980 12 ,299 3, 701 8,983 2,952 8,942 3,421 6,563 2,831
6,933 3,249 5,454 2, 710 5,476 2,645 4,479 2,225 5,357 2,379 4,101 2,031 5,056 2,136 3,968 1, 678 4 , 900 1,672 3, 736 1,309
I
I 4,924 1, 887 3,844 1,457 I 5, 282 2,515 4, 290 l , 987 6,072 5,316 4,425 4,460 8,761 9,718 6 ,515 8, 140
20,628 7, 071 9,306
8 , 150 12,409 5,999 10,609 7,089 12,099 5,270 10,340 6,022 9,676 4,666 8 , 601
Aircr:tfL Engine:; & Part:;
u.s. I Go vern- Other
m en t ----
s 75!) s 27 710 3!)
1,3!)!) 71 3,350 181 4,992 180
3,953 153 2,806 123 2, 730 331 3 ,316 74!) 2, 379 590
] ,47!) 539 997 420
1,256 348 1,088 458 1, 164 363
1, 080 430 9!)2 528
1,647 856 2, 246 1,578
4, 251
2,151 1 ,suo 1, 819 1, 759 1,356 1,075
NOTI:: : 194 8 lo 1960 based on reports from about 48 compani es- a ll companies kno wn to be engaged in the manufact ure of co mpl ete a ircraft, aircraf t engines a mi a ircra ft propell ers. After 1!)60, based on reports from about 55 aerospace companies .
a Including "Aircraft Propellers and Part.s." r Revised . Source: Bureau of the Census, 11Current Industrial llcport..s , Seri es l\'IQ37D ", (QuarLcrly ).
28

AIRCRAFT PRODUCTION
DEPARTl\IENT OF D EFEKSE
ExPEKD ITURE3 FOR AIRCRAFT PROCUREMEKT, BY AGEKCY
Fiscal Years 1951 to Date .. , (lVIillions of Dollars)
I Total Defense I Year E nding June 30 I Department
1
1951 I $2,412 1952 4,888 1953 8, 189 1954 9,080 1955 8 ,804
1956 7,835 1957 8,647 1958 8,793 1959 7,730 1960 6,272
1961 5,898 1962 I 6,659 1963 6 ,309 1964 6,053 1965 5,200
l9GG 6,635 1967 8,411 1968 9,462 1969 9' 177 1970 7,948
l971E 6,603 l972Jo: 6 ,167
N.A. - No t a va ila b le. E Estimate.
Air Force
S1, 812 3,633 N.A . N .A. N.A.
N .A. N .A. N.A . N.A. 4,414
3,926 4,387 3,746 3,894 3, 115
4 ,074 4,842 5, 079 5,230 :!, .623
3 ,946 3,518
I
Navy
s 594 1,205
I N.A. N.A . N .A.
N .A. N .A. N.A. N.A. 1,765
1, 832 2, 102 2,328 1,859 1,739
2,021 2,607 3,244 2 ,821 2,488
2,119 2 ,362
Army
s 7 51
N.A. N .A. N.A .
N.A. N.A . N.A. N.A .
93
141 170 234 300 346
540 962
1 ' 139 1 '126
837
538 287
Source : D epa rtment of D efe nse, R Pport "F,\ D 67G", Jan uary 2n, 1971, a nd curli er reports.
29
Year Ending
Decem-her 31
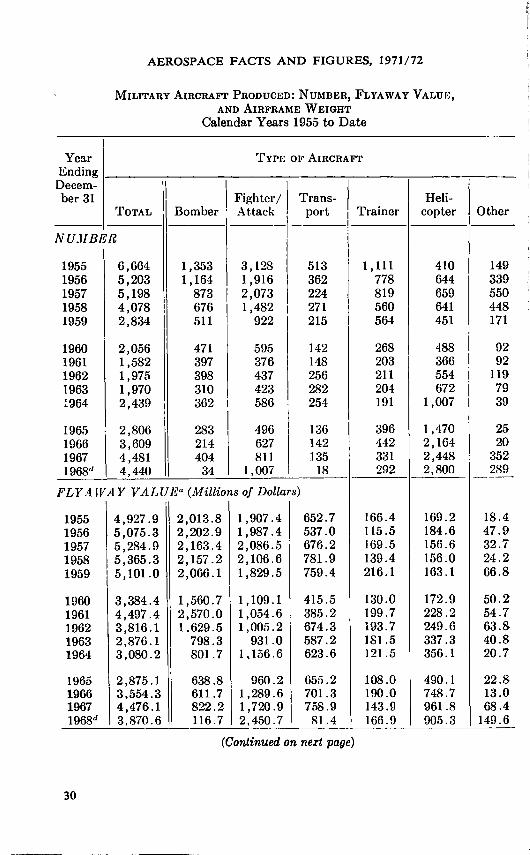
AEROSPACE FACTS AND FIGURES, 1971/72
MILITARY AIRCRAFT PRODUCED: NuMBER, FLYAWAY VALur,;, AND AIRFRAME WEIGHT
Calendar Years 1955 to Date
TYPE OF AIRCRAFT
11 I Fighter/ I I Trans- Heli-TOTAL Bomber · Attack pmt I Trainer copter
NUJIBER !
1955 6,664 1,353 3,128 513 1 '111 410 1956 5,203 1,164 1,916 362 778 644 1957 5,198
I 873 I 2,073 224 819 659
1958 4,078 I 676 I
1,482 I 271 560 641 1959 2,834 511 922 215 564 451
1960 2,056 471 595 142 268 488 1961 1,582 397 376 148 203 366 1962 1,975 398 437 256 211 554 1963 1,970 310 423 282 204 672 !964 2,439 362 I 586 254 191 1,007
1965 2,806 283 496 136 396 1,470 1966 3,609 214 627 142 442 2,164 1967 4,481 404 811 135 331 2,448 1968cl 4,440 34 1,007 18 292 2,800
FLY A. IV AY VALUBa (Millions of Dollars) '
1955 4,927.9 2,013.8 1,907.41 652.7 166.4 169.2 1956 5,075.3 2,202.9 1,987.4 537.0 115.5 184.6 1957 5,284.9 2,163.4 2,086.5 . 676.2 169.5 156.6 1958 5,365.3 2,157.2 2,106.6 781.9 139.4 156.0 1959 5,101.0 2,066.1 1,829.5 759.4 216.1 163.1
1960 3,384.4 I 1,560.7 . 1,109.1 415.5 130.0 172.9
1961 4,497.4 2,570.0 1,054.6 385.2 199.7 228.2 1962 3,816.1 1.629.5 1,005.2 674.3 193.7 249.6 1963 2,876.1 798.3 931.0 587.2 181.5 337.3 1964 3,080.2 801.7 1 '156. 6 623.6 121 .5 356.1
1965 2,875.1 638.8 960.2 655.2 108.0 490.1 1966 3.554.3 611.7 1,289.6 701.3 190.0 748.7 1967 4,476.1 822.2 1,720.9 758.9 143.9 961.8 1968d 3,870.6 116.7 2,450.7 81 .4 166.9 905.3
(Continued on next page)
30
;
Other
149 339 550 448 171
92 I 92
119 79 39
25 20
352 289 ---
18.4 47.9 32.7 24.2 66.8
50.2 54.7 63.8 40.8 20.7
22.8 13.0 68.4
149.6 -

AIRCRAFT PROD UCTION
:\1JLITARY AIRCRAFT PRODUCED: NUMBER FLYAWAY VALUE AND AIRFRAME WEIGBT-Co~tinued ,
Calendar Years 1955 to Date
y ear T YPE OF A IRCRAFT Ending Decem-
be r 31 Fighter/ Trans- Heli-TOTAL l3omber Attack port Trainer copter Other
A IRFRAME li'EIGHTc (Millions of Pounds)
1955 ll4.3 I 39.9 43.2 20.9 7.4 b 2.9 1956 90 .0
I 38.6 30.6 13.1 3.3 b 4.4
1957 79.4 32.7 28.7 9 .3 4.2 b 4.5 1958 66.1 25.2 18 .0 15.9 3 .1 b 3.9 1959 51.8 18.6 12.9 14.6 3.5 b 2.2
1960 35.8 13 .6 9.1 9.7 1.1 b 2.3 1961 29.6 11.9 6.1 8.3 0.9 b 2.4 1962 •• 35.6 10 .3 7.4 13.2 1.3 b 3.4 1963 32.1 4.1 8.2 14 .5 1.3 b 4.0 1964 38 .7 5.6 12.4 15 .1 1.1 b 4 .5
1965 3:3.9 4.7 10.7 10.8 1 .4, b 6.3 1966 44.1 4.4 12.6 14.0 1 .8 b 11.3 1967 41.3 4.2 11 .7 13.0
I 1.9 b 10.5
1968d I 39.4 1 .8 20 .9 3.0 1.6 b 12. 1 I
NoTE: Data exc lud e g liderR and targets. a Va lues up to HHH, are based on unit prices in latest production contracts and do not in c lud e ,·nl uc9
of spares, spare parts , a nd other s upport eq uipment. Since 1961, datn inc lude spares, spnre parts, a nd sup· port eq uipment that a re procured with th e basic aircraft.
b Airfram e weight of helicopters is inc luded in the "other" category . c Airframe weight includ es aircraft produced for 1\1ilitnry Assistance and other federa l agencies . d 1955-1967. Na,·y attack planes included with Bombers ; 1968, Na,·y attack p lanes included und er
Fil!hter/ Attack. Source: Department of Defense. Data r~l eased wi th n t\\·o-ynar lag fo r security reasons.
31

AER OSPACE FACTS AND FIGURES, 1971/72
FLY,\W,\Y ,\ ND V'iTEAPON SYSTEM Cos T OF M uxr,\HY AIRCRAFT PRODL"CED (By D epartment, Type and Model)
Calendar Year 1968 (Dollar Figures in Millions)
D epa rtmen t , T y pe a nd Model
D EP,\RTMEN T OF D EFE NS Ec- To tal . ..
Am FoRCE- T o trtl. . ... . . . . . . . . . . . Bombers (FB-111 ) . . . . . . .. . . . . Fighter/ At tack . . . . . . . . . . . . . . . . . .
A-7 .. ... . . . . . . . . . ••• 0 . . . . . . .. A-37 . . . . . . . . . . . . . . . . . . . . .. .. F-4 .. . . . . . . . . . . . . . . . . . . . . . ... RF-4... . . .. . . . . F / RF-5 ... . .. . ... ...... ... ... ·I F-111. ... .. . . . .. .. . .
Transpo rts . . .. .. . ... . . . . . C-141. C-9 . .. .
Tra iners . . . .. . .. . .... .. . . . . . . . . . T-37.. . . . .. . . T -38 . . . .. ... . . . . ...... . . ... . . . T-41 . .. ... . . . .. ... .
I-Ielicopters . . . . . . . . . . . . . .. . . . ... 1
UI-I-1. C H-3 . HH-3. I-IH-53 . .. ... . .
Utili ty .. .. . . . . . . . 0 -2 ... . . . . . .. . . OV-10 . . . .. . . . . U -17 .. . .... . . . . . .. . . .
ARMY- Tota l . H elicopters.
AH-1. U H -1 . . OFI-6 . TH-13 . .. .... . .. . . .... . . . . . . . . C H-47 . C H -54 . .. . . . . . . . . . . . . . . . . .. . . . TH-55 .
Other . OV-1 ... U-21 .
.. . .II
N umber
4, 440
823 2
446 5
47 276
43 10 65 10
3 7
195 84 92 19 37 12
1 16 8
133 35 91
7 2 , 626 2 , 565
419 796 737 151 120 30
312 fil 37 24
I
(Conti nued on next page)
32
F lyaway Costa
S3 , 871
1, 433 16
1 , 214 80 26
535 98 8
467 43 16 27 71 14 57
40 4 1
16 19 49
3 46
732 677 191 197 56 11
151 60 11 55 47
8
I I
\\' ea pon Sys tem Cos t b
S4 , 560 -----
1,824 25
1 , 585 104 27
812 108
8 526
44 17 27 76 15 61
d
42 4 I
16 21 52
4 48
737 682 191 Hl7 57 ]]
153 62 ]]
55 47
8

AIRCRAFT PRODUCTION
FLYAWAY AND 'VEAPON SYSTEM CosT OF :1\'liLlTARY AIRCRAFT PRODUCED-Continued (By Department, Type and Model)
Calendar Year 1968 (Dollar Figures in Millions)
Department, Type and Model
NAVY-Total. .................... . Patrol (P-3) .................... . Attack ......................... .
A-4 .......................... . A-6 .......................... . EA-6 ........................ . A-7 .......................... .
Fighters ........................ . F-4 .......................... . F-111 ........................ .
Transports ..................... . LC-130 ...................... . EC-130 ...................... .
Trainers ....................... . T-2 .......................... . TC-4 ........................ . T-39 ......................... . TA-4,p;;.· ..................... .
Utility "\uV-10) ................. . Helicopters ...................... I
UH-1 ......................... I SH-3 ........................ . CH-46 ....................... . CH-53 ....................... . TH-57 ....................... .
Number
991 32
343 64 98
1 180 218 217
1 8 1 7
97 29
7 3
58 95
198 24 28 92 14 40
Flyaway Costa
1,706 101 667 67
312 5
283 570 543 27 38 4
34 .96 20 19 3
54 45
189 7
30 127 20 5
Weapon System Cost&
1,999 154 793 76
349 6
362 632 599 33 45
4 41
101 21 19 3
58 55
219 8
35 147 24 5
a Flyaway Cost includes airframe, engines, electronics, communication, armament and other installed equipment.
I• \Veapon System Cost includes flyaway items, initial spares, and ground equipment and training equipment. ·
c Data exclude aircraft produced for Militar\· Assistance and U.S. Coast Guard. d Less than $1,000,000. · Source: Department of Defens ... Data released with a two·year lag for security reasons .
...
33
AEROSPACE FACTS AN D FIGURES, 1971/72
,,
c;~\i?;; . ~ ·:· : .
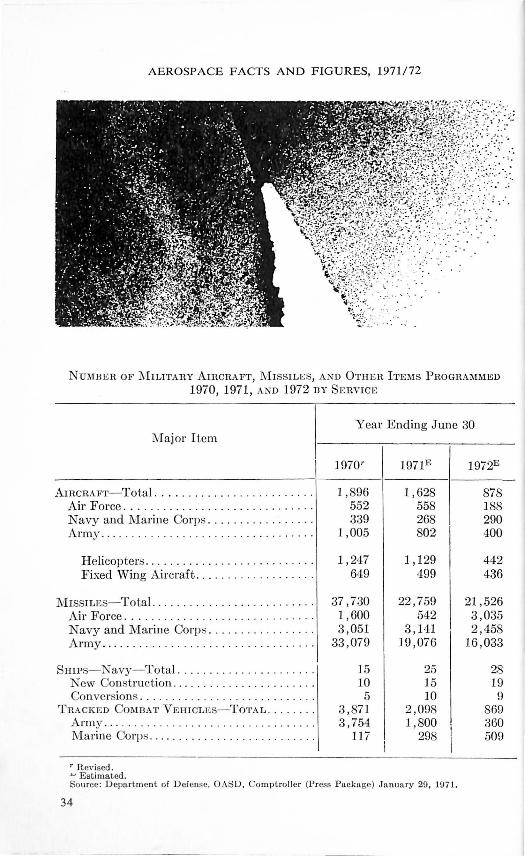
NUMBER OF :i\lhLITARY AIRCRAFT, MISSILES, AND OTHER ITEMS PROGRAMMED 1970, 1971, AND 1972 BY SERVICE
Major Item
AIRCRAFT- T otal .. . . . .......... . . . . .. . . . . A ir F orce . . . ......... .... . . . .. . . ...... . Navy and Marine Corps .... ..... . .. .. . . . Army ..... . . .. . . .. .... ... . .. . ... . . .. . . .
H eli copters ........ . ... . . . . . .. .. . . . .. . Fixed W ing Aircraft . .. .. ... . . . .. ... . . .
MISSILES-Total .. . . . ... . . . .. . . .. . . . ..... . Air Force ... . ...... . ... . .. . . . ...... . .. . Navy and Marine Corp:; . ... . .... . . .. . . . . Army ......... .. ......... . . .. . . . ... . . . .
SHIPS-Navy-Total. .. .. . . .. . ... . . . . .... . New Construction . .. ... . . ... . . ... .. . . . . . Con versions . .. ... . . .. . . . ......... . . . . . .
TRACKED COMBAT VEHICLES-TOTAL .. ..... . Army... . ....... . ..... ... . .... . .. . . Marine Corps .. .. .. . .... . ............ .. .
r R ev ised. ~ Estimated.
Year Ending June 30
1970r
1 ,896 552 339
1,005
1,247 649
37,730 1,600 3,051
33,079
15 10
5 3 ,871 3,754
117
1,628 558 268 802
1,129 499
22,759 542
3,141 19,076
25 15 10
2, 098 1 ,800
298
878 188 290 400
442 436
21,526 3,035 2,458
16,033
28 19
9 869 360 509
Source : Department of D efense, OASD, Comptroll er (Press P ackage) J a nua ry 29, 197 1.
34

AIRCRAFT PRODUCTION
PRODUCTION OF COMMERCIAL" TRANSPORT AIRCRAFT 1963 to Date
(Fixed Wing, Multiple Engine)
Company 1963 1964 1965 1966 1967 1968 and Aircraft
---------------TOTAL ............. 100 163 233 344 480 702
---------------Boeing
707 ............... 28 32 54 77 113 111 720 ............... 6 6 9 6 5 -727 ................ 6 95 112 135 115 160 737':'.' .............. - - - - 4 105 747 ................ - - - - - -
Convair 880 ................ 14 - - - - -990 ................ 15 - - - - -
F airchild F-27 ............... 6 5 12 3 3 -FH-227 ............ - - - 27 35 6
L ockheed 130 ................ 6 - 10 11 9 25
l\ 1cDonnell Douglas DC-8 .............. 19 20 31 16 41 102 DC-9 .............. - - 5 69 155 193
0 ther ............... - I 5 - - - -
--
1969 1970
------514 311 ------
59 19 - -
115 54 114 37
4 92
- -- -
2 -- -
13 25
85 33 122 51
- -I
"Commercial transport totals differ from FAA totals for "Transports" because the FAA totals includ 1 some executive and other transports for other than commercial use.
Source: Aerospace Industries Association, company reports •
... 35

AEROSPACE FACTS AND F IGURES, 1971 / 72
Transports
T o TAL Onu~-:n;; r-on J leT THA:\;;POHT"
(Domestic and Foreign) _-\.s of D ecember 3 1, 1970
T OT A L
Aircraft for D eli very in
I 97 1 or Later
.. ... .. .. . . . . . . . I N umber of aircraft. Value-million doll a rs" . . .. .
634 S9,319
D ome,.;ti c Order,.;
336 S5 , 182 I
1
I
----- --1---- -N umber of Transport _-\.ircra ft
Boeing ! B-707.. . . .. . . . ... . .... . . . . . . I B-727..... . . . . . . . . . . . . . . . . . . . . .. . J
B-737. .. . . . . . . . . . . . . . . . . . . I B-747 .... .. . ... . ... . . . . . . . . . .. . . .. . 1
Lockheed L-1011 .... L-100-30 .
:V[ cDonnell Douglas D C-8 . . . . . D C-9 . .. . DC-10 ... . . . .. .......... . . ..... . . . .
a Dollar yaJu e excl11d es the cost o f spare pans . ::)mu ce: A erospace Intlus l ri cs .Assoc ia ti on , compa ny repo r t ~ .
36
5 0 38 5 17 I
lOS 38
178 12R 1 J
16 0 33 5
23S 158
Foreign O rders
298 S-± , 137
;)
33 16 70
50 0
16 2S so
AIRCRAFT PRODUCTION
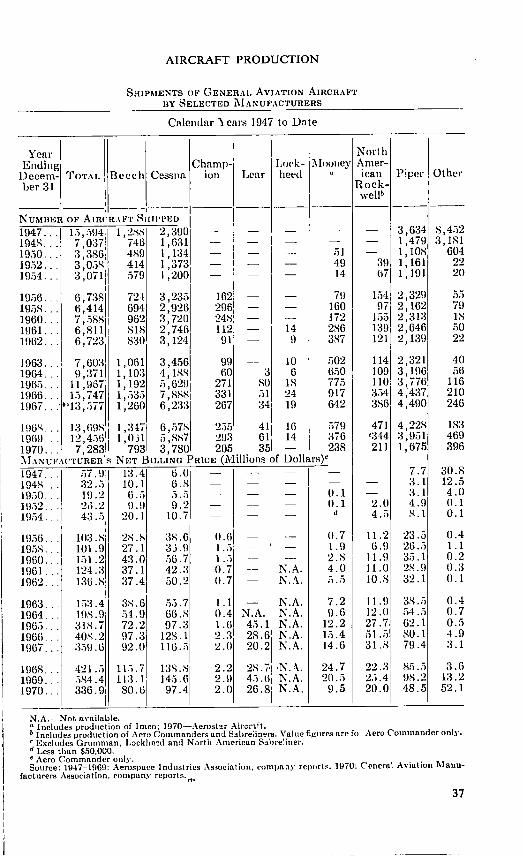
SHIPliiENTS OF GENERAl. AVIATION AIRCRAFl' BY SELECTED MANUFACTURERS
Calendar\ ent"!l I947 to Date
Yeat· I I 1 I North Ending Champ-' Lork- l\Iooney Amer-
Decern- ToTAL
1
Beech Cessna ion Lear het-d • ican Piper Other bet· 31 Rock-
wellb
NUMBER 0~ ~IR~'~;~-~---~------1947... 1a,•J9411 ,~llS 2,::l90 - - - - -I94S... 7,0:~7 746 1,631 - I - I - - -1950... 3,386 4S9 I' t:34 - - I - :il -I952... 3,Q.jR 414 1,373 - - - 49 3!1 1954... 3,onj .'l79 1 .~oo - - - I4 ti7
19;')6 .. . 19.'lS .. . 1960 .. . 1961. .. 1962 ...
1963 ... I 1964 .. . 1965 .. . 1966 .. . I967 ... '
I 6,73S ~,~I~ t ,aSS 6,SI1 6,723
7,60) 9,a11l
I1 ,967' 1·i, 747
'I3,'>77
724 694 962 IllS 830
1,061 1,10:1 1,192 1 ,;i3il 1,260
3,235 2,926 3,720 2,746 3,124
3,456 4,1SS :1,629 7,RSH1 6,233
162 296 248 1121 -91
99 60
271 331 267
3 so :11 34•
14 9
10 6
IS 24 19
79 I60 172 2S6 3S7
;j02 6il0 77.'l 917 642
l!JGH ... 1;~.6~~ 1 1 ,3~7~ ~~~~~s ~:>n 41 16 :i~9 1969... 12,4.J6Ii I ,0J1 a,SS7 293 61 14 3t6 I970... 7,283 793 3, 780 205 35 - 238 MANUFACTURER'S NET BILLING PRICE (Millions of Dollars)<
I94H... 32.:> 10.1 6.H - - 1 - -I947 .. 'I il7.\.l l::l.4 6.0 - - I - I -19.'10... 1!!.2 6.:i ;j,i} - - - 0.1 19.i2... 2d.2 !).9 9.2 - - - 0.1 t9n4 ... ! 43.•i 20.1 10.1 - I - - d
1956 .. . 19iiH .. . 1960 .. . I961. .. 1962 ...
wa.s 101.9 1il1.2 124.3 136.S
2X.S 27 .I 43.0 37.1 37.41
as.6 33.!! :i6.7 42.3 50.2
0.61 -l,;j• -
1 . .;) -0.7 -0.7 -
N.A. I N'.A.
0.7 1.9 2.S 4.0 :1 ,;1
1:i4 97
1!)5 139 12I
114 109 110 3:i4 386
471 •:J44 211
2.0 4.:i
11.2 6.9
11.9 Il.O lO.S
1963 .. . lo)3.4 3S.6 !i5.7 1.1- N.A. i.2 11.9 l!IS.9 '>4.9 66.H 0.4 N.A. N.A. 9.6 I2.0 3IS.7 72.2 97.3 1.61 4il.I N.A. I2.2 27.7 40S.2 97.3 128.1 2.3 2S.6 N.A. 1•i.4 51 .il ;{S9.6 92.0 116.:11 2.0 20.2 l\.A. 14.6 3I.S
1964 .. . I965 .. . 1966 .. . 1967 .. .
Hl68 .. . 1969 .. . I970 .. .
3,634 1,479 1,108 1,161 1 'I9I
2,329 2,162 2,313 2,646 2,139
2,321 3,196 3,776 4 437 4:490
I 4,22X1
:~,951 1,675
7.7 ::1. 1 3.1 4.9 8.I
23.5 26.5 3ii.1 2S.9 32.1
3X.:1 54.fi 62.1 HO.I 79.4
S:i.:1 9X.2 48.5
8,4:12 3,181
604 22 20
5:i 79 18 50 22
40 56
116 210 246
183 469 396
30.8 12.5 4.0 0.1 0.1
0.4 1.1 0.2 0.3 0.1
0.4 0.7 0.5 4.9 3.1
3.6 1:J.2 52.1
42t.'> u:;.7 13s.sl 2.2 2s.i·1·N.A. 24.7 22.3 .iS4.4 11:~.1 1 I4.'l.6 2.!1 4.1.111 N.A. 20./i 2.i.41 336.91 80.6 97.4 2.0 26.8i N.A. 9.5 20.0
---------~----~----~--------~--~----~----~--~----N.A.-Not a\·ailable. • Includes production or lmco; 1970-Aerost!l.r Aircr'l.ft. b Includes production or Aero Commanders and S!!.breiiners. Value fi~tures are ru Aero Commander only. ~Excludes Grumman, Lockheed and North American S!!.bre:iner.
Less than $50,000. • Aero Commander only. Source: 1947-19611: Aerospace Industries As;ucintiun, rompn:l\' report•. 1970: Ceneral A\'intiun 1\lnnu-
facturers Association, emnpany repol"ts. ... ·
37

AEROSPACE FACTS AND FIGURES, 1971!72
PRODUCTION OF CoMMERCIAL HELICOPTERS (Number of Helicopters)
Calendar Years 1961 to Date
Comflany and He 'copter 1961 1962 1963 1964 1965 1966 1967
------------TOTAL 378 407 504 579 598 583a 455ab
------------Bell
U.S. production 47 series .......... 93 92 101 118 134 183 171 204 series ......... - 1 13 8 16 20 20 205 series ......... - - - - - - 12 206 series ......... - - - - - - 113 212 series ......... - - - - - - -
Foreign licensees 47 series .......... 70 63 81 103 123 147 N.A. 204 series ......... - 18 32 48 48 46 N.A. 102 series ......... 2 - - - - - N.A.
Boeing-Vertol U.S. production
BV-44/43 ......... - 1 - - - - -BV-107 ........... - 4 5 16 13 13 -
Foreign licensees BV-107 ........... - - 7 3 1 1 -
Brantly B2 series .......... 77 62 36 48 25 14 13 305 ............... - - - - 14 23 4
Enstrom F-28 .............. - - - - - 4 7 F-28A - - - - - - -
Fairchild Hiller 12 series .......... 99 54 34 34 73 29 9 FH-1100 ...... ·-·. - - - ' - - 8 44
Hughes 200's ............. 17 86 163 46 23 - -300's ............. - - - 121 81 62 48 500's ............. - - - - - - -
J{aman HH-43B .......... 6 11 11 11 10 1 -HH-43F .......... - - - - - 5 -
Sikorsky U.S. and foreign
production S-55 .............. 3 - - - - - -S-58 .............. - - 1 - - - -S-61 .............. 1 8 13 18 31 18 10 S-62 .............. 10 6 6 5 1 9 4 S-64 .............. - 1 1 - - - -S-65 .............. - - - - - - -
N.A.-Not available.
1968 --522•rb --
151 -29
184 -
N.A. N.A. N.A.
--
-
--
-13
4 60
-57 15
--
--
6 3
--
b Excludes 3 Fairchild "Porters" in 1966; 9 in 1967; 5 in 1968; 13 in 1969; 1 in 1970. Excludes foreign licensees of Bell.
Source: Aerospace Industries Association, company reports.
38
1969 1970 ----534ab 482"b ----
134 124 - -49 23
156 138 - 3
N.A. N.A. N.A. N.A. N.A. N.A.
- -- -- -
- -- -
- -25 -
2 -40 37
- -43 74 65 75
- -- -
- -- -13 6
7 -- -- 2
I

.,
L
Year
1954 1955 1956 1957 1958
1959 1960 1961 1962 1963
1964 1965 1966 1967 1968
1969 1970
AIRCRAFf PRODUCfiON
PRODUCTION OF HELICOPTERS TOTAL, CoMMERCIAL AND MILITARY
Calendar Years 1954 to Date
Military" TOTAL Commer-
cial I AirForce Total Navy
562 131 431 172 46 590 146 444 82 128 915 268 647 62 152
1,003 314 689 16 193 908 240 668 2 204
704 253 451 28 101 760 266 494 57 147 744 378 366 42 187
1,031 407 624 33 208 1,266 504 762 45 165
1,678 579 1,099 34 145 2,086 598 1,488 60 195 2,825 583 2,242 80 253 2,903 455b 2,448 73 279 3,322 522b 2,800 37 198
N.A. 534b N.A. N.A. N.A. N.A. 482b N.A. N.A. N.A.
Army
155 200 430 450 435
322 284 137 313 462
828 1,215 1,831 2,096 2,565
N.A. N.A.
"Prior to 1959 the total includes helicopters bought by the Department of Defense under the Military Assistance Program and for other federal agencies.
b Excludes foreign licensees of Bell. N.A.-Not available. Sources: Aerospace Industries Association, company reports. Department of Defense.
39

AIRCRAFT ENGINE PRODUCTIO N , CALENDAR Y E AHS 1917 T O DATC.
(Number of Engines)
Year Ending December 31
1917-1919 1928 1929 1930 1935
TOTAL
N.A. 3,252 7,378 3,766 2,965
M ili tary
44,453 2,620 1,861 1,841
991
Civi l
N.A. 632
5,517 1 '925 1,974
1940 1941 1942 1943
301 167E
64,68JE 138,089 227' 116
22,667 58,181
138,089 227 '116
7,500E 6,500 E
1944 1945 1946 1947 1948
1949 1950 1951 1952 1953
1954 1955 1956 1957 19.'>8
1959 1960 1961 1962 1963
1964 1965 1966 1967 1968
196() 1970
256,911 111 ,650E 43,407 20,912 14,027
11 '972 13,675 20,867 31,041 40,263
26,959 21,108 21, 343 21,946 18,354
17,162 16' 199 15,832 15,919 17' 185
19,585 23,378 30,810 28,268 29 ,459
27,0J 2E J6 ,65JE
NoTE:: .f et in clud es t urbopro p a nd turbofan . N .A.- Not a va ila b le. E Es Li ma tc.
Recipr. I Jet I Recipr. ---12_2_1-=-
256,789 108,442
1,680 2,683 2,495
2,981 3, 122 6,471 8,731
13,365
7,868 3,875 2,663 2,429 1,452
661 756 417 241 155
175 92
1 45 I
-!
1,208 2,000E 905 40,822
1,878 16 ,351 2,493 9,039
5,009 6,239 9,816
16,928 20,251
13,572 9,594 I 7 '186 8,658 6,669
3,965 2,917 4,755 5,200 5 ,235
5,205 5,090 7,503 8 ,046 8 ,542
7,600E 5 ,8QQ E
3,982 4 ,314 4,580 5,382 U,6,l7
5,519 7,630
ll ,490 10,859 10,233
11,152 I 10,801 0,660 9,021
11 ,322
13, 346 17,018 21 ,32-l 17 ,686 18, I S2
I 17 , 565~' ,1 9 ,583
Sources: Aeros par. e Ind us tries Assoc ia tio n, " ;\ c ro~ pacc Fa cts & Fi g:urc~"' (:\nnu a ll y ). Bureau of t he Census , "Curren t lncl us t riu l R epo rts , Series i\1 37G " (:\l o n t hl y) . D epa r tmen t of D efense.
40
Jet
3S 515
L, 38-l I ,625
001 557 -173
850 1 '1 69 1 ' 038 2 ,536 2 ' 7:1!)
1 ,S-17 I ,26S

AIRCRAFT PRODUCfiON
CIVIL AIRCRAFT E));GJNE PRODl"CTION
Calendar Years 1966 to Date (Number of Engines)
Manufacture1· and Engine Designation 1966 1967 1968
---ToT.\1, .................. 23,262 20,222 20,917
Reciprocating ............ 21,324 I 17,686 18,182 Jet ..................... 1,938 I 2,536 2,735
Continental .............. 11,132 7,845 7,073 0-200/(~-90 ............ 3,298 2,224 1,912 0-300 ................. 1,655 620 1 10-346 ................ 64 58 I -10-360/THI0-360 ...... 739 1,101 568 0-470/10-4 70 /TS10-
470/GI0-470 ........ 2,508 1,337 1,656 GTSI0-520 /TSI0-520 I
10-520 .............. 2,851 2,385 2,515 l'E-150 ................ - 120 421 Other ................. 17 - -
General Electric .......... 489 260 I 207 CT-58 ................ 12
I 28 27
CF-700 ................ 122 150 130 CJ-610 ................ 355 82 50
Lycoming ............... 10,192 9,841 11,109 0-720/10-720 .......... 71 27 17 0-541 /TI 0-541/
TIG0-541. .......... 4 143
I 210
0-540 /I 0-540 /TI 0-540 I I G0-540 /I GS0-540 I IV0-540 /V0-540 ..... 3,429 2,507 2,885
0-480/G0-480 /IGSO-480/GH0-480 ........ 221 203 181
0-435/G0-435/VO-435/TV0-435 ........ 506 344 307
0-360 /I 0-360 /TI 0-360/HI0-360/AIO-360 ................. 2,629 2,733 3,077
0-320 I I 0-320 /LI 0-320 I A 10-320 ........ 3,098 3,673 4,055
0-290 ................. 9 6 8 0-235 ................. 222 205 369 Other ................. 3 - -
Pratt & Whitney ......... 1,449 2,276 2,528 JT-30 ................ 598 874 969 JT-12 ................. 167 157 156 JT-80 ................ 684 1,244 1,401 JT-9D ................ - - -Other ................. - 1 2
Revised. Source: Amospace Industries Association, company reports.
1969 1970
19,412• 10,851
17,565• I 9,583
i 1,847 1,268
7,695• 4,384 N.A. N.A. N.A. N.A. N.A. N.A. N.A. N.A.
N.A. I N.A.
N.A. N.A. N.A. N.A. N.A. N.A.
192 148 16 21 54 34
122 93 9,870 5,199
6 36
142 160
3,580 1,355
151 100
164 114
1,925 1,442
3,437 1,684 9 6
456 302 - -
1,655 1,120 542 127 129 79 821 448 163 466 - -
41

AEROSPACE FACfS AND FIGURES, 1971!72
MILITARY AIRCRAFT ENGINE ACCEPTANCES Calendar Years 1959 to Date
(Number of Engines)
ENGINE DESIGNATION 1959 1960 1961 1962 1963 1964 1965
------------TOTAL 4,626 3,674 5,172 5,441 5,390 5,380 5,191
------------Jet ................... 3,421 2,025 2,821 3,162 2,871 2,638 2,111
J-34 ................ 139 80 J-44 ... 0 •• 0. 0 ••• 0 •• 55 - - - - - -J-48 ................ 24 - - - - - -J-52 ................ 36 299 305 471 318 310 202 J-57 ................ 1,957 565 532 562 476 133 6 J-60 ................ 1 29 184 219 207 44 48 J-69 ................ 538 487 284 435 321 335 186 J-75 ................ 293 256 229 219 174 42 -J-79 ................ 309 174 598 752 894 1,279 1,027 J-85 ................ 69 214 688 486 471 495 642 J-93 ................ - - 1 - - - -JT-3D .............. - - - 18 10 - -
Turbo-Fan ............ - 168 683 298 76 195 392 TF-33 .............. - 168 683 298 76 182 343 TF-30 .............. - - - - - 13 49 TF-39 .............. - - - - - - -TF-41 .............. - - - - - - -
Turbo-Prop ........... 544 724 1,251 1,740 2,288 2,372 2,596 T-33 ................ 2 - - - - - -T-34 ................ 63 49 - - - - -T..:5o ................ - - 43 68 78 131 154 T-53 ................ 165 339 358 452 759 981 1,284 T-56 ................ 260 234 522 763 1,019 719 497 T-58 ................ 54 96 298 384 348 342 370 T-YT-55 ............ - - 30 73 68 138 228 T-64 ................ - - - 1 16 61 63 T-63 ............... - - - - - - -T-73 ................ - - - - - - -T-74 ................ - - - - - - -T-76 ................ - - - - - - -
Reciprocating .......... 661 756 417 241 155 175 92 0-435 ............... 327 189 - - - - -0-480 ............... 66 57 11 - - - -R-1820 ............. 155 418 282 241 155 175 92 R-3350 .............. 113 93 124 - - - -
1966 --7,548 --3,142
--
261 -
100 479 -
1,416 886 --
631 489 142 --
3,730 --
242 1,747
566 626 394 155 ----45 --45 -
Source: Department of Defense. Data released with a two-year lag for security reasons.
42
1967 1968 ----8,046 8,542 ----3,190 3,061
- -- -
471 363 - -21 -
587 795 - -
1,174 937
1,055 844
- -- 4
831 402 468 14 355 312
8 52 - 24
4,025 5,079 - -- -
159 -1,924
318 2,706
252 221 329 462 249 32 49
656 1,303 53 77
102 114 98 -
- -- -- -- -- -

0
Missile Programs
Department of Defense expenditures for guided missile procurement rose in Fiscal Year 1970 for the third consecutive year, and estimates are that the gradual increase will continue.
At the same time, however, the total figure for missile research, development, test and evaluation (RDT&E) fell off slightly, as it had during the previous fiscal year, and this trend also is expected to continue in the next two years.
Procurement spending climbed in all three services, with the result that total DoD expenditures for guided missiles went from $2.5 billion in FY 1969 to $2.9 billion in FY 1970-the highest figure since FY 1964.
Net sales of missile systems and parts rose slightly, from $2.7 biillion in calendar 1969 to $2.8 billion in 1970. Backlog as of Dec. 31, 1970,
43

AEROSPACE FACTS AND FIGURES, 1971/72
was $2.7 billion, compared with $2.4 a year earlier, thus reversing the decline between 1968 and 1969.
Sales of propulsion systems for missiles and space vehicles declined, as they had for several preceding years. The drop was from $702 million in calendar 1969 to $641 million in 1970. In contras t with the previous year's decline, which resulted almost entirely from cutbacks in non-military systems, the bulk of the reduction was in military sales . The latter dropped from $667 million to $61 9 million, while non-military sales fe ll from $35 million to $22 million. Total backlog rose substantially, however, from $497 million to $619 million ; military backlog accounted for all of the increase, rising from $485 million to $611 million while non-military backlog fell from $12 million to $8 million, continuing a six-year decline.
Intercept tes t firings of the Army's Safeguard ABM missi les- Spartan and Sprint- continued and were mainly successful. The Navy's Sea Sparrow surface-to-air system became operational, and research was begun on a new Navy air-to-surface weapon, the H arpoon.
5 ,000
4,000
3 ,000
2 ,000
1,000
0 1960
l/
E- Esti mated
EXPENDITURES FOR GUIDED MISSILES (I N MILLI ONS OF DOLLARS)
v ~ -..
i\
\ v ~---
v ~
]1
'-., .....
1965 1970 '71 E '72 E
FISCAL YEARS
SOU RCE : DEPARTMENT OF DEFENSE
44

MISSILE PROGRAMS
DEPARTMENT OF DEFEl\SE ExPEXDITURES FOR GuiDED :MrssrLE PROCUREMENT, BY AGENCY
Fiscal Years 1951 to Date (Millions of Dollars)
I TOTAL Year Ending I DEFENSE .-\.ir Force Navy Army
June 30 DEPARTi\!ENT
1951 s 21 s 16 s 5 -1952 169 66 56 $ 46 1953 245 N.A. N.A . N.A. 1954 417 N.A. N.A. N.A. 1955 604 N.A. N.A. N .A.
1956 1,005 N.A. N.A. N.A. 1957 1,855 N.A. N.A. N.A. 1958 2,434 N.A. N.A. N.A. 1959 3,337 N.A. N.A. N.A. 1960 3,027 2,021 423 583
1961 I
2,972 1,922 493 557 1962 3,442 2,385 593 464 1963 3,817 2,676 718 423 1964 3,577 2,101 981 496 1965 2,096 1,320 521 254
1966 I
2,069 1,313 512 244 1967 1,930 1,278 432 220 1968 2,219 1,388 436 395 1969 2,509 1,382 534 593 1970 2,912 1,467 702 743
1971 E 3,036 ] ,459 766 812 1972E 3,348 1,507 828 1,013
I
NoTE: For data on research and development expenditures for missiles see pages 48 and 67. N .A.- Not availab le. E E stimate. Source: D epartment uf DPfense, R ('porL °F.AD G7G, " January 2U , 1 !)71 . and cn rlirr r£"port s.
45

AEROSPACE FACTS AND FIGURES, 1971/ 72
Year Ending June 30
1960 .... .......... . 1961 . ............ . . 1962 ... .... ... . ... . 1963 . .... . .. .. .. ... 1964 .. .. . . . .... . ...
1965 ............ ... 1966 .. . . .. . ..... . .. 1967 ..... . ....... .. 1968 .. . .. .. ....... . 1969 . .. . . ... .... ...
1970 .... .. .. . ..... . 1971E .... .. . .. . .... 1972E . . . . . ... ... . ..
E Estimate.
DEPARTMENT OF D EFENSE OUTLAYS FOR GUIDED MISSILES
Fiscal Year 1960 to Date (Millions of Dollars)
TOTAL I DEFENSE
I Procurement
DEPARTMENT
-----
$5,086 $3,027 5,997 2,972 6,219 3,442 6,058 3,817 5,929 3,577
3,997 2,096 3,870 2,069 4,432 1,930 4,741 I 2,219 4,919 2,509
5,108 2,912 5 ' 151 3,036 5,135 3,348
NoTE: Does not incl ude mili ta ry assistance.
Research, Development,
Test and Evaluation
$2,059 3,025 2,777 2,241 2,352
1,901 1,801 2,502 2,522 2,410
2,196 2,115 1,787
Source: Departmen t of Defense, Press Package, .Ja nuary 2!-J, 1971 , & ea rlie r FAD Reports .
46
•

SALES AND BACKLOG REPORTED BY MAJOR MANUFACTURER"] OF MISSILE SYSTEMS AND PARTS
Year Ending
December 31
1961 1962 1963 1964 1965
1966 1967 1968 1969 1970
Calendar Years 1961 to Date (Millions of Dollars)
Missile Systems and Parts
Net Sales During Year
$3,628 3,699 3,318 2,580 2,082
2,260 2,877 2,812 2,686 2,831
Backlog
December 31
$2,873 2,143 2,146 1,921 2,394
2,157 3,121 3,218 2,364 2,740
NoTE: Based on data from about 55 companies engaged in the manufacture of aerospace products. Data exclude sales of military engines and propulsion units. (See page 48).
Source: Bureau of the Census, "Current Industrial Reports," MQ37D (Quarterly).
SALES AND BACKLOG OF ENGINES AND PROPULSION lTNlTS FOR MISSILES AND SPACE VEHICLES
Reported by Major Manufacturers 1961 to Date
(Millions of Dollars)
Year Net Sales During Year Backlog as of Dec. 31 Ending Decem-
I her 31 Non- Non-TOTAL Military Military ToTAL Military Military
1961 N.A. $ 784 a NA. $367 a
1962 N.A. 1,060 a N.A. 498 a
1963 $1,675 1,135 $522 $ 888 699 $189 1964 1,579 851 728 1,024 557 467 1965 1,288 560 728 883 513 370
I 1966 1,211 511 700 859 534 325 1967 978 441 537 609 405 204 1968 907 676 231 535 406 129 1969 702 667
I 35 497 485 12
1970 641 619 22 619 611 8 I
• Data included in totals for space vehicle systems. See page 53. NoTE: Based on data from about 55 companies engaged in the manufacture of aerospace products.
The figures are inflated by the inclusion of subcontracts. N.A.-Not available. Source: Bureau of the Census, "Current Industrial Reports," ~:!cries Ma7D (Quarterly).
47

AEROSPACE FACTS AND F IGURES, 1971 ;72
M AJ OR M I SSILES I N D EVELOPMENT OR P RODUOI'ION
I I Propulsion
Systems j Manufacturer I
Guidance Project Service Contractor Type Mfr. Status
SURFACE-TO-AIR
Bomarc B I USAF Boeing Marquardt Solid Westinghouse Operational Chaparral Army Philco-Ford NAR/ Rocket· Solid GE/ Raytheon Operational
dyne Hawk Army Raytheon Aero jet Solid Raytheon Operational Nike-Hercules Army Western Thiokol/ Solid Bell Tel. Operational
Electric Hercules Lab/West. Electric
Red eye Army General Atlantic Solid Norden Operational Dynamics Research
Sam-D Army Raytheon Thiokol Solid - Development Sea Sparrow USN Raytheon NAR / Rocket- Solid Raytheon Operational
dyne Safeguard/ Army Bell Te l. Lab/ Thiokol Solid Bell Tel. Lab / Development
Spartan Western Western Electric Electric
Sa feguard/ Army Bell Tel. Lab/ Hercules Solid Bell Tel. Lab/ Development Sprint Western Western
Electric Electric Standard {MR) USN General Aero jet Solid General Oper~ tional
Dynamics Dynamics Standard {ER) USN General Atlantic Solid General Operational
Dynamics Research Dynamics Talos USN Bendix Bendix Ramjet Bendix Operational Tartar USN General Aero jet Solid General Operational
Dynam ics
I
Dynamics Terrier USN General I Atl antic Solid General Op erational
Dynamics Research Dynamics
AIR-TO-AIR
Falcon USAF Hughes Thiokol Solid Hughes Operational Falcon USAF Hughes Lockheed Solid Hughes Operational
Propulsion Super Falcon USAF Hughes Thiokol Sol id Hughes Operatio na l Nuclea r USAF Hughes
Falcon Thiokol Solid Hughes Operati onal
Genie USAF McDonnell Aero jet/ Solid - Operational Douglas Thiokol
Phoenix USN Hughes NAR / Rocket- So lid 1 Hughes Development dyne
Sidewinder USN Naval Naval So lid Phi lco / GE Operational lA Weapons/ Propulsion
Phi lco / Plant GE
Sidewinder USN Nava l N:l\R/ Rocket- Solid Philco / Operational l C Weapons/
Phil co/ dyne Raytheon
Raytheon j Op erational Sparrow 3 USN Raytheon NAR/ Rocket- Solid Raytheon
I dyne
48

MISSILE PROGRAMS
MAJOR MISSILES IN DEVELOPMENT OR PRODUCTION-Continued
Propulsion Systems
Manufacturer I Guidance Project Service Contractor Type Mfr. Status
SURFACE-TO-SURFACE
Advanced I
USAF - - - - Research ICBM
Mace B USAF Martin GM-AIIison Turbo jet GM/Delco Operational Marietta Electronics
Minuteman USAF Boeing Thiokol/ Solid NAR/Auto- Operational Aero jet/ netics Hercules
Polaris USN lockheed Aero jet/ Solid GE/MIT/ Operational Hercules Hughes/
Raytheon Poseidon USN lockheed Thiokol/ Solid GE/MIT/ Development
Hercules Raytheon Titan II USAF Martin Aero jet Liquid GM/AC Operational
Marietta Electronics
AIR-TO-SURFACE
Bullpup A USN Maxson Thiokol/ I Solid Maxson Operational Electronics Reaction Electronics
Bullpup B USN Maxson Thiokol/ Solid Maxson Operational Electronics Reaction Electronics
Cobra USAF - - - - Research Condor USN Naval Air NAR/ Rocket- Solid Hughes Development
Systems Command/
dyne
NAR Harpoon USN - - - - Research Hornet USAF NAR/Col - - - Development Hound Dog USAF NAR P&W Turbo jet NAR/Auto- Development
netics Maverick USAF Hughes/NAR Thiokol Solid - Development Quail USAF McDonnell General Turbo jet McDonnell Operational
Douglas Electric Douglas SCAD USAF - - - - Research Shrike USN NASC/NWC NAR/ Solid Tex. I nstru ./ Operational
Rocketdyne Sperry/ Bristol
SRAM USAF Boeing lockheed Solid General Precision
Development
w Standard ARM USN General Aero jet Solid Maxson Operational
Dynamics Electronics all eye USN Martin - Glide Martin Operational
Marietta/ Bomb Marietta Hughes
--
49

MAJOR J.V!ISS ILES IN D EVELO l 'UE:-1 '1' OR PRODUC'l'WN-C:onti n tted
I Propulsion I
Systems I Manufacturer \ Guidance
Project Service Contractor Type Mfr. Status
BATTLEFIELD SUPPORT GUIDED MISSILES
I I LTv lance I Army lTV Aerospace NAR/ liquid Development
I Rocketdyne Systron -Donner I Arm a
Dragon Army McDonnell McDonnell Solid McDonnel l Development Douglas Douglas Douglas
Pershing 1-A Army Martin Thiokol Solid Bend ix Operational Marietta
Sergeant
I Army Sperry Rand Thiokol Solid Sperry Operational
Rand Shillelagh Army Philco -Ford Amoco Solid Philco-Ford Operational
Chern. SS-1181 Army Nord Nord Solid Nord Operational
Aviation Aviation Aviation (France)
TOW Army Hughes Hercules Solid I - Deve lopment
UNGUIDED MISSILES
Honest John I Army I Emerson I El ectric
I Hercules Solid I Operational
ANTI-SUBMARINE
As ro c USN Honeywe ll Naval Sol id - Operational Propulsion
Subro c USN Goodyear Thi okol So lid General Operati onal Aerospace Precision
Source : Aerospnr:e Jnrhts Lr ies Assoc iat ion , based o n lat est aYa ilable in fo n n at. io n .
l Yn mcO:\Tl :-i i·:NTAL B A LLISTICS i\Irssr LES Puoouc ~::n Fon T il l·: .-\11t F otlC I·:
Yea r E ncl inf,!; December 31
Calenda r Year 1961 to Date
vVeapons System::; in Acquisit ion December 31
-------------------1----------------1961 1962 1963 1964 1965
1966 1967 1968 1969 1970
Suu!TC: D r pu rl m cn t uf Dcfen~ C' .
50
-J. 4 2 I
1 1 1 1 1
In tercon linen tal Balli st ic :\li ~s ib
Deli vered
Ill 186 ..J-86 -105 172
221 216 101 104 83

0
Space Programs
Apollo 14 early in 197 1 demonst rated that the U. S. space program has reached a leve l of technica l excelk nce that opens the way to expanded exploration and exploitation of the near universe .
T he most rewarding lun ar-l anding miss ion to date, in terms of hours spent exploring the Moon , experiments performed, and materi al and information re turned, Apo llo 14 began with li ftoff from Cape Ke nnedy o n Jan. 3 1. Ast rona uts A lan B. Shepard , Jr. , and Edgar D . Mitchell ca rried out the lun ar landi ng and ex plorat ion while Stuart A. R oosa remained in the Comma nd Module. Miss ion completed, the Lun ar Module returned to the mother ship , which brought the crew back to a now nearly routine splashdown and recovery in the South Pacific on Feb. 9.
Apo ll o 14 made its landing in the Fra M auro area of the Moon where
5 1
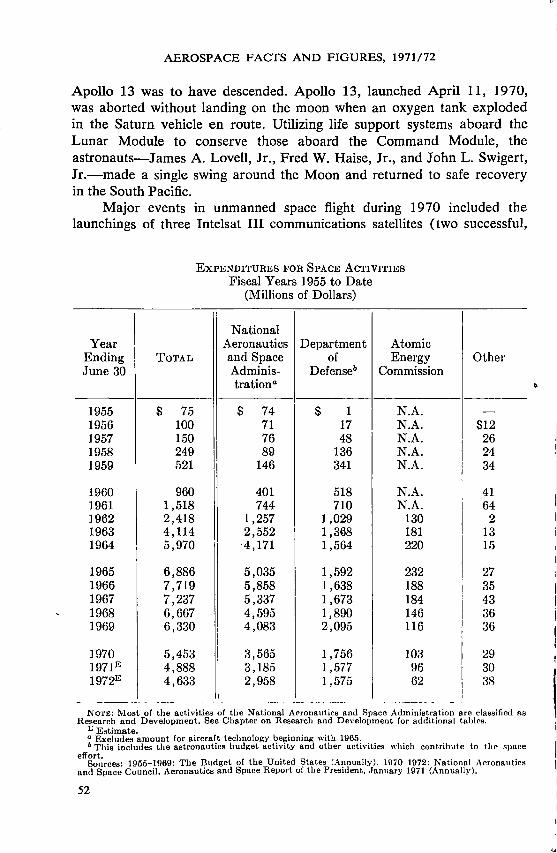
AEROSPACE FACfS AND FIGURES, 1971/72
Apollo 13 was to have descended. Apollo 13, launched April 11, 1970, was aborted without landing on the moon when an oxygen tank exploded in the Saturn vehicle en route. Utilizing life support systems aboard the Lunar Module to conserve those aboard the Command Module, the astronauts-James A. Lovell, Jr., Fred W. Haise, Jr., and John L. Swigert, Jr.-made a single swing around the Moon and returned to safe recovery in the South Pacific.
Major events in unmanned space flight during 1970 included the launchings of three Intelsat III communications satellites (two successful,
Year I Ending ToTAL
June 30
1955 $ 75 1956 100 1957 150 1958 249 1959 521
1960 960 1961 1,518 1962 2,418 1963 4,114 1964 5,970
1965 6,886 1966 7,719 1967 7,237 1968 6,667 1969 6,330
1970 5,453 1971E 4,888 1972E 4,633
EXPENDITURES FOR SPACE ACTIVITIES
Fiscal Years 1955 to Date (Millions of Dollars)
I National Aeronautics Department Atomic and Space of Energy Admin is- Defense6 Commission tration"
$ 74 $ 1 N.A. 71 17 N.A.
II 76 48 N.A. 89 136 N.A.
146 341 N.A.
401 518 N.A. 744 710 N.A.
1,257 1,029 130 2,552 1,368 181 4,171 1,564 220
5,035 1,592 232 5,858 1,638 188 5,337 1,673 184 4,595 1,890 146 4,083 2,095 116
3,565 1,756 103 3,185 1,577 96 2,958 1,575 62
Other
-$12
26 24 34
41 64 2
13 15
27 35 43 36 36
29 30 38
NOTE: Most of the activities of the National A~ronautics and Space Administration are classified as Research and Development. See Chapter on Research and De,·elopment for additional tables.
E Estimate. a Excludes amount for aircraft technology beginning with 1965. b This includes the astronautics budget activity and other acti\'ities which contribute to the space
effort. . Sources: 1955-1969: The Budget of the Umted States (Annually). 1970-1972: National Aeronautics
and Space Council, Aeronautics and Space Report of the President, January 1971 (Annually).
52
0

SPACE PROGRAMS
SALES AND BACKLOG OF SPACE VEHICLE SYSTEIIIS (Excluding Engines and Propulsion Units)
Reported by Major Manufacturers 1961 to Date
(Millions of Dollars)
Year Net Sales During Year Backlog, December 31 Ending Decem- Non- Non-ber 31 TOTAL Military" military TOTAL Military" military
1961 $ 775 $ 551 $ 224a $ 586 $ 350 $ 2364
1962 1,319 712 607a 1,435 852 583a 1963 1,911 1,061 850 1,612 856 756 1964 2,222 732 1,490 1,611 391 1,220 1965 2,449 602 1,847 2,203 503 1,700
1966 2,710 734 1,967 1,494 428 1,066 1967 2,199 789 1,410 1,974 1,096 878 1968 2,357 899 1,458 1,329 834 495 1969' 2,282 1,187 1,095 1,330 869 461 1970 2,014 1,065 949 1,132 708 424
NoTE: Based on data from about 55 companies engaged in the manufacture of aerospace produrts. r Revised. a Includes engines and propulsion units. Source: Bureau of the Census, "Current Industrial Reports," Series MQ37D.
one failing to reach its planned orbit); the first operational spacecraft of the Improved TIROS Operational System (ITOS) meteorological satellite series; the Nimbus-IV satellite, for global sampling of atmospheric radiation; the SERT-11, first orbital test of electron-bombardment on engines; the Orbiting Frog Otolith (OFO), in which it was found that frogs adapted to zero gravity after three days in orbit.
Also, the first launch of a U S. spacecraft by a crew of another nation occurred on Dec. 12, 1970, when an Italian crew launched Explorer XLII (SAS-A), from a mobile seaborne platform off Kenya, East Africa.
In the military space program, a highlight was the launch of the sixth pair of Vela nuclear detection satellites from Cape Kennedy on April 8, 1970. These spacecraft can view surface and low-altitude detonations while still maintaining a constant monitoring of deep space. NATO I, a military communications satellite for the NATO forces, was launched from the Cape on March 20, and the Department of Defense (DoD) successfully conducted a number of launches of classified payloads.
DoD also continued to operate and refine its satellite navigation and geodetic systems through previously launched spacecraft.
The Atomic Energy Commission continued to develop nuclear power
53

AEROSPACE FACTS AND FIGURES, 1971 / 72
systems for future space use. The SNAP-19 and SNAP-27 radioisotope generators launched in 1969 passed one year of continuous operation. Nuclear Engine for Rocket Vehicle Application (NER VA) engine development work concentrated on definition and preliminary design of a flight-rated engine, a candidate fuel element for NERV A successfully completed 10 hours of electrical corrosion testing, and the Pewee-2 experimental reactor was fabricated and delivered for testing in early 1971.
Among other Government agencies, the Environmental Sciences Services Administration (ESSA) of the Department of Commerce continued operation of its ESSA weather satellite network ; the Departments of Interior and Agriculture conducted further joint studies with NASA on development of Earth resources survey satellites, and the National Science Foundation maintained its contribution to space sciences through a number of programs.
54

Year Ending June 30
1959 1960 1961 1962 1963
1964 1965 1966 1967 1968
1969 1970 1971E 1972E
1~ Estimate.
SPACE PROGRAMS
::\ATIOXAL ..\.EROXAUTICS AND SPACE ADMIXISTRATIOX, EXPKS'DITURES BY BUDGET FuNCTI0::-1
Fiscal Years, 1959 to Date (~iillions of Dollars)
Research Construction TOTAL and of
ExPJ-:XoiTum:s Development Facilities
I $ 145 $ 34 $ 25 401 256 54 744 487 98
1,257 936 114 2,552 1,912 225
4,171 3,317 438
I 5,093 3,984 531 5,933 4,741 573
i 5,426 4,487 289 I
4,724 3,946 126
4,251 3,530 65
I 3,753 2,992 54 3,369 2,610 50
I 3,152 2,411 43 I i
Source: "The Budget or the United States" (Annually).
Research & Program
Management
$ 87 91
159 207 417
416 578 619 650 652
656 707 709 698
Estimated total space expenditures in Fiscal Year 1971 were about $4.9 billion, continuing a downward trend that began in FY 1967 following a peak of $7.7 billion in FY 1966. The FY 1971 estimate indicated a drop of m'ore than $550 million from actual spending in the previous year.·
Of the FY 1971 estimated total, $3.19 billion is for NASA, a decline of $380 million from FY 1970; $1.58 billion is for DoD, down by $180 million; $96 million for AEC, down $7 million; and $30 million for other agencies, up $1 million. ·
Space sales in calendar year 1970 continued their corresponding decline, dropping to $3.6 billion compared with $4.3 billion in 1969. This reflected the virtual completion of the hardware phase of the Apollo program, as well as the decline in military space expenditures.
Another, smaller decline is expected in total space expenditures for FY 1972, to a level of about $4.6 billion. NASA is expected to absorb nearly all of the $250-million decline, with DoD spending continuing at its present level. Civilian funding may be expected to increase thereafter, however, with approval of the space shuttle program, key to the space effort of the 1970s and 1980s.
55

56
AEROSPACE FACTS AND FIGURES, 1971/72
SPACECRAFT LAUNCHINGS (AS OF MAY 30, 1971)
686 (TOTAL)
305
538 TOTAL)
127
~ ~ ...... ~18 16
U.S.A. U.S.S.R.
PAYLOADS IN EARTH ORBIT
~ PAYLOADS DECAYED
SPACE PROBES
OTHER COUNTRIES
SOURCE: NATIONAL AERONAUTICS AND SPACE ADMINI STRATION

SPACE PROGRAMS
S PA CECRAFT L.-\ U :\CHI 1\GS AS OF ;'vl.-1. Y 30, 1971
Pay loads Payloads Space Coun try T OTA L in Earth Decayed Probes
Orbit
T OTAL 1 ,257 457 766 34
u nited States . . . 686 305 363 18 U.S.S.R. . ... . . . .. ... . . ..... . . . 538 127 395 16 Fra nce.... . . .... . ...... . . . 7 7 Uni ted Kingdom . ... . . .. . ..... . 5 3 2 Canada ... . ...... .. . . . . . . .. . . . 4 4 E uropean Space Re:search
Organization ... . ... . .... . .. . . 4 1 3 Ita ly .. .. . . .. .... . . . . . . ... . . . . . 3 1 2 Aust ra lia .. ..... . ... . . . . . . . . 2 1 1 Ja pan .. . . . . . .. ..... . . . . . ... . . . 2 2 China (Mainland) . .. . 2 2 K .A.T.O . . . . . . . .. . . . 2 2 Germany . . . . 2 2
Source : Natio nal Aeronau t ics nnd Space Adm inistrat.ion.
57

AEROSPACE FACTS AND FIGURES, 1971 /72
CHRONO LOGY OF J.\IL\J OH UN ITED STATES S t> .-ICE L .I CI\CH I!\G S , 1970
D ,1te
1970 J an . 15
J an . 23
Feb . 4
Mar. 20 Apr. 8 Apr. 11
Apr . 23
.Jul. 23
Aug. 19
Nov. 9
Dec. 11
Dec. 12
Designation
lntelsat III F -6
ITOS (Tiros M )
SERT-II
NATO I Nimbus-IV Apollo 13
In telsat III F -7
In telset III F -8
SKYNET II
Orbit ing Frog Otoli t h (OFO)
NOAA-I
Explorer XLI I (SAS-A)
Purpose
T o provide eq uiva len t of I ,200 2-way voicecircuits or 4 color TV channels to carry cotnmunications traffi c between the Un it ed States, Latin Ameri ca, E urope a nd t he :.VIidd le East.
To flight-qualify t he prototy pe second-generation operational meteorological satellit e.
F irst orbital test of electron-bombardment ion engines.
Mili .ary communicat ions satellite. Global sampling of atmospheric radia tion . Third manned lunar landing attempt. Abo rt eu
after 36 hours Jue to oxygen ta nk explosion. Successful recovery .
To provide eq uivalen t of 1,200 2-way voicecircuits or 4 color TV channels to carry communications traffic betw, en the U ni ted Sta tes, E urope, North Africa and t he i\Iidd le Eas t.
To provide equivalen t of 1,200 2-way voicecircui ts or 4 color TV channels to ca rry communications traffi c between the con tin en tal Uni ted States , Hawaii and the Western Pam fir:. Motor cut off before satelli te achieved planneu sy nchronous orbit; contact los t.
Second a nd final mili tary communicat ions satelli te launched for U ni ted .Kingdom. Contact los t during a pogee boost motor firing.
To obtain information o n t he fun ctioning and adaptabili ty in weightlessness of t he portion of t he inner ear which cont rols balance. Frogs adapted to zero gravity a fter 3 days in orbit.
F irst operationa l spacecraft of Im proved TIHOS Operational System (ITOS) series.
To develop a catalog of celest ial X -ray sources by systematic sca nning of t he celestia l sphere in t he energy range from 2- 20 l(EV. F irst la unch of a Uni ted States spacecraft by a crew of another nation (Italy) . La unched from mobi le seaborne platform off Kenya.
NoTE : For data for earlier yea rs , see previous editions of 1'Aerospace Facts and F ig ures., This chronol· ogy of major U. S . space programs in cludes the :; uccesstul, part ial ly successfu l, and unsuccessful launchings of a ll veh icles larger than soundin~ rockets .
Source: N ationa l Aerona utics and Space Adm inis tration.
58

SPACE PROGRAMS
~ATIO:-JAL AERONAUTICS AND SPACE ADl\UNISTRATION RESEARCH AND DEVELOPl\IENT PROGRAMS BUDGJ•;T PLAN
Fiscal Years, 1968 to Date (Millions of Dollars)
Fiscal Years Ending June 30 ------
1968 1969 1970 1971 1972
TOTAL ........................ $3,967 $3,193 $3,110 $2,555 $2,518
:\iAXXED SPACI·: FLIGHT-TOTAL .................... 2,809 2,177 2,030 1,431 1,287
Apollo ...................... 2,556 2,025 1,684 914 612 Space flight operations ........ 253 150 343 515 673 Advanced missions ........... - 2 3 2 2
SPACE SCIENCE AXD APPLI-CATIOXS-TOTAL ........... 553 438 520 566 750
Physics and astronomy ....... 140 125 113 116 110 Lunar and planetary explor-
ation ..................... 148 82 151 145 312 Bioscience ................... 42 33 20 13 -Space applications ............ 99 98 128 167 182 Launch vehicle procurement. .. 124 100 108 125 146
ADVANCED RESEARCH AXD TECHXOLOGY-TOTAL ....... 315 285 271 264 213
Aeronautical research & technology ................ N.A. N.A. 96 102 110
Space research & technology ................ N.A. N.A. 120 107 75
Nucleai' power & pl"Opulsion ... N.A. N.A. 55 55 28
TRACKTXG AXD DATA AcQUI-SITIOX-TOTAL ............ 276 280 278 290 264
U:-JJVERHITY Al•"FAIRS-TOTAL .... 10 9 7 - -Sustaining university pl'Ogram. 10 9 7 - -
TECHNOLOGY UTILIZATIO:-i-TOTAL .................... 4 4 5 4 4
NoTE: Administrath·e operations costs for NASA are not included. SourP-e: National Aeronautics and Space Administration, Briefing on the Budget of the United States,
January 29, 1971.
59

AEROSPACE FACTS AND FIGURES, 1971/72
CHRONOLOGY OF M.\NNED SPACE FLIGHTS, 1967 TO D.\TE
Launch Date Project Pilot Nation Duration
Apr 23, 1967 Soyuz 1 Vladimir M. USSR 26 hr. 40 min. Komarov
Oct 11, 1968 Apollo 7 Walter M. Schirra, USA 260 hr. 8 min. Jr.
I Donn F. Eisele R. Walter
Cunningham Oct 26, 1968 Soyuz 3 Georgi Beregovoy USSR 94 hr. 51 min. Dec 21, 1968 Apollo 8 Frank Borman USA 147 hr., in-
James A. Lovell, Jr. eluding 20 William A. Anders hours in
lunar orbit Jan 14, 1969 Soyuz 4 Vladimir Shatalov USSR 71 hr. 22 min. Jan 15, 1969 Soyuz 5 Boris Volynov USSR 72 hr. 40 min.
Alecksey Yeliseyev Yevgemv Khrunov
Mar 3, 1969 Apollo 9 James A. McDivitt USA 241 hr. 53 min. David R. Scott Russell L.
Schweickart May 18, 1969 Apollo 10 Thomas P. Stafford USA 192 hr. 3 min.
John W. Young • Eugene A. Cernan Jul16, 1969 I Apollo 11 Neil A. Armstrong USA 195 hr. 19 min.
Michael Collins Edwin E. Aldrin, Jr.
Oct 11, 1969 Soyuz 6 Georgiv Shonin USSR 118 hr. 21 min. Valeriy Kubasov
Oct 12, 1969 Soyuz 7 Anatoliy USSR 118 hr. 43 min. Filipchencko
Vladislav Volkov Viktor Gorbatko
Oct 13, 1969 Soyuz 8 Vladimir Shatalov USSR 118 hr. 51 min. Aleksey Yeliseyev
Nov 14, 1969 Apollo 12 Charles Conrad, Jr. USA 244 hr. 36 min. Richard F. Gordon,
Jr. Alan L. Bean
Apr 11, 1970 Apollo 13 James A. Lovell, Jr. USA 142 hr. 55 min. Fred W. Haise, Jr. John L. Swigert, Jr.
Jun 1, 1970 Soyuz 9 Andrian G. USSR 424 hr. 59 min. Nikolayev
Vitaliy I. Sevastianov
.Jan 31, 19 71 Apollo 14 Alan B. Shepard, Jr. USA 216 hr. 2 min. Edgar D. Mitchell Stuart A. Roosa
Apr 22, 1971 Soyuz 10 Vladiinir Shatalov USSR 47 hr. 46 min. Aleksey Y eliseyev Nikolai
Ruka vishnikov Jun 6, 1971 I Soyuz 11 Georgi Dobrovolsky USSR (Still in orbit
Vladislav Volkov Jun 16) Viktor Patsayev
NoTE: For data for earlier rears see previous editions of "Aerospace Facts and Figures." Source: National Aeronautics and Space Administration; Library of Congress.
60
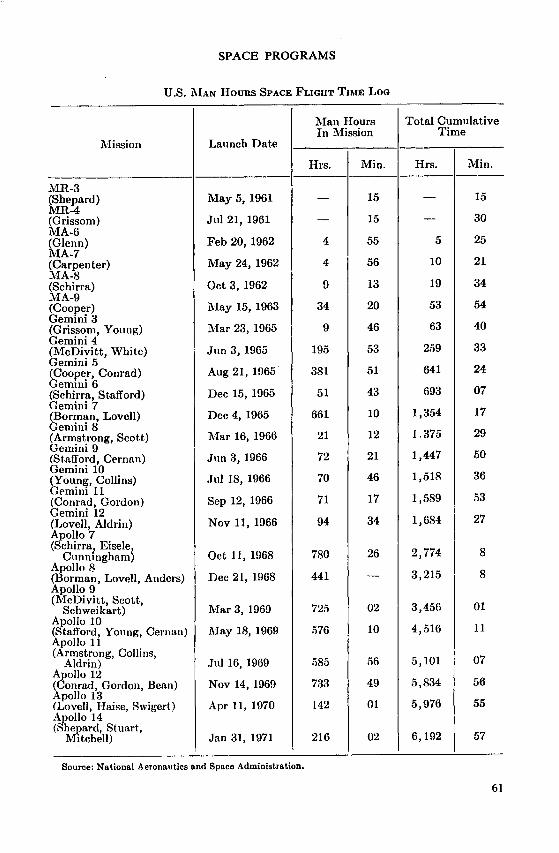
SPACE PROGRAMS
U.S. l\'IAN Houns SPACE FLIGHT TIME LoG
1\Ian Hours Total Cumulative In Mission Time
Mission Launch Date
Hrs. Min. Hrs. Min.
MR-3 (Shepard) May 5, 1961 - 15 -- 15 MR-4 (Grissom) Jul 21, 1961 - 15 - 30 MA-6 (Glenn) Feb 20, 1962 4 55 5 25 MA-7 (Carpente1·) May 24, 1962 4 56 10 21 MA-8 (Schirra) Oct 3, 1962 !) 13 19 34 MA-9 (Cooper) l\Iay 15, 1963 34 20 53 54 Gemini 3 (Grissom, Young) Mar 23, 1965 9 46 63 40 Gemini 4 (McDivitt, White) Jun 3, 1965 195 53 21)9 33 Gemini 5 (Cooper, Conrad) Aug 21, 1965 381 51 641 24 Gemmi 6 (Schirra, Stafford) Dec 15, 1965 51 43 693 07 Gemini 7 (Borman, Lovell) Dec 4, 1965 661 10 1,354 17 Gemini 8 (Armstrong, Scott) Mar 16, 1966 21 12 1.375 29 Gemini 9 (St.afford, Cernan) Jun 3, 1966 72 21 1,447 50 Gemini 10 (Young, Collin~) .lui 18, 1966 70 46 1,51R 36 Gt>mini 11 (Conrad, Gordon) Sep 12, 1966 71 17 1,589 53 Gemini 12 (Lovell, Aldrin) Nov 11, 1966 94 34 1,684 27 Apollo 7 (Schirra1 Eisele,
Oct 11, 1968 780 26 2,774 8 Cunmngham) Apollo 8 (Borman, Lovell, Anders) Dec 21, 1968 441 - 3,215 8 Apollo 9 (McDivitt, Scott, 01 Schweikart) Mar 3, 1969 721) 02 3,45{i Apollo 10 (Stafford, Young, Ceman) May 18, 1969 .'>76 10 4,516 11 Apollo II (Armstrong, Collins,
Aldrin) Jnl 16, 1969 585 56 5,101 07 Apollo 12 (Conrad, Gordon, Bean) Nov 14, 1969 733 49 5,834 56 Apollo 13 (Lovell, Haise, Swigert) Apr 11, 1970 142 01 5,976 55 Apollo 14 (Shepard, Stuart,
Mitchell) Jan 31, 1971 216 02 6,192 57
Source: National Aeronautics and Space Administration.
61

AEROSPACE FACTS AND FIGURES, 1971 / 72
Vehicle
Scout
Thrust Aug-mented Thorad-Delta
Thrust Aug-m.ented Thorad-A gena
Atlas-Burner 1I
At las-.-\.gena
T itan liiB-.-\.gena
Ti tan IIJ C
62
UNITED STATES SPACE LAU:\CH VEHICLES
Stages
1. Algol (liB)* 2. Castor II* 3. Antares II* 4. Altair Ill* or FW4 1. Thor (SLV-2J) plus
t hree TX354-5* 2. Delta (DSV-3) 3. FW -4D / TE 364 *
l. Thor (SLV-2H) plus 3 TX 354-5*
2. Agena
l. Atlas Booster and Sustainer (SL V -3A)
2. Burner ll *
1. Atlas Booste r and Sustainer (SL V -3A)
2. i\ gena
1. LR-87 2. LR-9 1 3. Ap,ena
I. Two 5--;egmcnt 120" di a meter*
~ 2. LR-8r 3. LR -9 l 4 . Tran .~ tage
Thrust (in thousands of pounds)
100.9 60.7 20.9 5.9
170plus 52 each
7 .8 5.9 /
10.0 170 plus 52 each
16
400
10
465
16
440 100
16
2,400
~
521 100
16
(Continued on next page)
I I
I
") Payload (pound.
300 Nauti cal
miles Esc a pe Orbit i
320 I 50
2,000 52;)
'
2 , 900
4, 950 700
7,500 1 ' 430
8, 000 I
I ' 550
25,000 5, 500

SPACE PROGRAMS
UxiTBD STATBS SPACE LAUXCH VEHICLEs-Continued
Vehicle Stages
Titan-Centaur 1. Two 5-Segmcn t 120" diameter*
2. LR-87 3. LR-91 4. Centaur (Two RL-10)
A.tlas-Ccn tam 1. Atlas Booster and Sustainer
2. Centaur (Two RL-10)
Cpra.ted Satum 1. S-IB (8 H-1) IB 2. S-IVB (1J-2)
Satum V 1. S-IC (5F-1) 2. S-ll (5J-2) 3. S-IVB (lJ-2)
Thrust (in thousands of pounds)
2,400
440 110 30
400
30
1,600 200
7,570 1,150
230
• Solid propellant, all other are liquid. Source: Aeronautics & Space Report of the President, January, 19il.
I
Payload (pounds)
300 Nautical Escape
miles Orbit
32,000 11,000
9,100 2,700
40,000@ -105Nl\I
' I 285,000@ 100,000
105Nl\I
63

0
Research and Development
Total Federal support of research and development rose slightly in FY 1971 and the trend is expected to continue into FY 1972. The $16.3 billion estimated for FY 1972, however, is below the all-time peak of $16.9 billion in FY 1968.
The major portion of the increased Federal support for R&D was registered in the social sciences, health services, mass transportation and other programs not connected with the Department of Defense, National Aeronautics and Space Administration and the Atomic E nergy Commission. Government funding in R&D for social programs rose by more than 13 percent while the increase in the DoD research and development budget was about 2 percent.
Clarification of the government's accounts is necessary, for the entire
64

RESEARCH AND DEVELOPMENT
NASA budget is listed as an R&D expenditure. This total of $3.2 billion m FY 1972 includes approximately $54 million for construction of new facilities and for administration, which are not included under R&D in the accounting for other agencies.
Company-initiated spending for R&D continued at a high level, with $1.3 billion invested by aerospace industry firms in 1969. This was the third year that the industry spent more than $1 billion for R&D, reflecting the steadily increasing complexity of the aircraft, missile and space business.
Aircraft received more funding than missiles for the first time in a
Year Ending June 30
1954 1955 1956 1957 1958
1959 1960 1961 1962 1963
1964 1965 1966 1967 1968
1969 1970 1971E 1972E
FEDERAL EXPENDITURES FOR RESEARCH AND DEVELOPMENT
Fiscal Years, 1954 to Date (Millions of Dollars)
I National I Department Aeronautics Atomic
ToTAL of and Space Energy Defense Admin is- Commission
tration
$ 3,148 $2,487 $ 90 $ 383 3,308 2,630 74 385 3,446 2,639 71 474 4,462 3,371 76 657 4,990 3,664 89 804
5,803 4,183 145 877 7,738 5,654 401 986 9,278 6,618 744 1,111
10,373 6,812 1,251 1,284 11,988 6,849
I 2,540 1,335
14,694 7,517 4,171 1,505 14,875 6,728 5,093 1,520 16,002 6,735 5,933 1,462 16,842 7,680 5,426 1,467 16,865 8,148 4,724 1,593
I 16,208 7,858 4,252 I ,654 15,632 7,568 3,753 1,616 15,960 7,706 3,369 1,619 16,258 7,887 3,152 1,523
Other
$ 188 219 262 358 433
598 697 805
1,026 1,264
1,501 1,534 1,872 2,269 2,400
2,444 2,695 3,266 3,696
NOTE: Includes military personnel, procurement, civil functions, and some other item• not included in other tables. Includes R & D facilities and administrative (lpprating costs.
EEstimate. Source: "The Budget of the United States Government", (Annually).
65
--- ·---·--·-- ---~,------------ --
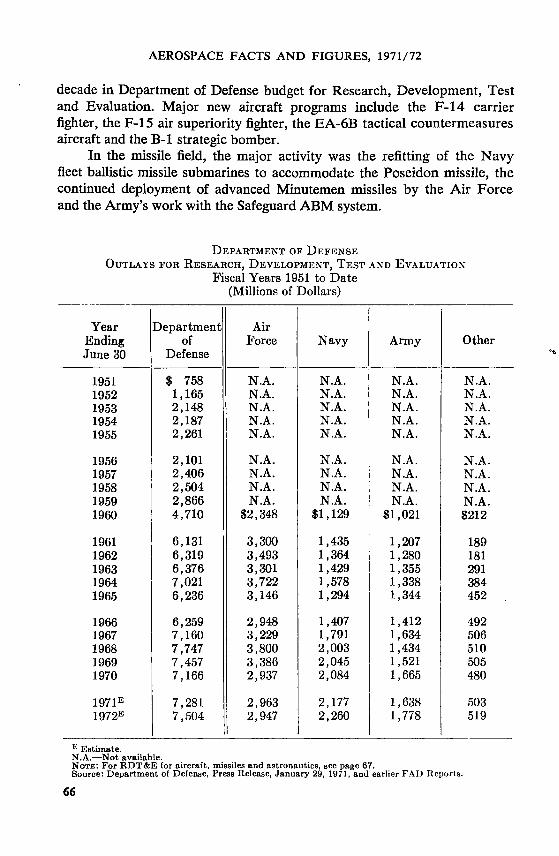
AEROSPACE FACfS AND FIGURES, 1971/72
decade in Department of Defense budget for Research, Development, Test and Evaluation. Major new aircraft programs include the F-14 carrier fighter, the F-15 air superiority fighter, the EA-6B tactical countermeasures aircraft and the B-1 strategic bomber.
In the missile field, the major activity was the refitting of the Navy fleet ballistic missile submarines to accommodate the Poseidon missile, the continued deployment of advanced Minutemen missiles by the Air Force and the Army's work with the Safeguard ABM system.
DEPARTMENT OF DEFENSE
OUTLAYS FOR RESEARCH, DEVELOPMENT, TEST AND EVALUATION
Fiscal Years 1951 to Date
Year Department En din~ June 30
1951 1952 1953 1954 1955
1956 1957 1958 1959 1960
1961 1962 1963 1964 1965
1966 1967 1968 1969 1970
1971E 1972E
E Estimate. N.A.-Not available.
of Defense -$ 758 1,165 2,148 2,187 2,261
2,101 2,406 2,504 2,866 4,710
6,131 6,319 6,376 7,021 6,236
6,259 7,160 7,747 7,457 7,166
7,281 7,504
i
(Millions of Dollars)
Air Force Navy Army Other
N.A. N.A. N.A. N.A. N.A. N.A. N.A. N.A. N.A. N.A. N.A. N.A. N.A. N.A. N.A. N.A. N.A. N.A. N.A. N.A.
N.A. N.A. N.A. N.A. N.A. N.A. N.A. N.A. N.A. N.A. N.A. N.A. N.A. N.A. N.A. N.A.
$2,348 $1,129 $1,021 $212
3,300 1,435 1,207 189 3,493 1,364 1,280 181 3,301 1,429 1,355 291 3,722 1,578 1,338
I 384 3,146 1,294 1,344 452
2,948 1,407 1,412 492 3,229 1,791 1,634 506 3,800 2,003 1,434 510 3,386 2,045 1,521 505 2,937 2,084 1,665 480
2,963 2,177 1,638 503 2,947 I 2,260 1,778 519
NoTE: For RDT&E for aircraft, missiles and astronautics, see page 67. Source: Department of Defense, Press Release, January 29, 1971, and earlier FAD Reports.
66

RESEARCH AND DEVELOPMENT
DEPARTMENT OF DEFENSE OUTLAYS FOR RESEARCH, DEVELOPMENT, TEST AND
EVALUATION, BY FuNCTIONS Fiscal Years, 1960 to Date
(Millions of Dollars)
ToTAL, AEROSPACE Year ALL
Ending RDT&E June 30 FUNC- TOTAL Aircraft Missiles Astro-
TIONS nautics --------1960 $4,710 $3,203 $ 632 $2,059 $ 512 1961 6,131 4,090 547 3,025 518 1962 6,319 4,150 624 2,777 749 1963 6,376 3,731 544 2,241 946 1964 7,021 4,575 939 2,352 1,284
1965 6,236 3,839 1,017 1,901 921 1966 6,259 3,707 976 1,801 930 1967 7,160 4,533 1,048 2,502 983 1968 7,747 5,077 1,335 2,522 1,220 1969 7,457 4,600 1,031 2,410 1,159
1970 7,166 4,188 1,239 2,196 753 1971E 7,281 4,312 1,708 2,115 489 1972E 7,504 4,251 1,975 1,787 489
E Estimate. Source: Department of Defense, Press Release, January 29, 1971.
Other
$1,507 2,041 2,169 2,645 2,446
2,397 2,552 2,627 2,670 2,857
2,978 2,969 3,253
RDT&E spending for space related activities was held to $489 million for the second straight year, down from $1.2 billion five years ago.
In NASA's budget, the most critical research and development project is the space shuttle, which is considered vital to the maintenance of U.S. leadership in space flight. The shuttle is a rocket-powered, recoverable booster that can return to ~!s launch site and land in aircraft fashion. It will lower the cost of sending payloads into orbit and will replace most of the launch vehicles now employed by NASA and the Department of Defense.
NASA also is working toward the launching of the Apollo Workshop, an orbiting station which will house crews of astronauts for periods of about two months. The current schedule calls for this station to become operational in 1973, about two years after the last Apollo flight to the moon.
Atomic Energy Commission research and development related to aerospace is due to drop substantially because the NERV A, nuclear rocket project, has been placed in mothball status.
67

AEROSPACE FACTS AND FIGURES, 1971/72
I NDUSTRIAL R ESEARCH AND DEVELOPl\IENT I:-< AEROSPACE, BY TYP8 oF RESEARCH AND FuND SouRCEr
Calendar Years 1957 to Date (Mi ll ions of Dollars)
Applied Research and Basic Research Funds
Year ToTAL Ending AERO-Decem- SPACE ber 31
1957 S2,574 1958 2,609 1959 3,090 1960 3,514 1961 3,829
1962 4 ,042 1963 4,712 1964 5,055 1965 5,098 1966 5,448
1967 5 ,570 1968T 5,658 1969 5,801
I
N.A .- Not available. r R ev ised .
Development Funds
Federal Com- Federal
Total Govern- pany Total Govern-ment ment
\Contracts Contra cts
$2,549 N.A. N.A. $25 N.A. 2 ,583 $2,266 $317 26 $10 3,058 2,733 325 32 18 3,452 3,108 344 62 32 3,789 N.A. N .A. 40 N.A.
3,987 N.A. N.A. 55 N.A. 4,653 4,219 434 59 31 4,988 4,532 456 67 34 5,028 4,440 588 70 40 5,380 4,656 724 68 36
5,500 ' 4,479 1 ,022 70 33 5,592 4,485a 1, 107 al 67 ')~ a _ i)
5,738 4 ,500 1 ,237 63 24
a Estimated by t he National Sc ience Foundatio n. R ev ised data not coll ected. Source: National Science Foundation, Aerospace Industries Association.
68
Com-pany
N.A. $16
15 30
N.A.
N.A. 28 33 30 32
38 42a 40

RESEARCH AND DEVELOPMENT
INDUSTRIAL RESEARCH AND DEVELOPMENT, ALL INDUSTRIES AND THE AEROSPACE INDUSTRY
CALENDAR YEARS 1956 TO DATE (Millions of Dollars)
AEROSPACE a
Year TOTAL, Ending RESEARCH AND I
December DEVELOPMENT Federal Company 31
1956 1957 1958 1959 1960
1961 1962 1963 1964 1965
1966 1967 1968• 1969
r Revised. N.A.-Not available.
I
$6,605 7,731 8,389 9,618
I 10,509
10,908 11,464 12,630 13,512 14,185
15,548 16,415 17,469 18,474
Total Government Funds Funds
$2,138 N.A. N.A. 2,574 $2,275 $299 2,609 2,276 333 3,090 2,754 336 3,514 3,150 364
3,829 3,438 392 4,042 3,588 454 4,712 4,261 451 5,055 4,610 455 5,098 4,476 622
5,448 4,695 756 5,570 4,499 1,070 5,658 4,506 1,152 5,801 4,524 1,277
a Includes companies primarily engaged in the manufacture of aircraft and parts SIC Code 372, and the manufacture of ordnance and accessories, including complete guided missiles and space vehicles, SIC Code 19.
Sources: National Science Foundation, Aerospace Industries Association.
69

0
Foreign Trade
Total aerospace exports reached a new high of $3.4 billion during 1970, an 8 percent increase over the previous record year of 1969. Exports represented 14 percent of the industry's total sales and 1970 was the fourteenth year in which aerospace exports exceeded $1 billion.
The aerospace trade balance increased to $3.1 billion in 1970, a 9 percent increase over 1969 which was a record $2.8 billion. Aerospace imports remained at the same level, with $308 million in 1970 compared with $307 million for 1969.
The exports of the aerospace industry continued to be a major factor in the nation's overall balance of trade position as high technology products played dominant roles in U.S.-manufactured exports.
Civilian aerospace exports increased in 1970 to $2.5 billion, a 24
70

FOREIGN TRADE
percent increase over the $2 billion in 1969. Military aerospace exports declined to $900 million in 1970 in comparison with $1,100 million in 1969 showing a 20 percent decrease.
Foreign deliveries of the wide-bodied jet transports which began during 1970 along with continued deliveries of other jet transports in the "over 33,000 pound" category posted a record $1.28 billion in 1970. The dollar value of the large commercial transports exported increased by 40 percent between 1969 and 1970 but units delivered remained constant. Total commercial transport aircraft exported in 1970 approached $1.3 billion, a 37 percent increase over 1969.
Helicopter exports during 1970 declined in value and increased in units in comparison with 1969. Units exported were 276 for 1970 over 268 during 1969, an increase of 3 percent. The total value of helicopters exported declined by 32 percent in 1970 compared with 1969, a clear indication that lighter helicopters were required 'in principal foreigri markets.
Year Ending Dec. 31
1955 1956 1957 1958 1959
1960 1961 1962 1963 1964
1965 1966 1967 1968 1969•
1970
U.S. AEROSPACE IMPORTS Calendar Years 1955 to Date
(Thousands of Dollars)
TOTAL Aircraft" Aircraft Engines
-$ 32,096 $ 14,415 $ 1,265
86,790 55,594 2,300 52,671 15,476 1,639 78,560 32, 71{) 5,991 68,066 16,273 7,510
60,901 6,841 7,388 151,667 82,821 17,485 128,204 54,280 9,707 95,290 26,831 4,675 90,062 21,505 6,573
158,837 73,406 20,149 303,264 162,645 32,774 286,968 61,136 30,750 333,469 110,817 37,913 306,625 104,375 30,540
308,469 48,297 33,821
" Aircraft includes new and used airplanes, seaplanes and amphibians. •Revised.
Aircratt Parts, N.E.C.
s 16,416 28,896 35,556 39,854 44,283
46,672 51,361 64,217 63,784 61,984
65,282 107,845 195,082 184,739 171,710
226,351
Source: Bureau of the Census, "U. S. Imports, General and Consumption, Schedule A, Commodity and Country", Reports FT 110, 125, 135 (Monthly).
71

AEROSPACE FACTS AND FIGURES, 1971/72
SOURCE· BUREAU OF THE CENSUS
74

FOREIGN TRADE
EXPORTS OF U. S. AEROSPACE PRODUCTS Calendar Years 1966 to Date
(Millions of Dollars)
Years Ending Dec. 31
1966 1967 1968 1969•
GRAND TOTAL •• 0 •••• 0 •• 0 $1,672.6 $2,248.1 $2,994.4 $3,138.4
TOTAL MILITARY .......... 637.5 867.6 765.6 1,111.4
COMPLETJ!: AIRCRAFT, TOTAL .... 221.7 323.8 407.9 601.0 Transports ... ............ 43.6 130.6 100.6 37.9 General Aviation ............ 1.6 1.2 0.6 0.6 Rotary ..................... 17.4 30.0 9.8 32.5 Fighters & Bombers ......... 107.6 115.2 278.6 483.6 Trainers .................... 31.8 15.1 11.0 10.2 e>ther, including Used ........ 19.7 31.7 7.3 36.2
ENGINES, TOTAL ............. · 31.2 26.4 31.1 50.0 Jet & Gas Turbine .......... 19.8 18.8 24.1 38.1 Missile Turbine ............. 4.1 2.4 3.0 8.0 Internal Combustion ......... 7.3 5.2 4.0 3.9
PARTS, AccEssoRIES & EQUIP-250.4 308.8 MENT INCLUDING SPARES, TOTAL. 192.8 303.4
Engine Spares & Accessories .. 72.7 83.8 41.9 58.4 Other Spares & Equipment ... 177.7 225.0 150.9 245.0
RocKETs, GuiDED MISSILES & PARTS TOTAL ................. 134.2 208.6 133.8 157.0 Co~plete Rockets & Guided
13.3 34.0 Missiles ................ ·· 41.6 67.3 Parts & Accessories for Rock-
ets & Guided Missiles ...... 120.9 174.6 92.2 89.7
TOTAL, CIVILIAN .......... 1,035.1 1,380.5 2,228.8 2,027.0
COMPLETE AIRCRAFT, TOTAL .... 552.4 789.3 1,405.4 1,241.0 Transports, New ............ 420.8 611.4 1,200.2 946.9 General Aviation, New ....... 89.1 91.2 101.3 125.6 Rotary Wing1 New .......... ll.6 25.3 33.0 29.1 Other, including Used ........ 30.9 61.4 70.9 139.4
ENGINES, ToTAL, NEw & UsED .. 77.0 101.2 115.7 102.4 Jet & Gas Turbine .......... 49.3 69.6 92.4 82.0 Internal Combustion ......... 27.7 31.6 23.3 20.4
PARTS, ACCESSORIES & EQUIP-MENT FOR AIRCRAFT AND EN-GINES, lNCLUDINO SPARES, TOTAL 405.7 490.0 707.7 683.6
Engine Spares & Accessories .. 116.9 132.1 191.0 177.0 I Other Spares & Equipment ... 288.8 357.9 516.7 506.6
I
r Revised.
1970
$3,400.0
892.1
467.4 81.9 4.2
22.3 330.8
12.9 15.3
45.8 30.6 8.0 7.2
270.5 67.5
203.0
108.4
7.9
100.5
2,507.9
1,529.9 1,294.7
113.5 27.6 94.1
116.1 97.2 18.9
861.9 197.4 664.5
NoTE: For earlier years, see previous editions of "Aerospace Facts and Figures". Source: Bureau of the Census, "U.S. Exports, Schedule B Commodity and Country", Report FT 410
(Monthly).
15
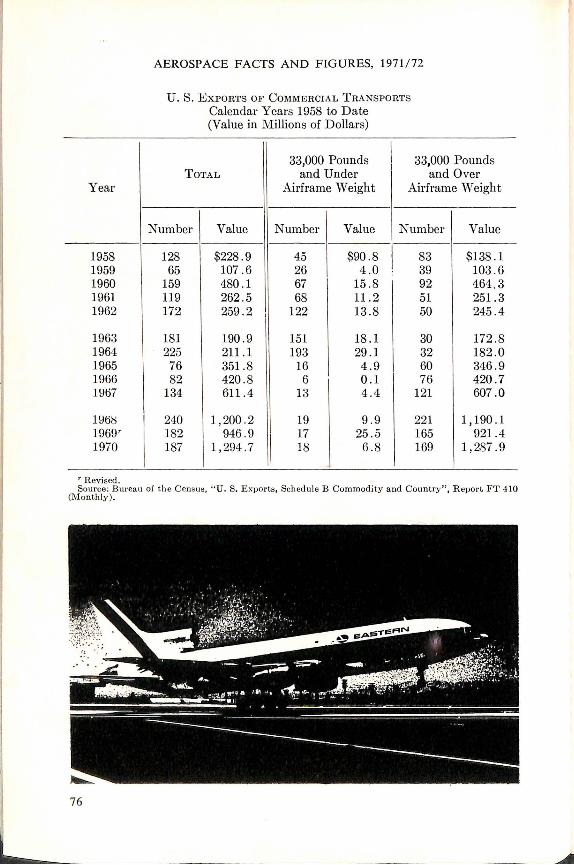
Year
1958 1959 1960 1961 1962
1963 1964 1965 1966 HH:i7
1\:J{jl:) 1969r 1970
r Revised.
AEROSPACE FACTS AND F IG URES, 1971/72
U. 8. EXPORTS OF COliiMERCIAL TRANSPORTS
Calendar Years 1958 to Date (Value in Millions of Dollars)
33,000 Pounds I 33,000 Pounds TOTAL and Under
I and Over
Airframe Weight Airframe Weight
Number Value Number Value Number Value
128 $228 .9 45 $90.8 83 $138.1 65 107.6 26 4.0 : 39 103 .6
159 480. 1 67 15 .8 92 464 .3 119 262.5 68 11 .2 51 251. 3 172 259 .2 I 122 13 .8 50 245.4
181 190 .9 151 18. 1 30 172 .8 225 211. 1 193 29.1 32 182 .0 76 351 .8 16 4 .9 60 346.9 82 420.8 6 0 .1 76 420.7
134 611.4 13 4.4 121 607. 0
240 1,200 .2 19 9.9 221 1,190.1 182 946.9
I 17 25 .5 165 921 .4
187 1,294 .7 18 6 .8 169 1,287.9
Source: Bureau of th e Census, " U. S. Exports, Schedule B Commod ity and Country" , R epor t FT 410 (Monthly ).
76

Year Ending Dec. 31
1948 .... 1949 .... 1950 .... 1951 .... 1952 ....
1953 .... 1954 .... 1955 .... 1956 .... 1957 ....
1958 .... 1959 .... 1960 .... 1961. ... 1962 ....
1963 .... 1964 ....
Year Ending Dec. 31
1965 .. 1966 .... 1967 .... 1968 .... 1969• .•• 1970 ....
• Revised.
FOREIGN TRADE
EXPORTS OF GENERAL AVIATION AIRCRAFT Calendar Years 1948 to Date
ToTAL Under 3000 Lbs. 3-Places or Less 4-Places and Over
Airframe Weight Only
Value Value Value Number (Millions) Number (Millions) Number (Millions)
935 $4.2 552 $1.5 383 $2.7 510 2.8 235 0.7 275 2.1 408 2.2 173 0.5 235 1.7 540 3.7 237 1.0 303 2.7 815 5.6 551 3.1 264 2.5
776 5.4 370 1.5 406 3.9 529 4.5 223 1.1 306 3.4 748 7.4 296 1.9 453 5.5 966 11.0 340 2.5 626 8.5
1,086 13.1 368 2.5 718 10.6
986 12.1 268 2.2 628 9.9 1,033 14.5 384 3.6 639 10.9 1,528 23.6 374 3.0 1,154 20.6 1,646 27.5 582 4.3 1,064 23.2 1,458 23.1 431 3.8 1,027 19.3
1,583 26.9 484 5.7 1,099 21.2 1,834 33.3 640 7.4 1,194 25.9
..
ToTAL Multi-Engine All Single Engine
Airframe Weights Under 3000 Lbs. 3000 Lbs. & Over ..
Num- Value Num- Value Num- Value Num- Value her (lVIil- her (Mil- her (Mil- her (Mil-
lions) lions) lions) lions)
2,457 $68.8 2,031 $30.6 184 $8.4 242 $29.8 2,985 89.1 2,387 35.2 261 13.4 337 40.5 3,125 91.2 2,554 36.9 198 9.5 373 44.8 2,890 101.3 2,295 36.1 163 8.5 432 56.7 2,461 125.6 1,761 35.0 211 11.9 489 78.7 2,045 113.5 1,493 31.5 142 8.6 410 73.4
Source: Bureau of the Census, "U.S. Exports, Schedule B Commodity and Country", Report FT 410 (Monthly).
77
-------===:=..:....:=--=·· ... _____ ·-------
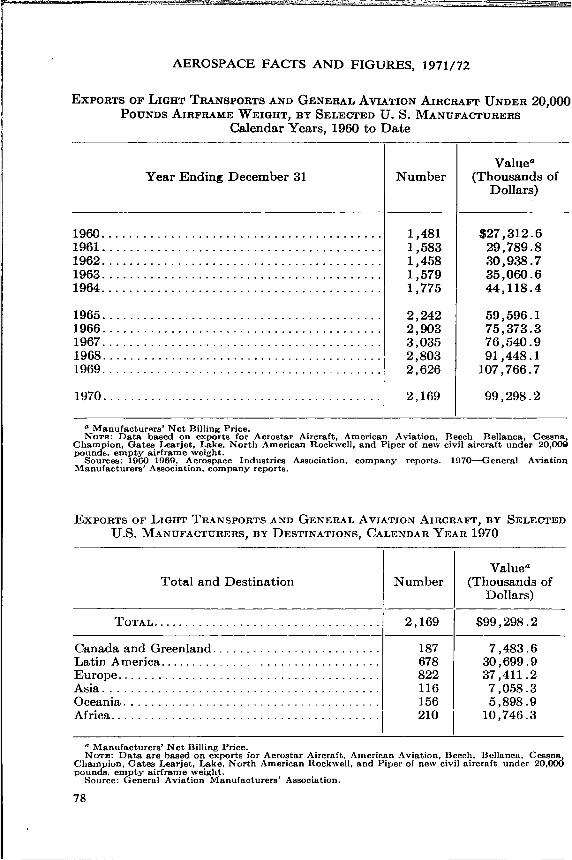
kii&ZL
AEROSPACE FACTS AND FIGURES, 1971/72
EXPORTS OF LIGHT TRANSPORTS AND GENERAL AVIATION AIRCRAFT UNDER 20,000 PoUNDs AIRFRAME WEIGHT, BY SELEC'l'ED U.S. MANUFAC'l'URERS
Calendar Years, 1960 to Date
Year Endinr; December 31
1960 ........................................ . 1961 ........................................ . 1962 ........................................ . 1963 ........................................ . 1964 ........................................ .
1965 ........................................ . 1966 ...... - ................................. . 1967 .................................. - .. - .. . 1968 ............ -- .......................... . 1969 .... - ........ - ... - .......... - ... ---.--- ..
1970.---- .. -- .. -- ... - .. - ......... - .......... .
Number
1,481 1,583 1,458 1,579 1,775
2,242 2,903 3,035 2,803 2,626
2,169
Valuea (Thousands of
Dollars)
$27,312.6 29,789.8 30,938.7 35,060.6 44,118.4
59,596.1 75,373.3 76,540.9 91,448.1
107,766.7
99,298.2
"ManufacturP.rs' Net Billing Price. NOTE: Data based on exports for Aerostar Aircraft, American Aviation, Beech Bellanca, Cessna,
Champion, Gates Learjet, Lake, North American Rockwell, and Piper of new civil aircraft under 20,008 pounds, empty airframe weight.
Sources: 1960-1969, Aerospace Industries Association, company reports. 1970-General Aviation Manufacturers' Association, company reports.
ExPORTS OF LIGHT TRANSPORTS AND GENERAL AVIATION AIRCRAFT, BY SELEC'l'ED u.s. MANUFAC'l'URERS, BY DESTINATIONS, CALENDAR YEAR 1970
Total and Destination
TOTAL .......... - . - •. - - ................ .
Canada. and Greenland ........................ . Latin America. ................................ . Europe ...................................... . Asia ............... _____ ....... _ .... __ ...... . Oceania. . . . . . . . . . . . . . . . . . . . . . . . . . . . . . . . . . . ... . Africa ............................ - ..... - ..... ,
Number
2,169
187 678 822 116 156 210
Value" (Thousands of
Dollars)
$99,298.2
7,483.6 30,699.9 37,411.2 7,058.3 5,898.9
10,746.3
a Manufacturers' Net Billing Price. NOTE: Data are based on exports for Aerostar Aircraft, American Aviation, Beech, Bellanca, Cessna,
Champion, Gates Learjet, Lake, North American Rockwell, and Piper of new civil aircraft under 20,000 pounds, em_pty airframe weight.
Source: General Aviation Manufacturers' Association.
78
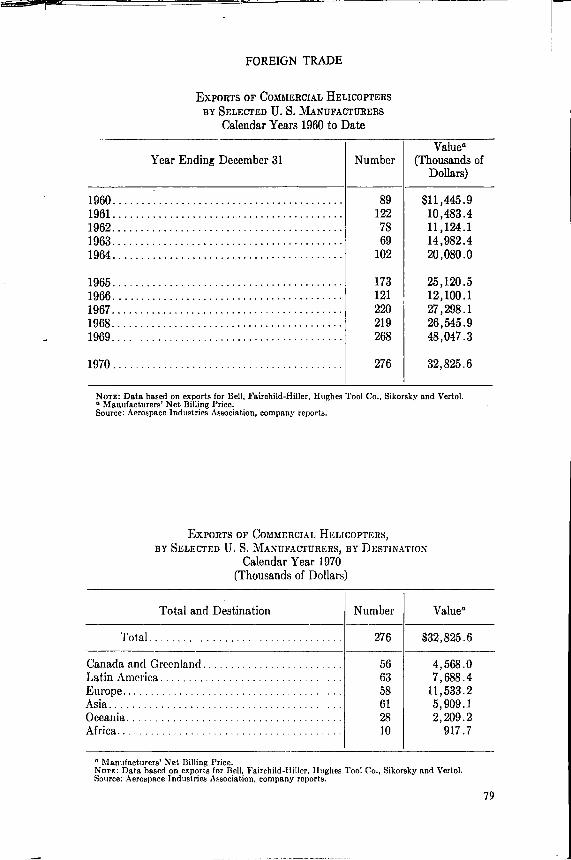
FOREIGN TRADE
ExPORTS oF CoMMERCIAL HELICOPTERS
BY SELECTED u. s. MANUFACTURERS
Calendar Years 1960 to Date
Year Endin~ December 31 Number Value"
(Thousands of Dollars)
1960......................................... 89 1961......................................... 122 1962......................................... 78 1963......................................... 69 1964......................................... 102
1965......................................... 173 1966......................................... 121 1967......................................... 220 1968......................................... 219 1969......................................... 268
1970......................................... 276
$11,445.9 10,483.4 11,124.1 14,982.4 20,080.0
25,120.5 12,100.1 27,298.1 26,545.9 48,047.3
32,825.6
NoTE: Data bued on exports for Bell, Fairchild-Hiller, Hughes Tool Co., Sikorsky and Vertol. • Manufacturers' Net Billing Price. Source: Aerospace Industries Association, company reports.
ExPORTS OF CoMMERCIAL HELICOPT~<:Rs, BY SELECTED U.S. MANUFACTURERS, BY DESTINATION
Calendar Year 1970 (Thousands of Dollars)
Total and Destination Number
Total.................................. 276 $32,825.6
Canada and Greenland . . . . . . . . . . . . . . . . . . . . . . . . . 56 Latin America. . . . . . . . . . . . . . . . . . . . . . . . . . . . . . . . 63 Europe....................................... 58 Asia......................................... 61 Oceania...................................... 28 Africa........................................ 10
4,568.0 7,688.4
11,533.2 5,909.1 2,209.2
917.7
• Manufacturers' Net Billing Price. Non: Data based on exports for Bell, Fairchild-Hiller, Hughes Tool Co., Sikorsky and Vertol. Source: Aerospace Industries Association, company reports.
79
I I

Year Ending Dec. 31
1958 1959 1960 1961 1962
1963 1964 1965 1966 1967
1968 1969'
I 1970
r Revised.
U. S. ExPORTS OF USED AIRCRAFT Calendar Years 1958 to Date (Value in Millions of Dollars)
TOTAL Military
----Number Value Number Value
595 $35.8 - -632 22.9 171 $ 3.1 634 26.2 70 0.5 618 35.1 124 1.2 511 37.5 129 0.9
423 16.6 67 0.2 589 31.7 201 2.8 474 39.7 67 0.7 397 45.7 33 15.0 391 85.5 29 25.3
304 75.5 14 6.8 382 137.7
I 3 a
363 95.1 8 2.7
I Non-Military
Numbe1· Value
595 $35.8 461 19.8 564 25.7 494 33.9 382 36.6
356 16.4 288 27.9 407 39.0 364 30.7 362 60.2
290 68.7 379 137.7 355 92.4
a Less than $0.05 million. Source: Bureau of the Census, "U.S. Exports, Scht'dule B Commodity and Country", Report FT 410
(Monthly).
I Year
1958 1959 1960 1961 1962
1963 1964 1965 1966 1967
1968 1969' 1970
r Revised.
U. 8. EXPORTS OF NEW AND USED CIVIL AIRCRAFT ENGINES
Calendar Years 1958 to Date (Value in Millions of Dollars)
Jet and Gas ToTAL Turbine
Internal Combustion
Number Value Number Value Number Value
3,904 $ 48.3 61 $ 8.0 3,843 s 40.3 2,900 43.7 313 18.6 2,587 25.1 3,725 70.7 480 47.5 3,245 23.2 3,630 75.3 364 53.6 3,276 21.7 3,690 63.1 341 44.8 3,349 18.2
3,143 45.1 253 25.7 2,890 19.4 4,062 46.7 247 25.0 3,815 21.7 3,330 56.2 372 38.8 2,958 17.4 4,006 77.0 564 49.3 3,442 27.7 4,236 101.2 756 69.6 3,480 31.6
3,279 115.6 866 92.4 2,413 23.2 4,178
I 102.4 759 82.0 3,419 20.4
3,768 116.1 61R 97.2 3,150 18.9 I I I I -- -----
Source: Bureau of the Census, "U. S. Exports, Schedule B Commodity and Country", Report FT 410 (Monthly).

FOREIGN TRADE
u. s. EXPORTS OF NEW SMALL AIRCRAFT ENGINES" FOR CIVILIAN AIRCRAFT
Calendar Years 1948 to Date
Year Ending Value (Thousands of December 31 Number dollars)
1948 660 $ 326 1949 107 112 1950 247 285 1951 304 509 1952 551 941
1953 347 708 1954 728 1,516 1955 897 2,016 1956 1,371 3,529 1957 1,516 3,860
1958 1,552 4,312 1959 948 2,448 1960 1,464 3,716 1961 1,575 4,399 1962 1,819 4,510
1963 1,292 3,635 1964 1,677 5,257 1965 1,491 4,815 1966 1,714 6,726 1967 1,748 6,816
1968 1,176 7,155 1969r 2,321 8,712 1970 2,173 8,931
r Revised. G 1948 and 1949, under 250 h.p.; 1950 to date, under 500 h.p. Source: Bureau of the Census, "U.S. Exports, Schedule B Commodity and Country", Report FT 410
(Monthly).
81

AEROSPACE FACTS AND FIGU RES, 197 1/ 72
V ALU E OF U.S . ExPORTS OF MILITARY AND C IVIL E NGIN ES0 AND PARTS
Calendar Years 1958 to Date (lVI illions of Dollars)
Year I I I nte rnal Combustion E nding T OTATJ Dec. 31
1958 $213.5 1959 208 .0 1960 235.1 1961 279 .8 1962 309 .6
1963 293 .3 1964 251 .3 1965 276 .4 1966 292 .3 1967 335 .2
1968 379 .7 ] 969r 387 .8 1970 426 .8
r R ev ised. N .A .- No t. ava ila b le .
Total
$204 .6 186 .9 184 .1 214 .0 250 .5
240 .8 201.4 156.8 150 .8 158 .9
149.0 129.6 126.2
a l nelud es ne w a nd used .
E ngines\ Parts
$68 .5 $1 36 .1 43 .1 143 .8 32 .5 151 .6 27 .4 186.6 23 .1 227 .4 1
27 .2 213. 6 26 .8 174 .6 40 .6 116 .2
I 35 .0 115 .8 I 36 .8 122 .1
27. 3 121 .7
24 .3 \ 105.3
I 26. l 100 .1
Jet and Gas T urbine l\lissile E ngine
\E ngines\ Parts and
Total Parts - --
s 8. 9 s 8 .9 r .A. :::\ .:\ .
21 .1 I 21 .1 N.A. ~ . A. 51.0 51.0 . A. I\.A . 65.8 65.8 N.A. N.A. 59.1 59 .1 N.A. N. :\ .
52 .5 52.5 N.A. I N. :\ . 49 .9 49 .9 N.A. I N.A.
113. 8 60 .9 852 .!) I 85 .8 136 .7 69.1 67.6 4. 8 173.1 88.4
84 'I 3 .2
227 .4 116 .5 110 .9 3.3 250 .0 120 . l 129 .!) H.2 292. 0 I 27 . 8 11 (j .. J. 2 I )).6
'
Sou rce: B11 rPau o f the Cens us , " U.S . Expo rts , Sc hed ule B Comm odiLy u nd Co un try " , H cpur l FT ·110 (!\llon t hl .v ) .
82
- ----------- - -- - -

FOREIGN TRADE
:MuTUAL SECURITY PROGRAM, SHIPMENT OF MILITARY AIRCRAFT
FISCAL YEARS 1950 TO DATE
Yea1· Ending June 30 Total Air Force Navy
1950 251 } 818 l 283 1951 850 f 1952 1,317 1,124 193 1953 2,689 2,274 415 1954 1,170 923 247
1955 1,292 1,136 154 1956 2,659 2,580 79 1957 2,182 2,085 97 1958 I ,714 I ,565 I49 I959 620 528 92
1960 355 317 3~ 1961 483 427 56 I962 358 341 17 1963 456 439 17 1964 499 409 90
1965 568 488 80 1966 387 379 8 1967 238 214 24 1968 275 257 I8 1969 1-!5 145
1970 342 1 342 , _ ---------------------- --------------
18,R50 1
16,791
--------~------ ---- ~-----~----------
"October 6, 1949 to Dnte. fo::ource: Department o£ De£enst...
2,057
83

AEROSPACE FACfS AND FIGURES, 1971172
E.UORT-IMPORT BANK GROSS AUTHORIZATIONS OF CREDITS AND GUARANTEES IN SUPPORT OF COMMERCIAL AIRCRAFT EXPORTS
Fiscal Years 1957 to Date (Millions of Dollars)
Year Credits and Guarantees Creditsa Guaranteesb Ending June 30
TOTAL Jets Other TOTAL Jets Other TOTAL Jets Other I -
1957 $ 46.8 s 17.2 $29.6 s 46.8 $ 17.2 $29.6 - - -1958 53.4 46.0 7.4 53.4 46.0 7.4 - - -1959 21.8 13.7 8.1 21.8 13.7 8.1 -- - -1960 93.8 93.1 0.7 93.8 93.1 0.7 - - -1961 94.3 93.8 0.5 94.3 93.8 0.5 - - -1962 51.4 50.6 0.8 4.2 3.7 0.5 $ 47.2 $ 46.9 $ 0.3 1963 20.3 15.7 4.6 3.0 - 3.0 17.3 15.7 1.6 1964 80.0 79 2 0.8 32.6 32.6 - 47.4 46.6 0.8 1965 93.6 86.9 6.7 1.4 1.4 - 92.2 85.5 6.7 1966 132.1 122.3 9.8 99.3 94.4 4.9 32.8 27.9 4.9
1967 811.2 791.3 19.9 806.3 789.1 17.2 4.9 2.2 2.7 1968 400.4 386.8 13.6 336.8 336.8 - 63.6 50.0 13.6
1969 318.1 308.7 9.4 204.7 197.5 7.2 113.4 111.2 2.2 1970 736.4 677.4 59.0 636.2 598.2 38.0 100.2 79.2 21.0 1971
401.21 (6 mos.) 381.8 19.4 205.4 200.7 4.7 195.8 181.1 14.7 I
a "Credit" is a commitment of direct financing by the Export-Import Bank. & "Guarantee" by the Export-Import Bank of principal and interl'St on a loan made by another institu
tion such as a commercial bank. Source: Export-Import Bank of the United States, Office of the Treasurer-Controller.
84

! I
Manpower
0
Despite layoffs resulting from cuts in defense and space expenditures, the aerospace industry in 1 970 continued to be the largest U.S. manufacturing employer. Monthly average employment during the year was 1 ,159,000-a decrease of 195,000 from the average in the previous year.
Most of the fall-off was in missile and space production, where the monthly average was 479,000, down 103,000 from the 1969 figure of 582,000. Aircraft manufacturing, including engines and spare parts, showed a payroll decline of 86,000-from 597,000 in 1969 to 511 ,000 in 1970. Employment in other industrial classifications involved in missile and
85

r
Monthly Average for the Year
1914 1919 1923 1929 1935
1939 1940 1941 1942 1943
1944 1945 1946 1951 1953
1955 1957 1959 1960 1961
1962 1963 1964 1965 1966
1967 1968 1969 1970 1971
Feb.
AEROSPACE FACTS AND FIGURES, 1971/72
EMPLOYMENT IN THE AIRCRAFT AND PARTS INDUSTRY Calendar Years 1914 to Date (Thousands of Employees)
Aircraft TOTAL Aircraft Engines
(Airframes) and Parts
0.2 N.A. N.A. 4.2 N.A. N.A. 3.5 N.A. N.A.
18.6 N.A. N.A. 14.9 N.A. N.A.
63.2 45.1 11.3 148.6 101.8 31.4 347.1 234.6 75.3 831.7 549.6 192.0
1,345.6 882.1 314.9
1,296.6 815.5 339.7 788.1 489.9 210.9 237.3 159.0 49.9 467.8 313.3 95.0 795.5 472.4 191.2
761.3 466.6 168.0 895.8 519.0 213.2 747.6 419.5 182.8 645.7 350.8 173.6 619.2 324.3 186.6
634.6 331.4 199.4 635.2 332.0 200.7 605.5 317.8 189.0 617.8 330.6 187.5 755.6 420.9 211.1
823.0 467.6 218.3 850.9 494.2 208.7 805.4 479.0 196.5 689.9 387.8
I 180.0
II 602.5 332.7
I 165.3
Other Aircraft
Parts and Equipment
N.A. N.A. N.A. N.A. N.A.
6.8 15.4 37.2 90.1
148.6
141.4 87.3 28.4 59.5
131.9
126.7 163.6 145.3 121.3 108.4
103.9 102.5 98.7 99.7
123.6
137.1 148.1 130.0 122.1
104.5
NoTE: The above figures include substantial missile and spacecraft employment in recent years. They do not, however, represent total aerospace employment, estimates for which appear in preceding tables in tbis chapter. An estimated 162,700 employees in the aircraft and parts industry worked on missiles and spacecraft in December, 1970.
Source: Bureau of Labor Statistics, "Employment and Earnings," (Monthly).
88

MANPOWER
PRODUCTION WoRKERS IN THE AIRCRAFT AND PARTs I:musTRY Calendar Years 1914 to Date
(Thousands of Production WorkE-rs)
Monthly Aircraft Other Average TOTAL Aircraft Engines Aircraft for the (Airframes) and Parts Parts and Year Equipment
1914 0.2 N.A. I
N.A. N.A. 1919 3.5 N.A. N.A. N.A. 1923 2.9 N.A. N.A. N.A. 1929 14.7 N.A. N.A. N.A. 1935 11.4 N.A. N.A. N.A.
1939 49.6 34.8 9.5 5.3 1940 118.0 79.2 26.5 12.3 1941 278.3 183.8 65.0 29.5 1942 674.8 433.9 168.3 72.6 1943 1,090.5 692.1 278.8 119.6
1944 1,016.0 616.3 290.3 109.4 1945 591.0 360.5 164.9 65.6 1946 167.5 113.1 34.0 20.4 1951 348.4 234.8 66.5 47.1 1953 586.2 346.8 136.1 103.3
1955 525.5 322.5 108.5 94..5 1957 591.4 342.4 132.1 116.9 1959 458.0 257.4 104.1 96.5 1960 376.8 203.8 96.6 76.4 1961 351.5 178.8 103.9 68.8
1962 350.6 175.9 108.7 65.9 1963 348.4 174.8 107.2 66.4 1964 338.4 175.0 99.1 64.3 1965 352.9 183.3 102.4 67.2 1966 448.0 241.9 121.1 85.0
1967 495.4 272.6 127.8 95.0 1968 505.0 284.5 119.5 100.9 1969 462.9 267.5 109.4 86.1 1970 380.4 206.7 95.0 78.7 1971
Feb. 325.5 170.9 87.2 67.4
NoTE: The above figures include substantial miBBile and spacecraft employment in recent years. They do not, however, represent total aerospace employment, estimates for which appear in preceding tables in this chapter. An estimated 88,600 production workers in the aircraft and parts industry worked on missiles and spacecraft in December, 1970.
Source: Bureau of Labor Statistics, "Employment and Earnings," (Monthly).
89

AEROSPACE FACTS AND FIGURES, 1971/72
AVERAGE HouRLY EAR~rxGs rN AIRCRAFT AXD PARTS PLAXTs 1947 to Date
PRoDUCTIO~ WoRKims ONLY (Includes Overtime Premiums)
----
:\Ionthly I Air·cr·aft Other Average ToTAL I Airct·aft Engine~ Ait·craft for the (Ait·frames) and Pat·ts Pat·b; and Year Equipment
1947 $1.37 $1.36 $1.38 X.A. 1952 1.89 1.87 1.94 N.A. 1957 2.35 2.35 2.35 N.A. 1958 2.50 2.51 2.51 S2.44 1959 2.62 2.64 2.64 2.55
1960 2.70 2.71 2.73 2.64 1961 2.77 2.78 2.81 2.70 1962 2.87 2.87 2.91 2.80 1963 2.95 2.95 2.99 2.90 1964 3.05 3.05 I 3.09 2.99
1965 I 3.14 3.15 3.17 3.06 1966 3.30 3.34 3.32 3.19 1967 3.44 3.49 3.42 :3.33 1968 3.62 3.64 3.65 3.53 1969 3.87 3.90 3.87 3.77
1970 4.12 4.17 4.10 4.01 1971
Feb. 4.28 4.31 4.31 4.15
NoTE: The production workers surveyed include substantial missile and spacerrn.ft employmrnt. See NOTE page 87.
N.A.-Not a\•ailable. Source: Bureau of Labor Statistics, "Employment and Earnings," (Monthly).
90

MANPOWER
AVERAGE WEEKLY EARNINGS IN AIRCRAFT AND PARTS PLAXT>' PRODUCTION WORKERS ONLY
1947 to Date (Includes Overtime Premium;;)
Monthly Ait·craft Other Average TOTAL Ail·craft Engines Aircraft for the (Airframes) and Pa1-ts Parts and Year Equipment
1947 $ 54.74 s 54.13 s 54.67 N .. \. 1952 81.27 79.85 84.20 N.A. 1957 96.35 95.88 95.65 N.A. 1958 101.25 101.66 99.65 $100.53 1959 106.63 105.86 108.50 106.34
1960 110.43 110.03 112.20 109.30 1961 114.68 114.26 116.62 113.40 1962 119.97 119.97 120.77 118.72 1963 122.43 121.84 123.49 122.67 1964 125.36 123.53 127.31 126.78
1965 131.88 131.26 133.46 131.27 1966 143.89 143.95 144.09 141.96 1967 146.54 147.28 145.35 146.19 1968 152.04 152.88 151.11 151.44 1969 161.77 163.41 158.28 159.47
1970 168.92 170.97 166.05 167.62 1971
Feb. 169.49 170.25 168.95 166.R3
NoTE: Tl1e production workers starveyed include stahstantial missiles and space-craft t'tnplu~·ntrnt. ~ee NoTE page 87.
N.A.-Not available. Source: Bureau of Labor Statistics, "Employment and Earnings,'' ii\Ionthl~·).
91

AER OSPACE FACTS A ND FIGU RES, 1971/72
EMPLOYMENT ON NATIONAL AERO NAUTICS AND SPACE ADMI NISTRATION PROGRAMS 1960 to Date
I J une NASA Contractor ToTAL
Employees Employees EMPLOYMENT
1960 10,268 36,500 46,786 1961 17,077 57,500 74,577 1962 22,156 115,500 137,656 1963 27,904 218,400 246,304 1964 31 ,984 i 347' 100 379,084
1965 33,200 376,700 409,900 1966 33,924 360,000 393,924 1967 33,726 273,200 306,926 1968 32,471 235,400 267,871 1969 31,745 186,600 218,345
1970' 31,350 129 ,500 160,850 1971E 29,850 108,400 137,250 1972E 28, 350 108,700 137,050
,. Revised. E Estimate. Source: The B udget of t he U nited States (Annually); Con t ractor Em ploym en t suppli ed by NASA.
92

Year End-ing
Dec. 31
---1958 1959 1960 1961 1962
1963 1964 1965 1966 1967
1968 1969 1970
MANPOWER
LA.Bc.>R TURNOVER RATES IN THE AEROSPACE INDUSTRY Calendar Years 1958 to Date
(Rates per 100 Employees per Year)
Aircraft
Complete
I Missiles Other and ToTAL Airframes Engines Parts
Spacecraft and and Parts Equipment
------ ------Sepa- Sepa- Sepa- Sepa- Sepa-
Acces- ra- Acces- ra- Acces- ra- Acces- ra- Acces- ra-sions tions sions tions sions tions sions tions sions tions ----------,----------58.1 26.0 28.3 33.3 26.9 29.8 27.8 35.0 33.8 42.0 48.9 29.2 27.4 37.9 22.4 36.5 29.1 35.0 39.4 45.0 32.3 30.9 28.6 39.2 23.4 33.8 35.1 39.5 34.3 53.9 37.0 27.2 32.6 30.9 31.3 29.3 28.9 24.8 43.2 44.9 37.2 31.6 35.2 31.3 32.9 29.0 30.5 23.9 49.3 47.9
29.9 31.5 28.9 29.4 28.6 27.9 24.3 25.0 39.5 42.9 23.5 39.1 24.7 31.0 23.0 28.9 20.2,28.0 38.6 42.9 32.6 28.7 38.7 26.9 38.5 22.8 32.2 28.4 51.9 20.5 44.1 30.8 48.6 31.5 47.3 28.1 43.2 31.0 61.0 46.9 43.5 34.0 37.4 32.2 36.6 27.9 32.5 34.1 46.6 43.9
40.7 45.4 28.1 32.3 27.1 30.2 22.9 31.3 39.8 41.1 27.4 46.6 23.4 33.2 20.8 30.8 24.6 32.2 31.5 42.4 19.3 48.7 16.1 41.7 13.9 43.8 15.1 32.1 26.2 47.4
Source: Bureau of Labor Statistics, "Employment and Earnings," (Monthly),
93

AEROSPACE FACTS A ND F IGURES, 1971/72
EMPLOYMENT ON NATIONAL AERONAUTICS AND SPACE ADMINISTRATION PROGRAMS 1960 to Date
June
1960 1961 1962 1963 1964
1965 1966 1967 1968 1969
1970' 1971E 1972E
r ... Revised. E Estimate.
NASA Employees
10,268 17,077 22,156 27,904 31,984
33,200 33,924 33,726 32,471 31,745
31,350 29,850 28,350
I Contractor ToTAL Employees EMPLOYMENT
36 ,500 46,786 57,500 74,577
115,500 137,656 218,400 246,304
I 347,100 379,084
376, 700 409,900 360,000 393,924 273,200 306,926 235,400 267,871 186,600 218,345
129,500 160,850 108,400 137,250 108,700 137,050
Source: The Budget of the United States (Annuall y) ; Contractor Employment s upplied by NASA.
92

Year End-ing
Dec. 31
---1958 1959 1960 1961 1962
1963 1964 1965 1966 1967
1968 1969 1970
MANPOWER
LABOR TURNOVER RATES IN THE AEROSPACE INDUSTRY Calendar Years 1958 to Date
(Rates per 100 Employees per Year)
Aircraft
Complete
I Missiles Other and I ToTAL Airframes Engines Parts
Spacecraft and and Parts Equipment
------ -------Sepa- Sepa- Sepa- Sepa- Sepa-
Acces- ra- Acces- ra- Acces- ra- Acces- ra- Acces- ra-sions tions sions tions sions tions sions tions sions tions -------- --o------------
58.1 26.0 28.3 33.3 26.9 29.8 27.8 35.0 33.8 42.0 48.9 29.2 27.4 37.9 22.4 36.5 29.1 35.0 39.4 45.0 32.3 30.9 28.6 39.2 23.4 33.8 35.1 39.5 34.3 53.9 37.0 27.2 32.6 30.9 31.3 29.3 28.9 24.8 43.2 44.9 37.2 31.6 35.2 31.3 32.9 29.0 30.5 23.9 49.3 47.9
29.9 31.5 28.9 29.4 28.6 27.9 24.3 25.0 39.5 42.9 23.5 39.1 24.7 31.0 23.0 28.9 20.2,28.0 38.6 42.9 32.6 28.7 38.7 26.9 38.5 22.8 32.2 28.4 51.9 20.5 44.1 30.8 48.6 31.5 47.3 28.1 43.2 31.0 61.0 46.9 43.5 34.0 37.4 32.2 36.6 27.9 32.5 34.1 46.6 43.9
40.7 45.4 28.1 32.3 27.1 30.2 22.9 31.3 39.8 41.1 27.4 46.6 23.4 33.2 20.8 30.8 24.6 32.2 31.5 42.4 19.3 48.7 16.1 41.7 13.9 43.8 15.1 32.1 26.2 47.4
Source: Bureau of Labor Statistics, "Employment and Earnings," (Monthly).
93

AEROSPACE FACTS AND FIGURES, 1971/72
l xJURY FnEQUI·:NCY RATES 0
FOR A LL :\'fA c-JUFACTUR!XG AND AIRCRAFT AXD PARTS
1958 to D~tte
Yea r All Aircra ft :\Ianufacturi ng and Parts
-------- - ---1958 11 .4 3 .5 1959 12 .4 3 .4 1960 12 .0 3.5 1961 11.8 3.5 1962 11 .9 3 .3
196:3 u .9 3.3 1964 12 3 3.4 1965 12 .8 3 .3 1966 13.6 4 .7 1967 14.0 4.3
196, 14.0 3.9 1969 14.8 4.3
0 D eflnerl as the nnmbcr of di sablin !..!: injuries per mil lion emplo.vee ~h o urs work ed. Su urPe : DPpartrncnt of Labor. Hurenu of La bor Statist ics .
94

MANPOWER
\VORK STOPPAGES I N THE AIRCRAFT A ND PARTS I N DUSTRY
Calendar Years 1927 to Date
Year Ending Number of Strikes Number of Man-Days December 31 Workers Involved Idle in Year
1027-1933 4 1,153 18,965 1934 4 3,207 111 ,Q48 1035 1 1,700 6,800 1036 - - -1937 6 9,390 90,964 1938 N .A. N.A. N .A.
1930 2 1,263 85,319 1940 3 6,270 36,402 1941 29 28,422 112,549 1942 15 6,584 12,416 HJ43 60 52,481 130' 112
HlH 103 189,801 386,371 1945 85 150,200 581 ,000 1946 15 21,300 557,000 1947- 10 3,520 67,900 1948 8 21,400 1,100,000
194\J 10 10, 300 451 ,000 1950 18 23,900 145,000 1951 29 48 ,800 765 ,000 1952 44 81,000 927,000 195:3 31 57 ,800 1,350 ,000
1954 11 6, 350 171,000 1955 38 48 ,500 403,000 1956 21 23 ,100 1,040 ,000 1957 18 23,200 88,200 1958 20 36,700 308,000
1959 26 21,700 31 2 ,000 1960 28 82 ,400 1,190,000 1961 14 2, 440 35,000 1962 19 23 ,000 555,000 1963 12 7,510 53, 700
1964 19 20, 300 160 ,000 1965 22 74,900 946,000 1966 23 38 ,000 204, 000 1967 22 28,800 161,000 1968 46 45 ,500 594,300
196\J i 2G 7u ,'100 1 ,564 ,600 I - -
!\: .A .- Not a va.ilab le. NoTE : The ''aircraft and pnrt.s industry " to which this ta bl e a pplies includes s ubsta ntial missil e and
spacEcraft employm ent .. It rep resents a pproxima t ely 60 per cent of to tal aerospace employment . Source: Depa rtment of Labor, Bureau of Labor Statis tics , Division of Wages and Indust ria l R elations.

Finance
0
The financial status of the aerospace industry in Fiscal Year 1970 continued its anticipated downward trend.
The decline in aerospace sales was reported by the Securities and Exchange Commission, based on reports by approximately 70 aerospace companies. The reported total 1970 sales (including sales of non-aerospace products) of $25.5 billion was down from $26.4 billion in 1969. This was nearly double the drop between 1968 and 1969. (These figures differ from sales reported in preceding pages because of differences in sources and reporting procedures) .
The net profit (after taxes) for the aerospace industry dropped from $804 million in FY 69 to $505 million in FY 70. A similar accelerated decrease showed in the amount of net profits retained in business which fell
96

FINANCE
BAJ,ANCE S H EET COMPARI SO:-<S, AEROSP ACE COMPANIES 1965 to Date
(Millions of Dollars)
1965 1966 1967 1968 1969 1 1970 --- - - - -----1------ ------------
Assets: Curren t Assets
Cash. . . . . ... S U.S. Government Securities ..
To ta l Cash and U.S. Govt. Securities ... . .... s
lleceivables (total). Inventories (gross) . ... .•• 0 .
Other current assets . . . . . . . . .
395 s 75
470 s 1 ' 788 4,048
331
369S 46
415S 2,066 5,453
302
460S 16
476S 2,387 7 , 550
314
576S 37
613 s 2,840 9,267
396
763 s 170
933S 3,318
11' 179 435
758 9
767 3,254
10 , 763 467
Total Current Assets ..... S 6,637S 8,236SI0,727S13,116SI5,865Sl5,251 Total Net Plant ... . .... . .. . 1,670 2,1481! 2 ,849 3,542 4,496 4 , 527 OtherNon-CurrentAssets.... 402 684 1,128 1,674 2,317 2,639
Total Assets .. .. . . . . . . . . . . . . . .. S 8, 709 Sll, 068 Sl4, 704 SIS, 332$22,678 S22, 417 - ------- -·------1------ --- --- --- - - - ----Liabilit ies: Curren~. Liabili t ies
Short. term loans . Advances by U.S. Govt . . Trade accounts and no tes
payable . . . Federal income taxes accrued . Installments due on long
term debts. Other em rent liabilit ies . .
339 1,868
835 252
670 2 , 446
1, 098 256
I ,055 3,578
1 '391 229
789 4 , 317
1 ' 922 304
1,132 5,135
2,303 365
1, 146 4,241
2,212 455
45 61 88 110 186 338 1,043 1 ,369 1, 558 1, 906 2,213 2, 148
----------- -------Total cu rrent liabilities .... S 4 , 382S 5,900S 7,899J's 9,348Sll,334S10,540
Long T erm Debt .. . . . 807 1, 094 1,897 2 , 668 3,618 4,113 Other Non-Cmrent Liabilities... 67 100 186 279 412 514
Total Liabilities ... ... . . . . . .... S 5 , 256S 7,094$ 9,982S12,295S15 , 364S15 , 167 - ·---------------- 1---·-- ---------- - - - ---Stockholders' E qui ty:
Capital Stock . . . . . . ... Earned Surplus and Reserves .
1,312 2,142
I ,488 2,486
1 ' 785 2,937
2,254 3,783
2,505 4,807
2 , 491 4,757
T otal Net Worth . . .. .. .. .. S 3,454S 3,974S 4,722S 6,037$ 7,312S 7,248 -·-------- -------1------ -------------
Total Liabilities and Stock-holder's Equity. . . . S 8,709Sll,068S14,704S18,332$22,678$22,417
-N-e--t ·-,-V-o-rk·--i·n_g_ C ___ n_p_i t-a--1.-.-. -.. - .- .·-. -. -.. --.-. -s -2-, 2-5-6 s2-, 3-3-6 s2-, 8-2-8 S -3-, 7_6_8,S_4_, 5-3-1 -s -4-, 7- 1-1
NoTE: Includ es 72 con1pnnics c lassifi ed in indus try g roup 072 which fil ed repo rts with the S ecuri t ies and Exchange Comrn iss ion.
Source : Sec uri ties & Ex change Commission- Fcdernl Trntle C on1m iss ion, "Qunrte l'! y Finnnein l Hcport fo r l\ I u.nufnc t uring Corporations ."
97

;
AEROSPACE FACTS AND FIGURES, 1971/72
from $467 million in FY 69 to $237 million in FY 70. The ratio of profits to sales (after taxes) dropped by one-third, from 3.0 percent in FY 69 to 2.0 percent in FY 70. This is only half of the 4.0 percent average for all manufacturing.
The value of industry stockholders' equity, which had increased by 21 percent between FY 68 and FY 69, declined from $7,312 million to $7,248 million during FY 70. Continuing a trend of several years' duration, net working capital was increased from $4,531 million in FY 69 to $4,711 million in FY 70. This increase in net working capital was a positive gain in the financial picture of the aerospace industry.
Short-term debt grew slightly from $1,132 million last year to $1,146 million in FY 70, and long-term debt was increased from $3 ,618 million to $4,113 million during FY 70.
Reversing a trend that had shown an annual increase during recent years, total assets declined during FY 70 from $22,678 million to $22,417 million, a decrease of 1.2 percent.
NET PROFITS (AFTER TAXES AS A PERCENTAGE OF SALES)
6 ~--------~----------~--------~~--------~--------~ .6 5.6 ----5.1
1
0 1965 1966 1967 1968
98
----- ALL MANUFACTURING CORPORATIONS
---- AEROSPACE
SOURCE: SECURITIES AND EXCHANGE COMMISSION FEDERAL TRADE COMMISSION
1969 1970

Year
1956 1957 1958 1959 1960
1961 1962 1963 1964 1965
1966 1967 1968 196.9 1970
FINANCE
TAXES AND PROFITS, AEROSPACE CoMPANIES
1956 to Date
Net Federal Taxes as a Percent
of Total Income
52.3 52.3 51.7 52.3 44.4
50.7 47.2 47.5 46.9 46.7
45.2 44.5 46.6 43.9 43.1
Net Profit Mter Taxes as a Percent of Sales
3.1 2.9 2.4 1.6 1.4
1.8 2.4 2.3 2.6 3.2
3.0 2.7 3.2 3.0 2.0
NoTE: Does not include data for companies which produce aerospace products but are classified in industries other than group 372.
Source: Securities and Exchange Commission-Federal Trade Commission, "Quarterly Financial Report for Manufacturing Corporations."
Net Sales ........
Net Profit from Operations .....
Total Income before Federal Income Taxes ..
Provision for Federal In-come Taxes ....
Net Profit after Taxes .........
Net Profit He-tained in Business .......
INCOME AccouNTS, AEROSPACE CoMPANIES 1963 to Date
(Millions of Dollars)
1963 1964 1965 1966 1967 1968 ------------------$15,313 $15,403 $16,073 $19,224 $22,739 $26,852
695 756 997 1,076 1,152 1,661
665 748 984 1,046 1,099 1,606
316 351 460 473 489 749
350 395 524 572 610 857
214 241 339 380 382 552
1969 1970 -------$26,392 $25,505
1,493 980
1,433 881
629 380
804 501
467 237
NOTE: Does not include data for companies which produce aerospace products but are classified in industries other than industry group 372. Includes 72 companies.
Source: Securities & Exchange Commiuion-Federal Trade Commission, "Quarterly Financial Report for Manufacturing Corporations."
99

AEROSPACE FACTS AND FIGURES, 1971 / 72
Federal income tax payments by aerospace companies in 1970 were $380 million, which amounted to 43.1 percent of the industry's total net income . This continued the preceding year's trend when $629 million in taxes represented 43.9 percent of income. But while 1969's federal income tax payments were 16 percent below those paid in 1968, the decline from 1969 to 1970 was 40 percent.
The other declining figures are reflected in the industry's plans for new
Year Ending
December 31
1947 1948 1949 1950 1951
I
1952 1953 1954 1955 1956
1957 1958 1959 1960 1961
1962 1963 1964 1965 1966
1967 1968 1969 1970 197la
NEw PLA:-<T A N D EQUI PMEN T ExPEK DITUnEs
Calendar Years 1947 to Da te (Billions of Dollars)
I All
All Manufacturing D urable Indust ri es Industries Goods
$19.33 s 8.44 s 3.25 21. 30 9 .01 3.30 18.98 7.12 2.45 20.21 7 .39 2.94 25.46 10 .71 4.82
26.43 11. 45 5.21 28 .20 11. 86 5.31 27 .19 11 .24 4.91 29.53 11.89 5.41 35 .73 15 .40 7.45
37.94 16 .51 7. 84 31.89 12.38 5.61 33.55 12 .77 5.81 36 .75 15.09 7 .23 35.91 14.33 6.31
38 .39 15.06 6 .79 40.77 16.22 7.53 46.97 19.34 9.28 54 .42 23 .44 11.50 63 .51
I 28.20 14.96
65 .47 28 .51 14 .06 67 .76 28 .37 14 .12 75.56 31.68 15.96 79.7 1 31. 95 15. 80 83. 13 31.86 15.40
Aircraft, Including
Guided Missiles and
Space Vehicles
$0 .04 0 .05 0 .05 0.06 0 .18
0 .18 0.15 0.15 0.23 0 .37
0.48 0 .30 0.30 0.34 0. 30
0.40 0 .45 0 .42 0.46 0. 92
0 .93 0. 86 0. 84 0. 55 0. 50
a Pl a ns acco rdi ng to a s urvey co nducted in Ja nuary a nd F ebruary 1971. So urces: 1947- 1967 : U.S . D epa rtm ent o f Comm erce. Su n· ey o f C urrent Busin ess .. Janua ry 1970 , p . 25; 1968- LH70 : U.S. D epartm ent or Comm erce . U .S . Securi ties a nd Exchange Commi ssio n, Join t S tatistica l R epo rt OBE 7 1- l :.l . S EC 2505, Ma rc!, 9 , HJ71.
100

FINANCE
M ILITARY PRll\IE co~TRACT AWARDS OF $10,000 OR M oRE FOR SELECTED M AJOR M ILITARY HARD Goons , BY Gr::o GRAPHIC R EGION
Fiscal Y ears 1968-1970
M illion Dolla rs Percen t of Program Total Progra m and
R egion FY 1968 F Y 1969 FY 1970 FY 1968 F Y 1969 F Y 1970
AIRCRA FT $9,644 $8,335 $6,993 100.0 100.0 100 .0 N ew E ngland . . .... . 1,791 1 ,308 955 18. 6 15.7 13 .7 M iddle Atlan t ic .. . . . 1,266 927 988 13 .1 11.1 14 .1 Eas t North Central .. 1 ,080 1 ,154 682 11.2 13 .8 9.7 West North Cen t ra l . 876 746 742 9.1 9.0 10 .6 Sou th Atlan tic . . .. . . 980 1,070 1,060 10 .2 12.8 15.2 Sou th Cen t ra l. . ... . . 2, 577 2 ,083 1 ,727 26 .7 25 .0 24 .7 lVIouu tain . . ..... . ... 74 58 69 0. 8 0 .7 1.0 Pacifi c . . . . . .. . .. . . . . 999 988 769 10 .4 11.9 ! 11 .0 Alaska and H awaii ... 1 1 1 a a a
-:MISSILE AN D
SPACE SYSTEMS $4,945 $5 ,474 $5, 021 100 .0 100 .0 100 .0 New E ngland . . .. . . . 577 702 605 11 .7 12 .8 12.0 M idd le Atlan t ic . ... 548 754 640 11 .1 13.8 12 .8 E ast Nor th Cent ra l .. 200 128 128 4. 0 2.3 2. 6 West Nor th Cen t ra l . 151 121 131 3 .0 2 .2 2 .6 Sou th Atlan t ic . . . .. . 516 499 508 10 .4 9 .1 10.1 South Cen t ra l. .. . . . . 143 125 100 2 .9 2. 3 2. 0 lVIoun tain .... .. . . . . . 261 317 305 5.3 5.9 6 .1 Pacific . .. . . ... . . . . 2,528 2 ,826 2 ,602 51 .1 51.6 51. 8 Alaska and H awaii . . . 21 2 2 0 .4 (1. a
E LECTRONICS AND CoMMUN ICATION E QUIPMENT S3,980 $4 ,036 $3 ,519 100 .0 100.0 100 .0
New E ngland .. . . . . . 552 486 444 13.9 12 .1 12 .6 Middle Atlan t ic . . . . . 1,095 1,026 797 27 .5 25 .4 22.7 East Nor th Central . . 409 447 290 10. 3 11. 1 8. 2 W est N or th Cen t ra l . 192
I
221 154 4.8 5 .5 4. 4 Sou th Atlantic ... . . 520 596 622 13 .1 14.8 17.7 Sou th Cen tra l. . . . . .. 254 262 265 6 .4 6 .5 7 .5 Moun ta in .. . . .. . . ... 109 96 88 2 .7 2.'! 2 .5 P acifi c ..... . . . . . . 333 873 823 20 .9 21 .6 23.'1 Alaska and H awaii . .. 16 29 36 0. 4 0. 7 1 .0
a Less cha n 0.05%. Source : D epart.ment o f D efense, Ofll ce of the Secre tary of D efense . Directorat.e For Inforrn at ion Op era
t ions , "~'l i l i tary P rim e Contract Awards by Region and S tate, F iscal Years 1908. Hl6H, 1970 ".
10 1

AEROSPACE FACTS AND FIGURES, 1971/72
MILITARY PRIME CONTRACT AWARDS OF $10,000 OR MORE FOR RESEARCH, DEvELOPME NT, TEsT .\ND EvALUATION WonK,
BY REGION AND BY TYPE OF CONTR,\CTOR Fiscal Year 1970
(Dollar Figures in Millions)
T ype of Contractor
ToT,\L Educational Other I Business
Region lnsti tu tions
Million Percent lVIillion Percent Dollars Dollars
------TOTAL .... . . $5,387 100.0 $356 100 .0
New England. 529 9 .8 107 30.0 Middle Atlantic. 1,072 19.9 43 11.9 East North I
Central. .... . . 295 5.5 36 10.2 West North
Central. ..... 230 4.3 9 2.4 South Atlantic . .. 714 13 .2 87 24.4 South Central. ... 266 4 .9 I 14 4.0 Mountain .... 170 3.2 18 5.1 Pacific ... . . . . . . 2,090 38 .8 38 10.8 . .Uaska and
Hawaii .. . .. . . 21 0.4 4 1.2
a Includ es contracts with other government agenci es. • Less than $500,000. • • Less than 0 .05 %.
Non-Profit Firms Institutions"
Million Percent Million Percent Dollars Dollars ---10().01 S4,745 100.0 S286
- - - -------40 14 .0 382 ! 8.1 27 I 9.5 1,002 I 21 .1
I
20 7.2 238 I 5.0
2 0.6 I
220 4.6 52 18.2 575 12.1 7 2 .3 246 5.2 7 2 .4 145 3.1
131 45.8 1,921 40.5 I
I I * I ** 16 0.3 I
So urce: Department of Defense, Office of the S ecretary of Defense, Directorate for 1 nformation Operat ions , "M ilitary Prime Contract Award s by R egion and State, Fisca l Years 1968, 1969, 1070.
plant and equipment in 1971. The aerospace industry estimate of $500 million is down slightly from 1970 when aerospace companies cut back from an estimate of $720 million to an actual figure of $550 million.
There also was a geographical shift in the spread of military prime contract awards of $10,000 or more for aircraft, missile and space systems, and electronics and communication equipment between FY 69 and FY 70. The Pacific region gained . 7 of one percent and remained in first place with 27 percent of the totaL The Middle Atlantic region gained .4 of one percent to remain in second place with 15.6 percent of the business. The greatest change was registered in the South Atlantic region where an increase of 2.0 percent to a share of 14.1 percent earned third place over the South Central and Northeast regions which dropped to fourth and fifth , respectively. The largest drop was 2.6 percent in the East North Central region which stayed in sixth pl ace with a 7.1 percent share.
Contract dollars for research, development, test and engineering followed the same general pattern with the Pacific, Middle Atlantic, South Atlantic and Northeast regions placing in that order at the bead of the list.
102

FINANCE
MAJOR DEFENSE CoNTRACTORS (Listed by rank according to net value of military prime contracts
awarded July 1, 1969-June 30, 1970) (Millions of Dollars)
July 1, July 1, July 1, July 1, 1965 1966 1967 1968
Company to to to to June 30, June 30, June 30, June 30,
1966 1967 1968 1969
U.S. ToTAL,
July 1, 1969
to June 30,
1970
ALL CoNTRACTS $33,532.6 S39,219.4 $38,826.6 $25,175.2 $31,314.6
Lockheed Aircraft Corp ... 1,531.0 1,807.2 1,870.2 2,040.2 1,847.7 General Dynamics Corp ... 1,136.0 1,831.9 2,239.3 1,243.1 1,183.2 General Electric Co ....... 1,187.0 1,289.8 1,488.7 1,620.8 1,000.5 American Telephone &
TelegraBh Co .......... 672.1 673.0 775.9 914.6 931.2 McDonne l Douglas Corp. a 722.2 2,124.6 1,100.8 1,069.7 882.7 United Aircraft Corp ...... 1,138.7 1,097.1 1,329.0 997.4 873.8 North American Rockwell
Corp.b ................ 520.4 688.8 668.6 674.2 707.1 Grumman Corp ........... 322.9 487.7 629.2 417.1 660.8 Litton Industries, Inc ..... 219.4 180.3 465.7 317.0 543.1 Hughes Aircraft Co~ ...... 336.6 419.5 286.1 439.0 496.9 Lin~ Temco Vought Inc ... 310.8 534.7 753.8 914.1 479.3 Boemg Co ............... 914.5 911.7 762.1 653.6 474.7 Textron Inc .............. 554.8 496.6 500.7 428.3 430.9 Westinghouse Electric
Corp .................. 348.7 453.1 251.0 429.6 417.7 Sperry Rand Corp ........ 426.8 484.1 447.2 467.9 398.9 Honeywell Inc ............ 250.6 313.7 351.7 435.6 397.9 General Motors Corp ...... 508.0 625.1 629.6 584.4 385.7 Raytheon Co ............. 356.7 403.3 451.8 546.8 379.6 Ford Motor Co ........... 439.6 403.8 381.3 396.3 345.9 Avco Corp ............... 506.0 448.6 583.6 456.1 269.7 American Motors Corp .... c c c c 266.3 RCA Corp ............... 242.4 268.4 255.0 299.0 262.8 General Tire &
Rubber Co ............. 327.3 273.1 248.1 263.5 261.8 International Business
Machines .............. 181.6 194.9 223.7 256.6 256.1 Raymond Morrison
Knudsen .............. 547.9 462.5 165.0 254.0 256.0 Martin Marietta Corp ..... 337.8 290.2 393.5 264.3 250.9 Tenneco Inc ............. c c c 236.7 248.9 Olin Corp ................ 173.0 154.3 329.4 354.4 247.7 Teledyne Inc ............. 62.3 87.8 92.5 308.5 238.4 Standard Oil Co.
(New Jersey) .......... 214.0 235.1 274.4 291.1 229.2
: Combined data for 1\fcDonnell and Douglas for earlier years. North American only before FY 1908.
c Not included in "100 Companies". Source: Department of Defense, "100 Companies and their Subsidiary Corporations Listed According
to Net Value of Military Prime Contract Awards", (Annually).
103

AEROSPACE FACTS AND FIGURES, 1971/72
MAJ OR NATIONAL AEiWNAUTICS AND SPACE ADMI NISTRATI ON CO NTRACTORS (Listed by rank according to net value of NASA prime contrac ts
awarded July 1, 1969 to June 30, 1970) (Millions of Dollars)
Fiscal Years Ending
Compa ny June 30, June 30,
1966 1967 - - - ---
u.s. TOTAL ALL CON TRA CTS S2,381.8 $3,864.1
--- - -- - - ----North American
Rockwell" ... .. . . . 682.8 983.8 Grumman Aerospace. 356.8 481.1 McDonnell Douglasb . 139 .0 243 .9 Boeing Company .. .. 187 .9 273 .5 International Busi-
ness Machines .. . . 130 .5 186 .4 General Electric Co . . 104.6 179 .3 Bendix Corp . . ... .. 71.0 120 .0 Mart in Mariet ta
Corp .. . . . . .. . 5 .8 12.8 Aerojet-General
Corp . . . . . . . . . . . . 42 .0 95 .7 TRW, Inc . .. . . .... 23 .8 52.6 R CA Corp . . . ....... 30 .1 57.5 Sperry R and Corp . . . Lockheed Aircraft
22 .9 38 .7
Corp . . .. . . . . . . . 24 .0 42 .0 General D yna mics
Corp . . . . . . . 24 .0 61.0 Trans World
Airlines . . . . .... . . 14 .1 25.1 Service T echnology
Corp .. d d
United Aircraft Corp. Federal E lectric
16.1 40.0
Corp . . . . . . . . . . . . . 10 .0 12.3 Philco-Ford Corp ... . 17.7 32 .1 General Mo tors Corp. 50.1 65 .2 LTV Aerospace Corp. 21.1 46 .3 Chrysler Corp . . Brown-Northrop
... . 51.6 76 .6
(Joint Venture) .. . 6.9 10 .0 ILC Industries, Inc .. d 6 .3 Singer-General
Precision, Inc.c .. . . 15.4 25 .0 Honeywell , Inc . . . . . . 10 .8 22 .6 Bell comm, Inc . .... . . 7.6 9.3 Computer Sciences
Corp . . 7.3 ll. 8 Brown E ngineering
Co., Inc . .. . ... . America n Science &
7.4 16 .7
E ngineering, Inc .. . 1.7 4.2
a Nort h America n only before FY 1968. b Comb ined da ta for McDonnell a nd Douglas . c General P recis io n only befo re F Y 1969. d Not in list of major contrac to rs fo r indicated year.
June 30, June 30, 1968 1969
------------
$3,446.7 S3,022.3 ------ - - - - - -
838.7 680 .9 394 .1 369 .2 209 .0 207.5 296 .7 228 .7
147.7 112 .5 190 .7 150 .1 123.8 127 .6
26 .8 56 .0
67 .1 64.9 52.4 50.0 63.2 51.6 31.8 34.1
40.5 39 .8
54.4 34. 0
25 .3 35.4
d 26 .2 18 .1 26 .2
22.0 27.0 32 .0 22 .4 46 .8 30.9 42.7 18 .3 62 .6 42 .5
14.5 12.7 8.1 12. 2
12.4 9 .7 15.7 8. 1 10 .0 10.1
ll. 8 8 .3
16 .3 11.1
6 .5 8.4
June 30, 1970
---- --
$2,759. 2 - -----
531.5 284.4 236 .3 158.6
133 .4 131 .7 109 .8
108.0
71.6 58 .3 54 .5 48.1
41.0
38.0
36 .0
27.5 27 .1
26 .3 24 .0 20. 4 17.9 16.7
16 .6 13 .0
12 .3 11 .5 11 .0
11.0
9.9
9. 8
Source : National Aeronaut ics and Space Administration, "NAS A An nual P rocurement Repo rt ," (A nnuall y) .
104

0
Air Transportation
U.S. scheduled airlines during 1970 flew 2,415 million revenue miles , only a slight increase over the 2,385 million revenue miles flown in 1969.
Despite the slight increase in operations, the financial plight of the air carriers worsened with losses totalling nearly $179 million.
Stuart G. Tipton, president of the Air Transport Association, provided this explanation :
" An economic recession hit the U.S. and just at the time the airlines brought in , on a schedule set up some years ago, additional capacity .. .. At the same time these trends bumped into each other, the cost of every thing that the airlines buy went zooming up at a rate even faster than the inflation rate of the nation as a whole.
T he most se rious cost problem for the industry has been labor, which
105

AEROSPACE FACTS AND FIGURES, 1971 / 72
accounts for almost one-half of airline costs. Average wages shot up last year ( 1970) by about 15 percent-among the highest increases in all industry. This fact, along with the rapidly rising costs of items such as fuel, landing fees and interest rates, resulted in an overall inflation rate of about 9 percent, almost twice the national average."
In world airline operations, excluding the U.S.S.R. and China, the carriers flew 4,405 million miles in scheduled and international operations. These carriers flew 307 million passengers compared with 290 million in 1969.
The world airlines during 1970 operated 3,999 aircraft of which 3,030 (76 percent) were manufactured in the U.S.
U.S. air lines operated a total of 2,586 aircraft of which 2,239 were turbine-powered.
106
AIRCRAFT IN OPERATION BY WORLD AIRLINES •
1964
SOURCE: INTERNI.ITIONAL AIR TRANSPORT ASSN .
• Excludes USSR and Mainland China
1969

AIR TRANSPORTATION
U. 8. MANUFACTURED AIRCRAFT IN OPERATION ON WoRLD AIRLINES Calendar Years 1963 to Date
1963 1964 1965 1966 1967 1968 1969 ------------------
TOTAL, MANUFACTURED IN U. 8 ... 2,266 2,317 2,548 2,556 2,735 2,890 3,030 ------------------
4 Engine ....................... 1,434 1,417 1,493 1,410 1,424 1,374 1,428 Turbojets .................... 580 627 738 825 941 1,102 1,221
Boeing 707 ................. 206 233 291 365 467 547 600 Boeing 720/720B ............ 107 109 119 118 121 119 113 Boeing 747 ................. - - - - - - 4 McDonnell Douglas DC-8 .... 183 199 236 254 276 372 437 Convair 880 ................ 53 53 52 53 58 48 47 Convair 990 ................ 31 33 40 35 19 16 20
Turboprops ................... 137 137 136 136 127 85 62 Lockheed Electra ............ 137 I 137 136 133 124 82 59 Lockheed L-100 Hercules ..... - - - 3 3 3 3
Piston Engine ................. 717 655 619 449 356 187 145 Lockheed Constellation ...... 179 176 136 83 31 10 3 Douglas DC-7 .............. 178 133 85 47 23 5 3 Douglas DC-6 .............. 257 250 265 210 193 76 72 Douglas DC-4 .............. 103 96 132 109 109 96 67 Boeing Stratocruiser ......... - - 1 - - - -
3 Engine ....................... 4 97 193 309 441 561 671 - Boeing 727 (turbojet) ........ 4 97 193 309 441 561 671
2 Engine ....................... 783 754 803 791 836 925 902 Turbojets ..................... - - 4 59 176 392 498
Boeing 737 ................. - - - - - 70 124 Lear Jet 24 ................. - - - - - 1 1 McDonnell Douglas DC-9 .... - - 4 59 176 324 373
Turboprops ................... 7 7 7 18 28 34 26 Fairchild F-27 /F-227 ......... 7 7 7 18 22 23 21 Convair 640/580 ............ - - - - 6 10 5 Beechcraft 99 ............... - - - - - 1 -
Piston Engine ................. 776 747 792 714 632 499 378 Convair 240, 340, 440 ........ 228 201 190 177 161 120 100 Martin 202, 404 ............. 4 - 4 - - - -Curtiss Commando C-46 ..... 37 38 57 56 44 23 18 Douglas DC-3/C-47 ......... 479 471 481 441 391 320 237 Other ...................... 28 37 60 40 36 36 23
1 Engine ....................... 18 19 21 13 10 12 14
Helicopters ..................... 27 30 38 33 24 18 15 ------------------
ALL MANUFACTURERS GRAND TOTAL ................. 3,086 3,137 3,461 3,541 3,725 3,903 3,999
------------------Per Cent of Grand Total
73.4,74.0 Manufactured in U. s ......... 73.4 73.9 73.6 72.2 75.8
NoTE: Excludes U.S.S.R. and China:· Source: International Air Transport Association, "World Air Transport Statistics" (Annually). Based
on reports by lATA members.
107

AEROSPACE FACTS AND FIGURES, 1971/72
u.s. CIVIL AND .JOL'\T-USE AIRPORTS
By Length of Runway and Regiona January 1, 1970
Airports by Leng th of Runway (in feet)
FAA Region TOTAL Under 5,000
ToTAL 11,050 9,622
Eastern .. . ..... ... . .. . .. . . . . .. 2,310 2,067 Southernb .... . . . . . . . . . . . . . . .. . . 1,218 1,043 Central. . ..... . .. .. . . .. . . . . . . . . 3,102 2,849 Southwest . .. .. . ..... . . .. .... . . 1,663 1,453 Western ....... . ... . . . . .. . . .. .. 1,997 1' 645
Alaskan ....... . . ..... . . .. . .. .. I 691 511 Pacific . . .. .... . .. . .. . .... ..... . 59 52 Outside U.S.< . . ........ . ..... .. 10 2
" Includes seaplane bases , heliports a nd milita ry fi elds having joint-civ il use. b Includes Puerto Rico (20 a irports) and the Virgin Islands (4 a irports) . c America n Samoa, Canton, Guam and " ' ake. Source: Department of Transportation, Federal Aviation Administration .
5,000-9,999
1,184
194 163 213 181 320
100 6 7
WORLD AIRLINE PASSENGER MILES (IN MILLIONS)
1970
1960
1950
108
SOURCE INTE~NATIONAL CIVIL AVIATION ORGANIZATION
• Exoludn USSR and Mainland China
10,000 & over
244
49 12 40 29 32
80 1 1
240,500

AIR TRANSPORTATION
wORLD CIVIL AIRLINES
Selected Calendar Years, 1919 to Date (Revenue Traffic, Scheduled Services, International and Domestic)
(Data in Millions)
Year I I
Ending Miles Passengers Passenger- Cargo Mail December Flown Carried Miles Ton-Miles Ton-Miles
31
1919 1 N.A. N.A. N.A. N.A. 1929 55 N.A. 105 N.A. N.A. 1934 100 N.A. 405 N.A. N.A. 1939 185 N.A. 1,260 N.A. N.A. 1944 260 N.A. 3,410 N.A. N.A.
1949 840 27 15,000 390 130 1951 1,005 42 22,000 630
I
160 I
1953 1,205 52 29,500 725 190 1955 1,425 68 38,000 905 255 1956 1,580 77 44,000 1,030 275
1957 1,765 86 51,000 1,125 295 1958 1,820 88 53,000 1,150 320 1959 1,920 99 61,000 1,330 355 1960 1,930 106 67,500 1,480 415 1961 1,940 111 72,500 1,700 490
1962 2,015 121 80,500 1,995 555 1963 2,130 135 91,500 2,230 590 1964r 2,300 155 106,000 2,680 625 1965r 2,550 177 123,000 !!,400 755 1966 2,790 200 142,000 4,010 1,050
1967 3,290 233 169,500 I 4,590 1,295 1968r 3,730 262 192,500 5,555 1,610 1969r 4,160 290 217,000 6,820 1,720 1970 4,405 307 240,500 7,375 1,875
I I --
N.A.-Not available. NoTB: Excludes China (mainland) and the U.S.S.R. Source: International Civil Aviation Organization, "Development of Civil Air Transport, Total Sched·
uled Services-Revenues Traffic" (Annually).
109

AEROSPACE FACTS AND FIGURES, 1971/72
u.S. DOMESTIC AND I NTERNATIONAL AIRLINE PASSENGER SERVICE
Selected Calendar Years, 1926 to Date
Domestic International
Revenue Revenue Year Passengers Passenger- Passengers Passenger-
Ending Carried Miles Carried Miles Dec 31 (Thousands) Flown (Thousands) Flown
(Mi ll ions) (Mill ions)
1926 6 1.3 N.A. N.A. 1930 385 85 .1 33 7.8 1935 679 281 .2 111 46 .7 1940 2,803 1,052.2 163 99.8 1945 6,541 3,360.3 511 450 .1
1950 17,468 8,029.1 1,752 2,21 4.0 1951 22,711 10,589.7 2,140 2,613.8 1952 25,176 12 ,559.3 2,391 3,065.0 1953 28,901 14,793 .9 2,745 3,450.8 1954 32,529 16 ,802.4 2,919 3,810. 4
1955 38,221 19,852.1 I
3,488 3,398.9 1956 41,937 22,398 .6 4,068 5,226 .2 1957 45 ,162 25,378 .8
I 4,259 5,882.0
1958 44,741 25,375 .5 4,428 6,123.9 1959 51,000 29,307.6 '1,999 7,064.2
1960 52,377 30,556.6 5,499 8,306.2 1961 52,712 31,062.3 5,699 8,768.5 1962 55 ,950 33,623.0 6,598 10,138.0 1963 63,925 38,456.6 7,513 11,905.4 1964 72,988 44,141 .3 8,775 14,352.4
1965 84 ,460 51 ,887 .4 10' 195 16,789.0 1966 97,746 60,590.8 11,646 19,298.4 1967 118,669 75,487.3 13,424 23,259.3 1968 134 ,423 87,507.6 15,728 26 ,450.6 1969 142 ,340 95,945 .8 16 ,848 29,468.3
1970 153,408 104,156.0 16 ,260 27,563.2
N OTE : F iguree represent total scheduled services excluding nonrevenue operations of certificated route air carriers . Passenger originations only .
N.A.- Not available. Source: C ivil Aerona utics Board.
110

Revenue Year Miles
Ending Flown Dec 31 (Millions)
1949 463 1951 527 1953 657 1955 780 1956 869
1957 976 1958 973 1959 1,030 1960 998 ~
1961 970
1962 1,010 1963 1,095 1964 1,189 1965 1,354 1966 1,482
1967 1,834 1968 2,146 1969 2,385 1970 2,415
AIR TRANSPORTATION
UNITED STATES ScHEDULED AIRLINES
Selected Calendar Years, 1949 to Date
Revenue Passengers Passenger- Cargo
Carried Miles Ton-Miles" (Millions) (Millions) (Millions)
17 8,827 196 25 13,204 324 32 18,245 359 42 24,351 503 46 27,625 634
49 31,261 721 49 31,499 726 56 36,372 853 58 38,863 880 58 I 39,831 1,023
63 43,760 1,388 71 50,365 1,346 82 58,494 1,634 95 68,676 2,270
109 79,889 3,048
132 98,484 3,537 150 113,958 3,872 159 125,414 4,443 170 131,719 3,862
I
Mail Ton-Milesb (Millions)
66 92
106 150 160
169 185 209 250 308
350 368 383 494 762
985 1,268 1,345 1,484
NoTE: Figures represent total scheduled service excluding nonrevenue operations of U.S. international and domestic certificated route air carriers.
: Includes freight plus express revenue ton-miles in scheduled and nonscheduled operations. U. S. mail ton-miles plus foreign mail ton-miles.
Source: Civil Aeronautics Board.
111

AEROSPACE FACTS AND FIGURES, 197 1/72
CoMPOSITIO:-< OF U. S. Am LTNr. FLEET, BY TYPI·: oF AmcH.H'T, ~UMBER OF
E!~:G J !\ES, AND MODEL, J A:\UARY 1, 1969, 1970 A:\ll 1971 . (Number of Airrraft)
Type of Aircraft, Number of Engines, and Model
TOTAL A TRCRAF'I' ... .. .. . .. . . . .. . .. . . . . . .. .
Total fixed -wing .. . ............. . .. . .... · -I Turbine-powered- total .... . . . . . .. . ... . . ·1
Four-engine--total . . . . . . ...... . .... . Turbojet-total ..... . .. .. . .. .... .
Boeing 707 . ...... . .. . .. . .... .. . . Boeing 720 .. . . . ... . . . . . . .. . ..... . Boeing 747 .. .. . .. .. . ... . . ... . . Convair 880 ... . . ....... . . .. . . Convair 990. . .. . .. ... .... . .. . .. . McDonnell Douglas DC-8 .... . .... .
Turboprop-total . ...... . ........ . . Arm~trong Whi tworth Argosy
AW-650 ... . . ................ .. . Canadair CL-44 . .. . ... . . . . .. . .. . . . Lockheed 188 ... . . . ...... . . .... . . . Lockheed 382 .... . . . .... . . .. . .. . . Vickers Viscoun t 745 .... . .. ... . . . .
T hree-engine-total ........ ... . . . . . . . . Turbojet- total ............ . .. . .. . .
Boeing 727 . ....... .. . . . . ...... . Twin-engine- total. ... . ... . . . .. . .... . .
Turbojet- total . . . . . . . . . . .. . Boeing 737 .. ....... . . . British Aircraft Corp. BAC-111 . . Sud Aviat ion Caravelle SE-210 ... . McDonnell Douglas D C-9 . ........ . Hamburger Flugzeugbau HF-320 ... .
T urboprop- total ................ . . Convair 240T . .... . .. .. . . . . .. .. . . . Convair 340T . ..... .. . . .. .. .. . .. . Convair 640 ................ . .. .. . DeHavilland DH;DI-I- C ....... .. . Fairchild F-27 .... . .......... . Fairchild FH-227 ..... ... . . . ..... . Grum man G-159 ...... . .. . ... . ... . Grumman G21T . .. .. . . . . ... . . . . . . Nord 262..... . .. .. . . . . . . . . Short SC-7 .... .. . . . . . . . ... . .. . . Nihon YS-11 . . . . .. . . . ... .... . . . . Beech 99 .. ..... . ...... . ... . . . .
1971
2 ,679
2 ,663 2,510 1 ,041
931 406 11 5 79 41
5 285 110
8 ~
69 22 3
659 659 659 805 546 149 59 -
337 1
259 24
108 10 6
37 47
1 --
2 21 3
(Conlin'Ued on 11f1:1 page)
112
I
1970 1969
2,690 2,586 ·--- -
2,672 2 ,570 2,448 2,239
997 983 S8fi 816 428 393 127 134
l -41 41 G 11
283 237 111 167
8 7 g 14
73 114 18 13 3 19
628 543 62~ 543 628 543 818 706 554 422 147 76
60 60 20 20
327 266 - -
264 284 24 36
119 11 3 - -
9 6 3~ 48 53 55
l 1 1 2
- 12 2 2
17 9 -
I -
--- -- -

AIR TRANSPORTATION
CoMPOSI'l'ION OF U.S. Am LINE FLEF.T, nY TYPI~ OF AmcRAFT, NmmER OF ENGINES AND MoDEL, JANUARY 1, 1969, 1970 AND 1971-Conlinued
(Number of Aircraft)
Type of Aircraft, Number of Engines, and Model
Single-engine turboprop-total ......... . Pilatus PC-6A ................... . Pilatus PC',..6B ................... .
Piston-powered-total .................. . Four-engine-total ................... .
Boeing 377 ...................... . Douglas D C-4 ................... . Douglas DC-6 ................... . Douglas DC-7 ................... . Lockheed049/149 ................ . Lockheed 7 49 .................... . Lockheed 1049/1649 .............. .
Twin-engine-total. .................. . Aero Commander 680E ........... . Convair 28-5-ACF ................ . Convair 240 ..................... . Convair 340/440 ................. . Curtiss C-46 ..................... . Douglas DC-3 ................... . Fairchild C82 ..................... ' Grumman G-21 .................. . Grumman G-44 .................. . Grumman G-73 .................. . Grumman SA-16 ................. . Martin 202 ...................... . Martin 40-1 ...................... . Other .......................... .
Single-engine-total. ................. . Rotary Wing-total ...................... .
Turbine-powered-total. ................ . Sikorsky S-61 .................... . Sikorsky S-62 .................... . Vertol V-107-II .................. . Bell BL-206 ..................... .
Piston-powered-total .................. . Sikorsky S-58C .................. .
1971
5 2 3
153 34
2 8
17 6
1
110 1
6 42 22
2 12 2 1
1 19
2 9
16 13 6
4 3 3 3
1970
5 2 3
224 64
1 11 33 14
1 4
153 1 2 1 7
43 37
2 11 3 1 2 1
38 4 7
18 15 8
4 3 3 3
1969
7 3 4
331 82
8 40 29 4 1
234 1 4 3
46 44 56
4 17 3 1 2 2
47 4
15 16 13 8 1 4
3 3
Source: Department or Transportation. Federal Aviation Administration, "FAA Statistical Handbook or Civil Aviation," (Annually).
113

U.S. DoMESTIC A I RLINES
ToTAL AssETS AND NET I NVESTMENT I N FLIGHT EQUIPMENT
(Dollar Figures in Millions) 1958 to Date
Flight Equip- Percent of Total As of June 30 Total Assetsa ment (Net-after Assets in Flight
depreciation) Equipment -----
1958 $1 '182 s 852 72 .1% 1959 1,494 1,048 70.1 1960 1,760 1,374 78 .1 1961 2,099 1,734 82.6 1962 2,273 1,874 82.4
1963 2,211 1,818 82.2 1964 2,415 2,030 84 .0 1965 2,816 2,391 84.9 1966 3,747 2,981 79.6 1967 5,003 3,833 76.6
1968 6,294 5,096 76 .6 1969 7,107 5,864 82.5 1970 7,417 6,030 R1.3
u Comprises net inves tment in bu ildings and ground eq uipm ent , fli~~ l t t, equipm ent. working ca pita l. etc. NoT~:;: Include..., data for sys tem tru nk and loca l serv ice carriers on!~· . Sources : Civi l Aeronantics Boa rd l9G·l "A nnual Report." Ch·i\ Aeronaut ics Board, Accounting: Costs
and S tatis tics Di\·ision.
U. S. DoMJ,STIC AIRLINES, VALUE OF FLJGIIT EQUIPMENTa
1958 to Date (Millions of Dollars)
As of Total Gross Less : June 30 Value of Flight Depreciation
Equipment
I 1958 S1 ,498 .5
I s 709. 8
1959 l ,752.8 816. 8 1960 2,174.3 889. 6 1961 2,719.2 I ,062.0 1962 3, 006.0 1,183.3
1963 3,132.4 l ,341.4 1964 3,382.7 1, 401.6 1965 3,843.5 1 ,504. 7 1966 4,519 .7 1,645.5 1067 5 ,48.5 .0 I ,805 .6
1968 0 ,!)36.2 2,043.7 1969 i\ ,003 .5 2,3:34.2 1970 8 ,546 .3 2,F-:13.9
I
(f Includes data for system t runk and loc::tl serv ice carriers on ly. t:;onrcc: Civil Aero nn.11 tics Board.
l'lu:;: Equals: Constru cti on Net Value
Work in of Flight Process Equipment
I s 63.-1 !
s 852.1 112.3 I ,048 .3 89 .;) I I ,374.2 76 .7
I I ,733.9
51 .7 I
I ,874.4 I
27 . 1 i l ,818.1 -18.4 : 2,029.5
I 51 .7 ' 2,390.5
106.9 ~ 2,081.1 153.2 3,832 .6
203.7 5, 096 .2 194.fi .1,863 .8 297 .0 ti ,030 .3
I

0PEHATI:-;G REYE:\UES OF S cHED U LED D o :-.n:;;TJC
PA SS I·: :-;GJ::n / C .-\RGO 0Pr-:RATORS. C ERTIFJ C.·\ ·n : n RouTE Am C .-\ Hil l EHS"
Calendar Year:; 1957 to D a te (::\1 ill ions of Dollar;:;)
Calendar Total l\Ia il (in- Ex pre:;,; Y ears Operating Pas:-;enger eluding and Excess Other
R evenues subsidy)
1957 S1 ,530 Sl , 347 s 75 1958 1 ,636 i 1,432 82 1959 1,955 1 ,723 95 1960 2 , 129 1 ,860 113 1961 2,245 1,951 I 130
1962 2 ,498 2 , 168 139 1963 2,722 2,375 143 1964 3 ,095 2,701 149 1965 3 ,608 3,142 157 1966 4,070
' 3,534 162
1967 4 ,887 4 ,260 170 196SC
I
5 ,606 4 ,913 182 1969 6,438 5 ,662 186
I
a Includ es Intra-Alas ka . In t rn-1-Tnwa ii, H e lico pter and oth er carriers . r Re,·ised. Source : C i,·il .-\ ero nnut ics noard. Bureau of Accounts a nrl Sta tist ic;;. .
Freight Baggage
s 68 s 19 7S 19 91 21
103 21 115 20
136 20 152 17 182 17 220 12 251 6
287 7 343 9 40 1 10
0PEHAT!:-;G REVI·:xu~-: s , ExPI·:i'\::; 1·: ,.; .-\XI> N' ET OP I·:nATIXG 1 :-; co~n: O F
ScHEDULED DoMEo;TI C PM;;;EXG I·: n / C AnGo OPI·: H.-\Ton:-; A:--lll
('1-:nTJFJCAT I·: D .-\m CARHII·:n;:; "
Calendar Years 1957 to Dalt• (IVJi ll ion;; o f Dolla rs)
s 21 25 25 32 29
35 35 46 77
117
163 159 179
( 'a lenda r Total Operating Total Operatin~ X e t: Operating Years Hevenue;; Expense
- ------- -1957 $1,530 $1,489 1958 I ,636 1,539 1959 I , 95:) 1 ,848 1960 2, 129 2,091 1961 2 ,245 2,244
1962 2,498 2 ,408 1963 2,722 2,580 1964 ;~ , 094 2,778 1965 3 ,608 3 ,165 196fi 4 ,070 :3 , 589
1967 4, :S:S7 -1,476 19687 5 ,606 5 , 298 1.969 6,438 6 , 156
a Inc lud es Intra-Alaska, Intrn-1-Inwnii, H e licopter and other cnrri cra. r R ov i ;ed. NoTE: Fig ures be fore 1061 d o not incluJ e i te ms of g ro und a nd ind irect expense. S ource: C iv il Ac ro na u t.ics Hoard, Burea u o f Acco unts nnd Stat.is t.ic3.
Income
s 41 97
107 38
1
90 142 316 443 ..J8 1
411 308 282

AEROSPACE FACTS AND FIGURES, 1971 / 72
GENERA!, AviATION, Houns, AN D lVhLES FLOWN, DY TYPE OF FLYING Calendar Years 1931 to Date
Business Commercial Instructional Personal Other Year Ending D ecember 31
Tot::tl U ni ts Cen t U ni ts Cent U ni ts Cent- U nits ,Cent U ni ts Cent I
Per Per Per [ Per Per
- -- - - -1- - --1------------ --- - --I--E STIMATED H ouns FLOWN, 'Thousands
1931 1 '0831 152 14 281 1936 1, 059 122 12 245 Hl41 4 , 460 2.'>0 6 511 1946 9, 788 I 1, 068 11 943 1951 I 8,451 2,9so :35 1,584
26 23 11 10 19
19:)3 1955 HJ57 1959 1960
8 5?7 9:5ao
10,038 12 , go;; 13, 121
:3 626 4 :300 4 , 864 5 ,6!!9 !i,699
42 4;j 4.'i 44 44
1 64'! 1!) 1:!)50 21 2 . 013 18 2;355 18 2,365 I 18
1!JG1 1962 l!Jti3 1964 1965
13,602 14 ,500 1!)' 106 15,738 16,733
;),6!)9 5,4:31 5, 740 ::> , 82il 5,857
42 38 :~s 3-
1 ab
2,634 :3, Q;j1 :3, 172 3,305 3,:348
' ID 21 21 21 20
1!)66 1967 1968 Ul69
2 1,023 22 ,1 :33 24, 0.):) 25 , 051
7 ,O:i7 (j , :)71; (\ , 97() 7,064
:13 3 J ~) i_) ;)
:30 3,!) 18 2!J '1, 8 10 28 4,928
17 18 20 1!)
Esn~t ATED M u .Es Fr.ow N, i\ Iillions
Hl:ll ().1 J:l H I J!):l6 ();; 12 l :l 1!l41 :;46 27 R 1946 87:i 122 14 19;) 1 !J7!i :380 3!)
l!Fi~ 1 9:i :i 1!l:i7 ) !);)!)
1!J60
1961 1962 196il 1964 1965
Ul66 1967 1968 1969
1 , 04:i 1 '2lli 1 LJ:.W 1 >16 1, 76!)
1, 8:)8 1,96!i 2, 04!) 2, 1Rl 2,562
3,336 3 ,440 3,70 1 3 , 926
40!) 48 628 ;)2 721 !i l 858 !iO 88 1 ;)Q
888 48 n:l,; 48 !!8::l 48
1, 047 48 1,204 47
1 ' .')46 46 1 ,43 1 42 I ,406 :J , I ,426 36
2(i 2 .~
5 1 108 l !JO
28 26 1:i 12 20
2 10 20 246 20 I 2'1!) 17 i 2!J2 17 2!)9 17
333 1- 18
367 18 369 18 393 18 461 18
5 16 .~69 (i(i(i
723
16 ](i
1R 19
307 380
2,816 5 !)!)6 1:902
28 36 63 61 ? '> ~v
I
343 312 883
1,686 1, 880
32 29 20 17 22
1 , 248 1 ,275 1, 864 2 ,043 1, 828
15 I 1 846 22 21 19 22 24
I, 796 2,385 2 ,417 2,675 3 ,346
13 17 l!i 14
1:l 16 16 17 20
1 '975 2, 109 2 ,796 3,172
'3 ·~n8
3:4s9 3,626 3, 777 '1,016
2;i 24 24 24 24
,-l ,674 6,262 ll 49,1 7:023
27 4,540 :2~ '!• ~ ?~ 27 ,) , .•. u 23 5, 9!19
2:i ;)()
1U7 47!J 100
27 ::n 57 ~1 .=)
l !J
121 11 12 1 10 202 14 223 13 194 11
203 11 2;)6 13 266 I 1:3 284 13 359 14
fi4fi 10 7 1?, 2 1 8 14 22 9 10 23
2!) 27 71
l.'i7 200
:H 28 20 18 2 1
19G 19 222 18 241 17 243 20 387 22
42:i 23 388 20 410 20 436 20 .512 20
606 1R 6!11 20 777 2 1 829 2 1
• Los• th~tn 0.5 per cent. Source: Federal Aviation Administration, "General :\ \· iation Stn list ics", October Hl iO.
116
95 135
158
88
57
7:i 144 1;) 1 LiG IG6
1 I
2
1!)7 l 222 1 24 1 1 337 I t
JO 1.5
1 1
1!) 2
13 1
8 n
n n
20 1 1 20 1 22 1 26 1
32 36 :n 38
1 1 I I

Year as of
J an. 1 TOTAL
1955 349,729 1956 298,076 1957 259,:367 1958 309,212 I 1959 354 ,365
1960 359,875 1961 348,062 1962 352 ,860E 1963 365' 971 1964 378,700
196;) 431,041 1966 479,770 1967 :)48' 757 1968 617,931 1969 691,695
!970 720,028
AIR TRANSPORTATION
ACTIVE AIR~L-\N CERTIFICATES HELD
19:35 to Date
Pilots
/ Private I Stu- Com- Airline Other dents mercia!
71,969 184,595 80,346 12,129 690 80,494 132,525 72,957 11 '774 326 96,124 96,864 54,545 11' 173 861 98,491:> 124,799 70,813 13,964 1,138
103,456 140,573 : 93,126 15,840 1,370
107,815 139,804 93,8 15 16 ,950 1,491 99,182 138,869 89,904 18,279 1,828 93,973 144,312l: 92,976E 19,155E 2,444E 95,870 149,755 96,047 20,032 4,267
105,298 152,209 96,341 20,269 4,583
120,743 175, 574 108,428 21,.572 4,724 139,172 196, 393 116,665 22,440 5,100 165,177 222,427 131,539 23,917 5,697 181,287 254,069 150,135 25,817 6,623 209,406 281 '728" 164,458 28,607 7,496 -203,520 299,491 176,585 31,442 8,990
1971 732,729 1195,861 298,627 186,821 34,430 16,990
E Estimate. a Inc ludes special certificates issued to foreig n nationals. Source: Federal Aviation Administration, Office of .Management Systems.
Non-pilots Other
140' 199 64,263 148,335 71 ,307 155, 121 62,927 149 , 274 74,682 157,424 88, 079
167,074 91,259 169,598 94,723 175,287E 98, 257E 181,982 101,793 186,304 83,800
195,396 116,600 204,463 128,541 217' 132 146,068 231,801 166 ,994 250' 151 169,707
269,775 189 ,871 289,681 207 , 670
117

AEROSPACE FACTS AND FIGURES, 1971/72
E LI GIBLE CIVIL AIRCRA FT BY TYPr, Calendar Years I954 to Date
Active Civil Aircraft
I General Aviation Aircraft
Year .Jan. 1 Total Fixed-Wing Aircraft
ToT.\L Air Car-rier(l TOTAL Single-Engine
Multi-engine
4-place 3-place & over & less
---1954 55,505 1,615 53,890 N.A. N.A. N.A. 1955 58 ,994 I ,606 57,388 2,600 17,078 37,278 1956 60,432 1,642 58, 790 3,342 19,240 35,654 1957 64,638 1,802 62,886 4, I83 22,805 35,291 1958 67,153 1,864 65,289 5,036 23,751 35,809
1959 69,718 I 1,879 67,839 5 ,416 26 , 170 35,440 1960d 70,747 2,020 68,727 6 ,034 27,301 34,543 1961 78,760 2,211 76,549 7,243 34 ,829 33,472 1962 82 ,853 2,221 80,632 8,40I 38,206 32,800 1963 86,287 2,166 84,121 9, 186 41 , I20 32,341
1964 87,267 2,179 85,088 9,695 42 , 657 30 ,977 1965 90,935 2,193 88,742 10 ,644 45 ,777 I 30,367 1966 97,741 2,299 95 ,442 11,977 49,789 31,364 1967 107 ,085 2,379 104,706 13 ,548 52 ,972 35,687 1968 116 ,781 2,595 114 , 186 14,651 56 ,865 39,675
1969 127,164 2, 927 I24,237 16 ,760 60, 977 42,830 1970 133 ,814 3 ,008 130,806 18,111 63 ,703 45,001
N .A. - Not a vai la ble. (J R egis tered, not necessarily in opera tio n. In cludes helicopters . b Lnclud ea autog iros; excludes a ir carri er helicopters . ' Includ es gliders , d irigibl es , and balloo ns. d Excludes a pprox imately 4.000 unclassifi ed active a ircraft.
Rotor-craftb
N.A. 235 283 350 433
521 525 634 798 967
I , 171 1,306 1,503 1,622 I ,899
2 ,350 2,557
Other•
----N. A.
197 27 1 257 260
292 324 36I 427 507
588 648 809 877
I , 096
1,320 1,434
Source : Federal Aviation Ad ministration, "U.S . Acti\·e Civ il Aircraft by State and Coun ty .''
11 8

AIR TRANSPORTATION
VERTICAL LIFT AIRCRAFT
A marked increase in the number of law enforcement agencies using helicopters was shown in 1970.
A survey conducted by the Aerospace Industries Association of the commercial-executive and civil government helicopter operators in the United States and Canada reported a total of 1,424 operators and 3,874 helicopters operated. This is an increase of 3 percent in the number of operators and 13 percent in the number of helicopters operated compared with the 1969 totals.
The largest increase-71 percent-was in the number of civil government agencies that operate helicopters. Law enforcement agencies, especially city and highway police departments, have found the helicopter uniquely effective for crime control.
An increase in the number of heliports and helistops is reported in the 1970 AlA Directory of Heliports, Helistops in the U.S., Canada and Puerto Rico. The Directory lists 2,310 heliports/ helistops. This is an increase of 22 percent of the 1968 totals.
In 1965, there were 34 hospital heliports in the country. By 1970, there were 285 landing facilities for today's aerial ambulance-the medicopter-to transport highway accident victims to the hospital.
It is significant to note that of the 2,310 heliports listed, 746 of these are for public-use, while 1 ,564 are for private use. Today's airport congestion and highway traffic have generated a new interest in the utilization of helicopters as city-center to city-center transports. With public-use, downtown and suburban heliports, helicopters can provide this service above the traffic on the ground and below the traffic on the airway.
119

--- - -
Year Ending Dec_ 31
1952 1953 1954 1955 1956
1957 1958 1959 1960 1961
1962 1963 1964 1965 1966
1967 1968 1969 1970
AEROSPACE FACTS AND FIGURES, 1971/72
I !
I
I
H ELICOPTER ScHEDULED AIRLINES
Available Service and Utilization Calendar Years 1952 to Date
(In Thousands)
I Revenue
Passengers Revenue Passenger-Carried Ton-Miles Miles
Flown Flown
- 75 -1 127 26 8 151 183
29 193 628 54 281 1,585
153 449 3,275 230 594 4,885 366 856 7,477 430 1,054 I 9,475 490 963 8,604
359 897 8,192 458 1,317 12,510 608 1,668 16,003 718
I 1,948 18,811
1,067 2,562 25,420
1,220 I 2,960 29,670 1,042 2,482 24,856
737 1,703 17 ,074 573 l ' 167 11 '341
I
Source: Civil Aeronaut ics Board.
120
Revenue Plane-Miles
Flown --
632 1,007 1,074 1,152 1,318
1,604 1,675 1,899 2,219 2,157
1,518 1,462 1,976 1,984 2,241
2,660 2,547 1,909 1,427

Year Ending Dec. 31
1952 1953 1954 1955 1956
1957 1958 1959 1960 1961
1962 1963 1964 1965 1966
1967 1968 1969 1970
I
AIR TRANSPORfATION
HELICOPTER ScHEDULED AIRLINEs Revenue Ton-Mile Traffic Carried
Calendar Years 1952 to Date (In Thousands)
I. TOTAL I I Passenger u.s. Express
j ToN-MILEs · Mail I
75 - 75 -127 2 125 -151 18 116 13 193 59 97 32 281 146 I 91 36
I 449 314 91 34 594 468 84 33 856 717 87 41
1,054 911 91 40 963 818 94 40
897 778 65 44 1,317 1,189 74 44 1,668 1,520 92 45 1,948 1,787 84 60 2,562 2,415 60 70
2,960 2,819 61 64 2,482 2,361 57 48 1,704 1,626 34 37 1,167 1' 134 5 25
Freight Excess Baggage
- -2 -4 -5 -7 1
7 3 6 3 7 4 7 5 7 5
6 3 6 5 6 6
10 6 10 7
9 8 8 7 6 4 4 a
"Effective January 1, 1970, the certificated route air carriers no longer report excess baggage separately. Excess baggage is now combined with passenger ton·miles and passenger weight standardized at 200 lbs.
Source: Civil Aeronautics Board.
121

AEROSPACE FACfS AND F IGURES, 1971 /72
HELIPORTS AND HeLI STOPS
I N THE Ul'\ITED STATES, CANADA, A:\"D PuERTO Ri co
1963 to Date
I Region 1963 1964 1965 1966
TOTAL .... • ••• 0 0 • • 797 1,000 1 ' 11 8 l ,225 (elevated) .... . . . . . N.A. N.A . (95) (125)
New England . . ... 67 95 88 93 Middle At! an tic . . ... 90 148 179 203 East North Central.. 169 151 122 139 West North Central. . 26 36 47 43 South Atlantic ..... 54 83 97 105
East South Central . 13 20 25 28 West South Central . 73 87 116 118 Mountain . .... . .. . 60 77 78 92 Pacific ... . . . .. . 203 262 320 358 Other . . . ... . .. . . . .. 42 42 46 46
I N .A.-Not availab le. NoTE: Data for 1967 a nd 1969 are not ava ilable. So urce : Aerospace Industries Assoc iation.
Hos PITAL HELIPORTS
I N THC Ul'\ JTED STATES, BY REGIO N
1965 to Da te
I
I
1965 1966 I 1967a 1968b
TOTAL .. . .. . . . ... . . . . . 34 67
New England ... .. . . . . 1 2 Middle Atlantic ... ... . 4 8 East North Central . ... 1 12 West North Central . . . - 1 South At! an tic .... . . . . 10 13
East South Central - 1 West South Central 9 : 13 Mountain. . . . . . ....... 1 3 Pacific .. .. ...... . ... 8 14 Other . .. ••• •• 0 • • • • . . . - -
a In addi t ion to those in operation , 21 are proposed. In ad di t io n to those in operation , 39 are proposed.
c In addi tio n to those in operation , 34 are proposed. d In add it io n to those in operat.ion , 4.5 a re proposed. Source : Aerospace Industries Associa t ion.
122
88 147
2 2 10 19 14 50 2 4
16 19
1 1 16 16 8 9
19 27 - -
1968
1,892 (158)
138 346 258 81
157
41 195 126 470 80
I
1969"
161
2 22 52 4
24
1 17 11 28 -
-
I 1970
2,310 (216)
93 514 293 107 192
47 205 157 593
I 109
1970d
285
5 29 74 18 33
5 20 24 73 4
I

AIR TRANSPORTATION
C'JVIL HELICOPTI!:R OPERATORS A:SD HELICOPTERS Qp~;RATED 1960 to Date
Year· as of TOTAL February 1 Number
CrvrL HELICOPTER Qp~:RATORS
1960 I 318 1961 406 1962 503 1963 600
II 1964 . 710
1965 860 1966 933 1967 1,023 1969
I 1,379
1971 1,424
Hr·:LrCOPTims 0PERATim
1960 936 1961 1,179 1962 1,319 1963 1,497 1964 1,767
1965 2,053 1966 2,318 1967 2,438 1969 3,433 1971 3,874 I
NoTE: Includes United States and Canada. a Federal, state and local governments.
Users
Companies Commercial and
Executives
193 94 265 106 322 145 405 150 451 212
508 299 519 353 522 427 689 596 672 590
705 134 882 173 994 213
1,157 218 1,333
I 311
1,537 401 1,699 475 1,764 487 2,390 770 2,605 802
Source: Aerospace Industries Association. manufacturers' and operators' reports.
I Government
I Agenciesa
31 35
I 36 45 47
53 61 74 94
162
97 124 112 122 123
115 144 187
I 273 467
123

Glossary
Accessions: new hires and rehires by industrial employer. Cumulated for a calendar month or year and expressed as a rate per 100 employees on the payroll.
Aerospace Industry: the industry primarily engaged in the manufacture of aircraft, guided missiles, spacecraft-i.e., all air and space vehicles and their related components and parts ..
AlA: Aerospace Industries Association, formerly Aircraft Industries Association.
Air Carriers: see Airlines. Aircraft: all airborne vehicles supported either by buoyancy or by
dynamic action. Used in this volume in a restricted· sense to mean an airplane-any winged aircraft, including helicopters but excluding gliders and guided missiles.
Aircraft Industry: the industry primarily engaged in the manufacture of aircraft, aircraft engines and parts, aircraft propellers and parts, and aircraft parts and auxiliary equipment. Part of the aerospace industry.
Airframe: the structural components of an airplane, such as fuselage, empennage, wings, landing gear, and engine mounts, but excluding engines, accessories and other parts that may be replaced from time to time.
Airlines: the commercial system of air transportation. Consists of scheduled domestic and (U. S.) international air carriers, supplemental and other carriers.
Airplane: see Aircraft. Appropriation (Federal Budget): an act of Congress authorizing an
agency to incur obligations and make payments out of funds held by the Treasury.
Astronautics: the art and science of designing, building and operating manned or unmanned objects through space.
Backlog: the sales value of orders accepted (supported by legal documents) that have not yet passed through the sales account.
Development: the process or activity of working out a basic design, idea, or piece of equipment (see also Research).
DoD: Department of Defense. Earnings: see Net Income. Evaluation: determination of technical suitability of material, equip
ment or a system. Expenditures (Federal Budget): the actual disbursements or payments.
They consist generally of checks issued and cash paid. The trans-
124

GLOSSARY
actions of business-type activities which generate their own receipts are normally recorded as net expenditures-that is, the excess of disbursements over receipts. If receipts exceed disbursements, the result is shown as a negative expenditure.
FAA: Federal Aviation Administration (formerly the Federal Aviation Agency).
Facility: a physical plant or installation, including real property, building, structures, improvements and plant equipment.
Fiscal Year (Federal Budget): from July 1 to June 30, e.g., the 1967 fiscal year begins on July 1, 1966, and ends June 30, 1967; abbreviated FY.
Funding: setting aside funds for a particular purpose. FY: see Fiscal Year. General Aviation: all civil flying except that of the trunk, regional
and supplemental airlines. Helicopter: A heavier-than-air aircraft supported in the air by power
driven rotors about one or more substantially vertical axes. ICBM: Intercontinental Ballistic Missile, range more than 5,000
miles. Labor Turnover: the gross movement of wage and salary workers into
and out of employment in individual manufacturing establishments, cumulated for a calendar month or year and expressed as a rate per 100 employees on the payroll.
Military Assistance: see Mutual Security Program. Mutual Security Program: a program of the U. S. Government de
signed to maintain the security, promote foreign policy, and provide for the general welfare of the U. S.; based on the Mutual Security Act of 1954.
NASA: National Aeronautics and Space Administration. Net Income: profit after depreciation, taxes and reserves for taxes,
chargeoffs, other reserves, etc., but before dividends; also identified as earnings or net earnings.
New Obligational Authority (Federal Budget): authority provided by the Congress to obligate the federal goveri1Plent to pay out money. While usually voted each year, it may become available annually under a perll}.anent law, as with interest on the public debt. "Appropriations" are the most common form of obligational authority.
Obligations (Federal Budget): commitments made by federal departments and agencies to pay out money-as distinct from the actual payments made for products, services, loans or other purposes.
125

AEROSPACE FACTS AND FIGURES. 197 1/72
The amounts must be within the maximum amounts provided by Congress.
Passenger Mile: one passenger moved one mile. Procurement: the process whereby federal govenm1ent agencies ac-
quire material, services, and property from industry. Profit: see Net Income. R & D: Research and Development. RDT&E: Research, Development, T es t and Evaluation. Research: "basic research" provides new knowledge and understand
ing; "applied research" puts the knowledge gained in basic research to some useful purpose.
Rotorcraft: an aircraft which in all its usual flight attitudes is supported in the air wholly or in part by a rotor o r rotors, i.e., by airfoils rotating or revolving about an ax is.
Satellite: a body that rotates about another body, such as the Moon revolving around the E arth , or a man-made obj ect rotating about any body such as the Sun, E arth or Moon.
Separations: terminations of employment. Terminations may be initiated by the employee (quits) or the employer (layoff , other separations). Both employee and employe r ac tions are accumulated for a calendar month or year and are expressed as a rate per 100 employees on the payroll.
STOL: short takeoff and landing aircraft. Test: an experiment designed to assess progress 111 attainment or
accomplishment of development objectives. Thrust: the driving fo rce exerted by an engine, particularly an air
craft or miss ile engine, in propelling the vehicle to which it is attached.
Ton Mile: one ton moved one mile. Turbine, Turbo: a mechanical device or engine that spins in reaction
to a flui d fl ow that passes through or over it. F requently used in " turbo-prop" and "turbo-jet. "
U.K.: United Kingdom. U.S.: U nited States. USA: United States Army. USAF: United States Air Force. USCG: United States Coast Gu ard. USN: United States Navy. USSR: U nion of Soviet Socialist R epublics . Utility A ircraft: an airc raft designed for general purpose work. V jSTOL: vertical or short takeoff and landing aircraft. VTOL: vertical takeoff and landing aircraft.
126

INDEX -
INDEX
A
ACCEPTANCES, See Production
ACCESSION RATES, 93
AEROSPACE INDUSTRY Average Hourly Earnings, 90 Comparison with All Manufacturing and Dur
abl e Goods, 7, 13 Average Weekly Earnings, 91 Early History, 15, 24ff, 40, 88ff, 95 , I 09, II 0,
116 Employment, 13 , 86ff Exports, 15, 71 ff Finance, 16, 97ff Payroll, 14, 90, 91 Sales, 7ff, 26ff, 47 , 53
AFRICA, 78 , 79
AIR CARGO, 109, Ill , 115, 121
AIR CARRIERS, See Airlines
AIRCRAFT, 15, 22, 24ff Aiiframe Weight, 31 Airline, 107, 112ff Backlog, 11 , 26, 28 Civil , 15, 24ff, 75ff Exports, 15, 71 fi Federal Finances, 8, 11 , 17ff Foreign Airlines, 107ff In Use, See Above Inventory, 21 , 22 , 107 Military, 24ff, 29fl' Mutual Security, 83 On Order, 36 Programmed, 34 Production, 23ff
General Aviation , 37 Helicopters, 38ff Military 30fl' Transports, 36
Sales, 7ff, 26ff
AIRCRAFT ENGINES, See Engines
AIRCRAFT INDUSTRY, See Individual Subjects
AIR FORCE, 21 , 29, 32ff, 34, 45, 66, 83
AIRFRAME WEIGHT, 31
AIRLINES Domestic, 108, 11 Off Flight Equipment, 22 , 107, 11211' Foreign, 107, 109 Helicopters, 120ff Operating Revenues, 11 5 International, 109 World, 22 , 107, 109
127

INDEX
128
AEROSPACE FACTS AND FIGURES, 1911!72
AIR MAIL, 109, 111, 115 AIRMEN, 117 AIRPLANES, See Aircraft AIRPORTS, 108 AIR TRANSPORT, See Airlines AIR TRANSPORTATION, 105ff ARMY, 21, 29, 32, 34, 45, 66 ASIA, 78, 79 ASSETS, Airline, 114 ASSETS, Corporate, 95, 96 ASTRONAUTICS, 20, 60 ASTRONAUTS, 61 ATOMIC ENERGY, 65 AUSTRALIA, 57
B BACKLOG, 11, See also products BALANCE OF TRADE, 73 BALANCE SHEET, 97 BOMBERS, 21, 30ff BUSINESS FLYING, 116
c CANADA, 57, 78, 79 CAPITAL SPENDING, 100 CARGO, See Air Cargo CARRIERS, See Airlines CERTIFICATED PILOTS, 117 CIVIL, See Individual Subjects CIVIL AIRPORTS, 108 COMMERCIAL AIRCRAFT, See Transports COMMERCIAL FLYING, 116 COMMUNICATION SATELLITES, 58 CONTRACTS, 10lff
, CONTRACTORS, MAJOR, 103,104
D DEFENSE CONTRACTORS, 103 DELIVERIES, See Production DEPARTMENT OF DEFENSE
Aircraft, 18ff, 29ff Air Force, 21, 29, 32ff, 34, 45, 66, 83 Army, 21, 29, 32, 34, 45, 66 Astronautics, 20, 60 Contractors, 103, 104 Expenditures, 18ff Marine Corps, 21, 34 Military Assistance, 18ff, 20 Missiles, 1 Off, 18ff, 20ff

INDEX
INDEX
Mutual Security Program, 83 1'1avy,21,29,32ff,34,39,45,66 Outlays, 17 Procurement, 18ff, 20, 29, ~~
EARNINGS Companies, 16, 97ff Employees, 14, 90ff
E
EMPLOYMENT, 14, 86ff ENGINEERS, 86 ENGINES
Backlog, 11, 26, 47 Civil, 27, 28, 40ff Employment, 85ff Exports, 71, 75ff, 80ff Military, 40, 42 Missile, 47 Production, 40ff Sales, 11, 27, 47 Space Vehicles, 47
EUROPE, 78, 79 EXPENDITURES
Atomic Energy Commission, 65 Aerospace, 17ff Aircraft, 18ff Department of Defense, 18ff Federal, 11, 17, 65 Missile, 1 Off, 18ff, 45 National Aeronautics and Space Administration,
8, 17, 52ff National Defense, 10ff, 18ff Plant and Equipment, See Capital Spending Research and Development, 18ff, 65ff Space Activities, 10, 52ff Space Vehicles, 53
EXPORT-IMPORT BANK, 84 EXPORTS, 15, 70ff
FIGHTERS, 30ff FINANCES
F
Government, See Expenditures Industry, 16, 96ff Flight Equipment, Value, 114
FLYING HOURS, 116 FOREIGN TRADE, 15, 70ff FRANCE, 57 FREIGHT, 109, 111, 115
G GEOGRAPHICAL DISTRIBUTION
Exports, 78ff
129

INDEX
130
AEROSPACE FACTS AND FIGURES, 1971 /72
GERMANY, 57
GOVERNMENT, See Individua l Subjects GENERAL AVIATION, 37, 16ff GROSS NATIONAL PRODU CT. 7 GUIDED MISSILES
Air-to-Air, 48 Air-to-Surface, 49 Anti-Submarine, 50 Backlog, 47 Expend itures, !Off, 45ff Intercontinental Ballistic Missiles, 21 , 50 Programmed, 34 Sales, !Off, 47 Squadrons, 21 Surface-to-Air, 48 Surface-to-Surface, 49 Unguided Missiles, 50
H HELICOPTERS, See Also Vertical Lift Aircraft
Airlines, 120ff Exports, 79 Inventory, 118 Military, 30ff Production, 30ff, 38ff
HELIPORTS, 122 HOURS, FLOWN, 116 HOURS IN SPACE, 61
I INCOME ACCOUNTS, 99 INJURY F REQUENCY RATES, 94 IN STRUCTIONAL FLYING, I 16 INVENTORY
Aerospace Companies, 97 Aircraft, 21
ITALY, 57
J JAPAN, 57 JET ENGIN ES, See Engi nes JETS, See Aircraft
L LABOR AND E MPLOYM ENT, I3, 85ff LATIN AMERICA, 78ff LIABILITIES, Co rporate, 97 LOCATION , See Geographical Distribution LOSSES AND PRO FITS, 99
M MA lL, See A ir Mail MANNED SPACE F LI GHT, 60ff
------- - ------ -

INDEX
INDEX
MANPOWER, 13, 85ff MARINE CORPS, 21 , 34 METEOROLOGICAL SATELLITES, 58 MlLITARY ASSISTANCE, 18ff, 20
See Guided Missiles MISSILE PROGRAMS, 34, 48ff MUTUAL SECURITY PROGRAM, 83
N
NATIONAL AERONAUTICS AND SPACE ADMINISTRATION, 8, 17, 52, 55, 59, 65
NASA CONTRACTORS, 104 NATIONAL DEFENSE, 17 NAVY, 21, 29 , 32ff, 34, 39, 45, 66 NET PROFIT, 99 NET WORTH, 97
0
OBLIGATIONAL AUTHORITY, 20 OCCUPATIONS, 86 OCEANIA, 78 , 79 ORDERS, AIRCRAFT, 36
p
PASSENGER MILES, 109ff PAYROLL, 14 PERSONAL AIRCRAFT, See General Aviation PILOTS, 117
PLANES, S::e Aircraft PLEASURE FLYING, 116 PROCUREMENT, 18, 19, 20 PRODUCTION , 23ff
See also Individual Products PRODUCTION WORKERS, 14, 87, 89ff PROFITS, 16, 99
PROPULSION, See Engines
R
RATINGS, PILOT, 117 RECIPROCATING ENGINES, See E ngines RESEARCH, APPLIED AND BASIC, 68 RESEARCH AND DEVELOPMENT, 18, 19, 64ff REVENUE PASSENGERS. 110, Ill , 115 ROCKETS, See Guided Missiles ROTARY WING , See Helicopters
131

INDEX
132
AEROSPACE FACTS AND FIGURES, 1971172
s SALA R TES, 14 SALES, 7, 8, 10, 11 , 26ff, 37, 47 , 53 SATELLITES, 57ff SCHEDULED AIRLINES, See Airlines and
Individual Subjects SCIENTISTS, 86 SEPARATIONS, 93 SPACE
Backlog, 53 Capsules, 60ff Expenditures, 55 Launchings, 57ff Missions, 60 Research, 18, 19, 51 ff Sales, 1 0, 53 Vehicles, 10, 53 , 62ff
STOCKHOLDERS EQUITY, 97 STUDENT PILOTS, 117 SUMMARY, AEROSPACE, 5ff
T TAXES, 97ff TRAINER, 30ff TRANSPORTATION, 105ff TRANSPORTS, 30ff TRANSPORTS ON ORDER, 36 TRAVEL, See Transportation TURNOVER, 93 TURBINE ENGINES, See Engines
u UNITED KINGDOM, 57 USAF, See Air F orce UNITED STATES, 57, 58 U.S. INTERNATIONAL AIRLINES, 110 UTILIT Y AIRCRAFT, See General Aviation USSR, 57, 58
v VERTICAL LIFT AIR CRAFT, 30fT. 38fT, 120ff
w WAG ES, 14, 90fT WEATH ER SATELLITES, 58 WORLD AIRLIN ES, 22, 107, 109

l
~ "' AEROSPACE INDUSTRIES ASSOCIATION OF AMERICA, INC.
1725 DE S ALES STRE E T , N . W ., W A S H I NGTON , D . C . 2003 6