Starbucks Corporation
42
Table of Contents UNITED STATES SECURITIES AND EXCHANGE COMMISSION Washington, DC 20549 FORM 10-Q ☒ QUARTERLY REPORT PURSUANT TO SECTION 13 OR 15(d) OF THE SECURITIES EXCHANGE ACT OF 1934 For the Quarterly Period Ended December 27, 2020 OR ☐ TRANSITION REPORT PURSUANT TO SECTION 13 OR 15(d) OF THE SECURITIES EXCHANGE ACT OF 1934 For the transition period from to . Commission File Number: 0-20322 Starbucks Corporation (Exact Name of Registrant as Specified in its Charter) Washington 91-1325671 (State or Other Jurisdiction of Incorporation or Organization) (IRS Employer Identification No.) 2401 Utah Avenue South, Seattle, Washington 98134 (Address of principal executive offices) (206) 447-1575 (Registrant’s Telephone Number, including Area Code) Securities registered pursuant to Section 12(b) of the Act: Title Trading Symbol Name of each exchange on which registered Common Stock, par value $0.001 per share SBUX NASDAQ Global Select Market Indicate by check mark whether the registrant: (1) has filed all reports required to be filed by Section 13 or 15(d) of the Securities Exchange Act of 1934 during the preceding 12 months (or for such shorter period that the Registrant was required to file such reports), and (2) has been subject to such filing requirements for the past 90 days. Yes x No ¨ Indicate by check mark whether the registrant has submitted electronically every Interactive Data File required to be submitted pursuant to Rule 405 of Regulation S-T (§232.405 of this chapter) during the preceding 12 months (or for such shorter period that the registrant was required to submit such files). Yes x No ¨ Indicate by check mark whether the registrant is a large accelerated filer, an accelerated filer, a non-accelerated filer, smaller reporting company, or an emerging growth company. See the definitions of “large accelerated filer,” “accelerated filer,” “smaller reporting company” and “emerging growth company” in Rule 12b-2 of the Exchange Act. Large accelerated filer x Accelerated filer ¨ Non-accelerated filer ¨ Smaller reporting company ☐ Emerging growth company ☐ If an emerging growth company, indicate by check mark if the registrant has elected not to use the extended transition period for complying with any new or revised financial accounting standards provided pursuant to Section 13(a) of the Exchange Act. ¨ Indicate by check mark whether the registrant is a shell company (as defined in Rule 12b-2 of the Exchange Act): Yes ☐ No x Indicate the number of shares outstanding of each of the issuer’s classes of common stock, as of the latest practicable date. Shares Outstanding as of January 20, 2021 1,177.3 million
-
Upload
khangminh22 -
Category
Documents
-
view
1 -
download
0
Transcript of Starbucks Corporation
Table of Contents
UNITED STATESSECURITIES AND EXCHANGE COMMISSION
Washington, DC 20549
FORM 10-Q
☒ QUARTERLY REPORT PURSUANT TO SECTION 13 OR 15(d) OF THE SECURITIES EXCHANGE ACT OF 1934For the Quarterly Period Ended December 27, 2020
OR
☐ TRANSITION REPORT PURSUANT TO SECTION 13 OR 15(d) OF THE SECURITIES EXCHANGE ACT OF 1934For the transition period from to .
Commission File Number: 0-20322
Starbucks Corporation(Exact Name of Registrant as Specified in its Charter)
Washington 91-1325671(State or Other Jurisdiction of
Incorporation or Organization)(IRS Employer
Identification No.)
2401 Utah Avenue South, Seattle, Washington 98134(Address of principal executive offices)
(206) 447-1575(Registrant’s Telephone Number, including Area Code)
Securities registered pursuant to Section 12(b) of the Act:Title Trading Symbol Name of each exchange on which registered
Common Stock, par value $0.001 per share SBUX NASDAQ Global Select Market
Indicate by check mark whether the registrant: (1) has filed all reports required to be filed by Section 13 or 15(d) of the Securities Exchange Act of 1934 during thepreceding 12 months (or for such shorter period that the Registrant was required to file such reports), and (2) has been subject to such filing requirements for thepast 90 days. Yes x No ¨Indicate by check mark whether the registrant has submitted electronically every Interactive Data File required to be submitted pursuant to Rule 405 of RegulationS-T (§232.405 of this chapter) during the preceding 12 months (or for such shorter period that the registrant was required to submit such files). Yes x No ¨
Indicate by check mark whether the registrant is a large accelerated filer, an accelerated filer, a non-accelerated filer, smaller reporting company, or an emerginggrowth company. See the definitions of “large accelerated filer,” “accelerated filer,” “smaller reporting company” and “emerging growth company” in Rule 12b-2of the Exchange Act.Large accelerated filer x Accelerated filer ¨ Non-accelerated filer ¨ Smaller reporting company ☐
Emerging growth company ☐
If an emerging growth company, indicate by check mark if the registrant has elected not to use the extended transition period for complying with any new orrevised financial accounting standards provided pursuant to Section 13(a) of the Exchange Act. ¨Indicate by check mark whether the registrant is a shell company (as defined in Rule 12b-2 of the Exchange Act): Yes ☐ No x Indicate the number of shares outstanding of each of the issuer’s classes of common stock, as of the latest practicable date.
Shares Outstanding as of January 20, 20211,177.3 million
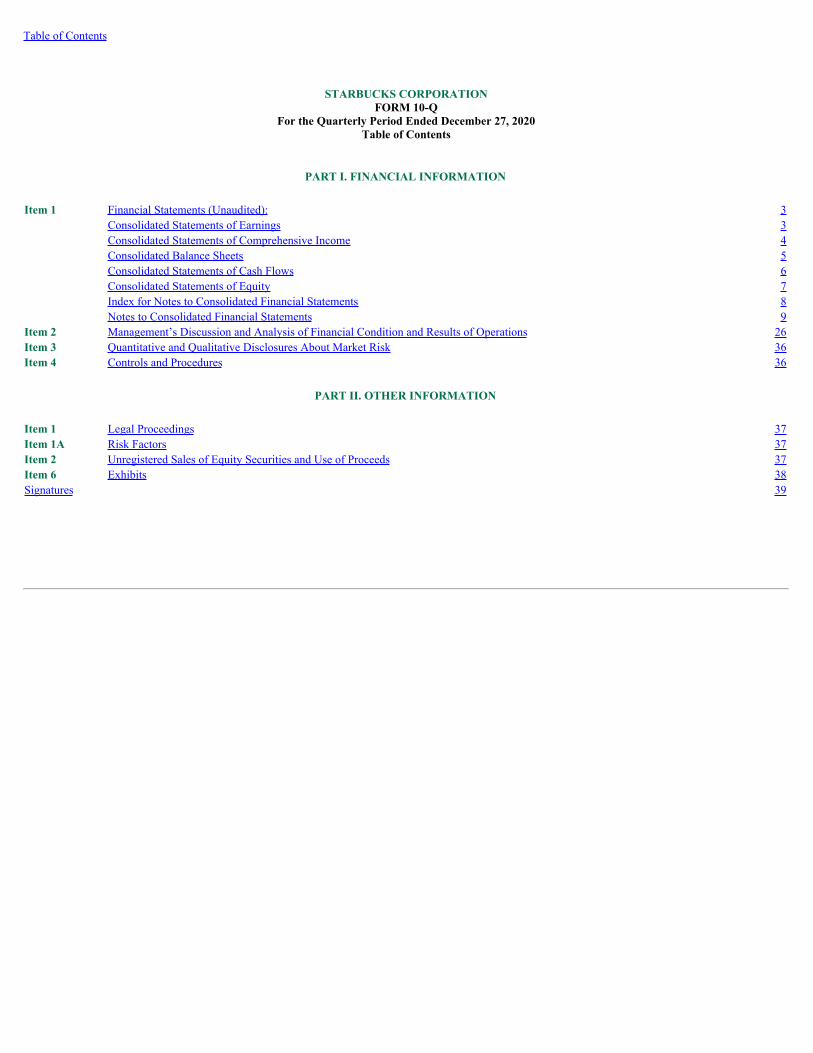
Table of Contents
STARBUCKS CORPORATIONFORM 10-Q
For the Quarterly Period Ended December 27, 2020Table of Contents
PART I. FINANCIAL INFORMATION
Item 1 Financial Statements (Unaudited): 3Consolidated Statements of Earnings 3Consolidated Statements of Comprehensive Income 4Consolidated Balance Sheets 5Consolidated Statements of Cash Flows 6Consolidated Statements of Equity 7Index for Notes to Consolidated Financial Statements 8Notes to Consolidated Financial Statements 9
Item 2 Management’s Discussion and Analysis of Financial Condition and Results of Operations 26Item 3 Quantitative and Qualitative Disclosures About Market Risk 36Item 4 Controls and Procedures 36
PART II. OTHER INFORMATION
Item 1 Legal Proceedings 37Item 1A Risk Factors 37Item 2 Unregistered Sales of Equity Securities and Use of Proceeds 37Item 6 Exhibits 38Signatures 39
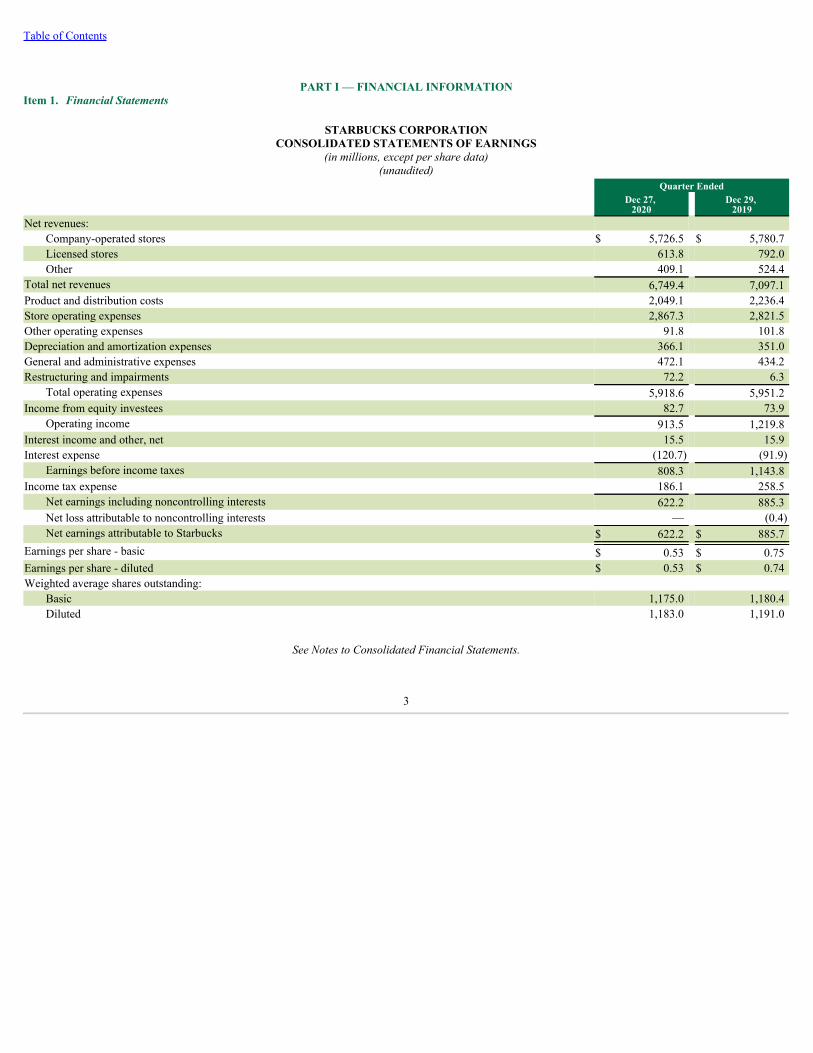
Table of Contents
PART I — FINANCIAL INFORMATIONItem 1. Financial Statements
STARBUCKS CORPORATIONCONSOLIDATED STATEMENTS OF EARNINGS
(in millions, except per share data)(unaudited)
Quarter EndedDec 27,
2020Dec 29,
2019Net revenues:
Company-operated stores $ 5,726.5 $ 5,780.7 Licensed stores 613.8 792.0 Other 409.1 524.4
Total net revenues 6,749.4 7,097.1 Product and distribution costs 2,049.1 2,236.4 Store operating expenses 2,867.3 2,821.5 Other operating expenses 91.8 101.8 Depreciation and amortization expenses 366.1 351.0 General and administrative expenses 472.1 434.2 Restructuring and impairments 72.2 6.3
Total operating expenses 5,918.6 5,951.2 Income from equity investees 82.7 73.9
Operating income 913.5 1,219.8 Interest income and other, net 15.5 15.9 Interest expense (120.7) (91.9)
Earnings before income taxes 808.3 1,143.8 Income tax expense 186.1 258.5
Net earnings including noncontrolling interests 622.2 885.3 Net loss attributable to noncontrolling interests — (0.4)Net earnings attributable to Starbucks $ 622.2 $ 885.7
Earnings per share - basic $ 0.53 $ 0.75 Earnings per share - diluted $ 0.53 $ 0.74 Weighted average shares outstanding:
Basic 1,175.0 1,180.4 Diluted 1,183.0 1,191.0
See Notes to Consolidated Financial Statements.
3
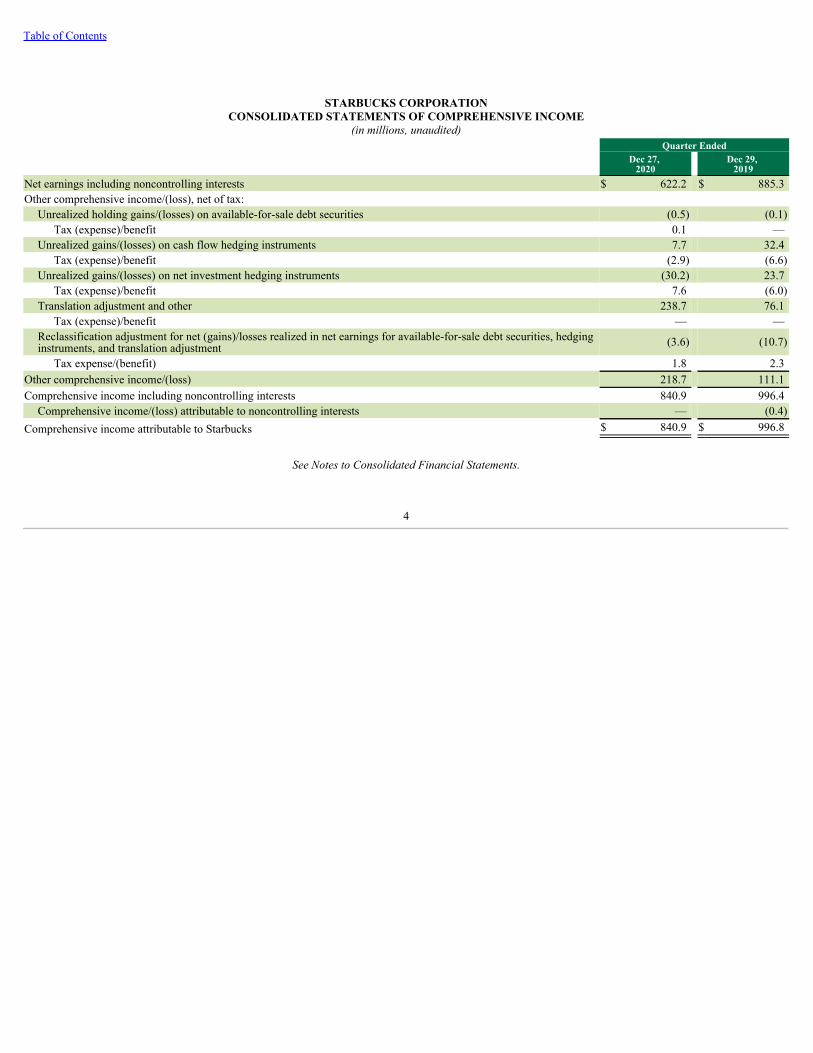
Table of Contents
STARBUCKS CORPORATIONCONSOLIDATED STATEMENTS OF COMPREHENSIVE INCOME
(in millions, unaudited)Quarter Ended
Dec 27, 2020
Dec 29, 2019
Net earnings including noncontrolling interests $ 622.2 $ 885.3 Other comprehensive income/(loss), net of tax:
Unrealized holding gains/(losses) on available-for-sale debt securities (0.5) (0.1)Tax (expense)/benefit 0.1 —
Unrealized gains/(losses) on cash flow hedging instruments 7.7 32.4 Tax (expense)/benefit (2.9) (6.6)
Unrealized gains/(losses) on net investment hedging instruments (30.2) 23.7 Tax (expense)/benefit 7.6 (6.0)
Translation adjustment and other 238.7 76.1 Tax (expense)/benefit — —
Reclassification adjustment for net (gains)/losses realized in net earnings for available-for-sale debt securities, hedginginstruments, and translation adjustment (3.6) (10.7)
Tax expense/(benefit) 1.8 2.3 Other comprehensive income/(loss) 218.7 111.1 Comprehensive income including noncontrolling interests 840.9 996.4
Comprehensive income/(loss) attributable to noncontrolling interests — (0.4)Comprehensive income attributable to Starbucks $ 840.9 $ 996.8
See Notes to Consolidated Financial Statements.
4
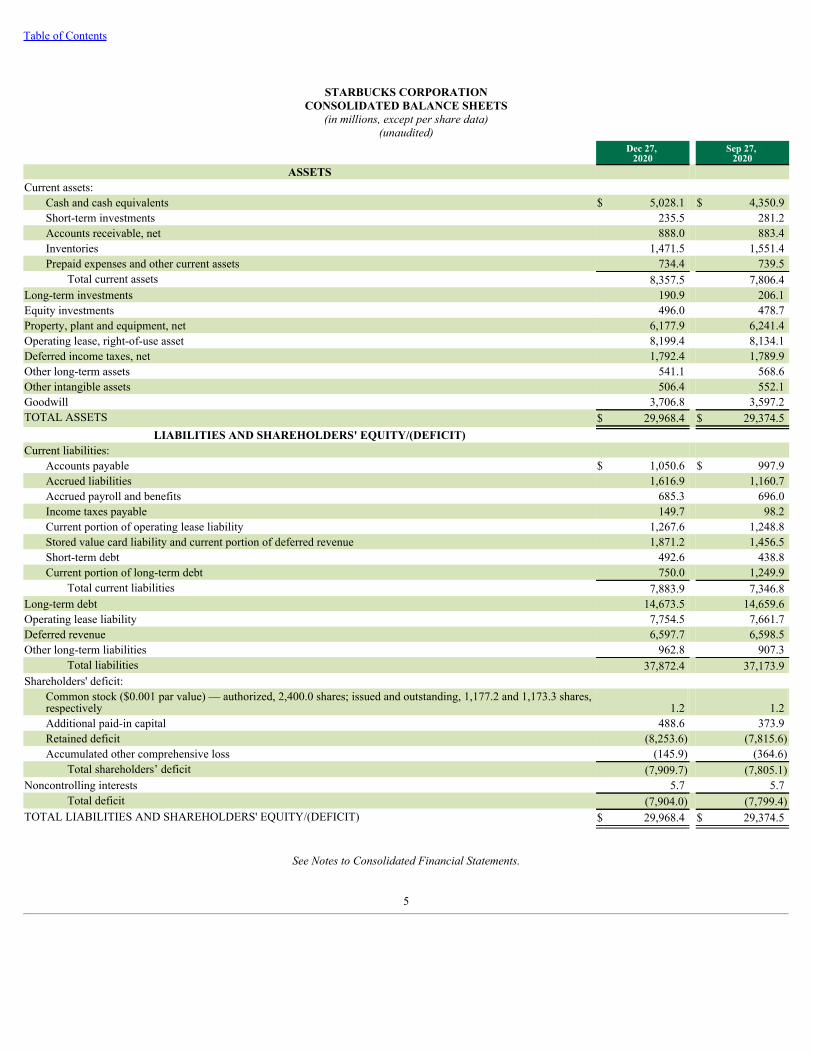
Table of Contents
STARBUCKS CORPORATIONCONSOLIDATED BALANCE SHEETS
(in millions, except per share data)(unaudited)
Dec 27, 2020
Sep 27, 2020
ASSETSCurrent assets:
Cash and cash equivalents $ 5,028.1 $ 4,350.9 Short-term investments 235.5 281.2 Accounts receivable, net 888.0 883.4 Inventories 1,471.5 1,551.4 Prepaid expenses and other current assets 734.4 739.5
Total current assets 8,357.5 7,806.4 Long-term investments 190.9 206.1 Equity investments 496.0 478.7 Property, plant and equipment, net 6,177.9 6,241.4 Operating lease, right-of-use asset 8,199.4 8,134.1 Deferred income taxes, net 1,792.4 1,789.9 Other long-term assets 541.1 568.6 Other intangible assets 506.4 552.1 Goodwill 3,706.8 3,597.2 TOTAL ASSETS $ 29,968.4 $ 29,374.5
LIABILITIES AND SHAREHOLDERS' EQUITY/(DEFICIT)Current liabilities:
Accounts payable $ 1,050.6 $ 997.9 Accrued liabilities 1,616.9 1,160.7 Accrued payroll and benefits 685.3 696.0 Income taxes payable 149.7 98.2 Current portion of operating lease liability 1,267.6 1,248.8 Stored value card liability and current portion of deferred revenue 1,871.2 1,456.5 Short-term debt 492.6 438.8 Current portion of long-term debt 750.0 1,249.9
Total current liabilities 7,883.9 7,346.8 Long-term debt 14,673.5 14,659.6 Operating lease liability 7,754.5 7,661.7 Deferred revenue 6,597.7 6,598.5 Other long-term liabilities 962.8 907.3
Total liabilities 37,872.4 37,173.9 Shareholders' deficit:
Common stock ($0.001 par value) — authorized, 2,400.0 shares; issued and outstanding, 1,177.2 and 1,173.3 shares,respectively 1.2 1.2 Additional paid-in capital 488.6 373.9 Retained deficit (8,253.6) (7,815.6)Accumulated other comprehensive loss (145.9) (364.6)
Total shareholders’ deficit (7,909.7) (7,805.1)Noncontrolling interests 5.7 5.7
Total deficit (7,904.0) (7,799.4)TOTAL LIABILITIES AND SHAREHOLDERS' EQUITY/(DEFICIT) $ 29,968.4 $ 29,374.5
See Notes to Consolidated Financial Statements.
5

Table of Contents
STARBUCKS CORPORATIONCONSOLIDATED STATEMENTS OF CASH FLOWS
(in millions, unaudited) Quarter Ended
Dec 27, 2020
Dec 29, 2019
OPERATING ACTIVITIES:Net earnings including noncontrolling interests $ 622.2 $ 885.3 Adjustments to reconcile net earnings to net cash provided by operating activities:
Depreciation and amortization 388.4 369.2 Deferred income taxes, net (6.1) 10.4 Income earned from equity method investees (69.0) (62.9)Distributions received from equity method investees 77.2 64.3 Stock-based compensation 99.3 90.3 Non-cash lease costs 308.3 294.9 Loss on retirement and impairment of assets 132.6 12.7 Other (10.2) (7.6)Cash provided by changes in operating assets and liabilities:
Accounts receivable 19.6 (22.9)Inventories 90.1 122.8 Prepaid expenses and other current assets 5.2 (28.5)Income taxes payable 56.9 125.1 Accounts payable 24.8 (110.3)Deferred revenue 398.9 426.7 Operating lease liability (314.8) (301.6)Other operating assets and liabilities 12.3 (31.8)
Net cash provided by operating activities 1,835.7 1,836.1 INVESTING ACTIVITIES:Purchases of investments (135.5) (38.0)Sales of investments 91.2 64.6 Maturities and calls of investments 113.7 1.3 Additions to property, plant and equipment (324.2) (394.3)Other (17.7) (19.9)Net cash used in investing activities (272.5) (386.3)FINANCING ACTIVITIES:Net proceeds from issuance of commercial paper — 398.9 Net proceeds from issuance of short-term debt 192.9 99.0 Repayments of short-term debt (144.7) — Repayments of long-term debt (500.0) — Proceeds from issuance of common stock 102.8 33.1 Cash dividends paid (528.2) (484.2)Repurchase of common stock — (1,091.4)Minimum tax withholdings on share-based awards (88.6) (78.4)Net cash used in financing activities (965.8) (1,123.0)Effect of exchange rate changes on cash and cash equivalents 79.8 27.1 Net increase in cash and cash equivalents 677.2 353.9 CASH AND CASH EQUIVALENTS:Beginning of period 4,350.9 2,686.6 End of period $ 5,028.1 $ 3,040.5 SUPPLEMENTAL DISCLOSURE OF CASH FLOW INFORMATION:Cash paid during the period for:Interest, net of capitalized interest $ 130.0 $ 87.2 Income taxes $ 109.4 $ 92.1
See Notes to Consolidated Financial Statements.
6
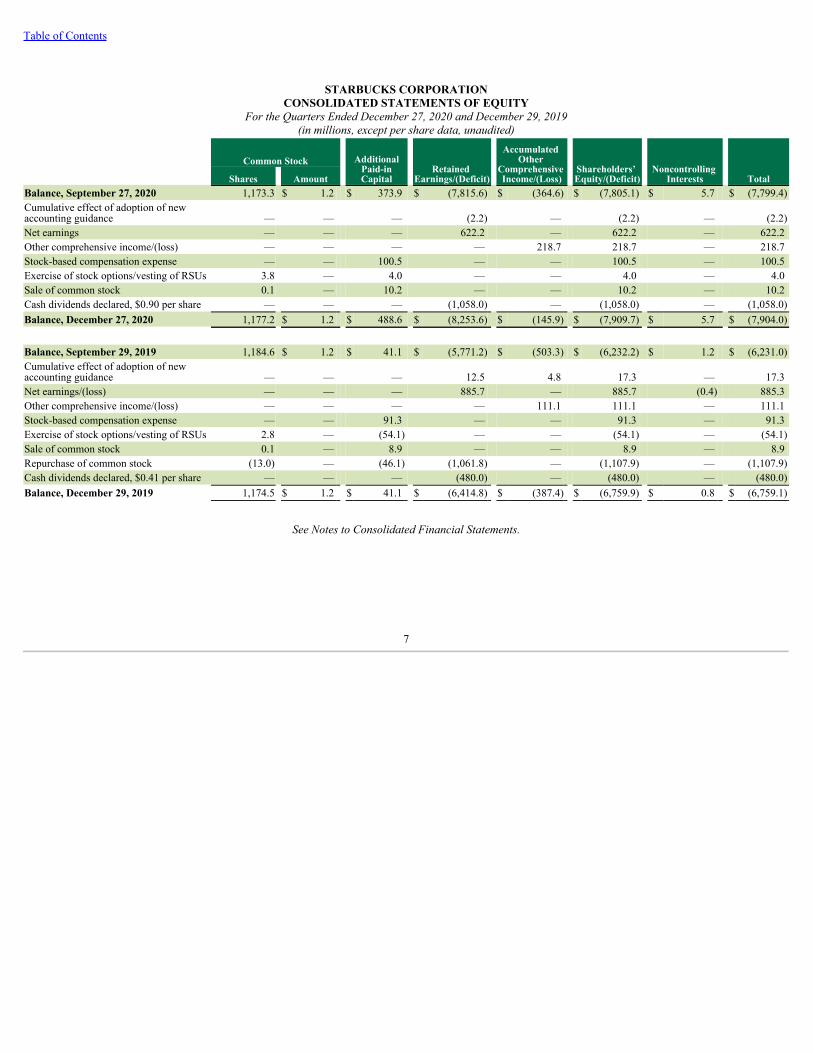
Table of Contents
STARBUCKS CORPORATIONCONSOLIDATED STATEMENTS OF EQUITY
For the Quarters Ended December 27, 2020 and December 29, 2019(in millions, except per share data, unaudited)
Common Stock AdditionalPaid-inCapital
Retained Earnings/(Deficit)
Accumulated Other
Comprehensive Income/(Loss)
Shareholders’ Equity/(Deficit)
Noncontrolling Interests Total Shares Amount
Balance, September 27, 2020 1,173.3 $ 1.2 $ 373.9 $ (7,815.6) $ (364.6) $ (7,805.1) $ 5.7 $ (7,799.4)Cumulative effect of adoption of newaccounting guidance — — — (2.2) — (2.2) — (2.2)Net earnings — — — 622.2 — 622.2 — 622.2 Other comprehensive income/(loss) — — — — 218.7 218.7 — 218.7 Stock-based compensation expense — — 100.5 — — 100.5 — 100.5 Exercise of stock options/vesting of RSUs 3.8 — 4.0 — — 4.0 — 4.0 Sale of common stock 0.1 — 10.2 — — 10.2 — 10.2 Cash dividends declared, $0.90 per share — — — (1,058.0) — (1,058.0) — (1,058.0)Balance, December 27, 2020 1,177.2 $ 1.2 $ 488.6 $ (8,253.6) $ (145.9) $ (7,909.7) $ 5.7 $ (7,904.0)
Balance, September 29, 2019 1,184.6 $ 1.2 $ 41.1 $ (5,771.2) $ (503.3) $ (6,232.2) $ 1.2 $ (6,231.0)Cumulative effect of adoption of newaccounting guidance — — — 12.5 4.8 17.3 — 17.3 Net earnings/(loss) — — — 885.7 — 885.7 (0.4) 885.3 Other comprehensive income/(loss) — — — — 111.1 111.1 — 111.1 Stock-based compensation expense — — 91.3 — — 91.3 — 91.3 Exercise of stock options/vesting of RSUs 2.8 — (54.1) — — (54.1) — (54.1)Sale of common stock 0.1 — 8.9 — — 8.9 — 8.9 Repurchase of common stock (13.0) — (46.1) (1,061.8) — (1,107.9) — (1,107.9)Cash dividends declared, $0.41 per share — — — (480.0) — (480.0) — (480.0)Balance, December 29, 2019 1,174.5 $ 1.2 $ 41.1 $ (6,414.8) $ (387.4) $ (6,759.9) $ 0.8 $ (6,759.1)
See Notes to Consolidated Financial Statements.
7
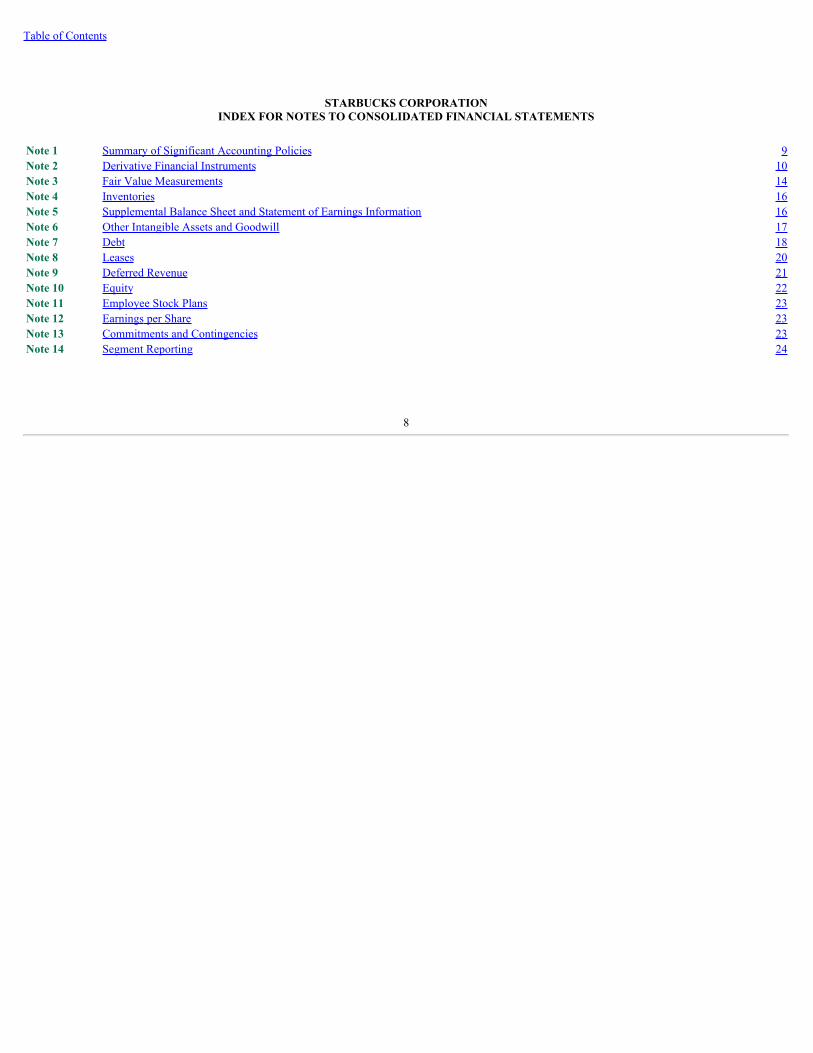
Table of Contents
STARBUCKS CORPORATIONINDEX FOR NOTES TO CONSOLIDATED FINANCIAL STATEMENTS
Note 1 Summary of Significant Accounting Policies 9Note 2 Derivative Financial Instruments 10Note 3 Fair Value Measurements 14Note 4 Inventories 16Note 5 Supplemental Balance Sheet and Statement of Earnings Information 16Note 6 Other Intangible Assets and Goodwill 17Note 7 Debt 18Note 8 Leases 20Note 9 Deferred Revenue 21Note 10 Equity 22Note 11 Employee Stock Plans 23Note 12 Earnings per Share 23Note 13 Commitments and Contingencies 23Note 14 Segment Reporting 24
8
Table of Contents
STARBUCKS CORPORATIONNOTES TO CONSOLIDATED FINANCIAL STATEMENTS
(unaudited)
Note 1: Summary of Significant Accounting Policies
Financial Statement Preparation
The unaudited consolidated financial statements as of December 27, 2020, and for the quarters ended December 27, 2020 and December 29, 2019, have beenprepared by Starbucks Corporation under the rules and regulations of the Securities and Exchange Commission (“SEC”). In the opinion of management, thefinancial information for the quarters ended December 27, 2020 and December 29, 2019 reflects all adjustments and accruals, which are of a normal recurringnature, necessary for a fair presentation of the financial position, results of operations and cash flows for the interim periods. In this Quarterly Report on Form 10-Q (“10-Q”), Starbucks Corporation is referred to as “Starbucks,” the “Company,” “we,” “us” or “our.”
The financial information as of September 27, 2020 is derived from our audited consolidated financial statements and notes for the fiscal year ended September 27,2020 (“fiscal 2020”) included in Item 8 in the Fiscal 2020 Annual Report on Form 10-K (“10-K”). The information included in this 10-Q should be read inconjunction with the footnotes and management’s discussion and analysis of the consolidated financial statements in the 10-K.
The results of operations for the quarter ended December 27, 2020 are not necessarily indicative of the results of operations that may be achieved for the entirefiscal year ending October 3, 2021 (“fiscal 2021”). Additionally, our 2021 fiscal year will include 53 weeks, with the 53rd week falling in the fourth fiscal quarter.
The novel coronavirus, known as the global pandemic COVID-19, was first identified in December 2019 before spreading to markets where we have company-operated or licensed stores. We have since established the necessary protocols to operate safely, and our businesses continue to recover. As of the end of the firstquarter of fiscal 2021, nearly all our company-operated and licensed stores have re-opened; however, many were operating at less than full capacity.
Government Subsidies
On March 27, 2020, the U.S. government enacted the Coronavirus Aid, Relief and Economic Security Act (“CARES Act”), which among other things, providesemployer payroll tax credits for wages paid to employees who are unable to work during the COVID-19 outbreak and options to defer payroll tax payments for alimited period. Based on our evaluation of the CARES Act, we qualify for certain employer payroll tax credits as well as the deferral of payroll tax payments in thefuture. Additionally, the Canadian government enacted the Canada Emergency Wage Subsidy (“CEWS”) to help employers offset a portion of their employeewages for a limited period. We elected to treat qualified government subsidies from the U.S., Canada and other governments as offsets to the related operatingexpenses. During the first quarter of fiscal 2021, qualified payroll credits reduced our store operating expenses by $19.8 million on our consolidated statement ofearnings. After netting the qualified U.S. payroll tax credits against our payroll tax payable, a receivable of $149.3 million was included in prepaid expenses andother current assets as of December 27, 2020. During the first fiscal quarter of fiscal 2021, we deferred $76.5 million of qualified payroll tax payments, and as ofDecember 27, 2020, deferred payroll tax payments of $227.5 million were included in other long-term liabilities on our consolidated balance sheets.
Restructuring
In fiscal 2020, we announced a plan to optimize our North America store portfolio, primarily in dense metropolitan markets by blending store formats to bettercater to changing customer tastes and preferences. As of December 27, 2020, we expect the total number of closures to be approximately 800 stores in the U.S. andCanada. As of December 27, 2020, we have identified 713 stores for closure under our restructuring plans, and as a result we recorded approximately $72.2 millionto restructuring and impairments on our consolidated statement of earnings. Of this total, $42.6 million related to the impairment of store assets for which either atriggering event occurred and the assets were determined not to be recoverable or the store was permanently closed. An additional $29.6 million was associatedwith accelerated amortization of right-of-use (“ROU”) lease assets due to planned store closures prior to the end of contractual lease terms. For impaired store assetgroups, we estimated the fair values using an income approach incorporating internal projections of revenue growth and operating expenses that are consideredLevel 3 fair value measurements, as well as applicable discount rates and market lease rates. The application of these projections and fair value measurements didnot have a significant impact on our final impairment decisions given that we plan to fully exit the majority of these identified stores over the next 9 to 12 months.
We expect total future restructuring costs, which are attributable to our Americas segment, to be approximately $100 million to $120 million. These restructuringcosts include accelerated amortization or impairments of ROU assets due to planned store closures prior to the end of contractual lease terms ($90 million to $100million), store impairment and disposal costs not previously recorded as part of our ongoing store impairment process ($10 million to $15 million), with theremaining amount related to employee termination costs. As we have previously recorded impairment charges for stores that may be identified for
9
Table of Contents
closure under our plans, and because store closure decisions are still subject to change, the final costs associated with these store closures may vary from theseestimates. These costs will depend on the asset carrying value and remaining lease term of the specific stores identified. Future restructuring costs are expected tobe incurred primarily over the next 9 to 12 months as stores are specifically identified for closure or, in the case of lease exit costs, either when a store ceasesoperations or when a reduced lease term is reasonably certain due to expected, early lease termination.
As of December 27, 2020, restructuring liabilities totaling $24.4 million were included in current and non-current operating lease liability for the remainingoutstanding rent liabilities due to landlords. The associated expense was recognized in fiscal 2020 or during the first quarter of fiscal 2021 for stores that wereeither closed or reasonably certain to close in fiscal 2021. Additionally, $14.9 million of accrued employee termination costs is included in accrued payroll andbenefits. Cash payments were immaterial for the first quarter of fiscal 2021.
Recently Adopted Accounting Pronouncements
In June 2016, the FASB issued guidance replacing the incurred loss impairment methodology with a new methodology that reflects current expected credit losseson financial assets, including receivables and available-for-sale securities. The new methodology requires entities to estimate and recognize expected credit losseseach reporting period. The guidance was adopted during the first quarter of fiscal 2021 under the modified retrospective approach which included a $2.2 milliontransition adjustment to opening shareholders' retained deficit on our consolidated statements of equity upon adoption.
Recent Accounting Pronouncements Not Yet Adopted
In March 2020, the FASB issued guidance related to reference rate reform. The pronouncement provides temporary optional expedients and exceptions to thecurrent guidance on contract modifications and hedge accounting to ease the financial reporting burden related to the expected market transition from the LondonInterbank Offered Rate ("LIBOR") and other interbank offered rates to alternative reference rates. The guidance was effective upon issuance and generally can beapplied to applicable contract modifications through December 31, 2022. We are currently evaluating the impact of the transition from LIBOR to alternativereference rates but do not expect a significant impact to our consolidated financial statements.
Note 2: Derivative Financial Instruments
Interest Rates
From time to time, we enter into designated cash flow hedges to manage the variability in cash flows due to changes in benchmark interest rates. We enter intointerest rate swap agreements and treasury locks, which are synthetic forward sales of U.S. treasury securities settled in cash based upon the difference between anagreed-upon treasury rate and the prevailing treasury rate at settlement. These agreements are cash settled at the time of the pricing of the related debt. Eachderivative agreement's gain or loss is recorded in AOCI and is subsequently reclassified to interest expense over the life of the related debt.
To hedge the exposure to changes in the fair value of our fixed-rate debt, we enter into interest rate swap agreements, which are designated as fair value hedges.The changes in fair values of these derivative instruments and the offsetting changes in fair values of the underlying hedged debt due to changes in the relevantbenchmark interest rates are recorded in interest expense. Refer to Note 7, Debt, for additional information on our long-term debt.
Foreign Currency
To reduce cash flow volatility from foreign currency fluctuations, we enter into forward and swap contracts to hedge portions of cash flows of anticipatedintercompany royalty payments, inventory purchases, and intercompany borrowing and lending activities. The resulting gains and losses from these derivatives arerecorded in AOCI and subsequently reclassified to revenue, product and distribution costs, or interest income and other, net, respectively, when the hedgedexposures affect net earnings.
From time to time, we may enter into financial instruments, including, but not limited to, forward and swap contracts or foreign currency-denominated debt, tohedge the currency exposure of our net investments in certain international operations. The resulting gains and losses from these derivatives are recorded in AOCIand are subsequently reclassified to net earnings when the hedged net investment is either sold or substantially liquidated.
Foreign currency forward and swap contracts not designated as hedging instruments are used to mitigate the foreign exchange risk of certain other balance sheetitems. Gains and losses from these derivatives are largely offset by the financial impact of translating foreign currency-denominated payables and receivables;these gains and losses are recorded in interest income and other, net.
10

Table of Contents
Commodities
Depending on market conditions, we may enter into coffee forward contracts, futures contracts and collars to hedge anticipated cash flows under our price-to-be-fixed green coffee contracts, which are described further in Note 4, Inventories, or our longer-dated forecasted coffee demand where underlying fixed price andprice-to-be-fixed contracts are not yet available. The resulting gains and losses are recorded in AOCI and are subsequently reclassified to product and distributioncosts when the hedged exposure affects net earnings.
Depending on market conditions, we may also enter into dairy forward contracts and futures contracts to hedge a portion of anticipated cash flows under our dairypurchase contracts and our forecasted dairy demand. The resulting gains or losses are recorded in AOCI and are subsequently reclassified to product anddistribution costs when the hedged exposure affects net earnings.
Cash flow hedges related to anticipated transactions are designated and documented at the inception of each hedge. Cash flows from hedging transactions areclassified in the same categories as the cash flows from the respective hedged items. For de-designated cash flow hedges in which the underlying transactions areno longer probable of occurring, the related accumulated derivative gains or losses are recognized in interest income and other, net on our consolidated statementsof earnings. There was no such significant cash flow hedge dedesignations in the periods presented.
To mitigate the price uncertainty of a portion of our future purchases, including diesel fuel and other commodities, we enter into swap contracts, futures and collarsthat are not designated as hedging instruments. The resulting gains and losses are recorded in interest income and other, net to help offset price fluctuations on ourbeverage, food, packaging and transportation costs, which are included in product and distribution costs on our consolidated statements of earnings.
Gains and losses on derivative contracts and foreign currency-denominated debt designated as hedging instruments included in AOCI and expected to bereclassified into earnings within 12 months, net of tax (in millions):
Net Gains/(Losses)Included in AOCI
Net Gains/(Losses) Expectedto be Reclassified from AOCI
into Earnings within 12Months
Outstanding Contract/DebtRemaining Maturity
(Months)Dec 27, 2020 Sep 27, 2020Cash Flow Hedges:
Coffee $ 7.4 $ (2.5) $ 1.0 12Cross-currency swaps 5.6 5.2 — 47Dairy 0.4 0.5 0.4 8Foreign currency - other (15.4) 5.3 (6.4) 33Interest rates (73.5) (90.6) (1.2) 142
Net Investment Hedges:Cross-currency swaps 17.9 32.6 — 105Foreign currency 16.0 16.0 — 0Foreign currency debt (47.4) (37.1) — 39
11
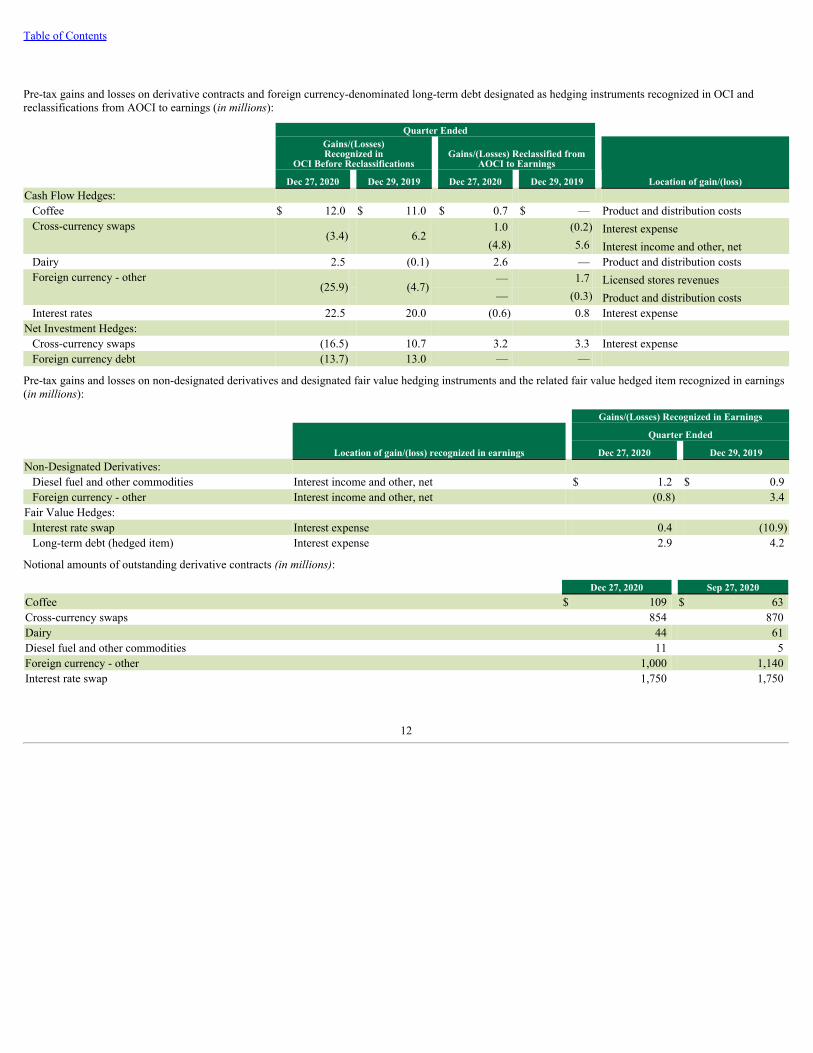
Table of Contents
Pre-tax gains and losses on derivative contracts and foreign currency-denominated long-term debt designated as hedging instruments recognized in OCI andreclassifications from AOCI to earnings (in millions):
Quarter EndedGains/(Losses)Recognized in
OCI Before ReclassificationsGains/(Losses) Reclassified from
AOCI to Earnings
Location of gain/(loss)Dec 27, 2020 Dec 29, 2019 Dec 27, 2020 Dec 29, 2019Cash Flow Hedges:
Coffee $ 12.0 $ 11.0 $ 0.7 $ — Product and distribution costsCross-currency swaps
(3.4) 6.2 1.0 (0.2) Interest expense
(4.8) 5.6 Interest income and other, netDairy 2.5 (0.1) 2.6 — Product and distribution costsForeign currency - other
(25.9) (4.7)— 1.7 Licensed stores revenues— (0.3) Product and distribution costs
Interest rates 22.5 20.0 (0.6) 0.8 Interest expenseNet Investment Hedges:
Cross-currency swaps (16.5) 10.7 3.2 3.3 Interest expenseForeign currency debt (13.7) 13.0 — —
Pre-tax gains and losses on non-designated derivatives and designated fair value hedging instruments and the related fair value hedged item recognized in earnings(in millions):
Gains/(Losses) Recognized in Earnings
Location of gain/(loss) recognized in earnings
Quarter Ended
Dec 27, 2020 Dec 29, 2019Non-Designated Derivatives:
Diesel fuel and other commodities Interest income and other, net $ 1.2 $ 0.9 Foreign currency - other Interest income and other, net (0.8) 3.4
Fair Value Hedges:Interest rate swap Interest expense 0.4 (10.9)Long-term debt (hedged item) Interest expense 2.9 4.2
Notional amounts of outstanding derivative contracts (in millions):
Dec 27, 2020 Sep 27, 2020Coffee $ 109 $ 63 Cross-currency swaps 854 870 Dairy 44 61 Diesel fuel and other commodities 11 5 Foreign currency - other 1,000 1,140 Interest rate swap 1,750 1,750
12

Table of Contents
Fair value of outstanding derivative contracts (in millions) including the location of the asset and/or liability on the consolidated balance sheets:
Derivative AssetsBalance Sheet Location Dec 27, 2020 Sep 27, 2020
Designated Derivative Instruments:Coffee Prepaid expenses and other current assets $ 13.6 $ 2.6 Cross-currency swaps Other long-term assets 17.3 37.7 Dairy Prepaid expenses and other current assets 1.7 2.1 Foreign currency - other Prepaid expenses and other current assets 1.8 8.6
Other long-term assets 0.3 3.8 Interest rate swap Other long-term assets 35.9 45.8
Non-designated Derivative Instruments:Diesel fuel and other commodities Prepaid expenses and other current assets 0.9 — Foreign currency Prepaid expenses and other current assets 6.7 2.3
Derivative LiabilitiesBalance Sheet Location Dec 27, 2020 Sep 27, 2020
Designated Derivative Instruments:Coffee Accrued liabilities $ — $ 1.4
Other long-term liabilities — 0.1 Cross-currency swaps Other long-term liabilities 9.9 7.3 Dairy Accrued liabilities 1.3 1.4 Foreign currency - other Accrued liabilities 10.3 1.6
Other long-term liabilities 10.7 2.6 Interest rates Other long-term liabilities 46.8 69.3
Non-designated Derivative Instruments:Diesel fuel and other commodities Accrued liabilities 0.2 1.7 Foreign currency Accrued liabilities 1.4 1.2
The following amounts were recorded on the consolidated balance sheets related to fixed-to-floating interest rate swaps designated in fair value hedgingrelationships:
Carrying amount of hedged itemCumulative amount of fair value hedging adjustment
included in the carrying amountDec 27, 2020 Sep 27, 2020 Dec 27, 2020 Sep 27, 2020
Location on the balance sheetLong-term debt $ 782.7 $ 785.6 $ 32.7 $ 35.6
Additional disclosures related to cash flow gains and losses included in AOCI, as well as subsequent reclassifications to earnings, are included in Note 10, Equity.
13

Table of Contents
Note 3: Fair Value Measurements
Assets and liabilities measured at fair value on a recurring basis (in millions):
Fair Value Measurements at Reporting Date Using
Balance at
December 27, 2020
Quoted Pricesin Active
Markets for Identical Assets
(Level 1)
Significant Other Observable
Inputs(Level 2)
SignificantUnobservable Inputs
(Level 3)Assets:Cash and cash equivalents $ 5,028.1 $ 5,028.1 $ — $ — Short-term investments:
Available-for-sale debt securitiesCertificates of deposit 1.6 — 1.6 — Commercial paper 71.8 — 71.8 — Corporate debt securities 78.5 — 78.5 — Mortgage and other asset-backed securities 16.7 — 16.7 — State and local government obligations 1.0 — 1.0 —
Total available-for-sale debt securities 169.6 — 169.6 — Marketable equity securities 65.9 65.9 — —
Total short-term investments 235.5 65.9 169.6 — Prepaid expenses and other current assets:
Derivative assets 24.7 14.6 10.1 — Long-term investments:
Available-for-sale debt securitiesAuction rate securities 5.7 — — 5.7 Corporate debt securities 82.6 — 82.6 — Mortgage and other asset-backed securities 9.8 — 9.8 — State and local government obligations 2.6 — 2.6 — U.S. government treasury securities 90.2 90.2 — —
Total long-term investments 190.9 90.2 95.0 5.7 Other long-term assets:
Derivative assets 53.5 — 53.5 — Total assets $ 5,532.7 $ 5,198.8 $ 328.2 $ 5.7 Liabilities:Accrued liabilities:
Derivative liabilities $ 13.2 $ 0.8 $ 12.4 $ — Other long-term liabilities:
Derivative liabilities 67.4 — 67.4 — Total liabilities $ 80.6 $ 0.8 $ 79.8 $ —
14

Table of Contents
Fair Value Measurements at Reporting Date Using
Balance at
September 27, 2020
Quoted Pricesin Active
Markets for Identical Assets
(Level 1)
Significant Other Observable
Inputs(Level 2)
SignificantUnobservable Inputs
(Level 3)Assets:Cash and cash equivalents $ 4,350.9 $ 4,350.9 $ — $ — Short-term investments:
Available-for-sale debt securitiesCertificates of deposit 1.6 — 1.6 — Commercial paper 66.8 — 66.8 — Corporate debt securities 123.6 — 123.6 — Foreign government obligations 8.5 — 8.5 — Mortgage and other asset-backed securities 15.8 — 15.8 —
Total available-for-sale debt securities 216.3 — 216.3 — Marketable equity securities 64.9 64.9 — —
Total short-term investments 281.2 64.9 216.3 — Prepaid expenses and other current assets:
Derivative assets 15.6 3.6 12.0 — Long-term investments:
Available-for-sale debt securitiesAuction rate securities 5.7 — — 5.7 Corporate debt securities 82.6 — 82.6 — Mortgage and other asset-backed securities 19.3 — 19.3 — State and local government obligations 3.6 — 3.6 — U.S. government treasury securities 94.9 94.9 — —
Total long-term investments 206.1 94.9 105.5 5.7 Other long-term assets:
Derivative assets 87.3 — 87.3 — Total assets $ 4,941.1 $ 4,514.3 $ 421.1 $ 5.7 Liabilities:Accrued liabilities:
Derivative liabilities $ 7.3 $ 1.9 $ 5.4 $ — Other long-term liabilities:
Derivative liabilities 79.3 0.1 79.2 — Total liabilities $ 86.6 $ 2.0 $ 84.6 $ —
There were no material transfers between levels, and there was no significant activity within Level 3 instruments during the periods presented. The fair values ofany financial instruments presented above exclude the impact of netting assets and liabilities when a legally enforceable master netting agreement exists.Gross unrealized holding gains and losses on available-for-sale debt securities and marketable equity securities were not material as of December 27, 2020 andSeptember 27, 2020.
15
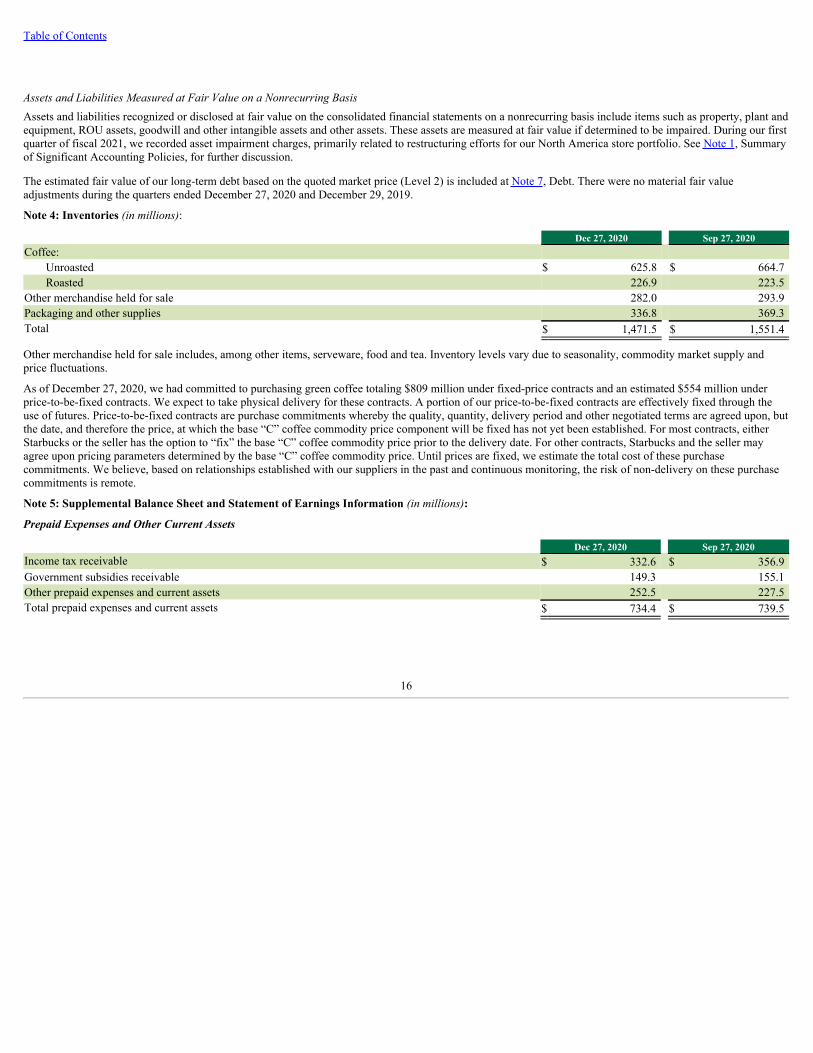
Table of Contents
Assets and Liabilities Measured at Fair Value on a Nonrecurring BasisAssets and liabilities recognized or disclosed at fair value on the consolidated financial statements on a nonrecurring basis include items such as property, plant andequipment, ROU assets, goodwill and other intangible assets and other assets. These assets are measured at fair value if determined to be impaired. During our firstquarter of fiscal 2021, we recorded asset impairment charges, primarily related to restructuring efforts for our North America store portfolio. See Note 1, Summaryof Significant Accounting Policies, for further discussion.
The estimated fair value of our long-term debt based on the quoted market price (Level 2) is included at Note 7, Debt. There were no material fair valueadjustments during the quarters ended December 27, 2020 and December 29, 2019.
Note 4: Inventories (in millions):
Dec 27, 2020 Sep 27, 2020Coffee:
Unroasted $ 625.8 $ 664.7 Roasted 226.9 223.5
Other merchandise held for sale 282.0 293.9 Packaging and other supplies 336.8 369.3 Total $ 1,471.5 $ 1,551.4
Other merchandise held for sale includes, among other items, serveware, food and tea. Inventory levels vary due to seasonality, commodity market supply andprice fluctuations.
As of December 27, 2020, we had committed to purchasing green coffee totaling $809 million under fixed-price contracts and an estimated $554 million underprice-to-be-fixed contracts. We expect to take physical delivery for these contracts. A portion of our price-to-be-fixed contracts are effectively fixed through theuse of futures. Price-to-be-fixed contracts are purchase commitments whereby the quality, quantity, delivery period and other negotiated terms are agreed upon, butthe date, and therefore the price, at which the base “C” coffee commodity price component will be fixed has not yet been established. For most contracts, eitherStarbucks or the seller has the option to “fix” the base “C” coffee commodity price prior to the delivery date. For other contracts, Starbucks and the seller mayagree upon pricing parameters determined by the base “C” coffee commodity price. Until prices are fixed, we estimate the total cost of these purchasecommitments. We believe, based on relationships established with our suppliers in the past and continuous monitoring, the risk of non-delivery on these purchasecommitments is remote.
Note 5: Supplemental Balance Sheet and Statement of Earnings Information (in millions):
Prepaid Expenses and Other Current Assets
Dec 27, 2020 Sep 27, 2020Income tax receivable $ 332.6 $ 356.9 Government subsidies receivable 149.3 155.1 Other prepaid expenses and current assets 252.5 227.5 Total prepaid expenses and current assets $ 734.4 $ 739.5
16
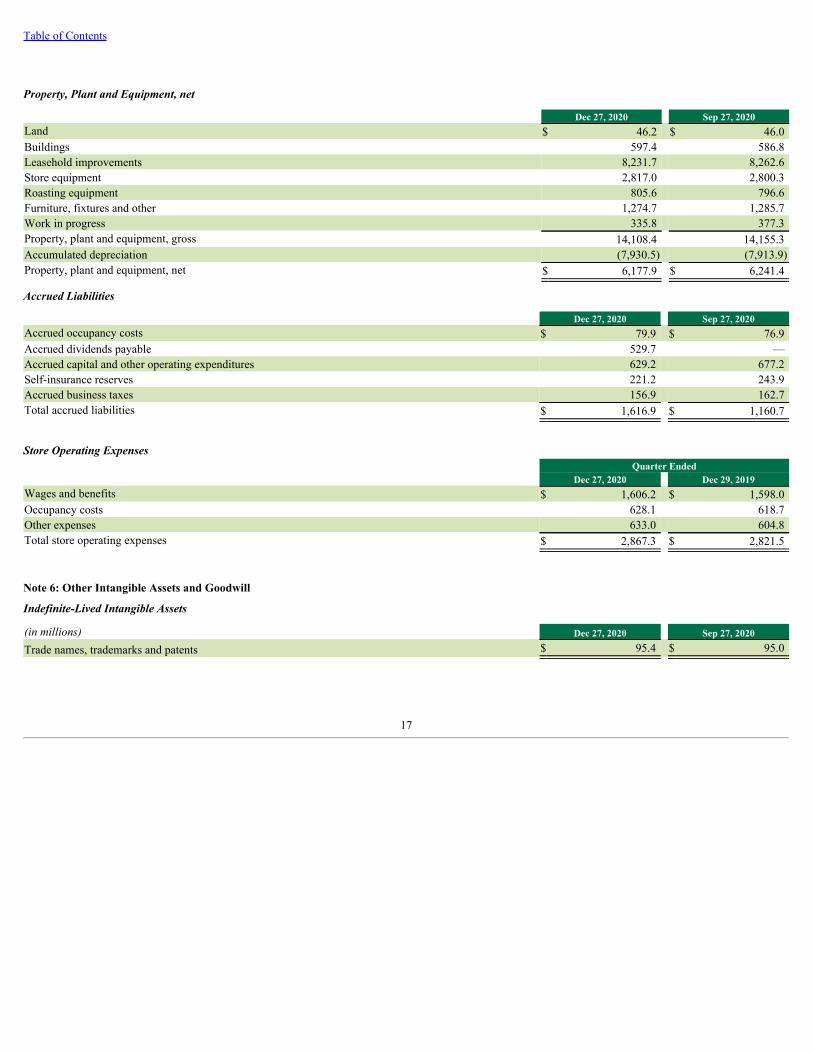
Table of Contents
Property, Plant and Equipment, net
Dec 27, 2020 Sep 27, 2020Land $ 46.2 $ 46.0 Buildings 597.4 586.8 Leasehold improvements 8,231.7 8,262.6 Store equipment 2,817.0 2,800.3 Roasting equipment 805.6 796.6 Furniture, fixtures and other 1,274.7 1,285.7 Work in progress 335.8 377.3 Property, plant and equipment, gross 14,108.4 14,155.3 Accumulated depreciation (7,930.5) (7,913.9)Property, plant and equipment, net $ 6,177.9 $ 6,241.4
Accrued Liabilities
Dec 27, 2020 Sep 27, 2020Accrued occupancy costs $ 79.9 $ 76.9 Accrued dividends payable 529.7 — Accrued capital and other operating expenditures 629.2 677.2 Self-insurance reserves 221.2 243.9 Accrued business taxes 156.9 162.7 Total accrued liabilities $ 1,616.9 $ 1,160.7
Store Operating ExpensesQuarter Ended
Dec 27, 2020 Dec 29, 2019Wages and benefits $ 1,606.2 $ 1,598.0 Occupancy costs 628.1 618.7 Other expenses 633.0 604.8 Total store operating expenses $ 2,867.3 $ 2,821.5
Note 6: Other Intangible Assets and Goodwill
Indefinite-Lived Intangible Assets
(in millions) Dec 27, 2020 Sep 27, 2020
Trade names, trademarks and patents $ 95.4 $ 95.0
17
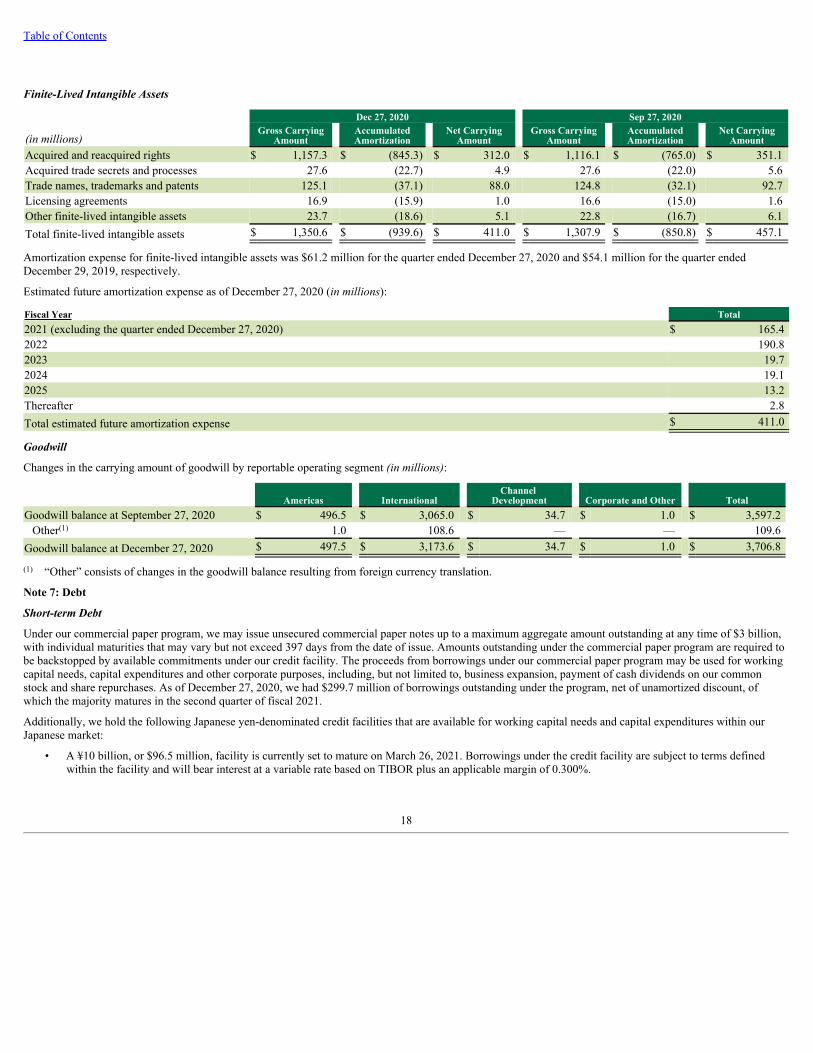
Table of Contents
Finite-Lived Intangible Assets
Dec 27, 2020 Sep 27, 2020
(in millions)Gross Carrying
AmountAccumulatedAmortization
Net CarryingAmount
Gross CarryingAmount
AccumulatedAmortization
Net CarryingAmount
Acquired and reacquired rights $ 1,157.3 $ (845.3) $ 312.0 $ 1,116.1 $ (765.0) $ 351.1 Acquired trade secrets and processes 27.6 (22.7) 4.9 27.6 (22.0) 5.6 Trade names, trademarks and patents 125.1 (37.1) 88.0 124.8 (32.1) 92.7 Licensing agreements 16.9 (15.9) 1.0 16.6 (15.0) 1.6 Other finite-lived intangible assets 23.7 (18.6) 5.1 22.8 (16.7) 6.1 Total finite-lived intangible assets $ 1,350.6 $ (939.6) $ 411.0 $ 1,307.9 $ (850.8) $ 457.1
Amortization expense for finite-lived intangible assets was $61.2 million for the quarter ended December 27, 2020 and $54.1 million for the quarter endedDecember 29, 2019, respectively.
Estimated future amortization expense as of December 27, 2020 (in millions):
Fiscal Year Total2021 (excluding the quarter ended December 27, 2020) $ 165.4 2022 190.8 2023 19.7 2024 19.1 2025 13.2 Thereafter 2.8 Total estimated future amortization expense $ 411.0
Goodwill
Changes in the carrying amount of goodwill by reportable operating segment (in millions):
Americas InternationalChannel
Development Corporate and Other TotalGoodwill balance at September 27, 2020 $ 496.5 $ 3,065.0 $ 34.7 $ 1.0 $ 3,597.2
Other 1.0 108.6 — — 109.6 Goodwill balance at December 27, 2020 $ 497.5 $ 3,173.6 $ 34.7 $ 1.0 $ 3,706.8
“Other” consists of changes in the goodwill balance resulting from foreign currency translation.
Note 7: Debt
Short-term Debt
Under our commercial paper program, we may issue unsecured commercial paper notes up to a maximum aggregate amount outstanding at any time of $3 billion,with individual maturities that may vary but not exceed 397 days from the date of issue. Amounts outstanding under the commercial paper program are required tobe backstopped by available commitments under our credit facility. The proceeds from borrowings under our commercial paper program may be used for workingcapital needs, capital expenditures and other corporate purposes, including, but not limited to, business expansion, payment of cash dividends on our commonstock and share repurchases. As of December 27, 2020, we had $299.7 million of borrowings outstanding under the program, net of unamortized discount, ofwhich the majority matures in the second quarter of fiscal 2021.
Additionally, we hold the following Japanese yen-denominated credit facilities that are available for working capital needs and capital expenditures within ourJapanese market:
• A ¥10 billion, or $96.5 million, facility is currently set to mature on March 26, 2021. Borrowings under the credit facility are subject to terms definedwithin the facility and will bear interest at a variable rate based on TIBOR plus an applicable margin of 0.300%.
(1)
(1)
18
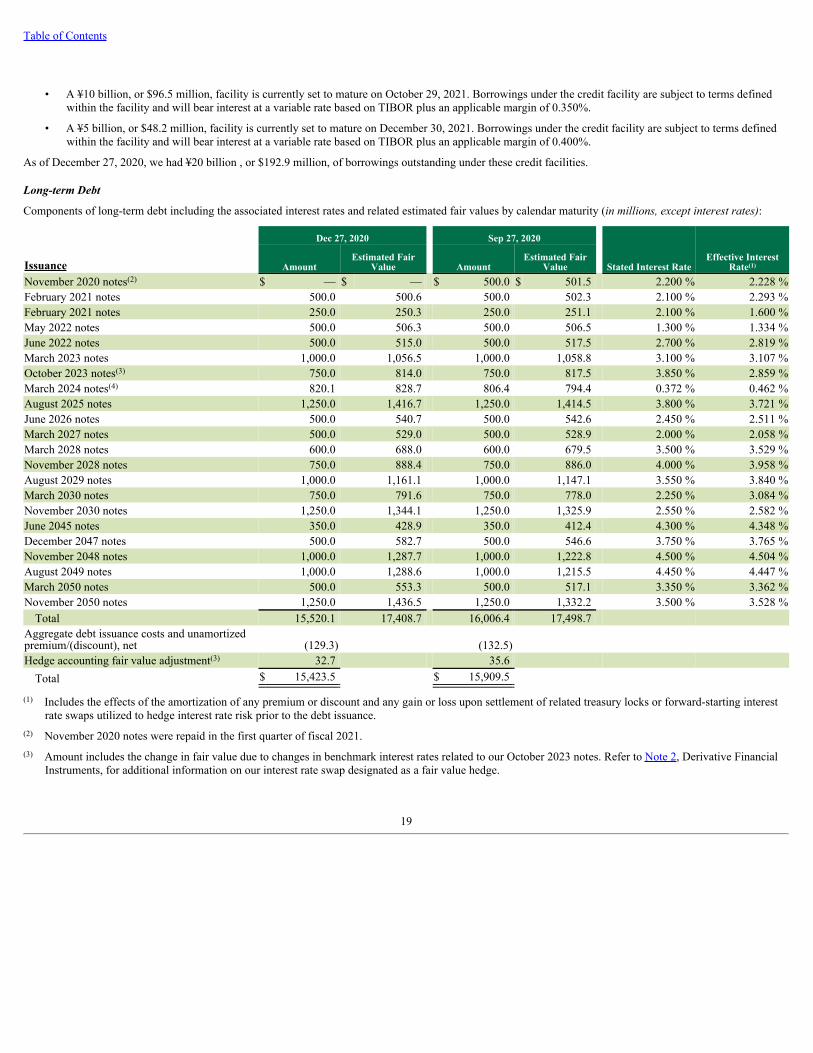
Table of Contents
• A ¥10 billion, or $96.5 million, facility is currently set to mature on October 29, 2021. Borrowings under the credit facility are subject to terms definedwithin the facility and will bear interest at a variable rate based on TIBOR plus an applicable margin of 0.350%.
• A ¥5 billion, or $48.2 million, facility is currently set to mature on December 30, 2021. Borrowings under the credit facility are subject to terms definedwithin the facility and will bear interest at a variable rate based on TIBOR plus an applicable margin of 0.400%.
As of December 27, 2020, we had ¥20 billion , or $192.9 million, of borrowings outstanding under these credit facilities.
Long-term Debt
Components of long-term debt including the associated interest rates and related estimated fair values by calendar maturity (in millions, except interest rates):
Dec 27, 2020 Sep 27, 2020
Stated Interest RateEffective Interest
RateIssuance AmountEstimated Fair
Value AmountEstimated Fair
ValueNovember 2020 notes $ — $ — $ 500.0 $ 501.5 2.200 % 2.228 %February 2021 notes 500.0 500.6 500.0 502.3 2.100 % 2.293 %February 2021 notes 250.0 250.3 250.0 251.1 2.100 % 1.600 %May 2022 notes 500.0 506.3 500.0 506.5 1.300 % 1.334 %June 2022 notes 500.0 515.0 500.0 517.5 2.700 % 2.819 %March 2023 notes 1,000.0 1,056.5 1,000.0 1,058.8 3.100 % 3.107 %October 2023 notes 750.0 814.0 750.0 817.5 3.850 % 2.859 %March 2024 notes 820.1 828.7 806.4 794.4 0.372 % 0.462 %August 2025 notes 1,250.0 1,416.7 1,250.0 1,414.5 3.800 % 3.721 %June 2026 notes 500.0 540.7 500.0 542.6 2.450 % 2.511 %March 2027 notes 500.0 529.0 500.0 528.9 2.000 % 2.058 %March 2028 notes 600.0 688.0 600.0 679.5 3.500 % 3.529 %November 2028 notes 750.0 888.4 750.0 886.0 4.000 % 3.958 %August 2029 notes 1,000.0 1,161.1 1,000.0 1,147.1 3.550 % 3.840 %March 2030 notes 750.0 791.6 750.0 778.0 2.250 % 3.084 %November 2030 notes 1,250.0 1,344.1 1,250.0 1,325.9 2.550 % 2.582 %June 2045 notes 350.0 428.9 350.0 412.4 4.300 % 4.348 %December 2047 notes 500.0 582.7 500.0 546.6 3.750 % 3.765 %November 2048 notes 1,000.0 1,287.7 1,000.0 1,222.8 4.500 % 4.504 %August 2049 notes 1,000.0 1,288.6 1,000.0 1,215.5 4.450 % 4.447 %March 2050 notes 500.0 553.3 500.0 517.1 3.350 % 3.362 %November 2050 notes 1,250.0 1,436.5 1,250.0 1,332.2 3.500 % 3.528 %
Total 15,520.1 17,408.7 16,006.4 17,498.7 Aggregate debt issuance costs and unamortizedpremium/(discount), net (129.3) (132.5)Hedge accounting fair value adjustment 32.7 35.6
Total $ 15,423.5 $ 15,909.5
Includes the effects of the amortization of any premium or discount and any gain or loss upon settlement of related treasury locks or forward-starting interestrate swaps utilized to hedge interest rate risk prior to the debt issuance.
November 2020 notes were repaid in the first quarter of fiscal 2021.
Amount includes the change in fair value due to changes in benchmark interest rates related to our October 2023 notes. Refer to Note 2, Derivative FinancialInstruments, for additional information on our interest rate swap designated as a fair value hedge.
(1)
(2)
(3)
(4)
(3)
(1)
(2)
(3)
19
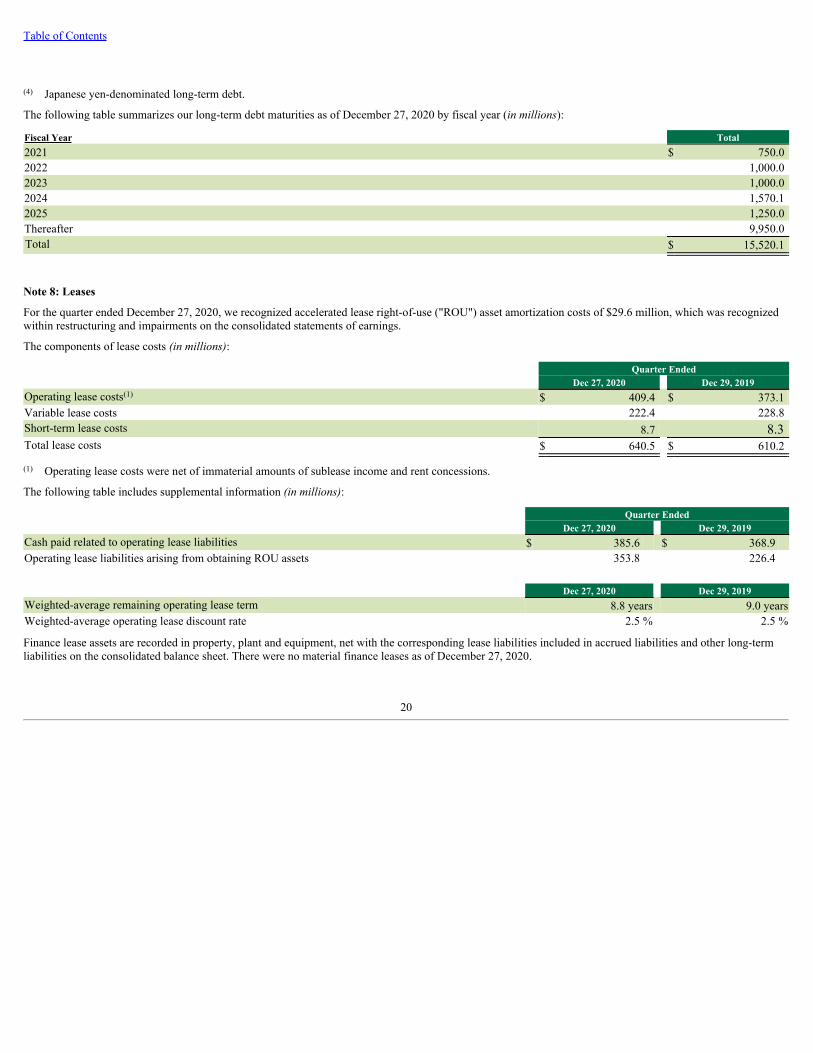
Table of Contents
Japanese yen-denominated long-term debt.
The following table summarizes our long-term debt maturities as of December 27, 2020 by fiscal year (in millions):
Fiscal Year Total2021 $ 750.0 2022 1,000.0 2023 1,000.0 2024 1,570.1 2025 1,250.0 Thereafter 9,950.0 Total $ 15,520.1
Note 8: Leases
For the quarter ended December 27, 2020, we recognized accelerated lease right-of-use ("ROU") asset amortization costs of $29.6 million, which was recognizedwithin restructuring and impairments on the consolidated statements of earnings.
The components of lease costs (in millions):
Quarter EndedDec 27, 2020 Dec 29, 2019
Operating lease costs $ 409.4 $ 373.1 Variable lease costs 222.4 228.8 Short-term lease costs 8.7 8.3 Total lease costs $ 640.5 $ 610.2
Operating lease costs were net of immaterial amounts of sublease income and rent concessions.
The following table includes supplemental information (in millions):
Quarter EndedDec 27, 2020 Dec 29, 2019
Cash paid related to operating lease liabilities $ 385.6 $ 368.9 Operating lease liabilities arising from obtaining ROU assets 353.8 226.4
Dec 27, 2020 Dec 29, 2019Weighted-average remaining operating lease term 8.8 years 9.0 yearsWeighted-average operating lease discount rate 2.5 % 2.5 %
Finance lease assets are recorded in property, plant and equipment, net with the corresponding lease liabilities included in accrued liabilities and other long-termliabilities on the consolidated balance sheet. There were no material finance leases as of December 27, 2020.
(4)
(1)
(1)
20

Table of Contents
Minimum future maturities of operating lease liabilities (in millions):
Fiscal Year Total2021 (excluding the quarter ended December 27, 2020) $ 1,173.9 2022 1,463.3 2023 1,321.2 2024 1,180.3 2025 1,030.6 Thereafter 3,992.3 Total lease payments 10,161.6 Less imputed interest (1,139.5)Total $ 9,022.1
As of December 27, 2020, we have entered into operating leases that have not yet commenced of $723.4 million, primarily related to real estate leases. Theseleases will commence between fiscal year 2021 and fiscal year 2027 with lease terms ranging from 3 years to 20 years.
Note 9: Deferred Revenue
Our deferred revenue primarily consists of the prepaid royalty from Nestlé, for which we have continuing performance obligations to support the Global CoffeeAlliance, our unredeemed stored value card liability and unredeemed loyalty points (“Stars”) associated with our loyalty program.
At December 27, 2020, the current and long-term deferred revenue related to the Nestlé was $180.3 million and $6.5 billion, respectively. During both quartersended December 27, 2020 and December 29, 2019, we recognized $44.2 million of prepaid royalty revenue related to Nestlé.
Changes in our deferred revenue balance related to our stored value cards and loyalty program (in millions):
Quarter Ended December 27, 2020 TotalStored value cards and loyalty program at September 27, 2020 $ 1,280.5 Revenue deferred - card activations, card reloads and Stars earned 3,437.4 Revenue recognized - card and Stars redemptions and breakage (2,980.2)Other 12.3 Stored value cards and loyalty program at December 27, 2020 $ 1,750.0
Quarter Ended December 29, 2019 TotalStored value cards and loyalty program at September 29, 2019 $ 1,113.7 Revenue deferred - card activations, card reloads and Stars earned 3,507.5 Revenue recognized - card and Stars redemptions and breakage (3,061.9)Other 1.7 Stored value cards and loyalty program at December 29, 2019 $ 1,561.0
“Other” primarily consists of changes in the stored value cards and loyalty program balances resulting from foreign currency translation.
As of December 27, 2020 and December 29, 2019, approximately $1,623.7 million and $1,460.9 million of these amounts were current, respectively.
(1)
(2)
(1)
(2)
(1)
(2)
21
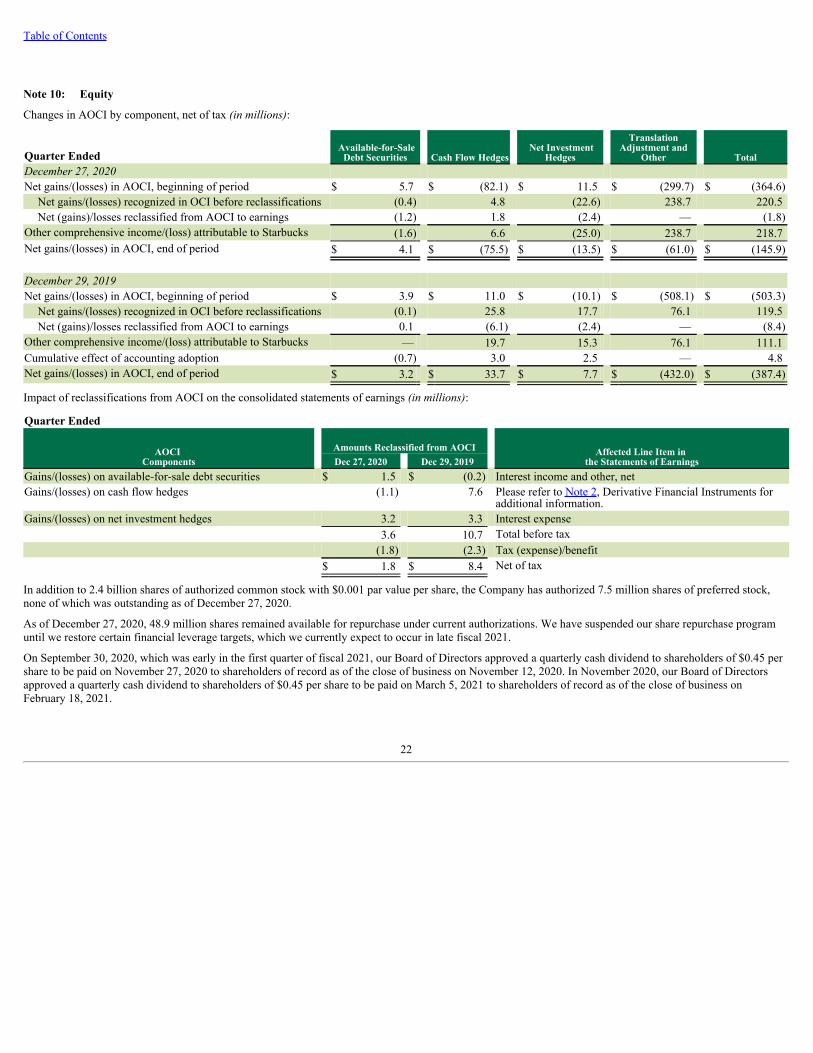
Table of Contents
Note 10: Equity
Changes in AOCI by component, net of tax (in millions):
Quarter Ended Available-for-Sale
Debt Securities Cash Flow Hedges Net Investment
Hedges
TranslationAdjustment and
Other TotalDecember 27, 2020Net gains/(losses) in AOCI, beginning of period $ 5.7 $ (82.1) $ 11.5 $ (299.7) $ (364.6)
Net gains/(losses) recognized in OCI before reclassifications (0.4) 4.8 (22.6) 238.7 220.5 Net (gains)/losses reclassified from AOCI to earnings (1.2) 1.8 (2.4) — (1.8)
Other comprehensive income/(loss) attributable to Starbucks (1.6) 6.6 (25.0) 238.7 218.7 Net gains/(losses) in AOCI, end of period $ 4.1 $ (75.5) $ (13.5) $ (61.0) $ (145.9)
December 29, 2019Net gains/(losses) in AOCI, beginning of period $ 3.9 $ 11.0 $ (10.1) $ (508.1) $ (503.3)
Net gains/(losses) recognized in OCI before reclassifications (0.1) 25.8 17.7 76.1 119.5 Net (gains)/losses reclassified from AOCI to earnings 0.1 (6.1) (2.4) — (8.4)
Other comprehensive income/(loss) attributable to Starbucks — 19.7 15.3 76.1 111.1 Cumulative effect of accounting adoption (0.7) 3.0 2.5 — 4.8 Net gains/(losses) in AOCI, end of period $ 3.2 $ 33.7 $ 7.7 $ (432.0) $ (387.4)
Impact of reclassifications from AOCI on the consolidated statements of earnings (in millions):
Quarter Ended
AOCI Components
Amounts Reclassified from AOCI Affected Line Item in the Statements of EarningsDec 27, 2020 Dec 29, 2019
Gains/(losses) on available-for-sale debt securities $ 1.5 $ (0.2) Interest income and other, netGains/(losses) on cash flow hedges (1.1) 7.6 Please refer to Note 2, Derivative Financial Instruments for
additional information.Gains/(losses) on net investment hedges 3.2 3.3 Interest expense
3.6 10.7 Total before tax(1.8) (2.3) Tax (expense)/benefit
$ 1.8 $ 8.4 Net of tax
In addition to 2.4 billion shares of authorized common stock with $0.001 par value per share, the Company has authorized 7.5 million shares of preferred stock,none of which was outstanding as of December 27, 2020.
As of December 27, 2020, 48.9 million shares remained available for repurchase under current authorizations. We have suspended our share repurchase programuntil we restore certain financial leverage targets, which we currently expect to occur in late fiscal 2021.
On September 30, 2020, which was early in the first quarter of fiscal 2021, our Board of Directors approved a quarterly cash dividend to shareholders of $0.45 pershare to be paid on November 27, 2020 to shareholders of record as of the close of business on November 12, 2020. In November 2020, our Board of Directorsapproved a quarterly cash dividend to shareholders of $0.45 per share to be paid on March 5, 2021 to shareholders of record as of the close of business onFebruary 18, 2021.
22
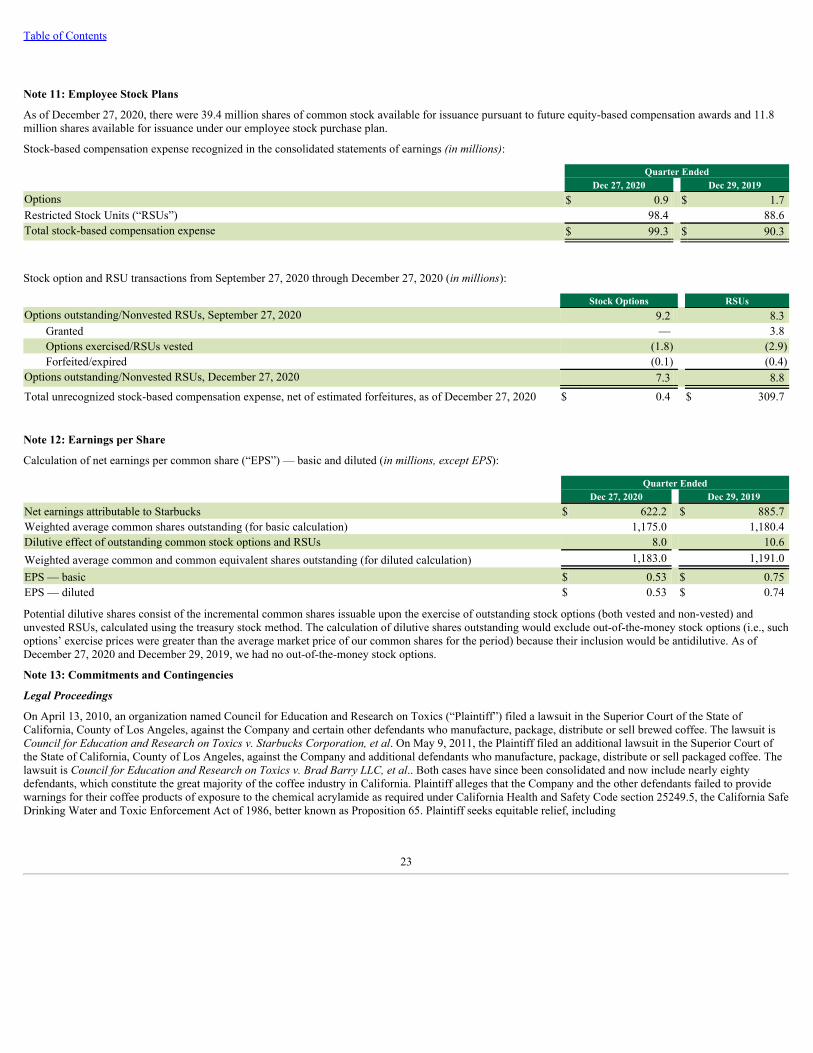
Table of Contents
Note 11: Employee Stock Plans
As of December 27, 2020, there were 39.4 million shares of common stock available for issuance pursuant to future equity-based compensation awards and 11.8million shares available for issuance under our employee stock purchase plan.
Stock-based compensation expense recognized in the consolidated statements of earnings (in millions):
Quarter Ended Dec 27, 2020 Dec 29, 2019Options $ 0.9 $ 1.7 Restricted Stock Units (“RSUs”) 98.4 88.6 Total stock-based compensation expense $ 99.3 $ 90.3
Stock option and RSU transactions from September 27, 2020 through December 27, 2020 (in millions):
Stock Options RSUsOptions outstanding/Nonvested RSUs, September 27, 2020 9.2 8.3
Granted — 3.8 Options exercised/RSUs vested (1.8) (2.9)Forfeited/expired (0.1) (0.4)
Options outstanding/Nonvested RSUs, December 27, 2020 7.3 8.8 Total unrecognized stock-based compensation expense, net of estimated forfeitures, as of December 27, 2020 $ 0.4 $ 309.7
Note 12: Earnings per Share
Calculation of net earnings per common share (“EPS”) — basic and diluted (in millions, except EPS):
Quarter Ended Dec 27, 2020 Dec 29, 2019Net earnings attributable to Starbucks $ 622.2 $ 885.7 Weighted average common shares outstanding (for basic calculation) 1,175.0 1,180.4 Dilutive effect of outstanding common stock options and RSUs 8.0 10.6 Weighted average common and common equivalent shares outstanding (for diluted calculation) 1,183.0 1,191.0 EPS — basic $ 0.53 $ 0.75 EPS — diluted $ 0.53 $ 0.74
Potential dilutive shares consist of the incremental common shares issuable upon the exercise of outstanding stock options (both vested and non-vested) andunvested RSUs, calculated using the treasury stock method. The calculation of dilutive shares outstanding would exclude out-of-the-money stock options (i.e., suchoptions’ exercise prices were greater than the average market price of our common shares for the period) because their inclusion would be antidilutive. As ofDecember 27, 2020 and December 29, 2019, we had no out-of-the-money stock options.
Note 13: Commitments and Contingencies
Legal Proceedings
On April 13, 2010, an organization named Council for Education and Research on Toxics (“Plaintiff”) filed a lawsuit in the Superior Court of the State ofCalifornia, County of Los Angeles, against the Company and certain other defendants who manufacture, package, distribute or sell brewed coffee. The lawsuit isCouncil for Education and Research on Toxics v. Starbucks Corporation, et al. On May 9, 2011, the Plaintiff filed an additional lawsuit in the Superior Court ofthe State of California, County of Los Angeles, against the Company and additional defendants who manufacture, package, distribute or sell packaged coffee. Thelawsuit is Council for Education and Research on Toxics v. Brad Barry LLC, et al.. Both cases have since been consolidated and now include nearly eightydefendants, which constitute the great majority of the coffee industry in California. Plaintiff alleges that the Company and the other defendants failed to providewarnings for their coffee products of exposure to the chemical acrylamide as required under California Health and Safety Code section 25249.5, the California SafeDrinking Water and Toxic Enforcement Act of 1986, better known as Proposition 65. Plaintiff seeks equitable relief, including
23
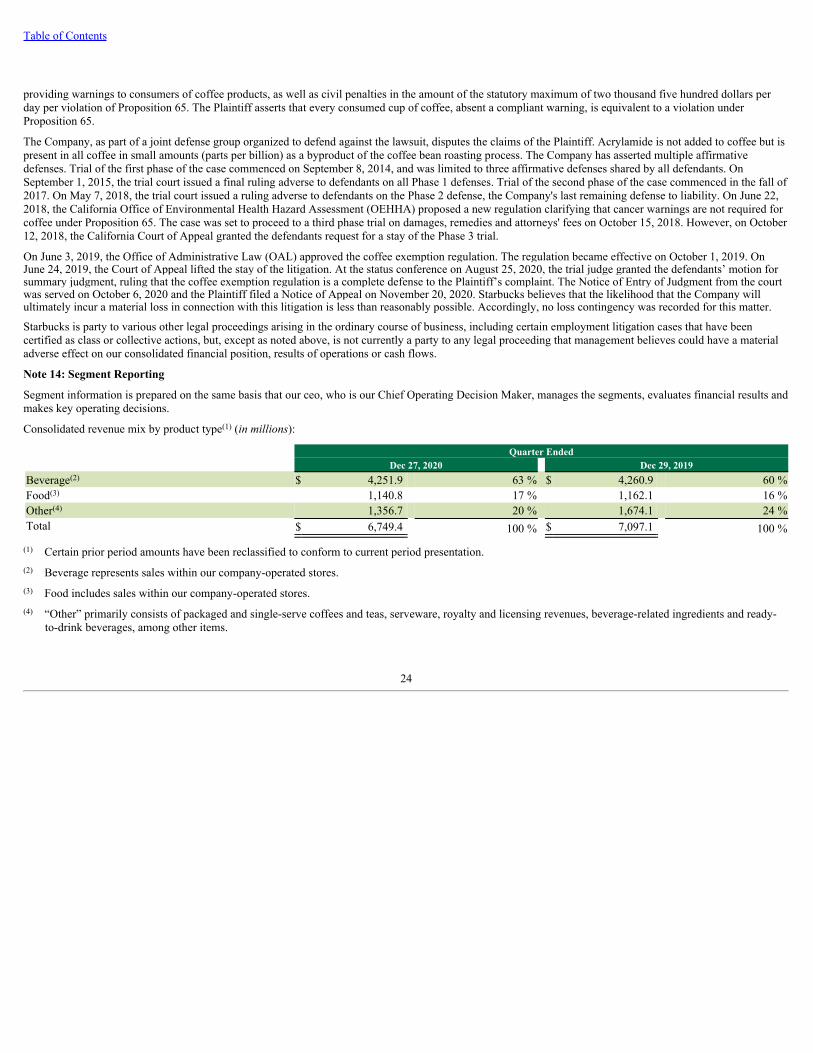
Table of Contents
providing warnings to consumers of coffee products, as well as civil penalties in the amount of the statutory maximum of two thousand five hundred dollars perday per violation of Proposition 65. The Plaintiff asserts that every consumed cup of coffee, absent a compliant warning, is equivalent to a violation underProposition 65.
The Company, as part of a joint defense group organized to defend against the lawsuit, disputes the claims of the Plaintiff. Acrylamide is not added to coffee but ispresent in all coffee in small amounts (parts per billion) as a byproduct of the coffee bean roasting process. The Company has asserted multiple affirmativedefenses. Trial of the first phase of the case commenced on September 8, 2014, and was limited to three affirmative defenses shared by all defendants. OnSeptember 1, 2015, the trial court issued a final ruling adverse to defendants on all Phase 1 defenses. Trial of the second phase of the case commenced in the fall of2017. On May 7, 2018, the trial court issued a ruling adverse to defendants on the Phase 2 defense, the Company's last remaining defense to liability. On June 22,2018, the California Office of Environmental Health Hazard Assessment (OEHHA) proposed a new regulation clarifying that cancer warnings are not required forcoffee under Proposition 65. The case was set to proceed to a third phase trial on damages, remedies and attorneys' fees on October 15, 2018. However, on October12, 2018, the California Court of Appeal granted the defendants request for a stay of the Phase 3 trial.
On June 3, 2019, the Office of Administrative Law (OAL) approved the coffee exemption regulation. The regulation became effective on October 1, 2019. OnJune 24, 2019, the Court of Appeal lifted the stay of the litigation. At the status conference on August 25, 2020, the trial judge granted the defendants’ motion forsummary judgment, ruling that the coffee exemption regulation is a complete defense to the Plaintiff’s complaint. The Notice of Entry of Judgment from the courtwas served on October 6, 2020 and the Plaintiff filed a Notice of Appeal on November 20, 2020. Starbucks believes that the likelihood that the Company willultimately incur a material loss in connection with this litigation is less than reasonably possible. Accordingly, no loss contingency was recorded for this matter.
Starbucks is party to various other legal proceedings arising in the ordinary course of business, including certain employment litigation cases that have beencertified as class or collective actions, but, except as noted above, is not currently a party to any legal proceeding that management believes could have a materialadverse effect on our consolidated financial position, results of operations or cash flows.
Note 14: Segment Reporting
Segment information is prepared on the same basis that our ceo, who is our Chief Operating Decision Maker, manages the segments, evaluates financial results andmakes key operating decisions.
Consolidated revenue mix by product type (in millions):
Quarter EndedDec 27, 2020 Dec 29, 2019
Beverage $ 4,251.9 63 % $ 4,260.9 60 %Food 1,140.8 17 % 1,162.1 16 %Other 1,356.7 20 % 1,674.1 24 %Total $ 6,749.4 100 % $ 7,097.1 100 %
Certain prior period amounts have been reclassified to conform to current period presentation.
Beverage represents sales within our company-operated stores.
Food includes sales within our company-operated stores.
“Other” primarily consists of packaged and single-serve coffees and teas, serveware, royalty and licensing revenues, beverage-related ingredients and ready-to-drink beverages, among other items.
(1)
(2)
(3)
(4)
(1)
(2)
(3)
(4)
24
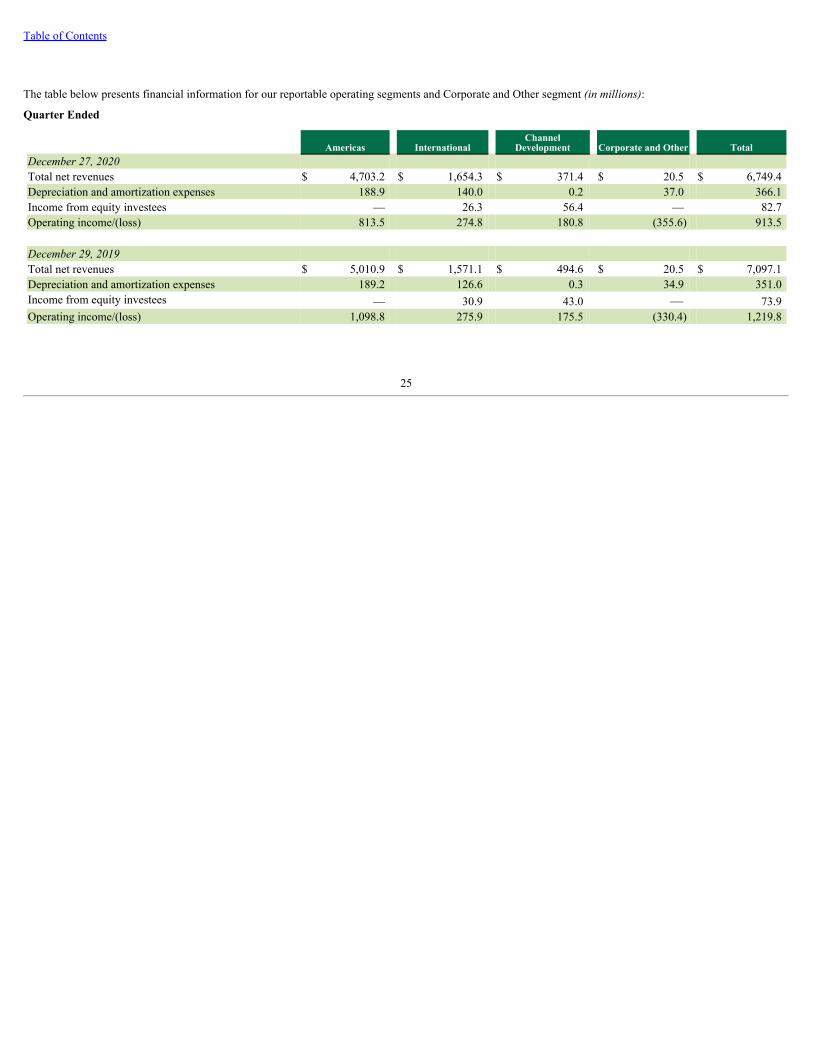
Table of Contents
The table below presents financial information for our reportable operating segments and Corporate and Other segment (in millions):
Quarter Ended
Americas InternationalChannel
Development Corporate and Other TotalDecember 27, 2020Total net revenues $ 4,703.2 $ 1,654.3 $ 371.4 $ 20.5 $ 6,749.4 Depreciation and amortization expenses 188.9 140.0 0.2 37.0 366.1 Income from equity investees — 26.3 56.4 — 82.7 Operating income/(loss) 813.5 274.8 180.8 (355.6) 913.5
December 29, 2019Total net revenues $ 5,010.9 $ 1,571.1 $ 494.6 $ 20.5 $ 7,097.1 Depreciation and amortization expenses 189.2 126.6 0.3 34.9 351.0 Income from equity investees — 30.9 43.0 — 73.9 Operating income/(loss) 1,098.8 275.9 175.5 (330.4) 1,219.8
25

Table of Contents
Item 2. Management’s Discussion and Analysis of Financial Condition and Results of Operations
CAUTIONARY STATEMENT PURSUANT TO THE PRIVATE SECURITIES LITIGATION REFORM ACT OF 1995
Certain statements herein are “forward-looking” statements within the meaning of the Private Securities Litigation Reform Act of 1995. Generally, thesestatements can be identified by the use of words such as “aim,” “anticipate,” “believe,” “continue,” “could,” “estimate,” “expect,” “feel,” “forecast,” “intend,”“may,” “outlook,” “plan,” “potential,” “project,” “seek,” “should,” “will,” “would,” and similar expressions intended to identify forward-looking statements,although not all forward-looking statements contain these identifying words. These statements include statements relating to trends in or expectations relating tothe expected effects of our initiatives, strategies and plans, as well as trends in or expectations regarding our financial results and long-term growth model anddrivers, the anticipated timing and effects of recovery of our business, the conversion of several market operations to fully licensed models, our plans forstreamlining our operations, including store openings, closures, and changes in store formats and models, expanding our licensing to Nestlé of our consumerpackaged goods and Foodservice businesses and its effects on our Channel Development segment results, tax rates, business opportunities and expansion,strategic acquisitions, expenses, dividends, share repurchases, commodity costs and our mitigation strategies, liquidity, cash flow from operations, use of cash andcash requirements, investments, borrowing capacity and use of proceeds, repatriation of cash to the U.S., the likelihood of the issuance of additional debt and theapplicable interest rate, the impact of the COVID-19 outbreak on our financial results, credits available to us under the CARES Act and other government credits,the expected effects of new accounting pronouncements and the estimated impact of changes in U.S. tax law, including on tax rates, investments funded by thesechanges, and potential outcomes and effects of legal proceedings. Such statements are based on currently available operating, financial and competitiveinformation and are subject to various risks and uncertainties. Actual future results and trends may differ materially depending on a variety of factors, including,but not limited to: further spread of COVID-19 and related disruptions to our business; regulatory measures or voluntary actions that may be put in place to limitthe spread of COVID-19, including restrictions on business operations or social distancing requirements, and the duration and efficacy of such restrictions; thepotential for a resurgence of COVID-19 infections in a given geographic region after it has hit its “peak”; fluctuations in U.S. and international economies andcurrencies; our ability to preserve, grow and leverage our brands; the ability of our business partners and third-party providers to fulfill their responsibilities andcommitments; potential negative effects of incidents involving food or beverage-borne illnesses, tampering, adulteration, contamination or mislabeling; potentialnegative effects of material breaches of our information technology systems to the extent we experience a material breach; material failures of our informationtechnology systems; costs associated with, and the successful execution of, the Company’s initiatives and plans, including the successful expansion of our GlobalCoffee Alliance with Nestlé; our ability to obtain financing on acceptable terms; the acceptance of the Company’s products by our customers, evolving consumerpreferences and tastes and changes in consumer spending behavior; changes in the availability and cost of labor; the impact of competition; inherent risks ofoperating a global business; the prices and availability of coffee, dairy and other raw materials; the effect of legal proceedings; the effects of changes in tax lawsand related guidance and regulations that may be implemented and other risks detailed in our filings with the SEC, including in Part I Item IA “Risk Factors” inthe 10-K.
A forward-looking statement is neither a prediction nor a guarantee of future events or circumstances, and those future events or circumstances may not occur.You should not place undue reliance on the forward-looking statements, which speak only as of the date of this report. We are under no obligation to update oralter any forward-looking statements, whether as a result of new information, future events or otherwise.
This information should be read in conjunction with the consolidated financial statements and the notes included in Item 1 of Part I of this 10-Q and the auditedconsolidated financial statements and notes, and Management’s Discussion and Analysis of Financial Condition and Results of Operations, contained in the 10-K.
Introduction and Overview
Starbucks is the premier coffee roaster and retailer of specialty coffee with operations in 83 markets around the world. As of December 27, 2020, Starbucks hadover 32,900 company-operated and licensed stores, an increase of 4% from the prior year. Additionally, we sell a variety of consumer-packaged goods, or CPG,primarily through the Global Coffee Alliance established with Nestlé and other partnerships and joint ventures. Our financial results and long-term growth modelwill continue to be driven by new store openings, comparable store sales and margin management. Comparable store sales represent company-operated stores openfor 13 months or longer, and exclude the impact of foreign currency translation. Stores that are temporarily closed or operating at reduced hours due to the COVID-19 outbreak remain in comparable store sales while stores identified for permanent closure have been removed. During the quarter ended December 27, 2020, ourglobal comparable store sales declined 5%, including the negative impacts of COVID-19.
We have three reportable operating segments: Americas, International and Channel Development. Non-reportable operating segments and unallocated corporateexpenses are reported within Corporate and Other.
26
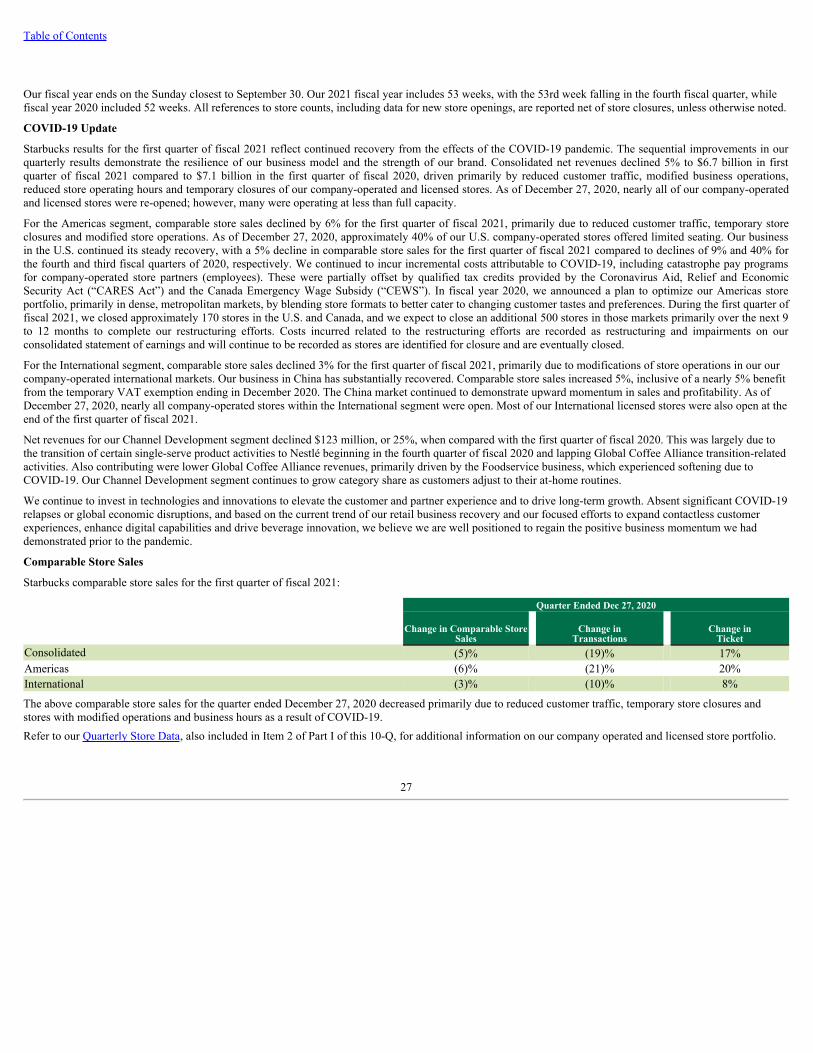
Table of Contents
Our fiscal year ends on the Sunday closest to September 30. Our 2021 fiscal year includes 53 weeks, with the 53rd week falling in the fourth fiscal quarter, whilefiscal year 2020 included 52 weeks. All references to store counts, including data for new store openings, are reported net of store closures, unless otherwise noted.
COVID-19 Update
Starbucks results for the first quarter of fiscal 2021 reflect continued recovery from the effects of the COVID-19 pandemic. The sequential improvements in ourquarterly results demonstrate the resilience of our business model and the strength of our brand. Consolidated net revenues declined 5% to $6.7 billion in firstquarter of fiscal 2021 compared to $7.1 billion in the first quarter of fiscal 2020, driven primarily by reduced customer traffic, modified business operations,reduced store operating hours and temporary closures of our company-operated and licensed stores. As of December 27, 2020, nearly all of our company-operatedand licensed stores were re-opened; however, many were operating at less than full capacity.
For the Americas segment, comparable store sales declined by 6% for the first quarter of fiscal 2021, primarily due to reduced customer traffic, temporary storeclosures and modified store operations. As of December 27, 2020, approximately 40% of our U.S. company-operated stores offered limited seating. Our businessin the U.S. continued its steady recovery, with a 5% decline in comparable store sales for the first quarter of fiscal 2021 compared to declines of 9% and 40% forthe fourth and third fiscal quarters of 2020, respectively. We continued to incur incremental costs attributable to COVID-19, including catastrophe pay programsfor company-operated store partners (employees). These were partially offset by qualified tax credits provided by the Coronavirus Aid, Relief and EconomicSecurity Act (“CARES Act”) and the Canada Emergency Wage Subsidy (“CEWS”). In fiscal year 2020, we announced a plan to optimize our Americas storeportfolio, primarily in dense, metropolitan markets, by blending store formats to better cater to changing customer tastes and preferences. During the first quarter offiscal 2021, we closed approximately 170 stores in the U.S. and Canada, and we expect to close an additional 500 stores in those markets primarily over the next 9to 12 months to complete our restructuring efforts. Costs incurred related to the restructuring efforts are recorded as restructuring and impairments on ourconsolidated statement of earnings and will continue to be recorded as stores are identified for closure and are eventually closed.
For the International segment, comparable store sales declined 3% for the first quarter of fiscal 2021, primarily due to modifications of store operations in our ourcompany-operated international markets. Our business in China has substantially recovered. Comparable store sales increased 5%, inclusive of a nearly 5% benefitfrom the temporary VAT exemption ending in December 2020. The China market continued to demonstrate upward momentum in sales and profitability. As ofDecember 27, 2020, nearly all company-operated stores within the International segment were open. Most of our International licensed stores were also open at theend of the first quarter of fiscal 2021.
Net revenues for our Channel Development segment declined $123 million, or 25%, when compared with the first quarter of fiscal 2020. This was largely due tothe transition of certain single-serve product activities to Nestlé beginning in the fourth quarter of fiscal 2020 and lapping Global Coffee Alliance transition-relatedactivities. Also contributing were lower Global Coffee Alliance revenues, primarily driven by the Foodservice business, which experienced softening due toCOVID-19. Our Channel Development segment continues to grow category share as customers adjust to their at-home routines.
We continue to invest in technologies and innovations to elevate the customer and partner experience and to drive long-term growth. Absent significant COVID-19relapses or global economic disruptions, and based on the current trend of our retail business recovery and our focused efforts to expand contactless customerexperiences, enhance digital capabilities and drive beverage innovation, we believe we are well positioned to regain the positive business momentum we haddemonstrated prior to the pandemic.
Comparable Store Sales
Starbucks comparable store sales for the first quarter of fiscal 2021:
Quarter Ended Dec 27, 2020
Change in Comparable Store
SalesChange in
TransactionsChange in
TicketConsolidated (5)% (19)% 17%Americas (6)% (21)% 20%International (3)% (10)% 8%
The above comparable store sales for the quarter ended December 27, 2020 decreased primarily due to reduced customer traffic, temporary store closures andstores with modified operations and business hours as a result of COVID-19.Refer to our Quarterly Store Data, also included in Item 2 of Part I of this 10-Q, for additional information on our company operated and licensed store portfolio.
27
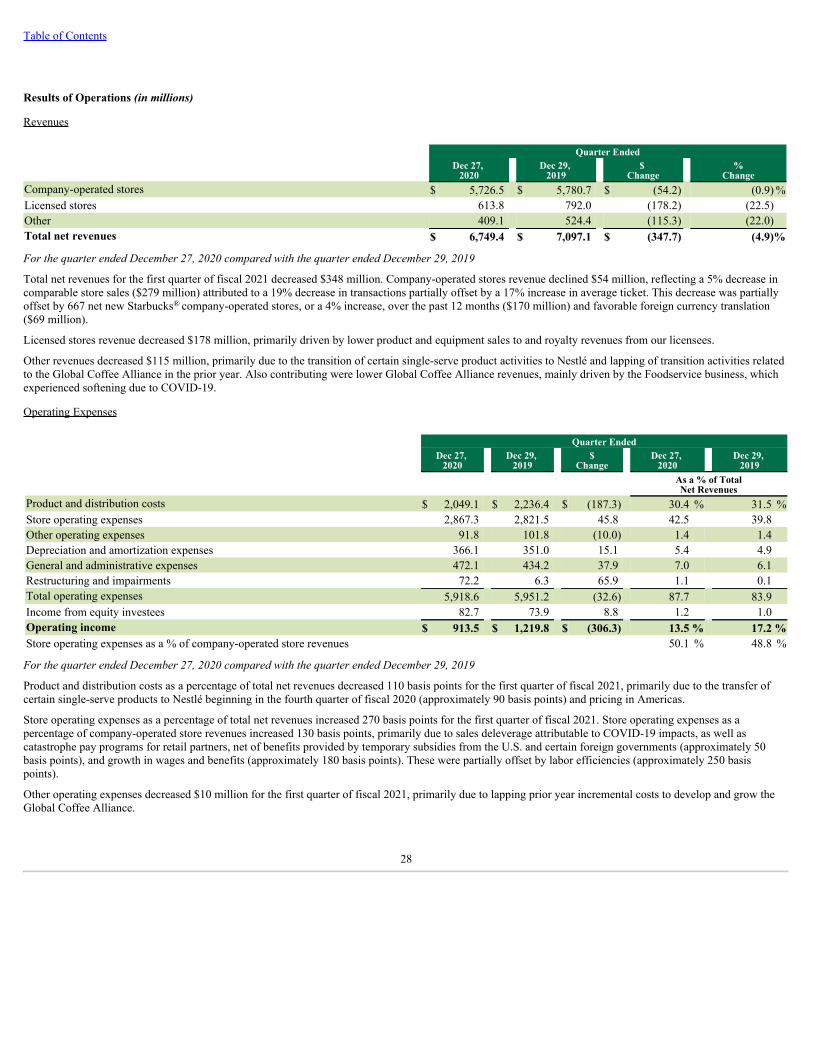
Table of Contents
Results of Operations (in millions)
Revenues
Quarter EndedDec 27,
2020Dec 29,
2019$
Change%
ChangeCompany-operated stores $ 5,726.5 $ 5,780.7 $ (54.2) (0.9) %Licensed stores 613.8 792.0 (178.2) (22.5)Other 409.1 524.4 (115.3) (22.0)Total net revenues $ 6,749.4 $ 7,097.1 $ (347.7) (4.9)%
For the quarter ended December 27, 2020 compared with the quarter ended December 29, 2019
Total net revenues for the first quarter of fiscal 2021 decreased $348 million. Company-operated stores revenue declined $54 million, reflecting a 5% decrease incomparable store sales ($279 million) attributed to a 19% decrease in transactions partially offset by a 17% increase in average ticket. This decrease was partiallyoffset by 667 net new Starbucks company-operated stores, or a 4% increase, over the past 12 months ($170 million) and favorable foreign currency translation($69 million).
Licensed stores revenue decreased $178 million, primarily driven by lower product and equipment sales to and royalty revenues from our licensees.
Other revenues decreased $115 million, primarily due to the transition of certain single-serve product activities to Nestlé and lapping of transition activities relatedto the Global Coffee Alliance in the prior year. Also contributing were lower Global Coffee Alliance revenues, mainly driven by the Foodservice business, whichexperienced softening due to COVID-19.
Operating Expenses
Quarter EndedDec 27,
2020Dec 29,
2019$
ChangeDec 27,
2020Dec 29,
2019
As a % of TotalNet Revenues
Product and distribution costs $ 2,049.1 $ 2,236.4 $ (187.3) 30.4 % 31.5 %Store operating expenses 2,867.3 2,821.5 45.8 42.5 39.8 Other operating expenses 91.8 101.8 (10.0) 1.4 1.4 Depreciation and amortization expenses 366.1 351.0 15.1 5.4 4.9 General and administrative expenses 472.1 434.2 37.9 7.0 6.1 Restructuring and impairments 72.2 6.3 65.9 1.1 0.1 Total operating expenses 5,918.6 5,951.2 (32.6) 87.7 83.9 Income from equity investees 82.7 73.9 8.8 1.2 1.0 Operating income $ 913.5 $ 1,219.8 $ (306.3) 13.5 % 17.2 %Store operating expenses as a % of company-operated store revenues 50.1 % 48.8 %
For the quarter ended December 27, 2020 compared with the quarter ended December 29, 2019
Product and distribution costs as a percentage of total net revenues decreased 110 basis points for the first quarter of fiscal 2021, primarily due to the transfer ofcertain single-serve products to Nestlé beginning in the fourth quarter of fiscal 2020 (approximately 90 basis points) and pricing in Americas.
Store operating expenses as a percentage of total net revenues increased 270 basis points for the first quarter of fiscal 2021. Store operating expenses as apercentage of company-operated store revenues increased 130 basis points, primarily due to sales deleverage attributable to COVID-19 impacts, as well ascatastrophe pay programs for retail partners, net of benefits provided by temporary subsidies from the U.S. and certain foreign governments (approximately 50basis points), and growth in wages and benefits (approximately 180 basis points). These were partially offset by labor efficiencies (approximately 250 basispoints).
Other operating expenses decreased $10 million for the first quarter of fiscal 2021, primarily due to lapping prior year incremental costs to develop and grow theGlobal Coffee Alliance.
®
28
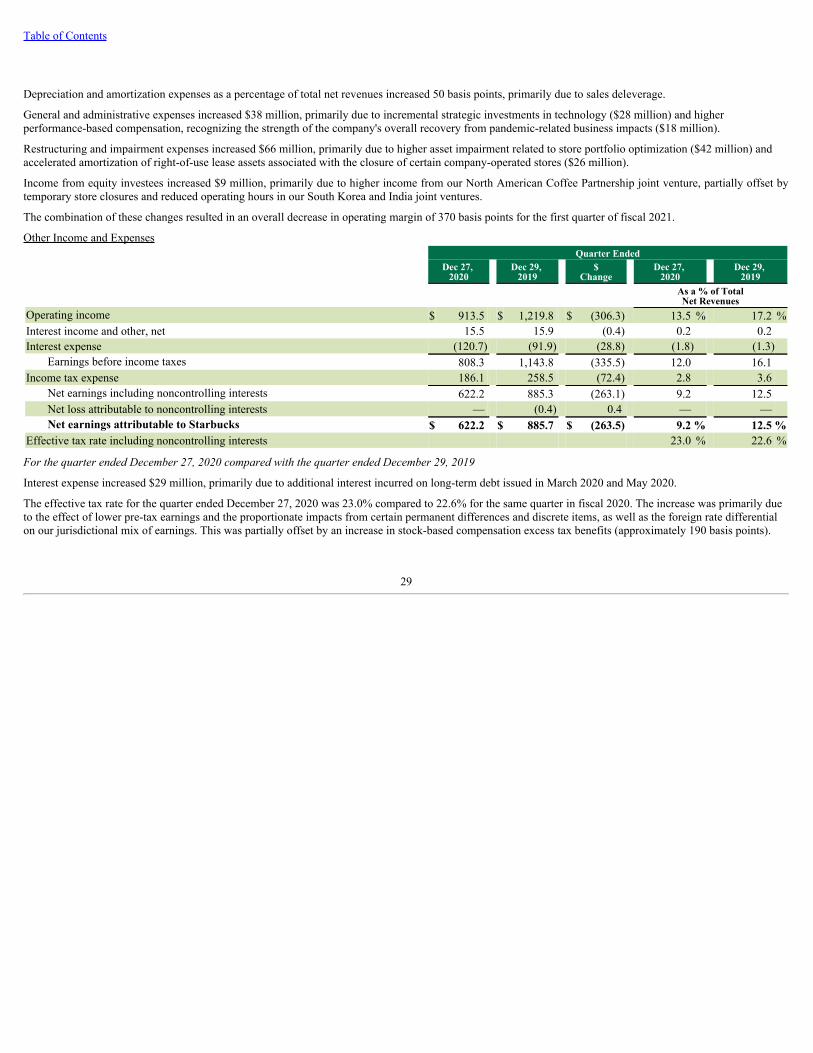
Table of Contents
Depreciation and amortization expenses as a percentage of total net revenues increased 50 basis points, primarily due to sales deleverage.
General and administrative expenses increased $38 million, primarily due to incremental strategic investments in technology ($28 million) and higherperformance-based compensation, recognizing the strength of the company's overall recovery from pandemic-related business impacts ($18 million).
Restructuring and impairment expenses increased $66 million, primarily due to higher asset impairment related to store portfolio optimization ($42 million) andaccelerated amortization of right-of-use lease assets associated with the closure of certain company-operated stores ($26 million).
Income from equity investees increased $9 million, primarily due to higher income from our North American Coffee Partnership joint venture, partially offset bytemporary store closures and reduced operating hours in our South Korea and India joint ventures.
The combination of these changes resulted in an overall decrease in operating margin of 370 basis points for the first quarter of fiscal 2021.
Other Income and Expenses Quarter Ended
Dec 27, 2020
Dec 29, 2019
$Change
Dec 27, 2020
Dec 29, 2019
As a % of TotalNet Revenues
Operating income $ 913.5 $ 1,219.8 $ (306.3) 13.5 % 17.2 %Interest income and other, net 15.5 15.9 (0.4) 0.2 0.2 Interest expense (120.7) (91.9) (28.8) (1.8) (1.3)
Earnings before income taxes 808.3 1,143.8 (335.5) 12.0 16.1 Income tax expense 186.1 258.5 (72.4) 2.8 3.6
Net earnings including noncontrolling interests 622.2 885.3 (263.1) 9.2 12.5 Net loss attributable to noncontrolling interests — (0.4) 0.4 — — Net earnings attributable to Starbucks $ 622.2 $ 885.7 $ (263.5) 9.2 % 12.5 %
Effective tax rate including noncontrolling interests 23.0 % 22.6 %
For the quarter ended December 27, 2020 compared with the quarter ended December 29, 2019
Interest expense increased $29 million, primarily due to additional interest incurred on long-term debt issued in March 2020 and May 2020.
The effective tax rate for the quarter ended December 27, 2020 was 23.0% compared to 22.6% for the same quarter in fiscal 2020. The increase was primarily dueto the effect of lower pre-tax earnings and the proportionate impacts from certain permanent differences and discrete items, as well as the foreign rate differentialon our jurisdictional mix of earnings. This was partially offset by an increase in stock-based compensation excess tax benefits (approximately 190 basis points).
29
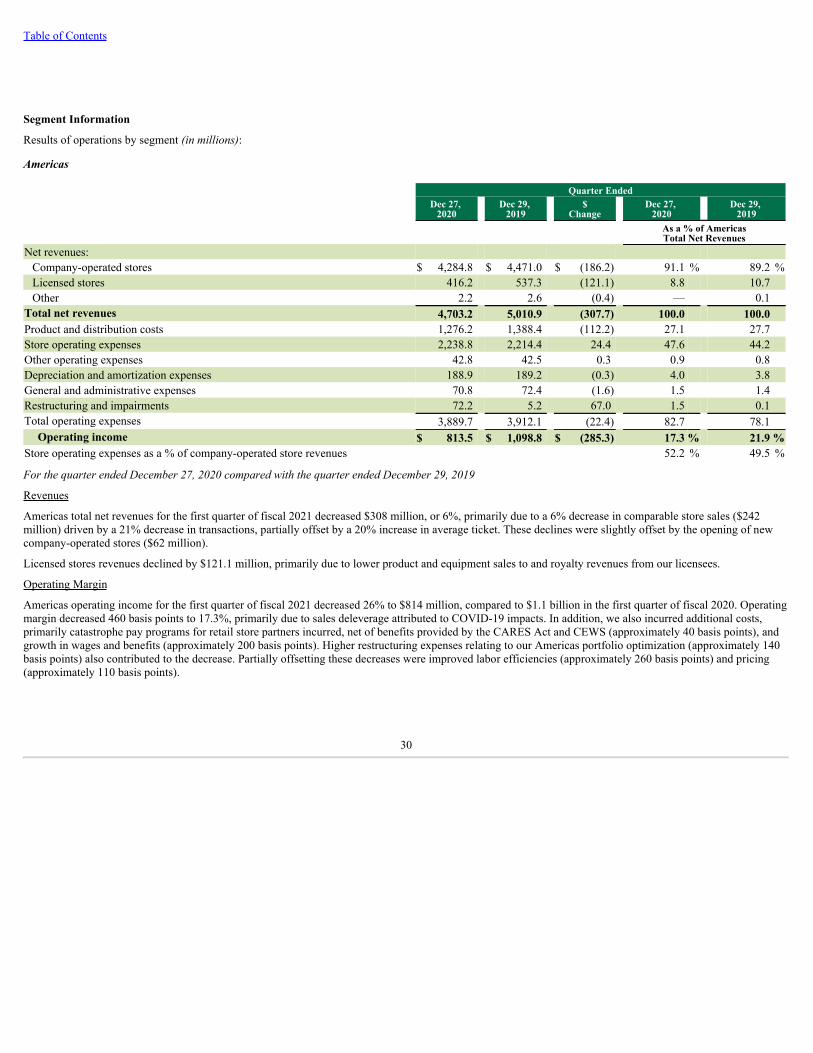
Table of Contents
Segment Information
Results of operations by segment (in millions):
Americas
Quarter EndedDec 27,
2020Dec 29,
2019$
ChangeDec 27,
2020Dec 29,
2019As a % of AmericasTotal Net Revenues
Net revenues:Company-operated stores $ 4,284.8 $ 4,471.0 $ (186.2) 91.1 % 89.2 %Licensed stores 416.2 537.3 (121.1) 8.8 10.7 Other 2.2 2.6 (0.4) — 0.1
Total net revenues 4,703.2 5,010.9 (307.7) 100.0 100.0 Product and distribution costs 1,276.2 1,388.4 (112.2) 27.1 27.7 Store operating expenses 2,238.8 2,214.4 24.4 47.6 44.2 Other operating expenses 42.8 42.5 0.3 0.9 0.8 Depreciation and amortization expenses 188.9 189.2 (0.3) 4.0 3.8 General and administrative expenses 70.8 72.4 (1.6) 1.5 1.4 Restructuring and impairments 72.2 5.2 67.0 1.5 0.1 Total operating expenses 3,889.7 3,912.1 (22.4) 82.7 78.1
Operating income $ 813.5 $ 1,098.8 $ (285.3) 17.3 % 21.9 %Store operating expenses as a % of company-operated store revenues 52.2 % 49.5 %
For the quarter ended December 27, 2020 compared with the quarter ended December 29, 2019
Revenues
Americas total net revenues for the first quarter of fiscal 2021 decreased $308 million, or 6%, primarily due to a 6% decrease in comparable store sales ($242million) driven by a 21% decrease in transactions, partially offset by a 20% increase in average ticket. These declines were slightly offset by the opening of newcompany-operated stores ($62 million).
Licensed stores revenues declined by $121.1 million, primarily due to lower product and equipment sales to and royalty revenues from our licensees.
Operating Margin
Americas operating income for the first quarter of fiscal 2021 decreased 26% to $814 million, compared to $1.1 billion in the first quarter of fiscal 2020. Operatingmargin decreased 460 basis points to 17.3%, primarily due to sales deleverage attributed to COVID-19 impacts. In addition, we also incurred additional costs,primarily catastrophe pay programs for retail store partners incurred, net of benefits provided by the CARES Act and CEWS (approximately 40 basis points), andgrowth in wages and benefits (approximately 200 basis points). Higher restructuring expenses relating to our Americas portfolio optimization (approximately 140basis points) also contributed to the decrease. Partially offsetting these decreases were improved labor efficiencies (approximately 260 basis points) and pricing(approximately 110 basis points).
30
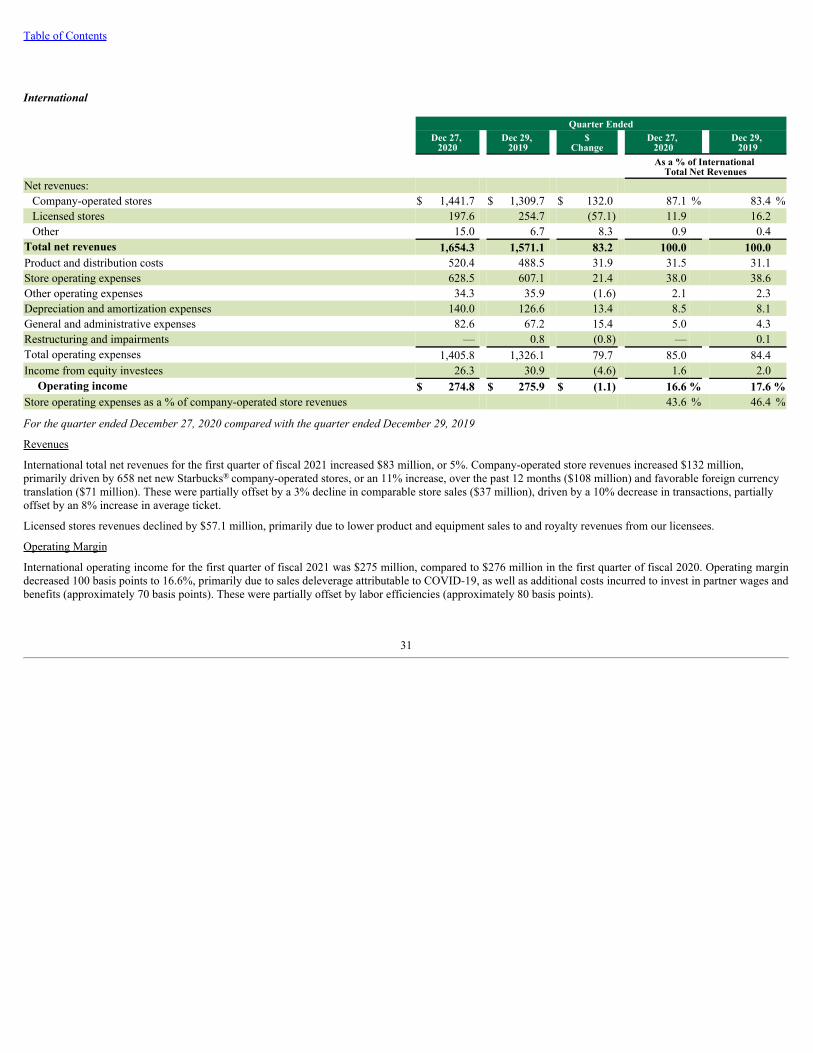
Table of Contents
International
Quarter Ended
Dec 27,
2020Dec 29,
2019$
ChangeDec 27,
2020Dec 29,
2019As a % of International
Total Net RevenuesNet revenues:
Company-operated stores $ 1,441.7 $ 1,309.7 $ 132.0 87.1 % 83.4 %Licensed stores 197.6 254.7 (57.1) 11.9 16.2 Other 15.0 6.7 8.3 0.9 0.4
Total net revenues 1,654.3 1,571.1 83.2 100.0 100.0 Product and distribution costs 520.4 488.5 31.9 31.5 31.1 Store operating expenses 628.5 607.1 21.4 38.0 38.6 Other operating expenses 34.3 35.9 (1.6) 2.1 2.3 Depreciation and amortization expenses 140.0 126.6 13.4 8.5 8.1 General and administrative expenses 82.6 67.2 15.4 5.0 4.3 Restructuring and impairments — 0.8 (0.8) — 0.1 Total operating expenses 1,405.8 1,326.1 79.7 85.0 84.4 Income from equity investees 26.3 30.9 (4.6) 1.6 2.0
Operating income $ 274.8 $ 275.9 $ (1.1) 16.6 % 17.6 %Store operating expenses as a % of company-operated store revenues 43.6 % 46.4 %
For the quarter ended December 27, 2020 compared with the quarter ended December 29, 2019
Revenues
International total net revenues for the first quarter of fiscal 2021 increased $83 million, or 5%. Company-operated store revenues increased $132 million,primarily driven by 658 net new Starbucks company-operated stores, or an 11% increase, over the past 12 months ($108 million) and favorable foreign currencytranslation ($71 million). These were partially offset by a 3% decline in comparable store sales ($37 million), driven by a 10% decrease in transactions, partiallyoffset by an 8% increase in average ticket.
Licensed stores revenues declined by $57.1 million, primarily due to lower product and equipment sales to and royalty revenues from our licensees.
Operating Margin
International operating income for the first quarter of fiscal 2021 was $275 million, compared to $276 million in the first quarter of fiscal 2020. Operating margindecreased 100 basis points to 16.6%, primarily due to sales deleverage attributable to COVID-19, as well as additional costs incurred to invest in partner wages andbenefits (approximately 70 basis points). These were partially offset by labor efficiencies (approximately 80 basis points).
®
31
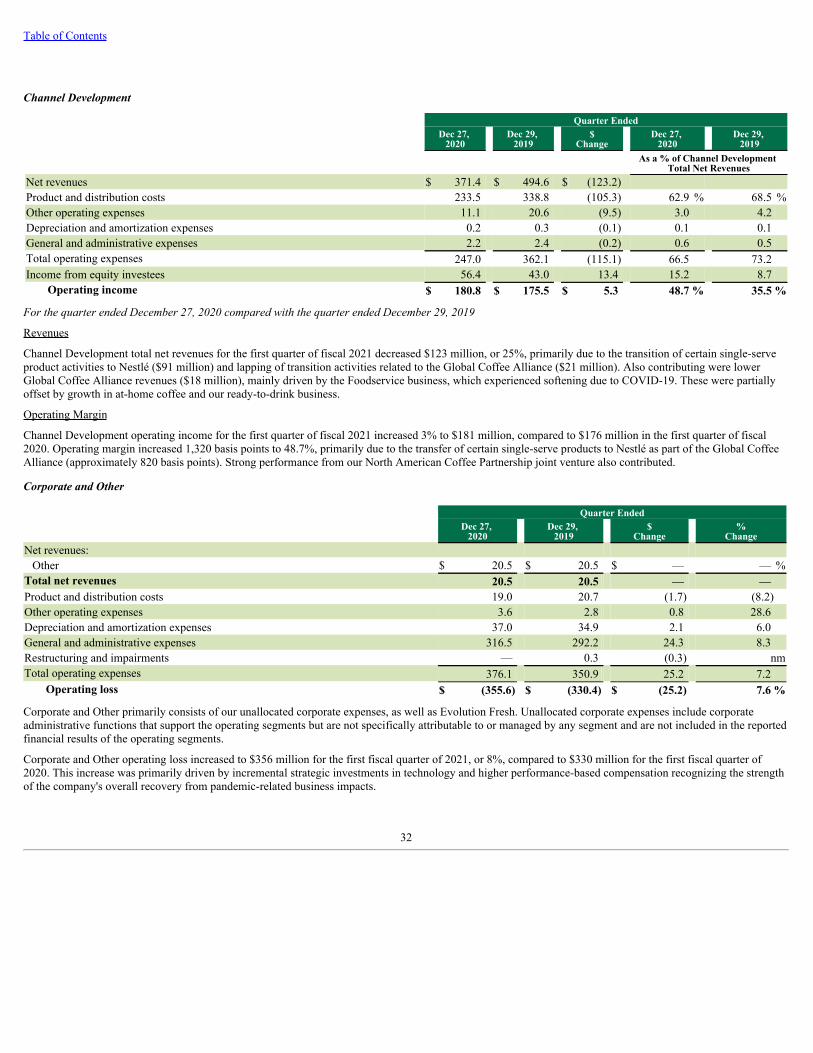
Table of Contents
Channel Development
Quarter Ended
Dec 27,
2020Dec 29,
2019$
ChangeDec 27,
2020Dec 29,
2019As a % of Channel Development
Total Net RevenuesNet revenues $ 371.4 $ 494.6 $ (123.2)Product and distribution costs 233.5 338.8 (105.3) 62.9 % 68.5 %Other operating expenses 11.1 20.6 (9.5) 3.0 4.2 Depreciation and amortization expenses 0.2 0.3 (0.1) 0.1 0.1 General and administrative expenses 2.2 2.4 (0.2) 0.6 0.5 Total operating expenses 247.0 362.1 (115.1) 66.5 73.2 Income from equity investees 56.4 43.0 13.4 15.2 8.7
Operating income $ 180.8 $ 175.5 $ 5.3 48.7 % 35.5 %
For the quarter ended December 27, 2020 compared with the quarter ended December 29, 2019
Revenues
Channel Development total net revenues for the first quarter of fiscal 2021 decreased $123 million, or 25%, primarily due to the transition of certain single-serveproduct activities to Nestlé ($91 million) and lapping of transition activities related to the Global Coffee Alliance ($21 million). Also contributing were lowerGlobal Coffee Alliance revenues ($18 million), mainly driven by the Foodservice business, which experienced softening due to COVID-19. These were partiallyoffset by growth in at-home coffee and our ready-to-drink business.
Operating Margin
Channel Development operating income for the first quarter of fiscal 2021 increased 3% to $181 million, compared to $176 million in the first quarter of fiscal2020. Operating margin increased 1,320 basis points to 48.7%, primarily due to the transfer of certain single-serve products to Nestlé as part of the Global CoffeeAlliance (approximately 820 basis points). Strong performance from our North American Coffee Partnership joint venture also contributed.
Corporate and Other
Quarter Ended
Dec 27,
2020Dec 29,
2019$
Change%
ChangeNet revenues:
Other $ 20.5 $ 20.5 $ — — %Total net revenues 20.5 20.5 — — Product and distribution costs 19.0 20.7 (1.7) (8.2)Other operating expenses 3.6 2.8 0.8 28.6 Depreciation and amortization expenses 37.0 34.9 2.1 6.0 General and administrative expenses 316.5 292.2 24.3 8.3 Restructuring and impairments — 0.3 (0.3) nmTotal operating expenses 376.1 350.9 25.2 7.2
Operating loss $ (355.6) $ (330.4) $ (25.2) 7.6 %
Corporate and Other primarily consists of our unallocated corporate expenses, as well as Evolution Fresh. Unallocated corporate expenses include corporateadministrative functions that support the operating segments but are not specifically attributable to or managed by any segment and are not included in the reportedfinancial results of the operating segments.
Corporate and Other operating loss increased to $356 million for the first fiscal quarter of 2021, or 8%, compared to $330 million for the first fiscal quarter of2020. This increase was primarily driven by incremental strategic investments in technology and higher performance-based compensation recognizing the strengthof the company's overall recovery from pandemic-related business impacts.
32
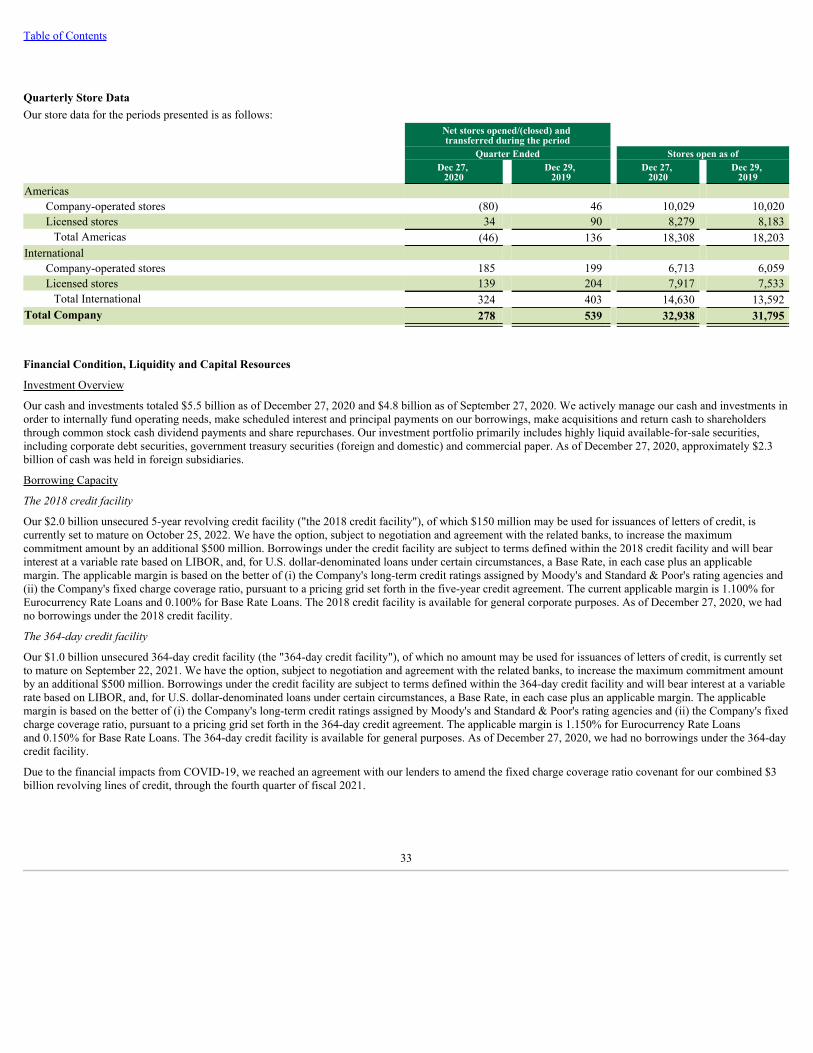
Table of Contents
Quarterly Store DataOur store data for the periods presented is as follows:
Net stores opened/(closed) and transferred during the period
Quarter Ended Stores open as ofDec 27,
2020Dec 29,
2019Dec 27,
2020Dec 29,
2019Americas
Company-operated stores (80) 46 10,029 10,020 Licensed stores 34 90 8,279 8,183
Total Americas (46) 136 18,308 18,203 International
Company-operated stores 185 199 6,713 6,059 Licensed stores 139 204 7,917 7,533
Total International 324 403 14,630 13,592 Total Company 278 539 32,938 31,795
Financial Condition, Liquidity and Capital Resources
Investment Overview
Our cash and investments totaled $5.5 billion as of December 27, 2020 and $4.8 billion as of September 27, 2020. We actively manage our cash and investments inorder to internally fund operating needs, make scheduled interest and principal payments on our borrowings, make acquisitions and return cash to shareholdersthrough common stock cash dividend payments and share repurchases. Our investment portfolio primarily includes highly liquid available-for-sale securities,including corporate debt securities, government treasury securities (foreign and domestic) and commercial paper. As of December 27, 2020, approximately $2.3billion of cash was held in foreign subsidiaries.
Borrowing Capacity
The 2018 credit facility
Our $2.0 billion unsecured 5-year revolving credit facility ("the 2018 credit facility"), of which $150 million may be used for issuances of letters of credit, iscurrently set to mature on October 25, 2022. We have the option, subject to negotiation and agreement with the related banks, to increase the maximumcommitment amount by an additional $500 million. Borrowings under the credit facility are subject to terms defined within the 2018 credit facility and will bearinterest at a variable rate based on LIBOR, and, for U.S. dollar-denominated loans under certain circumstances, a Base Rate, in each case plus an applicablemargin. The applicable margin is based on the better of (i) the Company's long-term credit ratings assigned by Moody's and Standard & Poor's rating agencies and(ii) the Company's fixed charge coverage ratio, pursuant to a pricing grid set forth in the five-year credit agreement. The current applicable margin is 1.100% forEurocurrency Rate Loans and 0.100% for Base Rate Loans. The 2018 credit facility is available for general corporate purposes. As of December 27, 2020, we hadno borrowings under the 2018 credit facility.
The 364-day credit facility
Our $1.0 billion unsecured 364-day credit facility (the "364-day credit facility"), of which no amount may be used for issuances of letters of credit, is currently setto mature on September 22, 2021. We have the option, subject to negotiation and agreement with the related banks, to increase the maximum commitment amountby an additional $500 million. Borrowings under the credit facility are subject to terms defined within the 364-day credit facility and will bear interest at a variablerate based on LIBOR, and, for U.S. dollar-denominated loans under certain circumstances, a Base Rate, in each case plus an applicable margin. The applicablemargin is based on the better of (i) the Company's long-term credit ratings assigned by Moody's and Standard & Poor's rating agencies and (ii) the Company's fixedcharge coverage ratio, pursuant to a pricing grid set forth in the 364-day credit agreement. The applicable margin is 1.150% for Eurocurrency Rate Loansand 0.150% for Base Rate Loans. The 364-day credit facility is available for general purposes. As of December 27, 2020, we had no borrowings under the 364-daycredit facility.
Due to the financial impacts from COVID-19, we reached an agreement with our lenders to amend the fixed charge coverage ratio covenant for our combined $3billion revolving lines of credit, through the fourth quarter of fiscal 2021.
33
Table of Contents
Commercial Paper
Under our commercial paper program, we may issue unsecured commercial paper notes up to a maximum aggregate amount outstanding at any time of $3.0billion, with individual maturities that may vary but not exceed 397 days from the date of issue. Amounts outstanding under the commercial paper program arerequired to be backstopped by available commitments under the 2018 and 364-day credit facilities discussed above. The proceeds from borrowings under ourcommercial paper program may be used for working capital needs, capital expenditures and other corporate purposes, including, but not limited to, businessexpansion, payment of cash dividends on our common stock and share repurchases. As of December 27, 2020, we had borrowings of $299.7 million outstanding,net of unamortized discount, under our commercial paper program, of which a majority will mature during the second quarter of fiscal 2021. As such, our totalcontractual borrowing capacity for general corporate purposes as of the end of our first quarter of fiscal 2021 was $2.7 billion when combining the unusedcommercial paper program and credit facilities, less outstanding borrowing.
Credit facilities in Japan
Additionally, we hold Japanese yen-denominated credit facilities for the use of our Japan subsidiary. These are available for working capital needs and capitalexpenditures within our Japanese market.
• A ¥10 billion, or $96.5 million, facility is currently set to mature on March 26, 2021. Borrowings under the credit facility are subject to terms definedwithin the facility and will bear interest at a variable rate based on TIBOR plus an applicable margin of 0.300%.
• A ¥10 billion, or $96.5 million, facility is currently set to mature on October 29, 2021. Borrowings under the credit facility are subject to terms definedwithin the facility and will bear interest at a variable rate based on TIBOR plus an applicable margin of 0.350%.
• A ¥5 billion, or $48.2 million, facility is currently set to mature on December 30, 2021. Borrowings under the credit facility are subject to terms definedwithin the facility and will bear interest at a variable rate based on TIBOR plus an applicable margin of 0.400%.
As of December 27, 2020, we had $192.9 million of borrowings outstanding under these credit facilities.
See Note 7, Debt, to the consolidated financial statements included in Item 1 of Part I of this 10-Q for details of the components of our long-term debt.
Our ability to incur new liens and conduct sale and leaseback transactions on certain material properties is subject to compliance with terms of the indentures underwhich the Senior Notes were issued. As of December 27, 2020, we were in compliance with all applicable covenants.
Use of Cash
We expect to use our available cash and investments, including, but not limited to, additional potential future borrowings under the credit facilities, commercialpaper program and the issuance of debt to support and invest in our core businesses, including investing in new ways to serve our customers and supporting ourstore partners, repaying maturing debts, as well as returning cash to shareholders through common stock cash dividend payments and discretionary sharerepurchases and investing in new business opportunities related to our core and developing businesses. Further, we may use our available cash resources to makeproportionate capital contributions to our investees. We may also seek strategic acquisitions to leverage existing capabilities and further build our business insupport of our “Growth at Scale” agenda. Acquisitions may include increasing our ownership interests in our investees. Any decisions to increase such ownershipinterests will be driven by valuation and fit with our ownership strategy.
We believe that net future cash flows generated from operations and existing cash and investments both domestically and internationally combined with our abilityto leverage our balance sheet through the issuance of debt will be sufficient to finance capital requirements for our core businesses as well as shareholderdistributions for the foreseeable future. Significant new joint ventures, acquisitions and/or other new business opportunities may require additional outside funding.We have borrowed funds and continue to believe we have the ability to do so at reasonable interest rates; however, additional borrowings would result in increasedinterest expense in the future. In this regard, we may incur additional debt, within targeted levels, as part of our plans to fund our capital programs, including cashreturns to shareholders through future dividends and discretionary share repurchases. To further strengthen our liquidity in the near term, we currently expect thesuspension of share repurchases to continue into late fiscal 2021. If necessary, we may pursue additional sources of financing, including both short-term and long-term borrowings and debt issuances.
We regularly review our cash positions and our determination of indefinite reinvestment of foreign earnings. In the event we determine that all or a portion of suchforeign earnings are no longer indefinitely reinvested, we may be subject to additional
34
Table of Contents
foreign withholding taxes and U.S. state income taxes, which could be material. We do not anticipate the need for repatriated funds to the U.S. to satisfy domesticliquidity needs.
In November 2020, our Board of Directors approved a quarterly cash dividend to shareholders of $0.45 per share to be paid on March 5, 2021 to shareholders ofrecord as of the close of business on February 18, 2021. As of the date of this report, we do not expect to reduce our quarterly dividend as a result of the COVID-19 pandemic.
On April 8, 2020, we announced a temporary suspension of our share repurchase program. Repurchases pursuant to this program were last made in mid-March2020. As of December 27, 2020, 48.9 million shares remained available for repurchase under current authorizations. The existing share repurchase programremains authorized by the Board of Directors, however, we have temporarily suspended our share repurchase program until we restore certain financial leveragetargets, which we currently expect to occur in late fiscal 2021.
Other than normal operating expenses, cash requirements for the remainder of fiscal 2021 are expected to consist primarily of capital expenditures for investmentsin our new and existing stores and our supply chain and corporate facilities. Total capital expenditures for fiscal 2021 are expected to be approximately $1.9billion.
Cash Flows
Cash provided by operating activities was $1.8 billion for the first quarter of fiscal 2021, compared to $1.8 billion for the same period in fiscal 2020. Although ournet earnings were negatively impacted by the COVID-19 pandemic, our cash flows from operations were flat when compared to the same period in fiscal 2020.This is largely attributable to the non-cash loss on retirement and impairment of assets and improvements to our working capital.
Cash used in investing activities for the first quarter of fiscal 2021 totaled $0.3 billion, compared to cash used in investing activities of $0.4 billion for the sameperiod in fiscal 2020. The change was primarily due to lower existing and new store investments, partially offset by higher maturities and calls of investments.
Cash used in financing activities for the first quarter of fiscal 2021 totaled $1.0 billion compared to cash used in financing activities of $1.1 billion for the sameperiod in fiscal 2020. The change was primarily due to temporary suspension of our share repurchase program, partially offset by increased debt repayments andlower net proceeds from new debt issuances.
Contractual Obligations
In Management’s Discussion and Analysis of Financial Condition and Results of Operations included in the 10-K, we disclosed that we had $35.4 billion in totalcontractual obligations as of September 27, 2020. There have been no material changes to our total obligations during the period covered by this 10-Q outside ofthe normal course of our business.
Off-Balance Sheet Arrangements
There has been no material change in our off-balance sheet arrangements discussed in Management’s Discussion and Analysis of Financial Condition and Resultsof Operations included in the 10-K.
Commodity Prices, Availability and General Risk Conditions
Commodity price risk represents our primary market risk, generated by our purchases of green coffee and dairy products, among other items. We purchase, roastand sell high-quality arabica coffee and related products and risk arises from the price volatility of green coffee. In addition to coffee, we also purchase significantamounts of dairy products to support the needs of our company-operated stores. The price and availability of these commodities directly impact our results ofoperations, and we expect commodity prices, particularly coffee, to impact future results of operations. For additional details, see Product Supply in Item 1 of the10-K, as well as Risk Factors in Item 1A of the 10-K.
Seasonality and Quarterly Results
Our business is subject to moderate seasonal fluctuations, of which our fiscal second quarter typically experiences lower revenues and operating income. However,the COVID-19 outbreak may have an impact on consumer behaviors and customer traffic that result in changes in the seasonal fluctuations of our business.Additionally, as our stored value cards are issued to and loaded by customers during the holiday season, we tend to have higher cash flows from operations duringthe first quarter of the fiscal year. However, since revenues from our stored value cards are recognized upon redemption and not when cash is loaded, the impact ofseasonal fluctuations on the consolidated statements of earnings is much less pronounced. As a result of moderate seasonal fluctuations, results for any quarter arenot necessarily indicative of the results that may be achieved for the full fiscal year.
35
Table of Contents
RECENT ACCOUNTING PRONOUNCEMENTS
See Note 1, Summary of Significant Accounting Policies, to the consolidated financial statements included in Item 1 of Part I of this 10-Q, for a detaileddescription of recent accounting pronouncements.
Item 3. Quantitative and Qualitative Disclosures About Market Risk
There has been no material change in the commodity price risk, foreign currency exchange risk, equity security price risk or interest rate risk discussed in Item 7Aof the 10-K.
Item 4. Controls and Procedures
We maintain disclosure controls and procedures that are designed to ensure that material information required to be disclosed in our periodic reports filed orsubmitted under the Securities Exchange Act of 1934, as amended (the “Exchange Act”), is recorded, processed, summarized and reported within the time periodsspecified in the SEC’s rules and forms. Our disclosure controls and procedures are also designed to ensure that information required to be disclosed in the reportswe file or submit under the Exchange Act is accumulated and communicated to our management, including our principal executive officer and principal financialofficer as appropriate, to allow timely decisions regarding required disclosure.
During the first quarter of fiscal 2021, we carried out an evaluation, under the supervision and with the participation of our management, including our chiefexecutive officer and our chief financial officer, of the effectiveness of the design and operation of the disclosure controls and procedures, as defined in Rules 13a-15(e) and 15d-15(e) under the Exchange Act. Based upon that evaluation, our chief executive officer and chief financial officer concluded that our disclosurecontrols and procedures were effective, as of the end of the period covered by this report (December 27, 2020).
There were no changes in our internal control over financial reporting (as defined in Rules 13a-15(f) and 15d-15(f) of the Exchange Act) during our most recentlycompleted fiscal quarter that materially affected or are reasonably likely to materially affect internal control over financial reporting.
The certifications required by Section 302 of the Sarbanes-Oxley Act of 2002 are filed as exhibits 31.1 and 31.2 to this 10-Q.
36
Table of Contents
PART II — OTHER INFORMATION
Item 1. Legal Proceedings
See Note 13, Commitments and Contingencies, to the consolidated financial statements included in Item 1 of Part I of this 10-Q for information regarding certainlegal proceedings in which we are involved.
Item 1A. Risk Factors
There have been no material changes to the risk factors previously disclosed in the 10-K.
Item 2. Unregistered Sales of Equity Securities and Use of Proceeds
Shares under our ongoing share repurchase program may be repurchased in open market transactions, including pursuant to a trading plan adopted in accordancewith Rule 10b5-1 of the Exchange Act, or through privately negotiated transactions. The timing, manner, price and amount of repurchases will be determined atour discretion and the share repurchase program may be suspended, terminated or modified at any time for any reason. On April 8, 2020, we announced atemporary suspension of our share repurchase program. During the first fiscal quarter ended December 27, 2020, there was no share repurchase activity.
37
Table of Contents
Item 6. Exhibits Incorporated by Reference
ExhibitNo. Exhibit Description Form File No.
Date ofFiling
ExhibitNumber
FiledHerewith
3.1 Restated Articles of Incorporation of Starbucks Corporation 10-Q 0-20322 04/28/2015 3.13.2 Amended and Restated Bylaws of Starbucks Corporation (As
amended and restated through June 1, 2018) 8-K 0-20322 06/05/2018 3.1
31.1 Certification of Principal Executive Officer Pursuant to Rule 13a-14(a) of the Securities Exchange Act of 1934, As AdoptedPursuant to Section 302 of the Sarbanes-Oxley Act of 2002
— — — — X
31.2 Certification of Principal Financial Officer Pursuant to Rule 13a-14(a) of the Securities Exchange Act of 1934, As AdoptedPursuant to Section 302 of the Sarbanes-Oxley Act of 2002
— — — — X
32* Certifications of Principal Executive Officer and PrincipalFinancial Officer Pursuant to 18 U.S.C. Section 1350, As AdoptedPursuant to Section 906 of the Sarbanes-Oxley Act of 2002
— — — — —
101 The following financial statements from the Company's 10-Q forthe fiscal quarter ended December 27, 2020, formatted in iXBRL:(i) Consolidated Statements of Earnings, (ii) ConsolidatedStatements of Comprehensive Income, (iii) Consolidated BalanceSheets, (iv) Consolidated Statements of Cash Flows, (v)Consolidated Statements of Equity and (vi) Notes to ConsolidatedFinancial Statements
— — — — X
104 Cover Page Interactive Data File (formatted in iXBRL andcontained in Exhibit 101) — — — — X
* Furnished herewith.
38
Table of Contents
SIGNATURESPursuant to the requirements of the Securities Exchange Act of 1934, the registrant has duly caused this report to be signed on its behalf by the undersignedthereunto duly authorized.
January 26, 2021
STARBUCKS CORPORATION
By: /s/ Patrick J. GrismerPatrick J. Grismerexecutive vice president, chief financial officerSigning on behalf of the registrant and asprincipal financial officer
39

Exhibit 31.1
CERTIFICATION PURSUANT TO RULE 13a-14(a) OF THE SECURITIES EXCHANGE ACT OF 1934AS ADOPTED PURSUANT TO SECTION 302 OF THE SARBANES-OXLEY ACT OF 2002
I, Kevin R. Johnson, certify that: 1. I have reviewed this Quarterly Report on Form 10-Q for the fiscal quarter ended December 27, 2020 of Starbucks Corporation;2. Based on my knowledge, this report does not contain any untrue statement of a material fact or omit to state a material fact necessary to make the
statements made, in light of the circumstances under which such statements were made, not misleading with respect to the period covered by this report;3. Based on my knowledge, the financial statements, and other financial information included in this report, fairly present in all material respects the
financial condition, results of operations and cash flows of the registrant as of, and for, the periods presented in this report;4. The registrant’s other certifying officer(s) and I are responsible for establishing and maintaining disclosure controls and procedures (as defined in
Exchange Act Rules 13a-15(e) and 15d-15(e)) and internal control over financial reporting (as defined in Exchange Act Rules 13a-15(f) and 15d-15(f))for the registrant and have:(a) Designed such disclosure controls and procedures, or caused such disclosure controls and procedures to be designed under our supervision, to
ensure that material information relating to the registrant, including its consolidated subsidiaries, is made known to us by others within thoseentities, particularly during the period in which this report is being prepared;
(b) Designed such internal control over financial reporting, or caused such internal control over financial reporting to be designed under oursupervision, to provide reasonable assurance regarding the reliability of financial reporting and the preparation of financial statements forexternal purposes in accordance with generally accepted accounting principles;
(c) Evaluated the effectiveness of the registrant’s disclosure controls and procedures and presented in this report our conclusions about theeffectiveness of the disclosure controls and procedures, as of the end of the period covered by this report based on such evaluation; and
(d) Disclosed in this report any change in the registrant’s internal control over financial reporting that occurred during the registrant’s most recentfiscal quarter (the registrant’s fourth fiscal quarter in the case of an annual report) that has materially affected, or is reasonably likely tomaterially affect, the registrant’s internal control over financial reporting; and
5. The registrant’s other certifying officer(s) and I have disclosed, based on our most recent evaluation of internal control over financial reporting, to theregistrant’s auditors and the audit committee of the registrant’s board of directors (or persons performing the equivalent functions):(a) All significant deficiencies and material weaknesses in the design or operation of internal control over financial reporting which are reasonably
likely to adversely affect the registrant’s ability to record, process, summarize and report financial information; and(b) Any fraud, whether or not material, that involves management or other employees who have a significant role in the registrant’s internal control
over financial reporting.
Date: January 26, 2021
/s/ Kevin R. JohnsonKevin R. Johnsonpresident and chief executive officer
Exhibit 31.2
CERTIFICATION PURSUANT TO RULE 13a-14(a) OF THE SECURITIES EXCHANGE ACT OF 1934AS ADOPTED PURSUANT TO SECTION 302 OF THE SARBANES-OXLEY ACT OF 2002
I, Patrick J. Grismer, certify that: 1. I have reviewed this Quarterly Report on Form 10-Q for the fiscal quarter ended December 27, 2020 of Starbucks Corporation;2. Based on my knowledge, this report does not contain any untrue statement of a material fact or omit to state a material fact necessary to make the
statements made, in light of the circumstances under which such statements were made, not misleading with respect to the period covered by this report;3. Based on my knowledge, the financial statements, and other financial information included in this report, fairly present in all material respects the
financial condition, results of operations and cash flows of the registrant as of, and for, the periods presented in this report;4. The registrant’s other certifying officer(s) and I are responsible for establishing and maintaining disclosure controls and procedures (as defined in
Exchange Act Rules 13a-15(e) and 15d-15(e)) and internal control over financial reporting (as defined in Exchange Act Rules 13a-15(f) and 15d-15(f))for the registrant and have:(a) Designed such disclosure controls and procedures, or caused such disclosure controls and procedures to be designed under our supervision, to
ensure that material information relating to the registrant, including its consolidated subsidiaries, is made known to us by others within thoseentities, particularly during the period in which this report is being prepared;
(b) Designed such internal control over financial reporting, or caused such internal control over financial reporting to be designed under oursupervision, to provide reasonable assurance regarding the reliability of financial reporting and the preparation of financial statements forexternal purposes in accordance with generally accepted accounting principles;
(c) Evaluated the effectiveness of the registrant’s disclosure controls and procedures and presented in this report our conclusions about theeffectiveness of the disclosure controls and procedures, as of the end of the period covered by this report based on such evaluation; and
(d) Disclosed in this report any change in the registrant’s internal control over financial reporting that occurred during the registrant’s most recentfiscal quarter (the registrant’s fourth fiscal quarter in the case of an annual report) that has materially affected, or is reasonably likely tomaterially affect, the registrant’s internal control over financial reporting; and
5. The registrant’s other certifying officer(s) and I have disclosed, based on our most recent evaluation of internal control over financial reporting, to theregistrant’s auditors and the audit committee of the registrant’s board of directors (or persons performing the equivalent functions):(a) All significant deficiencies and material weaknesses in the design or operation of internal control over financial reporting which are reasonably
likely to adversely affect the registrant’s ability to record, process, summarize and report financial information; and(b) Any fraud, whether or not material, that involves management or other employees who have a significant role in the registrant’s internal control
over financial reporting.
Date: January 26, 2021
/s/ Patrick J. GrismerPatrick J. Grismerexecutive vice president, chief financial officer
Exhibit 32
CERTIFICATIONS PURSUANT TO 18 U.S.C. SECTION 1350AS ADOPTED PURSUANT TO SECTION 906 OF THE SARBANES-OXLEY ACT OF 2002
In connection with the Quarterly Report of Starbucks Corporation (“Starbucks”) on Form 10-Q for the fiscal quarter ended December 27, 2020, as filed with theSecurities and Exchange Commission on January 26, 2021 (the “Report”), Kevin R. Johnson, president and chief executive officer, and Patrick J. Grismer,executive vice president, chief financial officer of Starbucks, each hereby certifies, pursuant to 18 U.S.C. Section 1350, as adopted pursuant to Section 906 of theSarbanes-Oxley Act of 2002, that, to his knowledge: (1) the Report fully complies with the requirements of Section 13(a) or 15(d) of the Securities Exchange Act of 1934; and(2) the information contained in the Report fairly presents, in all material respects, the financial condition and results of operations of Starbucks.
January 26, 2021
/s/ Kevin R. JohnsonKevin R. Johnsonpresident and chief executive officer
January 26, 2021
/s/ Patrick J. GrismerPatrick J. Grismerexecutive vice president, chief financial officer