Half-yearly Economic Report 2003
245
-
Upload
khangminh22 -
Category
Documents
-
view
3 -
download
0
Transcript of Half-yearly Economic Report 2003


HALF-YEARLYECONOMIC REPORT 2003
ECONOMIC ANALYSIS DIVISIONFINANCIAL SERVICES AND THE TREASURY BUREAU
GOVERNMENT OF THEHONG KONG SPECIAL ADMINISTRATIVE REGION
August 2003

CONTENTS
Paragraphs
CHAPTER 1: OVERALL VIEW
Overall situation 1.1 - 1.10The external sector 1.11 - 1.19Domestic demand 1.20 - 1.24The Government account 1.25 - 1.27The property market 1.28 - 1.31The labour market 1.32 - 1.36Prices 1.37 - 1.39The financial sector 1.40 - 1.44
CHAPTER 2: THE EXTERNAL SECTOR
Major external influences 2.1 - 2.4Overall visible and invisible trade situation 2.5 - 2.13Visible trade
Total exports of goods 2.14 - 2.27Re-exports 2.28 - 2.31Domestic exports 2.32 - 2.33Outward processing trade 2.34 - 2.36Imports of goods 2.37 - 2.38Retained imports 2.39 - 2.42
Invisible tradeExports of services 2.43 - 2.46Imports of services 2.47 - 2.50
Overall balance of payments 2.51 - 2.53
CHAPTER 3: THE DOMESTIC ECONOMY
Net output or value added by economic activity 3.1 - 3.2Local manufacturing output 3.3 - 3.4Service sector receipts 3.5 - 3.6Property 3.7 - 3.16Building and construction 3.17 - 3.23Land 3.24 - 3.27Electricity and gas 3.28 - 3.29Internal transport 3.30 - 3.31External transport 3.32 - 3.35Tourism 3.36 - 3.41Telecommunications 3.42 - 3.43
CHAPTER 4: THE FINANCIAL SECTOR
Overall financial market situation 4.1Exchange rates 4.2 - 4.4Interest rates 4.5 - 4.7Deposits and money supply 4.8 - 4.12Hong Kong dollar external claims and liabilities of authorized
institutions4.13 - 4.14
Loans and advances 4.15 - 4.19Banks and other deposit-taking institutions 4.20 - 4.23Insurance 4.24The debt market 4.25 - 4.29The stock, futures and gold markets 4.30 - 4.37Unit trusts and mutual funds 4.38 - 4.39

CHAPTER 5: THE LABOUR SECTOR
Overall labour market situation 5.1 - 5.6Profile of unemployment and underemployment 5.7 - 5.11Profile of employment 5.12 - 5.16Vacancies 5.17 - 5.19Earnings and wages 5.20 - 5.29
CHAPTER 6: PRICES
Consumer prices 6.1 - 6.6Import prices 6.7 - 6.10Prices of key inputs 6.11Prices of local manufacturing output 6.12Prices of output in selected service sectors 6.13Export prices 6.14 - 6.15Terms of trade 6.16GDP deflator 6.17
STATISTICAL APPENDIX

1
CHAPTER 1 : OVERALL VIEW
Overall situation
1.1 The spread of Severe Acute Respiratory Syndrome (SARS) in HongKong since mid-March had dealt a heavy blow to the economy in the secondquarter of 2003. Particularly in April and May, inbound tourism and thetravel-related sectors were hard hit. Visitor arrivals plunged by two-thirds inthose two months combined as compared to a year earlier, while passenger loadof the two local airlines plummeted by almost three-quarters. The average hotelroom occupancy rate fell to only around 20%. The nascent recovery in domesticdemand felt at the beginning of this year was also derailed. Local consumerspending fell off abruptly for most of the second quarter, as consumer sentimentwas severely curbed by the SARS threat. Investment spending likewiseslackened markedly in the second quarter, as the business outlook for manysectors in the shorter term was dimmed.
1.2 Nevertheless, the overall situation began to bottom out towards the endof May, and turned progressively better in June and July. A notable relativeimprovement was seen in inbound tourism and the travel-related sectors, uponlifting of the travel advisory against non-essential travel to Hong Kong by theWorld Health Organisation (WHO) on 23 May and then removal of Hong Kongfrom the list of SARS-affected areas by WHO on 23 June. Visitor arrivals andpassenger load of the two local airlines declined less, by less than two-fifths andthree-fifths respectively in June as compared to a year earlier, while the averagehotel room occupancy rate turned up to around 35%. Local consumer sentimentlikewise improved, with retail business showing a much lesser decline in Junethan in April and May, as the SARS situation was brought under control and asstrong promotion by the affected trades and relaunch by the Government helpedresurrect consumers’ inclination to spend. The two packages of relief measuresintroduced by the Government in April and then in June also helped thecommunity and the affected businesses tide over the SARS impact(1).
1.3 Meanwhile, exports of goods were strongly sustained, withdouble-digit year-on-year increase through the more recent months. Offshoretrade also continued to grow apace. The robust external trade thus renderedconsiderable cushion to overall performance of the economy in the secondquarter.
/1.4 …..

2
1.4 For the second quarter of 2003 as a whole, the Gross Domestic Product(GDP)(2) fell only modestly, by 0.5% in real terms over a year earlier, thoughdistinctly down from the solid growth of 4.5% in the first quarter (latter figureunchanged from the estimate put out earlier). On a seasonally adjustedquarter-to-quarter comparison(3), GDP fell more visibly, by 3.7% in real terms inthe second quarter of 2003, following a 0.3% decline in the first quarter (latterfigure also unchanged from the estimate put out earlier).
Q1 Q2 Q3 Q4 Q1 Q2 Q3 Q4 Q1 Q2 Q3 Q4 Q1 Q2 Q3 Q4 Q1 Q2 Q3 Q4 Q1 Q21998 1999 2000 2001 2002 2003
0
2
4
6
8
10
12
14
16
-2
-4
-6
-8
-10
Percent
Diagram 1.1Gross Domestic Product
Year-on-year rate of change in real terms
Seasonally adjusted quarter-to-quarter rate of
change in real terms
/Table 1.1 …..

3
Table 1.1
Gross Domestic Product and its main expenditure componentsand the main price indicators
(year-on-year rate of change (%))
2001# 2002# 2002 2003Q1# Q2# Q3# Q4# Q1# Q2+
Change in real terms ofGDP and its mainexpenditure components (%)Private consumption expenditure
1.6 -1.3 -0.1 -2.2 -1.2 -1.8 -2.0 -2.2
Government consumption expenditure
6.1 2.4 2.3 3.0 3.5 0.8 1.3 0.6
Gross domestic fixed capital formation
2.7 -4.3 -11.8 -0.2 -4.3 -0.7 3.5 -5.3
of which : Building and construction -1.1 1.2 -3.2 7.6 8.2 -6.2 -3.5 -7.2 Machinery, equipment and computer software
6.2 -9.1 -19.8 -6.7 -12.2 3.2 11.9 -2.4
Total exports of goods -3.3 8.7 -2.4 5.9 11.5 18.4 19.1 14.3 Re-exports -2.4 11.0 -1.4 8.4 13.7 22.2 22.3 17.0 Domestic exports -10.2 -11.2 -11.1 -13.6 -7.5 -12.9 -12.0 -12.6Imports of goods(a) -1.9 7.9 -4.0 6.0 10.8 18.2 18.8 10.9Exports of services 6.9 11.7 6.0 7.7 13.9 18.1 12.6 -14.7Imports of services 2.0 0.2 -0.7 -3.8 2.0 3.4 -3.9 -19.6Gross Domestic Product 0.5 2.3 -0.6 0.8 3.4 5.1 4.5 -0.5Change in the mainprice indicators (%) GDP deflator -1.9 -3.0 -2.3 -2.2 -3.1 -4.1 -4.6 -5.5Composite Consumer Price Index(b) -1.6 -3.0 -2.6 -3.2 -3.5 -2.9 -2.0 -2.5
Consumer Price Index (A)(b) -1.7 -3.2 -2.8 -3.6 -4.1 -2.4 -1.8 -1.8
Change in nominal GDP (%) -1.4 -0.8 -3.0 -1.4 0.2 0.8 -0.2 -6.0
GDP at current marketprices ($ billion)
1,270 1,260 298 306 325 331 298 288
GDP at constant (2000)market prices ($ billion)
1,294 1,324 310 318 343 353 324 316
Changes in inventories atconstant (2000) marketprices ($ billion)
-5 3 -3 1 1 3 3 2
Notes : (#) Revised figures.
(+) Preliminary figures.
(a) Here imports of goods are valued on f.o.b. basis, instead of on c.i.f. basis as is the on-going practicefor the merchandise trade statistics.
(b) Final figures.
/Table 1.2 …..
4
Table 1.2
Gross Domestic Product and its main expenditure componentsand the main price indicators
(seasonally adjusted quarter-to-quarter rate of change (%))
2002 2003Q1# Q2# Q3# Q4# Q1# Q2+
Change in real terms ofGDP and its mainexpenditure components (%)Private consumption expenditure
0.5 -0.7 -0.3 -0.9 -0.2 -0.7
Government consumption expenditure
0.4 -0.2 2.3 -1.2 0.1 -0.1
Gross domestic fixed capital formation
N.A. N.A. N.A. N.A. N.A. N.A.
Total exports of goods 4.6 5.7 4.1 3.9 3.1 2.4 Re-exports 5.8 6.6 4.6 4.7 3.9 2.7 Domestic exports -5.5 -2.0 -0.6 -4.3 -6.3 -1.8
Imports of goods(a) 4.6 5.9 4.6 3.0 3.7 -0.9
Exports of services 1.9 4.3 6.1 5.1 -3.4 -21.1
Imports of services 0.4 -1.6 3.8 1.1 -6.9 -17.7
Gross Domestic Product(b) 0.3 1.1 2.0 1.7 -0.3 -3.7Change in the mainprice indicators (%) GDP deflator -0.7 -0.8 -0.9 -1.6 -1.4 -1.7
Composite Consumer Price Index(c) -1.1 -0.6 -0.7 -0.6 -0.1 -1.1
Consumer Price Index (A)(c) -0.6 -0.6 -0.7 -0.6 * -0.5
Notes : (#) Revised figures.(+) Preliminary figures.(*) Change of less than 0.05%.N.A. Not applicable, as no clear seasonal pattern is found in gross domestic fixed capital
formation, due to the presence of considerable short-term fluctuations.(a) Here imports of goods are valued on f.o.b. basis, instead of on c.i.f. basis as is the
on-going practice for the merchandise trade statistics.(b) As gross domestic fixed capital formation does not exhibit a clear seasonal pattern, the
seasonally adjusted series of GDP is compiled separately at the overall level.(c) Final figures.
/1.5 …..
5
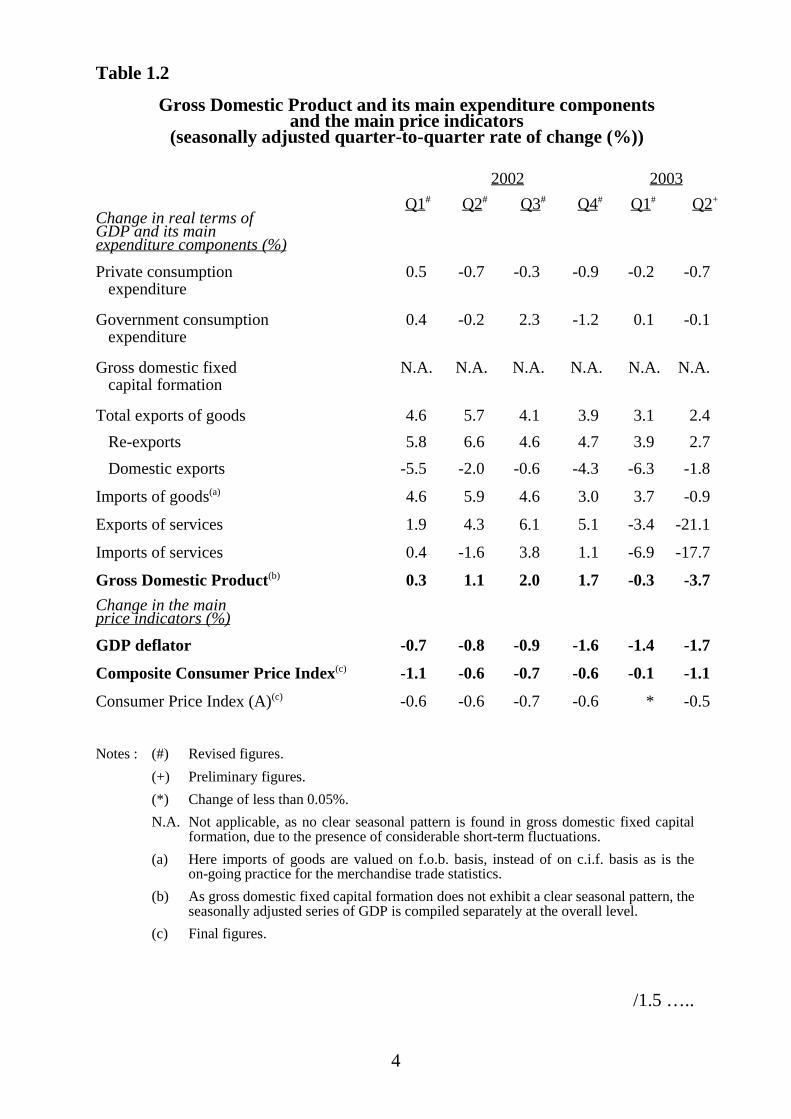
1.5 The labour market slackened distinctly further in the second quarter of2003, mainly affected by the spread of SARS. The impact was felt almostacross-the-board. The consumption and travel-related sectors faced particularlyvisible increases in unemployment. Also, as many employees were temporarilysuspended from work or asked to take no-pay leave, it lifted underemployment.The seasonally adjustment unemployment rate and the underemployment ratethus rose to new highs, at 8.6% and 4.3% respectively in the second quarter of2003, from 7.5% and 2.9% in the first quarter. Overall labour income in moneyterms continued to drift lower, with earnings falling by 2.0% in the first quarter of2003 over a year earlier, and with wages down by 1.5% in March 2003 over ayear earlier.
1.6 The property market remained generally sluggish in the second quarterof 2003. The spread of SARS since mid-March aggravated the already subduedsituation. On residential property, market activity quietened distinctly amidst theSARS impact. Flat prices came down further by 6% in the second quarter of2003 over the preceding quarter, after a 4% drop in the first quarter. Flat rentalsalso declined further, by 5% in the second quarter, following a 3% decrease in thefirst quarter. On commercial property, both the rental and sales markets for officespace weakened further as business conditions faltered upon the SARS impact.For the rental and sales markets for shopping space, conditions were likewisebleak. Landlords faced a widespread plea from tenant operators to granttemporary rental concessions in order to help tide over the difficulties. Themarket for industrial property remained in the doldrums.
1.7 In the financial market, the spot exchange rate of the Hong Kong dollaragainst the US dollar stayed very close to the linked rate during the secondquarter of 2003. The spread of the twelve-month Hong Kong dollar/US dollarforward rate over the spot rate shot up to 355 pips (each pip equivalent toHK$0.0001) in late April, amidst concern over the impact of SARS on theeconomy. Yet it fell back to 120 pips at end-June as the SARS situation wasbrought under control, even lower than 136 pips at end-March and 169 pips atend-2002. Local inter-bank interest rates likewise picked up briefly in April uponthe impact of SARS, but soon eased back to re-align broadly with their US dollarcounterparts. With a further decline in Hong Kong dollar loans but a modestincrease in Hong Kong dollar deposits, the Hong Kong dollar loan-to-depositratio fell again during the second quarter. The local stock market was on adownslide in most of April as concern over SARS weighed heavily on market
/sentiment …..
6
sentiment, pushing the Hang Seng Index to a 4½-year low of 8 409 on 25 April.Yet the market rebounded visibly thereafter, largely upon the improving localSARS situation. The Hang Seng Index reached 9 577 at end-June 2003, 10.9%higher than the level at end-March and 2.7% higher than the level at end-2002.Transactions turned more active, with the average daily turnover rising to$8.1 billion in the second quarter of 2003, from $6.1 billion in the first quarter.
1.8 On consumer prices, the Composite Consumer Price Index continued todrift lower, with the year-on-year rate of decline enlarging to 2.5% in the secondquarter of 2003, from 2.0% in the first quarter. Domestic costs and prices camedown even more upon the spread of SARS since mid-March, with local retailersand service providers generally offering larger price discounts and otherattractions in a move to induce sales. A one-off rebate of electricity charges by apower company in June and new fare concessions granted by some publictransport operators also dampened the CPI. These together more than offset theeffects of the recent pick-up in prices of retained imports upon a weaker USdollar and continued rise in world commodity prices.
1.9 Statistics on the Gross National Product (GNP)(4) are available up to thefirst quarter of 2003. Both external factor income inflow and outflow registeredmodest decline in the first quarter of 2003 over a year earlier. This was mainlycaused by a fall-off in interest income into and out of Hong Kong amidst a lowinterest environment worldwide. There was a sharper decline in interest incomeinflow than in the corresponding outflow within other investment. Yet withincome inflow on direct investment rising to a larger extent than thecorresponding income outflow, and with income inflow on portfolio investmentagain exceeding the corresponding income outflow, overall net external factorincome inflow still posted a marked increase, to 5.4% of GDP in the first quarterof 2003. GNP thus grew at a faster rate than GDP, by 4.9% in real terms asagainst 4.5% in real terms in the first quarter of 2003 over a year earlier.
1.10 Within the net external factor income flow, net direct investmentincome outflow fell in the first quarter of 2003 over a year earlier, mainly due toincreased investment earnings by some prominent local enterprises frominvestment abroad. Net portfolio investment income inflow was distinctly largerin the first quarter, mainly on account of increased income from holding ofnon-resident equity securities and reduced dividend pay-outs by resident
/companies …..
7
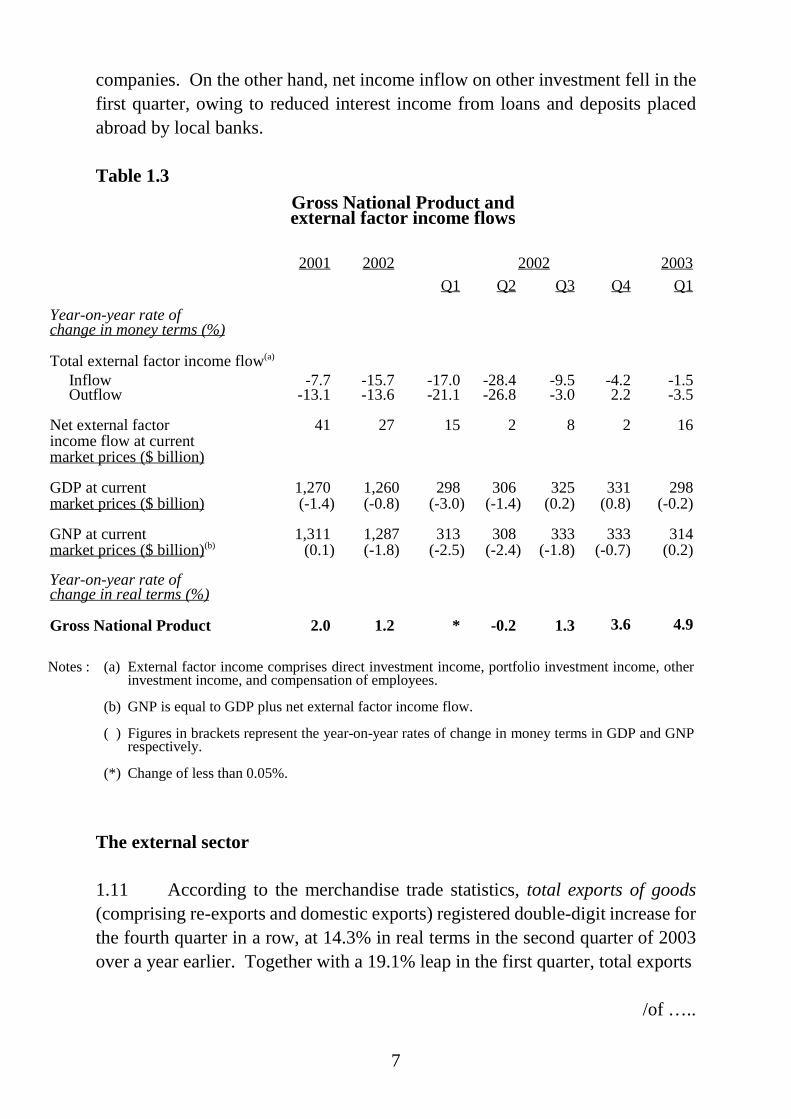
companies. On the other hand, net income inflow on other investment fell in thefirst quarter, owing to reduced interest income from loans and deposits placedabroad by local banks.
Table 1.3Gross National Product andexternal factor income flows
2001 2002 2002 2003Q1 Q2 Q3 Q4 Q1
Year-on-year rate ofchange in money terms (%)
Total external factor income flow(a)
Inflow -7.7 -15.7 -17.0 -28.4 -9.5 -4.2 -1.5Outflow -13.1 -13.6 -21.1 -26.8 -3.0 2.2 -3.5
Net external factorincome flow at currentmarket prices ($ billion)
41 27 15 2 8 2 16
GDP at currentmarket prices ($ billion)
1,270(-1.4)
1,260(-0.8)
298(-3.0)
306(-1.4)
325(0.2)
331(0.8)
298(-0.2)
GNP at currentmarket prices ($ billion)(b)
1,311(0.1)
1,287(-1.8)
313(-2.5)
308(-2.4)
333(-1.8)
333(-0.7)
314(0.2)
Year-on-year rate ofchange in real terms (%)
Gross National Product 2.0 1.2 * -0.2 1.3 3.6 4.9
Notes : (a) External factor income comprises direct investment income, portfolio investment income, otherinvestment income, and compensation of employees.
(b) GNP is equal to GDP plus net external factor income flow.
( ) Figures in brackets represent the year-on-year rates of change in money terms in GDP and GNPrespectively.
(*) Change of less than 0.05%.
The external sector
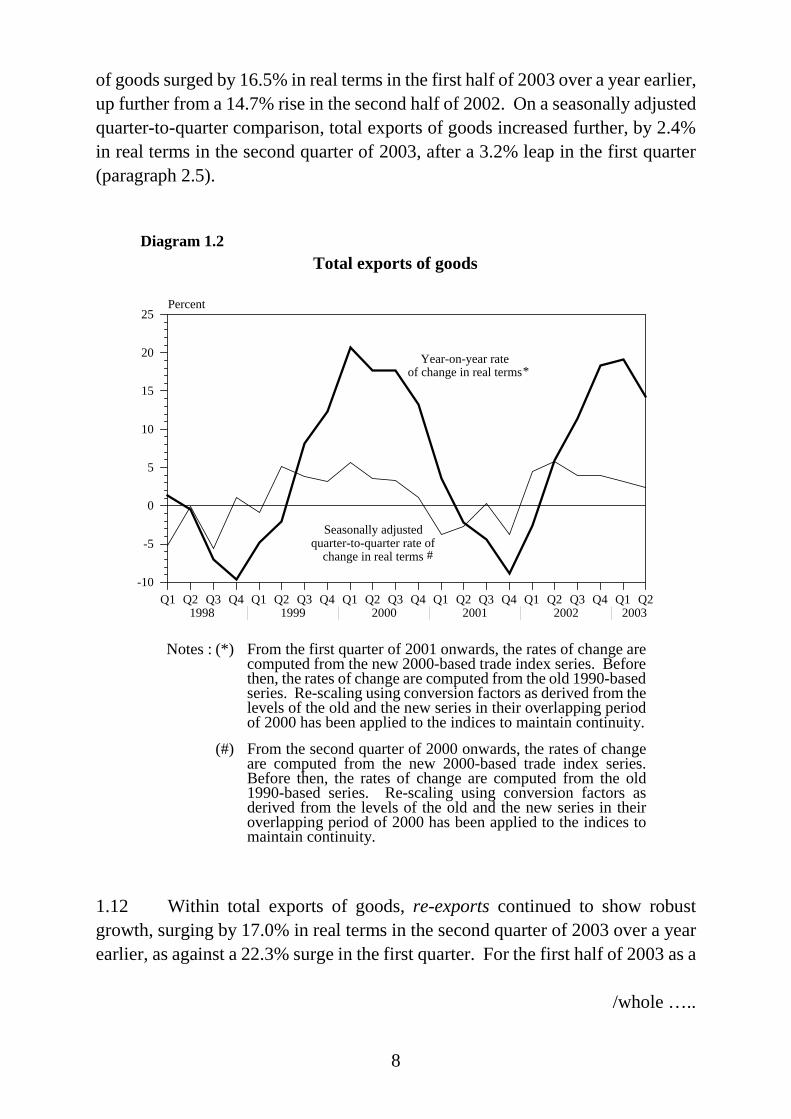
1.11 According to the merchandise trade statistics, total exports of goods(comprising re-exports and domestic exports) registered double-digit increase forthe fourth quarter in a row, at 14.3% in real terms in the second quarter of 2003over a year earlier. Together with a 19.1% leap in the first quarter, total exports
/of …..
8
of goods surged by 16.5% in real terms in the first half of 2003 over a year earlier,up further from a 14.7% rise in the second half of 2002. On a seasonally adjustedquarter-to-quarter comparison, total exports of goods increased further, by 2.4%in real terms in the second quarter of 2003, after a 3.2% leap in the first quarter(paragraph 2.5).
Total exports of goods
Q1 Q2 Q3 Q4 Q1 Q2 Q3 Q4 Q1 Q2 Q3 Q4 Q1 Q2 Q3 Q4 Q1 Q2 Q3 Q4 Q1 Q21998 1999 2000 2001 2002 2003
0
5
10
15
20
25
-5
-10
Percent
Diagram 1.2
Year-on-year rate of change in real terms*
Seasonally adjusted quarter-to-quarter rate of
change in real terms #
Notes : (*) From the first quarter of 2001 onwards, the rates of change arecomputed from the new 2000-based trade index series. Beforethen, the rates of change are computed from the old 1990-basedseries. Re-scaling using conversion factors as derived from thelevels of the old and the new series in their overlapping periodof 2000 has been applied to the indices to maintain continuity.
(#) From the second quarter of 2000 onwards, the rates of changeare computed from the new 2000-based trade index series.Before then, the rates of change are computed from the old1990-based series. Re-scaling using conversion factors asderived from the levels of the old and the new series in theiroverlapping period of 2000 has been applied to the indices tomaintain continuity.
1.12 Within total exports of goods, re-exports continued to show robustgrowth, surging by 17.0% in real terms in the second quarter of 2003 over a yearearlier, as against a 22.3% surge in the first quarter. For the first half of 2003 as a
/whole …..

9
whole, re-exports increased distinctly by 19.4% in real terms over a year earlier,following a 17.7% surge in the second half of 2002. On a seasonally adjustedquarter-to-quarter comparison, re-exports rose further, by 2.7% in real terms inthe second quarter of 2003, following a 4.0% increase in the first quarter. Incontrast, domestic exports plunged further, by 12.6% in real terms in the secondquarter of 2003 over a year earlier, following a 12.0% fall in the first quarter. Forthe first half of 2003 as a whole, domestic exports shrank further by 12.3% in realterms over a year earlier, enlarged from the 10.2% dip in the second half of 2002.On a seasonally adjusted quarter-to-quarter comparison, domestic exportsdeclined further, by 1.8% in real terms in the second quarter of 2003, following a6.3% fall in the first quarter (paragraphs 2.6 and 2.7).
1.13 The region remained the key driver of Hong Kong’s export growth inthe first half of 2003. Total exports of goods to East Asia as a whole surged by20.9% in real terms in the second quarter of 2003 over a year earlier. Togetherwith a 23.6% rise in the first quarter, total exports of goods to the region leapedby 22.2% in real terms for the first half of 2003 as a whole over a year earlier.This was further up from the already robust growth of 19.2% in the second half of2002. In the second quarter, exports to Japan, the Republic of Korea andSingapore picked up further to distinct growth, while exports to the mainland ofChina (the Mainland), Taiwan and Indonesia continued to grow strongly, albeitrelatively not so fast as in the first quarter. By contrast, exports to Thailand andMalaysia moderated considerably in growth. Total exports of goods to NorthAmerica however slackened markedly, to a 3.3% decline in real terms in thesecond quarter of 2003 over a year earlier, from a 9.1% rise in the first quarter.Apparently, the earlier war tension had led to some cut-back in export ordersparticularly from the United States. For the first half of 2003 as a whole, totalexports of goods to this area eased distinctly to a 2.2% increase in real terms overa year earlier, from a robust growth of 10.8% in the second half of 2002. Yet totalexports of goods to the European Union continued to soar, by 19.4% in real termsin the second quarter of 2003 over a year earlier. Together with a 17.8% surge inthe first quarter, there was a strong rise of 18.6% for the first half of 2003 as awhole, representing a further significant pick-up from the 6.6% rise in the secondhalf of 2002. This could have much to do with the relative strength of the euro,which enhanced considerably the price attractiveness of Hong Kong’s exports inthe EU market (paragraphs 2.15 to 2.17).
/1.14 …..

10
1.14 Imports of goods likewise rose further, by 10.6% in real terms in thesecond quarter of 2003 over a year earlier, after an 18.7% leap in the first quarter.Retained imports were however slack throughout the second quarter, as importsfor local use were cut back sharply upon the spread of SARS in Hong Kongduring the period. They recorded a 1.9% decline in real terms in the secondquarter of 2003 over a year earlier, sharply down from the 11.5% increase in thefirst quarter. For the first half of 2003 as a whole, imports of goods hadsignificant growth at 14.3% in real terms over a year earlier, while retainedimports still rose by 4.3%. These compared with the respective increases by14.3% and 7.5% in the second half of 2002. On a seasonally adjustedquarter-to-quarter comparison, imports of goods and retained imports both fellback distinctly, by 1.1% and 9.6% respectively in real terms in the second quarterof 2003, following increases by 3.6% and 2.9% in the first quarter(paragraph 2.8).
1.15 With a faster growth in total exports of goods than in imports of goodsin value, the visible trade deficit reckoned on a GDP basis narrowed to$9.8 billion or 2.3% of the value of imports of goods in the second quarter of2003, from $16.4 billion or 4.2% in the same quarter in 2002. In the first half of2003, the visible trade deficit also narrowed, to $25.8 billion or 3.1% of the valueof imports of goods, from $28.8 billion or 4.0% in the same period in 2002(paragraph 2.9).
1.16 On invisible trade, exports of services plummeted by 14.7% in realterms in the second quarter of 2003 over a year earlier, in stark contrast to a12.6% rise in the first quarter. The abrupt fall-off in exports of services wascaused entirely by the shock impact of SARS, with inbound tourism and exportsof transportation services both considerably down in the second quarter.Continued robust growth in offshore trade rendered only a partial offset. For thefirst half of 2003 as a whole, exports of services fell by 1.4% in real terms over ayear earlier, sharply reversing the 16.1% surge in the second half of 2002. On aseasonally adjusted quarter-to-quarter comparison, exports of services weremarkedly down by 21.1% in real terms in the second quarter of 2003, havingfallen by 3.4% in the first quarter (paragraph 2.10).
/Diagram 1.3 …..

11
Exports of services
Q1 Q2 Q3 Q4 Q1 Q2 Q3 Q4 Q1 Q2 Q3 Q4 Q1 Q2 Q3 Q4 Q1 Q2 Q3 Q4 Q1 Q21998 1999 2000 2001 2002 2003
0
10
20
-10
-20
-30
Percent
Diagram 1.3
Year-on-year rate of change in real terms
Seasonally adjusted quarter-to-quarter rate of
change in real terms
1.17 Imports of services plunged even more, by 19.6% in real terms in thesecond quarter of 2003 over a year earlier, distinctly enlarged from the 3.9%decrease in the first quarter. Outbound travel and related spending, whichaccounted for over half of imports of services, had been severely deterred by theSARS situation elsewhere in the region and the arrival restrictions andpost-arrival quarantine imposed in some of the destinations on people travellingfrom Hong Kong. For the first half of 2003 as a whole, imports of servicesslumped by 11.5% in real terms over a year earlier, as against a 2.7% rise in thesecond half of 2002. On a seasonally adjusted quarter-to-quarter comparison,imports of services fell significantly, by 17.7% in real terms in the second quarterof 2003, enlarged from the 6.9% decrease in the first quarter (paragraph 2.11).
1.18 Taking exports and imports of services together, the invisible tradesurplus reckoned on a GDP basis declined to $31.5 billion or 84.6% of the valueof imports of services in the second quarter of 2003, from $37.8 billion or 83.0%in the same quarter in 2002. For the first half of 2003 as a whole, the invisibletrade surplus still enlarged, to $72.1 billion or 85.9% of the value of imports ofservices, from $69.0 billion or 74.5% in the same period in 2002(paragraph 2.12).
/1.19 …..

12
1.19 With the reduction in the invisible trade surplus offset by the reductionin the visible trade deficit, the combined surplus reckoned on a GDP basis wasbroadly unchanged in the second quarter of 2003, at $21.7 billion or 4.6% of thetotal value of imports of goods and services, as against $21.4 billion or 4.9% inthe same quarter in 2002. For the first half of 2003 as a whole, the combinedsurplus rose to $46.3 billion or 5.1% of the total value of imports of goods andservices, from $40.1 billion or 4.9% in the same period in 2002 (paragraph 2.13).
Domestic demand
1.20 Local consumer spending receded abruptly upon the spread of SARS inmid-March, as local people shunned the more crowded shopping areas to avoidbeing contracted. Coupled with a concurrent plunge in visitor arrivals and hencein tourist spending, the volume of retail sales shrank by 12.2% in April 2003 overa year earlier. There were extensive fall-offs in sales amongst nearly all types ofcommodities. Yet sales of Chinese drugs and herbs and of health and sanitaryproducts were exceptions, as demand for these products rose amidst the SARSthreat. Local consumer sentiment began to improve in May, as the SARSsituation was progressively being brought under control and as WHO’s traveladvisory against Hong Kong was lifted later in that month. It improved further inJune, upon intensive promotion by the affected trades complemented withrelaunch by the Government. The decline in the volume of retail sales narrowedto 7.5% in May, and further to 3.2% in June. For the second quarter of 2003 as awhole, the volume of retail sales went down by 7.7% over a year earlier,considerably widened from the 0.8% decline in the first quarter. On a seasonallyadjusted quarter-to-quarter comparison, the volume of retail sales fell by 7.5% inthe second quarter of 2003, as against a 1.0% increase in the first quarter.
1.21 Private consumption expenditure (PCE) fell by 2.2% in real terms inthe second quarter of 2003 over a year earlier, slightly further down from the2.0% decline in the first quarter. The setback in the second quarter was mostlyconcentrated in residents’ spending abroad, as local people avoided visits to theSARS-affected places and as some of the neighbouring places imposed arrivalrestrictions and post-arrival quarantine amidst the spread of SARS. Residents’spending locally also dipped in April, yet turned up steadily in May and June aslocal sentiment improved. On a seasonally adjusted quarter-to-quartercomparison, PCE dropped by 0.7% in real terms in the second quarter of 2003,having fallen by 0.2% in the first quarter.
/Table 1.4 …..

13
Table 1.4
Local consumer and visitor spending in the domestic market(year-on-year rate of change in real terms (%))
Retail sales(a) Consumer spending by major component(a)Visitor
spending(b)
Food DurablesNon-
durables Services
Residents’expenditure
abroad Total
2002 Annual -2.6 * * -5 3 -2 * 21
Q1 -1.8 (2.1) 1 * -2 2 -3 1 8Q2 -4.5 (-1.5) * -4 -8 3 -5 -1 14Q3 -3.0 (-1.4) -1 * -7 4 * 1 24Q4 -1.1 (0.1) * 5 -4 3 -1 1 35
2003 Q1 -0.8 (1.0) 1 5 -5 1 -8 * 18Q2 -7.7 (-7.5) * -1 -17 -5 -29 -8 -61
Notes : (a) Retail sales and consumer spending by major component include both local consumer and visitorspending, which are not separable from the survey data.
(b) This is a broad estimate of spending by non-residents in the domestic market, as a deduction itemwithin private consumption expenditure amongst the expenditure components of GDP.
( ) Figures in brackets represent the seasonally adjusted quarter-to-quarter % changes in real terms.
(*) Change of less than 0.5%.
Domestic demand (year-on-year rate of change in real terms)
Q1 Q2 Q3 Q4 Q1 Q2 Q3 Q4 Q1 Q2 Q3 Q4 Q1 Q2 Q3 Q4 Q1 Q2 Q3 Q4 Q1 Q21998 1999 2000 2001 2002 2003
0
10
20
-10
-20
-30
Percent
Diagram 1.4
Investment demand in terms of gross domestic fixed capital formation
Consumption demand #
Note : (#) Comprising private consumption expenditure and governmentconsumption expenditure.
/1.22 …..

14
1.22 Government consumption expenditure (GCE) reckoned on a nationalaccounts basis(5) registered a further modest increase, by 0.6% in real terms in thesecond quarter of 2003 over a year earlier, after a 1.3% rise in the first quarter.On a seasonally adjusted quarter-to-quarter comparison, GCE dipped by 0.1% inreal terms in the second quarter of 2003, after a meagre 0.1% rise in the firstquarter.
1.23 Overall investment spending, as represented by gross domestic fixedcapital formation (GDFCF), fell back by 5.3% in real terms in the second quarterof 2003 over a year earlier, following a 3.5% rise in the first quarter. Expenditureon building and construction had an enlarged decline, by 7.2% in real terms in thesecond quarter of 2003 over a year earlier, further down from a 3.5% fall in thefirst quarter. Private sector building activity continued to be held back by thesubdued property market. Concurrently, private sector civil engineering worksshrank markedly, upon near completion of the first berth of Container Terminal 9and a dearth of new projects. Public sector expenditure on building andconstruction recorded a further modest decline, as work on the KCR West Railwas near completion while work on the Ma On Shan Rail and the Tsim Sha TsuiExtension had subsided from their peaks. Meanwhile, expenditure on machinery,equipment and computer software slackened into decline, falling by 2.4% in realterms in the second quarter of 2003 over a year earlier, having risen markedly by11.9% in the first quarter. Conceivably, the dimmer business outlook in theshorter term upon the spread of SARS had curbed investment intentions.
1.24 Inventories continued to rise in the second quarter of 2003. However,the stock accumulation by and large was likely to be involuntary, as bothdomestic demand and inbound tourism faltered abruptly upon the outbreak ofSARS.
The Government account
1.25 In the first quarter of the financial year 2003/04 (April to June 2003),government revenue amounted to $30.1 billion, broadly unchanged in moneyterms from the outturn in the first quarter of the financial year 2002/03. Whilethere was a rise-back in revenue from general rates owing to dissipation of theeffect of the rates concession granted in 2002, revenue from most of the othermajor sources, including profits tax, salaries tax, stamp duties and land sales,continued to decline.
/1.26 …..

15
1.26 Government spending in the first quarter of the financial year 2003/04amounted to $59.0 billion, and was up by 4.6% in money terms over the outturnof $56.4 billion in the same quarter of the financial year 2002/03. Within thistotal, there was a 40.1% surge in capital expenditure, to $11.2 billion, more thanoffsetting a 1.2% decline in recurrent spending, to $47.8 billion.
1.27 The fiscal balance recorded a deficit of $28.9 billion in the first quarterof the financial year 2003/04, as compared to a deficit of $26.3 billion in the samequarter of the financial year 2002/03.
The property market
1.28 The sales market for residential property remained sluggish duringmost of the first half of 2003. After a relatively more active start early in the year,acquisition interest was curtailed further during the period from mid-March toearly June, amidst the severe impact from the spread of SARS in Hong Kong.Apart from dwindled demand under the poor sentiment, the ample supply of newflats in the mass market continued to pose a drag. Faced with such an austeresituation, developers either withheld sales or else staged more intensivepromotion, by offering larger price discounts and more sweeteners to prospectiveflat buyers. Then, with the impact of SARS fading away since early June, therewere signs of improvement in sentiment, lifting demand mostly in the primarymarket. Meanwhile, the luxurious end of the market turned slightly more activeduring the first half of this year, stimulated in part by the Government’s newpolicy measure announced in February to attract investment immigrants to HongKong. As to the rental market for residential property, performance likewiseremained lacklustre in overall terms, given the still subdued user demand andincreased supply of flats for lease (paragraph 3.7).
1.29 On a quarter-to-quarter comparison, flat prices fell further, on averageby 6% in the second quarter of 2003, after a 4% drop in the first quarter. For thefirst half of 2003 as a whole, flat prices went down on average by 10%. Flatrentals also declined further, on average by 5% in the second quarter of 2003,following a 3% fall in the first quarter. For the first half of 2003 as a whole, flatrentals were on average lower by 8%. Compared with the respective peak levelsin the third quarter of 1997, flat prices and rentals in the second quarter of 2003were down substantially, by an average of 65% and 48% respectively(paragraph 3.8).
/1.30 ..…

16
1.30 On commercial property, both the sales and rental markets for officespace remained weak in the first half of 2003, upon further consolidation anddownsizing in the corporate sector amidst an uncertain business outlook,especially under the impact of SARS. The market for Grade A office space,particularly that in the central business district, continued to be pulled down byabundant supply with the completion of some new projects, as well as by reduceddemand with the relocation of more companies to the secondary districts forsaving costs. The sales and rental markets for shopping space also remainedbleak in the first half of 2003, especially during the period from mid-March toearly June when both inbound tourism and local consumption were hit severelyby the spread of SARS in Hong Kong. Landlords of such premises were under awidespread plea to grant temporary rental concessions to help ease the difficultiesfacing tenant operators. On industrial property, the rental and sales marketsremained stagnant in overall terms in the first half of 2003, on the back of acontinued downtrend in local manufacturing activity (paragraphs 3.9 to 3.11).
1.31 Planned developments of all types of property in the private sector, asindicated by the total usable floor area on building plans with consent tocommence work, went up by 28% in the first half of 2003 over a year earlier.This followed a 34% increase in the second half of 2002. Analysed by main typeof property and on a year-on-year comparison, planned developments of privateresidential property soared by 90% in terms of units or by 31% in terms of totalusable floor area in the first half of 2003 from a low base a year earlier. This wasin stark contrast to the corresponding decreases of 30% and 18% in the secondhalf of 2002. On the other hand, planned developments of commercial propertyplummeted, by 64% in the first half of 2003, after a 186% surge in the second halfof 2002. There were no new planned developments of industrial property in thefirst half of 2003, such developments having risen sharply by 117% in the secondhalf of 2002 from a low base. Planned developments of property in the “others”category continued to surge, by 483% in the first half of 2003, following a 539%leap in the second half of 2002, both from a low base. Comparing the twelvemonths ending June 2003 with the preceding twelve-month period, planneddevelopments of all types of property increased by 31%. Planneddevelopments of private residential property rose by 25% in terms of units or by8% in terms of total usable floor area. Planned developments of property in the“others” category, commercial property and industrial property were also up, by498%, 33% and 13% respectively (paragraph 3.16).
/The …..

17
The labour market
1.32 The labour market, which was already slack in the first quarter of 2003,weakened visibly further in the second quarter. Total employment contractedbetween the two quarters, as the outbreak of SARS curtailed business activity anddampened labour demand. Coupled with a pick-up in labour supply, this led to adistinct further loosening in the overall manpower resource balance(paragraph 5.1).
1.33 The seasonally adjusted unemployment rate went sharply higher, to8.6% in the second quarter of 2003 (and further to 8.7% in May - July), from7.5% in the first quarter. The number of unemployed persons (not seasonallyadjusted) showed a marked increase, to 300 000 in the second quarter of 2003,from 259 800 in the first quarter. The surge in unemployment, whilst occurringalmost across-the-board, was particularly pronounced in the tourism andconsumption-related sectors. Meanwhile, there was little change in theproportion of persons unemployed for less than three months, at 54% in thesecond quarter, as well as in the median duration of unemployment, at 82 days inthe second quarter (paragraph 5.2).
1.34 The underemployment rate had an even steeper rise, to 4.3% in thesecond quarter of 2003 (though fell back slightly to 4.2% in May - July), from2.9% in the first quarter, as many employees were temporarily suspended fromwork or asked to take no-pay leave after the SARS outbreak. The number ofunderemployed persons rose from 100 700 to 151 000 between the two quarters(paragraph 5.3).
/Diagram 1.5 …..

18
Unemployment and underemployment rates
Q1 Q2 Q3 Q4 Q1 Q2 Q3 Q4 Q1 Q2 Q3 Q4 Q1 Q2 Q3 Q4 Q1 Q2 Q3 Q4 Q1 Q21998 1999 2000 2001 2002 2003
0.0
2.0
4.0
6.0
8.0
10.0Percent
Diagram 1.5
Seasonally adjusted unemployment rate
Underemployment rate
0
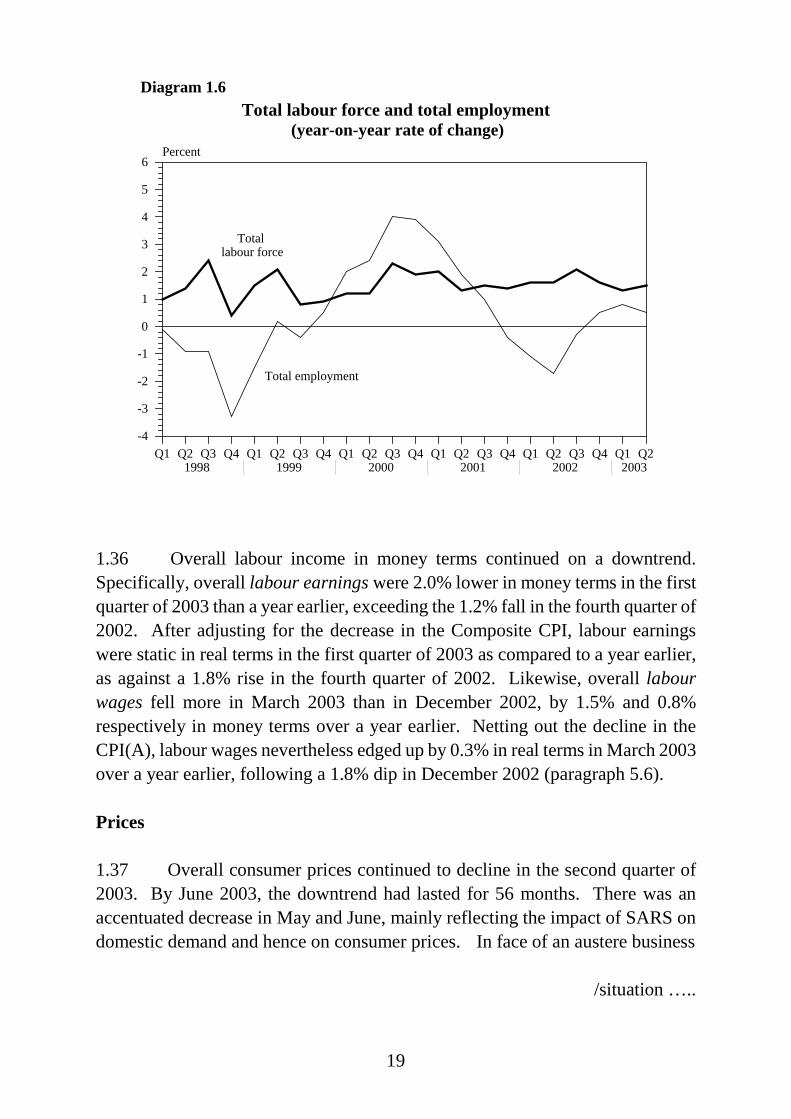
1.35 On a quarter-to-quarter comparison, total employment as enumeratedfrom households was reduced by 0.7% in the second quarter of 2003, further to a0.4% fall in the first quarter. Yet total labour force expanded by 0.5% in thesecond quarter, reversing the 0.1% drop in the first quarter. This growthdifferential aggravated the labour demand and supply imbalance, thereby leadingto a leap in unemployment rate in the more recent periods. On reduction inemployment, service workers and shop sales workers engaged in restaurants andthe retail trade were affected most. As to expansion in labour force, it wasentirely attributable to a 0.5% rise in the population of working age, with nilchange in the overall labour force participation rate. On a year-on-yearcomparison, employment growth, though still positive in the second quarter of2003, was distinctly slower than labour force growth, at 0.5% as against 1.5%. Aroughly similar picture was observed in the first quarter, yet with a smallerdifference between the two growth rates, at 0.8% as against 1.3%(paragraph 5.5).
/Diagram 1.6 …..
19
Total labour force and total employment(year-on-year rate of change)
Q1 Q2 Q3 Q4 Q1 Q2 Q3 Q4 Q1 Q2 Q3 Q4 Q1 Q2 Q3 Q4 Q1 Q2 Q3 Q4 Q1 Q21998 1999 2000 2001 2002 2003
0
1
2
3
4
5
6
-1
-2
-3
-4
Percent
Diagram 1.6
Total labour force
Total employment
1.36 Overall labour income in money terms continued on a downtrend.Specifically, overall labour earnings were 2.0% lower in money terms in the firstquarter of 2003 than a year earlier, exceeding the 1.2% fall in the fourth quarter of2002. After adjusting for the decrease in the Composite CPI, labour earningswere static in real terms in the first quarter of 2003 as compared to a year earlier,as against a 1.8% rise in the fourth quarter of 2002. Likewise, overall labourwages fell more in March 2003 than in December 2002, by 1.5% and 0.8%respectively in money terms over a year earlier. Netting out the decline in theCPI(A), labour wages nevertheless edged up by 0.3% in real terms in March 2003over a year earlier, following a 1.8% dip in December 2002 (paragraph 5.6).
Prices
1.37 Overall consumer prices continued to decline in the second quarter of2003. By June 2003, the downtrend had lasted for 56 months. There was anaccentuated decrease in May and June, mainly reflecting the impact of SARS ondomestic demand and hence on consumer prices. In face of an austere business
/situation …..

20
situation under the SARS impact, local retailers and service providers generallyoffered larger price discounts and other attractions in a move to induce sales.There was a one-off rebate of electricity charges from a power company in June.Also, new fare concessions were granted by some public transport operators.These, coupled with lower labour wages and continued softening in propertyrentals, more than offset the effect of the recent pick-up in prices of retainedimports brought about by a weaker US dollar and higher world commodity prices(paragraph 6.1).
1.38 The Composite Consumer Price Index went down by 2.5% in thesecond quarter of 2003 from a year earlier (and further by 4.0% in July), largerthan the 2.0% fall in the first quarter. Clothing and footwear, durable goods,transport, private housing and miscellaneous services were the categories withaccentuated price declines. For the first half of 2003 as a whole, the CompositeCPI fell by 2.2% over a year earlier, which was smaller than the 3.2% decrease inthe second half of 2002. Yet this was entirely due to dissipation of the downwardeffect of the special relief measures implemented by the Government in theearlier periods, including the rates concession in 2002 and the waiver of waterand sewage charges over the twelve months ending March 2003. After adjustingfor these special factors as well as for the difference in base of comparison causedby the waiver of public housing rentals in December 2001, the decline in theComposite CPI actually widened, by around 0.7 of a percentage point betweenthe two half-yearly periods (paragraph 6.2).
/Diagram 1.7 …..

21
Composite Consumer Price Index
Q1 Q2 Q3 Q4 Q1 Q2 Q3 Q4 Q1 Q2 Q3 Q4 Q1 Q2 Q3 Q4 Q1 Q2 Q3 Q4 Q1 Q21998 1999 2000 2001 2002 2003
0
2
4
6
8
-2
-4
-6
-8
Percent
Diagram 1.7
Seasonally adjusted quarter-to-quarter rate of change #
Year-on-year rate of change *
Notes : (*) From the fourth quarter of 2000 onwards, the year-on-yearchanges in the Composite CPI are computed from the new1999/2000-based series. Before then, the year-on-yearchanges are computed from the old 1994/95-based series.Splicing has been applied to the indices to maintain continuity.
(#) From the first quarter of 2000 onwards, the quarter-to-quarterchanges in the seasonally adjusted Composite CPI arecomputed from the new 1999/2000-based series. Before then,the quarter-to-quarter changes are computed from the old1994/95-based series. Splicing has been applied to the indicesto maintain continuity.
1.39 The GDP deflator, as a broad measure of overall price change in theeconomy, declined by 5.5% in the second quarter of 2003 from a year earlier,larger than the 4.6% drop in the first quarter. This was mainly due to enlargeddeclines in the terms of trade in goods and services, in the price deflator forprivate consumption expenditure, and in the price deflator for governmentconsumption expenditure. Within the GDP deflator, the domestic demanddeflator and the total final demand deflator likewise showed accentuated declines,by 4.1% and 2.8% respectively in the second quarter of 2003 from a year earlier,as compared to the corresponding decreases of 3.9% and 2.1% in the first quarter.On a seasonally adjusted quarter-to-quarter comparison, the GDP deflator wentdown further by 1.7% in the second quarter of 2003, following a 1.4% decrease inthe first quarter (paragraph 6.17).
/Diagram 1.8 …..

22
GDP deflator
Q1 Q2 Q3 Q4 Q1 Q2 Q3 Q4 Q1 Q2 Q3 Q4 Q1 Q2 Q3 Q4 Q1 Q2 Q3 Q4 Q1 Q21998 1999 2000 2001 2002 2003
0
2
4
-2
-4
-6
-8
Percent
Diagram 1.8
Year-on-year rate of change
Seasonally adjusted quarter-to-quarter
rate of change
The financial sector
1.40 The spot exchange rate of the Hong Kong dollar against the US dollarmoved within a narrow range of 7.798 to 7.800 during the first half of 2003. Thepremium of the twelve-month forward rate over the spot rate held steady for mostof the period. There was a brief upsurge to 355 pips (each pip equivalent toHK$0.0001) in late April, amidst worries about the impact of SARS on theeconomy. But as SARS was being progressively brought under control, thepremium narrowed back to 120 pips at end-June 2003, even less than 169 pips atend-2002 (paragraph 4.2).
1.41 Under the linked exchange rate system, the movements in the exchangerates of the Hong Kong dollar against other major currencies follow closely thoseof the US dollar. During the first half of 2003, the US dollar depreciated againstmost of the other major currencies. This was triggered by uncertaintiessurrounding the US-led war on Iraq and concern over the pace of recovery in theUS economy. In particular, the dollar - euro rate surged by 14.2%, from amonthly average of 1.022 in December 2002 to that of 1.167 in June 2003. Also,the dollar - pound sterling rate rose by 4.5% from a monthly average of 1.589 in
/December …..

23
December 2002 to that of 1.661 in June 2003, and the yen - dollar rate fell by2.8% from a monthly average of 121.8 in December 2002 to that of 118.3 in June2003. Likewise, the US dollar eased against many of the East Asian currencies.Taking these currency movements together, the trade-weighted NominalEffective Exchange Rate Index of the Hong Kong dollar declined by 2.0%, from amonthly average of 102.7 in December 2002 to that of 100.6 in June 2003. Afteradjusting for changes in the respective consumer price indices, thetrade-weighted Real Effective Exchange Rate Index of the Hong Kong dollar hada larger decrease, by 3.5% from 93.3 to 90.0 over the same period (paragraphs 4.3and 4.4).
1.42 Affected by movements in the Hong Kong dollar forward rate premiumover the spot rate, local inter-bank interest rates moved up briefly in April, andthen fell back in the ensuing two months. At end-June 2003, the three-monthHIBOR closed at 1.0%, down from 1.4% at end-2002. Over the same period, thespread of the three-month HIBOR over the corresponding Euro-dollar depositrate reversed from a premium of 9 basis points to a discount of 6 basis points.Following the movement in the US Fed Funds target rate, the Base Rate under theDiscount Window operated by the Hong Kong Monetary Authority was reducedby 25 basis points to 2.5% in late June 2003. Yet the best lending rate andsavings deposit rate offered by the major commercial banks were kept at 5.00%and 0.03% respectively throughout the first half of 2003. Meanwhile, the spreadof the best lending rate over the three-month time deposit rate widened modestly,from an average of 4.78 percentage points in the second half of 2002 to that of4.91 percentage points in the first half of 2003 (paragraphs 4.5 and 4.6).
1.43 Hong Kong dollar deposits rose by 2.1% during the second quarter of2003, following a 1.2% drop during the first quarter. Hong Kong dollar loanswere reduced by 0.8% during the second quarter, after a 0.4% decline during thefirst quarter. As Hong Kong dollar loans declined further while Hong Kongdollar deposits resumed increase during the first half of 2003, the Hong Kongdollar loan-to-deposit ratio went down appreciably, from 88.5% at end-2002 to86.7% at end-June 2003 (paragraphs 4.8, 4.15 and 4.16).
1.44 The local stock market staged a distinct rebound during the secondquarter of 2003. After falling to a 4½-year low of 8 409 on 25 April, the HangSeng Index showed a significant upturn in the ensuing two months. This wasaided by rallies in the major stock markets overseas upon the end of the US-led
/war …..
24
war on Iraq. Also, market sentiment was buoyed by SARS being progressivelybrought under control in Hong Kong, leading to withdrawal by WHO of its traveladvisory against non-essential travel to Hong Kong on 23 May. The Hang SengIndex surged to a six-month high of 10 030 on 17 June. Removal of Hong Kongfrom the list of SARS-affected areas by WHO on 23 June, coupled withexpectation for signing of the Closer Economic Partnership Arrangement(CEPA) by the end of June, rendered additional support to share prices. Yettowards the end of the month, profit taking amidst renewed concern about the USeconomic outlook reduced some of the earlier price gains. The Hang Seng Indexstood at 9 577 at end-June 2003, 10.9% above the level at end-March and 2.7%above the level at end-2002. (The Hang Seng Index rose progressively further, toa high of 10 761 on 22 August.) Trading turned more active, with the averagedaily turnover rising to $8.1 billion in the second quarter of 2003, from$6.1 billion in the first quarter. For the first half of 2003 as a whole, the averagedaily turnover at $7.1 billion was 22% higher than in the second half of 2002(paragraphs 4.30 and 4.31).
Notes :
(1) On 23 April 2003, the Government announced a package of relief measures amountingto $11.8 billion, in order to help the community tide over the difficulties brought aboutby the outbreak of SARS and to revive the economy after SARS. The measures includerates concession, waiver of water and sewage charges, waiver of licence fees, salariestax rebate, rent reduction at public sector commercial premises, job creation schemes, abank loan guarantee plan for the hard-hit industries, etc.
On 15 June 2003, the Government put out an enhanced package of employment andtraining initiatives, in a move to alleviate further the impact of SARS on the labourmarket. This package costs $715 million, and will create over 32 000 additionalshort-term jobs and training places. Of these, 19 050 are short-term jobs and 13 000 aretraining places. Most of the short-term jobs will last for six months. These new jobs willhelp to enhance environmental hygiene; promote culture, arts, recreation and sportsactivities as well as community and personal hygiene; and foster community buildingand improve the ecological environment.
/(2) …..

25
(2) The Gross Domestic Product (GDP) is an overall measure of net output produced withinan economy in a specified period, such as a calendar year or a quarter, before deductingthe consumption of fixed capital. In accordance with the expenditure approach to itsestimation, GDP is the sum of private consumption expenditure, governmentconsumption expenditure, gross domestic fixed capital formation, changes ininventories, and exports less imports of goods and services.
(3) The seasonally adjusted quarter-to-quarter GDP series, by removing the variations thatoccur at about the same time and in about the same magnitude each year, providesanother perspective for discerning the trend, particularly in regard to turning points. Adetailed examination reveals the presence of seasonality in the overall GDP and in someof its main components, including private consumption expenditure, governmentconsumption expenditure, exports of goods, imports of goods, exports of services, andimports of services. However, due to the presence of considerable short-termfluctuations, no clear seasonal pattern is found in gross domestic fixed capital formation.Therefore, the seasonally adjusted series of GDP is compiled separately at the overalllevel, rather than summing up from its main components.
(4) The Gross National Product (GNP) is obtained by adding net external factor incomeflow, being the income inflow minus the corresponding income outflow, to GDP.External factor income inflow refers to income earned by residents from abroad, whileexternal factor income outflow refers to income earned by non-residents from within thedomestic territory. Hence GNP is an overall measure of income earned by the residentsof an economy in a specified period, both domestically and from elsewhere. Itdistinguishes from GDP in that GDP is an overall measure of income earned by bothresidents and non-residents, from within the domestic territory in a specified period.Factor income comprises direct investment income, portfolio investment income, otherinvestment income, and compensation of employees.
(5) Government consumption expenditure reckoned on a national accounts basis covers therecurrent expenditure on goods and services incurred by government departments. Italso covers the recurrent expenditure of quasi-government non-profit bodies, such as theHong Kong Trade Development Council, Hong Kong Productivity Council, Hong KongTourism Board, Consumer Council and Hospital Authority. On the other hand, it doesnot include the expenditure of those government departments and statutory entitiesengaged in the production of goods and services principally for sale to the public, suchas the Housing Department, Post Office and Water Supplies Department, and such as theMass Transit Railway Corporation Limited, Kowloon-Canton Railway Corporation andAirport Authority Hong Kong. Government subventions to the various organisationsproviding community and welfare services are also excluded, because such expenditureis in the nature of transfer payments and not direct consumption of economic resources.

26
CHAPTER 2 : THE EXTERNAL SECTOR
Major external influences
2.1 The swift end to the war on Iraq in April 2003 removed a major geo-political uncertainty in the global economy, which should help steer a bettercourse of recovery in the remainder of the year after a largely subduedperformance in the first quarter. Yet notwithstanding a generally improvedsentiment, there were few signs that the global economy had gathered pace inthe second quarter. In particular, the slack in the US and EU economiescontinued to cause concern. In East Asia, the outbreak of SARS dealt a severeblow to some of the economies in the second quarter. Although more recentlySARS had been contained, any of its impact on the earlier export orders, andhenceforth on the ensuing export performance in the region, might yet be fullyrevealed.
2.2 In the US economy, both consumer and business sentiment improvedconsiderably after the war on Iraq ended. Consumer spending held firm andremained the key driver of growth for the economy. Yet industrial outputstayed subdued. The primary focus was on the worsened labour market, withthe unemployment rate having risen to successive new highs before edgingdown only lately. As to the EU economy, activity on the whole stayed sluggish.While domestic conditions remained bleak amidst an also worsened labourmarket, exports continued to be curbed by a relatively strong euro.
2.3 In East Asia, Japan’s domestic economy remained flat. Despite someimprovement in consumer confidence, retail sales were still in the doldrums.But both industrial output and exports still held up rather well, thereby liftingits overall performance. The Mainland economy slowed distinctly in growth inthe second quarter, as consumer demand faltered upon the outbreak of SARS.But the external sector was still buoyant and there was a continuous influx offoreign direct investment. For the other economies in the region hit by SARS,their domestic demand was likewise sharply down. Their export performancein the second quarter was also weaker than in the first quarter, due in large partto slow-down in export orders from the United States.
/Table 2.1 .....

27
Table 2.1Gross Domestic Product of selected major economies
(year-on-year rate of change in real terms (%))
UnitedStates
EuropeanUnion
Mainlandof China Japan Taiwan Singapore
Republicof Korea
2002 Annual 2.4 1.0 8.0 0.2 3.6 2.2 6.3
H1 1.8 0.8 7.8 -1.7 2.3 1.1 6.4H2 3.1 1.3 8.2 2.0 4.9 3.4 6.3
Q1 1.4 (1.2) 0.6 (0.4) 7.6 -3.1 (0.1) 0.9 -1.5 (1.7) 6.2 (2.5)Q2 2.2 (0.3) 1.0 (0.5) 8.0 -0.3 (1.3) 3.7 3.8 (2.9) 6.6 (1.3)Q3 3.3 (1.0) 1.2 (0.4) 8.1 1.7 (0.7) 5.2 3.8 (-1.7) 5.8 (1.0)Q4 2.9 (0.3) 1.4 (0.1) 8.3 2.3 (0.5) 4.5 3.0 (0.1) 6.8 (2.0)
2003 H1 2.2 0.8 8.2 2.5 1.7 -1.3 2.7
Q1 2.0 (0.4) 1.1 (0.1) 9.9 2.9 (0.3) 3.5 1.7 (0.4) 3.7 (-0.4)Q2 2.3 (0.6) 0.6 (*) 6.7 2.1 (0.6) -0.1 -4.2 (-3.0) 1.9 (-0.7)
Notes : Figures in brackets are the seasonally adjusted quarter-to-quarter rates of change.For the mainland of China and Taiwan, seasonally adjusted series are not available.
(*) Change of less than 0.05%.
Table 2.2Total exports of goods of selected major economies
(year-on-year rate of change in local currency terms (%))
UnitedStates
EuropeanUnion
Mainlandof China* Japan Taiwan Singapore#
Republicof Korea*
2002 Annual -5.1 1.2 22.4 6.4 8.9 1.9 8.0
H1 -11.0 0.5 14.1 1.3 4.6 -7.9 -3.3H2 1.5 1.9 29.6 11.8 13.3 12.8 20.3
Q1 -15.1 -2.1 10.0 -3.0 -1.0 -15.0 -11.1Q2 -6.7 2.9 17.8 5.7 10.1 -0.4 4.9Q3 1.0 3.2 28.7 7.4 16.0 16.1 15.9Q4 1.9 0.7 30.5 16.2 10.9 9.7 24.6
2003 H1 3.0 -4.1 34.0 3.9 7.0 15.1 17.6
Q1 4.5 -2.2 33.6 5.1 10.3 20.6 20.8Q2 1.5 -5.8 34.3 2.8 4.0 10.1 14.7
Notes : (#) Non-oil domestic exports.
(*) Data on exports in the mainland of China and the Republic of Korea are in USdollar terms.
/Table 2.3 .....

28
Table 2.3Imports of goods of selected major economies
(year-on-year rate of change in local currency terms (%))
UnitedStates
EuropeanUnion
Mainlandof China* Japan Taiwan Singapore
Republicof Korea*
2002 Annual 1.6 -4.1 21.2 -0.4 7.6 0.4 7.8
H1 -6.2 -6.8 10.4 -6.3 -1.0 -4.8 -2.2H2 10.0 -1.1 31.1 5.8 16.7 5.8 18.5
Q1 -12.7 -9.1 5.1 -8.2 -8.9 -12.2 -11.4Q2 0.5 -4.5 15.0 -4.4 6.8 3.0 7.8Q3 7.7 -2.7 29.2 2.1 20.0 5.3 13.8Q4 12.3 0.3 33.0 9.4 13.5 6.3 23.1
2003 H1 10.2 -0.4 44.5 7.2 11.5 4.5 21.0
Q1 14.4 2.7 52.3 8.2 18.7 9.5 30.9Q2 6.6 -3.3 38.3 6.3 5.4 -0.1 12.1
Note : (*) Data on imports in the mainland of China and the Republic of Korea are in USdollar terms.
Hong Kong's total exports of goods
(year-on-year rate of change)
Hong Kong's total exports of goods
and total import demand in Hong Kong's major markets
Q1 Q2 Q3 Q4 Q1 Q2 Q3 Q4 Q1 Q2 Q3 Q4 Q1 Q2 Q3 Q4 Q1 Q2 Q3 Q4 Q1 Q21998 1999 2000 2001 2002 2003
0
5
10
15
20
25
30
35
-5
-10
Percent
Total import demand in Hong Kong's major markets
Diagram 2.1
2003
Note : Total exports of goods as depicted refer to the year-on-year rate ofchange in real terms, while total import demand in Hong Kong’smajor markets as depicted refers to the year-on-year rate of changein US dollar terms in the aggregate import demand in East Asia,the United States and the European Union taken together.
/2.4 .....
29
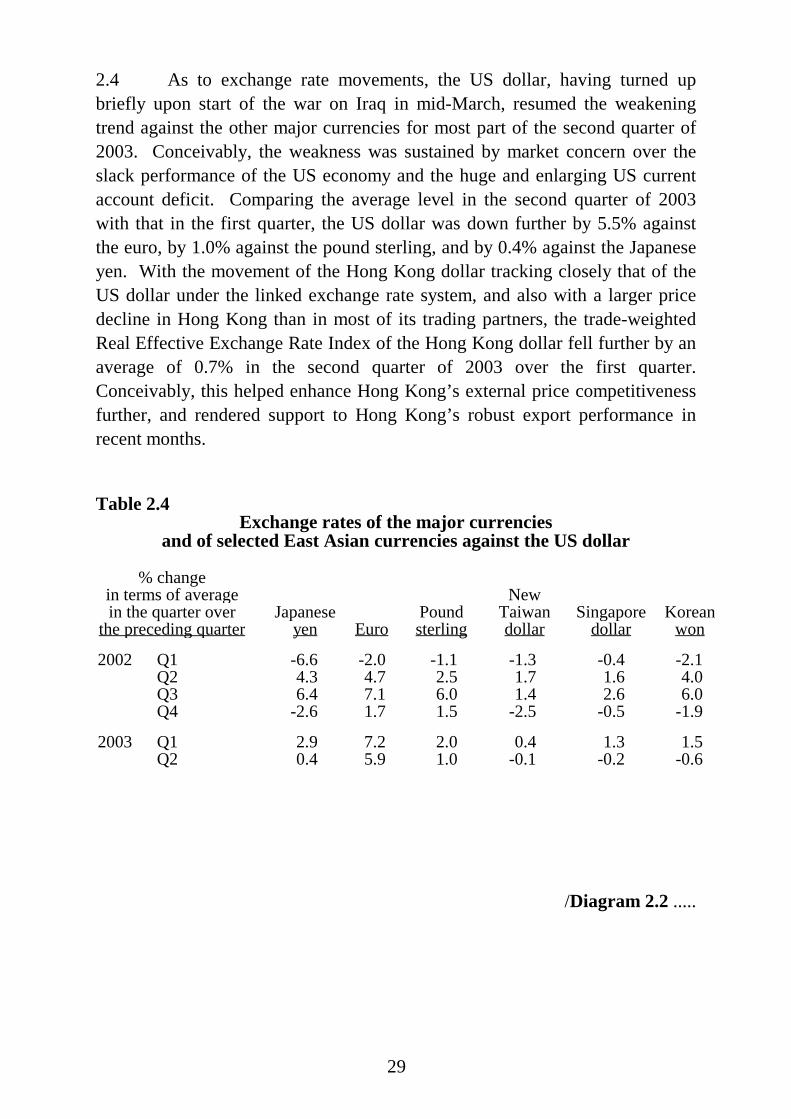
2.4 As to exchange rate movements, the US dollar, having turned upbriefly upon start of the war on Iraq in mid-March, resumed the weakeningtrend against the other major currencies for most part of the second quarter of2003. Conceivably, the weakness was sustained by market concern over theslack performance of the US economy and the huge and enlarging US currentaccount deficit. Comparing the average level in the second quarter of 2003with that in the first quarter, the US dollar was down further by 5.5% againstthe euro, by 1.0% against the pound sterling, and by 0.4% against the Japaneseyen. With the movement of the Hong Kong dollar tracking closely that of theUS dollar under the linked exchange rate system, and also with a larger pricedecline in Hong Kong than in most of its trading partners, the trade-weightedReal Effective Exchange Rate Index of the Hong Kong dollar fell further by anaverage of 0.7% in the second quarter of 2003 over the first quarter.Conceivably, this helped enhance Hong Kong’s external price competitivenessfurther, and rendered support to Hong Kong’s robust export performance inrecent months.
Table 2.4Exchange rates of the major currencies
and of selected East Asian currencies against the US dollar
% changein terms of averagein the quarter over
the preceding quarterJapanese
yen EuroPoundsterling
NewTaiwandollar
Singaporedollar
Koreanwon
2002 Q1 -6.6 -2.0 -1.1 -1.3 -0.4 -2.1Q2 4.3 4.7 2.5 1.7 1.6 4.0Q3 6.4 7.1 6.0 1.4 2.6 6.0Q4 -2.6 1.7 1.5 -2.5 -0.5 -1.9
2003 Q1 2.9 7.2 2.0 0.4 1.3 1.5Q2 0.4 5.9 1.0 -0.1 -0.2 -0.6
/Diagram 2.2 .....
30
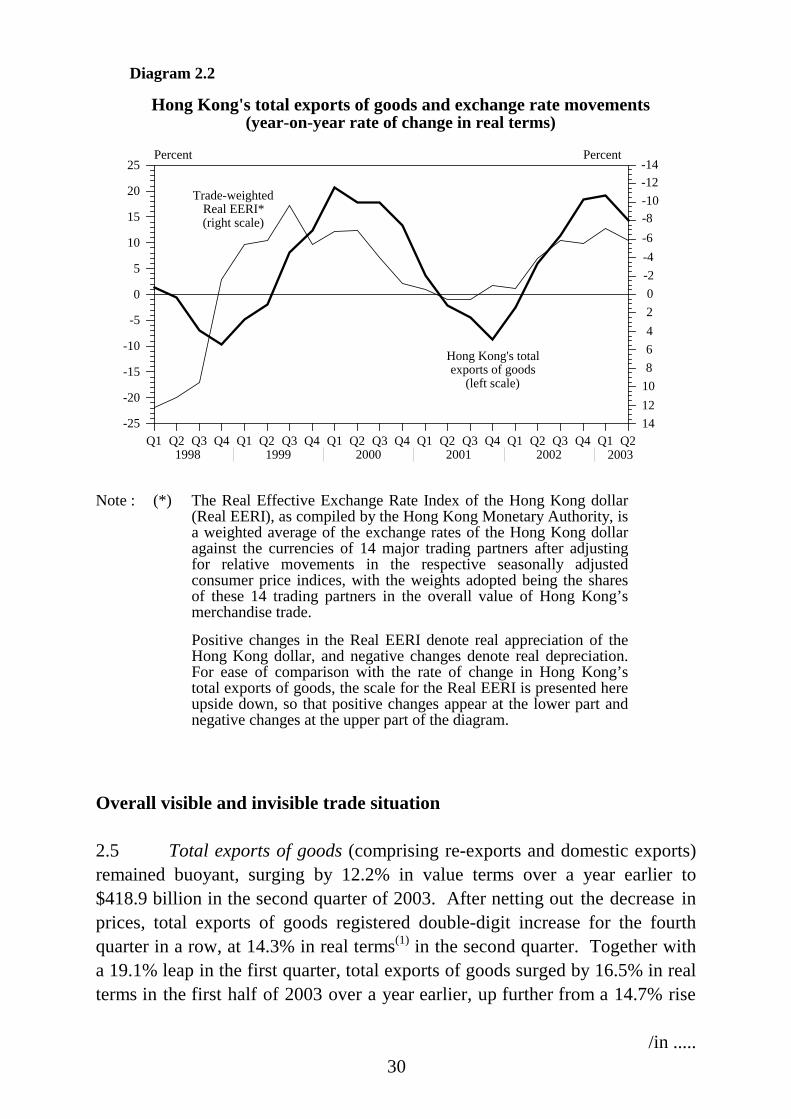
Hong Kong's total exports of goods and exchange rate movements(year-on-year rate of change in real terms)
Diagram 2.2
Hong Kong's total exports of goods
(left scale)
Q1 Q2 Q3 Q4 Q1 Q2 Q3 Q4 Q1 Q2 Q3 Q4 Q1 Q2 Q3 Q4 Q1 Q2 Q3 Q4 Q1 Q21998 1999 2000 2001 2002 2003
0
5
10
15
20
25
-5
-10
-15
-20
-25
Percent
02468101214
-2-4-6-8-10-12-14
Percent
Trade-weighted Real EERI*(right scale)
-12-10-8-6-4-202468
1012
-14
14
2003
Note : (*) The Real Effective Exchange Rate Index of the Hong Kong dollar(Real EERI), as compiled by the Hong Kong Monetary Authority, isa weighted average of the exchange rates of the Hong Kong dollaragainst the currencies of 14 major trading partners after adjustingfor relative movements in the respective seasonally adjustedconsumer price indices, with the weights adopted being the sharesof these 14 trading partners in the overall value of Hong Kong’smerchandise trade.
Positive changes in the Real EERI denote real appreciation of theHong Kong dollar, and negative changes denote real depreciation.For ease of comparison with the rate of change in Hong Kong’stotal exports of goods, the scale for the Real EERI is presented hereupside down, so that positive changes appear at the lower part andnegative changes at the upper part of the diagram.
Overall visible and invisible trade situation
2.5 Total exports of goods (comprising re-exports and domestic exports)remained buoyant, surging by 12.2% in value terms over a year earlier to$418.9 billion in the second quarter of 2003. After netting out the decrease inprices, total exports of goods registered double-digit increase for the fourthquarter in a row, at 14.3% in real terms(1) in the second quarter. Together witha 19.1% leap in the first quarter, total exports of goods surged by 16.5% in realterms in the first half of 2003 over a year earlier, up further from a 14.7% rise
/in .....

31
in the second half of 2002. On the monthly profile, there was a slightmoderation in export growth in April, to 10.6% in real terms over a year earlier,due to the earlier cut-back in orders at a time when the tension before the waron Iraq loomed high. But exports gathered momentum again in May and June,to growth at 15.4% and 16.7% respectively in real terms. On a seasonallyadjusted quarter-to-quarter comparison, total exports of goods increased further,by 2.4% in real terms in the second quarter of 2003, after a 3.2% leap in thefirst quarter.
2.6 Within total exports of goods, re-exports(2) continued to show robustgrowth, surging by 14.4% in value terms over a year earlier to $390.3 billion inthe second quarter of 2003. After netting out the decrease in prices, there was a17.0% increase in real terms, as against a 22.3% surge in the first quarter. On ayear-on-year comparison, the growth in re-exports in real terms likewise had abrief moderation in April, to 13.3%, before picking up again in May and June,to 17.8% and 19.7% respectively. For the first half of 2003 as a whole,re-exports increased distinctly by 19.4% in real terms over a year earlier,following a 17.7% surge in the second half of 2002. On a seasonally adjustedquarter-to-quarter comparison, re-exports rose further, by 2.7% in real terms inthe second quarter of 2003, following a 4.0% increase in the first quarter.
2.7 In contrast, domestic exports plunged further, by 11.4% in value termsover a year earlier to $28.5 billion in the second quarter of 2003, under theinfluence of an on-going structural shift towards re-exports and offshore trade(3).After netting out the increase in prices, domestic exports plummeted even more,by 12.6% in real terms, following a 12.0% fall in the first quarter. Domesticexports declined throughout the three months of the second quarter, with themost significant year-on-year decrease in April, by 18.1% in real terms, andthen with lesser declines by 8.9% and 11.2% respectively in May and June. Forthe first half of 2003 as a whole, domestic exports shrank further by 12.3% inreal terms over a year earlier, enlarged from the 10.2% dip in the second half of2002. On a seasonally adjusted quarter-to-quarter comparison, domesticexports declined further, by 1.8% in real terms in the second quarter of 2003,following a 6.3% fall in the first quarter.
/Table 2.5 .....

32
Table 2.5Total exports of goods, re-exports and domestic exports
(year-on-year rate of change (%))
Total exports of goods Re-exports Domestic exports
In value In real Change In value In real Change In value In real Change terms terms in prices terms terms in prices terms terms in prices
2002 Annual 5.4 8.6 -2.7 7.7 10.9 -2.7 -14.7 -11.3 -3.3
H1 -1.6 1.8 -3.1 0.2 3.5 -2.9 -17.7 -12.5 -4.4H2 11.8 14.7 -2.4 14.6 17.7 -2.4 -11.9 -10.2 -2.2
Q1 -6.2 -2.5 -3.4 -5.0 -1.5 -3.2 -17.5 -11.2 -5.4Q2 2.8 5.9 -2.7 5.3 8.3 -2.6 -17.8 -13.7 -3.6Q3 8.5 11.4 -2.4 10.6 13.6 -2.3 -10.4 -7.6 -3.1Q4 15.5 18.3 -2.3 18.8 22.1 -2.4 -13.6 -12.9 -1.2
2003 H1 14.7 16.5 -1.1 17.2 19.4 -1.3 -11.0 -12.3 0.8
Q1 17.6 19.1 -0.9 20.3 22.3 -1.1 -10.4 -12.0 0.8Q2 12.2 14.3 -1.4 14.4 17.0 -1.6 -11.4 -12.6 0.7
Apr 9.0 10.6 -1.1 11.3 13.3 -1.3 -16.9 -18.1 0.8May 13.6 15.4 -1.2 15.6 17.8 -1.4 -7.8 -8.9 0.7Jun 14.0 16.7 -1.8 16.5 19.7 -2.0 -10.4 -11.2 0.7
Table 2.6Total exports of goods, re-exports and domestic exports
(seasonally adjusted quarter-to-quarterrate of change in real terms (%))
Total exports of goods Re-exports Domestic exports
2002 Q1 4.5 5.7 -5.6Q2 5.8 6.6 -2.0Q3 4.0 4.5 -0.7Q4 4.0 4.7 -4.3
2003 Q1 3.2 4.0 -6.3Q2 2.4 2.7 -1.8
/Diagram 2.3 .....

33
Total exports of goods, re-exports and domestic exports(a) Year-on-year rate of change in real terms
Q1 Q2 Q3 Q4 Q1 Q2 Q3 Q4 Q1 Q2 Q3 Q4 Q1 Q2 Q3 Q4 Q1 Q2 Q3 Q4 Q1 Q21998 1999 2000 2001 2002 2003
0
5
10
15
20
25
-5
-10
-15
-20
Percent
Diagram 2.3
Re-exports
Total exports of goods
Domestic exports
2003
Note : From the first quarter of 2001 onwards, the rates of change arecomputed from the new 2000-based trade index series. Beforethen, the rates of change are computed from the old 1990-basedseries. Re-scaling using conversion factors as derived from thelevels of the old and the new series in their overlapping period of2000 has been applied to the indices to maintain continuity.
(b) Seasonally adjusted quarter-to-quarterrate of change in real terms
Q1 Q2 Q3 Q4 Q1 Q2 Q3 Q4 Q1 Q2 Q3 Q4 Q1 Q2 Q3 Q4 Q1 Q2 Q3 Q4 Q1 Q21998 1999 2000 2001 2002 2003
0
2
4
6
8
10
12
-2
-4
-6
-8
-10
Percent
Re-exports
Total exports of goods
Domestic exports
2003
Note : From the second quarter of 2000 onwards, the rates of change arecomputed from the new 2000-based trade index series. Beforethen, the rates of change are computed from the old 1990-basedseries. Re-scaling using conversion factors as derived from thelevels of the old and the new series in their overlapping period of2000 has been applied to the indices to maintain continuity.
/2.8 .....

34
2.8 Imports of goods likewise rose further, by 9.6% in value terms over ayear earlier to $432.2 billion in the second quarter of 2003. After netting out amarginal decline in prices, the increase was 10.6% in real terms, after an 18.7%leap in the first quarter. Mirroring closely the trend in re-exports, imports ofgoods eased to an 8.8% growth in real terms in April over a year earlier, andthen accentuated to growth at 10.0% and 12.9% respectively in May and June.Retained imports were however slack throughout the second quarter, as importsfor local use were cut back sharply upon the spread of SARS in Hong Kongduring the period. Retained imports recorded declines in real terms at 0.1%,5.2% and 0.3% respectively in April, May and June over a year earlier, bringingthe decline for the second quarter as a whole to 1.9%, sharply down from the11.5% increase in the first quarter. For the first half of 2003 as a whole,imports of goods had significant growth at 14.3% in real terms over a yearearlier, while retained imports still rose by 4.3%. These compared with therespective increases by 14.3% and 7.5% in the second half of 2002. On aseasonally adjusted quarter-to-quarter comparison, imports of goods andretained imports both fell back distinctly, by 1.1% and 9.6% respectively in realterms in the second quarter of 2003, following increases by 3.6% and 2.9% inthe first quarter.
Table 2.7Imports of goods and retained imports
(year-on-year rate of change (%))Imports of goods Retained imports(a)
In value In real Change In value In real Change terms terms in prices terms terms in prices
2002 Annual 3.3 7.8 -3.9 -9.0 1.8 -9.7H1 -4.2 0.9 -4.8 -15.6 -3.9 -11.7H2 10.5 14.3 -3.0 -2.1 7.5 -7.6Q1 -9.1 -4.1 -4.9 -19.7 -8.9 -11.6Q2 0.4 5.7 -4.6 -11.7 0.8 -11.7Q3 6.5 10.8 -3.6 -6.0 5.2 -9.6Q4 14.9 18.1 -2.3 2.2 10.0 -5.5
2003 H1 13.4 14.3 -0.2 4.7 4.3 2.4Q1 17.8 18.7 -0.1 11.8 11.5 1.9Q2 9.6 10.6 -0.3 -1.5 -1.9 2.8Apr 8.4 8.8 0.1 1.5 -0.1 3.2May 9.4 10.0 -0.2 -5.1 -5.2 2.3Jun 11.5 12.9 -0.6 0.1 -0.3 2.6
Note : (a) Based on the results of the Annual Survey of Re-export Trade conducted bythe Census and Statistics Department, re-export margins by individual end-usecategory are estimated and adopted for deriving the value of imports retainedfor use in Hong Kong.
/Diagram 2.4 .....

35
Imports of goods and retained imports(a) Year-on-year rate of change in real terms
Q1 Q2 Q3 Q4 Q1 Q2 Q3 Q4 Q1 Q2 Q3 Q4 Q1 Q2 Q3 Q4 Q1 Q2 Q3 Q4 Q1 Q21998 1999 2000 2001 2002 2003
0
10
20
30
-10
-20
-30
Percent
Diagram 2.4
Imports of goods
Retained imports
2003
Note : See the footnote to Diagram 2.3 (a).
(b) Seasonally adjusted quarter-to-quarterrate of change in real terms
Q1 Q2 Q3 Q4 Q1 Q2 Q3 Q4 Q1 Q2 Q3 Q4 Q1 Q2 Q3 Q4 Q1 Q2 Q3 Q4 Q1 Q21998 1999 2000 2001 2002 2003
0
5
10
-5
-10
-15
Percent
Imports of goods
Retained imports
2003
Note : See the footnote to Diagram 2.3 (b).
/Table 2.8 .....

36
Table 2.8Imports of goods and retained imports(seasonally adjusted quarter-to-quarter
rate of change in real terms (%))
Imports of goods Retained imports(a)
2002 Q1 4.5 2.3Q2 5.8 4.2Q3 4.8 5.4Q4 2.9 -1.0
2003 Q1 3.6 2.9Q2 -1.1 -9.6
Note : (a) See Note (a) to Table 2.7.
2.9 With a faster growth in total exports of goods than in imports ofgoods in value, the visible trade deficit reckoned on a GDP basis(4) narrowed to$9.8 billion or 2.3% of the value of imports of goods in the second quarter of2003, from $16.4 billion or 4.2% in the same quarter in 2002. In the first halfof 2003, the visible trade deficit also narrowed, to $25.8 billion or 3.1% of thevalue of imports of goods, from $28.8 billion or 4.0% in the same period in2002.
Q1 Q2 Q3 Q4 Q1 Q2 Q3 Q4 Q1 Q2 Q3 Q4 Q1 Q2 Q3 Q4 Q1 Q2 Q3 Q4 Q1 Q21998 1999 2000 2001 2002 2003
0
50
100
150
200
250
300
350
400
450
500
550
-50
-100
HK$ Billion
Total exports of goods Imports of goods Visible trade balance
Value of Hong Kong's visible trade and the visible trade balance
Diagram 2.5
2003
/2.10 .....

37
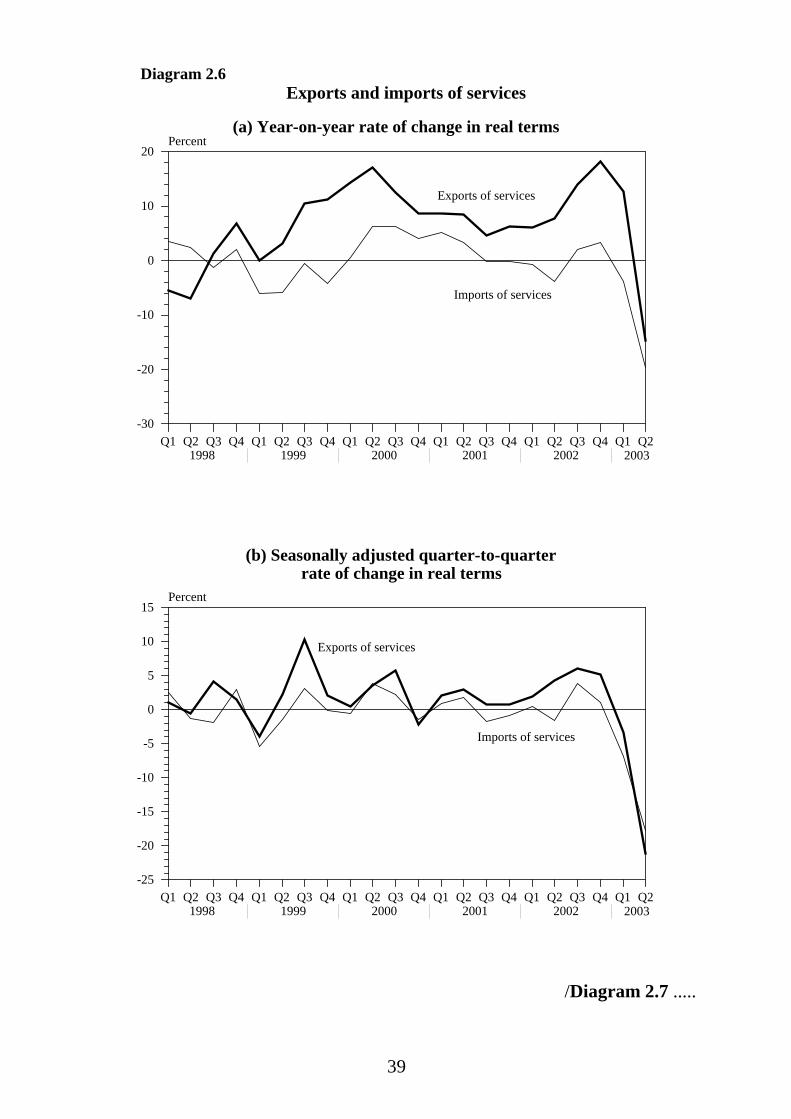
2.10 On invisible trade, exports of services plummeted by 17.6% in valueterms over a year earlier to $68.7 billion in the second quarter of 2003. Afternetting out the decline in prices, there was still a significant decrease by 14.7%in real terms, in stark contrast to a 12.6% rise in the first quarter. The abruptfall-off in exports of services was caused entirely by the shock impact of SARS,with inbound tourism and exports of transportation services both considerablydown in the second quarter. Continued robust growth in offshore traderendered only a partial offset. For the first half of 2003 as a whole, exports ofservices fell by 1.4% in real terms over a year earlier, sharply reversing the16.1% surge in the second half of 2002. On a seasonally adjustedquarter-to-quarter comparison, exports of services were markedly down by21.1% in real terms in the second quarter of 2003, having fallen by 3.4% in thefirst quarter.
2.11 Imports of services plunged even more, by 18.3% in value terms overa year earlier to $37.2 billion in the second quarter of 2003. After netting outthe increase in prices, imports of services fell by 19.6% in real terms, distinctlyenlarged from the 3.9% decrease in the first quarter. Outbound travel andrelated spending, which accounted for over half of imports of services, hadbeen severely deterred by the SARS situation elsewhere in the region and thearrival restrictions and post-arrival quarantine imposed in some of thedestinations on people travelling from Hong Kong. For the first half of 2003 asa whole, imports of services slumped by 11.5% in real terms over a year earlier,as against a 2.7% rise in the second half of 2002. On a seasonally adjustedquarter-to-quarter comparison, imports of services fell significantly, by 17.7%in real terms in the second quarter of 2003, enlarged from the 6.9% decrease inthe first quarter.
/Table 2.9 .....

38
Table 2.9Exports and imports of services
(year-on-year rate of change (%))
Exports of services Imports of services
In valueterms
In realterms
Changein prices
In valueterms
In realterms
Changein prices
2002 Annual 9.6 11.7 -1.9 0.5 0.2 0.2
H1 3.3 6.8 -3.3 -3.5 -2.2 -1.3H2 15.4 16.1 -0.6 4.5 2.7 1.7
Q1 1.4 6.0 -4.3 -3.2 -0.7 -2.4Q2 5.2 7.7 -2.4 -3.8 -3.8 *Q3 13.2 13.9 -0.6 3.5 2.0 1.4Q4 17.5 18.1 -0.5 5.5 3.4 2.0
2003 H1 -3.4 -1.4 -2.0 -9.3 -11.5 2.5
Q1 11.8 12.6 -0.7 -0.6 -3.9 3.4Q2 -17.6 -14.7 -3.4 -18.3 -19.6 1.6
Note : (*) Change of less than 0.05%.
Table 2.10Exports and imports of services
(seasonally adjusted quarter-to-quarterrate of change in real terms (%))
Exports of services Imports of services
2002 Q1 1.9 0.4Q2 4.3 -1.6Q3 6.1 3.8Q4 5.1 1.1
2003 Q1 -3.4 -6.9Q2 -21.1 -17.7
/Diagram 2.6 .....
39
(a) Year-on-year rate of change in real terms
Q1 Q2 Q3 Q4 Q1 Q2 Q3 Q4 Q1 Q2 Q3 Q4 Q1 Q2 Q3 Q4 Q1 Q2 Q3 Q4 Q1 Q21998 1999 2000 2001 2002 2003
0
10
20
-10
-20
-30
Percent
Exports of services
Imports of services
Diagram 2.6Exports and imports of services
2003
(b) Seasonally adjusted quarter-to-quarterrate of change in real terms
Q1 Q2 Q3 Q4 Q1 Q2 Q3 Q4 Q1 Q2 Q3 Q4 Q1 Q2 Q3 Q4 Q1 Q2 Q3 Q4 Q1 Q21998 1999 2000 2001 2002 2003
0
5
10
15
-5
-10
-15
-20
-25
Percent
Exports of services
Imports of services
2003
/Diagram 2.7 .....

40
Q1 Q2 Q3 Q4 Q1 Q2 Q3 Q4 Q1 Q2 Q3 Q4 Q1 Q2 Q3 Q4 Q1 Q2 Q3 Q4 Q1 Q21998 1999 2000 2001 2002 2003
0
20
40
60
80
100
120HK$ Billion
Exports of services Imports of services Invisible trade balance
Value of Hong Kong's invisible trade and Diagram 2.7
the invisible trade balance
2003
2.12 Taking exports and imports of services together, the invisible tradesurplus(5) reckoned on a GDP basis declined to $31.5 billion or 84.6% of thevalue of imports of services in the second quarter of 2003, from $37.8 billion or83.0% in the same quarter in 2002. For the first half of 2003 as a whole, theinvisible trade surplus still enlarged, to $72.1 billion or 85.9% of the value ofimports of services, from $69.0 billion or 74.5% in the same period in 2002.
2.13 With the reduction in the invisible trade surplus offset by thereduction in the visible trade deficit, the combined surplus reckoned on a GDPbasis was broadly unchanged in the second quarter of 2003, at $21.7 billion or4.6% of the total value of imports of goods and services, as against$21.4 billion or 4.9% in the same quarter in 2002. For the first half of 2003 asa whole, the combined surplus rose to $46.3 billion or 5.1% of the total value ofimports of goods and services, from $40.1 billion or 4.9% in the same period in2002.
/Diagram 2.8 .....

41
Visible and invisible trade balance
Q1 Q2 Q3 Q4 Q1 Q2 Q3 Q4 Q1 Q2 Q3 Q4 Q1 Q2 Q3 Q4 Q1 Q2 Q3 Q4 Q1 Q21998 1999 2000 2001 2002 2003
0
10
20
30
40
50
60
-10
-20
-30
-40
HK$ Billion Visible trade balance Invisible trade balance Combined visible and invisible trade balance
Diagram 2.8
2003
Note : See the first footnote to Table 2.11.
Table 2.11Visible and invisible trade balance($ billion at current market prices)
Total exports Imports Trade balance
Goods Services Goods Services Goods Services Combined
2002 Annual 1,562.1 357.1 1,601.5 193.4 -39.4 163.7 124.3
H1 699.8 161.6 728.6 92.6 -28.8 69.0 40.1 H2 862.3 195.6 872.9 100.8 -10.6 94.8 84.2
Q1 326.1 78.2 338.5 47.1 -12.4 31.2 18.7 Q2 373.7 83.3 390.1 45.5 -16.4 37.8 21.4 Q3 435.5 94.8 440.5 52.1 -5.0 42.7 37.7 Q4 426.8 100.8 432.4 48.7 -5.6 52.1 46.5
2003 H1 802.8 156.1 828.6 84.0 -25.8 72.1 46.3
Q1 383.4 87.4 399.4 46.8 -16.0 40.7 24.7 Q2 419.3 68.7 429.1 37.2 -9.8 31.5 21.7
Notes : Figures in this table are reckoned on a GDP basis. Specifically, imports of goodsare valued on f.o.b. basis, instead of on c.i.f. basis as is still the on-going practice forthe merchandise trade statistics.
Figures may not add up exactly to the total due to rounding./Visible .....

42
Visible trade
Total exports of goods
2.14 Reflecting the intimate trade relations between Hong Kong and theregion, East Asia(6) continued to account for the largest share in Hong Kong’stotal exports of goods, at 58% by value in the first half of 2003. This wasfollowed by North America(7) (with a share of 19%), and the European Union(8)
(13%).
2.15 The region remained the key driver of Hong Kong’s export growth inthe first half of 2003. Total exports of goods to East Asia as a whole surged by20.9% in real terms in the second quarter of 2003 over a year earlier. Togetherwith a 23.6% rise in the first quarter, total exports of goods to the region leapedby 22.2% in real terms for the first half of 2003 as a whole over a year earlier.This was further up from the already robust growth of 19.2% in the second halfof 2002. In the second quarter, exports to Japan, the Republic of Korea andSingapore picked up further to distinct growth, while exports to the Mainland,Taiwan and Indonesia continued to grow strongly, albeit relatively not so fastas in the first quarter. By contrast, exports to Thailand and Malaysia moderatedconsiderably in growth.
2.16 Total exports of goods to North America however slackened markedly,to a 3.3% decline in real terms in the second quarter of 2003 over a year earlier,from a 9.1% rise in the first quarter. Apparently, the earlier war tension had ledto some cut-back in export orders particularly from the United States. For thefirst half of 2003 as a whole, total exports of goods to this area eased distinctlyto a 2.2% increase in real terms over a year earlier, from a robust growth of10.8% in the second half of 2002.
2.17 Yet total exports of goods to the European Union continued to soar,by 19.4% in real terms in the second quarter of 2003 over a year earlier.Together with a 17.8% surge in the first quarter, there was a strong rise of18.6% for the first half of 2003 as a whole, representing a further significantpick-up from the 6.6% rise in the second half of 2002. This could have much todo with the relative strength of the euro, which enhanced considerably the priceattractiveness of Hong Kong’s exports in the EU market.
/Table 2.12 .....

43
Table 2.12Total exports of goods by major region
(year-on-year rate of change in real terms (%))
East Asia(a)(d)North
America(b) European
Union(c)
2002 Annual 13.4 3.9 -0.4H1 7.1 -4.1 -8.1H2 19.2 10.8 6.6Q1 4.8 -12.4 -12.1Q2 9.3 3.5 -3.9Q3 14.7 9.5 3.6Q4 23.9 12.3 9.7
2003 H1 22.2 2.2 18.6Q1 23.6 9.1 17.8Q2 20.9 -3.3 19.4
Notes : (a) For the coverage of East Asia, see Note (6).
(b) For the coverage of North America, see Note (7).
(c) For the coverage of the European Union, see Note (8).
(d) For those constituent markets where separate quantum indices are notcompiled, their levels of total exports of goods in real terms are estimated froman aggregate implicit price deflator covering all those export markets in theAsia-Pacific region for which separate unit value indices are not available.
Diagram 2.9Total exports of goods by major region in the first half of 2003
Total exports of goods in the first half of 2003 : $802.0 billion
East Asia$467.3 billion (58%)
North America$154.3 billion (19%)
European Union$106.4 billion (13%)
Others$74.0 billion (9%)
/2.18 .....
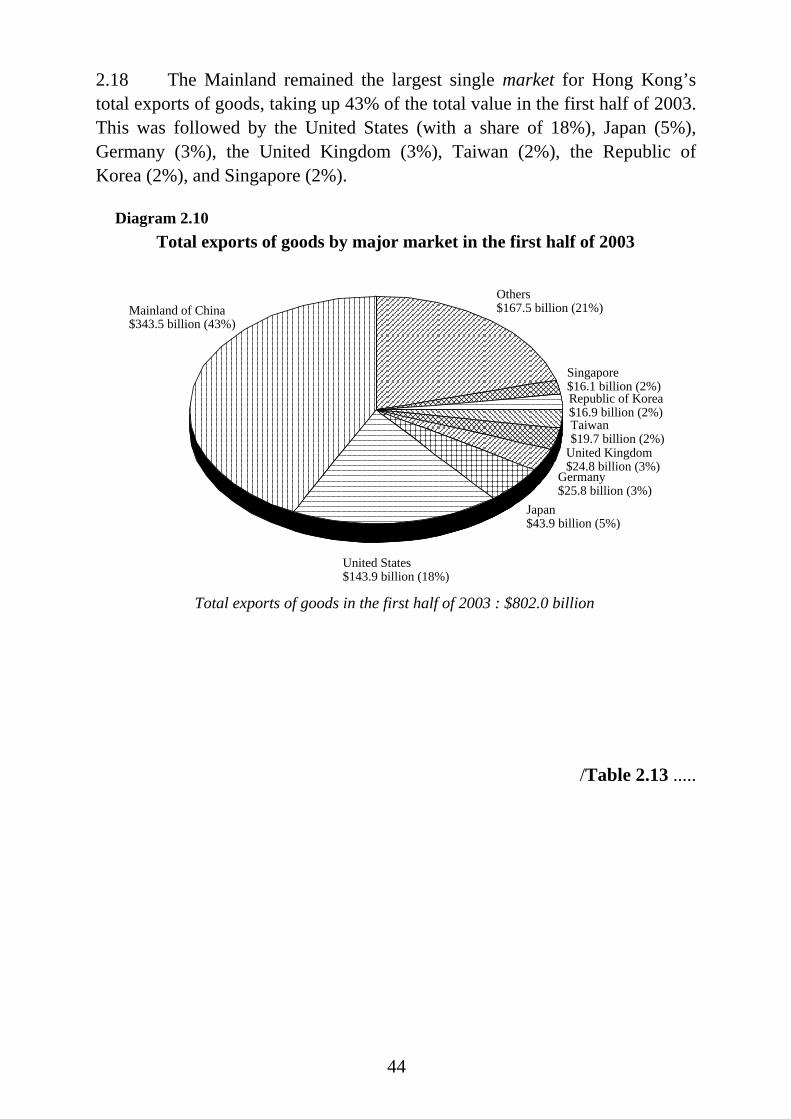
44
2.18 The Mainland remained the largest single market for Hong Kong’stotal exports of goods, taking up 43% of the total value in the first half of 2003.This was followed by the United States (with a share of 18%), Japan (5%),Germany (3%), the United Kingdom (3%), Taiwan (2%), the Republic ofKorea (2%), and Singapore (2%).
Diagram 2.10Total exports of goods by major market in the first half of 2003
Total exports of goods in the first half of 2003 : $802.0 billion
Mainland of China$343.5 billion (43%)
United States$143.9 billion (18%)
Japan$43.9 billion (5%)
Germany$25.8 billion (3%)
United Kingdom$24.8 billion (3%)
Others$167.5 billion (21%)
Taiwan$19.7 billion (2%)
Singapore$16.1 billion (2%)Republic of Korea$16.9 billion (2%)
/Table 2.13 .....
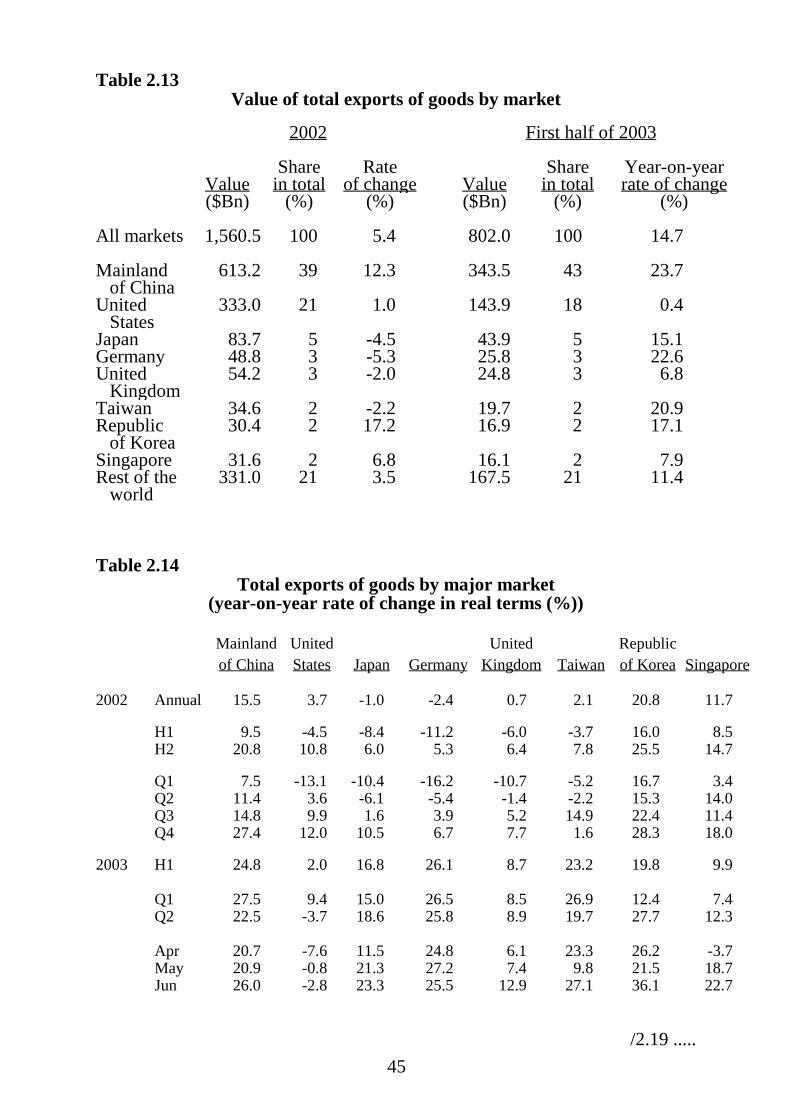
45
Table 2.13Value of total exports of goods by market
2002 First half of 2003
Value($Bn)
Sharein total
(%)
Rateof change
(%)Value($Bn)
Sharein total
(%)
Year-on-yearrate of change
(%)
All markets 1,560.5 100 5.4 802.0 100 14.7
Mainland of China
613.2 39 12.3 343.5 43 23.7
United States
333.0 21 1.0 143.9 18 0.4
Japan 83.7 5 -4.5 43.9 5 15.1Germany 48.8 3 -5.3 25.8 3 22.6United Kingdom
54.2 3 -2.0 24.8 3 6.8
Taiwan 34.6 2 -2.2 19.7 2 20.9Republic of Korea
30.4 2 17.2 16.9 2 17.1
Singapore 31.6 2 6.8 16.1 2 7.9Rest of the world
331.0 21 3.5 167.5 21 11.4
Table 2.14Total exports of goods by major market
(year-on-year rate of change in real terms (%))
Mainlandof China
UnitedStates Japan Germany
UnitedKingdom Taiwan
Republicof Korea Singapore
2002 Annual 15.5 3.7 -1.0 -2.4 0.7 2.1 20.8 11.7
H1 9.5 -4.5 -8.4 -11.2 -6.0 -3.7 16.0 8.5H2 20.8 10.8 6.0 5.3 6.4 7.8 25.5 14.7
Q1 7.5 -13.1 -10.4 -16.2 -10.7 -5.2 16.7 3.4Q2 11.4 3.6 -6.1 -5.4 -1.4 -2.2 15.3 14.0Q3 14.8 9.9 1.6 3.9 5.2 14.9 22.4 11.4Q4 27.4 12.0 10.5 6.7 7.7 1.6 28.3 18.0
2003 H1 24.8 2.0 16.8 26.1 8.7 23.2 19.8 9.9
Q1 27.5 9.4 15.0 26.5 8.5 26.9 12.4 7.4Q2 22.5 -3.7 18.6 25.8 8.9 19.7 27.7 12.3
Apr 20.7 -7.6 11.5 24.8 6.1 23.3 26.2 -3.7May 20.9 -0.8 21.3 27.2 7.4 9.8 21.5 18.7Jun 26.0 -2.8 23.3 25.5 12.9 27.1 36.1 22.7
/2.19 .....

46
2.19 Total exports of goods to the Mainland continued to register vibrantgrowth, with a 22.5% surge in real terms in the second quarter of 2003 over ayear earlier, following a 27.5% growth in the first quarter. For the first half of2003 as a whole, total exports to the Mainland picked up further to aconsiderable growth of 24.8% in real terms over a year earlier, furtheraccentuated from an already strong growth of 20.8% in the second half of 2002.Growth in real terms in exports to this market remained at over 20% throughoutthe second quarter, as the Mainland’s highly robust performance of its ownexports should have continued to boost the intake of materials for exportprocessing as well as intake of machinery for production use. Intake of goodsfor meeting its own demand should have also held up.
Q1 Q3 Q1 Q3 Q1 Q3 Q1 Q3 Q1 Q3 Q11998 1999 2000 2001 2002 2003
05
1015202530354045505560
-5-10-15
Percent
Total exports of goods to themainland of China and the
(year-on-year rate of change)
Total exports of goods to the
Mainland
The Mainland's import demand
Q1 Q3 Q1 Q3 Q1 Q3 Q1 Q3 Q1 Q3 Q11998 1999 2000 2001 2002 2003
05101520253035404550
-5-10-15
Percent
goods and its importsThe Mainland's exports of
(year-on-year rate of change)
The Mainland's imports for
processing trade
The Mainland's exports of goods
Diagram 2.11
for processing tradeMainland's import demand
2003 2003
Note : Total exports of goods to thismarket as depicted refer tothe year-on-year rate ofchange in real terms, whileimport demand in this marketrefers to the year-on-year rateof change in US dollar terms.
Note : Both refer to theyear-on-year rate of changein US dollar terms.
/2.20 .....
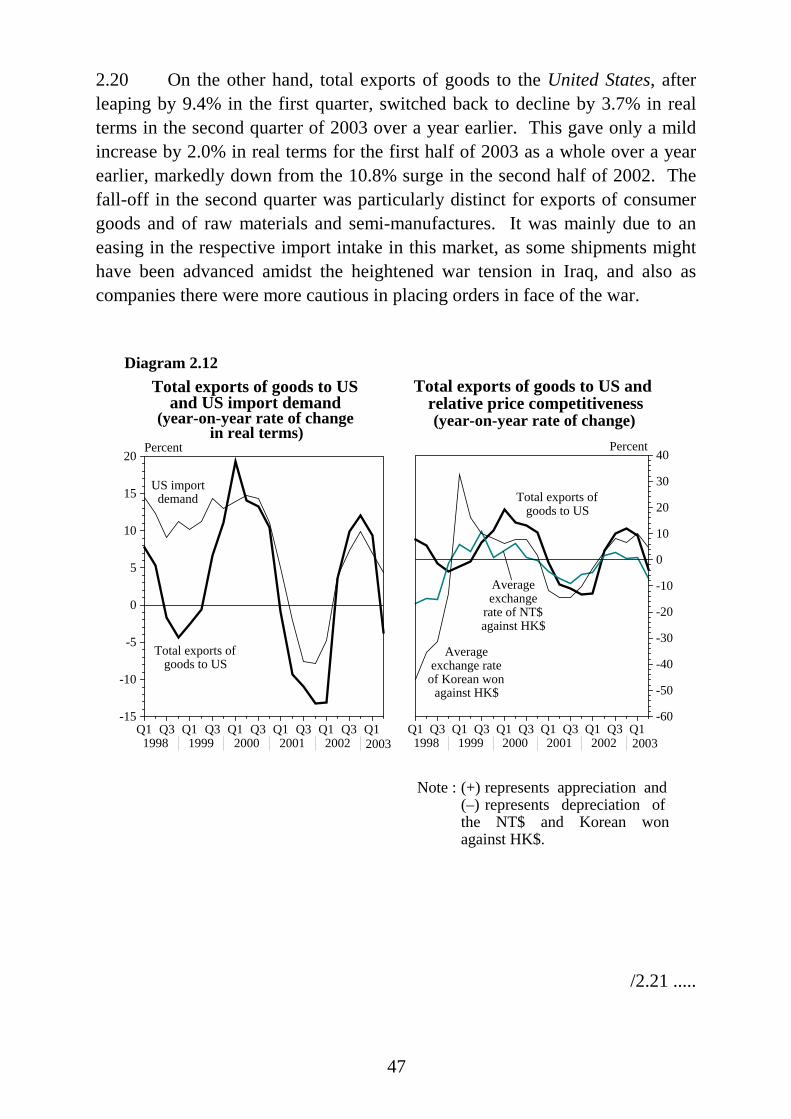
47
2.20 On the other hand, total exports of goods to the United States, afterleaping by 9.4% in the first quarter, switched back to decline by 3.7% in realterms in the second quarter of 2003 over a year earlier. This gave only a mildincrease by 2.0% in real terms for the first half of 2003 as a whole over a yearearlier, markedly down from the 10.8% surge in the second half of 2002. Thefall-off in the second quarter was particularly distinct for exports of consumergoods and of raw materials and semi-manufactures. It was mainly due to aneasing in the respective import intake in this market, as some shipments mighthave been advanced amidst the heightened war tension in Iraq, and also ascompanies there were more cautious in placing orders in face of the war.
Q1 Q3 Q1 Q3 Q1 Q3 Q1 Q3 Q1 Q3 Q11998 1999 2000 2001 2002 2003
0
5
10
15
20
-5
-10
-15
Percent
Q1 Q3 Q1 Q3 Q1 Q3 Q1 Q3 Q1 Q3 Q11998 1999 2000 2001 2002 2003
0
10
20
30
40
-10
-20
-30
-40
-50
-60
Percent
Diagram 2.12
Total exports of goods to US
US importdemand
Averageexchange
rate of NT$ against HK$
relative price competitivenessTotal exports of goods to US and
(year-on-year rate of change)
Total exports of goods to USand US import demand
(year-on-year rate of change
Average exchange rate
of Korean won against HK$
Total exports of goods to US
in real terms)
2003 2003
Note : (+) represents appreciation and(–) represents depreciation ofthe NT$ and Korean wonagainst HK$.
/2.21 .....

48
2.21 After an already significant growth of 15.0% in the first quarter, totalexports of goods to Japan picked up further to an 18.6% surge in real terms inthe second quarter of 2003 over a year earlier. This gave a distinct rise of16.8% in real terms for the first half of 2003 as a whole over a year earlier,markedly up from the 6.0% increase in the second half of 2002. The resilientexport production activity in Japan, coupled with a relatively stronger yen,should have continued to render support to Hong Kong’s exports to this market.
Q1 Q3 Q1 Q3 Q1 Q3 Q1 Q3 Q1 Q3 Q11998 1999 2000 2001 2002 2003
0
5
10
15
20
25
30
-5
-10
-15
-20
Percent
Q1 Q3 Q1 Q3 Q1 Q3 Q1 Q3 Q1 Q3 Q11998 1999 2000 2001 2002 2003
0
5
10
15
20
25
30
-5
-10
-15
-20
Percent
Diagram 2.13
and the exchange rate factorTotal exports of goods to Japan
(year-on-year rate of change)
Total exports of goods to Japanand Japan's import demand(year-on-year rate of change
Total exports of goods to Japan
Japan's import
demand Average exchangerate of yen
against HK$
Total exports of goods to Japan
in real terms)
2003 2003
Note : (+) represents appreciation and(–) represents depreciation ofthe yen against HK$.
/2.22 .....
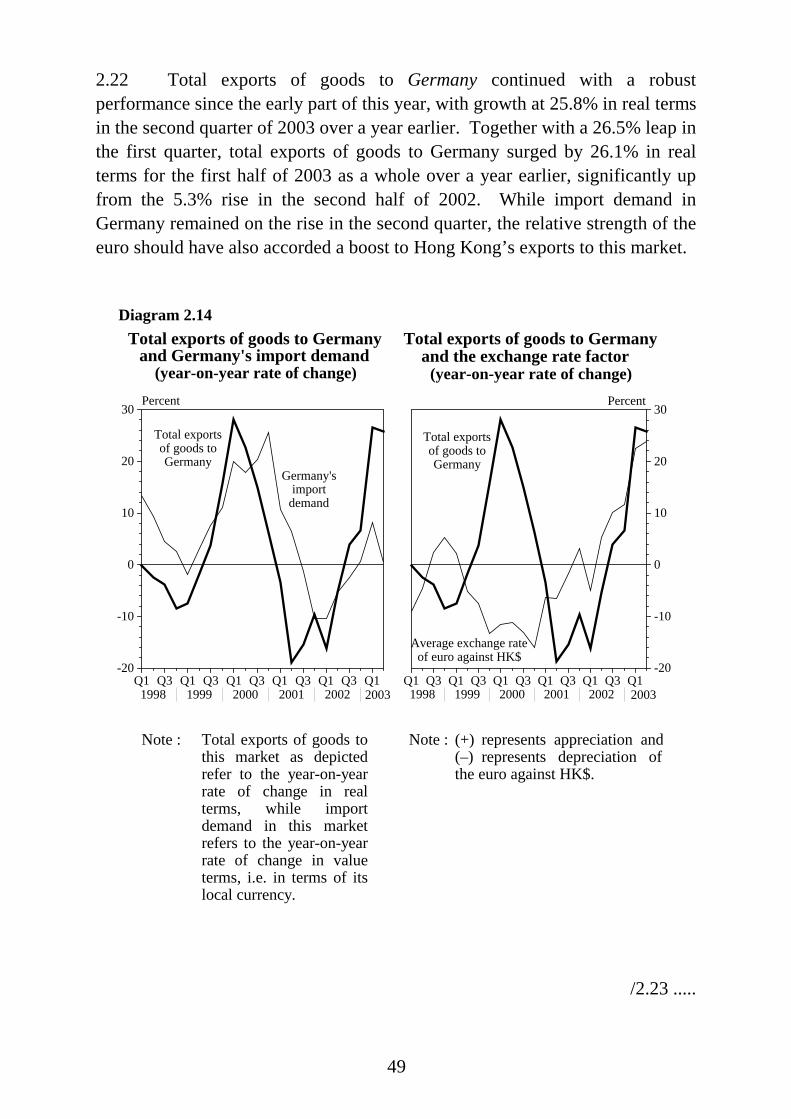
49
2.22 Total exports of goods to Germany continued with a robustperformance since the early part of this year, with growth at 25.8% in real termsin the second quarter of 2003 over a year earlier. Together with a 26.5% leap inthe first quarter, total exports of goods to Germany surged by 26.1% in realterms for the first half of 2003 as a whole over a year earlier, significantly upfrom the 5.3% rise in the second half of 2002. While import demand inGermany remained on the rise in the second quarter, the relative strength of theeuro should have also accorded a boost to Hong Kong’s exports to this market.
Q1 Q3 Q1 Q3 Q1 Q3 Q1 Q3 Q1 Q3 Q11998 1999 2000 2001 2002 2003
0
10
20
30
-10
-20
Percent
Q1 Q3 Q1 Q3 Q1 Q3 Q1 Q3 Q1 Q3 Q11998 1999 2000 2001 2002 2003
0
10
20
30
-10
-20
Percent
Diagram 2.14
and the exchange rate factorTotal exports of goods to Germany
(year-on-year rate of change)
Total exports of goods to Germanyand Germany's import demand
(year-on-year rate of change)
Total exportsof goods to Germany
Total exportsof goods to Germany
Germany's import
demand
Average exchange rateof euro against HK$
2003 2003
Note : Total exports of goods tothis market as depictedrefer to the year-on-yearrate of change in realterms, while importdemand in this marketrefers to the year-on-yearrate of change in valueterms, i.e. in terms of itslocal currency.
Note : (+) represents appreciation and(–) represents depreciation ofthe euro against HK$.
/2.23 .....

50
2.23 Total exports of goods to the United Kingdom remained on the rise.There was a further growth of 8.9% in real terms in the second quarter of 2003over a year earlier, after an 8.5% leap in the first quarter. For the first half of2003 as a whole, total exports of goods to this market grew by 8.7% in realterms over a year earlier, following a 6.4% rise in the second half of 2002.UK’s import demand actually decelerated slightly in growth in the secondquarter, partly due to an advancement in shipments to the first quarter, andconceivably also due to a cut-back in orders during the war period. Yet againstthese, the further strengthening in the pound sterling should have given supportto Hong Kong’s exports to this market.
Q1 Q3 Q1 Q3 Q1 Q3 Q1 Q3 Q1 Q3 Q11998 1999 2000 2001 2002 2003
0
5
10
15
20
25
30
35
-5
-10
-15
Percent
Q1 Q3 Q1 Q3 Q1 Q3 Q1 Q3 Q1 Q3 Q11998 1999 2000 2001 2002 2003
0
5
10
15
20
25
30
35
-5
-10
-15
Percent
Diagram 2.15
and the exchange rate factorTotal exports of goods to UK
(year-on-year rate of change)
Total exports of goods to UKand UK's import demand(year-on-year rate of change
Total exports of goods to UK
UK's import demand*
Total exports of goods to UK
in real terms)
Aveage exchangerate of pound sterling
against HK$
2003 2003
Note : (*) UK's import demandas depicted refers toits imports sourcedfrom outside theEuropean Union.
Note : (+) represents appreciation and(–) represents depreciation ofthe pound sterling againstHK$.
/2.24 .....

51
2.24 Total exports of goods to Taiwan held up well in the second quarterof 2003, growing by 19.7% in real terms over a year earlier, notwithstanding arather erratic profile within that quarter. Together with an even more distinctsurge by 26.9% in the first quarter, total exports of goods to Taiwan rosesharply by 23.2% in real terms for the first half of 2003 as a whole over a yearearlier, after a milder growth at 7.8% in the second half of 2002. The muchaccentuated increase in the first half of this year was mainly underpinned by anupsurge in exports of material inputs and a further leap in exports of capitalgoods to this market. Exports of consumer goods also rebounded distinctly,after the dip last year.
Q1 Q3 Q1 Q3 Q1 Q3 Q1 Q3 Q1 Q3 Q11998 1999 2000 2001 2002 2003
0
10
20
30
40
-10
-20
-30
Percent
Q1 Q3 Q1 Q3 Q1 Q3 Q1 Q3 Q1 Q3 Q11998 1999 2000 2001 2002 2003
0
10
20
30
40
-10
-20
-30
Percent
Diagram 2.16
and the exchange rate factorTotal exports of goods to Taiwan
(year-on-year rate of change)
Total exports of goods to Taiwanand Taiwan's import demand(year-on-year rate of change)
Total exports of goods to
Taiwan
Total exports of goods to
Taiwan
Average exchange
rate of NT$ against HK$Taiwan's import
demand
2003 2003
Note : See the footnote toDiagram 2.14.
Note : (+) represents appreciation and(–) represents depreciation ofthe NT$ against HK$.
/2.25 .....

52
2.25 Total exports of goods to the Republic of Korea picked up again to ahighly robust growth at 27.7% in real terms in the second quarter of 2003 overa year earlier, having moderated to a 12.4% growth in the first quarter from themuch faster increases in the latter part of 2002. Taken together, total exports ofgoods to this market grew significantly by 19.8% in real terms for the first halfof 2003 as a whole over a year earlier, following a 25.5% surge in the secondhalf of 2002. The conspicuous pick-up in the second quarter was mainlycontributed by an upsurge in exports of capital goods, and to a lesser extentalso by a faster growth in exports of material inputs.
Q1 Q3 Q1 Q3 Q1 Q3 Q1 Q3 Q1 Q3 Q11998 1999 2000 2001 2002 2003
0
20
40
60
80
100
-20
-40
-60
Percent
Q1 Q3 Q1 Q3 Q1 Q3 Q1 Q3 Q1 Q3 Q11998 1999 2000 2001 2002 2003
0
20
40
60
80
100
-20
-40
-60
Percent
Diagram 2.17
the exchange rate factor(year-on-year rate of change)
Total exports of goods to theRepublic of Korea and the Republic
(year-on-year rate of change)
Total exports of goods to the
Republic of Korea
Average exchange rate of Korean won
against HK$
The Republic of Korea's
import demand
of Korea's import demand
Total exports of goods tothe Republic of Korea and
Total exports of goods to the
Republic of Korea
2003 2003
Note : See the footnote toDiagram 2.11.
Note : (+) represents appreciation and(–) represents depreciation ofthe Korean won against HK$.
/2.26 .....
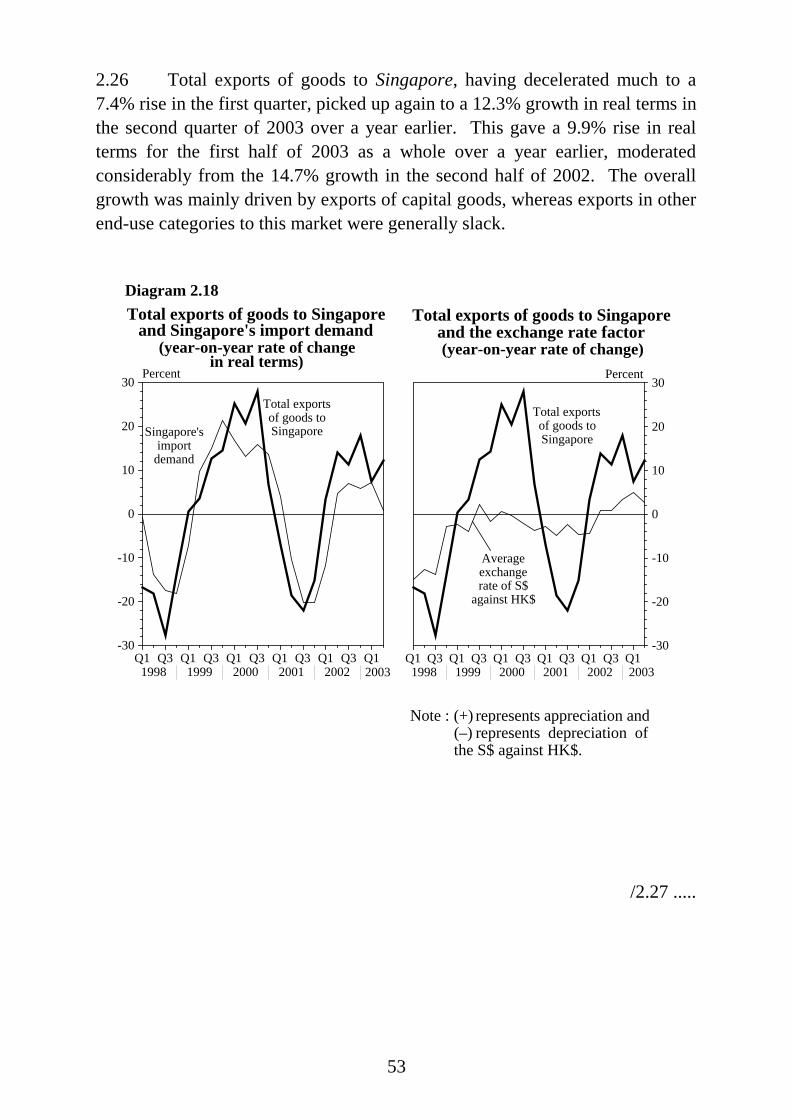
53
2.26 Total exports of goods to Singapore, having decelerated much to a7.4% rise in the first quarter, picked up again to a 12.3% growth in real terms inthe second quarter of 2003 over a year earlier. This gave a 9.9% rise in realterms for the first half of 2003 as a whole over a year earlier, moderatedconsiderably from the 14.7% growth in the second half of 2002. The overallgrowth was mainly driven by exports of capital goods, whereas exports in otherend-use categories to this market were generally slack.
Q1 Q3 Q1 Q3 Q1 Q3 Q1 Q3 Q1 Q3 Q11998 1999 2000 2001 2002 2003
0
10
20
30
-10
-20
-30
Percent
Q1 Q3 Q1 Q3 Q1 Q3 Q1 Q3 Q1 Q3 Q11998 1999 2000 2001 2002 2003
0
10
20
30
-10
-20
-30
Percent
Diagram 2.18
and the exchange rate factorTotal exports of goods to Singapore
(year-on-year rate of change)
Total exports of goods to Singaporeand Singapore's import demand
(year-on-year rate of change
Total exports of goods to Singapore
Total exports of goods to Singapore
Average exchange rate of S$
against HK$
Singapore'simport
demand
in real terms)
2003 2003
Note : (+) represents appreciation and(–) represents depreciation ofthe S$ against HK$.
/2.27 .....
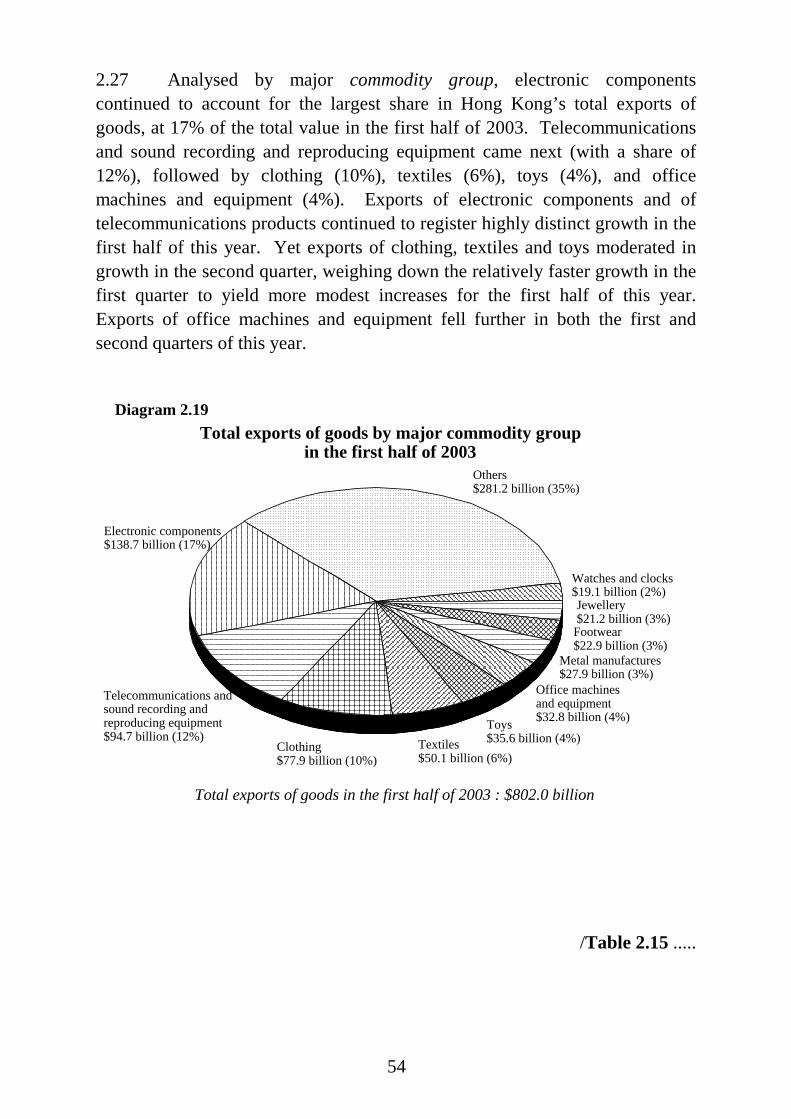
54
2.27 Analysed by major commodity group, electronic componentscontinued to account for the largest share in Hong Kong’s total exports ofgoods, at 17% of the total value in the first half of 2003. Telecommunicationsand sound recording and reproducing equipment came next (with a share of12%), followed by clothing (10%), textiles (6%), toys (4%), and officemachines and equipment (4%). Exports of electronic components and oftelecommunications products continued to register highly distinct growth in thefirst half of this year. Yet exports of clothing, textiles and toys moderated ingrowth in the second quarter, weighing down the relatively faster growth in thefirst quarter to yield more modest increases for the first half of this year.Exports of office machines and equipment fell further in both the first andsecond quarters of this year.
Diagram 2.19Total exports of goods by major commodity group
in the first half of 2003
Total exports of goods in the first half of 2003 : $802.0 billion
Electronic components$138.7 billion (17%)
Clothing$77.9 billion (10%)
Watches and clocks$19.1 billion (2%)
Textiles$50.1 billion (6%)
Telecommunications and sound recording and reproducing equipment$94.7 billion (12%)
Metal manufactures$27.9 billion (3%)
Jewellery $21.2 billion (3%)
Office machines and equipment$32.8 billion (4%)
Others$281.2 billion (35%)
Toys$35.6 billion (4%)
Footwear$22.9 billion (3%)
/Table 2.15 .....

55
Table 2.15Total exports of goods by major commodity group
(year-on-year rate of change in real terms (%))
Electroniccomponents
Telecom-munications
and soundrecording andreproducingequipment Clothing Textiles Toys
Officemachines
andequipment
2002 Annual 20.4 24.6 -1.1 5.5 1.4 31.1
H1 9.4 10.7 -5.5 2.3 -5.2 36.4H2 30.9 36.3 2.4 8.6 6.0 26.4
Q1 5.1 6.6 -7.7 -7.3 -12.6 37.8Q2 13.6 14.7 -3.6 10.3 1.5 35.0Q3 22.8 40.1 5.4 5.5 -1.8 18.7Q4 39.0 32.7 -0.9 11.9 17.5 33.9
2003 H1 39.3 33.7 5.5 7.1 7.9 -4.6
Q1 37.2 37.2 9.6 16.2 10.0 -5.9Q2 41.2 30.4 1.9 0.8 6.3 -3.2
Re-exports
2.28 Re-exports continued to dominate over domestic exports, with theirportion in total exports of goods rising further to 93% by value in the first halfof 2003, from 91% in the same period in 2002. Analysed by major market, theMainland accounted for the largest share in Hong Kong’s re-exports, at 44% byvalue in the first half of 2003. This was followed by the United States (with ashare of 17%), Japan (6%), Germany (3%), the United Kingdom (3%), Taiwan(2%), the Republic of Korea (2%), and Singapore (2%).
/Diagram 2.20 .....

56
Diagram 2.20
Re-exports by major market in the first half of 2003
Total re-exports in the first half of 2003 : $747.5 billion
Mainland of China$326.3 billion (44%)
United States$127.9 billion (17%)
Japan$42.5 billion (6%)
Germany$23.5 billion (3%)
United Kingdom$21.4 billion (3%)
Others$156.3 billion (21%)
Taiwan$18.0 billion (2%)
Singapore$15.1 billion (2%)Republic of Korea$16.4 billion (2%)
Table 2.16Value of re-exports by market
2002 First half of 2003
Value($Bn)
Sharein total
(%)
Rateof change
(%)Value($Bn)
Sharein total
(%)
Year-on-yearrate of change
(%)
All markets 1,429.6 100 7.7 747.5 100 17.2
Mainland of China
571.9 40 15.2 326.3 44 27.2
United States
291.0 20 3.1 127.9 17 2.1
Japan 80.7 6 -3.4 42.5 6 16.3Germany 44.6 3 -2.6 23.5 3 23.8United Kingdom
46.6 3 -0.3 21.4 3 6.5
Taiwan 30.2 2 0.6 18.0 2 28.9Republic of Korea
29.3 2 18.8 16.4 2 18.3
Singapore 29.4 2 9.3 15.1 2 8.7Rest of the world
305.8 21 5.1 156.3 21 12.7
/2.29 .....
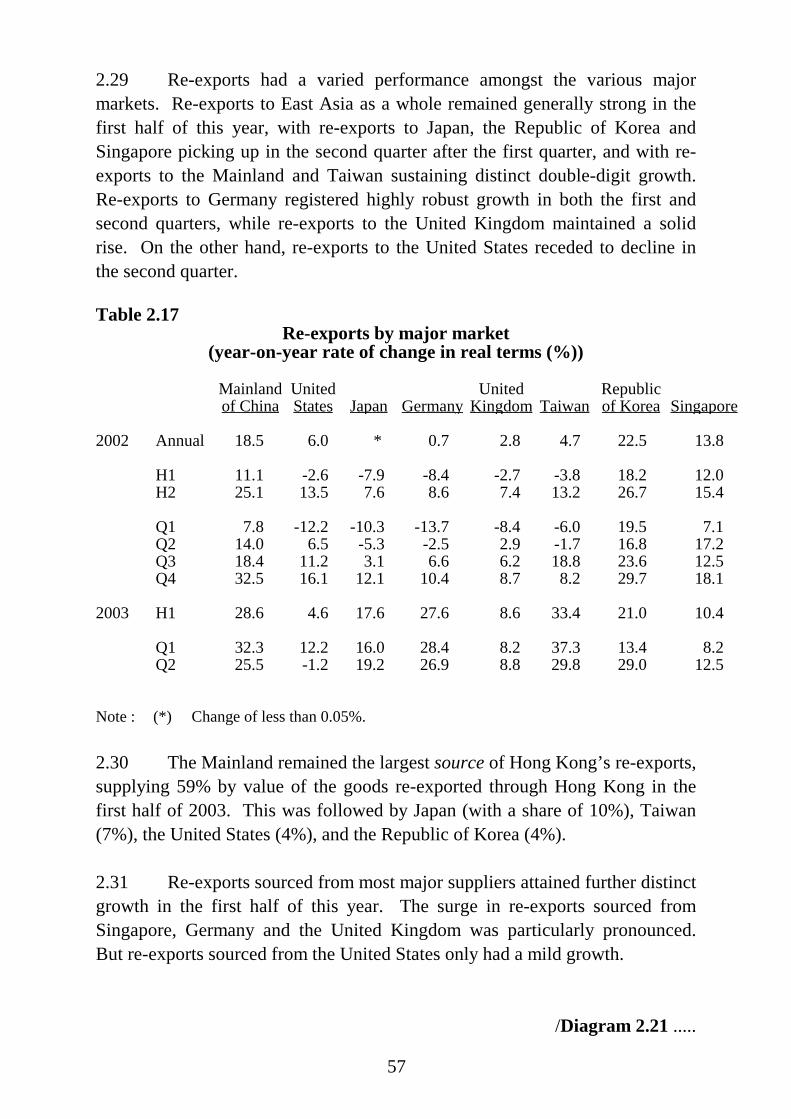
57
2.29 Re-exports had a varied performance amongst the various majormarkets. Re-exports to East Asia as a whole remained generally strong in thefirst half of this year, with re-exports to Japan, the Republic of Korea andSingapore picking up in the second quarter after the first quarter, and with re-exports to the Mainland and Taiwan sustaining distinct double-digit growth.Re-exports to Germany registered highly robust growth in both the first andsecond quarters, while re-exports to the United Kingdom maintained a solidrise. On the other hand, re-exports to the United States receded to decline inthe second quarter.
Table 2.17Re-exports by major market
(year-on-year rate of change in real terms (%))
Mainlandof China
UnitedStates Japan Germany
UnitedKingdom Taiwan
Republicof Korea Singapore
2002 Annual 18.5 6.0 * 0.7 2.8 4.7 22.5 13.8
H1 11.1 -2.6 -7.9 -8.4 -2.7 -3.8 18.2 12.0H2 25.1 13.5 7.6 8.6 7.4 13.2 26.7 15.4
Q1 7.8 -12.2 -10.3 -13.7 -8.4 -6.0 19.5 7.1Q2 14.0 6.5 -5.3 -2.5 2.9 -1.7 16.8 17.2Q3 18.4 11.2 3.1 6.6 6.2 18.8 23.6 12.5Q4 32.5 16.1 12.1 10.4 8.7 8.2 29.7 18.1
2003 H1 28.6 4.6 17.6 27.6 8.6 33.4 21.0 10.4
Q1 32.3 12.2 16.0 28.4 8.2 37.3 13.4 8.2Q2 25.5 -1.2 19.2 26.9 8.8 29.8 29.0 12.5
Note : (*) Change of less than 0.05%.
2.30 The Mainland remained the largest source of Hong Kong’s re-exports,supplying 59% by value of the goods re-exported through Hong Kong in thefirst half of 2003. This was followed by Japan (with a share of 10%), Taiwan(7%), the United States (4%), and the Republic of Korea (4%).
2.31 Re-exports sourced from most major suppliers attained further distinctgrowth in the first half of this year. The surge in re-exports sourced fromSingapore, Germany and the United Kingdom was particularly pronounced.But re-exports sourced from the United States only had a mild growth.
/Diagram 2.21 .....

58
Diagram 2.21
Re-exports by major source in the first half of 2003
Total re-exports in the first half of 2003 : $747.5 billion
Mainland of China$439.5 billion (59%)
United States$31.5 billion (4%)
Japan$75.4 billion (10%)
Republic of Korea$27.4 billion (4%)
Taiwan$49.5 billion (7%)
Others$124.2 billion (17%)
Table 2.18Value of re-exports by source
2002 First half of 2003
Value($Bn)
Sharein total
(%)
Rateof change
(%)Value($Bn)
Sharein total
(%)
Year-on-yearrate of change
(%)
All sources 1,429.6 100 7.7 747.5 100 17.2
Mainland of China
864.0 60 6.9 439.5 59 15.7
Japan 135.8 9 8.1 75.4 10 23.7Taiwan 94.3 7 17.4 49.5 7 17.8United States
62.9 4 -3.5 31.5 4 3.7
Republic of Korea
47.2 3 18.7 27.4 4 27.5
Rest of the world
225.4 16 8.3 124.2 17 20.1
/Domestic .....
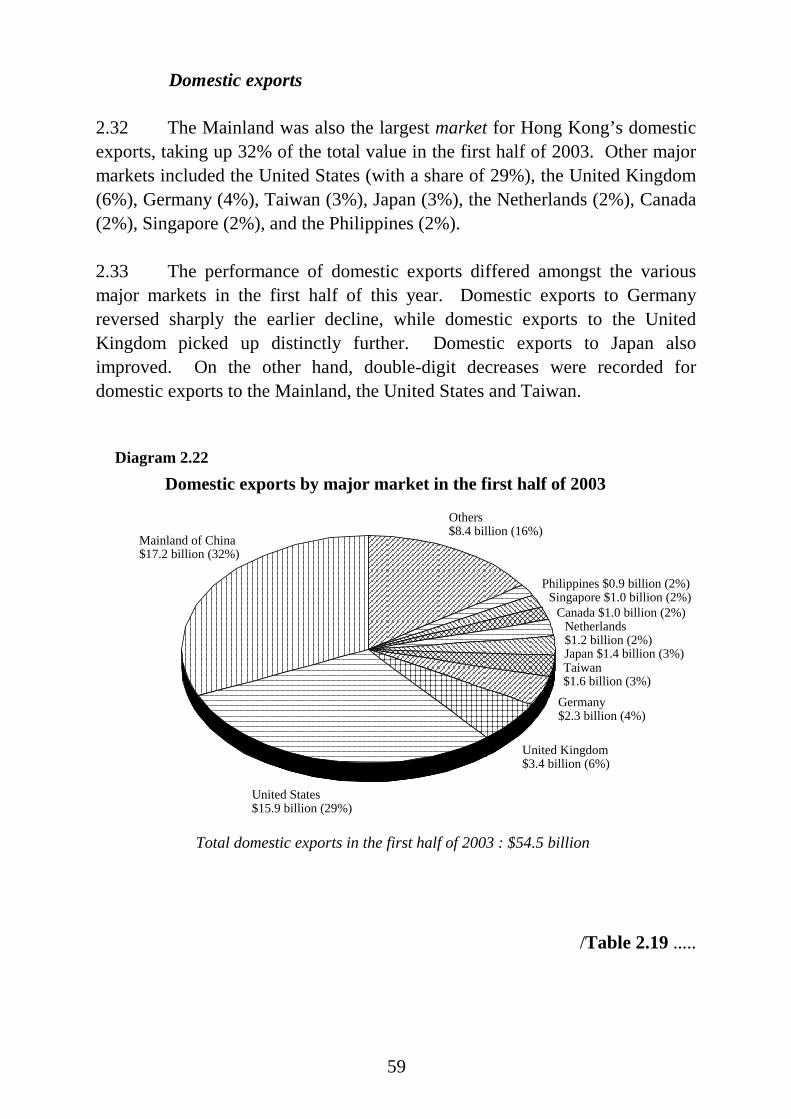
59
Domestic exports
2.32 The Mainland was also the largest market for Hong Kong’s domesticexports, taking up 32% of the total value in the first half of 2003. Other majormarkets included the United States (with a share of 29%), the United Kingdom(6%), Germany (4%), Taiwan (3%), Japan (3%), the Netherlands (2%), Canada(2%), Singapore (2%), and the Philippines (2%).
2.33 The performance of domestic exports differed amongst the variousmajor markets in the first half of this year. Domestic exports to Germanyreversed sharply the earlier decline, while domestic exports to the UnitedKingdom picked up distinctly further. Domestic exports to Japan alsoimproved. On the other hand, double-digit decreases were recorded fordomestic exports to the Mainland, the United States and Taiwan.
Diagram 2.22
Domestic exports by major market in the first half of 2003
Total domestic exports in the first half of 2003 : $54.5 billion
Mainland of China$17.2 billion (32%)
United States$15.9 billion (29%)
Japan $1.4 billion (3%)
Germany$2.3 billion (4%)
United Kingdom$3.4 billion (6%)
Others$8.4 billion (16%)
Taiwan$1.6 billion (3%)
Singapore $1.0 billion (2%)
Netherlands$1.2 billion (2%)
Philippines $0.9 billion (2%)
Canada $1.0 billion (2%)
/Table 2.19 .....

60
Table 2.19Value of domestic exports by market
2002 First half of 2003
Value($Bn)
Sharein total
(%)
Rateof change
(%)Value($Bn)
Sharein total
(%)
Year-on-yearrate of change
(%)
All markets 130.9 100 -14.7 54.5 100 -11.0
Mainland of China
41.4 32 -16.5 17.2 32 -18.4
United States 41.9 32 -11.9 15.9 29 -11.1United Kingdom
7.6 6 -11.5 3.4 6 9.3
Germany 4.3 3 -26.6 2.3 4 11.7Taiwan 4.4 3 -17.9 1.6 3 -28.5Japan 3.0 2 -26.9 1.4 3 -11.0Netherlands 3.5 3 -24.9 1.2 2 -35.5Canada 2.4 2 -22.0 1.0 2 1.6Singapore 2.2 2 -18.4 1.0 2 -3.0Philippines 1.7 1 -7.0 0.9 2 11.9Rest of the world
18.7 14 -8.4 8.4 16 0.8
Table 2.20Domestic exports by major market
(year-on-year rate of change in real terms (%))
Mainlandof China
UnitedStates
UnitedKingdom Germany Taiwan Japan Netherlands Canada
2002 Annual -13.5 -9.5 -10.2 -25.7 -11.4 -22.0 -4.5 -19.9
H1 -5.9 -15.2 -22.8 -29.7 -3.1 -17.1 7.0 -28.9H2 -20.3 -4.5 1.0 -21.4 -19.1 -26.5 -16.2 -12.1
Q1 3.5 -18.1 -22.8 -33.3 -0.8 -12.9 14.0 -24.7Q2 -13.3 -12.7 -22.7 -25.6 -5.3 -21.4 2.4 -32.4Q3 -19.1 1.5 -0.5 -17.6 -5.8 -27.2 -0.3 -22.5Q4 -21.7 -10.9 2.5 -25.0 -29.6 -25.7 -30.9 3.8
2003 H1 -18.8 -15.3 9.8 13.3 -32.3 -2.1 -45.0 6.3
Q1 -23.2 -9.1 10.4 10.2 -27.7 -6.4 -34.2 6.3Q2 -14.6 -20.3 9.2 16.5 -36.9 2.7 -53.0 6.2
/Outward .....

61
Outward processing trade
2.34 Outward processing trade(9) remained an integral component in HongKong’s overall merchandise trade, but its prominence has been diminishing inrecent years along with the on-going structural shift from re-exports towardsoffshore trade and direct shipment from the Mainland. In the first quarter of2003, the proportion of Hong Kong’s total exports of goods to the Mainland foroutward processing fell further, to 41%, from the corresponding proportion of46% in the same quarter in 2002. The proportion of re-exports after outwardprocessing in Hong Kong’s re-exports of Mainland origin likewise fell, to 78%in the first quarter of 2003, from 87% in the same quarter in 2002. Importsafter outward processing in Hong Kong’s imports of goods from the Mainlandalso fell in relative significance, to 68% in the first quarter of 2003, from 74%in the same quarter in 2002. Apart from the structural shift to offshore tradeand direct shipment, the fall in the proportion of Hong Kong’s trade involvingoutward processing in the first quarter was also due to the sharp upsurge inHong Kong’s exports for meeting the Mainland’s own demand.
2.35 Despite the fall in relative significance, total exports of goods to theMainland for outward processing still had notable growth, at 13.6% in valueterms over a year earlier to $66.0 billion in the first quarter of 2003, buoyed bythe continued surge in the Mainland’s exports. This followed a markedincrease of 24.7% in the fourth quarter of 2002. Total exports of goods to theMainland for meeting its own demand soared even more, on the back of thebuoyant domestic demand there, with a 39.0% rise in value terms over a yearearlier to $95.4 billion in the first quarter of 2003. This was even faster thanthe already marked growth of 25.6% in the fourth quarter of 2002.
/Diagram 2.23 .....

62
Exports to the mainland of China for outward processing and for meeting its own demand
(year-on-year rate of change in value terms)
Q1 Q2 Q3 Q4 Q1 Q2 Q3 Q4 Q1 Q2 Q3 Q4 Q1 Q2 Q3 Q4 Q1 Q2 Q3 Q4 Q11998 1999 2000 2001 2002 2003
0
10
20
30
40
50
-10
-20
-30
Percent
Diagram 2.23
Exports to the Mainland for outward processing
Exports to the Mainland for meeting its own demand
2003
Table 2.21Total exports of goods to the mainland of China
for outward processing and for meeting its own demand(year-on-year rate of change in value terms (%))
Total exportsof goods to
the Mainland
Of which :
Total exportsof goods to
the Mainlandfor outward
processing
Total exportsof goods to
the Mainlandfor meeting
its own demand
2002 Annual 12.3 7.0 17.1
H1 5.4 -0.1 10.6H2 18.7 13.8 23.0
Q1 2.6 -6.0 11.2 Q2 7.9 5.4 10.2
Q3 12.8 5.1 20.3Q4 25.2 24.7 25.6
2003 Q1 27.3 13.6 39.0
/2.36 .....

63
2.36 On the other hand, imports of goods from the Mainland after outwardprocessing eased to a 5.4% increase in value terms over a year earlier to$114.6 billion in the first quarter of 2003, from a 7.8% increase in the fourthquarter of 2002. Re-exports of Mainland origin after outward processingretarded in growth to an even larger extent, to a meagre 0.1% rise in valueterms over a year earlier to $130.4 billion in the first quarter of 2003, incontrast to the distinct growth at 17.2% in the fourth quarter of 2002.
Table 2.22Imports of goods from the mainland of China
and re-exports of Mainland originto overseas markets after outward processing
(year-on-year rate of change in value terms (%))
Imports of goods Re-exports of from the Mainland Mainland origin after
after outward processing outward processing
2002 Annual -0.2 2.8
H1 -8.1 -5.2H2 7.0 10.4
Q1 -9.0 -5.3Q2 -7.3 -5.0Q3 6.3 4.3Q4 7.8 17.2
2003 Q1 5.4 0.1
Imports of goods
2.37 The Mainland continued to be the largest source of Hong Kong’simports of goods, accounting for 43% of the total value in the first half of 2003.This was followed by Japan (with a share of 12%), Taiwan (7%), the UnitedStates (5%), Singapore (5%), and the Republic of Korea (5%).
2.38 In tandem with the uptrend in re-exports, imports from all sourcescontinued to register notable growth in the first half of this year, yet the extentof increase varied amongst economies.
/Diagram 2.24 .....

64
Diagram 2.24Imports of goods by major source in the first half of 2003
Total imports of goods in the first half of 2003 : $835.4 billion
Mainland of China$358.5 billion (43%)
Japan$99.4 billion (12%)
Taiwan$57.7 billion (7%)
Singapore$42.8 billion (5%)
Others$191.0 billion (23%)
United States$45.8 billion (5%)
Republic of Korea $40.1 billion (5%)
Table 2.23Value of imports of goods by source
2002 First half of 2003
Value($Bn)
Sharein total
(%)
Rateof change
(%)Value($Bn)
Sharein total
(%)
Year-on-yearrate of change
(%)
All sources 1,619.4 100 3.3 835.4 100 13.4
Mainland of China
717.1 44 5.1 358.5 43 12.2
Japan 182.6 11 3.4 99.4 12 20.2Taiwan 115.9 7 7.4 57.7 7 7.8United States
91.5 6 -12.8 45.8 5 4.4
Singapore 75.7 5 3.9 42.8 5 24.5Republic of Korea
76.0 5 7.3 40.1 5 15.0
Rest of the world
360.7 22 2.2 191.0 23 14.0
/Table 2.24 .....
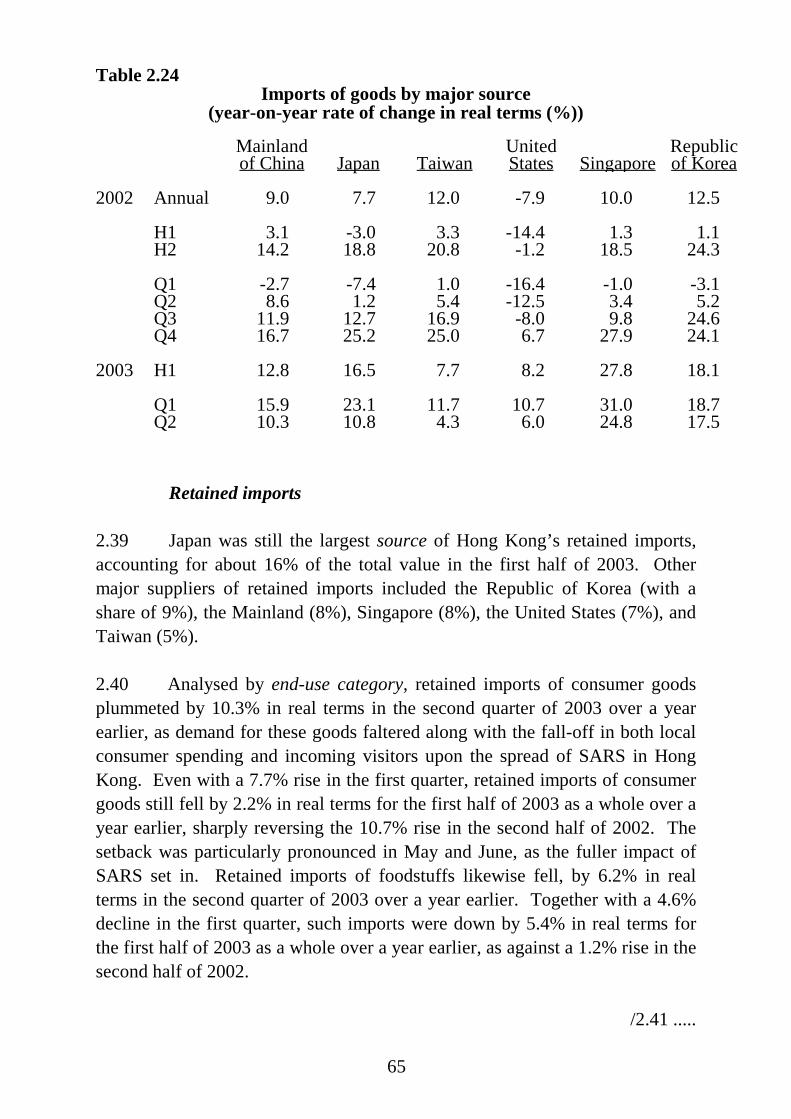
65
Table 2.24Imports of goods by major source
(year-on-year rate of change in real terms (%))
Mainlandof China Japan Taiwan
UnitedStates Singapore
Republicof Korea
2002 Annual 9.0 7.7 12.0 -7.9 10.0 12.5
H1 3.1 -3.0 3.3 -14.4 1.3 1.1H2 14.2 18.8 20.8 -1.2 18.5 24.3
Q1 -2.7 -7.4 1.0 -16.4 -1.0 -3.1Q2 8.6 1.2 5.4 -12.5 3.4 5.2Q3 11.9 12.7 16.9 -8.0 9.8 24.6Q4 16.7 25.2 25.0 6.7 27.9 24.1
2003 H1 12.8 16.5 7.7 8.2 27.8 18.1
Q1 15.9 23.1 11.7 10.7 31.0 18.7Q2 10.3 10.8 4.3 6.0 24.8 17.5
Retained imports
2.39 Japan was still the largest source of Hong Kong’s retained imports,accounting for about 16% of the total value in the first half of 2003. Othermajor suppliers of retained imports included the Republic of Korea (with ashare of 9%), the Mainland (8%), Singapore (8%), the United States (7%), andTaiwan (5%).
2.40 Analysed by end-use category, retained imports of consumer goodsplummeted by 10.3% in real terms in the second quarter of 2003 over a yearearlier, as demand for these goods faltered along with the fall-off in both localconsumer spending and incoming visitors upon the spread of SARS in HongKong. Even with a 7.7% rise in the first quarter, retained imports of consumergoods still fell by 2.2% in real terms for the first half of 2003 as a whole over ayear earlier, sharply reversing the 10.7% rise in the second half of 2002. Thesetback was particularly pronounced in May and June, as the fuller impact ofSARS set in. Retained imports of foodstuffs likewise fell, by 6.2% in realterms in the second quarter of 2003 over a year earlier. Together with a 4.6%decline in the first quarter, such imports were down by 5.4% in real terms forthe first half of 2003 as a whole over a year earlier, as against a 1.2% rise in thesecond half of 2002.
/2.41 .....

66
2.41 Retained imports of capital goods, having reverted to increase notablyby 10.6% in the first quarter, receded to decline by 2.8% in real terms in thesecond quarter of 2003 over a year earlier. For the first half of 2003 as a whole,retained imports of capital goods still rose by 3.5% in real terms over a yearearlier, after a 10.9% plunge in the second half of 2002. The slackening inmachinery intake in the second quarter was almost across-the-board. Analysedby broad type, intake of construction machinery turned even more subdued,with an enlarged decline in the second quarter after the first quarter. Intake ofindustrial machinery and of office equipment also fell back in the secondquarter. Intake of capital goods in the “others” category still recorded anincrease, though much moderated from that in the first quarter. Intake oftelecommunications equipment reverted to a slight increase in the secondquarter, yet this was partly due to a distinctly lower base a year earlier.
2.42 Retained imports of raw materials and semi-manufactures showedmarkedly slower growth, at 5.9% in real terms in the second quarter of 2003over a year earlier, down from the 18.0% surge in the first quarter. Takentogether, there was still distinct growth at 11.2% in real terms for the first halfof 2003 as a whole over a year earlier, though less robust than the 23.1% leapin the second half of 2002. Retained imports of fuels also fell back, by 12.8%in real terms in the second quarter of 2003 over a year earlier, after a build-upin oil inventories leading to a 9.1% increase in the first quarter. For the firsthalf of 2003 as a whole, retained imports of fuel reverted to decline by 2.7% inreal terms over a year earlier, following an 8.8% increase in the second half of2002.
/Table 2.25 .....

67
Table 2.25Retained imports by end-use category
(year-on-year rate of change in real terms (%))
Consumergoods Foodstuffs
Capitalgoods
Rawmaterials and
semi-manufactures Fuels
2002 Annual 5.7 5.3 -13.6 9.8 4.8
H1 0.7 9.7 -16.6 -2.1 0.7H2 10.7 1.2 -10.9 23.1 8.8
Q1 -2.3 14.2 -23.0 -9.2 -3.3Q2 3.3 5.0 -10.1 4.4 4.4Q3 11.9 -8.9 -18.0 27.1 7.8Q4 9.3 12.7 -2.3 19.1 9.7
2003 H1 -2.2 -5.4 3.5 11.2 -2.7
Q1 7.7 -4.6 10.6 18.0 9.1Q2 -10.3 -6.2 -2.8 5.9 -12.8
Note : See Note (a) to Table 2.7.
Table 2.26Retained imports of capital goods by broad type(year-on-year rate of change in real terms (%))
Industrialmachinery for
manufacturing useConstructionmachinery
Officeequipment
Tele-communications
equipment
Othercapitalgoods
2002 Annual -1.5 11.1 -12.3 -2.5 -38.9
H1 -6.0 14.7 -22.9 -10.5 -30.9H2 3.0 7.7 -2.4 6.1 -44.9
Q1 -7.5 2.2 -43.5 -4.3 -36.2Q2 -4.6 25.3 1.0 -16.7 -25.2Q3 -5.3 19.8 -18.5 12.7 -50.0Q4 12.1 -3.3 21.0 -0.5 -38.2
2003 H1 -2.3 -16.6 19.6 -6.5 8.7
Q1 3.9 -9.4 52.9 -12.9 16.0Q2 -7.6 -21.6 -2.0 1.1 2.1
Note : See Note (a) to Table 2.7.
/Invisible .....

68
Invisible trade
Exports of services
2.43 Trade-related services (comprising mainly offshore trade) continuedto account for the largest share in Hong Kong’s exports of services, at 34% byvalue in the first half of 2003. This was followed by exports of transportationservices (with a share of 30%), travel services (17%), and financial, businessand other services (18%).
Diagram 2.25Exports of services by major service group in the first half of 2003
Exports of services in the first half of 2003 : $156.1 billion
Transportation services$47.5 billion (30%)
Financial, businessand other services$28.8 billion (18%)
Trade-related services$53.7 billion (34%)
Travel services$26.1 billion (17%)
2.44 Exports of services, having undergone an uninterrupted growth trendsince the second quarter of 1999, fell off abruptly after mid-March under theadverse impact of SARS. The decline was 14.7% in real terms in the secondquarter of 2003 over a year earlier, in stark contrast to a 12.6% surge in the firstquarter. For the first half of 2003 as a whole, exports of services were downmarginally by 1.4% in real terms over a year earlier, sharply reversing the16.1% leap in the second half of 2002.
2.45 The setback in the second quarter was caused by an across-the-boardplunge in inbound tourism amidst the influence of SARS. Exports of travel
/services .....

69
services went down sharply, by 61.1% in real terms in the second quarter of2003 over a year earlier. This contrasted with a 17.9% surge in the first quarter,and was even more drastic than the declines seen during the Asian financialcrisis. Exports of transportation services concurrently dipped, by 14.6% in realterms in the second quarter of 2003 over a year earlier, reversing from the 8.7%increase in the first quarter. The plunge in incoming visitors, and in turn that inair passenger movements, was again the main reason. The decline in cargotransportation services was much more moderate.
2.46 Exports of financial, business and other services also slackened,receding to decline by 1.7% in real terms in the second quarter of 2003 over ayear earlier, as against a 1.5% rise in the first quarter. But offshore tradecontinued to be resilient on the back of a further strong surge in the Mainland’strade, thereby rendering some offset to the setback in the other components ofexports of services. Exports of trade-related services registered further distinctgrowth, at 15.0% in real terms in the second quarter of 2003 over a year earlier,after a 20.1% surge in the first quarter.
Table 2.27Exports of services by major service group
(year-on-year rate of change in real terms (%))
Exportsof services
Of which :
Trade-relatedservices(a)
Transportationservices
Travelservices(b)
Financial,businessand otherservices
2002 Annual 11.7 13.5 11.5 21.1 -0.7
H1 6.8 7.9 6.6 11.5 0.9H2 16.1 17.7 16.3 30.5 -2.2
Q1 6.0 7.1 6.7 8.0 1.4Q2 7.7 8.7 6.5 14.4 0.3Q3 13.9 16.5 15.4 24.6 -3.5Q4 18.1 18.8 17.2 35.6 -0.9
2003 H1 -1.4 17.6 -3.4 -25.9 -0.1
Q1 12.6 20.1 8.7 17.9 1.5Q2 -14.7 15.0 -14.6 -61.1 -1.7
Notes : (a) Comprising mainly offshore trade.
(b) Comprising mainly inbound tourism receipts./Imports .....

70
Imports of services
2.47 Travel services continued to account for the largest share in HongKong’s imports of services, at 48% by value in the first half of 2003. This wasfollowed by imports of transportation services (with a share of 27%), financial,business and other services (19%), and trade-related services (6%).
Diagram 2.26Imports of services by major service group in the first half of 2003
Imports of services in the first half of 2003 : $84.0 billion
Transportation services$22.9 billion (27%)
Travel services$39.9 billion (48%)
Financial, business and other services$15.9 billion (19%)
Trade-related services$5.3 billion (6%)
2.48 Imports of services suffered an even sharper downturn under theadverse impact of SARS, with a 19.6% decline in real terms in the secondquarter of 2003 over a year earlier, much enlarged from the 3.9% fall in the firstquarter. For the first half of 2003 as a whole, imports of services fell markedlyby 11.5% in real terms over a year earlier, in stark contrast to a 2.7% increase inthe second half of 2002.
/2.49 .....

71
2.49 The setback in imports of services in the second quarter waspredominantly due to the plunge in travel services, as local people avoidedvisiting the SARS-affected countries and territories and as the imposition ofarrival restrictions and post-arrival quarantine by some neighbouring placesalso deterred their interest in travel. As a result, Hong Kong residents’spending abroad was markedly curbed, plummeting by 29.1% in real terms inthe second quarter of 2003 over a year earlier, further down from the 10.1% fallin the first quarter. As air passenger movements slumped, and as imports forlocal use and hence cargo inflows were reduced upon the shrinkage in domesticdemand, imports of transportation services fell back distinctly, by 17.6% in realterms in the second quarter of 2003 over a year earlier, as against a 3.7%increase in the first quarter.
2.50 Imports of financial, business and other services also declined, by4.6% in real terms in the second quarter of 2003 over a year earlier, havingremained flat in the first quarter. Yet imports of trade-related services wereaffected not so much by SARS, and still grew by 8.1% in real terms in thesecond quarter of 2003 over a year earlier, though also slower than the 12.9%increase in the first quarter.
Table 2.28Imports of services by major service group
(year-on-year rate of change in real terms (%))
Of which : Financial,
Importsof services
Travel services(a)
Transportationservices
Trade-relatedservices
businessand otherservices
2002 Annual 0.2 -0.5 2.8 6.8 -3.7H1 -2.2 -1.9 -3.4 1.4 -2.6H2 2.7 0.9 9.1 10.6 -4.6Q1 -0.7 0.1 -2.0 0.7 -1.8Q2 -3.8 -4.1 -4.7 2.2 -3.3Q3 2.0 1.0 6.8 9.5 -5.4Q4 3.4 0.8 11.7 11.7 -3.9
2003 H1 -11.5 -18.9 -7.4 10.5 -2.3Q1 -3.9 -10.1 3.7 12.9 *Q2 -19.6 -29.1 -17.6 8.1 -4.6
Notes : (a) Comprising mainly outbound travel spending.
(*) Change of less than 0.05%.
/Overall .....

72
Overall balance of payments(10)
2.51 The current account remained in sizeable surplus in the first quarter of2003, at $36.5 billion, equivalent to 12.3% of GDP in that quarter. Yet this wassmaller than the surplus of $45.3 billion in the fourth quarter of 2002,equivalent to 13.7% of GDP in that quarter. The reduction in surplus waslargely attributable to a decrease in surplus in the combined visible andinvisible trade account, which was partly offset by an increase in net inflow ofexternal factor income.
2.52 Within the capital and financial account, there was a distinctreduction in net outflow from the portfolio investment account, to $54.8 billionin the first quarter of 2003. This was due to decreased purchase of overseasdebt securities by Hong Kong residents as well as renewed purchase of localdebt securities by overseas investors. Also, both net cash settlement offinancial derivatives and the direct investment account reverted from netoutflows to net inflows, at $12.1 billion and $3.0 billion respectively in the firstquarter of 2003. Yet the other investment account had a reduced net inflow, at$13.6 billion in the first quarter of 2003, owing to decreased inter-bankplacements by resident banks to non-resident banks. Taken together, financialnon-reserve assets recorded a net outflow of $26.0 billion in the first quarter of2003, equivalent to 8.7% of GDP in that quarter. This was much smaller thanthe corresponding net outflow of $65.5 billion in the fourth quarter of 2002,equivalent to 19.8% of GDP in that quarter.
2.53 Overall, the balance of payments account switched back to surplus at$10.4 billion in the first quarter of 2003, equivalent to 3.5% of GDP in thatquarter, having been in deficit in the preceding three quarters. Hence, therewas a corresponding increase in reserve assets by the same amount in thatquarter. This compared with the deficit figures of $11.6 billion and 3.5% in thefourth quarter of 2002.
/Diagram 2.27 .....

73
Q1 Q2 Q3 Q4 Q1 Q2 Q3 Q4 Q1 Q2 Q3 Q4 Q1 Q2 Q3 Q4 Q11999 2000 2001 2002 2003
0
20
40
60
80
-20
-40
-60
-80
HK$ Billion
Current account balance Net change in capital and financial non-reserve assets Net change in reserve assets
Major balances in Hong Kong's balance of paymentsDiagram 2.27
Note : A negative value for net change in reserve assets represents a netincrease, and a positive value represents a net decrease.
/Table 2.29 .....

74
Table 2.29Hong Kong’s balance of payments account
($ billion at current market prices)
2001# 2002# 2002 2003
Q1# Q2# Q3# Q4# Q1#
Current account(a) 95.8 137.3 30.0 19.9 42.0 45.3 36.5
Trade in goods -65.0 -39.4 -12.4 -16.4 -5.0 -5.6 -16.0
Trade in services 133.4 163.7 31.2 37.8 42.7 52.1 40.7
External factor income flows 41.2 27.4 14.8 2.1 8.1 2.4 15.9
Current transfers -13.9 -14.5 -3.5 -3.6 -3.8 -3.6 -4.1
Capital and financial account -97.4 -191.4 -46.8 -30.4 -57.1 -57.2 -38.4
Net change in capital transfers -9.2 -15.7 -3.0 -7.6 -1.9 -3.2 -1.9
Net change in financial non-reserve assets
-51.7 -194.2 -39.9 -25.9 -62.8 -65.5 -26.0
of which :
Direct investment 96.9 -31.0 -10.1 15.3 -32.7 -3.4 3.0
Portfolio investment -322.0 -290.7 7.1 -117.8 -82.5 -97.6 -54.8
Financial derivatives 39.6 10.6 12.3 6.1 -5.7 -2.0 12.1
Other investment 133.8 116.9 -49.2 70.6 58.1 37.5 13.6
Net change in reserve assets(b) -36.5 18.5 -3.9 3.1 7.7 11.6 -10.4
Net errors and omissions 1.6 54.1 16.8 10.4 15.1 11.9 1.9
Overall balance of payments 36.5 -18.5 3.9 -3.1 -7.7 -11.6 10.4
Notes : (#) Revised figures.
(a) According to the international statistical standard for compiling balance of payments(BoP) account, imports of goods are valued on free-on-board (f.o.b.) basis, which isdifferent from the practice for merchandise trade statistics where imports are valuedon cost, insurance and freight (c.i.f.) basis. In the BoP account, the insurance andfreight costs related to merchandise imports are entered as imports of services.
(b) A negative value for net change in reserve assets represents a net increase, and apositive value represents a net decrease.
/Notes .....
75
Notes :
(1) Estimates of price changes for the trade aggregates are based on changes in unitvalues, which do not take into account changes in the composition or quality of thegoods traded, except for some selected commodities for which specific price indicesare available. Changes in real terms are derived by discounting the effect of pricechanges from changes in the value of the trade aggregates.
(2) Re-exports are those goods which have previously been imported into Hong Kong andare subsequently exported without having undergone in Hong Kong anymanufacturing processes which change permanently the shape, nature, form or utilityof the goods.
(3) Offshore trade is covered in exports of trade-related services within the broadercomponent of exports of services in the Gross Domestic Product. It covers theservices of both “merchanting” and “merchandising for offshore transactions”.Merchanting is defined as the services associated with trading of goods which arepurchased from a party outside Hong Kong and then sold to another party outsideHong Kong, without the goods ever entering and leaving Hong Kong. Merchandisingfor offshore transactions is defined as the services of arranging on behalf ofbuyers/sellers outside Hong Kong the purchase/sale of goods according to theirspecifications. Earnings from offshore trade include the gross margin frommerchanting and the commission from merchandising for offshore transactions.
(4) Here imports of goods are valued on free-on-board (f.o.b.) basis, which is differentfrom the practice for merchandise trade statistics where imports are valued on cost,insurance and freight (c.i.f.) basis. The insurance and freight costs related tomerchandise imports are entered as imports of services.
(5) Exports of financial and banking services in the GDP account include commissionsand fees for rendering financial and related ancillary services to non-residents.However, these do not include interest receipts from non-residents, which account fora major part of the external receipts of financial intermediaries in Hong Kong. Interestreceipts from non-residents are correctly classified as investment income from abroadunder GNP. The same situation applies, in an opposite direction, to interest paymentsto non-residents. Hence the trade in services component and the invisible tradesurplus of Hong Kong would have been larger if such interest receipts and paymentswere classified to the services account.
(6) East Asia here covers nine major markets in the region, namely the mainland of China,Japan, Taiwan, Singapore, the Republic of Korea, the Philippines, Thailand, Malaysiaand Indonesia.
(7) North America here comprises the United States and Canada.
/(8) .....
76
(8) There are currently 15 member countries in the European Union, namely the UnitedKingdom, Germany, the Netherlands, France, Sweden, Italy, Denmark, Spain, Finland,Belgium, Luxembourg, Ireland, Austria, Greece and Portugal.
(9) Outward processing arrangements are made between Hong Kong companies andmanufacturing entities in the Mainland under which the companies concernedsub-contract the whole or part of the production processes relating to their products tothe Mainland entities. Raw materials or semi-manufactures are normally exported tothe Mainland for such processing. The Mainland entity involved can be a localenterprise, a joint venture, or some other forms of business involving foreigninvestment.
There is no restriction on outward processing activities in general. However, outwardprocessing on goods which claim Hong Kong origin status is strictly governed by theHong Kong origin rules. The Trade and Industry Department operates an effectiveadministrative arrangement whereby goods manufactured in Hong Kong but havingundergone outward processing activities can be conferred Hong Kong origin statussubject to the Hong Kong origin rules being fully met.
(10) A balance of payments (BoP) account is a statistical framework that systematicallysummarises the external transactions of an economy with the rest of the world in aspecific time period.
A complete BoP account comprises the current account and the capital and financialaccount. The current account records the flows of real resources, including exports andimports of goods and services, factor income received from and paid to abroad, andcurrent transfers from and to abroad. The capital account records external capitaltransfers, and external acquisitions and disposals of non-produced and non-financialassets. The financial account records transactions in financial assets and liabilitiesbetween residents and non-residents, including direct investment, portfolio investment,financial derivatives, and other investment. Also included is net change in reserveassets.
Within the overall BoP account, the current account balance and the net change incapital and financial non-reserve assets taken together, which is deemed to representthe BoP position of the economy, matches exactly the net change in reserve assets, byvirtue of the BoP accounting identity.
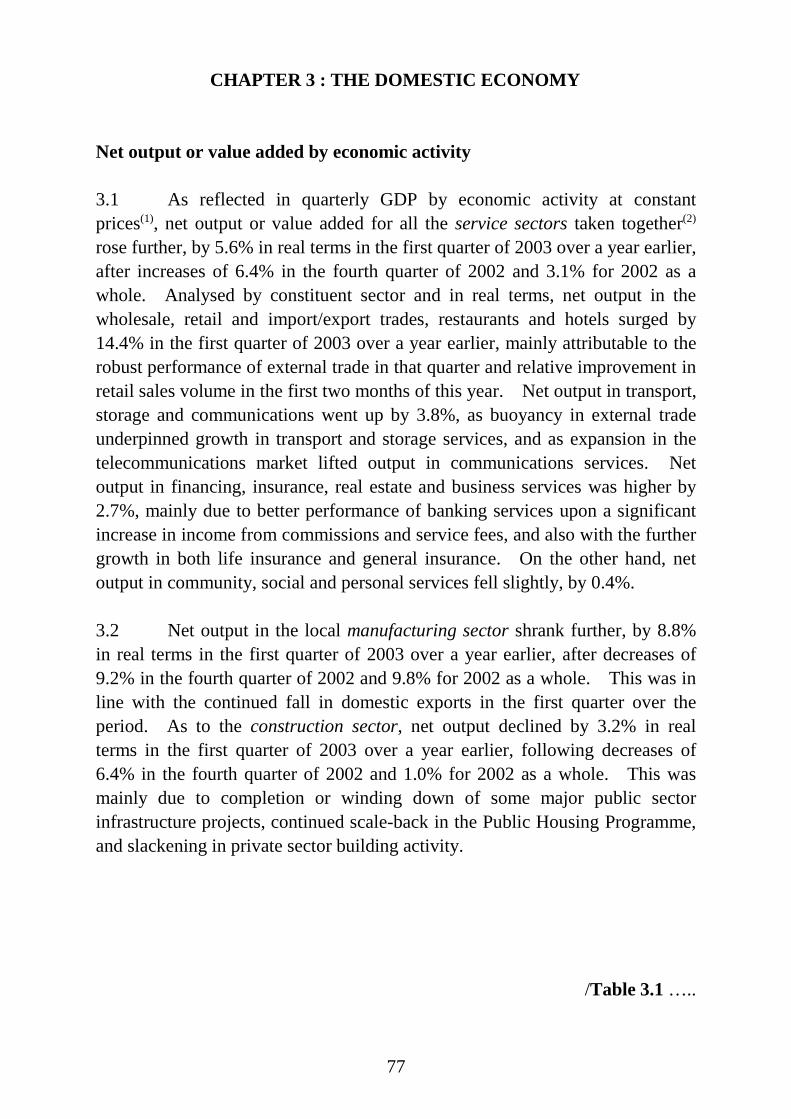
77
CHAPTER 3 : THE DOMESTIC ECONOMY
Net output or value added by economic activity
3.1 As reflected in quarterly GDP by economic activity at constantprices(1), net output or value added for all the service sectors taken together(2)
rose further, by 5.6% in real terms in the first quarter of 2003 over a year earlier,after increases of 6.4% in the fourth quarter of 2002 and 3.1% for 2002 as awhole. Analysed by constituent sector and in real terms, net output in thewholesale, retail and import/export trades, restaurants and hotels surged by14.4% in the first quarter of 2003 over a year earlier, mainly attributable to therobust performance of external trade in that quarter and relative improvement inretail sales volume in the first two months of this year. Net output in transport,storage and communications went up by 3.8%, as buoyancy in external tradeunderpinned growth in transport and storage services, and as expansion in thetelecommunications market lifted output in communications services. Netoutput in financing, insurance, real estate and business services was higher by2.7%, mainly due to better performance of banking services upon a significantincrease in income from commissions and service fees, and also with the furthergrowth in both life insurance and general insurance. On the other hand, netoutput in community, social and personal services fell slightly, by 0.4%.
3.2 Net output in the local manufacturing sector shrank further, by 8.8%in real terms in the first quarter of 2003 over a year earlier, after decreases of9.2% in the fourth quarter of 2002 and 9.8% for 2002 as a whole. This was inline with the continued fall in domestic exports in the first quarter over theperiod. As to the construction sector, net output declined by 3.2% in realterms in the first quarter of 2003 over a year earlier, following decreases of6.4% in the fourth quarter of 2002 and 1.0% for 2002 as a whole. This wasmainly due to completion or winding down of some major public sectorinfrastructure projects, continued scale-back in the Public Housing Programme,and slackening in private sector building activity.
/Table 3.1 …..

78
Table 3.1
GDP by economic activity(a)
(year-on-year rate of change in real terms (%))
2002# 2003#
Annual Q1 Q2 Q3 Q4 Q1
Manufacturing -9.8 -11.6 -11.2 -7.3 -9.2 -8.8
Construction -1.0 -1.7 3.2 2.4 -6.4 -3.2
Services(b) 3.1 * 1.5 4.3 6.4 5.6
Of which :
Wholesale, retail andimport/export trades,restaurants and hotels
5.1 -2.8 0.5 6.9 14.5 14.4
Transport, storage andcommunications
4.0 0.2 3.6 5.5 6.2 3.8
Financing, insurance,real estate andbusiness services
0.9 -1.5 0.9 1.6 2.5 2.7
Community, social andpersonal services
0.7 1.0 0.3 1.1 0.5 -0.4
Notes : (a) The GDP figures shown in this table are compiled from the productionapproach, in parallel with those shown in Table 1.1 which are compiled fromthe expenditure approach. For details, see Note (1) to this chapter.
(b) In the context of value added contribution to GDP, the service sectors includeownership of premises as well, which is analytically a service activity. Also,charges of financial intermediation services are deducted.
(#) Revised figures.
(*) Change of less than 0.05%.
/Local …..

79
Local manufacturing output
3.3 The Index of Industrial Production(3), as also reflecting output in thelocal manufacturing sector, declined further by 8.8% in the first quarter of 2003over a year earlier, following declines of 9.2% in the fourth quarter of 2002 and9.8% for 2002 as a whole. Analysed by major constituent industry and involume, output of the consumer electrical and electronic products, the fabricatedmetal products, and the machinery and equipment industries plummeted by30.1%, 27.5% and 25.4% respectively in the first quarter of 2003 over a yearearlier. Output of the plastic products industry declined more moderately, by6.0%, while output of the wearing apparel and the textiles industries went downonly slightly, by 0.1% and 0.8% respectively. On the other hand, output of thepaper products and printing industry continued to rise distinctly, by 11.7%.On a seasonally adjusted quarter-to-quarter comparison, the Index shrankfurther, by 2.2% in volume in the first quarter of 2003, after a 3.9% decrease inthe fourth quarter of 2002.
Table 3.2Index of Industrial Production for the major local manufacturing industries
(year-on-year rate of change in volume (%))
2002 2003
Annual Q1 Q2 Q3 Q4 Q1#
Industry groupWearing apparel -6.6 -13.4 -10.5 4.0 -7.2 -0.1Textiles -7.2 -10.6 -7.3 -5.9 -6.4 -0.8Plastic products -10.8 -13.1 -7.4 -15.5 -7.0 -6.0Consumer electrical and
electronic products-23.6 -0.8 -29.6 -28.2 -35.4 -30.1
Machinery and equipment -16.8 -17.4 -19.7 -11.4 -18.8 -25.4Fabricated metal products -29.4 -27.4 -30.7 -30.6 -28.8 -27.5Paper products and
printing-0.2 -10.5 1.0 0.1 8.3 11.7
Overall manufacturing -9.8 -11.6 -11.2 -7.3 -9.2 -8.8<-2.4> <-1.3> <-0.7> <-3.9> <-2.2>
Notes : (#) Provisional figures.< > Seasonally adjusted quarter-to-quarter % change in volume.
/Diagram 3.1 …..
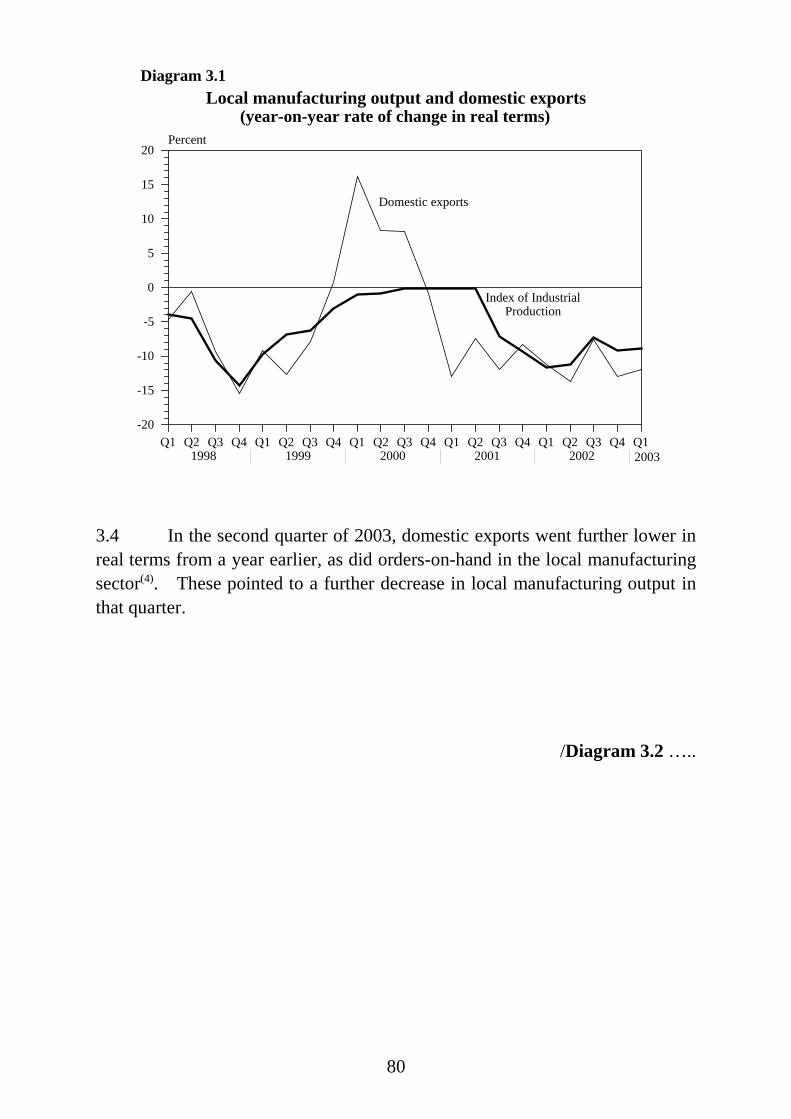
80
Local manufacturing output and domestic exports(year-on-year rate of change in real terms)
Diagram 3.1
Q1 Q2 Q3 Q4 Q1 Q2 Q3 Q4 Q1 Q2 Q3 Q4 Q1 Q2 Q3 Q4 Q1 Q2 Q3 Q4 Q11998 1999 2000 2001 2002 2003
0
5
10
15
20
-5
-10
-15
-20
Percent
Index of Industrial Production
Domestic exports
2003
3.4 In the second quarter of 2003, domestic exports went further lower inreal terms from a year earlier, as did orders-on-hand in the local manufacturingsector(4). These pointed to a further decrease in local manufacturing output inthat quarter.
/Diagram 3.2 …..

81
Orders-on-hand and domestic exports(year-on-year rate of change in value terms)
M J S D M J S D M J S D M J S D M J S D M J1998 1999 2000 2001 2002 2003
0
10
20
30
-10
-20
-30
Percent
Diagram 3.2
Domestic exports
Orders-on-hand
20022001200019991998 2003
Table 3.3
Orders-on-hand in the local manufacturing sector
Value index oforders-on-hand
(1993=100)
Year-on-year rate ofchange in value terms
(%)
2002 Mar 54.1 -11.5Jun 55.6 -11.3Sep 49.2 -7.3Dec 42.4 -10.7
2003 Mar 45.3 -16.3Jun# 49.5 -11.0
Note : (#) Provisional figures.
/Service …..

82
Service sector receipts
3.5 Business receipts in most of the service sectors surveyed declined inthe first quarter of this year. Analysed by constituent sector and in value terms,business receipts in restaurants showed the largest decline, by 8.6% in the firstquarter of 2003 over a year earlier. Business receipts in hotels also fell, by2.7%. The performance of these two sectors was partly affected by the spreadof SARS in Hong Kong since mid-March. Business receipts in real estatedeclined by 4.3%, mainly caused by reduced transactions in the property market.Business receipts in storage fell by 7.8%, owing to lower rental charges forstorage space. Business receipts in financing (except banking) dipped by 5.7%,mainly reflecting reduced trading and fund-raising activities in the stock market.Business receipts in the wholesale trade, the retail trade and film entertainmentwent down by 3.5%, 2.6% and 1.0% respectively, affected by subduedconsumer spending and the offer of greater price discounts upon the SARSimpact. Business receipts in banking dropped slightly by 1.3%, as commercialactivities generally moderated upon the SARS impact.
3.6 On the other hand, business receipts in insurance surged by 22.4% inthe first quarter of 2003 over a year earlier, amidst expansion in both generalinsurance and life insurance. Business receipts in transport also rose, by 5.6%,on account of further growth in cargo throughput. Business receipts in theimport/export trade went up more moderately, by 2.4%, affected by the war onIraq and keen competition in the trade. Business receipts in communicationsand business services increased slightly, by 1.6% and 0.2% respectively.
/Table 3.4 …..

83
Table 3.4Index of Business Receipts for individual service sectors
(year-on-year rate of change in value terms (%))
2002 2003
Annual Q1 Q2 Q3 Q4 Q1
Service sector
Import/export trade -2.8 -15.4 -2.6 1.8 5.3 2.4
Wholesale trade -10.7 -14.7 -12.8 -8.9 -6.2 -3.5
Retail trade -4.1 -3.7 -5.8 -4.3 -2.4 -2.6
Restaurants -5.4 -5.4 -6.0 -4.5 -5.9 -8.6
Hotels -2.3 -12.5 -6.6 -2.5 12.5 -2.7
Banking -0.8 -7.2 0.3 -4.2 7.4 -1.3
Financing (exceptbanking)
-14.3 -25.2 -11.4 -6.9 -11.1 -5.7
Insurance 10.3 10.0 6.0 9.8 15.0 22.4
Real estate -2.5 -0.1 3.5 -8.4 -5.2 -4.3
Business services -5.8 -10.4 -4.0 -5.0 -3.5 0.2
Transport 2.3 -8.2 0.3 6.1 10.6 5.6
Storage -19.6 -21.7 -27.4 -20.4 -6.8 -7.8
Communications -2.6 -5.2 -4.3 -1.4 0.5 1.6
Film entertainment -9.1 2.6 -15.5 -18.9 -1.8 -1.0
Property
3.7 The sales market for residential property remained sluggish duringmost of the first half of 2003. After a relatively more active start early in theyear, acquisition interest was curtailed further during the period from mid-March to early June, amidst the severe impact from the spread of SARS in HongKong. Apart from dwindled demand under the poor sentiment, the amplesupply of new flats in the mass market continued to pose a drag. Faced withsuch an austere situation, developers either withheld sales or else staged more
/intensive …..

84
intensive promotion, by offering larger price discounts and more sweeteners toprospective flat buyers(5). Then, with the impact of SARS fading away sinceearly June, there were signs of improvement in sentiment, lifting demandmostly in the primary market. Meanwhile, the luxurious end of the marketturned slightly more active during the first half of this year, stimulated in partby the Government’s new policy measure announced in February to attractinvestment immigrants to Hong Kong(6). As to the rental market for residentialproperty, performance likewise remained lacklustre in overall terms, given thestill subdued user demand and increased supply of flats for lease.
3.8 On a quarter-to-quarter comparison, flat prices fell further, on averageby 6% in the second quarter of 2003, after a 4% drop in the first quarter. Forthe first half of 2003 as a whole, flat prices went down on average by 10%.Flat rentals also declined further, on average by 5% in the second quarter of2003, following a 3% fall in the first quarter. For the first half of 2003 as awhole, flat rentals were on average lower by 8%. Compared with therespective peak levels in the third quarter of 1997, flat prices and rentals in thesecond quarter of 2003 were down substantially, by an average of 65% and 48%respectively.
3.9 On commercial property, both the sales and rental markets for officespace remained weak in the first half of 2003, upon further consolidation anddownsizing in the corporate sector amidst an uncertain business outlook,especially under the impact of SARS. The market for Grade A office space,particularly that in the central business district, continued to be pulled down byabundant supply with the completion of some new projects, as well as byreduced demand with the relocation of more companies to the secondarydistricts for saving costs. On a quarter-to-quarter comparison, prices for officespace on average fell further by 7% in the second quarter of 2003, havingdropped by 4% in the first quarter. For the first half of 2003 as a whole, therewas on average a 11% decrease. Office rentals on average declined by 4% inthe second quarter of 2003, following a 3% fall in the first quarter. For thefirst half of 2003 as a whole, the decrease on average amounted to 7%. Theeffective rentals could have fallen more, given the longer rent-free periods andother lease concessions offered by many landlords in order to improveoccupancy. Against their respective peak levels in 1994, prices and rentals ofoffice space in the second quarter of 2003 were drastically lower, by an averageof 76% and 60% respectively.
/3.10 …..
85
3.10 The sales and rental markets for shopping space also remained bleakin the first half of 2003, especially during the period from mid-March to earlyJune when both inbound tourism and local consumption were hit severely bythe spread of SARS in Hong Kong. Landlords of such premises were under awidespread plea to grant temporary rental concessions to help ease thedifficulties facing tenant operators. On a quarter-to-quarter comparison,rentals for shopping space fell on average by 5% in the second quarter of 2003,after a 2% fall in the first quarter. For the first half of 2003 as a whole, therewas on average a 8% decline. Prices for shopping space were on averagedown by 1% in the second quarter of 2003, after a 3% decrease in the firstquarter. For the first half of 2003 as a whole, there was on average a 5%decline. Compared with the peak levels in the third quarter of 1997, pricesand rentals for shopping space in the second quarter of 2003 plummeted by anaverage of 59% and 32% respectively.
3.11 On industrial property, the rental and sales markets remained stagnantin overall terms in the first half of 2003, on the back of a continued downtrendin local manufacturing activity. On a quarter-to-quarter comparison, rentals ofindustrial space on average went down by 6% in the second quarter of 2003,following a 1% decline in the first quarter. For the first half of 2003 as awhole, rentals of industrial space on average slid by 7%. Prices of industrialspace on average went down by 4% in the second quarter of 2003, after zerochange in the first quarter. For the first half of 2003 as a whole, prices ofindustrial space on average fell by 5%. Against their respective peak levels in1994, prices and rentals of industrial space in the second quarter of 2003slumped by an average of 70% and 50% respectively.
3.12 Property transactions, as measured by agreements for sale andpurchase of property registered with the Land Registry, fell by 26% in numberand by 32% in total value in the first half of 2003 over a year earlier,considerably larger than the corresponding declines of 14% and 18% in thesecond half of 2002. Analysed by main type of property and on a year-on-yearcomparison, transactions in residential property declined by 30% in number andby 37% in total value in the first half of 2003, much exceeding thecorresponding declines of 6% and 5% in transactions in non-residential property.On a quarter-to-quarter comparison, overall property transactions went downfurther in the second quarter of 2003, by 1% in number and 9% in total value, as
/against …..
86
against a decline of 5% and zero change respectively in the first quarter.Within this total, transactions in residential property remained unchanged innumber but fell by 10% in total value in the second quarter of 2003, afterdeclines of 10% and 7% respectively in the first quarter. Transactions in non-residential property were lower by 5% in number and 3% in total value in thesecond quarter of 2003, reversing leaps of 19% and 46% respectively in the firstquarter.
3.13 Property transfer assignments, being a lagging indicator of propertytransactions, went down by 15% in number and by 13% in total value in the firsthalf of 2003 over a year earlier, after decreasing by 14% and 17% respectivelyin the second half of 2002. On a quarter-to-quarter comparison, propertytransfer assignments fell by 17% in number and by 6% in total value in thesecond quarter of 2003, following an increase of 4% in number yet a decrease of7% in total value in the first quarter. As to mortgage arrangements in the firsthalf of 2003, there was a decrease of 23% in number over a year earlier,somewhat smaller than the 26% decline in the second half of 2002. On aquarter-to-quarter comparison, the number of mortgage arrangements wentdown by 16% in the second quarter of 2003, reversing the 1% rise in the firstquarter.
3.14 On Government-subsidised flats, there were no new sales of flatsunder the Home Ownership Scheme (HOS) and the Tenants Purchase Scheme(TPS) in the first half of 2003, following the announcement in mid-November2002 to cease the production and sale of HOS flats and also to halt the sale ofpublic rental flats under TPS.
/Table 3.5 …..

87
Table 3.5
Indices of Property Prices and Rentals
Residential flats Office space Shopping spaceConventional
flatted factory space
Price index(a)
(1999=100)Rental index(b)
(1999=100)Price index(1999=100)
Rental index(b)
(1999 =100)Price index(1999=100)
Rental index(b)
(1999=100)Price index(1999=100)
Rental index(b)
(1999=100)
2002 Q1 73.8 (*) 87.4 (-4) 71.2 (*) 89.6 (-6) 84.4 (*) 94.0 (-3) 75.4 (-3) 85.5 (-2)
Q2 72.2 (-2) 84.8 (-3) 68.8 (-3) 85.4 (-5) 86.6 (3) 92.6 (-1) 76.9 (2) 83.0 (-3)
Q3 68.6 (-5) 82.4 (-3) 68.6 (*) 84.0 (-2) 86.1 (-1) 92.8 (*) 74.4 (-3) 81.1 (-2)
Q4 65.1 (-5) 79.0 (-4) 64.9 (-5) 82.7 (-2) 83.0 (-4) 92.1 (-1) 72.6 (-2) 81.2 (*)
2003 Q1^ 62.5 (-4) 76.5 (-3) 62.0 (-4) 80.2 (-3) 80.1 (-3) 89.8 (-2) 72.4 (*) 80.2 (-1)
Q2^ 58.7 (-6) 72.9 (-5) 57.5 (-7) 76.8 (-4) 79.1 (-1) 84.9 (-5) 69.3 (-4) 75.7 (-6)
Notes : All rental indices shown in this table have been adjusted for changes in concessionary leasing terms suchas provision of refurbishment, granting of rent-free periods, and waiver of miscellaneous charges, ifknown.
(a) Prices for residential property in this table cover existing flats traded in the secondary market, butnot new flats sold in the primary market.
(b) Rentals for residential property in this table cover only new tenancies for which rentals are freshly
determined, while rentals for non-residential property in this table cover also lease renewals uponwhich rentals may be revised.
( ) % change over the preceding quarter.
(^) Provisional figures.
(*) Change of less than 0.5%.
Source : Rating and Valuation Department.
/Diagram 3.3 …..

88
Property prices and rentals
Q1 Q3 Q1 Q3 Q1 Q3 Q1 Q3 Q1 Q3 Q11998 1999 2000 2001 2002 2003
0
20
40
60
80
100
120
140
160
180Index (1999=100)
Q1 Q3 Q1 Q3 Q1 Q3 Q1 Q3 Q1 Q3 Q11998 1999 2000 2001 2002 2003
0
20
40
60
80
100
120
140
160
180Index (1999=100)
(a) Residential property (b) Office space
Rental index
Price index Price index
Rental index
Diagram 3.3
2003 2003
Q1 Q3 Q1 Q3 Q1 Q3 Q1 Q3 Q1 Q3 Q11998 1999 2000 2001 2002 2003
0
20
40
60
80
100
120
140
160
180Index (1999=100)
Q1 Q3 Q1 Q3 Q1 Q3 Q1 Q3 Q1 Q3 Q11998 1999 2000 2001 2002 2003
0
20
40
60
80
100
120
140
160
180Index (1999=100)
Rental index
Price index
Rental index
Price index
(c) Shopping space (d) Conventional flatted factory space
20032003
Note : See the footnotes to Table 3.5.
/Table 3.6 …..

89
Table 3.6Relationship between mortgage rate
and monthly instalment payment
Average of thebest lending rates
quoted by theprincipal banksin Hong Kong
Average of theeffective mortgage
rates charged on newmortgages by theprincipal banks
in Hong Kong(a)
Monthly instalment on$100,000 mortgage
loan charged according tothe average effective mortgagerate with mortgage period of(b)
(%) (%) ($)
10 years 15 years 20 years
2002 Q1 5.13 2.63 949 673 536Q2 5.13 2.63 949 673 536Q3 5.13 2.63 949 673 536Q4 5.07 2.55 945 669 533
2003 Q1 5.00 2.50 943 667 530Q2 5.00 2.50 943 667 530
Jan 5.00 2.50 943 667 530Feb 5.00 2.50 943 667 530Mar 5.00 2.50 943 667 530
Apr 5.00 2.50 943 667 530May 5.00 2.50 943 667 530Jun 5.00 2.50 943 667 530
Notes : (a) Here the effective mortgage rate refers to the modal value, representing the rate mostcommonly charged to customers amongst the banks.
(b) These figures are based on equal monthly repayments throughout the mortgageperiod.
3.15 Tracking the supply of new property on a year-on-year comparison,completions of private residential flats increased distinctly further, by 19% inthe first half of 2003, after an 80% jump in the second half of 2002.Completions of office space rose sharply further, by 82% in the first half of2003, yet not as large as the 119% surge in the second half of 2002.Completions of other commercial premises leaped even more, by 86% in thefirst half of 2003, having soared by 64% in the second half of 2002. As toindustrial property, completions bounced up by 474% in the first half of 2003from a very low base a year earlier, after a decrease of 12% in the second half of
/2002 …..

90
2002. Comparing the twelve months ending June 2003 with the precedingtwelve-month period, completions of private residential flats, office space, othercommercial premises and industrial property all went up markedly, by 55%,90%, 72% and 27% respectively.
Table 3.7
Agreements for sale and purchase of property
Number Total value ($Bn)
Residentialproperty(a)
Non-residentialProperty Total
Residentialproperty(a)
Non-residentialproperty Total
2002 Annual 72 974 (5) 12 947 (-30) 85 921 (-3) 154.3 (2) 31.1 (-26) 185.4 (-4)
H1 40 921 (25) 6 877 (-37) 47 798 (9) 89.9 (27) 14.4 (-38) 104.3 (11)H2 32 053 (-13) 6 070 (-19) 38 123 (-14) 64.4 (-19) 16.7 (-11) 81.1 (-18)
Q1 18 992 (26) 3 569 (-40) 22 561 (7) 41.5 (21) 6.1 (-44) 47.7 (5)Q2 21 929 (24) 3 308 (-35) 25 237 (11) 48.3 (32) 8.3 (-32) 56.6 (16)Q3 16 120 (-11) 3 277 (-12) 19 397 (-11) 32.3 (-22) 11.9 (37) 44.2 (-11)Q4 15 933 (-15) 2 793 (-26) 18 726 (-17) 32.1 (-17) 4.8 (-52) 36.9 (-24)
2003 H1 28 722 (-30) 6 478 (-6) 35 200 (-26) 56.9 (-37) 13.7 (-5) 70.6 (-32)
Q1 14 386 (-24) 3 329 (-7) 17 715 (-21) 29.9 (-28) 7.0 (14) 36.9 (-23)Q2 14 336 (-35) 3 149 (-5) 17 485 (-31) 27.0 (-44) 6.8 (-19) 33.7 (-40)
<*> <-5> <-1> <-10> <-3> <-9>
Jan 6 187 (-21) 1 106 (-20) 7 293 (-21) 12.0 (-34) 2.6 (5) 14.6 (-29)Feb 3 649 (-36) 973 (-14) 4 622 (-32) 6.4 (-48) 1.6 (-4) 8.0 (-43)Mar 4 550 (-17) 1 250 (19) 5 800 (-11) 11.5 (5) 2.8 (40) 14.3 (10)
Apr 5 373 (-27) 1 009 (-4) 6 382 (-25) 10.5 (-31) 2.3 (16) 12.8 (-26)May 4 130 (-44) 960 (-16) 5 090 (-40) 7.5 (-56) 1.9 (-44) 9.4 (-54)Jun 4 833 (-33) 1 180 (6) 6 013 (-28) 9.0 (-44) 2.5 (-13) 11.5 (-40)
Notes : Figures may not add up exactly to the total due to rounding.
(a) It should be noted that primary sales of units under the Home Ownership Scheme (HOS)and the Tenants Purchase Scheme (TPS) are not covered in this table, as sale andpurchase agreements are commonly not required for these transactions. Also, sale andpurchase agreements for primary sales of units under the Private Sector ParticipationScheme (PSPS) are not included in the column on residential property, yet they areincluded in the column on non-residential property, and thus also in the total column.
( ) % change over a year earlier.
< > % change over the preceding quarter.
(*) Change of less than 0.5%.
Source : Land Registry.
/Diagram 3.4 …..

91
Sale and purchase agreements by broad type of property
Q1 Q2 Q3 Q4 Q1 Q2 Q3 Q4 Q1 Q2 Q3 Q4 Q1 Q2 Q3 Q4 Q1 Q2 Q3 Q4 Q1 Q21998 1999 2000 2001 2002 2003
0
10
20
30
40
50Number ('000)
Residential property # Non-residential property
Diagram 3.4
Residential property #Non-residential property
Note : (#) See Footnote (a) to Table 3.7.
/Table 3.8 …..
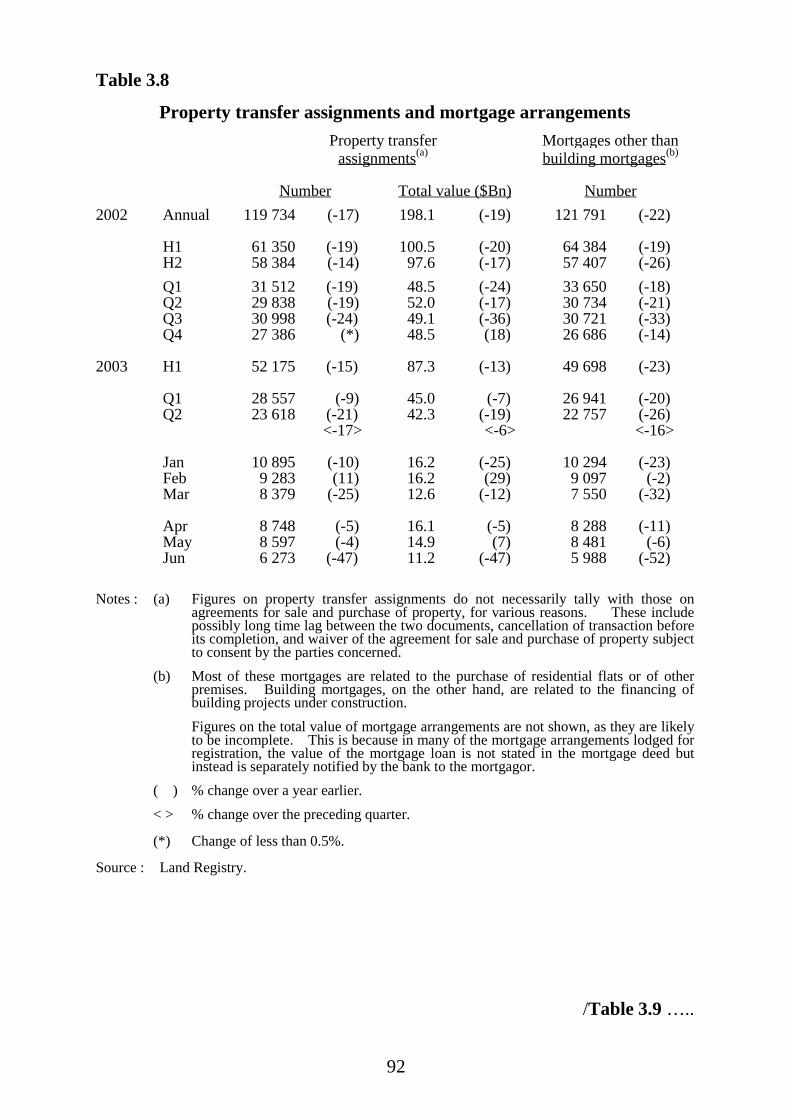
92
Table 3.8
Property transfer assignments and mortgage arrangementsProperty transfer
assignments(a)Mortgages other thanbuilding mortgages(b)
Number Total value ($Bn) Number2002 Annual 119 734 (-17) 198.1 (-19) 121 791 (-22)
H1 61 350 (-19) 100.5 (-20) 64 384 (-19)H2 58 384 (-14) 97.6 (-17) 57 407 (-26)Q1 31 512 (-19) 48.5 (-24) 33 650 (-18)Q2 29 838 (-19) 52.0 (-17) 30 734 (-21)Q3 30 998 (-24) 49.1 (-36) 30 721 (-33)Q4 27 386 (*) 48.5 (18) 26 686 (-14)
2003 H1 52 175 (-15) 87.3 (-13) 49 698 (-23)
Q1 28 557 (-9) 45.0 (-7) 26 941 (-20)Q2 23 618 (-21) 42.3 (-19) 22 757 (-26)
<-17> <-6> <-16>
Jan 10 895 (-10) 16.2 (-25) 10 294 (-23)Feb 9 283 (11) 16.2 (29) 9 097 (-2)Mar 8 379 (-25) 12.6 (-12) 7 550 (-32)
Apr 8 748 (-5) 16.1 (-5) 8 288 (-11)May 8 597 (-4) 14.9 (7) 8 481 (-6)Jun 6 273 (-47) 11.2 (-47) 5 988 (-52)
Notes : (a) Figures on property transfer assignments do not necessarily tally with those onagreements for sale and purchase of property, for various reasons. These includepossibly long time lag between the two documents, cancellation of transaction beforeits completion, and waiver of the agreement for sale and purchase of property subjectto consent by the parties concerned.
(b) Most of these mortgages are related to the purchase of residential flats or of otherpremises. Building mortgages, on the other hand, are related to the financing ofbuilding projects under construction.Figures on the total value of mortgage arrangements are not shown, as they are likelyto be incomplete. This is because in many of the mortgage arrangements lodged forregistration, the value of the mortgage loan is not stated in the mortgage deed butinstead is separately notified by the bank to the mortgagor.
( ) % change over a year earlier.< > % change over the preceding quarter.
(*) Change of less than 0.5%.
Source : Land Registry.
/Table 3.9 …..

93
Table 3.9
Completions of new property by the private sector('000m2 of internal floor area)
Usage
Firsthalf
of 2002
Firsthalf
of 2003^
Year-on-yearrate ofchange
TwelvemonthsendingJune2002
TwelvemonthsendingJune
2003^
Year-on-yearrate ofchange
(%) (%)
Residential(a) 9 628 11 433 19 23 156 35 840 55
Commercial
Of which:
144 264 83 232 423 82
Office space 105 191 82 133 251 90
Other commercialpremises (mainlyshopping space)(b)
40 73 86 100 172 72
Industrial(c)
Of which:
3 16 474 33 42 27
Industrial-cum-officepremises
0 16 -- 0 16 --
Flatted factoryspace
3 0 -100 33 0 -100
Storage premises(d) 0 0 -- 0 27 --
Notes : (a) These include all newly completed residential premises to which either temporary orfull Occupation Permits have been granted, as well as village-type houses issued withLetters of Compliance. Property developments subject to a Consent Scheme will needa Certificate of Compliance, Consent to Assign or Consent to Lease in addition to anOccupation Permit before the premises can be individually assigned.The figures shown are in respect of private residential units, excluding units completedby the Hong Kong Housing Authority and Hong Kong Housing Society.
(b) These include shopping arcades in residential and commercial developments, as well aspremises designed or adapted for commercial use other than offices, in the nature ofnon-domestic space on the podium floors of tenement apartment/commercial buildings.Car-parking space is excluded.
(c) Including industrial-cum-office premises but excluding specialised factory buildings,which are developed mainly for own use.
(d) Including storage premises at the container terminals and the airport.(^) Provisional figures.(--) Not applicable.
Source : Rating and Valuation Department.
/Diagram 3.5 …..

94
Completions of new property by major category
Q1 Q2 Q3 Q4 Q1 Q2 Q3 Q4 Q1 Q2 Q3 Q4 Q1 Q2 Q3 Q4 Q1 Q2 Q3 Q4 Q1 Q21998 1999 2000 2001 2002 2003
0
2
4
6
8
10
12
14
16
18
20
22Number of units ('000)
Sale units of Housing Authority and Housing Society Private residential units
Diagram 3.5
Sale units of the Hong Kong Housing Authority and the Hong Kong Housing Society
Private residential units
Q1 Q2 Q3 Q4 Q1 Q2 Q3 Q4 Q1 Q2 Q3 Q4 Q1 Q2 Q3 Q4 Q1 Q2 Q3 Q4 Q1 Q21998 1999 2000 2001 2002 2003
0
50
100
150
200
250
300
350
400
450
500Internal floor area ('000 sq. metres)
Office space Other commercial premises (mainly shopping space)
Office spaceOther commercial premises (mainly shopping space)
Q1 Q2 Q3 Q4 Q1 Q2 Q3 Q4 Q1 Q2 Q3 Q4 Q1 Q2 Q3 Q4 Q1 Q2 Q3 Q4 Q1 Q21998 1999 2000 2001 2002 2003
0
20
40
60
80
100
120Internal floor area ('000 sq. metres)
Industrial-cum-office premises Conventional flatted factory space Conventional flatted factory space
Industrial-cum-office premises
Note : See the footnotes to Table 3.9.
/3.16 …..

95
3.16 Planned developments of all types of property in the private sector, asindicated by the total usable floor area on building plans with consent tocommence work, went up by 28% in the first half of 2003 over a year earlier.This followed a 34% increase in the second half of 2002. Analysed by maintype of property and on a year-on-year comparison, planned developments ofprivate residential property soared by 90% in terms of units or by 31% in termsof total usable floor area in the first half of 2003 from a low base a year earlier.This was in stark contrast to the corresponding decreases of 30% and 18% inthe second half of 2002. On the other hand, planned developments ofcommercial property plummeted, by 64% in the first half of 2003, after a 186%surge in the second half of 2002. There were no new planned developments ofindustrial property in the first half of 2003, such developments having risensharply by 117% in the second half of 2002 from a low base. Planneddevelopments of property in the “others” category continued to surge, by 483%in the first half of 2003, following a 539% leap in the second half of 2002, bothfrom a low base. Comparing the twelve months ending June 2003 with thepreceding twelve-month period, planned developments of all types of propertyincreased by 31%. Planned developments of private residential property roseby 25% in terms of units or by 8% in terms of total usable floor area. Planneddevelopments of property in the “others” category, commercial property andindustrial property were also up, by 498%, 33% and 13% respectively.
/Table 3.10 …..

96
Table 3.10
Building plans with consent tocommence work in the private sector
('000m2 of usable floor area)
Usage
Firsthalf
of 2002
Firsthalf
of 2003
Year-on-yearrate ofchange
TwelvemonthsendingJune2002
TwelvemonthsendingJune2003
Year-on-yearrate ofchange
(%) (%)
Residential(a) 453 594 31 863 931 8(9 450) (17 971) (90) (20 672) (25 813) (25)
Commercial 130 48 -64 213 282 33
Industrial(b) 32 0 -100 67 75 13
Others 32 186 483 44 264 498
Total 647 828 28 1 187 1 553 31
Notes : Figures may not add up exactly to the total due to rounding.
Developers are required to re-apply for issue of consent to commence work on every majorrevision of their development projects. The figures reported here may include re-application cases and hence are subject to a certain degree of double-counting. Figuresfor June 2003 are provisional.
(a) Here the classification of residential property includes developments under the UrbanImprovement Scheme of the Hong Kong Housing Society, but excludesdevelopments under the Home Ownership Scheme and the Private SectorParticipation Scheme of the Hong Kong Housing Authority.
(b) Including multi-purpose industrial premises designed also for office use.
( ) Number of units.
Source : Buildings Department.
/Diagram 3.6 …..

97
Building plans with consent to commence work
Q1 Q2 Q3 Q4 Q1 Q2 Q3 Q4 Q1 Q2 Q3 Q4 Q1 Q2 Q3 Q4 Q1 Q2 Q3 Q4 Q1 Q21998 1999 2000 2001 2002 2003
0
100
200
300
400
500
600
700Usable floor area ('000 sq. metres)
Commercial Residential
Diagram 3.6
in the private sector by major category
Q1 Q2 Q3 Q4 Q1 Q2 Q3 Q4 Q1 Q2 Q3 Q4 Q1 Q2 Q3 Q4 Q1 Q2 Q3 Q4 Q1 Q21998 1999 2000 2001 2002 2003
0
20
40
60
80
100
120
140Usable floor area ('000 sq. metres)
Others Industrial
Note : See the footnotes to Table 3.10.
/Building …..

98
Building and construction
3.17 Building and construction activity slackened appreciably further inoverall terms. Reflecting this, overall expenditure on building andconstruction contracted more, by 7% in real terms in the second quarter of 2003over a year earlier, following a 4% fall in the first quarter. For the first half of2003 as a whole, there was a decrease of 5%, reversing the increase of 1% in thesecond half of 2002.
3.18 Expenditure on building and construction by the public sector edgeddown further, by 1% in real terms in the second quarter of 2003 over a yearearlier, after a 4% drop in the first quarter. Thus there was a modest decreaseof 2% for the first half of 2003 as a whole. This mainly reflected the windingdown of civil engineering works on several KCR railway projects, including theWest Rail, the Ma On Shan Extension and the Tsim Sha Tsui Extension, as wellas continued scale-back in the Public Housing Programme. Yet other publicsector building works, including such projects as redevelopment of the PoliceHeadquarters in Wan Chai and erection of Government quarters in Kwun Tong,remained intensive to provide a partial offset. It was likewise withcommencement of construction of the KCR Lok Ma Chau Spur Line.
3.19 Expenditure on building and construction by the private sector had alarger decline, by 10% in real terms in the second quarter of 2003 over a yearearlier, having fallen by 4% in the first quarter. Thus there was a 7% declinefor the first half of 2003 as a whole. The subdued property market continuedto dampen private sector building activity. It had tended to ease off since late2002, after a more distinct increase earlier in that year.
/Table 3.11 …..

99
Table 3.11
Expenditure on building and construction(year-on-year rate of change in real terms (%))
Private sector Public sector Total
2002 Annual# 4 -6 1
Q1# 5 -17 -3Q2# 10 3 8Q3# 14 -6 8Q4# -10 2 -6
2003 H1+ -7 -2 -5
Q1# -4 -4 -4Q2+ -10 -1 -7
Notes : (#) Revised figures.
(+) Preliminary figures.
Expenditure on building and construction(year-on-year rate of change in real terms)
Q1 Q2 Q3 Q4 Q1 Q2 Q3 Q4 Q1 Q2 Q3 Q4 Q1 Q2 Q3 Q4 Q1 Q2 Q3 Q4 Q1 Q21998 1999 2000 2001 2002 2003
0
10
20
30
-10
-20
-30
Percent
Private sectorPublic sector
Overall
Diagram 3.7
/3.20 …..

100
3.20 Retained imports of construction machinery went down significantlyfurther, by 22% in real terms in the second quarter of 2003 over a year earlier,after a decline of 9% in the first quarter. For the first half of 2003 as a whole,retained imports of construction machinery dipped by 17% in real terms over ayear earlier, in contrast to an increase of 8% in the second half of 2002. Thiswas in line with the slow-down in activity within the entire building andconstruction sector in the same period.
3.21 On the other hand, retained imports of general construction materialsincreased further by 23% in real terms in the second quarter of 2003 over a yearearlier, following a surge of 42% in the first quarter. Yet these increases wereaffected by a low base of comparison a year earlier. For the first half of 2003as a whole, retained imports of construction materials increased markedly by32% over a year earlier, after an increase of 10% in the second half of 2002.
3.22 Labour cost in the building and construction sector, as measured bythe Labour Cost Index, was virtually unchanged in the first quarter of 2003 froma year earlier, having likewise remained stable in the fourth quarter of 2002 andfor 2002 as a whole. Building material cost, as measured by the Material CostIndex, increased by 1% in the first quarter of 2003 over a year earlier, havingremained stable in the fourth quarter of 2002 and declined by 1% for 2002 as awhole. Taken together, the combined Labour and Material Cost Index wasstatic in the first quarter of 2003 from a year earlier, after nil change in thefourth quarter of 2002 and also being virtually flat for 2002 as a whole.
/Table 3.12 …..

101
Table 3.12Labour and Material Cost Index forthe building and construction sector
(Feb 1970=100)
Labour Index Material Index Combined Index2002 Annual 3 575 (*) 754 (-1) 1 752 (*)
Q1 3 570 (-1) 752 (-1) 1 749 (-1)Q2 3 588 (*) 753 (-1) 1 756 (*)Q3 3 583 (*) 755 (*) 1 755 (*)Q4 3 561 (*) 756 (*) 1 748 (*)
2003 Q1 3 574 (*) 759 (1) 1 754 (*)<*> <*> <*>
Notes : ( ) % change over a year earlier.
< > % change over the preceding quarter.
(*) Change of less than 0.5%.
Source : Architectural Services Department.
Diagram 3.8Labour and Material Cost Indices
(year-on-year rate of change)
Q1 Q2 Q3 Q4 Q1 Q2 Q3 Q4 Q1 Q2 Q3 Q4 Q1 Q2 Q3 Q4 Q1 Q2 Q3 Q4 Q11998 1999 2000 2001 2002 2003
0
5
10
15
-5
-10
-15
Percent
OverallLabour
Material
2003
/3.23 …..

102
3.23 Tender prices were still under downward pressure in the first quarterof this year. The Tender Price Index (TPI) for public housing projectscompiled by the Housing Department fell further, by 14% in the first quarter of2003 over a year earlier, after a 10% decline in the fourth quarter of 2002 andalso a 10% decline for 2002 as a whole. Continued keen competition for amuch reduced volume of public housing projects forced contractors to submitlower tender bids. Meanwhile, the TPI for public sector building projectscompiled by the Architectural Services Department rose by 5% in the firstquarter of 2003 over a year earlier, after a 2% increase in the fourth quarter of2002 yet a 12% decline for 2002 as a whole. This was partly due to a low basein the same quarter last year and partly supported by sustained Governmentbuilding activity. Compared with the fourth quarter of last year, the latter TPIshowed a 2% decline in the first quarter of this year.
Table 3.13
Tender Price Indices (TPI) for public sector projects
TPI for publichousing projects(a)
(Jan 1970=100)
TPI for public sectorbuilding projects(b)
(Jan 1970=100)2002 Annual 527 (-10) 714 (-12)
Q1 556 (-9) 687 (-20)Q2 533 (-13) 742 (-12)Q3 525 (-6) 692 (-14)Q4 495 (-10) 733 (2)
2003 Q1 476 (-14) 720 (5)<-4> <-2>
Notes : (a) Compiled by the Housing Department.
(b) Compiled by the Architectural Services Department.
( ) % change over a year earlier.
< > % change over the preceding quarter.
/Diagram 3.9 …..
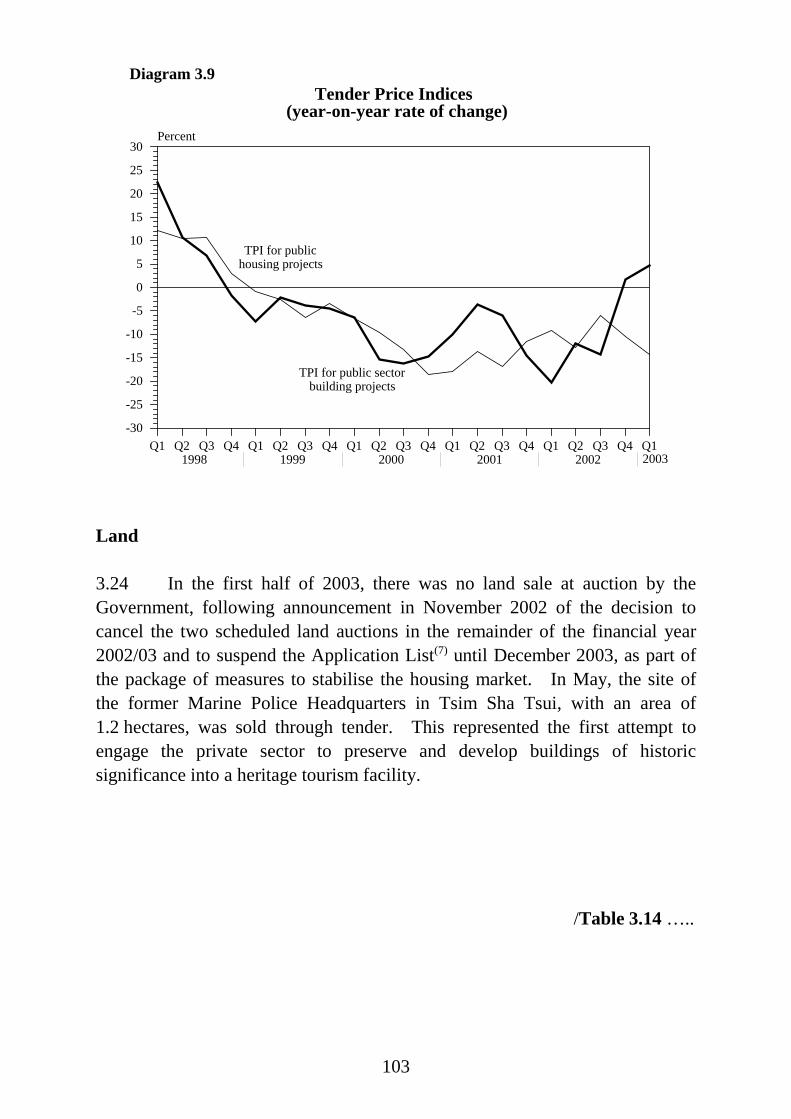
103
Diagram 3.9Tender Price Indices
(year-on-year rate of change)
Q1 Q2 Q3 Q4 Q1 Q2 Q3 Q4 Q1 Q2 Q3 Q4 Q1 Q2 Q3 Q4 Q1 Q2 Q3 Q4 Q11998 1999 2000 2001 2002 2003
0
5
10
15
20
25
30
-5
-10
-15
-20
-25
-30
Percent
TPI for public housing projects
TPI for public sector building projects
2003
Land
3.24 In the first half of 2003, there was no land sale at auction by theGovernment, following announcement in November 2002 of the decision tocancel the two scheduled land auctions in the remainder of the financial year2002/03 and to suspend the Application List(7) until December 2003, as part ofthe package of measures to stabilise the housing market. In May, the site ofthe former Marine Police Headquarters in Tsim Sha Tsui, with an area of1.2 hectares, was sold through tender. This represented the first attempt toengage the private sector to preserve and develop buildings of historicsignificance into a heritage tourism facility.
/Table 3.14 …..

104
Table 3.14
Land sales at auction and by tenderby the Government (hectares)
Usage 2002First halfof 2003
Residential 6.4 -Residential/commercial 0.1 -Commercial - 1.2Industrial - -Others - -Total 6.4 1.2
Note : Figures may not add up exactly to the total due to rounding.
Source : Lands Department.
3.25 On modification of lease on existing developed and developable landin the private sector domain(8), 52 applications were approved by theGovernment in the first half of 2003. Of this total, 19 applications were forresidential development, and 6 for residential-cum-commercial development, 2for commercial development, 1 for industrial development, and 6 for educationand community facilities. The remaining 18 were for other miscellaneouspurposes.
3.26 In the first half of 2003, one site of 0.35 hectare was taken up in theTai Po Industrial Estate. There was no new take-up of sites in the other twoindustrial estates at Yuen Long and Tseung Kwan O. Meanwhile, one site of0.35 hectare in the Tai Po Industrial Estate and one site of 0.49 hectare in theYuen Long Industrial Estate were surrendered. As at end-June 2003, the take-up rates in these three industrial estates were 94.7%, 91.3% and 47.9%respectively.
/3.27 …..

105
3.27 As to the Science Park at Pak Shek Kok, approvals for admission weregranted to 6 technology companies in the first half of 2003. This followed22 admissions in 2002 since the official commencement of operation of theScience Park in June last year, upon completion of Phase 1a of the developmentproject. Most of the companies admitted were engaged in the electronics,biotechnology, information technology and telecommunications, and precisionengineering fields. The remainder of Phase 1 would be completed bymid-2004. Planning for Phase 2 was underway.
Electricity and gas
3.28 Local electricity consumption went down by 3% over a year earlier to9 615 million kWh in the second quarter of 2003, reversing the 3% increase inthe first quarter. Conceivably, this decline was related to the widespreadslackening in local activity under the SARS impact from mid-March to June.For the first half of 2003 as a whole, local electricity consumption showed littlechange over a year earlier, as against a 2% increase in the second half of 2002.Analysed by main user type, domestic consumption, commercial consumptionand industrial consumption decreased by 1%, 3% and 8% respectively in thesecond quarter of 2003 over a year earlier. Electricity exports to the Mainland,which accounted for 6% of the total electricity generated in Hong Kong, alsodecreased, by 12% in the second quarter of 2003 over a year earlier, again dueto the SARS impact. This reversed the 8% increase in the first quarter.
3.29 Towngas consumption in the second quarter of 2003, at7 057 terajoules, showed little change over a year earlier, following an increaseof 4% in the first quarter. Conceivably, the SARS impact also mattered. Forthe first half of 2003 as a whole, there was still a 2% increase over a year earlier,having remained virtually unchanged in the second half of 2002. Analysed bymain user type, domestic consumption increased by 7% in the second quarter of2002 over a year earlier, more than offsetting the decreases by 10% and 6%respectively in commercial consumption and industrial consumption. Therelative shift towards domestic consumption from commercial consumptioncould have been induced by the SARS threat.
/Internal …..
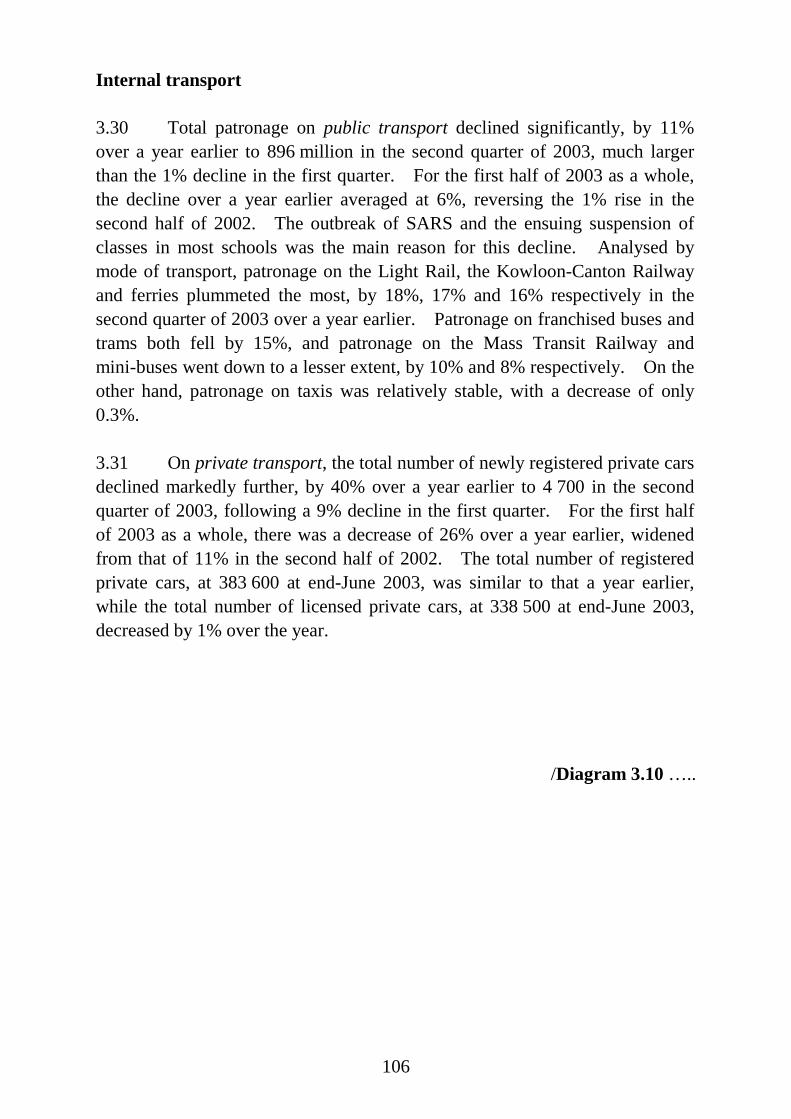
106
Internal transport
3.30 Total patronage on public transport declined significantly, by 11%over a year earlier to 896 million in the second quarter of 2003, much largerthan the 1% decline in the first quarter. For the first half of 2003 as a whole,the decline over a year earlier averaged at 6%, reversing the 1% rise in thesecond half of 2002. The outbreak of SARS and the ensuing suspension ofclasses in most schools was the main reason for this decline. Analysed bymode of transport, patronage on the Light Rail, the Kowloon-Canton Railwayand ferries plummeted the most, by 18%, 17% and 16% respectively in thesecond quarter of 2003 over a year earlier. Patronage on franchised buses andtrams both fell by 15%, and patronage on the Mass Transit Railway andmini-buses went down to a lesser extent, by 10% and 8% respectively. On theother hand, patronage on taxis was relatively stable, with a decrease of only0.3%.
3.31 On private transport, the total number of newly registered private carsdeclined markedly further, by 40% over a year earlier to 4 700 in the secondquarter of 2003, following a 9% decline in the first quarter. For the first halfof 2003 as a whole, there was a decrease of 26% over a year earlier, widenedfrom that of 11% in the second half of 2002. The total number of registeredprivate cars, at 383 600 at end-June 2003, was similar to that a year earlier,while the total number of licensed private cars, at 338 500 at end-June 2003,decreased by 1% over the year.
/Diagram 3.10 …..

107
Passenger journeys by mode of public transport in the first half of 2003
Diagram 3.10
Total passenger journeys in the first half of 2003 : 1 890 million
MTR363 million (19%)
Franchised buses713 million (38%)
Minibuses287 million (15%)
Light Rail 51 million (3%)
KCR134 million (7%)
Taxis236 million (13%)
Ferries 19 million (1%)Trams 39 million (2%)
Others 47 million (2%)
External transport
3.32 On air transport, total air passenger movements declined drasticallyby 66% over a year earlier to 1.9 million in the second quarter of 2003,significantly worsened from the 5% decline in the first quarter. The issuanceof travel advisory against non-essential travel to Hong Kong by the WorldHealth Organisation (WHO) following the spread of SARS in Hong Kong sincemid-March had a severe deterring effect on air travel. Within this total for thesecond quarter, air passenger arrivals and departures decreased by 67% and64% respectively to 935 800 and 993 900. Air passengers coming from andgoing to the Mainland plunged even more, by 79% and 76% respectively. Forthe first half of 2003 as a whole, total air passenger movements fell markedlyby 35% from a year earlier, with air passenger arrivals and departures falling by36% and 35% respectively. This compared with a 6% rise in the second halfof 2002. Aircraft movements (including passenger and cargo flights) alsorecorded a marked decrease, by 40% over a year earlier to 30 200 in the secondquarter of 2003, in contrast to a 10% increase in the first quarter. For the firsthalf of 2003 as a whole, aircraft movements dropped by 15% over a yearearlier, reversing the 9% rise in the second half of 2002.
/Diagram 3.11 …..
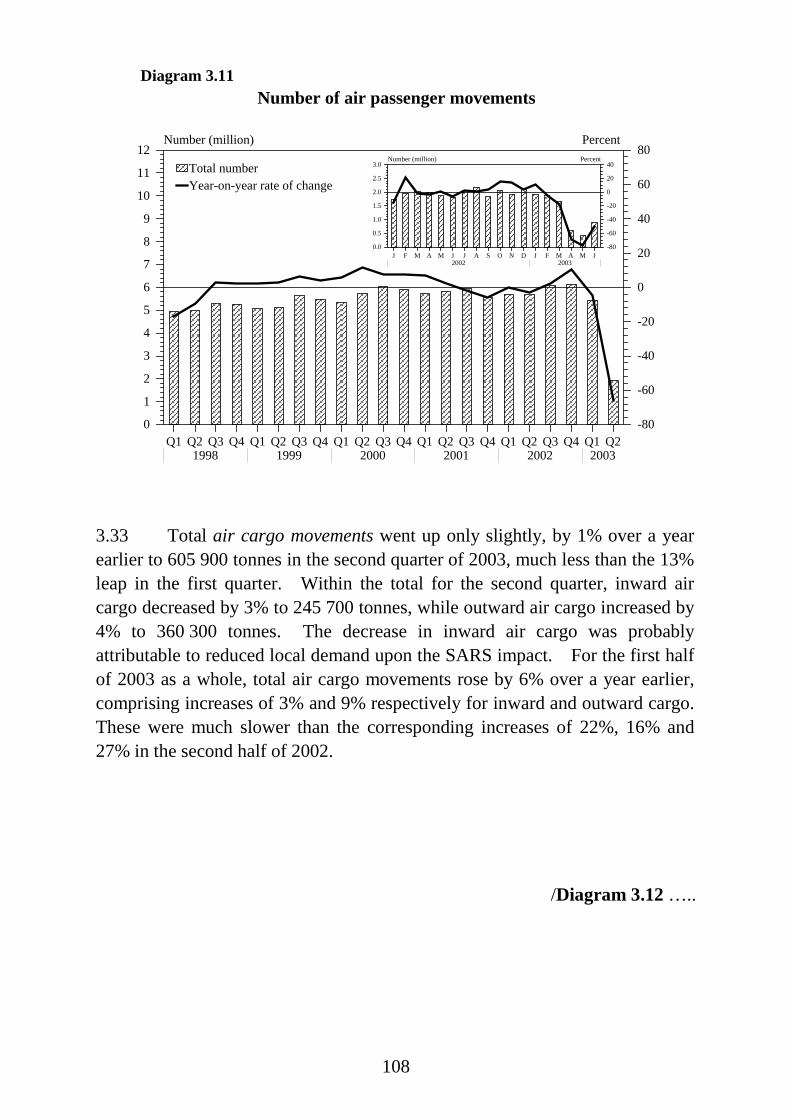
108
Number of air passenger movements
Q1 Q2 Q3 Q4 Q1 Q2 Q3 Q4 Q1 Q2 Q3 Q4 Q1 Q2 Q3 Q4 Q1 Q2 Q3 Q4 Q1 Q21998 1999 2000 2001 2002 2003
0
1
2
3
4
5
6
7
8
9
10
11
12Number (million)
0
20
40
60
80
-20
-40
-60
-80
Percent
Total number Year-on-year rate of change
Diagram 3.11
J F M A M J J A S O N D J F M A M J2002 2003
0.0
0.5
1.0
1.5
2.0
2.5
3.0Number (million)
0
20
40
-20
-40
-60
-80
Percent
3.33 Total air cargo movements went up only slightly, by 1% over a yearearlier to 605 900 tonnes in the second quarter of 2003, much less than the 13%leap in the first quarter. Within the total for the second quarter, inward aircargo decreased by 3% to 245 700 tonnes, while outward air cargo increased by4% to 360 300 tonnes. The decrease in inward air cargo was probablyattributable to reduced local demand upon the SARS impact. For the first halfof 2003 as a whole, total air cargo movements rose by 6% over a year earlier,comprising increases of 3% and 9% respectively for inward and outward cargo.These were much slower than the corresponding increases of 22%, 16% and27% in the second half of 2002.
/Diagram 3.12 …..

109
Cargo carried by air
Q1 Q2 Q3 Q4 Q1 Q2 Q3 Q4 Q1 Q2 Q3 Q4 Q1 Q2 Q3 Q4 Q1 Q2 Q3 Q4 Q1 Q21998 1999 2000 2001 2002 2003
0
100
200
300
400500
600
700800
900
1000
1100
1200
1300Tonnes ('000)
0
1020
30
4050
60
70
80
90
100
-10
-20
-30
Percent
Total volume Year-on-year rate of change
Diagram 3.12
*
J F M A M J J A S O N D J F M A M J2002 2003
0
40
80
120
160
200
240
280Tonnes ('000)
0
5
10
15
20
25
30
-5
Percent
*
Note : (*) Provisional figures.
3.34 On ocean transport, total ocean cargo movements amounted to24.7 million tonnes in April-May 2003, up by 7% over a year earlier, muchslower than the 17% surge in the first quarter. While transhipment cargo roseby 21%, direct shipment cargo fell by 2%. Within the total for April-May,inward and outward ocean cargo increased by 2% and 16% respectively to 16.4million tonnes and 8.3 million tonnes. For the first five months of 2003 as awhole, these two particular streams of cargo movement rose by 11% and 16%respectively over a year earlier, leading to a 13% rise for total ocean cargomovements. In the second half of 2002, the corresponding increases were10%, 13% and 11%.
/Diagram 3.13 …..
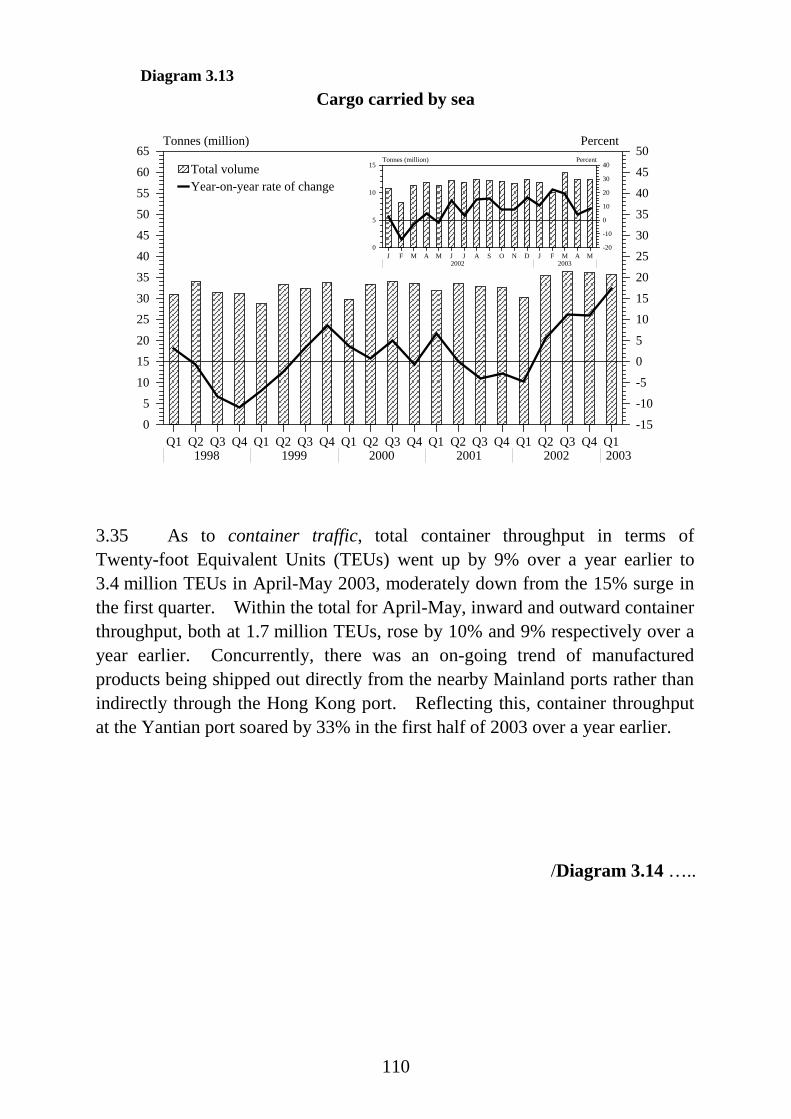
110
Cargo carried by sea
Q1 Q2 Q3 Q4 Q1 Q2 Q3 Q4 Q1 Q2 Q3 Q4 Q1 Q2 Q3 Q4 Q1 Q2 Q3 Q4 Q11998 1999 2000 2001 2002 2003
0
5
10
1520
2530
35
4045
50
55
60
65Tonnes (million)
05
1015
20
2530
35
40
45
50
-5
-10
-15
Percent
Total volume Year-on-year rate of change
Diagram 3.13
J F M A M J J A S O N D J F M A M2002 2003
0
5
10
15Tonnes (million)
0
10
20
30
40
-10
-20
Percent
2003
3.35 As to container traffic, total container throughput in terms ofTwenty-foot Equivalent Units (TEUs) went up by 9% over a year earlier to3.4 million TEUs in April-May 2003, moderately down from the 15% surge inthe first quarter. Within the total for April-May, inward and outward containerthroughput, both at 1.7 million TEUs, rose by 10% and 9% respectively over ayear earlier. Concurrently, there was an on-going trend of manufacturedproducts being shipped out directly from the nearby Mainland ports rather thanindirectly through the Hong Kong port. Reflecting this, container throughputat the Yantian port soared by 33% in the first half of 2003 over a year earlier.
/Diagram 3.14 …..

111
Container throughput
Q1 Q2 Q3 Q4 Q1 Q2 Q3 Q4 Q1 Q2 Q3 Q4 Q1 Q2 Q3 Q4 Q1 Q2 Q3 Q4 Q11998 1999 2000 2001 2002 2003
0000
1000
2000
3000
4000
5000
6000
7000
8000
9000TEUs ('000)
0
10
20
30
40
50
60
70
-10
-20
Percent
Total number Year-on-year rate of change
Diagram 3.14
J F M A M J J A S O N D J F M A M2002 2003
0
500
1000
1500
2000TEUs('000)
0
10
20
30
-10
Percent
0
2003
Tourism
3.36 Inbound tourism was depressed in the second quarter of 2003, due tothe SARS impact since mid-March. The issuance of travel advisory againstnon-essential travel to Hong Kong by WHO on 2 April, though subsequentlylifted on 23 May, worsened the situation. The total number of incomingvisitors fell drastically by 58% over a year earlier to only 1.6 million in thesecond quarter of 2003, in stark contrast to a 20% surge in the first quarter.For the first half of 2003 as a whole, the total number of incoming visitorsdeclined by 21% over a year earlier, reversing the 28% rise in the second half of2002.
3.37 Analysed by major source, visitors from the Mainland dipped theleast, by 26% in the second quarter of 2003 over a year earlier. Visitors fromTaiwan, the United Kingdom, South and Southeast Asia, the United States andJapan plunged much more, by 74%, 78%, 81%, 84% and 86% respectively.
/Diagram 3.15 …..
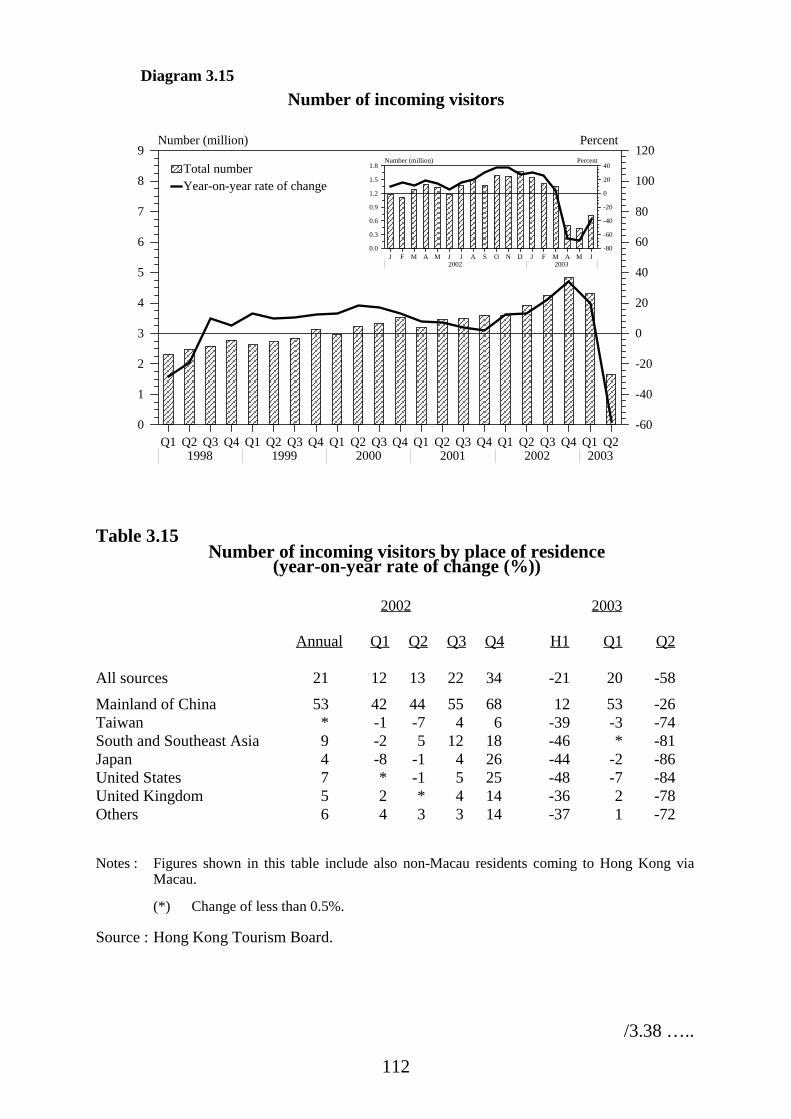
112
Number of incoming visitorsDiagram 3.15
Q1 Q2 Q3 Q4 Q1 Q2 Q3 Q4 Q1 Q2 Q3 Q4 Q1 Q2 Q3 Q4 Q1 Q2 Q3 Q4 Q1 Q21998 1999 2000 2001 2002 2003
0
1
2
3
4
5
6
7
8
9Number (million)
0
20
40
60
80
100
120
-20
-40
-60
Percent
Total number Year-on-year rate of change
J F M A M J J A S O N D J F M A M J2002 2003
0.0
0.3
0.6
0.9
1.2
1.5
1.8Number (million)
0
20
40
-20
-40
-60
-80
Percent
Table 3.15Number of incoming visitors by place of residence
(year-on-year rate of change (%))
2002 2003
Annual Q1 Q2 Q3 Q4 H1 Q1 Q2
All sources 21 12 13 22 34 -21 20 -58Mainland of China 53 42 44 55 68 12 53 -26Taiwan * -1 -7 4 6 -39 -3 -74South and Southeast Asia 9 -2 5 12 18 -46 * -81Japan 4 -8 -1 4 26 -44 -2 -86United States 7 * -1 5 25 -48 -7 -84United Kingdom 5 2 * 4 14 -36 2 -78Others 6 4 3 3 14 -37 1 -72
Notes : Figures shown in this table include also non-Macau residents coming to Hong Kong viaMacau.
(*) Change of less than 0.5%.
Source : Hong Kong Tourism Board.
/3.38 …..

113
3.38 The Mainland remained the largest source of visitors to Hong Kong,with a share of 54% in the first half of 2003. Taiwan came next (with a shareof 12%), followed by South and Southeast Asia (8%), Japan (6%), the UnitedStates (4%), and the United Kingdom (2%).
Number of incoming visitors by source in the first half of 2003
Total number of incoming visitors in the first half of 2003 : 5.95 million
Diagram 3.16
Mainland of China3.24 million (54%)
Japan0.37 million (6%)
Taiwan0.71 million (12%)
South andSoutheast Asia0.46 million (8%)
United States0.25 million (4%)
United Kingdom0.12 million (2%)
Others0.79 million (13%)
3.39 As at end-June 2003, there were 41 987 hotel rooms in Hong Kong,down from 43 634 at end-December 2002, owing to the closure of severalhotels in the second quarter. The average hotel room occupancy rate, down toonly 25% in the second quarter of 2003 due to the SARS impact, was waybelow that of 83% in the same quarter in 2002.
/Table 3.16 …..

114
Table 3.16
Stock of hotel rooms and occupancy rate
Number of hotel roomsas at end of period*
Average hotel roomoccupancy rate
during the period(%)
2002 Annual 43 634 (--) 84
Q1 41 829 (--) 81Q2 42 747 (--) 83Q3 42 758 (--) 83Q4 43 634 (--) 89
2003 Q1 42 792 (2) 81Q2 41 987 (-2) 25
Apr 41 976 (-2) 22May 41 979 (-2) 18Jun 41 987 (-2) 34
Notes : (*) As from the first quarter of 2002, this data series has a wider coverage,including all hotels and tourist guest houses on the record of the Officeof the Licensing Authority in the Home Affairs Department. Assuch, the data for the first quarter of 2002 onwards are not directlycomparable to those in the earlier periods.
( ) % change over a year earlier.
(--) Not applicable.
Source : Hong Kong Tourism Board.
3.40 On Hong Kong residents travelling abroad, the total number ofresident departures decreased markedly by 21% over a year earlier to12.3 million in the second quarter of 2003, significantly enlarged from the 4%decrease in the first quarter. For the first half of 2003 as a whole, the totalnumber of resident departures fell by 12% over a year earlier, reversed the 5%rise in the second half of 2002. The SARS threat had led many Hong Kongresidents to cancel or defer their trips abroad. Analysed by major destinationand on year-on-year comparison, resident departures to Taiwan and Americas
/declined …..

115
declined the most, by 76% and 54% respectively in the second quarter of 2003over a year earlier. Resident departures to Europe plunged by 30%, whileresident departures to North Asia and the Mainland both dipped by 21%.Resident departures to Macau, South and Southeast Asia, and Australia andNew Zealand went down to a lesser extent, by 15%, 14% and 8% respectively.
Number of Hong Kong resident departuresDiagram 3.17
Q1 Q2 Q3 Q4 Q1 Q2 Q3 Q4 Q1 Q2 Q3 Q4 Q1 Q2 Q3 Q4 Q1 Q2 Q3 Q4 Q1 Q21998 1999 2000 2001 2002 2003
0
4
8
12
16
20
24
28
32Number (million)
05101520253035404550
-5-10-15-20-25-30
Percent
Total number Year-on-year rate of change
J F M A M J J A S O N D J F M A M J2002 2003
0
1
2
3
4
5
6
7Number (million)
0
10
20
30
-10
-20
-30
-40
Percent
2003
/Table 3.17 …..

116
Table 3.17
Number of Hong Kong resident departures by destination(year-on-year rate of change (%))
2002 2003
Annual Q1 Q2 Q3 Q4 H1 Q1 Q2
All destinations 6 7 5 6 4 -12 -4 -21
Mainland of China 7 9 7 7 5 -12 -3 -21Macau -3 -3 -5 * -2 -11 -7 -15South and Southeast
Asia-3 -2 -11 1 -1 -12 -10 -14
North Asia 2 5 -7 3 6 -19 -18 -21Americas(a) -8 -14 -20 -6 18 -30 -7 -54Taiwan 2 20 -10 -3 5 -37 -4 -76Europe 7 10 * 8 13 -20 -11 -30Australia and
New Zealand-6 -8 -16 -2 2 -8 -7 -8
Others -16 -40 -24 -2 35 -20 -21 -20
Notes : (a) This includes the United States, Canada, Central America and South America.
(*) Change of less than 0.5%.
Source : Hong Kong Tourism Board.
3.41 The Mainland continued to be the most popular destination for HongKong resident departures, accounting for 86% of the total outbound trips in thefirst half of 2003. Most of these trips were destined for Guangdong Province.Macau came next (with a share of 7%), followed by South and Southeast Asia(4%), North Asia (1%), and Taiwan (1%).
/Diagram 3.18 …..

117
Number of Hong Kong resident departures by destination in the first half of 2003
Total number of resident departures in the first half of 2003 : 27.63 million
Mainland of China23.89 million (86%)
Macau1.83 million (7%)
South and Southeast Asia1.05 million (4%)
Others0.54 million (2%)
Diagram 3.18
North Asia0.31 million (1%)
Telecommunications
3.42 On wireline services, the total number of direct exchange linescontinued to fall, by 1.6% over a year earlier to 3.81 million at end-June 2003.Within the total, the number of fixed telephone lines went down by 5% over ayear earlier to 3.30 million at end-June 2003. It comprised decreases in thenumber of lines for business customers and for residential customers, by 3%and 6% respectively over a year earlier to 1.48 million and 1.82 million at end-June 2003. These two particular groups of customers accounted for 45% and55% respectively of all the fixed telephone lines installed at end-June 2003.At 49 fixed telephone lines per 100 inhabitants, per capita tele-density in HongKong was amongst the highest in Asia. As regards the number of facsimilelines, it leaped by 26% over a year earlier to 514 800 at end-June 2003. At 35facsimile lines per 100 business exchange lines, Hong Kong again rankedamongst the highest in Asia. On external telecommunications, externaltelephone traffic volume(9) went up by 2% over a year earlier to 1 452 millionminutes in the second quarter of 2003, following a 1% increase in the first
/quarter …..

118
quarter. As to Internet usage, broadband services continued on a sharpuptrend, with the traffic volume soaring by 315% over a year earlier to 182 900terabits in the second quarter of 2003. This came after a 177% leap the firstquarter. There was a further profound shift in Internet usage away from thepublic switch telephone network, where the traffic volume plummeted by 25%to 1 086 million minutes in the second quarter of 2003. The correspondingdecline in the first quarter was 41%.
Number of fixed telephone lines* by main user category(as at end of quarter)
Q1 Q2 Q3 Q4 Q1 Q2 Q3 Q4 Q1 Q2 Q3 Q4 Q1 Q2 Q3 Q4 Q1 Q2 Q3 Q4 Q1 Q21998 1999 2000 2001 2002 2003
0
500
1000
1500
2000
2500
3000Number ('000)
0
5
10
15
20
-5
-10
Percent
Number of business users Number of residential users Year-on-year rate of change for business users Year-on-year rate of change for residential users
Diagram 3.19
Note : (*) Not including facsimile lines.
/Diagram 3.20 …..

119
External telephone traffic volume*(in the quarter)
Q2 Q3 Q4 Q1 Q2 Q3 Q4 Q1 Q2 Q3 Q4 Q1 Q2 Q3 Q4 Q1 Q2 Q3 Q4 Q1 Q21998 1999 2000 2001 2002 2003
0
200
400
600
800
1000
1200
1400
1600Minutes (million)
0
5
10
15
20
25
30
35
-5
Percent
Traffic volume Year-on-year rate of change
Diagram 3.20
rate
Notes : Data prior to the second quarter of 1998 are not available.
(*) Including access by international direct dialling (IDD)through telephone lines, facsimile lines and datel lines.
3.43 On wireless services, the mobile phone segment continued to expand.The number of mobile phone customers went up by 11% from a year earlier to6.5 million at end-June 2003(10). This corresponded to a mobile phonepenetration rate of 95%, amongst the highest in the world. Meanwhile, thepaging segment continued to shrink, with the number of paging customersdeclining further by 23% from a year earlier to 172 400 at end-June 2003.
/Diagram 3.21 …..
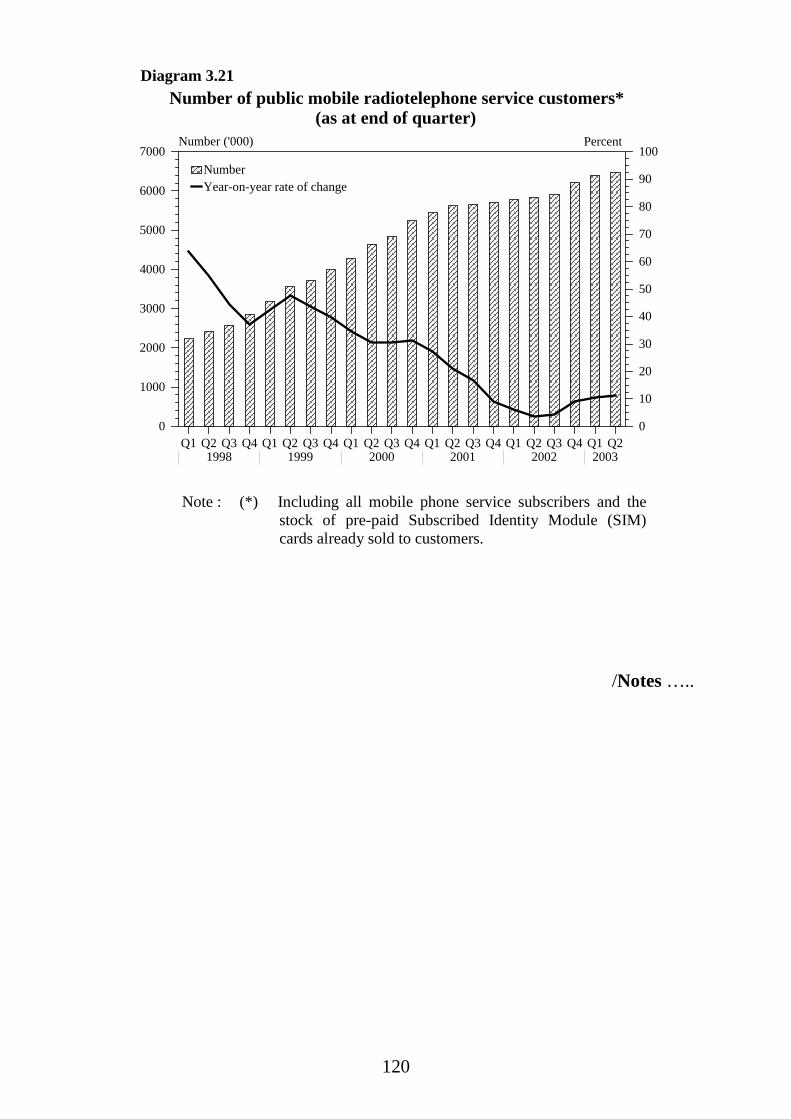
120
Number of public mobile radiotelephone service customers*(as at end of quarter)
Q1 Q2 Q3 Q4 Q1 Q2 Q3 Q4 Q1 Q2 Q3 Q4 Q1 Q2 Q3 Q4 Q1 Q2 Q3 Q4 Q1 Q21998 1999 2000 2001 2002 2003
0
1000
2000
3000
4000
5000
6000
7000Number ('000)
0
10
20
30
40
50
60
70
80
90
100 Percent
Number Year-on-year rate of change
rate
Diagram 3.21
Note : (*) Including all mobile phone service subscribers and thestock of pre-paid Subscribed Identity Module (SIM)cards already sold to customers.
/Notes …..

121
Notes :
(1) On 1 August 2002, the Census and Statistics Department introduced a technicalrevision to the existing GDP series, as compiled from the expenditure approach. Atthe same time, a new data series on quarterly GDP by economic activity at constantprices, backdated to the first quarter of 2000, was released. This new GDP series, ascompiled from the production approach, enables analysis to be done of the value addedcontributions of the various economic sectors in real terms, in regard to their trend andrelative significance.
(2) The service sectors comprise the wholesale, retail and import/export trades, restaurantsand hotels; transport, storage and communications; financing, insurance, real estate andbusiness services; and community, social and personal services. In respect ofcontribution to GDP, the service sectors also include ownership of premises, which isanalytically a service activity. Charges of financial intermediation are howeverdeducted.
(3) The Index of Industrial Production is intended to reflect the recent trend of net outputin real terms in the various local manufacturing industries. Output from outwardprocessing operations across the boundary is not included.
(4) The Monthly Survey of Orders-on-hand covers manufacturing firms engaging 50 ormore workers. Its main purpose is to provide a broad indicator of the orders positionin value terms in the local manufacturing sector at monthly intervals. Orders to bemet by outward processing across the boundary are not included.
(5) Developers were offering a variety of inducements including flexible payment terms,top-up loans, cash rebates, and mortgage subsidies in the early part of the repaymentperiod. Flat buyers could opt for different combinations of these privileges, or elseseek a direct price discount. In effect, the acquisition cost initially and/or themortgage cost in the ensuing few years would be reduced for the flat buyers.
(6) As part of the population policy announced on 26 February 2003, persons with netassets under their control and disposal for investment of no less than $6.5 million inpermissible investment assets, including real estate and specified financial assets, willbe eligible for admission into Hong Kong as capital investment entrants. This newpolicy will be applied to all foreign nationals, Macao SAR residents and Taiwanresidents, but not Mainland residents. Acceptance of applications for entry isexpected to start later in the year.
(7) The Government operates an Application System under the Land Sale Programme asfrom April 1999, whereby additional sites are set aside on an Application List for openapplication by property developers. Provided that the minimum price offered by theapplicant is acceptable to the Government, the site involved can be released from theApplication List for open auction or tender. This helps ensure a flexible supply ofGovernment land in response to market demand.
/(8) …..

122
(8) Virtually all the land in Hong Kong is held on a leasehold basis. A predominant partof the existing developed and developable land is already in the private sector domain.In order to facilitate redevelopment in line with the town planning and urban renewalobjectives, modification of usage (including modification by way of land exchange)may be granted by the Government to old leases of land upon application from thelandlords. A land premium, equivalent to the difference in land value between theold and the new usage, is normally required for granting of the modification.
(9) This includes access by international direct dialling (IDD) through telephone lines,facsimile lines and datel lines.
(10) This figure includes all mobile phone service subscribers and the stock of pre-paidSubscribed Identity Module (SIM) cards already sold to customers.

123
CHAPTER 4 : THE FINANCIAL SECTOR*
Overall financial market situation
4.1 The Hong Kong dollar exchange and money markets held broadlystable in the first half of 2003. The spot exchange rate of the Hong Kong dollaragainst the US dollar stayed very close to the linked rate. In April, thetwelve-month forward rate premium over the spot rate exhibited a brief upsurge,amidst concern over the impact of SARS on the economy. But as SARS wasprogressively being brought under control, the premium soon settled back. Thegrowth profiles of narrow and broad money supply continued to diverge, alongwith the on-going compositional shift more for higher liquidity under theprevailing low interest rate environment. The Hong Kong dollar loan-to-depositratio went lower, as Hong Kong dollar loans declined further while Hong Kongdollar deposits resumed increase during the first half of this year. As to the localstock market, share prices staged a distinct rebound during the second quarter.Market sentiment was lifted by the strong rallies in many stock markets overseasand SARS being brought under control in Hong Kong. At end-June 2003, theHang Seng Index closed at 9 577, up by 10.9% over end-March 2003 and 2.7%over end-2002.
Exchange rates
4.2 The spot exchange rate of the Hong Kong dollar against the US dollarmoved within a narrow range of 7.798 to 7.800 during the first half of 2003. Thepremium of the twelve-month forward rate over the spot rate held steady formost of the period. There was a brief upsurge to 355 pips (each pip equivalentto HK$0.0001) in late April, amidst worries about the impact of SARS on theeconomy. But as SARS was being progressively brought under control, thepremium narrowed back to 120 pips at end-June 2003, even less than 169 pips atend-2002.
_________
(*) This chapter is jointly prepared by the Hong Kong Monetary Authority and theEconomic Analysis Division.
/4.3 .....

124
4.3 Under the linked exchange rate system(1), the movements in theexchange rates of the Hong Kong dollar against other major currencies followclosely those of the US dollar. During the first half of 2003, the US dollardepreciated against most of the other major currencies. This was triggered byuncertainties surrounding the US-led war on Iraq and concern over the pace ofrecovery in the US economy. In particular, the dollar - euro rate surged by14.2%, from a monthly average of 1.022 in December 2002 to that of 1.167 inJune 2003. Also, the dollar - pound sterling rate rose by 4.5% from a monthlyaverage of 1.589 in December 2002 to that of 1.661 in June 2003, and theyen - dollar rate fell by 2.8% from a monthly average of 121.8 in December2002 to that of 118.3 in June 2003. Likewise, the US dollar eased against manyof the East Asian currencies.
4.4 Taking these currency movements together, the trade-weightedNominal Effective Exchange Rate Index(2) of the Hong Kong dollar declined by2.0%, from a monthly average of 102.7 in December 2002 to that of 100.6 inJune 2003. After adjusting for changes in the respective consumer price indices,the trade-weighted Real Effective Exchange Rate Index of the Hong Kong dollarhad a larger decrease, by 3.5% from 93.3 to 90.0 over the same period.
/Table 4.1 .....

125
Table 4.1
Trade-weighted Effective Exchange Rate Indexof the Hong Kong dollar
Averagefor the month
Trade-weightedNominal EERI(a)
(Jan 2000 = 100)
Trade-weightedReal EERI(b)
(Jan 2000 = 100)
2002 Mar 105.9 (0.5) 99.3 (1.2)Jun 103.5 (-2.3) 95.5 (-3.8)Sep 103.0 (-0.5) 94.4 (-1.1)Dec 102.7 (-0.3) 93.3 (-1.2)
2003 Mar 101.8 (-0.9) 92.1 (-1.2)Jun 100.6 (-1.2) 90.0 (-2.3)
Notes : (a) The Nominal Effective Exchange Rate Index (EERI) of the Hong Kong dollar isa weighted average of the exchange rates of the Hong Kong dollar against thecurrencies of its major trading partners, with the weights adopted being therespective shares of these trading partners in the total value of merchandisetrade for Hong Kong.
As from 2 January 2002, a new series of nominal EERI replaces the old series,with the weights updated to reflect the average pattern of merchandise tradeduring 1999 and 2000, and with the base period brought up to January 2000.
The currency basket of the new series has also been updated to include the euroand the Philippine peso, and to exclude the five currencies pertaining to theparticipating countries of the euro.
(b) The Real Effective Exchange Rate Index of the Hong Kong dollar is obtained byadjusting the Nominal EERI for relative movements in the seasonally adjustedconsumer price indices of the respective trading partners.
( ) % change over three months earlier.
Positive change in the EERI denotes appreciation of the Hong Kong dollar; negativechange in the EERI denotes depreciation.
/Diagram 4.1 .....

126
Exchange rate of the Hong Kong dollar against the US dollarDiagram 4.1
M J S D M J S D M J S D M J S D M J S D M J7.5
7.7
7.9
8.1
8.3
8.5HK$/US$
0
HK$/US$ spot rate
HK$/US$twelve-month forward rate
HK$/US$three-month forward rate
20021998 1999 2000 2001 2003
(average for the month)
Diagram 4.2Trade-weighted Effective Exchange Rate Index
of the Hong Kong dollar
M J S D M J S D M J S D M J S D M J S D M J80
90
100
110
120Index (Jan 2000 = 100)
Nominal EERI
0
Real EERI
2002 20031998 1999 2000 2001
(average for the month)
Note : See the footnotes to Table 4.1.
/Interest .....

127
Interest rates
4.5 Affected by movements in the Hong Kong dollar forward ratepremium over the spot rate, local inter-bank interest rates moved up briefly inApril, and then fell back in the ensuing two months. At end-June 2003, thethree-month HIBOR closed at 1.0%, down from 1.4% at end-2002. Over thesame period, the spread of the three-month HIBOR over the correspondingEuro-dollar deposit rate reversed from a premium of 9 basis points to a discountof 6 basis points.
4.6 Following the movement in the US Fed Funds target rate, the BaseRate under the Discount Window operated by the Hong Kong MonetaryAuthority (HKMA) was reduced by 25 basis points to 2.5% in late June 2003.Yet the best lending rate and savings deposit rate offered by the majorcommercial banks were kept at 5.00% and 0.03% respectively throughout thefirst half of 2003. Meanwhile, the spread of the best lending rate over thethree-month time deposit rate widened modestly, from an average of 4.78percentage points in the second half of 2002 to that of 4.91 percentage points inthe first half of 2003.
4.7 Competition amongst the banks for residential mortgage businessremained intense, particularly on flats sold in the primary market. In June 2003,92.0% of the new residential mortgages were granted at more than twopercentage points below the best lending rate, up from 90.9% inDecember 2002(3).
/Diagram 4.3 .....

128
(a) Base Rate under the Discount Window, andInterest ratesDiagram 4.3
M J S D M J S D M J S D M J S D M J S D M J0
2
4
6
8
10
12Percent per annum
Overnight Euro-dollar deposit rate
Overnight HIBOR
overnight HIBOR and Euro-dollar deposit rate
Base Rate under the Discount Window
20021998 1999 2000 2001
(average for the month)
2003
(b) Three-month HIBOR and Euro-dollar deposit rate
M J S D M J S D M J S D M J S D M J S D M J0
2
4
6
8
10
12
14Percent per annum
Three-month Euro-dollardeposit rate
Three-month HIBOR
2002 20031998 1999 2000 2001
(average for the month)
/Diagram 4.3 (cont’d) .....

129
(c) Twelve-month HIBOR and Euro-dollar deposit rate
M J S D M J S D M J S D M J S D M J S D M J0
2
4
6
8
10
12
14Percent per annum
Twelve-month Euro-dollar deposit rate
Twelve-month HIBOR
2002 20031998 1999 2000 2001
(average for the month)
Table 4.2
Hong Kong dollar inter-bank offer rates (HIBORs)(% per annum)
Averagefor the month
OvernightHIBOR
Three-monthHIBOR
Twelve-monthHIBOR
2002 Mar 1.86 (9) 2.12 (17) 2.93 (11)Jun 1.41 (-35) 1.75 (-9) 2.34 (-4)Sep 1.67 (-11) 1.77 (*) 1.82 (-3)Dec 1.16 (-13) 1.48 (10) 1.68 (12)
2003 Jan 1.18 (-9) 1.36 (4) 1.54 (7)Feb 1.20 (-7) 1.34 (4) 1.50 (12)Mar 1.17 (-11) 1.28 (5) 1.37 (7)
Apr 1.29 (1) 1.41 (15) 1.50 (18)May 1.14 (-12) 1.30 (6) 1.33 (11)Jun 1.06 (-18) 1.06 (1) 1.13 (8)
Notes : ( ) Figures in brackets represent the spread between the HIBOR and thecorresponding Euro-dollar deposit rate in basis point. A positive value denotesa differential in favour of the Hong Kong dollar, while a negative valuedenotes a differential in favour of the US dollar.
(*) Spread of less than one basis point.
/Table 4.3 .....
Diagram 4.3 (cont’d)

130
Table 4.3
Hong Kong dollar deposit and lending rates(% per annum, as average of the rates
quoted by the major banks)
Interest rates on timedeposits below HK$100,000
Averagefor the month
One-week
One-month
Three-month
Six-month
Twelve-month
Savings deposit rate
Bestlending rate
2002 Mar 0.21 0.55 0.62 0.84 1.39 0.16 5.13Jun 0.17 0.29 0.36 0.46 0.74 0.16 5.13Sep 0.16 0.33 0.38 0.40 0.43 0.16 5.13Dec 0.09 0.13 0.15 0.19 0.25 0.03 5.00
2003 Jan 0.08 0.10 0.11 0.16 0.21 0.03 5.00Feb 0.08 0.08 0.09 0.14 0.19 0.03 5.00Mar 0.08 0.09 0.09 0.12 0.17 0.03 5.00
Apr 0.08 0.09 0.10 0.13 0.17 0.03 5.00May 0.08 0.08 0.09 0.12 0.14 0.03 5.00Jun 0.08 0.08 0.08 0.09 0.10 0.03 5.00
Deposits and money supply
4.8 Hong Kong dollar deposits (adjusted to include foreign currency swapdeposits)(4) rose by 2.1% during the second quarter of 2003 to $1,842 billion atend-June, following a 1.2% drop during the first quarter. At end-June 2003, theshare of Hong Kong dollar deposits in total deposits, at 55.0%, was virtuallyunchanged from that at end-2002. On a year-on-year comparison, Hong Kongdollar deposits fell slightly, by 0.3% at end-June 2003.
4.9 Within Hong Kong dollar deposits, demand deposits turned up to anincrease of 10.7% during the second quarter of 2003, from a decrease of 2.9%during the first quarter. Savings deposits rose during the first two quarters, by2.2% and 6.6% respectively, whereas time deposits shrank during both quarters,by 3.2% and 2.3%. These indicated a continued shift towards deposits withhigher liquidity under the prevailing low interest rate environment. Thistendency was even more apparent from a year-on-year comparison, withincreases of 24.4% and 14.7% respectively for demand and savings deposits yeta decrease of 12.1% for time deposits at end-June 2003.
/Table 4.4 .....

131
Table 4.4
Hong Kong dollar deposits with authorized institutions
% changeduring
the quarterDemanddeposits
Savingsdeposits
Time deposits(a)(b)
TotalHong Kong
dollar deposits(a)
2002 Q1 -4.9 0.5 -1.9 -1.3Q2 3.6 3.9 -1.0 1.0Q3 4.7 -0.9 -2.5 -1.5Q4 10.5 6.2 -4.7 0.2
2003 Q1 -2.9 2.2 -3.2 -1.2Q2 10.7 6.6 -2.3 2.1
Total amountat the end ofJune 2003(HK$Bn))
157 735 950 1,842
% change overa year earlier
24.4 14.7 -12.1 -0.3
Notes : (a) Adjusted to include foreign currency swap deposits.
(b) Time deposits with licensed banks plus deposits with restricted licence banksand deposit-taking companies.
4.10 Total foreign currency deposits (adjusted to exclude foreign currencyswap deposits) expanded by 1.9% during the second quarter of 2003 to$1,509 billion at end-June, reversing a 0.9% dip during the first quarter. Thiswas attributable entirely to a pick-up in US dollar deposits, by 4.0% during thesecond quarter, more than offsetting a decline in non-US dollar deposits, by2.1%. Yet on a year-on-year comparison, both US dollar deposits and non-USdollar deposits rose, by 1.8% and 2.0% respectively at end-June 2003. Takentogether, total foreign currency deposits increased by 1.9% at end-June 2003.
/Table 4.5 .....

132
Table 4.5
Foreign currency deposits with authorized institutions
% change duringthe quarter
US$deposits(a)
Non-US$ deposits(a)
Total foreigncurrency
deposits(a)
Foreigncurrency
swap deposits
2002 Q1 -2.9 -12.7 -6.2 -6.9Q2 1.1 3.2 1.7 -8.0Q3 -3.3 4.2 -0.9 -7.5Q4 3.4 -1.6 1.7 -8.6
2003 Q1 -2.1 1.7 -0.9 -8.4Q2 4.0 -2.1 1.9 -7.2
Total amountat the end ofJune 2003(HK$Bn)
1,031 477 1,509 2
% change overa year earlier
1.8 2.0 1.9 -28.2
Note : (a) Adjusted to exclude foreign currency swap deposits.
Deposits with authorized institutionsby currency denomination and
Diagram 4.4
share of Hong Kong dollar deposits in total deposits
Q1 Q2 Q3 Q4 Q1 Q2 Q3 Q4 Q1 Q2 Q3 Q4 Q1 Q2 Q3 Q4 Q1 Q2 Q3 Q4 Q1 Q21998 1999 2000 2001 2002 2003
0
2
4
6
8
10
-2
-4
-6
-8
Rate of change during the quarter (percent)
0
10
20
30
40
50
60 Share in total (percent)
HK$ deposits *(left scale)
Foreign currency deposits *(left scale)
Share of HK$ deposits * in total deposits
(right scale)
Note : (*) Adjusted for foreign currency swap deposits./4.11 .....

133
4.11 Total deposits with authorized institutions in Hong Kong moved up by2.0% during the second quarter of 2003 to $3,351 billion at end-June, havingdeclined by 1.0% during the first quarter. This was influenced predominantly bythe growth profile of deposits with licensed banks, which turned up to a 2.0%rise during the second quarter, from a 1.0% fall during the first quarter. Suchdeposits constituted 98.8% of total deposits with authorized institutions atend-June 2003. As to deposits with restricted licence banks and withdeposit-taking companies, they also rose back, by 4.6% and 0.9% respectivelyduring the second quarter, following decreases of 5.5% and 7.0% during the firstquarter. On a year-on-year comparison, deposits with these three types ofauthorized institutions had respective changes of 0.7%, -1.0% and -5.2% atend-June 2003. Taken together, there was an increase of 0.6% at end-June 2003.
Table 4.6
Total deposits by major type of authorized institution
Withlicensed banks
Withrestrictedlicence banks
Withdeposit-taking
companies
% change duringthe quarter
Demanddeposits
Savingsdeposits
Timedeposits
Sub-total
Timedeposits
Timedeposits Total
2002 Q1 -1.5 0.2 -5.0 -3.5 -3.0 -7.0 -3.5Q2 4.4 4.4 -0.2 1.2 10.6 -3.0 1.3Q3 2.2 0.3 -2.2 -1.3 7.7 -2.2 -1.2Q4 10.9 6.1 -1.9 1.0 -6.9 3.3 0.9
2003 Q1 -0.6 3.3 -2.9 -1.0 -5.5 -7.0 -1.0Q2 11.0 5.5 -0.4 2.0 4.6 0.9 2.0
Total amountat the end ofJune 2003(HK$Bn)
201 1,032 2,077 3,310 35 6 3,351
% changeover a yearearlier
25.1 15.9 -7.2 0.7 -1.0 -5.2 0.6
/4.12 .....

134
4.12 At end-June 2003, narrow money supply, HK$M1(5), amounted to$277 billion, representing a 6.4% rise during the second quarter. This was fasterthan the 0.4% increase during the first quarter. On a seasonally adjusted basis,HK$M1 rose more, by 2.7% during the first quarter and 8.7% during the secondquarter(6). Broader money supply, HK$M2 and HK$M3 (adjusted to includeforeign currency swap deposits), went up by 2.2% and 2.1% respectively duringthe second quarter, to $2,012 billion and $2,031 billion respectively at end-June2003. These reversed a decrease of 0.8% in both monetary aggregates duringthe first quarter. On a year-on-year comparison, HK$M1 surged by 18.7%,while both HK$M2 and HK$M3 rose slightly by 0.5% at end-June 2003.Subdued domestic economic activity and low return from interest-bearingdeposits relative to other financial assets, including in particular debt securities,were the major factors underlying the slower growth in broader money supply.
Table 4.7
Hong Kong dollar money supply and total money supply
% changeduring
M1 M2 M3
the quarter HK$ Total HK$(a) Total HK$(a) Total
2002 Q1 -0.1 (0.5) 1.5 -1.0 -3.1 -1.0 -3.1Q2 1.7 (5.4) 2.4 1.2 1.7 1.2 1.7Q3 3.5 (2.9) 2.1 -1.4 -0.8 -1.3 -0.7Q4 7.3 (3.4) 8.0 0.4 1.4 0.5 1.3
2003 Q1 0.4 (2.7) 1.4 -0.8 -0.3 -0.8 -0.4Q2 6.4 (8.7) 7.1 2.2 2.2 2.1 2.2
Total amountat the end ofJune 2003(HK$Bn)
277 (282) 321 2,012 3,584 2,031 3,626
% change overa year earlier
18.7 (18.8) 19.8 0.5 2.4 0.5 2.4
Notes : ( ) Figures in brackets represent percentage changes on the basis of the seasonallyadjusted series of HK$M1. Seasonality is not apparent for the other monetaryaggregates.
(a) Adjusted to include foreign currency swap deposits.
/Diagram 4.5 .....

135
Hong Kong dollar money supply
Q1 Q2 Q3 Q4 Q1 Q2 Q3 Q4 Q1 Q2 Q3 Q4 Q1 Q2 Q3 Q4 Q1 Q2 Q3 Q4 Q1 Q21998 1999 2000 2001 2002 2003
0
2
4
6
8
10
12
-2
-4
-6
-8
-10
Percent
HK$M1
HK$M2 *
HK$M3 *
Diagram 4.5
(rate of change during the quarter)
Note : (*) Adjusted to include foreign currency swap deposits.
Hong Kong dollar external claims and liabilities of authorized institutions
4.13 Comparing end-May 2003 with end-2002, Hong Kong dollar claimsheld by Hong Kong’s authorized institutions on banks outside Hong Kong roseby 19.9% to $222.5 billion. On a year-on-year comparison, the increase was19.1% at end-May 2003. This was partly due to increased placements withbanks in Europe and the Mainland. By contrast, Hong Kong dollar liabilitiesowed by Hong Kong’s authorized institutions to banks outside Hong Kongcontracted by 15.4% from $161.2 billion at end-2002 to $136.3 billion atend-May 2003. On a year-on-year comparison, there was a decrease of 10.1% atend-May 2003. Taken together, Hong Kong’s authorized institutionsmaintained net claims against banks abroad, at $86.1 billion at end-May 2003,much exceeding those of $24.4 billion at end-2002.
/4.14 .....

136
4.14 On the external position vis-à-vis banks in the Mainland, Hong Kongdollar liabilities owed by Hong Kong’s authorized institutions to banks in theMainland continued to be prominent, accounting for 41% of total Hong Kongdollar liabilities owed to banks abroad at end-May 2003. Hong Kong dollarclaims held by Hong Kong’s authorized institutions on banks in the Mainlandhad a smaller share in total Hong Kong dollar claims held on banks abroad, at10% at end-May 2003. Owing to less deposits from banks in the Mainland,Hong Kong dollar liabilities owed by Hong Kong’s authorized institutions tobanks in the Mainland fell considerably, by 24.6% during the first five monthsof 2003 to $55.5 billion at end-May. On a year-on-year comparison, thedecrease was 22.7% at end-May 2003. On the other hand, with more lendingand placement to banks in the Mainland, Hong Kong dollar claims held by HongKong’s authorized institutions on banks in the Mainland went up by 9.0%during the first five months of 2003 to $22.5 billion at end-May. On ayear-on-year comparison, there was a surge of 19.5% at end-May 2003. Takentogether, Hong Kong’s authorized institutions had net Hong Kong dollarliabilities to banks in the Mainland, amounting to $33.0 billion at end-May 2003,which was reduced from $52.9 billion at end-2002.
Table 4.8
Hong Kong dollar external claims and liabilitiesheld by Hong Kong’s authorized institutions
As at the end of
Claims on banksoutside Hong Kong
(HK$Bn)
Liabilities to banksoutside Hong Kong
(HK$Bn)
Net liabilities to banksoutside Hong Kong
(HK$Bn)
Overall
Involvingbanks in
the Mainland Overall
Involvingbanks in
the Mainland Overall
Involvingbanks in
the Mainland
2002 Q1 171.8 (1.1) 19.1 (3.2) 147.0(-16.2) 68.4 (-28.7) -24.9 49.3Q2 190.1 (10.6) 19.8 (3.4) 151.2 (2.9) 67.4 (-1.4) -38.9 47.6Q3 192.3 (1.2) 21.5 (8.7) 154.3 (2.1) 70.6 (4.6) -38.0 49.0Q4 185.6 (-3.5) 20.6 (-4.2) 161.2 (4.5) 73.6 (4.3) -24.4 52.9
2003 Q1 202.4 (9.0) 21.9 (6.4) 149.8 (-7.1) 62.2 (-15.4) -52.5 40.3Apr 200.0 (-1.2) 23.2 (5.6) 135.7 (-9.4) 53.7 (-13.7) -64.2 30.5May 222.5 (11.2) 22.5 (-3.0) 136.3 (0.5) 55.5 (3.3) -86.1 33.0
<19.1> <19.5> <-10.1> <-22.7>
Notes : ( ) % change during the period.
< > % change over a year earlier./Loans .....

137
Loans and advances
4.15 Total loans and advances contracted further, by 0.3% during thesecond quarter of 2003 to $2,053 billion at end-June, after a 0.8% decreaseduring the first quarter. Within this total, Hong Kong dollar loans were reducedby 0.8% during the second quarter to $1,597 billion at end-June, while foreigncurrency dollar loans rose by 1.4% to $456 billion. This followedcorresponding reductions of 0.4% and 2.3% during the first quarter. The shareof Hong Kong dollar loans in total loans and advances stood at 77.8% atend-June 2003, little changed from that at end-2002. On a year-on-yearcomparison, both Hong Kong dollar loans and foreign currency loans wentdown, by 3.0% and 8.7% respectively, giving a decrease of 4.3% in total loansand advances at end-June 2003.
Table 4.9
Loans and advances by currency denomination
% change during the quarter
Hong Kongdollar loans
Foreigncurrency loans
Total loansand advances
2002 Q1 0.7 -7.2 -1.2Q2 -0.8 0.2 -0.5Q3 -1.3 -5.5 -2.2Q4 -0.6 -2.4 -1.0
2003 Q1 -0.4 -2.3 -0.8Q2 -0.8 1.4 -0.3
Total amountat the end ofJune 2003(HK$Bn)
1,597 456 2,053
% change overa year earlier
-3.0 -8.7 -4.3
/Diagram 4.6 .....

138
Loans and advances by currency denomination
Q1 Q2 Q3 Q4 Q1 Q2 Q3 Q4 Q1 Q2 Q3 Q4 Q1 Q2 Q3 Q4 Q1 Q2 Q3 Q4 Q1 Q21998 1999 2000 2001 2002 2003
0
5
10
-5
-10
-15
-20
Rate of change during the quarter (percent)
0
10
20
30
40
50
60
70
80
90
100Share in total (percent)
Diagram 4.6
Foreigncurrency loans
(left scale)
HK$ loans(left scale)
and share of Hong Kong dollar loans in total loans and advances
Share of HK$ loans in total loans and advances
(right scale)
4.16 As Hong Kong dollar loans declined further while Hong Kong dollardeposits resumed increase during the first half of 2003, the Hong Kong dollarloan-to-deposit ratio went down appreciably, from 88.5% at end-2002 to 86.7%at end-June 2003.
Table 4.10
Hong Kong dollar loan-to-deposit ratio(a)
As at the end of %
2002 Q1 90.7Q2 89.1Q3 89.3Q4 88.5
2003 Q1 89.2Q2 86.7
Note : (a) Hong Kong dollar deposits have been adjusted to include foreign currency swapdeposits.
/Diagram 4.7 .....

139
Hong Kong dollar loan-to-deposit ratio*
Q1 Q2 Q3 Q4 Q1 Q2 Q3 Q4 Q1 Q2 Q3 Q4 Q1 Q2 Q3 Q4 Q1 Q2 Q3 Q4 Q1 Q21998 1999 2000 2001 2002 2003
75
80
85
90
95
100
105
110
115Percent
Diagram 4.7
0
Note : (*) See the footnote to Table 4.10.
4.17 Analysed by place of usage, loans for use in Hong Kong, at$1,819 billion at end-June 2003, continued to decrease, by 0.3% during thesecond quarter, following a 0.5% fall during the first quarter. Loans for useoutside Hong Kong also declined, by 3.4% during the first quarter and further by0.2% during the second quarter, to $234 billion at end-June, upon continuedcut-backs in Euro-yen Impact Loans(7). On a year-on-year comparison, loans foruse in Hong Kong and outside Hong Kong fell by 2.8% and 14.8% respectivelyat end-June 2003.
/Table 4.11 .....
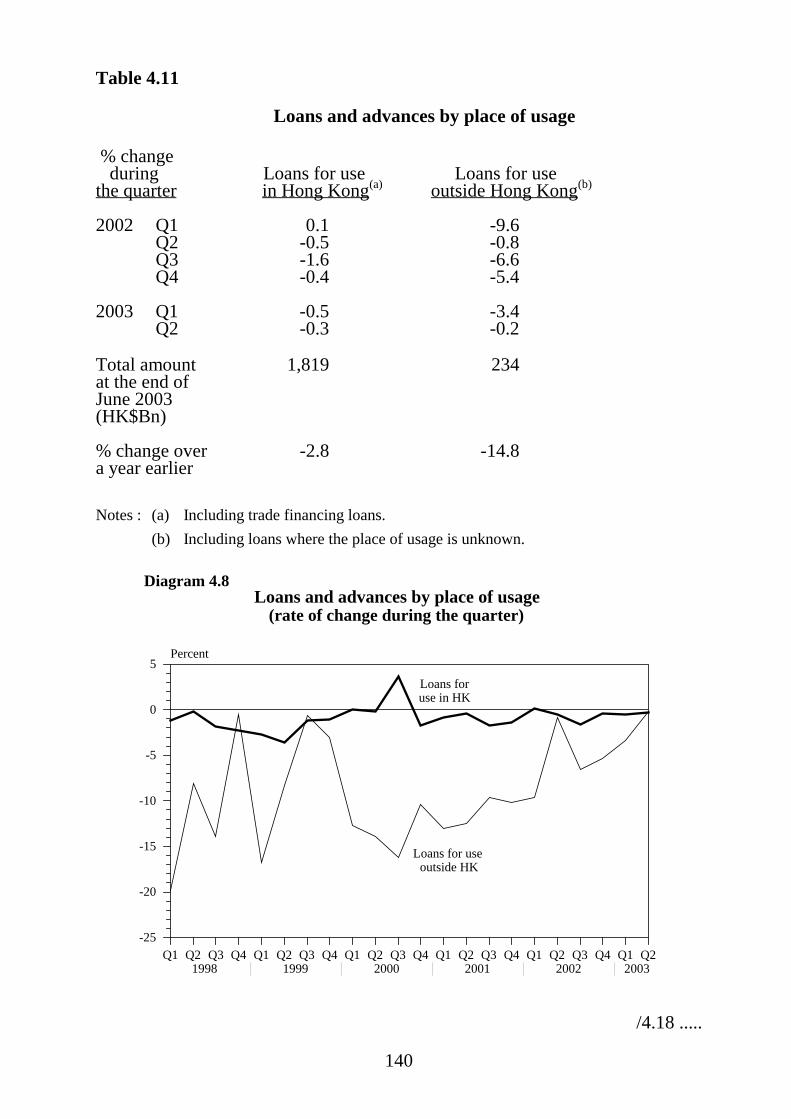
140
Table 4.11
Loans and advances by place of usage
% change during Loans for use Loans for usethe quarter in Hong Kong(a) outside Hong Kong(b)
2002 Q1 0.1 -9.6Q2 -0.5 -0.8Q3 -1.6 -6.6Q4 -0.4 -5.4
2003 Q1 -0.5 -3.4Q2 -0.3 -0.2
Total amount 1,819 234at the end ofJune 2003(HK$Bn)
% change over -2.8 -14.8a year earlier
Notes : (a) Including trade financing loans.(b) Including loans where the place of usage is unknown.
Loans and advances by place of usage
Q1 Q2 Q3 Q4 Q1 Q2 Q3 Q4 Q1 Q2 Q3 Q4 Q1 Q2 Q3 Q4 Q1 Q2 Q3 Q4 Q1 Q21998 1999 2000 2001 2002 2003
0
5
-5
-10
-15
-20
-25
Percent
Diagram 4.8
Loans for use outside HK
Loans for use in HK
(rate of change during the quarter)
/4.18 .....

141
4.18 Analysed by major usage, domestic loans continued to show a mixedperformance. Loans for trade financing expanded by 6.2% during the secondquarter of 2003, larger than the 2.2% increase during the first quarter.Continued robust performance of external trade was the major contributoryfactor. Loans to the manufacturing sector and for financial concerns also wentup faster, by 4.9% and 2.8% respectively during the second quarter, as comparedto the increases of 1.7% and 0.1% during the first quarter. On the other hand,loans to stockbrokers reverted to decline, by 5.5% during the second quarter of2003, after a brief rise by 4.2% during the first quarter. So did loans for thewholesale and retail trade, to a 0.6% decrease during the second quarter, from a2.3% increase during the first quarter, as local retail business was hit by SARS.As to loans for residential mortgages and for building, construction, propertydevelopment and property investment, both shrank by 1.4% during the secondquarter, as the subdued property market continued to weigh down on suchlending. This followed respective declines of 1.3% and 0.3% during the firstquarter.
Table 4.12
Loans and advances for use in Hong Kong by major usage(a)
Loans to :Building,
construction,Whole- property
sale develop- Purchase% change Finance Manu- and ment and resi- during visible facturing retail property dential Financial Stock-
the quarter trade sector trades investment property(b) concerns brokers Others
2002 Q1 -2.6 1.2 1.0 -0.5 * 0.9 2.1 0.7Q2 7.3 1.3 -0.1 -1.9 0.6 -8.2 23.9 -0.8Q3 1.9 -4.9 -0.9 -2.4 -0.7 -3.2 -22.2 -1.5Q4 -3.7 1.2 -2.6 1.0 -0.7 0.3 -5.3 -0.3
2003 Q1 2.2 1.7 2.3 -0.3 -1.3 0.1 4.2 -1.2Q2 6.2 4.9 -0.6 -1.4 -1.4 2.8 -5.5 -0.9
Total amountat the end ofJune 2003(HK$Bn)
99 75 102 373 624 129 8 409
% changeover a yearearlier
6.5 2.6 -1.8 -3.0 -4.1 -0.1 -27.5 -3.9
Notes : (a) Figures in this table are revised on a regular basis to incorporate subsequent amendmentsand loan re-classifications made by the authorized institutions concerned. The rates ofchange for the earlier quarters have been adjusted for the revisions known up to the latestreference quarter.
(b) Including loans for the purchase of flats under the Home Ownership Scheme, PrivateSector Participation Scheme, and Tenants Purchase Scheme.
(*) Change of less than 0.05%./4.19 .....

142
4.19 The quality of assets held by the local banking sector showed somesigns of deterioration, amidst the subdued local business environment.Specifically, the ratio of non-performing loans to total loans increased, from3.94% at end-2002 to 4.03% at end-March 2003, as did the ratio of overdue andrescheduled loans to total loans, from 3.59% to 3.64%(8). This wasnotwithstanding a slight decline in the ratio of classified loans to total loans,from 5.04% to 5.03%. Amongst different types of loans, arrears for over threemonths in mortgage repayment rose from 1.06% at end-2002 to 1.11% atend-March 2003, whereas arrears for over three months in credit card repaymentfell from 1.28% to 1.25%. Nevertheless, the local banks remained wellcapitalised in overall terms, with their consolidated capital adequacy ratioaveraging at 15.9% at end-March 2003, still far higher than the standard set bythe Bank for International Settlements.
Banks and other deposit-taking institutions
4.20 During the first half of 2003, the number of licensed banks increasedby three to 136 at end-June. On the other hand, the number of restricted licencebanks fell by four to 42, and the number of deposit-taking companies by five to40. Altogether, 218 authorized institutions (excluding representative offices)from 33 countries and territories had a presence in Hong Kong at end-June 2003.Taking all the authorized institutions in Hong Kong together, their total assetswent up by 0.8% during the first half of 2003 to $6,049 billion at end-June.
4.21 On enhancing deposit protection in Hong Kong, opinions obtainedfrom an earlier public consultation by HKMA indicated broad support forintroduction of a deposit protection scheme in Hong Kong. After further studiesand another round of public consultation by HKMA on the details of theproposed scheme, the bill for establishment of the deposit protection scheme inHong Kong was drawn up and introduced into the Legislative Council on 30April 2003. In order to prevent moral hazard and ensure financial viability ofthe scheme, it is proposed that the amount of protection for each eligible claimbe capped at a specified level, and that a system of differential contributionsfrom the depository institutions according to their regulatory ratings beintroduced. It is expected to take at least 18 months after the passage of the billfor the scheme to commence operation.
/4.22 .....
143
4.22 To help address the issues of increases in consumer credit defaults andpersonal bankruptcies, the revised Code of Practice on Consumer Credit Databecame effective as from 2 June 2003. Designed to provide practical guidanceto data users in the handling of consumer credit data, the revised Code ofPractice covers the collection, accuracy, use, security, access and correctionissues, as they relate to the personal data of those individuals who are or havebeen applicants for consumer credit. It covers, on the one hand, credit referenceagencies, and on the other hand, credit providers in their dealing with creditreference agencies and debt collection agencies.
4.23 As another initiative to facilitate credit assessment and maintainsoundness of the local banking sector, HKMA, the Hong Kong Association ofBanks and the Deposit Taking Companies Association jointly announced on16 June 2003 the plan to establish a commercial credit reference agency (CCRA)in Hong Kong in the third quarter of 2004. CCRA is expected to collect creditdata of small and medium-sized enterprises and make such data available to theauthorized institutions. To safeguard confidentiality of the data held by CCRA,HKMA will issue a supervisory guideline to set out the minimum standards thatauthorized institutions have to observe in respect of sharing and use ofcommercial credit data.
Insurance
4.24 During the first half of 2003, the total number of insurance companiesdecreased by five to 190 at end-June. Within this total, 46 were engaged inlong-term business, 125 in general business, and 19 in composite business.Taken together, insurance companies from 25 countries and territoriesmaintained a presence in Hong Kong at end-June 2003. Benefiting from strongexpansion in both life insurance and general insurance, the value of businessreceipts in the insurance industry surged, by 22% in the first quarter of 2003over a year earlier, even exceeding the 15% leap in the fourth quarter of 2002.
/The .....

144
The debt market
4.25 In the first half of 2003, a total of 55 issues of Exchange Fund paperwere launched by HKMA to replace the maturing issues(9). The total marketvalue of Exchange Fund paper outstanding rose by 1.3% during the period to$119.0 billion at end-June 2003. Market response to the tenders of ExchangeFund paper remained favourable, with the average over-subscription ratemoving higher to 6.7 times in the first half of 2003, from 5.5 times in the secondhalf of 2002. Trading in Exchange Fund paper also turned more active, with theaverage daily turnover increasing to $25.8 billion in the first half of 2003, from$22.2 billion in the second half of 2002. Comparing end-June 2003 withend-2002, the yield spread of five-year Exchange Fund Notes over thecorresponding US Treasuries narrowed from 48 basis points to 28 basis points.
Table 4.13
Exchange Fund Bills and Notes issued by HKMA
Amount outstanding Average daily turnoveras at the end of the quarter in the quarter
(HK$Bn) (HK$Bn)
2002 Q1 114.7 22.3Q2 115.7 22.7Q3 116.6 23.4Q4 117.5 21.0
2003 Q1 118.2 27.8Q2 119.0 23.8
/Diagram 4.9 .....

145
Hong Kong dollar and US dollar yield curvesDiagram 4.9
Time to Maturity
1M 1 Y 2 Y 3 Y 4 Y 5 Y 6 Y 7 Y 8 Y 9 Y 10 Y0
1
2
3
4
5
6
7Percent per annum
0
(as at the end of June 2003)
IFC US Treasuries
Exchange Fund
Bills/Notes
IBRD
EIB
EIB
NIB
NIB
Note : AAA Hong Kong dollar debt issuers
EIB European Investment BankIBRD International Bank for Reconstruction and DevelopmentIFC International Finance CorporationNIB Nordic Investment Bank
4.26 At present, the Hong Kong Mortgage Corporation (HKMC) is one ofthe major issuers of debt securities in Hong Kong. In the first half of 2003,$5.0 billion worth of HKMC debt paper was launched. By end-June, the totaloutstanding value of debt securities issued by HKMC under its Note IssuanceProgramme amounted to $4.5 billion, and that under its Debt IssuanceProgramme reached $22.0 billion. In addition, retail bonds were issued byHKMC, with the outstanding value totalling $5.4 billion at end-June.
/4.27 .....

146
4.27 In the first half of 2003, $49.0 billion worth of new negotiablecertificates of deposit (NCDs) was launched, less than $52.7 billion in thesecond half of 2002. Of the new issuance of NCDs in the first half of 2003,$27.9 billion was denominated in Hong Kong dollars, also down from$31.1 billion in the second half of 2002. The total value of NCDs outstandingnevertheless went up, to $234.7 billion at end-June 2003, from $211.2 billion atend-2002. Within the total, $139.5 billion was denominated in Hong Kongdollars at end-June 2003, above that of $138.4 billion at end-2002. Yet theproportion of Hong Kong dollar denominated NCDs held by the local bankingsector fell, from 52.3% at end-2002 to 50.6% at end-June 2003.
Table 4.14
NCDs issued by authorized institutions in Hong Kong
Issued andoutstanding
Held byauthorizedinstitutions
Held outsidethe local
banking sector(HK$Bn) (HK$Bn) (HK$Bn)
As at the end of In HK$ Total In HK$ Total In HK$ Total
2002 Q1 132.1 173.3 73.5 85.0 58.6 88.2Q2 142.0 192.3 77.2 86.2 64.8 106.1Q3 136.8 201.0 72.9 82.0 63.9 118.9Q4 138.4 211.2 72.4 80.2 66.1 131.1
2003 Q1 140.6 229.5 74.0 83.1 66.6 146.5Q2 139.5 234.7 70.6 79.2 69.0 155.5
/4.28 .....

147
4.28 In the first half of 2003, 363 new issues of other Hong Kong dollardebt instruments, worth $61.2 billion, were launched by the private sector.These were more than the 275 new issues worth $38.8 billion in the second halfof 2002. Partly reflecting risk aversion by debt issuers against potential interestrate volatility, the issuance of fixed rate bonds by the private sector, at$46.5 billion in the first half of 2003, was still considerably higher than that offloating rate notes, at $14.7 billion in the same period. At end-June 2003, thetotal outstanding value of Hong Kong dollar fixed rate bonds and floating ratenotes issued by the private sector amounted to $206.1 billion and $85.0 billionrespectively, adding up to a total of $291.1 billion(10). These exceeded thecorresponding figures of $193.9 billion, $76.2 billion and $270.1 billion atend-2002. Furthermore, there were three new issues of Hong Kong dollar debtpaper by multilateral agencies in the first half of 2003, raising a total of$1.6 billion, as against four issues for $1.0 billion in the second half of 2002.
4.29 Taking the public and private sectors together, the total value of HongKong dollar debt paper outstanding thus amounted to $552.8 billion at end-June2003(11), up from $532.9 billion at end-2002. The size of the Hong Kong dollardebt market was equivalent to 27.2% of HK$M3, or 20.5% of the Hong Kongdollar denominated assets of the entire banking sector.
/The .....
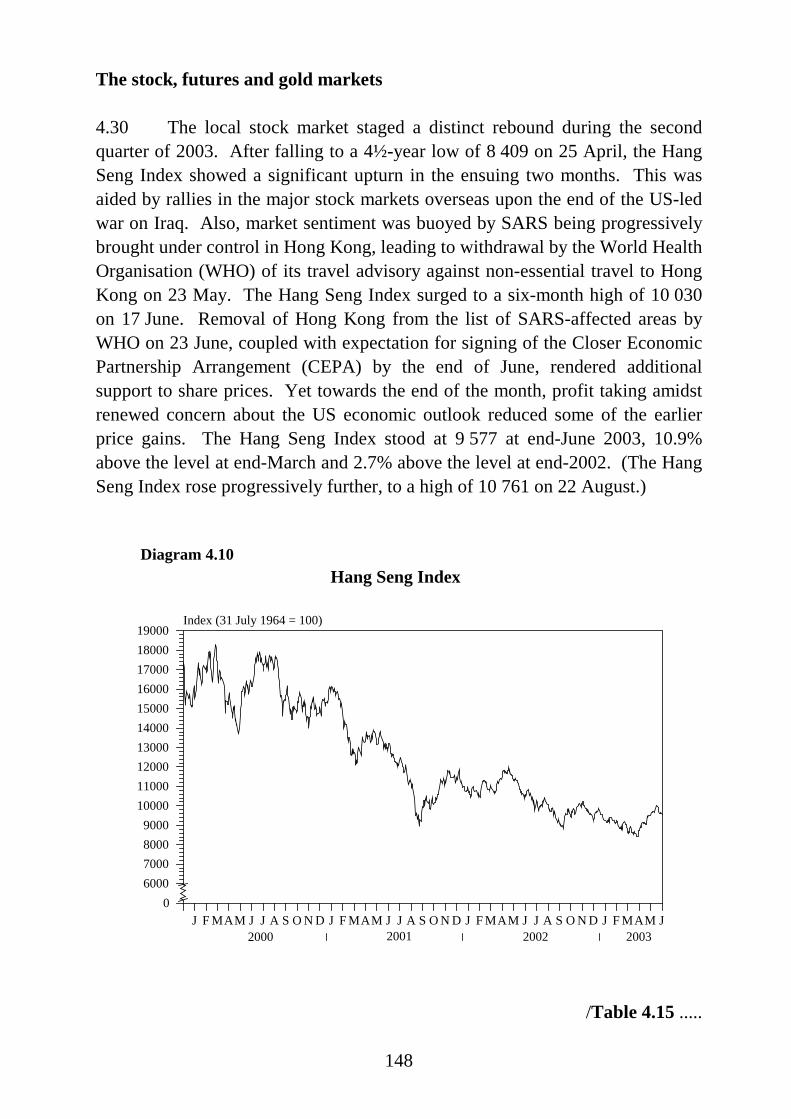
148
The stock, futures and gold markets
4.30 The local stock market staged a distinct rebound during the secondquarter of 2003. After falling to a 4½-year low of 8 409 on 25 April, the HangSeng Index showed a significant upturn in the ensuing two months. This wasaided by rallies in the major stock markets overseas upon the end of the US-ledwar on Iraq. Also, market sentiment was buoyed by SARS being progressivelybrought under control in Hong Kong, leading to withdrawal by the World HealthOrganisation (WHO) of its travel advisory against non-essential travel to HongKong on 23 May. The Hang Seng Index surged to a six-month high of 10 030on 17 June. Removal of Hong Kong from the list of SARS-affected areas byWHO on 23 June, coupled with expectation for signing of the Closer EconomicPartnership Arrangement (CEPA) by the end of June, rendered additionalsupport to share prices. Yet towards the end of the month, profit taking amidstrenewed concern about the US economic outlook reduced some of the earlierprice gains. The Hang Seng Index stood at 9 577 at end-June 2003, 10.9%above the level at end-March and 2.7% above the level at end-2002. (The HangSeng Index rose progressively further, to a high of 10 761 on 22 August.)
Hang Seng Index
J F MAM J J A S O N D J F MAM J J A S O N D J F MAM J J A S O N D J F MAM J50006000700080009000
10000110001200013000140001500016000170001800019000
Index (31 July 1964 = 100)
Diagram 4.10
0 0
2000 2001 2002 2003
/Table 4.15 .....

149
Table 4.15Movements in the Hang Seng Index and
in the share price indices in selected stock markets overseas(index as at the last trading day of the quarter)
HangSengIndex
NewYorkDowJones
IndustrialAverage
TokyoNikkei
Average
LondonFTSE 100
Index
FrankfurtDAX 30 Index
ParisCAC 40 Index
SydneyAll
Ordinaries Index
SingaporeStraitsTimes Index
2002 Q1 11 033 10 404 11 025 5 272 5 397 4 688 3 363 1 803Q2 10 599 9 243 10 622 4 656 4 383 3 898 3 163 1 553Q3 9 072 7 592 9 383 3 722 2 769 2 777 2 928 1 352Q4 9 321 8 342 8 579 3 940 2 893 3 064 2 976 1 341
2003 Q1 8 634 7 992 7 973 3 613 2 424 2 618 2 849 1 268Q2 9 577 8 985 9 083 4 031 3 221 3 084 3 000 1 448
% changeduring the firstquarter of 2003
-7.4 -4.2 -7.1 -8.3 -16.2 -14.5 -4.3 -5.5
% changeduring thesecond quarterof 2003
10.9 12.4 13.9 11.6 32.9 17.8 5.3 14.2
% changeduring the firsthalf of 2003
2.7 7.7 5.9 2.3 11.3 0.7 0.8 8.0
% change atend-June 2003over a yearearlier
-9.6 -2.8 -14.5 -13.4 -26.5 -20.9 -5.2 -6.8
4.31 Consequential to the pick-up in share prices, total stock marketcapitalisation, including the Main Board and the Growth Enterprise Market(GEM)(12), rose by 10% during the first half of 2003 to $3,968 billion atend-June. Trading turned more active, with the average daily turnover rising to$8.1 billion in the second quarter of 2003, from $6.1 billion in the first quarter.For the first half of 2003 as a whole, the average daily turnover at $7.1 billionwas 22% higher than in the second half of 2002.
/Table 4.16 .....
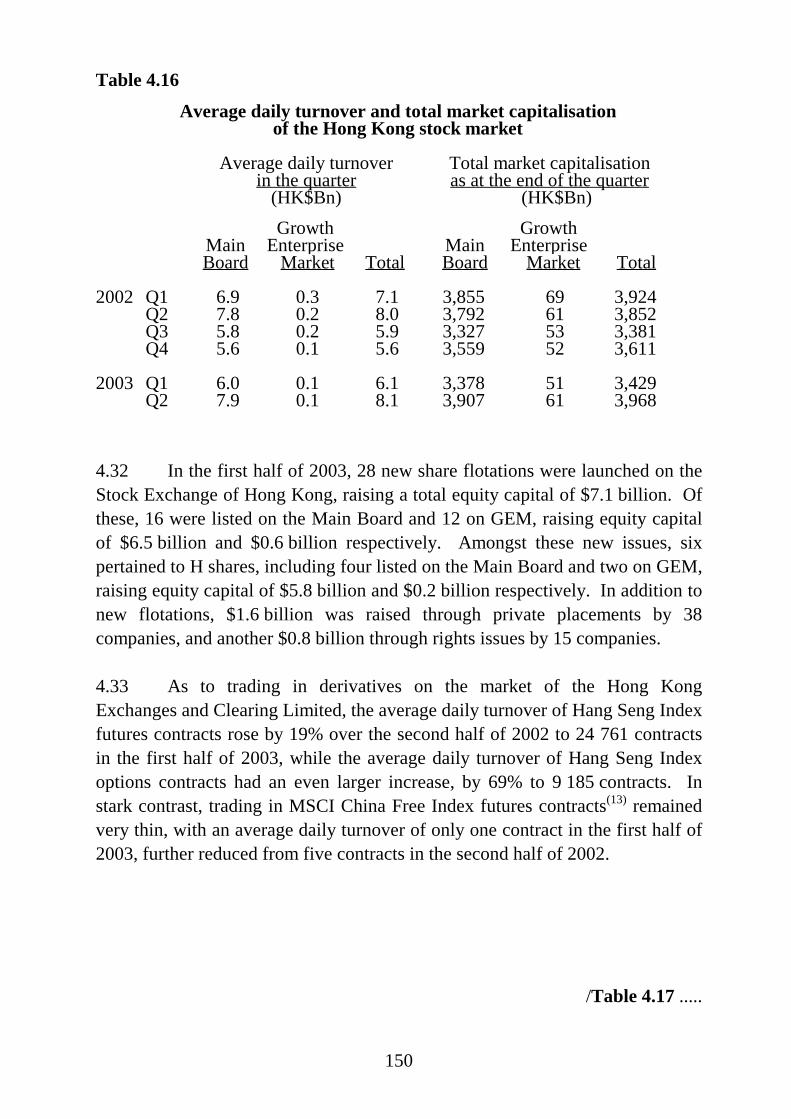
150
Table 4.16
Average daily turnover and total market capitalisationof the Hong Kong stock market
Average daily turnoverin the quarter
Total market capitalisationas at the end of the quarter
(HK$Bn) (HK$Bn)
MainBoard
GrowthEnterprise Market Total
MainBoard
GrowthEnterprise
Market Total
2002 Q1 6.9 0.3 7.1 3,855 69 3,924Q2 7.8 0.2 8.0 3,792 61 3,852Q3 5.8 0.2 5.9 3,327 53 3,381Q4 5.6 0.1 5.6 3,559 52 3,611
2003 Q1 6.0 0.1 6.1 3,378 51 3,429Q2 7.9 0.1 8.1 3,907 61 3,968
4.32 In the first half of 2003, 28 new share flotations were launched on theStock Exchange of Hong Kong, raising a total equity capital of $7.1 billion. Ofthese, 16 were listed on the Main Board and 12 on GEM, raising equity capitalof $6.5 billion and $0.6 billion respectively. Amongst these new issues, sixpertained to H shares, including four listed on the Main Board and two on GEM,raising equity capital of $5.8 billion and $0.2 billion respectively. In addition tonew flotations, $1.6 billion was raised through private placements by 38companies, and another $0.8 billion through rights issues by 15 companies.
4.33 As to trading in derivatives on the market of the Hong KongExchanges and Clearing Limited, the average daily turnover of Hang Seng Indexfutures contracts rose by 19% over the second half of 2002 to 24 761 contractsin the first half of 2003, while the average daily turnover of Hang Seng Indexoptions contracts had an even larger increase, by 69% to 9 185 contracts. Instark contrast, trading in MSCI China Free Index futures contracts(13) remainedvery thin, with an average daily turnover of only one contract in the first half of2003, further reduced from five contracts in the second half of 2002.
/Table 4.17 .....
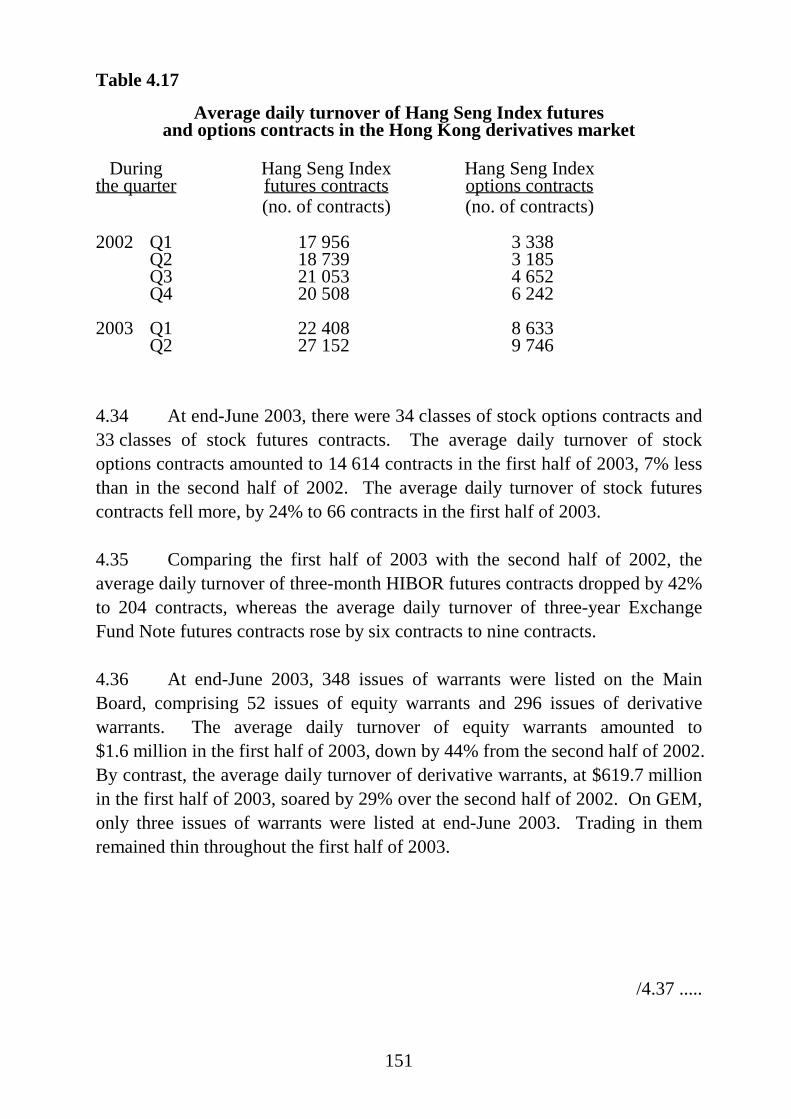
151
Table 4.17
Average daily turnover of Hang Seng Index futuresand options contracts in the Hong Kong derivatives market
Duringthe quarter
Hang Seng Indexfutures contracts
Hang Seng Indexoptions contracts
(no. of contracts) (no. of contracts)
2002 Q1 17 956 3 338Q2 18 739 3 185Q3 21 053 4 652Q4 20 508 6 242
2003 Q1 22 408 8 633Q2 27 152 9 746
4.34 At end-June 2003, there were 34 classes of stock options contracts and33 classes of stock futures contracts. The average daily turnover of stockoptions contracts amounted to 14 614 contracts in the first half of 2003, 7% lessthan in the second half of 2002. The average daily turnover of stock futurescontracts fell more, by 24% to 66 contracts in the first half of 2003.
4.35 Comparing the first half of 2003 with the second half of 2002, theaverage daily turnover of three-month HIBOR futures contracts dropped by 42%to 204 contracts, whereas the average daily turnover of three-year ExchangeFund Note futures contracts rose by six contracts to nine contracts.
4.36 At end-June 2003, 348 issues of warrants were listed on the MainBoard, comprising 52 issues of equity warrants and 296 issues of derivativewarrants. The average daily turnover of equity warrants amounted to$1.6 million in the first half of 2003, down by 44% from the second half of 2002.By contrast, the average daily turnover of derivative warrants, at $619.7 millionin the first half of 2003, soared by 29% over the second half of 2002. On GEM,only three issues of warrants were listed at end-June 2003. Trading in themremained thin throughout the first half of 2003.
/4.37 .....

152
4.37 Gold price regained part of its strength in the second quarter of 2003,having undergone some consolidation in the first quarter. While the end of theUS-led war on Iraq had dampened buying interest, growing expectation forfurther cut in US dollar and euro interest rates increased the relativeattractiveness of holding non-interest bearing assets such as gold. The weakerUS dollar also boosted the demand for gold, as it being denominated in USdollar became cheaper in terms of other major currencies. The price ofloco-London gold touched a high of US$371.8 per troy ounce on 27 May. Butprofit taking brought the price down subsequently to close at US$345.2 per troyounce at end-June 2003, only slightly above that of US$344.0 at end-2002.Gold price at the Chinese Gold and Silver Exchange Society exhibited a similarprofile, with its level at $3,204 per tael at end-June 2003 being also marginallyabove that of $3,199 at end-2002. Turnover on the Exchange amounted to1.8 million taels in the first half of 2003, higher than that of 1.7 million taels inthe second half of 2002.
Unit trusts and mutual funds
4.38 At end-June 2003, the total number of unit trusts and mutual funds(including sub-funds and umbrella funds) in Hong Kong stood at 986, up from942 at end-2002. Gross sales of mutual funds amounted to US$9.3 billion in thefirst half of 2003, representing a marked increase of 55% over the second half of2002. After deducting redemptions, net sales amounted to US$2.5 billion in thefirst half of this year, up by 46% over the second half of last year. Amongst thevarious types of mutual funds, equity funds continued to account for the largestshare, at 55% of the total value of funds at end-June 2003. This was followedby bond funds, asset allocation funds and money market funds, with respectiveshares of 29%, 8% and 7%(14).
/4.39 .....

153
4.39 The Mandatory Provident Fund (MPF) System(15) continues to generatea substantial amount of retirement fund assets which, in the course of time,should add impetus to further development of the local capital market. Atend-June 2003, the aggregate net asset value of the approved constituent fundsof MPF schemes rose further to $69.2 billion, from $55.1 billion at end-2002.This was mainly attributable to continued contributions from the enrolledpopulation. By end-June 2003, there were 20 approved corporate trustees. OnMPF products, 44 master trust schemes, two industry schemes and two employersponsored schemes, comprising altogether 317 constituent funds, were approvedby the Mandatory Provident Fund Schemes Authority. About 216 000employers, 1.73 million employees and 300 000 self-employed persons had beenenrolled in MPF schemes, with the compliance rates for employers, relevantemployees and self-employed persons reaching 94%, 96% and 79% respectively.
/Notes .....

154
Notes :
(1) Under the linked exchange rate system established in October 1983, the note-issuingcommercial banks are required to pay US dollars to the Hong Kong Monetary Authority(HKMA) for the account of the Exchange Fund at the fixed rate of HK$7.8 to US$1.0 inreturn for non-interest-bearing Certificates of Indebtedness (CIs), as backing for theissue of their Hong Kong dollar banknotes. As from 7 September 1998, HKMA alsoprovides an explicit undertaking to convert the Hong Kong dollar balances held in theclearing accounts maintained by the banks with HKMA at the ConvertibilityUndertaking Rate. This was set at the then market exchange rate of 7.750 when theconvertibility undertaking was introduced. From 1 April 1999, the ConvertibilityUndertaking Rate for the Aggregate Balance was raised from 7.750 by 1 pip percalendar day, reaching 7.800 on 12 August 2000, where it has stayed.
(2) The trade-weighted Nominal Effective Exchange Rate Index (EERI) is an indicator ofthe overall exchange value of the Hong Kong dollar against a fixed basket of othercurrencies. These currencies are selected on account of their importance in HongKong's trade, and the weights reflect their relative importance in Hong Kong'smerchandise trade.
As from 2 January 2002, a new series of nominal Effective Exchange Rate Indexreplaces the old series. The weights adopted for the new EERI series are based on theaverage pattern of Hong Kong’s merchandise trade during 1999 and 2000, as againstthat during 1991 to 1993 for the old series. The currency basket for the new series hasalso been updated to include the euro and the Philippine peso, and to exclude the fivecurrencies pertaining to the participating countries of the euro. Thus the currency basketfor the new series contains 14 currencies, instead of 17 currencies for the old series.The base period is changed from October 1983 to January 2000.
The corresponding Real EERI, which takes into account the relative movements in theseasonally adjusted consumer price indices of the respective economies, is revisedaccordingly, in line with the updated weights and the new base period of the nominalEERI.
It is important to note that the EERIs thus compiled adopt constant weights on therespective currencies, while the pattern of merchandise trade changes over time. Inparticular, Hong Kong’s trade with the Mainland has shifted more towards re-exports,from domestic exports and retained imports. Also, with the Mainland being the largestsource of Hong Kong’s re-exports, movements in the exchange rate of the Renminbicould have somewhat different implications for Hong Kong’s export competitiveness,as against movements in the other currencies.
/(3) .....
155
(3) In the light of the changing market shares of individual authorized institutions (AIs) inthe residential mortgage business, the coverage of the Monthly Survey on ResidentialMortgage Lending conducted by HKMA has been expanded as from May 2001, in orderto increase the proportion of business covered by the survey. Altogether 38 AIs wereso included immediately after the coverage expansion. The number of AIs has sincefallen to 28 due to banking sector consolidation. The AIs currently covered togetheraccount for around 96% of the total business, as compared to 92% for the 32 AIsformerly covered. The outstanding amount of mortgage loans covered by the survey ishence lifted, by 8.8%.
(4) Foreign currency swap deposits are deposits involving customers buying foreigncurrencies in the spot market and placing them as deposits with authorized institutions,whilst at the same time entering into a contract to sell such foreign currencies(principal plus interest) forward in line with the maturity of such deposits. For mostanalytical purposes, they should be regarded as Hong Kong dollar deposits.
(5) The various definitions of the money supply are as follows:
M1 : notes and coins with the public, plus customers’ demand deposits withlicensed banks.
M2 : M1 plus customers’ savings and time deposits with licensed banks, plusnegotiable certificates of deposit (NCDs) issued by licensed banks and held outside themonetary sector.
As from June 2002, short-term Exchange Fund placements of less than one month areincluded under time deposits as part of the monetary aggregates. The data series ontime deposits and M2 are backdated to April 1997 using this revised definition.
M3 : M2 plus customers’ deposits with restricted licence banks and deposit-takingcompanies, plus NCDs issued by such institutions and held outside the monetary sector.
(6) Amongst the various monetary aggregates, more apparent seasonal patterns are found inHK$M1, currency held by the public, and demand deposits. Seasonally adjusted data onthese three series back-dated to January 1990 have been compiled. The deseasonaliseddata facilitate analysis of the underlying trends. For details, see the November 2000issue of the HKMA Quarterly Bulletin.
(7) Euro-yen Impact Loans (EYIL) are loans made to customers in Japan by a domesticbranch of a Japanese bank but booked in an overseas branch of the bank. Loans bookedin this way generally have tax and funding cost advantages for customers. Reflecting amore cautious lending stance by the Japanese banks and the need to reduce the size oftheir balance sheets, EYIL has declined substantially since the second half of 1997.
/(8) .....

156
(8) Overdue loans are defined here as those that have been overdue for more than threemonths. Rescheduled loans are those that have been restructured or renegotiatedbecause of deterioration in the financial position of the borrower, or because of inabilityof the borrower to meet the original repayment schedule. Non-performing loans arethose on which interest has been placed in suspense or on which interest accrual hasceased. Classified loans are those that have been classified as substandard, doubtful orloss. Of these categorisations, classified loans overlap to certain extent with overdueand rescheduled loans.
(9) As from 1 April 1999, interest payments on Exchange Fund paper are allowed forexpanding the stock of outstanding Exchange Fund paper.
(10) These figures may not represent a full coverage of all the Hong Kong dollar debt paperissued by the private sector.
(11) Due to different sources for NCD data, the total value of Hong Kong dollar debt paperoutstanding may not equal the sum of the outstanding values of Exchange Fund paper,HKMC debts, NCDs, and other Hong Kong dollar debt instruments issued by theprivate sector.
(12) The Growth Enterprise Market was launched by the then Stock Exchange of Hong KongLtd in November 1999 as an alternative market to the Main Board, in order to giveemerging growth companies easier access to the funds of the investing public. Thoughopen to companies in all industries and of all sizes, the market provides an efficientvenue for fund raising especially by small to medium-sized enterprises.
(13) The MSCI China Free Index is a market-capitalisation-weighted stocks index, coveringRed-chip shares and H shares listed in Hong Kong, B shares listed in Shanghai andShenzhen, and N shares listed in New York. The Index thus represents the universe ofChinese stocks open to investors outside the Mainland, and complements the Red-chipand H share markets in Hong Kong. Trading in MSCI China Free Index futurescontracts commenced on 7 May 2001.
(14) These figures are sourced from the sales and redemptions and performance surveyconducted by the Hong Kong Investment Funds Association on their members, and assuch cover only the active authorized funds that have responded to the survey.
/(15) .....

157
(15) The Mandatory Provident Fund (MPF) System, launched on 1 December 2000, is aprivately managed mandatory system of provident fund schemes covering members ofthe workforce aged between 18 and 65, subject to certain exceptions. It provides forjoint contributions by the employer and the employee, each at 5% of the employee’srelevant income, to a registered MPF scheme, subject to a maximum and a minimumlevel of income for MPF contribution purposes. As from February 2003, the minimumincome level for MPF contribution purpose is raised from $4,000 per month to $5,000,yet the maximum income level is kept at $20,000 per month. The accrued MPF benefitsare fully vested in the scheme, and members can be transferred from scheme to schemewhen there is a change in employment.
The Mandatory Provident Fund Schemes Authority (MPFA) is the statutory body taskedwith the responsibility for regulation and supervision of the MPF System and forensuring compliance with the Mandatory Provident Fund Schemes Ordinance.
An MPF scheme may consist of one or more constituent funds each with its owninvestment policy. A constituent fund may maintain a portfolio of direct investment inequities, bonds or other debt instruments, or may invest in approved pooled investmentfunds which may be in the form of unit trusts authorized by the Securities and FuturesCommission or insurance policies issued by authorized insurers. Both constituent fundsand pooled investment funds have to be approved by MPFA, and be subject toinvestment standards applicable to MPF investment funds. Following a recentlegislative amendment, a constituent fund may also invest in some other types offinancial products, such as index-tracking collective investment schemes, subject toMPFA’s prior approval.

158
CHAPTER 5 : THE LABOUR SECTOR
Overall labour market situation
5.1 The labour market, which was already slack in the first quarter of2003, weakened visibly further in the second quarter. Total employmentcontracted between the two quarters, as the outbreak of SARS curtailedbusiness activity and dampened labour demand. Coupled with a pick-up inlabour supply, this led to a distinct further loosening in the overall manpowerresource balance.
5.2 The seasonally adjusted unemployment rate(1) went sharply higher, to8.6% in the second quarter of 2003 (and further to 8.7% in May - July), from7.5% in the first quarter. The number of unemployed persons (not seasonallyadjusted) showed a marked increase, to 300 000 in the second quarter of 2003,from 259 800 in the first quarter. The surge in unemployment, whilst occurringalmost across-the-board, was particularly pronounced in the tourism andconsumption-related sectors. Meanwhile, there was little change in theproportion of persons unemployed for less than three months, at 54% in thesecond quarter, as well as in the median duration of unemployment, at 82 daysin the second quarter.
5.3 The underemployment rate(2) had an even steeper rise, to 4.3% in thesecond quarter of 2003 (though fell back slightly to 4.2% in May - July), from2.9% in the first quarter, as many employees were temporarily suspended fromwork or asked to take no-pay leave after the SARS outbreak. The number ofunderemployed persons rose from 100 700 to 151 000 between the two quarters.
5.4 Concurrent with the upsurge in unemployment and underemployment,there was a noticeable decline in work intensity in overall terms. Reflectingthis, the proportion of employed persons working for 50 hours or more perweek dropped to 36% in the second quarter of 2003, from 38% in the firstquarter. The proportion of persons working for 60 hours or more per weeklikewise decreased, from 23% to 22%. On the other hand, the proportion ofpersons working for 35 - 49 hours per week moved up from 46% to 49%. Forall the employed persons taken together, the median hours of work fell from 48hours per week in the first quarter of 2003 to 45 hours per week in thesecond quarter.
/Table 5.1 .....

159
Table 5.1
Unemployment and underemployment rates
Seasonally adjustedunemployment rate
(%)Underemployment rate
(%)
2002 Annual 7.3 3.0
Q1 7.0 3.2Q2 7.7 2.9Q3 7.4 2.9Q4 7.2 3.1
2003 Q1 7.5 2.9Q2 8.6 4.3
Feb - Apr 7.8 3.2Mar - May 8.3 3.8Apr - Jun 8.6 4.3
Note : Labour force statistics for 2002 have been slightly revised, upon finalisation ofthe end-2002 population estimates in August 2003. The revised statistics havebeen incorporated into Tables 5.1 - 5.16 and Diagrams 5.1 - 5.5 and 5.10.
Source : General Household Survey, Census and Statistics Department.
Unemployment and underemployment ratesDiagram 5.1
Q1 Q2 Q3 Q4 Q1 Q2 Q3 Q4 Q1 Q2 Q3 Q4 Q1 Q2 Q3 Q4 Q1 Q2 Q3 Q4 Q1 Q21998 1999 2000 2001 2002 2003
0.00.51.01.52.02.53.03.54.04.55.05.56.06.57.07.58.08.59.09.5
10.0Percent
Seasonally adjusted unemployment rate
Underemployment rate
0
/Table 5.2 .....

160
Table 5.2The labour force, and persons employed,
unemployed and underemployed
Labour force Persons employed Persons
unemployed(a)Persons
underemployed
2002 Annual 3 487 100 (1.8) 3 231 600 (-0.6) 255 500 105 200
Q1 3 457 600 (1.6) 3 219 000 (-1.1) 238 600 109 200Q2 3 466 500 (1.6) 3 203 100 (-1.7) 263 400 100 600Q3 3 517 000 (2.1) 3 249 000 (-0.3) 268 000 101 500Q4 3 507 400 (1.6) 3 255 300 (0.5) 252 100 109 400
2003 Q1 3 503 500 (1.3) 3 243 700 (0.8) 259 800 100 700Q2 3 519 500 (1.5) 3 219 400 (0.5) 300 000 151 000
<0.5> <-0.7>
Feb - Apr 3 505 500 (1.6) 3 231 800 (0.8) 273 700 112 700Mar - May 3 516 500 (1.8) 3 229 200 (0.8) 287 300 135 000Apr - Jun 3 519 500 (1.5) 3 219 400 (0.5) 300 000 151 000
<0.5> <-0.7>
Notes : (a) These include first-time job-seekers and re-entrants into the labour force.
( ) % change over a year earlier.
< > % change over the preceding quarter.
Source : General Household Survey, Census and Statistics Department.
Table 5.3Median duration of unemployment and
proportion of the unemployed populationby duration of unemployment
Proportion unemployed for :Median
duration ofunemployment
(Days)
Less than 3 months
(%)
3 months to less than 6 months
(%)
6 months or more
(%)
2002 Annual 87 52 19 29
Q1 86 53 20 27Q2 89 51 19 30Q3 82 55 17 28Q4 90 51 19 30
2003 Q1 82 54 17 29Q2 82 54 18 28
Note : Figures may not add up exactly to the total due to rounding.
Source : General Household Survey, Census and Statistics Department.
/Table 5.4 .....

161
Table 5.4Median hours of work per week and
proportion of the employed populationby hours of work per week
Proportion of employed persons working for :Median hours ofwork per week
for allemployed persons
(Hours)
35 - 49 hours per week
(%)
50 hours or more per week
(%)
60 hours or more per week
(%)
2002 Annual 48 51 38 22
Q1 46 52 34 20Q2 48 52 36 21Q3 48 50 40 22Q4 48 50 40 24
2003 Q1 48 46 38 23Q2 45 49 36 22
Note : Figures may not add up exactly to the total due to rounding.
Source : General Household Survey, Census and Statistics Department.
5.5 On a quarter-to-quarter comparison, total employment(3) asenumerated from households was reduced by 0.7% in the second quarter of2003, further to a 0.4% fall in the first quarter. Yet total labour force(4)
expanded by 0.5% in the second quarter, reversing the 0.1% drop in the firstquarter. This growth differential aggravated the labour demand and supplyimbalance, thereby leading to a leap in unemployment rate in the more recentperiods. On reduction in employment, service workers and shop sales workersengaged in restaurants and the retail trade were affected most. As to expansionin labour force, it was entirely attributable to a 0.5% rise in the population ofworking age, with nil change in the overall labour force participation rate(5).On a year-on-year comparison, employment growth, though still positive in thesecond quarter of 2003, was distinctly slower than labour force growth, at 0.5%as against 1.5%. A roughly similar picture was observed in the first quarter, yetwith a smaller difference between the two growth rates, at 0.8% as against 1.3%.
/Diagram 5.2 .....

162
Total labour force and total employment(year-on-year rate of change)
Q1 Q2 Q3 Q4 Q1 Q2 Q3 Q4 Q1 Q2 Q3 Q4 Q1 Q2 Q3 Q4 Q1 Q2 Q3 Q4 Q1 Q21998 1999 2000 2001 2002 2003
0
1
2
3
4
5
6
-1
-2
-3
-4
Percent
Diagram 5.2
Total labour force
Total employment
Table 5.5
Labour force participation rates by sex (%)
Male Female Both sexes combined
2002 Annual 72.5 51.9 61.8
Q1 72.4 51.5 61.5Q2 72.3 51.4 61.5Q3 73.0 52.3 62.3Q4 72.2 52.5 61.9
2003 Q1 71.9 52.0 61.5Q2 72.1 51.8 61.5
Source : General Household Survey, Census and Statistics Department.
/Diagram 5.3 .....
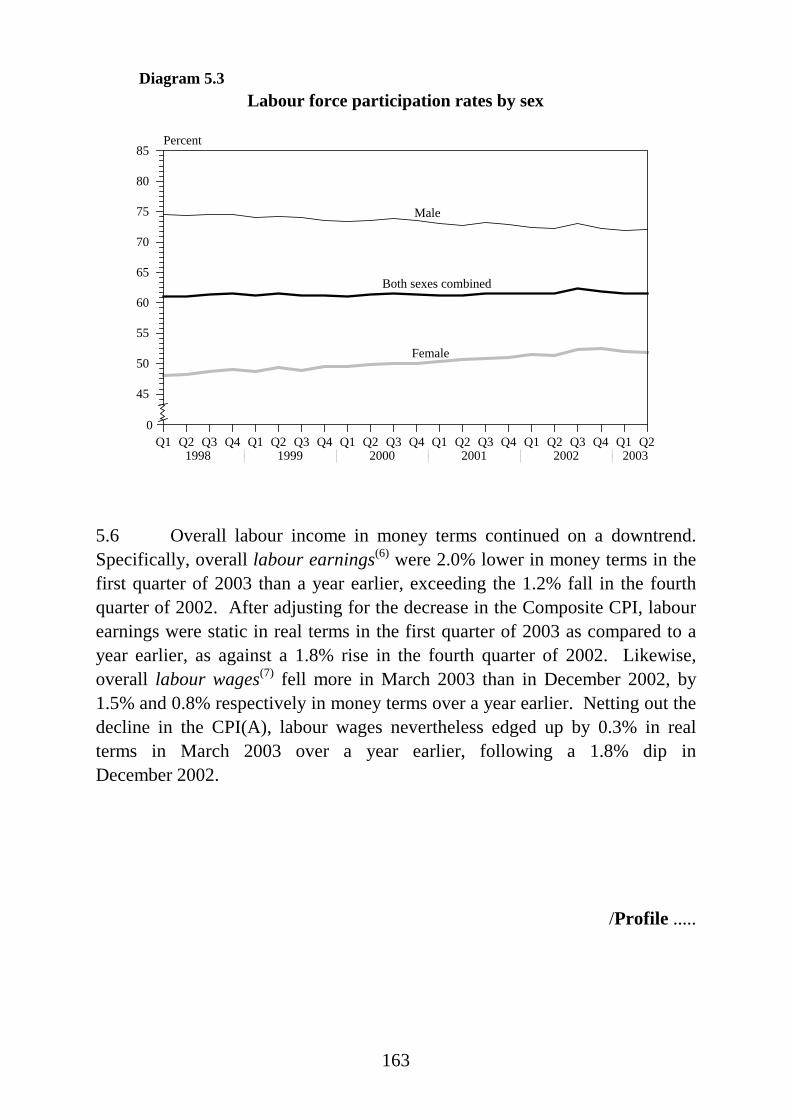
163
Labour force participation rates by sex
Q1 Q2 Q3 Q4 Q1 Q2 Q3 Q4 Q1 Q2 Q3 Q4 Q1 Q2 Q3 Q4 Q1 Q2 Q3 Q4 Q1 Q21998 1999 2000 2001 2002 2003
40
45
50
55
60
65
70
75
80
85Percent
Both sexes combined
Female
0
Diagram 5.3
Male
5.6 Overall labour income in money terms continued on a downtrend.Specifically, overall labour earnings(6) were 2.0% lower in money terms in thefirst quarter of 2003 than a year earlier, exceeding the 1.2% fall in the fourthquarter of 2002. After adjusting for the decrease in the Composite CPI, labourearnings were static in real terms in the first quarter of 2003 as compared to ayear earlier, as against a 1.8% rise in the fourth quarter of 2002. Likewise,overall labour wages(7) fell more in March 2003 than in December 2002, by1.5% and 0.8% respectively in money terms over a year earlier. Netting out thedecline in the CPI(A), labour wages nevertheless edged up by 0.3% in realterms in March 2003 over a year earlier, following a 1.8% dip inDecember 2002.
/Profile .....

164
Profile of unemployment and underemployment
5.7 Analysed by economic sector, there was an extensive leap inunemployment rate across almost all the major sectors between the first twoquarters of 2003. The increase was particularly visible in restaurants, hotels,the retail trade, transport, amusement and recreational services, businessservices and real estate, which had all been severely hit by the outbreak ofSARS. Likewise, the underemployment rate exhibited sharper increases in theSARS-affected sectors, including in particular hotels, restaurants, transport andthe retail trade, although distinct rises were also observed in construction andmanufacturing.
Table 5.6
Unemployment rates by major economic sector (%)(a)
2002 2003
Annual Q1 Q2 Q3 Q4 Q1 Q2
Wholesale, retail and import/export trades, restaurants and hotels
7.8 7.4 8.3 7.7 7.9 7.9 9.1
Transport, storage and communications
5.4 5.6 5.3 5.3 5.4 6.1 7.6
Financing, insurance, real estate and business services
4.7 4.9 4.5 4.6 4.7 4.5 5.6
Community, social and personal services
3.2 2.7 3.3 3.5 3.1 2.9 3.7
Manufacturing 7.3 7.2 8.2 7.1 6.6 7.3 8.4
Construction(b) 15.8 15.7 16.8 15.6 15.2 18.9 19.7
Notes : (a) Not seasonally adjusted, and not including first-time job-seekers and re-entrantsinto the labour force.
(b) Including both site and non-site workers.
Source : General Household Survey, Census and Statistics Department.
/Table 5.7 .....

165
Table 5.7
Underemployment rates by major economic sector (%)
2002 2003
Annual Q1 Q2 Q3 Q4 Q1 Q2
Wholesale, retail and import/export trades, restaurants and hotels
1.8 1.8 1.6 1.8 1.7 1.9 3.2
Transport, storage and communications
3.0 3.1 3.0 2.5 3.4 3.3 6.2
Financing, insurance, real estate and business services
0.6 0.7 0.5 0.6 0.5 0.7 0.9
Community, social and personal services
2.1 2.3 1.8 2.1 2.0 2.3 2.8
Manufacturing 2.5 2.4 2.6 2.3 2.6 1.8 3.6
Construction(a) 13.8 14.2 13.7 12.8 14.6 11.2 15.8
Note : (a) Including both site and non-site workers.
Source : General Household Survey, Census and Statistics Department.
/Table 5.8 .....

166
Table 5.8
Unemployment and underemployment ratesby detailed economic sub-sector in the second quarter of 2003
Unemployment Numbers Underemploy- Numbersrate(a) unemployed(a) ment rate underemployed(%) (%)
Wholesale, retail and import/export trades, restaurants and hotels
9.1 98 300 3.2 34 400
Wholesale/retail trade 10.0 36 600 3.4 12 600 Import/export trade 4.1 17 800 0.5 2 300 Restaurants and hotels 15.7 43 800 7.0 19 500
Transport, storage and communications 7.6 28 800 6.2 23 600
Transport 7.7 24 200 7.1 22 600 Storage 11.0 600 1.7 100 Communications 7.1 4 000 1.7 900
Financing, insurance, real estate and business services
5.6 27 700 0.9 4 500
Financing 3.6 4 800 0.1 200 Insurance 3.8 1 600 0.9 400 Real estate 6.9 8 100 0.8 1 000 Business services 6.5 13 300 1.5 3 000
Community, social and personal services
3.7 33 100 2.8 24 900
Public administration 1.4 1 900 0.3 500 Education, medical and other health and welfare services
2.5 8 200 2.0 6 700
Other services 5.4 23 000 4.2 17 700
Manufacturing 8.4 25 500 3.6 11 100
Food and beverages 7.3 1 800 2.8 700 Clothing and footwear 9.1 7 400 5.8 4 700 Paper and printing 7.2 4 100 2.8 1 600 Plastic products 5.3 1 000 4.6 900 Metal products 4.7 900 2.0 400 Electrical and electronic products 11.0 6 900 1.7 1 100 Other manufacturing industries 8.1 3 500 4.3 1 900
Construction 19.7 64 200 15.8 51 600
Foundation and superstructure 17.2 42 600 13.7 33 800 Decoration and maintenance 27.2 21 600 22.5 17 800
Notes : As the above figures are based on a sample survey, they are subject to sampling errors,more so for the finer breakdowns.
Figures may not add up exactly to the total due to rounding.
(a) Not seasonally adjusted, and not including first-time job-seekers and re-entrants intothe labour force.
Source : General Household Survey, Census and Statistics Department.
/Diagram 5.4 .....

167
Unemployment rates by major economic sector*
Q1 Q2 Q3 Q4 Q1 Q2 Q3 Q4 Q1 Q2 Q3 Q4 Q1 Q2 Q3 Q4 Q1 Q2 Q3 Q4 Q1 Q21998 1999 2000 2001 2002 2003
0
5
10
15
20
25Percent
Manufacturing Construction #
Diagram 5.4
Q1 Q2 Q3 Q4 Q1 Q2 Q3 Q4 Q1 Q2 Q3 Q4 Q1 Q2 Q3 Q4 Q1 Q2 Q3 Q4 Q1 Q21998 1999 2000 2001 2002 2003
0
1
2
3
4
5
6
7
8
9
10Percent
Wholesale, retail and import/export trades, restaurants and hotels Transport, storage and communications Financing, insurance, real estate and business services Community, social and personal services
Notes : (*) Not seasonally adjusted, and not including first-timejob-seekers and re-entrants into the labour force.
(#) Including both site and non-site workers.
/Diagram 5.5 .....

168
Underemployment rates by major economic sector
Q1 Q2 Q3 Q4 Q1 Q2 Q3 Q4 Q1 Q2 Q3 Q4 Q1 Q2 Q3 Q4 Q1 Q2 Q3 Q4 Q1 Q21998 1999 2000 2001 2002 2003
0
2
4
6
8
10
12
14
16
18Percent
Manufacturing Construction #
Diagram 5.5
Q1 Q2 Q3 Q4 Q1 Q2 Q3 Q4 Q1 Q2 Q3 Q4 Q1 Q2 Q3 Q4 Q1 Q2 Q3 Q4 Q1 Q21998 1999 2000 2001 2002 2003
0
1
2
3
4
5
6
7Percent
Wholesale, retail and import/export trades, restaurants and hotels Transport, storage and communications Financing, insurance, real estate and business services Community, social and personal services
Note : (#) Including both site and non-site workers.
/5.8 .....

169
5.8 Analysed by occupation category, the leap in unemployment ratebetween the first two quarters of 2003 affected workers at all levels. At themiddle to lower segments, service workers and shop sales workers, and workersin elementary occupations faced the largest rise in unemployment rate. At theupper segment, the increase was more apparent amongst professionals andassociate professionals. As to the underemployment rate, while the increasewas likewise widespread across occupation categories, it was more visibleamongst workers at the middle to lower segments, including craft and relatedworkers, plant and machine operators and assemblers, service workers and shopsales workers, and workers in elementary occupations.
Table 5.9
Unemployment rates by major occupation category (%)(a)
2002 2003
Annual Q1 Q2 Q3 Q4 Q1 Q2
Managers and administrators 2.7 3.5 3.1 2.3 1.9 2.1 2.2
Professionals 2.4 2.6 2.5 2.3 2.1 2.2 2.8
Associate professionals(b) 4.3 4.2 4.3 4.5 4.3 4.3 4.9
Clerks 5.3 5.2 5.5 5.4 5.2 5.0 5.4
Service workers and shop sales workers
9.1 8.4 9.5 9.1 9.4 9.4 12.3
Craft and related workers 14.0 12.6 15.7 14.2 13.5 16.2 16.3
Plant and machine operators and assemblers
5.9 6.4 6.6 5.4 5.2 6.8 7.3
Elementary occupations 7.7 7.4 7.7 7.8 7.9 8.0 9.6
Others 3.4 2.4 2.9 4.7 3.8 4.6 1.6
Notes : (a) Not seasonally adjusted, and not including first-time job-seekers and re-entrants intothe labour force.
(b) Including technicians and supervisors.
Source : General Household Survey, Census and Statistics Department.
/Table 5.10 .....

170
Table 5.10
Underemployment rates by major occupation category (%)
2002 2003
Annual Q1 Q2 Q3 Q4 Q1 Q2
Managers and administrators * * 0 0.2 0 0.1 0.3
Professionals 0.3 0.4 0.3 0.3 0.2 0.3 0.6
Associate professionals(a) 0.8 0.8 1.0 0.8 0.7 0.9 1.6
Clerks 1.1 1.1 0.9 1.2 1.2 1.1 1.5
Service workers and shop sales workers
2.5 2.6 2.3 2.8 2.4 2.8 5.0
Craft and related workers 11.3 11.2 11.0 10.6 12.5 9.4 13.6
Plant and machine operators and assemblers
3.8 4.3 3.8 3.0 3.9 3.6 7.2
Elementary occupations 4.8 5.2 4.5 4.6 5.0 4.7 5.7
Others 3.5 0.8 6.8 5.8 0 1.0 10.1
Notes : (a) Including technicians and supervisors.
(*) Less than 0.05%.
Source : General Household Survey, Census and Statistics Department.
/5.9 .....

171
5.9 Analysed by sex, the unemployment rate for males went upsignificantly, by 1.4 percentage points to 10.1% in the second quarter of 2003,from 8.7% in the first quarter. The unemployment rate for females also surged,though to a lesser extent, by 0.7 of a percentage point from 5.8% to 6.5%between the two quarters. In consequence, the difference between these twounemployment rates widened further, from 2.9 percentage points in the firstquarter to 3.6 percentage points in the second quarter. In a similar vein, theunderemployment rate for males had a much larger increase than that forfemales, from 3.4% to 5.1% as compared to 2.2% to 3.3% between the twoquarters. This again led to a widening in difference between the two rates, from1.2 percentage points in the first quarter to 1.8 percentage points in thesecond quarter.
Table 5.11
Unemployment rates by sex (%)(a)
Male Female
2002 Annual 8.4 6.0
Q1 8.1 5.3Q2 8.8 6.1Q3 8.5 6.5Q4 8.2 5.9
2003 Q1 8.7 5.8Q2 10.1 6.5
Note : (a) Not seasonally adjusted, but including first-time job-seekers and re-entrantsinto the labour force.
Source : General Household Survey, Census and Statistics Department.
/Table 5.12 .....

172
Table 5.12
Underemployment rates by sex (%)
Male Female
2002 Annual 3.7 2.1
Q1 3.8 2.3Q2 3.6 2.0Q3 3.5 2.0Q4 3.8 2.2
2003 Q1 3.4 2.2Q2 5.1 3.3
Source : General Household Survey, Census and Statistics Department.
5.10 Analysed by age group, the surge in unemployment rate in the secondquarter of 2003 over the first quarter was more visible amongst persons at bothends of the age spectrum than those in the middle. Specifically, persons aged15-24 and aged 60 and above were the ones having the largest increase inunemployment rate. Within the former group, a considerable proportioncomprised first-time job-seekers, who were mainly fresh graduates and schoolleavers entering the labour force. On the underemployment rate, steeperincreases were seen mainly amongst persons aged 15-19 and aged 40-59.
/Table 5.13 .....
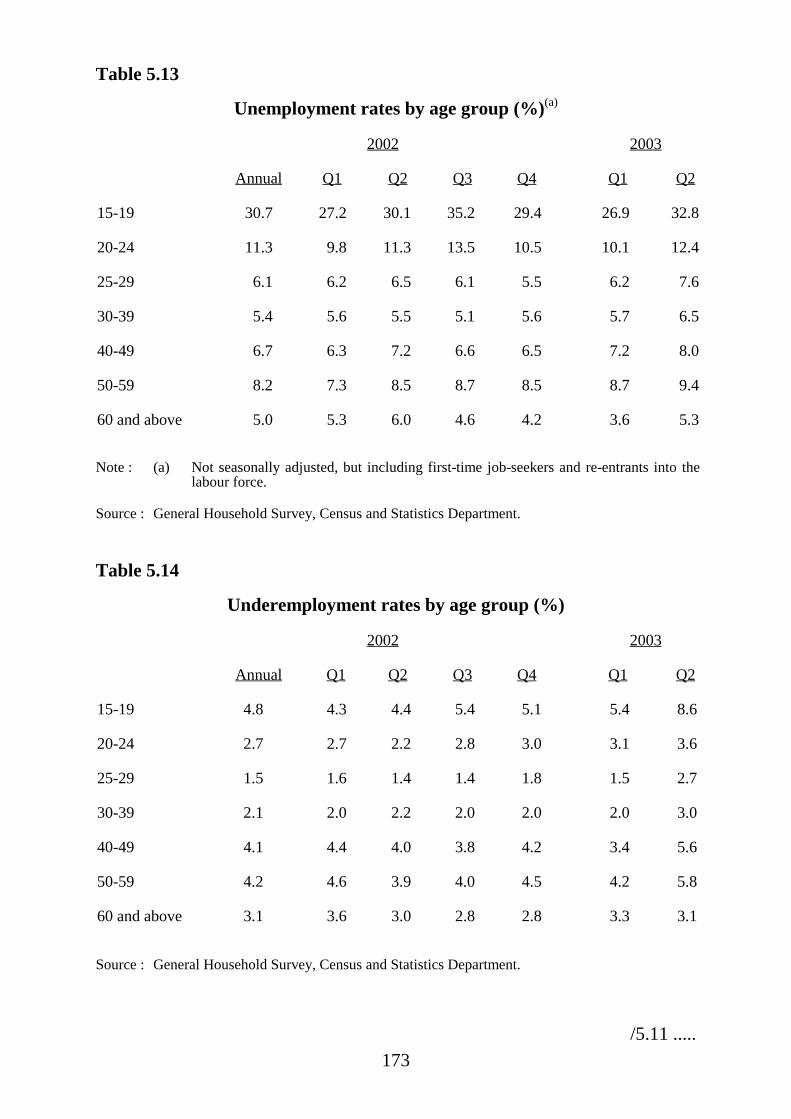
173
Table 5.13
Unemployment rates by age group (%)(a)
2002 2003
Annual Q1 Q2 Q3 Q4 Q1 Q2
15-19 30.7 27.2 30.1 35.2 29.4 26.9 32.8
20-24 11.3 9.8 11.3 13.5 10.5 10.1 12.4
25-29 6.1 6.2 6.5 6.1 5.5 6.2 7.6
30-39 5.4 5.6 5.5 5.1 5.6 5.7 6.5
40-49 6.7 6.3 7.2 6.6 6.5 7.2 8.0
50-59 8.2 7.3 8.5 8.7 8.5 8.7 9.4
60 and above 5.0 5.3 6.0 4.6 4.2 3.6 5.3
Note : (a) Not seasonally adjusted, but including first-time job-seekers and re-entrants into thelabour force.
Source : General Household Survey, Census and Statistics Department.
Table 5.14
Underemployment rates by age group (%)
2002 2003
Annual Q1 Q2 Q3 Q4 Q1 Q2
15-19 4.8 4.3 4.4 5.4 5.1 5.4 8.6
20-24 2.7 2.7 2.2 2.8 3.0 3.1 3.6
25-29 1.5 1.6 1.4 1.4 1.8 1.5 2.7
30-39 2.1 2.0 2.2 2.0 2.0 2.0 3.0
40-49 4.1 4.4 4.0 3.8 4.2 3.4 5.6
50-59 4.2 4.6 3.9 4.0 4.5 4.2 5.8
60 and above 3.1 3.6 3.0 2.8 2.8 3.3 3.1
Source : General Household Survey, Census and Statistics Department.
/5.11 .....
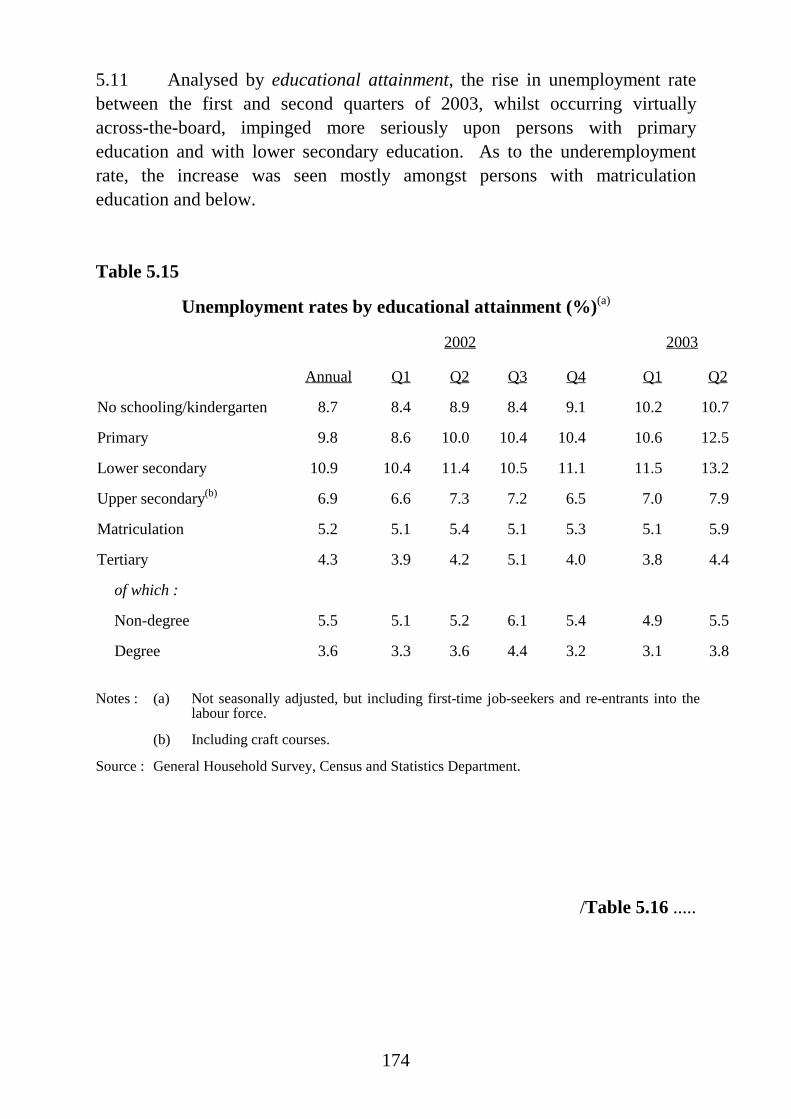
174
5.11 Analysed by educational attainment, the rise in unemployment ratebetween the first and second quarters of 2003, whilst occurring virtuallyacross-the-board, impinged more seriously upon persons with primaryeducation and with lower secondary education. As to the underemploymentrate, the increase was seen mostly amongst persons with matriculationeducation and below.
Table 5.15
Unemployment rates by educational attainment (%)(a)
2002 2003
Annual Q1 Q2 Q3 Q4 Q1 Q2
No schooling/kindergarten 8.7 8.4 8.9 8.4 9.1 10.2 10.7
Primary 9.8 8.6 10.0 10.4 10.4 10.6 12.5
Lower secondary 10.9 10.4 11.4 10.5 11.1 11.5 13.2
Upper secondary(b) 6.9 6.6 7.3 7.2 6.5 7.0 7.9
Matriculation 5.2 5.1 5.4 5.1 5.3 5.1 5.9
Tertiary 4.3 3.9 4.2 5.1 4.0 3.8 4.4
of which :
Non-degree 5.5 5.1 5.2 6.1 5.4 4.9 5.5
Degree 3.6 3.3 3.6 4.4 3.2 3.1 3.8
Notes : (a) Not seasonally adjusted, but including first-time job-seekers and re-entrants into thelabour force.
(b) Including craft courses.
Source : General Household Survey, Census and Statistics Department.
/Table 5.16 .....
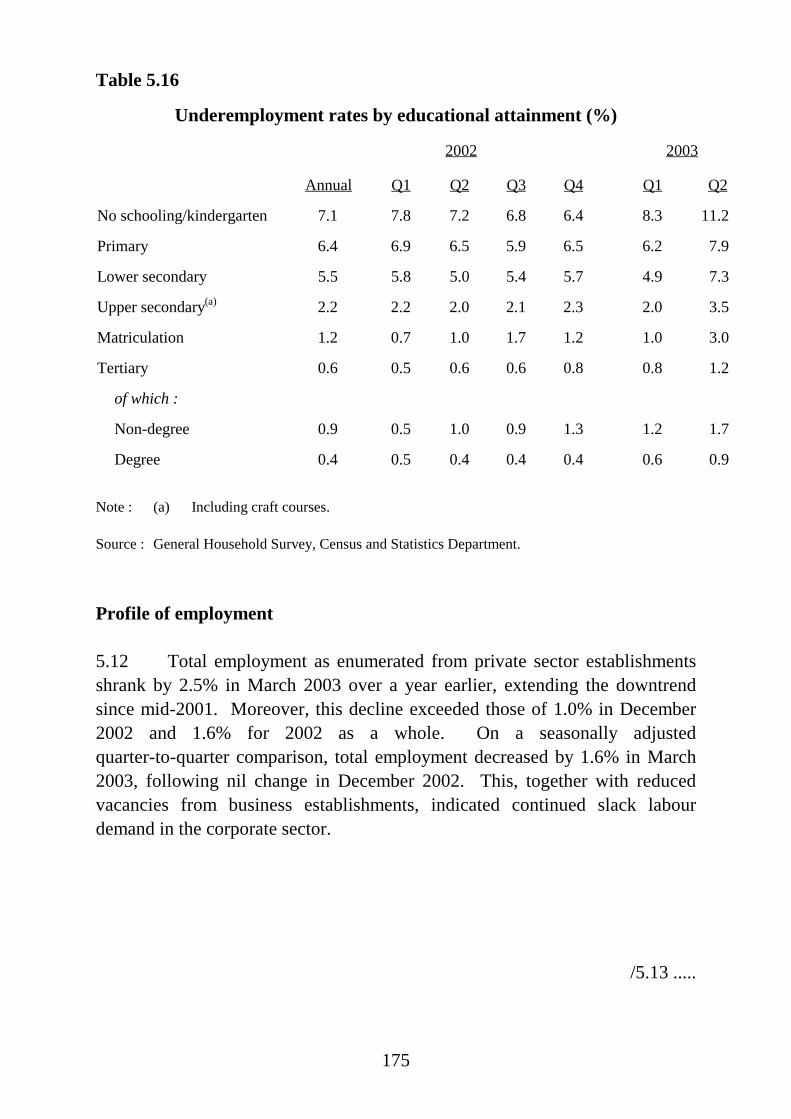
175
Table 5.16
Underemployment rates by educational attainment (%)
2002 2003
Annual Q1 Q2 Q3 Q4 Q1 Q2
No schooling/kindergarten 7.1 7.8 7.2 6.8 6.4 8.3 11.2
Primary 6.4 6.9 6.5 5.9 6.5 6.2 7.9
Lower secondary 5.5 5.8 5.0 5.4 5.7 4.9 7.3
Upper secondary(a) 2.2 2.2 2.0 2.1 2.3 2.0 3.5
Matriculation 1.2 0.7 1.0 1.7 1.2 1.0 3.0
Tertiary 0.6 0.5 0.6 0.6 0.8 0.8 1.2
of which :
Non-degree 0.9 0.5 1.0 0.9 1.3 1.2 1.7
Degree 0.4 0.5 0.4 0.4 0.4 0.6 0.9
Note : (a) Including craft courses.
Source : General Household Survey, Census and Statistics Department.
Profile of employment
5.12 Total employment as enumerated from private sector establishmentsshrank by 2.5% in March 2003 over a year earlier, extending the downtrendsince mid-2001. Moreover, this decline exceeded those of 1.0% in December2002 and 1.6% for 2002 as a whole. On a seasonally adjustedquarter-to-quarter comparison, total employment decreased by 1.6% in March2003, following nil change in December 2002. This, together with reducedvacancies from business establishments, indicated continued slack labourdemand in the corporate sector.
/5.13 .....

176
5.13 Taking all the service sectors surveyed together(8), employmentcontracted by 1.4% in March 2003 over a year earlier, reversing the 0.2% risein December 2002. Analysed by constituent sector and on a year-on-yearcomparison, employment in storage and communications fell the most, by19.5% in March 2003, amidst on-going rationalisation in thetelecommunications sector. Employment in restaurants and hotels and in theretail trade dropped by 7.2% and 3.1% respectively, possibly with much of thedecrease occurring in late March upon the impact of SARS. Employment inwater transport, air transport and services allied to transport, in the wholesaleand import/export trades, and in financing, insurance, real estate and businessservices had much lesser declines, by 0.6%, 0.4% and 0.2% respectively. Onthe other hand, employment in community, social and personal services wentup by 1.5%, underpinned by larger labour demand from welfare, education, andmedical and dental services.
5.14 Employment in the local manufacturing sector kept on shrinking, by9.4% in March 2003 over a year earlier, similar to the 9.1% dip in December2002. Labour demand in this sector continued to be restrained by the setback indomestic exports and on-going relocation of production processes outsideHong Kong.
5.15 Employment of manual workers at building and construction siteswas 13.3% fewer in March 2003 than a year earlier, following a decrease of thesame magnitude in December 2002. Employment at private sector sitesdiminished more, by 14.2%. While a modest rise in employment was observedat commercial developments along the MTR Tung Chung Line, this wasoutweighed by a reduction in employment at some residential developments atHung Hom, Tai Po and Kwai Shing. Employment at public sector sites wasalso reduced, by 12.1%. This was attributable to the winding down/completionof public housing re-development projects at Yau Tong, Upper Ngau Tau KokEstate Phase 1 and Kwai Fong Estate Phase 7, as well as a further scale-back inthe Public Housing Programme. Also partly contributed was a relatively higherbase of comparison a year earlier, caused by intensive work on the KCR WestRail at that time. Analysed by type of project, employment at civil engineeringsites was slashed by 9.6%, and that at building sites even more by 14.7%.Taking into account off-site workers and related professional and support staff,employment in the entire building and construction sector(9) declined by 3.5%in the first quarter of 2003 over a year earlier, after a 2.7% rise in the fourthquarter of 2002.
/5.16 .....

177
5.16 In line with the Government’s move to reduce operating expenditureand contain the size of the Civil Service, employment in the Civil Servicecontracted by 2.3% in March 2003 from a year earlier, further to a 2.8% fall inDecember 2002. As stated in the Chief Executive’s Policy Address on8 January 2003, the Government plans to downsize the Civil Serviceestablishment further to around 160 000 by 2006/07 through natural wastageand normal retirement. As from 1 April 2003, recruitment to the Civil Serviceis frozen. The Second Voluntary Retirement Scheme is another measure fordownsizing. Applications for the Scheme started on 21 March 2003 and closedon 20 May 2003. Result of the applications was announced on 24 July 2003.
/Table 5.17 .....
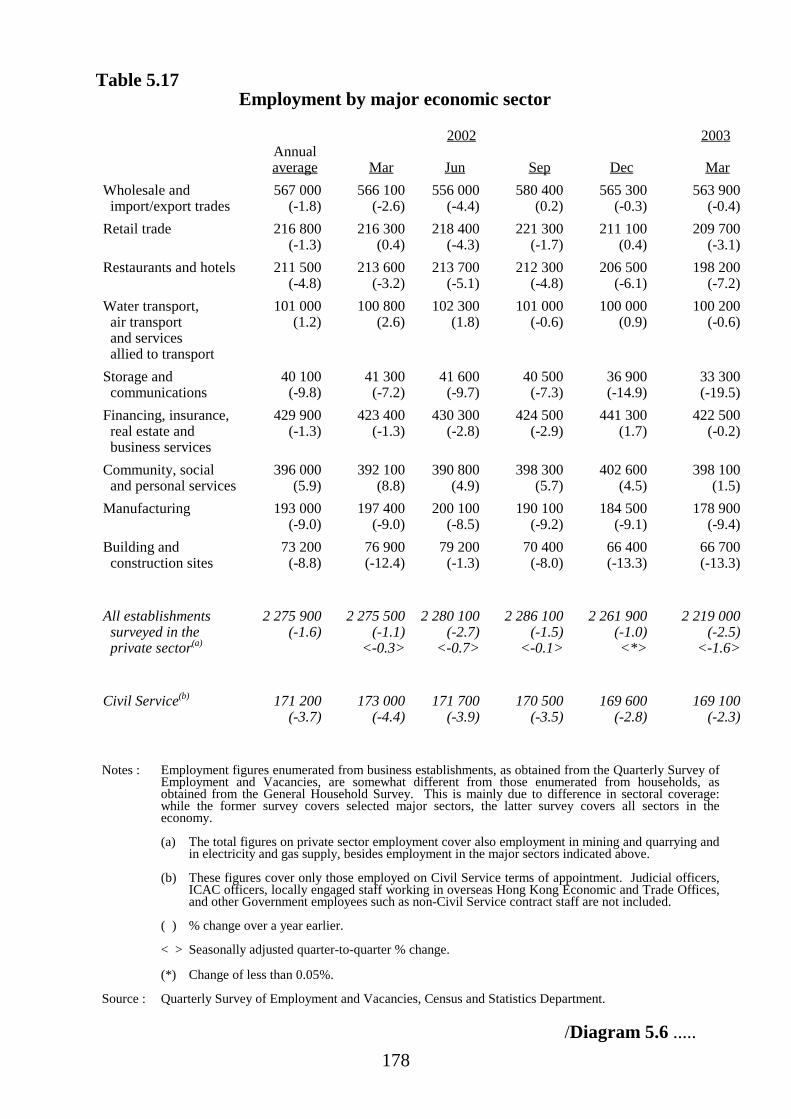
178
Table 5.17Employment by major economic sector
2002 2003 Annual average Mar Jun Sep Dec Mar
Wholesale and import/export trades
567 000(-1.8)
566 100(-2.6)
556 000(-4.4)
580 400(0.2)
565 300(-0.3)
563 900(-0.4)
Retail trade 216 800(-1.3)
216 300(0.4)
218 400(-4.3)
221 300(-1.7)
211 100(0.4)
209 700(-3.1)
Restaurants and hotels 211 500(-4.8)
213 600(-3.2)
213 700(-5.1)
212 300(-4.8)
206 500(-6.1)
198 200(-7.2)
Water transport, air transport and services allied to transport
101 000(1.2)
100 800(2.6)
102 300(1.8)
101 000(-0.6)
100 000(0.9)
100 200(-0.6)
Storage and communications
40 100(-9.8)
41 300(-7.2)
41 600(-9.7)
40 500(-7.3)
36 900(-14.9)
33 300(-19.5)
Financing, insurance, real estate and business services
429 900(-1.3)
423 400(-1.3)
430 300(-2.8)
424 500(-2.9)
441 300(1.7)
422 500(-0.2)
Community, social and personal services
396 000(5.9)
392 100(8.8)
390 800(4.9)
398 300(5.7)
402 600(4.5)
398 100(1.5)
Manufacturing 193 000(-9.0)
197 400(-9.0)
200 100(-8.5)
190 100(-9.2)
184 500(-9.1)
178 900(-9.4)
Building and construction sites
73 200(-8.8)
76 900(-12.4)
79 200(-1.3)
70 400(-8.0)
66 400(-13.3)
66 700(-13.3)
All establishments surveyed in the private sector(a)
2 275 900(-1.6)
2 275 500(-1.1)
<-0.3>
2 280 100(-2.7)
<-0.7>
2 286 100(-1.5)
<-0.1>
2 261 900(-1.0)<*>
2 219 000(-2.5)
<-1.6>
Civil Service(b) 171 200(-3.7)
173 000(-4.4)
171 700(-3.9)
170 500(-3.5)
169 600(-2.8)
169 100(-2.3)
Notes : Employment figures enumerated from business establishments, as obtained from the Quarterly Survey ofEmployment and Vacancies, are somewhat different from those enumerated from households, asobtained from the General Household Survey. This is mainly due to difference in sectoral coverage:while the former survey covers selected major sectors, the latter survey covers all sectors in theeconomy.
(a) The total figures on private sector employment cover also employment in mining and quarrying andin electricity and gas supply, besides employment in the major sectors indicated above.
(b) These figures cover only those employed on Civil Service terms of appointment. Judicial officers,ICAC officers, locally engaged staff working in overseas Hong Kong Economic and Trade Offices,and other Government employees such as non-Civil Service contract staff are not included.
( ) % change over a year earlier.
< > Seasonally adjusted quarter-to-quarter % change.
(*) Change of less than 0.05%.
Source : Quarterly Survey of Employment and Vacancies, Census and Statistics Department.
/Diagram 5.6 .....
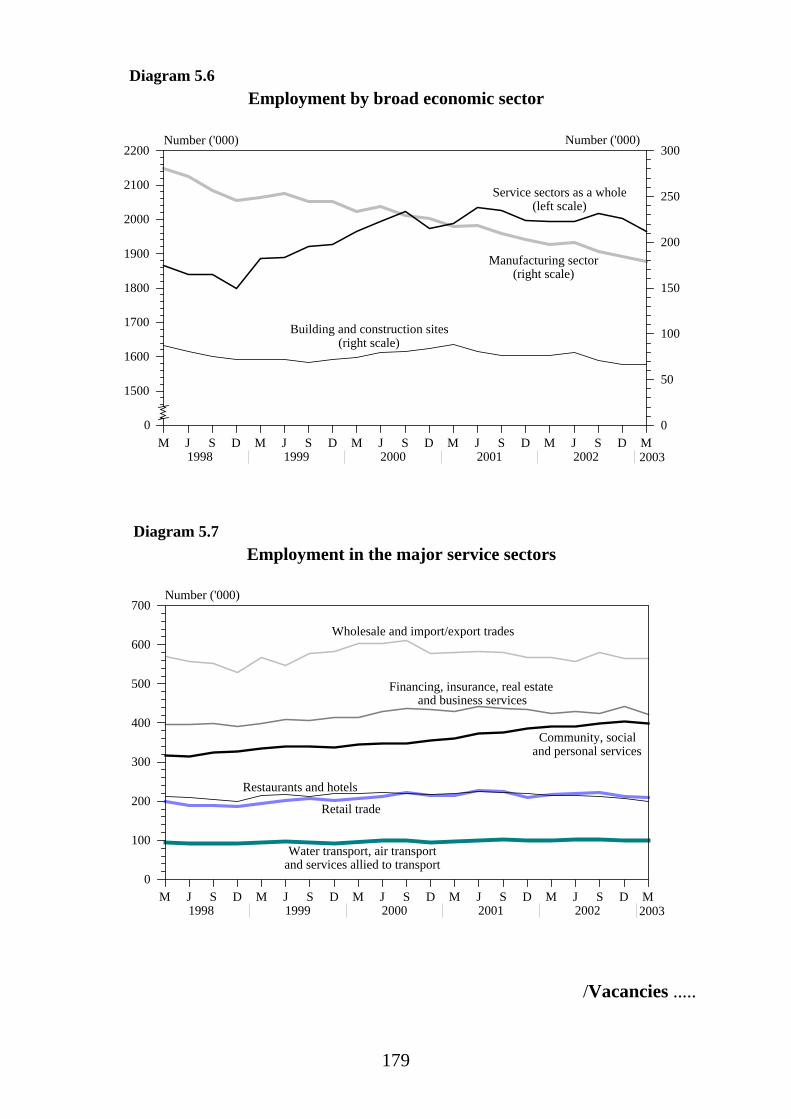
179
Employment by broad economic sector
M J S D M J S D M J S D M J S D M J S D M1998 1999 2000 2001 2002 2003
1400
1500
1600
1700
1800
1900
2000
2100
2200Number ('000)
0
50
100
150
200
250
300Number ('000)
Diagram 5.6
Service sectors as a whole(left scale)
Building and construction sites(right scale)
Manufacturing sector(right scale)
0
2003
Employment in the major service sectors
M J S D M J S D M J S D M J S D M J S D M1998 1999 2000 2001 2002 2003
0
100
200
300
400
500
600
700Number ('000)
Diagram 5.7
Wholesale and import/export trades
Financing, insurance, real estate and business services
Restaurants and hotels
Retail trade
Community, social and personal services
Water transport, air transportand services allied to transport
2003
/Vacancies .....

180
Vacancies
5.17 Vacancies in the private sector showed an accentuated decline.Taking all the private sector establishments surveyed together, vacancies were23.4% less in March 2003 than a year earlier, much larger than the decreases of5.5% in December 2002 and 17.5% for 2002 as a whole. On a seasonallyadjusted quarter-to-quarter comparison, vacancies also plummeted, by 20.7% inMarch 2003, having held broadly stable in December 2002. Although theoverall vacancy rate in the private sector in March 2003, at 0.7%, was virtuallyunchanged from that in December 2002, it was lower than that of 0.8% for2002 as a whole.
5.18 Analysed by economic sector, vacancies for all the service sectorssurveyed taken together were slashed by 23.0% in March 2003 over a yearearlier, distinctly exceeding the 4.4% fall in December 2002. Analysed byconstituent sector and on a year-on-year comparison, the decrease was mostpronounced in restaurants and hotels and in the retail trade, by 47.0% and35.1% respectively in March 2003, as employers generally became even morestringent about staffing after the SARS outbreak. Vacancies in storage andcommunications, in community, social and personal services, and in financing,insurance, real estate and business services were also substantially trimmed, by25.6%, 23.8% and 22.1% respectively. Vacancies in the wholesale andimport/export trades and in water transport, air transport and services allied totransport were reduced to a lesser extent, by 12.2% and 9.7% respectively. Asto the local manufacturing sector, vacancies went down by 23.5% in March2003 over a year earlier, also enlarged from the decrease of 17.9% in December2002. On building and construction sites, vacancies were sharply cut by 81.7%in March 2003 over a year earlier, after an already steep decline of 62.7% inDecember 2002. By comparison, vacancies in the Civil Service had a moremodest decrease, by 3.8% in March 2003 over a year earlier, following an11.2% dip in December 2002.
/Table 5.18 .....
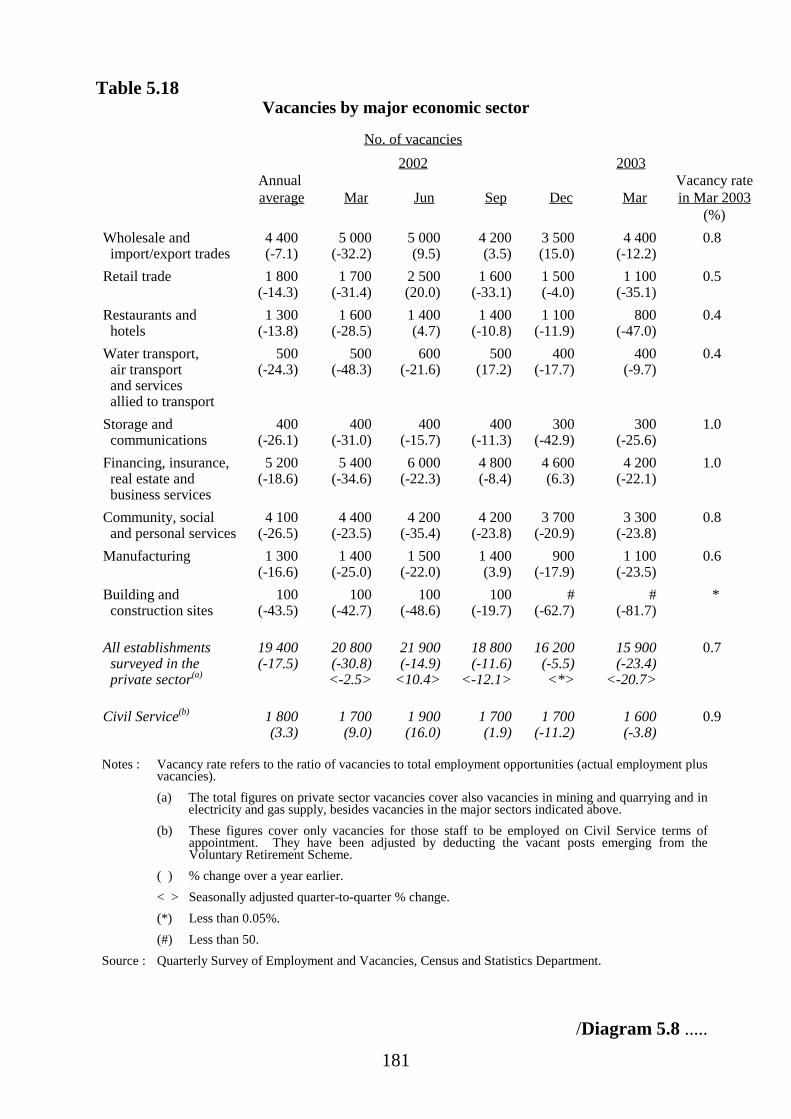
181
Table 5.18Vacancies by major economic sector
No. of vacancies2002 2003
Annual average Mar Jun Sep Dec Mar
Vacancy ratein Mar 2003
(%)Wholesale and import/export trades
4 400(-7.1)
5 000(-32.2)
5 000(9.5)
4 200(3.5)
3 500(15.0)
4 400(-12.2)
0.8
Retail trade 1 800(-14.3)
1 700(-31.4)
2 500(20.0)
1 600(-33.1)
1 500(-4.0)
1 100(-35.1)
0.5
Restaurants and hotels
1 300(-13.8)
1 600(-28.5)
1 400(4.7)
1 400(-10.8)
1 100(-11.9)
800(-47.0)
0.4
Water transport, air transport and services allied to transport
500(-24.3)
500(-48.3)
600(-21.6)
500(17.2)
400(-17.7)
400(-9.7)
0.4
Storage and communications
400(-26.1)
400(-31.0)
400(-15.7)
400(-11.3)
300(-42.9)
300(-25.6)
1.0
Financing, insurance, real estate and business services
5 200(-18.6)
5 400(-34.6)
6 000(-22.3)
4 800(-8.4)
4 600(6.3)
4 200(-22.1)
1.0
Community, social and personal services
4 100(-26.5)
4 400(-23.5)
4 200(-35.4)
4 200(-23.8)
3 700(-20.9)
3 300(-23.8)
0.8
Manufacturing 1 300(-16.6)
1 400(-25.0)
1 500(-22.0)
1 400(3.9)
900(-17.9)
1 100(-23.5)
0.6
Building and construction sites
100(-43.5)
100(-42.7)
100(-48.6)
100(-19.7)
#(-62.7)
#(-81.7)
*
All establishments surveyed in the private sector(a)
19 400(-17.5)
20 800(-30.8)<-2.5>
21 900(-14.9)
<10.4>
18 800(-11.6)
<-12.1>
16 200(-5.5)<*>
15 900(-23.4)
<-20.7>
0.7
Civil Service(b) 1 800(3.3)
1 700(9.0)
1 900(16.0)
1 700(1.9)
1 700(-11.2)
1 600(-3.8)
0.9
Notes : Vacancy rate refers to the ratio of vacancies to total employment opportunities (actual employment plusvacancies).(a) The total figures on private sector vacancies cover also vacancies in mining and quarrying and in
electricity and gas supply, besides vacancies in the major sectors indicated above.(b) These figures cover only vacancies for those staff to be employed on Civil Service terms of
appointment. They have been adjusted by deducting the vacant posts emerging from theVoluntary Retirement Scheme.
( ) % change over a year earlier.< > Seasonally adjusted quarter-to-quarter % change.(*) Less than 0.05%.(#) Less than 50.
Source : Quarterly Survey of Employment and Vacancies, Census and Statistics Department.
/Diagram 5.8 .....

182
Vacancies by broad economic sector
M J S D M J S D M J S D M J S D M J S D M1998 1999 2000 2001 2002 2003
0
10
20
30
40Number ('000)
0
1
2
3
4
5Number ('000)
Diagram 5.8
Service sectors as a whole(left scale)
Building and construction sites
(right scale)
Manufacturing sector
(right scale)
2003
5.19 Analysed by occupation category, vacancies showed a broad-baseddecrease across nearly all the major segments of the occupational hierarchy.On the middle and lower segments, vacancies for plant and machine operatorsand assemblers, service workers and shop sales workers, workers in elementaryoccupations, clerks, and craft and related workers all fell, by 54.4%, 41.9%,16.0%, 11.9% and 4.9% respectively in March 2003 over a year earlier. As tothe upper segment, vacancies for associate professionals and professionals alsodropped, by 24.5% and 12.9% respectively. Managers and administrators werethe only category with an increase in vacancies, by 25.5%.
/Table 5.19 .....

183
Table 5.19
Vacancies by major occupation category
No. of vacancies
2002 2003Annualaverage Mar Jun Sep Dec Mar
Managers and administrators 400(-21.5)
400(-48.7)
500(-31.0)
500(23.2)
400(1.5)
500(25.5)
Professionals 1 100(-39.1)
1 300(-52.0)
1 100(-53.5)
900(-26.5)
1 100(10.3)
1 100(-12.9)
Associate professionals 6 900(-5.8)
7 500(-21.8)
8 300(7.2)
6 400(-4.1)
5 500(1.7)
5 600(-24.5)
Clerks 3 800(-32.4)
4 100(-42.7)
4 200(-37.9)
3 400(-26.7)
3 400(-9.7)
3 600(-11.9)
Service workers and shop sales workers
3 700(-8.1)
3 900(-20.1)
3 900(7.3)
3 800(-4.4)
3 000(-11.7)
2 300(-41.9)
Craft and related workers 500(-27.8)
600(-37.8)
600(-13.9)
400(-40.9)
500(-9.0)
600(-4.9)
Plant and machine operators and assemblers
800(-6.3)
900(3.0)
700(-31.9)
900(22.5)
500(-8.3)
400(-54.4)
Elementary occupations 2 300(-17.8)
2 200(-32.4)
2 700(-8.0)
2 400(-13.8)
1 800(-13.7)
1 900(-16.0)
Note : ( ) % change over a year earlier.
Source : Quarterly Survey of Employment and Vacancies, Census and Statistics Department.
/Earnings .....
184
Earnings and wages
5.20 With worsening in the employment situation, labour income alsocame under greater downward pressure. Overall labour earnings in the privatesector, as measured by payroll per person engaged, fell by 2.0% in money termsin the first quarter of 2003 over a year earlier, larger than the declines of 1.2%in the fourth quarter of 2002 and 1.1% for 2002 as a whole. Amongst thebusiness establishments surveyed in the first quarter of 2003, 45% reported areduction in average labour earnings over a year earlier, while 18% reportedvirtually nil change. The remaining 37% reported a rise in average labourearnings, but this was partly due to a higher proportion of higher-skill andbetter-paid workers in place upon retrenchment of workers at the lower level.Netting out the decline in consumer prices as reflected by the Composite CPI,overall labour earnings were almost unchanged in real terms in the first quarterof 2003 from a year earlier, as against increases of 1.8% in the fourth quarter of2002 and 2.0% for 2002 as a whole. On a seasonally adjustedquarter-to-quarter comparison, overall labour earnings went down by 0.9% bothin money terms and in real terms in the first quarter of 2003. In the fourthquarter of 2002, there was a decrease of 0.3% in money terms, yet an increaseof 0.2% in real terms.
5.21 Analysed by economic sector, labour earnings in money terms showeda broad-based decline. Taking all the service sectors surveyed together,earnings fell by 2.1% in money terms in the first quarter of 2003 over a yearearlier, further to a 1.6% dip in the fourth quarter of 2002. Yet in real terms,earnings moved down only marginally by 0.1% in the first quarter of 2003,having risen by 1.4% in the fourth quarter of 2002. Amongst the variousconstituent sectors, earnings in restaurants and hotels had the largest drop, by6.6% in money terms or 4.7% in real terms in the first quarter of 2003 over ayear earlier. Earnings in community, social and personal services and infinancing, insurance, real estate and business services decreased by 4.2% and2.7% respectively in money terms, or by 2.2% and 0.7% in real terms. Earningsin the wholesale, retail and import/export trades and in transport, storage andcommunications declined by 1.3% and 0.3% respectively in money terms, butstill rose by 0.7% and 1.7% in real terms. As to the local manufacturing sector,earnings were 5.1% lower in money terms in the first quarter of 2003 than ayear earlier, enlarged from a 2.2% fall in the fourth quarter of 2002. In realterms, earnings decreased by 3.2% in the first quarter of 2003, after a 0.7% risein the fourth quarter of 2002.
/Table 5.20 .....

185
Table 5.20
Labour earnings by major economic sector(year-on-year rate of change (%))
Payroll per person engaged
2002 2003 Averageamount in
Annual Q1 Q2 Q3 Q4 Q1 Q1 2003($)
Wholesale, retail and import/export trades
-1.6(1.4)
-1.0(1.6)
-1.6(1.7)
-2.1(1.5)
-2.0(1.0)
-1.3(0.7)
14,200
Restaurants and hotels -4.2(-1.1)
-4.9(-2.3)
-5.5(-2.4)
-3.0(0.5)
-3.1(-0.1)
-6.6(-4.7)
8,800
Transport, storage and communications
-0.2(2.9)
-1.9(0.7)
1.5(4.9)
-2.5(1.0)
2.0(5.1)
-0.3(1.7)
19,900
Financing, insurance, real estate and business services
-2.2(0.8)
-2.0(0.6)
-2.6(0.6)
-1.4(2.2)
-2.9(*)
-2.7(-0.7)
20,300
Community, social and personal services
-1.3(1.9)
*(2.7)
0.1(3.4)
-2.4(1.2)
-2.7(0.3)
-4.2(-2.2)
19,500
Manufacturing -1.2(1.9)
-0.8(1.8)
-0.6(2.7)
-1.1(2.6)
-2.2(0.7)
-5.1(-3.2)
12,400
All sectors surveyed in the private sector
-1.1(2.0)
-0.6(2.1)
-1.0(2.2)
-1.5(2.1)
-1.2(1.8)
-2.0(*)
16,400
<*>{0.9}
<-0.4>{0.3}
<-0.4>{0.4}
<-0.3>{0.2}
<-0.9>{-0.9}
Notes : Figures not in brackets represent percentage changes in money terms, while those in roundbrackets represent percentage changes in real terms.
< > Seasonally adjusted quarter-to-quarter % change in money terms.
{ } Seasonally adjusted quarter-to-quarter % change in real terms.
(*) Change of less than 0.05%.
Source : Labour Earnings Survey, Census and Statistics Department.
/Diagram 5.9 .....

186
Earnings by broad economic sector(year-on-year rate of change in money terms)
Q1 Q2 Q3 Q4 Q1 Q2 Q3 Q4 Q1 Q2 Q3 Q4 Q1 Q2 Q3 Q4 Q1 Q2 Q3 Q4 Q11998 1999 2000 2001 2002 2003
0
2
4
6
8
10
-2
-4
-6
Percent
Diagram 5.9
Service sectors as a whole
Manufacturing sector
2003
5.22 Overall labour wages in the private sector likewise had a largerdecrease in March 2003, by 1.5% in money terms over a year earlier, than thosein December 2002 and for 2002 as a whole, by 0.8% and 1.0% respectively.Amongst the business establishments surveyed in March 2003, 50% reportedsome downward adjustment in average wage rate over a year earlier, partlyreflecting a cut in guaranteed bonuses and allowances. Another 14% reportednil change. The remaining 36% reported an increase in average wage rate,which again was partly attributable to a shift in employment compositiontowards better-paid workers upon retrenchment of the lower-paid clerical staffand operatives. Yet discounting the decline in consumer prices as measured bythe CPI(A)(10), overall labour wages were still higher by 0.3% in real terms inMarch 2003 than a year earlier. This followed a decline of 1.8% in December2002(11), but a rise of 1.3% for 2002 as a whole.
/5.23 .....

187
5.23 Analysed by economic sector, wages in personal services and inrestaurants and hotels fell more visibly, by 3.4% and 3.2% respectively inmoney terms or by 1.6% and 1.4% in real terms in March 2003 over a yearearlier. Wages in transport services and in the wholesale, retail andimport/export trades were down by 1.4% and 1.2% respectively in money terms,but up by 0.4% and 0.7% in real terms. Wages in financing, insurance, realestate and business services registered increase both in money terms and in realterms, by 0.3% and 2.2% respectively. As to the local manufacturing sector,wages were reduced by 2.6% in money terms, or by 0.7% in real terms.
Table 5.21
Wages by selected major economic sector(year-on-year rate of change (%))
By reference to the wage index
2002 2003
Annual Mar Jun Sep Dec(a) Mar
Wholesale, retail and import/export trades
-0.6(1.7)
*(2.1)
0.3(4.4)
-2.0(2.4)
-0.7(-1.7)
-1.2(0.7)
Restaurants and hotels -2.6(-0.3)
-1.4(0.6)
-3.3(0.6)
-2.7(1.6)
-3.0(-4.0)
-3.2(-1.4)
Transport services 0.6(2.9)
1.1(3.1)
0.8(4.9)
*(4.4)
0.5(-0.5)
-1.4(0.4)
Financing, insurance, real estate and business services
-0.8(1.5)
-1.7(0.3)
-1.8(2.2)
*(4.4)
0.3(-0.8)
0.3(2.2)
Personal services -1.5(0.8)
-0.9(1.1)
-2.0(2.0)
-3.0(1.3)
-0.1(-1.1)
-3.4(-1.6)
Manufacturing -1.4(0.8)
-2.1(-0.2)
-0.7(3.4)
-1.5(2.8)
-1.4(-2.5)
-2.6(-0.7)
All selected sectors surveyed in the private sector
-1.0(1.3)
-0.8(1.2)
-0.9(3.1)
-1.5(2.8)
-0.8(-1.8)
-1.5(0.3)
Notes : Figures not in brackets represent percentage changes in money terms, while those in bracketsrepresent percentage changes in real terms.
(a) Because of a low base of comparison in December 2001, due to the waiver of publichousing rentals in that month, the CPI(A) had an upswing in December 2002, and thisdampened the change in wages to decline in real terms across-the-board in December 2002over a year earlier.
(*) Change of less than 0.05%.
Source : Labour Earnings Survey, Census and Statistics Department.
/5.24 .....

188
5.24 Analysed by occupation category, wages for miscellaneousnon-production workers, operatives, service workers, and clerical andsecretarial workers all came down, by 2.2 - 2.8% in money terms or by0.4 - 1.0% in real terms in March 2003 over a year earlier. Wages for craftsmenfell by 1.5% in money terms, but rose by 0.3% in real terms. Wages forsupervisory and technical workers declined less, by 0.2% in money terms, withan increase of 1.7% in real terms.
Table 5.22Wages by selected major occupation category
(year-on-year rate of change (%))
By reference to the wage index
2002 2003
Annual Mar Jun Sep Dec(a) Mar
Supervisory and technical workers
-0.2(2.1)
-0.2(1.8)
0.1(4.2)
-0.7(3.7)
*(-1.0)
-0.2(1.7)
Clerical and secretarial workers
-1.1(1.2)
-0.2(1.8)
-0.8(3.2)
-1.8(2.5)
-1.7(-2.7)
-2.2(-0.4)
Craftsmen -0.9(1.4)
-0.6(1.4)
-1.6(2.4)
-1.5(2.9)
0.2(-0.8)
-1.5(0.3)
Operatives -0.9(1.4)
-1.0(1.0)
0.1(4.2)
-1.3(3.0)
-1.3(-2.3)
-2.7(-0.9)
Service workers -3.0(-0.8)
-3.0(-1.0)
-3.6(0.3)
-3.4(0.9)
-2.1(-3.2)
-2.3(-0.4)
Miscellaneous non-production workers
-1.3(1.0)
-0.9(1.1)
-1.4(2.6)
-1.8(2.6)
-1.0(-2.1)
-2.8(-1.0)
Notes : Figures not in brackets represent percentage changes in money terms, while those inbrackets represent percentage changes in real terms.
Also see Note (a) to Table 5.21.
(*) Change of less than 0.05%.
Source : Labour Earnings Survey, Census and Statistics Department.
/Diagram 5.10 .....
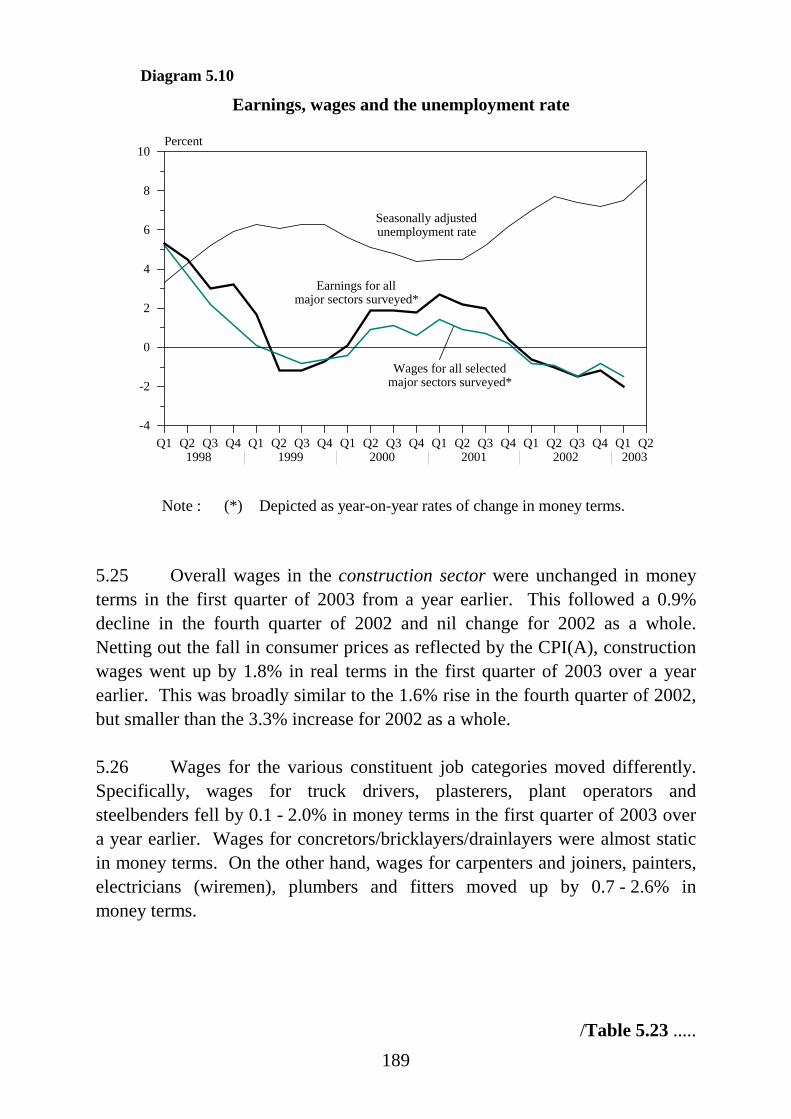
189
Earnings, wages and the unemployment rate
Q1 Q2 Q3 Q4 Q1 Q2 Q3 Q4 Q1 Q2 Q3 Q4 Q1 Q2 Q3 Q4 Q1 Q2 Q3 Q4 Q1 Q21998 1999 2000 2001 2002 2003
0
2
4
6
8
10
-2
-4
Percent
Diagram 5.10
Seasonally adjusted unemployment rate
Earnings for all major sectors surveyed*
Wages for all selectedmajor sectors surveyed*
Note : (*) Depicted as year-on-year rates of change in money terms.
5.25 Overall wages in the construction sector were unchanged in moneyterms in the first quarter of 2003 from a year earlier. This followed a 0.9%decline in the fourth quarter of 2002 and nil change for 2002 as a whole.Netting out the fall in consumer prices as reflected by the CPI(A), constructionwages went up by 1.8% in real terms in the first quarter of 2003 over a yearearlier. This was broadly similar to the 1.6% rise in the fourth quarter of 2002,but smaller than the 3.3% increase for 2002 as a whole.
5.26 Wages for the various constituent job categories moved differently.Specifically, wages for truck drivers, plasterers, plant operators andsteelbenders fell by 0.1 - 2.0% in money terms in the first quarter of 2003 overa year earlier. Wages for concretors/bricklayers/drainlayers were almost staticin money terms. On the other hand, wages for carpenters and joiners, painters,electricians (wiremen), plumbers and fitters moved up by 0.7 - 2.6% inmoney terms.
/Table 5.23 .....

190
Table 5.23
Construction wage rates by selected job category(year-on-year rate of change (%))
2002 2003
Annual Q1 Q2 Q3 Q4 Q1
Concretors/bricklayers/ drainlayers
0.4 -0.2 3.0 1.1 -2.0 *
Steelbenders 2.2 1.0 3.1 3.4 1.4 -0.1
Carpenters and joiners 3.0 -1.5 5.2 5.6 3.0 2.6
Plumbers -1.9 -3.8 -2.1 -2.3 0.6 1.1
Fitters -0.8 2.6 -0.7 -2.4 -2.5 0.7
Plasterers -1.8 -3.6 -1.9 -1.3 -0.3 -1.3
Painters -3.0 -2.1 -3.6 -4.5 -1.5 2.1
Electricians (wiremen) 1.9 3.3 2.7 0.3 1.4 1.4
Plant operators 1.2 3.3 2.8 0.2 -1.4 -1.1
Truck drivers -0.3 2.5 1.3 -1.9 -2.8 -2.0
All job categories in the construction sector(a)
*(3.3)
-0.2(2.6)
1.6(5.3)
-0.4(3.8)
-0.9(1.6)
*(1.8)
Notes : Figures not in brackets represent percentage changes in money terms, while those inbrackets represent percentage changes in real terms.
(a) Apart from the above selected job categories, this also covers such other jobcategories as masons, blacksmiths, terrazzo and granolithic workers, glaziers, heavyload coolies, pneumatic drillers, bamboo workers and scaffolders, structural steelerectors, divers, and diver’s linesmen. Yet as the employment involved in such jobcategories is much smaller, their respective wages are of lesser significance and aretherefore not separately shown in this table.
(*) Change of less than 0.05%.
Source : Census and Statistics Department.
/5.27 .....

191
5.27 Following enactment of the Public Officers Pay AdjustmentOrdinance on 19 July 2002, Civil Service pay at the directorate level and theupper salary band was adjusted downwards by 4.42%, and those at the middleand the lower salary bands by 1.64% and 1.58% respectively, as from1 October 2002.
5.28 On 25 February 2003, the Government announced its decision torestore the dollar value of all Civil Service pay points below Directorate PayScale 3 (D3) or equivalent to the levels as at 30 June 1997 in cash terms by twoadjustments of broadly equal amount to be implemented on 1 January 2004 and1 January 2005 respectively, and to restore the dollar value of all Civil Servicepay points at D3 and above or equivalent to the levels as at 30 June 1997 incash terms from 1 January 2004. This pay reduction will be implemented bylegislation. Following consultation with staff representatives on the draftlegislation, the Government gazetted the Public Officers Pay Adjustments(2004/2005) Bill on 16 May 2003 and introduced the Bill into the LegislativeCouncil on 21 May 2003. It plans to have the Bill enacted before the end of2003 so that the first stage of the Civil Service pay reduction can beimplemented on 1 January 2004 as scheduled.
5.29 The Government has embarked on an exercise to develop, inconsultation with staff, an improved Civil Service pay adjustment mechanismon the basis of the existing one. The improved mechanism will comprise theconduct of periodic pay level surveys to compare the Civil Service pay levelswith those in the private sector, the conduct of annual pay trend surveys basedon an improved methodology, and an effective means for implementing bothupward and downward adjustments. To take forward the exercise, a steeringcommittee has been established to tender advice in the process. Staff feedbackis gauged through a consultative group comprising staff representatives. Theaim is to complete the exercise, including the conduct of a pay level survey, byend-2004.
/Notes .....

192
Notes :
(1) For a person aged 15 or above to be classified as unemployed, he or she should: (a) nothave a job and not be performing any work for pay or profit during the reference period(i.e. seven days before enumeration); and (b) be available for work during the referenceperiod; and (c) be seeking work during the 30 days before enumeration.
Notwithstanding the above, the following types of persons are also considered asunemployed: (a) persons without a job, having sought work but not available for workbecause of temporary sickness; (b) persons without a job, available for work but nothaving sought work because they will take up new jobs or start business at a subsequentdate, or expect to return to their original jobs; and (c) discouraged workers not havingsought work because they believe work is not available to them.
Even at full employment, some frictional unemployment is bound to exist as workersmove between jobs in order to obtain better terms of employment. The precise level ofunemployment which can be described as purely frictional varies amongst economies,depending on the structure and characteristics of their labour markets.
In April 2001, the Census and Statistics Department put out a revised series ofseasonally adjusted unemployment rate compiled by reference to the X-11 ARIMAmethod, which adjusts for all seasonal variations in employment and unemployment(i.e. the changes due to holiday effects, seasonally ups and downs in economic activity,seasonal variations in first-time job-seekers, etc). This replaces the former serieswhich adjusts only for seasonal variations in the proportion of first-time job-seekers inthe labour force. For more details, see Note (3) at the end of Chapter 5 of theHalf-yearly Economic Report 2001.
(2) The main criteria for an employed person aged 15 or above to be classified asunderemployed are: involuntarily working less than 35 hours during the referenceperiod (i.e. seven days before enumeration), and either available for additional workduring the reference period or seeking additional work during the 30 days beforeenumeration.
Following these criteria, employed persons taking no-pay leave due to slack workduring the reference period are also classified as underemployed if they had worked lessthan 35 hours or were on leave for the entire reference period.
(3) The employed population refers to those persons aged 15 or above who performed workfor pay or profit or had a formal job attachment during the reference period (i.e. sevendays before enumeration).
(4) The labour force, or the economically active population, is defined to include allpersons aged 15 or above who either were engaged in productive work during thereference period (i.e. seven days before enumeration) or would otherwise have beenengaged in productive work but were unemployed.
/(5) .....

193
(5) The labour force participation rate is defined as the proportion of economically activepopulation (i.e. those working or unemployed) in the population aged 15 or above.
(6) In addition to wages, which include all regular payments like basic pay and stipulatedbonuses and allowances, earnings also cover overtime pay and other non-guaranteed orirregular bonuses and allowances, except severance pay and long service payment.Because of this difference, as well as the difference in sectoral and occupationalcoverage, the movements in average earnings, as measured by payroll per personengaged, do not necessarily match closely with those in wage rates.
(7) The wage data as collected have a more limited coverage than the correspondingearnings data. More specifically, the coverage of the service sectors in the wage data isfar from complete, and the coverage of occupation categories in the wage data is onlyup to the supervisory and technical level.
(8) The service sectors cover the wholesale, retail and import/export trades, restaurants andhotels; transport, storage and communications; financing, insurance, real estate andbusiness services; and community, social and personal services.
(9) Employment for the construction sector as a whole is enumerated from the GeneralHousehold Survey carried out by the Census and Statistics Department. Apart from siteworkers, it also includes non-site workers engaged in minor alteration and addition,repair, maintenance and interior decoration work on existing buildings. In addition, itincludes professional, administrative and other support personnel engaged in thatsector, such as engineers, architects, surveyors and contract managers, as well asgeneral clerical staff.
(10) Different consumer price indices are used for compiling the real indices of labourearnings and wages, taking into account their relevance to the respective occupationcoverage. Specifically, the Composite CPI, being an indicator of overall consumerprices, is taken as the price deflator for earnings received by employees at all levels ofthe occupational hierarchy. The CPI(A), being an indicator of consumer prices for themiddle to lower income groups, is taken as the price deflator for wages in respect ofworkers on occupations up to the supervisory level, and also in respect of manualworkers engaged in the construction sector.
(11) The decrease in real wages in December 2002 was entirely attributable to an upswing inthe CPI(A) in that month, owing to a low base of comparison in December 2001 uponthe waiver of public housing rentals at that time.

194
CHAPTER 6 : PRICES
Consumer prices
6.1 Overall consumer prices continued to decline in the second quarter of2003. By June 2003, the downtrend had lasted for 56 months. There was anaccentuated decrease in May and June, mainly reflecting the impact of SARS ondomestic demand and hence on consumer prices. In face of an austerebusiness situation under the SARS impact, local retailers and service providersgenerally offered larger price discounts and other attractions in a move to inducesales. There was a one-off rebate of electricity charges from a power companyin June. Also, new fare concessions were granted by some public transportoperators. These, coupled with lower labour wages and continued softening inproperty rentals, more than offset the effect of the recent pick-up in prices ofretained imports brought about by a weaker US dollar and higher worldcommodity prices.
6.2 The Composite Consumer Price Index(1) went down by 2.5% in thesecond quarter of 2003 from a year earlier (and further by 4.0% in July), largerthan the 2.0% fall in the first quarter. Clothing and footwear, durable goods,transport, private housing and miscellaneous services were the categories withaccentuated price declines. For the first half of 2003 as a whole, theComposite CPI fell by 2.2% over a year earlier, which was smaller than the3.2% decrease in the second half of 2002. Yet this was entirely due todissipation of the downward effect of the special relief measures implementedby the Government in the earlier periods, including the rates concession in2002(2) and the waiver of water and sewage charges over the twelve monthsending March 2003(3). After adjusting for these special factors as well as forthe difference in base of comparison caused by the waiver of public housingrentals in December 2001, the decline in the Composite CPI actually widened,by around 0.7 of a percentage point between the two half-yearly periods.
/6.3 .....

195
6.3 Analysed by sub-index and on a year-on-year comparison, the CPI(B)and CPI(C) dropped by 2.6% and 2.9% respectively in the second quarter of2003, enlarged from the decreases of 2.1% and 1.7% in the first quarter. Yetthe CPI(A) had the same magnitude of decrease, by 1.8% in both quarters. Asagainst the other two sub-indices, this sub-index was influenced much more bythe low base effect arising from the waiver of water and sewage chargesbetween April 2002 and March 2003. For the first half of 2003 as a whole, theCPI(A), CPI(B) and CPI(C) all moved lower, by 1.8%, 2.3% and 2.3%respectively over a year earlier. These were smaller than the decreases of 3.3%,3.3% and 2.9% in the second half of 2002. However, after discounting theeffects of the special relief measures implemented earlier by the Governmentand the lower base of comparison a year earlier, the CPI(A), CPI(B) and CPI(C)all showed larger declines between the two half-yearly periods, by around 0.5 ofa percentage point, 0.8 of a percentage point, and 0.7 of a percentage pointrespectively.
Q1 Q2 Q3 Q4 Q1 Q2 Q3 Q4 Q1 Q2 Q3 Q4 Q1 Q2 Q3 Q4 Q1 Q2 Q3 Q4 Q1 Q21998 1999 2000 2001 2002 2003
0
2
4
6
-2
-4
-6
-8
Percent
Consumer Price Indices(year-on-year rate of change)
Diagram 6.1
Consumer Price Index (A)
Composite ConsumerPrice Index
Consumer Price Index (B)
Consumer Price Index (C)
Note : From the fourth quarter of 2000 onwards, the year-on-yearchanges in the Consumer Price Indices are computed from thenew 1999/2000-based CPI series. Before then, the changes arecomputed from the old 1994/95-based CPI series. Splicing hasbeen applied to the indices to maintain continuity.
/Table 6.1 .....
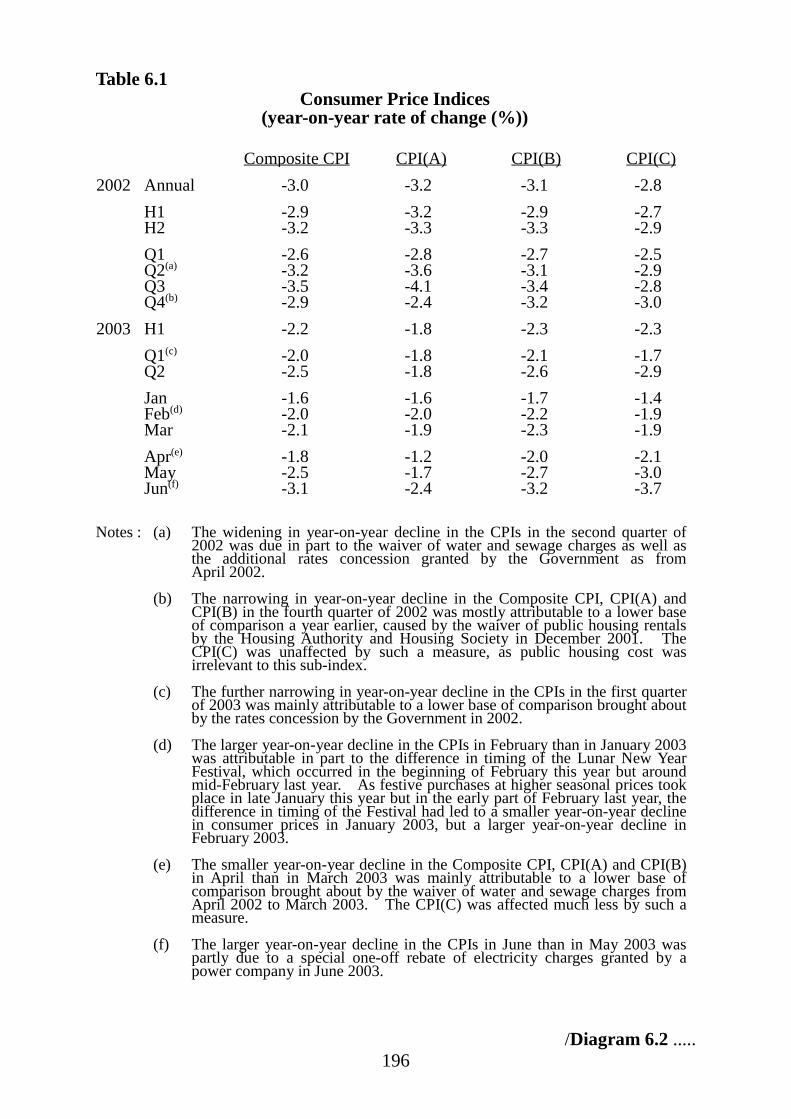
196
Table 6.1Consumer Price Indices
(year-on-year rate of change (%))
Composite CPI CPI(A) CPI(B) CPI(C)2002 Annual -3.0 -3.2 -3.1 -2.8
H1 -2.9 -3.2 -2.9 -2.7H2 -3.2 -3.3 -3.3 -2.9Q1 -2.6 -2.8 -2.7 -2.5Q2(a) -3.2 -3.6 -3.1 -2.9Q3 -3.5 -4.1 -3.4 -2.8Q4(b) -2.9 -2.4 -3.2 -3.0
2003 H1 -2.2 -1.8 -2.3 -2.3Q1(c) -2.0 -1.8 -2.1 -1.7Q2 -2.5 -1.8 -2.6 -2.9Jan -1.6 -1.6 -1.7 -1.4Feb(d) -2.0 -2.0 -2.2 -1.9Mar -2.1 -1.9 -2.3 -1.9Apr(e) -1.8 -1.2 -2.0 -2.1May -2.5 -1.7 -2.7 -3.0Jun(f) -3.1 -2.4 -3.2 -3.7
Notes : (a) The widening in year-on-year decline in the CPIs in the second quarter of2002 was due in part to the waiver of water and sewage charges as well asthe additional rates concession granted by the Government as fromApril 2002.
(b) The narrowing in year-on-year decline in the Composite CPI, CPI(A) andCPI(B) in the fourth quarter of 2002 was mostly attributable to a lower baseof comparison a year earlier, caused by the waiver of public housing rentalsby the Housing Authority and Housing Society in December 2001. TheCPI(C) was unaffected by such a measure, as public housing cost wasirrelevant to this sub-index.
(c) The further narrowing in year-on-year decline in the CPIs in the first quarterof 2003 was mainly attributable to a lower base of comparison brought aboutby the rates concession by the Government in 2002.
(d) The larger year-on-year decline in the CPIs in February than in January 2003was attributable in part to the difference in timing of the Lunar New YearFestival, which occurred in the beginning of February this year but aroundmid-February last year. As festive purchases at higher seasonal prices tookplace in late January this year but in the early part of February last year, thedifference in timing of the Festival had led to a smaller year-on-year declinein consumer prices in January 2003, but a larger year-on-year decline inFebruary 2003.
(e) The smaller year-on-year decline in the Composite CPI, CPI(A) and CPI(B)in April than in March 2003 was mainly attributable to a lower base ofcomparison brought about by the waiver of water and sewage charges fromApril 2002 to March 2003. The CPI(C) was affected much less by such ameasure.
(f) The larger year-on-year decline in the CPIs in June than in May 2003 waspartly due to a special one-off rebate of electricity charges granted by apower company in June 2003.
/Diagram 6.2 .....

197
Diagram 6.2Composite Consumer Price Index vis-à-vis labour wages,
residential flat rentals, and prices of retained imports(year-on-year rate of change)
Q1 Q2 Q3 Q4 Q1 Q2 Q3 Q4 Q1 Q2 Q3 Q4 Q1 Q2 Q3 Q4 Q1 Q2 Q3 Q4 Q1 Q21998 1999 2000 2001 2002 2003
0
2
4
6
-2
-4
-6
-8
Percent
Nominal wage index
(a) Compared with labour wages
Composite Consumer Price Index
Q1 Q2 Q3 Q4 Q1 Q2 Q3 Q4 Q1 Q2 Q3 Q4 Q1 Q2 Q3 Q4 Q1 Q2 Q3 Q4 Q1 Q21998 1999 2000 2001 2002 2003
0
5
10
15
20
-5
-10
-15
-20
-25
-30
Percent
Residential flatrental index
(b) Compared with residential flat rentals
Composite Consumer Price Index
Private housing cost in the Composite CPI
/Diagram 6.2 (cont’d) .....

198
Diagram 6.2 (cont’d)
Q1 Q2 Q3 Q4 Q1 Q2 Q3 Q4 Q1 Q2 Q3 Q4 Q1 Q2 Q3 Q4 Q1 Q2 Q3 Q4 Q1 Q21998 1999 2000 2001 2002 2003
0
4
8
12
-4
-8
-12
Percent
Prices of all retained imports
(c) Compared with prices of retained imports
Composite ConsumerPrice Index
Prices of retained imports of foodstuffs and consumer goods
Note : See the footnote to Diagram 6.1.
6.4 On a quarter-to-quarter comparison, the seasonally adjustedComposite CPI fell considerably more in the second quarter of 2003 than in thefirst quarter, by 1.1% as against 0.1%. Reflecting the SARS impact, enlargeddeclines were recorded in charges for meals at restaurants and prices of clothingand footwear, while renewed falls were seen in private housing cost, prices ofmiscellaneous goods, and charges for miscellaneous services. These decreasesoutweighed the effect of a rebound in charges for electricity, gas and watertaken as a whole, upon expiry of the waiver of water and sewage charges atend-March 2003. A broadly parallel pattern of movement was observed forthe three sub-indices. The seasonally adjusted CPI(A), CPI(B) and CPI(C)went down by 0.5%, 1.1% and 1.8% respectively in the second quarter of 2003,following nil change, -0.2% and nil change in the first quarter.
/Table 6.2 .....

199
Table 6.2
Seasonally adjusted Consumer Price Indices(quarter-to-quarter rate of change (%))
Composite CPI CPI(A) CPI(B) CPI(C)
2002 Q1(a) -1.1 -0.6 -1.4 -1.3Q2(b) -0.6 -0.6 -0.6 -0.7Q3 -0.7 -0.7 -0.7 -0.5Q4 -0.6 -0.6 -0.6 -0.6
2003 Q1(c) -0.1 * -0.2 *Q2(d) -1.1 -0.5 -1.1 -1.8
Notes : (a) The relatively larger quarter-to-quarter decline in most of the seasonallyadjusted CPIs in the first quarter of 2002 was mainly due to the ratesconcession for 2002 as well as the one-off rebate of electricity charges grantedby a power company in January and February 2002.
(b) The quarter-to-quarter decline in the seasonally adjusted CPIs mostlynarrowed in the second quarter of 2002. There was little additionaldampening effect from the rates concession in the second quarter, given thatthe base of comparison in the first quarter was already lowered by thatmeasure. Also, the effect of the one-off rebate of electricity charges grantedby a power company in the first two months of 2002 had dissipated. Theseoutweighed the new dampening effect from the waiver of water and sewagecharges for one year as from April 2002.
(c) The quarter-to-quarter decline in the seasonally adjusted CPIs narroweddistinctly further in the first quarter of 2003. This was mainly attributable todissipation of the downward effect of the rates concession granted by theGovernment in 2002, which outweighed the downward effect of the one-offrebate of electricity charges granted by a power company in January andFebruary 2003.
(d) The quarter-to-quarter declines in the seasonally adjusted CPIs widenedconsiderably in the second quarter of 2003, mainly reflecting the impact ofSARS on consumer demand and hence consumer prices.
(*) Change of less than 0.05%.
/Diagram 6.3 .....

200
Q1 Q2 Q3 Q4 Q1 Q2 Q3 Q4 Q1 Q2 Q3 Q4 Q1 Q2 Q3 Q4 Q1 Q2 Q3 Q4 Q1 Q21998 1999 2000 2001 2002 2003
0
1
2
-1
-2
-3
Percent
Seasonally adjusted Consumer Price Indices(quarter-to-quarter rate of change)
Diagram 6.3
Consumer Price Index (A)
Composite Consumer Price Index
Consumer Price Index (B)
Consumer Price Index (C)
Note : From the first quarter of 2000 onwards, the quarter-to-quarterchanges in the seasonally adjusted Consumer Price Indices arecomputed from the new 1999/2000-based CPI series. Before then,the quarter-to-quarter changes are computed from the old1994/95-based CPI series. Splicing has been applied to theindices to maintain continuity.
/6.5 .....

201
6.5 Analysed by major commodity group in the Composite CPI and on ayear-on-year comparison, the prices of durable goods were slashed by 7.7% inthe second quarter of 2003, exceeding the 6.0% dip in the first quarter. Thiswas mainly due to further reduction in the prices of watches, cameras, computerproducts and telecommunications equipment. The prices of clothing andfootwear also had a widened decline, from 3.5% in the first quarter to 6.3% inthe second quarter, largely attributable to an accentuated fall in the prices ofouterclothing. The charges for miscellaneous services likewise showed asteeper decrease, from 1.6% to 3.7%, mainly reflecting larger price discounts ontelecommunications services and renewed decline in the charges for packagetours. The cost of transport sank by 0.6% in the second quarter, on account ofdownward adjustments in inbound and outbound transport fares as well as fareconcessions by some of the public transport operators. This followed a slightdecline of 0.1% in the first quarter. The prices of basic foodstuffs slipped by1.3% in the second quarter, narrowed from the 2.5% drop in the first quarter.A pick-up in the prices of fresh fruits and vegetables was the major contributoryfactor. The charges for meals at restaurants fell by 1.6% in both quarters,amidst sustained downward pressure from lower food cost and slack demandconditions. On the other hand, the charges for electricity, gas and waterbounced up by 7.6% in the second quarter of 2003, reversing a 6.5% decline inthe first quarter. But this was mainly due to dissipation of the waiver of waterand sewage charges by March 2003, outweighing the dampening effect from aspecial one-off rebate of electricity charges granted by a power company forJune 2003(4). The prices of miscellaneous goods went higher by 0.5% in thesecond quarter, yet smaller than the 3.3% rise in the first quarter, along withmoderated increase in the prices of jewellery. The prices of alcoholic drinksand tobacco, having risen by 0.5% in the first quarter, edged up further by 0.2%in the second quarter, mainly because of higher retail prices of wine. As toprivate housing cost, there was a larger drop in the second quarter, by 4.9%,than that in the first quarter, by 3.5%. This was in line with the softening inprivate residential flat rentals in the market over the past year(5). By contrast,public housing cost leaped by 11.8% in both quarters, as the low base owing tothe rates concession in 2002 continued to carry effect.
/6.6 .....

202
6.6 For the first half of 2003 as a whole as compared to a year earlier, theprices of durable goods and of clothing and footwear had the largest decreases,by 6.9% and 4.9% respectively. These were followed by private housing cost,charges for miscellaneous services, prices of basic foodstuffs, charges for mealsat restaurants, and cost of transport, with declines of 4.2%, 2.7%, 1.9%, 1.6%and 0.4% respectively. On the other hand, public housing cost was distinctlyhigher by 11.8%, due to the low base effect. Concurrently, the prices ofmiscellaneous goods, charges for electricity, gas and water, and prices ofalcoholic drinks and tobacco registered modest increases, by 1.9%, 0.7% and0.4% respectively.
/Table 6.3 .....

203
Table 6.3
Consumer Price Indices by component(year-on-year rate of change (%))
(a) In the first and second quarters of 2003
Composite CPI CPI(A) CPI(B) CPI(C)Expenditurecomponent 2003 Q1 2003 Q2 2003 Q1 2003 Q2 2003 Q1 2003 Q2 2003 Q1 2003 Q2Food -1.9 -1.5 -2.2 -1.6 -2.1 -1.7 -1.1 -0.8
Meals boughtaway from home
-1.6 -1.6 -1.8 -1.7 -2.1 -1.9 -0.3 -0.8
Other foodstuffs -2.5 -1.3 -2.6 -1.5 -2.5 -1.4 -2.6 -0.8Housing# -2.3 -3.4 -0.6 -1.6 -2.5 -3.7 -3.9 -5.1
Private dwellings -3.5 -4.9 -3.3 -4.6 -3.2 -4.6 -3.9 -5.4Public dwellings 11.8 11.8 11.8 11.8 11.8 11.9 -- --
Electricity, gas and water -6.5 7.6 -8.3 8.4 -5.8 7.4 -4.4 6.6Alcoholic drinks and
tobacco0.5 0.2 0.3 0.2 0.5 0.2 1.5 0.8
Clothing and footwear -3.5 -6.3 -3.6 -5.5 -3.2 -5.5 -3.7 -8.4Durable goods -6.0 -7.7 -6.4 -7.6 -6.2 -7.9 -5.5 -7.4Miscellaneous goods 3.3 0.5 1.5 0.1 3.0 0.5 5.3 1.0Transport -0.1 -0.6 -0.6 -1.3 -0.2 -0.8 0.6 0.4Miscellaneous services -1.6 -3.7 -2.4 -4.3 -1.7 -3.4 -1.0 -3.6All items -2.0 -2.5 -1.8 -1.8 -2.1 -2.6 -1.7 -2.9
(b) In the second half of 2002 and first half of 2003
Composite CPI CPI(A) CPI(B) CPI(C)Expenditurecomponent 2002 H2 2003 H1 2002 H2 2003 H1 2002 H2 2003 H1 2002 H2 2003 H1Food -2.3 -1.7 -2.6 -1.9 -2.5 -1.9 -1.6 -0.9
Meals boughtaway from home
-1.8 -1.6 -2.0 -1.8 -2.2 -2.0 -0.4 -0.5
Other foodstuffs -3.3 -1.9 -3.3 -2.1 -2.9 -1.9 -3.7 -1.7Housing# -5.6 -2.8 -4.7 -1.1 -6.1 -3.1 -5.9 -4.5
Private dwellings -7.1 -4.2 -7.5 -4.0 -7.1 -3.9 -6.4 -4.6Public dwellings 6.7 11.8 6.7 11.8 6.7 11.8 -- --
Electricity, gas and water -7.8 0.7 -9.1 0.3 -7.5 0.9 -5.8 1.1Alcoholic drinks and
tobacco1.6 0.4 1.4 0.2 1.6 0.3 2.3 1.1
Clothing and footwear 0.1 -4.9 1.4 -4.6 1.1 -4.4 -2.5 -6.2Durable goods -5.8 -6.9 -5.7 -7.0 -5.9 -7.0 -5.8 -6.5Miscellaneous goods 2.0 1.9 1.0 0.8 1.7 1.7 3.6 3.1Transport -0.8 -0.4 -0.7 -1.0 -0.6 -0.5 -1.1 0.5Miscellaneous services -2.9 -2.7 -4.1 -3.4 -2.9 -2.6 -1.7 -2.3All items -3.2 -2.2 -3.3 -1.8 -3.3 -2.3 -2.9 -2.3
Notes : (#) The housing component covers rents, rates, Government rent, maintenance costs and other housingcharges. Its sub-components on private and public dwellings as presented here, however, coverrents, rates and Government rent only.
(--) Not applicable.
/Diagram 6.4 .....

204
Diagram 6.4
Composite Consumer Price Index by component(year-on-year rate of change)
Food Meals Other Housing Private Public Electricity, Alcoholic Clothing Durable Misc. Transport Misc.
0
2
4
6
8
10
12
14
-2
-4
-6
-8
-10
Percent
First quarter of 2003 Second quarter of 2003
gas anddwellingsdwellingsout foodstuffs drinks and
tobacco
goodsgoods servicesandfootwearwaterFood Housing
(a) In the first and second quarters of 2003
Food Meals Other Housing Private Public Electricity, Alcoholic Clothing Durable Misc. Transport Misc.
0
2
4
6
8
10
12
14
-2
-4
-6
-8
-10
Percent
Second half of 2002 First half of 2003
gas anddwellingsdwellingsout foodstuffs drinks and
tobacco
goodsgoods servicesandfootwearwaterFood Housing
(b) In the second half of 2002 and first half of 2003
/Diagram 6.5 .....

205
Diagram 6.5
Consumer Price Index (A) by component(year-on-year rate of change)
Food Meals Other Housing Private Public Electricity, Alcoholic Clothing Durable Misc. Transport Misc.
0
2
4
6
8
10
12
14
-2
-4
-6
-8
-10
Percent
First quarter of 2003 Second quarter of 2003
gas anddwellingsdwellingsout foodstuffs drinks and
tobacco
goodsgoods servicesandfootwearwaterFood Housing
(a) In the first and second quarters of 2003
Food Meals Other Housing Private Public Electricity, Alcoholic Clothing Durable Misc. Transport Misc.
0
2
4
6
8
10
12
14
-2
-4
-6
-8
-10
Percent
Second half of 2002 First half of 2003
gas anddwellingsdwellingsout foodstuffs drinks and
tobacco
goodsgoods servicesandfootwearwaterFood Housing
(b) In the second half of 2002 and first half of 2003
/Import .....
206
Import prices
6.7 The prices of imports of goods, as measured by the unit value index ofimports of goods, fell by 0.3% in the second quarter of 2003 from a year earlier,after a decline of 0.1% in the first quarter. For the first half of 2003 as a whole,there was a decrease of 0.2%. This was distinctly narrowed from the 3.0% fallin the second half of 2002. To a large extent, import prices were boosted bythe weaker US dollar and higher world commodity prices in recent months.
6.8 Analysed by major source and on a year-on-year comparison, theprices of goods imported from Japan went up by 2.9% in the second quarter of2003, following an increase of 3.3% in the first quarter. This was mainlyunderpinned by a strengthening in the Japanese yen against the US dollar andhence the Hong Kong dollar over the past year or so. The prices of goodsimported from the Mainland reverted to increase, by 0.1% in the second quarterof 2003, from a fall of 1.0% in the first quarter. This was mainly attributableto a renewed pick-up in the prices of consumer goods from the Mainland, whichconstituted about half of the total value of goods imported from there. On theother hand, the prices of goods imported from the United States fell by 1.4% inthe second quarter of 2003, with the decrease concentrated in the prices ofconsumer goods and of raw materials and semi-manufactures. This followed a2.6% decline in the first quarter. The prices of goods imported from Taiwanedged lower by 0.3% in the second quarter of 2003, reversing the 1.1% increasein the first quarter. Accentuated decline in the prices of foodstuffs and capitalequipment imported from Taiwan largely contributed.
/Table 6.4 .....

207
Table 6.4World commodity prices
(year-on-year rate of change (%))
Of which :
FuelsAll non-fuelcommodities
Food andbeverages
Agriculturalraw materials Metals
2002 Annual -0.2 0.6 2.2 1.6 -2.7
H1 -14.8 -5.9 -3.1 -9.5 -7.4H2 17.2 7.5 7.4 14.2 2.4
Q1 -21.4 -7.0 -3.7 -10.7 -9.3Q2 -8.3 -4.7 -2.5 -8.5 -5.4Q3 4.7 3.1 2.3 9.3 -0.3Q4 33.2 12.1 13.0 19.5 5.3
2003 H1 25.2 8.7 11.1 9.5 4.1
Q1 46.6 10.6 13.0 12.9 4.8Q2 7.2 6.9 9.3 6.5 3.4
Source : IMF International Financial Statistics.
Spot price of crude oil*
M J S D M J S D M J S D M J S D M J S D M J1998 1999 2000 2001 2002 2003
0
10
20
30
40US$ per barrel
Diagram 6.6
West Texas Intermediate
North Sea Brent
Note : (*) Month-end figures.
/Table 6.5 .....

208
Table 6.5
Unit value indices of imports of goods by major source(year-on-year rate of change (%))
Mainlandof China Japan Taiwan United States All sources
2002 Annual -3.3 -3.7 -3.5 -5.0 -3.9
H1 -3.4 -6.1 -5.4 -5.3 -4.8H2 -3.2 -1.3 -1.7 -4.6 -3.0
Q1 -3.2 -7.0 -6.4 -5.1 -4.9Q2 -3.5 -5.4 -4.4 -5.6 -4.6Q3 -3.5 -2.1 -2.7 -4.6 -3.6Q4 -2.8 -0.5 -0.6 -4.5 -2.3
2003 H1 -0.4 3.1 0.3 -2.0 -0.2
Q1 -1.0 3.3 1.1 -2.6 -0.1Q2 0.1 2.9 -0.3 -1.4 -0.3
/Diagram 6.7 .....

209
Q1 Q3 Q1 Q3 Q1 Q3 Q1 Q3 Q1 Q3 Q11998 1999 2000 2001 2002 2003
0
2
4
6
-2
-4
-6
Percent
Diagram 6.7
Q1 Q3 Q1 Q3 Q1 Q3 Q1 Q3 Q1 Q3 Q11998 1999 2000 2001 2002 2003
0
4
8
12
-4
-8
-12
Percent
Prices of importsfrom the Mainland
Japan's export prices adjusted for exchange rate of yen
Prices of imports from Japan
Retail prices in the Mainland adjusted for the market exchange
rate of renminbi
(b) For imports from Japan
Prices of imports of goods by major source(year-on-year rate of change)
(a) For imports from the mainland of China
2003 2003
Q1 Q3 Q1 Q3 Q1 Q3 Q1 Q3 Q1 Q3 Q11998 1999 2000 2001 2002 2003
0
2
4
6
-2
-4
-6
-8
-10
-12
Percent
Q1 Q3 Q1 Q3 Q1 Q3 Q1 Q3 Q1 Q3 Q11998 1999 2000 2001 2002 2003
0
2
4
6
-2
-4
-6
-8
-10
-12
Percent
(d) For imports from the United States
Prices of imports from
Taiwan
Taiwan's export prices adjusted for exchange
rate of NT$
Prices ofimports from US
US export prices adjusted for exchange
rate of US$
(c) For imports from Taiwan
2003 2003
/6.9 .....

210
6.9 The prices of retained imports, as measured by the unit value index ofretained imports, moved higher by 2.8% in the second quarter of 2003 over ayear earlier, having ascended by 1.9% in the first quarter. For the first half of2003 as a whole, there was an increase of 2.4%, in contrast to a 7.6% dip in thesecond half of 2002.
6.10 Analysed by end-use category and on a year-on-year comparison, theprices of retained imports of fuels went up by 8.9% in the second quarter of2003. Yet this was smaller than the surge of 37.3% in the first quarter, alongwith the moderation in international crude oil price in the more recent months.The prices of retained imports of consumer goods increased by 7.2% in thesecond quarter, much enlarged from the 2.1% rise in the first quarter, on accountof a further pick-up in the prices of imported travel goods, motor vehicles, andwatches and clocks. The prices of retained imports of raw materials andsemi-manufactures also showed an accelerated increase, to 4.0% in the secondquarter, from 2.3% in the first quarter, mainly reflecting an upsurge in the pricesof imported textiles and plastic materials. The prices of retained imports offoodstuffs turned up to a 1.3% rise in the second quarter, from a 0.2% fall in thefirst quarter, partly due to renewed increase in the prices of foodstuffs importedfrom some major sources other than the Mainland. On the other hand, theprices of retained imports of capital goods went down by 5.1% in the secondquarter, further to a 6.1% decrease in the first quarter. This was mainlyattributable to a sharp fall in the prices of imported telecommunicationsequipment.
/Table 6.6 .....

211
Table 6.6
Unit value indices of retained imports by end-use category(year-on-year rate of change (%))
Food-stuffs
Consumer goods Fuels
Rawmaterialsand semi-
manufacturesCapital goods
Allcategories
2002 Annual -4.1 -9.5 0.5 -9.5 -11.4 -9.7
H1 -5.9 -9.6 -10.7 -12.4 -11.8 -11.7H2 -2.4 -9.4 11.8 -6.2 -10.9 -7.6
Q1 -6.0 -9.6 -15.7 -12.0 -11.0 -11.6Q2 -5.8 -9.5 -6.9 -12.6 -12.7 -11.7Q3 -3.2 -9.5 0.1 -9.5 -11.4 -9.6Q4 -1.6 -9.3 25.6 -2.5 -10.2 -5.5
2003 H1 0.5 4.8 21.5 3.3 -5.5 2.4
Q1 -0.2 2.1 37.3 2.3 -6.1 1.9Q2 1.3 7.2 8.9 4.0 -5.1 2.8
Prices of key inputs
6.11 On labour cost, wages and earnings continued to drift lower, by 1.5%in money terms in March 2003 and by 2.0% in money terms in the first quarterof 2003 from a year earlier respectively, amidst a further slackening in labourmarket conditions. On property cost, the prices of office space, shoppingspace and conventional flatted factory space all went down distinctly, by anaverage of 11.4%, 4.7% and 4.5% respectively in the second quarter of 2003over the fourth quarter of 2002. So did the corresponding rentals, by anaverage of 7.1%, 7.8% and 6.8%. On capital equipment and material costs,the prices of retained imports of capital goods were lower by 5.5% in the firsthalf of 2003 from a year earlier, yet the prices of retained imports of rawmaterials and semi-manufactures turned up to an increase of 3.3%. On thewhole, there was a further easing in the overall cost of doing business in HongKong.
/Prices .....

212
Prices of local manufacturing output
6.12 The prices of local manufacturing output, as measured by theProducer Price Index(6), remained on a downtrend, falling by 1.3% in the firstquarter of 2003 over a year earlier. Yet this was smaller than the 2.4%decrease in the fourth quarter of 2002. Analysed by major industry group andon a year-on-year comparison, output prices in the fabricated metal productsand the machinery and equipment industries had relatively larger declines, by3.5% and 3.3% respectively in the first quarter of 2003. This was followed byoutput prices in the paper products and printing industry (down by 2.1%), theconsumer electrical and electronic products industry (1.5%), the wearingapparel industry (0.8%), and the textiles industry (0.8%). On the other hand,output prices in the plastic products industry reverted to a mild increase, by0.8%.
Table 6.7Producer Price Index for the local manufacturing sector
(year-on-year rate of change (%))
2002 2003
Annual Q1 Q2 Q3 Q4 Q1
Industry groupWearing apparel -3.5 -3.2 -4.1 -3.6 -2.9 -0.8Textiles -1.3 -1.8 -1.8 -1.1 -0.7 -0.8Plastic products -2.8 -1.7 -1.5 -4.1 -3.7 0.8Consumer electrical and
electronic products-4.7 -4.4 -5.7 -4.5 -4.2 -1.5
Machinery and equipment -5.1 -3.8 -5.2 -5.5 -5.9 -3.3Fabricated metal products -2.6 -3.1 -2.5 -2.0 -2.6 -3.5Paper products and
printing-2.4 -2.6 -1.7 -2.0 -3.2 -2.1
Overall manufacturing -2.8 -3.3 -2.6 -2.7 -2.4 -1.3
/Diagram 6.8 .....

213
Producer Price Index, world commodity prices, and prices
(year-on-year rate of change)
Q1 Q2 Q3 Q4 Q1 Q2 Q3 Q4 Q1 Q2 Q3 Q4 Q1 Q2 Q3 Q4 Q1 Q2 Q3 Q4 Q1 Q21998 1999 2000 2001 2002 2003
0
4
8
12
16
20
-4
-8
-12
-16
-20
Percent
Diagram 6.8
of retained imports of raw materials and semi-manufactures
Prices of all non-fuel commodities in the world market
Prices of retained imports of raw materials and semi-manufactures
Producer Price IndexQ1/2003
Prices of output in selected service sectors
6.13 The prices of output in selected service sectors, as measured by therespective Producer Price Indices, continued to show mixed movement.Output prices in telecommunications sank further, by 8.9% in the first quarter of2003 from a year earlier, following an 11.0% drop in the fourth quarter of 2002.Substantial cuts in the charges for international calls and Internet services, aswell as in the prices of mobile phone sets and related items, were the majorcontributory factors. Output prices in land transport eased slightly, by 0.6% inthe first quarter of 2003, mainly due to lower charges for freight transport.This followed a decrease of 2.1% in the fourth quarter of 2002. On the otherhand, output prices in miscellaneous communications services rose distinctlyfurther, by 7.1% in the first quarter of 2003 over a year earlier, after a 9.8%surge in the fourth quarter of 2002. This was largely attributable to continuedupward adjustment in the charges for international courier services. Outputprices in maritime transport and air transport also ascended, by 5.5% and 1.8%respectively in the first quarter of 2003, following increases of 0.9% and 7.1%in the fourth quarter of 2002. Robust growth in cargo forwarding servicesamidst continued buoyancy in external trade largely contributed. Output pricesin hotels and boarding houses were lifted by 9.3% in the fourth quarter of 2002and then by 1.3% in the first quarter of 2003, upon upward adjustment in hotelroom tariffs just before the outbreak of SARS in mid-March.
/Table 6.8 .....
214
Table 6.8
Producer Price Indices for selected service sectors+
(year-on-year rate of change (%))
2002 2003
Annual Q1 Q2 Q3 Q4 Q1
Selected service sector
Hotels and boardinghouses
-1.1 -5.8 -4.2 -3.6 9.3 1.3
Land transport -1.9 -1.4 -2.0 -2.1 -2.1 -0.6Maritime transport -3.0 -9.4 -5.5 2.9 0.9 5.5Air transport 0.3 -5.5 -3.4 3.4 7.1 1.8Telecommunications -18.6 -21.7 -24.5 -15.5 -11.0 -8.9Miscellaneous
communicationsservices
3.9 0.4 0.1 5.1 9.8 7.1
Note : (+) Producer Price Indices for other service sectors are not available, due to thedifficulties involved in defining and delineating the various types of servicesand hence in measuring their respective price changes. This is particularly sofor such sectors as banking and insurance, where the producers often do notcharge their customers explicitly.
Export prices
6.14 Export prices generally remained soft, amidst keen competition in theoverseas market. The prices of total exports of goods, as measured by the unitvalue index of total exports of goods, edged lower by 1.4% in the secondquarter of 2003 from a year earlier, following a 0.9% fall in the first quarter.For the first half of 2003 as a whole, there was a 1.1% decrease, which wasnevertheless smaller than that of 2.4% in the second half of 2002. Thisnarrowed decrease was attributable in part to improved import demand in someof the major overseas markets. Within the total, the prices of domestic exportsbounced up, by 0.8% in the first half of 2003 over a year earlier, while theprices of re-exports had a moderated decline, by 1.3%.
/6.15 .....

215
6.15 Analysed by major market and on a year-on-year comparison, theprices of total exports of goods fell virtually across-the-board. Specifically, theprices of total exports of goods to Singapore dropped by 3.1% in the secondquarter of 2003, almost doubled the 1.6% decrease in the first quarter. Thiswas mainly due to an accentuated fall in the prices of capital equipment,particularly those of office equipment and construction machinery, exported tothat market. The prices of total exports of goods to Germany and the UnitedKingdom declined by 2.9% and 1.7% respectively in the second quarter, alsolarger than the decreases of 2.3% and 1.0% in the first quarter. Generally softerprices of capital equipment and of raw materials and semi-manufacturesexported to the two markets largely contributed. The prices of total exports ofgoods to Japan fell by 1.2% in the second quarter, broadly similar to the 1.1%decrease in the first quarter. The prices of total exports of goods to theMainland reverted to decline, by 1.0% in the second quarter, after a 0.1% rise inthe first quarter. As to the prices of total exports of goods to the United States,the decline in the second quarter, at 0.6%, was moderated from that in the firstquarter, at 1.3%.
Table 6.9
Unit value indices of total exports of goods by major market(year-on-year rate of change (%))
UnitedStates
Mainlandof China Germany
UnitedKingdom Japan Singapore
Allmarkets
2002 Annual -2.6 -2.5 -3.2 -2.5 -3.2 -3.9 -2.7
H1 -2.2 -3.5 -3.4 -3.0 -3.5 -4.2 -3.1H2 -2.9 -1.6 -2.9 -2.1 -2.9 -3.4 -2.4
Q1 -1.9 -4.2 -4.0 -3.6 -3.5 -4.8 -3.4Q2 -2.4 -2.8 -2.8 -2.3 -3.4 -3.5 -2.7Q3 -3.2 -1.6 -2.8 -2.3 -2.7 -3.1 -2.4Q4 -2.6 -1.5 -3.0 -1.9 -3.0 -3.6 -2.3
2003 H1 -0.9 -0.5 -2.6 -1.4 -1.1 -2.4 -1.1
Q1 -1.3 0.1 -2.3 -1.0 -1.1 -1.6 -0.9Q2 -0.6 -1.0 -2.9 -1.7 -1.2 -3.1 -1.4
/Diagram 6.9 .....
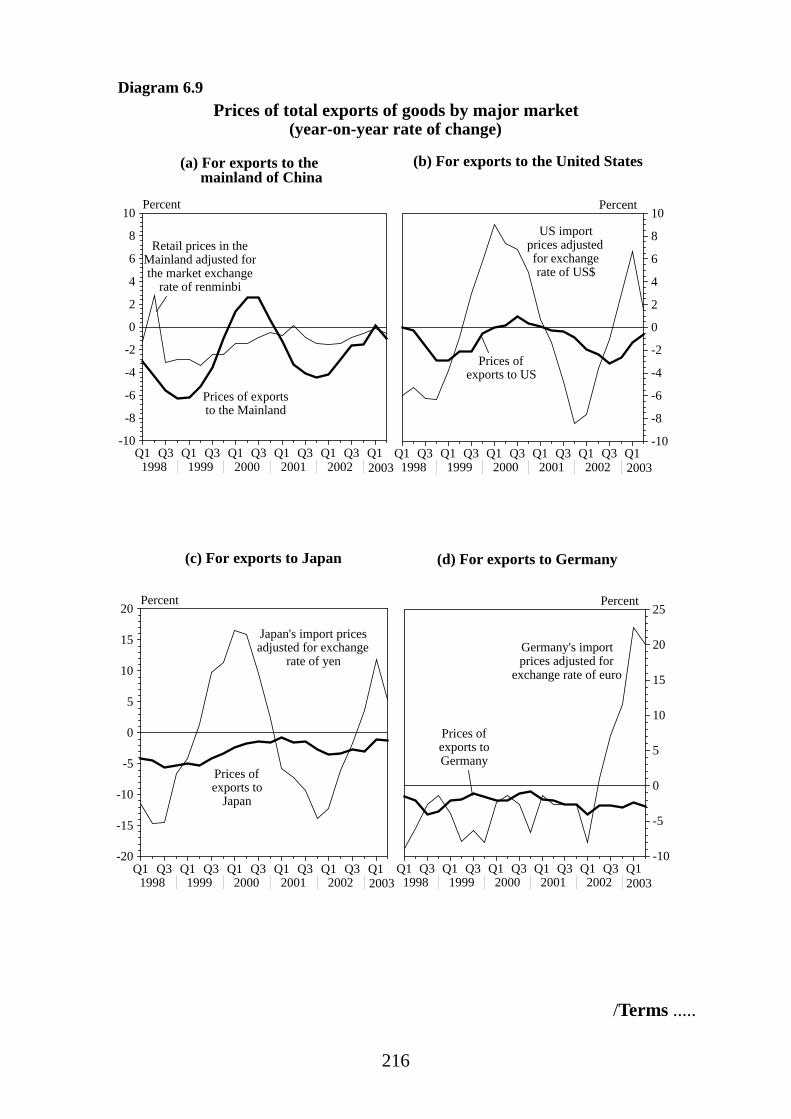
216
Q1 Q3 Q1 Q3 Q1 Q3 Q1 Q3 Q1 Q3 Q11998 1999 2000 2001 2002 2003
0
2
4
6
8
10
-2
-4
-6
-8
-10
Percent
Diagram 6.9
Q1 Q3 Q1 Q3 Q1 Q3 Q1 Q3 Q1 Q3 Q11998 1999 2000 2001 2002 2003
0
2
4
6
8
10
-2
-4
-6
-8
-10
Percent
Prices of exportsto the Mainland
US import prices adjusted for exchange rate of US$
Prices of exports to US
Retail prices in the Mainland adjusted for the market exchange
rate of renminbi
(a) For exports to the mainland of China
(b) For exports to the United States
Prices of total exports of goods by major market(year-on-year rate of change)
2003 2003
Q1 Q3 Q1 Q3 Q1 Q3 Q1 Q3 Q1 Q3 Q11998 1999 2000 2001 2002 2003
0
5
10
15
20
25
-5
-10
Percent
Q1 Q3 Q1 Q3 Q1 Q3 Q1 Q3 Q1 Q3 Q11998 1999 2000 2001 2002 2003
0
5
10
15
20
-5
-10
-15
-20
Percent
(d) For exports to Germany
Prices of exports to
Japan
Japan's import prices adjusted for exchange
rate of yen
Prices ofexports to Germany
Germany's import prices adjusted for
exchange rate of euro
(c) For exports to Japan
2003 2003
/Terms .....

217
Terms of trade
6.16 As the prices of imports of goods fell by less than the prices of totalexports of goods, the terms of trade in goods(7) for Hong Kong went down by1.1% in the second quarter of 2003 from a year earlier. This followed adecrease of 0.8% in the first quarter, giving a 1.0% decline for the first half of2003 as a whole.
Table 6.10
Terms of trade in goods
Index on the terms of trade in goods
(2000 = 100)
Year-on-yearrate of change
(%)
2002 Annual 102.1 1.2
H1 102.3 1.8H2 101.9 0.7
Q1 102.2 1.6Q2 102.5 2.0Q3 102.1 1.2Q4 101.7 *
2003 H1 101.4 -1.0
Q1 101.4 -0.8Q2 101.3 -1.1
Note : (*) Change of less than 0.05%.
/Diagram 6.10 .....

218
Unit value indices of total exports of goods and imports of goods
Q1 Q2 Q3 Q4 Q1 Q2 Q3 Q4 Q1 Q2 Q3 Q4 Q1 Q2 Q3 Q4 Q1 Q2 Q3 Q4 Q1 Q21998 1999 2000 2001 2002 2003
0
1
2
3
4
-1
-2
-3
-4
-5
-6
Percent (year-on-year rate of change)
Imports of goods
Total exports of goods
Diagram 6.10
Terms of trade in goods
Q1 Q2 Q3 Q4 Q1 Q2 Q3 Q4 Q1 Q2 Q3 Q4 Q1 Q2 Q3 Q4 Q1 Q2 Q3 Q4 Q1 Q21998 1999 2000 2001 2002 2003
97
98
99
100
101
102
103Index (2000=100)
0
0.5
1
1.5
2
2.5
3
-0.5
-1
-1.5
Percent
Index on the terms of trade in goods Year-on-year rate of change
Diagram 6.11
0
/GDP .....

219
GDP deflator
6.17 The GDP deflator(8), as a broad measure of overall price change in theeconomy, declined by 5.5% in the second quarter of 2003 from a year earlier,larger than the 4.6% drop in the first quarter. This was mainly due to enlargeddeclines in the terms of trade in goods and services, in the price deflator forprivate consumption expenditure, and in the price deflator for governmentconsumption expenditure. Within the GDP deflator, the domestic demanddeflator and the total final demand deflator likewise showed accentuateddeclines, by 4.1% and 2.8% respectively in the second quarter of 2003 from ayear earlier, as compared to the corresponding decreases of 3.9% and 2.1% inthe first quarter. On a seasonally adjusted quarter-to-quarter comparison, theGDP deflator went down further by 1.7% in the second quarter of 2003,following a 1.4% decrease in the first quarter.
/Table 6.11 .....

220
Table 6.11
GDP deflator and the main expenditure component deflators(year-on-year rate of change (%))
2001# 2002# 2002 2003
Q1# Q2# Q3# Q4# Q1# Q2+
Private consumptionexpenditure
-1.2 -3.8 -3.2 -3.8 -4.0 -4.1 -2.8 -3.2
Government consumptionexpenditure
1.1 -0.5 1.4 -0.6 -0.7 -2.6 -2.5 -3.5
Gross domestic fixedcapital formation
-6.6 -8.1 -7.4 -8.5 -9.2 -7.5 -6.8 -6.5
Total exports of goods -2.6 -2.9 -3.8 -3.0 -2.7 -2.4 -1.3 -1.8
Imports of goods -3.5 -4.2 -5.2 -4.9 -3.9 -2.6 -0.8 -0.8
Exports of services -4.0 -1.9 -4.3 -2.4 -0.6 -0.5 -0.7 -3.4
Imports of services -1.5 0.2 -2.4 * 1.4 2.0 3.4 1.6
Gross Domestic Product -1.9 -3.0 -2.3 -2.2 -3.1 -4.1 -4.6 -5.5<-0.7> <-0.8> <-0.9> <-1.6> <-1.4> <-1.7>
Total final demand -2.7 -3.5 -3.9 -3.6 -3.3 -3.1 -2.1 -2.8
Domestic demand -2.5 -4.6 -3.6 -4.7 -5.1 -5.1 -3.9 -4.1
Notes : (#) Revised figures.
(+) Preliminary figures.
< > Seasonally adjusted quarter-to-quarter % change.
(*) Change of less than 0.05%.
/Diagram 6.12 .....

221
GDP deflator, total final demand deflatorand domestic demand deflator
Q1 Q2 Q3 Q4 Q1 Q2 Q3 Q4 Q1 Q2 Q3 Q4 Q1 Q2 Q3 Q4 Q1 Q2 Q3 Q4 Q1 Q21998 1999 2000 2001 2002 2003
0
2
4
-2
-4
-6
-8
Percent
GDP deflator
Domestic demand deflator
Diagram 6.12
(year-on-year rate of change)
*
Total final demand deflator
Notes : (*) Preliminary figures.
GDP deflator
Q1 Q2 Q3 Q4 Q1 Q2 Q3 Q4 Q1 Q2 Q3 Q4 Q1 Q2 Q3 Q4 Q1 Q2 Q3 Q4 Q1 Q21998 1999 2000 2001 2002 2003
0
1
-1
-2
-3
Percent
Diagram 6.13
(seasonally adjusted quarter-to-quarter rate of change)
*
Notes : (*) Preliminary figure.
/Notes .....

222
Notes :
(1) The Consumer Price Indices (A), (B) and (C) are compiled by reference to the averageexpenditure patterns for different groups of households as enumerated from theHousehold Expenditure Survey. Then, by aggregating the expenditure patterns of allthe households covered by these three indices, a Composite CPI is compiled.
The expenditure ranges of the households covered in the 1999/2000-based CPIs areshown below:
Approximate proportion of households covered
Monthly expenditure range(at 1999/2000 prices)
(%) ($)CPI(A) 50 4,500 to 18,499CPI(B) 30 18,500 to 32,499CPI(C) 10 32,500 to 65,999
The weightings of the various components in the 1999/2000-based CPIs are as follows:Expenditurecomponent Composite CPI CPI(A) CPI(B) CPI(C)
(%) (%) (%) (%)Food 26.67 31.88 25.94 21.38
Meals boughtaway from home
16.39 17.94 17.20 13.28
Other foodstuffs 10.28 13.94 8.74 8.10Housing 29.91 29.13 29.68 31.22
Private dwellings 24.59 21.76 25.48 26.67Public dwellings 2.07 5.08 1.03 --Maintenance costs
and otherhousing charges
3.25 2.29 3.17 4.55
Electricity, gas andwater
2.98 3.99 2.81 2.02
Alcoholic drinks andtobacco
0.94 1.50 0.86 0.39
Clothing andfootwear
4.13 3.36 4.47 4.55
Durable goods 6.24 4.96 6.93 6.73Miscellaneous goods 5.70 5.25 5.58 6.43Transport 9.01 8.23 9.05 9.94Miscellaneous
services14.42 11.70 14.68 17.34
All items 100.00 100.00 100.00 100.00
(2) The Chief Executive in his 2001 Policy Address announced that a concession on ratespayable for 2002 was to be granted by a maximum of $2,000 per household. TheFinancial Secretary in his 2002/03 Budget further announced that the maximumamount of reduction in rates payable for 2002 was to be raised to $5,000. These tworounds of rates concession taken together had the effect of lowering the Composite CPIby 0.9 of a percentage point in 2002. Owing to different weightings attached to therates payment and different impacts of these two successive rounds of concessions onhouseholds in the various expenditure ranges, the dampening effects on the threesub-indices varied. Specifically, the CPI(A) was lowered by 1.2 percentage points,the CPI(B) by 0.9 of a percentage point, and the CPI(C) by 0.6 of a percentage point.
/(3) .....

223
(3) As announced by the Financial Secretary in the 2002/03 Budget, water and sewagecharges for domestic households were to be waived for one year as from April 2002,subject to maximum amounts of $800 and $200 respectively. This had the effect oflowering the Composite CPI by 0.2 of a percentage point in 2002. Reflecting relativelygreater effect on the lower income households, the corresponding dampening effectson the CPI(A), CPI(B) and CPI(C) were 0.3, 0.2 and 0.1 of a percentage point.
(4) A special one-off rebate of electricity charges, at half of the electricity consumption inMarch 2003 with a maximum of $200 per user account, was granted by a powercompany in the billing period of June-July 2003.
(5) In any particular period, only a small proportion of the tenancies of private dwellingsare new lettings for which rentals are freshly determined, and lease renewals uponwhich rentals are revised. The majority of the tenancies are existing leases withrentals fixed until their expiry. Upon aggregation, the movements in private housingcost, as indicated in the various CPIs, thus tend to be less responsive than thecorresponding movements in market rentals, as reflected in the Rating and ValuationDepartment’s rental index for private residential flats.
(6) The Producer Price Index is designed to reflect changes in the prices of goods andservices received by local producers. Producer prices refer to the transacted prices,net of any discounts or rebates allowed to the buyers. Transportation and otherincidental charges are not included.
(7) The terms of trade in goods is defined as the ratio of the prices of total exports ofgoods to the prices of imports of goods.
(8) The implicit price deflators of GDP and its main expenditure components are derivedby dividing GDP at current prices by the corresponding constant price figures. Incompiling the constant price GDP at the finer sub-component level, a standarddeflation approach is adopted whereby an appropriate price index is used to deflateeach of the sub-components of GDP at current prices. Summing up the individuallydeflated sub-components gives the main expenditure components of GDP at constantprices. These are further aggregated to arrive at the overall GDP at constant prices.Then, by dividing the current price GDP with the corresponding constant price GDP atthe overall level, the GDP deflator is implicitly obtained. Similarly, by dividing eachof the main expenditure components of GDP at current prices with each of thecorresponding measures at constant prices, the respective price deflators at the mainexpenditure component level are implicitly obtained. Hence as it stands, the implicitprice deflators of GDP and its main expenditure components are not used as input forcompiling the corresponding constant price measures. By the same token, the growthrates in real terms of GDP and its main expenditure components are not derived fromtheir corresponding growth rates in money terms using the rates of change in therespective implicit prices deflators. Rather, the growth rates in real terms arecalculated directly by comparing the constant price measures over two periods.
/The .....

224
The rate of change in the GDP deflator may differ substantially from that in theComposite CPI over the same time span. The Composite CPI covers consumer priceinflation in particular. Yet the GDP deflator is a much broader measure of inflationfor the entire economy, and takes into account all the price changes related toconsumption, investment, exports and imports. Also, as total final demand in theeconomy is equated to GDP plus imports, the rate of change in the GDP deflator maydiffer appreciably from that in the total final demand deflator, depending on themovement in the prices of imports. Likewise, as domestic demand in the economy isequated to GDP plus imports and less exports, the rate of change in the GDP deflatormay differ appreciably from that in the domestic demand deflator, depending on themovement in the prices of imports and exports.

225
STATISTICAL APPENDIX
Table Page
1. Gross Domestic Product (GDP) by expenditure component 227
2. Gross Domestic Product (GDP) by economic activity (at current prices) 228
3. Gross Domestic Product (GDP) by economic activity (at constant (2000) prices) 229
4. Gross National Product (GNP) and external factor income flows (EFIF) 230
5. Balance of payments account 231
6. Major economic indicators in the external sector for the second quarter of 2003 232 – 233
7. Major economic indicators in the domestic economy 234 – 235
8. Major economic indicators in the financial sector as at end-June 2003 236 – 237
9. Major economic indicators in the labour sector 238 – 239
10. Various price indices for the second quarter of 2003 240

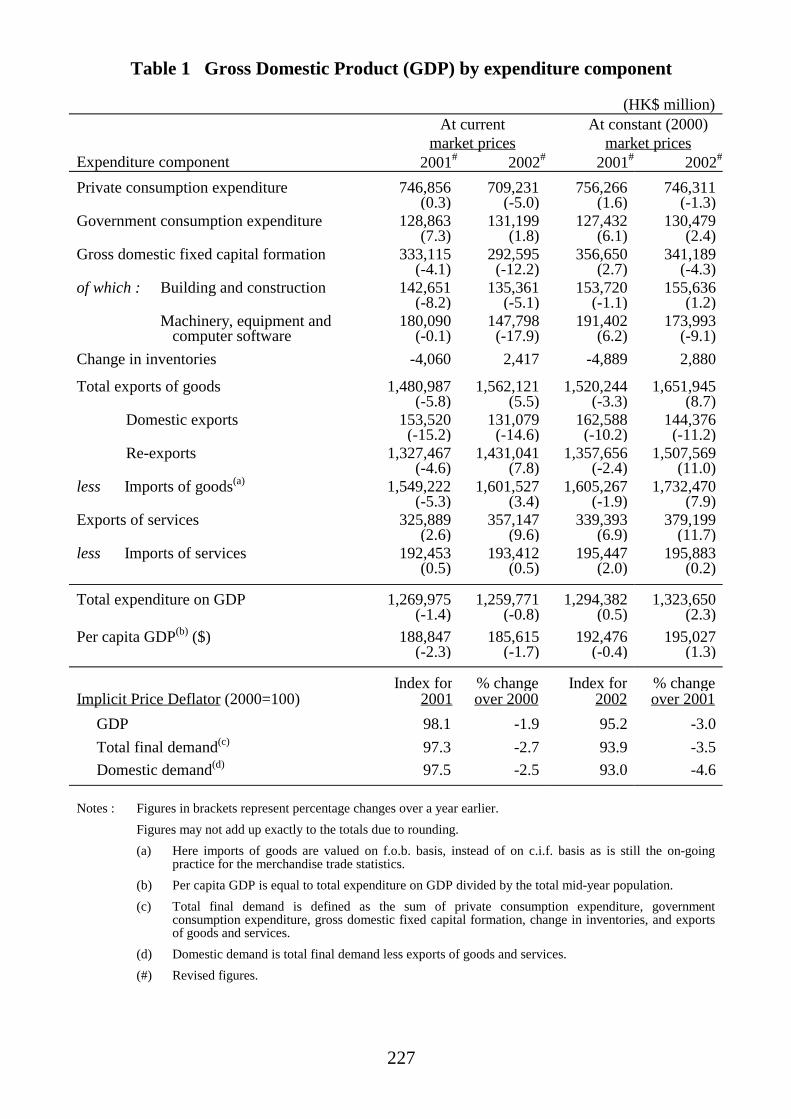
227
Table 1 Gross Domestic Product (GDP) by expenditure component
(HK$ million)At current
market pricesAt constant (2000)
market pricesExpenditure component 2001# 2002# 2001# 2002#
Private consumption expenditure 746,856 709,231 756,266 746,311(0.3) (-5.0) (1.6) (-1.3)
Government consumption expenditure 128,863 131,199 127,432 130,479(7.3) (1.8) (6.1) (2.4)
Gross domestic fixed capital formation 333,115 292,595 356,650 341,189(-4.1) (-12.2) (2.7) (-4.3)
of which : Building and construction 142,651 135,361 153,720 155,636(-8.2) (-5.1) (-1.1) (1.2)
Machinery, equipment and 180,090 147,798 191,402 173,993 computer software (-0.1) (-17.9) (6.2) (-9.1)
Change in inventories -4,060 2,417 -4,889 2,880
Total exports of goods 1,480,987 1,562,121 1,520,244 1,651,945(-5.8) (5.5) (-3.3) (8.7)
Domestic exports 153,520 131,079 162,588 144,376(-15.2) (-14.6) (-10.2) (-11.2)
Re-exports 1,327,467 1,431,041 1,357,656 1,507,569(-4.6) (7.8) (-2.4) (11.0)
less Imports of goods(a) 1,549,222 1,601,527 1,605,267 1,732,470(-5.3) (3.4) (-1.9) (7.9)
Exports of services 325,889 357,147 339,393 379,199(2.6) (9.6) (6.9) (11.7)
less Imports of services 192,453 193,412 195,447 195,883(0.5) (0.5) (2.0) (0.2)
Total expenditure on GDP 1,269,975 1,259,771 1,294,382 1,323,650(-1.4) (-0.8) (0.5) (2.3)
Per capita GDP(b) ($) 188,847 185,615 192,476 195,027(-2.3) (-1.7) (-0.4) (1.3)
Implicit Price Deflator (2000=100)Index for
2001% changeover 2000
Index for2002
% changeover 2001
GDP 98.1 -1.9 95.2 -3.0 Total final demand(c) 97.3 -2.7 93.9 -3.5 Domestic demand(d) 97.5 -2.5 93.0 -4.6
Notes : Figures in brackets represent percentage changes over a year earlier.Figures may not add up exactly to the totals due to rounding.(a) Here imports of goods are valued on f.o.b. basis, instead of on c.i.f. basis as is still the on-going
practice for the merchandise trade statistics.(b) Per capita GDP is equal to total expenditure on GDP divided by the total mid-year population.(c) Total final demand is defined as the sum of private consumption expenditure, government
consumption expenditure, gross domestic fixed capital formation, change in inventories, and exportsof goods and services.
(d) Domestic demand is total final demand less exports of goods and services.(#) Revised figures.
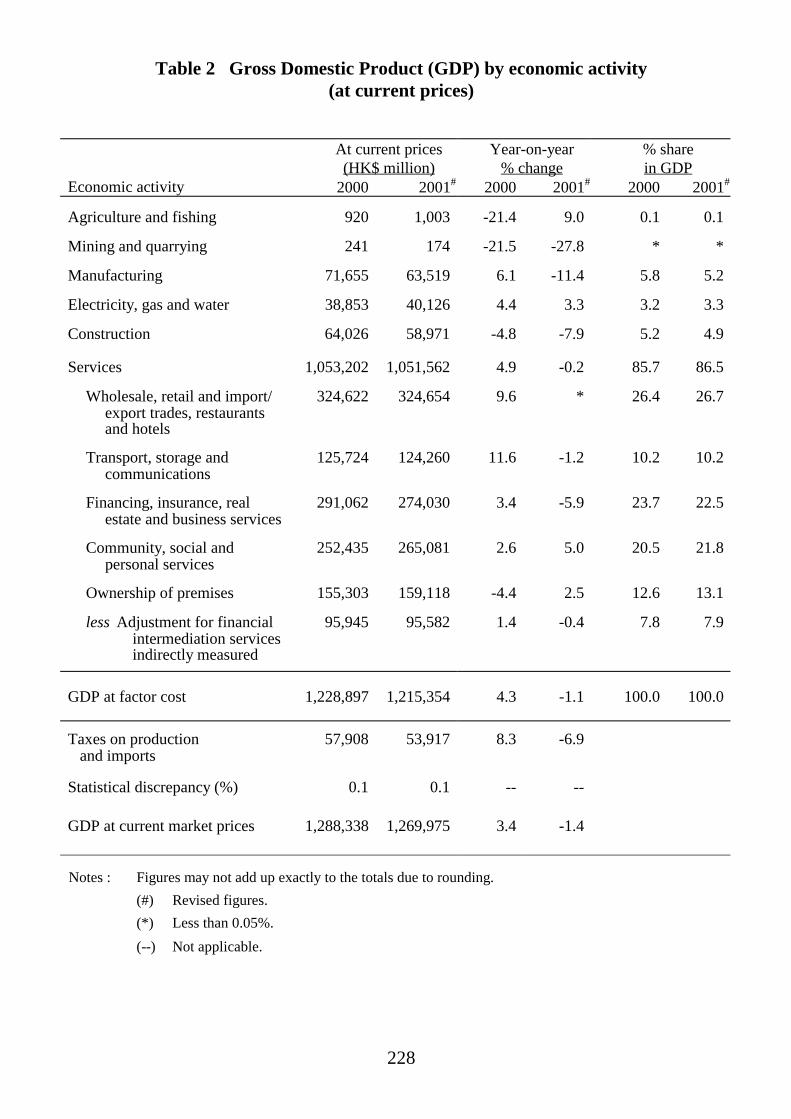
228
Table 2 Gross Domestic Product (GDP) by economic activity(at current prices)
At current prices(HK$ million)
Year-on-year% change
% sharein GDP
Economic activity 2000 2001# 2000 2001# 2000 2001#
Agriculture and fishing 920 1,003 -21.4 9.0 0.1 0.1
Mining and quarrying 241 174 -21.5 -27.8 * *
Manufacturing 71,655 63,519 6.1 -11.4 5.8 5.2
Electricity, gas and water 38,853 40,126 4.4 3.3 3.2 3.3
Construction 64,026 58,971 -4.8 -7.9 5.2 4.9
Services 1,053,202 1,051,562 4.9 -0.2 85.7 86.5
Wholesale, retail and import/export trades, restaurantsand hotels
324,622 324,654 9.6 * 26.4 26.7
Transport, storage andcommunications
125,724 124,260 11.6 -1.2 10.2 10.2
Financing, insurance, realestate and business services
291,062 274,030 3.4 -5.9 23.7 22.5
Community, social andpersonal services
252,435 265,081 2.6 5.0 20.5 21.8
Ownership of premises 155,303 159,118 -4.4 2.5 12.6 13.1
less Adjustment for financialintermediation servicesindirectly measured
95,945 95,582 1.4 -0.4 7.8 7.9
GDP at factor cost 1,228,897 1,215,354 4.3 -1.1 100.0 100.0
Taxes on productionand imports
57,908 53,917 8.3 -6.9
Statistical discrepancy (%) 0.1 0.1 -- --
GDP at current market prices 1,288,338 1,269,975 3.4 -1.4
Notes : Figures may not add up exactly to the totals due to rounding.(#) Revised figures.(*) Less than 0.05%.(--) Not applicable.

229
Table 3 Gross Domestic Product (GDP) by economic activity(at constant (2000) prices)
(HK$ million)2002# 2002# 2003#
Economic activity 1st Qtr 2nd Qtr 3rd Qtr 4th Qtr 1st Qtr
Agriculture and fishing 997 246 262 226 264 253(4.1) (3.4) (6.9) (2.7) (3.5) (2.8)
Mining and quarrying 179 40 40 38 60 43(-13.5) (-23.1) (-20.0) (-30.9) (20.0) (7.5)
Manufacturing 59,107 13,434 14,967 15,953 14,753 12,252(-9.8) (-11.6) (-11.2) (-7.3) (-9.2) (-8.8)
Electricity, gas and water 41,030 8,506 10,632 12,157 9,736 8,868(3.0) (1.2) (6.9) (2.9) (0.7) (4.3)
Construction 60,677(-1.0)
14,876(-1.7)
14,128(3.2)
15,156(2.4)
16,516(-6.4)
14,400(-3.2)
Services 1,104,002(3.1)
257,084(*)
264,713(1.5)
286,422(4.3)
295,783(6.4)
271,370(5.6)
Wholesale, retail and import/export trades, restaurantsand hotels
341,835(5.1)
73,724(-2.8)
76,012(0.5)
94,063(6.9)
98,035(14.5)
84,331(14.4)
Transport, storage andcommunications
133,498(4.0)
31,263(0.2)
31,988(3.6)
35,141(5.5)
35,106(6.2)
32,458(3.8)
Financing, insurance, realestate and business services
292,640(0.9)
70,361(-1.5)
73,282(0.9)
73,417(1.6)
75,579(2.5)
72,250(2.7)
Community, social andpersonal services
264,266(0.7)
63,886(1.0)
66,359(0.3)
65,450(1.1)
68,570(0.5)
63,648(-0.4)
Ownership of premises 164,468(2.1)
40,889(2.8)
40,228(1.4)
41,535(2.1)
41,816(1.9)
41,783(2.2)
less Adjustment for financialintermediation servicesindirectly measured
92,705(-4.1)
23,040(-5.4)
23,156(-4.3)
23,184(-4.8)
23,325(-1.6)
23,099(0.3)
Taxes on productionand imports
57,768(0.8)
15,002(-0.1)
15,403(1.2)
12,531(-0.6)
14,833(2.6)
14,833(-1.1)
Statistical discrepancy (%) * 0.1 -0.7 0.1 0.4 0.5
GDP at constant (2000) marketprices
1,323,650(2.3)
309,548(-0.6)
317,857(0.8)
342,983(3.4)
353,262(5.1)
323,628(4.5)
Notes : Figures in brackets represent percentage changes over a year earlier.Figures may not add up exactly to the totals due to rounding.(#) Revised figures.(*) Less than 0.05%.
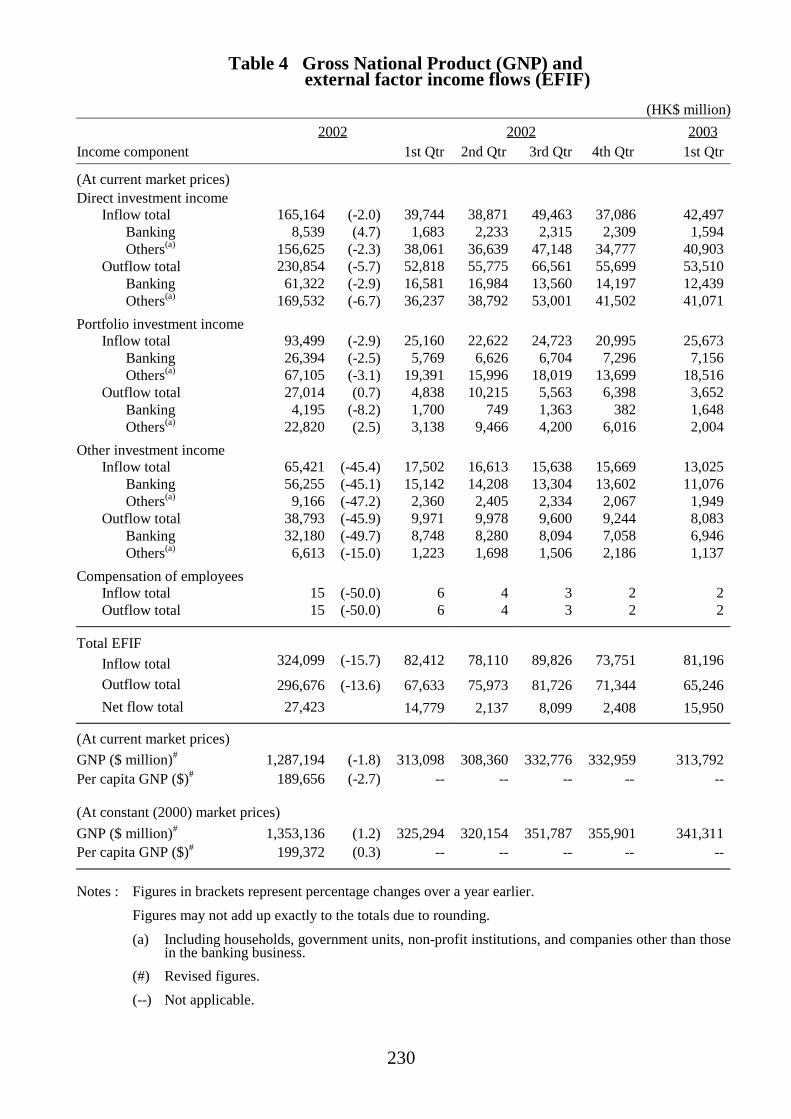
230
Table 4 Gross National Product (GNP) and external factor income flows (EFIF)
(HK$ million) 2002 2002 2003
Income component 1st Qtr 2nd Qtr 3rd Qtr 4th Qtr 1st Qtr
(At current market prices)Direct investment income
Inflow total 165,164 (-2.0) 39,744 38,871 49,463 37,086 42,497Banking 8,539 (4.7) 1,683 2,233 2,315 2,309 1,594Others(a) 156,625 (-2.3) 38,061 36,639 47,148 34,777 40,903
Outflow total 230,854 (-5.7) 52,818 55,775 66,561 55,699 53,510Banking 61,322 (-2.9) 16,581 16,984 13,560 14,197 12,439Others(a) 169,532 (-6.7) 36,237 38,792 53,001 41,502 41,071
Portfolio investment incomeInflow total 93,499 (-2.9) 25,160 22,622 24,723 20,995 25,673
Banking 26,394 (-2.5) 5,769 6,626 6,704 7,296 7,156Others(a) 67,105 (-3.1) 19,391 15,996 18,019 13,699 18,516
Outflow total 27,014 (0.7) 4,838 10,215 5,563 6,398 3,652Banking 4,195 (-8.2) 1,700 749 1,363 382 1,648Others(a) 22,820 (2.5) 3,138 9,466 4,200 6,016 2,004
Other investment incomeInflow total 65,421 (-45.4) 17,502 16,613 15,638 15,669 13,025
Banking 56,255 (-45.1) 15,142 14,208 13,304 13,602 11,076Others(a) 9,166 (-47.2) 2,360 2,405 2,334 2,067 1,949
Outflow total 38,793 (-45.9) 9,971 9,978 9,600 9,244 8,083Banking 32,180 (-49.7) 8,748 8,280 8,094 7,058 6,946Others(a) 6,613 (-15.0) 1,223 1,698 1,506 2,186 1,137
Compensation of employeesInflow total 15 (-50.0) 6 4 3 2 2Outflow total 15 (-50.0) 6 4 3 2 2
Total EFIFInflow total 324,099 (-15.7) 82,412 78,110 89,826 73,751 81,196
Outflow total 296,676 (-13.6) 67,633 75,973 81,726 71,344 65,246Net flow total 27,423 14,779 2,137 8,099 2,408 15,950
(At current market prices)GNP ($ million)# 1,287,194 (-1.8) 313,098 308,360 332,776 332,959 313,792Per capita GNP ($)# 189,656 (-2.7) -- -- -- -- --
(At constant (2000) market prices)GNP ($ million)# 1,353,136 (1.2) 325,294 320,154 351,787 355,901 341,311Per capita GNP ($)# 199,372 (0.3) -- -- -- -- --
Notes : Figures in brackets represent percentage changes over a year earlier.Figures may not add up exactly to the totals due to rounding.(a) Including households, government units, non-profit institutions, and companies other than those
in the banking business.(#) Revised figures.(--) Not applicable.

231
Table 5 Balance of payments account
(HK$ million)2002# 2002 2003
Standard components 1st Qtr# 2nd Qtr# 3rd Qtr# 4th Qtr# 1st Qtr#
Current account(1) 137,277 30,034 19,943 41,993 45,306 36,494
Trade in goods -39,406 -12,444 -16,381 -4,979 -5,603 -15,985Exports 1,562,121 326,087 373,691 435,519 426,824 383,436Imports -1,601,527 -338,531 -390,072 -440,498 -432,427 -399,421
Trade in services 163,735 31,160 37,805 42,695 52,075 40,660Exports 357,147 78,241 83,343 94,798 100,765 87,441Imports -193,412 -47,081 -45,538 -52,103 -48,690 -46,781
External factor income flows 27,423 14,779 2,137 8,099 2,408 15,950Inflow 324,099 82,412 78,110 89,826 73,751 81,196Outflow -296,676 -67,633 -75,973 -81,726 -71,344 -65,246
Current transfers -14,475 -3,461 -3,618 -3,822 -3,573 -4,131Inflow 5,357 1,076 2,174 1,031 1,076 1,199Outflow -19,831 -4,537 -5,792 -4,853 -4,649 -5,330
Capital and financial account(1) -191,417 -46,809 -30,363 -57,056 -57,189 -38,356
Capital transfers -15,725 -2,998 -7,586 -1,912 -3,229 -1,948
Direct investment -31,007 -10,139 15,254 -32,735 -3,387 3,016Abroad -137,993 -40,923 -29,503 -62,429 -5,138 -36,046In HK 106,986 30,784 44,757 29,694 1,751 39,062
Portfolio investment -290,749 7,056 -117,765 -82,478 -97,561 -54,803Assets -283,684 -13,435 -126,842 -60,200 -83,208 -59,387Liabilities -7,065 20,491 9,076 -22,279 -14,353 4,584
Financial derivatives 10,616 12,316 6,054 -5,706 -2,048 12,122Assets 107,530 42,239 23,266 15,343 26,683 62,992Liabilities -96,914 -29,923 -17,212 -21,049 -28,731 -50,871
Other investment 116,906 -49,183 70,560 58,075 37,454 13,649Assets 324,054 96,784 50,015 126,936 50,318 58,386Liabilities -207,147 -145,967 20,545 -68,862 -12,863 -44,738
Net change in reserve assets(2) 18,541 -3,861 3,120 7,700 11,582 -10,392
Net errors and omissions 54,140 16,775 10,420 15,063 11,883 1,862
Overall balance of payments
-18,541(in deficit)
3,861(in surplus)
-3,120(in deficit)
-7,700(in deficit)
-11,582(in deficit)
10,392(in surplus)
Notes : Figures may not add up exactly to the totals due to rounding.
(1) In accordance with the balance of payments accounting rules, a positive value for the balance figure in thecurrent account represents a surplus whereas a negative value represents a deficit. In the capital andfinancial account, a positive value for the balance figure indicates a net inflow and a negative valueindicates a net outflow. As increases in external assets are debit entries and decreases are credit entries, anegative value for net change in reserve assets represents a net increase and a positive value represents anet decrease.
(2) The estimates on net change in reserve assets under the balance of payments framework are transactionfigures. Effects from valuation changes (including price changes and exchange rate changes) andreclassifications are excluded.
(#) Revised figures.
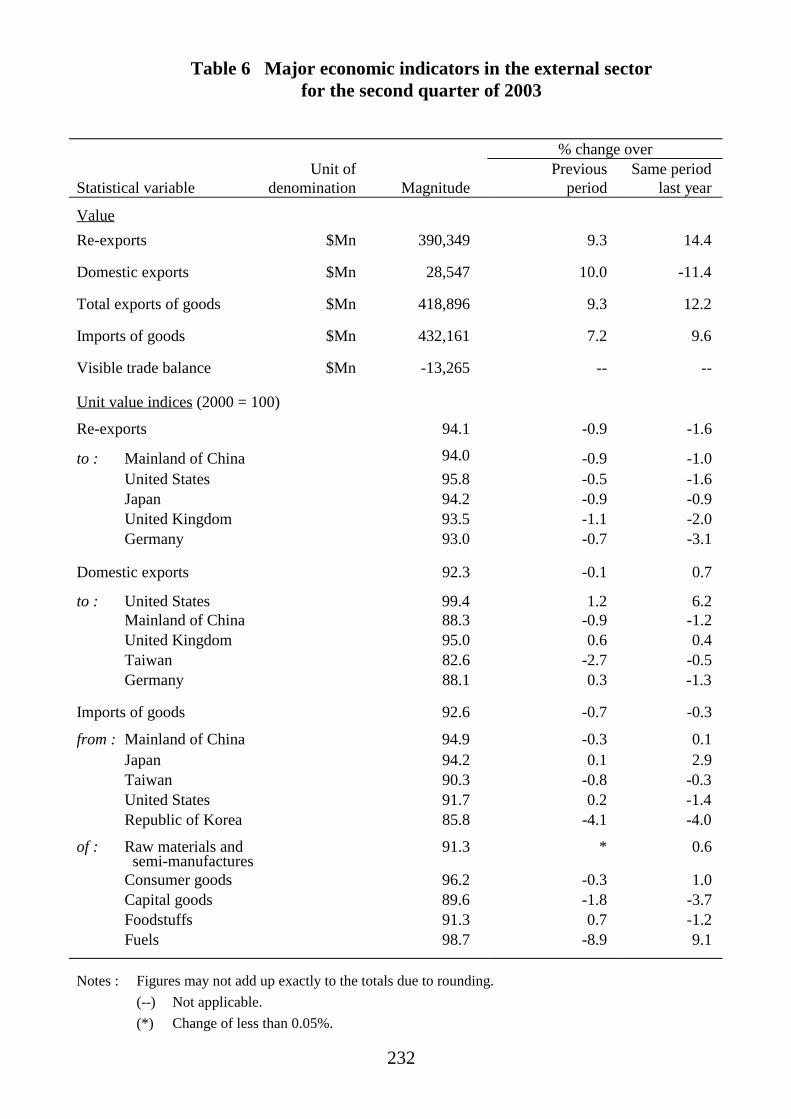
232
Table 6 Major economic indicators in the external sectorfor the second quarter of 2003
% change over
Statistical variableUnit of
denomination MagnitudePrevious
periodSame period
last year
ValueRe-exports $Mn 390,349 9.3 14.4
Domestic exports $Mn 28,547 10.0 -11.4
Total exports of goods $Mn 418,896 9.3 12.2
Imports of goods $Mn 432,161 7.2 9.6
Visible trade balance $Mn -13,265 -- --
Unit value indices (2000 = 100)
Re-exports 94.1 -0.9 -1.6
to : Mainland of China 94.0 -0.9 -1.0United States 95.8 -0.5 -1.6Japan 94.2 -0.9 -0.9United Kingdom 93.5 -1.1 -2.0Germany 93.0 -0.7 -3.1
Domestic exports 92.3 -0.1 0.7
to : United States 99.4 1.2 6.2Mainland of China 88.3 -0.9 -1.2United Kingdom 95.0 0.6 0.4Taiwan 82.6 -2.7 -0.5Germany 88.1 0.3 -1.3
Imports of goods 92.6 -0.7 -0.3
from : Mainland of China 94.9 -0.3 0.1Japan 94.2 0.1 2.9Taiwan 90.3 -0.8 -0.3United States 91.7 0.2 -1.4Republic of Korea 85.8 -4.1 -4.0
of : Raw materials and semi-manufactures
91.3 * 0.6
Consumer goods 96.2 -0.3 1.0Capital goods 89.6 -1.8 -3.7Foodstuffs 91.3 0.7 -1.2Fuels 98.7 -8.9 9.1
Notes : Figures may not add up exactly to the totals due to rounding.(--) Not applicable.(*) Change of less than 0.05%.

233
Table 6 Major economic indicators in the external sectorfor the second quarter of 2003 (cont’d)
% change over
Statistical variable MagnitudePrevious
periodSame period
last year
Terms of trade index (2000 = 100) 101.3 -0.1 -1.1
Quantum indices (2000 = 100)
Re-exports 120.6 10.5 17.0
to : Mainland of China 152.1 14.0 25.5United States 91.6 13.2 -1.2Japan 109.4 -1.6 19.2United Kingdom 93.8 14.9 8.8Germany 99.4 -0.5 26.9
Domestic exports 69.3 10.3 -12.6
to : United States 63.1 9.1 -20.3Mainland of China 76.9 18.0 -14.6United Kingdom 71.1 11.3 9.2Taiwan 57.4 -12.2 -36.9Germany 56.0 3.4 16.5
of : Textiles and clothing 77.9 14.7 -11.1Products other than textiles and clothing
61.5 5.7 -14.3
Imports of goods 114.1 8.2 10.6
from : Mainland of China 112.4 12.7 10.3Japan 109.0 4.4 10.8Taiwan 108.4 9.6 4.3United States 93.2 6.7 6.0Republic of Korea 122.8 14.2 17.5
of : Raw materials and semi-manufactures
122.7 11.3 13.5
Consumer goods 100.8 6.2 3.8Capital goods 125.6 10.2 19.1Foodstuffs 88.5 -13.4 -7.4Fuels 91.5 -5.2 -11.5
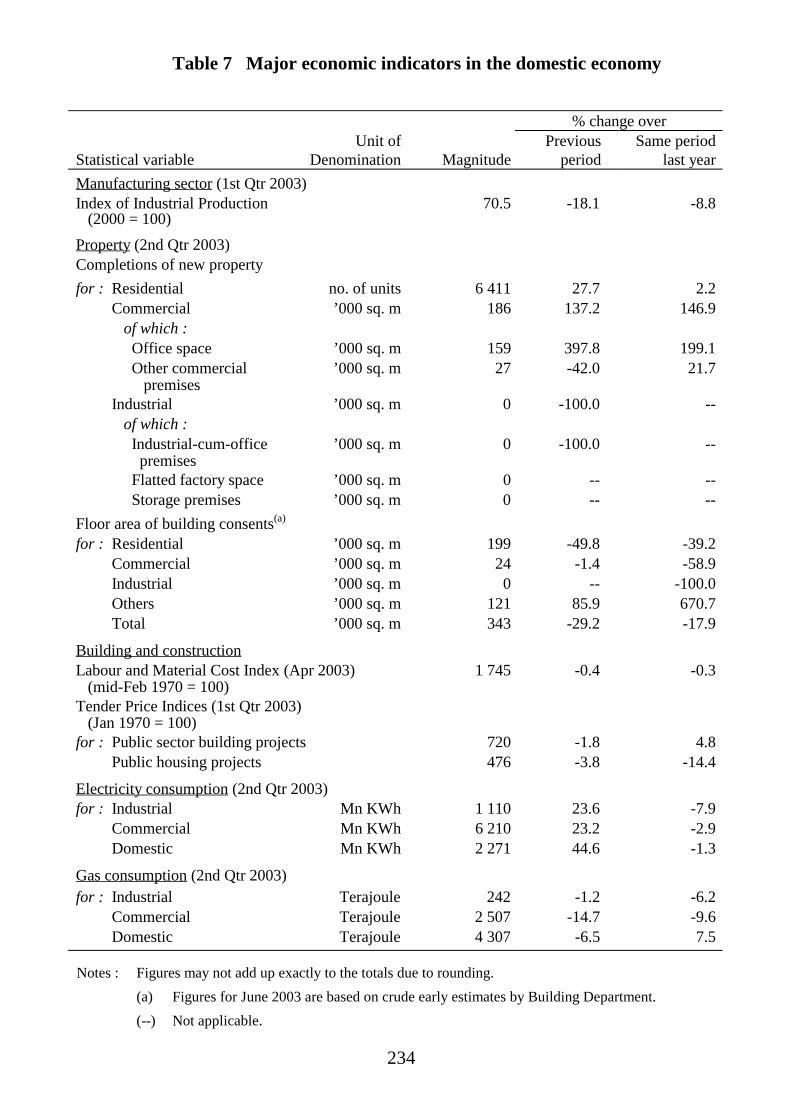
234
Table 7 Major economic indicators in the domestic economy
% change over
Statistical variableUnit of
Denomination MagnitudePrevious
periodSame period
last yearManufacturing sector (1st Qtr 2003)Index of Industrial Production
(2000 = 100)70.5 -18.1 -8.8
Property (2nd Qtr 2003)Completions of new propertyfor : Residential no. of units 6 411 27.7 2.2
Commercial ’000 sq. m 186 137.2 146.9of which : Office space ’000 sq. m 159 397.8 199.1 Other commercial premises
’000 sq. m 27 -42.0 21.7
Industrial ’000 sq. m 0 -100.0 --of which : Industrial-cum-office premises
’000 sq. m 0 -100.0 --
Flatted factory space ’000 sq. m 0 -- -- Storage premises ’000 sq. m 0 -- --
Floor area of building consents(a)
for : Residential ’000 sq. m 199 -49.8 -39.2Commercial ’000 sq. m 24 -1.4 -58.9Industrial ’000 sq. m 0 -- -100.0Others ’000 sq. m 121 85.9 670.7Total ’000 sq. m 343 -29.2 -17.9
Building and constructionLabour and Material Cost Index (Apr 2003)
(mid-Feb 1970 = 100)1 745 -0.4 -0.3
Tender Price Indices (1st Qtr 2003)(Jan 1970 = 100)
for : Public sector building projects 720 -1.8 4.8Public housing projects 476 -3.8 -14.4
Electricity consumption (2nd Qtr 2003)for : Industrial Mn KWh 1 110 23.6 -7.9
Commercial Mn KWh 6 210 23.2 -2.9Domestic Mn KWh 2 271 44.6 -1.3
Gas consumption (2nd Qtr 2003)for : Industrial Terajoule 242 -1.2 -6.2
Commercial Terajoule 2 507 -14.7 -9.6Domestic Terajoule 4 307 -6.5 7.5
Notes : Figures may not add up exactly to the totals due to rounding.(a) Figures for June 2003 are based on crude early estimates by Building Department.(--) Not applicable.
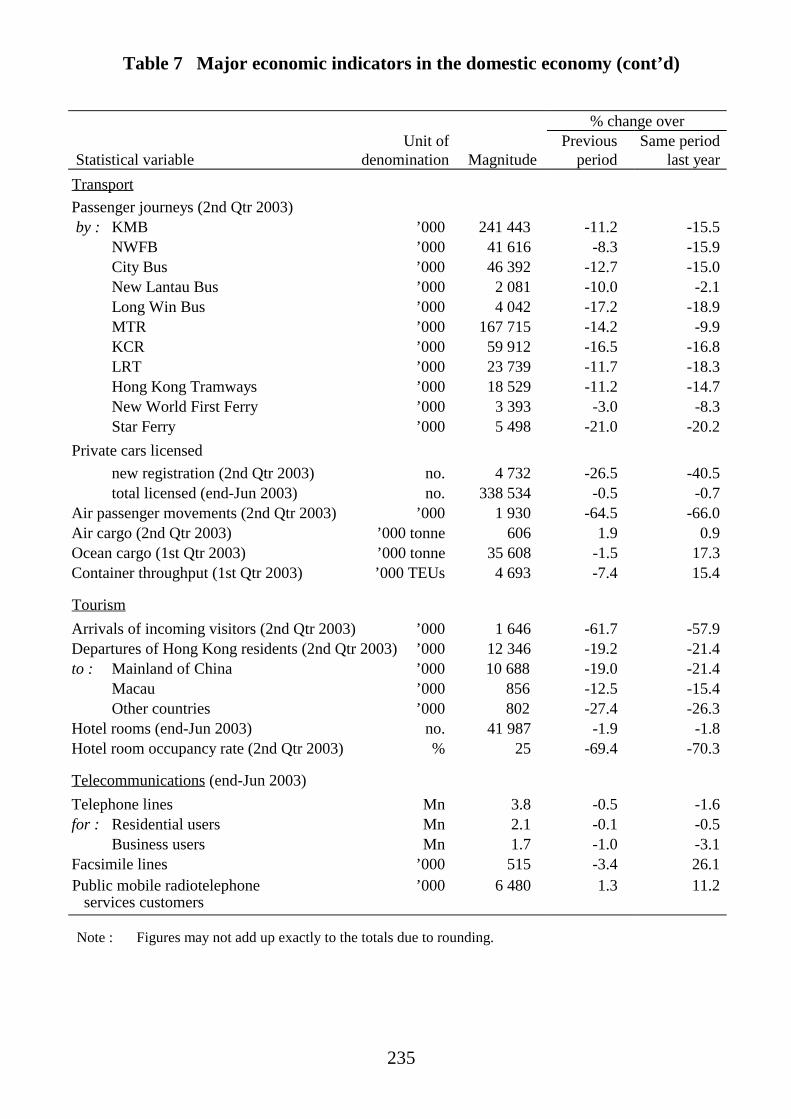
235
Table 7 Major economic indicators in the domestic economy (cont’d)
% change over
Statistical variableUnit of
denomination MagnitudePrevious
periodSame period
last yearTransportPassenger journeys (2nd Qtr 2003)by : KMB ’000 241 443 -11.2 -15.5
NWFB ’000 41 616 -8.3 -15.9City Bus ’000 46 392 -12.7 -15.0New Lantau Bus ’000 2 081 -10.0 -2.1Long Win Bus ’000 4 042 -17.2 -18.9MTR ’000 167 715 -14.2 -9.9KCR ’000 59 912 -16.5 -16.8LRT ’000 23 739 -11.7 -18.3Hong Kong Tramways ’000 18 529 -11.2 -14.7New World First Ferry ’000 3 393 -3.0 -8.3Star Ferry ’000 5 498 -21.0 -20.2
Private cars licensed new registration (2nd Qtr 2003) no. 4 732 -26.5 -40.5 total licensed (end-Jun 2003) no. 338 534 -0.5 -0.7
Air passenger movements (2nd Qtr 2003) ’000 1 930 -64.5 -66.0Air cargo (2nd Qtr 2003) ’000 tonne 606 1.9 0.9Ocean cargo (1st Qtr 2003) ’000 tonne 35 608 -1.5 17.3Container throughput (1st Qtr 2003) ’000 TEUs 4 693 -7.4 15.4
TourismArrivals of incoming visitors (2nd Qtr 2003) ’000 1 646 -61.7 -57.9Departures of Hong Kong residents (2nd Qtr 2003) ’000 12 346 -19.2 -21.4to : Mainland of China ’000 10 688 -19.0 -21.4
Macau ’000 856 -12.5 -15.4Other countries ’000 802 -27.4 -26.3
Hotel rooms (end-Jun 2003) no. 41 987 -1.9 -1.8Hotel room occupancy rate (2nd Qtr 2003) % 25 -69.4 -70.3
Telecommunications (end-Jun 2003)Telephone lines Mn 3.8 -0.5 -1.6for : Residential users Mn 2.1 -0.1 -0.5
Business users Mn 1.7 -1.0 -3.1Facsimile lines ’000 515 -3.4 26.1Public mobile radiotelephone services customers
’000 6 480 1.3 11.2
Note : Figures may not add up exactly to the totals due to rounding.
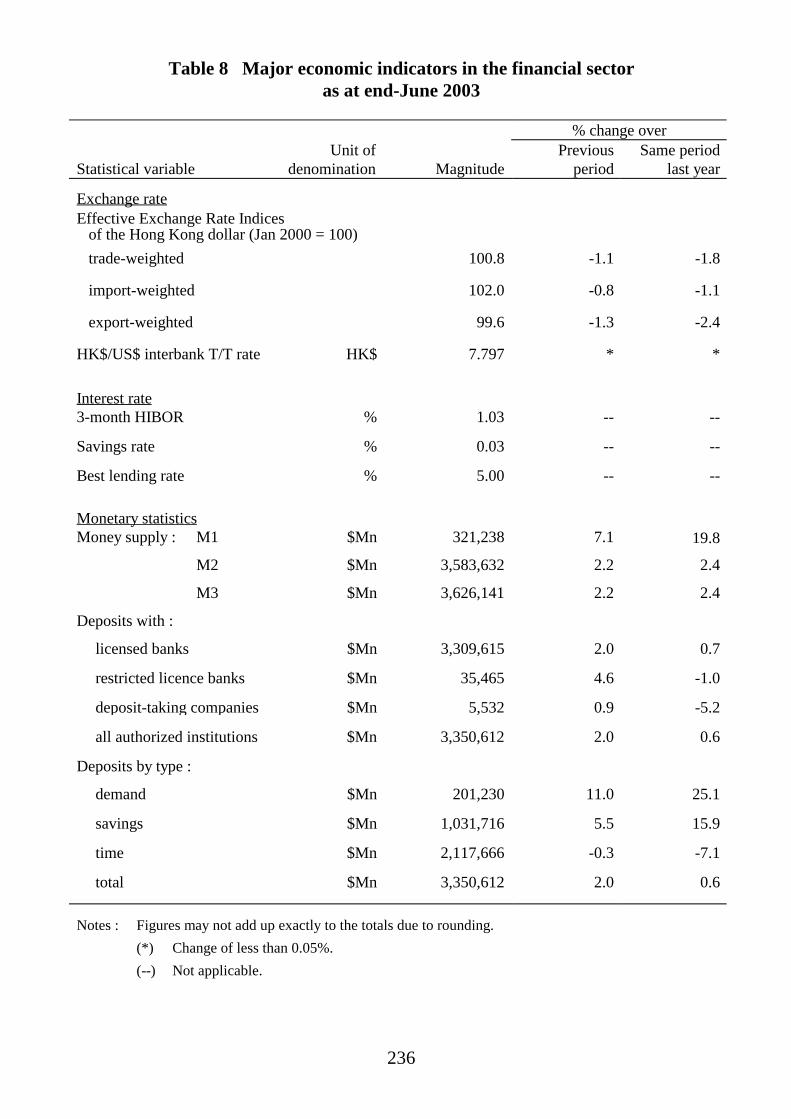
236
Table 8 Major economic indicators in the financial sectoras at end-June 2003
% change over
Statistical variableUnit of
denomination MagnitudePrevious
periodSame period
last year
Exchange rateEffective Exchange Rate Indices of the Hong Kong dollar (Jan 2000 = 100) trade-weighted 100.8 -1.1 -1.8
import-weighted 102.0 -0.8 -1.1
export-weighted 99.6 -1.3 -2.4
HK$/US$ interbank T/T rate HK$ 7.797 * *
Interest rate3-month HIBOR % 1.03 -- --
Savings rate % 0.03 -- --
Best lending rate % 5.00 -- --
Monetary statisticsMoney supply : M1 $Mn 321,238 7.1 19.8
M2 $Mn 3,583,632 2.2 2.4
M3 $Mn 3,626,141 2.2 2.4
Deposits with :
licensed banks $Mn 3,309,615 2.0 0.7
restricted licence banks
$Mn 35,465 4.6 -1.0
deposit-taking companies $Mn 5,532 0.9 -5.2
all authorized institutions $Mn 3,350,612 2.0 0.6
Deposits by type :
demand $Mn 201,230 11.0 25.1
savings $Mn 1,031,716 5.5 15.9
time $Mn 2,117,666 -0.3 -7.1
total $Mn 3,350,612 2.0 0.6
Notes : Figures may not add up exactly to the totals due to rounding.(*) Change of less than 0.05%.(--) Not applicable.

237
Table 8 Major economic indicators in the financial sectoras at end-June 2003 (cont’d)
% change over
Statistical variableUnit of
denomination MagnitudePrevious
periodSame period
last yearLoans and advances by :
licensed banks $Mn 1,924,360 * -3.6
restricted licence banks $Mn 103,096 -5.1 -13.8
deposit-taking companies $Mn 25,738 -4.4 -15.6
all authorized institutions $Mn 2,053,194 -0.3 -4.3
Loans and advances by all authorized institutions :
to finance imports to, exports and re-exports from Hong Kong
$Mn 88,263 5.6 5.4
to finance merchandising trade not touching Hong Kong
$Mn 10,366 11.6 17.1
other loans for use in Hong Kong
$Mn 1,720,717 -0.7 -3.3
other loans for use outside Hong Kong
$Mn 217,487 -0.8 -18.0
other loans where the place of use is not known
$Mn 16,361 9.5 73.0
Stock marketHang Seng Index (31 Jul 1964 = 100) 9 577 10.9 -9.6
Stock market capitalisation
Main Board $Mn 3,907,287 15.7 3.0
Growth Enterprise Market $Mn 60,965 18.7 0.7
Total $Mn 3,968,252 15.7 3.0
Stock market turnover (2nd Qtr 2003)
Main Board $Mn 476,632 30.6 0.1
Growth Enterprise Market $Mn 7,638 59.6 -42.1
Total $Mn 484,270 31.0 -1.1
Notes : Figures may not add up exactly to the totals due to rounding.(*) Change of less than 0.05%.

238
Table 9 Major economic indicators in the labour sector
% change over
Statistical variableUnit of
denomination MagnitudePrevious
periodSame period
last year
Labour force characteristics (2nd Qtr 2003)Labour force ’000 3 519 0.5 1.5Unemployed ’000 300 15.5 13.9Underemployed ’000 151 50.0 50.1Employed ’000 3 219 -0.7 0.5Labour force participation rate % 61.5 -- --Seasonally adjusted
unemployment rate% 8.6 -- --
Underemployment rate % 4.3 -- --
Employment (Mar 2003)Manufacturing ’000 179 -3.0 -9.4Services ’000 1 965 -1.9 -1.4of which :
Wholesale, retail andimport/export trades
’000 774 -0.4 -1.1
Restaurants and hotels ’000 198 -4.0 -7.2Transport, storage and
communications’000 172 -1.8 -4.9
Financing, insurance, realestate and business services
’000 423 -4.3 -0.2
Community, social andpersonal services
’000 398 -1.1 1.5
Building and construction sites ’000 67 0.4 -13.3Civil service ’000 169 -0.3 -2.3
Vacancies (Mar 2003)Manufacturing ’000 1 20.1 -23.5Services ’000 15 -3.1 -23.0of which :
Wholesale, retail andimport/export trades
’000 5 10.7 -18.0
Restaurants and hotels ’000 1 -23.1 -47.0Transport, storage and
communications’000 1 -1.3 -20.3
Financing, insurance, realestate and business services
’000 4 -8.1 -22.1
Community, social andpersonal services
’000 3 -10.2 -23.8
Building and construction sites ’000 # -7.1 -81.7Civil Service ’000 2 -5.5 -3.8
Notes : Figures may not add up exactly to the totals due to rounding.(--) Not applicable.(#) Less than 500.

239
Table 9 Major economic indicators in the labour sector (cont’d)
% change over
Statistical variable MagnitudePrevious
periodSame period
last year
Earnings (1st Qtr 2003)Nominal index of payroll per person 100.2 6.5 -2.0 engaged (Q1 1999 = 100) (7.0) (*)for : Manufacturing 97.5 8.0 -5.1
(8.5) (-3.2)Services 99.3 6.6 -2.1
(7.0) (-0.1)of which :
Wholesale, retail and 101.5 14.4 -1.3import/export trades (14.9) (0.7)
Restaurants and hotels 85.0 5.6 -6.6(6.0) (-4.7)
Transport, storage and 99.1 -2.2 -0.3communications (-1.8) (1.7)
Financing, insurance, real 97.7 5.0 -2.7 estate and business services (5.5) (-0.7)Community, social and 95.7 0.7 -4.2 personal services (1.2) (-2.2)
Wages (Mar 2003)Nominal wage index (Sep 1992 = 100) 148.0 -0.9 -1.5
(-1.2) (0.3)for : Manufacturing 143.2 -2.2 -2.6
(-2.5) (-0.7)Servicesof which :
Wholesale, retail and 158.1 -0.5 -1.2 import/export trades (-0.8) (0.7)Restaurants and hotels 131.7 -1.4 -3.2
(-1.7) (-1.4)Transport services 149.0 -1.1 -1.4
(-1.4) (0.4)Financing, insurance, real 154.7 -0.2 0.3 estate and business services (-0.6) (2.2)Personal services 150.1 -0.7 -3.4
(-1.0) (-1.6)
Nominal index of construction 3 548.9 -1.1 -1.8 wage rate (Jan 1970 = 100) (May 2003) (-0.1) (0.7)
Notes : Figures in brackets represent percentage changes in real terms.(*) Change of less than 0.05%.

240
Table 10 Various price indices for the second quarter of 2003
% change over
Statistical variable MagnitudePrevious
periodSame period
last year
Consumer Price Indices(Oct 1999 - Sep 2000 = 100)
Composite CPI 92.8 -1.1# -2.5
CPI(A) 93.3 -0.5# -1.8
CPI(B) 92.5 -1.1# -2.6
CPI(C) 92.7 -1.8# -2.9
Property Price Indices (1999 = 100)
Residential flats 58.7 -6.1 -18.7
Office space 57.5 -7.3 -16.4
Shopping space 79.1 -1.2 -8.7
Conventional flattedfactory space
69.3 -4.3 -9.9
GDP deflator+ (2000 = 100) 91.0 -1.7# -5.5
Notes : (+) Preliminary figures.
(#) Seasonally adjusted series.