HALF YEAR REPORT - Interloop
40
HALF YEAR REPORT for the period ended December 31, 2021
-
Upload
khangminh22 -
Category
Documents
-
view
0 -
download
0
Transcript of HALF YEAR REPORT - Interloop

HALF YEAR REPORTfor the period ended December 31, 2021

MISSIONTo be an agent of positive change for the stakeholders and community by pursuing an ethical and sustainable business

Half Year Report 01
CONTENTS
Company Information 02Directors’ Review 04
11Independent Auditor’s Review Report 12Condensed Interim Financial StatementsCondensed Interim Statement of Financial Position 14Condensed Interim Statement of Profit or Loss 16Condensed Interim Statement of Comprehensive Income 17Condensed Interim Statement of Changes in Equity 18Condensed Interim Statement of Cash Flows 19Notes to the Condensed Interim Financial Statements 21

02
COMPANY INFORMATION
BOARD OF DIRECTORSMusadaq Zulqarnain Chairman / Non-Executive Director
Navid Fazil Chief Executive Officer / Executive Director Muhammad Maqsood Executive Director / Group CFO Jahan Zeb Khan Banth Non-Executive Director Shereen Aftab Non-Executive Director
Saeed Ahmad Jabal Independent Director
Tariq Iqbal Khan Independent Director
CHIEF FINANCIAL OFFICER Muhammad Maqsood
COMPANY SECRETARY Rana Ali Raza
HEAD OF INTERNAL AUDIT Jamshaid Iqbal
CHIEF INFORMATION OFFICER Yaqub Ahsan
LEGAL ADVISOR HaidermotaBNR & Co.
AUDITORSKreston Hyder Bhimji & Co.Chartered Accountants
AUDIT COMMITTEETariq Iqbal KhanChairman
Saeed Ahmad JabalMember
Jahan Zeb Khan BanthMember
HUMAN RESOURCE & REMUNERATION COMMITTEESaeed Ahmad Jabal Chairman
Navid Fazil Member
Jahan Zeb Khan Banth Member
NOMINATION COMMITTEEMusadaq Zulqarnain Chairman
Navid Fazil Member
Muhammad Maqsood Member
RISK MANAGEMENT COMMITTEETariq Iqbal KhanChairman
Muhammad MaqsoodMember
Yaqub AhsanMember
Syed Hamza GillaniMember
Ahsan Pervaiz SheikhMember

Half Year Report 03
SHARE REGISTRARCDC Share Registrar ServicesLimited
Karachi Office:Share Registrar DepartmentCDC House, 99-B, Block B,S.H.C.H.S, Main Shahra-e-Faisal,Karachi – 74400Tel: (92-21) 111-111-500Fax: (92-21) 34326031
Lahore Office:Mezzanine Floor,South Tower, LSE Plaza,19-Khayaban-e-Aiwan-e-Iqbal, Lahore.Tel: (042) – 36362061-66
BANKERS• Allied Bank Limited • Askari Bank Limited • Bank Alfalah Limited • Faysal Bank Limited • Habib Bank Limited • Habib Metropolitan Bank Limited • MCB Bank Limited • MCB Islamic Bank Limited • Meezan Bank Limited • National Bank of Pakistan • Standard Chartered Bank Pak Limited • Summit Bank Limited • The Bank of Punjab • United Bank Limited
REGISTERED OFFICEInterloop LimitedAl – Sadiq Plaza, P – 157,Railway Road, Faisalabad, PakistanPhone: +92 – 41 – 2619724Fax: +92 – 41 – 2639400Email: [email protected]: www. interloop-pk.com
HEAD OFFICEInterloop Limited1 KM, Khurrianwala-Jaranwala Road,Khurrianwala,Faisalabad, PakistanPhone: +92 – 41 – 4360400Fax: +92 – 41 – 2428704
PLANT SITEPlant 1:1 KM Khurrianwala-Jaranwala Road, Khurrianwala,Faisalabad, Pakistan. Plant 2 & 4:7 KM Khurrianwala-Jaranwala Road, Khurrianwala,Faisalabad, Pakistan. Plant 3:8 KM, Manga-Raiwind Road, Distt. Kasur, Lahore, Pakistan.
Plant 5:6 KM, By Pass Road, Khurrianwala, Faisalabad, Pakistan
Denim Plant: 8 KM, Manga-Raiwind Road,Lahore, Pakistan.

04
The Board of Directors is pleased to present un-audited financial results of the Company duly reviewed by the statutory auditors, for the half year ended December 31, 2021.
ECONOMIC OVERVIEWPakistan’s current economic challenges are enormous but they are not insurmountable. World Bank report forecasted that Pakistan’s economy would grow by 3.4% in the current fiscal year (FY) 2021-22 despite the fact that Omicron-related economic disruptions could substantially reduce growth, globally. During first half (July – December 2021) of the current FY, Country’s exports increased by 25% to $15.125 billion, compared to $12.110 billion during the same period last year (July-December 2020). The current account deficit has already reached to 5.3% of the GDP and the Country’s total external debt and liabilities have escalated to 93.7% of the GDP, according to the State Bank of Pakistan (SBP). Similarly, trade deficit has touched $25 billion in 1HFY22, compared to $12.363 billion in the corresponding period last year. The Country is struggling with accelerating inflation and a weakening currency. The inflation settled at an average of 9.8% YoY in 1HFY22.
INDUSTRY OVERVIEWThe textile industry is at the heart of Country’s export-led growth strategy and the government has targeted an ambitious growth of 4.8% in the ongoing fiscal year. During July-December FY2021-22, textile exports surged by 26% YoY, fetching $9.39 billion in total exports, compared to $7.44 billion in the same period last year. The textile commodities that contributed in trade growth included cotton yarn whose export increased by 52.33%, from $400.733 million last year to $610.427 million during the current year.
On the other hand, Pakistan’s natural gas shortage is hurting its crucial textile exports which are playing a major role of estimated 60% of the total exports of the Country. Despite government efforts in restoring gas supplies to the textiles sector, frequent power blackouts are still curbing operations across the Country and if this situation persists, manufacturing units will only be able to run at about 80% capacity. However, your Company is also utilizing the most economical energy resource mix for generating energy at our power plants.
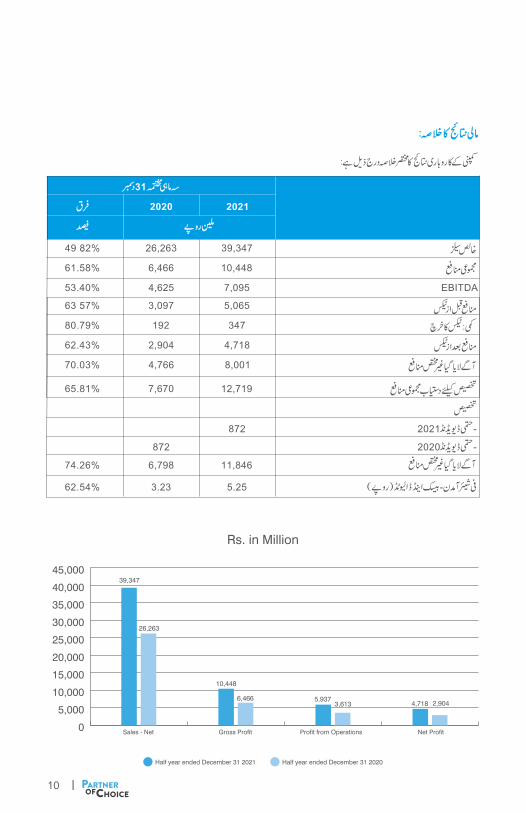
FINANCIAL AND OPERATING RESULTSDespite the challenging economic conditions, your Company has performed well and maintained the significant profitability ratios during the period under review (July – December 2021). During the half year ended December 31, 2021, the net sales increased by Rs. Rs. 13,084 million and reach to Rs. 39,347 million, i.e. 49.82% in comparison with the corresponding period last year. The gross profit stood at 26.55%, compared to 24.62% as on December 31, 2020. The profit after tax has also increased by Rs. 1,813 million (EPS: Rs. 5.25 per share), an increase of 62.43%, compared to corresponding period last year. The sales volume in the current period increased notably, owing partially to the spill over from last year, and also as the Company managed to tap fresh opportunities.
DIRECTORS’ REVIEW

Half Year Report 05
0
5,000
10,000
15,000
20,000
25,000
30,000
35,000
40,000
45,00039,347
Rs. in Million
Sales - Net
Half year ended December 31 2021 Half year ended December 31 2020
Gross Profit Profit from Operations Net Profit
26,263
10,448
6,466 5,9373,613 4,718 2,904
SUMMARIZED FINANCIAL RESULTSThe operating results of the Company are summarized as follows:
Half year ended December 31,
2021 2020 Variance
Rs. in millions %
Sales – Net 39,347 26,263 49.82%
Gross Profit 10,448 6,466 61.58%
EBITDA 7,095 4,625 53.40%
Profit before Tax 5,065 3,097 63.57%
Less : Tax Expense 347 192 80.79%
Profit after Tax 4,718 2,904 62.43%
Unappropriated profit brought forward 8,001 4,766 70.03%
Accumulated Profit available for Appropriations 12,719 7,670 65.81%
Appropriations
- Final dividend 2021 872
- Final dividend 2020 872
Unappropriated profit carried forward 11,846 6,798 74.26%
Earnings per share – Basic & Diluted (Rs.) 5.25 3.23 62.54%

06
The Company had booked provision of DDT in the first quarter of the current fiscal year. Since the previous Textile Policy was valid up to June 30, 2021 and the Government has not issued the new Textile Policy yet, the Company has not made any provision for DDT during the second quarter, and also reversed the provision made in the first quarter of the current fiscal year.
EARNINGS PER SHAREThe Basic and Diluted earning per share after tax is Rs. 5.25 (HY 2020: Rs. 3.23).
SEGMENTAL REVIEW OF BUSINESSEach reportable segment contributed towards the better operating results of the Company. Reportable segments are defined based on the criteria prescribed under the International Financial Reporting Standards and includes Hosiery, Spinning, Denim, Apparel and Others. The details of operating results of each reportable segment can be found in Note 15 of the half yearly financial statements.
FUTURE OUTLOOK With the Grace of Almighty Allah, Plant V is fully operational now with all infrastructure and building work completed and all 1,200 machines successfully installed. Through the expansion of knitting segment with Plant V, the performance will significantly improve in the upcoming period.
The management of the Company has always made strong efforts to improve cost effectiveness through optimizing capacity utilization, cost rationalization, effective procurement strategy, etc. Accordingly, the Company is following its footprints to ensure that maximum profit can be generated for the well-being of the Company’s shareholders.
Our commitment to sustainability is deeply rooted in our mission, and our operations are monitored keenly for improvements for reaching Net-Zero carbon emissions by 2050. We are stepping forward with initiatives like paperless environment, air quality monitoring systems, renewable energy, and other energy-efficient technologies to reduce our carbon footprint.

Half Year Report 07
We have joined United Nations Global Compact (UNGC) as participant, signed UN Fashion Industry Charter for Climate Change and have committed to set Science-based targets, aligning ourselves with limiting global temperature rise to1.5°C above the pre-industrial level. We have also been a part of the UN Climate Change Conference (COP26) on Race to Zero.
ACKNOWLEDGEMENTThe Board would like to express its gratitude to all valued customers, financial institutions and shareholders for the cooperation extended by them during the course of business activities and look forward to their continued support. The Directors also wish to place on record their appreciation for the hard work and dedication of the staff members and workers of the Company.
For and on behalf of the Board of Directors
Navid Fazil Jahan Zeb Khan Banth (Chief Executive Officer) (Director)
Place: FaisalabadDate: January 26, 2022
Furthermore, as the new wave of Covid-19 (Omicron) is spreading widely and positivity rate has also suddenly jumped high during December-21, accordingly, your Company has immediately arranged for in-house booster dose administration to all its employees, to augment health and safety for them and the people around.

08

Half Year Report 09
10
0
5,000
10,000
15,000
20,000
25,000
30,000
35,000
40,000
45,00039,347
Rs. in Million
Sales - Net
Half year ended December 31 2021 Half year ended December 31 2020
Gross Profit Profit from Operations Net Profit
26,263
10,448
6,466 5,9373,613 4,718 2,904

Half Year Report 11

12
Introduction
We have reviewed the accompanying condensed interim statement of financial position of Interloop Limited (“the Company”) as at December 31, 2021 and the related condensed interim statement of profit or loss, condensed interim statement of comprehensive income, condensed interim statement of changes in equity, condensed interim statement of cash flows, and notes to the condensed interim financial statements for the six-month period then ended (here-in-after referred to as the condensed interim financial statements). Management is responsible for the preparation and presentation of these condensed interim financial statements in accordance with accounting and reporting standards as applicable in Pakistan for interim financial reporting. Our responsibility is to express a conclusion on these financial statements based on our review.
The figures of the condensed interim statement of profit or loss and the condensed interim statement of comprehensive income for the quarters ended December 31, 2021 and 2020 have not been reviewed, as we are required to review only the cumulative figures for the half year ended December 31, 2021.
Scope of review
We conducted our review in accordance with the International Standard on Review Engagements 2410, “Review of Interim Financial Information Performed by the Independent Auditor of the Entity”. A review of interim financial statements consists of making inquiries, primarily of persons responsible for financial and accounting matters, and applying analytical and other review procedures. A review is substantially less in scope than an audit conducted in accordance with International Standards on Auditing and consequently does not enable us to obtain assurance that we would become aware of all significant matters that might be identified in an audit. Accordingly, we do not express an audit opinion.
Conclusion
Based on our review, nothing has come to our attention that causes us to believe that the accompanying interim financial statements are not prepared, in all material respects, in accordance with the approved accounting standards as applicable in Pakistan for interim financial reporting.
The engagement partner on the review resulting in this independent auditor’s report is Amber Razzaq.
Place: Faisalabad KRESTON HYDER BHIMJI & CO.Date: January 26, 2022 Chartered AccountantsUDIN: AR202110075oe87lpQLd
INDEPENDENT AUDITORS’ REVIEW REPORT TO THE MEMBERS OF INTERLOOP LIMITEDREPORT ON REVIEW OF CONDENSED INTERIM FINANCIAL STATEMENTS
Office No 1,2ndFloor, Lagacy, Kohinoor City, Faisalabad-Pakistan. Phone:+ 92-41-8731632, 8731650Email: [email protected] Website: www.krestonhb.com
Other offices: Karachi, Lahore, Islamabad.A member of Kreston International- A Global Network of Independent Accounting Firms

CONDENSED INTERIM FINANCIAL STATEMENTS
For The Quarter and Half Year Ended December 31, 2021

14
Un audited Audited December 31, June 30, 2021 2021 Note (Rupees in ‘000) (Rupees in ‘000)
Assets
Non current assets
Property, plant and equipment 5 31,389,560 26,193,029 Intangible assets 206,881 209,623 Long term loans 170,161 144,673 Long term deposits 71,805 60,478
31,838,407 26,607,803 Current assets
Stores and spares 1,555,140 1,199,116 Stock in trade 18,644,889 11,276,308 Trade debts 6 20,672,258 15,052,940 Loans and advances 2,797,672 1,034,836 Prepayments and other receivables 890,506 318,708 Accrued income 3,314 2,131 Receivables from Government 5,327,933 4,328,555 Short term investments 500,000 500,000 Cash and bank balances 136,296 374,442
50,528,008 34,087,036
Total assets 82,366,415 60,694,839
CONDENSED INTERIM STATEMENT OF FINANCIAL POSITIONAs at December 31, 2021

Half Year Report 15
Un audited Audited December 31, June 30, 2021 2021 Note (Rupees in ‘000) (Rupees in ‘000)
Equity and Liabilities
Share Capital and Reserves
Authorized share capital 7 15,000,000 10,000,000
Issued, subscribed and paid up capital 8 8,983,634 8,721,975 Share premium 3,528,149 3,791,602 Unappropriated profit 11,846,443 8,001,035
24,358,226 20,514,612 Non Current Liabilities
Long term financing 9 10,422,665 8,213,978 Lease liabilities 127,189 152,969 Deferred liabilities 4,467,691 3,816,001
15,017,545 12,182,948 Current Liabilities
Trade and other payables 6,642,528 5,551,641 Unclaimed dividend 3,068 4,004 Accrued mark up 393,633 221,674 Short term borrowings 33,383,041 19,636,066 Derivative financial instruments 41,669 33,074 Current portion of non current liabilities 2,526,705 2,550,820
42,990,644 27,997,279 Contingencies and Commitments 10 – –
Total Equity and Liabilities 82,366,415 60,694,839
The annexed notes from 1 to 19 form an integral part of these condensed interim financial statements.
Chief Executive Officer Director Chief Financial Officer

16
CONDENSED INTERIMSTATEMENT OF PROFIT OR LOSSFor the Quarter and Half Year Ended December 31, 2021
Chief Executive Officer Director Chief Financial Officer
Quarter ended Half year ended
Un audited Un audited Un audited Un audited December 31, December 31, December 31, December 31, 2021 2020 2021 2020 Note (Rupees in ‘000) (Rupees in ‘000)
Sales - net 20,017,023 13,352,961 39,346,676 26,262,548 Cost of sales 11 (15,105,911) (9,995,394) (28,898,550) (19,796,131)
Gross profit 4,911,112 3,357,567 10,448,126 6,466,417 Distribution costs (802,060) (585,838) (1,610,260) (1,203,753)Administrative expenses (1,012,954) (656,204) (1,951,389) (1,288,143)Other operating expenses 12 (394,646) (227,728) (974,904) (408,904)
(2,209,660) (1,469,770) (4,536,553) (2,900,800)Other income 20,371 51,429 25,076 47,561
Profit from operations 2,721,823 1,939,226 5,936,649 3,613,178 Finance cost (511,847) (291,485) (871,555) (516,607)
Profit before taxation 2,209,976 1,647,741 5,065,094 3,096,571 Taxation (182,452) (125,729) (347,489) (192,209)
Profit for the period 2,027,524 1,522,012 4,717,605 2,904,362 Earnings per share - basic and diluted (Rupees) - Restated 2.26 1.69 5.25 3.23
The annexed notes from 1 to 19 form an integral part of these condensed interim financial statements.

Half Year Report 17
CONDENSED INTERIMSTATEMENT OF COMPREHENSIVE INCOMEFor the Quarter and Half Year Ended December 31, 2021
Chief Executive Officer Director Chief Financial Officer
Quarter ended Half year ended
Un audited Un audited Un audited Un audited December 31, December 31, December 31, December 31, 2021 2020 2021 2020 (Rupees in ‘000) (Rupees in ‘000)
Profit for the period 2,027,524 1,522,012 4,717,605 2,904,362 Other comprehensive income – – – –
Total comprehensive incomefor the period 2,027,524 1,522,012 4,717,605 2,904,362 The annexed notes from 1 to 19 form an integral part of these condensed interim financial statements.

18
CONDENSED INTERIMSTATEMENT OF CHANGES IN EQUITYFor The Half Year Ended December 31, 2021
Chief Executive Officer Director Chief Financial Officer
Capital Revenue reserve reserve
Share Share Unappropriated Total capital premium profit
(Rupees in ‘000) Balance as at July 01, 2020 - Audited 8,721,975 3,791,602 4,766,115 17,279,692
Profit for the period – – 2,904,362 2,904,362
Other comprehensive income for the period – – – –
Total comprehensive income for the period – – 2,904,362 2,904,362
Transactions with owners:
Dividend to ordinary shareholders – – (872,197) (872,197)
Balance as at December 31, 2020 (Un-audited) 8,721,975 3,791,602 6,798,280 19,311,857
Balance as at July 01, 2021 - Audited 8,721,975 3,791,602 8,001,035 20,514,612
Profit for the period – – 4,717,605 4,717,605
Other comprehensive income for the period – – – –
Total comprehensive income for the period – – 4,717,605 4,717,605
Transaction cost on issuance of shares – (1,794) – (1,794)
Issuance of bonus shares 261,659 (261,659) – –
Transactions with owners:
Dividend to ordinary shareholders – – (872,197) (872,197)
Balance as at December 31, 2021 (Un-audited) 8,983,634 3,528,149 11,846,443 24,358,226
The annexed notes from 1 to 19 form an integral part of these condensed interim financial statements.

Half Year Report 19
CONDENSED INTERIMSTATEMENT OF CASH FLOWSFor The Half Year Ended December 31, 2021
Un audited Un audited December 31, December 31, 2021 2020 (Rupees in ‘000) (Rupees in ‘000)
A) CASH FLOWS FROM OPERATING ACTIVITIES
Profit before taxation 5,065,094 3,096,571 Adjustments for: Depreciation on operating fixed assets 1,236,204 1,077,505 Depreciation on right of use assets 31,367 12,872 Amortization of intangible assets 22,553 4,785 Workers’ profit participation fund 272,019 166,304 Workers’ welfare fund 103,369 63,195 Staff retirement gratuity 623,310 452,103 (Gain) / loss on disposal of non current assets (233) 30,432 Inventory write off – 434 Unrealized loss/(gain) on derivative financial in struments 8,596 (2,100) Realized loss on derivative financial instruments 320,466 – Profit on investments in TFCs and TDRs (23,449) (26,952) Interest on loan to Metis International (Pvt) Ltd (676) (120) Interest on receivables from IL Bangla Limited – (2,910) Finance cost 871,555 516,607
Operating cash flows before working capital changes 8,530,175 5,388,727 Changes in working capital (Increase) / decrease in current assets Stores and spares (356,024) (39,936) Stock in trade (7,368,581) (736,491) Trade debts (5,619,318) (5,950,551) Loans and advances (1,755,183) (967,147) Prepayments and other receivables (571,942) (225,871) Receivables from Government (1,138,830) (483,366) Increase in current liabilities Trade and other payables 1,080,734 1,049,050
(15,729,144) (7,354,312)
Cash used in operations (7,198,969) (1,965,585)
Finance cost paid (673,468) (529,810) Income tax paid (208,037) (235,322) Staff retirement gratuity paid (161,083) (139,174) Workers’ profit participation fund paid (380,983) (119,000) Long term loans paid (33,141) (64,629) Long term deposits paid (11,327) (2,479)
Net cash used in operating activities (8,667,008) (3,055,999)

20Chief Executive Officer Director Chief Financial Officer
Un audited Un audited December 31, December 31, 2021 2020 (Rupees in ‘000) (Rupees in ‘000)
B) CASH FLOWS FROM INVESTING ACTIVITIES
Additions in: Property, plant and equipment (6,475,408) (1,518,273) Intangible assets (19,811) (19,762) Proceeds from disposal of non current assets 17,633 21,385 Profit received from investments in TFCs and TDRs 23,086 26,826
Net cash used in investing activities (6,454,500) (1,489,824)
C) CASH FLOWS FROM FINANCING ACTIVITIES
Long term financing obtained 3,708,182 2,095,319 Repayment of long term financing (1,334,454) (56,383) Payment of lease rentals (41,948) (14,726) Short term borrowings - net 13,746,975 3,261,026 Settlement of derivative financial instruments (320,466) – Transaction cost on issuance of shares (1,794) – Dividend paid (873,133) (872,355)
Net cash generated from financing activities 14,883,362 4,412,881
Net decrease in cash and cash equivalents (A+B+C) (238,146) (132,942)
Cash and cash equivalents at beginning of the period 374,442 275,831
Cash and cash equivalents at end of the period 136,296 142,889 The annexed notes from 1 to 19 form an integral part of these condensed interim financial statements.

Half Year Report 21
NOTES TO THE CONDENSED INTERIM FINANCIAL STATEMENTSFor The Half Year Ended December 31, 2021
1. LEGAL STATUS AND OPERATIONS Interloop Limited (the Company) was incorporated in Pakistan on April 25, 1992 as a
private limited company and subsequently it was converted into public limited company on July 18, 2008 and was listed on Pakistan Stock Exchange on April 5, 2019. The registered office of the Company is situated at Al-Sadiq Plaza, P-157, Railway Road, Faisalabad. The manufacturing facilities are located at 1-km, 6-km and 7-km Jaranwala road, Khurrianwala, Faisalabad, 117-J.B, Millat Road Dhanola, Faisalabad and 8-km Manga Mandi, Raiwand road, Lahore. The Company is engaged in the business of manufacturing and selling of socks, leggies, denim, garments and allied products, yarn, providing yarn dyeing services and generating electricity for its own use.
2. BASIS OF PREPARATION These condensed interim financial statements have been prepared in accordance with
the accounting and reporting standards as applicable in Pakistan for interim financial reporting. The accounting and reporting standards as applicable in Pakistan for interim financial reporting comprise of:
i) International Accounting Standard (‘IAS’) 34, ‘Interim Financial Reporting’, issued
by International Accounting Standards Board (‘IASB’) as notified under the Companies Act, 2017, and
ii) Provisions of and directives issued under the Companies Act, 2017. Where provisions of and directives issued under the Companies Act, 2017 differ
with the requirements of IAS 34, the provisions of and directives issued under the Companies Act, 2017 have been followed.
These condensed interim financial statements have been subjected to limited scope
review by the auditors, as required under section 237 of Companies Act, 2017. These condensed interim financial statements do not include all the information as required in annual financial statements prepared in accordance with approved accounting standards as applicable in Pakistan, and should therefore be read in conjunction with the financial statements for the year ended June 30, 2021.
3. CRITICAL ACCOUNTING ESTIMATES AND JUDGMENTS The preparation of condensed interim financial statements requires management to
make judgments, estimates and assumptions that affect the application of accounting policies and the reported amounts of assets and liabilities, income and expenses. The estimates and associated assumptions are based on historical experience and various other factors that are believed to be reasonable under the circumstances, the results of which form the basis of making the judgments about carrying values of assets and liabilities that are not readily apparent from other sources. Actual results may differ from these estimates.
In preparing these condensed interim financial statements, the significant judgments
made by the management in applying accounting policies and the key sources of estimates were the same as those applied to the annual financial statements of the Company for the year ended June 30, 2021.
4. SUMMARY OF SIGNIFICANT ACCOUNTING POLICIES The accounting policies adopted in the preparation of these condensed interim financial
statements are the same as those applied in the preparation of preceding annual audited financial statements of the Company for the year ended June 30, 2021.

22
Un audited Audited December 31, June 30, 2021 2021 Note (Rupees in ‘000) (Rupees in ‘000)
5. PROPERTY, PLANT AND EQUIPMENT
Operating fixed assets 5.1 27,103,956 23,467,161 Capital work-in-progress 5.2 4,123,784 2,543,689 Right of use assets 161,820 182,179
31,389,560 26,193,029 5.1 Operating fixed assets
Cost
Opening balance 38,139,987 34,348,943 Additions during the period/year 5.1.1 4,895,315 3,268,184 Effect of amalgamation of IL Apparel (Private) Limited – 759,107 Disposals during the period/year (53,674) (236,247)
Closing balance 42,981,628 38,139,987 Accumulated depreciation
Opening balance 14,672,826 12,451,147 Depreciation expense for the period/year 1,236,204 2,279,613 Effect of amalgamation of IL Apparel (Private) Limited – 96,171 Adjustment during the period/year (31,358) (154,105)
Closing balance 15,877,672 14,672,826
Written down value 27,103,956 23,467,161 5.1.1 Additions during the period/year
Freehold land 291,394 188,598 Buildings on freehold land 965,471 610,953 Plant and machinery 2,916,534 1,593,773 Tools and equipment 214,345 96,820 Office equipment 105,761 195,230 Electric installations 248,368 290,621 Furniture and fixtures 58,065 93,405 Vehicles 95,377 198,784
4,895,315 3,268,184

Half Year Report 23
Un audited Audited December 31, June 30, 2021 2021 Note (Rupees in ‘000) (Rupees in ‘000)
5.2 Capital work-in-progress
Civil works 1,654,026 1,216,376 Plant and machinery 635,923 547,137 Capital stores 5.2.1 434,234 129,762 Advances to suppliers 1,399,601 650,414
4,123,784 2,543,689
5.2.1 Capital stores include factory tools and equipment, office equipment, electric installations and furniture and fixtures that are held in store for future use and capitalization.
Un audited Audited December 31, June 30, 2021 2021 Note (Rupees in ‘000) (Rupees in ‘000)
6. TRADE DEBTS
Foreign
- Secured 9,708,722 6,234,955 - Unsecured 6.1 9,704,968 7,869,261
19,413,690 14,104,216 Local
- Unsecured 6.1 1,258,568 948,724
20,672,258 15,052,940
6.1 Management consider that these debts are good and will be recovered in due course.
7. AUTHORIZED SHARE CAPITAL Un audited Audited Un audited Audited December 31, June 30, December 31, June 30, 2021 2021 2021 2021 [ Number of shares in ‘000] (Rupees in ‘000)
1,500,000 1,000,000 Ordinary shares of Rs. 10 each 15,000,000 10,000,000
7.1 The Company has increased its authorized share capital from 1,000 million shares to 1,500 million shares by the resolution passed in its 29th Annual General Meeting held on October 15, 2021.

24
8. ISSUED, SUBSCRIBED AND PAID UP CAPITAL Un audited Audited Un audited Audited December 31, June 30, December 31, June 30, 2021 2021 2021 2021 [ Number of shares in ‘000] (Rupees in ‘000)
132,166 132,166 Ordinary shares of Rs. 10 each fully paid in cash 1,321,662 1,321,662 766,197 740,031 Ordinary shares of Rs. 10 each issued as fully paid bonus shares 7,661,972 7,400,313
898,363 872,197 8,983,634 8,721,975
8.1 During the period, the Company has issued 3% bonus shares (i.e. 3 shares for every 100 shares held on the entitlement date) out of the share premium account.
Un audited Audited December 31, June 30, 2021 2021 (Rupees in ‘000) (Rupees in ‘000)
9. LONG TERM FINANCING
From financial institutions - secured
Opening balance 10,652,580 7,222,513 Add: Obtained during the period/year 3,708,182 3,997,643 Add: Effect of amalgamation of IL Apparel (private) Limited – 188,036 Less: Paid during the period/year (1,334,454) (747,505) Less: Effect of recognition/adjustment of Government grant - net (166,014) (8,107)
12,860,294 10,652,580 Less: Current portion of long term financing (2,437,629) (2,438,602)
10,422,665 8,213,978 10. CONTINGENCIES AND COMMITMENTS
10.1 Contingencies
10.1.1 The Punjab Revenue Authority has created a demand of an amount of Rs. 29.931 million in respect of an alleged default on withholding of provincial sales tax on account of various transport services received by the Company during the period from March 01, 2015 to May 31, 2016 along with default surcharge and penalty under Punjab Sales Tax on Services Act, 2012, rejecting the exemption claim of the taxpayer company. The Company being aggrieved, filed an appeal before Commissioner (Appeals) Punjab Revenue Authority (PRA) which is pending adjudication at the terminal date.

Half Year Report 25
The Company has not made any provision against the above demand as the management is confident that the ultimate outcome of the appeal would be in favour of the Company, inter alia on the basis of the advice of the tax consultant and relevant law and facts.
10.1.2 Bank guarantees issued by various banks on behalf of the Company in favour of:
Un audited Audited December 31, June 30, 2021 2021 (Rupees in ‘000) (Rupees in ‘000)
Sui Northern Gas Pipelines limited against supply of gas 550,328 635,853
The Director, Excise and Taxation, Karachi against imposition of infrastructure cess 492,353 300,853
Faisalabad Electric Supply Company (FESCO) against supply of electricity 143,245 134,245
Punjab Revenue Authority 11,533 11,533 State Bank of Pakistan 271,256 110,112 Total Parco Pakistan Limited 3,000 3,000
1,471,715 1,195,596
10.1.3 Post dated cheques issued in favour of custom authorities for release of imported goods. 6,524,058 5,546,980 10.2 Commitments
Under letters of credit for: Capital expenditure 2,171,455 2,993,664 Raw material 4,220,385 2,998,175 Stores and spares 105,572 38,595
6,497,412 6,030,434
26
Quarter ended Half year ended
Un audited Un audited Un audited Un audited December 31, December 31, December 31, December 31, 2021 2020 2021 2020 (Rupees in ‘000) (Rupees in ‘000)
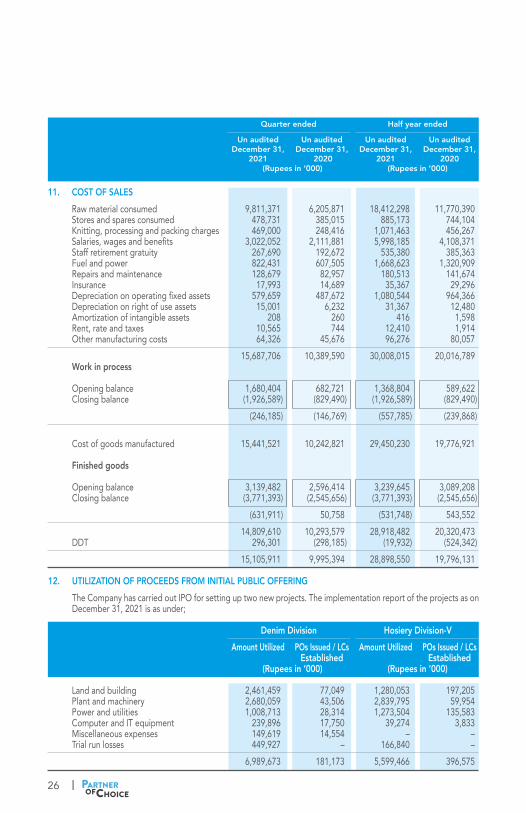
11. COST OF SALES Raw material consumed 9,811,371 6,205,871 18,412,298 11,770,390 Stores and spares consumed 478,731 385,015 885,173 744,104 Knitting, processing and packing charges 469,000 248,416 1,071,463 456,267 Salaries, wages and benefits 3,022,052 2,111,881 5,998,185 4,108,371 Staff retirement gratuity 267,690 192,672 535,380 385,363 Fuel and power 822,431 607,505 1,668,623 1,320,909 Repairs and maintenance 128,679 82,957 180,513 141,674 Insurance 17,993 14,689 35,367 29,296 Depreciation on operating fixed assets 579,659 487,672 1,080,544 964,366 Depreciation on right of use assets 15,001 6,232 31,367 12,480 Amortization of intangible assets 208 260 416 1,598 Rent, rate and taxes 10,565 744 12,410 1,914 Other manufacturing costs 64,326 45,676 96,276 80,057 15,687,706 10,389,590 30,008,015 20,016,789 Work in process Opening balance 1,680,404 682,721 1,368,804 589,622 Closing balance (1,926,589) (829,490) (1,926,589) (829,490) (246,185) (146,769) (557,785) (239,868) Cost of goods manufactured 15,441,521 10,242,821 29,450,230 19,776,921 Finished goods Opening balance 3,139,482 2,596,414 3,239,645 3,089,208 Closing balance (3,771,393) (2,545,656) (3,771,393) (2,545,656) (631,911) 50,758 (531,748) 543,552 14,809,610 10,293,579 28,918,482 20,320,473 DDT 296,301 (298,185) (19,932) (524,342) 15,105,911 9,995,394 28,898,550 19,796,131
12. UTILIZATION OF PROCEEDS FROM INITIAL PUBLIC OFFERING
The Company has carried out IPO for setting up two new projects. The implementation report of the projects as on December 31, 2021 is as under;
Denim Division Hosiery Division-V Amount Utilized POs Issued / LCs Amount Utilized POs Issued / LCs Established Established (Rupees in ‘000) (Rupees in ‘000)
Land and building 2,461,459 77,049 1,280,053 197,205 Plant and machinery 2,680,059 43,506 2,839,795 59,954 Power and utilities 1,008,713 28,314 1,273,504 135,583 Computer and IT equipment 239,896 17,750 39,274 3,833 Miscellaneous expenses 149,619 14,554 – – Trial run losses 449,927 – 166,840 – 6,989,673 181,173 5,599,466 396,575

Half Year Report 27
13. TRANSACTIONS WITH RELATED PARTIES
Related parties include subsidiary company, associated companies and undertakings, entities under common directorship, directors, major shareholders, key management personnel, employees benefit trust and post employment benefit plans. The Company in the normal course of business carries out transactions with various related parties.
Detail of transactions with related parties during the period are as follows: Half year ended
Un audited Un audited December 31, December 31, 2021 2020 Name Nature of transaction (Rupees in ‘000) (Rupees in ‘000) Interloop Holdings (Pvt) Limited-Associate Services received 95,886 53,922 Transfer of assets – 1,004 Gratuity transferred – 472
Interloop Limited ESOS Management Trust-Trustee Dividend paid 106 82
Interloop Welfare Trust-Trustee Donations paid 63,060 14,000 Gratuity transferred 577 –
Texlan Center (Pvt) Limited-Associate Sale of yarn 990,076 456,381 Sale of packing material 36,028 22,769
Global Veneer Trading Limited-Associate Selling commission 27,106 188,177
Octans Digital (Private) Limited-Associate Services received 574 –
Eurosox Plus BV-Associate Sale of socks 256,594 154,373
Layallpur Literary Council-Trustee Donation paid 1,600 800
Momentum Logistics (Private) Limited-Associate Services received 152,752 20,997
PrintKraft (Private) Limited-Associate Purchase of packing material 108,533 2,978
Interloop Employees Provident Fund-Trustee Contributions to the fund 30,302 22,768
Socks & Socks (Private) Limited-Associate Rent expenses 2,200 – Processing services 4,242 – Sale of goods - net 191,611 –
Key management personnel and other Sale of assets 1,182 4,253 related parties Remuneration and other benefits 934,314 488,512 Rent expenses 707 619 Repayment of housing finance loan 2,308 2,308 Markup on housing finance loan 157 212 Dividend paid 759,571 635,594 Directorship fee 7,000 6,600

28
Un audited Audited December 31, June 30, 2021 2021 (Rupees in ‘000) (Rupees in ‘000)
14. SHARIAH SCREENING DISCLOSURE
Loans/advances as per Islamic mode Loans 13,149,940 9,987,775
Shariah compliant bank deposits/ bank balances
Bank balances 95,432 115,316 Revenue earned from a shariah compliant business 39,346,676 54,962,265
Loss/Gain or dividend from shariah compliant investments
Net realized gain / (loss) on disposal of mutual funds – 683 Mark up on Islamic mode of financing (282,440) (448,839)
Profits or interest on any conventional loan or advance
Interest on loan to Metis International (Pvt) Ltd 676 1,152 Profit on term deposit receipts (TDRs) – 3,088 Profit on term finance certificates (TFCs) 23,449 45,624 Interest on receivables from IL Bangla Limited – 5,308 Interest on workers’ profit participation fund (15,747) (1,553) Interest on lease liabilities (10,381) (18,068) Interest on other conventional loans (431,510) (495,112) Relationship with shariah compliant banks
Name of institutions Relationship with institutions
Bank Alfalah Limited (Islamic) Bank balance
Allied Bank Limited (Islamic Banking) Bank balance and long term financing
Bank of Punjab (Taqwa Islamic Banking) Bank balance and long term financing
Habib Bank Limited (Islamic Banking) Bank balance and long term financing
Meezan Bank Limited Bank balance, short term borrowing and long term financing
MCB Islamic Bank Bank balance, short term borrowing and long term financing
Faysal Bank Limited Bank balance, short term borrowing and long term financing

Half Year Report 29
15. OPERATING SEGMENTS
Management has determined the operating segments based on the information that is presented to the Board of Directors of the Company for allocation of resources and assessment of performance. Operating segments are reported in a manner consistent with internal reporting provided to the Chief Operating Decision Maker (‘CODM’). Segment performance is generally evaluated based on certain key performance indicators including business volume and gross profit.
Based on internal management reporting structure and products produced and sold,
the Company is organized into the following operating segments: a) Hosiery
This segment relates to the sale of socks. b) Spinning
This segment relates to the sale of yarn. c) Denim
This segment mainly relates to sale of garments. d) Apparel
This segment relates to the sale of fashion apparels. e) Other operating segments
This represent various segments of the Company which currently do not meet the minimum reporting threshold mentioned in International Financial Reporting Standards ‘ Operating Segments’ (IFRS 8). These mainly includes domestic sales, yarn dyeing, energy and active wear.

30
15.1
Seg
men
t Inf
orm
atio
n
Hosie
ry Sp
inning
De
nim
Appa
rel
Othe
rs Eli
mina
tion o
f Inte
r To
tal
segm
ent t
ransa
ction
Co
mpan
y
Un au
dited
Un
audit
ed
Un au
dited
Un
audit
ed
Un au
dited
Un
audit
ed
Un au
dited
Dece
mber
De
cemb
er
Dece
mber
De
cemb
er
Dece
mber
De
cemb
er
Dece
mber
De
cemb
er
Dece
mber
De
cemb
er
Dece
mber
De
cemb
er
Dece
mber
De
cemb
er
31
, 202
1 31
, 202
0 31
, 202
1 31
, 202
0 31
, 202
1 31
, 202
0 31
, 202
1 31
, 202
0 31
, 202
1 31
, 202
0 31
, 202
1 31
, 202
0 31
, 202
1 31
, 202
0
Rupe
es in
‘000
Ru
pees
in ‘0
00
Rupe
es in
‘000
Ru
pees
in ‘0
00
Rupe
es in
‘000
Ru
pees
in ‘0
00
Rupe
es in
‘000
Sa
les - n
et
Ex
terna
l sale
30,31
6,538
21
,873,0
66
3,28
0,285
2,
395,1
22
2,05
0,357
1
,371,4
85
2,37
2,452
–
1,
327,0
44
622,8
75
–
–
39,34
6,676
26
,262,5
48
Int
erseg
ment
sale
151,1
37
118,8
11
3,36
4,647
2,
277,1
72
2,07
4
12,74
7 1,
053
–
2,09
2,637
1,
902,4
77
(5,61
1,548
) (4
,311,2
07)
–
–
30,46
7,675
21
,991,8
77
6,64
4,932
4,
672,2
94
2,05
2,431
1,
384,2
32
2,37
3,505
–
3,
419,6
82
2,52
5,352
(5
,611,5
48)
(4,31
1,207
) 39
,346,6
76
26,26
2,548
Cost
of sal
es (2
1,412
,581)
(15,5
89,11
0) (4
,803,1
10)
(4,27
8,138
) (2,
809,2
14)
(2,04
1,690
) (2
,280,7
65)
–
(3,20
4,428
) (2
,198,4
00)
5,61
1,548
4,
311,2
07
(28,89
8,550
) (1
9,796
,131)
Gr
oss p
rofit/(
loss)
9,05
5,094
6,
402,7
67
1,84
1,822
39
4,156
(7
56,78
3) (6
57,45
8) 92
,740
–
215,2
54
326,9
52
–
–
10,44
8,126
6,
466,4
17
Dis
tributi
on co
sts
(1,18
9,306
) (1
,073,2
61)
(19,5
46)
(23,7
88)
(130
,102)
(68,4
15)
(190
,242)
–
(8
1,064
) (3
8,289
) –
–
(1
,610,2
60)
(1,20
3,753
)
Admi
nistra
tive e
xpen
ses
(1,52
0,616
) (1
,089,4
50)
(35,3
12)
(31,9
15)
(235
,220)
(155
,583)
(134
,342)
–
(2
5,899
) (1
1,195
) –
–
(1
,951,3
89)
(1,28
8,143
)
(2,70
9,922
) (2
,162,7
11)
(54,8
58)
(55,7
03)
(365
,322)
(223
,998)
(324
,584)
–
(106
,963)
(49,4
84)
–
–
(3,56
1,649
) (2
,491,8
96)
Pro
fit/(lo
ss) be
fore t
axati
on
and u
nallo
cated
inco
me an
d exp
ense
s 6,
345,1
72
4,24
0,056
1,
786,9
64
338,4
53
(1,12
2,105
) (8
81,45
6) (2
31,84
4) –
10
8,291
27
7,468
–
–
6,
886,4
77
3,97
4,521
Un
alloc
ated i
ncom
e and
expe
nses
Ot
her o
perat
ing ex
pense
s
(9
74,90
4) (4
08,90
4)
Othe
r inco
me
25,07
6 47
,561
Fin
ance
cost
(871
,555)
(516
,607)
Tax
ation
(3
47,48
9) (1
92,20
9)
Pro
fit aft
er tax
ation
4,
717,6
05
2,90
4,362
De
precia
tion a
nd am
ortiza
tion
658,3
79
588,0
98
98,23
9 10
4,474
29
6,493
27
4,534
85
,138
–
151,8
76
128,0
56
–
–
1,29
0,124
1,
095,1
62

Half Year Report 31
15.2
Rec
onci
liatio
n of
repo
rtab
le s
egm
ent a
sset
s an
d lia
bilit
ies
Hosie
ry Sp
inning
De
nim
Appa
rel
Othe
rs Un
alloc
ated
Total
Comp
any
Un au
dited
Au
dited
Un
audit
ed
Audit
ed
Un au
dited
Au
dited
Un
audit
ed
Audit
ed
Un au
dited
Au
dited
Un
audit
ed
Audit
ed
Un au
dited
Au
dited
Dece
mber
Ju
ne
Dece
mber
Ju
ne
Dece
mber
Ju
ne
Dece
mber
Ju
ne
Dece
mber
Ju
ne
Dece
mber
Ju
ne
Dece
mber
Ju
ne
31
, 202
1 30
, 202
1 31
, 202
1 30
, 202
1 31
, 202
1 30
, 202
1 31
, 202
1 30
, 202
1 31
, 202
1 30
, 202
1 31
, 202
1 30
, 202
1 31
, 202
1 30
, 202
1
Rupe
es in
‘000
Ru
pees
in ‘0
00
Rupe
es in
‘000
Ru
pees
in ‘0
00
Rupe
es in
‘000
Ru
pees
in ‘0
00
Rupe
es in
‘000
To
tal as
sets
for re
porta
ble se
gmen
t 45
,309,2
43
33,27
4,677
10
,853,5
68
5,70
0,781
8,
712,5
06
8,37
0,046
6,
506,6
23
3,78
8,161
5,
058,5
19
4,29
5,567
5,
925,9
56
5,26
5,606
82
,366,4
15
60,69
4,839
To
tal lia
bilitie
s for
report
able
segm
ent
21,09
9,255
17
,718,8
14
748,4
81
395,6
11
966,8
23
935,7
41
769,2
96
648,7
91
605,9
91
586,4
52
33,81
8,343
19
,894,8
17
58,00
8,189
40
,180,2
27
Se
gmen
t Cap
ital E
xpen
diture
s 5,
378,0
51
2,88
1,847
71
,740
75,41
1 93
,637
596,9
79
767,4
31
891,5
93
184,3
60
712,9
44
-
-
6,49
5,219
5,
158,7
74
15.3
The
Com
pany
disa
ggre
gate
d re
venu
e ba
sed
on g
eogr
aphi
cal l
ocat
ions
of i
ts c
usto
mer
s:
Half y
ear e
nded
Un au
dited
Dece
mber
De
cemb
er
31
, 202
1 31
, 202
0
Rupe
es in
‘000
Fo
reign
coun
tries
36,02
8,074
2
4,235
,367
Pa
kistan
3
,318,6
02
2,02
7,181
39,34
6,676
2
6,262
,548

32
16. FINANCIAL RISK MANAGEMENT
16.1 Financial Risk Factors
The Company’s activities expose it to a variety of financial risks: market risk (including currency risk, fair value interest rate risk, cash flow interest rate risk and price risk), credit risk and liquidity risk.
The Company finances its operations through equity, borrowings and
management of working capital with a view to maintain an appropriate mix between various sources of finance to minimize risk. The Company follows an effective cash management and planning policy and maintains flexibility in funding by keeping committed credit lines available. Market risks are managed by the Company through the adoption of appropriate policies to cover currency risks and interest rate risks.
The Company has managed its currency risks by forward currency contracts. There have been no changes in the risk management policies during the
period since June 30, 2021 except those specifically mentioned. Consequently these condensed interim financial statements do not include all the financial risk management information and disclosures required in the annual financial statements.
16.2 Fair value measurements of financial instruments
Fair value is defined as the price that would be received to sell an asset or paid to settle a liability in an orderly transaction between market participants at the measurement date. To provide an indication about the reliability of the inputs used in determining fair value, the Company classifies its financial instruments into the three levels prescribed under the IFRSs.
Level 1: The fair value of financial instruments traded in active markets (such as
publicly traded equity securities) is based on quoted (unadjusted) market prices at the end of the reporting period. The quoted market price used for financial assets held by the Company is the current bid price. These instruments are included in Level 1.
Level 2: The fair value of financial instruments that are not traded in an active
market (for example over-the counter derivatives) is determined using valuation techniques which maximize the use of observable market data and rely as little as possible on entity specific estimates. If all significant inputs required to determine fair value of an instrument are observable, the instrument is included in Level 2.
Level 3: If one or more of the significant inputs is not based on observable market
data, the instrument is included in level 3. This is the case for unlisted equity instruments.

Half Year Report 33
The following table presents the Company’s significant financial assets and liabilities measured and recognized at fair value at December 31, 2021 on a recurring basis:
Un audited
December 31, 2021
Rupees in ‘000 Level 1 Level 2 Level 3 Total
Total financial assets – – – –
Financial liabilities
Trading derivatives – 41,669 – 41,669
Total financial liabilities – 41,669 – 41,669
Audited
June 30, 2021
Rupees in ‘000 Level 1 Level 2 Level 3 Total
Total financial assets – – – –
Financial liabilities
Trading derivatives – 33,074 – 33,074
Total financial liabilities – 33,074 – 33,074
During the period, there were no significant changes in the business or economic
circumstances that affect the fair value of the Company’s financial assets and financial liabilities.
17. NON-ADJUSTING EVENT AFTER THE REPORTING PERIOD
The Board of Directors in their meeting held on January 26, 2022 have approved an interim cash dividend of Rs. 2 per share (i.e 20%) in respect of six months ended December 31, 2021 (December 31, 2020: Rs. 1.5 per share). These condensed interim financial statements for the six months ended December 31, 2021 do not include the effect of the above interim dividend which will be accounted for in the period in which it is approved.
18. DATE OF AUTHORIZATION FOR ISSUE
These condensed interim financial statements were authorized for issue on January 26, 2022 by the Board of Directors of the Company.

34
19. GENERAL
19.1 Corresponding figures
In order to comply with the requirements of IAS 34, the condensed interim statement of financial position has been compared with the balances of annual audited financial statements of immediately preceding financial year, whereas, the condensed interim statement of profit or loss, condensed interim statement of comprehensive income, condensed interim statement of changes in equity and condensed interim statement of cash flows have been compared with the balances of comparable periods of immediately preceding financial year.
19.2 Rounding
Figures have been rounded off to the nearest thousand.
Chief Executive Officer Director Chief Financial Officer

NOTES

NOTES


Interloop Limited InterloopLtd interlooplimited interlooplimitedwww.interloop-pk.com
CORPORATE OFFICE1-KM, Khurrianwala-Jaranwala Road Khurrianwala, Faisalabad, Pakistan
T +92 41 4360400 F +92 41 2428704
REGISTERED OFFICEAl–Sadiq Plaza, P–157,Railway Road, Faisalabad, Pakistan
Tel: +92–41–2619724Fax: +92–41–2639400Email: [email protected]