Half year results 2015
80
Half year results 2015 Standard Life plc
-
Upload
khangminh22 -
Category
Documents
-
view
3 -
download
0
Transcript of Half year results 2015

Half year results2015Standard Life plc

Contents
1. Strategic report 1 1.1 Chief Executive’s overview 1 1.2 Chief Financial Officer’s overview 2 1.3 Business segment performance 6 1.3.1 Standard Life Investments 7 1.3.2 UK and Europe 10 1.3.3 India and China 13 1.3.4 Discontinued operations 14 1.4 Principal risks and uncertainties 15 1.5 Basis of preparation 19
2. Statement of Directors’ responsibilities 20
3. Independent review report from our external auditors 21
4. Financial statements 23 IFRS condensed consolidated primary statements 23 Notes to the IFRS condensed consolidated financial information 31
5. Shareholder information 72
6. Glossary 73
7. Contact details 77
Look out for these icons within this report
Find out more information within this report
Find out more information online
The Half year results 2015 are published on the Group’s website at www.standardlife.com
The Half year 2015 press release and supplementary information are also published on www.standardlife.com
The Directors are responsible for the maintenance and integrity of the financial information published on the website in accordance with UK legislation governing the dissemination of financial statements.
Access to the website is available outside the UK, where comparable information may be different.

Standard Life is a long-term investment savings business, with a growing presence in the global institutional investment and wholesale markets, and a strong distribution position in the workplace and retail markets in the UK, Europe, India and China. We use our investment expertise to create products and solutions, and distribute them globally – both through wholly owned businesses in the UK and elsewhere and also through our global strategic partnerships including Manulife, John Hancock, Sumitomo Mitsui, HDFC and Phoenix.
We aim to create sustainable value for our customers, clients, shareholders and for the communities in which we operate. We do this by focusing on fee based asset management and administration in markets with strong growth potential. This strategy is underpinned by a simple business model which enables us to generate profit, both to support dividend payments to our shareholders and to create the capacity to reinvest in growing our business.
Focus on fee business driving growth and performance Standard Life has performed well during the first half of 2015 driven by a focus on providing value for our customers, clients and shareholders. Group operating profit before tax from continuing operations increased by 6% to £290m. We have increased the assets that we administer on behalf of our customers to £302bn helped by strong demand for our propositions.
Standard Life Investments actively manages £250bn of assets across the globe driven by consistently strong investment performance. We are continuing to see the benefits of our expanding distribution capabilities and strategic relationships.
Our UK fee based propositions continue to build momentum. The strength of these propositions, investment solutions and our market positioning means we have been able to help our customers with the new pensions regulations and continue to support them as saving for their futures becomes increasingly front of mind.
Outlook We continue to deliver our clear and consistent strategy.
Standard Life Investments remains focused on delivering excellent investment performance and continuing to respond to the needs of our customers and clients through new and innovative investment solutions. We aim to continue to expand our geographic reach by building on success in overseas markets through strengthening our own distribution as well as relationships with global distribution partners in the US, Canada, India, Japan and across the Standard Life Group. The integration of Ignis Asset Management (Ignis) is on track.
The investments we have made in our UK business in recent years leave us well positioned to benefit from evolving customer needs and regulatory changes. This, combined with the investment expertise of Standard Life Investments and our focus on providing value for our customers, continues to drive demand for our propositions across the retail, workplace, institutional and wholesale channels. Our fee business, including our leading income drawdown proposition, is well placed for future growth.
In Hong Kong, our wholly owned operation continues to adapt to regulatory change. Our joint venture (JV) in China is continuing to focus on profitable growth and in India, HDFC Life and HDFC AMC continue to perform strongly.
It has been an absolute privilege to lead Standard Life for the last six years and to help build our business into the strong global player it is today. I wish Keith and the inspirational people across all of our Group every success for the future.
‘Standard Life is very well positioned to deliver ongoing growth and to help our customers and clients to save and invest, so that they can look forward to their financial futures with confidence.’
David Nish Chief Executive
Optimising the balance sheet
Increasing assets
Maximising revenue
Driving profit
Lowering unit costs
Details of how we have delivered against our business model are highlighted throughout the Strategic report
Standard Life 1

1 Discontinued operations for segmental reporting comprises the Canadian business which was sold on 30 January 2015 and the Dubai and Singapore businesses, the closures of which were announced in November 2014 and June 2015 respectively. Further details are included in Section 1.3.4.
Driving profit
H1 2013 H1 2014 H1 2015
Group AUA and net flows
£214.7bn
£6.4bn
£296.6bn
£4.3bn
£302.1bn
£3.4bn
H1 net flows
Key financial performance indicators
We operate through a simple business model that is aligned with how we manage and report performance. We aim to grow assets resulting in higher fee based revenue and to manage our costs and capital which drives increased shareholder value. Our results in H1 2015 demonstrate that we have made good progress against each of the dimensions of our business model.
Our key financial performance indicators are used to measure our progression and performance and unless otherwise stated exclude discontinued operations1. Comparatives have been restated. The acquisition of Ignis completed in July 2014 and the results of Ignis are included in our H1 2015 results.
Group assets under administration and net flows As a long-term investment savings business, assets under administration (AUA) and net flows are key drivers of shareholder value.
Group AUA increased by 2% to £302.1bn driven by strong net flows in our fee business and favourable market movements.
Fee business AUA increased to £275.4bn (FY 2014: £268.6bn). Adjusted net inflows into our fee based propositions were £6.4bn (H1 2014: £5.1bn), with the key driver being Standard Life Investments third party net inflows which saw continued demand for our multi-asset and MyFolio funds.
Adjusted fee net inflows excludes natural run-off from UK conventional with profits (CWP) business of £0.4bn (H1 2014: £0.5bn) and £2.2bn of expected net outflows from the closed book of assets managed for the Phoenix Group. The mandate to manage the Phoenix Group assets was included as part of the acquisition of Ignis and was therefore not part of H1 2014 net flows. Total fee business net inflows were £3.8bn (H1 2014: £4.6bn).
Spread/risk business AUA decreased to £15.4bn (FY 2014: £16.1bn) resulting from scheduled annuity outflows and adverse market movements.
Group operating profit before tax Group operating profit before tax continues to be a key measure which provides an indication of our ability to deliver returns for our shareholders, supports further investment in the business and indicates our dividend paying capability.
Group operating profit before tax increased by 6% to £290m (H1 2014: £274m), driven mainly by continued organic growth in Standard Life Investments and also by the acquisition of Ignis. This was offset by expected challenging conditions impacting spread/risk margin in the UK business due to the current low yield
environment and following the 2014 Budget changes.
Our share of profit from associates and JVs also contributed to the growth in operating profit with an increase of £10m to £30m. This includes continued strong performance in India by our joint venture HDFC Life and our associate HDFC Asset Management.
Group underlying performance increased by 9% to £299m. This excludes £9m (H1 2014: £nil) of operating expenses relating to shareholder support provided to the German With Profits Fund (GWPF).
‘Our financial results demonstrate our ability to deliver sustainable returns for our shareholders.’
Increasing assets
Visit www.standardlife.com/investor for further information on AUA and net flows
Analysis of Group operating profit is included in Section 1.3
Luke Savage Chief Financial Officer
RemovePhoenix
life business
net outflows
Removespread/risk,
CWP &insuranceJVs netoutflows
Adjusted fee net flows
H1 2015 net
flows
H1 2015 adjusted fee net flows
£6.4bn
£3.4bn
£2.2bn £0.8bn
AUA at 30 June AUA at 31 December
2 Standard Life

Strategic report Governance information
Financial statements Other information
£191m £223m
H1 2014 H1 2015
Group underlying cash generation
+17%
Maximising revenue Lowering unit costs
Fee based revenue increased by 17% to £761m driven by a strong demand for our fee based products and a £54m contribution from Ignis with the revenue yield holding steady across our major business units.
Spread/risk margin, which mainly relates to the margin earned on UK annuities, decreased by 49% to £40m. Asset and liability management actions which focus on ensuring an efficient use of capital were lower than H1 2014, in line with our expectations, due to fewer opportunities in a low yield environment. Spread/risk margin was also impacted by reduced annuity sales following the 2014 Budget changes.
Operating expenses increased by 15% to £542m reflecting further investment in expanding the global reach of Standard Life Investments, including additional expenses of £34m in relation to Ignis, acquired in H2 2014. Whilst we invest to enhance our propositions and capabilities, we have also demonstrated our scalability with operating expense bps decreasing to 42bps.
Group underlying cash generation Group underlying cash generation is a key performance indicator. This measure aligns closely with how the business is managed and demonstrates our ability to generate cash that supports further investment in the business and the payment of dividends to our shareholders.
Group underlying cash generation increased to £223m benefiting from higher Group underlying performance (excluding joint ventures) and lower current tax on underlying performance.
Reconciliation of Group underlying cash generation
H1 2015
£m
H1 2014
£m Group underlying performance from continuing operations 299 274 Exclude share of associates and JVs’ profit before tax (30) (20) Less current tax on underlying performance (33) (51) DAC/DIR adjustment (3) (16) Fixed and intangible asset adjustment (10) 4 Group underlying cash generation 223 191
Group operating expense bps1
FY 2013 FY 2014 H1 2015
42bps
50bps
47bps
1 Operating expenses as a proportion of average AUA.
Reduction inspread/risk
margin
Fee basedrevenueexcl Ignis
Operatingexpensesexcl Ignis
Capitalmanagement
Share ofassociates
and JV profit
Ignisoperating
profit(acquired
1 July 2014)
Supportprovided tothe GWPF
Movement in Group underlying performance and operating profit
H1 2014 operating profit
/ underlying performance
£290m (£26m)
£5m
H1 2015 underlying
performance
H1 2015 operating
profit
£299m £20m £55m
£10m (£39m)
(£9m)
£274m
Visit www.standardlife.com/investor for further information on underlying cash generation
Standard Life 3

1.2 Chief Financial Officer’s overview continued
13.0% 12.9%
H1 2014 H1 2015
Group operating return on equity
H1 2014 H1 2015Continuing operations Discontinued operations Gain on sale of Canadian business
Group IFRS profit1
£1,211m
£275m
1 After tax attributable to equity holders of Standard Life plc. 2 Dubai and Singapore are presented as discontinued operations in the Strategic report and in the Group operating profit by segment. However, under IFRS 5,
Dubai and Singapore do not constitute discontinued operations and are included in continuing operations in the consolidated income statement. Therefore, a reclassification of these results between discontinued and continuing operations is required. For further information see Note 4.3 in the Financial Statements
section. 3 Includes profit from non-controlling interests. 4 £1.75bn return of value and receipt of sale proceeds both assumed to have taken place on date of disposal of the Canadian business for calculation of the
Group operating return on equity. This assumption increased Group operating return on equity from 12.1% to 12.9%.
This section covers further financial highlights which help to explain the Group financial performance and concludes with our proposed interim dividend.
IFRS profit1
Total IFRS profit1, including discontinued operations, increased to £1,211m (H1 2014: £275m). This included the £1,097m gain on sale of the Canadian business which concluded on 30 January 2015.
IFRS profit1 from continuing operations decreased to £69m (H1 2014: £196m) due to an increased non-operating loss of £158m (H1 2014: £36m), partially offset by the increase in operating profit before tax and decrease in total tax expense. The non-operating loss consists of: Short-term fluctuations in investment
return and economic assumption changes, which generated a loss of £42m (H1 2014: £nil) with adverse UK economic variances driven by market movements on assets backing subordinated liabilities
Restructuring and corporate transaction expenses of £62m (H1 2014: £26m), which included £20m for staff pension scheme restructuring, £17m for the integration of Ignis, and other business unit restructuring programmes
Other non-operating loss of £54m (H1 2014: £10m), which includes a £46m loss in Hong Kong mainly due to an impairment of deferred acquisition costs following regulatory change and £10m amortisation of acquired intangibles primarily relating to the acquisition of Ignis
The total tax expense attributable to equity holder’s profit from continuing operations was £18m (H1 2014: £35m) of which £37m (H1 2014: £46m) related to operating items and a credit of £19m (H1 2014: credit £11m) for non-operating items. The effective tax rate was 15%3 (H1 2014: 15%3) compared to a UK corporation tax rate of 20.25% (H1 2014: 21.5%).
Other2 for continuing operations comprises the share of associates and JV tax of £5m (H1 2014: £1m) and Dubai and Singapore IFRS loss before tax of £40m (H1 2014: loss £6m) which mainly relates to expenses for the closure of the Singapore business.
Group operating return on
equity Return on equity measures our success in generating profit relative to our shareholder capital. Group operating return on equity, which includes discontinued operations, decreased slightly to 12.9%4 (H1 2014: 13.0%) as a result of the relatively low return
earned on the net retained proceeds from the disposal of the Canadian business.
We will continue to manage our capital position to ensure that we generate sustainable returns for our shareholders.
Further financial highlights
H1
2015 H1
2014 £m £m
Continuing operations: Group operating profit before tax 290 274 Non operating loss before tax (158) (36) Total tax expense (18) (35) Other2 (45) (7) IFRS profit1 from continuing operations 69 196 IFRS profit1 from discontinued operations 1,142 79
Total IFRS profit1 1,211 275
IFRS profit from discontinued operations is discussed in Section 1.3.4
4 Standard Life

Strategic report Governance information
Financial statements Other information
4.90p 5.22p 5.60p 6.02p
9.80p 10.58p 11.43p
FY 2012 FY 2013 FY 2014 H1 2015
Dividend per share
£3.8bn
£2.9bn £2.6bn
FY 2013 FY 2014 H1 2015
Group capital surplus1 Optimising the balance sheet
Group capital surplus Group capital surplus over regulatory requirements decreased to £2.6bn primarily due to a net £0.2bn reduction resulting from the sale of our Canadian business comprising of: The removal of its contribution to Group
surplus of £0.6bn at FY 2014 The return of value to shareholders in
April 2015 of £1.75bn Partially offset by the disposal proceeds
of £2.2bn received in January 2015
The Group capital surplus also reduced following the payment of the final dividend of £224m in May 2015.
Our capital position remains strong and the sensitivity of the Group capital surplus to market volatility has reduced further following the disposal of our Canadian business. The estimated impact on the Group capital surplus from significant market movements, after taking into account management actions appropriate to these stresses, is as follows: 30% fall in equities: Reduction of £0.1bn
(FY 2014: £0.2bn) 100bps rise in yields: Reduction of less
than £0.1bn (FY 2014: £0.1bn) 100bps fall in yields (minimum yields of
zero): Increase of less than £0.1bn (FY 2014: £0.1bn increase)
We expect our capital position to remain strong following implementation of the Solvency II regime.
Liquidity management Standard Life plc holds substantial cash and liquid resources. At 30 June 2015, Standard Life plc held £600m (H1 2014: £419m) of cash and short-term debt securities, £292m (H1 2014: £338m) of bonds and £199m (H1 2014: £nil) of holdings in pooled investment funds managed by Standard Life Investments.
The increase in total Standard Life plc cash and liquid resources at 30 June 2015 was due to the net retained proceeds from the disposal of the Canadian business, consisting of the proceeds received from the disposal less the return of value to shareholders of £1.75bn.
We continue to focus on efficient capital management and cash generation. During H1 2015, subsidiaries remitted £247m to Standard Life plc and we made a final dividend payment of £224m. The Group continues to maintain a strong liquidity position and this was again shown in the stress testing undertaken during H1 2015.
In May 2015, we reduced our syndicated revolving credit facility which we hold as part of our contingency funding plans, to £400m in line with our lower risk profile following the sale of the Canadian business. The maturity date for this facility was extended until 2020 and is currently undrawn.
Dividends We propose an interim dividend of 6.02p per share. This represents an increase of 7.5% per share.
In H1 2015 we paid the 2014 final dividend of £224m (2013: £252m) which was paid on the lower adjusted number of ordinary shares following the share consolidation.
We intend to continue to apply our existing ‘pence per share’ progressive dividend policy taking account of market conditions and our financial performance.
Standard Life plc cash and liquid resources
H1 2015
£m
H1 2014
£m Opening 1 January 657 907 Canada net retained proceeds 459 - Dividends received from subsidiaries 247 546 Cash dividends paid to shareholders (224) (252) Cash investments in subsidiaries (43) (411) Cash investments in associates and JVs (3) (14) Other (2) (19)
Closing 30 June2 1,091 757 2 Liquid resources include uncashed cheque
payments relating to dividends and return of value of £61m (H1 2014: £29m).
1 H1 2015 based on an estimated regulatory position. FY 2014 and FY 2013 based on final regulatory returns.
Standard Life 5

The Group’s reportable segments have been identified in accordance with the way the Group is structured and managed and are as follows:
Continuing operations: Standard Life Investments provide a range of investment products for individuals and institutional clients through a number of different investment vehicles. Investment management services are also provided to the Group’s other reportable segments and through third party relationships. This segment includes Ignis, which was acquired on 1 July 2014 and the Group’s share of the results of HDFC Asset Management Company (HDFC AMC) in India.
Standard Life Investments continues to deliver strong investment performance with total AUM up 2% from FY 2014 to £250bn. The acquisition of Ignis and increase in demand for our higher margin products has contributed to a 51% increase in operating profit.
The UK and Europe segment provides a broad range of long-term savings and investment products and services to workplace and retail customers in the UK, Germany, Austria and Ireland.
UK and Europe operating profit was down 22%, impacted by expected lower spread/risk margin given the current low yield environment and the 2014 Budget changes to the pension regime. AUA of £147.8bn benefited from strong demand for our UK propositions and investment solutions.
The India and China segment (formerly Asia and Emerging Markets) consists of the life insurance joint venture businesses in India (HDFC Life) and China (Heng An Standard Life) and our wholly owned business in Hong Kong. These businesses offer insurance and savings products to customers, with AUA up 4% from FY 2014 to £2.6bn.
Other primarily relates to corporate centre costs and other head office related activities.
Discontinued operations: Following changes in the Group structure and operations in 2014/15, continuing operations for segmental reporting purposes excludes our Canadian business which was sold on 30 January 2015 and our Dubai and Singapore businesses, the closures of which were announced in November 2014 and June 2015 respectively.
Analysis of operating profit1 from continuing operations
Standard Life Investments
UK and Europe
India and China2 Other
Eliminations3
Total continuing operations
H1
2015 H1
2014 H1
2015 H1
2014 H1
2015 H1
2014 H1
2015 H1
2014 H1
2015 H1
2014 H1
2015 H1
2014 £m £m £m £m £m £m £m £m £m £m £m £m
Fee based revenue4 402 288 396 389 23 26 - - (60) (51) 761 652 Spread/risk margin - - 40 79 - - - - - - 40 79 Total income4 402 288 436 468 23 26 - - (60) (51) 801 731 Total operating expenses4,5 (263) (197) (297) (281) (17) (23) (25) (23) 60 51 (542) (473) Capital management - - 8 1 - - (7) (5) - - 1 (4) Share of associates’ and JVs’ PBT 15 11 - - 15 9 - - - - 30 20 Group operating profit before tax 154 102 147 188 21 12 (32) (28) - - 290 274
Underlying adjustments - - 9 - - - - - - - 9 - Group underlying performance 154 102 156 188 21 12 (32) (28) - - 299 274 1 Operating profit is IFRS profit before tax adjusted to remove the impact of short-term market driven fluctuations in investment return and economic assumptions, restructuring costs,
impairment of intangible assets, amortisation of intangible assets acquired in business combinations, profit or loss on the sale of a subsidiary, associate or joint venture and other significant one-off items outside the control of management and not indicative of the long-term operating performance of the Group. The impact of the restructuring of the UK staff pension scheme has been adjusted so that H1 2015 operating profit is based on the expected long-term pension expense, which results in a £20m increase to H1 2015 operating profit before tax and a corresponding increase to H1 2015 non-operating restructuring and corporate transaction expenses – Refer to Note 4.4 of the IFRS condensed consolidated financial information for further information.
2 India and China segment was formerly known as Asia and Emerging Markets. Dubai and Singapore are included in discontinued operations in Section 1.3.4. 3 Eliminations primarily relate to revenue and expenses included in the UK and Europe segment and Standard Life Investments. Therefore, at a Group level an elimination adjustment is
required to remove any duplication. 4 Institutional pension business previously included in both UK and Europe and Standard Life Investments has now been excluded from UK and Europe and is only included in the Standard Life
Investments segment. UK and Europe and eliminations have been adjusted and there is a £nil impact on UK and Europe and Group operating profit. Comparatives have been restated. 5 Total operating expenses comprise acquisition expenses, maintenance expenses and corporate centre costs.
6 Standard Life

1 Excluding strategic partner life business.
‘We are continuing to see the benefits of our expanding distribution capabilities with £5.0bn of net inflows1 from outside the UK.’ Keith Skeoch Chief Executive, Standard Life Investments
Overview Standard Life Investments is a leading active asset manager with total AUM of £250.0bn, representing 83% of Group AUA.
We have developed our capabilities across a range of asset classes, including equities, fixed income, real estate and private equity. We also provide innovative investment solutions, such as high-quality multi-asset and liability aware investments, including our absolute return strategies, and our wealth proposition available through Standard Life Wealth. We remain focused on meeting the needs of our institutional and wholesale clients globally and securing new business backed by consistently strong investment performance and exceptional levels of client service.
We continue to expand our global reach and now have offices in 23 cities worldwide including our Head Office in Edinburgh and regional hubs in Boston and Hong Kong. As well as our own distribution, we also benefit from leveraging our strategic partner relationships in the US, Canada, India, Japan and with Standard Life in the UK.
Our distinctive ‘Focus on Change’ investment philosophy lies at the heart of our wide range of investment funds and solutions. This combined with disciplined risk management and shared commitment to a culture of investment excellence is fundamental to helping our clients look forward to their future with confidence.
Sustainable global growth We continue to invest to drive performance, to further raise our profile and to enhance our infrastructure to support our growth ambitions. We are investing to strengthen the range of investment solutions we offer, including new innovative propositions across the range of asset classes.
The global economy has continued to expand at a moderate pace over the last 12 months despite a slowdown in emerging markets, particularly in China.
Moderate economic growth and strong cost control have allowed companies to expand profits steadily into 2015. The interplay of corporate and macro trends has resulted in investors taking a more selective approach to investment opportunities. In the UK, regulatory change impacting pensions presents ongoing opportunities for us to provide solutions to meet client needs, particularly for our multi-asset suite of products and MyFolio risk based funds.
We continue to recognise that corporate governance along with responsible stewardship of a business’ capital, employees, customers and environment has a fundamental impact on long-term investment returns. Our commitment to socially responsible investing was recently reflected in Standard Life Investments being voted as the leading UK asset management firm in this area at the Extel 2015 Awards.
We remain well positioned to deliver profitable growth. We have a strong pipeline of new investment initiatives which positions us well to continue to meet the changing demands of our clients through new and innovative investment solutions. The integration of Ignis is on track and we expect to achieve £50m of annual cost savings and our EBITDA target of 45% by 2017.
We continue our focus on delivering consistently strong investment performance and strengthening relationships with our global distribution partners.
Standard Life 7

1.3.1 Standard Life Investments continued
Increasing assets
Third party1 AUM above benchmark
1 year 3 years 5 years
95% 97% 79%
Net flows AUM H1 2015 H1 2014 H1 2015 FY 2014 £bn £bn £bn £bn
Wholesale 5.3 2.5 40.6 35.5
Institutional 1.8 1.5 64.6 61.4
Wealth - - 6.3 6.1
Ignis (1.9) - 12.9 14.5
Total third party1 5.2 4.0 124.4 117.5
Standard Life Group (1.2) (1.1) 83.5 84.6
Phoenix Group (2.2) - 42.1 43.8
Total strategic partner life business (3.4) (1.1) 125.6 128.4
Total 1.8 2.9 250.0 245.9
1 Excluding strategic partner life business.
Delivering on our business model
We continue to be one of the five largest asset managers in the UK in both institutional and wholesale markets. We are also ranked as 33rd largest asset manager globally by AUM, up from 56th in 2013.
Investment Performance Growth in AUM was underpinned by excellent money weighted average investment performance. 97% of third party funds were ahead of benchmark over five years, with 95% ahead over three years and 79% over one year.
Fixed income funds continued to perform strongly with 100% of funds ahead of benchmark at three years (one year 45%, five years 94%). Our suite of multi-asset funds has outperformed their cash benchmark over all time periods noted above.
Total AUM increased 2% to £250.0bn (FY 2014: £245.9bn) largely as a result of strong investment performance, positive market movements and good net inflows. AUM comprised third party1 AUM of £124.4bn (2014: £117.5bn) and strategic partner life business AUM of £125.6bn (2014: £128.4bn). Third party1 AUM increased to 50% of total AUM (FY 2014: 48%).
Total net inflows of £1.8bn (H1 2014: £2.9bn) decreased 38% due to higher net outflows from strategic partner life business which, following the acquisition of Ignis on 1 July 2014, includes a mandate to manage assets on behalf of the Phoenix Group. The closed nature of this mandate of insurance business means it is in long-term run-off and these net outflows are expected. Excluding Ignis, total net inflows increased 103% to £5.9bn.
Strong third party1 net inflows of £5.2bn (H1 2014: £4.0bn) largely in our wholesale and institutional businesses were impacted by the disinvestment of one low revenue margin mandate within Ignis third party1. Excluding Ignis, net inflows for third party1 increased 78% to £7.1bn. This result reflects the diverse nature of our product offering, our expanding global distribution capability and the increasingly international nature of our client base.
Third party1 key highlights By channel: We split our business into channels which differ by client base needs and distribution methods:
Wholesale In our Wholesale business, we continued to perform well with net inflows in H1 2015 at £5.3bn (H1 2014: £2.5bn). In particular, inflows into MyFolio, equities, fixed income, real estate and multi-asset strategies remain strong.
Our position in the wholesale market in the UK remains relatively stable with share of gross sales of 4.6% (H1 2014: 4.7%). UK mutual funds AUM increased by 13% to £24.6bn and represents 20% of third party assets.
Institutional Institutional business net inflows were £0.3bn higher than H1 2014 at £1.8bn. Our pipeline of institutional business continues to see fixed income, real estate and multi-asset propositions attract interest.
Wealth Standard Life Wealth continues to develop and as we improve the operating platform, we expect it will start to gain momentum in the market. AUM increased to £6.3bn due to positive market movements.
FY 2013 FY 2014 H1 2015
Total AUM
£245.9bn
Strategic partner life business Third party1
£170.1bn
£250.0bn
£5.2bn
£4.0bn
8 Standard Life

Strategic report Governance information
Financial statements Other information
H1
2015 H1
2014 £m £m Fee based revenue 402 288 Operating expenses (263) (197) Share of associates profit before tax 15 11 Operating profit before tax 154 102 Interest, depreciation, amortisation, FX movements 7 3
EBITDA 161 105
£102m
£154m
H1 2014 H1 2015
Operating profit before tax
+51%
Lowering unit costs
Maximising revenue
Multi-asset 19%
Real estate
6%
Total AUM by asset class
Driving profit
Ignis Our Ignis business, which is mostly institutional in nature, saw net outflows of £1.9bn, following the disinvestment of £1.7bn from one large low revenue margin mandate. The ARGBF net outflows have reduced to £0.2bn in H1 2015 following the £2.6bn net outflow in 2014.
By asset class: In H1 2015, multi-asset continued to have strong net inflows contributing £5.6bn (H1 2014: £2.7bn) as AUM increased to £45.9bn (FY 2014: £38.6bn). MyFolio saw net inflows of £0.9bn (H1 2014: £0.8bn) as AUM increased to £6.9bn (FY 2014: £5.9bn). Net inflows were also achieved in fixed income of £0.4bn (H1 2014: outflow £0.1bn), and £0.2bn in real estate (H1 2014: £0.2bn).
By geography: Continued strong net inflows in North America of £1.5bn (H1 2014: £1.1bn) contributed to AUM reaching £9.7bn (FY 2014: £8.1bn).
We began to see increasing success in Asia Pacific, with net inflows of £0.8bn (H1 2014: £0.1bn). In India, our share of HDFC AM net inflows were good at £0.5bn (H1 2014: £0.4bn). In UK and Europe net inflows increased by 79% to £4.3bn (H1 2014: £2.4bn).
Strategic partner life business key highlights Overall strategic partner life business outflows increased to £3.4bn (H1 2014: £1.1bn) largely due to the inclusion of expected net outflows of £2.2bn from the assets managed on behalf of Phoenix Group which were not acquired until H2 2014. Net outflows from Standard Life Group increased slightly to £1.2bn (H1 2014: £1.1bn). Other key highlights In H1 2015, we successfully converted our award winning Property Income Trust into a Real Estate Investment Trust to ensure greater accessibility and tax efficiency for investors.
Our dedication to meeting clients financial needs resulted in us winning a number of industry awards. These included: Four Lipper Awards for Best Equity
House for Austria, Switzerland, Netherlands and Hong Kong
Our UK Equity Income Unconstrained Fund won the UK Core Equity category at the Institutional Investor Awards
Our Global Equity Income Fund won the Best Smaller Global Equity Income Fund category at the Money Observer awards
DC Investment Manager of the Year at the Professional Pension Awards 2015
Profitability
Operating profit before tax increased 51% to £154m. Key drivers included strong fee revenue growth, £20m contribution from Ignis which was acquired on 1 July 2014 and increased share of profit before tax for HDFC AMC, our associate business, due to increased AUM in H1 2015.
Operating return on equity reduced to 32.0% (H1 2014: 43.9%) while we fully integrate Ignis and reflects a capital injection from Standard Life plc to fund the acquisition.
EBITDA increased to £161m, including £22m contribution from Ignis. Our EBITDA margin of 40% (H1 2014: 36%) remains strong and we are on track to deliver an EBITDA margin of 45% by 2017.
Ongoing management of costs, combined with expansion in revenue margins, has resulted in a 20% compound annual growth in EBITDA over the last 8 years.
Fee based revenue increased by 40%, benefiting £54m from Ignis, performance fees of £8m (H1 2014: £4m), increased AUM and a continued shift in mix towards our higher margin products, including UK mutual funds. We maintained our revenue yield on third party1 AUM at 53bps and the revenue yield for strategic partner life business increased 1bp to 17bps.
Total operating expenses increased by 34% reflecting the increased scale of our business, including £34m operating expenses in Ignis. We continue to see a larger increase in revenue relative to expenses showing our ability to be a scalable business through investment in expanding distribution and geographic reach. We have maintained our operating expenses bps of 22bps and remain on track to deliver £50m cost synergies.
Visit www.standardlife.com/investor for further information on AUA and net flows
1 Excluding strategic partner life business.
Other 14%
MyFolio 3%
Fixed income
33%
Equities 25%
Standard Life 9

Overview Our UK and Europe business is a leading provider of long-term investment savings propositions to workplace and retail customers including self-invested and workplace pensions, drawdown propositions, individual savings accounts, investment bonds and mutual funds. We have the clear objective of being our customers’ first choice for their life savings and aim to achieve this by providing engaging, digital-led solutions with the flexibility to adapt to customers’ needs over their lifetimes.
AUA for our UK and Europe business has grown to £147.8bn. Within this, our market leading workplace pensions have attracted 1.6m customers and AUA of £33.2bn. Growth in our retail business is driven by our award winning Wrap platform, which has £23.3bn of AUA and the highest net sales in the UK advised platform market1. Approximately 25% of our Wrap assets are now managed by Standard Life Investments.
Our close collaboration with Standard Life Investments allows us to engage with customers across the value chain, providing benefit to our customers, our UK business and Standard Life as a whole.
A period of change and opportunity 2015 has seen the implementation of significant new regulations within the UK savings and retirement markets. The pension freedoms effective from 6 April 2015 have provided customers with increased flexibility when accessing income in retirement. This resulted in operational challenges across the industry, with unprecedented levels of customer contact as they sought to understand their options. Many customers with smaller savings pots have withdrawn their cash, reflecting a build-up of demand since the reforms were first announced. We have worked hard to provide a high level of customer service in meeting this demand and believe that our online journey has been a success in helping our customers.
The strength of our drawdown propositions and our award-winning Wrap platform enable us to deal with the new regulations, and to provide customers with the quality and choice to make the most of their retirement.
Whilst the new regulations give customers greater control and flexibility, with increased choice comes complexity. We anticipate a significant increase in demand for financial advice and in response to this are building our own UK-wide financial advice business under the brand 1825 – the year Standard Life was founded. The growth strategy of 1825 includes acquiring progressive financial advice firms aligned to our operating model and building on our existing capabilities. The acquisition of Pearson Jones in the second quarter of 2015 was the first acquisition for this new business.
In a market influenced by regulatory change, our workplace business continues to build scale. Since auto enrolment began in 2012, we have helped over 3,700 employers set up qualifying workplace pension schemes with 680,000 new savers enrolled into these schemes. As the average auto enrolment scheme size reduces, our online Good to Go proposition meets the needs of these employers, processing schemes on the same day as application. This proposition demonstrates the scalability of our business at a time when the industry is facing capacity constraints, securing approximately 2,400 schemes to date.
In response to the Department for Work and Pensions price cap, all of our qualifying workplace pension schemes became fully compliant with the new regulations before the April 2015 deadline.
In the July 2015 UK Budget, the Chancellor announced a Green Paper consultation on pension tax relief. As a leading provider of long-term savings, we will engage constructively in the debate to ensure positive customer outcomes.
The challenges arising from a prolonged low interest rate environment have been felt in a number of European jurisdictions. In Germany, we believe the level of guarantees typically provided by insurers have become unsustainable. As a result our German business with-profits book is no longer open to new business. Whilst supporting our existing customers, focus now moves to the sale of our unit linked products.
‘We have the clear objective of being our customers’ first choice for their life savings and aim to achieve this by providing engaging, digital-led savings with the flexibility to adapt to customers’ needs over their lifetimes.’ Paul Matthews Chief Executive, UK and Europe
10 Standard Life

Strategic report Governance information
Financial statements Other information
Increasing assets
Net flows AUA H1 2015 H1 2014 H1 2015 FY 2014 £bn £bn £bn £bn UK retail new fee business 1.8 1.5 40.4 37.3 UK retail old fee business (1.2) (1.1) 33.4 33.5 Workplace2 1.1 0.9 33.2 32.0
UK retail and workplace fee business 1.7 1.3 107.0 102.8 Conventional with profits (0.4) (0.5) 1.7 2.1 UK spread/risk (0.5) (0.4) 14.9 15.5 Assets not backing products - - 6.8 7.7 UK total 0.8 0.4 130.4 128.1 Europe fee 0.5 0.6 16.9 17.2 Europe spread/risk - - 0.5 0.6 Europe total 0.5 0.6 17.4 17.8 Total UK and Europe 1.3 1.0 147.8 145.9 1 Highest net sales in Q1 2015, source Fundscape.
2 In H1 2015, UK corporate assets have been renamed as workplace.
FY 2013 FY 2014 H1 2015
Wrap AUA
£16.6bn
£20.9bn £23.3bn
Delivering on our business model
UK and Europe AUA increased by 1% to £147.8bn. Fee based AUA which accounts for 85% of total AUA increased by 3% to £125.6bn, benefiting from a combination of net inflows and favourable market movements.
Net inflows of £1.8bn (H1 2014: £1.5bn) into our UK retail new propositions which include SIPP and Wrap were driven by a 16% increase in gross inflows to £3.6bn (H1 2014: £3.1bn).
Our Wrap platform continues to lead the UK advised platform market1 with AUA increasing 11% to £23.3bn. In 2015 we have added 65 new firms to the platform and now have 1,405 firms using our Wrap platform.
SIPP AUA rose to £28.3bn (FY 2014: £26.2bn) with £12.9bn (FY 2014: £11.5bn) of assets invested in our market-leading drawdown proposition.
Our UK retail old business saw a 9% increase in net outflows to £1.2bn with customers postponing investment decisions in H1 2014 to take advantage of the new pension freedoms from 6 April 2015.
We engage with our customers who are approaching retirement or have maturing policies to ensure they are equipped to make informed decisions. This is valued by our customers with many choosing to
continue saving with us. We continue to benefit from ongoing increments, customers transferring to our UK retail new propositions and positive market movements.
UK workplace pension AUA increased 4% to £33.2bn. Although the large employer market remains subdued, net inflows increased to £1.1bn (H1 2014: £0.9bn). Growing contributions into our existing schemes and our success in attracting new flows through auto enrolment has resulted in a 15% increase in regular premiums. Our workplace business continues to add new customers through auto enrolment, enrolling approximately 120,000 new customers in H1 2015 (H1 2014: 180,000).
UK spread/risk AUA decreased to £14.9bn (FY 2014: £15.5bn), with net outflows of £0.5bn (H1 2014: £0.4bn) as annuity sales were impacted by the changes to retirement regulations in the 2014 UK Budget.
In our Europe business fee based AUA decreased by 2% to £16.9bn due to adverse foreign exchange movements partly offset by net inflows of £0.5bn (H1 2014: £0.6bn). In Germany net inflows from unit linked business doubled, with the proportion of net inflows from unit linked business rising to 19% (H1 2014: 9%).
Visit www.standardlife.com/investor for further information on AUA and net flows
H1 2013 H1 2014 H1 2015
£147.8bn
£135.1bn
UK and Europe AUA and net flows
£145.9bn
£1.3bn £1.0bn
£0.2bn
AUA at 31 December H1 net flows
AUA at 30 June
Standard Life 11

1.3.2 UK and Europe continued
Maximising revenue
Lowering unit costs
UK operating expense bps
FY 2013 FY 2014 H1 2015
41bps
43bps
42bps
Profitability UK Europe UK and Europe H1 2015 H1 2014 H1 2015 H1 2014 H1 2015 H1 2014 £m £m £m £m £m £m
Fee based revenue 314 303 82 86 396 389 Spread/risk margin 38 75 2 4 40 79 Total income 352 378 84 90 436 468 Operating expenses (219) (214) (78) (67) (297) (281) Capital management 8 1 - - 8 1 Operating profit before tax 141 165 6 23 147 188 Underlying adjustments1 - - 9 - 9 - Underlying performance 141 165 15 23 156 188 1 Relating to shareholder support provided to the German with-profits business and is included in operating expenses.
Driving profit H1 2014 H1 2015
-22%
UK & Europe operating profit before tax
£188m
£147m
UK and Europe operating profit before tax reduced by 22% to £147m with underlying performance decreasing by 17% to £156m. Operating return on equity decreased to 13.0% (H1 2014:19.8%) reflecting the decrease in operating profit after tax to £129m (H1 2014: £157m) and higher opening shareholder net assets.
UK operating profit reduced by £24m to £141m, as strong growth in fee business was more than offset by a spread/risk margin reduction which included lower contribution from asset and liability management as expected.
Europe operating profit reduced by £17m to £6m and includes a £9m impact of shareholder support provided to the German with-profits business. This is a one-off contribution as we no longer write new with- profits business in Germany. Europe underlying performance was lower by 35% at £15m with a reduced benefit from asset and liability management, changes in actuarial reserves and adverse foreign exchange movements.
UK fee based revenue increased by 4% to £314m benefiting from higher AUA as a result of positive market movements and retail new and workplace net inflows. This includes growing inflows into Standard Life Investments’ MyFolio fund range, which now accounts for £6.0bn of MyFolio AUA and continues to secure additional revenue for the Group. We also continue to benefit from retention activity on our retail old propositions. Average fee revenue yield reduced to 61bps (FY 2014: 62bps) reflecting the impact of changes in business mix including a growing proportion of newer style propositions as well as a £6m reduction in revenue earned on client cash balances.
Our Active Money Personal Pension product has been updated with drawdown capability, delivering for customers who require a simplified means of accessing income in retirement. This will generate long-term revenue from the customers who continue to save with us.
UK spread/risk margin which mainly relates to our annuity business decreased by 49% to £38m. This included the expected £26m reduction in the benefit from asset and liability management, as fewer opportunities for more effective management of our assets exist in the current low yield environment. This was accompanied by a reduction in the new business margin by £9m to £4m, caused by a 66% reduction in annuity sales as a result of the 2014 Budget changes.
UK operating expenses increased 2% to £219m, due to higher fees paid to Standard Life Investments, in line with higher AUA. Expressed as a proportion of average AUA, operating expenses decreased to 41bps (FY 2014: 42bps) as we continue to benefit from the scalability of our business model and cost discipline.
Our investment in technology has allowed further process automation and customer self-service which has helped to lower unit costs. Examples of our progress include: Our ability to process the Good to Go
schemes on the same day as application demonstrating the scalability of our business at a time when the industry is facing capacity constraints
Our online Retirement Pathfinder & Calculator tools launched in 2015 enabling customers to explore how to make best use of the new pension rules
Our new online journey allows customers to access their savings on a fully self-serve basis. Since April, approximately 64,000 customers have used our online journey to explore their options.
H1 2013 H1 2014 H1 2015
UK fee based revenue
£292m
£303m
£314m
12 Standard Life

H1 2013 H1 2014 H1 2015
AUA and net flows
£1.9bn
£139m
£2.5bn
£138m
£2.6bn
£150m
Increasing Assets
Driving profit
Overview Our India and China segment consists of our life joint ventures in India and China and our wholly owned business in Hong Kong. We announced the closure of our businesses in Dubai in November 2014 and Singapore in June 2015. Subject to regulatory approvals, Singapore will close by the end of 2015. Further details are included in our discontinued operations segment in Section 1.3.4 on the next page.
HDFC Life, our life joint venture business in India, is one of the leading private life insurance companies in the market. It provides 20 million customers with innovative needs-based insurance and savings solutions.
In China, our joint venture Heng An Standard Life, continues to build a sustainable business by offering a range of insurance and savings products to a large customer base.
In Hong Kong, we continue to evolve our propositions to meet the needs of the growing affluent and wealth segments both in Hong Kong and cross-border from mainland China.
Continued focus in Asia We continue to support the development of our operations in India and China, including identifying opportunities across Asia that can benefit our wider Group, including asset management opportunities for Standard Life Investments.
Following the passing of the Insurance Laws (Amendment) Act by the Indian Parliament in March 2015, we are in discussions with our JV partner regarding a potential increased stake in HDFC Life. India is a highly attractive growth market and we continue to maintain a long-term commitment to India and HDFC Life.
Heng An Standard Life has seen continued growth in sales in 2015 building on momentum from 2014. Management continues to focus on growing productivity levels of its in-house agency sales force.
A new regulatory environment came into effect on 1 January 2015 in Hong Kong, which banned advance payment of commission on all investment-linked products and has impacted the market significantly. We are supportive of these changes in creating a more professional advisory marketplace but it will take time for the market to adjust and we are also adapting our propositions in light of these changes.
Delivering on our business model1
Total AUA increased to £2.6bn, due to a 5% increase for our joint venture businesses to £2.2bn (FY 2014: £2.1bn). Wholly owned operations AUA remained stable at £0.4bn. The growth in AUA was driven by continued positive net inflows in our joint venture businesses of £119m (H1 2014: £102m) with our joint venture in India maintaining their market leading position within the private market. In Hong Kong, net inflows decreased to £31m (H1 2014: £36m). New propositions are under development to drive asset growth in the new market landscape.
Operating profit before tax increased to £21m (H1 2014: £12m) mainly driven by an increase in our joint venture businesses profit to £15m (H1 2014: £9m) as they benefit from continued growth in premium income. Hong Kong operating profit increased to £6m (H1 2014: £3m) due to the timing of project related expenses and changes in product mix.
Operating return on equity for the India and China segment increased to 15.6% (H1 2014: 13.9%) reflecting higher operating profit.
Through development of new online products and technology, HDFC Life has achieved a market-leading share of online sales. Heng An Standard Life has increased sales through its core distribution channel by over 30%.
Successful management of expenses has resulted in HDFC Life reporting one of the lowest operating expense ratios among its peer group. Hong Kong continues to manage costs whilst investing in new propositions in response to changes in regulation.
Other financial information Following regulatory change in Hong Kong a review of expense and reserving assumptions was undertaken which resulted in a £46m non-operating loss being recognised, primarily relating to impairment of deferred acquisition costs.
H1 2014 H1 2015
Operating profit before tax
£12m
£21m
1 Financial results reflect our share of the joint ventures comprising 26% of HDFC Life and 50% of Heng An Standard Life.
AUA at 30 June
H1 net flows
Maximising Revenue
Lowering unit costs
+75%
AUA at 31 December
Standard Life 13

Sale of the Canadian business On 30 January 2015, we successfully concluded the sale of the Canadian business to Manulife for a fixed consideration of C$4.0bn (£2.2bn including related hedging derivative contracts). We recognised a gain on disposal of £1,097m.
The sale of our Canadian business was significant for the Group, and reaffirms our continued focus on growing fee based business, whilst reducing our exposure to spread/risk business. In addition, the expanded relationship with Manulife deepens Standard Life Investments’ ongoing access to Canadian, and wider global, distribution.
IFRS profit after tax for the Canadian business, which in H1 2015 included the results for the month of January, was £45m (H1 2014: £79m) excluding the gain on sale. The result mainly benefited from favourable short-term fluctuations on investment return of £63m due to large yield movements in the month, offset by a £20m tax expense.
Dubai and Singapore The regulatory landscapes in the markets in which we operate in Asia have changed significantly in the past 12 months and we have responded by reviewing our strategy. Our increasing focus in Asia is building on our relationships with our India and China joint venture partners, expanding our asset management presence through Standard Life Investments and growing our wholly owned business in Hong Kong. As a result, we announced the closure of the Dubai business in November 2014 and Singapore in June 2015. Subject to regulatory approvals, Singapore will close by the end of 2015.
For segmental reporting the discontinued operations segment includes results for Dubai and Singapore. Singapore made an operating loss before tax of £2m (H1 2014: loss £3m) and a £38m non-operating loss (H1 2014: £nil) relating to closure costs. The Dubai business closed at the start of 2015 and therefore made an operating loss before tax of £nil (H1 2014: loss £3m).
Find out more about the gain on sale in Note 4.2 in the Financial statements section
H1 2014 H1 2015
Canada IFRS profit after tax
£79m £45m
£1,097m
Gain on sale
£1,142m
14 Standard Life

Our approach to risk Strong risk management is at the core of how we deliver our strategic objective to be a leading customer-centric business, focused on long-term savings and investments.
As we expand our global reach we continue to manage a range of different risks across the Group. This includes risks that affect both the Group as a whole – such as regulatory risks, and risks that are more relevant to specific parts of the Group – for example the agency risks associated with managing third party funds within our asset management business. Wherever a risk is managed we apply the same consistent risk framework.
Our approach to risk ensures well informed risk-reward decisions are taken in pursuit of the Group’s strategy and business plan objectives. This ensures capital is delivered to areas where the most long term value can be created for the risks taken.
Management of risk Our Group Enterprise and Risk Management (ERM) Framework governs our risk based approach to managing our business. Our systems of governance, of which our ERM is a key part, support oversight of risk at the highest levels of the Group, across our Executive and Board committees.
Our framework has developed and been embedded over several years. The increasing strength of our risk management approach was externally recognised in May 2015 when Standard & Poor’s upgraded their assessment of our ERM framework to ‘strong’.
Updates to our principal risks There have been no material changes to our principal risks during H1 2015. Whilst not new risks, we have now chosen to explicitly separate strategic and conduct risks as principal risks in their own right.
In the case of conduct risk this reflects the importance that we place on ‘doing the right thing’. It is essential that we continue to have a strong focus in this area particularly as we develop new relationships with customers, for example through 1825, our new UK advice business. Earlier this year we launched our new group-wide Code of Conduct, which reinforces across the Group, a culture that at Standard Life we seek to do the right thing in every action we take.
During H1 2015, Standard Life’s strategic delivery has continued, for example with the completion of the sale of our Canadian business. Including strategic risk as a separate principal risk reflects the importance to the Group that we continue to make strong and successful decision making in this area.
Over the remainder of 2015 we expect continued focus on regulatory changes, including the implementation of Solvency II and developments in the market following the pension freedoms.
Visit www.standardlife.com/investor/financial_reports for further information about our ERM framework in our Annual report and accounts 2014
‘At Standard Life, our risk culture is at the core of how we operate and run our business. Risk is at the forefront of decisions we take as an organisation and drives important discussions in the Boardroom and throughout the business.’
Raj Singh Chief Risk Officer
Find out more about our risk management in Note 4.12 in the Financial statements section
Standard Life 15

1.4 Principal risks and uncertainties continued
Principal Risk The risk in our business How we manage the risk
Strategic Risk
Strategic risk arises from our choice of strategy and direction, and the actions we take to implement these. The risk arises if our strategic decisions do not maximise shareholder value. During H1 2015 we have made a number of important strategic decisions, for example we launched 1825 (our new UK advice business), stopped selling new German with profits business, continued the global expansion of our asset management business, decided to close our Singapore business and also completed the sale of our Canadian business.
Through our ERM framework, a pro-active approach to risk is at the forefront of strategic decisions we take as a business. We have experienced leadership teams throughout the organisation which ensure this risk is managed and mitigated. Additionally, business plans are challenged and stressed to understand sensitivities, and actual experience is managed against plans.
Customer Demand Risk
Delivering our strategic objectives relies on increasing net new business flows by attracting new and retaining existing institutional, wholesale, workplace and retail customers across Standard Life Group. If we are not successful, fee based revenue would reduce or be lower than planned. A fall in customer demand could be triggered by a range of events including a fall in demand for long-term savings products, poor persistency, propositions/funds that don’t meet customer needs and poor investment performance.
Standard Life focuses on being a customer-centric business, meeting our customers’ needs and developing propositions that build trust and long-term relationships with customers, to ensure the ongoing demand for our propositions and products. Our asset management business aims to attract and retain customers by delivering consistently strong investment performance across a broad investment range, operating through a variety of distribution channels and geographic locations. The Ignis acquisition deepens our investment capabilities in addition to organically developing a wider offering such as commercial real estate lending and infrastructure lending.
Market Risk
We seek to maximise shareholder value by taking specific market risks which provide an appropriate level of risk-adjusted returns. Fee based revenue, a key driver of our profitability, is exposed to fluctuations in the market values of the underlying investments. Market risks in our UK and German with profits funds, such as the funds interest rate exposure, continue to be managed. We seek to maximise the expected risk-adjusted return of the assets backing our spread-risk business, shareholder equity and subordinated debt by primarily investing in credit assets.
Through our Group risk appetite framework we set risk appetites for market risks and our exposures are managed in line with these. We use our stress and scenario testing program to understand our sensitivities to market parameters and identify any mitigating actions. Our credit risk management policy plays a key role in ensuring the quality of our asset portfolios, which includes setting portfolio limits such as sectors and credit ratings. We set asset benchmarks appropriate to their liabilities and cash flow match where appropriate.
Regulatory Risk
Our business is required to comply with the regulatory requirements that are in-force in the countries and regions in which we choose to operate. As we increase the number of countries we operate in, this in turn increases the regulatory regimes with which we must comply. In addition to the risk of failing to comply with current requirements, regulations continually undergo change. In recent years our industry has needed to adapt to a high volume of regulatory change, which we expect to continue. For example, in the July 2015 UK Budget the Chancellor announced a Green Paper for consultation on the tax treatment of pensions, which could potentially lead to further changes to the pension landscape. The main risk comes from any non-compliance, but regulatory change can give rise to additional costs, complexity and opportunity costs within our business.
Ensuring the ongoing compliance with regulations is governed via our Group policy framework. We are pro-active at building strong and open relationships with our regulators. We seek to engage early with regulatory change and capitalise on any opportunities that arise in the best interests of our customers and stakeholders. Our emerging risk process looks at potential and future regulatory changes and risks to our business. Any risks identified are continually monitored and appropriate mitigation plans put in place.
16 Standard Life

Strategic report Governance information
Financial statements
Other information Principal Risk The risk in our business How we manage the risk
Conduct Risk
Conduct risk arises from our business not acting in the right way, including any actions that do not treat our customers with consideration and fairness. It can lead to material financial and reputational losses. From a regulatory perspective there is a strong focus on conduct risk. For example, the Financial Conduct Authority (FCA) is currently carrying out a range of thematic reviews across the industry. As a leading savings and investments provider we have been asked to participate in a number of these. Our conduct risk exposure continues to evolve. The sales and advice practices of our new UK advice business 1825 will need to be suitable and appropriate for each of its customers. Conduct is also a key risk for our asset management business, which includes ensuring that assets are managed in the best interests of customers at all times.
We continue to carefully manage and be pro-active with conduct risk. We have launched our new Group Code of Conduct across Standard Life to ensure our business always seeks to do the right thing in every action we take. Our conduct risk policy ensures the standards and outcomes we set are implemented across the business. Our business works closely with the FCA, providing any information requested as required. Our new conduct and compliance risk centre strengthens oversight of conduct exposures and risks.
Political Risk
The heightened and continued political focus on the financial services industry exposes our business and propositions to change and uncertainties. Additionally, such focus can have a negative impact on the perception of our industry. As a Scottish based company with a large number of customers across the UK and Europe, the devolution of powers in Scotland, as well as the expected referendum on the UK’s membership of the EU, all contribute to the risk of political uncertainty our Group faces. The political environment in which we operate can impact our business in different ways, from how competitive we can be, our cost base or direct impacts on our customers and stakeholders.
The political risks that we are exposed to are closely monitored. We are pro-active and engage with the political change process in the best interests of our customers and stakeholders. Political risks often form part of our stress and scenario testing program and our emerging risk process, helping us to understand the risks that could evolve. We maintain appropriate contingency plans and these are reviewed with changes to our business and the environment in which we operate.
Change Programme Risk
Successful businesses need to innovate and evolve. The Group runs a significant change programme with key changes this period including the integration of Ignis, launch of 1825 and the changes we have put in place to respond to pension freedoms. Additionally, our asset management business continues to invest, grow and upgrade its capabilities. The key risk relates to our execution of the change both in terms of cost and timing, which could lead to additional costs and ultimately impacts the delivery of our strategy.
Change management forms part of our operational risk management framework which provides a robust and established framework under which change is managed, reported and implemented across the Group. Our business has vast experience of successfully responding and adapting to change and developing market-leading propositions for customers.
Outsourcing Risk
The Group uses a number of outsourcing partners, some of which are integral to running our business. These include those partners who support the back office functions within our asset management business and our fund platforms for our savings business. Outsourcing enables us to benefit from specialist services and skills and enable our business to run more efficiently. However, this means that we are exposed to the risk of the failure of our outsourcing partners. This could have a material impact on our ability to run our business and lead to significant costs and disruption whilst we put in place alternative arrangements.
Our Group policy framework includes an outsourcing policy which sets out the standards that must be complied with. These include the monitoring and management of material risks and maintaining a remedial plan in the event of failure of any services. The risks arising from our key outsourcing partners are well understood. These risks form part of our stress testing processes which help us to understand the impact of their failure and how we would continue to operate under such circumstances. There is a rigorous risk approval process which must be completed before any new outsourcing partners are used. This includes putting in place risk mitigation plans, which are reviewed annually.
Standard Life 17

1.4 Principal risks and uncertainties continued
Principal Risk The risk in our business How we manage the risk
IT Failure & Security Risk
The Group uses a range of systems to serve its customers and operate its business. These are exposed to the risk of failure. The implementation of our strategy includes greater use of technology, for example via our online propositions, which increases our exposure to security risks such as fraud and cyber-attacks. As we increase our global brand awareness, our higher profile can also lead to greater risk. The crystallisation of any of these risks could mean that we are unable to deliver our services to clients and customers, cause reputational damage and lead to remedial costs.
We invest in our IT infrastructure and continually improve our processes to mitigate operational failings. We are proactive in our defensive approach to any security threats, including educating our staff around these issues. We actively ensure appropriate contingency plans are in place as secure and robust systems are key to achieving our strategic objectives. We monitor evolving security threats and work with specialist third parties and information sharing partnerships to better understand the risks and develop our response to them.
Longevity Risk
Longevity risk is the risk that people live longer than expected leading to increases to the value of our liabilities. This is an exposure we actively take onto our balance sheet via our annuity propositions. We believe we can create value for our shareholders by taking and managing this risk. We have a large number of existing annuity customers but the growth of this business line is expected to slow following the introduction of pension freedoms in the UK.
Our longevity risk exposure is actively monitored and managed within our risk appetites framework. We have a robust internal governance process for setting our longevity assumptions and use the latest internal and external data sources. We have a reinsurance arrangement in place with Canada Life which transfers a material part of our longevity risk exposure. The business actively monitors opportunities to implement further reinsurance or capital market transactions to reduce the exposure on our balance sheet.
Counterparty Risk
Across the Group we use a number of credit and reinsurance counterparties to implement our business strategy. This exposes our business to losses if they fail to meet their obligations to us. Credit failings in financial markets could affect our AUA and hence our fee based revenue. Other credit events could see the decline of asset values through defaults or financial losses from the failure of a bi-lateral counterparty, such as our longevity risk reinsurer.
Exposures are pro-actively monitored with mitigation action taken where necessary. Our business has a strong record of this, for example, removing exposure to Eurozone peripheral economies during the credit crisis. Counterparties are collateralised and internal credit assessments are used where appropriate. A credit risk management framework is in place across the Group and is managed and implemented by the Group Credit Risk Committee. This policy sets out the requirements for any credit risk exposure, including the required quality and diversification of assets. Exposures are further mitigated by Standard Life Investments active management of credit assets under management.
18 Standard Life

Overview Our Strategic report for the period to 30 June 2015 has been prepared in line with the Disclosure and Transparency Rules (DTR) issued by the FCA. The DTR incorporates the requirement of the European Union (EU) Transparency Directive for all UK listed companies to report their half year results in accordance with IAS 34 Interim Financial Reporting. Under DTR 4.2.7R, the Group is required to provide at least an indication of important events that have occurred during the first six months of the financial year, and their impact on the financial information, and a description of the principal risks and uncertainties for the remaining six months of the financial year. Principal risks and uncertainties are detailed in Section 1.4 – Principal risks and uncertainties and Note 42 of the Group’s Annual report and accounts 2014. Under DTR 4.2.8R the Group is also required to make certain related party disclosures. These are contained in Note 4.17 of the IFRS condensed consolidated financial information. To provide clear and helpful information, we have also considered the voluntary best practice principles of the Reporting statement: Operating and Financial Review (OFR) issued by the Accounting Standards Board (ASB) in 2006 and Guidance on the Strategic report issued by the Financial Reporting Council in 2014.
The Group’s IFRS condensed consolidated half year financial information has been prepared in accordance with IAS 34 Interim Financial Reporting, as endorsed by the EU. However, our Board believes that non-Generally Accepted Accounting Principles (non-GAAP) measures, which have been used in the Strategic report, are useful for both management and investors and make it easier to understand our Group’s performance. The most important non-GAAP measures in the Strategic report include operating profit, assets under administration and underlying cash generation.
All non-GAAP measures should be read together with the Group’s IFRS condensed consolidated income statement, IFRS condensed consolidated statement of financial position and IFRS condensed consolidated statement of cash flows, which are presented in the IFRS condensed consolidated financial information in Section 4 of this report.
Going concern After making appropriate enquiries, the Directors have a reasonable expectation that the Company and the Group as a whole have adequate resources to continue in operational existence for the foreseeable future. For this reason, they continue to adopt the going concern basis in preparing the financial information.
IFRS reporting The financial results, which are unaudited at the half year, are prepared on an IFRS basis. All EU-listed companies are required to prepare consolidated financial statements using IFRS issued by the International Accounting Standards Board (IASB) as endorsed by the EU. The IFRS financial results in the Strategic report and in Section 4 have been prepared on the basis of the IFRS accounting policies applied by the Group in the Annual report and accounts 2014 as amended for new standards effective from 1 January 2015, as described in Note 4.1 – Accounting policies.
Group operating profit The H1 2015 reconciliation of consolidated operating profit to IFRS profit for the period, presented in Section 4 of this report, presents profit before tax expense attributable to equity holders adjusted for non-operating items. Further details on the calculation of Group operating profit is presented in the Group accounting policies (jj) – Operating profit in the Annual report and accounts 2014. By presenting our results in this way, the Directors believe they are presenting a more meaningful indication of the underlying business performance of the Group.
Forward-looking statements This document may contain ‘forward-looking statements’ about certain of the Standard Life Group’s current plans, goals and expectations relating to future financial conditions, performance, results, strategy and objectives. Statements containing the words: ‘believes’, ‘intends’, ‘targets’, ‘estimates’, ‘expects’, ‘plans’, ‘seeks’ and ‘anticipates’ and any other words of similar meaning are forward-looking. By their nature, all forward-looking statements involve risk and uncertainty because they relate to future events and circumstances which may be beyond the Group’s control. As a result, the Group’s actual financial condition, performance and results may differ materially from the plans, goals and expectations set out in the forward-looking statements, and persons receiving this document should not place undue reliance on forward-looking statements. The Standard Life Group undertakes no obligation to update any of the forward-looking statements in this document or any other forward-looking statements it may make.
Standard Life 19

2. Statement of Directors’ responsibilities
2. Statement of Directors’ responsibilities
Each of the Directors, whose names and functions are listed on the Standard Life plc website, www.standardlife.com, confirms to the best of his or her knowledge that:
1. The International Financial Reporting Standards (IFRS) condensed consolidated income statement, the IFRS condensed consolidated statement of comprehensive income, the IFRS condensed consolidated statement of financial position, the IFRS condensed consolidated statement of changes in equity and the IFRS condensed consolidated statement of cash flows and associated notes, which have been prepared in accordance with IAS 34 Interim Financial Reporting as endorsed by the European Union, give a true and fair view of the assets, liabilities, financial position and profit of the Company and the undertakings included in the consolidation taken as a whole as required by DTR 4.2.4R
2. The Strategic report includes a fair review of the information required by DTR 4.2.7R, namely important events that have occurred during the period and their impact on the condensed consolidated financial information, as well as a description of the principal risks and uncertainties faced by the Company and the undertakings included in the consolidation taken as a whole for the remaining six months of the financial year
3. The Strategic report and the notes to the condensed consolidated financial information include a fair review of the information required by DTR 4.2.8R, namely material related party transactions that have occurred during the period and any material changes in the related party transactions described in the last annual report
4. As per provision C1 of the UK Corporate Governance Code, the Half year results 2015, taken as a whole, present a fair, balanced and understandable position of the Company’s prospects
Changes to Directors As previously announced, John Paynter retired as a non-executive Director on 28 April 2015. David Grigson retired as a non-executive Director at the conclusion of the Company’s Annual General Meeting on 12 May 2015 and David Nish will stand down as an executive Director on 5 August 2015.
By order of the Board
Sir Gerry Grimstone Chairman 4 August 2015
Luke Savage Chief Financial Officer 4 August 2015
20 Standard Life

Strategic report Governance information
Financial statements Other information
3. Independent review report to Standard Life plc
Report on the interim financial information Our conclusion We have reviewed the IFRS condensed consolidated interim financial information (the ‘interim financial information’), defined below, in the Half year results of Standard Life Plc for the six months ended 30 June 2015.
Based on our review, nothing has come to our attention that causes us to believe that the interim financial information is not prepared, in all material respects, in accordance with International Accounting Standard 34 as adopted by the European Union and the Disclosure and Transparency Rules of the United Kingdom's Financial Conduct Authority.
This conclusion is to be read in the context of what we say in the remainder of this report.
What we have reviewed The interim financial information, which is prepared by Standard Life plc, comprises: • The IFRS condensed consolidated statement of financial
position as at 30 June 2015 • The IFRS condensed consolidated income statement and
IFRS condensed consolidated statement of comprehensive income for the period then ended
• The IFRS condensed consolidated statement of changes in equity for the period then ended
• The IFRS condensed consolidated statement of cash flows for the period then ended
• The notes to the IFRS condensed consolidated interim financial information
As disclosed in Note 4.1, the financial reporting framework that has been applied in the preparation of the full annual financial statements of the group is applicable law and International Financial Reporting Standards (IFRSs) as adopted by the European Union.
The interim financial information included in the Half year results has been prepared in accordance with International Accounting Standard 34, Interim Financial Reporting, as adopted by the European Union and the Disclosure and Transparency Rules of the United Kingdom's Financial Conduct Authority.
What a review of interim financial information involves
We conducted our review in accordance with International Standard on Review Engagements (UK and Ireland) 2410, ‘Review of Interim Financial Information Performed by the Independent Auditor of the Entity’ issued by the Auditing Practices Board for use in the United Kingdom. A review of interim financial information consists of making enquiries, primarily of persons responsible for financial and accounting matters, and applying analytical and other review procedures.
A review is substantially less in scope than an audit conducted in accordance with International Standards on Auditing (UK and Ireland) and, consequently, does not enable us to obtain assurance that we would become aware of all significant matters that might be identified in an audit. Accordingly, we do not express an audit opinion.
We have read the other information contained in the Half year results and considered whether it contains any apparent misstatements or material inconsistencies with the information in the interim financial information.
Responsibilities for interim financial information and the review Our responsibilities and those of the Directors The Half year results, including the interim financial information, are the responsibility of, and has been approved by, the Directors. The Directors are responsible for preparing the Half year results in accordance with the Disclosure and Transparency Rules of the United Kingdom's Financial Conduct Authority.
Our responsibility is to express to the Company a conclusion on the interim financial information in the Half year results based on our review.
This report, including the conclusion, has been prepared for and only for the Company for the purpose of complying with the Disclosure and Transparency Rules of the Financial Conduct Authority and for no other purpose.
Standard Life 21

3. Independent review report to Standard Life plc continued We do not, in giving this conclusion, accept or assume responsibility for any other purpose or to any other person to whom this report is shown or into whose hands it may come save where expressly agreed by our prior consent in writing.
PricewaterhouseCoopers LLP Chartered Accountants Edinburgh 4 August 2015
(a) The maintenance and integrity of the Standard Life plc website is the responsibility of the Directors; the work carried out by the auditors does not involve consideration of these matters and, accordingly, the auditors accept no responsibility for any changes that may have occurred to the financial statements since they were initially presented on the website.
(b) Legislation in the United Kingdom governing the preparation and dissemination of financial statements may differ from legislation in other jurisdictions.
22 Standard Life

Strategic report Governance information
Financial statements Other information
4. Financial statements IFRS condensed consolidated income statement For the six months ended 30 June 2015
6 months
2015
6 months 2014
restated1 Full year
2014 Notes £m £m £m
Revenue
Gross earned premium 1,162 1,227 2,404 Premium ceded to reinsurers (27) (32) (61) Net earned premium 1,135 1,195 2,343 Investment return 3,956 4,504 13,179 Fee and commission income 540 424 985 Other income 37 36 81 Total revenue 5,668 6,159 16,588 Expenses Claims and benefits paid 2,254 2,190 4,389 Claim recoveries from reinsurers (260) (270) (533) Net insurance benefits and claims 1,994 1,920 3,856 Change in reinsurance assets and liabilities 296 76 (60) Change in insurance and participating contract liabilities (814) 1,037 3,834 Change in unallocated divisible surplus (134) 4 (71) Change in non-participating investment contract liabilities 2,877 1,582 5,362 Expenses under arrangements with reinsurers (13) 242 639 Administrative expenses
Restructuring and corporate transaction expenses 4.4 48 27 106 Other administrative expenses 792 634 1,430
Total administrative expenses 4.4 840 661 1,536 Change in liability for third party interest in consolidated funds 396 278 758 Finance costs 40 49 98 Total expenses 5,482 5,849 15,952 Share of profit from associates and joint ventures 24 22 36 Profit before tax 210 332 672 Tax expense attributable to policyholders’ returns 4.5 89 91 250 Profit before tax expense attributable to equity holders’ profits 121 241 422 Total tax expense 4.5 107 126 292 Less: Tax attributable to policyholders’ returns 4.5 (89) (91) (250) Tax expense attributable to equity holders’ profits 4.5 18 35 42 Profit for the period from continuing operations 103 206 380 Profit for the period from discontinued operations 4.2 1,142 79 127 Profit for the period 1,245 285 507 Attributable to: Equity holders of Standard Life plc
From continuing operations 69 196 376 From discontinued operations 1,142 79 127
Equity holders of Standard Life plc 1,211 275 503 Non-controlling interests 34 10 4 1,245 285 507 Earnings per share from continuing operations Basic (pence per share) 4.6 3.2 8.3 15.8 Diluted (pence per share) 4.6 3.2 8.2 15.7 Earnings per share Basic (pence per share) 4.6 56.7 11.6 21.1 Diluted (pence per share) 4.6 56.6 11.5 21.0 1 Comparatives for the six months ended 30 June 2014 have been restated to reflect the classification of the Group’s Canadian business as discontinued operations.
Refer to Note 4.2 – Acquisitions and disposals.
The Notes on pages 31 to 71 are an integral part of this IFRS condensed consolidated financial information
Standard Life 23

4. IFRS condensed consolidated primary statements continued
IFRS condensed consolidated statement of comprehensive income For the six months ended 30 June 2015
6 months
2015
6 months 2014
restated1 Full year
2014 Notes £m £m £m
Profit for the period 1,245 285 507
Less: Profit from discontinued operations 4.2 (1,142) (79) (127)
Profit from continuing operations 103 206 380
Items that will not be reclassified subsequently to profit or loss:
Remeasurement gains on defined benefit pension plans 70 4 292
Revaluation of owner occupied property - 1 5
Equity movements transferred to unallocated divisible surplus - 16 (4) Equity holder tax effect relating to items that will not be reclassified subsequently to profit or loss - - -
Total items that will not be reclassified subsequently to profit or loss 70 21 293
Items that may be reclassified subsequently to profit or loss:
Fair value gains on cash flow hedges - 1 1
Net investment hedge - 1 (1)
Fair value (losses)/gains on available-for-sale financial assets (6) 10 27
Exchange differences on translating foreign operations (46) (31) (13)
Equity movements transferred to unallocated divisible surplus 21 (1) 6
Share of other comprehensive income of joint ventures - 2 4
Equity holder tax effect relating to items that may be reclassified subsequently to profit or loss 4.5 1 (2) (6)
Total items that may be reclassified subsequently to profit or loss (30) (20) 18
Other comprehensive income for the period from continuing operations 40 1 311
Total comprehensive income for the period from continuing operations 143 207 691
Profit from discontinued operations 4.2 1,142 79 127
Other comprehensive income from discontinued operations 4.2 (187) (20) (18)
Total comprehensive income for the period from discontinued operations 955 59 109
Total comprehensive income for the period 1,098 266 800
Attributable to:
Equity holders of Standard Life plc
From continuing operations 109 197 687
From discontinued operations 955 59 109
Non-controlling interests
From continuing operations 34 10 4
1,098 266 800 1 Comparatives for the six months ended 30 June 2014 have been restated to reflect the classification of the Group’s Canadian business as discontinued operations.
Refer to Note 4.2 – Acquisitions and disposals.
The Notes on pages 31 to 71 are an integral part of this IFRS condensed consolidated financial information
24 Standard Life

Strategic report Governance information
Financial statements Other information
Pro forma reconciliation of consolidated operating profit to IFRS profit for the period For the six months ended 30 June 2015 6 months 2015 6 months 2014
Continuing operations
Discontinued operations Total
Continuing operations
Discontinued operations Total
Notes £m £m £m £m £m £m
Operating profit before tax
Standard Life Investments 154 - 154 102 2 104
UK and Europe 147 - 147 188 - 188
Canada - 5 5 - 69 69
India and China1 21 (2) 19 12 (6) 6
Other (32) - (32) (28) - (28)
Operating profit before tax 4.3 290 3 293 274 65 339
Adjusted for the following items Short-term fluctuations in investment return and economic assumption changes (42) 63 21 - 50 50 Restructuring and corporate transaction expenses (62) (8) (70) (26) (1) (27)
Impairment of intangible assets - (2) (2) - - -
Gain on sale of Canadian business - 1,097 1,097 - - -
Other2 (54) (31) (85) (10) - (10)
Non-operating (loss)/profit before tax 4.3 (158) 1,119 961 (36) 49 13 Dubai included in discontinued operations segment1 4.3 - - - (3) 3 - Singapore included in discontinued operations segment1 4.3 (40) 40 - (3) 3 - Share of associates’ and joint ventures’ tax expense 4.3 (5) - (5) (1) - (1)
Profit attributable to non-controlling interests 4.3 34 - 34 10 - 10 Profit before tax expense attributable to equity holders’ profits 121 1,162 1,283 241 120 361
Tax (expense)/credit attributable to
Operating profit 4.3 (37) - (37) (46) (27) (73)
Non-operating items 4.3 19 (20) (1) 11 (14) (3) Dubai included in discontinued operations segment1 4.3 - - - - - - Singapore included in discontinued operations segment1 4.3 - - - - - -
Total tax expense attributable to equity holders’ profits (18) (20) (38) (35) (41) (76)
Profit for the period 103 1,142 1,245 206 79 285 1 Dubai and Singapore businesses, the closure of which were announced in November 2014 and June 2015 respectively, are included as discontinued operations for
segmental reporting purposes under IFRS 8 as this is reflective of the presentation of information provided to the Chief Operating Decision Maker. These were previously included in the Asia and Emerging Markets segment which has been renamed India and China. Under IFRS 5, Dubai and Singapore do not constitute discontinued operations and are included under continuing operations in the IFRS condensed consolidated income statement. Therefore the pro forma reconciliation above includes the reclassification of Dubai and Singapore results between discontinued and continuing operations. Comparatives have been restated.
2 Following regulatory change in Hong Kong a review of expense and reserving assumptions was undertaken which resulted in a £46m non-operating loss being recognised, primarily relating to an impairment of deferred acquisition costs. This is included in Other non-operating items from continuing operations for the six months ended 30 June 2015. Other non-operating items from discontinued operations for the six months ended 30 June 2015 includes £31m in respect of impairment of deferred acquisition costs and plan enhancements relating to the closure of the Singapore business.
Standard Life 25

4. IFRS condensed consolidated primary statements continued
Pro forma reconciliation of consolidated operating profit to IFRS profit for the period continued
Continuing operations
Discontinued operations Total
Full year 2014 Notes £m £m £m
Operating profit before tax
Standard Life Investments 257 4 261
UK and Europe 390 - 390
Canada - 132 132
India and China1 23 (9) 14
Other (62) - (62)
Operating profit before tax 4.3 608 127 735
Adjusted for the following items Short-term fluctuations in investment return and economic assumption changes 17 71 88
Restructuring and corporate transaction expenses (109) (31) (140)
Impairment of intangible assets (43) (4) (47)
Gain on sale of Canadian business - - -
Other (22) (3) (25)
Non-operating (loss)/profit before tax 4.3 (157) 33 (124)
Dubai included in discontinued operations segment1 4.3 (22) 22 -
Singapore included in discontinued operations segment1 4.3 (6) 6 -
Share of associates’ and joint ventures’ tax expense 4.3 (5) - (5)
Profit attributable to non-controlling interests 4.3 4 - 4
Profit before tax expense attributable to equity holders’ profits 422 188 610
Tax (expense)/credit attributable to
Operating profit 4.3 (82) (42) (124)
Non-operating items 4.3 40 (19) 21
Dubai included in discontinued operations segment1 - - -
Singapore included in discontinued operations segment1 - - -
Total tax expense attributable to equity holders’ profits (42) (61) (103)
Profit for the year 380 127 507 1 Dubai and Singapore businesses, the closure of which were announced in November 2014 and June 2015 respectively, are included as discontinued operations for
segmental reporting purposes under IFRS 8 as this is reflective of the presentation of information provided to the Chief Operating Decision Maker. These were previously included in the Asia and Emerging Markets segment which has been renamed India and China. Under IFRS 5, Dubai and Singapore do not constitute discontinued operations and are included under continuing operations in the IFRS condensed consolidated income statement. Therefore the pro forma reconciliation above includes the reclassification of Dubai and Singapore results between discontinued and continuing operations. Comparatives have been restated.
The Group’s chosen supplementary measure of performance is operating profit. The Directors believe that operating profit provides a more useful indication of the long-term operating performance of the Group. To align the measure of the Group’s performance with the long-term nature of its business, operating profit excludes items which create short-term volatility. Operating profit includes the impact of significant actions taken by management during the period.
The Notes on pages 31 to 71 are an integral part of this IFRS condensed consolidated financial information
26 Standard Life

Strategic report Governance information
Financial statements Other information
IFRS condensed consolidated statement of financial position As at 30 June 2015
30 June
2015 30 June
2014 31 December
2014 Notes £m £m £m
Assets Intangible assets 570 299 565 Deferred acquisition costs 663 897 771 Investments in associates and joint ventures 4,795 1,885 4,508 Investment property 4.12 9,584 9,302 9,041 Property, plant and equipment 175 206 186 Pension and other post-retirement benefit assets 4.11 820 442 760 Deferred tax assets 31 91 33 Reinsurance assets 5,736 6,088 6,036 Loans 4.12 791 2,645 400 Derivative financial assets 4.12 2,642 2,648 4,021 Equity securities and interests in pooled investment funds 4.12 73,033 87,732 71,327 Debt securities 4.12 64,610 72,602 64,441 Receivables and other financial assets 4.12 1,544 1,891 1,248 Other assets 343 329 307 Assets held for sale 4.12 975 33 29,338 Cash and cash equivalents 4.12 10,588 9,675 10,617 Total assets 176,900 196,765 203,599
Equity
Share capital 4.9 241 239 239 Shares held by trusts 4.9 (2) (3) 1 Share premium reserve 4.9 627 1,110 1,115 Retained earnings 1,955 1,431 1,816 Other reserves 957 1,468 1,501 Equity attributable to equity holders of Standard Life plc 3,778 4,245 4,672 Non-controlling interests 344 312 278 Total equity 4,122 4,557 4,950
Liabilities Non-participating insurance contract liabilities 4.10 21,528 29,309 21,841 Non-participating investment contract liabilities 4.10 91,589 100,716 88,207 Participating contract liabilities 4.10 29,784 30,705 31,276 Reinsurance liabilities - 257 - Deposits received from reinsurers 5,359 5,538 5,642 Third party interest in consolidated funds 4.13 16,607 17,994 15,805 Borrowings 28 136 44 Subordinated liabilities 1,325 1,841 1,612 Pension and other post-retirement benefit provisions 4.11 40 119 44 Deferred income 254 300 276 Deferred tax liabilities 223 194 214 Current tax liabilities 105 94 172 Derivative financial liabilities 858 1,101 1,693 Other financial liabilities 4,064 3,778 3,690 Other liabilities 117 126 100 Liabilities of operations held for sale 4.2 897 - 28,033 Total liabilities 172,778 192,208 198,649
Total equity and liabilities 176,900 196,765 203,599
The Notes on pages 31 to 71 are an integral part of this IFRS condensed consolidated financial information
Standard Life 27
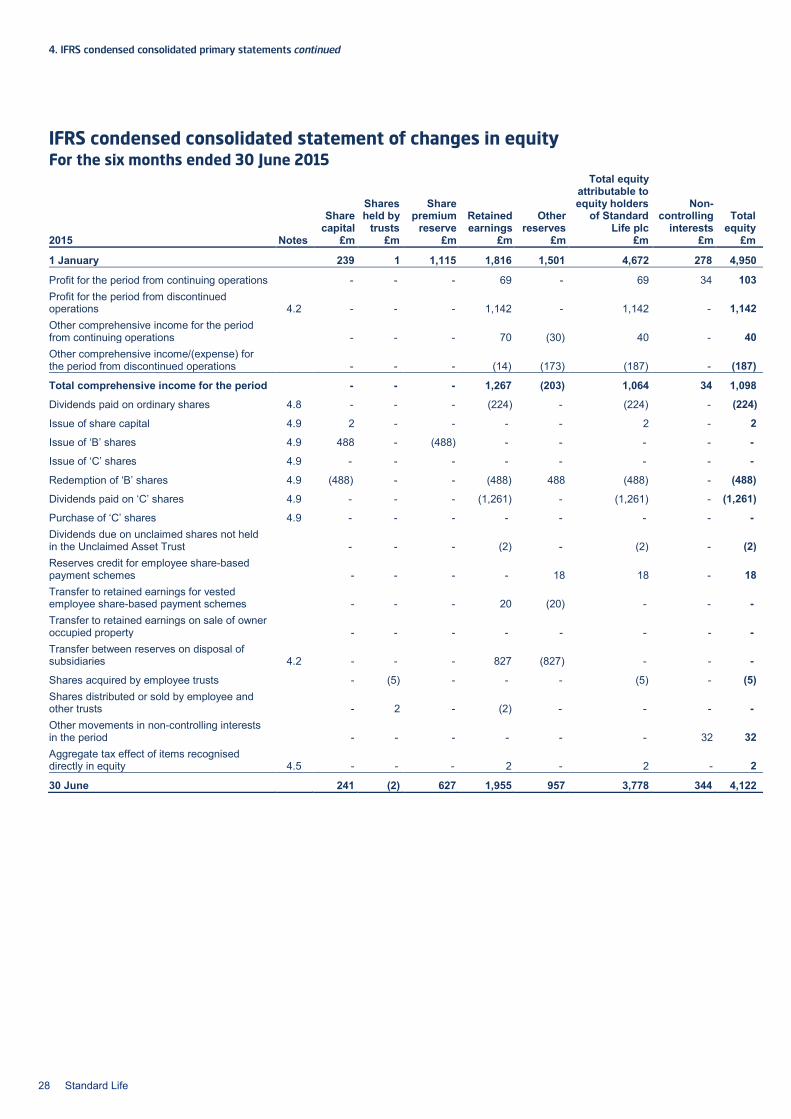
4. IFRS condensed consolidated primary statements continued
IFRS condensed consolidated statement of changes in equity For the six months ended 30 June 2015
Share capital
Shares held by
trusts
Share premium
reserve Retained earnings
Other reserves
Total equity attributable to equity holders
of Standard Life plc
Non-controlling
interests Total
equity 2015 Notes £m £m £m £m £m £m £m £m
1 January 239 1 1,115 1,816 1,501 4,672 278 4,950
Profit for the period from continuing operations - - - 69 - 69 34 103 Profit for the period from discontinued operations 4.2 - - - 1,142 - 1,142 - 1,142 Other comprehensive income for the period from continuing operations - - - 70 (30) 40 - 40 Other comprehensive income/(expense) for the period from discontinued operations - - - (14) (173) (187) - (187)
Total comprehensive income for the period - - - 1,267 (203) 1,064 34 1,098
Dividends paid on ordinary shares 4.8 - - - (224) - (224) - (224)
Issue of share capital 4.9 2 - - - - 2 - 2
Issue of ‘B’ shares 4.9 488 - (488) - - - - -
Issue of ‘C’ shares 4.9 - - - - - - - -
Redemption of ‘B’ shares 4.9 (488) - - (488) 488 (488) - (488)
Dividends paid on ‘C’ shares 4.9 - - - (1,261) - (1,261) - (1,261)
Purchase of ‘C’ shares 4.9 - - - - - - - - Dividends due on unclaimed shares not held in the Unclaimed Asset Trust - - - (2) - (2) - (2) Reserves credit for employee share-based payment schemes - - - - 18 18 - 18 Transfer to retained earnings for vested employee share-based payment schemes - - - 20 (20) - - - Transfer to retained earnings on sale of owner occupied property - - - - - - - - Transfer between reserves on disposal of subsidiaries 4.2 - - - 827 (827) - - -
Shares acquired by employee trusts - (5) - - - (5) - (5) Shares distributed or sold by employee and other trusts - 2 - (2) - - - - Other movements in non-controlling interests in the period - - - - - - 32 32 Aggregate tax effect of items recognised directly in equity 4.5 - - - 2 - 2 - 2
30 June 241 (2) 627 1,955 957 3,778 344 4,122
28 Standard Life

Strategic report Governance information
Financial statements Other information
Share
capital
Shares held by
trusts
Share premium
reserve Retained earnings
Other reserves
Total equity attributable to equity holders
of Standard Life plc
Non-controlling
interests Total
equity 2014 Notes £m £m £m £m £m £m £m £m
1 January 238 (6) 1,110 1,391 1,494 4,227 333 4,560
Profit for the period from continuing operations - - - 196 - 196 10 206 Profit for the period from discontinued operations 4.2 - - - 79 - 79 - 79 Other comprehensive income for the period from continuing operations - - - 6 (5) 1 - 1 Other comprehensive income/(expense) for the period from discontinued operations - - - (13) (7) (20) - (20)
Total comprehensive income for the period - - - 268 (12) 256 10 266
Dividends paid on ordinary shares 4.8 - - - (252) - (252) - (252)
Issue of share capital 4.9 1 - - - - 1 - 1 Reserves credit for employee share-based payment schemes - - - - 12 12 - 12 Transfer to retained earnings for vested employee share-based payment schemes - - - 25 (25) - - - Transfer to retained earnings on sale of owner occupied property - - - 4 (4) - - -
Shares acquired by employee trusts - (2) - - - (2) - (2) Shares distributed or sold by employee and other trusts - 5 - (5) - - - - Other movements in non-controlling interests in the period - - - - - - (31) (31) Aggregate tax effect of items recognised directly in equity 4.5 - - - - 3 3 - 3
30 June 239 (3) 1,110 1,431 1,468 4,245 312 4,557
Share
capital
Shares held by
trusts
Share premium
reserve Retained earnings
Other reserves
Total equity attributable to equity holders
of Standard Life plc
Non-controlling
interests Total
equity 2014 Notes £m £m £m £m £m £m £m £m
1 January 238 (6) 1,110 1,391 1,494 4,227 333 4,560
Profit for the year from continuing operations - - - 376 - 376 4 380
Profit for the year from discontinued operations 4.2 - - - 127 - 127 - 127 Other comprehensive income for the year from continuing operations - - - 296 15 311 - 311 Other comprehensive income for the year from discontinued operations - - - (15) (3) (18) - (18)
Total comprehensive income for the year - - - 784 12 796 4 800
Dividends paid on ordinary shares 4.8 - - - (386) - (386) - (386)
Issue of share capital 4.9 1 - 5 - - 6 - 6 Reserves credit for employee share-based payment schemes - - - - 27 27 - 27 Transfer to retained earnings for vested employee share-based payment schemes - - - 27 (27) - - - Transfer to retained earnings of sale of owner occupied property - - - 4 (4) - - -
Shares acquired by employee trusts - (3) - - - (3) - (3) Shares distributed or sold by employee and other trusts - 10 - (10) - - - - Other movements in non-controlling interests in the year - - - - - - (59) (59) Aggregate tax effect of items recognised directly in equity 4.5 - - - 6 (1) 5 - 5
31 December 239 1 1,115 1,816 1,501 4,672 278 4,950
The Notes on pages 31 to 71 are an integral part of this IFRS condensed consolidated financial information
Standard Life 29

4. IFRS condensed consolidated primary statements continued
IFRS condensed consolidated statement of cash flows For the six months ended 30 June 2015
6 months
2015 6 months
2014 Full year
2014 Notes £m £m £m
Cash flows from operating activities
Profit before tax from continuing operations 210 332 672
Profit before tax from discontinued operations 4.2 1,162 120 188
1,372 452 860
Change in operating assets (5,711) (8,646) (13,455)
Change in operating liabilities 5,097 6,765 11,700
Adjustment for non-cash movements in investment income (58) (209) (242)
Change in unallocated divisible surplus (134) 4 (71)
Non-cash items relating to investing and financing activities (1,005) 63 189
Taxation paid (199) (139) (242)
Net cash flows from operating activities (638) (1,710) (1,261)
Cash flows from investing activities
Purchase of property, plant and equipment (3) (3) (21)
Proceeds from sale of property, plant and equipment 4 12 13
Acquisition of subsidiaries and unincorporated businesses net of cash acquired (5) - (297)
Disposal of subsidiaries net of cash disposed of 1,600 - -
Acquisition of investments in associates and joint ventures (9) (14) (14)
Purchase of intangible assets not acquired through business combinations (28) (14) (54)
Net cash flows from investing activities 1,559 (19) (373)
Cash flows from financing activities
Repayment of other borrowings (1) (2) (4)
Repayment of subordinated liabilities (282) - -
Capital flows from third party interest in consolidated funds and non-controlling interests 930 1,528 3,434
Distributions paid to third party interest in consolidated funds and non-controlling interests (62) (86) (172)
Shares acquired by trusts (4) (2) (1)
Proceeds from exercise of share options - - 5
Interest paid (54) (56) (112)
Return of cash to shareholders under ‘B/C’ share scheme 4.9 (1,749) - -
Ordinary dividends paid 4.8 (224) (252) (386)
Net cash flows from financing activities (1,446) 1,130 2,764
Net (decrease)/increase in cash and cash equivalents (525) (599) 1,130
Cash and cash equivalents at the beginning of the period 11,243 10,253 10,253
Effects of exchange rate changes on cash and cash equivalents (148) (92) (140)
Cash and cash equivalents at the end of the period1 10,570 9,562 11,243
Supplemental disclosures on cash flows from operating activities
Interest paid 5 6 13
Interest received 1,039 1,085 2,317
Dividends received 1,165 1,137 2,364
Rental income received on investment property 250 309 597 1 Comprises £10,588m (30 June 2014: £9,675m; 31 December 2014: £11,326m) of cash and cash equivalents, including cash and cash equivalents held for sale, and
(£18m) (30 June 2014: (£113m); 31 December 2014: (£83m)) of overdrafts which are reported in borrowings and liabilities of operations held for sale in the IFRS condensed consolidated statement of financial position.
The Notes on pages 31 to 71 are an integral part of this IFRS condensed consolidated financial information
30 Standard Life

Strategic report Governance information
Financial statements Other information
Notes to the IFRS condensed consolidated financial information 4.1 Accounting policies (a) Basis of preparation The IFRS condensed consolidated half year financial information has been prepared in accordance with the Disclosure Rules and Transparency Rules of the Financial Conduct Authority and IAS 34 Interim Financial Reporting issued by the International Accounting Standards Board as endorsed by the European Union (EU).
The accounting policies for recognition, measurement, consolidation and presentation as set out in the Group’s Annual report and accounts for the year ended 31 December 2014 have been applied in the preparation of the IFRS condensed consolidated half year financial information except as noted below.
(a)(i) New standards, interpretations and amendments to existing standards that have been adopted by the Group The Group has adopted and early adopted the following new International Financial Reporting Standards (IFRSs), International Accounting Standards (IASs), interpretations and amendments to existing standards, which are effective by EU endorsement for annual periods beginning on or after 1 January 2015 unless otherwise stated. • IFRIC 21 Levies • Amendments to IAS 19 Defined Benefit Plans: Employee Contributions (effective for annual periods beginning on or after 1
February 2015) • Annual improvements 2010 – 2012 cycle (effective for annual periods beginning on or after 1 February 2015) • Annual improvements 2011 – 2013 cycle
The Group’s accounting policies have been updated to reflect these. Management considers the implementation of the above interpretations and amendments to existing standards has had no significant impact on the Group’s financial statements.
(b) IFRS condensed consolidated half year financial information This IFRS condensed consolidated half year financial information does not comprise statutory accounts within the meaning of Section 434 of the Companies Act 2006. Statutory accounts for the year ended 31 December 2014 were approved by the Board of Directors on 20 February 2015 and delivered to the Registrar of Companies. The report of the auditors on those accounts was unqualified, did not contain an emphasis of matter paragraph and did not contain any statement under Section 498 of the Companies Act 2006. This IFRS condensed consolidated half year financial information has been reviewed, not audited.
(c) Exchange rates The income statements and cash flows and statements of financial position of Group entities that have a different functional currency from the Group’s presentation currency have been translated using the following principal exchange rates:
6 months 2015 6 months 2014 Full year 2014 Income
statement exchange rate
Statement of financial position
(closing rate)
Income statement
exchange rate
Statement of financial position
(closing rate)
Income statement
exchange rate
Statement of financial position
(closing rate)
Euro 1.365 1.411 1.220 1.249 1.244 1.289
US Dollar 1.532 1.573 1.674 1.710 1.647 1.559
Canadian Dollar 1.893 1.963 1.826 1.821 1.818 1.806
Indian Rupee 96.441 110.150 101.807 102.839 100.735 98.425
Hong Kong Dollar 11.881 12.192 12.984 13.252 12.775 12.092
The sale of Standard Life Financial Inc. and Standard Life Investments Inc. completed on 30 January 2015. Refer to Note 4.2 – Acquisitions and disposals. The average Canadian dollar rate used to translate the income statements and cash flows of these entities for the period ended 30 January 2015 was 1.855 and the rate used to translate the statement of financial position of these entities at 30 January 2015 was 1.904. The Canadian dollar rates in the table above for the six months to 30 June 2015 were used to translate the income statement, cash flows and statement of financial position of Standard Life Assurance Limited (SLAL) Canada branch.
Standard Life 31

4. Notes to the IFRS condensed consolidated financial information continued
4.2 Acquisitions and disposals (a) Acquisitions On 6 February 2015, the Group announced the launch of its wholly owned, UK-wide financial advice business, 1825. At the same time, the Company agreed to purchase the entire share capital of Pearson Jones plc from Skipton Group Holdings Limited. Pearson Jones is an established advice firm with assets under advice of £1.1bn. The acquisition completed on 11 May 2015 and is not material to the Group.
Prior year acquisition On 1 July 2014, Standard Life Investments (Holdings) Limited, a wholly owned subsidiary of the Company acquired the entire share capital of Ignis Asset Management Limited (Ignis). The consideration transferred included a £20m contingent consideration asset. There have been no settlements of this asset since recognition and at 30 June 2015 and 31 December 2014 the fair value remained at £20m.
(b) Disposals On 3 September 2014 the Group announced its intention to sell its Canadian business to The Manufacturers Life Insurance Company (MLC), a subsidiary of Manulife Financial Corporation (Manulife). The sale of the Group’s Canadian long-term savings and retirement, individual and group insurance business (Standard Life Financial Inc.) and Canadian investment management business (Standard Life Investments Inc.) completed on 30 January 2015 for consideration of CA$4.0bn (£2.1bn). A further £0.1bn was received from the settlement of related hedging derivative contracts. The Group recognised a gain on disposal in respect of the sale which is included in profit from discontinued operations in the IFRS condensed consolidated income statement for the six months ended 30 June 2015. The gain on sale was calculated as follows:
30 January 2015
£m
Total assets of operations disposed of (28,643)
Total liabilities of operations disposed of 27,436
Net assets of operations disposed of (1,207)
Consideration less transaction costs 2,067
Release of available-for-sale financial assets reserve 17
Release of cash flow hedges reserve 60
Release of net investment hedge reserve 110
Release of foreign currency translation reserve 50
Gain on sale 1,097
The gain on sale was exempt from tax under UK and Canadian tax legislation.
The following additional reserve releases were made as a result of the sale. These releases were taken directly to retained earnings.
30 January 2015
£m
Reserve arising on Group reconstruction (221)
Merger reserve 1,028
Revaluation of owner occupied property reserve 20
827
32 Standard Life

Strategic report Governance information
Financial statements Other information
(b)(i) Assets and liabilities of operations held for sale Under the agreements entered into in September 2014, the assets and liabilities of the SLAL Canada Branch will transfer once certain conditions to completion, including regulatory approval, are fulfilled. The assets and liabilities of the Canadian business held for sale at 30 June 2015 (which relate to the SLAL Canada Branch) and 31 December 2014 are as follows:
30 June 2015
31 December 2014
£m £m
Assets of operations held for sale
Intangible assets - 13
Deferred acquisition costs - 115
Investments in associates and joint ventures - 103
Investment property - 1,417
Property, plant and equipment - 31
Deferred tax assets - 54
Reinsurance assets 889 187
Loans - 2,313
Derivative financial assets - 44
Equity securities and interests in pooled investment funds - 12,961
Debt securities - 11,059
Receivables and other financial assets 8 214
Other assets - 34
Assets held for sale - -
Cash and cash equivalents - 709
Total assets of operations held for sale 897 29,254
Liabilities of operations held for sale
Non-participating insurance contract liabilities 614 9,425
Non-participating investment contract liabilities 283 15,852
Participating contract liabilities - 704
Reinsurance liabilities - 273
Deposits received from reinsurers - -
Third party interest in consolidated funds - 953
Borrowings - 59
Subordinated liabilities - 223
Pensions and other post-retirement benefit provisions - 101
Deferred income - 1
Deferred tax liabilities - 13
Current tax liabilities - 3
Derivative financial liabilities - 26
Other financial liabilities - 368
Other liabilities - 32
Total liabilities of operations held for sale 897 28,033
Standard Life 33

4. Notes to the IFRS condensed consolidated financial information continued
4.2 Acquisitions and disposals continued (b) Disposals continued (b)(ii) Discontinued operations Discontinued operations relates solely to the Group’s Canadian business. The consolidated income statement, other comprehensive income and cash flows from discontinued operations are shown below for the six months ended 30 June 2015:
6 months
2015 6 months
2014 Full year
2014 Consolidated income statement £m £m £m
Revenue Gross earned premium 126 773 1,720 Premium ceded to reinsurers (20) (18) (36) Net earned premium 106 755 1,684 Investment return 1,166 1,810 2,914 Fee and commission income 11 61 124 Gain on sale of subsidiaries 1,097 - - Other income 1 8 17 Total revenue from discontinued operations 2,381 2,634 4,739
Expenses Claims and benefits paid 110 528 1,121 Claim recoveries from reinsurers (31) (13) (29) Net insurance benefits and claims 79 515 1,092 Change in reinsurance assets and liabilities (11) (51) (36) Change in insurance and participating contract liabilities 564 866 1,548 Change in non-participating investment contract liabilities 516 902 1,403 Administrative expenses
Restructuring and corporate transaction expenses 3 1 21 Other administrative expenses 37 212 430
Total administrative expenses 40 213 451 Change in liability for third party interest in consolidated funds 30 60 80 Finance costs 1 4 9 Total expenses from discontinued operations 1,219 2,509 4,547 Share of loss from associates and joint ventures - (5) (4) Profit before tax from discontinued operations 1,162 120 188
Tax expense attributable to policyholders’ returns - - - Profit before tax expense attributable to equity holders’ profits 1,162 120 188 Total tax expense 20 41 61 Less: Tax attributable to policyholders’ returns - - - Tax expense attributable to equity holders’ profits 20 41 61 Profit for the period from discontinued operations 1,142 79 127 Attributable to: Equity holders of Standard Life plc 1,142 79 127 Non-controlling interests - - -
1,142 79 127
34 Standard Life

Strategic report Governance information
Financial statements Other information
6 months
2015 6 months
2014 Full year
2014 Other comprehensive income £m £m £m
Items that will not be reclassified subsequently to profit or loss:
Remeasurement losses on defined benefit pension plans (19) (18) (20)
Revaluation of owner occupied property - 5 (2)
Equity holder tax effect relating to items that will not be reclassified subsequently to profit or loss 5 5 5
Total items that will not be reclassified subsequently to profit or loss (14) (8) (17)
Items that may be reclassified subsequently to profit or loss:
Fair value gains on cash flow hedges 58 - 2
Net investment hedge 57 25 16
Fair value gains on available-for-sale financial assets 15 12 22
Exchange differences on translating foreign operations (62) (46) (36)
Equity holder tax effect relating to items that may be reclassified subsequently to profit or loss (4) (3) (5)
Total items that may be reclassified subsequently to profit or loss 64 (12) (1)
Items that were transferred to profit or loss on disposal of subsidiaries:
Release of available-for-sale financial assets reserve (17) - -
Release of cash flow hedges reserve (60) - -
Release of net investment hedge reserve (110) - -
Release of foreign currency translation reserve (50) - -
Total items that were transferred to profit or loss on disposal of subsidiaries (237) - -
Other comprehensive income/(expense) for the period from discontinued operations (187) (20) (18)
6 months 2015
6 months 2014
Full year 2014
Cash flows £m £m £m
Net cash flows from operating activities (132) 58 117
Net cash flows from financing activities (7) (19) (1)
Net cash flows from investing activities (500) 11 (65)
Total net cash flows (639) 50 51
The net cash flows from investing activities for the six months ended 30 June 2015 represents the cash and cash equivalents of the operations disposed of at the date of disposal and do not include the cash consideration received of £2,100m.
Standard Life 35

4. Notes to the IFRS condensed consolidated financial information continued
4.3 Segmental analysis (a) Basis of segmentation The Group’s reportable segments have been identified in accordance with the way in which the Group is structured and managed. The Group’s reportable segments are as follows:
Continuing operations: Standard Life Investments Standard Life Investments provides a range of investment products for individuals and institutional customers through a number of different investment vehicles. Investment management services are also provided by Standard Life Investments to the Group’s other reportable segments. This segment includes the Group’s share of the results of HDFC Asset Management Company Limited.
UK and Europe UK and Europe provide a broad range of long-term, savings and investment products to individual and corporate customers in the UK, Germany, Austria and Ireland.
India and China (formerly Asia and Emerging Markets) The businesses included in India and China offer a range of insurance and savings products and comprise the Group’s life joint ventures in India and China and wholly owned operations in Hong Kong.
Other This primarily includes the corporate centre and related activities.
Discontinued operations: Canada The operations in Canada provided long-term savings, investment and insurance solutions to individuals, and group benefit and retirement plan members. The Canadian business was sold on 30 January 2015.
Dubai The business in Dubai provided a range of savings and investment products. The closure of this business was announced in November 2014. This business was previously included in the Asia and Emerging Markets segment. Singapore The business in Singapore provided a range of savings and insurance products. The closure of this business was announced in June 2015. This business was previously included in the Asia and Emerging Markets segment.
(b) Reportable segments – Group operating profit, revenue and asset information IFRS 8 Operating Segments requires that the information presented in the financial statements is based on information provided to the ‘Chief Operating Decision Maker’. The Chief Operating Decision Maker for the Group is the executive team.
The key performance metrics of the Group include operating profit before tax and assets under administration (AUA), which are analysed in the tables that follow by reportable segment.
A number of changes were made to the financial information provided to the executive team in the six months to 30 June 2015 and in the year to 31 December 2014 and as a result to the Group’s segmental reporting as follows: • On 3 September 2014, the Group announced the disposal of its Canadian business. As a consequence, the results of this
business have been presented as discontinued operations. Previously the results of Standard Life Financial Inc. were reported and managed as a separate segment (Canada) and the Standard Life Investments Inc. business was reported and managed as part of the Standard Life Investments segment. Withholding tax in relation to dividends received from the Canadian business previously reported as operating tax in the other segment, has also been included in discontinued operations.
• On 5 November 2014, the Group announced the closure of the Dubai business. The results of this business are included as discontinued operations for segmental reporting purposes as this is reflective of the presentation of information provided to the Chief Operating Decision Maker. Dubai was previously included in the Asia and Emerging Markets segment (now India and China). Under IFRS 5, Dubai does not constitute a discontinued operation and is included under continuing operations in the IFRS condensed consolidated income statement. Therefore the segmental analysis disclosures include the reclassification of Dubai results between discontinued and continuing operations.
• On 25 June 2015, the Group announced the closure of the Singapore business. The results of this business are included as discontinued operations for segmental reporting purposes as this is reflective of the presentation of information provided to the Chief Operating Decision Maker. Singapore was previously included in the Asia and Emerging Markets segment (now India and China). Under IFRS 5, Singapore does not constitute a discontinued operation and is included under continuing operations in the IFRS condensed consolidated income statement. Therefore the segmental analysis disclosures include the reclassification of Singapore results between discontinued and continuing operations.
• Institutional pension business managed by Standard Life Investments but legally written by the UK business has previously been reported in both the Standard Life Investments and UK and Europe segments with the inter-segment transactions and balances removed through eliminations. In 2014, it was agreed by management that to allow a more meaningful presentation of revenue, expenses and AUA for each segment, institutional pension business would be removed from the UK and Europe results and only presented within Standard Life Investments. The UK and Europe results and the eliminations have therefore been adjusted with no impact on the Group results. This change reduces UK and Europe fee based revenue and total operating expenses but there is no impact on UK and Europe operating profit.
36 Standard Life
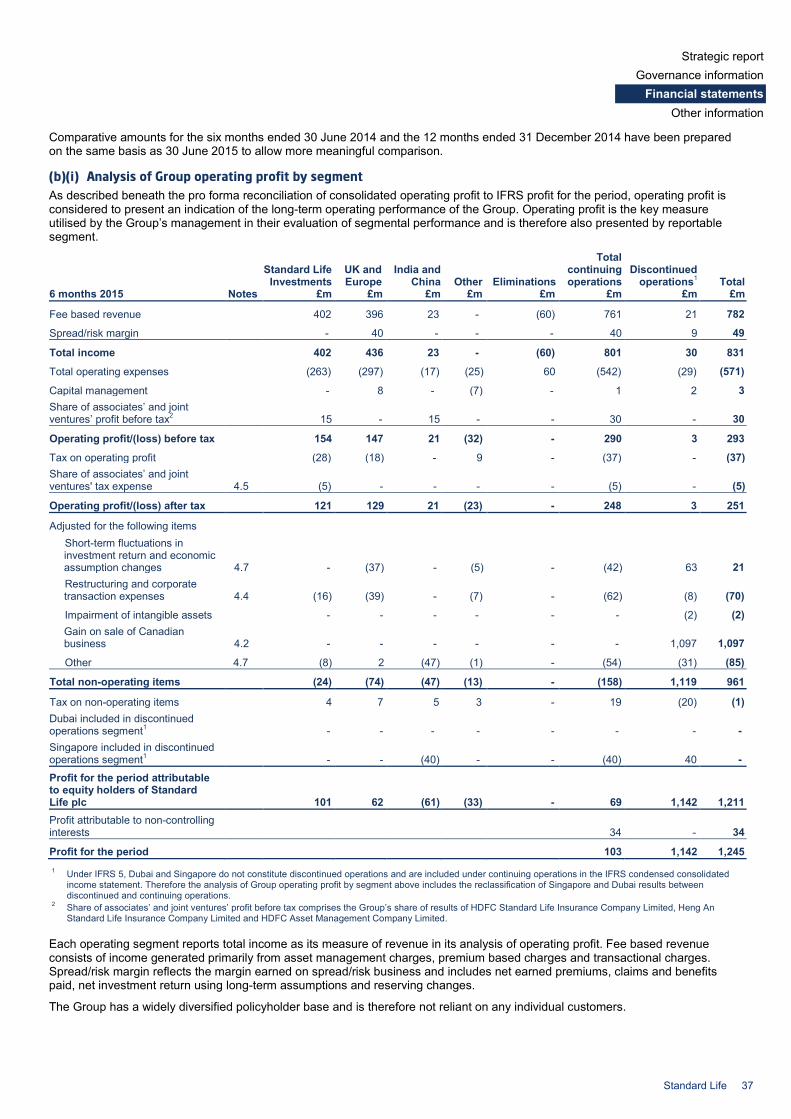
Strategic report Governance information
Financial statements Other information
Comparative amounts for the six months ended 30 June 2014 and the 12 months ended 31 December 2014 have been prepared on the same basis as 30 June 2015 to allow more meaningful comparison.
(b)(i) Analysis of Group operating profit by segment As described beneath the pro forma reconciliation of consolidated operating profit to IFRS profit for the period, operating profit is considered to present an indication of the long-term operating performance of the Group. Operating profit is the key measure utilised by the Group’s management in their evaluation of segmental performance and is therefore also presented by reportable segment.
Standard Life
Investments UK and Europe
India and China Other Eliminations
Total continuing operations
Discontinued operations1 Total
6 months 2015 Notes £m £m £m £m £m £m £m £m
Fee based revenue 402 396 23 - (60) 761 21 782
Spread/risk margin - 40 - - - 40 9 49
Total income 402 436 23 - (60) 801 30 831
Total operating expenses (263) (297) (17) (25) 60 (542) (29) (571)
Capital management - 8 - (7) - 1 2 3 Share of associates’ and joint ventures’ profit before tax2 15 - 15 - - 30 - 30
Operating profit/(loss) before tax 154 147 21 (32) - 290 3 293
Tax on operating profit (28) (18) - 9 - (37) - (37) Share of associates’ and joint ventures' tax expense 4.5 (5) - - - - (5) - (5)
Operating profit/(loss) after tax 121 129 21 (23) - 248 3 251
Adjusted for the following items Short-term fluctuations in investment return and economic assumption changes 4.7 - (37) - (5) - (42) 63 21 Restructuring and corporate transaction expenses 4.4 (16) (39) - (7) - (62) (8) (70)
Impairment of intangible assets - - - - - - (2) (2) Gain on sale of Canadian business 4.2 - - - - - - 1,097 1,097
Other 4.7 (8) 2 (47) (1) - (54) (31) (85)
Total non-operating items (24) (74) (47) (13) - (158) 1,119 961
Tax on non-operating items 4 7 5 3 - 19 (20) (1) Dubai included in discontinued operations segment1
- - - - - - - -
Singapore included in discontinued operations segment1
- - (40) - - (40) 40 -
Profit for the period attributable to equity holders of Standard Life plc
101 62 (61) (33) - 69 1,142 1,211
Profit attributable to non-controlling interests
34 - 34
Profit for the period 103 1,142 1,245 1 Under IFRS 5, Dubai and Singapore do not constitute discontinued operations and are included under continuing operations in the IFRS condensed consolidated
income statement. Therefore the analysis of Group operating profit by segment above includes the reclassification of Singapore and Dubai results between discontinued and continuing operations.
2 Share of associates’ and joint ventures’ profit before tax comprises the Group’s share of results of HDFC Standard Life Insurance Company Limited, Heng An Standard Life Insurance Company Limited and HDFC Asset Management Company Limited.
Each operating segment reports total income as its measure of revenue in its analysis of operating profit. Fee based revenue consists of income generated primarily from asset management charges, premium based charges and transactional charges. Spread/risk margin reflects the margin earned on spread/risk business and includes net earned premiums, claims and benefits paid, net investment return using long-term assumptions and reserving changes. The Group has a widely diversified policyholder base and is therefore not reliant on any individual customers.
Standard Life 37

4. Notes to the IFRS condensed consolidated financial information continued
4.3 Segmental analysis continued (b) Reportable segments – Group operating profit, revenue and asset information continued (b)(i) Analysis of Group operating profit by segment continued
Standard Life Investments
UK and Europe
India and China Other Eliminations
Total continuing operations
Discontinued operations1 Total
6 months 2014 Notes £m £m £m £m £m £m £m £m
Fee based revenue 288 389 26 - (51) 652 106 758
Spread/risk margin - 79 - - - 79 103 182
Total income 288 468 26 - (51) 731 209 940
Total operating expenses (197) (281) (23) (23) 51 (473) (152) (625)
Capital management - 1 - (5) - (4) 8 4 Share of associates’ and joint ventures’ profit before tax2 11 - 9 - - 20 - 20
Operating profit/(loss) before tax 102 188 12 (28) - 274 65 339
Tax on operating profit (20) (31) - 5 - (46) (27) (73) Share of associates’ and joint ventures' tax expense 4.5 (3) - 2 - - (1) - (1)
Operating profit/(loss) after tax 79 157 14 (23) - 227 38 265 Adjusted for the following items
Short-term fluctuations in investment return and economic assumption changes 4.7 1 6 (1) (6) - - 50 50 Restructuring and corporate transaction expenses 4.4 (4) (21) - (1) - (26) (1) (27)
Impairment of intangible assets - - - - - - - - Other - (9) - (1) - (10) - (10)
Total non-operating items (3) (24) (1) (8) - (36) 49 13
Tax on non-operating items - 10 - 1 - 11 (14) (3) Dubai included in discontinued operations segment1
- - (3) - - (3) 3 -
Singapore included in discontinued operations segment1
- - (3) - - (3) 3 -
Profit/(loss) for the period attributable to equity holders of Standard Life plc
76 143 7 (30) - 196 79 275 Profit attributable to non-controlling interests
10 - 10
Profit for the period 206 79 285 1 Under IFRS 5, Dubai and Singapore do not constitute discontinued operations and are included under continuing operations in the consolidated income statement.
Therefore the analysis of Group operating profit by segment above includes the reclassification of Dubai and Singapore results between discontinued and continuing operations.
2 Share of associates’ and joint ventures’ profit before tax comprises the Group’s share of results of HDFC Standard Life Insurance Company Limited, Heng An Standard Life Insurance Company Limited and HDFC Asset Management Company Limited.
38 Standard Life

Strategic report Governance information
Financial statements Other information
Standard Life Investments
UK and Europe
India and China Other Eliminations
Total continuing operations
Discontinued operations1 Total
Full year 2014 Notes £m £m £m £m £m £m £m £m
Fee based revenue 686 802 49 - (108) 1,429 223 1,652
Spread/risk margin - 183 - - - 183 191 374
Total income 686 985 49 - (108) 1,612 414 2,026
Total operating expenses (450) (605) (44) (54) 108 (1,045) (302) (1,347)
Capital management - 10 - (8) - 2 15 17 Share of associates’ and joint ventures’ profit before tax2 21 - 18 - - 39 - 39
Operating profit/(loss) before tax 257 390 23 (62) - 608 127 735
Tax on operating profit (51) (43) (1) 13 - (82) (42) (124) Share of associates’ and joint ventures' tax expense 4.5 (7) - 2 - - (5) - (5)
Operating profit/(loss) after tax 199 347 24 (49) - 521 85 606
Adjusted for the following items Short-term fluctuations in investment return and economic assumption changes 4.7 1 29 - (13) - 17 71 88 Restructuring and corporate transaction expenses 4.4 (51) (51) - (7) - (109) (31) (140)
Impairment of intangible assets (43) - - - - (43) (4) (47)
Other (9) (11) - (2) - (22) (3) (25)
Total non-operating items (102) (33) - (22) - (157) 33 (124)
Tax on non-operating items 17 18 - 5 - 40 (19) 21 Dubai included in discontinued operations segment1
- - (22) - - (22) 22 -
Singapore included in discontinued operations segment1
- - (6) - - (6) 6 -
Profit/(loss) for the year attributable to equity holders of Standard Life plc
114 332 (4) (66) - 376 127 503 Profit attributable to non-controlling interests
4 - 4
Profit for the year
380 127 507 1 Under IFRS 5, Dubai and Singapore do not constitute discontinued operations and are included under continuing operations in the IFRS condensed consolidated
income statement. Therefore the analysis of Group operating profit by segment above includes the reclassification of Dubai and Singapore results between discontinued and continuing operations.
2 Share of associates’ and joint ventures’ profit before tax comprises the Group’s share of results of HDFC Standard Life Insurance Company Limited, Heng An Standard Life Insurance Company Limited and HDFC Asset Management Company Limited.
Standard Life 39
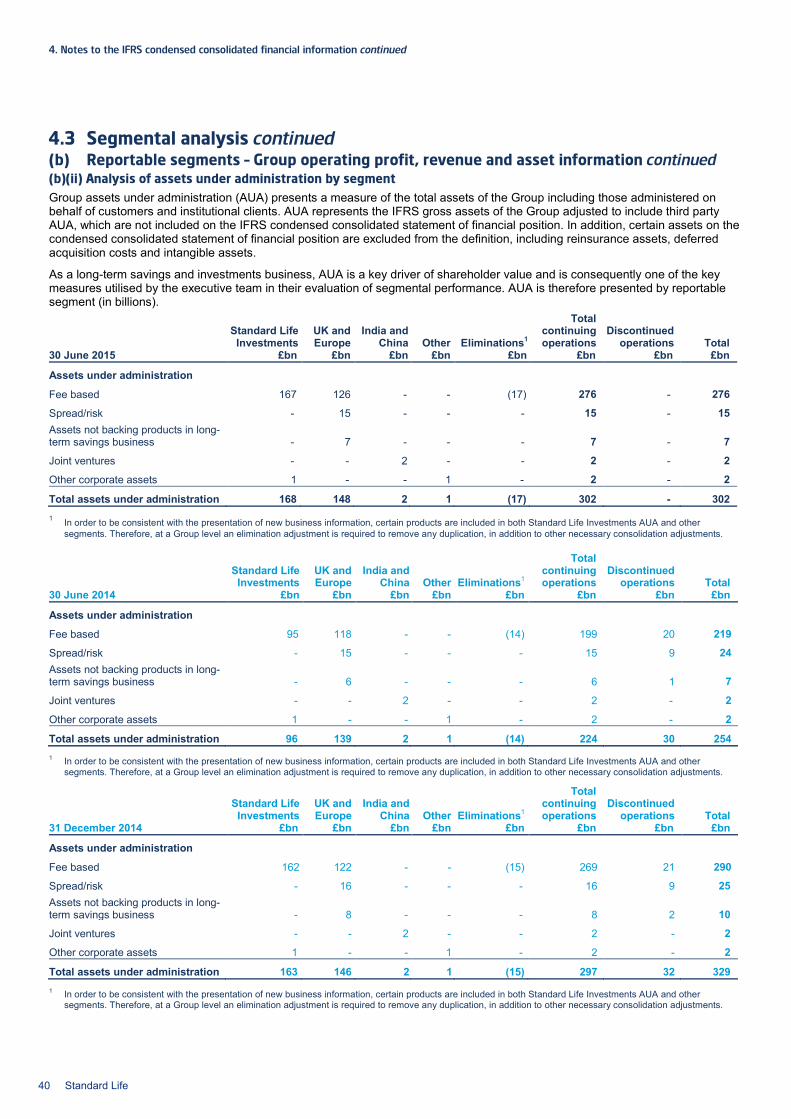
4. Notes to the IFRS condensed consolidated financial information continued
4.3 Segmental analysis continued (b) Reportable segments – Group operating profit, revenue and asset information continued (b)(ii) Analysis of assets under administration by segment Group assets under administration (AUA) presents a measure of the total assets of the Group including those administered on behalf of customers and institutional clients. AUA represents the IFRS gross assets of the Group adjusted to include third party AUA, which are not included on the IFRS condensed consolidated statement of financial position. In addition, certain assets on the condensed consolidated statement of financial position are excluded from the definition, including reinsurance assets, deferred acquisition costs and intangible assets.
As a long-term savings and investments business, AUA is a key driver of shareholder value and is consequently one of the key measures utilised by the executive team in their evaluation of segmental performance. AUA is therefore presented by reportable segment (in billions).
Standard Life Investments
UK and Europe
India and China Other Eliminations1
Total continuing operations
Discontinued operations Total
30 June 2015 £bn £bn £bn £bn £bn £bn £bn £bn
Assets under administration
Fee based 167 126 - - (17) 276 - 276
Spread/risk - 15 - - - 15 - 15 Assets not backing products in long-term savings business - 7 - - - 7 - 7
Joint ventures - - 2 - - 2 - 2
Other corporate assets 1 - - 1 - 2 - 2
Total assets under administration 168 148 2 1 (17) 302 - 302 1 In order to be consistent with the presentation of new business information, certain products are included in both Standard Life Investments AUA and other
segments. Therefore, at a Group level an elimination adjustment is required to remove any duplication, in addition to other necessary consolidation adjustments.
Standard Life Investments
UK and Europe
India and China Other Eliminations1
Total continuing operations
Discontinued operations Total
30 June 2014 £bn £bn £bn £bn £bn £bn £bn £bn
Assets under administration
Fee based 95 118 - - (14) 199 20 219
Spread/risk - 15 - - - 15 9 24 Assets not backing products in long-term savings business - 6 - - - 6 1 7
Joint ventures - - 2 - - 2 - 2
Other corporate assets 1 - - 1 - 2 - 2
Total assets under administration 96 139 2 1 (14) 224 30 254 1 In order to be consistent with the presentation of new business information, certain products are included in both Standard Life Investments AUA and other
segments. Therefore, at a Group level an elimination adjustment is required to remove any duplication, in addition to other necessary consolidation adjustments.
Standard Life Investments
UK and Europe
India and China Other Eliminations1
Total continuing operations
Discontinued operations Total
31 December 2014 £bn £bn £bn £bn £bn £bn £bn £bn
Assets under administration
Fee based 162 122 - - (15) 269 21 290
Spread/risk - 16 - - - 16 9 25 Assets not backing products in long-term savings business - 8 - - - 8 2 10
Joint ventures - - 2 - - 2 - 2
Other corporate assets 1 - - 1 - 2 - 2
Total assets under administration 163 146 2 1 (15) 297 32 329 1 In order to be consistent with the presentation of new business information, certain products are included in both Standard Life Investments AUA and other
segments. Therefore, at a Group level an elimination adjustment is required to remove any duplication, in addition to other necessary consolidation adjustments.
40 Standard Life

Strategic report Governance information
Financial statements Other information
4.4 Administrative expenses
6 months
2015
6 months 2014
restated1 Full year
2014 £m £m £m
Restructuring and corporate transaction expenses 48 27 106
Interest expense 6 5 11
Commission expenses 86 123 234
Staff costs and other employee-related costs 310 269 577
Other administrative expenses 306 242 592
756 666 1,520
Acquisition costs deferred during the period (51) (81) (143)
Impairment of deferred acquisition costs 71 - 9
Amortisation of deferred acquisition costs 64 76 150
Total administrative expenses from continuing operations 840 661 1,536 1 Comparatives for the six months ended 30 June 2014 have been restated to reflect the classification of the Group’s Canadian business as discontinued operations.
Refer to Note 4.2 – Acquisitions and disposals.
Total restructuring and corporate transaction expenses incurred from continuing operations during the year were £48m (six months ended 30 June 2014: £27m; 12 months ended 31 December 2014: £106m) which includes £nil of deal costs (six months ended 30 June 2014: £3m; 12 months ended 31 December 2014: £11m) relating to acquisitions as described in Note 4.2 – Acquisitions and disposals. The remaining expenses relate to the integration of Ignis and a number of other business unit restructuring programmes.
In December 2014 the Group announced that the UK staff defined benefit pension plan would be closed to future accrual effective April 2016. All employees in the closing plan will be transferred to the UK defined contribution plan for future service and employer contributions into the defined contribution plan will be amended. Following this restructuring of the pension plans, operating profit from continuing operations for the six months ended 30 June 2015 has been increased by £20m (12 months ended 31 December 2014: £15m) so that operating profit reflects the expected long-term pension expense for the period and is therefore more indicative of the long-term operating performance of the Group. As a result £20m (12 months ended 31 December 2014: £15m) of pension costs that are included in staff costs in the IFRS condensed consolidated income statement for the six months ended 30 June 2015, are included in restructuring and corporate transaction expenses in determining operating profit from continuing operations. Further details of the defined benefit pension plan expense for the period are included in Note 4.11 – Pension and other post-retirement benefit provisions.
The table below reconciles restructuring and corporate transaction expenses incurred from continuing operations with restructuring and corporate transaction expenses used to determine operating profit from continuing operations. 6 months
2015 6 months
2014 Full year
2014 £m £m £m
Restructuring and corporate transaction expenses from continuing operations 48 27 106 Pension plan restructuring 20 - 15 Expenses incurred by the Heritage With Profit Fund (1) (1) (2) Closure of Dubai1 - - (10) Closure of Singapore1 (5) - - Restructuring and corporate transaction expenses used to determine operating profit from continuing operations 62 26 109 1 Dubai and Singapore businesses, the closure of which were announced in November 2014 and June 2015 respectively, are included as discontinued operations for
segmental reporting purposes under IFRS 8 as this is reflective of the presentation of information provided to the Chief Operating Decision Maker. Under IFRS 5, Dubai and Singapore do not constitute discontinued operations and are included under continuing operations in the IFRS condensed consolidated income statement.
Restructuring and corporate transaction expenses of £8m (six months ended 30 June 2014: £1m; 12 months ended 31 December 2014: £31m) are used to determine operating profit before tax from discontinued operations. These expenses relate to the sale of the Canadian business and the closure of the Dubai and Singapore businesses.
Standard Life 41

4. Notes to the IFRS condensed consolidated financial information continued
4.5 Tax expense The tax expense is attributed as follows:
6 months
2015
6 months 2014
restated1 Full year
2014 £m £m £m
Tax expense attributable to policyholders’ returns 89 91 250
Tax expense attributable to equity holders’ profits 18 35 42
Total tax expense from continuing operations 107 126 292 1 Comparatives for the six months ended 30 June 2014 have been restated to reflect the classification of the Group’s Canadian business as discontinued operations.
Refer to Note 4.2 – Acquisitions and disposals.
The standard rate of corporation tax in the UK changed from 21% to 20% with effect from 1 April 2015. Accordingly, the Group’s UK profit for this accounting period was subject to a rate of 20.25% (six months ended 30 June 2014: 21.5%; 12 months ended 31 December 2014: 21.5%). The UK corporation tax rate for 2016 is 20% and this rate has been applied in calculating the UK deferred tax position at 30 June 2015. The UK Government announced in July 2015 that the corporation tax rate is set to be cut to 19% in 2017 and 18% in 2020. These rate reductions have not been substantively enacted, therefore the impact of these reductions has not been incorporated into the tax charge for the period.
The share of tax of associates and joint ventures from continuing operations is £5m (six months ended 30 June 2014: £1m; 12 months ended 31 December 2014: £5m) and is included in profit before tax in the IFRS condensed consolidated income statement in Share of profit from associates and joint ventures.
The total tax expense is split as follows:
6 months
2015
6 months 2014
restated1 Full year
2014 £m £m £m
Current tax:
UK 95 94 268
Overseas 4 13 14
Adjustment to tax expense in respect of prior years (5) (2) (7)
Total current tax attributable to continuing operations 94 105 275
Deferred tax:
Deferred tax expense arising from the current periods 13 21 17
Total deferred tax attributable to continuing operations 13 21 17
Total tax expense attributable to continuing operations 107 126 292 1 Comparatives for the six months ended 30 June 2014 have been restated to reflect the classification of the Group’s Canadian business as discontinued operations.
Refer to Note 4.2 – Acquisitions and disposals.
Tax relating to components of other comprehensive income is as follows:
6 months 2015
6 months 2014
restated1 Full year
2014 £m £m £m
Current tax on net change in financial assets designated as available-for-sale (1) 2 6
Equity holder tax effect relating to items that may be reclassified subsequently to profit or loss (1) 2 6
Tax relating to each component of other comprehensive income from continuing operations (1) 2 6 1 Comparatives for the six months ended 30 June 2014 have been restated to reflect the classification of the Group’s Canadian business as discontinued operations.
Refer to Note 4.2 – Acquisitions and disposals.
All of the amounts presented above are in respect of equity holders of Standard Life plc.
Tax relating to items taken directly to equity is as follows: 6 months
2015 6 months
2014 Full year
2014 £m £m £m
Tax credit on reserves for employee share-based payments (2) (3) (5)
Tax relating to items taken directly to equity (2) (3) (5)
42 Standard Life

Strategic report Governance information
Financial statements Other information
4.6 Earnings per share (a) Basic earnings per share Basic earnings per share is calculated by dividing profit attributable to ordinary equity holders by the weighted average number of ordinary shares outstanding during the period. The weighted average number of ordinary shares outstanding during the period is the weighted average number of shares in issue less the weighted average number of shares owned by employee share trusts that have not vested unconditionally to employees.
6 months
2015 6 months
2014 Full year
2014
Profit attributable to equity holders of Standard Life plc from continuing operations (£m) 69 196 376
Profit attributable to equity holders of Standard Life plc from discontinued operations (£m) 1,142 79 127
Profit attributable to equity holders of Standard Life plc (£m) 1,211 275 503
Weighted average number of ordinary shares outstanding (millions) 2,136 2,379 2,384
Basic earnings per share from continuing operations (pence per share) 3.2 8.3 15.8
Basic earnings per share from discontinued operations (pence per share) 53.5 3.3 5.3
Basic earnings per share (pence per share) 56.7 11.6 21.1
(b) Diluted earnings per share Diluted earnings per share is calculated by adjusting the weighted average number of ordinary shares outstanding to assume conversion of all dilutive potential ordinary shares. The Group has one category of dilutive potential ordinary shares – share awards and share options awarded to employees.
For share options, a calculation is made to determine the number of shares that could be acquired at fair value (determined as the average annual market share price of the Company’s shares) based on the monetary value of the subscription rights attached to outstanding share options. The number of shares calculated is compared with the number of shares that could be issued, or purchased, assuming the exercise of the share options.
6 months
2015 6 months
2014 Full year
2014
Profit attributable to equity holders of Standard Life plc from continuing operations (£m) 69 196 376
Profit attributable to equity holders of Standard Life plc from discontinued operations (£m) 1,142 79 127
Profit attributable to equity holders of Standard Life plc (£m) 1,211 275 503
Weighted average number of ordinary shares outstanding for diluted earnings per share (millions) 2,140 2,384 2,396
Diluted earnings per share from continuing operations (pence per share) 3.2 8.2 15.7
Diluted earnings per share from discontinued operations (pence per share) 53.4 3.3 5.3
Diluted earnings per share (pence per share) 56.6 11.5 21.0
The dilutive effect of share awards and options included in the weighted average number of ordinary shares above was four million (six months ended 30 June 2014: five million; 12 months ended 31 December 2014: 12 million).
(c) Alternative earnings per share Earnings per share is also calculated based on operating profit before tax as well as on the profit attributable to equity holders of Standard Life plc. The Directors believe that earnings per share based on operating profit provides a more useful indication of the long-term operating performance of the Group.
Standard Life 43

4. Notes to the IFRS condensed consolidated financial information continued
4.6 Earnings per share continued (c) Alternative earnings per share continued (c)(i) Basic alternative earnings per share
Continuing operations
Continuing operations
Discontinued operations
Discontinued operations
6 months 2015 £m p per share £m p per share Operating profit before tax 290 13.6 3 0.1 Tax on operating profit (37) (1.8) - - Share of associates’ and joint ventures’ tax expense (5) (0.2) - - Operating profit after tax 248 11.6 3 0.1 Adjusted for the following items
Short-term fluctuations in investment return and economic assumption changes (42) (2.0) 63 2.9 Restructuring and corporate transaction expenses (62) (2.9) (8) (0.4) Impairment of intangible assets - - (2) (0.1) Gain on sale of Canadian business - - 1,097 51.4 Other (54) (2.5) (31) (1.4)
Total non-operating items (158) (7.4) 1,119 52.4 Tax on non-operating items 19 0.9 (20) (0.9) Dubai included in discontinued operations segment1 - - - - Singapore included in discontinued operations segment1 (40) (1.9) 40 1.9 Profit attributable to equity holders of Standard Life plc 69 3.2 1,142 53.5
Continuing operations
Continuing operations
Discontinued operations
Discontinued operations
6 months 2014 £m p per share £m p per share Operating profit before tax 274 11.5 65 2.7 Tax on operating profit (46) (2.0) (27) (1.1) Share of associates’ and joint ventures’ tax expense (1) - - - Operating profit after tax 227 9.5 38 1.6 Adjusted for the following items
Short-term fluctuations in investment return and economic assumption changes - - 50 2.1 Restructuring and corporate transaction expenses (26) (1.1) (1) - Impairment of intangible assets - - - - Other (10) (0.4) - -
Total non-operating items (36) (1.5) 49 2.1 Tax on non-operating items 11 0.5 (14) (0.6) Dubai included in discontinued operations segment1 (3) (0.1) 3 0.1 Singapore included in discontinued operations segment1 (3) (0.1) 3 0.1 Profit attributable to equity holders of Standard Life plc 196 8.3 79 3.3
Continuing operations
Continuing operations
Discontinued operations
Discontinued operations
Full year 2014 £m p per share £m p per share Operating profit before tax 608 25.5 127 5.3 Tax on operating profit (82) (3.4) (42) (1.7) Share of associates’ and joint ventures’ tax expense (5) (0.2) - - Operating profit after tax 521 21.9 85 3.6 Adjusted for the following items
Short-term fluctuations in investment return and economic assumption changes 17 0.7 71 3.0 Restructuring and corporate transaction expenses (109) (4.6) (31) (1.3) Impairment of intangible assets (43) (1.8) (4) (0.2) Other (22) (0.9) (3) (0.1)
Total non-operating items (157) (6.6) 33 1.4 Tax on non-operating items 40 1.7 (19) (0.9) Dubai included in discontinued operations segment1 (22) (0.9) 22 0.9 Singapore included in discontinued operations segment1 (6) (0.3) 6 0.3 Profit attributable to equity holders of Standard Life plc 376 15.8 127 5.3
1 Dubai and Singapore businesses, the closure of which were announced in November 2014 and June 2015 respectively, are included as discontinued operations for segmental reporting purposes under IFRS 8 as this is reflective of the presentation of information provided to the Chief Operating Decision Maker. Under IFRS 5, Dubai and Singapore do not constitute discontinued operations and are included under continuing operations in the IFRS condensed consolidated income statement. Therefore the analysis of Group operating profit above includes the reclassification of Dubai and Singapore results between discontinued and continuing operations.
44 Standard Life

Strategic report Governance information
Financial statements Other information
(c)(ii) Diluted alternative earnings per share
Continuing
operations Continuing operations
Discontinued operations
Discontinued operations
6 months 2015 £m p per share £m p per share Operating profit before tax 290 13.6 3 0.1 Tax on operating profit (37) (1.8) - - Share of associates’ and joint ventures’ tax expense (5) (0.2) - - Operating profit after tax 248 11.6 3 0.1 Adjusted for the following items
Short-term fluctuations in investment return and economic assumption changes
(42) (2.0) 63 2.9
Restructuring and corporate transaction expenses (62) (2.9) (8) (0.4) Impairment of intangible assets - - (2) (0.1) Gain on sale of Canadian business - - 1,097 51.3 Other (54) (2.5) (31) (1.4)
Total non-operating items (158) (7.4) 1,119 52.3 Tax on non-operating items 19 0.9 (20) (0.9) Dubai included in discontinued operations segment1 - - - - Singapore included in discontinued operations segment1 (40) (1.9) 40 1.9 Profit attributable to equity holders of Standard Life plc 69 3.2 1,142 53.4
Continuing
operations Continuing operations
Discontinued operations
Discontinued operations
6 months 2014 £m p per share £m p per share Operating profit before tax 274 11.4 65 2.7 Tax on operating profit (46) (1.9) (27) (1.1) Share of associates’ and joint ventures’ tax expense (1) - - - Operating profit after tax 227 9.5 38 1.6 Adjusted for the following items
Short-term fluctuations in investment return and economic assumption changes
- - 50 2.1
Restructuring and corporate transaction expenses (26) (1.2) (1) - Impairment of intangible assets - - - - Other (10) (0.4) - -
Total non-operating items (36) (1.6) 49 2.1 Tax on non-operating items 11 0.5 (14) (0.6) Dubai included in discontinued operations segment1 (3) (0.1) 3 0.1 Singapore included in discontinued operations segment1 (3) (0.1) 3 0.1 Profit attributable to equity holders of Standard Life plc 196 8.2 79 3.3
Continuing operations
Continuing operations
Discontinued operations
Discontinued operations
Full year 2014 £m p per share £m p per share Operating profit before tax 608 25.4 127 5.3 Tax on operating profit (82) (3.5) (42) (1.8) Share of associates’ and joint ventures’ tax expense (5) (0.2) - - Operating profit after tax 521 21.7 85 3.5 Adjusted for the following items
Short-term fluctuations in investment return and economic assumption changes 17 0.7 71 3.0 Restructuring and corporate transaction expenses (109) (4.5) (31) (1.3) Impairment of intangible assets (43) (1.8) (4) (0.2) Other (22) (0.9) (3) (0.1)
Total non-operating items (157) (6.5) 33 1.4 Tax on non-operating items 40 1.7 (19) (0.8) Dubai included in discontinued operations segment1 (22) (0.9) 22 0.9 Singapore included in discontinued operations segment1 (6) (0.3) 6 0.3 Profit attributable to equity holders of Standard Life plc 376 15.7 127 5.3
1 Dubai and Singapore businesses, the closure of which were announced in November 2014 and June 2015 respectively, are included as discontinued operations for segmental reporting purposes under IFRS 8 as this is reflective of the presentation of information provided to the Chief Operating Decision Maker. Under IFRS 5, Dubai and Singapore do not constitute discontinued operations and are included under continuing operations in the IFRS condensed consolidated income statement. Therefore the analysis of Group operating profit above includes the reclassification of Dubai and Singapore results between discontinued and continuing operations.
Standard Life 45

4. Notes to the IFRS condensed consolidated financial information continued
4.7 Non-operating items The Group focuses on operating profit as a measure of its performance, which incorporates expected returns on investments backing equity holder funds with a consistent allowance for corresponding expected movements in equity holder liabilities. The methodology used in calculating operating profit is outlined below.
Operating profit is calculated based on expected returns on investments backing equity holder funds, with consistent allowance for the corresponding expected movements in equity holder liabilities. Impacts arising from the difference between the expected return and actual return on investments, and the corresponding impact on equity holder liabilities except where they are directly related to a significant management action, are excluded from operating profit and are presented within profit before tax. As a result, the components of IFRS profit attributable to market movements and interest rate changes which give rise to variances between actual and expected investment returns, as well as the impact of changes in economic assumptions on equity holder liabilities, are excluded from operating profit and disclosed separately within the heading of short-term fluctuations in investment return and economic assumption changes.
Short-term fluctuations in investment return and economic assumption changes The expected rates of return for debt securities, equity securities and property are determined separately for each of the Group’s operations. The expected rates of return for equity securities and property, with the exception of the Canadian operations, are determined based on the gilt spot rates of an appropriate duration plus an equity risk premium or property risk premium, respectively. The expected rates of return on equity securities and property for Canadian operations were determined by the Appointed Actuary in Canada.
The principal assumptions, as set at the start of the year, in respect of gross investment returns underlying the calculation of the expected investment return for equity securities and property are as follows: 2015 2014 UK Canada UK Canada % % % %
Equity securities 4.86 8.60 6.01 8.60
Property 3.86 8.60 5.01 8.60
In respect of debt securities at fair value through profit or loss, the expected rate of return is determined based on the average prospective yields for the debt securities actually held or, in respect of the Canadian operations, was determined by the Appointed Actuary in Canada. For debt securities classified as available-for-sale that support liabilities measured at amortised cost, the expected rate of return is the effective interest rate adjusted for an allowance, established at initial recognition, for expected defaults. If debt securities classified as available-for-sale are sold, any gain or loss is amortised within the expected return over the period to the earlier of the maturity date of the sold debt security, or the redemption date of the supported liability.
Gains and losses on foreign exchange are deemed to represent short-term fluctuations in investment return and economic assumption changes and thus are excluded from operating profit.
For the six months ended 30 June 2015, short-term fluctuations in investment return and economic assumption changes resulted in losses of £42m (six months ended 30 June 2014: £nil; 12 months ended 31 December 2014: gains of £17m) from continuing operations and gains of £63m (six months ended 30 June 2014: gains of £50m, 12 months ended 31 December 2014: gains of £71m) from discontinued operations. Short-term fluctuations in investment return from continuing operations relate principally to investment volatility in UK annuities, and in respect of the Group’s subordinated liabilities, and assets backing those liabilities. Short-term fluctuations in investment return from discontinued operations relate principally to investment volatility in Canada non-segregated funds.
Other Other non-operating items from continuing operations for the six months ended 30 June 2015 includes £10m (six months ended 30 June 2014: £2m; 12 months ended 31 December 2014: £15m) in relation to amortisation of intangible assets acquired through business combinations and £46m (six months ended 30 June 2014: £nil; 12 months ended 31 December 2014: £nil) relating to a review of expense and reserving assumptions in Hong Kong following regulatory change. The Hong Kong non-operating loss primarily relates to an impairment of deferred acquisition costs.
Other non-operating items from discontinued operations for the six months ended 30 June 2015 includes £31m (six months ended 30 June 2014: £nil; 12 months ended 31 December 2014: £nil) in respect of impairment of deferred acquisition costs and plan enhancements relating to the closure of the Singapore business.
Non-operating items also include restructuring and corporate transaction expenses as discussed in Note 4.4 – Administrative expenses.
46 Standard Life

Strategic report Governance information
Financial statements Other information
4.8 Dividends and return of value 6 months 2015 6 months 2014 Full year 2014 Pence per
share £m Pence per
share £m Pence per
share £m
Dividends relating to reporting period
Interim dividend (2015 and 2014) 6.02 119 5.60 134 5.60 134
Final dividend (2014) - - - - 11.43 224
Total 6.02 119 5.60 134 17.03 358
Dividends paid in reporting period
Current year interim dividend - - - - 5.60 134
Final dividend for prior year 11.43 224 10.58 252 10.58 252
Total 11.43 224 10.58 252 16.18 386
The final dividend for the year ended 31 December 2014 which was paid in the six months ended 30 June 2015 was paid on the lower adjusted number of ordinary shares following the share consolidation.
Subsequent to 30 June 2015, the Directors have proposed an interim dividend for 2015 of 6.02 pence per ordinary share (interim 2014: 5.60 pence), an estimated £119m in total (interim 2014: £134m). The dividend is expected to be paid on 20 October 2015 and will be recorded as an appropriation of retained earnings in the financial statements for the year ended 31 December 2015.
In addition to the dividend distribution on ordinary shares, the Group returned 73 pence per ordinary share (£1,749m) to shareholders through a ‘B/C’ share scheme. Refer to Note 4.9 – Issued share capital, share premium and shares held by trusts for more detail.
4.9 Issued share capital, share premium and shares held by trusts (a) Issued share capital The movement in the issued ordinary share capital of the Company was:
6 months
2015 6 months
2015 6 months
2015 6 months
2014 6 months
2014 Full year
2014 Full year
2014 Issued shares fully paid 10p each 12 2/9p each £m 10p each £m 10p each £m
At start of period 2,394,373,744 - 239 2,376,616,730 238 2,376,616,730 238 Shares issued in respect of share incentive plans 169,283 80,904 - 153,768 - 287,120 - Shares issued in respect of share options 642,089 9,489,898 2 13,896,549 1 17,469,894 1 New shares issued immediately prior to share consolidation 6 - - - - - -
Share consolidation (2,395,185,122) 1,959,696,918 - - - - -
At end of period - 1,969,267,720 241 2,390,667,047 239 2,394,373,744 239
The Group operates share incentive plans, allowing employees the opportunity to buy shares from their salary each month. The maximum purchase that an employee can make in any one year is £1,800. The Group offers to match the first £25 of shares bought each month. During the six months ended 30 June 2015, the Company allotted 250,187 ordinary shares to Group employees under the share incentive plans (six months ended 30 June 2014: 153,768; 12 months ended 31 December 2014: 287,120).
The Group also operates long-term incentive plans (LTIPs) for executives and senior management and a Sharesave (Save-as-you-earn) scheme for all eligible employees. During the six months ended 30 June 2015, 9,836,651 ordinary shares were issued on exercise of share options in respect of the LTIP (six months ended 30 June 2014: 13,836,439; 12 months ended 31 December 2014: 14,509,687) and 295,336 ordinary shares were issued on exercise of share options in respect of the Sharesave scheme (six months ended 30 June 2014: 60,110; 12 months ended 31 December 2014: 2,960,207).
All ordinary shares in issue in the Company rank pari passu and carry the same voting rights to receive dividends and other distributions declared or paid by the Company.
Standard Life 47

4. Notes to the IFRS condensed consolidated financial information continued
4.9 Issued share capital, share premium and shares held by trusts continued (a) Issued share capital continued (a)(i) Share consolidation and return of value
On 13 March 2015, the Company undertook a share consolidation of the Company’s share capital. Nine new ordinary shares of 12 2/9 pence each were issued for each holding of eleven existing ordinary shares of 10 pence each. As a result, the number of shares in issue reduced from 2,395,185,122 to 1,959,696,918.
668,370,013 ‘B’ shares were issued for nil consideration with a nominal value of 73 pence each on 19 March 2015, resulting in a total of £488m being credited to the ‘B’ share capital account. At the same time £488m was deducted from the share premium account. On 20 March 2015 the ‘B’ shares were redeemed at 73 pence each. An amount of £488m was deducted from the ‘B’ share capital account and £488m was transferred from retained earnings to the capital redemption reserve.
1,726,815,109 ‘C’ shares were issued for nil consideration with a nominal value of 0.0000001 pence each on 19 March 2015. An amount of £1.73 was credited to the ‘C’ share capital account. On 20 March 2015 a dividend of 73 pence per share became payable at a total cost of £1,261m and this amount has been recorded as a deduction from retained earnings. On the same date, the ‘C’ shares were automatically reclassified as deferred shares. The Company subsequently purchased the deferred shares for an aggregate consideration of one pence.
(b) Share premium
6 months
2015 6 months
2014 Full year
2014 £m £m £m
1 January 1,115 1,110 1,110
Issue of ‘B’ shares (488) - -
Premium arising on shares issued - - 5
30 June 627 1,110 1,115
As noted above, 668,370,013 ‘B’ shares were issued at 73 pence each on 19 March 2015, resulting in a deduction of £488m from the share premium account.
The premium arising on shares issued during the period was £nil (six months ended 30 June 2014: £nil; 12 months ended 31 December 2014: £5m) and relates to share options exercised in respect of the Sharesave scheme.
(c) Shares held by trusts The Employee Share Trust (EST) purchases and holds shares in the Company for delivery to employees under various employee share schemes. Share-based liabilities to employees may also be settled by the issue of new shares which may also be held in trust until delivery to employees. The number of shares held in trust for the purposes of settling employee share schemes at 30 June 2015 was 730,582 (30 June 2014: 2,916,212; 31 December 2014: 1,081,758).
Shares held by trusts also include shares held by the Unclaimed Asset Trust (UAT). The shares held by the UAT are those not yet claimed by the eligible members of The Standard Life Assurance Company (SLAC) following its demutualisation on 10 July 2006. The corresponding obligation to deliver these shares to eligible members of SLAC is also included in the shares held by trusts reserve. The number of shares held by the UAT at 30 June 2015 was 15,907,401 (30 June 2014: 24,521,450; 31 December 2014: 21,143,650).
48 Standard Life

Strategic report Governance information
Financial statements Other information
4.10 Insurance contracts, investment contracts and reinsurance contracts 30 June
2015 30 June
2014 31 December
2014 £m £m £m
Non-participating insurance contract liabilities 22,142 29,309 31,266 Less: Non-participating insurance contract liabilities classified as held for sale (614) - (9,425) 21,528 29,309 21,841
Non-participating investment contract liabilities 91,872 100,716 104,059 Less: Non-participating investment contract liabilities classified as held for sale (283) - (15,852) 91,589 100,716 88,207
Non-participating contract liabilities 114,014 130,025 135,325 Less: Non-participating contract liabilities classified as held for sale (897) - (25,277) 113,117 130,025 110,048
30 June 2015
30 June 2014
31 December 2014
£m £m £m
Participating insurance contract liabilities 14,309 15,240 16,099 Less: Participating insurance contract liabilities classified as held for sale - - (702) 14,309 15,240 15,397
Participating investment contract liabilities 14,809 14,764 15,193 Less: Participating investment contract liabilities classified as held for sale - - (2) 14,809 14,764 15,191
Unallocated divisible surplus 666 701 688 Less : Unallocated divisible surplus classified as held for sale - - - 666 701 688
Participating contract liabilities 29,784 30,705 31,980 Less: Participating contract liabilities classified as held for sale - - (704) 29,784 30,705 31,276
Due to changes in economic and non-economic factors, certain assumptions used in estimating insurance and investment contract liabilities have been revised. Therefore, the change in liabilities reflects actual experience over the period, changes in assumptions and, to a limited extent, improvements in modelling techniques.
The movement in insurance contract liabilities, participating investment contract liabilities and reinsurance contracts for continuing operations during the six months ended 30 June 2015, and the six months ended 30 June 2014 arising from changes in estimates are set out below:
Participating insurance
contract liabilities
Non-participating insurance
contract liabilities
Participating investment
contract liabilities
Total insurance and
participating contracts
Reinsurance contracts Net
6 months 2015 £m £m £m £m £m £m
Changes in
Methodology/modelling 2 2 9 13 (3) 10
Economic assumptions 13 (346) (28) (361) 95 (266)
Non-economic assumptions - (9) 1 (8) - (8)
6 months 2014 (restated)1
Changes in
Methodology/modelling (15) (30) 5 (40) - (40)
Economic assumptions 57 403 (75) 385 (83) 302
Non-economic assumptions - - (2) (2) - (2) 1 Comparatives for the six months ended 30 June 2014 have been restated to reflect the classification of the Group’s Canadian business as discontinued operations.
Refer to Note 4.2 – Acquisitions and disposals.
Standard Life 49

4. Notes to the IFRS condensed consolidated financial information continued
4.10 Insurance contracts, investment contracts and reinsurance contracts continued
The movement in insurance contract liabilities, participating investment contract liabilities and reinsurance contracts during the year ended 31 December 2014 was as follows:
Participating insurance
contract liabilities
Non-participating insurance
contract liabilities
Participating investment
contract liabilities
Total insurance and
participating contracts
Reinsurance contracts Net
2014 £m £m £m £m £m £m
At 1 January 15,060 28,312 14,707 58,079 (5,857) 52,222
Reclassified as held for sale during the year (667) (8,135) (3) (8,805) (123) (8,928)
14,393 20,177 14,704 49,274 (5,980) 43,294
Expected change (1,014) (717) (701) (2,432) 350 (2,082)
Methodology/modelling changes (3) (81) 44 (40) - (40)
Effect of changes in
Economic assumptions 356 1,625 (344) 1,637 (410) 1,227
Non-economic assumptions 37 (65) (52) (80) 7 (73)
Effect of
Economic experience 2,092 207 1,319 3,618 6 3,624
Non-economic experience 79 (264) 252 67 (1) 66
New business 42 1,000 22 1,064 (12) 1,052
Total change in contract liabilities 1,589 1,705 540 3,834 (60) 3,774
Foreign exchange adjustment (585) (41) (53) (679) 4 (675)
At 31 December 15,397 21,841 15,191 52,429 (6,036) 46,393
Reinsurance assets (6,036)
Reinsurance liabilities -
(6,036)
The change in non-participating investment contract liabilities during the year ended 31 December 2014 was as follows: 2014 £m
At 1 January 97,659
Reclassified as held for sale during the year (15,097)
Contributions 11,261
Initial charges and reduced allocations (3)
Account balances paid on surrender and other terminations in the year (10,230)
Change in non-participating investment contracts recognised in the IFRS condensed consolidated income statement 5,362
Foreign exchange adjustment (306)
Recurring management charges (439)
At 31 December 88,207
50 Standard Life

Strategic report Governance information
Financial statements Other information
4.11 Pension and other post-retirement benefit provisions In December 2014 the Group announced that the UK staff defined benefit pension plan would be closed to future accrual effective April 2016. From April 2016, all UK employees will accrue a pension through a defined contribution plan.
(a) Analysis of amounts recognised in the IFRS condensed consolidated income statement The amounts recognised in the IFRS condensed consolidated income statement for defined contribution and defined benefit plans are as follows:
6 months
2015
6 months 2014
restated1 Full year
2014 £m £m £m
Current service cost (42) (30) (60)
Interest income 13 10 21
Administrative expenses (1) - -
Charge recognised in the IFRS condensed consolidated income statement (30) (20) (39) 1 Comparatives for the six months ended 30 June 2014 have been restated to reflect the classification of the Group’s Canadian business as discontinued operations.
Refer to Note 4.2 – Acquisitions and disposals.
An additional pension contribution of 6% of pensionable salary into the defined contribution plan for eligible members of the defined benefit plan on 16 March 2015 was made on 16 April 2015. A further additional contribution of 6% will be made on 16 April 2016. These contributions have been accrued over the vesting period and are included in current service cost.
(b) Analysis of amounts recognised on the IFRS condensed consolidated statement of financial position
30 June 2015 30 June 2014 31 December 2014 UK Other Total UK Canada Other Total UK Other Total Canada £m £m £m £m £m £m £m £m £m £m £m
Present value of funded obligation (2,750) (89) (2,839) (2,456) (232) (73) (2,761) (2,816) (98) (2,914) (242)
Present value of unfunded obligation - (8) (8) - (69) (7) (76) - (8) (8) (73)
Fair value of plan assets 4,030 57 4,087 3,140 204 58 3,402 3,990 62 4,052 214
Effect of limit on plan surplus (460) - (460) (242) - - (242) (414) - (414) - Net asset/(liability) on the IFRS condensed consolidated statement of financial position 820 (40) 780 442 (97) (22) 323 760 (44) 716
(101)
(c) Principal assumptions The principal economic assumptions for the plans are as follows: 30 June 2015 30 June 2014 31 December 2014 UK UK Canada UK Canada % % % % %
Discount rate 3.75 4.35 4.20 3.60 4.00 Rates of inflation
Consumer Price Index (CPI) 2.60 2.80 2.00 2.45 2.00 Retail Price Index (RPI) (UK only) 3.50 3.60 - 3.35 - Salary inflation (Canada only) - - 3.50 - 3.50
Standard Life 51

4. Notes to the IFRS condensed consolidated financial information continued
4.12 Risk management (a) Overview The Group’s strategic objectives and performance against them is subject to a number of financial and non-financial risks. The principal risks and uncertainties that affect the business model are set out in detail in the Strategic report section 1.4 – Principal risks and uncertainties.
The Group’s IFRS condensed consolidated half year financial information does not include all financial risk management information and disclosures required in the Group's Annual report and accounts. This note should therefore be read in conjunction with the Group's Annual report and accounts for the year ended 31 December 2014. The information presented in this note has been prepared on the same basis as that presented in the Group’s Annual report and accounts.
There have been no significant changes to the Group’s risk management framework since 31 December 2014 and no changes have been made to the Group’s qualitative risk appetites. The business continues to be managed through a range of risk, capital and profit metrics.
Standard Life Financial Inc. and Standard Life Investments Inc. collectively were sold on 30 January 2015 – refer to Note 4.2 – Acquisitions and disposals. The assets and liabilities of these businesses were classified as held for sale on the consolidated statement of financial position at 31 December 2014 and the comparatives reflect this, however comparatives at 30 June 2014 have not been restated to reflect the sale. The transaction does not impact the classification of the Group’s assets and liabilities within the risk segments.
(b) Investment property and financial assets The values of the Group’s holdings of investment property and financial assets are impacted by the Group’s exposure to adverse fluctuations in financial markets (referred to as market risk) and counterparty failure (referred to as credit risk).
The assets on the Group’s IFRS condensed consolidated statement of financial position can be split into four categories (risk segments) which give the shareholder different exposures to these risks as follows:
Shareholder business Shareholder business refers to the assets and liabilities to which the shareholder is directly exposed. For the purposes of this note, the shareholder refers to the equity holders of the Company.
Participating business Participating business refers to the assets and liabilities of the participating funds of the life operations of the Group. It includes the liabilities for insurance features and financial guarantees contained within contracts held in the Heritage With Profits Fund that invest in unit linked funds. It does not include the liabilities for insurance features contained in contracts invested in the German With Profits Fund or German Smoothed Managed With Profits Fund. Such liabilities are included in shareholder business.
Unit linked and segregated funds Unit linked and segregated funds refers to the assets and liabilities of the unit linked and segregated funds of the life operations of the Group. It does not include the cash flows (such as asset management charges or investment expenses) arising from the unit linked or segregated fund contracts or the liabilities for insurance features or financial guarantees contained within the unit linked or segregated fund contracts. Such cash flows and liabilities are included in shareholder business or participating business.
Third party interest in consolidated funds and non-controlling interests Third party interest in consolidated funds and non-controlling interests refers to the assets and liabilities recorded on the Group’s consolidated statement of financial position which belong to third parties. The Group controls the entities which own the assets and liabilities but the Group does not own 100% of the equity or units of the relevant entities.
52 Standard Life

Strategic report Governance information
Financial statements Other information
The total Group holding in investment property and financial assets has been presented below based on the risk segment.
Shareholder
business Participating business
Unit linked and segregated funds TPICF and NCI1 Total
30 June
2015 31 Dec
2014 30 June
2015 31 Dec
2014 30 June
2015 31 Dec
2014 30 June
2015 31 Dec
2014 30 June
2015 31 Dec
2014 £m £m £m £m £m £m £m £m £m £m
Investments in associates2 26 16 433 535 3,850 3,568 218 145 4,527 4,264
Investment property 1 - 2,100 2,090 5,588 5,223 1,895 1,728 9,584 9,041
Loans 27 4 340 194 326 166 98 36 791 400
Derivative financial assets 25 18 1,368 1,649 920 1,711 329 643 2,642 4,021 Equity securities and interests in pooled investment funds 54 31 8,975 9,658 57,370 55,471 6,634 6,167 73,033 71,327
Debt securities 7,635 7,235 26,232 27,785 24,683 23,597 6,060 5,824 64,610 64,441
Receivables and other financial assets 582 468 115 98 662 534 185 148 1,544 1,248
Assets held for sale 929 9,837 - 857 27 17,679 19 965 975 29,338
Cash and cash equivalents 813 976 1,589 1,778 6,055 5,751 2,131 2,112 10,588 10,617
Total 10,092 18,585 41,152 44,644 99,481 113,700 17,569 17,768 168,294 194,697 1 Third party interest in consolidated funds and non-controlling interests. 2 Comprises investments in associates at FVTPL and loans to associates.
Shareholder
business Participating
business Unit linked and
segregated funds TPICF and NCI1 Total 30 June 2014 £m £m £m £m £m
Investments in associates2 4 375 1,105 101 1,585
Investment property 482 2,117 5,205 1,498 9,302
Loans 2,367 187 91 - 2,645
Derivative financial assets 67 899 1,127 555 2,648 Equity securities and interests in pooled investment funds 215 10,235 69,141 8,141 87,732
Debt securities 12,009 27,230 26,542 6,821 72,602
Receivables and other financial assets 629 168 859 235 1,891
Assets held for sale 33 - - - 33
Cash and cash equivalents 1,443 1,400 5,111 1,721 9,675
Total 17,249 42,611 109,181 19,072 188,113 1 Third party interest in consolidated funds and non-controlling interests. 2 Comprises investments in associates at FVTPL and loans to associates.
The shareholder is exposed to the impact of market movements such as in property prices, interest rates and foreign exchange rates and the impact of defaults and movements in credit spreads on the value of assets held by the shareholder business. Appropriate risk oversight, risk management and mitigation actions are in place. The shareholder is also exposed to the market and credit risk that the assets of the participating funds of the life operations of the Group are not sufficient to meet their obligations. In this situation, the shareholder would be exposed to the full shortfall in the funds.
No further analysis is provided on the assets of the remaining risk segments – unit linked and segregated funds and TPICF and NCI. Assets of the unit linked and segregated funds are managed in accordance with the mandates of the particular funds and the financial risks of the assets are expected to be borne by the policyholder. The unit linked business includes £3,383m (30 June 2014: £4,515m; 31 December 2014: £3,523m) of assets that are held as reinsured external fund links. Under certain circumstances the shareholder may be exposed to losses relating to the default of the insured external fund links. These exposures are actively monitored and managed by the Group and the Group considers the circumstances under which losses may arise to be remote.
The shareholder is not exposed to market and credit risk from assets in respect of TPICF and NCI since the financial risks of the assets are borne by third parties.
Further information on the investment property and financial assets of the shareholder and participating business at the reporting date is provided below.
Standard Life 53

4. Notes to the IFRS condensed consolidated financial information continued
4.12 Risk management continued (b) Investment property and financial assets continued Investment property The Group is subject to property price risk due to changes in the value and return on holdings in investment properties. This risk arises from various direct and indirect holdings which are controlled through the use of portfolio limits.
The tables below analyse investment property held by the shareholder and participating businesses by country and sector.
Shareholder business Office Industrial Retail Other Total
30 Jun
2015 30 Jun
2014 31 Dec
2014 30 Jun
2015 30 Jun
2014 31 Dec
2014 30 Jun
2015 30 Jun
2014 31 Dec
2014 30 Jun
2015 30 Jun
2014 31 Dec
2014 30 Jun
2015 30 Jun
2014 31 Dec
2014 £m £m £m £m £m £m £m £m £m £m £m £m £m £m £m
UK - - - - - - 1 - - - - - 1 - -
Canada - 348 - - 45 - - - - - 89 - - 482 -
Total - 348 - - 45 - 1 - - - 89 - 1 482 -
Participating business Office Industrial Retail Other Total
30 Jun
2015 30 Jun
2014 31 Dec
2014 30 Jun
2015 30 Jun
2014 31 Dec
2014 30 Jun
2015 30 Jun
2014 31 Dec
2014 30 Jun
2015 30 Jun
2014 31 Dec
2014 30 Jun
2015 30 Jun
2014 31 Dec
2014 £m £m £m £m £m £m £m £m £m £m £m £m £m £m £m
UK 680 598 608 219 285 237 993 1,007 1,051 6 - 6 1,898 1,890 1,902
Canada - 47 - - 19 - - 5 - - 15 - - 86 -
Belgium 12 13 14 - - - - - - - - - 12 13 14
France - - - - 4 3 - - - 1 2 2 1 6 5
Germany - - - 4 - - 14 - - - - - 18 - -
Ireland - - - - - - - - - 23 - 26 23 - 26
Netherlands 16 - - 13 - 14 - - - - - - 29 - 14
Spain 119 122 129 - - - - - - - - - 119 122 129
Total 827 780 751 236 308 254 1,007 1,012 1,051 30 17 34 2,100 2,117 2,090
There is no direct exposure to residential property in the shareholder and participating businesses.
54 Standard Life

Strategic report Governance information
Financial statements Other information
Equity securities The Group is subject to equity price risk due to daily changes in the market value and returns in the holdings in its equity security portfolio. Exposure to equity securities are primarily managed through the use of investment mandates including constraints based on appropriate equity indices.
The following table analyses equity securities held by the shareholder and participating businesses by country. Shareholder business Participating business Total
30 Jun
2015 30 Jun
2014 31 Dec
2014 30 Jun
2015 30 Jun
2014 31 Dec
2014 30 Jun
2015 30 Jun
2014 31 Dec
2014 £m £m £m £m £m £m £m £m £m
UK 9 3 - 3,792 4,438 4,060 3,801 4,441 4,060
Canada - 148 - 53 252 42 53 400 42
Australia 1 1 1 32 33 53 33 34 54
Austria - - - - 25 - - 25 -
Belgium 1 - - 54 101 73 55 101 73
Denmark 1 - - 156 166 165 157 166 165
Finland 1 - - 88 62 48 89 62 48
France 2 - 1 422 546 453 424 546 454
Germany 2 - 1 398 503 523 400 503 524
Greece - - - 1 9 12 1 9 12
Ireland 1 - - 179 132 137 180 132 137
Italy 2 - - 138 72 100 140 72 100
Japan 1 1 1 119 124 114 120 125 115
Mexico - - - 1 6 1 1 6 1
Netherlands 2 - 1 346 454 364 348 454 365
Norway - - - 65 101 44 65 101 44
Portugal - - - 40 30 19 40 30 19
Russia - - - 4 5 4 4 5 4
Spain 2 - - 148 222 161 150 222 161
Sweden 1 - - 203 278 236 204 278 236
Switzerland 2 - - 621 597 669 623 597 669
US 7 26 - 1,784 1,814 1,977 1,791 1,840 1,977
Other 17 11 7 253 263 311 270 274 318
Total 52 190 12 8,897 10,233 9,566 8,949 10,423 9,578
In addition to the equity securities analysed above, the shareholder business has interests in pooled investment funds of £2m (30 June 2014: £25m; 31 December 2014: £19m). The participating business has interests in pooled investment funds of £78m (30 June 2014: £2m; 31 December 2014: £92m).
Debt securities The Group is exposed to interest rate risk and credit risk through its holdings in debt securities. The Group manages its exposure to debt securities through the use of investment mandates including setting exposure limits such as by issuer, sector and credit rating.
At 30 June 2015, the total shareholder business holding of debt securities was £7,635m (30 June 2014: £12,009m; 31 December 2014: £7,235m), of which 86% (30 June 2014: 96%; 31 December 2014: 89%) was rated as investment grade. The total participating business holding of debt securities at 30 June 2015 was £26,232m (30 June 2014: £27,230m; 31 December 2014: £27,785m), of which 97% (30 June 2014: 97%; 31 December 2014: 97%) was rated as investment grade. This illustrates the quality of the debt securities we choose to invest in.
Standard Life 55

4. Notes to the IFRS condensed consolidated financial information continued
4.12 Risk management continued (b) Investment property and financial assets continued The following tables show the shareholder and participating businesses’ exposure to credit risk from debt securities analysed by credit rating and country.
Shareholder business
Government, provincial
and municipal1 Banks Other financial
institutions Other
corporate Other2 Total
30 Jun
2015 30 Jun
2014 31 Dec
2014 30 Jun
2015 30 Jun
2014 31 Dec
2014 30 Jun
2015 30 Jun
2014 31 Dec
2014 30 Jun
2015 30 Jun
2014 31 Dec
2014 30 Jun
2015 30 Jun
2014 31 Dec
2014 30 Jun
2015 30 Jun
2014 31 Dec
2014 £m £m £m £m £m £m £m £m £m £m £m £m £m £m £m £m £m £m
AAA 232 673 150 121 98 108 39 50 40 - 77 - 216 205 226 608 1,103 524
AA 714 1,403 699 359 636 297 302 179 275 236 532 246 - 31 - 1,611 2,781 1,517
A 5 1,174 4 1,375 1,269 1,392 418 1,014 399 1,254 2,738 1,498 - - - 3,052 6,195 3,293
BBB 6 - 5 172 163 97 252 94 247 847 1,201 756 - - - 1,277 1,458 1,105
Below BBB 1 - 2 8 4 7 46 - 1 85 15 21 - - - 140 19 31
Not rated - - - - - - 25 17 - 17 13 1 - 29 - 42 59 1 Internally rated 74 4 78 - - - 483 330 480 348 51 206 - 9 - 905 394 764
Total 1,032 3,254 938 2,035 2,170 1,901 1,565 1,684 1,442 2,787 4,627 2,728 216 274 226 7,635 12,009 7,235
Government, provincial and municipal1 Banks
Other financial institutions
Other corporate Other2 Total
30 Jun
2015 30 Jun
2014 31 Dec
2014 30 Jun
2015 30 Jun
2014 31 Dec
2014 30 Jun
2015 30 Jun
2014 31 Dec
2014 30 Jun
2015 30 Jun
2014 31 Dec
2014 30 Jun
2015 30 Jun
2014 31 Dec
2014 30 Jun
2015 30 Jun
2014 31 Dec
2014 £m £m £m £m £m £m £m £m £m £m £m £m £m £m £m £m £m £m
UK 520 354 565 428 491 377 1,338 955 1,286 1,480 1,254 1,330 - 69 - 3,766 3,123 3,558
Canada - 2,534 3 25 300 25 - 283 - 1 1,949 1 - - - 26 5,066 29
Australia - - - 75 79 72 6 14 6 10 10 10 - - - 91 103 88
Austria 21 22 25 - - - - - - - - - - - - 21 22 25
Belgium - - - 25 7 25 - - - 12 11 11 - - - 37 18 36
Denmark - - - 80 16 41 - - - 15 15 16 - - - 95 31 57
Finland - - - 25 50 25 - - - - - - - - - 25 50 25
France 200 24 209 223 211 228 - 16 - 313 440 347 - - - 736 691 784
Germany 243 303 87 124 97 115 1 1 1 280 301 300 - - - 648 702 503
Greece - - - - - - - - - - - - - - - - - -
Ireland - - - - - - - 3 3 - - - - - - - 3 3
Italy - - - 26 34 36 - - - 79 72 86 - - - 105 106 122
Japan - - - 51 135 119 62 29 10 31 30 32 - - - 144 194 161
Mexico 5 1 1 - - - - - - 106 83 112 - - - 111 84 113
Netherlands - - - 273 366 313 - - - 24 6 24 - - - 297 372 337
Norway - - - - - - - - - 38 37 40 - - - 38 37 40
Portugal 1 - - - - - - - - - - - - - - 1 - -
Russia - - - - - - - - - - - - - - - - - -
Spain - - - 116 2 37 - - - 50 26 52 - - - 166 28 89
Sweden - - - 67 12 38 1 1 1 61 59 66 - - - 129 72 105
Switzerland - - - 163 77 87 - - - 7 7 7 - - - 170 84 94
US - 13 - 255 273 302 130 381 133 268 318 283 - - - 653 985 718
Other 42 3 48 79 20 61 27 1 2 12 9 11 216 205 226 376 238 348
Total 1,032 3,254 938 2,035 2,170 1,901 1,565 1,684 1,442 2,787 4,627 2,728 216 274 226 7,635 12,009 7,235
1 Government, provincial and municipal includes debt securities which are issued by or explicitly guaranteed by the national government. For Canada, this includes debt securities which are issued by or explicitly guaranteed by the Crown Corporations of the Government of Canada.
2 This balance primarily consists of securities held in supranationals.
56 Standard Life

Strategic report Governance information
Financial statements Other information
Participating business
Government, provincial
and municipal1 Banks Other financial
institutions Other
corporate Other2 Total
30 Jun
2015 30 Jun
2014 31 Dec
2014 30 Jun
2015 30 Jun
2014 31 Dec
2014 30 Jun
2015 30 Jun
2014 31 Dec
2014 30 Jun
2015 30 Jun
2014 31 Dec
2014 30 Jun
2015 30 Jun
2014 31 Dec
2014 30 Jun
2015 30 Jun
2014 31 Dec
2014 £m £m £m £m £m £m £m £m £m £m £m £m £m £m £m £m £m £m
AAA 3,191 3,226 3,764 514 402 591 154 371 168 27 28 28 234 248 291 4,120 4,275 4,842
AA 13,130 13,658 13,543 945 1,255 601 683 779 829 512 583 635 - 5 - 15,270 16,280 15,608
A 29 126 27 1,736 1,189 2,093 1,124 1,392 995 1,609 1,442 1,787 - - - 4,498 4,149 4,902
BBB 6 16 10 302 335 283 369 487 446 885 773 839 - - - 1,562 1,611 1,578
Below BBB - - - 180 201 209 27 84 25 225 222 247 - - - 432 507 481
Not rated 1 1 - - 5 - 65 129 33 93 169 - - 1 - 159 305 33 Internally rated - - 2 7 - - 158 84 194 26 19 145 - - - 191 103 341
Total 16,357 17,027 17,346 3,684 3,387 3,777 2,580 3,326 2,690 3,377 3,236 3,681 234 254 291 26,232 27,230 27,785
Government, provincial
and municipal1 Banks Other financial
institutions Other
corporate Other2 Total
30 Jun
2015 30 Jun
2014 31 Dec
2014 30 Jun
2015 30 Jun
2014 31 Dec
2014 30 Jun
2015 30 Jun
2014 31 Dec
2014 30 Jun
2015 30 Jun
2014 31 Dec
2014 30 Jun
2015 30 Jun
2014 31 Dec
2014 30 Jun
2015 30 Jun
2014 31 Dec
2014 £m £m £m £m £m £m £m £m £m £m £m £m £m £m £m £m £m £m
UK 10,719 11,332 11,030 826 861 926 2,018 2,242 2,050 1,792 1,707 1,966 - 1 - 15,355 16,143 15,972
Canada 33 323 35 214 166 77 8 55 10 1 58 1 - - - 256 602 123
Australia - - - 173 173 199 39 63 39 37 24 42 - - - 249 260 280
Austria 218 206 240 3 35 8 - - - - - - - - - 221 241 248
Belgium 362 383 381 7 18 16 - - - 17 20 16 - - - 386 421 413
Denmark 4 6 5 7 13 10 - - - 26 26 32 - - - 37 45 47
Finland 74 74 83 43 175 57 - 25 - 4 8 5 - - - 121 282 145
France 1,713 1,749 1,641 450 359 473 25 146 19 335 306 375 - - - 2,523 2,560 2,508
Germany 2,633 2,450 2,996 423 275 440 119 168 114 204 185 214 - - - 3,379 3,078 3,764
Greece - - - - - - - - - - - - - - - - - -
Ireland 4 1 1 8 14 6 10 12 10 12 13 13 - - - 34 40 30
Italy 2 2 3 32 29 31 8 66 13 112 118 138 - - - 154 215 185
Japan 20 22 20 184 277 295 - - - 10 10 10 - - - 214 309 325
Mexico - - - - - - - - - 60 66 64 - - - 60 66 64
Netherlands 390 356 358 362 270 228 41 42 46 33 13 31 - - - 826 681 663
Norway 17 65 18 27 56 16 - 13 - 64 59 72 - - - 108 193 106
Portugal - - - - - - - - - 4 - 3 - - - 4 - 3
Russia - - - - - - - - - - 7 7 - - - - 7 7
Spain 3 12 8 8 22 8 - - - 50 65 62 - - - 61 99 78
Sweden 1 4 1 211 101 261 6 16 8 19 18 20 - - - 237 139 290
Switzerland - - - 170 104 182 31 52 35 56 50 56 - - - 257 206 273
US 77 2 434 391 334 383 215 252 254 420 381 408 - - - 1,103 969 1,479
Other 87 40 92 145 105 161 60 174 92 121 102 146 234 253 291 647 674 782
Total 16,357 17,027 17,346 3,684 3,387 3,777 2,580 3,326 2,690 3,377 3,236 3,681 234 254 291 26,232 27,230 27,785
1 Government, provincial and municipal includes debt securities which are issued by or explicitly guaranteed by the national government. For Canada, this includes debt securities which are issued by or explicitly guaranteed by the Crown Corporations of the Government of Canada.
2 This balance primarily consists of securities held in supranationals.
Loans The Group is exposed to interest rate risk and credit risk from loans issued. The Group manages its exposure by setting portfolio limits for business units specifying the proportion of the value of the total portfolio loans that can be represented by a single, or group of related counterparties and requires each business unit to implement appropriate portfolio limits and benchmarks for the assets.
The shareholder business holding of loans of £27m (30 June 2014: £2,367m; 31 December 2014: £4m) primarily comprises bank deposits of more than 3 months maturity. At 30 June 2014 the holding primarily comprised the Canada non-segregated funds commercial mortgage book.
The participating business holding of loans of £340m (30 June 2014: £187m; 31 December 2014: £194m) comprises bank deposits of more than 3 months maturity and UK mortgages.
Standard Life 57

4. Notes to the IFRS condensed consolidated financial information continued
4.13 Fair value of assets and liabilities (a) Determination of fair value hierarchy To provide further information on the approach used to determine and measure the fair value of certain assets and liabilities, the following fair value hierarchy categorisation has been used: Level 1: Fair values measured using quoted prices (unadjusted) in active markets for identical assets or liabilities. An active
market exists where transactions take place with sufficient frequency and volume to provide pricing information on an ongoing basis.
Level 2: Fair values measured using inputs other than quoted prices included within level 1 that are observable for the asset or liability, either directly (i.e. as prices) or indirectly (i.e. derived from prices).
Level 3: Fair values measured using inputs that are not based on observable market data (unobservable inputs).
(b) Methods and assumptions used to determine fair value of assets and liabilities Information on the methods and assumptions used to determine fair values for each major category of financial instrument measured at fair value is given below. These methods and assumptions include those used to fair value assets and liabilities held for sale, including the individual assets and liabilities of operations held for sale.
Investments in associates at FVTPL, equity securities and interests in pooled investment funds and amounts seeded into funds classified as held for sale Investments in associates at FVTPL are valued in the same manner as the Group’s equity securities and interests in pooled investment funds.
Equity instruments listed on a recognised exchange are valued using prices sourced from the primary exchange on which they are listed. These instruments are generally considered to be quoted in an active market and are therefore treated as level 1 instruments within the fair value hierarchy.
Unlisted equities are valued using an adjusted net asset value. The Group’s exposure to unlisted equity securities primarily relates to private equity investments. The majority of the Group’s private equity investments are carried out through European fund of funds structures, where the Group receives valuations from the investment managers of the underlying funds.
The valuations received from investment managers of the underlying funds are reviewed and where appropriate adjustments are made to reflect the impact of changes in market conditions between the date of the valuation and the end of the reporting period. The valuation of these securities is largely based on inputs that are not based on observable market data, and accordingly these instruments are treated as level 3 instruments within the fair value hierarchy. Where appropriate, reference is made to observable market data.
Where pooled investment funds have been seeded and the investments in the fund have been classified as held for sale, the costs to sell are assumed to be negligible. The fair value of pooled investment funds held for sale is calculated as equal to the observable unit price.
Investment property and owner occupied property The fair value of investment property and all owner occupied property is valued by external property valuation experts. The current use is considered the best indicator of the highest and best use of the Group’s property from a market participants’ perspective. No adjustment is made for vacant possession for the Group’s owner occupied property.
In UK and Europe valuations are completed in accordance with the Royal Institution of Chartered Surveyors (RICS) valuation standards and predominantly an income capitalisation method is used. In Canada all valuations are completed in accordance with International Valuation Standards (IVS) and predominantly a discounted cash flow method is used. Both valuation techniques are income approaches as they consider the income that an asset will generate over its useful life and estimate fair value through a capitalisation process. Capitalisation involves the conversion of income into a capital sum through the application of an appropriate discount rate.
The determination of the fair value of investment property and all owner occupied property requires the use of estimates such as future cash flows from the assets for example, future rental income and discount rates applicable to those assets.
Where it is not possible to use an income approach a market approach will be used whereby comparisons are made to recent transactions with similar characteristics and locations to those of the Group’s assets. Where appropriate, adjustments will be made by the valuer to reflect any differences.
Where an income approach, or a market approach with significant unobservable adjustments, has been used, valuations are predominantly based on unobservable inputs and accordingly these assets are categorised as level 3 within the fair value hierarchy. Where a market approach valuation does not include significant unobservable adjustments, these assets are categorised as level 2.
58 Standard Life

Strategic report Governance information
Financial statements Other information
Derivative financial assets and derivative financial liabilities The majority of the Group’s derivatives are over-the-counter (OTC) derivatives which are fair valued using valuation techniques based on observable market data and are therefore treated as level 2 investments within the fair value hierarchy.
Exchange traded derivatives are valued using prices sourced from the relevant exchange. They are considered to be instruments quoted in an active market and are therefore categorised as level 1 instruments within the fair value hierarchy.
Non-performance risk arising from the credit risk of each counterparty has been considered on a net exposure basis in line with the Group’s risk management policies. At 30 June 2015, 30 June 2014 and 31 December 2014, the residual credit risk is considered immaterial and no credit risk adjustment has been made.
Debt securities For debt securities, the Group has determined a hierarchy of pricing sources. The hierarchy consists of reputable external pricing providers who generally use observable market data. If prices are not available from these providers or are considered to be stale, the Group has established procedures to arrive at an internal assessment of the fair value. These procedures are based largely on inputs that are not based on observable market data. A further analysis by category of debt security is as follows: • Government, including provincial and municipal, and supranational institution bonds
These instruments are valued using prices received from external pricing providers who generally base the price on quotes received from a number of market participants. They are categorised as level 1 or level 2 instruments within the fair value hierarchy depending upon the nature of the underlying pricing information used for valuation purposes.
• Corporate bonds listed or quoted in an established over-the-counter market including asset-backed securities These instruments are generally valued using prices received from external pricing providers who generally consolidate quotes received from a panel of banks into a composite price. As the market becomes less active the quotes provided by some banks may be based on modelled prices rather than on actual transactions. These sources are based largely on observable market data, and therefore these instruments are categorised as level 2 instruments within the fair value hierarchy. When prices received from external pricing providers are based on a single broker indicative quote, the instruments are treated as level 3 instruments.
For instruments for which prices are either not available from external pricing providers or the prices provided are considered to be stale, the Group performs its own assessment of the fair value of these instruments. This assessment is largely based on inputs that are not based on observable market data, principally single broker indicative quotes, and accordingly these instruments are categorised as level 3 instruments within the fair value hierarchy.
• Other corporate bonds including unquoted bonds, commercial paper and certificates of deposit These instruments are valued using models. For unquoted bonds the model uses inputs from comparable bonds and includes credit spreads which are obtained from brokers or estimated internally. Commercial paper and certificates of deposit are valued using standard valuation formulas. The categorisation of these instruments within the fair value hierarchy will be either level 2 or 3 depending upon the nature of the underlying pricing information used for valuation purposes.
• Commercial mortgages These instruments are valued using models. The models use a discount rate adjustment technique which is an income approach. The key inputs for the valuation models are contractual future cash flows, which are discounted using a discount rate that is determined by adding a spread to the current base rate. The spread is derived from a pricing matrix which incorporates data on current spreads for similar assets and which may include an internal underwriting rating. These inputs are generally observable with the exception of the spread adjustment arising from the internal underwriting rating. The classification of these instruments within the fair value hierarchy will be either level 2 or 3 depending on whether the spread is adjusted by an internal underwriting rating.
Contingent consideration asset A contingent consideration asset was recognised during 2014 in respect of a purchase price adjustment mechanism relating to the acquisition of Ignis. The fair value of the asset is calculated using a binominal tree model. The main inputs are management fee income and expected probabilities of payouts. These are considered unobservable and as a result the asset is classified as level 3 in the fair value hierarchy.
Non-participating investment contract liabilities The fair value of the non-participating investment contract liabilities is calculated equal to the fair value of the underlying assets and liabilities in the funds. Thus, the value of these liabilities is dependent on the methods and assumptions set out above in relation to the underlying assets and liabilities in which these funds are invested. The underlying assets and liabilities are predominately categorised as level 1 or 2 and as such, the inputs into the valuation of the liabilities are observable. Therefore, the liabilities are categorised within level 2 of the fair value hierarchy.
Liabilities in respect of third party interest in consolidated funds The fair value of liabilities in respect of third party interest in consolidated funds is calculated equal to the fair value of the underlying assets and liabilities in the funds. Thus, the value of these liabilities is dependent on the methods and assumptions set out above in relation to the underlying assets in which these funds are invested. When the underlying assets and liabilities are valued using readily available market information the liabilities in respect of third party interest in consolidated funds are treated as level 2. Where the underlying assets and liabilities are not valued using readily available market information the liabilities in respect of third party interest in consolidated funds are treated as level 3.
Standard Life 59

4. Notes to the IFRS condensed consolidated financial information continued
4.13 Fair value of assets and liabilities continued (b) Methods and assumptions used to determine fair value of assets and liabilities continued (b)(i) Fair value hierarchy for assets measured at fair value in the statement of financial position The table below presents the Group's assets measured at fair value by level of the fair value hierarchy.
As recognised in the consolidated
statement of financial position
line item Classified as held for sale Total Level 1 Level 2 Level 3
30 June
2015 31 Dec
2014 30 June
2015 31 Dec
2014 30 June
2015 31 Dec
2014 30 June
2015 31 Dec
2014 30 June
2015 31 Dec
2014 30 June
2015 31 Dec
2014 £m £m £m £m £m £m £m £m £m £m £m £m
Investments in associates at FVTPL 4,527 4,264 14 33 4,541 4,297 4,433 4,214 7 - 101 83
Investment property 9,584 9,041 38 1,427 9,622 10,468 - - - 105 9,622 10,363
Owner occupied property 134 138 - 26 134 164 - - - 1 134 163
Derivative financial assets 2,642 4,021 - 44 2,642 4,065 638 971 2,004 3,094 - - Equity securities and interests in pooled investment vehicles 73,033 71,327 20 13,035 73,053 84,362 72,130 83,521 - 1 923 840
Debt securities 64,610 64,441 - 11,059 64,610 75,500 22,120 23,780 41,841 50,077 649 1,643 Contingent consideration asset 20 20 - - 20 20 - - - - 20 20
Total assets at fair value 154,550 153,252 72 25,624 154,622 178,876 99,321 112,486 43,852 53,278 11,449 13,112
As recognised in the consolidated
statement of financial position
line item Classified as held for sale Total Level 1 Level 2 Level 3
30 June 2014 £m £m £m £m £m £m Investments in associates at FVTPL 1,585 - 1,585 1,585 - -
Investment property 9,302 - 9,302 - 65 9,237
Owner occupied property 163 - 163 - 1 162
Derivative financial assets 2,648 - 2,648 746 1,902 - Equity securities and interests in pooled investment vehicles 87,732 9 87,741 86,692 - 1,049
Debt securities 72,602 20 72,622 22,353 49,049 1,220 Contingent consideration asset - - - - - -
Total assets at fair value 174,032 29 174,061 111,376 51,017 11,668
There were no significant transfers between levels 1 and 2 during the period (six months ended 30 June 2014: none; 12 months ended 31 December 2014: none). Refer to 4.13 (b)(iii) for details of movements in level 3.
All transfers between fair value hierarchy levels are deemed to occur on the last day of the quarter in which they arise.
60 Standard Life
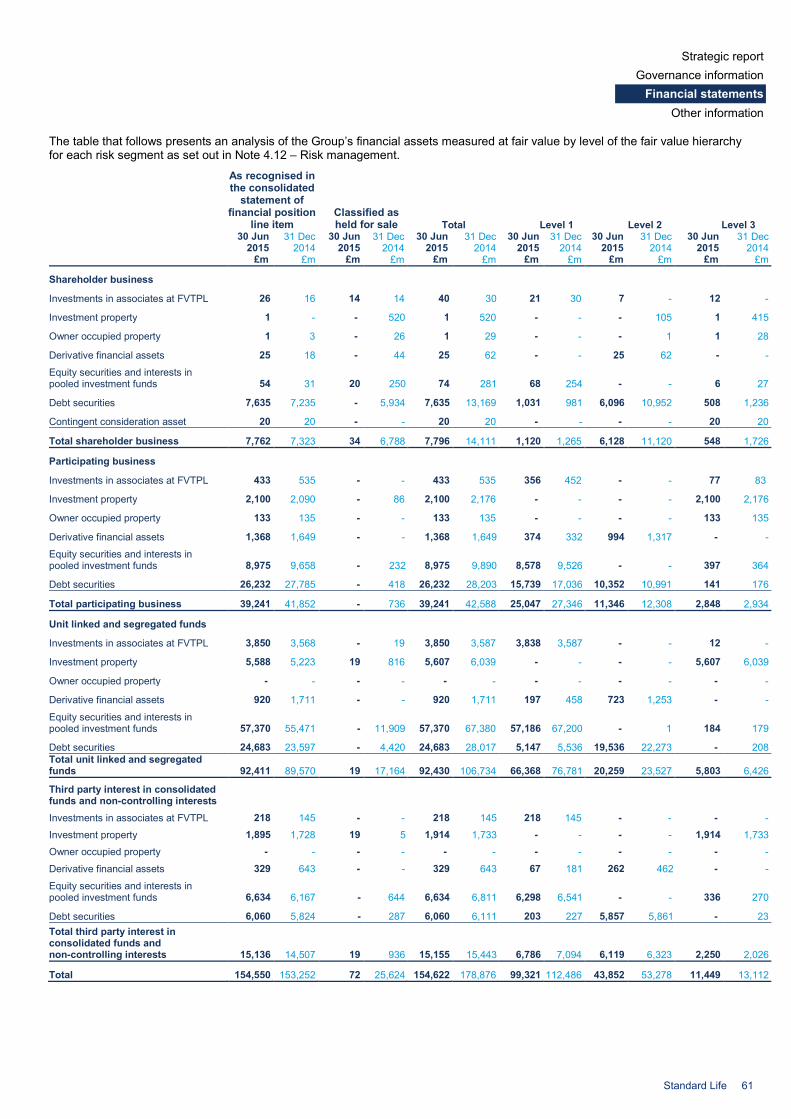
Strategic report Governance information
Financial statements Other information
The table that follows presents an analysis of the Group’s financial assets measured at fair value by level of the fair value hierarchy for each risk segment as set out in Note 4.12 – Risk management.
As recognised in the consolidated
statement of financial position
line item Classified as held for sale Total Level 1 Level 2 Level 3
30 Jun
2015 31 Dec
2014 30 Jun
2015 31 Dec
2014 30 Jun
2015 31 Dec
2014 30 Jun
2015 31 Dec
2014 30 Jun
2015 31 Dec
2014 30 Jun
2015 31 Dec
2014 £m £m £m £m £m £m £m £m £m £m £m £m
Shareholder business
Investments in associates at FVTPL 26 16 14 14 40 30 21 30 7 - 12 -
Investment property 1 - - 520 1 520 - - - 105 1 415
Owner occupied property 1 3 - 26 1 29 - - - 1 1 28
Derivative financial assets 25 18 - 44 25 62 - - 25 62 - -
Equity securities and interests in pooled investment funds 54 31 20 250 74 281 68 254 - - 6 27
Debt securities 7,635 7,235 - 5,934 7,635 13,169 1,031 981 6,096 10,952 508 1,236
Contingent consideration asset 20 20 - - 20 20 - - - - 20 20
Total shareholder business 7,762 7,323 34 6,788 7,796 14,111 1,120 1,265 6,128 11,120 548 1,726
Participating business
Investments in associates at FVTPL 433 535 - - 433 535 356 452 - - 77 83
Investment property 2,100 2,090 - 86 2,100 2,176 - - - - 2,100 2,176
Owner occupied property 133 135 - - 133 135 - - - - 133 135
Derivative financial assets 1,368 1,649 - - 1,368 1,649 374 332 994 1,317 - -
Equity securities and interests in pooled investment funds 8,975 9,658 - 232 8,975 9,890 8,578 9,526 - - 397 364
Debt securities 26,232 27,785 - 418 26,232 28,203 15,739 17,036 10,352 10,991 141 176
Total participating business 39,241 41,852 - 736 39,241 42,588 25,047 27,346 11,346 12,308 2,848 2,934
Unit linked and segregated funds
Investments in associates at FVTPL 3,850 3,568 - 19 3,850 3,587 3,838 3,587 - - 12 -
Investment property 5,588 5,223 19 816 5,607 6,039 - - - - 5,607 6,039
Owner occupied property - - - - - - - - - - - -
Derivative financial assets 920 1,711 - - 920 1,711 197 458 723 1,253 - -
Equity securities and interests in pooled investment funds 57,370 55,471 - 11,909 57,370 67,380 57,186 67,200 - 1 184 179
Debt securities 24,683 23,597 - 4,420 24,683 28,017 5,147 5,536 19,536 22,273 - 208 Total unit linked and segregated funds 92,411 89,570 19 17,164 92,430 106,734 66,368 76,781 20,259 23,527 5,803 6,426
Third party interest in consolidated funds and non-controlling interests
Investments in associates at FVTPL 218 145 - - 218 145 218 145 - - - -
Investment property 1,895 1,728 19 5 1,914 1,733 - - - - 1,914 1,733
Owner occupied property - - - - - - - - - - - -
Derivative financial assets 329 643 - - 329 643 67 181 262 462 - -
Equity securities and interests in pooled investment funds 6,634 6,167 - 644 6,634 6,811 6,298 6,541 - - 336 270
Debt securities 6,060 5,824 - 287 6,060 6,111 203 227 5,857 5,861 - 23 Total third party interest in consolidated funds and non-controlling interests 15,136 14,507 19 936 15,155 15,443 6,786 7,094 6,119 6,323 2,250 2,026
Total 154,550 153,252 72 25,624 154,622 178,876 99,321 112,486 43,852 53,278 11,449 13,112
Standard Life 61

4. Notes to the IFRS condensed consolidated financial information continued
4.13 Fair value of assets and liabilities continued (b) Methods and assumptions used to determine fair value of assets and liabilities continued (b)(i) Fair value hierarchy for assets measured at fair value in the statement of financial position continued
As recognised in the consolidated
statement of financial position
line item
Classified as held for
sale Total Level 1 Level 2 Level 3 30 June 2014 £m £m £m £m £m £m
Shareholder business
Investments in associates at FVTPL 4 - 4 4 - -
Investment property 482 - 482 - 65 417
Owner occupied property 36 - 36 - 1 35
Derivative financial assets 67 - 67 1 66 - Equity securities and interests in pooled investment funds 215 9 224 196 - 28
Debt securities 12,009 20 12,029 907 10,196 926
Contingent consideration asset - - - - - -
Total shareholder business 12,813 29 12,842 1,108 10,328 1,406
Participating business
Investments in associates at FVTPL 375 - 375 375 - -
Investment property 2,117 - 2,117 - - 2,117
Owner occupied property 127 - 127 - - 127
Derivative financial assets 899 - 899 249 650 - Equity securities and interests in pooled investment funds 10,235 - 10,235 9,572 - 663
Debt securities 27,230 - 27,230 16,391 10,828 11
Total participating business 40,983 - 40,983 26,587 11,478 2,918
Unit linked and segregated funds
Investments in associates at FVTPL 1,105 - 1,105 1,105 - -
Investment property 5,205 - 5,205 - - 5,205
Owner occupied property - - - - - -
Derivative financial assets 1,127 - 1,127 332 795 - Equity securities and interests in pooled investment funds 69,141 - 69,141 69,097 - 44
Debt securities 26,542 - 26,542 4,807 21,509 226
Total unit linked and segregated funds 103,120 - 103,120 75,341 22,304 5,475 Third party interest in consolidated funds and non-controlling interests
Investments in associates at FVTPL 101 - 101 101 - - Investment property 1,498 - 1,498 - - 1,498 Owner occupied property - - - - - - Derivative financial assets 555 - 555 164 391 - Equity securities and interests in pooled investment funds 8,141 - 8,141 7,827 - 314
Debt securities 6,821 - 6,821 248 6,516 57 Total third party interest in consolidated funds and non-controlling interests 17,116 - 17,116 8,340 6,907 1,869
Total 174,032 29 174,061 111,376 51,017 11,668
62 Standard Life

Strategic report Governance information
Financial statements Other information
(b)(ii) Fair value hierarchy for liabilities measured at fair value in the statement of financial position The table below presents the Group's liabilities measured at fair value by level of the fair value hierarchy.
As recognised in the consolidated
statement of financial position line item
Classified as held for sale Total Level 1 Level 2 Level 3
30 June
2015 31 Dec
2014 30 June
2015 31 Dec
2014 30 June
2015 31 Dec
2014 30 June
2015 31 Dec
2014 30 June
2015 31 Dec
2014 30 June
2015 31 Dec
2014 £m £m £m £m £m £m £m £m £m £m £m £m
Non-participating investment contract liabilities 91,583 88,203 - 13,734 91,583 101,937 - - 91,583 101,937 - - Liabilities in respect of third party interest in consolidated funds 16,607 15,805 - 953 16,607 16,758 - - 15,214 15,419 1,393 1,339
Derivative financial liabilities 858 1,693 - 26 858 1,719 160 441 698 1,278 - - Contingent consideration liability - 3 - - - 3 - - - - - 3
Total liabilities at fair value 109,048 105,704 - 14,713 109,048 120,417 160 441 107,495 118,634 1,393 1,342
As recognised in the consolidated
statement of financial position line item
Classified as held for sale Total Level 1 Level 2 Level 3
30 June 2014 £m £m £m £m £m £m
Non-participating investment contract liabilities 98,448 - 98,448 - 98,448 - Liabilities in respect of third party interest in consolidated funds 17,994 - 17,994 - 16,715 1,279
Derivative financial liabilities 1,101 - 1,101 207 894 -
Contingent consideration liability - - - - - -
Total liabilities at fair value 117,543 - 117,543 207 116,057 1,279
There were no transfers between levels 1 and 2 during the six months ended 30 June 2015 (six months ended 30 June 2014: none; 12 months ended 31 December 2014: none). Refer to 4.13 (b)(iii) for details of movements in level 3.
The table that follows presents an analysis of the Group’s financial liabilities measured at fair value by level of the fair value hierarchy for each risk segment as set out in Note 4.12 – Risk management.
Standard Life 63

4. Notes to the IFRS condensed consolidated financial information continued
4.13 Fair value of assets and liabilities continued (b) Methods and assumptions used to determine fair value of assets and liabilities continued (b)(ii) Fair value hierarchy for liabilities measured at fair value in the statement of financial position continued
As recognised in the consolidated
statement of financial position line item
Classified as held for sale Total Level 1 Level 2 Level 3
30 June
2015 31 Dec
2014 30 June
2015 31 Dec
2014 30 June
2015 31 Dec
2014 30June
2015 31 Dec
2014 30 June
2015 31 Dec
2014 30 June
2015 31 Dec
2014 £m £m £m £m £m £m £m £m £m £m £m £m
Shareholder business
Derivative financial liabilities 7 17 - 23 7 40 1 8 6 32 - -
Contingent consideration liability - 3 - - - 3 - - - - - 3
Total shareholder business 7 20 - 23 7 43 1 8 6 32 - 3
Participating business
Derivative financial liabilities 69 80 - - 69 80 42 26 27 54 - -
Total participating business 69 80 - - 69 80 42 26 27 54 - - Unit linked and segregated funds Non-participating investment contract liabilities 91,583 88,203 - 13,734 91,583 101,937 - - 91,583
101,937 - -
Derivative financial liabilities 583 1,187 - 2 583 1,189 92 319 491 870 - - Total unit linked and segregated funds 92,166 89,390 -
13,736 92,166 103,126 92 319 92,074
102,807 - -
Third party interest in consolidated funds and non-controlling interests Liabilities in respect of third party interest in consolidated funds 16,607 15,805 - 953 16,607 16,758 - - 15,214
15,419 1,393
1,339
Derivative financial liabilities 199 409 - 1 199 410 25 88 174 322 - - Third party interest in consolidated funds and non-controlling interests 16,806 16,214 - 954 16,806 17,168 25 88 15,388
15,741 1,393
1,339
Total 109,048
105,704 - 14,713 109,048 120,417 160 441 107,495
118,634 1,393 1,342
64 Standard Life

Strategic report Governance information
Financial statements Other information
As recognised in the consolidated statement of
financial position line item Classified as held for sale Total Level 1 Level 2 Level 3
30 June 2014 £m £m £m £m £m £m
Shareholder business
Derivative financial liabilities 21 - 21 2 19 -
Contingent consideration liability - - - - - -
Total shareholder business 21 - 21 2 19 -
Participating business
Derivative financial liabilities 49 - 49 5 44 -
Total participating business 49 - 49 5 44 -
Unit linked and segregated funds Non-participating investment contract liabilities 98,448 - 98,448 - 98,448 -
Derivative financial liabilities 690 - 690 147 543 - Total unit linked and segregated funds 99,138 - 99,138 147 98,991 - Third party interest in consolidated funds and non-controlling interests Liabilities in respect of third party interest in consolidated funds 17,994 - 17,994 - 16,715 1,279
Derivative financial liabilities 341 - 341 53 288 - Third party interest in consolidated funds and non-controlling interests 18,335 - 18,335 53 17,003 1,279
Total 117,543 - 117,543 207 116,057 1,279
Standard Life 65

4. Notes to the IFRS condensed consolidated financial information continued
4.13 Fair value of assets and liabilities continued (b) Methods and assumptions used to determine fair value of assets and liabilities continued (b)(iii) Reconciliation of movements in level 3 instruments The movements during the period of level 3 assets and liabilities held at fair value, excluding assets and liabilities held for sale, are analysed below.
Investments in associates at
FVTPL Investment
property Owner occupied
property
Equity securities and interests
in pooled Debt
securities
Liabilities in respect of third party interest in
consolidated funds 30 June
2015 31 Dec
2014 30 June
2015 31 Dec
2014 30 June
2015 31 Dec
2014 30 June
2015 31 Dec
2014 30 June
2015 31 Dec
2014 30 June
2015 31 Dec
2014 £m £m £m £m £m £m £m £m £m £m £m £m
At start of period 83 - 9,041 8,542 138 171 836 1,066 519 1,299 (1,338) (1,246)
Reclassified as held for sale - - - (1,233) - (42) - (1) - (945) - - Total (losses)/gains recognised in the consolidated income statement (1) 2 249 825 1 4 62 (31) (9) 38 2 (124)
Purchases 31 101 412 1,033 - - 167 112 166 439 14 35
Settlement - - - - - - - - - - (71) (3)
Sales (10) (20) (82) (128) (5) - (146) (306) (30) (87) - -
Transfers in to level 3 - - - - - - 21 1 15 436 - -
Transfers out of level 3 - - - - - - - (1) (12) (659) - - Foreign exchange adjustment (2) - (20) (14) - - (17) (4) - (2) - -
Total gains recognised in revaluation of owner occupied property within other comprehensive income - - - - - 5 - - - - - -
Other - - (16) 16 - - - - - - - -
At end of period 101 83 9,584 9,041 134 138 923 836 649 519 (1,393) (1,338)
Investments in associates
at FVTPL Investment
property Owner occupied
property
Equity securities and
interests in pooled
Debt securities
Liabilities in respect of third party interest in
consolidated funds
2014 £m £m £m £m £m £m
1 January - 8,542 171 1,066 1,299 (1,246) Total gains/(losses) recognised in the consolidated income statement - 395 1 56 41 (68)
Purchases - 531 - 60 290 5
Settlement - - - - - 30
Sales - (188) (13) (117) (122) -
Transfers in to level 3 - - - 1 - -
Transfers out of level 3 - - - - (258) -
Foreign exchange adjustment - (48) (2) (17) (30) - Total gains recognised in revaluation of owner occupied property within other comprehensive income - - 5 - - -
Other - 5 - - - -
30 June - 9,237 162 1,049 1,220 (1,279)
In addition to the above, the Group had a contingent consideration asset with a fair value of £20m at 30 June 2015 (30 June 2014: £nil; 31 December 2014: £20m). There were no settlements during the period (12 months ended 31 December 2014: none) in respect of the contingent consideration asset.
66 Standard Life
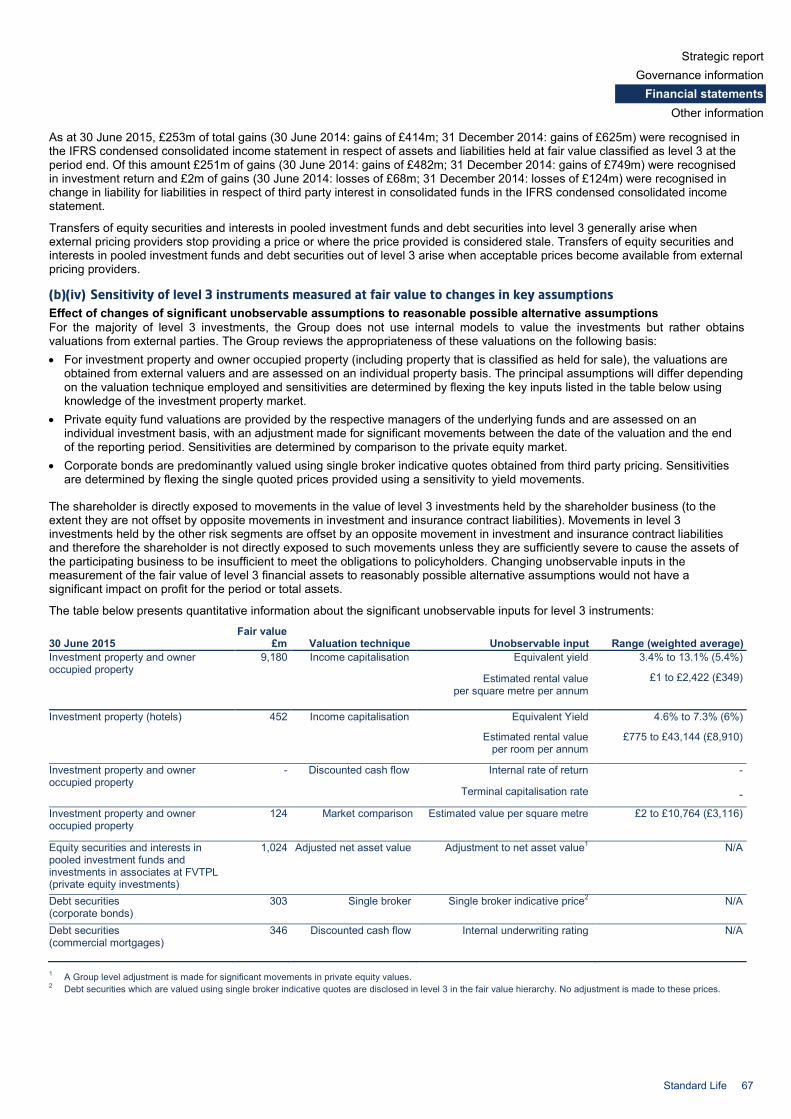
Strategic report Governance information
Financial statements Other information
As at 30 June 2015, £253m of total gains (30 June 2014: gains of £414m; 31 December 2014: gains of £625m) were recognised in the IFRS condensed consolidated income statement in respect of assets and liabilities held at fair value classified as level 3 at the period end. Of this amount £251m of gains (30 June 2014: gains of £482m; 31 December 2014: gains of £749m) were recognised in investment return and £2m of gains (30 June 2014: losses of £68m; 31 December 2014: losses of £124m) were recognised in change in liability for liabilities in respect of third party interest in consolidated funds in the IFRS condensed consolidated income statement.
Transfers of equity securities and interests in pooled investment funds and debt securities into level 3 generally arise when external pricing providers stop providing a price or where the price provided is considered stale. Transfers of equity securities and interests in pooled investment funds and debt securities out of level 3 arise when acceptable prices become available from external pricing providers.
(b)(iv) Sensitivity of level 3 instruments measured at fair value to changes in key assumptions Effect of changes of significant unobservable assumptions to reasonable possible alternative assumptions For the majority of level 3 investments, the Group does not use internal models to value the investments but rather obtains valuations from external parties. The Group reviews the appropriateness of these valuations on the following basis: • For investment property and owner occupied property (including property that is classified as held for sale), the valuations are
obtained from external valuers and are assessed on an individual property basis. The principal assumptions will differ depending on the valuation technique employed and sensitivities are determined by flexing the key inputs listed in the table below using knowledge of the investment property market.
• Private equity fund valuations are provided by the respective managers of the underlying funds and are assessed on an individual investment basis, with an adjustment made for significant movements between the date of the valuation and the end of the reporting period. Sensitivities are determined by comparison to the private equity market.
• Corporate bonds are predominantly valued using single broker indicative quotes obtained from third party pricing. Sensitivities are determined by flexing the single quoted prices provided using a sensitivity to yield movements.
The shareholder is directly exposed to movements in the value of level 3 investments held by the shareholder business (to the extent they are not offset by opposite movements in investment and insurance contract liabilities). Movements in level 3 investments held by the other risk segments are offset by an opposite movement in investment and insurance contract liabilities and therefore the shareholder is not directly exposed to such movements unless they are sufficiently severe to cause the assets of the participating business to be insufficient to meet the obligations to policyholders. Changing unobservable inputs in the measurement of the fair value of level 3 financial assets to reasonably possible alternative assumptions would not have a significant impact on profit for the period or total assets.
The table below presents quantitative information about the significant unobservable inputs for level 3 instruments:
Fair value 30 June 2015 £m Valuation technique Unobservable input Range (weighted average) Investment property and owner occupied property
9,180 Income capitalisation Equivalent yield
Estimated rental value per square metre per annum
3.4% to 13.1% (5.4%)
£1 to £2,422 (£349)
Investment property (hotels) 452 Income capitalisation Equivalent Yield
Estimated rental value per room per annum
4.6% to 7.3% (6%)
£775 to £43,144 (£8,910)
Investment property and owner occupied property
- Discounted cash flow Internal rate of return
Terminal capitalisation rate
-
-
Investment property and owner occupied property
124 Market comparison Estimated value per square metre
£2 to £10,764 (£3,116)
Equity securities and interests in pooled investment funds and investments in associates at FVTPL (private equity investments)
1,024 Adjusted net asset value Adjustment to net asset value1 N/A
Debt securities (corporate bonds)
303 Single broker Single broker indicative price2 N/A
Debt securities (commercial mortgages)
346 Discounted cash flow Internal underwriting rating N/A
1 A Group level adjustment is made for significant movements in private equity values. 2 Debt securities which are valued using single broker indicative quotes are disclosed in level 3 in the fair value hierarchy. No adjustment is made to these prices.
Standard Life 67

4. Notes to the IFRS condensed consolidated financial information continued
4.13 Fair value of assets and liabilities continued (b) Methods and assumptions used to determine fair value of assets and liabilities continued (b)(iv) Sensitivity of level 3 instruments measured at fair value to changes in key assumptions continued Fair value 30 June 2014 £m Valuation technique Unobservable input Range (weighted average) Investment property and owner occupied property
7,710 Income capitalisation Equivalent yield
Estimated rental value per square metre per annum
4.0% to 13.6% (5.8%)
£11 to £4,844 (£446)
Investment property (hotels) 301 Income capitalisation Equivalent Yield
Estimated rental value per room per annum
5.3% to 8.0% (6.5%)
£412 to £9,100 (£3,725)
Investment property and owner occupied property
1,284 Discounted cash flow Internal rate of return
Terminal capitalisation rate
6.0% to 10.8% (7.4%)
5.3% to 9.5% (6.6%)
Investment property and owner occupied property
104 Market comparison Estimated value per square metre
£2 to £10,000 (£1,607)
Equity securities and interests in pooled investment funds and investments in associates at FVTPL (private equity investments)
1,049 Adjusted net asset value Adjustment to net asset value1 N/A
Debt securities (corporate bonds)
1,169 Single broker Single broker indicative price2 N/A
Debt securities (commercial mortgages)
51 Discounted cash flow Internal underwriting rating N/A
1 A Group level adjustment is made for significant movements in private equity values. 2 Debt securities which are valued using single broker indicative quotes are disclosed in level 3 in the fair value hierarchy. No adjustment is made to these prices.
Fair value 31 December 2014 £m Valuation technique Unobservable input Range (weighted average) Investment property and owner occupied property
8,753 Income capitalisation Equivalent yield
Estimated rental value per square metre per annum
3.8% to 12.9% (5.5%)
£11 to £2,422 (£345)
Investment property (hotels) 312 Income capitalisation Equivalent Yield
Estimated rental value per room per annum
4.6% to 7.3% (6.2%)
£215 to £43,143 (£8,918)
Investment property and owner occupied property
1,337 Discounted cash flow Internal rate of return
Terminal capitalisation rate
6.0% to 10.5% (7.3%)
5.3% to 9.5% (6.6%)
Investment property and owner occupied property
124 Market comparison Estimated value per square metre
£2 to £10,764 (£2,591)
Equity securities and interests in pooled investment funds and investments in associates at FVTPL (private equity investments)
923 Adjusted net asset value Adjustment to net asset value1 N/A
Debt securities (corporate bonds)
1,369 Single broker Single broker indicative price2 N/A
Debt securities (commercial mortgages)
274 Discounted cash flow Internal underwriting rating N/A
1 A Group level adjustment is made for significant movements in private equity values. 2 Debt securities which are valued using single broker indicative quotes are disclosed in level 3 in the fair value hierarchy. No adjustment is made to these prices.
68 Standard Life

Strategic report Governance information
Financial statements Other information
(c) Fair value of assets and liabilities not carried at fair value The table below presents estimated fair values of financial assets and liabilities whose carrying value does not approximate fair value. Fair values of assets and liabilities are based on observable market inputs where available, or are estimated using other valuation techniques.
As recognised in the consolidated
statement of financial position line item
Classified as held for sale
Total carrying value Fair value
30 June 2015
31 Dec 2014
30 June 2015
31 Dec 2014
30 June 2015
31 Dec 2014
30 June 2015
31 Dec 2014
£m £m £m £m £m £m £m £m
Assets
Loans secured by mortgages 97 107 - 2,230 97 2,337 93 2,426
Liabilities
Non-participating investment contract liabilities 6 4 283 2,118 289 2,122 332 2,285
Subordinated notes 499 499 - 223 499 722 579 800
Subordinated guaranteed bonds 519 502 - - 519 502 610 580
Mutual Assurance Capital Securities 307 611 - - 307 611 337 643
As recognised in the consolidated
statement of financial position line item
Classified as held for sale
Total carrying value Fair value
30 June 2014 £m £m £m £m
Assets
Loans secured by mortgages 2,449 - 2,449 2,535
Liabilities Non-participating investment contract liabilities 2,268 - 2,268 2,354
Subordinated notes 721 - 721 777
Subordinated guaranteed bonds 519 - 519 599
Mutual Assurance Capital Securities 601 - 601 646
The estimated fair values of the subordinated liabilities are based on the quoted market offer price. The estimated fair values of the other instruments detailed above are calculated by discounting the expected future cash flows at current market rates.
It is not possible to reliably calculate the fair value of participating investment contract liabilities. The assumptions and methods used in the calculation of these liabilities are set out in Note 34 of the Group’s Annual report and accounts for the year ended 31 December 2014. The carrying value of participating investment contract liabilities at 30 June 2015 was £14,809m (30 June 2014: £14,764m; 31 December 2014: £15,193m).
The carrying value of all other financial assets and liabilities measured at amortised cost approximates their fair value.
Standard Life 69

4. Notes to the IFRS condensed consolidated financial information continued
4.14 Subordinated liabilities On 6 January 2015, the Company redeemed in full the Euro denominated 5.314% fixed/floating rate perpetual Mutual Assurance Capital Securities at their outstanding principal amount of €360,000,000 (£282m).
4.15 Contingent assets and contingent liabilities (a) Legal proceedings and regulations The Group, like other financial organisations, is subject to legal proceedings and complaints in the normal course of its business. While it is not practicable to forecast or determine the final results of all pending or threatened legal proceedings, the Directors do not believe that such proceedings (including litigation) will have a material effect on the results and financial position of the Group.
The Group is subject to insurance solvency regulations in all the territories in which it issues insurance and investment contracts, and it has complied in material respects with local solvency and other regulations. Therefore, there are no contingencies in respect of these regulations.
(b) Unclaimed asset trust (UAT) The UAT was established in July 2006. It holds shares and cash which were allocated to eligible members of The Standard Life Assurance Company at the date of demutualisation where those eligible members have not yet claimed their entitlement. Dividends paid on the shares held by the UAT are also held in the UAT until the related shares are claimed. The Scheme of Demutualisation sets a 10-year time limit, ending in July 2016, for those eligible members to claim their entitlements. On expiry of the UAT in July 2016, the ownership of any assets remaining in the UAT would be transferred to the Company, for general corporate purposes including charitable donations, and may be subject to a tax charge. At 30 June 2015 the UAT held cash of £45m (30 June 2014: £35m; 31 December 2014: £32m). The number of shares held by the UAT is presented in Note 4.9(c). The position at July 2016 will depend on the actions of eligible members and the success of the ongoing efforts to trace eligible members.
4.16 Commitments (a) Capital commitments As at 30 June 2015 capital expenditure that was authorised and contracted for, but not provided and incurred, was £285m (30 June 2014: £425m; 31 December 2014: £332m) in respect of investment property. Of this amount, £259m (30 June 2014: £378m; 31 December 2014: £287m) and £26m (30 June 2014: £47m; 31 December 2014: £36m) relates to the contractual obligations to purchase, construct or develop investment property and repair, maintain or enhance investment property respectively.
(b) Unrecognised financial instruments The Group has committed the following unrecognised financial instruments to customers and third parties:
30 June
2015 30 June
2014 31 December
2014 £m £m £m
Commitments to extend credit with an original term to maturity of one year or less - 89 1
Other commitments 341 299 300
Included in other commitments is £325m (30 June 2014: £278m; 31 December 2014: £300m) committed by certain subsidiaries which are not fully owned by the Group. These commitments are funded through contractually agreed additional investments in the subsidiary by the Group and the non-controlling interests. The levels of funding are not necessarily in line with the relevant percentage holdings.
(c) Operating lease commitments The Group has entered into commercial non-cancellable leases on certain property, plant and equipment where it is not in the best interest of the Group to purchase these assets. Such leases have varying terms, escalation clauses and renewal rights.
The future aggregate minimum lease payments under non-cancellable operating leases are as follows:
30 June 2015
30 June 2014
restated1 31 December
2014 £m £m £m
Not later than one year 32 26 36
Later than one year and no later than five years 64 50 61
Later than five years 103 64 63
Total operating lease commitments 199 140 160 1 Comparatives for the six months ended 30 June 2014 have been restated to reflect the classification of the Group’s Canadian business as discontinued operations.
Refer to Note 4.2 – Acquisitions and disposals.
70 Standard Life

Strategic report Governance information
Financial statements Other information
4.17 Related party transactions (a) Transactions with related parties Transactions with related parties carried out by the Group were as follows:
6 months
2015
6 months 2014
restated1 Full year
2014 £m £m £m
Sales to:
Associates 413 75 451
Joint ventures - 1 1
Other related parties 36 4 94
449 80 546
Purchases from:
Associates 629 179 816
Joint ventures 9 14 14
638 193 830 1 Comparatives for the six months ended 30 June 2014 have been restated to reflect the classification of the Group’s Canadian business as discontinued operations.
Refer to Note 4.2 – Acquisitions and disposals.
Sales to other related parties include management fees received from non-consolidated investment vehicles managed by Standard Life Investments.
The Group’s defined benefit pension plans have assets of £1,114m (30 June 2014: £797m; 31 December 2014: £1,553m) invested in investment vehicles managed by the Group.
(b) Transactions with key management personnel and their close family members All transactions between key management personnel and their close family members and the Group during the period are on terms which are equivalent to those available to all employees of the Group.
During the six months ended 30 June 2015, key management personnel and their close family members contributed £3m (six months ended 30 June 2014: £1m; 12 months ended 31 December 2014: £1m) to products sold by the Group.
Standard Life 71

5. Shareholder information
5. Shareholder informationRegistered office Company registration number: SC286832 Standard Life House 30 Lothian Road Edinburgh EH1 2DH Scotland
Phone: 0800 634 7474 or 0131 225 2552
For shareholder services call 0345 113 0045
Registrar Capita Registrars Limited Auditors PricewaterhouseCoopers LLP Solicitors Slaughter and May Brokers JP Morgan Cazenove Deutsche Bank
Shareholder services We offer a wide range of shareholder services, some details of which are set out below. If you need any further information about any of these services, please:
Contact our registrar, Capita, on 0345 113 0045 if calling from the UK. International numbers for Capita can be found on the last page of this report Visit our share portal at www.standardlifeshareportal.com
Sign up for ecommunications You can choose to receive your shareholder communications electronically. Just go to www.standardlife.com/shareholders to find out how. Signing up means: • You’ll receive an email when documents like the Annual
report and accounts and AGM guide are available on our website. You can then read these online in an easy-to-use, searchable format instead of receiving paper copies in the post.
• Voting instructions for the Annual General Meeting will be sent to you electronically
Set up a share portal account Just go to www.standardlifeshareportal.com to find out how. Having a share portal account means you can: • Manage your account at a time that suits you • Download your dividend tax vouchers when you need
them • View your Standard Life Share Account statement
Preventing unsolicited mail By law, the Company has to make certain details from its share register publicly available. Because of this, it is possible that some registered shareholders could receive unsolicited mail or phone calls. You could also be targeted by fraudulent ‘investment specialists’. Remember, if it sounds too good to be true, it probably is. You can find more information about share scams at the Financial Conduct Authority website www.fca.org.uk/consumers/scams
If you are a certificated shareholder, your name and address may appear on a public register. Using a nominee company to hold your shares can help protect your privacy. You can transfer your shares into the Company-sponsored nominee – the Standard Life Share Account – by contacting Capita, or you could get in touch with your broker to find out about their nominee services.
If you want to limit the amount of unsolicited mail you receive generally, please contact:
Mailing Preference Service (MPS) DMA House 70 Margaret Street London W1W 8SS
You can also register online at www.mpsonline.org.uk Analysis of registered shareholdings as at 30 June 2015
Range of shares
Number of holders
% of total holders
Number of shares
% of total shares
1-1,000 63,884 60.83 27,577,224 1.40
1,001-5,000 36,315 34.58 73,768,454 3.75
5,001-10,000 2,804 2.67 19,049,147 0.97 10,001-100,000 1,592 1.51 36,568,910 1.86
*100,001+ 433 0.41 1,812,303,985 92.02
Total 105,028 100 1,969,267,720 100
* These figures include the Company-sponsored nominee – the Standard Life Share Account – which had 1,083,266 participants holding 750,217,500 shares, and the Unclaimed Asset Trust, which holds 15,907,401 shares on behalf of 60,007 eligible claimants.
Ex-dividend date for 2015 interim dividend 10 September 2015
Record date for 2015 interim dividend 11 September 2015 Last date for DRIP elections for 2015 interim dividend 23 September 2015
Interim dividend payment date 20 October 2015
2015 Q3 AUA and flows update 28 October 2015
Financial calendar
72 Standard Life

Strategic report Governance information
Financial statements Other information
6. Glossary
6.1 Product related terms Annuity A periodic payment made for an agreed period of time (usually up to the death of the recipient) in return for a cash sum. The cash sum can be paid as one amount or as a series of premiums. If the annuity commences immediately after the payment of the sum, it is called an immediate annuity. If it commences at some future date, it is called a deferred annuity.
Auto enrolment The UK Government introduced auto enrolment to help people save for their retirement. Employers have to automatically enrol eligible employees into a qualifying workplace pension scheme (QWPS). This pension scheme needs to meet the standards set by the Pensions Regulator.
Flexible income (drawdown) Flexible income, also known as drawdown, allows the policyholder to withdraw pension income as and when they request it. The remainder of the pension fund remains invested, giving it the potential for growth.
Global Absolute Return Strategies (GARS) A discretionary multi-asset fund provided under several regulated pooled and segregated structures globally by Standard Life Investments. Their investment objective is to deliver consistent positive returns at a level exceeding the risk free rate by an average of 5% per annum, and to do so with as little risk as possible.
Mutual fund A collective investment vehicle enabling investors to pool their money, which is then invested in a diverse portfolio of stocks or bonds, enabling investors to achieve a more diversified portfolio than they otherwise might have done by making an individual investment.
Non-participating/non-profit policy A policy, including a unit linked policy, which is not a participating/with profits policy.
Participating/with profits policy A policy where, in addition to guaranteed benefits specified in the policy, additional bonuses may be payable from relevant surplus. The declaration of such bonuses (usually annually) reflects, amongst other things, the overall investment performance of the fund of which the policy forms part.
Personal pension plan An individual pension arrangement with particular tax advantages whereby individuals who are self-employed or those who are not members of employer-sponsored pension scheme arrangements can make provision for retirement or provide benefits for their dependents in a tax efficient manner.
SICAV A SICAV (société d’investissement à capital variable) is an open-ended collective investment scheme common in Western Europe. SICAVs can be cross-border marketed in the EU under the Undertakings for Collective Investment in Transferable Securities (UCITS) directive.
SIPP A self invested personal pension which provides the policyholder with greater choice and flexibility as to the range of investments made, how those investments are managed, the administration of those assets and how retirement benefits are taken.
Unit linked policy A policy where the benefits are determined by reference to the investment performance of a specified pool of assets referred to as the unit linked fund.
Wrap platform An investment platform which is essentially a trading platform enabling investment funds, pensions, direct equity holdings and some life assurance contracts to be held in the same administrative account rather than as separate holdings.
6.2 Key financial terms Assets under administration (AUA) A measure of the total assets that the Group administers on behalf of individual customers and institutional clients. It includes those assets for which the Group provides investment management services, as well as those assets that the Group administers where the customer has made a choice to select an external third party investment manager. Assets under administration reflect the value of the IFRS gross assets of the Group adjusted, where appropriate, for consolidation adjustments, inter-company assets and intangible assets. In addition, the definition includes third party assets administered by the Group which are not included on the consolidated statement of financial position.
Assets under management (AUM) A measure of the total assets that Standard Life Investments manages on behalf of individual customers and institutional clients, for which it receives a fee.
Business unit underlying performance Business unit underlying performance is operating profit before tax after excluding the impact of spread/risk operating actuarial assumption changes, specific management actions, group centre costs and group centre capital management in the reporting period.
Earnings before interest, tax, depreciation and amortisation (EBITDA) EBITDA is defined as earnings before interest, taxation, depreciation, amortisation, foreign exchange gains and losses, fair value movements on certain derivatives, restructuring costs and non-controlling interest.
EBITDA margin This is an industry measure of performance for investment management companies. It is calculated as EBITDA divided by net revenue.
Standard Life 73

6. Glossary continued Fee based business Fee based business is a component of operating profit and is made up of products where we generate revenue primarily from asset management charges (AMCs), premium based charges and transactional charges. AMCs are earned on products such as SIPP, corporate pensions and mutual funds, and are calculated as a percentage fee based on the assets held. Investment risk on these products rests principally with the customer, with the major indirect Group exposure to rising or falling markets coming from higher or lower AMCs.
Group capital surplus This is a regulatory measure of our financial strength and compares the Group's capital resources to its capital resources requirements in accordance with the Insurance Groups Directive.
Group underlying cash generation This is a measure of the underlying shareholder cash flow of the Group. Group underlying cash generation adjusts Group underlying performance for non-cash items. Adjustments are made for deferred acquisition costs/deferred income reserve, fixed/intangible assets and the Asian joint ventures and associates. Depreciation/ amortisation that would normally be included in operating profit is replaced with the cash movement in the period. The measure is stated net of current (cash) tax on Group underlying performance.
Group underlying performance Group underlying performance is Group operating profit before tax after excluding the impact of spread/risk operating actuarial assumption changes and specific management actions in the reporting period.
International Financial Reporting Standards (IFRS) International Financial Reporting Standards are accounting standards issued by the International Accounting Standards Board (IASB). The Group's consolidated financial statements are required to be prepared in accordance with IFRS.
Net flows Net flows represent gross inflows less redemptions. For long-term savings business, gross inflows are premiums and deposits recognised in the period on a regulatory basis (excluding any switches between funds). Redemptions are claims and annuity payments (excluding any reinsurance transactions and switches between funds).
Operating profit The Group’s chosen supplementary measure of performance is operating profit. This is a non-Generally Accepted Accounting Principles (GAAP) measure. Operating profit excludes impacts arising from short-term fluctuations in investment return and economic assumption changes. It is calculated based on expected returns on investments backing equity holder funds, with consistent allowance for the corresponding expected movements in equity holder liabilities. Impacts arising from the difference between the expected return and actual return on investments, and the corresponding impact on equity holder liabilities except where they are directly related to a significant management action, are excluded from operating profit and are presented within profit before tax. The impact of certain changes in economic assumptions is also excluded from operating profit and is presented within profit before tax.
Operating profit also excludes the impact of the following items: Restructuring costs and significant corporate transaction
expenses Impairment of intangible assets Profit or loss arising on the disposal of a subsidiary, joint
venture or associate Amortisation of intangibles acquired in business
combinations Items which are one-off in nature and outside the control
of management and which, due to their size or nature, are not indicative of the long-term operating performance of the Group
Return on equity (RoE) The annualised post-tax profit on an IFRS basis expressed as a percentage of the opening IFRS equity, adjusted for time apportioned dividends paid to equity holders. Operating RoE is based on operating profit after tax and total RoE is based on IFRS profit after tax attributable to equity holders.
Spread/risk based business Spread/risk based business mainly comprises products where we provide a guaranteed level of income for our customers in return for an investment, for example, Annuities. The ‘spread’ referred to in the title primarily relates to the difference between the guaranteed amount we pay to customers and the actual return on the assets over the period of the contract.
Spread/risk margin Spread/risk margin is a component of operating profit and reflects the margin earned on spread/risk business. This includes net earned premiums, claims and benefits paid, net investment return using long-term assumptions and reserving changes.
Standard Life Investments Institutional Standard Life Investments institutional business sell to institutions (including corporates, pension schemes, local authorities, government agencies and insurance companies) either directly or through intermediaries.
Standard Life Investments Wholesale Standard Life Investments wholesale sell retail products through wholesale distributors including third party fund supermarkets, global financial institutions and private banks.
Strategic partner life business A measure of the assets that Standard Life Investments manages on behalf of Standard Life Group companies and under other long-term life book partnership agreements, such as Phoenix Group.
Third party (excluding strategic partner life business) A measure of the assets that Standard Life Investments manages on behalf of individual customers and institutional clients, for which it receives a fee. This measure excludes the assets that are managed on behalf of strategic partners in life assurance books.
74 Standard Life

Strategic report Governance information
Financial statements Other information
UK retail This relates to business where we have a relationship with the customer either directly or through an independent financial adviser. We analyse this type of business into new and old categories. Retail new includes the products, platforms, investment solutions and services of our UK retail business that we continue to market actively to our customers. Retail old includes business that was predominantly written before demutualisation.
UK workplace UK workplace pensions, savings and benefits to UK employers and employees. These are sold through corporate benefit consultants, independent financial advisers, or directly to employers.
6.3 Other terms B/C share scheme Following the completion of the sale of the Canadian business on 30 January 2015 the Company returned 73 pence per share to shareholders via a B/C share scheme. Eligible shareholders were able to elect to receive one B share or one C share for each ordinary share that they held on 13 March 2015. The B shares were redeemable and had a nominal value of 73 pence each. The Company redeemed all outstanding B shares on 20 March 2015 giving rise to a capital receipt for shareholders. The C shares were non-redeemable and had a negligible nominal value. A dividend was declared on the C shares of 73 pence per share on 20 March 2015, giving rise to an income receipt for shareholders. Thereafter C shares were automatically reclassified as deferred shares.
Board The Board of Directors of the Company.
Canadian business On 3 September 2014 the Group announced its intention to sell its Canadian business to The Manufacturers Life Insurance Company (MLC), a subsidiary of Manulife Financial Corporation (Manulife). The assets and liabilities of the Canadian business were classified as held for sale at 31 December 2014 and the results of this business were classified as discontinued operations for the year then ended. The comparative consolidated income statement, statement of comprehensive income and related notes were restated on this basis. The Canadian business comprises the Canadian long-term savings and retirement, individual and group insurance business (Standard Life Financial Inc. and its subsidiaries), the Canadian investment management business (Standard Life Investments Inc. and its subsidiaries) and the business of the Canadian branch of Standard Life Assurance Limited (SLAL Canada branch).
The sale of Standard Life Financial Inc. and Standard Life Investments Inc. completed on 30 January 2015. Under the agreements entered into in September 2014, the business of the SLAL Canada Branch will transfer to MLC and one or more subsidiaries of Manulife once certain conditions to completion, including regulatory approval, are fulfilled. The net assets of the SLAL Canada branch classified as held for sale are £nil at 31 December 2014 and no further consideration will be received when the transfer takes place.
Capital resources (CR) Capital resources include the assets in excess of liabilities, valued on a regulatory basis, and certain other components of capital.
Capital resources requirement (CRR) A company must hold capital resources in excess of the capital resources requirement. The CRR represents the total of the individual capital resources requirements (ICRR) of each regulated company in the Group.
Chief Operating Decision Maker The executive team.
Company Standard Life plc.
Constant currency Eliminates the effects of exchange rate fluctuations and is used when calculating financial performance on a range of measures.
Deferred acquisition costs (DAC) The method of accounting whereby acquisition costs on long-term business are deferred on the consolidated statement of financial position as an asset and amortised over the life of those contracts. This leads to a smoothed recognition of up front expenses instead of the full cost in the year of sale.
Deferred income reserve (DIR) The method of accounting whereby front end fees that relate to services to be provided in future periods are deferred on the consolidated statement of financial position as a liability and amortised over the life of those contracts. This leads to a smoothed recognition of up front income instead of the full income in the year of sale.
Director A director of the Company.
Discounting The reduction to present value at a given date of a future cash transaction at an assumed rate, using a discount factor reflecting the time value of money. The choice of a discount rate will usually greatly influence the value of insurance provisions, and may give indications on the conservatism of provisioning methods.
Dividend cover This is a measure of how easily a company can pay its dividend from profit. It is calculated as profit for the year attributable to equity holders of Standard Life plc divided by the total dividend for that financial period.
Earnings per share (EPS) EPS is a commonly used financial metric which can be used to measure the profitability and strength of a company over time. EPS is calculated by dividing profit by the number of ordinary shares. Basic EPS uses the weighted average number of ordinary shares outstanding during the year. Diluted EPS adjusts the weighted average number of ordinary shares outstanding to assume conversion of all dilutive potential ordinary shares, for example share awards and share options awarded to employees.
Effective tax rate Tax expense/(credit) attributable to equity holders’ profit divided by profit before tax attributable to equity holders’ profits expressed as a percentage.
Standard Life 75

6. Glossary continued Executive team The executive team is responsible for the day-to-day running of the Group and comprises: the Chief Executive, Chief Executive – UK and Europe, Chief Executive – Standard Life Investments, the Group Operations Officer, Chief Financial Officer and the Chief Risk Officer.
Fair value through profit or loss (FVTPL) FVTPL is an IFRS measurement basis permitted for assets and liabilities which meet certain criteria. Gains or losses on assets or liabilities measured at FVTPL are recognised directly in the income statement.
Group, Standard Life Group or Standard Life Prior to demutualisation on 10 July 2006, SLAC and its subsidiaries and, from demutualisation on 10 July 2006, the Company and its subsidiaries.
Heritage With Profits Fund (HWPF) The Heritage With Profits Fund contains all business – both with profits and non profit – written before demutualisation in the UK, Irish or German branches, with the exception of the classes of business which the Scheme of Demutualisation allocated to the Proprietary Business Fund. The HWPF also contains increments to this business.
Investment grade Debt securities with a credit rating of BBB or higher.
Key performance indicators (KPI) This is a measure by reference to which the development, performance or position of the business can be measured effectively.
Liability aware Liability Aware is a framework for proactively managing the various liability risks and requirements that are faced by defined benefit pension schemes and insurance companies.
Proprietary Business Fund The Proprietary Business Fund in Standard Life Assurance Limited (SLAL) contains, amongst other things, most new insurance business written after demutualisation in the UK, Ireland and Germany and certain classes of business written before demutualisation – pension contribution insurance policies, income protection plan policies and a number of SIPP policies.
Recourse cash flow (RCF) Certain cash flows arising in the HWPF on specified blocks of UK and Irish business, which are transferred out of the fund on a monthly basis and accrue to the ultimate benefit of equity holders, as determined by the Scheme of Demutualisation.
Regular premium A regular premium contract (as opposed to a single premium contract), is one where the policyholder agrees at inception to make regular payments throughout the term of the contract.
Retail Distribution Review (RDR) Rules introduced in the UK in 2013 aimed at introducing greater transparency and fairness in the investment industry. RDR led to changes in advice provision, professionalism, adviser charging and platform rules.
Single premium A single premium contract (as opposed to a regular premium contract), involves the payment of one premium at inception with no obligation for the policyholder to make subsequent additional payments.
SLAC The Standard Life Assurance Company (renamed The Standard Life Assurance Company 2006 on 10 July 2006).
SLAL Standard Life Assurance Limited.
SLIL Standard Life International Limited.
Solvency II Solvency II is an EU-wide initiative that brings consistency to how EU insurers manage capital and risk. Solvency II will be implemented on 1 January 2016.
76 Standard Life

Strategic report Governance information
Financial statements Other information
7. Contact details We want to make sure you have answers to all your questions.
Visit Mail Phone
UK and Ireland If you have any questions about voting at the Annual General Meeting, dividends or your shareholding, please contact our registrar:
www.standardlifeshareportal.com
[email protected] Address: Standard Life Shareholder Services 34 Beckenham Road Beckenham Kent BR3 4TU
0345 113 0045* +44 (0)20 3367 8224* (01) 431 9829*
Germany and Austria If you have any questions about voting at the Annual General Meeting, dividends or your shareholding, please contact our registrar:
www.standardlifeshareportal.com/de
[email protected] Address: Standard Life Aktionärsservice Postfach 2705 36243 Niederaula Germany
+49 (0)69 9753 3030
Canada If you have any questions about voting at the Annual General Meeting, dividends or your shareholding, please contact our registrar:
www.standardlifeshareportal.com (English) www.standardlifeshareportal.com/fr (French)
[email protected] Address: Standard Life Shareholder Services PO Box 4636 Station A Toronto M5W 7A4
1-866-982-9939
* Calls may be monitored and/or recorded to protect both you and us and help with our training. Call charges will vary. Secretary, registered office and head office Kenneth A Gilmour Standard Life plc Standard Life House 30 Lothian Road Edinburgh EH1 2DH Scotland
Standard Life 77

Please remember that the value of shares can go down as well as up and you may not get back the �llamount invested or any income from it. All �gures and share price information have been calculated asat 30 June 2015 (unless otherwise indicated).
This document has been published by Standard Life for information only. It is based on our understanding as at August 2015 and does not provide �nancial or legal advice.
Standard Life plc is registered in Scotland (SC286832) atStandard Life House, 30 Lothian Road, Edinburgh EH1 2DH.
UKIR15 0815 © 2015 Standard Life
www.standardlife.com