Arkansas State Broadband Manager's Report - Period Ending ...
Upload
khangminh22Category
view
4download
0
© SEGA SAMMY HOLDINGS INC. All Rights Reserved.
Fiscal Year Ending March 2021
3Q Results Appendix
February 12, 2021
[Disclaimer]
Market forecasts, operating results forecast, and other information contained in these materials are
based on judgements and projections of the Company’s managements from currently available
information. Therefore, please understand that the contents herein involve risks and uncertainties
and that actual results could differ materially depending on various factors.

- 2 -
Market and business environment for the current fiscal year
2020 2021
Apr. May. Jun. Jul. Aug. Sep. Oct. Nov. Dec. Jan. Feb. Mar.
Pachislot and
Pachinko
machines
Consumer
Amusement
Machine Sales
Amusement
Center
Operations
Animation /
Toys
PHOENIX
Resort
PARADISE
SEGA SAMMY
• Halls suspended operation
• Deadline for removal extended• Expecting that the recovery of purchasing motivation of pachinko halls take a while as the deadline for removal extended.
• Utilization has been recovering
since resumption of operations• Utilization is stable at about 70-80 percent, and the removal of previous
regulation machines is expected to proceed from the second half of the year.
• Temporary
closure for
all facilities
• Utilization recovering gradually.
• The number of users continuously
decline
• Personal demand increased due to
“Go To Travel Campaign“, and
utilization of facilities recovered.
• Suspension of
operations at some
facilities and casino area.
• Facilities utilization is recovering
• Sales conditions are expected to improve gradually as utilization of facilities recovers.
• Growth in sales due to spending
from staying at home
• Revenue from rev. sharing model and
machine sales decreased due to
closure and declined store utilization.
• Spending from staying at home is stabilized, but repeat and other sales are expected to be strong continuously.
• Take measures of temporary
closure of stores sequentially.
• Sales of existing stores YoY: 27.4%
• Significant decrease in production and allocated revenues due to
postponement of theatrical release, etc.
• Expecting the gradual recovery from the resumption of operation at
theatres, etc.
• Sales of existing stores YoY: 61.4% (Through Dec.)
• Expecting that the restriction of foreign visitors will continue
• Temporary closure of some facilities from 7/1
• Decline of travel demand is expected
due to temporary suspension of "Go
To Travel Campaign“.

- 3 -
(JPY Billion)
1QThrough
2Q
Through
3Q
Through
4Q1Q
Through
2Q
Through
3Q
Full Year
Forecast
(announced on
Nov 6)
Revised
Full Year
Forecast
(announced on
Feb 12)
Sales 72.7 165.5 280.8 366.5 48.3 110.2 210.1 283.0 276.0
Pachislot and Pachinko Machines 17.1 44.2 86.3 108.5 2.7 10.7 37.3 60.0 51.5
Entertainment Contents 53.0 115.7 186.1 247.6 45.1 97.0 167.6 216.0 218.0
Resort 2.4 5.5 8.2 10.4 0.4 2.2 4.8 6.5 6.0
Other / Elimination 0.0 0.0 0.0 0.0 0.1 0.3 0.4 0.5 0.5
Operating Income 3.4 14.6 28.0 27.6 -3.8 -3.0 13.5 -1.5 9.0
Pachislot and Pachinko Machines 1.0 7.3 19.9 23.2 -8.4 -12.0 -8.2 -10.0 -11.5
Entertainment Contents 5.2 13.2 17.0 16.5 8.1 14.9 29.9 21.5 32.0
Resort -0.8 -1.5 -2.3 -3.6 -1.7 -2.6 -3.1 -5.5 -4.5
Other / Elimination -2.0 -4.4 -6.6 -8.5 -1.8 -3.3 -5.1 -7.5 -7.0
Non-operating income 0.8 1.3 1.8 3.2 0.6 3.2 5.6 5.0 6.5
Non-operating expenses 1.9 3.3 4.0 5.5 0.8 3.7 6.5 8.5 8.5
Ordinary Income 2.3 12.6 25.8 25.2 -4.0 -3.5 12.5 -5.0 7.0
Pachislot and Pachinko Machines 0.9 7.2 19.4 22.7 -8.5 -12.4 -8.7 -10.5 -12.5
Entertainment Contents 4.9 12.8 16.0 16.2 8.2 16.8 33.1 24.0 36.0
Resort -1.6 -3.1 -3.3 -5.3 -2.1 -4.6 -6.6 -11.0 -9.0
Other / Elimination -1.9 -4.3 -6.3 -8.4 -1.6 -3.3 -5.3 -7.5 -7.5
Ordinary Income Margin 3.2% 7.6% 9.2% 6.9% - - 5.9% - 2.5%
Extraordinary income 0.0 0.0 3.0 3.1 0.2 1.5 10.3 7.5 26.0
Extraordinary losses 0.1 0.1 0.5 1.2 2.5 21.1 31.8 34.0 38.0
Income before income taxes 2.2 12.5 28.3 27.1 -6.4 -23.1 -8.8 -31.5 -5.0
Profit attributable to owners of parent 1.7 9.8 22.9 13.7 -3.3 -21.7 -6.2 -24.5 -3.0
Dividends per share (JPY) - 20.00 20.00 40.00 - 10.00 10.00 - 0.00
Earnings per share (JPY) 7.32 42.05 97.92 58.65 -14.04 -92.38 -26.54 104.21 -12.76
Net Assets per share (JPY) 1,259.70 1,276.36 1,318.14 1,251.02 1,219.49 1,149.63 1,181.27 - -
2021/32020/3(JPY Billion)
1QThrough
2Q
Through
3Q
Through
4Q1Q
Through
2Q
Through
3Q
Full Year
Forecast
(announced on
Nov 6)
Revised
Full Year
Forecast
(announced on
Feb 12)
Sales 72.7 165.5 280.8 366.5 48.3 110.2 210.1 283.0 276.0
Pachislot and Pachinko Machines 17.1 44.2 86.3 108.5 2.7 10.7 37.3 60.0 51.5
Entertainment Contents 53.0 115.7 186.1 247.6 45.1 97.0 167.6 216.0 218.0
Resort 2.4 5.5 8.2 10.4 0.4 2.2 4.8 6.5 6.0
Other / Elimination 0.0 0.0 0.0 0.0 0.1 0.3 0.4 0.5 0.5
Operating Income 3.4 14.6 28.0 27.6 -3.8 -3.0 13.5 -1.5 9.0
Pachislot and Pachinko Machines 1.0 7.3 19.9 23.2 -8.4 -12.0 -8.2 -10.0 -11.5
Entertainment Contents 5.2 13.2 17.0 16.5 8.1 14.9 29.9 21.5 32.0
Resort -0.8 -1.5 -2.3 -3.6 -1.7 -2.6 -3.1 -5.5 -4.5
Other / Elimination -2.0 -4.4 -6.6 -8.5 -1.8 -3.3 -5.1 -7.5 -7.0
Non-operating income 0.8 1.3 1.8 3.2 0.6 3.2 5.6 5.0 6.5
Non-operating expenses 1.9 3.3 4.0 5.5 0.8 3.7 6.5 8.5 8.5
Ordinary Income 2.3 12.6 25.8 25.2 -4.0 -3.5 12.5 -5.0 7.0
Pachislot and Pachinko Machines 0.9 7.2 19.4 22.7 -8.5 -12.4 -8.7 -10.5 -12.5
Entertainment Contents 4.9 12.8 16.0 16.2 8.2 16.8 33.1 24.0 36.0
Resort -1.6 -3.1 -3.3 -5.3 -2.1 -4.6 -6.6 -11.0 -9.0
Other / Elimination -1.9 -4.3 -6.3 -8.4 -1.6 -3.3 -5.3 -7.5 -7.5
Ordinary Income Margin 3.2% 7.6% 9.2% 6.9% - - 5.9% - 2.5%
Extraordinary income 0.0 0.0 3.0 3.1 0.2 1.5 10.3 7.5 26.0
Extraordinary losses 0.1 0.1 0.5 1.2 2.5 21.1 31.8 34.0 38.0
Income before income taxes 2.2 12.5 28.3 27.1 -6.4 -23.1 -8.8 -31.5 -5.0
Profit attributable to owners of parent 1.7 9.8 22.9 13.7 -3.3 -21.7 -6.2 -24.5 -3.0
Dividends per share (JPY) - 20.00 20.00 40.00 - 10.00 10.00 - 30.00
Earnings per share (JPY) 7.32 42.05 97.92 58.65 -14.04 -92.38 -26.54 104.21 -12.76
Net Assets per share (JPY) 1,259.70 1,276.36 1,318.14 1,251.02 1,219.49 1,149.63 1,181.27 - -
2021/32020/3
Consolidated Income Statements (Summary)
*The results of FY2020/3 reflect the change of segment classification retrospectively.

- 4 -
(JPY Billion)
1QThrough
2Q
Through
3Q
Through
4Q1Q
Through
2Q
Through
3Q
Full Year
Forecast
(announced
on Nov 6)
Revised
Full Year
Forecast
(announced
on Feb 12)
R&D Expense / Content
Production Expense17.1 33.5 56.4 76.5 14.7 28.3 43.5 62.7 62.5
Pachislot and Pachinko Machines 4.3 8.9 14.3 18.1 5.4 9.3 12.6 17.5 16.8
Entertainment Contents 12.8 24.7 42.3 58.6 9.2 19.0 30.8 45.2 45.5
Resort 0.0 0.0 0.1 0.1 0.0 0.0 0.1 0.0 0.1
Other / Elimination 0.0 -0.1 -0.3 -0.3 0.1 0.0 0.0 0.0 0.1
Cap-ex 5.1 10.5 16.1 22.8 3.6 7.2 11.4 13.9 14.5
Pachislot and Pachinko Machines 0.9 1.8 2.5 3.5 1.1 1.8 2.5 3.6 3.6
Entertainment Contents 4.0 8.3 12.9 18.2 2.2 5.0 8.5 9.4 10.0
Resort 0.0 0.1 0.1 0.2 0.0 0.0 0.1 0.3 0.3
Other / Elimination 0.2 0.3 0.6 0.9 0.3 0.4 0.3 0.6 0.6
Depreciation 3.6 7.3 10.9 14.8 3.6 7.3 9.5 13.1 10.9
Pachislot and Pachinko Machines 1.0 1.9 2.8 3.6 0.8 1.7 2.6 2.8 2.7
Entertainment Contents 2.1 4.2 6.4 8.9 2.2 4.5 5.2 8.2 6.3
Resort 0.2 0.5 0.8 1.1 0.2 0.4 0.7 1.0 0.9
Other / Elimination 0.3 0.7 0.9 1.2 0.4 0.7 1.0 1.1 1.0
Advertising 3.6 8.5 12.9 17.4 2.0 5.6 9.5 16.3 13.0
Pachislot and Pachinko Machines 0.2 0.8 1.2 1.5 0.1 0.7 1.0 2.1 1.5
Entertainment Contents 3.0 6.4 10.2 14.1 1.7 4.5 7.8 12.8 10.3
Resort 0.1 0.2 0.3 0.4 0.0 0.1 0.2 0.3 0.3
Other / Elimination 0.3 1.1 1.2 1.4 0.2 0.3 0.5 1.1 0.9
2021/32020/3
Costs and Expenses
*The results of FY2020/3 reflect the change of segment classification retrospectively.

- 5 -
Consolidated Balance Sheet (Summary)
AccountAs of end of
March 2020
As of end of
Dec 2020Change Account
As of end of
March 2020
As of end of
Dec 2020Change
Cash and Deposits 159.0 151.4 -7.6 Accounts Payable 17.8 18.1 +0.3
Accounts Receivable 40.4 51.8 +11.4 Corporate Bonds 10.0 - -10.0
Short term investment securities 5.3 11.0 +5.7 Short Term Loans Payable 13.3 39.1 +25.8
Inventories 47.0 56.5 +9.5 Other 45.0 46.6 +1.6
Other 17.2 34.8 +17.6 Total Current Liabilities 86.1 103.8 +17.7
Total Current Assets 268.9 305.5 +36.6 Corporate Bonds 10.0 10.0 -
Tangible Fixed Assets 86.6 67.0 -19.6 Long Term Loans Payable 42.0 42.0 -
Intangible Fixed Assets 17.9 17.6 -0.3 Other 23.2 18.6 -4.6
Investment Securities 55.0 43.1 -11.9 Total Noncurrent Liabilities 75.2 70.6 -4.6
Other 29.7 19.4 -10.3 Total Liabilities 161.4 174.4 +13.0
Shareholders Equity 301.2 287.7 -13.5
Total accumulated other
comprehensive income-7.1 -10.0 -2.9
Subscription rights to shares 0.8 - -0.8
Non-controlling intesrests 1.9 0.5 -1.4
Total Noncurrent Assets 189.2 147.1 -42.1 Total Net Assets 296.8 278.2 -18.6
Total Assets 458.2 452.7 -5.5 Total Liabilities and Net Assets 458.2 452.7 -5.5
(Billion yen) 【Assets】 【Liabilities and Net Assets】

- 6 -
(JPY Billion)
1QThrough
2Q
Through
3Q
Through
4Q1Q
Through
2Q
Through
3Q
Full Year
Forecast
(announced on
Nov 6)
Revised
Full Year
Forecast
(announced on
Feb 12)
Sales 17.1 44.2 86.3 108.5 2.7 10.7 37.3 60.0 51.5
Pachislot 7.0 11.1 46.2 54.1 0.2 2.0 4.8 14.9 13.5
Pachinko 5.4 23.8 26.8 37.4 0.0 3.7 24.6 35.8 28.2
Other / Elimination 4.7 9.3 13.3 17.0 2.5 5.0 7.9 9.3 9.8
Operating Income 1.0 7.3 19.9 23.2 -8.4 -12.0 -8.2 -10.0 -11.5
Non-operating income 0.1 0.2 0.4 0.7 0.1 0.2 0.3 0.5 0.5
Non-operating expenses 0.1 0.3 0.8 1.1 0.2 0.6 0.9 1.0 1.5
Ordinary Income 0.9 7.2 19.4 22.7 -8.5 -12.4 -8.7 -10.5 -12.5
Ordinary Income Margin 5.3% 16.3% 22.5% 20.9% - - - - -
Pachislot
Number of Titles 0 title 1 title 3 titles 5 titles 0 title 1 title 3 titles 6 titles 5 titles
Unit Sales (units) 17,930 28,360 105,860 123,336 485 4,885 12,487 38,300 34,300
Pachinko
Number of Titles 2 titles 4 titles 5 titles 7 titles 0 title 2 titles 3 titles 5 titles 4 titles
Unit Sales (units) 16,212 66,140 75,094 104,581 177 11,342 59,359 89,200 68,300
Board + Frame 8,020 15,850 18,878 33,056 54 1,187 46,574 63,500 52,900
Board 8,192 50,290 56,216 71,525 123 10,155 12,785 25,700 15,400
2020/3 2021/3
Segment Results: Pachislot and Pachinko Machines
*From FY2021/3, the gaming machine business, which develops and sells gaming machines for casino, was shifted from Amusement Machine Sales area of
Entertainment Contents Business segment to Pachislot and Pachinko Machines Business segment.
*The results of FY2020/3 reflect the change of segment classification retrospectively.

- 7 -
Segment Results: Pachislot and Pachinko Machines
Specification changed title
New title
■Major Titles in FY2021/3 P
ach
islo
tP
ach
ink
o
~FY2021/3 3Q 4Q~
Pachislot Shin
Hokuto Muso
P Psalms of Planets Eureka
Seven HI-EVOLUTION ZERO
Pachislot Kaidoumokushiroku
kaiji numa
P ROAD TO EDEN
P Shin Hokuto Muso Chapter 3
Pachislot The Seven deadly
Sins
P BIG DREAM2 GEKISHIN
199Ver.
Pachislot Initial D
(Titles launched in 3Q) Installed
from
Total sales
Pachislot Pachislot The Seven deadly
SinsNovember 6,206 Units
Pachislot Shin
Hokuto MusoJuly 4,295 Units
Pachislot Kaidoumokushiroku
kaiji numaOctober 1,361 Units
Pachinko P Shin Hokuto Muso Chapter 3 December 43,741 Units
P Psalms of Planets Eureka
Seven HI-EVOLUTION ZEROAugust 10,213 Units
P BIG DREAM2 GEKISHIN
199Ver.November 4,231 Units
Dejihane PA Psalms of Planets
Eureka Seven HI-EVOLUTION ZERO
P 〈Monogatari〉 Series
Secondseason
Pachislot Hokuto No Ken
Shukumei
Pachislot Angel Beats!
*Scheduled for 2021
P Kabaneri of the Iron Fortress
*Scheduled in April 2021
(Titles to be launched after 4Q) Installed from
Pachislot Pachislot Initial D Jan.
Pachislot Hokuto No Ken Shukumei Mar.
Pachislot Angel Beats! TBD
Pachinko Dejihane PA Psalms of Planets Eureka
Seven HI-EVOLUTION ZEROJan.
P 〈Monogatari〉 Series Secondseason Feb.
P Kabaneri of the Iron Fortress Apr.

- 8 -
(JPY Billion)
1QThrough
2Q
Through
3Q
Through
4Q1Q
Through
2Q
Through
3Q
Full Year
Forecast
(announced on
Nov 6)
Revised Full
Year Forecast
(announced on
Feb 12)
Sales 53.0 115.7 186.1 247.6 45.1 97.0 167.6 216.0 218.0Consumer 26.7 55.8 90.2 125.5 32.4 61.4 102.4 132.5 136.0Amusement Machine Sales 10.1 24.6 41.1 51.0 5.4 13.6 25.6 37.5 36.0Amusement Center Operations 10.4 22.0 32.2 41.9 3.4 11.8 20.6 20.0 21.0Animation / Toy 5.0 11.7 20.3 26.2 3.4 9.0 17.1 24.0 23.0Other / Elimination 0.6 1.6 2.2 2.9 0.4 1.2 1.9 2.0 2.0
Operating Income 5.2 13.2 17.0 16.5 8.1 14.9 29.9 21.5 32.0Consumer 5.3 9.7 12.1 14.7 12.5 20.3 30.9 30.0 36.5Amusement Machine Sales -0.4 0.7 1.1 -0.6 -1.6 -1.9 -0.1 -2.5 -1.5Amusement Center Operations 0.7 1.9 1.7 1.4 -2.0 -2.7 -1.4 -4.5 -1.5Animation / Toy 0.3 1.7 2.9 2.7 -0.0 0.2 2.1 0.9 1.4Other / Elimination -0.7 -0.9 -0.9 -1.7 -0.8 -1.0 -1.6 -2.4 -2.9
Non-operating income 0.3 0.3 0.3 1.3 0.2 2.5 4.7 3.3 5.5Non-operating expenses 0.6 0.8 1.3 1.6 0.1 0.6 1.4 0.8 1.5
Ordinary Income 4.9 12.8 16.0 16.2 8.2 16.8 33.1 24.0 36.0Ordinary Income Margin 9.2% 11.1% 8.6% 6.5% 18.2% 17.3% 19.7% 11.1% 16.5%
No. of domestic amusement centers 191 192 195 192 195 193 193 - -YoY sales rate comparison of existing
amusement centers109.0% 103.6% 100.7% 97.7% 27.4% 50.1% 61.4% - -
2020/3 2021/3
Segment Results: Entertainment Contents Business
*As the breakdown of sub-segment, Digital Games area and Packaged Games area have been integrated into 1 sub-segment and changed the name to Consumer area from FY2021/3.
*From FY2021/3, the gaming machine business, which develops and sells gaming machines for casino, was shifted from Amusement Machine Sales area of Entertainment Contents Business
segment to Pachislot and Pachinko Machines Business segment.
*The results of FY2020/3 reflect the change of segment classification retrospectively.

- 9 -
(JPY Billion)
1QThrough
2Q
Through
3Q
Through
4Q1Q
Through
2Q
Through
3Q
Full Year
Forecast
(announced on
Nov 6)
Revised Full
Year Forecast
(announced on
Feb 12)
Sales 26.7 55.8 90.2 125.5 32.4 61.4 102.4 132.5 136.0Domestic 12.9 27.0 45.9 64.2 12.4 27.9 48.7 66.3 63.4Overseas 13.9 29.0 45.4 63.9 19.6 33.4 54.3 67.6 73.6
Overseas sales ratio 52.1% 52.0% 50.3% 50.9% 60.5% 54.4% 53.0% 51.0% 54.1%Other / Elimination -0.1 -0.2 -1.2 -2.6 0.2 0.1 -0.6 -1.4 -1.0
Full Game 11.5 19.4 37.8 57.0 14.4 25.2 42.6 48.5 55.7New titles 7.3 11.3 25.6 39.1 2.0 5.2 13.8 17.8 20.7
Japan 0.2 0.6 7.5 12.5 0.0 0.1 1.8 1.9 2.1
Asia 0.4 0.5 1.1 3.5 0.7 1.0 1.2 1.9 1.7
North America / Europe 6.6 10.1 16.9 22.9 1.2 4.1 10.6 13.9 16.9Repeat titles 4.2 8.1 12.1 17.8 12.3 19.9 28.8 30.7 35.0
Japan 0.5 1.1 1.5 2.7 1.7 2.7 3.7 4.7 4.2Asia 0.3 0.8 1.1 1.7 0.5 1.1 1.5 2.7 2.3North America / Europe 3.3 6.1 9.4 13.3 9.9 16.1 23.5 23.3 28.3
Download sales ratio 65.9% 58.6% 48.4% 46.0% 66.5% 67.7% 62.8% 61.8% 61.8%
F2P 9.1 18.1 27.6 38.1 11.1 25.5 41.0 58.1 54.7Japan 8.4 16.9 25.8 35.3 9.1 21.5 35.5 50.4 47.6Asia 0.0 0.0 0.1 0.3 0.0 0.1 0.2 0.7 0.2North America / Europe 0.6 1.1 1.6 2.4 1.9 3.9 5.2 7.0 6.8
Other 6.1 18.4 25.8 33.0 6.5 10.6 19.4 27.3 26.6
2021/32020/3
Segment Results: Entertainment Contents Business
Consumer Area (KPI)
<Sales by Business Model>
Full Game = Mainly physical sales and download sales of full game for home video game consoles and PCs. (Additional download content sales are not included.)
F2P = Mainly sales of contents offering free basic play and microtransaction for smartphones and PCs.
Others = Sales of additional downloadable contents, consignment sales of 3rd party titles, revenue from consignment development, transfer of titles, offering of titles in batches to 1st parties,
sales of non-game software products, etc.
*Portion of figures for FY2021/3 1Q have been revised.
**
*

- 10 -
1QThrough
2Q
Through
3Q
Through
4Q1Q
Through
2Q
Through
3Q
Full Year
Forecast
(announced on
Nov 6)
Revised Full
Year Forecast
(announced on
Feb 12)
Full Game: Number of Titles 9 titles 13 titles 26 titles 36 titles 4 titles 6 titles 15 titles 22 titles 18 titles
Japan 2 titles 3 titles 9 titles 11 titles 0 title 0 title 2 titles 2 titles 2 titles
Asia 3 titles 3 titles 6 titles 12 titles 1 title 1 title 4 titles 7 titles 6 titles
North America / Europe 4 titles 7 titles 11 titles 13 titles 3 titles 5 titles 9 titles 13 titles 10 titles
Full Game: Sales in Units
(Thousands)6,490 12,100 20,570 28,570 12,980 19,080 34,200 33,040 40,540
Total New titles 2,300 3,550 7,460 11,480 790 1,180 3,770 5,580 6,030
Japan 60 170 1,180 1,910 10 20 370 420 420
Asia 130 130 300 780 150 200 260 450 390
North America / Europe 2,110 3,240 5,970 8,790 620 960 3,130 4,720 5,200
Total Repeat titles 4,180 8,550 13,110 17,090 12,190 17,900 30,420 27,460 34,510
Japan 210 440 580 880 460 690 990 1,190 1,140
Asia 110 280 380 580 240 510 700 1,130 1,050
North America / Europe 3,860 7,820 12,140 15,620 11,480 16,690 28,730 25,130 32,310
2020/3 2021/3
2021/3 3Q Major Titles
Segment Results: Entertainment Contents Business
Repeat titles Platform Launched region
Total War series PCJapan / Asia / North
America / Europe
Sonic series Multi-platformJapan / Asia / North
America / Europe
Football Manager series PCJapan / Asia / North
America / Europe
*Sales in units don’t include the figure for free download
*Numbers of titles and sales units of Full Game in FY2020/3 results was revised due to the change of subsegment classifications
3Q titles Release Platform Launched region
Shin Megami Tensei Ⅲ NOCTURNE
HD REMASTER2020/10 Switch™ / PlayStation®4 Japan
Football Manager 2021 2020/11 PCJapan / Asia / North America
/ Europe
YAKUZA : LIKE A DRAGON 2020/11 Xbox Series X❘S / PC North America / Europe

- 11 -
Segment Results: Entertainment Contents Business
2021/3 3Q Results of Titles
IP Unit Sales Main titles (released month)
SonicApprox.
3,700K units
“Mario & Sonic at the Olympic Games Tokyo 2020” (November 2019)
“Team Sonic Racing” (May 2019)
“Sonic Generations” (December 2011)
“Sonic Mania” (August 2017), etc.
Total WarApprox.
3,600K units
“Total War: SHOGUN 2” (March 2011)
“Total War: ROME II” (September 2013)
“Total War: WARHAMMER 2” (September 2017)
“Total War: Three Kingdoms” (May 2019), etc.
Football ManagerApprox.
2,900K units
“Football Manager 2020” (November 2019)
“Football Manager 2021” (November 2020)
“Football Manager 2020 Mobile” (November 2019)
“Football Manager 2021 Mobile” (November 2020)
PersonaApprox.
1,900K units
“Persona 4 The Golden” (June 2020)
“Persona 5 Royal” (October 2019)
“Persona 5” (September 2016)
“Persona 5 Scramble: The Phantom Strikers” (February 2020), etc.
Others ー
“Alien: Isolation” (October 2014)
“Endless Space2” (May 2017)
“Two Point Hospital” (August 2018)
“YAKUZA : LIKE A DRAGON“ (January 2020), etc.

- 12 -
(JPY Billion)
1QThrough
2Q
Through
3Q
Through
4Q1Q
Through
2Q
Through
3Q
Full Year
Forecast
(announced on
Nov 6)
Revised Full
Year Forecast
(announced on
Feb 12)
Sales 9.1 18.1 27.6 38.1 11.1 25.5 41.1 58.1 54.8
Titles before FY2018/3 6.5 12.7 18.2 24.5 5.1 11.4 16.4 22.5 20.8Titles released in FY2019/3 2.4 4.7 7.0 9.1 2.2 5.2 7.3 9.0 8.7Titles released in FY2020/3 0.0 0.6 2.3 4.4 2.1 4.8 7.2 9.2 9.0Titles release in FY2021/3 - - - - 1.5 4.1 10.2 17.3 16.4
1QThrough
2Q
Through
3Q
Through
4Q1Q
Through
2Q
Through
3Q
Full Year
Forecast
(announced on
Nov 6)
Revised Full
Year Forecast
(announced on
Feb 12)
1 4 4 4 2 4 5 5 5
20 21 20 19 20 22 22 22 22
-4 -6 -7 -8 -1 -1 -2 -2 -2
2021/3
No. of new titles launched
2020/3 2021/3
2020/3
No. of titles in operation
No. of titles ended services
Segment Results: Entertainment Contents Business
Consumer Area (KPI)
<Sales breakdown of F2P>
<Numbers of titles for F2P>*Portion of figures for FY2021/3 1Q have been revised.
*
*
*Top three titles in the period of Oct-Dec 2020
Title name Release
1. Project SEKAI COLORFUL STAGE feat. Hatsune Miku 2020/9
2. Re: ZERO -Starting Life in Another World- Lost in Memories 2020/9
3. PHANTASY STAR ONLINE 2 (Japanese version) 2012/7
Top 3 titles in sales for F2P

- 13 -
Segment Results: Entertainment Contents Business
Amusement Center Area (KPI)
Temporary
Closure
period
◼ YoY comparison of monthly sales of existing stores of amusement facilities of our Group

- 14 -
Segment Results: Entertainment Contents Business
~FY2021/3 3Q FY2021/3 4Q~C
on
su
me
r
FIST OF THE NORTH STAR LEGENDS ReVIVE / Kemono Friends 3
SHIN MEGAMI TENSEI Liberation D×2 / SEGA Pocket Club Manager
Fu
ll G
am
e
Ne
w t
itle
s
PHANTASY STAR ONLINE 2 (Global version)
Sonic at the Olympic Games – Tokyo 2020™
F2
P
Re: ZERO -Starting Life in Another World- Lost in Memories
Project SEKAI COLORFUL STAGE feat. Hatsune Miku
In or before
FY2018/3~
FY2019/3~
FY2020/3~
FY2021/3
New titles
Sakura Revolution
Re
pe
at
Persona 4 Golden
(PC version)
A Total War Saga: TROY
Shin Megami Tensei Ⅲ
NOCTURNE HD REMASTERFootball Manager 2021
Puyo Puyo™ Tetris® 2
YAKUZA : LIKE A DRAGON
Sonic Series / Persona Series / Total War Series / Football Manager Series / Yakuza Series, etc.
PHANTASY STAR ONLINE 2 / Puyo puyo!! Quest / CHAIN CHRONICLE
PHANTASY STAR ONLINE 2 NEW GENESISFY2022/3~New titles
*Scheduled for 2021
■Major Titles in 3Q and titles to be launched in and after 4Q, fiscal year ending Mar 2021
Shin Megami Tensei Ⅴ
Total War: WARHAMMER III
* Scheduled for 2021
*Scheduled for 2021
Persona 5 Scramble Strikers
HUMANKIND™
*Scheduled in April 2021

- 15 -
Segment Results: Entertainment Contents Business
Am
us
em
en
t M
ac
hin
e S
ale
sA
nim
ati
on
/ T
oys
KanColle Arcade / StarHorse Series / Fate/Grand Order Arcade / WCCF FOOTISTA 2019 / SANGOKUSHI TAISEN Series
maimai Series / O・N・G・E・K・I / CHUNITHM Series<Existing titles>
UFO CATCHER series / prizes for UFO CATCHER
TRANSFORMERS SHADOWS
RISINGfiz
Disney&Disney/Pixar Characters
Magical Smart Note
Sonic The Hedgehog
(in Japan)
Fun to change mouse covers!
Sumikkogurashi Personal
Computer Plus
Initial D THE ARCADE
~FY2021/3 3Q FY2021/3 4Q~
<Regular titles>
Detective Conan: The Scarlet
Bullet
StarHorse4
(Content Update)
SOREIKE! ANPANMAN:
FUWAFUWA FUWARI TO
KUMONOKUNI(Working Title)
*Scheduled to be released on
April 16, 2021
*Scheduled to be released on
June 25, 2021
■Major Titles in 3Q and titles to be launched in and after 4Q, fiscal year ending Mar 2021

- 16 -
(JPY Billion)
1QThrough
2Q
Through
3Q
Through
4Q1Q
Through
2Q
Through
3Q
Full Year
Forecast
(announced
on Nov 6)
Revised Full
Year Forecast
(announced
on Feb 12)
Sales 2.4 5.5 8.2 10.4 0.4 2.2 4.8 6.5 6.0
Operating Income -0.8 -1.5 -2.3 -3.6 -1.7 -2.6 -3.1 -5.5 -4.5
Non-operating income 0.1 0.2 0.2 0.2 0.0 0.0 0.0 0.2 0.0
Non-operating expenses 0.9 1.7 1.2 1.9 0.3 2.0 3.5 5.7 4.5
Ordinary Income -1.6 -3.1 -3.3 -5.3 -2.1 -4.6 -6.6 -11.0 -9.0
Ordinary Income Margin - - - - - - - - -
<PHOENIX RESORT>
Sales 2.2 5.0 7.7 9.9 0.3 2.0 4.6 6.1 6.0
Operating Income -0.1 -0.1 -0.0 -0.2 -1.0 -1.6 -1.4 -2.1 -2.1
No. of facility users (Thousands) 189 454 658 839 44 211 430 539 533
3 accommodation facilities 75 194 283 359 12 78 177 224 214
2 golf courses 25 46 70 92 9 31 57 73 74
Other facilities 89 214 305 388 23 102 196 242 245
2020/3 2021/3
Segment Results: Resort Business

- 17 -
Transition of Drop amount* at Paradise City
(KRW Millions)
*Drop amount: Purchased amount of chips by customers at the table
Apr,2017
Opened
Paradise City
Segment Results: Resort Business (PARADISE CITY)
* PARADISE SEGASAMMY Co., Ltd. is an equity method affiliate
* Figures for PARADISE SEGASAMMY Co., Ltd. are recorded with three months delay
* Local accounting standards
(KRW Billion)FY2020 3Q
Results
FY2021 3Q
Results
Sales 331.7 144.9
Casino 269.0 106.9
Hotel 49.5 32.8
Other 13.1 5.1
Cost of sales 279.4 174.2
Casino 145.5 78.1
Hotel 87.2 67.0
Other 46.6 29.0
Gross profit 52.2 -29.2
SG&A 39.9 22.0
Operating profit 12.3 -51.3
EBITDA 60.0 -7.0
Net profit -11.2 -77.1
Number of casino visitors
(Thousands)286 137
Source: Paradise IR
SEGASAMMY
Equity method acquisition
amount (Billion yen)-0.9 -3.4

- 18 -
Segment Results: Resort Business
■ PHENIX RESORT
Number of facilities users and YoY comparison
■ PARADISE SEGASAMMY
Drop amount and YoY comparison
(Users)
(KRW Million)

- 19 -
<Overview>
■Golf Course■Exterior ■Convention Center
Facility name Phoenix Seagaia Resort
Operating
companyPhoenix Resort Co., Ltd.
Facility address 3083 Aza Hamayama, O-Aza Shioji, Miyazaki City, Miyazaki Prefecture
Access
■Miyazaki Airport 20-minute by car
■JR Miyazaki train station Approx. 25-minute by public bus(chargeable) 15-minute by car
■Express way Approx. 25-minute drive from Miyazaki Interchange
Number of
employees
744 (as of December 31 2020) (including, concurrent officers, full-time employees, seconded employees, contract employees
and part-time employees)
Site area 2,511,144m2
Facility
composition
Hotel 950 rooms (Sheraton Grande Ocean Resort, Luxze Hitotsuba and Cottage HIMUKA)
Golf Courses 45 holes (Phoenix Country Club, Tom Watson Golf Course), Phoenix Golf Academy
Convention Center Approx. 5,500 m2 (capacity for approx. 5,000 people)
Other Entertainment Facilities
etc.Spa, hot springs, fitness club, horse riding club, tennis court and wedding halls
©Phoenix Resort
Segment Results: Resort Business (Phoenix Seagaia Resort)

- 20 -
<Overview>
■Casino facility ■Exterior ■Lobby lounge (Hotel)
Facility name PARADISE CITY
Operating company PARADISE SEGASAMMY Co.,Ltd.
Facility address 186, Yeongjonghaeannam-ro 321-gil, Jung-gu, Incheon, Republic of Korea
Access to PARADISE CITY■3-minute drive by car or shuttle bus (free of charge) 5-minute ride on linear monorail (free of charge)
and 15-minute walk from Incheon International Airport
■Also a 5-minute drive from Incheon Interchange on the expressway
Number of employees1,659 (as of December 31, 2020) (including, concurrent officers,
full-time employees, seconded employees, contract employees and part-time employees)
Site area 330,000㎡
Investment amount Approx. 1,567.5 billion KRW (amount invested by SEGA SAMMY: 331.9 billion KRW; shareholding ratio: 45%)
Facility composition
• Casino (table games: 158 units, electronic table games: 4 units 62 seats, slot machines: 291 units)
• Hotel (711 rooms; additional facilities: restaurant, banquet hall, indoor and outdoor pools, etc.)
• Convention ・PLAZA (Commercial facility / cultural center, shopping mall)
Facilities in temporary suspension (from Jul 1, 2020)
• SPA ・CLUB ・Boutique Hotel (58 rooms)
• WONDER BOX (for families)
Segment Results: Resort Business (PARADISE CITY)

- 21 -
Order for Enforcement of the Act on Development of Specified Complex Tourist Facilities Areas
Casino facilityUpper limit for square measures of gaming areas within casino facility is 3% of
the total floor area of IR facilities
Facility No.1: International
convention and
conference facilities
Capacity of the largest international convention and conference room must be
more than 1,000 people. Total capacity of whole international convention and
conference facilities must be more than twice of the capacity of the largest
international convention and conference room.
Facility No.2: Exhibition facilities
Square measures of exhibition facilities must meet the standards according to
the below tier based on capacity of the largest international convention and
conference room.(Capacity of the largest international convention and conference room)
・More than 1,000 and less than 3,000 people ⇔ Total floor area of exhibition facilities: more than 120K ㎡
・More than 3,000 and less than 6,000 people ⇔ Total floor area of exhibition facilities: more than 60K ㎡
・More than 6,000 people ⇔ Total floor area of exhibition facilities: more than 20K ㎡
Facility No.3: Facilities enhancing
the attractiveness of
tourism
Theater, entertainment hall, concert hall, stadium, cinema, museum, gallery,
restaurant and other facilities that contribute enhancing the attractiveness of
Japanese tourism
Facility No.4: Facilities with
customer transfer
functions
Facilities satisfying below 4 conditions
1) showcase function, 2) concierge function, 3) multilingual support function, 4)
sufficient facility scale
Facility No.5: Accommodation
facilities
Total square measures for floor area of all guest rooms must be more than
100K ㎡ and facilities must have suite rooms with appropriate square measures
and certain ratio of suite rooms.
Facility No. 6 Other facilitiesFacility contributing to the promotion of visit and stay of domestic and inbound
tourists
Other: Restriction of casino ads
Can applies only to places where foreign travelers can stay until they complete
immigration procedures at airports operating international flights and passenger
terminals of ports where foreign cruise ships are in service
Other: Transaction subject to reportCash transactions exceeding 1 million yen between casino business operators
and customers

- 22 -
Pachislot and Pachinko Machines revision of rules
< APPENDIX:Overview of revision to the rules>
✓ Curbing of gambling
element is intended in
the matters related to
regulations of pay-out
balls/medals.
✓ “Multi stage payout-
ratio” is newly
approved for
pachinko machines.
February 1, 2018Date of
enforcement
(1) Matters related to regulations of pay-out balls/medals(2) Addition of standards for pachislot and pachinko machines with which pay-out balls/medals information can be easily checked(3) Introduction of “multi stage payout-ratio” to pachinko machines
Pachislot and
pachinko
machine
manufacturers
(4) Addition of responsibilities of
administrators
Pachinko
halls
*(2) Able to play without touching balls and medals (record and pay-out electronically)

- 23 -
Pachislot and Pachinko Machines revision of rules
<APPENDIX:Comparisons of pay-out ratio (image)>
✓ Machines will be
transformed to become
more playable with the
setting of the lower limit
of pay-out probability.
✓ The introduction of
“multi stage payout-
ratio” will allow broader
ways to play.
Play time
【Pachislot】
【Pachinko】
Pay-o
ut
ratio
G=Games
()=Current regulation
New
regulation
Regulation
before change
New
regulation
Pay-o
ut
ratio
Pay-out ratio=Balls and medals used
Balls and medals payed out
Regulation
before change

- 24 -
400G 1,600G 6,000G 17,500G
Regulation
before
change
Less than 300% - Less than 150%Over 55% and less
than 120%Up to 6 stages 480
New
regulation
Over 33% and less
than 220%
Over 40% and less
than 150%
Over 50% and less
than 126%
Over 60% and less
than 115%Up to 6 stages 300
Content
Test Number of pay-out
medals when hitting a
jackpot (Upper limit)
Multi stage
payout-ratio
Pachislot and Pachinko Machines revision of rules
<APPENDIX:Overview of revisions to regulations >
G=Games【Pachislot】
【Pachinko】
1 hour 4 hours 10 hours
Regulation
before
change
Less than 300% -Over 50% and less
than 200%- 2,400
New
regulation
Over 33% and less
than 220%
Over 40% and less
than 150%
Over 50% and less
than 133%Up to 6 stages 1,500
ContentTest Multi stage
payout-ratio
Number of pay-out
balls when hitting a
jackpot (Upper limit)

- 25 -
Transition of revision of rules (February 2018) and easing of voluntary regulation, etc.
• Elimination of the 65%
upper limit in
continuous rate of
probability change
Development of machines
with high jackpot
continuous rate
• Addition of visual effects using the lever and buttons
• Addition of visual effects using mini-reel machine (video reel machine)
• Gameplay of assist time(*1) improved
Mainly improved gameplay related to visual effects
• Ability to enter into time reduction (*2) after consumed the
predetermined number of games
• Elimination of 100 times upper limit of count in time reduction
• Enable to enter into time reduction with specific symbols
• Can use count of limiters (*3) up to 2 types
Primarily new gameplay added
2019/12 Review of voluntary regulation
2020/1 Changes in Interpretation
2021/12
Complete transition
to new regulation
machines
• Removal of upper limit of the no. of obtained medals
per game
• Revival of assist time machines
Gameplay in shorter time improved
New Regulation Machine (2)
(Regulation for 6.1 model machine)
New Regulation Machine (1)
(Regulation for 6.0 model machine)
New Regulation
Machine (3)
New Regulation
Machine (1)
• Elimination of the lower limit on
the number of win balls
• Elimination of the lower limit in
game numbers can be played at
normal status
Gameplay Widens
New Regulation
Machine (2)
2018/11 2019/5
Revision of rules
Pa
ch
ink
o
2018/2
Pa
ch
islo
t
2018/4
• Changes in pay-out
regulation
• Introducing "Setting" to
pachinko machines
• Changes in pay-out
regulation
*2: Time reduction = Function to play games efficiently without greatly reducing the number of balls.
*3: Limiter = one of the functions in probability change, refers to the function of the probability change
ends when the predetermined number of jackpots times consumed.
2020/5
Extension of deadline for
removal of previous reg.
machines
*1: AT=assist time

- 26 -
Schedule for transferring to new regulation machines
✓ Replacement accelerated from January 2021 due to the arrival of previous
regulation machines’ deadline for removal
YoY comparison of average utilization rate of
Pachislot and Pachinko
Removal scheduleFY2022/3
Number of machines
expected to be removed
Pachislot: 600K Units
Pachinko: 697K Units
Olympic
Games
Term
Transition
to new
regulation
machines
Unable to compare the
data during the state of
emergency period.
*In-house estimation based on DK-SIS data (Data for 4 yen Pachinko and 20 yen Pachislot)
of Daikoku Electronic Co., Ltd *In-house estimates as of the end of January 2021
(Unit: K units)

- 27 -
Schedule for transferring to new regulation machines
Pachislot: Removal Rule May 20,
2020
Dec. 1, 2021
Complete
transition
to new
regulation
machines
Jan. 31,
2021
Dec. 31,
2020
*Need to be removed by initial (*1) removal deadline.
(Final deadline for removal January 31, 2021)
*Need to be removed within 7 month after the initial (*1) removal deadline.
(Subject only to A type machines)
*Need to remove around 15% of installation number at January 31, 2021
per month from February 1, 2021 to November 31, 2021.
(Except Olympic period of July to September)
Nov. 30,
2021
1) Pachislot with high
gambling aspects
2) Specific machines which
verification of licenses originally
expires by December 31
3) Machines which verification of
licenses originally expires by
December 31, 2020
except 1) and 2)
4) Machines which verification of
licenses originally expires after
January 1, 2021 except 1)
*Need to remove around 15% of installation number at May 20, 2020 per
month from May 20, 2020 to December 31, 2020.
Approx.
160K units
Approx.
650K units
*2 Number of unit to be removed are in-house estimation as of end of January,
2020
*1 Expiration timing of verification of licenses before the revision of rule on May 20, 2020
(*1)
(*1)
(*1) (*2)
Not
applicable
Not
applicable

- 28 -
Schedule for transferring to new regulation machines
Pachinko: Removal Rule
1) Pachislot with high
gambling aspects
2) Specific machines which
verification of licenses originally
expires by December 31
3) Machines which verification of
licenses originally expires by
December 31, 2020,
except 2)
4) Machines which verification of
licenses originally expires after
January 1, 2021
Need to remove around 15% of installation number at May 20, 2020 per
month from May 20, 2020 to December 31, 2020.
Not
applicable
Approx.
50K units
Approx.
940K units
*Need to be removed by initial (*1) removal deadline.
(Final deadline for removal January 31, 2021)
*Need to be removed within 7 month after the initial (*1) removal
deadline. (Subject only to Amadeji, Hanemono and Choipachi machines)
*Need to remove around 15% of installation number at January 31, 2021
per month from February 1, 2021 to November 31, 2021.
(Except Olympic period of July to September)
May 20,
2020
Dec. 31,
2020
Jan. 31,
2021
Nov. 30,
2021
Dec. 1, 2021
Complete
transition
to new
regulation
machines
*1 Expiration timing of verification of licenses before the revision of rule on May 20, 2020
(*1)
(*1)
(*1)(*2)
*2 Number of unit to be removed are in-house estimation as of end of January,
2020
Not
applicable

- 29 -
Pachinko and Pachislot Machine Markets
Source: White Paper on Leisure Industry 2019, Japan Productivity Center

- 30 -
Pachinko and Pachislot Machine Markets
Sources: National Police Agency and Yano research Institute Ltd. (*The data for 2019 are our forecasts)
Sources : National Police Agency

- 31 -
Pachinko and Pachislot Machine Markets
Sources: National Police Agency and Yano research Institute Ltd. (*The data for 2019 are our forecasts)

- 32 -
Pachinko and Pachislot Machine Markets
Source: Security Communications Association

- 33 -
Rank Manufacturer Units sold Share Manufacturer Units sold Share Manufacturer Units sold Share Manufacturer Units sold Share Manufacturer Units sold Share Manufacturer Units sold Share
1 SANYO 330,000 16.3% Sansei R&D 300,000 15.9% SANYO 306,000 19.8% SANYO 330,000 23.4% S company 250,000 18.2% S company 149,520 15.5%
2 SANKYO 329,892 16.3% SANKYO 296,346 15.7% Sansei R&D 209,000 13.5% SANKYO 171,919 12.2% S company 196,007 14.2% N company 120,000 12.5%
3 KYORAKU 308,000 15.3% SANYO 275,000 14.6%HEIWA/
OLYMPIA192,761 12.5% Sammy 140,013 9.9% K company 192,800 14.0% K company 106,000 11.0%
4HEIWA/
OLYMPIA252,103 12.5%
HEIWA/
OLYMPIA234,616 12.4% SANKYO 172,954 11.2% KYORAKU 140,000 9.9% Sammy 159,848 11.6% S company 106,000 11.0%
5 Sammy 241,425 12.0% Newgin 220,000 11.7% Newgin 160,000 10.4% Sansei R&D 130,000 9.2% H company 118,880 8.6% Sammy 104,581 10.9%
6 Sammy 199,014 10.5% Sammy 138,321 9.0%
20182014 201720162015 2019
Rank Manufacturer Units sold Share Manufacturer Units sold Share Manufacturer Units sold Share Manufacturer Units sold Share Manufacturer Units sold Share Manufacturer Units sold Share
1 Sammy 207,828 16.8% UNIVERSAL 165,000 17.0% Sammy 215,736 24.3%KITA
DENSHI107,000 17.7% D company 80,000 17.7% Sammy 123,336 21.9%
2 UNIVERSAL 205,000 16.6% Sammy 142,337 14.7% UNIVERSAL 203,000 22.9% DAITO 100,000 16.5% K company 68,000 15.0% D company 73,000 13.0%
3 DAITO 128,000 10.4%HEIWA/
OLYMPIA113,997 11.8%
KITA
DENSHI90,500 10.2% Sammy 85,041 14.1% Sammy 67,140 14.8% H company 68,917 12.3%
4 YAMASA 108,000 8.8%KITA
DENSHI100,000 10.3%
HEIWA/
OLYMPIA80,953 9.1% UNIVERSAL 43,000 7.1% H company 47,244 10.4% U company 59,143 10.5%
5HEIWA/
OLYMPIA92,763 7.5% SANKYO 80,125 8.3% Enterrise 57,000 6.4% YAMASA 38,000 6.3% U company 37,365 8.3% K company 48,000 8.5%
20182014 201720162015 2019
Pachislot / Pachinko Machine Sales Share
Share of Annual Pachislot Machine Sales
Share of Annual Pachinko Machine Sales
Source: Yano Research Institute Ltd.
*Estimated by Yano Research Institute Ltd. with fiscal years from July of each year through June the following year as criteria
- 34 -
Source: f-ism
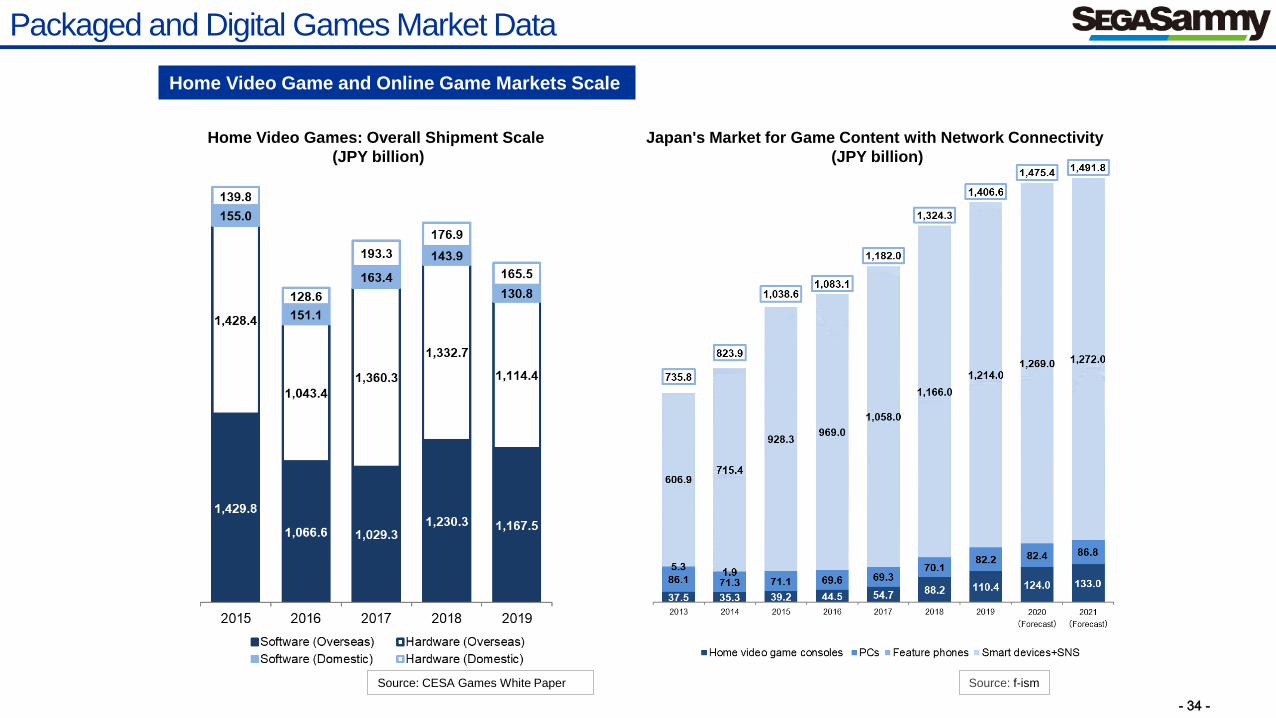
Home Video Game and Online Game Markets Scale
Packaged and Digital Games Market Data
Japan's Market for Game Content with Network Connectivity
(JPY billion)
Home Video Games: Overall Shipment Scale
(JPY billion)
Source: CESA Games White Paper

- 35 -
Amusement Machine and Amusement Center Operations Markets Scale
Amusement Market Data
Number of Amusement Facilities / Amusement Machine unit installed
Amusement Machine / Facilities sales (JPY billion)
Source: JAIA, National Police Agency

- 36 -
FY Ended
March 2015
FY Ended
March 2016
366.8 347.9 169.5 366.9 194.7 323.6 171.0 331.6 72.7 165.5 280.8 366.5 48.3 110.2 210.1
Pachislot and Pachinko Machines 152.1 132.7[141.0]* 64.9 148.2 88.3 105.6 58.6 101.4 17.1 44.1[44.2]* 86.2[86.3]* 108.3[108.5]* 2.7 10.7 37.3
Entertainment Contents 199.6 198.8[190.5]* 97.8 205.7 101.5 208.0 107.2 219.6 53.0 115.8[115.7]* 186.2[186.1]* 247.7[247.6]* 45.1 97.0 167.6
Resort 14.9 16.3 6.7 13.0 4.7 9.9 5.1 10.5 2.4 5.5 8.2 10.4 0.4 2.2 4.8
Other / Elimination - - - - - - - - 0.0 0.0 0.0 0.0 0.1 0.3 0.4
17.4 17.6 15.3 29.5 26.8 17.7 10.2 13.0 3.4 14.6 28.0 27.6 -3.8 -3.0 13.5
Pachislot and Pachinko Machines 25.7 21.5[20.9]* 10.6 26.3 21.4 11.9 9.6 13.4 1.3[1.0]* 7.8[7.3]* 20.7[19.9]* 24.9[23.2]* -8.4 -12.0 -8.2
Entertainment Contents 0.0 3.6[4.2]* 9.1 11.1 10.1 14.8 6.1 9.8 4.9[5.2]* 12.7[13.2]* 16.1[17.0]* 14.8[16.5]* 8.1 14.9 29.9
Resort -2.3 -1.8 -1.3 -2.2 -1.2 -2.5 -1.1 -2.4 -0.8 -1.5 -2.3 -3.6 -1.7 -2.6 -3.1
Other / Elimination -6.0 -5.7 -3.1 -5.7 -3.4 -6.5 -4.4 -7.8 -2.0 -4.4 -6.6 -8.5 -1.8 -3.3 -5.1
Operating Margin 4.7% 5.1% 9.0% 8.0% 13.8% 5.5% 6.0% 3.9% 4.7% 8.8% 10.0% 7.5% - - 6.4%
2.8 3.1 2.1 3.8 1.8 3.2 1.3 2.1 0.8 1.3 1.8 3.2 0.6 3.2 5.6
Pachislot and Pachinko Machines - - - - - - - - 0.1 0.2 0.4 0.7 0.1 0.2 0.3
Entertainment Contents - - - - - - - - 0.3 0.3 0.3 1.3 0.2 2.5 4.7
Resort - - - - - - - - 0.1 0.2 0.2 0.2 0.0 0.0 0.0
3.4 4.3 2.0 4.8 3.3 6.4 2.3 7.7 1.9 3.3 4.0 5.5 0.8 3.7 6.5
Pachislot and Pachinko Machines - - - - - - - - 0.1 0.3 0.8 1.1 0.2 0.6 0.9
Entertainment Contents - - - - - - - - 0.6 0.8 1.3 1.6 0.1 0.6 1.4
Resort - - - - - - - - 0.9 1.7 1.2 1.9 0.3 2.0 3.5
16.8 16.4 15.4 28.5 25.2 14.5 9.1 7.4 2.3 12.6 25.8 25.2 -4.0 -3.5 12.5
Pachislot and Pachinko Machines - - - - - - - - 0.9 7.2 19.4 22.7 -8.5 -12.4 -8.7
Entertainment Contents - - - - - - - - 4.9 12.8 16.0 16.2 8.2 16.8 33.1
Resort - - - - - - - - -1.6 -3.1 -3.3 -5.3 -2.1 -4.6 -6.6
Other / Elimination - - - - - - - - -1.9 -4.3 -6.3 -8.4 -1.6 -3.3 -5.3
Ordinary Income Margin 4.6% 4.7% 9.1% 7.8% 12.9% 4.5% 5.3% 2.2% 3.2% 7.6% 9.2% 6.9% - - 5.9%
-11.3 5.3 24.2 27.6 17.7 8.9 6.7 2.6 1.7 9.8 22.9 13.7 -3.3 -21.7 -6.2
Net Income Margin - 1.5% 14.3% 7.5% 9.1% 2.8% 3.9% 0.8% 2.3% 5.9% 8.2% 3.7% - - -
Results
Through 3Q
FY Ended
March 2021
Ordinary Income
Net Sales
Operating Income
FY Ended
March 2018
Results
Through 4Q
(JPY Billion)
Profit attributable to owners of parent
Full Year
Results
Results
Through 4Q
Full Year
Results
Full Year
Results
Results
Through 2Q
FY Ended
March 2017
Results
Through 2Q
Results
Through 3Q
Results
Through 4Q
Results
Through 2Q
Results
Through 1Q
Results
Through 2Q
FY Ended
March 2020
FY Ended
March 2019
Non-operating income
Non-operating expenses
Results
Through 2Q
Results
Through 1Q
Past Operating Results①
From FY Ended March 2015~*The data in this page can be downloaded from following URL.
(https://www.segasammy.co.jp/english/ir/library/pdf/settlement/2020/e_202103_3q_transition.xls)
*Net sales of new segment is shown in total amount bases.*Basis for recording of sales was changed from shipping basis to delivery basis from FY2016/3.*In line with the change of accounting policy, the figures for new segment reflect the change from FY2015/3 retrospectively.*Some business has shifted from Entertainment Contents business to Pachinko and Pachislot business and numbers shown in [] are retroactively adjusted figures which reflect such change. *Number of packaged titles include the number of titles in Asian territory except Japan from FY2017/3.*Numbers of titles and sales units of Full Game in FY2020/3 results was revised due to the change of subsegment classifications in Entertainment Contents business

- 37 -
FY Ended
March 2015
FY Ended
March 2016
-2.2% 1.0% - 5.2% - 1.8% - 0.6% - - - 3.0% - - -
-3.4% 1.8% - 9.2% - 2.9% - 0.9% - - - 4.6% - - -
60.0% 55.3% - 59.0% - 65.0% - 65.1% - - - 64.2% - - -
301.9% 798.8% - 178.6% - 334.7% - 520.9% - - - 207.2% - - -
45.2 times 19.1 times - 61.4times - 36.5 times - 27.3 times - - - 83.6 times - - -
67.6 58.0 31.7 67.1 30.7 62.0 30.8 66.6 17.1 33.5 56.4 76.5 14.7 28.3 43.5
28.7 28.0 13.8 27.0 10.3 24.1 17.8 34.4 5.1 10.5 16.1 22.8 3.6 7.2 11.4
17.6 16.6 7.6 16.3 8.2 16.2 7.4 14.5 3.6 7.3 10.9 14.8 3.6 7.3 9.5
19.1 17.9 7.6 14.8 7.8 15.4 8.4 16.0 3.6 8.5 12.9 17.4 2.0 5.6 9.5
6 titles 7 titles 3 titles 10 titles 8 titles 9 titles 1 title 6 titles 0 title 1 title 3 titles 5 titles 0 title 1 title 3 titles
207,830 units 142,337 units 81,895 units 215,736 units 75,380 units 85,041 units 12,853 units 67,140 units 17,930 units 28,360 units 105,860 units 123,336 units 485 units 4,885 units 12,487 units
10 titles 8 titles 3 titles 9 titles 4 titles 5 titles 3 titles 7 titles 2 title 4 titles 5 titles 7 titles 0 title 2 titles 3 titles
241,425 units 199,014 units 75,542 units 138,321 units 119,312 units 140,013 units 117,891 units 159,848 units 16,212 units 66,140 units 75,094 units 104,581 units 177 units 11,342 units 59,359 units
100.1% 103.1% 110.8% 108.5% 101.5% 101.9% 104.5% 104.0% 109.0% 103.6% 100.7% 97.7% 27.4% 50.1% 61.4%
198 facilities 194 facilities 189 facilities 191 facilities 189 facilities 189 facilities 189 facilities 190 facilities 191 facilities 192 facilities 195 facilities 192 facilities 195 facilities 193 facilities 193 facilities
30 titles 29 titles 21 titles 42 titles 16 titles 38 titles 18 titles 31 titles 9 titles 13 titles 26 titles 36 titles 4 titles 6 titles 15 titles
12,280 9,220 4,650 10,280 8,650 17,330 11,180 23,440 6,490 12,100 20,570 28,570 12,980 19,080 34,200
Results
Through 2Q
Results
Through 1Q
Results
Through 2Q
Results
Through 3Q
Results
Through 4Q
Results
Through 1Q
Results
Through 2Q
Full Year
Results
Results
Through 2Q
Results
Through 4Q
Results
Through 2Q
Results
Through 4Q
# of game software titles
No. of domestic amusement centers
YoY sales comparison of existing
amusement centers
(JPY Billion) FY Ended
March 2017
FY Ended
March 2018
# of pachinko titles
Unit sales
Cash flows to interest bearing debt ratio
R&D expense / content production expense
Equity Ratio
Sales (Thousand units)
Depreciation
Advertising
# of pachislot titles
Unit sales
ROA
Cap-ex
Full Year
Results
Full Year
Results
ROE
Interest coverage ratio
Results
Through 3Q
FY Ended
March 2021
FY Ended
March 2019
FY Ended
March 2020
Past Operating Results②
From FY Ended March 2015~*The data in this page can be downloaded from following URL.
(https://www.segasammy.co.jp/english/ir/library/pdf/settlement/2020/e_202103_3q_transition.xls)
- 38 -
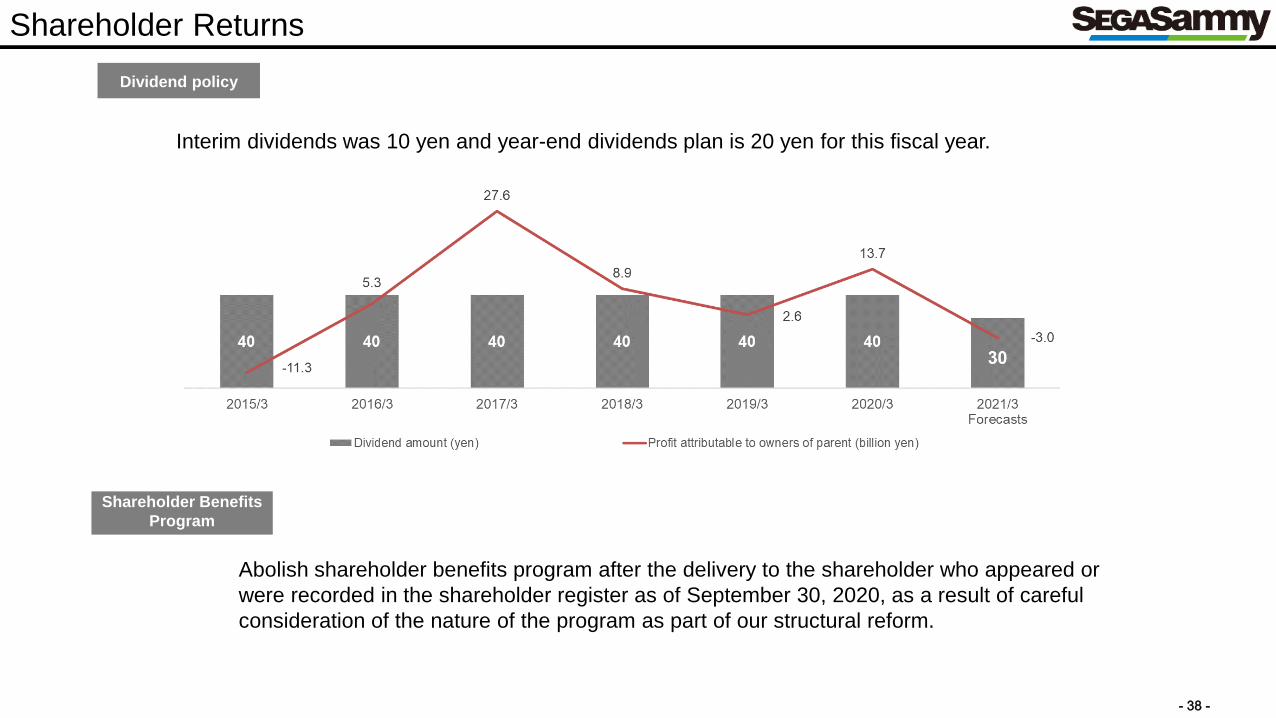
Shareholder Returns
Shareholder Benefits
Program
Abolish shareholder benefits program after the delivery to the shareholder who appeared or
were recorded in the shareholder register as of September 30, 2020, as a result of careful
consideration of the nature of the program as part of our structural reform.
Interim dividends was 10 yen and year-end dividends plan is 20 yen for this fiscal year.
Dividend policy
- 39 -
Company Name
Address
Established
Capital
Number of Employees
Stock ExchangeName of Shareholder
Shares
Held
Shareholding
Ratio (%)
HS Company 35,308,000 13.26
SEGA SAMMY HOLDINGS INC. 31,136,672 11.69
The Master Trust Bank of Japan, Ltd.
(Trust account)14,098,000 5.29
FSC Co., Ltd. 13,682,840 5.13
Custody Bank of Japan, Ltd.
(Trust account)8,685,700 3.26
■Distribution of Shareholders
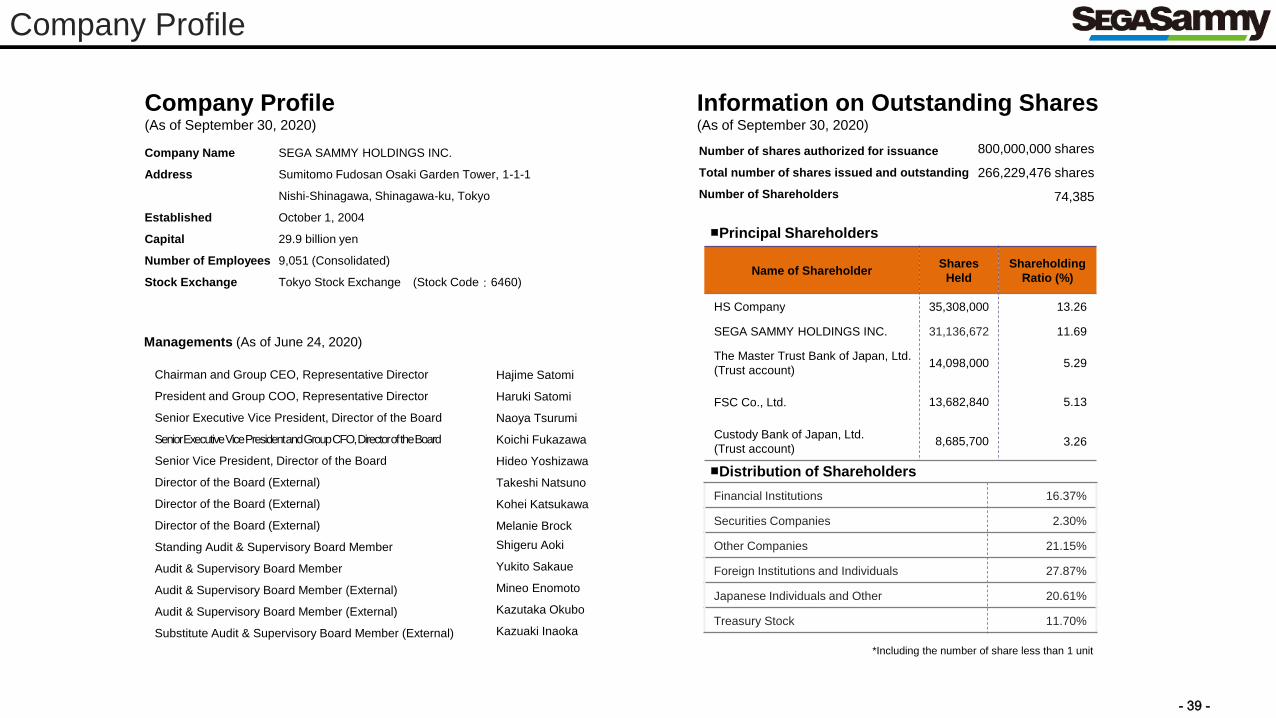
Company Profile(As of September 30, 2020)
Information on Outstanding Shares(As of September 30, 2020)
800,000,000 shares
266,229,476 shares
74,385
■Principal Shareholders
Financial Institutions 16.37%
Securities Companies 2.30%
Other Companies 21.15%
Foreign Institutions and Individuals 27.87%
Japanese Individuals and Other 20.61%
Treasury Stock 11.70%
Company Profile
SEGA SAMMY HOLDINGS INC.
Sumitomo Fudosan Osaki Garden Tower, 1-1-1
Nishi-Shinagawa, Shinagawa-ku, Tokyo
October 1, 2004
29.9 billion yen
9,051 (Consolidated)
Tokyo Stock Exchange (Stock Code:6460)
Hajime Satomi
Haruki Satomi
Naoya Tsurumi
Koichi Fukazawa
Hideo Yoshizawa
Takeshi Natsuno
Kohei Katsukawa
Melanie Brock
Shigeru Aoki
Yukito Sakaue
Mineo Enomoto
Kazutaka Okubo
Kazuaki Inaoka
Managements (As of June 24, 2020)
Number of shares authorized for issuance
Total number of shares issued and outstanding
Number of Shareholders
Chairman and Group CEO, Representative Director
President and Group COO, Representative Director
Senior Executive Vice President, Director of the Board
Senior Executive Vice President and Group CFO, Director of the Board
Senior Vice President, Director of the Board
Director of the Board (External)
Director of the Board (External)
Director of the Board (External)
Standing Audit & Supervisory Board Member
Audit & Supervisory Board Member
Audit & Supervisory Board Member (External)
Audit & Supervisory Board Member (External)
Substitute Audit & Supervisory Board Member (External)
*Including the number of share less than 1 unit

- 40 -
Please visit below websites for products and service information.
https://www.segasammy.co.jp/english/pr/corp/group/list.html
(SegaSammy Group Website list)
* Company / product names in this document are trademarks or registered trademarks of the respective companies.
https://www.segasammy.co.jp/english/ir/
Cautionary Statement for Investors and Shareholders with Respect to Nevada Gaming Statutes and
Regulations
SEGA SAMMY HOLDINGS INC. (“the Company”) is registered with the Nevada Commission as a publicly
traded corporation and has been found suitable to directly or indirectly own the stock of SEGA SAMMY
CREATION INC., and Sega Sammy Creation USA, Inc., both of which are subsidiaries that have been licensed
as manufacturers and distributors of gaming devices in Nevada. Pursuant to Nevada law, the Company’s
shareholders are subject to the rules and regulations of the Nevada Gaming Authorities. A detailed explanation
of Nevada gaming statutes and regulations can be found on the Company’s corporate website:
https://www.segasammy.co.jp/english/ir/stock/regulation/
Copyright © 2022 FDOKUMEN