for the fiscal year ending june 30, 2018 - South Placer ...
76
SOUTH PLACER MUNICIPAL UTILITY DISTRICT COMPREHENSIVE ANNUAL FINANCIAL STATEMENTS FOR THE FISCAL YEAR ENDING JUNE 30, 2018 SOUTH PLACER MUNICIPAL UTILITY DISTRICT| 5807 SPRINGVIEW DRIVE, ROCKLIN CA 95677
-
Upload
khangminh22 -
Category
Documents
-
view
1 -
download
0
Transcript of for the fiscal year ending june 30, 2018 - South Placer ...

SOUTH PLACER
MUNICIPAL UTILITY DISTRICT
COMPREHENSIVE ANNUAL FINANCIAL
STATEMENTS FOR THE FISCAL YEAR ENDING JUNE 30, 2018
SOUTH PLACER MUNICIPAL UTILITY DISTRICT| 5807 SPRINGVIEW DRIVE, ROCKLIN CA 95677
SOUTH PLACER MUNICIPAL UTILITY DISTRICTANNUAL FINANCIAL REPORT
FOR THE YEAR ENDED JUNE 30, 2018
TABLE OF CONTENTS
Page
INTRODUCTORY SECTION:
Transmittal Letter i
Board of Directors ix
Organizational Chart x
FINANCIAL SECTION:
Independent Auditor's Report on Basic Financial Statements 1 - 2
Management's Discussion and Analysis 3 - 16
Basic Financial Statements:
Balance Sheet 17
Statement of Revenues, Expenses, and Changes in Net Position 18
Statement of Cash Flows 19 - 20
Notes to the Basic Financial Statements 21 - 42
Required Supplementary Information:
Schedule of the District's Proportionate Share of the Net Pension Liability 43
Schedule of Contributions to the Cost Sharing Defined Benefit Pension Plan 44
Schedule of Changes to the Net OPEB Liability and Related Ratios 45
Schedule of Contributions to the OPEB Plan 46
Supplementary Information:
Schedule of Operating Expenses 47
STATISTICAL SECTION 48 - 59
STATISTICAL SECTION OBJECTIVES
SOUTH PLACER MUNICIPAL UTILITY
DISTRICT
INTRODUCTORY SECTION
FISCAL YEAR ENDING JUNE 30, 2018

SOUTH PLACER MUNICIPAL UTILITY DISTRICT 5807 Springview Drive, Rocklin, CA 95677
(916) 786-8555 Fax: (916) 786-8553
i
TRANSMITTAL LETTER
November 12, 2018
To the Honorable SPMUD Board Directors
The South Placer Municipal Utility District
(the District) staff submits to you the
Comprehensive Annual Financial Report
(CAFR) for the year ended June 30, 2018.
The CAFR provides an assessment of the
District’s financial condition, informs readers
about District services, gives details of
infrastructure replacement projects, discusses
current issues, and provides financial and
demographic trend information. This letter
of transmittal is designed to complement
Management’s Discussion and Analysis and
should be read in conjunction with it.
The District’s financial statements were
audited by Mann, Urrutia, Nelson, Certified
Public Accountants. Management believes
the Annual Financial Report is complete and
accurate in all material respects. Internal
controls through policies and procedures and
the services of an outside Accountant
safeguard assets and assure proper recording
and reporting of transactions using Generally
Accepted Accounting Principles.
DISTRICT OVERVIEW
The Rocklin-Loomis Municipal Utility
District was created in 1956 to provide
sanitary sewer service to Rocklin and
Loomis. The District is divided into five
wards and governed by an elected five-
member Board of Directors whom establish
policy and oversee the General Manager,
who manages the day-to-day operations.
In the 1970’s the District decommissioned its
sewage treatment facilities and began using
the City of Roseville (City) Dry Creek
Wastewater Treatment Plant (DCWWTP).
In the 1980’s, the name changed to South
Placer Municipal Utility District to reflect its
larger service area. In 2000, the District, the
City of Roseville and Placer County (PC)
created the South Placer Wastewater
Authority (SPWA) to finance the
construction of the Pleasant Grove
Wastewater Treatment Plant (PG WWTP).
In 2008, SPMUD boundaries expanded to
match the incorporated town limits of
Loomis, and in 2010, SPMUD annexed the
Newcastle Sanitary District (NSD) area. The
District provides sewer collection services in
southwestern Placer County, CA and
currently serves residents and businesses in
the City of Rocklin and Town of Loomis, and
in the unincorporated communities of
Penryn, Newcastle and the Rogersdale area
of Granite Bay. Sewage is collected by the
District and conveyed to regional wastewater
treatment plants (WWTP) operated by the
City of Roseville.
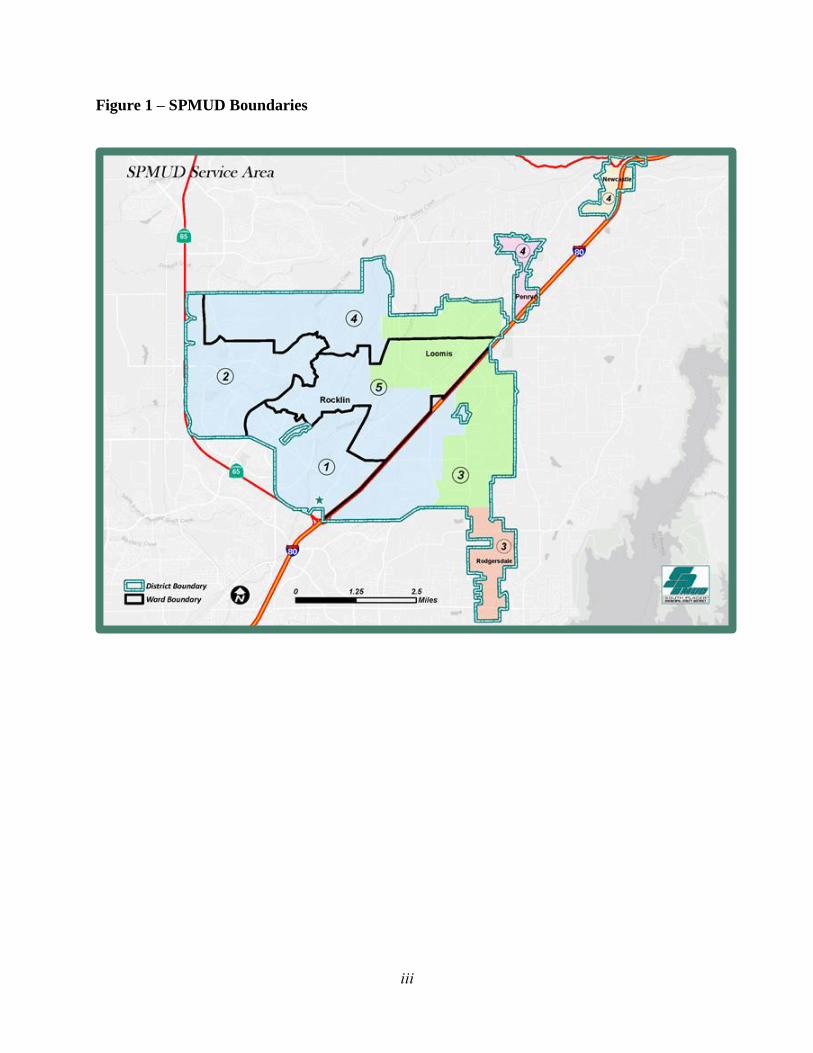
The SPMUD service area covers 31 square
miles as shown in Figure 1 The District
provides service to 22,775 customers (80%
ii
residential and 20% commercial); this
equates to 33,445 Equivalent Dwelling Units
(EDU) or an equivalent population of about
75,000 people. Our customers discharge an
average sewer flow of about five million
gallons per day. The District collects the
sewage through customer owned sewer
laterals (the pipe connecting their building
sewer to the sewer mainlines) and transports
this via 276.9 miles of District owned and
operated sewer mains (from 4” to 42”
diameter). The District maintains an
additional 103.3 miles of lower laterals
within our easement or public right-of-way.
Other assets include our Headquarters,
Maintenance and Corporation Yard facilities,
6399 manholes/flushing branches, 13 lift
stations, 12 metering sites, and related
buildings, facilities and equipment.
During FY 2017/18 the monthly service
charges increased on October 1, 2017 and
June 30, 2018, to the current rate of $34.00
per month. Local Participation Fees
increased on June 30, 2018 to $3,923 per
equivalent dwelling unit (EDU).
INVESTING IN INFRASTRUCTURE
The District’s customers have high
expectation from the Board of Directors.
They expect sewage to be contained in the
pipes, to be treated efficiently and disposed
of effectively. The District has developed a
High-Risk Facilities (HRF) Program that
meets the requirements of provision
D.13.vi.c of the Statewide General Waste
Discharge Requirements for Sanitary Sewer
Systems, Water Quality Order No. 2006-003
(SSS WDR), which requires sewer systems to
develop a rehabilitation and replacement plan
to identify and prioritize system deficiencies
and implement short-term and long-term
rehabilitation actions to address each
deficiency. The program includes regular
visual and TV inspections of manholes and
sewer pipes, and a system for ranking the
condition of sewer pipes and scheduling
rehabilitation. Rehabilitation and
replacement focus on sewer pipes that are at
risk of collapse or prone to more frequent
blockages due to pipe defects. Finally, the
rehabilitation and replacement plan includes
a capital improvement plan that addresses
proper management and protection of the
infrastructure assets.
SPMUD MISSION
• PROTECT public health and the water
environment.
• PROVIDE efficient and effective
sanitary sewer service.
• PREPARE for the future.
SPMUD VISION
To be a reliable, innovative operations and
maintenance organization that preserves
and prolongs the life of our assets,
resulting in sustainable, efficient, cost-
effective customer services.
SPMUD VALUES
1. INTEGRITY: We will be trustworthy,
truthful and honest.
2. STEWARDSHIP: We will be
accountable and committed to responsible
management and
respect our environment.
3. SERVICE: We will be responsive,
reliable and respectful; putting the needs
of the District and
customers first.
4. QUALITY: We will be dedicated to
continuous improvement.
iii
Figure 1 – SPMUD Boundaries

iv
Above grade creek crossings represent a
unique and special risk to the District. By
default, above grade creek crossings are
potential HRFs due to their immediate
proximity to a waterway. Any failure of an
above grade creek crossing results in the
potential for serious consequences to public
health and the environment, and litigation
and fines for the District. For these reasons,
a separate and more detailed risk assessment
was conducted on this subset of the
District’s assets.
The District has also embarked on a multi-
year plan to address projects identified in the
Wastewater Collection System Evaluation
and Capacity Assurance Plan (SECAP). The
purpose of the SECAP is to provide the
District guidance in its efforts to assure
capacity for existing customers and
information on how to prepare and plan for
future development. This document
summarizes the District’s compliance with
provision D.13.viii – System Evaluation and
Capacity Assurance Plan of the California
State Water Resources Control Board
(SWRCB) Order No. 2006-0003-DWQ, the
Statewide General Waste Discharge
Requirements for Sanitary Sewer Systems
(SSS WDR). It is included by reference to the
District’s Sewer System Management Plan
(SSMP); is reviewed annually; and is updated
as deemed necessary by District staff (at
minimum every five years) to account for
conditions affecting collection system
capacity.
LOCAL ECONOMIC CONDITIONS
Placer County is in the northern portion of the
Sacramento Valley and has an eastern border
that touches the Nevada state line. Placer
County has a population of 386,166 people
and approximately 148,700 wage and salary
jobs. The median household income in Placer
County is $76,926. The strong recovery of
the local economy indicates that the South
Placer area should see additional growth in
future years.
Employment across the South Placer region
increased by 2.8% in 2017. A significant area
of growth in jobs can be attributed to a surge
in Health Care employment. The
unemployment rate improved markedly,
falling from 5.0% in 2016 to 3.7% in 2017.
During 2017, the largest employment gains
were observed in education and healthcare,
construction, manufacturing, wholesale and
retail trade and financial activities. Declines
were not observed in any major sector. Net
migration added over 70,000 residents to the
County, including both legal and
unauthorized foreign immigrants, residents
who left the State to live abroad and others
moving to and from Placer County from
within California and the United States.
Job growth has continued to accelerate and
over the next few years is expected to grow
in the areas of leisure and hospitality,
professional and business services, education
and healthcare, and wholesale and retail
trade. These sectors will account for 83% of
net job creation in the county.

v
Annual population in California surpassed
over 40 million this year. It remains the most
populous state in the nation. With the next
State being Texas, having a population of 28
million.
ENTERPRISE OPERATIONS
The District finances sewer operations
through user charges, property tax receipts
and miscellaneous other income. All charges
are based upon an Equivalent Dwelling Unit
(EDU) and the cost of providing the sewer
service is allocated to each customer
proportionate to the strength and flow of the
wastewater generated in EDUs. An EDU is
intended to represent the wastewater
generated by a single residential consumer.
Based upon previous strength and flow
monitoring studies, one EDU is equivalent to
200 gallons of wastewater daily with
wastewater strength of less than 200 mg/1
B.O.D. and/or suspended solids. Service
Charge revenues are derived from flat rates
charged for sewer service, based upon the
EDU’s assigned to each account.
The top priority of the District is to provide a
level of service that meets state and federal
regulatory requirements, and the demands
and expectations of its customers. Customers
of the District have an expectation for cost-
effective reliable sewer operations, with
minimal sewage spills that have the capacity
to impact the environment. Furthermore,
District customers have become accustomed
to excellent customer service and response at
low cost. The District currently has some of
the lowest monthly service charge for sewer
service.
California Population Growth Source: California Department of Finance Estimates
vi
In January 2018 the Districts Lifeline Low
income rate assistance program began. This
program offers a small monthly discount of
$5.00 to those owner-occupied residences
that qualify for the PG&E CARE Program.
Funding for this program is generated
through the collection of late fees, charged to
customers with delinquent utility accounts.
In 2013 and most recently in 2017 the District
developed forward thinking Strategic Plans.
Strategic Plan 2018/2022 establishes the
blueprint for the District’s current activities
and response to future activities and changing
priorities. The Strategic Plan confirms the
District’s Mission, Vision and Core Values as
a customer driven utility dedicated to
protecting the public health by providing
quality sanitary sewer collection service
while protecting and preserving our water
environment and resources for future
generations. The plan is used to guide the
annual budget process and capture the
Board’s goals and objectives to be achieved
during the planning period while meeting the
District’s mission to Protect, Provide and
Prepare.
Careful stewardship of financial resources,
along with a focus on long-term financial
planning, provides the District with a firm
financial base. The District has shown its
financial abilities in capably responding to
the operational requirements of the sewer
system while responsibly investing in
infrastructure replacement. The Board of
Directors’ policies carefully coordinate
reasonable rate increases to meet the
District’s mission.
PUBLIC OUTREACH
The District conducts regular Board
Meetings that are open to the public. They
are normally held on the first Thursday of the
month. Dates can be found on the District
website. The District’s website continues to
be updated to be more informative, and easier
to use and provides information about
SPMUD’s activities. The website can be
found at www.spmud.ca.gov.
District staff provide presentations to civic
groups, service organizations, and local
schools. The District also engages the public
through newsletters, door hangars and
written notices.
BUDGETARY CONTROLS
The Annual Budget is a blueprint of planned
operating, public goods and debt service
expenses, capital expenditures and multi-year
projects for each fiscal year beginning on
July 1st and ending on June 30th. For each
fiscal year, the South Placer Municipal
Utility District adopts an annual budget that
provides the Board of Directors with the
upcoming fiscal year revenues and expenses
for the General and Capital Funds. The
Budget’s primary use is as a fiscal planning
tool to accomplish the District’s strategic
goals and objectives.
The annual budget conforms to all policies
previously adopted by the Board of Directors.
District staff work with the Board of
Directors’ Fee & Finance Committee to
develop the annual budget. Staff presents the
budget at public workshops and meetings
before adoption.
LOOKING FORWARD TO THE
FUTURE
The top priority of the District is to provide a
level of service that meets state and federal
regulatory requirements, and the demands
and expectations of its customers. The long-
term goal of the 5-year Financial Plan is to
develop a utility system that is stable,

vii
requiring limited increases in the cost of
services, minimizing those increases that are
required, and provide sufficient revenues to
cover necessary operations and maintenance
programs, capital investment and reserves to
meet the utility’s stated needs.
Because the District’s customers bear the
ultimate cost of service, there exists a need to
have a financial plan that will permit the
utility to meet its priorities at an affordable
and stable cost for the long-term. To this end,
the District operates under the Municipal
Utility District Act and is set up as an
enterprise fund to operate very much like a
business. Sewer customers are not
subsidized by the General Fund taxpayers of
any local government and must be
individually self-sustaining.
In May 2017, the Board approved a 5-year
financial plan and cost of service study which
resulted in an increase in wastewater rates for
the first time in 5 years. The 3-consecutive
annual increases in rates will fully fund all
operations, maintenance and regulatory
obligations as well as capital improvements
until 2022. The increase will also provide
funding of the District’s pension and other
post-employment benefit obligations as well
as meet the debt indenture revenue
requirements mandated by the South Placer
Wastewater Authority.
Capital Outlays are categorized to their
respective fund centers. Those projects
designated as Capital Replacement &
Rehabilitation (R&R) projects would be
funded by accumulated depreciation; those
projects designated as Capital Improvement
Projects (CIP) and Expansion projects are
funded through the accumulation of the
Sewer Participation fee; the remainder of the
District’s projects would be pay-as-you-go
through the General Fund. It is only those
projects covered by the General Fund that are
directly funded as pay-as-you-go by
customers through the monthly service
charge.
The District’s 5-year financial plan and cost
of service study included a capital
improvement plan to take the district out to
fiscal Year 2021/22 and contains District
planned construction of R&R projects, CIP
projects and General Fund projects.
DISTRICT HONORS
In 2016, the South Placer Municipal Utility
District was awarded the District
Transparency Certificate of Excellence by
the Special District Leadership Foundation
for outstanding efforts to promote
transparency and good governance. In order
to receive the award, SPMUD demonstrated
the completion of eight essential governance
transparency requirements, including
conducting ethics training for all District
Board members; properly conducting open
and public meetings; and filing financial
transactions and compensation reports with
the State Controller in a timely manner.
The District also fulfilled 15 website
requirements, including providing readily
available information to the public, such as
board agendas, past minutes, current budget
and the most recent financial audit.

viii
ANNUAL FINANCIAL REPORT CONTRIBUTING STAFF
Herb Niederberger General Manager
Joanna Belanger Administrative Services Manager and Board Secretary
Sam Rose Superintendent
Eric Nielsen District Engineer
Sincerely,
Herb Niederberger
General Manager

ix
DISTRICT BOARD OF DIRECTORS
Gerald Mitchell
WARD 1: Southwest central area of the City of Rocklin lying north of
Interstate 80, including the Woodside, Five Star/Fairway Heights, south
Stanford Ranch, and Sunset neighborhoods, as well as the west parts of
old Rocklin.
William Dickinson
WARD 2: Northwest part of the City of Rocklin lying on the east side
of Highway 65 in the Sunset West and north central Stanford Ranch
neighborhoods.
John Murdock
WARD 3: Southeast Rocklin lying south of Interstate 80 in the vicinity
of Sierra Community College. Also includes south Loomis and a stretch
of land extending into Granite Bay in the Joe Rogers Road area.
Victor Markey
WARD 4: Community of Penryn, the Town of Loomis lying north of
King Road, extending west into the north part of the City of Rocklin in
the Whitney Ranch and north Whitney Oaks neighborhoods.
James Williams
WARD 5: West and central part of the Town of Loomis lying between
Interstate 80 and King Road, extending west into the City of Rocklin into
the east Stanford Ranch and south Whitney Oaks neighborhoods, as well
as the east part of old Rocklin.

x
ORGANIZATION
The District is organized into three departments, Field Services, Technical Services and
Administrative Services. In general, all operation and maintenance functions are performed by
Field Services staff; all engineering, development improvements, construction activity and
inspections are overseen by Technical Services staff; and, all office, billing, accounting, customer
service, financial and administrative functions are performed by Administrative Service staff.
District Audit and Legal Services are performed under contract. Employees and Management
salaries are governed by a Memorandum of Understanding (MOU) between each of the two
employee groups and the Board of Directors.
DISTRICT ORGANIZATIONAL CHART FY 18/19
5 EL
6 FT 16 FT 4 FT
1 PT
ADMINISTRATIVE SERVICE ASSISTANT III
ASSOCIATE ENGINEER INSPECTOR II ADMINISTRATIVE SERVICE ASSISTANT II
ENGINEERING TECH II INSPECTOR II ADMINISTRATIVE SERVICE ASSISTANT II
STUDENT INTERN (PT) INSPECTOR I
2 MAINT. WORKER II MAINT. WORKER II MAINT. WORKER I/II MAINT. WORKER I LEAD WORKER*
2 MAINT. WORKER I/II MAINT. WORKER I/II MAINT. WORKER II/INSP. MAINT. WORKER I
35 TOTAL POSITIONS: 5 ELECTED, 2 CONTRACT, 4 MANAGEMENT, 2 SUPERVISIORS, 21 FULL-TIME, & 1 PART-TIME
EFFECTIVE: JULY 1, 2018
* Leadworker performs Facilities duties
DEPARTMENT
DISTRICT ENGINEER
SOUTH PLACER MUNICIPAL UTILITY DISTRICT
ADMINISTRATIVE SERVICES MANAGER
BOARD OF DIRECTORS
GENERAL MANAGERAuditor DISTRICT COUNSEL
TECHNICAL SERVICES ADMINISTRATIVE SERVICESFIELD MAINTENANCE
FIELD SUPERVISOR
SERVICES DEPARTMENT
SUPERINTENDENT
LEAD WORKER LEAD WORKER
FIELD SUPERVISOR
DEPARTMENT
LEAD WORKER
CCTV CREWs HYDRO CREW CONSTRUCTION CREW LATERAL CREW FACILIT IES CREW
STATISTICAL SECTION OBJECTIVES
SOUTH PLACER MUNICIPAL UTILITY
DISTRICT
FINANCIAL SECTION
FISCAL YEAR ENDING JUNE 30, 2018
MANN • URRUTIA • NELSON CPAs & ASSOCIATES, LLP GLENDALE • ROSEV I LLE • SACRAM ENTO • SOUTH LAKE TAHO E • KAUAI, HAWA II
To the Board of Directors South Placer Municipal Utility District Rocklin, California
Report on the Financial Statements
INDEPENDENT AUDITOR'S REPORT
We have audited the accompanying financial statements of each major fund of the South Placer Municipal Utility District as of and for the year ended June 30, 2018, and the related notes to the financial statements, which collectively comprise the District's basic financial statements as listed in the table of contents.
Management's Responsibility for the Financial Statements
Management is responsible for the preparation and fair presentation of these financial statements in accordance with accounting principles generally accepted in the United States of America; this includes the design, implementation, and maintenance of internal control relevant to the preparation and fair presentation of financial statements that are free from material misstatement, whether due to fraud or error.
Auditor's Responsibility
Our responsibility is to express an opinion on these financial statements based on our audit. We conducted our audit in accordance with auditing standards generally accepted in the United States of America and the standards applicable to financial audits contained in Government Auditing Standards, issued by the Comptroller General of the United States. Those standards require that we plan and perform the audit to obtain reasonable assurance about whether the financial statements are free from material misstatement.
An audit involves performing procedures to obtain audit evidence about the amounts and disclosures in the financial statements. The procedures selected depend on the auditor's judgment, including the assessment of the risks of material misstatement of the financial statements, whether due to fraud or error. In making those risk assessments, the auditor considers internal control relevant to the entity's preparation and fair presentation of the financial statements in order to design audit procedures that are appropriate in the circumstances, but not for the purpose of expressing an opinion on the effectiveness of the entity's internal control. Accordingly, we express no such opinion. An audit also includes evaluating the appropriateness of accounting policies used and the reasonableness of significant accounting estimates made by management, as well as evaluating the overall presentation of the financial statements.
We believe that the audit evidence we have obtained is sufficient and appropriate to provide a basis for our audit opinions.
Opinion
In our opinion, the financial statements referred to above present fairly, in all material respects, the respective financial position of each major fund of South Placer Municipal Utility District as of June 30, 2018, and the respective changes in financial position and cash flows thereof for the year then ended in accordance with accounting principles generally accepted in the United States of America.
SACRAMENTO O FFICE • 1760 CREEKSIDE OAKS DRIVE, SuiTE 160 • SACRAMENTO, CA 95833 • o. 916.929.0540 • F. 9 16.929.054 1
WWW.MUNCPAS.COM

Emphasis of Matter
Change in Accounting Principles
As described in Note 1 to the financial statements, during the year ended June 30, 2018, the District adopted new accounting guidance, GASB Statement No. 75, Accounting and Financial Reporting for Postemployment Benefits other than Pensions. Our opinion is not modified with respect to this matter.
Other Matters
Required Supplementary Information
Accounting principles generally accepted in the United States of America require that the management's discussion and analysis, schedules related to the District's net pension liability, and the schedules of changes in the District's net OPEB liability and related ratios as listed in the table of contents be presented to supplement the basic financial statements. Such information, although not a part of the basic financial statements, is required by the Governmental Accounting Standards Board, who considers it to be an essential part of financial reporting for placing the basic financial statements in an appropriate operational, economic, or historical context. We have applied certain limited procedures to the required supplementary information in accordance with auditing standards generally accepted in the United States of America, which consisted of inquiries of management about the methods of preparing the information and comparing the information for consistency with management's responses to our inquiries, the basic financial statements, and other knowledge we obtained during our audit of the basic financial statements. We do not express an opinion or provide any assurance on the information because the limited procedures do not provide us with sufficient evidence to express an opinion or provide any assurance.
Other information
Our audit was conducted for the purpose of forming an opinion on the financial statements that collectively comprise the District's basic financial statements. The introductory section, statistical section and schedule of operating expenses is presented for purposes of addtional analysis and is not a required part of the basic financial statements.
The schedule of operating expenses is the responsiblity of management and was derived from and relates directly to the underlying accounting and other records used to prepare the basic financial statements. Such information has been subjected to the auditing procedures applied in the audit of the basic financial statements and certain additional procedures, including comparing and reconciling such information directly to the underlying accounting and other records used to prepare the basic financial statements or to the basic financial statements themselves, and other additional procedures in accordance with auditing standards generally accepted in the United States of America. In our opinion, the schedule of operating expenses is fairly stated in all material respects in relation to the basic financial statements as a whole.
The introductory and statistical sections have not been subjected to the auditing procedures applied in the audit of the basic financial statements and, accordingly, we do not express an opinion or provide any assurance on them.
Other Reporting Required by Government Auditing Standards
In accordance with Government Auditing Standards, we have also issued our report dated November 12, 2018, on our consideration of the South Placer Municipal Utility District's internal control over financial reporting and on our tests of its compliance with certain provisions of laws, regulations, contracts, and grant agreements and other matters. The purpose of that report is to describe the scope of our testing of internal control over financial reporting and compliance and the results of that testing, and not to provide an opinion on internal control over financial reporting or on compliance. That report is an integral part of an audit performed in accordance with Government Auditing Standards in considering the South Placer Municipal Utility District's internal control over financial reporting and compliance.
Sacramento, California November 12, 2018
3
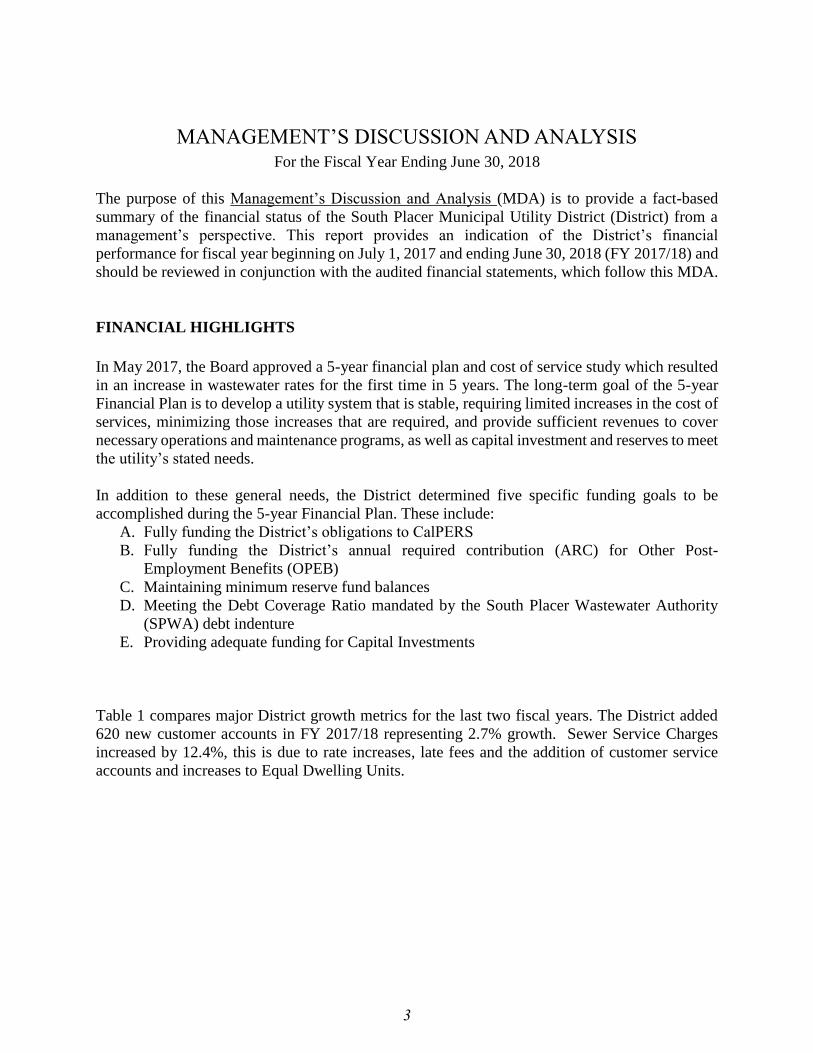
MANAGEMENT’S DISCUSSION AND ANALYSIS For the Fiscal Year Ending June 30, 2018
The purpose of this Management’s Discussion and Analysis (MDA) is to provide a fact-based
summary of the financial status of the South Placer Municipal Utility District (District) from a
management’s perspective. This report provides an indication of the District’s financial
performance for fiscal year beginning on July 1, 2017 and ending June 30, 2018 (FY 2017/18) and
should be reviewed in conjunction with the audited financial statements, which follow this MDA.
FINANCIAL HIGHLIGHTS
In May 2017, the Board approved a 5-year financial plan and cost of service study which resulted
in an increase in wastewater rates for the first time in 5 years. The long-term goal of the 5-year
Financial Plan is to develop a utility system that is stable, requiring limited increases in the cost of
services, minimizing those increases that are required, and provide sufficient revenues to cover
necessary operations and maintenance programs, as well as capital investment and reserves to meet
the utility’s stated needs.
In addition to these general needs, the District determined five specific funding goals to be
accomplished during the 5-year Financial Plan. These include:
A. Fully funding the District’s obligations to CalPERS
B. Fully funding the District’s annual required contribution (ARC) for Other Post-
Employment Benefits (OPEB)
C. Maintaining minimum reserve fund balances
D. Meeting the Debt Coverage Ratio mandated by the South Placer Wastewater Authority
(SPWA) debt indenture
E. Providing adequate funding for Capital Investments
Table 1 compares major District growth metrics for the last two fiscal years. The District added
620 new customer accounts in FY 2017/18 representing 2.7% growth. Sewer Service Charges
increased by 12.4%, this is due to rate increases, late fees and the addition of customer service
accounts and increases to Equal Dwelling Units.

4
TABLE 1: Annual DISTRICT Growth
(compares major District metrics for the last two fiscal years)
Item Unit
Fiscal Year
2016/17
Fiscal Year
2017/18
% Change
over Previous
Service Charges Dollars 10,983,759$ 12,344,676$ 12.4%
Customer Accounts Each 22,175 22,775 2.7%
Equal Dwelling Units EDU 32,825 33,445 1.9%
Service Fee per EDU Monthly $28.00 $34.00 21.4%
Annual Flow to WWTP Million Gallons 1,675 1,570 -6.3%
Sewer Mains Miles 273.5 276.9 1.2%
Lower Service Laterals Miles 127 133 4.8%
Manhole/Flushing Branch Each 6,365 6,399 0.5%
Lift Stations Each 13 13 0.0%
Force Mains Miles 6.8 6.8 0.0%
OVERVIEW OF THE BASIC FINANCIAL STATEMENTS
The District’s basic financial statements are the Statement of Net Position, the Statement of
Revenues, Expenses and Changes in Net Position, and the Statement of Cash Flows. An important
part of the basic financial statements is the accompanying notes, which provide the users additional
information required by generally accepted accounting principles (GAAP). The Management
Discussion and Analysis is required supplementary information to the basic financial statements.
The Statement of Net Position includes the District’s assets and liabilities. The difference between
assets and liabilities is reported as net position. The Statement of Revenues, Expenses and Changes
in Net Position account for revenue, expenses, and capital contributions and calculates the change
in net position. Over time, increases or decreases in net position serve as a key indicator of the
District’s financial position. The Statement of Cash Flows provides the details on the changes in
cash and cash equivalents during the year. By contrast the Statement of Net Position and Statement
of Revenues, Expenses and Changes in Net Position are prepared on an accrual basis, meaning
revenues are recorded when earned and expenses are recorded when incurred regardless of the
timing of cash receipts and payments.
FINANCIAL ANALYSIS OF THE DISTRICT
Net Position
The condensed Statement of Net Position shown in Statistical Section at the end of this analysis
shows the District is investing in capital assets. Since 2015, the District has been required to
implement GASB 68, Accounting and Financial Reporting for Pensions. Under the new GASB
standards, each participating cost-sharing employer is required to report its actuarially determined
proportionate share of the collective net pension liability, pension expense, and deferred
outflows/deferred inflows of resources in their financial statements determined in conformity with

5
GASB 68. Prior to GASB 68, the District was only required to report the actual payments
submitted to the pension plan as an expense and no liability or deferred inflows/deferred outflows.
The net pension liability reported in the Statement of Net Position for year ended June 30, 2018 is
summarized as follows:
Items Reporting at Fiscal Year Ending June 30, 2018
Total Pension Liability $17,893,687
Fiduciary Net Position $13,164,827
Net Pension Liability (Asset) $4,728,860
Deferred (Outflows) of Resources ($1,132,423)
Impact on Statement of Net Position $3,596,437
Pension Expense, FY 2018 $497,945
For more information on the District’s pension plan, see Note 5 of the Financial Statements.
TABLE 2 – NET POSITION RELATED TO PENSIONS
6/30/2017 6/30/2018 Change ($)
Total Pension Liability 16,269,009$ 17,893,687$ 1,624,678$
Fiduciary Net Position 12,184,045 13,164,827 980,782
Net Pension Liability (Asset) 4,084,964 4,728,860 643,896
Deferred (Outflows) Inflows Consist:Assumption Changes 108,116 (689,730) (797,846)
Plan Experience (8,809) 80,197 89,006
Investment Experience (562,707) (168,863) 393,844
Changes in Proportions (359,940) (189,355) 170,585
Differences between actual contributions and
proportionate share of contributions283,736 260,274 (23,462)
Contributions Made Subsequent to the Measurement
Date(369,153) (424,946) (55,793)
Net Deferred (Outflows) Inflows (908,757) (1,132,423) (223,666)
Net reduction of Net Position due to liability 3,176,207$ 3,596,437$ 420,230$
An Actuarial Valuation report for Other Post Employment Benefit Programs (OPEB) was
completed in July 2018 by the Districts Actuary, MacCleod Watts. The explanation of the
increases to the Actuarial Accrued Liability between is as follows:
The Actuarial Accrued Liability (AAL) decreased by approximately $333,000 between July 1,
2015 and July 1, 2017 from approximately 1,771,000 to $1,438,000. Some of the differences was
expected based upon the assumptions made in the prior valuation. Premium changes and employee
decisions affecting coverage were not anticipated.

6
The District has chosen to fund the total OPEB liability (including implicit subsidy) based on an
expected long-term return of trust assets of 6.73% per year.
REVENUES AND EXPENSES
Revenues: General Fund Revenues derived from customer service charges were up by 12% over
last year. This increase is primarily from increases to service charge rate, but also from the added
EDU’s from the previous year. General fund revenue derived from permits, plan check fees and
inspections decreased by 28.8% due to the decrease in development activity. Local home resales
drove an increase in revenue from the Districts’ portion of the local property taxes by 6.3%. Total
General Fund Revenue used to fund ongoing operations, maintenance and administrative functions
of the District were increased over $1.54M from the previous year.
Revenue received from Sewer Participation charges increased by approximately $1.07 Million
over the previous year due to development activities within the District boundaries. On February
4, 2016, the District adopted a strategy for the investment of District funds. Total SPMUD revenue
reported for FY 2017/18 showed a decrease of $3.81 Million (26%) over the previous year, due
primarily to funds being utilized for the Loomis Diversion Trunkline Project. The Loan
Repayment for NSD – PRSC (Project Related Service Charges) is included in Sewer Service
Charges and reported as $196,939 for FY 17/18.
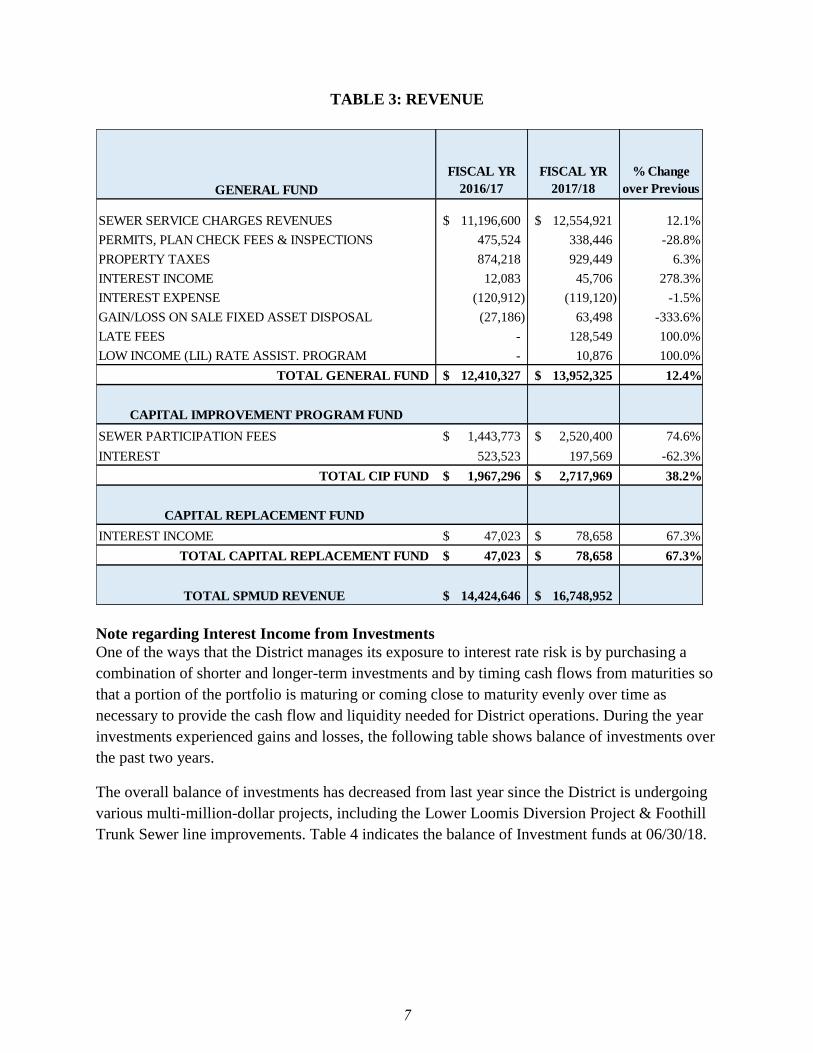
Table 3 reflects the Statement of Revenues from the Financial Statement. Interest Income for
District investments is included within the balance of each investment instrument as noted under
Note 2 of the Financial Statements.
7
TABLE 3: REVENUE
GENERAL FUND
FISCAL YR
2016/17
FISCAL YR
2017/18
% Change
over Previous
SEWER SERVICE CHARGES REVENUES 11,196,600$ 12,554,921$ 12.1%
PERMITS, PLAN CHECK FEES & INSPECTIONS 475,524 338,446 -28.8%
PROPERTY TAXES 874,218 929,449 6.3%
INTEREST INCOME 12,083 45,706 278.3%
INTEREST EXPENSE (120,912) (119,120) -1.5%
GAIN/LOSS ON SALE FIXED ASSET DISPOSAL (27,186) 63,498 -333.6%
LATE FEES - 128,549 100.0%
LOW INCOME (LIL) RATE ASSIST. PROGRAM - 10,876 100.0%
TOTAL GENERAL FUND 12,410,327$ 13,952,325$ 12.4%
CAPITAL IMPROVEMENT PROGRAM FUND
SEWER PARTICIPATION FEES 1,443,773$ 2,520,400$ 74.6%
INTEREST 523,523 197,569 -62.3%
TOTAL CIP FUND 1,967,296$ 2,717,969$ 38.2%
CAPITAL REPLACEMENT FUND
INTEREST INCOME 47,023$ 78,658$ 67.3%
TOTAL CAPITAL REPLACEMENT FUND 47,023$ 78,658$ 67.3%
TOTAL SPMUD REVENUE 14,424,646$ 16,748,952$
Note regarding Interest Income from Investments
One of the ways that the District manages its exposure to interest rate risk is by purchasing a
combination of shorter and longer-term investments and by timing cash flows from maturities so
that a portion of the portfolio is maturing or coming close to maturity evenly over time as
necessary to provide the cash flow and liquidity needed for District operations. During the year
investments experienced gains and losses, the following table shows balance of investments over
the past two years.
The overall balance of investments has decreased from last year since the District is undergoing
various multi-million-dollar projects, including the Lower Loomis Diversion Project & Foothill
Trunk Sewer line improvements. Table 4 indicates the balance of Investment funds at 06/30/18.

8
TABLE 4: INVESTMENTS
Investment Balance 06/30/17 Balance 06/30/18
Wells Fargo Fixed Income Securities & Money
Market Mutual Funds$22,011,526 $21,966,843
Local Agency Investment Fund (LAIF) 5,042,235 5,114,252
Caltrust Investments 19,181,658 19,275,339
Placer County Treasury Investments 5,094,193 5,177,180
Unrestricted deposits in financial institutions 4,592,055 575,599
TOTAL $55,921,667 $52,109,213
Expenses: General Fund Expenses increased from FY 2016/17 to FY 2017/18 by $1,180,412
(9.0%) from $12.6M to $13.81M. This increase was primarily for the increased amount paid to
CalPERS for the UAL and for Newcastle Master Plan Improvements and District participation in
Regional Projects. Table 5 and Chart 1 show the District’s General Fund expenditures. General
Fund Revenues of $13.98M exceeded General Fund Expenses of $13.81M.

9
TABLE 5 – GENERAL FUND EXPENDITURES
FISCAL YR
16/17
FISCAL YR
17/18
Salaries/Wages 2,021,529$ 2,330,199$
FICA - Social Security 134,846 177,385
CalPERS Retirement 459,750 234,089
CalPERS UAL 580,669 263,855 457 & 401a Retirement 46,575 79,098 Performance Merit Pay Program - - Insurance Benefits 496,890 606,026 Pers OPEB 216,683 211,085
Sub Total Salaries & Benefits 3,956,942 3,901,736
Property & Liability Insurance 98,407 119,949 Professional Services 59,643 89,124
Vehicle Repair and Maintenance 82,277 84,911 Professional Development 33,384 46,329 Legal Services 111,568 31,994 Utility Billing/Banking Expense/Printing 163,984 160,606 Other Operating Expenses 19,892 45,558
General Operating Supplies & Maintenance 158,048 167,821 Gas & Oil Expenses 29,109 39,095 Safety Gear/Uniforms 16,128 17,569 Utilities 134,652 135,779 Repair/Maintenance Agreements 74,792 73,446 Regulatory Compliance/Government Fees 39,289 30,015 Lift Station & Flow Recorder Programs 46,533 29,851 Building & Grounds Maintenance 39,810 73,546 Asphalt Paving 6,795 48,192
Sub Total Local SPMUD General Fund Expenses 1,114,311 1,193,785
RWWTP Maintenance & Operations 4,711,758 5,003,758 RWWTP Rehab & Replacement 1,505,199 2,289,670
Sub Total SPWA O&M + R&R Expenses 6,216,957 7,293,428
Total Operations Expense before Depreciation 11,288,210 12,388,949 Depreciation expense 1,343,872 1,423,548
Total General Fund Expenses 12,632,082$ 13,812,497$
Expenditure type
AUDITED
10
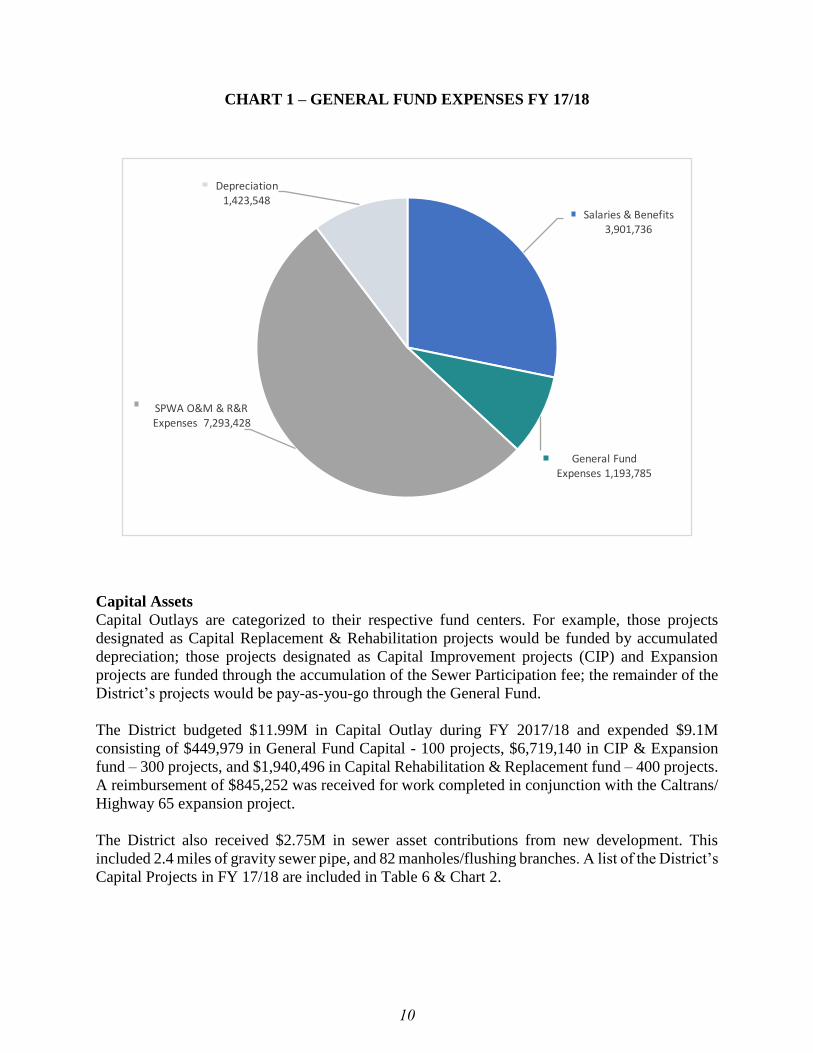
CHART 1 – GENERAL FUND EXPENSES FY 17/18
Salaries & Benefits 3,901,736
General Fund Expenses 1,193,785
SPWA O&M & R&R Expenses 7,293,428
Depreciation1,423,548
Capital Assets
Capital Outlays are categorized to their respective fund centers. For example, those projects
designated as Capital Replacement & Rehabilitation projects would be funded by accumulated
depreciation; those projects designated as Capital Improvement projects (CIP) and Expansion
projects are funded through the accumulation of the Sewer Participation fee; the remainder of the
District’s projects would be pay-as-you-go through the General Fund.
The District budgeted $11.99M in Capital Outlay during FY 2017/18 and expended $9.1M
consisting of $449,979 in General Fund Capital - 100 projects, $6,719,140 in CIP & Expansion
fund – 300 projects, and $1,940,496 in Capital Rehabilitation & Replacement fund – 400 projects.
A reimbursement of $845,252 was received for work completed in conjunction with the Caltrans/
Highway 65 expansion project.
The District also received $2.75M in sewer asset contributions from new development. This
included 2.4 miles of gravity sewer pipe, and 82 manholes/flushing branches. A list of the District’s
Capital Projects in FY 17/18 are included in Table 6 & Chart 2.

11
TABLE 6: FY17/18 CAPITAL OUTLAY ACTIVITY
FUND 100 FUND 300 FUND 400
CAPITAL IMPROVEMENTS
FY 17/18
BUDGETGeneral Fund
Capital CIP & Expansion
Capital
Replacement &
Rehabilitation
Computers/Office Furniture 20,000$ 9,516$ -$ -$
Board Room Audio/Visual upgrades 5,000 - - -
Software Upgrades/Tyler 5,000 - - -
HQ Front Office/Reception Area 10,000 - - -
Energy Upgrades 200,000 - - -
Archiving/Disaster Development Plan 30,000 - - -
Easement Roadway Replacements 35,000 19,195 - 3,428
HRF Creek Crossings - Design & Permitting 50,000 - - -
Software/Data Acquisition 11,000 4,002 - -
System Improvements 155,000 64,575 - -
Newcastle Master Plan Improvements 200,000 222,695 - -
Corporation Yard Master Plan Improvements 50,000 - - 3,244
Lower Clover Valley Trunk - Design 410,000 - 12,149 -
Corporation Yard Perimeter Fencing Upgrades 110,000 - - -
Lateral Camera Replacements 37,000 - - 20,677
Portable Generator Replacement 82,000 - - 72,654
Portable Generator Connection Upgrades L.S. 20,000 - - 33,602
Corp Yard Fuel Tank Removal 9,000 - - 9,860
Vehicle Replacement (x3) 488,000 - - 908,821
District Participation in Regional Projects 185,000 129,996 - -
System Rehabilitation 835,000 - - 778,148
Foothill Trunk Project - Construction 2,130,000 - 16,974 -
Loomis Diversion Trunkline - Construction 5,960,000 - 6,690,017 -
CalTrans I80/Hwy65 pipe-Reimb. $845,253 960,000 - - 110,062
Total Capital Improvements 11,997,000$ 449,979$ 6,719,140$ 1,940,496$
TOTAL GENERAL FUND CAPITAL IMPROVEMENTS 362,089$ 75,910$ 16,037$ 449,979$
TOTAL CIP & EXPANSION 590,189 259,533 2,819,904 6,719,140
TOTAL REPLACEMENT & REHABILITATION 930,138 159,558 389,039 1,940,496
TOTAL CAPITAL INVESTMENT 1,882,416$ 495,001$ 3,224,980$ 9,109,615$
FISCAL YR
14/15
FISCAL YR
15/16
FISCAL YR
16/17
FISCAL YR
17/18
AUDITED FINANCIALS

12
CHART 2 – CAPITAL FUND EXPENSES FY 17/18
General Fund Capital $449,979
CIP & Expansion Funds $6,719,140
Capital Replacement & Rehabilitation
Funds $1,940,496
For additional information on Capital Assets, see Note 3 in the Notes to Financial Statements.
Debt Administration
The District does not currently have any debt in the sense of conventional loans or bond financing
of District Improvements. The District, the City of Roseville and Placer County (PC) are
participants in the South Placer Wastewater Authority (SPWA) with the intended purpose to
finance the construction of the Pleasant Grove Wastewater Treatment Plant (PG WWTP) through
bonds, low-interest loans or other types of debt. As such, the district is subject to the SPWA
Funding Agreement and debt indenture.
The SPWA Funding Agreement established a Rate Stabilization Account to be used for the
payment of debt service on the Bonds and other costs of the Authority. Monthly contributions of
regional connection fees are deposited into the Rate Stabilization Account, and SPWA pays the
debt service and other costs from the Account on behalf of each member of SPWA, based on each
member’s proportionate share. As of June 30, 2018, the District maintained a balance of
$52,745,211 in the Rate Stabilization Account on deposit with the Authority. Per the last approved
financial statement accepted by the SPWA, the annual SPWA Debt assigned to SPMUD was
$3,291,332. Without any changes, the District currently has approximately 16 years’ worth of debt
13
service on account with SPWA. SPWA is proposing $80M in Capital Improvements and
Treatment Upgrades at the PG WWTP to prepare for regional growth, incorporate energy related
improvements and to maximize solids digestion. SPWA is proposing to finance this construction
through a blend of bond financing, State Revolving Fund loans and cash payments.
In accordance with the SPWA debt indenture, SPMUD has covenanted to prescribe and collect
rates and charges sufficient to yield net revenues at least equivalent to 110% of its share of debt
service. The source of funding for this reserve can be accounted for from all SPMUD revenues
and are expected to provide Debt Coverage Ratio (DCR) of 110% over the lives of the Bonds.
ECONOMIC FACTORS AND FISCAL YEAR 2018/19 BUDGET OVERVIEW
Revenue: The Economic forecast for growth within the District’s service area boundaries looks
favorable. There continues to be a backlog of development proposals which are under review and
should allow the District to add an additional 500 EDUs during the next fiscal year. The Federal
Government hiked its benchmark interest rate to a range of 1.75 to 2 percent, a move that will
probably cause a slight increase in mortgage, credit card, auto loan and small business loan rates.
The District will be reviewing its investment policy to enhance revenue potential through
diversification of the investment portfolio.
The monthly service rate increased from $31/EDU to $34/EDU in July, one additional scheduled
increase will occur July 1 of 2019 changing to $36/EDU/month. Revenues are expected to increase
accordingly.
Expenses: Indexes for electricity, and natural gas have been declining which is helping to keep
those related costs down; however, the recently enacted California Gas Tax will impact overall
fuel purchase for the coming year. The District has been successful keeping a cap on locally
controlled expenses as well. Total charges from SPWA continue to rise, which constitute over half
of the expenses incurred by the District annually. Prior drought and last year’s record rainfall have
impacted flows to sewers which may necessitate a review of the sewage allocation to the RWWTP
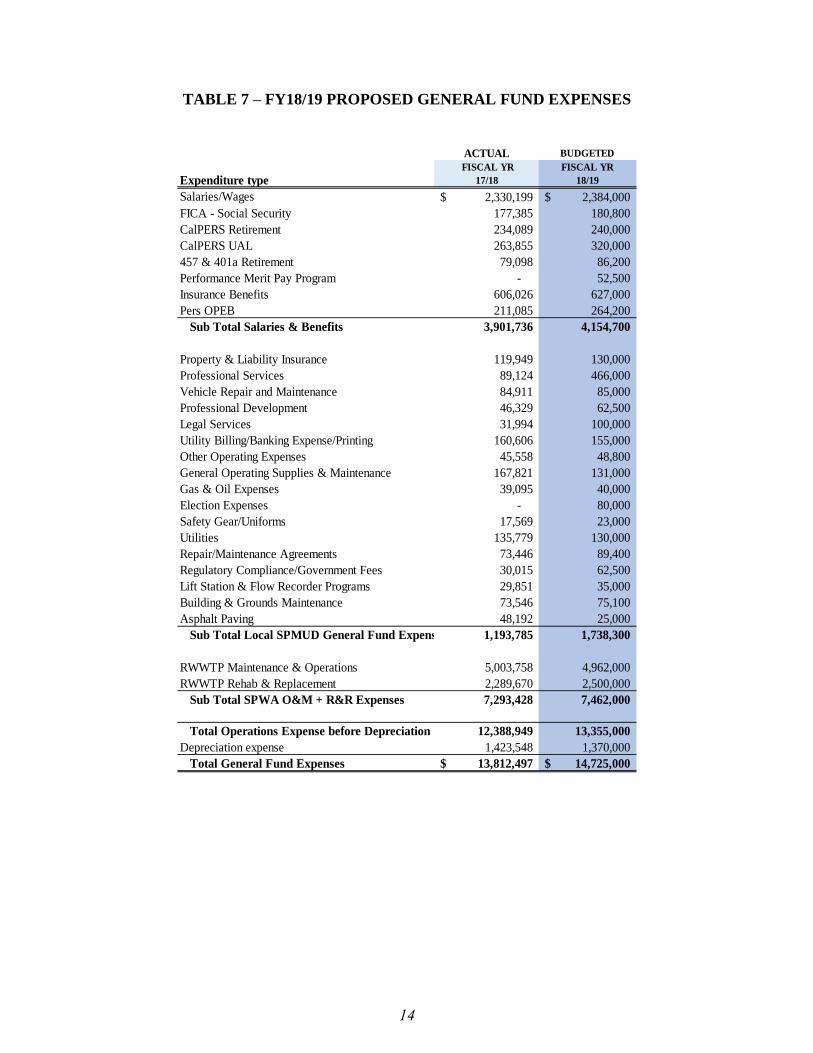
by the SPWA partners. Projected General Fund expenses are shown in Table 7.
As part of the 5-year Financial Plan and Cost of Services study, the District projected expenses to
the year 2022. One of the major components affecting salary and benefits is the objective to fully
funding the District’s obligations to CalPERS as well as funding the District’s annual required
contribution (ARC) for Other Post-Employment Benefits (OPEB).
SPMUD has 35 approved personnel positions that include 5 elected, 2 contracted, 4 management,
2 supervisors, and 22 staff positions; there are currently 27 Full Time Employees. The current
MOU’s for employees and management were negotiated in FY16/17, and cover the following
fiscal years 17/18, 18/19 & 19/20, Cost of Living increases are tied to the Consumer Cost Index.
14
TABLE 7 – FY18/19 PROPOSED GENERAL FUND EXPENSES
ACTUAL BUDGETED
FISCAL YR
17/18
FISCAL YR
18/19
Salaries/Wages 2,330,199$ 2,384,000$
FICA - Social Security 177,385 180,800
CalPERS Retirement 234,089 240,000
CalPERS UAL 263,855 320,000
457 & 401a Retirement 79,098 86,200
Performance Merit Pay Program - 52,500
Insurance Benefits 606,026 627,000
Pers OPEB 211,085 264,200
Sub Total Salaries & Benefits 3,901,736 4,154,700
Property & Liability Insurance 119,949 130,000
Professional Services 89,124 466,000
Vehicle Repair and Maintenance 84,911 85,000
Professional Development 46,329 62,500
Legal Services 31,994 100,000
Utility Billing/Banking Expense/Printing 160,606 155,000
Other Operating Expenses 45,558 48,800
General Operating Supplies & Maintenance 167,821 131,000
Gas & Oil Expenses 39,095 40,000
Election Expenses - 80,000
Safety Gear/Uniforms 17,569 23,000
Utilities 135,779 130,000
Repair/Maintenance Agreements 73,446 89,400
Regulatory Compliance/Government Fees 30,015 62,500
Lift Station & Flow Recorder Programs 29,851 35,000
Building & Grounds Maintenance 73,546 75,100
Asphalt Paving 48,192 25,000
Sub Total Local SPMUD General Fund Expenses 1,193,785 1,738,300
RWWTP Maintenance & Operations 5,003,758 4,962,000
RWWTP Rehab & Replacement 2,289,670 2,500,000
Sub Total SPWA O&M + R&R Expenses 7,293,428 7,462,000
Total Operations Expense before Depreciation 12,388,949 13,355,000
Depreciation expense 1,423,548 1,370,000
Total General Fund Expenses 13,812,497$ 14,725,000$
Expenditure type
15
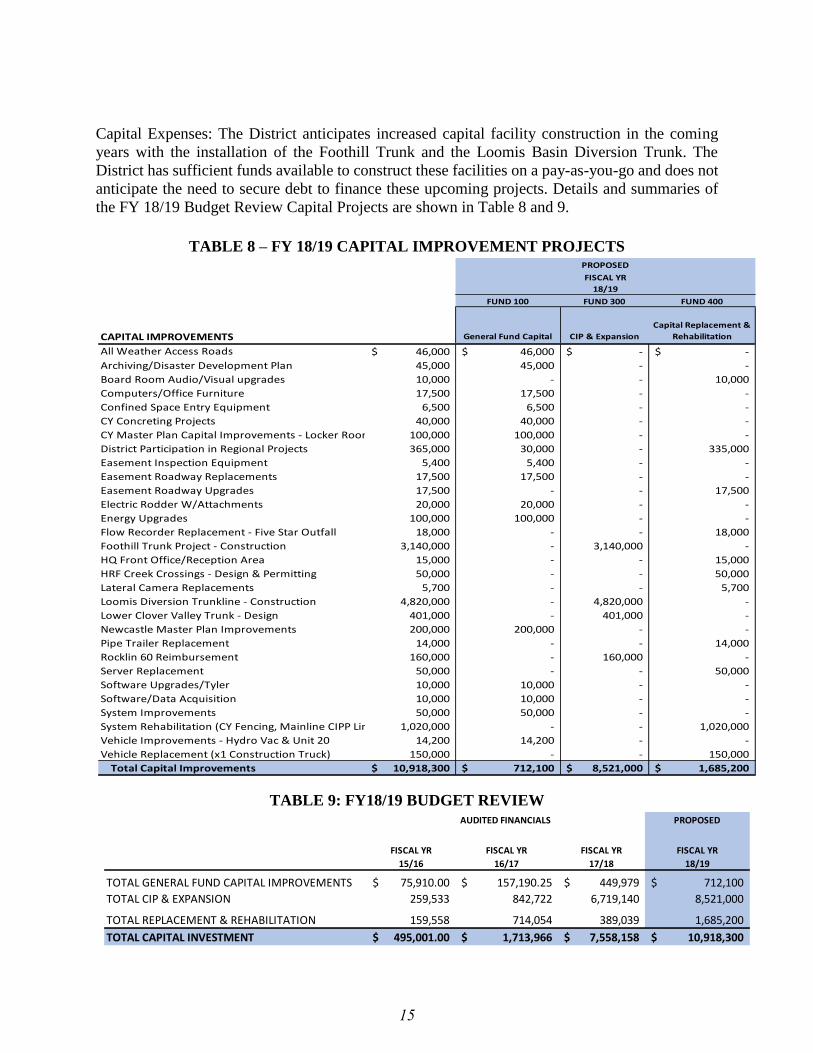
Capital Expenses: The District anticipates increased capital facility construction in the coming
years with the installation of the Foothill Trunk and the Loomis Basin Diversion Trunk. The
District has sufficient funds available to construct these facilities on a pay-as-you-go and does not
anticipate the need to secure debt to finance these upcoming projects. Details and summaries of
the FY 18/19 Budget Review Capital Projects are shown in Table 8 and 9.
TABLE 8 – FY 18/19 CAPITAL IMPROVEMENT PROJECTS
FUND 100 FUND 300 FUND 400
CAPITAL IMPROVEMENTS General Fund Capital CIP & Expansion
Capital Replacement &
Rehabilitation
All Weather Access Roads 46,000$ 46,000$ -$ -$
Archiving/Disaster Development Plan 45,000 45,000 - -
Board Room Audio/Visual upgrades 10,000 - - 10,000
Computers/Office Furniture 17,500 17,500 - -
Confined Space Entry Equipment 6,500 6,500 - -
CY Concreting Projects 40,000 40,000 - -
CY Master Plan Capital Improvements - Locker Room 100,000 100,000 - -
District Participation in Regional Projects 365,000 30,000 - 335,000
Easement Inspection Equipment 5,400 5,400 - -
Easement Roadway Replacements 17,500 17,500 - -
Easement Roadway Upgrades 17,500 - - 17,500
Electric Rodder W/Attachments 20,000 20,000 - -
Energy Upgrades 100,000 100,000 - -
Flow Recorder Replacement - Five Star Outfall 18,000 - - 18,000
Foothill Trunk Project - Construction 3,140,000 - 3,140,000 -
HQ Front Office/Reception Area 15,000 - - 15,000
HRF Creek Crossings - Design & Permitting 50,000 - - 50,000
Lateral Camera Replacements 5,700 - - 5,700
Loomis Diversion Trunkline - Construction 4,820,000 - 4,820,000 -
Lower Clover Valley Trunk - Design 401,000 - 401,000 -
Newcastle Master Plan Improvements 200,000 200,000 - -
Pipe Trailer Replacement 14,000 - - 14,000
Rocklin 60 Reimbursement 160,000 - 160,000 -
Server Replacement 50,000 - - 50,000
Software Upgrades/Tyler 10,000 10,000 - -
Software/Data Acquisition 10,000 10,000 - -
System Improvements 50,000 50,000 - -
System Rehabilitation (CY Fencing, Mainline CIPP Liners, Lateral Liners)1,020,000 - - 1,020,000
Vehicle Improvements - Hydro Vac & Unit 20 14,200 14,200 - -
Vehicle Replacement (x1 Construction Truck) 150,000 - - 150,000
Total Capital Improvements 10,918,300$ 712,100$ 8,521,000$ 1,685,200$
PROPOSED
FISCAL YR
18/19
TABLE 9: FY18/19 BUDGET REVIEW
PROPOSED
TOTAL GENERAL FUND CAPITAL IMPROVEMENTS 75,910.00$ 157,190.25$ 449,979$ 712,100$
TOTAL CIP & EXPANSION 259,533 842,722 6,719,140 8,521,000
TOTAL REPLACEMENT & REHABILITATION 159,558 714,054 389,039 1,685,200
TOTAL CAPITAL INVESTMENT 495,001.00$ 1,713,966$ 7,558,158$ 10,918,300$
FISCAL YR
15/16
FISCAL YR
16/17
FISCAL YR
17/18
FISCAL YR
18/19
AUDITED FINANCIALS
16
CONTACTING THE DISTRICT’S FINANCIAL MANAGEMENT
This Financial Report is designed to provide the District’s customers and other interested parties
with a general overview of the District’s finances and to demonstrate the District’s accountability.
Questions about this report should be addressed in writing to the General Manager, Herb
Niederberger:
South Placer Municipal Utility District
5807 Springview Drive
Rocklin, CA 95677
Telephone: (916) 786-8555
Fax: (916) 786-8553
Web: www.spmud.ca.gov
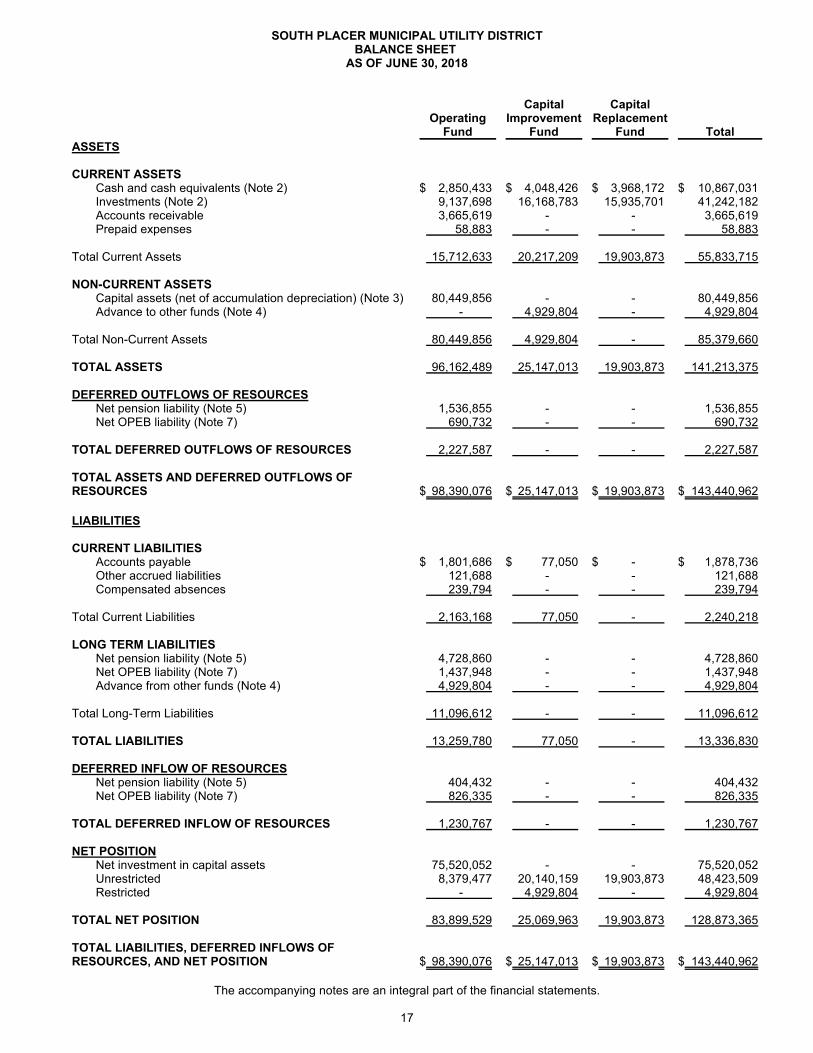
SOUTH PLACER MUNICIPAL UTILITY DISTRICTBALANCE SHEET
AS OF JUNE 30, 2018
OperatingFund
CapitalImprovement
Fund
CapitalReplacement
Fund Total
ASSETS
CURRENT ASSETSCash and cash equivalents (Note 2) $ 2,850,433 $ 4,048,426 $ 3,968,172 $ 10,867,031Investments (Note 2) 9,137,698 16,168,783 15,935,701 41,242,182Accounts receivable 3,665,619 - - 3,665,619Prepaid expenses 58,883 - - 58,883
Total Current Assets 15,712,633 20,217,209 19,903,873 55,833,715
NON-CURRENT ASSETSCapital assets (net of accumulation depreciation) (Note 3) 80,449,856 - - 80,449,856Advance to other funds (Note 4) - 4,929,804 - 4,929,804
Total Non-Current Assets 80,449,856 4,929,804 - 85,379,660
TOTAL ASSETS 96,162,489 25,147,013 19,903,873 141,213,375
DEFERRED OUTFLOWS OF RESOURCESNet pension liability (Note 5) 1,536,855 - - 1,536,855Net OPEB liability (Note 7) 690,732 - - 690,732
TOTAL DEFERRED OUTFLOWS OF RESOURCES 2,227,587 - - 2,227,587
TOTAL ASSETS AND DEFERRED OUTFLOWS OFRESOURCES $ 98,390,076 $ 25,147,013 $ 19,903,873 $ 143,440,962
LIABILITIES
CURRENT LIABILITIESAccounts payable $ 1,801,686 $ 77,050 $ - $ 1,878,736Other accrued liabilities 121,688 - - 121,688Compensated absences 239,794 - - 239,794
Total Current Liabilities 2,163,168 77,050 - 2,240,218
LONG TERM LIABILITIESNet pension liability (Note 5) 4,728,860 - - 4,728,860Net OPEB liability (Note 7) 1,437,948 - - 1,437,948Advance from other funds (Note 4) 4,929,804 - - 4,929,804
Total Long-Term Liabilities 11,096,612 - - 11,096,612
TOTAL LIABILITIES 13,259,780 77,050 - 13,336,830
DEFERRED INFLOW OF RESOURCESNet pension liability (Note 5) 404,432 - - 404,432Net OPEB liability (Note 7) 826,335 - - 826,335
TOTAL DEFERRED INFLOW OF RESOURCES 1,230,767 - - 1,230,767
NET POSITIONNet investment in capital assets 75,520,052 - - 75,520,052Unrestricted 8,379,477 20,140,159 19,903,873 48,423,509Restricted - 4,929,804 - 4,929,804
TOTAL NET POSITION 83,899,529 25,069,963 19,903,873 128,873,365
TOTAL LIABILITIES, DEFERRED INFLOWS OFRESOURCES, AND NET POSITION $ 98,390,076 $ 25,147,013 $ 19,903,873 $ 143,440,962
The accompanying notes are an integral part of the financial statements.
17

SOUTH PLACER MUNICIPAL UTILITY DISTRICTSTATEMENT OF REVENUES, EXPENSES AND CHANGES IN NET POSITION
FOR THE FISCAL YEAR ENDEDJUNE 30, 2018
OperatingFund
CapitalImprovement
Fund
CapitalReplacement
Fund Total
OPERATING REVENUE
Sewer charges $ 12,694,346 $ - $ - $ 12,694,346Connection charges - 2,520,400 - 2,520,400Permits, fees, and inspections 338,446 - - 338,446
Total Operating Revenues 13,032,792 2,520,400 - 15,553,192
OPERATING EXPENSES
Collection and treatment 7,393,545 - 13,164 7,406,709Administrative and general 1,745,033 - - 1,745,033Technical services 3,237,207 - - 3,237,207Depreciation 1,423,548 - - 1,423,548
Total Operating Expenses 13,799,333 - 13,164 13,812,497
Operating income (loss) (766,541) 2,520,400 (13,164) 1,740,695
NON-OPERATING REVENUE (EXPENSES)
Tax revenue 929,449 - - 929,449Gain (loss) on sale of asset 63,498 - - 63,498Interest income 45,706 197,569 78,658 321,933Interest expense (119,120) - - (119,120)
Total Nonoperating revenues 919,533 197,569 78,658 1,195,760
TRANSFERS AND CAPITAL CONTRIBUTIONS
Capital Contributions 6,680,289 - - 6,680,289Transfers in 4,126,098 - 1,343,872 5,469,970Transfers out (1,343,872) (2,795,390) (1,330,708) (5,469,970)
Total Transfers and Capital Contributions 9,462,515 (2,795,390) 13,164 6,680,289
CHANGE IN NET POSITION 9,615,507 (77,421) 78,658 9,616,744
TOTAL NET POSITION, BEGINNING OF YEAR 75,906,022 25,147,384 19,825,215 120,878,621
PRIOR PERIOD ADJUSTMENT (Note 10) (1,622,000) - - (1,622,000)
NET ASSETS, BEGINNING OF YEAR - RESTATED 74,284,022 25,147,384 19,825,215 119,256,621
TOTAL NET POSITION, END OF YEAR $ 83,899,529 $ 25,069,963 $ 19,903,873 $128,873,365
The accompanying notes are an integral part of the financial statements.
18
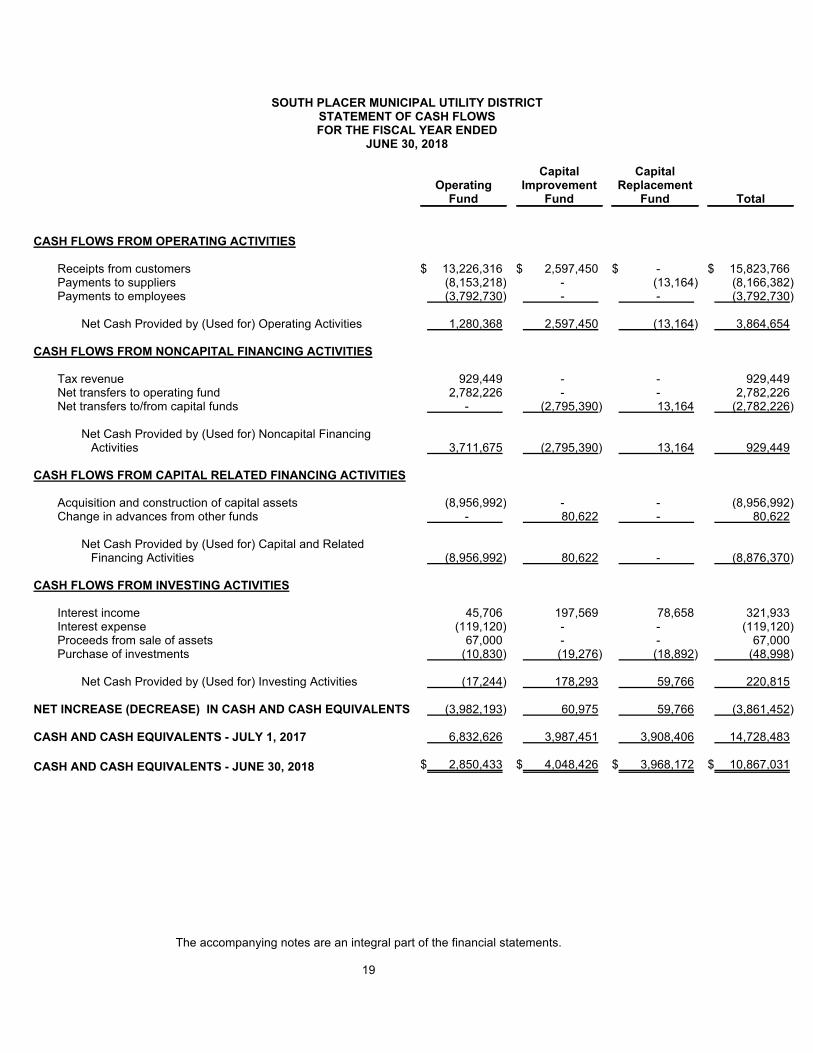
SOUTH PLACER MUNICIPAL UTILITY DISTRICTSTATEMENT OF CASH FLOWSFOR THE FISCAL YEAR ENDED
JUNE 30, 2018
OperatingFund
CapitalImprovement
Fund
CapitalReplacement
Fund Total
CASH FLOWS FROM OPERATING ACTIVITIES
Receipts from customers $ 13,226,316 $ 2,597,450 $ - $ 15,823,766Payments to suppliers (8,153,218) - (13,164) (8,166,382)Payments to employees (3,792,730) - - (3,792,730)
Net Cash Provided by (Used for) Operating Activities 1,280,368 2,597,450 (13,164) 3,864,654
CASH FLOWS FROM NONCAPITAL FINANCING ACTIVITIES
Tax revenue 929,449 - - 929,449Net transfers to operating fund 2,782,226 - - 2,782,226Net transfers to/from capital funds - (2,795,390) 13,164 (2,782,226)
Net Cash Provided by (Used for) Noncapital FinancingActivities 3,711,675 (2,795,390) 13,164 929,449
CASH FLOWS FROM CAPITAL RELATED FINANCING ACTIVITIES
Acquisition and construction of capital assets (8,956,992) - - (8,956,992)Change in advances from other funds - 80,622 - 80,622
Net Cash Provided by (Used for) Capital and RelatedFinancing Activities (8,956,992) 80,622 - (8,876,370)
CASH FLOWS FROM INVESTING ACTIVITIES
Interest income 45,706 197,569 78,658 321,933Interest expense (119,120) - - (119,120)Proceeds from sale of assets 67,000 - - 67,000Purchase of investments (10,830) (19,276) (18,892) (48,998)
Net Cash Provided by (Used for) Investing Activities (17,244) 178,293 59,766 220,815
NET INCREASE (DECREASE) IN CASH AND CASH EQUIVALENTS (3,982,193) 60,975 59,766 (3,861,452)
CASH AND CASH EQUIVALENTS - JULY 1, 2017 6,832,626 3,987,451 3,908,406 14,728,483
CASH AND CASH EQUIVALENTS - JUNE 30, 2018 $ 2,850,433 $ 4,048,426 $ 3,968,172 $ 10,867,031
The accompanying notes are an integral part of the financial statements.
19

SOUTH PLACER MUNICIPAL UTILITY DISTRICTSTATEMENT OF CASH FLOWS (CONTINUED)
FOR THE FISCAL YEAR ENDEDJUNE 30, 2018
OperatingFund
CapitalImprovement
Fund
CapitalReplacement
Fund Total
RECONCILIATION OF OPERATING INCOME (LOSS) TO NETCASH PROVIDED BY (USED FOR) OPERATING ACTIVITES
OPERATING INCOME (LOSS) $ (766,541) $ 2,520,400 $ (13,164) $ 1,740,695
Adjustments to reconcile operating income (loss) to net cashprovided by (used for) operating activities:
Depreciation expense 1,423,548 - - 1,423,548Changes in assets and liabilities:
Increase in deferred inflows 833,771 - - 833,771Increase in deferred outflows (1,099,996) - - (1,099,996)Decrease in accounts receivable 274,146 - - 274,146Increase in prepaid expenses (41,347) - - (41,347)Decrease in other payables (122,502) - - (122,502)Increase in accounts payable 362,978 77,050 - 440,028Increase in compensated absences 37,089 - - 37,089Decrease in advances to other funds (80,622) - - (80,622)Increase in net pension liability 643,896 - - 643,896Decrease in net OPEB liability (184,052) - - (184,052)
Total adjustments 2,046,909 77,050 - 2,123,959
NET CASH PROVIDED BY (USED FOR) OPERATINGACTIVITIES $ 1,280,368 $ 2,597,450 $ (13,164) $ 3,864,654
- - - -NON-CASH CAPITAL ACTIVITES
Non-cash capital contributions $ 6,680,289 $ - $ - $ -
The accompanying notes are an integral part of the financial statements.
20
SOUTH PLACER MUNICIPAL UTILITY DISTRICTNOTES TO THE FINANCIAL STATEMENTS
FOR THE YEAR ENDEDJUNE 30, 2018
NOTE 1: SUMMARY OF SIGNIFICANT ACCOUNTING POLICIES
Reporting Entity
The South Placer Municipal Utility District (the "District") operates under the Municipal Utility District Act. The Actpermits formation of multipurpose government agencies to provide public services on a regional basis. Inaccordance with the Act, voters approved creating the South Placer Municipal Utility District to provide sewagedisposal facilities. The District's governing body is a Board of Directors comprised of 5 members with 4 yearstaggered terms.
Basis of Presentation
The basic financial statements of the South Placer Municipal Utility District (District) have been prepared inconformity with generally accepted accounting principles as applied to government units. The GovernmentalAccounting Standards Board (GASB) is the accepted standard setting body for establishing governmentalaccounting and financial reporting principles.
Basis of Accounting
The South Placer Municipal Utility District follows the enterprise method of accounting practices and reportingmethods approved for waste disposal districts. An enterprise type fund is a proprietary type fund used to account foroperations (a) that are financed and operated in a manner similar to private business enterprise, where the intent ofthe governing body is that the costs (expenses excluding depreciation) of providing goods and services to thegeneral public on a continuing basis be financed or recovered primarily through user charges; or (b) where thegoverning body has decided that periodic determination of revenues earned, expenses incurred, and net income isappropriate for capital maintenance, public policy, management control, accountability or other purposes.
Revenues and expenses are recognized on the accrual basis. Revenues are recognized in the accounting period inwhich they are earned and become measurable; expenses are recognized in the period incurred.
Operating revenues are those revenues that are generated from the primary operations of the District. All otherrevenues are reported as non-operating revenues. Operating expenses are those expenses that are essential to theprimary operations of the fund. All other expenses are reported as non-operating expenses.
As described below, the client maintains three major funds to run their operations:
Operating Fund - The purpose of the Operating Fund is to ensure that the district will have sufficient fundingavailable at all times to meet its operating obligations. Operating revenue is flat rate and consistent over the year.Delinquencies are trued up through tax liens which are recoverable twice a year. Operating expenses are generallyincurred uniformly over the year, however, work can be planned or deferred during the year to accommodate minorfluctuations in revenue. The source of funding for this reserve is from Sewer Service Charges.
Capital Improvement Fund - The purpose of the Capital Improvement Fund is to fund on a pay-as-you-go basisfuture capital facilities that are expansion or growth related. These capital improvements will be identified in aWastewater Collection Master Plan, a System Evaluation and Capacity Assurance Plan or other such capitalimprovement plan designated by the District. These funds are accumulated in an orderly manner in conformancewith State law and drawn down as required by growth related projected. The source of funding for the CapitalImprovement Fund is the Sewer Participation Fee.
Capital Replacement Fund - The purpose of this fund is to accumulate the probable replacement cost of equipmenteach year over the life of the asset, so it can be replaced readily when it becomes obsolete, are totally depreciatedor are scheduled for replacement. Annual depreciation is calculated as a function of the depreciation schedulemaintained within the District's Financial Management Software. The source of funding for this reserve is in the formof an annual operating expense (transfer) to the Capital Replacement Fund. The District incurs an annual expenseequivalent to the annual depreciation and accumulates this balance in the Capital Replacement Fund to fundreplacements of assets that have reached their useful life or are fully depreciated.
21
SOUTH PLACER MUNICIPAL UTILITY DISTRICTNOTES TO THE FINANCIAL STATEMENTS
FOR THE YEAR ENDEDJUNE 30, 2018
NOTE 1: SUMMARY OF SIGNIFICANT ACCOUNTING POLICIES (continued)
Budgetary Reporting
The District prepares an annual operating and capital budget which is approved and adopted by the Board ofDirectors. The budget serves as an approved plan to facilitate financial control and operational evaluation. CaliforniaState law does not require formal adoption of appropriated budgets for enterprise funds.
Cash and Cash Equivalents
For the purpose of the cash flows the District defines cash and cash equivalents as short-term, highly liquidinvestments that are both readily convertible to known amounts of cash and so near to their maturity that theypresent insignificant risk of changes in value. This includes deposits in financial institutions, cash with Placer County,and deposits with the State of California Local Agency Investment Fund (LAIF).
Fair Value Inputs, Methodologies and Hierarchy
Fair value is defined as the price that would be received to sell an asset or paid to transfer a liability in an orderlytransaction between market participants at the measurement date. Observable inputs are developed based onmarket data obtained from sources independent of the reporting entity. Unobservable inputs are developed based onthe best information available about the assumptions market participants would use in pricing the assets. Theclassification of securities within the fair value hierarchy is based upon the activity level in the market for the securitytype and the inputs used to determine their fair value, as follows:
Level 1 Unadjusted price quotations in active markets/exchanges for identical assets or liabilities that areaccessible to the District.Level 2 Other observable inputs (including, but not limited to, quoted prices for similar assets or liabilitiesin markets that are active, quoted prices for identical or similar assets or liabilities in markets that are notactive, inputs other than quoted prices that are observable for the assets or liabilities (such as interestrates, yield curves, volatilities, loss severities, credit risks and default rates) or other marketcorroboratedinputs.)Level 3 Unobservable inputs based on the best information available in the circumstance, to the extentobservable inputs are not available (including each Fund's own assumptions used in determining the fairvalue of investments).
The hierarchy gives the highest priority to unadjusted quoted prices in active markets for identical assets or liabilities(level 1 measurements) and the lowest priority to unobservable inputs (level 3 measurements). Accordingly, thedegree of judgment exercised in determining fair value is greatest for instruments categorized in Level 3. The inputsused to measure fair value may fall into different levels of the fair value hierarchy. In such cases, for disclosurepurposes, the fair value hierarchy classification is determined based on the lowest level input that is significant to thefair value measurement in its entirety.
Receivables and Payables
Receivables consist of all revenues earned at year-end and not yet received. Receivables are recorded in thefinancial statements net of any allowance for doubtful accounts if applicable, and estimated refunds due.Management believes its receivables are fully collectible and, accordingly, no allowance for doubtful accounts isrequired.
Prepaid Expenses
Certain payments for health insurance and liability insurance reflect costs applicable to future accounting periodsand are recorded as prepaid items.
22

SOUTH PLACER MUNICIPAL UTILITY DISTRICTNOTES TO THE FINANCIAL STATEMENTS
FOR THE YEAR ENDEDJUNE 30, 2018
NOTE 1: SUMMARY OF SIGNIFICANT ACCOUNTING POLICIES (continued)
Capital Assets
Capital assets are recorded at historical cost or estimated historical cost if actual historical cost is not available.Capital assets include land, buildings, sewer system, equipment, office furniture and vehicles. Capital assets aredefined by the District as assets with an initial, individual cost of more than $5,000.
The costs of normal maintenance and repairs that do not add to the value of the asset or materially extend assetslives are not capitalized. Major outlays for capital assets and improvements are capitalized as projects areconstructed. Depreciation is recorded on the straight-line basis over the useful life of the assets as follows:
Assets Useful Life
Buildings 15 - 25 yearsSewer system 75 yearsGeneral equipment 10 - 20 yearsOffice furniture and vehicles 5 - 15 years
Capital Contributions
Transmission and distribution system assets contributed to the District by installers are capitalized at the installersestimated cost, which approximates the acquisition value at the date of the District's acquisition, and is recorded ascapital contributions when received.
Risk Management
The District maintains an insurance policy with Special District Risk Management Authority (SDRMA) Insurance thatprovides limits of liability for general liability, auto and an additional umbrella policy. The District also maintainsworkers compensation insurance through Special District Risk Management Authority, with the employer's liabilitylimit of $10,000,000 per occurrence.
Net Position
Net position comprises the various net earnings from operating income, non-operating revenues and expenses andcapital contributions. Net position is classified in the following three components:
Net investment in capital assets - This component of net position consists of capital assets, net of accumulateddepreciation and reduced by the outstanding balances of any bonds, mortgages, notes or other borrowings that areattributable to the acquisition, construction or improvement of those assets. If there are significant unspent relateddebt proceeds at year-end, the portion of the debt attributable to the unspent proceeds is not included in thecalculation of net investment in capital assets. Rather, that portion of the debt is included in the same net positioncomponent as the unspent proceeds.
Restricted - This component of net position consists of constraints imposed by any creditors (such as through debtcovenants), grantors, contributors, or laws or regulations of other governments or constraints imposed by lawthrough constitutional provisions or enabling legislation. At June 30, 2018, restricted net position, totaling$4,929,804, consisted of the total outstanding Newcastle Sanitary District (NSD) loan receivable balance (see note4). South Placer Municipal Utility District and Newcastle Sanitary District have entered into agreements relating tothe annexation of the NSD service area to SPMUD and the financing of the 'NSD project' costs associated with theannexation required the creation of the Newcastle Special Benefit Area (NSBA) for adoption of levying of a project-related service charge (PRSC) for the repayment of said financing. Under SPMUD Resolutions 12-19 and 13-13,PRSC should be used exclusively to repay the principal and interest on the amount repayable.
Unrestricted net position - This component of net position consists of net position that do not meet the definition of"restricted" or "net investment in capital assets."
23

SOUTH PLACER MUNICIPAL UTILITY DISTRICTNOTES TO THE FINANCIAL STATEMENTS
FOR THE YEAR ENDEDJUNE 30, 2018
NOTE 1: SUMMARY OF SIGNIFICANT ACCOUNTING POLICIES (continued)
Compensated Absences
Compensated absences represent the vested portion of accumulated vacation leave. The liability for accumulatedleave includes all salary - related payments that are directly and incrementally connected with leave payments toemployees.
Property Taxes
The District receives property taxes from Placer County, which has been assigned the responsibility for assessment,collections, and apportionment of property taxes for all taxing jurisdictions within the County. Secured property taxesare levied on January 1 for the following fiscal year and on which date it becomes a lien on real property.
Secured property taxes are due in two installments on November 1 and February 1 and are delinquent afterDecember 10 and April 10, respectively, for the secured roll. Based on a policy by the County called the Teeter Plan,100% of the allocated taxes are transmitted by the County to the District, eliminating the need for an allowance foruncollectible taxes. The County, in return, receives all penalties and interest. Property taxes on the unsecured rollare due on the January 1 lien date and become delinquent if unpaid by August 31. Property tax revenues arerecognized in the fiscal year they are received.
Pensions
For purposes of measuring the net pension liability and deferred outflows/inflows of resources related to pensions,and pension expense, information about the fiduciary net position of the District’s California Public Employees’Retirement System (CalPERS) plan (Plan) and additions to/deductions from the Plan’s fiduciary net position havebeen determined on the same basis as they are reported by CalPERS. For this purpose, benefit payments(including refunds of employee contributions) are recognized when due and payable in accordance with the benefitterms. Investments are reported at fair value.
Other Postemployment Benefits (OPEB)
For purposes of measuring the net OPEB liability, deferred outflows of resources and deferred inflows of resourcesrelated to OPEB, and OPEB expense, information about the fiduciary net position of the District's plan (OPEB Plan)and additions to/deductions from the OPEB Plan's fiduciary net position have been determined on the same basis.For this purpose, benefit payments are recognized when currently due and payable in accordance with the benefitterms. Investments are reported at fair value.
Generally accepted accounting principles require that the reported results must pertain to liability and assetinformation within certain defined timeframes. For this report, the following timeframes are used:
Valuation Date June 30, 2017Measurement Date June 30, 2017 Measurement Period July 1, 2016 to June 30, 2017
Deferred Outflows/Inflows of Resources
In addition to assets, the statement of net position, or balance sheet, will sometimes report a section for deferredoutflows of resources. This separate financial statement element, deferred outflows of resources, represents aconsumption of net position of fund balance that applies to a future period(s) and so will be recognized as an outflowof resources (expense/expenditure) until then.
In addition to liabilities, the statement of net position, or balance sheet, will sometimes report a separate section fordeferred inflows of resources. This separate financial statement element, deferred inflows of resources, representsan acquistion of net position or fund balance that applies to a future period(s) and so will not be recognized as aninflow of resources (revenue) until that time.
24
SOUTH PLACER MUNICIPAL UTILITY DISTRICTNOTES TO THE FINANCIAL STATEMENTS
FOR THE YEAR ENDEDJUNE 30, 2018
NOTE 1: SUMMARY OF SIGNIFICANT ACCOUNTING POLICIES (continued)
Deferred Participation Agreements
The District has extended credit to a small number of commercial customers to pay for connection fees over time inperiods up to 5 years. These contracts, also known as deferred participation agreements are recorded as revenuewhen the contracts are approved and executed. The District collects the receivable and interest for these contractsat the current Wall Street Journal Prime rate +2% per annum, as designated in the agreement. In the event ofdefault or non-payment of the fees the District may impose a lien on the property to collect fees through propertytaxes.
Use of Estimates
The preparation of financial statements in accordance with generally accepted accounting principles requiresmanagement to make estimates and assumptions that affect certain reported amounts and disclosures. Accordingly,actual results could differ from these estimates.
Subsequent Events
Subsequent events have been evaluated through November 12, 2018, which is the date the financial statementswere issued.
Implementation of Government Accounting Standards Board Statements
Effective July 1, 2017, the District implemented the following accounting and financial reporting standards:
Government Accounting Standards Board Statement No. 75
In June 2015, GASB issued Statement No. 75, Accounting and Financial Reporting for Postemployment Benefitsother than Pensions. The primary objective of this Statement is to improve accounting and financial reporting bystate and local governments for postemployment benefits other than pensions (other postemployment benefits orOPEB), and replaces Statements No. 45 and 57. This Statement establishes standards for recognizing andmeasuring liabilities, deferred outflows of resources, deferred inflows of resources, and expense/expendituresrelated to OPEB.
Government Accounting Standards Board Statement No. 85
In March 2017, GASB issued Statement No. 85, Omnibus 2017. The objective of this statement is to addresspractice issues that have been identified during implementation and application of certain GASB statements. Thisstatement addresses a variety of topics including issues related to blending component units, goodwill, fair valuemeasurement and application, and postemployment benefits (pensions and other postemployment benefits).
Future Government Accounting Standards Board Statements
These statements are not effective until July 1, 2018 or later and may be applicable for the District. However, theDistrict has not determined the effects, if any, on the financial statements.
Government Accounting Standards Board Statement No. 86
In May 2017, GASB issued Statement No. 86, Certain Debt Extinguishments Issues. The primary objective of thisStatement is to improve consistency in accounting and financial reporting for in-substance defeasance of debt byproviding guidance for transactions in which cash and other monetary assets acquired with only existingresources—resources other than the proceeds of refunding debt—are placed in an irrevocable trust for the solepurpose of extinguishing debt. This Statement also improves accounting and financial reporting for prepaidinsurance on debt that is extinguished and notes to financial statements for debt that is defeased in substance. TheDistrict has not determined what impact, if any, this pronouncement will have on the financial statements. Application
25

SOUTH PLACER MUNICIPAL UTILITY DISTRICTNOTES TO THE FINANCIAL STATEMENTS
FOR THE YEAR ENDEDJUNE 30, 2018
NOTE 1: SUMMARY OF SIGNIFICANT ACCOUNTING POLICIES (continued)
of this statement is effective for the District's fiscal year ending June 30, 2019.
Government Accounting Standards Board Statement No. 87
In June 2017, GASB issued Statement No. 87, Leases. The objective of this statement is to better meet theinformation needs of financial statement users by improving accounting and financial reporting for leases bygovernments. This statement requires recognition of certain lease assets and liabilities for leases that previouslywere classified as operating leases and recognized as inflows of resources or outflows of resources based on thepayment provisions of the contract. It establishes a single model for lease accounting based on the foundationalprinciple that leases are financings of the right to use an underlying asset. Under this statement, a lessee is requiredto recognize a lease liability and an intangible right-to-use lease asset, and a lessor is required to recognize a leasereceivable and a deferred inflow of resources, thereby enhancing the relevance and consistency of information aboutgovernments' leasing activities. Application of this statement is effective for the District's fiscal year ending June 30,2021. The District has not determined what impact, if any, this pronouncement will have on the financial statements.
Government Accounting Standards Board Statement No. 88
In March 2018, GASB issued Statement No. 88, Certain Disclosures Related to Debt, Including Direct Borrowingsand Direct Placements. The objective of this statement is to clarify which liabilities governments should include intheir note disclosures related to debt. GASB is requiring debt borrowings and direct placements to be presentedseparately because they may expose a government to risks that are different from, or in addition to, risks related toother types of debt. The new standard also requires the disclosure of additional essential debt-related information forall types of debt, including amounts of unused lines of credit and assets pledged as collateral for debt. Also requiredto be disclosed are terms specified in debt agreements related to: (1) significant events of default with finance-related consequences, (2) significant termination events with finance-related consequences, (3) significantsubjective acceleration clauses. The District has not determined what impact, if any, this pronouncement will have onthe financial statements. Application of this statement is effective for the District's fiscal year ending June 30, 2020.
Government Accounting Standards Board Statement No. 89
In June 2018, GASB issued Statement No. 89, Accounting for Interest Cost Incurred before the End of aConstruction Period. This statement requires interest costs incurred before the end of a construction period to berecorded as an expenditure in the applicable period. As a result, intrest cost incurred before the end of aconstruction period will not be included in the historical cost of a capital asset reported in a business-type activity orenterprise fund. The District has not determined what impact, if any, this pronouncement will have on the financialstatements. Application of this statement is effective for the District's fiscal year ending June 30, 2021.
Government Accounting Standards Board Statement No. 90
In August 2018, GASB issued Statement No. 90, Majority Equity Interests. The purpose of this statement is toimprove the consistency and comparability of reporting a government's majority equity interst in a legally separateorganization and to improve the relevence of financial statement information for certain component units. The newstandard clarifies the differences between a majority equity interests reported as an investement and majority equityinterest reported as a component unit of the governmental entity. The District has not determined what impact, if any,this pronouncement will have on the financial statements. Application of this statement is effective for the District'sfiscal year ending June 30, 2020.
26

SOUTH PLACER MUNICIPAL UTILITY DISTRICTNOTES TO THE FINANCIAL STATEMENTS
FOR THE YEAR ENDEDJUNE 30, 2018
NOTE 2: CASH AND INVESTMENTS
The components of the District's cash and cash equivalents at June 30, 2018 are as follows:
June 30, 2018
Cash and cash equivalents:
Unrestricted deposits in financial institutions $ 575,599Placer County Treasury 5,177,180Local Agency Investment Fund (LAIF) 5,114,252
Total cash and cash equivalents 10,867,031
Investments:
Fixed income securities 20,462,410Money market mutual fund 1,504,433CalTrust investment fund 19,275,339
Total investments 41,242,182
Total cash and investments $ 52,109,213
Authorized Investments of the District
The table below identifies the investment types that are authorized for the South Placer Municipal Utility District(District) by California Government Code 53601 (or the District's investment policy, where more restrictive). The tablealso identifies certain provisions of the California Government Code (or the District's investment policy, where morerestrictive) that addresses interest rate risk, credit risk and concentration of credit risk. This table does not addressinvestments of debt proceeds held by bond trustees that are governed by the provisions of debt agreements of theDistrict, rather than the general provisions of the California Government Code or the District investment policy.
Authorized Investment Type Maximum Maturity
MaximumPercentage of
Portfolio
MaximumInvestment inOne Issuer
Investment pools authorized under CA statutegoverned by Government Code: $40 Million
Local Agency Investment Fund (LAIF) N/A 75% No LimitPlacer County Treasurer's Investment Pool N/A 75% No LimitInvestment Trust of CA (CalTRUST) N/A 75% No Limit
Bank Savings Account N/A 75% No LimitFederal Agencies 5 years No Limit No LimitCommercial Paper 270 Days 15% No LimitNegotiable Certificates of Deposits 270 Days 30% No LimitRepurchase Agreements 180 Days 20% No LimitU.S. Treasury Obligations 5 years No Limit No LimitAny other allowed investments under CGC 53601 Limited 20% No Limit
27
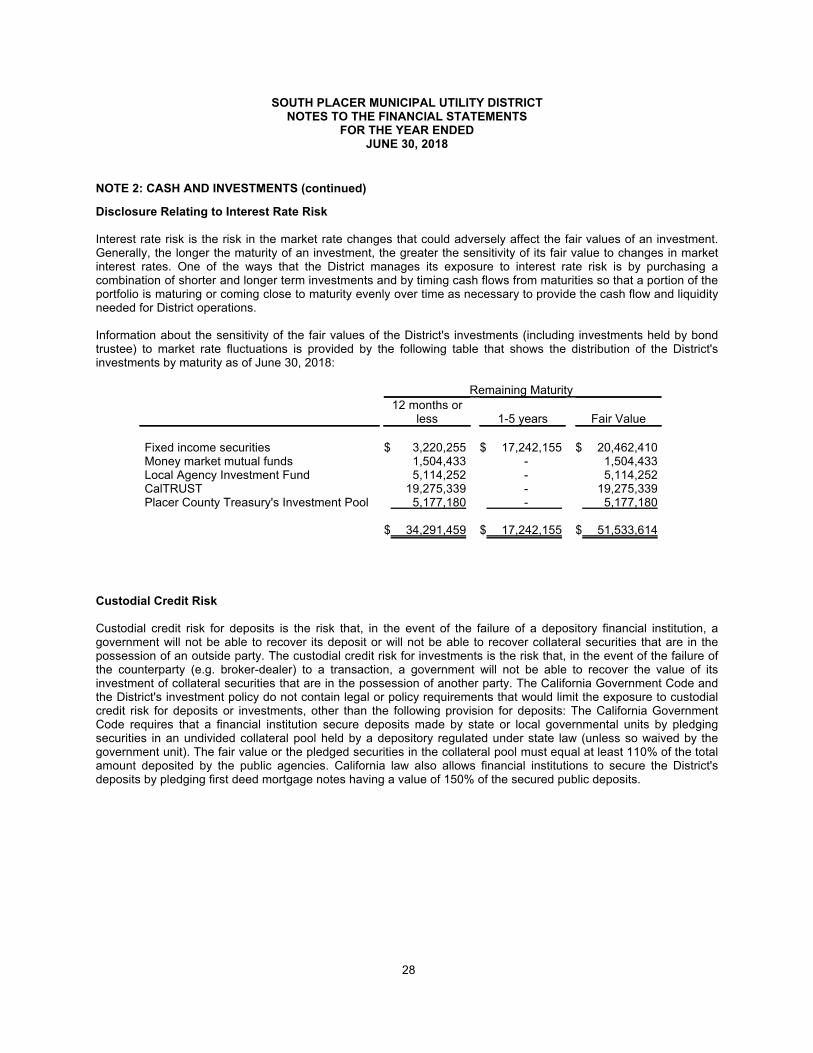
SOUTH PLACER MUNICIPAL UTILITY DISTRICTNOTES TO THE FINANCIAL STATEMENTS
FOR THE YEAR ENDEDJUNE 30, 2018
NOTE 2: CASH AND INVESTMENTS (continued)
Disclosure Relating to Interest Rate Risk
Interest rate risk is the risk in the market rate changes that could adversely affect the fair values of an investment.Generally, the longer the maturity of an investment, the greater the sensitivity of its fair value to changes in marketinterest rates. One of the ways that the District manages its exposure to interest rate risk is by purchasing acombination of shorter and longer term investments and by timing cash flows from maturities so that a portion of theportfolio is maturing or coming close to maturity evenly over time as necessary to provide the cash flow and liquidityneeded for District operations.
Information about the sensitivity of the fair values of the District's investments (including investments held by bondtrustee) to market rate fluctuations is provided by the following table that shows the distribution of the District'sinvestments by maturity as of June 30, 2018:
Remaining Maturity
12 months orless 1-5 years Fair Value
Fixed income securities $ 3,220,255 $ 17,242,155 $ 20,462,410Money market mutual funds 1,504,433 - 1,504,433Local Agency Investment Fund 5,114,252 - 5,114,252CalTRUST 19,275,339 - 19,275,339Placer County Treasury's Investment Pool 5,177,180 - 5,177,180
$ 34,291,459 $ 17,242,155 $ 51,533,614
Custodial Credit Risk
Custodial credit risk for deposits is the risk that, in the event of the failure of a depository financial institution, agovernment will not be able to recover its deposit or will not be able to recover collateral securities that are in thepossession of an outside party. The custodial credit risk for investments is the risk that, in the event of the failure ofthe counterparty (e.g. broker-dealer) to a transaction, a government will not be able to recover the value of itsinvestment of collateral securities that are in the possession of another party. The California Government Code andthe District's investment policy do not contain legal or policy requirements that would limit the exposure to custodialcredit risk for deposits or investments, other than the following provision for deposits: The California GovernmentCode requires that a financial institution secure deposits made by state or local governmental units by pledgingsecurities in an undivided collateral pool held by a depository regulated under state law (unless so waived by thegovernment unit). The fair value or the pledged securities in the collateral pool must equal at least 110% of the totalamount deposited by the public agencies. California law also allows financial institutions to secure the District'sdeposits by pledging first deed mortgage notes having a value of 150% of the secured public deposits.
28

SOUTH PLACER MUNICIPAL UTILITY DISTRICTNOTES TO THE FINANCIAL STATEMENTS
FOR THE YEAR ENDEDJUNE 30, 2018
NOTE 2: CASH AND INVESTMENTS (continued)
Disclosures Relating to Credit Risk
Generally, credit risk is the risk that an issuer of an investment will not fulfill its obligation to the holder of aninvestment. This is measured by the assignment of a rating by a nationally recognized statistical rating organization.Presented below is the minimum rating required by (where applicable) the California Government Code, theinvestment policy, or debt agreements, and the actual rating as of the fiscal year for each investment type.
Rating as of Fiscal Year End
Total S&P Moody's N/A
Local Agency Investment Fund $ 5,114,252 Not ratedPlacer County Treasury's Investment Pool 5,177,180 Not ratedCalTRUST 19,275,339 Not ratedFixed income securities 20,462,410 AAAmMoney market mutual funds 1,504,433 AAAm
$ 51,533,614
Concentration of Credit Risk
The investment policy of the District contains limitations on the amount that can be invested in any one issuer.There are no investments to one issuer exceeding those limits.
Investment in State Investment Pool and Other Investments
The District is a voluntary participant in the Local Agency Investment Fund (LAIF) that is regulated by the CaliforniaGovernment Code under the oversight of the Treasurer of the State of California.
The fair value of the District's investment in this pool is reported in the accompanying financial statements atamounts based upon the District's pro-rata share of the fair value provided by LAIF for the entire LAIF portfolio (inrelation to the amortized cost of that portfolio). The balance available for withdrawal is based on the accountingrecords maintained by LAIF which are recorded on an amortized cost basis.
The District is a voluntary participant in the Placer County Treasurer's Investment Portfolio that is administered bythe Placer County Treasurer. Its primary objectives are to safeguard the principal of the funds under its control andto meet any liquidity needs of the depositor. Maximizing the rate of return is performed consistent with the objectivesof safeguarding principal and meeting liquidity needs.
The fair value of the District's investment in this pool is reported in the accompanying financial statements atamounts based upon the District's pro-rata share of the fair value provided by the County Treasurer for the entireportfolio under its control.
The District is a voluntary participant in the Investment Trust of California (CalTrust). CalTrust is a program operatedby the joint powers authority to offer a high level of current income consistent with preservation of principal. It offersshort and medium term bond funds. The objective of the investment policy is to obtain the best possible returncommensurate with the degree of risk that participants are willing to assume in obtaining such return.
The District has a portfolio Brokerage account managed by Wells Fargo Securities. This portfolio is primarilyinvested in bonds issued by government sponsored enterprises. The portfolio is organized with staggered maturitydates. This structure assures part of the portfolio is liquidating at par value on a regular basis.
29
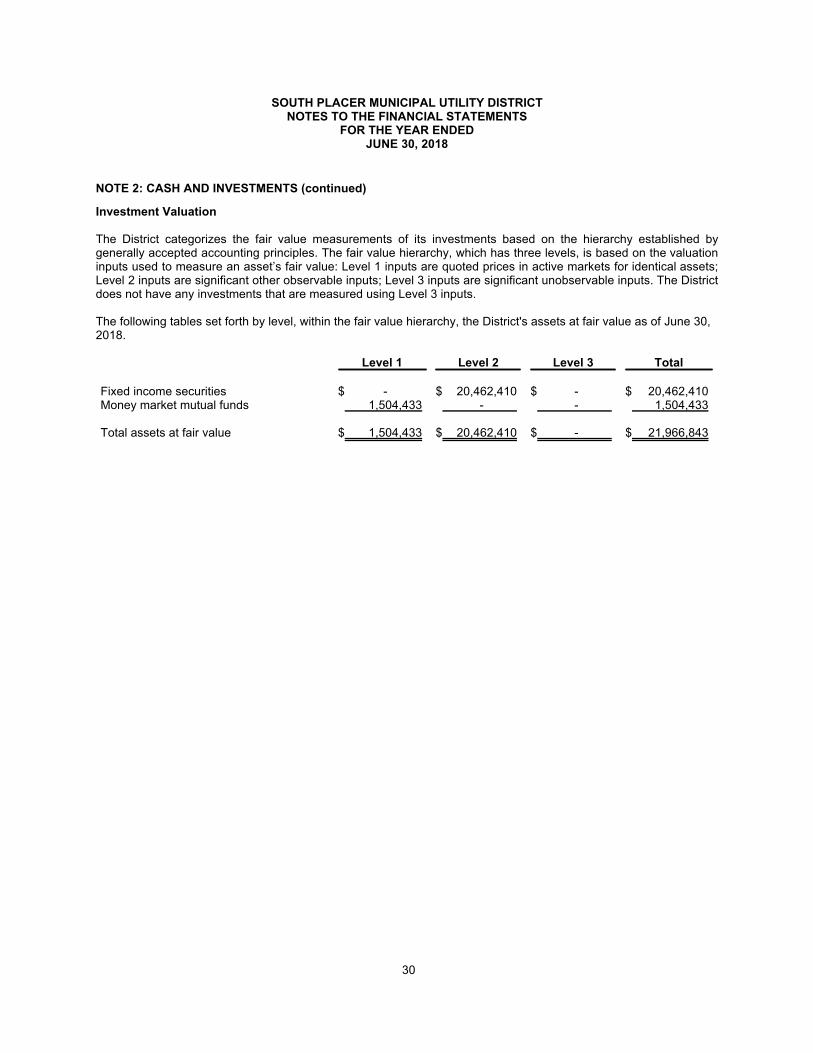
SOUTH PLACER MUNICIPAL UTILITY DISTRICTNOTES TO THE FINANCIAL STATEMENTS
FOR THE YEAR ENDEDJUNE 30, 2018
NOTE 2: CASH AND INVESTMENTS (continued)
Investment Valuation
The District categorizes the fair value measurements of its investments based on the hierarchy established bygenerally accepted accounting principles. The fair value hierarchy, which has three levels, is based on the valuationinputs used to measure an asset’s fair value: Level 1 inputs are quoted prices in active markets for identical assets;Level 2 inputs are significant other observable inputs; Level 3 inputs are significant unobservable inputs. The Districtdoes not have any investments that are measured using Level 3 inputs.
The following tables set forth by level, within the fair value hierarchy, the District's assets at fair value as of June 30,2018.
Level 1 Level 2 Level 3 Total
Fixed income securities $ - $ 20,462,410 $ - $ 20,462,410Money market mutual funds 1,504,433 - - 1,504,433
Total assets at fair value $ 1,504,433 $ 20,462,410 $ - $ 21,966,843
30
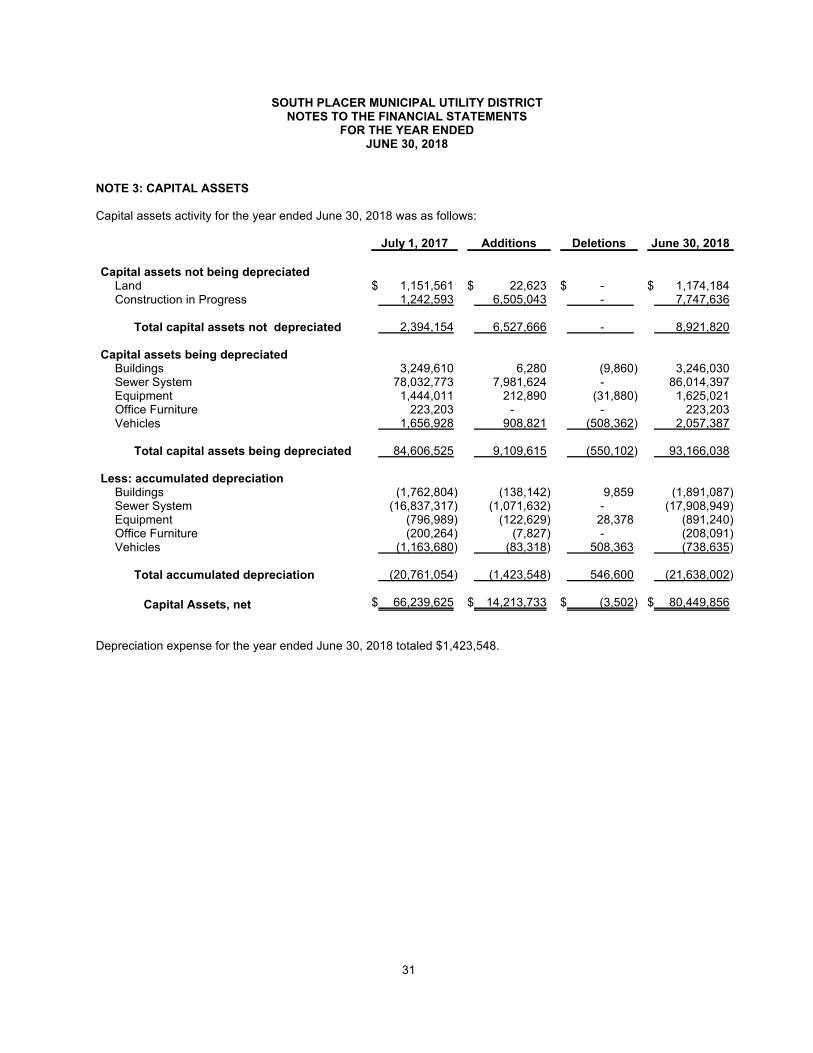
SOUTH PLACER MUNICIPAL UTILITY DISTRICTNOTES TO THE FINANCIAL STATEMENTS
FOR THE YEAR ENDEDJUNE 30, 2018
NOTE 3: CAPITAL ASSETS
Capital assets activity for the year ended June 30, 2018 was as follows:
July 1, 2017 Additions Deletions June 30, 2018
Capital assets not being depreciatedLand $ 1,151,561 $ 22,623 $ - $ 1,174,184Construction in Progress 1,242,593 6,505,043 - 7,747,636
Total capital assets not depreciated 2,394,154 6,527,666 - 8,921,820
Capital assets being depreciatedBuildings 3,249,610 6,280 (9,860) 3,246,030Sewer System 78,032,773 7,981,624 - 86,014,397Equipment 1,444,011 212,890 (31,880) 1,625,021Office Furniture 223,203 - - 223,203Vehicles 1,656,928 908,821 (508,362) 2,057,387
Total capital assets being depreciated 84,606,525 9,109,615 (550,102) 93,166,038
Less: accumulated depreciationBuildings (1,762,804) (138,142) 9,859 (1,891,087)Sewer System (16,837,317) (1,071,632) - (17,908,949)Equipment (796,989) (122,629) 28,378 (891,240)Office Furniture (200,264) (7,827) - (208,091)Vehicles (1,163,680) (83,318) 508,363 (738,635)
Total accumulated depreciation (20,761,054) (1,423,548) 546,600 (21,638,002)
Capital Assets, net $ 66,239,625 $ 14,213,733 $ (3,502) $ 80,449,856
Depreciation expense for the year ended June 30, 2018 totaled $1,423,548.
31
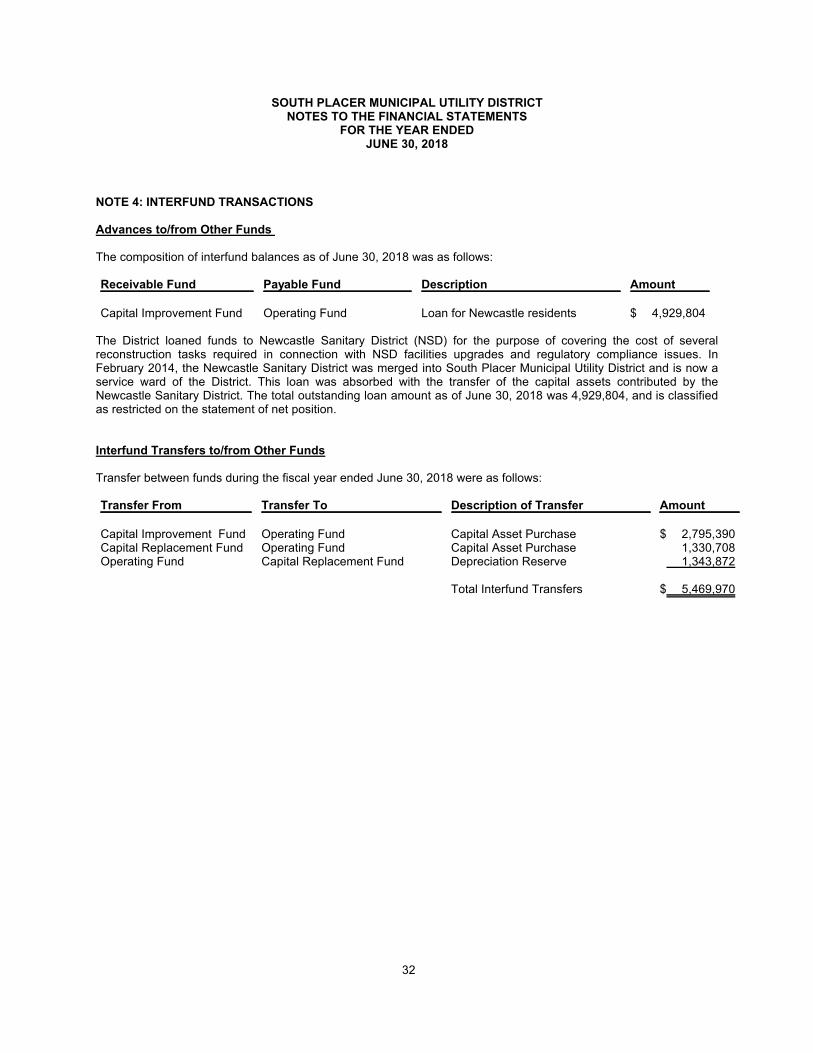
SOUTH PLACER MUNICIPAL UTILITY DISTRICTNOTES TO THE FINANCIAL STATEMENTS
FOR THE YEAR ENDEDJUNE 30, 2018
NOTE 4: INTERFUND TRANSACTIONS
Advances to/from Other Funds
The composition of interfund balances as of June 30, 2018 was as follows:
Receivable Fund Payable Fund Description Amount
Capital Improvement Fund Operating Fund Loan for Newcastle residents $ 4,929,804
The District loaned funds to Newcastle Sanitary District (NSD) for the purpose of covering the cost of severalreconstruction tasks required in connection with NSD facilities upgrades and regulatory compliance issues. InFebruary 2014, the Newcastle Sanitary District was merged into South Placer Municipal Utility District and is now aservice ward of the District. This loan was absorbed with the transfer of the capital assets contributed by theNewcastle Sanitary District. The total outstanding loan amount as of June 30, 2018 was 4,929,804, and is classifiedas restricted on the statement of net position.
Interfund Transfers to/from Other Funds
Transfer between funds during the fiscal year ended June 30, 2018 were as follows:
Transfer From Transfer To Description of Transfer Amount
Capital Improvement Fund Operating Fund Capital Asset Purchase $ 2,795,390Capital Replacement Fund Operating Fund Capital Asset Purchase 1,330,708Operating Fund Capital Replacement Fund Depreciation Reserve 1,343,872
Total Interfund Transfers $ 5,469,970
32

SOUTH PLACER MUNICIPAL UTILITY DISTRICTNOTES TO THE FINANCIAL STATEMENTS
FOR THE YEAR ENDEDJUNE 30, 2018
NOTE 5: DEFINED BENEFIT PENSION PLAN
A. General Information about the Pension Plan
Plan Description – All qualified permanent full time and part-time District employees working at least 1,000 hoursper year are eligible to participate in the District's cost-sharing multiple-employer defined benefit pension plan(Plan) administered by the California Public Employees' Retirement System (CalPERS). The Plan consists ofindividual rate plans (benefit tiers) within a safety risk pool (police and fire) and a miscellaneous risk pool (allothers). Plan assets may be used to pay benefits for any employer rate plan of the safety and miscellaneous pools.Accordingly, rate plans within the safety or miscellaneous pools are not separate plans under GASB Statement No.68. Individual employers may sponsor more than one rate plan in the miscellaneous or safety risk pools. TheDistrict sponsors three rate plans (all miscellaneous). Benefit provisions under the Plan are established by Statestatue and Agency resolution. CalPERS issues publicly availabe reports that include a full description of thepension plans regarding benefit provisions, assumptions and membership information that can be found on theCalPERS website.
Benefits Provided – CalPERS provides service retirement and disability benefits, annual cost of livingadjustments and death benefits to plan members, who must be public employees and beneficiaries. Benefits arebased on years of credited service, equal to one year of full time employment. Members with five years of totalservice are eligible to retire at age 50 with statutorily reduced benefits. Active plan members in the 2.7% @ 55 TierI plan are required to contribute 8% of all earnings in excess of $133.33 per month. As a benefit to the Districtemployees, the District contributed the employee required contribution. For those employees hired on or after April20th, 2012 the District had implemented a 2% @ 55 Tier II plan which reduced the amount of employeecontribution paid by the District to 7%. Effective July 1st, 2017 all employees pay the CalPERS employee share.The district is required to contribute the actuarially determined remaining amounts necessary to fund the benefitsfor its members. For new employees hired after January 1, 2013 the District benefit formula changed to a 2% @ 62Tier III where the employee contributes the full employee contribution of 6.25% of all earnings in excess of $133.33per month. The actuarial methods and assumptions used are those adopted by the CalPERS Board ofAdministration. The contribution requirements of the plan members are established by state statute and theemployer contribution rate is established and may be amended by CalPERS.
Miscellaneous
Tier I Tier II Tier III
Hire date Prior toApril 20, 2012
April 20, 2012 toDecember 31, 2012
On or after January 1, 2013
Benefit formula 2.7% @ 55 2% @ 55 2% @ 62Benefit vesting schedule 5 years service 5 years service 5 years serviceBenefit payments Monthly for life Monthly for life Monthly for lifeRetirement age 50-55 50-55 52-67Monthly benefits, as a % of eligible
compensation 2.7% 2.0% 2.0%Required employee contribution rates 8.000% 7.000 6.250%Required employer contribution rates 30.813% 8.444% 6.565%
* Employer contribution rates include the employer normal cost rate and the unfunded accrued liability contribution.
33

SOUTH PLACER MUNICIPAL UTILITY DISTRICTNOTES TO THE FINANCIAL STATEMENTS
FOR THE YEAR ENDEDJUNE 30, 2018
NOTE 5: DEFINED BENEFIT PENSION PLAN (continued)
Contributions – Section 20814(c) of the California Public Employees’ Retirement Law requires that the employercontribution rates for all public employers be determined on an annual basis by the CalPERS actuary and shall beeffective on the July 1 following notice of a change in the rate. Funding contributions for the Plan are determinedannually on an actuarial basis as of June 30 by CalPERS. The actuarially determined rate is the estimated amountnecessary to finance the costs of benefits earned by employees during the year, with an additional amount tofinance any unfunded accrued liability. The District is required to contribute the difference between the actuariallydetermined rate and the contribution rate of employees. The District's contributions to the Plan for the year endedJune 30, 2018 were $424,946.
B. Pension Liabilities, Pension Expenses and Deferred Outflows/Inflows of Resources Related to Pensions
As of June 30, 2018, the District reported a net pension liability of $4,728,860 for its proportionate shares of thenet pension liability of the Plan.
The District’s net pension liability for the Plan is measured as the proportionate share of the net pension liability.The net pension liability of the Plan is measured as of June 30, 2017, and the total pension liability for the Planused to calculate the net pension liability was determined by an actuarial valuation as of June 30, 2016 rolledforward to June 30, 2017 using standard update procedures. The District’s proportion of the net pension liabilitywas based on a projection of the District’s long-term share of contributions to the pension plan relative to theprojected contributions of all participating employers, actuarially determined. The District’s proportionate share ofthe net pension liability for the Plan as of June 30, 2016 and 2017 was as follows:
Miscellaneous
Proportion - June 30, 2016 0.1176%Proportion - June 30, 2017 0.1200%Change - Increase (Decrease) 0.0024%
For the year ended June 30, 2018, the District recognized pension expense of $497,945. At June 30, 2018,the District reported deferred outflows of resources and deferred inflows of resources related to pensions from thefollowing sources:
Deferred Outflows ofResources
Deferred Inflows ofResources
Pension contributions subsequent to measurement date $ 424,946 $ -
Net difference between projected and actual earnings onplan investments 168,863 -
Changes in assumptions 746,665 56,935
Differences between expected and actual experience 6,018 86,215
Adjustment due to differences in proportions 190,363 1,008
Difference between actual contributions made by theemployer and the employer's proportionate share of the riskpool's total contribution - 260,274
Total $ 1,536,855 $ 404,432
34

SOUTH PLACER MUNICIPAL UTILITY DISTRICTNOTES TO THE FINANCIAL STATEMENTS
FOR THE YEAR ENDEDJUNE 30, 2018
NOTE 5: DEFINED BENEFIT PENSION PLAN (continued)
$424,946 reported as deferred outflows of resources related to contributions subsequent to the measurement datewill be recognized as a reduction of the net pension liability in the subsequent fiscal period. Other amountsreported as deferred outflows of resources and deferred inflows of resources related to pensions will berecognized as pension expense as follows:
FIscal Year EndedJune 30,
2019 $ 177,2492020 $ 396,2342021 $ 234,2532022 $ (100,259)
C. Actuarial Assumptions – The total pension liabilities in the June 30, 2016 actuarial valuations weredetermined using the following actuarial assumptions:
Valuation Date June 30, 2016Measurement Date June 30, 2017Actuarial Cost Method Entry-Age Normal Cost Method Actuarial Assumptions:
Discount Rate 7.15%Inflation 2.75%Salary Increases Varies by entry age and serviceInvestment Rate of Return 7.38% net of pension plan investment expenses,
includes inflationMortality (1) Derived Using CalPERS membership data for all
fundsPost Retirement Benefit Increase Contract COLA up to 2.75% until purchasing power
protection allowance floor on purchasing powerapplies, 2.75% thereafter
(1) The mortality table used was developed based on CalPERS' specific data. The table includes 20 years ofmortality improvements using Society of Actuaries Scale BB. For more on this table, please refer to the 2014Experience Study Report.
The underlying mortality assumptions and all other actuarial assumptions used in the June 30, 2016 valuationwere based on the results of an actuarial experience study for the fiscal years 1997 to 2011, including updates tosalary increase, mortality and retirement rates. The Experience Study report can be obtained at CalPERS' websiteunder Forms and Publications.
D. Changes in Assumptions – The discount rated used to measure the total pension liability was lowered from7.65 percent to 7.15 percent during the measurement period ended June 30, 2017.
E. Discount Rate – The discount rate used to measure the total pension liability was 7.15 percent for the Plan. Todetermine whether the municipal bond rate should be used in the calculation of a discount rate for the Plan,CalPERS stress tested plans that would most likely result in a discount rate that would be different from theactuarially assumed discount rate. Based on the testing, none of the tested plans run out of assets. Therefore, thecurrent 7.15 percent discount rate is adequate and the use of the municipal bond rate calculation is not necessary.The long term expected discount rate of 7.15 percent will be applied to all plans in the Public Employees'Retirement Fund (PERF). The stress test results are presented in a detailed report called "GASB CrossoverTesting Report" that can be obtained from the CalPERS website under the GASB 68 section.
35
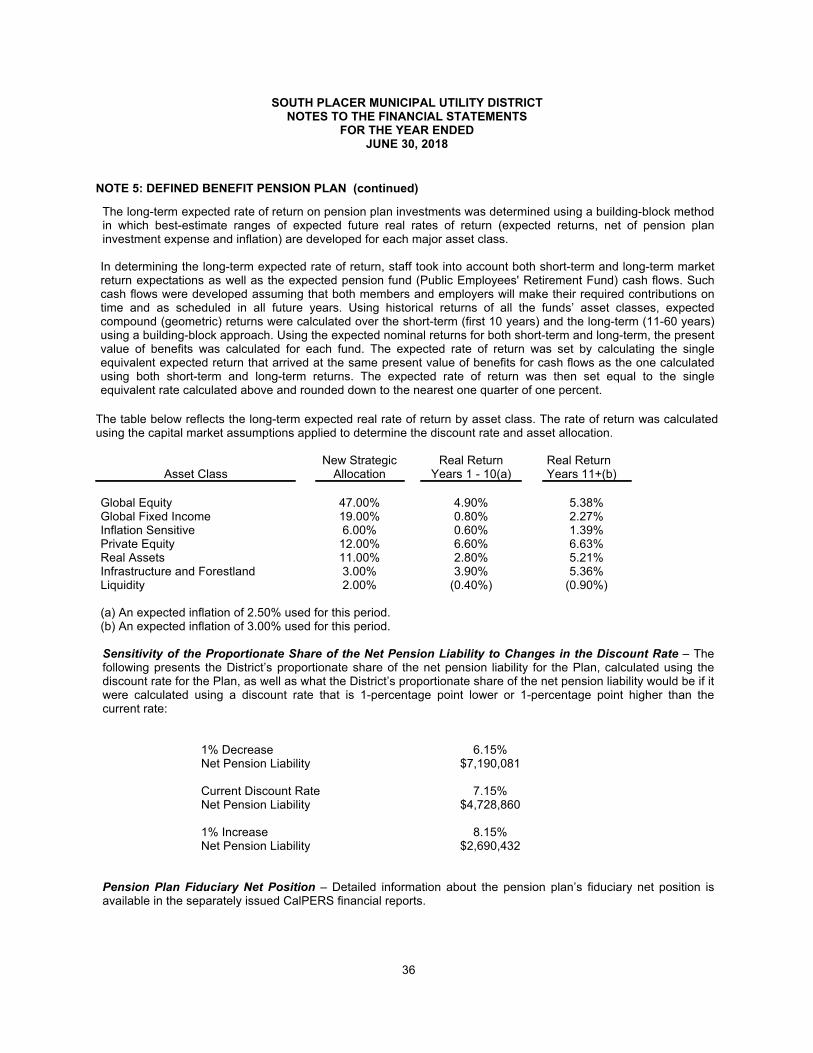
SOUTH PLACER MUNICIPAL UTILITY DISTRICTNOTES TO THE FINANCIAL STATEMENTS
FOR THE YEAR ENDEDJUNE 30, 2018
NOTE 5: DEFINED BENEFIT PENSION PLAN (continued)
The long-term expected rate of return on pension plan investments was determined using a building-block methodin which best-estimate ranges of expected future real rates of return (expected returns, net of pension planinvestment expense and inflation) are developed for each major asset class.
In determining the long-term expected rate of return, staff took into account both short-term and long-term marketreturn expectations as well as the expected pension fund (Public Employees' Retirement Fund) cash flows. Suchcash flows were developed assuming that both members and employers will make their required contributions ontime and as scheduled in all future years. Using historical returns of all the funds’ asset classes, expectedcompound (geometric) returns were calculated over the short-term (first 10 years) and the long-term (11-60 years)using a building-block approach. Using the expected nominal returns for both short-term and long-term, the presentvalue of benefits was calculated for each fund. The expected rate of return was set by calculating the singleequivalent expected return that arrived at the same present value of benefits for cash flows as the one calculatedusing both short-term and long-term returns. The expected rate of return was then set equal to the singleequivalent rate calculated above and rounded down to the nearest one quarter of one percent.
The table below reflects the long-term expected real rate of return by asset class. The rate of return was calculatedusing the capital market assumptions applied to determine the discount rate and asset allocation.
Asset ClassNew Strategic
AllocationReal Return
Years 1 - 10(a)Real ReturnYears 11+(b)
Global Equity 47.00% 4.90% 5.38%Global Fixed Income 19.00% 0.80% 2.27%Inflation Sensitive 6.00% 0.60% 1.39%Private Equity 12.00% 6.60% 6.63%Real Assets 11.00% 2.80% 5.21%Infrastructure and Forestland 3.00% 3.90% 5.36%Liquidity 2.00% (0.40%) (0.90%)
(a) An expected inflation of 2.50% used for this period.(b) An expected inflation of 3.00% used for this period.
Sensitivity of the Proportionate Share of the Net Pension Liability to Changes in the Discount Rate – Thefollowing presents the District’s proportionate share of the net pension liability for the Plan, calculated using thediscount rate for the Plan, as well as what the District’s proportionate share of the net pension liability would be if itwere calculated using a discount rate that is 1-percentage point lower or 1-percentage point higher than thecurrent rate:
1% Decrease 6.15%Net Pension Liability $7,190,081
Current Discount Rate 7.15%Net Pension Liability $4,728,860
1% Increase 8.15%Net Pension Liability $2,690,432
Pension Plan Fiduciary Net Position – Detailed information about the pension plan’s fiduciary net position isavailable in the separately issued CalPERS financial reports.
36
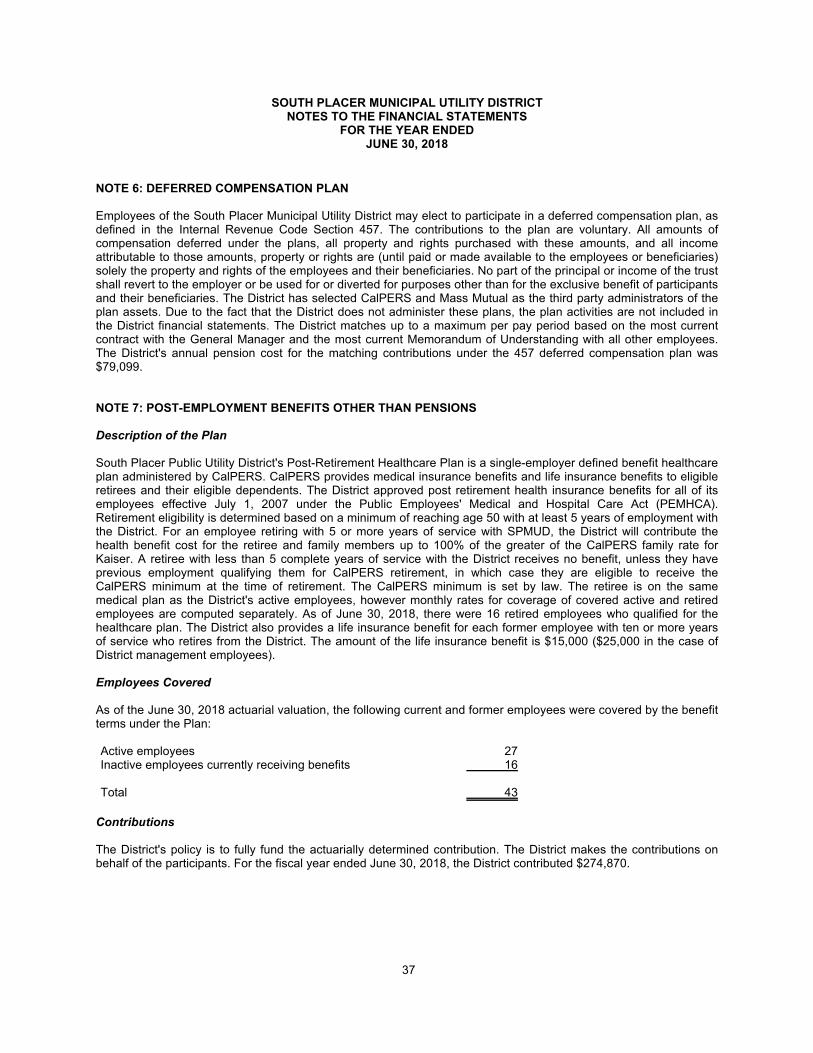
SOUTH PLACER MUNICIPAL UTILITY DISTRICTNOTES TO THE FINANCIAL STATEMENTS
FOR THE YEAR ENDEDJUNE 30, 2018
NOTE 6: DEFERRED COMPENSATION PLAN
Employees of the South Placer Municipal Utility District may elect to participate in a deferred compensation plan, asdefined in the Internal Revenue Code Section 457. The contributions to the plan are voluntary. All amounts ofcompensation deferred under the plans, all property and rights purchased with these amounts, and all incomeattributable to those amounts, property or rights are (until paid or made available to the employees or beneficiaries)solely the property and rights of the employees and their beneficiaries. No part of the principal or income of the trustshall revert to the employer or be used for or diverted for purposes other than for the exclusive benefit of participantsand their beneficiaries. The District has selected CalPERS and Mass Mutual as the third party administrators of theplan assets. Due to the fact that the District does not administer these plans, the plan activities are not included inthe District financial statements. The District matches up to a maximum per pay period based on the most currentcontract with the General Manager and the most current Memorandum of Understanding with all other employees.The District's annual pension cost for the matching contributions under the 457 deferred compensation plan was$79,099.
NOTE 7: POST-EMPLOYMENT BENEFITS OTHER THAN PENSIONS
Description of the Plan
South Placer Public Utility District's Post-Retirement Healthcare Plan is a single-employer defined benefit healthcareplan administered by CalPERS. CalPERS provides medical insurance benefits and life insurance benefits to eligibleretirees and their eligible dependents. The District approved post retirement health insurance benefits for all of itsemployees effective July 1, 2007 under the Public Employees' Medical and Hospital Care Act (PEMHCA).Retirement eligibility is determined based on a minimum of reaching age 50 with at least 5 years of employment withthe District. For an employee retiring with 5 or more years of service with SPMUD, the District will contribute thehealth benefit cost for the retiree and family members up to 100% of the greater of the CalPERS family rate forKaiser. A retiree with less than 5 complete years of service with the District receives no benefit, unless they haveprevious employment qualifying them for CalPERS retirement, in which case they are eligible to receive theCalPERS minimum at the time of retirement. The CalPERS minimum is set by law. The retiree is on the samemedical plan as the District's active employees, however monthly rates for coverage of covered active and retiredemployees are computed separately. As of June 30, 2018, there were 16 retired employees who qualified for thehealthcare plan. The District also provides a life insurance benefit for each former employee with ten or more yearsof service who retires from the District. The amount of the life insurance benefit is $15,000 ($25,000 in the case ofDistrict management employees).
Employees Covered
As of the June 30, 2018 actuarial valuation, the following current and former employees were covered by the benefitterms under the Plan:
Active employees 27Inactive employees currently receiving benefits 16
Total 43
Contributions
The District's policy is to fully fund the actuarially determined contribution. The District makes the contributions onbehalf of the participants. For the fiscal year ended June 30, 2018, the District contributed $274,870.
37

SOUTH PLACER MUNICIPAL UTILITY DISTRICTNOTES TO THE FINANCIAL STATEMENTS
FOR THE YEAR ENDEDJUNE 30, 2018
NOTE 7: POST-EMPLOYMENT BENEFITS OTHER THAN PENSIONS (continued)
Net OPEB Liability
The District's net OPEB liability ("NOL") was measured as of June 30, 2017 and the total OPEB liability used tocalculate the net OPEB liability was determined by an actuarial valuation dated June 30, 2017 based on the followingactuarial methods and assumptions:
Valuation Date June 30, 2017 Funding Method Entry Age Normal Cost, level percent pay Asset Valuation Method Market value of assets Long Term Return on Assets 6.73%Discount Rates 6.73%Participates Valued Only current active employees and retired participants and covered
dependents are valued. No future entrants are considered in thisvaluation.
Assumed Wage Inflation 3.00% per annumSalary Increases 3.25% per annumGeneral Inflation Rate 2.75% per annum Mortality Improvement MacLeod Watts Scale 2017 applied generationally Healthcare Trend Rate 7.50% per annum
Discount Rate
The discount rate used to measure the total OPEB liability was 6.73% based on an assumption that contributionswould be sufficient to fully fund the obligation over a period not to exceed 30 years.
Changes in the OPEB Liability
The District invoked Paragraph 244 of GASB 75 for the transition. Consequently, in order to determine the beginningNOL, the District used a "roll-back" technique. The following table shows the results of the roll-back. The June 30,2017 NOL was restated accordingly.
Total OPEBLiability
(a)
Plan FiduciaryNet Position
(b)
Net OPEBLiability/(Asset)
(c) = (a) - (b)
Roll back balance at June 30, 2017 $ 5,835,955 $ 3,866,661 $ 1,969,294
Service cost 167,083 - 167,083Interest cost 424,380 - 424,380Expected investment income - 281,418 (281,418)Employer contributions - 347,294 (347,294)Administrative expenses - (2,072) 2,072Benefit payments (347,294) (347,294) -Assumption changes 497,052 - 497,052Plan experience (866,361) - (866,361)Investment experience - 126,860 (126,860)
Net change during 2017-18 (125,140) 406,206 (531,346)
Balance at June 30, 2018 $ 5,710,815 $ 4,272,867 $ 1,437,948
38

SOUTH PLACER MUNICIPAL UTILITY DISTRICTNOTES TO THE FINANCIAL STATEMENTS
FOR THE YEAR ENDEDJUNE 30, 2018
NOTE 7: POST-EMPLOYMENT BENEFITS OTHER THAN PENSIONS (continued)
Sensitivity of the Net OPEB Liability to Changes in the Discount Rate
The following represents the Net OPEB Liability of the District if it were calculated using a discount rate that is onepercentage-point lower or one percentage-point higher than the current rate, for measurement period ended June 30, 2017:
1% Decrease(5.73%)
Current DiscountRate
(6.73%)1% Increase
(7.73%)
Net OPEB Liability $ 2,177,832 $ 1,437,948 $ 828,640
Sensitivity of the Net OPEB Liability to Changes in the Health Care Cost Trent Rates
The following represents the net OPEB liability of the District if it were calculated using health care cost trend ratesthat are one percentage-point lower or one percentage-point higher than the current rate, for measurement periodended June 30, 2017:
1% Decrease(6.50%)
Current HealthcareCost Trend Rate
(7.50%)1% Increase
(8.50%)
Net OPEB Liability $ 773,837 $ 1,437,948 $ 2,305,569
Recognition of Deferred Outflows and Deferred Inflows of Resources
Gains and losses related to changes in total OPEB liability and fiduciary net position are recognized in OPEBexpense systematically over time.
Amounts first recognized in OPEB expense for the year the gain or loss occurs. The remaining amounts arecategorized as deferred outflows and deferred inflows of resources related to OPEB and are to be recognized infuture OPEB expense.
The recognition period differs depending on the source of the gain or loss:
Net difference between projected and actual earningson OPEB plan investments
5 year straight-line recognition
All other amounts Straight-line recognition over the expected averageremaining service lifetime (EARSL) of all members thatare provided with benefits, determined as of thebeginning of the Measurement Period. In determiningthe EARSL, all active, retired and inactive (vested)members are counted, with the latter two groups having0 remaining service year.
39
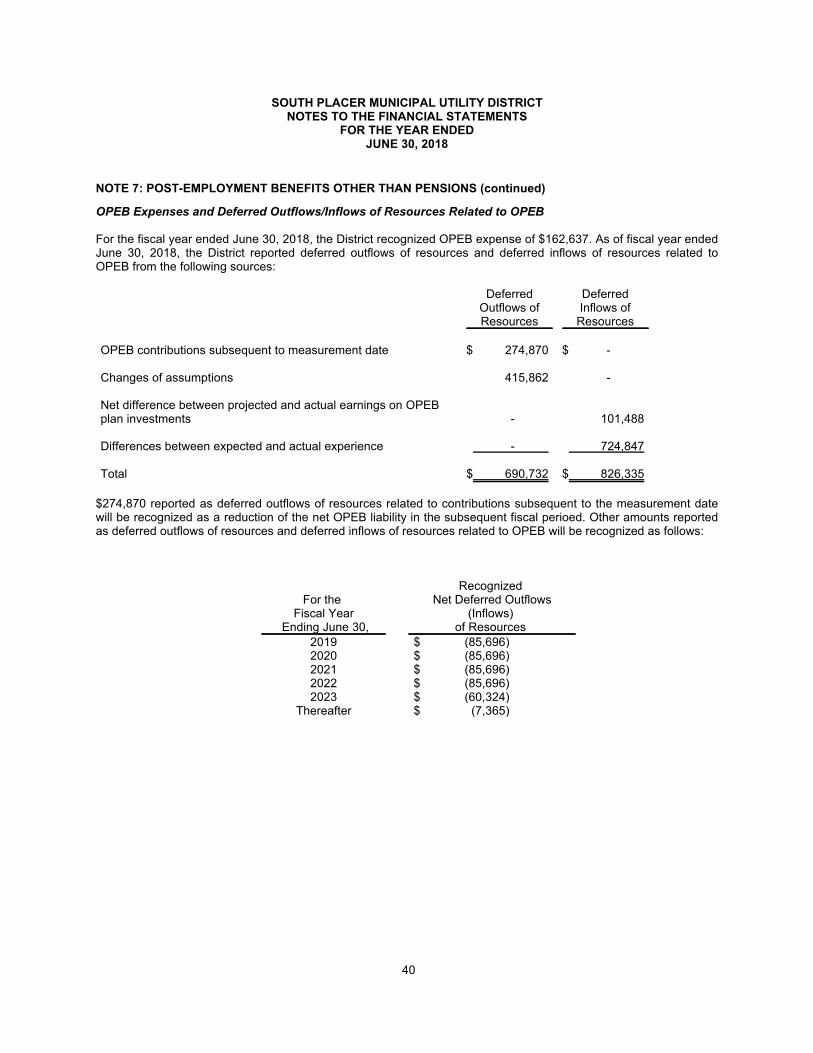
SOUTH PLACER MUNICIPAL UTILITY DISTRICTNOTES TO THE FINANCIAL STATEMENTS
FOR THE YEAR ENDEDJUNE 30, 2018
NOTE 7: POST-EMPLOYMENT BENEFITS OTHER THAN PENSIONS (continued)
OPEB Expenses and Deferred Outflows/Inflows of Resources Related to OPEB
For the fiscal year ended June 30, 2018, the District recognized OPEB expense of $162,637. As of fiscal year endedJune 30, 2018, the District reported deferred outflows of resources and deferred inflows of resources related toOPEB from the following sources:
DeferredOutflows ofResources
DeferredInflows of
Resources
OPEB contributions subsequent to measurement date $ 274,870 $ -
Changes of assumptions 415,862 -
Net difference between projected and actual earnings on OPEBplan investments - 101,488
Differences between expected and actual experience - 724,847
Total $ 690,732 $ 826,335
$274,870 reported as deferred outflows of resources related to contributions subsequent to the measurement datewill be recognized as a reduction of the net OPEB liability in the subsequent fiscal perioed. Other amounts reportedas deferred outflows of resources and deferred inflows of resources related to OPEB will be recognized as follows:
For the Fiscal Year
Ending June 30,
Recognized Net Deferred Outflows
(Inflows) of Resources
2019 $ (85,696)2020 $ (85,696)2021 $ (85,696)2022 $ (85,696)2023 $ (60,324)
Thereafter $ (7,365)
40

SOUTH PLACER MUNICIPAL UTILITY DISTRICTNOTES TO THE FINANCIAL STATEMENTS
FOR THE YEAR ENDEDJUNE 30, 2018
NOTE 8: JOINT POWERS AGREEMENT
On October 1, 2000 the South Placer Wastewater Authority was created to finance and construct the new PleasantGrove treatment plant along with expanding facilities at the Dry Creek plant and other regional facilities. TheAuthority is made up of the City of Roseville, Placer County, and South Placer Municipal Utility District. Thecomposition of the Board of Directors for the Authority is two directors appointed by the City of Roseville, twodirectors appointed by Placer County and one director appointed by South Placer Municipal Utility District. Theagreement provides that the City will own and operate the regional facilities. The Authority originally issued a total of$179,775,000 of fixed and variable rate bonds and later refunded to obtain more favorable interest rates in acombination of fixed, SIFMA Index and variable rate bonds. The agreement was also amended effective October 1,2012. South Placer Municipal Utility District proportionate share decreased from its original allocation of 25% to22.43% for the shared operating costs and debt service on these bonds. Bond payments are funded by regionalconnection fees charged by the District and remitted to the City of Roseville. Total connection fees collected by theDistrict and paid to the Authority under this agreement, for the fiscal year ended June 30, 2018 was $5,530,094. Thefinancial statements for the South Placer Wastewater Authority are availabe online athttps://roseville.ca.us/government/departments/finance/general_accounting_department/south_placer_wastewater_authority.
The District is responsible for its share of maintenance and operation expenses incurred at the Regional Treatmentplants based on the volume of flow from District lines as a percentage of total volume of flow into the plants. Thetotal amount calculated for South Placer Municipal Utility District during the fiscal year ended June 30, 2018 formaintenance and operation expenses was $5,003,758 and an additional $2,159,674 for the District's share of rehabproject costs.
NOTE 9: COMMITMENTS AND CONTINGENCIES
The District is responsible for maintenance and operation expenses incurred at the Regional Treatment plant basedon the volume of flow from District lines as a percentage of total volume of flow into the plant. The share of theDistrict cost is subject to periodic review and recalculations. The amount paid versus recalculated amounts can varyresulting in additional costs or credits to the District.
In the normal course of business, the District is subject to various lawsuits. Defense of lawsuits is typically handledby the District's insurance carrier and losses, if any, are expected to be covered by insurance. The District'sinsurance carrier also covers defense costs that are not recovered from the opposing side upon successfulresolution.
At June 30, 2018, the District had commitments with respect to various engineering services and constructionprojects.
Over the years, a number of agreements have been entered into by the District and local developers for installationof wastewater servicing facilities to the developer's projects. The developers constructed and installed thewastewater facilities at their own expense and thereafter dedicated said facilities to the District for public use. Inreturn the Developers will receive partial reimbursement from construction fees actually collected on the propertieswithin the project area, through the Agreement period. No contingent liability to the District is incurred for theuncollected portion of the agreed maximum amount.
Project NameMax
Reimbursement EDUs BenefitedCroftwood Offsite Sewer (Sierra College) $ 186,010 1,958Sierra College Annexation $ 1,094,218 612Yankee Hill Estates (Middle Antelope Creek) $ 217,375 925Rocklin 60 - Phase I $ 68,255 999Rocklin 60 - Phase II $ 139,621 999Rocklin 60 - Phase III $ 785,764 999Granite Bluff $ 36,856 40Massie Trust - 3264 Taylor Road $ 185,614 80
41

SOUTH PLACER MUNICIPAL UTILITY DISTRICTNOTES TO THE FINANCIAL STATEMENTS
FOR THE YEAR ENDEDJUNE 30, 2018
NOTE 10: PRIOR PERIOD ADJUSTMENTS
For the year ending June 30, 2018, the District implemented GASB 75 for their valuation of their Net Other PostEmployment Benefits. As mentioned in Note 7, the district used a "roll-back" technique for net OPEB Liability at thebeginning of the year. As a result of the roll-back, the district determined that an net OPEB liability totalling$1,969,294 and deferred outflows of resources totalling $347,294 should have been recorded as of June 30, 2017.Therefore, the overall change of $1,622,000 was recorded as a decrease in beginning net position.
42
Required Supplementary Information

SOUTH PLACER MUNICIPAL UTILITY DISTRICTREQUIRED SUPPLEMENTARY INFORMATION
SCHEDULE OF THE DISTRICT'S PROPORTIONATE SHARE OF THE NET PENSION LIABILITYAS OF JUNE 30, 2018
LAST 10 YEARS*
Measurement Period2017 2016 2015
Proportion of the net pension liability %0.11996 %0.11759 %0.11300
Proportionate share of the net pension liability $ 4,728,860 $ 4,084,964 $ 2,403,545
Covered - employee payroll $ 1,897,932 $ 1,772,689 $ 1,582,401
Proportionate share of the net pension liability as a percentage ofcovered - employee payroll %249.16 %230.44 %151.89
Plan fiduciary net position as a percentage of the total pension liability %73.31 %74.06 %78.40
Notes to Schedule:
Changes in assumptions: For the measurement period ended June 30, 2017, the accounting discount rate wasreduced from 7.65 percent to 7.15 percent. In 2016, the discount rate remained at 7.65 percent. In 2015, amountreported reflect an adjustment of the discount rate from 7.50 percent (net of administrative expense) to 7.65 percent(without a reduction for pension plan administrative expenses). In 2014, amounts reported were based on the 7.50percent discount rate.
*Schedule is intended to show information for ten years. Fiscal year 2015 was the first year of implementation. Theschedule above is only three years as shown. Fiscal year 2015 numbers are available from prior year disclosureinformation. Additional years' information will be displayed as it becomes available.
43

SOUTH PLACER MUNICIPAL UTILITY DISTRICTREQUIRED SUPPLEMENTARY INFORMATION
SCHEDULE OF CONTRIBUTIONS TO THE COST SHARING DEFINED BENEFIT PENSION PLANAS OF JUNE 30, 2018
LAST 10 YEARS*
Fiscal Year-End2018 2017 2016
Contractually required contribution (actuarially determined) $ 424,946 $ 369,153 $ 164,024
Contributions in relation to the actuarially determined contributions (424,946) (369,153) (164,024)
Contribution deficiency (excess) $ - $ - $ -
Covered - employee payroll 2,347,526 1,897,932 1,772,689
Contributions as a percentage of covered - employee payroll %18.10 %19.45 %9.25
*Schedule is intended to show information for ten years. Fiscal year 2015 was the first year of implementation. Theschedule above is only three years as shown. Fiscal year 2015 numbers are available from prior year disclosureinformation. Additional years' information will be displayed as it becomes available.
44
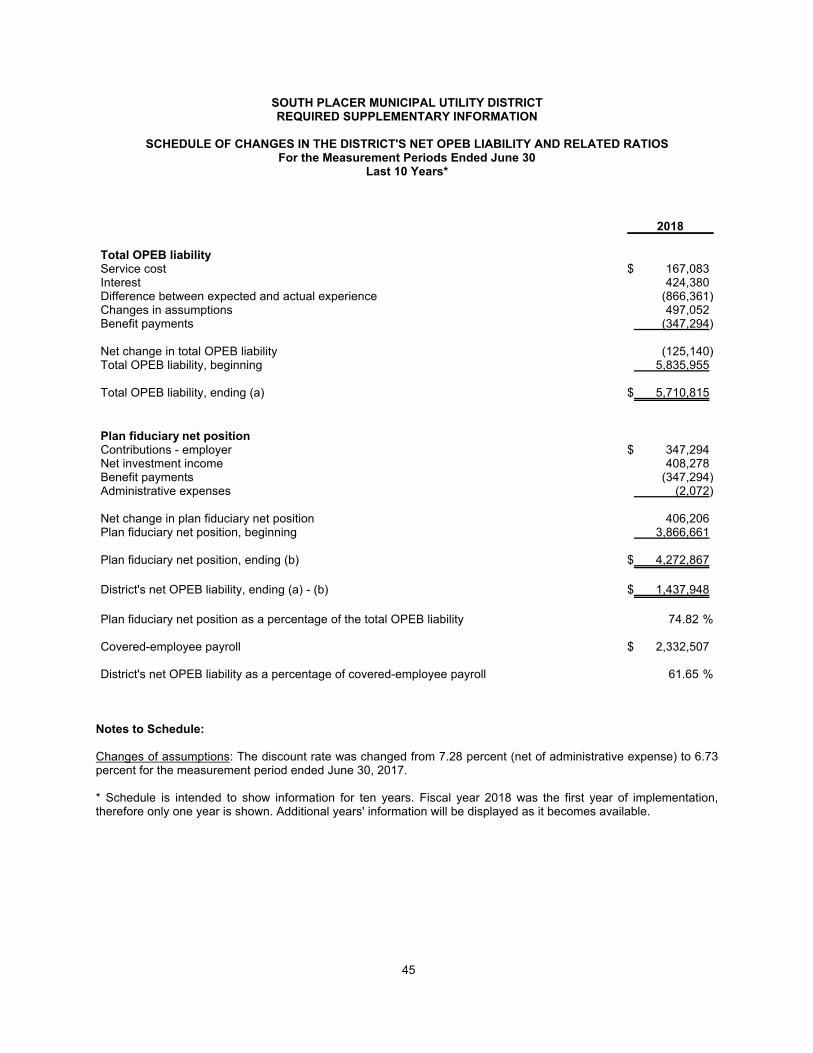
SOUTH PLACER MUNICIPAL UTILITY DISTRICTREQUIRED SUPPLEMENTARY INFORMATION
SCHEDULE OF CHANGES IN THE DISTRICT'S NET OPEB LIABILITY AND RELATED RATIOSFor the Measurement Periods Ended June 30
Last 10 Years*
2018
Total OPEB liabilityService cost $ 167,083Interest 424,380Difference between expected and actual experience (866,361)Changes in assumptions 497,052Benefit payments (347,294)
Net change in total OPEB liability (125,140)Total OPEB liability, beginning 5,835,955
Total OPEB liability, ending (a) $ 5,710,815
Plan fiduciary net positionContributions - employer $ 347,294Net investment income 408,278Benefit payments (347,294)Administrative expenses (2,072)
Net change in plan fiduciary net position 406,206Plan fiduciary net position, beginning 3,866,661
Plan fiduciary net position, ending (b) $ 4,272,867
District's net OPEB liability, ending (a) - (b) $ 1,437,948
Plan fiduciary net position as a percentage of the total OPEB liability %74.82
Covered-employee payroll $ 2,332,507
District's net OPEB liability as a percentage of covered-employee payroll %61.65
Notes to Schedule:
Changes of assumptions: The discount rate was changed from 7.28 percent (net of administrative expense) to 6.73percent for the measurement period ended June 30, 2017.
* Schedule is intended to show information for ten years. Fiscal year 2018 was the first year of implementation,therefore only one year is shown. Additional years' information will be displayed as it becomes available.
45

SOUTH PLACER MUNICIPAL UTILITY DISTRICTREQUIRED SUPPLEMENTARY INFORMATION
SCHEDULE OF CONTRIBUTIONS For the Fiscal Year Ended June 30
Last 10 Years*
2018
Actuarilly Determined Contribution (ADC) $ 292,275Contributions in relation to the ADC (274,870)
Contribution deficiency (excess)** $ 17,405
Covered-employee payroll 2,332,507
Contributions as a percentage of covered-employee payroll 11.78%
* Schedule is intended to show information for ten years. Fiscal year 2018 was the first year of implementation,therefore only one year is shown. Additional years' information will be displayed as it becomes available.
** The District has consistently contributed 100% or more of the ADC each year for at least the past 5 years. In July2018, the District deposited an additional $17,405. This amount, when added to the contributions shown above, fullysatisfies the fiscal year end 2018 ADC shown above.
46

Supplementary Information
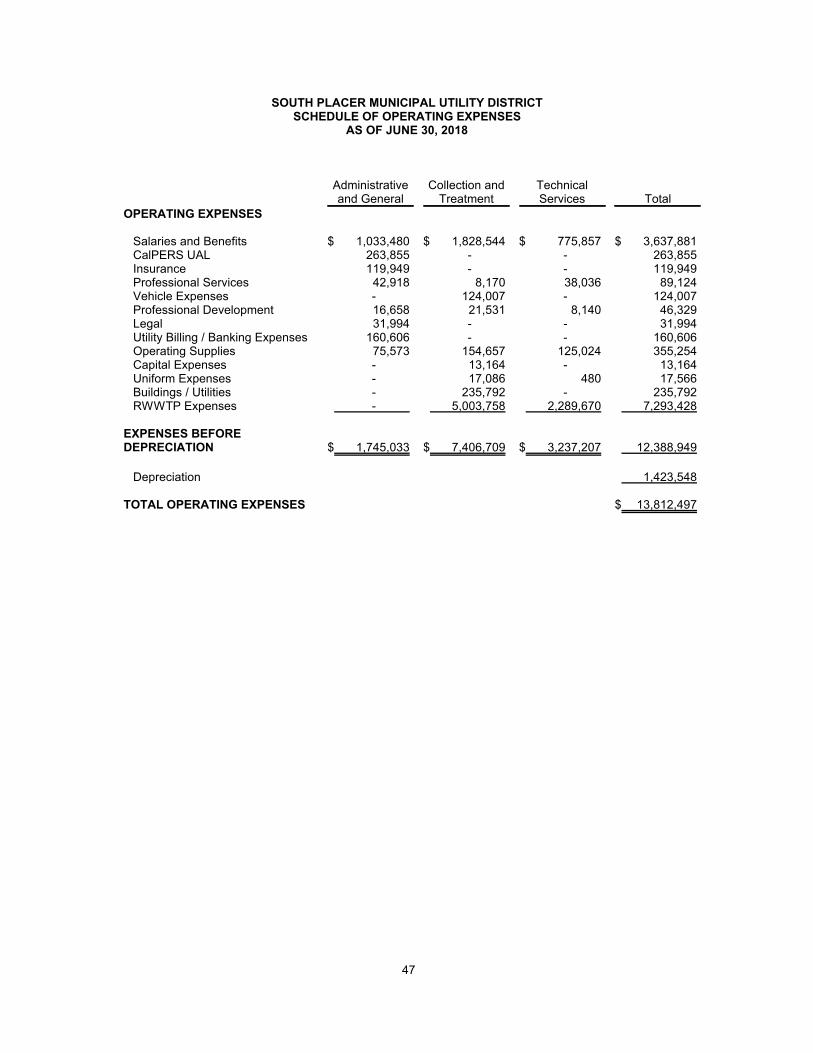
SOUTH PLACER MUNICIPAL UTILITY DISTRICTSCHEDULE OF OPERATING EXPENSES
AS OF JUNE 30, 2018
Administrativeand General
Collection andTreatment
TechnicalServices Total
OPERATING EXPENSES
Salaries and Benefits $ 1,033,480 $ 1,828,544 $ 775,857 $ 3,637,881CalPERS UAL 263,855 - - 263,855Insurance 119,949 - - 119,949Professional Services 42,918 8,170 38,036 89,124Vehicle Expenses - 124,007 - 124,007Professional Development 16,658 21,531 8,140 46,329Legal 31,994 - - 31,994Utility Billing / Banking Expenses 160,606 - - 160,606Operating Supplies 75,573 154,657 125,024 355,254Capital Expenses - 13,164 - 13,164Uniform Expenses - 17,086 480 17,566Buildings / Utilities - 235,792 - 235,792RWWTP Expenses - 5,003,758 2,289,670 7,293,428
EXPENSES BEFOREDEPRECIATION $ 1,745,033 $ 7,406,709 $ 3,237,207 12,388,949
Depreciation 1,423,548
TOTAL OPERATING EXPENSES $ 13,812,497
47

STATISTICAL SECTION OBJECTIVES
SOUTH PLACER
MUNICIPAL UTILITY
DISTRICT
STATISTICAL SECTION
FISCAL YEAR ENDING
JUNE 30, 2018
48
STATISTICAL SECTION
The Statistical Section of the South Placer Municipal Utility District Comprehensive Annual
Financial Report presents detailed information as a context for understanding the District’s
economic condition and overall health.
CONTENTS
Financial Trends Data
These schedules contain financial trend information for the District’s financial performance.
1. Changes in Net Position
2. EDU Connections by Fiscal Year.
Revenue Capacity Data
These schedules contain information to help the reader access the District’s most significant
local revenue source.
3. Delinquent Accounts - Equal Dwelling Units – Sewer Service Charges
4. Annual/Monthly Sewer Rates/Participation Fees & Rate Comparison
Debt Capacity Data
This narrative presents information regarding the District’s participation and debt burden
through the South Placer Wastewater Authority (SPWA).
Demographic & Economic Information
These schedules contain demographic information for Placer County
5. Ten Largest District Customers
6. County Demographics, unemployment
7. Placer County Largest Employers
8. Property Taxes
Operating Information
These schedules provide information on the Districts infrastructure replacement program and
details spending on current large projects.
9. Capital Spending
10. Detail of Capital Spending

49
Sources: Unless otherwise noted, the information in these schedules is derived from the District Annual Financial Reports for the relevant year.
1. CHANGES IN NET POSITION
LAST TEN YEARS
These schedules contain financial trend information for the District’s financial performance
for the last ten years.
2013-14 2014-15 2015-16 2016-17 2017-18
OPERATING REVENUES:
Sewer charges 10,202,898 10,758,026 10,911,091 11,196,600 12,694,346
Connections charges 1,005,529 888,198 1,443,773 4,700,227 2,520,400
Permits, Fees and Inspections 538,220 274,971 443,885 475,524 338,446
Total Operating Revenues 11,746,647 11,921,195 12,798,749 16,372,351 15,553,192
OPERATING EXPENSES:
Collection & Treatment 6,418,108 6,403,314 6,476,122 6,756,711 7,406,709
Administrative & General 1,104,119 1,332,209 1,269,273 2,226,083 1,745,033
Technical Services 704,383 1,818,102 2,106,383 2,443,940 3,237,207
Depreciation 1,088,844 1,163,361 1,381,819 1,343,872 1,423,548
Total Operating Expenses 9,315,454 10,716,986 11,233,597 12,770,606 13,812,497
Operating Income (loss) 2,431,193 1,204,209 1,565,152 3,601,745 1,740,695
NON-OPERATING REVENUES (EXPENSES):
Tax Revenue 893,954 686,237 790,587 874,218 929,449
Gain (loss) on sale of asset - - - (27,186) 63,498
Interest Income 545,196 513,964 825,604 193,023 321,933
Interest Expense 14,544 (129,039) (122,564) (120,912) (119,120)
Total Non-Operating Revenues 1,453,694 1,071,162 1,493,627 919,143 1,195,760
TRANSFERS & CAPITAL CONTRIBUTIONS:
Capital Contributions 4,099,981 2,651,181 1,957,751 2,819,904 6,680,289
Transfers In 1,527,718 1,027,284 2,451,218 4,128,264 5,469,970
Transfers Out (1,527,718) (1,027,284) (2,451,218) (4,128,264) (5,469,970)
Total Transfers & Capital Contributions 4,099,981 2,651,181 1,957,751 2,819,904 6,680,289
INCREASE IN NET POSIITON: 7,984,868 4,926,552 5,016,530 7,340,792 9,616,744
NET POSITION, BEGINNING OF YEAR: 98,782,297 106,767,165 108,521,299 113,537,829 120,878,621
PRIOR PERIOD ADJUSTMENT - (3,172,418) - - (1,622,000)
NET POSITION, END OF YEAR: 106,767,165 108,521,299 113,537,829 120,878,621 128,873,365

50
CHANGES IN NET POSITION – continued
2008-09 2009-10 2010-11 2011-12 2012-13
OPERATING REVENUES:
Sewer charges 7,250,894 7,827,078 8,599,106 9,489,453 10,260,093
Connections charges 696,125 376,895 267,268 411,250 680,755
Permits, Fees and Inspections 102,231 53,592 51,049 44,720 132,774
Total Operating Revenues 8,049,250 8,257,565 8,917,423 9,945,423 11,073,622
OPERATING EXPENSES:
Collection & Treatment 6,927,431 7,811,646 8,665,187 7,060,338 6,080,773
Administrative & General 1,130,248 978,741 1,032,454 998,869 1,054,767
Technical Services - 657,671 617,663 667,200 688,465
Depreciation 1,058,521 1,059,168 1,067,596 1,052,093 1,022,054
Total Operating Expenses 9,116,200 10,507,226 11,382,900 9,778,500 8,846,059
Operating Income (loss) (1,066,950) (2,249,661) (2,465,477) 166,923 2,227,563
NON-OPERATING REVENUES (EXPENSES):
Tax Revenue 718,957 655,680 607,420 575,130 610,400
Gain (loss) on sale of asset 496,039 - 7,279 312 4,039
Interest Income 1,059,780 653,106 619,371 643,017 595,320
Interest Expense 39,219 9,523 15,979 10,551 12,271
Total Non-Operating Revenues 2,313,995 1,318,309 1,250,049 1,229,010 1,222,030
TRANSFERS & CAPITAL CONTRIBUTIONS:
Capital Contributions 477,350 324,280 10,000 342,900 330,760
Transfers In - 2,516,683 - - -
Transfers Out - (2,516,683) - - -
Total Transfers & Capital Contributions 477,350 324,280 10,000 342,900 330,760
INCREASE IN NET POSIITON: 1,724,395 (607,072) (1,205,428) 1,738,833 3,780,353
NET POSITION, BEGINNING OF YEAR: 90,703,247 92,339,286 91,734,163 94,947,491 94,491,070
PRIOR PERIOD ADJUSTMENT (88,356) 1,949 4,418,756 (2,195,254) 510,874
NET POSITION, END OF YEAR: 92,339,286 91,734,163 94,947,491 94,491,070 98,782,297

51
2. EQUAL DWELLING CONNECTIONS BY FISCAL YEAR
FISCAL
YEAR
TOTAL
EDU'S
EDU
INCREASE% INCREASE
1998/99 18,395 2,033 11.10%
1999/00 20,026 1,631 8.10%
2000/01 21,426 1,353 6.50%
2001/02 23,089 1,663 7.20%
2002/03 24,624 1,535 6.20%
2003/04 25,493 869 3.40%
2004/05 26,160 667 2.50%
2005/06 26,954 783 2.90%
2006/07 27,790 836 3.00%
2007/08 28,665 1,044 3.10%
2008/09 29,130 465 1.60%
2009/10 29,515 385 1.30%
2010/11 29,619 104 0.40%
2011/12 30,124 505 1.70%
2012/13 30,249 125 0.40%
2013/14 30,355 106 0.30%
2013/14 30,670 315 1.00%
2014/15 30,900 230 0.70%
2015/16 31,241 341 1.10%
2016/17 31,834 593 1.90%
2017/18 32,825 991 3.00%
2018/19 33,445 620 1.90%

52
3. COLLECTIONS AND DELINQUENT ACCOUNTS – TOTAL EQUAL
DWELLING UNITS/SEWER CHARGES
These schedules contain information about the District’s most significant local revenue source.
FISCAL YEAR SENT TO
TAX COLLECTIONS
DELINQUENT
RECEIVABLES
DELINQUENT
ACCOUNTS TOTAL EDU'S SEWER CHARGES
2017-18 336,459.90 845 33,445 12,344,700.00
2016-17 257,783.00 852 32,810 11,196,600.00
2015-16 271,300.00 890 31,834 10,911,100.00
2014-15 244,165.00 820 31,241 10,758,000.00
2013-14 243,315.00 828 30,925 10,203,000.00
2012-13 224,416.00 886 30,595 10,260,000.00
2011-12 209,925.74 898 30,235 9,489,000.00
2010-11 207,530.00 897 29,730 8,600,000.00
2009-10 174,132.00 866 29,626 7,827,000.00
2008-09 145,100.00 798 29,241 7,250,900.00
Note: Delinquent Accounts are assigned once each year. The delinquent account balances are
collected through the Placer County Property Tax Rolls and paid throughout the year to the
District.
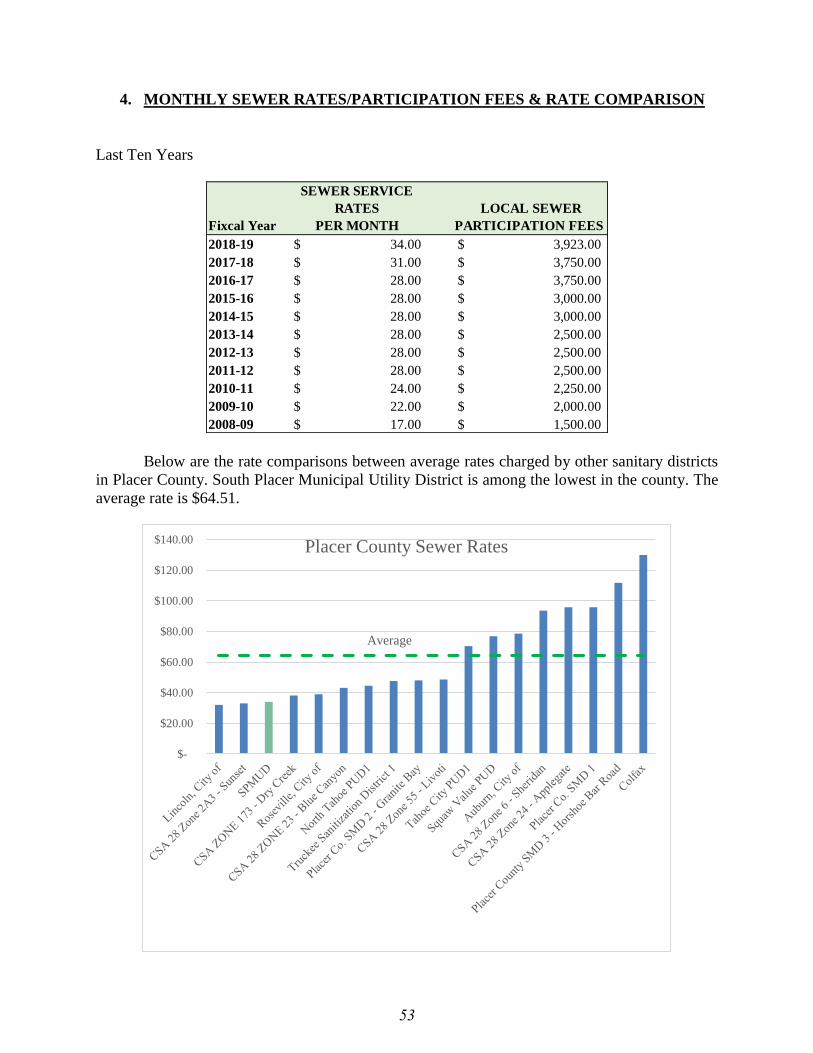
53
4. MONTHLY SEWER RATES/PARTICIPATION FEES & RATE COMPARISON
Last Ten Years
Fixcal Year
SEWER SERVICE
RATES
PER MONTH
LOCAL SEWER
PARTICIPATION FEES
2018-19 34.00$ 3,923.00$
2017-18 31.00$ 3,750.00$
2016-17 28.00$ 3,750.00$
2015-16 28.00$ 3,000.00$
2014-15 28.00$ 3,000.00$
2013-14 28.00$ 2,500.00$
2012-13 28.00$ 2,500.00$
2011-12 28.00$ 2,500.00$
2010-11 24.00$ 2,250.00$
2009-10 22.00$ 2,000.00$
2008-09 17.00$ 1,500.00$
Below are the rate comparisons between average rates charged by other sanitary districts
in Placer County. South Placer Municipal Utility District is among the lowest in the county. The
average rate is $64.51.
$-
$20.00
$40.00
$60.00
$80.00
$100.00
$120.00
$140.00
Average
Placer County Sewer Rates
54
DEBT ADMINISTRATION
5. DEBT CAPACITY
The District does not currently have any debt in the sense of conventional loans or bond
financing of District Improvements. The District, the City of Roseville and Placer County are
participants in the South Placer Wastewater Authority (SPWA) with the intended purpose to
finance the construction of the Pleasant Grove Wastewater Treatment Plant through bonds, low-
interest loans or other types of debt. As such, the District is subject to the SPWA Funding
Agreement and debt indenture. AS of 2016, the District maintained a balance of $43 Million in
the Rate Stabilization Account on deposit with the Authority. Without any changes the District
currently has over 21 years of debt service on account with SPWA.
SPWA has programed over $80 Million in Capital Improvements and Treatment Upgrades at the
Placer Grove Wastewater Treatment Plant. These improvements are funded through a blend of
bond financing, State Revolving Fund loans and cash payments. SPMUD estimates that an
increase of debt payments assigned to the District will be approximately $1.1 Million over the
current 5-year Financial Plan.
In accordance with the SPWA debt indenture, SPMUD has covenanted to prescribe and collect
rates and charges sufficient to yield net revenues at least equivalent to 110% of its share of debt
service. The source of funding for this reserve can be accounted for from all SPMUD revenues
and are expected to provide Debt Coverage Ratio of 110% over the lives of the Bonds.
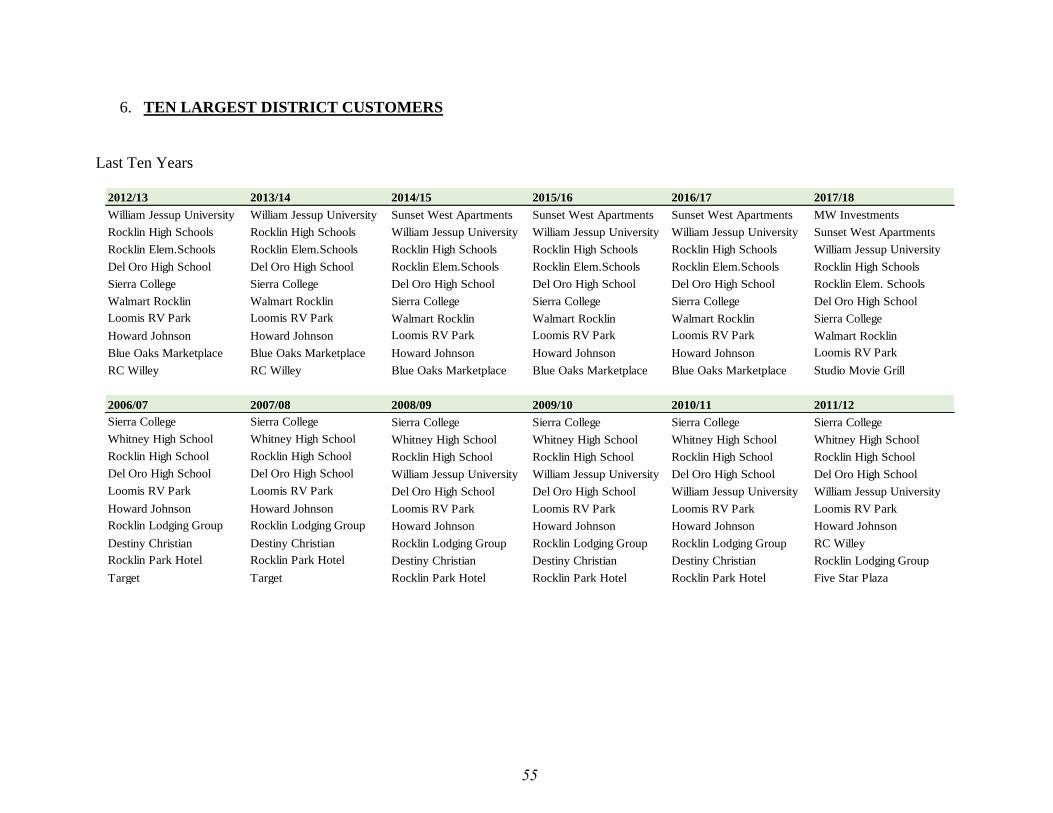
55
6. TEN LARGEST DISTRICT CUSTOMERS
Last Ten Years
2012/13 2013/14 2014/15 2015/16 2016/17 2017/18
William Jessup University William Jessup University Sunset West Apartments Sunset West Apartments Sunset West Apartments MW Investments
Rocklin High Schools Rocklin High Schools William Jessup University William Jessup University William Jessup University Sunset West Apartments
Rocklin Elem.Schools Rocklin Elem.Schools Rocklin High Schools Rocklin High Schools Rocklin High Schools William Jessup University
Del Oro High School Del Oro High School Rocklin Elem.Schools Rocklin Elem.Schools Rocklin Elem.Schools Rocklin High Schools
Sierra College Sierra College Del Oro High School Del Oro High School Del Oro High School Rocklin Elem. Schools
Walmart Rocklin Walmart Rocklin Sierra College Sierra College Sierra College Del Oro High School
Loomis RV Park Loomis RV Park Walmart Rocklin Walmart Rocklin Walmart Rocklin Sierra College
Howard Johnson Howard Johnson Loomis RV Park Loomis RV Park Loomis RV Park Walmart Rocklin
Blue Oaks Marketplace Blue Oaks Marketplace Howard Johnson Howard Johnson Howard Johnson Loomis RV Park
RC Willey RC Willey Blue Oaks Marketplace Blue Oaks Marketplace Blue Oaks Marketplace Studio Movie Grill
2006/07 2007/08 2008/09 2009/10 2010/11 2011/12
Sierra College Sierra College Sierra College Sierra College Sierra College Sierra College
Whitney High School Whitney High School Whitney High School Whitney High School Whitney High School Whitney High School
Rocklin High School Rocklin High School Rocklin High School Rocklin High School Rocklin High School Rocklin High School
Del Oro High School Del Oro High School William Jessup University William Jessup University Del Oro High School Del Oro High School
Loomis RV Park Loomis RV Park Del Oro High School Del Oro High School William Jessup University William Jessup University
Howard Johnson Howard Johnson Loomis RV Park Loomis RV Park Loomis RV Park Loomis RV Park
Rocklin Lodging Group Rocklin Lodging Group Howard Johnson Howard Johnson Howard Johnson Howard Johnson
Destiny Christian Destiny Christian Rocklin Lodging Group Rocklin Lodging Group Rocklin Lodging Group RC Willey
Rocklin Park Hotel Rocklin Park Hotel Destiny Christian Destiny Christian Destiny Christian Rocklin Lodging Group
Target Target Rocklin Park Hotel Rocklin Park Hotel Rocklin Park Hotel Five Star Plaza

56
7. DEMOGRAPHICS AND ECONOMIC STATISTICS
Employment and Income Statistics - Last Ten Years
Fiscal
Year
Placer
County
Workforce
Employed UnemployedUnemployment
Rate %
District
Population
Income per
Capita
2017-18 183,900 177,800 6,100 3.32% 22,675 $ 76,600
2016-17 179,800 171,800 8,000 4.45% 22,175 $ 71,435
2015-16 176,800 167,900 8,900 5.03% 21,658 $ 70,490
2014-15 175,800 164,800 11,000 6.26% 21,003 $ 70,100
2013-14 175,800 162,300 13,500 7.68% 20,777 $ 69,800
2012-13 174,900 158,500 16,400 9.38% 20,529 $ 68,800
2011-12 173,700 154,900 18,800 10.82% 20,500 $ 68,200
2010-11 173,700 154,900 18,800 10.82% 20,138 $ 67,900
2009-10 173,300 153,200 20,100 11.60% 20,047 $ 67,900
2008-09 173,300 153,200 20,100 11.60% 19,688 $ 67,000
2007-08 179,700 161,400 18,300 10.18% 19,300 $ 64,400
Sources: State of California, Department of Finance
8. PLACER COUNTY LARGEST EMPLOYERS
Current Year and Ten Years ago
2017/18
Business or Organization
Number of
Employees Business or Organization
Number of
Employees
Kaiser Permanente 5835 Hewlett Packard Enterprise Co. 3600
Sutter Health 5630 County of Placer 2875
Squaw Valley Alpine Meadows 2600 Kaiser Permanente 2673
Thunder Valley Casino Resort 2114 Thunder Valley Casino Resort 1700
Hewlett Packard Enterprise Co. 2000 Sutter Health 1543
Pride Industries Inc. 1747 Pride Industries Inc. 1479
Roseville City School District 1486 Union Pacific Railroad Company 1400
City of Roseville 1137 Wells Fargo 1320
Adventist Health System 1008 City of Roseville 1319
Union Pacific Railroad Co. Inc 994 Dry Creek Joint Elementary School District 992
2008/09
Source: Sacramento Business Journal, May 2017

57
9. TOP TEN TAXPAYERS – PLACER COUNTY
Taxpayer Name Total Tax Percentage Net Taxable Value
Pacfic Gas & Electric Company 12,313,926$ 1.30% 742,468,290$
Roseville Shoppingtown LLC 4,448,238$ 0.46% 421,334,951$
Cellco Partnership 3,519,107$ 0.37% 212,326,968$
BBC Roseville Oaks LLC 1,934,975$ 0.20% 48,363,529$
Roseville Fountains LP 1,592,974$ 0.17% 70,452,372$
Liberty Utilities (Calpeco Electric), LLC 1,426,437$ 0.15% 86,064,736$
Union Pacific Railroad Company 1,257,358$ 0.13% 87,498,614$
Consolidated Communications of CA 1,190,618$ 0.12% 71,973,730$
MGP X Properties LLC 1,175,846$ 0.12% 72,822,135$
ATC Realty One LLC 1,147,686$ 0.12% 29,800,281$

58
10. CAPITAL SPENDING - FY 11/12 TO FY 17/18
CAPITAL PROJECT REVIEW FY11/12 FY12/13 FY13/14 FY14/15 FY15/16 FY16/17 FY17/18
ACCOUNT CLERK WORKSTATION/CUBICLES 3,543$ 5,585$ 8,989$
BOARD ROOM FURNITURE 6,057
CCTV REPLACEMENT SINGLE COND. CABLE 4,159 4,981
CCTV SOFTWARE EVALUATION 3,154 4,205 6,308
CCTV VEHICLE REPLACEMENT 96,950 208,623 3,366 106,792
CORP YARD STORAGE ENCLOSURE UPGRADE 37,342 53,554
CORP YARD VEHICLE WASH FACILITY UPGRADES 20,000
COMPUTER EQUIPMENT 36,444 18,300 19,280 24,452 4,255 9,516
CORP YARD BATHROOM RENOVATION 6,970
CORP YARD & HQ FIRE AND ENTRY ALARM REPLACEMENT 37,890 5,647
CORP YARD/HQ SMART T.V. SCREENS 1,615
CORPORATION YARD EXTERIOR REHABILITATION 3,837 37,342 9,860
CORPORATION YARD MASTER PLAN IMPROVEMENTS 21,528 3,245
CORPORATION YARD PAVEMENT INSTALLATION 20,000 101,437 53,555
DATA ACQUISITION 19,944 82,030 409,000 33,297 20,915 8,821 4,002
DISTRICT PARTICIPATION IN REGIONAL PROJECTS 129,996
EASEMENT ROADWAY REPLACEMENTS 64,715 52,679 30,740 35,000 22,623
FLAIL MOWER REPLACEMENT 6,581
FOOTHILL TRUNK PROJECT 216,414 85,535 16,974
GPS SURVEY UNIT 13,539
HANDS FREE COMMUNICATION 6,500
HYDRO-VAC EXCAVATION KIT 6,800
HYDRO CLEANING NOZZLE - CHAIN FLAIL 7,800
HRF PRE-DESIGN 38,953
INTERIOR PAINTING 3,950
LATERAL CAMERA REPLACEMENTS 20,677

59
CAPITAL SPENDING - CONTINUED
CAPITAL PROJECT REVIEW FY11/12 FY12/13 FY13/14 FY14/15 FY15/16 FY16/17 FY17/18
LIFT STATION REHAB/PUMP REPLACEMENT 17,339 12,420 12,533 34,817 4,415
LOWER CLOVER VALLEY TRUNK 45,329 12,149
LOWER LOOMIS "10" TRUNK CIPP LINER 378,941
LOWER LOOMIS DIVERSION TRUNKLINE PROJECT 69,998 43,119 517,468 6,690,017
NEWCASTLE MASTER PLAN IMPROVEMENTS 222,695
PORTABLE FLOW RECORDER REPLACEMENT 40,000
PORTABLE GENERATOR REPLACEMENT 106,256
RECONDITION SUPER BACKHOE 15,000
REMOTE SITE CONTROLS IMPROVEMENTS - SCADA 102,934
REPLACEMENT 580 SUPER E BACKHOE 86,761
REPLACEMENT OF MINI-CAMERAS 4,159 28,204
REPLACEMENT OF VIBRA-PLATE COMPACTOR 2,074
ROOT FOAMING - HYDRO TRUCK RETROFIT 4,306 4,853 49,694
RPS HARDWARE/SOFTWARE UPGRADE 10,000 4,500 150,000 51,098
SAFETY TRAINING AIDS 1,945
SCADA (Lift Station Control Panel Impr.) 12,511 76,812 88,557 102,933
SCANNER 7,488
SEWER CLEANING HEADS 4,306 5,741 8,612 9,980 7,844
SMART COVERS 9,982
SMOKE TESING EQUIPMENT 4,558
SYSTEM REHABILITATION 273,155 45,876 259,284 116,643 220,000 778,147
SYSTEM IMPROVEMENTS 64,575
VEHICLE - VACTOR TRUCK 908,821
UPPER ANTELOPE CREEK-EAST TRUNK 1,817,550 547,456
VOIP TELEPHONE REPLACEMENT 8,300
WATER SAMPLING EQUIP 3,570 6,000
WHITNEY RANCH RECORDER 29,744
I80/HWY 65 PIPLEINE RELOCATION - DISTRICT SHARE 110,062
TOTALS 457,735$ 2,169,400$ 1,823,795$ 1,422,137$ 756,053$ 839,062$ 9,109,615$