Ending Poverty and Hunger by 2030
32
Ending Poverty and Hunger by 2030 AN AGENDA FOR THE GLOBAL FOOD SYSTEM Second Edition with Foreword by Dr. Jim Yong Kim Public Disclosure Authorized Public Disclosure Authorized Public Disclosure Authorized Public Disclosure Authorized
-
Upload
khangminh22 -
Category
Documents
-
view
0 -
download
0
Transcript of Ending Poverty and Hunger by 2030

Ending Poverty and Hunger by 2030An AgEndA for tHE globAl food SyStEm
Second Editionwith foreword by dr. Jim yong Kim
Pub
lic D
iscl
osur
e A
utho
rized
Pub
lic D
iscl
osur
e A
utho
rized
Pub
lic D
iscl
osur
e A
utho
rized
Pub
lic D
iscl
osur
e A
utho
rized
WB406484
Typewritten Text
95768

© 2015 World Bank Group
1818 H Street NWWashington, DC 20433Telephone: 202-473-1000Internet: www.worldbank.org www.worldbank.org/foodsecurityTwitter: @WBG_AgricultureEmail: [email protected]
All rIGHTS rESErvED
This volume is a product of the staff of the World Bank Group. The findings, interpretations, and conclusions ex-pressed in this volume do not necessarily reflect the views of the Executive Directors of World Bank Group or the governments they represent.
The World Bank Group does not guarantee the accuracy of the data included in this work. The boundaries, colors, denominations, and other information shown on any map in this work do not imply any judgment on the part of World Bank Group concerning the legal status of any territory or the endorsement or acceptance of such bound-aries.
Rights and Permissions
The material in this publication is copyrighted. Copying and/or transmitting portions or all of this work without permission may be a violation of applicable law. World Bank Group encourages dissemination of its work and will normally grant permission to reproduce portions of the work promptly.
For permission to photocopy or reprint any part of this work, please send a request with complete information to the Copyright Clearance Center, Inc., 222 rosewood Drive, Danvers, MA 01923, USA, telephone: 978-750-8400, fax: 978-750-4470, http://www.copyright.com/.
All other queries on rights and licenses, including subsidiary rights, should be addressed to the Office of the Pub-lisher, World Bank Group, 1818 H Street NW, Washington, DC 20433, USA, fax: 202-522-2422, e-mail: [email protected].
Authorsrobert F. Townsend (lead author), in collaboration with a broad World Bank Group team.
ImagesFront cover: Boubakary Cisse Back cover: Sarwat Hussain/World BankInterior: 2, Bijay Gajmer/World Bank 4, Maria Fleischmann/World Bank 6, H. De Groote/CIMMYT 9, Bart verweij/World Bank 11, Markus Kostner/World Bank 13, UN Photo/lamphay Inthakoun 15 (l), John Bill 15 (c), Danilo Pinzon 15 (r), Maria Fleischmann 24, africa924/Shutterstock.com 26, Simone D. McCourtie/World Bank

mAy 2015
Second Edition
Ending Poverty and Hungerby 2030An AgEndA for tHE globAl food SyStEm

3an agenda for the global food system
forEword
The food system is fundamental for human life. It provides the energy and nutrition that people need as a basis for economic and social advance. It provides an income source for billions of people, many of whom are poor, and it is the largest user of the world’s natural resources. Yet about 800 million people still go to bed hungry every night, and many more suffer from the “hidden hunger” of malnutrition.
That’s why the world needs a food system that can feed every person, every day, everywhere with a nutritious and affordable diet, delivered in a sustainable way.
The food system operates across many sectors and touches upon many aspects of society— agriculture, health and nutrition, the environment, business, equity and culture, to name a few. As a result, improvements in its operations that help end hunger can also contribute to ending extreme poverty.
To achieve these goals, however, we need action. For this reason, the World Bank Group is pleased to present “Ending Poverty and Hunger by 2030: An Agenda for the Global Food System.”
This report is a guide for change, identifying key issues where the global food system should improve. The food system must become more sustainable. It must also raise the agricultural productivity of poor farmers, improve nutritional outcomes, and broadly adopt climate-smart agriculture that can withstand and mitigate climate change. (A digital version of the report is available at www.worldbank.org/agriculture.)
Later this year, we expect that the Sustainable Development Goals will endorse ending extreme poverty and hunger by 2030. Achieving these goals depends on what we do next because, as this report shows, we have the knowledge we need. The World Bank Group is committed to using that knowledge and strengthening partnerships to build a global food system that creates a healthier and more prosperous world.
Jim Yong KimPresident
The World Bank Group

4 ending poverty and hunger by 2030
The Global Food System Needed by 2030 To permanently end poverty and hunger by 2030, the world needs a food system that can feed every person, every day, everywhere; that can raise real incomes of the poorest peo-ple; that can provide safe food and adequate
nutrition; and that can better steward the world’s natural resources. Urgently, we need a food system that is more resilient and that shifts from being a major contributor to cli-mate change to being part of the solution. All these aspects are closely interlinked, calling for a more comprehensive approach to deliv-ering a healthier and more prosperous future.

5an agenda for the global food system
A Call for Action. This document lays out key elements of an action agenda for the global food system called for by the Sus-tainable Development Goals of ending pov-erty and hunger by 2030. It builds on les-sons learned, recognizing the need for broad partnerships and multisectoral approaches to achieve these goals. It calls on key partners, coalitions, and alliances to come together to help shape the evolution of the global food system to permanently end poverty and hun-ger by 2030. We need to accelerate progress on raising incomes of the poor, on ending hunger, and on ensuring a more sustain-able path for the food system. The three core elements of the agenda are aligned around (i) ensuring a more climate-smart agricul-ture, (ii) improving nutritional outcomes, and (iii) strengthening value chains and improv-ing market access. Within these groupings, a combination of policies, investments, knowl-edge, partnerships, South-South learning, and political will and leadership will be needed.
Accelerated Progress needed to End Poverty and Hunger by 2030Among the Sustainable Development Goals, to be finalized later this year, are goals to end
poverty and hunger by 2030—a considerable push is needed to achieve them. The world has made significant progress since setting the Millennium Development Goal to halve poverty and hunger between 1990 and 2015. Despite progress, 800 million people still go to bed hungry every night, and an even greater number live in poverty (defined as living on less than $1.25 per day). Poverty in the devel-oping world has halved since 1990, with an ongoing push to halve hunger by the end of 2015. Poverty and hunger prevalence in devel-oping countries had declined to 21 percent and 15 percent of the population, respectively, by 2010.1 Overall progress has been uneven, with a lag in low-income countries, where poverty and hunger prevalence in 2010 were 48 percent and 28 percent of the population, respectively.2
In addition, more progress has been made on reducing undernourisment (providing ade-quate amounts of available dietary energy) than on reducing undernutrition (under-weight and micronutrient deficiency). Given the number of people still living in poverty and suffering from hunger, new Sustainable Devel-opment Goals that are to be finalized later this year include ending poverty and hunger by 2030. A significant acceleration of progress and support is required to achieve these goals, particularly in low-income countries.

6 ending poverty and hunger by 2030
raising Incomes of the PoorMost of the world’s poor live in rural areas. By 2030, some will migrate to urban areas, but most will not, and the rural population in less developed regions may even increase slightly. Most of the income gains needed to end poverty by 2030 therefore will need to come from activities in rural areas. In 2010, over 900 million poor people (78 percent of the poor) lived in rural areas, with about 750
million working in agriculture (63 percent of the total poor).3 About 200 million rural poor could migrate to urban areas by 2030, based on urbanization projections and assuming migration of a proportional share of the rural population that is poor (if 3 of every 10 people who migrate are poor). This would leave about 700 million poor people in rural areas to be lifted out of poverty by 2030. Even with a pro-jected increase of the share of the population

7an agenda for the global food system
living in urban areas in less developed regions (increasing from 46 percent in 2010 to 56 per-cent in 2030), population growth is projected to still lead to a small net increase in the num-ber of people in rural areas from 3.06 billion to 3.13 billion people.4
Ending poverty will require substantial income increases for poor people in rural areas. In low-income countries, the average income of poor people (defined as those liv-ing on less than $1.25 per day) is 78 cents; in China and India it is 95 cents and 96 cents, respectively.5 Lifting these people above $1.25 per day requires average income gains of at least 60 percent in Sub-Saharan Africa and at least 30 percent in Asia (particularly in China and India). While this represents average incomes of the poor, for those earning signifi-cantly less, incomes will need to double. The implied per capita income increases needed are 3 percent per year to raise average incomes
by 60 percent from 2015 to 2030, and 4.4 per-cent per year to double incomes of the poorest groups.6 These rates are higher than the rates recently achieved in the poorest countries. Improved agricultural productivity and cli-mate resilience, strengthened links to mar-kets, agribusiness growth, and rural non-farm incomes are needed to raise incomes. Overall, growth originating from agriculture has been two to four times more effective at reducing poverty than growth originating from other sectors.7 And there is some evi-dence that income gains from agricultural activities have been no more costly to achieve than income gains in other sectors.8 Small-holder productivity has recently increased even in the poorest regions such as Sub- Saharan Africa, where higher cereal yields have been closely correlated with a higher share of the population above the poverty line (see figure 1). Rwanda and Ethiopia are
Figure 1 Poverty reduction has been closely correlated with higher yields in Sub-Saharan Africa
Source: World Development Indicators, POVCAL.
30
35
40
45
50
55
700
800
900
1,000
1,100
1,200
1,300
1,400
1,500
1989
1990
1991
1992
1993
1994
1995
1996
1997
1998
1999
2000
2001
2002
2003
2004
2005
2006
2007
2008
2009
2010
Perce
nt of
popu
lation
living
on m
ore t
han $
1.25 p
er da
y
Cere
al yie
ld, kg
/ha
Cereal yield
Percent of population living on more than $1.25 per day

8 ending poverty and hunger by 2030
examples of very significant yield growth and correspondingly large reductions in poverty.9
But this has not happened everywhere; for example, Zambia experienced similarly high cereal yield growth, but the impacts on pov-erty were more limited there as possibly poor farmers have participated less in this growth.10
Ensuring that growth has significant impacts on the incomes of the poor is what is needed to end poverty. Linking farmers to markets, strengthening agribusinesses, and generating rural non-farm income can help raise incomes and provide jobs.
Improving crop and livestock systems, aqua-culture and fisheries is needed. In addition to raising crops yields, in many areas improved livestock productivity and animal health will be essential to end poverty.11 Animal agricul-ture is the only means of livelihood for poor people in many agroecological areas. In mixed crop and livestock systems, livestock help to diversify income sources; they provide draft power, fertilizer fuel, and transportation, as well as act as a store of wealth or savings for poor households. In addition, livestock can provide value-adding activities such as pro-duction of eggs, other livestock food products (such as milk and yogurt), and nonfood prod-ucts (such as wool and woven products) that can help raise incomes. Aquaculture and cap-ture fisheries also provide an important source of income for poor people. Most of the recent growth in aquaculture has been in developing countries accounting for over 40 percent of global fish production.12
Economic structural transformation is under way, but the food system remains (and is likely to remain for some time) a significant
source of employment. Globally, 30 per-cent of all workers are employed in primary agriculture. The share is 60 percent in Sub- Saharan Africa.13 Even though the overall share of employment in farming may be lower by 2030, the number of farmers may still increase in many countries—as projected for many African countries—with a concurrent increase in new jobs in food manufacture, preparation, marketing, transport, and other agrifood sys-tem services.14 As economies grow, the eco-nomic size of agribusiness (agricultural input- supplying and output processing subsec-tors) relative to farming increases. In Sub- Saharan Africa, the agribusiness sector is about half the economic size of farming; in Asia and Latin America, it is about two to three times the size; while in some indus-trial countries it is more than 10 times as large.15 The rising importance of agribusiness offers significant scope and opportunities for employment growth and value added in the post-harvest phase. In India, a 10 percent growth in organized food processing output leads to employment growth in this subsec-tor of about 5 percent.16 Agriculture and the broader food system thus is a key part of the jobs agenda. Rural non-farm employment is also a significant source of jobs and incomes. In India, rural non-farm employment is greater than all of urban employment.17 Higher agricultural productivity and rural non-farm employment are positively correlated.
Improving the performance of the food sys-tem can contribute significantly to broader shared prosperity. Labor is often the most important asset of the poor in developing countries. Thus, raising the returns to labor in agriculture and in the jobs in the food system,

9an agenda for the global food system
including in agribusiness, can significantly contribute to shared prosperity. Additionally, increasing agricultural supply chain efficiency helps to: (i) lower consumer prices, thereby raising real incomes of poor people every-where (rural as well as urban), because poor people spend a large share of their income on food, and (ii) raise relative prices received by farmers, providing them additional income as well as incentives to enhance productivity and to diversify. Improved food security can dampen the impact of food shocks, avert civil unrest, and reduce impairment of human cap-ital—all of which can contribute to boosting shared prosperity.
under five who are moderately or severely underweight is higher than the share of the population living in poverty (for example, in Yemen). In still other countries, the shares are similar (for example, in Ethiopia).18 This vari-ability calls for a differentiated approach to addressing hunger. In some of the extremely poor countries with low initial levels of agri-cultural production, income gains and food production growth will be vitally important to reduce hunger; but where hunger rates remain stubbornly high despite a low poverty rate, a more targeted and direct approach to improv-ing health outcomes is needed. Social norms also play a role.
Feeding every person, every day, every-where, with a safe, nutritious, and affordable diet will require a multisectoral approach that includes but extends beyond raising incomes. Ensuring the production of sufficient quantities and diversity of food remains fun-damental. Ending hunger by 2030 will require higher incomes and productivity growth of the poorest groups, but this alone will not be sufficient. For the poorest countries, income growth helps reduce the prevalence of calorie deficiency, and in most countries, agricultural growth plays a key role in this income growth.19
Incomes also affect child undernutrition. Esti-mates based on past experience indicate that a 60 percent increase in per capita incomes could reduce current stunting and underweight prevalence, respectively, by about 35 percent and 45 percent.20 But undernutrition becomes less responsive to growth as prevalence rates decline, and impacts are much smaller for lower levels of income growth.21And some countries that have experienced rapid income growth had limited associated improvements
Ending Hunger A differentiated approach, country by coun-try, is needed. Currently there are countries where the share of the population living in poverty is higher than the share of the pop-ulation that is undernourished, and higher than the share of children under five who are moderately or severely underweight (for example, in Togo). In other countries, the reverse is true: the share of the population that is undernourished and the share of children
10 ending poverty and hunger by 2030
in nutrition outcomes. Agricultural produc-tion growth has also been shown to reduce stunting when initial levels of production are low.22 Income growth remains vitally important for ending hunger by 2030, and income growth for most of the poor will need to come from higher agricultural pro-ductivity and better links to markets. In addition to income, investments in nutrition- specific and nutrition-sensitive interventions will also be needed, together with ensuring food availability and stability, particularly in the time of more extreme weather precipitated by a changing climate.
Targeted nutrition programs and nutri-tion-sensitive interventions need to be expanded. Targeted nutrition programs are a critical element of efforts to end stunting and wasting. One study has shown that scaling up 10 proven effective nutrition-specific inter-ventions23 in 34 countries that have 90 percent of the world’s children with stunted growth could reduce child stunting worldwide by 20 percent and the prevalence of severe wasting by 60 percent.24 Increasing the nutrition sen-sitivity of other investments in agriculture and social protection programs can also help significantly.
Nutrition-sensitive interventions in agri-culture include a focus on women, access, availability, and knowledge. For agriculture, these interventions include: (i) investing in women to safeguard and strengthen their capacity to provide for the food security, health, and nutrition of their families; (ii) increasing access to and year-round availability of high-nutrient content food; (iii) improving nutrition knowledge among rural households
to enhance dietary diversity—evidence shows that when diets are extremely undiversified, additional calories have no effect on reducing child malnutrition and that dietary diversity likely moderates the link between income growth and reductions in malnutrition;25 and (iv) incorporating explict nurition objectives and indicators into agricultural investments.26
Closing the gender gap can improve yield and nutritional outcomes. Women are key players in the agriculture sector, accounting for 43 percent of the labor force globally and over 50 percent in some countries in East Asia and Sub-Saharan Africa. But across all regions they own fewer assets (land, livestock, and human capital) and have less access to inputs (seeds, fertilizer, labor, and finance) and ser-vices (extension and insurance) than men do. Ensuring that women have the same access to assets, inputs, and services in agriculture as men could increase women’s yields on farms by 20–30 percent and potentially reduce the number of hungry people by 12–17 percent.27
Ensuring food availability and resilience to more weather extremes is fundamen-tal. Food demand is projected to increase by at least 20 percent globally over the next 15 years,28 with future demand growth increas-ingly concentrated in cities as the world urbanizes and through increased demand for resources required to produce diets that are more intensive in animal-based products.29
Most of the increase in world food demand will be in developing countries, increasing by about 30 percent in Asia and by about 60 per-cent in Sub-Saharan Africa, closely matching needed average income gains of the poor in these regions. Concurrently, global diets are

11an agenda for the global food system
shifting—with more consumption of meat, fish, dairy products, and fruits and vegeta-bles. The largest increase in food demand is expected in the poorest regions,30 where cli-mate change is projected to reduce crop yields by 15–20 percent if temperatures rise above 2°C.31 The global food system is already fac-ing a higher frequency of weather extremes and fundamental shifts in seasonality, all of which have negative impacts, especially for the most vulnerable. Weather extremes con-tributed to three world food price spikes between 2008 and 2012 and the frequency of extreme weather events is projected to increase.32 Climate change adds a significant challenge to ensuring enough food to feed the world by 2030. The world needs a more resil-ient food system that can better withstand cli-mate shocks and longer-term adverse changes in agro-climatic conditions to ensure food is available to meet shifting levels and composi-tion of global food demand.
Different types and scale of production will contribute to ensuring food availability. The world’s food is produced on a range of farm sizes—small, medium, and large. Most of the food in developing countries is produced on approximately 500 million small farms.33
Smallholder production will still be the dom-inant form of production in developing coun-tries by 2030, and it is important that small-holders be able to participate in advances in productivity. Overall, about 85 percent of food is produced in the country where it is con-sumed. Most of the world’s exports of maize, wheat, and soybean are produced on larger farms in OECD counties, Latin America, and the Black Sea region, while world rice exports are produced predominantly by smallholders
in Asia. Among smallholders, commercially oriented farmers deliver surpluses to food markets, but many others are subsistence- oriented farmers, many of whom are net buy-ers of food. This heterogeneity also perme-ates local traders, retailers, and wholesalers with both large-scale and small-scale oper-ators. This diversity will persist to 2030, and the policy environment and associated public investment need to recognize and support this diversity.
Addressing growing levels of obesityObesity has become a significant global health challenge, yet is preventable and reversible. Over the past 20 years, a global overweight/obesity epidemic has emerged, ini-tially in industrial countries and now increas-ingly in low- and middle-income countries, particularly in urban settings, resulting in a triple burden of undernutrition, micronutrient deficiency, and overweight/obesity. There is significant variation by region; some have very high rates of undernourishment and low rates of obesity, while in other regions the opposite

12 ending poverty and hunger by 2030
is true (see figure 2). However, obesity has increased to the extent that the number of overweight people now exceeds the number of underweight people worldwide. The eco-nomic cost of obesity has been estimated at $2 trillion, accounting for about 5 percent of deaths worldwide.34 Almost 30 percent of the world’s population, or 2.1 billion people, are overweight or obese, 62 percent of whom live in developing countries.35 Obesity accounts for a growing level and share of worldwide noncommunicable diseases, including dia-betes, heart disease, and certain cancers that
can reduce quality of life and increase public health costs of already underresourced devel-oping countries. The number of overweight children is projected to double by 2030. Driven primarily by increasing availability of processed, affordable, and effectively marketed food,36 the global food system is falling short with rising obesity and related poor health outcomes. Due to established health impli-cations and rapid increase in prevalence, obe-sity is now a recognized major global health challenge, and no national success stories in curbing its growth have so far been reported.37
Figure 2 Undernourishment and obesity rates vary significantly by region
Source: FAO (2014). The State of Food Insecurity in the World. Rome; Ng, M. et al. (2014). “Global, regional, and national prevalence of overweight and obesity in children and adults during 1980–2013: a systematic anal-ysis for the Global Burden of Disease Study 2013,” Lancet 384:766-81; UN Population Division data. Note: For each developing country the respective obesity data from Ng et al., are weighted by the share of the population above and below 20 years old, and within regions, by the population of each country.
0
5
10
15
20
25
Sub-SaharanAfrica
South Asia East Asia &the Pacific
Latin America &the Carribean
Europe &Central Asia
Middle East &North Africa
Sha
re o
f the
pop
ulat
ion
(%)
UndernourishedObese

13an agenda for the global food system
Ensuring SustainabilityEfforts to lift populations out of poverty and hunger require environmental management to ensure sustainable solutions. Income growth and reductions in hunger have come at a significant environmental cost, with signifi-cant land and water degradation, biodiversity loss, and greenhouse gas (GHG) emissions. Continued environmental degradation will make it increasingly difficult to make needed gains to end poverty and hunger by 2030 and to ensure that these gains are sustained per-manently. We need a food system that makes more-efficient use of already limited land and water resources, is more resilient, and has a significantly lower environmental footprint.
Natural resource degradation and depletion needs to be slowed and reversed. Compe-tition for scarce land and water resources in some regions, due to high population den-sities and growing demand, is increasingly stressing these resources. This competition is expected to increase through 2030. Land and water systems, particularly in major Asian food-producing areas, are now at risk38
from intensive agricultural practices that are
degrading prime agricultural lands, depleting nonrenewable groundwater resources, and degrading aquifers upon which many of the poor depend. The impacts of climate change and the acceleration of the global hydrolog-ical cycle—an increase in evapotranspiration and a change in the frequency, intensity, and seasonal patterns of rainfall as global warm-ing continues—place additional pressures on these scarce resources. More efficient and sus-tainable use of water, particularly groundwater in highly water-stressed regions, is critical.
Agriculture has to become more climate- smart. Agriculture is the production sector most affected by climate change. Significant average crop yield declines are projected with higher temperatures. Declines of 5–10 percent in the concentrations of iron, zinc, and protein in crops such as wheat, rice, and soybeans are projected with increased CO2 concentrations, placing people at greater health risks due to malnutrition.39
Agriculture is also a significant contributor to climate change, accounting for about 25 percent of all GHG emissions (resulting from agriculture and land use change for agricul-ture). Projected global shifts in consumption patterns to more livestock and dairy prod-ucts, which are more emissions-intensive than cereals, will increase the challenge of lowering the aggregate emissions intensity in the sec-tor. Crop and livestock yield gains can reduce emissions per kilogram or liter of output. For example, if there had been no crop yield gains for the major cereals since 1960, 2.8 times more land than is currently cultivated would need to have been brought into production to produce the amount of major cereals the world consumes today.40 In the absence of historical

14 ending poverty and hunger by 2030
yield gains and the implied deforestation needed to feed the world, emissions would per-haps be about double compared to the current emissions from agriculture.41 Nevertheless, a continuation of current agricultural practices is projected to increase agriculture and land use change emissions to the equivalent of 70 percent of total emissions allowable in 2050 to achieve only a 2°C average global tempera-ture increase.42 The three priorities for mak-ing agriculture more climate-smart—raising agricultural productivity, improving resilience, and reducing emissions—will vary by region, reflecting opportunities and trade-offs.
A more responsiveness global food sys-tem can improve resilience to shocks. As incomes rise and households spend a smaller share of their incomes on food, they tend to reduce food consumption less in the case of a food price spike. With less downward adjust-ment of demand, the supply side (through production, stocks, and trade) will need to adjust more quickly to production shocks. This responsiveness is needed to reduce over-all food price volatility and lower the magni-tude and frequency of food price spikes over time, especially given the high vulnerability of the poor, who are least able to cope. Current trade and social protection policies leave many poor people vulnerable to adverse nutritional consequences of food price shocks. And the logistical capacity to transport food from areas of production to areas of demand is especially stretched in many food-insecure locations.
Animal diseases must be contained, as they pose a threat to livelihoods and human health. The food system also needs to help reduce the significant risks and burden of ani-mal diseases, including zoonotic diseases. Cli-mate change could increase risks and uncer-tainty by affecting the range, seasonality, and incidence of animal diseases. Reducing live-stock losses helps to preserve a critical capital asset and source of income and food for poor people.
Capture fisheries and aquaculture need to become more sustainable. Most global capture fisheries are exploited to their bio-logical limit or beyond, threatening biodi-versity, the integrity of coastal habitats, and the livelihoods and food security of about 3 billion people worldwide who rely on these ecosystems. Despite larger fishing fleets and improved technology, the annual volumes of capture fisheries has remained relatively stagnant, accounting for about half of global fish production. Shifting capture fisheries toward sustainable extraction rates remains a challenge, but it is beginning to happen in some fisheries. Aquaculture production is growing rapidly, mostly in developing countries and is projected to be the prime source of fish by 2030. The development of aquaculture needs to be more sustainable, limiting pollution and disruption to the eco-systems, and ensuring biodiversity.

15an agenda for the global food system
Key Elements of the Agenda for ActionMany of the actions needed to end poverty and hunger and to ensure that these gains are permanent, particularly in the context of climate change, overlap. Many of the potential solutions to the emerging challenges are not distinct and separate; often they are
complementary. Core actions can be grouped into ensuring a more climate-smart agricul-ture, improving nutritional outcomes, and strengthening value chains—forming the key elements of the agenda for action. The important issues of environmental sustain-ability, gender, and vulnerability cut across the agenda, and actions are reflected accord-ingly. Within these groupings, a combination

16 ending poverty and hunger by 2030
of investments, policies, knowledge, partner-ships, South-South learning, and political will and leadership will be needed.
1. Ensuring a more climate-smart agricultureClimate-smart agriculture—higher agri-cultural productivity, greater climate resil-ience, reduced GHG emissions (including increased carbon storage in farmland and rangeland)—is essential to permanently end poverty and hunger. While past actions to address these three elements have gener-ally been considered independently, a high priority is to increasingly move to actions that can deliver all three simultaneously—the triple-win. Agricultural productivity is a core element of climate-smart agriculture, and improve-ments in productivity are important for all
regions, particularly Sub-Saharan Africa. The world needs to feed a growing popu-lation. Increasing crop and livestock yields can reduce aggregate GHG emissions per kilogram of food produced and can reduce expansion of production areas into forests,43
providing a form of mitigation of GHG emissions. If the 60 percent average income increase of the poor needed in low-income countries is to be achieved by yield gains alone, yields will need to increase by at least 3 percent per year over the next 15 years, assum-ing no output price effects and no relative input cost increases. Doubling incomes from yield gains alone would require 4.4 percent per year yield growth. These yield gains are higher than the 2.1 percent cereal yield gains achieved in Sub-Saharan Africa from 2000 to 2013. However, the good news is that agricul-tural growth has improved in Sub-Saharan Africa, with real agricultural GDP increasing
Figure 3 Scope to shift more countries to the right side of the cereal yield distribution in Sub-Saharan AfricaDistribution of cereal yields across countries in Sub-Saharan Africa (using 2011–13 average yields)
Source: World Development Indicators.
5
11
13
7
43
2
<500 500-1000 1000-1500 1500-2000 2000-2500 2500-3000 >3000
Numb
er of
coun
tries
Cereal yield range (kg/ha)

17an agenda for the global food system
at 5.2 percent per year from 2000 to 2013.44
This was the highest rate of all regions, thanks to macroeconomic stability, lower agricultural taxation, reduced conflict,45 and increased investment. Growth was driven by both yield gains and area expansion, and for cereals each contributed about 2 percent, with price effects adding about an additional 1 percent to growth. This was a substantial improve-ment from the 0.9 percent cereal yield growth registered from 1990 to 1999. However, there is a wide, positively skewed distribution in cereal yields in Sub-Saharan Africa (see fig-ure 3), with some countries achieving average yields of about 2.5 tons per hectare, while in most countries yields range from 0.5 to 1.5 tons per hectare. For some countries at the low end of the distribution, agroecological conditions limit crop yield growth potential, with livestock systems being the dominant form of livelihoods of the poor in these coun-tries. The overall yield distribution needs to be shifted to the right, and the poor need to participate more in this growth. Addressing gender inequality can help, as earlier indi-cated, as ensuring that women farmers have the same access to productive assets, inputs, and services as men do could increase yields on their farms by 20–30 percent.46 Productiv-ity improvements are important not only in Africa but in all regions, particularly for poor farmers. In Asia, falling farm sizes with popu-lation increases on finite land call for increases in sustainable intensification of smallholder livestock production and horticulture.
Ensuring improved climate resilience of productivity growth and reduced GHG emissions are both needed for a more cli-mate-smart agriculture. Key outcomes
needed, and key elements of the associated action agenda, include:
• Adoption of improved technology and access to inputs. Ensuring existing and new climate-smart technologies are avail-able to poor countries, and poor farmers, can help reduce yield gaps and improve resilience. The agenda includes: (i) promot-ing the adoption of drought- and flood- tolerant crop varieties (such as drought- tolerant maize and scuba rice) and more- resilient and emissions-efficient livestock; (ii) expanding the reach of agricultural advisory/extension and veterinary ser-vices and improving the quality of these services; (iii) further harmonizing seed standards and certification (at regional levels) to ease administrative procedures for seed trade and variety release to bring access to a wider diversity of seed vari-eties; (iv) improving pasture and range-land management; (v) facilitating private sector investments in input supply; and (vi) aligning farmer incentives, ensuring associated policies do not promote pro-duction in unsuitable geographic areas (such as water-intensive production in water-stressed areas).
• Reduced gender inequality. Closing the gender gap can help raise yields. The agenda includes: (i) strengthen-ing women’s land rights (through land laws), increasing knowledge of these rights (through awareness and educa-tion), and supporting enforcement of rights (through legal advice and capacity strengthening); (ii) improving the gender mix in agricultural service providers and tailoring advice to the needs of women,

18 ending poverty and hunger by 2030
including the content, timing, and means of advice; (iii) supporting integration of women into producer organizations; (iv) ensuring equal access to information on input programs; and (v) improving liter-acy on rural finance.
• Greater commitment to agricultural research to develop a new generation of technologies that can more efficiently deliver the triple win of higher productiv-ity, greater resilience, and reduced GHG emissions. These new technologies need to deliver more sustainable ecologocal outcomes. The agenda includes: (i) step-ping up global, regional, and national efforts where climate impacts are pro-jected to be greatest (in Sub-Saharan Africa, for example, which accounts for only 5 percent of global public spending on agricultural research and develop-ment);47 (ii) focusing more on the needs of poor farmers; and (iii) strengthening links of national research systems with extension services and other national systems though South-South exchanges, and further drawing on innovations for smallholders from the CGIAR.48
• Improved water management and sus-tainable use. The agenda includes: (i) improving management of soil moisture in rain-fed agriculture to stabilize yields and combining this with improvements in other practices (soil fertility, improved varieties, and tillage practices) to help raise yields; (ii) improving rangeland management and animal grazing prac-tices to reduce water runoff, preserve soil moisture, and promote increased vegeta-tive cover; (iii) supporting the expansion
of irrigated areas in Sub-Saharan Africa where there is significant potential for further expansion; and (iv) improving water catchment and water productivity (kg/unit of water), particularly in areas of high water stress such as the Middle East and North Africa, and Asia.
• Improved land governance and reduced land degradation. Improving land gov-ernance can significantly raise farm incomes and reduce poverty, with signif-icant scope to further improve land gov-ernance across countries, particularly in Africa and Asia. The agenda includes: (i) improving tenure security over individual land and communal lands; (ii) increasing land access and tenure for women and for poor and vulnerable families; (iii) resolv-ing land disputes; (iv) better managing public land; and (v) increasing efficiency and transparency in land administration services. Activities should be aligned with the Voluntary Guidelines on the Respon-sible Governance of Tenure of Land, Fisheries and Forests in the Context of National Food Security. In addition, a major global push to reduce land degra-dation is needed to help restore soil fer-tility, boost organic matter, and increase carbon storage in soils. Improving range-land management and planned livestock grazing practices can help reduce and even reverse land degradation.
• Reduced GHG emissions from agricul-ture and land use change. The agenda includes: (i) reducing nitrous oxide emis-sions through improved fertilizer use; (ii) reducing methane emissions through alternative wetting and drying of rice, and

19an agenda for the global food system
improved livestock waste management; (iii) reducing CO2 emissions equivalent from land use change by raising yields (as per preceding agenda) to reduce pressure for agricultural land expansion into for-ests, or promote production expansion in areas with no forests; and (iv) absorb-ing more carbon from the atmosphere through improved rangeland manage-ment and increased use of landscape approaches. The emissions intensity of agricultural production will need to be lowered across all countries, particularly where overall emissions are large. Nota-bly, eight countries account for over 50 percent of GHG emissions from agricul-ture and land use change (Brazil, Indone-sia, India, China, the United States, Aus-tralia, Nigeria, and Argentina). Growth in emissions is projected for South Asia (with increased livestock demand) and Sub-Saharan Africa (with a projected increase in fertilizer use).
• Strengthened human resource develop-ment. The agenda includes: (i) improv-ing agricultural education in schools and universities; (ii) strengthening capacity development of policy makers, agri-cultural researchers, extension works, and farmers, particularly in the poorest countries; and (iii) tapping into skilled, technology-savvy youth for sophisti-cated high-tech, more precision agricul-ture that offers significant opportunities to facilitate a more knowledge-intensive agriculture.
2. Improving nutritional outcomes A combination of support will be needed to end hunger by 2030. The two Millennium
Development Goal indicators used to track progress on hunger are the proportion of the population below the minimum level of dietary energy consumption and the prevalence of moderately or severely underweight children under the age of five. The UN Zero Hunger Challenge includes reduced child stunting as a key objective. We will need to make prog-ress on all nutritional outcomes, including undernourishment (calorie deficiency), child stunting, and overweight/obesity. The spe-cific measures in the Sustainable Develop-ment Goals are to be finalized later this year. A combination of support will be needed to improve nutritional outcomes. Countries that have made significant progress in improving nutrition and health outcomes (such as Bra-zil, China, and Chile) did so during peri-ods of rapid growth. They also implemented nutrition-specific interventions, which were complemented with investments in nutri-tion-sensitive interventions to address health, education, and social sector development.49
South-South learning and exchange can help draw on lessons from countries that have made significant progress. Raising agriculture productivity and improving market access remain fundamental to improving incomes and to ensuring available food, but there are additional elements needed to end hunger and improve nutritional outcomes. Key outcomes needed, and key elements of the associated action agenda, include:
• Raised income and gender equality. Higher household incomes can allow families to invest in more and higher nutritious food consumption, access to clean water, and better hygiene, which can help improve nutritional outcomes. Key

20 ending poverty and hunger by 2030
elements of the agenda to raise incomes are: (i) raising agricultural productiv-ity and its climate resilience (previous section); (ii) strengthening value chains and agribusiness growth (addressed in next section), and raising rural non-farm incomes. As indicated earlier, increasing incomes by 60 percent (the gains needed to raise average incomes of the poor in low-income countries to the $1.25 per day poverty line) could reduce average child stunting prevalence by an esti-mated 34 percent and underweight prev-alence by 45 percent; and (iii) reducing gender inequality to help raise incomes and strengthen the link between higher household income and nutritional out-comes, as women are responsible for most of food production, purchasing, process-ing, and meal preparation.
• Expanded coverage of nutrition-spe-cific investments. Scaling up proven interventions to 90 percent coverage in the 34 countries with the highest stunt-ing rates could potentially reduce child stunting by 20 percent worldwide and wasting by 60 percent worldwide. The package of interventions includes, among other things, deworming, growth moni-toring and promotion for children under two, and iron and folic acid supplements for pregnant women.50
• Refocused investments to make them more nutrition-sensitive can further help reduce stunting and underweight prevalence. The nutrition-sensitive invest-ments include nutrition-sensitive agricul-ture and social protection.
◊ Nutrition-sensitive agriculture: Key nutrition-sensitive investments in-clude a focus on female smallhold-er farmers; technologies to reduce women’s workloads; development and adoption of biofortified crop varieties; food fortification that adds micronutrients to processed foods; aflatoxin control strategies; crop di-versification to food with higher nu-trient content (such as horticulture, pulses, dairy, and fish); and increased nutrition education through agricul-tural extension and livelihoods pro-grams that can improve dietary va-riety in production and, if designed and implemented appropriately, can increase consumption.
◊ Nutrition-sensitive social protection: Social protection programs may have a greater impact on nutritional outcomes by fostering links between conditional cash transfers for the poor and health services or water supply, hygiene, and sanitation pro-grams, and specifically through ac-tivities related to nutrition education or micronutrient supplementation.51
• Ensured food availability, and stabil-ity. Ensuring availability of sufficient quantities and diversity of food is fun-damental. While higher food prices can reduce poverty over the long term,52
significant short-term escalations of food prices, often induced by availability shortfalls, can negatively affect poverty53
and nutritional outcomes. For example, the 2008 global food price spikes may

21an agenda for the global food system
have increased global undernourishment by 6.8 percent, equivalent to 68 million people.54 Key elements of the action agenda include:
◊ Food production, stocks, reducing food loss and waste: (i) adopting climate-smart production practic-es to improve resilience of the food system to climate shocks; (ii) better managing food stocks through stock size, procurement, and release poli-cies to lower costs, reduce disincen-tives for private storage, and ensure available food for targeting to the poorest groups; and (iii) reducing food loss and waste to reduce stresses on the food system to produce more.
◊ Trade and safety nets: (i) reducing ad hoc trade-restricting policies, such as export bans, to prevent amplify-ing food price spikes, as they did in 2008;55 (ii) improving transparency of markets through improved quality and access to food market informa-tion, including on available stocks to help better inform policy responses; and (iii) aligning safety nets to help preserve purchasing power of the poorest and most vulnerable popula-tions when food prices spike. Safety nets can help dampen the political pressure to reduce food prices for poor consumers through trade mea-sures that also reduce farmer incen-tives to produce food when global food prices spike.
◊ Risk management: The agenda in-cludes: (i) country assessments and
prioritization of risks; (ii) developing and implementing integrated man-agement strategies; (iii) improving early warning systems; (iv) invest-ing in resilient production systems, infrastructure, and adaptation mea-sures; and (v) using cost-effective financial instruments for risk trans-fer (such as insurance, physical for-ward contracts, and hedging) and for risk coping (contingent financ-ing, for instance, including weather derivatives).
• Effective control of animal diseases. The agenda includes: (i) upgrading vet-erinary and human public health systems to perform at international standards and to collaborate for surveillance, early detection, correct diagnosis, and prompt and effective control of outbreaks; and (ii) implementing a ‘one health’ approach to reduce the cost of addressing diseases at the animal-human interface.
• Curbed obesity and reduced food-re- lated noncommunicable diseases. A comprehensive set of interventions are needed56 to address this challenging and relatively new area for many develop-ing countries. Included among these are reducing subsidies on food high in sugar and salt, providing better information and education to inform diet choice, and improved food industry standards.
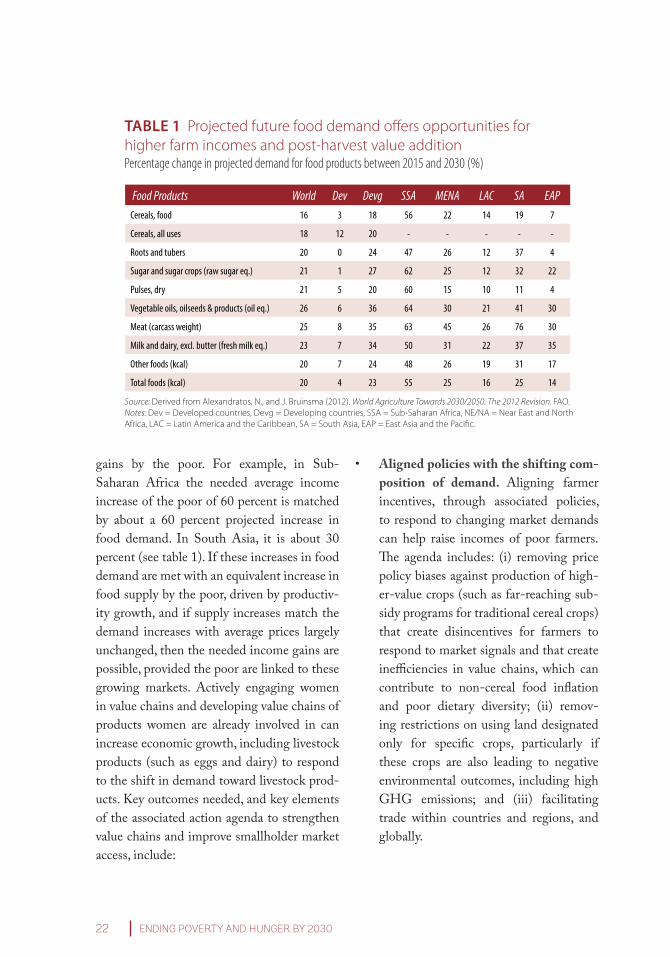
3. Strengthening value chains and improving market accessMore inclusive and efficient value chains. Encouragingly, the projected food demand growth closely matches needed income
22 ending poverty and hunger by 2030
gains by the poor. For example, in Sub- Saharan Africa the needed average income increase of the poor of 60 percent is matched by about a 60 percent projected increase in food demand. In South Asia, it is about 30 percent (see table 1). If these increases in food demand are met with an equivalent increase in food supply by the poor, driven by productiv-ity growth, and if supply increases match the demand increases with average prices largely unchanged, then the needed income gains are possible, provided the poor are linked to these growing markets. Actively engaging women in value chains and developing value chains of products women are already involved in can increase economic growth, including livestock products (such as eggs and dairy) to respond to the shift in demand toward livestock prod-ucts. Key outcomes needed, and key elements of the associated action agenda to strengthen value chains and improve smallholder market access, include:
• Aligned policies with the shifting com-position of demand. Aligning farmer incentives, through associated policies, to respond to changing market demands can help raise incomes of poor farmers. The agenda includes: (i) removing price policy biases against production of high-er-value crops (such as far-reaching sub-sidy programs for traditional cereal crops) that create disincentives for farmers to respond to market signals and that create inefficiencies in value chains, which can contribute to non-cereal food inflation and poor dietary diversity; (ii) remov-ing restrictions on using land designated only for specific crops, particularly if these crops are also leading to negative environmental outcomes, including high GHG emissions; and (iii) facilitating trade within countries and regions, and globally.
Table 1 Projected future food demand offers opportunities for higher farm incomes and post-harvest value additionPercentage change in projected demand for food products between 2015 and 2030 (%)
Source: Derived from Alexandratos, N., and J. Bruinsma (2012). World Agriculture Towards 2030/2050. The 2012 Revision. FAO.Notes: Dev = Developed countries, Devg = Developing countries, SSA = Sub-Saharan Africa, NE/NA = Near East and North Africa, LAC = Latin America and the Caribbean, SA = South Asia, EAP = East Asia and the Pacific.
Food Products World Dev Devg SSA MENA LAC SA EAPCereals, food 16 3 18 56 22 14 19 7
Cereals, all uses 18 12 20 - - - - -
Roots and tubers 20 0 24 47 26 12 37 4
Sugar and sugar crops (raw sugar eq.) 21 1 27 62 25 12 32 22
Pulses, dry 21 5 20 60 15 10 11 4
Vegetable oils, oilseeds & products (oil eq.) 26 6 36 64 30 21 41 30
Meat (carcass weight) 25 8 35 63 45 26 76 30
Milk and dairy, excl. butter (fresh milk eq.) 23 7 34 50 31 22 37 35
Other foods (kcal) 20 7 24 48 26 19 31 17
Total foods (kcal) 20 4 23 55 25 16 25 14

23an agenda for the global food system
• Upgraded infrastructure, logistics, institutions, and information and communication technology. Reducing transaction costs, improving the structure of markets, and access to information can increase prices farmers receive for their produce (crops, livestock, and fish). The agenda includes: (i) addressing structural barriers such as movement restrictions and building roads to link smallholder producers to major road networks; (ii) increasing competition in wholesale mar-kets; (iii) streamlining or reducing multi-ple taxes and fees; (iv) encouraging private storage and handling; and (v) developing sustainable models of linking market data collection with ICT technology providers to help improve access by poor farmers to market information.
• Improved supply chain management. Strengthening producer organizations and value chain coordination can help smallholders better link to local, urban, regional, and international markets and lower costs (operating, procurement, marketing, and distribution).
• Improved food safety and quality stan-dards. The agenda includes: (i) improving capacity to meet food quality and safety standards in growing high- and middle- income markets, including in Europe and Central Asia and in Latin America, to help improve smallholder competitive-ness in these markets and improve domes-tic health and nutrition; (ii) addressing food safety issues, such as aflatoxins, that both have a negative impact on health and reduce options for trading key agri-cultural products like maize and peanuts;
and (iii) reducing overuse and misuse of antibiotics in livestock and aquaculture to lower their impact on microbial resistance in humans.
• Reduced food loss and waste. Reducing food losses can help reduce income losses, and together with lower food waste can increase overall food supply without GHG emissions, and help preserve food micronutrients. The agenda includes: (i) improving economic incentives through infrastructure and logistic investments to reduce transport time and costs, improv-ing market information to better target poorly supplied markets, and facilitating product differentiation in markets for sale of less standardized, lower-quality products; (ii) addressing climatic factors (temperature and humidity) through improved storage technology; and (iii) improving knowledge and learning.
• Fortified food. Supporting fortification of processed food with vitamins and min-erals can enhance the nutritional value of food. Actions could include: (i) develop-ing and supporting financing mechanisms to offset additional fortification costs of commercial food processors, millers, or refiners; and (ii) developing regulatory frameworks for fortification standards.
• Productive partnerships. The agenda includes: (i) linking smallholders with larger-scale producers to help them link with markets, advisory services on agri-cultural practices, and inputs; and (ii) cre-ating effective forums for policy dialogue between producers, agribusiness, and the public sector to better align policies

24 ending poverty and hunger by 2030
to commercial realties and changing opportunities.
• Expanded agribusiness growth and jobs. The agenda includes: (i) improving the rural investment climate (streamlin-ing and reducing licenses and fees); (ii) promoting medium, small, and microen-terprise actors in value chains, especially in rural towns; (iii) targeting investments (in roads, electricity, and water) in partic-ular economic clusters to help induce pri-vate agribusiness investment and increase economies of scale; and (iv) improving access of local agribusinesses to competi-tive financing to help them compete with foreign agribusiness investors who have access to cheaper finance, but also seiz-ing opportunities for foreign investors to apply their globally sourced financing to benefit supply chains.
depend on the extent to which policies and financing are aligned to these objectives.
Targeting the poor. Directly targeting invest-ment to benefit those living below the $1.25 per day poverty line, the undernourished, and children who are stunted and underweight will likely lead to a greater impact per dollar spent than programs that do not reach these groups. Targeting investment programs can be particularly challenging, requiring close monitoring, and avoidance of elite capture. Well-targeted programs can help increase the strength of the link between income growth and reductions in poverty and hunger as well as the effectiveness of nutrition-specific and nutrition-sensitive investments.
Improving the alignment and efficiency of public spending. Countries have legitimate food security concerns, reflected in their sup-port programs to farmers and protection of consumers. And many have had past success. However, in many countries these support programs are becoming financially costly and are hampering sustainability and growth. Key elements of the action agenda include:
• Shifting from current subsidies to investments in climate-smart out-comes. Aligning agriculture support to the adoption of more climate-resil-ient practices and technologies can help improve resilience. Currently about $500 billion is provided in subsidies to farm-ers (through price supports and direct payment) in OECD countries plus Bra-zil, China, Indonesia, Kazakhstan, Rus-sia, South Africa, and Ukraine.57 These
Aligning Policies and financing The magnitude of additional resources needed to end poverty and hunger permanently will

25an agenda for the global food system
countries account for half of the global GHG emissions from agriculture. Ensur-ing price support does not shift produc-tion to more emission-intensive practices, and making direct payments to farmers conditioned upon adoption of climate resilient and mitigation practices, should lead to better climate outcomes. Already, 30 percent of direct farm payments under the EU Common Agricultural Policy require adoption of environmentally ben-eficial farming practices.
• Using new technologies to provide sim-ilar levels of support in more efficient ways. Price supports, inputs policies, and restricting land to the production of cer-tain crops can limit crop diversification, induce economic inefficiency, compro-
mise productivity and resilience (with water and soil degradation), and lead to high GHG emissions. Consider options to achieve objectives more efficiently. For example, new technologies (cell phones, biometric cards, and so on) have lowered the costs and transfer programs, and ini-tiatives on financial inclusion make shifts to these programs more feasible.
Ensuring that private investment benefits the poor. Since 2008, private sector interest and investment in agriculture in developing countries has increased. We need to ensure that the inflow of private capital delivers growth and poverty reduction and helps to reduce hunger, following the Principles for Responsible Investment in Agriculture and Food Systems.


27an agenda for the global food system
A CAll for ACtIonThe historical evolution of the global food system has made possible rapid urbanization and population growth, contributing signifi-cantly to welfare improvements in the world. The impacts on poverty and hunger have been positive and significant. Yet we stand at a crit-ical moment in history, where we can and we must help shape the evolution of the global food system to permanently end poverty and hunger by 2030. Climate change adds to the complexity of this challenge. The agenda is large and will require focused, multisectoral approaches and stronger partnerships.
The Global Strategic Framework for Food Security and Nutrition provides an overar-ching framework that can help coordinate action on hunger. The implications of the food system action agenda to end poverty and hunger by 2030 are highlighted in the previous sections. There are many ongoing initiatives on elements of the agenda through
existing alliances and commitments, such as the UN Zero Hunger Challenge, the Global Alliance on Climate-Smart Agriculture, Scaling-up Nutrition, and others. Following the finalization of the Sustainable Devel-opment Goals later this year, we call on these key alliances and coalitions to come together to align their respective initiatives and actions around commonly agreed tar-gets. This can catalyze efforts, align focus, and initiate immediate action. The agenda out-lined here cuts across the entire World Bank Group, including all Global Practices, Cross- Cutting Solution Areas, and the IFC and MIGA. The World Bank Group will come together on this agenda and work as one Bank to help countries design and implement inte-grated approaches to end poverty and hun-ger. With other partners, we can help shape a global food system that will deliver a healthier and more prosperous world now and for gen-erations to come.

28 ending poverty and hunger by 2030
Endnotes1. In developing countries, the poverty head count
declined from 43 percent in 1990 to 21 percent in 2010, and the share of the population undernourished declined from 23 percent to 15 percent over the same period. Source: http://data.worldbank.org/mdgs/compare-trends-and-targets-of-each-mdg-indicator.
2. In low-income countries, the poverty head count declined from 65 percent in 1990 to 48 percent in 2010; the share of the population under-nourished declined from 38 percent to 28 per-cent. Source: http://data.worldbank.org/mdgs/compare-trends-and-targets-of-each-mdg-indicator.
3. UN Population Division data.
4. P. Olinto, K. Beegle, C. Sobrado, and H. Uematsu, The State of the Poor: Where Are the Poor, Where is Extreme Poverty Harder to End, and What is the Current Profile of the World’s Poor (Washington, DC: World Bank, 2013).
5. Ibid.
6. N. Yoshida, H Uematsu, and C. Sobrado, “Is Extreme Poverty Going to End? An Analytical Framework to Evaluate Progress in Ending Extreme Poverty.” Policy Research Working Paper 6740 (Washington, DC: World Bank, 2014).
7. World Bank, World Development Report 2008: Agricul-ture for Development (Washington, DC: 2007).
8. Independent Evaluation Group, Cost-Benefit Analysis of World Bank Projects (Washington, DC: World Bank, 2010).
9. From 1999/2000 to 2010, cereal yields increased at 7.2 percent and 4.4 percent per year in Rwanda and Ethi-opia, respectively, leading to a respective decline in the poverty head count rate by 21 percent and 33 percent.
10. In Zambia cereal yields increased at 5.9 percent per year from early 2000 but with limited poverty reduction.
11. J.-P. Pradere, “Improving Animal Health and Livestock Productivity to Reduce Poverty,” Scientific and Technical Review (Office International of Epizootics) 33 (3): 735–44, 2014.
12. FAO data.
13. ILO, Key Indicators of the Labor Market, 8th Edition (Geneva: 2014). Includes agriculture, hunting, forestry, and fishing.
14. D. Tschirley, J. Snyder, M. Dolislager, T. Reardon, S. Haggblade, J. Goeb, L. Traub, F. Ejobi, and F. Meyer, “Africa’s Unfolding Diet Transformation: Implica-tions for Agrifood System Employment,” Journal of Agribusiness in Developing and Emerging Economies, forthcoming.
15. As economies grow, the agribusiness share of GDP relative to the farming share of GDP increases. In agriculture-based economies (most of Sub-Saharan Africa), this relative share is about 0.6; in transforming economies (most in Asia), it is 2; in urbanized countries (mostly in Latin America), it is 3.3; and in the United
States, it is 13. Source: World Bank, Growing Africa: Unlocking the Potential of Agribusiness (Washington, DC: 2013).
16. World Bank, Republic of India: Accelerating Agricultural Productivity Growth (Washington, DC: 2014).
17. National Sample Survey Office, National Statistical Organisation, Employment and Unemployment Situation in India: 2009–10 (New Delhi: Ministry of Statistics & Programme Implementation, Government of India, 2011).
18. In Togo, the share of the population in poverty, under-nourished, and the share of children under five moder-ately or severely underweight are 52.5, 18.9, and 16.5 percent, respectively. In Yemen, the respective shares are 9.8, 29.6, and 35.5 percent. In Ethiopia, the shares are 36.8, 36.5, and 29.2 percent. All data are at the time of the latest poverty survey in the respective countries.
19. O. Ecker, C. Breisinger, and K. Pauw, “Growth Is Good, but Is Not Enough to Improve Nutrition,” in S. Fan and R. Pandya-Lorch, eds, Reshaping Agriculture for Nutrition and Health (Washington, DC: International Food Policy Research Institute (IFPRI), 2012).
20. Estimates [from S. Tiwari, H. Zaman, and J. Saaveda, “Economic Growth, Poverty, and Nutrition,” in World Bank, Improving Nutrition Through Multisectoral Approaches (Washington, DC: 2013)] imply that a 60 percent increase in incomes could reduce stunting by 8.9 percentage points, and the underweight incidence by 6.8 percentage points. As currently 25 percent of children under five are stunted, and about 15 percent are underweight (according to UNICEF-WHO-World Bank Joint Child Malnutrition Estimates in 2013, “Levels and Trends in Child Malnutrition”), this equates to reducing stunting by about 35 percent (8.9/25) and underweight children under five by about 45 percent (6.8/15).
21. S. Vollmer, K. Harttgen, M. A. Subramanyam, J. Finlay, S. Klasen, and S. V. Subramanian, “Association between Economic Growth and Early Childhood Undernu-trition: Evidence from 121 Demographic and Health Surveys from 36 Low-Income and Middle-Income Countries,” Lancet Global Health 2: e225–e234, 2014.
22. Heady, D. (2013). “Developmental Drivers of Nutri-tional Change: A Cross-country Analysis.” World Development, 42:76-88.
23. Salt iodisation, multiple micronutrient supplementation in pregnancy (includes iron-folate), calcium supplemen-tation during pregnancy, energy-protein supplemen-tation during pregnancy, vitamin A supplementation during childhood, zinc supplementation during child-hood, breastfeeding promotion, complementary feeding education, complementary food supplementation, severe and acute malnutrition management, and severe acute malnutrition (SAM) management (including deworming).
24. Z. A. Bhutta, J. K. Das, A. Rizvi, M. F. Gaffey, N. Walker, S. Horton, P. Webb, A. Lartey, and B. E. Black, “Evidence-Based Interventions for Improvement of Maternal and Child Nutrition: What Can Be Done and at What Cost?” Lancet 382: 452–77, 2013.

25. D. Heady, “Hit and Miss: Why is the Relationship Between Economic Growth and Malnutrition So Varied?” (Washington, DC: IFPRI, 2010).
26. World Bank, Improving Nutrition through Multisectoral Approaches (Washington, DC: 2013).
27. United Nations Food and Agriculture Organization (FAO), The State of Food and Agriculture 2010–11: Women in Agriculture (Rome: 2011).
28. Derived from N. Alexandratos and J. Bruinsma, “World Agriculture Towards 2030/2050,” ESA Working Paper 12-03 (Rome: FAO, 2012).
29. E. Fukase and W. Martin, “Who Will Feed China in the 21st Century? Income Growth and Food Demand and Supply in China,” Policy Research Working Paper 6926 (Washington, DC: World Bank, 2014).
30. N. Alexandratos and J. Bruinsma, “World Agriculture Towards 2030/2050,” ESA Working Paper 12-03 (Rome: FAO, 2012).
31. World Bank, Turn Down the Heat: Climate Extremes, Regional Impacts, and the Case for Resilience (Washing-ton, DC: 2013).
32. Intergovernmental Panel on Climate Change, “Impacts, Adaptation, and Vulnerability.” Working Group II Contribution to Fifth Assessment Report (Cambridge, U.K.: Cambridge University Press, 2014).
33. FAO, The State of Food and Agriculture: Innovation in Family Farming (Rome: 2014).
34. McKinsey Global Institute, Overcoming Obesity: An Initial Economic Analysis (2014).
35. M. Ng, T. Fleming, M. Robinson, B. Thomson, N. Graetz, C. Margono, E. C. Mullany et al., “Global, Regional, and National Prevalence of Overweight and Obesity in Children and Adults during 1980–2013: A Systematic Analysis for the Global Burden of Disease Study 2013,” Lancet 384:766–81, 2014.
36. B. A. Swinburn, G. Sacks, K. D. Hall, K. McPherson, D. T. Finegood, M. L. Moodie, and S. L. Gortmaker, “The Global Obesity Pandemic: Shaped by Global Drivers and Local Environments,” Lancet 378: 804–14, 2011.
37. M. Ng, T. Fleming, M. Robinson, B. Thomson, N. Graetz, C. Margono, E. C. Mullany et al., “Global, Regional, and National Prevalence of Overweight and Obesity in Children and Adults during 1980–2013: A Systematic Analysis for the Global Burden of Disease Study 2013,” Lancet 384:766–81, 2014.
38. FAO and Earthscan, The State of the World’s Land and Water Resources for Food and Agriculture (SOLAW): Managing Systems at Risk (Rome and London: 2011).
39. S. S. Myers, A. Zanobetti, I. Kloog, P. Huybers, A. D. B. Leakey, A. J. Bloom, E. Carlisle et al., “Increasing CO2 Threatens Human Nutrition,” Nature 510: 139–42, 2014.
40. Based on estimates for maize, rice, and wheat using the U.S. Department of Agriculture’s Foreign Agriculture Service’s Database on Production, Supply, and Dis-tribution. Similar results were derived from the FAO Statistical Database using data from 1961.
41. J. Burney, S. Davis, and D. B. Lobell, “Greenhouse Gas Mitigation by Agricultural Intensification,” Proceedings of the National Academy of Sciences of the United States of America 107 (26): 12052–57, 2010.
42. World Resources Institute, Creating a Sustainable Food Future: World Resources Report 2013–14 (Washington, DC: 2013).
43. A. Angelsen, “Policies for Reduced Deforestation and Their Impact on Agricultural Production,” Proceedings of the National Academy of Sciences of the United States of America 107 (46):19639–44, 2010.
44. World Bank, World Development Indicators 2014 (Wash-ington, DC: 2014).
45. S. Straus, “Wars Do End! Changing Patterns of Polit-ical Violence in Sub-Saharan Africa,” African Affairs 111: 179–201, 2012.
46. FAO, The State of Food and Agriculture 2010–11: Women in Agriculture (Rome: 2011).
47. IFPRI, “ASTI Global Assessment of Agricultural R&D Spending” (Washington, DC: IFPRI, Agriculture Science and Technology Indicators, and Global Forum of Agricultural Research, 2012).
48. Improved crop varieties, which have been adopted on 65 percent of total area planted to the world’s 10 most important food crops, 60 percent of which is sown to varieties with CGIAR ancestry—have had major impacts on productivity, food security, and poverty, with economic benefits reaching at least $14.4 billion per year for rice in Asia and wheat and maize worldwide.
49. Z. A. Bhutta, J. K. Das, A. Rizvi, M. F. Gaffey, N. Walker, S. Horton, P. Webb, A. Lartey, and B. E. Black, “Evidence-Based Interventions for Improvement of Maternal and Child Nutrition: What Can Be Done and at What Cost?” Lancet 382: 452–77, 2013.
50. See endnote 23 for broader list of interventions.
51. World Bank, Improving Nutrition through Multisectoral Approaches (Washington, DC: 2013).
52. D. Heady, “Food Prices and Poverty Reduction in the Long Run,” IFPRI Discussion Paper 01331 (Washing-ton, DC: 2014).
53. M. Ivanic and W. Martin, “Short- and Long-Run Impact of Food Price Changes on Poverty,” Policy Research Working Paper 7011 (Washington, DC: World Bank, 2014).
54. S. Tiwari and H. Zaman, “The Impact of Economic Shocks on Global Undernourishment,” Policy Research Working Paper 5215 (Washington, DC: World Bank, 2010).
55. W. Martin and K. Anderson, “Export Restrictions and Price Insulations during Commodity Price Booms,” Policy Research Working Paper 5645 (Washington, DC: World Bank, 2011).
56. McKinsey Global Institute, Overcoming Obesity: An Initial Economic Analysis (2014).
57. Organisation for Economic Co-operation and Devel-opment, Agricultural Policy Monitoring and Evaluation. OECD Countries and Emerging Economies (Paris: 2013).

1818 H Street, nwwashington, dC 20433 USAtelephone: 202-473-1000Internet: www.worldbank.org/agriculture www.worldbank.org/foodsecuritytwitter: @wbg_Agriculture