sustainable agriculture leads to zero hunger
248
-
Upload
khangminh22 -
Category
Documents
-
view
0 -
download
0
Transcript of sustainable agriculture leads to zero hunger


SUSTAINABLE
AGRICULTURE LEADS TO
ZERO HUNGER
EDITORS:
Dr. Ristina Siti SUNDARI
Dr. Korkmaz BELLİTÜRK
AUTHORS:
Muhammad Rabnawaz KHAN
Muhammad ARIF
Farhan AHMAD
Ristina Siti SUNDARI
Junaid AHMAD
Aydın ADİLOĞLU
Eda ÖZEL
Reny SUKMAWANI
Endang Tri ASTUTININGSIH1
Ema Hilma MEILANI
Jujun RATNASARI
Fitriani
Eny LATIFAH
Raziye IŞIK
Rilla Tresnadola TARIGAN
Rizky Adi Nugraha TARIGAN
Ai Kusmiati ASYIAH
Bahar SÖZÜBEK
Mergül ÖZTÜRK
Nina LISANTY
Agustia Dwi PAMUJIATI
Yudhi Zuriah Wirya PURBA
Emel ÖZCAN GÖKÇEK
Hedrika OETMUSU
Carla Krisanti FIOS
Holand Francisco BANI
Umbu JOKA
Dennis Mark ONUIGBO
İlkay ÇOKA
Ahmet KORKMAZ
Güney AKINOĞLU

Copyright © 2022 by iksad publishing house
All rights reserved. No part of this publication may be reproduced, distributed or transmitted in any form or by any means, including photocopying, recording or other
electronic or mechanical methods, without the prior written permission of the publisher, except in the case of brief quotations embodied in critical reviews and
certain other noncommercial uses permitted by copyright law. Institution of Economic Development and Social Researches Publications®
(The Licence Number of Publicator: 2014/31220) TURKEY TR: +90 342 606 06 75
USA: +1 631 685 0 853 E mail: [email protected]
www.iksadyayinevi.com
It is responsibility of the author to abide by the publishing ethics rules. The first degree responsibility of the works in the book belongs to the authors.
Iksad Publications – 2021©
ISBN: 978-625-8323-59-7 Cover Design:
Ristina Siti SUNDARI, Korkmaz BELLİTÜRK, Rafif Naufal Assadel TARIGAN, Farhan Ahmad
July / 2022 Ankara / Turkey Size = 16x24 cm

1 | SUSTAINABLE AGRICULTURE LEADS TO ZERO HUNGER
PREFACE
We are grateful for the sake of Allah for blessing and helping us to
complete this book chapter entitled Sustainable Agriculture Leads to Zero
Hunger.
Achieving zero hunger needs agriculture from upstreams to downstream
agribusiness to be sustainable. Achieving zero hunger requires agriculture and
food systems to become more efficient, sustainable, climate-smart, nutrition-
sensitive, and affordable economically regarding stunting and food insecurity
in some regions. In addition, there is a crucial need for synchronization between
malnutrition, dietary diversity, and production diversity. The world needs to
produce an estimated 60percent more food by 2050 to ensure global food
security, and it has to do to conserve and enhance natural resources. The
increasing world population inflates the importance placed upon producing
more food.
However, it must be realized that increased food production does not
necessarily translate into improved nutritional food security. Shifting away
from unsustainable high input-intensive crop production and monocultures
towards more sustainable agro-ecological practices and diverse crop mix will
yield improved production diversity and waste utilization to added value.
Further, agro-ecological practices such as zero-budget and zero-waste natural
farming, organic farming, and permaculture play an essential role in their
impact on food and nutrition security and climate resilience. Similarly, organic
farming, aquaculture, breeding, fisheries, marketing, permaculture, and social
and economy have the potential to help farmers adapt to climate change and
environmental conservation by planting crops, vegetables, fruit, viticulture,
aquaculture, floriculture, livestock, aquaponics, hydroponics, vertical farming
hardy, and restoring soil and water health, local food processing of biodiversity
and feeding population in sustainable agriculture.
Thank you to all excellent authors for your valuable chapters and
cooperative work. However, we appreciate that our book chapter project is
going well because of you.
Finally, we hope this book will greatly benefit you, respected readers.
Indonesia – Turkey, 22nd July, 2022
Editor Team:
Ristina Siti SUNDARI
Korkmaz BELLİTÜRK

SUSTAINABLE AGRICULTURE LEADS TO ZERO HUNGER | 2
BRIEF CURRICULUM VITAE OF EDITORS
Ristina Siti Sundari is an Associate Professor in the
Agribusiness Department, Agriculture Faculty at the
University of Perjuangan Tasikmalaya, West Java,
Indonesia. She has been working there since 2016 –
date. She did his undergraduate degree at the
Winayamukti University in 1991 and took Soil Science
in Agronomy Department, Agricultural Faculty. She
worked as Head of Research & Development in
Industrial Forestry, PT. Kelawit Hutani Lestari and PT
Bara Kaltim Sejahtera in Borneo Island (Kalimantan
Island) until 2002. She did an entrepreneurship activity
as Bee Consultant & business. She graduated Magister of Agriculture in 2013
efficiency of Fisheries-hatchery at Siliwangi University. She has been doing
housewife until 2015. She started at Perjuangan University in 2016, as a lecturer
assistant at department of Agrotechnology and Agribusiness. Then mandated
department secretary of Agribusiness and Agrotechnology. In 2017 – 2018 was
mandated to be a head of Agribusiness Department, Agricultural Faculty of
Perjuangan University. She has been involved in University and Department
Quality Control in 2017 – date. She has 101 articles (10 of them are the articles
published in international periodicals citced by international science indexes
[SCI-SCI-Exp.]), as presented in national and international scientific meetings,
3 book chapters and 3 books on Agricultural Biology, Agricultural Chemistry,
Parametric statistics, non-parametric statistics, Harvesting Food Management
and Processing. She has been an editor-in-chief of the journal Hexagro since
2017–date. She has been an indexed international and national journal reviewer
as well. He has 2 national patents and Copyrights. The link you can view: Web
of Science Researcher ID AAZ-9469-2020;
https://scholar.google.co.id/citations?user=HDXkQdAAAAAJ&hl=en ;
https://sinta.kemdikbud.go.id/authors/profile/6105719; http://orcid.org/0000-
0002-5310-8520 ; https://publons.com/researcher/3920243/ristina-siti-sundari/
https://www.scopus.com/authid/detail.uri?authorId=57214594907;
https://www.researchgate.net/profile/Ristina-Sundari/research?ev=prf_act;
https://sinta.kemdikbud.go.id/authors/profile/6105719.

3 | SUSTAINABLE AGRICULTURE LEADS TO ZERO HUNGER
Korkmaz Bellitürk is an Associate Professor of
Soil Science and Plant Nutrition Department of
Agriculture Faculty at the Tekirdag Namık Kemal
University, in Tekirdag, Turkey. He did his
undergraduate degree at the Trakya University in
Turkey in 1996 as head of the department,
followed by a Ph.D project on hydrolysis of urea.
He started at the Trakya University in 1996,
focusing on plant mineral nutrition, and was a
Research Assistant at the Faculty of Agriculture
from 1996 till 2007. In 2007, he became Assistant Professor of Soil
Science and Plant Nutrition Department, Tekirdag Namık Kemal
University, Turkey. He was assigned to lecture for one week each within
the context of Erasmus teaching staff mobility at Trakia Democritus
University in Greece in 2011 and at the University of Technology and
Life Sciences in Poland in 2013. He was assigned for 3 months between
11 July and 11 October at the University of Vermont in
Burlington/Vermont, USA to take a part in a project called “use of soil
earthworms in agriculture” in 2011. From 2014 to 2015, he worked as a
postdoc researcher at the University of Vermont in USA, working on soil
ecology, earthworms and vermicompost. After the postdoc he became
Associate Professor of Soil Science and Plant Nutrition Department of
Agriculture Faculty at the Tekirdag Namık Kemal University, in
Tekirdag, in 2018, where he focused of phytoremediation, plant
nutrition, soil and water pollution, soil ecology, organic farming,
composting and vermicomposting. He conducts one of the bilateral
cooperation projects signed between the Council of Higher Education-
Turkey and Higher Education Commission-Pakistan. The universities
involved in the project are Tekirdag Namık Kemal University-Turkey
and University of Agriculture Faisalabad-Pakistan in 2019. He served as
project head and researcher in 29 projects supported by TUBITAK,
Trakya University, Tekirdag Namık Kemal University, Nevsehir Hacı
Bektas Veli University, Bilecik Seyh Edebali University, TAGEM,
University of Agriculture-Faisalabad and Yozgat Bozok University
Scientific Research Projects Units. He has 145 articles (Totally, 21 of
K

SUSTAINABLE AGRICULTURE LEADS TO ZERO HUNGER | 4
them are the articles published in international periodicals cited by
international science indexes [SCI-SCI-Exp.]), 9 book chapters and 3
books on soil science, ecological management for soil quality, plant
nutrition, soil-water pollution, ecologic agriculture, vermicomposting
and fertilization topics as research articles and papers presented in
domestic and abroad scientific meetings. He has been awarded many
projects and scientific publication awards in his field of study. He has
been editor-in-chief of the journal Rice Research since 2015. He has one
national patent. He features on ISI’s list of highly cited authors in the
field of soil fauna, soil fertility and plant sciences since 2010. Link:
https://www.scopus.com/authid/detail.uri?authorId=35811876500,
https://orcid.org/0000-0003-4944-3497, Web of Science Researcher ID
ABA-1887-2020,.https://publons.com/wos-op/researcher/3929063/
korkmaz-belliturk/,

5 | SUSTAINABLE AGRICULTURE LEADS TO ZERO HUNGER
TABLE OF CONTENT
PREFACE ...................................................................................................... 1
TABLE OF CONTENT ................................................................................ 5
CHAPTER 1 ................................................................................................ 11
RESIDUAL EFFECT OF BIOCHAR ON BERSEEM YIELD AND
YIELD ATTRIBUTES UNDER DOSAGES OF NITROGEN AND
FARMYARD MANURE LEVELS ............................................................ 11
Muhammad Rabnawaz KHAN1, Muhammad ARIF1, Farhan AHMAD1,
Ristina Siti SUNDARI2*, Junaid AHMAD1 ............................................... 11
1.1. Introduction .................................................................................... 13
1.2. Materials and Methods ................................................................... 15
1.3. Results And Discussions ................................................................. 16
1.4. Conclusion ....................................................................................... 24
References ............................................................................................... 25
Brief Curriculum Vitae of Authors ....................................................... 28
CHAPTER 2 ................................................................................................ 31
DETERMINATION OF NUTRITIONAL STATUS OF OLIVE (Olea
europaea L.) ORCHARDS GROWN IN BANDIRMA DISTRICT,
BALIKESIR TURKEY, BY PLANT ANALYSIS .................................... 31
Aydın ADİLOĞLU1*, Eda ÖZEL1 ............................................................. 31
2.1. Introduction ..................................................................................... 33
2.2. Materials and Methods ................................................................... 34
2.3. Results and Discussion ................................................................... 36
2.4. Conclusion and Recommendations ................................................ 40
References ............................................................................................... 42
Brief Curriculum Vitae of Authors ....................................................... 43
CHAPTER 3 ................................................................................................ 45
ECONOMIC POTENTIAL OF TERUBUK .............................................. 45
Reny SUKMAWANI1*, Endang Tri ASTUTININGSIH1, ........................ 45

SUSTAINABLE AGRICULTURE LEADS TO ZERO HUNGER | 6
3.1. Introduction .................................................................................... 47
3.2. General Overview of Terubuk ....................................................... 48
3.3. Economic Potential of Terubuk ..................................................... 50
3.4. Conclusion ....................................................................................... 54
References ............................................................................................... 55
Brief Curiculum Vitae of Authors......................................................... 56
CHAPTER 4 ................................................................................................ 57
SUSTAINABLE AGRICULTURE PRODUCTION IN UPSTREAM
WATERSHED: SOCIO-ECOLOGICAL APPROACH .......................... 57
Fitriani1* ....................................................................................................... 57
4.1. Introduction ..................................................................................... 59
4.2. Sustainable Agriculture Production in Upstream Watershed ..... 62
4.3. Social Assessment ........................................................................... 71
4.4. Conclusion ....................................................................................... 75
4.5. Policy Implications ......................................................................... 76
References ............................................................................................... 77
Brief Curriculum Vitae of Author ........................................................ 80
CHAPTER 5 ................................................................................................ 81
MARKETING STRATEGY OF AGRICULTURAL COMMODITY
FOR FINANCIAL IMPROVEMENT ....................................................... 81
Eny LATIFAH1* .......................................................................................... 81
5.1. Introduction .................................................................................... 83
5.2. Marketing Strategy ......................................................................... 83
5.3. Agricultural Financial Management ............................................. 84
5.4. Government Strategy in Financial Inclusion of The Agricultural
Sector....................................................................................................... 89
5.5. Systems in Agricultural Product Marketing Strategy ................. 91
5.6. Agricultural Commodity Marketing Strategy for Financial
Improvement .......................................................................................... 92

7 | SUSTAINABLE AGRICULTURE LEADS TO ZERO HUNGER
5.7. Conclusion ....................................................................................... 98
5.8. Implication ...................................................................................... 98
References ............................................................................................... 99
Brief Curriculum Vitae of Author ...................................................... 100
CHAPTER 6 .............................................................................................. 101
GENOME-WIDE ASSOCIATION STUDIES IN SUSTAINABLE
LIVESTOCK BREEDING ....................................................................... 101
Raziye IŞIK1, 2* ........................................................................................... 101
6.1 Introduction .................................................................................. 103
6.2. Methodology of GWAS ................................................................ 103
6.3. Genome-wide association studies in cattle .................................. 104
6.4. Genome-wide association studies in sheep .................................. 106
6.5. Genome-wide association studies in goats ................................... 109
6.6. Genome-wide association studies in chickens ............................. 110
6.7. Conclusion ..................................................................................... 113
References ............................................................................................. 114
Brief Curriculum Vitae of Author ...................................................... 118
CHAPTER 7 .............................................................................................. 119
WORTH AND NUTRITIOUS BANANA PSEUDOSTEM’S WASTE
LEADS TO ZERO HUNGER .................................................................. 119
Ristina Siti SUNDARI1,2*, Rilla Tresnadola TARIGAN3, Rizky Adi
Nugraha TARIGAN4, Ai Kusmiati ASYIAH5 ......................................... 119
7.1. Introduction .................................................................................. 121
7.2. Material and Method .................................................................... 122
7.3. Discussion ....................................................................................... 128
7.4. Conclusion ..................................................................................... 131
7.5. Implication .................................................................................... 131
References ............................................................................................. 132

SUSTAINABLE AGRICULTURE LEADS TO ZERO HUNGER | 8
Brief Curriculum Vitae of Authors ..................................................... 133
CHAPTER 8 .............................................................................................. 135
RICE STRAW COMPOST IN SUSTAINABLE AGRICULTURE ...... 135
Bahar SÖZÜBEK1*, Mergül ÖZTÜRK1 .................................................. 135
8.1. Introduction ................................................................................... 137
8.2. Characteristic of Rice Straw ......................................................... 138
8.3. Rice Straw Compost ...................................................................... 140
8.4. Compost Preparation .................................................................... 140
8.5. Composting Stages and Compost Maturity ................................. 141
8.6. Studies on Rice Straw Compost.................................................... 144
8.7. Effects of Rice Straw Compost on Soil and Plant ....................... 146
8.8. Conclusion and Suggestions .......................................................... 147
Brief Curriculum Viate of Author ...................................................... 154
CHAPTER 9 .............................................................................................. 155
CONSTRAINTS TO IRRIGATED RICE FARMING TECHNOLOGY
ADOPTION IN INDONESIA................................................................... 155
Nina LISANTY1*, Agustia Dwi PAMUJIATI1, ....................................... 155
9.1. Introduction .................................................................................. 157
9.2. Method ........................................................................................... 158
9.3. Results and Discussion ................................................................. 159
9.4. Conclusion ..................................................................................... 171
References ............................................................................................. 173
Brief Curriculum Vitae of Authors ..................................................... 176
CHAPTER 10 ............................................................................................ 179
MOLECULAR MARKER STUDIES IN SUSTAINABLE
AQUACULTURE...................................................................................... 179
Emel Özcan GÖKÇEK1* ........................................................................... 179
10.1. Introduction ................................................................................ 181

9 | SUSTAINABLE AGRICULTURE LEADS TO ZERO HUNGER
10.2. Molecular Markers .................................................................... 181
10.3. Non-PCR based markers ........................................................... 182
10.4. PCR-based markers ................................................................... 183
10.5. Conclusıon .................................................................................. 190
References ............................................................................................. 191
Brıef Currıculum Vıtae of Authors ..................................................... 196
CHAPTER 11 ............................................................................................ 197
THE ROLE OF LOCAL FOOD IN MANAGING STUNTING IN EAST
NUSA TENGGARA PROVINCE ............................................................ 197
Hedrika OETMUSU1, Carla Krisanti FIOS1, ......................................... 197
Holand Francisco BANI1, Umbu JOKA1*, .............................................. 197
11.1. Introduction ................................................................................ 199
11.2. Food ............................................................................................. 200
11.3. Stunting ....................................................................................... 203
11.4. Local Food Processing Into Value-Added Products ................ 205
11.5. The Role of Local Food in Preventing Stunting ....................... 208
11.6. The Role of Government and Community Institutions in
Tackling Stunting in NTT .................................................................... 209
11.7. Related Local Government Programs to Promote Local Food
Consumption......................................................................................... 212
11.8. Conclusion .................................................................................. 213
References ............................................................................................. 214
Brief Curriculum Vitae of Authors ..................................................... 215
CHAPTER 12 ............................................................................................ 217
COMPARISON OF BEAN CULTIVARS A GROWN IN SUFFICIENT
IRON-CONTAINING ENVIRONMENT IN TERMS OF SOME
NUTRITIONAL PROPERTIES .............................................................. 217
İlkay ÇOKA1, Ahmet KORKMAZ2, Güney AKINOĞLU2 .................... 217
12.1. Introduction ................................................................................ 219
SUSTAINABLE AGRICULTURE LEADS TO ZERO HUNGER | 10
12.2. Material and Method ................................................................. 221
12.3. Results and Discussion ............................................................... 222
12.4. Conclusion .................................................................................. 226
References ............................................................................................. 228
Brief Curriculum Vitae of Authors ..................................................... 229
CHAPTER 13 ............................................................................................ 231
DETERMINATION OF THE RESISTANCE OF SOME SUNFLOWER
LINES TO IRON DEFICIENCY ............................................................. 231
Ahmet KORKMAZ1, Güney AKINOĞLU1, E. BOZ2, İlkay ÇOKA3 .... 231
13.1. Introduction ................................................................................. 233
13.2. Material and Method ................................................................. 234
13.3. Results and Discussion ................................................................ 236
13.4. Conclusion .................................................................................... 240
References ............................................................................................. 241
Brief Curriculum Vitae of Authors ..................................................... 243

11 | SUSTAINABLE AGRICULTURE LEADS TO ZERO HUNGER
CHAPTER 1
RESIDUAL EFFECT OF BIOCHAR ON BERSEEM
YIELD AND YIELD ATTRIBUTES UNDER DOSAGES
OF NITROGEN AND FARMYARD MANURE LEVELS
Muhammad Rabnawaz KHAN1, Muhammad ARIF1, Farhan
AHMAD1, Ristina Siti SUNDARI2*, Junaid AHMAD1
1 Department of Agronomy, Faculty of crop production sciences, The
University of Agriculture Peshawar, Peshawar 2 Agribusiness Department, Perjuangan University, Jl. PETA No. 177
Tasikmalaya, 46115 Indonesia
*Corresponding Author: [email protected]

SUSTAINABLE AGRICULTURE LEADS TO ZERO HUNGER | 12

13 | SUSTAINABLE AGRICULTURE LEADS TO ZERO HUNGER
1.1. Introduction
Forage plant production could be very vital for successful animal
productivity. Trifolium is a larger genus within the Leguminosae family.
Berseem (Trifolium alexandrinum L.) is Iran's maximum extensively grown
clover (Sher et al., 2016). Berseem is thought to have an excessive capability
for organic N fixation, and the persistent nitrogen is made to related plants via
mineralized root and nodule nitrogen. Berseem, oats, Lucerne, barley, and shaft
are key winter forage vegetation (Roy and Jana, 2016). Berseem is utilized in
current decades and is famous for farmers due to its speedy increase, an
excessive wide variety of harvests, and sparkling forage productivity with
suitable quality and quantity. Berseem is the king of fodder because of its
capacity to supply greater cuts and produce the best clean fodder yield. Because
of the excessive populace pressure and unavailability of fodder, farmers
normally exercise greater fertilizer utility to berseem (Daneshnia et al., 2016).
Biochar is excellent grained charcoal excessive in natural carbon and largely
proof against decomposition (Yao et al., 2017). It is constituted of pyrolysis of
flora and waste feedstocks. Otherwise it needed to concern on changing rainfall
pattern (Ashraf, 2021).
Biochar application has developed interest as a sustainable generation to
enhance enermously weathered or degraded soils. It can enhance plant boom
with the aid of using enhancing soil chemical traits (i.e., nutrient retention and
availability) and soil bodily traits (i.e., bulk density, water protecting potential,
permeability) and soil organic homes, all contributing to an extended crop
productiveness (Xie et al., 2018). The net impact on the soil's physical
properties relies upon the interaction of the biochar with the Physico-chemical
traits of the soil and different determinant elements along with the climatic
situations typical on the site and the control of biochar application (Wang et al.,
2015). Adding natural manures might also enhance the fertility of the soil and
crop productivity to convert the physicochemical properties of soil, including
bioavailability of nutrients, water protection, cation exchange potential, soil
pH, and microbial population (Utomo et al., 2018). In addition, biochar is
especially recalcitrant to microbial decomposition and, as a consequence,
ensures a long-term gain for soil fertility. Biochar impact the law and
productivity function of the agricultural soil.
There are numerous reasons to anticipate that biochar would possibly
lower the opportunity of nutrient leaching in soils and create stronger nutrients
(Streubel et al., 2017). And also in limited soil or soiless (Sundari, et al., 2022)

SUSTAINABLE AGRICULTURE LEADS TO ZERO HUNGER | 14
substitute with biochar. Recently using natural substances like fertilizers for
crop productivity has obtained interest for sustainable crop productiveness.
Organic matter is the existence of soil, and the practices that aid natural matter
also favor sustainable productiveness (Sial et al., 2019). Incorporation of plant
residues is a beneficial means to preserve organic matter content material and
thereby enhance organic activity, enhance physical properties, and growth
nutrient availability. Organic manuring with the aid of using manner of the
direct application of traditional farmyard manure, mulching, crop residue, or
green manuring has declined over the years because of various operational
constraints (Pasley et al., 2019). Agricultural scientists are engaged in setting
up an agricultural system that may decrease production value and preserve
herbal resources. Therefore, the latest interest in manuring has re-emerged due
to excessive fertilizer prices and the significance of biochar, green manure,
farmyard manure, and different forms of manures retaining long-time period
soil productiveness except for meeting the well-timed requirement of nutrients.
Likewise, there is a positive interaction between the mixture of natural manures
and urea as a nitrogen source (Oladele et al., 2019).
Nitrogen fertilization performs a vital function in enhancing soil fertility
and growing crop productiveness. Nitrogen fertilization will increase grain
yield (43-68%) and biomass (25-42%) in maize (Almodares et al., 2019). It
contributes 18-34% growth in soil residual N. Sole residue incorporation or
mixture with N fertilizer has nice consequences on plant growth and production
and soil physicochemical properties (Khalid et al., 2017). Using natural
substances in a mixture with inorganic fertilizers to optimize nutrient
availability to flora is a tough challenge as natural substances have a variable
and complicated chemical nature. This availability called for the information
and understanding of the chemical composition, particularly the nutrient
content material and C first-class natural substances and their interplay with
inorganic nutrient sources. Unfortunately, there the little synthesis of the
incorporated consequences of organic substances on net nutrient control (Xie
et al., 2018). Numerous trials have compared the yields from a given quantity
of inorganic fertilizer and natural material and their mixture, and in lots of
conditions have produced better yields (Wang et al., 2013). It must now no
longer be sudden that the mixture increases because greater total nutrients were
added. Economically FYM 50% and Nitrogen 50% in 85,000 maize plants per
ha resulted in a higher harvest index of 31.5% and the highest R/C ratio of 6.2
(Ahmad, et al. 2021a, 2021b)

15 | SUSTAINABLE AGRICULTURE LEADS TO ZERO HUNGER
Therefore, it is miles vital to evaluate the consequences of biochar and
FYM on crop productiveness beneath field situations when it comes to
agronomic practices at a given site because such studies are uncommon and are
little recognized as approximately viable interaction consequences (Ulyett et
al., 2014). For this purpose, a field test has been initiated of biochar, FYM, and
chemical fertilizer N on crop yields and soil homes. Nitrogen is one of the
maximum vital plant nutrients proscribed in soil and that sells vigorous plant
vegetative growth. This paper reviews the effects of the impact of biochar,
alone and in mixtures with FYM and fertilizer N, on soil organic matter and
mineral N in a decided cropping system (Almodares et al., 2019). Nitrogen
fertilization is one of the maximum essential agronomic practices, and
consequently, there is various research carried out with nitrogen fertilizer.
Nitrogen deficiency impacts the partitioning of assimilates amongst vegetative
and reproductive organs and may affect the growth and improvement of the
flora.
It improves diverse crop parameters like grain weight and yield
(Mohammad et al., 2013). Its excess application might also lead to
accommodations and make the plant vulnerable to diseases. Though the
significance of inorganic fertilizer cannot be ignored, the non-stop application
of inorganic fertilizer now no longer leads to soil degradation and increases
production costs and diverse environmental issues related to heavy inorganic
fertilization (Sher et al., 2016; Ahmad et al., 2022). The research was designed
to keep in view the above facts to assess the residual and integrate the impact
of biochar, FYM, and mineral nitrogen on berseem yield and yield additives
under the agro-climatic circumstance Peshawar-Pakistan.
1.2. Materials and Methods
Field experimentation was executed to assess the residual biochar impact
on berseem productivity under numerous nitrogen and farmyard manure rates
at Agronomy Research Farm, The University of Agriculture Peshawar, from
2013–to 2014. The consequences of formerly provided biochar at 3 degrees
such as 0, 25, and 50 t ha-1 have been studied in the test. In contrast, FYM
carried out before sowing @5 and 10 t ha-1 on the time of sowing in mixture
with nitrogen carried out in degrees (15 and 30 kg ha-1) in identical splits, 1/2
of at sowing and remaining after planting. A control turned into also covered
withinside the test. Berseem seed of local variety "Pelosi Type" was sown on
October 15th, 2013 @ 25 kg ha-1. The experiment was specified in a

SUSTAINABLE AGRICULTURE LEADS TO ZERO HUNGER | 16
randomized complete block design with three replications having a plot size of
4. 5 m by 4 m.
Moreover, the field was plowed twice as much as 30 cm in-depth with
the cultivator's assistance, followed by planking. Plowing was carried out
carefully for non-disturbance of the preceding layout of the experiment.
Berseem seeds were sewed in standing water (flooding), and the field was
irrigated in line with the requirement of the crop. All other cultural practices
have been carried out uniformly in every experimental unit.
Procedure for data recording
Emergence: Emergence m-2 was recorded by throwing 1m2quadrate
randomly in 3 distinctive spots in every plot, after which the seedling numbers
were counted. The data have been averaged to get emergence m-2. Weed
density: Weeds were measured at three spots in each experimental unit 45 days
after sowing with the help of quadrate and were converted into the number of
weeds m-2. Plant height: Plant height was measured before the final cut. The
ten randomly selected plants were measured from soil to the end of the plant in
each plot after calculating the average change. A number of seeds head -1:
Seeds from ten randomly decided heads or bolls of every experimental unit
have been hand threshed, counted, and transformed into an average number of
seeds boll-1. Thousand seed weight: After counting the number of seeds head-
1 at random from the sample of every experimental unit, the counted seeds were
weighed and then transformed into a thousand seed weight. Seed yield: Seed
yield was measured in kg ha-1. Three distinctive spots have been harvested with
the assistance of one m2 quadrate, and seed heads have been threshed. Seeds of
every pattern have been weighed with digital balance and transformed into kg
ha-1. Biological yield: The dry forage yield was taken after every cut was
introduced and transformed into kg ha-1 for recording biological yield data.
1.3. Results And Discussions
1. Emergence
A perusal of the data revealed that the effects of biochar, farmyard
manure, and nitrogen application were not significant on the appearance of m-2
of berseem (Table 1). Planned mean comparison indicated that the contrast
between control vs. rest and biochar vs. no biochar were non-significant.
Similarly, all interactions were found non-significant. Though treatments’
effects were not significant, high emergence was noted in no biochar plots

17 | SUSTAINABLE AGRICULTURE LEADS TO ZERO HUNGER
compared to BC plots. Similarly, FYM @5 t ha-1 resulted in higher emergence.
Likewise, a lower level of N (15 kg ha-1) resulted in higher emergence.
2. Weeds density m-2
Data perusal revealed that previously applied BC, FYM and N
significantly influenced weeds density m-2. Biochar Plots had more weeds as
contrasted with no BC density was higher where BC applied @50 t ha-1. FYM
@10 t ha-1 application to plots had more weeds, and 5 t ha-1 had lesser weeds
population. Likewise, as the commercial N treatment was increased from 15 to
30 kg ha-1, the density of the weeds was noted high.
Figure 1. Interaction of BC and FYM for weeds density m-2.
Comparison between fertilized and unfertilized plots exhibited that
weeds density was higher in fertilized plots and lower in control plots. Fig. 2c
shows that as the BC levels boost up from 25 to 50 t ha-1 along with 10 t ha
FYM, the weeds' density reached a peak point. The dry biomass of weeds after
3rd cut was significantly affected by BC, FYM, and N levels. The contrast
between control vs. rest and BC vs. no BC was significant, while all interactions
remained not significant. Planned mean comparison indicated that the dry
weight of weeds was higher (546 kg ha-1) in plots where residual biochar (BC)
was applied as compared to p without biochar (495 kg ha-1). Fertilized plots
resulted in higher (522 kg ha-1) weeds dry biomass, and control plots resulted
in lower (413 kg ha-1) dry mass of weeds. Plots with BC @50 t ha-1,

SUSTAINABLE AGRICULTURE LEADS TO ZERO HUNGER | 18
incorporated FYM @10 t ha-1, and N application @30 kg ha-1 resulted in higher
dry biomass of weeds than 25 t ha-1 BC, 5 t ha-1 FYM 15 kg ha-1 N application.
Mean values of weeds' dry biomass after the fifth cut revealed that the
remaining BC, FYM, and N rates impacted weeds' dry biomass after the fifth
cut. BC x FYM x N and N x FYM communications were non-huge, while BC
x N and BC x FYM were critical. Higher weeds dry biomass were examined in
plots got BC @50 t ha-1. Amended FYM@ 10 t ha-1 and N 30 kg ha-1 had higher
dry biomass of weeds when contrasted with 5 t ha-1 FYM and 15 kg ha-1 N.
mutual effect of BC and FYM showed that weeds' dry weight expanded in both
5 and 10 t ha-1 with a high degree of BC yet this increment was more with 10 t
ha-1 FYM application (figure 1). Interaction of N and BC uncovered that weeds'
dry biomass straightly improved 15 and 30 kg ha-1 with expanded in 50 t ha-1
BC, yet expansion in dry biomass of weeds was substantially more with N
application @30 kg ha-1 (Figure 1)
3. Plant height
A measurable exagetation of plant tallness in Table 2 revealed that the
past applied BC, FYM, and N significantly influenced plant stature. Short
height plants (75.08 cm) were inspected in no BC plots, while long height plants
(90.25 cm) were examined with BC @25 t ha-1 Incorporation of FYM @10 t
ha-1 brought about higher plant tallness (86.72 cm) than 5 t ha-1 (82.78 cm).
Higher plant tallness (88.33 cm) was kept in plots treated with 30 kg ha-1 N
when contrasted with 15 kg N ha-1 (81.17 cm). Our findings are also supported
by Utomo et al. (2018), who observe higher stature of plants with optimal doses
of N while further increment in N leads to plant lodging. Similarly, Yao et al.
(2017) reported the same findings for nitrogen application.
4. Number of heads m-2
Heads m-2 mean data are presented in Table 2. Biochar, nitrogen, and
FYM levels significantly impacted heads m-2. Higher berseem heads m-2 were
analyzed in plots where BC was previously utilized at @25 t ha-1, followed by
a high measure of BC with 50 t ha-1. Besides, the high stockpile of farmyard
manure 10 t ha-1 and N 30 kg ha - 1 brought about higher heads m-2 when
contrasted with 5 t FYM ha-1 and 15 kg N ha-1 separately. Nitrogen and BC
collaboration uncovered that number of seeds head-1 expanded in both the entire
and half portion of N with expansion in BC from 0 to 25 t ha-1. Albeit high
measure of N 30 kg ha-1 supported heads m-2yield more when contrasted with

19 | SUSTAINABLE AGRICULTURE LEADS TO ZERO HUNGER
15 kg ha-1 (Fig. 3). Xie et al. (2018) and Wang et al. (2015) found similar
findings with N fertilization. They revealed that productive units significantly
enhanced with nitrogen fertilization, but higher doses may decline the yield
attributess and expand the vegetative growth.
Figure 2. Interaction of BC and N for seed head-1
Figure 3. Interaction of BC and FYM for seed head-1
5. Biological yield
Residual BC, FYM, and N fundamentally impacted biological yield.
Biochar control plots created lesser biomass (40380 kg ha-1) of berseem while

SUSTAINABLE AGRICULTURE LEADS TO ZERO HUNGER | 20
higher biomass (49211 kg ha-1) was kept in plots treated with 50 t ha-1 BC
application. BC 50 t ha-1 plots had more organic yield than no biochar plots.
Figure 4. Interaction of BC and FYM for biological yield (kg ha-1)
Application of FYM @ 10 t ha-1 and N @ 30 kg ha-1 gave higher natural
yield as connected with 5 t FYM ha-1 and 15 kg N ha-1 separately. The BC and
FYM communication for biological yield showed that improving BC expanded
natural product with 10 t ha-1 FYM than 5 t ha-1. However, further expansion
in BC diminished biological yield (Fig. 4). Interaction between BC and N for
biological yield (Fig. 5) demonstrated that rising BC upgraded biological yield
directly with 15 kg N ha-1 than 30 kg N ha-1, where it declined with additional
expansion in BC. Streubel et al. (2017) reasoned that biological yield
increments with the mutual utilization of urea and organic manures.
Biochar application rate (t ha-1)
0 25 50
Bio
log
ica
l Y
ield
(kg
ha
-1)
38000
40000
42000
44000
46000
48000
50000
52000
Nitrogen (15 kg ha-1)
Nitrogen (30 kg ha-1)
Figure 5. Interaction of BC and N for biological yield (kg ha-1)

21 | SUSTAINABLE AGRICULTURE LEADS TO ZERO HUNGER
6. Seed yield
Seed yield was affected by BC, FYM, and nitrogen. Treated plots
brought about higher seed yield when contrasted with control. Lower seed yield
(705 kg ha-1) was inspected in plots where no BC was practiced, while higher
returns (914 kg ha-1) of berseem seed delivered by plots got BC with how much
25 t ha-1. FYM @5 t ha-1produced a lower seed yield (773 kg ha-1) as put next
to each other with 10 t ha-1 (809 kg ha-1). A higher yield of berseem (805 kg
ha-1) was kept in plots treated with N 30 kg ha-1 as adjusted to 15 kg N ha-1
(777 kg ha-1). Expanding seed yield biochar from 0 - 25 t ha-¬1 on the seed
yield improved in 30 and 15 kg N ha-1. However, the increment was more with
30 kg N ha-1 (Figure 5a). Moreover, the communication of BC and FYM
uncovered that rising the degree of FYM from 5-10 t ha-1 seed yield expanded
with 25 t ha-1 BC (Figure 4). Sial et al. (2019) and Mhsen et al. (2010) came
about that nitrogenous manures improved the yielding nature of berseem.
Figure 5. Interaction of BC and FYM for seed yield (kg ha-1)
Figure 6. Interaction of BC and FYM for seed yield (kg ha-1)
Fig 5(c)
Biochar application rate (ton ha-1)
0 25 50
Se
ed
yie
ld k
g h
a-1
600
650
700
750
800
850
900
950
FYM (5 ton ha-1)
FYM (10 ton ha-1)

SUSTAINABLE AGRICULTURE LEADS TO ZERO HUNGER | 22
7. Number of seed head-1
The mean value in Table 9 showed that seed head-1 was significantly
influenced by biochar and mineral nitrogen. Moreover, the contrast between
control versus rest and biochar versus no biochar is likewise enormous. Already
applied 25 t ha-1 BC brought about additional while fewer seeds head-1were got
from plots where no biochar was applied. Moreover, more seeds head-1studied
with FYM supply @ 10 t ha-1. In like manner, N @ 30 kg ha - 1 contributed to
expanded seeds head-1.
Biochar application rate (t ha-1)
0 25 50
Nu
mb
er
of h
ea
ds
(m-2
)
1500
1550
1600
1650
1700
1750
1800
1850Nitrogen (15 kg ha-1)
Nitrogen (30 kg ha-1)
Figure 7. Interaction of BC and N for number of heads m-2
Meanwhile, Seed head-1 expanded in the two levels 5 and 10 t ha-1 FYM
application with BC application at the pace of 25 t ha-1. FYM at the rate of 10 t
ha-1 delivered more seeds head-1(Fig. 7). The interaction among N and BC
exposed that seeds head-1 upgraded in both (15 and 30 kg ha-1 N) with
expanding BC from 0 to 25 t ha-1. Higher seed head - 1 was delivered by 30 kg
ha-1 N application when contrasted with N application at the pace of 15 kg ha-1
(Fig. 7). Shah and Ahmad, 2009, revealed that combined utilization of FYM
and N supplements further develops seed numbers. Moreover, Pasley et al.
(2019) and Sial et al. (2019) declared that the integrated use of nitrogen
enhances seeds productivity.
8. Thousand seed weight
A measurable examination of the information revealed that 1000 seed
weight was significantly impacted by past applied BC, FYM, and N. BC x N x

23 | SUSTAINABLE AGRICULTURE LEADS TO ZERO HUNGER
FYM and FYM x N were non-critical. The control versus rest and BC versus
no BC contrast was critical. Planned mean examination showed that previously
applied BC came about higher than 1000 grains weight when contrasted with
no BC plots.
Figure 8. Interaction of BC and FYM for thousand seed weight (g)
In like manner, a comparison of treated plots with control uncovered that
heavier 1000 grains were higher in fertilized plots while lower in unfertilized
plots. Lower weight (4 g) of thousand grains was kept in no biochar plots, while
higher (5 g) was acquired in plots with 25 t ha-1 biochar. FYM @ 10 t ha-1
brought about heavier 1000 grains (5 g) when contrasted with 5 t ha-1 (4 g).
Low use of mineral N delivered a lower weight of 1000 grains (4 g). Higher
thousand-grain weight (6 g) was examined in plots treated with 30 kg ha-1 N.
Figure 9. Interaction of N and BC for thousand seed weight (g)

SUSTAINABLE AGRICULTURE LEADS TO ZERO HUNGER | 24
BC, and FYM combined effect showed that Increasing biochar from 0 to
25 t ha¬1, 1000 grains weight expanded both in 5 and 10 t ha-1 FYM, yet the
increment was more in 5 t FYM ha-1 contrasted and 10 t ha-1 (Figure 6a). A
thousand grains weight increments with the expansion in biochar levels up to
25 t ha¬1 with both 30 and 15 kg N ha-1, yet the increase was more in 30 kg N
ha-1 (Figure 9). Our present results outcomes are following Oladele et al. (2019).
They also explored the heavier weight of the richer grainsntegrated organic and
inorganic fertilization approaches.
1.4. Conclusion
Farmyard manure at 10 t ha-1 produced higher seed yield, biological
yield, heavier grains, weed density, and fresh and dry biomass of weeds. Plots
treated with 30 kg N ha-1 resulted in tallest plants, higher weeds density, fresh
and dry biomass of weeds, higher biological and grains productivity, and
heavier grains. It was concluded from the study that 50 t ha-1 BC, 10 t ha-1 FYM,
and 30 kg ha-1 N enhanced yield and yield attributes.
Acknowledgment
This manuscript was prepared from Muhammad Rabnawaz Khan’s
thesis part.

25 | SUSTAINABLE AGRICULTURE LEADS TO ZERO HUNGER
REFERENCES
Ahmad, F., Siddiqui. S.A., Sundari, R.S., Ahmad, J., Shah, S.M.A., Khan, M.R.,
Tarigan, R.A.N., Andrey Nagdalian, A., Moazzem, M., M.S., Ali, A., Fidan, H.,
Kasulla, S., Malik, S.J., Andrey Blinov, A., Fazili, M.A., Kiptum, CK., Ibrahim,
SA. (2022) Assessing Integrated Nitrogen And Planting Density On Growth,
Yield Component And Financial Analysis Of Maize Crops (Zea Mays). Journal
of Hygienic Engineering and Design (JHED). Original Scientific Paper UDC
633.11-184(549).
Ahmad, F., Sundari, R.S., Arshad, A., and Ahmad, J. (2021a). The Financial Analysis
of Nitrogen Fertilizers and Planting Systems and Its Implications on Maize
Agribusiness: Evidence from Peshawar, Pakistan. Journal of Socioeconomics
and Development. 2021. 4(1): 145-155. https://doi.org/10.31328/jsed.v4i1.2197
Ahmad, F., Sundari, R.S., Arshad, A., and Ahmad, J., Shafi, M. (2021b). Economic
Return, Yield and Harvest Index of Integrated Nitrogen In 85,000 Plants Ha-1
on Zea mays Agribusiness Inpeshawar, Pakistan. Jurnal Hexagro 5(1):45-53.
DOI: 10.36423/hexagro.v5i1.558
Ashraf, M., Arshad, A., Babar, J. R., Patel, P., Khan, A., Qumar, H., Sundari, R.S.,
Ghani, M. U., Amin, A. (2021). Quantifying climate - induced drought risk to
livelihood and mitigation actions in Balochistan. Natural Hazards. 107(3)-1-25.
https://doi.org/10.1007/s11069-021-04913-4
Ali, K., Khalil. SK., Munsif F, Rab A, Nawab K, Khan AZ, Kamal A and Khan ZH,
2012. Response of Maize (Zea Mays L.) to various nitrogen sources and tillage
practices. Sarhad J. Agric. 28(1): 9-14.
Almodares, A.; M. Jafarinia and M.R. Hadi (2019). The effects of nitrogen fertilizer on
chemical compositions in corn and sweet sorghum. American-Eurasian Journal
of Agriculture and Environmental Science, 6 (4): 441-446.
Daneshnia F, Amini A, Chaichi MR (2016) Berseem clover quality and basil essential
oil yield in intercropping system under limited irrigation treatments with
surfactant. Agric Water Manage 164: 331–339.
Khalid M, Ijaz A, Muhammad A (2017) Effect of nitrogen and phosphorus on the
fodder yield and quality of two Sorghum cultivars (Sorghum bicolor L.). Int J
Agri Biol 5: 61–63.
Khan I, Jan AU, Khan I, Ali K, Jan D, Ali S and Khan MN, 2012. Wheat and berseem
cultivation: A comparison of profitability in district Peshawar. Sarhad J. Agric.
28(1): 83-88.
Khan N, Shah Z, Ahmed N, Ahmad S, Mehmood N (2013) Effect of integrated use of
biochar, FYM and nitrogen fertilizer on soil organic fertility. J Pure Appl Bio
2(2):42–47.
Lua K, Yang X, Shenb J, Robinsonc B, Huangd H, Liua D, Bolane N, Peib J, Wanga
H (2014). Effect of bamboo and rice straw biochars on the bioavailability of Cd,
Cu, Pb and Zn to Sedum plumbizincicola. Agric Ecosyst Environ 191:124–132.

SUSTAINABLE AGRICULTURE LEADS TO ZERO HUNGER | 26
Lentz RD, Ippolito JA (2012) Biochar and manure affect calcareous soil and corn silage
nutrient concentrations and uptake. J Environ Qual 41(4):1033–1043.
Mohammad, D. and Alamgir A 2013. Response of wheat to residual biochar and FYM.
MSc (Hons) thesis. Submitted to the University of Agriculture Peshawar,
Pakistan.
Naeem MA, Khalid M, Arshad M, Ahmad R (2014) Yield and nutrient composition of
biochar produced from different feedstocks at varying pyrolytic temperatures.
Pak J Agri Sci 51(1):75–82
Oladele, S. O., A. J. Adeyemo, M. A. Awodun, A. E. Ajayi, and A. Fasina. 2019.
Effects of biochar and nitrogen fertilizer on soil physicochemical properties,
nitrogen use efficiency and upland rice (Oryza sativa) yield grown on an Alfisol
in Southwestern Nigeria. International Journal of Recycling of Organic Waste
in Agriculture 8 (3): 295–308. DOI: 10.1007/s40093-019-0251-0.
Pasley, H. R., J. E. Cairns, J. J. Camberato, and T. J. Vyn. 2019. Nitrogen fertilizer rate
increases plant uptake and soil availability of essential nutrients in continuous
maize production in Kenya and Zimbabwe. Nutrient Cycling in Agroecosystems
115 (3):373–89.
Qayyum MF, Abid M, Danish S, Saeed MK, Ali MA (2014) Production,
characterization and evaluation of various biochars for use as an organic
amendment in Pakistan. Pak J Agric Sci
Roy DC, Jana K (2016) Biomass production and quality of berseem fodder (Trifolium
alexandrinum L.) as influenced by application of phosphorus and phosphate
solubilizing bacteria. Adv Life Sci 5: 1225–1229.
Saleem A, Parveen S, Khan MJ (2012) Effect of biochar, farmyard manure and poultry
manure on Zn adsorption in calcareous alkaline soil. Sarhad J Agric 32(4):354–
363
Sher F, Latif MT, Hussain M, et al. (2016) Impact of berseem (Trifolium alexandrinum
L.) cultivation on productivity of subsequent crops in wheat-rice system. Int J
Adv Res Biol Sci 3: 16–20.
Sial, T. A., M. N. Khan, Z. Lan, F. Kumbhar, Z. Ying, J. Zhang, D. Sun, and X. Li.
2019a. Contrasting effects of banana peel waste and its biochar on greenhouse
gas emissions and soil biochemical properties. Process Safety and
Environmental Protection 122:366–77.
Streubel, J. D., H. P. Collins, M. Garcia-Perez, J. Tarara, D. Granatstein, and C. E.
Kruger. 2017. Influence of contrasting biochar types on five soils at increasing
rates of application. Soil Science Society of America Journal 75 (4):1402–13.
Sundari, R.S., Sulistyowati, L., Noor, T. I., Setiawan, I. 2022. Soilless Culture for
Agribusiness throughout Urban Farming in Indonesia. Soiless Culture Chapter.
IntechOpen. United Kingdom. 10.5772/intechopen.101757
Tonutare T, Krebstein K, Utso M, Rodima A, Kolli R, Shanskiy M (2014) Biochar
contribution to soil pH buffer capacity. Geophys Res Abstr 16. EGU2014-10354

27 | SUSTAINABLE AGRICULTURE LEADS TO ZERO HUNGER
Utomo, W. M., T. Islami, E. I. Wisnubroto, and E. Suhartini. 2018. Biochar as a carrier
for nitrogen plant nutrition: 2, The growth of maize (Zea mays L.) applied with
nitrogen-enriched biochar on different soil texture. Bioscience Research 15
(3):1749–56.
Uzoma KC, Inoue M, Andry H, Fujimaki H, Zahoor A, Nihihara E (2011) Effect of
cow manure biochar on maize productivity under sandy soil conditions. Soil Use
Mgt 27:205–212.
Ulyett J, Sakrabani R, Kibblewhite M, Hann M (2014) Impact of biochar addition on
water retention, nitrification and carbon dioxide evolution from two sandy loam
soils. Eur J Soil Sci 65:96–104.
Verheijen F, Jeffery S, Bastos A. C., Velde M. V., Diafas I. (2010) Biochar application
to soils: a critical scientific review of effects on soil properties, processes and
functions. JRC Sci-Tech Rep 149.
Wang S, Zhao X, Xing G, Yang L (2013) Large-scale bio-char production from crop
residue. a new idea and the biogas-energy pyrolysis system. Biol Res 8(1):8–11.
Wang, X., D. Song, G. Liang, Q. Zhang, C. Ai, and W. Zhou. 2015. Maize biochar
addition rate influences soil enzyme activity and microbial community
composition in a fluvo-aquic soil. Applied Soil Ecology 96:265–72.
Xie, Z. B., Y. P. Xu, G. Liu, Q. Liu, J. G. Zhu, C. Tu, J. E. Amone-Tte, G. Cadisch, J.
W. H. Yong, and S. J. Hu. 2018. Impact of biochar application on nitrogen
nutrition of rice, greenhouse-gas emissions and soil organic carbon dynamics in
two paddy soils of China. Plant and Soil 370 (1–2):527–40.
Yao, Q., J. Liu, Z. Yu, Y. Li, J. Jin, X. Liu, and G. Wang. 2017. Three years of biochar
amendment alters soil physiochemical properties and fungal community
composition in black soil of northeast China. Soil Biology and Biochemistry
110:56–67.
Zhang, M. G., Cheng, H. Feng, B. Sun, Y. Zhao, H. Chen, J. Chen, M. Dyck, X. Wang,
and J. Zhang. 2017. Effects of straw and biochar amendments on aggregate
stability, soil organic carbon, and enzyme activities in the Loess Plateau, China.
Environmental Science and Pollution Research 24:1–13. DOI: 10.1007/s11356-
017-8505-8.
Zhu, Q., X. Peng, and T. Huang. 2015. Contrasted effects of biochar on maize growth
and N use efficiency depending on soil conditions. International Agrophysics 29
(2):257–66. DOI: 10.1515/intag-2015-0023.
Zwieten VL, Kimber S, Morris S, Chan YK, Downie A, Rust J, Joseph S, Cowie A
(2010) Effect of biochar from slow pyrolysis of papermill waste on agronomic
performance and soil fertility. Plant Soil 327:235–246.

SUSTAINABLE AGRICULTURE LEADS TO ZERO HUNGER | 28
Brief Curriculum Vitae of Authors
Dr. Muhammad Rabnawaz Khan. He is now a visiting lecturer at
Department of Agronomy UAP, AMK Campus Mardan.
Previously he is a visiting lecturer at Agriculture Department,
Hazara University Mansehra. He published 19 indexed
international journals (Scopus: 5), 2 international proceedings.
https://www.scopus.com/authid/detail.uri?authorId=5730736830
0. https://www.researchgate.net/profile/Muhammad-Rabbawaz-
Khan.
Dr. Muhammad Arif from Department of Agronomy, the
University of Agriculture Peshawar, Pakistan. Email:
[email protected], [email protected]. Area of
interest: Seed priming, Crop nutrition and dual purpose crops, use
of biochar as soil amendment. He achieve 7 awards in academic,
involved in 10 professional societies, organizer of 12 training and
congress, 7 international book chapter, 68 impact factor journal
since 2010. 15 international proceedings. 59 HEC recognized
national journals. Since 2000.
Agronomist and Livelihood Specialist in Pakistan. He graduated
from the Department of Agronomy, Agricultural University of
Peshawar, Khyber Pakhtunkhwa, Pakistan. He published 1
International book chapter, 19 international journals, and 3
proceeding articles since 2018.
https://www.scopus.com/authid/detail.uri?authorId=576567742
00. http://orcid.org/000-0002-4248-0714.
https://www.researchgate.net/profile/Farhan-Ahmad-36/research. Research interest:
Agricultural, Livelihood Support and food security programs and Operations
Management, Emergency (relief) and early recovery| Program Management,
Livelihoods & Social Protection, Food Security & Social Research, Cash-Based
Programming; cash-for-work, Micro-enterprise. He works at FRD-WFP Project.
Assoc. Prof. Ristina Siti Sundari, is a researcher and lecturer in the
Department of Agribusiness, Agricultural Faculty University of
Perjuangan Tasikmalaya, and at Agricultural Science, University
of Padjadjaran Bandung. Research interest in Agricultural
development, Environment, Climate change, Urban
Farming/Agriculture, Food Science and Technology. She is also
an Editor in Chief in Jurnal Hexagro, a journal in Agribusiness

29 | SUSTAINABLE AGRICULTURE LEADS TO ZERO HUNGER
She is a journal reviewer in indexed international and national journals. She published
53 International (indexed of Scopus, WoS, SCI, SCIE) and national (indexed Sinta)
articles.3 International Book and book chapters, 2 Intelectual copyrights, 18
Conference Papers (International Proceeding), and 5 posters since 2017.
https://scholar.google.co.id/citations?user=HDXkQdAAAAAJ&hl=en ;
https://sinta3.kemdikbud.go.id/authors/profile/6105719; http://orcid.org/0000-0002-
5310-8520 ; https://publons.com/researcher/3920243/ristina-siti-sundari/
https://www.scopus.com/authid/detail.uri?authorId=57214594907
https://www.researchgate.net/profile/Ristina-Sundari/research?ev=prf_act;
https://sinta.kemdikbud.go.id/authors/profile/6105719. WoS R id AAZ-9469-2020.
Junaid Ahmad. He graduated from the Department of Agronomy,
Agricultural University of Peshawar, Khyber Pakhtunkhwa,
Pakistan, Ph.D in progress. He published 32 international journals
(Scopus, SCI, HEC), and 3 international proceeding articles since
2018. He also is active in Tobacco Ltd. [email protected]
https://www.scopus.com/authid/detail.uri?authorId=5722451015
2, https://www.researchgate.net/profile/Junaid-Ahmad-
13/research, https://orcid.org/0000-0001-7178-3901,

SUSTAINABLE AGRICULTURE LEADS TO ZERO HUNGER | 30

31 | SUSTAINABLE AGRICULTURE LEADS TO ZERO HUNGER
CHAPTER 2
DETERMINATION OF NUTRITIONAL STATUS OF
OLIVE (Olea europaea L.) ORCHARDS GROWN IN
BANDIRMA DISTRICT, BALIKESIR TURKEY, BY
PLANT ANALYSIS
Aydın ADİLOĞLU1*, Eda ÖZEL1
1Tekirdağ Namık Kemal University, Agricultural Faculty, Department of Soil
Science and Plant Nutrition 59030- Süleymanpaşa-Tekirdağ/Turkey
*Corresponding Author: [email protected]

SUSTAINABLE AGRICULTURE LEADS TO ZERO HUNGER | 32

33 | SUSTAINABLE AGRICULTURE LEADS TO ZERO HUNGER
2.1. Introduction
The olive, the oldest cultural crop, belongs to the Oleaceae family, the
genus Olea, species Olea europaea, and subspecies Olea europaea sativa
(Kiritsakis and Markakis, 1987). Olive grows under warm and rainy winter and
dry summer conditions like hot weather (Bozdoğan Konuşkan, 2008). Olive is
an essential crop in terms of nutrition. The color and shape of olive differ
depending on the variety. Olive mainly consists of water and oil. Protein,
cellulose, sugar, minerals, and hydrocarbons are also found in the chemical
structure of olive. Factors such Asthe region where it is grown and its variety
affects the chemical composition of olive (Vinha et al., 2005).
The rising consumption of olive oil is essential for our country. Olive oil
and olive consumption are the most essential for human health. According to
studies, olive oil ranks first in terms of heart health. Vitamin E in the content of
olive is cancer preventive. Vitamins A, D, E, K and minerals such as calcium,
phosphorus, potassium, sulfur, magnesium, iron, copper, and manganese in the
content of olive are beneficial for bone growth. All technical requirements in
establishing the olive orchards should be considered to obtain a high olive yield.
Plant variety and crop quality are important factors for optimizing the
application time of N fertilizer. For example, late nitrogen fertilization in wheat
cultivars significantly improves wheat bread quality by increasing gluten
content in the grain. Thus, it is recommended to apply some nitrogen fertilizer
under adequate soil moisture conditions a few months before the wheat harvest
(Adiloğlu and Eraslan, 2012).
A study was conducted to determine the nutrition status of wheat
(Triticum aestivum L.) in the Muratlı district of Tekirdağ with leaf analysis.
Some plant nutrients were analyzed in leaf samples taken from 20 different
wheat (Triticum aestivum L.) fields in the Muratlı district. When the analysis
results were compared with the reference values, deficiencies were found in 5
% for K, 10 % for N, 25 % for Ca and P, 90 % for Zn, 100 % for Mg, and 20
% for Cu element (Çaktü, 2015).
The minimum temperature for growing an olive tree is -70C. The
branches of young and old olive trees are negatively affected by cold
temperatures. Olive should not be grown in areas where the temperature falls
below 0 0C before olive harvest. In addition, olive cultivation should not be
done in the areas with frost risk in March and April (Dokuzoğuz and
Mendilcioğlu, 1971). High temperature, drying winds, and heavy rain at the
pollination and flowering stage negatively influence fruit set in olive. The

SUSTAINABLE AGRICULTURE LEADS TO ZERO HUNGER | 34
maximum temperature olive can resist 40 0C (Buldan and Çukur, 2003). In a
study conducted in the Başiskele district of Kocaeli province, leaf analysis of
macro and micronutrient elements was carried out on leaf samples collected
from 20 collards (Brassica oleracea var. Acephala) garden to determine the
nutritional status of collards (Brassica oleracea var. Acephala). According to
the results, 40 % of leaf samples were deficient in N and Mg, 60 % in K, 75 %
in Ca, 15 % in Fe, and 25 % in Zn and Mn. It was found that N, K, and Ca
contents were high in 5 % of leaf samples and Fe content in 10 % (Yıldız, 2014).
The research aims to determine the nutritional status of olive plants (Olea
europaea L.) with leaf analysis in the Bandirma District of Balikesir province
and to provide fertilization by plant requirements in line with the determined
plant nutrient deficiencies and excesses.
2.2. Materials and Methods
In this study, olive (Olea europaea L.) plant leaf samples were taken
from 20 different olive orchards in the Bandirma District of Balikesir province,
as stated in the study conducted by Jones et al. (1991). Some macro (N, P, K,
Ca, and Mg) and some micro (Fe, Cu, Zn, and Mn) plant nutrient analyses were
performed on leaf samples (Kacar and İnal, 2010). For each nutrient element,
the data obtained were compared with the reference values, and the nutritional
status of the olive plant was revealed in the research areas. Table 1 shows some
information about the olive orchards from which samples were taken. On the
other hand, some pictures are given from the orchards (Fig. 1, Fig. 2, and Fig.
3).
Figure 1. A view from researched olive orchards

35 | SUSTAINABLE AGRICULTURE LEADS TO ZERO HUNGER
Table 1. Some information about researched olive orchards
No Location Farmer names Parcel no Area (m2)
1 Bıyıklı Ertaç Yalçın 2872 2747
2 İnkaya Mebruke Razi 6800 1175
3 Kalemlik Ülkü Kılıç 3684 1999
4 Ergili Sevgiser Şuvman 250 4550
5 Yeşilçomlu Fatma Saraçoğlu 235 7550
6 Şirinçavuş Kroman Çelik Sanayi A. Ş. 155 2417
7 Hıdırköy Halit Dedeokayoğulları 216 3000
8 Hıdırköy Nurten Eken-Cemil ve Erden Dönmez 314 788
9 Kuzguncuk Birol Gürel 3472 2014
10 Narlık Saadet Arı 4712 1125
11 Söğütlüçeşme Cihan Güneş 6952 1500
12 Bezirci Barış Olgun 130 1218
13 Ergili Ahmet Engin 125 2500
14 Aksakal Fikret Çakmak 273 3030
15 Doğa İbrahim Yılmaz 255 1300
16 Dedeoba Ali Çelik 188 76651
17 Mahbubeler Recep Baytemur 231 4352
18 Eskiziraatli Beşire Bingöl 152 1962
19 Dutlimanı Sevgi Uzun 702 1700
20 Küçükkoru Halil Karaböcek 321 9200
Figure 2. A view from researched olive orchards
SUSTAINABLE AGRICULTURE LEADS TO ZERO HUNGER | 36
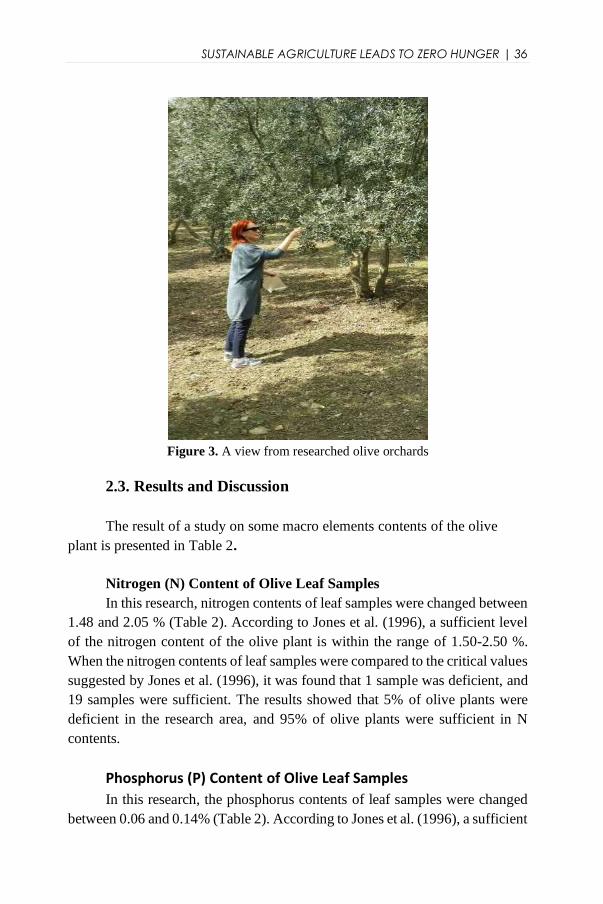
Figure 3. A view from researched olive orchards
2.3. Results and Discussion
The result of a study on some macro elements contents of the olive
plant is presented in Table 2.
Nitrogen (N) Content of Olive Leaf Samples
In this research, nitrogen contents of leaf samples were changed between
1.48 and 2.05 % (Table 2). According to Jones et al. (1996), a sufficient level
of the nitrogen content of the olive plant is within the range of 1.50-2.50 %.
When the nitrogen contents of leaf samples were compared to the critical values
suggested by Jones et al. (1996), it was found that 1 sample was deficient, and
19 samples were sufficient. The results showed that 5% of olive plants were
deficient in the research area, and 95% of olive plants were sufficient in N
contents.
Phosphorus (P) Content of Olive Leaf Samples
In this research, the phosphorus contents of leaf samples were changed
between 0.06 and 0.14% (Table 2). According to Jones et al. (1996), a sufficient

37 | SUSTAINABLE AGRICULTURE LEADS TO ZERO HUNGER
level of the phosphorus content of the olive plant is within the range of 0.10-
0.30 %.
Table 2. Some macronutrient element contents of olive plant, %
Sample
No
Nitrogen Phosphorus Potassium Calcium Magnesium
(N) (P) (K) (Ca) (Mg)
1 1.57 0.09 0.30 1.33 0.13
2 1.68 0.11 0.71 1.37 0.11
3 1.51 0.14 1.03 1.13 0.08
4 1.57 0.14 0.07 1.43 0.10
5 1.48 0.08 0.83 1.29 0.10
6 1.74 0.09 0.72 1.10 0.07
7 1.65 0.08 0.78 1.10 0.09
8 1.65 0.08 0.63 1.01 0.10
9 1.57 0.08 0.73 0.92 0.08
10 1.51 0.13 0.77 0.82 0.09
11 1.71 0.10 0.71 0.92 0.07
12 1.76 0.14 0.69 1.15 0.10
13 1.74 0.09 0.71 0.98 0.06
14 1.65 0.06 0.54 1.18 0.06
15 2.05 0.10 0.97 1.23 0.11
16 1.71 0.08 0.52 0.59 0.04
17 1.82 0.09 0.83 1.10 0.06
18 1.79 0.10 0.95 0.98 0.07
19 1.82 0.07 0.58 0.60 0.05
20 1.60 0.08 0.69 1.35 0.08
Max. 1.48 0.06 0.30 0.59 0.04
Min. 2.05 0.14 1.03 1.43 0.13
According to Table 2, when the phosphorus contents of leaf samples
were compared to the critical values suggested by Jones et al. (1996), it was
found that 12 samples were deficient and eight samples were sufficient. The
results showed that 60 % of olive plants were deficient in the research area, and
40 % of olive plants were sufficient in P contents.
Potassium (K) Content of Olive Leaf Samples
In this research, the Potassium contents of leaf samples were changed
between 0.30 and 1.03 % (Table 2). According to Jones et al. (1996), a
sufficient level of the Potassium content of the olive plant is within the range
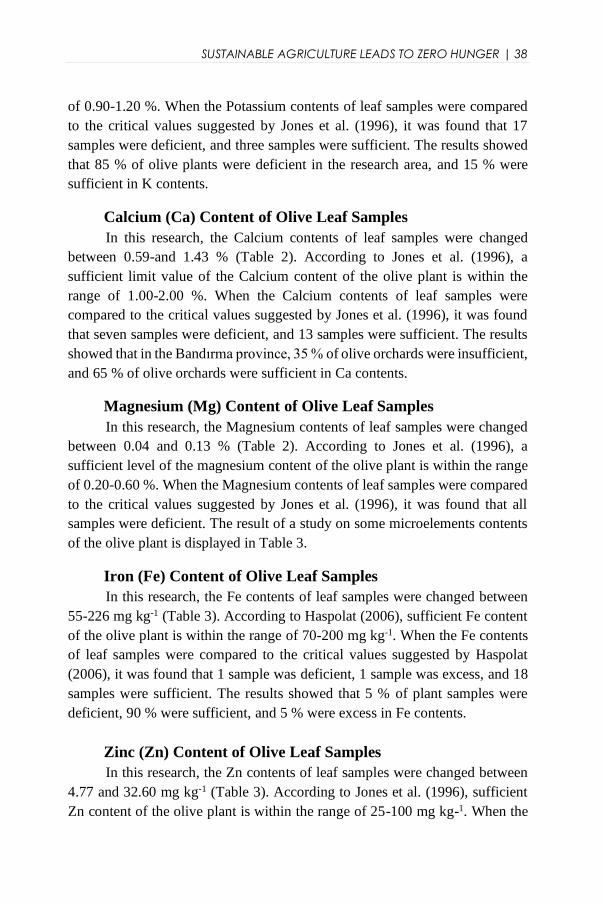
SUSTAINABLE AGRICULTURE LEADS TO ZERO HUNGER | 38
of 0.90-1.20 %. When the Potassium contents of leaf samples were compared
to the critical values suggested by Jones et al. (1996), it was found that 17
samples were deficient, and three samples were sufficient. The results showed
that 85 % of olive plants were deficient in the research area, and 15 % were
sufficient in K contents.
Calcium (Ca) Content of Olive Leaf Samples
In this research, the Calcium contents of leaf samples were changed
between 0.59-and 1.43 % (Table 2). According to Jones et al. (1996), a
sufficient limit value of the Calcium content of the olive plant is within the
range of 1.00-2.00 %. When the Calcium contents of leaf samples were
compared to the critical values suggested by Jones et al. (1996), it was found
that seven samples were deficient, and 13 samples were sufficient. The results
showed that in the Bandırma province, 35 % of olive orchards were insufficient,
and 65 % of olive orchards were sufficient in Ca contents.
Magnesium (Mg) Content of Olive Leaf Samples
In this research, the Magnesium contents of leaf samples were changed
between 0.04 and 0.13 % (Table 2). According to Jones et al. (1996), a
sufficient level of the magnesium content of the olive plant is within the range
of 0.20-0.60 %. When the Magnesium contents of leaf samples were compared
to the critical values suggested by Jones et al. (1996), it was found that all
samples were deficient. The result of a study on some microelements contents
of the olive plant is displayed in Table 3.
Iron (Fe) Content of Olive Leaf Samples
In this research, the Fe contents of leaf samples were changed between
55-226 mg kg-1 (Table 3). According to Haspolat (2006), sufficient Fe content
of the olive plant is within the range of 70-200 mg kg-1. When the Fe contents
of leaf samples were compared to the critical values suggested by Haspolat
(2006), it was found that 1 sample was deficient, 1 sample was excess, and 18
samples were sufficient. The results showed that 5 % of plant samples were
deficient, 90 % were sufficient, and 5 % were excess in Fe contents.
Zinc (Zn) Content of Olive Leaf Samples
In this research, the Zn contents of leaf samples were changed between
4.77 and 32.60 mg kg-1 (Table 3). According to Jones et al. (1996), sufficient
Zn content of the olive plant is within the range of 25-100 mg kg-1. When the
39 | SUSTAINABLE AGRICULTURE LEADS TO ZERO HUNGER
Zn contents of leaf samples were compared to the critical values suggested by
Jones et al. (1996), it was found that 19 samples were deficient, and 1 sample
was sufficient. The results showed that 95 % of olive plants were deficient in
the research area, and 5 % of olive plants were sufficient in Zn contents.
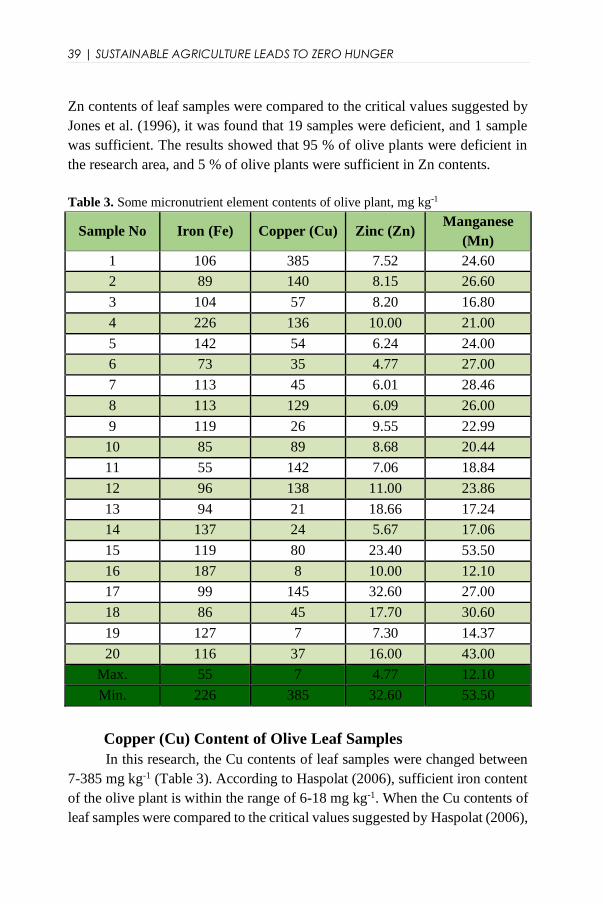
Table 3. Some micronutrient element contents of olive plant, mg kg-1
Sample No Iron (Fe) Copper (Cu) Zinc (Zn) Manganese
(Mn)
1 106 385 7.52 24.60
2 89 140 8.15 26.60
3 104 57 8.20 16.80
4 226 136 10.00 21.00
5 142 54 6.24 24.00
6 73 35 4.77 27.00
7 113 45 6.01 28.46
8 113 129 6.09 26.00
9 119 26 9.55 22.99
10 85 89 8.68 20.44
11 55 142 7.06 18.84
12 96 138 11.00 23.86
13 94 21 18.66 17.24
14 137 24 5.67 17.06
15 119 80 23.40 53.50
16 187 8 10.00 12.10
17 99 145 32.60 27.00
18 86 45 17.70 30.60
19 127 7 7.30 14.37
20 116 37 16.00 43.00
Max. 55 7 4.77 12.10
Min. 226 385 32.60 53.50
Copper (Cu) Content of Olive Leaf Samples
In this research, the Cu contents of leaf samples were changed between
7-385 mg kg-1 (Table 3). According to Haspolat (2006), sufficient iron content
of the olive plant is within the range of 6-18 mg kg-1. When the Cu contents of
leaf samples were compared to the critical values suggested by Haspolat (2006),

SUSTAINABLE AGRICULTURE LEADS TO ZERO HUNGER | 40
it was found that two samples were sufficient, and 18 samples were excess. The
results showed that 10 % of olive orchards were sufficient, and 90 % of olive
orchards were excess in Cu contents.
Manganese (Mn) Content of Olive Leaf Samples
In this research, the Mn contents of leaf samples were changed between
12.10-53.50 mg kg-1 (Table 3). According to Jones et al. (1996), a sufficient
level of Mn content of the olive plant is within the range of 25-200mg kg-1.
When the Mn contents of leaf samples were compared to the critical values
suggested by Jones et al. (1996), it was found that 12 samples were low and
eight samples were sufficient. The results showed that 60 % of examined olive
orchards were deficient, and 40 % of olive orchards were sufficient in Mn
contents.
2.4. Conclusion and Recommendations
Conclusion
The levels of some macro and micronutrients in the olive plant, cultivated
by a large part of the population living in the Bandırma district of Balıkesir
province, were examined by leaf analysis. The finding was that concentration
of nitrogen varied from 1.48 to 2.05 %. This concentration showed that nitrogen
was deficient in 5 % and adequate in 95 % of plants in the research area.
According to these results, there is no need to apply especially nitrogen
fertilizer to olive plants nowadays. It was observed that the phosphorus
concentration in leaf samples ranged from 0.06 to 0.14 %. When phosphorus
analysis results were compared to the critical phosphorus values, phosphorus
deficiency was observed in 60 % of plants. Phosphorus fertilization should be
done based on a soil analysis to reduce phosphorus deficiency in olive plants.
It was found that the potassium values of plants changed between 0.30
and 1.03 % in this research. According to this, potassium deficiency was
determined in 85 % of the plants in the study area. Potassium fertilization
should be done based on soil and plant analysis to reduce potassium deficiency
in plants. It was determined that the calcium contents of plants changed between
0.59 and 1.43 %. According to this, calcium deficiency was determined in 35
% of the plants. Calcium fertilizers should be applied to the plants to meet their
Calcium needs.

41 | SUSTAINABLE AGRICULTURE LEADS TO ZERO HUNGER
It was found that the content of magnesium varied from 0.04 to 0.13 %.
In the case of magnesium content, all samples were found deficient.
Magnesium leaf fertilization should be applied to all examined olive orchards
to reduce plant potassium deficiency.
It was determined that the iron contents of plants changed between 55
and 226 mg kg-1. The acceptable limit value of the iron content is between 70
and 200 mg kg-1. It was observed that 5 % of analyzed plant samples were
deficient, and 5 % were excess in Fe concentrations. In general, the iron content
of the plants was found sufficient. Therefore, there is no need for iron fertilizers
in the fertilization program nowadays. Copper concentration ranged from 7-385
mg kg-1, 10 % of olive plants in the research area were found to be sufficient,
and 2 % were excess in Cu content. Elevated copper concentrations can cause
toxic effects in plants. The plant is driving some difficulties in absorbing iron.
Therefore, chlorosis can be observed like in iron deficiency. The deficiency
must be taken into account in the fertilization process.
It was determined that the zinc content of plants varied between 4.77 and
32.60 mg kg-1. The acceptable limit value of the zinc content is between 25 and
100 mg kg-1. According to this, zinc deficiency was determined in 95 % of the
plants in the study area. Zinc leaf fertilization should be applied to orchards that
determine zinc deficiency. It was observed that the manganese content in plants
ranged from 12.10-53.50 mg kg-1. The acceptable limit value of the manganese
content is between 25 and 200 mg kg-1. According to this, manganese
deficiency was determined in 60 % of the research area. Manganese fertilization
should be applied to examine orchards.
Recommendation
When the results of this research are generally evaluated, magnesium
deficiency (100 %) takes first place among nutrient deficiencies, followed by
zinc (95%). The deficiency of potassium element was in third place with a rate
of 85%, and the deficiency of manganese element was in fourth place with a
rate of 60%. Eliminating the deficiencies of these four nutrient elements must
be considered in the fertilization program in the olive cultivation in Bandırma,
Balıkesir.
Acknowledgement
This chapter was prepared from the M.Sc. thesis of Eda ÖZEL.

SUSTAINABLE AGRICULTURE LEADS TO ZERO HUNGER | 42
References
Adiloğlu, A., Eraslan, F. (2012). Gübreler ve Gübreleme Tekniği. Bitki Besleme (Ed.:
M.R. Karaman), Gübretaş Rehber Kitaplar Dizisi: 2, Dumat Ofset Matbaacılık,
s: 347-473. Ankara.
Bozdoğan Konuşkan, D. (2008). Hatay’da Yetiştirilen Halhalı, Sarı Haşebi ve Gemlik
Zeytin Çeşitlerinden Çözücü Ekstraksiyonuyla Elde Edilen Yağların Bazı
Niteliklerinin Belirlenmesi ve Mekanik Yöntemle Elde Edilen Zeytinyağları ile
Karşılaştırılması. Çukurova Üniversitesi, Fen Bilimleri Enstitüsü, Gıda Müh.
Anabilim Dalı, Doktora Tezi, Adana.
Buldan, İ., Çukur, H. (2003) Edremit Körfezinde Zeytincilik. Doğal Ortam- İnsan. Tariş
Yayınları, İzmir.
Çaktü, E. (2015) Tekirdağ ili Muratlı İlçesinde Yetiştirilen Buğday (Triticum aestivum
L.) Bitkisinin Beslenme Durumunun Bitki Analizleriyle Belirlenmesi. NKÜ Fen
Bilimleri Enstitüsü, Toprak Bilimi ve Bitki Besleme Anabilim Dalı, Yüksek
Lisans Tezi, Tekirdağ.
Dokuzoğuz. M., Mendilcioğlu, K. (1971) Ege Bölgesinin Önemli Zeytin Çeşitleri
Üzerinde Pomolojik Çalışmalar. Ege Üniversitesi Ziraat Fakültesi Yayınları
181, Ege Üniversitesi Matbaası, İzmir
Haspolat, G. (2006). Gemlik Zeytin Çeşidinde Biyolojik Olarak Şelatize Edilmiş KNO3
(Potasyum Nitrat), ZnSO4 (Çinko Sülfat) ve MgSO4’ ün (Magnezyum Sülfat)
Yapraktan Uygulanmasının ve Plastik Malç Uygulamasının Vegetatif
Gelişmeye ve Meyve Verimine Etkisi. Çukurova Üniversitesi, Fen Bilimleri
Enstitüsü, BaHÇE Bitkileri Anabilim Dalı, Yüksek Lisans Tezi, Adana.
Jones, J.B. Jr., Mills, H.A. (1996). Plant Analysis Handbook II. A Practical Sampling,
Preparation, Analysis and Interpretation Guide. p.1-422. Micro- Macro
Publishing Inc. The USA.
Kiritsakis, A., Markakis, P. (1987). Olive Oil: A Review. Department of Food Science
and Human Nutrition. Michigan State Üniversity. East Landing. Michigan
48824.
Vinha, A.F., Ferreres, F., Silva, B.M., Vantelao, P., Gonçalves, A., Pereira, J.A. (2005).
Phenolic Profiles of Portuguese Olive Fruits (Olea europaea L.): Influences of
Cultivar and Geographical Origin. Food Chem., 89 (4): 561–568.
Yıldız, Y. (2015). Kocaeli ili Başiskele İlçesinde Yetiştirilen Karalahana (Brassica
oleracea var. acephala) Bitkisinin Beslenme Durumunun Bitki Analizleriyle
Belirlenmesi. Namık Kemal Üniversitesi Fen Bilimleri Enstitüsü, Toprak Bilimi
ve Bitki Besleme ABD Yüksek Lisans Tezi, Tekirdağ.

43 | SUSTAINABLE AGRICULTURE LEADS TO ZERO HUNGER
Brief Curriculum Vitae of Authors
Prof. Dr. Aydın ADİLOĞLU, ORCID ID: 0000-0002-
7926-509X. He graduated from Atatürk University, Faculty
of Agriculture, and Department of Soil Science in 1986 as
head of the department. In the same year, he started to M.Sc.
in the institute of natural and applied sciences at Trakya
University. He published about 150 articles.
He started to work as a research assistant at Trakya
University, Faculty of Agriculture, Department of Soil
Science. He assumed “MSc Engineer” in 1989 and “Ph.D.” in 1992. He is still
working as Professor at Tekirdağ Namık Kemal University, Faculty of
Agriculture, Department of Soil Science and Plant Nutrition. Research
Interests: Soil Fertility, Phytoremediation, Plant Nutrition, Soil and Water
Pollution, Soil Biology, Soil Ecology, Organic Farming, Plant Nutrition, Soil
Chemistry
Eda ÖZEL orcid no: 0000-001-5969-6776. She graduated from Tekirdağ
Namık Kemal University, Faculty of Agriculture, Department of Soil Science
and Plant Nutrition in 2011 as head of the department. In the same year, she
both started to MSc. in Institute of Natural and Applied Sciences at Tekirdağ
Namık Kemal University. She assumed the title “MSc Engineer” in 2019.

SUSTAINABLE AGRICULTURE LEADS TO ZERO HUNGER | 44

45 | SUSTAINABLE AGRICULTURE LEADS TO ZERO HUNGER
CHAPTER 3
ECONOMIC POTENTIAL OF TERUBUK
(Saccharum edule Hasskarl)
Reny SUKMAWANI1*, Endang Tri ASTUTININGSIH1,
Ema Hilma MEILANI1, Jujun RATNASARI1
1Universitas Muhammadiyah Sukabumi, West Java, Indonesia
*Corresponding Author: [email protected]

SUSTAINABLE AGRICULTURE LEADS TO ZERO HUNGER | 46

47 | SUSTAINABLE AGRICULTURE LEADS TO ZERO HUNGER
3.1. Introduction
Economic development, especially at the regional level, aims to improve
the community's welfare. Efforts are being made to achieve this, including
acceleration of growth in the agricultural sector. Meanwhile, the dynamics in
the development of agricultural progress are currently faced with a global
phenomenon that creates new competitive challenges. This challenge indeed
demands each region to be able to compete and spur its development. The
strategy to encourage regional competitiveness, especially in the economic
sector, is through managing the potential of local-owned resources. For this
reason, it is necessary to identify superior prospects, including agricultural
commodities, products, and services in each region, so that they can be
developed and become regional leverage.
Figure 1. Industrial Tree of Terubuk
Source: Sukmawani et al. (2018), Copy Right No. 000119318
The potential and superiority of each region will undoubtedly vary
according to its characteristics; they can come in the form of agricultural
commodities in general (plants, livestock, and fisheries), products, or services.
One of the potentials in the agricultural sector to develop is the commodity of
Terubuk or Saccharum edule Hasskarl.
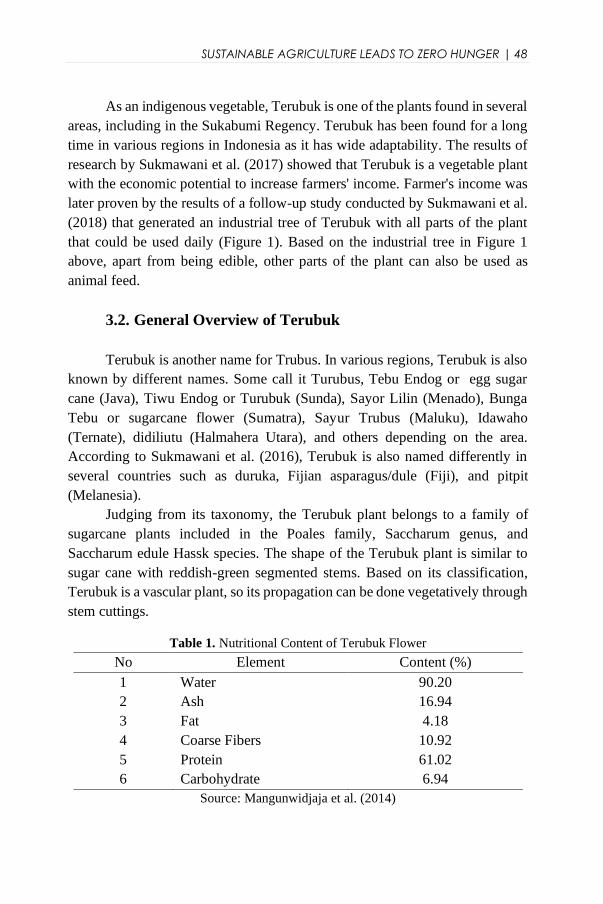
SUSTAINABLE AGRICULTURE LEADS TO ZERO HUNGER | 48
As an indigenous vegetable, Terubuk is one of the plants found in several
areas, including in the Sukabumi Regency. Terubuk has been found for a long
time in various regions in Indonesia as it has wide adaptability. The results of
research by Sukmawani et al. (2017) showed that Terubuk is a vegetable plant
with the economic potential to increase farmers' income. Farmer's income was
later proven by the results of a follow-up study conducted by Sukmawani et al.
(2018) that generated an industrial tree of Terubuk with all parts of the plant
that could be used daily (Figure 1). Based on the industrial tree in Figure 1
above, apart from being edible, other parts of the plant can also be used as
animal feed.
3.2. General Overview of Terubuk
Terubuk is another name for Trubus. In various regions, Terubuk is also
known by different names. Some call it Turubus, Tebu Endog or egg sugar
cane (Java), Tiwu Endog or Turubuk (Sunda), Sayor Lilin (Menado), Bunga
Tebu or sugarcane flower (Sumatra), Sayur Trubus (Maluku), Idawaho
(Ternate), didiliutu (Halmahera Utara), and others depending on the area.
According to Sukmawani et al. (2016), Terubuk is also named differently in
several countries such as duruka, Fijian asparagus/dule (Fiji), and pitpit
(Melanesia).
Judging from its taxonomy, the Terubuk plant belongs to a family of
sugarcane plants included in the Poales family, Saccharum genus, and
Saccharum edule Hassk species. The shape of the Terubuk plant is similar to
sugar cane with reddish-green segmented stems. Based on its classification,
Terubuk is a vascular plant, so its propagation can be done vegetatively through
stem cuttings.
Table 1. Nutritional Content of Terubuk Flower
No Element Content (%)
1
2
3
4
5
6
Water
Ash
Fat
Coarse Fibers
Protein
Carbohydrate
90.20
16.94
4.18
10.92
61.02
6.94
Source: Mangunwidjaja et al. (2014)

49 | SUSTAINABLE AGRICULTURE LEADS TO ZERO HUNGER
According to Kurniatusolihat and Nia (2009), propagation of Terubuk by
cuttings consisting of 3 segments can increase the number of shoots and flower
weight. In addition, Terubuk plants are characterized by unusual
inflorescences; they do not have perfect flowers, so they do not produce seeds.
Thus, another solution for the propagation of Terubuk, according to Arsela, P
(2011), is the tissue culture method. The most edible part of the Terubuk plant
is the flower; it has nutritional content, as presented in Table 1.
In addition to the nutritional content listed in Table 1, Andarwulan, Nuri,
and Rh Fitri Faradilla (2012) in their research stated that Terubuk also contains
vitamins such as Phosphorus, Calcium, Iron, Vitamin A Activity, Thiamine
(Vitamin B1), and Ascorbic Acid (Vitamin C). Meanwhile, Pentury et al.
(2017) conducted a study on the nutritional content of Terubuk flowers in fresh
and processed conditions, as shown in Table 2 below.
Table 2. Nutritional Content of Terubuk Flower before and after Processing
No Element Before Processing After Processing
1 Water content 88,64% 77,34%
2 Fat 1,44% 11,81%
3 Protein 4,40% 3,77%
4 Ash content 1,25% 1,66%
5 Carbohydrate 4,25% 5,37%
6 Coarse Fibers 0,63% 1,07%
Source: Pentury et al. (2017)
Based on nutritional value and vitamin content, it can see that Terubuk
contributes positively to health. Although there has been no further specific
research on the benefits of Terubuk for health, at least the content of nutrients
and vitamins in Terubuk is sufficient evidence that it is suitable for
consumption. Terubuk is an annual plant (perennial) that has fibrous roots and
segmented stems like sugar cane but is not branched. Terubuk leaves are
elongated ribbon-shaped with fine hairs on the surface. The flowers of the
Terubuk plant are compound. These flowers are harvested when they are still
young (buds) and consumed either fresh or processed further.
Terubuk plant is mainly found in areas with friable soil; it is easy to plant,
has high adaptability, and is suitable when planted on land with a soil pH of 5-
6 and planting height between 1-1500 m above sea level. Having this high
adaptability makes Terubuk plants easy to cultivate. They do not require too
much attention to grow well and produce. Maintaining the land planted by
Terubuk is also easy: just get rid of nuisance plants and bury them in the ground

SUSTAINABLE AGRICULTURE LEADS TO ZERO HUNGER | 50
to get compost. Fertilizing the Terubuk plant does not take too much effort
either: simply use drum fertilizer of about 10 tons for a hectare. Terubuk should
be planted in a monoculture system with a spacing of 1.5 m x 1 m or 1 m x 1 m
for optimal growth
Figure 2. Terubuk Plant
The age of the Terubuk plant until it produces flowers ready to harvest is
5 -10 months after planting, depending on the plant's growth. Meanwhile, the
productive age of the Terubuk plant is around 2-3 years and can be extended by
rejuvenating the plant, such as through pruning, fertilizing, and soil hoarding.
Criteria for ready-to-harvest plants include the distance between the more
tenuous leaf arrangements. Harvesting can be done by cutting the buds of
flowers still covered with leaf sheath. The harvesting is better carried out by
taking the entire leaf sheaths to protect the Terubuk flower and maintain longer
shelf life.
3.3. Economic Potential of Terubuk
Although it is a potential crop, Terubuk has not yet been specifically
cultivated as the primary commodity by farmers. Meilani, EH et al. (2017)
conducted research on "Agribisnis Terubuk Sebagai Komoditas Potensi
Unggulan Lokal Kabupaten Sukabumi” (Terubuk Agribusiness as a Local
Leading Potential Commodity of Sukabumi Regency) stated that Terubuk
planting in Sukabumi Regency is usually carried out with an intercropping
system; some even plant Terubuk only as an intercrop between other major

51 | SUSTAINABLE AGRICULTURE LEADS TO ZERO HUNGER
plants. Many people also plant Terubuk as a hedge in rice fields, ponds, or yards
so that the yields are easy to pick and can be used for daily consumption.
Terubuk is worth being developed as a primary or side commodity by
farmers since it has economic value. According to research conducted in
Sukabumi Regency, Terubuk flowers are not sold in kilograms but in a bunch
consisting of several Terubuk flowers. Terubuk is marketed not only in the
traditional market but has also entered the modern one. The research of Siddiq,
Syahrul, et al. (2020) concluded that the perception of most consumers in the
current market stated that this Terubuk vegetable was attractive. The selling
price of Terubuk is also quite good, around Rp. 50,000 per bunch, where each
bunch consists of 10 Terubuk flowers. This price is the selling price at the
consumer level, while the selling price at the farmer level varies depending on
the size of Terubuk, starting from Rp. 1000 per flower up to Rp. 5000 for three
Terubuk flowers (Figure 2).
Figure 2. Terubuk Flowers are ready for the market
The selling price of Terubuk flowers, which is relatively high, tends to
be stable and is not affected by seasons or specific days. During the time of
research conducted in Sukabumi Regency from 2016 to 2021, the prevailing
price of Terubuk did not change much due to the high demand but low supply,
for there was not much Terubuk available. The lack of Terubuk quantity is

SUSTAINABLE AGRICULTURE LEADS TO ZERO HUNGER | 52
reasonable because, as previously stated, Terubuk is not the main crop
cultivated by farmers.
Table 3. Analysis of Terubuk Farming per Hectare
No Description Quantity
(unit)
Unit Price Total Remark
I Fixed Costs
Ground lease 1 ha 3.000.000 3.000.000
Tools depreciation
Hoe Six units 200.000 1.200.000 17.000/year
Total fixed cost 3.017.000
II Variable Costs
Seeds 9600 500 4.800.000
Manure 5 quintal 230.000 1.150.000
Soil hoeing/plowing 5 people 25.000 625.000 125000 x 5
Seeds planting 5 people 25.000 625.000 125000 x 5
Fertilizing 5 people 25.000 125.000
Watering 5 people 25.000 125.000
Weeding 5 people 25.000 125.000
Hoarding 5 people 25.000 375.000 125000 x 3
Harvesting 5 people 25.000 125.000
Transporting 5 people 25.000 125.000
Total variable cost 8.200.000
III Total cost
Fixed cost 3.017.000
Variable cost 8.200.000
Total cost 11.217.000
IV Receipts
Production 9600 2000 19.200.000
V Revenue (IV-III)
Receipts 19.200.000
Total Cost 11.217.000
7.883.000
VI R/C Ratio 1,7
VII BEP of Production 2633 piece
VIII BEP of Receipts 5.266.036 Rupiah
IX BEP of Price 1168,4375 Rupiah/stalk
Source: Primary data, 2016 (processed)
Thus it is not widely available in the market. The high and stable selling
price of Terubuk proves that Terubuk has the economic potential to increase

53 | SUSTAINABLE AGRICULTURE LEADS TO ZERO HUNGER
farmers' income. The following table presents the results of farming analysis
on Terubuk plants based on research conducted in Sukabumi Regency,
Indonesia.
The results of the Terubuk farming analysis are supported by a study
conducted by Sangadji (2018) in Tidore Island which concluded that Terubuk
farming is feasible to be developed with an R/C ratio above one and an average
profit of Rp. 989,000 in a single production. Terubuk farming analysis
presented above is only from its flower, excluding the by-products that can be
obtained from other parts of the Terubuk plant. In addition to the flowers, the
other parts of the Terubuk plant are used to increase the added value obtained
by cultivating Terubuk. Research conducted by Chaniago, Ramadhani, et al.
(2015) proved that Terubuk has potential for animal feed. The feed can help
overcome the problem of meals, especially forage-based ones, which many
farmers face.
The results of research by Sukmawani et al. (2018) also concluded that
Terubuk waste could be used as animal feed and organic fertilizer (compost).
Their results are supported by silage trials using Terubuk waste raw materials
conducted by Miftahunnisa, and Aulia (2018), which prove that Terubuk waste
as animal feed is made into silage can increase the weight of cattle. Based on
the result of research by Chaniago (2015), it is stated that an average of 11,300
kg of leaf wet biomass is produced from 1 ha of Terubuk plant. Such an amount
is sufficient to feed four cows within 90 days. Furthermore, Chaniago (2015)
proved that cattle fed with Terubuk-based feed twice a day (morning and
evening) as much as 7.5 kg has gained weight about 0.03 kg/head/day.
The utilization of Terubuk waste as an alternative feed can be applied
during the dry season to overcome the limited availability of forage. As an
alternative feed, Terubuk plant waste must be preserved first by turning it into
silage to maintain its quality. According to Moran (2005), hay is the result of
fermenting forage that has been held by acids intentionally added or naturally
produced during the storage period.
Since Terubuk has potential as a vegetable for consumption and its waste
for alternative animal feed, this plant is perfectly suitable to be developed in an
integrated manner. The results of the study by Sukmawani Reny and
Miftahunnisa (2021) have proven that the integration of Terubuk farming with
sheep and ducks can improve the community's economy by getting more
income from livestock and plants raised (meat, eggs, fertilizer, Terubuk
flowers, and Terubuk plant waste). The implementation of an integrated
farming system of animals and Terubuk crops will increase farmers' income in

SUSTAINABLE AGRICULTURE LEADS TO ZERO HUNGER | 54
three ways: (1) increasing the selling price accompanied by an increase in
quality, (2) reducing production costs through efficiency, and (3) obtaining crop
yields from more than one product.
Another potential added value of the Terubuk plant is its waste utilization
as compost material, especially on parts that are not consumed and cannot be
used as animal feed ingredients, such as stems and roots, which have
complicated character. In addition, the leaves and leaf sheaths can also be used
as compost if they are not used for animal feed. The Terubuk can be
implemented to support the zero-waste campaign. The tremendous economic
potential described earlier will provide maximum added value if it is
implemented by properly considering aspects of input, output, and production
processes. Input relates to human and natural resources, output refers to food
products (agriculture and livestock) and organic waste, and the production
process refers to time and the environment.
3.4. Conclusion
Terubuk is not a popular commodity and is not widely known in the
community. With its economic potential, Terubuk deserves to be developed by
farmers as a commodity cultivated either in monoculture, intercropping, or
integrated with livestock. As a potential vegetable source, a well-managed
Terubuk development will provide added value for farmers or ranchers.

55 | SUSTAINABLE AGRICULTURE LEADS TO ZERO HUNGER
References
Andarwulan, N dan Faradilla, N. R. (2012). Senyawa Fenolik Pada Beberapa Sayuran
Indigenous Dari Indonesia. South East Asian Food and Agricultural Science and
Technology (SEAFAST) Center, Institut Pertanian Bogor.
Ariela, P. 2011. In Vitro Regeneration of Terubuk (Saccharum
edule). http://repository.ipb.ac.id/handle/123456789/53293
Chaniago, R. 2015. Analisis Usahatani Integrasi Antara Tanaman Trubus (Saccharum
edule Hasskarl) Dengan Ternak Sapi. Jurnal Galung Tropika, 4 (1): 36-41.
Chaniago, R. 2015. Potensi Biomassa Terubuk (Saccharum edule Hasskarl) Sebagai
Pakan Untuk Pertambahan Bobot Badan Sapi. Jurnal Galung Tropika. Vol 4
(2): 68-73
Kurniatusolihat, N. 2009. Pengaruh Bahan Stek Dan Pemupukan terhadap Produksi
Trubus (Saccharum edule Hasskarl). Prodi Hortikultura. Fakultas Pertanian.
IPB.
Mangunwidjaja, D., Rahayuningsih, M., dan Suparwati, D. 2014. Pengaruh
Konsentrasi Enzim Dan Waktu Hidrolisis Enzimatis Terhadap Mutu Frukto-
Oligosakarida Dari Inulin Umbi Dahlia (Dahlia pinnata). E-Jurnal
Agroindustri Indonesia Vol. 3 No. 1, p .http://tin.fateta.ipb.ac.id/journal/e-jaii
ISSN: 2252 – 3324.
Meilani, E. H., Sukmawani, R dan Ramdan, A. M. (2017). Agribisnis Terubuk
(Saccharum edule Hasskarl) sebagai Potensi Unggulan Lokal Kabupaten
Sukabumi. Seminar Nasional Ekonomi Pertanian Universitas Padjadjaran -
Daya Saing Berkelanjutan Agribisnis Spesifik Lokal.
Pentury, M. M. Kleangan, H. S. J., Runtuwene, M. R. J. (2017). Kandungan Nilai Gizi
Pada Sayur Lilin (Saccharum Edule Hasskarl) Makanan Khas Di Halmahera
Utara, Maluku Utara Sebelum Dan Sesudah Pengolahan. Pharmacon Jurnal
Ilmiah Farmasi –Unsrat Vol. 6 (4): 249-254
Sangadji, S. S. 2020. Profitability Analysis: Terubuk Farming (Saccharum Module
Hasskarl) In Subdistrict Tosa District of East Tidore Of Tidore Island. Jurnal
Akrab Juara, 3 (2):168-174
Siddiq, S., Sukmawani, R dan Meilani, E. H. (2020). Persepsi Konsumen Terhadap
Sayuran Terubuk Di Pasar Modern. AGRICORE Jurnal Agribisnis Dan Sosial
Ekonomi Pertanian UNPAD. Vol 5 (1) : 25-34
Sukmawani, R., Meilani, E. H., Ramdan, A. M., Saprudin dan Jujun Ratnasari. (2016).
Potensi dan Pengembangan Trubus. CV Nurani.
Sukmawani, R, Exa. A. M P, Ema Hilma Meilani dan Asep M Ramdan. 2018. Pohon
Industri Terubuk (Saccharum edule Hasskarl). Universitas Muhammadiya
Sukabumi, Kemenristekdikti, dan Dinas Peternakan Kabupaten Sukabumi.
Kompilasi Ciptaaan. Hak Cipta Kemenhuum dan HAM No. 000119318.

SUSTAINABLE AGRICULTURE LEADS TO ZERO HUNGER | 56
Sukmawani, R., Meilani, E. H., Ramdan, A. M. (2019). Model Pengembangan
Usahatani Terubuk (Saccharum Edule Hassk). Jurnal Ekonomi Pertanian dan
Agribisnis (JEPA). Vol 3 93) : 631-638
Sukmawani, R, Exa, A. M., Putriyana. and Andayani, S. A. (2021). The Advantages of
Implementing Integrated Farming Systems For Integration of Goats and Ducks
With Terubuk (Saccharum edule Harl). IOP Conf. Series: Earth and
Environmental Science 748. IOP Publishing.
Brief Curiculum Vitae of Authors
Reny Sukmawani is a Doctor of Agricultural Sciences,
graduated from UNPAD Bandung. She is a lecturer in the
Agribusiness Study Program, Muhammadiyah University of
Sukabumi, and actively conducting research and publications.
She is also the Associated Professor in the field of agricultural
development. Not only keeping herself busy in the teaching
environment, but she is also active in various activities in
community organizations, including being an instructor and
resource person for many activities.
Endang Tri Astutiningsih is a Doctor from Agricultural
economy, IPB Uiversity was born in Banyumas on
December 2, 1972. She currently lives in Sukabumi and
serves as a Lecturer in the Agribusiness Study Program at
the Muhammadiya University of Sukabumi. She earned a
Bachelor's degree in Agricultural and Resource Economics
(EPS) Study Program at the Department of Agricultural
Socio-Economic IPB. She received her Master's Degree
from the Department of Agribusiness, Winaya Mukti
University.
Ema Hilma Meilani has been a lecturer in the Muhammadiyah
University of Sukabumi, Agribusiness study program since
2003. She completed her doctoral program in regional planning
at IPB University. She also actively conducts research and
community service according to her field of expertise. Besides
being active in teaching, she also engages in mass organizations
and community empowerment.
Jujun Ratnasari was born in Bandung, December 9, 1971.
She graduated from SMAN 3 Bandung in 1991 and
completed her Bachelor's, master's, and doctoral studies at
ITB. Since 2003, she has taught at the Biology Education
Study Program, Muhammadiyah University of Sukabumi.
Her expertise in the field of Biology includes physiology,
microbiology, and biotechnology

57 | SUSTAINABLE AGRICULTURE LEADS TO ZERO HUNGER
CHAPTER 4
SUSTAINABLE AGRICULTURE PRODUCTION IN
UPSTREAM WATERSHED: SOCIO-ECOLOGICAL
APPROACH
Fitriani1*
1State Polytechnique Lampung, Jl. Soekarno Hatta No. 10 Rajabasa, Bandar
Lampung, Sumatera Selatan, Indonesia
*Corresponding Author: [email protected]

SUSTAINABLE AGRICULTURE LEADS TO ZERO HUNGER | 58

59 | SUSTAINABLE AGRICULTURE LEADS TO ZERO HUNGER
4.1. Introduction
Sustainable Agriculture Production (SAP) is very strategic in achieving
the Sustainable Development Goals (SDGs), especially providing sufficient
food and reaching zero hunger for everyone. A global sustainable development
platform is implemented in all economic activities. Demand for the production
and consumption of sustainable products in the global market is increasing.
Nowadays, demands for sustainable production are part of a global standard
that is believed to answer sustainability challenges at the production level
(economic, social, and environmental).
Land and environmental damage have implications for the emergence of
critical land because of erosion and landslides. The rate of soil erosion on
agricultural land in Indonesia with slopes of 3-15% is high, reaching the range
of 97.5-423.6 tons/ha/year (Abdurachman, 2008). Many agricultural lands
have more than 15% slopes so the erosion rate can be very high, especially in
areas with high rainfall. The degradation of agricultural land is a serious
problem. Land degradation costs around US$40 billion annually worldwide,
not considering the hidden costs of increased fertilizer use, loss of biodiversity,
and loss of unique landscapes (WMO - World Meteorological Organization,
2020).
Land and water have a close interactive relationship, but the two
resources have different characteristics. Water has the characteristics of
mobility or flow, variability, and diversity, making it difficult to claim
ownership. Water can flow across administrative boundaries, both within a
country and between countries, so water is often referred to as common-pool
resources; its use is not exclusive, but users can compete. According to Law
No. 11 concerning Irrigation, "Water" is all water contained in and or derived
from water sources, both above and below the surface of the land, not included
in this sense water found in the sea; "Water sources" are places and containers
of water, both above and below the ground surface.
Furthermore, the notion of a watershed is a land area that is a unit with a
river and its tributaries, which functions to accommodate, store, and drain water
from rainfall to lakes or to the sea naturally, which limits land. It is a topography
and boundary separator at sea to water areas still affected by land activities. A
Watershed can also be interpreted as a spatial unit consisting of abiotic elements
(soil, water, air), biotic (vegetation, animals, and other living organisms), and
human activities that interact and depend on each other in a unified ecosystem.
A unified ecosystem means that if the linkages have been established, the

SUSTAINABLE AGRICULTURE LEADS TO ZERO HUNGER | 60
management of forest, land, water, communities, and others must pay attention
to the role of these ecosystem components (Indonesian Law Decree No.
7/2004).
Watershed management must be carried out through a system that can
provide high land productivity and sustainability and improve community
welfare (Sudaryono, 2002). Watersheds must be managed sustainably by
balancing economic, ecological, and social aspects. Many transboundary
problems, such as inter-district water resource management problems, are not
appropriately handled (Suradisastra, 2004).
The community movement in maintaining and preserving watersheds is
very dependent on the level of participation and the tendency of community
attitudes in watershed management activities (Radjabaycolle & Sumarjo,
2014). The national policies that form the basis for regions to form watershed
forums are Minister of Forestry Regulation No.P.39/Menhut-II/2009
concerning Guidelines for Formulating Integrated Watershed Management
Plans and Minister of Forestry Regulation No.P.42/Menhut-II/2009 concerning
General Patterns, Integrated Watershed Management Standards and Criteria.
However, according to (Slamet, 2015), managing the watershed system
is not easy because it faces many conflicts of interest, so any approach taken
will have general cost and benefit consequences for the parties involved.
Commons research theory assumes the most considerable difficulty in
managing watersheds is in social organizations/institutions. Building collective
action is easiest to start from the micro watershed level, but hydrological
management demands a scope of work at the macro watershed level. Potential
trade-offs between the two occur (Fisher et al., 2008). Therefore, at the
watershed (macro-watershed) scale, institutional arrangements are needed to
increase interactions between sub-watershed groups (micro-watershed)
members of the watershed.
The success of sustainable production depends on land tenure within the
property rights. At the same time, the property rights in natural resource
management brought implications for maintaining sustainability. The certainty
of land tenure rights will legally guarantee sustainable management practices
as long-term agricultural production investments. The property right is the basic
need in designing the precise rules of the constellation of mutual trust and
cooperation among institutions, actors, and natural resource users. This
difference in management rights results in jurisdictional uncertainty in farming,
including investment in sustainable production activities.

61 | SUSTAINABLE AGRICULTURE LEADS TO ZERO HUNGER
Most cash-crop commodities are near production and protection forest
and watershed catchment areas. The development of cash-crop production in
the upstream area requires conservation principles (Banuwa et al., 2008).
Appropriate conservation technologies should be developed on plantations,
including partial weeding, ridging, sediment pits, end trenches, and shade
plants/multi-strata systems (Agus et al., 2002). The combination of plantations
with various shade plants is known as agroforestry systems.
Sustainable farming will enhance the environment's ability as an
"indirect" service provider in the form of carbon storage, protection of
watersheds, replenishment of the groundwater layer, and habitat for
biodiversity (Hope et al., 2005). Agroforestry in coffee farming is one of the
sustainable adaptive management efforts to address the risk of damage to forest
ecosystems (Bernard et al., 2014; Buongiorno & Zhou, 2015; Eakin et al.,
2014; FAO, 2014; Fitriani et al., 2018; Fitriani et al., 2018; Fitriani & Kuswadi,
2021; Foran et al., 2014; Fu, 2009; Kuswadi & Fitriani, 2021).
The right to access natural resources, including forest management, has
implications for the efforts to utilize and maintain sustainability. Land rights
jurisdiction is the first-order condition in maintaining sustainable farming
production in upstream watersheds (Fitriani et al., 2020). Sustainable
production will guarantee the ecological system's function. The threat of social
unsustainability faced by communities in the upstream watershed. The still-
high poverty rate and pre-prosperous communities around the forest showed
that cash-crop production does not fulfill the adequate income to support a
prosperous economic life. Poverty and inequality occur in the rural economy.
Limited sources lower the production and income, also unemployment turn as
causes poverty conditions (Fitriani et al., 2017). The root cause of obtaining
property rights led to uncertainty in natural management rights. Complex
problems are related to the low institutional performance of CFM. The
limitations of jurisdiction, game rules, and social capital are still weak in
realizing trust and cooperation, and the quality of human resources in adopting
sustainable production techniques are still not synergized. Information on
internal and external factors supporting community institutions to achieve
sustainable goals is minimal.
Generally, the formulation of the problem of this paper is to answer the
question of what and how the sustainability of agriculture production in the
upstream watershed should establish and consider the social and ecological
aspects. The discussion will trigger the establishment of ecological services in
the upstream watersheds. Furthermore, the specific objectives of this study are

SUSTAINABLE AGRICULTURE LEADS TO ZERO HUNGER | 62
(1) to explore farming production systems in the upstream watersheds to meet
the ecological requirement for environmentally sustainable, and (2) to assess
the social sustainability performs that the criteria for social sustainability can
be met.
4.2. Sustainable Agriculture Production in Upstream
Watershed
The sustainable agriculture production upstream is explored through the
agriculture system the farmer practically implements. Discussion of sustainable
production starts from the property right on natural resources, sustainable
agriculture and sustainable production literacy, and sustainable production at
the practical level. At the same time, the explanation of sustainable production
at the practical level is the representation of sustainable production that meets
ecological sustainability. The last social sustainability assessment will discuss
the equality of income distribution.
1. Property rights in natural resources
A Watershed, according to Indonesia Government Regulation No.
37/2012, is a land area that is a unit with a river and its tributaries, which
functions to accommodate, store, and drain water that comes from rainfall to
lakes or the sea naturally. Land and water have a close interactive relationship,
but the two resources have different characteristics. Water has the
characteristics of mobility or flow, variability, and diversity, making it difficult
to claim ownership. Water can flow across administrative boundaries, both
within a country and between countries, so water is often referred to as
common-pool resources; its use is not exclusive, but users can compete.
The upstream watershed is a water catchment area included in the
conservation and protected forest areas. Therefore, the upstream watershed
needs to be managed sustainably by balancing economic, ecological, and social
aspects. Indonesia's watersheds and forest regions are destroyed, then the
ecological function declines and worsens. Good governance in watershed and
forest management is needed. The initial form of policy to manage the state
forest and natural resources with participatory community involvement were
the Community Forest Management (CFM) (Minister of Forestry Decree
No.622/1995) and No. 677/1997, which provided the land forest use rights to
the community. The Ministry of Forestry has issued Decree No.52/2007
concerning the Community Forests and No.49/2008 concerning Village

63 | SUSTAINABLE AGRICULTURE LEADS TO ZERO HUNGER
Forests. The Decree prevents land encroachment and ensures the flow of
economic benefits from the existence of forests to local communities. The
policies are seen as one of the efforts to reduce the rate of deforestation in
Indonesia. The regulation gives local communities the right to access and
manage non-timber products for the sustainable protection of forests.
Good governance in watershed management must have management
capabilities to improve and maintain the sustainability of natural resources in
meeting the community's needs. Good governance in watershed management
is needed because bad governance could worsen the damage to natural
resources. Social actors will strongly influence decisions and choices of
sustainable agricultural practices (Bernard et al., 2014; Eakin et al., 2014). The
characteristics of good watershed management (Ntabe et al., 2015) require
conditions such as (1) it must consist of a participatory nature in the sense of
opening up opportunities for good contact and interaction; (2) It should have a
polycentric organization, consisting of several stakeholders who have of
authority in the organization; (3) It is accountable to the community and the
holders of authority above it; (4) It is deliberative in the sense of providing
opportunities for its members to debate, mediate and negotiate; and (5) have a
multi-layered management structure in the sense of containing broad
representation, and also (6) fair in the distribution of unexpected benefits and
risks.
The main problems in upstream watershed management lay in the
conceptual state's approach to controlling the upstream watershed area. It
assumes that individual farmers in the practice of using land directly cause
conflict with the social goal of protecting the upstream watershed area. Forests
are assumed to be the only whole land for watershed protection, and planting
trees is the best way to protect and restore watersheds from damage.
Responsibilities of government seem often just motivated by partial
achievement such as biodiversity conservation, not integrated action to protect
watersheds. The forestry department uses state forests as a political image,
profit extraction, and retention of political power. On the other side, millions
of forest-dwelling farmers who do not have legal access threaten the
sustainability of upstream watersheds and the protection of forests (Swallow et
al., 2001).
The history of the Community Forest Management (CFM, Indonesian
term called Kelompok Hutan Kemasyarakatan/HKm) was first issued in 1995
through the Decree of the Minister of Forestry No.622/1995. Recognition of
CBM was very slow until 1997, then the next Decree No. 677/1997issued to

SUSTAINABLE AGRICULTURE LEADS TO ZERO HUNGER | 64
strengthen forest rights use to communities, well-known as Community Forest
Management Rights (CFMR). In 2001, Decree No. 31/2001 gave flexibility to
the community as the leading actor in forest management. Then, the Regulation
No. P.13/2010 issued the right of Forest Management to empower local
communities. CFMR implements restrictions in protected forest areas and
production forests. The forest is not burdened with rights or permits for forest
products to become a source of livelihood for the local community. The CFMR
is granted for 35 years and is extended according to the results of the evaluation
every five years. The CFMR extension is submitted to the Governor three years
before the permit expires. Then the management of forest areas through
partnerships is regulated in Regulation No. P.39/2013 and No. 47/2013 about
the Forest Utilization in Certain Areas. Forest utilization activities in
partnership should deal with the third parties (local communities, local
government corporations and private, Cooperatives, MSMEs) in the context of
partnerships and opening business opportunities.
Community and public participation in sustainable management of
protection forests and watersheds area was a new direction for forest
sustainability policies in Indonesia. Forestry agencies conduct long-term
planning to expand community access through a partnership program.
Partnership program in Community Forest Management is part of efforts to
minimize deforestation and land degradation and achieve a prosperous forest
function.
Farmers with CFMR on land management rights have more opportunities
than other land tenures. Differences in land management impact farmers'
decisions about the type of plant and the conservation technology requirement.
Investing in natural resources sustainability is linked with the authority among
stakeholders in watersheds management synergistically. The status of
landholders will determine the willingness of coffee growers to follow the
scheme of providing environmental services. The land tenure status changes
could enhance the farmer's participation in following the environmental service
scheme more than other land tenures. The existence of farmers with partnership
and CBFM scheme on different land tenure on upper Sekampung has a strategic
position to minimize the deforestation and recovery watersheds destruction.
Forestry agencies, correspondingly in implementing the forest management
strategy, elaborate the community participation. For instance, the local
involvement community in the revitalization strategy for the restoration of the
Sekampung watershed (54,283 ha) and the Seputih watershed (12,290 ha) with

65 | SUSTAINABLE AGRICULTURE LEADS TO ZERO HUNGER
sustainable agriculture production, primarily through the sustainable
agroforestry practiced (Fitriani et al., 2018a).
Land rights are fundamental land management decisions and long-term
investments (Klemick, 2011). This pathway is the most likely to lead to
sustainable ecosystem management (Poudel et al., 2016) and is linked as a
critical norm in rural area management (Eisenberg, 2016). Property rights affect
environmental sustainability efforts, although the relationship between
property rights and environmental services is very complex (Swallow et al.,
2010). The farmers' income sources are the prerequisite to sustainable
agricultural production activities in upstream watersheds. There is a significant
difference in income based on land tenure among coffee farmers. A significant
difference between the income of private land, community forest base
management right holder (CFBM), and rent-land. The average income of
private land farmers is higher than CFBM and rent-land farmers (IDR 4.4
million > IDR 2.9 million > IDR 2.7 million) (Fitriani et al., 2018c).
2. Sustainable Agriculture Production
Agriculture is managing natural resources to produce physical
commodities with the help of technology, capital, labor, plantations, and or
livestock agriculture, including food crops, horticulture, and agroecosystems.
Sustainable agriculture is an agricultural business that utilizes and
simultaneously conserves resources to produce optimally harvested products
using renewable production facilities with reasonable input costs, meeting
social and environmental criteria. Sustainable agriculture is a philosophy of
values and farming systems. Values reflect an awareness of ecological and
social realities and a commitment to respond appropriately to that awareness.
The procedures, design, and management of conservation of all resources to
maintain and increase farm profitability are critical points of sustainable
farming practices. Nutrient and water cycles, energy flows, soil organisms, and
natural pest control to produce nutritious, healthy, and safe food from
contamination are at the core of the biological agricultural production process.
Sustainable farming systems can maintain productivity and resource
benefits to be socially supportive, commercially competitive, and
environmentally friendly in a sustainable manner. Sustainable agriculture also
refers to an integrated system of plant and animal production practices,
integrated farming, and agroforestry that maintains natural biological cycles
and controls, maintain the economic viability of agricultural operations, and
improves the quality of life of farmers and society. Indonesian Law No.

SUSTAINABLE AGRICULTURE LEADS TO ZERO HUNGER | 66
22/2019 concerning the Sustainable Agricultural Cultivation system through
better regulation of efforts to meet human needs, sustainable production of
agricultural commodities, and maintaining a sustainable living environment.
Sustainable agriculture seen from agroindustry should give added value to
activate economic circle for communities (Saepulloh, et. Al., 2021 and usndari,
et. al., 2017)
The study of sustainable agricultural development begins with the global
paradigm of sustainable development goals (SDGs), the development platform
for countries worldwide. The direction and design of development programs in
Indonesia are also in line with the SDGs targets. Sustainable agricultural
development is the target of the SDGs linked with the goals of eradicating
hunger (goal 2), sustainable consumption and production (goal 12), and the
preservation and sustainable use of terrestrial ecosystems (goal 15).
Agriculture can be a significant source of growth for agriculture-based
countries, reducing poverty and improving the environment. Making
smallholder agriculture more productive and sustainable through increasing
productivity, profitability, and sustainability of smallholder agriculture is the
leading way out of poverty. The laws and regulations that form the basis of
sustainable agricultural development policies in Indonesia are:
1. Law Number 41 of 2009 concerning the Protection of Sustainable
Food Agricultural Land;
2. Law no. 22 of 2019 concerning Sustainable Agricultural Cultivation
Systems
3. Government Regulation No. 25/2012 concerning Information
Systems for Sustainable Food Agriculture.
4. Minister of Agriculture Decree No 07/2012 concerning the technical
guidelines for criteria and requirements for areas, lands, and land
reserves for Sustainable Agri-food production;
5. Regulation of the Minister of Agrarian Affairs and Spatial Planning
No. 19/2016 concerning determination of sustainable agri-food land
in areas that have not formed a regional spatial plan.
The objectives of the SDGs at the practical level are manifested in the
discussion of the theme of agricultural production, agroecosystem unity, and
assessment of the achievement of sustainable indicators in an ecological, social,
and economic inclusive review. Food production technology and sustainable
ecosystems are critical points in sustainable agriculture. The assessment
focuses on the policy and evaluation of the fulfillment of sustainability

67 | SUSTAINABLE AGRICULTURE LEADS TO ZERO HUNGER
indicators in the interdependence of environmental, social, and economic
sustainability. The final part, as a closing, includes a discussion on best
practices for sustainable agricultural development. Good practice in integrating
crops and livestock, integrated farming, agroforestry, and permaculture farming
systems represent the implementation of sustainable agriculture in Indonesia.
Sustainable agriculture in Indonesia is simplified as an agricultural business for
optimal yields while preserving agricultural resources and the environment.
The operationalization of this objective is carried out in the following activities:
a. The production process takes place efficiently for excellent quality
products
b. Actions to conserve agricultural resources and the environment in
every stage of the production process.
c. Availability and ability to access technology for quality conservation
of agricultural and environmental resources
3. Sustainable production: agroforestry practices
Cash-crop commodities in upstream watersheds and protection forests
are coffee, cocoa, pepper, rubber, and palm oil (Fitriani et al., 2018b). The
empirical study in two main upstream watersheds in Lampung, which
implemented the CFMR, which involved 408 coffee farmers, revealed that the
coffee farmers derive their source of income from various commodities, mainly
were coffee, pepper as intercropping crops, and shade trees. The average
contribution of coffee farming attaint to 24% of the total farm income. The
farmers with private land tenure are the highest compared to another. The
diversity of income sources in the upstream watershed from various plant
vegetation is essential in maintaining land cover as a water catchment area.
These farming practices are called coffee agroforestry (Fitriani et al., 2020;
Kuswadi & Fitriani, 2021a). The practice of coffee agroforestry is an adaptation
of sustainable production in the upstream watershed.
Coffee farming in the coffee agroforestry system is the proprietary land
management that meets the criteria for sustainability and provides long-term
socio-economic benefits. Coffee farming carried out by farmers in different
land management conditions meets the criteria for socially sustainable.
Meanwhile, the external factor that influences the successful
performance of coffee production is the market, through commodity price
incentives, both at the local, regional, and global levels. The commodity market
is developing towards a buyer's obsession (global consumer desire) which
requires sustainable production of commodities. International standards

SUSTAINABLE AGRICULTURE LEADS TO ZERO HUNGER | 68
institutions develop sustainability principles to minimize environmental risks
and tackle global climate change. Complex issues refer to excess dependencies,
transaction costs, and vulnerabilities that threaten producers (especially the
poorest). Several studies have shown that farmers' participation in coffee
certification is more due to economic incentives to obtain premium price
incentives. However, further investigation still needs to investigate whether the
price incentive in the environmental service scheme becomes a central external
factor in mobilizing community participation in realizing sustainable coffee
production performance.
The performance of sustainable coffee farming is essential as part of
efforts to improve the structure of revenue, income, expenditure, and welfare
of coffee farmers, most of whom are still facing problems of poverty and
economic inequality. The incentives for GAP coffee actors can be formulated
in a payment scheme for environmental services. Parties who have
implemented the coffee GAP appropriately are entitled to incentives or
compensation for their hard work and efforts to ensure environmental
sustainability in the upstream area of the Sekampung watershed by the
beneficiary in the downstream area. Compensation payments for the provision
of environmental services are an alternative to improving new sources of
income for farmers who run the coffee GAP well. Incentives and premium
pricing approaches tend to be more effective in achieving conservation and
development goals.
Agroforestry was categorized as dense when ground-truthing indicated
it had an average of 144 trees with a diameter (DBH) > 30 cm and 844 DBH
trees ranging from 5 to 30 cm, respectively; the middle class had 42 trees, and
742 trees were found for the second diameter category (Markum et al., 2013).
With this basis, the condition of vegetation density in coffee farming lands is
in the middle-class agroforestry density criteria because the ratio of the median
density of coffee: intercropping: MPTS is 2508: 142: 84 trees. Almost all coffee
farmers have coffee plantations that are planted in a mixed garden pattern
(96.25%), with shade plants (MPTS1, 44%) and with various crops (MPTS2
56%) (Fitriani et al., 2018c).
Coffee farming with a combination of shade provides an overview of the
biodiversity performance of complex vegetation in middle-class agroforestry
density. Understanding which tree species to choose and how to manage them
for different socio-ecological contexts underlies farmers' choices in planting
shade trees (Barrios et al., 2017). This fact is relevant to (Yulilistyarini, 2013)
that non-timber MPTS are mostly found as mixed agroforestry systems in

69 | SUSTAINABLE AGRICULTURE LEADS TO ZERO HUNGER
multi-strata coffee agroforestry systems. This was also found in coffee farmers
in Pulau Panggung District, Tanggamus (Fitriani et al., 2018).
The sustainable coffee farming system is described by the presence of
other trees as shade trees and various intercropping plants. Coffee farmers
classify the planting of trees on their plantations as protection trees, well-known
as multipurpose tree species (MPTS). They also cultivate pepper and banana as
the main intercropping crops in coffee fields. This condition shows that coffee
farmers can optimize their land use by combining coffee plants with other crops
and carrying out productive activities outside the agricultural sector.
Soil conservation activities are essential to reach sustainable agriculture
production. Production activities in water catchment areas must apply soil
conservation principles. Conservation practices carried out by coffee farmers
in the research area fall into mechanical technology and soil bioengineering
categories. The farmers stated that they had implemented soil conservation on
their land. Land conservation activities are carried out as a combination of
ditch, mounds, and terraces according to the contours of the land. The soil
bioengineering practices implement shade trees, mulch, manure, and multiple
cropping plant (Kuswadi & Fitriani, 2021b).
Local communities called Ditch as Roark. It is a small hole measuring
about 50 cm long, 50 cm wide, and 50 cm high. Roark is also a place to
accumulate plant residues. This action is carried out based on the benefits of
improving plant root aeration and increasing production. Roark accumulates
litter and topsoil transported by surface runoff to be relatively rich in nutrients.
Coffee farmers in the research area, apart from doing work, also make
excavations that are technically conservation called dead-end canals. This
excavation is a rorak with a length of 1 to 1.5 m. If one canal is filled with plant
residues and soil, another canal is made on the other side of the coffee plant.
Conservation techniques that are suitable for coffee-based agricultural land are
(Agus et al., 2002) partial weeding- Natural plant strips (NPS) - like cover crops
and partial weeding, ridging, tied ridging, sediment pit, dead-end trench, shade
plants/multi-story systems, and the combination of various techniques.
As the 8th-year coffee plant gets bigger and taller, the value of plant
protection against the soil will increase. Its effectiveness in resisting erosion
will resemble the forest. Multi-strata treatment effectively suppresses erosion
tolerably on almost any slope and length. Thus, erosion management treatment
is mechanical (engineering), mostly needed when the coffee plants and shade
plants are still young. However, some farmers believe mechanical conservation

SUSTAINABLE AGRICULTURE LEADS TO ZERO HUNGER | 70
can improve soil fertility through litter accumulation, root improvement, and a
further increase in coffee production.
Furthermore, land conservation using shade plants on coffee farms was
carried out by 96.76% of coffee farmers. They operate the coffee farming
system with agroforestry in the upstream watershed. Shade plants are
widespread among coffee farmers, as well as in other locations in coffee
production centers in Indonesia. The shade plant species vary widely (Agus et
al., 2002); it is called: (a). Shade (protective) plants of the same type that form
a simple agroforestry system, namely a combination of coffee and one type of
protective plants, such as Gamal/quickstick (Gliricidia sepium), December tree
(Erythrina subumbrans), lamtoro (Leucaena leucocephala) or cinnamon
(Cinnamomum burmamii)). (b) Protective plants that are diverse and form a
complex agroforestry system (complex agroforestry or multi-strata system), for
example, coffee plants with two or more of the following plants: candlenut
(Aleurites muluccana), jengkol bean (Pithecellobium jiringa), petai/sting
bean/bitter bean/sator bean (Parkia speciosa), cinnamon (Cinnamomum
verum), durian (Durio zibethinus), avocado (Persea Americana), jackfruit
(Artocarpus heterophyllus), cempedak (Artocarpus integer), etcetera.
Coffee with multi-strata shade trees can be achieved gradually. Farmers
start with a simple system; over time, they add to the diversity of plants in their
coffee plantations. The stratified canopy of the system causes this system to
resemble a forest which conditions only a small portion of rainwater that
directly hits the ground surface. Most of the rainwater first falls on the plant's
leaves before reaching the ground, so the impact power (kinetic energy) is
significantly reduced. In addition, in multi-strata systems, especially complex
ones, the number of leaves that fall and protect the soil surface from rain is
greater.
The high density of coffee trees is mainly planted by farmers in Upstream
Sekampung watersheds (Pekon Datar Lebuay dan Sinar Jawa, especially in Cita
Laksana, Talang Tengah, Ciherang, and Sukoharjo). Farmers responded
positively to strengthening the sustainable coffee farming program with
agroforestry. Coffee farmers are familiar with and familiar with the term
environmental services. They realize that agricultural production activities in
the upstream watershed must be aware of preventive and rehabilitative
measures to secure land capability. The farmers' willingness to provide
sustainable agroforestry practices on their land.
Coffee farming with agroforestry is essential in developing sustainable
production management that provides better vegetation cover in the upstream

71 | SUSTAINABLE AGRICULTURE LEADS TO ZERO HUNGER
watershed. Increasing community participation in a sustainable coffee
production system is an integral part of a long-term plan that ensures the
availability of environmental/ecological services upstream of the watershed.
The certainty of land management rights greatly influences farmers' preferences
for better types of agroforestry. The interaction of mechanistic understanding
and innovation adoption drive can help select the right technology to ensure
sustainability (Meijer et al., 2015). The expansion of the coffee area must be
managed carefully through the delegation of land management rights
responsible for maintaining sustainability. The spread of new coffee areas must
avoid the trade-off of sacrificing biodiversity and conservation areas/national
parks (Jezeer & Verweij, 2015).
4.3. Social Assessment
The social sustainability assessment relates to the quality of life of those
working and living in agriculture and the surrounding community. The main
goals of national development are to enhance society's quality of life.
Development is a physical reality and a people's determination to strive as hard
as possible—through social, economic, and institutional processes—to achieve
a better life. Unfortunately, at the beginning of 2021, the poverty rate in
Indonesia increased, exacerbated by the Covid 19 pandemic. In March 2021,
the poverty rate reached 10.14 percent, or as many as 27.54 million people, or
an increase of 1.12 million compared to March 2020.
Meanwhile, the Open Unemployment rate in February 2021 was
recorded at 6.26 percent. There are 19.10 million people (9.30 percent of the
working-age population) affected by Covid-19. Consisted of unemployment
due to Covid-19 (1.62 million people), Non-Work Force due to Covid-19 (0.65
million people), temporarily not working due to Covid-19 (1.11 million
people), and residents working who experienced a reduction in working hours
due to Covid-19 (15.72 million people), 27.54 millions are below the poverty
line until the first quarter of 2021.
Based on the Human Development Index (HDI) in 2020, there was a
slowdown in growth compared to previous years. Indonesia's HDI in 2020 is
71.94. The decline greatly influenced this slowdown in the average per capita
expenditure. This indicator fell from 11.30 million IDR in 2019 to 11.01 million
IDR in 2020. Meanwhile, in terms of education, in 2020, children aged seven
years hope to enjoy 12.98 years of education or almost equivalent to the length
of time to complete education up to Diploma I. The average length of schooling

SUSTAINABLE AGRICULTURE LEADS TO ZERO HUNGER | 72
for residents aged 25 years and over 8.48 years in 2020. Regarding health,
babies born in 2020 expect to live up to 71.47 years, 0.13 years longer than
those born in the previous year (Badan Pusat Statistik, 2021).
The impact of development in improving welfare can be made through a
study of income distribution. The size distribution measures the various
incomes received by individuals and families. The availability of new sources
of income is a solution for the availability of jobs and reducing rural
unemployment. Farmers' household incomes will increase, so people's welfare
will be better, poverty will decrease, and the economic gap in rural areas can
be narrowed. Voluntary transactions for environmental services through the
provision of incentives from users of environmental services to providers can
take place if and only if the provider of environmental services can guarantee
the stock and flow of environmental services on an ongoing basis (which is a
conditionality).
Social sustainability relates to the quality of life of those working and
living in agriculture and the surrounding community. Quality of life includes
equal revenue or income for different stakeholders in the agricultural
production chain. In situations of high unemployment, sustainable agriculture
promotes the sharing of agricultural value-added to more members of society
through more available labor and will increase social cohesion and equity.
Social sustainability assessment related to income distribution could regulate
by the Gini coefficient, Loren's curve, and Theil index. Gini coeficient (Gini
ratio) formulate as follow (Hayami, 2001):
G = Σ Σ | yi –yj |/ 2n2u, …………………………... (1)
Gini Coeficient operationalize formulate as follow (Widodo, 1990):
n
GC= 1 – Σ . f1 (Xi+1 – X i) (Y i + Y i+1) .........................................................(2)
1
GC = Gini Coeficient
Xi = Proportion of cumulative number of households in class i
fi = Proportion number of households in class i
Yi = Proportion of cumulative number of households in class i=
- If divided by 5 classes:
20% poorest class, 20% second class, 20% third class, 20% fouth class, and 20% of
richest
- If divided into three classes:
40% poorest class, 40% moderate, 20% richest

73 | SUSTAINABLE AGRICULTURE LEADS TO ZERO HUNGER
Inequality determination used the World Bank clasification and Oshima
(1976):
a. G<0,4 = low
b. <0,4<G<0,5 = moderate
c. G>0,5 = high
Social sustainability assessment of sustainable farming practice upstream
was carried out using the Gini Coefficient, Lorens Curve, and Theil's Index.
The Gini coefficient is an indicator that shows overall income inequality. Based
on the case in the upstream Sekampung watershed in Lampung, which is
implementing coffee agroforestry as an upstream land use management, the
Gini coefficient value for coffee farmers as a whole is 0.42 (Figure 1). The Gini
coefficient for coffee farmers with the highest property rights reached 0.52,
followed by HK farmers at 0.48 and non-partner farmers reaching 0.49. The
Gini coefficient value for coffee farmers is higher than the Gini coefficient for
the population of Lampung. In September 2016, when the research was
conducted, the Gini coefficient for the Lampung population was 0.358, with
conditions in urban areas of 0.384 and rural areas of 0.330. The value of the
Gini coefficient can be seen in the following figure.
The average Gini coefficient for coffee farmers (0.42) is not much
different from the national Gini ratio, which is 0.403. The results of the Gini
coefficient calculation based on coffee farmers' income are in the classification
range <0.4 <G <0.5, which means they have a moderate inequality value or the
difference in income between coffee farmers in the moderate inequality
category. The income shows that the proportion of coffee farmers at high-
income levels is more significant. Moderate inequality can occur due to
differences in land area, with a reasonably high variation (least 0.25 ha, widest
5 ha, with an average of 1.37 ha).
Figure 1. Gini Ratio of coffee farmers in the study area
0,42
0,520,48 0,49
0,00
0,20
0,40
0,60
Gini Ratio
All Farmer Private land CBFM land land-rent

SUSTAINABLE AGRICULTURE LEADS TO ZERO HUNGER | 74
The condition of land use, which has a reasonably high variation, causes
production, productivity, price differences, and coffee farming income to vary,
causing a gap in farmers' farming income. In addition, it can also occur due to
inequality in infrastructure and economic development in the research area.
Furthermore, the income distribution analysis is strengthened by the Lorens
Curve, which relates the proportion of the population to the proportion of
income received (Figure 2).
The Lorenz curve for private coffee farmers has the smallest area because
the curve is close to the population proportion curve. The curve shows that other
activities besides coffee farming carried out by private property farmers can
shift the Lorenz curve closer to the diagonal line, which means improving the
condition of income distribution inequality among property rights coffee
farmers. Business activities other than coffee farming also show improvements
in land productivity, labor, and the agricultural sector.
Figure 2. Loren's curve of coffee farmers in the study area
The more productive the allocation of labor owned by farmers and the
more business activities in the agricultural sector will improve the structure and
distribution of farmers' income. Activities in the agricultural and non-
agricultural sectors can alleviate the unequal distribution of household incomes
(Fitriani et al., 2022). While CBFM right holders and land-rent farmers have a
wider area than the Lorenz curve of property rights farmers, they differ slightly
in the highest 20% income proportion. The curve means that the proportion of
income between CBFM right holders and land-rent farmers is not much
different. Inequality can also occur due to differences in age, education,
1,163,627,1111,79
17,5725,23
35,31
49,43
73,12
100
0
20
40
60
80
100
120
10 20 30 40 50 60 70 80 90
100
(%) kumulatifjumlah penduduk
Petani Hak Milik
Petani HKm(mitra)
Petani non-Mitra
(%kumulatif pendapatan)
(%) kumulatif penduduk
(%) Cumulative all
farmer
Private
landholders
CBFM landholders
Land-rent farmer
(%) income
cumulative

75 | SUSTAINABLE AGRICULTURE LEADS TO ZERO HUNGER
employment, gender, etcetera (Daryanto & Hafizrianda, 2010). Furthermore,
Theil Index produces the following conditions.
Table 1. Value of Theil Index of coffee farmers
Group Inequality Theil Index
Private
Inequality within groups 0.18
Inequality among groups (0.36)
CBFM
Inequality within groups 0.21
Inequality among groups (0.37)
Land rent farmer
Inequality within groups 0.78
Inequality among groups (0.34)
The calculation results show that the T value in the coffee farmers with
the private rights group is 0.18, and for CBFM farmers is 0.21. The T-value
indicates that both proprietary coffee farmers and HKm and non-HKm/non-
partner coffee farmers show relative equality or, in other words, do not indicate
any inequality within the group because if the T value = 0 means perfect equity.
Meanwhile, the entropy T value of coffee farmers was 0.36 and 0.37, and 0.34
was relatively more prominent than the T value in the group. The high
difference in the total group inequality index is partly due to the relatively large
variation in income levels over the difference in average ownership. Theil index
value of Lampung Province in 2016 was 0.13. Assessment of social indicators
shows that coffee farming contributes better income to 60% of the proportion
of coffee farmers. The proportion of the population (40%) with the lowest 40%
income is tiny (±11%). Therefore, the Gini coefficient and Theil index show
values of moderate inequality and close to equity. Thus, coffee farming carried
out by farmers in different land management conditions meets socially
sustainable criteria, which means that coffee farming activities carried out by
farmers in the upstream Sekampung watershed can socially demonstrate the
fulfillment of equitable income distribution.
4.4. Conclusion
1. Ecologically, sustainable production in the upstream watershed is
characterized by the agroforestry pattern in coffee farming. Coffee agroforestry
in the upstream Watersheds met as the medium-class density of agroforestry.
Coffee farming in the upstream Watersheds fulfills the criteria for being
environmentally sustainable.

SUSTAINABLE AGRICULTURE LEADS TO ZERO HUNGER | 76
2. The assessment of social sustainability indicators showed that the
income distribution among coffee farmers does not indicate an imbalance
within the group, so the criteria for social sustainability can be met.
4.5. Policy Implications
Promoting sustainable coffee farming systems as sustainable agriculture
production is the answer to providing environmentally sustainable production.
The development of sustainable coffee farming needs to be fully supported by
appropriate and strong policies integrated between relevant
ministries/agencies/agencies, communities, and third parties in the global
coffee value chain system. As an academic paper, the performance of
sustainable coffee farming upstream of the Sekampung watersheds is essential
to be the basis of regional policies in institutionalizing sustainable production
and establishing good governance in sustainable watersheds management.
Therefore, coordination is needed at the national, regional, and local levels
involved, including University and intermediary, to meet the parties' agreement
on the sustainable watersheds management scheme. Third parties
(intermediaries) play an essential role in driving the process of empowering
farmers in sustainable production.

77 | SUSTAINABLE AGRICULTURE LEADS TO ZERO HUNGER
References
Abdurachman, A. (2008). Teknologi dan Strategi Konservasi Tanah dalam Kerangka
Revitalisasi Pertanian. Pengembangan Inovasi Pertanian, 1(2), 105–124.
Agus, F., Ngaloken, G. A., & Nordwijk, M. van N. (2002). Pilihan Teknologi
Agroforestri / Konservasi Tanah Untuk Areal Pertanian Berbasis Kopi.
Badan Pusat Statistik. (2021). Laporan Bulanan Data Sosial Ekonomi. Jakarta: BPS
Indonesia.
Banuwa, I. S., Sinukaban, N., Tarigan, S. D., & Darusman, D. (2008). Evaluasi
Kemampuan Lahan DAS Sekampung Hulu. 13(1), 145–153.
Bernard, F., Noordwijk, M. Van, Luedeling, E., Villamor, G. B., Sileshi, G. W., &
Namirembe, S. (2014). Social actors and unsustainability of agriculture. Current
Opinion in Environmental Sustainability, 6(February), 155–161.
https://doi.org/10.1016/j.cosust.2014.01.002
Buongiorno, J., & Zhou, M. (2015). Adaptive economic and ecological forest
management under risk. https://doi.org/10.1186/s40663-015-0030-y
Eakin, H., Tucker, C. M., Castellanos, E., Diaz-Porras, R., Barrera, J. F., Morales, H.,
… Morales, H. (2014). Adaptation in a multi-stressor environment: perceptions
and responses to climatic and economic risks by coffee growers in Mesoamerica.
Environ Dev Sustain, 16, 123–139. https://doi.org/10.1007/s10668-013-9466-9
Eakin, H., Tucker, C. M., Castellanos, E., Juan, R. D., & Helda, F. B. (2014).
Adaptation in a multi-stressor environment : perceptions and responses to
climatic and economic risks by coffee growers in Mesoamerica. 123–139.
https://doi.org/10.1007/s10668-013-9466-9
Eisenberg, A. (2016). Addressing Rural Blight: Lessons from West Virginia and WV
LEAP. Journal of Affordable Housing, 24, 513–546. Retrieved from
http://www.americanbar.org/content/dam/aba/images/affordable_housing/publi
cation/journalaffordhouselaw/2015/AH 24-3_08Eisenberg.pdf
FAO. (2014). Evidence-Based Assessment of The Sustainability and Replicability of
Integrated Food-Energy System. Rome, Italy: Food and Agriculture
Organization of the United Natio.
Fisher, B., Turner, K., Zylstra, M., Brouwer, R., De Groot, R., Farber, S., … Balmford,
A. (2008). Ecosystem Services And Economic Theory: Integration For Policy-
Relevant Research. Ecological Applications, 18(8), 2050–2067. Retrieved from
http://www.uvm.edu/giee/pubpdfs/Fisher_2008_Ecological_Applications.pdf
Fitriani, Arifin, B., Abbas Zakaria, W., Hanung Ismono, R., & Erry Prasmatiwi, F.
(2020). Sustainable Production of Lampung Robusta Coffee: A Cost-Benefit
Analysis. International Journal of Ecology and Development, 35(1). Retrieved
from www.ceserp.com/cp-jour
Fitriani, Arifin, B., Zakaria, W. A., Ismono, H., & Hilmanto, R. (2018). Coffee
Agroforestry Performance in Pulau Panggung Sub-district , Tanggamus ,
Lampung , Indonesia. Pelita Perkebunan, 34(2), 69–79.

SUSTAINABLE AGRICULTURE LEADS TO ZERO HUNGER | 78
Fitriani, Arifin, B., Zakaria, W. A., & Ismono, R. H. (2018a). Coffee agroforestry for
sustainability of Upper Sekampung Watershed management. IOP Conference
Series: Earth and Environmental Science, 141(1). https://doi.org/10.1088/1755-
1315/141/1/012006
Fitriani, Arifin, B., Zakaria, W. A., & Ismono, R. H. (2018b). Coffee agroforestry for
the sustainability of Upper Sekampung Watershed management Coffee
agroforestry for sustainability of Upper Sekampung Watershed management.
International Conference on Biomass: Toward Sustainable Biomass Utilization
for Industrial and Energy Applications, 1–13. https://doi.org/10.1088/1755-
1315/141/1/012006
Fitriani, Arifin, B., Zakaria, W. A., & Ismono, R. H. (2018c). Kinerja Usahatani Kopi
di Hulu DAS Sekampung , Tanggamus , Lampung Performance of Coffee
Agroforestry in Hulu DAS Sekampung ,. Jurnal Penelitian Pertanian Terapan,
18(3), 165–174.
Fitriani, F., & Kuswadi, D. (2021). Driving factors of sustainable production in upland
watersheds: systematic literature review. E3S Web of Conferences, 306, 04015.
https://doi.org/10.1051/e3sconf/202130604015
Fitriani, Sutarni, Haryono, D., Ismono, H., & Lestari, D. A. H. (2017). Pertanian
Perdesaan Lampung: Peluang dan Tantangan. JofSA (Journal of Food System &
Agribusiness), 1(2), 43–52.
Fitriani, Sutarni, Yuniarti, E., Ismono, H., Lestari, D. A. H., & Haryono, D. (2022).
Lampung Macroeconomy: A Model of Social Accounting Matrix. Jurnal
Ekonomi Pembangunan: Kajian Masalah Ekonomi Dan Pembangunan, 2(2),
263–273.
Foran, T., Butler, J. R. a, Williams, L. J., Wanjura, W. J., Hall, A., Carter, L., &
Carberry, P. S. (2014). Taking complexity in food systems seriously: An
interdisciplinary analysis. World Development, 61, 85–101.
https://doi.org/10.1016/j.worlddev.2014.03.023
Fu, F. (2009). Farmers ’ perception of sustainable agriculture and its determinants : a
case study in Kahramanmaras province of Turkey. 1091–1106.
https://doi.org/10.1007/s10668-008-9168-x
Hope, R. a, Porras, I. T., Borgoyar, M., Miranda, M., Agarwal, C., Tiwari, S., &
Amezaga, J. M. (2005). Negotiating Watershed Services. Water Resources,
(11), 1–30.
Jezeer, R., & Verweij, P. (2015). Shade-Grown Coffe: Double dividend for biodiversity
and small-scale farmer in Peru. Netherlands: HIVOS & Utrecht University,
Copernicus Institute of Sustainable Development.
Klemick, H. (2011). Shifting cultivation , forest fallow , and externalities in ecosystem
services : Evidence from the Eastern Amazon. Journal of Environmental
Economics and Management, 61(1), 95–106.
https://doi.org/10.1016/j.jeem.2010.07.003
Kuswadi, D., & Fitriani. (2021a). Soil bioengineering for sustainable coffee farming in

79 | SUSTAINABLE AGRICULTURE LEADS TO ZERO HUNGER
way Besai sub-watersheds, Lampung, Indonesia. IOP Conference Series: Earth
and Environmental Science, 922(1), 012023. https://doi.org/10.1088/1755-
1315/922/1/012023
Kuswadi, D., & Fitriani, F. (2021b). Soil bioengineering for sustainable coffee farming
in way Besai sub-watersheds, Lampung, Indonesia. IOP Conference Series:
Earth and Environmental Science, 922(1), 012023.
https://doi.org/10.1088/1755-1315/922/1/012023
Meijer, S. S., Catacutan, D., Ajayi, O. C., Sileshi, G. W., & Nieuwenhuis, M. (2015).
The role of knowledge, attitudes and perceptions in the uptake of agricultural
and agroforestry innovations among smallholder farmers in sub-Saharan Africa.
International Journal of Agricultural Sustainability, 13(1), 40–54.
https://doi.org/10.1080/14735903.2014.912493
Ntabe, E. N., Lebel, L., & Munson, A. D. (2015). Author ’ s Accepted Manuscript.
Intern. Journal of Production Economics.
https://doi.org/10.1016/j.ijpe.2015.08.008
Poudel, L. K., Johnson, T. G., & Tewari, R. (2016). Property Rights and Sustainable
Natural Resource Management. Environmental Management and Sustainable
Development, 5(2), 30–40. https://doi.org/10.5296/emsd.v5i2.9304
Radjabaycolle, L. R., & Sumarjo. (2014). Community Participation of Cikapundung
Watershead Management Activities in Dago Village Bandung. Jurnal
Penyuluhan, 10(1), 43–58.
Saepulloh, D., Sundari, R., S., Fitriadi, B., W. 2021. Nilai Tambah Baby Fish Ikan Were
dan Ikan Nilem sebagai Produk Pangan Fungsional.. Jurnal Agrinika 5(1)-39-50
Slamet, B. (2015). Analisis Kebijakan Land Use Land Use Change Forestry (Lulucf)
Dan Skenario Adaptasi Dan Mitigasi Perubahan Iklim. Researchgate.Net,
(July). https://doi.org/10.13140/RG.2.1.1921.7764
Sudaryono. (2002). Pengelolaan daerah aliran sungai (das) terpadu, konsep
pembangunan berkelanjutan. Jurnal Teknologi Lingkungan, 3(Mei), 153–158.
Sundari, R. S., Kusmayadi, A., Umbara, D., S. 2017. Komparasi Nilai Tambah
Agroindustri Abon Ikan Lele dan Ikan Patin di Tasikmalaya. Jurnal Pertanian
Agros. 19(1):45-54
Suradisastra, K. (2004). Tata pengelolaan yang baik dalam pengelolaan das. In
Penegelolaan DAS (p. 219). Balibang Deptan RI.
Swallow, B. M., Garrity, D. P., & Noordwijk, M. Van. (2001). The effects of scales ,
flows and filters on property rights and collective action in watershed
management. Water Policy, 3(2002), 457–474.
Swallow, B. M., Leimona, B., Yatich, T., & Velarde, S. J. (2010). The conditions for
functional mechanisms of compensation and reward for environmental services.
Ecology and Society, 15(4). https://doi.org/6
WMO - World Meteorological Organization. (2020). Global Climate Report - August
2020 | State of the Climate. Retrieved from
https://www.ncdc.noaa.gov/sotc/global/202008

SUSTAINABLE AGRICULTURE LEADS TO ZERO HUNGER | 80
Brief Curriculum Vitae of Author
Dr. Fitriani, S.P., M.E.P. is an Associate Professor in
Polytechnique Negeri Lampung, Jl. Soekarno Hatta
No. 10 Rajabasa, Bandar Lampung, Sumatera Selatan,
Indonesia. She Completed her doctoral program in
University of Lampung (Unila) Sumatra selatan
Indonesia. Orcid id: 0000-0002-0329-9867; Scopus
author id: 57200958808; Publon id WoS:
N-4504-2019; Researcher id: N-1126-2017;
https://scholar.google.com/citation?user=T66v-vkAAAAJ&hl=en. She
conducted the funded research such as Resilience and mitigation od
environmental risks in the upstream watersheds in Lampung (2021;
Upstream sekampung watershed sustainability in supporting regional food
security (2018); Local value chance (LVC) model of cassava-based
agroindustry in Lampung (2017-2018) Agronomy and socio-economic study
of the application of the ‘jajar manten’ cultivation system on paddy crops in
Lampung. She published 16 research papers either journals or proceeding
since 2018-2021 in national and international publishers. She had four
intelectual rights and 2 books.

81 | SUSTAINABLE AGRICULTURE LEADS TO ZERO HUNGER
CHAPTER 5
MARKETING STRATEGY OF AGRICULTURAL
COMMODITY FOR FINANCIAL IMPROVEMENT
Eny LATIFAH1*
1Institut Agama Islam Tarbiyatut Tholabah Lamongan, Jl. Raya Deandleas No.1
Kranji Paciran Lamongan Jawa Timur Indonesia
*Corresponding Author: [email protected]

SUSTAINABLE AGRICULTURE LEADS TO ZERO HUNGER | 82

83 | SUSTAINABLE AGRICULTURE LEADS TO ZERO HUNGER
5.1. Introduction
Commodities are among the most diverse trade goods because they
consist of various types. Agricultural commodities are not only in the form of
farm products such as rice and wheat. According to the Food and Agriculture
Organization of the United Nations, agriculture has a broad meaning, including
animals and plants and using natural resources. According to the Regulation of
the Minister of Agriculture of the Republic of Indonesia Number 18 concerning
Guidelines for the Development of Agricultural Areas Based on Farmers'
Corporations, agricultural areas consist of food crops, horticulture, plantation,
and livestock commodities sub-sectors.
Examples of agricultural commodities of each entity ranging from
plantations, livestock, and food crops. Food crops are plants with high
carbohydrate content that can be used as staple foods. Examples of food crop
commodities are rice, corn, soybeans, and cassava or cassava. Examples of
horticultural commodities are chili, shallots, garlic, leeks, cabbage, potatoes,
bananas, durian, mango, oranges, ornamental plants (such as orchids, gladiolus
flowers, and chrysanthemums), as well as medicinal plants (such as turmeric,
aromatic ginger, and Curcuma zanthorrhiza). The plantation is an agricultural
sub-sector that requires large areas of land, planting media, and suitable
ecosystems to cultivate many plants The creative economy sector is one of the
key sectors that is the focus and hope for accelerating the recovery of national
economic activity and growth (Sundari, et al., 2021, 2022).
Examples of plantation commodities are sugarcane, coffee, tea, tobacco,
cocoa, quinine, cinnamon, cashew, cloves, nutmeg, pepper, sugar palm, vanilla,
castor, lemongrass, vetiver, candlenut, cotton, kapok, palm oil, roselle, coconut,
and rubber. Indonesian Export Commodities Livestock and Fisheries Livestock
Livestock commodities are agricultural activities that raise animals, breed
them, and use them for human needs. Examples of livestock commodities are
dairy cattle, beef cattle, buffalo, goats, sheep, ducks, and local chickens.
5.2. Marketing Strategy
There are several experts' opinions regarding strategy; among others,
according to Stephanie K. Marrus, strategy is a process of determining the plan
agricultural sector has not been optimally exploited. The agricultural sector is
one sector that has a significant contribution to the economy in Indonesia,
which can be seen in the agricultural sector's contribution to national income

SUSTAINABLE AGRICULTURE LEADS TO ZERO HUNGER | 84
and employment in Indonesia. Regarding national income, the agricultural
sector's contribution to gross domestic product (GDP) was 12.54 percent in
2018, while at the level of employment, the agricultural sector contributed
30.46 percent in 2017. The agricultural sector itself consists of several sub-
sectors. , namely food crops and horticulture, plantation crops, animal
husbandry, fisheries, and forestry.
All creation in the heavens and on earth is a gift from Allah SWT,
including the agricultural sector. Everything that grows on Earth is His gift, and
He wills over everything on this earth. Therefore, humans are obliged to be
grateful and grateful. One of the signs of gratitude and gratitude that humans
can do is pay zakat, including its relation to zakat in the agricultural sector.
Jumhur Ulama expands the scope of agricultural products to four commodities
with other crops with the exact 'Allah (legal cause). Abu Hanifah argues that
zakat on agricultural products is on everything planted: hubbub (seeds), fruits,
and vegetables. Imam Malik and Imam Shafi'i argue that zakat is obligatory on
all staple foods eaten and stored. Therefore, according to Imam Malik and
Imam Shafi'i, staple foods other than wheat, such as corn, rice, and tubers, must
be paid zakat.
Along with the times, the majority of Ulama agree that all commodities
in the agricultural sector can be used as objects of zakat after fulfilling certain
conditions. The difference lies in categorizing these commodities into
agricultural or commercial zakat. Agricultural zakat is zakat with a nishab of 5
wasaq, with a zakat rate of 10 percent for rain-fed and 5 percent for irrigation
systems, and is paid at harvest time without any haul.
On the other hand, commercial zakat is imposed on retail businesses that
have exceeded the nishab and haul. The object of commercial zakat is
calculated from current assets minus short-term liabilities. The nishab for
commercial zakat is 20 dinars or 85 grams of pure gold, reaching 2.5 percent.
As previously explained, the agricultural sector consists of several sub-sectors:
food crops and horticulture, plantations, livestock, fisheries, and forestry. Each
sub-sector has its method of calculating zakat. The following sub-chapter will
explain the methods for calculating zakat in the agricultural sub-sector, ranging
from food crops and horticulture to the forestry sub-sector.
5.3. Agricultural Financial Management
Finance is a business function responsible for obtaining funds for the
company, managing finances within the company, and planning expenditures

85 | SUSTAINABLE AGRICULTURE LEADS TO ZERO HUNGER
in the form of assets (plant, equipment, machinery). Financial management is
working the resources owned by the company to achieve its goals and
objectives (Griffin and Ebert, 2004; Nickels et al., 1996). What is the concept
of agricultural financial management? To answer this question, you need to
understand three keywords attached to the concept of agricultural financial
management such as (1) management, (2) finance, and (3) agriculture.
According to Pinches (1995), finance is a word that describes the
availability of financial resources for governments, companies, or individuals
and the management of all resources. This discussion pays special attention to
the second aspect, namely financial management. They further explained that
what is meant by financial management is managing and financing (financing)
resources for companies using money and considering prices as external factors
determined by the market.
Financial activities have also involved many interrelated functions, as
stated by Siegel and Shim (1991) and Brigham and Houston (2007), including
1. Obtaining funds 2. Using funds 3. Monitoring performance 4. Solving
problems occur, both now and in the future. According to Kadarsan (1995),
finance is related to the following. 1. Demand for capital 2. Supply of capital 3.
Regulation and use of capital 4. Control of capital. The two financial concepts
described by Siegel and Shim (1991) and Kadarsan (1995) above have the same
meaning. The two financial concepts presented include finding, using, and
monitoring funds used to finance company activities.
Furthermore, understanding finance is necessary to know about financial
goals. There are several corporate financial goals, as stated by Siegel and Shim
(1991), Brigham and Houston (2007), and Van Horne and Wachowicz (2001),
namely as follows. 1. Maximizing profit 2. Maximizing shareholder wealth 3.
Maximizing managerial rewards 4. Social responsibility. Modern financial
theory has used the assumption or requirement that the main goal in business is
to maximize the wealth of shareholders or debt securities issued by the
company, which means maximizing the company's share price. The other
financial goals mentioned above also influence company policy but have a
lower priority than maximizing share price. The higher the share price, the
wealth of shareholders will increase. In the traditional view, economists
emphasize the financial goal of maximizing profit. However, currently, the
purpose of maximizing profit is not enough, especially for large-scale
companies and companies that have gone public. Maximizing the welfare of
shareholders (owners) by providing adequate rewards from the share of profits
generated is the goal of maximizing profit.

SUSTAINABLE AGRICULTURE LEADS TO ZERO HUNGER | 86
Thus, three critical decisions are the most important in financial
management: investment, financing, and profit distribution. Investment
decisions involve decisions to procure assets according to company needs, in
this case, related to allocating capital or funds to procure assets needed to
achieve profit maximization targets. Financing decisions include decisions to
meet funding needs. Financing decisions are a consequence of investment
decisions.
Therefore, financing decisions must refer to and pay attention to the
results of investment decisions related to the amount, time, and source of
financing. The decision to distribute profits (also known as dividend policy)
shows that after management can allocate resources in the form of investments
to achieve maximum profit, it is crucial to determine the allocation of these
profits to shareholders appropriately.The ability to generate maximum profit
that is not followed by the ability to distribute earnings to shareholders will
result in shareholders withdrawing from the company. In studying agricultural
financial management or in managing business activities, you need to master
the vocabulary of financial terms. According to Siegel and Shim (1991), the
benefits you can get from learning financial terms are 1. Understand financial
information 2. Know how to use the information effectively 3. Communicate
clearly about quantitative aspects of performance and results. Knowledge of
finance and how to apply it successfully is one of the most important things to
learn about financial management. Knowledge of finance is beneficial for you
in planning, problem-solving, and decision-making.
The average financial manager spends time planning, setting goals, and
developing courses of action to achieve company goals. If you are a financial
manager, you must handle and master broader production, marketing, finance,
and personnel (human resources) plans. Each of these plans requires financial
knowledge, thus allowing for better communication between departments
within the company. For example, the company's budget, in this case, the
financial plan, communicates its overall goals to the leaders, namely managers,
so that they can know what the company expects of itself and the economic
parameters that guide it. You must be able to identify problems in the proposed
budget before it is passed and provide suggestions or recommendations on the
budgets that are prepared.
Your failure to understand the budget indicates that you will fail in
achieving company goals. After you know about the concept of finance, then
the following concept is about agriculture. Agriculture refers to agriculture in a
broad sense which includes agriculture (plants), animal husbandry, forestry,

87 | SUSTAINABLE AGRICULTURE LEADS TO ZERO HUNGER
and fisheries. Why is agriculture, in a general sense, necessary to discuss? You
can get the answer by listening to the following description. In developing
countries, the agricultural sector is one economic development sector with a
relatively significant role. You may ask how to measure the part of the
agricultural sector in economic development? Measure the role of the
agricultural sector in economic growth can be seen from the contribution of the
agricultural sector's Gross Domestic Product (GDP) to the total GDP.
If it is a concept of financial management, what about the concept of
agricultural financial management. Kadarsan (1995) states that agricultural
finance is related to financial matters in the agricultural sector. Furthermore,
agricultural financial management is financial management in business
activities related to the agricultural sector, including planning, use, and
supervision of capital used to finance agricultural sector business activities.
Meanwhile, Kadarsan (1995) added that agricultural financial management
includes companies outside the agricultural sector, but their activities involve
the agricultural sector, such as agro-industry, agro-tourism, and economic
institutions that support the agricultural sector activities, such as banks. The
financial institution is a subsystem in the agribusiness system. The examples
and illustrations in this module cover all subsystems in agribusiness.
According to Krisnamurthi (2001), the agribusiness system is a series of
interrelated subsystems, namely upstream, downstream, farming, and
supporters. Agribusiness is the concept of an integrative system consisting of
subsystems. Agribusiness consists of a collection of units/business actors in
each subsystem. In the following, each subsystem will be explained as follows.
1. Up-stream agribusiness subsystem: economic activities that produce
(upstream agro-industry) and trade in primary agricultural production facilities.
Example: fertilizer industry, medicine, seeds/seedlings, agricultural machine
tools, and others. 2. Farming subsystem (on-farm agribusiness): the primary
agricultural and cultivation sectors. 3. Downstream agribusiness: economic
activities that process primary agricultural products into processed products,
both in ready-to-cook/ready-for-use, ready-to-consumer forms and trading
activities in the domestic and international markets. International. Example:
postharvest, packaging, storage, processing, distribution, marketing, retail. 4.
Supporting service subsystem: supporting institutions and activities, for
example, banks and financial institutions, transportation, extension,
agribusiness information services, research and development, insurance, and
others.

SUSTAINABLE AGRICULTURE LEADS TO ZERO HUNGER | 88
The party who has a close relationship with financial management, in
general, is the financial manager. The financial manager's responsibilities will
describe the activities in financial management. The most critical responsibility
for financial managers is planning the procurement and use of funds to
maximize company profits (Weston and Brigham, 1990). Financial obligation
shows that a financial manager is decisive in procuring funds for the company
by looking at the various alternative funding sources.
In addition to seeking funding sources, a financial manager is also very
decisive in using funds to achieve company goals. Furthermore, Weston and
Brigham (1990) explained several details of activities related to financial
management, namely as follows: 1. Forecasting and financial planning
Financial managers must interact with other managers to predict the company's
future and establish a joint plan to determine the company's future position. 2.
Decision-making in investment and financing following the long-term plan,
financial managers must provide capital to support growth. Successful
companies usually get high levels of sales, which requires additional
investments in land, factories, equipment, and current assets (assets) necessary
to produce goods and services.
The financial manager must help determine the optimal level of sales
growth, make decisions on specific investments to be carried out, and determine
the type of funds used to finance these investments. A financial manager must
consider decisions about using internal or external funds, such as from debt. 3.
Coordination and financial control The financial manager must work closely
with other field managers so that the company operates as efficiently as
possible. All business decisions have financial implications, and all managers
in finance and other fields must consider this. For example, marketing decisions
will affect sales growth which in turn causes changes in the need for investment.
Thus, marketing decision-makers must consider how managers' actions
affect and are influenced by factors such as availability of funds, policies
regarding inventory, and utilization of company (factory) capacity. 4.
Interaction with capital markets. Financial managers must deal with money
markets and capital markets as it is known that every company often needs
additional funds. For example, the company may need to build a new factory
or expand agricultural land to meet market demand, or it may develop into other
business fields. If the company wants to grow its business and requires Rp. 200
million funds, the available capital is only Rp. 50 million, so it needs funding
from other sources. The need for additional funds can be met from own funds
(company owners) or other sources outside the company. Generally, own funds

89 | SUSTAINABLE AGRICULTURE LEADS TO ZERO HUNGER
are insufficient to meet investment needs, so the money market or capital
market becomes an alternative source of funding that needs attention. The
description of funding sources will be discussed in detail in the module that
discusses funding sources.
As Weston and Brigham (1990) explained regarding activities in
financial management, according to Kadarsan (1995), five factors must be a
unique rationale in financial management. Decisions related to finance are as
follows. 1. Determine the amount of capital required by the company. 2.
Determine the flow of capital investment that has many alternative uses. 3.
Determine the source and composition of finance to be used. 4. Determine
strategies to eliminate and reduce the company's financial risks and uncertainty
factors. 5. Determine the form of the company's legal entity.
5.4. Government Strategy in Financial Inclusion of The
Agricultural Sector
The Coordinating Ministry for Economic Affairs is intensively
integrating economic activities and inclusive finance in the agricultural sector,
especially for millennial farmers, to accelerate national economic recovery and
improve people's welfare. (https://www.merdeka.com/uang/strategi-
governmental-push-inclusion-keuangan-sector agriculture.html). Several state-
owned companies carry out programs to increase financial inclusion in the
agricultural sector, such as those by PT Bank Mandiri Tbk, PT Telkom
Indonesia Tbk, and PT Pupuk Indonesia. The low-interest People's Business
Credit (PBC=KUR) program is one of the government's efforts to increase
farmer financing. As one of the state-owned banks, Bank Mandiri has
distributed KUR since 2008, with an outstanding until March 2021 reaching
Rp46.2 trillion to 1.94 million debtors.
Financial inclusion is also carried out through increasing access to
banking through Mandiri Agen, which serves banking transactions such as
account opening, cash deposits, cash withdrawals, transfers, and payments or
purchases. Specifically for support in the government's program for Farmer
Entrepreneurship, Bank Mandiri has also provided CSR in the form of
constructing an Integrated Rice Processing Center (SPBT) in Pamarican
District, Ciamis Regency in 2018, which has been operated to provide benefits
to farmers. Plus the support for access to capital with KUR, the Kartu Tani
program for suggestions for purchasing subsidized fertilizers, and integrated
coaching and training. Through the integrative Agree scheme from PT Telkom

SUSTAINABLE AGRICULTURE LEADS TO ZERO HUNGER | 90
Indonesia, farmers can optimize production results through good supply and
demand management, facilitate the distribution of subsidies, and encourage
farmer regeneration by giving birth to millennial farmers. To complement this
synergism, PT Pupuk Indonesia (Persero) also provides complete upstream-
downstream agricultural assistance in on-farm and off-farm activities through
the Agrosolution program.
In on-farm activities, Agro Solution farmers get quality agro-input
products such as non-subsidized fertilizers and medicines, as well as
technology escort and technical guidance. Meanwhile, off-farm activities take
the form of access to capital, insurance, and off-take guarantees for harvests.
Through this program, Pupuk Indonesia increased crop yields from an average
of 5 to 6 tons per hectare to 8 to 10 tons per hectare. "Support for digitalization
in agricultural ecosystems can elevate the livelihood and economic level of
farmers and facilitate the development of integrated agricultural services," said
Deputy for Macroeconomic and Financial Coordination as Secretary of the
National Council for Financial Inclusion (DNKI) Iskandar Simorangkir at the
FGD Synergy Programs Supporting Financial Inclusion for Millennial Farmer.
To date, there have been 13 piloting locations for the digitalization of the
national agricultural ecosystem, and it is hoped that the number will increase.
Therefore the program has objectives to improve farmer welfare and develop
the agricultural sector can be achieved soon.
President Joko Widodo, as Chairman of the National Council for
Inclusive Finance (DNKI), emphasized that he prioritized the expansion and
ease of access to formal financial services through digital financial services for
all levels of society, especially the beneficiary groups of micro and small
enterprises (UMK), farmers, fishers, and low-income communities following
the mandate of Presidential Decree No. 114 of 2020 concerning the National
Strategy for Financial Inclusion (SNKI).
In 2020, the financial inclusion index in Indonesia had reached 81.4
percent, higher than in 2019, which reached 76.19 percent. Financial inclusion
is in line with the various efforts DNKI has made to achieve the financial
inclusion target of 90 percent by 2024. When viewed from the employment
structure in August 2020, 29.76 percent of workers worked in the agricultural
sector. However, only about 8 percent are young farmers (millennial
generation). When viewed from the age structure, the Indonesian population is
dominated by the millennial generation (25.87 percent) and generation Z (27.94
percent). (https://www.merdeka.com/uang/strategi-governmental-push-
inclusion-keuangan-sector-pertanian).

91 | SUSTAINABLE AGRICULTURE LEADS TO ZERO HUNGER
5.5. Systems in Agricultural Product Marketing Strategy
A strategy needs a series of stages that synergize with the system in the
economic and agricultural sectors. Knowing the existing system will make it
easier to determine the marketing strategy for the resulting product and also
applies to the system in the marketing strategy of agricultural products. A
system is a group of items or parts that are interconnected and regularly
interrelated in forming an integrated whole. The system can be interpreted as
the marketing system as a collection of institutions that carry out the task of
marketing goods, services, ideas, people, and environmental factors that
influence each other and shape and influence the company's relationship with
its market.
In marketing, the group of interrelated and interrelated items includes 1.
Combined organizations that carry out marketing work. 2. Products, services,
ideas, or people that are marketed. 3. Target market. 4. Intermediaries (retailers,
wholesalers, transportation agents, financial institutions). 5. Environmental
constraints (environmental constraints). The most straightforward marketing
system consists of two interrelated elements: the marketing organization and its
target market. The elements in a marketing system are similar to those in a
stereo radio system. The agricultural product marketing system is an
interrelated part from the planting process to distributing agricultural products
to final consumers in the hope that farmers will receive compensation for
money or income from these agricultural products.
This marketing system is expected to be able to create a strategy for
marketing agricultural products. Marketing strategy is making decisions about
marketing costs, marketing mix, and marketing allocation concerning expected
and competitive environmental conditions. In marketing strategy, three main
factors cause changes in marketing strategy: 1. Product life cycle. The strategy
must be adapted to the life cycle stages, namely the introduction stage, the
growth stage, the maturity stage, and the decline stage. 2. The company's
competitive position in the market. The marketing strategy must adapt to the
company's role in the competition, whether to lead, challenge, follow or only
take a small part of the market. 3. Economic situation. The marketing strategy
must be adjusted to the economic situation and the outlook, whether the
economy is in a prosperous situation or high inflation. (Yulianti: 8).

SUSTAINABLE AGRICULTURE LEADS TO ZERO HUNGER | 92
5.6. Agricultural Commodity Marketing Strategy for
Financial Improvement
Financial improvement requires a linkage and synergism in monetary
policies to fulfill financial inclusion, including in the agricultural sector. The
financial improvement involves government intervention in services for
farmers in marketing agricultural products so that they have high prices or at
least not below the standard, which can later cause losses because they have
lower prices than the Price of financing and maintenance of these agricultural
products. There must be a facilitator from the government and the need for
assistance from experts in carrying out the skills of agricultural commodity
marketing strategies given to farmers. The government's role as a facilitator of
marketing strategy can provide an official forum that becomes a place for
farmers to make it easier to sell agricultural products with standards that do not
cause losses. Meanwhile, the role of experts from educational institutions is to
provide literacy-related marketing strategies for farmers in carrying out
agricultural systems to realize personal and community financial
improvements. So, it can give added value for any commodities (Sundari, et al.,
2016). The following is a plan that must be prepared to reach so that marketing
strategies are practical and efficient.
1. Promotion
In the marketing strategy of agricultural products, promotion is needed
to introduce agricultural products to potential consumers and explain directly
the quality of farm products that have been produced. Promotion is essential so
that consumers who initially do not know can get information related to
products that may initially be considered the same as other products. It turns
out that this product has much better quality than other agricultural products.
2. Creativity
Creativity in marketing methods involves marketing efforts and
strategies to make it seem unique and different and finding new ways to pursue
marketing activities so that they can run optimally. There are many creative
ways that people do today. One of them is utilizing worldwide internet facilities
to market business products.

93 | SUSTAINABLE AGRICULTURE LEADS TO ZERO HUNGER
3. Consistency
Consistency in all marketing areas can help reduce marketing costs and
increasing the effectiveness of brand creation.
4. Planning
In the marketing strategy for agricultural products, it is necessary to have
good planning related to market share, selling prices, and the shape of the
packaging of these agricultural products. Because all businesses must have a
goal of wanting maximum results to create economic opportunities for others,
planning is closely related to the vision, mission, and goals that have been
determined by a business or business community, and agricultural products are
no exception.
5. Budget
Calculating the marketing budget is a challenging part and requires
accurate calculation results. The funds needed for marketing can be prepared
from the allocation made. Usually, small businesses make budgets with less
accuracy, resulting in waste.
6. Branding
Branding is how consumers receive products and the companies that
make those products. Sometimes small businesses forget the need for a brand
or recognition of images, logos, and even products that small businesses
produce.
7. Customer Relationship
Proper management of customer relationships is one of the essential
things to creating loyal and consistent customers. Remember, a business can be
destroyed if the wrong marketing strategy is chosen.
Building a business and developing it requires a serious effort. The
serious and, at the same time, the critical part that can bring our business
success lies in how to manage business finances. It takes discipline and
sufficient understanding to collect money in any business. Here's how to
manage business finances effectively in a business:

SUSTAINABLE AGRICULTURE LEADS TO ZERO HUNGER | 94
1. Record All Expenses
The way to manage business finances is to record all expenses in detail
and as well as possible. Suppose we can't do this well; developing whatever
type of business we do will not be easy. One of the essential things that will
make it easier for us to record all expenses is to keep all evidence of costs while
running a business. It would be better to document proof of income because
every incoming income measures every ordinary expense. The difference in the
numbers that occur will be seen as a bright spot. The main goal of recording all
expenses is to cover any discrepancies in the numbers. The difference in
numbers is a natural thing, the money that has been spent is usually not
following the existing evidence of expenditure. The expenditure can be done
by looking at proof of income. That way, all financial movements can be
appropriately tracked if you have a record of all costs incurred.
2. Making Financial Projections
The following way to manage business finances is to make financial
projections. The economic forecast in question is to imagine in the future what
expenses will need to be made for business purposes. We can determine the
period, for example, in the next six months. What are the expenses that will
occur during the six months? Every week/month, buy agricultural seeds that
run out. The second month buys additional equipment to support agriculture.
The third month of multiplying complementary agricultural goods. The fourth
month of expanding agricultural land. In the fifth month, opening a branch of
agricultural land. The sixth month of promotion to develop buyers
Making financial posts is essential. The first post we can focus on for
monthly and weekly needs, and the next post for other interests following
predetermined requirements. This step is an essential tip for managing business
finances, especially for business development, so it is more organized with a
clear vision and mission.
3. Keep Personal and Business Finances Separate
It is important to remember and note that for every novice business
person, one factor that makes business finances a mess is the mix of personal
and business finances. If in normal and stable business conditions, the unifying
of personal finance and business finance may not be felt immediately. However,
if in a crisis and emergency, the mix of personal finances and business finances
will make the business go bankrupt and fall apart.

95 | SUSTAINABLE AGRICULTURE LEADS TO ZERO HUNGER
Therefore, the wisest way to manage business finances is to separate in
advance which is personal money and which is money for the business. For
example, in how to manage small business finances, personal finances will be
difficult to track because the movement of money into small businesses is
languid. One of the main goals of separating personal and business finances is
to follow the trend of finances. In the basic principles of accounting and money
management, separating personal and business money is fundamental. To be
able to do how to manage finances in a company, especially for every
entrepreneur who wants to develop a business, finances should not be mixed
and messy. Create two financial accounts for the personal use of your name and
identity, and for business, finance uses your business name. Save money for
business development in a business account and money for daily needs in a
personal account. Therefore, everything can be appropriately tracked and run
well.
4. Pay All Bills On Time
It must be mandatory to pay all bills on time, so we can know the profit
earned. It Must pay bills on time in manage business finances. Because the
invoice has not been paid, the profit obtained is not pure. Profits can be
calculated on a net basis when all bills and arrears have been paid off. In the
way of small business financial management, there are terms gross profit and
net profit. Gross profit is income that has not been deducted from expenses,
including bills. The net profit is the pure profit that we get.
5. Calculate Income and Profit in Detail
Tips on how to manage business finances next are to calculate income
and profits in detail. This section is not much different from the point in number
one, which is to record all expenses. The difference is in expenditure and
income. In these tips on how to manage business finances, calculate every
income that has been obtained. Cut by every obligation to be paid, then we will
get a pure count of our profit. That way, we can find out how much our income
and profits are in detail. That way, we can continue managing business money
to achieve business success. Therefore, a good entrepreneur is an entrepreneur
who can wisely record every financial flow that occurs.
6. Minimize Travel Costs
Tips on how to manage business finances well next are to minimize the
expenses. One of the expenses that we can minimize is the cost of travel.

SUSTAINABLE AGRICULTURE LEADS TO ZERO HUNGER | 96
Traveling, especially for business purposes, is essential. However, spending
money on a business is also important. Especially in running a culinary
business, the importance of observing ingredients and experimenting with food
tastes requires us to travel. However, we can outsmart the cost of the trip. That
way, we can manage the finances of agricultural businesses well.
7. Pay Attention to Contract Agreements with Third Parties
We often enter into business agreements with third parties in managing
business finances, especially during business development. Partners in
managing a business are essential to make our business progress and develop.
Especially in today's online-based digital world, business development
collaborates and relies on various parties to work together. Therefore, managing
a business must organize better in understanding and paying attention to
business contracts. The business contract can also overcome the ominous
possibility that occurs, namely the occurrence of fraud from an adverse third
party. With the employment contract, we have strong evidence to sue and
compensate for all our losses.
8. Monitor Financial Cash Flow
One way to manage business finances that we must do in a very
disciplined and responsible manner is related to the supervision of financial
cash flows. If you think about it, just monitoring financial cash flow is
effortless. We need to separate where the money is for business interests and
where the money is for personal interests. However, in practice, monitoring
financial cash flow is complex. The difficulties encountered are usually related
to self-discipline and responsibility in supervision. The smooth flow of finances
will affect the smooth running of a business.
9. Use Profits to Grow Your Business
Profit is the profit we get from the business we run. Getting very high
profits from business results is something that every entrepreneur covets, but
unfortunately, many entrepreneurs are immediately tempted to use profits for
personal gain. In fact, in a good way of managing business finances, profits
should not be used directly for personal interests. A wise entrepreneur will save
the profit first and then use it as capital to develop the business being run. The
profit earned, be it big or small, is diverted to develop the business. We have to

97 | SUSTAINABLE AGRICULTURE LEADS TO ZERO HUNGER
pass several stages to use earnings for personal purposes. One indication is
when we feel a business is running steadily.
10. Look at Ownership of Assets, Capital, and Accounts Payable
In running a business, we may be busy doing business development.
Expand business capacity, widen customer reach, and create various programs
for our business interests. And frequently, every entrepreneur forgets one
important thing: to take note of everything he owns. Observing the ownership
of assets, ownership of capital, and also debts owned is an essential thing.
Before we master managing business finances, we must be very aware of asset
ownership. Because assets are our principal capital to run a business, do not let
us sacrifice the assets we already have in the name of business development.
Many entrepreneurs pawn the assets they already have, such as buildings or
equipment, to get additional money for business purposes. Observing assets,
capital, and accounts payable is fundamental so that we can carry out how to
manage personal and business finances. Before making developments in how
to manage the finances of a startup business, we must continue to update the
list related to asset ownership, capital, and accounts payable. This way, we can
find out what we have and haven't finished.
11. Consultation with an Expert Mentor
Don't hesitate to consult with a mentor who is an expert in managing
business finances. Consultation from experts will be very significant in
improving business performance, especially for those of us who intend to grow
our business even more prominent. For those who have run how to manage the
finances of a small trading business, and want to move into more significant
trading business, consulting with a mentor is a tip for managing business
finances to be more organized. The presence of a mentor can also be better for
educating our entrepreneurs mentally. Mentoring with this expert can also
measure how well our mental development as entrepreneurs is. Knowing how
far our cognitive development as entrepreneurs can help us go beyond our limits
to become even better is essential.
12. Use Software to Manage Finances and Sales
The last tip on how to manage business finances is to use special software
to manage the finances of a business. During the development of digital
technology today, there are many software or applications to manage finances.
Especially for those of us who are beginners, the use of financial software and

SUSTAINABLE AGRICULTURE LEADS TO ZERO HUNGER | 98
applications is crucial. So how to manage small business finances can be
arranged, and the business will develop slowly. The use of software to manage
finances is also critical to minimize the occurrence of recording errors that lead
to unwanted things. Both paid software or applications that we can freely
download are available for use. It's just that, use the one that fits and is
comfortable for us. It is better to be accompanied by a mentor or financial expert
when using the software or application.
5.7. Conclusion
The strategies needed in marketing to increase finances are (a). Choose
the consumers you want to target. (b). Identify consumer desires. (c). Define
the marketing mix. Strategies for financial improvement are (1). Determine the
amount of capital required by the company. (2). Determine the flow of capital
investment that has many alternative uses. (3). Determine the source and
composition of finance to be used. (4). Determine strategies to eliminate and
reduce the company's financial risks and uncertainty factors. (5). Determine the
legal entity form of the company.
5.8. Implication
The implication of marketing strategies in the context of increasing
finances can be carried out by all farmers with various agricultural
commodities. In the process of implementing the strategy, it is necessary to
have assistance from the government and parties directly involved with
agricultural activities. Because actually farmers are heroes of natural resources
for all mankind.

99 | SUSTAINABLE AGRICULTURE LEADS TO ZERO HUNGER
References
Al Ries. (1993). Marketing Role, Jakarta. Erlangga.
Umar, H. (2001). Strategy Management in Action, Jakarta. PT. Gramedia Main Library
Kasmir. (2004). Bank Marketing, Jakarta: Kencana.
Kotler, P and Armstrong, G. 2003. Fundamentals of Marketing, Jakarta: PT. Index,
2003.
Kotler, P and Armstrong, G. (1997). Marketing Principles, Jakarta. Erlangga.
Kotler, P.and Bloom, P. N. (1995). Marketing Techniques and Strategies and
Professional Services, Jakarta: Intermedia.
Philip K. (1993). Marketing Management (Analysis, Planning, Implementation, and
Control), Jakarta, FEUI Publishing Institute.
Philip K. and Armstrong, G. (1997). Principles of Marketing, Jakarta. Erlangga, 1997,
ed. 2, vol. 1,
Oliver, S. (2006). Public Relations Strategy, London. Erlangga
https://www.merdeka.com/uang/strategi-pemerintah-dorong-inklusi-keuangan-sektor-
pertanian.
Sundari, R.S. Kusmayadi, A., Umbara, D. S. 2016. Komparasi Nilai Tambah Abon Ikan
Lele dan Ikan patin. Jurnal Agros 19(1):45-54
Sundari, R.S., 2021. Meningkatkan Kualitas dan Kesegaran Ikan Lele dengan Inovasi
Antioksidan Daun Jintan dalam Agribisnis Pangan Hewani. Pengembangan
Ekonomi Kreatif di Pedesaan. Editor Yo Cheng Giap. ISBN 978-623-98446-0-
8. CV. Pustaka Kreasi Mandiri. Tangerang. Indonesia
Sundari, R. S., Tarigan, R.T., Asyiah, A.K. (2022). Gedebog Pisang Dibuang Sayang.
Abdi Laksana. Jurnal Pengabdian kepada Masyarakat 3(2): 235-
242.10.32493/al-jpkm.v3i2.20292
Sundari R.S., Asyiah, A.K., Tarigan, R.T. (2022). Waste Utilization of Banana
Pseudostem as Nutritious Food for Human Being (Supports SDGs 1, 2, 13) DO
not Throw Away. International Euroasia Congress on Scientific Researches and
Recent Trends 9 At: 18-20 February 2022 Antalya – Turkey. ISBN: 978-625-
8405-46-0

SUSTAINABLE AGRICULTURE LEADS TO ZERO HUNGER | 100
Brief Curriculum Vitae of Author
Eny Latifah, SE, Sy., M.Ak.completed her master in
Accounting at UPN Veteran Surabaya, EastJava. Work as
lecturer of Institut Agama Islam Tarbiyatut Tholabah
Lamongan, Jl. Raya Deandleas No.1 Kranji Paciran Lamongan
Jawa Timur Indonesia. She active in entrepreuneur.
https://scholar.google.co.id/citations?user=r2nzqIwAAAAJ&hl=id. She wrote
Accounting Information System, Sharia Accounting Practicum, Islamic
Microeconomics, 4. Introduction to Islamic Business, Book Chapter of Islamic
Education Management, Book Chapter of Islamic Economic Research
Methodology, Book Chapter Introduction to Islamic Economics, A Potpourri
of Religious Moderation and 25 research and review articles.
ELTHIFAH.Blogspot.

101 | SUSTAINABLE AGRICULTURE LEADS TO ZERO HUNGER
CHAPTER 6
GENOME-WIDE ASSOCIATION STUDIES IN
SUSTAINABLE LIVESTOCK BREEDING
Raziye IŞIK1, 2*
Faculty of Agriculture, Department of Agricultural Biotechnology, Tekirdağ
Namık Kemal University, Tekirdağ, Turkey
Faculdade de Medicina Veterinária - Câmpus de Araçatuba - FMVA/ Unesp,
São Paulo State University, Brasil
*Corresponding Author: [email protected]

SUSTAINABLE AGRICULTURE LEADS TO ZERO HUNGER | 102

103 | SUSTAINABLE AGRICULTURE LEADS TO ZERO HUNGER
6.1 Introduction
Single nucleotide polymorphisms (SNPs) are the common variations
throughout the genome in farm animals. Last few decades, many genes or
associated genetic markers have been detected that affect crucial traits in
livestock (Meuwissen et al., 2001; Dekkers, 2004). Major genes related to
economic characters in livestock have been identified by genomic scans and
animal genetic mapping methods. The emergence of the high-throughput
genotyping and sequencing technologies make possible and affordable the
genotyping of hundreds of thousands of SNPs. SNP chips have facilitated to
benefit the genome-wide association studies (GWAS) in defining molecular
markers related to complex quantitative traits such as meat production, milk
yield and quality, wool production and quality, This progress altered the
selection efficacy for the characters which are hard to improve using classical
selection methods (Dekkers, 2004; Gökçek, 2020).
These genome-wide studies offer new potential for marker-assisted and
genomic selection (Goddard and Hayes, 2009). The contribution of genomic
selection or marker-assisted selection to animal breeding programs could make
them more effective and increase the acquisition of selection in many livestock
species worldwide (Meuwissen et al., 2001; Goddard et al., 2010; 2016;
Gholizadeh and Esmaeili-Fard, 2022). This chapter summarizes the genome-
wide association studies performed on livestock species such as sheep, goats,
cattle, and chickens worldwide.
6.2. Methodology of GWAS
In genome-wide association studies, morphological data should be
obtained from animals. The methodology of GWAS step by step is shown in
Figure 1. This morphological data could be obtained using some measurements
or observation. Afterward, the same animals with morphological data must be
genotyped with different chips. The animals have been genotyped with the SNP
chips or whole-genome sequencing.
Various methods are applied for quality control of raw genotypes.
Firstly, individuals with low call rates (<0.90-0.97) should be discarded from
additional statistical analysis. Secondly, SNPs that have a low call rate (<0.90-
0.97), a minor allele frequency < 0.01, and significant deviations from Hardy-
Weinberg equilibrium (< 0.00001) should be excluded. PLINK 1.9 and
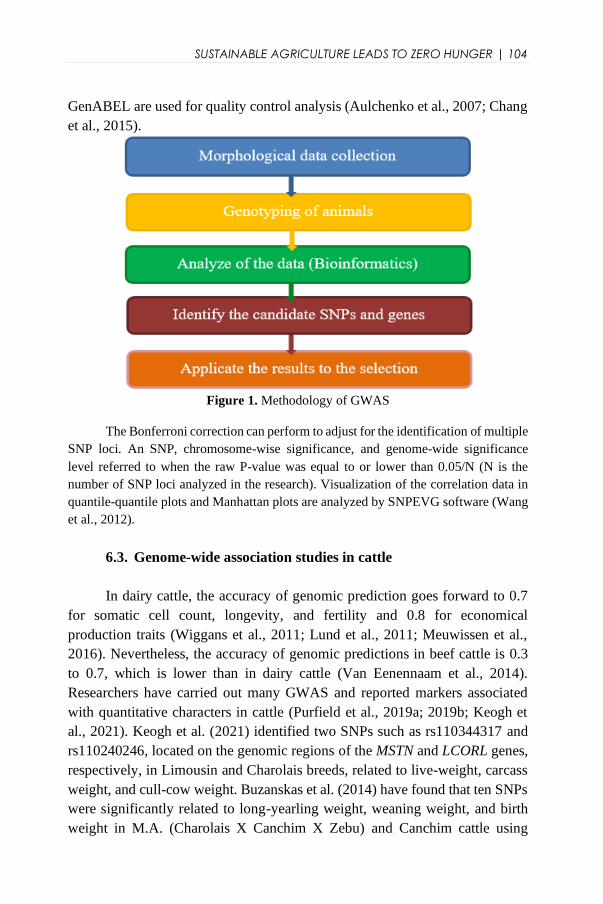
SUSTAINABLE AGRICULTURE LEADS TO ZERO HUNGER | 104
GenABEL are used for quality control analysis (Aulchenko et al., 2007; Chang
et al., 2015).
Figure 1. Methodology of GWAS
The Bonferroni correction can perform to adjust for the identification of multiple
SNP loci. An SNP, chromosome-wise significance, and genome-wide significance
level referred to when the raw P-value was equal to or lower than 0.05/N (N is the
number of SNP loci analyzed in the research). Visualization of the correlation data in
quantile-quantile plots and Manhattan plots are analyzed by SNPEVG software (Wang
et al., 2012).
6.3. Genome-wide association studies in cattle
In dairy cattle, the accuracy of genomic prediction goes forward to 0.7
for somatic cell count, longevity, and fertility and 0.8 for economical
production traits (Wiggans et al., 2011; Lund et al., 2011; Meuwissen et al.,
2016). Nevertheless, the accuracy of genomic predictions in beef cattle is 0.3
to 0.7, which is lower than in dairy cattle (Van Eenennaam et al., 2014).
Researchers have carried out many GWAS and reported markers associated
with quantitative characters in cattle (Purfield et al., 2019a; 2019b; Keogh et
al., 2021). Keogh et al. (2021) identified two SNPs such as rs110344317 and
rs110240246, located on the genomic regions of the MSTN and LCORL genes,
respectively, in Limousin and Charolais breeds, related to live-weight, carcass
weight, and cull-cow weight. Buzanskas et al. (2014) have found that ten SNPs
were significantly related to long-yearling weight, weaning weight, and birth
weight in M.A. (Charolais X Canchim X Zebu) and Canchim cattle using
105 | SUSTAINABLE AGRICULTURE LEADS TO ZERO HUNGER
GWAS. In this study, they revealed an SNP rs43421095, which is within the
dipeptidyl-peptidase 6 (DPP6) gene, was significantly related to birth weight
trait. Also, on BTA 4, an SNP rs43421095, which has a pleiotropic effect, was
found to correlate with birth weight and weaning weight traits. An SNP
rs29011435, close to the MARCH3 and LMNB1 genes, was significantly related
to the long-yearling weight trait.
Pedrosa et al. (2021) have revealed many genes associated with milk
traits such as; TMEM160, SAE1, ARHGAP35, ZC3H4, NPAS1, ZMIZ1, LDB2,
ABI3, PPIF, SERPINB9 and SERPINB6 for lactation persistency; SPIDR,
GABRA2, ZNF131, NIM1K, DCHS1 and GABRG1 for milk yield; EXT2,
OLFML2A, ETV6, GOT1, POLD1 and NR6A1 for fat gain; the KCN gene
family, LRRC26 and DPP6 for fat percentage; ODAM, CDC14A, HSTN and
RTCA for protein yield; and LALBA, HERC3, CCL28, HERC5 and NEURL1
for protein percentage in North American Holstein cattle using GWAS.
Prakapenka et al. (2021) have reported that inter-chromosome epistasis effects
of milk fat percentage are related to the Chr14 region, including the DGAT1
gene, which has the regulatory role for Chr14 in Holstein cattle. MEPE, PKD2,
HERC3, SPP1, ABCG2, IBSP, CSN1S2, ODAM, CSN1S1, CSN2, and
LOC526979 genes have the crucial effects on intra-chromosome epistasis of
milk protein percentage in this breed. They have found that the SLC4A4-GC-
NPFFR2 gene region significantly affects protein and milk yields.
Ilie et al. (2021) reported an SNP rs110749552 located within the HERC3
gene correlated with somatic cell score in Romanian Brown and Romanian
Spotted cattle breeds. The population structure is shown as pairwise scatter
plots in Ilie et al. (2021)’s study and is shown in Fig. 2. Also, three genes such
as LUZP2, MEGF10, and AKAP8, were associated with somatic cell scores in
studied breeds. Nine SNPs that are located close to known genes CLHC1,
GATA6, SATB2, SPATA6, EPS8, COL12A1, IL12A, RAMAC, and ANKRD55
have been identified correlated with somatic cell scores in Romanian Brown
cattle; three SNPs that located to near the ZDHHC19, MMP7, and DAPK1
genes have been identified correlated with somatic cell score in Romanian
Spotted cattle.
Wolf et al. (2021) found sequence variants correlated with non-return
after 56 days, calving-to-first service interval, and three candidate genes as
ARHGAP21, ZNF462, and MARCH11 related to health and fertility in German
Black Pied cattle using GWAS due to whole-genome sequence data. They have
revealed five SNPs within the ARHGAP21 gene related to post-partum anestrus

SUSTAINABLE AGRICULTURE LEADS TO ZERO HUNGER | 106
trait in tropical beef cattle (Fortes et al., 2014) on BTA 13 or within a region
downstream of the gene correlated with the calving-to-first service interval.
Figure 2. Population structure from the PCA (principal component analysis) of the
SNPs and Romanian Brown, Romanian Spotted cattle (Ilie et al., 2021).
Also, they reported that CLDN8 and RBFOX1 genes are the potential
candidate genes correlated with somatic cell scores in this breed. Santana et al.
(2015) have defined thirty significant SNPs on chromosomes 2, 8, 12, and 17
and many genes such as DMRT2, LNX2, IFFO2, TRNAG-CCC, and MTIF3
correlated with residual body weight gain in Nellore cattle breed using GWAS.
Braz et al. (2021) have revealed that ecoregion-specific G × E SNPs might play
an essential role in the adaptation and resilience of beef cattle to different
environments. Ecoregion-specific genomic predictions should be generated to
define livestock best adapted for divergent backgrounds.
6.4. Genome-wide association studies in sheep
Many GWAS for quantitative characters in sheep have been carried out
in the last decades and successfully revealed various genetic markers (Demars
et al., 2013; Gholizadeh et al., 2014; Benavides and Souza, 2018; Calvo et al.,
2021). Gholizadeh and Esmaeili-Fard (2022) have found 29 significant
relations for litter size by meta-analysis of GWAS in six sheep breeds. The

107 | SUSTAINABLE AGRICULTURE LEADS TO ZERO HUNGER
result of protein-protein interaction analysis could determine hub genes like
GRIA2, PLCB1, RPTOR, CASK, and PLCB4 that have an essential role in cell
growth, cell adhesion, and cell proliferation, and autophagy pathways. Also,
they confirmed the role of the BMPR1B gene in prolificacy traits with GWAS
analysis. Besides that, they defined that some SNPs dispersed on chromosomes
express various genetic backgrounds underlying mutations of prolific traits in
each breed. In another study, Demars et al. (2013) have determined a region
around the BMP15 gene located on chromosome X and revealed two non-
conservative variations called FecXGR and FecXO related to ovulation rate and
litter size in the two sheep breeds. Gholizadeh et al. (2014) defined some SNPs
(within the DYNC2H1 gene) on chromosomes 10 and 15 as related to litter size
in Baluchi sheep breed with GWAS analysis. Benavides and Souza (2018) have
found a causal SNP related to the GDF9 gene variation in the Vacaria sheep
population.
Smołucha et al. (2021) identified a causal SNP in the EPHA6 gene
connected to litter size in the Polish Mountain sheep breed using genome-wide
association analysis. Esmaeili-Fard et al. (2021) have defined NTRK2 as a novel
gene related to litter size in the Baluchi sheep breed. Xu et al. (2018) reported
that candidate genes such as MMP2, FBN1, BMPR1B, SPP1, FLI1, and
MMP15 related to litter size in low and high prolific sheep breeds with GWAS.
Calvo et al. (2021) have found that the FecXGR allele has genome-wide
significance related to prolificacy trait in Spain's Rasa Aragonesa sheep breed.
They also defined a novel SNP in the second exon region of the BMP15 gene
called FecXRA (c.1172C > T) that caused an amino acid change from threonine
to isoleucine (T400I). They have revealed the significantly altered prolificacy
of 0.52 ± 0.05, 0.42 ± 0.05, and 0.32 ± 0.01 in FecXGR, FecXRA, and FecXR
heterozygous ewes.
Sutera et al. (2019) have found nine SNPs correlated with milk
production characters in Italy's Valle del Belice sheep breed. They have
revealed that rs398340969, within the DCPS gene, was related to protein and
milk yield. Also, the rs425417915 and rs417079368, located within the TTC7B
gene and the SUCNR1 gene, respectively, were related to fat percentage and
protein percentage, as shown in Fig. 3. In another study, Marina et al. (2021)
have investigated the milk traits such as milk yield, protein yield, fat yield, fat
percentage, protein percentage, and milk somatic cell count and also cheese-
making properties such as rennet clotting time, cheese yield, dried curd yield,
curd firmness curd-firming time and individual laboratory cheese yield in
Churra and Assaf sheep breeds. They have found that PTHLH and LALBA

SUSTAINABLE AGRICULTURE LEADS TO ZERO HUNGER | 108
genes were associated with the protein percentage and individual laboratory
cheese yield traits in the Churra breed. In the Asaf breed, the SLC2A2 gene and
the SCUBE2 and NRP1 genes were related to the milk and cheese-making traits.
Figure 3. Manhattan plots of GWA analysis milk production characters and SNPs in
Valle del Belice sheep (Sutera et al., 2019).
Ghasemi et al. (2019) have reported that the three significant SNPs
located on chromosome 1 as rs423491318, which is close to a member of the
RAS oncogene family (RAB6B) gene, rs405981386, which is close to
serotransferrin (Tf) and rs421198841 which is within the GRB10 interacting
GYF protein 2 (GIGYF2) correlated with birth weight in Lori-Bakhtiari sheep
breed of Iran. Similarly, Zhang et al. (2013) have found five candidate genes
(RIPK2, MEF2B, RFXANK, TRHDE, and CAMKMT) related to post-weaning
gain in sheep by GWAS. They also reported six genes (SMC2, GRM1, MBD5,
POL, RPL7, and UBR2) that affect the post-weaning gain trait.

109 | SUSTAINABLE AGRICULTURE LEADS TO ZERO HUNGER
6.5. Genome-wide association studies in goats
Several recent studies have been carried out with quantitative traits in
goats using GWAS and successfully revealed various genetic markers
(Scholtens et al., 2020; Islam et al., 2020; Gu et al., 2022). Gu et al. (2022) have
found that the fifty-three significant SNPs and forty-two candidate genes (such
as PSTPIP2, CCL19, C7orf57, SIPA1L, FIGN, SGCG, and FGF9) correlated
with body conformation traits using GWAS of Dazu black goats which is a
Chinese meat goat breed. They have reported that forty SNPs within or close to
twenty-eight genes (UBAP1, RPP25L, CNTFR, CCL19, TLR4, CCL21,
BRINP1, FGF9, CDK5RAP2, and SGCG) which are located on chromosome 8
and 12 associated with cannon circumference from whole-genome sequencing
data. Also, they have found eleven significant SNPs (SUN3, MANEA, C7orf57,
ENSCHIG00000020259, CBLN4, DOK5, ENSCHIG00000022146,
ENSCHIG00000008494, CDH9, CDKAL1, EDEM1, and SOX4) within the
chromosomes 4, 20, and 22 correlated with chest depth, and it is shown in Fig.
4. Similarly, Zhang et al. (2021) reported twenty-one SNPs on MAPK3, LRP1B,
LDB2, et cetera. Genes were correlated with birth weight traits in Inner
Mongolia Cashmere goats.
Islam et al. (2020) have reported sixty-six genomic regions related to
reproduction traits in the Chinese Arbas Cashmere goat. They have identified
significant candidate genes as KISS1, WNT10B, KHDRBS2, PPP3CA, and
SETDB2 genes related to fecundity traits. Nazari-Ghadikolaei et al. (2018) have
revealed the significant correlations with coat color close to or within the RALY,
ASIP, ITCH, and AHCY genes located on chromosome 13 for brown and black
coat color and the PDGFRA and KIT genes located on chromosome 6 for white
coat color in Iranian Markhoz goat by GWAS. They also found important
candidate genes such as POU1F1 associated with mohair quality, MREG
correlated with mohair volume, DUOX1 related to yearling fleece weight, and
ADGRV1 associated with grease percentage. Similarly, Martin et al. (2017)
have reported a significant SNP located on chromosome 13 within the ASIP
gene, which is related to coat color trait in the French Saanen goat breed.
Scholtens et al. (2020) have revealed that forty-three SNPs located on
chromosomes 19 and 29 are correlated with somatic cell score, fat, protein, and
lactation milk yield in New Zealand dairy goats (Alpine, Nubian, Saanen,
Toggenburg) using GWAS. The two SNPs located in the intron of the ASGR2
gene were correlated with four milk traits using GWAS. Other SNPs within the
intron of the DLG4 gene and close to downstream of the ELP5 gene were
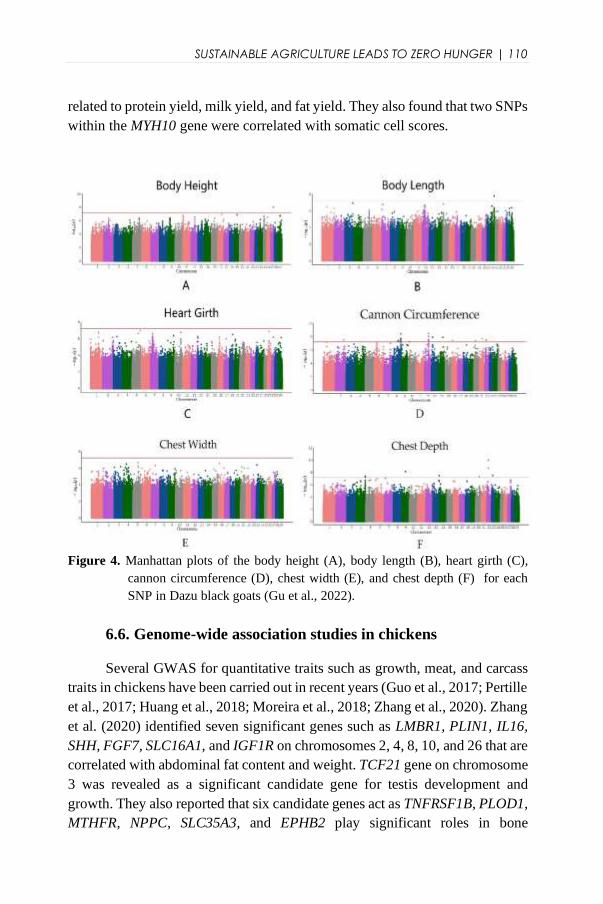
SUSTAINABLE AGRICULTURE LEADS TO ZERO HUNGER | 110
related to protein yield, milk yield, and fat yield. They also found that two SNPs
within the MYH10 gene were correlated with somatic cell scores.
Figure 4. Manhattan plots of the body height (A), body length (B), heart girth (C),
cannon circumference (D), chest width (E), and chest depth (F) for each
SNP in Dazu black goats (Gu et al., 2022).
6.6. Genome-wide association studies in chickens
Several GWAS for quantitative traits such as growth, meat, and carcass
traits in chickens have been carried out in recent years (Guo et al., 2017; Pertille
et al., 2017; Huang et al., 2018; Moreira et al., 2018; Zhang et al., 2020). Zhang
et al. (2020) identified seven significant genes such as LMBR1, PLIN1, IL16,
SHH, FGF7, SLC16A1, and IGF1R on chromosomes 2, 4, 8, 10, and 26 that are
correlated with abdominal fat content and weight. TCF21 gene on chromosome
3 was revealed as a significant candidate gene for testis development and
growth. They also reported that six candidate genes act as TNFRSF1B, PLOD1,
MTHFR, NPPC, SLC35A3, and EPHB2 play significant roles in bone

111 | SUSTAINABLE AGRICULTURE LEADS TO ZERO HUNGER
development. In another study, Gu et al. (2011) identified twenty-six SNPs
related to body weight traits by GWAS in chicken. They have found that for
late growth for weeks 7–12, the GGA4 region of chicken chromosome 4 had
many significant SNP effects, and in this region, the LDB2 gene had a
significant correlation with body weight (7–12 weeks) and with average daily
gain (6–12 weeks).
Table 1. Significant SNPs were identified for studied traits in the Russian White
chickens (Kudinov et al., 2019)
Trait SNP Position (bp) Candidate / nearest
genes
day-old chick-
down color
rs314384321 123,194,966 SLC7A13
rs15150566 122,907,241 RALYL
rs15151359 124,071,457 MMP16
rs16116752 119,793,622 ZFHX4
rs14243963 122,016,783 IMPA1
rs16455118 91,252,525 DYSF
rs317256404 12,113,970 PLEKHM3
rs16209462 556,300 SPPL2B
extraembryonic
fluid yield
rs13730111 121,679,302 ZNF704
rs316856766 123,425,663 CA2
rs15630281 1,302,350 PRKCD
rs315166929 1,006,316 LOC107054345
first egg age rs317931060 178,102,549 FGF9
body weight rs15619223 76,404,421 LCORL
egg weight
rs14201361 68,512,817 KIAA1468
rs14200974 68,304,144 PHLPP1
rs14439117 24,250,433 TLL1
Kudinov et al. (2019) have defined many SNPs close to genes associated
with day-old chick down the color, the yield of extraembryonic fluid, age at
first egg, body weight, and egg weight traits in Russian White chickens by
GWAS, and it is shown in Table 1. In broilers, Moreira et al. (2018) identified
twenty-two QTLs for carcass fat content and abdominal fat traits, and INSR,
CHST11, GPD2, and NR4A2 genes were correlated with fat deposition.
Li et al. (2018) have reported that the GGA1 gene region (170Mb) is a
significant region for small intestine lengths. Four SNPs rs313207223 within
the RB1 gene, which is a negative regulator of cell proliferation, rs312737959
within the CKAP2 gene, which is a marker for proliferation and rs312771221,

SUSTAINABLE AGRICULTURE LEADS TO ZERO HUNGER | 112
rs15494052 within the SIAH3 gene, which is a regulator of multicellular
organism development were associated with small intestine lengths.
Habimana et al. (2021) have found that four significant SNPs
rs14123335, rs314702374, rs13792572, and rs74098018 near PBX1, MRM1,
GPATCH1, and MPHOSPH6 genes located on chromosomes 19, 11, and 8
significantly correlated with body weight in Rwanda indigenous chicken by
GWAS and it is shown in Fig. 5. Also, four SNPs as rs13910430, rs737507850
rs314787954, and rs13623466 close to zinc finger, ZBED1, CDC16, GRB2,
GRAP2, and MX1 genes on chromosome 1 were significantly associated with
Rwanda indigenous chicken’s antibody response to Newcastle disease.
Figure 5. A Manhattan plot for significant SNPs correlated with body weight in
Rwanda indigenous chicken (Habimana et al., 2021).
In another study, Dou et al. (2022) have found 113 QTNs and genes such
as ACTA1, TAPT1, IGF2BP1, LDB2, TGFBR2, PRKCA, GLI3, INHBA,
SLC16A7, BAMBI, GPR39, APCDD1, and GATA4 were associated with
growth traits in broilers. Similarly, Mebratie et al. (2019) reported eleven QTL
and twenty-one SNPs correlated with body weight traits in commercial broiler
chicken. Five QTL and SNPs were reported related to feeding efficiency traits
by GWAS. They revealed that SNP, rs14042911 is within chromosome 12 in
the PTPRG gene, pertaining to body weight (BW36 days). Also, SNPs
rs16617885 and rs14073523 within the CACNA1H gene correlated with BW36.
They have found that the KDM6A gene is a candidate gene linked to feeding
intake traits. In Chinese Yancheng chickens, Jin et al. (2015) have reported that

113 | SUSTAINABLE AGRICULTURE LEADS TO ZERO HUNGER
the four genes, such as GLI3, FAM184B, MIR15A, and KCNIP4, were closely
correlated with body weight.
6.7. Conclusion
Many genome-wide association studies for quantitative traits have been
performed in livestock species. These studies aimed to increase the accuracy of
prediction for economic traits. The prediction can increase with the use of high-
density SNPs for the QTL, and if the cost of DNA testing continues to fall, it
will be more efficient to generate larger reference populations for using
genomic selection. Genomic selection has many advantages for QTL that are
hard to select for traditionally. The improvements in the technology in this field
may also decrease the costs of genotyping and phenotyping economical traits
in livestock and may increase the use of genomic selection in livestock.

SUSTAINABLE AGRICULTURE LEADS TO ZERO HUNGER | 114
References
Aulchenko, Y.S., Ripke S., Isaacs, A., & van Duijn, C.M. (2007). GenABEL: an R
package for genome-wide association analysis. Bioinformatics, 23(10), 1294-6.
https://doi.org/10.1093/bioinformatics/btm108
Benavides, M.V., & Souza, H. (2018). How efficiently Genome-Wide Association
Studies (GWAS) identify prolificity-determining genes in sheep. Genetics and
Molecular Research, 17(2), gmr16039909.
https://doi.org/10.4238/gmr16039909
Braz, C.U., Rowan, T.N., Schnabel, R.D., & Decker J. (2021). Genome-wide
association analyses identify genotype-by-environment interactions of growth
traits in Simmental cattle. Scientific Reports, 11, 13335.
https://doi.org/10.1038/s41598-021-92455-x
Buzanskas, M.E., Grossi, D.A., Ventura, R.V., Schenkel, F.S., Sargolzaei, M.,
Meirelles, S.L., & Munari, D.P. (2014). Genome-wide association for growth
traits in Canchim beef cattle. PLoS One, 14, 9(4), e94802.
https://doi.org/10.1371/journal.pone.0094802
Chang, C.C., Chow, C.C., Tellier, L.C., Vattikuti, S., Purcell, S.M., & Lee, J.J. (2015).
Second-generation PLINK: rising to the challenge of larger and richer datasets.
GigaScience, 4, 7. https://doi.org/10.1186/s13742-015-0047-8.
Calvo, J.H., Chantepie, L., Serrano, M., Sarto, M.P., Iguacel, L.P., Jimenez, M.A., &
Lahoz, B. (2020). A new allele in the BMP15 gene (FecXRA) that affects
prolificacy co-segregates with FecXR and FecXGR in Rasa aragonesa sheep.
Theriogenology, 144, 107e11.
https://doi.org/10.1016/j.theriogenology.2020.01.010
Dekkers, J.C.M. (2004). Commercial application of marker- and gene-assisted
selection in livestock: strategies and lessons. Journal of Animal Science, 82,
313–328. http://dx.doi.org/10.2527/2004.8213_supplE313x
Demars, J., Fabre, S., Sarry, J., Rossetti, R., Gilbert, H., & Persani, L. (2013). Genome-
wide association studies identify two novel BMP15 mutations responsible for
an atypical hyperprolificacy phenotype in sheep. PLoS Genetics, 9, e1003482.
https://doi.org/10.1371/journal.pgen.1003482
Dou, D., Shen, L., Zhou, J., Cao, Z., Luan, P., Li, Y., & Zhang, H. (2022). Genome-
wide association studies for growth traits in broilers. BMC Genom Data, 23, 1.
https://doi.org/10.1186/s12863-021-01017-7
Esmaeili-Fard, S.M., Gholizadeh, M., Hafezian, S.H., & Abdollahi-Arpanahi, R.
(2021). Genome-wide association study and pathway analysis identify NTRK2
as a novel candidate gene for litter size in sheep. PLoS One, 16, e0244408.
https://doi.org/10.1371/journal.pone.0244408
Fortes, M.R.S., Suhaimi, A.H.M.S., Porto-Neto, L.R., McWilliam, S.M., Flatscher-
Bader, T., Moore, S.S., … & Snelling, W.M. (2014). Post-partum anoestrus in
tropical beef cattle: A systems approach combining gene expression and

115 | SUSTAINABLE AGRICULTURE LEADS TO ZERO HUNGER
genome-wide association results. Livestock Science, 166, 158–166.
http://dx.doi.org/10.1016/j.livsci.2014.06.017
Ghasemi, M., Zamani, P., Vatankhah, M., & Abdoli, R. (2019). Genome-wide
association study of birth weight in sheep. Animal, 13, 9, 1797-1803,
https://doi.org/10.1017/S1751731118003610.
Gholizadeh, M., & Esmaeili-Fard, S.M. (2022). Meta-analysis of genome-wide
association studies for litter size in sheep. Theriogenology, 180, 103-112.
https://doi.org/10.1016/j.theriogenology.2021.12.025.
Gholizadeh, M., Rahimi-Mianji, G., Nejati-Javaremi, A., De Koning, D.J., & Jonas, E.
(2014). Genome-wide association study to detect QTL for twinning rate in
Baluchi sheep. Journal of Genetics, 93:489e93. https://doi.org/10.1007/s12041-
014-0372-1
Goddard, M.E., & Hayes, B.J. (2009). Mapping genes for complex traits in domestic
animals and their use in breeding programmes. Nature Reviews Genetics, 10,
381–391. https://doi.org/10.1038/nrg2575
Goddard, M.E., Hayes, B.J., & Meuwissen, T.H.E. (2010). Genomic selection in
livestock populations. Genetics Research, 92, 413e21.
https://doi.org/10.1017/s0016672310000613
Goddard, M.E., Kemper, K.E., MacLeod, I.M., Chamberlain, A.J., & Hayes, B.J.
(2016). Genetics of complex traits: prediction of phenotype, identification of
causal polymorphisms and genetic architecture. Proceedings of the Royal
Society B: Biological Sciences, 283, 20160569.
https://doi.org/10.1098/rspb.2016.0569
Gökçek, E.Ö. (2020). Akuakültür türlerinin ıslahında aday genler, Tarım bilimleri ve
su ürünlerinde vizyonel çalışmalar II, Akademisyen Kitabevi, 19-30.
Gu, B., Sun, R., Fang, X., Zhang, J., Zhao, Z., Huang, D., … & Zhao, Y. (2022).
Genome-Wide Association Study of Body Conformation Traits by Whole
Genome Sequencing in Dazu Black Goats. Animals, 12, 548.
https://doi.org/10.3390/ani12050548
Gu, X., Feng, C., Ma, L., Song, C., Wang, Y., … & Li N. (2011). Genome-Wide
Association Study of Body Weight in Chicken F2 Resource Population. PLoS
ONE, 6, 7, e21872. https://doi.org/10.1371/journal.pone.0021872
Habimana, R., Ngeno, K., Okeno, T.O., Hirwa, C.D., Keambou Tiambo, C., & Yao,
N.K. (2021). Genome-Wide Association Study of Growth Performance and
Immune Response to Newcastle Disease Virus of Indigenous Chicken in
Rwanda. Frontiers in Genetics, 12, 723980,
https://doi.org/10.3389/fgene.2021.723980.
Ilie, D.E., Mizeranschi, A.E., Mihali, C.V., Neamț, R.I., Goilean, G.V., Georgescu,
O.I., … & Huțu, I. (2021). Genome-Wide Association Studies for Milk Somatic
Cell Score in Romanian Dairy Cattle. Genes, 12, 1495.
https://doi.org/10.3390/genes12101495

SUSTAINABLE AGRICULTURE LEADS TO ZERO HUNGER | 116
Islam, R., Liu, X., Gebreselassie, G., Abied, A., Ma Q., & Ma Y., (2020). Genome-
wide association analysis reveals the genetic locus for high reproduction trait in
Chinese Arbas Cashmere goat. Genes & Genomics, 42, 893–899.
https://doi.org/10.1007/s13258-020-00937-5
Jin, C.F., Chen, Y.J., Yang, Z.Q., Shi, K., & Chen, C.K. (2015). A genome-wide
association study of growth trait-related single nucleotide polymorphisms in
Chinese Yancheng chickens. Genetics and Molecular Research, 14, 4, 15783-
15792. https://doi.org/10.4238/2015.december.1.30
Keogh, K., Carthy, T.R., McClure, M.C., Waters, S.M., & Kenny, D.A. (2021).
Genome-wide association study of economically important traits in Charolais
and Limousin beef cows, Animal, 15, 1, 100011,
https://doi.org/10.1016/j.animal.2020.100011.
Kudinov, A.A., Dementieva, N.V., Mitrofanova, O.V., Stanishevskaya, O.I., Fedorova,
E.S., Larkina, T.A., … & Romanov, M.N. (2019). Genome-wide association
studies targeting the yield of extraembryonic fluid and production traits in
Russian White chickens. BMC Genomics, 20, 270.
https://doi.org/10.1186/s12864-019-5605-5
Li, S., Wang, X., Qu, L., Dou, T., Ma, M., Shen, M. & Wang, K.H. (2018). Genome-
wide association studies for small intestine length in an F2 population of
chickens. Italian Journal of Animal Science, 17, 2, 294-300,
https://doi.org/10.1080/1828051X.2017.1368419
Marina, H., Pelayo, R., Suárez-Vega, A., Gutiérrez-Gil, B., Esteban-Blanco, C., &
Arranz, J.J. (2021). Genome-wide association studies (GWAS) and post-GWAS
analyses for technological traits in Assaf and Churra dairy breeds. Journal of
Dairy Science, 104, 11, 11850-11866. https://doi.org/10.3168/jds.2021-20510.
Martin, P.M., Palhière, I., Ricard, A., Tosser-Klopp, G., Rupp, R. (2017). Genome-
Wide Association Study Identifies New Loci Associated with Undesired Coat
Color Phenotypes in Saanen Goats. PLoS ONE, 12, 10, e0186029.
https://doi.org/10.1371/journal.pone.0186029
Mebratie, W., Reyer, H., Wimmers, K., Bovenhuis, H., & Jensen, J. (2019). Genome-
wide association study of body weight and feed efficiency traits in a commercial
broiler chicken population, a re-visitation. Scientivfic Reports, 9, 922.
https://doi.org/10.1038/s41598-018-37216-z
Meuwissen, T.H.E., Hayes, B.J., & Goddard, M.E. (2001). Prediction of total genetic
value using genome-wide dense marker maps. Genetics, 157, 1819e29.
Meuwissen, T., Hayes, B., & Goddard, M. (2016). Genomic selection: A paradigm shift
in animal breeding, Animal Frontiers, 6, 1, 6–14,
https://doi.org/10.2527/af.2016-0002
Moreira, G.C.M., Boschiero, C., Cesar, A.S.M., Reecy, J.M., Godoy, T.F., Pértille F.
& Coutinho L.L. (2018). Integration of genome-wide association studies and
whole-genome sequencing provides novel insights into fat deposition in

117 | SUSTAINABLE AGRICULTURE LEADS TO ZERO HUNGER
chicken. Scientific Reports, 8, 16222. https://doi.org/10.1038/s41598-018-
34364-0
Nazari-Ghadikolaei, A., Mehrabani-Yeganeh, H., Miarei-Aashtiani, S.R., Staiger, E.A.,
Rashidi, A. & Huson, H.J. (2018). Genome-Wide Association Studies Identify
Candidate Genes for Coat Color and Mohair Traits in the Iranian Markhoz Goat.
Frontiers in Genetics, 9, 105. https://doi.org/10.3389/fgene.2018.00105
Pedrosa, V.B., Schenkel, F.S., Chen, S.-Y., Oliveira, H.R., Casey, T.M., Melka, M.G.,
& Brito, L.F. (2021). Genomewide Association Analyses of Lactation
Persistency and Milk Production Traits in Holstein Cattle Based on Imputed
Whole-Genome Sequence Data. Genes, 12, 1830.
https://doi.org/10.3390/genes12111830
Prakapenka, D., Liang, Z., Jiang, J., Ma, L., & Da, Y. (2021). A Large-Scale Genome-
Wide Association Study of Epistasis Effects of Production Traits and Daughter
Pregnancy Rate in U.S. Holstein Cattle. Genes, 12, 1089.
https://doi.org/10.3390/genes12071089
Purfield, D.C., Evans, R.D., & Berry, D.P. (2019a). Reaffirmation of known major
genes and the identification of novel candidate genes associated with carcass-
related metrics based on whole-genome sequence within a large multi-breed
cattle population. BMC Genomics, 20, 720. https://doi.org/10.1186/s12864-019-
6071-9
Purfield, D.C., Evans, R.D., Carthy, T.R., & Berry, D.P. (2019b). Genomic regions
associated with gestation length detected using whole-genome sequence data
differ between dairy and beef cattle. Frontiers in Genetics, 10, 1068.
https://doi.org/10.3389/fgene.2019.01068
Santana, M.H.A., Gomes, R.C., Utsunomiya, Y.T., Neves, H.H.R., Novais, F.J., Bonin,
M.N., & Ferraz, J.B.S. (2015). Genome-wide association with residual body
weight gain in Bos indicus cattle. Genetics and Molecular Research, 14, 2,
5229-5233. https://doi.org/10.4238/2015.May.18.14
Scholtens, M., Jiang, A., Smith, A., Littlejohn, M., Lehnert, K., Snell, R. & Blair H.
(2020). Genome-wide association studies of lactation yields of milk, fat, protein,
and somatic cell score in New Zealand dairy goats. Journal of Animal Science
and Biotechnology, 11, 55. https://doi.org/10.1186/s40104-020-00453-2
Smołucha, G., Gurgul, A., Jasielczuk, I., Kawecka, A., & Miksza-Cybulska, A. (20219.
A genome-wide association study for prolificacy in three Polish sheep breeds.
Journal of Applied Genetics, 62, 323e6. https://doi.org/10.1007/s13353-021-
00615-6
Sutera, A.M., Riggio, V., Mastrangelo, S., Di Gerlando, R., Sardina, M.T., Pong-Wong,
R., … & Portolano, B. (2019). Genome-wide association studies for milk
production traits in Valle del Belice sheep using repeated measures. Animal
Genetics, 50, 311-314. https://doi.org/10.1111/age.12789

SUSTAINABLE AGRICULTURE LEADS TO ZERO HUNGER | 118
Wang, S., Dvorkin, D., & Da, Y. (2012). SNPEVG: a graphical tool for GWAS
graphing with mouse clicks. BMC Bioinformatics, 13, 319.
https://doi.org/10.1186/1471-2105-13-319.
Van Eenennaam, A.L., Weigel, K.A., Young, A.E., Cleveland, M.A., & Dekkers J.C.
(2014). Applied animal genomics: Results from the field. Annual Review of
Animal Biosciences, 2, 105–139. https://doi.org/10.1146/annurev-animal-
022513-114119
Zhang, H., Shen, L.Y., Xu, Z.C., Kramer, L.M., Yu, J.Q., Zhang, X.Y., … & Li, H.
(2020). Haplotype-based genome-wide association studies for carcass and
growth traits in chicken. Poultry Science, 99(5): 2349-2361,
https://doi.org/10.1016/j.psj.2020.01.009.
Zhang, L, Liu, J., Zhao, F., Ren, H., Xu, L., Jian, L., … & Lixin, D. (2013) Genome-
Wide Association Studies for Growth and Meat Production Traits in Sheep.
PLoS ONE 8, 6, e66569. https://doi.org/10.1371/journal.pone.0066569
Zhang, L., Wang, F., Gao, G., Yan, X., Liu, H., Liu, Z & Su, R. (2021). Genome-Wide
Association Study of Body Weight Traits in Inner Mongolia Cashmere Goats.
Frontiers in Veterinary Science 8 752746. DOI: 10.3389/fvets.2021.752746
Brief Curriculum Vitae of Author
Assoc. Professor Dr. Raziye IŞIK, Faculty of Agriculture,
Department of Agricultural Biotechnology, Tekirdağ
Namık Kemal University, Tekirdağ, Turkey, Faculdade
de Medicina Veterinária - Câmpus de Araçatuba - FMVA/
Unesp, São Paulo State University, Brasil.
[email protected]. Orcid ID:
https://orcid.org/0000-0003-2982-6562. Researcher id: V-4030-2017,
Scopus ID: 57200696504. Her expertise is Genetic and Breeding. Along with
her career, She published 20 papers in International journals as full text, 25
articles in International proceedings, 15 national proceedings, and six books
and chapters. A total of 66 scientific masterpieces have been made.

119 | SUSTAINABLE AGRICULTURE LEADS TO ZERO HUNGER
CHAPTER 7
WORTH AND NUTRITIOUS BANANA
PSEUDOSTEM’S WASTE LEADS TO ZERO HUNGER
Ristina Siti SUNDARI1,2*, Rilla Tresnadola TARIGAN3, Rizky Adi
Nugraha TARIGAN4, Ai Kusmiati ASYIAH5
1 Agribusiness Department, Faculty of Agriculture, University of Perjuangan
Tasikmalaya, Jl. PETA No. 177 Tasikmalaya 46115 Indonesia 2Agricultural Sciences, Faculty of Agriculture, Univarsitas Padjadjaran, Jl.
Bandung Sumedang km 24, Jatinangor, Sumedang, Indonesia 3Food Technology Department, Faculty of Technology, Pasundan University,
Jl. Setiabudhi, Bandung Indonesia 4Agrotechnology Department, Faculty of Agriculture, University of Siliwangi,
Jl. Siliwangi No. 24, Tasikmalaya 46115 Indonesia 5Management and Business Department, Faculty of Economy, University of
Perjuangan Tasikmalaya, Jl. PETA No. 177 Tasikmalaya 46115 Indonesia
*Corresponding Author: [email protected]

SUSTAINABLE AGRICULTURE LEADS TO ZERO HUNGER | 120

121 | SUSTAINABLE AGRICULTURE LEADS TO ZERO HUNGER
7.1. Introduction
Many countries where banana trees can grow use bananas as a nutritious
fibre food and calm the nerves because they contain lots of potassium, folic acid,
and gelatin, which can be used as capsules. Despite this, it is still scarce to use the
banana pseudo-stem as food that can be used as food that can relieve hunger
because banana pseudostem is considered waste, something that is not valuable
and then often piles up into garbage. Whereas overseas, banana pseudostem is a
source of nutritious food with a high price, in Indonesia, it is still wasted. Indonesia
has a wealth of banana plants of more than 1000 edible cultivars (Dwivany et al.,
2021), 537 accessions of bananas, and 3042 clumps (Poerba et al., 2016).
The plant parts that can be used include leaves, fruit, heart, weevil, stem, or
often banana pseudostem. Bananas pseudostem produced are far more than the
bananas themselves and until now are still waste that has not been utilized
optimally. Before being used as a diversified food and feed material, the banana
tree trunk was made of rope, shade for planting, humidity, art, paper, and textiles,
and could be decomposed into compost, liquid fertilizer, and others. The high fiber
in bananas can cleanse the digestive system, prevent kidney stones, control
stomach acidity, and help treat diabetics and anemia. (Devri et al., 2020,
Widyastuti, 2019).
Pseudostem Pisang contains steroid, triterpenoid, alkaloid, flavonoid,
tannin, dan saponin (Wibowo & Prasetyaningrum, 2015), and the nutritional
composition it contains are water (92.50%), crude protein (0.35%), carbohydrates
(4.60%), and rich in minerals such as calcium 122 mg, phosphorus 135 mg, iron
0.70 mg, potassium 213 mg, (Devri et al., 2020) and (Dhalika, T., Budiman &
Ayuningsih, B., 2011). Banana pseudostem has unique nutritional composition and
secondary metabolites contained in banana stems. So this community service is
carried out to increase the repertoire of knowledge, skills, and technology in
making the most of the banana stem, especially for fulfilling family nutrition to
achieve SDGs 1 and 2 and to be an inspiration for the business.

SUSTAINABLE AGRICULTURE LEADS TO ZERO HUNGER | 122
7.2. Material and Method
Utilization of Banana Pseudo-Stem Waste into Nutritious
Food
The activity begins with a pretest on understanding the banana pseudostem.
Then counseling on the importance of family food security, the ins and outs of the
banana pseudostem, the benefits of the banana pseudostem, and recognizing the
types of banana pseudostem that are good for processing into the food
diversification products. This diversification of food made from banana
pseudostem will be processed into urap/salad, curry, and chips. All raw and
complementary materials are taken from urban farming activities, so almost all of
them are available in the yard.
Figure 1. Banana Plant and Pseudostem
1. Pseudostem Crispy
About 12 pieces of banana pseudostem weigh about 1 kg after slicing.
Ingredients for marinade: Water, Salt to taste, and whiting. Ingredients for
marinating: mushroom broth or chicken stock or beef stock, Salt, Water, Pepper,
and Baking soda. The ingredients for coating are wheat flour, tapioca flour, rice
flour, instant crispy seasoning flour (if any), powdered broth, and salt. When

123 | SUSTAINABLE AGRICULTURE LEADS TO ZERO HUNGER
finished, you can add seasoning toppings, such as seasoning flour, topping with
roasted corn flavor, cheese flavor, roast beef flavor, Balado flavor, and others.
Implementation: Prepare water to soak the sliced banana pseudostem. Add
water whiting solution and salt. Stir evenly and set aside. Then take a banana tree
about of a tree down (we will make the rest for animal feed), which is about 1.5–
2.0 m long, and cut it into 3-4 pieces so that it is not too long. The outermost layer
of the banana pseudostem is not used. The banana pseudostem used is layer 3 to
layer three from the center. The middle one is used as a curry ingredient.
Figure 2. Raw matter of Banana Pseudostem for Crispy
Take a piece of banana pseudostem, peel both sides, and take the middle part, which is in
the form of a grid. Then cut according to taste or lengthwise about 3-4 cm. The outside of
the banana pseudostem is peeled by adjusting it using a sharp knife so that the inner sheet
of the banana pseudostem is seen in the form of checkered net fibers like the texture of
Taro.
Then cut into pieces according to taste for practice; here, it is 3 x 5 cm. Put
it directly into the soaking water immediately after it is cut so that the black sap
does not come out. Set the rest until the available materials are used up. After
soaking, wash thoroughly with running water. Wash gently, so the texture does not
crumble until it is free from whiting and the water becomes clear. Then squeeze
and drain.
Furthermore, it is marinated by mixing all the ingredients of the banana
pseudostem that have been squeezed earlier and stirring gently. Let stand until the

SUSTAINABLE AGRICULTURE LEADS TO ZERO HUNGER | 124
flavors infuse for about 30 minutes. While waiting, prepare the flour coating for
the chips. Then mix it evenly on the sliced banana pseudostem. Set aside. After
being marinated, separate the sliced banana pseudostem from the marinated water,
drain and squeeze it until it is rough along the lengthwise direction to keep the
texture intact and from clumping together. Drain.
Figure 3. Raw matter of Banana Pseudostem for Crispy (marinated in lime clam)
Figure 4. Sliced Banana Pseudostem for Crispy

125 | SUSTAINABLE AGRICULTURE LEADS TO ZERO HUNGER
Prepare cooking oil and heat it. Then roll each piece of banana pseudostem
in the flour coating so that it separates and does not stick. All the banana chunks
are stirred until they are coated with flour. Then fry in hot oil on medium heat.
Once the chips are stiff, transfer to medium or low heat so the oil does not clump
or settle down. When the banana chips are almost ripe or look golden white, turn
up the heat again. Then fry on high heat for about 1-2 minutes at the last minute.
Then lift and drain.
2. Spicy Curry of Banana Pseudostem
The banana pseudostem in the process of making curry is as follows:
Condiment prepared is one pcs of star anise, three pcs of cardamom, five cloves of
flowers, three bay leaves, and three stalks of lemongrass. Seven large red chilies,
seven shallots, seven garlic cloves, 3 cm turmeric, 2 cm ginger, and 5 cm galangal
must blend. 100 ml beef broth, 100 ml coconut milk, 700 ml water, and vegetable
oil for frying. Raw matter of 05. kg banana pseudostem center (the soft part in
banana pseudostem) is cut 3 cm in length.
Figure 5. Raw matter of Banana Pseudostem for Curry

SUSTAINABLE AGRICULTURE LEADS TO ZERO HUNGER | 126
Step by step, making banana pseudostem curry is straightforward, from
sauteing the ground spices until fragrant. Enter the condiment salam, lemon grass,
flower lawing, cardamom, and cloves until everything is soft and the smell of curry
can be smelled. Then add the banana pseudostem, stir until slightly soft, and add
the beef broth and coconut milk. Stir again until the banana pseudostem is cooked.
Remove and serve on a container to be ready to eat as complete nutritional food
without expensive costs, avoiding malnutrition, food insecurity, and eradicating
poverty and hunger.
Figure 6. Cooking Banana Pseudostem Curry
2. Pseudostem Salad (Urap)
The ingredients for making banana pseudostem urap include banana
pseudostem, kecombrang, roay beans, bokor lettuce, chayote, mushroom broth,
candlenut, kencur, chili, cayenne and sizeable red chili, shrimp paste, garlic, onion,
grated coconut, sugar, and salt. All ingredients for a healthy lifestyle are delicious
without added flavoring. All the raw materials are sliced, and the spices are
mashed. The grated coconut is roasted until it is brownish yellow. Add the blended
spices, mix well, add sugar and salt, mix well, and Enter. Stir until cooked, then

127 | SUSTAINABLE AGRICULTURE LEADS TO ZERO HUNGER
add other vegetables in the yard, namely bokor lettuce, pumpkin, and torch ginger
(Etlingera elatior). The ingredients for making banana pseudostem curry include
banana pseudostem. The middle part is cut into 4 cm, mushroom broth, onion,
garlic, chili, candlenut, cardamom, flower lawing, candlenut, coconut milk,
turmeric, and ginger. The crushed spices are galangal, lemongrass, and kaffir lime
leaves.
Figure 7. Raw Matter Banana Pseudostem for Salad (Urap) and Grated Coconut
Figure 8. Processing Condiments and Spices of Salad (Urap)

SUSTAINABLE AGRICULTURE LEADS TO ZERO HUNGER | 128
The mashed spices are sauteed until fragrant. Add lemongrass, kaffir lime
leaves, galangal, sugar, and salt; give coconut milk and enough water; stir until it
blends with the spices, add the banana pseudostem and stir until cooked.
Pseudostem banana curry is ready to be served.
7.3. Discussion
Many people do not know that banana stem waste can help humans escape
hunger. They know that banana plants can only be used for their fruit to eat. The
rest is garbage to be thrown away. KWT partners Mekar Sari and Harum Manis
were enthusiastic about the results in community service activities. The previous
partners had never used banana gizzards for food. In addition, some asked about
the toxic content in banana pseudostem because they were worried that the partner
had never processed banana pseudostem. At times like this pandemic, food
diversification with food processing (Azis et al., 2019) especially neglected local
food sources, is very important. Food diversification will strengthen household
food security (Food Sovereignty as a Base for Realizing National Food Security,
2016), especially with abundant raw materials in Indonesia, such as banana plants.
Processing such as making urap (salad), curry, and chips will lead to
additional use-value, economic value (Sundari et al., 2017), and higher consumer
preferences (Sundari et al., 2018; Sundari, Umbara, et al., 2019; Sundari &
Umbara, 2019), as well as partners, provide positive attitudes and behaviors
(Sundari et al., 2020; Sundari, Fitriadi, et al., 2019) towards this diversification of
food made from banana pseudostem. This food diversification will benefit if a
value-added analysis is carried out (Syaputra et al., 2014). Utilizing technology
according to people's tastes, situations, and conditions through processing and
other resources will be very profitable (Kotler, 2013, 2011, 2012a, 2012b; Kotler
& Keller, 2016).
In making chips, the function of soaking in salt water is to remove toxins
from the banana pseudostem, while the content of the betel solution is to remove
the sap, thereby eliminating the bitter and rough taste. In addition, the texture
becomes more robust with a savory taste so that it becomes mor-crunchy when
fried later. With the proper technique for managing the size of the fire, the Gebog
chips are not prone to being greasy. Gradually fry all that is left over. After frying,
if it has cooled a bit, you can put it in an oil draining machine to separate the banana
chips and the oil. Another way can be entered into the digital air fryer machine by
standing up. Put it in the water Fryer machine with a temperature of 180 0C, and

129 | SUSTAINABLE AGRICULTURE LEADS TO ZERO HUNGER
turn it on for about 5-7 minutes. That way, the results of the chips can be
dehydrated and free of oil.
Alternatively, use a low-temperature oven (130 °C) for about 20 minutes.
Another way, for an economical way, is to wrap it in large crackle plastic covered
with tissue or multi-layered HVS paper. Do not use newsprint or those with writing
on it. It is feared that the carbon will migrate to food that can harm health in the
long run. The crackle is tied tightly and then stored for at least 24 hours. That way,
the oil will usually be absorbed in the paper, so the chips can be rougher and not
quickly rancid.
Figure 1. Pretest and Postest Citizen Understanding about Banana Pseudostem
The processed salad (urap) is delicious; some even plan to cook banana
pseudostem for daily family consumption. As well as with banana pseudostem
curry, partners assess that it does not feel like eating banana pseudostem like eating
meat because it tastes good. The chips produced are also exciting and delicious.
Partners say these chips want to be used as a home-based snack business to earn
additional income. The results of the pretest and post-test evaluations of the
women's farmer groups of Mekar Sari and Harum Manis can be seen in the
following table.
The analysis results show differences in understanding and skills that are
very real before and after being given counseling, assistance, and the
implementation of processing banana pseudostem waste into various delicious
preparations full of nutrition. This service activity dramatically increases the
insight and skills of partners and can develop these products for Micro, Small, and
0
20
40
60
80
100
1 2 3 4 5 6 7 8 9 10 11 12 13 14 15 16 17 18 19 20 21 22 23 24 25 26 27 28 29 30
Grafik Başlığı
Pre-test Post Test

SUSTAINABLE AGRICULTURE LEADS TO ZERO HUNGER | 130
Medium Enterprises activities that will launch the wheels of the community's
economy and improve public welfare and health. There is a need for broader
socialization with other partners so that people can use the banana pseudostem in
addition to the fruit and leaves, which are known to be helpful as a daily meal full
of nutrition.
Figure 9. Salad (Urap) Pseudostem Dish
Figure 10. Pseudostem Curry

131 | SUSTAINABLE AGRICULTURE LEADS TO ZERO HUNGER
Figure 11. Pseudostem Crispy
7.4. Conclusion
Waste treatment that had been neglected for a long time turned out to
provide significant benefits for partners and the community in order to strengthen
the pillars of family food security, save household expenses, help protect the
environment, meet nutritional needs, empowering household, become
entrepreneurial or business opportunities.
7.5. Implication
Utilize the banana pseudostem, a food diversification program that can be
made to alleviate poverty, and food insecurity, fulfill family nutrition and
entrepreneurship. the policy should make by the authorities, which can be
disseminated to the public through the community and non-governmental
organizations for welfare. we are ready to extent

SUSTAINABLE AGRICULTURE LEADS TO ZERO HUNGER | 132
References
Azis, A., Safitri, E., Irmawati, & Suparmin. (2019). Pemberdayaan Masyarakat Berbasis
Ketahan Pangan melalui Pengolahan Abon dari Ikan Nila di Desa Pringarata
Kecamatan Pringarata Kabupaten Lombok Tengah. Jurnal Warta Desa, 1(1), 75–
79.
Devri, A. N., Santoso, H., & Muhfahroyin, M. (2020). Manfaat Batang Pisang Dan Ampas
Tahu Sebagai Pakan Konsentrat Ternak Sapi. Biolova, 1(1), 30–35.
https://doi.org/10.24127/biolova.v1i1.33
Dhalika, T., Budiman, A., & Ayuningsih, B., M. (2011). Nilai Nutrisi Batang Pisang dari
Produk Bioproses ( Ensilage ) Sebagai Ransum Lengkap ( Nutrition value of
Banana Pseudostem from Bioprecces Produt ( ensilage ) as A Complete Ration ).
Jurnal Ilmu Ternak, 11(1), 17–23.
Dwivany, F., Wikantika, K., Sutanto, A., Ghazali, F., Lim, C., & Kamalesha, G. (2021).
Pisang Indonesia. In Supply Chain Management (Issue September).
Johnson, R. B. (2015). Educational Research. February.
Kotler. (2013). Manajemen Pemasaran Jilid 2. In Penerbit Erlangga.
Kotler, P. (2011). Reinventing marketing to manage the environmental imperative. In
Journal of Marketing. https://doi.org/10.1509/jmkg.75.4.132
Kotler, P. (2012a). Kotler On Marketing. In Kotler On Marketing.
Kotler, P. (2012b). Marketing management/Philip Kotler, Kevin Lane Keller. Pearson
Education International.
Kotler, P., & Keller, K. L. (2016). A Framework for Marketing Management. In Marketing
Management.
Poerba, Y. S., Martanti, D., Handayani, T., Herlina, & Witjaksono. (2016). Katalog Pisang-
Koleksi Kebun Plasma Nutfah Pisang. In Lembaga Ilmu Pengetahuan Indonesia
(Vol. 53, Issue 9).
Saepuloh, D., Sundari, R., S. Fitriadi, B., W. 2021. Nilai Tambah Baby Fish Ikan Were dan
Ikan Nilem sebagai Produk Pangan Fungsional. Jurnal Agrinika. 5(1):39-50.
Sundari, R. S., Fitriadi, B. W., Kusmayadi, A., Arshad, A., & Priyanto, Y. A. (2019).
Aplikasi Teknologi Pembuatan Abon Ikan Antioksidan Daun Jintan. Jurnal KUAT,
1(3), 181–185.
Sundari, R. S., Kusmayadi, A., & Umbara, D. S. (2017). Komparasi nilai Tambah
Agroindustri Abon Ikan Lele dan Ikan Patin di Tasikmalaya. Jurnal Pertanian
Agros, 19(1), 45–54.
Sundari, R. S., Tarigan, R. T., & Asyiah, A. K. (2022). Pseudostem Pisang, Limbah
Dibuang Sayang. Abdi Laksana Jurnal Pengabdian Kepada Masyarakat, 3(2), 235–
242. https://doi.org/10.32493/al-jpkm.v3i2.20292
Sundari, R. S., & Umbara, D. S. (2019). Preferensi Konsumen terhadap Produk
Agroindustri Abon Ikan. Mebis, 4(1), 36–43.
https://doi.org/https://doi.org/10.33005/mebis.

133 | SUSTAINABLE AGRICULTURE LEADS TO ZERO HUNGER
Sundari, R. S., Umbara, D. S., & Arshad, A. (2020). Perilaku Konsumen Terhadap
Keputusan Mengkonsumsi Produk Agroindustri Abon Ikan Lele Original. Mimbar
Agribisnis: Jurnal Pemikiran Masyarakat Ilmiah Berwawasan Agribisnis, 6(2),
833. https://doi.org/10.25157/ma.v6i2.3571
Sundari, R. S., Umbara, D. S., Fitriadi, B. W., & Sulaeman, M. (2019). Consumer
Preference on Catfishes ( Patin and Lele ) Sweetmeat Product. Journal of Physic:
Conf.Series, 1179. https://doi.org/10.1088/1742-6596/1179/1/012166
Sundari, R. S., Umbara, D. S., & Priyanto, Y. A. (2018). Is Catfish Shredded More
Preferable Than Beef In This Digital. The 2nd International Conference and Call
for Paper on Trade “Strategy and Innovation of Trade in the Dugital Economy
Age", 169–174. http://conference.kemendag.go.id/download.%0A
Kedaulatan Pangan sebagai Basis untuk Mewujudkan Ketahanan Pangan Nasional, 33
Forum penelitian Agro Ekonomi 95 (2016). https://doi.org/10.21082
/fae.v33n2.2015.95-109
Syaputra, E., Lubis, S. N., & Iskandarini. (2014). Analisis Nilai Tambah Produk Olahan
Bolu dan Brownies Rambutan. USU, 1–12. https://media.neliti.com/media
/publications/94703-ID-analisis-nilai-tambah-produk-olahan-bolu.pdf
Wibowo, F. . S., & Prasetyaningrum, E. (2015). Pemanfaatan Ekstrak Batang Tanaman
Pisang (Musa Paradisiacal) Sebagai Obat Antiacne Dalam Sediaan Gel Antiacne.
Publikasi Fakultas Farmasi, 12(1), 38–46
Widyastuti, PR. 2019. Biasa Diabaikan, Batang Pohon pisang Miliki 5 Manfaat Kesehatan,
Bisa obati Diabetes. (https://www.tribunnews.com/kesehatan/ 2019/03/31/biasa-
diabaikan-batang-pohon-pisang-miliki-5-manfaat-kesehatan-bisa-obati-
diabetes?page=3).
Brief Curriculum Vitae of Authors
Assoc. Prof. Ristina Siti Sundari, is a researcher and lecturer
in Department of Agribusiness, Agricultural Faculty
University of Perjuangan Tasikmalaya, and at Agricultual
science, University of Padjadjaran Bandung. Research interest
in Agricultural development, Environment, Climate change,
Urban Farming/Agriculture, Food science and Technology.
She is also an Editor in Chief in Indexed Jurnal Hexagro, a
journal in Agribusiness and Agricultural Development. She is a journal reviewer
in indexed international and national journal as well. She published 53
International (indexed of Scopus, WoS, SCI, SCIE) and national (indexed Sinta)
article..3 Book and book chapters, 2 Intelectual copy rights, 18 Conference Papers

SUSTAINABLE AGRICULTURE LEADS TO ZERO HUNGER | 134
(International Proceeding), 5 posters. https://scholar.google.
co.id/citations?user=HDXkQdAAAAAJ&hl=en ;
https://sinta3.kemdikbud.go.id/authors/profile/6105719; http://orcid.org/0000-
0002-5310-8520 ; https://publons.com/researcher/3920243/ristina-siti-sundari/
https://www.scopus.com/authid/detail.uri?authorId=57214594907;
https://www.researchgate.net/profile/Ristina-Sundari/research?ev=prf_act;
https://sinta.kemdikbud.go.id/authors/profile/6105719 ;
Web of Science Researcher ID AAZ-9469-2020.
Rilla Tresnadola Tarigan is a Master Student of Food
Technology Department, Faculty of Technology, University of
Pasundan Bandung, West Java, Indonesia. She is a Korean
Language Interpreter. She published at least 1 International
proceeding, National Journal and 1 International Book Chapter.
Link: https://www.researchgate.net/profile/Rilla-Tarigan,
Rizky Adi Nugraha Tarigan is an Undergraduate student of
Agrotechnology Department, Faculty of Agriculture, University
of Siliwangi Tasikmalaya, West Java, Indonesia. He published
at least 2 Indexed International Journal. 1 International
Conference Proceeding, https://orcid.org/0000-0002-6076-
1165, [email protected],
https://www.researchgate.net/profile/Rizky-Tarigan/research
https://www.scopus.com/authid/detail.uri?authorId=57657737300

135 | SUSTAINABLE AGRICULTURE LEADS TO ZERO HUNGER
CHAPTER 8
RICE STRAW COMPOST IN SUSTAINABLE
AGRICULTURE
Bahar SÖZÜBEK1*, Mergül ÖZTÜRK1
1TekirdağNamık Kemal University, Muratlı Vocational School of Higher
Education, Chemistry Technology Program, Tekirdağ, Turkey.
*Corresponding Author: [email protected]

SUSTAINABLE AGRICULTURE LEADS TO ZERO HUNGER | 136

137 | SUSTAINABLE AGRICULTURE LEADS TO ZERO HUNGER
8.1. Introduction
Rice which its cultivation has a history of more than thousands of years is
the most produced third cereal in the world after maize and wheat. It is one of the
major sources of human diet and has nearly 757 million tonnes of production in
164 million hectares in the world by 2020. Besides, total population of the world
was 7.4 billion in 2015 however; the projections show that it will be 16% more by
2030 (FAOSTAT, 2022). As a result of the increase in population, the requirement
of the world will be 50% more rice in 2030 with respect to that in 2015 while
nearly in 30% less arable land than now (Swaminathan, 2016) meaning more rice
straw will be generated after harvest.
According to the statistics, workers employed in agriculture is 26 % of the
total (UN, 2022) and the projection of the rural population ratio to the total will
decrease more than 6% by 2030 when compared to the data in 2015 (FAOSTAT,
2022) which means a potential decrease in the population of workers in agriculture
inspite of the increase in the quantity of rice and rice straw. An additional 100
million tonnes of rice is estimated that will be required by 2035 in the Asia-Pacific
region (Swaminathan, 2016). In this case, sustainable recycling management of
rice straw will be needed more.
Asia is the biggest producers of rice. As seen in Figure 1, top ten rice
producers are also in Asia with the average of 90 percent in overall between the
years 2015 and 2020. Nevertheless, undernourishment and sustainability problems
are still being reported. According to United Nations (UN) report on world hunger,
the largest number of undernourished people live in Asia even roughly 63% of
world’s hunger was in Asia in 2017 (WHO, 2019; UN, 2022). Among the
sustainable development goals of UN adopted by United Nations Members States
in 2015, Goal 2 (SDG2) on zero hunger and Goal 12 (SDG12) on responsible
consumption and production are directly related topics with undernourished
people, food loss and waste, sustainability in agriculture and use of resources
especially in rice growing regions of Asia.
Food losses starting with pre-harvest, harvest and post harvest includes
transport, storage and processing operations whereas retail and public consumption
is referred as food waste rather than food losses (Durán-Sandoval et al., 2021; Fabi
and English, 2019). Not only rice itself but also rice straw can be considered to be
wasted during the harvest and post harvest because there is a huge lack of recycling
or reuse of it. Rice straw is generally disposed of by burning in the field which
gives harm to the soil and its flora as well as causing air pollution via greenhouse
gas emissions (Singh et al., 2021; Rashad et al., 2010; Ratnakumar et al., 2019).

SUSTAINABLE AGRICULTURE LEADS TO ZERO HUNGER | 138
Figure 1. Top 10 producers of rice between the years 2015 and 2020. (FAOSTAT,
2022).
Surely, there are other management methods of rice straw except for
burning. Some of these are papermaking, animal bedding, livestock feed, energy
production, mushroom production, incorporation and mulching, composting and
using as construction material and composites (Sözübek and Öztürk, 2022).
Among these methods, utilization of rice straw by composting and turning it into
fertilizer is valuable in terms of recyling, reuse and reducing the straw waste, as
well as reducing greenhouse emissions caused by burning of the straws in the field.
8.2. Characteristic of Rice Straw
After rice harvesting, large quantities of rice straw remain in the field. The
quantity of rice straw is directly related to both the cutting height and the
production yield of rice that is also vary with the factors such as the type and
chemical properties of the soil, fertilizer application and wheather (Van Hung et
al., 2020). In the expression of the straw biomass, generally straw to grain ratio is
used and this ratio is mainly between 0.7 and 1.5 (Kausar et al., 2010; Wageningen,
2013). Rice straw amount can also be calculated according to the following
equation generally valid in Asian countries (Gadde et al., 2009).
QRS = PRR x SGR
where QRS is the quantity of rice straw (kt a–1), PRR is the production of rough
rice (kt a–1) and SGR is Straw-to-Grain Ratio.

139 | SUSTAINABLE AGRICULTURE LEADS TO ZERO HUNGER
Rice straw mainly includes lignin, cellulose and hemicellulose as a complex
structure and this lignocellulosic structure makes the decomposition difficult
(Chakma et al., 2016; Ratnakumar et al., 2019; Zhang and Cai, 2008). Lignin is a
complex biopolymer composing from aromatic monomers. Both the tight bonds
with cellulosic components and the functional groups being carried by lignin that
is in charge of its recalcitrant and heterogeneous structure makes resistant to
microbial degradation (Xu et al., 2021; Liu et al., 2019).
Silica and ash are also other components of rice straw. Silica that have roles
in the protection of plant cell wall, carbohydrate and phenolic synthesis as well as
grain yield is amended with urea and ammonia to fissure the silicified cuticular
layer however they do not dissolve silica like sodium hydroxide (Van Soest,
2006). The resistant lignocellulosic structure and silica content of rice straw
generally limits its use. (Ratnakumar et al., 2019)
Table 1: Composition of Rice Straw
Moisture (%)
Silica (%)
Ash (%)
Cellulose (%)
Hemicellulose (%)
Lignin (%)
Reference
12.8 38.6 19.7 13.6 (Zhu et al., 2005)
8.3 12.4 33.7 19.9 (Gu et al.,2013)
11.33
32.15 28.00 19.64 (Shawky et al., 2011)
6.9 11.8 33.9 25.6 (Jin and Chen, 2007)
33.69 35.02 15.20 (Shan et al., 2008)
6.8 11.2 (Agbagla-Dohnani et
al.,2001) 18,8 38.3 28.0 14,9 (Zhang and Cai,2008)
6.67 36.29 20.67 9.42 (Bhattacharyya et al.,
2020)
5.4 16.2 33.4 16.2 8.9 (Ma et al., 2009)
10.2 32.0 29.9 18.8 (Murakami et al.,
2012)
The physical and chemical properties of rice straw also affect the content of
the compost. Carbon to Nitrogen ratio (C:N), pH, moisture, macro and micro
nutrients, heavy metal content are the most analyzed properties as well as lignin,
cellulose, hemicelluloses, ash, silica and protein content analysis of rice straw.
Lignin, cellulose and hemicellulose content of rice straw is 8-20%, 30-45% and
15-40% respectively whereas moisture, silica and ash content is 5-15%, 5-15%
and 10-20% respectively according to the studies given in Table 1. C:N ratio of

SUSTAINABLE AGRICULTURE LEADS TO ZERO HUNGER | 140
rice straw is mainly between 40 % and 60%. C:N ratio is an important criteria for
the initiation of composting. In order to supply optimum initial C:N ratio, rice
straw is generally mixed with other wastes
.
8.3. Rice Straw Compost
Composting is a microbial and anaerobic process in which decomposion
reactions take place after mixing the substrates. Soil elements are transported to
other places after harvesting and little amounts are return to the soil by some
amendments like incorporation or mulching. In order to put these element to the
soil again, chemical fertilizers are used and often surplus chemical fertilizers
disrupt soil balance and hence affect plants, soil and underground waters (Savcı,
2012). Despite the chemical fertilizers, organic fertilizers like compost, decompose
slowly and in the correct time of plant need promoting sustainable agriculture.
Rice straw can be composted by itself but mainly by mixing other substrates
such as manure, slurry, food wastes, green wastes, sewage sludge or other wastes
with or without inoculants mainly due to its difficult degradation. In order to
maintain a better agricultural sustainability via composting rice straw, optimum
initial ratios of substrates for composting can be determined according to the
results of analyses of physical and chemical properties of rice straw.
8.4. Compost Preparation
The factors that affect the overall composting stages can be counted as the
size of substrate, porosity and aeration, C:N ratio, moisture, temperature, pH and
other substrates or inoculants (Nakhshiniev et al., 2014; Rashad et al., 2010).
Decreasing particle size increases the surface area thus decomposition rate
increases. However, smaller particle size can also reduce the porocity by
compacting the substrates and inhibits the required aeration for composting. In that
case, anaerobic conditions form accompanying odor problems. Optimum porosity
for composting is 35-50 % in order to supply a balance between temperature,
moisture, CO2 and O2 during the composting process. If the porosity is above 50%,
it leads the temperature remains low because of heat lost (Bernal et al., 2009). Rice
straw generally were cut or sieved for 2-3 cm sizes in the studies and it is possible
to come across researchs grounding and sieving the rice straw to get smaller sizes
e.g. 2 mm for composting of rice straw by fungi (Zhou et al., 2015; Kausar et al.,
2010; Zhao et al., 2016).

141 | SUSTAINABLE AGRICULTURE LEADS TO ZERO HUNGER
C:N ratio is the major effect on the beginning of composting process. The
reasonable range for raw materials to be composed is 20:1 to 40:1 whereas,
preferred range is 25:1-30:1 (Rynk et. al., 1992). Although the initial C:N ratio of
the compost near 50:1 is suitable for a rapid composting progress (Sharma et al.,
2014), this ratio is often below 40:1 in many of the studies. If this ratio is too high
then, degradation time elongates and if too low then, nitrogen is easily mineralised
into NH3 (Nghi et al., 2020).
Initial moisture content is adjusted by adding water in the range of 40-70%
(Ma et al., 2022; Goyal and Sindhu, 2011; Jusoh et al., 2013; Georg, 1993). During
the composting stages, optimum moisture content should be remained in the range
of 50-65%. Moisture content exceeding 65% have the similar affect with smaller
particle size. Exchanging pore air with water causes anaerobic conditions (Nghi et
al., 2020). On the other hand, if moisture content is below 40%, activity of
bacteries is blocked (Fogarty and Tuovinen, 1991). Sometimes, a pretreatment is
applied to accelerate the degradation for instance, moistening by urea solution of
0.1% blent with small quantity of cow dung (Sodhi et al., 2009).
Rice straw compost is prepared by mixing the substrate with other
agricultural wastes or manure or various inoculants or combinations of these.
Compost is turned over in definite periods. This turning over application makes a
good aeration and controls both temperature and moisture. Moisture content is kept
constant during the composting period such as 50-60 days (Sodhi et al., 2009).
8.5. Composting Stages and Compost Maturity
Carbon in organic compounds in rice straw is mineralised into CO2 by fungi,
bacteria or other microorganisms and nitrogen is mineralized into NH3 while H2O
is another product meaning moisture. During these exothermic reactions,
temperature of media increases and both pathogenic microorganisms and weed
seeds are destroyed (Bernal et al., 2009). Although there is no accepted definite
index worldwide, stability and maturity of the compost reflects its quality required
for use as a fertilizer or soil conditioner in agriculture (Nakhshiniev et al., 2014;
(Zhou et al., 2015). Volume reduction and degree of lignocellulusic degradation as
well as the change in pH, temperature and C:N ratio are the measurable indicators
that can be evaluated the stability and maturity status of the compost (Zhou et al.,
2015; Nghi et al., 2020). Among these, the measurement of pH and temperature is
relatively simpler.
Compost is accepted to reach its stability and maturity state if degradation
rate and CO2 emission speeds down and temperature stay constant after decreasing

SUSTAINABLE AGRICULTURE LEADS TO ZERO HUNGER | 142
close to ambient temperature (Jusoh et al., 2013; Lannan et al., 2013; Fialho et al.,
2010). Besides, seed germination test performed for the evaluation of phytotoxicity
is also an indicator for the maturity of the compost (Ng et al., 2016; Goyal and
Sindhu, 2011). Maturation indicates the existence of the humic substances
comprising of humic acid, fulvic acid and humin (Zhao et al., 2016; Ywih Ch’ng
et al., 2018). Amino acids are among the factors of humus formation; moreover
they modify bacterial functions (Ma et al., 2022).
Although pH values ranging from 6.7 to 9.0 promotes microbial activity
positively, pH of 5.5-8.0 is accepted optimal value where fungi prefer acidic pH
values and bacteria prefer close to neutral pH values (Bernal et al., 2009; Fogarty
and Tuovinen, 1991). Finally, pH coming back close to neutral values indicates
humus formation (Fogarty and Tuovinen, 1991).
Figure 5. Changes in Temperature with Time in Stages of Composting (Shilev et al.,2007).
(1=mesophilic stage, 2=thermophilic stage, 3=cooling stage, 4=maturing stage)
The change in temperature gives the idea about the stage of maturation
during composting. In a typical composting, temperature changes follow each
other in the order of mesophilic, thermophilic, cooling, and maturing stages as
given in the Figure 5 (Nghi et al., 2020).
The first stage is mesophilic stage in which temperature increases quickly
but not above 500C. Bacteria are dominant in the beginning of composting (Bernal
et al., 2009) and in this stage, mesophilic bacteria species is dominant but its
dominance decreases with increasing temperature up to nearly 40 °C (Nghi et al.,
2020). Mesophilic bacteria quickly breaks down the biodegradable compounds
causing heat release, thus a rapid rise in temperature is observed (Shilev et
al.,2007). After 40 0C, thermophilic bacteria become dominant instead of
143 | SUSTAINABLE AGRICULTURE LEADS TO ZERO HUNGER
mesophilic bacteria (Nghi et al., 2020). Fungi coexist in all stages but are dominant
at moisture below 35% and are not active at temperatures above 60 0C (Bernal et
al., 2009).
The second stage is the thermophilic stage, which the temperature attained
to its maximum value (Fialho et al., 2010). Temperature first increses to 55 0C that
pathogens are destructed then, at 60 0C, sanitation takes place which weed seeds
and parasites are destructed (Shilev et al., 2007). Nghi et al. (2020) states that
according to Haug (1980), the composting temperature has to be above 55 °C for
three consecutive days to kill the pathogens The compost temperature reaches 60
°C in a couple of days or up to 10 days according to substrates and other physical
variables (Jusoh et al., 2013; Shilev et al., 2007). In this stage, microorganism
activities peak resulting the maximum organic material degradation (Zhao et al.,
2016) and high temperatures fasten the degradation of complex carbohydrates such
as cellulose and hemicellulose (Shilev et al., 2007).
Even so, the temperature should not exceed 65 °C in order not to inactivate
the useful microbe otherwise a decrease in the rate of degradation is observed
(Shilev et al., 2007). Therefore, temperature should be adjusted not to exceed that
temperature by proper aeration and turning over the compost (Nghi et al., 2020;
Shilev et al., 2007).
After the exhaustion of these compounds, a gradual decrease in the
temperature occurs in the third stage which is cooling stage (Shilev et al., 2007)
followed by the last stage called maturing stage. The temperature decreases then,
remains constant close to ambient temperature in 60 to 90 days of composting
(Jusoh et al., 2013; Fialho et al., 2010). Dominant microorganism in this stage is
actinomycetes and fungi which can decompose the resistant polymers (Bernal et
al., 2009). Additionally, mesophilic microorganisms occur again in maturing stage
that is also known as curing (Shilev et al., 2007). Thereby, humus is formed after
maturing stage (Nghi et al., 2020).
C:N ratio is a favourable indicator for the determination of maturity stage of
the compost (Ywih Ch’ng et al., 2018; Kausar et al., 2011). Initially, carbon
content of the substrates are high, with lossing of carbon compounds, decrease in
C:N ratio is in prospect (Nakhshiniev et al., 2014). Composts used for fertilizing
is desired to be stable in the soil and not to continue degradating, thus the C:N ratio
lower than 25 is accepted for maturity and stability for many countries (Topal and
Topal, 2013). Similarly, Ywih Ch’ng et al. (2018) reports that C:N ratio below 20
indicates the maturity of the compost, stated by Brady and Weil (2002). Even, a
C:N ratio of 15 or below being more prefable, stated by Jimenez and Garcia (1989)
is reported by Nakhshiniev et al. (2014). When C:N ratio is low e.g. green wastes,

SUSTAINABLE AGRICULTURE LEADS TO ZERO HUNGER | 144
microbial decomposition causes ammonia formation, thus increasing pH and
ammonia volatilization, on the contrary, high C:N ratio means more substrate to
degrade and limitation of nitrogen decreases pH which inhibits microorganisms
thuswise, composting process slows down (Fogarty and Tuovinen, 1991; Bernal et
al., 2009).
8.6. Studies on Rice Straw Compost
Crop residues, especially rice straw is degradated hardly and slowly due to
lignocellulosic structures. In order to overcome this elongated process, crop
residues are generally mixed with animal wastes for compost formation which are
mainly used as biofertilizers (Jusoh et al., 2013). The nature, structure and
composition of the organic substances and their decomposition by microorganisms
affect the maturity of the compost and both the time elapsed for composting and
the quality of compost hinge upon microorganisms (Kausar et al., 2016). For that
reason, adding inoculants, mainly effective microorganisms (EM), are frequently
encountered case. The ratios of the substrates to each other is changed in order to
obtain acceptable initial C:N ratios.
Rice straw can be composted either alone or in combination of animal
manures and/or green wastes, again and/or effective microorganism. Although rice
straw itself is already responsible for the odor absorption in the compost (Rynk et.
al., 1992), in the case of composting rice straw alone, besides elongated
degradation period, odor and undesired microorganismal activities may arise.
Hence, generally co-composting is preferred and sometimes rice straw is
moistened by urea solution resulting reduction in N loss (Omar et al., 2016).
The term EM was first developed by Japanese horticulturist Dr. Teruo Higa
in 1970s (Jusoh et al., 2013; Sharma et al., 2014). EM refers to bacteria, fungi and
actinobacteria where the combination of microorganisms for instance,
lignocellulolytic fungi, cellulolytic bacteria, lactic acid bacteria, yeast, and
photosynthetic bacteria that fasten the composting (Kausar et al., 2011; Sharma et
al., 2014). EM increases both macronutrient and micronutrient content of the
compost when compared with control (Jusoh et al., 2013).
Studies on composting of rice straw in terms of substrate ratios, additional
inoculant, composting period and C:N ratio of the compost are summerized and
given in the Table 4. As can be seen in the table, studies are performed mainly co-
composting of rice straw with animal manures and green wastes with or without
EM. Animal manures are generally rich in N, decomposes quickly and need
amendments with high C content (Rynk et. al., 1992). Odor problem may arise in

145 | SUSTAINABLE AGRICULTURE LEADS TO ZERO HUNGER
composting of poultry manure despite the low odor potential of goat manure (Rynk
et. al., 1992). Besides, reduction in lead and cadmium content of the compost is
reported in a study of co-composting of rice straw with chicken and donkey manure
(Karanja et al., 2019).
After moistening of unchopped rice straw with 0.1 urea solution, increase of
humic substances in RS+cattle dung and RS+consortium of fungi by 34% and 27
% when compared with RS compost alone is obtained in a sudy of Goyal and
Sindhu (2011). Another study of composting sewage sludge with crop straws
including rice straw reveals that more hemicellulosic structure and smaller C:N
ratio of the straw causes faster the rate of organic matter thus more humic
substance formation in the compost (Zhao et al., 2016).
Also, inoculants fasten the increase in temperature and the degradation of
lignocelluloses so that C:N ratio decreases more quickly accompanying higher
volume loss of the substrates compared to the control without inoculants (Zhou et
al., 2015).
Table 4: Brief information about some of the studies on composting of rice straw
Ratio of
Substrates EM /Inoculant
Composting
Period
C:N ratio
of Compost Reference
RS+chicken
manure(1:1)
Fungal consortium
A.niger+T.viride 6 weeks
initial: 29.25
maturity:15.33
control:19.83
(Kausar et
al., 2010)
RS+chicken
manure(1:1)
Lignocellulolytic
actinobacteria
%10 (v/w)
6 weeks initial: 29.3
maturity:18.1
(Kausar et
al., 2011)
RS+chicken
manure(2:1) - 49 days
initial: 29.25
maturity:10.55
(Ali et al.,
2006)
RS+chicken manure (10:1)
- 62 days initial: 58.67
maturity:10.84
control:23.75
(Karanja et al., 2019)
RS+chicken slurry+zeolite+
urea(20:1:1:1)
- 55 days initial: 33.8 maturity: 15
(Omar et al., 2016)
RS+poulty droppings(8:1)
EM consortium 60 days initial: 60:1
maturity:15:1 (Sharma et al., 2014)
RS+dairy
manure (1.2:35.2)
Thermo
actinomyces+ fungi
45 days initial: 27
maturity: 16.5 control: 21.7
(Zhou et al.,
2015)
RS+cow
manure+
rapeseed cake
(100:60:3)
- 22 days initial: 31.2
maturity: 17.8
(Wang et al.,
2016)
RS+cattle dung+0.1% urea
solution
- 90 days initial: 41.7 maturity: 17
(Goyal and Sindhu,
2011)

SUSTAINABLE AGRICULTURE LEADS TO ZERO HUNGER | 146
RS+goat
manure+green
waste (5:3:2)
EM consortium
A.niger+T.Viride 90 days
initial: 32.4
maturity: 10.3
(Jusoh et
al., 2013)
RS+goat
manure+green
waste (5:3:2)
- 90 days initial: 34
maturity: 16.1
(Jusoh et
al., 2013)
RS+green waste
(4:1)
EM 3% (w/w)
microbial
inoculation
24 days maturity:
below 20
(Chen et al.,
2019)
RS+green waste(4:1)
- 24 days maturity: below 20
(Chen et al., 2019)
RS+donkey manure (10:1)
- 62 days initial: 52.00
maturity:11.32
control:23.75
(Karanja et al., 2019)
RS+sewage
sludge - 45 days
initial: 20
maturity:12.18
(Zhao et al.,
2016)
RS=rice straw, EM:=effective microorganisms, C:N=carbon to nitrogen ratio.
8.7. Effects of Rice Straw Compost on Soil and Plant
Organic fertilizers are used to enrich the soil organic matter, increase soil
fertility and also improve and preserve the physical, chemical, biologycal
properties of the soil (Assefa and Taddese, 2019; Bellitürk et al., 2019). They
release nutrients slowly into the soil and feed both soil and plants as acting both
fertilizer and soil conditioner, so keep the nutrient balance and supress the need of
repeated synthetic fertilizer application (Shaji et al., 2021; Assefa and Taddese,
2019).
Studies show the improvement of soil quality and fertility after the
replacement 50% of the inorganic fertilizers with rice straw compost (Sharma and
Dhaliwal, 2019) and after the application of rice straw compost either alone or
combined with inorganic fertilizers (Sodhi et al., 2009). Soil physical and
chemical properties are enhanced by the application of rice straw/animal waste
compost (Mahmoud et al., 2018) and by the repeated rice straw compost
applications (Watanabe et al., 2009).
Organic fertilizers are safer, more beneficial and environment friendly than
inorganic fertilizers so that they are used either instead of or in combination with
inorganic fertilizers (Shaji et al., 2021; Assefa and Taddese, 2019; Bellitürk et al.,
2019). The yield of rice is increased after the substitution 40-50% of inorganic
fertilizer with rice straw compost (Sharma and Dhaliwal, 2019; Watanabe et al.,
2009). The grain yield of the rice fertilized by rice straw compost is also found
higher in comparison to fertilization by rice straw only and in comparison to the

147 | SUSTAINABLE AGRICULTURE LEADS TO ZERO HUNGER
control with any amendment (Takakai et al., 2020). Similarly, yield of rice is found
to be increased 13-26% higher by rice straw compost than that of control without
compost application (Barus, 2012).
Plant growth and management of rice blast disease is improved by the
application of rice straw compost prepared with cow manure and EM consortium
(Ng et al., 2016). The yield and dry biomass of tomato is also significantly
increased with the addition of rice straw compost at a rate of 30 % (v/v) (Ali et al.,
2006). In an another study, rice straw compost application also increased dry
weight of canola plants while increasing the organic matter of the soil three times
more than the control (Mahmoud et al., 2009). Fertilization at a rate of 40% (w/w)
with the compost prepared with rice straw, green wastes and EM lead to increase
in cabbage seeding and cucumber growth performed by (Chen et al., 2019).
Composts are generally rich in micronutrients like Zn and Fe despite their
relative poor macronutrient contents and additionally, the ones made of biosolids
such as rice straw, have less heavy metal contents (Georg, 1993). A study of
Mahmoud et al. (2018) confirmed that the rice straw compost produced from rice
straw and animal waste and combined with rice straw bichar decreased the heavy
metal uptake of canola while having the highest canola growth. There are various
researches confirm the effect of composting the rice straw on soil health eg.
fertility, aeration and plant health eg. availability of nutrients and yield.
8.8. Conclusion and Suggestions
Rice, as a major feed of human diet is being produced and consumed in a
very high scale and this will continue accompanying an increase due to increasing
population. Despite the increasing demand, the arable lands and agricultural labour
tends to decrease and also hunger is still a great problem in the world especially in
Asia where the rice is produced most and will be getting more demanded all around
the world. Besides, losts and wastes from the field to and after the consumer affect
negatively not only the economic losts and direct access to the food but also the
environment in terms of pollution and the soil poisoning with excess chemical
fertilizers instead of organic ones. In the frame of sustainability, agricultural,
environmental and waste management systems should spin the wheel in a
harmony.
Considerable amount of rice straw forms after harvest and that can easily
been composted in or near the field so that environmental pollution coming from
both transportation of the straw and burning in the field can be prevented. Compost
can be prepared either with manures or effective microorganisms or other wastes

SUSTAINABLE AGRICULTURE LEADS TO ZERO HUNGER | 148
or in different ratios of them. By using this compost in the field, chemical fertilizer
addiction can be lowered and soil health can be healed in the following years after
use as well as recyle and reuse the other wastes. These amendments can be
performed by well organized farm systems and the role of rice farming systems in
achieving the zero hunger and responsible consumption and production goals has
to be precisely taken into consideration.

149 | SUSTAINABLE AGRICULTURE LEADS TO ZERO HUNGER
References
Agbagla-Dohnani, A., Nozière, P., Clément, G., & Doreau, M. (2001). In sacco
degradability, chemical and morphological composition of 15 varieties of
european rice straw. Animal Feed Science and Technology, 94(1), 15-27.
Ali, H. I., Ismail, M. R., Manan, M. M., & Saudi, H. M. (2006). Rice straw compost and
water deficit affect yield, quality and water use efficiency (WUE) of tomatoes
grown in different media. Biological Agriculture & Horticulture, 24(3), 301-315.
Assefa, S., & Tadesse, S. (2019). The principal role of organic fertilizer on soil properties
and agricultural productivity-a review. Agri Res and Tech: Open Access J, 22(2),
556192.10.19080/ARTOAJ.2019.22.556192.
Barus, Y. (2012). Application of rice straw compost with different bioactivators on the
growth and yield of rice plant. Jurnal Tanah Tropika Dan Kualitas
Lingkungan, 17(1), 25-29.
Bellitürk, K., Kuzucu, M., Çelik, A., & Baran, M. F. (2019). The effects of fertilization on
the yield and quality of pistachio (Pistacia vera L.) in dry conditions. Journal of
Tekirdag Agricultural Faculty, 16(2), 251-259.
Bernal, M. P., Alburquerque, J. A., & Moral, R. (2009). Composting of animal manures
and chemical criteria for compost maturity assessment. A review. Bioresource
Technology, 100(22), 5444-5453.
Bhattacharyya, P., Bhaduri, D., Adak, T., Munda, S., Satapathy, B. S., Dash, P. K., ... &
Pathak, H. (2020). Characterization of rice straw from major cultivars for best
alternative industrial uses to cutoff the menace of strawburning. Industrial Crops
and Products, 143, 111919.
Brady NC, Weil RR. (2002). The nature and properties of soils, 13th edition. New Jersey:
Pearson Education Inc.
Chakma, S., Ranjan, A., Choudhury, H. A., Dikshit, P. K., & Moholkar, V. S. (2016).
Bioenergy from rice crop residues: Role in developing economies. Clean
Technologies and Environmental Policy, 18(2), 373-394.
Chen, Y., Hu, C., Liu, D., Li, S., & Qiao, Y. (2019). Co-composting of Chinese milk vetch
with rice straw and using the compost as a peat substitute of seeding substrate of
vegetables. International Journal of Agricultural and Biological
Engineering, 12(1), 214-220.
Durán-Sandoval, D., Durán-Romero, G., & López, A. M. (2021). Achieving the food
security strategy by quantifying food loss and waste. A casestudy of the chinese
economy. Sustainability, 13(21), 12259.
Fabi, C. and English, A. (2019). Methodological Proposal for Monitoring SDG Target
12.3. Sub-Indicator 12.3.1.a The Food Loss Index Design, Data Collection
Methods and Challenges. FAO. 60 pp.
FAOSTAT (2022) Food and Agriculture Organization of the United Nations (FAO).
Faostat database. www.faostat.fao.org (accessed 18.04.2022).

SUSTAINABLE AGRICULTURE LEADS TO ZERO HUNGER | 150
Fialho, L. L., Lopes da Silva, W. T., Milori, D. M. B. P., Simões, M. L., & Martin-Neto,
L. (2010). Characterization of organic matter from composting of different
residues by physicochemical and spectroscopic methods. Bioresource
Technology, 101(6), 1927-1934.
Fogarty, A & Tuovinen, O. (1991). Microbiological Degradation of Pesticides in Yard
Waste Composting. Microbiological reviews, 55(2), 225-233.
Gadde, B., Menke, C., &Wassmann, R. (2009). Rice straw as a renewable energy source
in India, Thailand, and the Philippines: Overall potential and limitations for
energy contribution and green house gas mitigation. Biomass &
Bioenergy, 33(11), 1532-1546.
Georg, W. (1993). Description and Use of Municipal Solid Waste Composts in New
Mexico, New Mexico State Universty, NMSU and the U.S. Department of
Agriculture Cooperating, Extension Horticulture Specialist, sircular 526.
Goyal, S. & Sindhu, S. (2011). Composting of Rice Straw Using Different Inocula and
Analysis of Compost Quality. Microbiology Journal. 1: 126-138.
Gu, F., Wang, W., Jing, L., &Jin, Y. (2013). Effects of green liquor pretreatment on the
chemical composition and enzymatic digestibility of rice straw. Bioresource
Technology, 149, 375-382.
Haug RT (1980) Compost engineering: principles and practice. Ann Arbor Science
Publishers, Michigan.
Jimenez, E.I., Garcia, V.P., (1989). Evaluation of city refuse compost maturity: a review.
Biol. Waste. 27, 115–142.
Jin, S., & Chen, H. (2007). Near-infrared analysis of the chemical composition of rice
straw. Industrial Cropsand Products, 26(2), 207-211.
Jusoh, M. L. C., Manaf, L. A., & Latiff, P. A. (2013). Composting of rice straw with
effective microorganisms (EM) and its influence on compost quality. Iranian
Journal of Environmental Health Science & Engineering, 10(1), 17.
Karanja, A. W., Njeru, E. M., & Maingi, J. M. (2019). Assessment of physicochemical
changes during composting rice straw with chicken and donkey
manure. International Journal of Recycling of Organic Waste in
Agriculture, 8(Suppl 1), 65-72.
Kausar, H., Ismail, M. R., Saud, H. M., Habib, S. H., Othman, R., & Miah, G. (2016). A
novel lignocellulolytic bacterium for bioconversion of rice straw. Pakistan Journal
of Agricultural Sciences, 53(3), 523-533.
Kausar, H., Sariah, M., Mohd Saud, H., Zahangir Alam, M., & Razi Ismail, M. (2010).
Development of compatible lignocellulolytic fungal consortium for rapid
composting of rice straw. International Biodeterioration & Biodegradation, 64(7),
594- 600.
Kausar, H., Sariah, M., Mohd Saud, H., Zahangir Alam, M., & Razi Ismail, M. (2011).
Isolation and screening of potential actinobacteria for rapid composting of rice
straw. Biodegradation (Dordrecht), 22(2), 367-375.

151 | SUSTAINABLE AGRICULTURE LEADS TO ZERO HUNGER
Lannan, A. P., Erich, M. S., & Ohno, T. (2013). Compost feedstock and maturity level
affect soil response to amendment. Biology and Fertility of Soils, 49(3), 273-285.
Liu, Z. H., Le, R. K., Kosa, M., Yang, B., Yuan, J., & Ragauskas, A. J. (2019). Identifying
and creating pathways to improve biological lignin valorization. Renewable and
Sustainable Energy Reviews, 105, 349-362.
Ma, H., Beadham, I., Ruan, W., Zhang, C., & Deng, Y. (2022). Enhancing rice straw
compost with an amino acid-derived ionic liquid as additive. Bioresource
Technology, 345, 126387-126387.
Ma, H., Liu, W. W., Chen, X., Wu, Y. J., &Yu, Z. L. (2009). Enhanced enzymatic
saccharification of rice straw by microwave pretreatment. Bioresource
Technology, 100(3), 1279-1284.
Mahmoud, E., Ibrahim, M., Ali, N., & Ali, H. (2018). Spectroscopic analyses to study the
effect of biochar and compost on dry mass of canola and heavy metal
immobilization in soil. Communications in Soil Science and Plant
Analysis, 49(16), 1990-2001.
Mahmoud, E., Ibrahim, M., Robin, P., Akkal-Corfini, N., & El-Saka, M. (2009). Rice straw
composting and its effect on soil properties. Compost Science &
Utilization, 17(3), 146-150.
Murakami, K., Sato, M., Kato, T., &Sugawara, K. (2012). Influence of difference in
chemical compositions of rice straw on hydrogen formation in nickel-catalyzed
steam gasification. Fuel ProcessingTechnology, 95, 78-83.
Nakhshiniev, B., Biddinika, M. K., Gonzales, H. B., Sumida, H., & Yoshikawa, K. (2014).
Evaluation of hydrothermal treatment in enhancing rice straw compost stability
and maturity. Bioresource Technology, 151, 306- 313.
Ng, L. C., Sariah, M., Radziah, O., Zainal Abidin, M. A., & Sariam, O. (2016).
Development of microbial-fortified rice straw compost to improve plant growth,
productivity, soil health, and rice blast disease management of aerobic
rice. Compost Science & Utilization, 24(2), 86-97.
Nghi, N. T., Romasanta, R. R., Hieu, N. V., Vinh, L. Q., Du, N. X., Ngan, N. V. C., ... &
Hung, N. V. (2020). Rice straw-based composting. In Sustainable rice straw
management (pp. 33-41). Springer, Cham.
Omar, L., Osumanu Haruna, A., & Majid, N. M., (2016). Effect of organic amendment
derived from co-composting of chicken slurry and rice straw on reducing nitrogen
loss from urea. Communications in Soil Science and Plant Analysis, 47(5), 639-
656.
Rashad, F. M., Saleh, W. D., & Moselhy, M. A. (2010). Bioconversion of rice straw and
certainagro-industrial wastes to amendments for organic farming systems: 1.
Composting, quality, stability and maturityindices. Bioresource
Technology, 101(15), 5952-5960.
Ratnakumar, A., Samarasekara, A. M. P. B., Amarasinghe, D. A. S., & Karunanayake, L.
(2019). Structural analysis of cellulose fibers and rice straw ashderived from

SUSTAINABLE AGRICULTURE LEADS TO ZERO HUNGER | 152
srilankan rice straw. In 2019 Moratuwa Engineering Research Conference
(MERCon) (pp. 78-83). IEEE.
Rynk, R., Van de Kamp, M., Willson, G. B., Singley, M. E., Richard, T. L., Kolega, J. J.,
... & Brinton, W. F. (1992). On-Farm Composting Handbook. (Ed) Robert Rynk
Plant and Life Sciences Publishing, New York ISBN:978-0- 935817-19-5.
Savci, S. (2012). An agricultural pollutant: chemical fertilizer. International Journal of
Environmental Science and Development, 3(1), 73.
Shaji, H., Chandran, V., & Mathew, L. (2021). Organic fertilizers as a route to controlled
release of nutrients. In: F.B. Lewu, T. Volova, S. Thomas, Rakhimol K.R., (eds.)
Controlled Release Fertilizers for Sustainable Agriculture (pp. 231-245).
Academic Press.
Shan, Y., Cai, Z., Han, Y., Johnson, S. E., & Buresh, R. J. (2008). Organic acid
accumulation under flooded soil conditions in relation to the incorporation of
wheat and rice straws with different C: N ratios. Soil Science and Plant
Nutrition, 54(1), 46-56.
Sharma, A., Sharma, R., Arora, A., Shah, R., Singh, A., Pranaw, K., & Nain, L. (2014).
Insights into rapid composting of paddy straw augmented with efficient
microorganism consortium. International Journal of Recycling of Organic Waste
in Agriculture, 3:54, 1-9.
Sharma, S., & Dhaliwal, S. S. (2019). Effect of sewage sludge and rice straw compost on
yield, micronutrient availability and soil quality under rice-wheat
system. Communications in Soil Science and Plant Analysis, 50(16), 1943-1954.
Shawky, B. T., Mahmoud, M. G., Ghazy, E. A., Asker, M. M., & Ibrahim, G. S. (2011).
Enzymatic hydrolysis of rice straw and corn stalks for monosugars production.
Journal of Genetic Engineering and Biotechnology, 9(1), 59-63.
Shilev, S., Naydenov, M., Vancheva, V., & Aladjadjiyan, A. (2007). Composting of food
and agricultural wastes. In Utilization of by-products and treatment of waste in
the food industry (pp. 283-301). Springer, Boston, MA.
Singh, G., Gupta, M. K., Chaurasiya, S., Sharma, V. S., &Pimenov, D. Y. (2021). Rice
straw burning: a review on its global prevalence and the sustainable alternatives
for its effective mitigation. Environmental Scienc eand Pollution
Research, 28(25), 32125-32155.
Sodhi, G. P. S., Beri, V., & Benbi, D. K. (2009). Soil aggregation and distribution of carbon
and nitrogen in different fractions under long-term application of compost in rice–
wheat system. Soil & Tillage Research, 103(2), 412-418.
Sözübek, B., and Öztürk, M. (2022). Valorization of Rice Straw: Agrochemical and
Environmental Aspects. In Sozubek, B. and Bellitürk, K. (eds) Innovative
Agricultural Practices in Soil, Plant and Environment. Iksad Publishing.
Swaminathan, M. (2016). Rice in Zero Hunger Challenge. In Combating Hunger and
Achieving Food Security (pp. 47-52). Cambridge: Cambridge University Press.
Doi:10.1017/CBO9781316389485.010 (Accessed 12.04.2022).

153 | SUSTAINABLE AGRICULTURE LEADS TO ZERO HUNGER
Takakai, F., Kominami, Y., Ohno, S., & Nagata, O. (2020). Effect of the long-term
application of organic matter on soil carbon accumulation and GHG emissions
from a rice paddy field in a cool-temperate region, japan. -I. comparison of rice
straw and rice straw compost. Soil Science and Plant Nutrition, 66(1), 84-95.
Topal, E. I. A., & Topal, M. (2013). A Review on Compost Standarts. Nevşehir Journal of
Science and Technology, 2(2), 85-108.
U.N. (2022). United Nations. https://www.un.org/sustainabledevelopment/hunger/
(accessed 07.04.2022).
Van Hung N. et al. (2020) Rice Straw Overview: Availability, Properties, and Management
Practices. In: Gummert M., Hung N., Chivenge P., Douthwaite B. (eds)
Sustainable Rice Straw Management. Springer, Cham.
Van Soest, P. J. (2006). Rice straw, the role of silica and treatments to improve
quality. Animal Feed Science and Technology, 130(3), 137-171.
Wageningen U. R. (2013). Food & Biobased research rice straw and wheat straw. Potential
Feedstocks for The Biobased Economy. NL Agency.
Wang, L., Mao, J., Zhao, H., Li, M., Wei, Q., Zhou, Y., & Shao, H. (2016). Comparison
of characterization and microbial communities in rice straw- and wheat straw-
based compost for agaricus bisporus production. Journal of Industrial
Microbiology & Biotechnology, 43(9), 1249-1260.
Watanabe, T., Man, L. H., Vien, D. M., Khang, V. T., Ha, N. N., Linh, T. B., & Ito, O.
(2009). Effects of continuous rice straw compost application on rice yield and soil
properties in the Mekong Delta. Soil Science & Plant Nutrition, 55(6), 754-763.
WHO (2019). World Health Organisation. https://www.who.int/news/item/15-07-2019-
world-hunger-is-still-not-going-down-after-three-years-and-obesity-is-still-
growing-un-report (accessed 07.04.2022).
Xu, C., Su, X., Wang, J., Zhang, F., Shen, G., Yuan, Y., Yan, L., Tang, H., Song, F.,
&Wang, W. (2021). Characteristics and functional bacteria in a microbial
consortium for rice straw lignin-degrading. Bioresource Technology, 331,
125066-125066.
Ywih Ch’ng, H., Yee Yue, Y., B. Othman Osman, S., & Young Liew, J. (2018).
Determination of extraction period and extractant ratio for extracting humic acid
from rice straw compost. Current Agriculture Research Journal, 6(2), 150-156.
Zhang, Q., & Cai, W. (2008). Enzymatic hydrolysis of alkali-pretreated rice straw by
Trichodermareesei ZM4-F3. Biomass and Bioenergy, 32(12), 1130-1135.
Zhao, X., Li, B., Ni, J., & Xie, D. (2016). Effect of four crop straws on transformation of
organic matter during sewage sludge composting. Journal of Integrative
Agriculture, 15(1), 232-240.
Zhou, C., Liu, Z., Huang, Z., Dong, M., Yu, X., & Ning, P. (2015). A new strategy for co-
composting dairy manure with rice straw: Addition of different inocula at three
stages of composting. Waste Management (Elmsford), 40, 38-43.

SUSTAINABLE AGRICULTURE LEADS TO ZERO HUNGER | 154
Zhu, S., Wu, Y., Yu, Z., Liao, J., &Zhang, Y. (2005). Pretreatment by microwave/alkali of
rice straw and its enzymic hydrolysis. Processbiochemistry, 40(9), 3082-3086.
Brief Curriculum Viate of Author
Bahar SÖZÜBEK is Ph.D in Soil Science and Plant Nutrition.
[email protected] OrcID: 0000-0002-5636-5936. She started
her career as a lecturer since 2005. She is an Assist. Prof. Dr
Tekirdağ Namık Kemal University Muratlı Vocational School of
Higher Education, Chemistry Technology Program
Muratlı/Tekirdağ / TÜRKİYE. She published at least 9 in indexed
International Journals and 2 international proceedings. Link: WoS Researcher ID:
AAB-8620-2021,
https://www.scopus.com/authid/detail.uri?authorId=35812529500,.https://publon
s.com/researcher/4180509/bahar-sozubek/.
https://www.researchgate.net/profile/Bahar-Sozubek
Mergül ÖZTÜRK. TekirdağNamık Kemal University, Muratlı Vocational School
of Higher Education, Chemistry Technology Program, Tekirdağ, Turkey.
[email protected] OrcID: 0000-0003-1257-6392
155 | SUSTAINABLE AGRICULTURE LEADS TO ZERO HUNGER
CHAPTER 9
CONSTRAINTS TO IRRIGATED RICE FARMING
TECHNOLOGY ADOPTION IN INDONESIA
Nina LISANTY1*, Agustia Dwi PAMUJIATI1, 1Yudhi Zuriah Wirya PURBA2
1Kadiri University, Kediri, Indonesia 2Sjakhyakirti University, Palembang, Indonesia
*Corresponding Author: [email protected]

SUSTAINABLE AGRICULTURE LEADS TO ZERO HUNGER | 156

157 | SUSTAINABLE AGRICULTURE LEADS TO ZERO HUNGER
9.1. Introduction
The availability of rice, the staple food of Indonesians, for domestic
consumption throughout the year is crucial. Indonesia has the third-largest area
planted with rice and the third-highest total production in the world, but domestic
rice production is still insufficient to meet domestic demand (FAO, 2020). In
recent decades, the Ministry of Agriculture (MoA) has attempted to introduce
many new technologies to rice farming to increase domestic production. In 2007,
the government initiated the P2BN/ Proyek Peningkatan Beras Nasional
(translated to National Rice Improvement Project). It was followed by a project of
quality improvement intensification (Perbaikan Mutu Intensifikasi/PMI)
technology, which was applied in all rice production centers included in the Supra
Insus program. However, most of the projects have not fully succeeded. Diffusion
rates for technology adoption have not reached the expected level. According to
the Directorate General of Food Crops (Ministry of Agriculture of Republic of
Indonesia, 2010), the adoption level of rice farming technology in the southern part
of Sumatra Island was only 48%, more than 30% lower than the target level.
Moreover, the Ministry of Agriculture of the Republic of Indonesia (2011)
reported that only 10% of farmers in the eastern part of Indonesia used modern
farming technologies in 2010, despite several innovations being introduced in
2007, such as the System of Rice Intensification and hybrid seeds.
The technology package with the PMI approach was still generally accepted.
In addition, the government introduced the location-specific technology package
with the PTT/Pengelolaan Tanaman Terpadu (Integrated Crop Management)
approach. The components of PTT technology or a combination thereof differ
between rice production centers with different biophysical and socio-economic
conditions of farmers. The PTT technology was part of the intensification of rice
crops on irrigated rice fields. As a technology package, it consists of various
components, including hybrid seeds, pest control, nutrient and water management,
and harvesting techniques.
Rogers (1983) illustrated the technology adoption process into five phases, from
the introduction to confirmation or modification by the users. The adoption
problem of agricultural innovation technology in Indonesia does not only lie in the
phase of decision making (whether to adopt or reject the technology) but also
includes the implementation and confirmation phase (Figure 1). According to Fagi
(2008), PTT technology's top-down, instructive, and vertical recommendation can
accelerate its adoption and dissemination, yet it is vulnerable to changes in the

SUSTAINABLE AGRICULTURE LEADS TO ZERO HUNGER | 158
strategic environment. Adopting PTT technology may not be sustainable when
some changes occur in the strategic environment, which is not conducive to
farmers.
Figure 1. Process of innovation technology adoption (Rogers, 1983)
It is essential to clarify the factors that constrain farmers from adopting (and
continue adopting) each technology to increase the diffusion rates of new
technologies and boost rice production. Therefore, this chapter discusses the
driving and inhibiting factors for technology adoption in Indonesia. It analyzes the
factors that determine farmers' behavior towards each technology component and
discusses the relationship between characteristics of the technology components
and farmers' socio-economic and other conditions. By knowing the barriers to
technology adoption, policymakers can determine the right policy direction,
supporting infrastructure, and concrete strategy that must be taken.
9.2. Method
The primary data in this chapter are based on a case study, a survey
conducted in 2007 and 2010 in an irrigated rice farming area in South Sumatra
Province, where an innovative technology project for rice farming was introduced
in 2006. Other primary data were collected from desk studies, including a literature
review of similar studies regarding PTT and official documents, reports, or
publications from related institutions. Various papers (on PTT, organic farming,
SRI, and several rice innovation technologies and their adoption, results of PTT on
socio-economic studies, and balanced fertilization) were employed as a basis for
evaluation and analytical tools.
Adoption
Adoption Continue
Slow Adoption
Adoption Discontinue
Rejection
Communica
Phase 1. Innovation Technology Introduction
Phase 2. Persuasion
Phase 3. Decision Making
Phase 4. Implementation
Phase 5. Confirmation (Modification)

159 | SUSTAINABLE AGRICULTURE LEADS TO ZERO HUNGER
Moreover, interviews were performed to evaluate the performance of PTT
in 2007, to study the perceptions of relevant local officials about PTT, and the
changes that occurred after the implementation of regional autonomy. The
interviews also provided technological input for PTT development locations, as an
integral part of the growth center for rice and secondary crops, as well as the
development of agribusiness principles through increasing productivity and the
efficiency of production inputs. The key respondents interviewed were senior staff
of the Provincial Agriculture Service, the Head of District Agriculture Sub-
Department, extension workers, and farmers. Key questions were prepared before
the Survey Team's departure to the field. New questions were asked during the
interview to obtain more detailed information. The triangulation technique was
used to clarify information.
The surveys were conducted in three out of eight of the 2006 PTT project's
demonstration districts. From these three districts, one village in each district was
selected. They were Bandar Jaya village in the Buay Madang district, Sido
Makmur village in Belitang I district, and Kerujon village in the Semendawai Suku
III district. Ten percent of the total rice farmer households in each village were
randomly selected as the sample farmers, comprising 65 sample farmers. The
demographic information collected for each household, using questionnaires,
interviews, and focus groups, included the following: how much land the
household owns, the form of land tenure, the number of family members, and their
age, education level, and length of farming experience, the distance from the
homestead to input-output markets and the local extension service, the household's
holding capital and funds available for farming, whether a household received
credit, whether farmers hold side jobs, and the amount of rice produced by
adopting the new technology. In addition, information on producer prices,
communication services, pests, and diseases were also obtained from the
community survey and through interviews with the staff of the related institutions
and organizations. The data gathered from these questionnaires and interviews
were the essential inputs for analysis.
9.3. Results and Discussion
The Survey
Because rice farming has been mainly concentrated on Java Island, the
government has been trying to expand rice production to the other islands, such as
Sumatra and Sulawesi. Over the last two decades, Sumatra Island has become the
government's main target because a permanent irrigation system exists in some
SUSTAINABLE AGRICULTURE LEADS TO ZERO HUNGER | 160
parts of the island, particularly in the southern areas. The Ogan Komering Ulu
Timur (OKUT) Regency is the core rice production area in the southern part of
Sumatra Island. It comprises 15 districts and 257 villages, with a total population
of 570,541 people in 2009. More than 80% of the population currently earns their
primary income from the agricultural sector (BPS Kabupaten OKUT, 2012).
On average, the sample farmers owned 1.3 hectares of rice field, with a
minimum of 0.5 hectares and a maximum of 5 hectares. Fields were mainly used
as rice for two seasons a year, but after the second harvest, some farmers planted
their fields with non-rice crops, such as soybeans, chilies, and shallots. The average
household consisted of four members. The majority of the sample farmers did not
go to high school or did not finish high school, with an average schooling duration
of 7.6 years. However, the average farming experience was 31.3 years. In addition
to being rice farmers, 16.9% of the participants had other jobs, such as a trader or
merchant, animal breeder, or local community worker. During the rubber-
harvesting season in the area, 35.3% of the farmers worked part-time at the rubber
plantations.
Outline of the PTT Project
A project to diffuse a new rice farming technology was held in the study
area during the dry cropping season (April to July) of 2006. Demonstration farming
was conducted over 40 hectares in eight districts. The project offered technical
advice and input materials (seeds, fertilizers, and bio-pesticides) to the farmers
whose lands were used for the demonstration. As a result of this project, the
government expected neighboring farmers to adopt the new technologies after
observing the demonstration. The project was called the "Pengelolaan Tanaman
Terpadu (PTT)," organized by the central Indonesian government in collaboration
with the local government, several companies in Indonesia, and experts from
Indonesian universities. Besides the OKUT Regency of South Sumatra Province,
Bengkulu Province, as the neighboring province, was also the target of this project.
PTT was introduced by the local government in Seluma Regency, especially in
South Seluma Subdistrict and Rimbo Kedui Village (Sulastri et al., 2022).
PTT or Integrated Crop Management is an approach to applying agricultural
technology performed directly on farmers' land in a participatory and site-specific
manner, depending on the local ecosystem and socio-economic conditions. In this
case, there may be differences in technological needs from one area to another.
The implementation of PTT is based on four main principles. First, PTT enables
plant, land, and water resources to be managed as well as possible. The second
principle, PTT, utilizes the best agricultural technology produced by considering

161 | SUSTAINABLE AGRICULTURE LEADS TO ZERO HUNGER
the elements of synergistic linkages between technology components. Third, PTT
pays attention to technology's suitability for farmers' physical and socio-economic
environment. Finally, PTT is participatory, meaning that farmers play an active
role in testing and selecting technologies appropriate to local conditions and can
go through the learning process (Arafah et al., 2007; Zaini, 2008).
PTT components are divided into essential components and optional
components. The basic components include the use of new inbred or hybrid
varieties, the use of quality and labeled seeds, spacing arrangements (known as the
legowo system), balanced fertilization based on plant needs and soil nutrient status,
the use of organic fertilizers, control of plant pest with a control approach, and
Integrated Pest Management (IPM). Meanwhile, the optional components include
tillage (based on season and cropping pattern), the use of young seedlings (younger
than 21 days), planting one to three stems of seedlings, adequate irrigation, proper
weeding, timely harvesting, and good post-harvest management (Jamal &
Mardiharini, 2008; Wihardjaka & Nursyamsi, 2012).
The Role of PTT in Rice Production Increase
As mentioned previously, there are six technology components in PTT
which are compulsory. Apart from being a feature of PTT, compulsory technology
plays an essential role in increasing farmers' yields and income. The utilization of
site-specific new high-yielding varieties in PTT provides high yields in various
environmental conditions rather than the utilization of "any" high-yielding
varieties. Moreover, using quality seeds with high purity and vigor and other
cultivation technology breakthroughs provides a synergistic effect on increasing
lowland rice yields. Seeds of superior varieties not only serve as an introduction to
the technology but also determine the potential yield to be achieved, the quality of
the grain to be produced, and production efficiency.
During the transplantation step, planting young seedlings in PTT provides
an advantage in their tolerance to stress due to seed removal in the nursery,
transportation, and replanting, compared to older seedlings. Furthermore, the
increase in plant population can be done by direct seeding system in rows, legowo
4:1 system, or row system 20 cm x 20 cm. In conditions of low solar radiation,
especially in the rainy season, increasing plant population is crucial to increase
grain yields and efficient use of N fertilizers because fewer tillers are formed
(Balasubramanian, 2002).
The PTT approach model is considered to be able to solve the problem of
increasing rice yields. The results of the PTT model in the 2001 dry season in eight
provinces (North Sumatra, West Sumatra, West Java, Central Java, East Java, Bali,

SUSTAINABLE AGRICULTURE LEADS TO ZERO HUNGER | 162
West Nusa Tenggara, and South Sulawesi) showed an increase in rice productivity.
The increase ranged from 7.1% to 38.4% compared to farmers' conventional
technology (Fagi, 2008). In more detail, Zaini (2008) revealed the increase in grain
yields and farmer profits from the application of each component of PTT in Table
1 below.
Table 1. Increase in yield and farmer's income by applying each PTT component
No PTT Components Yield Increase Income Increase
Kg/ha % IDR'000/ha %
1. Site-specific high yield variety 275±20 8.9 228±18 5.2
2. High-growth certified seedling 192±10 6.2 324±26 7.4
3. Embankment height increase 96±10 3.1 70±5 1.6
4. Nursery uniformity 232±20 7.5 337 ±27 7.7
5. Optimum plant population/legowo 578±40 18.7 337±27 7.7
6. Site-specific fertilization 765±60 24.7 1,117±88 25.5
7. Water management 451±30 14.6 668±54 15.7
8. Integrated pest management 346±30 11.2 587±46 13.4
9. Early grain threshing 158±240 5.1 171±13 3.9
Total 3,096±240 100 4,383±346 100
Source: Zaini (2008)
PTT Adoption
After the demonstration period in 2006, the PTT technology rapidly
disseminated among farmers in the regency. The project succeeded in that all the
farmers adopted at least one component of the new technology package.
Unfortunately, the project failed to encourage farmers to adopt the whole
technology package. In 2006, only 9 sample farmers adopted the whole package,
while another 56 farmers adopted only one or some of the components of the
technology package. The farmers who continued using the whole technology
package had decreased to two in 2009. However, on average, the number of
technology components used by the farmers increased from 3 in 2006 to 4 in 2009.
It was discovered that a farmer might adopt one or several components during a
particular cropping season and neglect them in the next season; moreover, the same
farmer might adopt another separate component during the next cropping season.
Likewise, farmers would adopt a component(s) for the first time during a particular
cropping season and continue to use that component for the following season or
re-adopted a component neglected during the previous season. Such conditions

163 | SUSTAINABLE AGRICULTURE LEADS TO ZERO HUNGER
emphasized that the adoption of the new technology wildly fluctuated even during
the three years after the demonstration period.
The level of adoption of new superior varieties was relatively low. Most
farmers used high-yielding varieties that have been planted many times to decrease
their production capacity. In addition, the mechanism of resistance to pests and
diseases also decreased. In this case, the inhibiting factor for its production is not
only due to the influence of the genetic ability of plants to produce but also the
effect of the vitality of N fertilization to cure plants that are attacked by borers
(Sipi & Subiadi, 2015). The interviews with farmers found that farmers' knowledge
of PTT was limited. It was related to the lack of introduction of PTT technologies
and the scarce availability of certified superior varieties in the field. Sjamsiar et al.
(2015) stated that farmers managed their farming based on knowledge and using
seeds that have been planted for generations.
The PTT can be considered more intensive than conventional or standard
rice farming. Some components of the PTT require more money, skill or
knowledge, and labor to perform than conventional methods. For example, the
fertilizing component requires more money, while transplantation, according to
PTT, requires more skilled labor than the conventional method. The interview with
extension workers discussed that the PTT technology package's components could
be categorized based on the decision type available for each component. Seed
selection, fertilizing, and IPM adoption were considered the "independent
individual" decision type, in which the adoption of these components was based
on each farmer's decision.
Meanwhile, transplantation and proper harvest handling were considered
"collective" type decisions because, in practice, both components required
cooperation and agreement among farmers regarding timing and the division of
hired skilled laborers owing to labor shortages in the area. It was also common for
each farmer's household to help others conduct these two farming activities; thus,
the adoption and implementation of these components depend on collective work.
Water management was considered an "authority-imposed" decision because the
adoption of this component depended on the availability and sufficiency of
irrigation water, which the local government regulated based on a presidential
decree.
Based on the survey, farmers adopted the technology component(s) that
were easy to apply or gave them a direct benefit without requiring many inputs,
such as proper harvest handling. Only the component of proper harvest handling
was adopted and used by all the sample farmers continuously from 2006 to 2009.
Notably, each farmer made unique decisions on which components to adopt, and
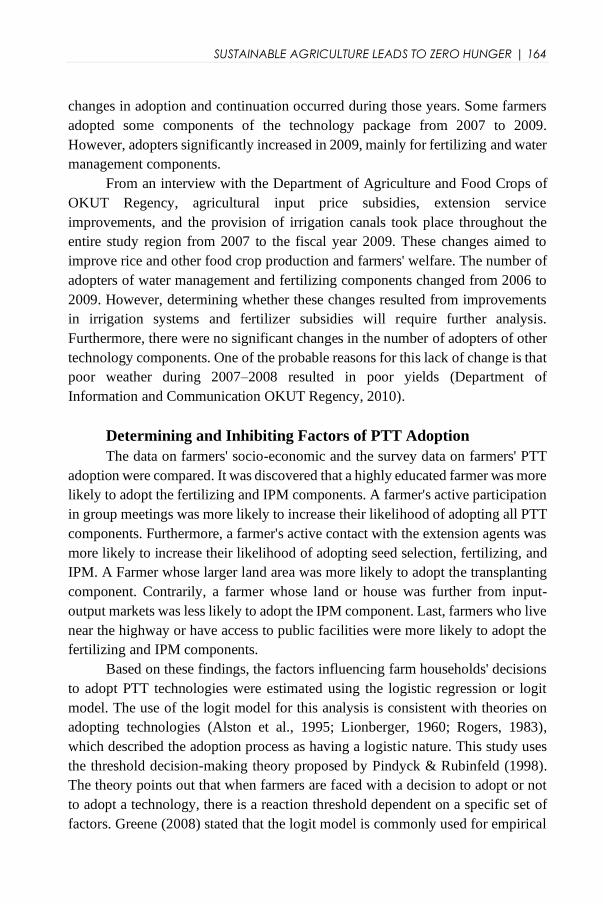
SUSTAINABLE AGRICULTURE LEADS TO ZERO HUNGER | 164
changes in adoption and continuation occurred during those years. Some farmers
adopted some components of the technology package from 2007 to 2009.
However, adopters significantly increased in 2009, mainly for fertilizing and water
management components.
From an interview with the Department of Agriculture and Food Crops of
OKUT Regency, agricultural input price subsidies, extension service
improvements, and the provision of irrigation canals took place throughout the
entire study region from 2007 to the fiscal year 2009. These changes aimed to
improve rice and other food crop production and farmers' welfare. The number of
adopters of water management and fertilizing components changed from 2006 to
2009. However, determining whether these changes resulted from improvements
in irrigation systems and fertilizer subsidies will require further analysis.
Furthermore, there were no significant changes in the number of adopters of other
technology components. One of the probable reasons for this lack of change is that
poor weather during 2007–2008 resulted in poor yields (Department of
Information and Communication OKUT Regency, 2010).
Determining and Inhibiting Factors of PTT Adoption
The data on farmers' socio-economic and the survey data on farmers' PTT
adoption were compared. It was discovered that a highly educated farmer was more
likely to adopt the fertilizing and IPM components. A farmer's active participation
in group meetings was more likely to increase their likelihood of adopting all PTT
components. Furthermore, a farmer's active contact with the extension agents was
more likely to increase their likelihood of adopting seed selection, fertilizing, and
IPM. A Farmer whose larger land area was more likely to adopt the transplanting
component. Contrarily, a farmer whose land or house was further from input-
output markets was less likely to adopt the IPM component. Last, farmers who live
near the highway or have access to public facilities were more likely to adopt the
fertilizing and IPM components.
Based on these findings, the factors influencing farm households' decisions
to adopt PTT technologies were estimated using the logistic regression or logit
model. The use of the logit model for this analysis is consistent with theories on
adopting technologies (Alston et al., 1995; Lionberger, 1960; Rogers, 1983),
which described the adoption process as having a logistic nature. This study uses
the threshold decision-making theory proposed by Pindyck & Rubinfeld (1998).
The theory points out that when farmers are faced with a decision to adopt or not
to adopt a technology, there is a reaction threshold dependent on a specific set of
factors. Greene (2008) stated that the logit model is commonly used for empirical

165 | SUSTAINABLE AGRICULTURE LEADS TO ZERO HUNGER
analysis in discrete choice situations because of its mathematical convenience and
simplicity.
This study's explanatory variables are classified into three main categories:
the household's sociodemographic characteristics and economic and social factors.
Beside, sociodemographic characteristics included farmers' age, education level,
farming experience, and the distance from their homesteads to input-output
markets. In addition, economic factors included the availability of farming funds,
farm size, and whether farmers had side jobs. Also, social factors included access
to extension services and farmers' group meetings. The data were from sample
farmers in 2010 based on their experiences in 2006 and 2009. Up to the present
(2021), these sample farmers no longer adopted the PTT technology, except for
one component of post-harvest handling. It is assumed that the data in 2006
captured factors for technology adoption, while the data estimation in 2009
specified factors for sustainable technology adoption. These data were calculated
using statistic software for Windows, SPSS, version 22.0 produced by IBM.
The factors influencing farmers' adoption of each component of the PTT
technology package were analyzed rather than the whole package at once.
Consequently, specific constraints on farmers' adoption of the new technology can
be considered. However, a limitation of this study was a lack of verifiable data
because the sample farmers (like many Indonesian farmers) did not have records
of their farming. All the available data was based on participants' recall of past
events correctly. For this reason, these findings cannot be generalized to the
broader community based on this study alone.
Furthermore, it was also acknowledged that not all variables' parameters
were significant in determining technology adoption. As the adoption situation of
the new technology wildly fluctuated from 2006 to 2009, it was suspected that
some factors other than the relatively stable socio-economic characteristics of
farmers affected the adoption and potentially increased the explanation power of
the regressions. Such factors may include each farmer's budget of inputs, sales
price, preference for a specific technology, an unexpected event for the farmer, and
other factors.
Many studies focus on the relationships between the cost to adopt and apply
new technologies and the expected revenue from the technology to study and
analyze farmers' behavior towards new technologies. However, this study found
that money was not a constraint on adoption. Based on the survey, there was only
a 20% difference in the costs spent by adopters who applied all the components
and those who applied only some components of the new technology in OKUT
Regency. However, adopting the entire package resulted in a greater than 50%

SUSTAINABLE AGRICULTURE LEADS TO ZERO HUNGER | 166
increase in production volume and revenue. It was observed that the variables
affecting farmers' adoption varied for each component of the technology package.
Farmers' participation in group meetings and contact with extension agents
were the most critical factors for adopting technology components. Participation
in group meetings affected the adoption of all technology components in both
years. In contrast, contact with extension agents affected the adoption of seed
selection, fertilizing, and IPM components for both observed years. Amala et al.
(2013) and Fachrista & Hendayana (2013) affirmed that households'
sociodemographic characteristics and economic factors such as age, farming
experience, education level, land size, and farming funds were the main factors
that influenced agricultural technology adoption in Indonesia. However, none of
these studies mentioned the effect of farmers' group meetings on agricultural
innovation adoption, although each farming area in Indonesia has at least one
farmers' group and association. Farmers' group meetings in the study area were
usually held once a week; thus, there were 15 to 16 meetings in one cropping
season. The evidence from this study suggested that farmers' group meetings
enabled their knowledge and information network. Not only limited to collective-
decision-related technology components, but the network effect was also crucial
for individual-decision components (including seed selection and fertilizing). This
finding is also supported by Conley & Udry (2000) and Foster & Rosenzweig
(1995), who stated that farmers share information and learn from each other
through such networks in agricultural innovations. Moreover, Effendy & Pratiwi
(2020) also confirmed that sources of information, extension activities, and the
nature of innovation significantly affected the adoption of PTT technology.
According to the interviews, before 2009, each extension worker had to
work with at least 20 villages; hence, dissemination of information regarding new
technologies was slow and sometimes overlapped with other kinds of technologies
introduced in other areas in the study region. Under the new president and
parliaments elected in 2009, the MoA employed nearly 10,000 new extension
agents; furthermore, the number of extension agents has grown continuously since
then. Currently, most rural districts in Indonesia are being served by public
extension services due to these new reformations. Group meeting participation and
contact with extension agents were essential variables in promoting technology
adoption; thus, encouraging farmers' participation in group meetings and
improving extension services will be indispensable to improving technology
adoption.
Because the farmers' households in the study area usually use either a
bicycle or a cart for transportation, farmers who live far away from the meeting

167 | SUSTAINABLE AGRICULTURE LEADS TO ZERO HUNGER
locations find it difficult to attend meetings. The finding suggested that the local
government facilitate farmers' group meetings in each village by allowing groups
to use village halls or other government buildings to hold meetings instead of using
the house of the village chief or school buildings. Holding meetings in various
locations within the village may solve transportation problems.
The results suggest that farmers' education levels affected fertilizing and
IPM component adoption. Because there are multiple steps involved in fertilizing
various types and quantities of fertilizer, it was suspected that the less-educated
farmers found applying the recommended fertilizing method difficult. Most of the
farmers applied fertilizer based on the availability of the fertilizer at the time and
decided the time of application and quantity based on their preferences. Likewise,
there were also some difficulties related to IPM adoption. Even though the
extension agents suggested when and what kind of plants should be planted for
IPM, most farmers neglected this advice. They planted their fields with income-
generating crops (such as soybeans and vegetables). When preventive methods
were no longer effective, and the extension agents suggested using certain bio-
pesticides, farmers were unwilling to buy the bio-pesticides. Fachrista &
Hendayana (2013) and Hidayatulloh et al. (2012) mentioned that less-educated
farmers tend to perform farming based on prior habits. When an innovation is
introduced and suggested to less-educated farmers, more time is required for such
farmers to change their habits and realize the importance of the adopted
innovations.
Moreover, farmers' living distant from input-output markets affected seed
selection and IPM adoption. According to the survey, the availability of ZA
fertilizer and bio-pesticide required for seed selection was limited to certain area
input stores. Meanwhile, in the case of the IPM component, based on the fact in
the area, early prevention and pest and disease control depended on the season.
High rainfall in the dry season during 2009 resulted in specific pests and diseases
occurring in rice fields in the area. Considering this abnormal weather pattern, the
recommended methods to prevent pests and diseases and the recommended bio-
pesticides from controlling damage differed from those recommended in previous
years.
Moreover, these methods were somewhat more complex than the
conventional method. Furthermore, the bio-pesticide recommended during that
time was only sold in specific markets nearby to urban areas, making it difficult
for some farmers to adopt the IPM component. These findings suggest that the
government must improve farmers' accessibility to the recommended inputs to

SUSTAINABLE AGRICULTURE LEADS TO ZERO HUNGER | 168
increase adoption. It can be initiated simply by providing input markets near rural
production areas instead of only near urban areas.
The regional factor also plays a role in the adoption of the technology. It
was found that farmers who lived in the areas closed by or traversed by the major
road were more likely to utilize the technology of fertilizing and IPM. It could be
attributed to the fact that the areas traversed by the major road usually had better
access to public facilities such as governmental office institutions, banks, credit
institutions, irrigation canals, and others. Burhansyah (2014) affirmed that distance
from settlement to location of the farm, distance from settlement to the source of
technology, accessibility to the road, and accessibility to the source of technology
also influence the adoption of innovation.
The interviews and focus group discussion revealed that farmers were afraid
of the risk of failure following periods of poor weather. Furthermore, they were
not willing to adopt particular technology components without seeing the success
of other farmers who had adopted the components. This finding provides insight
to the government that it is necessary to implement policies to minimize risk and
uncertainty due to poor weather. As FAO (2013) presented, response farming can
form the basis of strategies to adapt agricultural systems under variable weather
conditions. Providing credit facilities and supporting institutions such as village
cooperatives can also be solutions for farmers to obtain credit and fair loan interest
rates and further minimize risk and uncertainty.
Sasongko & Witjaksono (2014) admitted that farmers' attitudes positively
affect technology adoption. Meanwhile, communication behavior and motivation
positively affect farmers' attitudes. Wongkar et al. (2016) added that the level of
cosmopolitanism is highly related to the level of adoption of innovations in rice
cultivation technology. Concerning the implementation of communication of
various innovation technology packages among rural communities, there are still
gaps and misunderstandings affected by several factors. Among these factors are
farmers' socio-economic factors, including income, formal and non-formal
education, and age of farmers.
Innovation characteristics become greatly important in influencing farmers'
perceptions and attitudes. One of the arguments is that this perception is often the
basis for farmers' decisions to accept or reject an innovation. If the technology has
the characteristics that farmers want, the innovation will be readily accepted.
According to Rogers (1983), these characteristics include components of
complexity, comparative advantage, observability, compatibility, and trialability.
Meanwhile, Sulastri et al. (2022) grouped it into variables of perceived ease of use
and perceived usefulness.

169 | SUSTAINABLE AGRICULTURE LEADS TO ZERO HUNGER
9.3.1. Innovation Adoption Acceleration Strategy
Based on the results of PTT development in many locations in Indonesia,
several lessons were learned for further scrutiny. The preparation of technology
components, conducted with farmers in a participatory manner by considering the
condition of the lowland rice farming system in each location, was intended not to
repeat the same mistakes from the uniform approach to technology packages to
increase rice production. Unfortunately, the PTT philosophy was poorly
understood by agricultural officials. The interviews with extension officers
revealed that extension communication techniques were generally one-way,
causing the spread and adoption of technology far from the expected impact. The
transfer of the extension function from the central government to the local
government resulted in less than optimal national PTT socialization. From the
farmer's perspective, there was no self-awareness of the economic benefits derived
from adopting the PTT approach and the impact on land resources, environmental
quality, and improvements in farmers' household incomes. The Indonesian
government needs to learn from neighboring countries regarding the PTT
approach. Integrated Crop Management in Thailand, the Philippines, and Vietnam
has become popular. In Vietnam, this activity has been widely introduced since
2002 through campaigns in radio and national television broadcasts (Zaini, 2008).
As a clean, competent, credible, and accountable development agent, agricultural
development can be accomplished with good governance (Kustiari, 2016). In
synergy with farmers, the government can support the successful application of
sustainable rice cultivation technology.
Simultaneously, according to Pello et al. (2019), the role and motivation of
the extension workers influence innovation adoption. Three aspects indicate the
role of agricultural extension workers: the role of extension workers as educators
and assistants, aspects of roles as analyzers and planners, and aspects as experts in
evaluating activities and results of extension services. Furthermore, the
motivational factor of agricultural instructors is also indicated by three aspects, the
instructor's motivation for basic needs, status or social needs, and work
performance need. Saridewi & Siregar (2010) agreed that the role of extension
workers and technology adoption synergizes to increase rice production.
The strategy for accelerating the application of PTT technology can be
achieved through group meetings and field meetings that invite farmers from
different villages. It impacts the spread of PTT Technology, specific components,
such as seed components, produced in demonstration activities. Sjamsiar et al.
(2015) proposed that a technology demonstration should involve farmers with
continuous group assistance so that farmers can learn and see firsthand the results.

SUSTAINABLE AGRICULTURE LEADS TO ZERO HUNGER | 170
In addition, the demonstration can be a place for practice and inspiration for
non-adopter farmers. The increased income that can be achieved with the
recommended technology determines the enthusiasm for implementing a program.
The technology that was first recommended should be able to increase farmers'
income by 50 to 150%. Permatasari et al. (2018) stated that the greater the benefits
provided by new technology than the value generated by conventional technology,
the more accelerate the adoption.
Pagiola & Holden (2001) stated that agricultural intensification with the
adoption of innovations would be accepted sustainability if it meets several
requirements. First, the higher the efficiency of the recommended technological
innovation, the higher the price of the harvest after the implementation of the
technological innovation. Second, the lower the opportunity cost due to the
application of technological innovation compared to other activities, the lower the
level of time preference (high discount factor). Third, the lower the current
marginal utility compared to future consumption, the handling and its
responsibilities must differ. And also the more extension, the more farmer
participation to reach the higher production (Padjari, et al., 2021) and the extensor
plays the importan rule (Ariana et al., 2021 and Sundari et al., 2021)
Referring to farmers' decision-making to adopt innovation, PTT has taken
anticipatory steps into account. A clear example of an anticipatory step from the
first requirement of "efficiency" is the use of balanced fertilization based on the
soil series to reduce P and K fertilization and N fertilizer efficiency using the Leaf
Color Chart (Zaini, 2008). The recommendation of planting quality seeds aims to
reduce the use of seeds. After applying technological innovation, the varieties
planted must follow market preferences to deal with the high price of grain. In
addition, it is necessary to improve grain quality by applying appropriate pre-and
post-harvest techniques. It is also crucial to disparate rice prices based on quality
(taste and appearance). Another step that can be taken, though still not fully
implemented from the government's perspective, is preventing imported rice
adulteration. Rice imports should only be done for high-quality products. The
government must put pressure and legal action on rice smugglers somewhat.
The lower opportunity cost of labor for other activities with PTT technology
allows agricultural mechanization for pre-and post-harvest. This technology is
intended to not depend too much on manual labor. The high marginal utility in the
future can be anticipated by suppressing consumer preferences for imported rice
by improving the quality of domestic rice. Another vital policy is encouraging
vertical diversification of rice and its waste. The existence of the Rural
Agribusiness Program in 2008 was beneficial for overcoming the problem of

171 | SUSTAINABLE AGRICULTURE LEADS TO ZERO HUNGER
agricultural financing. Burhansyah (2014) disclosed that this program increased
the number of innovation adopters.
Learning from the era of the green revolution, the development of
agricultural programs must take a closer look at the conditions in which
productivity improvement programs must have a balanced benefit for farmers.
These conditions include profitable cultivation technology packages at various
scales of land ownership and balanced land distribution with guaranteed ownership
or rental rights. Obtaining inputs, farming credit, and marketing of products mean
that policymakers pay more attention to small-scale farmers and farm laborers.
Although this condition is not easy to achieve, concerted efforts must ensure that
smallholders and farm laborers have equitable access to land, technological
innovations, and more modern inputs. Therefore, farmers with different land
tenure scales have equal access to advanced technology and get a fair price for
their products.
9.4. Conclusion
The food security of a nation is not solely determined by the abundance of
natural resources such as land and water. However, it is primarily determined by
the quality and capacity of its human capital. Quality human capital will be able to
make scientific and technological inventions and innovations, including irrigated
rice cultivation technology. Appropriate application of rice science and technology
will be able to provide innovative breakthroughs to break up deadlocks to increase
rice productivity. The two pillars of a sustainable green revolution are applying
rice science and technology based on ecology and economy. An absolute
requirement to achieve food security through increased production is a serious
effort with total dedication and responsibility, based on harmonious cooperation
between development actors and efforts to conserve natural resources in a peaceful
living situation.
As for the majority of agricultural technology introduced to farming areas
in Indonesia, in some irrigated rice-farming areas of South Sumatra, agricultural
technology was promoted as a package that included various components. This
study revealed that, instead of adopting the technology as a package, farmers
tended to adopt some technology components while neglecting other components.
Whereas previous studies presented economic and sociodemographic
characteristics of farmers as the significant constraints to adopting new
technologies, the study highlighted the importance of farmers' group meetings in
exchanging technical information among group members to promote component

SUSTAINABLE AGRICULTURE LEADS TO ZERO HUNGER | 172
adoption. The findings suggested that a lack of knowledge and information
networks may challenge technology adoption constraints. In addition, the findings
recommend improving several conditions, including the availability of local
government facilities for farmers' group meeting places and the construction of
credit facilities and nearby markets for inputs. Such changes could promote the
sustained success and stability of new technology adoption in rice farming in
Indonesia.

173 | SUSTAINABLE AGRICULTURE LEADS TO ZERO HUNGER
References
Alston, J. M., Norton, G. W., & Pardey, P. G. (1995). Science Under Scarcity: Principles
and Practice for Agricultural Research Evaluation and Priority Setting. Cornell
University Press. https://doi.org/10.1111/j.1574-0862.1996.tb00428.x
Amala, T., Chalil, D., & Sihombing, L. (2013). Faktor-Faktor Yang Berhubungan Dengan
Tingkat Adopsi Petani Terhadap Sistem Pertanian Padi Organik. Journal of
Agriculture and Agribusiness Socioeconomics, 2(11).
https://media.neliti.com/media/publications/15156-ID-faktor-faktor-yang-
berhubungan-dengan-tingkat-adopsi-petani-terhadap-sistem-pert.pdf
Arafah, Bahri, S., & Satna, A. (2007). Pengelolaan Tanaman Terpadu (PTT) Padi Sawah.
Ariana, S., Sundari, R. S., Umbara, D. S. 2021. Peran Penyuluh Pertanian terhadap
Produksi Padi Sawah di Desa Cibuniasih Kecamatan Pancatengah Kabupaten
Tasikmalaya. Mimbar Agribisnis. Jurnal Pemikiran Masyarakat Ilmiah berwawasan
Agribisnis. 7(2):1474-1487.
Balasubramanian, R. (2002). Response of hybrid rice (Oryza sativa) to levels and time of
nitrogen application. Indian Journal of Agronomy, 47, 203–206.
BPS Kabupaten OKUT. (2012). OKU Timur Dalam Angka 2009-2012 (OKUT Regency in
Number 2009-2012). BPS Kabupaten OKUT.
Burhansyah, R. (2014). Faktor-faktor yang Mempengaruhi Adopsi Inovasi Pertanian pada
Gapoktan PUAP Dan Non PUAP di Kalimantan Barat. Jurnal Informatika
Pertanian, 23(1), 65–74.
Conley, T. G., & Udry, C. R. (2000). Learning About a New Technology : Pineapple in
Ghana (No. 817; Center Discussion Paper).
http://www.econ.yale.edu/growth_pdf/cdp817.pdf
Department of Information and Communication OKUT Regency. (2010). Laporan Khusus
Cuaca dan Iklim di Wilayah Kerja untuk Kegunaan Kegiatan Pertanian Tanaman
Pangan, Tanaman Tahunan, dan Perikanan Tahun 2007-2009. Department of
Information and Communication OKUT Regency.
Effendy, L., & Pratiwi, S. D. (2020). Tingkat Adopsi Teknologi Sistem Jajar Legowo Padi
Sawah Di Kecamatan Cigasong Kabupaten Majalengka. Jurnal Agrica Ekstensia,
14(1), 81–85.
Fachrista, I. A., & Hendayana, R. (2013). Socio economic factor as determinant for
adoption of integrated crops management (icm) of paddy at Bangka Belitung.
Inform. Pertan., 22, 113–120.
Fagi, A. M. (2008). Alternatif Teknologi Peningkatan Produksi Beras Nasional. Iptek
Tanaman Pangan, 3(1), 9–26.
FAO. (2013). Climate Impact on Agriculture – Response Farming. FAO.
http://www.fao.org/nr/climpag/pub/farming_in_response_to_the_weather.pdf
FAO. (2020). FAO Statistical Yearbook – World Food and Agriculture 2020. FAO.
https://doi.org/https://doi.org/10.4060/cb1329en

SUSTAINABLE AGRICULTURE LEADS TO ZERO HUNGER | 174
Foster, A. D., & Rosenzweig, M. R. (1995). Learning by Doing and Learning from Others:
Human Capital and Technical Change in Agriculture. Journal of Political Economy,
103(6), 1176–1209. http://www.jstor.org/stable/2138708
Greene, W. H. (2008). Econometric Analysis (Sixth). New York University.
Hidayatulloh, W. A., Supardi, S., & Sasongko, L. A. (2012). Tingkat Ketepatan Adopsi
Petani terhadap Sistem Tanam Jajar Legowo pada Tanaman Padi Sawah (Studi
kasus di Desa Undaan Kidul, Kecamatan Undaan, Kabupaten Kudus). Mediagro,
8(2), 71–82.
Jamal, E., & Mardiharini, M. (2008). Proses Diseminasi Pengelolaan Tanaman dan
Sumberdaya Terpadu (PTT) Padi : Suatu Pembelajaran dan Perspektif Ke Depan.
Analisis Kebijakan Pertanian, 6(3), 272–285.
Kustiari, T. (2016). Tingkat Penerapan Teknologi Budidaya Padi Organik Di Desa Lombok
Kulon Kecamatan Wonosari Kabupaten Bondowoso. Dinamika Global :
Rebranding Keunggulan Kompetitif Berbasis Kearifan Lokal, 612–621.
http://download.portalgaruda.org/article.php?article=479041&val=9212&title=tin
gkat penerapan teknologi budidaya padi organik di desa lombok kulon kecamatan
wonosari kabupaten bondowoso
Lionberger, H. F. (1960). Adoption of new ideas and practices; a summary of the research
dealing with the acceptance of technological change in agriculture, with
implications for action in facilitating such change. Ames, Iowa State University
Press.
Ministry of Agriculture of Republic of Indonesia. (2010). Laporan Tahunan Pertanian
Indonesia per Provinsi Tahun 2008/2009. Directorate General of Food Crops,
Ministry of Agriculture of Republic of Indonesia.
Padjari, I., Sundari, R. S., Umbara, D. S. 2021. Hubungan Antara Peran Penyuluh Pertanian
dengan Partisipasi Petani dalam Usahatani Padi Hitam di Kelurahan Cikalang
Kecamatan Tawang Kota Tasikmalaya. Mimbar Agribisnis. Jurnal Pemikiran
Masyarakat Ilmiah berwawasan Agribisnis. 7(2):1537-1544.
Perundangan Pertanian Indonesia Tahun 2009/2010, (2011) (testimony of Ministry of
Agriculture of The Republic of Indonesia).
Pagiola, S., & Holden, S. (2001). Farm Household Intensification Decisions and the
Environment." In Tradeoffs or Synergies? Agricultural Intensification, Economic
Development, and the Environment (R. Lee & B. Barrett (eds.)). CAB International.
Pello, W. Y., Renoat, E., & Banunaek, M. F. (2019). The Effect of Agricultural Extension
Agent's Role and Motivation on Wet-Rice Cultivation Technology Innovation in
East Kupang Sub District of Kupang Regency of East Nusa Tenggara Province.
Jurnal Penyuluhan, 15(2), 184–194.
Permatasari, P., Anantanyu, S., & Dewi, W. S. (2018). Pengaruh Tingkat Adopsi Budidaya
Padi Organik terhadap Keberlanjutan Budidaya Padi Organik di Kabupaten
Boyolali. Caraka Tani: Journal of Sustainable Agriculture, 33(2), 153.
https://doi.org/10.20961/carakatani.v33i2.22296

175 | SUSTAINABLE AGRICULTURE LEADS TO ZERO HUNGER
Pindyck, R. S., & Rubinfeld, D. L. (1998). Econometric Models and Economic Forecasts.
Irwin/McGraw-Hill. https://books.google.co.id/books?id= ZQLsAAAAMAAJ
Rogers, E. M. (1983). Diffusion of innovations. In An Integrated Approach to
Communication Theory and Research, Third Edition. The Free Press: A Division
of Macmillan Publishing Co. and Collier Macmillan Publishers.
https://doi.org/10.4324/9780203710753-35
Saridewi, T. R., & Siregar, A. N. (2010). Hubungan antara peran penyuluh dan adopsi
teknologi oleh petani terhadap peningkatan produksi padi di Kabupaten
Tasikmalaya. Jurnal Penyuluhan Pertanian, 5(1), 55–61.
Sasongko, W. A., & Witjaksono, R. H. (2014). Pengaruh Perilaku Komunikasi Terhadap
Sikap Dan Adopsi Teknologi Budidaya Bawang Merah Di Lahan Pasir Pantai
Kecamatan Sanden Kabupaten Bantul. Agro Ekonomi, 24(1), 35–43.
Sipi, S., & Subiadi. (2015). Penerapan Pengelolaan Tanaman Terpadu (PTT) Padi Dan
Produktivitas Padi Sawah Di Kabupaten Manokwari. Buletin Agro-Infotek, 1(1),
60–65. http://repository.pertanian.go.id/handle/123456789/8779
Sjamsiar, Zainuddin, Y., & Konyep, S. (2015). Percepatan Penerapan Teknologi PTT Padi
Sawah di Tingkat Petani melalui Gelar Teknologi di Kendari Prov. Sulawesi
Tenggara. Seminar Nasional: Mewujudkan Kedaulatan Pangan Melalui Penerapan
Invoasi Teknologi Pertanian Spesifik Lokasi Pada Kawasan Pertanian, 366–371.
Sulastri, A. M., Utama, S. P., & Sukiyono, K. (2022). Tingkat Adopsi Teknologi
Pengelolaan Tanaman Terpadu (PTT) di Kabupaten Seluma. Jurnal Penyuluhan,
18(01), 75–86. https://doi.org/10.25015/18202237348
Sundari, R. S., Umbara, D. S., Hidayati, R., Fitriadi, B. W. 2021. Peran Penyuluh Pertanian
terhadap Produksi Padi Sawah di Kabupaten Tasikmalaya. Agriekonomika.
10(1):59-67. https://doi.org/10.21107/agriekonomika.v10i1.9962
Wihardjaka, A., & Nursyamsi, D. (2012). Pengelolaan Tanaman Terpadu pada Padi Sawah
yang Ramah Lingkungan (Integrated Crop Management in Rice Environmentally
Friendly). Jurnal Pangan, 21(2), 185–196.
Wongkar, D. K. R., Wangke, W. M., Loho, A. E., & Tarore, M. L. G. (2016). Hubungan
Faktor-faktor Sosial. Agri-Sosioekonomi, 12(2), 15–32. https://e-
resources.perpusnas.go.id:2217/publications/3539/hubungan-faktor-faktor-sosial-
ekonomi-petani-dan-tingkat-adopsi-inovasi-budidaya
Zaini, Z. (2008). Inovasi Teknologi Budidaya Padi Sawah Spesifik Lokasi. Balitbangtan
Departemen Pertanian. www.lapan.go.id

SUSTAINABLE AGRICULTURE LEADS TO ZERO HUNGER | 176
Brief Curriculum Vitae of Authors
Nina Lisanty is a lecturer in Study Program of
Agribusiness, Faculty of Agriculture, Kadiri University,
Kediri, East Java, Indonesia. She is an Editor in Chief in
Journal Agrinika: Journal of Agribusiness and
Agrotechnology, accredited Rank 3rd by Indonesian
Ministry of Research, Technology, and Higher
Education. Link: https://orcid.org/0000-0003-2899-
1216
https://www.scopus.com/authid/detail.uri?authorId=57224619196https://sc
holar.google.co.id/citations?user=wJ3QKgYAAAAJ&hl=id&oi=ao
She published in one indexed International Journal, 25 indexed national
journal and one national book chapter. Nina Lisanty and Yudhi Zuriah Wirya
Purba were part of the Komering Irrigation Evaluation Research Team,
OKUT Regency, South Sumatra Province, from 2006-2010. Lisanty is a
lecturer at the Faculty of Agriculture, Kadiri University of East Java
Province. Meanwhile, Purba is a lecturer in the Agribusiness Graduate
Program of Sjakhyakirti University, Palembang. The collaboration between
the two was strengthened by Agustia Dwi Pamujiati, with her educational
background in the food and agro-industry fields. Pamujiati provided insight
and enriched this chapter from the perspective of food security and food
policy.
Agustia Dwi Pamujiati is a lecturer in Kadiri
University, Kediri, East Java Indonesia. She is a
Journal Manager in Journal JINTAN (National Journal
of Agriculture).
https://scholar.google.co.id/citations?user=ZSe4eyUA
AAAJ&hl=id , https://orcid.org/0000-0003-4336-9070.
She published in 17 national indexed journal.
Dr. Yudhi Zuriah Wirya Purba in Graduate school of
Agribusiness, Sjakhyakirti University, Palembang,
South Sumatra, Indonesia. She is an editor in Jimanggis,
Journal of Agribusiness. She has published 2 indexed
international seminar proceedings and 13 national
indexed journals.
https://www.scopus.com/authid/detail.uri?authorId=57
200725155.

177 | SUSTAINABLE AGRICULTURE LEADS TO ZERO HUNGER
https://scholar.google.co.id/citations?hl=id&user=ZQzsXBkAAAAJ
Yudhi Zuriah Wirya Purba and Nina Lisanty were part of the Komering
Irrigation Evaluation Research Team, OKUT Regency, South Sumatra
Province, from 2006-2010. Lisanty is a lecturer at the Faculty of Agriculture,
Kadiri University of East Java Province. Meanwhile, Purba is a lecturer in
the Agribusiness Graduate Program of Sjakhyakirti University, Palembang.
The collaboration between the two was strengthened by Agustia Dwi
Pamujiati, with her educational background in the food and agro-industry
fields. Pamujiati provided insight and enriched this chapter from the
perspective of food security and food policy.
.

SUSTAINABLE AGRICULTURE LEADS TO ZERO HUNGER | 178

179 | SUSTAINABLE AGRICULTURE LEADS TO ZERO HUNGER
CHAPTER 10
MOLECULAR MARKER STUDIES IN SUSTAINABLE
AQUACULTURE
Emel Özcan GÖKÇEK1*
1Ege Üniversitesi, Su Ürünleri Fakültesi, Yetiştiricilik Bölümü, Bornova/İzmir
*Corresponding Author: [email protected]

SUSTAINABLE AGRICULTURE LEADS TO ZERO HUNGER | 180

181 | SUSTAINABLE AGRICULTURE LEADS TO ZERO HUNGER
10.1. Introduction
Aquaculture production has become the fastest growing and most
demanding food production sector in the world. While the aquaculture production
was 87500927 tons, fisheries production was 1119435 tons, according to the FAO
2020 statistics (FAO, 2022). It is estimated that the aquaculture sector will grow
by 31% in the next ten years (Gratacap et al., 2019). The aquaculture sector is
affected by constantly increasing food demand, climate change, fisheries pressure
on natural stocks, and environmental pollution. Under these conditions, the
continuation of aquaculture production depends on sustainable approaches.
As in other production sectors, sustainability can be achieved with
economically efficient and environmentally friendly approaches. Improving the
yield of the stocks under production is essential to making aquaculture sustainable.
Selection studies are essential in improving economic traits such as improving
growth rate, feed conversion coefficient (FCR), increasing disease resistance, and
increasing cold or heat tolerance. It has become more critical to improving the
adaptation of aquaculture stocks to changing environmental conditions with
climate change. Even in both aquaculture and hydroponic mixture system that
called aquaponics to produce more fishes and vegetable at once (Sundari, et al.,
2021) Protecting the genetic resources of aquatic stocks is crucial for the
sustainability of fisheries and farming. Not only fish but other invertebrate aquatic
organisms such as mussels and sea cucumbers are threatened by overfishing
(Günay et al., 2021). It is reported that if necessary precautions are not taken until
2050, severe losses may occur in natural fish stocks due to fisheries (Béné et al.,
2015).
The advances in molecular genetics have provided significant benefits and
rapidity to the genetic improvement of aquaculture stocks in the last 30 years.
Species identification, population genetic studies, marker-assisted selection
(MAS) studies, gene-assisted selection (GAS), parent determination, quantitative
trait locus (QTL) determination, linkage mapping, and genome-wide association
studies (GWAS) can be carried out via molecular markers (Özcan Gökçek, 2020a).
10.2. Molecular Markers
Genetic markers are essential molecular tools in taxonomic studies,
identifying unknown species even at the larval stage, and population genetic
studies. The main fields of molecular marker studies:

SUSTAINABLE AGRICULTURE LEADS TO ZERO HUNGER | 182
- Determining the genetic diversity of natural and aquaculture populations
is essential to the sustainability of the aquatic ecosystem,
- Gene-assisted selection (GAS) and marker-assisted (MAS) selection
studies,
- Genetic identification of invasive species, determination of the effect on
genetic diversity of natural populations, hybridization, and monitoring of
interactions,
- Detection of species obtained through illegal fishing,
- Species detection of bacteria, viruses, and parasites in aquaculture
species.
The presence of a gene or locus in more than one form in a population is
called polymorphism. At least two alleles must be present in a gene to identify as
a polymorphism. Monomorphism is the presence of a single type of allele in the
locus or gene region. Molecular markers provide direct (DNA-based) or indirect
(phenotype-based) information about a genotype in a particular locus or gene (Işık
et al., 2022). The detection of polymorphisms and possible relationships with yield
characteristics (harvest weight, growth rate, meat quality, etcetera.) are revealed
with the help of molecular markers (Özcan Gökçek and Işık, 2020b; Işık and Özdil,
2020). The prediction accuracy increases with the genotypic information of
selection studies in aquaculture populations. Havestein et al. (2003) reported that
the yield of farm animals could improve by 600% with the application of genetic
technologies in the selection.
In addition to breeding studies, molecular markers can be used in many
areas, such as controlling and monitoring genetic diversity in natural and cultural
stocks, detecting the spread of invasive species, and species determination in
aquatic food products. It is possible to classify molecular markers into three
categories: I. Generation hybridization (RFLP), II. Generation PCR-based (PCR-
RFLP, RAPD, SSRs, etcetera.) and III. Generation sequencing (Sanger) and
DNAchip (Illumina etcetera) based SNP (Single Nucleotide Polymorphisms)
markers. Also, markers can classify as PCR-based and non-PCR-based markers.
New technologies are being developed to reveal the genome more quickly,
precisely, and comprehensively.
10.3. Non-PCR based markers
The development of molecular technology in the 1970s made it the first non-
PCR-based marker to analyze polymorphisms (variation) in the genome sequence

183 | SUSTAINABLE AGRICULTURE LEADS TO ZERO HUNGER
at the DNA level. Genomic DNA is cut with a restriction enzyme that recognizes
a specific nucleotide sequence, or different cutting sites are detected in the DNA
to which the probe DNA hybridizes. Thus, differentiation can be detected by
sequence differences between individuals. Since the RFLP technique has a
codominant feature and is more disadvantageous than PCR-based studies, its use
has decreased today (Yorgancılar et al., 2015).
10.4. PCR-based markers
The discovery of the Polymerase Chain Reaction (PCR) by Kary Mullis in
1983 gave great impetus to molecular marker studies.
PCR-RFLP (Restricted Fragment Length Polymorphism)
Figure 1. RFLP analysis (Özcan Gökçek et al., 2020c)
PCR amplifies a locus on the genome, and the PCR product is cut from the
polymorphic sites with various restriction enzymes. The PCR products are cut and
separated by agarose gel electrophoresis, and differences between individuals are
determined according to their band size (Figure 1). PCR-RFLP determines
polymorphisms in gene regions, and possible relationships with economic traits
are investigated in many studies. Sánchez-Ramos et al. (2012) amplified the 13000
bp region of five candidate genes related to growth in Sparus aurata by the PCR-
RFLP method. As a result of the study, they determined a significant relationship

SUSTAINABLE AGRICULTURE LEADS TO ZERO HUNGER | 184
between the MSTN-1 gene and the growth traits of Sparus aurata. Özcan Gökçek
et al. (2020c) found statistically significant associations between the genotypes of
IGF-II-NdeI locus and body weight and total length of European seabass
(Dicentrarchus labrax) with the PCR-RFLP method.
PCR-RFLP technique was also used to identify fish and aquatic
invertebrates (Galal-Khallaf et al., 2017; Wilwet et al., 2018; Pappalardo et al.,
2018). Ferrito et al. (2019) defined shark and swordfish slices via COIBar-RFLP
analysis. They reported that the mislabeled swordfish products were identified
with the MboI restriction enzyme. Researchers have found that COIBar-RFLP
could be a suitable molecular tool for food identification in seafood. Madeira et al.
(2018) used Sau3Al ve 16S rRNA restriction nucleases to identify two sea
cucumber species. They suggested that the PCR-RFLP was a valuable method for
genetic and taxonomic studies of holothurians.
RAPD (Random Amplified Polymorphic DNA)
The RAPD method reveals genetic differences in plant and animal samples.
It is an easy and cheap method. This method does not need prior knowledge of a
specific target DNA region or gene. A large number of individuals and many loci
can be examined simultaneously and quickly with the help of primers of 8-15
nucleotides (Liua ve Cordesb, 2004). Because it does not require prior knowledge
about the DNA sample provides a tremendous advantage for organisms whose
genome has not been identified yet. In addition, the RAPD technique is an
excellent tool where urgent identification is required, such as bivalve species and
invasive species (Özcan-Gökçek et al., 2017). Neekhra et al. (2014) reported that
6 of 10 random decanucleotide primers were a fast, cheap, and suitable method for
detecting genetic differentiation and band evaluation in 3 species belonging to the
Cyprinidae family. In another RAPD study, species-specific identification was
performed with unique band patterns via random primers in 3 different gray mullet
species (M. cephalus, L. Murata, and L. ramada) (Abou-Gabal et al., 2018).
Özcan Gökçek et al. (2017) used RAPD markers to genetically identify
invasive and native oyster species collected from the Aegean Sea (Figure 2).
Sixteen diagnostic RAPD bands were found in the study; eleven were specific to
the Crassostrea genus, and five were specific to the Ostrea genus. RAPD markers;
have low reproducibility and limited use compared to other markers due to
difficulties in evaluating PCR band homologies (Ali et al., 2004).

185 | SUSTAINABLE AGRICULTURE LEADS TO ZERO HUNGER
Figure 2. Different oyster species and a gel photo of RAPD bands (Gökçek et al., 2017)
Microsatellites/ SSRs
The SSRs (Single Strand Repeats) or microsatellites marker consists of
sequentially repeated groups scattered throughout the prokaryotic and eukaryotic
genome. They are species-specific, highly polymorphic, codominant markers,
easily studied by PCR. Microsatellite markers are widely used to detect genetic
diversity, inbreeding, parental determination, species identification, and
commercial tracking (Olununmi 2019). Besides, they are very effective markers
for QTL (Quantitative Trait Locus) determination, MAS, and genetic linkage
mapping. Sigang et al. (2021) have determined 220709 SSRs in the spotted seabass
(Lateolabrax maculatus) population. Dinucleotide replication was found at an 85%
rate and was primarily seen in AG replications in the L.maculatus genoe. The use
of genome-wide SSRs found in this study was recommended for marker-assisted
selection studies of spotted sea ba s. The progress of SSR markers has been
successfully carried out in many aquatic species such as common carp (Cyprinus
carpio) (Ji et al., 2012), (Huang et al., 2019), Pacific oyster (Crassostrea Gigas)
(Jiang et al., 2014), and shrimp (Zhang et al., 2019; Yuan et al., 201 ). Sawayama
et al. (2017) reported that the MHC immune gene, which is associated with a major
QTL, is a candidate gene for Red sea bream iridoviral disease in red sea bream.
They reported that this gene could be used in the MAS study of red sea bream.
Microsatellites are widely used to determine the genetic diversity of natural
and farm populations. The microsatellite markers were used for monitoring the
genetic diversity of 9 clams (M. petechial) populations (Xu et al., 202 ). They

SUSTAINABLE AGRICULTURE LEADS TO ZERO HUNGER | 186
stated that these results would be a handy reference for detecting genetic diversity,
monitoring, and protecting clam populations in the future. Genetic diversity of
European seabass (Quere et al., 2012; Karahan et al., 2014), Atlantic salmon
(Salmo salar) (Gilbey et al., 2018), carpet shell (Polititapes rhomboids) (Chac'on
et al., 2021), silver carp (Hypophthalmichthys molitrix) (Luo et al., 2022), lumpfish
(Cyclopterus lumpus) (Maduna et al., 2020), Nile tilapia (Oreochromis niloticus)
(Makeche et al., 2022) were studied with SSRs.
SNPs (Single Nucleotide Polymorphisms)
SNPs are caused by polymorphism of a single nucleotide in the genome, and
some SNPs seen in exon regions may change the amino acid sequence g. SNPs can
be found in the DNA sequence as transition, transversion, insertion, and deletion
(Işık et al., 202 ). Some SNPs located in a gene's intron regions or UTR regions
can indirectly affect gene expression by changing regulator sequences. SNP
markers are widespread, suitable for digital genotyping, located in coding and non-
coding regions of DNA, and more stable than microsatellites. SNPs are widely
used to identify candidate genes that affect quantitative traits. SNPs are determined
by sequencing many gene regions associated with growth, development, and yield
characteristics in farm animals and aquaculture species (Işık et al., 2021) (Figure
). Jaser et al. (2017) identified ten SNPs in the GH gene of Nile tilapia; nine of
them in the promoter region and one within the 5’UTR region. They have found
that five SNPs were significantly correlated with growth traits. Özcan Gökçek and
Işık (2020) found AT indel and two SNPs in exon 1 and 5’ UTR regions of IGF-I
gene of European seabass.
Figure 3. Steps of the SNP analysis (Özcan Gökçek et al., 2020b)

187 | SUSTAINABLE AGRICULTURE LEADS TO ZERO HUNGER
They determined statistically significant associations between the genotypes
of IGF-I g.46749C > T, g.46672A > G and growth trai s. Tran et al. (2021)
identified that two SNPs (IGF1:13680 A>T and IGF1R:13357 T>C) were
significantly associated with the growth trait IGFIR and IGFI genes of striped
catfish (Pangasianodon hypophthalmus). The new methods in sequencing
technologies (NGS, WGS) and high-density linkage maps are created by
identifying large numbers of SNPs in the genome (Abdelrahman et al., 2017;
Sigang et al., 2021; Penaloza et al., 2021) (Figure1). Genetic variances and genetic
structures of populations of Gilthead sea bream and European sea bass were
investigated with a MedFishSNP array (~60K) (Villanueva et al., 202 ).
Table 1. Summarization of SNP studies in the aquaculture species
Species Method of
Identification
SNP
array
density
Numbers of
SNPs References
Dicentrachus labrax Read-Seq 234,148 SNPs Tine et al., 2014
Dicentrachus labrax Pool-Seq ~30K ~20 million SNPs Penaloza et al., 2021
Salmo salar RNA-seq ~96,000 SNPs Tsai et al., 2016
Ostrea edulis Rad-Seq ~11K 588,266 SNPs Gutierrez et al., 2017
Crassostrea gigas Rad-Seq ~27K 12.4 million SNPs Gutierrez et al., 2017
Cyprinus carpio 2b-Rad Seq ~413,059 SNPs Su et al., 2020
Oreochromis niloticus Pool-Seq ~65K ~20 million SNPs Penaloza et al., 2020
Sparus aurata Pool-Seq ~30K ~20 million SNPs Penaloza et al., 2021
The study results detected slight differentiation between eastern and western
Mediterranean seabass populations and between Mediterranean and Atlantic
seabream populations. It has been reported that the adequate population size is
generally more than 1000 in natural populations and less than 100 in farm
populations. They suggested that breeding and selection programs should increase
genetic variation in farm populations, and escaping from fish farms to nature
should be prevented. Some studies of SNPs summarization in the aquaculture
species are shown in Table 1.
Aslam et al. (2020) analyzed with Affymetrix SNP-chip (57,184 SNPs) for
parasitic diseases (AGD: Amoebic gill disease) of salmon (Salmo sala ). They
identified three candidate genes, c4, tnxb, and slc44a4, in the QTL2 region of
salmon with GWAS (Genome-Wide Analysis Study) analysis. The GWAS method
has been reported to increase the prediction accuracy rate by 9-17% compared to
breeding studies based on pedigree knowledge. GWAS analysis was performed
with a 190 K high-density SNP array in Pacific oysters (Crassostrea gigas) (Liu et
al., 202?).

SUSTAINABLE AGRICULTURE LEADS TO ZERO HUNGER | 188
Figure 4. Process of SNP array analysis (medaid-h2020.eu 2020)
This study found the associations of eleven SNPs with growth, yield
characteristics, and shell shape of Pacific oysters significant. An SNP is within the
exon region of the dipetalogastin gene, which may affect the growth of oysters.
This study identified new candidate genes and SNPs related to oyster growth,
which is helpful for marker-assisted selection. The studies of whole-genome
analysis have stimulated the gene transfer and genome editing studies in
aquaculture species (Dunham 2014; Simora et al., 2020; Tao et al., 2020; Özcan
Gökçek, 2022).
DNA Barcoding
DNA barcoding technique is based on sequencing of amplified a specific
region of genomic DNA, chloroplast DNA or mitochondrial D A. Hebert et al.
(2003) have developed universal primers specific to the mitochondrial
cytochrome-c oxidase subunit 1 (COI) gene, so the COI gene has been accepted as
the official barcode marker in animals (Hebert 2003a, ). The universal primers of
the COI gene are pretty stable, and the nucleotide substitution rate is high enough
to distinguish closely related species and different populations of the same species
(Yatkın and Nurper, 201 ). DNA barcoding was a quick, reliable, and effective
method for identifying aquatic animals and processed products (Zhang and

189 | SUSTAINABLE AGRICULTURE LEADS TO ZERO HUNGER
Hanner, 2011; Crocetta, 2015; Shen et al., 2016; Koban Baştanlar, 201 ). The
spread of invasive species is increasing due to climate change and human activities
within the aquatic ecosystem. DNA barcodes and integrated databases (BOLD:
HTTP: //www.boldsystems.org) play an essential role in tracking the biodiversity
of natural populations, identifying alien species, and identifying species acquired
from illegal fishing (Williams et al., 2013; Imtiaz et al., 2017) (Figure 5).
In Rahman et al. (2018) study, they investigated 149 freshwater fish species
by sequencing the COI gene region in Bangladesh. They revealed that the mt COI
regions of 53 fish had not been reported before in this country. In addition,
identified 30 fish species have never been previously described. Invasive
Crustacean species are widespread throughout the world. Primers are widely used
in detecting these mt COI species and other barcodes (16S rDNA, ITS1, ITS2,
etcetera.). Özcan Gökçek et al. (2020d) have identified an invasive oyster species:
Pacific oyster with mt COI barcode in the Marmara sea of Turk y. In aquaculture,
mainly broodstocks are obtained from natural stocks. Therefore, DNA barcoding
plays a vital role in monitoring the spread of invasive species and their effects on
native aquatic populations.
Figure 5. The ML tree of Sparidae fish species is based on the fragment of the mtCOI
gene (Abbas et al., 2017)

SUSTAINABLE AGRICULTURE LEADS TO ZERO HUNGER | 190
10.5. Conclusıon
Efforts to increase production productivity and cultural stocks' welfare are
essential for sustainable aquaculture. In this context, molecular markers are
powerful tools that increase the accuracy of selection studies to improve economic
traits. The precision in species identification of molecular markers enables them to
find applications in various areas, from natural and hunting stocks to invasive
species, endangered species, and species identification in processed fishery
products.

191 | SUSTAINABLE AGRICULTURE LEADS TO ZERO HUNGER
References
Abbas, E. M., Soliman, T., El-Magd, M. A., Farrag, M. M. S., Ismail, R. F., & Kato, M.
(201 ). Phylogeny And DNA Barcoding Of The Family Sparidae İnferred From
Mitochondrial DNA Of The Egyptian Waters. J. Fi H. Aquat. Sci, 12(2), 73-81.
Abdelrahman, H., Elhady, M., Alcivar-Warren, A., Allen, S., Al-Tobasei, R., Bao, L., ...
& Zhou, T. (2017). Aquaculture Genomics, Genetics, And Breeding İn The United
States: Current Status, Challenges, And Priorities For Future Research. BMC
Genomics, 18(1), 1-23.
Abou-Gabal, A. A., Abbas, E. M., Ali, H. M. M., El-Baramawi, N., Khaled, A. A., & El
Deeb, S. I. (201 ). Molecular Identification Of Grey Mullet Species İn The
Mediterranean Sea Of Egy T. Egyptian Journal Of Aquatic Biology And Fisheries,
22(4), 125-139.
Ali, B. A., Huang, T. H., Qin, D. N., & Wang, X. M. (2004). A Review Of Random
Amplified Polymorphic DNA (RAPD) Markers In Fish Research. Reviews In Fish
Biology And Fisheries, 14(4), 443-453.
Aslam, M. L., Boison, S. A., Lillehammer, M., Norris, A., & Gjerde, B. (2020). Genome-
Wide Association Mapping and Accuracy of Predictions for Amoebic Gill Disease
İn Atlantic Salmon (Salmo Sala ). Scientific Reports, 10(1), 1-9.
Baştanlar, E. K. (201 ). Identification Of Mislabelling İn Frozen Fish Fillets Based On
DNA Barcoding Analysis. Marine Science And Technology Bulletin, 8(1), 30-35.
Béné, C., Barange, M., Subasinghe, R., Pinstrup-Andersen, P., Merino, G., Hemre, G. I.,
& Williams, M. (2015). Feeding 9 Billion By 2050–Putting Fish Back on the Menu.
Food Security, 7(2), 261-274.
Bingpeng, X., Heshan, L., Zhilan, Z., Chunguang, W., Yanguo, W., & Jianjun, W. (2018).
DNA Barcoding For İdentification of Fish Species in The Taiwan Stra T. Plos One,
13(6), E0198109.
Chacón, G. M., Arias-Pérez, A., Freire, R., Martínez, L., Ojea, J., & Insua, A. (2021).
Genetic Characterization of Wild, Broodstock and Seed Samples of Polititapes
Rhomboides (Bivalvia: Veneridae): Implications for Hatchery Seed Production.
Aquaculture Reports, 20, 100658.
Crocetta, F., Mariottini, P., Salvi, D., & Oliverio, M. (2015). Does Genbank Provide A
Reliable DNA Barcode Reference To İdentify Small Alien Oysters İnvading The
Mediterranean Sea?. Journal Of The Marine Biological Association of The United
Kingdom, 95(1), 111-122.
Dunham, R. A., Taylor, J. F., Rise, M. L., & Liu, Z. (2014). Development Of Strategies for
İntegrated Breeding, Genetics and Applied Genomics for Genetic İmprovement of
Aquatic Organisms. Aquaculture, (420-421), S121-S123.
FAO (2022). Food And Agriculture Organization. Fisheries And Aquaculture Department.
(24/05/2022 Tarihinde Https://Www.Fao.Org/3/Ca9229en/Ca9229en.Pdf.
Adresinden Ulaşılmıştır.)

SUSTAINABLE AGRICULTURE LEADS TO ZERO HUNGER | 192
Ferrito, V., Raffa, A., Rossitto, L., Federico, C., Saccone, S., & Pappalardo, A. M. (2019).
Swordfish or Shark Slice? A Rapid Response By Coıbar–RFLP. Foods, 8(11), 537.
Galal-Khallaf, A., Mohammed-Geba, K., Osman, A. G., Abouelfadl, K. Y., Borrell, Y. J.,
& Garcia-Vazquez, E. (2017). SNP-Based PCR-RFLP, T-RFLP, and FINS
Methodologies for the Identification of Commercial Fish Species in Egy T.
Fisheries Research, 185, 34-42.
Gilbey, J., Coughlan, J., Wennevik, V., Prodöhl, P., Stevens, J. R., Garcia De Leaniz, C.,
... & Verspoor, E. (201 ). A Microsatellite Baseline for Genetic Stock Identification
of European Atlantic Salmon (Salmo Salar L). ICES Journal of Marine Science,
75(2), 662-674.
Gratacap, R. L., Wargelius, A., Edvardsen, R. B., & Houston, R. D. (2019). Potential of
Genome Editing to İmprove Aquaculture Breeding and Production. Trends in
Genetics, 35(9), 672-684.
Günay, D. Emiroğlu, D. Sarı, J. (2021). Important Specıes of Turkey, Mussels (Famıly:
Mytılıdae): Capture, Aquaculture and Tra E. Research & Revıews in Agrıculture,
Forestry and Aquaculture Scıences, 27.
Gutierrez, A. P., Turner, F., Gharbi, K., Talbot, R., Lowe, N. R., Peñaloza, C., ... &
Houston, R. D. (2017). Development of A Medium-Density Combined-Species
SNP Array for Pacific and European Oysters (Crassostrea Gigas and Ostrea Eduli).
G3: Genes, Genomes, Genetics, 7(7), 2209-2218.
Havenstein, G. B., Ferket, P. R., & Qureshi, M. A. (2003). Carcass Composition and Yield
Of 1957 Versus 2001 Broilers When Fed Representative 1957 and 2001 Broiler Die
S. Poultry Science, 82(10) 2003, 1509–15 8.
Https://doi.Org/10.1093/Ps/82.10.1509
Hebert PDN, Cywinska A, Ball SL, Dewaard JR (2003a). Biological İdentifications
Through DNA Barcodes. Proc R Soc Lond B Biol Sci. 270: 313-321.
Hebert PDN, Ratnasingham S, Dewaard JR (2003b). Barcoding Animal Life: Cytochrome
C Oxidase Subunit 1 Divergence Among Closely Related Species. Proc Biol Sci.
270: 96-99.
Hurtado, N. S., Perez-Garcia, C.P., Morán, P., Pasantes, J.J., 2011. Genetic and Cytological
Evidence of Hybridization between Native Ruditapes Decussatus and İntroduced
Ruditapes Philippinarum (Mollusca, Bivalvia, Veneridae) in NW Spa N.
Aquaculture, 311:123–128.
Imtıaz, A., Nor, S. A. M., & Naım, D. M. (2017). Progress and Potential of DNA Barcoding
for Species İdentification of Fish Species. Biodiversitas Journal of Biological
Diversity, 18(4), 1394-1405.
Işık, R., & Özdil, F. (202 ). Leptin Receptor Gene Polymorphisms in Some Turkish Donkey
Populations. Journal of Equine Veterinary Science, 84, 1028 3.
Https://Doi.Org/10.1016/J.Jevs.2019.102823
Işık, R., Fidan, A., Soysal, M. I., & Ünal, E. Ö. (2021). Identification of Novel Genetic
Variants For KA 1. 1, KA 1. 3 And K33 Genes in Some of İndigenous Goat Breeds

193 | SUSTAINABLE AGRICULTURE LEADS TO ZERO HUNGER
of Turk Y. Turkish Journal of Veterinary And Animal Sciences, 45(5), 805-8 3.
HTTPS:// Doi.Org/10.3906/Vet-2101-35
Işık, R., Özkan Ünal, E., & Soysal, M. İ. (2022). Polymorphism Detection of DGAT1 and
Lep Genes in Anatolian Water Buffalo (Bubalus Bubalis) Populations in Turk Y.
Archives Animal Breeding, 65(1), 1-9.
Jaser, S. K. K., Dias, M. A. D., Lago, A. D. A., Reis Neto, R. V., & Hilsdorf, A. W. S.
(2017). Single Nucleotide Polymorphisms in The Growth Hormone Gene of
Oreochromis Niloticus and Their Association with Growth Performance.
Aquaculture Research, 48(12), 5835-5845.
Karahan, B., Gökçek, E. Ö., Gamsız, K., & Magoulas, A. (2014). Microsatellite
Polymorphism of Seabass (Dicentrarchus labrax) Breeders: Natural and Cultured
Stoc S. Fresenius Environmental Bulletin, 23(6), 1289-1294.
Liu, S., Li, L., Shi, R., Wang, W., Wu, F., & Zhang, G. Genome‐Wide Association Study
For Desirable Traits in The Pacific Oyster Crassostrea Gigas (Thunberg ).
Aquaculture Research.
Luo YT, Fang DA, Zhou YF, Xu DP, Peng YX, Zhang MY, Mao CC, Tang XM, Xu J,
And You Y (2022) Genetic Diversity, Habitat Relevance And Conservation
Strategies Of The Silver Carp İn The Yangtze River By Simple Sequence Repe T.
Fro T. Ecol. Evol. 10:8501 3. DOI: 10.3389/Fevo.2022.850183
Madeira, P., Stefanni, S., & Ávila, S. P. (2018). Non-Destructive Tissue Sampling And
The Use Of PCR-Rflps In Two Edible Sea Cucumbers From The North-Eastern
Atlantic, Holothuria Mammata Grube, 1840 And H. Sanctori Delle Chiaje, 1823
(Echinodermata: Holothuroide ). The European Zoological Journal, 85(1), 88-93.
Maduna, S. N., Vivian-Smith, A., Jónsdóttir, Ó. D. B., Imsland, A. K., Klütsch, C. F.,
Nyman, T., & Hagen, S. B. (2020). Genome-And Transcriptome-Derived
Microsatellite Loci İn Lumpfish Cyclopterus Lumpus: Molecular Tools For
Aquaculture, Conservation, And Fisheries Management. Scientific Reports, 10(1),
1-11.
Makeche, M. C., Nhiwatiwa, T., Ndebe, J., Mulavu, M., Khumalo, C. S., Simulundu, E.,
... & Muleya, W. (2022). Characterization Of Oreochromis Niloticus Fish Species
Of Lake Kariba, Zambia, Using Morphological, Meristic, And Genetic Metho S.
Aquaculture, Fish And Fisheries, 2(2), 116-129.
Neekhra, B., Mansoori, A., Verma, S., Koiri, R. K., & Jain, S. K. (2014). RAPD-PCR
Based Biomarker Study In Fish Species (Family: Cyprinidae) Of Madhya Pradesh,
Ind A. Austin J Mol & Cell Biol, 1(1), 1003.
Olubunmi, O. O. (201 ). Application Of Microsatellite In Fish Biotechnology: Prospects
And Drawback–A Review. International Journal of Bioengineering And
Biotechnology, 4(3), 37-43.
Özcan Gökçek, E., Lök, A., Karahan, B., & Kurtay, E. (2017). Identification Of Different
Oyster Species Using RAPD-PCR. Su Ürünleri Dergisi, 34(1), 25-30.

SUSTAINABLE AGRICULTURE LEADS TO ZERO HUNGER | 194
Özcan Gökçek E. (2020)A. Akuakültür Türlerinin Islahında Aday Genler. Tarım Bilimleri
Ve Su Ürünlerinde Vizyonel Çalışmalar II, Akademisyen Kitabevi A.Ş., Ankara,
Ss.19-30.
Özcan Gökçek, E., & Işık, R. (2020)B. Associations Between Genetic Variants Of The
İnsulin-Like Growth Factor I (IGF-I) Gene And Growth Traits İn European Sea
Bass (Dicentrarchus Labrax, L ). Fish Physiology And Biochemistry, 46(3), 1131-
1138.
Özcan Gökçek, E., Isik, R., Karahan, B., & Gamsiz, K. (2020)C. Genetic Variation Of
Insulin-Like Growth Factor II (IGF-II) Gene And İts Associations With Growth
Traits İn European Sea Bass (Dicentrarchus Labra ). Turkish Journal Of Fisheries
And Aquatic Sciences, 20(7).
Özcan Gökçek, E. Acarlı, S., Karahan, B., Vural, P., & Baştanlar, E. K. (2020)D. First
Molecular Record Of The Alien Species Pacific Oyster (Crassostrea Gigas,
Thunberg 1793) İn The Marmara Sea, Turk Y. Marine Science And Technology
Bulletin, 9(1), 23-31.
Özcan Gökçek, E. Ö. (2022). Su Ürünleri Yetiştiriciliğinde İnovatif Yaklaşımlar Ve
Genom Düzenleme. Innovatıve Agrıcultural Pratıces in Soıl, Plant And
Envıronment, 479.
Pappalardo, A. M., Federico, C., Saccone, S., & Ferrito, V. (2018). Differential Flatfish
Species Detection By Coıbar-RFLP İn Processed Seafood Products. European Food
Research And Technology, 244(12), 2191-2201.
Penaloza, C., Manousaki, T., Franch, R., Tsakogiannis, A., Sonesson, A. K., Aslam, M. L.,
... & Tsigenopoulos, C. S. (202 ). Development And Testing Of A Combined
Species SNP Array For The European Seabass (Dicentrarchus Labrax) And
Gilthead Seabream (Sparus Aurat ). Genomics, 113(4), 2096-2107.
Penaloza, C., Manousaki, T., Franch, R., Tsakogiannis, A., Sonesson, A. K., Aslam, M. L.,
... & Tsigenopoulos, C. S. (202 ). Development And Testing Of A Combined
Species SNP Array For The European Seabass (Dicentrarchus Labrax) And
Gilthead Seabream (Sparus Aurat ). Genomics, 113(4), 2096-2107.
Peñaloza, C., Robledo, D., Barría, A., Trịnh, T. Q., Mahmuddin, M., Wiener, P., ... &
Houston, R. D. (2020). Development And Validation Of An Open-Access SNP
Array For Nile Tilapia (Oreochromis Niloticu). G3: Genes, Genomes, Genetics,
10(8), 2777-2785.
Quere, N., Desmarais, E., Tsigenopoulos, C.S., Belkhir, K., Bonhomme, F., And Guinand,
B. (2012) Gene Flow At Major Transitional Areas In Sea Bass (Dicentrarchus
Labrax) And The Possible Emergence Of A Hybrid Swa M. Ecol. And Evol. 2(12):
3061-3078.
Sawayama, E., Tanizawa, S., Kitamura, S. I., Nakayama, K., Ohta, K., Ozaki, A., &
Takagi, M. (2017). Identification Of Quantitative Trait Loci For Resistance To
RSIVD İn Red Sea Bream (Pagrus Major). Marine Biotechnology, 19(6), 601-613.
Sigang, F., Hao, H., Yong, L., Pengfei, W., Chao, Z., Lulu, Y., ... & Qiu, L. (2021).
Genome-Wide İdentification Of Microsatellite And Development Of Polymorphic

195 | SUSTAINABLE AGRICULTURE LEADS TO ZERO HUNGER
SSR Markers For Spotted Sea Bass (Lateolabrax Maculatus). Aquaculture Reports,
20, 100677.
Simora, R. M. C., Xing, D., Bangs, M. R., Wang, W., Ma, X., Su, B., ... & Dunham, R. A.
(2020). CRISPR/Cas9-Mediated Knock-İn Of Alligator Cathelicidin Gene İn A
Non-Coding Region Of Channel Catfish Genome. Scientific Reports, 10(1), 1-14.
Stamatis C, Sarri CA, Moutou KA, Argyrakoulis N, Galara I, Godosopoulos V, Kolovos
M, Liakou C, Stasinou V, Mamuris Z (2015) What Do We Think We Eat? Single
Tracing Method Across Foodstuff Of Animal Origin Found İn The Greek Mark T.
Food Res Int 69:151–155
Su, S., Raouf, B., He, X., Cai, N., Li, X., Yu, J., ... & Tang, Y. (2020). Genome-Wide
Analysis For Growth At Two Growth Stages İn A New Fast-Growing Common
Carp Strain (Cyprinus Carpio L ). Scientific Reports, 10(1), 1-12.
Sundari, R. S., Arshad, A., Sulistyowati, L., Noor, T. I., Setiawan, I. 2021. Enhancing Food
Security throughout Aquaponics in Urban Farming Development Strategy. IOP
Conference Series: Journal of Physic. 1764(0122091):1-9 doi:10.1088/1742-
6596/1764/1/012209
Tao, W., Shi, H., Yang, J., Diakite, H., Kocher, T. D., & Wang, D. (2020). Homozygous
Mutation Of Foxh1 Arrests Oogenesis, Causing İnfertility İn Female Nile Tilapia.
Biology Of Reproduction, 102(3), 758-769.
Tine, M., Kuhl, H., Gagnaire, P. A., Louro, B., Desmarais, E., Martins, R. S., ... &
Reinhardt, R. (2014). European Sea Bass Genome And İts Variation Provide
İnsights İnto Adaptation To Euryhalinity And Speciation. Nature Communications,
5(1), 1-10.
Tran, T. T. H., Nguyen, H. T., Le, B. T. N., Tran, P. H., Van Nguyen, S., & Kim, O. T. P.
(2021). Characterization Of Single Nucleotide Polymorphism İn IGF1 And IGF1R
Genes Associated With Growth Traits İn Striped Catfish (Pangasianodon
Hypophthalmus Sauvage, 187 ). Aquaculture, 538, 736542.
Tsai, H. Y., Robledo, D., Lowe, N. R., Bekaert, M., Taggart, J. B., Bron, J. E., & Houston,
R. D. (201 ). Construction And Annotation Of A High-Density SNP Linkage Map
Of The Atlantic Salmon (Salmo Salar) Genome. G3: Genes, Genomes, Genetics,
6(7), 2173-2179.
Villanueva, B., Fernández, A., Peiró-Pastor, R., Peñaloza, C., Houston, R. D., Sonesson,
A. K., ... & Saura, M. (2022). Population Structure And Genetic Variability İn Wild
And Farmed Mediterranean Populations Of Gilthead Seabream And European
Seabass İnferred From A 60K Combined Species SNP Array. Aquaculture Reports,
24, 101145.
Williams Z, Ben-Dov I. Z, Elias R, Mihailovic A, Brown M, Rosenwaks Z, Tuschl T. 2013.
Comprehensive Profiling Of Circulating Microrna Via Small RNA Sequencing Of
Cdna Libraries Reveals Biomarker Potential And Limitations. Proceedings Of The
National Academy Of Sciences 110 (11): 4255-4260.

SUSTAINABLE AGRICULTURE LEADS TO ZERO HUNGER | 196
Shen Y, Guan L, Wang D, Gan X. 2016. DNA Barcoding And Evaluation Of Genetic
Diversity İn Cyprinidae Fish İn The Midstream Of The Yangtze Riv R. Ecol Evol
6 (9): 2702-2713.
Zhang JB, Hanner R.20 1. DNA Barcoding İs A Useful Tool For The İdentification Of
Marine Fishes From Jap N. Biochem Syst Ecol 39 (1): 31-42.
Crocetta, F., Mariottini, P., Salvi, D. & Oliverio, M. (2015). Does Genbank Provide A
Reliable DNA Barcode Reference To İdentify Small Alien Oysters İnvading The
Mediterranean S A? Journal Of The Marine Biological Association Of The United
Kingdom, 95(1): 111–122.
Wilwet, L., Jeyasekaran, G., Shakila, R. J., Sivaraman, B., & Padmavathy, P. (2018). A
Single Enzyme PCR-RFLP Protocol Targeting The 16S Rrna/Trnaval Region To
Authenticate Four Commercially Important Shrimp Species In Ind A. Food
Chemistry, 239, 369-376.
Xu, Q., Zheng, J., Yan, X. 2020. Genetic Diversity And Differentiation Of Nine
Populations Of The Hard Clam (Meretrix Petechial) Assessed By EST-Derived
Microsatellites. Electron J Biotechnol 2020; 8. https://doi.Org/ 0.
1016/J.Ejbt.2020.09.003
Yatkın, G., & Nurper, G. Ü. Z. (2018). Entomolojide DNA Barkodlama Tekniğinin
Kullanımı. Yüzüncü Yıl Üniversitesi Tarım Bilimleri Dergisi, 28(1), 126-134.
Yorgancılar, M., Yakışır, E., & Erkoyuncu, M. T. (2015). Moleküler Markörlerin Bitki
Islahında Kullanımı. Bahri Dağdaş Bitkisel Araştırma Dergisi, 4(2), 1-12.
Brıef Currıculum Vıtae of Authors
Dr. Emel Özcan Gökçek is a lecturer in Ege Üniversitesi,
Su Ürünleri Fakültesi, Yetiştiricilik Bölümü, Bornova -
İzmir. [email protected] Orcid ID: 0000-
0001-6566-7680. Her work focuses on molecular genetics,
bioinformatics, and optimisation breeding program of
aquaculture species.

197 | SUSTAINABLE AGRICULTURE LEADS TO ZERO HUNGER
CHAPTER 11
THE ROLE OF LOCAL FOOD IN MANAGING
STUNTING IN EAST NUSA TENGGARA PROVINCE
Hedrika OETMUSU1, Carla Krisanti FIOS1,
Holand Francisco BANI1, Umbu JOKA1*,
Dennis Mark ONUIGBO2
1Agribusiness Department, Faculty of Agriculture, University of Timor,
Kefamenanu, NTT, Indonesia 2University of Tasmania, Australia (Tasmania – Australia), Discipline:
Environmental Resource Economics,
*Corresponding Author: [email protected]

SUSTAINABLE AGRICULTURE LEADS TO ZERO HUNGER | 198

199 | SUSTAINABLE AGRICULTURE LEADS TO ZERO HUNGER
11.1. Introduction
Stunting is one of the nutritional problems faced in the world, especially in
developing countries, which causes stunted growth and mental development. The
problem of stunting is driven by individual factors, including food intake, birth
weight, infectious diseases, and environmental factors (UNICEF, 2013).
Presidential Regulation Number 72 of 2021 concerning the acceleration of stunting
reduction, which aims to reduce the prevalence of stunting, reduce the quality of
preparation for family life, ensure the fulfil of nutritional intake, improve parenting
patterns, service quality, and health, access to drinking water and sanitation. Even
can increase nutrient status of community throughout local food (Sundari, et al.,
2021, 2021) such banana pseudostem, tubers, bulbis etcetera.
The Indonesian Nutritional Status Study (2021) explains that the national
stunting rate in Indonesia has decreased by 1.6% per year from 27.7% in 2019 to
24.4% in 2021. Most of the 34 provinces showed a decline. However, it differs
from East Nusa Tenggara Province, the only province in Indonesia that still
recorded the highest stunting rate with 37.8%. Furthermore (NTT Provincial
Government, 2015) made it clear that this percentage indicates that public health
problems are at an appalling level or below the average described according to the
WHO classification.
Nursalam (2010) explained that there were various shocks in the occurrence
of malnutrition (stunting), and one of the triggers was the problems in the province
of NTT. Food scarcity caused by the NTT area, which has a rocky soil structure
and little rainfall, has resulted in stunting in NTT. Furthermore (NTT Provincial
Government, 2015) also explained the limitations of the NTT community in
obtaining nutritious food caused by limited access to food and local food shortages.
The Indonesian Nutritional Status Study (2021) found that South Central
Timor Regency had the highest stunting prevalence rate in NTT, reaching 48.3%,
followed by North Central Timor District at 46.7% in 20, where this figure was the
second-highest in Indonesia. NTT Province. The factors that cause stunting in NTT
Province are a lack of nutritional intake, such as a lack of consuming healthy,
nutritious, vitamin, protein, and mineral foods.
It can do it by empowering the community by introducing food ingredients.
One of the foodstuffs that contain much nutritional intake is local food which is a
source of zinc and protein because malnutrition or stunting has a lot to do with
micronutrient deficiencies. Micronutrients are contained in local food ingredients
for height and weight gain. Local food is an agricultural raw material that is rarely

SUSTAINABLE AGRICULTURE LEADS TO ZERO HUNGER | 200
sought after, even though its nutritional content plays a role in reducing the
prevalence of stunting.
Several types of local food in NTT Province contain the nutritional value of
protein and zinc, which play a role in improving stunting growth, such as local
corn, sweet potatoes, and beans. Corn contains complex carbohydrates, vitamins
(B, C, D), and omega-3 (is an essential nutrient ordered by the brain); sweet
potatoes contain iron, vitamins (C, D, B6) are rich in fiber; while the nuts contain
protein, vitamins (C, B6) iron and magnesium, and others.
Local food is a raw material that will later be processed into value-added
products. Several community organizations campaign for local food consumption
to be promoted by the local community. These organizations educate people to
process food ingredients such as corn, beans, sweet potatoes, and Fruits into value-
added foods. The organization called Lakota Kujawas has a mission to cultivate
residents and solve some of the social problems faced in the village, such as
poverty, low literacy culture, human trafficking, and others. This organization aims
to develop the tradition (Culture) of the Mollo people with various creations and
innovations as well as community empowerment and cultural wealth in the Land
of Timor through literacy, entrepreneurship, and the arts. This study aimed to
determine local food's role in stunting prevention in East Nusa Tenggara Province
using a descriptive method.
11.2. Food
Food is biological and air resources, either processed or unprocessed, so that
human life can consume, including food and other raw materials that can use in
the process of preparing, manufacturing, and processing food and beverages (Law
of the Republic of Indonesia No.18 of 2012 concerning Food).
Local Food
Nugraheni (2017) explains that the local community consumes local food
according to the potential and local wisdom. Local food is a food product that has
long been produced, developed, and consumed in an area or a specific local
community group. Generally, local food products are processed from local raw
materials, local technology, and local knowledge as well. In addition, local food
products are usually developed according to local consumer preferences, so these
local food products are closely related to the local culture. Furthermore (Feliase,
2021) explained that local food sources in Eastern Indonesia are abundant in
abundance, not East Nusa Tenggara (NTT). Local food is well managed to meet

201 | SUSTAINABLE AGRICULTURE LEADS TO ZERO HUNGER
the needs of the community. Several types of local food are often found in NTT,
such as sorghum, beans, corn, moringa leaves, sweet potatoes, and many other
types of local food in the NTT area. Local food has been known to the people of
NTT for a long time. Besides that, local food has various types and forms to be
consumed to meet needs. Local food contains sources of carbohydrates, proteins,
minerals, vitamins, and other functions that can be flavored.
Types of local food in NTT Province
a. Tubers
Tubers are one type of plant that changes in size and shape (swelling) due
to changes. These changes also result in anatomical changes. The organs that make
up the tuber are mainly stems, roots, or their modifications. Only a few plants form
tubers using their leaves (Heny, 2012). Root crops are one plant often used as food
by the community, especially in rural areas, as a substitute for rice. The existence
of root crops commonly known to the public is currently limited to root crops such
as cassava, sweet potato, and taro.
Figure 1. Local sweet potato. (Source: @ig lakoat.kujawas)
Maybe it is less popular with other types of tubers, and the community has
tended to fulfill their carbohydrate needs from rice (Budie, 2013). Root crops such
as sweet potato can be processed into:
1. Sweet potato jam uses ingredients such as sugar, citric acid, sweet
potatoes, and salt to taste.
2. Dodol uses ingredients such as coconut, glutinous rice flour, sugar, sweet
potato, and salt.

SUSTAINABLE AGRICULTURE LEADS TO ZERO HUNGER | 202
3. Sweet potato candy with ingredients, namely sugar, sweet potato, citric
acid, and water
4. Sweet potato flour uses sweet potato ingredients that have been dried and
then ground.
b. Corn
The Research and Development Center for Food Crops (2015) explains that
corn is a carbohydrate-producing food crop. Besides being a carbohydrate source,
corn is also an essential source of protein on the Indonesian menu. Corn is rich in
functional foods, including dietary fiber that the body needs, essential fatty acids,
isoflavones, minerals (Ca, Mg, K, Na, P, Ca, and Fe), anthocyanins, beta carotene,
(provitamin A), amino acid composition, essential, and so on. Corn is a resource
that is rich in calories and is often used as a staple food. The corn calories are 342
calories/100 grams, one high cereal type.
Cahyani (2010) explained that corn could be distinguished based on the
planting period, variety, and shape of the seeds. There are three types of maize
based on the planting period, namely: maize with a planting period of 75-90 days
which is called short-lived maize, maize with a planting period of 90-120 days
which is called early maturity maize, and maize with a planting period of more
than 120 days which is called long-lived maize. Furthermore (Jatmiko, 2009)
explained that corn could be divided into local, hybrid, and transgenic corn based
on the type or variety.
Figure 2. Local varieties of maize. (Source: @ig. lakoat.kujawas)

203 | SUSTAINABLE AGRICULTURE LEADS TO ZERO HUNGER
c. Beans
Susilowati et al. (2021) explained that beans, also called legumes, belong to
the leguminous family. Nuts contain large amounts of dietary fiber if they can help
lower cholesterol levels. Nuts are low in calories, low fat, and low in sodium salt.
Nuts also contain protein, complex carbohydrates, folate, and iron. Various types
of beans have been widely known, such as soybeans (Glycine max.), green beans
(Phaseolus radiatus ), kidney beans ( Phaseolus Vulgaris ), and various other
types. Various types of beans can be distinguished based on the variety or type of
name, color, shape, and physical character.
Figure 3. Local beans (Source: @ig. lakoat.kujawas)
Nuts are the primary source of vegetable protein and have many benefits.
Nuts have many nutritional advantages, including a cheap source of protein, rich
in the amino acid lysine, low in fat and no cholesterol, and a good source of B
vitamins, calcium, iron, zinc, copper, and magnesium. , low in sodium and sodium
content.
11.3. Stunting
Stunting is a chronic malnutrition problem caused by a lack of nutritional
intake for a long time. Malnutrition causes problems in the future, such as
difficulties in achieving optimal physical and cognitive development. Stunting
children have a lower Intelligence Quotient (IQ) than the average IQ of normal

SUSTAINABLE AGRICULTURE LEADS TO ZERO HUNGER | 204
children (Kemenkes RI, 2018). Septisuari (2018) explains the impact and factors
that cause stunting.
Stunting Impact
Stunting can have a harmful impact, both in the short and long term. In the
short term, stunting can cause growth failure, cognitive and motor development
barriers that affect brain development and educational success, and not optimal
physical body size and metabolic disorders. Stunting is a manifestation of a growth
disorder in the body. If this happens, then one of the organs of the body that is
quickly at risk is the brain. In the brain, nerve cells are closely related to the child's
response, including seeing, hearing, and thinking during the learning process.
The long-term impact of stunting is a decrease in intellectual capacity,
structural and functional disorders of nerves and brain cells that are permanent and
cause a decrease in the ability to absorb lessons at school age which will affect
productivity as adults and increase the risk of diseases such as diabetes mellitus,
hypertension, coronary heart disease, and stroke. Children experiencing stunting
have the potential for imperfect growth and development, low motor skills and
productivity, and a higher risk of suffering from non-communicable diseases.
Stunting in toddlers impacts potential economic losses due to decreased work
productivity and maintenance. All of this will reduce the quality of human
resources, productivity, and competitiveness of the nation.
Factors Causing Stunting
Stunting is related to many factors, and these factors are related to one
another. Furthermore (UNICEF, 1998) explained that factors related to nutritional
status include stunting. First, the direct causes of stunting are nutritional intake and
infectious diseases. Unbalanced nutritional intake does not meet the amount and
composition of nutrients that meet the requirements of balanced nutrition, such as
varied, appropriate, clean, and safe foods. For example, babies are not exclusively
breastfed. Second, indirect causes, namely the availability of food at the household
level, the behavior or care of mothers and children, and health and environmental
services. All are related to the quality of parenting. Food availability at the
household level, the behavior or care of mothers and children, and health and
environmental services are influenced by the main problems in the form of low
education, food availability, and job opportunities. All the causes of nutritional
problems above are influenced by fundamental problems called political and
economic crises.

205 | SUSTAINABLE AGRICULTURE LEADS TO ZERO HUNGER
Features of stunting
Persistent characteristics or symptoms are characterized by late puberty, age
8-10. Most children are quieter, do not make much eye contact, stunted growth,
the face looks younger than their age, and delayed tooth growth. Some cases have
poor performance on attention and learning memory tests, low body weight for
their age, and spinal growth. We acknowledge that this is not the case for everyone
who is stunted.
Figure 4. Characteristics of stunting children. (Source: www.viva.co.id)
11.4. Local Food Processing Into Value-Added Products
Food is the raw material of agricultural products such as vegetables, fruits,
nuts, and tubers, which are then processed into new products with added value.
This food product is then processed according to local culture and wisdom by the
local area, which is then termed "local food."
One of the organizations in NTT called Lakota Kujawas is a children's social
entrepreneurship community that converts local food ingredients into products that
have added value. Some of the processed food products are:
1. Processing of candied dried fruit from orange peel and carom, star fruit

SUSTAINABLE AGRICULTURE LEADS TO ZERO HUNGER | 206
Figure 5. Candied dried fruit. (Source: @ig. lakoat.kujawas)
2. Processing forest yam, sweet potato, cassava, plantain banana, and taro
are processed into flour for noodles and bread.
3. Processing luat sauce using raw materials from fermented chili, salt,
tamarind juice, lemon peel, basil leaves, sipa leaves, mint leaves,
coriander leaves, and garlic. This luat sauce can last up to 1 year.
Figure 6. Flour from sweet potato, banana,
and soybeans (Source: @ig. lakoat.kujawas)
Figure 7. Noodles made from sweet
potatoes, bananas, and soybeans
(Source: @ig. lakoat.kujawas)

207 | SUSTAINABLE AGRICULTURE LEADS TO ZERO HUNGER
Figure 8. Luat Sauce
4. Tempeh is made using local beans (rope beans, green beans, red beans,
Turi beans, and koto).
Figure 5. Tempeh made from local. (Source: @ig. lakoat.kujawas)
5. Processing sourdough bread made using mocaff flour variants of
pumpkin and purple sweet potato (using wild yeast and natural bacteria,
homemade lactic acid staying 24 days).

SUSTAINABLE AGRICULTURE LEADS TO ZERO HUNGER | 208
Figure 6. Sourdough bread
11.5. The Role of Local Food in Preventing Stunting
Utilization of local food that contains nutrients is a solution to encourage the
prevalence of high growth rates or reduce failure to thrive due to chronic
malnutrition (stunting). Proper processing and packaging allow local food to be
consumed safely and healthily without containing chemicals. Pranita (2021)
explains that some sources of nutrition are derived from local food:
1. Carbohydrates are the largest source of energy in the human body.
Carbohydrate intake is needed for 50 to 60% of total daily calories. Types
of carbohydrate sources in food intake are vegetables, fruits, and sweet
potatoes.
2. Protein is a nutrient needed for the body because it has a very vital
function. Protein is one of the nutrients that the body needs in large
quantities. When protein is consumed, it is then converted by the
digestive system into amino acids, which will then be used by the body
to work as a source of energy.
3. Fat is a substance needed by the body as follows:
a. My source of energy
b. As a form of membrane and structure of body cells as well as
introducing several substances and absorbers of fat-soluble vitamins

209 | SUSTAINABLE AGRICULTURE LEADS TO ZERO HUNGER
c. As a means of transportation of various substances in the body's
metabolism
d. As a body temperature regulator (insulator)
e. Some essential fatty acids must be present in the food consumed
because the body cannot produce them independently.
f. Children who grow up in conditions of lack of fat intake in their daily
menu will not grow optimally.
4. Mineral
a. Calcium has the most functions compared to other body minerals,
including regulating the body's muscle contractions and heart rate,
helping build bones and teeth, and ensuring blood pumps usually
walk. Sources of calcium are found in dairy and processed products,
tofu, fish, beans, and green vegetables such as broccoli and cabbage.
b. Iron. Some sources of iron are red meat, liver, dried fruit, nuts, seeds,
cereals, dark green leafy vegetables, and eggs.
Sources in local food have nutritional value that meets nutritional
requirements, are easy to manage, like, and accept, have appropriate protein quality
to stimulate physical growth, and are free from germs, preservatives, dyes, and
toxins meet value. Social, economic, cultural, and religious.
11.6. The Role of Government and Community Institutions in
Tackling Stunting in NTT
Local Food Processing Training
Activities regarding the processing of local food into the food of national
standard organized by the local government by utilizing various types of local food
such as corn, beans, sweet potatoes, potatoes and sorghum, and others that are
converted into foods that have added value. In addition, there are also other training
programs such as packaging, prospects for local food products in modern markets,
business analysis, public speaking related to product marketing, and digitalization
of marketing to increase SME business opportunities and partnerships.
Local Government Programs in Preventing Stunting
The grand strategy to prevent and overcome stunting in East Nusa Tenggara
Province in 2019-2023, to implement convergence actions in handling and
preventing stunting (short toddlers) in NTT Province, is considering that stunting
prevention and handling cannot be carried out only by the health sector. Thus, there
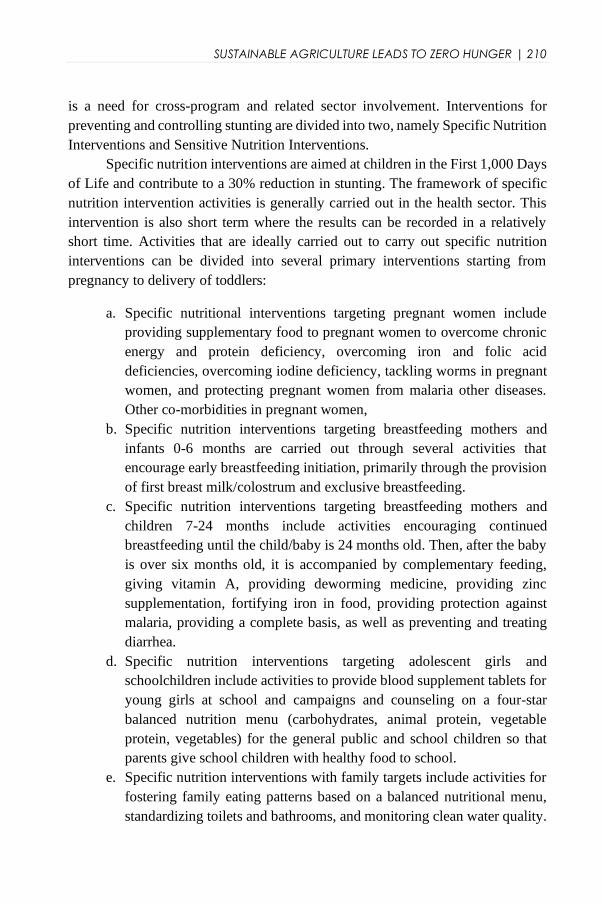
SUSTAINABLE AGRICULTURE LEADS TO ZERO HUNGER | 210
is a need for cross-program and related sector involvement. Interventions for
preventing and controlling stunting are divided into two, namely Specific Nutrition
Interventions and Sensitive Nutrition Interventions.
Specific nutrition interventions are aimed at children in the First 1,000 Days
of Life and contribute to a 30% reduction in stunting. The framework of specific
nutrition intervention activities is generally carried out in the health sector. This
intervention is also short term where the results can be recorded in a relatively
short time. Activities that are ideally carried out to carry out specific nutrition
interventions can be divided into several primary interventions starting from
pregnancy to delivery of toddlers:
a. Specific nutritional interventions targeting pregnant women include
providing supplementary food to pregnant women to overcome chronic
energy and protein deficiency, overcoming iron and folic acid
deficiencies, overcoming iodine deficiency, tackling worms in pregnant
women, and protecting pregnant women from malaria other diseases.
Other co-morbidities in pregnant women,
b. Specific nutrition interventions targeting breastfeeding mothers and
infants 0-6 months are carried out through several activities that
encourage early breastfeeding initiation, primarily through the provision
of first breast milk/colostrum and exclusive breastfeeding.
c. Specific nutrition interventions targeting breastfeeding mothers and
children 7-24 months include activities encouraging continued
breastfeeding until the child/baby is 24 months old. Then, after the baby
is over six months old, it is accompanied by complementary feeding,
giving vitamin A, providing deworming medicine, providing zinc
supplementation, fortifying iron in food, providing protection against
malaria, providing a complete basis, as well as preventing and treating
diarrhea.
d. Specific nutrition interventions targeting adolescent girls and
schoolchildren include activities to provide blood supplement tablets for
young girls at school and campaigns and counseling on a four-star
balanced nutrition menu (carbohydrates, animal protein, vegetable
protein, vegetables) for the general public and school children so that
parents give school children with healthy food to school.
e. Specific nutrition interventions with family targets include activities for
fostering family eating patterns based on a balanced nutritional menu,
standardizing toilets and bathrooms, and monitoring clean water quality.

211 | SUSTAINABLE AGRICULTURE LEADS TO ZERO HUNGER
f. Specific nutrition interventions through health promotion and
community empowerment include the development of promotional
media related to stunting prevention and control both through print media
(newspapers, billboards, banners, posters, leaflets, etcetera.) and
electronic media (television, radio) as well as the development of local
specific media, increasing community capacity through orientation
training for Community Leaders, Religious Leaders, Cadres, PKK,
Professional Organizations, etcetera., and Improvement of Community-
Based Health Efforts (UKBM) such as monitoring the growth of children
under five at the Posyandu (Integrated Healthcare Center)
Sensitive nutrition interventions should ideally be carried out through
various development activities outside the health sector and contribute to 70% of
stunting interventions. The target of NTT, the growing NTT welfare through
specific nutrition intervention, is for the public and not specifically for pregnant
women and toddlers in the First 1,000 Days of Life. Activities are related to
Sensitive Nutrition Interventions can be carried out through several generally
macro activities across ministries and institutions. Eighteen activities can reduce
stunting through sensitive nutrition interventions. They are as follows:
a. Coordinator of the Task Force for Handling Stunting at the provincial
and district/city levels (Regional Development Planning, Research, and
Development Agency).
b. Research on Moringa consumption for pregnant women (Regional
Research and Development Agency).
c. Provide and ensure access to clean water up to the household level
(Public Works and Public Housing Service).
d. Provide and ensure access to sanitation (Department of Public Works and
Public Housing).
e. Perform food fortification, Moringa food processing industry
(Department of Industry and Trade).
f. Provide access to health services and Family Planning, Youth and
Toddler Family Development (BKKBN).
g. Provision of National Health Insurance (JKN) (BPJS Kesehatan).
h. Universal Maternity Guarantee (Jampersal) is available.
i. Provide parenting education for parents (Department of Women's
Empowerment and Child Protection).

SUSTAINABLE AGRICULTURE LEADS TO ZERO HUNGER | 212
j. Provision of Universal Early Childhood Education (PAUD) to prevent
stunting (Department of Education and Culture).
k. Provide education on reproductive health and nutrition for adolescents
(BKKBN and the Office of Women's Empowerment and Child
Protection).
l. Provision of social assistance and security for low-income families
(Social Service).
m. Increasing food security and nutrition (Department of Agriculture and
Food Security).
n. Dissemination of information to the public related to nutritional
problems, especially stunting, through mass media (Department of
Communication and Information).
o. Provision and Utilization of Village Funds in the context of intervention
in nutritional problems for toddlers and under-fives and Members of the
Village Community Business Entity (BUMDES).
p. Provision and marketing of marine and fishery products up to the Village
Level (Department of Marine and Fisheries and Department of Industry
and Trade).
q. Non-Cash Food Assistance and Joint Business Cooperatives (KUBE).
r. Extension of food access until it reaches the household level (Department
of Agriculture and Food Security).
s. And the availability of Animal Food Proteins up to the household level
(Department of Marine and Fisheries and Department of Animal
Husbandry).
11.7. Related Local Government Programs to Promote Local
Food Consumption
Related local government progam that carried out in site can promote
communitie to consumpt local foor.
1. Technology utilization program: With the existence of technology, it is
easier for the community to obtain food with the help of local food
provider applications.
2. Urban agriculture program: helping local food farmers who cannot
produce locally because of limited land can be overcome by urban
farming ( urban farming ).
3. Program to increase the variety of processed: Rice which is a basic need,
can be supported with other foods such as sweet potatoes, corn, and

213 | SUSTAINABLE AGRICULTURE LEADS TO ZERO HUNGER
sorghum. Compared to rice, sorghum is far superior in terms of nutrition,
such as protein, calcium, iron, phosphorus, and vitamin B1.
11.8. Conclusion
The government's policy of increasing local food production is one of the
efforts to overcome the problem of stunting in the Province of East Nusa Tenggara
(NTT). South Central Timor Regency is the most significant stunting case with
48.3%, followed by North Central Timor Regency with a stunting rate of 46.7%.
The policy taken by the local government to help reduce the stunting rate in NTT
is by managing local food so that the nutritional value is relatively high. The use
of local food can also be improved by processing it into several types of value-
added food pioneered by a youth entrepreneurial organization called "Lakota
Kujawas" such as processing candied dried fruit from orange peel and carom, star
fruit; local food processing, and there are still many processed local food products.
The local community still needs policies to manage local food sources because
there are inadequate skills in managing local food.
SUSTAINABLE AGRICULTURE LEADS TO ZERO HUNGER | 214
References
Budi. (2013). Traditional Roots Plants. Retrieved April 12, 2014.
http://wedankkopie.blogspot.com/2010/07/tanaman-umbi-umbian-traditional.html
Cahyani & Widhi. (2010). Substitution of Corn (Zea mays) with Jali (Coix Lacryma-Jobi
L.) in Tortilla Making: A Study of Chemical and Sensory Characteristics. Faculty
of Agriculture, Sebelas Maret University, Surakarta.
Henry. (2012), Plant Anatomy and Morphology. Accessed on April 12, 2014,
http://bangkuschool-id.blogspot.com/2012/10/anatomy-dan-morfologi-plant.html .
Public Relations R & D. December 28, 2021. Stunting Rates Drop in 2021. https:
//www.litbang.kemkes.go.id/angka-stunting-turun-di-tahun-2021 /
Jatmiko, W., Arieyanti, D . & Astuti. ( 2011 ). Making Liquid Organic Fertilizer from
Biogas Waste (Utilization of Biogas Waste in Sukoharjo Village, Margorejo
District). Pat County Research and Development office.
http://Litbag.patikab.go.id/index.php/jurnal/138-html
Ministry of Health of the Republic of Indonesia. (2018). This is the cause of stunting in
children. Retrieved from http://www.depkes.go.id / article / view/18052800006/ini
- causes - stunting - in - children.html
Nugraheni, M. (2017). Improvement of Local Food Image. Yogyakarta
Nursalam. (2010). Policy Implementation for Increasing Local Food Crop Production and
Food Security in East Nusa Tenggara (NTT) Province, Journal of Public
Administration, Vol. 1, No.1, pp.66 – 77.
NTT Provincial Government. (2015). East Nusa Tenggara Food Security and Vulnerability
Map.
Pranita, E. (2021). Most Stunting Cases, Indonesia Ranks Fourth in the World
.https://www.kompas.com/sains/re a d/2021/05/19/09030723/case-stunting-most-
indonesia-placed-urutan-keempat-dunia?page=all.
Septisuari, UT (2018), stunting events in toddlers based on family characteristics in
Sidoharjo Village, Simigaluk District, Kulon Progo Regency, Yogyakarta.
Setyowati, ND, & Tutiasri, RP (2021). Marketing Communication Strategy for Food
Businesses Affected by COVID-19. JISIP: Journal of Social and Political Sciences,
10(1), 73–84. https://doi.org/10.33366/jisip.v10i1.2268
Suarni Y. and Yasin M. (2015), Research and Development Center for Food Crops
Sundari, R. S., Asyiah, A. K., Tarigan, R. T. 2022. Waste Utilization of Pseudo-stem
Bananaa as Nutritious Food for Human Being (Support SDGs 1, 2, 13). Do Not
Throw Away. International Euroasia Congress on Scientific Researches and
Recent Trends 9. 18 – 20th February 2022 Antalya – Turkey. ISBN 978-625-8405-
46-0
Sundari, R. S., Tarigan, R. T., Asyiah, A. K. (2022) Gedebog Pisang, Limbah Dibuang
Sayang. Abdi Laksana Jurnal Pengabdian kepada Masyarakat. 3(2):235-242.
10.32493/al-jpkm.v3i2.20292.

215 | SUSTAINABLE AGRICULTURE LEADS TO ZERO HUNGER
Susiliwarti, S., T. Sajito, I. Mustofa, OS Widodo, & R. Kurnijasanti. (2021) . E effect of a
green tea extract prolonger from Simmental Bullock on the pregnant curate of the
recipient. AJAS. Animation. Biosci. 34:198-204.
https://doi.org/10.5713/ajas.20.002
UNICEF. (2013). Improving child nutrition is an achievable imperative for global progress.
New York: United Nations Children's Fund.
Brief Curriculum Vitae of Authors
Hendrika Oetmusu, [email protected]
Carla Krisanti Fios, [email protected]
Holand Fransisco Bani, [email protected].
Umbu Joka S.P., M.Si, is a lecturer in Agribusiness Department,
Faculty of Agriculture, University of Timor, Kefamenanu, NTT,
Indonesia. Link: [email protected], Orcid id:0000-0002-
4358-5892, umbujoka69.blogspot.com, Publons id: 4177674,
Garuda id 1186677. Professional training has benn attended at least
5 times. He is a Journal editor (Agrimor), Blog writer, He wrote
two teaching material, 10 researches, published at least 34 national
journals and proceedings. He presented, participated and volunteer
his researches in seminars, conferences and workshops and also
doing at least 4 community services.

SUSTAINABLE AGRICULTURE LEADS TO ZERO HUNGER | 216
Dennis Mark Onuigbo. Journal reviewer in Agrimor, Ph.D Economics
& Graduate Certificate in RESEARCH (in view), University of
Tasmania, Australia (Tasmania – Australia), Discipline: Environmental
Resource Economics, He presented in 9 International conferences, 7
National seminars

217 | SUSTAINABLE AGRICULTURE LEADS TO ZERO HUNGER
CHAPTER 12
COMPARISON OF BEAN CULTIVARS A GROWN IN
SUFFICIENT IRON-CONTAINING ENVIRONMENT IN
TERMS OF SOME NUTRITIONAL PROPERTIES
İlkay ÇOKA1, Ahmet KORKMAZ2, Güney AKINOĞLU2
1Mersin University, Vocational School of Gulnar, Department of Plant
and Animal Production, Mersin, Turkey 2Ondokuz Mayıs University, Faculty of Agriculture. Department of Soil
Science & Plant Nutrition. 55139, Samsun, Turkey
Corresponding Author: [email protected]

SUSTAINABLE AGRICULTURE LEADS TO ZERO HUNGER | 218

219 | SUSTAINABLE AGRICULTURE LEADS TO ZERO HUNGER
12.1. Introduction
Bean is a dicotyledonous plant, and in terms of iron uptake
mechanism, it is included in the plant group specified as Strategy-I. The
plants in this group take the ferric (Fe+3) iron in the soil after converting it
into ferrous (Fe+2) iron (Figure 1).
Figure 1. Iron uptake mechanism in Strategy-I plants (including beans)
In Strategy-I, plants’ iron uptake was improved by obtaining plants with the
following characteristics: i) by obtaining plants that provide protons, increase the
acidity of soil and the solubility of iron in the soil, ii) by obtaining plants that
reduce Fe+3 to Fe through increasing the activity of Fe+3 chelate reductase enzyme,
iii) by obtaining plants that transport Fe+2 from plasmalemma by providing Fe+2
career activity.
Strategy-I plants are usually dicotyledon plants, and by transferring genes
related to iron uptake and transfer from Arabidopsis thaliana to these plants, it has
been tried to obtain varieties effective in iron uptake. Studies have shown that in
tomato plants exposed to iron deficiency, Fe+3 chelate reductase enzyme activity
increased in the root where chlorophyll is decreased (Zamboni et al., 2012). In
selecting bean cultivars that are effective in iron uptake, chlorophyll content of

SUSTAINABLE AGRICULTURE LEADS TO ZERO HUNGER | 220
leaves in varieties grown in iron deficient or iron sufficient mediums, chlorosis
index values, active iron in leaves, root ferric reductase enzyme activity, acidity in
root medium are taken into account as index values. In recent studies, iron content
in nodules of the roots of different bean cultivars has also been used as an index
due to the importance of iron in bean rhizobium symbiont (Krouma et al., 2006).
According to Loué (1986), the physiological roles of iron in plants are listed
as follows:
1) Iron is effective in respiration in plants,
2) It is influential in chlorophyll formation
3) It is effective in photosynthesis
4) It is essential in protein metabolism. In iron deficiency, the protein
content in the leaf is reduced by half compared to healthy leaves.
5) It is effective in nucleic acid metabolism, half reducing RNA in iron
deficiency. It is effective in nitrogen fixation in leguminous plants. The
large protein part of nitrogenase has a 9:1 ratio of Fe:Mo. In the small
protein part of the enzyme, there is an iron atom in each protein molecule.
Iron-containing ferredoxin provides the electrons required to reduce
molecular nitrogen in legumes.
6) It is required in the reduction of nitrates. In addition to iron, flavin
adenine dinucleotide, cytochrome b, molybdenum, and manganese are
also required to reduce nitrates.
Başar (2002) stated that foliar ferrous sulfate application provided
successful results in the removal of iron chlorosis in soybean and reported that
foliar application of Fe-EDDHA increased the active and total iron content of
leaves and prevented chlorosis. In their study in Tunisian vineyards, Ksouri et al.
(2001) found that chlorosis in leaves occurred due to the decrease in chlorophyll-
a and chlorophyll-b content, while total iron did not change in leaves with and
without chlorosis. Researchers have stated a high correlation between active iron
(Fe+2) content and chlorophyll content in plant leaves. Researchers have also
reported that the photosynthesis activities of plants depend on the active iron
content of leaves. Korkmaz et al. (2006) stated that the correlation coefficients of
the relationships between chlorophyll-a, chlorophyll-b, and total chlorophyll
content of peach leaves and active iron content of leaves were positive and
statistically significant and reported that the correlation coefficients of these
relationships were r=0.972**, r=0,963** and r=0,975**, respectively. In the study,
chlorophyll-a, chlorophyll-b, and total chlorophyll content of leaves increased as
their active iron content increased. The researchers who concluded that active iron

221 | SUSTAINABLE AGRICULTURE LEADS TO ZERO HUNGER
could be a good criterion for determining plants' iron nutritional status reported no
correlations between active iron and the total iron content of peach leaves.
Barak and Chen (1983) reported that potassium fertilizers in peanuts
reduced the chlorosis of limestone due to their effect on cation-anion balance.
Researchers reported that while the chlorophyll content of plants grown in soils
containing 63% lime increased by 90% with the effect of Fe-EDDHA chelate, it
increased by 73% and improved with the effect of potassium chloride and
potassium nitrate fertilizer. Loué (1986) stated that the interaction between
phosphorus and iron was meaningful and that the enrichment of soils with
phosphorus is among the factors that increase chlorosis in calcareous soils, while
they reported that there was no general correlation between the available
phosphorus content of the soil and iron chlorosis. Olsen (1972) reported that
phosphorus-bound iron was less mobile than citrate-bound iron and stated that the
reducing effect of phosphor on iron uptake was more critical when the pH of the
growth medium was high. Ayed (1970) stated that since the phosphor content of
the medium was high, iron content was slightly affected in plants showing iron
chlorosis, while the phosphor iron ratio was very high. This study also reported
that high phosphor content in plants could decrease iron mobility. The phosphor
and iron content in tomato roots was higher than the part above ground, related to
the formation of iron phosphate in or on the roots.
Watanabe et al. (1965) also reported that excessive amounts of phosphor
applied to the growth medium of various plants increased iron chlorosis and caused
decreases in the product. Within the framework of these studies, in the comparison
of bean cultivars grown in sufficient iron medium in terms of iron nutritional
properties, dry matter amount, chlorophyll concentration, the active and total iron
content of plants, ferric reductase enzyme activity on leaves, total nitrogen in the
plant, phosphor and potassium content of plants were taken into account. This
study aimed to compare bean cultivars grown in a medium including sufficient
iron in terms of some iron nutritional properties and to determine the best iron
nutritional characteristic of the cultivars.
12.2. Material and Method
The 15 bean varieties examined in the study were obtained from the T.R.
Ministry of Agriculture Black Sea Agricultural Research Institute Directorate. The
names of the 15 different bean cultivars examined in the study are as follows: 1)
Önceler (pole bean), 2) Göynük (dwarf), 3) Eskfbud-2 (pole bean), 4)
Ktakfbv.2(FÇ.113) (dwarf), 5) Pure line (Eskfbvd-6) (dwarf), 6) Yunus90 (dwarf),

SUSTAINABLE AGRICULTURE LEADS TO ZERO HUNGER | 222
7) Eskfbud-11 (pole bean), 8) Eskfbvd-14 (pure line) (pole bean), 9) Zülbiye
(dwarf), 10) Eskfbud-7(dwarf), 11) Karalcaşehir 90 (dwarf), 12) Ada - 13-6-
(dwarf), 13) Ktakfbvd1(pure line) (dwarf), 14) Ktakfbvd-3 (Fç.304) (dwarf), 15)
Eskfbvd-8-(pure lne) (dwarf). In the trial, the following nutrient solution reported
by Hewitt [15], which was adjusted to pH 6.0, was applied: 1,0 mM NH4NO3; 1,60
mM KH2PO2; 3,50 mM CaSO4; 1,50 mM MgSO4; 1,50 mM K2SO4; 4,0 µM
H3BO3; 4,0 µM ZnSO4; 4,0 µM MnSO4; 0,12 µM (NH4)6Mo7O24. Chelated Iron
(Fe-EDDHA) containing 100 µM Fe was added to this nutrient solution. This
nutrient solution was applied to 15 bean cultivars in pots filled with 445 g quartz
sand.
In the trial carried out by growing a bean plant in each pot, 30 mL of the
nutrient solution prepared at the above concentrations was applied daily. Bean
cultivars were grown for 50 days. Leaf samples were taken from the plants for
analyses on fresh leaves. Above-ground parts of the plants were dried in ovens set
at 65 o C, and dry matter weights were determined (Kacar and Inal, 2008). Ferric
reductase activity in fresh leaves was carried out according to the method reported
by Ojeda et al. (2004). Active iron was determined in fresh leaf samples. For this,
fresh leaf samples were extracted with 1,0 N hydrochloric acid, and the atomic
absorption of active iron in the filter was determined with a spectrophotometer
(Takkar and Kaur, 1984). Chlorophyll-a, chlorophyll-b, and total chlorophyll
determination were made in fresh leaf samples as reported by Arnon (1949) and
Witham et al. (1971). Kacar and Inal (2008) reported that total nitrogen,
phosphorus, potassium, and iron were found in dried and ground plant samples.
CLA clustest or similarity test was applied to determine and group the similarity
and dissimilarity of bean cultivars grown in a good iron environment. Clustering
analysis was performed according to the Ward method in JMP.5.0 statistical
package program. In addition, Biplot analysis was performed to determine the best
iron nutritional properties of cultivars grown in a sufficient iron environment and
to group these bean cultivars.
12.3. Results and Discussion
Iron nutritional properties are determined in some bean cultivars
grown in a sufficient iron environment.
Table 1 shows the mean values of 10 characteristics determined in bean
cultivars grown in sufficient iron nutrition environment. When the table is
examined, the highest dry matter amount was found in variety number 4, while the
lowest dry matter amount was found in variety number 9 in sufficient iron nutrition

223 | SUSTAINABLE AGRICULTURE LEADS TO ZERO HUNGER
environment. The highest ferric reductase activity in the leaf was found in variety
6, while the lowest ferric reductase activity in the leaf was found in variety 7. The
highest chlorophyll-a content was found in variety 11 leaf, while the lowest was
found in variety 4. the highest chlorophyll-b content was found in variety 7. In
contrast, the lowest chlorophyll-b content was found in variety 9. The highest total
chlorophyll content was found in variety 11, while the lowest total chlorophyll
content was found in variety 4. The highest active iron and total iron content were
found in variety 9, while the lowest active iron and total iron content were found
in variety 11. The highest nitrogen content was found in variety 7, while the lowest
nitrogen content was found in variety 14; the highest phosphorus content was
found in variety 3, while the lowest phosphorus content was found in variety 15;
the highest potassium content was found in variety 3, while the lowest potassium
content was found in variety 14.
Table 1. Mean values of 10 characteristics were determined in bean cultivars grown in
sufficient iron nutrition environment (plants fed with 100 µM iron solution)
Cultivar
number
DM
g
plant-
1
Chlo.
a, mg
g-1TM
Chlo.
b, mg
g-1 M
Total
chlo. ,
mg g-1
TM
Active
Fe,
ppm
FRA,
µmol
hour-1 g -1
TM
Total Fe
content,
ppm
N
content,
%
P
content,
%
K
content,
%
1 7,34* 0,73 0,39 1,12 29,40 66,68 212 2,89 0,65 2,31
2 6,82 0,80 0,44 1,25 24,43 23,27 208 2,61 0,65 2,21
3 5,76 0,96 0,51 1,47 24,00 26,95 202 2,68 0,92 2,97
4 10,00 0,66 0,42 1,08 26,50 103,58 183 2,13 0,72 2,52
5 8,19 0,69 0,41 1,10 34,96 42,85 196 2,55 0,59 1,86
6 7,87 0,74 0,43 1,17 30,86 341,30 255 2,19 0,49 2,01
7 5,54 0,99 0,56 1,55 47,45 20,78 257 3,21 0,64 2,57
8 6,03 0,81 0,40 1,21 29,63 42,93 190 2,50 0,54 2,34
9 4,47 0,74 0,38 1,12 61,25 42,59 446 2,61 0,73 2,90
10 5,19 0,75 0,39 1,15 47,50 32,57 282 2,33 0,45 1,91
11 4,57 1,06 0,50 1,56 23,33 56,73 180 2,49 0,51 2,02
12 4,68 0,81 0,41 1,22 24,76 159,6 189 2,49 0,63 1,92
13 5,55 0,81 0,45 1,26 29,00 146,55 196 2,44 0,66 1,88
14 5,25 0,76 0,41 1,22 26,33 137,47 202 2,11 0,59 1,80
15 5,45 0,94 0,50 1,44 30,43 110,71 227 2,57 0,41 2,30
*Each number is the mean of three replicatios
Grouping of some bean cultivars grown in a sufficient iron
environment in terms of predetermined iron nutritional
properties, similarity and dissimilarity values
Figure 2 shows some bean cultivars grown in a sufficient iron environment
regarding predetermined iron nutritional properties. When Figure 2 is examined, it
can be seen that bean cultivars grown in a sufficient iron environment are grouped
in 2 in terms of iron nutritional properties. 11 varieties (1, 5, 2, 8, 10, 4, 6, 12, 13,
14, 9) are clustered in the first leading group, while four varieties (3, 7, 11 and 15)
are clustered in the second leading group.

SUSTAINABLE AGRICULTURE LEADS TO ZERO HUNGER | 224
Figure 2. Grouping of some bean cultivars grown in a sufficient iron environment in
terms of predetermined iron nutritional properties
Table 2 shows the intragroup similarity values of the cultivars in terms of
the properties examined in a good iron nutrition environment. When Table 2 is
examined, it can be seen that varieties 12 and 13 were the most similar, while
varieties 1 and 3 were the most dissimilar in terms of iron nutritional properties in
a good iron nutrition environment.
Table 2. Similarity and dissimilarity values of the cultivars in a sufficient iron nutrition
environment in terms of iron nutritional properties
Grouping of some bean cultivars grown in a sufficient iron
environment in terms of the best iron nutritional properties
Number of groups Intragroup similarity value Group members
14 0,783 12 13
13 1,059 2 8
12 1,221 12 14
11 1,426 1 5
10 1,500 11 15
9 1,724 1 2
8 2,687 1 10
7 2,824 3 7
6 2,901 6 12
5 3,090 1 4
4 3,591 1 6
3 3,617 3 11
2 5,200 1 9
1 6,583 1 3

225 | SUSTAINABLE AGRICULTURE LEADS TO ZERO HUNGER
Figure 3 shows some bean cultivars grown in a sufficient iron environment
regarding the best iron nutritional properties. Figure 3 shows the classification of
the characteristics examined in a sufficient iron nutrition environment and the
changes in cultivars in terms of characteristics. In the analysis made with the Biplot
method, PC1 (1st main component) constituted 36.3% of the variation, PC2 (2nd
main component) constituted 30.1% of the variation, and the sum of PC1 and PC2
constituted 66.4% of the variation.
As seen in Figure 3, characteristics according to cultivars and the
distribution of cultivars differed in a sufficient iron nutrition environment.
According to the results of the analysis made, it was found that cultivars 4, 6, 12,
13, and 14 were suitable in terms of ferric reductase activity in leaf and dry matter
amounts in a sufficient iron nutrition environment and that these cultivars were in
the same group. Similarly, it was found that cultivars 1, 2, 5, 8, 9, and 10 were
suitable in terms of active Fe in leaf, total phosphorus, and iron content in a
sufficient iron nutrition environment and that these cultivars were in the same
group.
Figure 3. Grouping of some bean cultivars grown in a sufficient iron environment in terms
of the best iron nutritional properties
It was also found that cultivars 3 and 7 were suitable in terms of total
nitrogen and potassium content in a sufficient iron nutrition environment and that
these cultivars were in the same group. Similarly, it was found that cultivars 11
and 15 were suitable in terms of chlorophyll-a, chlorophyll -b, and total

SUSTAINABLE AGRICULTURE LEADS TO ZERO HUNGER | 226
chlorophyll in leaf in a sufficient iron nutrition environment and that these cultivars
were in the same group.
The resistance of five different dry bean cultivars (Coco Blanc, Striker,
ARA14, SVM29-21, and BAT477) to iron deficiency was examined in a study
(Krouma et al., 2003). Chlorosis symptoms, plant development, acidity capacity in
the root environment, and ferric reductase enzyme activity in roots were chosen as
the index in this study. In this study, chlorosis symptoms in BAT477 and Coco
Blanc cultivars were found to be more severe when compared with other cultivars.
It was observed that the rhizosphere acidification capacity of Striker, SVM29-21,
and especially ARA14 bean cultivars was high in nutrient solution but deficient in
iron. In addition, it was also observed that plants grown in iron sufficient
environment increased the pH of plants’ nutrition solution. The rhizosphere
acidification capacity of plants was measured in a nutrition solution environment
containing 10 mM KCL+1mM CaCl2. ARA14 was found to have the highest
acidification capacity, followed by Coco Blanc and BAT477. It was found that
root ferric reductase activity increased in all bean lines in iron deficiency
conditions, and the highest root ferric reductase activity was found in the Striker
bean cultivar. The deficiency condition means that the Striker cultivar is effective
in iron uptake.
The same study on selecting bean cultivars adapted to iron deficiency was
based on cultivars' rhizosphere acidification capacity and root ferric-chelate
reductase activity (Krouma et al., 2003). When the indices specified in this study
were considered, the bean cultivar resistant to iron deficiency was determined as
ARA14. The solubility of ferric iron is facilitated as a result of rhizosphere
acidification. An increasing correlation was found between proton outlet and ferric
reductase activity in the cultivars examined. Researchers showed that ferric
reductase activity is pH sensitive and inhibited in alkaline soil. It was stated that
iron content in the nodule could also be used as an index in selecting cultivars
resistant to iron deficiency in legume plants. In this study, researchers also showed
that the chlorophyll content of Flamingo bean (resistant to iron deficiency) grown
in sufficient and deficient iron environment was higher than the Coco Blanc
(sensitive to iron deficiency).
12.4. Conclusion
Bean cultivars grown in a sufficient iron environment were grouped in 2 in
terms of iron nutritional properties. 11 cultivars (1, 5, 2, 8, 10, 4, 6, 12, 13, 14, 9)
were clustered in the first leading group, while four cultivars (3, 7, 11 and 15) were

227 | SUSTAINABLE AGRICULTURE LEADS TO ZERO HUNGER
clustered in the second leading group. In other words, varieties 1, 5, 2, 8, 10, 4, 6,
12, 13, 14, and 9 grown in a sufficient iron environment were similar regarding
iron nutritional properties. Similarly, cultivars 3, 7, 11, and 15 were similar
regarding iron nutritional properties. It was found that cultivars 12 [Ada-13-6-
(dwarf)] and 13 [Ktakfbvd1 (pure line) (dwarf)] were the most similar, while
cultivars 1 [Önceler (pole bean)] and 3 [Eskfbud-2 (pole bean)] were the most
dissimilar in terms of iron nutritional properties in sufficient iron nutrition
environment. It was found that cultivars 12 and 13 were suitable in terms of ferric
reductase activity in leaf and dry matter amounts. Cultivar 1 [Önceler (pole bean)]
was excellent regarding active Fe in leaf, total phosphorus, and iron content. It was
also found that cultivar 3 [Eskfbud-2 (pole bean)] was a suitable cultivar in terms
of total nitrogen and potassium content.
Of the cultivars 1 [Önceler (pole bean)] and 3 [Eskfbud-2 (pole bean)],
which were dissimilar, it was found that cultivar 1 [Önceler (pole bean)] had higher
dry matter, active iron, total iron, and nitrogen content and ferric reductase activity
values than cultivar 3 [Eskfbud-2 (pole bean)]. However, it was found that cultivar
3 [Eskfbud-2 (pole bean)] had higher chlorophyll-a, higher chlorophyll-b, total
chlorophyll, total phosphorus, and potassium content than cultivar 1 [Önceler (pole
bean)].

SUSTAINABLE AGRICULTURE LEADS TO ZERO HUNGER | 228
References
Arnon, D. (1949). Copper enzymes in isolated chloroplast polyphenol oxidase in Beta
vulgaris. Plant Physiol., 24:1-15.
Ayed, I.A. (1970). A Study of the Mobilization of Iron in Tomato Roots by Chelate
Treatments. Plant Soil, 32: 18-26.
Barak, P. & Chen, Y. (1983). The Effect of Potassium Fertilization on Iron Deficiency.
Commun. Soil Sci. Plant Anal. 14(10): 945-950.
Başar, H. (2002). Yapraktan uygulanan değişik bileşiklerin soya fasulyesinin demirle
beslenmesine etkisi. Uludağ. Üniv. Zir. Fak. Derg., 16: 15-27.
Hewitt, E.J. (1966). Sand and water culture methods used in the study of plant nutrition.
Kacar, B. & Inal, A. (2008). Bitki Analizleri, 1. Basım. Nobel Yayınları: Ankara.
Korkmaz, A. Horuz, A. & Sürücü, A. (2006). Effects of sulfur, humic acid, some iron and
potassium fertilizers on chlorophyll, total and active iron contents in peach trees
having chlorosis. 18th International Soil Meeting (ISM) on "Soil Sustaining Life
on Earth, Managing Soil and Technology ."May 22-26, 2006, Proceedings Vol II.
Şanlıurfa-Turkey.
Krouma, A. & Abdelly, C. (2003). Importance of iron use efficiency in common bean
(Phaseolus vulgaris L.) for iron chlorosis resistance. Journal of Plant Nutrition and
Soil Science, 4: 525–528.
Krouma, A., Drevon, J.J. & Abdelly, C. (2006). Genotypic variation of N2-Fixing common
bean (Phaseolus vulgaris L.) in response to iron deficiency. J. Plant Physiol.,
163(11): 1094-1100.
Ksouri, R., Gharsallı, M. & Lachaal, M. (2001). Diagnostic Rapide de la Cholorose
Ferrique Chez la Vigne (Vitis vinifera L.). Bulletin de L’O.I.V. 74, n° 847-848, pp.
569-577.
Loué, A. (1986). Les Oligo-elements en Agriculture. Agrı-Nathan Dntenational. Paris.
Ojeda, M., Schaffer, B., Davies, F.S. (2004). Root and leaf ferric chelate reductase activity
in pond apple and soursop. J Plant Nutr., 27: 1381-1393.
Olsen, S.R. (1972). Micronutrient Interactions. In "Micronutrients in Agriculture." Soil Sci.
Soc. of America, Madison, USA, 11, 243-264.
Takkar, P.N. & Kaur, N.P. (1984). HCI method for Fe+2 estimation to resolve iron chlorosis
in plants. J Plant Nutr.,7(1-5): 81-90.
Watanabe, F.S., Lindsay W.L. & Olsen, S.R. (1965). Nutrition Balance Involving
Phosphorus, Iron and Zinc. Soil Sci. Soc. Amer. Proc. 29: 562-565.
Withan, F.H., Blayedes, D.F. & Devlin, R.M. (1971). Experiments in Plant Physiology.
Van Nostrand Reinhold Co., New York, p.55-58.
Zamboni, A., Zanin, L., Tomasi, N., Pezzotti, M., Pinton, R., Varanini Z., et al. (2012).
Genome-wide microarray analysis of tomato roots showed defined responses to iron
deficiency. BMC Genomics 13:101. 10.1186/1471-2164-13-101

229 | SUSTAINABLE AGRICULTURE LEADS TO ZERO HUNGER
Brief Curriculum Vitae of Authors
İlkay ÇOKA as a Lecturer in Mersin University,
Vocational School of Gulnar, Department of Plant
and Animal Production Techniques, Arboriculture
Department, Mersin / TURKEY. E-mail:
[email protected]. Mobile Phone: +90 507
106 96 18. Research Expertise: Plant Physiology,
Botany, Plant Nutrition and Fertilization, Soiless
culture, Physiological Changes in Plants under
Nutrient Deficiencies. She did researche project. She published indexed
national Journals and international journals, 4 book chapters, 8 proceeding
conferences. Link: https://orcid.org/0000-0001-8387-8457,
üney AKINOĞLU is a Research Assistant Dr. Ondokuz
Mayıs University, Faculty of Agriculture, Department of
Soil Science and Plant Nutrition, Kurupelit Campus, 55139
Atakum/Samsun/TURKEY. E-mail:
[email protected] Phone: +90-362-312-
1919/1059. PhD-Ankara University Graduate School of Natural and
Applied Science, Department of Soil Science and Plant Nutrition. Research
Expertise is in: Soil Fertility, Soil Chemistry, Mineral Nutrition of Plants,
Fertilizers, Soilless culture, Physiological Changes in Plants under Nutrient
Deficiencies, Oxygen Free Radicals and Antioxidants in Stressed Plants.
Selected Research Projects: The Effects of Silicon Fertilization on Silicon
and Some Other Nutrient Elements in the Hull Grain of Rice Soils in
Samsun Province. Ondokuz Mayıs University Scientific Research Project,
2013-2015, (Researcher); Selection of Bean Varieties and Tomato Lines
Sensitive and Resistant to Iron Deficiency. Ondokuz Mayıs University
Scientific Research Project, 2016-2017, (Researcher). He has four
Publications in Peer-Reviewed Journals (SCI), 13 indexed international
journals, 6 books and 4 chapters.
G

SUSTAINABLE AGRICULTURE LEADS TO ZERO HUNGER | 230

231 | SUSTAINABLE AGRICULTURE LEADS TO ZERO HUNGER
CHAPTER 13
DETERMINATION OF THE RESISTANCE OF SOME
SUNFLOWER LINES TO IRON DEFICIENCY
Ahmet KORKMAZ1, Güney AKINOĞLU1, E. BOZ2, İlkay ÇOKA3
1Ondokuz Mayıs University, Faculty of Agriculture. Department of Soil
Science & Plant Nutrition. 55139, Samsun, Turkey 2General Directorate of Turkish Coal Enterprises, Ankara, Turkey
3Mersin University, Vocational School of Gulnar, Department of Plant
and Animal Production, Mersin, Turkey
*Corresponding author: [email protected]

SUSTAINABLE AGRICULTURE LEADS TO ZERO HUNGER | 232

233 | SUSTAINABLE AGRICULTURE LEADS TO ZERO HUNGER
13.1. Introduction
The sunflower plant is a plant species sensitive to iron deficiency, and in
case it is grown in soils with iron deficiency, significant yield and quality losses
occur. According to the analysis of many soil samples collected from different
regions of Turkey, Fe deficiency is the most common micro element deficiency
after zinc, with a rate of 27% (Eyüpoğlu and Korucu, 1997). The characteristics of
reducing the rhizosphere pH and increasing the capacity of the roots to reduce +3-
valent iron (Fe+3) to +2-valent iron (Fe+2) in order to adapt to iron deficiency
conditions in plants such as sunflower were reported to differ considerably
between genotypes (Alcantara and Guardia, 1991). Researchers also stated that
iron uptake in sunflower was related to the capacity of roots to decrease
rhizosphere pH or to reduce +3 valent iron to divalent iron (Fe+2) in the
rhizosphere. It was stated that the sunflower was one of the plant species sensitive
to iron deficiency (Mengel et al., 1994; Ranieri et al., 2001).
Görmüş and Barutçular (2016) reported that the sunflower was a susceptible
plant to iron deficiency, and they also stated that the cultivation area and
production of sunflower in Turkey, especially in the Çukurova Region, increased
significantly in recent years. Eyüpoğlu et al. (1997) stated that the available iron
concentration of Turkish soils was low, which may cause significant losses in the
yield and quality of sunflowers. Strategy-I plants are generally dicotyledonous
plants, and by transferring genes related to iron uptake and transport from
Arabidopsis thaliana to these plants, it has been tried to obtain varieties that are
effective in iron uptake. The studies determined that chlorophyll decreased in
tomato plants exposed to iron deficiency, and Fe+3 chelate reductase enzyme
activity increased in the root. In Strategy-I plants, it was reported that plants with
the following issues were capable of iron uptake. These features were: 1) the roots
of varieties capable of iron uptake had the feature of increasing the acidity of the
soil and the solubility of iron in the rhizosphere by removing protons. 2) Plants
capable of iron uptake had the feature of reducing +3-valent iron (Fe+3) to +2-
valent iron (Fe+2) by increasing the Fe+3 chelate reductase enzyme activity in their
roots under iron deficiency conditions. 3) Varieties capable of iron uptake had the
feature of enabling the transport of +2 valent iron (Fe+2) from the plasmalemma by
increasing the Fe+2 transporter activity (Zamboni et al., 2012). It was reported that
the uptake and availability of iron significantly decreased due to unsuitable soil,
climate, and plant factors. It was also stated that poorly ventilated, cold, calcareous
or alkaline soils were soils where iron deficiency was common in plants
(Marschner et al., 1986; Inskeep and Bloom, 1987). Plants grown in such soils

SUSTAINABLE AGRICULTURE LEADS TO ZERO HUNGER | 234
developed adaptation mechanisms against iron deficiency conditions by increasing
iron availability in the rhizosphere. As a result of these mechanisms, it was stated
that they got enough iron with their roots. Root responses in adaptation to iron
deficiency conditions varied among plant species. It was stated that reducing +3-
valent iron to +2-valent iron (Fe+2) on root surfaces was an essential process for
iron uptake of Strategy-I plants (Chaney et al., 1972; Römheld and Marschner,
1986). Marschner et al. (1986) stated that another characteristic of Strategy-I plants
in conditions of iron deficiency was to increase the acidity of the rhizosphere with
an ATPaz proton pump, which contributed to the iron nutrition of the plant by
increasing the solubility of iron in the rhizosphere.
It was reported that iron was an essential element in the many cellular
functions of the plants on the biosynthesis of the chlorophyll, photosynthesis,
respiration, DNA synthesis, electron transport chain in mitochondria and
chloroplasts, protein synthesis, reduction of nitrates to ammonia. (Ishimaru et al.,
2006; Kumar et al., 2013). Iron is also involved in the structure of enzymes such
as catalase, peroxidase, aconitase, and superoxide dismutase. (Marschner, 1995).
Fe+2 and Fe+3 redox couple play an essential role in plant development by
increasing enzymatic redox reactions (Gill and Tuteja, 2010). In plant breeding,
hybrid varieties are obtained by crossing between lines. The iron nutritional
abilities of hybrid varieties come primarily from the lines used in crossing.
Individuals formed as a result of inbreeding are called lines. Inbreeding is the
process of crossing between close relatives. Knowing the iron nutrition capabilities
of the lines obtained by inbreeding for many years is crucial because it reflects the
iron nutrition ability of the hybrid variety to be obtained. This study aims to
compare the resistance of some sunflower lines to iron deficiency and determine
the best characteristics of the line that is resistant to iron deficiency.
13.2. Material and Method
Material
In the study, seven different sunflower lines were examined. It consisted
sunflower line,laboratory number, the average number of seed per head, rate if
grain filling, head diameter, head shape, sunflower seed shell or debulled seed.
Some characteristics of sunflower lines are given in Table 1.

235 | SUSTAINABLE AGRICULTURE LEADS TO ZERO HUNGER
Table1. Some table characteristics of sunflower lines (Aytaç et al., 2016)
Sunflower
line no
Laboratory
number
The average
number of
seeds per head
Rate of
grain
filling
Head
diameter Head shape
Sunflower
seed shell
/ dehulled
seed
12 1 869 80.0 25.2 Smooth-smooth
conic 52.2
18 2 972 77.0 27.1 Smooth conic 58.5
21 3 708 82.0 24.2 Smooth-smooth
conic 53.66
25 4 928 73.0 25.1 Smooth 54.65
28 5 967 62.8 26.6 Smooth-smooth
conic-invert conic 51.63
34 6 869 68.0 23.8 Smooth-invert
conic 58.42
37 7 754 81.2 22.5 Smooth conic-
invert conic 65.18
Method
Sunflower lines were grown in 300mL plastic pots with drain holes filled
with 445g of washed quartz sand. Factorial trials were carried out in a randomized
parcel plot design of 7×3 (line × iron dose) in a quartz sand environment. In the
trials, each treatment was applied with three repetitions, the pH of the nutrient
solution used was adjusted to 6.0, and the nutrient concentration was given below
(Öztürk et al., 2008): 0.75 mM K2SO4; 2.0 mM Ca(NO3)2.4H2O; 1.0 mM
MgSO4.7H2O; 0.25 mM KH2PO4; 0.1 mM KCl; 1.0 µM MnSO4; 1.0 µM
ZnSO4.7H2O; 10 µM H3BO3; 0.01 µM (NH4)6Mo7O24; 0.1 µM CuSO4.5H2O. Fe-
EDDHA was added to the applied nutrient solution containing 0.45 and 100 µM
Fe. Dilution was done after emergence, so there was one sunflower plant in each
pot. After dilution, 50 ml of the nutrient solution was applied to each pot from the
nutrient solution every day.
Sunflower lines were grown for 50 days by applying the nutrient solution.
Leaf samples were taken for analysis to be made on fresh leaves. The aboveground
parts of the plants were dried in an oven set at 65oC, and their dry matter (DM)
weights were determined (Kacar and İnal, 2008). Ferric reductase enzyme activity
was determined in fresh roots and leaves, according to Ojeda et al. (2004). Enzyme
activity was expressed as µmol/hr/g of Fresh Matter (FM)
For the determination of active iron, fresh leaf samples were extracted with
1.0 N hydrochloric acid, and the iron in the filtrate was determined by atomic
absorption spectrophotometer (Takkar and Kaur, 1984). Chlorophyll-a,
chlorophyll-b, total chlorophyll, and carotenoid determinations were made

SUSTAINABLE AGRICULTURE LEADS TO ZERO HUNGER | 236
according to Arnon (1949) and Witham et al. (1971). Tolerance index values of
sunflower lines to iron deficiency were calculated as follows:
Proportional values, % = (A / B) × 100
A: Chlorophyll-a, chlorophyll-b, total chlorophyll, active iron contents, and
dry matter amounts determined in lines grown with iron-free nutrient
solution
B: Chlorophyll-a, chlorophyll-b, total chlorophyll, active iron contents, and
dry matter amounts determined in lines grown with 45 µM or 100 µM
iron-containing nutrient solution
Statistical Analysis
A cluster test or similarity test was applied to determine the proximity and
distance of sunflower lines from each other in terms of iron nutrition indices under
iron deficiency conditions. According to Ward's Method, cluster analysis was
performed in the JMP.5.0 statistical package program. In addition, Biplot analysis
was carried out to classify the iron nutrition indices and other characteristics
according to the lines, determine the change of the lines according to these indices
and characteristics, and determine the best characteristics of the lines.
13.3. Results and Discussion
Classification of sunflower lines under iron deficiency conditions, their
proximity distances, and their good characteristics
The values of 19 different parameters related to iron nutrition indices and
other characteristics examined in sunflower lines under iron deficiency conditions
are given in Table 2. Under iron deficiency conditions, line 25 had the highest
values among sunflower lines regarding root ferric reductase enzyme activity
(FRA), dry matter content, and leaf nitrogen content. In addition, it was determined
that line 21 had the highest values in terms of ferric reductase activity and active
iron content in the leaf, then line 34 had the highest values in terms of chlorophyll-
a content in the leaf. Line 18 had the highest values in terms of chlorophyll-b
content in the leaf; Line 12 had the highest values in terms of total chlorophyll
content in the leaf and line 28 had the highest values in terms of root cation
exchange capacity (Root CEC)

237 | SUSTAINABLE AGRICULTURE LEADS TO ZERO HUNGER
Table 2. Values of iron nutrition indices and some other characteristics of sunflower lines
under iron deficiency conditions
Sunflower
line no
FRA at
root µmol/hr/g
FM
FRA in
leaf, µmol/hr/g
FM
Chlorophyll-
a, mg/g FM
Chlorophyll-
b, mg/g FM
Total
chlorophyll, mg/g FM
Active
Fe, ppm
Yield,
g DM/plant
N, %
Root
KDK, me/100g
DM
(I) (II) (III) (IV) (V) (VI) (VII) (VIII) (IX)
12
252.42
337.24
1.5
0.62
2.13
7.56
10.35
0.98
3.51
18
258.95
332.12
1.05
0.7
1.89
7.32
12.8
1.04
3.2
21
245.48
355.31
1.42
0.54
1.96
14.64
9.48
0.94
3.55
25
273.11
341.75
1.43
0.58
2.02
9.12
13.32
1.1
4.58
28
234.9
333.93
1.46
0.59
2.06
8.02
8.6
1.03
5.89
34
249.53
333
1.58
0.53
2.11
7.85
10.46
1.06
3.89
37
253.9
327.9
1.46
0.5
1.97
7.03
12.81
0.96
4.54
Seven different sunflower lines grown under iron deficiency conditions
were divided into two groups regarding the determined characteristics. While the
first group consisted of 18 numbered sunflower lines, the second group consisted
of lines 12, 28, 34, 37, 25, and 21 (Figure 1).
.
Figure 1. Classification of sunflower lines according to their iron nutritional abilities in
iron deficiency conditions
Among the lines forming the second group, line 12 was found to be high in
terms of chlorophyll-b and total chlorophyll contents. Korkmaz et al. (2021)
compared the sunflower lines grown under iron deficiency conditions in sand
supplemented with lime regarding their iron nutritional abilities. Researchers
found that ferric reductase activity, chlorophyll-a, chlorophyll-b, and total
chlorophyll contents in root and leaf in sunflower line 12 were higher than in
sunflower line 21.
It was concluded that line 12 was better than line 21 regarding iron
nutritional characteristics in iron deficiency conditions. Researchers compared the
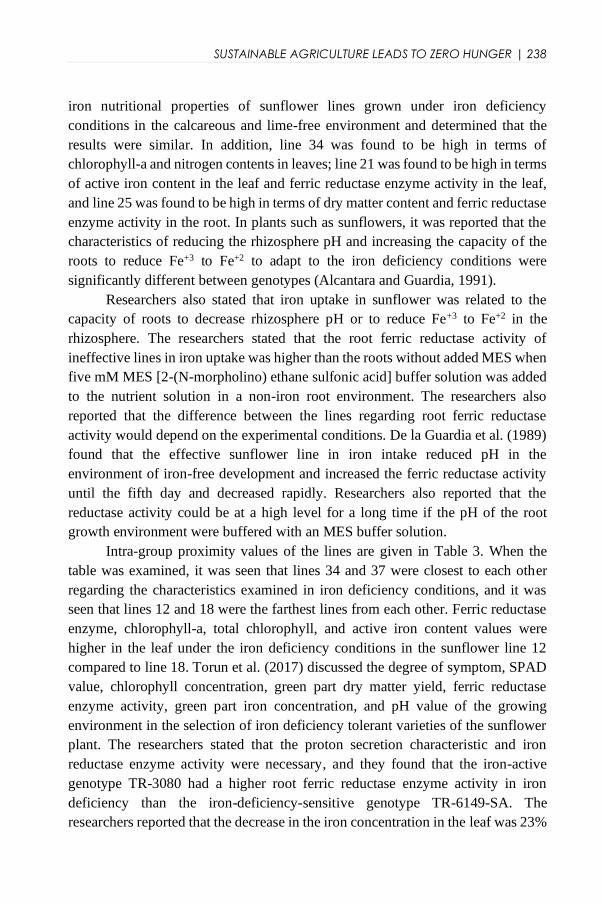
SUSTAINABLE AGRICULTURE LEADS TO ZERO HUNGER | 238
iron nutritional properties of sunflower lines grown under iron deficiency
conditions in the calcareous and lime-free environment and determined that the
results were similar. In addition, line 34 was found to be high in terms of
chlorophyll-a and nitrogen contents in leaves; line 21 was found to be high in terms
of active iron content in the leaf and ferric reductase enzyme activity in the leaf,
and line 25 was found to be high in terms of dry matter content and ferric reductase
enzyme activity in the root. In plants such as sunflowers, it was reported that the
characteristics of reducing the rhizosphere pH and increasing the capacity of the
roots to reduce Fe+3 to Fe+2 to adapt to the iron deficiency conditions were
significantly different between genotypes (Alcantara and Guardia, 1991).
Researchers also stated that iron uptake in sunflower was related to the
capacity of roots to decrease rhizosphere pH or to reduce Fe+3 to Fe+2 in the
rhizosphere. The researchers stated that the root ferric reductase activity of
ineffective lines in iron uptake was higher than the roots without added MES when
five mM MES [2-(N-morpholino) ethane sulfonic acid] buffer solution was added
to the nutrient solution in a non-iron root environment. The researchers also
reported that the difference between the lines regarding root ferric reductase
activity would depend on the experimental conditions. De la Guardia et al. (1989)
found that the effective sunflower line in iron intake reduced pH in the
environment of iron-free development and increased the ferric reductase activity
until the fifth day and decreased rapidly. Researchers also reported that the
reductase activity could be at a high level for a long time if the pH of the root
growth environment were buffered with an MES buffer solution.
Intra-group proximity values of the lines are given in Table 3. When the
table was examined, it was seen that lines 34 and 37 were closest to each other
regarding the characteristics examined in iron deficiency conditions, and it was
seen that lines 12 and 18 were the farthest lines from each other. Ferric reductase
enzyme, chlorophyll-a, total chlorophyll, and active iron content values were
higher in the leaf under the iron deficiency conditions in the sunflower line 12
compared to line 18. Torun et al. (2017) discussed the degree of symptom, SPAD
value, chlorophyll concentration, green part dry matter yield, ferric reductase
enzyme activity, green part iron concentration, and pH value of the growing
environment in the selection of iron deficiency tolerant varieties of the sunflower
plant. The researchers stated that the proton secretion characteristic and iron
reductase enzyme activity were necessary, and they found that the iron-active
genotype TR-3080 had a higher root ferric reductase enzyme activity in iron
deficiency than the iron-deficiency-sensitive genotype TR-6149-SA. The
researchers reported that the decrease in the iron concentration in the leaf was 23%

239 | SUSTAINABLE AGRICULTURE LEADS TO ZERO HUNGER
under iron deficiency conditions in the TR-3080 sunflower genotype, which was
an iron-active variety, whereas it was 35.4% in the TR-6149-SA sunflower cultivar
sensitive to iron deficiency.
Although lines 34 and 37 were close to each other, line 34 showed higher
values in leaf than line 37 in terms of ferric reductase enzyme activity, chlorophyll-
a, chlorophyll-b, total chlorophyll, and active iron contents.
Table 3. Intra-group proximity values of sunflower lines under conditions of iron
deficiency in a lime-free environment
Group numbers In-group proximity
value
Group constituents
6 3.027 3 37
5 3.362 12 28
4 3.988 12 34
3 4.304 12 25
2 5.371 12 21
1 5.501 12 18
` The characteristics classification examined in iron deficiency conditions and
the change of the lines according to the characteristics is given in Figure 2. In the
analysis made with the Biplot method, PC1 (1st main component) constituted
28.6%, PC2 (2nd main component) constituted 24.3% and 52.9% of the variation.
As seen in Figure 2, it differed in terms of the characteristics and distribution of
lines according to lines. According to the analysis results, it was seen that Line 37
in the second group was found to have the best characteristics of chlorophyll-a (III)
and total chlorophyll contents (V) in the leaf in terms of iron nutrition under iron
deficiency conditions. Lines 12, 25, and 28 in the second group had the best
characteristics of proportional chlorophyll-a (XV), root cation exchange capacity
(VIII), proportional total chlorophyll (XVII), proportional chlorophyll-b (XVI),
and proportional dry matter (XIX) and nitrogen content (IX) in terms of iron
nutrition in iron deficiency conditions. In other words, lines 12, 25, and 28 were
found to be tolerant to iron deficiency in terms of chlorophyll-a, chlorophyll-b,
total chlorophyll, and yield. The best characteristics of line 18 under iron
deficiency conditions were yield (VII), ferric reductase activity in root and leaf (I
and II, respectively), chlorophyll-b (IV), and proportional active iron (XIII) and
proportional chlorophyll-b (XI).
In iron deficiency conditions, it can be said that line 18 was tolerant in terms
of active iron and chlorophyll-b. The best characteristics of lines 21 and 34 under
iron deficiency conditions were found as active iron (VI), proportional total
chlorophyll (XII), and proportional chlorophyll-a (X). Lines 21 and 34 were

SUSTAINABLE AGRICULTURE LEADS TO ZERO HUNGER | 240
tolerant in terms of total chlorophyll and chlorophyll-a under iron deficiency
conditions (Figure 2). It was stated that dicotyledonous plants such as tomatoes
showed reactions related to iron activity, removed protons, and ferric chelate
reducing activity in iron deficiency. It was reported that these reactions were not
observed in tomato plants fed with sufficient iron in the plasma membranes of stem
cells (Bienfait, 1988).
Figure 2. Determination of the best iron nutrition indices of sunflower lines under iron
deficiency conditions and grouping the lines according to these indices
13.4. Conclusion
Sunflower lines formed two groups regarding iron nutritional status under
iron deficiency conditions. While line 18 formed the first group, the second group
consisted of lines 12, 28, 34, 37, 25, and 21. In terms of iron nutritional status in
iron deficiency conditions, it was seen that lines 34 and 37 were closest to each
other, and lines 12 and 18 were found to be the farthest from each other. It was
observed that ferric reductase enzyme, chlorophyll-a, total chlorophyll, and active
iron content values were higher in the leaf in sunflower line 12 than in line 18. The
best characteristics of line 12 in terms of iron nutrition in iron deficiency conditions
were proportional chlorophyll-a, root cation exchange capacity, proportional total
chlorophyll, proportional chlorophyll-b, and proportional dry matter and nitrogen
content.

241 | SUSTAINABLE AGRICULTURE LEADS TO ZERO HUNGER
References
Alcantara, E., De La Guardia, M.D. (1991). Variability of sunflower inbred lines to iron
deficiency stress. Plant and Soil, 130: 93-96
Arnon, D. (1949). Copper enzymes in isolated chloroplasts. Plant Physiology, 24: 1-12
Aytaç, S., Arslanoğlu, Ş.F., Yiğen, Ç. (2016). Some morphological characteristics of
confectionary sunflower genotypes obtained through selective breeding. p. 1102-
1105. 19th International Sunflower Conference, Edirne, Turkey.
Bienfait, H.F. (1988). Proteins under the control of the gene for Fe efficiency in tomato.
Plant Physiology, 88: 785-787.
Chaney, R.L., Brown, J.C. Tiffin, L.O. (1972). Obligatory reduction of ferric chelates in
iron uptake by soybeans. Plant Physiology, 50: 208-213
Curie, C., Panaviene, Z., Loulergeu, C., Dellaporta, S.L, Briat, J.F., Walker, E.L. (2011).
Maize yellow stripe 1 encodes a membrane protein directly involved in Fe (III)
uptake. Nature, 409: 346-349
De la Guardia, M.D, Alcantara, E., Fernandez, M. (1989). Iron reduction by sunflower
roots under iron stress. In plasma membrane oxidoreductases in control of animal
and plant growth. Eds. F L Crane, D J Morre and H Löw. NATO ası Series. Series
A: Life Sci. Vol. 157, 430. Plenum Press, New York and London.
Eyüpoğlu, F., Kurucu, N. (1997). Plant available trace iron, zinc, manganese and copper in
Turkish soils. In Soil Fertility Workshop, Aleppo (Syria), 19-23 Nov 1995.
ICARIA.
Eyüpoğlu, F., Kurucu, N., Talaz, S., Canısağ, U. (1997). Plant available trace iron, zinc,
manganese and copper in Turkish soils. Accomplishments and Future Challenges
in Dryland Soil Fertility Research in the Mediterranean Area, ICARDA book, 191-
196
Gill, S.S., Tuteja, N. (2010). Reactive oxygen species and antioxidant machinery in abiotic
stress tolerance in crop plants. Plant Physiol Biochem., 48: 909-930
Görmüş, O., Barutçular, C. (2016). Boron nutrition studies with cotton and sunflower in
Southern Turkey. Communications in Soil Science and Plant Analysis, 47(7): 915-
929
Inskeep, W.P., Bloom, P.R. (1987). Soil chemical factors associated with soybean b
chlorosis in calciaquolls of western Minnesota. Agronomy Journal, 79: 779-786
Ishimaru, Y., Suzuki, M., Tsukamoto, T., Suzuki, K., Nakazono, M., Kobayashi, T., Wada,
Y., Watanabe, S., Matsuhashi, S., Takahashi, M. (2006). Rice plants take up iron as
a Fe+3 phytosiderophore and as Fe+2. The Plant Journal, 45: 335-346
Kacar, B., İnal, A. (2008). Bitki Analizleri, 1. Basım. Nobel Yayınları, Ankara, Türkiye
Korkmaz, A., Akınoğlu, G., Boz, E. 2021. Ayçiçeği hatlarının demir beslenme kabiliyetleri
yönünden gruplandırılması ve bu hatların en iyi demir beslenme özelliklerinin
belirlenmesi. Black Sea Journal of Engineering and Science, 4(4), doi:
10.34248/bsengineering.899753

SUSTAINABLE AGRICULTURE LEADS TO ZERO HUNGER | 242
Kumar, S, Asif, M.H., Chakrabarty, D., Tripathi, R.D., Dubey, R.S., Trivedi, P.K. (2013).
Differential expression of rice lambda class GST gene family members during plant
growth, development, and response to stress conditions. The Plant Molecular
Biology Reporter, 31: 569-580
Marschner, H. (1995). Function of mineral nutrients: micronutrients. p.313-324. In:
Mineral nutrition of higher plants. Academic Press, London
Marschner, H., Römheld, V., Kissel, M. (1986). Different strategies in higher plants in
mobilization and uptake of iron. Journal of Plant Nutrition, 6: 695-713
Mengel, K., Planker, R., Hoffmann, B. (1994). Relationship between leaf apoplast pH and
iron chlorosis of sunflower (Helianthus annuus L.). Journal of Plant Nutrition,
17(6):1053-1065
Ojeda, M., Schaffer, B., Davies, F.S. (2004). Root and leaf ferric chelate reductase activity
in pond apple and soursop. Journal of Plant Nutrition, 27: 1381-1393
Öztürk, L., Yazıcı, A., Eker, S., Gökmen, Ö., Römheld, V., Çakmak, I. (2008). Glyphosate
inhibition of ferric reductase activity in iron deficiency sunflower roots. New
Phytologist, 177: 899-906
Ranieri, A., Castagna, A., Baldan, B., Soldatini, G.F. (2001). Iron deficiency differently
affects peroxidase isoforms in sunflower. Journal of Experimental Botany, 52(354):
25-35
Römheld, V., Marschner, H. (1986). Evidence for a specific uptake system for iron
phytosiderophores in roots of grasses. Plant Physiology, 80: 175-180
Takkar, P.N., Kaur, N.P. (1984). HCI method for Fe+2 estimation to resolve iron chlorosis
in plants. Journal of Plant Nutrition, 7(1-5): 81-90
Torun, A.A., Erdem, H., Torun, M.B. (2017). Ayçiçeği genotiplerinin demir noksanlığına
karşı tolerans düzeylerinin belirlenmesi. Türk Tarım-Gıda Bilimi ve Teknolojisi
Dergisi, 5(11): 1323-1329
Witham, F.H., Blaydes, D.F., Devlin, R.M. (1971). Experiments in plant physiology. Van
Nostrend Reinhold Company, New York
Zamboni, A., Zanin, L., Tomasi, N., Pezzotti, M., Pinton, R., Varanini, Z. (2012). Genome-
wide microarray analysis of tomato roots showed defined responses to iron
deficiency. BMC Genomics, 13:101. 10.1186/1471-2164-13-101

243 | SUSTAINABLE AGRICULTURE LEADS TO ZERO HUNGER
Brief Curriculum Vitae of Authors
üney AKINOĞLU is a Research Assistant Dr.. Ondokuz
Mayıs University, Faculty of Agriculture, Department of
Soil Science and Plant Nutrition, Kurupelit Campus, 55139
Atakum/Samsun/TURKEY.
E-mail: [email protected] Phone: +90-362-312-
1919/1059. PhD-Ankara University Graduate School of Natural and
Applied Science, Department of Soil Science and Plant Nutrition. Research
Expertise is in: Soil Fertility, Soil Chemistry, Mineral Nutrition of Plants,
Fertilizers, Soilless culture, Physiological Changes in Plants under Nutrient
Deficiencies, Oxygen Free Radicals and Antioxidants in Stressed Plants.
Selected Research Projects: The Effects of Silicon Fertilization on Silicon
and Some Other Nutrient Elements in the Hull Grain of Rice Soils in
Samsun Province. Ondokuz Mayıs University Scientific Research Project,
2013-2015, (Researcher); Selection of Bean Varieties and Tomato Lines
Sensitive and Resistant to Iron Deficiency. Ondokuz Mayıs University
Scientific Research Project, 2016-2017, (Researcher). He has four
Publications in Peer-Reviewed Journals (SCI), 13 indexed international
journals, 6 books and 4 chapters.
lkay ÇOKA as a Lecturer in Mersin University, Vocational
School of Gulnar, Department of Plant and Animal
Production Techniques, Arboriculture Department, Mersin /
TURKEY. E-mail: [email protected]. Mobile Phone:
+90 507 106 96 18. Research Expertise: Plant Physiology,
Botany, Plant Nutrition and Fertilization, Soiless culture,
Physiological Changes in Plants under Nutrient Deficiencies.
She did researche project. She published indexed national Journals and
international journals, 4 book chapters, 8 proceeding conferences. Link:
https://orcid.org/0000-0001-8387-8457,
G

SUSTAINABLE AGRICULTURE LEADS TO ZERO HUNGER | 244

ISBN: 978-625-8323-59-7