Ending Rural Hunger: The case of Ghana
45
ENDING RURAL HUNGER Francis Mulangu www.endingruralhunger.org The case of Ghana October 2017
-
Upload
khangminh22 -
Category
Documents
-
view
1 -
download
0
Transcript of Ending Rural Hunger: The case of Ghana
ENDING RURAL HUNGER
Francis Mulangu
www.endingruralhunger.org
The case of Ghana
October 2017

ii
Francis Mulangu is an economist at the
Millennium Challenge Corporation.
Author’s note and acknowledgements
This report was prepared by Francis Mulangu, an economist at the Millennium Challenge
Corporation, as part of the Ending Rural Hunger project led by Homi Kharas. The team at the
Africa Growth Initiative within the Global Economy and Development program of the Brookings
Institution, led by Eyerusalem Siba and comprising Amy Copley, Christina Golubski, Mariama
Sow, and Amadou Sy, oversaw the production of the report. Christina Golubski provided design
and editorial assistance. John McArthur provided invaluable feedback on the report. Data support
was provided by Lorenz Noe, Krista Rasmussen, and Sinead Mowlds.
This study would not have been possible without the additional insights provided by the following
individuals during the course of interviews and exchanges: Faisal Munkaila (Ministry of Food and
Agriculture), Dr Irene Egyir (Ministry of Finance and Economic Development), Dr. Kathleen
Beegle (World Bank), Theophilus Okyere Labri (International Fund for Agricultural Development),
Dr. Fenton Sands (United States Agency for International Development), Samuel Adjei (World
Food Program), Boroto Ruhiza (Food and Agriculture Organization), Paulina Addy (WIAD), Aba
Hagan (Christian Aid), Eric Banye (Netherlands Development Organization), Dr. Shashi Kolavalli
(International Food Policy Research Institute), Philip Tetteh Quarshie (Alliance for Green
Revolution in Africa), and Gertrude Ananse-Baiden (Partnership for Child Development). Dr.
Francis Kemeze and Mr. Chapman Kodam contributed significantly to the production of this case
study. This paper reflects the views of the author only and not those of the Africa Growth Initiative.
The Brookings Institution is a nonprofit organization devoted to independent research and policy
solutions. Its mission is to conduct high-quality, independent research and, based on that
research, to provide innovative, practical recommendations for policymakers and the public. The
conclusions and recommendations of any Brookings publication are solely those of its author(s),
and do not reflect the views of the Institution, its management, or its other scholars.
Brookings gratefully acknowledges the Bill & Melinda Gates Foundation’s support of the Ending
Rural Hunger project.
Brookings recognizes that the value it provides is in its absolute commitment to quality,
independence, and impact. Activities supported by its donors reflect this commitment.

iii
Contents
Abstract...................................................................................................................................... 1
1. Introduction ......................................................................................................................... 2
2. Ghana’s strategy for achieving SDG2 ................................................................................. 7
3. Country needs scorecards .................................................................................................10
3.1 State of food and nutrition security in Ghana...............................................................14
3.2 Validating ERH scorecards ..............................................................................................17
4. Policies and interventions to address food and nutrition security needs .............................22
4.1. Ghana School Feeding Program (GSFP) ........................................................................22
4.2 Livelihood Empowerment against Poverty (LEAP) ...........................................................23
4.3. Agricultural enhancement programs ...............................................................................24
5. Resources .............................................................................................................................28
5.1 National and external resource allocations to FNS ..........................................................28
5.2. Resource mobilization strategy for funding SDG2 goal ...................................................33
6. Conclusion and recommendations ........................................................................................36
References ...............................................................................................................................37
Appendix ...................................................................................................................................39
iv
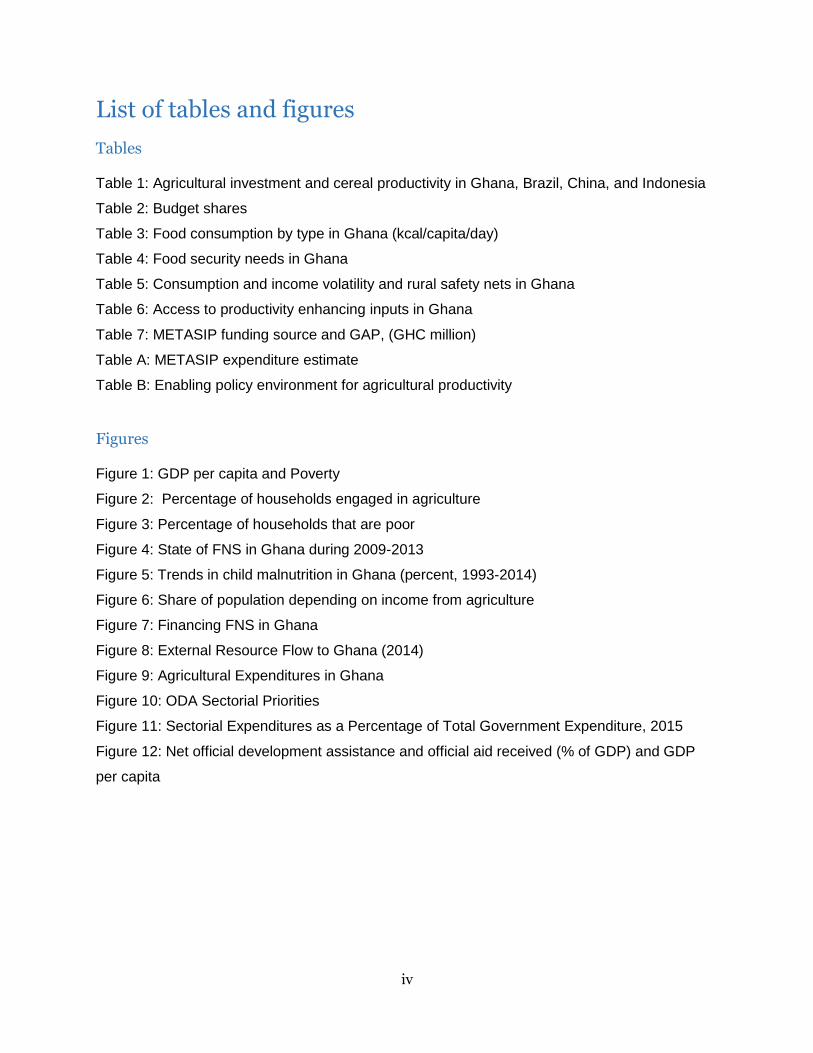
List of tables and figures
Tables
Table 1: Agricultural investment and cereal productivity in Ghana, Brazil, China, and Indonesia
Table 2: Budget shares
Table 3: Food consumption by type in Ghana (kcal/capita/day)
Table 4: Food security needs in Ghana
Table 5: Consumption and income volatility and rural safety nets in Ghana
Table 6: Access to productivity enhancing inputs in Ghana
Table 7: METASIP funding source and GAP, (GHC million)
Table A: METASIP expenditure estimate
Table B: Enabling policy environment for agricultural productivity
Figures
Figure 1: GDP per capita and Poverty
Figure 2: Percentage of households engaged in agriculture
Figure 3: Percentage of households that are poor
Figure 4: State of FNS in Ghana during 2009-2013
Figure 5: Trends in child malnutrition in Ghana (percent, 1993-2014)
Figure 6: Share of population depending on income from agriculture
Figure 7: Financing FNS in Ghana
Figure 8: External Resource Flow to Ghana (2014)
Figure 9: Agricultural Expenditures in Ghana
Figure 10: ODA Sectorial Priorities
Figure 11: Sectorial Expenditures as a Percentage of Total Government Expenditure, 2015
Figure 12: Net official development assistance and official aid received (% of GDP) and GDP
per capita
1
Abstract
This report seeks to examine where food and nutrition security (FNS) needs are highest in Ghana,
the factors that explain the prevalence of high food and nutrition needs there, and whether its
policies addressing FNS are adequately financed. To attain these objectives, we use the Ending
Rural Hunger (ERH) database to identify key findings on country needs, policies, and resource
gaps in addressing food insecurity. We also use supplemental secondary data from external
sources such as the Ghana Living Standard Surveys 2013/2014 (GLSS 6), Demographic and
Health Surveys (DHS), Population Based Surveys (PBS), FAOSTAT data, World Development
Indicators (WDI), ministry-level data, and policy documents. In sum, Ghana performs much better
than the African average on FNS indicators, with the exception of percent of calories from staples
and anemia in children under five. This is largely due to a number of ongoing social protection
and agricultural growth programs heavily supported by development institutions and NGOs,
thanks to the country’s sustained political stability. However, although the FNS needs are not as
high as those in other African countries, Ghana is not able to self-finance FNS and other
agricultural projects. It still heavily relies on ODA. Going forward, the country will have to push
toward domestic resource mobilization and find innovative public private partnerships to help
close the resource gap and finance SDG2 and other FNS objectives. The recent graduation of
Ghana to lower-middle-income country (LMIC) status means that it will be less likely to qualify for
external development assistance, which has historically supported FNS needs. We have noted
that extensive work has been undertaken to both restructure internal resource mobilization and
make aid money more effective. But further work needs to be done. Ghana needs to work with
traditional FNS donor partners to provide clarity about their strategies, timeline, and implications
of said strategies.
2
1. Introduction
Ghana has experienced high economic growth in recent years, propelling it to lower-middle-
income status. Maintained by the rise in commodity prices throughout the past decade and half,
a buoyant mining sector, and the discovery of petroleum in 2007, economic growth in Ghana
averaged 5.4 percent between 2000 and 2010 and grew to 7.1 percent between 2010 and 2016.
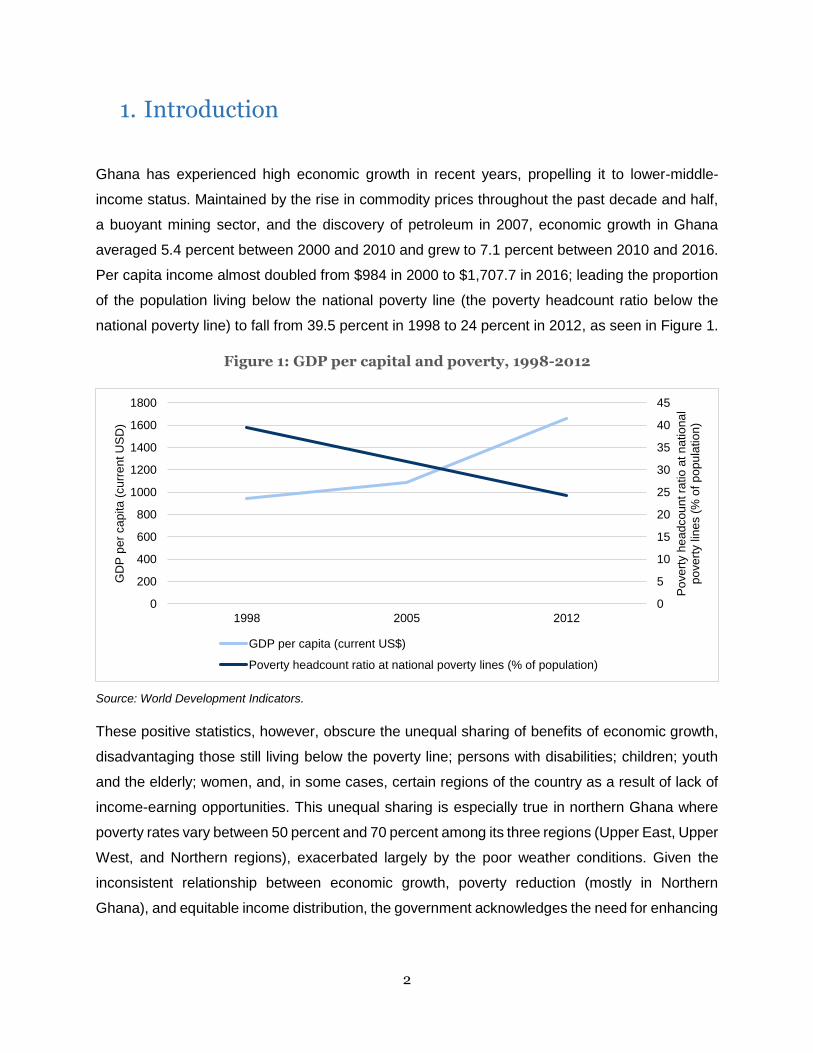
Per capita income almost doubled from $984 in 2000 to $1,707.7 in 2016; leading the proportion
of the population living below the national poverty line (the poverty headcount ratio below the
national poverty line) to fall from 39.5 percent in 1998 to 24 percent in 2012, as seen in Figure 1.
Figure 1: GDP per capital and poverty, 1998-2012
Source: World Development Indicators.
These positive statistics, however, obscure the unequal sharing of benefits of economic growth,
disadvantaging those still living below the poverty line; persons with disabilities; children; youth
and the elderly; women, and, in some cases, certain regions of the country as a result of lack of
income-earning opportunities. This unequal sharing is especially true in northern Ghana where
poverty rates vary between 50 percent and 70 percent among its three regions (Upper East, Upper
West, and Northern regions), exacerbated largely by the poor weather conditions. Given the
inconsistent relationship between economic growth, poverty reduction (mostly in Northern
Ghana), and equitable income distribution, the government acknowledges the need for enhancing
0
5
10
15
20
25
30
35
40
45
0
200
400
600
800
1000
1200
1400
1600
1800
1998 2005 2012
Po
ve
rty h
ea
dco
un
t ra
tio
at n
atio
na
l p
ove
rty lin
es (
% o
f p
op
ula
tio
n)
GD
P p
er
ca
pita
(cu
rre
nt U
SD
)
GDP per capita (current US$)
Poverty headcount ratio at national poverty lines (% of population)
3
fiscal measures to better target social protections and helping households meet their food and
nutritional security needs.
Goal 2 of the recently adopted Sustainable Development Goals (SDG2) aims to “end hunger,
achieve food security and improve nutrition, and promote sustainable agriculture” by 2030. The
goal’s targets include doubling agricultural productivity; ensuring sustainable food production;
ending all forms of malnutrition, and increasing investment in rural infrastructure and agricultural
research, among others. In the aim to outline countries’ progress toward achieving SDG2 and
evaluating the needs, policies, and resources in relation to that goal, in October 2015, the
Brookings Institution published the report Ending Rural Hunger: Mapping Needs and Actions for
Food and Nutrition Security. The present report presents the case of Ghana and assesses its
existing food and nutrition security (FNS) needs, the policies put in place by the national
government in order to address these needs, and the resources available.
Ghana’s Medium-Term Agriculture Sector Investment Plan (METASIP) (2011-2015), which
outlines the country’s plan to enhance food security and emergency preparedness with the
ultimate goal of transforming Ghana’s agricultural sector, echoes SDG2. Ghana has seen success
but, while poised to meet its SDG2 targets, a number of factors threaten its progress. Recent
deteriorating macroeconomic indicators—i.e., high government debt following the 2012 elections,
currency depreciation, inflation, all of which exacerbated existing power shortages—have been
detrimental to the performance of many other social indicators (IFRPI, 2016). Maternal and infant
mortality associated with inadequate food and poor access to improved sanitation is an especially
concerning area (WDI Online). In addition, the ongoing International Monetary Fund’s (IMF) fiscal
stabilization agreement to help shore up the macroeconomic instabilities led the government to
scale down social protection programs for FNS, such as fertilizer subsidy and school feeding
programs (IFPRI, 2016).
Given the past disconnect between Ghana’s economic growth, poverty alleviation, and
performance in achieving FNS (Government of Ghana 2013), successive governments have
implemented a series of social protection programs that eventually helped the country meet
Millennium Development Goal 1 (MDG1) of reducing poverty by half before the 2015 deadline.
Indeed, these multiple interventions coupled with external incentives such as the conditions for
the release of the Heavily Indebted Poor Countries (HIPC) funds led to Ghana’s successful
poverty reduction. The creation of Ministry of Women and Children’s Affairs in 2002 (renamed
Ministry of Gender, Children and Social Protection (MoGCSP)) also marked a step to
systematically provide the infrastructure to meet specific needs of vulnerable groups, for example,
4
in areas of reducing maternal and infant mortality and to tackle cultural practices that inhibit girls’
education.
The current list of social protection programs cuts across sectors, ranging from education and
health to livelihood support, including agriculture. The social protection programs in Ghana
directly targeting FNS include: school feeding programs and take-home rations for girls (which
include rice and a can of oil each time they attend school for 85 percent of the month), livelihood
empowerment support programs (such as livelihood empowerment against poverty), a national
health insurance system, and support for off-farm livelihood enhancement activities. In terms of
agriculture, there are programs such as the fertilizer subsidies program, block farm program,
agricultural mechanism stock company, and a national food buffer stock program.
The objective of this report is multiple. First, it examines where food and nutrition security needs
are highest in Ghana, examining the spatial and demographic decomposition of the affected
population in order to assist in better policy targeting. It also investigates factors that explain the
prevalence of high food and nutrition needs and how they relate to policy variables such as access
to food, consumption and production shocks, rural safety net programs, and the rural investment
climate. Second, it explores whether effective policies addressing FNS are in place and whether
financial resources are adequately allocated to places with the highest needs. Third, it identifies
challenges to existing efforts of the national government to ascertain the right set of priorities in
their effort to achieve SDG2. Fourth, it explores more efficient ways by which the government of
Ghana and its external stakeholders can align their priorities to achieve the common goal of
SDG2. Finally, it provides policy recommendations to assist national governments in addressing
FNS needs and achieving the zero-hunger target by 2030.
To attain these objectives, we use the Ending Rural Hunger (ERH) database to identify key
findings on country needs, policies, and resource gaps in addressing food insecurity. We also use
supplemental secondary data from external sources such as the Ghana Living Standard Surveys
2013/2014 (GLSS 6), Demographic and Health Surveys (DHS), Population Based Surveys (PBS),
FAOSTAT data, World Development Indicators (WDI), and ministry-level data on expenditures
from budget documents to identify spatial and demographic composition of the population most
affected by food and nutrition needs in the country and to assess whether adequate resources
are available to address them. Similarly, we systematically analyze national and regional strategic
documents to identify government efforts and priority areas to achieve SDG2.
5
Summary of main findings
Except for percent of calories from staples and anemia in children under five, Ghana
performs much better than the African average on FNS indicators. This is largely due
to a number of ongoing social protection and agricultural growth programs heavily
supported by development institutions and NGOs, thanks largely to the country’s
sustained political stability.
Persistent poverty, limited agricultural outputs, and seasonal effects as well as
fluctuations in food prices have been reported to be the main causes of food
insecurity in northern Ghana. Unlike the southern part of the country, northern Ghana
experiences only one rainy season, which makes prices and yields very volatile. Despite
the existence of mitigating tools such as rainfall insurance, buffer stock company, and food
storage, additional market failures affect the effectiveness of these mitigation tools.
Transport and logistical infrastructure for moving food stuff both internally and
internationally to maintain food security performs well in Ghana. In addition to having
an adequate road network, Ghana’s export time statistic is better than the African average,
largely due to the two ports of Tema and Takoradi and the single window systems where
importers/exporters can go and pay for all the clearance fees. These factors have also
contributed to its better-than-average logistical performance (an indicator measuring a
country’s quality of trade and transport-related infrastructure, as perceived by logistics
professionals).
Fertilizer subsidy is by far the most preferred FNS budgetary expenditure item,
absorbing between 10 and 34 percent of all agriculture expenditures between 2006
and 2012. Fertilizer subsidies were fully reintroduced after the 2008 global food price
crises and remained in effect until recently. The macroeconomic instabilities that Ghana
has been facing since 2012 led the government to abandon the subsidy program due to
budget tightening measures in 2016.
Rural health and food aid, and school feeding program expenditures are a distant
second and third budgetary expenditure, respectively. These programs have
historically been supported by external resources either through budget support from
donors or NGO interventions. For this reason, the government of Ghana allocates less of
its own resources to these programs.
Ghana is not able to self-finance FNS and other agricultural projects. It still heavily
relies on ODA, as the country only allocated 4 percent of its budget to both social
6
protection contributions and subsidies in 2014. Even when it comes to agriculture-related
activities, the government of Ghana only supports input subsidies and leaves the rest to
development partners.
Going forward, Ghana will have to push toward domestic resource mobilization to
help close the resource gap and finance SDG2 and other FNS objectives. The recent
graduation of Ghana to lower-middle-income country (LMIC) status means that it will be
less likely to qualify for external development assistance, which has historically supported
FNS needs. Ghana has to rely on its own resources to fund FNS.
Extensive work has been undertaken to both restructure internal resource
mobilization and make aid money more effective. But further work needs to be done.
Ghana needs to work with traditional FNS donor partners to provide clarity about their
strategies, timeline, and the implications. Issues for consideration include: How will any
phasing out be managed to ensure that development gain previously obtained through
donor funds are sustained, particularly in the FNS sectors where donors have played a
key role? Are there experiences with LMIC graduations in other continent that can guide
Ghana’s transition?
The rest of the paper is outlined as follows: Section 2 discusses Ghana’s strategy for achieving
SDG2. We will then discuss the state of Ghana’s FNS and compare it with the key facts coming
out of the ERH scorecards in Section 3. Section 4 discusses some of the on-going interventions
to improve FNS outcomes in Ghana. Section 5 discusses the resources allocated by the
government to address FNS and compare it to donors’ priorities and Ghana’s strategy to internally
mobilize resources to close the SDG2 financing gap. We conclude in Section 6 with policy
recommendations.
7
2. Ghana’s strategy for achieving SDG2
Agriculture has a central role to play in promoting growth, poverty reduction, and in achieving FNS
in Ghana. Agriculture contributes about 20 percent of the Gross Domestic Product (GDP).
According to the Ghana Living Standards Survey (2013), about 71 percent of the rural population
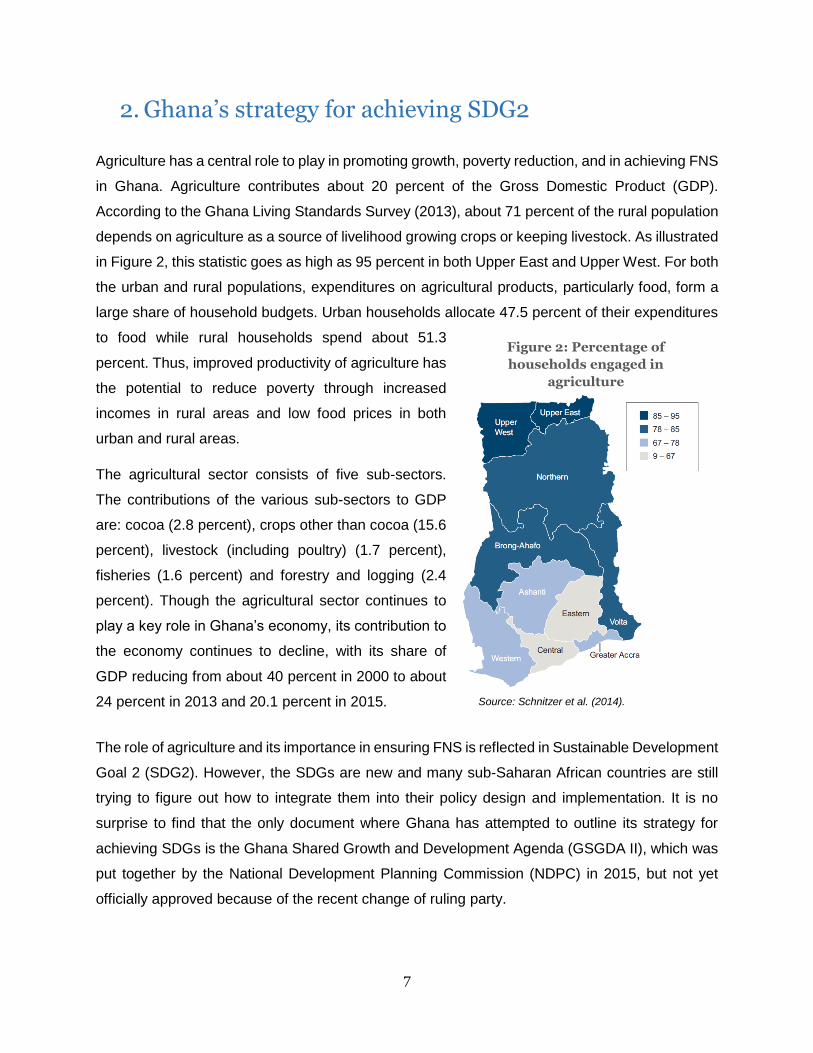
depends on agriculture as a source of livelihood growing crops or keeping livestock. As illustrated
in Figure 2, this statistic goes as high as 95 percent in both Upper East and Upper West. For both
the urban and rural populations, expenditures on agricultural products, particularly food, form a
large share of household budgets. Urban households allocate 47.5 percent of their expenditures
to food while rural households spend about 51.3
percent. Thus, improved productivity of agriculture has
the potential to reduce poverty through increased
incomes in rural areas and low food prices in both
urban and rural areas.
The agricultural sector consists of five sub-sectors.
The contributions of the various sub-sectors to GDP
are: cocoa (2.8 percent), crops other than cocoa (15.6
percent), livestock (including poultry) (1.7 percent),
fisheries (1.6 percent) and forestry and logging (2.4
percent). Though the agricultural sector continues to
play a key role in Ghana’s economy, its contribution to
the economy continues to decline, with its share of
GDP reducing from about 40 percent in 2000 to about
24 percent in 2013 and 20.1 percent in 2015.
The role of agriculture and its importance in ensuring FNS is reflected in Sustainable Development
Goal 2 (SDG2). However, the SDGs are new and many sub-Saharan African countries are still
trying to figure out how to integrate them into their policy design and implementation. It is no
surprise to find that the only document where Ghana has attempted to outline its strategy for
achieving SDGs is the Ghana Shared Growth and Development Agenda (GSGDA II), which was
put together by the National Development Planning Commission (NDPC) in 2015, but not yet
officially approved because of the recent change of ruling party.
Source: Schnitzer et al. (2014).
Figure 2: Percentage of
households engaged in
agriculture
8
The Medium-Term Agriculture Sector Investment Plan (METASIP) is the closest to Ghana’s
strategy for achieving SDG2, a strategy designed to echo the regional goals outlined in the Malabo
Declaration. METASIP’s mission is “a modernized agriculture culminating in a structurally
transformed economy and evident in food security, employment opportunities and reduced
poverty.” Its stated objectives are: securing food security and emergency preparedness;
improving growth in incomes; increasing competitiveness and enhanced integration into domestic
and international markets; sustaining management of land and environment; improving science
and technology applied in food and agriculture development and improving institutional
coordination. In addition, METASIP targeted to achieve agricultural growth of at least 6 percent
of GDP through the allocation of at least 10 percent of government expenditures to agriculture
during the period 2011-2015. METASIP is made up of 6 programs, including 1: Food Security and
Emergency Preparedness; 2: Increased Growth in Incomes; 3: Increased Competitiveness and
Enhanced Integration into Domestic and International Markets; 4: Sustainable Management of
Land and Environment; 5: Science and Technology Applied in Food and Agriculture Development;
and 6: Improved Institutional Coordination.
Program 1 fits squarely into the FNS theme echoed in SDG 2. Its sub-components are:
(i) Productivity improvement;
(ii) Support to improved nutrition;
(iii) Support for diversification of livelihood options of the poor with off-farm activities linked to
agriculture, (d) Food storage and distribution;
(iv) Early warning system and emergency preparedness;
(v) Irrigation and water management; and
(vi) Mechanization services.
One of the key objectives of the support to improved nutrition is to reduce childhood stunting and
underweight as well as vitamin A, iron, and iodine deficiencies (in children and women of
reproductive age) by 50 percent by 2015. Some of the activities planned to help meet this
objective are:
(i) Promoting the production and consumption of high-quality protein maize, orange flesh
sweet potato (for vitamin a) as well as moringa and other leafy vegetables;
(ii) Developing other high quality staples—such as cassava, yam, rice, etc.—through
breeding,
(iii) Promoting fortification of staples during processing (micronutrient fortification and
blending products) and link to the school feeding program;
9
(iv) Educating and training consumers on the appropriate combination of available foods to
improve nutrition; and
(v) Promoting the consumption of micro-nutrient rich foods (e.g., eggs, meat/fish, leafy
vegetables, fruits) by children and women of reproductive age, especially in rural areas.
The objective of the Early Warning System and Emergency Preparedness sub-component is to
reduce the number of food insecure (vulnerable) households by 20 percent. Some of the planned
activities for reaching that objective include:
(i) Identifying vulnerable households in disaster prone areas of the country;
(ii) Constructing vulnerability maps to support targeting of food security and emergency
preparedness interventions;
(iii) Supporting vulnerable households and communities to establish household and
community systems that can respond to emergencies (with regards to food insecurity);
(iv) Monitoring crops, livestock and fish pests and diseases;
(v) Using weather forecasting to inform farmer decisions;
(vi) Building capacity of National Food Buffer Stock Company to manage national strategic
reserves. This will be done by establishing a 6-month supply of food strategic stocks
(maize, sorghum, gari, etc.) and using market and price information for managing the
stocks and price stabilization; and
(vii) Establishing a National Seed Security stock for emergencies.
Already, a 2014 study on the perceived impact of METASIP finds that the program had a
positive impact on productivity improvement as access to fertilizer seeds and information
improved. However, challenges still exist: Study respondents highlighted challenges such as the
poor adaptability of the machines to local conditions (Boateng and Nyaaba, 2014).
10
3. Country needs scorecards
Food production and prices
FNS is often associated with a resilient agricultural sector. The experience in Asian and Latin
American countries strongly suggests that agriculture can be an engine of growth early in the
development process and an important force for poverty reduction and achieving FNS (World
Bank, 2008). While agricultural growth has been the precursor to the acceleration of industrial
growth in a number of emerging economies such as China, Brazil, and Indonesia; for Ghana, as
well as for most African countries, current agricultural productivity is low, and there have been
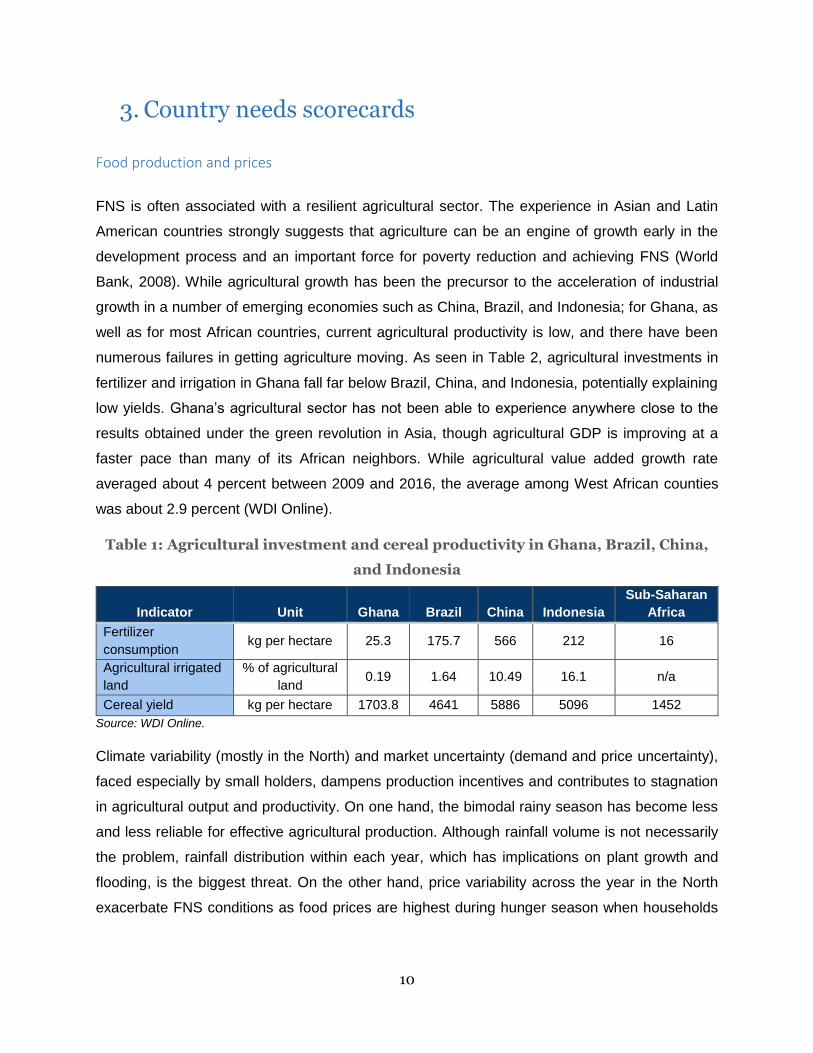
numerous failures in getting agriculture moving. As seen in Table 2, agricultural investments in
fertilizer and irrigation in Ghana fall far below Brazil, China, and Indonesia, potentially explaining
low yields. Ghana’s agricultural sector has not been able to experience anywhere close to the
results obtained under the green revolution in Asia, though agricultural GDP is improving at a
faster pace than many of its African neighbors. While agricultural value added growth rate
averaged about 4 percent between 2009 and 2016, the average among West African counties
was about 2.9 percent (WDI Online).
Table 1: Agricultural investment and cereal productivity in Ghana, Brazil, China,
and Indonesia
Indicator Unit Ghana Brazil China Indonesia
Sub-Saharan
Africa
Fertilizer
consumption kg per hectare 25.3 175.7 566 212 16
Agricultural irrigated
land
% of agricultural
land 0.19 1.64 10.49 16.1 n/a
Cereal yield kg per hectare 1703.8 4641 5886 5096 1452
Source: WDI Online.
Climate variability (mostly in the North) and market uncertainty (demand and price uncertainty),
faced especially by small holders, dampens production incentives and contributes to stagnation
in agricultural output and productivity. On one hand, the bimodal rainy season has become less
and less reliable for effective agricultural production. Although rainfall volume is not necessarily
the problem, rainfall distribution within each year, which has implications on plant growth and
flooding, is the biggest threat. On the other hand, price variability across the year in the North
exacerbate FNS conditions as food prices are highest during hunger season when households
11
have run out of their reserves and saving resources to buy inputs for the next season. Households
eat fewer meals and are forced to sell their buffer stocks in order to meet FNS needs.
Food distribution margins and seasonal price variability can be high in Ghana. The volatility of
maize prices, which is about 0.32 annually mainly due to the high inflation rate and high
international prices, is a huge burden for many households, especially for those who are net maize
consumers. This is important to note because maize is a key staple with direct implications on
FNS. Maize is Ghana’s most important cereal crop (accounting for 55 percent of all cereal output),
second-most important staple food after rice (both local and imported), second-most important
commodity crop, and supports the livelihoods of more than 20 percent of small-holder farmers
(FAOSTAT Online).
Poverty and food insecurity
Food insecurity, poverty, and malnutrition in Ghana are highest in the northern part of the country
(Zereyesus et al, 2014). The 2013 Ghana Comprehensive Food Security and Vulnerability
Analysis (CFSVA) report presents a detailed picture of the food security and nutrition situation in
northern Ghana. The report employs two indicators to classify household food security. The first
is a food consumption score, which combines dietary diversity, frequency of consumption, and
relative nutritional importance, and then divides households into three groups: poor, borderline,
and acceptable food consumption. The second is a wealth index, which is based on asset
ownership and housing conditions and divides households into quintiles with the bottom two
quintiles generally referred to as poor. The report uses the above two indicators to categorize
households into four food security groups:
(i) Severely food insecure (households with poor food consumption);
(ii) Moderately food insecure (households with borderline food consumption and in the
two lowest (poorest) wealth quintiles);
(iii) Mildly food insecure (households with borderline food consumption and in the three
highest (wealthiest) quintiles); and
(iv) Food secure (households with acceptable food consumption).
In 2013, the Upper East Region had the highest proportion of households that are either severely
or moderately food insecure (28 percent). In the Northern and Upper West regions 9 percent and
16 percent of households, respectively, were either severely or moderately food insecure,. The
five districts across the country, which are located in the three northernmost regions of Ghana,
with the highest proportion of households that were severely or moderately food insecure were

12
Wa West (42 percent), Central Gonja (39 percent), Talensi-Nabdam (39 percent), Kassena-
Nankana West (35 percent), and Kassena-Nankana East (33 percent). The CFSVA (2013) report
also indicates that more than 680,000 people in the northern regions of Ghana (or about 15
percent of the population) were either severely or moderately food insecure. Of these, 140,000
had a very poor diet, subsisting on staple foods, some vegetables, and oil. The CFSVA report
states that persistent poverty, limited agricultural outputs, and seasonal effects as well as
fluctuations in food prices are the main causes of food insecurity in northern Ghana. Indeed,
seasonal variability of rainfall in Ghana is prominent in the three northern regions. Households in
northern parts of Ghana are highly dependent on rain-fed subsistence agriculture and livestock
rearing, showing a low degree of economic diversification.
Similarly, when it comes to poverty in rural and urban
areas, contrasts emerge. Ghana’s population is quite
young, with a national dependency ratio of about 79
percent. Notably, the proportion of children (under 15
years old) in rural areas (42.4 percent) is higher than
in Accra (33.8 percent) and other urban areas (37.6
percent). Household size in rural areas is also larger
than in urban areas (4.5 versus 3.6 members per
family, respectively). Both poverty and extreme
poverty incidences reveal regional heterogeneity
(Figure 3). Poverty incidence stands at 70.7 percent
in Upper West while in Accra it stands at 5.6 percent,
with a national level of 24.4 percent.
It is important to describe the patterns of income
sources and expenditure shares across the income
distribution to better understand the food and nutritional insecurity vulnerability of households to
changes in staple prices. As noted above, maize is one of Ghana’s key staples. We note that
maize prices are volatile but this volatility is not constant across regions and over time. In some
years, such as 2008 and 2011, prices experienced high volatility while in other years this volatility
is less noticeable. We also notice differences across the regions. The nonexistence of efficient
storage facilities could be one of the other factors that may explain the differences in maize price
volatility across the regions. However, empirical analysis will be required here to provide the
implications of storage infrastructure on price volatility.
Figure 3: Percentage of
households that are poor
Source: Schnitzer et al. (2014).
13
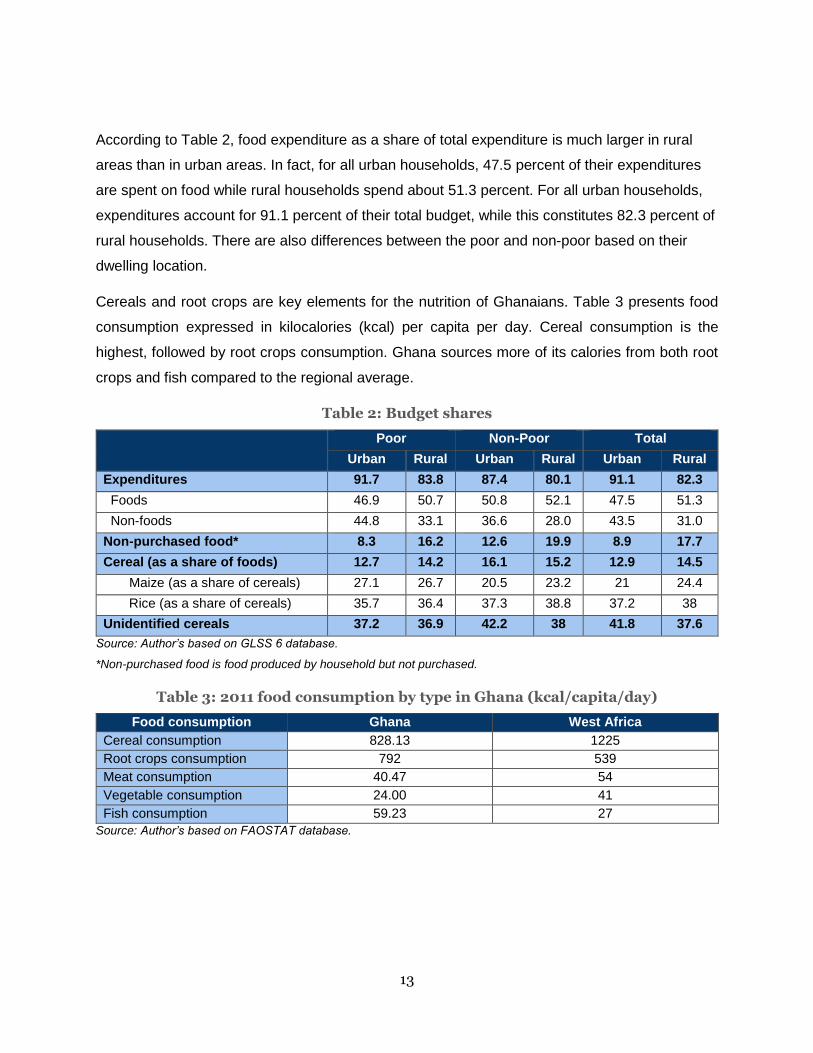
According to Table 2, food expenditure as a share of total expenditure is much larger in rural
areas than in urban areas. In fact, for all urban households, 47.5 percent of their expenditures
are spent on food while rural households spend about 51.3 percent. For all urban households,
expenditures account for 91.1 percent of their total budget, while this constitutes 82.3 percent of
rural households. There are also differences between the poor and non-poor based on their
dwelling location.
Cereals and root crops are key elements for the nutrition of Ghanaians. Table 3 presents food
consumption expressed in kilocalories (kcal) per capita per day. Cereal consumption is the
highest, followed by root crops consumption. Ghana sources more of its calories from both root
crops and fish compared to the regional average.
Table 2: Budget shares
Poor Non-Poor Total
Urban Rural Urban Rural Urban Rural
Expenditures 91.7 83.8 87.4 80.1 91.1 82.3
Foods 46.9 50.7 50.8 52.1 47.5 51.3
Non-foods 44.8 33.1 36.6 28.0 43.5 31.0
Non-purchased food* 8.3 16.2 12.6 19.9 8.9 17.7
Cereal (as a share of foods) 12.7 14.2 16.1 15.2 12.9 14.5
Maize (as a share of cereals) 27.1 26.7 20.5 23.2 21 24.4
Rice (as a share of cereals) 35.7 36.4 37.3 38.8 37.2 38
Unidentified cereals 37.2 36.9 42.2 38 41.8 37.6
Source: Author’s based on GLSS 6 database.
*Non-purchased food is food produced by household but not purchased.
Table 3: 2011 food consumption by type in Ghana (kcal/capita/day)
Food consumption Ghana West Africa
Cereal consumption 828.13 1225
Root crops consumption 792 539
Meat consumption 40.47 54
Vegetable consumption 24.00 41
Fish consumption 59.23 27
Source: Author’s based on FAOSTAT database.
14
3.1 State of food and nutrition security in Ghana
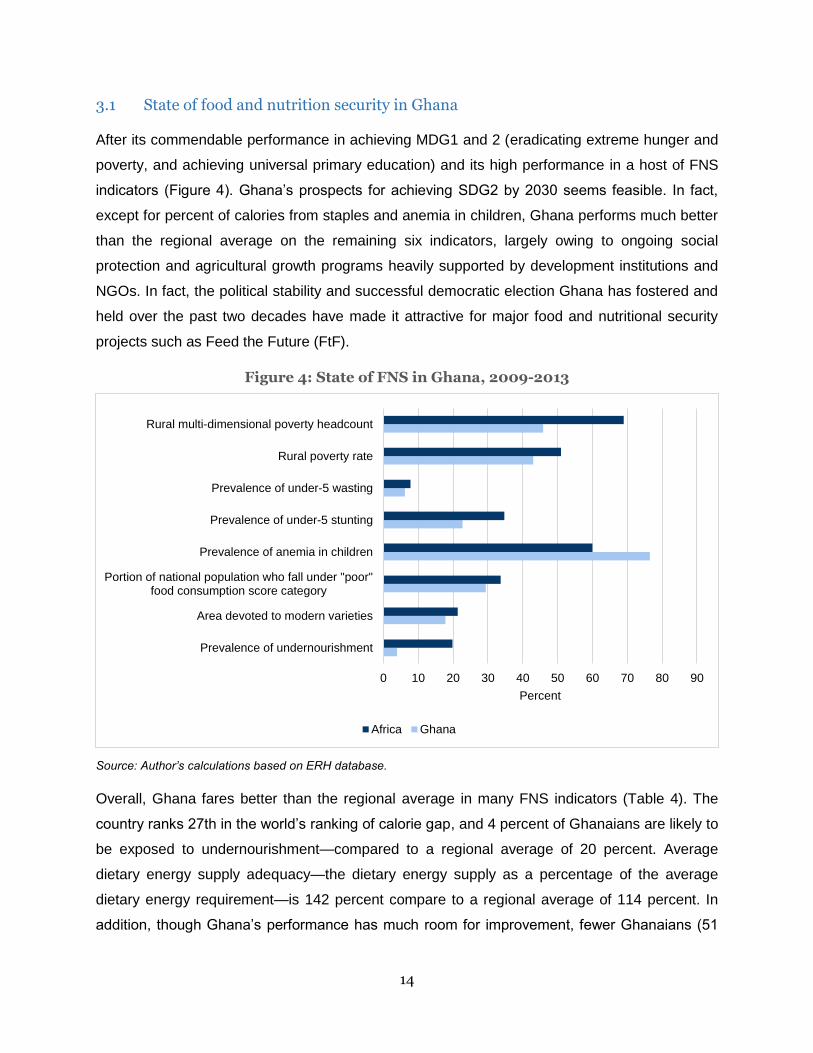
After its commendable performance in achieving MDG1 and 2 (eradicating extreme hunger and
poverty, and achieving universal primary education) and its high performance in a host of FNS
indicators (Figure 4). Ghana’s prospects for achieving SDG2 by 2030 seems feasible. In fact,
except for percent of calories from staples and anemia in children, Ghana performs much better
than the regional average on the remaining six indicators, largely owing to ongoing social
protection and agricultural growth programs heavily supported by development institutions and
NGOs. In fact, the political stability and successful democratic election Ghana has fostered and
held over the past two decades have made it attractive for major food and nutritional security
projects such as Feed the Future (FtF).
Figure 4: State of FNS in Ghana, 2009-2013
Source: Author’s calculations based on ERH database.
Overall, Ghana fares better than the regional average in many FNS indicators (Table 4). The
country ranks 27th in the world’s ranking of calorie gap, and 4 percent of Ghanaians are likely to
be exposed to undernourishment—compared to a regional average of 20 percent. Average
dietary energy supply adequacy—the dietary energy supply as a percentage of the average
dietary energy requirement—is 142 percent compare to a regional average of 114 percent. In
addition, though Ghana’s performance has much room for improvement, fewer Ghanaians (51
0 10 20 30 40 50 60 70 80 90
Prevalence of undernourishment
Area devoted to modern varieties
Portion of national population who fall under "poor"food consumption score category
Prevalence of anemia in children
Prevalence of under-5 stunting
Prevalence of under-5 wasting
Rural poverty rate
Rural multi-dimensional poverty headcount
Percent
Africa Ghana

15
percent) lack enough money to buy food, compared to 53.8 percent of Africans. The food
consumption score (FCS), which is a composite score based on dietary diversity, food frequency,
and the relative nutritional importance of different food groups, categorizes each household as
having either poor, borderline, or acceptable food consumption. The percentage of Ghana with a
poor or borderline food consumption score is 29.4 percent compared to 33.69 percent in Africa.
On the other hand, Ghana performs relatively worse than the regional average in the area of
dietary diversity, where it ranks 78th: Ghana receives 66 percent of its calories from staples,
compared to 61.8 percent at the regional level. Its average protein supply is 60 grams per capita
per day compared to 64.3.
Table 4: Food security needs in Ghana
Indicators Unit Ghana
Regional
average
Ghana’s
global
ranking
SSA
comparison
Calorie gap 27
Undernourishment Percent 3.92 19.82 24 Bottom 10
Average dietary
energy supply
As a percentage of the
average dietary energy
requirement
141.62 114.46 5 Top 10
Lack enough money to
buy food
Percentage of respondents
who have admitted to “not
having enough money to
buy food” in the 12 months
before the survey was
conducted
50.97 53.82 77
Dietary diversity 78
Calories from staples Percent 66 61.81 87
Average protein
supply Grams per capita per day 60 64.34
Food consumption
score
Percentage of national
population with "poor" or
“borderline” score
29.40 33.69 14
Child malnutrition 81
Under-5 wasting Percent 6.2 7.80 63
Under-5 stunting Percent 22.7 34.73 50 Top 10
Anemia in children Percent 76.5 60.03 110 Bottom 10
Rural poverty 57
Rural poverty rate Percent 43.24 51.40 54
Rural multidimensional
poverty headcount Percent 45.87 69 43 Top 10
Note: The above statistics represent a five-year average for the period 2009-2013.
16
Ghana ranks 81st in childhood malnutrition and performs higher than the African average. The
share of Ghana’s young population that suffers from under-5 wasting is 6.2 percent, compared to
the regional average of 7.8 percent, while that of under-5 stunting is 22.7 percent, compared to
34.7 percent. However, the prevalence of anemia among children is relatively high at 76.5
percent, compared to a regional average of 60 percent.
After comparing the ERH scorecards across West African countries, anemia in children appears
to be the most important FNS need in Ghana—a finding confirmed by many individuals at
institutions handling FNS objectives in the country. Anemia in children impairs mental, physical,
and social development, causing negative behavioral and cognitive effects, resulting in poor
school performance and work capacity in later years (Soliman, De Sanctis and Kalra, 2014).
Ghana has the fifth-worst case of anemia in children in Africa after Niger (76.6 percent), Senegal
(79.4 percent), Mali (80.5 percent), and Burkina Faso (86.5 percent). Iron deficiency is globally
the most common cause of anemia in under-5 children with a smaller proportion due to
deficiencies in other micronutrients such as folate, vitamin A, and vitamin B12. The relatively high
costs of nutritious baby food pushes parents to feed their children high-starch content foods, such
as yam and cassava, which have low iron content. As part of the government’s response, the
Ghana Health Service, Food and Drugs Board (FDB), and other collaborators have initiated the
National Food Fortification Project (NFFP) as a means of addressing malnutrition in the country.
The objective of this nationwide campaign is to raise the consciousness of the public to patronize
fortified foods (Gyebi, 2011).
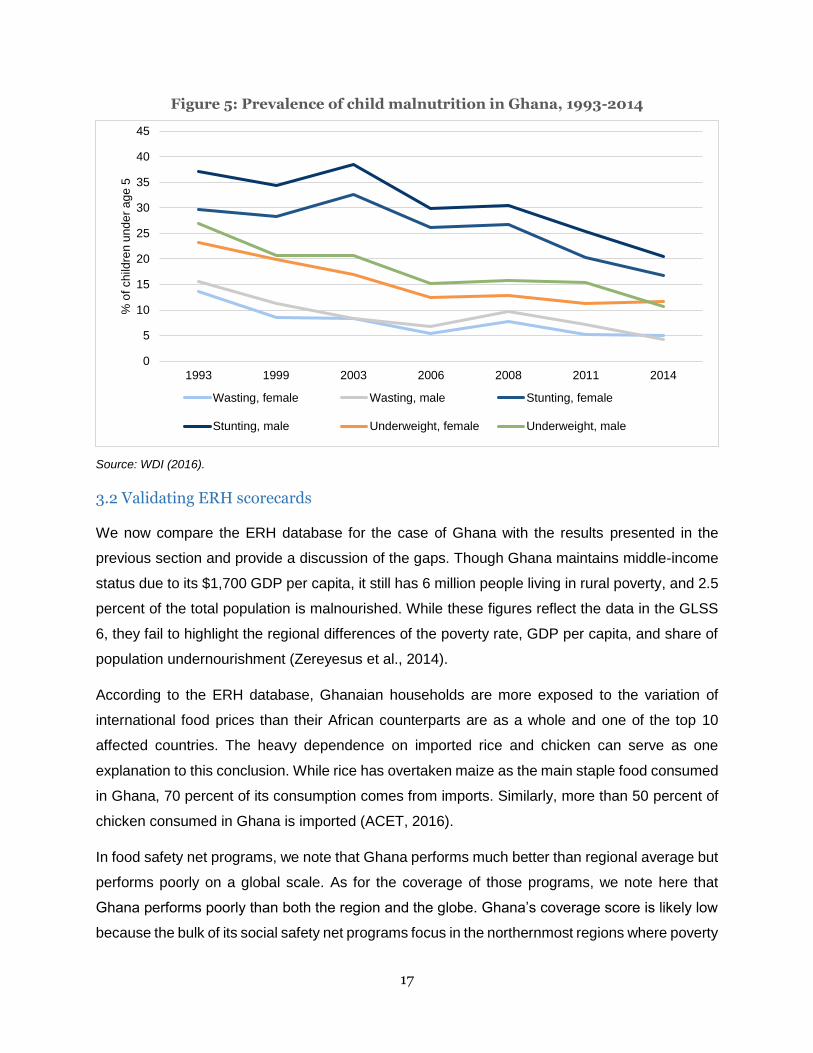
As seen in Figure 5, the incidence of childhood malnutrition has been decreasing dramatically
over the past 17 years. Notably, female children do have better nutritional outcomes than their
male counterparts (WDI, 2016), which is not surprising given the mostly matrilineal kinship system
that prevails in Ghana. In addition, the decreasing incidence of malnutrition over time is not
unexpected in light of the multiple interventions sponsored by both the government and donors.
17
Figure 5: Prevalence of child malnutrition in Ghana, 1993-2014
Source: WDI (2016).
3.2 Validating ERH scorecards
We now compare the ERH database for the case of Ghana with the results presented in the
previous section and provide a discussion of the gaps. Though Ghana maintains middle-income
status due to its $1,700 GDP per capita, it still has 6 million people living in rural poverty, and 2.5
percent of the total population is malnourished. While these figures reflect the data in the GLSS
6, they fail to highlight the regional differences of the poverty rate, GDP per capita, and share of
population undernourishment (Zereyesus et al., 2014).
According to the ERH database, Ghanaian households are more exposed to the variation of
international food prices than their African counterparts are as a whole and one of the top 10
affected countries. The heavy dependence on imported rice and chicken can serve as one
explanation to this conclusion. While rice has overtaken maize as the main staple food consumed
in Ghana, 70 percent of its consumption comes from imports. Similarly, more than 50 percent of
chicken consumed in Ghana is imported (ACET, 2016).
In food safety net programs, we note that Ghana performs much better than regional average but
performs poorly on a global scale. As for the coverage of those programs, we note here that
Ghana performs poorly than both the region and the globe. Ghana’s coverage score is likely low
because the bulk of its social safety net programs focus in the northernmost regions where poverty
0
5
10
15
20
25
30
35
40
45
1993 1999 2003 2006 2008 2011 2014
% o
f ch
ildre
n u
nd
er
ag
e 5
Wasting, female Wasting, male Stunting, female
Stunting, male Underweight, female Underweight, male
18
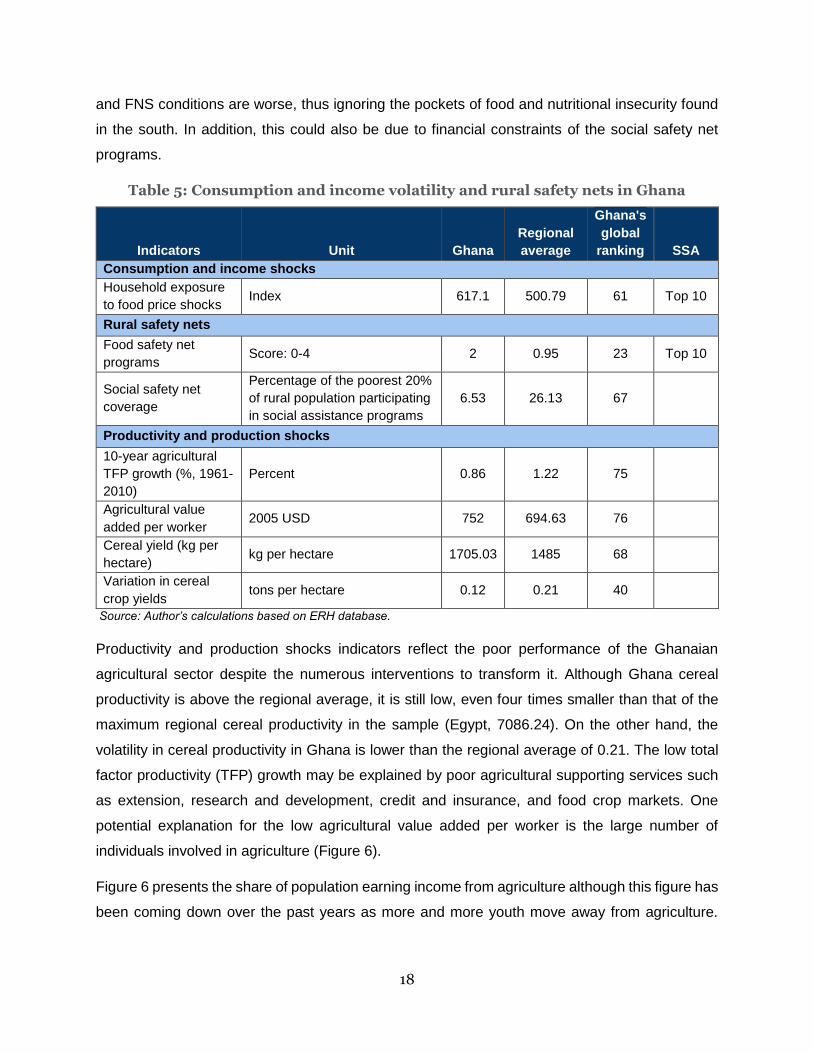
and FNS conditions are worse, thus ignoring the pockets of food and nutritional insecurity found
in the south. In addition, this could also be due to financial constraints of the social safety net
programs.
Table 5: Consumption and income volatility and rural safety nets in Ghana
Indicators Unit Ghana
Regional
average
Ghana's
global
ranking SSA
Consumption and income shocks
Household exposure
to food price shocks Index 617.1 500.79 61 Top 10
Rural safety nets
Food safety net
programs Score: 0-4 2 0.95 23 Top 10
Social safety net
coverage
Percentage of the poorest 20%
of rural population participating
in social assistance programs
6.53 26.13 67
Productivity and production shocks
10-year agricultural
TFP growth (%, 1961-
2010)
Percent 0.86 1.22 75
Agricultural value
added per worker 2005 USD 752 694.63 76
Cereal yield (kg per
hectare) kg per hectare 1705.03 1485 68
Variation in cereal
crop yields tons per hectare 0.12 0.21 40
Source: Author’s calculations based on ERH database.
Productivity and production shocks indicators reflect the poor performance of the Ghanaian
agricultural sector despite the numerous interventions to transform it. Although Ghana cereal
productivity is above the regional average, it is still low, even four times smaller than that of the
maximum regional cereal productivity in the sample (Egypt, 7086.24). On the other hand, the
volatility in cereal productivity in Ghana is lower than the regional average of 0.21. The low total
factor productivity (TFP) growth may be explained by poor agricultural supporting services such
as extension, research and development, credit and insurance, and food crop markets. One
potential explanation for the low agricultural value added per worker is the large number of
individuals involved in agriculture (Figure 6).
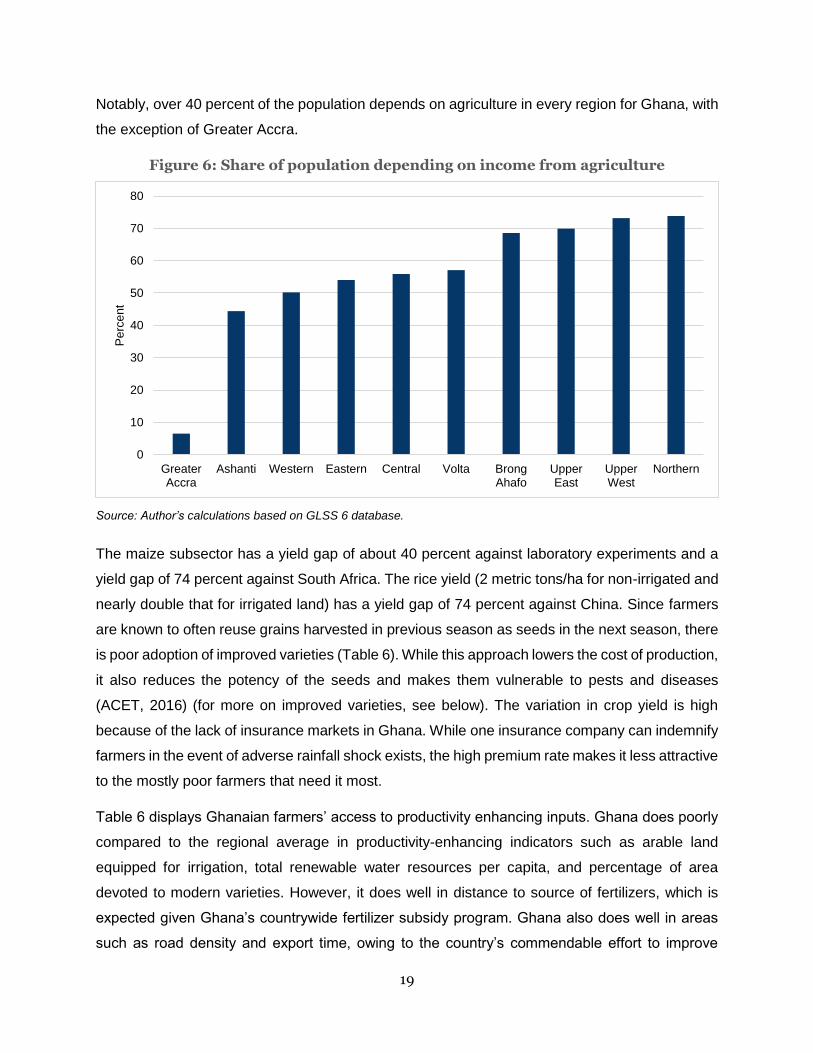
Figure 6 presents the share of population earning income from agriculture although this figure has
been coming down over the past years as more and more youth move away from agriculture.
19
Notably, over 40 percent of the population depends on agriculture in every region for Ghana, with
the exception of Greater Accra.
Figure 6: Share of population depending on income from agriculture
Source: Author’s calculations based on GLSS 6 database.
The maize subsector has a yield gap of about 40 percent against laboratory experiments and a
yield gap of 74 percent against South Africa. The rice yield (2 metric tons/ha for non-irrigated and
nearly double that for irrigated land) has a yield gap of 74 percent against China. Since farmers
are known to often reuse grains harvested in previous season as seeds in the next season, there
is poor adoption of improved varieties (Table 6). While this approach lowers the cost of production,
it also reduces the potency of the seeds and makes them vulnerable to pests and diseases
(ACET, 2016) (for more on improved varieties, see below). The variation in crop yield is high
because of the lack of insurance markets in Ghana. While one insurance company can indemnify
farmers in the event of adverse rainfall shock exists, the high premium rate makes it less attractive
to the mostly poor farmers that need it most.
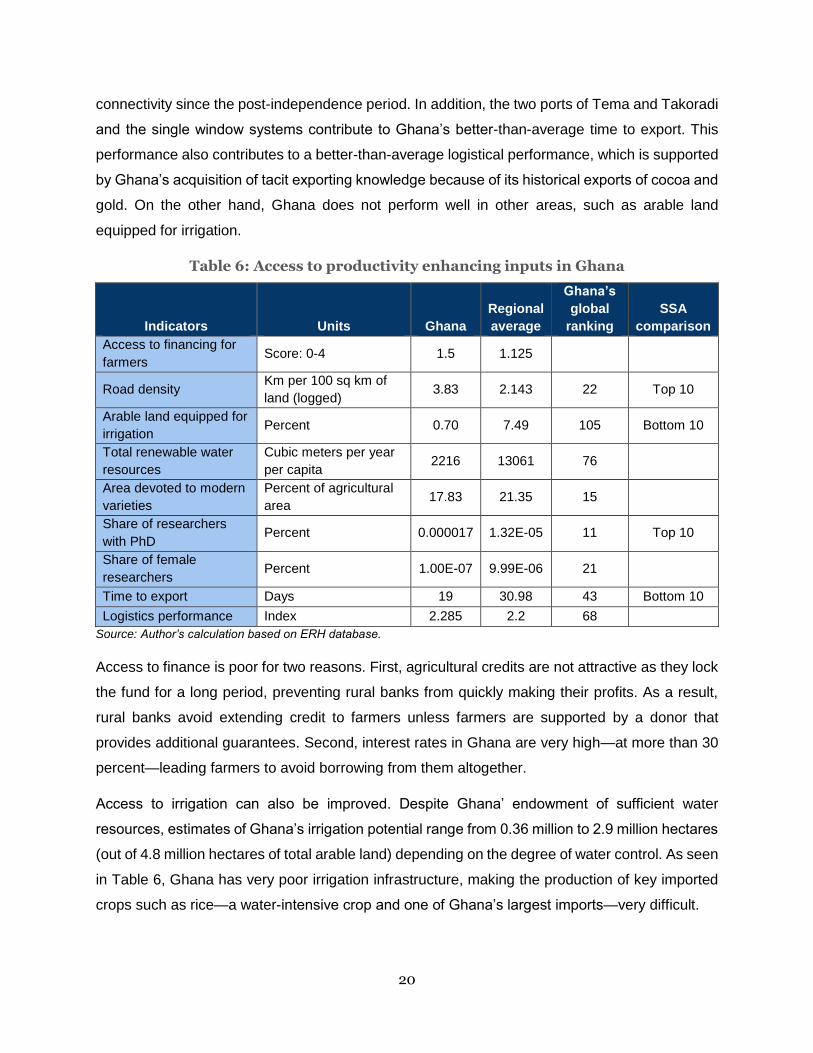
Table 6 displays Ghanaian farmers’ access to productivity enhancing inputs. Ghana does poorly
compared to the regional average in productivity-enhancing indicators such as arable land
equipped for irrigation, total renewable water resources per capita, and percentage of area
devoted to modern varieties. However, it does well in distance to source of fertilizers, which is
expected given Ghana’s countrywide fertilizer subsidy program. Ghana also does well in areas
such as road density and export time, owing to the country’s commendable effort to improve
0
10
20
30
40
50
60
70
80
GreaterAccra
Ashanti Western Eastern Central Volta BrongAhafo
UpperEast
UpperWest
Northern
Pe
rce
nt
20
connectivity since the post-independence period. In addition, the two ports of Tema and Takoradi
and the single window systems contribute to Ghana’s better-than-average time to export. This
performance also contributes to a better-than-average logistical performance, which is supported
by Ghana’s acquisition of tacit exporting knowledge because of its historical exports of cocoa and
gold. On the other hand, Ghana does not perform well in other areas, such as arable land
equipped for irrigation.
Table 6: Access to productivity enhancing inputs in Ghana
Indicators Units Ghana
Regional
average
Ghana’s
global
ranking
SSA
comparison
Access to financing for
farmers Score: 0-4 1.5 1.125
Road density Km per 100 sq km of
land (logged) 3.83 2.143 22 Top 10
Arable land equipped for
irrigation Percent 0.70 7.49 105 Bottom 10
Total renewable water
resources
Cubic meters per year
per capita 2216 13061 76
Area devoted to modern
varieties
Percent of agricultural
area 17.83 21.35 15
Share of researchers
with PhD Percent 0.000017 1.32E-05 11 Top 10
Share of female
researchers Percent 1.00E-07 9.99E-06 21
Time to export Days 19 30.98 43 Bottom 10
Logistics performance Index 2.285 2.2 68
Source: Author’s calculation based on ERH database.
Access to finance is poor for two reasons. First, agricultural credits are not attractive as they lock
the fund for a long period, preventing rural banks from quickly making their profits. As a result,
rural banks avoid extending credit to farmers unless farmers are supported by a donor that
provides additional guarantees. Second, interest rates in Ghana are very high—at more than 30
percent—leading farmers to avoid borrowing from them altogether.
Access to irrigation can also be improved. Despite Ghana’ endowment of sufficient water
resources, estimates of Ghana’s irrigation potential range from 0.36 million to 2.9 million hectares
(out of 4.8 million hectares of total arable land) depending on the degree of water control. As seen
in Table 6, Ghana has very poor irrigation infrastructure, making the production of key imported
crops such as rice—a water-intensive crop and one of Ghana’s largest imports—very difficult.
21
The low total renewable water resources per capita score is mostly explained by poor access in
the north of Ghana, which constitutes 50 percent of the country land mass. Poor adoption of
modern varieties is explained by the past failure of the improved seed introductions that relied on
a market-based system to minimize leakage rather than a collaborative system that allows
farmers to contribute to seed development through individual trials. The Ghana seed development
system has always relied on a participatory plant-breeding system. This system relies on farmer’s
own evaluations of new varieties based on local knowledge and preferences. This method
enables public research systems to fine-tune new seeds to existing conditions; moreover, it also
results in open access arrangements through which farmers gain access to unreleased varieties,
which they experiment with and distribute through their own network. However, the new seed
multiplication and distribution system supported by current legislation commercializes seeds by
creating commercial networks to minimize leakages of seeds to farmers to ensure that farmers
purchase seeds rather than multiply and distribute them. This framework of property rights in
commercial seeds devalues farmers’ knowledge and their contribution to the adaptation of the
modern seed (Amanor, 2010).
22
4. Policies and interventions to address food and
nutrition security needs
Strengthening Ghana’s food and nutrition security—the capacity to ensure that all Ghanaians
have access at all times to enough food for an active and healthy life—remains a fundamental
challenge to the country’s future prosperity. Although pockets of food insecurity have always
existed in Ghana, the situation became particularly prominent after prices of staple foods, such
as rice and vegetable oil, doubled between January and May 2008 (Cudjoe et al., 2010). A
combination of rising oil prices, depreciation of the U.S. dollar, biofuel policies to reallocate the
use of food crop to produce biofuel, market speculation, and temporarily imposed trade
restrictions contributed to the rapid surge in food prices—resulting in a 53 percent food price hike
and subsequent increase in poverty by 0.3 percentage point from its 2005 levels (Minot and
Dewina, 2015). This situation prompted the government to initiate trade-oriented, consumer-
oriented, and producer-oriented policy responses to cushion and address the distortions created
by the rising food prices. Studies after the 2008 crisis have shown that the two most widely applied
market and trade policy measures to address the challenge of rising food prices are reducing of
tariffs or custom fees, and selling grain from public stocks or from imports (Miranda et al., 2016).
Specifically, the initial Ghanaian government’s reaction to mitigate the impact of the high food
prices included: an export ban of maize and other commodities in May 2008; provision of 50
percent subsidies on fertilizer in 2009, which was first introduced in 2008; 20 percent subsidies
on tractor prices; and the removal of imports duties on rice, wheat, yellow corn, and vegetable oil.
While these policies were initially established in response to the crisis, many of them became
permanent tools to improve FNS.
The social protection programs in Ghana are meant not just to assist the vulnerable and excluded,
but also to empower them to make meaningful contributions towards economic transformation of
the country. To this end, Ghana’s social protection strategy is an integrated one that
encompasses direct and indirect cash transfer schemes, specific sectoral development programs,
skills development, and job creation instruments with wide range of targets. We describe below
some of the key programs.
4.1. Ghana School Feeding Program (GSFP)
The Ghana School Feeding Program (GSFP) is an initiative introduced in 2004 by the government
of Ghana first to meet the MDGs of reducing poverty and later, in 2010, mainstreamed into Ghana
23
social protection policy to increase school enrollment and reduce hunger. The basic concept of
the program is to provide pupils in select public primary schools in the country with one hot,
nutritious meal per school day, using locally grown foodstuffs. The long-term objective of the
GSFP is to contribute to poverty reduction and FNS and to increase school enrollment,
attendance, and retention through better nutrition and elimination of child wasting, stunting, and
underweight. In 2010, when designed, the program was intended to serve about 1.04 million
children in all 138 districts of Ghana.
The GSFP is based on locally grown food products, which should promote domestic food
production and improve market access for resource-poor farmers. The government wanted to
achieve this objective through an increase in employment and income level of farmers at the
community and national levels. In addition, greater availability, access, and utilization of food
crops and products at the community level are assumed to enhance FNS. By the end of the
program in 2016, it was expected that there will be an 8 percent increase in real income at national
and community levels, an 8 percent increase in employment at the community level, and greater
availability, access, utilization, and stability of food crops at the community level.
The most comprehensive evaluation of the GSFP has been conducted by the Partnership for
Childhood Development (PCD). The study consisted of a randomized control trial conducted over
5,000 children between 2013 and 2016 across all regions of Ghana. Some of the key results,
summarized by Aurino et al., (2016), include: Participation in agriculture increased by about 5
percent in GSFP communities; value of own food consumed increased for households in GSFP
communities by 1,729 GHC ($450); and net enrollment at the kindergarten level increased by
nearly 11 percent. On the nutrition front, school feeding reduced the probability of stunting among
children by 0.158 points.
4.2 Livelihood Empowerment against Poverty (LEAP)
The flagship program of the country’s National Social Protection Strategy, the Livelihood
Empowerment against Poverty (LEAP) program, is a social cash transfer program that provides
cash to extremely poor households across the country. A unique feature of LEAP is that, aside
from these payments, beneficiaries are provided with free health insurance through the National
Health Insurance Scheme, which began in 2004-2005. LEAP’s main goals are to alleviate short-
term poverty and encourage long-term human capital development. Following the rise in food
prices in 2008, 15,000 households were selected to participate in the emergency LEAP (E-LEAP)
program and eligibility criteria included small-scale crop producers with few productive assets and

24
female-headed household without income. Without the cash transfer, selected households would
not have been able to afford meeting their food and nutritional needs given the exorbitant cost of
living. The program expanded gradually and now reaches over 70,000 households with an annual
expenditure of approximately $20 million. The program is funded by the government of Ghana
(50 percent), donations from DFID, and a loan from the World Bank, and is implemented by the
Department of Social Welfare (DSW) in the Ministry of Gender, Children and Social Protection
(MoGCSP).
Interestingly, a recent assessment of the program shows LEAP has increased school enrollment
among secondary school aged children by 7 percentage points and reduced grade repetition
among both primary- and secondary-aged children. Among primary school aged children, LEAP
has reduced absenteeism by 10 percentage points (Handa et al., 2013). The FNS impacts of the
free health insurance have yet to be evaluated.
4.3. Agricultural enhancement programs
4.3.1. The Block Farms Program (BFP)
The Block Farm Program aims to, among other things, increase food security through the use of
science and technology in agricultural production. The program consolidated large tracts of arable
land (in blocks) to exploit economies of scale and to ensure that participating farmers benefit from
subsidized mechanization services and inputs (fertilizers, improved seed, and pesticides) made
available in the form of credit as well as provision of extension services by the Ministry of Food
and Agriculture (MoFA) for the production of crops with a comparative advantage. Started on a
pilot basis in 2009 in six regions—Ashanti, Brong Ahafo, Central, Northern, Upper East, and
Upper West—the program led to increased productivity in maize, rice, and soybean (Benin et al,
2013). By 2010, all 10 regions of Ghana were participating in BFP, and more crops had been
added, including sorghum, tomato, and onions.
Designed to focus on youth, BFP was expected to generate employment among the rural poor,
especially the youth (15-35); increase productivity; improve farmers’ incomes; and increase food
security. However, as Benin et al., (2013) report, the participation rate of youth in the program is
low (at 25 percent).Youth cultivated only slightly more than an acre on average, compared to 1.5
acres for adult females and 2.5 acres for adult males.

25
4.3.2. Agricultural Mechanism Service Centers (AMSEC)
The Agricultural Mechanism Service Centers (AMSEC) were introduced in 2007 to improve
agricultural production by providing timely and affordable mechanized services to farmers who
cannot afford their own agricultural machinery. The improved access to subsidized tractor
services also came with introduction of improved farm practices (row planting, recommended
planting density, and spacing).
The centers are designed as private entities specialized in mechanization service provision. At
first, 12 AMSECs were piloted in eight regions of the country and expanded to 88 centers by
August 2011. Each AMSEC was allocated a package of five tractors with basic implements and
a trailer, and had to pay 20 percent of the subsidized equipment prices up front with the balance
to be repaid over a two- to three-year period. The subsidies, covered by the government, amount
to one-third of the tractor prices. It reduced the capital cost of the machinery, a major barrier to
entry into the mechanization services market. The AMSEC program has contributed to improving
access by all farmers in the targeted regions to those services and has raised the average area
mechanized from 5.3 acres per farmer in 2008 to 7.8 acres per farmer in 2010, representing a 21
percent per year increase in the area mechanized (Benin et al., 2013).
The AMSEC program has had some challenges too, the Ministry of Food and Agriculture had
estimated that the country would need about 16,667 tractors by 2015. However, only 5,000
tractors (with accompanying disc ploughs, disc harrows, trailers, and power tillers) had been
imported and made available to qualified private-sector operators and farmers by 2013 (Benin et
al., 2013). In addition, the sustainability of such programs are questionable given its low
profitability (Houssou et al., 2013). Houssou et al., (2013) found that the high cost of moving
tractors from one district to another affected its profitability.
4.3.3. The Fertilizer Subsidy Program
The government of Ghana introduced a fertilizer subsidy program (FSP) in 2008 to promote the
domestic production of agricultural products, increase the productivity of Ghanaian farmers, and
modernize its agricultural sector. The FSP also aimed to raise the national average rate of fertilizer
use from 8 kg per hectare to 20 kg per hectare, increase the profitability of farm production, and
improve private sector development in the fertilizer market. The fertilizer subsidy program was
originally implemented via a voucher system in 2008-2009 and later replaced by a waybill system
where four types of fertilizer (NPK 15:15:15, NPK 23:10:05, urea, and sulphate of ammonia) were
26
subsidized at the port entry, making the fertilizer available to farmers who can afford the fertilizers
at price of about 64 percent of the retail market.
The program has led to an increase in the fertilizer application rate and improved yields and profit
margins for beneficiary farmers (Goyal and Nash, 2016: Benin et al., 2013). It also led to an
increase in the number of providers of agricultural inputs, which increased the availability of
fertilizer and raised fertilizer imports by 39.5 percent (Benin et al., 2013). The overall future
economic return of the program is positive, with an estimated benefit-cost ratio of 1.7, although
potential success comes with high risks because costs associated with the program over time
could easily take up a larger share of the MoFA budget (up to 35 percent by 2020) (Goyal and
Nash, 2016). However, the program was discontinued in 2016.
4.3.4. National Food Buffer Stock Company Limited (NAFCO)
Established in 2009 as a state-owned company with initial budget of $3.8 million, NAFCO was set
up as a limited liability company to manage the government’s emergency food program. Its main
task consists of purchasing, selling, preserving, and distributing food; reducing postharvest
losses; facilitating the export of excess stock; and insuring farmers against income shocks by
providing a minimum guaranteed price and a ready market for their production as NAFCO
expanded the demand for food grown in Ghana by selling products to all state institutions such
as the military, schools, hospitals, and prisons.
NAFCO also serves as buffer stock mechanism to ensure stability in the demand and supply of
food. It usually purchases cereals at pre-determined prices taking into consideration cost of
production and some profit margin for farmers based on farm budget analysis estimated by the
National Post Harvest Committee of MoFA. Not many studies have looked at the impact of
NAFCO, but Benin et al. (2013) concluded that grain price stability noticed in 2010 in Ghana can
partially be attributed to NAFCO.
In recent years, NAFCO has faced some challenges, such as access to sufficient funds to
purchase stocks from farmers during glut and excess production, lack of enough and modern
warehouses, shortages in drying and cleaning facilities for storing excess foodstuffs, and limited
market to sell excess stored grains. These obstacles affected its ability to stabilize prices and be
the buyer of last resort that it was designed to be in order to fight the market variability faced by
small-holder farmers.
27
To conclude, these consumer-, producer-, and trade-oriented programs have encountered a
mixture of success and failures. While programs such as school feeding programs, AMSEC, and,
to some extent, the fertilizer subsidy program registered success, the same cannot be said of the
other programs. Notably, programs implemented by government alone are among those that felt
short of meeting their targets. On the other hand, programs either implemented via some form of
public-private partnership (PPP), such as private actors in the case of AMSEC and fertilizer
subsidy program were relatively more successful.
28
5. Resources
5.1 National and external resource allocations to FNS
Ghana is not able to finance FNS and other agricultural projects as noted in the METASIP
program by itself. It still heavily relies on ODA as the country only allocates 4 percent of its budget
to social contributions and subsidies (Development Initiative Data Hub, 2014). This is notably true
for of agriculture-related activities, where the government of Ghana only targets input subsidies
and leaves the rest to development partners. On the other hand, we have noted that 40 percent
($462 million) of ODA was allocated to agriculture and food security ($139 million), health ($228
million), and WASH programs ($95 million) in 2014. In order to meet SDG2, it is important for the
country to rethink its resource mobilization strategy in light of its new LMIC status that precludes
the country from qualifying for certain aid monies.
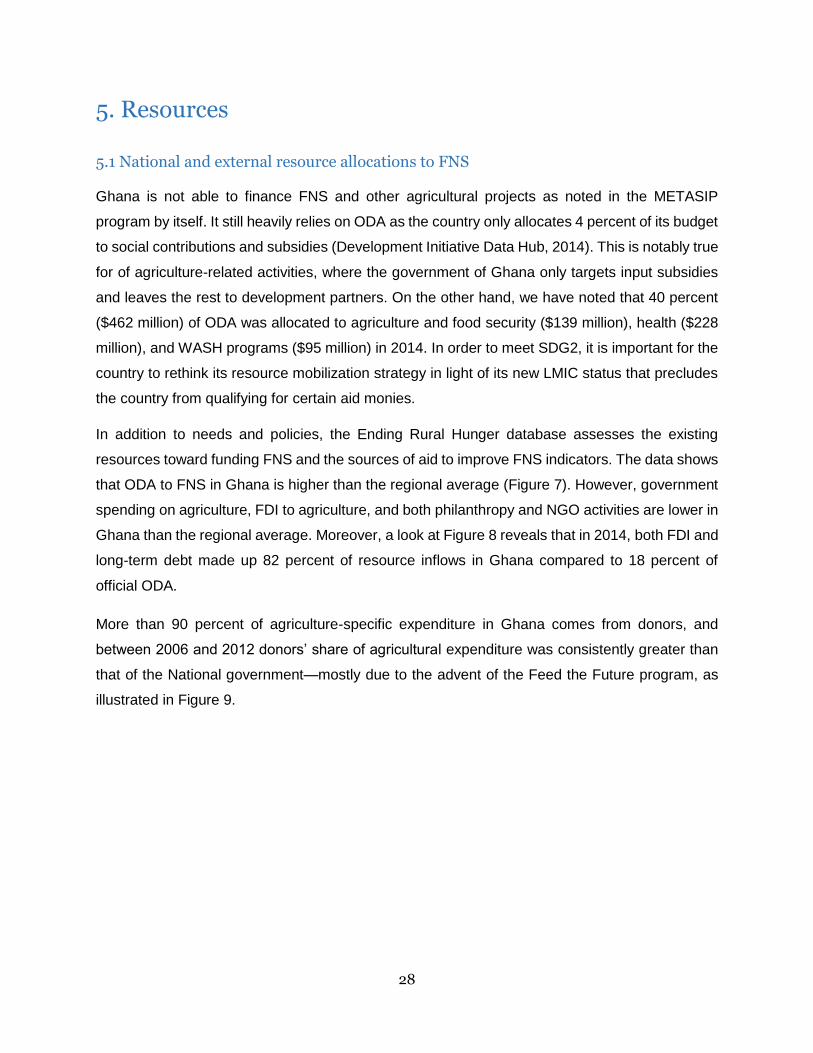
In addition to needs and policies, the Ending Rural Hunger database assesses the existing
resources toward funding FNS and the sources of aid to improve FNS indicators. The data shows
that ODA to FNS in Ghana is higher than the regional average (Figure 7). However, government
spending on agriculture, FDI to agriculture, and both philanthropy and NGO activities are lower in
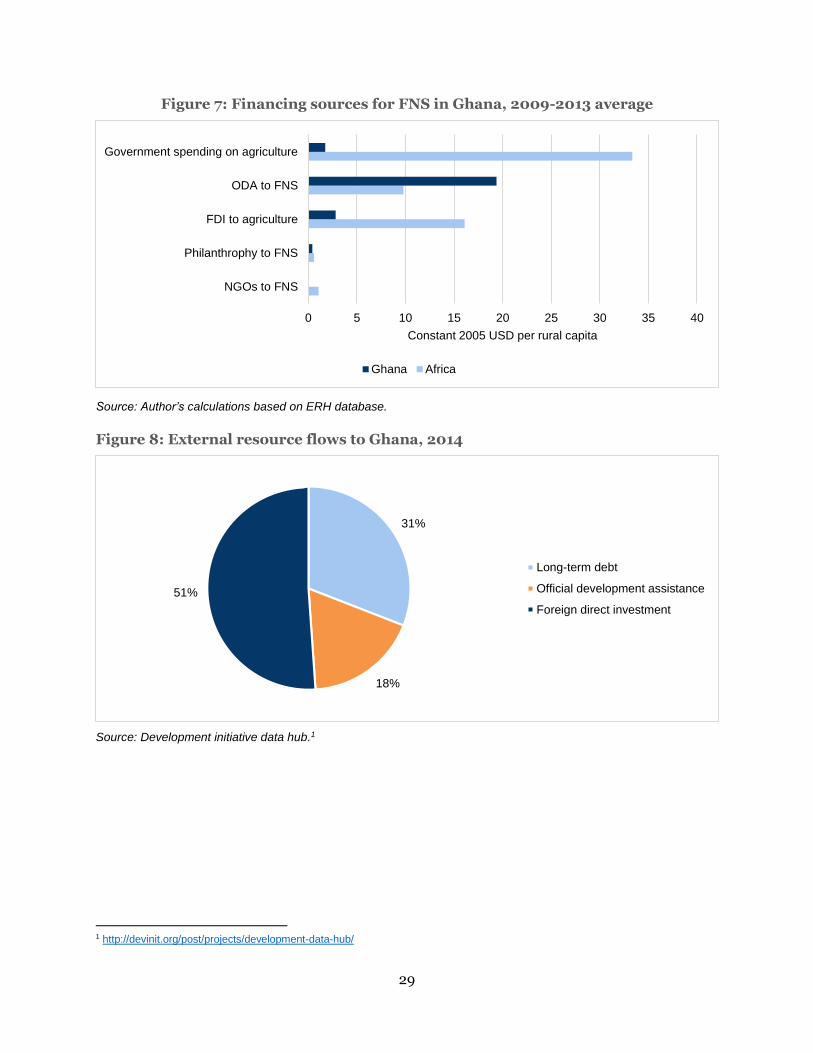
Ghana than the regional average. Moreover, a look at Figure 8 reveals that in 2014, both FDI and
long-term debt made up 82 percent of resource inflows in Ghana compared to 18 percent of
official ODA.
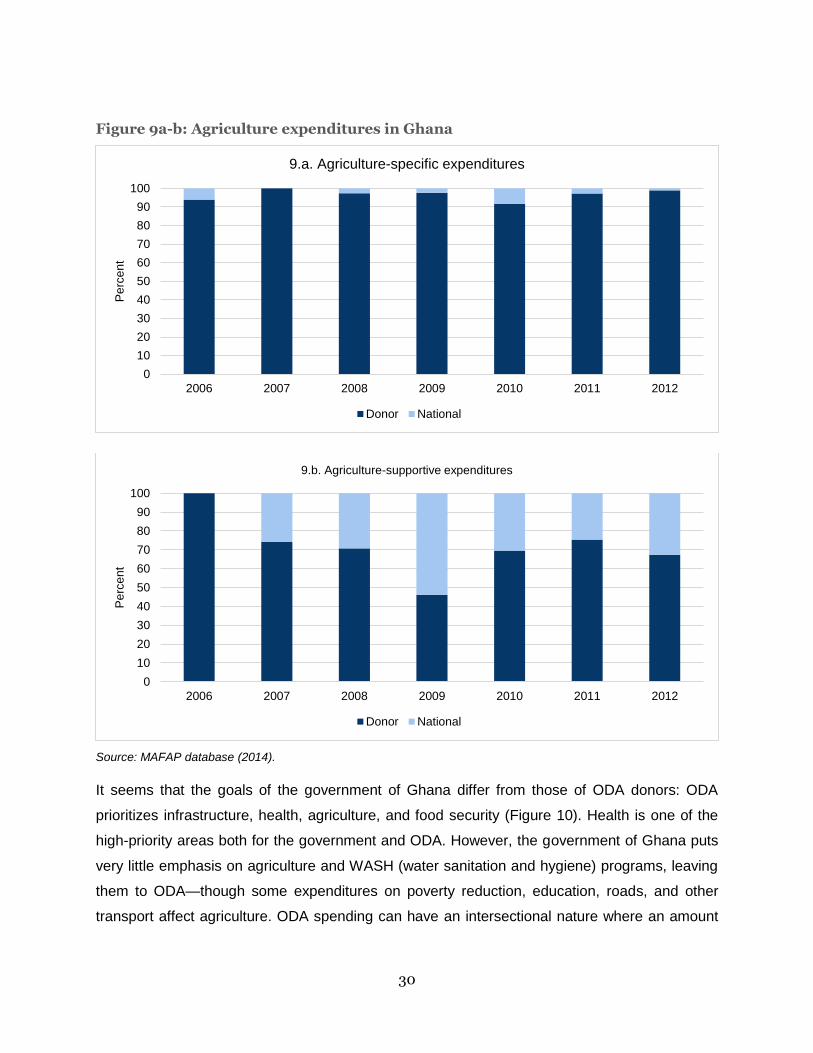
More than 90 percent of agriculture-specific expenditure in Ghana comes from donors, and
between 2006 and 2012 donors’ share of agricultural expenditure was consistently greater than
that of the National government—mostly due to the advent of the Feed the Future program, as
illustrated in Figure 9.
29
Figure 7: Financing sources for FNS in Ghana, 2009-2013 average
Source: Author’s calculations based on ERH database.
Figure 8: External resource flows to Ghana, 2014
Source: Development initiative data hub.1
1 http://devinit.org/post/projects/development-data-hub/
0 5 10 15 20 25 30 35 40
NGOs to FNS
Philanthrophy to FNS
FDI to agriculture
ODA to FNS
Government spending on agriculture
Constant 2005 USD per rural capita
Ghana Africa
31%
18%
51%
Long-term debt
Official development assistance
Foreign direct investment
30
Figure 9a-b: Agriculture expenditures in Ghana
Source: MAFAP database (2014).
It seems that the goals of the government of Ghana differ from those of ODA donors: ODA
prioritizes infrastructure, health, agriculture, and food security (Figure 10). Health is one of the
high-priority areas both for the government and ODA. However, the government of Ghana puts
very little emphasis on agriculture and WASH (water sanitation and hygiene) programs, leaving
them to ODA—though some expenditures on poverty reduction, education, roads, and other
transport affect agriculture. ODA spending can have an intersectional nature where an amount
0
10
20
30
40
50
60
70
80
90
100
2006 2007 2008 2009 2010 2011 2012
Pe
rce
nt
9.a. Agriculture-specific expenditures
Donor National
0
10
20
30
40
50
60
70
80
90
100
2006 2007 2008 2009 2010 2011 2012
Pe
rce
nt
9.b. Agriculture-supportive expenditures
Donor National

31
computed in one category can have spillovers in another. For example, spending on improving
road and transport will improve farmers’ access to markets.
Figure 10: ODA sectoral priorities, 2014
Source: Development initiative data hub (2014).
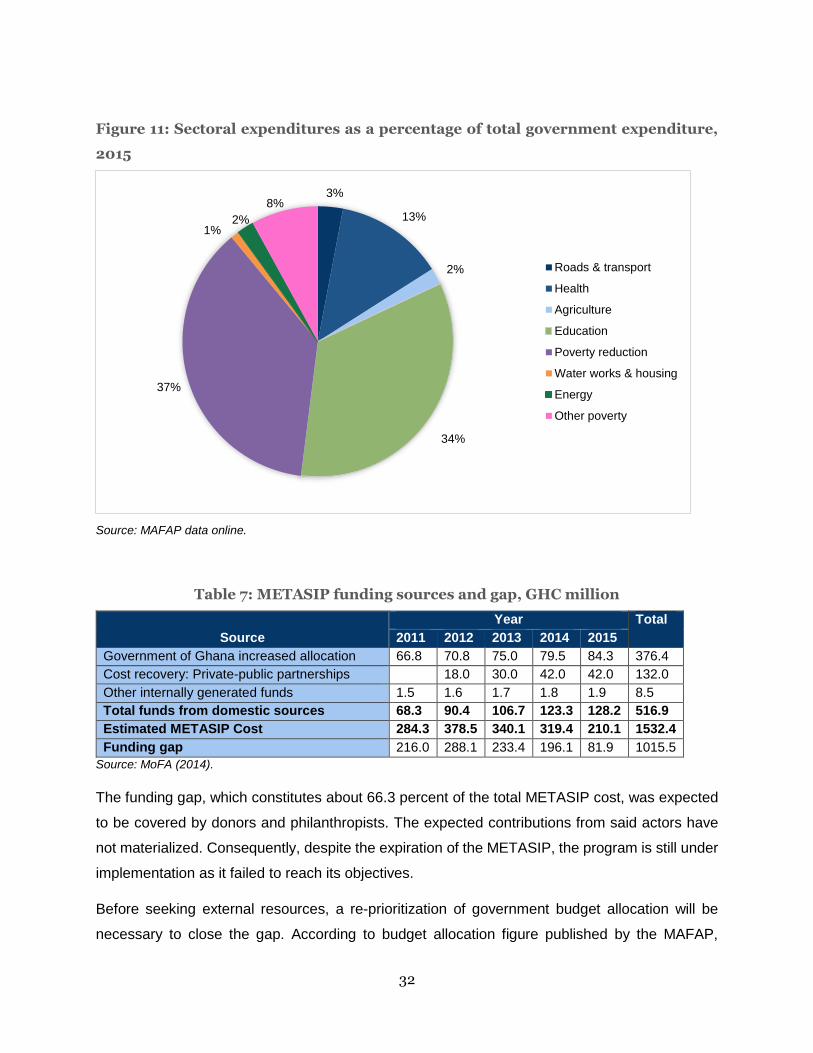
We take a deeper dive by looking at the composition of public agricultural expenditures because
the low figures on agricultural expenditure presented in Figure 11 seem lower than expected;
especially given the CAADP compact signed by Ghana to allocate 10 percent of its budget to
agriculture during the Maputo declaration of 2003. The low expenditure share might be due to the
fact that some infrastructure investment, such as feeder roads (for which Ghana performs well,
as illustrated under road density in Table 6), that are supposed to support agriculture are not
registered as agricultural expenditure. The data put together by the Monitoring African Food and
Agricultural Policies (MAFAP) project looks at agriculture-specific expenditures (expenditures that
directly target the agricultural sector), as well as agriculture-supportive expenditures (those that
indirectly benefit the sector).
Additional domestic and international resources will be necessary to finance the cost of the
implementing the METASIP. Only approximately 34 percent of funds were domestically provided
through the 10 percent budget allocated to agriculture and other cost recovery funds from private
and public partnerships. Table 7 provides the source of internal funds and the funding gap.
28%
20%
12%
8. 8%
7%
7%
4%
4%
10%
Infrastructure
Health
Agriculture & food security
Water & sanitation
Education
Governance & security
Industry & trade
Banking & business
Other
32
Figure 11: Sectoral expenditures as a percentage of total government expenditure,
2015
Source: MAFAP data online.
Table 7: METASIP funding sources and gap, GHC million
Source
Year Total
2011 2012 2013 2014 2015
Government of Ghana increased allocation 66.8 70.8 75.0 79.5 84.3 376.4
Cost recovery: Private-public partnerships 18.0 30.0 42.0 42.0 132.0
Other internally generated funds 1.5 1.6 1.7 1.8 1.9 8.5
Total funds from domestic sources 68.3 90.4 106.7 123.3 128.2 516.9
Estimated METASIP Cost 284.3 378.5 340.1 319.4 210.1 1532.4
Funding gap 216.0 288.1 233.4 196.1 81.9 1015.5
Source: MoFA (2014).
The funding gap, which constitutes about 66.3 percent of the total METASIP cost, was expected
to be covered by donors and philanthropists. The expected contributions from said actors have
not materialized. Consequently, despite the expiration of the METASIP, the program is still under
implementation as it failed to reach its objectives.
Before seeking external resources, a re-prioritization of government budget allocation will be
necessary to close the gap. According to budget allocation figure published by the MAFAP,
3%
13%
2%
34%
37%
1%2%
8%
Roads & transport
Health
Agriculture
Education
Poverty reduction
Water works & housing
Energy
Other poverty
33
poverty reduction welfare programs and education are given priority, while agriculture and water
works and housing are among the lowest (Figure 11). Poverty reduction programs include welfare
improvement projects, which include FNS. While these are important expenditures, investing in
productive sectors such as agriculture will yield better results, including economic transformation
(McArthur and McCord, 2017).
5.2. Resource mobilization strategy for funding SDG2
Given the huge gap between the resources needed to attain the large number of SDGs and other
social and agricultural projects as mentioned in METASIP, ODA will continue to be very important.
Improving the effectiveness of the use of ODA at the country level will not only enable greater
achievement of the SDGs, It would also help Ghana sustain ODA to finance SDGs and other
social projects listed in METASIP. In addition, as the aid landscape becomes more complex with
many new actors and traditional resources become much more uncertain amid the economic
slowdown in the European Union and the forthcoming aid cuts from the United States, the ability
of national authorities to manage the various actors in place to support a national development
strategy in a coherent manner and domestic resource mobilization become critical in determining
whether or not countries are able to attain their SDGs. For this reason, this section will discuss
Ghana’s experience in adjusting its aid management practices.
Recently, fiscal pressures in traditional donor home countries have meant reallocation of
resources from lower-middle-income countries (LMICs) to least-developed countries (LDCs). As
a result, bilateral grant resources to Ghana are on the decline, as illustrated in Figure 12. ODA
has become an increasingly smaller part of financial flows, with ODA inflows as a percentage of
GDP declining from 12 percent in 2000 to 4.71 percent in 2015. Net ODA inflow peaked at $2.4
billion in 2008, declining steadily thereafter to $1.7 billion by 2015 (World Development Indicators
Online). Ghana's LMIC status has limited its eligibility for concessional funds, and loan terms and
conditions from traditional multilateral and bilateral donors are being reviewed.
The changing landscape and the multiplicity of sources and channels of aid2 have posed
enormous challenges for mobilizing external resources to address goals such as SDG2 among
newly vetted LMICs such as Ghana. Challenges include aligning resources to development
priorities; assessing funds relative to their cost and weighing the economic benefits of projects
vis-à-vis the cost; assessing the efficiency and cost of projects; improving the negotiating capacity
of the government and its ability to accept and reject funds based on the terms and conditions
2 Each source come with its conditionalities, which makes it hard for Ghana to meet and therefore access the resources.
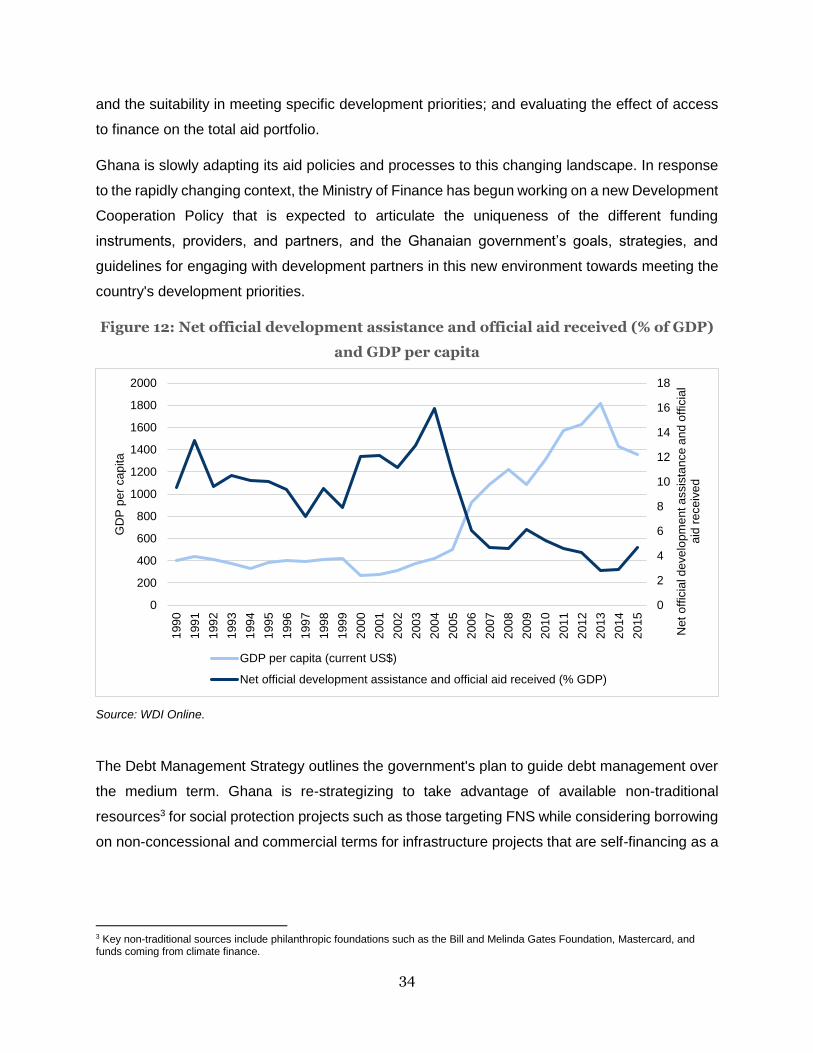
34
and the suitability in meeting specific development priorities; and evaluating the effect of access
to finance on the total aid portfolio.
Ghana is slowly adapting its aid policies and processes to this changing landscape. In response
to the rapidly changing context, the Ministry of Finance has begun working on a new Development
Cooperation Policy that is expected to articulate the uniqueness of the different funding
instruments, providers, and partners, and the Ghanaian government’s goals, strategies, and
guidelines for engaging with development partners in this new environment towards meeting the
country's development priorities.
Figure 12: Net official development assistance and official aid received (% of GDP)
and GDP per capita
Source: WDI Online.
The Debt Management Strategy outlines the government's plan to guide debt management over
the medium term. Ghana is re-strategizing to take advantage of available non-traditional
resources3 for social protection projects such as those targeting FNS while considering borrowing
on non-concessional and commercial terms for infrastructure projects that are self-financing as a
3 Key non-traditional sources include philanthropic foundations such as the Bill and Melinda Gates Foundation, Mastercard, and funds coming from climate finance.
0
2
4
6
8
10
12
14
16
18
0
200
400
600
800
1000
1200
1400
1600
1800
2000
199
0
199
1
199
2
199
3
199
4
199
5
199
6
199
7
199
8
199
9
200
0
200
1
200
2
200
3
200
4
200
5
200
6
200
7
200
8
200
9
201
0
201
1
201
2
201
3
201
4
201
5
Net
off
icia
l de
ve
lop
me
nt a
ssis
tan
ce
an
d o
ffic
ial
aid
re
ce
ive
d
GD
P p
er
ca
pita
GDP per capita (current US$)
Net official development assistance and official aid received (% GDP)
35
means to minimize costs and refinance risks. Capital expenditure is to be financed with long-term
debt and short-term bills for liquidity management.
In terms of institutional structures and processes, there is a strong push toward domestic resource
mobilization to help finance SDG2 and other social and agricultural projects. The Tax Policy Unit
at the Ministry of Finance coordinates with the Ghana Revenue Authority to ensure effective
mobilization of domestic revenue. There have been extensive reforms in tax administration in the
last six years, since the merging of the Tax and Revenue Agencies into the Ghana Revenue
Authority in 2009. Extensive work has been undertaken to merge the structures and processes of
the domestic tax divisions and to build their capacity with the objective of providing the taxpayer
with efficient and seamless service.
36
6. Conclusion and recommendations
The second of the 17 proposed SDGs is “end hunger, achieve food security and improved
nutrition, and promote sustainable agriculture.” This report aimed to study Ghana’s progress
toward achieving SDG2, using data from the Ending Rural Hunger database. It finds that except
for calories from staples and anemia in children under five, Ghana performs better than most
African countries in FNS indicators such as children stunting, wasting, and underweight. National
scores, however, obscure the within-country differences that exist between the poor north and
the less-poor south of Ghana. Though Ghana has a strategy for improving its FNS, the resources
available and allocated to meet the policy objectives are mostly dependent on donors. Only in
rare occasions, such as after the 2008 food price crises, does the government intervene in a large
way to remedy deteriorating FNS conditions.
While Ghana was able to meet most of the FNS-related goals outlined in the MDGs, its current
economic status will make tackling the SDGs more challenging. In the past, Ghana received
assistance through the HIPC initiatives to address poverty and FNS needs. Today, its middle-
income status makes it ineligible for such funds. However, the recent economic crisis the country
is facing may cast a few doubts about the end of traditional aid for Ghana. Either way, it is
important for Ghana to internally mobilize resources for financing FNS-related initiatives,
especially targeting the northernmost regions of Upper East, Upper West, and Northern.
To both end poverty and improve FNS, Ghana must depend less on donors as its income rises
(Laborde et al., 2016). Internal resource mobilization will become a key tool for meeting FNS
needs, and it is important for Ghana to rethink and redraft its aid management policy. Ghana has
already begun to merge the structures and processes of the domestic tax divisions in an effort to
maximize internal resources, but further work needs to be done. Ghana needs to work with
traditional donor partners to provide clarity about their strategies, timeline, and the implications.
Issues for consideration include: How will any phasing out be managed to ensure that
development gains previously obtained through donor funds are sustained, particularly in the FNS
sectors where donors have played a key role? Are there experiences with LMIC graduations in
other continents that can guide Ghana’s transition?

37
References
Amanor, K. 2010 Participation, Commercialization and Actor Networks: The Political Economy
of Cereal Seed Production Systems in Ghana. Future Agriculture Working Paper 016.
Aurino E. Felix Asante, Boss Kwasabem, Aulo Gelli, Lesley Drake, Gloria Folson, Isaac Osei-
Akoto. 2016. The impact of school feeding on nutrition, education, agriculture and other
social outcomes: design of a randomised controlled trial of 'home-grown' school feeding
in Ghana. Seminar presentation at the Institute of Statistical Social and Economic
Research, University of Ghana
Benin, S., and Yu, B. (2013). Complying the Maputo Declaration Target: Trends in public
agricultural expenditures and implications for pursuit of optimal allocation of public
agricultural spending. ReSAKSS Annual Trends and Outlook Report 2012. International
Food Policy Research Institute (IFPRI).
Benin, S., Johnson, M., Abokyi, E., Ahorbo, G., Jimah, K., Nasser, G., Owusu, V., Taabazuing,
J., Tenga, A., (2013). Revisiting Agricultural Input and Farm Support Subsidies in Africa:
The Case of Ghana’s Mechanization, Fertilizer, Block Farms, and Marketing Programs.
IFPRI Discussion Paper 01300.
Cudjoe, G., Breisinger, C., and Diao, X. (2010). Local impacts of a global crisis: food price
transmission, consumer welfare and poverty in Ghana. Food Policy, 35, 294-302.
Goyal., A and Nash, J. 2016. Reaping Richer Returns: Public Spending Priorities for More
Productive African Agriculture. AFR Regional Study (P153531), Agriculture GP and
Poverty GP. World Bank, Washington DC
Gyebi, E. (2011). 78% of children in the north are anaemic. The chronicle Online. Article
available at : http://thechronicle.com.gh/78-of-children-in-the-north-are-anaemic/.
Ghana Statistical Service (2014). Ghana Living Standards Survey Round 6: Labour Force Report.
Government of Ghana (2013). The livelihood Empowerment against poverty (LEAP)
Programme: Reducing poverty and promoting growth in Ghana. Briefing paper.
Handa, S., Park, M.J., Darko, R.O., Osei-Akoto, I., Davis, B., Diadone, S. (2013). Livelihood
Empowerment against Poverty Impact Evaluation, Carolina Population Center,
University of North Carolina.
Houssou, N., Kolavalli, S., Bobobe, E., & Owusu, V. (2013). Animal traction in Ghana. GSSP
Working Paper 34. International Food Policy Research Institute.
International Food Policy Research Institute (IFPRI), 2016. Ghana Strategy Support Program
(GSSP) Policy Dialogue. October 17th, 2016 Labadi Beach Hotel, Accra Ghana
Laborde, D., L. Bizikova, T., Lallemant, and C., Smaller. 2016. Ending Hunger: What would it
cost? Joint publication of International Institute for Sustainable Development and
International Food Policy Research Institute
38
McArthur, J and, G. McCord. 2017. Fertilizing growth: Agricultural inputs and their effects in
economic development. Journal of Development Economics, Vol. 127, pp 133–152
Ministry of Food and Agriculture (2010). Medium Term Agricultural Sector Investment Plan
(METASIP) 2011-2015.
Ministry of Food and Agriculture (2007). Food and Agriculture Sector Development Policy.
FASDEP II- Ministry of Food and Agriculture.
Minot, N., Dewina, R., 2015. Are we overestimating the negative impact of higher food prices?
Evidence from Ghana. Agric. Econ. 46, 579–593
National Development Planning Commission (NDPC), 2015. Ghana Shared Growth and
Development Agenda (GSGDA) II. Government of Ghana.
Schnitzer, Pascale; Tinonin, Cecilia; Azzarri, Carlo (2014) "Ghana Agricultural Snapshot
2005/6," Working Paper, HarvestChoice - International Food Policy Research Institute
(IFPRI).
SRID-MoFA. (2015). Facts and figures (2010). Mofa.Gov.Gh/Site/Wp-
Content/Uploads/.../Mofa_Facts_and_Figures.Pdf. Statistics, Research and Information
Directorate (SRID), Ministry of Food and Agriculture, Accra. Ghana.
Soliman, Ashraf T., Vincenzo De Sanctis, and Sanjay Kalra. “Anemia and Growth.” Indian
Journal of Endocrinology and Metabolism 18.Suppl 1 (2014): S1–S5. PMC. Web. 24
Aug. 2017.
United Nations (2016). The Sustainable Development Goals Report 2016.
http://unstats.un.org/sdgs/report/2016/.
World Bank (2000). Ghana - Agricultural sector performance review and accountability on the
National Agricultural Research, National Agricultural Extension, National Livestock
Services, Agricultural Diversification, and Agricultural Sector Investment Projects.
Washington, DC: World Bank.
World Bank (2007). World Development Report 2008: Agriculture for Development. Washington,
DC. World Bank. https://openknowledge.worldbank.org/handle/10986/5990 License: CC
BY 3.0 IGO.
Zereyesus, Y. A., K. L. Ross, V. Amanor-Boadu, and T. J. Dalton. Baseline Feed the Future
Indicators for Northern Ghana 2012. Kansas State University, Manhattan, KS, March
2014.
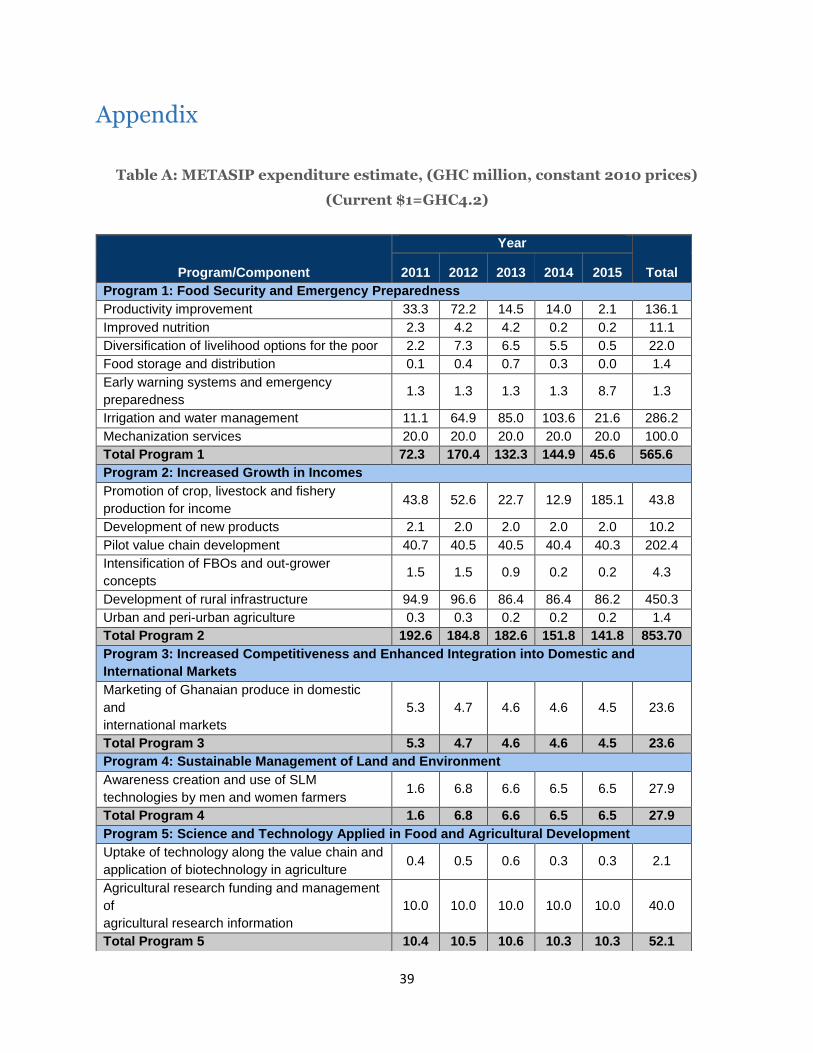
39
Appendix
Table A: METASIP expenditure estimate, (GHC million, constant 2010 prices)
(Current $1=GHC4.2)
Program/Component
Year
Total 2011 2012 2013 2014 2015
Program 1: Food Security and Emergency Preparedness
Productivity improvement 33.3 72.2 14.5 14.0 2.1 136.1
Improved nutrition 2.3 4.2 4.2 0.2 0.2 11.1
Diversification of livelihood options for the poor 2.2 7.3 6.5 5.5 0.5 22.0
Food storage and distribution 0.1 0.4 0.7 0.3 0.0 1.4
Early warning systems and emergency
preparedness 1.3 1.3 1.3 1.3 8.7 1.3
Irrigation and water management 11.1 64.9 85.0 103.6 21.6 286.2
Mechanization services 20.0 20.0 20.0 20.0 20.0 100.0
Total Program 1 72.3 170.4 132.3 144.9 45.6 565.6
Program 2: Increased Growth in Incomes
Promotion of crop, livestock and fishery
production for income 43.8 52.6 22.7 12.9 185.1 43.8
Development of new products 2.1 2.0 2.0 2.0 2.0 10.2
Pilot value chain development 40.7 40.5 40.5 40.4 40.3 202.4
Intensification of FBOs and out-grower
concepts 1.5 1.5 0.9 0.2 0.2 4.3
Development of rural infrastructure 94.9 96.6 86.4 86.4 86.2 450.3
Urban and peri-urban agriculture 0.3 0.3 0.2 0.2 0.2 1.4
Total Program 2 192.6 184.8 182.6 151.8 141.8 853.70
Program 3: Increased Competitiveness and Enhanced Integration into Domestic and
International Markets
Marketing of Ghanaian produce in domestic
and
international markets
5.3 4.7 4.6 4.6 4.5 23.6
Total Program 3 5.3 4.7 4.6 4.6 4.5 23.6
Program 4: Sustainable Management of Land and Environment
Awareness creation and use of SLM
technologies by men and women farmers 1.6 6.8 6.6 6.5 6.5 27.9
Total Program 4 1.6 6.8 6.6 6.5 6.5 27.9
Program 5: Science and Technology Applied in Food and Agricultural Development
Uptake of technology along the value chain and
application of biotechnology in agriculture 0.4 0.5 0.6 0.3 0.3 2.1
Agricultural research funding and management
of
agricultural research information
10.0 10.0 10.0 10.0 10.0 40.0
Total Program 5 10.4 10.5 10.6 10.3 10.3 52.1
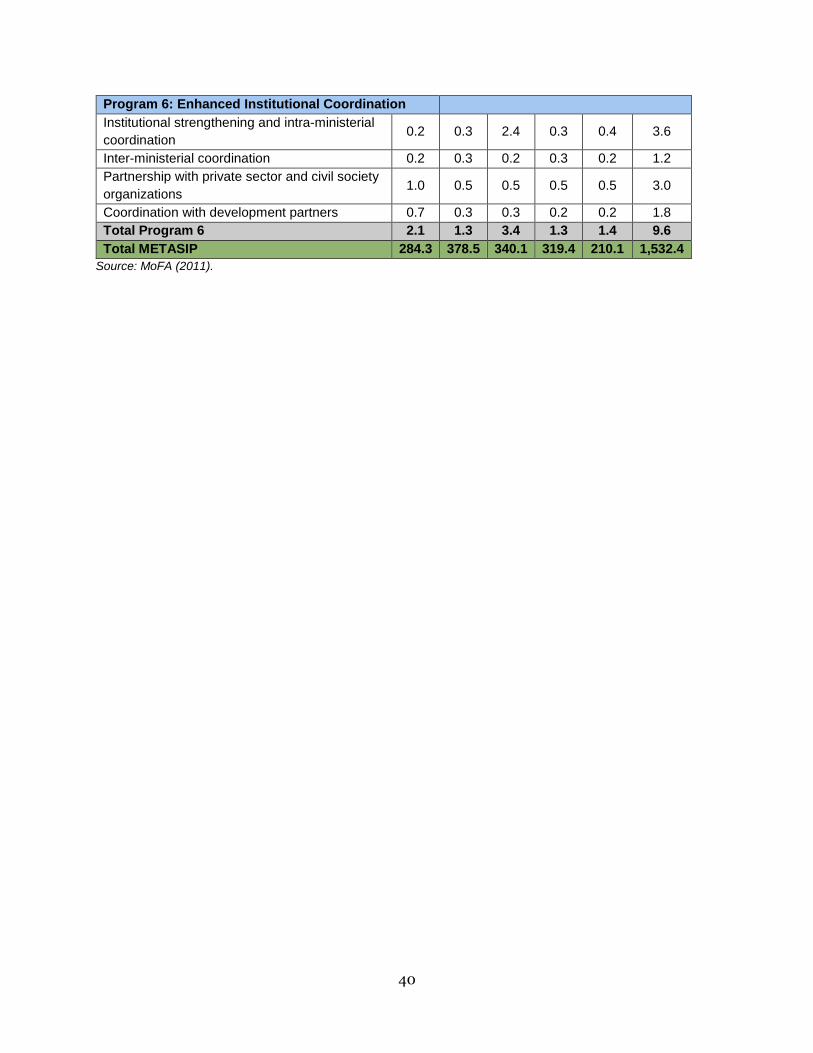
40
Source: MoFA (2011).
Program 6: Enhanced Institutional Coordination
Institutional strengthening and intra-ministerial
coordination 0.2 0.3 2.4 0.3 0.4 3.6
Inter-ministerial coordination 0.2 0.3 0.2 0.3 0.2 1.2
Partnership with private sector and civil society
organizations 1.0 0.5 0.5 0.5 0.5 3.0
Coordination with development partners 0.7 0.3 0.3 0.2 0.2 1.8
Total Program 6 2.1 1.3 3.4 1.3 1.4 9.6
Total METASIP 284.3 378.5 340.1 319.4 210.1 1,532.4
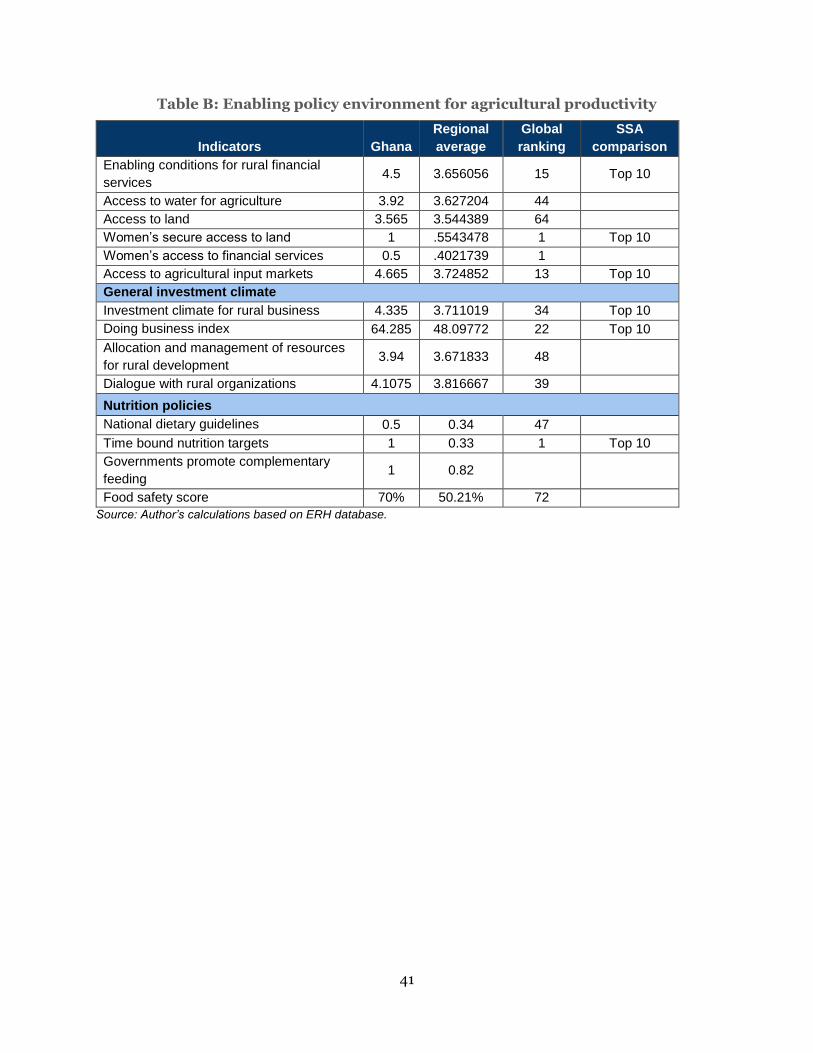
41
Table B: Enabling policy environment for agricultural productivity
Indicators Ghana
Regional
average
Global
ranking
SSA
comparison
Enabling conditions for rural financial
services 4.5 3.656056 15 Top 10
Access to water for agriculture 3.92 3.627204 44
Access to land 3.565 3.544389 64
Women’s secure access to land 1 .5543478 1 Top 10
Women’s access to financial services 0.5 .4021739 1
Access to agricultural input markets 4.665 3.724852 13 Top 10
General investment climate
Investment climate for rural business 4.335 3.711019 34 Top 10
Doing business index 64.285 48.09772 22 Top 10
Allocation and management of resources
for rural development 3.94 3.671833 48
Dialogue with rural organizations 4.1075 3.816667 39
Nutrition policies
National dietary guidelines 0.5 0.34 47
Time bound nutrition targets 1 0.33 1 Top 10
Governments promote complementary
feeding 1 0.82
Food safety score 70% 50.21% 72
Source: Author’s calculations based on ERH database.