Financial Statements, Year Ending 31 March 2015
82
Kettlewell House Austin Fields Industrial Estate Kings Lynn Norfolk PE30 1PH STATEMENT OF ACCOUNTS FOR THE YEAR ENDING 31 MARCH 2015
-
Upload
khangminh22 -
Category
Documents
-
view
3 -
download
0
Transcript of Financial Statements, Year Ending 31 March 2015
Kettlewell House Austin Fields Industrial Estate
Kings Lynn Norfolk
PE30 1PH
STATEMENT OF ACCOUNTS FOR THE YEAR ENDING
31 MARCH 2015
STATEMENT OF ACCOUNTS FOR THE YEAR ENDING 31 MARCH 2015
CONTENTS PAGE
Statement of Accounting Policies 2 - 4
Norfolk Pension Fund Actuarial Valuation as at 31 March 2015 for FRS17 Purposes Appendix 1
Income and Expenditure Account 5
Balance Sheet, as at 31 March 2015 6
Notes to the Accounts 7 - 12
Supplementary Reports:
Capital Programme 13
Maintenance Programme 14 - 16
Mobile Plant Operations Account 17
Labour Operations Account 18
Fixed Assets Register 19 - 20
Annual Report for DEFRA (as required by Paragraph 4 of Schedule 2 to the Land Drainage Act 1991)
Appendix 2
Board Members Attendance Register Appendix 3
Board Members and Officers Register of Gifts and Hospitality Appendix 4
Audited Statements:
Accounting Statement for the Annual Return and Reconciliation to Accounts 21 -24
Annual Return for the year ended 31 March 2015 Appendix 5
Internal Audit Report for the year ended 31 March 2015 Appendix 6
NOTE ACCOUNTING POLICIES
1 FINANCIAL REPORTING STANDARDS, REGULATION AND GUIDANCE
(i)
(ii)
(iii)
2 ACCOUNTING CONCEPTS
Going ConcernPrudenceAccruals
3 FIXED ASSETS
(i)
(ii)
(iii)
(iv)
(v)
Motor Vehicles and Equipment: 3 yearsExcavators and Tractors: 5 yearsSpecialist Plant and Equipment: <= 10 yearsFixed Pumping Plant: 20 years
The useful lives of the various assets held on the Fixed Asset Register are as follows:
Land and buildings are included in the balance sheet at lower of net current replacement cost and net realisablevalue, net of accumulated depreciation. Net current replacement cost is assessed as:
Non-specialised operational properties - existing use value
Specialised operational properties - depreciated replacement cost
Vehicles, plant and equipment are included at cost less depreciation
Disposals are written off at cost less depreciation. Any surplus/deficit arising is charged/credited to ExceptionalItems in the Income and Expenditure Account.
Depreciation has been provided for using the straight line method.
The Board has not elected to prepare a full Statement of Accounts required by larger public bodies, as providedfor in Regulation 12(b) of the Accounts and Audit Regulations 2011.
The Board has completed this Statement of Accounts in accordance with the Financial Reporting Standard forSmaller Entities 2008 (FRSSE) issued by the Accounting Standards Board and has prepared an Annual Return,which smaller bodies are required to do, in accordance with Regulation 12(a) of the Accounts and AuditRegulations 2011, based on these Accounts.
The Annual Return has been prepared in accordance with proper practices that are set out in Parts 1 to 3 of theGuidance published by the Association of Drainage Authorities in 2008. This Statement of Accounts thereforeincludes the Accounting Statement reported on the Annual Return, which has been reconciled to the Incomeand Expenditure Account and Balance Sheet stated herein.
These accounts have been prepared in accordance with the following accounting concepts:
Fixed Assets are recognised as expenditure on the acquisition, creation or enhancement of fixed assets. Mostassets with estimated useful economic lives in excess of one year and a value of £5,000 or above arecapitalised on an accruals basis in the Accounts.
All fixed Assets are valued on the following basis:
2
NOTE ACCOUNTING POLICIES
Land: not depreciatedPumping Stations: 10 yearsBuildings: 50 years
4 STOCKS AND WORK IN PROGRESS
5 GOVERNMENT GRANTS AND SUBSIDIES
6 PENSIONS
(i)
(ii)
(iii)
7 TAXATION
8 EXCEPTIONAL ITEMS, EXTRAORDINARY ITEMS AND PRIOR YEAR ADJUSTMENTS
(i)
(ii)
9 INCOME RECOGNITION
10 FINANCE LEASES
The Board's pension liability has been calculated by the fund actuary as set out in the accompanying report entitled: 'Actuarial Valuation as at 31 March 2015 for FRS17 Purposes'.
Drainage Boards are exempt from Income, Corporation and Capital Gains Taxes. Value Added Tax is includedin the Income and Expenditure Account only to the extent that it is irrecoverable.
There are no material exceptional or extraordinary items to disclose in the Accounts.
Profits or losses on the disposal of fixed assets are shown separately on the face of the Income andExpenditure Account prior to the Operating Net Surplus/(Deficit).
Income is recognised at the time of invoicing. In the case of Drainage Rates this is on the 1st April annually.
There are no longer any Finance Leases held on any items of plant/equipment.
Stocks and work in progress are valued at the lower of cost or net realisable value.
Government grants and contributions have been credited to the Income and Expenditure Account on anaccruals basis.
The Board participates in the Local Government Pension Scheme, a defined benefit scheme operated byNorfolk County Council. The Board has paid a contribution of 20% on employees pensionable pay into thepension fund for 2014/15.
The expected cost of providing pensions, as calculated periodically by professionally qualified actuaries, ischarged to the Income and Expenditure Account in order to spread the cost over the service lives of employeesin the scheme. Further costs arise in respect of certain pensions paid to retired employees on an unfundedbasis.
3
NOTE ACCOUNTING POLICIES
11 RESERVES
This policy is reviewed by the Board triennially.
(i) General Reserve
(ii) Development Reserve
(iii) Plant Reserve
(iv) Maintenance Works Reserve
(v) Capital Works Reserve
(vi) Capacity Building/Partnership Working Reserve
(vii) Revaluation Reserve
(viii) Pension Reserve
The Board holds Reserves as itemised below. The adequacy of these Reserves is reviewed by the Boardannually. The purpose of these Reserves can be noted in the Board's Capital Financing and Reserves Policy:
http://www.wlma.org.uk/uploads/BIDB_Capital_Financing_and_Reserves_Policy.pdf
4
Nor
folk
Pen
sion
Fun
d
Act
uaria
l Val
uatio
n as
at 3
1 M
arch
201
5 fo
r FR
S17
pur
pose
s A
pril
2015
Robert Bilton Fellow of the Institute and Faculty of Actuaries For and on behalf of Hymans Robertson LLP
NORFOLK PENSION FUND
HYMANS ROBERTSON LLP
April 2015
C
onte
nts
Section PAGE
1 Introduction and summary 1 2 Approach 4 3 Data and information used 6 4 Actuarial assumptions 8 5 Miscellaneous matters 13
Appendices Appendix 1 - Glossary of technical terms Appendix 2 – Long term expected return assumptions Appendix 3 – Briefing Note on assumptions
NORFOLK PENSION FUND 001
HYMANS ROBERTSON LLP
April 2015
1 Introduction and summary Scope 1 I have been instructed by the Administering Authority named in the accompanying Results Schedule to
undertake estimated projected pension expense calculations for the Employer named in the Results Schedule, for the purpose of complying with Financial Reporting Standard 17 (“FRS17”) (“the Accounting Standard”) for the period ending 31 March 2015. The instruction is set out in the Terms of Engagement letter (see Results Schedule for date of signature). These calculations relate principally to the Employer’s participation in the Norfolk Pension Fund (“the Fund”) which is part of the Local Government Pension Scheme (“the LGPS”). See paragraph 15 for further details.
2 These figures are prepared in accordance with our understanding of the latest version of FRS17, published in November 2000. My calculations and advice, in this report and the accompanying Results Schedule, have been carried out in accordance with the Pensions Technical Actuarial Standard adopted by the Financial Reporting Council, which came into effect on 1 January 2013 (version 2), and other TASs: see 4.1. This report does not constitute an audit opinion in relation to the Fund. This constitutes a “valuation exercise”, as the results of my calculations will be formalised in the Employer’s financial statements.
3 FRS17 requires that actuarial gains and losses are recognised through a Statement of Total Recognised Gains and Losses (STRGL) in the period in which they occur.
4 Under accounting guidance, employers are expected to disclose the sensitivity of the valuation to key assumptions, and the required information is contained in section 4 of this report.
Results 5 The results of our calculations for the period ended 31 March 2015 and the projected net pension cost for
the year ended 31 March 2016 are set out in the Results Schedule.
6 The significant changes that have taken place during the year for a typical employer in the Fund are that:
• the deficit has increased due to falling real bond yields;
• this has been partially offset by strong asset returns; and
• the projected pension expense for next year has also risen due to falling bond yields.
7 Please let me know if the Employer wishes to discuss the contents of this report or if, having considered the results, the Employer wishes to consider alternative assumptions. Note that this is likely to incur additional fees. As noted above, the impact of varying certain key assumptions is illustrated in section 4.
Reliances and limitations 8 This report (including the accompanying Results Schedule) is provided to the Employer solely for the
purpose of complying with the Accounting Standard for the period ending 31 March 2015. It should not be used for any other purpose and in particular should not be used for actual disclosures. It should not be released or otherwise disclosed to any third party except as required by law or with our prior written consent, in which case it should be released in its entirety. However, a copy of this report may be passed to the Employer’s auditor to be used solely for the purpose of their audit.
9 We accept no liability to any third party unless we have expressly accepted such liability in writing.
NORFOLK PENSION FUND 002
HYMANS ROBERTSON LLP
April 2015
10 Note that the methodology of the Accounting Standard, in conjunction with the Fund’s investment strategy, means that the surplus or deficit identified in this report can vary significantly over short periods of time. This means that the results set out should not be taken as being applicable at any date other than 31 March 2015.
11 The figures presented in this report are prepared only for the purposes of FRS17 and have no validity in other circumstances. In particular, they are not relevant for calculations undertaken for funding purposes, for accounting under any other standard, for bulk transfers or for other statutory purposes under LGPS Regulations.
12 The last formal valuation of the Fund was carried out as at 31 March 2013. We have projected the results of this valuation forward using approximate methods. Further comments in relation to this can be found in section 2.
13 The data with which we have been provided for this exercise is summarised in section 3. Where year-end information is not readily available, we have assumed that actual experience since 31 March 2013 has been in line with our expectations at that valuation.
14 The projected pension expense calculations for the year to 31 March 2016 may be used for the purpose of any interim financial reporting during the year to 31 March 2016. However, subsequent adjustments may be necessary to take account of:
• any material events, such as curtailments, settlements or the discontinuance of the Employer’s participation in the Fund;
• any changes to accounting practices; or
• any changes to the Fund.
15 The LGPS is a defined benefit statutory scheme, administered in accordance with the Local Government Pension Scheme Regulations 2013. It is contracted out of the State Second Pension.
16 This report and the Results Schedule deal principally with pension benefits provided via the LGPS. However, the Accounting Standard also requires the disclosure of any additional liabilities, for example, those in respect of additional pensions paid on retirement under the Discretionary Payment Regulations (“compensatory added years pensions”)1. I have only valued such additional liabilities, which would not be covered in the formal LGPS funding valuation, to the extent that they have been notified to me and are summarised in the Results Schedule.
17 I have not been notified by the auditor to the Employer of the materiality limits which apply to the Employer and I have therefore prepared these figures using methods which are as accurate as is feasible using the data made available to me and the timescale within which the report is required.
1 The Local Government (Early Termination of Employment) (Discretionary Compensation) (England and Wales) Regulations 2000 were
revoked on 1 October 2006. However, this revocation had no effect on any benefits granted under those Regulations.
NORFOLK PENSION FUND 003
HYMANS ROBERTSON LLP
April 2015
Next steps The information set out in this report and Results Schedule should be included in a disclosure note in the Employer’s report and accounts. Please let me know if the Employer would like us to assist in drafting this note.
I would be pleased to discuss this report with the Employer and its auditors.
Robert Bilton FFA
For and on behalf of Hymans Robertson LLP
30 April 2015
NORFOLK PENSION FUND 004
HYMANS ROBERTSON LLP
April 2015
2 Approach Valuation method 1 As required under the Accounting Standard we have used the projected unit credit method of valuation.
2 No allowance has been made for administration expenses in the present value of the defined benefit obligation, or the balance sheet. Expenses are allowed for by way of increase in the current service cost.
3 The last formal valuation of the Fund was carried out as at 31 March 2013. We have projected the results of this valuation forward to 31 March 2015 using approximate methods (unless otherwise stated in the Results Schedule). The roll-forward allows for:
• changes in financial assumptions;
• additional benefit accrual;
• actual pension increase orders;
• estimated cash flows over the period; and
• membership information as summarised in Section 3.
4 In order to assess the value of the Employer’s liabilities in the Fund as at 31 March 2015 (unless otherwise stated in the Results Schedule), I have rolled forward the value of the Employer’s liabilities calculated at the latest formal valuation, allowing for the different financial assumptions required under the Accounting Standard at the accounting date. In calculating the current service cost I have allowed for changes in the Employer’s pensionable payroll as estimated from either contribution or payroll information provided. In calculating the asset share, I have rolled forward the Employer’s share of the assets allocated as at the latest valuation, allowing for investment returns (estimated where necessary), the effect of contributions paid into, and estimated benefits paid from, the Fund by the Employer and its employees.
5 In preparing the balance sheet at 31 March 2015 and the revenue account to 31 March 2015, no allowance is made for the effect of and changes in the membership profile since 31 March 2013 (unless otherwise stated in the Results Schedule). The principal reason for this is that insufficient information is available to allow me to make any such adjustment. However, for most employers, the effect is likely to be immaterial in actuarial terms. If there have been significant changes (e.g. a large number of new entrants) since 31 March 2013, the Employer should discuss with its auditor whether an investigation into the effect on the balance sheet and service cost for 2014/2015 is required.
6 Whilst the liabilities calculated under the Accounting Standard include an allowance for some premature retirements on grounds of ill-health, there is no allowance for early retirements on grounds of redundancy or efficiency other than those actual cases of which I have been notified.
7 It is not possible to assess the accuracy of the estimated rolled-forward liability shown in the Results Schedule without conducting a full valuation. Such a valuation is generally not practical in the time available to meet the Employer’s reporting requirements. The estimated liability will not reflect differences in demographic experience from that assumed (e.g. pensioner longevity) or the impact of differences between aggregate changes in salary and pension and changes for specific individuals.
8 Whilst we have no reason to believe that the approximations used in rolling forward the 31 March 2013 valuation to 31 March 2015 introduce any undue distortion in the results, the Employer and its auditors may wish to consider the size of the Fund’s assets and liabilities in relation to the Employer’s materiality limits. The Results Schedule will state if a full valuation has been carried out instead of a roll-forward.
9 For employers whose separate membership of the Fund started during the year:
NORFOLK PENSION FUND 005
HYMANS ROBERTSON LLP
April 2015
• The Results Schedule relates to the part year from date of joining to 31 March 2015.
• The initial asset allocation used for accounting purposes (and in calculation of the opening funding level) will supersede any initial asset allocation previously quoted. However, if the calculations carried out in the past (contribution rate, etc) were based on final data and final assumptions as at the date of joining then the initial asset allocation used will be in line with that which was previously quoted.
• The liability value reported in the Results Schedule will differ from those in any previous reports related to the employer due to the different assumptions adopted under the Accounting Standard, compared to funding assumptions used for setting contribution rates etc.
FRS 102 10 On 14th March 2013, the Financial Reporting Council issued FRS 102: The Financial Reporting Standard
applicable in the UK and Republic of Ireland, which sets out the accounting and reporting requirements for unlisted entities. It replaces the majority of current UK accounting standards (including FRS17). FRS102 first applies to accounting periods beginning on or after 1 January 2015, although early adoption is permitted, meaning that for March employers the new FRS102 accounting standard will come into effect for the financial year to 31 March 2016.
The projected pension expense for the year to 31 March 2016 has been prepared on the new FRS102 basis. In particular, the Expected Return on Assets assumption has been set in line with the discount rate, as required.
An appendix showing the impact of FRS102 has also been provided in the schedule of results to help employers who will be reporting on FRS102 next year. Further information of the impact of FRS102 is available on request.
I am aware that certain employers may continue to report under FRS17 next year. For FRS17 reports, the Expected Return on Assets assumption will continue to be based on the long-term future expected investment return for each asset class as at the beginning of the period (details are provided in section 4.13 below).
We recommend that employers consult with their auditor to consider which standard is appropriate ahead of the 31 March 2016 accounting exercise.
NORFOLK PENSION FUND 006
HYMANS ROBERTSON LLP
April 2015
3 Data and information used Benefit changes 1 The pension expense for the period to 31 March 2015 and the projected pension expense for the year to
31 March 2016 allow for the new LGPS benefit design (CARE), implemented for service from 1 April 2014. The figures are based on my understanding of the provisions of the Fund and are subject to change as any changes are made to the Fund.
Data sources 2 Our calculations are based on the following information and documents, all provided by the Administering
Authority:
• the individual membership data submitted as at 31 March 2013 for the purpose of the formal funding valuation at that date (or, for employers which have joined the Fund after 31 March 2013, membership data as at the date of joining). Alternatively, if the Results Schedule states that a roll-forward approach has not been used, the individual membership data submitted for this accounting purpose;
• the individual pensioner member data in respect of LGPS unfunded pensions and Teachers’ pensions where appropriate;
• the latest numbers of employees, deferred pensioners and pensioners;
• actual payroll information up to the latest available date;
• employer and employee contributions up to the latest available date and payroll data if available (in order to estimate contribution income and pensionable payroll for the accounting period)2;
• the actual split of Fund assets as at the latest available date;
• the actual Fund returns provided up to the latest available date;
• the bid value of the Fund assets as at the latest available date; and
• any new early retirements from 1 April 2014 to the latest available date on unreduced pensions which are not anticipated in the normal employer service cost (e.g. non ill-health retirements before the earliest retirement age at which all the member’s benefits can be taken unreduced), as set out in Section 1 of the Results Schedule.
Employer membership data 3 The membership data as at the last valuation (or at date of joining, for new employers), from which this
year’s results are rolled forward and the latest available membership data is summarised in the Results Schedule.
4 Details of the new early retirements from 1 April 2014 to the latest available date not allowed for in the formal valuation or the assumptions are summarised in the Results Schedule.
Assets and investment returns 5 Details of the return on the Fund over the year and the Fund’s assets at the year end are set out in the
Results Schedule.
Unfunded benefits 6 Details of any unfunded benefits are set out in the Results Schedule.
2 Benefit expenditure is estimated from the data used for the previous formal valuation. I have assumed that all other income and expenditure (e.g. individual transfers) do not have a material impact on the estimated asset share as at 31 March 2015.

NORFOLK PENSION FUND 007
HYMANS ROBERTSON LLP
April 2015
Additional comments 7 Any specific comments on the data provided in respect of the Employer are set out in the Results
Schedule.
NORFOLK PENSION FUND 008
HYMANS ROBERTSON LLP
April 2015
4 Actuarial assumptions Reliances and limitations 1 My advice to the Employer on the assumptions (and resulting draft disclosures) to be adopted for the
purpose of the Accounting Standard is compliant with the Pensions Technical Actuarial Standard, TAS D – Data, TAS M – Modelling and TAS R – Reporting 3. This report, the attached Results Schedule and our briefing note (which is attached to this report as an appendix) comprise the totality of my advice on the assumptions: these documents show my recommendations, and the Results Schedule will show if I have been instructed by the Employer to use different assumptions.
Accounting principles 2 I have been advised of the accounting principles adopted by the Employer in preparing its accounts (see
Results Schedule). The report and Results Schedule have been prepared in line with my understanding of the relevant guidance. The Employer should confirm adherence of the guidance with its auditor.
Responsibility 3 The assumptions are ultimately the responsibility of the directors (or equivalent) based on actuarial
advice. Where we have been instructed to use different assumptions to those recommended, details are given in the Results Schedule.
Demographic assumptions 4 The mortality assumptions adopted for this year’s exercise are consistent with those used for the formal
funding valuation as at 31 March 2013. Please refer to the valuation report for further information.
5 The post-retirement mortality assumptions that I recommend this year are in line with our Club Vita analysis which was carried out for the formal funding valuation as at 31 March 2013. These are a bespoke set of VitaCurves that are specifically tailored to fit the membership profile of the Fund and are based on the data provided to us for the purposes of the last formal valuation. Improvements have been applied that are in line with the CMI 2010 assuming the rate of longevity improvements has reached a peak and will converge to a long term rate of 1.25% p.a.
6 The other demographic assumptions which I recommend are adopted (e.g. commutation, pre-retirement mortality) are the same as those used for the formal funding valuation as at 31 March 2013. Full details of these assumptions are set out in the formal valuation report.
3 Technical Actuarial Standards (TASs) are issued by the Financial Reporting Council (FRC) and set standards for certain items of actuarial work, including the information and advice contained in this report.
NORFOLK PENSION FUND 009
HYMANS ROBERTSON LLP
April 2015
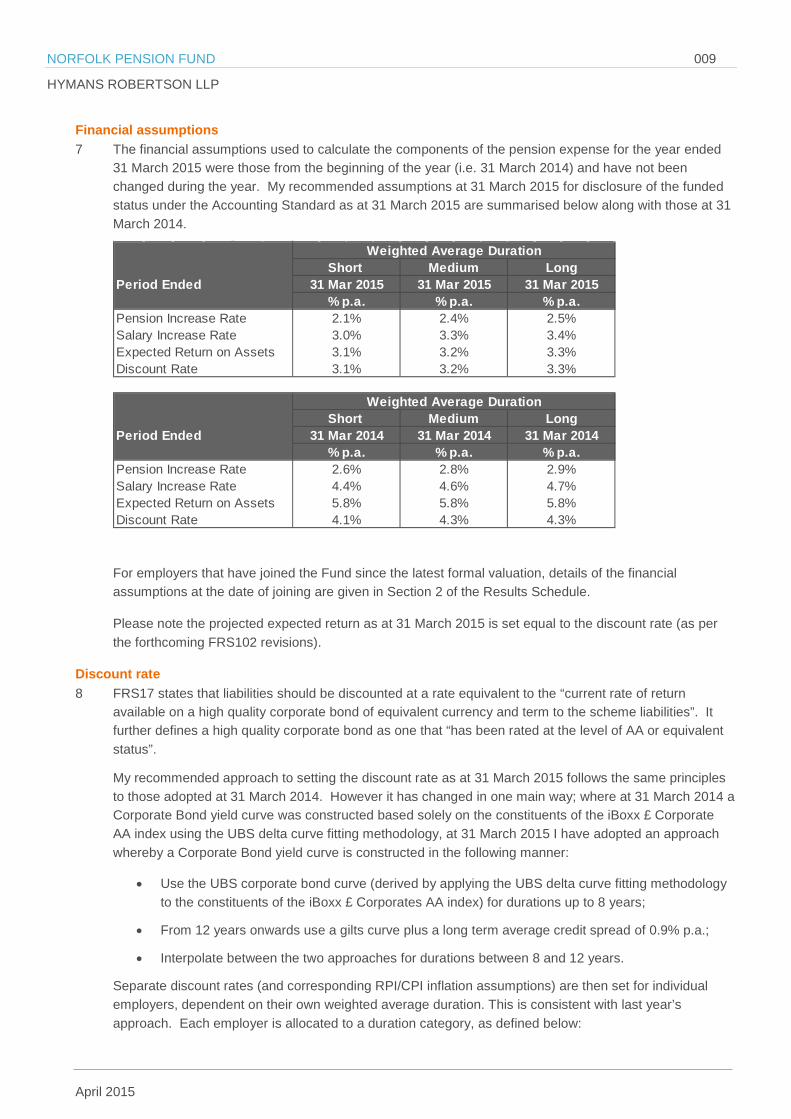
Financial assumptions 7 The financial assumptions used to calculate the components of the pension expense for the year ended
31 March 2015 were those from the beginning of the year (i.e. 31 March 2014) and have not been changed during the year. My recommended assumptions at 31 March 2015 for disclosure of the funded status under the Accounting Standard as at 31 March 2015 are summarised below along with those at 31 March 2014.
For employers that have joined the Fund since the latest formal valuation, details of the financial assumptions at the date of joining are given in Section 2 of the Results Schedule.
Please note the projected expected return as at 31 March 2015 is set equal to the discount rate (as per the forthcoming FRS102 revisions).
Discount rate 8 FRS17 states that liabilities should be discounted at a rate equivalent to the “current rate of return
available on a high quality corporate bond of equivalent currency and term to the scheme liabilities”. It further defines a high quality corporate bond as one that “has been rated at the level of AA or equivalent status”.
My recommended approach to setting the discount rate as at 31 March 2015 follows the same principles to those adopted at 31 March 2014. However it has changed in one main way; where at 31 March 2014 a Corporate Bond yield curve was constructed based solely on the constituents of the iBoxx £ Corporate AA index using the UBS delta curve fitting methodology, at 31 March 2015 I have adopted an approach whereby a Corporate Bond yield curve is constructed in the following manner:
• Use the UBS corporate bond curve (derived by applying the UBS delta curve fitting methodology to the constituents of the iBoxx £ Corporates AA index) for durations up to 8 years;
• From 12 years onwards use a gilts curve plus a long term average credit spread of 0.9% p.a.;
• Interpolate between the two approaches for durations between 8 and 12 years.
Separate discount rates (and corresponding RPI/CPI inflation assumptions) are then set for individual employers, dependent on their own weighted average duration. This is consistent with last year’s approach. Each employer is allocated to a duration category, as defined below:
Period Ended
Pension Increase RateSalary Increase RateExpected Return on AssetsDiscount Rate
3.1% 3.2% 3.3%3.1% 3.2% 3.3%
2.1% 2.4% 2.5%3.0% 3.3% 3.4%
31 Mar 2015 31 Mar 2015 31 Mar 2015% p.a. % p.a. % p.a.
Weighted Average DurationShort Medium Long
Period Ended
Pension Increase RateSalary Increase RateExpected Return on AssetsDiscount Rate
Weighted Average Duration
31 Mar 2014 31 Mar 2014 31 Mar 2014
2.6% 2.8% 2.9%
5.8%
Short Medium Long
4.4% 4.6% 4.7%
% p.a. % p.a. % p.a.
5.8% 5.8%4.1% 4.3% 4.3%
NORFOLK PENSION FUND 010
HYMANS ROBERTSON LLP
April 2015
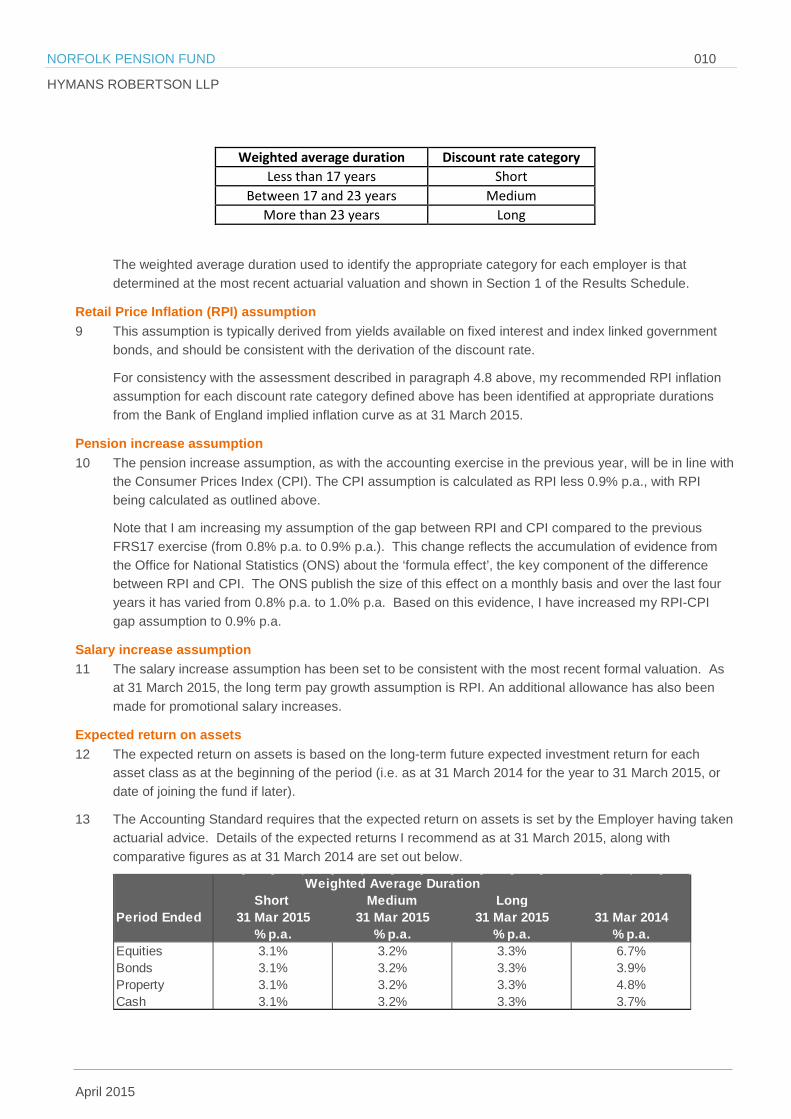
Weighted average duration Discount rate category Less than 17 years Short
Between 17 and 23 years Medium More than 23 years Long
The weighted average duration used to identify the appropriate category for each employer is that determined at the most recent actuarial valuation and shown in Section 1 of the Results Schedule.
Retail Price Inflation (RPI) assumption 9 This assumption is typically derived from yields available on fixed interest and index linked government
bonds, and should be consistent with the derivation of the discount rate.
For consistency with the assessment described in paragraph 4.8 above, my recommended RPI inflation assumption for each discount rate category defined above has been identified at appropriate durations from the Bank of England implied inflation curve as at 31 March 2015.
Pension increase assumption 10 The pension increase assumption, as with the accounting exercise in the previous year, will be in line with
the Consumer Prices Index (CPI). The CPI assumption is calculated as RPI less 0.9% p.a., with RPI being calculated as outlined above.
Note that I am increasing my assumption of the gap between RPI and CPI compared to the previous FRS17 exercise (from 0.8% p.a. to 0.9% p.a.). This change reflects the accumulation of evidence from the Office for National Statistics (ONS) about the ‘formula effect’, the key component of the difference between RPI and CPI. The ONS publish the size of this effect on a monthly basis and over the last four years it has varied from 0.8% p.a. to 1.0% p.a. Based on this evidence, I have increased my RPI-CPI gap assumption to 0.9% p.a.
Salary increase assumption 11 The salary increase assumption has been set to be consistent with the most recent formal valuation. As
at 31 March 2015, the long term pay growth assumption is RPI. An additional allowance has also been made for promotional salary increases.
Expected return on assets 12 The expected return on assets is based on the long-term future expected investment return for each
asset class as at the beginning of the period (i.e. as at 31 March 2014 for the year to 31 March 2015, or date of joining the fund if later).
13 The Accounting Standard requires that the expected return on assets is set by the Employer having taken actuarial advice. Details of the expected returns I recommend as at 31 March 2015, along with comparative figures as at 31 March 2014 are set out below.
Period Ended
EquitiesBondsPropertyCash
3.1% 3.2% 3.3% 3.9%3.1% 3.2% 3.3% 4.8%3.1% 3.2% 3.3% 3.7%
31 Mar 2015 31 Mar 2014% p.a. % p.a. % p.a. % p.a.3.1% 3.2% 3.3% 6.7%
Weighted Average DurationShort Medium Long
31 Mar 2015 31 Mar 2015
NORFOLK PENSION FUND 011
HYMANS ROBERTSON LLP
April 2015
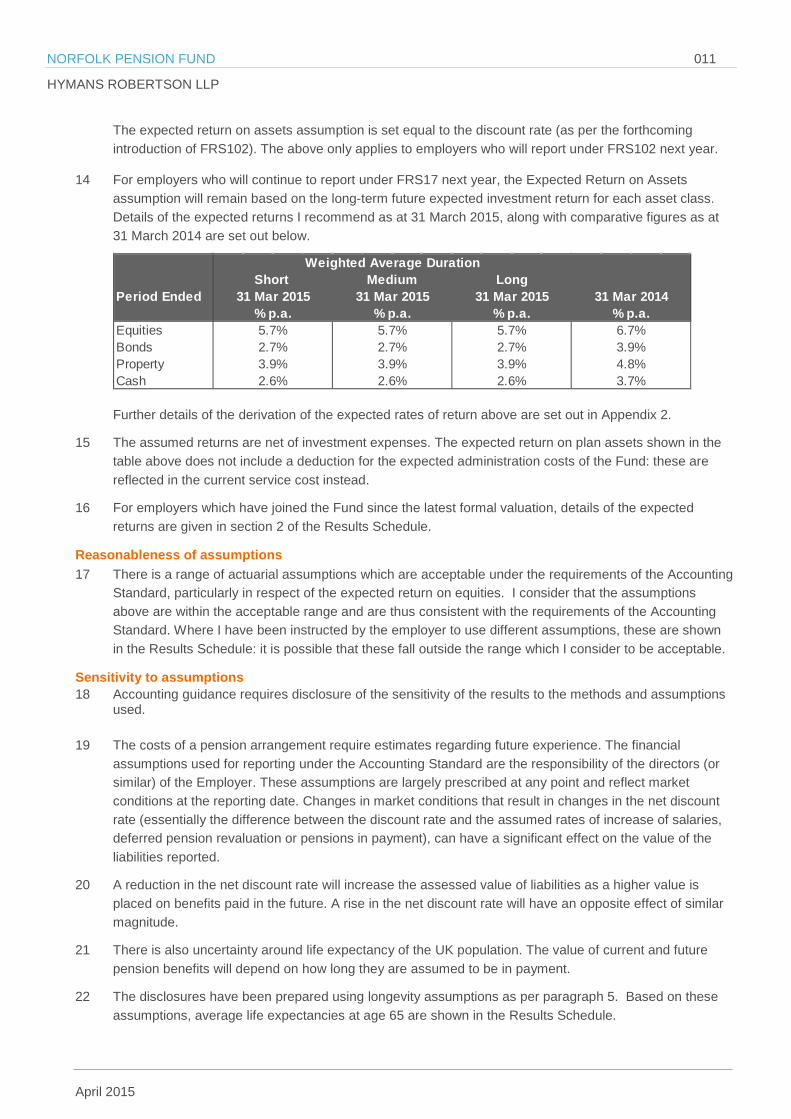
The expected return on assets assumption is set equal to the discount rate (as per the forthcoming introduction of FRS102). The above only applies to employers who will report under FRS102 next year.
14 For employers who will continue to report under FRS17 next year, the Expected Return on Assets assumption will remain based on the long-term future expected investment return for each asset class. Details of the expected returns I recommend as at 31 March 2015, along with comparative figures as at 31 March 2014 are set out below.
Further details of the derivation of the expected rates of return above are set out in Appendix 2.
15 The assumed returns are net of investment expenses. The expected return on plan assets shown in the table above does not include a deduction for the expected administration costs of the Fund: these are reflected in the current service cost instead.
16 For employers which have joined the Fund since the latest formal valuation, details of the expected returns are given in section 2 of the Results Schedule.
Reasonableness of assumptions 17 There is a range of actuarial assumptions which are acceptable under the requirements of the Accounting
Standard, particularly in respect of the expected return on equities. I consider that the assumptions above are within the acceptable range and are thus consistent with the requirements of the Accounting Standard. Where I have been instructed by the employer to use different assumptions, these are shown in the Results Schedule: it is possible that these fall outside the range which I consider to be acceptable.
Sensitivity to assumptions 18 Accounting guidance requires disclosure of the sensitivity of the results to the methods and assumptions
used.
19 The costs of a pension arrangement require estimates regarding future experience. The financial assumptions used for reporting under the Accounting Standard are the responsibility of the directors (or similar) of the Employer. These assumptions are largely prescribed at any point and reflect market conditions at the reporting date. Changes in market conditions that result in changes in the net discount rate (essentially the difference between the discount rate and the assumed rates of increase of salaries, deferred pension revaluation or pensions in payment), can have a significant effect on the value of the liabilities reported.
20 A reduction in the net discount rate will increase the assessed value of liabilities as a higher value is placed on benefits paid in the future. A rise in the net discount rate will have an opposite effect of similar magnitude.
21 There is also uncertainty around life expectancy of the UK population. The value of current and future pension benefits will depend on how long they are assumed to be in payment.
22 The disclosures have been prepared using longevity assumptions as per paragraph 5. Based on these assumptions, average life expectancies at age 65 are shown in the Results Schedule.
Period Ended
EquitiesBondsPropertyCash
31 Mar 2015 31 Mar 2015 31 Mar 2015% p.a. % p.a. % p.a.
Weighted Average DurationShort Medium Long
3.9% 3.9% 3.9%2.6% 2.6% 2.6%
5.7% 5.7% 5.7%2.7% 2.7% 2.7%
3.7%
31 Mar 2014% p.a.6.7%3.9%4.8%
NORFOLK PENSION FUND 012
HYMANS ROBERTSON LLP
April 2015
23 Details of the effect on the Fund of the changes in the above assumptions are displayed in the Schedule of Results (Section 6 – Sensitivity Analysis).
Risks and uncertainties 24 There are risks and uncertainties associated with whatever assumptions are adopted. The Accounting
Standard requires the assumptions to be determined on a ‘best estimate’ basis. However, the assumptions are in effect projections of future investment returns and demographic experience many years into the future and there is inevitably a great deal of uncertainty inherent in what constitutes ‘best estimate’ with such projections. For the purpose of this report, I have interpreted best estimate to mean that the proposed assumptions are ‘neutral’: there is in my opinion an equal chance of actual experience being better or worse than the assumptions proposed.
25 It is also important to note that the Accounting Standard requires the discount rate to be set with reference to the yields on high quality corporate bonds irrespective of the actual investment strategy of the Fund. As such, the figures illustrated in the Results Schedule are unlikely to reflect either the actual eventual cost of providing the benefits or the likely level of contributions to fund the Employer’s obligations to the Fund. Also, the balance sheet position may change significantly due to relative changes in the equity and bond markets at the reporting date.
26 The main risk to the Employer is that it determines assumptions that are more prudent (for example a lower net discount rate, lower expected returns on assets, higher longevity) than its peers, leading to a relatively poorer reported financial position. The Employer therefore needs to take into account both the requirement for a ‘best estimate’ set of assumptions and the commercial need not to overstate the pension liabilities.
27 There is also a risk that the Employer determines assumptions which are less prudent than its peers. This does not have an impact on the underlying cost of the Fund nor the level of contributions that will be derived from future funding valuations. However, analysts and other users of the accounts may take a view that the Employer is understating its pension liabilities if it uses weaker assumptions and this may have adverse consequences.
28 I have not addressed any risks to the Fund itself. Such advice would generally be given to the Administering Authority by the Fund Actuary through the actuarial valuation process.
NORFOLK PENSION FUND 013
HYMANS ROBERTSON LLP
April 2015
5 Miscellaneous matters Past service costs 1 Past service costs can arise from the Employer awarding discretionary benefits e.g. added years
augmentation or allowing LGPS employees to retire on unreduced benefits before attaining their “Rule of 85” age (subject to a minimum of age 60 and a maximum age of 65) on grounds of efficiency.
2 Details of any such retirements are summarised in Section 1 of the Results Schedule and any Past Service Costs are set out in the Revenue Account figures in Section 4 of the Results Schedule. These represent the difference between an active member reserve and the actual early retirement reserve both calculated at the time of early retirement based on year-end assumptions. Note that these costs relate only to LGPS benefits and not other elements such as redundancy lump sums.
Curtailments 3 My calculations take into account the cost arising from early payment (i.e. before “Rule of 85” age) of
accrued pensions (including augmentations) in respect of any redundancies effected during the period ended 31 March 2015.
4 Details of any such retirements are summarised in Section 1 of the Results Schedule and any Curtailment Costs are set out in the Revenue Account figures in Section 4 of the Results Schedule.
Settlements 5 My calculations do not take account of any liabilities being settled at a cost materially different to the
Accounting Standard reserve during the period ended 31 March 2015, other than as set out in the Results Schedule.
Gains and losses 6 As noted in Section 1, FRS17 requires the employer to immediately recognise actuarial gains and losses,
through a Statement of Total Recognised Gains and Losses, in the period in which they occur.
Actual Asset return 7 It is worth noting that the expected asset return plus the gain/loss on assets will not always equal the
actual return shown on the results schedule. This will typically arise due to the ‘recalibration’ at each formal funding valuation.
Bulk transfers 8 My calculations do not take account of any bulk transfers (in or out) since the Employer’s previous
Accounting Standard valuation as at 31 March 2014 (or following the date of joining for new employers), other than as set out in the Results Schedule.
Recognition of surplus/deficit 9 The Accounting Standard imposes a limit on the maximum amount of surplus which can be recognised on
the employer’s balance sheet. In broad terms, surplus can only be recognised to the extent that it is no greater than the present value of the liability expected to arise from future service by current and future scheme members less the value of future employee contributions. Where this situation may apply, this is indicated on the front page of the Results Schedule and further calculations may be required before publishing the results in the employer’s formal accounts.
10 My understanding is that the Employer has a “constructive obligation” to fund any deficit allocated to its share of the Fund and it should therefore fully recognise the whole of any deficit.
Deferred tax 11 No allowance has been made for deferred tax, and the appropriate treatment in respect of this should be
agreed with the Employer’s auditors.

NORFOLK PENSION FUND 014
HYMANS ROBERTSON LLP
April 2015
Results and disclosures 12 FRS12
Some employers may account for their unfunded pensioners under FRS12 instead of FRS17. For simplicity, we have included all unfunded liabilities in our FRS17 disclosures. However, we are happy for employers to move the unfunded results to an FRS12 section of their accounts if they wish and the figures will be unaffected.

NORFOLK PENSION FUND 015
HYMANS ROBERTSON LLP
April 2015
Appendix 1 – Glossary of terms
Actuarial gains and losses Over a reporting period, these consist of:
- experience adjustments (the effects of differences between the previous actuarial assumptions and what has actually occurred, including reflection of any funding valuation which has taken place since the last report; and
-the effects of changes in actuarial assumptions
Current service cost The increase in the present value of the defined benefit obligation resulting from employee service in the current period. This is based on the employer’s “service cost” rate which accounts for the cost to the employer of benefits accruing over the period allowing for market conditions at the outset of the period. This may differ from what the employer is currently paying in cash contributions based on the certified rates at the last formal valuation.
Curtailment Occurs when an entity either:
-is demonstrably committed to make a material reduction in the number of employees covered by a defined benefit plan; or
-amends the terms of a plan such that a material element of future service by current employees will no longer qualify for benefits, or will qualify only for reduced benefits.
Expected return on assets The expected increase during a period in the value of assets, based on values and long term expected returns as at the start of the period. For further details of the derivation of this assumption, see Appendix 2.
Interest cost The increase during a period in the present value of a defined benefit obligation which arises because the benefits are one period closer to payment.
NORFOLK PENSION FUND 016
HYMANS ROBERTSON LLP
April 2015
Past service cost The increase in the present value of the defined benefit obligation for employee service in prior periods, resulting in the current period from the introduction of, or changes to, post-employment benefits or other long-term employee benefits. Past service cost may either be positive (where benefits are introduced or improved) or negative (where existing benefits are reduced).
Present value of defined benefit obligation The present value, without deducting any plan assets, of expected future payments required to settle the obligation resulting from employee service in the current and prior periods.
Settlement Occurs when an entity enters into a transaction that eliminates all further legal or constructive obligation for part or all of the benefits provided under a defined benefit plan, for example, when a lump-sum cash payment is made to, or on behalf of, plan participants in exchange for their rights to receive specified post-employment benefits.
Vested employee benefits Employee benefits that are not conditional on future employment.
Weighted Average Duration The weighted average time until payment of all expected future discounted cashflows, determined based on membership and the financial and demographic assumptions as at the most recent actuarial valuation. The shorter the duration, the more ‘mature’ the employer.
NORFOLK PENSION FUND 017
HYMANS ROBERTSON LLP
April 2015
Appendix 2 – Long term expected return assumptions FRS17 requires employers with defined benefit pension obligations to disclose the expected return on pension fund assets as a credit against interest costs on the liabilities in the "other finance income" element of the Revenue Account. FRS174 states:
The average rate of return, including both income and changes in fair value...expected over the remaining life of the related obligation on the actual assets held by the scheme.
The asset return assumptions under FRS17 are the responsibility of the company directors or equivalent. The figures shown in our standard FRS17 report for Fund employers are based on our recommended return assumptions which we derived from the Hymans Robertson Asset Model (HRAM), the proprietary stochastic asset model developed and maintained by Hymans Robertson LLP.
Asset model The HRAM type of model is known as an economic scenario generator and uses probability distributions to project a range of possible outcomes for the future behaviour of asset returns and economic variables. Some of the parameters of the model are dependent on the current state of financial markets and are updated each month (for example, the current level of equity market volatility) while other more subjective parameters do not change with different calibrations of the model.
Key subjective assumptions are:
• the average excess equity return over the risk free asset (tending to approximately 3% p.a. as the investment horizon is increased),
• the volatility of equity returns (approximately 18% p.a. over the long term) and the level and volatility of yields, credit spreads, inflation and expected (breakeven) inflation, which affect the projected value placed on the liabilities and bond returns.
• The output of the model is also affected by other more subtle effects, such as the correlations between economic and financial variables.
While the model allows for the possibility of scenarios that would be extreme by historical standards, including very significant downturns in equity markets, large systemic and structural dislocations are not captured by the model. Such events are unknowable in effect, magnitude and nature, meaning that the most extreme possibilities are not necessarily captured within the distributions of results.
Given the context of this modelling, we have not undertaken any sensitivity analysis to assess how different the results might be with alternative calibrations of the economic scenario generator.
We would be happy to provide fuller information about the scenario generator, and the sensitivities of the results to some of the parameters, on request.
Expected rate of returns The expected returns shown in this report have been calculated using 5,000 simulations of HRAM, calibrated using market data as at a recent date.
4 Paragraph 2
NORFOLK PENSION FUND 018
HYMANS ROBERTSON LLP
April 2015
Please note that whilst we comment that the returns shown are “expected”, this identifies the level at which 50% of all possible outcomes will be above and 50% will be below – this does not mean that the return quoted is in any way the “most likely” outcome.
The only exception to the use of HRAM is in deriving the expected return on bond assets: instead of the HRAM output, I have used the yields applicable at the accounting date on suitable bond indices.
General risk warnings Please note the value of investments, and income from them, may fall as well as rise. This includes equities, government or corporate bonds, and property, whether held directly or in a pooled or collective investment vehicle. Further, investments in developing or emerging markets may be more volatile and less marketable than in mature markets.
Exchange rates may also affect the value of an overseas investment. As a result, an investor may not get back the amount originally invested. Past performance is not necessarily a guide to future performance.
NORFOLK PENSION FUND 019
HYMANS ROBERTSON LLP
April 2015
Appendix 3 – Briefing Note on Assumptions
Briefing Note 01
We recommend that each employer should discuss the proposed assumptions with their auditor.
Steven Scott Actuary
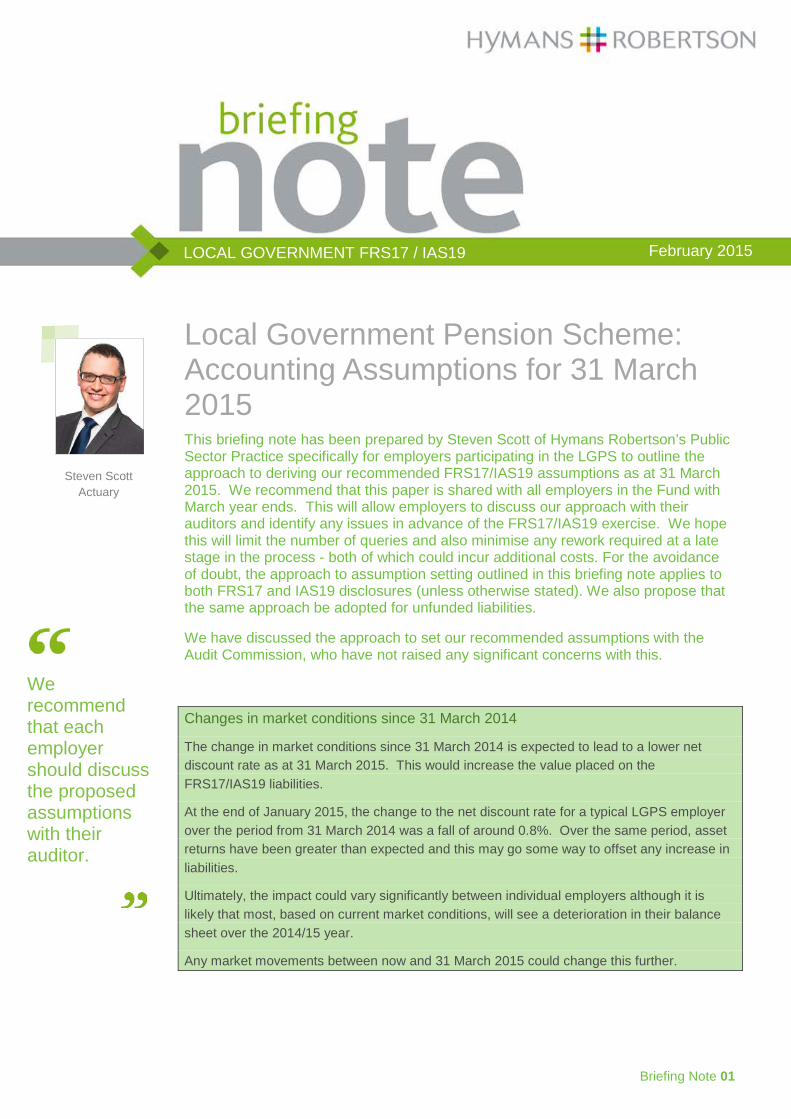
Local Government Pension Scheme: Accounting Assumptions for 31 March 2015 This briefing note has been prepared by Steven Scott of Hymans Robertson’s Public Sector Practice specifically for employers participating in the LGPS to outline the approach to deriving our recommended FRS17/IAS19 assumptions as at 31 March 2015. We recommend that this paper is shared with all employers in the Fund with March year ends. This will allow employers to discuss our approach with their auditors and identify any issues in advance of the FRS17/IAS19 exercise. We hope this will limit the number of queries and also minimise any rework required at a late stage in the process - both of which could incur additional costs. For the avoidance of doubt, the approach to assumption setting outlined in this briefing note applies to both FRS17 and IAS19 disclosures (unless otherwise stated). We also propose that the same approach be adopted for unfunded liabilities.
We have discussed the approach to set our recommended assumptions with the Audit Commission, who have not raised any significant concerns with this.
Changes in market conditions since 31 March 2014
The change in market conditions since 31 March 2014 is expected to lead to a lower net discount rate as at 31 March 2015. This would increase the value placed on the FRS17/IAS19 liabilities.
At the end of January 2015, the change to the net discount rate for a typical LGPS employer over the period from 31 March 2014 was a fall of around 0.8%. Over the same period, asset returns have been greater than expected and this may go some way to offset any increase in liabilities.
Ultimately, the impact could vary significantly between individual employers although it is likely that most, based on current market conditions, will see a deterioration in their balance sheet over the 2014/15 year.
Any market movements between now and 31 March 2015 could change this further.
February 2015 LOCAL GOVERNMENT FRS17 / IAS19
Briefing Note 02
LOCAL GOVERNMENT FRS17 / IAS19
Background to FRS17/IAS19 assumptions As for any actuarial calculation, the value of the liabilities for FRS17/IAS19 purposes is heavily dependent on the assumptions underpinning the calculations. If they are not already, employers should be aware that, ultimately, they are responsible for the assumptions used.
For example, FRS17 states:
The assumptions underlying the valuation should be mutually compatible and lead to the best estimate of the future cash flows that will arise under the scheme liabilities. The assumptions are ultimately the responsibility of the directors (or equivalent) but should be set upon advice given by an actuary.
Any assumptions that are affected by economic conditions (financial assumptions) should reflect market expectations at the balance sheet date.
For a number of reasons, principally cost and employer timescales, we have historically recommended a standard set of assumptions as at a given date for all employers within the LGPS. (This is subject to any specific guidelines for any group of employers, such as Government agencies who follow the Financial Reporting Manual guidance). However, FRS17/IAS19 has become increasingly important to employers and we understand that auditors’ guidance now requires them to go beyond simply accepting the actuary’s calculations as the work of an expert.
We welcome the greater interest in the assumptions being taken by employers and their auditors. However, in order to maintain service standards and contain costs, our default approach is that reports for employers with the same year-end and similar maturity profile are processed using the same assumptions. We believe that this approach remains appropriate for the majority of employers, particularly local authorities and other public sector bodies.
Corporate entities for whom FRS17/IAS19 affects decision-making may take a different view; the additional costs associated with adopting bespoke assumptions are possibly worthwhile for them. It should also be noted that Hymans Robertson fees for LGPS employers are a fraction of those for sponsoring employers of stand-alone private sector schemes; this is due to the efficiencies and economies of scale which Hymans Robertson has put in place for your benefit.
An employer in the Fund and its auditor may decide that they wish to use a different approach to setting just the financial assumptions (e.g. discount rate) for accounting purposes. In this case we will normally be able to accommodate this, although it will lead to an increase in costs. It will, however, still be possible to prepare the report as part of a batch and so will still be cheaper than a fully bespoke report.
If an employer wishes to use different financial assumptions, then it is essential that we are made aware of their desired approach to assumption setting prior to 31 March 2015. If we are informed after this date, we will have to process the report individually and the employer will not benefit from reduced fees from being part of a group.
Any different approach to demographic assumptions (e.g. life expectancy) will be more time-consuming to adopt, and so a further increase in fees will result.
To assist employers in assessing whether they wish to accept our recommended assumptions, we have set out below the rationale for our recommendations for each of the principal assumptions.
Briefing Note 03
LOCAL GOVERNMENT FRS17 / IAS19
Discount Rate FRS17 (and in effect IAS19 also) state that liabilities should be discounted at a rate equivalent to the “current rate of return available on a high quality corporate bond of equivalent currency and term to the scheme liabilities”. It further defines a high quality corporate bond as one that “has been rated at the level of AA or equivalent status”.
The principle behind our approach to setting the recommended discount rate as at 31 March 2015 has remained unchanged since 31 March 2014 i.e. the discount rate is still derived from a corporate bond yield curve whilst recognising the weighted average duration (or term) of the benefit obligation for each separate employer.
However, the way we have constructed the corporate bond yield curve has been revised.
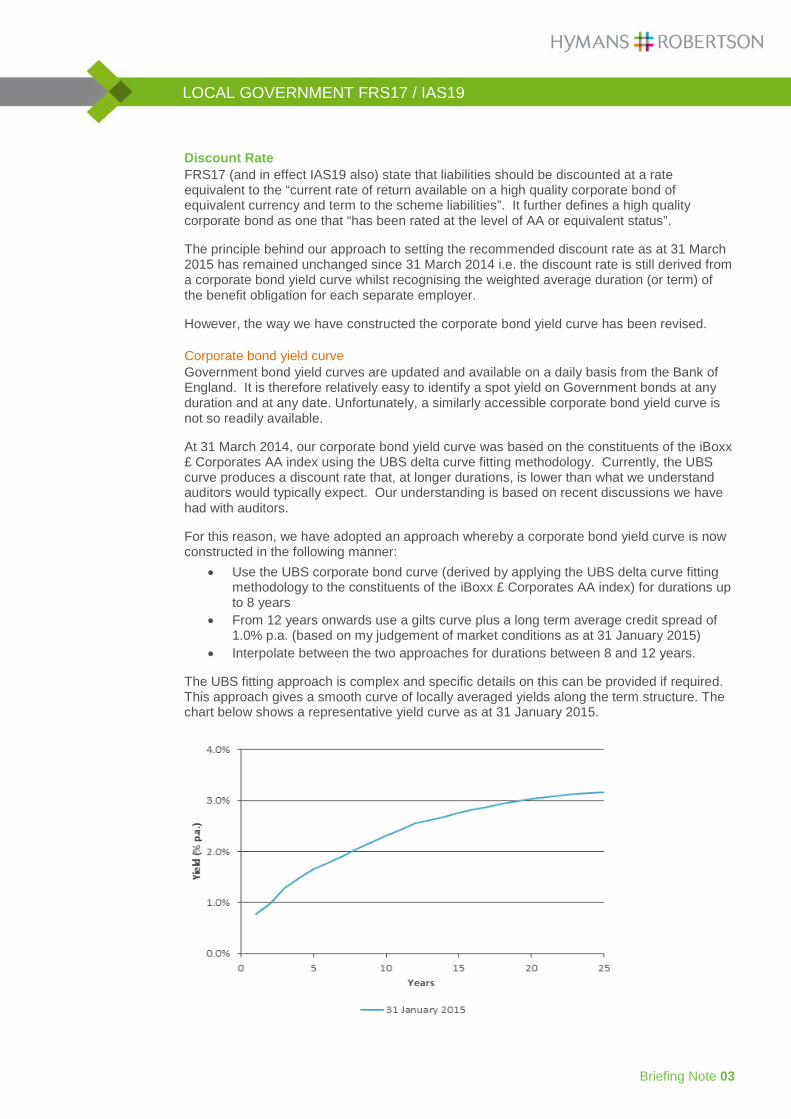
Corporate bond yield curve Government bond yield curves are updated and available on a daily basis from the Bank of England. It is therefore relatively easy to identify a spot yield on Government bonds at any duration and at any date. Unfortunately, a similarly accessible corporate bond yield curve is not so readily available.
At 31 March 2014, our corporate bond yield curve was based on the constituents of the iBoxx £ Corporates AA index using the UBS delta curve fitting methodology. Currently, the UBS curve produces a discount rate that, at longer durations, is lower than what we understand auditors would typically expect. Our understanding is based on recent discussions we have had with auditors.
For this reason, we have adopted an approach whereby a corporate bond yield curve is now constructed in the following manner:
• Use the UBS corporate bond curve (derived by applying the UBS delta curve fitting methodology to the constituents of the iBoxx £ Corporates AA index) for durations up to 8 years
• From 12 years onwards use a gilts curve plus a long term average credit spread of 1.0% p.a. (based on my judgement of market conditions as at 31 January 2015)
• Interpolate between the two approaches for durations between 8 and 12 years.
The UBS fitting approach is complex and specific details on this can be provided if required. This approach gives a smooth curve of locally averaged yields along the term structure. The chart below shows a representative yield curve as at 31 January 2015.
Briefing Note 04
LOCAL GOVERNMENT FRS17 / IAS19
Weighted average duration As mentioned above, the discount rate should reflect the term of the benefit obligation. We have interpreted ‘term’ to be the weighted average duration of the benefit obligation. This is broadly defined as;
The weighted average time until payment of all expected future discounted cashflows, determined based on membership and the financial and demographic assumptions at a particular time. The shorter the duration, the more ‘mature’ the employer.
Historically, the weighted average duration of the benefit obligation for each LGPS employer was similar. With increased divergence of LGPS employers, in particular the introduction of Academies in England and the increased number of outsourcings, it is now the case that the weighted average durations of individual employers are likely to be materially different. The use of a single discount rate appropriate for a typical employer in the fund is no longer appropriate for all employers.
In accordance with the approach adopted at 31 March 2014, we recommend separate discount rates (and corresponding RPI/CPI inflation assumptions – see below) for individual employers, dependent on their own weighted average duration. The first step in this is to allocate each employer to a duration category as defined below:
Weighted average duration Discount rate category Less than 17 years Short
Between 17 and 23 years Medium More than 23 years Long
The weighted average duration used to identify the appropriate category for each employer is that determined at the most recent actuarial valuation. For English and Welsh LGPS Funds this will be the duration determined at the 2013 valuation and will be identical to that used at 31 March 2014. For Scottish LGPS Funds, employers may see themselves being allocated to a different duration category with the duration calculated at the 2014 formal valuation being applied as opposed to the duration at the 2011valuation that was used to set the FRS17/IAS19 assumptions as at 31 March 2014.
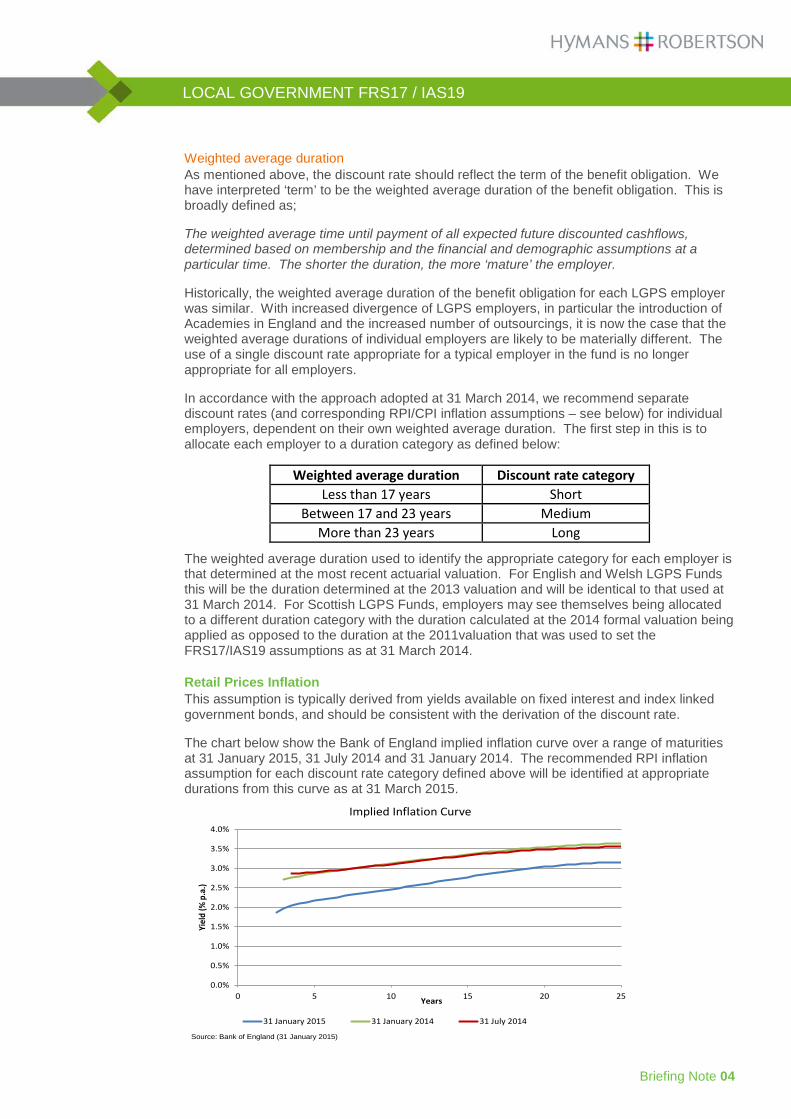
Retail Prices Inflation This assumption is typically derived from yields available on fixed interest and index linked government bonds, and should be consistent with the derivation of the discount rate.
The chart below show the Bank of England implied inflation curve over a range of maturities at 31 January 2015, 31 July 2014 and 31 January 2014. The recommended RPI inflation assumption for each discount rate category defined above will be identified at appropriate durations from this curve as at 31 March 2015.
0.0%
0.5%
1.0%
1.5%
2.0%
2.5%
3.0%
3.5%
4.0%
0 5 10 15 20 25
Yiel
d (%
p.a
.)
Years
Implied Inflation Curve
31 January 2015 31 January 2014 31 July 2014
Source: Bank of England (31 January 2015)
Briefing Note 05
LOCAL GOVERNMENT FRS17 / IAS19
Pension Increases In the LGPS pension increases are linked to the rate of CPI as opposed to RPI. As a market in CPI linked bonds does not exist, we need to estimate the long term gap between RPI and CPI in order to derive a CPI assumption for FRS17/IAS19 purposes.
In the past we have estimated that CPI would be approximately 0.8% below RPI. This was based on our estimate of the ‘formula effect’. The Office for National Statistics (ONS) publish the size of the actual formula effect on a monthly basis and over the last four years it has varied between 0.8% and 1.0%. Based on this evidence and as a result of discussions we have had with auditors, we are increasing our assumed RPI-CPI gap to 0.9% p.a. at 31 March 2015. This will lead to a reduction in the assumed rate of CPI (all else being equal).
Indicative financial assumptions based on market conditions as at 31 January 2015 The following table shows the indicative financial assumptions based on this methodology and market conditions as at 31 January 2015. It is unlikely that market conditions as at 31 March 2015 will be identical to those as at 31 January 2015 therefore the actual 31 March 2015 assumptions are likely to differ to those shown below.
Weighted average duration Discount rate RPI inflation (CPI) Less than 17 years (Short) 2.9% 2.8% (1.9%)
Between 17 and 23 years (Medium) 3.0% 3.1% (2.2%) More than 23 years (Long) 3.1% 3.2% (2.3%)
Salary growth Our recommended assumption will generally be consistent with the most recent actuarial valuation. In particular, recognition of short term pay restraints is made implicitly in determining a long term pay growth assumption linked to the assumed rate of RPI.
An additional allowance for promotional salary increases is also made
Longevity Assumptions Our recommended longevity assumptions for the FRS17/IAS19 2015 exercise are in line with those adopted by funds for the most recent actuarial valuation (please refer to the valuation report for your own fund for further information).
Demographic assumptions These include assumptions for commutation (a higher allowance for commutation will reduce the value of the liabilities), withdrawal, ill-health early retirements, proportions of deaths leaving a dependant, etc. The assumptions underlying the valuation should be mutually compatible and lead to the best estimate of the future cash flows that will arise under the scheme liabilities. Best estimate is not defined in FRS17/IAS19 so there is scope for actuarial judgement in setting these assumptions.
We gathered data on recent experience of LGPS funds in order to set appropriate demographic assumptions for the most recent formal funding valuation. For all funds, our recommendation will be to use the same demographic assumptions for FRS17/IAS19 purposes as at the most recent valuation. Collectively, these are intended to be best estimate.
Briefing Note 06
LOCAL GOVERNMENT FRS17 / IAS19
Putting them all together FRS17 and IAS19 do not require that every individual assumption is a best estimate. The Directors (or equivalent) of the organisation should be satisfied that the combined effect of the assumptions is reasonable as a whole.
Surplus limits It may seem unusual to talk of surpluses in current market conditions, but we do expect to see a few employers whose IAS19/FRS17 balance sheet shows a surplus (net asset) position. These employers are often contractors who were set up fully funded in the midst of adverse market conditions.
For such employers, please note that:
• both IAS19 and FRS17 currently contain provisions to limit the amount of surplus recognised in the balance sheet;
• this limit will depend on various factors such as whether the employer is closed to new entrants or not, how the surplus compares to the service cost, and what contributions the employer is duty bound to pay to the Fund;
• if there is a surplus then further checks are required to see if the limit applies; if so, then changes are needed to the calculations and disclosures. These tasks are outside our standard pricing approach. Therefore, where a material surplus exists at 31 March 2015, we will simply flag this to the employer in the first place and await further instructions: any subsequent work would require separate agreement on timescales and fees.
FRS17 or IAS19? Many larger employers, such as local authorities, are required to account for pension costs under IAS19 instead of FRS17. Many other bodies will also report on an IAS basis, and so it is important we are instructed whether to adopt IAS19 or FRS17 for each employer.
FRS102 FRS102 comes into effect for accounting years starting on or after 1 January 2015, (i.e. the first year of adoption for employers with a 31 March year-end will be 1 April 2015 to 31 March 2016). The changes to the FRS102 standard are broadly in line with the IAS19 changes i.e. the most significant change is to the Expected Return on Assets assumption, which should lead to a higher charge to the Profit and Loss account.
In order to help employers understand the implementation of FRS102, the FRS17 reports as at 31 March 2015 will include an appendix showing the 2014/15 figures on the FRS102 basis i.e. the impact on the profit and loss figures of setting the Expected Return on Assets assumption equal to the discount rate. This is what the 31 March 2016 FRS102 reports will show as the 2014/15 position.
LGPS employers are individually responsible for ensuring their accounts are prepared in line with their own specific statutory requirements. We will be able to provide FRS17 reports in the future for any LGPS employer who still requires this information to comply with their statutory accounting requirements.
London | Birmingham | Glasgow | Edinburgh T 020 7082 6000 | www.hymans.co.uk | www.clubvita.co.uk
This communication has been compiled by Hymans Robertson LLP, and is based upon their understanding of legislation and events as at February 2015. It is designed to be a general information summary and may be subject to change. It is not a definitive analysis of the subject covered or specific to the circumstances of any particular employer, pension scheme or individual. The information contained is not intended to constitute advice, and should not be considered a substitute for specific advice in relation to individual circumstances. Where the subject of this document involves legal issues you may wish to take legal advice. Hymans Robertson LLP accepts no liability for errors or omissions or reliance on any statement or opinion.
Hymans Robertson LLP (registered in England and Wales - One London Wall, London EC2Y 5EA - OC310282 ) is authorised and regulated by the Financial Conduct Authority. A member of Abelica Global. © Hymans Robertson LLP.
LOCAL GOVERNMENT FRS17 / IAS19
Valuation approach For Scottish LGPS Funds the FRS17/IAS19 balance sheet position disclosed as at 31 March 2014 was typically based on a roll forward from the 2011 valuation position. The FRS17/IAS19 balance sheet position as at 31 March 2015 will be based on a roll-forward of each employer’s assets and liabilities determined at the 2014 valuation. The change in the accounting balance sheet position from 31 March 2014 to 31 March 2015 will likely be affected by this ‘step change’, with the impact differing for each employer. This will not be the case for English and Welsh LGPS Funds where the balance sheet at both 31 March 2014 and 31 March 2015, will typically be based on a roll-forward from the 2013 valuation position.
Next steps Unless otherwise advised, any FRS17/IAS19 reports commissioned by employers through the Administering Authority will be based on our default recommended assumptions.
Our recommended assumptions are intended to fully comply with FRS17 and IAS19. As prescribed we have aimed for best estimate assumptions and have not tried to be prudent.
We have discussed the approach to set our recommended assumptions with the Audit Commission, who have not raised any significant concerns with this.
The Administering Authority should issue this Briefing Note to all employers in the Fund with a March year end.
We recommend that each employer should discuss the proposed assumptions with their auditor. We would be happy to tailor any of the assumptions to the needs of individual employers. If the employer wishes to use different financial assumptions we will be able to process as part of the main batch of reports for a small extra fee provided this is communicated to us prior to 31 March 2015.
However, if the employer wishes to commission a fully bespoke report with changes to non-financial assumptions or if changes are requested after the accounting date, this will require preparation outside of the main bulk of the reports. This will fall outside of our standard fee scale and timetable.
If an employer wishes to use an assumption setting approach which differs from those specified in this Briefing Note, then it is essential that they advise us through the Administering Authority as soon as possible and no later than 31 March 2015. This will ensure that we are able to carry out the reports in the most cost effective manner.
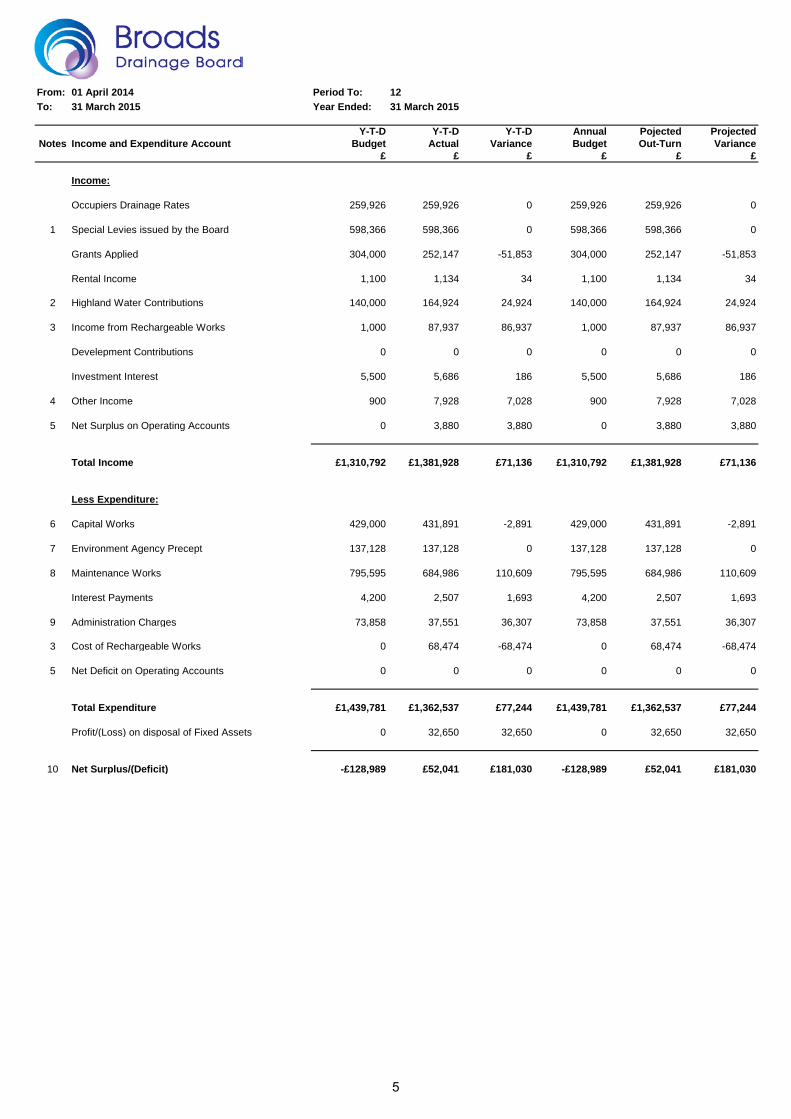
From: 01 April 2014 Period To: 12To: 31 March 2015 Year Ended: 31 March 2015
Y-T-D Y-T-D Y-T-D Annual Pojected ProjectedNotes Income and Expenditure Account Budget Actual Variance Budget Out-Turn Variance
£ £ £ £ £ £
Income:
Occupiers Drainage Rates 259,926 259,926 0 259,926 259,926 0
1 Special Levies issued by the Board 598,366 598,366 0 598,366 598,366 0
Grants Applied 304,000 252,147 -51,853 304,000 252,147 -51,853
Rental Income 1,100 1,134 34 1,100 1,134 34
2 Highland Water Contributions 140,000 164,924 24,924 140,000 164,924 24,924
3 Income from Rechargeable Works 1,000 87,937 86,937 1,000 87,937 86,937
Develepment Contributions 0 0 0 0 0 0
Investment Interest 5,500 5,686 186 5,500 5,686 186
4 Other Income 900 7,928 7,028 900 7,928 7,028
5 Net Surplus on Operating Accounts 0 3,880 3,880 0 3,880 3,880
Total Income £1,310,792 £1,381,928 £71,136 £1,310,792 £1,381,928 £71,136
Less Expenditure:
6 Capital Works 429,000 431,891 -2,891 429,000 431,891 -2,891
7 Environment Agency Precept 137,128 137,128 0 137,128 137,128 0
8 Maintenance Works 795,595 684,986 110,609 795,595 684,986 110,609
Interest Payments 4,200 2,507 1,693 4,200 2,507 1,693
9 Administration Charges 73,858 37,551 36,307 73,858 37,551 36,307
3 Cost of Rechargeable Works 0 68,474 -68,474 0 68,474 -68,474
5 Net Deficit on Operating Accounts 0 0 0 0 0 0
Total Expenditure £1,439,781 £1,362,537 £77,244 £1,439,781 £1,362,537 £77,244
Profit/(Loss) on disposal of Fixed Assets 0 32,650 32,650 0 32,650 32,650
10 Net Surplus/(Deficit) -£128,989 £52,041 £181,030 -£128,989 £52,041 £181,030
5
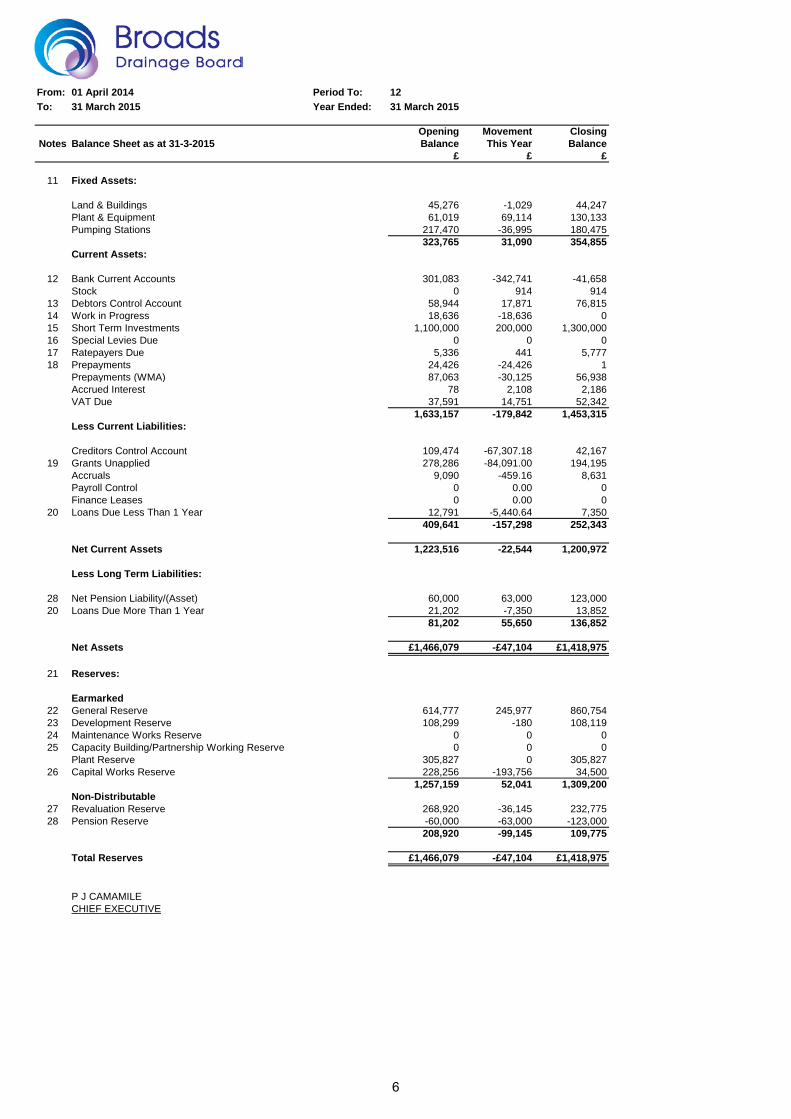
From: 01 April 2014 Period To: 12To: 31 March 2015 Year Ended: 31 March 2015
Opening Movement ClosingNotes Balance Sheet as at 31-3-2015 Balance This Year Balance
£ £ £
11 Fixed Assets:
Land & Buildings 45,276 -1,029 44,247Plant & Equipment 61,019 69,114 130,133Pumping Stations 217,470 -36,995 180,475
323,765 31,090 354,855Current Assets:
12 Bank Current Accounts 301,083 -342,741 -41,658Stock 0 914 914
13 Debtors Control Account 58,944 17,871 76,81514 Work in Progress 18,636 -18,636 015 Short Term Investments 1,100,000 200,000 1,300,00016 Special Levies Due 0 0 017 Ratepayers Due 5,336 441 5,77718 Prepayments 24,426 -24,426 1
Prepayments (WMA) 87,063 -30,125 56,938Accrued Interest 78 2,108 2,186VAT Due 37,591 14,751 52,342
1,633,157 -179,842 1,453,315Less Current Liabilities:
Creditors Control Account 109,474 -67,307.18 42,16719 Grants Unapplied 278,286 -84,091.00 194,195
Accruals 9,090 -459.16 8,631Payroll Control 0 0.00 0Finance Leases 0 0.00 0
20 Loans Due Less Than 1 Year 12,791 -5,440.64 7,350409,641 -157,298 252,343
Net Current Assets 1,223,516 -22,544 1,200,972
Less Long Term Liabilities:
28 Net Pension Liability/(Asset) 60,000 63,000 123,00020 Loans Due More Than 1 Year 21,202 -7,350 13,852
81,202 55,650 136,852
Net Assets £1,466,079 -£47,104 £1,418,975
21 Reserves:
Earmarked22 General Reserve 614,777 245,977 860,75423 Development Reserve 108,299 -180 108,11924 Maintenance Works Reserve 0 0 025 Capacity Building/Partnership Working Reserve 0 0 0
Plant Reserve 305,827 0 305,82726 Capital Works Reserve 228,256 -193,756 34,500
1,257,159 52,041 1,309,200Non-Distributable
27 Revaluation Reserve 268,920 -36,145 232,77528 Pension Reserve -60,000 -63,000 -123,000
208,920 -99,145 109,775
Total Reserves £1,466,079 -£47,104 £1,418,975
P J CAMAMILECHIEF EXECUTIVE
6
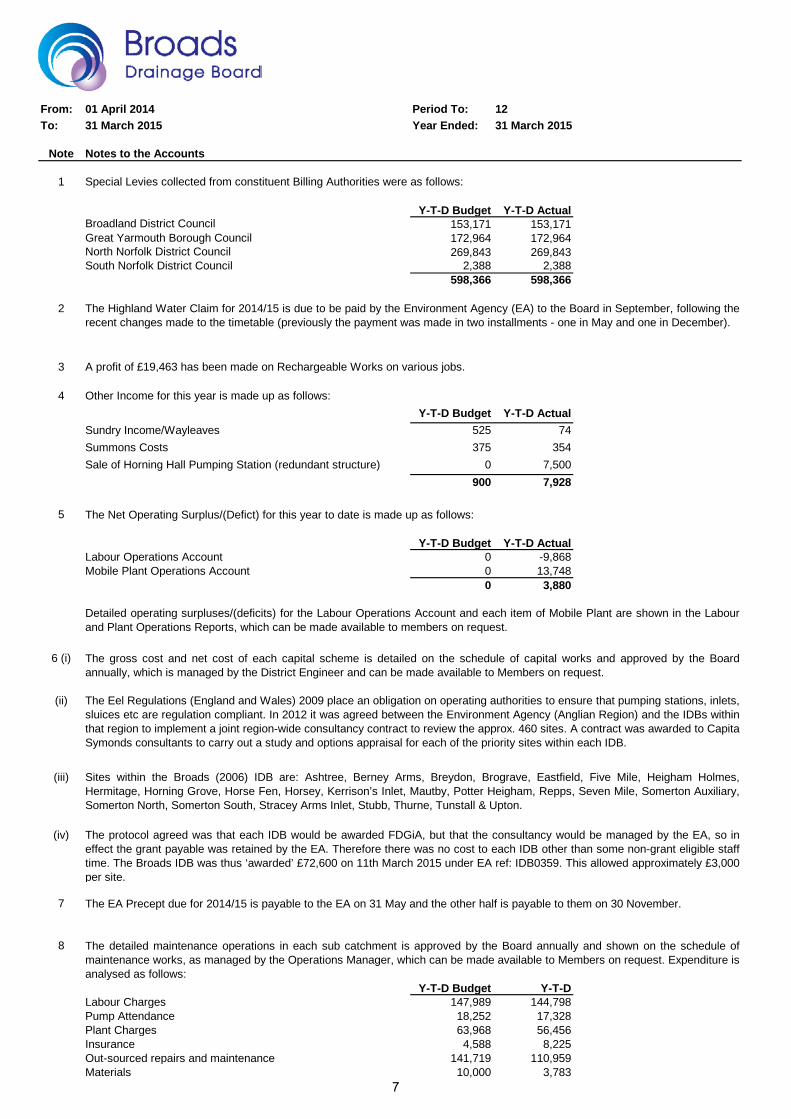
From: 01 April 2014 Period To: 12To: 31 March 2015 Year Ended: 31 March 2015
Note Notes to the Accounts
1
Y-T-D Budget Y-T-D ActualBroadland District Council 153,171 153,171Great Yarmouth Borough Council 172,964 172,964North Norfolk District Council 269,843 269,843South Norfolk District Council 2,388 2,388
598,366 598,366
2
3
4 Other Income for this year is made up as follows:Y-T-D Budget Y-T-D Actual
Sundry Income/Wayleaves 525 74Summons Costs 375 354Sale of Horning Hall Pumping Station (redundant structure) 0 7,500
900 7,928
5
Y-T-D Budget Y-T-D ActualLabour Operations Account 0 -9,868Mobile Plant Operations Account 0 13,748
0 3,880
6 (i)
(ii)
(iii)
(iv)
7
8
Y-T-D Budget Y-T-DLabour Charges 147,989 144,798Pump Attendance 18,252 17,328Plant Charges 63,968 56,456Insurance 4,588 8,225Out-sourced repairs and maintenance 141,719 110,959Materials 10,000 3,783
Special Levies collected from constituent Billing Authorities were as follows:
The Net Operating Surplus/(Defict) for this year to date is made up as follows:
Detailed operating surpluses/(deficits) for the Labour Operations Account and each item of Mobile Plant are shown in the Labourand Plant Operations Reports, which can be made available to members on request.
The Highland Water Claim for 2014/15 is due to be paid by the Environment Agency (EA) to the Board in September, following therecent changes made to the timetable (previously the payment was made in two installments - one in May and one in December).
A profit of £19,463 has been made on Rechargeable Works on various jobs.
The EA Precept due for 2014/15 is payable to the EA on 31 May and the other half is payable to them on 30 November.
The gross cost and net cost of each capital scheme is detailed on the schedule of capital works and approved by the Boardannually, which is managed by the District Engineer and can be made available to Members on request.
The detailed maintenance operations in each sub catchment is approved by the Board annually and shown on the schedule ofmaintenance works, as managed by the Operations Manager, which can be made available to Members on request. Expenditure isanalysed as follows:
The Eel Regulations (England and Wales) 2009 place an obligation on operating authorities to ensure that pumping stations, inlets,sluices etc are regulation compliant. In 2012 it was agreed between the Environment Agency (Anglian Region) and the IDBs withinthat region to implement a joint region-wide consultancy contract to review the approx. 460 sites. A contract was awarded to CapitaSymonds consultants to carry out a study and options appraisal for each of the priority sites within each IDB.
Sites within the Broads (2006) IDB are: Ashtree, Berney Arms, Breydon, Brograve, Eastfield, Five Mile, Heigham Holmes,Hermitage, Horning Grove, Horse Fen, Horsey, Kerrison’s Inlet, Mautby, Potter Heigham, Repps, Seven Mile, Somerton Auxiliary,Somerton North, Somerton South, Stracey Arms Inlet, Stubb, Thurne, Tunstall & Upton.
The protocol agreed was that each IDB would be awarded FDGiA, but that the consultancy would be managed by the EA, so ineffect the grant payable was retained by the EA. Therefore there was no cost to each IDB other than some non-grant eligible stafftime. The Broads IDB was thus ‘awarded’ £72,600 on 11th March 2015 under EA ref: IDB0359. This allowed approximately £3,000per site.
7
From: 01 April 2014 Period To: 12To: 31 March 2015 Year Ended: 31 March 2015
Note Notes to the Accounts
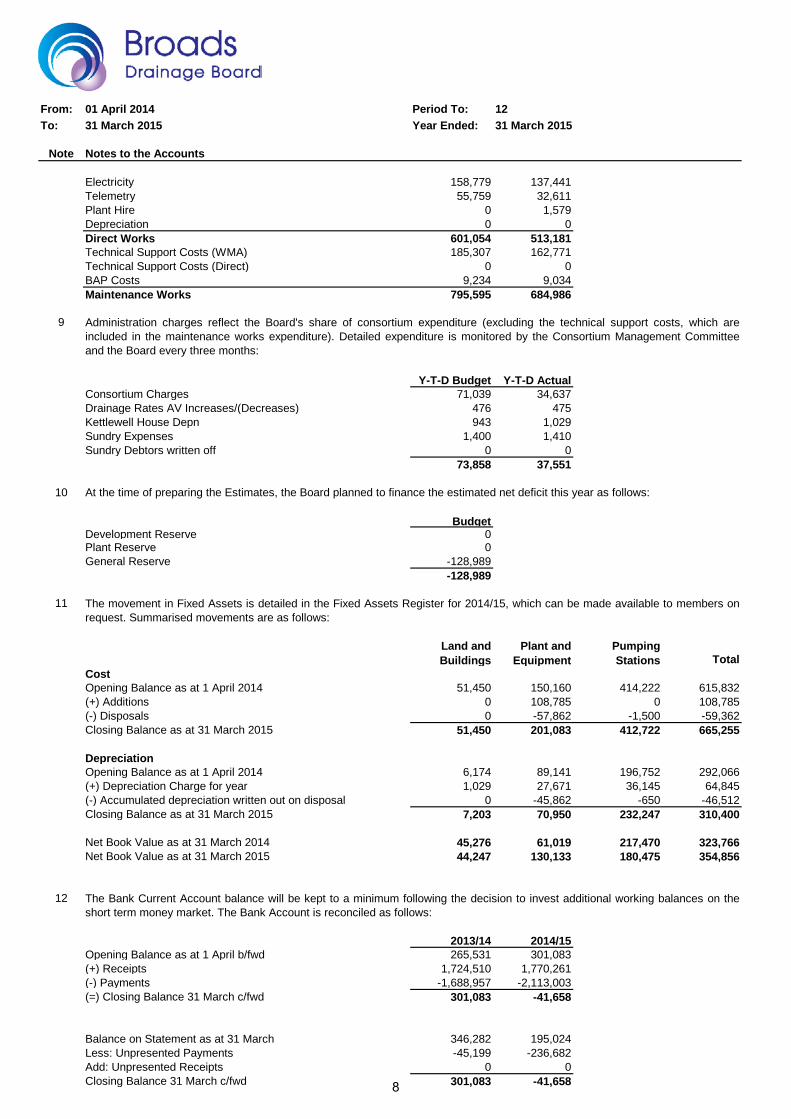
Electricity 158,779 137,441Telemetry 55,759 32,611Plant Hire 0 1,579Depreciation 0 0Direct Works 601,054 513,181Technical Support Costs (WMA) 185,307 162,771Technical Support Costs (Direct) 0 0BAP Costs 9,234 9,034Maintenance Works 795,595 684,986
9
Y-T-D Budget Y-T-D ActualConsortium Charges 71,039 34,637Drainage Rates AV Increases/(Decreases) 476 475Kettlewell House Depn 943 1,029Sundry Expenses 1,400 1,410Sundry Debtors written off 0 0
73,858 37,551
10
BudgetDevelopment Reserve 0Plant Reserve 0General Reserve -128,989
-128,989
11
CostOpening Balance as at 1 April 2014 51,450 150,160 414,222 615,832(+) Additions 0 108,785 0 108,785(-) Disposals 0 -57,862 -1,500 -59,362Closing Balance as at 31 March 2015 51,450 201,083 412,722 665,255
DepreciationOpening Balance as at 1 April 2014 6,174 89,141 196,752 292,066(+) Depreciation Charge for year 1,029 27,671 36,145 64,845(-) Accumulated depreciation written out on disposal 0 -45,862 -650 -46,512Closing Balance as at 31 March 2015 7,203 70,950 232,247 310,400
Net Book Value as at 31 March 2014 45,276 61,019 217,470 323,766Net Book Value as at 31 March 2015 44,247 130,133 180,475 354,856
12
2013/14 2014/15Opening Balance as at 1 April b/fwd 265,531 301,083(+) Receipts 1,724,510 1,770,261(-) Payments -1,688,957 -2,113,003(=) Closing Balance 31 March c/fwd 301,083 -41,658
Balance on Statement as at 31 March 346,282 195,024Less: Unpresented Payments -45,199 -236,682Add: Unpresented Receipts 0 0Closing Balance 31 March c/fwd 301,083 -41,658
The Bank Current Account balance will be kept to a minimum following the decision to invest additional working balances on theshort term money market. The Bank Account is reconciled as follows:
Land and Buildings
Plant and Equipment
Pumping Stations Total
Administration charges reflect the Board's share of consortium expenditure (excluding the technical support costs, which areincluded in the maintenance works expenditure). Detailed expenditure is monitored by the Consortium Management Committeeand the Board every three months:
The movement in Fixed Assets is detailed in the Fixed Assets Register for 2014/15, which can be made available to members onrequest. Summarised movements are as follows:
At the time of preparing the Estimates, the Board planned to finance the estimated net deficit this year as follows:
8
From: 01 April 2014 Period To: 12To: 31 March 2015 Year Ended: 31 March 2015
Note Notes to the Accounts
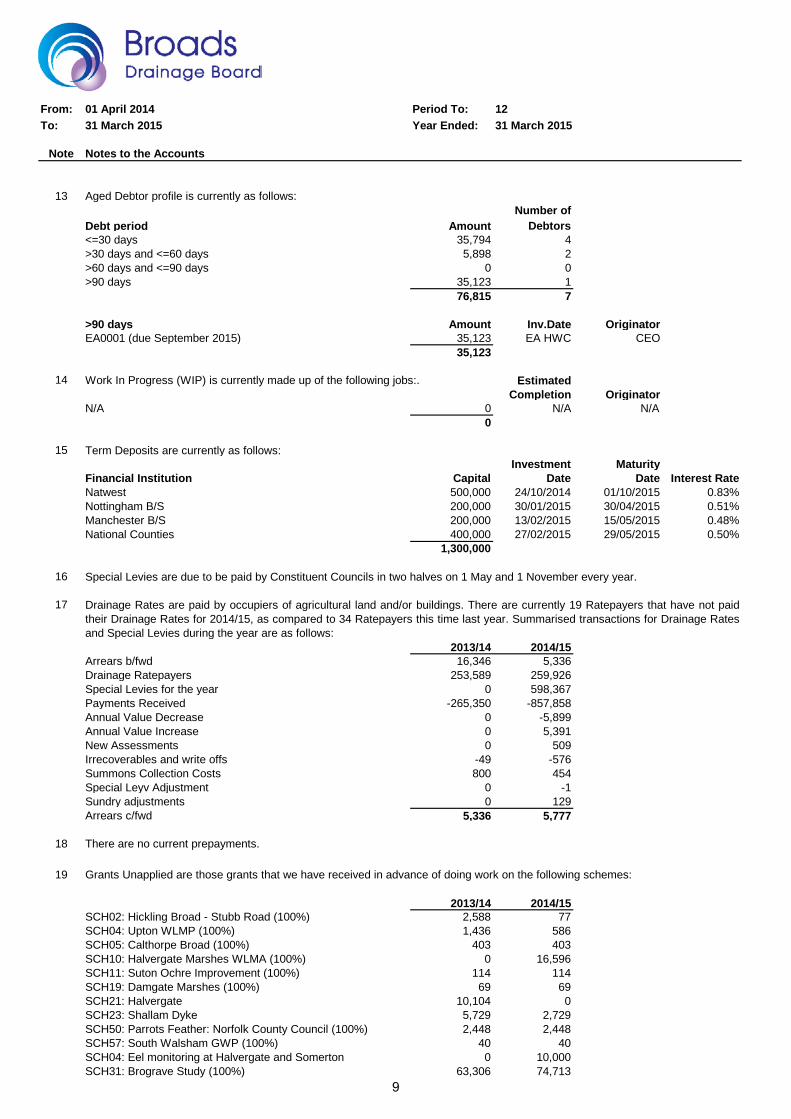
13 Aged Debtor profile is currently as follows:Number of
Debt period Amount Debtors<=30 days 35,794 4>30 days and <=60 days 5,898 2>60 days and <=90 days 0 0>90 days 35,123 1
76,815 7
>90 days Amount Inv.Date OriginatorEA0001 (due September 2015) 35,123 EA HWC CEO
35,123
14 EstimatedCompletion Originator
N/A 0 N/A0
15 Term Deposits are currently as follows:Investment Maturity
Financial Institution Capital Date Date Interest RateNatwest 500,000 24/10/2014 01/10/2015 0.83%Nottingham B/S 200,000 30/01/2015 30/04/2015 0.51%Manchester B/S 200,000 13/02/2015 15/05/2015 0.48%National Counties 400,000 27/02/2015 29/05/2015 0.50%
1,300,000
16
17
2013/14 2014/15Arrears b/fwd 16,346 5,336Drainage Ratepayers 253,589 259,926Special Levies for the year 0 598,367Payments Received -265,350 -857,858Annual Value Decrease 0 -5,899Annual Value Increase 0 5,391New Assessments 0 509Irrecoverables and write offs -49 -576Summons Collection Costs 800 454Special Leyv Adjustment 0 -1Sundry adjustments 0 129Arrears c/fwd 5,336 5,777
18
19 Grants Unapplied are those grants that we have received in advance of doing work on the following schemes:
2013/14 2014/15SCH02: Hickling Broad - Stubb Road (100%) 2,588 77SCH04: Upton WLMP (100%) 1,436 586SCH05: Calthorpe Broad (100%) 403 403SCH10: Halvergate Marshes WLMA (100%) 0 16,596SCH11: Suton Ochre Improvement (100%) 114 114SCH19: Damgate Marshes (100%) 69 69SCH21: Halvergate 10,104 0SCH23: Shallam Dyke 5,729 2,729SCH50: Parrots Feather: Norfolk County Council (100%) 2,448 2,448SCH57: South Walsham GWP (100%) 40 40SCH04: Eel monitoring at Halvergate and Somerton 0 10,000SCH31: Brograve Study (100%) 63,306 74,713
Special Levies are due to be paid by Constituent Councils in two halves on 1 May and 1 November every year.
N/A
Drainage Rates are paid by occupiers of agricultural land and/or buildings. There are currently 19 Ratepayers that have not paidtheir Drainage Rates for 2014/15, as compared to 34 Ratepayers this time last year. Summarised transactions for Drainage Ratesand Special Levies during the year are as follows:
Work In Progress (WIP) is currently made up of the following jobs:.
There are no current prepayments.
9
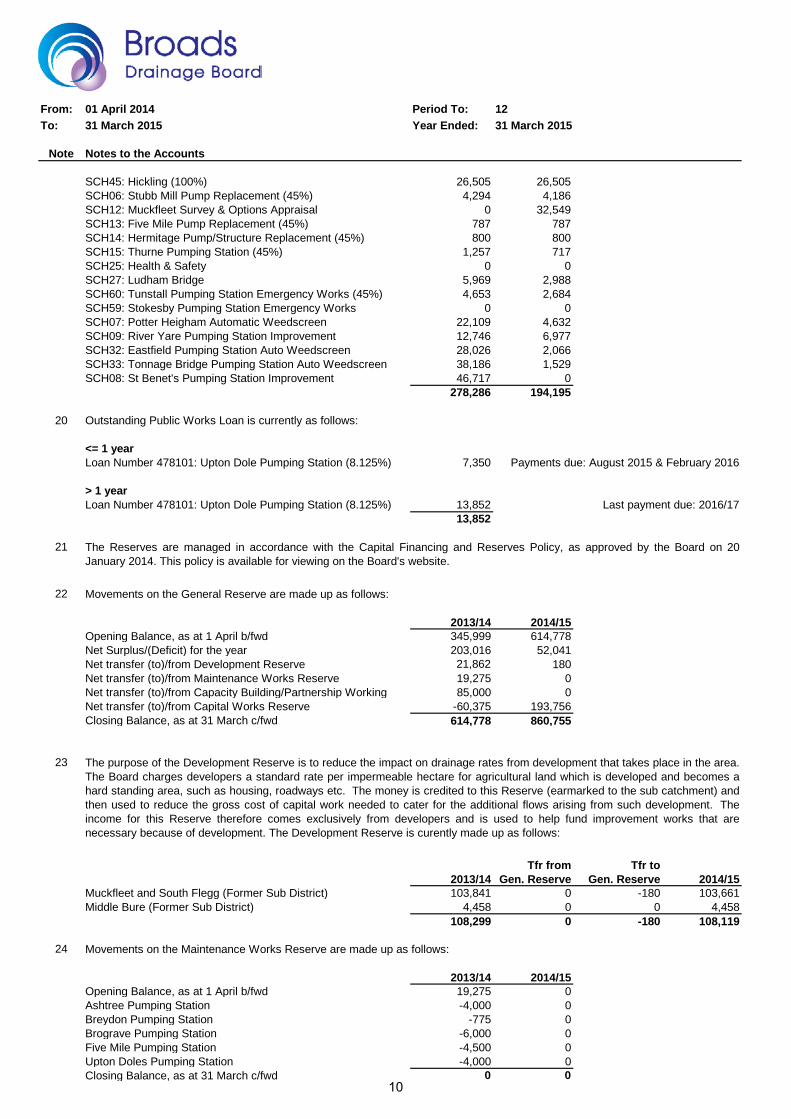
From: 01 April 2014 Period To: 12To: 31 March 2015 Year Ended: 31 March 2015
Note Notes to the Accounts
SCH45: Hickling (100%) 26,505 26,505SCH06: Stubb Mill Pump Replacement (45%) 4,294 4,186SCH12: Muckfleet Survey & Options Appraisal 0 32,549SCH13: Five Mile Pump Replacement (45%) 787 787SCH14: Hermitage Pump/Structure Replacement (45%) 800 800SCH15: Thurne Pumping Station (45%) 1,257 717SCH25: Health & Safety 0 0SCH27: Ludham Bridge 5,969 2,988SCH60: Tunstall Pumping Station Emergency Works (45%) 4,653 2,684SCH59: Stokesby Pumping Station Emergency Works 0 0SCH07: Potter Heigham Automatic Weedscreen 22,109 4,632SCH09: River Yare Pumping Station Improvement 12,746 6,977SCH32: Eastfield Pumping Station Auto Weedscreen 28,026 2,066SCH33: Tonnage Bridge Pumping Station Auto Weedscreen 38,186 1,529SCH08: St Benet's Pumping Station Improvement 46,717 0
278,286 194,195
20 Outstanding Public Works Loan is currently as follows:
<= 1 yearLoan Number 478101: Upton Dole Pumping Station (8.125%) 7,350 Payments due: August 2015 & February 2016
> 1 yearLoan Number 478101: Upton Dole Pumping Station (8.125%) 13,852 Last payment due: 2016/17
13,852
21
22 Movements on the General Reserve are made up as follows:
2013/14 2014/15Opening Balance, as at 1 April b/fwd 345,999 614,778Net Surplus/(Deficit) for the year 203,016 52,041Net transfer (to)/from Development Reserve 21,862 180Net transfer (to)/from Maintenance Works Reserve 19,275 0Net transfer (to)/from Capacity Building/Partnership Working 85,000 0Net transfer (to)/from Capital Works Reserve -60,375 193,756Closing Balance, as at 31 March c/fwd 614,778 860,755
23
Tfr from Tfr to2013/14 Gen. Reserve Gen. Reserve 2014/15
Muckfleet and South Flegg (Former Sub District) 103,841 0 -180 103,661Middle Bure (Former Sub District) 4,458 0 0 4,458
108,299 0 -180 108,119
24
2013/14 2014/15Opening Balance, as at 1 April b/fwd 19,275 0Ashtree Pumping Station -4,000 0Breydon Pumping Station -775 0Brograve Pumping Station -6,000 0Five Mile Pumping Station -4,500 0Upton Doles Pumping Station -4,000 0Closing Balance, as at 31 March c/fwd 0 0
The Reserves are managed in accordance with the Capital Financing and Reserves Policy, as approved by the Board on 20January 2014. This policy is available for viewing on the Board's website.
The purpose of the Development Reserve is to reduce the impact on drainage rates from development that takes place in the area.The Board charges developers a standard rate per impermeable hectare for agricultural land which is developed and becomes ahard standing area, such as housing, roadways etc. The money is credited to this Reserve (earmarked to the sub catchment) andthen used to reduce the gross cost of capital work needed to cater for the additional flows arising from such development. Theincome for this Reserve therefore comes exclusively from developers and is used to help fund improvement works that arenecessary because of development. The Development Reserve is curently made up as follows:
Movements on the Maintenance Works Reserve are made up as follows:
10
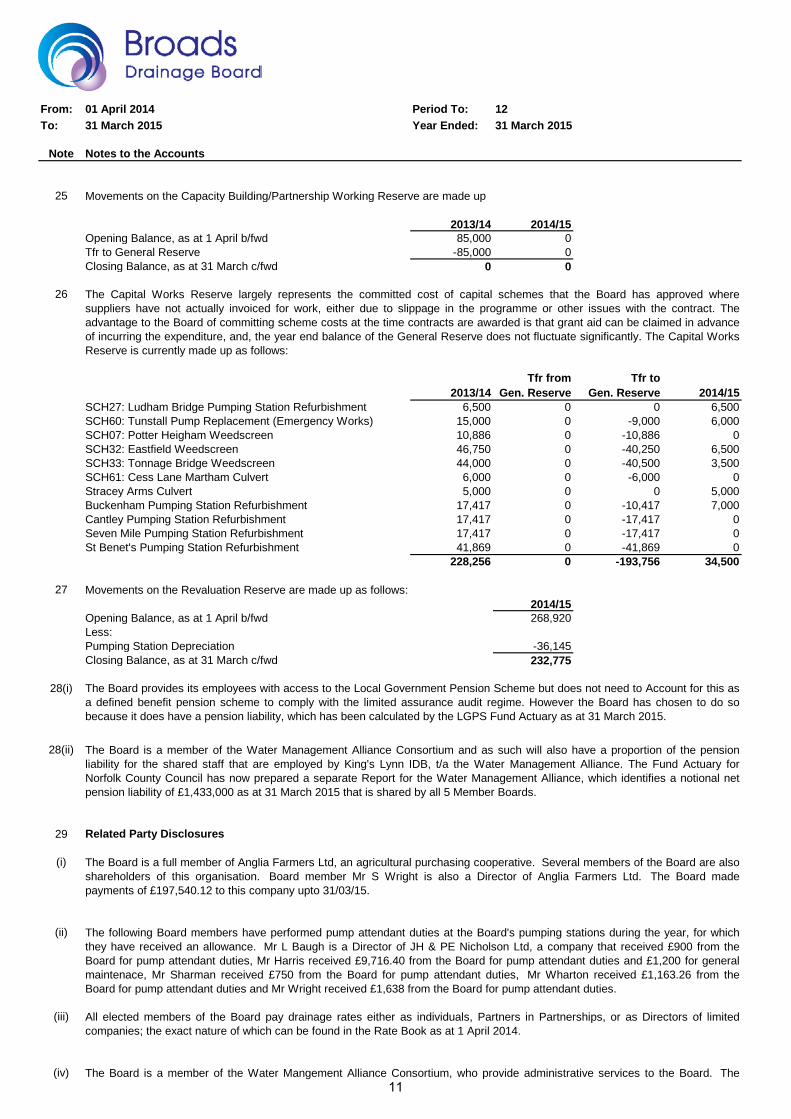
From: 01 April 2014 Period To: 12To: 31 March 2015 Year Ended: 31 March 2015
Note Notes to the Accounts
25
2013/14 2014/15Opening Balance, as at 1 April b/fwd 85,000 0Tfr to General Reserve -85,000 0Closing Balance, as at 31 March c/fwd 0 0
26
Tfr from Tfr to2013/14 Gen. Reserve Gen. Reserve 2014/15
SCH27: Ludham Bridge Pumping Station Refurbishment 6,500 0 0 6,500SCH60: Tunstall Pump Replacement (Emergency Works) 15,000 0 -9,000 6,000SCH07: Potter Heigham Weedscreen 10,886 0 -10,886 0SCH32: Eastfield Weedscreen 46,750 0 -40,250 6,500SCH33: Tonnage Bridge Weedscreen 44,000 0 -40,500 3,500SCH61: Cess Lane Martham Culvert 6,000 0 -6,000 0Stracey Arms Culvert 5,000 0 0 5,000Buckenham Pumping Station Refurbishment 17,417 0 -10,417 7,000Cantley Pumping Station Refurbishment 17,417 0 -17,417 0Seven Mile Pumping Station Refurbishment 17,417 0 -17,417 0St Benet's Pumping Station Refurbishment 41,869 0 -41,869 0
228,256 0 -193,756 34,500
272014/15
Opening Balance, as at 1 April b/fwd 268,920Less:Pumping Station Depreciation -36,145Closing Balance, as at 31 March c/fwd 232,775
28(i)
28(ii)
29 Related Party Disclosures
(i)
(ii)
(iii)
(iv)
Movements on the Capacity Building/Partnership Working Reserve are made up
The Board is a member of the Water Management Alliance Consortium and as such will also have a proportion of the pensionliability for the shared staff that are employed by King's Lynn IDB, t/a the Water Management Alliance. The Fund Actuary forNorfolk County Council has now prepared a separate Report for the Water Management Alliance, which identifies a notional netpension liability of £1,433,000 as at 31 March 2015 that is shared by all 5 Member Boards.
Movements on the Revaluation Reserve are made up as follows:
The Board provides its employees with access to the Local Government Pension Scheme but does not need to Account for this asa defined benefit pension scheme to comply with the limited assurance audit regime. However the Board has chosen to do sobecause it does have a pension liability, which has been calculated by the LGPS Fund Actuary as at 31 March 2015.
The Capital Works Reserve largely represents the committed cost of capital schemes that the Board has approved wheresuppliers have not actually invoiced for work, either due to slippage in the programme or other issues with the contract. Theadvantage to the Board of committing scheme costs at the time contracts are awarded is that grant aid can be claimed in advanceof incurring the expenditure, and, the year end balance of the General Reserve does not fluctuate significantly. The Capital WorksReserve is currently made up as follows:
The Board is a full member of Anglia Farmers Ltd, an agricultural purchasing cooperative. Several members of the Board are alsoshareholders of this organisation. Board member Mr S Wright is also a Director of Anglia Farmers Ltd. The Board madepayments of £197,540.12 to this company upto 31/03/15.
All elected members of the Board pay drainage rates either as individuals, Partners in Partnerships, or as Directors of limitedcompanies; the exact nature of which can be found in the Rate Book as at 1 April 2014.
The Board is a member of the Water Mangement Alliance Consortium, who provide administrative services to the Board. The
The following Board members have performed pump attendant duties at the Board's pumping stations during the year, for whichthey have received an allowance. Mr L Baugh is a Director of JH & PE Nicholson Ltd, a company that received £900 from theBoard for pump attendant duties, Mr Harris received £9,716.40 from the Board for pump attendant duties and £1,200 for generalmaintenace, Mr Sharman received £750 from the Board for pump attendant duties, Mr Wharton received £1,163.26 from theBoard for pump attendant duties and Mr Wright received £1,638 from the Board for pump attendant duties.
11
From: 01 April 2014 Period To: 12To: 31 March 2015 Year Ended: 31 March 2015
Note Notes to the Accounts
(v)
(vi)
(vii)
(viii)
Recommended Actions:
1.
2.
P J CAMAMILE M FUTTERCHIEF EXECUTIVE FINANCE OFFICER
To approve the Accounting Statement shown in section 1 of the Annual Return for 2014/15.
To approve the Financial Report for the year ending 31 March 2015.
Board has 3 representatives who serve on the Consortium Management Committee, that include the Chairman and the 2 ViceChairmen of the Board. The Chairman received £2,333 Chairman's Allowance and £54 travelling expenses.
The Board rents land at Mustard Hyrn Farm, Cess Road, Martham from B G Goose & Partners, to whom it paid £4,200 rent costsfor 2014/15. The Board has also paid B G Goose & Partners a sum of £23,368.20 for undertaking tractor & flail work upto31/03/15. The Board's Operations Manager is a partner of this business.
The Board has paid Ben Goose £35,180.10 upto 31/03/15 for undertaking excavation and basket cutting work. The Board'sOperations Manager is related to Ben Goose.
The Board has paid £1,261.18 to Chapman Farms Ltd during 2014/15 for renting space to house telemetry equipment atThunderhill and for renting the land to house Somerton Auxilliary Pumping Station Kiosk. The Board member Mr J Chapman is aDirector in this company.
The Board uses Rating Software for the collection of Drainage Rates known as DRS. This software is owned by South HollandIDB and was developed by Mr P J Camamile, the Chief Executive. The software is supported at no cost to the Board by ByzantineLtd. Mr P J Camamile is the Company Secretary of Byzantine Ltd and his wife Mrs P Camamile is a Director. Both areshareholders.
12
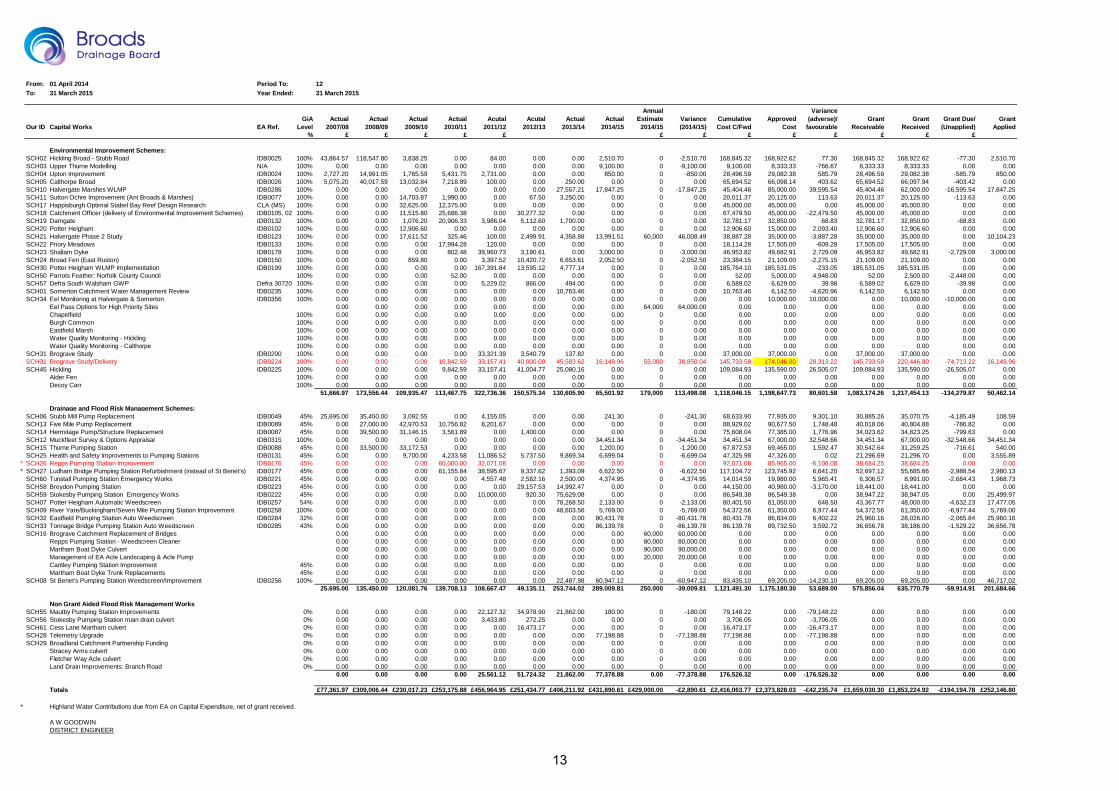
From: 01 April 2014 Period To: 12To: 31 March 2015 Year Ended: 31 March 2015
Our ID Capital Works EA Ref.GiA
LevelActual
2007/08Actual
2008/09Actual
2009/10Actual
2010/11Acutal
2011/12Acutal
2012/13Actual
2013/14Actual
2014/15
Annual Estimate
2014/15Variance (2014/15)
Cumulative Cost C/Fwd
Approved Cost
Variance (adverse)/
favourableGrant
ReceivableGrant
ReceivedGrant Due/
(Unapplied)Grant
Applied% £ £ £ £ £ £ £ £ £ £ £ £ £
Environmental Improvement Schemes:SCH02 Hickling Broad - Stubb Road IDB0025 100% 43,864.57 118,547.80 3,838.25 0.00 84.00 0.00 0.00 2,510.70 0 -2,510.70 168,845.32 168,922.62 77.30 168,845.32 168,922.62 -77.30 2,510.70SCH03 Upper Thurne Modelling N/A 100% 0.00 0.00 0.00 0.00 0.00 0.00 0.00 9,100.00 0 -9,100.00 9,100.00 8,333.33 -766.67 8,333.33 8,333.33 0.00 0.00SCH04 Upton Improvement IDB0024 100% 2,727.20 14,991.05 1,765.59 5,431.75 2,731.00 0.00 0.00 850.00 0 -850.00 28,496.59 29,082.38 585.79 28,496.59 29,082.38 -585.79 850.00SCH05 Calthorpe Broad IDB0026 100% 5,075.20 40,017.59 13,032.84 7,218.89 100.00 0.00 250.00 0.00 0 0.00 65,694.52 66,098.14 403.62 65,694.52 66,097.94 -403.42 0.00SCH10 Halvergate Marshes WLMP IDB0286 100% 0.00 0.00 0.00 0.00 0.00 0.00 27,557.21 17,847.25 0 -17,847.25 45,404.46 85,000.00 39,595.54 45,404.46 62,000.00 -16,595.54 17,847.25SCH11 Sutton Ochre Improvement (Ant Broads & Marshes) IDB0077 100% 0.00 0.00 14,703.87 1,990.00 0.00 67.50 3,250.00 0.00 0 0.00 20,011.37 20,125.00 113.63 20,011.37 20,125.00 -113.63 0.00SCH17 Happisburgh Optimal Stabel Bay Reef Design Research CLA (MS) 100% 0.00 0.00 32,625.00 12,375.00 0.00 0.00 0.00 0.00 0 0.00 45,000.00 45,000.00 0.00 45,000.00 45,000.00 0.00 0.00SCH18 Catchment Officer (delivery of Environmental Improvement Schemes) IDB0105, 02 100% 0.00 0.00 11,515.80 25,686.38 0.00 30,277.32 0.00 0.00 0 0.00 67,479.50 45,000.00 -22,479.50 45,000.00 45,000.00 0.00 0.00SCH19 Damgate IDB0132 100% 0.00 0.00 1,076.20 20,906.33 3,986.04 5,112.60 1,700.00 0.00 0 0.00 32,781.17 32,850.00 68.83 32,781.17 32,850.00 -68.83 0.00SCH20 Potter Heigham IDB0102 100% 0.00 0.00 12,906.60 0.00 0.00 0.00 0.00 0.00 0 0.00 12,906.60 15,000.00 2,093.40 12,906.60 12,906.60 0.00 0.00SCH21 Halvergate Phase 2 Study IDB0123 100% 0.00 0.00 17,611.52 325.46 100.00 2,499.91 4,358.88 13,991.51 60,000 46,008.49 38,887.28 35,000.00 -3,887.28 35,000.00 35,000.00 0.00 10,104.23SCH22 Priory Meadows IDB0133 100% 0.00 0.00 0.00 17,994.28 120.00 0.00 0.00 0.00 0 0.00 18,114.28 17,505.00 -609.28 17,505.00 17,505.00 0.00 0.00SCH23 Shallam Dyke IDB0178 100% 0.00 0.00 0.00 802.48 39,960.73 3,190.61 0.00 3,000.00 0 -3,000.00 46,953.82 49,682.91 2,729.09 46,953.82 49,682.91 -2,729.09 3,000.00SCH24 Broad Fen (East Ruston) IDB0150 100% 0.00 0.00 859.80 0.00 3,397.52 10,420.72 6,653.61 2,052.50 0 -2,052.50 23,384.15 21,109.00 -2,275.15 21,109.00 21,109.00 0.00 0.00SCH30 Potter Heigham WLMP Implementation IDB0199 100% 0.00 0.00 0.00 0.00 167,391.84 13,595.12 4,777.14 0.00 0 0.00 185,764.10 185,531.05 -233.05 185,531.05 185,531.05 0.00 0.00SCH50 Parrots Feather: Norfolk County Council 100% 0.00 0.00 0.00 52.00 0.00 0.00 0.00 0.00 0 0.00 52.00 5,000.00 4,948.00 52.00 2,500.00 -2,448.00 0.00SCH57 Defra South Walsham GWP Defra 30720 100% 0.00 0.00 0.00 0.00 5,229.02 866.00 494.00 0.00 0 0.00 6,589.02 6,629.00 39.98 6,589.02 6,629.00 -39.98 0.00SCH01 Somerton Catchment Water Management Review IDB0235 100% 0.00 0.00 0.00 0.00 0.00 0.00 10,763.46 0.00 0 0.00 10,763.46 6,142.50 -4,620.96 6,142.50 6,142.50 0.00 0.00SCH34 Eel Monitoring at Halvergate & Somerton IDB0356 100% 0.00 0.00 0.00 0.00 0.00 0.00 0.00 0.00 0 0.00 0.00 10,000.00 10,000.00 0.00 10,000.00 -10,000.00 0.00
Eel Pass Options for High Priority Sites 0.00 0.00 0.00 0.00 0.00 0.00 0.00 0.00 64,000 64,000.00 0.00 0.00 0.00 0.00 0.00 0.00 0.00Chapelfield 100% 0.00 0.00 0.00 0.00 0.00 0.00 0.00 0.00 0 0.00 0.00 0.00 0.00 0.00 0.00 0.00 0.00Burgh Common 100% 0.00 0.00 0.00 0.00 0.00 0.00 0.00 0.00 0 0.00 0.00 0.00 0.00 0.00 0.00 0.00 0.00Eastfield Marsh 100% 0.00 0.00 0.00 0.00 0.00 0.00 0.00 0.00 0 0.00 0.00 0.00 0.00 0.00 0.00 0.00 0.00Water Quality Monitoring - Hickling 100% 0.00 0.00 0.00 0.00 0.00 0.00 0.00 0.00 0 0.00 0.00 0.00 0.00 0.00 0.00 0.00 0.00Water Quality Monitoring - Calthorpe 100% 0.00 0.00 0.00 0.00 0.00 0.00 0.00 0.00 0 0.00 0.00 0.00 0.00 0.00 0.00 0.00 0.00
SCH31 Brograve Study IDB0200 100% 0.00 0.00 0.00 0.00 33,321.39 3,540.79 137.82 0.00 0 0.00 37,000.00 37,000.00 0.00 37,000.00 37,000.00 0.00 0.00SCH31 Brograve Study/Delivery IDB0224 100% 0.00 0.00 0.00 10,842.59 33,157.41 40,000.00 45,583.62 16,149.96 55,000 38,850.04 145,733.58 174,046.80 28,313.22 145,733.58 220,446.80 -74,713.22 16,149.96SCH45 Hickling IDB0225 100% 0.00 0.00 0.00 9,842.59 33,157.41 41,004.77 25,080.16 0.00 0 0.00 109,084.93 135,590.00 26,505.07 109,084.93 135,590.00 -26,505.07 0.00
Alder Fen 100% 0.00 0.00 0.00 0.00 0.00 0.00 0.00 0.00 0 0.00 0.00 0.00 0.00 0.00 0.00 0.00 0.00Decoy Carr 100% 0.00 0.00 0.00 0.00 0.00 0.00 0.00 0.00 0 0.00 0.00 0.00 0.00 0.00 0.00 0.00 0.00
51,666.97 173,556.44 109,935.47 113,467.75 322,736.36 150,575.34 130,605.90 65,501.92 179,000 113,498.08 1,118,046.15 1,198,647.73 80,601.58 1,083,174.26 1,217,454.13 -134,279.87 50,462.14
Drainage and Flood Risk Management Schemes:SCH06 Stubb Mill Pump Replacement IDB0049 45% 25,695.00 35,450.00 3,092.55 0.00 4,155.05 0.00 0.00 241.30 0 -241.30 68,633.90 77,935.00 9,301.10 30,885.26 35,070.75 -4,185.49 108.59SCH13 Five Mile Pump Replacement IDB0089 45% 0.00 27,000.00 42,970.53 10,756.82 8,201.67 0.00 0.00 0.00 0 0.00 88,929.02 90,677.50 1,748.48 40,018.06 40,804.88 -786.82 0.00SCH14 Hermitage Pump/Structure Replacement IDB0087 45% 0.00 39,500.00 31,146.15 3,561.89 0.00 1,400.00 0.00 0.00 0 0.00 75,608.04 77,385.00 1,776.96 34,023.62 34,823.25 -799.63 0.00SCH12 Muckfleet Survey & Options Appraisal IDB0315 100% 0.00 0.00 0.00 0.00 0.00 0.00 0.00 34,451.34 0 -34,451.34 34,451.34 67,000.00 32,548.66 34,451.34 67,000.00 -32,548.66 34,451.34SCH15 Thurne Pumping Station IDB0088 45% 0.00 33,500.00 33,172.53 0.00 0.00 0.00 0.00 1,200.00 0 -1,200.00 67,872.53 69,465.00 1,592.47 30,542.64 31,259.25 -716.61 540.00SCH25 Health and Safety Improvements to Pumping Stations IDB0131 45% 0.00 0.00 9,700.00 4,233.58 11,086.52 5,737.50 9,869.34 6,699.04 0 -6,699.04 47,325.98 47,326.00 0.02 21,296.69 21,296.70 0.00 3,555.89
* SCH26 Repps Pumping Station Improvement IDB0176 45% 0.00 0.00 0.00 60,000.00 32,071.08 0.00 0.00 0.00 0 0.00 92,071.08 85,965.00 -6,106.08 38,684.25 38,684.25 0.00 0.00* SCH27 Ludham Bridge Pumping Station Refurbishment (instead of St Benet's) IDB0177 45% 0.00 0.00 0.00 61,155.84 38,595.67 9,337.62 1,393.09 6,622.50 0 -6,622.50 117,104.72 123,745.92 6,641.20 52,697.12 55,685.66 -2,988.54 2,980.13
SCH60 Tunstall Pumping Station Emergency Works IDB0221 45% 0.00 0.00 0.00 0.00 4,557.48 2,582.16 2,500.00 4,374.95 0 -4,374.95 14,014.59 19,980.00 5,965.41 6,306.57 8,991.00 -2,684.43 1,968.73SCH58 Breydon Pumping Station IDB0223 45% 0.00 0.00 0.00 0.00 0.00 29,157.53 14,992.47 0.00 0 0.00 44,150.00 40,980.00 -3,170.00 18,441.00 18,441.00 0.00 0.00SCH59 Stokesby Pumping Station Emergency Works IDB0222 45% 0.00 0.00 0.00 0.00 10,000.00 920.30 75,629.08 0.00 0 0.00 86,549.38 86,549.38 0.00 38,947.22 38,947.05 0.00 25,499.97SCH07 Potter Heigham Automatic Weedscreen IDB0257 54% 0.00 0.00 0.00 0.00 0.00 0.00 78,268.50 2,133.00 0 -2,133.00 80,401.50 81,050.00 648.50 43,367.77 48,000.00 -4,632.23 17,477.05SCH09 River Yare/Buckingham/Seven Mile Pumping Station Improvement IDB0258 100% 0.00 0.00 0.00 0.00 0.00 0.00 48,603.56 5,769.00 0 -5,769.00 54,372.56 61,350.00 6,977.44 54,372.56 61,350.00 -6,977.44 5,769.00SCH32 Eastfield Pumping Station Auto Weedscreen IDB0284 32% 0.00 0.00 0.00 0.00 0.00 0.00 0.00 80,431.78 0 -80,431.78 80,431.78 86,834.00 6,402.22 25,960.16 28,026.00 -2,065.84 25,960.16SCH33 Tonnage Bridge Pumping Station Auto Weedscreen IDB0285 43% 0.00 0.00 0.00 0.00 0.00 0.00 0.00 86,139.78 0 -86,139.78 86,139.78 89,732.50 3,592.72 36,656.78 38,186.00 -1,529.22 36,656.78SCH16 Brograve Catchment Replacement of Bridges 0.00 0.00 0.00 0.00 0.00 0.00 0.00 0.00 60,000 60,000.00 0.00 0.00 0.00 0.00 0.00 0.00 0.00
Repps Pumping Station - Weedscreen Cleaner 0.00 0.00 0.00 0.00 0.00 0.00 0.00 0.00 80,000 80,000.00 0.00 0.00 0.00 0.00 0.00 0.00 0.00Martham Boat Dyke Culvert 0.00 0.00 0.00 0.00 0.00 0.00 0.00 0.00 90,000 90,000.00 0.00 0.00 0.00 0.00 0.00 0.00 0.00Management of EA Acle Landscaping & Acle Pump 0.00 0.00 0.00 0.00 0.00 0.00 0.00 0.00 20,000 20,000.00 0.00 0.00 0.00 0.00 0.00 0.00 0.00Cantley Pumping Station Improvement 45% 0.00 0.00 0.00 0.00 0.00 0.00 0.00 0.00 0 0.00 0.00 0.00 0.00 0.00 0.00 0.00 0.00Martham Boat Dyke Trunk Replacements 45% 0.00 0.00 0.00 0.00 0.00 0.00 0.00 0.00 0 0.00 0.00 0.00 0.00 0.00 0.00 0.00 0.00
SCH08 St Benet's Pumping Station Weedscreen/Improvement IDB0256 100% 0.00 0.00 0.00 0.00 0.00 0.00 22,487.98 60,947.12 0 -60,947.12 83,435.10 69,205.00 -14,230.10 69,205.00 69,205.00 0.00 46,717.0225,695.00 135,450.00 120,081.76 139,708.13 108,667.47 49,135.11 253,744.02 289,009.81 250,000 -39,009.81 1,121,491.30 1,175,180.30 53,689.00 575,856.04 635,770.79 -59,914.91 201,684.66
Non Grant Aided Flood Risk Management WorksSCH55 Mautby Pumping Station Improvements 0% 0.00 0.00 0.00 0.00 22,127.32 34,978.90 21,862.00 180.00 0 -180.00 79,148.22 0.00 -79,148.22 0.00 0.00 0.00 0.00SCH56 Stokesby Pumping Station main drain culvert 0% 0.00 0.00 0.00 0.00 3,433.80 272.25 0.00 0.00 0 0.00 3,706.05 0.00 -3,706.05 0.00 0.00 0.00 0.00SCH61 Cess Lane Martham culvert 0% 0.00 0.00 0.00 0.00 0.00 16,473.17 0.00 0.00 0 0.00 16,473.17 0.00 -16,473.17 0.00 0.00 0.00 0.00SCH28 Telemetry Upgrade 0% 0.00 0.00 0.00 0.00 0.00 0.00 0.00 77,198.88 0 -77,198.88 77,198.88 0.00 -77,198.88 0.00 0.00 0.00 0.00SCH29 Broadland Catchment Partnership Funding 0% 0.00 0.00 0.00 0.00 0.00 0.00 0.00 0.00 0 0.00 0.00 0.00 0.00 0.00 0.00 0.00 0.00
Stracey Arms culvert 0% 0.00 0.00 0.00 0.00 0.00 0.00 0.00 0.00 0 0.00 0.00 0.00 0.00 0.00 0.00 0.00 0.00Fletcher Way Acle culvert 0% 0.00 0.00 0.00 0.00 0.00 0.00 0.00 0.00 0 0.00 0.00 0.00 0.00 0.00 0.00 0.00 0.00Land Drain Improvements: Branch Road 0% 0.00 0.00 0.00 0.00 0.00 0.00 0.00 0.00 0 0.00 0.00 0.00 0.00 0.00 0.00 0.00 0.00
0.00 0.00 0.00 0.00 25,561.12 51,724.32 21,862.00 77,378.88 0.00 -77,378.88 176,526.32 0.00 -176,526.32 0.00 0.00 0.00 0.00
Totals £77,361.97 £309,006.44 £230,017.23 £253,175.88 £456,964.95 £251,434.77 £406,211.92 £431,890.61 £429,000.00 -£2,890.61 £2,416,063.77 £2,373,828.03 -£42,235.74 £1,659,030.30 £1,853,224.92 -£194,194.78 £252,146.80
* Highland Water Contributions due from EA on Capital Expenditure, net of grant received.
A W GOODWINDISTRICT ENGINEER
13
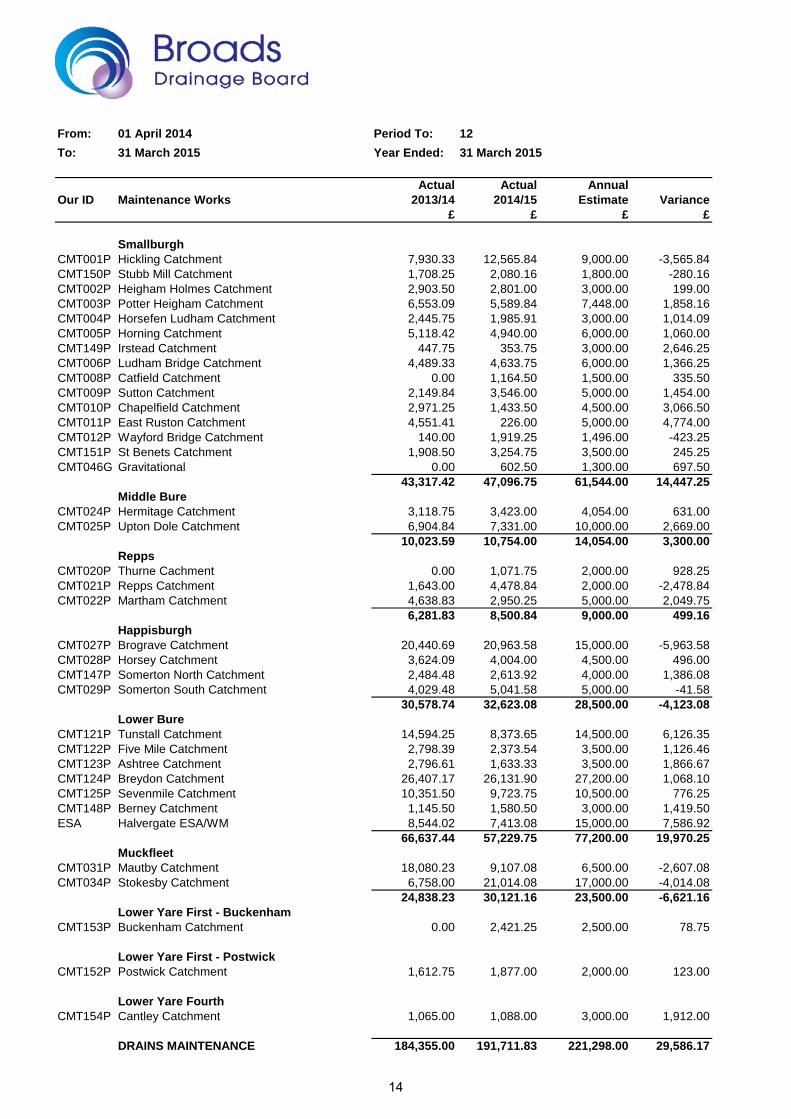
From: 01 April 2014 Period To: 12To: 31 March 2015 Year Ended: 31 March 2015
Actual Actual AnnualOur ID Maintenance Works 2013/14 2014/15 Estimate Variance
£ £ £ £
SmallburghCMT001P Hickling Catchment 7,930.33 12,565.84 9,000.00 -3,565.84CMT150P Stubb Mill Catchment 1,708.25 2,080.16 1,800.00 -280.16CMT002P Heigham Holmes Catchment 2,903.50 2,801.00 3,000.00 199.00CMT003P Potter Heigham Catchment 6,553.09 5,589.84 7,448.00 1,858.16CMT004P Horsefen Ludham Catchment 2,445.75 1,985.91 3,000.00 1,014.09CMT005P Horning Catchment 5,118.42 4,940.00 6,000.00 1,060.00CMT149P Irstead Catchment 447.75 353.75 3,000.00 2,646.25CMT006P Ludham Bridge Catchment 4,489.33 4,633.75 6,000.00 1,366.25CMT008P Catfield Catchment 0.00 1,164.50 1,500.00 335.50CMT009P Sutton Catchment 2,149.84 3,546.00 5,000.00 1,454.00CMT010P Chapelfield Catchment 2,971.25 1,433.50 4,500.00 3,066.50CMT011P East Ruston Catchment 4,551.41 226.00 5,000.00 4,774.00CMT012P Wayford Bridge Catchment 140.00 1,919.25 1,496.00 -423.25CMT151P St Benets Catchment 1,908.50 3,254.75 3,500.00 245.25CMT046G Gravitational 0.00 602.50 1,300.00 697.50
43,317.42 47,096.75 61,544.00 14,447.25Middle Bure
CMT024P Hermitage Catchment 3,118.75 3,423.00 4,054.00 631.00CMT025P Upton Dole Catchment 6,904.84 7,331.00 10,000.00 2,669.00
10,023.59 10,754.00 14,054.00 3,300.00Repps
CMT020P Thurne Cachment 0.00 1,071.75 2,000.00 928.25CMT021P Repps Catchment 1,643.00 4,478.84 2,000.00 -2,478.84CMT022P Martham Catchment 4,638.83 2,950.25 5,000.00 2,049.75
6,281.83 8,500.84 9,000.00 499.16Happisburgh
CMT027P Brograve Catchment 20,440.69 20,963.58 15,000.00 -5,963.58CMT028P Horsey Catchment 3,624.09 4,004.00 4,500.00 496.00CMT147P Somerton North Catchment 2,484.48 2,613.92 4,000.00 1,386.08CMT029P Somerton South Catchment 4,029.48 5,041.58 5,000.00 -41.58
30,578.74 32,623.08 28,500.00 -4,123.08Lower Bure
CMT121P Tunstall Catchment 14,594.25 8,373.65 14,500.00 6,126.35CMT122P Five Mile Catchment 2,798.39 2,373.54 3,500.00 1,126.46CMT123P Ashtree Catchment 2,796.61 1,633.33 3,500.00 1,866.67CMT124P Breydon Catchment 26,407.17 26,131.90 27,200.00 1,068.10CMT125P Sevenmile Catchment 10,351.50 9,723.75 10,500.00 776.25CMT148P Berney Catchment 1,145.50 1,580.50 3,000.00 1,419.50ESA Halvergate ESA/WM 8,544.02 7,413.08 15,000.00 7,586.92
66,637.44 57,229.75 77,200.00 19,970.25Muckfleet
CMT031P Mautby Catchment 18,080.23 9,107.08 6,500.00 -2,607.08CMT034P Stokesby Catchment 6,758.00 21,014.08 17,000.00 -4,014.08
24,838.23 30,121.16 23,500.00 -6,621.16Lower Yare First - Buckenham
CMT153P Buckenham Catchment 0.00 2,421.25 2,500.00 78.75
Lower Yare First - PostwickCMT152P Postwick Catchment 1,612.75 1,877.00 2,000.00 123.00
Lower Yare FourthCMT154P Cantley Catchment 1,065.00 1,088.00 3,000.00 1,912.00
DRAINS MAINTENANCE 184,355.00 191,711.83 221,298.00 29,586.17
14
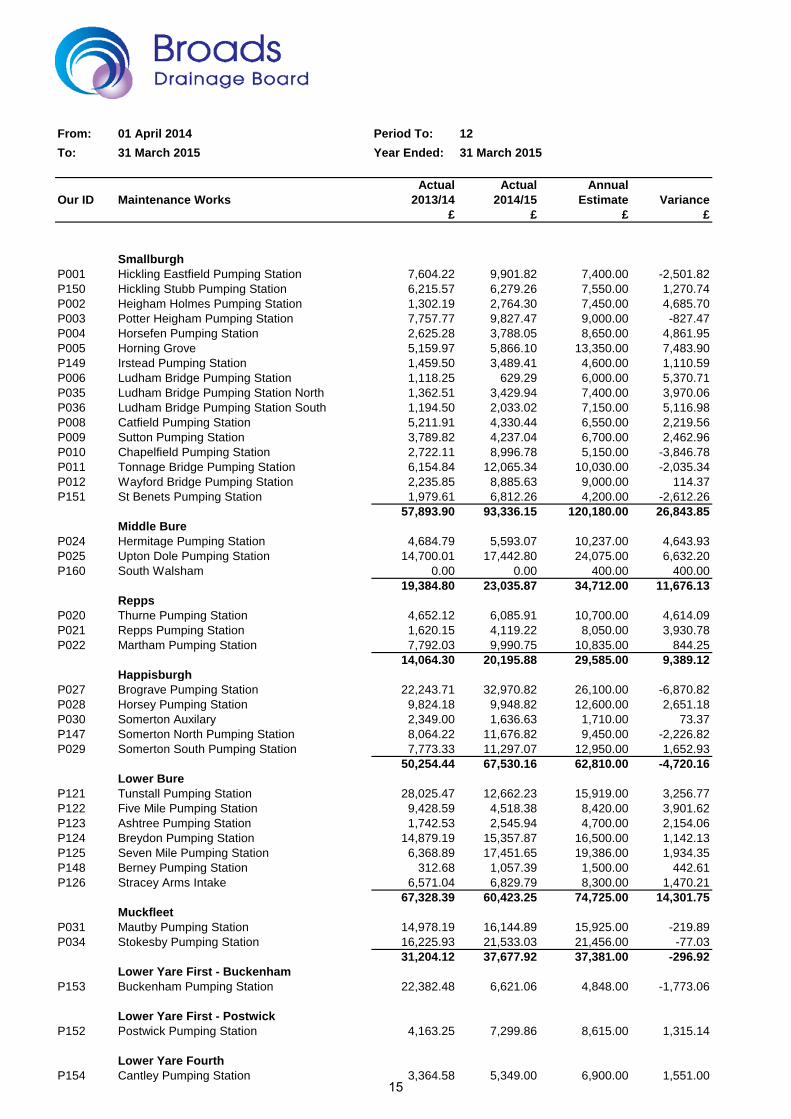
From: 01 April 2014 Period To: 12To: 31 March 2015 Year Ended: 31 March 2015
Actual Actual AnnualOur ID Maintenance Works 2013/14 2014/15 Estimate Variance
£ £ £ £
SmallburghP001 Hickling Eastfield Pumping Station 7,604.22 9,901.82 7,400.00 -2,501.82P150 Hickling Stubb Pumping Station 6,215.57 6,279.26 7,550.00 1,270.74P002 Heigham Holmes Pumping Station 1,302.19 2,764.30 7,450.00 4,685.70P003 Potter Heigham Pumping Station 7,757.77 9,827.47 9,000.00 -827.47P004 Horsefen Pumping Station 2,625.28 3,788.05 8,650.00 4,861.95P005 Horning Grove 5,159.97 5,866.10 13,350.00 7,483.90P149 Irstead Pumping Station 1,459.50 3,489.41 4,600.00 1,110.59P006 Ludham Bridge Pumping Station 1,118.25 629.29 6,000.00 5,370.71P035 Ludham Bridge Pumping Station North 1,362.51 3,429.94 7,400.00 3,970.06P036 Ludham Bridge Pumping Station South 1,194.50 2,033.02 7,150.00 5,116.98P008 Catfield Pumping Station 5,211.91 4,330.44 6,550.00 2,219.56P009 Sutton Pumping Station 3,789.82 4,237.04 6,700.00 2,462.96P010 Chapelfield Pumping Station 2,722.11 8,996.78 5,150.00 -3,846.78P011 Tonnage Bridge Pumping Station 6,154.84 12,065.34 10,030.00 -2,035.34P012 Wayford Bridge Pumping Station 2,235.85 8,885.63 9,000.00 114.37P151 St Benets Pumping Station 1,979.61 6,812.26 4,200.00 -2,612.26
57,893.90 93,336.15 120,180.00 26,843.85Middle Bure
P024 Hermitage Pumping Station 4,684.79 5,593.07 10,237.00 4,643.93P025 Upton Dole Pumping Station 14,700.01 17,442.80 24,075.00 6,632.20P160 South Walsham 0.00 0.00 400.00 400.00
19,384.80 23,035.87 34,712.00 11,676.13Repps
P020 Thurne Pumping Station 4,652.12 6,085.91 10,700.00 4,614.09P021 Repps Pumping Station 1,620.15 4,119.22 8,050.00 3,930.78P022 Martham Pumping Station 7,792.03 9,990.75 10,835.00 844.25
14,064.30 20,195.88 29,585.00 9,389.12Happisburgh
P027 Brograve Pumping Station 22,243.71 32,970.82 26,100.00 -6,870.82P028 Horsey Pumping Station 9,824.18 9,948.82 12,600.00 2,651.18P030 Somerton Auxilary 2,349.00 1,636.63 1,710.00 73.37P147 Somerton North Pumping Station 8,064.22 11,676.82 9,450.00 -2,226.82P029 Somerton South Pumping Station 7,773.33 11,297.07 12,950.00 1,652.93
50,254.44 67,530.16 62,810.00 -4,720.16Lower Bure
P121 Tunstall Pumping Station 28,025.47 12,662.23 15,919.00 3,256.77P122 Five Mile Pumping Station 9,428.59 4,518.38 8,420.00 3,901.62P123 Ashtree Pumping Station 1,742.53 2,545.94 4,700.00 2,154.06P124 Breydon Pumping Station 14,879.19 15,357.87 16,500.00 1,142.13P125 Seven Mile Pumping Station 6,368.89 17,451.65 19,386.00 1,934.35P148 Berney Pumping Station 312.68 1,057.39 1,500.00 442.61P126 Stracey Arms Intake 6,571.04 6,829.79 8,300.00 1,470.21
67,328.39 60,423.25 74,725.00 14,301.75Muckfleet
P031 Mautby Pumping Station 14,978.19 16,144.89 15,925.00 -219.89P034 Stokesby Pumping Station 16,225.93 21,533.03 21,456.00 -77.03
31,204.12 37,677.92 37,381.00 -296.92Lower Yare First - Buckenham
P153 Buckenham Pumping Station 22,382.48 6,621.06 4,848.00 -1,773.06
Lower Yare First - PostwickP152 Postwick Pumping Station 4,163.25 7,299.86 8,615.00 1,315.14
Lower Yare FourthP154 Cantley Pumping Station 3,364.58 5,349.00 6,900.00 1,551.00
15
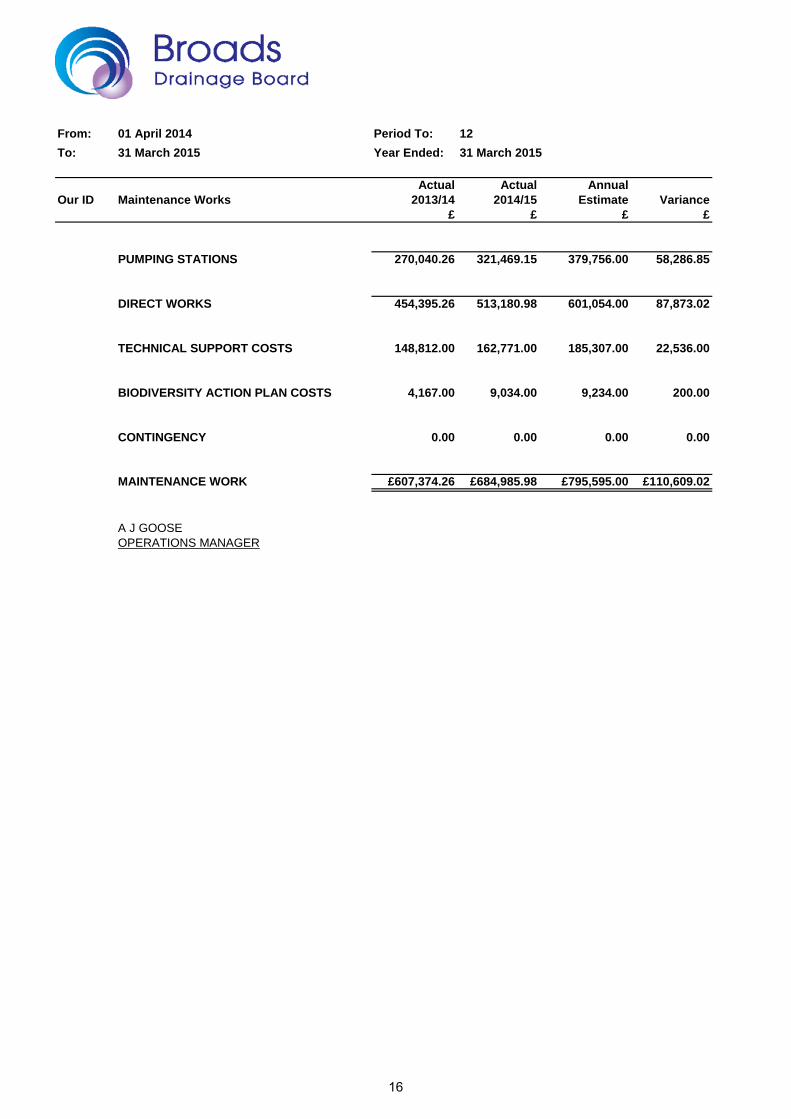
From: 01 April 2014 Period To: 12To: 31 March 2015 Year Ended: 31 March 2015
Actual Actual AnnualOur ID Maintenance Works 2013/14 2014/15 Estimate Variance
£ £ £ £
PUMPING STATIONS 270,040.26 321,469.15 379,756.00 58,286.85
DIRECT WORKS 454,395.26 513,180.98 601,054.00 87,873.02
TECHNICAL SUPPORT COSTS 148,812.00 162,771.00 185,307.00 22,536.00
BIODIVERSITY ACTION PLAN COSTS 4,167.00 9,034.00 9,234.00 200.00
CONTINGENCY 0.00 0.00 0.00 0.00
MAINTENANCE WORK £607,374.26 £684,985.98 £795,595.00 £110,609.02
A J GOOSEOPERATIONS MANAGER
16
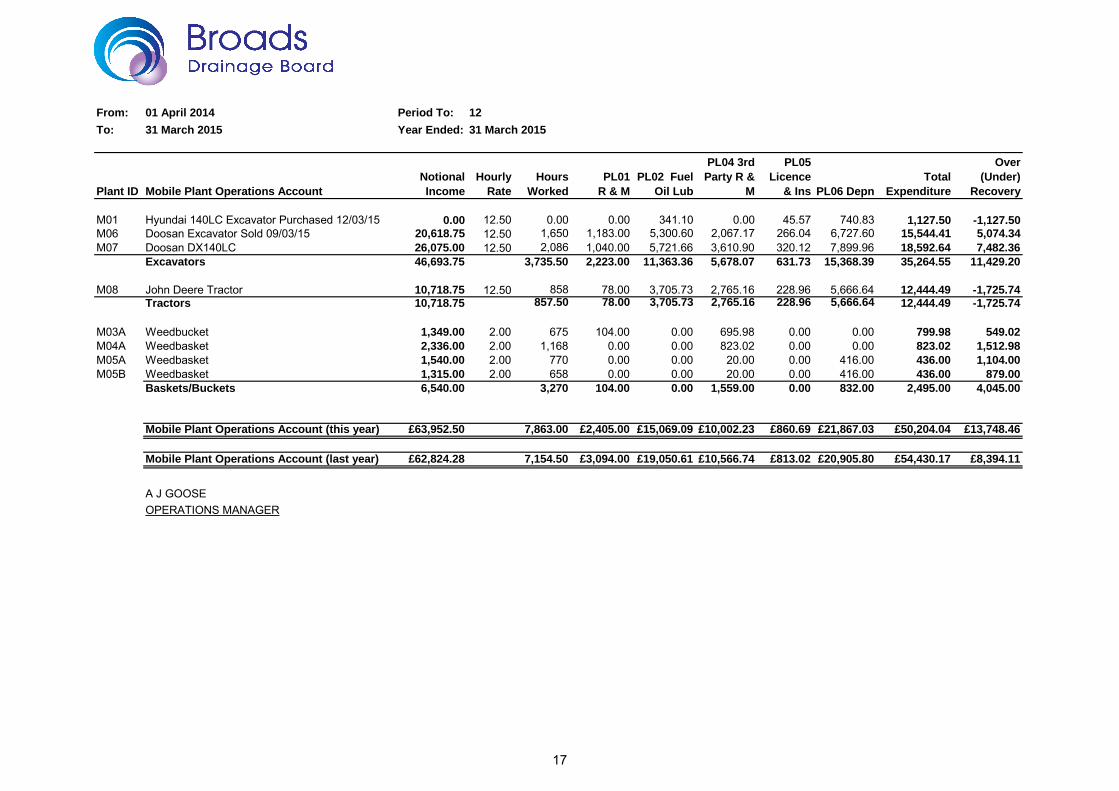
From: 01 April 2014 Period To: 12
To: 31 March 2015 Year Ended: 31 March 2015
Plant ID Mobile Plant Operations Account
Notional
Income
Hourly
Rate
Hours
Worked
PL01
R & M
PL02 Fuel
Oil Lub
PL04 3rd
Party R &
M
PL05
Licence
& Ins PL06 Depn
Total
Expenditure
Over
(Under)
Recovery
M01 Hyundai 140LC Excavator Purchased 12/03/15 0.00 12.50 0.00 0.00 341.10 0.00 45.57 740.83 1,127.50 -1,127.50
M06 Doosan Excavator Sold 09/03/15 20,618.75 12.50 1,650 1,183.00 5,300.60 2,067.17 266.04 6,727.60 15,544.41 5,074.34
M07 Doosan DX140LC 26,075.00 12.50 2,086 1,040.00 5,721.66 3,610.90 320.12 7,899.96 18,592.64 7,482.36
Excavators 46,693.75 3,735.50 2,223.00 11,363.36 5,678.07 631.73 15,368.39 35,264.55 11,429.20
M08 John Deere Tractor 10,718.75 12.50 858 78.00 3,705.73 2,765.16 228.96 5,666.64 12,444.49 -1,725.74Tractors 10,718.75 857.50 78.00 3,705.73 2,765.16 228.96 5,666.64 12,444.49 -1,725.74
M03A Weedbucket 1,349.00 2.00 675 104.00 0.00 695.98 0.00 0.00 799.98 549.02
M04A Weedbasket 2,336.00 2.00 1,168 0.00 0.00 823.02 0.00 0.00 823.02 1,512.98
M05A Weedbasket 1,540.00 2.00 770 0.00 0.00 20.00 0.00 416.00 436.00 1,104.00
M05B Weedbasket 1,315.00 2.00 658 0.00 0.00 20.00 0.00 416.00 436.00 879.00
Baskets/Buckets 6,540.00 3,270 104.00 0.00 1,559.00 0.00 832.00 2,495.00 4,045.00
Mobile Plant Operations Account (this year) £63,952.50 7,863.00 £2,405.00 £15,069.09 £10,002.23 £860.69 £21,867.03 £50,204.04 £13,748.46
Mobile Plant Operations Account (last year) £62,824.28 7,154.50 £3,094.00 £19,050.61 £10,566.74 £813.02 £20,905.80 £54,430.17 £8,394.11
A J GOOSEOPERATIONS MANAGER
17
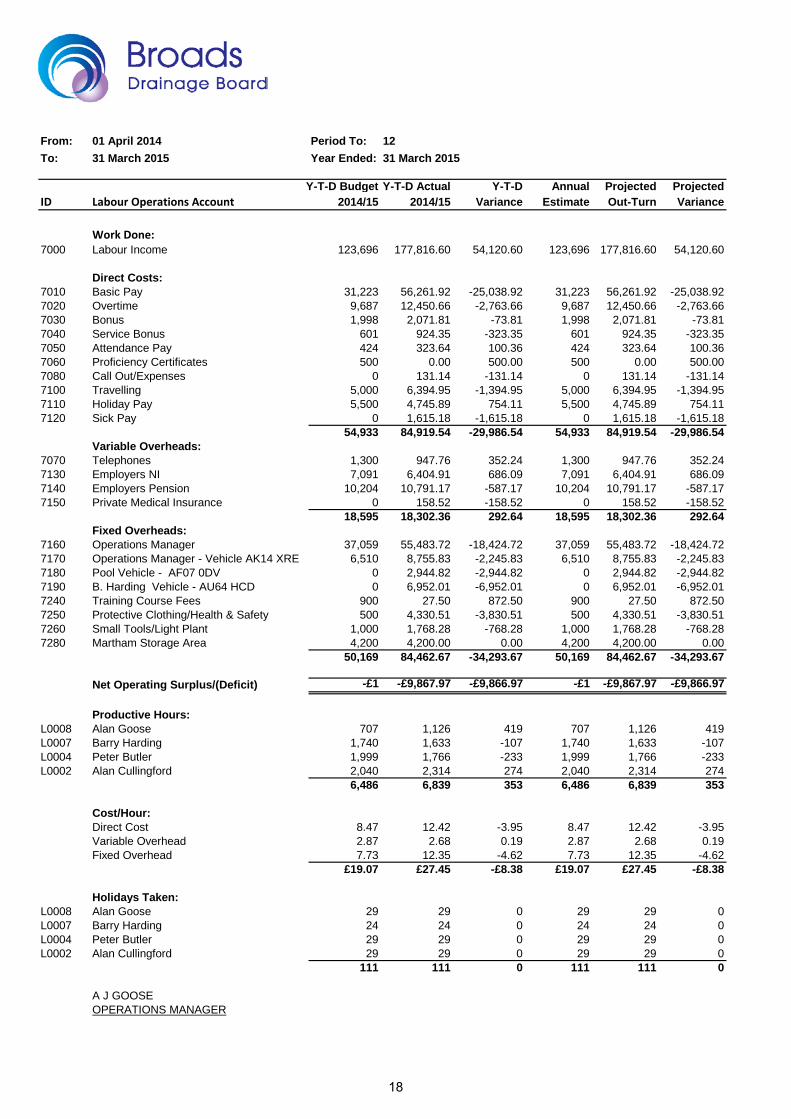
From: 01 April 2014 Period To: 12To: 31 March 2015 Year Ended: 31 March 2015
Y-T-D Budget Y-T-D Actual Y-T-D Annual Projected ProjectedID Labour Operations Account 2014/15 2014/15 Variance Estimate Out-Turn Variance
Work Done:7000 Labour Income 123,696 177,816.60 54,120.60 123,696 177,816.60 54,120.60
Direct Costs:7010 Basic Pay 31,223 56,261.92 -25,038.92 31,223 56,261.92 -25,038.927020 Overtime 9,687 12,450.66 -2,763.66 9,687 12,450.66 -2,763.667030 Bonus 1,998 2,071.81 -73.81 1,998 2,071.81 -73.817040 Service Bonus 601 924.35 -323.35 601 924.35 -323.357050 Attendance Pay 424 323.64 100.36 424 323.64 100.367060 Proficiency Certificates 500 0.00 500.00 500 0.00 500.007080 Call Out/Expenses 0 131.14 -131.14 0 131.14 -131.147100 Travelling 5,000 6,394.95 -1,394.95 5,000 6,394.95 -1,394.957110 Holiday Pay 5,500 4,745.89 754.11 5,500 4,745.89 754.117120 Sick Pay 0 1,615.18 -1,615.18 0 1,615.18 -1,615.18
54,933 84,919.54 -29,986.54 54,933 84,919.54 -29,986.54Variable Overheads:
7070 Telephones 1,300 947.76 352.24 1,300 947.76 352.247130 Employers NI 7,091 6,404.91 686.09 7,091 6,404.91 686.097140 Employers Pension 10,204 10,791.17 -587.17 10,204 10,791.17 -587.177150 Private Medical Insurance 0 158.52 -158.52 0 158.52 -158.52
18,595 18,302.36 292.64 18,595 18,302.36 292.64Fixed Overheads:
7160 Operations Manager 37,059 55,483.72 -18,424.72 37,059 55,483.72 -18,424.727170 Operations Manager - Vehicle AK14 XRE 6,510 8,755.83 -2,245.83 6,510 8,755.83 -2,245.837180 Pool Vehicle - AF07 0DV 0 2,944.82 -2,944.82 0 2,944.82 -2,944.827190 B. Harding Vehicle - AU64 HCD 0 6,952.01 -6,952.01 0 6,952.01 -6,952.017240 Training Course Fees 900 27.50 872.50 900 27.50 872.507250 Protective Clothing/Health & Safety 500 4,330.51 -3,830.51 500 4,330.51 -3,830.517260 Small Tools/Light Plant 1,000 1,768.28 -768.28 1,000 1,768.28 -768.287280 Martham Storage Area 4,200 4,200.00 0.00 4,200 4,200.00 0.00
50,169 84,462.67 -34,293.67 50,169 84,462.67 -34,293.67
Net Operating Surplus/(Deficit) -£1 -£9,867.97 -£9,866.97 -£1 -£9,867.97 -£9,866.97
Productive Hours:L0008 Alan Goose 707 1,126 419 707 1,126 419L0007 Barry Harding 1,740 1,633 -107 1,740 1,633 -107L0004 Peter Butler 1,999 1,766 -233 1,999 1,766 -233L0002 Alan Cullingford 2,040 2,314 274 2,040 2,314 274
6,486 6,839 353 6,486 6,839 353
Cost/Hour:Direct Cost 8.47 12.42 -3.95 8.47 12.42 -3.95Variable Overhead 2.87 2.68 0.19 2.87 2.68 0.19Fixed Overhead 7.73 12.35 -4.62 7.73 12.35 -4.62
£19.07 £27.45 -£8.38 £19.07 £27.45 -£8.38
Holidays Taken:L0008 Alan Goose 29 29 0 29 29 0L0007 Barry Harding 24 24 0 24 24 0L0004 Peter Butler 29 29 0 29 29 0L0002 Alan Cullingford 29 29 0 29 29 0
111 111 0 111 111 0
A J GOOSEOPERATIONS MANAGER
18
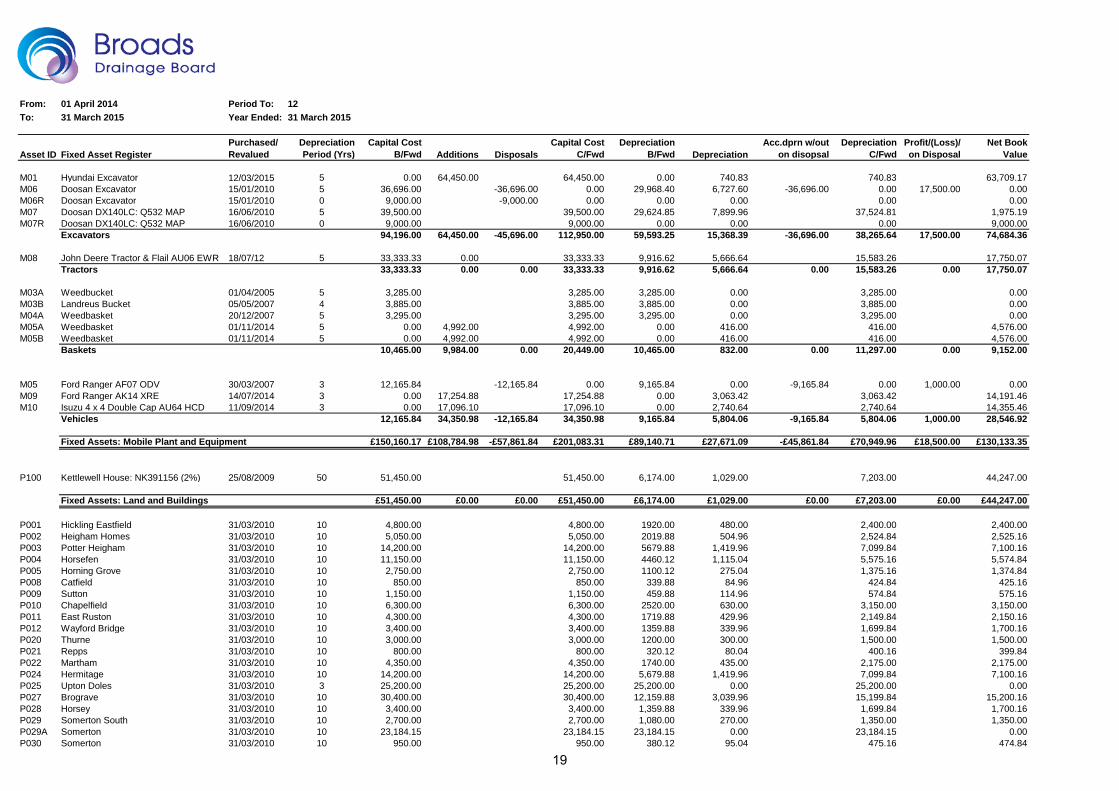
From: 01 April 2014 Period To: 12To: 31 March 2015 Year Ended: 31 March 2015
Asset ID Fixed Asset RegisterPurchased/Revalued
Depreciation Period (Yrs)
Capital Cost B/Fwd Additions Disposals
Capital Cost C/Fwd
Depreciation B/Fwd Depreciation
Acc.dprn w/out on disopsal
Depreciation C/Fwd
Profit/(Loss)/on Disposal
Net Book Value
M01 Hyundai Excavator 12/03/2015 5 0.00 64,450.00 64,450.00 0.00 740.83 740.83 63,709.17M06 Doosan Excavator 15/01/2010 5 36,696.00 -36,696.00 0.00 29,968.40 6,727.60 -36,696.00 0.00 17,500.00 0.00M06R Doosan Excavator 15/01/2010 0 9,000.00 -9,000.00 0.00 0.00 0.00 0.00 0.00M07 Doosan DX140LC: Q532 MAP 16/06/2010 5 39,500.00 39,500.00 29,624.85 7,899.96 37,524.81 1,975.19M07R Doosan DX140LC: Q532 MAP 16/06/2010 0 9,000.00 9,000.00 0.00 0.00 0.00 9,000.00
Excavators 94,196.00 64,450.00 -45,696.00 112,950.00 59,593.25 15,368.39 -36,696.00 38,265.64 17,500.00 74,684.36
M08 John Deere Tractor & Flail AU06 EWR 18/07/12 5 33,333.33 0.00 33,333.33 9,916.62 5,666.64 15,583.26 17,750.07Tractors 33,333.33 0.00 0.00 33,333.33 9,916.62 5,666.64 0.00 15,583.26 0.00 17,750.07
M03A Weedbucket 01/04/2005 5 3,285.00 3,285.00 3,285.00 0.00 3,285.00 0.00M03B Landreus Bucket 05/05/2007 4 3,885.00 3,885.00 3,885.00 0.00 3,885.00 0.00M04A Weedbasket 20/12/2007 5 3,295.00 3,295.00 3,295.00 0.00 3,295.00 0.00M05A Weedbasket 01/11/2014 5 0.00 4,992.00 4,992.00 0.00 416.00 416.00 4,576.00M05B Weedbasket 01/11/2014 5 0.00 4,992.00 4,992.00 0.00 416.00 416.00 4,576.00
Baskets 10,465.00 9,984.00 0.00 20,449.00 10,465.00 832.00 0.00 11,297.00 0.00 9,152.00
M05 Ford Ranger AF07 ODV 30/03/2007 3 12,165.84 -12,165.84 0.00 9,165.84 0.00 -9,165.84 0.00 1,000.00 0.00M09 Ford Ranger AK14 XRE 14/07/2014 3 0.00 17,254.88 17,254.88 0.00 3,063.42 3,063.42 14,191.46M10 Isuzu 4 x 4 Double Cap AU64 HCD 11/09/2014 3 0.00 17,096.10 17,096.10 0.00 2,740.64 2,740.64 14,355.46
Vehicles 12,165.84 34,350.98 -12,165.84 34,350.98 9,165.84 5,804.06 -9,165.84 5,804.06 1,000.00 28,546.92
Fixed Assets: Mobile Plant and Equipment £150,160.17 £108,784.98 -£57,861.84 £201,083.31 £89,140.71 £27,671.09 -£45,861.84 £70,949.96 £18,500.00 £130,133.35
P100 Kettlewell House: NK391156 (2%) 25/08/2009 50 51,450.00 51,450.00 6,174.00 1,029.00 7,203.00 44,247.00
Fixed Assets: Land and Buildings £51,450.00 £0.00 £0.00 £51,450.00 £6,174.00 £1,029.00 £0.00 £7,203.00 £0.00 £44,247.00
P001 Hickling Eastfield 31/03/2010 10 4,800.00 4,800.00 1920.00 480.00 2,400.00 2,400.00P002 Heigham Homes 31/03/2010 10 5,050.00 5,050.00 2019.88 504.96 2,524.84 2,525.16P003 Potter Heigham 31/03/2010 10 14,200.00 14,200.00 5679.88 1,419.96 7,099.84 7,100.16P004 Horsefen 31/03/2010 10 11,150.00 11,150.00 4460.12 1,115.04 5,575.16 5,574.84P005 Horning Grove 31/03/2010 10 2,750.00 2,750.00 1100.12 275.04 1,375.16 1,374.84P008 Catfield 31/03/2010 10 850.00 850.00 339.88 84.96 424.84 425.16P009 Sutton 31/03/2010 10 1,150.00 1,150.00 459.88 114.96 574.84 575.16P010 Chapelfield 31/03/2010 10 6,300.00 6,300.00 2520.00 630.00 3,150.00 3,150.00P011 East Ruston 31/03/2010 10 4,300.00 4,300.00 1719.88 429.96 2,149.84 2,150.16P012 Wayford Bridge 31/03/2010 10 3,400.00 3,400.00 1359.88 339.96 1,699.84 1,700.16P020 Thurne 31/03/2010 10 3,000.00 3,000.00 1200.00 300.00 1,500.00 1,500.00P021 Repps 31/03/2010 10 800.00 800.00 320.12 80.04 400.16 399.84P022 Martham 31/03/2010 10 4,350.00 4,350.00 1740.00 435.00 2,175.00 2,175.00P024 Hermitage 31/03/2010 10 14,200.00 14,200.00 5,679.88 1,419.96 7,099.84 7,100.16P025 Upton Doles 31/03/2010 3 25,200.00 25,200.00 25,200.00 0.00 25,200.00 0.00P027 Brograve 31/03/2010 10 30,400.00 30,400.00 12,159.88 3,039.96 15,199.84 15,200.16P028 Horsey 31/03/2010 10 3,400.00 3,400.00 1,359.88 339.96 1,699.84 1,700.16P029 Somerton South 31/03/2010 10 2,700.00 2,700.00 1,080.00 270.00 1,350.00 1,350.00P029A Somerton 31/03/2010 10 23,184.15 23,184.15 23,184.15 0.00 23,184.15 0.00P030 Somerton 31/03/2010 10 950.00 950.00 380.12 95.04 475.16 474.84
19
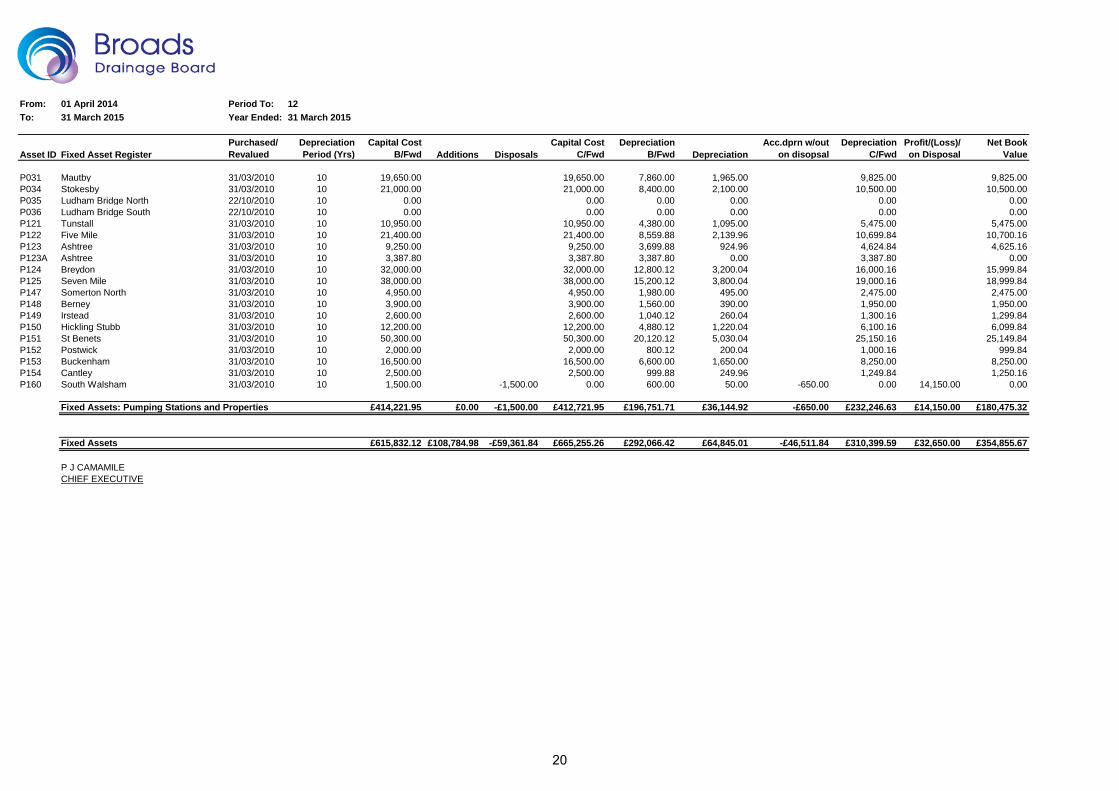
From: 01 April 2014 Period To: 12To: 31 March 2015 Year Ended: 31 March 2015
Asset ID Fixed Asset RegisterPurchased/Revalued
Depreciation Period (Yrs)
Capital Cost B/Fwd Additions Disposals
Capital Cost C/Fwd
Depreciation B/Fwd Depreciation
Acc.dprn w/out on disopsal
Depreciation C/Fwd
Profit/(Loss)/on Disposal
Net Book Value
P031 Mautby 31/03/2010 10 19,650.00 19,650.00 7,860.00 1,965.00 9,825.00 9,825.00P034 Stokesby 31/03/2010 10 21,000.00 21,000.00 8,400.00 2,100.00 10,500.00 10,500.00P035 Ludham Bridge North 22/10/2010 10 0.00 0.00 0.00 0.00 0.00 0.00P036 Ludham Bridge South 22/10/2010 10 0.00 0.00 0.00 0.00 0.00 0.00P121 Tunstall 31/03/2010 10 10,950.00 10,950.00 4,380.00 1,095.00 5,475.00 5,475.00P122 Five Mile 31/03/2010 10 21,400.00 21,400.00 8,559.88 2,139.96 10,699.84 10,700.16P123 Ashtree 31/03/2010 10 9,250.00 9,250.00 3,699.88 924.96 4,624.84 4,625.16P123A Ashtree 31/03/2010 10 3,387.80 3,387.80 3,387.80 0.00 3,387.80 0.00P124 Breydon 31/03/2010 10 32,000.00 32,000.00 12,800.12 3,200.04 16,000.16 15,999.84P125 Seven Mile 31/03/2010 10 38,000.00 38,000.00 15,200.12 3,800.04 19,000.16 18,999.84P147 Somerton North 31/03/2010 10 4,950.00 4,950.00 1,980.00 495.00 2,475.00 2,475.00P148 Berney 31/03/2010 10 3,900.00 3,900.00 1,560.00 390.00 1,950.00 1,950.00P149 Irstead 31/03/2010 10 2,600.00 2,600.00 1,040.12 260.04 1,300.16 1,299.84P150 Hickling Stubb 31/03/2010 10 12,200.00 12,200.00 4,880.12 1,220.04 6,100.16 6,099.84P151 St Benets 31/03/2010 10 50,300.00 50,300.00 20,120.12 5,030.04 25,150.16 25,149.84P152 Postwick 31/03/2010 10 2,000.00 2,000.00 800.12 200.04 1,000.16 999.84P153 Buckenham 31/03/2010 10 16,500.00 16,500.00 6,600.00 1,650.00 8,250.00 8,250.00P154 Cantley 31/03/2010 10 2,500.00 2,500.00 999.88 249.96 1,249.84 1,250.16P160 South Walsham 31/03/2010 10 1,500.00 -1,500.00 0.00 600.00 50.00 -650.00 0.00 14,150.00 0.00
Fixed Assets: Pumping Stations and Properties £414,221.95 £0.00 -£1,500.00 £412,721.95 £196,751.71 £36,144.92 -£650.00 £232,246.63 £14,150.00 £180,475.32
Fixed Assets £615,832.12 £108,784.98 -£59,361.84 £665,255.26 £292,066.42 £64,845.01 -£46,511.84 £310,399.59 £32,650.00 £354,855.67
P J CAMAMILECHIEF EXECUTIVE
20
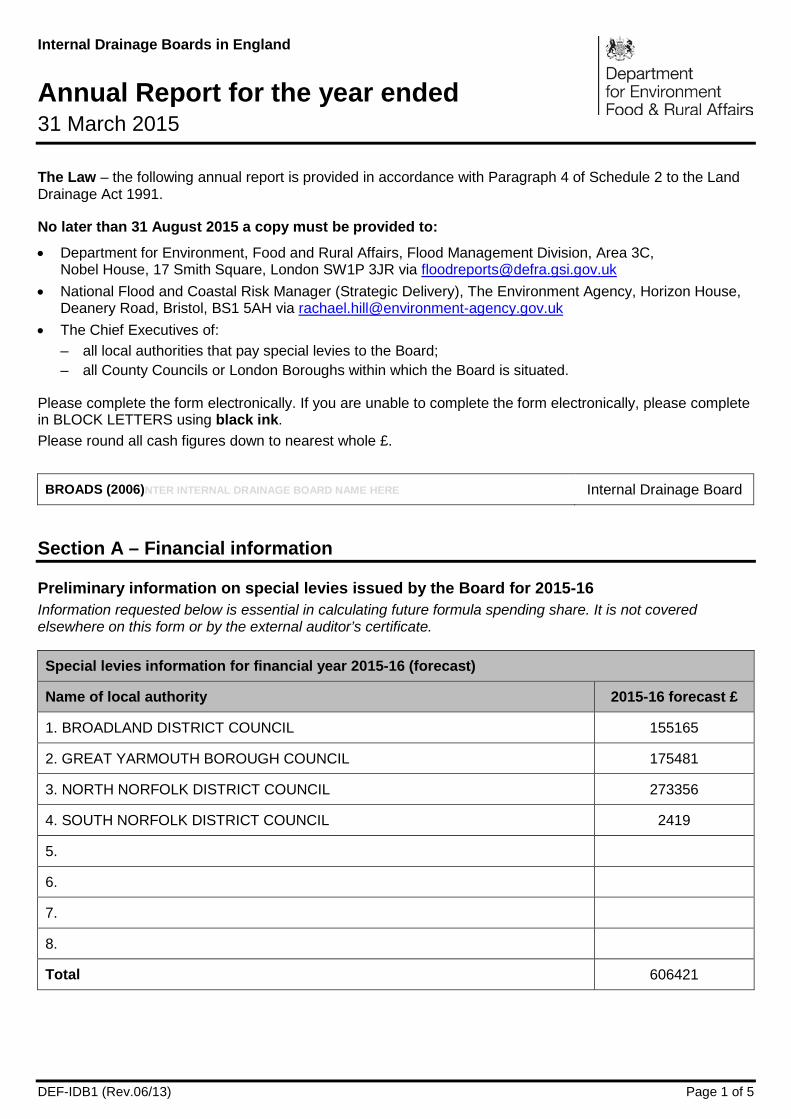
DEF-IDB1 (Rev.06/13) Page 1 of 5
Internal Drainage Boards in England
Annual Report for the year ended 31 March 2015
The Law – the following annual report is provided in accordance with Paragraph 4 of Schedule 2 to the Land Drainage Act 1991.
No later than 31 August 2015 a copy must be provided to:
• Department for Environment, Food and Rural Affairs, Flood Management Division, Area 3C, Nobel House, 17 Smith Square, London SW1P 3JR via [email protected]
• National Flood and Coastal Risk Manager (Strategic Delivery), The Environment Agency, Horizon House, Deanery Road, Bristol, BS1 5AH via [email protected]
• The Chief Executives of: – all local authorities that pay special levies to the Board; – all County Councils or London Boroughs within which the Board is situated.
Please complete the form electronically. If you are unable to complete the form electronically, please complete in BLOCK LETTERS using black ink. Please round all cash figures down to nearest whole £.
BROADS (2006)NTER INTERNAL DRAINAGE BOARD NAME HERE Internal Drainage Board
Section A – Financial information
Preliminary information on special levies issued by the Board for 2015-16 Information requested below is essential in calculating future formula spending share. It is not covered elsewhere on this form or by the external auditor’s certificate.
Special levies information for financial year 2015-16 (forecast)
Name of local authority 2015-16 forecast £
1. BROADLAND DISTRICT COUNCIL 155165
2. GREAT YARMOUTH BOROUGH COUNCIL 175481
3. NORTH NORFOLK DISTRICT COUNCIL 273356
4. SOUTH NORFOLK DISTRICT COUNCIL 2419
5.
6.
7.
8.
Total 606421
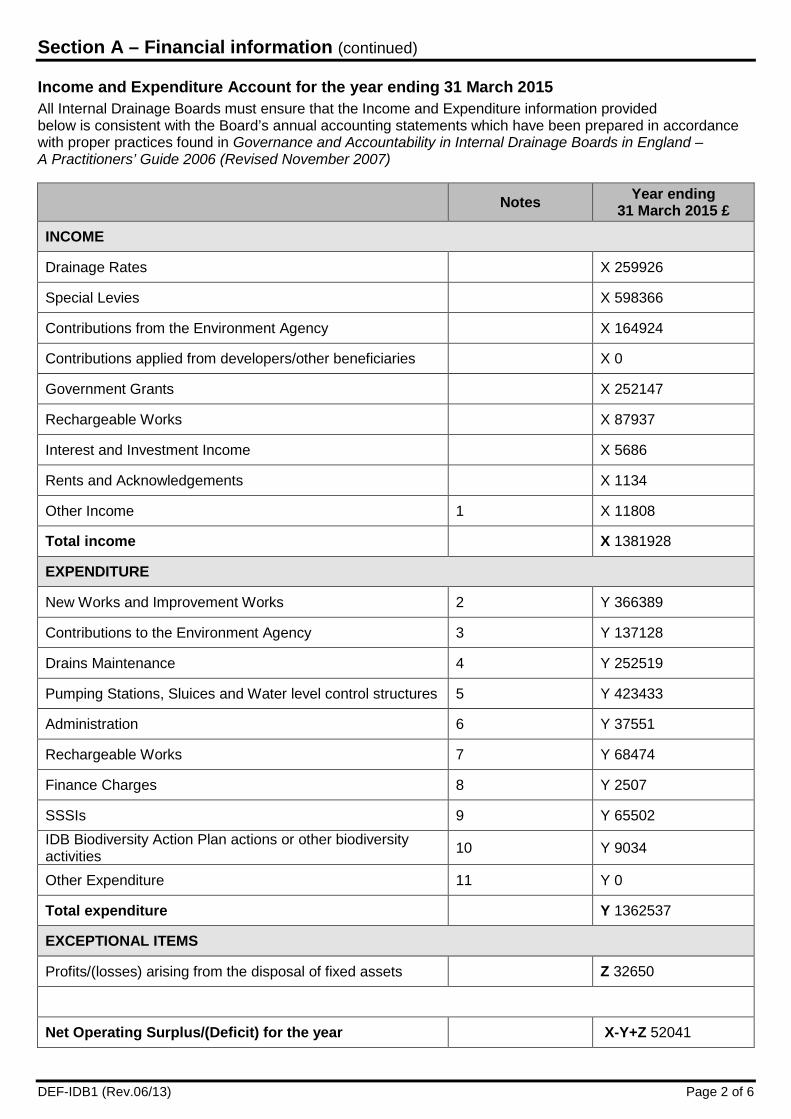
DEF-IDB1 (Rev.06/13) Page 2 of 6
Section A – Financial information (continued)
Income and Expenditure Account for the year ending 31 March 2015 All Internal Drainage Boards must ensure that the Income and Expenditure information provided below is consistent with the Board’s annual accounting statements which have been prepared in accordance with proper practices found in Governance and Accountability in Internal Drainage Boards in England – A Practitioners’ Guide 2006 (Revised November 2007)
Notes Year ending 31 March 2015 £
INCOME
Drainage Rates X 259926
Special Levies X 598366
Contributions from the Environment Agency X 164924
Contributions applied from developers/other beneficiaries X 0
Government Grants X 252147
Rechargeable Works X 87937
Interest and Investment Income X 5686
Rents and Acknowledgements X 1134
Other Income 1 X 11808
Total income X 1381928
EXPENDITURE
New Works and Improvement Works 2 Y 366389
Contributions to the Environment Agency 3 Y 137128
Drains Maintenance 4 Y 252519
Pumping Stations, Sluices and Water level control structures 5 Y 423433
Administration 6 Y 37551
Rechargeable Works 7 Y 68474
Finance Charges 8 Y 2507
SSSIs 9 Y 65502
IDB Biodiversity Action Plan actions or other biodiversity activities 10 Y 9034
Other Expenditure 11 Y 0
Total expenditure Y 1362537
EXCEPTIONAL ITEMS
Profits/(losses) arising from the disposal of fixed assets Z 32650
Net Operating Surplus/(Deficit) for the year X-Y+Z 52041
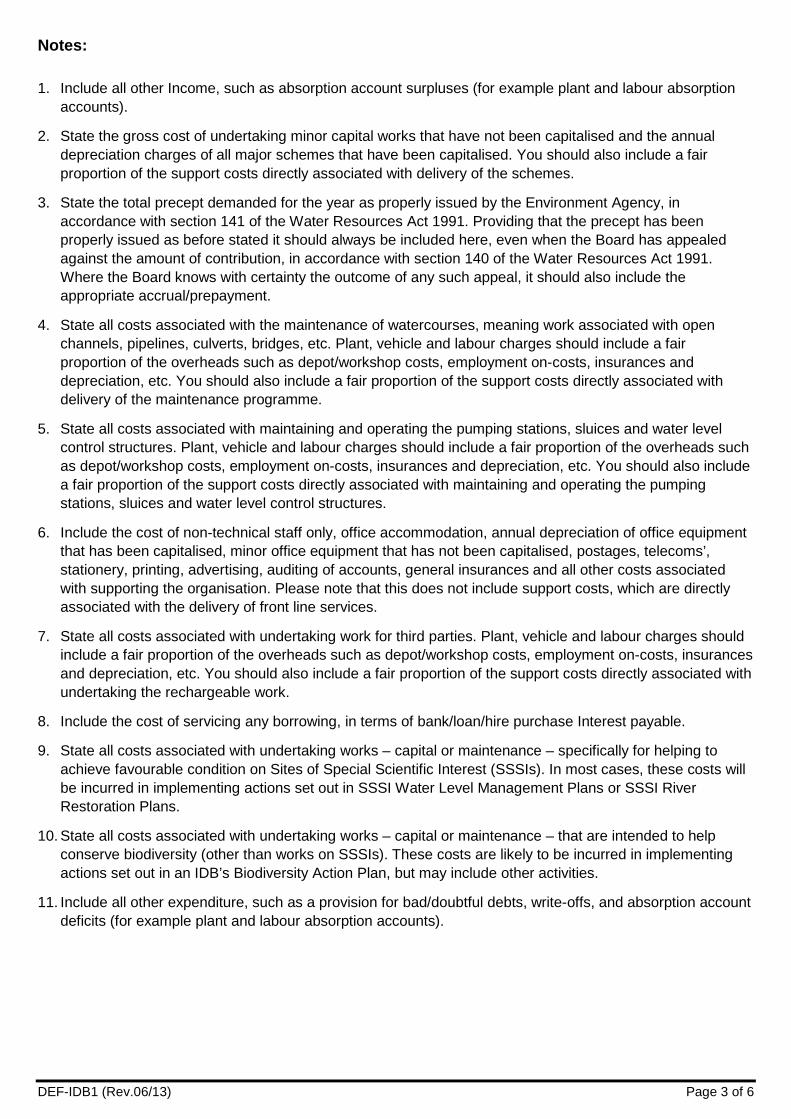
DEF-IDB1 (Rev.06/13) Page 3 of 6
Notes:
1. Include all other Income, such as absorption account surpluses (for example plant and labour absorption accounts).
2. State the gross cost of undertaking minor capital works that have not been capitalised and the annual depreciation charges of all major schemes that have been capitalised. You should also include a fair proportion of the support costs directly associated with delivery of the schemes.
3. State the total precept demanded for the year as properly issued by the Environment Agency, in accordance with section 141 of the Water Resources Act 1991. Providing that the precept has been properly issued as before stated it should always be included here, even when the Board has appealed against the amount of contribution, in accordance with section 140 of the Water Resources Act 1991. Where the Board knows with certainty the outcome of any such appeal, it should also include the appropriate accrual/prepayment.
4. State all costs associated with the maintenance of watercourses, meaning work associated with open channels, pipelines, culverts, bridges, etc. Plant, vehicle and labour charges should include a fair proportion of the overheads such as depot/workshop costs, employment on-costs, insurances and depreciation, etc. You should also include a fair proportion of the support costs directly associated with delivery of the maintenance programme.
5. State all costs associated with maintaining and operating the pumping stations, sluices and water level control structures. Plant, vehicle and labour charges should include a fair proportion of the overheads such as depot/workshop costs, employment on-costs, insurances and depreciation, etc. You should also include a fair proportion of the support costs directly associated with maintaining and operating the pumping stations, sluices and water level control structures.
6. Include the cost of non-technical staff only, office accommodation, annual depreciation of office equipment that has been capitalised, minor office equipment that has not been capitalised, postages, telecoms’, stationery, printing, advertising, auditing of accounts, general insurances and all other costs associated with supporting the organisation. Please note that this does not include support costs, which are directly associated with the delivery of front line services.
7. State all costs associated with undertaking work for third parties. Plant, vehicle and labour charges should include a fair proportion of the overheads such as depot/workshop costs, employment on-costs, insurances and depreciation, etc. You should also include a fair proportion of the support costs directly associated with undertaking the rechargeable work.
8. Include the cost of servicing any borrowing, in terms of bank/loan/hire purchase Interest payable.
9. State all costs associated with undertaking works – capital or maintenance – specifically for helping to achieve favourable condition on Sites of Special Scientific Interest (SSSIs). In most cases, these costs will be incurred in implementing actions set out in SSSI Water Level Management Plans or SSSI River Restoration Plans.
10. State all costs associated with undertaking works – capital or maintenance – that are intended to help conserve biodiversity (other than works on SSSIs). These costs are likely to be incurred in implementing actions set out in an IDB’s Biodiversity Action Plan, but may include other activities.
11. Include all other expenditure, such as a provision for bad/doubtful debts, write-offs, and absorption account deficits (for example plant and labour absorption accounts).
DEF-IDB1 (Rev.06/13) Page 4 of 6
Section B – Defra high level target and IDB Review Reporting
This section relates to the Board’s achievement of High Level Targets (HLTs) issued by Defra in March 2005, including information required by the Environment Agency as a result of the targets or in relation to their general supervisory duty. Only those HLTs relevant to IDBs are covered below. This section also allows for reporting on IDB Review Targets.
HLT 1 – Policy Delivery Statement Boards were required to produce a publicly available policy statement by 31 March 2001 setting out their plans for delivering the Government’s policy aims and objectives. The full range of issues to be covered was set out in a template issued in June 2000. It is recommended that these statements be published on Boards’ websites where they have them and reviewed every three years.
Is an up to date statement in place and copy (or weblink) provided to Defra, EA and CLG? http://www.wlma.org.uk/uploads/BIDB_Policy_Statement.pdf Yes √ No If ‘NO’, please say why not and when the statement will be produced/revised:
HLT 2 – Information on the National Flood and Coastal Defence Database The IDB Review Project Board and the Environment Agency have agreed the means to allow data to be stored on the National Flood and Coastal Defence Database or equivalent systems. Boards are required to report on their asset holding and asset condition at the end of 2007/08.
HLT 3 – Biodiversity Please indicate whether your Board has published a Biodiversity Action Plan .......................................... Yes √
Access to environmental expertise Does your IDB have access to environmental expertise? If so please tick all those options below through which environmental expertise is regularly provided to your IDB: Appropriately skilled Board Members (e.g. Board member from an Environmental Body/Authority) √ Directly employed staff √ Contracted persons or consultants √ Environmental Partners/NGOs √ Other (please describe)
DEF-IDB1 (Rev.06/13) Page 5 of 6
Asset Management (IDB Review Strand A3) What system/database does your Board use to manage the assets it is responsible for? (A) ADIS (B) NFCDD (C) Paper Records (D) Other Electronic System (please describe)
D) Bespoke Microsoft Access Database and GIS
Has your Board continued to undertake visual inspections and update asset databases on an annual basis? ........................................................................................................... Yes
DEF-IDB1 (Rev.06/13) Page 6 of 6
Guidance and Best Practice (IDB Review Section B) How many Board members (in total – elected and appointed) do you have on your IDB? 39
Has your IDB adopted a formal Scheme of Delegation? ............................................................................... Yes Has your IDB provided training for members in the last year? Considered: .................................................................................................................................................. Yes Implemented: ................................................................................................................................................ Yes
Please detail: Various presentations at Board Meetings.
Immediate Action (IDB Review Section C) Has your IDB adopted minimum website requirements as specified in the IDB Review Implementation Plan? ................................................................................................................ Yes Is your Board’s website information current for 2015? (Board membership, audited accounts, programmes of works, WLMPS, etc) ................................................................................ Yes
Has your IDB adopted computerised accounting and rating systems, as specified in the IDB Review Implementation Plan? ................................................................................... Yes Has your Board adopted the following governance documents?
Standing Orders .......................................................................................................................................... Yes Have the Standing Orders been approved by Ministers ................................................................................ Yes Byelaws ........................................................................................................................................................ Yes Have the Byelaws been approved by Ministers ............................................................................................. Yes Code of Conduct for Board Members ............................................................................................................ Yes Financial Regulations .................................................................................................................................... Yes Register of Member’s Interests ..................................................................................................................... Yes
DEF-IDB1 (Rev.06/13) Page 7 of 6
Section C – Declaration
BROADS (2006)ENTER INTERNAL DRAINAGE BOARD NAME HERE Internal Drainage Board
I confirm that the information provided in sections A-C or with this form is correct.
Signature
Date 21 August 2015
Name in BLOCK LETTERS P J CAMAMILE
Designation CHIEF EXECUTIVE
Email address [email protected]
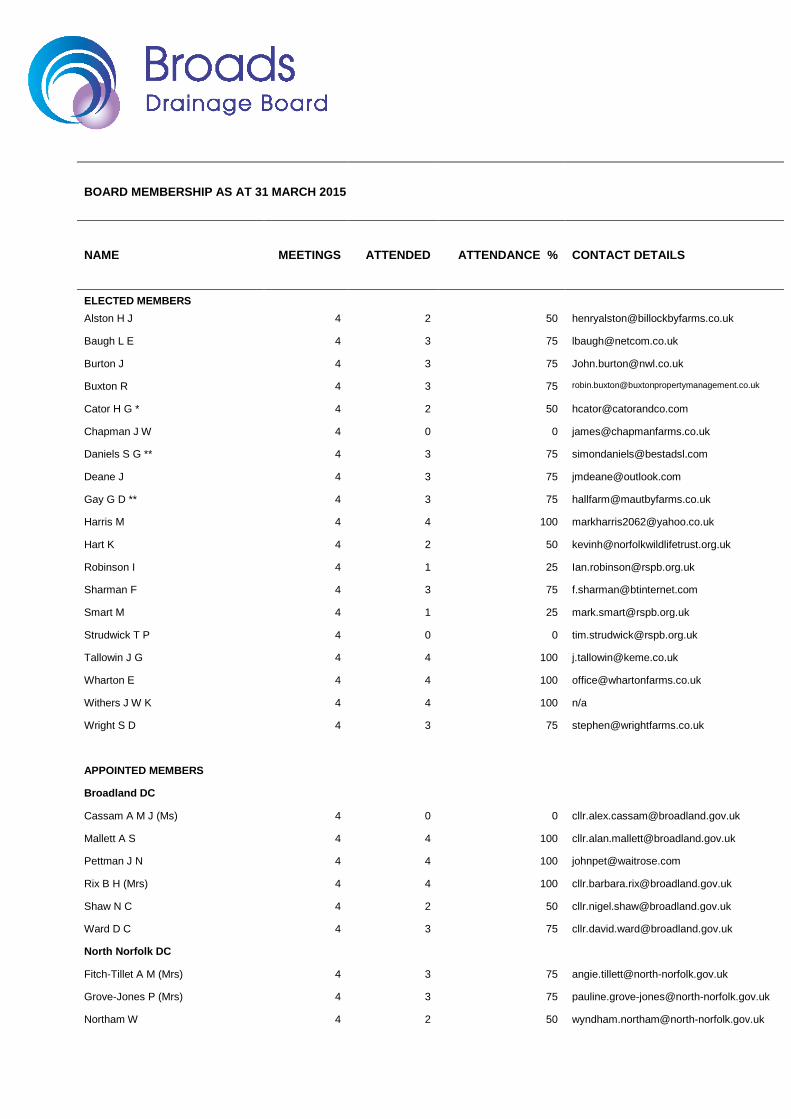
BOARD MEMBERSHIP AS AT 31 MARCH 2015
NAME MEETINGS ATTENDED ATTENDANCE % CONTACT DETAILS
ELECTED MEMBERS Alston H J 4 2 50 [email protected]
Baugh L E 4 3 75 [email protected]
Burton J 4 3 75 [email protected]
Buxton R 4 3 75 [email protected]
Cator H G * 4 2 50 [email protected]
Chapman J W 4 0 0 [email protected]
Daniels S G ** 4 3 75 [email protected]
Deane J 4 3 75 [email protected]
Gay G D ** 4 3 75 [email protected]
Harris M 4 4 100 [email protected]
Hart K 4 2 50 [email protected]
Robinson I 4 1 25 [email protected]
Sharman F 4 3 75 [email protected]
Smart M 4 1 25 [email protected]
Strudwick T P 4 0 0 [email protected]
Tallowin J G 4 4 100 [email protected]
Wharton E 4 4 100 [email protected]
Withers J W K 4 4 100 n/a
Wright S D 4 3 75 [email protected]
APPOINTED MEMBERS
Broadland DC
Cassam A M J (Ms) 4 0 0 [email protected]
Mallett A S 4 4 100 [email protected]
Pettman J N 4 4 100 [email protected]
Rix B H (Mrs) 4 4 100 [email protected]
Shaw N C 4 2 50 [email protected]
Ward D C 4 3 75 [email protected]
North Norfolk DC
Fitch-Tillet A M (Mrs) 4 3 75 [email protected]
Grove-Jones P (Mrs) 4 3 75 [email protected]
Northam W 4 2 50 [email protected]
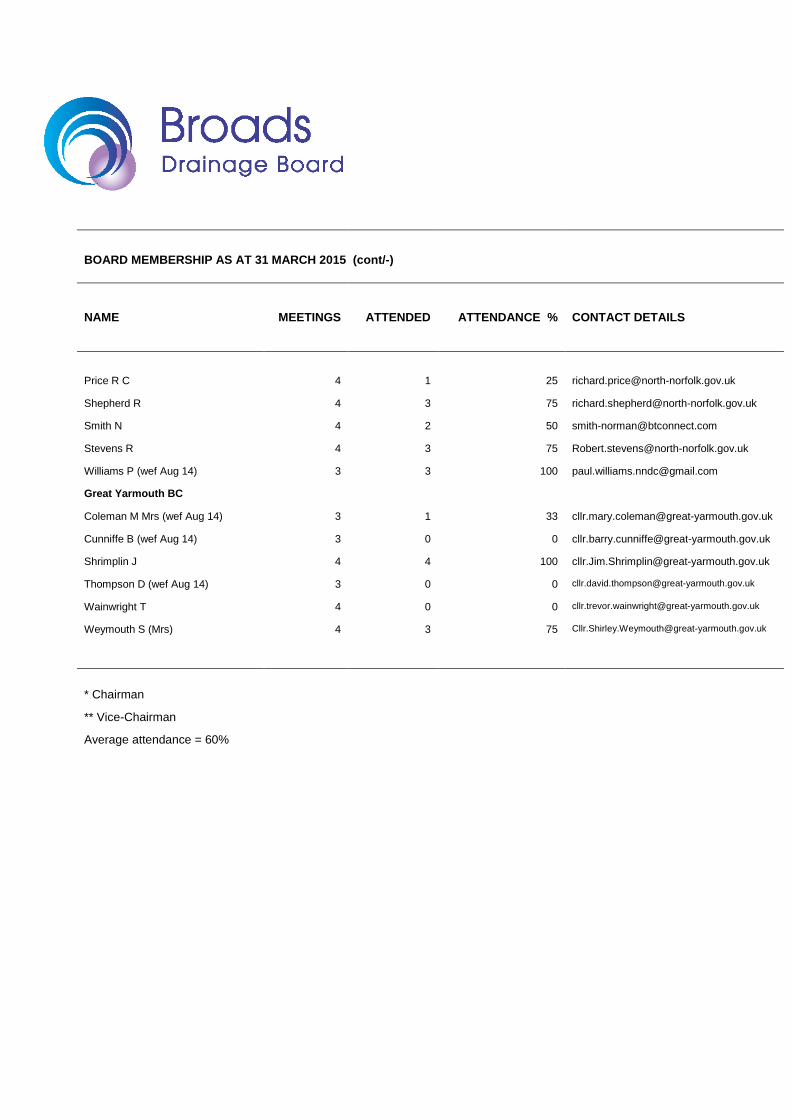
BOARD MEMBERSHIP AS AT 31 MARCH 2015 (cont/-)
NAME MEETINGS ATTENDED ATTENDANCE % CONTACT DETAILS
Price R C 4 1 25 [email protected]
Shepherd R 4 3 75 [email protected]
Smith N 4 2 50 [email protected]
Stevens R 4 3 75 [email protected]
Williams P (wef Aug 14) 3 3 100 [email protected]
Great Yarmouth BC
Coleman M Mrs (wef Aug 14) 3 1 33 [email protected]
Cunniffe B (wef Aug 14) 3 0 0 [email protected]
Shrimplin J 4 4 100 [email protected]
Thompson D (wef Aug 14) 3 0 0 [email protected]
Wainwright T 4 0 0 [email protected]
Weymouth S (Mrs) 4 3 75 [email protected]
* Chairman
** Vice-Chairman
Average attendance = 60%

Board Members and Officers
Gifts and Hospitality Register for 2014/15
Date Member/Employee Offer from Description Value (if known)
Accepted/Declined
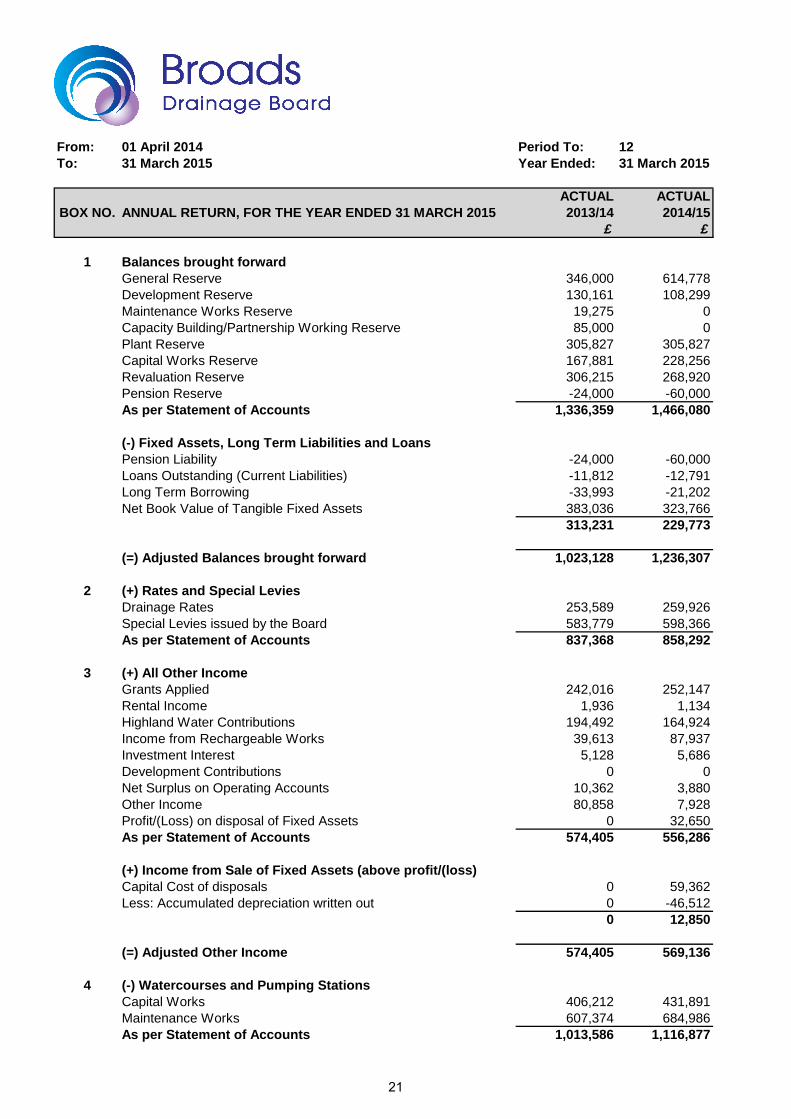
From: 01 April 2014 Period To: 12To: 31 March 2015 Year Ended: 31 March 2015
ACTUAL ACTUALBOX NO. ANNUAL RETURN, FOR THE YEAR ENDED 31 MARCH 2015 2013/14 2014/15
£ £
1 Balances brought forwardGeneral Reserve 346,000 614,778Development Reserve 130,161 108,299Maintenance Works Reserve 19,275 0Capacity Building/Partnership Working Reserve 85,000 0Plant Reserve 305,827 305,827Capital Works Reserve 167,881 228,256Revaluation Reserve 306,215 268,920Pension Reserve -24,000 -60,000As per Statement of Accounts 1,336,359 1,466,080
(-) Fixed Assets, Long Term Liabilities and LoansPension Liability -24,000 -60,000Loans Outstanding (Current Liabilities) -11,812 -12,791Long Term Borrowing -33,993 -21,202Net Book Value of Tangible Fixed Assets 383,036 323,766
313,231 229,773
(=) Adjusted Balances brought forward 1,023,128 1,236,307
2 (+) Rates and Special LeviesDrainage Rates 253,589 259,926Special Levies issued by the Board 583,779 598,366As per Statement of Accounts 837,368 858,292
3 (+) All Other IncomeGrants Applied 242,016 252,147Rental Income 1,936 1,134Highland Water Contributions 194,492 164,924Income from Rechargeable Works 39,613 87,937Investment Interest 5,128 5,686Development Contributions 0 0Net Surplus on Operating Accounts 10,362 3,880Other Income 80,858 7,928Profit/(Loss) on disposal of Fixed Assets 0 32,650As per Statement of Accounts 574,405 556,286
(+) Income from Sale of Fixed Assets (above profit/(loss)Capital Cost of disposals 0 59,362Less: Accumulated depreciation written out 0 -46,512
0 12,850
(=) Adjusted Other Income 574,405 569,136
4 (-) Watercourses and Pumping StationsCapital Works 406,212 431,891Maintenance Works 607,374 684,986As per Statement of Accounts 1,013,586 1,116,877
21
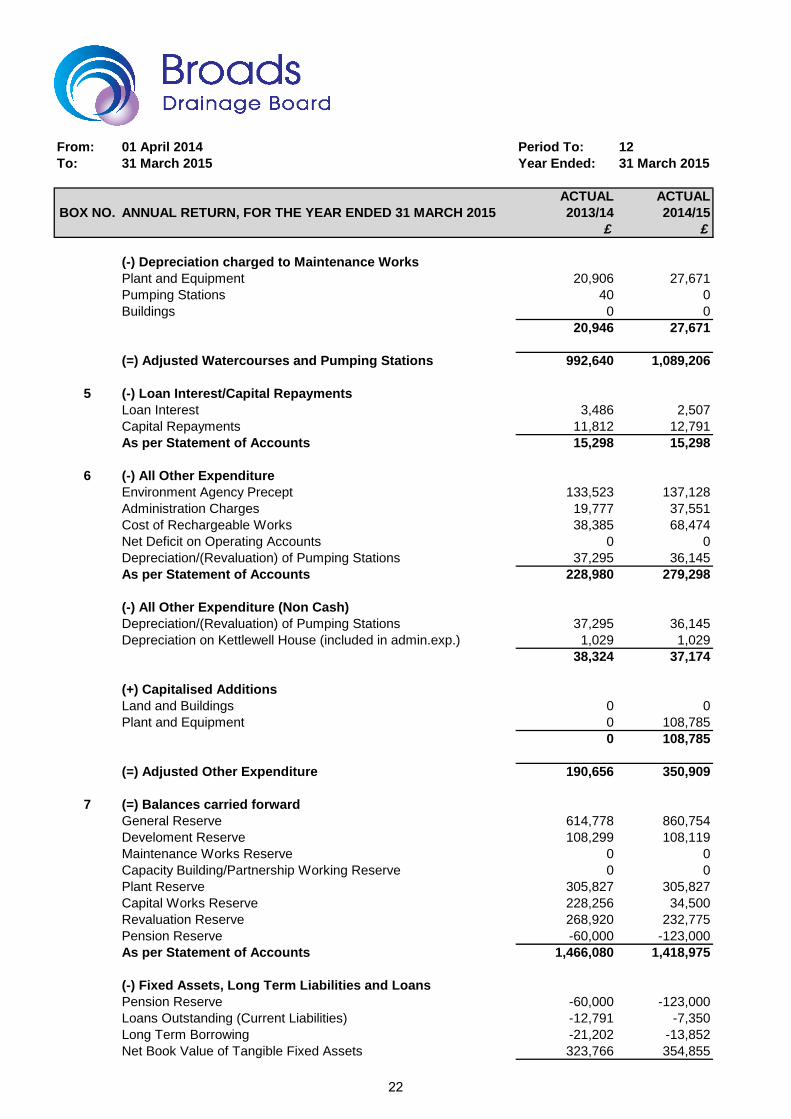
From: 01 April 2014 Period To: 12To: 31 March 2015 Year Ended: 31 March 2015
ACTUAL ACTUALBOX NO. ANNUAL RETURN, FOR THE YEAR ENDED 31 MARCH 2015 2013/14 2014/15
£ £
(-) Depreciation charged to Maintenance WorksPlant and Equipment 20,906 27,671Pumping Stations 40 0Buildings 0 0
20,946 27,671
(=) Adjusted Watercourses and Pumping Stations 992,640 1,089,206
5 (-) Loan Interest/Capital RepaymentsLoan Interest 3,486 2,507Capital Repayments 11,812 12,791As per Statement of Accounts 15,298 15,298
6 (-) All Other ExpenditureEnvironment Agency Precept 133,523 137,128Administration Charges 19,777 37,551Cost of Rechargeable Works 38,385 68,474Net Deficit on Operating Accounts 0 0Depreciation/(Revaluation) of Pumping Stations 37,295 36,145As per Statement of Accounts 228,980 279,298
(-) All Other Expenditure (Non Cash)Depreciation/(Revaluation) of Pumping Stations 37,295 36,145Depreciation on Kettlewell House (included in admin.exp.) 1,029 1,029
38,324 37,174
(+) Capitalised AdditionsLand and Buildings 0 0Plant and Equipment 0 108,785
0 108,785
(=) Adjusted Other Expenditure 190,656 350,909
7 (=) Balances carried forwardGeneral Reserve 614,778 860,754Develoment Reserve 108,299 108,119Maintenance Works Reserve 0 0Capacity Building/Partnership Working Reserve 0 0Plant Reserve 305,827 305,827Capital Works Reserve 228,256 34,500Revaluation Reserve 268,920 232,775Pension Reserve -60,000 -123,000As per Statement of Accounts 1,466,080 1,418,975
(-) Fixed Assets, Long Term Liabilities and LoansPension Reserve -60,000 -123,000Loans Outstanding (Current Liabilities) -12,791 -7,350Long Term Borrowing -21,202 -13,852Net Book Value of Tangible Fixed Assets 323,766 354,855
22
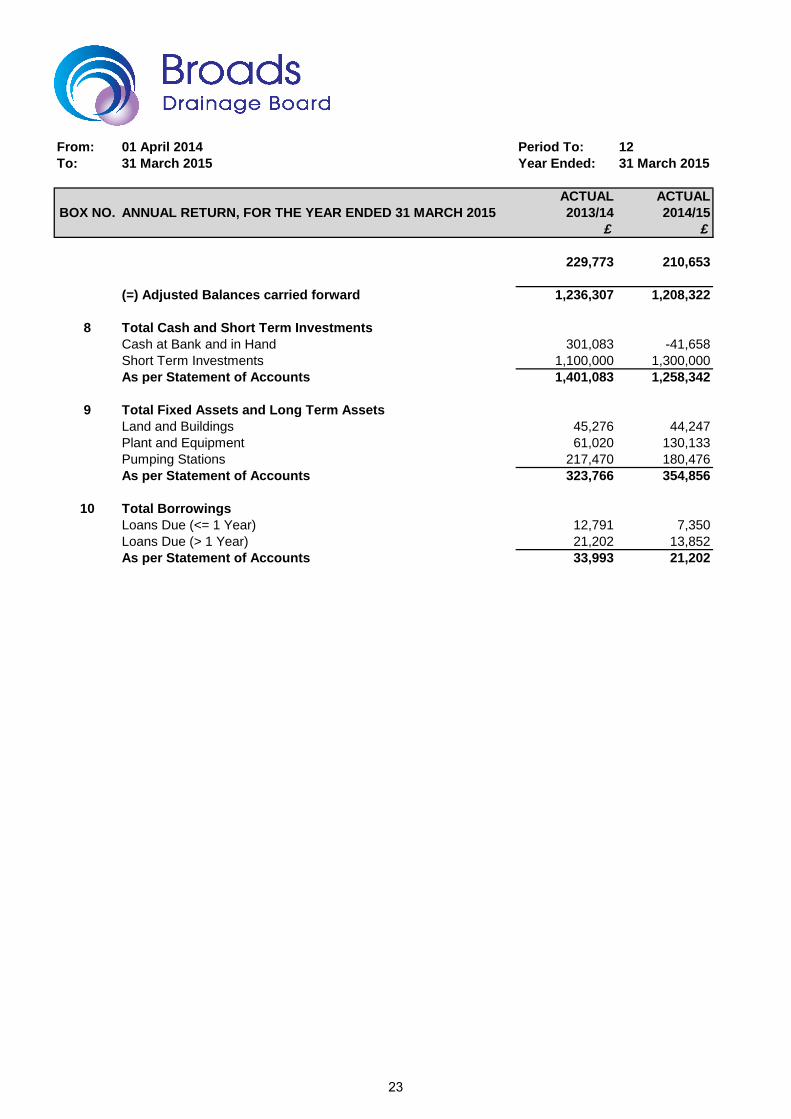
From: 01 April 2014 Period To: 12To: 31 March 2015 Year Ended: 31 March 2015
ACTUAL ACTUALBOX NO. ANNUAL RETURN, FOR THE YEAR ENDED 31 MARCH 2015 2013/14 2014/15
£ £
229,773 210,653
(=) Adjusted Balances carried forward 1,236,307 1,208,3221,236,307 1,208,322
8 Total Cash and Short Term InvestmentsCash at Bank and in Hand 301,083 -41,658Short Term Investments 1,100,000 1,300,000As per Statement of Accounts 1,401,083 1,258,342
9 Total Fixed Assets and Long Term AssetsLand and Buildings 45,276 44,247Plant and Equipment 61,020 130,133Pumping Stations 217,470 180,476As per Statement of Accounts 323,766 354,856
10 Total BorrowingsLoans Due (<= 1 Year) 12,791 7,350Loans Due (> 1 Year) 21,202 13,852As per Statement of Accounts 33,993 21,202
23
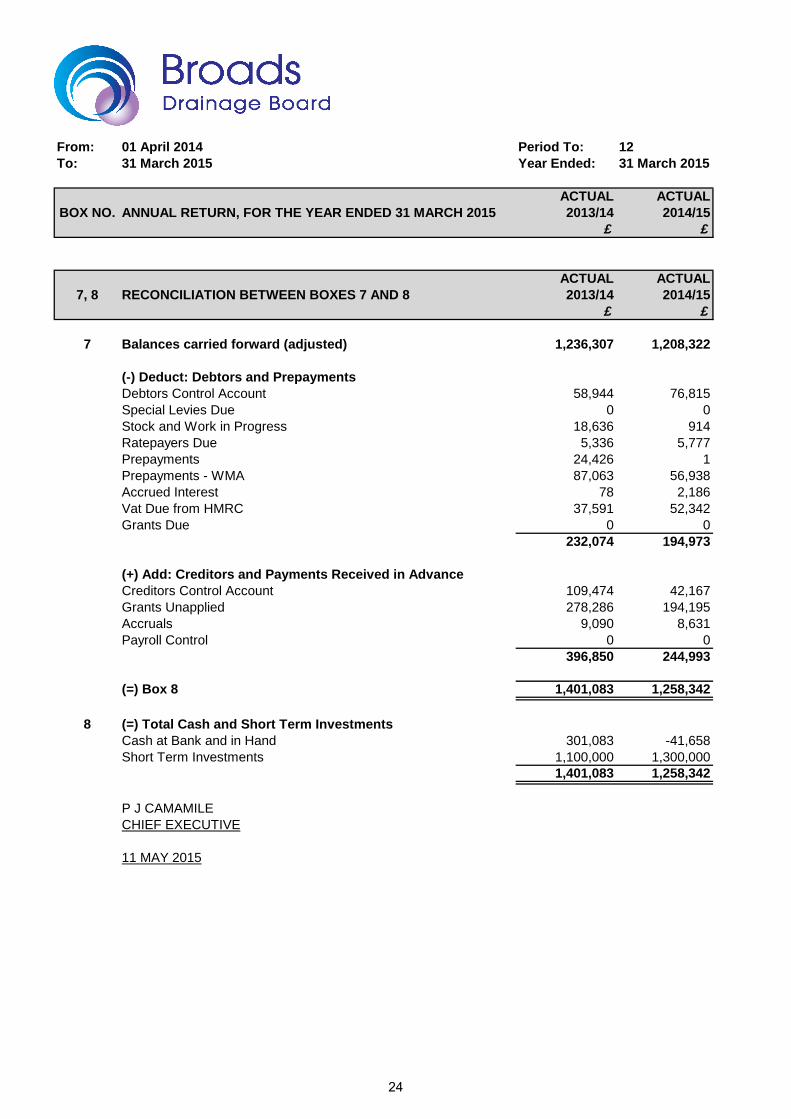
From: 01 April 2014 Period To: 12To: 31 March 2015 Year Ended: 31 March 2015
ACTUAL ACTUALBOX NO. ANNUAL RETURN, FOR THE YEAR ENDED 31 MARCH 2015 2013/14 2014/15
£ £
ACTUAL ACTUAL7, 8 RECONCILIATION BETWEEN BOXES 7 AND 8 2013/14 2014/15
£ £
7 Balances carried forward (adjusted) 1,236,307 1,208,322
(-) Deduct: Debtors and PrepaymentsDebtors Control Account 58,944 76,815Special Levies Due 0 0Stock and Work in Progress 18,636 914Ratepayers Due 5,336 5,777Prepayments 24,426 1Prepayments - WMA 87,063 56,938Accrued Interest 78 2,186Vat Due from HMRC 37,591 52,342Grants Due 0 0
232,074 194,973
(+) Add: Creditors and Payments Received in AdvanceCreditors Control Account 109,474 42,167Grants Unapplied 278,286 194,195Accruals 9,090 8,631Payroll Control 0 0
396,850 244,993
(=) Box 8 1,401,083 1,258,342
8 (=) Total Cash and Short Term InvestmentsCash at Bank and in Hand 301,083 -41,658Short Term Investments 1,100,000 1,300,000
1,401,083 1,258,342
P J CAMAMILECHIEF EXECUTIVE
11 MAY 2015
24
Internal Drainage Boards in England Annual re urn fo the 1nancial year ended 31 March 2015
Internal Drainage Boards in England with an annual turnover of £6.5 million or less must
complete an annual return in accordance with proper practices summarising their activities at
the end of each financial year.
Each annual return on pages 2 to 5 is made up of four sections:
sections 1 and are completed by the person nominated by the board.
Section is completed by the external auditor appointed by the Audit Commission.
Section is completed by the board's internal audit provider.
Each board must approve this annual return no later than 30 June 2015.
Comple''ing 1ou 1nu I eturn Guidance notes, including a completion checklist, are provided on page 6 and at relevant points in
the annual return.
Complete all sections highlighted in blue. Do not leave any blue box blank. Incomplete or incorrect
returns require additional external audit work and may incur additional costs.
Send the annual return, together with your bank reconciliation as at 31 March 2015, an explanation
of any significant year on year variances in the accounting statements and any additional information
requested, to your external auditor by the due date.
Your external auditor will identify and ask for any additional documents needed for their work. Therefore,
unless requested, do not send any original financial records to the external auditor.
Once the auditor has completed their work, certified annual returns will be returned to the local council for publication or public display of sections 1, 2 and 3. You must publish or display the annual return, including the external auditor's report, by 30 September 2015.
It should not be necessary for you to contact the external auditor for guidance.
More guidance on completing this annual return is available in the Practitioners' Guide for Internal
Drainage Boards that can be downloaded from the Association of Drainage Authorities' website at
www.ada.org.uk
Page 1 of 6
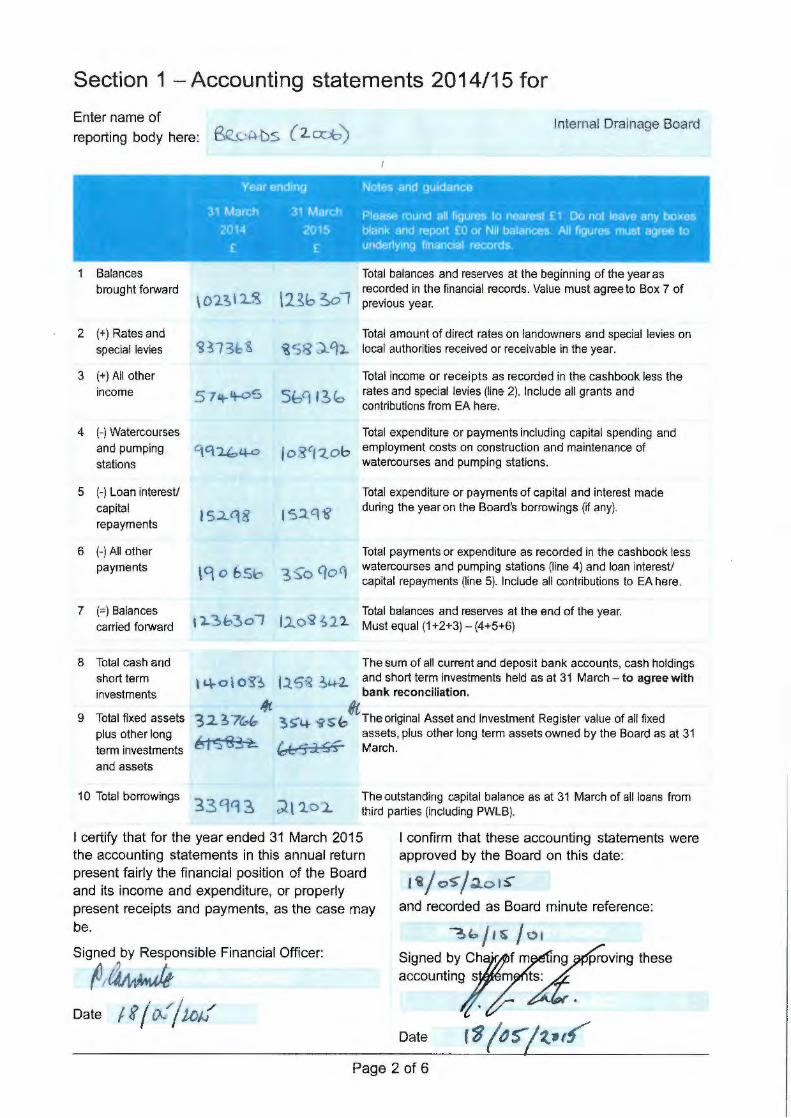
Section 1 -Accounting statements 2014/15 for
Enter name of
reporting body here: BC:...<-~~ s ( 2 eob) Internal Drainage Board
2
3
4
5
6
Balances
brought foiward
(+) Rates and
special levies
(+)All other income
(-) Watercourses and pumping
stations
(-) Loan interest/ capital repayments
(-) All other payments
7 (=) Balances carried foiward
8 Total cash and short term investments
9 Total fixed assets plus other long term investments
and assets
10 Total borrowings
~373b~ ~~ ~;). t.}2.
5 7tt-'t-05 s~ci 1~6
'1<"t1bt.t-o jo5'.,.z.ob
I 5.1.<l8 15.'.l.'\~
\8 o bSb 3:;0 C}o(l
Total balances and reserves at the beginning of the year as recorded in the financial records. Value must agree to Box 7 of previous year.
Total amount of direct rates on landowners and special levies on local authorities received or receivable in the year.
Total income or receipts as recorded in the cashbook less the rates and special levies (line 2). Include all grants and contributions from EA here.
Total expenditure or payments including capital spending and employment costs on construction and maintenance of watercourses and pumping stations.
Total expenditure or payments of capital and interest made during the year on the Board's borrowings (if any).
Total payments or expenditure as recorded in the cashbook less watercourses and pumping stations (line 4) and loan interest/ capital repayments (line 5). Include all contributions to EA here.
Total balances and reserves at the end of the year. \ l..3f:.3o/ 1.2.o~ s12. Must equal (1+2+3)-(4+5+6)
The sum of all current and deposit bank accounts, cash holdings \ c..\-O I 0 ~ ~ I l 5·~ ~~2.. and short term investments held as at 31 March - to agree with
bank reconciliation.
3 2 ~ 7"~ 4t 3 $'4- ~ s 1,/lThe original Asset and Investment Register value of all fixed 5'1 '83; assets, plus other long term assets owned by the Board as at 31
CS ;e. ~'j;l:Sr March.
The outstanding capital balance as at 31 March of all loans from third parties (including PWLB).
I certify that for the year ended 31 March 2015 the accounting statements in this annual return present fairly the financial position of the Board and its income and expenditure, or properly present receipts and payments, as the case may be.
I confirm that these accounting statements were approved by the Board on this date:
t~J o~/:J...ol~ and recorded as Board minute reference:
~<o/1& /01 Signed by~ ~=r.ng Signed by Responsible Financial Officer:
~I~ accountin/:;. ~.
Date (~ 1~~12...-.f,,,. Page 2 of 6
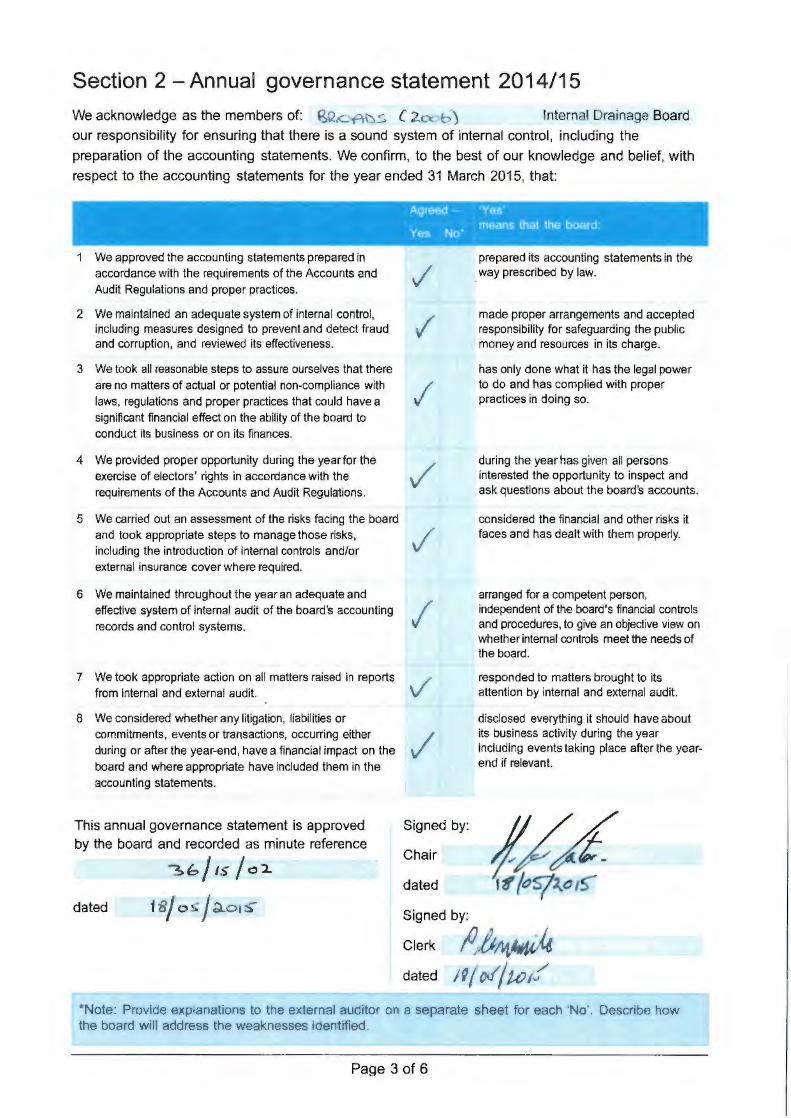
Section 2 -Annual governance statement 2014/15
We acknowledge as the members of: ~;J~ + :. ( 2.l I ) Internal Drainage Board
our responsibility for ensuring that there is a sound system of internal control, including the
preparation of the accounting statements. We confirm, to the best of our knowledge and belief, with
respect to the accounting statements for the year ended 31 March 2015, that:
We approved the accounting statements prepared in accordance with the requirements of the Accounts and Audit Regulations and proper practices.
2 We maintained an adequate system of internal control, including measures designed to prevent and detect fraud and corruption, and reviewed its effectiveness.
3 We took all reasonable steps to assure ourselves that there are no matters of actual or potential non-compliance with laws, regulations and proper practices that could have a significant financial effect on the ability of the board to conduct its business or on its finances.
4 We provided proper opportunity during the year for the exercise of electors' rights in accordance with the requirements of the Accounts and Audit Regulations.
5 We carried out an assessment of the risks facing the board and took appropriate steps to manage those risks, including the introduction of internal controls and/or external insurance cover where required.
6 We maintained throughout the year an adequate and effective system of internal audit of the board's accounting records and control systems.
7 We took appropriate action on all matters raised in reports from internal and external audit.
8 We considered whether any litigation. liabilities or commitments, events or transactions, occurring either during or after the year-end, have a financial impact on the board and where appropriate have included them in the accounting statements.
This annual governance statement is approved by the board and recorded as minute reference
~b/ IS /ci dated t8j o~ j d..01~
/
,/
I
/
/
I
v
/
Signed by:
Chair
dated
Signed by:
prepared its accounting statements in the way prescribed by law.
made proper arrangements and accepted responsibility for safeguarding the public money and resources in its charge.
has only done what it has the legal power to do and has complied with proper practices in doing so.
during the year has given all persons interested the opportunity to inspect and ask questions about the board's accounts.
considered the financial and other risks it faces and has dealt with them properly.
arranged for a competent person, independent of the board's financial controls and procedures, to give an objective view on whether internal controls meet the needs of the board.
responded to matters brought to its attention by internal and external audit.
disclosed everything it should have about its business activity during the year including events taking place after the yearend if relevant.
Clerk /J, l)!Vt}>M;4 dated 19/ o.//t<J1~
*Note: Provide explanations to the external auditor on a separate sheet for each 'No'. Describe how the board will address the weaknesses identified.
Page 3 of 6
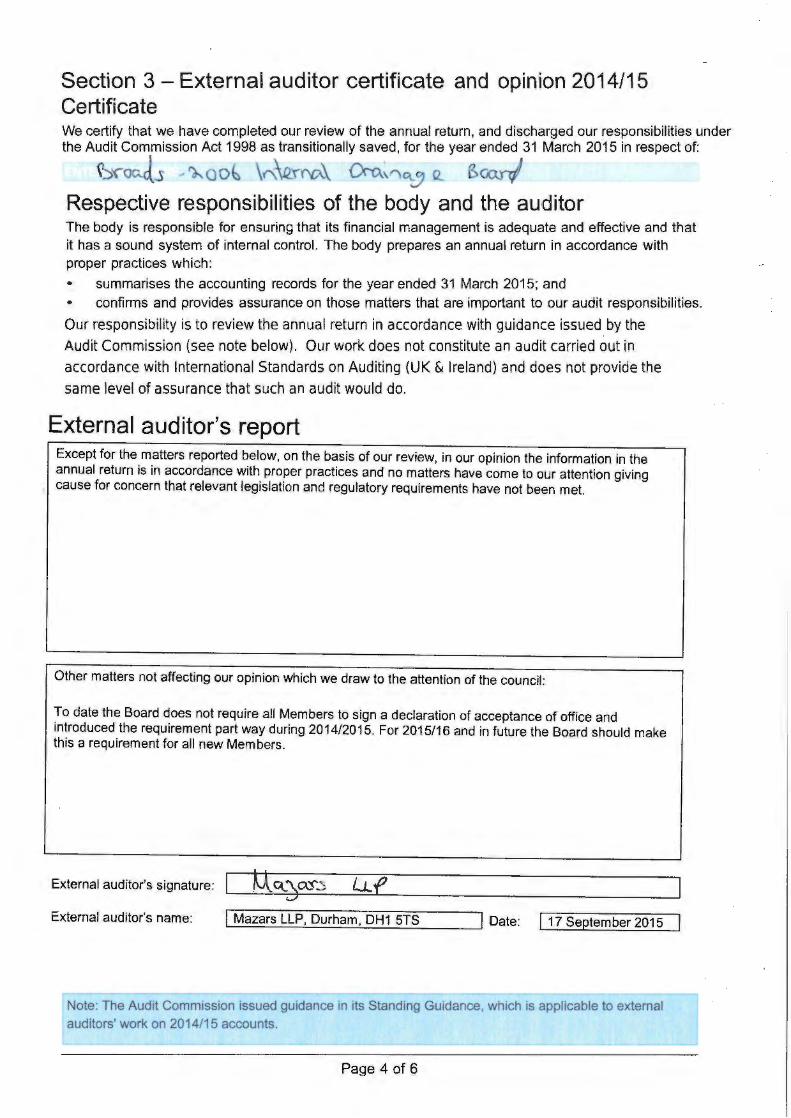
Section 3 - External auditor certificate and opinion 2014/15 Certificate We certify that we have completed our review of the annual return, and discharged our responsibilities under the Audit Commission Act 1998 as transitionally saved, for the year ended 31 March 2015 in respect of:
~,ocJ.s -'}.. o o~ \r-. Vln'lA\ 0--0., "~ Q. &<XJ.:rr/ Respective responsibilities of the body and the auditor The body is responsible for ensuring that its financial management is adequate and effective and that it has a sound system of internal control. The body prepares an annual return in accordance with proper practices wh ich :
summarises the accounting records for the year ended 31 March 2015; and
• confirms and provides assurance on those matters that are important to our audit responsibilities.
Our responsibility is to review the annual return in accordance with guidance issued by the Audit Commission (see note below). Our work does not constitute an audit carried out in accordance with International Standards on Auditing (UK & Ireland) and does not provide the same level of assurance that such an audit would do.
External auditor's report Except for the matters reported below, on the basis of our review, in our opinion the information in the annual return is in accordance with proper practices and no matters have come to our attention giving cause for concern that relevant legislation and regulatory requirements have not been met.
Other matters not affecting our opinion which we draw to the attention of the council:
To date the Board does not require all Members to sign a declaration of acceptance of office and introduced the requirement part way during 2014/2015. For 2015/16 and in future the Board should make this a requirement for all new Members.
External auditor's signature:
External auditor's name: ..... I _M_a_za_r_s_L_LP-'''--D_u_r_ha_m----'-, D_H_1---'-5T..c..S.:..._ __ __JI Date: I 17 September 2015
Note: The Audit Commission issued guidance in its Standing Guidance which is applicable to external
auditors' work on 2014/15 accounts.
Page 4 of 6
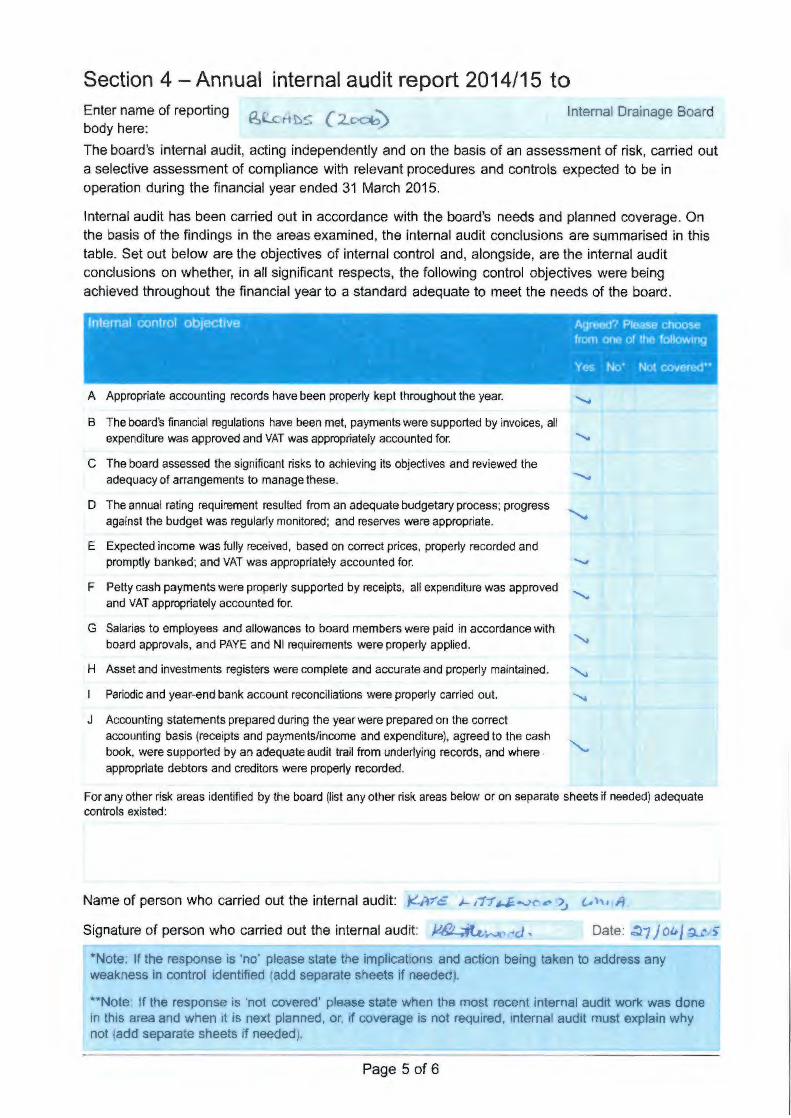
Section 4 -Annual internal audit report 2014/15 to Enter name of reporting ~ t
1b.S ( .
body here: Internal Drainage Board
The board's internal audit, acting independently and on the basis of an assessment of risk, carried out a selective assessment of compliance with relevant procedures and controls expected to be in
operation during the financial year ended 31 March 2015.
Internal audit has been carried out in accordance with the board's needs and planned coverage. On the basis of the findings in the areas examined, the internal audit conclusions are summarised in this table. Set out below are the objectives of internal control and, alongside, are the internal audit
conclusions on whether, in all significant respects, the following control objectives were being achieved throughout the financial year to a standard adequate to meet the needs of the board.
~al •.c6n rb •,o active • ·, .... : • ,. ., ,. . • . :: . ...~ I . ' I: ; . ; . Agi-eca? ·Please dhbose "I - . .,_ .. -:, i,.•' •' .._-, ;·: ....... ., ·r. . .. " .... . ~ - ... fj , 'I
r • · t .. ' · " · ,. r. ••• · :t.. · · · . ·from one of &he · follOwing
~ + .... • •" ,· - " • ' •• - \' ••
• '' • ' IL., • • I •• !, •' I • • ' r--- +-- ----- • ---t
. • • . • . •· : a' t " .t, ' ' " , . •• J ! < '• t ,'. JI y ll No• Not • ' r00•• I .' . .. ·•• ..... ., · es • cove. , • ": "\,. ~ , • ' I of,' • '-' j, ;, .., ., • ~ , ,. • I_ -- -"lo..'• - ' -- - l • . ~
A Appropriate accounting records have been properly kept throughout the year.
B The board's financial regulations have been met, payments were supported by invoices, all expenditure was approved and VAT was appropriately accounted for.
C The board assessed the significant risks to achieving its objectives and reviewed the adequacy of arrangements to manage these.
D The annual rating requirement resulted from an adequate budgetary process; progress against the budget was regularly monitored; and reserves were appropriate.
E Expected income was fully received, based on correct prices, properly recorded and promptly banked; and VAT was appropriately accounted for.
F Petty cash payments were properly supported by receipts, all expenditure was approved and VAT appropriately accounted for.
G Salaries to employees and allowances to board members were paid in accordance with board approvals, and PAYE and NI requirements were properly applied.
H Asset and investments registers were complete and accurate and properly maintained.
Periodic and year-end bank account reconciliations were properly carried out.
J Accounting statements prepared during the year were prepared on the correct accounting basis (receipts and payments/income and expenditure), agreed to the cash book, were supported by an adequate audit trail from underlying records, and where appropriate debtors and creditors were properly recorded.
For any other risk areas identified by the board (list any other risk areas below or on separate sheets if needed) adequate controls existed:
Name of person who carried out the internal audit: !.A7'e J- rt"r:t-Ii...., ti!'~ l .. , /1
Signature of person who carried out the internal audit: Date: rr.>7 job J a.r: > ·Note. If the response 1s ·no please state the 1mpltcat1ons and action being taken to address any weakness in control identified {add separate sheets if needed).
*'*Note: Ir the response Is 'not covered' please state when the most recent internal audit work was done in this area and when rt is next planned, or, 1f coverage is not required, internal audrt must explain why not add separate sheets 1f needed .
Page 5 of 6
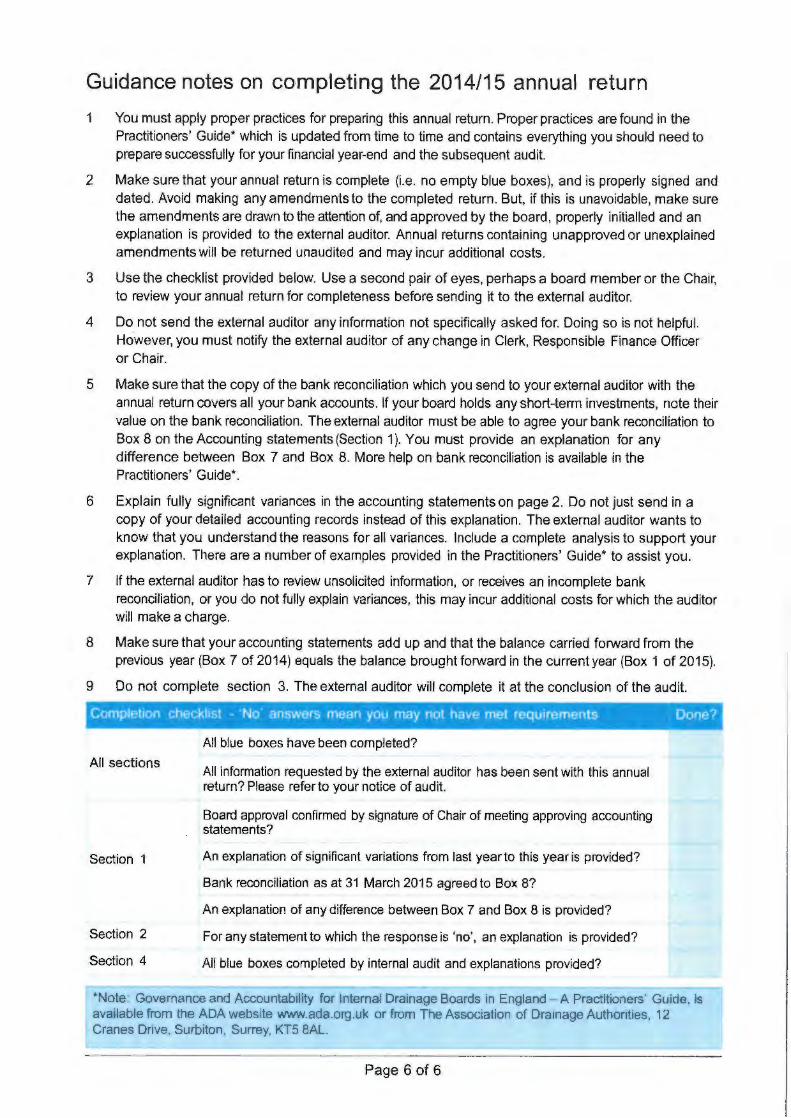
Guidance notes on completing the 2014/15 annual return
1 You must apply proper practices for preparing this annual return. Proper practices are found in the Practitioners' Guide* which is updated from time to time and contains everything you should need to prepare successfully for your financial year-end and the subsequent audit.
2 Make sure that your annual return is complete (i.e. no empty blue boxes), and is properly signed and dated. Avoid making any amendments to the completed return. But, if this is unavoidable, make sure the amendments are drawn to the attention of, and approved by the board, properly initialled and an explanation is provided to the external auditor. Annual returns containing unapproved or unexplained amendments will be returned unaudited and may incur additional costs.
3 Use the checklist provided below. Use a second pair of eyes, perhaps a board member or the Chair, to review your annual return for completeness before sending it to the external auditor.
4 Do not send the external auditor any information not specifically asked for. Doing so is not helpful. However, you must notify the external auditor of any change in Clerk, Responsible Finance Officer or Chair.
5 Make sure that the copy of the bank reconciliation which you send to your external auditor with the annual return covers all your bank accounts. If your board holds any short-term investments, note their value on the bank reconciliation. The external auditor must be able to agree your bank reconciliation to Box 8 on the Accounting statements (Section 1 ). You must provide an explanation for any difference between Box 7 and Box 8. More help on bank reconciliation is available in the Practitioners' Guide*.
6 Explain fully significant variances in the accounting statements on page 2. Do not just send in a copy of your detailed accounting records instead of this explanation. The external auditor wants to know that you understand the reasons for all variances. Include a complete analysis to support your explanation. There are a number of examples provided in the Practitioners' Guide* to assist you.
7 If the external auditor has to review unsolicited information, or receives an incomplete bank reconciliation, or you do not fully explain variances, this may incur additional costs for which the auditor will make a charge.
8 Make sure that your accounting statements add up and that the balance carried forward from the previous year (Box 7 of 2014) equals the balance brought forward in the current year (Box 1 of 2015).
9 Do not complete section 3. The external auditor will complete it at the conclusion of the audit.
All sections
Section 1
Section 2
Section 4
All blue boxes have been completed?
All information requested by the external auditor has been sent with this annual return? Please refer to your notice of audit.
Board approval confirmed by signature of Chair of meeting approving accounting statements?
An explanation of significant variations from last year to this year is provided?
Bank reconciliation as at 31 March 2015 agreed to Box 8?
An explanation of any difference between Box 7 and Box 8 is provided?
For any statementto which the response is 'no', an explanation is provided?
All blue boxes completed by internal audit and explanations provided?
*Note: Governance and Accountability for Internal Drainage Boards in England A Practitioners' Guide, is available from the ADA website www.ada.org. uk or from The Association of Drainage Authorities. 12 Cranes Dnve. Surbiton, Surrey, KTS 8AL.
Page 6 of 6
Audit Code: EX1 Final @ 27/04/2015 - 1 of 13 -
Water Management Alliance
INTERNAL AUDIT REPORT 2014/15
April 2015
Contents: 1. Executive Summary 2. Reporting 3. Acknowledgements 4. Detailed Observations, Recommendations and Agreed Actions APP 1 Agreed Terms of Reference
Audit Code: EX1 Final @ 27/04/2015 - 2 of 13 -
1. Executive Summary The audit of the Water Management Alliance and the constituent Internal Drainage Boards was carried out by Kate Littlewood for the year 2014-15. This Executive Summary sets out our overall conclusion on the system reviewed, and summarises the key recommendations arising. A copy of the Terms of Reference for this audit is attached as Appendix 1. Regulation 6 of the Accounts and Audit Regulations 2011 requires that ‘A relevant body must undertake an adequate and effective internal audit of its accounting records and of its system of internal control in accordance with the proper practices in relation to internal control’. The completion of this internal audit fulfils that role. It should be noted that any system of internal control is designed to manage risk to a reasonable level, and therefore Internal Audit cannot provide absolute assurance against loss. As well as being effective, controls need to be proportionate to the risk involved and not overburden the organisation with excessive costs. The Water Management Alliance provides administration and management services to the five constituent Internal Drainage Boards, namely Broads, King’s Lynn, East Suffolk, Norfolk Rivers and South Holland. Using the ‘Governance and Accountability in Internal Drainage Boards in England – A Practitioners Guide (Rev 2007)’ this audit reviewed the procedures and systems of control in place at the Water Management Alliance and considered if they were effective and being applied as intended. Sample testing was carried out on elements as considered necessary by the auditor in order to substantiate the application of the control. As part of the audit a follow-up was carried out on the recommendations raised in last year’s report. The results of this are included in section 4. 2. Overall Conclusion In conclusion, the procedures used at the Water Management Alliance are simple but effective, and appear to be carried out diligently by all staff concerned. Controls are working as expected. However, there are some aspects that can be improved and details of recommendations can be found in Section 4 together with the actions agreed with the Chief Executive. The overall level of assurance attributed to the system is: Substantial Assurance A sound system of internal control, but there are a few
weaknesses that could put achievement of system objectives at risk.
Audit Code: EX1 Final @ 27/04/2015 - 3 of 13 -
The observations and recommendations are detailed in Section 4. Each recommendation is allocated a priority as defined below: High Major risk requiring action by the time the final report is issued.
Medium Medium risk requiring action within six months of the issue of the draft
report. Low Matters of limited risk. Action should be taken as resources permit.
3. Acknowledgements I would like to express my thanks for their assistance and co-operation to: Phil Camamile, Chief Executive Officer Mary Creasy, Personal Assistant (CEO) Michelle Futter, Finance Officer Trish Walker, Finance Assistant Graham Tinkler, Rating Officer/Site Warden
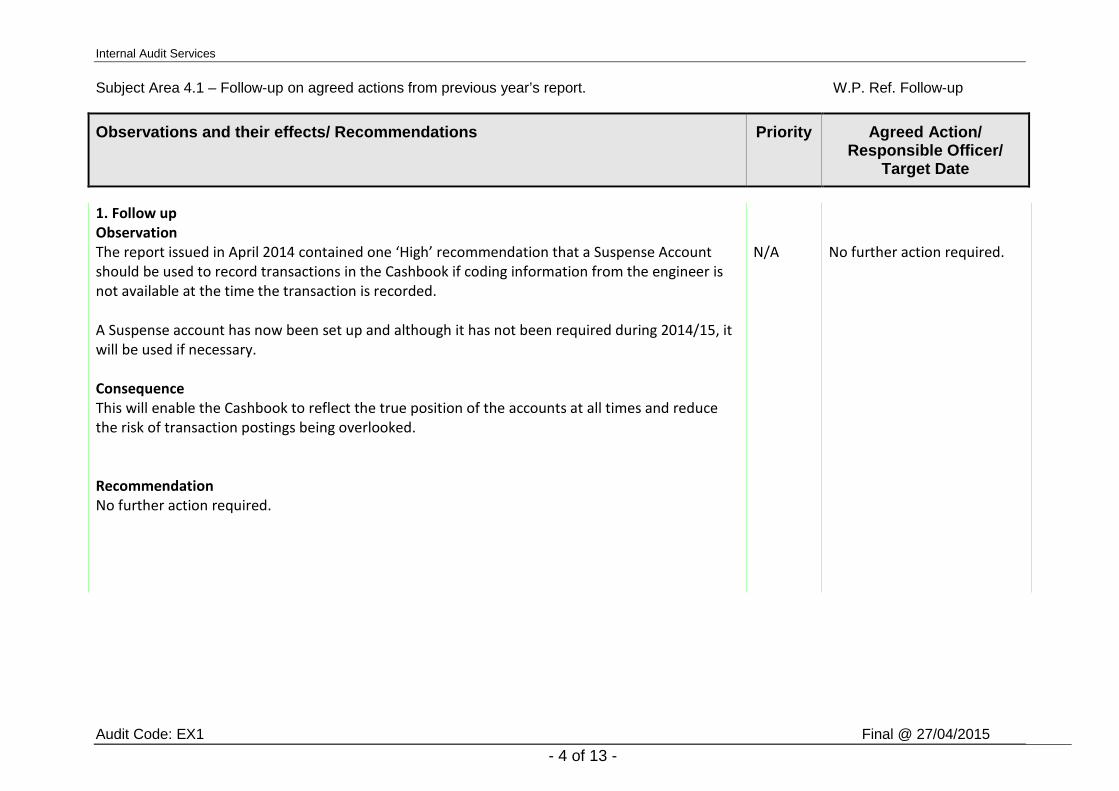
Internal Audit Services Subject Area 4.1 – Follow-up on agreed actions from previous year’s report. W.P. Ref. Follow-up
Observations and their effects/ Recommendations Priority Agreed Action/ Responsible Officer/
Target Date
Audit Code: EX1 Final @ 27/04/2015 - 4 of 13 -
1. Follow up Observation The report issued in April 2014 contained one ‘High’ recommendation that a Suspense Account should be used to record transactions in the Cashbook if coding information from the engineer is not available at the time the transaction is recorded. A Suspense account has now been set up and although it has not been required during 2014/15, it will be used if necessary. Consequence This will enable the Cashbook to reflect the true position of the accounts at all times and reduce the risk of transaction postings being overlooked. Recommendation No further action required.
N/A
No further action required.
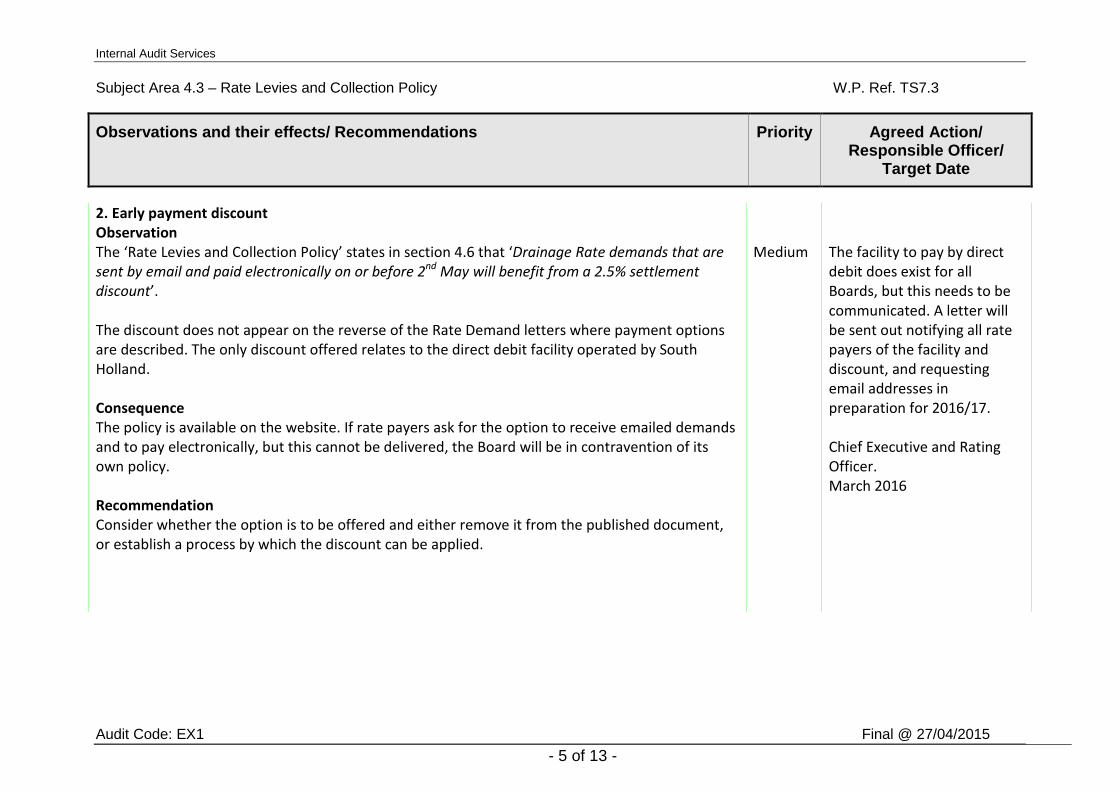
Internal Audit Services Subject Area 4.3 – Rate Levies and Collection Policy W.P. Ref. TS7.3
Observations and their effects/ Recommendations Priority Agreed Action/ Responsible Officer/
Target Date
Audit Code: EX1 Final @ 27/04/2015 - 5 of 13 -
2. Early payment discount Observation The ‘Rate Levies and Collection Policy’ states in section 4.6 that ‘Drainage Rate demands that are sent by email and paid electronically on or before 2nd May will benefit from a 2.5% settlement discount’. The discount does not appear on the reverse of the Rate Demand letters where payment options are described. The only discount offered relates to the direct debit facility operated by South Holland. Consequence The policy is available on the website. If rate payers ask for the option to receive emailed demands and to pay electronically, but this cannot be delivered, the Board will be in contravention of its own policy. Recommendation Consider whether the option is to be offered and either remove it from the published document, or establish a process by which the discount can be applied.
Medium
The facility to pay by direct debit does exist for all Boards, but this needs to be communicated. A letter will be sent out notifying all rate payers of the facility and discount, and requesting email addresses in preparation for 2016/17. Chief Executive and Rating Officer. March 2016
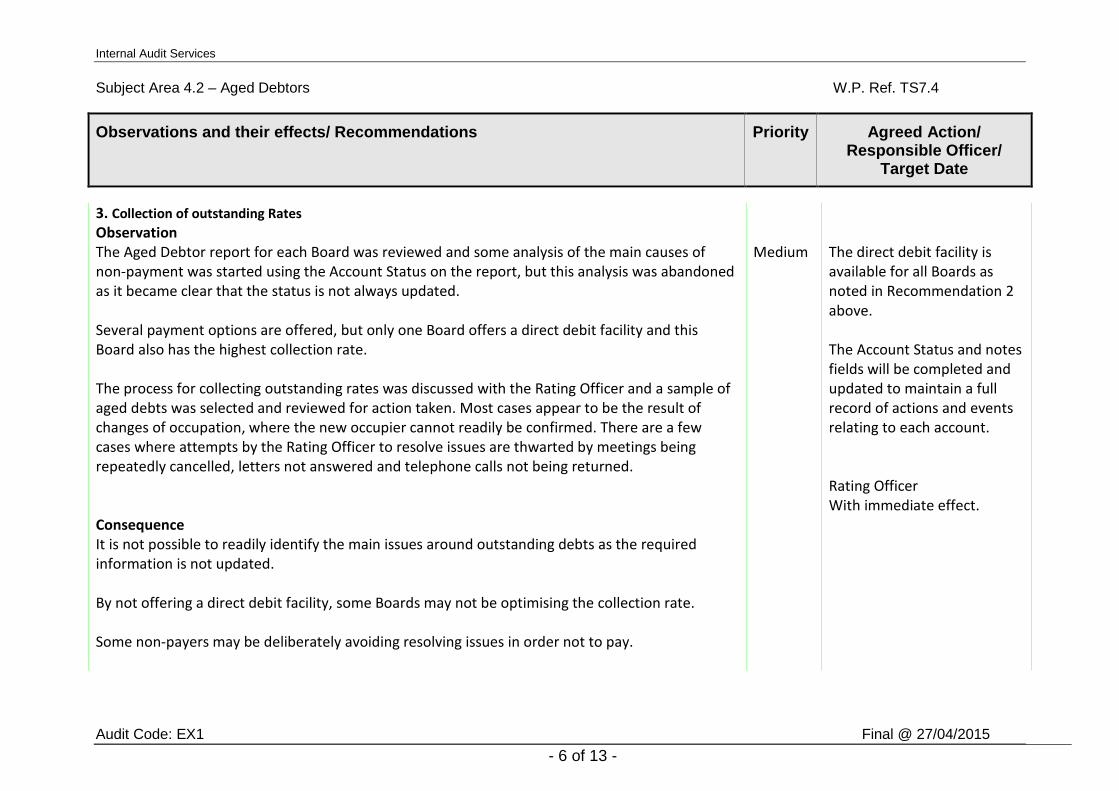
Internal Audit Services Subject Area 4.2 – Aged Debtors W.P. Ref. TS7.4
Observations and their effects/ Recommendations Priority Agreed Action/ Responsible Officer/
Target Date
Audit Code: EX1 Final @ 27/04/2015 - 6 of 13 -
3. Collection of outstanding Rates Observation The Aged Debtor report for each Board was reviewed and some analysis of the main causes of non-payment was started using the Account Status on the report, but this analysis was abandoned as it became clear that the status is not always updated. Several payment options are offered, but only one Board offers a direct debit facility and this Board also has the highest collection rate. The process for collecting outstanding rates was discussed with the Rating Officer and a sample of aged debts was selected and reviewed for action taken. Most cases appear to be the result of changes of occupation, where the new occupier cannot readily be confirmed. There are a few cases where attempts by the Rating Officer to resolve issues are thwarted by meetings being repeatedly cancelled, letters not answered and telephone calls not being returned. Consequence It is not possible to readily identify the main issues around outstanding debts as the required information is not updated. By not offering a direct debit facility, some Boards may not be optimising the collection rate. Some non-payers may be deliberately avoiding resolving issues in order not to pay.
Medium
The direct debit facility is available for all Boards as noted in Recommendation 2 above. The Account Status and notes fields will be completed and updated to maintain a full record of actions and events relating to each account. Rating Officer With immediate effect.
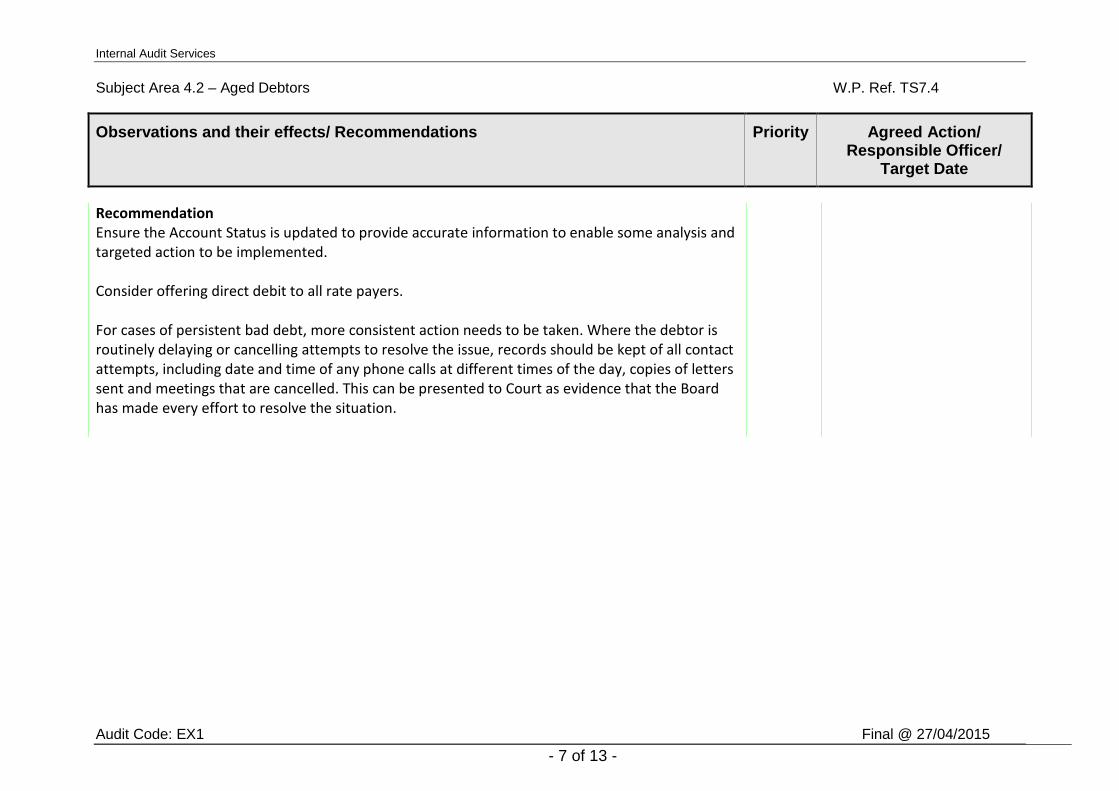
Internal Audit Services Subject Area 4.2 – Aged Debtors W.P. Ref. TS7.4
Observations and their effects/ Recommendations Priority Agreed Action/ Responsible Officer/
Target Date
Audit Code: EX1 Final @ 27/04/2015 - 7 of 13 -
Recommendation Ensure the Account Status is updated to provide accurate information to enable some analysis and targeted action to be implemented. Consider offering direct debit to all rate payers. For cases of persistent bad debt, more consistent action needs to be taken. Where the debtor is routinely delaying or cancelling attempts to resolve the issue, records should be kept of all contact attempts, including date and time of any phone calls at different times of the day, copies of letters sent and meetings that are cancelled. This can be presented to Court as evidence that the Board has made every effort to resolve the situation.
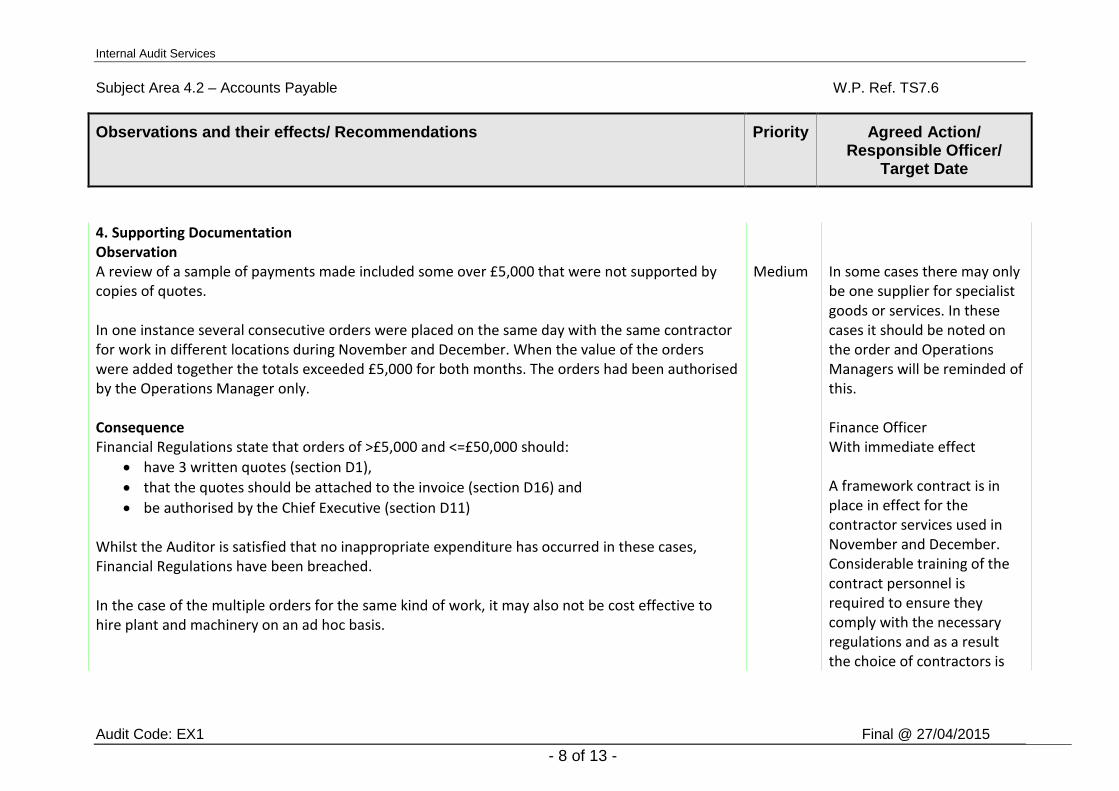
Internal Audit Services Subject Area 4.2 – Accounts Payable W.P. Ref. TS7.6
Observations and their effects/ Recommendations Priority Agreed Action/ Responsible Officer/
Target Date
Audit Code: EX1 Final @ 27/04/2015 - 8 of 13 -
4. Supporting Documentation Observation A review of a sample of payments made included some over £5,000 that were not supported by copies of quotes. In one instance several consecutive orders were placed on the same day with the same contractor for work in different locations during November and December. When the value of the orders were added together the totals exceeded £5,000 for both months. The orders had been authorised by the Operations Manager only. Consequence Financial Regulations state that orders of >£5,000 and <=£50,000 should:
• have 3 written quotes (section D1), • that the quotes should be attached to the invoice (section D16) and • be authorised by the Chief Executive (section D11)
Whilst the Auditor is satisfied that no inappropriate expenditure has occurred in these cases, Financial Regulations have been breached. In the case of the multiple orders for the same kind of work, it may also not be cost effective to hire plant and machinery on an ad hoc basis.
Medium
In some cases there may only be one supplier for specialist goods or services. In these cases it should be noted on the order and Operations Managers will be reminded of this. Finance Officer With immediate effect A framework contract is in place in effect for the contractor services used in November and December. Considerable training of the contract personnel is required to ensure they comply with the necessary regulations and as a result the choice of contractors is
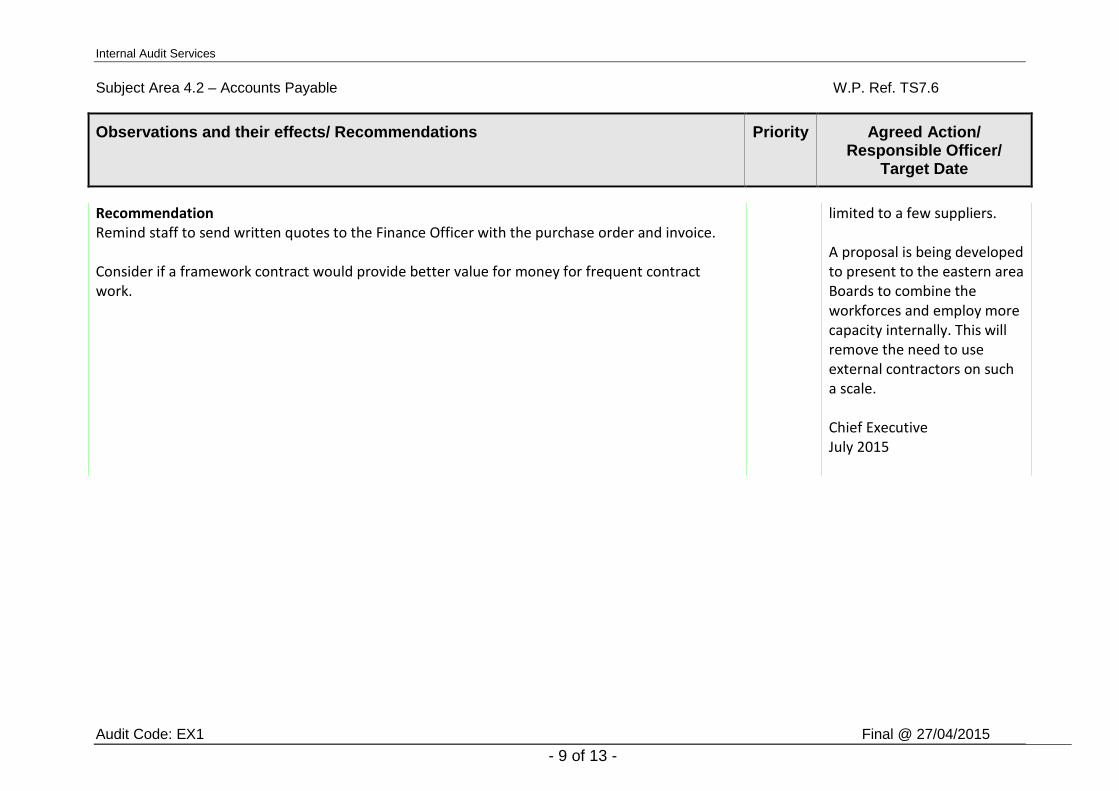
Internal Audit Services Subject Area 4.2 – Accounts Payable W.P. Ref. TS7.6
Observations and their effects/ Recommendations Priority Agreed Action/ Responsible Officer/
Target Date
Audit Code: EX1 Final @ 27/04/2015 - 9 of 13 -
Recommendation Remind staff to send written quotes to the Finance Officer with the purchase order and invoice. Consider if a framework contract would provide better value for money for frequent contract work.
limited to a few suppliers. A proposal is being developed to present to the eastern area Boards to combine the workforces and employ more capacity internally. This will remove the need to use external contractors on such a scale. Chief Executive July 2015
APPENDIX 1
Internal Audit Services
WATER MANAGEMENT ALLIANCE
INTERNAL AUDIT TERMS OF REFERENCE
2014-15
Internal Audit Services
1. INTRODUCTION 1.1 This document sets out the strategy and plan for the audit of the Water Management Alliance for the year 2014-15. 1.2 Section 4 of The Accounts and Audit Regulations 2011 states that ‘The relevant body must conduct a review at least once in a year of the effectiveness of its system of internal control’. 1.3 Internal Audit is defined as ‘an independent, objective assurance and consulting activity designed to add value and improve an organisation’s operations. It helps an organisation accomplish its objectives by bringing a systematic, disciplined approach to evaluate and improve the effectiveness of risk management, control, and governance processes.’ Public Sector Internal Audit Standards, April 2013 1.4 The Internal Auditor will work in accordance with the Public Sector Internal Audit Standards (PSIAS) adopted by CIPFA from April 2013 and thus will be able to provide the review required by the Regulations. 1.5 The authority of the Internal Auditor is established in the Financial Regulations. 1.6 The audit work will concentrate on records and systems used by the Water Management Alliance, who provide the financial and administrative functions for:
• Broads (2006) IDB • East Suffolk IDB • King’s Lynn IDB • Norfolk Rivers IDB • South Holland IDB.
As such, this work will enable the auditor to complete the Annual Returns for all five Boards. 2. OBJECTIVES AND SCOPE OF THE AUDIT 2.1 The work of the Internal Auditor will be guided by ‘Governance and Accountability in Internal Drainage Boards in England – A Practitioners Guide (Rev 2007)’. 2.2 In order to be able to complete section 4 of the Electronic Annual Return for 2014/15 the auditor will consider the following:
A. The Accounting Records To ensure that the accounting system is accurate, complete and timely, and that data input is being verified appropriately.
B. Financial Regulations and Standing Orders To ensure that they are current and are being adhered to.
C. Risk Management processes To ensure that management review the Risk Register on a regular basis and that risk is being identified and actively managed in a proportionate manner.
D. Budgetary Controls
Internal Audit Services
To ensure that the budgets are prepared on a realistic basis and are monitored throughout the year and any variations are investigated, with corrective action being taken if necessary.
E. Income Controls To ensure that processes are in place and functioning correctly to collect, record and bank income in full and on time with a particular focus on rating collection procedures.
F. Petty Cash Procedures To ensure petty cash provisions are reasonable, used in accordance with Financial Regulations and adequate records are kept of payments made.
G. Payroll Controls To ensure that remuneration to employees and Board Members is calculated correctly and in accordance with the levels agreed by the Board, and that all HMRC requirements are complied with.
H. Asset Management To ensure that there are satisfactory processes in place to maintain the register and check for accuracy.
I. Bank Reconciliation To ensure that periodic and year-end bank account reconciliations were properly completed and verified.
J. Year-end Procedures To ensure that the appropriate accounting basis have been used to prepare the year-end accounting statements and that figures contained in the statements can be verified by reference to working papers and accounting records.
2.3 Any recommendations and issues arising from the previous audit will also be followed up to establish if they have been implemented or if there is a satisfactory explanation for non-implementation. 2.4 Contained within the scope of work described above it is implied that the auditor will have due regard for Value for Money considerations and the potential for fraud. 3. TASKS 3.1.1 The project tasks are to:
• Establish if the procedures recorded as part of the audit for 2013-14 remain the same and document any changes that may have taken place.
• Perform tests to establish that systems are operating in accordance with
the procedures and that good practice is being complied with. • Assess strengths and weaknesses of the systems operated and the levels
of financial and management risk.
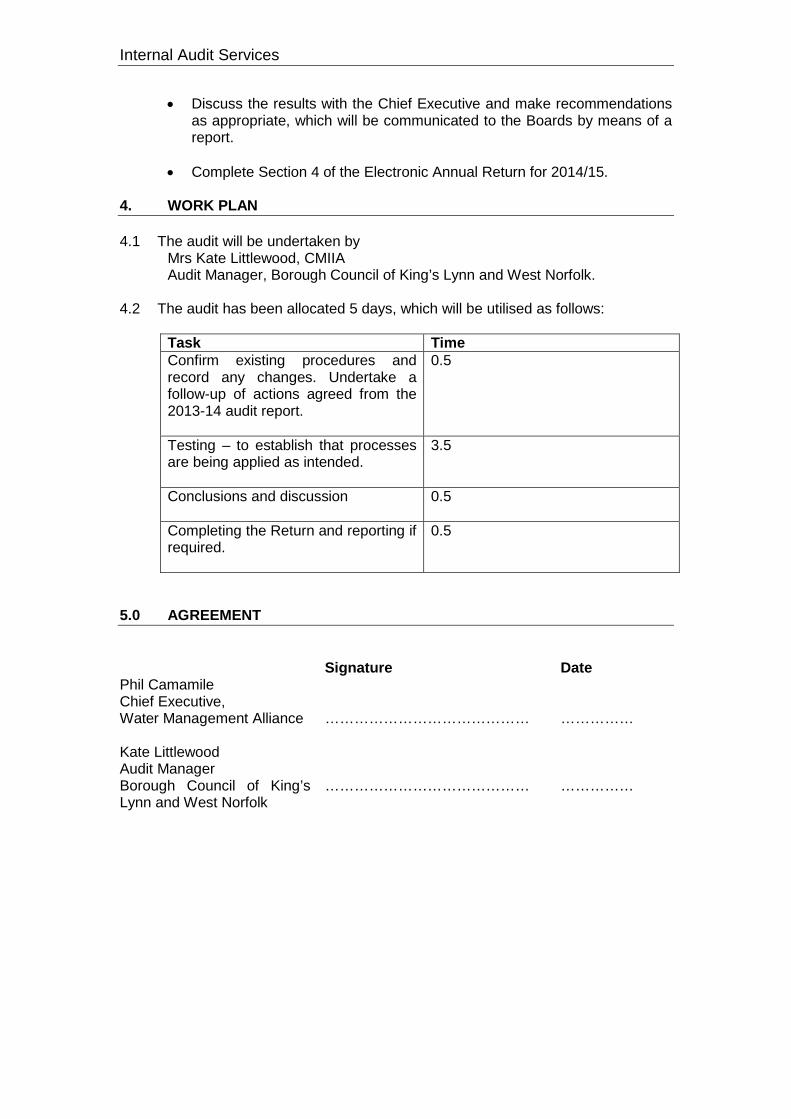
Internal Audit Services
• Discuss the results with the Chief Executive and make recommendations as appropriate, which will be communicated to the Boards by means of a report.
• Complete Section 4 of the Electronic Annual Return for 2014/15.
4. WORK PLAN 4.1 The audit will be undertaken by
Mrs Kate Littlewood, CMIIA Audit Manager, Borough Council of King’s Lynn and West Norfolk.
4.2 The audit has been allocated 5 days, which will be utilised as follows:
Task Time Confirm existing procedures and record any changes. Undertake a follow-up of actions agreed from the 2013-14 audit report.
0.5
Testing – to establish that processes are being applied as intended.
3.5
Conclusions and discussion
0.5
Completing the Return and reporting if required.
0.5
5.0 AGREEMENT Signature Date Phil Camamile Chief Executive, Water Management Alliance
……………………………………
……………
Kate Littlewood Audit Manager Borough Council of King’s Lynn and West Norfolk
……………………………………
……………