FINANCIAL STATEMENTS - insage
259
FINANCIAL STATEMENTS 211 Directors’ Report 218 Statement by Directors 219 Report of the Shariah Supervisory Council 225 Statutory Declaration 226 Independent Auditors’ Report 230 Statements of Financial Position 231 Statements of Profit or Loss 232 Statements of Other Comprehensive Income 233 Consolidated Statement of Changes in Equity 237 Statements of Cash Flow 241 Notes to the Financial Statements 375 Pillar 3 Disclosure 210
-
Upload
khangminh22 -
Category
Documents
-
view
1 -
download
0
Transcript of FINANCIAL STATEMENTS - insage

FINANCIALSTATEMENTS211 Directors’ Report
218 Statement by Directors
219 Report of the Shariah Supervisory Council
225 Statutory Declaration
226 Independent Auditors’ Report
230 Statements of Financial Position
231 Statements of Profit or Loss
232 Statements of Other Comprehensive Income
233 Consolidated Statement of Changes in Equity
237 Statements of Cash Flow
241 Notes to the Financial Statements
375 Pillar 3 Disclosure
210

The Directors have pleasure in submitting their report and the audited financial statements of the Group and of the Bank for the financial year ended 31 December 2021.
PRINCIPAL ACTIVITIES
The Bank is principally engaged in Islamic banking business and the provision of related services. The principal activities of the subsidiaries are as stated in Note 13 to the financial statements. There has been no significant change in the nature of these activities during the financial year.
The address of the registered office of the Bank is Level 32, Menara Bank Islam, No. 22, Jalan Perak, 50450 Kuala Lumpur.
During the current financial year, BIMB Holdings Sdn. Bhd. (formerly known as BIMB Holdings Berhad) (“BHB”), the former holding company of the Bank have undertaken an internal reorganisation as disclosed in Note 46 to the financial statements respectively.
SUBSIDIARIES
The details of the Bank’s subsidiaries are disclosed in Note 13 to the financial statements.
RESULTS
GroupRM’000
BankRM’000
Profit before zakat and tax 704,221 710,625Zakat and tax expense (169,916) (169,478)
Profit for the year 534,305 541,147
RESERVES AND PROVISIONS
There were no material transfers to or from reserves or provisions during the financial year under review except as disclosed in the financial statements.
DIVIDENDS
Since the end of the previous financial year, the amount of dividends paid by the Bank were as follows:
RM’000
In respect of the financial year ended 31 December 2020 as reported in the Directors’ Report of that year:
Final dividend of approximately 5.37 sen per ordinary share paid on 4 June 2021 139,639
In respect of the financial year ended 31 December 2021: Interim dividend of approximately 10.93 sen per ordinary share paid on 20 January 2022^ 226,893
366,532
^ The dividend is based in number of shares after consolidation as disclosed in Note 46(v)(ii).
The Directors do not recommend final dividend to be paid for the financial year ended 31 December 2021.
INTEGR ATED ANNUAL REPORT 2021
Key Messages Overview Value Creation MD&A Sustainability Leadership Accountability Financial Additional Information
211
DIRECTORS’ REPORTfor the financial year ended 31 December 2021

DIRECTORS OF THE BANK
Directors of the Bank who served during the financial year until the date of this report are:Tan Sri Dr. Ismail Hj. Bakar (Chairman) Azizan AhmadMohamed Ridza Mohamed AbdullaDatuk Nik Mohd Hasyudeen Yusoff Dato’ Sri Khazali AhmadMohd Yuzaidi Mohd Yusoff Mashitah Haji Osman Dato’ Sri Amrin Awaluddin (appointed on 10 September 2021)Mohd Asri Awang (appointed on 1 October 2021)Datuk Bazlan Osman (appointed on 7 January 2022)Puan Nuraini Ismail (appointed on 7 January 2022)Zahari @ Mohd Zin Idris (retired on 20 September 2021)Noraini Che Dan (deceased on 26 August 2021)
DIRECTORS OF THE SUBSIDIARIES
Directors of the subsidiaries who served during the financial year until the date of this report are:
Name of Company Directors
Al-Wakalah Nominees (Tempatan) Sendirian BerhadDr. Mohd Afzanizam Abdul Rashid (Chairman) (appointed
on 1 January 2022)Sazrin Mohd Razak (appointed on 1 January 2022)Maria Mat Said (resigned on 1 January 2022)Mohamad Jamali Haron (resigned on 1 January 2022)
BIMB Investment Management Berhad Mohamed Ridza Mohamed Abdulla Najmuddin Mohd LutfiDr. Mohd Hatta DagapAzizan Abd Aziz Datin Maznah Mahbob Dato’ Dr. Mohamad Zabidi Ahmad (appointed on
8 October 2021)Dato’ Ghazali Awang (resigned on 31 October 2021)
Bank Islam Trust Company (Labuan) Ltd. and its subsidiary:
Zahari @ Mohd Zin Idris (Chairman)Maria Mat Said
BIMB Offshore Company Management Services Maria Mat Said (Chairman)Sdn. Bhd. Zaharin Mohd Ali (appointed on 31 December 2021)
Zahari @ Mohd Zin Idris (retired on 3 January 2022)
Farihan Corporation Sdn. Bhd.Ahmad Haliman Abdul Halim (Chairman)
(appointed on 1 January 2022)Iskandar Shah Zulkarnain (appointed on 1 January 2022)Zaharin Mohd Ali (resigned on 1 January 2022)Maria Mat Said (resigned on 1 January 2022)
BANK ISL AM MAL AYSIA BERHAD
212
DIRECTORS’ REPORTfor the financial year ended 31 December 2021

DIRECTORS OF THE SUBSIDIARIES (CONTINUED)
Name of Company Directors
BIMB Holdings Sdn. Bhd. (converted status from BIMB Holdings Berhad on 15 November 2021)
Mohamed Iran Moriff Mohd Shariff (Chairman) (appointed on 30 October 2021)
Said Mohd Jawahir Said Bahari (appointed on 30 October 2021)
Tan Sri Ambrin Buang (retired on 1 November 2021)Datuk Nik Mohd Hasyudeen Yusoff (retired on
1 November 2021)Zahari @ Mohd Zin Idris (retired on 1 November 2021)Mohd Muazzam Mohamed (resigned on 1 November 2021)Noraini Che Dan (deceased on 26 August 2021)
BIMB Securities (Holdings) Sdn. Bhd. Mohamad Jamali Haron (appointed on 24 February 2022)Sarina Mohd Ali (appointed on 24 February 2022)Zahari @ Mohd Zin Idris (retired on 3 January 2022)Adi Asri Baharom (resigned on 25 February 2022)Kamaruzaman Abdullah (appointed on 31 December 2021
and resigned on 25 February 2022)
Subsidiary of BIMB Securities (Holdings) Sdn. Bhd.BIMB Securities Sdn. Bhd. Adi Asri Baharom
Dr. Mohd Hatta DagapKamaruzaman AbdullahMuhamad Lukman Musa @ Hussain (appointed on
1 February 2022)Dr. Normazilah Mahzan (appointed on 1 February 2022)Zahari @ Mohd Zin Idris (retired on 31 December 2021)Mustapha Hamat (retired on 31 December 2021)
Subsidiaries of BIMB Securities Sdn. Bhd.BIMSEC Nominees (Tempatan) Sdn. Bhd. Aida Sharini Abdul Wahab
Adam Abdul Aziz (appointed on 31 December 2021)BIMSEC Nominees (Asing) Sdn. Bhd. Kamaruzaman Abdullah (resigned on 3 January 2022)
Roziah Jais (resigned on 3 January 2022)Syarikat Al-Ijarah Sdn. Bhd Mohamad Jamali Haron (appointed on 31 December 2021)
Mohd Zamri Hassan (appointed on 31 December 2021)Salih Amaran Jamiaan (retired on 3 January 2022)Khairudin Idris (retired on 3 January 2022)
None of the Bank and subsidiaries’ Directors holding office as at 31 December 2021 had any interest in the ordinary shares of the Bank and of its related corporations during the financial year.
INTEGR ATED ANNUAL REPORT 2021
Key Messages Overview Value Creation MD&A Sustainability Leadership Accountability Financial Additional Information
213

DIRECTORS’ BENEFITS
Since the end of the previous financial year, no Director of the Bank has received nor become entitled to receive any benefit (other than those fees and other benefits included in the aggregate amount of remuneration received or due and receivable by Directors as shown in the Note 32 to financial statements or the fixed salary of a full time employee of the Bank) by reason of a contract made by the Bank or a related corporation with the Director or with a firm of which the Director is a member, or with a firm in which the Director has a substantial financial interest.
There were no arrangements during and at the end of the financial year which had the object of enabling Directors of the Bank to acquire benefits by means of the acquisition of shares in or debentures of the Bank or any other body corporate.
DIRECTORS’ INTERESTS IN SHARES AND DEBENTURES
According to the Register of Directors’ Shareholdings required to be kept under Section 59 of the Companies Act 2016, none of the Directors who held office at the end of the financial year held any shares or debentures in the Company or its subsidiaries during the financial year.
ISSUE OF SHARES AND DEBENTURES
During the financial year, the Bank has issued 42,966,054 new ordinary shares at a consideration of RM3.25 each arising from the Dividend Reinvestment Plan. As disclosed in Note 46 to the financial statements, the Bank has completed a consolidation of its ordinary shares into 2,075,872,514 Bank Islam shares to match BHB’s outstanding shares in issue so that the distribution of the Bank shares will be on a one-for-one basis. There were no debentures issued during the financial year.
OPTIONS GRANTED OVER UNISSUED SHARES
No options were granted to any person to take up unissued shares of the Bank during the financial year.
INDEMNITY AND TAKAFUL COSTS
During the financial year, the Bank maintained on group basis, a Directors’ and Officers’ Liability Takaful of up to an aggregate limit of RM50 million against any legal liability incurred by the Directors and Officers in the discharge of their duties while holding the office. The Directors and Officers shall not be indemnified by such takaful for any deliberate negligence, fraud, intentional breach of law or breach of trust proven against them. The amount of premium paid was RM207,575 with certain reimbursement made by the Directors and Officers.
In previous financial year, through the former immediate holding company, BIMB Holdings Berhad has maintained a Directors’ and Officers’ Liability Takaful for the Directors and Officers of BIMB Holdings and its subsidiaries (excluding Syarikat Takaful Malaysia Keluarga Berhad and its subsidiaries) of up to an aggregate limit of RM50 million against any legal liability incurred by the Directors and Officers in the discharge of their duties while holding the office. The Directors and Officers shall not be indemnified by such takaful for any deliberate negligence, fraud, intentional breach of law or breach of trust proven against them. The amount of premium paid was RM231,372 with certain reimbursement made by the Directors and Officers.
BANK ISL AM MAL AYSIA BERHAD
214
DIRECTORS’ REPORTfor the financial year ended 31 December 2021

OTHER STATUTORY INFORMATION
Impaired financing
Before the financial statements of the Group and of the Bank were made out, the Directors took reasonable steps to ascertain that proper actions had been taken in relation to the writing off of bad financing and the making of impairment provisions for impaired financing, and have satisfied themselves that all known bad financing have been written-off and adequate impairment provisions made for impaired financing.
At the date of this report, the Directors are not aware of any circumstances that would render the amount written-off for bad financing, or amount of impairment provisions for impaired financing in the financial statements of the Group and of the Bank, inadequate to any substantial extent.
Current assets
Before the financial statements of the Group and of the Bank were made out, the Directors took reasonable steps to ascertain that any current assets, other than financing, which were unlikely to be realised in the ordinary course of business at their values as shown in the accounting records of the Group and of the Bank have been written down to their estimated realisable value.
At the date of this report, the Directors are not aware of any circumstances that would render the values attributed to the current assets in the financial statements of the Group and of the Bank to be misleading.
Valuation methods
At the date of this report, the Directors are not aware of any circumstances which have arisen which would render adherence to the existing methods of valuation of assets or liabilities of the Group and of the Bank to be misleading or inappropriate.
Contingent and other liabilities
At the date of this report, there does not exist:
(a) any charge on the assets of the Group or of the Bank which has arisen since the end of the financial year and which secures the liabilities of any other person, or
(b) any contingent liability in respect of the Group or of the Bank that has arisen since the end of the financial year other than those incurred in the ordinary course of business.
No contingent or other liability of any company in the Group has become enforceable, or is likely to become enforceable within the period of twelve months after the end of the financial year which, in the opinion of the Directors, will or may substantially affect the ability of the Group and of the Bank to meet their obligations as and when they fall due.
INTEGR ATED ANNUAL REPORT 2021
Key Messages Overview Value Creation MD&A Sustainability Leadership Accountability Financial Additional Information
215

OTHER STATUTORY INFORMATION (CONTINUED)
Change of circumstances
At the date of this report, the Directors are not aware of any circumstances, not otherwise dealt with in this report or the financial statements which would render any amount stated in the financial statements of the Group and of the Bank misleading.
Items of an unusual nature
The results of the operations of the Group and of the Bank for the financial year were not, in the opinion of the Directors, substantially affected by any item, transaction or event of a material and unusual nature.
There has not arisen in the interval between the end of the financial year and the date of this report any item, transaction or event of a material and unusual nature, likely to affect substantially the results of the operations of the Group or of the Bank for the current financial year in which this report is made.
Compliance with Bank Negara Malaysia’s expectations on financial reporting
In the preparation of the financial statements, the Directors have taken reasonable steps to ensure that Bank Negara Malaysia (“BNM”)’s expectations on financial reporting have been complied with, including those as set out in the Financial Reporting for Islamic Banking Institutions and Circular on the Application of MFRS.
2022 BUSINESS PLAN AND OUTLOOK
Business Plan, Strategy and Future Outlook
Economic recovery is expected in FY2022 with Gross Domestic Product (“GDP”) of 5.3%, despite downward revision of 2021 GDP to 3.0% (previous projection: 4.2%). This is in light of gradual normalisation of domestic economic activities amid higher vaccination rates and easing restrictions on production capacity which will bolster GDP expansion alongside improving global trade.
The domestic banking sector is expected to stay resilient in 2022 amid the challenges of the Covid pandemic. Even as impairments begin to surface in the coming year, credit losses will be amply cushioned by healthy earnings accretion, comfortable provisioning buffers and solid capitalisation. Driven by household segment with mortgages as the main driver, overall sentiments shall remain positive for banking sector with continued support to viable consumers facing temporary financial difficulties through repayment assistance packages. In addition, Bank Negara Malaysia (“BNM”) has released a new five-year Financial Services Blueprint 2022 – 2026 in January this year. The blueprint is anchored on 4 key thrusts in fostering greater market dynamism and advancing the sustainability agenda to support the transition towards a greener economy.
We have gone into the first year of LEAP25. Our 5-year aspiration of LEAP25 is to increase the asset size and ESG-rated financing assets, reduce Cost-to-Income ratio, sustain superior industry Return-to-Equity (“ROE”), increase our non-fund based income (“NFBI”) contribution, create positive social impact and retain high-performing talents. The Bank’s targets are anchored by the six pillars namely Sustainable Prosperity, Value Based Culture, Community Empowerment, Customer Centricity, Real Economy and Digitalisation.
Gearing up for 2022 as the economy moves into the recovery period, the Bank will be focusing on the goal and ensuring effective execution of our strategies. Our customers will always be at the heart of our strategy execution. Cost rationalisation will remain our focus and spending will be allocated to our priority areas.
BANK ISL AM MAL AYSIA BERHAD
216
DIRECTORS’ REPORTfor the financial year ended 31 December 2021

2022 BUSINESS PLAN AND OUTLOOK (CONTINUED)
Business Plan, Strategy and Future Outlook (continued)
The Bank is currently approaching the tail end of its IT Blueprint Phase 1, which was started in the middle of 2021. As we move into the Phase 2 of the IT Blueprint, we are positive that this will escalate the digitalisation of the Bank’s operations. In addition, the Bank is gearing towards the launch of its own digital channel in 2022, which is expected to further improve customer experience.
Subsequent the completion of the restructuring in Q4 2021, the Bank has become the first pure-play full-fledged Islamic financial institution listed on the Main Market of Bursa Malaysia. Consequently, the Bank will have access to a wider and more diverse capital base, allowing for a greater opportunity for future expansion programmes and business growth.
RATINGS ACCORDED BY EXTERNAL RATING AGENCY
During the financial year, the Bank’s rating was re-affirmed as follows:
Rating agency Date re-affirmed Ratings
RAM Rating Services Berhad 10 December 2021 Long-term rating: AA3
Short-term rating: P1
Outlook: Stable
AUDITORS
The auditors, PricewaterhouseCoopers PLT (LLP0014401-LCA & AF1146), have indicated their willingness to accept reappointment.
The auditors’ remuneration is disclosed in Note 31 to the financial statements.
Signed on behalf of the Board of Directors in accordance with a resolution of the Directors:
Tan Sri Dr. Ismail Hj. BakarDirector
Mohd Yuzaidi Mohd Yusoff Director
Kuala Lumpur,Date: 7 March 2022
INTEGR ATED ANNUAL REPORT 2021
Key Messages Overview Value Creation MD&A Sustainability Leadership Accountability Financial Additional Information
217

In the opinion of the Directors, the financial statements set out on pages 230 to 374 are drawn up in accordance with Malaysian Financial Reporting Standards, International Financial Reporting Standards, and the requirements of the Companies Act 2016 in Malaysia, and Shariah requirements so as to give a true and fair view of the financial position of the Group and of the Bank as of 31 December 2021 and of their financial performance and cash flows for the financial year then ended.
Signed on behalf of the Board of Directors in accordance with a resolution of the Directors:
Tan Sri Dr. Ismail Hj. BakarDirector
Mohd Yuzaidi Mohd Yusoff Director
Kuala Lumpur,Date: 7 March 2022
BANK ISL AM MAL AYSIA BERHAD
218
STATEMENT BY DIRECTORS pursuant to Section 251(2) of the Companies Act 2016

‘Salam Sejahtera’
In carrying out the roles and responsibilities of the Shariah Supervisory Council (SSC) as prescribed in the Shariah Governance Policy Document (SGPD) issued by Bank Negara Malaysia (BNM), and in compliance with our letter of appointment, we hereby submit our report for the financial year ended 31 December 2021.
The Bank’s management ensures that its conducts, operations, business, affairs, and activities follow the relevant Shariah rules and principles. Our responsibility is to form an independent opinion based on the review of conduct and businesses of the Bank in producing this report.
We had convened nine (9) meetings during the financial year in which we reviewed, among others, products, transactions, services, processes and documents of the Bank.
In performing our roles and responsibilities, we had obtained all the information and explanations which we considered necessary in providing us with sufficient evidence to give a reasonable assurance that the Bank has complied with the applicable Shariah rules and principles.
At the management level, the Group Chief Shariah Officer (cum Secretary of the SSC), who functionally reports to the SSC, oversees the conduct and effectiveness of Group Shariah Division’s (GSD) functions that carry out the roles and responsibilities related to the Shariah secretariat, research and advisory. The control functions further confirm the Bank’s Shariah governance comprising of Shariah Risk Management, Shariah Compliance and Shariah Audit that resides in the Group Risk Management Division, Group Compliance Division, and Group Internal Audit Division, and reports directly to the Group Chief Risk Officer, Group Chief Compliance Officer, and Group Chief Internal Auditor respectively.
The following are the significant developments that took place during the financial year, which reside under our purview:
APPROVALS
To ensure smooth and timely execution of our business operation, we empower the Group Chief Shariah Officer (GCSO) and Senior Manager of Group Shariah Division to approve a non-substantial variation of Shariah related matters. The approvals are then reported to us periodically as notification. Concurrently, the GCSO or his representative is also sitting as a member in the following committees to advise the Bank on matters relating to Shariah rules and principles:
i) Management Committee;ii) Sadaqa House and Zakat Committee (Vice Chairman);iii) Management Risk Control Committee;iv) Operational Risk Control Committee;v) Underwriting and Investment Committee;vi) Product Development Oversight Steering Committee;
INTEGR ATED ANNUAL REPORT 2021
Key Messages Overview Value Creation MD&A Sustainability Leadership Accountability Financial Additional Information
219
REPORT OF THE SHARIAH SUPERVISORY COUNCIL

APPROVALS (CONTINUED)
vii) Rescheduling & Restructuring Oversight Committee;viii) Financing Committee A;ix) Financing Committee B; x) iTEKAD Asnaf Assessment Committee; andxi) Tender Evaluation Committee for Vendor Management.
SHARIAH GOVERNANCE
We had approved in our meetings several initiatives undertaken by the Bank in strengthening its Shariah governance, including the review of the Shariah Compliance Policy and Shariah Compliance Guideline of Bank Islam Labuan Offshore Branch (BILOB), Charity Fund Management Guideline and Business Zakat Guideline for subsidiaries, i.e. Farihan Corporation Sdn Bhd and Al-Wakalah Nominees (Tempatan) Sdn. Bhd. that aims, among others, to set out the Shariah governance framework within the Bank and ensure our business operations are in line with the Shariah rules and principles.
SHARIAH RISK MANAGEMENT
We observed that the Bank continuously implemented appropriate measures in managing its Shariah non-compliance (SNC) risk.
Firstly, the implementation of Risk Control Self-Assessment (RCSA) aims to assess the significance of identified SNC risks and the effectiveness of the controls in the respective functional areas.
Since the introduction of RCSA, a continuous process of identifying and assessing SNC risks at various functional areas have been carried out by all Risk Controllers (RCs). The RCs are also responsible for driving and implementing appropriate controls to mitigate any SNC events while achieving the business objectives of their respective areas. The semi-annually RCSA result, specifically the SNC risk exposures of the Bank, is also tabled in the Management Risk Control Committee and our meetings for monitoring and oversight purposes.
Secondly, this year we continue our initiatives in establishing checklists to assist frontliners and relevant functions in managing SNC. For instance, in 2020, the Bank established the Shariah Related Complaint Checklist to guide complaint handlers and product owners to identify Shariah-related complaints lodged by customers. This year, the Bank has extended the initiative by establishing the Shariah Non-Compliant Issues Checklist to identify Shariah related litigation cases.
Finally, the Operational Risk Integrated System (ORIS) launch covers the Shariah compliance elements on top of Operational Risk and Business Continuity Management. This platform can manage risk profiles for all business and support units more effectively, thus reducing the probability of SNC or Shariah-related events.
BANK ISL AM MAL AYSIA BERHAD
220
REPORT Of ThE ShARIAh SUPERVISORY COUNCIL

SHARIAH REVIEW & SHARIAH AUDIT
The Shariah Review and Shariah Audit functions play a vital role in ensuring Shariah compliance by evaluating and assessing activities in the Bank. Shariah Compliance Department performs shariah review under Group Compliance Division, which conducts regular assessment and validation on the Bank’s compliance with Shariah in its operations, business, affairs and activities, including new products and services implementation alongside adherence with relevant regulatory requirements. Shariah Audit Department carries out Shariah Audit under Group Internal Audit Division which provides an independent assurance to add value and improve the degree of Shariah compliance concerning such activities.
Both Shariah Review and Shariah Audit plans for the financial year were reviewed and approved by us for their implementation. Their reports were deliberated in our meetings to confirm that the Bank has complied with the applicable rulings issued by the Shariah Advisory Council (SAC) of Bank Negara Malaysia, the SAC of Securities Commission (for capital market-related matters) and our decisions. Throughout the year, the Shariah review and Shariah audit functions have been conducted by the Bank, covering the following entities/areas:
Shariah Audit Shariah Review
1) Trade Operations Department
2) Consumer Collections Department and Consumer Recovery Department
3) Corporate Recovery Department
1) Trade Tawarruq-i (TTQ-i)
2) Ar Rahnu Tawarruq
3) Personal Financing-i Asnaf
4) Consumer Banking Division 4) Takaful – 3rd Party New Products:
a) Takaful myWealth Plus; andb) Takaful Tunai Ehsan.
5) Shariah Risk Management 5) Unit Trust - 3rd Party New Products:
a) BIMB Shariah IncomePlus Fund (BSIF);b) Bank Islam Premier Fund (BIPF);c) Eastspring Investments Dana Al-Islah;d) Eastspring Investments Islamic Income Fund;e) Eastspring Investments Dinasti Equity Fund;f) Eastspring Investments Islamic Small-Cap Fund; andg) Eastspring Investments Islamic Equity Income Fund.
6) Shariah Compliance Department 6) ASB Financing-i
7) Treasury & Markets Division 7) Targeted Repayment Assistance (TRA) (joint review)
8) Corporate Support Division 8) Annual Shariah Compliance Review on Compliance with Labuan Financial Services Authority’s Guidelines on Shariah Governance for Labuan Islamic Financial Institutions (joint review)
9) Group Shariah Division 9) Assessment on the Implementation of Bank Negara Malaysia’s Guidelines on Late Payment Charges for Islamic Financial Institutions
10) Financial Inclusion Division 10) Assessment on the Implementation of Bank Negara Malaysia’s Policy Document on Credit Card-i
INTEGR ATED ANNUAL REPORT 2021
Key Messages Overview Value Creation MD&A Sustainability Leadership Accountability Financial Additional Information
221

SHARIAH REVIEW & SHARIAH AUDIT (CONTINUED)
Shariah Audit Shariah Review
11) Human Resources Division 11) Review on Trade Products Against the Bank Negara Malaysia’s Shariah Policy Documents of Murabahah
12) Bank Islam Labuan Offshore Branch (BILOB)^ 12) Review on Term Deposit-i (Tawarruq) (TDT-i) and TDT-i Special Against Bank Negara Malaysia’s Policy Document of Tawarruq
13) 53 Bank Islam Branches^ 13) Qard Micro Financing (BangKIT)
14) Commodity Trading Platform – Bursa Suq al-Sila’ (BSAS) (joint review)
15) Dynamic Hedging
16) Site Visit Verification on TPG Oil & Gas SB (Follow-Up Review on Ableace Raakin’s Commodity Supplier) (joint review)
^ Only Shariah related findings were escalated for deliberation and decision.
SHARIAH TRAINING & AWARENESS
During the year, various Shariah training and awareness programmes were designed and organised for the Bank Group’s Board of Directors (BOD) and the Bank’s staff nationwide. These include:
a) Two (2) sessions for the BOD on ‘Maqasid Shariah in Islamic Banking’ and ‘Dinamika Dalam Fiqh Muamalat’ by Professor Dato’ Dr Ahmad Hidayat Buang and Dr Shamsiah Mohamad, respectively;
b) Three (3) sessions of Bicara SSC on prevalent Shariah topics for the Bank’s staff by Sahibus Samahah Datu Hj. Kipli Hj. Yassin, Dr Shamsiah Mohamad and Prof. Dr Asmadi Mohd Naim;
c) Four (4) sessions of quarterly Shariah Ruling and Resolution Training (Shariah Townhall) for the Bank’s Risk Controllers provided by Group Shariah Division (GSD), Shariah Risk Management Department and Shariah Compliance Department;
d) Shariah e-learning of Module 1 and Module 2 for the Bank’s staff with requirements to pass a specific test at the end of the session and to complete both Modules by the end of July, August and September 2021. These Modules equip the Bank’s staff with fundamental knowledge of Fiqh al-Muamalat (Islamic Law of Transactions), which is applied in the practice of Islamic banking, requirements of Shariah governance within the industry and types of Shariah contracts used for the Bank’s products and services;
e) Four (4) sessions of quarterly online Shariah training by the GSD personnel to further enhance the Shariah knowledge in addition to Shariah e-learning Modules;
f) Shariah Online Quiz consisting of five (5) Modules, another platform for the Bank’s staff to assess their level of Shariah knowledge in understanding the fundamental concepts and principles of Islamic banking with the issuance of a certificate of achievement for each Module;
g) Six (6) Shariah awareness sessions conducted during induction programme for new Bank’s staff;
h) Two (2) Shariah risk sessions were conducted at head office as part of Operational Risk Management training, and two (2) sessions at branch level targeted Risk Controller (RC) to increase awareness and Shariah risk culture among staff. In addition to virtual training, the Shariah Risk e-learning module, which is part of Operational Risk Management e-learning, is provided to staff as a mandatory course.
BANK ISL AM MAL AYSIA BERHAD
222
REPORT Of ThE ShARIAh SUPERVISORY COUNCIL

SHARIAH TRAINING & AWARENESS (CONTINUED)
The Bank has also continued to elevate Shariah and Islamic banking knowledge of its SSC members and relevant staff by engaging relevant bodies such as Islamic Banking & Finance Institute Malaysia (IBFIM) and Association of Shariah Advisors in Islamic Finance (ASAS). The SSC members and relevant staff attend the following certification programmes and courses, among others:
1. Certified Shariah Advisors (CSA).2. Certified Shariah Practitioner (CSP) and 3. Certified Professional Shariah Auditor (CPSA),4. Islamic Financial Planner (IFP) programme,
SHARIAH NON-COMPLIANT EVENTS & INCOME
Throughout 2021, we confirmed five (5) incidences of SNC events:
1. Four (4) of the events have occurred at branches that are related to non-execution of aqad; and2. One (1) event occurred at head office related to incomprehensive product structure for refinancing products.
We were also informed of the causes of the incidence and noted that the Bank had taken necessary corrective and preventive measures to avoid the same incident from recurring in the future. We also confirmed that the SNC event and the rectification plan were presented to the Board of Directors and us and reported to BNM according to the prescribed reporting requirement.
Within the financial year, the Bank has collected Shariah non-compliant income amounting to RM41,182.96. A total of RM39,692.42 from the collected amount was purified and disposed to charitable causes upon our approval, as noted in Note 23 (Sources and Uses of Charity Fund).
BUSINESS ZAKAT
In the financial year, the Bank has fulfilled its obligation to pay zakat on its business to state zakat authorities by adopting the growth capital computation method, in compliance with the Banking Zakat Management Manual (Pengurusan Zakat Perbankan) issued by the Wakaf, Zakat and Hajj Department (Jabatan Wakaf, Zakat dan Haji – JAWHAR). The Bank paid the zakat on the Bank’s portion, i.e. shareholders’ fund and other funds received by the Bank excluding depositors’ fund and Investment Account Holders’ fund.
Several zakat authorities had mandated distribution of a portion of the zakat paid by the Bank based on their agent (wakil) for distribution to eligible beneficiaries (asnaf) as guided by the Business Zakat Guideline we approved.
SAFEGUARDING THE INVESTMENT ACCOUNT HOLDERS (“IAH”) INTEREST
In ensuring that the interest of IAH is protected, we confirmed that the profit allocation for the IAH is per Shariah rules and principles where the profit computation formula has been duly presented and approved by us. The performance of the Investment Account has also been disclosed and reported via issuance of Fund Performance Report (FPR), which was already made available on the Bank’s website.
INTEGR ATED ANNUAL REPORT 2021
Key Messages Overview Value Creation MD&A Sustainability Leadership Accountability Financial Additional Information
223

SADAQA HOUSE INITIATIVE
In protecting the objective of the Sadaqa House fund and the interest of its donors, we confirmed that the fund management and distribution are implemented per the applicable Shariah rules and principles. We have approved the Sadaqa House Management Guideline that governs the conduct and management of the Sadaqa House fund to ensure it operates in line with Shariah rules and principles. The Sadaqa House and Zakat Committee that the Group Chief Financial Inclusion Officer chairs are mandated to oversee the conduct of the Sadaqa House initiative to be in line with the Sadaqa House Management Guideline.
We had also reviewed the financial statement of the Bank and confirmed that the financial statement complies with the applicable Shariah rules and principles.
Based on the above, in our opinion:
1) The contracts, transactions and dealings entered into by the Bank, excluding the five (5) Shariah non-compliance incidents mentioned above, during the financial year ended 31 December 2021 that were reviewed comply with the applicable Shariah rules and principles;
2) The allocation of profit and charging of losses relating to Investment Account conformed to the basis that we have approved;
3) The computation, payment and distribution of business zakat comply with the applicable Shariah rules and principles;
4) All earnings realised from sources or by means prohibited by the applicable Shariah rules and principles were disposed to charitable causes and refunded to the deserving counterparties.
On that note, we, members of Shariah Supervisory Council of Bank Islam Malaysia Berhad, do hereby confirm that, in our level best, the operations of the Bank for the year ended 31 December 2021 have been conducted in conformity with the applicable Shariah rules and principles.
We bear witness only to what we know, and we could not well guard against the unseen! (Surah Yusuf, verse:81)
Allah knows best.
Professor Dato’ Dr. Ahmad Hidayat Buang Dr. Shamsiah Mohamad
Associate Professor Dr. Yasmin Hanani Mohd Safian Sahibus Samahah Datu Hj. Kipli Hj. Yassin
Professor Dr. Asmadi Mohamed Naim
Kuala Lumpur,Date: 7 March 2022
BANK ISL AM MAL AYSIA BERHAD
224
REPORT Of ThE ShARIAh SUPERVISORY COUNCIL

I, Azizan Abd Aziz, the officer primarily responsible for the financial management of Bank Islam Malaysia Berhad, do solemnly and sincerely declare that the financial statements set out on pages 230 to 374 are, to the best of my knowledge and belief, correct and I make this solemn declaration conscientiously believing the same to be true, and by virtue of the provisions of the Statutory Declarations Act, 1960.
Subscribed and solemnly declared by the above named Azizan Abd Aziz, MIA CA (32474) in Kuala Lumpur on 7 March 2022.
Azizan Abd Aziz
Before me,
INTEGR ATED ANNUAL REPORT 2021
Key Messages Overview Value Creation MD&A Sustainability Leadership Accountability Financial Additional Information
225
STATUTORY DECLARATION pursuant to Section 251(1)(b) of the Companies Act 2016

OUR OPINION
In our opinion, the financial statements of Bank Islam Malaysia Berhad (“the Bank”) and its subsidiaries (“the Group”) give a true and fair view of the financial position of the Group and of the Bank as at 31 December 2021, and of their financial performance and their cash flows for the financial year then ended in accordance with Malaysian Financial Reporting Standards, International Financial Reporting Standards and the requirements of the Companies Act 2016 in Malaysia.
WHAT WE HAVE AUDITED
We have audited the financial statements of the Group and of the Bank, which comprise the statements of financial position as at 31 December 2021 of the Group and of the Bank, and the statements of profit or loss, statements of other comprehensive income, consolidated statement of changes in equity, statement of changes in equity and statements of cash flows of the Group and of the Bank for the financial year then ended, and notes to the financial statements, including a summary of significant accounting policies, as set out on pages 230 to 374.
BASIS FOR OPINION
We conducted our audit in accordance with approved standards on auditing in Malaysia and International Standards on Auditing. Our responsibilities under those standards are further described in the “Auditors’ responsibilities for the audit of the financial statements” section of our report.
We believe that the audit evidence we have obtained is sufficient and appropriate to provide a basis for our opinion.
INDEPENDENCE AND OTHER ETHICAL RESPONSIBILITIES
We are independent of the Group and of the Bank in accordance with the By-Laws (on Professional Ethics, Conduct and Practice) of the Malaysian Institute of Accountants (“By-Laws”) and the International Ethics Standards Board for Accountants’ International Code of Ethics for Professional Accountants (including International Independence Standards) (“IESBA Code”), and we have fulfilled our other ethical responsibilities in accordance with the By-Laws and the IESBA Code.
OUR AUDIT APPROACH
As part of designing our audit, we determined materiality and assessed the risks of material misstatement in the financial statements of the Group and of the Bank. In particular, we considered where the Directors made subjective judgements; for example, in respect of significant accounting estimates that involved making assumptions and considering future events that are inherently uncertain. As in all of our audits, we also addressed the risk of management override of internal controls, including among other matters, consideration of whether there was evidence of bias that represented a risk of material misstatement due to fraud.
We tailored the scope of our audit in order to perform sufficient work to enable us to provide an opinion on the financial statements as a whole, taking into account the structure of the Group and of the Bank, the accounting processes and controls, and the industry in which the Group and the Bank operate.
KEY AUDIT MATTERS
Key audit matters are those matters that, in our professional judgement, were of most significance in our audit of the financial statements of the Group and of the Bank for the current financial year. These matters were addressed in the context of our audit of the financial statements of the Group and of the Bank as a whole, and in forming our opinion thereon, and we do not provide a separate opinion on these matters.
BANK ISL AM MAL AYSIA BERHAD
226
INDEPENDENT AUDITORS’ REPORT to the members of Bank Islam Malaysia Berhad (Incorporated in Malaysia) (Company No. 198301002944 (98127-X))

KEY AUDIT MATTERS (CONTINUED)
Key audit matters How our audit addressed the key audit matters
Impairment of Financing, Advances and OthersRefer to Note 2.5 and 2.9 of the summary of significant accounting policies and Notes 8, 27 and 39 (b)(iii) of the Financial Statements.
We focused on this area due to the size of the carrying value of f inancing, advances and others, which represented 72.6% of total assets of the Group.
In addition, impairment is a highly subjective area as the Group exercised significant judgement on the following areas:
Timing of identification of Stage 2 and Stage 3 financing, advances and others
• Assessment of objective evidence of impairment of financing, advances and others based on mandatory and judgemental triggers.
• Identification of financing, advances and others that have experienced a significant increase in credit risk.
Individual assessment
Estimates on the amount and timing of futures cash flows based on realisation of collateral or customer’s business cash flows.
Collective assessment
Choosing the appropriate collective assessment models and assumptions for the measurement of ECL such as expected future cash flows and forward – looking macroeconomic factors given the wide range of potential economic outcomes due to Covid-19.
We tested the design and operating effectiveness of the controls over impairment of financing, advances and others. These controls covered:
• Identification of financing, advances and others that have experienced significant increase in credit risk or objective evidence of impairment;
• Governance over the impairment processes, including model development, model approval and model validation;
• Data used to determine the allowances for credit losses including the completeness and accuracy of the key inputs and assumptions into respective ECL models; and
• Review and approval of the ECL calculation. Our detailed testing over the financing, advances and others are as follows:
Individual assessment
• Examined a sample of financing, advances and others particularly focused on customers identified by the Group as having lower credit quality, rescheduled and restructured, borrowers in high risk industries impacted by Covid-19, and formed our own judgement as to whether there was a significant increase in credit risk or any objective evidence of impairment.
• Where objective evidence of impairment was identified by the Group and impairment loss was individually calculated, we examined both the quantum and timing of future cash flows used by the Group in the impairment loss calculation, challenging the assumptions and comparing estimates to external evidence where available. Calculations of the discounted cash flows were also re-performed.
Collective assessment
• Assessed the methodologies inherent within the collective assessment ECL models applied against the requirements of MFRS 9, including the basis used by the management to determine the key assumptions used in respective ECL models;
• Assessed and tested the significant modelling assumptions, including the basis or judgment used for management’s overlays;
• Assessed and considered reasonableness of forward-looking forecasts assumptions; and
• Tested the accuracy of data inputs used in ECL models and checked the calculation of ECL amount, on a sample basis. Based on the procedures performed on individual and collective assessment, we did not find any material exceptions to the Group’s assessment on impairment of financing, advances and others.
INTEGR ATED ANNUAL REPORT 2021
Key Messages Overview Value Creation MD&A Sustainability Leadership Accountability Financial Additional Information
227

INFORMATION OTHER THAN THE FINANCIAL STATEMENTS AND AUDITORS’ REPORT THEREON
The Directors of the Bank are responsible for the other information. The other information comprises the Directors’ Report, Report of the Shariah Supervisory Council and Annual Report, which we obtained prior to the date of this auditors’ report, and Annual Report, which is expected to be made available to us after that date. Other information does not include the financial statements of the Group and of the Bank and our auditors’ report thereon.
Our opinion on the financial statements of the Group and of the Bank does not cover the other information and we do not express any form of assurance conclusion thereon.
In connection with our audit of the financial statements of the Group and of the Bank, our responsibility is to read the other information and, in doing so, consider whether the other information is materially inconsistent with the financial statements of the Group and of the Bank or our knowledge obtained in the audit or otherwise appears to be materially misstated.
If, based on the work we have performed on the other information that we obtained prior to the date of this auditors’ report, we conclude that there is a material misstatement of this other information, we are required to report that fact. We have nothing to report in this regard.
RESPONSIBILITIES OF THE DIRECTORS FOR THE FINANCIAL STATEMENTS
The Directors of the Bank are responsible for the preparation of the financial statements of the Group and of the Bank that give a true and fair view in accordance with Malaysian Financial Reporting Standards, International Financial Reporting Standards and the requirements of the Companies Act 2016 in Malaysia. The Directors are also responsible for such internal control as the Directors determine is necessary to enable the preparation of financial statements of the Group and of the Bank that are free from material misstatement, whether due to fraud or error.
In preparing the financial statements of the Group and of the Bank, the Directors are responsible for assessing the Group’s and the Bank’s ability to continue as a going concern, disclosing, as applicable, matters related to going concern and using the going concern basis of accounting unless the Directors either intend to liquidate the Group or the Bank or to cease operations, or have no realistic alternative but to do so.
AUDITORS’ RESPONSIBILITIES FOR THE AUDIT OF THE FINANCIAL STATEMENTS
Our objectives are to obtain reasonable assurance about whether the financial statements of the Group and of the Bank as a whole are free from material misstatement, whether due to fraud or error, and to issue an auditors’ report that includes our opinion. Reasonable assurance is a high level of assurance, but is not a guarantee that an audit conducted in accordance with approved standards on auditing in Malaysia and International Standards on Auditing will always detect a material misstatement when it exists. Misstatements can arise from fraud or error and are considered material if, individually or in the aggregate, they could reasonably be expected to influence the economic decisions of users taken on the basis of these financial statements.
As part of an audit in accordance with approved standards on auditing in Malaysia and International Standards on Auditing, we exercise professional judgement and maintain professional scepticism throughout the audit. We also:
(a) Identify and assess the risks of material misstatement of the financial statements of the Group and of the Bank, whether due to fraud or error, design and perform audit procedures responsive to those risks, and obtain audit evidence that is sufficient and appropriate to provide a basis for our opinion. The risk of not detecting a material misstatement resulting from fraud is higher than for one resulting from error, as fraud may involve collusion, forgery, intentional omissions, misrepresentations, or the override of internal control.
(b) Obtain an understanding of internal control relevant to the audit in order to design audit procedures that are appropriate in the circumstances, but not for the purpose of expressing an opinion on the effectiveness of the Group’s and of the Bank’s internal control.
BANK ISL AM MAL AYSIA BERHAD
228
INDEPENDENT AUDITORS’ REPORT to the members of Bank Islam Malaysia Berhad (Incorporated in Malaysia) (Company No. 198301002944 (98127-X))

AUDITORS’ RESPONSIBILITIES FOR THE AUDIT OF THE FINANCIAL STATEMENTS (CONTINUED)
As part of an audit in accordance with approved standards on auditing in Malaysia and International Standards on Auditing, we exercise professional judgement and maintain professional scepticism throughout the audit. We also: (continued)
(c) Evaluate the appropriateness of accounting policies used and the reasonableness of accounting estimates and related disclosures made by the Directors.
(d) Conclude on the appropriateness of the Directors’ use of the going concern basis of accounting and, based on the audit evidence obtained, whether a material uncertainty exists related to events or conditions that may cast significant doubt on the Group’s or on the Bank’s ability to continue as a going concern. If we conclude that a material uncertainty exists, we are required to draw attention in our auditors’ report to the related disclosures in the financial statements of the Group and of the Bank or, if such disclosures are inadequate, to modify our opinion. Our conclusions are based on the audit evidence obtained up to the date of our auditors’ report. However, future events or conditions may cause the Group or the Bank to cease to continue as a going concern.
(e) Evaluate the overall presentation, structure and content of the financial statements of the Group and of the Bank, including the disclosures, and whether the financial statements of the Group and of the Bank represent the underlying transactions and events in a manner that achieves fair presentation.
(f) Obtain sufficient appropriate audit evidence regarding the financial information of the entities or business activities within the Group to express an opinion on the financial statements of the Group. We are responsible for the direction, supervision and performance of the group audit. We remain solely responsible for our audit opinion.
We communicate with the Directors regarding, among other matters, the planned scope and timing of the audit and significant audit findings, including any significant deficiencies in internal control that we identify during our audit.
We also provide the Directors with a statement that we have complied with relevant ethical requirements regarding independence, and to communicate with them all relationships and other matters that may reasonably be thought to bear on our independence, and where applicable, actions taken to eliminate threats or safeguards applied.
From the matters communicated with the Directors, we determine those matters that were of most significance in the audit of the financial statements of the Group and of the Company for the current financial year and are therefore the key audit matters. We describe these matters in our auditors’ report unless law or regulation precludes public disclosure about the matter or when, in extremely rare circumstances, we determine that a matter should not be communicated in our report because the adverse consequences of doing so would reasonably be expected to outweigh the public interest benefits of such communication.
OTHER MATTERS
This report is made solely to the members of the Bank, as a body, in accordance with Section 266 of the Companies Act 2016 in Malaysia and for no other purpose. We do not assume responsibility to any other person for the content of this report.
Pricewaterhousecoopers PLT Dato' Mohammad Faiz Bin Mohammad AzmiLLP0014401-LCA & AF 1146 02025/03/2022 JChartered Accountants Chartered Accountant
Kuala Lumpur,7 March 2022
INTEGR ATED ANNUAL REPORT 2021
Key Messages Overview Value Creation MD&A Sustainability Leadership Accountability Financial Additional Information
229

Group Bank
Note2021
RM’0002020
RM’0002021
RM’0002020
RM’000
ASSETSCash and short-term funds 3 5,222,848 5,216,737 5,204,364 5,216,280Financial assets at fair value through profit or loss 4 1,582,494 1,181,200 1,550,700 1,175,440Derivative financial assets 5 26,037 61,665 26,037 61,665Financial assets at fair value through other
comprehensive income 6 12,604,204 12,557,991 12,605,067 12,558,729Financial assets at amortised costs 7 1,348,844 – 1,348,844 –Financing, advances and others 8 58,153,769 54,670,635 58,153,769 54,670,635Other assets 9 312,954 207,349 257,080 196,588Statutory deposits with Bank Negara Malaysia 10 264,050 192,425 264,050 192,425Current tax assets 7,047 106,773 6,662 106,773Deferred tax assets 11 193,214 1,511 191,773 –Right-of-use assets 12 196,000 209,736 195,614 209,736Investments in subsidiaries 13 – – 100,905 15,525Property and equipment 14 244,753 231,000 241,952 230,516
Total assets 80,156,214 74,637,022 80,146,817 74,634,312
LIABILITIES AND EQUITYDeposits from customers 15 57,338,834 51,077,262 57,363,926 51,095,451Investment accounts of customers 16 10,452,902 12,368,528 10,561,601 12,368,897Derivative financial liabilities 5 20,421 105,872 20,421 105,872Bills and acceptance payable 20,112 29,621 20,112 29,621Recourse obligations on financing sold to Cagamas 17 2,001,720 1,501,187 2,001,720 1,501,187Subordinated Sukuk Murabahah 18 2,014,849 1,713,164 2,014,849 1,713,164Other liabilities 19 1,570,602 1,136,863 1,538,375 1,121,885Lease liabilities 12 303,448 312,429 302,984 312,429Zakat and taxation 20 33,388 31,952 33,256 31,776Deferred tax liabilities 11 – 74,445 – 74,445
Total liabilities 73,756,276 68,351,323 73,857,244 68,354,727
EQUITYShare capital 21 3,445,757 3,306,118 3,445,757 3,306,118Reserves 22 2,954,181 2,979,581 2,843,816 2,973,467
Total equity 6,399,938 6,285,699 6,289,573 6,279,585
Total liabilities and equity 80,156,214 74,637,022 80,146,817 74,634,312
Restricted investment accounts managed by the Bank 16 849 11,915 849 11,915
Total Islamic banking assets owned and managed by the Bank 80,157,063 74,648,937 80,147,666 74,646,227
Commitments and contingencies 42 18,764,994 20,189,496 18,764,994 20,189,496
The notes on pages 241 to 374 are an integral part of these financial statements.
BANK ISL AM MAL AYSIA BERHAD
230
STATEMENTS OF fINANCIAL POSITIONas at 31 December 2021

Group Bank
Note2021
RM’0002020
RM’0002021
RM’0002020
RM’000
Income derived from investment of depositors’ funds 24 2,260,072 2,504,013 2,260,072 2,504,013Income derived from investment account funds 25 497,538 513,934 497,538 513,934Income derived from investment of shareholders’
funds 26 458,750 460,059 430,950 436,313Net allowance for impairment on financing and
advances, net of recoveries 27 (190,738) (208,671) (190,738) (208,671)Loss on modification of financial assets (48,911) (136,380) (48,911) (136,380)Net allowance for impairment on other financial
assets (7,406) 2,757 (7,406) 2,757Direct expenses (10,938) (13,660) (10,938) (13,660)
Total distributable income 2,958,367 3,122,052 2,930,567 3,098,306Wakalah fees from restricted investment accounts 16 308 576 308 576Income attributable to depositors 28 (818,688) (1,006,479) (818,883) (1,006,700)Income attributable to investment account holders 29 (160,127) (222,026) (160,643) (222,026)
Total net income 1,979,860 1,894,123 1,951,349 1,870,156Personnel expenses 30 (723,830) (663,367) (701,784) (649,361)Other overhead expenses 31 (461,922) (411,085) (449,062) (402,502)
794,108 819,671 800,503 818,293Finance cost 34 (89,887) (91,458) (89,878) (91,457)
Profit before zakat and tax 704,221 728,213 710,625 726,836Zakat (12,275) (11,770) (12,222) (11,815)Tax expense 35 (157,641) (151,489) (157,256) (151,308)
Profit for the year 534,305 564,954 541,147 563,713
Earnings per share (sen) 36 21.87 22.19
The notes on pages 241 to 374 are an integral part of these financial statements.
INTEGR ATED ANNUAL REPORT 2021
Key Messages Overview Value Creation MD&A Sustainability Leadership Accountability Financial Additional Information
231
STATEMENTS OF PROfIT OR LOSS for the financial year ended 31 December 2021

Group Bank
2021RM’000
2020RM’000
2021RM’000
2020RM’000
Profit for the year 534,305 564,954 541,147 563,713
Other comprehensive income, net of tax:Items that are or may be reclassified subsequently to
profit or lossCurrency translation differences in respect of foreign
operations (14,774) 7,198 (14,680) 7,214Movement in fair value reserve (debt securities):Net change in fair value (303,103) 248,060 (303,228) 248,060Changes in expected credit loss (debt securities) (6,834) (138) (6,834) (138)Net amount transferred to profit or loss (87,903) (271,311) (87,903) (271,311)Income tax effect relating to components of other
comprehensive income 94,671 5,492 94,671 5,492
(317,943) (10,699) (317,974) (10,683)Items that will not be reclassified to profit or lossMovement in fair value reserve (equity instrument):Net change in fair value 13,583 16,992 13,708 16,992
Other comprehensive income for the year, net of tax (304,360) 6,293 (304,266) 6,309
Total comprehensive income for the year 229,945 571,247 236,881 570,022
The notes on pages 241 to 374 are an integral part of these financial statements.
BANK ISL AM MAL AYSIA BERHAD
232
STATEMENTS OF OThER COMPREhENSIVE INCOME for the financial year ended 31 December 2021

Note
Attributable to equity holders of the Bank
Non-distributable Distributable
Group
Sharecapital
RM’000
OtherreservesRM’000
RetainedearningsRM’000
Totalequity
RM’000
At 1 January 2021, restated 3,306,118 182,274 2,797,307 6,285,699
Profit for the year – – 534,305 534,305Currency translation difference in respect of
foreign operations – (14,774) – (14,774)Fair value reserve (debt instruments):
Net change in fair value – (303,103) – (303,103)Changes in expected credit losses – (6,834) – (6,834)Net amount transferred to profit or loss – (87,903) – (87,903)Income tax effect relating to components of
other comprehensive income – 94,671 – 94,671Fair value reserve (equity instruments):
Net change in fair value – 13,583 – 13,583
Total comprehensive income for the year – (304,360) 534,305 229,945
Effect on predecessor accounting – 111,187 – 111,187Dividends paid on ordinary shares 37 – – (366,532) (366,532)Issue of shares pursuant to Dividend
Reinvestment Plan 139,639 – – 139,639
At 31 December 2021 3,445,757 (10,899) 2,965,080 6,399,938
Note 22
The notes on pages 241 to 374 are an integral part of these financial statements.
INTEGR ATED ANNUAL REPORT 2021
Key Messages Overview Value Creation MD&A Sustainability Leadership Accountability Financial Additional Information
233
CONSOLIDATED STATEMENT OF ChANGES IN EQUITY for the financial year ended 31 December 2021

Note
Attributable to equity holders of the Bank
Non-distributable Distributable
Group
Sharecapital
RM’000
OtherreservesRM’000
RetainedearningsRM’000
Totalequity
RM’000
At 1 January 2020 3,012,368 107,265 2,594,820 5,714,453
Prior year adjustment on currency translation difference in respect of foreign operations 47 – 93,716 (93,716) –
At 1 January 2020, restated 3,012,368 200,981 2,501,104 5,714,453
Profit for the year – – 564,954 564,954Currency translation difference in respect of
foreign operations – 7,198 – 7,198Fair value reserve (debt instruments):
Net change in fair value – 248,060 – 248,060Changes in expected credit losses – (138) – (138)Net amount transferred to profit or loss – (271,311) – (271,311)Income tax effect relating to components of
other comprehensive income – 5,492 – 5,492Fair value reserve (equity instruments):
Net change in fair value – 16,992 – 16,992
Total comprehensive income for the year – 6,293 564,954 571,247
Transfer from regulatory reserve 22 – (25,000) 25,000 –Dividends paid on ordinary shares 37 – – (293,751) (293,751)Issue of shares pursuant to Dividend
Reinvestment Plan 293,750 – – 293,750
At 31 December 2020 3,306,118 182,274 2,797,307 6,285,699
Note 22
The notes on pages 241 to 374 are an integral part of these financial statements.
BANK ISL AM MAL AYSIA BERHAD
234
CONSOLIDATED STATEMENT Of ChANGES IN EQUITY for the financial year ended 31 December 2021

Note
Attributable to equity holders of the Bank
Non-distributable Distributable
Bank
Sharecapital
RM’000
OtherreservesRM’000
RetainedearningsRM’000
Totalequity
RM’000
At 1 January 2021, restated 3,306,118 182,423 2,791,044 6,279,585
Profit for the year – – 541,147 541,147Currency translation difference in respect of
foreign operations – (14,680) – (14,680)Fair value reserve (debt instruments):
Net change in fair value – (303,228) – (303,228)Changes in expected credit losses – (6,834) – (6,834)Net amount transferred to profit or loss – (87,903) – (87,903)Income tax effect relating to components of
other comprehensive income – 94,671 – 94,671Fair value reserve (equity instruments):
Net change in fair value – 13,708 – 13,708
Total comprehensive income for the year – (304,266) 541,147 236,881
Dividends paid on ordinary shares 37 – – (366,532) (366,532)Issue of shares pursuant to Dividend
Reinvestment Plan 139,639 – – 139,639
At 31 December 2021 3,445,757 (121,843) 2,965,659 6,289,573
Note 22
The notes on pages 241 to 374 are an integral part of these financial statements.
INTEGR ATED ANNUAL REPORT 2021
Key Messages Overview Value Creation MD&A Sustainability Leadership Accountability Financial Additional Information
235

Note
Attributable to equity holders of the Bank
Non-distributable Distributable
Bank
Sharecapital
RM’000
OtherreservesRM’000
RetainedearningsRM’000
Totalequity
RM’000
At 1 January 2020 3,012,368 107,398 2,589,798 5,709,564
Prior year adjustment on currency translation difference in respect of foreign operations 47 – 93,716 (93,716) –
At 1 January 2020, restated 3,012,368 201,114 2,496,082 5,709,564
Profit for the year – – 563,713 563,713Currency translation difference in respect of
foreign operations – 7,214 – 7,214Fair value reserve (debt instruments):
Net change in fair value – 248,060 – 248,060Changes in expected credit losses – (138) – (138)Net amount transferred to profit or loss – (271,311) – (271,311)Income tax effect relating to components of
other comprehensive income – 5,492 – 5,492Fair value reserve (equity instruments):
Net change in fair value – 16,992 – 16,992
Total comprehensive income for the year – 6,309 563,713 570,022
Transfer from regulatory reserve 22 – (25,000) 25,000 –Dividends paid on ordinary shares 37 – – (293,751) (293,751)Issue of shares pursuant to Dividend
Reinvestment Plan 293,750 – – 293,750
At 31 December 2020 3,306,118 182,423 2,791,044 6,279,585
Note 22
The notes on pages 241 to 374 are an integral part of these financial statements.
BANK ISL AM MAL AYSIA BERHAD
236
CONSOLIDATED STATEMENT Of ChANGES IN EQUITY for the financial year ended 31 December 2021

Group Bank
2021RM’000
2020RM’000
2021RM’000
2020RM’000
Cash flows from operating activitiesProfit before zakat and tax 704,221 728,213 710,625 726,836
Adjustments for:Depreciation of property and equipment 59,225 56,546 58,803 56,341Depreciation of right-of-use assets 18,197 18,348 18,042 18,317Net gain on disposal of property and equipment (603) (3) (602) (3)Property and equipment written-off 619 925 619 925Allowance for impairment on financing, advances and
others 265,937 288,187 265,937 288,187Losses on modification of financial assets 48,911 136,380 48,911 136,380Net allowance for impairment on other financial assets 7,406 (2,757) 7,406 (2,757)Net loss/(gain) on sale of financial assets at FVTPL 7,347 (528) 7,373 (528)Net gain on sale of financial assets at FVOCI (87,903) (271,311) (87,903) (271,311)Fair value (gain)/loss on FVTPL (16,497) 6,717 (16,350) 6,713Dividends from subsidiary – – (800) (500)Dividends from financial assets at FVTPL (11,677) (13,860) (11,326) (13,722)Dividends from financial assets at FVOCI – (503) – (503)Rebate on investment in unit trust (2,217) (979) (2,217) (979)Net derivative loss (7) (31) (7) (31)Finance cost on Subordinated Sukuk Murabahah 72,575 73,622 72,575 73,622Profit expense on lease 17,312 17,836 17,303 17,835
Operating profit before changes in assets and liabilities 1,082,846 1,036,802 1,088,389 1,034,822Changes in assets and liabilities:Financing, advances and others (3,797,982) (5,622,680) (3,797,982) (5,622,680)Statutory deposits with Bank Negara Malaysia (71,625) 977,711 (71,625) 977,711Bills and other receivables (1,313,346) (87,545) (1,374,267) (81,439)Deposits from customers 6,261,572 3,668,524 6,268,475 3,618,579Investment accounts of customers (1,915,626) 2,128,155 (1,807,296) 2,128,524Bills and acceptance payable (9,509) (19,463) (9,509) (19,463)Other liabilities 100,097 214,455 104,148 259,327Recourse obligation on financing sold to Cagamas 500,533 – 500,533 –
Cash generated from operations 836,960 2,295,959 900,866 2,295,381
Zakat paid (11,967) (10,862) (11,822) (10,795)Tax paid (227,995) (100,444) (227,612) (100,261)
Net cash generated from operating activities 596,998 2,184,653 661,432 2,184,325
The notes on pages 241 to 374 are an integral part of these financial statements.
INTEGR ATED ANNUAL REPORT 2021
Key Messages Overview Value Creation MD&A Sustainability Leadership Accountability Financial Additional Information
237
STATEMENTS OF CASh fLOW for the financial year ended 31 December 2021

Group Bank
2021RM’000
2020RM’000
2021RM’000
2020RM’000
Cash flows from investing activitiesPurchase of property and equipment (71,155) (92,879) (70,862) (92,684)Acquisition of subsidiaries – – (85,380) –Acquisition of subsidiaries, net of cash acquired (14,793) – – –Proceeds from disposal of property and equipment 609 5 607 5Dividends from subsidiary – – 800 500Dividends from financial assets at FVTPL 11,677 13,860 11,326 13,722Dividends from financial assets at FVOCI – 503 – 503Income from rebate on investment in unit trust 2,217 979 2,217 979Net proceeds from disposal/purchase of securities (702,959) (670,896) (715,809) (670,757)
Net cash used in investing activities (774,404) (748,428) (857,101) (747,732)
Cash flows from financing activitiesIssuance of Subordinated Sukuk Murabahah 300,000 1,100,000 300,000 1,100,000Dividend paid on ordinary shares (139,639) (293,751) (139,639) (293,751)Proceeds from issuance of ordinary shares pursuant to
Dividend Reinvestment Plan 139,639 293,750 139,639 293,750Redemption of Subordinated Sukuk Murabahah – (700,000) – (700,000)Finance cost paid on Subordinated Sukuk Murabahah (70,890) (69,152) (70,890) (69,152)Payments of lease liabilities (30,818) (29,920) (30,676) (29,883)
Net cash generated from financing activities* 198,292 300,927 198,434 300,964
Net increase in cash and cash equivalents 20,886 1,737,152 2,765 1,737,557Cash and cash equivalents at 1 January 5,216,737 3,472,386 5,216,280 3,471,509Exchange difference on translation (14,775) 7,199 (14,681) 7,214
Cash and cash equivalents at 31 December 5,222,848 5,216,737 5,204,364 5,216,280
* Net cash (used in)/generated from financing activities are solely attributable to changes from financing cash flows.
The notes on pages 241 to 374 are an integral part of these financial statements.
BANK ISL AM MAL AYSIA BERHAD
238
STATEMENTS Of CASh fLOW for the financial year ended 31 December 2021

RECONCILIATION OF LIABILITIES ARISING FROM FINANCING ACTIVITIES
The table below details changes in liabilities arising from financing activities, including both cash and non-cash changes. Liabilities arising from financing activities are those for which cash flows were, or future cash flows will be, classified in the Group’s and the Bank’s statements of cash flows from financing activities.
Subordinated sukuk Murabahah
GroupNominalRM’000
Finance cost
payableRM’000
Leaseliabilities
RM’000Total
RM’000
At 1.1.2020 1,300,000 8,694 325,559 1,634,253New acquisition 1,100,000 – 437 1,100,437Redemption/reversal (700,000) – (1,472) (701,472)Changes from financing cash flows – (69,152) (29,920) (99,072)Finance cost for the year – 73,622 17,836 91,458Effects of movement in exchange rates – – (11) (11)
At 31.12.2020 1,700,000 13,164 312,429 2,025,593
At 1.1.2021 1,700,000 13,164 312,429 2,025,593New acquisition 300,000 – 4,512 304,512Redemption/reversal – – – –Changes from financing cash flows – (70,890) (30,818) (101,708)Finance cost for the year – 72,575 17,312 89,887Effects of movement in exchange rates – – 13 13
At 31.12.2021 2,000,000 14,849 303,448 2,318,297
The notes on pages 241 to 374 are an integral part of these financial statements.
INTEGR ATED ANNUAL REPORT 2021
Key Messages Overview Value Creation MD&A Sustainability Leadership Accountability Financial Additional Information
239

RECONCILIATION OF LIABILITIES ARISING FROM FINANCING ACTIVITIES (CONTINUED)
Subordinated sukuk Murabahah
BankNominalRM’000
Finance cost
payableRM’000
Leaseliabilities
RM’000Total
RM’000
At 1.1.2020 1,300,000 8,694 325,559 1,634,253New acquisition 1,100,000 – 401 1,100,401Redemption/reversal (700,000) – (1,472) (701,472)Changes from financing cash flows – (69,152) (29,883) (99,035)Finance cost for the year – 73,622 17,835 91,457Effects of movement in exchange rates – – (11) (11)
At 31.12.2020 1,700,000 13,164 312,429 2,025,593
At 1.1.2021 1,700,000 13,164 312,429 2,025,593New acquisition 300,000 – 3,915 303,915Redemption/reversal – – – –Changes from financing cash flows – (70,890) (30,676) (101,566)Finance cost for the year – 72,575 17,303 89,878Effects of movement in exchange rates – – 13 13
At 31.12.2021 2,000,000 14,849 302,984 2,317,833
The notes on pages 241 to 374 are an integral part of these financial statements.
BANK ISL AM MAL AYSIA BERHAD
240
STATEMENTS Of CASh fLOW for the financial year ended 31 December 2021

1. PRINCIPAL ACTIVITIES AND GENERAL INFORMATION
The Bank is principally engaged in Islamic banking business and the provision of related financial services. The principal activities of its subsidiaries are as disclosed in Note 13 to the financial statements.
The Bank is a public limited liability company, incorporated and domiciled in Malaysia and is listed on the Main Market of Bursa Malaysia Securities Berhad. The address of its registered office and principal place of business is as follows:
Level 32, Menara Bank IslamNo. 22, Jalan Perak, 50450 Kuala Lumpur.
The consolidated financial statements comprise the Bank and its subsidiaries (together referred to as the “Group”).
These financial statements were approved by the Board of Directors on 7 March 2022.
2. SUMMARY OF SIGNIFICANT ACCOUNTING POLICIES
The accounting policies set out below have been applied consistently to the periods presented in these financial statements and have been applied consistently by Group entities, unless otherwise stated.
2.1 Basis of preparation
(a) Statement of compliance
The financial statements of the Group and of the Bank have been prepared in accordance with the applicable Malaysian Financial Reporting Standards (“MFRS”), International Financial Reporting Standards (“IFRS”), the requirements of Companies Act 2016 in Malaysia and Shariah requirements.
The Government has introduced certain measures to assist customers experiencing temporary financial constraints due to the pandemic. The key measures affecting regulatory and accounting treatment and classifications are as follows:
(i) Moratorium repayment on financing:
• The Bank has granted an automatic repayment moratorium on all individuals’ and small-medium enterprises’ (“SMEs”) financing (except for credit card balances) for a period of six months from 1 April 2020. The automatic moratorium applied to financing not in arrears exceeding 90 days as at 1 April 2020 and denominated in Malaysian Ringgit. This measure is extended beyond 1 October 2020 to viable customers on a case-to-case basis, whose applications are received on or before 30 June 2021 via various repayment assistance. On 6 July 2021, BNM announced that individuals, microenterprise customers and SMEs affected by the COVID-19 pandemic, may start applying for the six-month moratorium from 7 July 2021 onwards, in line with the Government’s Pakej Perlindungan Rakyat dan Pemulihan Ekonomi (PEMULIH). In addition to the moratorium, The Bank has offered a reduction in instalments and other packages, including to reschedule and restructure financing and advances to suit the specific financial circumstances of customers..
• Furthermore, the Bank and Agensi Kaunseling dan Pengurusan Kredit has introduced the Financial Management & Resillience Programme (“URUS”) for individual customers who continued to be affected by the COVID-19 pandemic whose applications are received from 15 November 2021 to 31 January 2022.
INTEGR ATED ANNUAL REPORT 2021
Key Messages Overview Value Creation MD&A Sustainability Leadership Accountability Financial Additional Information
241
NOTES TO THE fINANCIAL STATEMENTS for the financial year ended 31 December 2021

2. SUMMARY OF SIGNIFICANT ACCOUNTING POLICIES (CONTINUED)
2.1 Basis of preparation (continued)
(a) Statement of compliance (continued)
• For credit card balances, the Bank offered the option to convert the balances to term financing.
• For corporate customers, the Bank granted assistance through repayment moratorium or additional working capital or rescheduling and restructuring of existing facilities. This is to enable viable corporations in preserving jobs and resuming economic activities when conditions stabilise and improve.
The financial impact of the moratorium repayment is disclosed in Note 2.18.
(ii) Definition of defaulted exposures under the policy documents on Capital Adequacy Framework for Islamic Banks for which assistance is granted:
• The determination of “days past due” is based on the new repayment terms of rescheduled and restructured financing.
• Individuals or SMEs are not considered to be in default based on the “unlikeliness to repay” at the time of when the assistance was granted, except for when customers are subject to bankruptcy action.
• Corporates “unlikeliness to repay” are based on holistic assessment of all relevant factors and information, not on the act of accepting assistance from the Bank.
The regulatory capital treatment above shall apply to financing denominated in Malaysian Ringgit that meet the following criteria;
• The principal or profit or both, is not in arrears exceeding 90 days at the application date of assistance. • The application is received on or before due date of the respective assistance programme.
The regulatory capital treatment would also be applicable to rescheduled and restructured financing that are facilitated by Agensi Kaunseling dan Pengurusan Kredit, the Small Debt Resolution Scheme and the Corporate Debt Restructuring Committee.
(iii) Classification in the Central Credit Reference Information System (“CCRIS”)
The following shall apply for rescheduled and restructured financing with arrears not exceeding 90 days at the application date of assistance received:
• The financing need not be reported as (R&R) in CCRIS; and • The financing need not be reported as credit-impaired in CCRIS
Customers under URUS shall be identified as enrolled in the programme to facilitate follow up and monitoring by AKPK and the Bank in order to provide further support. The identification shall be removed once the customers exit the programme or at the earliest, six months after enrollment date.
(iv) Bank Negara Malaysia (“BNM”) allows financial institutions to drawdown certain prudential buffers as below:
• Drawdown the capital conservation buffer of 2.5%; • Operate below the minimum Liquidity Coverage Ratio (“LCR”) of 100%; • Reduce the regulatory reserves held against expected credit losses to 0%; and • Minimum Net Stable Funding Ratio (“NSFR”) is lowered to 80% from 100% effective 1 July 2020.
BNM requires financial institutions to restore the minimum regulatory requirements by 30 September 2021.
BANK ISL AM MAL AYSIA BERHAD
NOTES TO ThE fINANCIAL STATEMENTS for the financial year ended 31 December 2021
242

2. SUMMARY OF SIGNIFICANT ACCOUNTING POLICIES (CONTINUED)
2.1 Basis of preparation (continued)
(a) Statement of compliance (continued)
Bank Islam has kept abreast with the latest IBOR developments in Malaysia. A Task Force (“TF”) involving key stakeholders has been formed, headed by Head of Treasury & Markets. There were five TF meetings held to date, on 18 August 2020, 8 December 2020, 16 February 2021, 28 May 2021 and 1 November 2021 respectively. Progress on LIBOR transition against the industry signpost issued by BNM, was discussed at the TF meetings, and tabled to the Asset & Liability Committee (“ALCO”), Board Risk Committee (“BRC”) and Board of Directors (“BOD”) of the Bank for deliberation and to be monitored on a regular basis. The Bank has ceased all new financing referenced to LIBOR, and have renegotiated the existing LIBOR financing, to a new Reference Rate ie. USD COF. Bank Islam no longer has any LIBOR exposure w.e.f. 9 July 2021.
Other than as described above, the adoption of other accounting standards, interpretations and amendments did not have any significant impact on the Group and the Bank.
The following are accounting standards, amendments and interpretations of the MFRS framework that have been issued by the Malaysian Accounting Standards Board (“MASB”) but have not been adopted by the Group and the Bank.
MFRSs, Interpretations and amendments effective for annual periods beginning on or after 1 January 2022
• Annual improvements to MFRS Standards 2018-2020 • Amendments to MFRS 3, Business Combinations • Amendments to MFRS 116, Property, Plant and Equipment • Amendments to MFRS 137, Onerous Contract – Cost of Fulfilling a Contract – Provisions, Contingent
Liabilities and Contingent Assets
MFRSs, Interpretations and amendments effective for annual periods beginning on or after 1 January 2023
• Amendments to MFRS 101, Presentation of Financial Statements – Classification of Liabilities as Current or Non-current, Disclosure of Accounting Policies
• MFRS 17, Insurance Contracts • Amendments to MFRS 17, Insurance Contract • Amendments to MFRS 108, Definition of Accounting Estimates
MFRSs, Interpretations and amendments effective for annual periods beginning or after a date yet to be confirmed
• Amendments to MFRS 112, Deferred Tax related to Assets and Liabilities arising from a Single Transaction • Amendments to MFRS 10, Consolidated Financial Statements and MFRS 128, Investments in Associates
and Joint Ventures – Sale or Contribution of Assets between an Investor and its Associate or Joint Venture
The Group and the Bank plan to apply the abovementioned standards, amendments and interpretations on the respective effective dates.
The initial application of the accounting standards, amendments and interpretations are not expected to have any material financial impacts to the current period and prior period financial statements of the Group and the Bank.
INTEGR ATED ANNUAL REPORT 2021
Key Messages Overview Value Creation MD&A Sustainability Leadership Accountability Financial Additional Information
243

2. SUMMARY OF SIGNIFICANT ACCOUNTING POLICIES (CONTINUED)
2.1 Basis of preparation (continued)
(b) Basis of measurement
The financial statements have been prepared on the historical cost convention except for derivative financial instruments, financial assets at fair value through profit or loss (“FVTPL”) and fair value through other comprehensive income (“FVOCI”), which have been measured at fair value.
(c) Functional and presentation currency
The financial statements are presented in Ringgit Malaysia (“RM”), which is the Bank’s functional currency. All financial information is presented in RM and has been rounded to the nearest thousand (RM’000), unless otherwise stated.
(d) Use of estimates and judgement
The preparation of the financial statements requires management to make judgements, estimates and assumptions that affect the application of accounting policies and the reported amounts of assets, liabilities, income and expenses. Actual results may differ from these estimates. Estimates and underlying assumptions are reviewed on an ongoing basis. Revisions to accounting estimates are recognised in the financial statements in the period in which the estimates are revised and in any future periods affected.
Significant areas of estimation, uncertainty and critical judgements used in applying accounting policies that have significant effect in determining the amount recognised in the financial statements are described in Note 2.9 – Impairment.
2.2 Basis of consolidation
(a) Subsidiaries
Subsidiaries are entities, including structured entities, controlled by the Bank. The financial statements of the subsidiaries are included in the consolidated financial statements from the date that control commences until the date that control ceases.
The Group controls an entity when it is exposed, or has rights, to variable returns from its involvement with the entity and has the ability to affect those returns through its power over the entity. Potential voting rights are considered when assessing control only when such rights are substantive. The Group also considers it has de facto power over an investee when, despite not having the majority of voting rights, it has the current ability to direct the activities of the investee that significantly affect the investee’s return.
Investments in subsidiaries are measured in the Bank’s statement of financial position at cost less impairment losses, if any. Where there is indication of impairment, the carrying amount of the investment is assessed. A write down is made if the carrying amount exceeds its recoverable amount.
(b) Business combinations
Business combinations are accounted for using the acquisition method from the acquisition date, which is the date on which control is transferred to the Group.
BANK ISL AM MAL AYSIA BERHAD
NOTES TO ThE fINANCIAL STATEMENTS for the financial year ended 31 December 2021
244

2. SUMMARY OF SIGNIFICANT ACCOUNTING POLICIES (CONTINUED)
2.2 Basis of consolidation
(b) Business combinations
For new acquisitions, the Group measures the cost of goodwill at the acquisition date as:
• the fair value of the consideration transferred; plus • the recognised amount of any non-controlling interests in the acquiree; plus • if the business combination is achieved in stages, the fair value of the existing equity interest in the
acquiree; less • the net recognised amount (generally fair value) of the identifiable assets acquired and liabilities assumed
When the excess is negative, a bargain purchase gain is recognised immediately in profit or loss.
For each business combination, the Group elects whether it measures the non-controlling interests in the acquiree either at fair value or at proportionate share of the acquiree’s identifiable net assets at the acquisition date.
Transaction costs, other than those associated with the issue of debt or equity securities, that the Group incurs in connection with a business combination are expensed as incurred.
The Group applies predecessor accounting to account for business combinations under common control. Under predecessor accounting, assets and liabilities acquired are not restated to their respective fair values. They are recognised at the carrying amounts from the consolidated financial statements of the ultimate holding company of the Group and adjusted to conform with the accounting policies adopted by the Group. The difference between any consideration given and the aggregate carrying amounts of the assets and liabilities of the acquired entity is recognised as an adjustment to equity. No additional goodwill is recognised.
The acquired entity’s results, assets and liabilities are consolidated from the date on which the business combination between entities under common control occurred. Consequently, the consolidated financial statements do not reflect the results of the acquired entity for the period before the transaction occurred. The comparative information is not restated.
(c) Loss of control
Upon the loss of control of a subsidiary, the Group derecognises the assets and liabilities of the former subsidiary, any non-controlling interests and the other components of equity related to the former subsidiary from the consolidated statement of financial position. Any surplus or deficit arising on the loss of control is recognised in profit or loss. If the Group retains any interest in the former subsidiary, then such interest is measured at fair value at the date that control is lost. Subsequently it is accounted for as an equity accounted investee or as a financial asset at FVOCI depending on the level of influence retained.
(d) Transactions eliminated on consolidation
In preparing the consolidated financial statements, intra-group balances and transactions, and any unrealised income and expenses arising from intra-group transactions are eliminated.
INTEGR ATED ANNUAL REPORT 2021
Key Messages Overview Value Creation MD&A Sustainability Leadership Accountability Financial Additional Information
245

2. SUMMARY OF SIGNIFICANT ACCOUNTING POLICIES (CONTINUED)
2.3 Foreign currency
(a) Foreign currency transactions
In preparing the financial statements of the Group entities, transactions in foreign currencies are translated to the respective functional currencies of Group entities at exchange rates at the dates of the transactions.
Monetary assets and liabilities denominated in foreign currencies at the end of reporting date are retranslated to the functional currency at the exchange rate at that date.
Non-monetary assets and liabilities denominated in foreign currencies are not retranslated at the end of the reporting date, except for those that are measured at fair value are retranslated to the functional currency at the exchange rate at the date that the fair value was determined.
Foreign currency differences arising on retranslation are recognised in profit or loss, except for differences arising on the retranslation of FVOCI equity instruments or a financial instrument designated as a hedge of currency risk, which are recognised in other comprehensive income.
(b) Foreign operations denominated in functional currencies other than Ringgit Malaysia (“RM”)
The results and financial position of all the Group entities and branch of the Bank (none of which has the currency of a hyperinflationary economy) that have a functional currency different from the presentation currency are translated into the presentation currency as follows:
• the assets and liabilities of operations denominated in functional currencies other than RM, including fair value adjustments arising on acquisition, are translated to RM at exchange rates at the end of the reporting date;
• the income and expenses of the foreign operations are translated to RM at average exchange rates for the period; and
• all resulting exchange differences are recognised as a separate component of other comprehensive income.
On consolidation and at Bank, exchange differences arising from the translation of any net investment in foreign entities and branch, and of borrowings and other financial instruments designated as hedges of such investments, are recognised in other comprehensive income.
On the disposal of a foreign operation (that is, a disposal of the Group’s entire interest in a foreign operation, or a disposal involving loss of control over a subsidiary that includes a foreign operation, a disposal involving loss of joint control over a joint venture that includes a foreign operation, or a disposal involving loss of significant influence over an associate that includes a foreign operation), all of the exchange differences relating to that foreign operation recognised in other comprehensive income and accumulated in the separate component of equity are reclassified to profit or loss, as part of the gain or loss on disposal. In the case of a partial disposal that does not result in the Group losing control over a subsidiary that includes a foreign operation, the proportionate share of accumulated exchange differences are re-attributed to non-controlling interests and are not recognised in profit or loss. For all other partial disposals (that is, reductions in the Group’s ownership interest in associates or joint ventures that do not result in the Group losing significant influence or joint control) the proportionate share of the accumulated exchange difference is reclassified to profit or loss.
BANK ISL AM MAL AYSIA BERHAD
NOTES TO ThE fINANCIAL STATEMENTS for the financial year ended 31 December 2021
246

2. SUMMARY OF SIGNIFICANT ACCOUNTING POLICIES (CONTINUED)
2.4 Cash and cash equivalents
Cash and cash equivalents include cash and short-term funds, and deposits and placements with banks and other financial institutions maturing within three month.
2.5 Financial instruments
Financial instruments are classified and measured using accounting policies as mentioned below. The Group and the Bank have consider the impact of the pandemic and there is no changes to the Group’s and the Bank’s business model for managing the financial instruments.
Initial recognition and measurement
A financial asset or a financial liability is recognised in the statement of financial position when, and only when, the Group and the Bank becomes a party to the contractual provisions of the instrument.
A financial instrument is recognised initially, at its fair value plus, in the case of a financial instrument not at fair value through profit or loss, transaction costs that are directly attributable to the acquisition or issue of the financial instrument.
Classification and subsequent measurement
On initial recognition, a financial asset is classified and measured at: amortised cost; FVOCI - debt instrument; FVOCI - equity instrument; or FVTPL.
Financial assets are not reclassified subsequent to their initial recognition unless the Group and the Bank change its business model for managing financial assets, in which case all affected financial assets are reclassified on the first day of the first reporting period following the change in the business model.
(a) Financial assets measured at amortised cost
A financial asset is measured at amortised cost if it meets both of the following conditions and is not designated as at FVTPL:
• it is held within a business model whose objective is to hold assets to collect contractual cash flows; and
• its contractual terms give rise on specified dates to cash flows that are solely payments of principal and profit on the principal amount outstanding.
These assets are subsequently measured at amortised cost using effective profit rate method. These assets are stated net of unearned income and any impairment loss.
Included in financial assets measured at amortised cost are financing, advances and others which consist of sale-based contracts (namely Bai’ Bithaman Ajil, Bai Al-Inah, Murabahah, Bai Al-Dayn and At-Tawarruq), lease-based contracts (namely Ijarah Muntahiah Bit-Tamleek, construction-based contract (Istisna’) and Ar-Rahnu contract.
These financing contracts are recorded in the financial statements as financial assets measured at amortised cost based on concept of ‘substance over form’ and in accordance with MFRS 9.
INTEGR ATED ANNUAL REPORT 2021
Key Messages Overview Value Creation MD&A Sustainability Leadership Accountability Financial Additional Information
247

2. SUMMARY OF SIGNIFICANT ACCOUNTING POLICIES (CONTINUED)
2.5 Financial instruments (continued)
Classification and subsequent measurement (continued)
(b) Financial assets at FVOCI
(i) FVOCI – debt instrument
A debt instrument is measured at FVOCI if it meets both of the following conditions and is not designated as at FVTPL:
• it is held within a business model whose objective is achieved by both collecting contractual cash flows and selling financial assets; and
• its contractual terms give rise on specified dates to cash flows that are solely payments of principal and profit on the principal amount outstanding.
These assets are subsequently measured at fair value. Any gain or loss arising from a change in the fair value is recognised in the fair value reserve through other comprehensive income except for profit income, impairment losses and foreign exchange gains and losses arising from monetary items which are recognised in profit or loss. On derecognition or disposal, the cumulative gains or losses previously recognised in OCI is reclassified from equity into profit or loss. Profit calculated for a debt instrument using the effective profit method is recognised in the profit or loss.
(ii) FVOCI – equity instrument
On initial recognition of an equity instrument that is not held for trading, the Group and the Bank may irrevocably elect to present subsequent changes in the investment’s fair value in OCI. This election is made on an investment-by-investment basis.
These assets are subsequently measured at fair value. Dividend are recognised as income in profit or loss unless the dividend clearly represents a recovery of part of the cost of the investment. Other net gains and losses are recognised in OCI and are never reclassified to profit or loss.
(c) Financial assets at FVTPL
All financial assets not measured at amortised cost or FVOCI as described above are measured at FVTPL. This includes all derivative financial assets. On initial recognition, the Group and the Bank may irrevocably designate a financial asset that otherwise meets the requirements to be measured at amortised cost or at FVOCI as at FVTPL if doing so eliminates or significantly reduces an accounting mismatch that would otherwise arise.
These financial assets are subsequently measured at their fair values and any gain or loss arising from a change in the fair value will be recognised in the profit or loss.
BANK ISL AM MAL AYSIA BERHAD
NOTES TO ThE fINANCIAL STATEMENTS for the financial year ended 31 December 2021
248

2. SUMMARY OF SIGNIFICANT ACCOUNTING POLICIES (CONTINUED)
2.5 Financial instruments (continued)
Classification and subsequent measurement (continued)
Financial assets – Business model assessment
The Group and the Bank make an assessment of the objective of the business model in which a financial asset is held at the portfolio level because this best reflects the way the business is managed and information is provided to management. The information considered includes:
• the stated policies and objectives for the portfolio and the operation of those policies in practice. These include whether management’s strategy focuses on earning contractual profit income, maintaining a particular profit rate profile, matching the duration of the financial assets to the duration of any related liabilities or expected cash outflows or realising cash flows through the sale of the assets;
• how the performance of the portfolio is evaluated and reported to the management;
• the risks that affect the performance of the business model (and the financial assets held within that business model) and how those risks are managed; and
• how managers of the business are compensated – e.g. whether compensation is based on the fair value of the assets managed or the contractual cash flows collected.
Transfers of financial assets to third parties in transactions that do not qualify for derecognition are not considered sales for this purpose, consistent with the Group’s and the Bank’s continuing recognition of the assets.
Financial assets that are held for trading or are managed and whose performance is evaluated on a fair value basis are measured at FVTPL.
Financial assets – Assessment whether contractual cash flows are solely payments of principal and profit (“SPPI”)
For the purposes of this assessment, ‘principal’ is defined as the fair value of the financial asset on initial recognition. ‘Profit’ is defined as consideration for the time value of money and for the credit risk associated with the principal amount outstanding during a particular period of time and for other basic lending risks and costs (e.g. liquidity risk and administrative costs), as well as a profit margin.
In assessing whether the contractual cash flows are solely payments of principal and profit, the Group and the Bank consider the contractual terms of the instrument. This includes assessing whether the financial asset contains a contractual term that could change the timing or amount of contractual cash flows such that it would not meet this condition. In making this assessment, the Group and the Bank consider:
• contingent events that would change the amount or timing of cash flows; • terms that may adjust the contractual coupon rate, including variable-rate features; • prepayment and extension features; and • terms that limit the Group’s claim to cash flows from specified assets (e.g. non-recourse features).
INTEGR ATED ANNUAL REPORT 2021
Key Messages Overview Value Creation MD&A Sustainability Leadership Accountability Financial Additional Information
249

2. SUMMARY OF SIGNIFICANT ACCOUNTING POLICIES (CONTINUED)
2.5 Financial instruments (continued)
Classification and subsequent measurement (continued)
Financial assets – Assessment whether contractual cash flows are solely payments of principal and profit (“SPPI”) (continued)
A prepayment feature is consistent with the SPPI criterion if the prepayment amount substantially represents unpaid amounts of principal and profit on the principal amount outstanding, which may include reasonable additional compensation for early termination of the contract. Additionally, for a financial asset acquired at a discount or premium to its contractual par amount, a feature that permits or requires prepayment at an amount that substantially represents the contractual par amount plus accrued (but unpaid) contractual profit (which may also include reasonable additional compensation for early termination) is treated as consistent with this criterion if the fair value of the prepayment feature is insignificant at initial recognition.
Derivative financial instruments
The Group and the Bank hold derivative financial instruments to hedge its foreign currency and profit rate exposures. However, the Group and the Bank elect not to apply hedge accounting. Hence, foreign exchange trading positions, including spot and forward contracts, are revalued at prevailing market rates at statement of financial position date and the resultant gains and losses for the financial year are recognised in the profit or loss.
An embedded derivative is recognised separately from the host contract and accounted for as a derivative if, and only if, it is not closely related to the economic characteristics and risks of the host contract and the host contract is not categorised at fair value through profit or loss. In the event of an embedded derivatives, the host contract that is not a financial assets are recognised separately and accounted for in accordance with the policy applicable to the nature of the host contract.
Financial liabilities
All financial liabilities are subsequently measured at amortised cost other than those categorised as fair value through profit or loss.
The financial liabilities measured at amortised cost are deposit from customers, investment accounts of customers, recourse obligations on financing sold to Cagamas, bills and acceptance payables, Subordinated Sukuk Murabahah and other liabilities.
Fair value through profit or loss category comprises financial liabilities that are derivatives or financial liabilities that are specifically designated into this category upon initial recognition.
Financial liabilities categorised as fair value through profit or loss are subsequently measured at their fair values with the gain or loss recognised in profit or loss.
BANK ISL AM MAL AYSIA BERHAD
NOTES TO ThE fINANCIAL STATEMENTS for the financial year ended 31 December 2021
250

2. SUMMARY OF SIGNIFICANT ACCOUNTING POLICIES (CONTINUED)
2.5 Financial instruments (continued)
Financial liabilities (continued)
(a) Investment accounts
Investment accounts are either:
(i) Unrestricted investment accounts
An unrestricted investment account (“UA”) refers to a type of investment account where the investment account holder (“IAH”) provides the Bank with the mandate to make the ultimate decision without specifying any particular restrictions or conditions. The UA is structured under Mudharabah and Wakalah contracts.
Impairment allowances required on the assets for investment accounts are charged to and borne by the investors.
(ii) Restricted investment accounts
Restricted investment account (“RA”) refers to a type of investment account where the IAH provides a specific investment mandate to the Bank such as purpose, asset class, economic sector and period of investment.
RA is accounted for as off balance sheet as the Bank has no risk and reward in respect of the assets related to the RA or to the residual cash flows from those assets except for the fee income generated by the Bank for managing the RA. The Bank also has no ability to exercise power over the RA to affect the amount of the Bank’s return. The RA is structured under the Wakalah contract whereby the IAH appoints the Bank as the agent to invest the funds provided by IAH to finance customers with a view of earning profits and the Bank receives fees for the agency service provided.
Financial guarantee contracts
A financial guarantee contract is a contract that requires the Group and the Bank to make specified payments to reimburse the holder for a loss it incurs because a specified debtor fails to make payment when due in accordance with the original or modified terms of a debt instrument.
Fees and commissions arising from financial guarantee contracts are classified as deferred income and are amortised to profit or loss using a straight-line method over the contractual period or, when there is no specified contractual period, recognised in profit or loss upon discharge of the guarantee. Financial guarantee contracts are initially measured at fair value and subsequently measured at the higher of:
• the amount of the allowance for impairment; and • the premium received on initial recognition less cumulative income recognised in accordance with the
principal of MFRS 15.
INTEGR ATED ANNUAL REPORT 2021
Key Messages Overview Value Creation MD&A Sustainability Leadership Accountability Financial Additional Information
251

2. SUMMARY OF SIGNIFICANT ACCOUNTING POLICIES (CONTINUED)
2.5 Financial instruments (continued)
Derecognition
A financial asset or part of it is derecognised when, and only when the contractual rights to the cash flows from the financial asset expire or the financial asset is transferred to another party without retaining control or substantially all risks and rewards of the asset. On derecognition of a financial asset, the difference between the carrying amount and the sum of the consideration received (including any new asset obtained less any new liability assumed) and any cumulative gain or loss that had been recognised in equity is recognised in profit or loss.
A financial liability or a part of it is derecognised when, and only when, the obligation specified in the contract is discharged or cancelled or expires. On derecognition of a financial liability, the difference between the carrying amount of the financial liability extinguished or transferred to another party and the consideration paid, including any non-cash assets transferred or liabilities assumed, is recognised in profit or loss.
Offsetting
Financial assets and financial liabilities are offset and the net amount presented in the statement of financial position when, and only when, the Group currently has a legally enforceable right to set off the amounts and it intends either to settle them on a net basis or to realise the asset and settle the liability simultaneously.
2.6 Property and equipment
(a) Recognition and measurement
Items of property and equipment are measured at cost less accumulated depreciation and any accumulated impairment losses.
Cost includes expenditures that are directly attributable to the acquisition of the asset and any other costs directly attributable to bringing the asset to working condition for its intended use, and the costs of dismantling and removing the items and restoring the site on which they are located. The cost of self-constructed assets also includes the cost of materials and direct labour. For qualifying assets, borrowing costs are capitalised in accordance with the accounting policy on borrowing costs. Cost also may include transfers from equity of any gain or loss on qualifying cash flow hedges of foreign currency purchases of property and equipment.
Purchased software and management information system under development that is integral to the functionality of the related equipment is capitalised as part of that equipment.
The cost of property and equipment recognised as a result of a business combination is based on fair value at acquisition date. The fair value of property is the estimated amount for which a property could be exchanged between knowledgeable willing parties in an arm’s length transaction after proper marketing wherein the parties had each acted knowledgeably, prudently and without compulsion. The fair value of equipment is based on the quoted market prices for similar items when available and replacement cost when appropriate.
BANK ISL AM MAL AYSIA BERHAD
NOTES TO ThE fINANCIAL STATEMENTS for the financial year ended 31 December 2021
252

2. SUMMARY OF SIGNIFICANT ACCOUNTING POLICIES (CONTINUED)
2.6 Property and equipment (continued)
(a) Recognition and measurement (continued)
When significant parts of an item of property and equipment have different useful lives, they are accounted for as separate items (major components) of property and equipment.
The gain or loss on disposal of an item of property and equipment is determined by comparing the proceeds from disposal with the carrying amount of property and equipment and is recognised net within “other income” and “other expenses” respectively in profit or loss.
(b) Subsequent costs
The cost of replacing a component of an item of property and equipment is recognised in the carrying amount of the item if it is probable that the future economic benefits embodied within the component will flow to the Group and the Bank, and its cost can be measured reliably. The carrying amount of the replaced component is derecognised to profit or loss. The costs of the day-to-day servicing of property and equipment are recognised in profit or loss as incurred.
(c) Depreciation
Depreciation is based on the cost of an asset less its residual value. Significant components of individual assets are assessed, and if a component has a useful life that is different from the remainder of that asset, then that component is depreciated separately.
Depreciation is recognised in profit or loss on a straight-line basis over the estimated useful lives of each component of an item of property and equipment. Leased assets are depreciated over the shorter of the lease term and their useful lives unless it is reasonably certain that the Group and the Bank will obtain ownership by the end of the lease term. Freehold land is not depreciated. Depreciation on management information system under develoment commences when the assets are ready for their intended use. The assets’ residual values and useful lives are reviewed, and adjusted if appropriate, at the end of each reporting period.
The estimated useful lives for the current and comparative periods are as follows:
• Long term leasehold land 50 years • Building improvement and renovations 10 years • Furniture, fixtures and fittings 2 – 10 years • Office equipment 6 years • Motor vehicles 5 years • Computer equipment 5 – 7 years
Depreciation methods, useful lives and residual values are reassessed at end of the reporting period, and adjusted as appropriate.
INTEGR ATED ANNUAL REPORT 2021
Key Messages Overview Value Creation MD&A Sustainability Leadership Accountability Financial Additional Information
253

2. SUMMARY OF SIGNIFICANT ACCOUNTING POLICIES (CONTINUED)
2.7 Leases
Leases are recognised as Right-Of-Use (“ROU”) assets and corresponding liabilities at the date at which the leased assets are available for use by the Group and the Bank. The right-of-use assets are depreciated over the lease term on a straight-line basis.
The associated lease liabilities are measured at the present value of the remaining lease payments, discounted using the interest rate implicit in the lease. If that rate cannot be readily determined, an incremental borrowing rate is used in determining the discount rate which assumes the interest rate that the Group would have to pay to borrow over a similar term, the funds necessary to obtain the asset. The weighted average incremental borrowing rate applied for the Group and the Bank was at 5.7%.
Each lease payment is allocated between the lease liability and finance cost. The finance cost is charged to profit or loss over the lease period so as to produce a constant periodic rate of profit on the remaining balance of the liability for each period.
Payments associated with short-term leases are recognised on a straight-line basis as an expense in profit or loss. Short-term leases are leases with a lease term of 12 months or less.
Lessee accounting
The Group and the Bank first consider whether a contract is, or contains a lease. A lease is defined as ‘a contract, or part of a contract, that conveys the right to use an asset (the underlying asset) for a period of time in exchange for consideration’.
To apply this definition, the Group and the Bank assesses whether the contract meets three key evaluations which are whether:
• the contract contains an identified asset, which is either explicitly identified in the contract or implicitly specified by being identified at the time the asset is made available to the Group and the Bank;
• the Group and the Bank have the right to obtain substantially all of the economic benefits from use of the identified asset throughout the period of use, considering its rights within the defined scope of the contract; or
• the Group and the Bank have the right to direct the use of the identified asset throughout the period of use.
The Group and the Bank assesses whether it has the right to direct ‘how and for what purpose’ the asset is used throughout the period of use.
Measurement and recognition of leases as a lessee
At lease commencement date, the Group and the Bank recognises a right-of-use asset and a lease liability on the statement of financial position. The ROU asset is measured at cost, which is made up of the initial measurement of the lease liability, any initial direct costs incurred by the Group and the Bank, an estimate of any costs to dismantle and remove the asset at the end of the lease, and any lease payments made in advance of the lease commencement date (net of any incentives received).
The Group and the Bank depreciates the ROU assets on a straight-line basis from the lease commencement date to the earlier of the end of the useful life of the ROU asset or the end of the lease term. The Group and the Bank also assesses the ROU asset for impairment when such indicators exist.
BANK ISL AM MAL AYSIA BERHAD
NOTES TO ThE fINANCIAL STATEMENTS for the financial year ended 31 December 2021
254

2. SUMMARY OF SIGNIFICANT ACCOUNTING POLICIES (CONTINUED)
2.7 Leases (continued)
Lessee accounting (continued)
Measurement and recognition of leases as a lessee (continued)
At the commencement date, the Group and the Bank measures the lease liability at the present value of the lease payments unpaid at that date, discounted using the profit rate implicit in the lease if that rate is readily available or the Group’s or Bank’s incremental financing rate.
Lease payments included in the measurement of the lease liability are made up of fixed payments (including in substance fixed), variable payments based on an index or rate, amounts expected to be payable under a residual value guarantee and payments arising from options reasonably certain to be exercised.
Subsequent to initial measurement, the liability will be reduced for payments made and increased for profit expense. It is remeasured to reflect any reassessment or modification, or if there are changes in in-substance fixed payments.
When the lease liability is remeasured, the corresponding adjustment is reflected in the ROU asset, or profit and loss if the ROU asset is already reduced to zero.
The Group and the Bank have elected to account for short-term leases using the practical expedients. Instead of recognising a ROU asset and lease liability, the payments in relation to these are recognised as an expense in profit or loss on a straight-line basis over the lease term.
Lessor accounting
As a lessor, the Group and the Bank classifies its leases as either operating or finance leases. A lease is classified as a finance lease if it transfers substantially all the risks and rewards incidental to ownership of the underlying asset, and classified as an operating lease if it does not.
Leases, where the Group and the Bank does not assume substantially all the risks and rewards of ownership are classified as operating leases and, the leased assets are not recognised on the statement of financial position.
Payments made under operating leases are recognised in profit or loss on a straight-line basis over the term of the lease. Lease incentives received are recognised in profit or loss as an integral part of the total lease expense, over the term of the lease. Contingent rentals are charged to profit or loss in the reporting period in which they are incurred.
When the Group and the Bank are an intermediate lessor, it assesses the lease classification of a sublease with reference to the ROU asset arising from the head lease, not with reference to the underlying asset. If a head lease is a short-term lease to which the Group and the Bank apply the exemption described above, then it classify the sublease as an operating lease.
2.8 Bills and other receivables
Bills and other receivables are stated at amortised cost less any allowance for impairment.
INTEGR ATED ANNUAL REPORT 2021
Key Messages Overview Value Creation MD&A Sustainability Leadership Accountability Financial Additional Information
255

2. SUMMARY OF SIGNIFICANT ACCOUNTING POLICIES (CONTINUED)
2.9 Impairment
Impairment of financial assets
(i) Impairment of financial assets
The Group and the Bank recognise allowance for impairment or allowance for expected credit losses “ECL” on financial assets measured at amortised cost, financial guarantee contracts, financing commitments and debt securities measured at FVOCI, but not to investments in equity instruments.
The Group and the Bank define a financial instruments that has objective evidence of impairment as default, when it meets one or more of the following criteria;
Quantitative criteria;
i) Principal or profit of both is past due for more than 90 days/MIA 3ii) Cross default
Qualitative criteria;
A financing is credit impaired when one or more triggers/criteria that have a detrimental impact on the estimated future cash flow of the financial asset have occurred. The Group and the Bank consider the following mandatory triggers;
i) Ceased operationii) Bankruptcy/wound upiii) Fraud with investigation report duly confirmed as fraudiv) Liquidator/R&M appointedv) Deceased
Financial instruments that are credit-impaired with exposure more than RM1 million are assessed on individual basis.
The Group and the Bank have considered the impact of the pandemic and has taken into account the economic and financial measures announced by the Government in estimating the ECL on the financial assets.
Under collective assessment, the Group and the Bank apply a three-stage approach to measuring ECL on financial assets measured at amortised cost and FVOCI. Financial assets migrate through the following three stages based on the change in credit quality since initial recognition:
i) Stage 1: 12 months ECL (“Stage 1”)
For exposures where there has not been a significant increase in credit risk since initial recognition and that are not credit impaired upon recognition, the portion of lifetime ECL associated with the probability of default events occurring within the next 12 months is recognised.
ii) Stage 2: Lifetime ECL – not credit impaired (“Stage 2”)
For exposures where there has been a significant increase in credit risk since initial recognition but that are not credit impaired, a lifetime ECL is recognised.
BANK ISL AM MAL AYSIA BERHAD
NOTES TO ThE fINANCIAL STATEMENTS for the financial year ended 31 December 2021
256

2. SUMMARY OF SIGNIFICANT ACCOUNTING POLICIES (CONTINUED)
2.9 Impairment (continued)
Impairment of financial assets (continued)
(i) Impairment of financial assets (continued)
iii) Stage 3: Lifetime ECL – credit impaired (“Stage 3”)
Financial assets are assessed as credit impaired when one or more events that have a negative impact on the estimated future cash flows of that asset have occurred. For financial assets that have become credit impaired, a lifetime ECL is recognised.
The Group and the Bank consider the economic and financial measures announced by the Government, i.e. automatic moratorium as well as rescheduling and restructuring for eligible customers are granted as part of an unprecedented government effort to support the economy amid the pandemic, rather than in response to the financial circumstances of individual customers. Judgement is excercised in determining the significant increase in credit risk for customers receiving relief assistance and do not automatically result in a stage transfer.
When determining whether the credit risk of a financial asset has increased significantly since initial recognition and when estimating ECLs, the Group and the Bank consider reasonable and supportable information that is relevant and available without undue cost or effort. This includes both quantitative and qualitative information and analysis, based on the Group’s and the Bank’s historical experience, informed credit assessment and including forward-looking information.
The Group and the Bank assume that the credit risk on a financial asset has increased significantly when it is more than 30 days past due. The Group and the Bank also use its internal credit risk grading system and external risk rating to assess deterioration in credit quality of a financial assets.
The Group and the Bank assess whether the credit risk on a financial asset has increased significantly on an individual or collective basis. For the purposes of a collective evaluation of impairment, financial assets are grouped on the basis of similar risk characteristics, taking into account the asset type, industry, geographical location, collateral type, past-due status and other relevant factors. These characteristics are relevant to the estimation of future cash flows for groups of such assets by being indicative of the counterparty’s ability to pay all amounts due according to the contractual terms of the assets being evaluated.
(ii) Measurement of ECL
ECLs are a probability-weighted estimate of credit losses. Credit losses are measured as the present value of all cash shortfalls (i.e. the difference between the cash flows due to the entity in accordance with the contract and the cash flows that the Group and the Bank expect to receive).
ECLs are discounted at the effective profit rate of the financial asset.
INTEGR ATED ANNUAL REPORT 2021
Key Messages Overview Value Creation MD&A Sustainability Leadership Accountability Financial Additional Information
257

2. SUMMARY OF SIGNIFICANT ACCOUNTING POLICIES (CONTINUED)
2.9 Impairment (continued)
Impairment of financial assets (continued)
(iii) Incorporation of forward-looking information
Relevant macroeconomic factors are incorporated in the risk parameters as appropriate. The key macroeconomics variables (“MEV”) that are incorporated in determining ECLs include, Oil Price (“OP”), Gross Domestic Product (“GDP”), House Price Index (“HPI”), and Kuala Lumpur Composite Index (“KLCI”).
Forward-looking macroeconomic forecasts are generated by the Group’s and the Bank’s Economist as part of the ECL process. An economic forecast is accompanied with three economic scenarios: a base case (60%), which is the median scenario, and two less likely scenarios, one upside (20%) and one downside (20%).
Selected MEVs are projected over the forecast period, and they could have a material impact in determining ECLs. Forecasted MEVs are derived by Economist using time series econometrics. The data series are procured from the official source such as Department of Statistics Malaysia (“DOSM”), BNM and other government agencies. Prior to MEV forecast, Economist would gather his or her intelligence from discussion with the policy makers, institutional investors and other news flow (main stream and social media) in order to form an opinion. The opinion may cover the economic policies, business cycle and financial market condition. This will be the main input before embarking MEV forecast exercise.
The methodology and assumptions including any forecasts of future economic conditions are reviewed regularly.
(iv) Credit impaired financial assets
At each reporting date, the Group and the Bank assess whether financial assets carried at amortised cost and debt securities at FVOCI are credit-impaired. A financial asset is ‘credit-impaired’ when one or more events that have a negative impact on the estimated future cash flows of the financial asset have occurred.
Certain mandatory and judgmental triggers that the Group and the Bank use to determine that there is objective evidence of an impairment loss include:
• significant financial difficulty of the issuer or obligor; • a breach of contract, such as default or delinquency in profit or principal payments; • the restructuring of a financing or advance by the Group and the Bank on terms that the Group and the
Bank would not consider otherwise; • it is probable that the borrower will enter bankruptcy or other financial reorganisation; or • based on external credit assessment institutions rating which indicates high likelihood of default.
(v) Presentation of allowance for ECL in the statement of financial position
Loss allowances for financial assets measured at amortised cost are deducted from the gross carrying amount of the assets.
For debt securities at FVOCI, the loss allowance is charged to profit or loss and is recognised in other comprehensive income.
BANK ISL AM MAL AYSIA BERHAD
NOTES TO ThE fINANCIAL STATEMENTS for the financial year ended 31 December 2021
258

2. SUMMARY OF SIGNIFICANT ACCOUNTING POLICIES (CONTINUED)
2.9 Impairment (continued)
Impairment of financial assets (continued)
(vi) Restructured financing
A financing that is renegotiated is derecognised if the existing agreement is cancelled and a new agreement made on substantially different terms or if the terms of an existing agreement are modified such that the renegotiated financing is a substantially different instrument. Where such financing are derecognised, the renegotiated contract is a new financing and impairment is assessed in accordance with the Group’s and the Bank’s accounting policy.
Where the renegotiation of such financing are not derecognised, the gross carrying amount is recalculated based on the revised cash flows with gain or loss on modification recognised in profit or loss. Impairment continues to be assessed for significant increases in credit risk compared to the initial origination credit risk rating.
(vii) Write-off
The gross carrying amount of a financial asset is written-off when the Group and the Bank have no reasonable expectations of recovering a financial asset in its entirety or a portion thereof. For individual customers, the Group and the Bank have a policy of writing off the gross carrying amount when the financial asset is 180 days past due based on historical experience of recoveries of similar assets. For commercial and corporate customers, the Group and the Bank individually make an assessment with respect to the timing and amount of write-off based on whether there is a reasonable expectation of recovery. The Group and the Bank expect no significant recovery from the amount written-off. However, financial assets that are written-off could still be subject to enforcement activities in order to comply with the Group’s and the Bank’s procedures for recovery of amounts due.
Impairment of other assets
The carrying amount of other assets (except for current tax assets and deferred tax assets) are reviewed at the end of each reporting period to determine whether there is any indication of impairment. If any such indication exists, then the asset’s recoverable amount is estimated.
The recoverable amount of an asset is the greater of its value in use and its fair value less costs to sell. In assessing value in use, the estimated future cash flows are discounted to their present value using a pre-tax discount rate that reflects current market assessments of the time value of money and the risks specific to the asset.
An impairment loss is recognised if the carrying amount of an asset exceeds its recoverable amount. Impairment losses are recognised in the profit or loss.
Impairment losses recognised in prior periods are assessed at each reporting date for any indications that the loss has decreased or no longer exists. An impairment loss is reversed if there has been a change in the estimates used to determine the recoverable amount. An impairment loss is reversed only to the extent that the asset’s carrying amount does not exceed the carrying amount that would have been determined, net of depreciation or amortisation, if no impairment loss had been recognised. Reversals of impairment losses are credited to the profit or loss in the year in which the reversals are recognised.
INTEGR ATED ANNUAL REPORT 2021
Key Messages Overview Value Creation MD&A Sustainability Leadership Accountability Financial Additional Information
259

2. SUMMARY OF SIGNIFICANT ACCOUNTING POLICIES (CONTINUED)
2.10 Bills and acceptances payable
Bills and acceptances payable represent the Group’s and the Bank’s own bills and acceptances rediscounted and outstanding in the market.
2.11 Government grants
Grant from the government are recognised at their fair value when there is a reasonable assurance that the grant will be received and the Group and the Bank will comply with all attached conditions.
Government grants relating to costs are recognised in the profit or loss over the periods to match the related costs for which the grants are intended to compensate.
The benefit of a government loan at a below-market rate of interest is treated as a government grant. The loan shall be recognised and measured in accordance with MFRS 9 Financial Instruments. The benefit of the below-market rate of interest shall be measured as the difference between the initial carrying value of the loan determined in accordance with MFRS 9 and the proceeds received. The benefit is accounted for in accordance with MFRS 120. The Group and the Bank shall consider the conditions and obligations that have been, or must be, met when identifying the costs for which the benefit of the loan is intended to compensate.
2.12 Provisions
A provision is recognised if, as a result of a past event, the Group and the Bank have a present legal or constructive obligation that can be estimated reliably, and it is probable that an outflow of economic benefits will be required to settle the obligation.
The provisions are reviewed at each reporting date and if it is no longer probable that an outflow of resources embodying economic benefits will be required to settle the obligation, the provision is reversed.
2.13 Contingent liabilities
Where it is not probable that an outflow of economic benefits will be required, or the amount cannot be estimated reliably, the obligation is not recognised in the statements of financial position and is disclosed as a contingent liability, unless the probability of outflow of economic benefits is remote. Possible obligations, whose existence will only be confirmed by the occurrence or non-occurrence of one or more future events not wholly within the control of the Group and the Bank, are also disclosed as contingent liabilities unless the probability of outflow of economic benefits is remote.
2.14 Contingent assets
A contingent asset is a possible asset that arises from past events whose existence will be confirmed by the occurence or non-occurrence of one or more uncertain future events beyond the control of the Group and the Bank. The Group and the Bank do not recognise contingent assets but discloses its existence where inflows of economic benefits are probable, but not virtually certain.
2.15 Segment reporting
An operating segment is a component of the Group that engages in business activities from which it may earn revenues and incur expenses, including revenues and expenses that relate to transactions with any of the Group’s other components. An operating segment’s operating results are reviewed regularly by the chief operating decision maker, which in this case is the Chief Executive Officer of the Group, to make decisions about resources to be allocated to the segment and to assess its performance, and for which discrete financial information is available.
BANK ISL AM MAL AYSIA BERHAD
NOTES TO ThE fINANCIAL STATEMENTS for the financial year ended 31 December 2021
260

2. SUMMARY OF SIGNIFICANT ACCOUNTING POLICIES (CONTINUED)
2.16 Share Capital
Ordinary shares are classified as equity in the statement of financial position. Cost directly attributable to the issuance of new equity shares are taken to equity as a deduction from the proceeds.
Dividend distribution
Liability is recognised for the amount of any dividend declared, being appropriately authorised and no longer at the discretion of the Group, on or before the end of the reporting period but not distributed at the end of the reporting period. Distributions to holders of an equity instrument is recognised directly in equity.
2.17 Recognition of income
Financing income
Financing income is recognised in the profit or loss using the effective profit rate method. The effective profit rate is the rate that discounts estimated future cash payments or receipts through the expected life of the financial instruments or, when appropriate, a shorter period to the net carrying amount of the financial instruments. When calculating the effective profit rate, the Group and the Bank have considered all contractual terms of the financial instruments but do not consider future credit losses. The calculation includes all fees and transaction costs integral to the effective profit rate, as well as premium or discounts.
Income from a sale-based contract is recognised on effective profit rate basis over the period of the contract based on the principal amounts outstanding whereas income from Ijarah (lease-based contract) is recognised on effective profit rate basis over the lease term.
For credit-impaired financial assets the effective profit rate is applied to the net carrying amount of the financial assets (after deduction of the loss allowance).
Fee and other income recognition
Financing arrangement, management and participation fees, underwriting commissions, brokerage fees and wakalah performance incentive fees are recognised as income based on contractual arrangements. Fees from advisory and corporate finance activities are recognised net of service tax, discounts on satisfaction of performance obligations and completion of each stage of the assignment.
Dividend income from subsidiaries and other investments are recognised when the Group’s and the Bank’s rights to receive payment is established.
2.18 Material profit or loss items
The Group and the Bank have identified item which is material due to the significance of their nature and/or their amount. This is listed separately here to provide a better understanding of the financial performance of the Group and of the Bank.
Group and Bank
2021RM’000
2020RM’000
Loss on modification of financial assets (48,911) (136,380)
INTEGR ATED ANNUAL REPORT 2021
Key Messages Overview Value Creation MD&A Sustainability Leadership Accountability Financial Additional Information
261

2. SUMMARY OF SIGNIFICANT ACCOUNTING POLICIES (CONTINUED)
2.18 Material profit or loss items (continued)
During the previous financial year, the Group and the Bank granted an automatic moratorium on certain financing repayments (except for credit card balances), to individuals and small and medium enterprises (SMEs) for a period of six months from 1 April 2020. The automatic moratorium was applicable to financing that are not in arrears exceeding 90 days and denominated in Malaysian Ringgit. This measure was to assist customers experiencing temporary financial constraints due to the COVID-19 pandemic.
Following the end of the six-month blanket moratorium, the Group and the Bank continue to support financing customers that face difficulties in fulfilling their financial obligation, through various Repayment Assistance (“RA”) programme.
As a result of the payment moratorium and TRA, the Group and the Bank recognised a one-off loss of RM48,910,000 (2020: RM136,380,000 arising from the modification of the expected cash flows of the financing.
The following table includes a summary of information for financial assets with lifetime ECL whose cash flows were modified during the financial year as part of the Group and Bank’s restructuring and rescheduling activities and their respective effect on the Group and the Bank’s financial performance:
Group and Bank
2021RM’000
2020RM’000
Financing, advances and others:Amortised cost before modification 1,247,366 1,881,218Net modification loss 1,232,548 1,867,943
2.19 Income tax
Income tax expense comprises current and deferred tax. Current tax and deferred tax are recognised in profit or loss except to the extent that it relates to a business combination or items recognised directly in equity or other comprehensive income.
Current tax is the expected tax payable or receivable on the taxable income or loss for the year, using tax rates enacted or substantively enacted by the end of the reporting period, and any adjustment to tax payable in respect of previous financial years.
Deferred tax is recognised using the liability method, providing for temporary differences between the carrying amounts of assets and liabilities in the statement of financial position and their tax bases. Deferred tax is not recognised for the following temporary differences: the initial recognition of assets or liabilities in a transaction that is not a business combination and that affects neither accounting nor taxable profit or loss. Deferred tax is measured at the tax rates that are expected to be applied to the temporary differences when they reverse, based on the laws that have been enacted or substantively enacted by the end of the reporting period.
Deferred tax assets and liabilities are offset if there is a legally enforceable right to offset current tax liabilities and assets, and they relate to income taxes levied by the same tax authority on the same taxable entity, or on different tax entities, but they intend to settle current tax liabilities and assets on a net basis or their tax assets and liabilities will be realised simultaneously.
BANK ISL AM MAL AYSIA BERHAD
NOTES TO ThE fINANCIAL STATEMENTS for the financial year ended 31 December 2021
262

2. SUMMARY OF SIGNIFICANT ACCOUNTING POLICIES (CONTINUED)
2.19 Income tax (continued)
A deferred tax asset is recognised to the extent that it is probable that future taxable profits will be available against which the temporary difference can be utilised. Deferred tax assets are reviewed at the end of each reporting period and are reduced to the extent that it is no longer probable that the related tax benefit will be realised.
2.20 Zakat
This represents business zakat that is paid on the Bank’s portion. It is an obligatory amount payable by the Group and the Bank to comply with the rules and principles of Shariah.
2.21 Employee benefits
Short-term employee benefits
Short-term employee benefit obligations in respect of salaries, annual bonuses, paid annual leave and sick leave are measured on an undiscounted basis and are expensed as the related service is provided.
A liability is recognised for the amount expected to be paid under short-term cash bonus and termination benefits if the Group and the Bank have a present legal or constructive obligation to pay this amount as a result of past service provided by the employee and the obligation can be estimated reliably.
The Group’s and the Bank’s contribution to the Employees Provident Fund is charged to the profit or loss in the year to which they relate. Once the contributions have been paid, the Group and the Bank have no further payment obligations.
2.22 Earnings per ordinary shares
The Group presents basic earnings per share data for its ordinary shares (“EPS”). Basic EPS is calculated by dividing the profit or loss attributable to ordinary shareholders of the Group by the weighted average number of ordinary shares outstanding during the year.
2.23 Fair value measurements
‘Fair value’ is the price that would be received to sell an asset or paid to transfer a liability in an orderly transaction between market participants at the measurement date in the principal or, in its absence, the most advantageous market to which the Group and the Bank have access at that date. The fair value of a liability reflects its non-performance risk.
When available, the Group and the Bank measure the fair value of an instrument using the quoted price in an active market for that instrument. A market is regarded as active if transactions for the asset or liability take place with sufficient frequency and volume to provide pricing information on an ongoing basis.
If there is no quoted price in an active market, then the Group and the Bank use valuation techniques that maximise the use of relevant observable inputs and minimise the use of unobservable inputs. The chosen valuation technique incorporates all of the factors that market participants would take into account in pricing a transaction.
INTEGR ATED ANNUAL REPORT 2021
Key Messages Overview Value Creation MD&A Sustainability Leadership Accountability Financial Additional Information
263

2. SUMMARY OF SIGNIFICANT ACCOUNTING POLICIES (CONTINUED)
2.23 Fair value measurements (continued)
The best evidence of the fair value of a financial instrument at initial recognition is normally the transaction price – i.e. the fair value of the consideration given or received. If the Group and the Bank determines that the fair value at initial recognition differs from the transaction price and the fair value is evidenced neither by a quoted price in an active market for an identical asset or liability nor based on a valuation technique that uses only data from observable markets, then the financial instrument is initially measured at fair value, adjusted to defer the difference between the fair value at initial recognition and the transaction price. Subsequently, that difference is recognised in profit or loss on an appropriate basis over the life of the instrument but no later than when the valuation is wholly supported by observable market data or the transaction is closed out.
If an asset or a liability measured at fair value has a bid price and an ask price, then the Group measures assets and long positions at a bid price and liabilities and short positions at an ask price.
Portfolios of financial assets and financial liabilities that are exposed to market risk and credit risk that are managed by the Group on the basis of the net exposure to either market or credit risk are measured on the basis of a price that would be received to sell a net long position (or paid to transfer a net short position) for a particular risk exposure. Those portfolio-level adjustments are allocated to the individual assets and liabilities on the basis of the relative risk adjustment of each of the individual instruments in the portfolio.
The fair value of a demand deposit is not less than the amount payable on demand, discounted from the first date on which the amount could be required to be paid.
The Group and the Bank recognise transfers between levels of the fair value hierarchy as of the end of the reporting period during which the change has occurred.
3. CASH AND SHORT-TERM FUNDS
Group Bank
2021RM’000
2020RM’000
2021RM’000
2020RM’000
Cash and balances with banks and other financial institutions 754,313 725,644 751,187 725,548
Money at call and interbank placements with remaining maturity not exceeding three months 4,468,535 4,491,093 4,453,177 4,490,732
5,222,848 5,216,737 5,204,364 5,216,280
All bank balances are assessed to have low credit risk as they are held with reputable banking institutions and the identified expected credit loss was immaterial.
Cash and bank balances of the Group includes restricted cash amounting to RM10,391,000 (2020: RM4,423,000) which is attributed to the creation of units of the funds. Accordingly, amount due to trustee was recognised and disclosed in Note 19 to the financial statements.
BANK ISL AM MAL AYSIA BERHAD
NOTES TO ThE fINANCIAL STATEMENTS for the financial year ended 31 December 2021
264

4. FINANCIAL ASSETS AT FAIR VALUE THROUGH PROFIT AND LOSS (“FVTPL”)
Group Bank
2021RM’000
2020RM’000
2021RM’000
2020RM’000
Malaysian Government Investment Issues – 602,925 – 602,925Unit trust 295,395 238,490 263,611 232,730Malaysian Islamic Treasury Bills 1,131,574 243,618 1,131,574 243,618Islamic Commercial Paper 145,300 30,051 145,300 30,051Corporate Sukuk 10,225 66,116 10,215 66,116
1,582,494 1,181,200 1,550,700 1,175,440
5. DERIVATIVE FINANCIAL ASSETS/(LIABILITIES)
The following tables summarise the contractual or underlying principal amounts of derivative financial instruments held at fair value through profit or loss. The principal or contractual amount of these instruments reflects the volume of transactions outstanding at financial position date, and do not represent amounts at risk.
Trading derivative financial instruments are revalued on a gross position and the unrealised gains or losses are reflected as derivative financial assets and liabilities respectively.
2021
NotionalamountRM’000
Fair value
Group and BankAssets
RM’000Liabilities
RM’000
Forward contracts 7,505,850 25,120 (19,753)Profit rate swaps 79,153 917 (668)
7,585,003 26,037 (20,421)
2020
NotionalamountRM’000
Fair value
Group and BankAssets
RM’000Liabilities
RM’000
Forward contracts 8,518,422 59,494 (104,228)Profit rate swaps 114,056 2,171 (1,644)
8,632,478 61,665 (105,872)
INTEGR ATED ANNUAL REPORT 2021
Key Messages Overview Value Creation MD&A Sustainability Leadership Accountability Financial Additional Information
265

6. FINANCIAL ASSETS AT FAIR VALUE THROUGH OTHER COMPREHENSIVE INCOME (“FVOCI”)
Group Bank
2021RM’000
2020RM’000
2021RM’000
2020RM’000
Financial assets at FVOCI:(a) Debt instrument* 12,526,670 12,494,040 12,526,670 12,494,040(b) Equity instrument 77,534 63,951 78,397 64,689
12,604,204 12,557,991 12,605,067 12,558,729
* Included in debt instruments are investment made in Malaysian Government Securities (“MGS”) and Malaysian Government Investment Issues (“MGII”) amounting to RM600,000,000 (2020: RM600,000,000) as part of the Bank’s Statutory Reserves Requirements (“SRR”) compliance.
(a) Debt instrument at FVOCI
Group and Bank
2021RM’000
2020RM’000
Malaysian Government Investment Issues 3,497,806 2,919,864Corporate Sukuk 7,143,163 9,314,815Malaysian Islamic Treasury Bills 962,313 –Islamic Commercial Papers 923,388 259,361
12,526,670 12,494,040
Movement of allowance for impairment on financial assets at FVOCI:
Group and Bank
2021RM’000
2020RM’000
Stage 1At 1 January 403 265Net allowances made during the year 6,834 138
At 31 December 7,237 403
BANK ISL AM MAL AYSIA BERHAD
NOTES TO ThE fINANCIAL STATEMENTS for the financial year ended 31 December 2021
266

6. FINANCIAL ASSETS AT FAIR VALUE THROUGH OTHER COMPREHENSIVE INCOME (“FVOCI”) (CONTINUED)
(b) Equity instrument at FVOCI
Group Bank
2021RM’000
2020RM’000
2021RM’000
2020RM’000
Quoted Shares– outside Malaysia# 17,004 13,755 17,004 13,755
Unquoted Shares– in Malaysia* 60,515 50,194 61,378 50,932– outside Malaysia 15 2 15 2
60,530 50,196 61,393 50,934
77,534 63,951 78,397 64,689
The Group and the Bank designated certain investments as equity instrument at FVOCI. The FVOCI designation was made because these instruments are either held for socio-economic purposes or not for trading purposes.
Equity instrument at FVOCI of the Bank mainly comprise the following significant individual investment:
Fair value Dividend income
2021RM’000
2020RM’000
2021RM’000
2020RM’000
#Amana Bank Limited 17,004 13,755 – 503*Payment Networks Malaysia Sdn Bhd 60,515 49,478 – –
7. FINANCIAL ASSETS AT AMORTISED COST (“AC”)
Group Bank
2021RM’000
2020RM’000
2021RM’000
2020RM’000
Debt instrument at amortised cost:Malaysian Government Investment Issues 802,446 – 802,446 –Corporate sukuk 551,687 5,289 551,687 5,289
1,354,133 5,289 1,354,133 5,289Less: Allowance for impairmentStage 3– Corporate sukuk (5,289) (5,289) (5,289) (5,289)
1,348,844 – 1,348,844 –
INTEGR ATED ANNUAL REPORT 2021
Key Messages Overview Value Creation MD&A Sustainability Leadership Accountability Financial Additional Information
267

8. FINANCING, ADVANCES AND OTHERS
(a) By type and Shariah contract
Group and Bank2021
Bai’Bithaman
AjilRM’000
MurabahahRM’000
Bai’ Al-DaynRM’000
Bai’Al-InahRM’000
At-Tawarruq
RM’000
IjarahMuntahiah
Bit-Tamleek^RM’000
Istisna’RM’000
TotalRM’000
Cash line - - - 484 1,429,002 - - 1,429,486Term financing
House financing 2,977,908 - - - 20,513,876 - 42,469 23,534,253Syndicated financing - - - - 1,454,811 - - 1,454,811Leasing financing - - - - - 96,020 - 96,020Bridging financing - - - - - - 40,328 40,328Personal financing - - - 3,734 18,071,544 - - 18,075,278Other term financing 295,209 1,383,579 - 11,080,781 - 961 12,760,530
Staff financing 40,459 18,789 - - 398,071 - 6,553 463,872Credit cards - - - - 445,839 - - 445,839Trade bills discounted - 622,908 107,820 - 87,051 - - 817,779Trust receipts - 4,415 - - - - - 4,415Pawn broking - 95,124 - - - - - 95,124
3,313,576 2,124,815 107,820 4,218 53,480,975 96,020 90,311 59,217,735
Allowance for impairment on financing, advances and others– Stage 1 (487,308)– Stage 2 (303,998)– Stage 3 (272,660)
Net financing, advances and others 58,153,769
^ Assets funded under Ijarah financing are owned by the Bank throughout the tenure of the Ijarah financing and ownership of the assets will be transferred to customer at the end of financing tenure for a token consideration or other amount as specified in the Ijarah financing contract.
BANK ISL AM MAL AYSIA BERHAD
NOTES TO ThE fINANCIAL STATEMENTS for the financial year ended 31 December 2021
268

8. FINANCING, ADVANCES AND OTHERS (CONTINUED)
(a) By type and Shariah contract (continued)
Group and Bank2020
Bai’Bithaman
AjilRM’000
MurabahahRM’000
Bai’ Al-DaynRM’000
Bai’Al-InahRM’000
At-Tawarruq
RM’000
IjarahMuntahiah
Bit-Tamleek^RM’000
Istisna’RM’000
Ar-RahnuRM’000
TotalRM’000
At amortised costCash line – – – 1,465 1,287,126 – – – 1,288,591Term financing
House financing 3,238,398 – – – 18,280,073 – 45,780 – 21,564,251Syndicated financing – – – – 1,459,016 – – – 1,459,016Leasing financing – – – – – 114,300 – – 114,300Bridging financing – – – – – – 47,380 – 47,380Personal financing – – – 5,256 16,816,181 – – – 16,821,437Other term financing 487,567 1,411,820 – 15 10,736,190 – 1,119 – 12,636,711
Staff financing 46,367 15,847 – – 307,861 – 7,584 – 377,659Credit cards – – – – 447,471 – – – 447,471Trade bills
discounted – 631,567 31,221 3,034 164,888 – – – 830,710Trust receipts – 5,584 5 – – – – – 5,589Pawn broking – – – – – – – 5,481 5,481
3,772,332 2,064,818 31,226 9,770 49,498,806 114,300 101,863 5,481 55,598,596
Allowance for impairment on financing, advances and others– Stage 1 (653,983)– Stage 2 (151,446)– Stage 3 (122,532)
Net financing, advances and others 54,670,635
^ Assets funded under Ijarah financing are owned by the Bank throughout the tenure of the Ijarah financing and ownership of the assets will be transferred to customer at the end of financing tenure for a token consideration or other amount as specified in the Ijarah financing contract.
INTEGR ATED ANNUAL REPORT 2021
Key Messages Overview Value Creation MD&A Sustainability Leadership Accountability Financial Additional Information
269

8. FINANCING, ADVANCES AND OTHERS (CONTINUED)
(a) By type and Shariah contract (continued)
Included in financing, advances and others are house financing and personal financing that are used for the underlying assets of Unrestricted Investment Accounts (“UA”) and financing sold to Cagamas with recourse to the Group and the Bank. The details are as follows:
Group Bank
Note2021
RM’0002020
RM’0002021
RM’0002020
RM’000
House financingUnrestricted Investment Accounts 16 8,554,270 8,740,902 8,608,619 8,741,086Sold to Cagamas with recourse 17 2,001,720 1,501,187 2,001,720 1,501,187
10,555,990 10,242,089 10,610,339 10,242,273
Personal financingUnrestricted Investment Accounts 16 1,898,632 3,627,626 1,952,982 3,627,811
(b) By type of customer
Group and Bank
2021RM’000
2020RM’000
Domestic banking institutions 200,018 200,459Domestic non-bank financial institutions 1,089,617 1,272,857Domestic business enterprise 10,137,127 9,859,263Small & medium enterprises 2,169,436 1,799,003Government & statutory bodies 919,583 743,051Individuals 44,451,160 41,353,603Other domestic entities 21,676 102,008Foreign entities 229,118 268,352
59,217,735 55,598,596
BANK ISL AM MAL AYSIA BERHAD
NOTES TO ThE fINANCIAL STATEMENTS for the financial year ended 31 December 2021
270

8. FINANCING, ADVANCES AND OTHERS (CONTINUED)
(c) By profit rate sensitivity
Group and Bank
2021RM’000
2020RM’000
Fixed rateHouse financing 983,468 732,437Others 4,645,157 3,859,673
Floating rateHouse financing 23,238,913 21,485,764Others 30,350,197 29,520,722
59,217,735 55,598,596
(d) By remaining contractual maturity
Group and Bank
2021RM’000
2020RM’000
Maturity within one year 4,117,569 3,660,883More than one year to three years 1,731,612 1,516,856More than three years to five years 3,136,006 3,272,167More than five years 50,232,548 47,148,690
59,217,735 55,598,596
(e) By geographical distribution
Group and Bank
2021RM’000
2020RM’000
Central Region 26,946,146 25,745,132Eastern Region 9,368,591 8,757,468Northern Region 8,066,342 7,431,066Southern Region 10,247,330 9,416,361East Malaysia Region 4,589,326 4,248,569
59,217,735 55,598,596
INTEGR ATED ANNUAL REPORT 2021
Key Messages Overview Value Creation MD&A Sustainability Leadership Accountability Financial Additional Information
271

8. FINANCING, ADVANCES AND OTHERS (CONTINUED)
(f) By sector
Group and Bank
2021RM’000
2020RM’000
Primary agriculture 960,757 1,044,451Mining and quarrying 67,474 67,305Manufacturing (including agro-based) 1,008,846 1,001,272Electricity, gas and water supply 2,054,242 2,032,684Wholesale & retail trade, and restaurants & hotels 956,449 951,149Construction 2,864,869 2,736,468Transport, storage and communications 726,341 681,659Finance, insurance, real estate and business activities 4,735,590 4,557,954Education, health and others 1,387,814 1,168,902Household sectors 44,455,353 41,356,752
59,217,735 55,598,596
(g) By stages
Group and BankStage 1RM’000
Stage 2RM’000
Stage 3RM’000
TotalRM’000
At 1 January 2020 48,265,712 1,525,256 433,001 50,223,969
Transfer to Stage 1 263,081 (237,179) (25,902) –Transfer to Stage 2 (843,859) 876,712 (32,853) –Transfer to Stage 3 (45,319) (68,566) 113,885 –Financial assets that have been derecognised (7,012,865) (280,945) (16,214) (7,310,024)New financial assets originated or purchased 12,410,241 480,762 13,992 12,904,995Modification of contractual cash flows (104,033) – – (104,033)Write-offs – – (112,675) (112,675)Exchange differences (3,636) – – (3,636)
At 31 December 2020/1 January 2021 52,929,322 2,296,040 373,234 55,598,596
Transfer to Stage 1 607,206 (593,384) (13,822) –Transfer to Stage 2 (620,226) 643,258 (23,032) –Transfer to Stage 3 (308,485) (54,276) 362,761 –Financial assets that have been derecognised (7,539,292) (491,190) (7,493) (8,037,975)New financial assets originated or purchased 11,490,674 305,048 4,684 11,800,406Modification of contractual cash flows (25,323) (5) – (25,328)Write-offs – – (127,949) (127,949)Exchange differences 9,985 – – 9,985
At 31 December 2021 56,543,861 2,105,491 568,383 59,217,735
BANK ISL AM MAL AYSIA BERHAD
NOTES TO ThE fINANCIAL STATEMENTS for the financial year ended 31 December 2021
272

8. FINANCING, ADVANCES AND OTHERS (CONTINUED)
(h) Movement in impaired financing and advances (“impaired financing”)
Group and Bank
2021RM’000
2020RM’000
At 1 January 373,234 433,001
Classified as impaired during the year 597,779 311,012Reclassified as not impaired during the year (212,296) (190,989)Amount repaid (62,386) (67,114)Amount written-off (127,948) (112,676)
At 31 December 568,383 373,234
Gross impaired financing as a percentage of gross financing, advances and others 0.96% 0.67%
The contractual amount outstanding on financing and advances that were written-off during the year are still subject to enforcement activity.
(i) Impaired financing by geographical distribution
Group and Bank
2021RM’000
2020RM’000
Central Region 395,781 174,617Eastern Region 68,146 86,291Northern Region 74,751 78,220Southern Region 17,458 19,167East Malaysia Region 12,247 14,939
568,383 373,234
(j) Impaired financing by sector
Group and Bank
2021RM’000
2020RM’000
Manufacturing (including agro-based) 10,307 28,328Wholesale & retail trade, and hotels & restaurants 76,992 89,812Construction 285,246 36,220Transport, storage and communications 15,311 17,801Finance, insurance, real estate and business activities 5,932 6,141Education, health & others 1,391 3,969Household sectors 173,204 190,963
568,383 373,234
INTEGR ATED ANNUAL REPORT 2021
Key Messages Overview Value Creation MD&A Sustainability Leadership Accountability Financial Additional Information
273

8. FINANCING, ADVANCES AND OTHERS (CONTINUED)
(k) Movement of allowance for impairment on financing, advances and others
Group and BankStage 1RM’000
Stage 2RM’000
Stage 3RM’000
TotalRM’000
At 1 January 2020 431,135 148,115 172,197 751,447
Transfer to Stage 1 1,245 (1,179) (66) –Transfer to Stage 2 (7,782) 10,508 (2,726) –Transfer to Stage 3 (264) (7,659) 7,923 –Changes in credit risk 134,059 13,592 60,558 208,209New financial assets originated or purchased 139,295 6,403 686 146,384Financial assets that have been derecognised (44,708) (18,334) (3,364) (66,406)Write-offs – – (112,676) (112,676)Exchange differences 1,003 – – 1,003
At 31 December 2020/1 January 2021 653,983 151,446 122,532 927,961
Transfer to Stage 1 2,461 (2,416) (45) –Transfer to Stage 2 (7,311) 8,826 (1,515) –Transfer to Stage 3 (167) (5,036) 5,203 –Changes in credit risk (189,876) 164,283 277,396 251,803New financial assets originated or purchased 98,862 8,326 2,029 109,217Financial assets that have been derecognised (68,660) (21,431) (4,992) (95,083)Write-offs – – (127,948) (127,948)Exchange differences (1,984) – – (1,984)
At 31 December 2021 487,308 303,998 272,660 1,063,966
(l) Effect of modifications on the measurement of allowance for impaired financing, advances and others
The following table discloses information on financing and advances that were modified but not derecognised during the year, for which the allowance for impaired financing, advances and others were measured at a lifetime ECL at the beginning of the year, and at the end of the year had changed to a 12-months ECL:
Group and Bank
2021RM’000
2020RM’000
Amortised cost before the modification 4,549 431Net modification loss 5 439
BANK ISL AM MAL AYSIA BERHAD
NOTES TO ThE fINANCIAL STATEMENTS for the financial year ended 31 December 2021
274

9. OTHER ASSETS
Group Bank
2021RM’000
2020RM’000
2021RM’000
2020RM’000
Other receivables 265,271 168,256 214,908 157,952Deposit and prepayments 50,343 41,012 43,730 40,457Related companies* 1,071 1,056 2,173 1,154
316,685 210,324 260,811 199,563Less: Allowance for impairmentStage 3– Other receivables (3,731) (2,975) (3,731) (2,975)
312,954 207,349 257,080 196,588
* This relates to amounts due from subsidiaries and related companies that are unsecured, not subject to compensation charges for late payment and repayment is neither fixed nor expected.
10. STATUTORY DEPOSITS WITH BANK NEGARA MALAYSIA
The non-interest bearing statutory deposits are maintained with Bank Negara Malaysia in compliance with Section 26(2)(c) of the Central Bank of Malaysia Act, 2009, the amount of which are determined as set percentages of total eligible liabilities.
INTEGR ATED ANNUAL REPORT 2021
Key Messages Overview Value Creation MD&A Sustainability Leadership Accountability Financial Additional Information
275

11. DEFERRED TAX ASSETS
Deferred tax assets and liabilities are offset when there is a legally enforceable right to set off current tax assets against current tax liabilities and when the deferred taxes relate to the same tax authority.
The components of deferred tax assets and liabilities during the financial year are as follows:
Group Bank
2021RM’000
2020RM’000
2021RM’000
2020RM’000
Deferred tax assets 193,214 1,511 191,773 –Deferred tax liabilities – (74,445) – (74,445)
193,214 (72,934) 191,773 (74,445)
Deferred tax assets:Provisions for expenses 26,301 32,505 26,393 32,520Financing, advances and others 104,763 86,457 104,763 86,457Lease liabilities 25,795 24,673 25,768 24,646FVOCI Reserves 46,292 – 46,292 –Tax losses 1,510 1,510 – –Unabsorbed capital allowances 10 – – –Offsetting (11,457) (143,634) (11,443) (143,623)
Total deferred tax assets 193,214 1,511 191,773 –
Deferred tax liabilities:Property and equipment (11,457) (6,370) (11,443) (6,359)FVOCI Reserves – (48,379) – (48,379)Deferred income from moratorium – (163,330) – (163,330)Offsetting 11,457 143,634 11,443 143,623
Total deferred tax liabilities – (74,445) – (74,445)
BANK ISL AM MAL AYSIA BERHAD
NOTES TO ThE fINANCIAL STATEMENTS for the financial year ended 31 December 2021
276

11. DEFERRED TAX ASSETS (CONTINUED)
The movement in temporary differences during the year are as follows:
Provision for
expensesRM’000
Financing, advances
and others
RM’000
Lease liabilities
RM’000
UnabsorbedCapital
AllowancesRM’000
Deferredincome
frommoratorium
RM’000
Taxlosses
RM’000
Propertyand
equipmentRM’000
FVOCIReserves
RM’000Total
RM’000
GroupAt 1 January 2020 33,347 33,108 23,142 – – 1,510 (3,462) (53,871) 33,774Recognised in profit or loss (842) 53,349 1,531 – (163,330) – (2,908) – (112,200)Recognised in other
comprehensive income – – – – – – – 5,492 5,492
At 31 December 2020/ 1 January 2021 32,505 86,457 24,673 – (163,330) 1,510 (6,370) (48,379) (72,934)
Acquisition of subsidiary – – – 10 – – – – 10Recognised in profit or loss (6,204) 18,306 1,122 – 163,330 – (5,087) – 171,467Recognised in other
comprehensive income – – – – – – – 94,671 94,671
At 31 December 2021 26,301 104,763 25,795 10 – 1,510 (11,457) 46,292 193,214
BankAt 1 January 2020 33,347 33,108 23,142 – – – (3,458) (53,871) 32,268Recognised in profit or loss (827) 53,349 1,504 – (163,330) – (2,901) – (112,205)Recognised in other
comprehensive income – – – – – – – 5,492 5,492
At 31 December 2020/ 1 January 2021 32,520 86,457 24,646 – (163,330) – (6,359) (48,379) (74,445)
Recognised in profit or loss (6,127) 18,306 1,122 – 163,330 – (5,084) – 171,547Recognised in other
comprehensive income – – – – – – – 94,671 94,671
At 31 December 2021 26,393 104,763 25,768 – – – (11,443) 46,292 191,773
INTEGR ATED ANNUAL REPORT 2021
Key Messages Overview Value Creation MD&A Sustainability Leadership Accountability Financial Additional Information
277

11. DEFERRED TAX ASSETS (CONTINUED)
Deferred tax assets have not been recognised in respect of the following items:
Group Bank
2021RM’000
2020RM’000
2021RM’000
2020RM’000
Unabsorbed capital allowance 131,819 131,819 131,784 131,784Unutilised tax losses 1,251 1,251 – –Deductible temporary differences 329 329 – –
133,399 133,399 131,784 131,784
Under the current tax legislation, the unutilised tax losses will expire in year 2025 where the unutilised capital allowance do not expire.
The Bank’s unabsorbed capital allowances of RM131,784,000 (2020: RM131,784,000) is in respect of its leasing business, whereby management considered it is uncertain whether the Bank is able to utilise the benefits in the future. As such, deferred tax assets have not been recognised.
12. RIGHTS-OF-USE ASSETS AND LEASE LIABILITIES
The statement of financial position shows the following amounts relating to leases:
Group Bank
2021RM’000
2020RM’000
2021RM’000
2020RM’000
Right-of-use assets (Buildings)As at 1 January 209,736 229,135 209,736 229,135Addition 4,461 432 3,920 401Reversal – (1,483) – (1,483)Depreciation (18,197) (18,348) (18,042) (18,317)
As at 31 December 196,000 209,736 195,614 209,736
Lease liabilitiesAs at 1 January 312,429 325,559 312,429 325,559Addition 4,512 437 3,915 401Reversal – (1,472) – (1,472)Payments of lease liabilities (30,818) (29,920) (30,676) (29,883)Finance cost 17,312 17,836 17,303 17,835Effects of movement in exchange rates 13 (11) 13 (11)
As at 31 December 303,448 312,429 302,984 312,429
BANK ISL AM MAL AYSIA BERHAD
NOTES TO ThE fINANCIAL STATEMENTS for the financial year ended 31 December 2021
278

12. RIGHTS-OF-USE ASSETS AND LEASE LIABILITIES (CONTINUED)
The statement of profit or loss shows the following amounts relating to leases:
Group Bank
2021RM’000
2020RM’000
2021RM’000
2020RM’000
Expenses relating to short-term leases (included in other overhead expenses) 35,165 35,192 35,012 35,477
Total cash outflow of leases (including short-term leases) 65,983 65,112 65,688 65,360
The nature of the Group’s and the Bank’s leasing activities recognised in the statement of financial position are described as below:
No. of leases
Range ofremaining
terms
Averageremaining
lease terms
No. of leaseswith
terminationoption
Right-of-use assets:Buildings 8 0.5-14.4 years 14.2 years 8
Future minimum lease payments are as follows:
Within 1 year
RM’000
Minimum lease payment due
TotalRM’000
1 – 5 yearsRM’000
> 5 yearsRM’000
Group
31 December 2021Lease payment 29,956 113,434 309,264 452,654Finance cost 17,536 59,931 71,739 149,206Net present value 12,420 53,502 237,526 303,448
31 December 2020Lease payment 30,639 109,103 338,038 477,780Finance cost 17,203 62,552 85,596 165,351Net present value 13,436 46,551 252,442 312,429
Bank
31 December 2021Lease payment 29,481 113,434 309,264 452,179Finance cost 17,525 59,931 71,739 149,195Net present value 11,956 53,502 237,526 302,984
31 December 2020Lease payment 30,639 109,103 338,038 477,780Finance cost 17,203 62,552 85,596 165,351Net present value 13,436 46,551 252,442 312,429
INTEGR ATED ANNUAL REPORT 2021
Key Messages Overview Value Creation MD&A Sustainability Leadership Accountability Financial Additional Information
279

13. INVESTMENTS IN SUBSIDIARIES
Bank
2021RM’000
2020RM’000
At costUnquoted shares in Malaysia 101,827 16,447Less: Accumulated impairment loss (922) (922)
100,905 15,525
Movement of Investment in SubsidiariesAt 1 January 16,447 16,447Acquisition via Proposed Internal Reorganisation (Note 46) 85,380 –
At 31 December 101,827 16,447
The principal place of business and country of incorporation of the subsidiaries is Malaysia unless stated otherwise. Details of subsidiaries are as follows:
Principal activities
Effective ownership interest
Name of Company2021
%2020
%
Al-Wakalah Nominees (Tempatan) Sdn. Bhd. Provides nominee services 100 100
BIMB Investment Management Berhad Manages Islamic Unit Trust Funds 100 100
Bank Islam Trust Company (Labuan) Ltd. and its subsidiary:
Provides services as a Labuan registered trust company
100 100
BIMB Offshore Company Management Services Sdn. Bhd.
Dormant 100 100
Farihan Corporation Sdn. Bhd. Provides manpower services to the Bank
100 100
BIMB Holdings Sdn. Bhd. (formerly known as BIMB Holdings Berhad)^
Dormant 100 –
BIMB Securities (Holdings) Sdn. Bhd.^ and its subsidiary:
Investment holding 100 –
BIMB Securities Sdn. Bhd.^ and its subsidiaries:
Stockbroking 100 –
BIMSEC Nominees (Tempatan) Sdn. Bhd.^ Provides nominee services 100 –
BIMSEC Nominees (Asing) Sdn. Bhd.^ Provides Nominee services 100 –
Syarikat Al-Ijarah Sdn. Bhd.^ Leasing of assets 100 –
^ Subsidiaries acquired during the financial year pursuant to the Proposed Internal Reorganisation (Note 46)
BANK ISL AM MAL AYSIA BERHAD
NOTES TO ThE fINANCIAL STATEMENTS for the financial year ended 31 December 2021
280

14. PROPERTY AND EQUIPMENT
Group
Long termleasehold
landRM’000
Freehold land
RM’000
Freehold building
RM’000
Buildingimprovements
andrenovations
RM’000
Furniture, fixtures and
fittingsRM’000
Office equipment
RM’000
Computer equipment
RM’000
Motor vehiclesRM’000
Renovation work-in-progressRM’000
Managementinformation
system under
developmentRM’000
TotalRM’000
CostAt 1 January 2021 14,784 – – 36,033 136,648 102,585 480,558 943 3,987 56,675 832,213From group reorganisation – 143 481 273 5 9 1,027 – 509 – 2,447Additions – – – 508 2,419 3,407 13,502 – 815 50,504 71,155Reclassifications – – – – – 29 36,506 – (45) (36,490) –Disposals – – – – – (94) (6,222) (74) – – (6,390)Written-off – – – (184) (823) (5,971) (21,694) – – – (28,672)Exchange difference – – – – 11 10 12 – – – 33
At 31 December 2021 14,784 143 481 36,630 138,260 99,975 503,689 869 5,266 70,689 870,786
Accumulated depreciationAt 1 January 2021 2,348 – – 29,123 108,486 91,229 369,233 794 – – 601,213Depreciation for the year 174 – 12 1,743 7,756 5,040 44,407 93 – – 59,225Disposals – – – – – (92) (6,218) (74) – – (6,384)Written-off – – – (86) (469) (5,840) (21,658) – – – (28,053)Exchange difference – – – – 11 10 11 – – – 32
At 31 December 2021 2,522 – 12 30,780 115,784 90,347 385,775 813 – – 626,033
Net carrying amountAt 31 December 2021 12,262 143 469 5,850 22,476 9,628 117,914 56 5,266 70,689 244,753
INTEGR ATED ANNUAL REPORT 2021
Key Messages Overview Value Creation MD&A Sustainability Leadership Accountability Financial Additional Information
281

14. PROPERTY AND EQUIPMENT (CONTINUED)
Group
Long termleasehold
landRM’000
Buildingimprovements
andrenovations
RM’000
Furniture, fixtures
andfittingsRM’000
Officeequipment
RM’000
Computerequipment
RM’000
MotorvehiclesRM’000
Renovationwork-in-progressRM’000
Managementinformation
systemunder
developmentRM’000
TotalRM’000
CostAt 1 January 2020 14,784 35,764 135,352 102,239 445,043 943 4,362 23,428 761,915Additions – 646 2,370 4,478 32,100 – 2,130 51,155 92,879Reclassifications – 372 1,782 351 17,908 – (2,505) (17,908) –Disposals – – (81) (85) (903) – – – (1,069)Written-off – (749) (2,770) (4,391) (13,584) – – – (21,494)Exchange difference – – (5) (7) (6) – – – (18)
At 31 December 2020 14,784 36,033 136,648 102,585 480,558 943 3,987 56,675 832,213
Accumulated depreciationAt 1 January 2020 2,174 27,857 101,793 89,781 344,014 701 – – 566,320Depreciation for the year 174 1,849 8,871 5,881 39,678 93 – – 56,546Disposals – – (81) (85) (901) – – – (1,067)Written-off – (583) (2,092) (4,342) (13,552) – – – (20,569)Exchange difference – – (5) (6) (6) – – – (17)
At 31 December 2020 2,348 29,123 108,486 91,229 369,233 794 – – 601,213
Net carrying amountAt 31 December 2020 12,436 6,910 28,162 11,356 111,325 149 3,987 56,675 231,000
BANK ISL AM MAL AYSIA BERHAD
NOTES TO ThE fINANCIAL STATEMENTS for the financial year ended 31 December 2021
282

14. PROPERTY AND EQUIPMENT (CONTINUED)
Bank
Long termleasehold
landRM’000
Buildingimprovements
andrenovations
RM’000
Furniture, fixtures
andfittingsRM’000
Officeequipment
RM’000
Computerequipment
RM’000
MotorvehiclesRM’000
Renovationwork-in-progressRM’000
Managementinformation
systemunder
developmentRM’000
TotalRM’000
CostAt 1 January 2021 14,784 35,795 136,559 102,269 478,250 943 3,987 56,675 829,262Additions – 508 2,419 3,305 13,374 – 752 50,504 70,862Reclassifications – – – – 36,490 – – (36,490) –Disposals – – – (48) (6,220) (74) – – (6,342)Written-off – (184) (817) (5,947) (21,690) – – – (28,638)Exchange difference – – 11 7 3 – – – 21
At 31 December 2021 14,784 36,119 138,172 99,586 500,207 869 4,739 70,689 865,165
Accumulated depreciationAt 1 January 2021 2,348 28,896 108,411 90,931 367,366 794 – – 598,746Depreciation for the year 174 1,703 7,747 5,031 44,055 93 – – 58,803Disposals – – – (47) (6,216) (74) – – (6,337)Written-off – (86) (463) (5,816) (21,654) – – – (28,019)Exchange difference – – 11 7 2 – – – 20
At 31 December 2021 2,522 30,513 115,706 90,106 383,553 813 – – 623,213
Net carrying amountAt 31 December 2021 12,262 5,606 22,466 9,480 116,654 56 4,739 70,689 241,952
INTEGR ATED ANNUAL REPORT 2021
Key Messages Overview Value Creation MD&A Sustainability Leadership Accountability Financial Additional Information
283

14. PROPERTY AND EQUIPMENT (CONTINUED)
Bank
Long termleasehold
landRM’000
Buildingimprovements
andrenovations
RM’000
Furniture, fixtures
andfittingsRM’000
Officeequipment
RM’000
Computerequipment
RM’000
MotorvehiclesRM’000
Renovationwork-in-progressRM’000
Managementinformation
systemunder
developmentRM’000
TotalRM’000
CostAt 1 January 2020 14,784 35,526 135,263 101,929 442,917 943 4,362 23,428 759,152Additions – 646 2,370 4,470 31,913 – 2,130 51,155 92,684Reclassifications – 372 1,782 351 17,908 – (2,505) (17,908) –Disposals – – (81) (85) (903) – – – (1,069)Written-off – (749) (2,770) (4,391) (13,584) – – – (21,494)Exchange difference – – (5) (5) (1) – – – (11)
At 31 December 2020 14,784 35,795 136,559 102,269 478,250 943 3,987 56,675 829,262
Accumulated depreciationAt 1 January 2020 2,174 27,646 101,727 89,486 342,318 701 – – 564,052Depreciation for the year 174 1,833 8,862 5,877 39,502 93 – – 56,341Disposals – – (81) (85) (901) – – – (1,067)Written-off – (583) (2,092) (4,342) (13,552) – – – (20,569)Exchange difference – – (5) (5) (1) – – – (11)
At 31 December 2020 2,348 28,896 108,411 90,931 367,366 794 – – 598,746
Net carrying amountAt 31 December 2020 12,436 6,899 28,148 11,338 110,884 149 3,987 56,675 230,516
BANK ISL AM MAL AYSIA BERHAD
NOTES TO ThE fINANCIAL STATEMENTS for the financial year ended 31 December 2021
284

15. DEPOSITS FROM CUSTOMERS
(a) By type of deposit
Group Bank
2021RM’000
2020RM’000
2021RM’000
2020RM’000
Savings DepositQard 7,221,380 6,051,242 7,221,380 6,051,242
Demand DepositQard 12,954,014 11,742,875 12,968,663 11,752,697
Term Deposit 37,044,548 33,163,038 37,054,991 33,171,405
Special Investment DepositMudharabah – 3,662 – 3,662
General Investment DepositMudharabah 149,833 176,359 149,833 176,359
Term Deposit-iTawarruq 35,721,908 31,496,106 35,732,351 31,504,473
Negotiable Islamic Debt Certificates (NIDC) 1,172,807 1,486,911 1,172,807 1,486,911
Others 118,892 120,107 118,892 120,107
Total Deposits 57,338,834 51,077,262 57,363,926 51,095,451
(b) Maturity structure of term deposits are as follows:
Group Bank
2021RM’000
2020RM’000
2021RM’000
2020RM’000
Due within six months 22,267,682 18,093,028 22,268,464 18,093,941More than six months to one year 11,193,457 9,960,654 11,196,267 9,962,675More than one year to three years 1,252,439 2,336,348 1,259,290 2,341,781More than three years to five years 2,330,970 2,773,008 2,330,970 2,773,008
37,044,548 33,163,038 37,054,991 33,171,405
INTEGR ATED ANNUAL REPORT 2021
Key Messages Overview Value Creation MD&A Sustainability Leadership Accountability Financial Additional Information
285

15. DEPOSITS FROM CUSTOMERS (CONTINUED)
(c) By type of customers
Group Bank
2021RM’000
2020RM’000
2021RM’000
2020RM’000
Domestic non-bank financial institutions 6,059,847 6,901,831 6,084,939 6,920,020Business enterprises 22,935,511 20,921,604 22,935,511 20,921,604Government and statutory bodies 16,414,063 13,033,032 16,414,063 13,033,032Individuals 7,864,062 7,042,432 7,864,062 7,042,431Domestic banking institutions 976,873 718,962 976,873 718,962Others 3,088,478 2,459,401 3,088,478 2,459,402
57,338,834 51,077,262 57,363,926 51,095,451
16. INVESTMENT ACCOUNTS OF CUSTOMERS
(a) By type and Shariah contract
Group Bank
2021RM’000
2020RM’000
2021RM’000
2020RM’000
Unrestricted investment accountsWithout maturity:Mudharabah 6,655,637 5,113,275 6,655,637 5,113,275– Savings 5,343,189 4,446,643 5,343,189 4,446,643– Demand 1,312,448 666,632 1,312,448 666,632
With maturity:Wakalah 3,797,265 7,255,253 3,905,964 7,255,622
10,452,902 12,368,528 10,561,601 12,368,897
Restricted investment accounts (“RA”) managed by the Bank^
With maturity:Wakalah 849 11,915 849 11,915
^ Included in RA managed by the Bank is an arrangement between the Bank and Lembaga Tabung Haji where the Bank acts as an investment agent to manage and administer the RA, with underlying assets amounting to RM849,000 (2020: RM11,915,000).
BANK ISL AM MAL AYSIA BERHAD
NOTES TO ThE fINANCIAL STATEMENTS for the financial year ended 31 December 2021
286

16. INVESTMENT ACCOUNTS OF CUSTOMERS (CONTINUED)
(b) By type of customers
Group Bank
2021RM’000
2020RM’000
2021RM’000
2020RM’000
Individuals 5,745,138 4,840,308 5,745,138 4,840,308Government and statutory bodies 2,437,046 4,385,196 2,437,046 4,385,196Business Enterprises 1,267,853 1,130,539 1,267,853 1,130,539Non-bank financial institutions 835,758 1,861,096 944,457 1,861,465International Islamic Bank – – – –Others 167,107 151,389 167,107 151,389
10,452,902 12,368,528 10,561,601 12,368,897
(c) Movement of investment accounts of customers
Unrestricted investment accountsRestricted
investmentaccountsWakalahRM’000Group
MudharabahRM’000
WakalahRM’000
TotalRM’000
As at 1 January 2020 3,211,343 7,029,030 10,240,373 35,062
Funding inflows/outflows:Net movement 1,891,324 – 1,891,324 –New placement – 7,231,351 7,231,351 –Redemption/Principal repayment – (7,216,546) (7,216,546) (23,849)Income from investment 167,812 339,397 507,209 1,278
Bank’s share of profit:Profit distributed to Mudharib (157,204) – (157,204) –Wakalah fees – (127,979) (127,979) (576)
As at 31 December 2020/ 5,113,275 7,255,253 12,368,528 11,9151 January 2021
Funding inflows/outflows:Net movement 1,528,718 – 1,528,718 –New placement – 7,534,543 7,534,543 –Redemption/Principal repayment – (11,139,014) (11,139,014) (10,784)Income from investment 209,529 282,542 492,071 26
Bank’s share of profit:Profit distributed to Mudharib (195,885) – (195,885) –Wakalah fees – (136,059) (136,059) (308)
As at 31 December 2021 6,655,637 3,797,265 10,452,902 849
INTEGR ATED ANNUAL REPORT 2021
Key Messages Overview Value Creation MD&A Sustainability Leadership Accountability Financial Additional Information
287

16. INVESTMENT ACCOUNTS OF CUSTOMERS (CONTINUED)
(c) Movement of investment accounts of customers (continued)
Unrestricted investment accountsRestricted
investmentaccountsWakalahRM’000Bank
MudharabahRM’000
WakalahRM’000
TotalRM’000
As at 1 January 2020 3,211,343 7,029,030 10,240,373 35,062
Funding inflows/outflows:Net movement 1,891,324 – 1,891,324 –New placement – 7,231,720 7,231,720 –Redemption/Principal repayment – (7,216,546) (7,216,546) (23,849)Income from investment 167,812 339,397 507,209 1,278
Bank’s share of profit:Profit distributed to Mudharib (157,204) – (157,204) –Wakalah fees – (127,979) (127,979) (576)
As at 31 December 2020/ 5,113,275 7,255,622 12,368,897 11,9151 January 2021
Funding inflows/outflows:Net movement 1,528,718 – 1,528,718 –New placement – 7,745,505 7,745,505 –Redemption/Principal repayment – (11,242,162) (11,242,162) (10,784)Income from investment 209,529 283,058 492,587 26
Bank’s share of profit:Profit distributed to Mudharib (195,885) – (195,885) –Wakalah fees – (136,059) (136,059) (308)
As at 31 December 2021 6,655,637 3,905,964 10,561,601 849
BANK ISL AM MAL AYSIA BERHAD
NOTES TO ThE fINANCIAL STATEMENTS for the financial year ended 31 December 2021
288

16. INVESTMENT ACCOUNTS OF CUSTOMERS (CONTINUED)
(c) Movement of investment accounts of customers (continued)
Unrestricted investment accountsRestricted
investmentaccountsWakalahRM’000
MudharabahRM’000
WakalahRM’000
TotalRM’000
Group
Investment portfolio:2021House financing 6,655,637 1,898,633 8,554,270 –Personal financing – 1,898,632 1,898,632 –Other term financing – – – 849
6,655,637 3,797,265 10,452,902 849
2020House financing 5,113,275 3,627,627 8,740,902 –Personal financing – 3,627,626 3,627,626 –Other term financing – – – 11,915
5,113,275 7,255,253 12,368,528 11,915
Bank
Investment portfolio:2021House financing 6,655,637 1,952,982 8,608,619 –Personal financing – 1,952,982 1,952,982 –Other term financing – – – 849
6,655,637 3,905,964 10,561,601 849
2020House financing 5,113,275 3,627,811 8,741,086 –Personal financing – 3,627,811 3,627,811 –Other term financing – – – 11,915
5,113,275 7,255,622 12,368,897 11,915
INTEGR ATED ANNUAL REPORT 2021
Key Messages Overview Value Creation MD&A Sustainability Leadership Accountability Financial Additional Information
289

16. INVESTMENT ACCOUNTS OF CUSTOMERS (CONTINUED)
(d) By maturity structures, profit sharing ratio and rate of return
TotalamountRM’000
Investment account holders
Group
Averageprofit
sharing ratio(%)
Averagerate ofreturn
(%)
Bank’swakalah
fee(%)
2021
Unrestricted investment accounts:
Less than 3 months– Mudharabah 6,655,637 2 0.24 –– Wakalah 1,347,882 – 1.94 1.77
8,003,519Between 3 to 12 months– Wakalah 2,431,471 – 2.30 1.40Between 1 to 2 years– Wakalah 17,912 – 1.59 2.12
2,449,383
10,452,902
Restricted investment accounts:Between 2 to 5 years 849 – 7.20 6.79
2020
Unrestricted investment accounts:
Less than 3 months– Mudharabah 5,113,275 2 0.25 –– Wakalah 2,889,632 – 2.44 1.84
8,002,907
Between 3 to 12 months– Wakalah 4,337,062 – 3.03 1.24Between 1 to 2 years– Wakalah 28,559 – 3.23 1.04
4,365,621
12,368,528
Restricted investment accounts:Between 2 to 5 years 11,915 – 3.70 2.36
BANK ISL AM MAL AYSIA BERHAD
NOTES TO ThE fINANCIAL STATEMENTS for the financial year ended 31 December 2021
290

16. INVESTMENT ACCOUNTS OF CUSTOMERS (CONTINUED)
(d) By maturity structures, profit sharing ratio and rate of return (continued)
TotalamountRM’000
Investment account holders
Bank
Averageprofit
sharing ratio(%)
Averagerate ofreturn
(%)
Bank’swakalah
fee(%)
2021
Unrestricted investment accounts:
Less than 3 months– Mudharabah 6,655,637 2 0.24 –– Wakalah 1,456,461 – 1.94 1.77
8,112,098Between 3 to 12 months– Wakalah 2,431,471 – 2.30 1.40Between 1 to 2 years– Wakalah 18,032 – 1.59 2.12
2,449,503
10,561,601
Restricted investment accounts:Between 2 to 5 years 849 – 7.20 6.79
2020
Unrestricted investment accounts:
Less than 3 months– Mudharabah 5,113,275 2 0.25 –– Wakalah 2,889,632 – 2.44 1.84
8,002,907
Between 3 to 12 months– Wakalah 4,337,062 – 3.03 1.24Between 1 to 2 years– Wakalah 28,928 – 3.23 1.04
4,365,990
12,368,897
Restricted investment accounts:Between 2 to 5 years 11,915 – 3.70 2.36
INTEGR ATED ANNUAL REPORT 2021
Key Messages Overview Value Creation MD&A Sustainability Leadership Accountability Financial Additional Information
291

17. RECOURSE OBLIGATIONS ON FINANCING SOLD TO CAGAMAS
Recourse obligations on financing sold to Cagamas represents house financing accounts that are sold to Cagamas with recourse. Under the agreement, the Bank undertakes to administer the financing on behalf of Cagamas and to buy back any financing which are regarded as defective based on pre-determined and agreed-upon prudential criteria with recourse against the Bank. Such financing transactions and the obligation to buy back the financing are reflected as a liability on the statements of financial position. The financing are not de-recognised and are analysed in Note 8. The details are as follows:
NoteNominal value
RM’000 Issue date Maturity DateProfit rate
(% p.a.)
(a) 1,500,000 25 May 2018 25 May 2023 4.75
(b) 500,000 15 May 2021 15 May 2024 2.95
18. SUBORDINATED SUKUK MURABAHAH
Group and Bank
Note2021
RM’0002020
RM’000
Issued under the RM1.0 billion Programme
Third tranche (a) 301,962 302,046
Issued under the RM10.0 billion Programme
First tranche (b) 302,286 302,243Second tranche (c) 403,945 403,904Third tranche (d) 704,971 704,971Fourth tranche (e) 301,685 –
1,712,887 1,411,118
2,014,849 1,713,164
Finance cost on Subordinated Sukuk Murabahah 72,575 73,622
BANK ISL AM MAL AYSIA BERHAD
NOTES TO ThE fINANCIAL STATEMENTS for the financial year ended 31 December 2021
292

18. SUBORDINATED SUKUK MURABAHAH (CONTINUED)
The details of the issued subordinated Sukuk are as follows:
NoteNominal value
RM’000 Issue date First call date* Maturity DateProfit rate
(% p.a.)#
(a) 300,000 13 November 2017 12 December 2022 12 November 2027 5.08
(b) 300,000 7 November 2018 7 December 2023 7 November 2028 5.15
(c) 400,000 26 March 2020 26 March 2025 26 March 2030 3.75
(d) 700,000 21 October 2020 21 October 2025 21 October 2030 3.60
(e) 300,000 12 November 2021 12 November 2026 12 November 2031 4.10
* Optional redemption date or any periodic payment date thereafter. # Accrued and payable semi-annually in arrears.
The Subordinated Sukuk Murabahah qualifies as Tier II capital for the computation of the regulatory capital of the Bank in accordance with the Capital Adequacy Framework (Capital Components) for Islamic Banks issued by BNM.
19. OTHER LIABILITIES
Group Bank
2021RM’000
2020RM’000
2021RM’000
2020RM’000
Other payables 877,901 357,571 848,589 344,347Advance payment 575,288 680,508 575,288 680,508Accruals 117,413 98,784 114,498 97,030
1,570,602 1,136,863 1,538,375 1,121,885
Included in other payables is amount due to trustee amounting to RM10,391,000 (2020: RM4,423,000) attributed to the creation of unit trust funds.
Other payables are also include funds received by the Bank under various government funding schemes as part of government support measure in response to COVID-19 pandemic for specific financing purposes amounting to RM310,967,326 (2020: RM59,522,673) at concession rate.
INTEGR ATED ANNUAL REPORT 2021
Key Messages Overview Value Creation MD&A Sustainability Leadership Accountability Financial Additional Information
293

20. ZAKAT AND TAXATION
Group Bank
2021RM’000
2020RM’000
2021RM’000
2020RM’000
Zakat 12,307 11,999 12,227 11,827Taxation 21,081 19,953 21,029 19,949
33,388 31,952 33,256 31,776
21. SHARE CAPITAL
Group and Bank
Number of shares (units) Amount
2020’000
2019’000
2021RM’000
2020RM’000
Issued and fully paidOrdinary sharesAt 1 January 2,600,367 2,509,982 3,306,118 3,012,368Consolidation of shares (Note 46) (567,460) – – –Allotment of new ordinary shares 42,966 90,385 139,639 293,750
At 31 December 2,075,873 2,600,367 3,445,757 3,306,118
BANK ISL AM MAL AYSIA BERHAD
NOTES TO ThE fINANCIAL STATEMENTS for the financial year ended 31 December 2021
294

22. RESERVES
Note
Group Bank
2021RM’000
2020RM’000
2021RM’000
2020RM’000
FVOCI reserve (a) (101,288) 188,298 (101,288) 188,298Translation reserve^ (b) (20,798) (6,024) (20,555) (5,875)Regulatory reserve (c) – – – –Merger reserve (d) 111,187 – – –
Total other reserves (10,899) 182,274 (121,843) 182,423
Retained earnings^ 2,965,080 2,797,307 2,965,659 2,791,044
2,954,181 2,979,581 2,843,816 2,973,467
(a) The FVOCI reserve includes the cumulative net change in the fair value of financial assets FVOCI until the financial asset is derecognised.
(b) The translation reserve comprises all foreign exchange differences arising from the translation of the financial statements of the offshore banking operations in the Federal Territory of Labuan.
(c) The regulatory reserve represents the Bank’s compliance with BNM’s Guideline on Financial Reporting for Islamic Banking Institution to maintain, in aggregate, loss allowance for non-credit-impaired exposures and regulatory reserves of no less than 1% of total credit exposures, net of loss allowance for credit- impaired exposures. No regulatory reserve recognised in 2021 and 2020.
(d) Merger reserve arising from the Proposed Internal Reorganisation and acquisition of two (2) new BHB ordinary shares. See Note 46.
23. SOURCES AND USES OF CHARITY FUNDS
Movement of sources and uses of charity funds are as follows:
Group and Bank2021
RM’0002020
RM’000
Undistributed funds as at the beginning of the financial year 11 3
Shariah non-compliance income:Funds collected/received during the year 41 60
Uses of funds during the year:Contribution to Public Benefit (40) (52)
Undistributed funds as at the end of the financial year 12 11
INTEGR ATED ANNUAL REPORT 2021
Key Messages Overview Value Creation MD&A Sustainability Leadership Accountability Financial Additional Information
295

24. INCOME DERIVED FROM INVESTMENT OF DEPOSITORS’ FUNDS
Group and Bank
2021RM’000
2020RM’000
Income derived from investment of:(i) General investment deposits 8,891 12,404(ii) Term deposit-i 1,394,791 1,564,207(iii) Savings and demand deposits 808,972 869,663(iv) Other deposits 47,418 57,739
2,260,072 2,504,013
(i) Income derived from investment of general investment deposits
Group and Bank
2021RM’000
2020RM’000
Finance income and hibahFinancing, advances and others 7,713 10,088
Financial assets:– fair value through profit and loss 49 85– fair value through other comprehensive income 604 965– other financial assets at amortised cost 38 2Money at call and deposits with financial institutions 202 141
8,606 11,281
Other dealing incomeNet (loss)/gain from sale of financial assets at fair value through profit or loss (25) 2Net gain/(loss) on revaluation of financial assets at fair value through profit or
loss 15 (10)
(10) (8)
Other operating incomeNet gain from sale of financial assets at fair value through other comprehensive
income 295 1,131
8,891 12,404
of which,Financing income earned on impaired financing 102 103Unwinding of modification loss 28 97
BANK ISL AM MAL AYSIA BERHAD
NOTES TO ThE fINANCIAL STATEMENTS for the financial year ended 31 December 2021
296

24. INCOME DERIVED FROM INVESTMENT OF DEPOSITORS’ FUNDS (CONTINUED)
(ii) Income derived from investment of term deposit-i
Group and Bank
2021RM’000
2020RM’000
Finance income and hibahFinancing, advances and others 1,171,513 1,216,391
Financial assets:– fair value through profit and loss 9,140 12,825– fair value through other comprehensive income 114,824 146,921– other financial assets at amortised cost 7,940 297Money at call and deposits with financial institutions 37,770 18,178
1,341,187 1,394,612
Other dealing incomeNet (loss)/gain from sale of financial assets at fair value through profit or loss (4,481) 355Net gain/(loss) on revaluation of financial assets at fair value through profit or
loss 3,414 (1,532)
(1,067) (1,177)
Other operating incomeNet gain from sale of financial assets at fair value through other comprehensive
income 54,669 170,772
Other incomeGain on disposal of leased assets 2 –
1,394,791 1,564,207
of which,Financing income earned on impaired financing 18,964 15,959Unwinding of modification loss 10,615 15,684
INTEGR ATED ANNUAL REPORT 2021
Key Messages Overview Value Creation MD&A Sustainability Leadership Accountability Financial Additional Information
297

24. INCOME DERIVED FROM INVESTMENT OF DEPOSITORS’ FUNDS (CONTINUED)
(iii) Income derived from investment of savings and demand deposits
Group and Bank
2021RM’000
2020RM’000
Finance income and hibahFinancing, advances and others 680,037 677,884
Financial assets:– fair value through profit and loss 5,287 7,134– fair value through other comprehensive income 66,690 81,880– other financial assets at amortised cost 4,622 167Money at call and deposits with financial institutions 21,920 10,029
778,556 777,094
Other dealing incomeNet (loss)/gain from sale of financial assets at fair value through profit or loss (2,673) 216Net gain/(loss) on revaluation of financial assets at fair value through profit or
loss 1,949 (1,126)
(724) (910)
Other operating incomeNet gain from sale of financial assets at fair value through other comprehensive
income 31,139 93,479
Other incomeGain on disposal of leased assets 1 –
808,972 869,663
of which,Financing income earned on impaired financing 10,970 8,794Unwinding of modification loss 7,032 9,061
BANK ISL AM MAL AYSIA BERHAD
NOTES TO ThE fINANCIAL STATEMENTS for the financial year ended 31 December 2021
298

24. INCOME DERIVED FROM INVESTMENT OF DEPOSITORS’ FUNDS (CONTINUED)
(iv) Income derived from investment of other deposits
Group and Bank
2021RM’000
2020RM’000
Finance income and hibahFinancing, advances and others 39,928 45,274
Financial assets:– fair value through profit and loss 314 487– fair value through other comprehensive income 3,978 5,484– other financial assets at amortised cost 248 12Money at call and deposits with financial institutions 1,254 689
45,722 51,946
Other dealing incomeNet loss from sale of financial assets at fair value through profit or loss (194) (73)Net gain/(loss) on revaluation of financial assets at fair value through profit or
loss 90 (63)
(104) (136)
Other operating incomeNet gain from sale of financial assets at fair value through other
comprehensive income 1,800 5,929
47,418 57,739
of which,Financing income earned on impaired financing 638 626Unwinding of modification loss 601 464
25. INCOME DERIVED FROM INVESTMENT ACCOUNT FUNDS
Group and Bank
2021RM’000
2020RM’000
Finance incomeUnrestricted investment accounts – Mudharabah 209,367 167,693– Wakalah 282,865 339,200Unwinding of modification loss 5,306 7,041
497,538 513,934
INTEGR ATED ANNUAL REPORT 2021
Key Messages Overview Value Creation MD&A Sustainability Leadership Accountability Financial Additional Information
299

26. INCOME DERIVED FROM INVESTMENT OF SHAREHOLDERS’ FUNDS
Group Bank
2021RM’000
2020RM’000
2021RM’000
2020RM’000
Finance income and hibahFinancing, advances and others 9,783 6,607 9,783 6,607Financial assets:– fair value through other comprehensive income 177,794 190,253 177,794 190,253Money at call and deposits with financial institutions 131 40 – 3
187,708 196,900 187,577 196,863
Other dealing incomeNet gain from foreign exchange transactions 32,485 43,478 32,519 43,531Net derivatives gain 7 31 7 31Net gain from sale of financial assets at fair value
through profit or loss 26 – – –Net gain/(loss) on revaluation of financial assets at fair
value through profit or loss 11,029 (3,986) 10,882 (3,982)
43,547 39,523 43,408 39,580
Other operating incomeDividend from financial assets at FVTPL 11,677 13,860 11,326 13,722Dividend from subsidiary – – 800 500Dividend from financial assets at FVOCI – 503 – 503Sale of investment in unit trust – 28 – 28Rebate on investment in unit trust 2,217 979 2,217 979
13,894 15,370 14,343 15,732
BANK ISL AM MAL AYSIA BERHAD
NOTES TO ThE fINANCIAL STATEMENTS for the financial year ended 31 December 2021
300

26. INCOME DERIVED FROM INVESTMENT OF SHAREHOLDERS’ FUNDS (CONTINUED)
Group Bank
2021RM’000
2020RM’000
2021RM’000
2020RM’000
Fees and commissionCard fees and commission 78,655 74,466 78,655 74,466Takaful service fees and commission 31,929 31,335 31,929 31,335Financing fees 19,372 17,680 19,372 17,680Sales charges on unit trust 13,150 11,856 – –Unit trust management fees 16,835 16,786 – –Commission on MEPS 7,854 2,108 7,854 2,108Ar-Rahnu fees 63 6,815 63 6,815Mobile banking fees 7,794 7,002 7,794 7,002Corporate advisory fees 8,885 9,491 8,700 9,491Deposit and payment service fees 3,819 4,629 3,819 4,629Processing fees 3,790 9,732 3,648 9,732Commission on bills payment system 1,815 1,331 1,815 1,331Commission from wealth management services 188 110 5,706 4,712Ta'widh Charges 1,555 1,387 1,554 1,387Others 15,406 10,760 11,717 10,433
211,110 205,488 182,626 181,121
Other incomeRental income 1,631 2,549 2,308 2,931Net gain on disposal of property and equipment 603 3 602 3Other income 257 226 86 83
2,491 2,778 2,996 3,017
458,750 460,059 430,950 436,313
27. NET ALLOWANCE FOR IMPAIRMENT ON FINANCING AND ADVANCES
Group and Bank
2021RM’000
2020RM’000
Net allowance for impairment on financing, advances and others:– Stage 1 (159,674) 228,646– Stage 2 151,178 1,661– Stage 3 274,433 57,880Bad debts and financing recovered (75,199) (79,516)
190,738 208,671
INTEGR ATED ANNUAL REPORT 2021
Key Messages Overview Value Creation MD&A Sustainability Leadership Accountability Financial Additional Information
301

28. INCOME ATTRIBUTABLE TO DEPOSITORS
Group Bank
2021RM’000
2020RM’000
2021RM’000
2020RM’000
Deposits from customers:– Mudharabah fund 2,109 4,758 2,109 4,758– Non-Mudharabah fund 736,559 930,187 736,754 930,408
Deposits and placements of banks and other financial institutions:
– Non-Mudharabah fund 36 421 36 421
Recourse obligation on financing sold to Cagamas 79,984 71,113 79,984 71,113
818,688 1,006,479 818,883 1,006,700
29. INCOME ATTRIBUTABLE TO INVESTMENT ACCOUNT HOLDERS
Group Bank
2021RM’000
2020RM’000
2021RM’000
2020RM’000
Unrestricted investment accounts – Mudharabah 13,644 10,609 13,644 10,609– Wakalah 146,483 211,417 146,999 211,417
160,127 222,026 160,643 222,026
30. PERSONNEL EXPENSES
Group Bank
2021RM’000
2020RM’000
2021RM’000
2020RM’000
Salaries and wages 443,849 387,121 429,717 378,437Allowances and bonuses 120,910 108,688 118,317 106,875Employees’ Provident Fund 80,482 75,992 78,019 74,534Directors and Shariah Supervisory Council Members’
remuneration 8,150 7,040 6,473 6,012Medical benefits 27,188 29,835 26,705 28,795Staff sales commission 22,391 25,543 22,391 25,543Others 20,860 29,148 20,162 29,165
723,830 663,367 701,784 649,361
BANK ISL AM MAL AYSIA BERHAD
NOTES TO ThE fINANCIAL STATEMENTS for the financial year ended 31 December 2021
302

31. OTHER OVERHEAD EXPENSES
Group Bank
2021RM’000
2020RM’000
2021RM’000
2020RM’000
PromotionCredit and debit card expenses 48,642 40,574 48,642 40,574Advertisement and publicity 20,290 12,469 16,061 12,363Others 16,680 14,824 7,314 5,189
85,612 67,867 72,017 58,126
EstablishmentDepreciation of property and equipment 59,225 56,546 58,803 56,341Depreciation of right-of-use assets 18,197 18,348 18,042 18,317Office rental 29,215 29,136 29,186 29,499Information technology expenses 72,490 56,133 72,490 56,133Security services 8,877 9,442 8,877 9,442Utilities 11,170 12,771 11,036 12,698Office maintenance 10,216 10,847 9,973 10,635Takaful 7,261 5,645 6,379 5,641Rental of equipment 5,950 6,056 5,826 5,978Others 320 320 320 320
222,921 205,244 220,932 205,004
General expensesOutsourcing fees
– Management of self-service terminal 8,564 13,716 8,564 13,716– Credit recovery – – 7,318 2,345– Others 4,109 1,960 4,109 1,960
Office supplies 8,333 9,911 8,239 9,788Licenses 12,551 9,957 12,551 9,957Bank and service charges 8,240 7,418 8,207 7,389General expenses 30,814 22,547 30,814 22,547Security services for cash in transit 4,915 5,735 4,915 5,735Postage and delivery charges 11,678 9,829 11,545 9,760Management fees – – 6,839 7,686Subscription fees 12,633 5,486 12,630 5,483SMS service charges 19,647 14,274 19,647 14,274Professional fees 15,267 11,199 13,396 10,956Mobile banking expenses 1,923 2,011 1,923 2,011Auditors’ remuneration
– Statutory audit 1,550 1,267 1,324 1,188– Regulatory related 263 150 263 150– Non-audit 345 312 345 312
Processing charges 1,030 1,201 1,030 1,201Property and equipment written-off 619 925 619 925Others 10,908 20,076 1,835 11,989
153,389 137,974 156,113 139,372
461,922 411,085 449,062 402,502
INTEGR ATED ANNUAL REPORT 2021
Key Messages Overview Value Creation MD&A Sustainability Leadership Accountability Financial Additional Information
303

32. CHIEF EXECUTIVE OFFICER, DIRECTORS AND SHARIAH SUPERVISORY COUNCIL MEMBERS’ REMUNERATION
Group Bank
2021RM’000
2020RM’000
2021RM’000
2020RM’000
Chief Executive Officer:Salaries and other remuneration, including meeting
allowances 2,814 2,663 2,814 2,663Benefits-in-kind 38 34 38 34
2,852 2,697 2,852 2,697
Non-Executive Directors:Fees 1,466 1,033 1,396 997Other emoluments 1,627 1,668 1,480 1,649Benefits-in-kind 621 259 621 259
3,714 2,960 3,497 2,905
Directors of subsidiariesExecutive Director:Salaries and other remuneration, including meeting
allowances 946 810 – –
Non-Executive Directors:Fees 221 72 – –Other emoluments 240 68 – –
461 140 – –
Total 7,973 6,607 6,349 5,602
Members of Shariah Supervisory Council (SSC) – SSC of the Bank 797 712 783 703– SSC of a subsidiary 39 14 – –
Total 836 726 783 703
Grand total (excluding benefits-in-kind) (Note 30) 8,150 7,040 6,473 6,012
BANK ISL AM MAL AYSIA BERHAD
NOTES TO ThE fINANCIAL STATEMENTS for the financial year ended 31 December 2021
304

32. CHIEF EXECUTIVE OFFICER, DIRECTORS AND SHARIAH SUPERVISORY COUNCIL MEMBER’S REMUNERATION (CONTINUED)
The total remuneration (including benefits-in-kind) of the Chief Executive Officer, Directors of the Bank is as follows:
31 December 2021
Remuneration received from the Bank Bank
TotalRM’000
Remuneration received from subsidiaries
Group
TotalRM’000
Salary and Bonus
RM’000Fees
RM’000
OtherEmoluments
RM’000
Benefits-in-kind
RM’000Fees
RM’000Others
RM’000
Chief Executive Officer:Mohd Muazzam Mohamed 2,283 – 531 38 2,852 – – 2,852
Non-Executive Directors:Tan Sri Dr. Ismail Hj. Bakar – 144 195 21 360 – – 360Azizan Ahmad – 198 200 75 473 – – 473Mohamed Ridza
Mohamed Abdulla – 108 140 50 298 24 17 339Datuk Nik Mohd
Hasyudeen Yusoff – 130 136 25 291 4 53 348Dato’ Sri Khazali Ahmad – 114 105 65 284 – – 284Mohd Yuzaidi Mohd Yusoff – 184 190 89 463 – – 463Mashitah Haji Osman – 156 168 35 359 – – 359Dato’ Sri Amrin Awaluddin
(appointed on 10 September 2021) 24 15 – 39 – – 39
Mohd Asri Awang (appointed on 1 October 2021) 36 27 25 88 – – 88
Zahari @ Mohd Zin Idris (retired on 20 September 2021) – 162 180 136 478 42 47 567
Noraini Che Dan (deceased on 26 August 2021) – 140 124 100 364 – 30 394
– 1,396 1,480 621 3,497 70 147 3,714
2,283 1,396 2,011 659 6,349 70 147 6,566
INTEGR ATED ANNUAL REPORT 2021
Key Messages Overview Value Creation MD&A Sustainability Leadership Accountability Financial Additional Information
305

32. CHIEF EXECUTIVE OFFICER, DIRECTORS AND SHARIAH SUPERVISORY COUNCIL MEMBER’S REMUNERATION (CONTINUED)
The total remuneration (including benefits-in-kind) of the Chief Executive Officer, Directors of the Bank is as follows: (continued)
31 December 2020
Remuneration received from the Bank Bank
TotalRM’000
Remuneration received from subsidiaries
Group
TotalRM’000
Salary and Bonus
RM’000Fees
RM’000
OtherEmoluments
RM’000
Benefits-in-kind
RM’000Fees
RM’000Others
RM’000
Chief Executive Officer:Mohd Muazzam Mohamed 2,183 – 480 34 2,697 – – 2,697
Non-Executive Directors:Tan Sri Dr. Ismail Hj. Bakar – 20 60 50 130 – – 130Datuk Zamani Abdul
Ghani – 20 144 46 210 – – 210Dato’ Sri Khazali Ahmad – 78 148 28 254 – – 254Zahari @ Mohd Zin Idris – 222 266 15 503 12 8 523Mohamed Ridza
Mohamed Abdulla – 119 158 25 302 24 11 337Datuk Nik Mohd
Hasyudeen Yusoff – 36 119 – 155 – – 155Noraini Che Dan – 154 260 25 439 – – 439Azizan Ahmad – 170 235 50 455 – – 455Mohd Yuzaidi Mohd Yusoff – 148 223 20 391 – – 391Mashitah Haji Osman – 30 36 – 66 – – 66
– 997 1,649 259 2,905 36 19 2,960
2,183 997 2,129 293 5,602 36 19 5,657
BANK ISL AM MAL AYSIA BERHAD
NOTES TO ThE fINANCIAL STATEMENTS for the financial year ended 31 December 2021
306

32. CHIEF EXECUTIVE OFFICER, DIRECTORS AND SHARIAH SUPERVISORY COUNCIL MEMBER’S REMUNERATION (CONTINUED)
The total remuneration of the members of the Shariah Supervisory Council of the Bank is as follows:
Remuneration received from the Bank
Bank
TotalRM’000
Remuneration received from
subsidiaryGroup
TotalRM’000
FeesRM’000
OtherEmoluments
RM’000Fees
RM’000
31 December 2021Professor Dato’ Dr. Ahmad Hidayat Buang 72 108 180 – 180Ustazah Dr. Yasmin Hanani Mohd Safian 66 71 137 – 137Asmadi Mohamed Naim 66 72 138 – 138Shamsiah Mohamad 66 36 102 6 108Datu Haji Kipli Haji Yassin (appointed on
1 January 2021) 66 18 84 – 84Ustaz Dr. Ahmad Shahbari @ Sobri Salamon
(retired on 31 March 2021) 17 64 81 8 89Assistant Professor Dr. Uzaimah Ibrahim
(retired on 31 March 2021) 17 44 61 – 61
370 413 783 14 797
31 December 2020Professor Dato’ Dr. Ahmad Hidayat Buang 72 95 167 – 167Ustaz Dr. Ahmad Shahbari @ Sobri Salamon 66 32 98 6 104Assistant Professor Dr. Uzaimah Ibrahim 66 36 102 – 102Ustazah Dr. Yasmin Hanani Mohd Safian 66 69 135 – 135Asmadi Mohamed Naim 61 35 96 – 96Shamsiah Mohamad 61 14 75 3 78Sahibus Samahah Dato' Dr. Haji Anhar
Haji Opir – 30 30 – 30
392 311 703 9 712
INTEGR ATED ANNUAL REPORT 2021
Key Messages Overview Value Creation MD&A Sustainability Leadership Accountability Financial Additional Information
307

33. KEY MANAGEMENT PERSONNEL
Key management personnel are defined as those persons having authority and responsibility for planning, directing and controlling the activities of the Group either directly or indirectly. The key management personnel include all the Directors of the Group, and certain senior management members of the Group.
The compensation for key management personnel other than the Directors’ remuneration is as follows:
Group and Bank
2021RM’000
2020RM’000
Other key management personnel:Short-term employee benefits 27,787 28,047
Number of employees categorised as key management personnel as at 31 December 2021 was 29 (2020: 30).
34. FINANCE COST
Group Bank
2021RM’000
2020RM’000
2021RM’000
2020RM’000
Finance cost:Subordinated Sukuk Murabahah 72,575 73,622 72,575 73,622Profit expense on lease 17,312 17,836 17,303 17,835
89,887 91,458 89,878 91,457
35. TAX EXPENSE
Group Bank
2021RM’000
2020RM’000
2021RM’000
2020RM’000
Malaysian income tax:Current year 183,112 67,027 182,802 66,860Under provision/(over provision) in prior year 145,996 (27,738) 146,001 (27,757)
329,108 39,289 328,803 39,103
Deferred tax expense relating to origination and reversal of temporary differences arising from:
Current year (23,614) 110,077 (23,614) 110,077(Over provision)/under provision in prior year (147,853) 2,123 (147,933) 2,128
(171,467) 112,200 (171,547) 112,205
157,641 151,489 157,256 151,308
BANK ISL AM MAL AYSIA BERHAD
NOTES TO ThE fINANCIAL STATEMENTS for the financial year ended 31 December 2021
308

35. TAX EXPENSE (CONTINUED)
A reconciliation of effective tax expense for the Group and the Bank are as follows:
Group Bank
2021RM’000
2020RM’000
2021RM’000
2020RM’000
Profit before tax 704,221 728,213 710,625 726,836
Income tax calculated using Malaysian tax rate of 24% 169,013 174,771 170,550 174,441Income not subject to tax (4,806) (1,920) (4,713) (1,634)Non-deductible expenses 5,182 6,844 3,242 6,721Impact of Cukai Makmur (7,011) – (7,011) –Zakat (2,880) (2,591) (2,880) (2,591)Overprovision in prior years (1,857) (25,615) (1,932) (25,629)
157,641 151,489 157,256 151,308
36. EARNINGS PER SHARE
Basic earnings per share are calculated based on the net profit attributable to equity holders of the Group of RM534,305,000 (2020: RM564,954,000) and the weighted average number of ordinary shares outstanding during the year of 2,443,188,000 (2020: 2,546,005,000).
The Group has no dilution in its earnings per ordinary shares in the current and previous financial year as there are no dilutive potential ordinary shares.
37. DIVIDENDS
Dividends paid by the Bank:
Senper share
TotalamountRM’000 Date of payment
2021Final 2020 5.37 139,639 4 June 2021Interim 2021 10.93 226,893 20 January 2022
366,532
2020Final 2019 6.05 151,854 29 June 2020Interim 2020 5.55 141,897 18 September 2020
293,751
INTEGR ATED ANNUAL REPORT 2021
Key Messages Overview Value Creation MD&A Sustainability Leadership Accountability Financial Additional Information
309

37. DIVIDENDS (CONTINUED)
From the Final 2020 dividend amount paid wholly in cash of RM139.639 million, RM139.639 million was reinvested to subscribe for 42,966,054 new ordinary shares at RM3.25 each via the Dividend Reinvestment Plan.
The dividend was reinvested by former holding company (prior to the Group reorganisation), BIMB Holdings Berhad to strengthen the Bank’s capital position to fund the business growth of the Bank.
During the financial year, the following dividend was declared and recognised in the financial position.
Senper share
TotalamountRM’000
Interim 2021 ordinary dividend 10.93 226,893
38. OPERATING SEGMENTS
The Group’s reportable segments, as described below, can be classified into four segments. Each segment offers different products and services. The following summary describes the operations in each of the segments:
• Consumer Banking Includes financing, deposits and other transactions and balances with retail customers
• Corporate and Commercial Banking Includes corporate finance activities, financing, deposits and other transactions and balances with corporate customers, commercial customers and small & medium enterprises
• Treasury Undertakes funding activities through borrowings and investing in liquid assets such as short-term placements and corporate and government debt securities
• Shareholders unit Operates shareholders’ funds
Information regarding the results of each reportable segment is included below. Performance is measured based on segment profit before allocation of overheads and income tax.
BANK ISL AM MAL AYSIA BERHAD
NOTES TO ThE fINANCIAL STATEMENTS for the financial year ended 31 December 2021
310

38. OPERATING SEGMENTS (CONTINUED)
2021
ConsumerBankingRM’000
Corporateand
CommercialBankingRM’000
TreasuryRM’000
Shareholdersunit
RM’000Elimination
RM’000
GroupTotal
RM’000
Total Revenue (a) 1,929,505 609,975 582,957 67,426 (22,106) 3,167,757
Net fund based income (b) 1,079,038 382,804 111,097 258,653 – 1,831,592Non-fund based income (c) 149,087 32,791 130,283 66,584 (21,395) 357,350
Net income 1,228,125 415,595 241,380 325,237 (21,395) 2,188,942Net allowance for
impairment on financial assets 37,290 (228,028) (6,650) (756) – (198,144)
Profit before overheads, zakat and tax 1,265,415 187,567 234,730 324,481 (21,395) 1,990,798
Operating expenses (1,286,577)Profit before zakat and
tax 704,221
Segment assets 44,032,459 14,121,310 19,983,824 385,141 (274,839) 78,247,895Unallocated assets 1,908,319
Total assets 80,156,214
(a) Included in total revenue are income derived from investment of depositors’ funds, investment account funds, investment of shareholders’ funds, loss on modification of financial assets, and wakalah fees from restricted investment accounts.
(b) Net fund based income is derived after deducting the income attributable to depositors and income attributable to investment account holders.
(c) Included in non-fund based income are fee and commission income that amounted to RM211,418,000, investment income of RM99,270,000 and other non-fund based income that amounted to RM46,662,000.
INTEGR ATED ANNUAL REPORT 2021
Key Messages Overview Value Creation MD&A Sustainability Leadership Accountability Financial Additional Information
311

38. OPERATING SEGMENTS (CONTINUED)
2020
ConsumerBankingRM’000
Corporateand
CommercialBankingRM’000
TreasuryRM’000
Shareholdersunit
RM’000Elimination
RM’000
GroupTotal
RM’000
Total Revenue 1,854,908 652,036 784,963 66,123 (15,828) 3,342,202
Net fund based income 941,306 351,755 146,795 141,026 – 1,580,882Non-fund based income 141,779 38,377 309,411 58,855 (15,607) 532,815
Net income 1,083,085 390,132 456,206 199,881 (15,607) 2,113,697Net allowance for
impairment on financial assets (125,989) (80,182) 257 – – (205,914)
Profit before overheads, zakat and tax 957,096 309,950 456,463 199,881 (15,607) 1,907,783
Operating expenses (1,179,570)Profit before zakat and
tax 728,213
Segment assets 40,874,237 13,796,398 18,286,566 54,179 (35,164) 72,976,216Unallocated assets 1,660,806
Total assets 74,637,022
(a) Included in total revenue are income derived from investment of depositors’ funds, investment account funds, investment of shareholders’ funds, loss on modification of financial assets, and wakalah fees from restricted investment accounts.
(b) Net fund based income is derived after deducting the income attributable to depositors and income attributable to investment account holders.
(c) Included in non-fund based income are fee and commission income that amounted to RM211,418,000, investment income of RM99,270,000 and other non-fund based income that amounted to RM46,662,000.
.
BANK ISL AM MAL AYSIA BERHAD
NOTES TO ThE fINANCIAL STATEMENTS for the financial year ended 31 December 2021
312

39. FINANCIAL RISK MANAGEMENT
Overview
The Group’s and the Bank’s business activities involve the use of financial instruments which expose the Group and the Bank to various financial risks, namely credit risk, market risk and liquidity risk.
The Group’s and the Bank’s financial risk management is guided by the Group’s Risk Appetite Statement and Risk Management Policies/Guidelines and subject to the oversight by the Board of Directors (“Board”) via the Board Risk Committee (“BRC”).
The BRC is assisted by the specific risk management committees namely the Management Risk Control Committee (“MRCC”) and the Asset & Liability Management Committee (“ALCO”).
(a) Financial instruments by categories
The table in subsequent pages provides an analysis of financial instruments categorised as follows:
• Fair value through profit or loss (“FVTPL”) • Financial assets at fair value through other comprehensive income (“FVOCI”) • Other financial assets at amortised cost (“AC”) • Financial liabilities measured at amortised cost (“FL”)
Group31 December 2021
CarryingamountRM’000
FVTPLRM’000
FVOCIRM’000
ACRM’000
Financial assetsCash and short-term funds and deposits and
placements with financial institutions 5,222,848 – – 5,222,848Financial assets at FVTPL 1,582,494 1,582,494 – –Derivative financial assets 26,037 26,037 – –Financial assets at FVOCI 12,604,204 – 12,604,204 –Financial assets at AC 1,348,844 – – 1,348,844Financing, advances and others 58,153,769 – – 58,153,769Other financial assets at AC* 294,508 – – 294,508Statutory deposits with Bank Negara Malaysia 264,050 – – 264,050
79,496,754 1,608,531 12,604,204 65,284,019
Financial liabilitiesDeposits from customers 57,338,834 – – 57,338,834Investment accounts of customers 10,452,902 – – 10,452,902Derivative financial liabilities 20,421 20,421 – –Bills and acceptance payable 20,112 – – 20,112Recourse obligations on financing sold to
Cagamas 2,001,720 – – 2,001,720Subordinated Sukuk Murabahah 2,014,849 – – 2,014,849Other liabilities 1,570,602 – – 1,570,602Lease liabilities 303,448 – – 303,448
73,722,888 20,421 – 73,702,467
* Excludes prepayment
INTEGR ATED ANNUAL REPORT 2021
Key Messages Overview Value Creation MD&A Sustainability Leadership Accountability Financial Additional Information
313

39. FINANCIAL RISK MANAGEMENT (CONTINUED)
(a) Financial instruments by categories (continued)
Group31 December 2020
CarryingamountRM’000
FVTPLRM’000
FVOCIRM’000
ACRM’000
Financial assetsCash and short-term funds and deposits and
placements with financial institutions 5,216,737 – – 5,216,737Financial assets at FVTPL 1,181,200 1,181,200 – –Derivative financial assets 61,665 61,665 – –Financial assets at FVOCI 12,557,991 – 12,557,991 –Financing, advances and others 54,670,635 – – 54,670,635Other financial assets at AC* 192,574 – – 192,574Statutory deposits with Bank Negara Malaysia 192,425 – – 192,425
74,073,227 1,242,865 12,557,991 60,272,371
Financial liabilitiesDeposits from customers 51,077,262 – – 51,077,262Investment accounts of customers 12,368,528 – – 12,368,528Derivative financial liabilities 105,872 105,872 – –Bills and acceptance payable 29,621 – – 29,621Recourse obligations on financing sold to
Cagamas 1,501,187 – – 1,501,187Subordinated Sukuk Murabahah 1,713,164 – – 1,713,164Other liabilities 1,136,863 – – 1,136,863Lease liabilities 312,429 – – 312,429
68,244,926 105,872 – 68,139,054
* Excludes prepayment
BANK ISL AM MAL AYSIA BERHAD
NOTES TO ThE fINANCIAL STATEMENTS for the financial year ended 31 December 2021
314

39. FINANCIAL RISK MANAGEMENT (CONTINUED)
(a) Financial instruments by categories (continued)
Bank31 December 2021
CarryingamountRM’000
FVTPLRM’000
FVOCIRM’000
ACRM’000
Financial assetsCash and short-term funds and deposits and
placements with financial institutions 5,204,364 – – 5,204,364Financial assets at FVTPL 1,550,700 1,550,700 – –Derivative financial assets 26,037 26,037 – –Financial assets at FVOCI 12,605,067 – 12,605,067 –Financial assets at AC 1,348,844 – – 1,348,844Financing, advances and others 58,153,769 – – 58,153,769Other financial assets at AC* 239,257 – – 239,257Statutory deposits with Bank Negara Malaysia 264,050 – – 264,050
79,392,088 1,576,737 12,605,067 65,210,284
Financial liabilitiesDeposits from customers 57,363,926 – – 57,363,926Investment accounts of customers 10,561,601 – – 10,561,601Derivative financial liabilities 20,421 20,421 – –Bills and acceptance payable 20,112 – – 20,112Recourse obligations on financing sold to
Cagamas 2,001,720 – – 2,001,720Subordinated Sukuk Murabahah 2,014,849 – – 2,014,849Other liabilities 1,538,375 – – 1,538,375Lease liabilities 302,984 – – 302,984
73,823,988 20,421 – 73,803,567
* Excludes prepayment
INTEGR ATED ANNUAL REPORT 2021
Key Messages Overview Value Creation MD&A Sustainability Leadership Accountability Financial Additional Information
315

39. FINANCIAL RISK MANAGEMENT (CONTINUED)
(a) Financial instruments by categories (continued)
Bank31 December 2020
CarryingamountRM’000
FVTPLRM’000
FVOCIRM’000
ACRM’000
Financial assetsCash and short-term funds and deposits and
placements with financial institutions 5,216,280 – – 5,216,280Financial assets at FVTPL 1,175,440 1,175,440 – –Derivative financial assets 61,665 61,665 – –Financial assets at FVOCI 12,558,729 – 12,558,729Financing, advances and others 54,670,635 – – 54,670,635Other financial assets at AC* 182,041 – – 182,041Statutory deposits with Bank Negara Malaysia 192,425 – – 192,425
74,057,215 1,237,105 12,558,729 60,261,381
Financial liabilitiesDeposits from customers 51,095,451 – – 51,095,451Investment accounts of customers 12,368,897 – – 12,368,897Derivative financial liabilities 105,872 105,872 – –Bills and acceptance payable 29,621 – – 29,621Recourse obligations on financing sold to
Cagamas 1,501,187 – – 1,501,187Subordinated Sukuk Murabahah 1,713,164 – – 1,713,164Other liabilities 1,121,885 – – 1,121,885Lease liabilities 312,429 – – 312,429
68,248,506 105,872 – 68,142,634
* Excludes prepayment
(b) Credit risk
Overview
Credit risk is the risk of a customer or counterparty failing to perform its obligations. It arises from all transactions that could lead to actual, contingent or potential claims against any party, customer or obligor. The types of credit risks that the Group and the Bank considers to be material include: Default Risk, Counterparty Risk, Credit Concentration Risk, Residual/Credit Mitigation Risk, and Migration Risk.
BANK ISL AM MAL AYSIA BERHAD
NOTES TO ThE fINANCIAL STATEMENTS for the financial year ended 31 December 2021
316

39. FINANCIAL RISK MANAGEMENT (CONTINUED)
(b) Credit risk (continued)
Credit risk governance
The management of credit risk is principally carried out by using sets of policies and guidelines approved by the MRCC and/or BRC, guided by the Board of Directors’ approved Risk Appetite Statement.
The Group and the Bank have instituted two (2) levels of Financing Committees, which assess and approve credits at their specified authority levels.
The MRCC is responsible under the authority delegated by the BRC for managing credit risk at strategic level. The MRCC reviews the Group’s and the Bank’s credit risk policies and guidelines, aligns credit risk management with business strategies and planning, reviews credit profile of the credit portfolios and recommends necessary actions to ensure that the credit risk remains within established risk tolerance levels.
The Group’s and the Bank’s credit risk management governance includes the establishment of detailed credit risk policies, guidelines and procedures which document the Group’s and the Bank’s financing standards, discretionary powers for financing approval, credit risk ratings methodologies and models, acceptable collaterals and valuation, and the review, rehabilitation and restructuring of problematic and delinquent financing.
Management of credit risk
The management of credit risk is being performed by Credit Management Division (“CMD”) and Risk Management Division (“RMD”), and two other units outside of the CMD and RMD domain, namely, Credit Administration Department and Recovery & Rehabilitation Division. The combined objectives are, amongst others:
• To build a high quality credit portfolio in line with the Group’s and the Bank’s overall strategy and risk appetite;
• To ensure that the Group and the Bank is compensated for the risk taken, balancing/optimising the risk/return relationship;
• To develop an increasing ability to recognise, measure and avoid or mitigate potential credit risk problem areas; and
• To conform with statutory, regulatory and internal credit requirements.
The Group and the Bank monitors its credit exposures either on a portfolio or individual basis through annual reviews. Credit risk is proactively monitored through a set of early warning signals that could trigger immediate reviews of (certain parts of) the portfolio. The affected portfolio or financing is placed on a watchlist to enforce close monitoring and prevent financing from turning impaired and to increase chances of full recovery.
A detailed limit structure is in place to ensure that risks taken are within the risk appetite as set by the Board and to avoid credit risk concentration on a single customer, sector, product, Shariah contract, etc.
Credit risk arising from dealing and investing activities are managed by the establishment of limits which include counterparty limits and permissible acquisition of private debt securities, subject to a specified minimum rating threshold. Furthermore, the dealing and investing activities are monitored by an independent middle office unit.
INTEGR ATED ANNUAL REPORT 2021
Key Messages Overview Value Creation MD&A Sustainability Leadership Accountability Financial Additional Information
317
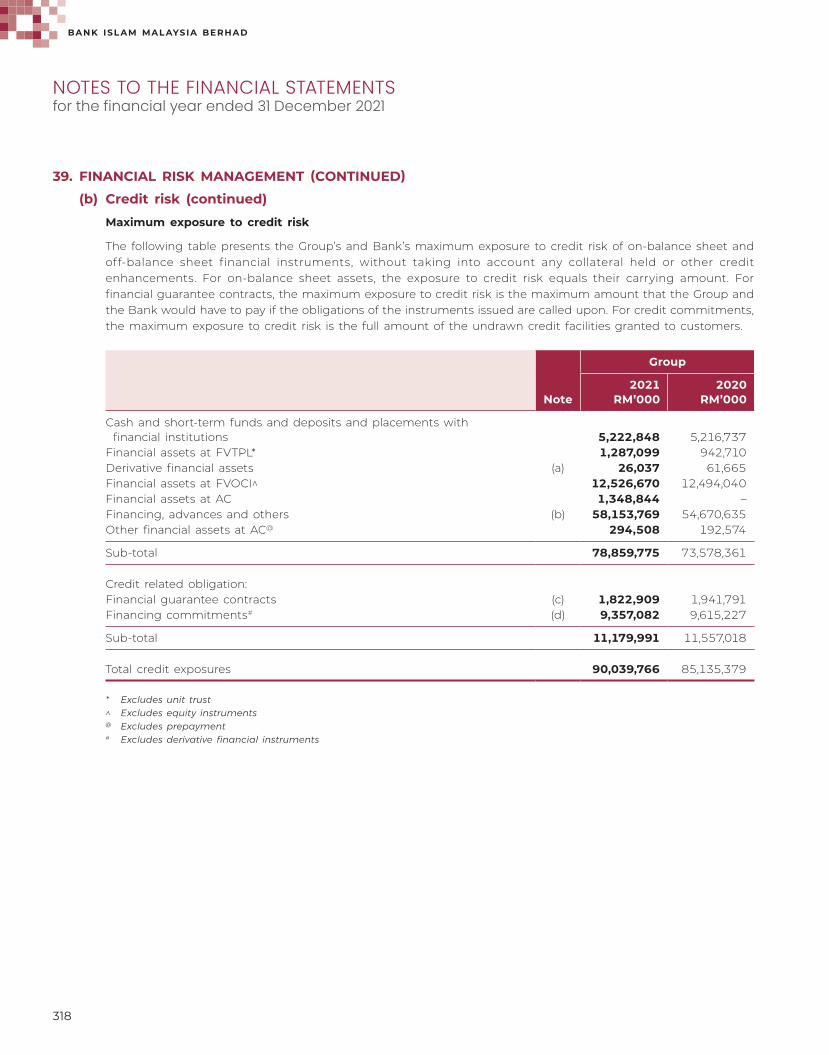
39. FINANCIAL RISK MANAGEMENT (CONTINUED)
(b) Credit risk (continued)
Maximum exposure to credit risk
The following table presents the Group’s and Bank’s maximum exposure to credit risk of on-balance sheet and off-balance sheet financial instruments, without taking into account any collateral held or other credit enhancements. For on-balance sheet assets, the exposure to credit risk equals their carrying amount. For financial guarantee contracts, the maximum exposure to credit risk is the maximum amount that the Group and the Bank would have to pay if the obligations of the instruments issued are called upon. For credit commitments, the maximum exposure to credit risk is the full amount of the undrawn credit facilities granted to customers.
Note
Group
2021RM’000
2020RM’000
Cash and short-term funds and deposits and placements with financial institutions 5,222,848 5,216,737
Financial assets at FVTPL* 1,287,099 942,710Derivative financial assets (a) 26,037 61,665Financial assets at FVOCI^ 12,526,670 12,494,040Financial assets at AC 1,348,844 –Financing, advances and others (b) 58,153,769 54,670,635Other financial assets at AC@ 294,508 192,574
Sub-total 78,859,775 73,578,361
Credit related obligation:Financial guarantee contracts (c) 1,822,909 1,941,791Financing commitments# (d) 9,357,082 9,615,227
Sub-total 11,179,991 11,557,018
Total credit exposures 90,039,766 85,135,379
* Excludes unit trust^ Excludes equity instruments@ Excludes prepayment# Excludes derivative financial instruments
BANK ISL AM MAL AYSIA BERHAD
NOTES TO ThE fINANCIAL STATEMENTS for the financial year ended 31 December 2021
318

39. FINANCIAL RISK MANAGEMENT (CONTINUED)
(b) Credit risk (continued)
Maximum exposure to credit risk (continued)
Note
Bank
2021RM’000
2020RM’000
Cash and short-term funds and deposits and placements with financial institutions 5,204,364 5,216,280
Financial assets at FVTPL* 1,287,089 942,710Derivative financial assets (a) 26,037 61,665Financial assets at FVOCI^ 12,526,670 12,494,040Financial assets at AC 1,348,844 –Financing, advances and others (b) 58,153,769 54,670,635Other financial assets at AC@ 239,257 182,041
Sub-total 78,786,030 73,567,371
Credit related obligation:Financial guarantee contracts (c) 1,822,909 1,941,791Financing commitments# (d) 9,357,082 9,615,227
Sub-total 11,179,991 11,557,018
Total credit exposures 89,966,021 85,124,389
* Excludes unit trust^ Excludes equity instruments@ Excludes prepayment# Excludes derivative financial instruments
(a) Derivative financial assets
In mitigating the counterparty credit risks from foreign exchange and derivatives transactions, the Group and the Bank enter into master agreements that provide for closeout netting with counterparties, whenever possible. A master agreement that governs all transactions between two parties, creates the greater legal certainty that the netting of outstanding obligations can be enforced upon termination of outstanding transactions if an event of default occurs.
(b) Financing, advances and others
Business and retail
Financing, advances and others will have levels of collateralisation depending on the nature of the product. The general creditworthiness of a corporate and commercial customer tends to be the most relevant indicator of credit quality of a financing extended to it.
The Group and the Bank manage its exposures to these customers by completing a credit evaluation to assess the customer’s character, industry, business model and capacity to meet their commitments in a timely manner. The Group and the Bank may take collateral in the form of a first charge over real estate, floating charges over all corporate assets and other liens and guarantees.
INTEGR ATED ANNUAL REPORT 2021
Key Messages Overview Value Creation MD&A Sustainability Leadership Accountability Financial Additional Information
319

39. FINANCIAL RISK MANAGEMENT (CONTINUED)
(b) Credit risk (continued)
Maximum exposure to credit risk (continued)
(b) Financing, advances and others (continued)
The Group and the Bank routinely update the valuation of collateral held against all financing as it adopts an annual internal valuation policy and a 2 years external valuation policy.
At 31 December 2021, the gross exposure of credit-impaired financing and advances to business customers amounted to RM395,179,000 (2020: RM182,271,000) and the forced sales value of collateral held against those financing and advances amounted to RM278,957,000 (2020: RM298,895,000).
House financing
The following table presents credit exposures from financing and advances that are credit impaired by ranges of financing-to-value (“FTV”) ratio. FTV is calculated as the ratio of the gross amount of the financing, or the amount committed for financing commitments - to the value of the collateral.
Group and Bank
FTV ratio2021
RM’0002020
RM’000
Credit-impaired financingLess than 51% 36,160 35,72551-70% 8,303 6,842More than 70% 88,708 91,517
Total 133,171 134,084
Vulnerable sectors
The Group and the Bank have also identified certain vulnerable sectors that are mostly impacted by the pandemic, of which tighter assessment was made on the customers’ credit rating, credit risk, credit cost and available financing.
Financing, advances and others
Group and BankOn balance sheet (net of
impairment)
2021RM’000
2020RM’000
Tourism, airlines, oil and gas, transportation, restaurant, hotel and others 10,667,494 10,189,233
% over total maximum exposure 18% 14%
BANK ISL AM MAL AYSIA BERHAD
NOTES TO ThE fINANCIAL STATEMENTS for the financial year ended 31 December 2021
320

39. FINANCIAL RISK MANAGEMENT (CONTINUED)
(b) Credit risk (continued)
Maximum exposure to credit risk (continued)
(b) Financing, advances and others (continued)
Relief and support measures
As mentioned in Note 2.1(a)(i), the Government has introduced certain measures to assist customers experiencing temporary financial constraints due to the pandemic. The table below summarised total payment moratoriums and repayment assistances granted to the affected customers;
2021
Matured andrepaying asper revised
schedulesRM’000
ExtendedRM’000
Missedpayments
RM’000
TotalgrantedRM’000
Consumer 13,709,948 19,987,014 267,364 33,964,326Mortgages 8,939,906 11,242,682 166,485 20,349,073Hire purchase 50,421 446,387 12,971 509,779Personal financing 4,719,621 8,297,945 87,908 13,105,474
Commercial 288,137 1,972,308 51,084 2,311,529of which SME 207,125 1,065,715 34,177 1,307,017Corporate 1,022,145 964,132 – 1,986,277
15,020,230 22,923,454 318,448 38,262,132
As a percentage of total:Consumer 40.4% 58.8% 0.8% 100.0%Mortgages 43.9% 55.2% 0.8% 100.0%Hire purchase 9.9% 87.6% 2.5% 100.0%Personal financing 36.0% 63.3% 0.7% 100.0%
Commercial 12.5% 85.3% 2.2% 100.0%of which SME 15.9% 81.5% 2.6% 100.0%Corporate 51.5% 48.5% – 100.0%
39.3% 59.9% 0.8% 100.0%
INTEGR ATED ANNUAL REPORT 2021
Key Messages Overview Value Creation MD&A Sustainability Leadership Accountability Financial Additional Information
321

39. FINANCIAL RISK MANAGEMENT (CONTINUED)
(b) Credit risk (continued)
Maximum exposure to credit risk (continued)
(b) Financing, advances and others (continued)
Relief and support measures (continued)
2020
Matured andrepaying asper revised
schedulesRM’000
ExtendedRM’000
Missedpayments
RM’000
TotalgrantedRM’000
Consumer 30,346,281 2,869,399 313,404 33,529,084Mortgages 17,388,738 1,801,123 151,010 19,340,871Hire purchase 1,247,353 131,952 23,764 1,403,069Personal financing 11,710,190 936,324 138,630 12,785,144
Commercial 756,016 1,165,548 20,928 1,942,492of which SME 657,724 468,414 20,928 1,147,066Corporate 1,852,238 556,124 – 2,408,362
32,954,535 4,591,071 334,332 37,879,938
As a percentage of total:Consumer 90.5% 8.6% 0.9% 100.0%
Mortgages 89.9% 9.3% 0.8% 100.0%Hire purchase 88.9% 9.4% 1.7% 100.0%Personal financing 91.6% 7.3% 1.1% 100.0%
Commercial 38.9% 60.0% 1.1% 100.0%of which SME 57.3% 40.9% 1.8% 100.0%Corporate 76.9% 23.1% – 100.0%
87.0% 12.1% 0.9% 100.0%
(c) Financial guarantee contracts (“FGC”)
FGCs mainly comprise guarantees to customers, standby or documentary letters of credit and performance related contingencies. The Group and the Bank will typically have recourse to specific assets pledged as collateral in the event of a default by a party for which the Group and the Bank have guaranteed its obligations to a third party.
(d) Financing commitments
Financing commitments mainly comprise irrevocable financing commitments to finance a customer provided there is no breach of any condition established in the contract. If such financing commitments are drawn down by the customer there will typically be specific collateral requirements that will need to be satisfied by the customer in order to access to credit facilities.
BANK ISL AM MAL AYSIA BERHAD
NOTES TO ThE fINANCIAL STATEMENTS for the financial year ended 31 December 2021
322

39. FINANCIAL RISK MANAGEMENT (CONTINUED)
(b) Credit risk (continued)
Maximum exposure to credit risk (continued)
(i) Concentration of credit risk for Group and Bank
Group2021
Cash and short-term funds and
deposits and placements
with financial institutions
RM’000
Financialassets at
FVTPLRM’000
Derivativefinancial
assetsRM’000
Financialassets at
FVOCIRM’000
Financial assets at
ACRM’000
Financing,advances
and othersRM’000
Other assets
RM’000
On-BalanceSheetTotal
RM’000
Financialguaranteecontracts
RM’000
Financingcommitments*
RM’000
Primary agriculture – – – 122,923 – 946,230 – 1,069,153 1,765 96,540Mining and quarrying – – – – – 64,750 – 64,750 10,198 93,940Manufacturing (including
agro-based) – – 4 47,066 – 908,794 – 955,864 110,587 564,756Electricity, gas and water – 10,215 – 635,629 104,270 2,014,732 – 2,764,846 71,617 142,967Wholesale & retail trade,
and hotels & restaurants – – 11,505 – – 902,904 – 914,409 155,005 235,621
Construction – – 16 1,062,079 158,591 2,597,014 – 3,817,700 527,396 1,476,088Transport, storage and
communications – – – 1,233,098 46,220 689,359 – 1,968,677 85,578 337,313Finance, insurance, real
estate and business activities 5,222,848 1,276,884 1,773 6,407,069 72,508 4,644,988 293,393 17,919,463 180,041 1,511,015
Education, health and others – – 7,497 838,381 60,640 1,351,617 – 2,258,135 454,975 1,921,771
Household sectors – – – – – 44,033,381 – 44,033,381 – 2,273,312Other sectors – – 5,242 2,180,425 906,615 – 1,115 3,093,397 225,747 703,759
5,222,848 1,287,099 26,037 12,526,670 1,348,844 58,153,769 294,508 78,859,775 1,822,909 9,357,082
* Financing commitments excluding derivative financial assets
INTEGR ATED ANNUAL REPORT 2021
Key Messages Overview Value Creation MD&A Sustainability Leadership Accountability Financial Additional Information
323

39. FINANCIAL RISK MANAGEMENT (CONTINUED)
(b) Credit risk (continued)
Maximum exposure to credit risk (continued)
(i) Concentration of credit risk for Group and Bank (continued)
Group2020
Cash and short-term funds and
deposits and placements
with financial institutions
RM’000
Financialassets at
FVTPLRM’000
Derivativefinancial
assetsRM’000
Financialassets at
FVOCIRM’000
Financing,advances
and othersRM’000
Other assets
RM’000
On-BalanceSheetTotal
RM’000
Financialguaranteecontracts
RM’000
Financingcommitments*
RM’000
Primary agriculture – – – 77,621 1,025,569 – 1,103,190 2,082 186,286Mining and quarrying – – – – 64,894 – 64,894 16,014 80,830Manufacturing (including
agro-based) – – 9 53,677 962,181 – 1,015,867 143,149 579,419Electricity, gas and water – 16,074 – 1,277,590 1,966,976 – 3,260,640 64,469 148,676Wholesale & retail trade, and
hotels & restaurants – – 37,921 – 897,828 – 935,749 128,968 401,704Construction – – 393 906,545 2,632,171 – 3,539,109 515,506 1,679,249Transport, storage and
communications – – – 1,384,140 642,844 – 2,026,984 91,714 106,633Finance, insurance, real estate
and business activities 5,216,737 926,636 8,938 5,758,025 4,451,540 187,617 16,549,493 134,802 1,772,325Education, health and others – – 746 870,928 1,152,752 – 2,024,426 515,978 1,837,248Household sectors – – – – 40,873,880 – 40,873,880 – 946,401Other sectors – – 13,658 2,165,514 – 4,957 2,184,129 329,109 1,876,456
5,216,737 942,710 61,665 12,494,040 54,670,635 192,574 73,578,361 1,941,791 9,615,227
* Financing commitments excluding derivative financial assets
BANK ISL AM MAL AYSIA BERHAD
NOTES TO ThE fINANCIAL STATEMENTS for the financial year ended 31 December 2021
324

39. FINANCIAL RISK MANAGEMENT (CONTINUED)
(b) Credit risk (continued)
Maximum exposure to credit risk (continued)
(i) Concentration of credit risk for Group and Bank (continued)
Bank2021
Cash and short-term funds and
deposits and placements
with financial institutions
RM’000
Financialassets at
FVTPLRM’000
Derivativefinancial
assetsRM’000
Financialassets at
FVOCIRM’000
Financial assets at
ACRM’000
Financing,advances
and othersRM’000
Other financial
assets at AC
RM’000
On-BalanceSheetTotal
RM’000
Financialguaranteecontracts
RM’000
Financingcommitments*
RM’000
Primary agriculture – – – 122,923 – 946,230 – 1,069,153 1,765 96,540Mining and quarrying – – – – – 64,750 – 64,750 10,198 93,940Manufacturing (including
agro-based) – – 4 47,066 – 908,794 – 955,864 110,587 564,756Electricity, gas and water – 10,215 – 635,629 104,270 2,014,732 – 2,764,846 71,617 142,967Wholesale & retail trade,
and hotels & restaurants – – 11,505 – – 902,904 – 914,409 155,005 235,621
Construction – – 16 1,062,079 158,591 2,597,014 – 3,817,700 527,396 1,476,088Transport, storage and
communications – – – 1,233,098 46,220 689,359 – 1,968,677 85,578 337,313Finance, insurance, real
estate and business activities 5,204,364 1,276,874 1,773 6,407,069 72,508 4,644,988 238,316 17,845,892 180,041 1,511,015
Education, health and others – – 7,497 838,381 60,640 1,351,617 – 2,258,135 454,975 1,921,771
Household sectors – – – – – 44,033,381 – 44,033,381 – 2,273,312Other sectors – – 5,242 2,180,425 906,615 – 941 3,093,223 225,747 703,759
5,204,364 1,287,089 26,037 12,526,670 1,348,844 58,153,769 239,257 78,786,030 1,822,909 9,357,082
* Financing commitments excluding derivative financial assets
INTEGR ATED ANNUAL REPORT 2021
Key Messages Overview Value Creation MD&A Sustainability Leadership Accountability Financial Additional Information
325

39. FINANCIAL RISK MANAGEMENT (CONTINUED)
(b) Credit risk (continued)
Maximum exposure to credit risk (continued)
(i) Concentration of credit risk for Group and Bank (continued)
Bank2020
Cash and short-term funds and
deposits and placements
with financial institutions
RM’000
Financialassets at
FVTPLRM’000
Derivativefinancial
assetsRM’000
Financialassets at
FVOCIRM’000
Financing,advances
and othersRM’000
Other assets
RM’000
On-BalanceSheetTotal
RM’000
Financialguaranteecontracts
RM’000
Financingcommitments*
RM’000
Primary agriculture - - - 77,621 1,025,569 - 1,103,190 2,082 186,286Mining and quarrying - - - - 64,894 - 64,894 16,014 80,830Manufacturing (including
agro-based) - - 9 53,677 962,181 - 1,015,867 143,149 579,419Electricity, gas and water - 16,074 - 1,277,590 1,966,976 - 3,260,640 64,469 148,676Wholesale & retail trade, and
hotels & restaurants - - 37,921 - 897,828 - 935,749 128,968 401,704Construction - - 393 906,545 2,632,171 - 3,539,109 515,506 1,679,249Transport, storage and
communications - - - 1,384,140 642,844 - 2,026,984 91,714 106,633Finance, insurance, real estate
and business activities 5,216,280 926,636 8,938 5,758,025 4,451,540 177,207 16,538,626 134,802 1,772,325Education, health and others - - 746 870,928 1,152,752 - 2,024,426 515,978 1,837,248Household sectors - - - - 40,873,880 - 40,873,880 - 946,401Other sectors - - 13,658 2,165,514 - 4,834 2,184,006 329,109 1,876,456
5,216,280 942,710 61,665 12,494,040 54,670,635 182,041 73,567,371 1,941,791 9,615,227
* Financing commitments excluding derivative financial assets
(ii) Collateral
The main types of collateral obtained by the Bank to mitigate the credit risk are as follows:
• For residential mortgages – charges over residential properties
• For commercial property financing – charges over the properties being financed
• For vehicle financing under Ijarah Thumma Al-Bai – ownership claims over the vehicles financed
• For other financing and advances – charges over business assets such as premises, inventories, trade receivables and/or cash deposits
As at 31 December 2021 and 31 December 2020, there were no assets repossessed by the Bank as a result of taking possession of collateral held as security, or by calling upon other credit enhancements.
BANK ISL AM MAL AYSIA BERHAD
NOTES TO ThE fINANCIAL STATEMENTS for the financial year ended 31 December 2021
326

39. FINANCIAL RISK MANAGEMENT (CONTINUED)
(b) Credit risk (continued)
(iii) Credit quality of financing, advances and others
The credit quality of the Bank’s financing, advances and others are summarised as follows:
Group and Bank2021
Stage 1RM’000
Stage 2RM’000
Stage 3RM’000
TotalRM’000
Financing, advances and othersNeither past due nor impaired (“NPDNI”):– Excellent 53,198,963 774,614 – 53,973,577– Satisfactory 3,178,361 778,566 – 3,956,927– Fair 166,537 137,945 – 304,482
56,543,861 1,691,125 – 58,234,986
Past due but not impaired (“PDNI”) – 414,366 – 414,366Impaired – – 568,383 568,383
Gross carrying amount 56,543,861 2,105,491 568,383 59,217,735
Financing commitmentsNPDNI: 8,898,782 179,252 – 9,078,034– Excellent 198,506 3,584 – 202,090– Satisfactory 35,876 3,537 – 39,413
– Fair 9,133,164 186,373 – 9,319,537
PDNI – 5,499 – 5,499Impaired – – 32,046 32,046
Gross exposure 9,133,164 191,872 32,046 9,357,082Impairment allowances (463,844) (279,621) (272,660) (1,016,125)
Net exposure 65,213,181 2,017,742 327,769 67,558,692
Financial guarantee contractsNPDNI:– Excellent 1,434,065 3,275 – 1,437,340– Satisfactory 357,840 16,079 – 373,919– Fair 428 172 – 600
1,792,333 19,526 – 1,811,859
PDNI – 11,045 – 11,045Impaired – – 5 5
Gross exposure 1,792,333 30,571 5 1,822,909Impairment allowances (23,464) (456) – (23,920)
Net exposure 1,768,869 30,115 5 1,798,989
INTEGR ATED ANNUAL REPORT 2021
Key Messages Overview Value Creation MD&A Sustainability Leadership Accountability Financial Additional Information
327

39. FINANCIAL RISK MANAGEMENT (CONTINUED)
(b) Credit risk (continued)
(iii) Credit quality of financing, advances and others (continued)
The credit quality of the Bank’s financing, advances and others are summarised as follows: (continued)
Group and Bank2020
Stage 1RM’000
Stage 2RM’000
Stage 3RM’000
TotalRM’000
Financing, advances and othersNPDNI:– Excellent 46,398,623 827,642 – 47,226,265– Satisfactory 6,267,615 727,566 – 6,995,181– Fair 263,084 112,065 – 375,149
52,929,322 1,667,273 – 54,596,595PDNI – 628,767 – 628,767Impaired – – 373,234 373,234
Gross carrying amount 52,929,322 2,296,040 373,234 55,598,596
Financing commitmentsNPDNI:– Excellent 7,924,991 33,371 – 7,958,362– Satisfactory 1,431,364 105,542 – 1,536,906– Fair 69,915 27,818 – 97,733
9,426,270 166,731 – 9,593,001PDNI – 5,501 – 5,501Impaired – – 16,725 16,725
Gross exposure 9,426,270 172,232 16,725 9,615,227Impairment allowances (625,052) (151,067) (122,532) (898,651)
Net exposure 61,730,540 2,317,205 267,427 64,315,172
Financial guarantee contractsNPDNI:– Excellent 1,691,570 583 – 1,692,153– Satisfactory 232,950 15,669 – 248,619– Fair 234 628 – 862
1,924,754 16,880 – 1,941,634PDNI – – – –Impaired – – 157 157
Gross exposure 1,924,754 16,880 157 1,941,791Impairment allowances (28,930) (380) – (29,310)
Net exposure 1,895,824 16,500 157 1,912,481
BANK ISL AM MAL AYSIA BERHAD
NOTES TO ThE fINANCIAL STATEMENTS for the financial year ended 31 December 2021
328

39. FINANCIAL RISK MANAGEMENT (CONTINUED)
(b) Credit risk (continued)
(iii) Credit quality of financing, advances and others (continued)
No significant changes to estimation techniques or assumptions were made during the year.
Internal rating definition:-
Excellent to Good: Sound financial position with no difficulty in meeting its obligations.
Satisfactory: Adequate safety of meeting its current obligations but more time is required to meet the entire obligation in full.
Fair: Higher risks on payment obligations. Financial performance may continue to deteriorate.
Classification of financing, advances and others:-
• Neither past due nor impaired financing
Financing for which the customer has not missed a contractual payment (profit or principal) when contractually due and is not impaired and there is no objective evidence of impairment.
• Past due but not impaired financing
Financing for which its contractual profit or principal payments are past due, but the Group and the Bank believe that impairment is not appropriate on the basis of the level of collateral available and/or the stage of collection amounts owed to the Group and the Bank.
• Impaired financing
In addition to Note 2.1(a)(ii), financing is classified as impaired/defaulted:
(i) where the principal or profit or both are past due for three months or more;
(ii) in the case of revolving credit facilities, where the outstanding amount has remained in excess of the approved limit for a period of three months or more;
(iii) where the amount is past due or the outstanding amount has been in excess of the approved limit for three months or less and the financing exhibits indications of significant credit weakness;
(iv) as soon as default occurs where the principal and/or profit repayments are schedule on intervals of 3 months or longer.
INTEGR ATED ANNUAL REPORT 2021
Key Messages Overview Value Creation MD&A Sustainability Leadership Accountability Financial Additional Information
329

39. FINANCIAL RISK MANAGEMENT (CONTINUED)
(b) Credit risk (continued)
(iii) Credit quality of financing, advances and others (continued)
Past due but not impaired financing
Group and Bank
2021 2020
RM’000% to gross
financing RM’000% to gross
financing
By ageingMonth-in-arrears 1 217,722 0.37 429,323 0.77Month-in-arrears 2 196,644 0.33 199,444 0.36
414,366 0.70 628,767 1.13
Impaired financing
Group and Bank
2021RM’000
2020RM’000
By ageingMonth-in-arrears 0 279,211 38,464Month-in-arrears 1 9,002 8,164Month-in-arrears 2 3,746 20,125Month-in-arrears 3 and above 276,424 306,481
568,383 373,234
Impaired financing of which rescheduled and restructured financing
Group and Bank
2021RM’000
2020RM’000
Consumer 26,791 23,608Business 74,352 65,369
101,143 88,977
Rescheduled or restructured financings are financings that have been rescheduled or restructured due to deterioration in the customers’ financial positions and the Bank has made concessions that it would not otherwise consider. Once the financing is rescheduled or restructured, its satisfactory performance is monitored for a period of six (6) months before it can be reclassified to performing.
BANK ISL AM MAL AYSIA BERHAD
NOTES TO ThE fINANCIAL STATEMENTS for the financial year ended 31 December 2021
330

39. FINANCIAL RISK MANAGEMENT (CONTINUED)
(b) Credit risk (continued)
(iii) Credit quality of financing, advances and others (continued)
Key macroeconomic variables
The following table shows certain key macroeconomic variables used in modelling the allowance for credit losses for Stages 1 and 2. For the base, upside and downside scenarios, the projections are provided for the next 12 months and for the remaining forecast period, which represents a medium-term view.
Base scenario Upside scenario Downside scenario
Next 12months
(2022)
Remainingforecast
period(2023)
Next 12months
(2022)
Remainingforecast
period(2023)
Next 12months
(2022)
Remainingforecast
period(2023)
Oil Price (“OP”) 63.34 62.24 72.18 71.07 30.89 29.79Gross Domestic
Production (“GDP”) 5.30% 4.50% 6.55% 5.75% -0.80% -1.50%House Price Index
(“HPI”) 1.32% 1.43% 2.20% 2.31% 0.79% 0.90%Kuala Lumpur
Composite Index (“KLCI”) 1,750.0 1,827.0 2,199.9 2,276.9 871.5 925.9
An increase in unemployment rate or CPI will generally correlate with higher allowances for credit losses, whereas an increase in the other macroeconomic factors (KLCI, HPI and GDP) will generally correlate with lower allowances for credit losses. Due to the unprecedented nature of the pandemic, and the difficulty of predicting reliably the forecast period, the Group and the Bank have applied certain management overlay on the overall allowance for credit losses.
These overlays and post-model adjustments were taken to reflect the latest macroeconomic outlook not captured in the modelled outcome and potential impact to delinquencies and defaults when the various relief and support measures are expiring in 2022. The impact were estimated at portfolio level. Total overlays for ECLs maintained by the Group and by the Bank as at 31 December 2021 are RM335,526,000 (31 December 2020: RM231,574,000).
INTEGR ATED ANNUAL REPORT 2021
Key Messages Overview Value Creation MD&A Sustainability Leadership Accountability Financial Additional Information
331

39. FINANCIAL RISK MANAGEMENT (CONTINUED)
(b) Credit risk (continued)
(iv) Credit quality of other financial assets excluding cash, short-term funds and deposits
Credit quality of other financial assets by external rating is as follows:
Group2021
Stage 1RM’000
Stage 3RM’000
TotalRM’000
Financial assets at FVOCIDebt instrumentGovernment bonds and GG 8,690,000 – 8,690,000Sukuk:Rated AAA 2,391,696 – 2,391,696Rated AA1 to AA3 1,429,133 – 1,429,133Lower than A 15,841 – 15,841
Gross carrying amount 12,526,670 – 12,526,670
Impairment allowances^ 7,237 – 7,237
Derivative financial assetsBank and financial institution counterparties 16,044Corporate 9,993
26,037
Financial assets at FVTPLGovernment bonds and GG 1,131,574Sukuk:
Rated AA1 to AA3 155,515
1,287,089
Financial assets at ACGovernment bonds and GG 1,348,844 – 1,348,844MARC C – 5,289 5,289Impairment allowance – (5,289) (5,289)
Net carrying amount 1,348,844 – 1,348,844
Other financial assets at ACOther unrated financial assets 294,508 2,975 297,483Impairment allowances – (2,975) (2,975)
Net carrying amount 294,508 – 294,508
^ The impairment allowances are recognised in OCI reserve.
BANK ISL AM MAL AYSIA BERHAD
NOTES TO ThE fINANCIAL STATEMENTS for the financial year ended 31 December 2021
332

39. FINANCIAL RISK MANAGEMENT (CONTINUED)
(b) Credit risk (continued)
(iv) Credit quality of other financial assets excluding cash, short-term funds and deposits (continued)
Credit quality of other financial assets by external rating is as follows: (continued)
Group2021
Stage 1RM’000
Stage 3RM’000
TotalRM’000
Financial assets at FVOCIDebt instrumentGovernment bonds and GG 7,938,079 – 7,938,079Sukuk:
Rated AAA 3,020,792 – 3,020,792Rated AA1 to AA3 1,519,327 – 1,519,327Lower than A – 15,842 15,842
Gross carrying amount 12,478,198 15,842 12,494,040
Impairment allowances^ 403 – 403
Derivative financial assetsBank and financial institution counterparties 55,409Corporate 6,256
61,665
Financial assets at FVTPLSukuk:
Rated AAA 942,710
Other financial assets at ACOther unrated financial assets 192,574 8,264 200,838Impairment allowances – (8,264) (8,264)
Net carrying amount 192,574 – 192,574
^ The impairment allowances are recognised in OCI reserve.
INTEGR ATED ANNUAL REPORT 2021
Key Messages Overview Value Creation MD&A Sustainability Leadership Accountability Financial Additional Information
333

39. FINANCIAL RISK MANAGEMENT (CONTINUED)
(b) Credit risk (continued)
(iv) Credit quality of other financial assets excluding cash, short-term funds and deposits (continued)
Credit quality of other financial assets by external rating is as follows: (continued)
Bank2021
Stage 1RM’000
Stage 3RM’000
TotalRM’000
Financial assets at FVOCIDebt instrumentGovernment bonds and GG 8,690,000 – 8,690,000Sukuk:Rated AAA 2,391,696 – 2,391,696Rated AA1 to AA3 1,429,133 – 1,429,133Lower than A 15,841 – 15,841
Gross carrying amount 12,526,670 – 12,526,670
Impairment allowances^ 7,237 – 7,237
Derivative financial assetsBank and financial institution counterparties 16,044Corporate 9,993
26,037
Financial assets at FVTPLGovernment bonds and treasury bills 1,131,574Sukuk:
Rated AA1 to AA3 155,515
1,287,089
Financial assets at ACGovernment bonds and GG 1,348,844 – 1,348,844MARC C – 5,289 5,289Impairment allowance – (5,289) (5,289)
Net carrying amount 1,348,844 – 1,348,844
Other financial assets at ACOther unrated financial assets 239,257 2,975 242,232Impairment allowances – (2,975) (2,975)
Net carrying amount 239,257 – 239,257
^ The impairment allowances are recognised in OCI reserve.
BANK ISL AM MAL AYSIA BERHAD
NOTES TO ThE fINANCIAL STATEMENTS for the financial year ended 31 December 2021
334

39. FINANCIAL RISK MANAGEMENT (CONTINUED)
(b) Credit risk (continued)
(iv) Credit quality of other financial assets excluding cash, short-term funds and deposits (continued)
Credit quality of other financial assets by external rating is as follows: (continued)
Bank2020
Stage 1RM’000
Stage 3RM’000
TotalRM’000
Financial assets at FVOCIDebt instrumentGovernment bonds and treasury bills 7,938,079 – 7,938,079Sukuk
Rated AAA 3,020,792 – 3,020,792Rated AA1 to AA3 1,519,327 – 1,519,327Lower than A – 15,842 15,842
Gross carrying amount 12,478,198 15,842 12,494,040
Impairment allowances^ 403 – 403
Derivative financial assetsBank and financial institution counterparties 55,409Corporate 6,256
61,665
Financial assets at FVTPLSukuk:
Rated AA1 to AA3 942,710
Other financial assets at ACOther unrated financial assets 182,041 8,264 190,305Impairment allowances – (8,264) (8,264)
Net carrying amount 182,041 – 182,041
^ The impairment allowances are recognised in OCI reserve..
INTEGR ATED ANNUAL REPORT 2021
Key Messages Overview Value Creation MD&A Sustainability Leadership Accountability Financial Additional Information
335

39. FINANCIAL RISK MANAGEMENT (CONTINUED)
(c) Market risk
Overview
Market risk is the risk of adverse impact to the Group’s and the Bank’s arises from fluctuations of market prices and rates. The following are the main market risk factors that the Group and the Bank are exposed to:
– Profit Rate Risk: also known as the Rate of Return Risk, is the potential impact on the Group’s and the Bank’s profitability caused by changes in the rate of return due to general market movements or issuer/customer specific reasons;
– Foreign Exchange Risk: the impact of exchange rate movements on the Group’s and the Bank’s currency positions; and
– Equity Instrument Risk: the profitability impact on the Group’s and the Bank’s equity positions or investments caused by changes in equity prices or values.
The Group and the Bank separates the market risk exposures into either trading book or banking book portfolios. Trading book portfolios include those positions arising from market making, proprietary position taking and other marked-to-market positions as per the Board-approved Trading Book Policy Statements. Banking book portfolios primarily arise from the Group’s and the Bank’s profit rate management of the Bank’s assets and liabilities and investment portfolio mainly for liquidity management.
Market risk governance
The management of market risk is principally carried out by using sets of policies and guidelines approved by the ALCO and/or BRC, guided by the Board-approved Risk Appetite Statement.
The ALCO is responsible under the authority delegated by the BRC for managing market risk at strategic level.
Management of market risk
The objective is to manage market risk exposures in order to optimise return on risk while maintaining a market risk profile consistent with the Group’s and the Bank’s approved risk appetite.
All market risk exposures are managed by Treasury, who has the necessary skills, tools, management and governance to manage such risks. The management of market risk is guided by comprehensive limits, policies and guidelines which are periodically reviewed.
The Market Risk Management Department (“MRMD”) is the independent risk control function that is responsible for the implementation of market risk management framework. MRMD is also responsible for developing and reviewing the Group’s and the Bank’s market risk management guidelines and policies, monitoring tools, behavioural assumptions and limit setting methodologies. Escalation procedures are documented and approved by the ALCO and/or BRC. In addition, the market risk exposures and limits are reported to the ALCO and the BRC.
Other controls to ensure that market risk exposures remain within tolerable levels include regular stress testing, ad-hoc simulations and rigorous new product approval procedures. Stress test results are produced regularly to determine the impact of changes in profit rates, foreign exchange rates and other risk factors on the Group’s and the Bank’s profitability, capital adequacy and liquidity. The stress test provides the Management and the BRC with an assessment of the financial impact of identified extreme events on the market risk exposures of the Group and the Bank.
BANK ISL AM MAL AYSIA BERHAD
NOTES TO ThE fINANCIAL STATEMENTS for the financial year ended 31 December 2021
336

39. FINANCIAL RISK MANAGEMENT (CONTINUED)
(c) Market risk (continued)
(i) Profit rate risk
The table below summarises the Group’s and the Bank’s exposure to profit rate risk. The table indicates average profit rates at the reporting date and the periods in which the financial instruments are repriced or mature, whichever is earlier.
Group2021
Banking book
Tradingbook
RM’000Total
RM’000
Effectiveprofit
rate%
Up to 1month
RM’000
>1–3monthsRM’000
>3–12monthsRM’000
1–5years
RM’000
Over 5years
RM’000
Non–profitsensitive
RM’000
AssetsCash and short-term funds and
deposits and placements with financial institutions 4,468,535 – – – – 754,313 – 5,222,848 1.53
Financial assets at FVTPL – – – – – – 1,582,494 1,582,494 2.51Derivative financial assets – – – – – – 26,037 26,037 0.34Financial assets at FVOCI 748,201 200,402 2,227,959 6,755,240 2,672,402 – – 12,604,204 3.69Financing, advances and others – – 50,529 1,288,203 10,112 – – 1,348,844 2.04
– non-impaired 46,991,212 4,788,799 1,040,059 1,251,679 3,656,933 920,670 – 58,649,352 4.24– impaired net of allowances * – – – – – (495,583) – (495,583) –
Other financial assets at amortised cost – – – – – 294,508 – 294,508 –Statutory deposits with Bank Negara
Malaysia – – – – – 264,050 – 264,050 –
Total assets 52,207,948 4,989,201 3,318,547 9,295,122 6,339,447 1,737,958 1,608,531 79,496,754
LiabilitiesDeposits from customers 13,126,938 9,285,290 14,086,170 497,276 48,874 20,294,286 – 57,338,834 1.45Investment accounts of customers 1,340,131 1,322,364 1,126,857 7,913 – 6,655,637 – 10,452,902 1.29Derivative financial liabilities – – – – – – 20,421 20,421 0.27Bills and acceptance payable – – – – – 20,112 – 20,112 –Recourse obligations on financing sold
to Cagamas – – – 2,000,000 – 1,720 – 2,001,720 4.36Subordinated Sukuk Murabahah – – – – 2,000,000 14,849 – 2,014,849 4.11Other liabilities – – – – – 1,570,602 – 1,570,602 –Lease liabilities 728 2,283 9,409 53,502 237,526 – – 303,448 –
Total liabilities 14,467,797 10,609,937 15,222,436 2,558,691 2,286,400 28,557,206 20,421 73,722,888
On-balance sheet profit sensitivity gap 37,740,151 (5,620,736) (11,903,889) 6,736,431 4,053,047 (26,819,248) 1,588,110 5,773,866Off-balance sheet profit sensitivity gap
(profit rate swaps) – – – 79,153 – – – 79,153
Total profit sensitivity gap 37,740,151 (5,620,736) (11,903,889) 6,815,584 4,053,047 (26,819,248) 1,588,110 5,853,019
* This is arrived at after deducting impairment allowances from the outstanding gross impaired financing.
INTEGR ATED ANNUAL REPORT 2021
Key Messages Overview Value Creation MD&A Sustainability Leadership Accountability Financial Additional Information
337

39. FINANCIAL RISK MANAGEMENT (CONTINUED)
(c) Market risk (continued)
(i) Profit rate risk (continued)
Group2020
Banking book
Tradingbook
RM’000Total
RM’000
Effectiveprofit
rate%
Up to 1month
RM’000
>1–3monthsRM’000
>3–12monthsRM’000
1–5years
RM’000
Over 5years
RM’000
Non–profitsensitive
RM’000
AssetsCash and short-term funds and
deposits and placements with financial institutions 4,490,732 – – – – 726,005 – 5,216,737 1.37
Financial assets at FVTPL – – – – – – 1,181,200 1,181,200 2.34Derivative financial assets – – – – – – 61,665 61,665 0.71Financial assets at FVOCI 79,793 678,405 1,226,955 6,725,858 3,846,980 – – 12,557,991 5.69Financing, advances and others
– non-impaired 50,683,675 442,090 42,052 1,030,556 2,282,468 744,521 – 55,225,362 4.72– impaired net of allowances * – – – – – (554,727) – (554,727)
Other financial assets at amortised cost – – – – – 192,574 – 192,574Statutory deposits with Bank Negara
Malaysia – – – – – 192,425 – 192,425
Total assets 55,254,200 1,120,495 1,269,007 7,756,414 6,129,448 1,300,798 1,242,865 74,073,227
LiabilitiesDeposits from customers 12,210,156 8,395,068 10,787,258 1,735,439 35,117 17,914,224 – 51,077,262 1.99Investment accounts of customers 2,482,295 2,231,737 2,534,420 6,801 – 5,113,275 – 12,368,528 1.91Derivative financial liabilities – – – – – – 105,872 105,872 1.23Bills and acceptance payable – – – – – 29,621 – 29,621Recourse obligations on financing sold
to Cagamas – – – 1,500,000 – 1,187 – 1,501,187 4.74Subordinated Sukuk Murabahah – – – – 1,700,000 13,164 – 1,713,164 4.69Other liabilities – – – – – 1,136,863 – 1,136,863Lease liabilities 1,409 2,267 9,760 46,551 252,442 – – 312,429 5.70
Total liabilities 14,693,860 10,629,072 13,331,438 3,289,140 1,987,559 24,208,334 105,872 68,244,926
On-balance sheet profit sensitivity gap 40,560,340 (9,508,577) (12,062,431) 4,467,274 4,141,889 (22,907,536) 1,136,993 5,828,301Off-balance sheet profit sensitivity gap
(profit rate swaps) – – – 114,056 – – – 114,056
Total profit sensitivity gap 40,560,340 (9,508,577) (12,062,431) 4,581,330 4,141,889 (22,907,536) 1,136,993 5,942,357
* This is arrived at after deducting impairment allowances from the outstanding gross impaired financing.
BANK ISL AM MAL AYSIA BERHAD
NOTES TO ThE fINANCIAL STATEMENTS for the financial year ended 31 December 2021
338

39. FINANCIAL RISK MANAGEMENT (CONTINUED)
(c) Market risk (continued)
(i) Profit rate risk (continued)
Bank2021
Banking book
Tradingbook
RM’000Total
RM’000
Effectiveprofit
rate%
Up to 1month
RM’000
>1–3monthsRM’000
>3–12monthsRM’000
1–5years
RM’000
Over 5years
RM’000
Non–profitsensitive
RM’000
AssetsCash and short-term funds and
deposits and placements with financial institutions 4,453,177 – – – – 751,187 – 5,204,364 1.53
Financial assets at FVTPL – – – – – – 1,550,700 1,550,700 2.50Derivative financial assets – – – – – 26,037 26,037 0.34Financial assets at FVOCI 749,064 200,402 2,227,959 6,755,240 2,672,402 – – 12,605,067 3.69Financial assets at amortised cost – – 50,529 1,288,203 10,112 – – 1,348,844 2.04Financing, advances and others
– non-impaired 46,991,212 4,788,799 1,040,059 1,251,679 3,656,933 920,670 – 58,649,352 4.24– impaired net of allowances * – – – – – (495,583) – (495,583) –
Other financial assets at amortised cost – – – – – 239,257 – 239,257 –Statutory deposits with Bank Negara
Malaysia – – – – – 264,050 – 264,050 –
Total assets 52,193,453 4,989,201 3,318,547 9,295,122 6,339,447 1,679,581 1,576,737 79,392,088
LiabilitiesDeposits from customers 13,127,720 9,286,497 14,094,624 497,276 48,874 20,308,935 – 57,363,926 1.45Investment accounts of customers 1,371,739 1,399,335 1,126,857 8,033 – 6,655,637 – 10,561,601 1.29Derivative financial liabilities – – – – – – 20,421 20,421 0.27Bills and acceptance payable – – – – – 20,112 – 20,112 –Recourse obligations on financing sold
to Cagamas – – – 2,000,000 – 1,720 – 2,001,720 4.36Subordinated Sukuk Murabahah – – – – 2,000,000 14,849 – 2,014,849 4.11Other liabilities – – – – – 1,538,375 – 1,538,375 –Lease liabilities 683 2,191 9,082 53,502 237,526 – – 302,984 5.70
Total liabilities 14,500,142 10,688,023 15,230,563 2,558,811 2,286,400 28,539,628 20,421 73,823,988
On-balance sheet profit sensitivity gap 37,693,311 (5,698,822) (11,912,016) 6,736,311 4,053,047 (26,860,047) 1,556,316 5,568,110Off-balance sheet profit sensitivity gap
(profit rate swaps) – – – 79,153 – – – 79,153
Total profit sensitivity gap 37,693,311 (5,698,822) (11,912,016) 6,815,464 4,053,047 (26,860,047) 1,556,316 5,647,253
* This is arrived at after impairment allowances from the outstanding gross impaired financing.
INTEGR ATED ANNUAL REPORT 2021
Key Messages Overview Value Creation MD&A Sustainability Leadership Accountability Financial Additional Information
339

39. FINANCIAL RISK MANAGEMENT (CONTINUED)
(c) Market risk (continued)
(i) Profit rate risk (continued)
Bank2020
Banking book
Tradingbook
RM’000Total
RM’000
Effectiveprofit
rate%
Up to 1month
RM’000
>1–3monthsRM’000
>3–12monthsRM’000
1–5years
RM’000
Over 5years
RM’000
Non–profitsensitive
RM’000
AssetsCash and short-term funds and
deposits and placements with financial institutions 4,490,732 – – – – 725,548 – 5,216,280 1.38
Financial assets at FVTPL – – – – – – 1,175,440 1,175,440 2.35Derivative financial assets – – – – – – 61,665 61,665 0.71Financial assets at FVOCI 80,531 678,405 1,226,955 6,725,858 3,846,980 – – 12,558,729 5.71Financing, advances and others– non-impaired 50,683,675 442,090 42,052 1,030,556 2,282,468 744,521 – 55,225,362 4.72– impaired net of allowances* – – – – – (554,727) – (554,727)Other financial assets at amortised cost – – – – – 182,041 – 182,041Statutory deposits with Bank Negara
Malaysia – – – – – 192,425 – 192,425
Total assets 55,254,938 1,120,495 1,269,007 7,756,414 6,129,448 1,289,808 1,237,105 74,057,215
LiabilitiesDeposits from customers 12,210,491 8,397,374 10,792,984 1,735,439 35,117 17,924,046 – 51,095,451 2.00Investment accounts of customers 2,482,295 2,231,757 2,534,420 7,150 – 5,113,275 – 12,368,897 1.91Derivative financial liabilities – – – – – – 105,872 105,872 1.23Bills and acceptance payable – – – – – 29,621 – 29,621Recourse obligations on financing sold
to Cagamas – – – 1,500,000 – 1,187 – 1,501,187 4.74Subordinated Sukuk Murabahah – – – – 1,700,000 13,164 – 1,713,164 4.69Other liabilities – – – – – 1,024,855 – 1,024,855Lease liabilities 1,409 2,267 9,760 46,551 252,442 – – 312,429 5.70
Total liabilities 14,694,195 10,631,398 13,337,164 3,289,140 1,987,559 24,106,148 105,872 68,151,476
On-balance sheet profit sensitivity gap 40,560,743 (9,510,903) (12,068,157) 4,467,274 4,141,889 (22,816,340) 1,131,233 5,905,739Off-balance sheet profit sensitivity gap
(profit rate swaps) – – – 114,056 – – – 114,056
Total profit sensitivity gap 40,560,743 (9,510,903) (12,068,157) 4,581,330 4,141,889 (22,816,340) 1,131,233 6,019,795
* This is arrived at after deducting impairment allowances from the outstanding gross impaired financing.
BANK ISL AM MAL AYSIA BERHAD
NOTES TO ThE fINANCIAL STATEMENTS for the financial year ended 31 December 2021
340

39. FINANCIAL RISK MANAGEMENT (CONTINUED)
(c) Market risk (continued)
(i) Profit rate risk (continued)
Profit rate risk in the banking book portfolio
Profit rate risk in the banking book portfolio is managed and controlled using measurement tools known as Earnings at Risk (“EaR”) and Economic Value of Equity (“EVE”).
The Group and the Bank monitor the sensitivity of EaR and EVE under varying profit rate scenarios (i.e. simulation modeling). The model is a combination of standard and non-standard scenarios relevant to the local market. The standard scenarios include the parallel fall or rise in the profit rate curve and historical simulation. These scenarios assume no management action. Hence, it does not incorporate actions that would be taken by Treasury to mitigate the impact of the profit rate risk. In reality, depending on the view on future market movements, Treasury would proactively manage and strategise to change the profit rate exposure profile to minimise losses and to optimise net revenues. The Bank’s hedging and risk mitigation strategies range from the use of derivative financial instruments, such as profit rate swaps, to more intricate hedging strategies to address inordinate profit rate risk exposures.
The table below shows the Group’s and the Bank’s profit rate sensitivity to a 150 basis points (2020: 100 basis point) parallel shift as at reporting date.
Impact on profit after tax/reserves – Increase/(Decrease)
2021 2020
-150bpsRM million
+150bpsRM million
-100bpsRM million
+100bpsRM million
GroupImpact on EaR (206.6) 206.6 (131.4) 131.4Impact on EVE 294.0 (294.0) 241.0 (241.0)
BankImpact on EaR (204.7) 204.7 (131.4) 131.4Impact on EVE 293.6 (293.6) 240.9 (240.9)
On 30 June 2020, BNM issued the revised reporting requirements for EVE and EaR which come into effect on 1 January 2021. One of the changes is to report both the EVE and EaR based on 150 basis point parallel shift instead of 100 basis point parallel shift.
Another control to manage the profit rate risk in the banking book portfolio includes present value of 1 basis point change (“PV01”) which measures the portfolio’s sensitivity to market rates movement.
INTEGR ATED ANNUAL REPORT 2021
Key Messages Overview Value Creation MD&A Sustainability Leadership Accountability Financial Additional Information
341

39. FINANCIAL RISK MANAGEMENT (CONTINUED)
(c) Market risk (continued)
(ii) Market risk in the trading book portfolio
Market risk in the trading book portfolio is monitored and controlled using Value-at-Risk (“VaR”). It is a technique that estimates the potential losses that could occur on risk positions as a result of movements in market rates over a specified time horizon and to a given level of confidence. The VaR model used by the Group and the Bank are based on historical simulation which derives plausible future scenarios from past series of recorded market rates and prices. The historical simulation model used by the Group and the Bank incorporates the following features:
• Potential market movements are calculated with reference to data from the past two years;
• Historical market rates and prices are calculated with reference to foreign exchange rates and profit rates; and
• VaR is calculated using a 99 per cent confidence level and for a one-day holding period.
A summary of the VaR position of the Bank’s trading book portfolios at the reporting date is as follows:
Bank
As at31.12.2021RM million
1.1.2021 to 31.12.2021
AverageRM million
MaximumRM million
MinimumRM million
Profit rate risk 0.14 1.05 2.39 0.14Foreign exchange risk 0.36 0.66 1.19 0.34Overall 0.50 1.71 2.78 0.50
Bank
As at31.12.2020RM million
1.1.2020 to 31.12.2020
AverageRM million
MaximumRM million
MinimumRM million
Profit rate risk 2.76 1.88 3.32 0.01Foreign exchange risk 0.42 0.47 1.02 0.23Overall 3.18 2.36 3.89 0.36
In addition to VaR, the Group and the Bank has put in place the maximum loss limits, position limits, tenor limits and PV01 limits in monitoring the trading book portfolio.
BANK ISL AM MAL AYSIA BERHAD
NOTES TO ThE fINANCIAL STATEMENTS for the financial year ended 31 December 2021
342

39. FINANCIAL RISK MANAGEMENT (CONTINUED)
(c) Market risk (continued)
(iii) Foreign exchange risk
The Group and the Bank manages and controls the trading book portfolio’s foreign exchange risk by limiting the net open exposure to individual currencies and on an aggregate basis. The Group and the Bank also has in place the sensitivity limit. For the Bank-wide (trading book and banking book portfolios) foreign exchange risk, the Group and the Bank manage and control by limiting the net open exposure on an aggregate basis.
Sensitivity Analysis
Assuming that other risk variables remain constant, the foreign currency revaluation sensitivity for the Group and the Bank as at reporting date is summarised as follows (only net open position for major currencies are shown in its specific currency in the table below. For other currencies, these exposures are grouped as ‘Others’):
Impact on profit after tax - Increase/(Decrease)
Group and Bank
2021 2020
-1%Depreciation
RM’000
+1%Appreciation
RM’000
-1%Depreciation
RM’000
+1%Appreciation
RM’000
US Dollar vs RM 12,136 (12,136) 8,844 (8,844)Euro vs RM 4,576 (4,576) 5,072 (5,072)Others vs RM (193) 193 (194) 194
(d) Liquidity risk
Overview
Liquidity risk is the potential inability of the Group and the Bank to meet its funding needs and regulatory obligation when they fall due, or will have to do it at excessive cost. This risk can arise from mismatches in the timing of cash flows.
The Group and the Bank maintains a diversified and stable funding base comprising of retail and corporate customer deposits. This is augmented by wholesale funding and highly liquid assets portfolios.
The objective of the Group’s and the Bank’s liquidity management is to ensure that all foreseeable funding commitments and deposit withdrawals can be met when due and that wholesale market remains accessible and cost effective.
Savings account, current account, investment accounts (IA) and term deposits form a critical part of the Group’s and the Bank’s funding profile and the Group and the Bank place considerable importance on maintaining their stability. The stability depends upon preserving depositor confidence in the Group and the Bank and the Group’s and the Bank’s capital strength and liquidity, and on competitive and transparent pricing.
INTEGR ATED ANNUAL REPORT 2021
Key Messages Overview Value Creation MD&A Sustainability Leadership Accountability Financial Additional Information
343

39. FINANCIAL RISK MANAGEMENT (CONTINUED)
(d) Liquidity risk (continued)
Overview (continued)
The Group’s and the Bank’s liquidity management is primarily carried out in accordance with Bank Negara Malaysia’s requirements and the internal limits are approved by the ALCO and/or BRC. The limits vary to take account of the depth and liquidity of the local market in which the Group and the Bank operate. The Group and the Bank maintain a strong liquidity position and manage the liquidity profile of its assets, liabilities and commitments to ensure that cash flows are appropriately balanced and all obligations are met when due.
The management of liquidity risk is principally carried out by using sets of policies and guidelines approved by ALCO and/or BRC, guided by the Board’s approved Risk Appetite Statement.
The ALCO is responsible under the authority delegated by the BRC for managing liquidity risk at strategic level.
Management of liquidity risk
All liquidity risk exposures are managed by Treasury, who has the necessary skills, tools, management and governance to manage such risks. Limits and other risk controls are set to meet the following objectives:
• Maintaining sufficient liquidity surplus and reserves to sustain a sudden liquidity shock;
• Ensuring cash flows are relatively diversified across all maturities;
• Ensuring deposit base is diversified and not overly concentrated to a relatively small number of depositors;
• Maintaining sufficient borrowing capacity in the Interbank market
• Maintain sufficient highly liquid financial assets;
• Not over-extending financing activities relative to the deposit base; and
• Not over-relying on non-Ringgit liabilities to fund Ringgit assets.
MRMD is also responsible for the implementation of liquidity risk management framework. It develops the Group’s and the Bank’s liquidity risk management guidelines, monitoring tools, behavioural assumptions and limit setting methodologies. Escalation procedures are documented and approved by the ALCO and/or BRC, with proper authorities to ratify or approve any excess. In addition, the liquidity risk exposures and limits are reported to the ALCO and the BRC.
Stress testing and scenario analysis are important tools used by the Group and the Bank to manage the liquidity risk. Stress test results are produced regularly to determine the impact of a sudden liquidity shock. The stress testing provides the Management and the BRC with an assessment of the financial impact of identified extreme events on the liquidity and funding risk exposures of the Group and the Bank.
Another key control feature of the Group’s and the Bank’s liquidity risk management is the liquidity contingency management plans. These plans identify the pre-emptive quantitative and qualitative indicators of stress conditions arising from systemic or other crises and provide guidance on the actions to be taken in order to minimise the adverse implications to the Group and the Bank.
BANK ISL AM MAL AYSIA BERHAD
NOTES TO ThE fINANCIAL STATEMENTS for the financial year ended 31 December 2021
344

39. FINANCIAL RISK MANAGEMENT (CONTINUED)
(d) Liquidity risk (continued)
Maturity analysis
The table below analyses assets and liabilities of the Group and the Bank based on the remaining period at the end of the reporting period to the contractual maturity date in accordance with the requirement of Bank Negara Malaysia Guidelines:
GroupAs at 31 December 2021
On demand/
no specific
maturity date
RM’000
Up to 1 month
RM’000
>1 to 3monthsRM’000
>3 to 6monthsRM’000
>6 to 12monthsRM’000
Over1 year
RM’000Total
RM’000
AssetsCash and short-term funds and
deposits and placements with financial institutions 754,313 4,468,535 – – – – 5,222,848
Financial assets at FVTPL 295,395 10,225 494,559 447,071 335,244 – 1,582,494Derivative financial assets – 5,316 7,759 11,972 73 917 26,037Financial assets at FVOCI 77,534 670,667 200,402 1,010,231 1,217,728 9,427,642 12,604,204Financial assets at amortised
cost – – – 50,529 – 1,298,315 1,348,844Financing, advances and others – 2,405,500 1,325,153 691,800 505,753 53,225,563 58,153,769Other financial assets at
amortised cost 294,508 – – – – – 294,508Statutory deposits with Bank
Negara Malaysia 264,050 – – – – – 264,050
Total assets 1,685,800 7,560,243 2,027,873 2,211,603 2,058,798 63,952,437 79,496,754
LiabilitiesDeposits from customers 20,294,286 13,126,938 9,285,290 8,116,272 5,969,898 546,150 57,338,834Investment accounts of
customers 6,655,637 1,340,131 1,322,364 907,940 218,917 7,913 10,452,902Derivative financial liabilities – 5,176 7,565 6,387 625 668 20,421Bills and acceptance payable 20,112 – – – – – 20,112Recourse obligations on
financing sold to Cagamas – – – – – 2,001,720 2,001,720Subordinated Sukuk
Murabahah – – 3,945 10,904 – 2,000,000 2,014,849Other liabilities 1,570,602 – – – – – 1,570,602Lease liabilities – 728 2,283 3,461 5,948 291,028 303,448
Total liabilities 28,540,637 14,472,973 10,621,447 9,044,964 6,195,388 4,847,479 73,722,888
Net liquidity gap on statement of financial position (27,227,766) (6,539,801) (8,593,574) (6,833,361) (4,136,590) 59,104,958 5,773,866
INTEGR ATED ANNUAL REPORT 2021
Key Messages Overview Value Creation MD&A Sustainability Leadership Accountability Financial Additional Information
345

39. FINANCIAL RISK MANAGEMENT (CONTINUED)
(d) Liquidity risk (continued)
Maturity analysis (continued)
The table below analyses assets and liabilities of the Group and the Bank based on the remaining period at the end of the reporting period to the contractual maturity date in accordance with the requirement of Bank Negara Malaysia Guidelines: (continued)
GroupAs at 31 December 2020
On demand/
no specific
maturity date
RM’000
Up to 1 month
RM’000
>1 to 3monthsRM’000
>3 to 6monthsRM’000
>6 to 12monthsRM’000
Over1 year
RM’000Total
RM’000
AssetsCash and short-term funds and
deposits and placements with financial institutions 725,644 4,490,732 – 361 – – 5,216,737
Financial assets at FVTPL 238,490 243,618 – 30,051 50,041 619,000 1,181,200Derivative financial assets – 25,579 26,773 6,915 227 2,171 61,665Financial assets at FVOCI 63,951 15,842 678,405 395,567 831,388 10,572,838 12,557,991Financing, advances and others – 1,799,333 1,054,893 429,657 377,000 51,009,752 54,670,635Other financial assets at
amortised cost 192,574 – – – – – 192,574Statutory deposits with Bank
Negara Malaysia 192,425 – – – – – 192,425
Total assets 1,413,084 6,575,104 1,760,071 862,551 1,258,656 62,203,761 74,073,227
LiabilitiesDeposits from customers 17,914,224 12,210,156 8,395,068 5,830,244 4,957,014 1,770,556 51,077,262Investment accounts of
customers 5,113,275 2,482,295 2,231,737 1,913,851 620,569 6,801 12,368,528Derivative financial liabilities – 29,422 56,599 17,269 938 1,644 105,872Bills and acceptance payable 29,621 – – – – – 29,621Recourse obligations on
financing sold to Cagamas – – – – – 1,501,187 1,501,187Subordinated Sukuk
Murabahah – – 3,904 9,260 – 1,700,000 1,713,164Other liabilities 978,556 – – – – 59,523 1,038,079Lease liabilities – 1,409 2,267 3,323 6,437 298,993 312,429
Total liabilities 24,035,676 14,723,282 10,689,575 7,773,947 5,584,958 5,338,704 68,146,142
Net liquidity gap on statement of financial position (22,925,033) (7,845,737) (8,929,504) (6,911,396) (4,326,302) 56,865,057 5,927,085
BANK ISL AM MAL AYSIA BERHAD
NOTES TO ThE fINANCIAL STATEMENTS for the financial year ended 31 December 2021
346

39. FINANCIAL RISK MANAGEMENT (CONTINUED)
(d) Liquidity risk (continued)
Maturity analysis (continued)
BankAs at 31 December 2021
On demand/
no specific
maturity date
RM’000
Up to 1 month
RM’000
>1 to 3monthsRM’000
>3 to 6monthsRM’000
>6 to 12monthsRM’000
Over1 year
RM’000Total
RM’000
AssetsCash and short-term funds and
deposits and placements with financial institutions 751,187 4,453,177 – – – – 5,204,364
Financial assets at FVTPL 263,611 10,215 494,559 447,071 335,244 – 1,550,700Derivative financial assets – 5,316 7,759 11,972 73 917 26,037Financial assets at FVOCI 78,397 670,667 200,402 1,010,231 1,217,728 9,427,642 12,605,067Financial assets at amortised
cost – – – 50,529 – 1,298,315 1,348,844Financing, advances and others – 2,405,500 1,325,153 691,800 505,753 53,225,563 58,153,769Other financial assets at
amortised cost 239,257 – – – – – 239,257Statutory deposits with Bank
Negara Malaysia 264,050 – – – – – 264,050
Total assets 1,596,502 7,544,875 2,027,873 2,211,603 2,058,798 63,952,437 79,392,088
LiabilitiesDeposits from customers 20,308,935 13,127,720 9,286,497 8,120,947 5,973,677 546,150 57,363,926Investment accounts of
customers 6,655,637 1,371,739 1,399,335 907,940 218,917 8,033 10,561,601Derivative financial liabilities – 5,176 7,565 6,387 625 668 20,421Bills and acceptance payable 20,112 – – – – – 20,112Recourse obligations on
financing sold to Cagamas – – – – – 2,001,720 2,001,720Subordinated Sukuk
Murabahah – – 3,945 10,904 – 2,000,000 2,014,849Other liabilities 1,538,375 – – – – – 1,538,375Lease liabilities – 683 2,191 3,322 5,760 291,028 302,984
Total liabilities 28,523,059 14,505,318 10,699,533 9,049,500 6,198,979 4,847,599 73,823,988
Net liquidity gap on statement of financial position (27,268,565) (6,618,435) (8,671,660) (6,837,897) (4,140,181) 59,104,838 5,568,100
INTEGR ATED ANNUAL REPORT 2021
Key Messages Overview Value Creation MD&A Sustainability Leadership Accountability Financial Additional Information
347

39. FINANCIAL RISK MANAGEMENT (CONTINUED)
(d) Liquidity risk (continued)
Maturity analysis (continued)
BankAs at 31 December 2020
On demand/
no specific
maturity date
RM’000
Up to 1 month
RM’000
>1 to 3monthsRM’000
>3 to 6monthsRM’000
>6 to 12monthsRM’000
Over1 year
RM’000Total
RM’000
AssetsCash and short-term funds and
deposits and placements with financial institutions 725,548 4,490,732 – – – – 5,216,280
Financial assets at FVTPL 232,730 243,618 – 30,051 50,041 619,000 1,175,440Derivative financial assets – 25,579 26,773 6,915 227 2,171 61,665Financial assets at FVOCI 64,689 15,842 678,405 395,567 831,388 10,572,838 12,558,729Financing, advances and others – 1,799,333 1,054,893 429,657 377,000 51,009,752 54,670,635Other financial assets at
amortised cost 182,041 – – – – – 182,041Statutory deposits with Bank
Negara Malaysia 192,425 – – – – – 192,425
Total assets 1,397,433 6,575,104 1,760,071 862,190 1,258,656 62,203,761 74,057,215
LiabilitiesDeposits from customers 17,924,046 12,210,491 8,397,374 5,832,265 4,960,719 1,770,556 51,095,451Investment accounts of
customers 5,113,275 2,482,295 2,231,757 1,913,851 620,569 7,150 12,368,897Derivative financial liabilities – 29,422 56,599 17,269 938 1,644 105,872Bills and acceptance payable 29,621 – – – – – 29,621Recourse obligations on
financing sold to Cagamas – – – – – 1,501,187 1,501,187Subordinated Sukuk
Murabahah – – 3,904 9,260 – 1,700,000 1,713,164Other liabilities 965,332 – – – – 59,523 1,024,855Lease liabilities – 1,409 2,267 3,323 6,437 298,993 312,429
Total liabilities 24,032,274 14,723,617 10,691,901 7,775,968 5,588,663 5,339,053 68,151,476
Net liquidity gap on statement of financial position (22,932,260) (7,851,094) (8,931,830) (6,913,778) (4,330,007) 56,864,708 5,905,739
BANK ISL AM MAL AYSIA BERHAD
NOTES TO ThE fINANCIAL STATEMENTS for the financial year ended 31 December 2021
348

39. FINANCIAL RISK MANAGEMENT (CONTINUED)
(d) Liquidity risk (continued)
Contractual maturity of financial liabilities on an undiscounted basis
The table below present the cash flows payable by the Bank under financial liabilities by remaining contractual maturities at the end of the reporting period. The amounts disclosed in the table are the contractual undiscounted cash flows:
GroupAs at 31 December 2021
Up to 1 month
RM’000
>1 to 3monthsRM’000
>3 to 6monthsRM’000
>6 to 12monthsRM’000
Over1 year
RM’000Total
RM’000
Financial LiabilitiesDeposits from customers 32,567,363 10,079,216 7,855,452 6,427,787 614,697 57,544,515Investment accounts of
customers 8,019,903 1,432,649 796,052 341,948 8,287 10,598,839Derivative financial liabilities 5,239 9,929 13,915 31,208 136,957 197,248
Forward contract 4,995 7,746 6,387 625 – 19,753Islamic Profit Rate Swap 244 2,183 7,528 30,583 136,957 177,495
Bills and acceptance payable 20,112 – – – – 20,112Recourse obligations on
financing sold to Cagamas 7,120 14,240 21,359 42,719 2,050,345 2,135,783Subordinated Sukuk Murabahah – 7,479 33,843 41,810 2,593,902 2,677,034Other liabilities 1,270,602 – – – 300,000 1,570,602Lease liabilities 2,542 5,084 7,626 14,155 422,605 452,012
41,892,881 11,548,597 8,728,247 6,899,627 6,126,793 75,196,145
Commitments and Contingencies
Financial guarantee contracts 205,501 144,324 132,935 365,503 974,646 1,822,909
205,501 144,324 132,935 365,503 974,646 1,822,909
INTEGR ATED ANNUAL REPORT 2021
Key Messages Overview Value Creation MD&A Sustainability Leadership Accountability Financial Additional Information
349

39. FINANCIAL RISK MANAGEMENT (CONTINUED)
(d) Liquidity risk (continued)
Contractual maturity of financial liabilities on an undiscounted basis (continued)
GroupAs at 31 December 2020
Up to 1 month
RM’000
>1 to 3monthsRM’000
>3 to 6monthsRM’000
>6 to 12monthsRM’000
Over1 year
RM’000Total
RM’000
Financial LiabilitiesDeposits from customers 30,022,422 8,429,037 5,879,065 5,061,386 1,919,877 51,311,787Investment accounts of
customers 7,610,826 2,240,679 1,930,504 630,355 7,427 12,419,791Derivative financial liabilities 256 2,183 7,528 30,583 349,233 389,783
Forward contract 11 – – – – 11Islamic Profit Rate Swap 245 2,183 7,528 30,583 349,233 389,772
Bills and acceptance payable 29,621 – – – – 29,621Recourse obligations on
financing sold to Cagamas 5,913 11,826 17,739 35,478 1,600,520 1,671,476Subordinated Sukuk Murabahah – 7,356 27,700 35,834 2,253,966 2,324,856Other liabilities 1,077,340 – – – 59,523 1,136,863Lease liabilities 2,568 5,135 7,607 14,891 446,908 477,109
38,748,946 10,696,216 7,870,143 5,808,527 6,637,454 69,761,286
Commitments and Contingencies
Financial guarantee contracts 136,040 154,767 154,596 339,429 1,156,959 1,941,791
136,040 154,767 154,596 339,429 1,156,959 1,941,791
BANK ISL AM MAL AYSIA BERHAD
NOTES TO ThE fINANCIAL STATEMENTS for the financial year ended 31 December 2021
350

39. FINANCIAL RISK MANAGEMENT (CONTINUED)
(d) Liquidity risk (continued)
Contractual maturity of financial liabilities on an undiscounted basis (continued)
BankAs at 31 December 2021
Up to 1 month
RM’000
>1 to 3monthsRM’000
>3 to 6monthsRM’000
>6 to 12monthsRM’000
Over1 year
RM’000Total
RM’000
Financial LiabilitiesDeposits from customers 32,567,363 10,079,216 7,855,452 6,427,787 614,697 57,544,515Investment accounts of
customers 8,019,903 1,432,649 796,052 341,948 8,287 10,598,839Derivative financial liabilities 5,239 9,929 13,915 31,208 136,957 197,248
Forward contract 4,995 7,746 6,387 625 – 19,753Islamic Profit Rate Swap 244 2,183 7,528 30,583 136,957 177,495
Bills and acceptance payable 20,112 – – – – 20,112Recourse obligations on
financing sold to Cagamas 7,120 14,240 21,359 42,719 2,050,345 2,135,783Subordinated Sukuk Murabahah – 7,479 33,843 41,810 2,593,902 2,677,034Other liabilities 1,238,375 – – – 300,000 1,538,375Lease liabilities 2,495 4,989 7,484 13,965 422,605 451,538
41,860,607 11,548,502 8,728,105 6,899,437 6,126,793 75,163,444
Commitments and Contingencies
Financial guarantee contracts 205,501 144,324 132,935 365,503 974,646 1,822,909
205,501 144,324 132,935 365,503 974,646 1,822,909
INTEGR ATED ANNUAL REPORT 2021
Key Messages Overview Value Creation MD&A Sustainability Leadership Accountability Financial Additional Information
351

39. FINANCIAL RISK MANAGEMENT (CONTINUED)
(d) Liquidity risk (continued)
Contractual maturity of financial liabilities on an undiscounted basis (continued)
BankAs at 31 December 2020
Up to 1 month
RM’000
>1 to 3monthsRM’000
>3 to 6monthsRM’000
>6 to 12monthsRM’000
Over1 year
RM’000Total
RM’000
Financial LiabilitiesDeposits from customers 30,022,422 8,429,037 5,879,065 5,061,386 1,919,877 51,311,787Investment accounts of
customers 7,610,826 2,240,679 1,930,504 630,355 7,427 12,419,791Derivative financial liabilities 256 2,183 7,528 30,583 349,233 389,783
Forward contract 11 - - - - 11Islamic Profit Rate Swap 245 2,183 7,528 30,583 349,233 389,772
Bills and acceptance payable 29,621 - - - - 29,621Recourse obligations on
financing sold to Cagamas 5,913 11,826 17,739 35,478 1,600,520 1,671,476Subordinated Sukuk Murabahah - 7,356 27,700 35,834 2,253,966 2,324,856Other liabilities 1,094,136 - - - 59,523 1,153,659Lease liabilities 2,568 5,135 7,607 14,891 446,908 477,109
38,765,742 10,696,216 7,870,143 5,808,527 6,637,454 69,778,082
Commitments and Contingencies
Financial guarantee contracts 136,040 154,767 154,596 339,429 1,156,959 1,941,791
136,040 154,767 154,596 339,429 1,156,959 1,941,791
(e) Operational Risk
Overview
Operational risk is defined as the risk of loss arising from inadequate or failed internal processes, people and systems and external events, which includes legal risk and Shariah compliance risk but excludes strategic and reputational risk.
Management of operational risk
The Group and the Bank recognises and emphasises the importance of operational risk management (“ORM”) and manages this risk through a control-based environment where processes are documented, authorisation is independent, transactions are reconciled and monitored and business activities are carried out within the established guidelines, procedures and limits.
BANK ISL AM MAL AYSIA BERHAD
NOTES TO ThE fINANCIAL STATEMENTS for the financial year ended 31 December 2021
352

39. FINANCIAL RISK MANAGEMENT (CONTINUED)
(e) Operational Risk (continued)
Management of operational risk (continued)
The Group’s and the Bank’s overall governance approach in managing operational risk is premised on the Three Lines of Defence Approach:
• 1st line of defence – The risk owner or risk taking unit i.e. Business or Support Unit is accountable for putting in place a robust control environment within their respective units. They are responsible for the day-to-day management of operational risk. Head of Division/Department (“HOD”) are accountable for effective management of operational risk within their respective divisions.
To reinforce accountability and ownership of risk and control, a Risk Controller for each risk taking unit is appointed to assist in driving the risk and control programme for the Group and the Bank.
In addition, an Embedded Risk & Compliance Unit (“ERU”) has been established within the significant business and support units (“BU/SU”). The ERU would assist in implementing and monitoring the ORM activities within the BU/SU. The ERU’s relationship and knowledge of the business allow for a more focused implementation and effective oversight of ORM within the BU/SU.
• 2nd line of defence – Operational Risk Management Department (“ORMD”) is responsible for establishing and maintaining the ORM Framework, developing various ORM tools to facilitate the management of operational risk, monitoring the effectiveness of ORM via an integrated operational risk management system, assessing operational risk issues from the risk owner and escalating the issues to the relevant governance level with recommendations on appropriate risk mitigation strategies. In creating a strong risk culture, ORMD is also responsible to promote risk awareness across the Group and the Bank.
Shariah Risk Management Department (“SRM”), Compliance Division which includes Shariah Compliance Department (“SCD”) and Information Security Governance (“ISGD”) complement the role of ORMD as the second line of defence. SRM is responsible for managing the Shariah compliance risk (“SCR”) by establishing and maintaining appropriate SRM guidelines, facilitating the process of identifying, assessing, controlling and monitoring SCR and promoting SCR awareness.
Compliance Division is responsible for ensuring effective oversight on compliance-related risks such as regulatory compliance risk, compliance risk as well as money laundering and terrorism financing risks through proper classification of risks and develops, reviews and enhances compliance-related training programmes as well as conducts training that promotes awareness creation.
SCD of Compliance Division, is responsible for reviewing and monitoring Shariah compliance of the Group’s operations, activities and services at BU/SU level.
ISGD is responsible in managing technology risk by establishing, maintaining and enforcing technology risk policies and guidelines, as well as promoting Bank-wide awareness on technology risk. It also works closely with Information Technology Division (“ITD”) in identifying, assessing, mitigating and monitoring of technology risk in the Group and the Bank.
• 3rd line of defence – Internal Audit provides independent assurance to the Board and senior management on the effectiveness of the ORM process.
INTEGR ATED ANNUAL REPORT 2021
Key Messages Overview Value Creation MD&A Sustainability Leadership Accountability Financial Additional Information
353

39. FINANCIAL RISK MANAGEMENT (CONTINUED)
(f) Offsetting Financial Assets and Financial Liabilities
The Group and the Bank report financial assets and financial liabilities on a net basis on the balance sheet only if there is a legally enforceable right to set off the recognised amounts and there is intention to settle on a net basis, or to realise the asset and settle the liability simultaneously.
The following financial assets and liabilities are subject to offsetting, enforceable master netting arrangements and similar agreements:
Gross amounts
of recognised
financial assets
in the statement
Gross amounts
of recognised
financial liabilities
in the statement
Net amount
presented in
statement
Related amounts not set off in the statements of
financial position
Net amountRM’000
of financial position
RM’000
of financial positionRM’000
of financial positionRM’000
Financialinstruments
RM’000
Financial collateral receivedRM’000
2021
Derivatives assets 26,037 – 26,037 (14,574) (130) 11,333Derivatives liabilities – 20,421 20,421 (14,574) (130) 5,717
2020Derivatives assets 61,665 – 61,665 (37,505) (130) 24,030Derivatives liabilities – 105,872 105,872 (37,505) (130) 68,237
BANK ISL AM MAL AYSIA BERHAD
NOTES TO ThE fINANCIAL STATEMENTS for the financial year ended 31 December 2021
354

40. FAIR VALUE OF FINANCIAL INSTRUMENTS
Financial instruments comprise financial assets, financial liabilities and off-balance sheet instruments. Fair value is the amount at which the financial assets could be exchanged or a financial liability settled, between knowledgeable and willing parties in an arm’s length transaction. The information presented herein represents the estimates of fair values as at the financial position date.
Quoted and observable market prices where available, are used as the measure of fair values. Where such quoted and observable market prices are not available, fair values are estimated based on a range of methodologies and assumptions regarding risk characteristics of various financial instruments, discount rates, estimates of future cash flows and other factors. Changes in the assumptions could materially affect these estimates and the corresponding fair values.
Fair value information for non-financial assets and liabilities such as investments in subsidiaries and taxation are excluded, as they do not fall within the scope of MFRS 7, Financial Instruments: Disclosure and Presentation which requires the fair value information to be disclosed.
The fair values are based on the following methodologies and assumptions:
Deposits and placements with banks and other financial institutions
For deposits and placements with financial instruments with maturities of less than six months, the carrying value is a reasonable estimate of fair values. For deposits and placements with maturities six months and above, the estimated fair values are based on discounted cash flows using prevailing Islamic money market profit rates at which similar deposits and placements would be made with financial instruments of similar credit risk and remaining period to maturity.
Financial assets measured at FVTPL and FVOCI
The estimated fair values are generally based on quoted and observable market prices. Where there is no ready market in certain securities, fair values have been estimated by reference to market indicative yields or net tangible asset backing of the investee.
Financing, advances and others
The fair values are estimated by discounting the estimated future cash flows using the prevailing market rates of financing with similar credit risks and maturities.
Deposits from customers and investment accounts of customers
The fair values of deposits and investment accounts are deemed to approximate their carrying amounts as rate of returns are determined at the end of their holding periods based on the profit generated from the assets invested.
Deposits and placements of banks and other financial institutions
The estimated fair values of deposits and placements of banks and other financial institutions with maturities of less than six months approximate the carrying values. For deposits and placements with maturities of six months or more, the fair values are estimated based on discounted cash flows using prevailing money market profit rates for deposits and placements with similar remaining period to maturities.
INTEGR ATED ANNUAL REPORT 2021
Key Messages Overview Value Creation MD&A Sustainability Leadership Accountability Financial Additional Information
355

40. FAIR VALUE OF FINANCIAL INSTRUMENTS (CONTINUED)
Bills and acceptance payable
The estimated fair values of bills and acceptance payables with maturity of less than six months approximate their carrying values. For bills and acceptance payable with maturities of six months or more, the fair values are estimated based on discounted cash flows using prevailing market rates for borrowings with similar risk profiles.
Fair value hierarchy
MFRS 13 specifies a hierarchy of valuation techniques based on whether the inputs to those valuation techniques are observable or unobservable. Observable inputs reflect market data obtained from independent sources and unobservable inputs reflect the Group’s market assumptions. The fair value hierarchy is as follows:
• Level 1 – Quoted price (unadjusted) in active markets for the identical assets or liabilities. This level includes listed equity securities and debt instruments.
• Level 2 – Inputs other than quoted prices included within Level 1 that are observable for the asset or liability, either directly (i.e. as prices) or indirectly (i.e. derived from prices). This level includes profit rate swaps and structured debt. The sources of input parameters include BNM indicative yields or counterparty credit risk.
• Level 3 – Inputs for asset or liability that are not based on observable market data (unobservable inputs). This level includes equity instruments and debt instruments with significant unobservable components.
The table below analyses financial instruments carried at fair value and those not carried at fair value for which fair value is disclosed, together with their fair values and carrying amounts shown in the statement of financial position. The table does not include those short-term/on demand financial assets and financial liabilities where the carrying amounts are reasonable approximation of their fair values.
BANK ISL AM MAL AYSIA BERHAD
NOTES TO ThE fINANCIAL STATEMENTS for the financial year ended 31 December 2021
356

40. FAIR VALUE OF FINANCIAL INSTRUMENTS (CONTINUED)
Fair value hierarchy (continued)
Group31 December 2021
Fair value of financial instruments carried at fair value
Fair value of financial instruments not carried
at fair valueTotal
fair valueRM’000
CarryingamountRM’000
Level 1RM’000
Level 2RM’000
Level 3RM’000
TotalRM’000
Level 3RM’000
Financial assetsFinancial assets at FVTPL – 1,582,494 – 1,582,494 – 1,582,494 1,582,494Derivative financial assets – 26,037 – 26,037 – 26,037 26,037Financial assets at FVOCI 17,004 12,526,670 60,530 12,604,204 – 12,604,204 12,604,204Financial assets at AC – – – – 1,330,502 1,330,502 1,348,844Financing, advances and others – – – – 61,303,303 61,303,303 58,153,769
Financial liabilitiesDerivative financial liabilities – 20,421 – 20,421 – 20,421 20,421Recourse obligations on financing sold
to Cagamas – – – – 2,044,330 2,044,330 2,001,720Subordinated Sukuk Murabahah – – – – 2,009,745 2,009,745 2,014,849
Group31 December 2020
Fair value of financial instruments carried at fair value
Fair value of financial instruments not carried
at fair valueTotal
fair valueRM’000
CarryingamountRM’000
Level 1RM’000
Level 2RM’000
Level 3RM’000
TotalRM’000
Level 3RM’000
Financial assetsFinancial assets at FVTPL – 1,181,200 – 1,181,200 – 1,181,200 1,181,200Derivative financial assets – 61,665 – 61,665 – 61,665 61,665Financial assets at FVOCI 13,755 12,494,040 50,196 12,557,991 – 12,557,991 12,557,991Financing, advances and others – – – – 58,065,344 58,065,344 54,670,635
Financial liabilitiesDerivative financial liabilities – 105,872 – 105,872 – 105,872 105,872Recourse obligations on financing sold
to Cagamas – – – – 1,577,805 1,577,805 1,501,187Subordinated Sukuk Murabahah – – – – 1,730,236 1,730,236 1,713,164
INTEGR ATED ANNUAL REPORT 2021
Key Messages Overview Value Creation MD&A Sustainability Leadership Accountability Financial Additional Information
357

40. FAIR VALUE OF FINANCIAL INSTRUMENTS (CONTINUED)
Fair value hierarchy (continued)
Bank31 December 2021
Fair value of financial instruments carried at fair value
Fair value of financial instruments not carried
at fair valueTotal
fair valueRM’000
CarryingamountRM’000
Level 1RM’000
Level 2RM’000
Level 3RM’000
TotalRM’000
Level 3RM’000
Financial assetsFinancial assets at FVTPL – 1,550,700 – 1,550,700 – 1,550,700 1,550,700Derivative financial assets – 26,037 – 26,037 – 26,037 26,037Financial assets at FVOCI 17,004 12,526,670 61,393 12,605,067 – 12,605,067 12,605,067Financial assets at AC – – – – 1,330,502 1,330,502 1,348,844Financing, advances and others – – – – 61,303,303 61,303,303 58,153,769
Financial liabilitiesDerivative financial liabilities – 20,421 – 20,421 – 20,421 20,421Recourse obligations on financing sold
to Cagamas – – – – 2,044,330 2,044,330 2,001,720Subordinated Sukuk Murabahah – – – – 2,009,745 2,009,745 2,014,849
Bank31 December 2020
Fair value of financial instruments carried at fair value
Fair value of financial instruments not carried
at fair valueTotal
fair valueRM’000
CarryingamountRM’000
Level 1RM’000
Level 2RM’000
Level 3RM’000
TotalRM’000
Level 3RM’000
Financial assetsFinancial assets at FVTPL – 1,175,440 – 1,175,440 – 1,175,440 1,175,440Derivative financial assets – 61,665 – 61,665 – 61,665 61,665Financial assets at FVOCI 13,755 12,494,040 50,934 12,558,729 – 12,558,729 12,558,729Financing, advances and others – – – – 58,065,344 58,065,344 54,670,635
Financial liabilitiesDerivative financial liabilities – 105,872 – 105,872 – 105,872 105,872Recourse obligations on financing sold
to Cagamas – – – – 1,577,805 1,577,805 1,501,187Subordinated Sukuk Murabahah – – – – 1,730,236 1,730,236 1,713,164
BANK ISL AM MAL AYSIA BERHAD
NOTES TO ThE fINANCIAL STATEMENTS for the financial year ended 31 December 2021
358

40. FAIR VALUE OF FINANCIAL INSTRUMENTS (CONTINUED)
Unobservable inputs used in measuring fair value
The following tables show the valuation techniques used in the determination of fair values within Level 3, as well as the key unobservable inputs used in the valuation models.
(a) Financial instruments carried at fair value
Type Valuation technique
Significant unobservableinputs
Inter-relationship between significant unobservable inputs and fair value measurement
Financial assets measured at FVOCI
Net tangible assets Net tangible assets Higher net tangible assets results in higher fair value
(b) Financial instruments not carried at fair value
The following methods and assumptions are used to estimate the fair values of the following classes of financial instruments:
(i) Other financial assets at amortised cost
The fair values of securities that are actively traded is determined by quoted mid prices. For non-actively traded securities, the fair values are estimated using valuation techniques such as discounted cash flows analysis. Where discounted cash flows technique is used, the estimated future cash flows are discounted using applicable prevailing market or indicative rates of similar instruments at the reporting date.
(ii) Financing and advances
The fair values of variable rate financing are estimated to approximate their carrying values. For fixed rate financing, the fair values are estimated based on expected future cash flows of contractual instalment payments, discounted at applicable and prevailing rates at reporting date offered for similar facilities to new borrowers with similar credit profiles. In respect of impaired financing, the fair values are deemed to approximate the carrying values which are net of impairment allowances.
(iii) Subordinated Sukuk Murabahah and Recourse obligations on financing sold to Cagamas
The fair values of subordinated obligations are estimated by discounting the expected future cash flows using the applicable prevailing profit rates for borrowings with similar risk profiles.
41. CAPITAL COMMITMENTS
Group and Bank
2021RM’000
2020RM’000
Property and equipmentContracted but not provided for in the financial statements 205,214 149,391
INTEGR ATED ANNUAL REPORT 2021
Key Messages Overview Value Creation MD&A Sustainability Leadership Accountability Financial Additional Information
359

42. COMMITMENTS AND CONTINGENCIES
(a) Commitment and contingencies
The off-Balance Sheet and counterparties credit risk for the Group and the Bank are as follows:
31 December 2021
Nature of item
PrincipalAmountRM’000
CreditEquivalent
AmountRM’000
RiskWeighted
AssetRM’000
Credit related exposuresDirect credit substitutes 501,511 501,511 503,088Transaction related contingent items 903,458 451,729 438,976Short-term self-liquidating trade related
contingencies 417,940 83,588 83,012Other commitments, such as formal standby
facilities and credit lines, with an original maturity of:– exceeding one year 1,246,592 623,295 503,494
Any commitments that are unconditionally cancelled at any time by the Bank without prior notice or that effectively provide for automatic cancellation due to deterioration in a borrower’s creditworthiness 8,110,490 – –
11,179,991 1,660,123 1,528,570
PrincipalAmountRM’000
Positive FairValue of
DerivativeContracts
RM’000
CreditEquivalent
AmountRM’000
RiskWeighted
AssetRM’000
Derivative Financial InstrumentsForeign exchange related contracts
– less than one year 7,505,850 25,120 114,431 66,277Profit rate related contracts
– one year to less than five years 79,153 917 2,368 1,735
7,585,003 26,037 116,799 68,012
Total 18,764,994 26,037 1,776,922 1,596,582
BANK ISL AM MAL AYSIA BERHAD
NOTES TO ThE fINANCIAL STATEMENTS for the financial year ended 31 December 2021
360

42. COMMITMENTS AND CONTINGENCIES (CONTINUED)
(a) Commitment and contingencies (continued)
The off-Balance Sheet and counterparties credit risk for the Group and the Bank are as follows: (continued)
31 December 2020
Nature of item
PrincipalAmountRM’000
CreditEquivalent
AmountRM’000
RiskWeighted
AssetRM’000
Credit related exposuresDirect credit substitutes 449,506 449,506 442,426Transaction related contingent items 899,541 449,770 436,481Short-term self-liquidating trade related
contingencies 592,744 118,549 117,165Other commitments, such as formal standby
facilities and credit lines, with an original maturity of:– exceeding one year 938,247 469,124 362,317
Any commitments that are unconditionally cancelled at any time by the Bank without prior notice or that effectively provide for automatic cancellation due to deterioration in a borrower’s creditworthiness 8,676,980 – –
11,557,018 1,486,949 1,358,389
PrincipalAmountRM’000
Positive FairValue of
DerivativeContracts
RM’000
CreditEquivalent
AmountRM’000
RiskWeighted
AssetRM’000
Derivative Financial InstrumentsForeign exchange related contracts
– less than one year 8,518,422 59,494 143,217 60,587Profit rate related contracts
– one year to less than five years 114,056 2,171 5,414 4,045
8,632,478 61,665 148,631 64,632
Total 20,189,496 61,665 1,635,580 1,423,021
INTEGR ATED ANNUAL REPORT 2021
Key Messages Overview Value Creation MD&A Sustainability Leadership Accountability Financial Additional Information
361

42. COMMITMENTS AND CONTINGENCIES (CONTINUED)
(b) Contingent liabilities
Perbadanan Harta Intelek Malaysia (“MyIPO” or “Plaintiff”) vide a Writ and Statement of Claim dated 18 October 2021, filed a claim against BIMB Investment Management Berhad (“BIMB Invest” or “First Defendant”), a wholly owned subsidiary of the Bank and Ahmad Azwan Bin Aboo Mansor (“Second Defendant”)
The Plaintiff has filed a statement of claim that the Defendants are liable for loss and damage caused by fraudulent misrepresentation, negligence, and breach of statutory duty in respect of placement of monies amounting to RM85.5 million with the First Defendant upon representation made by Second Defendant.
BIMB Invest had on 8 December 2021 filed a Defense and subsequently, the Reply to Defense by the Plaintiff was filed on 5 January 2022.
Case Management was fixed on 20 January 2022 and subsequently another Case Management has been fixed on 22 February 2022 for First Defendant to inform the court on the status of the application for leave proceedings in the Bankruptcy Court, so as to bring third party proceedings against Second Defendant.
During the Case Management held on 22 February 2022, the Plaintiff's application to serve the Writ and Statement of Claim on the Second Defendant by way of substituted service was allowed by the Court and the First Defendant to file and serve the Third Party Notice on the Second Defendant. The next case management was fixed on 22 March 2022.
The potential liability of BIMB Invest if there was an adverse decision related to the claim is estimated to be approximately RM71.3 million.
The possible obligation towards BIMB Invest to settle the litigation claim are subject to decision by the court and as the case are still preliminary, the settlement to the litigation claim may not be probable at this juncture and therefore no provision is recognised in the financial statements.
43. CAPITAL ADEQUACY
Total capital and capital adequacy ratios of the Group and the Bank have been computed based on Bank Negara Malaysia (“BNM”)’s Capital Adequacy Framework for Islamic Banks (Capital Components) issued on 9 December 2020 and Capital Adequacy Framework for Islamic Banks (Risk-Weighted Assets) issued on 3 May 2019. The Group and the Bank is required to meet minimum Common Equity Tier I (“CET I”), Tier I and Total Capital adequacy ratios of 4.5%, 6.0% and 8.0% respectively.
To ensure that banks build up adequate capital buffer outside period of stress, a Capital Conservation Buffer (“CCB”) of 2.5% above the minimum capital adequacy was introduced by BNM. The CCB is maintained in the form of CET I Capital above the minimum CET I Capital, Tier I Capital and Total Capital adequacy at 2.5% starting 1 January 2019 onwards.
Therefore, the minimum regulatory capital adequacy ratios requirement for CET I capital ratio, Tier I capital ratio and Total Capital ratio are 7.0%, 8.5% and 10.5% respectively starting year 2019 onwards. The Group and the Bank have adopted the Standardised Approach for Credit Risk and Market Risk and the Basic Indicator Approach for Operational Risk.
BANK ISL AM MAL AYSIA BERHAD
NOTES TO ThE fINANCIAL STATEMENTS for the financial year ended 31 December 2021
362

43. CAPITAL ADEQUACY (CONTINUED)
The capital adequacy ratios of the Group and the Bank are set out below:
Group Bank
2021 2020 2021 2020
Common Equity Tier I (“CET I”) Capital Ratio 13.179% 14.667% 12.799% 14.642%Total Capital Ratio 18.561% 19.822% 18.203% 19.804%
The components of CET I, Tier I and Tier II capital:
Group Bank
2021RM’000
2020RM’000
2021RM’000
2020RM’000
Paid-up share capital 3,445,757 3,306,118 3,445,757 3,306,118Retained earnings 2,965,080 2,797,307 2,965,659 2,791,044Other reserves (10,899) 182,274 (121,843) 182,423Less: Deferred tax assets (193,214) (1,511) (191,773) –Gain on financial instruments classified as FVOCI – (103,564) – (103,564)Investment in subsidiaries – – (100,905) (15,525)
Total CET I and Tier I Capital 6,206,724 6,180,624 5,996,895 6,160,496
Sukuk Murabahah 2,000,000 1,700,000 2,000,000 1,700,000Loss provisions ^ 534,465 472,256 532,094 472,005
Total Tier II Capital 2,534,465 2,172,256 2,532,094 2,172,005
Total Capital 8,741,189 8,352,880 8,528,989 8,332,501
^ Impairment allowances on non-impaired financing and regulatory reserve, subject to maximum of 1.25% of total credit risk-weighted assets less credit absorbed by unrestricted investment accounts.
The breakdown of risk-weighted assets in the various categories of risk-weights are as follows:
Group Bank
2021RM’000
2020RM’000
2021RM’000
2020RM’000
Credit risk 50,180,739 46,862,577 50,080,971 46,842,825Less: Credit risk absorbed by unrestricted investment
accounts (7,423,579) (9,082,114) (7,513,437) (9,082,416)
42,757,160 37,780,463 42,567,534 37,760,409Market risk 489,559 638,925 489,559 638,925Operational risk 3,847,886 3,719,636 3,797,811 3,675,867
47,094,605 42,139,024 46,854,904 42,075,201
INTEGR ATED ANNUAL REPORT 2021
Key Messages Overview Value Creation MD&A Sustainability Leadership Accountability Financial Additional Information
363

44. RELATED PARTY TRANSACTIONS
Identity of related parties
For the purposes of these financial statements, parties are considered to be related to the Group if the Group has the ability, directly or indirectly, to control the party or exercise significant influence over the party in making financial and operating decisions, or vice versa, or where the Group and the party are subject to common control or common significant influence. Related parties may be individuals or other entities.
Related parties that have material transactions and their relationship with the Bank are as follows:
Parties Relationship before reorganisation Relationship after reorganisation
Lembaga Tabung Haji Ultimate holding entity Major shareholder*
BIMB Holdings Sdn. Bhd. (formerly known as BIMB Holdings Berhad)
Holding company Subsidiaries
Syarikat Takaful Malaysia Berhad Subsidiary of holding company* Associate company of major shareholder*
Subsidiaries of Bank Islam Malaysia Berhad as disclosed in Note 13
Subsidiaries Subsidiaries
Associate company of Lembaga Tabung Haji
Other related companies Other related companies
Koperasi Kakitangan Kumpulan BIMB Holdings Malaysia Berhad
Co-operative society in which the employees have interest
Co-operative society in which the employees have interest
Related party transactions have been entered into in the normal course of business under normal trade terms.
* Balances are disclosed under other related companies
BANK ISL AM MAL AYSIA BERHAD
NOTES TO ThE fINANCIAL STATEMENTS for the financial year ended 31 December 2021
364

44. RELATED PARTY TRANSACTIONS (CONTINUED)
(a) The related party transactions of the Bank, other than key management personnel compensation, are as follows (continued):
Transaction amounts for
2021RM’000
2020RM’000
Ultimate holding entity Income
Wakalah fee 108 576Office rental 48 66
Expenses
Income attributable to depositors 52,357 51,173Income attributable to investment account holders 8,293 8,823Finance cost on Subordinated Sukuk Murabahah 2,289 2,348Office rental 946 1,252Depreciation of right-of-use assets 9,895 13,193Profit expense on lease 12,827 17,501Other rental 266 383
Holding company
Income
Office rental 849 1,038Others 1 129
Expenses
Income attributable to depositors 10 7Income attributable to investment account holders 5,240 9,340Office rental 60 23
INTEGR ATED ANNUAL REPORT 2021
Key Messages Overview Value Creation MD&A Sustainability Leadership Accountability Financial Additional Information
365

44. RELATED PARTY TRANSACTIONS (CONTINUED)
(a) The related party transactions of the Bank, other than key management personnel compensation, are as follows (continued):
Transaction amounts for
2021RM’000
2020RM’000
Subsidiaries Income
Fees and commission 5,518 4,602Office rental 677 382Others 114 75
Expenses
Fees and commission 5,830 7,365Income attributable to depositors 196 220Income attributable to investment account holders 516 1Office rental 119 –
Other related companiesIncome
Income from financing, advances and others 116 239Fees and commission income 342 203Bancatakaful service fee 25,190 25,551Others 2,240 1,970
Expenses
Income attributable to depositors 30,151 22,111Income attributable to investment account holders 4,493 908Finance cost on Subordinated Sukuk Murabahah 856 2,637Office rental 3,505 3,109Other rental 82 12Depreciation of right-of-use assets 3,298 –Profit expense on lease 4,216 –Takaful fee 4,607 6,419
Co-operative society in which the employees have interestIncome
Income from financing, advances and others 2,550 2,897
Expenses
Income attributable to depositors 4 4Income attributable investment account holders 10 17Others 1,768 95
The inter-company charges of the Group and the Bank with related parties were mainly transacted in Central region.
BANK ISL AM MAL AYSIA BERHAD
NOTES TO ThE fINANCIAL STATEMENTS for the financial year ended 31 December 2021
366

44. RELATED PARTY TRANSACTIONS (CONTINUED)
(b) The outstanding balances of the Bank with related parties, are as follows:
2021RM’000
2020RM’000
Ultimate holding entity Amount due from Right-of-use assets – 203,399Other receivables – 23
Amount due toDeposits from customers – 3,409,339Investment account of customers – 200,000Income payable to depositors – 14,656Income payable to investment account holders – 1,405Subordinated Sukuk Murabahah – 85,000Finance cost payable on Subordinated Sukuk Murabahah – 604Commitments and contingencies – 2,880Lease liabilities – 305,465Other payables – 136
Holding companyAmount due from Other receivables – 1
Amount due to Deposits from customers – 315Investment account of customers – 317,269Income payable to investment account holders – 729Other payables – 132
SubsidiariesAmount due from Redeemable non-cumulative preference shares 2,417 2,292Others 854 72
Amount due toDeposits from customers 23,877 17,306Investment account of customers 108,369 369Income payable to investment account holders 330 1Income payable to depositors 106 97Other payables 10 12
INTEGR ATED ANNUAL REPORT 2021
Key Messages Overview Value Creation MD&A Sustainability Leadership Accountability Financial Additional Information
367

44. RELATED PARTY TRANSACTIONS (CONTINUED)
(b) The outstanding balances of the Bank with related parties, are as follows (continued):
2021RM’000
2020RM’000
Other related companiesAmount due from Financing, advances and others 4,002 –Right-of-use assets 190,206 –Other receivables 176 150
Amount due toDeposits from customers 3,411,729 719,894Investment account of customers 634,768 51,122Income payable to depositors 26,797 5,603Income payable to investment account holders 11,307 44Subordinated Sukuk Murabahah 100,000 –Finance cost payable on Subordinated Sukuk Murabahah 688 –Commitments and contingencies 13,216 16,570Lease liabilities 297,034 –
Co-operative society in which the employees have interestAmount due from Financing, advances and others 57,987 62,568
Amount due toDeposits from customers 119 119Investment account of customers 581 569Income payable to depositors 1 1Income payable to investment account holders 4 4
BANK ISL AM MAL AYSIA BERHAD
NOTES TO ThE fINANCIAL STATEMENTS for the financial year ended 31 December 2021
368

45. CREDIT TRANSACTIONS AND EXPOSURES WITH CONNECTED PARTIES
Credit exposures with connected parties as per BNM’s revised Guidelines on Credit Transactions and Exposures with Connected Parties are as follows:
Group and Bank
2021RM’000
2020RM’000
Outstanding credit exposures with connected parties 2,132,777 2,411,078
Percentage of outstanding credit exposures to connected parties as a proportion of total credit exposures 3.24% 3.73%
Percentage of outstanding credit exposures with connected parties which is non-performing or in default 0.00% 0.00%
The above disclosure on Credit Transaction and Exposures with Connected Parties is presented in accordance with Para 9.1 of Bank Negara Malaysia’s Revised Guidelines on Credit Transaction and Exposures with Connected Parties.
46. SIGNIFICANT EVENTS DURING THE FINANCIAL YEAR
COVID-19 pandemic
The World Health Organisation declared the outbreak of Coronavirus disease (COVID-19) as a global pandemic in March 2020. The direct and indirect effects of the COVID-19 outbreak have impacted the global economy, markets and the Group's and the Bank’s counterparties and clients.
The COVID-19 effects have a material negative impact on the Group's and the Bank's results of operations. In particular, the process to determine expected credit losses (“ECL”) requires numerous estimates and assumptions, some of which require a high degree of judgement. Changes in the estimates and assumptions can result in significant changes in ECL. The Group and the Bank are not able to predict the COVID-19’s potential future direct or indirect effects other than as disclosed in Note 39(b)(iii). However, the Group and the Bank are taking actions to mitigate the impacts, and will continue to closely monitor the impact and the related risks as they evolve.
Proposed placement, proposed scheme of arrangement (“SOA”), proposed internal reorganisation, proposed distribution and capital repayment and proposed transfer of listing status (collectively referred to as the 'Proposals')
INTEGR ATED ANNUAL REPORT 2021
Key Messages Overview Value Creation MD&A Sustainability Leadership Accountability Financial Additional Information
369

46. SIGNIFICANT EVENTS DURING THE FINANCIAL YEAR (CONTINUED)
On 11 December 2019, the immediate holding, BIMB Holdings Berhad (“BHB”) had announced and proposed to undertake the following proposals:
(i) Proposed placement
Proposed placement of new ordinary shares in BHB to raise gross proceeds of up to RM800 million. The proceeds together with internal cash will be used to fully settle BHB’s outstanding sukuk.
(ii) Proposed scheme of arrangement
Proposed payment to the warrantholder of the outstanding warrants 2013/2023 of BHB by way of a scheme of arrangement under section 366 of the Companies Act 2016 (“the Act”). The total warrants consideration to be paid by BHB will be funded using internally generated funds of BHB.
(iii) Proposed Internal Reorganisation
The proposed internal reorganisation entails the disposal of BHB’s entire shareholdings in the identified subsidiaries namely BIMB Securities (Holdings) Sdn. Bhd., BIMB Securities Sdn. Bhd. and Syarikat Al Ijarah Sdn. Bhd. to the Bank to be fully settled in cash.
(iv) Proposed distribution and capital repayment
Proposed distribution of the entire shareholdings of BHB in the Bank and Syarikat Takaful Malaysia Keluarga Berhad (“STMKB”) by way of distribution-in-specie via a reduction and repayment of the entire share capital of BHB in accordance with Section 115 and Section 116 of the Act as well as using the retained earnings of BHB.
Prior to the proposed distribution and capital repayment, BHB will undergo a capital reduction and the Bank will undertake a share consolidation. This is to match BHB’s outstanding shares so that the distribution of the Bank shares will be on a one-for-one basis.
Concurrently with the completion of the proposed distribution and capital repayment, BHB will issue two (2) new BHB shares to the Bank such that BHB will become a wholly-owned subsidiary of Bank Islam.
(v) Proposed transfer of listing
After the completion of the proposed distribution and capital repayment, the Bank will assume the listing status of BHB. Accordingly, BHB proposed that the Bank be admitted to the official list of Bursa Securities in place of BHB, with the listing and quotation of the entire consolidated the Bank shares on the main market of Bursa Securities.
The Bank will emerge as the first pure-play full-fledged Islamic financial institution to be listed in the region and enhance its corporate stature. The listing will allows Bank Islam to better position itself in the Islamic finance and Islamic capital market and capitalise on the growth of both markets in its efforts to expand its customer base.
BANK ISL AM MAL AYSIA BERHAD
NOTES TO ThE fINANCIAL STATEMENTS for the financial year ended 31 December 2021
370

46. SIGNIFICANT EVENTS DURING THE FINANCIAL YEAR (CONTINUED)
The proposed placement, proposed SOA, proposed internal reorganisation, proposed distribution and capital repayment and proposed transfer of listing are not conditional upon each other, save for the following:
(i) The proposed distribution and capital repayment is conditional upon the proposed internal reorganisation and proposed transfer of listing; and
(ii) The proposed transfer of listing is conditional upon the proposed internal reorganisation and proposed distribution and capital repayment.
BHB has on 10 December 2020 announced that it has received the approval from the Minister of Finance (on the recommendation of BNM), and BNM in relation to the Proposals.
On 23 February 2021, BHB has announced that it has received approval from Bursa Securities for the listing and quotation of BHB shares to be issued pursuant to the proposed placements and admission of the Bank to the official list of Bursa Securities and the listing of and quotation for the entire issued share capital of the Bank on the Main Market of Bursa Securities pursuant to the proposed transfer of listing.
BHB on 13 April 2021 has announce that it has completed the book building exercise pursuant to the proposed placement and has raised gross proceeds of RM795.6 million. The proceeds raised together with internal cash of BHB has been used to fully redeem outstanding sukuk by BHB on 3 June 2021 with total redemption amount of RM988.4 million.
On 27 August 2021, BHB has announced the completion of scheme of arrangement following the payment to the warrantsholders amounting RM162.15 million.
On 3 September 2021, the Bank has completed a consolidation of its ordinary shares into 2,075,872,514 Bank Islam shares to match BHB’s outstanding shares in issue so that the distribution of the Bank shares will be on a one-for-one basis.
No. of Bank Islam’s
shares (’000) RM’000
As at the Last Practicable Date (“LPD”) 2,600,367 3,306,118Consolidated (567,460) –Allotment of ordinary shares 42,966 139,639
After consolidation 2,075,873 3,445,757
INTEGR ATED ANNUAL REPORT 2021
Key Messages Overview Value Creation MD&A Sustainability Leadership Accountability Financial Additional Information
371

46. SIGNIFICANT EVENTS DURING THE FINANCIAL YEAR (CONTINUED)
The internal reorganisation which entailed the disposal by BHB of its entire shareholdings in BIMB Securities (Holdings) Sdn. Bhd. (“BIMB SEC HOLDINGS”), BIMB Securities Sdn. Bhd. (“BIMB SEC”) and Syarikat Al Ijarah Sdn. Bhd. (“SASB”) to the Bank was completed on 13 September 2021 following the payment made by the Bank.
Identified companies Sale shares/%
Purchase consideration
(RM’000)
BIMB SEC HOLDINGS5,000,000 ordinary shares and 45,000,000 preference shares/100% 37,667
BIMB SEC 49,000,000 ordinary shares/49% 34,909SASB 10,000,000 ordinary shares/100% 12,804
Total 85,380
The Group has adopted predecessor accounting and only incorporate the acquired entity’s results and statements of financial position prospectively from the date on which the business combination between entities under common control occurred. Accordingly, the corresponding amounts for the previous year are also not restated. The differences between the consideration given and the aggregated carrying amounts of the assets and liabilities (as of the date of transaction) of the acquired entities are recorded as an adjustment to equity. No additional goodwill/gain on bargain purchased is recognised.
Transfer of the identified companies are as follows:
BIMB SEC HOLDINGS
RM’000BIMB SEC
RM’000SASB
RM’000
ASSETSCash and short-term funds 16 41,693 105Deposits and placements with financial institutions 1,342 25,575 –Financial assets at fair value through profit or loss – 2,048 11,698Other financial assets at amortised cost – 46,190 –Current tax assets – 329 –Right-of-use assets – 541 –Property and equipment – 1,507 624
TOTAL ASSETS 1,358 117,883 12,427
LIABILITIESOther liabilities 10 19,933 69Lease Liabilities – 597 –Zakat and taxation 1 – 3
TOTAL LIABILITIES 11 20,530 72
Net assets transferred to the Group 1,347 97,353 12,355Total purchase consideration (37,667) (34,909) (12,804)Difference between purchase consideration and the net assets
transferred to the Group (as at the date of transaction) recognised in Equity) (36,320) 62,444 (449)
BANK ISL AM MAL AYSIA BERHAD
NOTES TO ThE fINANCIAL STATEMENTS for the financial year ended 31 December 2021
372

46. SIGNIFICANT EVENTS DURING THE FINANCIAL YEAR (CONTINUED)
On 7 October 2021, the distribution and capital repayment, was completed following the distribution of BHB’s entire shareholding in Bank Islam and Syarikat Takaful Malaysia Keluarga Berhad to its shareholders. Concurrently, BHB has issued two (2) new ordinary shares to Bank Islam such that BHB is now a wholly-owned subsidiary of Bank Islam.
No. of BHB
shares (000) RM’000
As at LPD 1,853,651 4,617,787Issued pursuant to Proposed Placements 222,222 800,000
2,075,873 5,417,787Cancelled pursuant to the Proposed Distribution and Capital Repayment (2,075,873) (5,417,787)Issued to Bank Islam * *
* *
* comprising two (2) new ordinary shares
Transfer of BHB as follows;
BHBRM’000
ASSETSCash and short-term funds 28,773Deposits and placements with financial institutions 50,000Other financial assets at amortised cost 380Deferred tax assets 10Property and equipment 316
TOTAL ASSETS 79,479
LIABILITIESOther liabilities (6,115)Zakat and taxation 82
TOTAL LIABILITIES (6,033)
Net assets transferred to the Group 85,512Difference between transfer consideration and net assets transferred
to the Group recognised in Equity 85,512
On 8 October 2021, the transfer of listing status has been completed following the de-listing of BHB from the Main Market of Bursa Securities and the listing of and quotation for Bank Islam in its place.
INTEGR ATED ANNUAL REPORT 2021
Key Messages Overview Value Creation MD&A Sustainability Leadership Accountability Financial Additional Information
373

47. PRIOR YEAR ADJUSTMENTS
The prior year adjustments are to restate the comparatives of the Translation Reserves and Retained Earnings balances in relation to foreign exchange differences from prior periods arising from the Bank’s net investment in its offshore banking operations in the Federal Territory of Labuan which should have been recognised in other comprehensive income.
The effects of the restatement of the financial statements are summarised below:
As previously
reportedRM’000
AdjustmentRM’000
RestatedRM’000
Group
1 January 2020Translation reserves (106,938) 93,716 (13,222)Retained earnings 2,594,820 (93,716) 2,501,104
Bank
1 January 2020Translation reserves (106,805) 93,716 (13,089)Retained earnings 2,589,798 (93,716) 2,496,082
BANK ISL AM MAL AYSIA BERHAD
NOTES TO ThE fINANCIAL STATEMENTS for the financial year ended 31 December 2021
374

OVERVIEW
The Pillar 3 Disclosure for financial year ended 31 December 2021 for Bank Islam Malaysia Berhad (“the Bank”) and its subsidiaries (“the Group”) describes the risk profile, risk management practices and capital adequacy position in accordance with the disclosure requirements governed by Bank Negara Malaysia’s (“BNM”) “Capital Adequacy Framework for Islamic Banks (“CAFIB”) – Disclosure Requirements (“Pillar 3”)”.
The Group adopts the following approaches in determining the capital requirements of Pillar 1 in accordance with BNM’s Guidelines on CAFIB (Basel II – Risk Weighted Assets (“RWA”)) since January 2008:
• Credit and Market Risk – the Standardised Approach (“SA”); and • Operational Risk – the Basic Indicator Approach (“BIA”).
Under the Standardised Approach, standard risk weights are used to assess the capital requirements whilst under the Basic Indicator Approach, the capital requirements are computed based on a fixed percentage over the Group’s average gross income for a fixed number of quarterly periods.
As required under Pillar 2, the Group has also developed an Internal Capital Adequacy Assessment Process (“ICAAP”) framework which closely integrates the risk and capital assessment processes and ensures that adequate levels of capital are maintained to support the Group’s current and projected demand for capital under expected and stressed conditions. The ICAAP was adopted in 2012 and has been fully implemented since 2013. The ICAAP is updated and approved on an annual basis by the Management Committee, Board Risk Committee (“BRC”) and Board of Directors (“Board”).
BASIS OF DISCLOSURE
The Pillar 3 Disclosure is prepared in accordance with BNM’s Pillar 3 Disclosure Guidelines issued in July 2010 and the Group’s internal policy on Pillar 3 Disclosure; which aims to enhance transparency on the risk management practices and capital adequacy of the Bank and the Group. The disclosures include both qualitative and quantitative disclosures with respect to capital adequacy, credit risk, market risk, liquidity risk, operational risk, management of Investment Account (IA) and key aspects of Shariah governance.
Whilst this document discloses the Group’s assets both in terms of exposures and capital requirements, the information disclosed herein may not be directly comparable with the information in the Full-Year Financial Statements 2021 published by the Group.
These disclosures have been reviewed and verified by the Group Internal Auditor and attested by the Group Chief Executive Officer.
MEDIUM AND LOCATION OF DISCLOSURE
The Group’s Pillar 3 Disclosure is made available at www.bankislam.com.
INTEGR ATED ANNUAL REPORT 2021
375
Key Messages Overview Value Creation MD&A Sustainability Leadership Accountability Financial Additional Information
375
PILLAR 3 DISCLOSUREas at 31 December 2021

MINIMUM REGULATORY CAPITAL REQUIREMENTS
The Group’s main activity is Islamic banking business which focuses on retail banking and financing operations. The following tables show the minimum regulatory capital requirement to support the Group’s and the Bank’s risk weighted assets.
31.12.2021 31.12.2020
Risk-weighted
assets
Minimum capital
requirement at 8%
Risk-weighted
assets
Minimum capital
requirement at 8%
Group RM’000 RM’000 RM’000 RM’000
Credit Risk 50,180,739 4,014,459 46,862,577 3,749,006 Less: Credit Risk absorbed by IA (7,423,579) (593,886) (9,082,114) (726,569)Market Risk 489,559 39,165 638,925 51,114 Operational Risk 3,847,886 307,831 3,719,636 297,571
Total 47,094,605 3,767,569 42,139,024 3,371,122
31.12.2021 31.12.2020
Risk-weighted
assets
Minimum capital
requirement at 8%
Risk-weighted
assets
Minimum capital
requirement at 8%
Bank RM’000 RM’000 RM’000 RM’000
Credit Risk 50,080,971 4,006,478 46,842,825 3,747,426 Less: Credit Risk absorbed by IA (7,513,437) (601,075) (9,082,416) (726,593)Market Risk 489,559 39,165 638,925 51,114 Operational Risk 3,797,811 303,825 3,675,867 294,069
Total 46,854,904 3,748,393 42,075,201 3,366,016
The Group does not have any capital requirement for Large Exposure Risk as there is no amount in excess of the lowest threshold arising from equity holdings as specified in BNM’s CAFIB (Risk-Weighted Assets) Guideline.
1. SCOPE OF APPLICATION
The Pillar 3 Disclosure is prepared on a consolidated basis and comprises information on the Bank (including the offshore banking operations in the Federal Territory of Labuan) and its subsidiaries.
There are no significant restrictions or impediments on the transfer of funds or regulatory capital within the Group. There were no capital deficiencies in any of the subsidiary companies of the Group as at the financial year end.
PILLAR 3 DISCLOSUREas at 31 December 2021
BANK ISL AM MAL AYSIA BERHAD
376

2. CAPITAL ADEQUACY
2.1 Capital Management
The Group’s primary objectives when managing capital are to maintain a strong capital position to support business growth and to maintain investors, depositors, customers, and market confidence. In line with this, the Group manages its capital actively and ensures that the capital adequacy ratios which take into account the risk profile of the Group, are above the regulatory minimum requirement.
To ensure that the Group has sufficient capital to support all its business and risk-taking activities, the Group has implemented a sound capital management process in its management systems and processes. A comprehensive capital management framework has been adopted by the Group as a key enabler for value creation which is important to the long-term survival of the Group. This comprehensive capital management process includes thorough risk assessment and risk management techniques that are embedded within the Group’s risk governance.
The assessment is based on the approved business plan, its estimation of current risks inherent in the Group and the impact of capital stress tests on the Group’s capital plan. The Group aims to achieve the following capital management objectives:
• Meeting regulatory capital requirements; • Optimising returns to shareholders; • Maintaining adequate levels and an optimum mix of different sources of capital to support the underlying
risks of its business; • Ensuring adequate capital to withstand shocks and stress; • Ensuring sufficient capital to expand its business ventures and inorganic growth; and • Allocating an appropriate amount of capital to business units to optimise return on capital.
The Group’s capital management is guided by the Capital Management Plan, approved by the Board, to ensure the management of capital is consistent and aligned with the Group’s Risk Appetite Statement and ICAAP Document Policy.
The Group’s capital management processes comprise:
• Capital Structuring – ensuring that the amount of regulatory and statutory capital available is consistent with the Group’s growth plan, risk appetite, and desired level of capital adequacy. Capital structuring focuses on selecting appropriate, most cost-effective mix of capital instruments;
• Capital Allocation – ensuring that the capital is employed efficiently across the Group based on risk-adjusted return on capital; and
• Capital Optimisation – seeking an optimal level of capital by facilitating the optimisation of the risk profile of the balance sheet. This will be done through: • reshaping of the balance sheet; • capital planning, allocation and optimisation; and • a sound management of the capital buffer.
As such, the four fundamental components of a sound capital planning process include:
• Internal control and governance; • Capital policy and risk capture; • Forward-looking view; and • Management framework for preserving capital.
INTEGR ATED ANNUAL REPORT 2021
377
Key Messages Overview Value Creation MD&A Sustainability Leadership Accountability Financial Additional Information
377

2. CAPITAL ADEQUACY (CONTINUED)
2.1 Capital Management (continued)
The Group’s Capital Management Plan is updated annually and approved by the Board for implementation at the beginning of each financial year. The capital plan is drawn up to cover at least a three-year horizon and takes into account, amongst others, the Group’s strategic objectives and business plans, regulatory capital requirements, capital benchmarking against the industry, available supply of capital and capital raising options, performance of business sectors based on a Risk Adjusted Return on Capital (“RAROC”) approach, as well as ICAAP and stress testing results.
The Group has fully issued Subordinated Sukuk Murabahah under its Subordinated Sukuk Murabahah Programme of up to RM1.0 billion in nominal value (“Subordinated Sukuk Murabahah Programme”) which was approved by the Securities Commission Malaysia (“SC”) on 7 October 2014. On 6 September 2018, the Group successfully lodged with SC under Lodge and Launch Framework a new Sukuk Murabahah Programme of up to RM10.0 billion in nominal value, which allows issuances of Subordinated Sukuk Murabahah and Senior Sukuk Murabahah. The purpose of the Subordinated Sukuk Murabahah issuance under both programmes is to enhance the capital adequacy of the Group, in line with the requirements under the Basel III capital framework. Table below depicts a summary of the Subordinated Sukuk Murabahah under both programmes which are qualified as Tier 2 regulatory capital of the Bank and the Group in accordance with BNM’s CAFIB (Capital Components) Guideline.
Capital InstrumentCapital Component Main Features
1) Subordinated Sukuk Murabahah Programme of up to RM1.0 billion (Programme 1)
a) Tranche 1: RM300 million at 5.75%
• Issued on 22 April 2015 • Mature on 22 April 2025
Note: Tranche 1 was called on 22 April 2020
Tier 2 Capital
• The tenure of both programmes are as follows:i. Programme 1 – up to thirty (30) years from the
date of the first issue under the Subordinated Sukuk Murabahah Programme.
ii. Programme 2 – perpetual. • The tenure of each issuance of the Subordinated
Sukuk Murabahah under both programmes are as follows:i. Programme 1 – shall be not less than five (5)
years and up to thirty (30) years from the issue date and provided that the Subordinated Sukuk Murabahah matures on or prior to the expiry of the tenure of the Subordinated Sukuk Murabahah Programme.
ii. Programme 2 – shall be not less than five (5) years from the issue date.
b) Tranche 2: RM400 million at 5.50%
• Issued on 15 December 2015 • Mature on 15 December 2025
Note: Tranche 2 was called on 15 December 2020
c) Tranche 3: RM300 million at 5.08%
• Issued on 13 November 2017 • Mature on 12 November 2027
PILLAR 3 DISCLOSUREas at 31 December 2021
BANK ISL AM MAL AYSIA BERHAD
378

2. CAPITAL ADEQUACY (CONTINUED)
2.1 Capital Management (continued)
Capital InstrumentCapital Component Main Features
2) Sukuk Murabahah Programme of up to RM10.0 billion (Programme 2)
a) Tranche 1: RM300 million at 5.15%
• Type: Subordinated Sukuk Murabahah
• Issued on 7 November 2018 • Mature on 7 November 2028
Tier 2 Capital
• Each of the Subordinated Sukuk Murabahah may have a call option to allow the Bank to redeem the relevant tranche of the Subordinated Sukuk Murabahah (in whole or in part) on any periodic profit payment date after a minimum period of five (5) years from the issue date of that tranche, subject to the relevant early redemption conditions being satisfied.
• Unsecured. • Subordinated Sukuk Murabahah shall be utilised to
finance the Bank’s Islamic banking activities, working capital requirements and other corporate purposes and/or, if required, to redeem any outstanding Sukuk Murabahah issued under both programmes. All utilisation shall be Shariah Compliant.
• Upon the occurrence of a Non-Viability Event, BNM, jointly with PIDM, shall have the option to require the entire or part of the nominal value of the outstanding Subordinated Sukuk Murabahah, and all other amounts owing under the Subordinated Sukuk Murabahah to be written off.
• No Conversion into Equity.
b) Tranche 2: RM400 million at 3.75%
• Type: Subordinated Sukuk Murabahah
• Issued on 26 March 2020 • Mature on 26 March 2030
c) RM700 million at 3.60% • Type: Subordinated Sukuk
Murabahah • Issued on 21 October 2020 • Mature on 21 October 2030
d) RM300 million at 4.10% • Type: Subordinated Sukuk
Murabahah • Issued on 12 November 2021 • Mature on 12 November 2031
Total outstanding Subordinated Sukuk Murabahah issued under both programmes which are qualified as Tier 2 regulatory capital of the Bank and the Group as of 31 December 2021 is RM2.0 billion.
2.2 Internal Capital Adequacy Assessment Process (“ICAAP”)
The Group has carried out the internal assessment process on capital as prescribed in BNM’s CAFIB – ICAAP (“Pillar 2”) to complement its current capital management practices. The first ICAAP Document Policy was formalised and approved by the Board in March 2013 and is being reviewed on an annual basis. The Group’s ICAAP helps to suggest the minimum internal capital requirement for its current and future business strategies and financial plans for the next three (3) years via a comprehensive risk assessment process on its portfolio risk exposures, its risk management practices towards its material risks and potential capital planning buffer required in the event of stress.
INTEGR ATED ANNUAL REPORT 2021
379
Key Messages Overview Value Creation MD&A Sustainability Leadership Accountability Financial Additional Information
379

2. CAPITAL ADEQUACY (CONTINUED)
2.2 Internal Capital Adequacy Assessment Process (“ICAAP”) (continued)
The Group’s ICAAP is conducted on a consolidated basis covering all the Bank’s legal entities as suggested by BNM’s Pillar 2 Guideline.
The Group’s ICAAP methodology can be summarised as follows:
Material
RiskAssessment
InitialCapital
Assessment
EconomicCapitalDefinition
CapitalSupply
CapitalDemand
CapitalStressTest
InternalCapitalTargetRatio
INTERNAL CAPITAL PLANNING
INTERNAL AUDIT INVOLVEMENT
Under ICAAP, the following risk types are identified and measured:
• Risks captured under Pillar 1 (i.e. Credit Risk, Market Risk, and Operational Risk); • Risk not fully captured under Pillar 1 (e.g. Migration and Residual Risk); and • Risk not covered under Pillar 1 (e.g. Credit Concentration Risk, Profit Rate in the Banking Book, Shariah Non-
Compliance Risk, Regulatory/Compliance Risk, Contagion Risk, and IT Risk).
2.3 Stress Testing
Regular stress testing (including reverse stress testing) is performed to assess the Group’s ability to maintain adequate capital under both normal business cycle and unfavourable economic conditions. The stress testing is embedded within the risk and capital management process of the Group and is a key function of capital planning and business planning processes. Stress Testing also plays an important role in:
• Identifying the possible events or future changes in the financial and economic conditions of the country and globally that could potentially have unfavourable effects on the Group’s exposures;
• Identifying the different portfolios response to changes in key economic variables (profit rate, foreign exchange rate, GDP, etc);
• Evaluating the Group’s ability to withstand such changes, i.e. its capacity in terms of its capital and earnings, to absorb potentially significant losses; and
• Analysing the Group’s ability to meet the minimum regulatory capital requirement at all times throughout a reasonably severe economic crisis.
The Group has put in place a stress testing programme (including reverse stress testing) which has taken into account all risks deemed material to the Group, namely credit risk, market risk, liquidity risk and operational risk including Shariah non-compliance risk, regulatory compliance risk, contagion risk and IT risk.
In line with the Group’s Stress Testing Policy, ad-hoc and more frequent stress testing has been conducted to assess the impact of deterioration on specific risk areas, in line with stressed macroeconomic variables. The impact of COVID-19 pandemic outbreak such as repayment assistance, vulnerable portfolio and liquidity risk to the Group were assessed to ensure the Group’s ability to maintain adequate capital under stressed condition.
PILLAR 3 DISCLOSUREas at 31 December 2021
BANK ISL AM MAL AYSIA BERHAD
380

2. CAPITAL ADEQUACY (CONTINUED)
2.4 Capital Adequacy Ratios
The Group is required to comply with the Common Equity Tier 1 (“CET 1”) Capital Ratio, Tier 1 Capital Ratio and Total Capital Ratio (“TCR”) as prescribed by BNM. The Group has been in compliance with all prescribed capital adequacy ratios throughout the period.
Total capital and capital adequacy ratios of the Group have been computed based on the updated BNM’s CAFIB - Capital Components Guideline issued on 9 December 2020 and BNM’s CAFIB – RWA Guideline issued on 3 May 2019. The minimum regulatory capital adequacy ratios requirement for CET 1 capital ratio, Tier 1 capital ratio and TCR including capital buffers i.e., Capital Conservation Buffers (“CCB”) are 7.0%, 8.5% and 10.5% respectively.
The CCB is intended to encourage the build-up of capital buffers by individual Islamic banking institutions during normal times that can be drawn down during stress periods.
The table below shows the composition of the regulatory capital and capital adequacy ratios as of 31 December 2021, determined by the requirements of the CAFIB. The capital adequacy ratios of the Group and Bank are set as per below:
(a) The capital adequacy ratios of the Group and of the Bank:
Group Bank
Before effect of IA 31.12.2021 31.12.2020 31.12.2021 31.12.2020
Before deducting proposed dividendsCET 1 Capital Ratio 11.39% 12.07% 11.03% 12.04%Tier 1 Capital Ratio 11.39% 12.07% 11.03% 12.04%Total Capital Ratio 16.03% 16.53% 15.69% 16.51%
After deducting proposed dividendsCET 1 Capital Ratio 10.82% 11.79% 10.45% 11.77%Tier 1 Capital Ratio 10.82% 11.79% 10.45% 11.77%Total Capital Ratio 15.47% 16.26% 15.11% 16.24%
Group Bank
After effect of IA 31.12.2021 31.12.2020 31.12.2021 31.12.2020
Before deducting proposed dividendsCET 1 Capital Ratio 13.18% 14.67% 12.80% 14.64%Tier 1 Capital Ratio 13.18% 14.67% 12.80% 14.64%Total Capital Ratio 18.56% 19.82% 18.20% 19.80%
After deducting proposed dividendsCET 1 Capital Ratio 12.53% 14.34% 12.13% 14.31%Tier 1 Capital Ratio 12.53% 14.34% 12.13% 14.31%Total Capital Ratio 17.91% 19.49% 17.53% 19.47%
INTEGR ATED ANNUAL REPORT 2021
381
Key Messages Overview Value Creation MD&A Sustainability Leadership Accountability Financial Additional Information
381

2. CAPITAL ADEQUACY (CONTINUED)
2.4 Capital Adequacy Ratios (continued)
(b) CET I, Tier I and Tier II capital components of the Group and of the Bank (continued):
31.12.2021
Group BankRM’000 RM’000
Tier I CapitalPaid-up share capital 3,445,757 3,445,757Share Premium – – Retained earnings 2,965,080 2,965,659 Other reserves (10,899) (121,843)Less: Deferred tax assets (193,214) (191,773)Less: 55% of fair value – –Less: Regulatory reserve attributable to financing – – Less: Investment in subsidiaries – (100,905)
Total Common Equity Tier I Capital 6,206,724 5,996,895 Total Additional Tier I Capital – –
Total Tier I Capital 6,206,724 5,996,895Subordinated Sukuk 2,000,000 2,000,000 Collective assessment allowance ^ 534,465 532,094
Total Tier II Capital 2,534,465 2,532,094
Total Capital 8,741,189 8,528,989
^ Collective assessment allowance on non-impaired financing and regulatory reserve, subject to maximum of 1.25% of total credit risk-weighted assets after deducting IA as Risk Absorbent.
PILLAR 3 DISCLOSUREas at 31 December 2021
BANK ISL AM MAL AYSIA BERHAD
382

2. CAPITAL ADEQUACY (CONTINUED)
2.4 Capital Adequacy Ratios (continued)
(b) CET 1, Tier I and Tier II capital components of the Group and of the Bank (continued):
31.12.2020
Group BankRM’000 RM’000
Tier I CapitalPaid-up share capital 3,306,118 3,306,118 Share Premium – –Retained earnings 2,797,307 2,791,044 Other reserves 182,274 182,423 Less: Deferred tax assets (1,511) –Less: 55% of fair value (103,564) (103,564)Less: Regulatory reserve attributable to financing – –Less: Investment in subsidiaries – (15,525)
Total Common Equity Tier I Capital 6,180,624 6,160,496 Total Additional Tier I Capital – –
Total Tier I Capital 6,180,624 6,160,496Subordinated Sukuk 1,700,000 1,700,000 Collective assessment allowance ^ 472,256 472,005
Total Tier II Capital 2,172,256 2,172,005
Total Capital 8,352,880 8,332,501
^ Collective assessment allowance on non-impaired financing and regulatory reserve, subject to maximum of 1.25% of total credit risk-weighted assets after deducting IA as Risk Absorbent.
INTEGR ATED ANNUAL REPORT 2021
383
Key Messages Overview Value Creation MD&A Sustainability Leadership Accountability Financial Additional Information
383

2. CAPITAL ADEQUACY (CONTINUED)
2.4 Capital Adequacy Ratios (continued)
(c) The breakdown of risk-weighted assets by exposures in each major risk category is as follows:
(i) Group
31 December 2021Gross
ExposureNet
Exposure
Risk-Weighted
Asset
Minimum Capital
Requirement At 8%
Exposure Class RM’000 RM’000 RM’000 RM’000
Credit RiskOn-Balance Sheet ExposuresSovereign/Central Banks 9,052,249 9,052,249 – – Public Sector Entities 1,701,095 1,690,995 461,944 36,955 Banks, Developments Financial
Institutions (“DFIs”) and Multilateral Development Banks (“MDBs”) 1,026,027 1,026,027 206,060 16,485
Corporate 19,388,649 19,013,390 10,336,801 826,944 Regulatory Retail 20,743,307 20,708,120 20,057,433 1,604,595 Residential Mortgages 23,669,331 23,662,639 15,511,861 1,240,949 Higher Risk Assets 3,173 3,173 4,760 381 Other Assets 1,937,277 1,937,277 991,753 79,340 Defaulted Exposures 1,128,766 1,089,559 1,013,545 81,084
Total for On-Balance Sheet Exposures 78,649,874 78,183,429 48,584,157 3,886,733
Off-Balance Sheet ExposuresCredit-related Exposures 1,623,839 1,614,088 1,478,572 118,286 Derivative Financial Instruments 116,795 116,795 68,005 5,440 Defaulted Exposures 36,288 36,278 50,005 4,000
Total for Off-Balance Sheet Exposures 1,776,922 1,767,161 1,596,582 127,726
Total On and Off-Balance Sheet Exposures 80,426,796 79,950,590 50,180,739 4,014,459
Less: Credit Risk absorbed by IA (7,423,579) (593,886)
Long Position
Short Position
Market RiskBenchmark Rate Risk 8,792,939 (7,505,740) 1,287,199 99,335 7,947 Foreign Exchange Risk 28,311 (390,224) (361,914) 390,224 31,218 Inventory Risk – – –
Total Market Risk 8,821,250 (7,895,964) 925,285 489,559 39,165
Operational Risk 3,847,886 307,831
Total RWA and Capital Requirements 47,094,605 3,767,569
Note: As at 31 December 2021, the Group did not have any exposures under securitisation.
PILLAR 3 DISCLOSUREas at 31 December 2021
BANK ISL AM MAL AYSIA BERHAD
384

2. CAPITAL ADEQUACY (CONTINUED)
2.4 Capital Adequacy Ratios (continued)
(c) The breakdown of risk-weighted assets by exposures in each major risk category is as follows (continued):
(i) Group (continued)
31 December 2020 Gross
ExposureNet
Exposure
Risk-Weighted
Asset
Minimum Capital
Requirement At 8%
Exposure Class RM’000 RM’000 RM’000 RM’000
Credit RiskOn-Balance Sheet ExposuresSovereign/Central Banks 8,165,933 8,165,933 – – Public Sector Entities 1,600,640 1,587,966 430,688 34,455 Banks, Developments Financial
Institutions (“DFIs”) and Multilateral Development Banks (“MDBs”) 510,976 510,976 103,179 8,254
Corporate 19,584,934 19,226,882 10,505,419 840,434 Regulatory Retail 19,456,154 19,416,328 18,879,252 1,510,340 Residential Mortgages 21,610,415 21,604,144 13,735,734 1,098,859 Higher Risk Assets 3,783 3,783 5,674 454 Other Assets 1,802,897 1,802,897 939,663 75,173 Defaulted Exposures 895,404 860,147 839,948 67,196
Total for On-Balance Sheet Exposures 73,631,136 73,179,056 45,439,557 3,635,165
Off-Balance Sheet ExposuresCredit-related Exposures 1,461,127 1,454,525 1,329,221 106,338 Derivative Financial Instruments 148,631 148,632 64,632 5,171 Defaulted Exposures 25,822 25,822 29,167 2,333
Total for Off-Balance Sheet Exposures 1,635,580 1,628,979 1,423,020 113,842
Total On and Off-Balance Sheet Exposures 75,266,716 74,808,035 46,862,577 3,749,006
Less: Credit Risk absorbed by IA (9,082,114) (726,569)
Long Position
Short Position
Market RiskBenchmark Rate Risk 9,461,133 (8,518,693) 942,439 313,417 25,073 Foreign Exchange Risk 23,673 (325,509) (301,836) 325,509 26,041 Inventory Risk – – –
Total Market Risk 9,484,806 (8,844,202) 640,603 638,926 51,114
Operational Risk 3,719,636 297,571
Total RWA and Capital Requirements 42,139,024 3,371,122
Note: As at 31 December 2020, the Group did not have any exposures under securitisation.
INTEGR ATED ANNUAL REPORT 2021
385
Key Messages Overview Value Creation MD&A Sustainability Leadership Accountability Financial Additional Information
385

2. CAPITAL ADEQUACY (CONTINUED)
2.4 Capital Adequacy Ratios (continued)
(c) The breakdown of risk-weighted assets by exposures in each major risk category is as follows (continued):
(ii) Bank
31 December 2021Gross
ExposureNet
Exposure
Risk-Weighted
Asset
Minimum Capital
Requirement at 8%
Exposure Class RM’000 RM’000 RM’000 RM’000
Credit RiskOn-Balance Sheet ExposuresSovereign/Central Banks 9,052,249 9,052,249 – – Public Sector Entities 1,701,095 1,690,995 461,944 36,956 Banks, Developments Financial
Institutions (“DFIs”) and Multilateral Development Banks (“MDBs”) 1,007,556 1,007,556 202,366 16,189
Corporate 19,388,649 19,013,389 10,336,801 826,944 Regulatory Retail 20,743,307 20,708,121 20,057,433 1,604,595 Residential Mortgages 23,669,331 23,662,639 15,511,861 1,240,949 Higher Risk Assets 3,173 3,173 4,760 381 Other Assets 1,846,888 1,846,888 895,679 71,654 Defaulted Exposures 1,128,766 1,089,559 1,013,545 81,084
Total for On-Balance Sheet Exposures 78,541,014 78,074,569 48,484,389 3,878,752
Off-Balance Sheet ExposuresCredit-related Exposures 1,623,839 1,614,088 1,478,572 118,286 Derivative Financial Instruments 116,795 116,795 68,005 5,440 Defaulted Exposures 36,288 36,278 50,005 4,000
Total for Off-Balance Sheet Exposures 1,776,922 1,767,161 1,596,582 127,726
Total On and Off-Balance Sheet Exposures 80,317,936 79,841,730 50,080,971 4,006,478
Less: Credit Risk absorbed by IA (7,513,437) (601,075)
Long Position
Short Position
Market RiskBenchmark Rate Risk 8,792,939 (7,505,740) 1,287,199 99,335 7,947 Foreign Exchange Risk 28,311 (390,224) (361,914) 390,224 31,218 Inventory Risk – – –
Total Market Risk 8,821,250 (7,895,964) 925,285 489,559 39,165
Operational Risk 3,797,811 303,825
Total RWA and Capital Requirements 46,854,904 3,748,393
Note: As at 31 December 2021, the Bank did not have any exposures under securitisation.
PILLAR 3 DISCLOSUREas at 31 December 2021
BANK ISL AM MAL AYSIA BERHAD
386

2. CAPITAL ADEQUACY (CONTINUED)
2.4 Capital Adequacy Ratios (continued)
(c) The breakdown of risk-weighted assets by exposures in each major risk category is as follows (continued):
(ii) Bank (continued)
31 December 2020 Gross
ExposureNet
Exposure
Risk-Weighted
Asset
Minimum Capital
Requirement at 8%
Exposure Class RM’000 RM’000 RM’000 RM’000
Credit RiskOn-Balance Sheet ExposuresSovereign/Central Banks 8,165,933 8,165,933 – – Public Sector Entities 1,600,640 1,587,966 430,688 34,455 Banks, Developments Financial
Institutions (“DFIs”) and Multilateral Development Banks (“MDBs”) 510,893 510,893 103,163 8,253
Corporate 19,584,934 19,226,882 10,505,419 840,434 Regulatory Retail 19,456,154 19,416,328 18,879,252 1,510,340 Residential Mortgages 21,610,415 21,604,144 13,735,734 1,098,859 Higher Risk Assets 3,783 3,783 5,674 454 Other Assets 1,786,255 1,786,255 919,927 73,594 Defaulted Exposures 895,404 860,147 839,948 67,196
Total for On-Balance Sheet Exposures 73,614,411 73,162,332 45,419,804 3,633,584
Off-Balance Sheet ExposuresCredit-related Exposures 1,461,127 1,454,525 1,329,221 106,338 Derivative Financial Instruments 148,631 148,632 64,632 5,171 Defaulted Exposures 25,822 25,822 29,167 2,333
Total for Off-Balance Sheet Exposures 1,635,580 1,628,979 1,423,020 113,842
Total On and Off-Balance Sheet Exposures 75,249,991 74,791,311 46,842,824 3,747,426
Less: Credit Risk absorbed by IA (9,082,416) (726,593)
Long Position
Short Position
Market RiskBenchmark Rate Risk 9,461,133 (8,518,693) 942,439 313,417 25,073 Foreign Exchange Risk 23,673 (325,509) (301,836) 325,509 26,041 Inventory Risk – – – – –
Total Market Risk 9,484,806 (8,844,202) 640,603 638,926 51,114
Operational Risk 3,675,867 294,069
Total RWA and Capital Requirements 42,075,201 3,366,016
Note: As at 31 December 2020, the Bank did not have any exposures under securitisation.
INTEGR ATED ANNUAL REPORT 2021
387
Key Messages Overview Value Creation MD&A Sustainability Leadership Accountability Financial Additional Information
387

3. RISK MANAGEMENT
3.1 Overview
The Group’s mission with respect to risk management is to advance its risk management capabilities, culture and practices so as to be in line with internationally accepted standards and practices.
In that regard, the specific objectives of managing risk are to:
• Inculcate a risk-awareness culture throughout the Group; • Establish a standard approach and methodology in managing risks namely credit, market, liquidity,
operational, IT & cyber risk, compliance risks and contagion risk across the Group; • Clarify functional structures including objectives, roles and responsibilities; • Implement and use a risk management information system that meets the international standards on
confidentiality, integrity and its availability; • Develop and use tools, such as economic capital, value at risk, and stress testing to support the measurement
of risks and enhance risk-based decisions; • Ensure that risk policies and overall risk appetite are in line with business targets; and • Ensure that the Group’s capital can support current and planned business needs in terms of risk exposures.
3.2 Risk Management Functional and Governance Structure
The Group has aligned its organisational responsibilities with the objective of ensuring a common view of risks across the Group. As a matter of prudence and good governance, the Group’s core risk management functions, which report to the Board Risk Committee (“BRC”), are independent and segregated from the business divisions and centralised at head office.
The following illustrates the Group’s governance structure:
Shariah Supervisory
Council (SSC)
Board of Directors
Group Chief ExecutiveOfficer
ManagementCommittee(MANCO)
OperationalRisk ControlCommittee
(ORCC)
DataManagementCommittee
(DMC)
RecoveryManagementCommittee
(RMC)
Rescheduling &Restructuring
OversightCommittee
(R&R)
BoardsNomination &Remuneration
Committee(BNRC)
BoardFinancing
ReviewCommittee
(BFRC)
Board Strategic &
Sustainability Committee
(BSSC)
Board ITCommittee
(BITC)
Board Audit& Examination
Committee(BAEC)
Man
agem
ent C
omm
ittee
sB
oard
Com
mitt
ees
Board Risk Committee (BRC)
Management
AuditCommittee
(MAC)
ManagementIT
Committee(MITC)
SustainabilityCommittee
(SC)
FinancingCommittees
(UIC,FCA,FCB, RFC)
BilobOversight
Committee(BOC)
TenderCommittee(TECA/TECB)
BusinessContinuity
ManagementCommittee
(BCMC)
ManagementRisk ControlCommittee
(MRCC)
Asset &Liability
ManagementCommittee
(ALCO)
Sadaqa House
and ZakatCommittee
(SHZC)
PILLAR 3 DISCLOSUREas at 31 December 2021
BANK ISL AM MAL AYSIA BERHAD
388

3. RISK MANAGEMENT (CONTINUED)
3.2 Risk Management Functional and Governance Structure (continued)
The Group recognises the fact that the essence of banking and financial services is centred on risk taking activities. The Group therefore:
• Recognises that it has to manage risks effectively to achieve its business targets; • Reaches an optimum level of risk-return in order to maximise stakeholders’ value; and • Ensures effective and integrated risk management processes that are commensurate with the size and
complexity of the current and future operations of the Group within its risk appetite and tolerance.
The Group has established the Group Risk Appetite Statement Policy that forms an integral part of the Group’s strategy and business plans. Risk appetite is an expression of the maximum level of risk that the Group is prepared to accept in support of a stated strategy, impacting all businesses from a credit, market and operational risk viewpoint.
4. CREDIT RISK
4.1 Overview
Credit risk is the risk of a customer or counterparty failing to fulfil its financial obligations in accordance with agreed terms. It arises from all transactions that could lead to actual, contingent or potential claims against any party, customer or obligor (collectively referred to as counterparties). The types of credit risks that the Group considers to be material include: Default Risk, Counterparty Risk, Credit Concentration Risk, Residual/Credit Mitigation Risk and Migration Risk.
4.2 Credit Risk Governance
The management of credit risk is principally carried out by using sets of policies and guidelines approved by the Management Risk Control Committee (“MRCC”) and/or BRC, guided by the Boards’ approved Group Risk Appetite Statement Policy.
The Group has several levels of Financing Committees, which assess and approve credits at their specified authority levels.
MRCC is responsible under the authority delegated by BRC for managing credit risk at strategic level. MRCC reviews the Group’s credit risk policies and guidelines, aligns credit risk management with business strategies and planning, reviews credit profile of the credit portfolios and recommends necessary actions to ensure that the credit risk remains within established risk tolerance levels.
The Group’s credit risk management governance includes the establishment of detailed credit risk policies, guidelines and procedures which document the Group’s financing standards, discretionary powers for financing approval, credit risk ratings methodologies and models, acceptable collaterals and valuation, and the review, rehabilitation and restructuring of problematic and delinquent financing.
INTEGR ATED ANNUAL REPORT 2021
389
Key Messages Overview Value Creation MD&A Sustainability Leadership Accountability Financial Additional Information
389

4. CREDIT RISK
4.3 Management of Credit Risk
The management of credit risk is being performed by the Group Credit Management Division (“CMD”) and Group Risk Management Division (“RMD”) and two other units outside of CMD and RMD domain, namely, Credit Administration Department and Recovery & Rehabilitation Division. The combined objectives are, amongst others:
• To build a high quality credit portfolio which is in line with the Group’s overall strategy and risk appetite; • To ensure that the Group is compensated for the risk taken, balancing/optimising the risk/return relationship; • To develop an increasing ability to recognise, measure and avoid or mitigate potential credit risk problem
areas; and • To conform with statutory, regulatory and internal credit requirements.
The Group monitors its credit exposures either on a portfolio basis or individual basis through annual reviews. Credit risk is proactively monitored through a set of early warning signals that could trigger immediate reviews of (a certain part of) the portfolio. The affected portfolio or financing is placed on a watchlist to enforce close monitoring and prevent financing from turning impaired and to increase chances of full recovery.
A detailed limit structure is in place to ensure that risks taken are within the risk appetite as set by the Board and to avoid credit risk concentration on a single customer, sector, product, etc.
Credit risk arising from dealing and investing activities are managed by the establishment of limits which include counterparty limits and permissible acquisition of private entities’ instruments, subject to a specified minimum rating threshold. Furthermore, the dealing and investing activities are monitored by an independent middle office unit.
4.4 Capital Treatment for Credit Risk
The Group adopts the Standardised Approach to compute the credit risk capital requirement under BNM’s CAFIB.
PILLAR 3 DISCLOSUREas at 31 December 2021
BANK ISL AM MAL AYSIA BERHAD
390
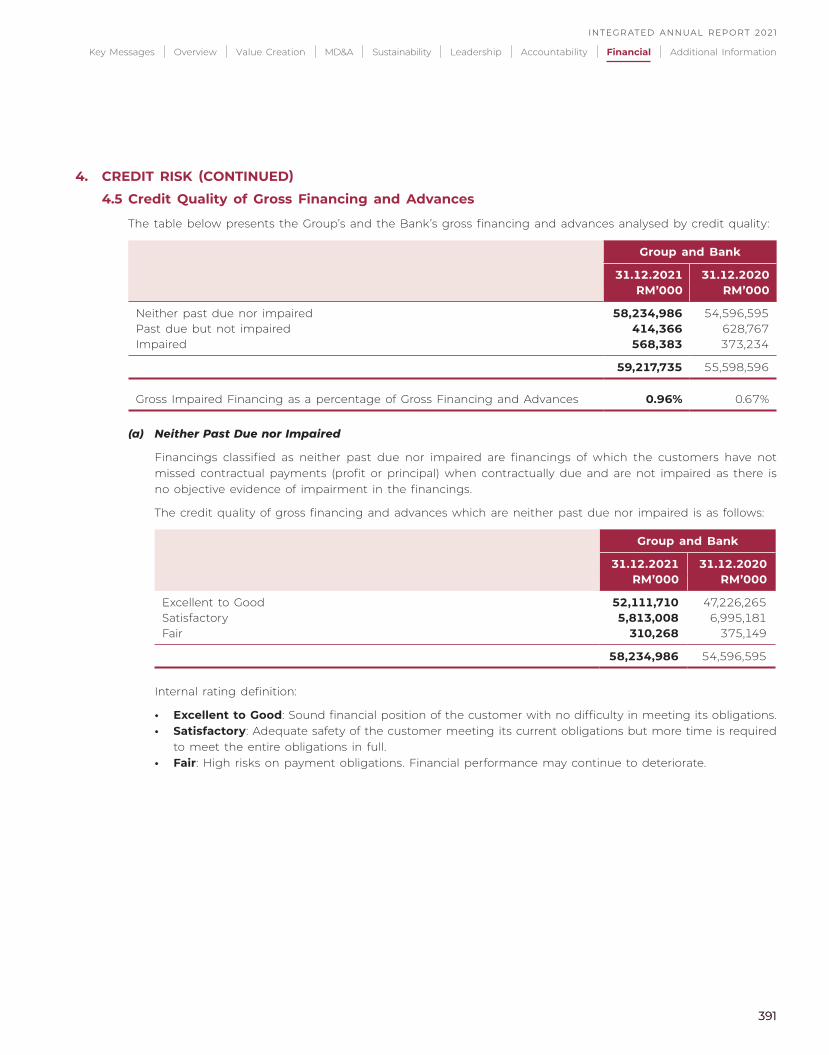
4. CREDIT RISK (CONTINUED)
4.5 Credit Quality of Gross Financing and Advances
The table below presents the Group’s and the Bank’s gross financing and advances analysed by credit quality:
Group and Bank
31.12.2021 31.12.2020RM’000 RM’000
Neither past due nor impaired 58,234,986 54,596,595 Past due but not impaired 414,366 628,767 Impaired 568,383 373,234
59,217,735 55,598,596
Gross Impaired Financing as a percentage of Gross Financing and Advances 0.96% 0.67%
(a) Neither Past Due nor Impaired
Financings classified as neither past due nor impaired are financings of which the customers have not missed contractual payments (profit or principal) when contractually due and are not impaired as there is no objective evidence of impairment in the financings.
The credit quality of gross financing and advances which are neither past due nor impaired is as follows:
Group and Bank
31.12.2021 31.12.2020RM’000 RM’000
Excellent to Good 52,111,710 47,226,265 Satisfactory 5,813,008 6,995,181 Fair 310,268 375,149
58,234,986 54,596,595
Internal rating definition:
• Excellent to Good: Sound financial position of the customer with no difficulty in meeting its obligations. • Satisfactory: Adequate safety of the customer meeting its current obligations but more time is required
to meet the entire obligations in full. • Fair: High risks on payment obligations. Financial performance may continue to deteriorate.
INTEGR ATED ANNUAL REPORT 2021
391
Key Messages Overview Value Creation MD&A Sustainability Leadership Accountability Financial Additional Information
391

4. CREDIT RISK (CONTINUED)
4.5 Credit Quality of Gross Financing and Advances (continued)
(b) Past Due but Not Impaired
Financings classified as past due but not impaired are financings of which their contractual profit or principal payments are past due, but the Group and the Bank believe that impairment is not appropriate on the basis of the level of collateral available and/or the stage of collection amounts owed to the Group and the Bank.
Analysis of the past due but not impaired financing and advances by ageing:
Group and Bank
31.12.2021 31.12.2020By ageing RM’000 RM’000
Month-in-arrears 1 217,722 429,323 Month-in-arrears 2 196,644 199,444
414,366 628,767
Analysis of the past due but not impaired financing and advances by sector:
Group and Bank
31.12.2021 31.12.2020RM’000 RM’000
Primary agriculture – – Mining and quarrying – 3,615 Manufacturing (including agro-based) 9,910 761Electricity, gas and water – – Wholesale & retail trade, and hotels & restaurants 667 23,195 Construction 342 8,215 Real estate – 136Transport, storage and communications 25,536 38,370 Finance, insurance and business activities 183 8,228 Education, health and others 27 2,424 Household sectors 377,701 543,823 Other sectors – –
414,366 628,767
PILLAR 3 DISCLOSUREas at 31 December 2021
BANK ISL AM MAL AYSIA BERHAD
392

4. CREDIT RISK (CONTINUED)
4.5 Credit Quality of Gross Financing and Advances (continued)
(c) Impaired Financing and Advances
A financing is classified as impaired when the principal or profit or both are past due for three months or more, or where a financing is in arrears for less than three months, but the financing exhibits indications of significant credit weakness.
The financing or group of financings is deemed to be impaired if, and only if, there is objective evidence of impairment as a result of one or more events that have occurred after the initial recognition of the financing (a ‘loss event’) and that the loss event has an impact on the estimated future cash flows of the financing or group of financings that can be reliably estimated.
The Group and the Bank first assess individually whether the objective evidence of impairment exists individually for financings which are individually significant, and collectively for financings which are not individually significant. If it is determined that no objective evidence of impairment exists for an individually assessed financing, the financing is included in a group of financings with similar credit risk characteristic and collectively assessed for impairment.
If there is objective evidence that an impairment loss has been incurred, the amount of the loss is measured as the difference between the financing’s carrying amount and the present value of the estimated future cash flows. The carrying amount of the financing is reduced through the use of an allowance account and the amount of the loss is recognised in the statement of profit or loss.
Group and Bank
31.12.2021 31.12.2020Impairment financing by assessment type: RM’000 RM’000
Individually Assessed 423,603 219,160of which:
Month-in-Arrears 0 268,316 23,780 Month-in-Arrears 1 3,478 6,659 Month-in-Arrears 2 1,479 17,010 Month-in-Arrears 3 and above 150,330 171,711
Collectively Assessed 144,780 154,074
568,383 373,234
INTEGR ATED ANNUAL REPORT 2021
393
Key Messages Overview Value Creation MD&A Sustainability Leadership Accountability Financial Additional Information
393

4. CREDIT RISK (CONTINUED)
4.5 Credit Quality of Gross Financing and Advances (continued)
(c) Impaired Financing and Advances (continued)
31 December 2021RM‘000
Impaired Financing
at 31.12.2021
Individual Assessment Allowance
Collective Assessment
Allowance at
31.12.2021
Total Impairment Allowances
for Financing
At 31.12.2021
Individual Assessment
as at 01.01.2021
Net Charge for the
Financial Year
Amounts Written Off/
Other Movements
Individual Assessment
as at 31.12.2021
Primary Agriculture – – – – – 14,579 14,579 Mining and Quarrying – – – – – 2,887 2,887 Manufacturing (including
Agro-based) 10,307 6,775 1,578 (6,439) 1,914 104,621 106,535 Electricity, Gas and Water – – – – – 43,233 43,233 Wholesale & Retail Trade and
Restaurants & Hotels 76,992 23,765 5,868 (23,116) 6,517 48,216 54,733 Construction 285,246 14,432 187,722 (5,810) 196,344 74,274 270,618 Real Estate – – – – – – –Transport, Storage and
Communication 15,311 4,567 55 (3,210) 1,412 35,947 37,359 Finance, Insurance and
Business Services 5,932 258 (257) – – 92,613 92,613 Education, Health and Others 1,391 519 (369) – 150 19,286 19,436 Household Sectors 173,204 14,879 482 (745) 14,617 407,356 421,973 Other Sectors – – – – – – –
Total 568,383 65,195 195,079 (39,320) 220,954 843,012 1,063,966
PILLAR 3 DISCLOSUREas at 31 December 2021
BANK ISL AM MAL AYSIA BERHAD
394

4. CREDIT RISK (CONTINUED)
4.5 Credit Quality of Gross Financing and Advances (continued)
(c) Impaired Financing and Advances (continued)
31 December 2020 RM‘000
Impaired Financing
at 31.12.2020
Individual Assessment Allowance
Collective Assessment
Allowance at
31.12.2020
Total Impairment Allowances
for Financing
At 31.12.2020
Individual Assessment
as at 01.01.2020
Net Charge for the
Financial Year
Amounts Written Off/
Other Movements
Individual Assessment
as at 31.12.2020
Primary Agriculture – – – – – 18,882 18,882 Mining and Quarrying – – – – – 2,411 2,411 Manufacturing (including
Agro-based) 28,329 25,797 (3,555) (15,469) 6,775 32,316 39,091 Electricity, Gas and Water – – – – – 65,708 65,708 Wholesale & Retail Trade and
Restaurants & Hotels 89,812 23,494 3,335 (3,064) 23,765 29,556 53,321 Construction 36,220 11,133 5,358 (2,059) 14,432 89,865 104,297 Real Estate – – – – – – –Transport, Storage and
Communication 17,801 4,349 218 – 4,567 34,248 38,815 Finance, Insurance and
Business Services 6,140 – 258 – 258 106,156 106,414 Education, Health and Others 3,969 3,676 (1,394) (1,763) 519 15,631 16,150 Household Sectors 190,963 19,598 (3,694) (1,024) 14,879 467,993 482,872 Other Sectors – – – – – – –
Total 373,234 88,047 526 (23,379) 65,195 862,766 927,961
INTEGR ATED ANNUAL REPORT 2021
395
Key Messages Overview Value Creation MD&A Sustainability Leadership Accountability Financial Additional Information
395

4. CREDIT RISK (CONTINUED)
4.5 Credit Quality of Gross Financing and Advances (continued)
(d) Gross Financing and Advances – Exposures by Geographical Areas
31 December 2021 RM‘000
Gross Financing
Of Which:
Individual Allowances
Collective Allowances
Past Due But Not
Impaired Financing
Impaired Financing
Central Region 26,946,146 215,749 395,781 210,034 436,151 Eastern Region 9,368,591 58,516 68,146 10,063 157,554 Northern Region 8,066,342 43,096 74,751 – 93,755 Southern Region 10,247,330 73,033 17,458 857 105,491 East Malaysia Region 4,589,326 23,972 12,247 – 50,061
Grand Total 59,217,735 414,366 568,383 220,954 843,012
31 December 2020 RM‘000
Gross Financing
Of Which:
Individual Allowances
Collective Allowances
Past Due But Not
Impaired Financing
Impaired Financing
Central Region 25,745,132 326,811 174,617 47,606 496,983 Eastern Region 8,757,468 80,907 86,291 15,481 94,975 Northern Region 7,431,066 93,699 78,220 – 93,343 Southern Region 9,416,361 88,776 19,167 2,108 89,166 East Malaysia Region 4,248,569 38,574 14,939 – 88,299
Grand Total 55,598,596 628,767 373,234 65,195 862,766
PILLAR 3 DISCLOSUREas at 31 December 2021
BANK ISL AM MAL AYSIA BERHAD
396

4. CREDIT RISK (CONTINUED)
4.6 Gross Credit Exposures
(a) Geographic Distribution of Credit Exposures
(i) Group
31 December 2021Central Region
Eastern Region
Northern Region
SouthernRegion
East Malaysia
Region TotalExposure Class RM’000 RM’000 RM’000 RM’000 RM’000 RM’000
Credit Risk
On-Balance Sheet ExposuresSovereign/Central Banks 9,052,249 – – – – 9,052,249 Public Sector Entities 1,128,435 128,848 87,712 329,923 26,177 1,701,095 Banks, Developments Financial
Institutions and Multilateral Development Banks 1,025,652 299 – 75 – 1,026,026
Corporate 16,303,740 1,080,165 728,181 1,464,805 783,541 20,360,432 Regulatory Retail 8,208,436 3,790,825 3,296,613 3,285,672 2,244,038 20,825,584 Residential Mortgages 8,764,194 4,344,115 3,924,785 5,174,453 1,536,322 23,743,869 Higher Risk Assets 1,921 438 217 98 668 3,342 Other Assets 1,936,666 – – – 611 1,937,277
Total for On-Balance Sheet Exposures 46,421,293 9,344,690 8,037,508 10,255,026 4,591,357 78,649,874
Off-Balance Sheet ExposuresCredit-related Exposures 1,255,100 81,379 70,193 109,475 143,976 1,660,123 Derivative Financial Instruments 116,799 – – – – 116,799
Total for Off-Balance Sheet Exposures 1,371,899 81,379 70,193 109,475 143,976 1,776,922
Total On and Off-Balance Sheet Exposures 47,793,192 9,426,069 8,107,701 10,364,501 4,735,333 80,426,796
INTEGR ATED ANNUAL REPORT 2021
397
Key Messages Overview Value Creation MD&A Sustainability Leadership Accountability Financial Additional Information
397

4. CREDIT RISK (CONTINUED)
4.6 Gross Credit Exposures (continued)
(a) Geographic Distribution of Credit Exposures (continued)
(i) Group (continued)
31 December 2020Central Region
Eastern Region
Northern Region
SouthernRegion
East Malaysia
Region TotalExposure Class RM’000 RM’000 RM’000 RM’000 RM’000 RM’000
Credit Risk
On-Balance Sheet ExposuresSovereign/Central Banks 8,165,933 – – – – 8,165,933 Public Sector Entities 1,060,099 143,574 46,935 344,404 5,628 1,600,640 Banks, Developments Financial
Institutions and Multilateral Development Banks 510,556 330 – 90 – 510,976
Corporate 16,313,849 1,058,669 703,735 1,469,709 789,298 20,335,260 Regulatory Retail 7,778,636 3,565,676 3,034,206 3,072,934 2,082,322 19,533,774 Residential Mortgages 8,184,067 3,965,812 3,627,072 4,534,191 1,366,731 21,677,873 Higher Risk Assets 2,083 620 141 118 821 3,783 Other Assets 1,800,176 – – – 2,721 1,802,897
Total for On-Balance Sheet Exposures 43,815,399 8,734,681 7,412,089 9,421,446 4,247,521 73,631,136
Off-Balance Sheet ExposuresCredit-related Exposures 1,217,355 60,569 40,546 120,305 48,174 1,486,949 Derivative Financial Instruments 148,631 – – – – 148,631
Total for Off-Balance Sheet Exposures 1,365,986 60,569 40,546 120,305 48,174 1,635,580
Total On and Off-Balance Sheet Exposures 45,181,385 8,795,250 7,452,635 9,541,751 4,295,695 75,266,716
PILLAR 3 DISCLOSUREas at 31 December 2021
BANK ISL AM MAL AYSIA BERHAD
398

4. CREDIT RISK (CONTINUED)
4.6 Gross Credit Exposures (continued)
(a) Geographic Distribution of Credit Exposures (continued)
(ii) Bank
31 December 2021Central Region
Eastern Region
Northern Region
SouthernRegion
East Malaysia
Region TotalExposure Class RM’000 RM’000 RM’000 RM’000 RM’000 RM’000
Credit Risk
On-Balance Sheet ExposuresSovereign/Central Banks 9,052,249 – – – – 9,052,249 Public Sector Entities 1,128,435 128,848 87,712 329,923 26,177 1,701,095 Banks, Developments Financial
Institutions and Multilateral Development Banks 1,007,181 299 – 75 – 1,007,555
Corporate 16,303,740 1,080,165 728,182 1,464,805 783,541 20,360,433 Regulatory Retail 8,208,436 3,790,825 3,296,612 3,285,672 2,244,038 20,825,583 Residential Mortgages 8,764,194 4,344,115 3,924,785 5,174,453 1,536,322 23,743,869 Higher Risk Assets 1,921 438 217 98 668 3,342 Other Assets 1,846,277 – – – 611 1,846,888
Total for On-Balance Sheet Exposures 46,312,433 9,344,690 8,037,508 10,255,026 4,591,357 78,541,014
Off-Balance Sheet ExposuresCredit-related Exposures 1,255,100 81,379 70,193 109,475 143,976 1,660,123 Derivative Financial Instruments 116,799 – – – – 116,799
Total for Off-Balance Sheet Exposures 1,371,899 81,379 70,193 109,475 143,976 1,776,922
Total On and Off-Balance Sheet Exposures 47,684,332 9,426,069 8,107,701 10,364,501 4,735,333 80,317,936
INTEGR ATED ANNUAL REPORT 2021
399
Key Messages Overview Value Creation MD&A Sustainability Leadership Accountability Financial Additional Information
399

4. CREDIT RISK (CONTINUED)
4.6 Gross Credit Exposures (continued)
(a) Geographic Distribution of Credit Exposures (continued)
(ii) Bank (continued)
31 December 2020Central Region
Eastern Region
Northern Region
SouthernRegion
East Malaysia
Region TotalExposure Class RM’000 RM’000 RM’000 RM’000 RM’000 RM’000
Credit Risk
On-Balance Sheet ExposuresSovereign/Central Banks 8,165,933 – – – – 8,165,933 Public Sector Entities 1,060,099 143,574 46,935 344,404 5,628 1,600,640 Banks, Developments Financial
Institutions and Multilateral Development Banks 510,473 330 – 90 – 510,893
Corporate 16,313,849 1,058,669 703,735 1,469,709 789,298 20,335,260 Regulatory Retail 7,778,636 3,565,676 3,034,206 3,072,934 2,082,322 19,533,774 Residential Mortgages 8,184,067 3,965,812 3,627,072 4,534,191 1,366,731 21,677,873 Higher Risk Assets 2,083 620 141 118 821 3,783 Other Assets 1,783,533 – – – 2,722 1,786,255
Total for On-Balance Sheet Exposures 43,798,673 8,734,681 7,412,089 9,421,446 4,247,522 73,614,411
Off-Balance Sheet ExposuresCredit-related Exposures 1,217,355 60,569 40,546 120,305 48,174 1,486,949 Derivative Financial Instruments 148,631 – – – – 148,631
Total for Off-Balance Sheet Exposures 1,365,986 60,569 40,546 120,305 48,174 1,635,580
Total On and Off-Balance Sheet Exposures 45,164,659 8,795,250 7,452,635 9,541,751 4,295,696 75,249,991
PILLAR 3 DISCLOSUREas at 31 December 2021
BANK ISL AM MAL AYSIA BERHAD
400

4.
CR
EDIT
RIS
K (
CO
NTI
NU
ED)
4.6
Gro
ss C
red
it E
xpos
ure
s (c
onti
nu
ed)
(b)
Dis
trib
utio
n of
Cre
dit
Exp
osur
es b
y Se
ctor
(i)
Gro
up
31 D
ecem
ber 2
021
Prim
ary
Agric
ultur
e
Minin
g an
d Qu
arryin
gMa
nufac
turing
Electr
icity,
Ga
s and
W
ater
Who
lesale
&
Retai
l Tra
de an
d R
estau
rant
& Ho
tels
Const
ructio
nRe
al Es
tate
Trans
port,
Sto
rage &
Comm
unica
tion
Finan
ce,
Insur
ance
an
d Bu
sines
s Se
rvice
s
Educ
ation
, He
alth
and
Othe
rsHo
useh
old
Secto
rOt
her
Secto
rsTo
talEx
posu
re C
lass
RM‘00
0RM
‘000
RM‘00
0RM
‘000
RM‘00
0RM
‘000
RM‘00
0RM
‘000
RM‘00
0RM
‘000
RM‘00
0RM
‘000
RM‘00
0
Cred
it Ri
sk
On-B
alanc
e Sh
eet
Expo
sure
sSo
vere
ign/
Cent
ral
Bank
s –
– –
– –
– –
– 3,
789,6
85
– –
5,26
2,565
9,
052,2
50
Publ
ic Se
ctor
Ent
ities
1,162
–
– –
– 58
,695
8,83
2 –
234,6
44
1,39
7,518
244
– 1,
701,0
95
Bank
s, De
velop
men
ts Fin
ancia
l Ins
titut
ions
and
Mult
ilate
ral
Deve
lopm
ent B
anks
– –
– –
– –
– –
943,0
22
– 37
4 8
2,629
1,
026,0
25
Corp
orat
e 1,
079,6
83
64,20
5 96
6,355
2,
793,9
13 70
2,350
3,
739,4
17 1,
885,9
32
1,95
6,311
4,09
3,785
8
34,97
0 14
3,296
2,
100,21
6 20
,360,4
33
Regu
lator
y Re
tail
6,42
6 3,
945
52,60
6 1,
023
157,1
89
103,2
32
42,6
37
29,64
5 8
1,752
4
8,037
20
,294,2
12 4
,880
20,82
5,584
Re
siden
tial M
ortg
ages
– –
1,00
5 –
– –
– –
– –
23,74
2,863
–
23,74
3,868
Hi
gher
Risk
Ass
ets
– –
– –
– –
– –
– –
3,34
2 –
3,34
2 Ot
her A
sset
s –
– –
– –
– –
– –
– –
1,93
7,277
1,
937,2
77
Tota
l for
On-
Balan
ce
Shee
t Exp
osur
es 1,
087,2
71 6
8,150
1,
019,96
6 2,
794,9
36
859
,539
3,90
1,344
1,
937,4
01 1,
985,9
56
9,142
,888
2,28
0,525
44
,184,3
31 9,
387,5
67 7
8,649
,874
Off-B
alanc
e Sh
eet
Expo
sure
sCr
edit-
relat
ed
Expo
sure
s 25
,443
7,189
11
0,873
70
,971
103,1
72
409
,607
10,37
2 8
9,420
10
9,493
18
4,349
38
1,302
15
7,932
1,
660,1
23
Deriv
ative
Fina
ncial
In
strum
ents
– –
361
– 24
,175
37
– –
27,77
3 50
,613
– 13
,840
116,7
99
Tota
l for
Off-
Balan
ce
Shee
t Exp
osur
es25
,443
7,189
11
1,234
70
,971
127,3
47
409
,644
10,37
2 8
9,420
13
7,266
23
4,962
38
1,302
17
1,772
1,
776,9
22
Tota
l On
and
Off-B
alanc
e Sh
eet
Expo
sure
s 1,
112,71
4 75
,339
1,131
,200
2,86
5,907
98
6,886
4
,310,9
88
1,94
7,773
2,
075,3
76
9,28
0,154
2,
515,48
7 4
4,565
,633
9,55
9,339
80,4
26,79
6
INTEGR ATED ANNUAL REPORT 2021
401
Key Messages Overview Value Creation MD&A Sustainability Leadership Accountability Financial Additional Information
401

4.
CR
EDIT
RIS
K (
CO
NTI
NU
ED)
4.6
Gro
ss C
red
it E
xpos
ure
s (c
onti
nu
ed)
(b)
Dis
trib
utio
n of
Cre
dit
Exp
osur
es b
y Se
ctor
(con
tinu
ed)
(i)
Gro
up (c
onti
nued
)
31 D
ecem
ber 2
020
Prim
ary
Agric
ultur
e
Minin
g an
d Qu
arryin
gMa
nufac
turing
Electr
icity,
Ga
s and
W
ater
Who
lesale
&
Retai
l Tra
de an
d R
estau
rant
& Ho
tels
Const
ructio
nRe
al Es
tate
Trans
port,
Sto
rage &
Comm
unica
tion
Finan
ce,
Insur
ance
an
d Bu
sines
s Se
rvice
s
Educ
ation
, He
alth
and
Othe
rsHo
useh
old
Secto
rOt
her
Secto
rsTo
talEx
posu
re C
lass
RM‘00
0RM
‘000
RM‘00
0RM
‘000
RM‘00
0RM
‘000
RM‘00
0RM
‘000
RM‘00
0RM
‘000
RM‘00
0RM
‘000
RM‘00
0
Cred
it Ri
sk
On-B
alanc
e Sh
eet
Expo
sure
sSo
vere
ign/
Cent
ral
Bank
s –
–
–
–
–
–
–
–
5,2
46,06
9 –
–
2,9
19,86
4 8,
165,93
3 Pu
blic
Sect
or E
ntitie
s95
5 –
112
,118
–
–
5,019
–
–
197,84
2 1,2
84,42
3 28
3–
1,600
,640
Bank
s, De
velop
men
ts Fin
ancia
l Ins
titut
ions
and
Mult
ilate
ral
Deve
lopm
ent B
anks
–
–
–
–
–
– –
–
35
8,688
100
,010
421
51,85
7510
,976
Corp
orat
e1,11
9,668
64
,577
1,099
,232
3,315,
698
660,8
32
3,539
,328
2,015,
830
2,024
,878
3,869
,984
598,0
72
135
,552
1,891,
609
20,33
5,260
Re
gulat
ory
Reta
il1,3
48
3,08
6 32
,791
866
63,85
0 62
,219
35,31
8 19,
599
72,75
0 44
,918
19,1
93,79
1 3,
238
19,53
3,774
Re
siden
tial M
ortg
ages
–
353
523
–
–
111 –
–
–
–
21
,676,8
86
–
21,67
7,873
Hi
gher
Risk
Ass
ets
–
–
–
–
–
–
–
–
–
–
3,78
3 –
3,
783
Othe
r Ass
ets
–
–
–
–
–
–
–
–
–
–
–
1,802
,897
1,802
,897
Tota
l for
On-
Balan
ce
Shee
t Exp
osur
es1,12
1,971
68,01
61,2
44,66
4 3,3
16,56
4 72
4,682
3,6
06,67
7 2,0
51,148
2,0
44,47
7 9,7
45,33
3 2,0
27,42
3 41,
010,71
6 6,6
69,46
5 73
,631,13
6
Off-B
alanc
e Sh
eet
Expo
sure
s
Cr
edit-
relat
ed
Expo
sure
s25
,804
12,9
8699
,159
58,42
9 81,
990
383,3
33
64,45
9 64
,311
89,116
177
,241
259,1
66
170,95
5 1,4
86,94
9 De
rivat
ive F
inanc
ial
Instr
umen
ts –
–
72
–
64,88
6 60
0 –
– 15,
854
37,79
5 –
29,42
4 148
,631
Tota
l for
Off-
Balan
ce
Shee
t Exp
osur
es25
,804
12,98
6 99
,231
58,42
9 146
,876
383,9
33
64,45
9 64
,311
104,97
0 215
,036
259,1
66
200,3
79
1,635
,580
Tota
l On
and
Off-B
alanc
e Sh
eet
Expo
sure
s 1,14
7,775
81,00
2 1,3
43,89
5 3,3
74,99
3 87
1,558
3,9
90,61
0 2,1
15,60
7 2,1
08,78
8 9,8
50,30
3 2,2
42,45
9 41,
269,8
82
6,869
,844
75,26
6,716
PILLAR 3 DISCLOSUREas at 31 December 2021
BANK ISL AM MAL AYSIA BERHAD
402

4.
CR
EDIT
RIS
K (
CO
NTI
NU
ED)
4.6
Gro
ss C
red
it E
xpos
ure
s (c
onti
nu
ed)
(b)
Dis
trib
utio
n of
Cre
dit
Exp
osur
es b
y Se
ctor
(con
tinu
ed)
(ii)
Ban
k
31 D
ecem
ber 2
021
Prim
ary
Agric
ultur
e
Minin
g an
d Qu
arryin
gMa
nufac
turing
Electr
icity,
Ga
s and
W
ater
Who
lesale
&
Retai
l Tra
de an
d R
estau
rant
& Ho
tels
Const
ructio
nRe
al Es
tate
Trans
port,
Sto
rage &
Comm
unica
tion
Finan
ce,
Insur
ance
an
d Bu
sines
s Se
rvice
s
Educ
ation
, He
alth
and
Othe
rsHo
useh
old
Secto
rOt
her
Secto
rsTo
talEx
posu
re C
lass
RM‘00
0RM
‘000
RM‘00
0RM
‘000
RM‘00
0RM
‘000
RM‘00
0RM
‘000
RM‘00
0RM
‘000
RM‘00
0RM
‘000
RM‘00
0
Cred
it Ri
sk
On-B
alanc
e Sh
eet
Expo
sure
sSo
vere
ign/
Cent
ral
Bank
s –
–
–
–
–
–
–
–
3,
789,6
85
–
–
5,26
2,565
9,
052,2
50
Publ
ic Se
ctor
Ent
ities
1,162
–
–
–
–
58
,695
8,83
2 –
23
4,643
1,
397,5
18 24
4 –
1,
701,0
94
Bank
s, De
velop
men
ts Fin
ancia
l Ins
titut
ions
and
Mult
ilate
ral
Deve
lopm
ent B
anks
–
–
–
–
–
–
–
–
943,0
23
–
374
64,15
8 1,
007,5
55
Corp
orat
e 1,
079,6
83
64,20
5 96
6,355
2,
793,9
13 70
2,350
3,
739,4
17 1,
885,9
32
1,95
6,311
4,09
3,785
8
34,96
9 14
3,296
2,
100,21
6 20
,360,4
32
Regu
lator
y Re
tail
6,42
6 3,
945
52,60
6 1,
023
157,1
90
103,2
32
42,6
37
29,64
5 8
1,752
4
8,037
20
,294,2
12 4
,880
20,82
5,585
Re
siden
tial M
ortg
ages
–
–
1,00
5 –
–
–
–
–
–
–
23,7
42,86
3 –
23,7
43,86
8 Hi
gher
Risk
Ass
ets
–
–
–
–
–
–
–
–
–
–
3,34
2 –
3,
342
Othe
r Ass
ets
–
–
–
–
–
–
–
–
–
–
–
1,84
6,888
1,
846,8
88
Tota
l for
On-
Balan
ce
Shee
t Exp
osur
es 1,
087,2
71 6
8,150
1,
019,96
6 2,
794,9
36
859
,540
3,90
1,344
1,
937,4
01 1,
985,9
56
9,142
,888
2,28
0,524
44
,184,3
31 9,
278,7
07
78,54
1,014
Off-B
alanc
e Sh
eet
Expo
sure
sCr
edit-
relat
ed
Expo
sure
s 25
,443
7,189
11
0,873
70
,971
103,1
72
409
,607
10,37
2 8
9,420
10
9,493
18
4,349
38
1,302
15
7,932
1,
660,1
23
Deriv
ative
Fina
ncial
In
strum
ents
–
–
361
–
24,17
5 37
–
–
27
,773
50,61
3 –
13
,840
116,7
99
Tota
l for
Off-
Balan
ce
Shee
t Exp
osur
es 25
,443
7,189
11
1,234
70
,971
127,3
47
409
,644
10,37
2 8
9,420
13
7,266
23
4,962
38
1,302
17
1,772
1,
776,9
22
Tota
l On
and
Off-B
alanc
e Sh
eet
Expo
sure
s 1,
112,71
4 75
,339
1,131
,200
2,86
5,907
98
6,887
4
,310,9
88
1,94
7,773
2,
075,3
76
9,28
0,154
2,
515,48
6 4
4,565
,633
9,45
0,479
80
,317,9
36
INTEGR ATED ANNUAL REPORT 2021
403
Key Messages Overview Value Creation MD&A Sustainability Leadership Accountability Financial Additional Information
403

4.
CR
EDIT
RIS
K (
CO
NTI
NU
ED)
4.6
Gro
ss C
red
it E
xpos
ure
s (c
onti
nu
ed)
(b)
Dis
trib
utio
n of
Cre
dit
Exp
osur
es b
y Se
ctor
(con
tinu
ed)
(ii)
Ban
k (c
onti
nued
)
31 D
ecem
ber 2
020
Prim
ary
Agric
ultur
e
Minin
g an
d Qu
arryin
gMa
nufac
turing
Electr
icity,
Ga
s and
W
ater
Who
lesale
&
Retai
l Tra
de an
d R
estau
rant
& Ho
tels
Const
ructio
nRe
al Es
tate
Trans
port,
Sto
rage &
Comm
unica
tion
Finan
ce,
Insur
ance
an
d Bu
sines
s Se
rvice
s
Educ
ation
, He
alth
and
Othe
rsHo
useh
old
Secto
rOt
her
Secto
rsTo
talEx
posu
re C
lass
RM‘00
0RM
‘000
RM‘00
0RM
‘000
RM‘00
0RM
‘000
RM‘00
0RM
‘000
RM‘00
0RM
‘000
RM‘00
0RM
‘000
RM‘00
0
Cred
it Ri
sk
On-B
alanc
e Sh
eet
Expo
sure
sSo
vere
ign/
Cent
ral
Bank
s –
–
–
–
–
–
–
–
5
,246,0
69
–
–
2,919,
864
8,165
,933
Publ
ic Se
ctor
Ent
ities
955
–
112,118
–
–
5,0
19 –
–
197
,842
1,28
4,423
28
3–
1,600
,640
Bank
s, De
velop
men
ts Fin
ancia
l Ins
titut
ions
and
Mult
ilate
ral
Deve
lopm
ent B
anks
–
–
–
–
–
–
–
358,6
88100
,010
42
1 5
1,774
510,89
3Co
rpor
ate
1,119,
668
64,57
7 1
,099,2
32
3,315
,698
660,8
32
3,539
,328
2,01
5,830
2,0
24,87
8 3,8
69,98
559
8,072
135
,552
1,89
1,608
20,33
5,260
Regu
lator
y Re
tail
1,348
3,
086
32,7
91 86
6 63
,850
62,21
9 35
,318
19,5
99
72,7
50
44,91
8 1
9,193
,791
3,23
8 1
9,533
,774
Resid
entia
l Mor
tgag
es –
35
3 5
23
–
–
111
–
–
–
–
21,67
6,886
–
21,67
7,873
High
er R
isk A
sset
s –
–
–
–
–
–
–
–
–
–
3,7
83
–
3,783
Othe
r Ass
ets
–
–
–
–
–
–
–
–
–
–
–
1,78
6,255
1,786
,255
Tota
l for
On-
Balan
ce
Shee
t Exp
osur
es1,12
1,971
68,01
6 1,2
44,66
4 3,3
16,56
4 72
4,682
3,6
06,67
7 2,0
51,148
2,0
44,47
7 9,
745,3
34
2,027
,423
41,010
,716
6,652
,739
73,61
4,411
Off-B
alanc
e Sh
eet
Expo
sure
s
–
Cred
it-re
lated
Ex
posu
res
25,80
5 12,
986
99,15
9 58
,429
81,99
0 38
3,333
64
,458
64,31
1 89
,116
177,24
1 25
9,166
170
,955
1,486
,949
Deriv
ative
Fina
ncial
In
strum
ents
– –
72
– 64
,886
600
– –
15,85
4 37
,795
– 29
,424
148,63
1
Tota
l for
Off-
Balan
ce
Shee
t Exp
osur
es25
,805
12,98
6 99
,231
58,42
9 146
,876
383,9
33
64,45
8 64
,311
104,9
70
215,03
6 25
9,166
20
0,379
1,6
35,58
0
Tota
l On
and
Off-B
alanc
e Sh
eet
Expo
sure
s 1,14
7,776
81,
002
1,343
,895
3,374
,993
871,5
58
3,990
,610
2,115,
606
2,108
,788
9,85
0,304
2,2
42,45
941,
269,8
82
6,853
,118
75,24
9,991
PILLAR 3 DISCLOSUREas at 31 December 2021
BANK ISL AM MAL AYSIA BERHAD
404

4. CREDIT RISK (CONTINUED)
4.6 Gross Credit Exposures (continued)
(c) Residual Contractual Maturity Breakdown
(i) Group
31 December 2021 Up to 1 Year > 1 – 5 Years Over 5 Years TotalExposure Class RM’000 RM’000 RM’000 RM’000
Credit Risk
On-Balance Sheet ExposuresSovereign/Central Banks 4,574,778 2,811,303 1,666,169 9,052,250 Public Sector Entities 106,851 814,612 779,632 1,701,095 Banks, Developments Financial
Institutions and Multilateral Development Banks 823,210 200,384 2,432 1,026,026
Corporate 5,152,471 6,005,414 9,202,547 20,360,432 Regulatory Retail 134,369 3,018,105 17,673,110 20,825,584 Residential Mortgages 17,442 136,540 23,589,887 23,743,869 Higher Risk Assets – 34 3,307 3,341 Other Assets 457,052 – 1,480,225 1,937,277
Total for On-Balance Sheet Exposures 11,266,173 12,986,392 54,397,309 78,649,874
Off-Balance Sheet ExposuresCredit-related Exposures 656,789 448,316 555,018 1,660,123 Derivative Financial Instruments 114,431 2,368 – 116,799
Total for Off-Balance Sheet Exposures 771,220 450,684 555,018 1,776,922
Total On and Off-Balance Sheet Exposures 12,037,393 13,437,076 54,952,327 80,426,796
INTEGR ATED ANNUAL REPORT 2021
405
Key Messages Overview Value Creation MD&A Sustainability Leadership Accountability Financial Additional Information
405

4. CREDIT RISK (CONTINUED)
4.6 Gross Credit Exposures (continued)
(c) Residual Contractual Maturity Breakdown (continued)
(i) Group (continued)
31 December 2020 Up to 1 Year > 1 – 5 Years Over 5 Years TotalExposure Class RM’000 RM’000 RM’000 RM’000
Credit Risk
On-Balance Sheet ExposuresSovereign/Central Banks 5,025,763 1,307,472 1,832,698 8,165,933 Public Sector Entities 126,850 672,694 801,096 1,600,640 Banks, Developments Financial
Institutions and Multilateral Development Banks 307,302 201,040 2,634 510,976
Corporate 3,418,150 6,616,986 10,300,124 20,335,260 Regulatory Retail 60,071 3,035,247 16,438,456 19,533,774 Residential Mortgages 10,535 136,323 21,531,015 21,677,873 Higher Risk Assets – 14 3,769 3,783 Other Assets 351,256 – 1,451,641 1,802,897
Total for On-Balance Sheet Exposures 9,299,927 11,969,776 52,361,433 73,631,136
Off-Balance Sheet ExposuresCredit-related Exposures 512,097 581,139 393,713 1,486,949 Derivative Financial Instruments 143,217 5,414 – 148,631
Total for Off-Balance Sheet Exposures 655,314 586,553 393,713 1,635,580
Total On and Off-Balance Sheet Exposures 9,955,241 12,556,329 52,755,146 75,266,716
PILLAR 3 DISCLOSUREas at 31 December 2021
BANK ISL AM MAL AYSIA BERHAD
406

4. CREDIT RISK (CONTINUED)
4.6 Gross Credit Exposures (continued)
(c) Residual Contractual Maturity Breakdown (continued)
(ii) Bank
31 December 2021 Up to 1 Year > 1 – 5 Years Over 5 Years TotalExposure Class RM’000 RM’000 RM’000 RM’000
Credit Risk
On-Balance Sheet ExposuresSovereign/Central Banks 4,574,778 2,811,303 1,666,169 9,052,250 Public Sector Entities 106,851 814,612 779,632 1,701,095 Banks, Developments Financial
Institutions and Multilateral Development Banks 804,739 200,384 2,432 1,007,555
Corporate 5,152,471 6,005,414 9,202,547 20,360,432 Regulatory Retail 134,369 3,018,105 17,673,110 20,825,584 Residential Mortgages 17,442 136,540 23,589,887 23,743,869 Higher Risk Assets – 34 3,307 3,341 Other Assets 366,663 – 1,480,225 1,846,888
Total for On-Balance Sheet Exposures 11,157,313 12,986,392 54,397,309 78,541,014
Off-Balance Sheet ExposuresCredit-related Exposures 656,789 448,316 555,018 1,660,123 Derivative Financial Instruments 114,431 2,368 – 116,799
Total for Off-Balance Sheet Exposures 771,220 450,684 555,018 1,776,922
Total On and Off-Balance Sheet Exposures 11,928,533 13,437,076 54,952,327 80,317,936
INTEGR ATED ANNUAL REPORT 2021
407
Key Messages Overview Value Creation MD&A Sustainability Leadership Accountability Financial Additional Information
407

4. CREDIT RISK (CONTINUED)
4.6 Gross Credit Exposures (continued)
(c) Residual Contractual Maturity Breakdown
(ii) Bank (continued)
31 December 2020 Up to 1 Year > 1 – 5 Years Over 5 Years TotalExposure Class RM’000 RM’000 RM’000 RM’000
Credit Risk
On-Balance Sheet ExposuresSovereign/Central Banks 5,025,763 1,307,472 1,832,698 8,165,933 Public Sector Entities 126,850 672,694 801,096 1,600,640 Banks, Developments Financial
Institutions and Multilateral Development Banks 307,219 201,040 2,634 510,893
Corporate 3,418,150 6,616,986 10,300,124 20,335,260 Regulatory Retail 60,071 3,035,247 16,438,456 19,533,774 Residential Mortgages 10,535 136,323 21,531,015 21,677,873 Higher Risk Assets – 14 3,769 3,783 Other Assets 334,615 – 1,451,640 1,786,255
Total for On-Balance Sheet Exposures 9,283,203 11,969,776 52,361,432 73,614,411
Off-Balance Sheet ExposuresCredit-related Exposures 512,097 581,139 393,713 1,486,949 Derivative Financial Instruments 143,217 5,414 – 148,631
Total for Off-Balance Sheet Exposures 655,314 586,553 393,713 1,635,580
Total On and Off-Balance Sheet Exposures 9,938,517 12,556,329 52,755,145 75,249,991
4.7 Assignment of Risk Weights for Portfolios Under the Standardised Approach
Under the Standardised Approach, the Group makes use of credit ratings assigned by credit rating agencies in the calculation of credit risk-weighted assets. The following are the rating agencies or External Credit Assessment Institutions (“ECAI”) ratings used by the Group and are recognised by BNM as per the CAFIB Guideline:
(a) Standard & Poor’s (“S&P”)(b) Moody’s Investors Services (“MOODY’S”)(c) Fitch Ratings (“FITCH”)(d) Rating Agency Malaysia Berhad (“RAM”)(e) Malaysian Rating Corporation Berhad (“MARC”)
The ECAI ratings accorded to the following counterparty exposure classes are used in the calculation of risk-weighted assets for capital adequacy purposes:
(a) Sovereigns and central banks(b) Banking institutions(c) Corporates
PILLAR 3 DISCLOSUREas at 31 December 2021
BANK ISL AM MAL AYSIA BERHAD
408

4. CREDIT RISK (CONTINUED)
4.7 Assignment of Risk Weights for Portfolios Under the Standardised Approach (continued)
Unrated and Rated Counterparties
As a general rule, the rating specific to the credit exposure is used, i.e. the issue rating. Where no specific rating exists, the credit rating assigned to the issuer or counterparty of that particular credit exposure is used. In cases where an exposure has neither an issue nor an issuer rating, it is deemed as unrated or the rating of another rated obligation of the same counterparty may be used if the exposure is ranked at least pari passu with the obligation that is rated, as stipulated in the CAFIB Guideline.
Where a counterparty or an exposure is rated by more than one ECAI, the second highest rating is used to determine the risk weight. In cases where the credit exposures are secured by guarantees issued by eligible or rated guarantors, the risk weights similar to that of the guarantor are assigned.
The below table summarises the rules governing the assignment of risk weights under the Standardised Approach:
Rating Category S & P MOODY’S FITCH RAM MARC
1 AAA to AA- Aaa to Aa3 AAA to AA- AAA to AA3 AAA to AA-
2 A+ to A- A1 to A3 A+ to A- A1 to A3 A+ to A-
3 BBB+ to BBB- Baa1 to Baa3 BBB+ to BBB- BBB1 to BBB3 BBB+ to BBB-
4 BB+ to BB- Ba1 to Ba3 BB+ to BB- BB1 to BB3 BB+ to BB-
5 B+ to B- B1 to B3 B+ to B- B1 to B3 B+ to B-
6 CCC+ and below Caa1 and below CCC+ and below C1 and below C+ and below
The below table summarises risk weight mapping matrix for each credit quality rating category:
Rating Category
Risk Weights Based on Credit Rating of the Counterparty Exposure Class
Sovereign and Central Banks Corporate
Banking Institutions
Maturity> 6 months
Maturity<= 6 months
Maturity<= 3 months
1 0% 20% 20% 20%
20%
2 20% 50% 50% 20%3 50% 100% 50% 20%4 100% 100% 100% 50%5 100% 150% 100% 50%6 150% 150% 150% 150%
Unrated 100% 100% 50% 20%
Under CAFIB, exposures to and/or guaranteed by the Federal Government of Malaysia and Bank Negara Malaysia are accorded a preferential sovereign risk weight of 0%.
INTEGR ATED ANNUAL REPORT 2021
409
Key Messages Overview Value Creation MD&A Sustainability Leadership Accountability Financial Additional Information
409

4.
CR
EDIT
RIS
K (
CO
NTI
NU
ED)
4.7
Ass
ign
men
t of
Ris
k W
eig
hts
for
Por
tfol
ios
Un
der
th
e St
and
ard
ised
Ap
pro
ach
(co
nti
nu
ed)
The
follo
win
g p
rese
nts
th
e cr
edit
exp
osu
res
by
risk
wei
gh
ts a
fter
th
e ef
fect
of
cred
it r
isk
mit
igat
ion
of
the
Gro
up
:
(i)
As
at 3
1 D
ecem
ber
20
21
Ris
k W
eig
hts
Expo
sure
s A
fter
Net
ting
& C
redi
t R
isk
Mit
igat
ion
(CR
M)
Tota
l Ex
posu
res
Aft
er
Net
ting
&
CRM
Tot
al R
isk
Wei
ghte
d A
sset
Sov
erei
gns/
Cen
tral
Ban
ks
Publ
icSe
ctor
Enti
ties
Ban
ks,
DFI
S &
MD
BS
Corp
orat
eRe
gula
tory
R
etai
lR
esid
enti
al
Mor
tgag
es
Hig
her
Ris
k A
sset
s O
ther
A
sset
sR
M’0
00 R
M’0
00
RM
’000
R
M’0
00
RM
’000
R
M’0
00
RM
’000
R
M’0
00
RM
’000
R
M’0
00
0%
9,0
52,2
49
826
,833
–
3
,904
,705
1
96,4
50
–
–
945
,524
1
4,92
5,76
1 –
20
% –
1
70,0
04
1,0
76,6
79
3,7
68,6
47
97
–
–
–
5,0
15,4
27
1,0
03,0
85
35%
–
–
–
–
–
6,9
96,6
69
–
–
6,9
96,6
69
2,4
48,8
34
50%
–
547
,870
7
,322
3
,841
,980
3
98,2
37
5,0
98,12
7 –
–
9
,893
,536
4
,946
,768
75
% –
–
–
5
71,4
02
1,12
0,99
3 4
,575
,502
–
–
6
,267
,898
4
,700
,924
10
0%
–
230
,234
–
8
,755
,974
1
9,04
7,74
6 7
,365
,935
–
9
91,7
53
36,3
91,6
42
36,3
91,6
42
150
% –
–
–
3
59,6
41
28,
089
60,
084
11,8
43
–
459
,657
6
89,4
86
Tota
l E
xpos
ures
9,0
52,2
49
1,7
74,9
41
1,0
84,0
01
21,2
02,3
49
20,
791,6
12
24,0
96,3
17
11,8
43
1,9
37,2
77
79,9
50,5
90
50,18
0,73
9
RW
A b
y E
xpos
ures
–
538
,170
218
,997
12
,398
,706
2
0,12
9,76
2 1
5,88
5,58
5 1
7,76
5 9
91,7
53
50,18
0,73
8
Ave
rag
e R
isk
Wei
ght
0.0%
30.3
%20
.2%
58.5
%96
.8%
65.9
%15
0.0%
51.2
%62
.8%
Ded
uct
ion
fro
m
Cap
ital
Bas
e
PILLAR 3 DISCLOSUREas at 31 December 2021
BANK ISL AM MAL AYSIA BERHAD
410

4.
CR
EDIT
RIS
K (
CO
NTI
NU
ED)
4.7
Ass
ign
men
t of
Ris
k W
eig
hts
for
Por
tfol
ios
Un
der
th
e St
and
ard
ised
Ap
pro
ach
(co
nti
nu
ed)
The
follo
win
g p
rese
nts
th
e cr
edit
exp
osu
res
by
risk
wei
gh
ts a
fter
th
e ef
fect
of
cred
it r
isk
mit
igat
ion
of
the
Gro
up
(co
ntin
ued
):
(ii)
As
at 3
1 D
ecem
ber
20
20
Ris
k W
eig
hts
Expo
sure
s A
fter
Net
ting
& C
redi
t R
isk
Mit
igat
ion
(CR
M)
Tota
l Ex
posu
res
Aft
er
Net
ting
&
CRM
Tot
al R
isk
Wei
ghte
d A
sset
Sov
erei
gns/
Cen
tral
Ban
ks
Publ
icSe
ctor
Enti
ties
Ban
ks,
DFI
S &
MD
BS
Corp
orat
eRe
gula
tory
R
etai
lR
esid
enti
al
Mor
tgag
es
Hig
her
Ris
k A
sset
s O
ther
A
sset
sR
M’0
00 R
M’0
00
RM
’000
R
M’0
00
RM
’000
R
M’0
00
RM
’000
R
M’0
00
RM
’000
R
M’0
00
0%
8,
165,
933
720
,449
–
3,
434,
129
60,
926
–
–
863,
234
13,
244,
671
–
20%
–
204
,553
609,
193
4,
392,
176
231
–
–
–
5
,206
,153
1,0
41,2
31
35%
–
–
–
–
–
6,3
19,4
35
–
–
6,3
19,4
35
2,2
11,8
02
50%
–
561
,814
5,76
13,
860,
407
403
,363
4
,555
,665
–
–
9
,387
,010
4
,693
,505
75
% –
–
–
44
9,35
0 1
,180,
029
6,16
9,93
0 –
–
7
,799
,309
5
,849
,482
10
0%
–
167
,431
–
8,69
3,84
8 1
7,81
7,35
4 4
,802
,963
–
93
9,66
3 3
2,42
1,259
3
2,42
1,259
15
0%
–
–
–
324,
094
33,
964
59,
547
12,
594
–
430
,199
645
,299
Tota
l E
xpos
ures
8,
165,
933
1,6
54,2
47 6
14,9
54
21
,154,
004
19,
495,
867
21,9
07,5
40
12,
594
1,8
02,8
97
74,
808,
036
46,
862,
578
RW
A b
y E
xpos
ures
–
489
,248
1
24,7
19
12
,325
,640
1
8,95
5,04
9 1
4,00
9,36
6 1
8,89
1 9
39,6
63
46,
862,
577
Ave
rag
e R
isk
Wei
ght
0.0%
29.6
%20
.3%
58.3
%97
.2%
63.9
%15
0.0%
52.1%
62.6
%
Ded
uct
ion
fro
m
Cap
ital
Bas
e
INTEGR ATED ANNUAL REPORT 2021
411
Key Messages Overview Value Creation MD&A Sustainability Leadership Accountability Financial Additional Information
411

4.
CR
EDIT
RIS
K (
CO
NTI
NU
ED)
4.7
Ass
ign
men
t of
Ris
k W
eig
hts
for
Por
tfol
ios
Un
der
th
e St
and
ard
ised
Ap
pro
ach
(co
nti
nu
ed)
The
follo
win
g p
rese
nts
th
e cr
edit
exp
osu
res
by
risk
wei
gh
ts a
fter
th
e ef
fect
of
cred
it r
isk
mit
igat
ion
of
the
Ban
k:
(i)
As
at 3
1 D
ecem
ber
20
21
Expo
sure
s A
fter
Net
ting
& C
redi
t R
isk
Mit
igat
ion
(CR
M)
Tota
l Ex
posu
res
Aft
er
Net
ting
&
CRM
Tot
al R
isk
Wei
ghte
d A
sset
Ris
k
Sov
erei
gns/
Cen
tral
Ban
ks
Publ
icSe
ctor
Enti
ties
Ban
ks,
DFI
S &
MD
BS
Corp
orat
eRe
gula
tory
R
etai
lR
esid
enti
al
Mor
tgag
es
Hig
her
Ris
k A
sset
s O
ther
A
sset
sW
eig
hts
RM
’000
RM
’000
R
M’0
00
RM
’000
R
M’0
00
RM
’000
R
M’0
00
RM
’000
R
M’0
00
RM
’000
0%
9,0
52,2
49
826
,833
–
3
,904
,705
1
96,4
50
–
–
951
,209
14
,931
,446
–
20
% –
1
70,0
04
1,0
58,2
08
3,7
68,6
47
97
–
–
–
4,9
96,9
56
999
,391
35
% –
–
–
–
–
6
,996
,669
–
–
6
,996
,669
2
,448
,834
50
% –
5
47,8
70
7,3
22
3,8
41,9
80
398
,237
5
,098
,127
–
–
9,8
93,5
36
4,9
46,7
68
75%
–
–
–
571
,402
1
,120,
993
4,5
75,5
02
–
–
6,2
67,8
98
4,7
00,9
24
100
% –
2
30,2
34
–
8,7
55,9
74
19,
047,
746
7,3
65,9
35
–
895
,679
36
,295
,568
36
,295
,568
15
0%
–
–
–
359
,641
2
8,08
9 6
0,08
4 1
1,843
–
4
59,6
57
689
,486
Tota
l E
xpos
ures
9,0
52,2
49
1,7
74,9
41
1,0
65,5
30
21,2
02,3
49
20,
791,6
12
24,0
96,3
17
11,8
43
1,8
46,8
88
79,8
41,7
30
50,0
80,9
71
RW
A b
y E
xpos
ures
–
538
,170
215
,303
12
,398
,706
2
0,12
9,76
2 1
5,88
5,58
5 1
7,76
5 8
95,6
79
50,0
80,9
70
Ave
rag
e R
isk
Wei
ght
0.0%
30.3
%20
.2%
58.5
%96
.8%
65.9
%15
0.0%
48.5
%62
.7%
Ded
uct
ion
fro
m
Cap
ital
Bas
e
PILLAR 3 DISCLOSUREas at 31 December 2021
BANK ISL AM MAL AYSIA BERHAD
412

4.
CR
EDIT
RIS
K (
CO
NTI
NU
ED)
4.7
Ass
ign
men
t of
Ris
k W
eig
hts
for
Por
tfol
ios
Un
der
th
e St
and
ard
ised
Ap
pro
ach
(co
nti
nu
ed)
The
follo
win
g p
rese
nts
th
e cr
edit
exp
osu
res
by
risk
wei
gh
ts a
fter
th
e ef
fect
of
cred
it r
isk
mit
igat
ion
of
the
Ban
k (c
ontin
ued
):
(ii)
As
at 3
1 D
ecem
ber
20
20
Expo
sure
s A
fter
Net
ting
& C
redi
t R
isk
Mit
igat
ion
(CR
M)
Tota
l Ex
posu
res
Aft
er
Net
ting
&
CRM
Tot
al R
isk
Wei
ghte
d A
sset
Ris
k
Sov
erei
gns/
Cen
tral
Ban
ks
Publ
icSe
ctor
Enti
ties
Ban
ks,
DFI
S &
MD
BS
Corp
orat
eRe
gula
tory
R
etai
lR
esid
enti
al
Mor
tgag
es
Hig
her
Ris
k A
sset
s O
ther
A
sset
sW
eig
hts
RM
’000
RM
’000
R
M’0
00
RM
’000
R
M’0
00
RM
’000
R
M’0
00
RM
’000
R
M’0
00
RM
’000
0%
8,16
5,93
472
0,44
9 –
3
,434
,128
60,9
26–
–
86
6,32
8 1
3,24
7,765
–
20
% –
204,
553
60
9,11
0 4
,392
,176
231
– –
–
5
,206
,070
1
,041
,214
35
% –
–
–
–
–
6,31
9,43
5 –
–
6
,319
,435
2
,211
,802
50
% –
561,8
145,
761
3,86
0,40
740
3,36
34,
555,
665
–
–
9,3
87,0
10
4,6
93,5
05
75%
–
–
–
449,
350
1,180
,029
6,16
9,93
0 –
–
7
,799
,309
5
,849
,482
10
0%
–
167,4
31 –
8,
693,
848
17,8
17,3
544,
802,
963
–
919,
927
32,
401,5
23
32,
401,5
23
150
% –
–
–
324,
094
33,9
6459
,547
12,
594
–
430
,199
645
,299
Tota
l E
xpos
ures
8,
165,
934
1,6
54,2
47
614
,871
21
,154,
003
19,4
95,8
6721
,907
,540
12,
594
1,7
86,2
55
74,
791,3
11 4
6,84
2,82
5
RW
A b
y E
xpos
ures
–
489
,249
1
24,7
03
12,3
25,6
4018
,955
,049
14,0
09,3
66 1
8,89
1 9
19,9
27
46,
842,
825
Ave
rag
e R
isk
Wei
ght
0.0%
29.6
%20
.3%
58.3
%97
.2%
63.9
%15
0.0%
51.5
%62
.6%
Ded
uct
ion
fro
m
Cap
ital
Bas
e
INTEGR ATED ANNUAL REPORT 2021
413
Key Messages Overview Value Creation MD&A Sustainability Leadership Accountability Financial Additional Information
413

4. CREDIT RISK (CONTINUED)
4.8 Disclosures of Rated and Unrated Exposures According to Ratings by ECAI
a) Ratings of Sovereigns and Central Banks by Approved ECAIs
Ratings of sovereigns and central banks by approved ECAIS
Moodys Aaa to Aa3 A1 to A3 Baa1 to Baa3 Ba1 to B3 Caa1 to C Unrated31 December 2021 S&P AAA to AA- A+ to A- BBB+ to BBB- BB+ to B- CCC+ to D UnratedExposure Class Fitch AAA to AA- A+ to A- BBB+ to BBB- BB+ to B- CCC+ to D Unrated
On and Off Balance-Sheet Credit Exposures
Sovereign and Central Banks* – 9,052,249 – – – –
Total – 9,052,249 – – – –
Ratings of sovereigns and central banks by approved ECAIS
Moodys Aaa to Aa3 A1 to A3 Baa1 to Baa3 Ba1 to B3 Caa1 to C Unrated31 December 2020 S&P AAA to AA- A+ to A- BBB+ to BBB- BB+ to B- CCC+ to D UnratedExposure Class Fitch AAA to AA- A+ to A- BBB+ to BBB- BB+ to B- CCC+ to D Unrated
On and Off Balance-Sheet Credit Exposures
Sovereign and Central Banks* – 8,165,933 – – – –
Total – 8,165,933 – – – –
* These exposures refer to exposures to Federal Government of Malaysia and Bank Negara Malaysia which are accorded a preferential sovereign risk weight of 0%.
b) Ratings of Corporate by Approved ECAIs
Ratings of corporate by approved ECAIS
Moodys Aaa to Aa3 A1 to A3 Baa1 to Ba3 B+ to C UnratedS&P AAA to AA- A+ to A- BBB+ to BB- B+ to D Unrated
Fitch AAA to AA- A+ to A- BBB+ to BB- B+ to D Unrated31 December 2021 RAMs AAA to AA3 A to A3 BBB to BB B to D UnratedExposure Class MARC AAA to AA- A+ to A- BBB+ to BB- B+ to D Unrated
On and Off Balance-Sheet Credit ExposuresPublic Sector Entities 170,004 – – – 1,604,937Insurance Cos, Securities Firms & Fund
ManagerCorporate 3,757,659 27,107 77,480 – 17,334,814
Total 3,927,663 27,107 77,480 – 18,939,751
PILLAR 3 DISCLOSUREas at 31 December 2021
BANK ISL AM MAL AYSIA BERHAD
414

4. CREDIT RISK (CONTINUED)
4.8 Disclosures of Rated and Unrated Exposures According to Ratings by ECAI (continued)
b) Ratings of Corporate by Approved ECAIs (continued)
Ratings of corporate by approved ECAIS
Moodys Aaa to Aa3 A1 to A3 Baa1 to Ba3 B+ to C UnratedS&P AAA to AA- A+ to A- BBB+ to BB- B+ to D Unrated
Fitch AAA to AA- A+ to A- BBB+ to BB- B+ to D Unrated31 December 2020 RAMs AAA to AA3 A to A3 BBB to BB B to D UnratedExposure Class MARC AAA to AA- A+ to A- BBB+ to BB- B+ to D Unrated
On and Off Balance-Sheet Credit ExposuresPublic Sector Entities 204,552 – – – 1,449,694Insurance Cos, Securities Firms & Fund
ManagerCorporate 4,069,429 27,707 83,259 – 16,968,321
Total 4,273,981 27,707 83,259 – 18,418,015
c) Ratings of Banking Institutions by Approved ECAIs
Ratings of banking institutions by approved ECAIS
Moodys Aaa to Aa3 A1 to A3 Baa1 to Baa3 Ba1+ to B3 Caa1 to C UnratedS&P AAA to AA- A+ to A- BBB+ to BBB- BB+ to B- CCC+ to D Unrated
Fitch AAA to AA- A+ to A- BBB+ to BBB- BB+ to B- CCC+ to D Unrated31 December 2021 RAMs AAA to AA3 A1 to A3 BBB1 to BBB3 BB1 to B3 C1 to D UnratedExposure Class MARC AAA to AA- A+ to A- BBB+ to BBB- BB+ to B- C+ to D Unrated
On and Off Balance-Sheet Credit Exposures
Banks, MDBs, and DFIs 743,371 151,728 – – – 188,903
Total 743,371 151,728 – – – 188,903
Ratings of banking institutions by approved ECAIS
Moodys Aaa to Aa3 A1 to A3 Baa1 to Baa3 Ba1+ to B3 Caa1 to C UnratedS&P AAA to AA- A+ to A- BBB+ to BBB- BB+ to B- CCC+ to D Unrated
Fitch AAA to AA- A+ to A- BBB+ to BBB- BB+ to B- CCC+ to D Unrated31 December 2020 RAMs AAA to AA3 A1 to A3 BBB1 to BBB3 BB1 to B3 C1 to D UnratedExposure Class MARC AAA to AA- A+ to A- BBB+ to BBB- BB+ to B- C+ to D Unrated
On and Off Balance-Sheet Credit Exposures
Banks, MDBs, and DFIs 450,463 5,526 – – – 158,965
Total 450,463 5,526 – – – 158,965
Note: There are no exposures under Short-term ratings for the period under review.
INTEGR ATED ANNUAL REPORT 2021
415
Key Messages Overview Value Creation MD&A Sustainability Leadership Accountability Financial Additional Information
415

4. CREDIT RISK (CONTINUED)
4.9 Credit Risk Mitigation (CRM)
As a first way out, the assessment of credit when granting a financing facility is based on a particular customer’s cash flow as the main source of payment and not on the collateral offered. However, the acceptance of tangible security as collateral would offer a second way out in the event of business failure thereby improving recovery rates.
The types of collaterals accepted by the Group would have an impact on the calculation of the Group’s capital adequacy as the quality and the type of collaterals determine whether the Group is able to obtain capital relief and the extent of such relief. Capital relief is defined as the assignment of a lower or zero risk weight to the counterparty exposure by setting off or reducing the counterparty exposure against the collateral value.
The main types of collaterals obtained by the Group to mitigate credit risks are as follows:
(a) Cash on lien(b) Landed property(c) Shariah compliant quoted shares and unit trusts(d) Malaysian Federal Government Securities(e) Rated/Unrated Islamic Securities/Sukuk(f) Guarantee
The reliance that can be placed on CRM is carefully assessed in light of issues such as compliance with Shariah rules and principles, legal enforceability, market value and counterparty credit risk of the guarantor. The Group has put in place policies and procedures which govern the determination of eligibility of various collaterals to protect the Group’s position from the onset of a customer relationship on the CRM, for instance, in requiring standard terms and conditions or specifically agreed upon documentation to ensure the legal enforceability of the credit risk mitigants.
In order to obtain a fair assessment of collateral securing the financing facility, a valuation is performed periodically ranging from weekly to annually, depending on the type, liquidity and volatility of the collateral value.
In mitigating the counterparty credit risks arising from foreign exchange and derivatives transactions, the Group enters into master agreements that provide for closeout netting with counterparties, whenever possible. A master agreement that governs all transactions between the two parties, creates a greater legal certainty that the netting of outstanding obligations can be enforced upon termination of outstanding transactions if an event of default occurs.
PILLAR 3 DISCLOSUREas at 31 December 2021
BANK ISL AM MAL AYSIA BERHAD
416

4. CREDIT RISK (CONTINUED)
4.9 Credit Risk Mitigation (CRM) (continued)
The Group manages its credit risk concentrations by diversifying its portfolios through several measures. The Group monitors credit risk limits via, among others, sector limits, programme limits, deviation limits and Single Counterparty Exposure Limits (SCEL). The following tables disclose the extent to which exposures are covered by eligible credit risk mitigants.
Disclosure of Credit Risk Mitigation (CRM):
31 December 2021Exposures
before CRM
Exposures covered by guarantees
Exposures covered by
eligible financial and non-financial
collateralExposure class RM’000 RM’000 RM’000
On-Balance Sheet ExposuresSovereign/Central Banks 9,052,249 – – Public Sector Entities 1,701,095 – 10,101 Banks, DFIs and MDBs 1,007,555 – – Corporates 19,388,649 706,085 1,224,343 Regulatory Retail 20,743,307 194,327 136,111 Residential Mortgages 23,669,331 452 100,983 Higher Risk Assets 3,173 – – Other Assets 1,846,888 – – Defaulted Exposures 1,128,766 384,941 69,715
Total for On-Balance Sheet Exposures 78,541,013 1,285,805 1,541,253
Off-Balance Sheet ExposuresCredit-related Exposures 1,623,840 4,805 56,026 Derivative Financial Instruments 116,795 – – Defaulted Exposures 36,288 4,752 10
Total for Off-Balance Sheet Exposures 1,776,923 9,557 56,036
Total On and Off-Balance Sheet Exposures 80,317,936 1,295,362 1,597,289
INTEGR ATED ANNUAL REPORT 2021
417
Key Messages Overview Value Creation MD&A Sustainability Leadership Accountability Financial Additional Information
417

4. CREDIT RISK (CONTINUED)
4.9 Credit Risk Mitigation (CRM) (continued)
Disclosure of Credit Risk Mitigation (CRM) (continued):
31 December 2020Exposures
before CRM
Exposures covered by guarantees
Exposures covered by
eligible financial and non-financial
collateralExposure class RM’000 RM’000 RM’000
On-Balance Sheet ExposuresSovereign/Central Banks 8,165,933 – – Public Sector Entities 1,600,640 – 26,565 Banks, DFIs and MDBs 510,893 – – Corporates 19,584,934 540,901 1,226,255 Regulatory Retail 19,456,153 56,341 100,260 Residential Mortgages 21,610,415 453 100,804 Higher Risk Assets 3,783 – – Other Assets 1,786,255 – – Defaulted Exposures 895,405 121,080 81,717
Total for On-Balance Sheet Exposures 73,614,411 718,775 1,535,601
Off-Balance Sheet ExposuresCredit-related Exposures 1,461,127 13,733 10,523 Derivative Financial Instruments 148,631 – – Defaulted Exposures 25,822 – –
Total for Off-Balance Sheet Exposures 1,635,580 13,733 10,523
Total On and Off-Balance Sheet Exposures 75,249,991 732,508 1,546,124
PILLAR 3 DISCLOSUREas at 31 December 2021
BANK ISL AM MAL AYSIA BERHAD
418

4. CREDIT RISK (CONTINUED)
4.10 Off-Balance Sheet and Counterparties Credit Risk for the Group and the Bank
(i) As at 31 December 2021
Principal amount
Positive fair value of
derivative contracts
Credit equivalent
amount
Risk weighted
assetNature of item RM’000 RM’000 RM’000 RM’000
Credit related ExposuresDirect credit substitutes 501,511 501,511 503,088 Assets sold with recourse – – – Transaction related contingent items 903,458 451,729 438,976 Short term self–liquidating trade related
contingencies 417,940 83,588 83,012 Other commitments, such as formal
standby facilities and credit lines, with an original maturity of:– not exceeding one year – – – – exceeding one year 1,246,592 623,295 503,494
Unutilised credit card lines – – – Any commitments that are unconditionally
cancelled at any time by the bank without prior notice or that effectively provide for automatic cancellation due to deterioration in a customer’s creditworthiness 8,110,490 – –
11,179,991 1,660,123 1,528,570
Derivative Financial InstrumentsForeign exchange related contracts
– less than one year 7,505,850 25,120 114,431 66,277 – one year to less than five years– Five years and above – – – –
Profit rate related contracts– less than one year – – – – – one year to less than five years 79,153 917 2,368 1,735 – five years and above – – – –
Equity related contracts– less than one year – – – – – one year to less than five years – – – – – Five years and above – – – –
7,585,003 26,037 116,799 68,012
Total 18,764,994 26,037 1,776,922 1,596,582
INTEGR ATED ANNUAL REPORT 2021
419
Key Messages Overview Value Creation MD&A Sustainability Leadership Accountability Financial Additional Information
419

4. CREDIT RISK (CONTINUED)
4.10 Off-Balance Sheet and Counterparties Credit Risk for the Group and the Bank (continued)
(ii) As at 31 December 2020
Principal amount
Positive fair value of
derivative contracts
Credit equivalent
amount
Risk weighted
assetNature of item RM’000 RM’000 RM’000 RM’000
Credit related ExposuresDirect credit substitutes 449,506 449,506 442,426 Assets sold with recourse – – – Transaction related contingent items 899,541 449,770 436,481 Short term self–liquidating trade related
contingencies 592,744 118,549 117,165 Other commitments, such as formal
standby facilities and credit lines, with an original maturity of:– not exceeding one year – – – – exceeding one year 938,247 469,124 362,317
Unutilised credit card lines – – – Any commitments that are unconditionally
cancelled at any time by the bank without prior notice or that effectively provide for automatic cancellation due to deterioration in a customer’s creditworthiness 8,676,980 – –
11,557,018 1,486,949 1,358,389
Derivative Financial InstrumentsForeign exchange related contracts
– less than one year 8,518,422 59,494 143,217 60,587 – one year to less than five years – – – –– Five years and above – – – –
Profit rate related contracts– less than one year – – – –– one year to less than five years 114,056 2,171 5,414 4,045 – five years and above – – – –
Equity related contracts– less than one year – – – –– one year to less than five years – – – –– Five years and above – – – –
8,632,478 61,665 148,631 64,632
Total 20,189,496 61,665 1,635,580 1,423,021
PILLAR 3 DISCLOSUREas at 31 December 2021
BANK ISL AM MAL AYSIA BERHAD
420

5. MARKET RISK
5.1 Overview
All the Group’s financial instruments are subject to the risk that market prices and rates will move, resulting in profit or losses to the Group. The following are the main market risk factors that the Group is exposed to:
• Profit Rate Risk: also known as the Rate of Return Risk is the potential impact on the Group’s profitability and capital caused by changes in the rate of return, due to general market movements or issuer/customer specific reasons;
• Foreign Exchange Risk: the impact of exchange rate movements on the Group’s currency positions; • Equity Investment Risk: the profitability impact on the Group’s equity positions or investments caused by
changes in equity prices or values;
The Group separates the market risk exposures into either trading book or banking book portfolios. Trading book portfolios include those positions arising from market making, proprietary position taking and other marked-to-market positions as per the Board approved Trading Book Policy Statements. Banking book portfolios primarily arise from the Group’s profit rate management of the Group’s asset & liabilities and investment portfolio mainly for liquidity management.
5.2 Market Risk Governance
The management of market risk is principally carried out by using sets of policies and guidelines approved by Asset & Liability Committee (“ALCO”) and/or BRC, guided by the Board’s approved Group Risk Appetite Statement Policy.
ALCO is responsible under the authority delegated by BRC for managing market risk at strategic level.
5.3 Management of Market Risk
The objective is to manage market risk exposures in order to optimise return on risk while maintaining a market risk profile consistent with the Group’s approved risk appetite.
All market risk exposures are managed by Treasury, who has the necessary skills, tools, management and governance to manage such risks. The management of market risk is guided by comprehensive limits, policies and guidelines which are periodically reviewed.
Market Risk Management Department (“MRMD”) is an independent risk control function and is responsible for ensuring effective implementation of market risk management framework. MRMD is also responsible for developing and reviewing the Group’s market risk management guidelines and policies, monitoring tools, behavioural assumptions and limit setting methodologies. Strict escalation procedures are documented and approved by ALCO and/or BRC. In addition, the market risk exposures and limits are regularly reported to ALCO and BRC.
Other controls to ensure that market risk exposures remain within tolerable levels include regular stress testing, ad-hoc simulations, and rigorous new product approval procedures. Stress test results are produced regularly to determine the impact of changes in profit rates, foreign exchange rates and other risk factors on the Group’s profitability, capital adequacy and liquidity. The stress test provides the Management and BRC with an assessment of the financial impact of identified extreme events on the market risk exposures of the Group.
INTEGR ATED ANNUAL REPORT 2021
421
Key Messages Overview Value Creation MD&A Sustainability Leadership Accountability Financial Additional Information
421

5. MARKET RISK (CONTINUED)
5.3 Management of Market Risk (continued)
a) Profit rate risk in the banking book portfolio
Profit rate risk in the banking book portfolio is managed and controlled using measurement tools known as Earnings-at-Risk (“EaR”) and Economic Value of Equity (“EVE”). The Group monitors the sensitivity of EaR and EVE under varying profit rate scenarios (i.e., simulation modelling). The model is a combination of standard and non-standard scenarios relevant to the local market. The standard scenarios include the parallel fall or rise in the profit rate curve and historical simulation. These scenarios assume no management action. Hence, it does not incorporate actions that would be taken by Treasury to mitigate the impact of the profit rate risk. In reality, depending on the view on future market movements, Treasury would proactively manage and strategise to change the profit rate exposure profile to minimise losses and to optimise net revenues. The Group’s hedging and risk mitigation strategies range from the use of derivative financial instruments, such as profit rate swaps, to more intricate hedging strategies to address inordinate profit rate risk exposures.
The table below shows the Group’s and Bank’s profit rate sensitivity to a 1501 basis points parallel shift as at reporting date.
31 December 2021 31 December 2020(Decrease)/Increase (Decrease)/Increase
-150bps +150bps -100bps +100bpsGroup RM million RM million RM million RM million
Impact on EaR (206.6) 206.6 (131.4) 131.4Impact on EVE 294.0 (294.0) 241.0 (241.0)
31 December 2021 31 December 2020(Decrease)/Increase (Decrease)/Increase
-150bps +150bps -100bps +100bpsBank RM million RM million RM million RM million
Impact on EaR (204.7) 204.7 (131.4) 131.4Impact on EVE 293.6 (293.6) 240.9 (240.9)
1 Based on BNM’s revised RORBB reporting requirements, the Group’s and the Bank’s reporting were revised from 100bps to 150bps parallel shock effective 1 January 2021.
PILLAR 3 DISCLOSUREas at 31 December 2021
BANK ISL AM MAL AYSIA BERHAD
422
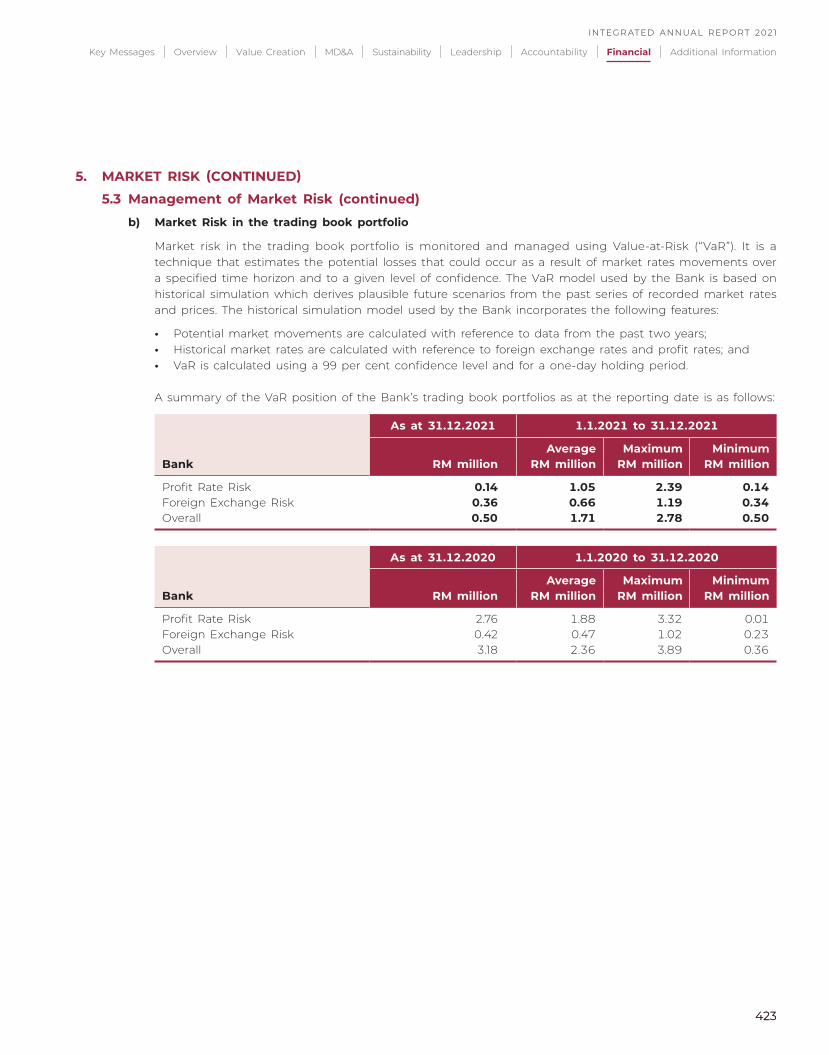
5. MARKET RISK (CONTINUED)
5.3 Management of Market Risk (continued)
b) Market Risk in the trading book portfolio
Market risk in the trading book portfolio is monitored and managed using Value-at-Risk (“VaR”). It is a technique that estimates the potential losses that could occur as a result of market rates movements over a specified time horizon and to a given level of confidence. The VaR model used by the Bank is based on historical simulation which derives plausible future scenarios from the past series of recorded market rates and prices. The historical simulation model used by the Bank incorporates the following features:
• Potential market movements are calculated with reference to data from the past two years; • Historical market rates are calculated with reference to foreign exchange rates and profit rates; and • VaR is calculated using a 99 per cent confidence level and for a one-day holding period.
A summary of the VaR position of the Bank’s trading book portfolios as at the reporting date is as follows:
As at 31.12.2021 1.1.2021 to 31.12.2021
Average Maximum MinimumBank RM million RM million RM million RM million
Profit Rate Risk 0.14 1.05 2.39 0.14Foreign Exchange Risk 0.36 0.66 1.19 0.34Overall 0.50 1.71 2.78 0.50
As at 31.12.2020 1.1.2020 to 31.12.2020
Average Maximum MinimumBank RM million RM million RM million RM million
Profit Rate Risk 2.76 1.88 3.32 0.01Foreign Exchange Risk 0.42 0.47 1.02 0.23Overall 3.18 2.36 3.89 0.36
INTEGR ATED ANNUAL REPORT 2021
423
Key Messages Overview Value Creation MD&A Sustainability Leadership Accountability Financial Additional Information
423

5. MARKET RISK (CONTINUED)
5.3 Management of Market Risk (continued)
c) Foreign Exchange Risk
The Bank manages and controls the trading book portfolio’s foreign exchange risk by limiting the net open exposure to individual currencies and on an aggregate basis. For the Bank-wide (trading and banking portfolios) foreign exchange risk, the Bank manages and controls by limiting the net open exposure on an aggregate basis.
Sensitivity Analysis
The Bank has a sensitivity limit for managing the foreign exchange risk in place. The foreign currency revaluation sensitivity for the Bank as at reporting date is summarised as follows (only net open position for major currencies are shown in its specific currency in the table below. For other currencies, these exposures are grouped as “Others”):
31 December 2021 31 December 2020
-1% Depreciation
+1% Appreciation
-1% Depreciation
+1% Appreciation
Bank RM’000 RM’000 RM’000 RM’000
US Dollar 12,136 (12,136) 8,844 (8,844)Euro 4,576 (4,576) 5,072 (5,072)Others (193) 193 (194) 194
5.4 Capital Treatment for Market Risk
The Group adopts the Standardised Approach to compute the market risk capital requirement under BNM’s CAFIB.
6. LIQUIDITY RISK
6.1 Overview
Liquidity risk is the risk of adverse impact to the financial condition of the Group, or the soundness of the Group being adversely affected by an inability (or perceived inability) to meet its contractual obligations. This risk can arise from mismatches in the timing of cash flows.
The Group maintains a diversified and stable funding base comprising retail and corporate customer deposits. This is augmented by wholesale funding and highly liquid assets portfolios.
The objectives of the Group’s liquidity management are to ensure that all foreseeable funding commitments and deposit withdrawals can be met when due and that wholesale market access remains accessible and cost effective.
Savings accounts, current accounts, investment accounts (IA) and term deposits form a critical part of the Group’s funding profile and the Group places considerable importance on maintaining their stability. The stability depends upon preserving depositors’ confidence in the Group and the Group’s capital strength and liquidity, and on competitive and transparent pricing.
PILLAR 3 DISCLOSUREas at 31 December 2021
BANK ISL AM MAL AYSIA BERHAD
424

6. LIQUIDITY RISK (CONTINUED)
6.1 Overview (continued)
The Group’s liquidity management is primarily carried out in accordance with Bank Negara Malaysia’s requirements and the internal limits approved by ALCO and/or BRC. The limits vary, taking into account the depth and liquidity of the market in which the Group operates. The Group maintains a strong liquidity position and manages the liquidity profile of its assets, liabilities, and commitments to ensure that cash flows are appropriately balanced, and all obligations are met when due.
The Group’s liquidity management process includes:
• Daily projection of cash flows and ensuring that the Group has sufficient liquidity surplus and reserves to sustain a sudden liquidity shock;
• Projecting cash flows and considering the level of liquid assets necessary in relation thereto; • Maintaining liabilities of appropriate term relative to the asset base; • Maintaining a diverse range of funding sources with adequate back-up facilities; • Monitoring depositor concentration in order to avoid undue reliance on large individual depositors and ensure
a satisfactory overall funding mix; and • Managing the maturities and diversifying funding liabilities across products and counterparties.
6.2 Liquidity Risk Governance
The management of liquidity risk is principally carried out by using sets of policies and guidelines approved by ALCO and/or BRC, guided by the Board’s approved Group Risk Appetite Statement Policy. ALCO is responsible under the authority delegated by BRC for managing liquidity risk at strategic level.
6.3 Management of Liquidity Risk
All liquidity risk exposures are managed by Treasury, who has the necessary skills, tools, management and governance to manage such risks. Limits and triggers are set to meet the following objectives:
• Maintaining sufficient liquidity surplus and reserves to sustain a sudden liquidity shock; • Ensuring that cash flows are relatively diversified across all maturities; • Ensuring that the deposit base is not overly concentrated on a relatively small number of depositors; • Maintaining sufficient borrowing capacity in the Interbank market and highly liquid financial assets to back it
up; and • Not over-extending financing activities relative to the deposit base.
MRMD is an independent risk control function and is responsible for ensuring efficient implementation of liquidity risk framework. It is also responsible for developing the Group’s liquidity risk management guidelines, monitoring tools, behavioural assumptions and limit setting methodologies. Strict escalation procedures are documented and approved by ALCO and/or BRC, with proper authorities to ratify or approve the excess. In addition, the liquidity risk exposures and limits are regularly reported to ALCO and BRC.
Stress testing and scenario analysis are important tools used by the Group to manage the liquidity risk. Stress test results are produced regularly to determine the impact of a sudden liquidity shock. The stress-testing provides the Management and BRC with an assessment of the financial impact of identified extreme events on the liquidity and funding risk exposures of the Group.
Another key control feature of the Group’s liquidity risk management is the liquidity contingency management plans. These plans identify the pre-emptive quantitative and qualitative indicators of stress conditions arising from systemic or other crises and provide guidance on actions to be taken in order to minimise the adverse implications to the Group.
INTEGR ATED ANNUAL REPORT 2021
425
Key Messages Overview Value Creation MD&A Sustainability Leadership Accountability Financial Additional Information
425

7. OPERATIONAL RISK
7.1 Overview
Operational Risk is defined as the “risk of loss resulting from inadequate or failed internal processes, people and systems or from external events, which includes legal risk and Shariah non-compliance risk but excludes strategic and reputational risk”.
It is inherent in all banking products, activities, processes and systems and the effective management of operational risk has always been a fundamental element of a bank’s risk management programme.
7.2 Operational Risk Governance
The Group’s operational risk management (“ORM”) is guided by its ORM Policy, Guideline and Enterprise-Wide Risk Management Policy, as well as its Group Risk Appetite Statement Policy which are designed to provide a sound and well-controlled operational environment within the Group.
BRC is a committee of Board to oversee the Management’s activities in managing risks for the Group, including operational risk. Its roles, with regard to ORM, include reviewing and recommending ORM Policy, strategies and risk appetite for Board’s approval. MRCC, under the authority delegated by BRC is responsible to perform the oversight function and to ensure effective management of issues relating to operational risk at strategic level. Operational Risk Control Committee (“ORCC”) which is a sub-committee of MRCC is primarily responsible in ensuring effective implementation and maintenance of policies, processes, and systems for managing operational risk for the Group.
Notwithstanding the above, the various Business & Support Units (“BU/SU”) are responsible for managing operational risk within their respective domains on a day-to-day basis and ensuring that their business & operational activities are carried out within the established ORM policies, guidelines, procedures and limits. To reinforce accountability and ownership of risk & control at BU/SU level, a Risk Controller (“RC”) for each BU/SU is appointed and Embedded Risk and Compliance Unit (“ERU”) is established at selected BU/SU to assist in driving the risk & control programme for the Group.
Ultimately, all staff of the Group are to ensure they properly discharge their day-to-day responsibilities and are well-equipped with the necessary knowledge including the policies and procedures in executing their job functions. This is in line with our Risk Management Tagline, i.e., “Managing Risk is Everyone’s Business”.
PILLAR 3 DISCLOSUREas at 31 December 2021
BANK ISL AM MAL AYSIA BERHAD
426

7. OPERATIONAL RISK (CONTINUED)
7.3 Management of Operational Risk
The Group recognises and emphasises the importance of ORM and manages this risk through a control-based environment where processes are documented, authorisation is independent, transactions are reconciled and monitored, and business activities are carried out within the established ORM policies, guidelines, procedures, and limits.
The Group’s overall governance approach in managing operational risk is premised on the Three Lines of Defence Approach:
a) 1st Line of Defence – The risk owner or risk-taking unit i.e., BU/SU is accountable for putting in place a robust control environment within their respective units. They are responsible for the day-to-day management of operational risk. To reinforce accountability and ownership of risk and control within 1st Line of Defence, the RC is appointed at each BU/SU and ERU is established at selected BU/SU.
2nd Line of Defence – Operational Risk Management Department (“ORMD”) is responsible for establishing and maintaining the ORM Policy and its supporting guidelines/manuals, developing methodologies and various ORM tools to facilitate the management of operational risk, monitoring the effectiveness of ORM, assessing operational risk issues from the risk owner and escalating operational risk issues to the relevant governance level with recommendations on appropriate risk mitigation strategies. In creating a strong risk culture, ORMD is also responsible to promote risk awareness across the Group. Shariah Risk Management Unit (“SRMU”), which forms part of ORMD, is responsible for managing the Shariah non-compliance risk (“SNCR”) by establishing and maintaining appropriate guidelines on Shariah Risk Management (SRM) by facilitating the process of identifying, assessing, controlling, and monitoring SNCR and promoting SNCR awareness.
Group Compliance Division, which includes Shariah Compliance Department and Group Information Security & Governance Division (“ISGD”) complement the role of ORMD as the 2nd Line of Defence.
Group Compliance Division is responsible for ensuring effective oversight on compliance-related risks such as regulatory compliance risk, compliance risk, corruption risk, money laundering and terrorism financing risks through proper classification of risks and developing, reviewing, and enhancing compliance-related training programmes, as well as conducting trainings that promote awareness creation. Shariah Compliance Department under Group Compliance Division is responsible for reviewing and monitoring Shariah compliance of the Group’s operations, activities, and services at BU/SU level.
ISGD is responsible in managing information technology risk by establishing, maintaining, and enforcing information technology risk policies/guidelines and it works closely with Group Technology Division in identifying, assessing, mitigating, and monitoring of information technology risk in the Group.
b) 3rd Line of Defence – Group Internal Audit including Shariah Audit Department provides independent assurance to the Board and senior management on the effectiveness of the ORM and SRM process.
INTEGR ATED ANNUAL REPORT 2021
427
Key Messages Overview Value Creation MD&A Sustainability Leadership Accountability Financial Additional Information
427

7. OPERATIONAL RISK (CONTINUED)
7.4 ORM Tools & Mitigation Strategies
The Group employs ORM tools comprising proactive and reactive tools which are in line with the best practices in managing and mitigating operational risks, namely:
Overview of ORM Tools
Proactive Tools Reactive Tools
Risk Control Self-Assessment Key Risk Indicator
Operational Risk Review
New Product Services Approval
Process
Risk Loss Event Management &
Reporting
• Self-assessment to identify and assess operational risks by Risk Owners;
• The tool creates ownership and increases operational risk awareness.
• A forward-looking tool to identify potential risks and to enable counter measures and risk mitigation actions before an incident occurs (early warning system);
• To assist management to focus on high-risk issues.
• End-to-end review of activities to identify risks and ensure appropriate controls are in place and are effective;
• To ensure controls are aligned with RCSA and able to mitigate the identified risk.
• To ensure risks are identified and adequate controls are in place prior to launching of new product/ services.
• Centralised group-wide loss database which provides line of business loss reporting overview, tracks frequency of events and facilitates detailed reviews of the incident and its impact.
Risk Analysis & Reporting
• Analysis and reporting of qualitative and quantitative results from various ORM tools.
Scenario Analysis
• A systematic and forward-looking tool of obtaining expert opinions to derive new risks, test the efficiency of existing controls and highlights unexpected risks.
In addition, a comprehensive Business Continuity Management (“BCM”) function has been established within the Group to ensure that in the event of material disruptions from internal or external events, critical business functions can be maintained or restored in a timely manner. This ensures minimal adverse impact on customers, staff and products and services. BCM constitutes an essential component of the Group’s risk management process by providing a controlled response to potential operational risk that could have a significant impact on the Group’s critical processes and revenue streams. The Group is also continuously reviewing its critical business operations’ resilience through regular testing and dependencies assessment on its assets (systems, data, third parties, facilities, processes and people) in order to ensure it has the required capability and resources to effectively prepare for different disruption events.
PILLAR 3 DISCLOSUREas at 31 December 2021
BANK ISL AM MAL AYSIA BERHAD
428

7. OPERATIONAL RISK (CONTINUED)
7.4 ORM Tools & Mitigation Strategies (continued)
As part of the risk transfer strategy, the Group obtains a 3rd party Takaful coverage to cover for the Group’s high impact loss events.
The Group also ensures that the group-wide Operational Risk awareness programme is conducted on an ongoing basis. This training programme emphasises on inculcating an operational risk culture among staff, effective implementation of ORM tools, fraud awareness, BCM and other aspects of ORM.
7.5 Capital Treatment for Operational Risk
Operational Risk capital charge is calculated using the BIA as per BNM’s CAFIB. The BIA for operational risk capital charge calculation applies an alpha (15%) to the average of positive gross income that was achieved over the previous three years by the Group. The RWA amount is computed by multiplying the minimum capital required with a multiplier of 12.5 (reciprocal of 8%).
8. SHARIAH GOVERNANCE
8.1 Overview
By virtue of BNM’s Shariah Governance Policy Document (“SGPD”), the Group has established a sound and robust Shariah governance framework with the emphasis placed on the roles of its key functionalities, which include having in place an effective and responsible Board and Management and an independent Shariah Supervisory Council (“SSC”) that is supported by strong and competent internal Shariah functions.
As part of the robust Shariah governance framework, to date, the Group has put in place the Shariah Compliance Policy, Shariah Compliance Guideline, Business Zakat Guideline and Charity Fund Management Guideline. These help to ensure the Group’s business activities and behaviours are in compliance with Shariah rules and principles, provisions of the Islamic Financial Services Act (“IFSA”) 2013, BNM’s SGPD and its other rules and regulations, and the resolutions of BNM and Securities Commission (“SC”)’s Shariah Advisory Council and the SSC.
8.2 Shariah Risk Management
The Group’s Shariah risk management as part of operational risk management is guided by Operational Risk Management (“ORM”) Policy and Guidelines which set out the high-level framework supporting the Shariah Compliance Policy and detail out the Shariah risk management processes and tools. The policy and guidelines serve to provide a consistent group-wide framework for managing SNCR across the Group.
In addition to this, the Risk Loss Event Management and Reporting (‘’RLEMR”) Guideline provides sound mechanism on Shariah non-compliance (“SNC”) management and reporting, in order to ensure the Group strictly complies with Shariah rules and principles, as well as the regulatory requirements. The guideline has been established to be in line with the mechanism set out by BNM’s Operational Risk Reporting Requirement – Operational Risk Integrated Online Network (“ORION”) and to ensure compliance with section 28(3) of the IFSA 2013 which requires any SNC event to be immediately reported to BNM. Additionally, pursuant to this guideline, any actual SNC events caused by operational lapses including negligence, breach of policies and lack of due care by staff may be subject to disciplinary action.
Being part of operational risk, Shariah risk management leverages on the same ORM principles, processes, and tools. The responsibility of managing SNCR is spearheaded by the Group’s Shariah Risk Management Unit (“SRMU”). In general, all ORM tools are extended to the process of managing SNCR. However, the tools are modified to suit the regulatory requirements on Shariah governance in order to provide a robust and consistent approach in managing SNCR.
INTEGR ATED ANNUAL REPORT 2021
429
Key Messages Overview Value Creation MD&A Sustainability Leadership Accountability Financial Additional Information
429

8. SHARIAH GOVERNANCE (CONTINUED)
8.2 Shariah Risk Management (continued)
Extensive and continuous Shariah risk awareness initiatives have been conducted for the Group’s staff and Risk Controllers (“RC”) to ensure understanding towards Shariah requirements/rulings, effective identification of SNC risks, establishment of controls to prevent SNC event, and to keep updated on the latest Shariah requirements/ rulings issued by Shariah Division, SSC and regulators, and any occurrence of Shariah non-compliance event. In the year 2021, 8 Shariah risk awareness sessions were conducted involving all RCs from HQ and branches. In addition, it is compulsory for all staff to participate in Shariah training via e-Learning as a refresher course.
8.3 Shariah Non-Compliance (“SNC”) Events
An SNC event is a result of the Group’s failure to comply with the Shariah rules and principles as determined by the Bank’s Shariah Supervisory Council, as well as other relevant body or institution such as the Shariah Advisory Council of BNM and Securities Commission.
Throughout the year 2021, there were five (5) incidents confirmed as SNC events by the SSC. In brief, the SNC events were related to non-execution of aqad for deposit-based product, outdated form used for account opening and incomprehensive product structure for the purpose of vehicle refinancing. None of these events have financial impact that contributed to SNC Income. To prevent similar recurrence, the Group is continuously improving its Shariah compliance culture through the issuance of reminders, conducting on-going awareness trainings, as well as establishing additional controls to ensure compliance with Shariah requirements.
8.4 Shariah Non-Compliant Income
31 December 2021 31 December 2020
RM41,182.96 RM59,960.47
The main contributors of the SNC income for 2021 were commissions from third party investment product offering (RM31,728.68) and commissions from SNC merchants of card business (RM9,454.28). The amount was disposed to charitable causes upon SSC’s approval.
All SNC events and rectification plans were presented and approved by the Board/SSC and reported to BNM in accordance with the prescribed reporting requirement by the regulator.
9. INVESTMENT ACCOUNT
9.1 Overview
Islamic Financial Services Act 2013 (“IFSA”) distinguishes investment account (IA) from Islamic deposits, where Shariah contracts that need to be applied for IA products are non-principal guaranteed, while Shariah contracts for deposit products are principal guaranteed.
In line with the implementation of the IFSA, the Group has developed investment account products based on Mudarabah and Wakalah contracts.
Mudarabah is a contract between a customer as capital provider and the Group as an entrepreneur under which the customer provides capital to be managed by the Group and any profit generated is shared according to a mutually agreed profit-sharing ratio (PSR) whilst financial losses are borne by the customer provided that such losses are not due to the Group’s misconduct, negligence or breach of specified terms.
PILLAR 3 DISCLOSUREas at 31 December 2021
BANK ISL AM MAL AYSIA BERHAD
430

9. INVESTMENT ACCOUNT (CONTINUED)
9.1 Overview (continued)
Wakalah refers to a contract where a customer, as the principal, authorises the Group as his agent to perform a particular task on matters that may be delegated i.e., investment, with or without imposition of a fee. In this context, the Shariah contract applied is Wakalah bi al-istithmar (Wakalah for the purpose of investment).
In terms of offering, the Group currently has the following two categories of IA:
Unrestricted Investment Account (UA) Restricted Investment Account (RA)
Unrestricted Investment Account refers to a type of inves tment account whereby the cus tomer/Investment Account Holder (IAH), without specifying any particular restrictions or conditions, provides the Group with the mandate to make the ultimate decision to invest.
Restricted Investment Account (RA) refers to an IA where the IAH provides a specific investment mandate to the Group.
IA product is not capital guaranteed and is not protected by the Perbadanan Insurans Deposit Malaysia (PIDM). Among the risks associated with IA include but not limited to the following:
• Market risk – the risk arising from the potential impact of adverse price movements on the economic value of an asset.
• Credit risk – the risk arising from the potential that the Bank fails to meet its obligations to IAH in accordance with agreed terms and conditions.
• Liquidity risk – the risk arising from the potential loss for IAH where there are lesser return and possible capital erosion or loss.
• Operational risk – the risk arising from the potential loss resulting from inadequate or failed internal processes, people and systems or external events.
• Legal risk – IAH should ensure that, in entering into this investment it is not in breach of any laws, regulations, contractual or any other legal limitations that may apply to investors. This investment is issued subject to all applicable laws, regulations and guidelines. In the event of change in such laws, regulations or guidelines, Bank Islam may be obliged to change some or all the terms and conditions of the investment, including the possibility of an early termination.
• Shariah non-compliance risk – the risk arising from possible failures to meet the obligation to Shariah principles or in other words, possible incident of Shariah non-compliances.
INTEGR ATED ANNUAL REPORT 2021
431
Key Messages Overview Value Creation MD&A Sustainability Leadership Accountability Financial Additional Information
431

9. INVESTMENT ACCOUNT (CONTINUED)
9.2 Governance Structure
To safeguard the IAH’s interest, the investment mandate, strategy and parameter are carried out in accordance with the Group’s governance set-up. The IA governance structure adopted by the Group is as depicted in the following diagram:
The roles and responsibilities of the above respective committees are as follows:
Committee Responsibility
Board of Directors (Board) Responsible to establish an effective governance arrangement to facilitate effective monitoring and control of the overall management and conduct of the IA. The adequacy of the governance arrangement shall be commensurate with the nature, scale, complexity, and risk profile associated with the conduct of the IA.
Board Risk Committee (BRC) Assists the Board in performing independent oversight and provides recommendations in respect of the management, operations, and performance of the IA, as well as to play the role of Board Investment Committee.
Shariah Supervisory Council Advises and provides clarification on relevant Shariah rulings, decisions, or policies on Shariah matters and endorses the terms and conditions stipulated in IA documentation and ensures that information published is in compliance with Shariah.
Management Risk Control Committee Assists BRC in performing independent oversight and provides recommendations in respect of the management, operations and performance of the IA.
Board of Directors
Board Risk Committee
Management Risk Control Committee
Business Units/Investment Account Units
Shariah Supervisory Council
BOARDCOMMITTEES
MANAGEMENTCOMMITTEES
PILLAR 3 DISCLOSUREas at 31 December 2021
BANK ISL AM MAL AYSIA BERHAD
432

9. INVESTMENT ACCOUNT (CONTINUED)
9.3 IA Performance
31 December 2021 31 December 2020
RM’000 RM’000
Gross Exposure: Financing funded by UA RM10,561,600,658.98 RM12,368,896,784.16
% %
Return on Assets (“ROA”) 3.92% 4.42%Average Net Distributable Income 3.49% 4.06%Average/Proportion Net Distributable Income Attributable
to the IAH 1.28% 1.93%Average Profit Sharing Ratio/Return to the IAH 36.68% 47.56%
RM’000 RM’000
Impaired assets/financing funded by UA (bank-wide) 568,382.80 373,233.77Total allowance for UA 54,648.62 40,354.48Collective allowance provisions funded by UA NA NAIndividual allowance provisions funded by UA NA NA
INTEGR ATED ANNUAL REPORT 2021
433
Key Messages Overview Value Creation MD&A Sustainability Leadership Accountability Financial Additional Information
433

GROUP CHIEF EXECUTIVE OFFICER ATTESTATION
In accordance with Bank Negara Malaysia’s Capital Adequacy Framework for Islamic Bank (CAFIB) Disclosure Requirements (Pillar 3), I hereby attest that to the best of my knowledge, the disclosures contained in Bank Islam Malaysia Berhad’s Pillar 3 Disclosure report for the financial year ended 31 December 2021 are consistent with the manner in which the Group and the Bank assesses and manages its risk, and are not misleading in any particular way.
Mohd Muazzam MohamedGroup Chief Executive, Bank Islam Malaysia Berhad
PILLAR 3 DISCLOSUREas at 31 December 2021
BANK ISL AM MAL AYSIA BERHAD
434

SHAREHOLDINGS’ ANALYSISas at 31 March 2022
ANALYSIS OF HOLDINGS (MALAYSIAN & FOREIGN)
NO. OF HOLDERS NO. OF HOLDERS %
SIZE OF HOLDINGS MALAYSIAN FOREIGN MALAYSIAN FOREIGN MALAYSIAN FOREIGN
1-99 664 8 6,964 143 _ _100-1,000 2,452 35 1,444,309 22,315 0.07 _1,001-10,000 3,563 63 13,853,818 291,250 0.64 0.0110,001-100,000 914 63 25,426,363 2,546,063 1.18 0.12100,001-107,763,454 (*) 291 47 646,862,854 33,532,734 30.01 1.56107,763,455 AND ABOVE (**) 3 _ 1,431,282,301 _ 66.41 _DIRECTORS HOLDING _ _ _ _ _ _
TOTAL 7,887 216 2,118,876,609 36,392,505 98.31 1.69
* Less than 5% of issued holdings** 5% and above of issued holdings
DISTRIBUTION TABLE ACCORDING TO CATEGORY OF HOLDERS
NO. OF HOLDERS NO. OF HOLDERS %
MALAYSIAN
FOREIGN
MALAYSIAN
FOREIGN
MALAYSIAN
FOREIGNCATEGORY OF SHAREHOLDERS BUMIPUTRA
NON-BUMIPUTRA BUMIPUTRA
NON-BUMIPUTRA BUMIPUTRA
NON-BUMIPUTRA
1. INDIVIDUAL 1,916 4,270 75 6,612,838 32,469,308 709,138 0,31 1,51, 0,032. BODY CORPORATE A. BANKS/
FINANCE COMPANIES 54 1 – 1,448,748,272 5,000 – 67.22 – –
B. INVESTMENTS TRUSTS/FOUNDATION/CHARITIES 1 – – 2,678,140 – – 0.12 – –
C. OTHER TYPES OF COMPANIES 59 48 2 12,269,336 7,777,669 1,515,190 0.57 0.36 0.07
3. GOVERNMENT AGENCIES/INSTITUTIONS
14 – – 55,671,036 – – 2.58 – –
4. NOMINEES 1,035 489 139 81,430,214 471,214,796 34,168,177 3.78 21.86 1.595. TRUSTEE _ – – – – – – – –6. OTHERS _ – – – – – – – –
TOTAL 3,079 4,808 216 1,607,409,836 511,466,773 36,392,505 74.58 23.73 1.69
INTEGR ATED ANNUAL REPORT 2021
Key Messages Overview Value Creation MD&A Sustainability Leadership Accountability Financial Additional Information
435

LIST OF DIRECTORS SHAREHOLDINGS
NAME OF DIRECTOR
NO. OF SHARES HELD
THROUGH OWN NAME
NO. OF SHARES HELD
THROUGH NOMINEES
TOTAL SHARES %
TAN SRI DR. ISMAIL HAJI BAKAR _ _ _ _MOHAMED RIDZA MOHAMED ABDULLA – – – –DATUK NIK MOHD HASYUDEEN YUSOFF – – – –DATO’ SRI KHAZALI AHMAD – – – –AZIZAN AHMAD – – – –MOHD YUZAIDI MOHD YUSOFF – – – –MASHITAH HAJI OSMAN – – – –DATO’ SRI AMRIN AWALUDDIN – – – –MOHD ASRI AWANG – – – –DATUK BAZLAN OSMAN – – – –NURAINI ISMAIL – – – –
TOTAL – – – –
LIST OF SUBSTANTIAL SHAREHOLDERS HOLDINGS OF 5% AND ABOVE
No. NameNRIC/
REGN. NO. SHAREHOLDINGSTOTAL
SHAREHOLDINGS %
1. LEMBAGA TABUNG HAJI ACT5351995 1,040,534,000 1,040,534,000 48.282. CITIGROUP NOMINEES (TEMPATAN) SDN BHD
EMPLOYEES PROVIDENT FUND BOARD199301012273 291,465,101 13.52
EMPLOYEES PROVIDENT FUND BOARD (AMUNDI) EMPLOYEES PROVIDENT FUND BOARD (AM INV) EMPLOYEES PROVIDENT FUND BOARD (CIMB PRIN) EMPLOYEES PROVIDENT FUND BOARD EMPLOYEES PROVIDENT FUND BOARD (ASIANISLAMIC) EMPLOYEES PROVIDENT FUND BOARD (RHBISLAMIC) EMPLOYEES PROVIDENT FUND BOARD (F.TEMISLAMIC) EMPLOYEES PROVIDENT FUND BOARD (ABERISLAMIC) EMPLOYEES PROVIDENT FUND BOARD (BNP NAJMAH EQ) EMPLOYEES PROVIDENT FUND BOARD (CPIAM EQ) EMPLOYEES PROVIDENT FUND BOARD (NIAM EQ)
6,563,800
1,671,800
6,153,100
247,762,20110,079,000
899,900
1,761,100
4,608,000
3,351,400
3,450,000
5,164,800
–
–
–
––
–
–
–
–
–
–
–
–
–
––
–
–
–
–
–
–
3. AMANAHRAYA TRUSTEES BERHAD AMANAH SAHAM BUMIPUTERA
200701008892 142,986,100 142,986,100 6.63
TOTAL 1,474,985,201 68.44
BANK ISL AM MAL AYSIA BERHAD
436
SHAREHOLDINGS’ ANALYSISas at 31 March 2022

TOP 30 HOLDERS
NO. NAMETOTAL
SHAREHOLDINGS %
1. LEMBAGA TABUNG HAJI 1,040,534,000 48.282. CITIGROUP NOMINEES (TEMPATAN) SDN BHD
EMPLOYEES PROVIDENT FUND BOARD247,762,201 11.50
3. AMANAHRAYA TRUSTEES BERHADAMANAH SAHAM BUMIPUTERA
142,986,100 6.63
4. PERMODALAN NASIONAL BERHAD 93,921,603 4.365. KUMPULAN WANG PERSARAAN (DIPERBADANKAN) 66,598,980 3.096. AMANAHRAYA TRUSTEES BERHAD
AMANAH SAHAM BUMIPUTERA 226,934,202 1.25
7. CITIGROUP NOMINEES (TEMPATAN) SDN BHDURUSHARTA JAMAAH SDN BHD (2)
24,423,626 1.13
8. CITIGROUP NOMINEES (TEMPATAN) SDN BHDEXEMPT AN FOR AIA BHD
16,258,600 0.75
9. MAYBANK NOMINEES (TEMPATAN) SDN BHDMTRUSTEE BERHAD FOR PRINCIPAL DALI EQUITY GROWTH FUND (UT-CIMB_DALI)(419455)
14,303,360 0.66
10. MAJLIS UGAMA ISLAM SABAH 11,717,299 0.5411. AMANAHRAYA TRUSTEES BERHAD
AMANAH SAHAM MALAYSIA 310,799,171 0.50
12. PERTUBUHAN KESELAMATAN SOSIAL 10,514,900 0.4913. MAJLIS UGAMA ISLAM SABAH 10,421,700 0.4814. CARTABAN NOMINEES (TEMPATAN) SDN BHD
PBTB FOR TAKAFULINK DANA EKUITI10,204,330 0.47
15. CITIGROUP NOMINESS (TEMPATAN) SDN BHDEMPLOYEES PROVIDENT FUND BOARD (ASIANISLAMIC)
10,079,000 0.47
16. AMIN BAITULMAL JOHOR 8,316,000 0.3917. AMANAHRAYA TRUSTEES BERHAD
AMANAH SAHAM MALAYSIA8,138,800 0.38
18. AMANAHRAYA TRUSTEES BERHADPUBLIC ISLAMIC DIVIDEND FUND 7,716,900
0.36
19. CITIGROUP NOMINEES (TEMPATAN) SDN BHDURUSHARTA JAMAAH SDN BHD (AFFIN 2)
7,388,200 0.34
20. MAJLIS AGAMA ISLAM SELANGOR 6,573,488 0.3021. CIMB ISLAMIC NOMINEES (TEMPATAN) SDN BHD
AFFIN HWANG ASSET MANAGEMENT BERHAD FOR MAJLIS UGAMA ISLAM DAN ADAT RESAM MELAYU PAHANG
6,571,600 0.30
22. CITIGROUP NOMINEES (TEMPATAN) SDN BHDEMPLOYEES PROVIDENT FUND BOARD (AMUNDI)
6,563,800 0.30
23. AMANAHRAYA TRUSTEES BERHADAC PRINCIPAL DALI ASIA PACIFIC EQUITY GROWTH FUND
6,450,900 0.30
24. CITIGROUP NOMINEES (TEMPATAN) SDN BHDEMPLOYEES PROVIDENT FUND BOARD (CIMB PRIN)
6,153,100 0.29
25. LEMBAGA TABUNG ANGKATAN TENTERA 6,008,652 0.2826. HSBC NOMINEES (TEMPATAN) SDN BHD
HSBC (M) TRUSTEE BHD FOR MANULIFE INVESTMENT SHARIAH PROGRESS FUND5,839,500 0.27
27. HSBC NOMINEES (TEMPATAN) SDN BHDHSSBC (M) TRUSTEE BHD FOR ALLIANZ LIFE INSURANCE MALAYSIA BERHAD (MEF)
5,725,400 0.27
28. MAJLIS AGAMA ISLAM NEGERI PULAU PINANG 5,544,000 0.2629. MAJLIS AMANAH RAKYAT 5,544,000 0.2630. AMANAHRAYA TRUSTEES BERHAD
AMANAH SAHAM BUMIPUTERA 3 - DIDIK5,217,364 0.24
TOTAL 1,835,210,776 85.14
INTEGR ATED ANNUAL REPORT 2021
Key Messages Overview Value Creation MD&A Sustainability Leadership Accountability Financial Additional Information
437

PROPERTIES OWNED BY BIMB GROUP
LocationDescription ofExisting Use Tenure
Age ofBuilding(years)
Land, Built-up Area
(square feet)
Net BookValue as at
31.12.2021(RM)
Date of Acquisition
HS (D) 80625PT 45Lot No. 37, Seksyen 87Jalan Tun Razak50750 Kuala Lumpur
Building site Leasehold for 99 yearsexpiring on 29.12.2093
NA 6,597 11,675,086.13 30.12.1994
No. PT 1708 & 1709H S (M) 2660 & 2661Lot No. 1 & 2, Batu 5 1/2 Jalan Cheras56100 Kuala Lumpur
Vacant land Leasehold for 99 yearsexpiring on 02.04.2085
NA 4,443 57,272.78 03.04.1986
Lot No. PT 805-HSD 1323Mukim Bagan Nakhoda Omar, Sabak Bernam Selangor
Vacant land Leasehold for 99 yearsexpiring on 03.02.2101
NA 405,000 533,305.13 25.03.1999
LocationDescription ofExisting Use Tenure
Age ofBuilding(years)
Land, Built-up Area
(square feet)
Net BookValue as at
31.12.2021(RM)
Date of Acquisition
No. PT Lot 002600 & 002601No.HS (D) 815 & 816No. 71 & 73Jalan Taman Selat OffJalan Bagan Luar12720 ButterworthPulau Pinang
4-storey shophouse/ office for Bank Islam Operation
Freehold 36 Lot 002600 - 171 Lot 002601 - 273(square meter)
612,477.63 30.09.1985
PROPERTY LISTING FOR BANK ISLAM MALAYSIA BERHAD
PROPERTY LISTING FOR SYARIKAT AL-IJARAH SENDIRIAN BERHAD
BANK ISL AM MAL AYSIA BERHAD
438

KUALA LUMPUR
• BANDAR TASIK PERMAISURI Tel : (6) 03 9171 4818 / 5078 / 7245 Fax : (6) 03 9171 7289
• BANDAR WAWASAN Tel : (6) 03 2694 8175 / 8192 / 8244 Fax : (6) 03 2694 8291
• BUKIT DAMANSARA Tel : (6) 03 2092 1064 / 1066 / 1067 Fax : (6) 03 2092 1072
• JALAN TUN RAZAK Tel : (6) 03 2161 1333 / 1340 / 1341 Fax : (6) 03 2161 1360 / 2164 8450
• KL SENTRAL Tel : (6) 03 2274 9878 / 9899 (6) 03 2274 9901 / 6430 Fax : (6) 03 2274 9902 / 4324
• MEDAN MARA Tel : (6) 03 2691 9079 / 9082 (6) 03 2691 9086 / 9088 Fax : (6) 03 2692 1890
1 Level 28 Menara Bank Islam No. 22, Jalan Perak 50450 Kuala Lumpur Tel : (6) 03 2688 2745 Fax : (6) 03 2688 2725
• MENARA BANK ISLAM Tel : (6) 03 2161 0073 / 0076 (6) 03 2166 0797 Fax : (6) 03 2166 0798
• MENARA TM Tel : (6) 03 2240 2020 / 0296 Fax : (6) 03 2240 2391
• SEMARAK Tel : (6) 03 2681 0042 / 0049 / 0057 Fax : (6) 03 2681 0076
• SELAYANG Tel : (6) 03 6135 2655 / 2934 Fax : (6) 03 6137 9199
• SERI PETALING Tel : (6) 03 9056 2939 / 2943 / 2969 Fax : (6) 03 9056 2982
• TAMAN MELAWATI Tel : (6) 03 4107 7800 / 6842 / 6852 Fax : (6) 03 4107 7181
2 2 & 4, Jalan 6C/7 Seksyen 16 43650 Bandar Baru Bangi Selangor Tel : (6) 03 8925 8490 / 8491 / 8492 Fax : (6) 03 8925 6168
• TAMAN TUN DR ISMAIL Tel : (6) 03 7726 5744 (6) 03 7728 7894 / 5270 Fax : (6) 03 7722 4539
• UIAM, GOMBAK Tel : (6) 03 6185 3150 / 3262 / 3282 Fax : (6) 03 6185 3402
• UNIVERSITI MALAYA Tel : (6) 03 7960 8934 / 7429 / 6235 Fax : (6) 03 7960 4320
• WANGSA MAJU Tel : (6) 03 4142 7733 / 7886 / 8204 Fax : (6) 03 4142 8209
3 1st Floor, No. 1 Jalan Elektron EU16/E Seksyen U16, Denai Alam 40160 Shah Alam, Selangor Tel : (6) 03 7831 1395 / 7734 2498 /
(6) 03 7831 3481
CENTRAL REGION
DIRECTORY OF MAIN AND REGIONAL OFFICES
INTEGR ATED ANNUAL REPORT 2021
Key Messages Overview Value Creation MD&A Sustainability Leadership Accountability Financial Additional Information
439

SELANGOR
• AMPANG Tel : (6) 03 9200 4389 / 4392 / 4497 Fax : (6) 03 9200 4507
• ARA DAMANSARA Tel : (6) 03 7846 0557 / 1165 / 1347 Fax : (6) 03 7846 1473
• BANDAR BARU BANGI Tel : (6) 03 8925 8490 / 8491 / 8492 Fax : (6) 03 8925 6168
• BANDAR BOTANIC, KLANG Tel : (6) 03 3324 7132 / 7623 / 8671 Fax : (6) 03 3324 8758
• BANDAR KINRARA Tel : (6) 03 8079 1601 / 1602 / 1603 Fax : (6) 03 8079 1604
• BANTING Tel : (6) 03 3187 3772 / 3181 4772 Fax : (6) 03 3187 3776 • BUKIT JELUTONG Tel : (6) 03 7847 3710 / 3711 / 3712 Fax : (6) 03 7847 3714
• CYBERJAYA Tel : (6) 03 8319 3491 / 3492 / 3493 Fax : (6) 03 8319 3494
• DENAI ALAM Tel : (6) 03 7734 0726 / 1750 / 1846 Fax : (6) 03 7734 5602
• KAJANG Tel : (6) 03 8736 0798 / 1773 / 2185 Fax : (6) 03 8736 2362
• KELANA JAYA Tel : (6) 03 7806 2955 / 2946 (6) 03 7803 8190 Fax : (6) 03 7806 1214
• KLANG Tel : (6) 03 3342 1911 / 1912 / 1913 Fax : (6) 03 3342 1914
• KOTA DAMANSARA Tel : (6) 03 6141 8447 / 8456 / 8465 Fax : (6) 03 6141 8474
• PJ NEW TOWN Tel : (6) 03 7960 4812 / 4813 / 4814 Fax : (6) 03 7860 4815
• PUTRA HEIGHTS Tel : (6) 03 5192 0981 / 1516 / 1532 Fax : (6) 03 5192 1534
• RAWANG Tel : (6) 03 6091 7652 / 7657 / 7661 Fax : (6) 03 6091 7682
• SAUJANA UTAMA Tel : (6) 03 6038 2877 / 3275 / 3308 Fax : (6) 03 6038 3384
• SECTION 14, PETALING JAYA Tel : (6) 03 7957 3131 / 3834 Fax : (6) 03 7957 4141
• SECTION 18, SHAH ALAM Tel : (6) 03 5541 0250 / 0255 Fax : (6) 03 5541 0259
• SEMENYIH Tel : (6) 03 8723 4624 / 4629 / 4630 Fax : (6) 03 8723 4631
• SETIA ALAM Tel : (6) 03 3358 1359 / 8413 / 7347 Fax : (6) 03 3362 3216
• SHAH ALAM Tel : (6) 03 5510 1481 / 1492 / 4509 Fax : (6) 03 5510 1497
• SRI GOMBAK Tel : (6) 03 6185 9655 / 9667 / 9672 Fax : (6) 03 6185 9675
• SUBANG JAYA Tel : (6) 03 8023 2072 / 2087 / 2125 Fax : (6) 03 8023 2140
• SUNGAI BESAR Tel : (6) 03 3224 2886 / 3478
(6) 03 3224 2434 / 2876 Fax : (6) 03 3224 3479
• SUNGAI BULOH Tel : (6) 03 6156 0082 / 0084 / 0086 Fax : (6) 03 6156 0085
• TANJUNG KARANG Tel : (6) 03 3269 1090 / 0090 Fax : (6) 03 3269 1091
• UiTM SHAH ALAM Tel : (6) 03 5510 4194 / 4196 Fax : (6) 03 5510 4186
WILAYAH PERSEKUTUAN
• PUTRAJAYA Tel : (6) 03 8889 3192 / 3193 / 3194 Fax : (6) 03 8889 3189
• IFiC PUTRAJAYA Tel : (6) 03 8861 3698 / 2824 Fax : (6) 03 8861 2673
BANK ISL AM MAL AYSIA BERHAD
440
DIRECTORY OF MAIN AND REGIONAL OFFICES

PERLIS
• KANGAR Tel : (6) 04 970 5525 / 5535 Fax : (6) 04 970 5565
KEDAH
• ALOR SETAR Tel : (6) 04 733 5126 / 5136 (6) 04 731 9813 Fax : (6) 04 733 5128
• BALING Tel : (6) 04 470 1678 / 7052 Fax : (6) 04 470 1679
• GUAR CHEMPEDAK Tel : (6) 04 468 0880 / 4827 / 4829 (6) 04 468 4830 Fax : (6) 04 468 0884
• JITRA Tel : (6) 04 917 4404 / 1151 Fax : (6) 04 917 4225
• KODIANG Tel : (6) 04 925 0397 / 0100 / 0208 Fax : (6) 04 925 0215
• KULIM Tel : (6) 04 403 3300 / 3003 / 3976 Fax : (6) 04 403 3977
• LANGKAWI Tel : (6) 04 966 2463 / 2464 / 2466 (6) 04 966 5191 Fax : (6) 04 966 2469
• ALOR SETAR 2 (PERSIARAN SULTAN ADDUL
HAMID) Tel : (6) 04 772 8800 / 5818 (6) 04 771 6575 Fax : (6) 04 772 8100
• POKOK SENA Tel : (6) 04 782 1033 / 1034 Fax : (6) 04 782 1022
• SIK Tel : (6) 04 469 2124 / 2127 / 2157 Fax : (6) 04 469 2142
• SUNGAI LIMAU, YAN Tel : (6) 04 769 1017 Fax : (6) 04 768 1042
• SUNGAI PETANI Tel : (6) 04 422 0620 / 0621 / 0622 (6) 04 423 8752 Fax : (6) 04 421 3912
• SUNGAI PETANI 2 Tel : (6) 04 422 0061 / 0062 / 0063 Fax : (6) 04 422 0064
• UNIVERSITI UTARA MALAYSIA Tel : (6) 04 924 6271 / 6272 / 6273 Fax : (6) 04 924 6270
1 1st Floor, No. 3009 Bangunan KWSP Seberang Jaya Lebuh Tenggiri 2 13700 Seberang Jaya Pulau Pinang Tel : (6) 04 382 9100 Fax : (6) 04 382 9166
2 1st Floor, 21 & 23 Jalan Taman Meru Utama A1 Medan Meru Utama Meru Raya, 30020 Ipoh, Perak Tel : (6) 05 527 7701 Fax : (6) 05 527 7706
NORTHERN REGION
INTEGR ATED ANNUAL REPORT 2021
Key Messages Overview Value Creation MD&A Sustainability Leadership Accountability Financial Additional Information
441

PULAU PINANG
• BANDAR BARU PERDA Tel : (6) 04 540 3150 / 3151 / 3153 Fax : (6) 04 540 3152
• BAYAN BARU Tel : (6) 04 642 5094 / 5095 / 5096
(6) 04 642 5097 Fax : (6) 04 642 5098
• BUTTERWORTH Tel : (6) 04 331 2357 / 2358 (6) 04 332 1301 / 1317 Fax : (6) 04 331 2360
• GEORGETOWN Tel : (6) 04 262 4724 / 4933 / 5019 (6) 04 262 0626 Fax : (6) 04 262 2594
• KEPALA BATAS Tel : (6) 04 575 5517 / 5579 / 3376 Fax : (6) 04 575 3986
PERAK
• BAGAN SERAI Tel : (6) 05 721 8509 / 8513 / 8512 Fax : (6) 05 721 8515
• IPOH Tel : (6) 05 255 3866 / 3867 / 3868 Fax : (6) 05 253 5760
• MERU RAYA Tel : (6) 05 527 7701 / 7702 / 7703 Fax : (6) 05 527 7706
• PARIT BUNTAR Tel : (6) 05 716 4493 / 4494 Fax : (6) 05 716 4495
• SERI ISKANDAR Tel : (6) 05 371 6020 / 6021 / 6022 Fax : (6) 05 371 6023
• SRI MANJUNG Tel : (6) 05 688 1227 / 9071 Fax : (6) 05 688 1672
• TAIPING Tel : (6) 05 806 5441 / 5442 / 5443 Fax : (6) 05 806 5436
• TANJUNG MALIM Tel : (6) 05 459 8237 / 5127 / 5125 Fax : (6) 05 459 8241
• TELUK INTAN Tel : (6) 05 622 1700 / 1200 / 1411 Fax : (6) 05 622 1489
BANK ISL AM MAL AYSIA BERHAD
442
DIRECTORY OF MAIN AND REGIONAL OFFICES

KELANTAN
• BANDAR BARU TUNJUNG Tel : (6) 09 743 0190 / 0192 / 0193 Fax : (6) 09 743 0194
• GUA MUSANG Tel : (6) 09 912 2003 Fax : (6) 09 912 1772
• KOTA BHARU Tel : (6) 09 741 9222 / 9333 / 9555
(6) 09 743 8825 Fax : (6) 09 743 8826
• KUALA KRAI Tel : (6) 09 966 4627 / 3002 / 3008 Fax : (6) 09 966 4651
• KUBANG KERIAN Tel : (6) 09 764 0058 / 0070 / 0071 Fax : (6) 09 764 0057
• MACHANG Tel : (6) 09 975 2800 / 1490 Fax : (6) 09 975 2900
• PASIR MAS Tel : (6) 09 790 0750 / 0751 Fax : (6) 09 790 0752
• PASIR PUTEH Tel : (6) 09 786 0061 / 0062 / 0063 Fax : (6) 09 786 0068
• PASIR TUMBOH Tel : (6) 09 764 4077 Fax : (6) 09 764 6077
• TANAH MERAH Tel : (6) 09 955 8341 / 2341 Fax : (6) 09 955 8342
• PADANG GARONG Tel : (6) 09 747 1867 / 9313 / 9317 Fax : (6) 09 747 1902
• WAKAF BHARU Tel : (6) 09 719 8444 / 8445 / 8446 Fax : (6) 09 719 8447
PAHANG
• BANDAR MUADZAM SHAH Tel : (6) 09 452 3175 / 5175 / 5176 Fax : (6) 09 452 3177
• JENGKA Tel : (6) 09 466 2890 / 2871 / 4837 (6) 09 466 4153 Fax : (6) 09 466 2891
• JERANTUT Tel : (6) 09 266 6120 / 6121 / 9096 (6) 09 266 9380 / 9381 Fax : (6) 09 266 6380
• KUALA ROMPIN Tel : (6) 09 414 6064 / 6065 / 6068 Fax : (6) 09 414 6074
• KUANTAN Tel : (6) 09 513 3366 / 3367 / 3368 Fax : (6) 09 513 3369
• PEKAN Tel : (6) 09 422 8622 / 8922 Fax : (6) 09 422 8818
• PUTRA SQUARE Tel : (6) 09 517 3225 / 3229 / 3231 Fax : (6) 09 517 3235
• RAUB Tel : (6) 09 355 8300 / 8301 Fax : (6) 09 355 8302
• TEMERLOH Tel : (6) 09 296 5301 / 3222 / 1416 Fax : (6) 09 296 5300
TERENGGANU
• CHUKAI Tel : (6) 09 859 9999 / 9977 Fax : (6) 09 858 1675
• DUNGUN Tel : (6) 09 848 5498 (6) 09 845 3302 / 3055 Fax : (6) 09 848 5502
• JALAN PADANG HILIRAN Tel : (6) 09 631 3533 / 8354 / 8355 Fax : (6) 09 631 3633
• JERTEH Tel : (6) 09 697 3388 / 1672 / 1673 Fax : (6) 09 697 1592
• KUALA TERENGGANU Tel : (6) 09 622 4730 / 4744 / 4754 (6) 09 622 4780 (6) 09 623 4537 Fax : (6) 09 623 3944
• KUALA NERUS Tel : (6) 09 667 1700 / 1702 / 1703 Fax : (6) 09 667 1705
1 No. 8033, 2nd Floor Bandar Satelit Pasir Tumboh 16150 Kota Bharu Kelantan Tel : (6) 09 764 3840 / 3850 / 3854 Fax : (6) 09 764 3870
2 2nd Floor Putra Square Branch 25200 Kuantan Pahang Tel : (6) 09 517 3452 / 3491 / 3584 Fax : (6) 09 517 3605
3 3rd & 4th Floor, Lot 35308 Dataran Austin Gong Badak Mukim Kuala Nerus 20200 Kuala Terengganu Terengganu Tel : (6) 09 667 2426 / 2427 / 2428 Fax : (6) 09 667 2429
EASTERN REGION
INTEGR ATED ANNUAL REPORT 2021
Key Messages Overview Value Creation MD&A Sustainability Leadership Accountability Financial Additional Information
443

JOHOR
• AUSTIN HEIGHT Tel : (6) 07 364 3070 / 3081 / 3293 Fax : (6) 07 364 3839
• BANDAR PENAWAR Tel : (6) 07 822 2802 / 2803 / 2804 Fax : (6) 07 822 2806
• BATU PAHAT Tel : (6) 07 431 9350 / 9352 / 8927 Fax : (6) 07 431 9351
• IFSC JOHOR BAHRU Tel : (6) 07 223 7030 / 7031 Fax : (6) 07 223 7032
• JOHOR BAHRU Tel : (6) 07 224 0242 / 0244 / 0272 Fax : (6) 07 224 0243
• KLUANG Tel : (6) 07 772 6423 / 6417 / 6878 Fax : (6) 07 773 2702
• KOTA TINGGI Tel : (6) 07 883 8800 / 5582 (6) 07 882 6205 Fax : (6) 07 882 4485
• KULAIJAYA Tel : (6) 07 663 5204 / 5205 / 5206 Fax : (6) 07 663 3208
• MERSING Tel : (6) 07 799 5076 / 6606 / 6607 (6) 07 799 6608 Fax : (6) 07 799 5077
• MUAR Tel : (6) 06 952 8301 / 8302 / 8303 Fax : (6) 06 952 8304
• PASIR GUDANG Tel : (6) 07 252 6671 / 6672 / 6673 Fax : (6) 07 252 6676
• PONTIAN Tel : (6) 07 688 1909 / 2259 (6) 07 686 5666 Fax : (6) 07 688 3660
• SEGAMAT Tel : (6) 07 932 4257 / 2901 / 2862
(6) 07 932 2873 Fax : (6) 07 932 4273
• TAMAN BUKIT INDAH Tel : (6) 07 239 5977 / 5978 / 5979 Fax : (6) 07 239 5980
• TAMPOI Tel : (6) 07 234 5228 / 5229 / 8785 Fax : (6) 07 234 5230
MELAKA
• AYER KEROH Tel : (6) 06 232 0986 / 1273 / 6559 Fax : (6) 06 232 6561
• BANDAR MELAKA Tel : (6) 06 284 1366 / 1367 / 1368 Fax : (6) 06 284 7257
• JASIN Tel : (6) 06 529 5301 / 5302 / 5303 Fax : (6) 06 529 5312
• MASJID TANAH Tel : (6) 06 384 5108 / 8340 / 8332 Fax : (6) 06 384 5109
NEGERI SEMBILAN
• KUALA PILAH Tel : (6) 06 481 4600 / 8482 Fax : (6) 06 481 1431
• NILAI Tel : (6) 06 799 0549 / 0277 / 6124 Fax : (6) 06 799 6217
• PORT DICKSON Tel : (6) 06 647 4330 (6) 06 646 3281 Fax : (6) 06 647 5657
• SENAWANG Tel : (6) 06 678 2731 / 2732 / 2733 Fax : (6) 06 678 2734
• SEREMBAN Tel : (6) 06 762 9814 / 9815 / 9816 (6) 06 762 9817 Fax : (6) 06 763 8391
• TAMPIN Tel : (6) 06 441 4131 / 4132 / 4133 Fax : (6) 06 441 7479
• BANDAR ENSTEK Tel : (6) 06 799 6484 / 6485 / 6486 Fax : (6) 06 799 6487
1 15th Floor, Menara TH Jalan Ayer Molek 80000 Johor Bahru Johor Tel : (6) 07 225 8800 Fax : (6) 07 225 8901
2 JC 526 & 527, Tingkat 1 Jalan Bestari 5 77200 Jasin Melaka Tel : (6) 06 529 4402 / 4403 Fax : (6) 06 529 4370
SOUTHERN REGION
BANK ISL AM MAL AYSIA BERHAD
444
DIRECTORY OF MAIN AND REGIONAL OFFICES

SABAH
• ALAMESRA Tel : (6) 088 487 978 / 975 / 976 Fax : (6) 088 487 980
• KOTA KINABALU Tel : (6) 088 447 285 / 306 / 312 /
(6) 088 447 314 Fax : (6) 088 447 315
• LAHAD DATU Tel : (6) 089 863 255 / 244 / 577 Fax : (6) 089 863 433
• SANDAKAN Tel : (6) 089 214 885 / 942 / 964 Fax : (6) 089 214 977
• TAWAU Tel : (6) 089 778 966 / 758 Fax : (6) 089 779 666
• KENINGAU Tel : (6) 087 342 201 / 202 / 203 Fax : (6) 087 342 204
WILAYAH PERSEKUTUAN
• LABUAN Tel : (6) 087 419 205 / 424 667 Fax : (6) 087 419 206
SARAWAK
• BINTULU Tel : (6) 086 337 413 / 418 / 493 / 781 Fax : (6) 086 337 401
• KOTA SAMARAHAN Tel : (6) 082 662 616 / 617 / 284
(6) 082 662 285 Fax : (6) 082 662 618
• KUCHING Tel : (6) 082 412 259 / 413 229 (6) 082 414 159 / 417 289 Fax : (6) 082 410 446
• MIRI Tel : (6) 085 415 422 / 424 / 425 Fax : (6) 085 415 421
• SIBU Tel : (6) 084 327 140 / 141 / 142 Fax : (6) 084 327 144
• SIMPANG TIGA, KUCHING Tel : (6) 082 453 716 / 726 / 736 Fax : (6) 082 453 711
1 1st Floor, UMNO Building Jalan Kemajuan 88500 Kota Kinabalu Sabah Tel : (6) 088 447 114 / 160 / 260 Fax : (6) 088 447 256
2 Lot 423 – 426, Bangunan Aiman Jalan Kulas Barat Section 5 93400 Kuching Sarawak Tel : (6) 082 425 118 / 235 419
(6) 082 416 215 Fax : (6) 082 233 172 / 234 108
(6) 082 235 521
EAST MALAYSIA REGION
INTEGR ATED ANNUAL REPORT 2021
Key Messages Overview Value Creation MD&A Sustainability Leadership Accountability Financial Additional Information
445

ALOR SETAR
• Lot 2024, Jalan Langgar 05000 Alor Setar Kedah Tel : (6) 04 731 9090 Fax : (6) 04 730 5050
SUNGAI PETANI
• 21-B, Jalan Ibrahim 08000 Sungai Petani Kedah Tel : (6) 04 421 9090 Fax : (6) 04 421 5050
KOTA BHARU
• No. 1154 & 1155, Seksyen 11 Lorong Medan MARA Bandar Kota Bharu 15000 Kota Bharu Kelantan Tel : (6) 09 748 9090 Fax : (6) 09 748 9050
KUBANG KERIAN
• PT 816, Ground Floor Jalan Raja Perempuan Zainab II Bandar Baru Kubang Kerian 16150 Kota Bharu Kelantan Tel : (6) 09 767 8090 Fax : (6) 09 764 5090
PASIR MAS
• Lot 319, Seksyen 1 Jalan Pasir Pekan 17000 Pasir Mas Kelantan Tel : (6) 09 790 8090 Fax : (6) 09 790 3090
PASIR PUTEH
• No. PT 546, Seksyen 2 Jalan Nara 16800 Pasir Puteh Kelantan Tel : (6) 09 786 9090 Fax : (6) 09 786 5050
TANAH MERAH
• Lot PT175 Jalan Hospital 17500 Tanah Merah Kelantan Tel : (6) 09 955 7090 Fax : (6) 09 955 5090
KUALA TERENGGANU
• MBKT-No 19 Pusat Niaga Paya Keladi Kampung Paya Keladi 20200 Kuala Terengganu Terengganu Tel : (6) 09 626 7090 Fax : (6) 09 623 5050
KUANTAN
• No. G-11, Ground Floor Mahkota Square Jalan Mahkota 25000 Kuantan Pahang Tel : (6) 09 517 9090 Fax : (6) 09 514 5050
AR-RAHNU BRANCHES
BANK ISL AM MAL AYSIA BERHAD
446

CENTRAL REGION
• SME BANKING SHAH ALAM Tingkat Bawah, Wisma PKPS Seksyen 14, Persiaran Perbandaran 40675 Shah Alam Selangor General Line : 03-5510 0103 / 0018 /
0288 Fax : 03-5519 7261
• SME BANKING BANGI Bank Islam Bandar Baru Bangi No. 2 & 4, Jalan 6C/7 43650 Bandar Baru Bangi Selangor General Line : 03-8920 1062 Fax : 03-8925 6168
• SME BANKING SRI GOMBAK Lot No. 120 & 121, Jalan Prima SG 5 Prima Sri Gombak 68100 Batu Caves Selangor General Line : 03-6181 1058 Fax : 03-6185 9675
• SME BANKING SRI PETALING No. 1 Jalan Radin Bagus Bandar Baru Seri Petaling 57100 Kuala Lumpur General Line : 03-9056 1421 Fax : 03-9056 2982
EASTERN REGION
• SME BANKING KELANTAN STATE Tingkat 2, PT1540, 1541 & 1542 Persiaran KK6, Jalan Raja Perempuan Zainab II Bandar Baru Kubang Kerian 16150 Kota Bharu Kelantan General Line : 09-764 1049 Fax : 09-765 0177
• SME BANKING TERENGGANU STATE Tingkat 2 & 3, PT 35308 & PT 35309 Dataran Austin, Mukim Kuala Nerus 21300 Kuala Terengganu Terengganu General Line : 09-667 2426 / 2427 Fax : 09-667 2433
• SME BANKING PAHANG STATE Bank Islam Putra Square No. 1 & 3, Tingkat 2 Jalan Putra Square 2 25200 Kuantan Pahang General Line : 09-517 3491 Fax : 09-517 3605
SOUTHERN REGION
• SME BANKING JOHOR STATE Tingkat 15, Menara Tabung Haji Jalan Ayer Molek 80000 Johor Bahru Johor General Line : 07-225 8800 Fax : 07-225 8899
• SME BANKING AYER KEROH No. 1 & 3, Jalan KF4 Kota Fesyen-MITC, Hang Tuah Jaya 75450 Ayer Keroh Melaka General Line : 06-232 6216 Fax : 06-232 6494
NORTHERN REGION
• SME BANKING KEDAH/ PERLIS STATE No. 212 & 213, Kompleks Perniagaan Sultan Abdul Hamid Persiaran Sultan Abdul Hamid 05050 Alor Setar Kedah Tel : 04-771 0102 Fax : 04-771 0112
• SME BANKING PULAU PINANG STATE Tingkat 1 (Mezanine) Bangunan KWSP, Seberang Jaya No. 3009, Lebuh Tenggiri 2 13700 Seberang Jaya Pulau Pinang General Line : 04-382 9100 Fax : 04-382 9166
• SME BANKING GEORGETOWN Ground Floor Wisma Great Eastern Light Street Peti Surat 1204 10200 Georgetown Pulau Pinang General Line : 04-262 4724 Fax : 04-262 2594
• SME BANKING PERAK STATE No. 21 & 23 Jalan Taman Meru Utama A1 Medan Meru Utama 30020 Ipoh Perak General Line : 05-527 2125 Fax : 05-527 7706
• SME BANKING SG PETANI Lot 71 & 72 Jalan Lagenda 1 Lagenda Height 08000 Sungai Petani Kedah. Tel : 04-422 0620 Fax : 04-421 3912
EAST MALAYSIA
• SME BANKING KUCHING STATE Lot 433, 434 & 435, Section 11 KTLD Bangunan Tuanku Muhamad Al Idrus
Jalan Kulas 93400 Kuching Sarawak Tel : 082-414 159 / 082-412 259 Fax : 082-410 446
• SME BANKING KOTA KINABALU STATE
Ground & First Floor UMNO Building Jalan Kemajuan Karamunsing 88850 Kota Kinabalu Sabah Tel : 088-447 274
• Level 29, Menara Bank Islam No. 22, Jalan Perak 50450 Kuala Lumpur Tel : 03-2028 3286
HEADQUARTERS
INTEGR ATED ANNUAL REPORT 2021
Key Messages Overview Value Creation MD&A Sustainability Leadership Accountability Financial Additional Information
447
SME HUB

KLIA ARRIVAL LANDSIDE
• Lot No. MTB-3-L11 Level 3, Arrival Hall Main Terminal Building Kuala Lumpur International Airport 64000 Sepang Selangor Tel : 03-8787 1239 Fax : 03-8787 1108
KLIA CONTACT PIER
• Lot No. CPI-4-A02 Contact Pier International Kuala Lumpur International Airport 64000 Sepang Selangor Tel : 03-8787 1840 Fax : 03-8787 1843
KLIA IMMIGRATION
• Lot No. MTB-3-A21 Arrival Hall (Immigration) Kuala Lumpur International Airport 64000 Sepang Selangor Tel : 03-8787 1213 Fax : 03-8787 1186
KLIA SATELLITE
• Lot No. SAT-P-A41 Passenger Level, Satellite Building Kuala Lumpur International Airport 64000 Sepang Selangor Tel : 03-8787 1214 Fax : 03-8787 1231
KLIA 2 LANDSIDE
• Lot L2-24A Gateway @ KLIA2, Terminal KLIA2 Kuala Lumpur International Airport 2 Jalan KLIA2/1 64000 Sepang Selangor Tel : 03-8775 8032 Fax : 03-8775 8029
KOTA KINABALU INTERNATIONAL AIRPORT
• Lot No. L1L01 (C7) Level 1, Arrival Hall (Landside) 88740 Kota Kinabalu International Airport Sabah Tel : 088-204 232 Fax : 088-204 175
PENANG INTERNATIONAL AIRPORT
• Lot No. L1AS14 Level 1, International Arrival (Airside) Penang International Airport 11900 Bayan Lepas Pulau Pinang Tel : 04-645 3388 Fax : 04-643 9488
BUREAU DE CHANGE
BANK ISL AM MAL AYSIA BERHAD
448

TEMERLOH
• D/A BANK ISLAM MALAYSIA BERHAD
TEMERLOH BRANCH Lot No. C-49 & C-50 Jalan Tengku Ismail 28000 Temerloh Pahang Tel : (6) 09 296 1416 Fax : (6) 09 296 5300
ALOR SETAR
• D/A BANK ISLAM MALAYSIA BERHAD
ALOR SETAR BRANCH No. 1, Kompleks Perniagaan Utama Jalan Sultanah Sambungan 05150 Alor Setar Kedah Tel : (6) 04 735 5966 Fax : (6) 04 735 1002
AYER KEROH
• D/A BANK ISLAM MALAYSIA BERHAD
AYER KEROH BRANCH 1st Floor, 1 & 3, Jalan KF 4 Kota Fesyen-MITC, Hang Tuah Jaya 75450 Ayer Keroh Melaka Tel : (6) 06 232 6216 / 6024 Fax : (6) 06-232 6494
BUTTERWORTH
• D/A BANK ISLAM MALAYSIA BERHAD
BUTTERWORTH BRANCH 1st Floor, No. 71 & 73 Jalan Taman Selat Off Jalan Bagan
Luar 12720 Butterworth Penang Tel : (6) 04 332 1333 Fax : (6) 04 333 4477
MERU RAYA
• D/A BANK ISLAM MALAYSIA BERHAD
MERU RAYA BRANCH Ground Floor, No. 19 Jalan Taman Meru Utama A1 Medan Meru Utama 30020 Ipoh Perak Tel : (6) 05 527 7742 / 7743 Fax : (6) 05 527 7751
KUALA TERENGGANU
• D/A BANK ISLAM MALAYSIA BERHAD
JLN SULTAN ISMAIL BRANCH 1st Floor, Lot 1128 Bangunan Majlis & Adat Melayu Terengganu, Jalan Banggol 20720 Kuala Terengganu Terengganu Tel : (6) 09 622 4730 Fax : (6) 09 631 5455
KOTA BHARU
• D/A BANK ISLAM MALAYSIA BERHAD
KOTA BHARU BRANCH 1st Floor, Seksyen 25, Lundang Jalan Sultan Yahya Petra 15720 Kota Bharu Kelantan Tel : (6) 09 747 3488 Fax : (6) 09 747 3491
JOHOR BAHRU
• D/A BANK ISLAM MALAYSIA BERHAD
JOHOR BAHRU BRANCH No. 8-01, Jalan Padi Emas 5/2 81200, Bandar Baru Uda Johor Bahru Johor Tel : (6) 07 237 9155 Fax : (6) 07 237 9166
KOTA KINABALU
• D/A BANK ISLAM MALAYSIA BERHAD
KOTA KINABALU BRANCH 1st Floor, Bangunan UMNO Jalan Kemajuan, Karamunsing 88000 Kota Kinabalu Sabah Tel : (6) 088 447 294/295 Fax : (6) 088 447 305
KUALA LUMPUR
• 3rd Floor, Block E Wisma RKT Ground Floor No 10, Jalan Raja Abdullah Off Jalan Sultan Ismail 50300 Kuala Lumpur Tel : (6) 03 2691 0277 Fax : (6) 03 2698 8636
KUANTAN
• D/A BANK ISLAM MALAYSIA BERHAD
KUANTAN BRANCH
No. 1-05, 1-06, 1-07 Mahkota Square Jalan Mahkota 25000 Kuantan Pahang Tel : (6) 09 513 6262 Fax : (6) 09 515 8623
SHAH ALAM
• Ground Floor, Wisma PKPS, Section 14, Persiaran Perbandaran 40675 Shah Alam Selangor Tel : (6) 03 5519 5188 Fax : (6) 03 5519 6188
INTEGR ATED ANNUAL REPORT 2021
Key Messages Overview Value Creation MD&A Sustainability Leadership Accountability Financial Additional Information
449
VEHICLE FINANCING SALES HUB

BIMB INVESTMENT MANAGEMENT BERHAD
• 19th Floor, Menara Bank Islam No. 22, Jalan Perak 50450 Kuala Lumpur Tel : (6) 03 2161 2524 / 2924 Toll Free : 1800 88 1196 Fax : (6) 03 2161 2464
BANK ISLAM TRUST COMPANY (LABUAN) LTD & BIMB OFFSHORE COMPANY MANAGEMENT SERVICES SDN BHD
• Level 15 (A), Main Office Tower Financial Park Complex Jalan Merdeka 87000 F.T. Labuan
Tel : (6) 087 451 806 Fax : (6) 087 451 808
AL-WAKALAH NOMINEES (TEMPATAN) SENDIRIAN BERHAD
• 21st Floor, Menara Bank Islam No. 22, Jalan Perak 50450 Kuala Lumpur Tel : (6) 03 2726 7724 Fax : (6) 03 2726 7733
FARIHAN CORPORATION SDN BHD
• 19th Floor, Menara Bank Islam No. 22, Jalan Perak 50450 Kuala Lumpur Tel : (6) 03 2782 1333 Fax : (6) 03 2782 1355
SUBSIDIARIES OF BIMB GROUP
BIMB HOLDINGS SDN BHD
• 31st Floor, Menara Bank IslamNo. 22, Jalan Perak50450 Kuala LumpurTel : (6) 03 2781 2999Fax : (6) 03 2781 2998Website : www.bimbholdings.com
SYARIKAT AL-IJARAH SENDIRIAN BERHAD
• 31st Floor, Menara Bank IslamNo. 22, Jalan Perak50450 Kuala LumpurTel : (6) 03 2781 2999Fax : (6) 03 2781 2998
BIMB SECURITIES (HOLDINGS) SDN BHD
• 31st Floor, Menara Bank IslamNo. 22, Jalan Perak50450 Kuala LumpurTel : (6) 03 2781 2999Fax : (6) 03 2781 2998
BIMB SECURITIES SDN BHD
• Level 32, Menara Multi-PurposeCapital SquareNo. 8, Jalan Munshi Abdullah50100 Kuala LumpurTel : (6) 03 2613 1600Fax : (6) 03 2613 1799Website : www.bimbsec.com.myOnlinetrading : www.bisonline.com.my
BIMSEC NOMINEES (TEMPATAN) SDN BHD
• Level 32, Menara Multi-PurposeCapital SquareNo. 8, Jalan Munshi Abdullah50100 Kuala LumpurTel : (6) 03 2613 1600Fax : (6) 03 2613 1799
BIMSEC NOMINEES (ASING) SDN BHD
• Level 32, Menara Multi-PurposeCapital SquareNo. 8, Jalan Munshi Abdullah50100 Kuala LumpurTel : (6) 03 2613 1600Fax : (6) 03 2613 1799
BANK ISL AM MAL AYSIA BERHAD
450

NOTICE OF THE 39TH ANNUAL GENERAL MEETING
NOTICE IS HEREBY GIVEN that the 39th Annual General Meeting of Bank Islam Malaysia Berhad (“BIMB” or “the Company”) will be held virtually at the broadcast venue at Level 10, Menara Bank Islam, 22 Jalan Perak, 50450 Kuala Lumpur on Monday, 23 May 2022 at 10.00 a.m. for the following purposes:
ORDINARY BUSINESS
1. To receive the Audited Financial Statements for the financial year ended 31 December 2021 together with the Reports of the Directors and Auditors thereon.
(Please refer to Note 1)
2. To re-elect the following Directors, each of whom is retiring by rotation in accordance with Clause 133 of the Company’s Constitution and being eligible, has offered himself for re-election:
i) Datuk Nik Mohd Hasyudeen Yusoffii) Encik Mohd Yuzaidi Mohd Yusoff
(Ordinary Resolution 1)(Ordinary Resolution 2)
3. To re-elect the following Directors, each of whom is retiring in accordance with Clause 142 of the Company’s Constitution and being eligible, has offered herself/himself for re-election:
i) Dato’ Sri Amrin Awaluddinii) Encik Mohd Asri Awangiii) Datuk Bazlan Osmaniv) Puan Nuraini Ismail
(Ordinary Resolution 3)(Ordinary Resolution 4)(Ordinary Resolution 5)(Ordinary Resolution 6)
4. To approve the payment of the following fees to each Non-Executive Directors for the period from the 39th AGM to the 40th AGM of the Company:
TOTAL AMOUNT (PER ANNUM) (RM)
BOARD BRC BAEC BNRC BFRC
Chairman 144,000.00 90,000.00 48,000.00 18,000.00 24,000.00
Member 72,000.00 72,000.00 36,000.00 12,000.00 18,000.00
SITTING FEE (PER MEETING) (RM)
Chairman Member
5,000.00 3,000.00
(Ordinary Resolution 7)
5. To approve the payment of benefits of up to RM1,150,000.00 to eligible Non-Executive Directors for the period from the 39th AGM to the 40th AGM of the Company.
(Ordinary Resolution 8)
6. To re-appoint Messrs. PricewaterhouseCoopers PLT as the External Auditors of the Company for the financial year ending 31 December 2022 and to authorise the Directors to fix their remuneration.
(Ordinary Resolution 9)
INTEGR ATED ANNUAL REPORT 2021
Key Messages Overview Value Creation MD&A Sustainability Leadership Accountability Financial Additional Information
451

SPECIAL BUSINESS
To consider, and if thought fit, to pass the following Ordinary Resolutions:
7. Authority to Directors to Allot New Ordinary Shares in BIMB (“BIMB shares”)
“THAT subject always to the Companies Act, 2016 (“the Act”), the Company’s Constitution, the Main Market Listing Requirements of Bursa Malaysia Securities Berhad (“Bursa Malaysia”) and approval of the relevant government/regulatory authorities, the Directors be and are hereby authorised pursuant to Section 75 of the Act, to allot BIMB shares at any time and upon such terms and conditions and for such purposes as the Directors may in their absolute discretion deem fit, provided that the aggregate number of BIMB shares to be allotted pursuant to the said allotment does not exceed ten percent (10%) of the total number of issued shares of the Company as at the date of such allotment and that the Directors be and are hereby authorised to obtain all necessary approvals from the relevant authorities for the allotment, listing and quotation of the additional shares so allotted on Bursa Malaysia and that such authority to allot BIMB shares shall continue to be in force until the conclusion of the next AGM of the Company.”
(Ordinary Resolution 10)
8. Proposed renewal of the authority for Directors to allot and issue new ordinary shares of BIMB, for the purpose of the Company’s Dividend Reinvestment Plan (“DRP”) that provides the shareholders of BIMB the option to elect to reinvest their cash dividend in new BIMB shares.
“THAT pursuant to the DRP as approved by the Shareholders at the Extraordinary General Meeting held on 19 November 2021 and subject to the approval of the relevant regulatory authority (if any), approval be and is hereby given to the Company to allot and issue such number of new BIMB shares from time to time as may be required to be allotted and issued pursuant to the DRP until the conclusion of the next Annual General Meeting upon such terms and conditions and to such persons as the Directors of the Company at their sole and absolute discretion, deem fit and in the interest of the Company PROVIDED THAT the issue price of the said new BIMB shares shall be fixed by the Directors based on the adjusted five (5) market days volume weighted average market price (“VWAP”) of BIMB shares immediately prior to the price-fixing date after applying a discount of not more than 10%, of which the VWAP shall be adjusted ex-dividend before applying the aforementioned discount in fixing the issue price;
AND THAT the Directors and the Secretary of the Company be and are hereby authorised to do all such acts and enter into all such transactions, arrangements, deeds, undertakings and documents as may be necessary or expedient in order to give full effect to the DRP with full power to assent to any conditions, modifications, variations and/or amendments as may be imposed or agreed to by any relevant authorities (if any) or consequent upon the implementation of the said conditions, modifications, variations and/or amendments, by the Directors as they, in their absolute discretion, deem fit and in the best interest of the Company.”
(Ordinary Resolution 11)
9. To transact any other ordinary business of which due notice shall have been given in accordance with the Companies Act 2016.
By Order of the Board
MARIA MAT SAID Company Secretary (LS 0009400)Practicing Certificate No. 202008002449Kuala Lumpur25 April 2022
BANK ISL AM MAL AYSIA BERHAD
452
NOTICE OF THE 39TH ANNUAL GENERAL MEETING

EXPLANATORY NOTES:
1. AUDITED FINANCIAL STATEMENTS
The Audited Financial Statements laid at this meeting pursuant to Section 340(1)(a) of the Companies Act 2016 are meant for the shareholders’ information and discussion only. It does not require the shareholders’ approval, and therefore the Audited Financial Statements are not put forward for voting.
2. RE-ELECTION OF DIRECTORS
Ordinary Resolutions 1, 2, 3, 4, 5 and 6
Clause 133 of the Company’s Constitution provides that one-third (1/3) of the Directors of the Company for the time being, or, if their number is not three (3) or a multiple of three (3), then the nearest one-third (1/3) shall retire from office, provided that all Directors shall retire from office at least once in three (3) years, but shall be eligible for re-election.
Clause 142 of the Company’s Constitution provides that the Directors shall have power at any time and from time to time to appoint any person to be a Director either to fill a casual vacancy or as an addition to the existing Directors. Any Director so appointed shall hold office only until the next following annual general meeting and shall then be eligible for re-election but shall not be taken into account in determining the Directors who are to retire by rotation at that meeting.
Based on the number of Directors who are subject to retirement by rotation under Clause 133 of the Company’s Constitution, two (2) out of seven (7) Directors shall retire at this 39th AGM. Datuk Nik Mohd Hasyudeen Yusoff and Encik Mohd Yuzaidi Mohd Yusoff will retire by rotation at this 39th AGM and being eligible, have offered themselves for re-election as Directors of the Company.
During the year under review, there are four (4) new Directors being appointed to the Company. According to Clause 142 of the Company’s Constitution, all four (4) Directors, namely, Dato’ Sri Amrin Awaluddin (appointed on 10 September 2021), Encik Mohd Asri Awang (appointed on 1 October 2021), Datuk Bazlan Osman and Puan Nuraini Ismail (both appointed on 7 January 2022) will retire at this 39th AGM and being eligible, have offered themselves for re-election as Directors of the Company.
The Board Nomination and Remuneration Committee (“BNRC”) of the Company has considered the performance and contribution of each retiring Director and has also assessed the independence of the Independent Non-Executive Directors seeking re-election.
Based on the results of the annual Board Effectiveness Evaluation conducted for the financial year ended 31 December 2021, the performance for each of the retiring Director was found to be satisfactory (rated between 4.1 to 4.3) with the exception of Datuk Bazlan Osman and Puan Nuraini Ismail who were evaluated separately as they were appointed on 7 January 2022. In addition, all retiring Directors met with all the requirements of fit and proper criteria issued by Bank Negara Malaysia. The retiring Independent Non-Executive Directors have also fulfilled the independence criteria as set out in the BNM CG Policy, the Main Market Listing Requirements of Bursa Malaysia Securities Berhad as well as the Company’s Board Charter. All the retiring Directors have no record of adverse finding under MACC Act 2009, LEXIS NEXIS, Insolvency Act or for any mismanagement that could adversely affect the Company.
The Board had endorsed the BNRC’s recommendation on the re-election of the retiring Directors. The retiring Directors had abstained from deliberation and decisions on their re-election at the BNRC and Board meetings.
The Board is of the collective view that all of the said Directors who are retiring at this 39th AGM have satisfactorily discharged their roles and responsibilities to act in the best interest of the Company. The Board is satisfied that, considering their wealth of expertise and experience that the retiring Directors possess and brings to the Board, shall further strengthen the Board composition and dynamic.
The profiles of the Directors seeking for re-election are set out on pages 137 to 142 under Profile of Directors’ section of the Company’s Integrated Annual Report 2021.
INTEGR ATED ANNUAL REPORT 2021
Key Messages Overview Value Creation MD&A Sustainability Leadership Accountability Financial Additional Information
453

3. DIRECTORS’ FEES AND BENEFITS
Ordinary Resolution 7 – Payment of Non-Executive Director’s Fees
The Proposed fees to be paid to each Non-Executive Directors from this AGM to the next AGM of the Company is based on the following fee structure which has not changed since it was first approved by the shareholder at 34th AGM held on 6 Maye 2017:
TOTAL AMOUNT (PER ANNUM) (RM)
BOARD BRC BAEC BNRC BFRC
Chairman 144,000.00 90,000.00 48,000.00 18,000.00 24,000.00
Member 72,000.00 72,000.00 36,000.00 12,000.00 18,000.00
SITTING FEE (PER MEETING) (RM)
Chairman Member
5,000.00 3,000.00
The fee structure is reasonable after benchmarking and taking into account prevailing market and economic conditions as well as practices of other comparable companies in the market.
Ordinary Resolution 8 – Benefits Payable to Non-Executive Directors
The benefits payable to Non-Executive Directors comprise allowances, benefits-in-kind and other emoluments payable to them, details of which are tabulated below:
a) Car Allowance - Chairman - RM10,000 per monthb) Senior Independent Director’ Allowance - RM2,000 per monthc) Other Benefits - Includes benefits that are claimable or otherwise such as leave passage, medical and insurance benefits and
other payments made available by the Company to eligible Non-Executive Directors.
The proposed amount of up to RM1,150,000.00 (remain unchanged with the approved benefits at the 38th AGM) to be paid as benefits to eligible Non-Executive Directors from this AGM to the next AGM of the Company will be paid on monthly basis and/or as and when claimed or incurred.
For shareholders’ ease of reference, the Board had endorsed the BNRC’s recommendation to provide the breakdown of the total fees and other benefits to be paid to NEDs from the 39th AGM until the 40th AGM as follows:- Taking into consideration there will be more meeting to discuss on the strategic matters, the Company anticipates higher number of meetings in 2022/2023, i.e., 83 meetings (2021/2022: 78 meetings). The detail on the fees to be paid to the NEDs are as follows:-
Retainer and sitting fees RM3,388,500.00
Other benefits RM1,150,000.00
Total RM4,538,500.00
Based on the above computation, the total fees (retaining and sitting fees together with other benefits) will be RM4,538,500.00, slightly higher than the amount approved by the shareholder of RM4,211,007.00 at the 38th AGM on 31 May 2021. The Company viewed that the amount proposed is reasonable taking into consideration the Company’s financial health and performance.
BANK ISL AM MAL AYSIA BERHAD
454
NOTICE OF THE 39TH ANNUAL GENERAL MEETING

4. RE-APPOINTMENT OF AUDITORS
Ordinary Resolution 9
The Board, through the Board Audit and Examination Committee (“BAEC”) had, on 27 January 2022, completed its annual assessment on the external auditors, i.e., Messrs. PricewaterhouseCoopers PLT (“PwC”) in accordance with BNM’s Guideline on Corporate Governance for the appointment/re-appointment of external auditors. The assessment covered the following aspects:
i. Level of knowledge, capabilities, experience and quality of previous work;ii. Level of engagement with the BAEC and the Management;iii. Ability to provide constructive observations, implications and recommendations in areas requiring improvements;iv. Adequacy in audit coverage, effectiveness in planning and conduct of audit;v. Ability to perform audit work within agreed timeframe; vi. Non-audit services rendered by the external auditors did not impede independence; andvii. The external auditors demonstrated unbiased stance when interpreting standards/policies adopted by the
Company.
Being satisfied with PwC’s performance in 2021, their technical competency and audit independence as well as fulfillment of criteria as set out in BNM’s Guideline for the Appointment/Re-appointment of External Auditors, the Board, at its meeting held on 28 January 2022, had approved the BAEC’s recommendation for the re-appointment of PwC as the external auditors of the Company for the financial year ending 31 December 2022.
5. AUTHORITY TO DIRECTORS TO ALLOT SHARES
Ordinary Resolution 10
The above proposed ordinary resolution is a general mandate to be obtained from the shareholders of the Company at this AGM and if passed, will empower the Directors pursuant to Section 75 of the Act, to allot BIMB shares of up to an aggregate amount not exceeding ten percent (10%) of the issued share capital of the Company as at the date of such allotment of shares without having to convene a general meeting. This general mandate, unless revoked or varied at a general meeting, will expire at the conclusion of the next AGM of the Company.
The general mandate, if granted, will provide the Company the flexibility to undertake any share issuance without having to convene a general meeting and thereby reducing administrative time and costs associated with the convening of additional general meeting(s). The general mandate is to allow for possible share issue and/or fund raising exercises including placement of shares for the purpose of funding current and/or future investment projects, working capital and/or acquisitions as well as in the event of any strategic opportunities involving equity deals which may require the Company to exercise the mandate. This is only to be undertaken if the Board considers it to be in the best interest of the Company.
The Company has not issued any new shares under the general mandate for allotment of share pursuant to Section 75 of the Act which was approved at the 38th AGM held on 31 May 2021 which will lapse at the conclusion of the upcoming 39th AGM.
6. RENEWAL OF AUTHORITY FOR THE DIRECTORS TO ALLOT AND ISSUE NEW ORDINARY SHARES IN RESPECT OF THE DIVIDEND REINVESTMENT PLAN (“DRP”)
Ordinary Resolution 11
If passed, will give authority to the Directors to allot and issue new ordinary share for the DRP in respect of dividends to be declared until the next AGM. A renewal of this authority will be sought at the next AGM.
INTEGR ATED ANNUAL REPORT 2021
Key Messages Overview Value Creation MD&A Sustainability Leadership Accountability Financial Additional Information
455

NOTES ON ABSTENTION FROM VOTING
Any Director referred to in Ordinary Resolutions 1 to 6, who is a Shareholder of the Company will abstain from voting on the resolutions in respect of his/her re-election at this AGM.
All Directors who are Shareholders of the Company will abstain from voting on Ordinary Resolutions 7 and 8 concerning Directors’ remuneration at this AGM.
For the record, none of the Directors holds any shares in the Company.
NOTES ON VIRTUAL AGM, VOTING RIGHTS AND PROCEDURES
1) The 39th AGM of the Company will be conducted on a virtual basis through live streaming and online remote voting via Remote Participation and Electronic Voting facilities (“RPEV”). The Virtual Meeting via RPEV will be available at https://meeting.boardroomlimited.my. Please follow the procedures provided in the Administrative Guide for the 39th AGM in order to register, participate and vote remotely.
2) The venue of the 39th AGM is strictly for the purpose of complying with Section 327(2) of the Companies Act 2016 and Clause 96 of the Company’s Constitution which requires the Chairman of the meeting to be present at the main venue of the meeting. The notification of the venue of the 39th AGM is to inform shareholders where the electronic AGM production and streaming would be conducted. No shareholders/proxies from the public will be physically allowed at the meeting venue.
3) In accordance with Clause 109 of the Company’s Constitution, each member of the Company (“Member”) shall be entitled to be present and to vote at any general meeting of the Company, either personally or by proxy or by attorney and to be reckoned in a quorum in respect of shares fully paid and in respect of partially paid shares where calls are not due and unpaid. Members may exercise their rights to participate (including pose questions via the RPEV) during the 39th AGM.
4) Pursuant to Paragraph 8.29A of the Main Market Listing Requirements of Bursa Malaysia Securities Berhad, all resolutions set out in this Notice of the 39th AGM will be conducted by way of a poll.
5) The Company had appointed its share registrar, i.e., Boardroom Share Registrars Sdn Bhd (“Boardroom”) as a poll administrator to conduct the poll by way of electronic voting (“e-voting”) and SKY Corporate Services Sdn Bhd as the Independent Scrutineers to verify the poll results.
BANK ISL AM MAL AYSIA BERHAD
456
NOTICE OF THE 39TH ANNUAL GENERAL MEETING

NOTES ON APPOINTMENT OF PROXY
1) In accordance with Clause 94 of the Company’s Constitution, a Member entitled to attend and vote at a meeting of the Company is entitled to appoint one (1) or more proxies to exercise all or any of his/her rights to attend, participate, speak and vote for him/her subject to the following provisions:
a) save as provided for Note (2) below, Clause 113 of the Company’s Constitution and the Companies Act 2016, each member shall not be permitted to appoint more than two (2) proxies to attend the same meeting; and
b) where a Member appoints more than one (1) proxy, the appointment shall be invalid unless he/she specifies the proportion of his/her holdings to be represented by each proxy.
2) For the avoidance of doubt and subject always to Note (1)(b) above, the Company’s Constitution and the Companies Act 2016:
a) where a Member is an exempt authorised nominee which holds ordinary shares in the Company for multiple beneficial owners in one (1) securities account (“omnibus account”), there is no limit to the number of proxies which an exempt authorised nominee may appoint in respect of each omnibus account it holds; and
b) where a Member is an authorised nominee, he/she may appoint at least one (1) proxy in respect of each securities account it holds to which ordinary shares in the Company are credited. Each appointment of proxy by an authorised nominee may be made separately or in one (1) instrument of proxy should specify the securities account number and the name of the beneficial owner for whom the authorised nominee is acting.
3) There shall be no restriction as to the qualification of the proxy. Hence, a proxy may not need to be a Member.
4) The instrument appointing a proxy shall be in writing under the hand of the appointer or his/her attorney duly authorised in writing or if such appointer is a corporation, under its Seal or the hand of its attorney.
5) The instrument appointing a proxy (“Proxy Form”) must be deposited at the Registrar’s office in the following manner:
a) by electronic means through the Boardroom Smart Investor Portal at https://investor.boardroomlimited.com by logging in and selecting “Submit eProxy Form”; orb) by hand or post to Boardroom Share Registrars Sdn Bhd at 11th Floor, Menara Symphony, No. 5, Jalan Prof. Khoo
Kay Kim, Seksyen 13, 46200 Petaling Jaya, Selangor, Malaysia, not less than forty eight (48) hours before the time appointed for holding the meeting which is no later than 10.00 a.m. on Saturday, 21 May 2022.
6) The lodging of a completed Proxy Form does not preclude a Member from attending and voting should the Member decided to do so. If the Member subsequently decided to attend the 39th AGM, the Member is requested to revoke the earlier appointment of proxy by notifying Boardroom in writing, no later than Saturday, 21 May 2022 at 10.00 a.m.
MEMBERS ENTITLED TO ATTEND THE VIRTUAL AGM
For the purpose of determining a Member who is entitled to attend the virtual 39th AGM, the Company will request Bursa Malaysia Depository Sdn Bhd, in accordance with Clause 95 of the Company’s Constitution, to issue a Record of Depositor (“ROD”) as at 17 May 2022. Only Depositor whose name appears on the ROD as at 17 May 2022 shall be entitled to attend the meeting or appoint a proxy(ies) to attend and/or vote on his/her behalf.
INTEGR ATED ANNUAL REPORT 2021
Key Messages Overview Value Creation MD&A Sustainability Leadership Accountability Financial Additional Information
457

DIRECTORS WHO ARE STANDING FOR RE-ELECTION AT THE 39TH ANNUAL GENERAL MEETING
Pursuant to Paragraph 8.27(2) of the Main Market Listing Requirements of Bursa Malaysia Securities Berhad, BIMB wishes to highlight the Directors who are standing for re-election pursuant to Clause 133 and Clause 142 of the Company’s Constitution at the 39th Annual General Meeting of the Company are as follows:
1. Clause 133 of the Company’s Constitution
• Datuk Nik Mohd Hasyudeen Yusoff (Non-Independent Non-Executive Director)• Encik Mohd Yuzaidi Mohd Yusoff (Independent Non-Executive Director)
2. Clause 142 of the Company’s Constitution
• Dato’ Sri Amrin Awaluddin (Non-Independent Executive Director)• Encik Mohd Asri Awang (Independent Non-Executive Director)• Datuk Bazlan Osman (Independent Non-Executive Director)• Puan Nuraini Ismail (Independent Non-Executive Director)
The Profiles of the above Directors are set out in 137 to 142 of this Integrated Annual Report.
AUTHORITY TO DIRECTORS TO ALLOT SHARES
Details on the authority to allot shares in BIMB pursuant to Section 75 of the Companies Act 2016 are provided under the explanatory notes no. 5 in the Notice of the 39th Annual General Meeting.
DATE, TIME AND PLACE OF THE 39TH ANNUAL GENERAL MEETING
The 39th Annual General Meeting of BIMB will be held as follows:
Date : Monday, 23 May 2022Time : 10.00 a.m.How : Virtual MeetingWhere : Broadcast venue at Level 10, Menara Bank Islam, 22 Jalan Perak, 50450 Kuala Lumpur, Malaysia.
STATEMENT ACCOMPANYING NOTICE OF THE 39TH ANNUAL GENERAL MEETING
BANK ISL AM MAL AYSIA BERHAD
458

ADMINISTRATIVE GUIDEFOR THE 39TH ANNUAL GENERAL MEETING
Day and Date : Monday, 23 May 2022
Time : 10.00 a.m.
Online Meeting Platform : https://meeting.boardroomlimited.my
Registration : Virtual meeting via Remote Participation and Electronic Voting (“RPEV”) facilities.
Broadcast Venue : Level 10, Menara Bank Islam, 22 Jalan Perak, 50450 Kuala Lumpur, Malaysia.
Mode of Communication : 1. Type text in the meeting platform. The Messaging window facility will be opened concurrently with the Virtual Meeting Portal, i.e., one (1) hour before the meeting, which is from 9.00 a.m. on Monday, 23 May 2022.
2. Shareholders may also submit their questions before the meeting via Boardoom’s website
at https://investor.boardroomlimited.com by selecting “SUBMIT QUESTION” to pose and submit their questions electronically. Please submit any questions in relation to the agenda items for the 39th AGM no later than 10.00 a.m. on Monday, 16 May 2022.
VIRTUAL 39TH AGM
1. The 39th AGM of the Company will be conducted entirely on a virtual basis through live streaming and online remote voting via RPEV.
2. The Company invites shareholders to participate in the 39th AGM from their home or office and follow the entire proceedings as the 39th AGM will be be conducted via RPEV. With the RPEV facilities, you may exercise your right as a member of the Company to participate and vote at the 39th AGM. The RPEV is also in line with Practices 12.1 and 13.3 of the Malaysian Code on Corporate Governance 2021. The decision is made pursuant to Section 327 of the Companies Act 2016 (“the Act”) and Clause 96 of the Company’s Constitution.
3. The broadcast venue is strictly for the purpose of complying with Section 327 (2) of the Act and Clause 96 of the Company’s Constitution that requires the Chairman of the meeting to be present at the main venue of the meeting. No shareholders/proxies from the public will be physically allowed at the meeting venue. All members are urged to attend the 39th AGM remotely via meeting platform available on the designated link at https://meeting.boardroomlimited.my.
4. Shareholders can participate in our virtual 39th AGM by registering online via Boardroom Smart Investor Portal at https://investor.boardroomlimited.com.
PROCEDURE OF THE 39TH AGM
1. The Login user Guide for participation, posing questions and voting at the 39th AGM will be emailed to you together with your remote access user ID and password once your registration has been approved.
2. No recording or photography of the 39th AGM meeting (“Meeting”, as applicable) proceedings is allowed without prior written permission of the Company.
3. You must ensure that you are connected to the internet at all times in order to participate and vote when the 39th AGM has commenced. Therefore, it is your responsibility to ensure that connectivity for the duration of the Meeting is maintained.
ENTITLEMENT TO PARTICIPATE AND VOTE
In respect of deposited securities, only members whose names appear on the Record of Depositors on 17 May 2022 (General Meeting Record of Depositors) shall be eligible to participate the Meeting or appoint proxy(ies) to participate on his/her behalf.
INTEGR ATED ANNUAL REPORT 2021
Key Messages Overview Value Creation MD&A Sustainability Leadership Accountability Financial Additional Information
459

ADMINISTRATIVE GUIDEFOR THE 39TH ANNUAL GENERAL MEETING (”39TH AGM”)
APPOINTMENT OF PROXY
1. Shareholders entitled to participate and vote at the 39th AGM is entitled to appoint proxy(ies) to participate and vote in his/her stead. If you are not able to participate in the 39th AGM remotely, you are encouraged to appoint the Chairman of the Meeting as your proxy and indicate the voting instruction in the Form of Proxy.
2. You may download the Form of Proxy from our website at www.bankislam.com
3. The Form of Proxy must be deposited at the office of the Share Registrar, Boardroom Share Registrars Sdn Bhd (“Boardroom”) at Ground Floor or 11th Floor, Menara Symphony, No. 5, Jalan Prof. Khoo Kay Kim, Seksyen 13, 46200 Petaling Jaya, Selangor Darul Ehsan, Malaysia or via electronic means through the Boardroom Smart Investor Online Portal (“BSIP”) at https://investor.boardroomlimited.com by logging in and selecting “Submit eProxy Form” not less than 48 hours before the meeting. Please refer to ‘Online Registration Procedure and RPEV’ for information and guidance.
CORPORATE SHAREHOLDER
Corporate shareholders who require their corporate representative to participate and vote at the 39th AGM must deposit their certificate of appointment of corporate representative to Boardroom not later than 10:00 am on 21 May 2022.
REVOCATION OF PROXY
If you have submitted your Form(s) of Proxy and subsequently decide to appoint another person or wish to participate in our virtual 39th AGM yourself, please write in to [email protected] to revoke the earlier appointed proxy 48 hours before the meeting.
ONLINE REGISTRATION PROCEDURE AND RPEV
1. Please note that this option is available to (i) individual member; (ii) corporate shareholders; (iii) Authorised Nominee; and (iv) Exempt Authorised Nominee.
2. If you choose to participate in the Meeting online, you will be able to view a live webcast of the Meeting, ask questions and submit your votes in real time whilst the Meeting is in progress.
3. Kindly follow the steps below on how to request for login ID and password.
PROCEDURE ACTION
Prior to AGM Date
1 Register Online with Boardroom Smart Investor Portal (for first time registration only)
(Note: If you have already signed up with Boardroom Smart Investor Portal, you are not required to register. You may proceed to Step 2)
(a) Open an internet browser. Latest version of Chrome, Firefox, Safari, Edge or Opera is recommended.
(b) Go to Boardroom Smart Investor Portal website at https://investor.boardroomlimited.com(c) Click Register to sign up for a BSIP account.(d) Complete registration with all required information. Upload and attached your MyKad front and
back image. Click Register.(e) You will receive an e-mail from BSIP Online for e-mail address verification. Click on Verify E-mail
Address from the e-mail received to proceed with the registration.(f) Once your email address is verified, you will be re-directed to BSIP Online for verification of
mobile number. Click on Request OTP Code and an OTP code will be sent to the registered mobile number. You will need to enter the OTP Code and click Enter to complete the process.
(g) Once your mobile number is verified, registration of your new BSIP account will be pending for final verification.
(h) An e-mail will be send to you to inform the approval of your BSIP account within one (1) business day. Subsequently, you can login at https://investor.boardroomlimited.com with the e-mail address and password filled up by you during registration to proceed.
BANK ISL AM MAL AYSIA BERHAD
460

PROCEDURE ACTION
Prior to AGM Date
2 Submit request for Remote Participation User ID and Password
(Note: Registration for RPEV will open from 25 April 2022. You are required to register to ascertain your eligibility to participate at the 39th AGM by using RPEV). Shareholders are encouraged to register at least 48 hours before the commencement of the meeting to avoid any delay in the registration.
Individual Members(a) Open an internet browser. Latest version of Chrome, Firefox, Safari, Edge or Opera is
recommended.(b) Go to Boardroom Smart Investor Portal website at https://investor.boardroomlimited.com(c) Login with your registered email address and password. [Note: If you do not have an account
with BSIP, please sign-up/register with Boardroom Smart Investor Portal for free - refer to Item Step 1 for guide.]
(d) Select and click on Corporate Meeting.(e) Go to “BANK ISLAM 39TH VIRTUAL ANNUAL GENERAL MEETING” and click Enter.(f) Go to VIRTUAL and click on Register for RPEV.(g) Read and agree to the Terms & Conditions.(h) Enter your CDS Account Number and click Submit to complete your request.(i) You will receive a notification that your RPEV registration has been received and is being verified.(j) Upon system verification against the AGM’s Record of Depositors as at 17 May 2022, you will
receive an email from Boardroom either approving or rejecting your registration for the remote participation.
(k) If approved, RPEV credential will be provided in your email. (l) Please note that one (1) user ID and password can only log on to one (1) device at a time.(m) If rejected, a rejection note will be provided in your email.
Please note that the closing date and time to submit your request is by Saturday, 21 May 2022 at 10.00 a.m.
Appointment of Proxy – Individual Members(a) Open an internet browser. Latest version of Chrome, Firefox, Safari, Edge or Opera is
recommended.(b) Go to BSIP website @ https://investor.boardroomlimited.com(c) Login with your registered email address and password. [Note: If you do not have an account
with BSIP, please sign-up/register with Boardroom Smart Investor Portal for free - refer to Item Step 1 for guide.]
(d) Select and click on Corporate Meeting.(e) Go to “BANK ISLAM 39TH VIRTUAL ANNUAL GENERAL MEETING” and click Enter.(f) Go to PROXY and click on Submit eProxy Form.(g) Read and agree to the Terms & Conditions.(h) Enter your CDS Account Number and insert the number of securities.(i) Appoint the Chairman of the meeting or your proxy(ies) and enter the required particulars for
your proxy(ies).(j) Indicate your voting instructions – FOR or AGAINST, otherwise your proxy(ies) will decide your
votes during meeting.(k) Review and confirm your proxy(ies) appointment.(l) Click submit.(m) Download or print the e-Proxy Form acknowledgement.
Please note that the closing date and time for proxy form submission is by Saturday, 21 May 2022 at 10.00 a.m.
INTEGR ATED ANNUAL REPORT 2021
Key Messages Overview Value Creation MD&A Sustainability Leadership Accountability Financial Additional Information
461

ADMINISTRATIVE GUIDEFOR THE 39TH ANNUAL GENERAL MEETING (”39TH AGM”)
PROCEDURE ACTION
Prior to AGM Date
Submit request for Remote Participation User ID and Password (continued)
Corporate Shareholders, Authorised Nominee and Exempt Authorised Nominee
(a) Write in to [email protected] by providing the name of Member, CDS Account Number accompanied with the Certificate of Appointment of Corporate Representative or Form of Proxy to submit the request.
(b) Please provide a copy of corporate representative’s or proxy holder’s MyKad/Identification Card (front and back) or Passport as well as his/her email address.
(c) You will receive notification from Boardroom that your request has been received.(d) Upon system verification of your registration against the General Meeting ROD as at 17 May
2022, you will receive your remote access User ID and Password along with the email from Boardroom if your registration is approved.
(e) Please note that one (1) user ID and password can only log on to one (1) device at a time.
Please note that the closing date and time to submit your request is by Saturday, 21 May 2022 at 10.00 a.m.
On the day of the AGM
3 Login to Meeting Platform
(a) The Meeting Platform will be open for login one (1) hour before the commencement of the 39th AGM.
(b) The Meeting Platform can be accessed via one of the following: • Launch the meeting platform by scanning the QR code given to you in the user login guide
along with your remote participation User ID and Password; OR • Navigate to the website at https://meeting.boardroomlimited.my (c) Enter the Meeting ID No. and sign in with the user ID and password provided to you via the
email notification in Step 2.
4 Participation (Note: Questions submitted online will be moderated before being sent to the Chairman to avoid repetition)(a) If you would like to view the live webcast, select the broadcast icon . (b) If you would like to ask a question during the 39th AGM, select the messaging icon . (c) Type your message within the chat box and click the send button once completed.
Please note that the quality of the connectivity to the Meeting Platform for live webcast, as well as for remote voting is highly dependent on the bandwidth and stability of the internet connection available at the location of the remote users. Kindly ensure that you are connected to the internet at all times in order to participate and vote when the virtual 39th AGM has commenced. Therefore, it is your responsibility to ensure that connectivity for the duration of the meeting is maintained.
5 Voting(a) Once the meeting is open for voting, the polling icon will appear with the resolutions and
your voting choices.(b) To vote, select your voting direction from the options provided. A confirmation message will
appear to show your vote has been received.(c) To change your vote, re-select another voting direction.(d) If you wish to cancel your vote, please press “Cancel”.
6 End of Participation
(a) Upon the announcement by the Chairman on the closure of the 39th AGM, the live webcast will end.
(b) You can now logout from the Meeting Platform.
BANK ISL AM MAL AYSIA BERHAD
462

PARTICIPATION THROUGH LIVE WEBCAST AND QUESTION AT THE 39TH AGM
1. Shareholders who participate in the virtual 39th AGM are able to view the Company’s presentation or slides via the live webcast.
2. All modes of communications are accepted for the purpose of posting questions to the Chairman and the Board of Directors before or during the 39th AGM. Shareholders are however encouraged to post questions via the online platform during the 39th AGM.
3. You may submit your questions in advance electronically in relation to the agenda items for the 39th AGM via Boardroom’s
website at https://investor.boardroomlimited.com by selecting “SUBMIT QUESTION”. If you have any questions, please submit them no later than 10.00 a.m. on Monday, 16 May 2022.
4. You may also use the Messaging window facility to submit your questions during the meeting. The Messaging window facility will be opened one (1) hour before the 39th AGM which is from 9.00 a.m. on Monday, 23 May 2022.
5. The Chairman and the Board of Directors will endeavour their best to respond to the questions submitted by the shareholders which are related to the resolutions to be tabled at the 39th AGM. If there is time constraint, the responses to relevant questions will be published on the Company’s website at the earliest possible, after the 39th AGM.
VOTING PROCEDURE AT THE 39TH AGM
1. The voting procedure will be conducted by poll in accordance with Paragraph 8.29A of Bursa Malaysia Securities Berhad Main Market Listing Requirements. The Company has appointed Boardroom as Poll Administrator to conduct the poll by way of electronic voting (e-voting) and SKY Corporate Services Sdn Bhd as the Independent Scrutineers to verify and validate the poll results.
2. At the Meeting, you will be provided a briefing on the e-voting housekeeping rules.
3. For the purposes of this 39th AGM, e-voting will be carried out via personal smart mobiles, tablets or personal computer/laptops.
4. Shareholders and proxies are required to use one (1) of the following methods to vote remotely:
a. Launch the meeting platform by scanning the QR code given to you in the user login guide along with your remote participation User ID and Password; OR
b. Access to the website at URL https://meeting.boardroomlimited.my
5. You may proceed to cast your votes on each of the proposed resolutions as soon as the Chairman calls for the poll to be opened until such time when the Chairman announces the closure of the poll. You are reminded to cast your votes before the poll is closed.
6. The Independent Scrutineers will verify the poll results reports upon closing of the poll session by the Chairman and the Chairman will declare whether with resolutions put on vote were successfully carried or otherwise.
INTEGRATED ANNUAL REPORT 2021
As part of our commitment to sustainable practices, the Integrated Annual Report (IAR) 2021 and the following documents are available on Bursa Malaysia Berhad’s website at www.bursamalaysia.com under Company Announcements of Bank Islam Malaysia Berhad and also at the Company’s website at www.bankislam.com
i. Corporate Governance (CG) Report 2021.ii. Notice of the 39th AGM, Form of Proxy and Administrative Guide for the 39th AGM.iii. Request IAR 2021 Hardcopy Form.
INTEGR ATED ANNUAL REPORT 2021
Key Messages Overview Value Creation MD&A Sustainability Leadership Accountability Financial Additional Information
463
ADMINISTRATIVE GUIDEFOR THE 39TH ANNUAL GENERAL MEETING (”39TH AGM”)
NO VOUCHERS/DOOR GIFTS
There will be no voucher(s) or any door gift(s) for shareholders/proxies who participate in the 39th AGM.
PERSONAL DATA PRIVACY
By registering for the remote participation and electronic voting meeting and/or submitting the instrument appointing a proxy(ies) and/or representative(s), the member of the Company (or their proxies) has consented to the use of such data for purposes of processing and administration by the Company (or its agents); and to comply with any laws, listing rules, regulations and/or guidelines. The member (or their proxies) agrees that he/she will indemnify the Company in respect of any penalties, liabilities, claims, demands, losses and damages as a result of the shareholder/proxies’ breach of warranty.
ENQUIRY
If you have general administrative enquiries on the 39th AGM, please contact the following during office hours (8.30 a.m. to 5.30 p.m.):
Boardroom Share Registrars Sdn Bhd
Office Helpdesk : 03-7890 4700Puan Nursyahirah Binti Che Rahimi : 03-7890 4754Facsimile No. : 03-7890 4670Email : [email protected] : [email protected]
BANK ISL AM MAL AYSIA BERHAD
464

*I/We
*NRIC No./Passport No./Company No.
of
and telephone no./email address being a *member/members of Bank Islam Malaysia Berhad (“BIMB” or “the Company”), hereby appoint
Full Name and Address (in Block Letters) NRIC/Passport No. No. of Shares % of Shareholdings
Email Address Tel No
*and/or
Full Name and Address (in Block Letters) NRIC/Passport No. No. of Shares % of Shareholdings
Email Address Tel No
or failing *him/her, the Chairman of the meeting as *my/our *proxy/proxies to vote for *me/us on *my/our behalf at the 39th Annual General Meeting of the Company to be held virtually at the broadcast venue at Level 10, Menara Bank Islam, 22 Jalan Perak, 50450 Kuala Lumpur on Monday, 23 May 2022 at 10.00 a.m. or any adjournment thereof.
Please indicate with an “x” in the appropriate space(s) provided below on how you wish your votes to be cast. If no specific direction as to voting is given, the proxy will vote or abstain from voting at *his/her discretion.
NO ORDINARY RESOLUTION FOR AGAINST
1 TO RE-ELECT DATUK NIK MOHD HASYUDEEN YUSOFF AS A DIRECTOR
2 TO RE-ELECT ENCIK MOHD YUZAIDI MOHD YUSOFF AS A DIRECTOR
3 TO RE-ELECT DATO’ SRI AMRIN AWALUDDIN AS A DIRECTOR
4 TO RE-ELECT ENCIK MOHD ASRI AWANG AS A DIRECTOR
5 TO RE-ELECT DATUK BAZLAN OSMAN AS A DIRECTOR
6 TO RE-ELECT PUAN NURAINI ISMAIL AS A DIRECTOR
7 TO APPROVE THE PAYMENT OF NON-EXECUTIVE DIRECTORS FEE FROM THE 39TH AGM TO THE 40TH AGM OF THE COMPANY
8 TO APPROVE THE PAYMENT OF BENEFIT TO THE NON-EXECUTIVE DIRECTORS OF UP TO RM1,150,000.00 FROM THE 39TH AGM TO THE 40TH AGM OF THE COMPANY
9 TO RE-APPOINT MESSRS. PRICEWATERHOUSECOOPERS PLT AS THE EXTERNAL AUDITORS OF THE COMPANY
10 AUTHORITY TO DIRECTORS TO ISSUE NEW SHARES IN BIMB PURSUANT TO SECTION 75 OF THE COMPANIES ACT, 2016
11 RENEWAL OF AUTHORITY FOR THE DIRECTORS TO ALLOT AND ISSUE ORDINARY SHARES OF THE COMPANY IN RELATION TO DIVIDEND REINVESTMENT PLAN
Signed this day of , 2022.
Signature of Member/Common Seal*Strike out whichever is not desired.
Unless otherwise instructed, the proxy may vote as he/she thinks fit
No. of Shares held CDS Account No.BANK ISLAM MALAYSIA BERHAD Company No. 198301002944 (98127-X)(Incorporated in Malaysia)
PROXY FORM

Notes:1. The 39th AGM of the Company will be conducted entirely on a virtual basis through live streaming
and online remote voting via Remote Participation and Electronic Voting Facilities (“RPEV”). The virtual meeting Facilities will be available at https://meeting.boardroomlimited.my. Please follow the procedures provided in the Administrative Guide for the 39th AGM in order to participate remotely.
2. The venue of the 39th AGM is strictly for the purpose of complying with Section 327(2) of the Act and Clause 96 of the Company’s Constitution which requires the Chairman of the meeting to be present at the main venue of the meeting. The notification of the venue of the 39th AGM is to inform shareholders where the electronic 39th AGM production and streaming will be conducted. NO shareholders/proxies from the public will be physically allowed at the meeting venue.
3. In accordance with Clause 109 of the Company’s Constitution, each member of the Company (“Member”) shall be entitled to present and to vote at any general meeting of the Company, either personally or by proxy or by attorney and to be reckoned in a quorum in respect of shares fully paid and in respect of partially paid shares where calls are not due and unpaid. Members may exercise their rights to participate (including pose questions via the RPEV) during the 39th AGM.
4. Pursuant to Paragraph 8.29A of the Main Market Listing Requirements of Bursa Malaysia Securities Berhad, all resolutions set out in this Notice of the 39th AGM will be conducted by way of a poll.
5. The Company has appointed its share registrar, i.e. Boardroom Share Registrars Sdn. Bhd. (“Boardroom” or “Registrar”) as the poll administrator to conduct the poll by way of electronic voting (“e-voting”) and SKY Corporate Services Sdn. Bhd. as the Independent Scrutineers to verify the poll results.
6. For the purpose of determining a Member who is entitled to attend the virtual 39th AGM, the Company will request Bursa Malaysia Depository Sdn. Bhd., in accordance with Clause 95 of the Company’s Constitution, to issue a Record of Depositor (“ROD”) as at 17 May 2022. Only a Member whose name appears on the ROD as at 17 May 2022 shall be entitled to attend the meeting or appoint a proxy(ies) to attend and/or vote on his/her behalf.
7. Notes on Appointment of Proxy:(a) In accordance with Clause 94 of the Company’s Constitution, a Member entitled to attend
and vote at a meeting of the Company is entitled to appoint one (1) or more proxies to exercise all or any of his/her rights to attend, participate, speak and vote for him/her subject to the following provisions:
(i) save as provided under Note (b) below, Clause 113 of the Company’s Constitution and the Companies Act 2016, each Member shall not be permitted to appoint more than two (2) proxies to attend the same meeting; and
(ii) where a Member appoints two (2) proxies, the appointment shall be invalid unless he/she specifies the proportion of his/her holdings to be represented by each proxy.
(b) For the avoidance of doubt and subject always to Note (a)(ii) above, the Company’s Constitution and the Companies Act 2016:(i) where a Member is an exempt authorised nominee which holds ordinary shares in the
Company for multiple beneficial owners in one securities account (“omnibus account”), there is no limit to the number of proxies which an exempt authorised nominee may appoint in respect of each omnibus account it holds; and
(ii) where a Member is an authorised nominee, he/she may appoint at least one (1) proxy in respect of each securities account it holds to which ordinary shares in the Company are credited. Each appointment of proxy by an authorised nominee may be made separately or in one instrument of proxy should specify the securities account number and the name of the beneficial owner for whom the authorised nominee is acting.
(c) There shall be no restriction as to the qualification of the proxy. Hence, a proxy need not be a Member.
(d) The instrument appointing a proxy shall be in writing under the hand of the appointer or his/her attorney duly authorised in writing or if such appointer is a corporation, under its Seal or the hand of its attorney.
(e) The instrument appointing a proxy (“Proxy Form”) must be deposited at the Registrar’s office in the following manner:(i) by electronic means through the Boardroom Smart Investor Portal at https://
boardroomlimited.my by logging in and selecting “Submit eProxy Form”; or(ii) by hand or post to Boardroom Share Registrars Sdn. Bhd. at 11th Floor, Menara Symphony,
No. 5, Jalan Prof. Khoo Kay Kim, Seksyen 13, 46200 Petaling Jaya, Selangor, Malaysia, not less than forty-eight (48) hours before the time appointed for holding the meeting which is no later than Saturday, 21 May 2022 at 10.00 a.m.
(f) The lodging of a completed Proxy Form does not preclude a Member from attending and voting should the Member decides to do so. If the Member subsequently decided to attend the 39th AGM, the Member is requested to revoke the earlier appointment of proxy by notifying Boardroom in writing, no later than Saturday, 21 May 2022 at 10.00 a.m.
1st fold here
Then fold here
BOARDROOM SHARE REGISTRARS SDN BHD11th Floor, Menara SymphonyNo. 5, Jalan Prof. Khoo Kay KimSeksyen 13, 46200 Petaling JayaSelangor Darul EhsanMalaysia
AFFIXSTAMP