Fiscal Rules: Towards a New Paradigm for Fiscal Sustainability
Upload
khangminh22Category
view
2download
0
fiscal year ending on December 31) 2013
CITY OF SOUTH BEND, IN I MAYOR PETE BUTTIGIEG
Prepared by: Department rf Administration and Finance - John Mwp!ry, City Controller

Comprehensive Annual Finance Report
City of South Bend, Indiana
For the year ending December 31, 2013
Prepared by: Department of Administration & Finance John H. Murphy, City Controller Jennifer C. Hockenhull, Deputy City Controller

Introductory Section

r-- - - - - -
City of South Bend, Indiana Comprehensive Annual Financial Report For The Year Ending December 31, 2013
Table of Contents
INTRODUCTORY SECTION
Table of Contents .... ..... .. ... ...... ... ... .... .... ... ...... .... .. ... .... ..... ... ....... .. .... ... .... .. ... ....... .. .... ....... ..... .. P1-P3 City Officials .... ............................ .. .. ....... .. ....... ........ ... ...... .... .... . ... ............. .... . ........... ... 1 Controller's Letter of Transmittal ..... .. ..... ....... ... ...... .......... ... .. ....... ....... ................. ......... ..... . ... 2-14 Certificate of Ach ievement for Excellence in Financial Reporting ..................... .............. ..... .......... 15 Organization Chart ... ... .... ......... ...... .. ...... ......... ............ .... ... ... ............. .. ... .. .... .. .............. .. .... ... ......... 16
II FINANCIAL SECTION
Independent Auditor's Report on Financial Statements and Supplementary Schedule of Expenditures of Federal Awards ..... .... .. ...... ............... .......... .. 18-19
Management's Discussion and Analysis ..... ... .... ..... .. ..... .... ..... ... ...... ..... .. ........ ......... .... ... ... ... .. .. 20-38
Basic Financial Statements: Government-Wide Financial Statements:
Statement of Net Position ..... .. ...... ... ......... .. ..... ........ .. .... .... ............ ... ...... .. .. .. ... ...... .... ... 39-40 Statement of Activities .... ...... ....... .. .... .... ..... ...... ....... .. ...... ... .. ..... ... ..... ........ ... .... ........... ...... 41
Fund Financial Statements: Balance Sheet- Governmental Funds .. .................... ..... ... .. .. ...... .................. ..... ... .. ... . .42-43 Statement of Revenues, Expenditures and Other Changes in Fund
Balances- Governmental Funds ..... .. ........... ... ........ ......... ... ..... .......... .. .. .. ... ... .... ..... ... 44 Reconciliation of the Statement of Revenues, Expenditures and Changes in
Fund Balances of Governmental Funds to the Statement of Activities .. ............... ..... .45 Statement of Net Position- Proprietary Funds .......... ..... ................ .. ...... .. ....... ....... .... .46-47 Statement of Revenues, Expenses and Other Changes in
Fund Net Position - Proprietary Funds .... .. ....... ... .... ....... .......... ........ .. .............. .... .48-49 Statement of Cash Flows- Proprietary Funds .. .... .......................... ..... . ., ...... ............... 50-51 Statement of Fiduciary Net Position - Fiduciary Funds .... .... .. ..... .. .... .... .... ...... ......... ... .... .. 52 Statement of Changes in Fiduciary Net Position - Fiduciary Funds ... ... .... ... ...... .. .... ... .. .... 53
Notes to Financial Statements .... .. ...... ........ .. ..... ........... ........ ...... .. ...... ..................... ... ..... ... 54-93
Required Supplementary Information: Schedules of Funding Progress .... ... .. ... ........... ... ... ......... ................ ......... ............ .... ... ... ... .. ..... 94 Schedules of Contributions from the Employer and Other Contributing Entities .......... ....... .... 95 Budgetary Comparison Schedules- General Fund & Major Special Revenue Funds .... . 96-103 BudgeUGAAP Reconciliation ...... .. .. ........ ...... ......... ...... ... ....... ....... ........ ......... ....... ..... ... ... .... .. 104 Notes to Required Supplementary Information .......... .. ... .... ... ... .. ...... .. .... .. ... ..... ... .. ... ..... 1 05-106
Ill Governmental Funds: Combining and Individual Fund Statements and Schedules:
Description- Non major Governmental Funds ... ........ ........ ....... ...... ..... .. ....... .................. 1 08-113 Combining Balance Sheet- Non major Governmental Funds ... ..... .. ..... ........ ............. .... 114-126 Combining Statement of Revenues, Expenditures and Other Changes in Fund
Balances- Non major Governmental Funds ..... ... ... ......... ... ...... ..... ..... ..................... 127-139 Schedules of Revenues, Expenditures, and Changes in Fund
Balances- Budget and Actual. .. ... .... ............... .. ........... ....... .. .. ... ........ ............... .. ..... 140-196
P1

- - - - - - - ---
City of South Bend, Indiana Comprehensive Annual Financial Report For The Year Ending December 31, 2013
Table of Contents
FINANCIAL SECTION (Continued)
IV Nonmajor Enterprise Funds: Combining and Individual Fund Statements and Schedules:
Description .. ..... .... ... .. ......... ......... ...... ...... ..... ........ .... ....... .... .................... ..... ....... ..... ........... ... 198 Combining Statement of Net Position .. ... .............. ........ ........... .... ...... .... .. ...... ...... ........... 199-200 Combining Statement of Revenues, Expenses and Other Changes in
Fund Net Position .. ... ... .... ... ........... .. .... ... ..... ............... ....... ..... ..... .... ... .. ..... ... .... ............ ... 201 Combining Statement of Cash Flows ... ....... ... ...... .. ...... .......... .... ...... ......... ... ... ..... ..... ...... 202-203
V Internal Service Funds: Combining and Individual Fund Statements and Schedules:
Description .................. .... .. ....... .... ........... .. ... .... .. ..... ....... .... ... .... ... ..... ..... ....... ...... .... .... ...... .... . 205 Combining Statement of Net Position .......... ....... ... .... ....... ...... .. .... ....... ........... .. ... ...... .. ... ....... 206 Combining Statement of Revenues, Expenses and Changes in
Fund Net Position .. ..... .. ....... ........ .... .... .... ... ... ....... ... ............ ........ .. ..... ....... ... .... .... .. ......... 207 Combining Statement of Cash Flows .... ..... ...... .. .. .. .. ........ .. .... ..... ... .... .... ....... ....... ........ ... ....... 208
VI Fiduciary Funds: Combining and Individual Fund Statements and Schedules:
Description ..... ... ...... ......... ... ...... ... ....... ...... ... .. .. .... .. .. ... ........................................ ..... .. ......... .. 21 0 Combining Statement of Fiduciary Net Position- Pension Trust Funds ...... .... ...... ...... ......... 211 Combining Statement of Changes in Fiduciary Net Position- Pension Trust Funds .... .. ...... 212 Statement of Changes in Assets and Liabilities- Agency Funds ................... .... ........ ..... ..... . 213
VII STATISTICAL SECTION
Financial Trends ... ... .. .. ....... ....... .. ......... .... ... ... ....... ... ... ..... ..... ... .................. ....... ... ...... ...... ......... 215 Net Position by Component- Last Ten Years ...... .... ....... .... ....... ... ...... ... ........ .... ..... ... .. ......... 216 Changes in Net Position- Last Ten Years .. .. .................. .. ....... ....... .............. ... ... ..... ... ... 217-219 Fund Balances, Governmental Funds- Last Ten Years .... .... .... .............. ..... .. ... .. .... ............. 220 Changes in Fund Balances, Governmental Funds- Last Ten Years ..... ................. .. ...... ... ... 221
Revenue Capacity .. ...... ......... ........ ...... ... ....... .. ...... .............. ... ..... ................. ...... .................... .. ... 222 Property Tax Levies and Collections- Last Ten Years .... .... .... ........ .. ... .. .. .. ...... .. ..... .... .... ... .. 223 Direct and Overlapping Property Tax Rates- Last Ten Years .. ...... ..... ... .. ........ ........ .. .... .. .... 224 Detail of Net Assessed Valuation- For Year 2012 Payable 2013 .. ...... ............. .... .... .... ...... .. 225 Assessed Value and Actual Value of Taxable Property- Last Ten Years ..... .. ....... .............. 226 Net Assessed Value of Taxable Property - Last Ten Years .... .... ........ .............. .... ........... .... . 227 Property Tax Collections- Cash Basis- 2004 to 2013 ....... ....... ............ .... .. .. .... .... ....... ........ 228 Principal Property Taxpayers- Current and Nine Years Ago ...... ... ...... .. ....... ....... .. ........ ....... 229 Local Option Income Tax Revenue- Last Ten Years (CEDIT) .... ....... ....... ....... ..... ... .. ..... ..... 230 Local Option Income Tax Revenue- Last Ten Years (COlT) ........ ... .... ......... ............ .. ... ... .. . 231 Local Option Income Tax Revenue- Last Ten Years (PS LOIT} ........ ..... .. .... ............ .. ......... 232 Total County Option Income Tax Distributions by Taxing Unit- 2004- 2013 .. ...... .. ....... ..... . 233 Ten Largest Water Customers- December 31 , 2013 ... ....... ........ .... .................... .. ........ .. ..... 234 Ten Largest Sewage Works Customers- December 31 , 2013 ............ .. ......... ... ........ ..... ..... 235 Gasoline Tax Collections- Cash Basis- Last Ten Years ...... .. ................... .. ... ...... .............. 236 Wheel and Excise Surtax Collections- Cash Basis- 2004 to 2013 ... ... ... .... .. ........ ......... .. ... 237 Hotel I Motel Tax Revenue- Last Ten Years ........... .. ............ .... ............ ...... ... ......... .. .. ......... 238 Professional Sports Development Tax - Cash Basis- Last Ten Years .......... .. .................... 239 Cable Television Franchise Fee Collections- Cash Basis- Last Ten Years .... ...... ..... .. ...... 240
P2

City of South Bend, Indiana Comprehensive Annual Financial Report For The Year Ending December 31, 2013
Table of Contents
STATISTICAL SECTION (Continued)
Debt Capacity .. ... ...... ... ..... ... ......... ... ... ..... .......... ....... ....... ......... ... .... ....... ... .. ...... ..... .......... ...... ... 241 Computation of Legal Debt Margin- December 31 , 2013 ..... .... .. ...... . ..... . ..... .... .. ... ....... 242 Legal Debt Margin Information- Last Ten Years ............ .. .............. .............................. .. ... 243 Ratios of Outstanding Debt by Type- Last Ten Years ...... .... ...................... ... ........ ............... 244 Computation of Direct and Overlapping Debt- December 31 , 2013 ...................... .... .... ....... 245 Ratio of Annual Debt Service Expenditures for General Obligation Bonded Debt to
Total General Governmental Expenditures- Last Ten Years .. .. ...... ... .................. .. ...... .. 246 Ratio of Net General Bonded Debt to Assessed Value and Net Bonded Debt
Per Capita- Last Ten Years .. .. .... ...... .. .. .............. .. .. .. ...... .... .... .. ...... ....... ... .. .......... .. .. .. .. . 247 Schedule of Revenue Bond Coverage- Water Utility Bonds- Last Ten Years .. .. ................ 248 Schedule of Revenue Bond Coverage- Wastewater Utility Bonds- Last Ten Years ... .. .. .. . 249 Annual Wastewater Flow Data and Number of Customers .................. .. .................... .. .... .... . 250 Statement of City-Owned Utility Debt... ............ .. .............. ........... ...... ... .... ...... ..... .. ......... .. ...... 251 Estimated Debt Service Coverage Calculation of Sewage Works ..... .. .................. ..... .. .. .. ..... 252 Estimated Debt Service Coverage Calculation of Water Utility ............ .. ..... ...... .. ..... ...... .. .. .. .. 253 Projected COlT Revenues ...... ..... .... ..................... .............. ... ....... ...... ... ..... .. .................... ..... 254 Statement of Estimated Cash Flow and Debt Service Coverage ..... .... .......... .. .. ... ... .. ........... 255 Estimated Tax Increment Revenue- Erskine Village Project .. .... .. ............ ........... .. .... .. ........ 256
Demographic and Economic Information .. ... ...... .. ..... .... ... .. .. ...... ..... ... ..... .. ....... .... ... .. ....... ....... 257 Demographic Statistics- Last Ten Years ...... ....... .. ...... ... ............ ...... .... .... .... .. .. ..... ........ 258-259 Comparison of Growth Rates in Personal Income for St. Joseph County,
The State of Indiana and U.S. Personal Income ............ .... ...................... .. ..... .. ... .. .. ... .... 260 Principal Employers- Current and Nine Years Ago- December 31 , 2013 .. ......................... 261
Operating and Other lnformation ..... .. ...... ........ ...... ... ...... ... .. ... ..... .. .. .... .. ... ... ... .. ...... .. ...... ... .... ... 262 Operating Indicators by Function/Program- Last Ten Fiscal Years ........ ...... .. .... .. .... .. ......... 263 Capital Asset and Infrastructure Statistics by Function/Program- Last Ten Years ...... ... .. ... 264 New Construction- Number of Permits and Property Values- Last Ten Years ...... .. .... .. .... . 265 Full-Time Equivalent City Government Employees by Department- Last Ten Years .. .. 266-267 Salary Rate Comparison -1990 to 2013 .................... .. .... .... .... .. .................. .. ........... .. ........... 268 Insurance Coverage- 2013 ............... ..... .............. .... ... ......... .. ..... .... .. ... .. ... .. .. .. .. ..... .. ..... .. ..... . 269 Miscellaneous Statistics- December 31 , 2013 .. .. ........... .. ..... ......... .. ...... .. .. ... ..... .. ......... 270-271
P3
CITY OFFICIALS
Office Official Term
Mayor Pete Buttigieg 01-01-12 to 12-31-15
Controller Mark Neal 01-01-12 to 01-02-14 John Murphy 01-03-14 to 12-31-15
City Clerk John Voorde 01-01-12 to 12-31-15
President of the Board of Public Works Gary A. Gilot 01-01-12 to 12-31-13
Common Council Members 1st District Tim Scott 01-01-12 to 12-:~1-15 2"d District Henry Davis, Jr. 01-01-12 to 12-31-15 3rd District Valerie Schey 01-01-12 to 12-31-15 4th District Fred Ferlic 01-01-12 to 12-31-15 5th District David Varner 01-01-12 to 12~31-15 6th District Oliver J. Davis, Jr. 01-01-12 to 12-31-15 At Large Karen L. White 01-01-12 to 12-31-15 At Large Derek D. Dieter 01-01-12 to 12-31-15 At Large Gavin Ferlic 01-01-12 to 12-31-15
1

----------- · ----
1200N COUNTY-CITY BUILDING 227 W. JEFFERSON BLVD.
SOUTH BEND, INDIANA 46601-1830
CITY OF SOUTH BEND PETE BUTTIGIEG, MAYOR
PHONE 574/ 235-7678 . FAX 574/235-9928
DEPARTMENT OF ADMINISTRATION AND FINANCE
June 17, 2014
The Honorable Pete Buttigieg, Mayor of the City of South Bend Members of the City of South Bend Common Council Residents of the City of South Bend:
The comprehensive mmual financial report of the City of South Bend, Indiana (the "City") for the year ended December 31,2013 is hereby submitted. Responsibility for both the accuracy ofthe data and the completeness and fairness of the presentation, including all disclosmes, rests with management. To the best of our knowledge and belief, the enclosed data is accurate in all material respects and is reported in a manner designed to present fairly the financial position and results of operations of the various funds of the City. All disclosures necessary to enable the reader to gain an understanding of the govemment's financial activities are included.
Generally Accepted Accounting Principles (GAAP) requires that management provide a nanative introduction, overview and analysis to accompany the basic financial statements in the form of the Management's Discussion and Analysis (MD&A). This letter of transmittal is designed to complement the MD&A m1d should be read in conjunction with it. The City of South Bend's MD&A can be found immediately following the independent auditors repo1i.
The comprehensive mmual fmancial rep01i is presented in four sections: introduct01y information, financial information, statistical infonnation and federal compliance information. The introductory section includes this transmittal letter, the City' s orgmlizational chmi, a list of principal City officials m1d the Certificate of Achievement for Excellence in Financial Reporting awarded to the City of South Bend for the year ending December 31, 2012. The financial section begins with the independent auditors ' rep01i on the City' s financial statements and schedules, the City managements' discussion and analysis rep01i, followed by the City's basic financial statenients and accompanying notes. The remaining portion of this section includes the combining and individual fund and othe1: financial statements and schedules. The statistical section includes selected financial and demographic infonnation generally presented on a multi-year basis, which has been provided to give the reader a broader understanding of the City. The federal awards compliance section, which includes the results of the supplemental audit of the City's federal awards and the internal controls necessary for compliance, is included in a separate report.
The City is required to undergo an mmual single audit in conforn1ity with the provisions of the U.S. Offi_ce of Management and Budget Circular A-133, Audits of States, Local Govermnents and NonProfit Orgm1izations, the provisions oflndiana Code section 5-11-1-9 and the requirements of the
2

Indiana State Board of Accounts. Information related to the single audit, including the schedule of federal financial assistance, findings and recommendations, and the auditors' repmis on the intemal control structure and compliance with applicable laws and regulations, is included in a separate report.
The following pages of this transmittal letter begin with a general overview of South Bend and the sunounding area. Also sununarized are the key financial , budgetary and prope1iy tax controls with which the City is required to comply. The remainder includes a discussion of the prior year's financial challenges and accomplishments, the City's goals and objectives for this year and beyond and other key issues the City is facing along with the impact they may have on current arid future budgets.
GENERAL INFORMATION
The City of South Bend is the county seat of St. Joseph County, Indiana, and is the fomih largest city in the state. The City of South Bend's 2010 U.S. Bureau ofthe Census population was 101,168. Accordingly, South Bend is classified as a "City of the Second Class" under Indiana statutes (cities with a population of 35,000 to 250,000). The City of South Bend operates with a mayor as chief executive and a nine-member City Common Council composed of six members elected from districts and three men~bers elected at-large.
The City provides a full range of traditional general govermnental services to its citizens. These services include police and fire protection; sanitation services; the construction and maintenance of highways, streets and infrastructure; recreational activities and cultural events. In addition to general govemmental activities, the City exercises oversight over the South Bend Water Works, the South
. Bend Wastewater Treatment Facility, the Century Center Convention Center, the Monis Perfmming Alis Center, the Studebaker National Museum, the City of South Bend Redevelopment Conunission ai1d Authority, and several downtown parking facilities.
Location
St. Joseph County lies within the hemiland of the manufacturing belt m1d metropolitm1 regions of the Upper Midwest and Canada. The City of South Bend is located in the north central pmi oflndiana, ten miles south of the Michigan state line, and is conm1only known to be within the "Michiana" area. The Michiana area is a vibrant and diverse area with a strong economy based on a mix of health care, agricultural, service, manufacturing, education and other conm1ercial and tourism industries. This diverse economic mix creates varied employment opportunities for the area's residents while providing insulation via diversification from future economic downturns.
The city is approximately 90 miles east of Chicago and 140 miles north oflndimmpolis. Accessibility to transportation, including Interstate 80/90, m1 international airpmi (which is the second busiest in the State of Indim1a) m1d the South Shore Line has supported economic growth within the community. Proximity to Chicago, the largest rail and intennodal (rail/truck/ocean/inland waterway) transfer point in the country, is a significant advantage to the City of South Bend as is proximity to the University ofNotre Dame with its scenic campus located adjacent to the city limits.
3

St. Joseph County I South Bend -Economic Conditions and Outlook
St. Joseph County, with its 2010 U.S. Bureau of the Census population of266,931 , boasts a strong history of manufacturing which continues today. The service industry and retail trade have also flourished, creating a balance that serves the c01mnunity well. The County experienced a net growth in population of28,317 (11.8% increase) between 1960 and 2010. After experiencing a reduction of 2.6% during 1969 to 1983, at which time the entire Midwest was at the depth of its economic restructuring and recess, the County's population increased 4.0% between 1983 and 1990 and another 7.5% between 1990 and 2000. The population of St. Joseph County has remained fairly flat during the past decade increasing by only 1,372 residents from 2000 to 2010.
The estimated labor force in St. Joseph County is 135,516 workers (US Census Bureau 2007-2011 Survey 5-Year Estimates). The workers are typical of the Midwest: well-trained with a strong work ethic. Approximately 87.5% of the area's adult population are high school graduates or higher (as compared to the national average of 75%) with an estimated 26.2% with a Bachelor' s Degree or higher. There are ten colleges, universities and technical schools within South Bend and the sunounding area including the University of Notre Dame; Indiana University South Bend; Bethel College; Saint Mary's College; Purdue University College ofTeclu1ology at South Bend; Holy Cross College; Trine University South Bend; Brown Mackie College; ITT Teclulical Institute; and Ivy Tech Community College. At the high school level, there are school-to-work transition programs. As of April20 14, St. Joseph County is experiencing an unemployment rate of 6.6%, which is higher than the State oflndiana unemployment rate of 5.5%. The unemployment rate in St. Joseph County is somewhat higher than some of its surrounding counties-Elkhart (5.0%), LaP01ie (7.3%), and Marshall (5.5%) in Indiana and Cass (5.9%) and Benien (6.8%) in Michigan (as of April2014).
The employment profile for St. Joseph County provides a good overview of the economic make-up of this community. Employment estimates for the County's major economic sectors are as follows (US Census Bureau 2007-2011 Survey 5-Year Estimates Civilian Employed Population):
Economic Sector Number Employed Educational Services, Healthcare, Social Assistance Manufacturing Retail Trade A1is, Ente11aimnent, Recreation, Accommodation,
Food Services Professional, Scientific, Management, Administrative,
Waste Management Services Finance and Insurance, Real Estate, Rentals, Leasing Construction Transportation and Warehousing, and Utilities Other Services, except Public Administration Wholesale Trade Public Administration Information Agriculture, Forestry, Fishing, Hunting, Mining Total
4
32,442 20,204 14,014 11 ,120
9,858
6,956 6,168 5,644 5,530 3,824 3,334 2,105
514 121,713
% ofTotal 26.7% 16.6% 11.5% 9.1%
8.1%
5.7% 5.1% 4.6% 4.5% 3.1% 2.7% 1.7% 0.4%
100.00%

St. Joseph County presently has an estimated 101,071 households with an average per capita personal income of $23,420, which compares to the State of Indiana average per capita income of $24,497 and the United States per capita income of $27,915. The per capita income in St. Joseph County compares favorably with many of its sunounding counties-Elkhart ($21 ,879), La Porte ($22,968), and Marshall ($22,376) in Indiana and Cass ($23,045) and Benien ($24,490) in Michigan.
Health and education lead the employment statistics for St. Joseph County. The largest employers in St. Joseph County as ofDecember 2013 were as follows: University ofNotre Dame (5 ,590); Beacon Health Systems (3,450); South Bend Community School Corporation (2,880); AM General (2,858); Trinity Health/Saint Joseph Regional Medical Center (2,597); Mmiin's Super Market (1,555); Meijer, Inc. (1,450); Indiana University- South Bend (1,445); The City of South Bend (1, 130); m1d Wal-Mart (1,245).
The following provides a profile of the residents of St. Joseph County (2010 Census Information):
Gender:
Age:
Race:
Marital Status:
Home Ownership:
48.5% male; 51.5% female
36.2% 0-24 years of age; 25.3% 25-44 years of age; 25.3% 45-64 years of age; and 13.2% 65 years of age and older.
76.0% White; 12.4% Black/African American; 7.1% Hispanic/Latina; 1.7% Asian; and 2.8% Other
46.1% Married; 53.9% Single/Widowed/Divorced/Other
70.7% own; 29.3% rent/other
The cost of living continues to be one of the greatest advantages of living in this conmmnity. The housing costs in South Bend m·e well below the national and regional averages. Per a repmi compiled by the National Association of Realtors in the first qumier of 2014, the median sales price for a single family home in the South Bend-Mishawaka Statistical Area was $85,700 as compared to a median sales price of$176,900 in Chicago and $132,900 in Indianapolis. The national median sales price is $191 ,600.
The City of South Bend continues to place high emphasis on a growing and diversified local economy. It has been active in developing ten industrial parks, offering itself as a low-cost altemative to the Chicago metropolitan area to companies engaged in light manufacturing, distribution and services. More than 240 businesses operate in South Bend's industrial parks, including companies engaged in metalworking, plastics, wm·ehousing and distribution, and professional services. In recent years, the City has developed bmovation and Ignition parks, the first dual-site, state-certified technology park in the State oflndiana.
5

--- ----
The South Bend Community School Corporation serves the entire City and some of the sunounding area and has a cmTent emollment of approximately 19,014 students in grades kindergarten through high school. An estimated 5,438 students attend private or parochial schools within the City. The nine institutions of higher education and teclmical training located within the South Bend area have a total emollment of approximately 33,500. Over the years, the University of Notre Dame has provided a stabilizing influence on the economy with a very significant positive economic impact upon the community. ·
South Bend History and Amenities
In 1820, Pierre Navarre of the American Fur Trading Company was the first settler in the area to become later known as South Bend. South Bend has continued to progress in its growth since 1842 when Father Edward Sorin named his rustic log chapel "Notre Dame duLac" and began to teach the local Indians. Today the chapel has grown into the University of Notre Dame. In 1852, H.C. Studebaker stmied the industry of making wagons and horse-drawn buggies that evolved into the manufactming of the Studebaker automobile. It made the name Studebaker synonymous with the area of South Bend and its major employer until its closure in 1963.
Another industrial firm that would later become the area's largest began in 1923 when Vincent Bendix began manufacturing automotive brakes. In 1929, the company became the Bendix Aviation Corporation, and now, as Honeywell (formerly AlliedSignal Inc.), is a leading manufacturer of automotive and aerospace products. The Singer Sewing Company and the Oliver Chilled Plow Works were other important companies during the early history of South Bend.
Special attractions within the South Bend area include the Olympic-class East Race Waterway and the East Bank m·ea; the renovated Monis Perfom1ing Arts Center, which provides for the Broadway Theater League, the South Bend Symphony Orchestra with the Chamber and Pops Orchestras, and the Southold Dm1ce Theater and Patchwork Dance Company; the award-wi1ming South Bend Civic Theater; the Studebaker National Musemn; the South Bend Museum of Art; the Snite Museum of Ali at Notre Dmne; the Northem Indiana Center for History; Copshaholm/The Oliver Mansion; Century Center; Potawatomi Zoo; the Monis Conservatory/Muessel-Ellison Tropical Gardens; Healthworks! Kids Museum; the Fanners ' Market; and the Belleville Softball Complex. The Four Winds Field Baseball Stadium is a 5,600-seat facility which opened in 1987 and is rated among the best in minor league baseball. The stadium is home to the South Bend Silver Hawks, a minor league team affiliated with the Arizona Diamondbacks. During 2011 , the Silver Hawks were sold to Chicago businessman, Andrew Berlin, who has forged a strong pruinership with the City ru1d plans to keep the team in South Bend for many years to come. Total attendance of approximately 237,000 for 2013 was up 25% from 2012's total attendance of 189,575 ru1d doubled since 2011's season total attendm1ce of 112,795.
Additional miscellaneous information about the City of South Bend can be found in the statistical section of tlus repOii.
6

Financial, Budgetary and Property Tax Controls
The City's management team is responsible for establishing and maintaining an internal control structure designed to ensure that the assets of the government are protected from loss, theft or misuse and to ensure that adequate accounting data is compiled to allow for the preparation of financial statements in conformity with generally accepted accounting principles. The internal control structure is designed to provide reasonable, but not absolute, assurance that these objectives are met. The concept of reasonable assurance recognizes that: (1) the cost of a control should not exceed the benefits likely to be derived; and (2) the valuation of costs and benefits requires estimates and judgments by management.
Single Audit. As a recipient of federal and state financial assistance, the City also is responsible for ensuring that an adequate internal control structure is in place to ensure compliance with applicable laws and regulations related to those programs. This internal control structure is subject to periodic evaluation by management of the City. As pmi of the City's single audit described earlier, tests are perfmmed to determine the adequacy of the internal control structure, including that portion related to federal financial assistance programs, as well as to determine that the City has complied with applicable laws and regulations. The results of the City's single audit for the yem· ended December 31, 2013 are included in a separate rep mi.
Budgetary Controls. In accordm1ce with Indiana statutes, the City maintains budgetary controls integrated within the accounting system. The objective of these budgetary controls is to ensure compliance with legal provisions embodied in the annual appropriated budget (prepared on a cash basis) which is adopted by the City Common Council or Redevelopment C01m11ission (depending on the fund) and then reviewed and approved by the State oflndiana Department of Local Govenm1ent and Finance (DLGF). Activities of the general fund, special revenue funds, capital project funds, enterprise funds , internal service funds, pension trust funds m1d debt service funds m·e included in the mmual budget. The level ofbudgetmy control (that is, the level at which expenditures cmmot legally exceed the appropriated a111ount) is established by major budget classification within funds. The Mayor and Conu11on Council may transfer appropriations from one major budget classification to m1other within a depm·tment by ordinm1ce as long as the total appropriations for that fund are not exceeded. Additional appropriations in excess ofthe original budget must be approved by the Mayor and Common Cow1cil m1d m·e also submitted to the DLGF for either approval or acknowledgement (depending on the fund). Additional appropriations for funds approved by the Redevelopment C01m11ission do not require DLGF approval. Beginning in budget year 2009, the City must also submit its mmual budget to the St. Joseph County Common Council for a non-binding review and recmm11endation. The deadline for adoption of the mmual budget is November 1. The city's fiscal year begins on J anum·y 1.
The City maintains an encwnbrance accounting system as one teclmique of accomplishing budgetmy control. Encumbered a111ounts do not lapse at year end and are cmTied over to the following year as a pmi of the subsequent year's budget.
7

Property Tax Controls. In addition to budgetary and other controls established by Indiana statute, the City must operate within specific and rigid controls goveming the amount of prope1iy tax it may levy. The property tax control program, which began in 1973, limits the amount of property tax that may be levied by each unit of government in its legally budgeted funds. The total amount of property tax levied by the unit may increase by the six year average annual growth in Indiana personal non-farm income, as calculated by the U.S. Bureau of Economic Analysis, with a 6% maximum.
During March 2008, the State oflndiana General Assembly enacted property tax reform legislation which made significant changes in the property tax system by capping the amount of property taxes at 1% of grossed assessed value for residential homesteads, 2% for agricultural/rental properties and 3% for all other real and personal property. This legislation was phased in over a two year period beginning in 2009. The loss of revenue to the City due to this legislation was significant but has been overcome by cost savings and the adoption oflocal option income taxes to in order to continue providing essential City services, including police and fire protection.
A historical view of the City's tax rate and its net assessed valuation has been included in the statistical section of this document.
Citywide Goals and Objectives for 2014 and Beyond
The City has developed eight broad goals that focus on the following areas: economy, safety, quality oflife, trust, responsiveness, infrastructure, finance and workforce. The City has identified various objectives that are tied directly to these goals which, if achieved, will result in the attainment of these goals. The eight goals are listed below.
GOAL ONE: The Community's Economy
Improve South Bend's economy to ensure a vigorous local business climate; ample employment, business and investment opportunities for all our customers; and a tax base that is sufficient to meet the needs of the City, its residents and other customers.
GOAL TWO: The Community's Public Safety and Civility
Improve South Bend' s public safety and civility to ensure that every resident and other customers can live, work, play, run a business and raise a family in a humane, pleasant and safe enviromnent; have adequate, affordable and timely access to all fom1s of emergency services; and can contribute and pmiicipate in a community where people of different backgrounds live in mutual respect and harmony.
8

GOAL THREE: The Community's Quality of Life
Improve South Bend' s quality of life to ensure that every resident and every family can earn an adequate income; secure adequate housing; live in a safe, pleasant and humane neighborhood; enjoy a wide range of social, cultural and recreational opportunities; and have access to quality educational and medical services within an excellent natural and mamnade enviromnent.
GOAL FOUR: Trust in City Government
Improve residents' trust in City government to ensure that South Bend has a broad base of consensus and support on which to build the future, a strong foundation for collaborative action a:nd community pminerships; and an increase in resident and customer participation in the daily public life of the community.
GOAL FIVE: The City's Responsiveness, Efficiency, and Effectiveness
Improve the responsiveness, efficiency, and effectiveness of City goverm11ent to ensure that the City's customers get the value they expect and deserve.
GOAL SIX: The City's Infrastructure
Improve the City's infrastructure to ensure that South Bend can suppmi physical growth and economic development; and offer an excellent quality of life to all of its residents and other customers.
GOAL SEVEN: The City's Financial Condition
Improve the financial condition of City goverrunent to ensure that South Bend has the financial resources necessary to achieve all of its goals during the next five years, while maintaining its strong credit rating.
GOAL EIGHT: The City's Workforce
Improve the City govenm1ent's existing workforce, work environment and human development systems to ensure that South Bend has the human resources necessary to achieve all its goals during the next five years.
City Mission Statement and Department Purpose Statements
The City provides services to its customers tlu·ough thirteen administrative departments. These depmiments have unique purposes that are intended to suppmi the citywide mission statement which is "to be recognized as a model city." Each depmiment has developed a purpose statement which identifies their specific role.
9

Mayor's Office: Leading the cmmnunity to become a model city through formulating policy, directing operations and responding to customer concems.
Common Council: Making ce1iain that our City government is always responsive to the needs of our residents and that the betterment of South Bend is always our highest priority.
City Clerk's Office: Preserving all City Ordinances and Council meeting minutes for generations yet to be, and providing fair and consistent treatment of our Ordinance Violations Bureau customers.
Administration and Finance: Providing financial and organizational stability for the City tlu·ough sound
financial and human resources management while ensuring the existence of a safe work environment, quality employee benefits and equal treatment for all City employees.
Legal Department: Providing superior, professional and ethical legal services for our client, the City of South Bend.
Police Department: Protecting the life, property and personal liberties of all individuals; improving the overall quality of life by deterring criminal activity and respecting cultural diversity; delivering fair and impmiial law enforcement services to all residents.
Fire Department: Providing the highest level of fire protection and emergency medical services possible to all of our customers, saving lives m1d prope1iy, and striving to become a model Fire Depm-tment for other cities in an efficient and costeffective mam1er.
Code Enforcement: Maintaining m1d improving the physical quality oflife in our neighborhoods.
Parks and Recreation:
Community Investment (Econ Dev):
Public Works:
Offering all residents a11d guests of South Bend the highest quality of recreational m1d leisure activities, while providing well-managed parks and recreational facilities with updated programming and friendly productive service.
Creating and expanding oppm-tunities tlu·ough partnerships in neighborhood revitalization, commercial m1d industrial development and community enhancement.
Providing leadership in the development and delivery of engineering, fleet,
10

Building Department:
Century Center:
-----------------------------------------------------
transpmiation, sanitation, wastewater, water and other services as called upon by our customers.
Serving om customers by inspecting, informing and ensuring a safe place to work, play and live.
Providing a state-of-the-art convention facility with excellent services to customers while generating maximum economic benefit to our community.
Building South Bend in 2014 and bevond
The City Administration's theme for the past several years has been "We're Building South Bend." That theme has had a major influence on the development ofthe 2014 budget. There are five areas of concentration that became or remained budget priorities for 2014.
• We're Building Neighborhoods - The City continues with its strong commitment to neighborhoods. The City will make a significant investment to fund or leverage state and federal funding for housing assistance, development and home ownership programs, neighborhood public works and parks, neighborhood development for social services and organizations, and public safety initiatives. Committing these resources will help us maintain, improve and suppmi strong neighborhood development.
• We're Building a Safe City- Public safety is the foundation of all the City's efforts to build South Bend. Through the targeted and creative use of available resources, the City is working to provide quality police, fire and ambulance services for the conunw1ity. The crime rate has decreased in several significant categories over the past year. The City's Fire Departments is rated one of the best in the State. A key initiative will focus on conununity policing, group violence, and placing more emphasis on training and recruitment for the Police and Fire Departments.
• We're Building an Attractive City - We are working to enhance the natmal and man-made beauty of our city tlu·ough effective City programs. The City has taken steps through its Department of Code Enforcement and a Mayoral Task force to address the issue ofvacant and abandoned propeliies. The City is funding major programs to renovate the former Studebaker Conidor area and other pruis ofthe City. The City has been recognized as a Bicycle Friendly Conununity by the League of American Bicyclists and has established over 60 miles of bicycle routes to date.
• We're Building Opportunity - A key issue for any city is education ru1d oppmiunity for young people. The City is cmmnitted to keeping schools open in our neighborhoods and to maximizing their use by the conmmnity. We ru·e building partnerships with the South Bend School Corporation ru1d other key stakeholders that will create new strategies for enhancing our formal educational systems. Working together with families, student groups, school officials, neighborhoods, the faith community and civic orgrulizations, we can support our local schools and improve the level of individual student performance.
11

• We're Building a Strong Economy - Local goverm11ent plays a key role in economic development. By providing adequate infrastructure and offering targeted assistance, the City can stimulate private investment, creating business opp01iunities and jobs. The City's policies encourage new start-up businesses, strengthen existing business, attract new jobs, increase assessed value and emphasize direct investment in hard-to-develop areas. Eff01is have been and will continue to focus on implementing the comprehensive plans for the areas around the East Bank and the downtown areas. The City .has had many significant economic development projects including Eddy Street Commons, a $220 million dollar mixed-use development south of Notre Dame, with more than 20 stores and restaurants, office space and hundreds of town homes, apartments and condominiums. In addition, the City has created Indiana's first dual-site, statecertified teclmology park site known as Innovation Park and Ignition Park.
Mayoral Leadership
Mayor Pete Buttigieg, a Harvard University graduate and Rhodes scholar, assumed office on January 1, 2012, bringing with him a group of leaders with new ideas and energy to implement transfonnational reform to city government. Elected at age 29, Mayor Buttigieg is the youngest chief executive of a municipality exceeding 100,000 residents in the United States. During 2012, Mayor Buttigieg launched eight new initiatives to improve city government:
1. New Economic Partnerships -to lay out anew economic vision for our conunwuty as well as to agree on a smarter division of labor among various groups involved in economic development.
2. High Ethical Standards - on his first day in office the Mayor issued an executive order introducing a new ethics code for City employees.
3. Customer Service Mentality - design ways that City employees can track and resolve citizens ' issues efficiently by using more advanced teclmology. Tlus effort led to the creation of a "311 Call Center" for non-emergency mw1icipal telephone calls during 2012.
4. Strong Partnerships with Schools - the Mayor has improved dialogue with the South Bend School Corporation and other stakeholders to ensure a strong educational system in the City. The Mayor has begun programs to double the number of public school mentors and curb youth and gun violence.
5. Transparency and Accessibility- choosing not to serve from behind his desk, Mayor Buttigieg has conducted a series of monthly "Mayor' s Night Out" and "Mayor's Night In" events around town to allow citizens to speak to him and Ius depmiment heads directly about concems and ideas. Also, efforts to implement a first-class perfonnance management system have been initiated and depmimental performance measures are being monitored on a monthly basis. The City website has been re-designed and additional financial and operational rep01is are being made available online.
12

6. Vacant and Abandoned Buildings- as with many large cities, the City of South Bend has an issue with vacant and abandoned buildings. The city has taken on this issue with the appointment of a blue-ribbon task force that developed new strategies and initiated an aggressive three-year program-1 ,000 buildings in 1,000 days-to reduce the number of vacant and abandoned buildings. Funding for demolition and remediation has increased significantly and is over $2.0 million dollars in the 2014 budget.
7. Smart Streets- an effort to improve the role of streets within South Bend. Projects within this initiative utilize the "Complete Streets" philosophy which advocates for the design of streets to enable safe access for all users, including pedestrians, bicyclists, motorists and transit riders of all ages and abilities.
8. South Bend Group Violence Intervention (SBGVI) - unites community leaders arotmd a common goal: to stop gun violence and keep South Bend's highest risk citizens alive and out of prison. SBGVI is a partnership among 30 conununity leaders from law enforcement, goverrunent, education, civil service, health-care and faith-based agencies.
Administration Vision
The administration of Mayor Buttigieg has a single, overarching vision-a safe, inclusive and wellconnected South Bend. In support of this vision, the Mayor has established tlu·ee main pillars of administration policy:
1. Basics are easy- it is essential to provide City residents basic services so seamlessly that they take them for granted and are able to focus on their own families and daily challenges.
2. Good government- make govenunent more accessible and accountable to those it serves by adopting a people-focused approach, trading partisanship for partnership and using teclmology to better serve all residents.
3. Create Jobs - focus on economic growth and make much needed investments in the future.
Awards
The Government Finance Officers Association of the United States and Canada (GFOA) awarded a Certificate of Achievement for Excellence in Financial Reporting to the City of South Bend for its comprehensive ammal financial report for the fiscal year ended December 31 , 2012. This was the 23rd consecutive year that the City has achieved this prestigious award. In order to be awarded a Certificate of Achievement for Excellence in Financial Repmting, a govemment unit must publish an easily readable and efficiently organized comprehensive annual financial report. This report must satisfy both generally accepted accounting principles and applicable legal requirements.
A Ce1iificate of Achievement is valid for a period of one year only. We believe that our cutTent comprehensive arumal financial repmi continues to meet the Certificate of Achievement Program's requirements, and we are submitting it to the GFOA to determine its eligibility for another certificate.
13

------ ---
Acknowledgments
The preparation of the comprehensive a1mual financial repmi (CAFR) was made possible by the dedicated service of the City' s departmental fiscal officers and the staff of the Department of Administration and Finance. Each fiscal officer and member of the Administration and Finance Department has our sincere appreciation for the contributions made in the preparation of this report. We would especially like to acknowledge the effmis of the core CAFRpreparation team ofRahman Johnson, Cecil Eastman and Danny Cocanower. In addition, we would like to thank the Field Examiners of the Indiana State Board of Accounts (led by Doug Wiese, Bruce Snyder and Alex Flores) for their hard work and dedication in this effort.
In closing, without the leadership and support of Mayor Pete Buttigieg, Deputy Mayor Mark Neal, City Depmiment Heads, and members of the City of South Bend Common Council, preparation of this repoti would not have been possible.
Sincerely,
~~---- \d · \n\ A ,./lo J
JoY~H.Murph~, M'~ City Controller
14
6V~~k_Q_ Jennifer Hockenhull, CPA Deputy City Controller

Government Finance Officers Association
Certificate of Achievement for Excellence
in Financial Reporting
Presented to
City of South Bend
Indiana
For its Comprehensive Annual Financial Report
for the Fiscal Year Ended
December 31, 2012
Executive Director/CEO
15

...... O'l
City of South Bend, Indiana Organizational Chart
;--------------_1 _______________ , i Board of Public !
I Safety (1) I '-------------··r··------------'
Police Department (Chief)
-Technical Services Division
Fire Department (Chief)
-Fire Prevention
City Council
;-------- -------1. .............. , i Board of Parks & i I Recreation (1) ! :---- - ----------r·------------~
Parks & Recreation (Superintendent)
- Park Adminislralion Division - Investiga ti ve Division - Administrative Services Division - Park Maintenance Division - Uniform Patrol -Communi ty Rei a lions Division
- Firefighting Operations Division - Recreation Division - EMS Division - Potawatomi Zoo Division
I Lega l Department
(City Attorney)
I Code Enforcement
(Director)
- Hearing Officer - Neighborhood Code Enforcement
-Abandoned Vehicles - Unsafe Building -Animal Control
- Go// Division
- Bureau of Weights and Measures
(1) Board Members include Mayoral Appointments (2) Board Members include Mayoral and Council Appointments (3) Board Members include Citizen Appointments
Citizens of South Bend
I
~--M,yoc I
;·-- --------· --J ............... , ! Board of Public !
I Works (1) I :----------·---r-------------:
Publi c Works (Director)
- Engineering Division -Streets Division -Water Works Division - Sewage Division -Central Services Division -Solid Waste Division - Energy Office
City Clerk
;------- -------] ___ ____________ _
! Century Center ! ! Board of Managers! i (2) : :-------------- -r------ -------~
Century Center (Director)
······-·····-··· .... ·---------··-··· ' . i Morris i ! Entertainment !
! Board (3) !
: -------- - -- -·-- r------------~
Morris Performing Arts Center (Director)
I Consolidated
Bu ilding Department
(4) Board Members include Mayoral and Council Appointments for Redevelopment Commission, Mayoral Appointment for Redevelopment A uthority
Effective as of January 1, 2011
-- -- - -- --- --- -~r ______ _____ ___ , Redevelopment i
Authority/ !
- -~?.~~~~-~-i-~-~--~:.~ ___ j Community &
Economic Development
(Director)
- Economic Development -Community Development - General Administration
l Administration &
Finance (City Controller)
- City Finance & Budgeting - Human Resources - Benefits Management -Information Technology - Safety & Risk Management - Human Rights - Purchasing
II Financial Section
17

- - - --- ---- - -------,
De··,····:. . ; ,
.
STATE OF INDIANA AN EQUAL OPPORTUNITY EMPLOYER STATE BOARD OF ACCOUNTS
302 WEST WASHINGTON STREET ROOM E41 8
INDIANA1'0LIS, INDIANA 46204-2769 ~/'.::-J
INDEPENDENT AUDITOR'S REPORT
Telephone: (3 17) 232-2513 Fax: (3 I 7) 232-4 711
Web Site: www.in.gov/sboa
TO: THE OFFICIALS OF THE CITY OF SOUTH BEND, ST. JOSEPH COUNTY, INDIANA
Report on the Financial Statements
We have audited the accompanying financial statements of the governmental activities, the businesstype activities, each major fund , and th,e aggregate remaining fund information of the City of South Bend (City) , as of and for the year ended December 31 , 2013, and the related notes to the financial statements, which collectively comprise the City's basic financial statements as listed in the Table of Contents.
Management's Responsibility for the Financial Statements
Management is responsible for the preparation and fair presentation of these financial statements in accordance with accounting principles generally accepted in the United States of America; this includes the design , implementation , and maintenance of internal control relevant to the preparation and fair presentation of financial statements that are free from material misstatement, whether due to fraud or error.
Auditor's Responsibility
Our responsibility is to express opinions on these financial statements based on our audit. We conducted our audit in accordance with auditing standards generally accepted in the United States of America and the standards applicable to financial audits contained in Government Auditing Standards, issued by the Comptroller General of the United States. Those standards require that we plan and perform the audit to obtain reasonable assurance. about whether the financial statements are free of material misstatement.
An audit involves performing procedures to obtain audit evidence about the amounts and disclosures in the financial statements. The procedures selected depend on the auditor's judgment, including the assessment of the risks of material misstatement of the financial statements, whether due to fraud or error. In making those risk assessments, the aud itor considers internal control relevant to the entity's preparation and fa ir presentation of the financial statements in order to design audit procedures that are appropriate in the cir- · cumstances, but not for the purpose of expressing an opinion on the effectiveness of the City's internal control. Accordingly, we express no such opinion. An audit includes evaluating the appropriateness of account-
. ing policies used and the reasonableness of significant accounting estimates made by management, as well as evaluating the overall presentation of the financial statements .
We believe that our audit evidence we have obtained is sufficient and appropriate to provide a basis for our audit opinions.
Opinions
In our opinion , based on our audit, the financial statements referred to above present fairly, in all material respects, the respective financial position of the governmental activities, the business-type activities , each major fund , and the aggregate remaining fund information of the City, as of December 31 , 2013, and the respective changes in financial position and cash flows, where applicable, thereof and for the year then ended, in accordance with accounting principles generally accepted in the United States of America.
18

Other Matters
INDEPENDENT AUDITOR'S REPORT (Continued)
Required Supplementary Information
Accounting principles generally accepted in the United States of America require that the Management's Discussion and Analysis, Schedules of Funding Progress, Schedules of Contributions From the Employer and Other Contributing Entities, and Budgetary Comparison Schedules, as listed in the Table of Contents, be presented to supplement the basic financial statements. Such information, although not a part of the basic financial statements, is required by the Governmental Accounting Standards Board who considers it to be an essential part of financial reporting for placing the basic financial statements in an appropriate operational , economic, or historical context. We have applied certain limited procedures to the required supplementary information in accordance with auditing standards generally accepted in the United States of America, which consisted of inquiries of management about the methods of preparing the information and comparing the information for consistency with management's responses to our inquiries, the basic financial statements, and other knowledge we obtained during our audit of the basic financial statements. We do not express an opinion or provide any assurance on the information because the limited procedures do not provide us with sufficient evidence to express an opinion or provide any assurance.
Other Information
Our audit was conducted for the purpose of forming opinions on the financial statements that collectively comprise the City basic financial statements. The accompanying introductory section, combining and individual fund financial statements, other budgetary comparison schedules, and statistical section are presented for purposes of additional analysis and are not a required part of the basic financial statements.
The combining and individual fund financial statements and other budgetary comparison schedules are the responsibility of management and were derived from and relate directly to the underlying accounting and other records used to prepare the basic financial statements. Such information has been subjected to the auditing procedures applied in the audit of the basic financial statements and certain additional procedures, including comparing and reconciling such information directly to the underlying accounting and other records used to prepare the basic financial statements or to the basic financial statements themselves, and other additional procedures in accordance with auditing standards generally. accepted in the United States of America. In our opinion , the combining fund financial statements and other budgetary comparison schedules are fa irly stated , in all material respects, in relation to the basic financial statements as a whole.
The introductory section and statistical schedules have not been subjected to the auditing procedures applied in the audit of the basic financial statements, and accordingly, we do not express an opinion or provide any assurance on them.
Other Reporting Required by Government Auditing Standards
In accordance with Government Auditing Standards, we have also issued our report dated June 17, 2014, on our consideration of the City's internal control over financial reporting and on our tests of its compliance with certain provisions of laws, regulations, contracts , and grant agreements and other matters. The purpose of that report is to describe the scope of our testing of internal control over financial reporting and compliance and the results of that testing and not to provide an opinion on internal control over financial reporting or on compliance. That report is an integral part of an audit performed in accordance with Government Auditing Standards in considering City's internal control over financial reporting and compliance.
June 17, 2014
19
P~s::J.~ Paul D. Joyce, CPA State Examiner
------ - ---- - - - -
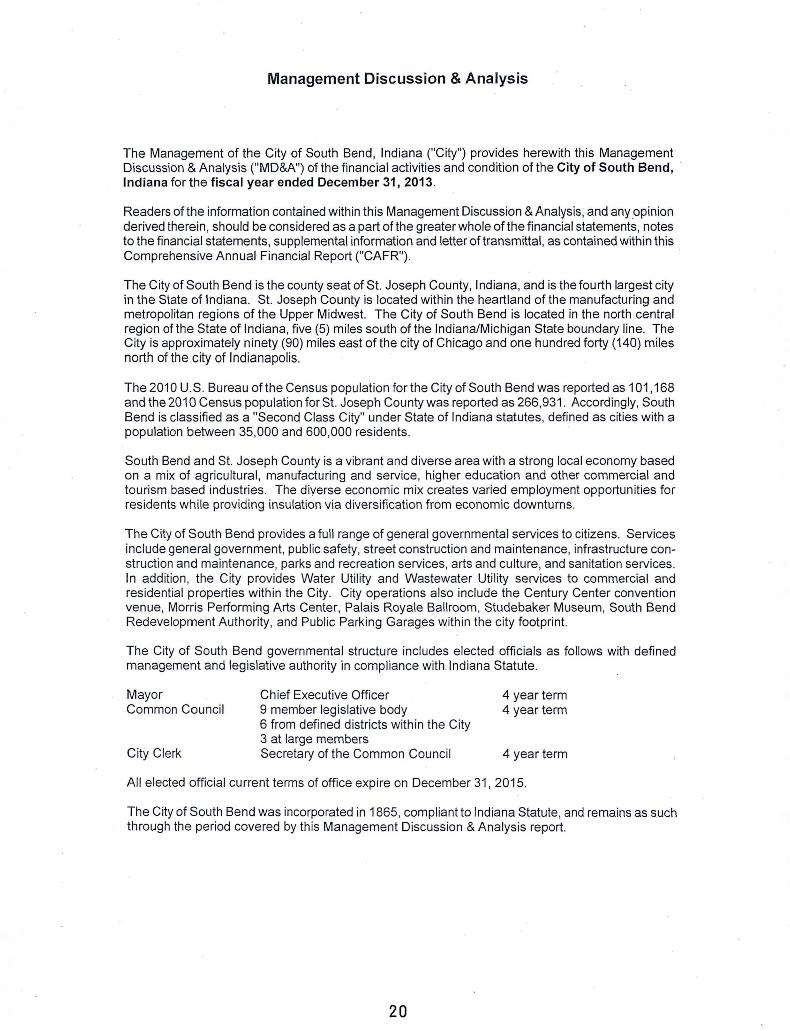
Management Discussion & Analysis
The Management of the City of South Bend, Indiana ("City") provides herewith this Management Discussion & Analysis ("MD&A") of the financial activities and condition of the City of South Bend, · Indiana for the fiscal year ended December 31, 2013.
Readers of the information contained within this Management Discussion & Analysis, and any opinion derived therein , should be considered as a part of the greater whole of the financial statements, notes to the financial statements, supplemental information and letter of transmittal , as contained within this Comprehensive Annual Financial Report ("CAFR") .
The City of South Bend is the county seat of St. Joseph County, Indiana, and is the fourth largest city in the State of Indiana. St. Joseph County is located within the heartland of the manufacturing and metropolitan regions of the Upper Midwest. The City of South Bend is located in the north central region of the State of Indiana, five (5) miles south of the Indiana/Michigan State boundary line. The City is approximately ninety (90) miles east of the city of Chicago and one hundred forty (140) miles north of the city of Indianapolis.
The 2010 U.S. Bureau of the Census population for the City of South Bend was reported as 101,168 and the 2010 Census population for St. Joseph County was reported as 266,931 . Accordingly, South Bend is classified as a "Second Class City" under State of Indiana statutes, defined as cities with a population between 35,000 and 600,000 residents.
South Bend and St. Joseph County is a vibrant and diverse area with a strong local economy based on a mix of agricultural, manufacturing and service, higher education and other commercial and tourism based industries. The diyerse economic mix creates varied employment opportunities for residents while providing insulation via diversification from economic downturns.
The City of South Bend provides a full range of general governmental services to citizens. Services include general government, public safety, street construction and maintenance, infrastructure construction and maintenance, parks and recreation services , arts and culture, and sanitation services. In addition, the City provides Water Utility and Wastewater Util ity services to commercial and residential properties within the City. City operations also include the Century Center convention venue, Morris Performing Arts Center, Palais Royale Ballroom, Studebaker Museum, South Bend Redevelopment Authority , and Public Parking Garages within the city footprint.
The City of South Bend governmental structure includes elected officials as follows with defined management and legislative authority in compliance with Indiana Statute.
Mayor Common Council
City Clerk
Chief Executive Officer 9 member legislative body 6 from defined districts within the City 3 at large members Secretary of the Common Council
4 year term 4 year term
4 year term
All elected official current terms of office expire on December 31 , 2015.
The City of South Bend was incorporated in 1865, compliant to Indiana Statute, and remains as s.uch through the period covered by this Management Discussion & Analys is report.
20

Management Discussion & Analysis
Financial Highlights
Governmental Business-type Government-wide Activities Activities Activities
2012 2012
2013 (Restated) 2013 2012 2013 (Restated)
Assets/deferred outflows 502,405,650 507,008,554 304 ,776,403 311 ,488,235 807,182,053 818,496,789
Liabilit ies/deferred inflows 215,811,805 221,879,951 134,096,229 142,076,868 349,908,034 363,956,819
Net position Capital net of debt 192, 190, 446 202,779,954 114,506,252 11 3,193,929 306,696,698 315,973,883 Restricted 7,990,172 8,050,418 48,267,664 29,259,933 56,257,836 37,310,351 Unrestricted 86, 41 3,227 71,992,457 7,906,258 26,957,505 94,319,485 98,949,962
Tota l net position 286,593,845 282,822,829 170,680,174 169,411,367 457,274,019 452,234,196
Change -.s. prior year 3,771,01 6 4,739,556 1,268,807 7,276,745 5,039,823 12,016,301
Expenses 153,017,817 153,984,307 54,949,283 48,559,092 207,967, 100 202,543,399 Revenues 152,263,646 147,341 ,522 60,743,277 59,715,558 213,006,923 207,057,080
• Government-wide net position was $457,274,019 as of December 31 , 2013.
• Government-wide net position increased by $5,039,823 or 1.1 percent during fiscal 2013. Governmental activity net position increased by $3,771 ,016 or 1.3 percent and business-type activity net position increased by $1,268,807 or 0.7 percent during fiscal 2013.
• Total assets and deferred outflows of resources as of December 31 , 2013, of $807,182,053 decreased by $11 ,314,736 or -1.4 percent as compared to total assets and deferred outflows of resources as of December 31, 2012.
• Total liabilities and deferred inflows of resources as of December 31, 2013, of $349,908,034 decreased by $14,048,785 or -3 .9 percent as compared to total liabilities and deferred inflows of resources as of December 31, 2012.
• As of December 31 , 2013, the government-wide net position of $457,27 4,019 has $306,696,698 invested in capital assets (net of debt) which is not available for spending, $56,257,836 classified as restricted for debt service and capital outlay, and $94,319,485 classified as unrestricted and may be used to meet ongoing obl igations to creditors.
• Government-wide revenue received in fiscal2013 totaled $213,006,923, an increase of $5,949,843 or 2.9 percent versus government-wide revenues received in fiscal 2012. Governmental activity revenue increased by $4,922,124 or 3.3 percent, whereas business-type activity revenue increased by $1 ,027,719 or 1.7 percent.
• Government-wide expenses in 2013 totaled $207,967,100, an increase of $5,423,701 or 2.7 percent compared to expenses of $202,543,399 in 2012. Government activity expenses decreased by $966,490 or -0.6 percent and business-type activity expenses increased by $6,390,191 or 13.2 percent compared to fiscal2012 .
• Explanatory commentary concerning the changes in assets, liabilities, revenue, and expenditures can be found in later sections of this MD&A.
21

Management Discussion & Analysis
Overview of the Financial Statements
The City of South Bend's financial statements are comprised of three components: (1) governmentwide financial statements, (2) fund financial statements, and (3) notes to the financial statements. This report also includes other supplementary information in addition to the basic financial statements themselves.
Government-wide financial statements
The government-wide financial statements are designed to provide readers with a broad overview of the City of South Bend's finances using ·:accrual based accounting ," a method of accounting used by private-sector businesses.
• Statement of Net Position
This statement reports all assets, deferred outflows of resources, liabilities, and deferred inflows of resources of the City of South Bend as of December 31 , 2013. The difference between total assets and deferred outflows of resources less total liabilities and deferred inflows of resources is reported as "net position ," and can generally be thought of as the net worth of the City. Increases in net position generally indicate an improvement in financial position while decreases in net position may indicate a deterioration offinancial position.
• Statement of Activities
This statement serves the purpose of the traditional income statement. It provides consolidated reporting of the results of all activities of the City of South Bend for the year ended December 31, 2013. Changes in net position are recorded in the period in which the underlying event takes place, which may differ from the period in which cash is received or disbursed. The Statement of Activities displays the expense of the City's various programs net of the related revenues, as well as a separate· presentation of revenue available for general purposes including property and county option income taxes, fees for services and other revenue sources.
The government-wide financial statements distinguish between functions of the City that are principally supported by taxes and intergovernmental revenue (governmental · activities) and other functions that are intended to recover all or a significant portion of their costs through user fees and charges (business-type activities) . The major governmental activities of the City of South Bend include general government, public safety , street construction and maintenance, infrastructure construction and maintenance, parks and recreation services, and arts and culture. The major businesstype activities of the City include the water utility, wastewater utility, solid waste sanitation services, Century Center convention center, and Blackthorn golf course operations.
Fund Financial Statements
A fund is a group of related accounts that is used to maintain control over resources that have been segregated for specific activities or objectives. The City, like other state and local governments, uses fund accounting to ensure and demonstrate compliance with finance-related legal requirements. All of the funds of the City of South Bend can be divided into three categories: governmental funds, proprietary funds, and fiduciary funds.
22
Management Discussion & Analysis
Governmental funds
Governmental funds are used to account for the same functions reported as governmental activities in the government-wide financial statements. However, unlike government-wide financial statements, governmental fund financial statements focus on short-term inflows and outflows of spendable resources, as well as on balances of spendable resources available at the end of the fiscal year. Such information may be useful in evaluating a government's short-term financing requirements. Governmental funds use the modified accrual accounting method. The City maintains six (6) major governmental funds (General, Parks and Recreation, Public Safety Local Option Income Tax, County Option Income Tax, Economic Development Income Tax, and Airport TIF) and sixty-two (62) nonmajor governmental funds.
Proprietary Funds
The City of South Bend maintains two types of proprietary funds: enterprise and internal service.
• Enterprise funds are used to report the same functions presented as business-type activities in the government-wide financial statements. The City maintains seven (7) enterprise funds. Information is presented separately in the proprietary statement of net position and the proprietary Statement of Revenues, Expenses, and Changes in Fund Net Position for the Water Utility, Wastewater utility and Century Center Convention Center, which are considered major enterprise funds. Data from the other four (4) nonmajor enterprise funds (Consolidated St. Joseph County/South Bend Building Department, Parking Garage, Solid Waste and Blackthorn Golf Course) are combined into a single, aggregated presentation. Individual fund d.ata for each of these non-major enterprise funds is provided in the form of combining statements elsewhere in this report.
• Internal service funds are used to accumulate and allocate costs internally among the City's various functions and funds. The City maintains five (5) internal service funds. The City of South Bend uses internal service funds to account for its self-funded liability insurance program, self-funded employee health benefits program, unemployment compensation claims, police take-home vehicle program .and central services unit (a department that accounts for expenses related to fuel, vehicle repairs , printing , and other services provided to City departments on a cost-reimbursement basis) . Because these services predominantly benefit governmental rather than business-type functions, they have been included within governmental activities in the government-wide financial statements but are combined into a single, aggregated presentation in the proprietary fund financial statements. Individual fund data for the internal service funds is provided in the form of combining statements elsewhere in the report.
Fiduciary Funds
Fiduciary funds are used to account for resources held for the benefit of parties outside the City government. Fiduciary funds are not reflected in the government-wide financial statements because the resources of those funds are not available to support City programs. The City maintains five (5) fiduciary funds, which consist of two (2) pension trust funds (1925 Police Pension and 1937 Firefighter's Pension) , two (2) agency funds (Payroll and Morris/Palais Royale Box Office) , and one (1) private-purpose trust fund (City Cemetery) .
Pension Trust Fund Operations.
City employees are covered by the Public Employees Retirement Fund ("PERF") and the 1977 Police Officers' and Firefighters' Pension Fund, both of which are administered by the State of Indiana. However, certain police officers and firefighters hired before May 1, 1977, (who did not opt into the 1977 fund) continue to be members of the 1925 Police Officers' Pension Fund or the 1937 Firefighters' Pension Fund. These two funds are administered by the City. The number of police officers and firefighters in the City-managed pension trust funds will continue to decline in the future as current participants pass away.
23

Management Discussion & Analysis
Effective in fiscal2009 with the passage of State legislation, funding responsibility for the 1925 Police and 1937 Firefighter's Pension Funds was assumed by the State of Indiana. These funds no longer receive property tax revenue distributions beyond fiscal2009. The transfer of pension responsibility to the State of Indiana is on a reimbursement basis and will not provide additional revenue to the City for use in other property tax funded areas. The administration of the pension plans remains the responsibility of the City.
Notes to the Financial Statements
The notes to the financial statements provide additional information that is essential in order to have a full understanding of the data provided in the government-wide and fund financial statements.
Other Information
In addition to the basic financial statements and accompanying notes and disclosures, th is CAFR report presents supplementary information. The combining statements referred to earlier in connection with nonmajor governmental, enterprise, internal service, and fiduciary funds are presented immediately after the basic financial statements within the financial statement section of the CAFR report.
Government-wide Financial Statements
The following financial analysis will focus on the Statement of Net Position and Statement of Changes in Net Position of the City's governmental and business-type activities . .
Statement of Net Position Governm ental Business type Government·wide
Activiti es Activities Activities 2012 2012
2013 (Restated) 201 3 2012 2013 (Restated)
Assets Current & other 218,030,938 212,405,426 71,410, 179 87,285,352 289,441,117 299,690,778 Capital assets (net) 284,374,7 12 294,607,604 231 ,494,566 222,492,21 4 515,869,278 517,099,818
Total Assets 502,405,650 507,013,030 302,904,745 309,777,566 805,310,395 816,790,596
Deferred Outflows 1,871,658 1,710,669 1,871 ,658 1,710,669
Liabiliti es Current 30,589,281 33,851 ,096 15,240,917 14,244,876 45,830,198 48,095,972 Long term 184,657, 140 187,369,257 118,317,952 127,793,032 302,975,092 315,162,289
Total Liabilities 215,246,421 221 ,220,353 133, 558,869 142,037 ,908 348,805,290 363,258,261
Deferred Inflows 565,384 659,598 537,360 38,960 1,102,744 698,558
Net position Capital net of debt 192,190,446 202,779,954 114,506,252 11 3, 193,929 306,696,698 315,973,883 Restricted 7,990, 172 8,050,418 48,267,664 29,259,933 56,257,836 37,310,351 Unrestricted 86,413,227 71,992,457 7,906,258 26,957,505 94,319,485 98,949,962
Total net position 286,593,845 282,822,829 170,680,174 169,411,367 457,27 4,019 452,234,196
• As of December 31 , 2013, total assets and deferred outflows exceeded liabilities and deferred inflows by $457,274,019, an increase of $5,039,823, or 1.1 percent, from the net position level as of December 31 , 2012.
• Governmental activities net position of $286,593,845 increased by $3,771,016 from December 31 , 2012, an increase of 1.3 percent.
24

-- ·--- -----------------------------------
Management Discussion & Analysis
• Business-type net position of $170,680,17 4 increased by $1 ,268,807 over December 31, 2012, an increase of 0. 7 percent. The increase in business-type net position was due primarily to a 9 percent increase in sewer rates which will be used to support long-term capital projects of the Wastewater utility.
• Government-wide assets and deferred outflows decreased $11 ,319,212 or -1.4 percent as compared to amounts as of December 31, 2012, mainly due to a decrease in govern-mental capital assets as a result of a capitalization policy change.
• Government-wide liabilities and deferred inflows decreased by $14,048,785 or -3.9 percent as compared to amounts as of December31, 2012. The decrease is due mainly to the City's decision to not seek new debt financing for the Wastewater Utility in 2013, unlike the previous 2 years in which the Utility issued bonds of $20 million or more.
Statement of Changes in Net Position
Governmental Business type Government-wide Activities Activities Activities
2012 2012 2013 (Restated) 2013 2012 2013 (Restated)
Revenue Program Revenue
Charge for services 13,158,358 12,967,034 59,906,998 57,419,733 73,065,356 70;386,767 . Operating grants 21,466,622 24,937,596 21,466,622 24,937,596 Capital grants 1,867,213 2,468,120 697,917 2,010,253 2,565,130 4,478,373
General Revenue Taxes
Property tax 72,018,650 71,775,415 72,018,650 71,775,415 Other tax 22,811,296 23,360,791 22,811,296 23,360,791 Unrestricted grants 5,893,924 3,891,810 5,893,924 3,891,810 Investment earnings 762,269 1,317,443 138,362 285,572 900,631 1,603,015 Other revenue 14,285,314 6,623,313 14,285,314 6,623,313
Total Revenue 152,263,646 147,341,522 60,743,277 59,715,558 213,006,923 207,057,080
Expense General government 13,200,898 16,102,189 13,200,898 16,102,189 Public safety 76,023,819 69,977,237 76,023,819 69,977,237 Highways & streets 20,915,815 15,198,102 20,915,815 . 15,198,102 Culture & recreation 26,846,471 21,724,589 26,846,471 21,724,589 Economic development 10,069,690 27,158,034 10,069,690 27,158,034 Interest on long term debt 5,961,124 6,134,406 5,961,124 6,134,406 Water utility 15,221,865 12,228,014 15,221,~65 12,228,014 Wastewater utility 26,390,790 23,809,975 26,390,790 23,809,975 Civic center 4,330,656 2,929,268 4,330,656 2,929,268 Building department 1,131,815 909,376 1,131,815 909,376 Parking 1,285,056 1,721,655 1,285,056 1,721,655 Solid waste 5,091,588 . 5,118,806 5,091,588 5,118,806 Golf course 1,497,513 1,841,998 1,497,513 1,841,998
Total Expense 153,017,817 156,294,557 54,949,283 48,559,092 207,967,100 204,853,649
Change in net position Before transfers I special (754,171) (8,953,035) 5,793,994 11,156,466 5,039,823 2,203,431 Transfers 4,525,187 3,879,721 (4,525,187) {3,879,721)
Change in net position 3,771,016 (5,073,314) 1,268,807 7,276,745 5,039,823 2,203,431
Beginning net position 282,822,829 287,896,143 169,411,367 162,134,622 452,234,196 450,030,765 (restated)
· Ending net position 286,593,845 282,822,829 170,680,174 169,411,367 457,274,019 452,234,196
25

Management Discussion & Analysis
Governmental Activities
Net position for government-wide activities increased by $5,039,823 during fiscal2013. Revenue of $213,006,923 increased by $5,949,843, or 2.9 percent. Expenses were $207,967,100 during 2013, an increase of $3 ,11 3,451 , or 1.5 percent as compared to fiscal 2012.
The revenue increase was due primarily to one-time payments for legal settlements , most notably from the Studebaker-Oliver Brownfield ($3.8 million) and Bosch ($2.0 million). Economic Development expenditures decreased significantly due to the continued phase-out of ARRA but increases in other areas resulted in the minimal net decrease of expenditures noted above.
Interest on long-term debt of $5,961 ,124 decreased by $173,282 from 2012, as the City continued to take advantage of favorable financing rates by either retiring older, higher-rate instruments, or re-financing instruments at better terms. ·
Transfers in the amount of $4,525,187 for 2013 represent payment in lieu of taxes (PILOT) paid by the Wastewater and Water Utilities to the General Fund, Parks and Recreation Fund and other funds that receive property taxes. The transfer amount increased by $645,466 from 2012.
Business-Type Activities
Net position from business-type activities increased by $1 ,268,807 during fiscal2013. During 2013, revenue of $60,743,277 increased by $1 ,027,719 or 1.7 percent over fiscal 2012. During 2013, expenses of $54,949,283 increased by $6,390,191 or 13.2 percent when compared to fiscal 2012.
Revenue increased primarily in the Water and Wastewater Utilities as a result of rate increases which '!'ere again offset by lower grant revenues.
Financial Analysis of Government Funds
The City of South Bend uses fund accounting to ensure and demonstrate compliance with financerelated legal requirements. Funds of the City are divided into three categories: governmental funds, proprietary funds, and fiduciary funds.
Condensed Balance Sheet, Statement of Revenue, Expenditures, and Changes in Fund Balance
As of December 31, 2013
General Park & Rec PS LOIT COlT EDIT TIF Airport Othe r
Tota l assets 29,689,725 4,388,261 2,030,864 17,495,359 11,284,910 36,673,858 111,348,345
Tota l liabilities 2,020,812 302,843 235,645 696,591 119,988 658,839 11,691,289
Fund Balances:
Non-spendable 656,848 84,308 2,597,472 449,831 10,498,432 9,198,433
Restricted 4,001,110 1,795,219 25,516,587 64,074,963
Committed 20,697,026
Assigned 531,959 14,201,296 10,715,091 10 ,538,803
Unassig ne d 26,480,106 14,852, 169)
Total fund balance 27,668,913 4,085,418 1,795,219 16,798,768 11,164,922 36,015,019 99,657,056
liability & fund balance 29,689,725 4,388,261 2,030,864 17,495,359 11,284,910 36,673,858 111,348,345
Revenues 60,034,428 10,927,283 5,895,440 8,421,470 8,769,448 16,908,969 40, 195,436 .
Expenditures 72,497,416 12,057,938 235,645 7,599,409 2,520,034 6,486,862 51,463,446
Net surplus (deficit) 112,462,988) 11,130,555) 5,659,795 822,061 6,249,414 10,422, 107 111,268,010)
Othe r source s (use s) 11,336,818 502,315 16,857,086) I 1,807,0981 15,456,519) 11,021,953) 15,264,972
Net change in fu nd I 1,126,170) 1628,340) 11,197,291) 1985,037) 792,895 9,400,154 3,996,962
balances
Beginning fund balances 28,795,083 4,713,758 2,992,510
- restated 17,783,805 10,372,027 26,614,865 95,660,094
Ending fund bal ances 27,668,913 4,085,418 1,795,219 16,798,768 11,164,922 36,015,019 99,657,056
26
Total
212,911,322
15,726,007
23,485,324
95,387,879
20,697,026
35,987,149
21, 627,937
197,185,315
212,911,322
151,152,474
152,860,750
11,708,276)
11,961,449
10,253,173
186,932,142
197, 185,315

- - -- - --- --------
Management Discussion & Analysis
As of December 31, 2013, the City governmental funds reported a combined ending fund balance of $197,185,315.
The Nonspendable fund balance of $23,485,324 is sequestered for property held for resale, inventory, non:..current loans receivable and advances to other funds and is, therefore, not available for new spending . The Restricted fund balance of $95,387,879 consists of monies in debt service funds or other funds such as Road funds that are limited by external parties as to their use: The
. Committed fund balance of $20,697,026 is designated by the South Bend Common Council to be used for certain purposes such as for environmental projects, The Assigned fund balance of $35,987,149 includes balances in local option income tax funds that have not been committed to certain projects and are available for spending by the City. The remaining Unassigned fund balance of $21 ,627,937 consists of money primarily in the General Fund that has not been obligated in any manner by the City.
The General Fund is the primary operating fund for City operations including general government, public safety, code enforcement, certain culture and recreation expenses, and certain debt service obligations.
As of December 31 , 2013, the General Fund balance of $27,668,913 represents a decrease of $1 ,126,170 or -3.9 percent from the balance as of December 31 , 2012. The decrease was due primarily to degrading tax revenues that continue to challenge City operations.
As of December 31 , 2013, the General Fund had an unassigned fund balance of $26,480,106 which is equal to 44.1 percent of 2013 General Fund Revenue.
The General Fund unassigned fund balance has traditionally been used by the City to fund certain capital projects and emergency contingencies. In addition, the City will use the unassigned fund balance in 2014 as a cash flow bridge to the receipt of property tax revenues from the County collection authority which distributes property tax revenue two times per year (June and December). General Fund unassigned balance will provide sufficient cash to cover City operating obligations without incurring tax anticipation notes and resultant borrowing costs during fiscal 2014.
As discussed in Governmental Accounting , Auditing, and Financial Reporting (GAAFR), a general fund unassigned fund balance should be either (1) no less than 5 to 15 percent of regular general fund operating revenues, or (2) no less than one to two months of regular general fund operating expenditures. An unassigned fund balance may be lower if circumstances dictate, such as a delay in collection of a major revenue source.
The Parks and Recreation Fund balance decreased $628,340 during fiscal2013 , due primarily to a combination of flat revenues and increased service costs. As of December 31 , 2013, the fund balance in the Parks and Recreation Fund was $4,085,418, or 37.4 percent of 2013 revenue.
The Public Safety Local Option Income Tax Fund ("Public Safety LOIT") was created in October 2009, with the local legislative passage of an increase in local option income taxes of 0.95 percent, a part of which (0.25 percent) tax increase was establ ished to fund public safety expenditures. The City has established the Public Safety LOIT Fund as a major governmental fund , due solely to its purpose of creating a funding source to sustain public safety staffing levels , which were compromised by state implementation of property tax reform that has reduced property tax revenues, which historically are the source of public safety funding . Operating transfers are made quarterly from the Public Safety LOIT Fund to the General Fund to cover the personnel costs of police officers and firefighters. Receipts of Public Safety LOIT tax revenue commenced in January 2010. The revenue collected in fiscal2013 of $5,895,440 decreased by $169,660 or -2.8 percent compared to 2012. The decrease in fund balance in the amount of $1,197,291 during 2013 is the result of increased costs for pol ice and f ire personnel. ·
27

Management Discussion & Analysis
The County Option Income Tax Fund ("COlT") and Economic Development Income Tax Fund ("EDIT") funds are used to fund major capital and construction projects, economic development initiatives, certain subsidies and support to organizations and units that benefit city economic development and cultural venues, certain city-wide expenditures such as telephone costs, and certain debt service payments.
The COlT fund decreased by $985,037 during 2013, due to higher expenditures in the areas of public safety, economic development, and general government. The City has operationally sequestered COlT funds for use in major capital and construction funding initiatives, certain subsidies and support to organizations and units that benefit city economic development and cultural venues, information technology costs, city-wide expenditures like telephone costs, and certain debt service payments.
As of December 31 , 2013, the COlT fund balance of$16,798,768 included assigned fund balance of $14,201 ,296 and non-spendable fund balance of $2,597,472, primarily for property held for resale and advances to other funds.
The EDIT fund increased by $792,895 during 2013 due to higher income tax receipJs than originally estimated and conservative commitment of expenses to initiatives of the highest priority. The City has operationally sequestered EDIT funds for use in major economic development initiatives, certain subsidies and support to organizations and units that benefit city economic development and cultural venues, operational costs of the street department, and certain debt service payments.
As of December 31 , 2013, the EDIT Fund balance of $11 ,164,922 included assigned fund balance of $10,715,091 and non-spendable fund balance of $449,831, consisting of property held for resale.
The fund balance in the TIF Airport Fund increased by $9,400,154 during 2013. Revenue increased by $5,023,905 due to increased tax collection and a one-time payment of $2 million from Bosch in fulfillment of their lease termination agreement. Actual expenditures dropped by $9,440,000 due to continuation of projects into 2014, and thus the fund's restricted balance for encumbrances increased proportionately.
As of December 31 , 2013, the TIF Airport Fund balance of $36,015,019 included $10,498,432 in property held for resale and advances to other funds , and $25,516,587 in restricted fund balance reserves. The TIF Airport Fund continues to be a major success for the City of South Bend and has generated in excess of $500 million dollars in private investment since its inception.
During 2013, the fund balances in Other Governmental funds increased by $3,996,962 due primarily to a one-time litigation settlement of $3.5 million for the Studebaker-Oliver Brownfield rehabilitation .
These fund balances provide the necessary resources that the City requires to meet future capital construction needs, ongoing debt service obligations, and economic development project initiatives in order to fuel commun ity growth within its boundaries.
Individual fund data for each of the non-major governmental funds is provided in the form of the combining statements in the Supplemental Information section of the CAFR report .
28

Management Discussion & Analysis
Governmental Fund Revenue
The following schedule presents a summary of governmental fund revenue for the year ended December 31 , 2013, with comparison to the prior year:
2013 %of 2012 %of Actual Total Actual Total
Tax Based General property 72,018,651 47.6% 71 ,775,415 48.7% County option income 13,739,325 9.1% 13,748,824 9.3% County economic development 8,177,352 5.4% 8,324,878 5.7% Professional sports development 649,996 0.4% 633,904 0.4% Community revitalization district 244,623 0 .2% 653, 185 0 .5%
Total Tax 94,829,947 62.7% 95,136,206 64.6%
Non Tax Based Licenses and permits 177,019 0.1 % 189,714 0.1 % Intergovernmental 29 ,227,759 19.3% 31 ,297,526 21 .3% Charge for services 12,320,498 8.2% 12,442,553 8.4% Fines and forfeitures 660,841 0.4% 334,767 0.2% Interest income 762,270 0.5% 1,317,443 0.9% Donations 367,825 0.2% 324,266 0.2% Other 12, 806,315 8.5% 6,336,609 4.3%
Total Non-Tax Based 56,322,527 37.3% 52,242,878 35.4%
Total Revenue 151,152,474 100.0% 147,379,084 . 100.0%
Tax revenue continues to represent the most significant source of revenue requ ired to support services provided by the City. Property tax revenue is the primary source of funding for governmental expenditures. Property tax revenue is based on a relationsh ip between two variables. The first variable is the assessed property valuation of industrial , commercial and residential parcels for both real and personal property. The second variable is the application of a tax rate to arrive at the total tax levy. Taxable property is assessed at 100 percent of the true tax value. The amount of property tax levied (billed to property owners) is further restricted by State of Indiana-enacted property tax legislative reform, or so-called "circuit breaker" property tax caps in 2009 of 1.0 percent (homestead), 2.0 percent (other residential/rental) and 3.0 percent (commercial/industrial) of gross assessed valuation. Property tax revenue includes taxes collected on behalf of the following funds: General Fund , Parks and Recreation Fund, Cumulative Capital Development Fund, Redevelopment Tax Incremental Financing ("TIF") Funds, and a special levy to cover debt service of the College Football Hall of Fame.
The City recognizes the need to further diversify the revenue stream, and to reduce its dependency on general property taxes to ensure that a broad base of users of city services, including nonresidents who work in the City, share in the fund ing of basic City services. As a result of the need to diversify the revenue stream, the City of South Bend Common Council and Saint Joseph County Council adopted an additional local option income tax of 0.95 percent during 2009, increasing the tax rate from 0.8 percent to 1.75 percent. The local option income tax increase consisted of three components: 0.2 percent increase in the economic development income tax, a new 0.25 percent publ ic safety local option income tax, and a new 0.5 percent property tax relief local option income tax.
29

- -- --- - - --- - ---
Management Discussion & Analysis
The City continues to seek diversified sources of revenue that will reduce its reliance on property and income taxes. The City has supported efforts of the Indiana Association of Cities and Towns ("IACT") "Hometown Matters" to lobby the state legislature to legislatively enable alternative revenue sources that best fit the needs of the community. A viable source of revenue is from user fees and/or charges for services currently being performed. City-performed services are priced based at levels representing the full cost of service, taking into consideration fees charged by providers of similar services. · The City performs ongoing reviews of user fee costs incurred and revises service fee prices as required .
Governmental Fund Expenditures
The City accounts for government fund expenditures in seven categories as follows: (1) general government, (2) public safety, (3) highways and streets, (4) economic development, (5) culture and recreation , (6) debt service, and (7) capital outlay.
The following schedule presents a summary of governmental fund expenditures for the year ended December 31 , 2013, with comparison to the prior year.
2013 %of 2012 %of Actual Total Actual Total
General government 7,154,965 4.7% 6,390,585 3.9% Public safety 64,041,549 41 .9% 67,138,414 41 .3% Highways & streets 9,769,942 6.4% 9,288,682 5.7% Economic development 8,068,458 5.3% 3,543,180 2.2% Culture & recreation 13,956,025 9.1% 18,557,986 11.4% Debt service 19,121 ,148 12.5% 17,557,026 10.9% Capital outlay 30,748,663 20.1% 39,984,127 24.6%
Total Expenditures 152,860,750 100.0% 162,460,000 100.0%
Government fund expenditures in fiscal 2013 of $152,860,750 decreased by $9,599,250 or -5.9 percent in comparison to government fund expenditures in fiscal 2012.
Capital outlay expenditures decreased by $9,235,464 during 2013 due primarily to a change in categorization of economic development projects from tax increment financing (TIF) funds. In addition , there was less spending on general government capital projects from the EDIT fund .
Public Safety expenditures decreased $3,096,865 or -4.6 percent as less grant funding was available for police and fire programs. Highways and Street expenditures increased by $481 ,260 as the curb and sidewalk program was expanded and additional work on street maintenance was performed.
Economic development spending increased $4,525,278 as a counter-balance to the decreased capital outlay spending noted above, due to a higher qualification threshold for capital expenditure.
Public Safety expenditure continues to be the primary use of government fund resources with 41.9 percent of expenditures used for this purpose in fiscal 2013. Public safety spending is followed by capital outlay expenditures (20.1 percent) , debt service (12.5 percent) , culture and recreation (9.1 percent), highways and streets (6.4 percent), economic development operating (5.3 percent) , and general government (4.7 percent) . General government spending is comprised of the executive offices of the Mayor, Common Council , City Clerk, City Attorney, Controller, Engineering , and other administrative offices.
30

Proprietary funds
Management Discussion & Analysis
Condensed Statement of Net Position Revenue, Expenses, and Changes in Fund Net Position
As of December 31 , 2013
Water Utility
76,986,961 132,668
wasteWdter Utility Century Center Other Totai Enterprise Internal Service
Total .assets Total deferred outflows
Tolalliabilities Total deferred inflows
tletoosition: Capital assets {net of debt) Restricted for: Debt seNice Capital outlay Unrestricted
.·. Total net position Operating revenues Operating expenses Operating income(loss)
Non-operating rev(exp}
Income (loss)before contributions & transfers
Capital contributions Transfers in Transfers out Change in net position
Total net position- beginning
Total net position -ending
23}22,037
41,813,616
3,596,396 4,181,496 3,806,084
53,397,592 13,783,701 14,244,940 (461,239)
369,048
(92,191)
(1,541 ,755) {1 ,633,946)
55,Q:l1,538
53,397,592
195,232,020 18,922,414 613 , 68~
106,123,750
40,925,619
11 ,070,930 27,454,651 10,270,759
31,926,078 17.793,476 14,132,602
(7,944,865}
6,187,737
(2,775,553) 3,412,184
86,309,775
89,121,959
332,759 527,083
16,175,602
1,757,697 129,273
2,034,509 4,330,437
(2,295,928)
1,432,479
(863,449)
. 697,917
18,228,104
18,062N2
13,524,160 1,125,301
5,141. i33 10.277
15,591,415
206,494 (6,299,858}
9,498,051 8,865,981 8,394,227
471 ,754
{607,774}
(136,020)
(207,879} (343,899}
9,841 ,950
9,498,051
304,665,555 15,298,896 1,871 ,658
135,319,679 537,360
114,506,252
14,667,326 33,600,338 7,906,258
170,680,174 56,610,269 44,763,080 11,847;189
{6,751,1"12)
5,096,077
697,917
(4,525, 187)
169,411,367
4,889,811
1,367,470
9,041 ,615
22;432,997 22,095,310
337,687
.30,086
367,773
i0,041,3"12
10,4091085
The City of South Bend maintains two types of proprietary funds; enterprise and internal service.
The City maintains seven enterprise funds. Information is presented separately in the Proprietary Statement of Net Position , the Proprietary Statement of Revenues and Expenditures, and Changes in Fund Net Position for the Water Utility, Wastewater Utility, and Century Center, which are considered major enterprise funds. Data from the other four non-major enterprise funds (Consolidated St. Joseph County/South Bend Building Department, Parking Garage, Solid Waste, and Blackthorn Golf Course) are combined into a single, aggregated presentation.
31

Management Discussion & Analysis
The City maintains five internal service funds. The City of South Bend uses internal service funds to account for its business insurance and self-funded liability insurance program, self-funded employee health benefits program, police take home vehicle program, unemployment compensation claims, and central services unit (a department that accounts for expenses related to fuel , vehicle repairs, printing and other services provided to City departments on a cost-reimbursement basis) . The internal service funds have been combined into a single, aggregated presentation.
As of December 31, 2013, City enterprise funds reported a net position of $170,680,17 4, an increase of $1,268,807 or 0.7 percent from December 31, 2012.
At December 31, 2013, net position includes capital assets, net of related debt of $114,506,252, restricted for debt service and capital outlay of $48,267,664, and unrestricted of $7,906,258.
During 2013, the Water Works experienced a decrease in net position of $1,633,946 while the Wastewater Utility experienced an increase of $3,412,184. The Water Utility experienced decreased revenues of $406,542 while transmission and distribution/pumping expense rose by $1 ,732,197. The Wastewater Utility experienced an increase in revenue of $962,595 as operating expense dropped by $930,244. The Wastewater Utility continues to build its fund balances in order to pay for the mandated Long Term Control Plan, a multi-year program being built by the City to control wastewater overflow events.
During 2013, Century Center experienced a decrease in net position of $165,532 as the facility transitioned to a new management company, SMG. SMG also contributed $575,000 to the facility to provide some much-needed equipment upgrades. The transition occurred on July 1, 2013, and the capital contribution will be amortized to revenue over the course of the initial contract which expires June 30, 2016.
Other Enterprise Funds experienced a decrease in net position of $343,899 during 2013. The Parking Garage Fund reported a decrease in net position of $315,057 primarily as the result of the amortization of sales/leaseback charges on the original acquisition. The Blackthorn Golf Course Fund reported an operating gain of $50,982 as the result of improved golf fee revenue.
As of December 31 , 2013, City internal service funds reported a net position of $10,409,085, an increase of $367,773 or 3.7 percent compared to 2012. The Liability Insurance fund increased its net position by $2,7 46,670 in 2013 as the result of the Bosch payment from the lease agreement noted above. The Central Services fund decreased its net position by $339,497. The Self-Funded Employee Benefits fund had a decrease its net position of $2 ,276,893 due to continually climbing health insurance claims. The City has initiated changes in its health insurance plan design and has an ongoing, active employee wellness program to help control future health insurance costs.
Fiduciary funds
Fiduciary funds are used to account for resources held for the benefit of parties outside the government. The City maintains five fiduciary funds , which consist of two pension trust funds (1925 Police Pension and 1937 Firefighters' Pension) , one private-purpose trust fund (Cemetery) and two agency funds (Payroll and Morris/Palais Royale Box Office) .
Pension Trust Private Purpose Trust Agency
Total assets 2,645,067 36,910 1,638,295 Total liabi lities 12,620 1,638,295
Tota I net position 2,632,447 36,910
Total Additions 10,908,243 78 Total Deductions 11 ,934,649 4,315 Changes in net position (1,026,406) (4,237)
32

- - - -- - - -------------
·Management Discussion & Analysis
The net position in the pension trust funds decreased by $1 ,026,406 during 2013. The net position in the private purpose trust fund (Cemetery) decreased by $4,237 as the City initiated a refurbishment program.
Effective in fiscal 2009, with the passage of State legislation, funding responsibility for the 1925 Police and 1937 Firefighters' Pension Funds was assumed by the State of Indiana. These funds no longer receive property tax revenue distributions beyond fiscal 2009. The transfer of pension responsibility to the State of Indiana is on a reimbursement basis and will not provide additional . revenue to the City for use in other property tax funded areas. The administration of the pension plans remains the responsibility of the City.
The State of Indiana reimbursement is on a year delayed basis, thus reimbursement in fiscal 2013 from the State of Indiana included reimbursement for pension benefits paid by the City in fiscal2012. In addition , state reimbursement excludes healthcare benefit coverage to pension plan members, which is covered under the City of South Bend pension benefit program and which is paid from the pension trust funds.
The decline in the net asset position of the pension trust is the result of timing differences in the payment of pension benefits and the reimbursement of same from the State of Indiana, as well as the cost of healthcare benefits to pension members, not covered by the state reimbursement program.
General Fund Budgetary ·Highlights
The City prepares an annual budget for General fund expenditures, which is subject to City of South Bend Common Council approval for adoption , before November 151 of the year preceding, the budget period , according to state statute concerning the annual budget of second class cities and towns. The Common Council adopted the 2013 budget at its meeting held in October 2012 .
The General Fund budget applicable for fiscal 2013 is reported as follows:
Actual Budgetary Original Final Basis Variance
Re~.enue 64,269,461 63,932,287 61 ,684,651 (2,247,636)
Expenditures 64,223,178 65,091 ,572 62,469,125 2,622,447
Surplus (deficit) 46,283 (1 ' 159,285) (784,474) 374,811
General Fund revenue was originally budgeted at $64,269,461 for fiscal2013. During the year, the General Fund revenue budget was decreased by $337,174 to $63,932,287. The revenue budget may be increased or decreased at any time based on updated revenue projections. By closely aligning the budget revenue with actual, more meaningful analysis is made possible.
During 2013, the General Fund collected $61 ,684,651 in revenue, a deficiency from the final budget level of $2 ,247,636. The primary reasons for the revenue shortfall were property tax collections, intergovernmental grants and charges for services revenue that were lower than budgeted.
General Fund expenditures were originally budgeted at $64,223,178 for fiscal2013. During the year, the General Fund expenditure budget was increased $868,394 to $65,091 ,572.
33

Management Discussion & Analysis
General Fund spending is reviewed on a monthly basis under the direction of the City Controller to ensure spending remains within budgetary constraints. Quarterly reviews are conducted as required with General fund department management to review spending projections to ensure that annual expenditures remain within the budgetary levels. Budget amendments for cost neutral redistribution
between expense categories (i.e. personnel , supplies, services, capital) are submitted to Common Council at mid-year and year-end, as required to adjust the budget as necessary to prevent any budget overruns in any expense category.
Additional appropriations for projects, initiatives, or unbudgeted spending requirements within the General fund are presented to the Common Council for adoption as deemed necessary by the Mayor.
General Fund expenditures incurred on a budgetary basis, including cash expended and outstanding encumbrances as of year-end December 31 , 2013, amounted to $62,469,125. The expenditures and commitments as of year-end December 31 , 2013, are less than the 2013 General Fund expenditure budget by $2,622,447 or 4.0 percent. The largest savings were in the police, fire , city attorney, and administration/finance department budgets as personnel and other costs spent were less than budgeted due to position vacancies and other factors .
Ca(2ital Assets and Debt Administration
Statement of Capital Assets Gove rnm e ntal Business type Governm ent·wide
Activitie s Activities Activ ities 201 3 2012 2013 201 2 201 3 2012
Asse ts not depreciated Land 15,883,485 15,921 ,386 3,024,582 3,024,582 18,908,067 18,945,968 Construction in progress 13,925,011 6,647 ,833 13,925,011 6,647,833
Tota l 15,883,485 15,921,386 16,949,593 9,672,415 32,833,078 25,593,801
Assets depreci ated Buildings 130,068,334 127,656,887 82 ,972 ,550 82 ,297 ,980 213,040 ,883 209,954,867 Non-building impr01.emenls 16,281,242 16,038,868 26,380,406 23,987,898 42,661,648 40,026,766 Machinery & equipment 46,353,978 50,304,539 30,211 ,994 29,235,757 76,565,972 79,540,296 Roads & Infrastructure 421 ,539,956 420,291 ,533 195,443,128 190,938,764 616,983,084 611 ,230,297
Total Cost 614,243,509 614,291 ,827 335,008 ,078 326,460,399 949,251,587 940,752,226
Accumulated d epreciation Buildings 40,365,200 36,735,257 33,316,064 31,348,151 73,681,284 68,083,408 Non-building impr01.ements 8,031,397 7,370,754 5,728,277 4,659,688 13,759,674 12,030,442 Machinery & equipment 28,077,898 33,647 ,007 21,578,145 22,162,990 49,656,043 55,809,997 Roads 269,277 ,787 257,852,591 59,640,599 55 ,469,771 329,118,386 313,322,362
Tota l 345,752,282 ' 335,605,609 120,463,105 113,640,600 466,215,387 449,246,209
Net Depreciated Asse ts 268,491 ,227 278,686,218 214,544,973 212,819,799 483,036,200 491 ,506,017
Net Capital. Asse ts 284,374,712 294,607,604 231 ,494,566 222,492,214 515,869,278 517,099,818
The investment in capital assets includes land and land improvements, buildings and build ing improvements, vehicles, information technology equipment, machinery and equipment, and construction in progress. A detailed explanation of these capital assets can be found in the Notes to the Basic Financial Statements. ·
Under the category of roads and infrastructure, the current cost amount of $616,983,084 includes estimated costs derived primarily from the City's 2006 implementation of GASB Statement No. 34 , which required the retroactive reporting of infrastructure capital assets. All other assets are recorded at historical cost.
34

Management Discussion & Analysis
Major Capital Asset Project Spending in 2013
lmpro~ments
M&E
Water utility impro~ments East Bank Sewer Separation, Phases 3 & 4 Chloride feed system Wastewater primary clarifier Other Sewer separation projects
Wastewater M&E
Capital Assets Analysis
2,107,867 Continued project 3, 197,954 Continued project
23,520 Continued project 3,047,919 Continued project 5,126,741 Continued project
421 ,010 Newprojects
As of December 31 , 2013, Government-wide capital assets were valued at $515,869,279, net of accumulated depreciation, a decrease of $1,230,540 or -0.2 percent since December 31 , 2012. Construction In Progress increased by $7,277,178, and capitalized assets in land, buildings, improvements, machinery and equipment, and roads decreased by $8,507,718, net of depreciation, since December 31, 2012. On January 1, 2013, the City instituted a new capitalization policy that included significantly higher thresholds for expenditures to qualify as capital assets. Consequently, many purchases formerly considered as capital assets no longer qualify as such. The asset decrease, therefore, was the result of fewer assets being added to the register as those assets that remain continue to depreciate.
At December 31, 2013, the cost of Roads & Infrastructure ($616,983,084) was the major asset class followed by Buildings ($213,040,883). Major new acquisitions include completed sewer separation projects ($4.1 million) and the newly-rebuilt Fire Station #5 ($1 .1 million).
Total depreciation expense for 2013 was $29,559,898, compared to $25,827,428 for 2012.
Additional information on capital assets can be found in the notes to the financial statements in Statement Note 1.0.6, Capital Asset Capitalization Policy, Statement Note III.C, Capital Asset Activity, and Statement Note III.D, Construction Commitments.
Debt Administration
Outstanding debt principal as of December 31 , 2013, was $248,694,531 , a decrease of $14,630,491 or -5.6 percent. City outstanding debt includes revenue bonds, mortgage bonds, notes and loans payable, and capital leases.
Type Beginning Additions Retirements Ending
Re~nue bonds 214,060,000 18,755,000 (26,210,000) 206,605,000 Mortgage bonds 18,485,000 5,580,000 (1 '735,000) 22,330,000 Notes & loans 18,802 ,540 34,302 (11 ,685,278) 7,151,564 Capital leases 11 ,977,482 3,292,737 (2,662,252) 12,607,967
Total Debt 263,325,022 27,662,039 (42,292,530) 248,694,531
During 2013, the City issued the 2013A Sewage Works Revenue Bond in the amount of $14,765,000 for the purpose of refunding a bond issuance in order to take advantage of a more favorable interest rate environment and lower future debt service payments. This bond is a twenty (20) year issue with maturity in 2033 with debt service coverage from the Sewage Works Bond Sinking fund. The bond issue refunded one revenue bond for $7,980,000 and one note for $9,445,000 that financed capital improvements addressing combined sewer overflow issues improving sewage discharge into the St. Joseph River, in compliance with the Environmental Protection Agency ("EPA") consent decree. It was part of a twenty year long-term control plan which will require additional bonding and sewer rate increases.
35

Management Discussion & Analysis
During 2013, the City refunded a bond issuance in order to take advantage of a more favorable interest rate environment and lower future debt service payments . The City issued bonds in the amount of $3,990,000 to refinance a 2008 revenue bond for Century Center, saving the City approximately $1 .02 million over the remaining term of the bond. The City also issued the 2013 Building Corporation EMS Fire StationfTower Bonds in the amount of $5,580,000 to finance the new fire department training facility.
During 2013, the City entered into capital lease agreements in the amount of $3,292,737 to purchase certa in vehicles, copiers, and equipment. The lease terms are typically for five years with semiannual debt service paid from the operating budgets of the user departments. Of the $3.292 million , $3.196 million were to acquire police cars and other vehicles needed by various City departments; the remaining $81 ,806 was used to lease office equipment such as copiers. The City solicits competitive financing proposals for lease financing from local and national companies.
Under the Indiana Constitution and State statute, the City's general obligation bonded debt and certain other debt is subject to a legal limitation based upon 2 percent of total assessed value of real and personal property. The City had no general obligation bonded debt outstanding at December 31, 2013, and none of the above debt issuance amounts are subject to this debt limitation.
In 2014, the City anticipates issuing additional debt for sewer improvement and fire department projects and plans to continue issuing refunding bonds as appropriate to take advantage of lower interest rates . In April 2014, the City approved issuance of refunding bonds in an amount not to exceed $3,700,000 to refinance its 2002 Redevelopment Special Taxing District bonds for the remaining 8 years of their original 20-year lives ..
Additional information on debt can be found in the notes to the financial statements in Statement Note 1.0.8, Long-Term Obligations , Statement Note III.F.2, Capital Lease Obligations, Statement Note III.G.5, Long-Term Liabilities, and Statement Note IV.C, Conduit Debt.
A calculation of the City's legal debt limitation can be found in the statistical debt capacity section of this document.
Economic Factors and 2015 Budget
Economic Factors
Property tax revenue, historically and at present, is the principal source of revenue for funding of governmental activities within the City of South Bend.
The State of Indiana General Assembly enacted property tax reform legislation in March of 2008. House Enrolled Act 1001 (HEA 1001) which limits property taxes paid to 1 percent of gross assessed value for residential homesteads, 2 percent for agricultural/rental properties, and 3 percent for all other real and personal property.
Under current legislation , all Indiana localities assess properties based on market values. Each year properties are trended. This process involves comparing property values to sales activity in the neighborhood and adjusting the current assessed values up or down according to the trended data.
This legislation (known as "circuit breaker" legislation) was phased in commencing in fiscal2009 and has led to sign ificant reductions in property tax revenues available to fund city governmental operations since 2009.
In 2013, the primary funds supported by property taxes (General Fund , Parks and Recreation Fund, and Cumulative Capital Development Fund) lost approximately $26 million dollars in taxable property tax levy due to the circuit breaker caps.
36

Management Discussion & Analysis
As a consequence of the state enacted legislation in 2008, the City enacted a 0.95 percent local option income tax increase to partially offset the property tax revenue loss. The local option tax increase became effective in October 2009, and has resulted in an increase in local income taxes available to the City to fund ongoing governmental operations of public safety, parks and recreation , code enforcement, highways and streets, and general government.
Management of the City of South Bend will continue to manage the financial affairs from a posture of fiscal conservatism similar to the management practices engaged during fiscal 2013.
City Management believes that the national economic recovery will continue according to the predictions of governmental economists, with low to no inflation over the next fiscal period . In addition , job creation is the primary engine to drive economic recovery.
2015 Budget
The City will engage to ensure effective delivery of requ ired services to taxpayers and citizens within the constraints of available financial resources. The City will continue to provide required services within the constraints of a balanced General fund budget.
The City continues to pursue reengineering programs targeted to create efficiency and cost improvements within City operations. These include purchasing process reengineering, back office process improvements for human resources, and other customer service operations .
These initiatives, upon successful deployment completion , will achieve the desired results to create efficiency gains in the delivery of services to taxpayers.
The City is committed to creating a budget for fiscal 2015 that will remain fiscally responsible to the effective delivery of required services to City citizens and stakeholders with in the existing revenue constraints. Specific concerns for the 2015 Budget include the continuing impact of circuit breaker property tax reform on City revenue, high health and pension costs and other stagnant or declining revenue sources such as gasoline, wheel , and auto excise taxes.
Current Economic Development Projects
Executive management of the City of South Bend continues to pursue economic development and public works opportunities that will have long-term favorable impact on the economic prospects for the community as a whole. These projects include:
• Ignition Park- Along with Innovation Park at Notre Dame, these two sites are Indiana's first dual-site, state-certified technology park. Transpo, the county's public transportation authority, was the first tenant in Ignition Park and dedicated its new facil ity in early 2010. The second tenant in Ignition Park, Data Realty, is a 50 ,000 square foot colocation , cloud services data center, with disaster recovery solutions and a managed analytics platform. Data Realty employs over 20 employees and committed over $15 million in private investment.
• Renaissance DistricUivy Tower- Rehabilitation of an 800,000 square foot industrial space near downtown to create an expected 400 new jobs through a mixed use space to include data centers , high tech office space, and research facilities. The owner of this property has committed $10 million in private investment over a 10 year period.
• Triangle Development - Planned construction of 55 new single family residential properties in the Triangle area adjacent to the existing new Eddy Street Commons commercial development, creating a diverse new neighborhood in the City's northeast sector. Eleven new homes are underway, with many more in the planning stages. 70 percent of the lots are being sold at market rate and 30 percent are reserved for incomeeligible buyers. Six million dollars in private investment will transform this neighborhood.
37

Management Discussion & Analysis
• Western Ave./Lincolnway West Business Corridors- The Department of Community Investment is working with citizens and stakeholders in the design and implementation of new streetscapes along these streets with the intention of attracting new business development to the west side of the City.
• 2-Way Streets - The City will be undertaking the reversion of some of its downtown streets from 1-way to 2-way over the course of the next couple of years. This type of activity has proven to be very successful in other cities at attracting business and residential growth in city centers.
• Workforce Strategy- The Department of Community Investment is preparing a workforce training initiative to coordinate those who offer workforce training into · a single council. This council will focus its training efforts in areas of greatest need and growth, and will include measurable goals and assessment factors . The council has identified and implemented a program to offer training in "deconstruction"- the process of recovering useful materials from buildings slated for demolition.
• Existing Business Expansions - The City continues to work with private sector business concerns to enable expansion of their business operations in the City, adding new employment opportunities and tax base to the City. Tax abatements in 2012 are expected to result in $41 ,411 ,500 of new investment and add 83 jobs with an annual payroll of $4,921,000.
Requests for Information
This Management Discussion & Analysis as contained within the City of South Bend Comprehensive Annual Financial Report is intended to provide readers with a general oveNiew of the financial condition ofthe City of South Bend as of December 31 , 2013. Questions concerning any of the information provided in this report, or requests for additional information, should be addressed to:
John H. Murphy, City Controller City of South Bend Department of Administration and Finance 227 W. Jefferson Boulevard, 1 z!h Floor South Bend , Indiana 46601
Telephone Facsimile
57 4-235-9216 57 4-235-9928
City of South Bend May 8, 2014
38

w co
Assets
Cash and cash equivalents Cash with fiscal agent Investments
CITY OF SOUTH BEND STATEMENT OF NET POSITION
December 31, 2013
Gpvemmental Activities
$ 46,756,222 50,162
126,656,282
Receivables (net of allowances for uncollectibles): Interest 189,677
Taxes 3,806,157
Accounts 948,234
Intergovernmental 802,771
Loans 7,694,684
Internal balances 1,725,261
Inventories 943,844
Prepaid expense 347,271
Restricted assets: Cash and cash equivalents 6,158,300
Cash with fiscal agent -Investments 2,967,526
Interest receivable 4,118
Taxes 6,349
Property held for resale 18,974,080
Capital assets: Land and construction in progress 15,883,485
Other capital assets, net of depreciation 268,491 ,227
Total assets 502,405,650
Deferred outflows of resources:
Unamortized loss on refunding -Unamortized loss on sale/leaseback -
Total deferred outflows of resources
Prima!X Government
Business-Type Activities Totals
$ 4,766,303 $ 51 ,522,525
- 50,162 9,426,151 136,082,433
16,422 206,099 3,806,157
3,626,627 4,574,861
- 802,771 7,694,684
(1,725,261) 342,916 ·1,286,760
66,594 413,865
20,661,402 26,819,702 628,472 628,472
33,550,935 36,518,461 49,618 53,736
- 6,349 18,974,080
16,949,593 32,833,078 214,544,973 483,036,200
302,904,745 805,310,395
746,357 746,357 . 1,125,301 1,125,301
1,871,658 1,871,658
The notes to the financial statements are an integral part of this statement.
(Continued on next page)

-'=" 0
Liabilities
Accounts payable Accrued payroll payable Unearned revenue Taxes payable Customer deposits Accrued interest payable Estimate of unfiled claims Other current payables Payable from restricted assets:
Accounts payable Contracts payable Customer deposits Accrued Interest payable
Noncurrent liabilities: Due within one year:
Mortgage bonds payable Compensated absences Revenue bonds payable Capital lease obligations Notes and loans payable
Due In more than one year:
CITY OF SOUTH BEND STATEMENT OF NET POSITION
December 31, 2013 (Continued)
Governmental Activities
5,912,699 2,372,712
2,678 247,198 839,166
2,891,134 18,172
-1,158,368
1,580,425 3,892,728 7,950,000 2,115,937 1,608,064
Mortgage bonds payable (net of discounts or premiums) 21,499,356 Compensated absences 1,292,184 Revenue bonds payable (net of dis9ounts or premiums) 82,222,826
Capital lease obligations 6,661,301 Notes and loans payable 1,422,490 Net other postemployment benefits obligation 8,300,677 Net pension obligation 63,258,306
Total liabilities 215,246,421
Deferred inflows of resources: Unamortized gain on refunding 565,384
Unamortized Service Agreement Unamoritzed gain on sale/leaseback
Total defemid inflows of resources 565,384
Net Position
Investment in capital assets 192,190,446
Restricted for: Debt service 7,990,172
Capital· outlay Unrestricted 86.413,227
Total net position $ 286,593,845
Prima!}' Government
Business-Type Activities
929,559 560,351
8,241 43,398
182,522
--
2,374,695. 474,016
1,452,855 295,469
64,575 615,884
6,910,000 1,003,006
326,346
487,027 -
111 ,208,539 2,827,722 3,794,664.
-133,558,869
-527,083
10,277
537,360
114,506,252
14,667,326 33,600,338
7,906,258
$ 170,680,174
The notes to the financial statements are an integral part of this statement
Totals
6,842,258 2,933,063
8,241 46,076
429,720 839,166
2,891,134 18,172
2,374,695 474,016
1,452,855 1,453,837
1,645,000 4,508,612
14,860,000 3,118,943 1,934,410
21,986,383 1,292,184
193,431,365 9,489,023 5,217,154 8,300,677
63,258,306
348,805,290
565,384 527,083
10,277
1,102,744
306,696,698
22,657,498 33,600,338 94,319.485
$457,274,019

CITY OF SOUTH BEND STATEMENT OF ACTIVITIES
For the Year Ended December 31, 2013
Program Revenues Net (Ex~ense) Revenue and Changes in Net Position
Operating Capital Plimact Government
Charges for Grants and Grants and Governmental Business-Type
Functions/Programs Expenses SeJVices Contributions Contributions Activities Activities Totals
Primary government: Governmental activities:
General government $ 13,200,898 $ 1,939,865 $ 146,650 $ 1.452,802 $ (9,661,581) $ $ (9,661,581)
Public safety 76,023,819 5,210,272 11,209,299 (59,604,248) (59,604,248)
Highways and streets 20,915,815 451,363 4,924,283 (15,540, 169) (15,540,169)
Economic development 26,846,471 444,839 4,566,550 398,500 (21,436,582) (21 ,436,582)
Culture and recreation 10,069,690 5,112,019 619,840 15,911 (4,321,920) (4,321,920)
Interest on long-lenm debt 5,961,124 - (5,961 '124) (5,961 '124)
Total governmental activities 153,017,817 13,158,358 21,466,622 1,867,213 (116,525,624) (116,525,624)
Business-type activities: Water 15,221,865 15,102,461 (119.404) (119,404)
Wastewater 26,390,790 32,474,743 6,083,953 6,083,953
Civic center 4,330,656 3,463,813 697,917 (168,926) (168,926)
Building department 1,131,815 967,667 (164,148) (164,148)
~ Parking 1,285,056 968,868 (316,188) (316,188) ....... Solid waste 5,091,588 5,399,044 307,456 307,456
Golf course 1,497 513 1,530,402 32,889 32,889
Total business-type activities 54,949,283 59,906,998 697 917 5,655,632 5,655,632
Total primary government $ 207,967,100 $_ 73,065,356 $ 21.466,622 $ 2,565,130 (116,525,624) 5,655,632 - (110,869,992)
General revenues: Property taxes 72,018,650 72,018,650
County option income tax 13,739,325 13,739,325 Economic development income tax 8,177,352 8,177,352 Professional sports development tax 649,996 - 649,996 Community revitalization enhancement district tax 244,623 - 244,623
Grants and contributions not restricted to specific programs 5,893,924 - 5,893,924 Unrestricted investment earnings 762,269 138,362 900,631
Other 14,285,314 14,285,314
Transfers 4,525,187 (4,525,187)
Total general revenues and transfers 120,296,640 (4,386,825} 115,909,815
Change in net position 3,771,016 1,268,807 5,039,823 Net position- beginning (restated) 282,822,829 169,411,367 452 234,196
Net position - ending !.J186,593,645 $ 170,680,174 $ 457,274,019
The notes to the financial statements are an integral part of this statement

CITY OF SOUTH BEND BALANCE SHEET-
GOVERNMENTAL FUNDS December31, 2013
Other Non major
Park and Public Safety Governmental
Assets General Recreation LOIT COlT EDIT TIFAirport Funds Totals
Cash and cash equivalents $ 7,088,418 $ 1,084,386 $ 517,885 $ 3,798,556 $ 2,763,011 $ 6,376,137 $ 27,947,211 $ 49,575,604
Cash with fiscal agent - - - - - 50,162 50,162
Investments 21,222,360 3,163,455 1,510,814 11,081,441 8,060,469 18,600,958 5~,319,954 119,959,451
Receivables (net of allowances for uncollectibles): Interest 30,330 4,519 2,165 15,970 11,599 26,767 88,517 179,867
Taxes 200,045 35,531 - - - 1,171,564 2,405,366 3,812,506
Accounts 475,847 4,284 - 1,920 - - 426,700 . 908,751
Intergovernmental - - - - - - 802,771 802,771
Loans - - - - - - 7,694,684 7,694,684
lnterfund receivable: lnterfund services provided and used 15,877 11,778 - - - - 1,710 29,365
Inventories - 84,308 - - - - - 84,308
Advances to other funds 656,848 - - 2,027,973 - 1,742,115 6,412,837 10,839,773
Property held for resale - - - 569,499 ~831 8,756,317 9,198,433 18,974,080
Total assets $ 29,689,725 $ 4,388,261 $ 2,030,864 $ 17,495,359 $ 11,284,910 $ 36,673,858 $ 111,348,345 $ 212,911,322
Liabilities and Fund Balances
~ Liabilities: N
Accounts payable $ 309,592 $ 68,957 $ - $ 696,591 $ 119,988 $ 102,797 $ 2,844,159 $ 4,142,084
Accrued payroll payable 1,494,589 227,793 235,645 - - - 213,184 2,171,211
lnterfund payable: lnterfund 'services provided and used 18,310 3,265 - - - 5,008 20,423 47,006
Taxes payable 407 2,271 - - - - - 2,678
Performance deposits payable 196,164 - - - - 51,034 - 247,198
Other current payables 1,750 557 - - - - 15,865 18,172
Advances from other funds - - - - - 500,000 8,597,658 9,097,658·
Total liabilities 2,020,812 3Q2,843 235,645 696,591 119,988 658,839 11,691,289 15,726,007
Fund balances: Nonspendable
Inventory - 84,308 - - - - - 84,308
Property held for resale - - - 569,499 449,831 8,756,317 9,198,433 18,974,080
Advances to otherfunds 656,848 - 2,027,973 - 1,742,115 - 4,426,936
Restricted - 4,001,110 1,795,219 - - 25,516,587 64,074,963 95,387,879
Committed - - - - - - 20,697,026 20,697,026
Assigned 531,959 - - 14,201,296 10,715,091 - 10,538,803 35,987,149
Unassigned 26,480,106 - - - - - (4,852,169) 21,627,937
Total fund balances 27,668,913 4,085,418 1,795,219 16 798,768 11,164,922 36,015,019 99,657,056 197,185,315
Total liabilities and fund balances $ 29,689,725 $ 4,388,261 $ 2,030,864 $ 17,495,359 ~ 1_1,284,910 $ 36,673,858 $ 111 ,348,345
The notes to the financial statements are an integral part of this statement.
(Continued on next page)

-~=a ~
CITY OF SOUTH BEND BALANCE SHEET -
GOVERNMENTAL FUNDS December.31, 2013
(Continued)
Amounts reported for governmental activities in the Statement of Net Position are different because: Capital assets used in governmental activities are not financial resources and,
therefore, are not reported in the funds. Prepaid expenses are not available to pay for current period expenditures and, therefore are
deferred in the funds. Internal service funds are used by management to charge the costs of certain services
to individual funds. The assets and liabilities of the internal service funds are included in governmental activities in the statement of net position.
Long-term liabilities, im;luding bonds payable, are not due and payable in the current period and, therefore, are not reported in the funds:
Compensated absences payable Deferred charge on refunding (to be amortized as interest expense) Bonds payable
Less: Issuance discount or (premium) (to be amortized as interest expense)
Capital leases payable Notes payable Net other postemployment benefits obligation Net pension obligation
Short-term liabilities that are not recognized in governmental funds until due: Accrued interest payable Compensated absences payable
Net position of governmental activities
Totals
282,995,172
347,271
10,409,085
(1,292, 184) (565,384)
(110,585,645)
(2,666,962) (8,765, 168) (3,030,554) (8,300,677)
(6~,258,306)
(1 ,997,397) (3,880,721)
$ 286,593,845

CITY OF SOUTH BEND STATEMENT OF REVENUES, EXPENDITURES, AND CHANGES IN FUND BALANCES·
GOVERNMENTAL FUNDS For the Year Ende~ December 31, 2013
., Other Total
Park and Public Safety Governmental Governmental General Recreation LOIT COlT EDIT ~crt Funds Funds
Revenues: Taxes
Property $ 35,767,912 $ 7,110,505 $ - $ - $ - $ 14,490,282 $ 14,649,952 $ 72,018,651 County option Income 5,892,386 7,846,939 - 13,739,325 County ecilnomic development income - 6,177,352 - 8,177,352 Professional sports development tax - 649,996 649,996 Community revitalization enhancement district - - 244,623 244,623
Ucenses and permits 177,019 - 177,019 Intergovernmental 15,223,644 619,840 - 13,384,075 29,227,759 Charges for services 3,376,541 3,032,837 50?.,028 150,000 5,258,092 12,320,498 Fines and forfeits 220,444 5,150 - 354,660 80,587 660,841 Interest 37,880 5,082 3,054 27,364 17,471 30,736 640,683 762,270 Donations 287,822 BOO 42,900 36,303 367,825 Sale of property 6,302 - 1,673 35,977 43,952 Other 4,942,966 146 767 1,239 69,965 2,386,278 5,215,148 12,762,363
Total revenues 60,034,428 10,927,283 5895440 8,421,470 8,769,448 16,908,969 40,195,436 ___!_§j_, 152,4 7 4
Expenditures: Current:
General government 6,605,015 - 549,950 7,154,965 Public safety 63,179,341 - 235,645 - 626,563 64,041,.549 Highways and streets 1,381,498 8,388,444 9,769,942
.f::oo Economic development 8,068,458 8,068,458 Culture and recreation 1,314,196 11,750,558 891,271 13,956,025
.f::oo Debt service: Principal 15,285 289,849 852,887 720,000 1,862,500 9,267,584 13,008,105 lnteresl and fiscal charges 2,081 17,531 593,515 155,214 276,127 4,746,566 5,793,034 Debt issue costs - 320,009 320,009
· Capital outlay: General government 4,769,037 1,434,044 737 6,203,818 Public safety - 1,040,226 8,752,702 9,792,928 Highways and streets - - 1,839,121 1,839,121 Economic development - 4,411 210,776 4,348,235 7,665,071 12,248,493 Culture and recreation 339 333 324,970 664,303
Total expenditures _____lg697,416 12,057,938 235,64~ 7,591l,409 2,520,034 6,486,862 51,463,446 152,860,750
Excess (deftciency) of revenues over (under) expenditures _mA62,9~ (1 .13Q,§QQ) - - 5,659, 795 822,0~t - 6,~~,414 1Q,422,107 (11,268,01Q) (1 ,708,276)
Other financing sources (uses): Transfers in 12,044,166 696,009 683,303 211,047 12,730,714 26,365,239 Transfers out (744,364) (209,824) (7,540,389) (1 ,807,098) (5,456,519) (1 ,233,000) ( 4,848,858) (21 ,640,052) Debt issuance 37,016 16,130 - 7,748,309 7,801,455 Premium on debt issuance ·- - - 21,576 21,576 Issuance of refunding bonds - 3,990,000 3,990,000 Payment to refunded bond escrow agent - - (4,376,769) (4,376,769)
Total other financing sources and uses 11,336,818 502 315 (6,857,086) (1,807,098) (5,456,519) (1,021,953) 15,264,972 11,961449
Net change in fund balances (1,126,170) (628,340) (1,197,291) (985,037) 792,895 9,400,154 3,996,962 10,253,173
Fund balances- beginning (restated) 28,795,083 4 713,758 2,992,510 17,783,805 10,372,027 26,614,865 95,660,094 186,932,142
Fund balances - ending $ 27,668,913 $ 4,085,418 $ 1,795,219 !.. 16,?98M !_ 11,164,922 $ 36,015,019 $ 99,657,05§ $ 197,185,315
The notes to the financial statements are an integral part of this statement

,.f::oo (TI
'·
CITY OF SOUTH BEND RECONCILIATION OF THE STATEMENT OF REVENUES,
EXPENDITURES, AND CHANGES IN FUND BALANCES OF GOVERNMENTAL FUNDS TO THE STATEMENT OF ACTIVITIES For the Year Ended December 31, 2013
Amounts reported for governmental activities in the Statement of Activities are different because:
Net change in fund balances -total governmental funds (Statement of Revenues, Expenditures, and Changes in Fund Balances).
Governmental funds report capital outlays as expenditures. However, in the Statement of Activities the cost of those assets is allocated over their estimated useful lives and reported as depreciation expense. This is the amount by which capital outlays exceeded depreciation in the current period:
Capital outlay Depreciation expense Loss on disposal of assets
The issuance of long-term debt (e.g., bonds, leases) provide current financial resources to governmental funds, while the repayment of the principal of long-term debt consumes the current financial resources of governmental funds. Neither transaction, however, has any effect on net position. Also, governmental funds report the effect of issuance costs, premiums, discounts and similar items when debt is first issued, whereas these amounts are deferred and amortized in the Statement of Activities. This amount is the net effect of these differences in the treatment of long-term debt and related items.
Long-term debt incurred during the current period: Bonds Refunding bonds Premium on bonds Loans Capital leases
Principal debt payments: Bonds Loans Capital leases
Payment to refunded bond escrow agent Amortization expenses
Some expenses reported in the statement of activities do not require the use of current financial resources and, therefore, are not reported as expenditures in governmental funds.
Prepaid expense Interest expense Compensated absences Change in net pension asset and net pension obligation
Internal service funds are used by management to charge the costs of certain activities to individual funds. The net revenue (expense) of the internal service funds is reported with governmental activities.
Change in net position of governmental activities (Statement of Activities)
The notes to the financial statements are an integral part of this statement.
$ 10,253,173
$
9,371,671 (19,714,555)
(309,187)
(5,580,000) (3,990,000)
(21,579)
-(2,240,007)
9,287,885 1,923,085 1,798,889 4,376,769
(97,529)
93,018 354,222
(182,988) (1,919,624)
367,773
3,771,016

CITY OF SOUTH BEND STATEMENT OF NET POSITION·
PROPRIETARY FUNDS December31, 2013
Governmental Business-T~Ee Activities - EnterErise Funds Activities
Other Nonmajor
Water Wastewater Century Enterprise Internal
Assets Utility Utility Center Funds Totals Service Funds
Current assets: Cash and cash equivalents $ 894,427 $ 1,856,767 $ 903,475 $ 1,111,634 $ 4,766,303 $ 3,338,918
Investments 2,609,292 5,416,704 1,400,155 9,426,151 9,664,357
Interest receivable 15,137 1,285 16,422 13,927 Accounts receivable (net of allowance) 796,971 2,158,717 72,070 441,634 3,469,392 39,483
Accounts receivable - other 52,558 104,677 157,235
lnterfund receivables: lnterfund services provided and used 20,906 8,383 6,260 35,549 3,135
Inventories 157,480 163,398 22,038 342,916 859,536 Prepaid items 22,270 37,014 7,310 66,594 Restricted assets:
Cash and cash equivalents: Repair fund - 347,525 347,525
Customer deposits 370,236 370,236 Revenue bond covenant accounts 938,824 8,325,406 9,264,230 Capital outlay accounts 1,107,117 7,696,156 1,757,697 118,441 10,679,411
~ Cash· with fiscal agent 76,130 552,342 628,472
en Investments: Repair fund 1,013,826 1,013,826 Customer deposits 1,080,080 - 1,080,080 Revenue bond covenant accounts 2,657,572 3,029,819 5,687,391 Capital outlay accounts 3,229,767 22,451,818 88,053 25,769,638
Interest receivable 49618 - 49618
Total current assets 13,952,637 52,735,958 2,746,812 3,735,582 73,170,989 13,919,356
Noncurrent assets: Capital assets:
Land and construction In progress 2,484,818 12,181,352 702,934 1,580,489 16,949,593
Other capital assets (net of accumulated depreciation) 60,549,506 130,314,710 15,472,668 8,208,089 214,544,973 ~540
Total noncurrent assets 63,034,324 142,496,062 16,175,602 9,788,576 231,494,566 ~540
Total assets - 76,986.961 195,232,020 18,922,414 13,524,160 304,665,555 15,298,896
Deferred outflows of resources: Unamortized loss on refunding 132,668 613,689 746,357
Unamortized Joss on saleneaseback - 1.125,301 1,125,301
Total deferred outflows of resources 132,668 613,669 1.125,301 1,871,658
The notes to the financial statements are an integral part of this statement
(Continued an next page)

CITY OF SOUTH BEND STATEMENT OF NET POSITION -
PROPRIETARY FUNDS December31, 2013
(Continuec)
B~siness-T~~e Activities - Enter~ri se Funds Governmental
Activities Other
Water Wastewater Century Enterprise Internal Liabilities Ulilily Utility Center Funds Totals Service Funds
Currenlliabililies: Accounts payable 431,541 10,042 166,236 321,740 929,559 1,770,615 lnlerfund payables:
lnterfund services provided and used 9,050 2,289 7,356 18,695 2,348 Accrued payroll payable 189,227 239,037 21,438 110,649 560,351 201,501 Compensated absences payable 196,516 257,748 161,620 615,884 12,007 Unearned revenue 8,241 8,241 Taxes payable 43,398 43,398 Performance deposits payable 37,437 37,437 Customer deposits 145,085 145,085 Capital leases payable 5,802 Interest payable 136 Estimate of unfiled claims 2,891,134 Current liabi lities payable from restricted assets:
Accounts payable 2,374,695 2,374,695 Contracts and retainage payable 155,388 318,628 474,016 Customer deposi ts 1,452,855 1,452,855 Mortgage bonds payable 64,575 64,575 Revenue bonds payable 1,105,000 5,805,000 6,910,000
-'=" Capital leases payable 2,698 233,457 766,851 1,003,006 Notes and loans payable 176,835 149,511 326,346
-.I Accrued interest payable 284,295 11,174 ~469
Total current liabilities 3,770 749 9,739,277 332,759 1,416,827 ~612 4,883,543
Noncurrent liabilities: Advances from other funds 1,742,115 1,742,11 5
· Mortgage bonds payable (net of unamortized discount) 487,027 487,027 Revenue bonds payable (net of unamortized discounts,
and premiums) 18,705,596 92,502,943 111,208,539 Capital leases payable 12,415 833,116 1,982,191 2,827,722 6,268 Notes and loans payable 1,233,277 2,561 387 ~664
Total noncurrent liabi lities 19.951,288 96,384,473 3,724,306 120,060,067 6,268
Total liabilities 23.722,037 106,123,750 332,759 5,141,133 135,319,679 4,889,811
Deferred inflows of resources: Unamortized service agreement 527,083 527,083 Unamoritzed gain on sale/leaseback 10,277 _ __ 1_0,277
Total deferred inflows of resources 527,083 10,277 ~360
Net Position
Investment in capita l assets 41,813,616 40,925,619 16,175,602 15,591,415 114,506,252 1,367,470 Restricted for debt service 3,596,396 11 ,070,930 14,667,326 Restricted for capital outlay 4,181,496 27,454,651 1,757,697 206,494 33,600,338 Unrestricted 3,806,084 10,270,759 129,273 (6,299,858) 7,906,258 9,041,615
Total net position $ 53,397,592 $ 89,721,959 $ 18,062,572 $ 9,498,051 $ 170,680, 174 $ 10,409,085
The notes to the financial statements are an integral part of this statement.

.J:>. CD
CITY OF SOUTH BEND STATEMENT OF REVENUES, EXPENSES, AND CHANGES IN NET POSITION
PROPRIETARY FUNDS FortheYear Ended December 31,2013
Business-T~::Ee Activities- Ente!:Erise Funds Other
Non major
Water Wastewater Century Enterprise
Utili~ Utility Center Funds
Operating revenues: Metered revenue:
Residential $ 6,527,228 $ 19,414,745 $ - $ -Commercial 3,315,238 6,871,803 - -Industrial 318,555 4,299,896 -
Fire protection revenue 1,961,037 - - -Leak insurance revenue 956,921 - - -Penalties 134,372 682,471 - -Convention fees - - 1,923,625 -Licenses and permits - - - 964,240
Parking fees - - 110,884 948,722
Solid waste fees - - - 4,800,454
Golf course fees - - - 1,530,402
Employee/employer contributions - - -Charges for sales and services - - - -Other 570,350 657,163 - 622,163
Total operating revenues 13,783,701 31,926,078 2,034,509 8,865,981
Operating expenses: Source of supply and expense/collection system expense -
operations and maintenance 1,143,558 4,496,044 - -Transmission and distribution/pumping expense-
operations and maintenance 5,621,388 5,591,192 - -Treatment and disposal expense - operations and maintenance 2,155,898 - -Operations and maintenance - - - 6,679,325
Customer accounts 1,518,372 194,012 - -Administration and general 1,880,791 1,245,306 3,566,567 941,065
Insurance claims and premiums - - - -. Depreciation 1,924,933 6,266,922 763,870 ' 773,837
Total operating expenses 14,244,940 17,793,476 '4,330,437 8,394,227
Operating income (loss) (461,239) 14,132,602 (2,295,928) 471,754
The notes to the financial statements are an integral part of this statement.
Governmental Activities
Internal Totals Service Funds
$. 25,941,973 $ 10,187,041 4,618,451 1,961,037
956:921 816,843
1,923,625 964,240
1,059,606 4,800,454 1,530,402
- 15,221,383
- 7,199,304 1,849,676 12 310
56,610,269 22,432,997
5,639,602
11,212,580 2,155,898 6,679,325 7,242,586 1,712,384 -7,633,729 1,033,318
- 13,703,625 9,729,562 115,781
44,763,080 22,095,310
11,847,189 337,687
(Continued on next page).
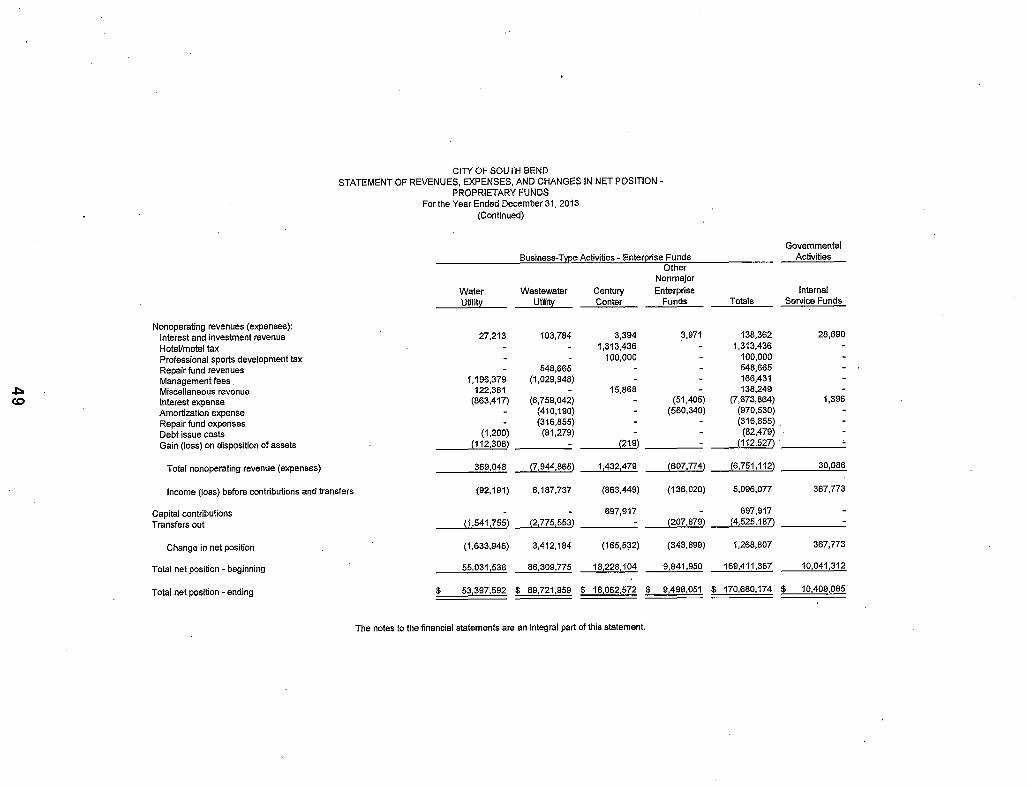
-~=a «>
Nonoperating revenues (expenses): Interest and investment revenue Hotel/motel tax Professional sports development tax Repair fund revenues Management fees Miscellaneous revenue Interest expense Amortization expense Repair fund expenses Debt issue costs Gain (loss) on disposition of assets
Total nonoperating revenue (expenses)
CITY OF SOUTH BEND STATEMENT OF REVENUES, EXPENSES, AND CHANGES IN NET POSITION
PROPRIETARY FUNDS For the Year Ended December 31,2013
(Continued)
Business-TJ!f2e Activities - Ente!:(2rise Funds Other
Non major
Water Wastewater Century Enterprise
Utili!)! Utility Center Funds
27,213 103,784 3,394 3,971
- - 1,313,436 -- - 100,000 -- 548,665 - -
1,196,379 (1,029,948) - -122,381 - 15,868 -
(863,417) (6,759,042) - (51,405)
- (410,190} - (560,340)
- (316,855} - -(1,200) (81,279) - -
(112,308) - (219) -369,048 (7 ,944,865} 1,432,479 (607,774)
Income (loss) before contributions and transfers (92,191) 6,187,737 (863,449) (136,020)
Capital contributions - - 697,917 -Transfers out (1,541,755) (2,775,553) - (207,879)
Change in net position {1,633,946) 3,412,184 (165,532) (343,899)
Total net position- beginning 55,031,538 86,309,775 18,228,104 9,841,950
Total net position- ending $ 53,397,592 $ 89,721,959 $ 18,062,572 $ 9,498,051
The notes to the financial statements are an integral part of this statement.
Totals
138,362 1,313,436
100,000 548,665 166,431 138,249
(7,673,864) (970,530) (316,855) '
(82,479) (112,527) .
(6,751,112)
5,096,077
697,917 (4,525,187)
1,268,807
169,411,367
$ 170,680,174
Governmental Activities
Internal Service Funds
28,690
1,396
30,086
367,773
367,773
10,041,312
$ 10,409,085

0'1 0
CITY OF SOUTH BEND STATEMENT OF CASH FLOWS
PROPRIETARY FUNDS For the Year Ended December 31, 2013
Governmental Business-Tyee Activities- Ente!Erise Funds Activities
Other Nonmajor
Water Wastewater Centul)' Enterprise Internal Utili!Y Utili!Y Center Funds Totals Service Fund
Cash flows from operating activities: Receipts from customers and users $ 13,965,625 $ 32,349,700 $ 2,090,850 $ 8,873,110 $ 57,279,285 $ 15,576,448 Receipts from intertund services provided 1,175,473 (6,260) - 1,169,213 7,669,757 Payments to suppliers (7,881 ,524) (5,666,204) (1,669,720) (3,917,031). (19,134,479) (21 ,951 ,309) Payments to employees (4,027,818) (6,383,973) (1 ,830,977) (3, 139,356) (15,382,124) (2,470,846) Payments for intertund services used (16,407) (447,151) !438,773) (902,331) 439
Net cash provided (used) by operating activities ~,215,34!! _19,852,3~ (1,416,107) 1,377,9§Q _23,029,§§1 (1,175,511)
Cash flows from noncapltal financing activities: lnterfund loan repaid (10,759) (10,759} Hotel/motel tax 1,313,436 1,313,436 Professional sports development tax 100,000 100,000 Transfer to other funds ___11._541 '75~ - (:1.7'72~ - ___j:107~ _{4,525,187)
Net cash provided (used) by noncapi\al financing activities (1,541,755) (2, 775,553) 1,413,436 (218,638) ~ 122,510)
Cash flows from capital and related financing activities: Capital contributions 1,225,000 1,225,000 Acquisition and construction of capital assets (3,029,294) (16,935,904) (741,940) (2,179,742) (22,886,880) (94,966) Proceeds from capital debt Issued 15,113 15,032,138 804,780 15,852,031 18,552 Debt issue costs paid (81,279) (81,279) Principal paid on capital debt (1,244,314) (22, 754, 157) - (1 ,294,200) (25,292,671) (1,754) Interest paid on capital debt ___j(l83,58fl) _('1,028,660) - __j60A§Z} _(5,072,713) (42)
Net cash provided (used) by capital and related financing activities _(Q242,081) _128,767,8@ 483,060 (:1J29,13g!1) _(36,256,Q1:1) (78,210)
. Cash flows from investing activities: 2,952,956 352,502 Investments sold 3,931,880 7,237,338 411,329
Investments purchased (2,336,417) (3,542,652) (252,D42) (6,131,111) (1,247,926) Interest received 32046 93,297 3,394 5,158 133,895 ___ 2_7,389
Net cash provided (used) by investing activities 648,585 482 525 3394 105,618 1,240,122 (809,208)
Net increase (decrease) In cash and cash equivalents (2,919,902) (11,208,518) 483,783 (1,464,699) (15, 109,336) (2,062,929)
Cash and cash equivalents, Janual)' 1 (Including $439,073, $533,295, $13,012,942, and $21,107,576 for the repair fund, customer deposits, revenue bond covenants and capital outlays, respectively, reported in restricted accounts) 6,230,506 29,510,502 2,177;389 3,247,116 41,165,513 __ 5,401,847
Cash and cash equivalents, December 31 (Including $347,525, $370,236, $9,264,230, and $10,679,411 for the repair fund, customer deposits, revenue bond covenants and capital outlays, respectively, reported in restricted accounts) $ 3,310,604 $ 18,301,984 $ 2,661,172 $ 1,782,417 $ 26,056,177 ~338,918
The notes to. the financial statements are an Integral part of this statement.
(Continued on next page)

(11 ~
Reconciliation of operating Income (loss) to net cash provided (used) by operating activities:
Operating income (loss)
Adjustments to reconcile operating Income (loss) to net cash provided (used) by operating activities:
·Depreciation expense Bad debt expense Nonoperating revenues (expenses) Lease proceeds used for non capital purchases (Increase) decrease in assets:
Accounts receivable Accounts receivable - other lnterlund receivables Inventories Prepaid items
Increase (decrease) in liabilities: Customer deposits Accounts payable Contracts payable Accrued payroll payable lnterfund payables Compensated absence payable Taxes payable Estimated unfiied claims
Total adjustments
.Net cash provided (used) by operating activities
Noncash lnvestin§, capital and financing activities: Capital asset disposals Completed project transferred to capital assets
CITY OF SOUTH BEND STATEMENT OF CASH FLOWS-
PROPRIETARY FUNDS For the Year Ended December 31, 2013
(Continued)
Basiness-T~~e Activities- Ente!]riSe Funds
Water Wastewater Century Utility__ Utili!~ Center
(461,239) $ 14,132,602 $ (2,295,928) $
1,924,933 90,650
1,459,446 15,113
(53,953) (21,315) (20,906)
(6,883) (17,126)
44,161 114,887 155,388
(1,312) (16,407)
9,723 189
3,676,588
3,215,349
960,473 337,023
6,266,922 763,870 194,012
(798,138) 15,868
(320,670) 14,585 1,615
(8,383) (6,260) (9,961)
(26,347) 13,982
25,888 198,504 30,450 272,108 -
28,140 21,438 (87,220)
9,188 -
5,719 770' 879 821
$ 19,852,372 $ (1,416,107) $
- $ - $ 150,000
Other Nonmajor Enterprise
Funds
471,754
773,837 75,204
(72,407)
4,333 (3,965)
84,396
33,052 (47,928) 59,674
906,196
1,377,950
Governmental Activities
Internal Totals Service Fund
$ 11,847,189 $
9,729,562 359,866 677,176
15,113
(432,445) (19,700) (31,216) (20,809) (29,491)
70,049 428,237 427,496
81,318 (151,555)
78,585 189
11,182,375
$ 23,029,564 $
$ 960,473 $ 487,023
337,687
115,781
275,321
536,272 (56,996)
406,097
116,016 2,054
(114,401) ~
(2, 793,342)
(1,513,198)
(1,175,511)
On April 25, 2013, the City of South Bend -Wastewater Utility issued $14,765,000 in refunding revenue bonds to refund $17,425,000 of outstanding bonds ($9,445,000 of 1998 State Revolving Loans and $7,980,000 of 2004 Sewage works Revenue Bonds). The net proceeds of $14,683,935 (after payment of $81,065 in issuance costs) and local contributions of $3,515,459 were deposited in an irrevocable trust with an escrow agent The accounting loss of $631,980 has been recognized on the Statement of Net Position as Deferral of Loss on Refunding and will be amortized using the straight-tine method and charged to interest expense over the next 12 years.
The notes to the financial statements are an integral part of this statement

CITY OF SOUTH BEND STATEMENT OF FIDUCIARY NET POSITION-
FIDUCIARY FUNDS December 31, 2013
Pension Private-Purpose Agency
Assets Trust Funds Trust Fund Fund
Cash and cash equivalents $ 674,500 $ 9,412 $ 1,638,295 Investments 1,967,704 27,458 Receivables:
Interest 2,863 40
Total assets 2,645,067 36,910 $ 1,638,295
c.n Lia~ilities
N Current liabilities: Accounts payable 12,000 Accrued payroll and withholdings payable 620 - 298,697
Customer deposits - - 1,339,598
Total liabilities 12,620 - $ 1,638,295
Net Position
Net position held in trust for: Employees' pension benefits 2,632,447
Individuals, organizations, and other governments - 36,910
Total net position $ 2,632,447 $ 36,910
The notes to the financial statements are an integral part of this statement.

CITY OF SOUTH BEND STATEMENT OF CHANGES IN FIDUCIARY NET POSITION-
FIDUCIARY FUNDS For the Year Ended December 31,2013
Pension Private-Purpose
Additions Trust Funds Trust Fund
Contributions: On behalf $ 10,898,989 $ Plan members 881
Other 4,854
Total contributions 10,904,724
Investment income: (11 Interest 3,519 78
w Total additions 10,908,243 78
Deductions
Benefits 11,922,137
Administrative expense 12,512 4,315
Total deductions 11,934,649 4,315
Changes in net position (1,026,406) (4,237)
Net position - beginning 3;658,853 41,147
Net position - ending $ 2,632,447 $ 36,910
The notes to the financial statements are an integral part of this statement.

CITY OF SOUTH BEND NOTES TO FINANCIAL STATEMENTS
I. Summary of Significant Accounting Policies
A. Reporting Entity
The City of South Bend (primary government) was established under the laws of the State of Indiana. The primary government operates under a Council-Mayor form of government and provides the following services: public safety (police and fire), highways and streets, health, welfare and social services, culture and recreation , public improvements, planning and zoning , general administrative services, water, sewer, and urban redevelopment and housing.
The accompanying financial statements present the activities of the primary government and its significant component units. The component units discussed below are included in the primary government's reporting entity because of the significance of their operational or financial relationships with the primary government. Blended component un its, although legally separate entities, are in substance part of the government's operations and exist solely to provide services for the government; data from these units is combined with data of the primary government.
Blended Component Units
The South Bend Redevelopment Authority, a legally separate entity, is a significant blended component unit of the primary government. The Redevelopment Authority's sole purpose is to finance and construct land, buildings, and other improvements for use by the primary government. Financial statements for the Redevelopment Authority are available at the City Controller's Office, City of South Bend, 227 West Jefferson , 1200N County-City Building, South Bend, Indiana, 46601 .
The South Bend Building Corporation , Inc., is also a legally separate nonprofit corporation, and is a significant blended component unit of the primary government. The Building Corporation's main purpose is to finance construction and remodeling of City buildings for the City of South Bend. Debt of the Building Corporation is repaid through lease payments from the City. Financial statements for the Building Corporation are available at the City Controller's Office, City of South Bend, 227 West Jefferson , 1200N, County-City Building, South Bend, Indiana, 46601 .
Related · Organizations
The primary government's officials are also responsible for appointing the members of the boards of other organizations , but the primary government's accountability for these organizations does not extend beyond making the appointments. The Mayor and the Common Council appoint the board members of the South Bend Housing Authority, South Bend Public Transportation Corporation (TRANSPO) , Urban Enterprise Association , and the Special Funds Board of Managers.
During 201 3, the Special Funds Board of Managers provided $1 ,313,436 to the City's Century Center to finance operations.
54

CITY OF SOUTH BEND NOTES TO FINANCIAL STATEMENTS
(Continued)
B. Government-Wide and Fund Financial Statements
Government-wide financial statements (i.e., the Statement of Net Position and the Statement of Activities) report information on all of the non-fiduciary activities of the primary government. For the most part, the effect of inter-fund activity has been removed from these statements. Governmental activities, which normally are supported by taxes and intergovernmental revenues, are reported separately from business-type activities, which rely to a significant extent on fees and charges for support. Likewise, the primary government is reported separately from certain legally separate component units for which the primary government is financially accountable.
The Statement of Activities demonstrates the degree to which direct expenses of a given function or segments are offset by program revenues. Direct expenses are clearly identifiable with a specific function or segment. Program revenues include (1) charges to customers or applicants who purchase, use or directly benefit from goods, services or privileges provided by a given function or segment and (2) grants and contributions that are restricted to meeting the operational or capital requirements of a particular function or segment. Taxes and other items not properly included among program revenues are reported instead as general revenues.
Separate financial statements are provided for governmental funds, proprietary funds and fiduciary funds, even though the latter are excluded from the government-wide financial statements. Major individual governmental funds and major individual enterprise funds are reported as separate columns in the fund financial statements.
C. Measurement Focus, Basis of Accounting and Financial Statement Presentation
The government-wide financial statements are reported using the economic resources measurement focus and the accrual basis of accounting as are the proprietary fund and pension trust and private purpose trust fund financial statements. Agency funds, however, report only assets and liabilities. Since they do not report equity (or changes in equity) , they have no measurement focus. Revenues are recorded when earned and expenses are recorded when a liability is incurred, regardless of the timing of the related cash flows. Property taxes are recognized in the year for which they are levied . Grants and similar items are recognized as revenue as soon as all eligibility requirements imposed by the provider have been met.
Governmental fund financial statements are reported using the current financial resources measurement focus and the modified accrual basis of accounting. Revenues are recognized as soon as they are both measurable and available . Revenues are considered to be available when they are collectible within the current period or soon enough thereafter to pay liabilities of the current period . For this purpose, the primary government considers revenues to be available if they are collected within 60 days of the end of the current fiscal period. Expenditures generally are recorded when a liability is incurred, as under accrual accounting. However, debt service expenditures, as well as expenditures related to compensated absences, claims and judgments, are recorded only when payment is due.
Property taxes, franchise taxes, licenses and interest associated with the current fiscal period are all considered to be susceptible to accrual and have been recognized as revenues of the current fiscal period. All other revenue items are considered to be measurable and available only when the primary government receives cash .
55

CITY OF SOUTH BEND NOTES TO FINANCIAL STATEMENTS
(Continued)
The primary government reports the following major governmental funds:
The General fund is the primary operating fund . It accounts for all financial resources of the general government, except those required to be accounted for in another fund.
The Park and Recreation fund is used to account for the operation of the City park system. Financing is provided by a specific annual property tax levy to the extent that user fees and miscellaneous revenues are insufficient to provide such financing.
The Public Safety Local Option Income Tax (LOIT) fund is used to account for the City's share of the public safety local option income tax. Expenditures are restricted to public · safety.
The County Option Income Tax (COlT) fund is used to account for the City's share of the county option income tax. Expenditures include any lawful purpose of the City.
The Economic Development Income Tax (EDIT) is to account for the City's share of the County Economic Development Tax. Expenditures include any lawful purpose of the City.
The Tax Incremental Financing (TIF) Airport fund is used to account for public improvement projects in the airport economic development area. Financing is provided by property tax proceeds in excess of those attributable to the assessed value of the property in the district before redevelopment.
The primary government reports the following major enterprise funds:
The Water Utility fund accounts for the operation of the primary government's water distribution system.
The Wastewater Utility fund accounts for the operation of the primary government's wastewater treatment plant, pumping stations, and collection systems.
The Century Center fund accounts for the operation and maintenance of the City's convention center. Financing is received from various user fees for conventions, meetings, and other events held at the civic center and a subsidy from the St. Joseph County's Special Funds Board of Managers.
Additionally, the primary government reports the following fund types:
The internal service funds account for various City liability coverage, employee medical coverage, unemployment claims, and central services such as fuel , vehicle repairs, and various supplies provided to other departments on a cost-reimbursement basis .
The pension trust funds account for the activities of the 1925 police and 1937 fire pension funds which accumulate resources for pension benefit payments.
The private-purpose trust fund reports a trust arrangement under which principal and income benefits cemetery maintenance.
The agency funds account for assets held by the primary government as an agent for employee payroll , pension, and payroll deductions and held for an entertainment center's event deposits.
56

CITY OF SOUTH BEND NOTES TO FINANCIAL STATEMENTS
(Continued)
As a general rule, the effect of inter-fund activity has been eliminated from the government-wide financial statements. Exceptions to this general rule are payments-in-lieu of taxes and payments of administrative costs. Elimination of these charges would distort the direct costs and program revenues reported for the various functions concerned .
Amounts reported as program revenues include (1) charges to customers or applicants for goods, services, or privileges provided, (2) operating grants and contributions, and (3) capital grants and contributions. Internally dedicated resources are reported as general revenues rather than as program revenues. Likewise, general revenues include all taxes.
Proprietary funds distinguish operating revenues from non-perating items. Operating revenues and expenses generally result from providing services and producing and delivering goods in connection with a proprietary fund's principal ongoing operations. The principal operating revenues of the enterprise funds are charges to customers for sales and services. Operating expenses for enterprise funds and internal service funds include the cost of sales and services , administrative expenses, and depreciation on capital assets. All revenues and expenses not meeting this definition are reported as nonoperating revenues and expenses.
When both restricted and unrestricted resources are available for use, it is the primary government's policy to use restricted resources first, then unrestricted resources as they are needed.
D. Assets, Liabilities, and Net Position or Equity
1. Deposits and Investments
The primary government's cash and cash equivalents are considered to be cash on hand, demand deposits and short-term investments with original maturities of three months or less from the date of acquisition.
State statute (IC 5-13-9) authorizes the primary government to invest in securities, including but not limited to, federal government securities, repurchase agreements , and certain money market mutual funds. Certain other statutory restrictions apply to all investments made by local governmental units.
Nonparticipating certificates of deposit, demand deposits, and sim ilar nonparticipating negotiable instruments that are not reported as cash and cash equ ivalents are reported as investments at cost.
Debt securities are reported at fair value. Debt securities are defined as securities backed by the full faith and credit of the United States Treasury or fully insured or guaranteed by the United States or any United States government agency. ·
Open-end mutual funds are reported at fair value.
Money market investments that mature within one year or less at the date of their acquisition are reported at amortized cost. There is no material difference between amortized cost and fair value. Other money market investments are reported at fair value.
Investment income, including changes in the fair value of investments, is reported as revenue in the operating statement.
57

CITY OF SOUTH BEND · NOTES TO FINANCIAL STATEMENTS
(Continued)
2. lnterfund Transactions and Balances
Activities between funds that are representative of lending/borrowing arrangements outstanding at the end of the fiscal year are referred to as "inter-fund receivables/payables" (i.e., the current and noncurrent portion of inter-fund loans). All other outstanding balances between funds are reported as "inter-fund services provided/used." Any residual balances outstanding between the governmental activities and business-type activities are reported in the government-wide financial statements as "internal balances."
3. Property Taxes
Property taxes levied are collected by the County Treasurer and are usually distributed to the primary government in June and in December. State statute (IC 6-1 .1-17 -16) requires the Indiana Department of Local Government Finance to establish property tax rates and levies by February 15. These rates were based upon the preceding year's March 1 (lien date) assessed valuations, adjusted for various tax credits. Taxable property is assessed at 100 percent of the true tax value (determined in accordance with rules and regulations adopted by the Indiana Department of Local Government Finance) . Taxes may be paid in two equal installments that become delinquent if not paid by May 10 and November 10, respectively.
4. Inventories and Prepaid Items
All inventories are valued at cost using the first in/first out (FIFO) method. Inventories of governmental funds are recorded as expenditures when consumed rather than when purchased.
Certain payments to vendors reflect costs applicable to future accounting periods and are recorded as prepaid items in both government-wide and fund financial statements.
5. Restricted Assets
Certain proceeds of the enterprise fund revenue bonds, as well as certain resources set aside for their repayment, are classified as restricted assets on the Statement of Net Position because their use is limited by applicable bond covenants.
6. Capital Assets
Capital assets, which include property, plant, equipment and infrastructure assets (e.g., roads, bridges, sidewalks, and similar items), are reported in the applicable governmental or business-type activities column in the government-wide financial statements.
Capital assets are reported at actual or estimated historical cost based on appraisals or deflated current replacement cost. Contributed or donated assets are reported at estimated fair value at the time received .
Capitalization thresholds (the dollar values above which asset acquisitions are added to the capital asset accounts), depreciation methods and estimated useful lives of capital assets reported in the government-wide statements and proprietary funds are as follows:
58

- - - - - - - - - - - --------.,
CITY OF SOUTH BEND NOTES TO FINANCIAL STATEMENTS
(Continued)
Buildings and improvements Large office equipment Vehicles and other equipment Roads - collectors and residential Utilities infrastructure (large)
Capitalization Threshold
$ 100,000 10,000 10,000
250,000 250,000
Depreciation Method
Straight-Line Straight-Line Straight-Line Straight-Line Straight-Line
Estimated Useful Life
20 to 30 years 5 to 10 5 to 20
40 to 50 30 to 99
The City has implemented retroactive reporting of its infrastructure as of December 31, 2006.
For depreciated assets, the cost of normal maintenance and repairs that do not add to the value of the asset or materially extend asset lives are not capitalized .
Major outlays for capital assets and improvements are capitalized as projects are constructed. Interest incurred during the construction phase of capital assets of business-type activities is included as part of the capitalized value of the assets constructed.
7. Compensated Absences
a. Sick Leave- primary government employees earn sick leave at the rate of 4 to 8 days per year, depending upon employee classification and length of service. Policemen, teamsters, 40 hour per week firemen , and all other employees earn 8 sick days per year, regardless of tenure of service. Firemen working 24 hour workdays with tenure greater than 5 years earn 5 days of sick leave per year, and firemen working 24 hour workdays with tenure less than 5 years, earn 4 days of sick leave per year. Sick leave may accumulate to a maximum 90 days for policemen, 100 days for 40 hour per week
· firemen, 38 days for 24 per day fireman , 75 days for teamsters and 65 days for all other employees. Accumulated sick leave is paid to firemen and policemen upon termination of employment depending upon the number of sick leave hours transacted, at a rate of 50 percent to 1 00 percent of the base hourly rate of pay for firemen and at a rate of one-half the 1 st class patrolman rank rate of pay for policemen. Accumulated sick leave is paid to teamster employees, upon retirement, at a rate of $25 for each accumulated sick leave day transacted. Sick leave buy-back during employment is paid to firemen and policemen annually upon request. Upon request, firemen are paid unused sick days earned in the previous year in excess of 252 hours in the sick day bank at the base hourly rate of pay. Upon request, policemen are paid up to a maximum 8 unused sick days at the 151 class patrolman rate of pay.
b. Vacation Leave - primary government employees earn vacation leave at rates from zero days to 28 days based upon hire date, years of service, and employee classification. Vacation leave does not accumulate from year to year for policemen, firemen, and teamster employees, except in instances where special cases are approved. Nonbargaining carryover to the following year unused vacation time up to a maximum of 80 hours. Employees earn vacation leave during the year for use in the succeeding year. Unused vacation leave is paid to employees upon termination of employment. Firemen may sell back vacation leave, up to a maximum 3 days per year, during selected times of the year, at the employee's normal hourly rate of pay.
59
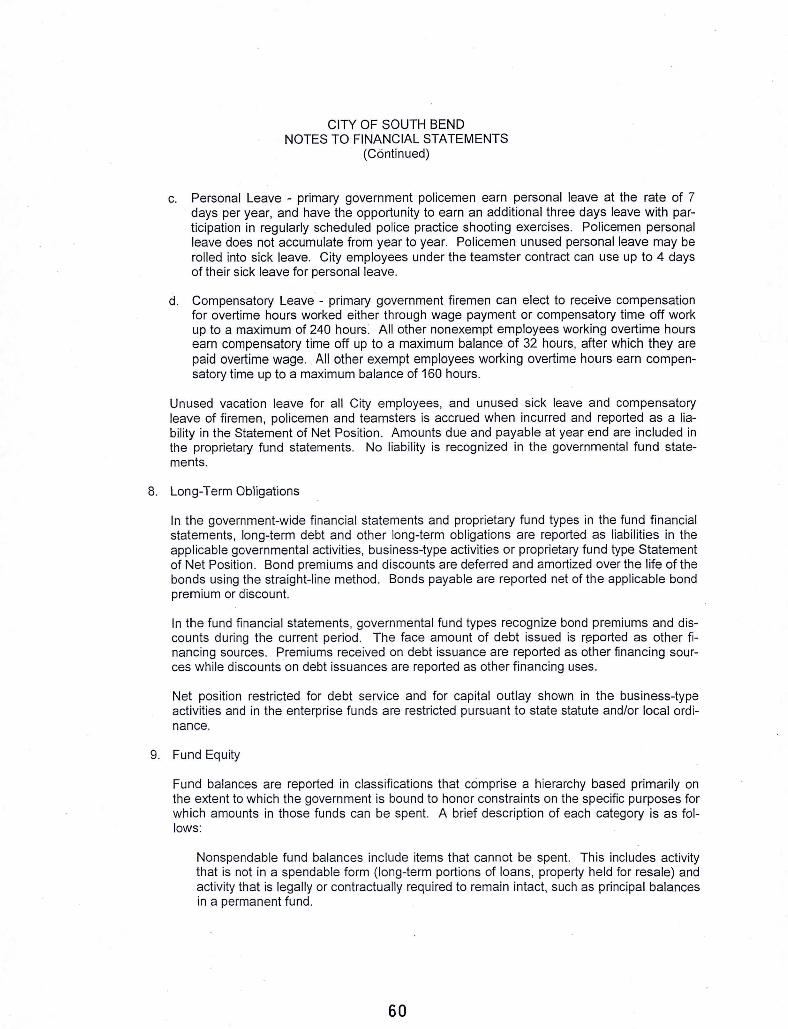
CITY OF SOUTH BEND NOTES TO FINANCIAL STATEMENTS
(Continued)
c. Personal Leave - primary government policemen earn personal leave at the rate of 7 days per year, and have the opportunity to earn an additional three days leave with participation in regularly scheduled police practice shooting exercises. Policemen personal leave does not accumulate from year to year. Policemen unused personal leave may be rolled into sick leave. City employees under the teamster contract can use up to 4 days of their sick leave for personal leave.
d. Compensatory Leave - primary government firemen can elect to receive compensation for overtime hours worked either through wage payment or compensatory time off work up to a maximum of 240 hours: All other nonexempt employees working overtime hours earn compensatory time off up to a maximum balance of 32 hours, after which they are paid overtime wage. All other exempt employees working overtime hours earn compensatory time up to a maximum balance of 160 hours.
Unused vacation leave for all City employees, and unused sick leave and compensatory leave of firemen, policemen and teamsters is accrued when incurred and reported as a liability in the Statement of Net Position . Amounts due and payable at year end are included in the proprietary fund statements. No liability is recognized in the governmental fund statements.
8. Long-Term Obligations
In the government-wide financial statements and proprietary fund types in the fund financial statements, long-term debt and other long-term obligations are reported as liabilities in the applicable governmental activities, business-type activities or proprietary fund type Statement of Net Position. Bond premiums and discounts are deferred and amortized over the life of the bonds using the straight-line method . Bonds payable are reported net of the applicable bond premium or discount.
In the fund financial statements, governmental fund types recognize bond premiums and discounts during the current period. The face amount of debt issued is r!3ported as other financing sources. Premiums received on debt issuance are reported as other financing sources while discounts on debt issuances are reported as other financing uses.
Net position restricted for debt service and for capital outlay shown in the business-type activities and in the enterprise funds are restricted pursuant to state statute and/or local ordinance.
9. Fund Equity
Fund balances are reported in classifications that comprise a hierarchy based primarily on the extent to which the government is bound to honor constraints on the specific purposes for which amounts in those funds can be spent. A brief description of each category is as follows:
Nonspendable fund balances include items that cannot be spent. This includes activity that is not in a spendable form (long-term portions of loans, property held for resale) and activity that is legally or contractually required to remain intact, such as principal balances in a permanent fund.
60

CITY OF SOUTH BEND NOTES TO FINANCIAL STATEMENTS
(Continued)
Restricted fund balances have constraints placed upon the use of the resources either by an external party such as a grantor or creditor or imposed by law through constitutional provisions or enabling leg islation .
Committed fund balances can be used only for specific purposes pursuant to constraints imposed by a formal action by the South Bend City Common Council , the City's highest level of decision-making authority, for all non-TIF Funds, or by the South Bend Redevelopment Commission for TIF Funds. This formal action is the passage of an ordinance by the Council or resolution by the Commission specifying the purposes for which the funds can be used. The same type of formal action is necessary to remove or change the specified use.
Assigned fund balances include amounts that are constrained by the City's intent to be used for a specific purpose, but are neither restricted nor committed . For the governmental fund types other than the General Fund, this is the residual amount within the fund that is not restricted or committed . Currently, state statute does not require the City's Common Council to undertake any resolution regarding the assignment of fund balances. Assignments of fund balance are imposed by informal action of the City Controller. Formal action by a governing body is not required to assign fund balances.
The unassigned fund balance is the residual amount of the General Fund not included in the four categories above. Only the General Fund may report a positive unassigned fund balance whereas, other governmental funds may need to report a negative unassigned fund balance if expenditures incurred for specific purposes exceeded the amounts restricted , committed , or assigned to those purposes.
When both restricted and unrestricted amounts are available for use, generally it is the City's policy to use restricted amounts first, with unrestricted resources utilized as needed. In the case of unrestricted resources , it is generally the City's policy to use committed amounts first, followed by assigned amounts, then unassigned amounts as needed .
The fund balance policy includes reserve ranges for funds as follows:
General: 25 percent of annual expenditures COlT: 50 percent of annual expenditures EDIT: 50 percent of annual expenditures Water operating: 5 percent of annual expenditures Wastewater operating : 5 percent of annual expenditures Other: generally 20 percent or 25 percent of annual expenditures
61

CITY OF SOUTH BEND NOTES TO FINANCIAL STATEMENTS
(Continued)
The detail of the fund balance classifications of the governmental funds for the year ended December 31 , 2013, is as follows:
Nonspendable:
General Fund
Major Governmental Funds
Park and Public Safety Recreation LOIT COlT EDIT
Inventory $ $ 84,308 Property held for resale Advances to other funds 656,848
Total Nonspendable
Restricted: General government Public safety Highways and streets Economic development Culture and recreation Debtser.ice
Total Restricted
Commitled: General government Public safety Highways and streets Economic development Cu~ure and recreation
Total Commitled
Assigned: General government Pubfi c safety Economic development Cu~ure and recreation
Total Assigned
Unassigned
656,848
15,976 478,326
37,657
531 ,959
26,480,106
84,308
1,795,219
4,001 ,110
4,001 ,110 1,795,219
569,499 2,027,973
2,597,472
449,831
449,831
14,201,296 10,715,091
14,201 ,296 10,715,091
Other Total
Governmental Governmental TlF Airport Funds Funds
$ 8,756,317 9,198,433
84,308 18,974,080 4,426,936 1,742,115
10,498,432
25,516,567
25,516,587
9,198,433 23,485,324
1,928,114 2,075,185
12,930,333 35,728,065
2,277,196 9,136,070
64,074,963
7,918,928 5,328,506 5,912,837
903,269 633,486
20,697,026
9,585,928 95,711
857,164
10,538,803
1,928,114 3,870,404
12,930,333 61 ,244,652 6,278,306 9,136,070
95,387,879
7,918,928 5,328,506 5,912,837
903,269 633,486
20,697,026
34,518,291 574,037 857,164 37,657
35,987,149
(4,852, 169) 21 ,627,937
Total fund balance $27,668,913 s 4,085,418 $ 1,795,219 $ 16,798,768 s 11 ,164,922 $ 36,015,019 $ 99,657,056 $197,185,315
Public Safety LOIT funds are primari ly restricted for payment of police and fire personnel. Park and Recreation funds are restricted primari ly for parks and recreation operating costs, including personnel. COlT and EDIT funds are assigned to general government primarily for debt service payments and operating expenses.
The government-wide Statement of Net Position reports restricted net position for debt service and capital outlay, which is restricted by enabling leg islation .
II. Stewardship , Compl iance and Accountability
A. Budgetary Information
Annual budgets are adopted on the cash basis wh ich is not consistent with accounting principles general ly accepted in the United States of America . All annual appropriations lapse at fiscal yearend.
62

CITY OF SOUTH BEND NOTES TO FINANCIAL STATEMENTS
(Continued)
On or before August 31 , the City Controller submits to the Common Council a proposed operating budget for the year commencing the following January 1. Prior to adoption, the budget is advertised and public hearings are conducted by the Common Council to obtain taxpayer comments. Prior to November 1 of each year, the Common Council, through the passage of an ordinance, approves the budget for the next year. Copies of the budget ordinance and the advertisement for funds for which property taxes are levied or highway use taxes are received are sent to the Indiana Department of Local Government Finance. The budget becomes legally enacted after the City Controller receives approval of the Indiana Department of Local Government Finance.
The primary government's management cannot transfer budgeted appropriations between object classifications, namely, Personnel, Supplies, Services, or Capital of a budget without approval of the Common Council. The Department of Local Government Finance must approve any revisions to the appropriations for any fund or any department of the General Fund. The legal level of budgetary control is by object and department within the fund for the General Fund and by object within the fund for all other budgeted funds.
B. Deficit Fund Equity
At December 31 , 2013, the following funds reported deficits in fund equity, which are violations of State statute:
Nonmajor governmental funds: Urban Development Action Grant (UDAG) 1l F - Douglas Road 1lF- Northeast Residential
Nonmajor enterprise funds: Consolidated Building
Deficit
$ 231 ,552 629,585
2,222,180
41 '717
Fund equity deficits arose primarily from expenditures or expenses exceeding revenues due to the underestimate of current requirements. It is anticipated that these deficits will be repaid from future revenues .
Ill. Detailed Notes on All Funds
A. Deposits and Investments
1. Deposits
Custodial credit risk is the risk that in the event of a bank failure, the government's deposits may not be returned to it. Indiana Code 5-13-8-1 allows a political subdivision of the State of Indiana to deposit public funds in a financial institution only if the financial institution is a depository eligible to receive state funds and has a principal office or branch that qualifies to receive public funds of the political subdivision . At December 31 , 2013, the bank balances held at the following institutions were collateralized with securities held by the pledging financial institution's trust department or agent in the depositor-City's name:
63

CITY OF SOUTH BEND NOTES TO FINANCIAL STATEMENTS
(Continued)
Wells Fargo Bank, NA US Bank NA 1 st Source Bank Sun Trust PNC
$1 ,897,179 7,691 ,544 2,028,437
431,511 91
At December 31, 2013, the bank balances held at the following institutions were collateralized with securities held by the pledging financial institution's trust department or agent but not in the depositor-City's name:
Bank of New York Mellon 1
51 Source Bank
$7,314,676 4,448,983
The remaining bank balances were insured by the Federal Deposit Insurance Corporation or the Public Deposit Insurance Fund, which covers all public funds held in approved depositories. The City has not formally adopted a deposit policy for custodial credit risk.
2. Investments
Authorization for investment activity is stated in Indiana Code 5-13. As of December 31 , 2013, the City had the following investments:
Investment T e
U.S. government agency securities
Investment Policies
$
Primary Government
Fair Value
79,635,467
Investment Maturities {in Years} Less More
Than 1 1-2 Than 2
$ 28,727,631 $ 50,907,836 $
Indiana Code 5-13-9 authorizes the City to invest in securities backed by the full faith and credit of the United States Treasury or fully guaranteed by the United States of America and issued by the United States Treasury, a federal agency, a federal instrumentality, or a federal government sponsored enterprise. These investments are required by statute to have a stated final maturity of not more than five years.
Ind iana Code C!lso provides for investment in money market mutual funds that are in the form of securities of, or interest in, an open-end , no-load, management-type investment company or investment trust registered under the provision of the federal Investment Company Act of 1940, as amended. Investments in money market mutual funds may not exceed 50 percent of the funds held by the City and available for investment. The portfolio of an investment company or investment trust used must be limited to direct obligations of the United States of America, obligations issued by a federal agency, a federal instrumentality, or a federal government sponsored enterprise; or repurchase agreements fully collateralized by direct obligations of the United States of America or obligations issued by a federal agency, a federal instrumentality, or a federal government sponsored enterprise. The form of securities of, or interest in , an investment company or investment trust must be rated as AAA, or its equivalent by Standard and Poor's Corporation or its successor or Aaa, or its equivalent, by Moody's Investors Service, Inc., or its successor. The form of securities in an investment company or investment trust should have a stated final maturity of one day.
64

CITY OF SOUTH BEND NOTES TO FINANCIAL STATEMENTS
(Continued)
Additionally, the City may enter into repurchase agreements with depositories designated by the State Board of Finance as depositories for state deposits involving the un it's purchase and guaranteed resale of any interest-bearing obligations issued or fully insured or guaranteed by the United States of America, a United States of America government agency, an instrumentality of the United States of America, or a federal government sponsored enterprise. The repurchase agreement is considered to have a stated final maturity of one day. This agreement must be fully collateralized by interest-bearing obligations as determined by their current market value.
Investment Custodial Credit Risk
The custodial credit risk for investments is the risk that, in the event of the failure of the counterparty to a transaction , a government will not be able to recover the value of investment or collateral securities that are in the possession of an outside party. The City does not have a formal investment policy for custodial credit risk for investments. At December 31 , 2013, the City held investments in U.S. government agency securities in the amount of $79,635,467. These investments were held by the counterparty's trust department or agent but not in the City's name.
Interest Rate Risk
Interest rate risk is the risk that changes in interest rates will adversely affect the fair value of an investment. The City must follow state statute and limit the stated final maturities of the investments to no more than five years. The City does not have a formal investment policy for interest rate risk. The following schedule is a summary of the interest rate risk disclosure as of December 31 , 2013:
lnve~tment
T e
U.S. government agency securities
Credit Risk
Investment Maturities (in Years)
Less Than 1 1-2
More Than 2
$28,727,631 $ 39,064,603 $ 11,843,233
Credit risk is the risk that an issuer or other counterparty to an investment will not fulfill its obligations. U.S. government agency securities are implicitly guaranteed by the full faith and credit of the U.S. government and are recognized as one of the safest investment available . The City does not have a formal investment policy for credit risk.
Concentration of Credit Risk
Concentration of credit risk is the risk of loss attributed to the magnitude of a government's investment in a single issuer. It is the City's practice to limit concentration of investments to no more than 10 percent of any institution's asset base. United States of America government and United States of America governmental agency securities are exempt from this policy requ irement.
65

CITY OF SOUTH BEND NOTES TO FINANCIAL STATEMENTS
(Continued)
Foreign Currency Risk
The City does not have a formal pol icy in regards to foreign currency risk. The City does not have any foreign currency.
B. Receivables
C.
The fo llowing receivable accounts have timing and credit characteristics different from typical accounts receivable. As of December 31 , 2013, City funds recognized the following loan receivable balances. The schedule shows the total receivable and the portion that is not due within one year. These loans were for economic development projects:
Fund Receivable Noncurrent
Nonmajor governmental funds: Economic development state grants $ 482,021 $ 58,200 Community investment grants 340,477 265,572 Urban development action grant 1,768,852 1,768,852 Industrial revolving 4,419,860 4,279,464 Tl F downtown 683,474 503,961
Totals $ 7,694,684 $ 6,876,049
Capital Assets
Capital asset activity for the year ended December 31 , 2013, was as follows:
Primary Gm.ernment
Go\.ernmental actil.1ties: Capital assets, not being depreciated:
Land
Capita l assets, being depreciated: Buildings I mpro\.ements other than buildings Machinery and equipment Roads and other inf rastructure
Totals
Less accumulated depreciation for : Buildings l mpro~.oements other than buildings Machinery and equipment Roads and other infrastructure
Totals
Total capital assets, being
depreciated, net
Total go\.ernmental acti l.1 ties capital assets, net
66
Begi nning Balance
(Restated)
$ 15,921 ,386 $
127 ,656,886 16 ,038,868 50,304 ,539
420 ,291 ,534
614,291 ,827
36,735,257 7,370,754
33,647 ,008 257,852,591
335,605,610
278,686,21 7
$294,607,603 $
Endi ng Increases Decreases Balance
99 $ (38,000) $ 15,883,485
2,610 ,108 (198,661) 130,068,333 242,374 16,281,242
5,845,475 (9, 796,037) 46,353,977 1,248,521 (99) 421,539,956
9,946,478 (9,994 ,797) 61 4 ,243,508
3,643,11 9 (13,175) 40,365,201 660,643 8,031,397
4 ,101,379 (9,670,490) 28,077,897 11,425,195 269,277,786
19 ,830,336 (9,683,665) 345,752,281
(9,883,858) (311 ,132) 268,491 ,227
(9,883,759) $ (349, 132) $284,374,712

-- -----------------------
CITY OF SOUTH-BEND NOTES TO FINANCIAL STATEMENTS
(Continued)
Beginning Prima!)( Gowrnment Balance Increases
Business-type actillites: Capital assets, not being depreciated:
Land $ 3,024,582 $ -Construction in progress 6,647,833 12,126,514
Total capital assets, not being depreciated 9,672,415 12,126,514
Capital assets, being depreciated: Buildings 82,297,980 827,827 lmprowments other than buildings 23,987,898 2,413,538 Machinery and equipment 29,235,757 3,240,000 Roads and other infrastructure 190,938,764 5,366,748
Totals 326,460,399 11,848,113
Less accumulated depreciation for: Buildings 31,348,151 2,120,891 lmprowments other than buildings 4,659,689 1,089,618 Machinery and equipment 22,162,989 1,557,807
Roads and other infrastructure 55,469,771 4,961,246
Totals 113,640,600 9,729,562
Total capital assets, being depreciated, net 212,819,799 2,118,551
Total business-type actillities capital assets, net $ 222,492,214 $ 14,245,065
Ending Decreases Balance
$ - $ 3,024,582 {4,849,336) 13,925,011
(4,849,336) 16,949,593
(153,257) 82,972,550 (21,030) 26,380,406
(2,263,763) 30,211,994 (862,384) 195,443,128
(3,300,434) 335,008,078
(152,959) 33,316,083 (21,030) 5,728,277
(2, 142,650) 21,578,146
{590,418) 59,840,599
{2,907,057) 120,463,105
(393,377) 214,544,973
$ (5,242,713) $ 231,494,566
Depreciation expense was charged to functions/programs of the primary government as follows:
Governmental activities: General government Public safety Highways and streets, and other
general infrastructure assets Culture and recreation Economic development Internal service funds*
Total depreciation expense - governmental activities
$ 660,287 3,248,469
11,939,894 3,165,783
700,122 115,781
$ 19,830,336
*Capital assets held by the primary government's internal service funds are charged to the vari-ous functions based on their usage of the assets. ·
67
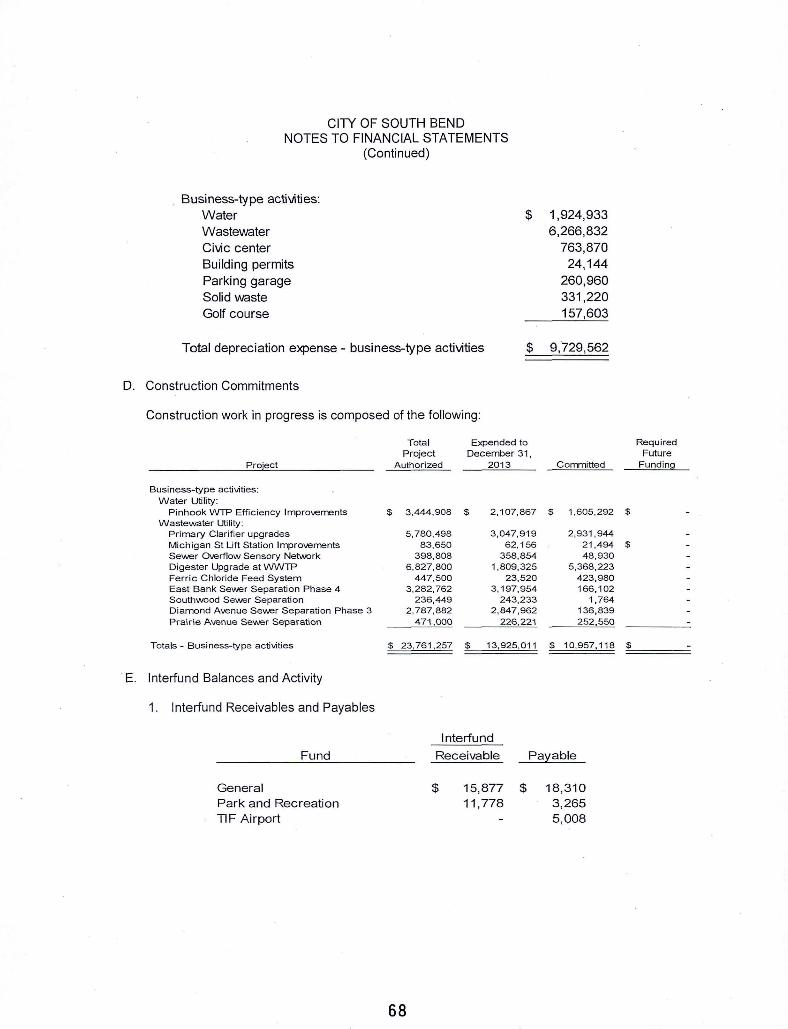
CITY OF SOUTH BEND NOTES TO FINANCIAL STATEMENTS
(Continued)
Business-type activities: Water Wastewater Civic center Building permits Parking garage Solid waste Golf course
Total depreciation expense - business-type activities
$
$
D. Construction Commitments
E.
Construction work in progress is composed of the following:
Pro'ect
Business-type activities: W ater Uti li ty :
Pinhook WTP Efficiency Improvements $ W astewater Uti lity:
P r imary C larif ier upgrades M ic h igan St Lift Station Improvements Sevver Overflow Sensory Network Digester Upgrade at WWTP Fe rr ic C hloride Feed System East Bank Sewer Separation Phase 4 Southwood Sewer Separation D iamond Avenue Sewer Separation Phase 3 P rairie Avenue Sewer Separation
Totals- B usiness- type activities $
lnterfund Balances and Activity
1. lnterfund Receivables and Payables
Tota l Project
Author ized
3 ,444,908
5 ,780,498 83,650
398,808 6 ,827,800
447 ,500 3,282,762
236,449 2,787,882
471 ,000
23,761 ,257
Expended to December 3 1,
2013
$ 2, 107,867
3,047,919 62,156
358,854 1,809,325
23,520 3,197,954
243 ,233 2,847,962
226,221
$ 13,925,011
1,924,933 6,266,832
763,870 24,144
260,960 331 ,220 157,603
9,729,562
Committed
$ 1,605,292
2 ,931,944 21,494 48,930
5,368,223 423,980 166,102
1 ,764 136,839 252,550
$ 10,957, 11 8
Fund
lnterfund
Rec eivable Pay able
General Park and Recreation TIF A irport
68
$ 15,877 $ 11 ,778
18 ,3 10 3 ,265 5 ,008
$
$
$
Required Future
Funding

CITY OF SOUTH BEND NOTES TO FINANCIAL STATEMENTS
(Continued)
Fund
Nonmajor governmental funds: Motor Vehicle Highway Park Non-reverti.ng Community Investment Hall of Fame Capital SBCDA Debt Reserve Tl F Dovvntovvn
Totals- nonmajor governmental funds
Total- governmental funds
Enterprise funds Water Utility Wastewater Utlity Century Center
Nonmajor enterprise funds: Consolidated Building
Total- nonmajor enterprise funds
Total- enterprise funds
Internal ser\lice funds: Self-funded Employee Benefits Central Services
Total- Internal service funds
Total- all funds
lnterfund .. Receivable
$
1,487
223
1,710
29,365
20,906 8,383 6,260
35,549
3,135
3,135
68,049
Payable
$
598
15,765 687 223
3,150
20,423
47,006
9,050 2,289
7,356
7,356
18,695
1,487 861
2,348
68,049
The composition of interfund balances as of December 31, 2013, is as follows:
lnterfund balances resulted from the time lag between the dates that (1) lnterfund loans are repaid, (2) lnterfund goods and services are provided or reimbursable expenditures occur, (3) transactions are recorded in the accounting system and {4) payments between funds are · made.
69

CITY OF SOUTH BEND NOTES TO FINANCIAL STATEMENTS
(Continued)
2. Advances Between Funds
The advances between funds record noncurrent portions of long-term loans from one fund to another. Advances at December 31, 2013, were as follows:
General COlT TIF Airport
Fund
Nonmajor governmental funds: Studebaker Oliver Revitalization Grants Urban Development Action Grant Football Hall of Fame Major Moves TlF Douglas Road TIF Northeast Residential
· Total - nonmajor governmental funds
Total - governmental funds
Nonmajor enterprise funds: Blackthorn Golf Course
Total - all funds
$
$
Advances
To Other Funds From Other Funds
656,848 2 ,027,973 1 ,742,115
500,000
5,912,837
6,412,837
10,839,773
$
500,000
2 ,027,973 656,848
923,829 4,989 ,008
8 ,597,658
9,097,658
1 ,742,115
1 0,839, 773 =$===1=0=,8=3=9=, 7=7=3
Specific purposes of the advances are as follows: The General Fund advanced funds to the Football Hall of Fame to cover operating expenses. The COlT Fund advanced funds to the Urban Development Action Grant Fund for community development projects. The Airport TIF advanced funds for the Blackthorn Golf Course deqt services payments. Major Moves advanced funds to the Douglas Road and Northeast Residential TIFs for project costs incurred to construct roads and a parking garage.
70

CITY OF SOUTH BEND NOTES TO FINANCIAL STATEMENTS
(Continued)
3. lnterfund Transfers
lnterfund transfers at December 31, 2013, were as follows:
Transfers
Fund From Other Funds To other Funds
General $ 12,044,166 $ 744,364 Park and Recreation · 696,009 209,824 Public Safety LOfT 683,303 7,540,389 COlT 1,807,098 EDIT 5,456,519 llF Airport 211,047 1,233,000
Nonmajor governmental funds: Motor Vehicle High\Nay 3,626,882 DCI Operating 1,717,519 Leaf Collection and Removal 250,000 College Football Hall of Fame Debt Service 71,468 Redevelopment Bond - Airport Taxable. 3,167 Redevelopment Bond - Palais Royale 5,292 Redevelopment Authority Debt Service 4,755,324 South Bend Building Corporation Debt Service 2,237,291 Emergency Medical Services 1,ooo;ooo Park Nonreverting Capital 209,824 Cumulative Capital Development 46,054 Cumulative Capital Improvement 367,575 11 F - Do\M'ltovvn 5,291 398,500 Collef;Je Football Hall of Fame Capital 61,061 llF- Northeast Residential 2,824,324
Total- Nonmajor governmental funds 12,730,714 4,848,858
Total- governmental funds 26,365,239 21,840,052
Water Utility 1,541,755 Wastewater Utility 2,775,553
Non-major enterprise .funds: Blackthorn Golf Course 207,879
Total- Nonmajor enterprise funds 207,879
Total·- enterprise funds 4,525,187
Total- all funds $ 26,365,239 $ 26,365,239
71

CITY OF SOUTH BEND NOTES TO FINANCIAL STATEMENTS
(Continued)
The primary government typically uses ·transfers to fund ongoing operating subsidies. Specific purposes of the transfers are as follows: The Public Safety LOIT and Emergency Medical Services Funds transferred funds to the General Fund for the payment of police and fire and EMS personneL The Water and Wastewater Utility Funds transferred PILOT funds to the General , Parks and Recreation, Redevelopment Bond Debt Service-Airport Taxable, and Cumulative Capital Development Funds for general use. The COlT, EDIT, TIF Airport, TIF Downtown, Cumulative Capital Improvement, and TIF Northeast Residential Funds transferred funds to the Redevelopment Authority and South Bend Building Corporation Debt Services Funds for debt service payments. The COlT and EDIT Funds transferred funds to the Motor Vehicle Highway Fund for general operations as well as for the curb and sidewalk improvements. The EDIT Fund transferred funds to the DCI Operating Fund for salaries and wages relating to community investment initiatives. The Leaf Collection and Removal Fund transferred funds collected from customers for leaf collection to the Motor Vehicle Highway Fund to cover supervisory personnel in charge of the Leaf Collectiol) and Removal program. The Parks and Recreation Fund transferred funds collected for park programs to the Park Nonreverting Capital Fund.
F. Leases
1. Operating Leases
The primary government has entered into various operating leases having initial or remaining noncancelable terms exceeding one year for golf cart global positioning systems, office machines, ·and office space. Rental expenditures for these leases were $271 ,570. The following is a schedule by years of future minimum rental payments as of December 31 , 2013:
Year Ended Annual December 31 Payment
2014 $ 166,773 2015 122,758 2016 83,758 2017 78,538 2018 6,000
Total $ 457,827
2. Capital Leases
The primary government has entered into various capital leases for various types of equipment and two parking garages. The parking garage capital leases are being repaid from governmental funds. Future minimum lease payments and present values of the net minimum lease payments under these capital leases as of December 31 , 2013, are as follows:
72

CITY OF SOUTH BEND NOTES TO FINANCIAL STATEMENTS
(Continued)
Governmental Activities
Business-Type Activities
2014 $ 2,351,558 $ 2015 2,325,625 2016 1,860,654 2017 1,117,531 2018 651 ,748 2019-2023 1,000,000 2024-2028 400,000
Total minimum lease payments 9,707,116
Less amount representing interest 929,877
Present value of net minimum lease payments $ 8,777,239 $
Assets acquired through capital leases still in effect are as follows:
Governmental Business-Type Activities Activities
Buildings $ 5,189,549 $ 4,115,612 Improvements other than buildings 2,645,045 Machinery and equipment 17,176,056 5,896,038
Totals 25,010,650 10,011 ,650
Accumulated depreciation 14,354,501 4,187,131
Totals $ 10,656,149 $ 5,824,519
G. Long-Term Liabilities
1. Mortgage Bonds
Mortgage Bonds outstanding at year end are as follows:
73
1,086,835 1,007,218
866,361 783,318 219,664
3
3,9f?3,399
132,671
3,830,728

CITY OF SOUTH BEND NOTES TO FINANCIAL STATEMENTS
(Continued)
Pur ose
Go>..ernmental Activities
201 0 Public Works Service Center Refunding - maturity February 1, 2021 -installments of $525,000 to $615,000 plus interest
2012 New Fire Station/Police renovations refunding - maturity February 1, 2023 - installments of $545,000 to $770,000 plus interest
2013 Building Corp EMS Fire StationfTower Bonds - maturity February 1, 2033 - instalments $215,000- $235,000 plus interest
Total- go>..ernmental activities
Business-Type Activities
201 0 Public Works Seliiice Center Refunding - maturity February 1, 2021 -installments of $525,000 to $615,000 plus interest
Interest Rates
Original Issue
Outstanding 12-31-1 3
3.0% to 5.0% $ 5,327,775 $ 3,845,645
2.1% to 5 .0% 13,595,000 12,365,000
3.0% to 4 .2% 5,580,000 5,580,000
$ 24,502,775 $ 21 '790,645
3.0% to 5.0% $ 7 4 7,225 =$ ===53=9=, 3=5=5
Mortgage bonds at year end include the following amounts of unamortized bond discount (premium) and unamortized loss (gain) on refunding :
Pur ose
Governmental Activities
2010 Public Works Service Center Refunding 2012 New Fire Station/Police renovations refunding 2013 EMS Training facility
Total Governmental Activities
Business-Type Activities
2010 Public Works Service Center Refunding
Balance at December 31
$ 3,845,645 12,365,000
5,580,000
$ 21 ,790,645
$ 539,355
Mortgage debt service requirements to maturity are as follows:
74
Unamortized Discount
(Premium)
$ (87,319)
(1 '118,615) (83,202)
$ (1 ,289,136)
$ (12,247)
$
Adjusted Balance
3,932,964 13,483;615
5,663,202
$ 23,079,781
$ 551 ,602

2.
CITY OF SOUTH BEND NOTES TO FINANCIAL STATEMENTS
(Continued)
Year Ended Governmental Activities Busi ness-T~ee Activities
December 31 Princieal Interest Principal Interest
2014 $ 1,580,425 $ 715,921 $ 64,575 $ 17,912 2015 1,852,965 708,085 67,035 15,956 2016 1,911 ,120 649,014 68,880 13,927 2017 1,969,275 587,407 70,725 11,807 2018 2,026,815 522,582 73,185 9,443 2019-2023 9,000,045 1,479,354 194,955 11 '715 2024-2028 1,520,000 528,456 2029-2033 1,930,000 207,076
Totals $ 21,790,645 $ 5,397,895 $ 539,355 $ 80,761
Revenue Bonds
The primary government issues bonds to be paid by income derived from the acquired or constructed assets. Revenue bonds outstanding at year end are as follows :
Pur ose
Governmental Activities: Tax Incremental Financing Revenue Bonds:
2002 TJX Special Taxing Distr ict - maturity January 1, 2022 - installments of $295,000 to $500,000 p lus interest
2003 Amended Ai rport Tl F Refund ing - maturity February 1, 2025 - insta llments -of $254,036 to $530,000 p lus interest
2003 Amended Downtown TlF Ref unding - maturity February 1 , 2025 - insta llments of $260,000 to $935,000 plus inte rest 2005 Southside TlF - maturity February 1, 2027 -insta llments of $165,000 to $465,000 p lus interest
2011 SB Career Academy Project - maturity November 15, 2014 - installments of $500,000 p lus interest
Redevelopment Author ity Reven ue Bonds: 2008 Eddy Street Common Improvements - m aturity February 15, 2033 - installments of $145,000 to $1,420,000 plus interest
2009 Morris Performing Arts Center Refinanc ing - maturity February 1, 2017 -insta llments of $400,000 to $515 ,000 p lus interest
2011 Hall of Fame Re financing - matu ri ty February 1, 2018 -installments of $550,000 to $615,000 p lus interest
201 1 Century Center Refinanci ng - maturity February 1, 2018 -installments of $215,000 to $260,000 p lus interest
75
Interest Original Outstanding Rates Issue 12-31- 13
3.0% to 4.75% $ 6,620 ,000 $ 3,405,000
4 .0% to 5 .20% 14,420,000 9 ,195,000
4.0% to 5 .20% 19,795,000 16, 120,000
6 .1% to 6.75% 5,485 ,000 4 ,465,000
4 .0% 1,500,000 500,000
4.0% to 6.0% 36,000,000 34,050,000
3.0% to 4.0% 7,210,000 3,380,000
.8% to 3.65% 7,580,000 5,285,000
2 .0% to 3 .0% 2,980,000 2,070,000

---------------------- -------
CITY OF SOUTH BEND NOTES TO FINANCIAL STATEMENTS
(Continued)
Pur cise
Governmental Activities (continued): 2013 Century Center Improvements - maturity May 1 , 2028 - installments of $155,000 to $375,000 plus interest
CEDIT Revenue Bonds: 2006 CEDIT Refinancing Bonds - maturity February 1, 201 7 -installments of $310,000 to $430,000 plus interest
Professional Sports/Convention DeV€1opment Revenue Bonds: 2010 Ta:xable
- maturity January 5, 2019 -installments of $580,000 to $670,000 plus interest
Tota l Governmental Activities
Interest Rates
4.0% to 5.63%
3.75% to4%
1.75% to 5 .2%
Original Outstanding Issue 12-31-13
4 ,655,000 3,990,000
7,440,000 2,815,000
4.980,000 3.520.000
$ 118,665,000 $ 88,795,000
• - St. Joseph County has irrevocably pledged hotel-motel tax revenues to finance debt payments
Business-Type Activities: 2006 Water Works Improvement - maturity January 1, 2027 - installments of $170,000 to $350,000 plus interest
2009 Water Works Improvement - maturity January 1, 2030 - installments of $195,000 to $455,000 plus interest 2012 Water Works Improvement - maturity January 1, 2023 - installments of $335,000 to $425,000 plus interest
20128 Water Works Improvement - maturity January 1, 2033 - installments of $340,000 to $540,000 plus interest
2006 Sewage Works Improvement - maturity December 1, 2026 - installments of $295,000 to $630,000 plus interest
2007A Sewage Works Improvement - maturity December 1, 2027 - installments of $585,000 to $ 1 ,225,000 plus interest 2007B Sewage Works Improvement - maturity December 1, 2027 - installments of $580 ,000 to $1 ,230,000 plus interest 2010 Sewage Works Revenue - maturity December 1 , 2030 - installments of $365,000 to $665 ,000 plus interest
2011 Sewage Works Revenue - maturity December 1, 2031 - installments of $365,000 to $665 ,000 plus interest
2012 Sewage Works Revenue - maturity December 1 , 2032 - installments of $1,105,000 to $ 1,650,000 plus interest 2013A Sewage Works revenue
- maturity December 1 , 2024 -installments of $1 ,065,000 to $715,000 plus interest
Total Business-Type Activities
4.25% to 4.50% 4 ,710,000 3 ,505,000
3.8% to 5.89% 5,380 ,000 4,985,000
2.0% 5,975 ,000 3,450,000
2 .0% to 3.7% 8,300 ,000 7 ,960,000
3.6% to 4.625% 7,630 ,000 6 ,090,000
4 .0% to 4.5% 16,600,000 13,010,000
4.0% to 4 .5% 16,515,000 12,960,000
2 .0% to 4 .5% 9 ,345,000 8,270,000
3% to 4% 21 ,500,000 19,895,000
2% to 2 .75% 25,000,000 23,985,000
1.94% 14,765,000 13,700,000
$ 135,720,000 $ 117,810.000
The City has pledged future revenues , net of operating expenses to repay Water and Wastewater Utilities' bonds. Bond ordinances require monthly deposits of a portion of user fee revenues sufficient to meet requirements of the next principal, interest, and bank fiscal charge payment. Water and wastewater bond ordinances also require monthly deposits of user fee revenues over 60 months to produce a bond reserve equal to approximately the maximum annual debt service:
76

----------------
CITY OF SOUTH BEND NOTES TO FINANCIAL STATEMENTS
(Continued)
During 201 3, the Water Utility paid $2,227,900 in debt payments or approximately 16 percent of operating revenues. The Wastewater Utility paid $13,858,305 in debt payments or approximately 43 percent of operating revenues.
The City has pledged tax incremental financing revenues to meet tax incremental financing and Redevelopment Authority debt requ irements. The City has pledged County Economic Development Income Taxes (CEDIT) to meet the CEDIT revenue bond debt requirements. The City has also pledged taxes in the Professional Sports and Convention Development (PSCD) Area to meet the PSCD revenue bonds.
Revenue bonds at year end include the following amounts of unamortized bond discount (premium) and unamortized loss (gain) on refunding:
Unamortized Balance at Discount Adjusted
P ur ose December 31 (Premium) Balance
Governmenta l ActiVities: Tax Incremental F inanc ing Revenue Bonds:
2002 TJX Special Taxing District $ 3,405,000 $ 28,856 $ 3,376, 144 2003 Amended A irport TlF Refunding 9,195,000 9,195,000 2003 Amended Downtown Tl F Refund ing 16, 1'20,000 16,120,000 2005 Southside TlF 4,465,000 42,948 4,422,052 201 1 SB Career Academy Project 500,000 500,000
Redevelopment Authority Revenue Bonds: 2008 Eddy Street Common Improvements 34,050,000 (1 ,338,574) 35,388,574 2009 Morris Performing Arts Center Refinancing 3,380,000 (35,416) 3,415,416 201 1 Hall of Fame Refinancing 5,285,000 5,285,000 2011 Century Center Re fi nancing 2,070,000 ( 18,607) 2 ,088,607 2013 Century C e nter Improvements 3,990,000 (41,527) 4 ,031,527
C E DIT Revenue Bo nds: 2006 C EDIT Refi nanc ing Bonds 2,815,000 ( 15,506) 2,830, 506
P rofessional Sports/Conventi on Development Revenue Bonds:
2010 Taxable 3 ,520,000 3,520,000
Total Governmental Activities $ 88,795.000 $ (1 '377,826) $ 90, 172,826
B usiness-Type Activities: 2006 Water Works Improvement 3 ,505,000 13,091 3,491,909 2009 Water Works Improvement 4 ,985.000 4 ,985,000 2012B Water Works Improvement 3,450,000 30,409 3,419,591 2012 Water Works Improvement 7 ,960,000 45,904 7,914,096 2006 Sewage Works Improvement 6 ,090,000 35,979 6,054 ,021 2007A Sewage Works Improvement 13,010,000 23,131 12,986,869 2007B 'Sewage Works Improvement 12,960,000 (81,996) 13,041,996 2010 Sewage Works Revenue 8 ,270,000 (158,840) 8,428,840 2011 Sewage Works Revenue 19,895,000 94,586 19,800,41 4 2012 Sewage Works Revenue 23,985,000 (174,581) 24,159,581 2013A Sewage Works Revenue 13,700,000 ( 136,222) 13,836,222
Total Business-Type Activities $ 117.810,000 $ (308,539) $ 1 18,118,539
77

3.
4.
CITY OF SOUTH BEND NOTES TO FINANCIAL STATEMENTS
(Continued)
Revenue bonds debt service requirements to maturity are as follows:
Year Ended Governmental Activities Business-T~n:~e Activities
December 31 Principal Interest Principal Interest
2014 $ 7,950,000 $ 4,326,765 $ 6,910,000 $ 3,992,614 2015 7,720,000 4 ,034,845 7,080,000 3,799,374 2016 8,030,000 3,728,416 7,265,000 3,600,160 2017 7,31:30,000 3,396,357 7,465,000 3,389,962 2018 5,840,000 3,084,214 13,745,000 3,172,319 2019-2023 24,480,000 11,739,534 35,585,000 12,475,115 2024-2028 16,000,000 5,280,643 33,670,000 6,024,668 2029-2033 11 ,395,000 1,776,750 6,090,000 1,086,583
Totals $ 88,795,000 $ 37,367,523 $ 117,810,000 $37,540,793
Notes and Loans Payable
The primary government has entered into various notes/ loans. Annual debt service require-ments to maturity for the notes/loans are as follows:
Year Ended Governmental Activities Business-T:tpe Activities December 31 Principal Interest Principal Interest
2014 $ 1,608,064 $ 73,056 $ 326,346 $ 117,945 2015 902,796 31 ,251 335,765 108,527 2016 162,817 16,770 345,456 98,835 2017 118,469 9,780 355,426 88,865 2018 65,591 6,419 365,686 73,397 2019-2023 172,817 7 ,209 1,209,971 266,898 2024-2028 1 ' 152,901 99,876 2029-2033 29,459 993
Totals $ 3,030,554 $ 144,485 $4,121 ,010 $ 855,336
Bond Refunding
On April 25, 2013, the City of South Bend issued $14,765,000 in refund ing revenue bonds with an average interest rate of 1.94 percent to advance refund $9,445,000 in outstanding 1998 state revolving loans payable and $7,980,000 in outstanding 2004 sewage works revenue bonds with an average interest rate of 3.98 percent. The net proceeds of $14,683,935 (after payment of $81 ,065 in issuance costs) and local contributions of $3,515,459 were used
78

CITY OF SOUTH BEND NOTES TO FINANCIAL STATEMENTS
(Continued)
to purchase U.S. government securities. Those securities were deposited in an irrevocable trust with an escrow agent to provide for all future debt service payments on the 1998 state revolving loans payable and 2004 series bonds. As a result, these loans payable and bonds are considered to be defeased and the liability for those bonds has been removed from the Statement of Net Position. The refunding resulted in the accounting loss of $631 ,980 which has been recognized on the Statement of Net Position as Deferral of Loss on Refunding . This amount will be amortized using the straight-line method and charged to interest expense over the next 12 years. The City of South Bend in effect reduced its aggregate debt service payment by $1 ,294,420 over the next 12 years and realized an economic gain (difference between the present values of the old and new debt service payments) of $970,950.
On December 5, 2013, the City of South Bend issued $3,990,000 in refunding revenue bonds with an average interest rate of 3.02 percent to advance refund $3,990,000 of outstanding 2008 Century Center project revenue series bonds with an average interest rate of 5.47 percent. The net proceeds of $3,895,417 (after payment of $136,110 in issuance costs) and local contributions of $494,433 were used to purchase U.S. government securities. Those securities were deposited in an irrevocable trust with an escrow agent to provide for all future debt service payments on the 2008 series bonds. As a result , these bonds are considered to be defeased and the liabil ity for those bonds has been removed from the Statement of Net Position . The refunding resu lted in the accounting loss of $466,724 which has been recognized on the Statement of Net Position as Deferral of Loss on Refunding . This amount will be amortized using the straight-line method and charged to interest expense over the next 13 years. The City of South Bend in effect reduced its aggregate debt service payments by $563 ,917 over the next 15 years and realized an economic gain (difference between the present values of the old and new debt service payments) of $234,133.
5. Changes in Long-Term Liabilities
Long-term liability activity for the year ended December 31 , 2013, was as follows:
Primary Government
Governmental activities: B onds payable :
Revenue Mortgage
Total bonds payable
Notes and loans pay ab le C apita l leases Compensated absences Net other postemployment
benef its obligati on Net pe ns io n obligati on
$
Be ginni ng B a lance
96,410 ,000 $ 17,883,530
114,293,530
4 ,953,639 8 ,336,12 0 5 , 116,325
6 ,539,338 63, 100,0 18
Endi ng Addi tio ns Reductio ns Balance
3,990 ,000 $( 11 ,605,000) $ 88 ,795 ,000 5 ,580 ,000 ( 1 ,672,8 85) 2 1,790,645
9 ,570 ,000 (13,277,885) 11 0 ,58 5 ,645
( 1 ,923,085) 3 ,030 ,5 54 2 ,240 ,007 ( 1,798,889) 8 ,777,238 3,892 ,728 (3,824, 141 ) 5 ,184,9 12
3 ,968,925 (2 ,207, 586) 8 ,300,67 7 13,520 ,569 ( 13 ,362,281) 63,258,3 0 6
Due Within
One Year
$ 7,9 50,000 1 ,580,425
9,530 ,425
1 ,608 ,064 2 ,115,937 3,892, 728
Total governmental activi ties lo ng-te rm lia bil ities $202,338 ,970 $33,192,229 $(36,393,867) $ 199 ,137, 3 32 $ 17,147, 154
79
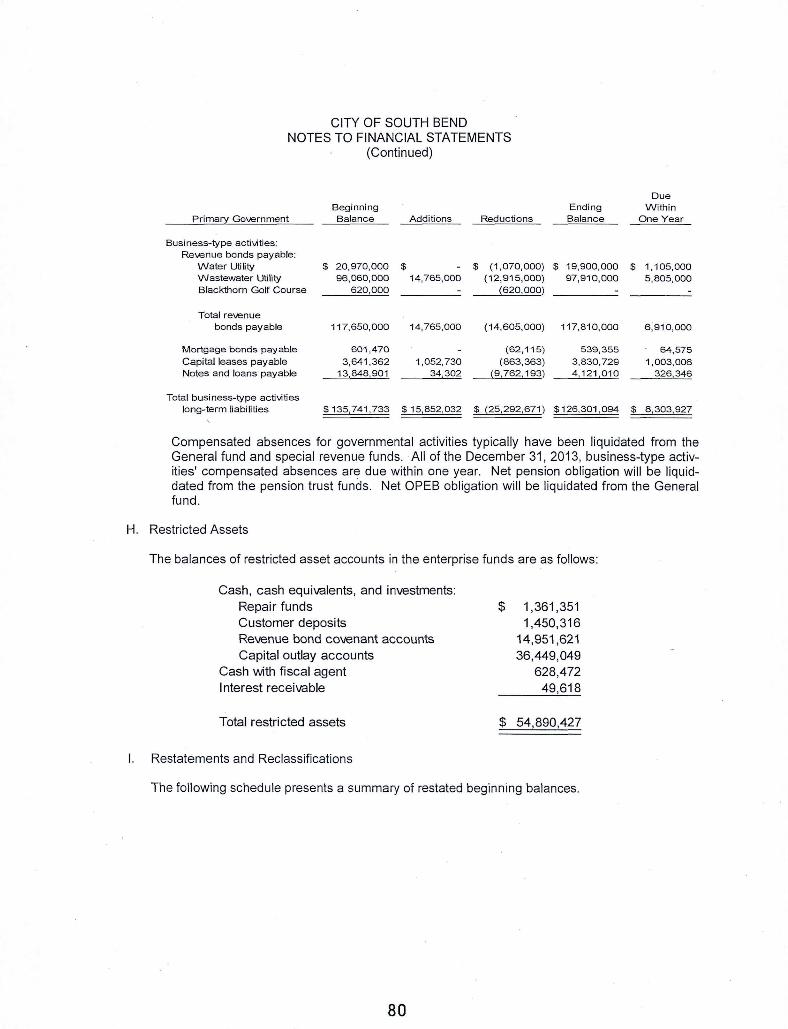
CITY OF SOUTH BEND NOTES TO FINANCIAL STATEMENTS
(Continued)
Beginning Primal}' Go\.€rnment Balance Add itions Reductions
Business-type activities: Re\.€nue bonds payable:
Wate r Uti li ty $ 20,970,000 $ - $ (1 ,070,000) Wastewater Uti lity 96,060,000 14 ,765,000 (12,915, 000) B lackthorn Golf Course 620,000 (620,000)
Total re\.€nue bonds payable 11 7 ,650,000 14,765,000 ( 14,605,000)
Mortgage bonds payable 601 ,470 (62, 115)
Capital leases payable 3,641 ,362 1,052,730 (863,363) Notes and loans payable 13,848,901 34,302 (9,762,193)
Total bus iness-type activities long-term liabi li ties $135,741 ,733 $ 15,852 ,032 $ (25,292,671)
Due Ending With in Balance One Year
$ 19,900,000 $ 1 '1 05,000 97,910,000 5 ,805,000
117,810,000 6 ;910,000
539,355 64,575 3,830,729 1 ,003,006 4,121,010 326,346
$126,301 ,094 $ 8,303,927
Compensated absences for governmental activities typical ly have been liquidated from the General fund and special revenue funds. All of the December 31 , 2013, business-type activities' compensated absences are due within one year. Net pension obligation will be liqu iddated from the pension trust funds. Net OPEB obligation will be liquidated from the General fund .
H. Restricted Assets
The ba lances of restricted asset accounts in the enterprise funds are as follows :
Cash, cash equivalents, and investments: Repair funds Customer deposits Revenue bond covenant accounts Capital outlay accounts
Cash with fiscal agent Interest receivable
Total restricted assets
I. Restatements and Reclassifications
$ 1,361 ,351 1,450,316
14,951 ,621 36,449,049
628,472 49,618
$ 54,890,427
The following schedule presents a summary of restated beginning balances.
80

CITY OF SOUTH BEND NOTES TO FINANCIAL STATEMENTS
(Continued)
0 inion Unit
Balance as Reported
December 31, 2012
Prior Period
Adjustments/ Reclassifications
Governmental activities- nef position: $ 292 ,631,223 $ ·Payment of property tax refund applicable to prior years Reclassification of construction in progress to expenses Change from reporting Net other post employment benefits
(1 '150,649) (7,502,620)
$
Balance as Restated January 1,
- 2013
obligation at January 1, 2012 to December 31,2012 (1 '155, 125) 282,822,829
Governmental activities (non major) fund balance: 96,810,743 Payment of property tax refund applicable to prior years (1 '150,649) 95,660,094
J. Loss on Sale/Leaseback of Leighton Parking GaraQe
During 2000, the City completed constructi9n of the Leighton Parking Garage and capitalized the cost of the garage, $11,439,712, in the Parking Garage Fund , ail enterprise fund. On December 1, 2000, the City sold the garage to the South Bend Transportation Company (TRANSPO) for $3,000,000 as part of a sale/leaseback agreement. The proceeds were receipted into the County Option Income Tax Fund. This fund is also making the future lease payments to TRANSPO.
The present value of the lease, $1,960,044, was the new basis for the parking garage. As part of this sale/leaseback, the Parking Garage Fund recognized a deferred loss of $8,439,712, which is being amortized over the fifteen year life of the lease.
K. Property Held for Resale
The City's Redevelopment Commission has purchased properties in blighted areas for redevelopment and subsequent resale. At December 31, 2013, the market value of these properties was not known. These properties are recognized as assets in the funds that purchased the property.
L. Service Concession Agreement
On July 1, 2013, the City entered into a Service Concession Agreement ("SCA") with SMG, a civic center management company, with the purpose of obtaining high-quality professional management of the Century Center. The initial term of the contract extends through June 30, 2016, and is renewable for 2 additional 3 year periods after that. SMG's compensation is a flat fee of $135,000 for the first year and is then adjusted by the CPI for each successive year. There are also additional financial incentives based on various operational goals. SMG is responsible for all operations and financial reporting.
Additionally, SMG contributed a onetime capital infusion of $575,000, to be used for capital improvement, that will be amortized over the life of the first three-year contract term.
Both parties retain certain rights regarding operations and contract cessation.
81

IV. Other Information
A. Risk Management
CITY OF SOUTH BEND NOTES TO FINANCIAL STATEMENTS
(Continued)
The primary government is exposed to various risks of loss related to torts; theft of, damage to, and destruction of assets; errors, and omissions; job related illnesses or injuries to employees; medical benefits to employees, retirees , and dependents; and natural disasters.
The risks of torts; theft of, damage to, and destruction of assets; errors and omissions; and natural disasters are covered by commercial insurance from independent third parties. Settled claims from these risks have not exceeded commercial insurance coverage for the past three years. There were no significant reductions in insurance by major category of risk.
Liability Insurance
The primary government has chosen to establish a risk financing fund for risks associated with job related illnesses or injuries to employees, automobile liability, and comprehensive liability. The risk financing fund is accounted for in the Liability Insurance Premium Reserve Fund , an internal service fund, where assets are set aside for claim settlements. An excess policy through commercial insurance covers individual claims in excess of $300,000 per claim for job-related illnesses or injuries to employees (workers' compensation) and $100,000 per claim for damage to and destruction of assets (property damage). Two claims resulting from property damage exceeded commercial insurance coverage in the past three years. The first claim occurred during 2012 and the gross claim was $215,286. In 2013, a second claim was incurred at a loss of $248,094. A premium is charged to each fund based on a study of paid claims and based on the number of employees and percent of the total budget. Provisions are also made for unexpected and unusual claims.
Claim expenditures and liabilities of the fund are reported when it is probable that a loss has occurred and the amount of the loss can be reasonably estimated. These losses include an estimate of claims that have been incurred but not reported (IBNRs) . Claim liabilities are calculated considering the effects of inflation, recent claim settlement trends including frequency and amounts of pay outs and other economic and social factors . The entire insurance liability balance is reported as a current liability as the City has the intent to pay within one year.
Changes in the balance of claim liabilities during the past two years are as follows:
Unpaid claims, beginning of fiscal year Incurred claims and changes in estimates
Claim payments
Unpaid claims, end of fiscal year
82
2012 2013
$ 2,255,972 5,155,318
(1 ,826,814)
$ 5,584,476
$5,584,476 44,210
(2, 837, 552)
$2,791,134

Group Health Insurance
CITY OF SOUTH BEND NOTES TO FINANCIAL STATEMENTS
(Continued)
The primary government has chosen to establish a risk financing fund for risks associated with medical benefits of employees and their covered dependents. The risk financing fund is accounted for in the Self-Funded Employee Benefits Fund, an internal service fund, where assets are set aside for benefit costs. An excess policy through commerCial insurance covers individual claims in excess of $300,000 per year. One claim resulting from this risk exceeded commercial insurance coverage in the past three years. The claim occurred during 2011 and the gross claim cost was $564,932. A premium is charged to each fund based on the number of employees and estimated costs exceeding the employees' contributions. Provisions are also made for unexpected and unusual claims.
Claim expenditures and liabilities of the fund are reported when it is probable that a loss has occurred and the amount of the loss can be reasonably estimated. These losses include an estimate of claims that have been incurred but not reported (IBNRs) . Claim liabilities are calculated considering the effects of inflation, recent claim settlement trends including frequency and amounts of pay outs and other economic and social factors .
Changes in the balance of claim liabilities during the past two years are as follows:
Unpaid claims, beginning of fiscal year Incurred claims and changes in estimates Claim payments
Unpaid claims, end of fiscal year
2012
$ 789,961 12,192,449
(12,012,333)
2013
$ 970,077 13,583,715
(13,346,518)
$ 970,077 $ 1,207,274
The December 31 , 2013 unpaid claims include $1 ,107,274 reported as current liabilities and expected to be paid within the current year.
During 2005, the City's former employee medical benefits' administrator, Healthcare Resources Group (HRG) , failed to pay $1,111 ,899 in health care claims for City employees. The City had paid HRG for the claims. HRG was purchased by another business that filed bankruptcy. Asset distribution, which amounted to approximately 19 percent, was made in August 2012, but erroneously paid to St. Joseph County. In May 2013, the County paid the asset distribution to the City.
B. Subsequent Events
On December 20, 2013, the City entered into a five-year Lease and Management Agreement with the Potawatomi Zoological Society (PZS) for the purpose of transferring day-to-day operations of the City's zoo, located at Potawatomi Park , to the Society. The Agreement became effective on January 1, 2014. A concurrent agreement also transferred some employees who heretofore had been employed by the City to PZS. The agreement stipulates an annual compensatory contribution by the City to PZS for each year of the lease as follows:
83

CITY OF SOUTH BEND NOTES TO FINANCIAL STATEMENTS
(Continued)
Years
2014 2015 2016 2017 2018
Contribution
$ 900,000 850,000 800,000 700,000 700,000
There are credit provisions in place that will reimburse the City for a portion of these payments if annual zoo attendance attains certain levels. The payments will be made semiannually from the Parks and Recreation fund .
On April 21 , 2014, the City Controller filed with the South Bend Common Council a resolution to authorize the issuance of refunding bonds for the South Bend Redevelopment District to refund the District's Special Taxing District Bonds of 2002, with an outstanding principal amount of $3,405,000. The aggregate principal of the bonds is not to exceed $3,700,000 with maturity dates no later than 2022. It is anticipated that the refund ing will result in significant savings for the South Bend Redevelopment Commission . The Redevelopment Commission approved the resolution on April 24, 2014, and the Common Council approved theirs on April 28 , 2014. The bond sale is expected to take place in May 2014.
C. Conduit Debt Obl igation
From time to time, the primary government has issued industrial revenue bonds to provide financial assistance to private-sector entities for the ·acquisition and construction of industrial and commercial faci lities deemed to be in the publ ic interest. The bonds are secured by the property financed and are payable solely from payments received on the underlying mortgage loans. Upon repayment of the bonds, ownership of the acquired facil ities transfers to the private-sector entity served by the bond issuance. Neither the primary government, the State, nor any political subdivis ion , thereof is obligated in any manner for the repayment of the bonds. Accordingly, the bonds are not reported as liabilities in the accompanying financial statements.
As of December 31 , 2013, there were several series of industrial revenue bonds outstanding. The City has been unable to obtain the total outstanding principal amount for the outstand ing bonds. During 2013, the City approved no new industrial revenue bonds.
D. Other Post-Employment Benefits (OPEB)
Plan Description
The City of South Bend Retiree Healthcare Plan is a single-employer defined benefit healthcare plan admin istered by the City of South Bend, Department of Administration and Finance, through the City's self-insurance fund . The plan provides for medical insurance benefits to eligible reti rees and their spouses. Ind iana Code 5-10-8 gives the unit the authority to establish and amend the plan.
The City issues a publicly available financial report that includes financial statements and required supplementary information for the plan. The report is available by contacting the City Controller's office: 227 West Jefferson Blvd. Rm. 1200N, South Bend, IN 46601 , Ph. (574) 235-9216.
84

Funding Policy
CITY OF SOUTH BEND NOTES TO FINANCIAL STATEMENTS
(Continued)
The contribution requirements of plan members for the City of South Bend Retiree Healthcare Plan are established and can be amended by the City's Common Council. The required contribution is based on projected pay-as-you-go financing requirements. For the year ended December 31 , 2013, the City contributed $702,134 to the plan for current premiums. Police and Fire members receiving benefits contributed approximately 30 percent of the total premiums, through their required contribution of $133 per month for retiree-only coverage and $395 for retiree and spouse coverage. General employee members receiving benefits contributed approximately 1 00 percent of the total premiums, through their required contribution of $346 per month for retiree-only coverage and $912 for retiree and spouse coverage.
Annual OPEB Cost and Net OPEB Obligation
The City's annual Other Post-Employment Benefit (OPEB) cost (expense) is calculated based on the Annual Required Contribution (ARC) of the employer, an amount actuarially determined in accordance with the parameters of GASB Statement 45. The ARC represents a level of funding that, if paid on an ongoing basis, is projected to cover normal cost each year and amortize any unfunded actuarial liabilities (or funding excess) over a period not to exceed 30 years. The following table shows the components of the City's annual OPEB cost for the year, the amount actually contributed to the plan, and changes in the City's net OPEB obligation to the plan:
Annual Required Contribution $ 2,570,663 Interest on net OPEB obligation 294,270
Adjustment to annual required contribution (401 ,460)
Annual OPEB cost 2,463,473
Contributions made (702,134)
Increase in net OPEB obligation 1,761,339
Net OPEB obligation - beginning of year 6,539,338
Net OPEB obligation- end of year $ 8,300,677
The City's annual OPEB cost, the percentage of the annual OPEB cost contributed to the plan, and the net OPEB obligation for 2013 and the two preceding years were as follows:
Fiscal Annual Percentage of Net Year OPEB Annual OPEB OPEB
Ended Cost Cost Contributed Obligation
12-31-11 $ 1,948,993 36.1% $ 5,384,213 12-31-12 1,928,572 40.1% 6,539,338 12-31-13 2,463,473 28.5% 8,300,677
85

CITY OF SOUTH BEND NOTES TO FINANCIAL STATEMENTS
(Continued)
Funded Status and Funding Progress
As of January 1, 2013, the most recent actuarial valuation date, the plan was 0 percent funded. The actuarial accrued liability for benefits was $21,493,998, and the actuarial value of assets was $0, resulting in an Unfunded Actuarial Accrued Liability (UAAL) of $21,493,998. The covered payroll (annual payroll of active employees covered by the plan) was not available, and the ratio of the UAAL to covered payroll was not available.
Actuarial valuations of an ongoing plan involve estimates of the value of reported amounts and assumptions about the probability of occurrence of events far into the future. Examples include assumptions about future employment, mortality, and the healthcare cost trend . Amounts determined regarding the funded status of the plan and the annual required contributions of the employer are subject to continual revision as actual results are compared with past expectations and new estimates are made about the future.
Actuarial Methods and Assumptions
Projections of benefits for financial reporting purposes are based on the substantive plan (the plan as understood by the employer and the plan members) and include the types of benefits provided at the time of each valuation and the historical pattern of sharing of benefit costs between the employer and plan members to that point. The actuarial methods and assumptions used include techniques that are designed to reduce the effects of short-term volatility in actuarial accrued liabilities and the actuarial value of assets , consistent with the long-term perspective of the calculations.
In the January 1, 2013, actuarial valuation, the entry age actuarial cost method was used. The actuarial assumptions included a 4.5 percent investment rate of return (net of administrative expenses), which is a blended rate of the expected long-term investment returns on plan assets and on the employer's own investments calculated based on the funded level of the plan at the valuation date, and an annual healthcare cost trend rate of 9.0 percent initially, reduced by decrements to an ultimate rate of 5.0 percent after 10 years. Both rates included a 3.0 percent inflation assumption. The UAAL is being amortized as a level dollar amount based on an open group. The remaining amortization period at December 31 , 2013, was 22 years.
E. Pension Plans
1. Agent Multiple-Employer and Single-Employer Defined Benefit Pension Plans
a. Publ ic Employees' Retirement Fund
Plan Description
The primary government contributes to the Indiana Public Employees' Retirement Fund (PERF) , a defined benefit pension plan. PERF is an agent multiple-employer public employee retirement system, which provides retirement benefits to plan members and beneficiaries. All full-time employees are eligible to participate in the defined benefit plan.
86

CITY OF SOUTH BEND NOTES TO FINANCIAL STATEMENTS
(Continued)
State statutes (IC 5-10.2 and 5-10.3) govern, through the Indiana Public Retirement System (INPRS) Board, most requirements of the system and give the primary government authority to contribute to the plan. The PERF retirement benefit consists of the pension provided by employer contributions plus an annuity provided by the member's annuity savings account. The annuity savings account consists of member's contributions, set by state statute at three percent of compensation, plus the interest credited to the member's account. The employer may elect to make the contributions on behalf of the member.
INPRS administers the plan and issues a publicly available financial report that includes financial statements and required supplementary information for the plan as a whole and for its participants. The report is available and may be obtained by contacting:
Indiana Public Retirement System One North Capitol, Suite 001 Indianapolis, IN 46204 Ph. (888) 526-1687
Funding Policy and Annual Pension Cost
The contribution requirements of plan members for PERF are established by the Board of Trustees of INPRS. The primary government's annual pension cost and related information, as provided by the actuary, is presented in this note.
Information to segregate the assets/liabilities and the actuarial study figures between the primary government and the Utilities is not available . Therefore, the Net Pension Obligation is considered a liability of the primary government and is presented in the governmental activities of the financial statements and is not presented as a liability of the proprietary funds.
b. 1925 Police Officers' Pension Plan
Plan Description
The City contributes to the 1925 Police Officers' Pension Plan which is a single-employer defined benefit pension plan. The plan is administered by the local pension board as authorized by state statute (IC 36-8-6) . The plan provides retirement, disability, and death benefits to plan members and beneficiaries. The plan was established by the plan administrator, as provided by state statute. The plan administrator does not issue a publicly available financial report that includes financial statements and required supplementary information of the plan.
Funding Policy
Plan members are required by state statute (IC 36-8-6-4) to contribute an amount equal to 6 percent of the salary of a first class patrolman. The contribution requirements of plan members are established by state statute. The primary government's annual pension cost and related information , as provided by the actuary, is presented in this note. The Net Pension Obligation (NPO) is considered an obligation of the City and is reflected in
87

CITY OF SOUTH BEND NOTES TO FINANCIAL STATEMENTS
(Continued)
the Statement of Net Position. The State of Indiana is required by Statute to reimburse the City for benefits paid and has contributed $5,863,697 during 2013 on behalf of the City. The City has recognized these on-behalf payments as intergovernmental revenue and public safety expenditures in the general fund.
c. 1937 Firefighters' Pension Plan
Plan Description
The City contributes to the 1937 Firefighters' Pension Plan which is a single-employer defined benefit pension plan. The plan is administered by the local pension board as authorized by state statute (IC 36-8-7) . The plan provides retirement, disability , and death benefits to plan members and beneficiaries. The plan was established by the plan administrator, as provided by state statute. The plan administrator does not issue a publicly available financial report that includes financial statements and required -supplementary information of the plan.
Funding Policy
Plan members are required by state statute (IC 36-8-7 -8) to contribute an amount equal to 6 percent of the salary of a first class fireman . The contribution requirements of plan members are established by state statute. The primary government's annual pension cost and related information , as provided by the actuary, is presented in this note. The Net Pension Obl igation (NPO) is considered an obligation of the City and is reflected in the Statement of Net Position. The State of Indiana is required by Statute to reimburse the City for benefits paid and has contributed $5,035,292 during 2013 on behalf of the City. The City has recognized these on behalf payments as intergovernmental revenue and public safety expenditures in the general fund .
Actuarial Information for the Above Plans
1925 Police 1937 Officers' Firefighters'
PERF Pension Pension
Annual required contribution $ 2,758,541 $ 6,633,200 $ 5,550,900 Interest on net pension obligation 181 ,503 2,080,000 1,544,600 Adjustment to annual required contribution (211 ,272) (2,879,000) (2,137,900)
Annual pension cost 2,728,772 5,834,200 4,957,600 Contributions made 2,457,505 5,868,322 5,036,457
Increase (decrease) in net pension obligation 271,267 (34, 122) (78,857) Net pension obligation, beginning of year 2,688,937 34,667,265 25,743,816
Net pension obligation, end of year $ 2,960,204 $34,633,143 $ 25,664,959
88
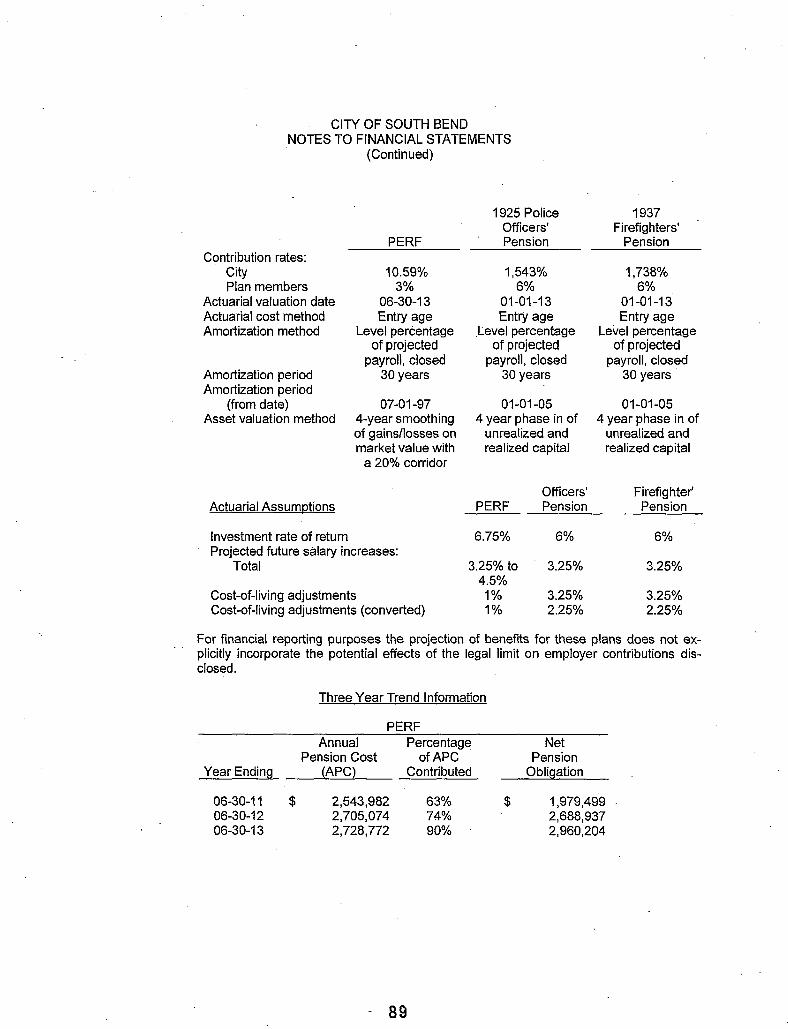
CITY OF SOUTH BEND NOTES TO FINANCIAL STATEMENTS
(Continued)
1925 Police Officers'
PERF Pension Contribution rates:
City 10.59% 1,543% Plan members 3% 6%
Actuarial valuation date 06~30~13 01~01-13
Actuarial cost method Entry age Entry age
1937 Firefighters'
Pension
1,738% 6%
01-01~13
Entry age Amortization method Level percentage .Level percentage Level percentage
of projected of projected of projected payroll, closed payroll, closed payroll, closed
Amortization period 30 years 30 years 30 years Amortization period
(from date) 07~01~97 01-01-05 01-01-05 Asset valuation method 4~year smoothing 4 year phase in of 4 year phase in of
of gains/losses on unrealized and unrealized and market value with realized capital realized capital
a 20% corridor
Officers' Firefighter' Actuarial Assumptions PERF Pension Pension
Investment rate of return 6.75% 6% 6% Projected future salary increases:
Total 3.25% to 3.25% 3.25% 4.5%
Cost-of-living adjustments 1% 3.25% 3.25% Cost~of-living adjustments (converted) 1% 2.25% 2.25%
For financial reporting purposes the projection of benefits for these plans does not explicitly incorporate the potential effects of the legal limit on employer contributions disclosed.
Three Year Trend Information
PERF Annual Percentage Net
Pension Cost ofAPC Pension Year Ending {A PC) Contributed Obligation
06~30-11 $ 2,543,982 63% $ 1,979,499 06-30-12 2,705,074 74% 2,688,937 06-30-13 2,728,772 90% 2,960,204
89

Year Ending
12-31-11 12-31-12 12-31-13
Year Ending
12-31-11 12-31-12 12-31-13
CITY OF SOUTH BEND NOTES TO FINANCIAL STATEMENTS
(Continued)
1925 Pol ice Officers' Pension Annual Percentage
Pensiori Cost ofAPC {A PC} Contributed
$ 6,726,600 96% $ 6,237,800 108% 5,834,200 101%
1937 Firefighters' Pension Plan Annual Percentage
Pension Cost ofAPC (APC) Contributed
$ 5,971 ,600 93% $ 5,239,700 100% 4,957,600 102%
Net Pension
Obligation
35,171 ,707 34,667,265 34,633,143
Net Pension
Obligation
25,739,227 25,743,816 25,664,959
Membership in the 1925 Police Officers' Pension Plan and the 1937 Firefighters' Pension Plan at January 1, 2013, was comprised of the following :
Retirees and beneficiaries currently receiving benefits
Terminated employees entitled to but not yet receiving benefits
Current active employees
1925 Police Officers' Pension
223
3
Funded Status and Funding Progress for the Above Plans
1937 Firefighters'
Pension
190
6
The funded status of each plan as of July 1, 2013, the most recent actuarial valuation date (except 1925 Police Officers' and 1937 Firefighters' pension funds which is as of January 1, 2013) is as follows :
Unfunded Actuar ia l AAL as a
Actuar ial Actuari al Accrued A nnual Percentage Valuation Value of Liabi li ty (AAL) Unfunded F unded Co~.ered of Co~.ered
Retirement Plan Date Plan Assets En~ Age AAL Rati o Pa:r: ro ll Pa:r:roll
PERF 06-30-13 s 22,259,873 s 40,791 ,780 $ (18,531 ,907) 54.6% $ 26,036,363 (71)% 1925 Police Officers' 01 - 01-13 2,310,522 78,787,400 (76.476,878) 2.9% 430,000 (17 ,7 85)% 1937 Firefighters' 01-01 - 13 1 ,348,330 66,057,700 (64, 709,370) 2. 0% 3 19,300 (20, 266)%
90

CITY OF SOUTH BEND NOTES TO FINANCIAL STATEMENTS
(Continued)
The Schedule of Funding Progress, presented as RSI for the above plans following the notes to the financial statements, presents multiyear trend information about whether the actuarial value of plan assets is increasing or decreasing over time relative to the actu-aria! accrued liability for benefits.
d. Financial Statements for Defined Benefit Plans
Statements of Fiduciary Net Position
1925 Police 1937 Officers' Firefighters' Pension Pension
Assets
Cash and cash equivalents $ 435,434 $ 239,066 Investments 1,270,283 697,421 Receivables:
Interest 1,845 1,018
Total assets 1,707,562 937,505
Liabilities
Accounts payable 12,000 Accrued payroll payable 620
Total liabilities 12,620
Net Position
Net Position held in trust for pension benefit obligations $ 1,707,562 $ 924,885
91

2.
CITY OF SOUTH BEND NOTES TO FINANCIAL STATEMENTS
(Continued)
Statements of Changes in Fiduciary Net Position
1925 Police 1937 Officers' Firefighters' Pension Pension
Additions:
Contributions: On behalf $ 5,863,697 $ 5,035,292 Plan members 881 Other 4,854
Total contributions 5,869,432 5,035,292
Investment income: Interest 2,355 1 '164
Total additions 5,871,787 5,036,456
Deductions:
Benefits and refunds paid to plan members and beneficiaries 6,463,447 5,458,690
Administrative expenses 11 ,300 1,212
Total deductions 6,474,747 5,459,902
Changes in net position (602 ,960) (423,446)
Net position- beginning 2,310 ,522 1,348,331
Net position - ending $ 1,707,562 $ 924,885
Cost-Sharing Multiple-Employer Defined Benefit Pension Plan
1977 Police Officers' and Firefighters' Pension and Disability Fund
Plan Description
The primary government contributes to the 1977 Police Officers' and Firefighters' Pension and Disability Fund, a cost-sharing multiple-employer defined benefit pension plan administered by the Indiana Public Employees' Retirement Plan (PERF) for all police officers and firefighters hired after April30 , 1977.
92

CITY OF SOUTH BEND NOTES TO FINANCIAL STATEMENTS
(Continued)
State statute (IC 36-8-8 and IC 36-8-8.5) regulates the operations of the system, including benefits, vesting and requirements for contributions by employers and by employees. Covered employees may retire at age 52 with 20 years of service. An employee with 20 years of service may leave service, but will not receive benefits until reaching age 52. The plan also provides for death and disability benefits.
PERF issues a publicly available financial report that includes financial statements and re- . quired supplementary information for the plan as a whole and for its participants. That report may be obtained by contacting :
Indiana Public Retirement System One North Capitol, Suite 001 Indianapolis, IN 46201 Phone(888)526-1687
Funding Policy and Annual Pension Costs
Plan members are required to contribute 6 percent of the first-class police officers' and firefighters' salary and the primary government is to contribute at an actuarially determined rate. The current rate, which has not changed since the inception of the plan, is 19.5 percent of the first-class police officers' and firefighters' salary. The contribution requirements of plan members and the primary government are established by the Board of Trustees of PERF. The primary government's contributions to the plan for the years ending December 31,2013, 2012, and 2011 were $4,189,100, $4,294,453 and $4,187,175, respectively , equal to the required contributions for each year.
93

CITY OF SOUTH BEND REQU IRED SUPPLEMENTARY INFORMATION
SCHEDULES OF FUNDING PROGRESS
Public Em~loyees' Retirement Fund Unfunded
Actuarial M Lasa Actuarial Accrued Percentage
Actuarial Value of Liability Unfunded Funded Covered of Covered Valuation Assets (ML) ML Ratio Payroll Payroll
Date (a) (b) (a-b) ~ (c) ((a-b)/c)
07-01-11 $ 23,111,685 $ 40,495,255 $ (17 ,383,570) 57% $ 25,613,579 (68%) 07-01-12 19,348,101 40,445,286 (21,097, 185) 48% 25,533,046 (83%) 07-01-13 22,259,873 40,791 ,780 (18 ,531,907) 55% 26,036,363 (71 %)
1925 Police Officers' Pension Plan
Unfunded Actuarial MLasa
Actuarial Accrued Percentage Actuarial Value of Liability Unfunded Funded Covered of Covered Valuation Assets (ML) ML Ratio Payroll Payroll
Date (a) (b) (a-b) ~ {c) ((a-b)/c)
01-01-08 $ 3,522,332 $ 85,203,100 $ (81 ,680,768) 4.13% $ 652,500 (12,518%) 01-01 -09 2,549,705 80,233,300 (77,683,595) 3.18% 611,000 (12,714%) 01 -01-10 2,809, 527 86,097,800 (83 ,288,273) 3.26% 569,500 . (14,625%) 01-01-11 2,367,050 89,947,300 (87,580,250) 2.63% 542,900 (16,132%) 01 -01-12 2, 166,759 84,884,700 (82,717,941) 2.55% 421,800 (19,611 %)
«> 01 -01-13 2,310,522 78,787,400 (76 ,476,878) 2.93% 430,000 (17,785%) ~
1937 Firefighters' Pension Plan Unfunded
Actuarial M Lasa Actuarial Accrued Percentage
Actuarial Value of Liability Unfunded Funded Covered of Covered Valuation Assets (ML) AAL Ratio Payroll Payroll
Date (a) (b) _ (a-b) ~ (c) ((a-b)/c)
01-01-07 $ 1,624,421 $ 66,072,400 $ (64 ,447,979) 2.46% $ 1,338,200 (4,816%) 01-01-08 2,968,691 58,489,000 (55,520,309) 5.08% 519,400 (10,689%) 01-01-09 2,285, 165 70,369,900 (68,084,735) 3.25% 474,450 (14,350%) 01-01-10 2,162,207 74,950,900 (72,788,693) 2.88% 429,500 (16,947%) 01-01-11 1,815,026 79,076,500 (77,261 ,474) 2.30% 397,100 (19,456%) 01-01-12 1,718,166 70,308,800 (68 ,590,634) 2.44% 365,500 (18,766%) 01-01-13 1,348,330 66,057,700 (64, 709,370) 2.04% 319,300 (20,266%)
Other Postem~loyment Benefits
Unfunded Actuarial Mlasa
Actuarial Accrued Percentage Actuarial Value of Liability Unfunded Funded Covered of Covered Valuation Assets (ML) AAL Ratio Payroll Payroll
Date (a) (b) (a-b) ~ (c) ((a-b)/c)
01-01-11 $ - $ 17,641,023 $ (17,641,023) 0.00% n/a n/a 01 -01-12 18,649,906 (18,649,906) 0.00% n/a n/a 01-01-13 21 ,493,998 (21 ,493,998) 0.00% nla n/a
nla - Not applicable
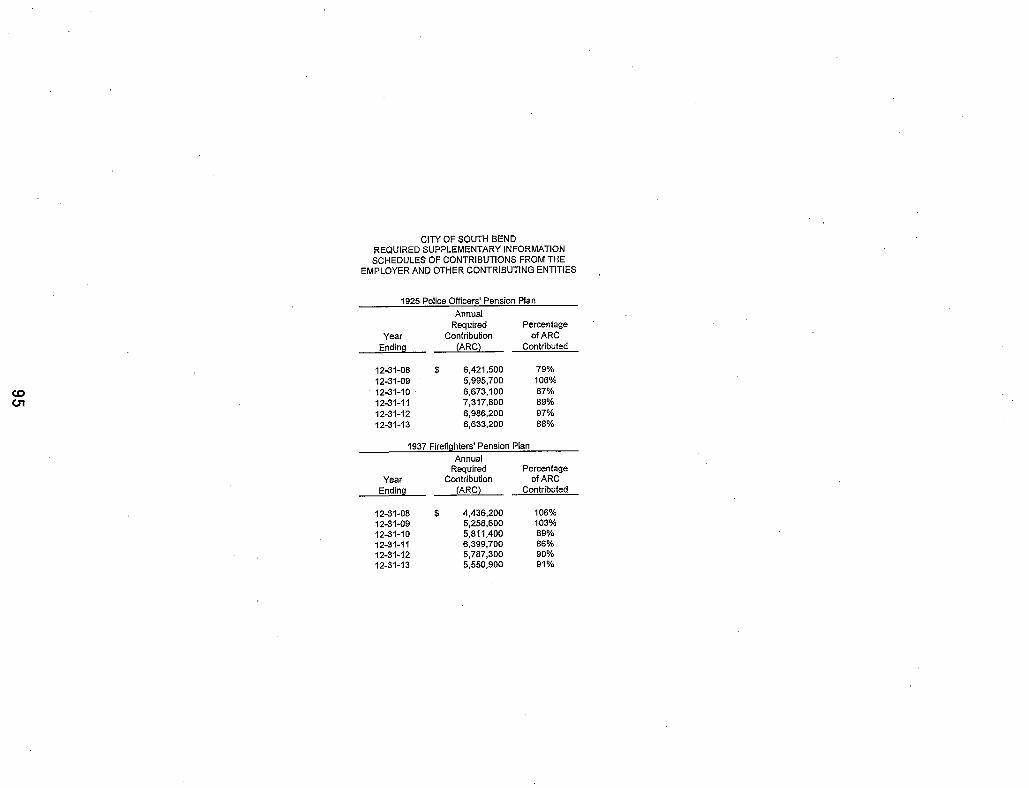
(0
c.n
CITY OF SOUTH BEND REQUIRED SUPPLEMENTARY INFORMATION SCHEDULES OF CONTRIBUTIONS FROM THE
EMPLOYER AND OTHER CONTRIBUTING ENTITIES
1925 Police Officers' Pension Plan
Year Ending
12-31-08 12-31-09 12-31-10 ' 12-31-11 12-31-12 12-31-13
$
Annual Required
Contribution (ARC)
6,421,500 5,995,700 6,673,100 7,317,800 6,986,200 6,633,200
Percentage of ARC
Contributed
79% 106% 87% 89% 97% 88%
1937 Firefighters' Pension Plan
Annual Required Percentage
Year Contribution of ARC Ending __ (ARC) Contributed
12-31-08 $ 4,436,200 106% 12-31-09 5,258,600 103% 12-31-10 5,811,400 89% 12-31-11 6,399,700 86% 12-31-12 5,787,300 90% 12-31-13 5,550,900 91%

co en
CITY OF SOUTH BEND REQUIRED SUPPLEMENTARY INFORMATION
BUDGETARY COMPARISON SCHEDULESGENERAL FUND AND MAJOR SPECIAL REVENUE FUNDS
For the Year Ended December 31,2013
Revenues: Taxes:
Property Licenses and permits lniergovemmental Charges for services Fines and forfeits Other
Total revenues
Expenditures: Current:
General Government: Mayor
Personnel services Supplies Other services and charges
Mayor· 311 Call Center Personnel services Supplies Other services and charges Capital ouHay
City Clerk Personnel services Supplies Other services and charges Capital ouHay
Common Council Personnel services Supplies Other services and charges Capital outlay Other uses
General Fund
Actual Budgetary
Bud!leted Amounts Basis
Ori~ Final Amounts
$ . 39,000,000 $ 39,000,000 $ 36,251,397 872,375 872,375 919,293
8,348,731 8,011,557 8,532,351 3,434,263 3,434,263 3,415,823
25,920 25,920 34,307 4,486,415 4,486,415 4,674,394
56,167,704 55,830,530 53,827,565
522,002 530,849 509,868 32,200 54,067 52,362 48,469 109,313 79,262
269,102 269,102 256,411 2,500 18,900 10,076
28,500 32,100 11,224 20,000
280,655 280,655 269,202 7,988 21,488 15,327
60,338 62,936 42,165 13,400 91 -
289,758 289,758 189,822 11,512 17,802 13,983
181,736 181,736 145,116 24,000 23,999 -
2,102 2,102
Variance With Final
Budget Positive
(Ne!Jative)
$ {2,748,603) 46,918
520,794 (18,440)
8,387 187,979
(2,002,965)
20,981 1,705
30,051
12,691 8,824
20;876
11,453 6,161
20,771 91
99,936 3,819
36,620 23,999
2,102
(Continued on next page)

(0 ......
CITY OF SOUTH BEND REQUIRED SUPPLEMENTARY INFORMATION
BUDGETARY COMPARISON SCHEDULESGENERAL FUND AND MAJOR SPECIAL REVENUE FUNDS
For the Year Ended December 31, 2013 (Continued)
Expenditures (continued): Current (continued):
General Government (continued): Administration/Finance
Personnel services Supplies Other services and charges
. City Attorney Personnel services Supplies Other services and charges
Human Rights Personnel services Supplies Other services and charges Capital outlay
Energy Office Other services and charges
Neighborhood Code Enforcement Personnel services Supplies Other services and charges Other uses Capital outlay
Code Hearing Officer Supplies Other services and charges
Total General Government
Public Safety: Police Department
Personnel services Supplies Other services and ~;:harges Capital outlay
General Fund
Budgeted Amounts Original ~
1,606,388 1,535,638 49,000 50,301
168,683 291,789
959,774 949,774 8,684 21,700
53,992 56,992
256,834 256,834 3,861 3,861
82,542 82,542 3,000 3,000
- 54,256
929,883 983,883 74,686 89,607
967,329 987,329 52,000 52,000
158,000 158,000
- 4 40 000 40,395
7,208,918 7,512,803
20,376,883 19,569,883 369,052 927,988
2,621,877 3,319,109 280,000 228,396
Actual Budgetary
Basis Amounts
1,493,377 41,741
278,143
819,999 21,510 54,280
241,726 3,710
68,619 -
54,256
920,598 85,818
865,890 52,000 71,482
4 38,973
6,706,944
19,287,913 857,880
2,916,947 159,181
Variance With Final
Budget Positive
(Negative)
42,261 8,560
13,646
129,775 190
2,712
15,108 151
13,923 3,000
63,285 3,789
121,439
86,518
1,422
805,859
281,970 70,108
402,162 69,215
(Continued on next page)

co (X)
CITY OF SOUTH BEND REQUIRED SUPPLEMENTARY INFORMATION
BUDGETARY COMPARISON SCHEDULESGENERAL FUND AND MAJOR SPECIAL REVENUE FUNDS
For the Year Ended December 31, 2013 (Continued)
Expenditures (continued): Current (continued):
Public Safety (continued): Police- PS LOIT Funded
Personnel services Communication Center
Personnel services Supplies Other services and charges
Fire Department Personnel services Supplies Other services and charges Other uses
Fire - PS LOIT Funded Personnel services
Junk Vehicle Personnel services Supplies Other services and charges
Animal Control Personnel services Supplies Other services and charges
Total Public Safety
Highways and Streets: Engineering
Personnel services Supplies Other services and charges
Street Department Supplies Other services and charges
Total Highways and Streets
General Fund
Budgeted Amounts Original ~
3,968,567
2,127,777 4,029
24,519
18,539,016 381,726
1,589,653 8,088
3,133,190
54,065 1,082
10,682
436,947 60,552 91~
54,079,044
637,072 16,394
701,652
1,355,118
3,893,567
2,123,012 4,029
24,519
18,550,680 398,387
1,660,128
3,131,690
53,666 1,232
10,682
423,607 66,364
106,140
54,493,079
633,572 22,124
737,865
110,148 1,667
1,505,376
Actual Budgetary
Basis Amounts
3,758,871
2,036,925 1,868
22,420
18,390,072 387,719
1,444,032
3,098,215
23,695 833
7,876
397;129 59,442 96,431
52,947,449
613,116 19,401
677,876
108,173 1,363
1,419,929
Variance With Final
Budget Positive
(Negative)
134,696
86,087 2,161 2,099
160,608 10,668
216,096
33,475
29,971 399
2,806
26,478 6,922 9,709
1,545,630
20,456 2,723
59,989
1,975 304
85,447
(Continued on next page)

co co
CITY OF SOUTH BEND REQUIRED SUPPLEMENTARY INFORMATION
BUDGETARY COMPARISON SCHEDULESGENERAL FUND AND MAJOR SPECIAL REVENUE FUNDS
For the Year Ended December 31,2013 (Continued)
Expenditures (continued): Current (continued):
Culture and Recreation: Palais Royale Ballroom
Personnel services Supplies Other services and charges Capital outlay
Morris Performing Arts Center Personnel services Supplies Other services and charges
Total Culture and Recreation
Economic Development Unsafe Building
Other services and charges
Total Economic Development
Total expenditures
Other financing sources (uses):
Transfers in
Net change in fund balances
Fund balances - beginning
Fund balances - ending $
General Fund
Budgeted Amounts Original ~
226,174 226,174 14,700 21,130
195,924 245,526 30,400
652,134 652,134 28,550 30,346
324,532 351,320
1,472,414 1,526,630
107,684 53,684
107,684 53,684
64,223,178 65,091,572
8,101,757 8,101,757
46,283 (1,159,285)
28,205,848 28,205,848
28,252,131 $ 27,046,563
Actual Budgetary
Basis Amounts
205,555 10,363
206,340
632,829 23,433
290,231
1,368,751
26,052
26,052
62,469,125
7,857,086
(784,474)
28,205,848
$ 27,421,374 $
Variance With Final
Budget Positive
(Negative)
20,619 10,767 39,186
19,305 6,913
61,089
157,879
27,632
27,632
2,622,447
(244,671)
374,811
374,811
(Continued on next page)

CITY OF SOUTH BEND REQUIRED SUPPLEMENTARY INFORMATION
BUDGETARY COMPARISON SCHEDULES-GENERAL FUND AND MAJOR SPECIAL REVENUE FUNDS
For the Year Ended December 31, 2013 (Continued)
Park and Recreation Fund
Variance
Actual With Final Budgetary Budget
Budgeted Amounts Basis Positive
~ina I Final Amounts (Negativ"}
Revenues: Taxes:
Property $ 7,800,000 $ 7,800,000 $ 7,207,060 $ (592,940)
Intergovernmental 1,292,887 1,229,090 1,315,849 86,759
Charges for services 3,1 46,140 3,146,140 3,083,133 (63,007)
Fines and forfe its 1,000 1,000 5,160 4,160
Other 186,099 186,099 157,003 (29,096) __. 0 Total revenues 12,426,126 12,362,329 11,768,205 (594,1 24)
0 Expfi'nditures:
Current: Culture and recreation:
Personnel services 7,991,934 7,836,634 7,609,507 227,127
Supplies 1 ,493,191 1,909,353 1,829,410 79,943
Other services and charges 2,341,267 2,689,081 2,611 ,986 77,095
Capi tal outlay 753,885 351,895 348,562 3,333
Total expenditures 12,580,277 12,786,963 12,399,465 387,498
Other financing sources (uses):
Transfers out (190,500) (230,500) (209,824) 20,676
Net change in fund balances (344,651) (655,134) (841 ,084) (185,950)
Fund balances- beginning 4,885,352 __ 4_,885,352 4,885,352
Fund balances - ending $ 4,540,701 $ 4,230,218 $ 4,044,268 $ (185,950}
(Continued on next page}

...I.
0 ...I.
CITY OF SOUTH BEND REQUIRED SUPPLEMENTARY INFORMATION
BUDGETARY COMPARISON SCHEDULESGENERAL FUND AND MAJOR SPECIAL REVENUE FUNDS
For the Year Ended December 31, 2013 (Continued)
Revenues: Taxes:
County option income tax $ Other
Total revenues
Other financing sources (uses): Transfers in Transfers out
Total other financing sources (uses)
Net change in fund balances
Fund balances - beginning
Fund balances- ending $
Public Safety LOIT Fund
Budgeted Amounts
Original ~
6,056,334 $ 5,892,386 8,000 8,000
6,064,334 5,900,386
- -(7,101,757) (7, 101 ,757)
(7,101,757) (7,101 ,757)
(1 ,037,423) (1,201,371)
2,989,940 _1,989,940
1,952,517 $ 1,788,569
$
$
Actual Budgetary
Basis
Amounts
5,892,386 6,954
5,899,339
683,303 (7,540,389)
(6,857,086)
(957,746)
2,989,940
2,032,194
$
$
Variance With Final
Budget Positive
(Negative)
(1,046)
(1,046)
683,303 (438,632)
244,671
243,625
243,625
(Continued on next page)

CITY OF SOUTH BEND REQUIRED SUPPLEMENTARY INFORMATION
BUDGETARY COMPARISON SCHEDULES-GENERAL FUND AND MAJOR SPECIAL REVENUE FUNDS
For the Year Ended December 31, 2013 (Continued)
COlT Fund Variance
Actual With Final Budgetary Budget
Budgeted Amounts Basis Positive
___Q!:!S.inal Final Amounts (Negative)
Revenues: Taxes:
County option income $ 7,691,991 $ 7,846,940 $ 7,846,939 $ (1)
Other 885,932 928,832 662,117 (266,715)
Total revenues 8,577,923 8,775,772 8,509,056 (266;716) ...I.
0 Expenditures: N Current:
General government: Supplies 1,138,808 1,476,918 1,229,333 247,585
Other services and charges 5,970,478 7,086,055 6,895,285 190,770
Capital outlay 791,755 678,562 349,186 329,376
Other uses - - - -
Total expenditures 7·,901,041 9,241,535 8,473,805 767,730
Other financing sources (uses):
Transfers out (676,882) (676,882) (676,882)
Net change in fund balances - (1 '142,645) (641,631) 501,014
Fund balances - beginning 15,327,002 15,327,002 15,327,002
Fund balances- ending $ 15,327,002 $ 14,184,357 $ 14,685,372 $ 501,014
(Continued on next page)

CITY OF SOVTH BEND REQUIRED SUPPLEMENTARY INFORMATION
BUDGETARY COMPARISON SCHEDULES-GENERAL FUND AND MAJOR SPECIAL REVENUE FUNDS
For the Year Ended December 31, 2013 (Continued)
EDIT Fund Valiance
Actual With Final Budgetary Budget
Budgeted Amounts Basis Positive
~inal Final Amounts (Negative)
Revenues: Taxes:
County economic development income tax $ 8,324,626 $ 8,177,352 $ 8,177,352 $ Other 554,660 ~660 607,726 53,066
....I.
0 Total revenues 8,879,286 8,732,012 8,785,078 53,066
(A) Expenditures:
General government: Other services and charges 4,213,119 4,571,389 4,266,813 304,576
Capital outlay . 4,471 4,471
Other uses - -Total expenditures 4,213,119 4,575,860 4,266,813 309,D47
Other financing sources (uses): Transfers out (4,417,519) (4,417,519) (4,417,519)
Net change in fund balances 248,648 (261,367) 100,746 362,113
Fund balances- beginning 9,984,411 9,984,411 9,984,411
Fund balances - ending $ 10,233,059 $ 9,723,044 $ 10,085,157 $ 362,113

..... 0 ~
CITY OF SOUTH BEND REQUIRED SUPPLEMENTARY INFORMATION
BUDGET/GMP RECONCILIATION GENERAL FUND AND MAJOR SPECIAL REVENUE FUNDS
For the Year Ended December 31,2013
The major differences between budgetary (Non-GMP) basis and GMP basis are:
a. Revenues are recorded when received in cash (budgetary} as opposed to susceptible to accrual (GMP). ·
b. Expenditures are recorded when paid in cash (budgetary) as opposed to when the liability is incurred (GMP).
c. Encumbrances are recorded as expenditures for budgetary purposes when purchase orders are issued .
Adjustments necessary to convert the results of operations at the end of the year on a budgetary basis to a GMP basis are as follows:
Park and Public Safety General Recreation LOIT COlT EDIT
Net change in fund balances (budgetary basis} $ (764,474} $ (641,064} $ (957,746) $ (641,631} $ 100,746
Adjustments: To adjust revenues for accruals (1 ,471,787) (122,661) (3,900} (4,389} (2,852,909) To adjust expenditures for accruals 303,993 119,056 (235,645} (559,280} 2,788,087 To adjust expenditures for encumbrances 826,098 216,349 - g20,263 7§6,971
Net change in fund balances (GMP basis) $ (1,126,170) $ (628,3<!0) $ {1, 197,291) $ (!)85,037) $ 792,895
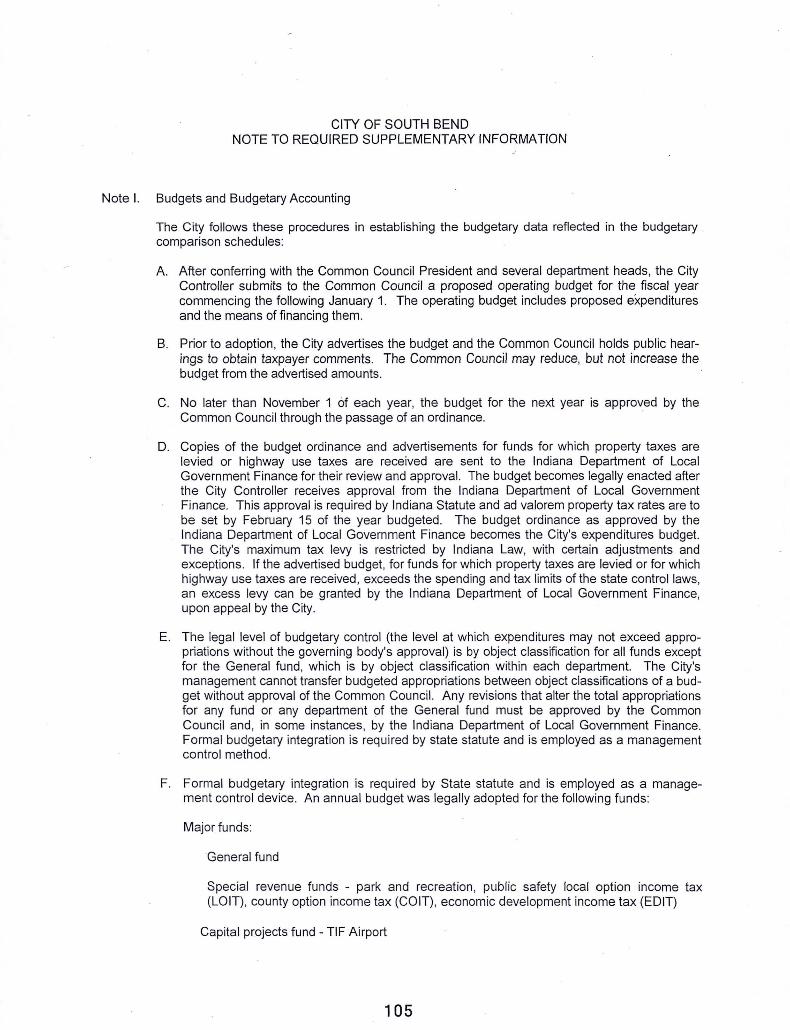
CITY OF SOUTH BEND NOTE TO REQUIRED SUPPLEMENTARY INFORMATION
Note I. Budgets and Budgetary Accounting
The City follows these procedures in establishing the budgetary data reflected in the budgetary . comparison schedules:
A. After conferring with the Common Council President and several department heads, the City Controller submits to the Common Council a proposed operating budget for the fiscal year commencing the following January 1. The operating budget includes proposed expenditures and the means of financing them.
B. Prior to adoption , the City advertises the budget and the Common Council holds public hearings to obtain taxpayer comments. The Common Council may reduce, but not increase the budget from the advertised amounts.
C. No later than November 1 of each year, the budget for the next year is approved by the Common Council through the passage of an ordinance. ·
D. Copies of the budget ordinance and advertisements for funds for which property taxes are levied or highway use taxes are received are sent to the Indiana Department of Local Government Finance for their review and approval. The budget becomes legally enacted after the City Controller receives approval from the Indiana Department of Local Government Finance. This approval is required by Indiana Statute and ad valorem property tax rates are to be set by February 15 of the year budgeted. The budget ordinance as approved by the Indiana Department of Local Government Finance becomes the City's expenditures budget. The City's maximum tax levy is restricted by Indiana Law, with certain adjustments and exceptions. If the advertised budget, for funds for which property taxes are levied or for which highway use taxes are received, exceeds the spending and tax limits of the state control laws, an excess levy can be granted by the Indiana Department of Local Government Finance, upon appeal by the City.
E. The legal level of budgetary control (the level at which expenditures may not exceed appropriations without the governing body's approval) is by object classification for all funds except for the General fund, which is by object classification within each department. The City's management cannot transfer budgeted appropriations between object classifications of a budget without approval of the Common Council. Any revisions that alter the total appropriations for any fund or any department of the General fund must be approved by the Common Council and, in some instances, by the Indiana Department of Local Government Finance. Formal budgetary integration is required by state statute and is employed as a management control method.
F. Formal budgetary integration is required by State statute and is employed as a management control device. An annual budget was legally adopted for the following funds:
Major funds:
General fund
Special revenue funds - park and recreation , public safety local option income tax (LOIT) , county option income tax (COlT) , economic development income tax (EDIT)
Capital projects fund - TIF Airport
105
CITY OF SOUTH BEND NOTE TO REQUIRED SUPPLEMENTARY INFORMATION
(Continued)
Nonmajor governmental funds:
Special revenue funds - motor vehicle highway, recreation non-reverting, Studebaker Oliver revitalization grants, economic development State grants, DCI operating , community investment grants, police state seizure, juvenile positive assistance, law enforcement continuing education, loss recovery, local road and street, excess welfare distribution , human rights-federal, East Race waterway, Morris ancj Palais marketing, police block grants, economic development commission , hazmat, Indiana river rescue, COPS block grant II , regional police academy, COPS MORE grant, federal drug enforcement, gift , urban development action grant, leaf collection and removal, police K-9 unit, rainy day
Debt service fund - College Footbal l Hall of Fame debt service, redevelopment bond -airport taxable, Coveleski bond debt service reserve, redevelopment bond - Palais Royale
Capital projects funds - emergency medical services , professional sports development, Coveleski stadium capital, zoo endowment, park non-reverting capital , cumulative capital development, cumulative capital improvement, Morris Performing Arts Center capital , TIF downtown, TIF Leighton Plaza, TIF - West Washington , redevelopment general, community revitalization enhancement district, TIF No. 1 -southside development, TIF No. 3-southside development, TIF -central medical service area, Football Hall of Fame capital , Major Moves, TIF - northeast development, TIF Douglas road, TIF northeast residential , certified technology park, Palais Royale historic preservation, airport urban enterprise zone
G. The City's budgetary process is based upon cash outflows, which is a Non-GAAP basis. Appropriations lapse with the expiration of the budgetary period unless encumbered by a purchase order or contract. Encumbered appropriations are carried over and added to the subsequent year's budget.
H. Budgeted amounts are as originally adopted, or as amended by the Common Council and approved by the Indiana Department of Local Government Finance in the regular legal manner. The net effect of individual amendments to the budget increased the original appropriations by $24,097,397 in 2013.
I. Expenditures did not exceed appropriations for any funds or any departments within the General fund which required legally approved budgets.
106

Ill Government Funds
107

NONMAJOR GOVERNMENTAL FUNDS
Special Revenue Funds
Motor Vehicle Highway-
Recreation Non-Reverting -
Studebaker/Oliver Revitalization Grants-
Economic Development State Grants -
DCI Operating-
Community Investment Grants-
Police State Seizure-
Juvenile Positive Assistance -
Law Enforcement Continuing Education -
Loss Recovery -
Emergency Telephone System-
Local Road and Street-
To account for street construction and the operations of the street maintenance department. Financing is provided by state motor vehicle highway distributions.
To account for fees and related expenses from park department activities.
To account for expenditures related to the Studebaker and Oliver revitalization projects. Financing is provided by federal and state grants and loans from other organizations.
To account for expenditures related to projects promoting economic development. Financing is provided by state grants and loan payments. Expenditures include grants and related expenses.
To account for the operating expenditures related to the South Bend Department of Community Investment. Financing will be provided by revenues received from charges for services, other revenue sources, and from fund transfers.
To account for revenues received from the U.S. Department of Housing and Urban Development related to community improvement projects.
To account for law enforcement expenditures financed by the authorized state or local agencies' sale of confiscated property.
To account for monies received from penalties paid for curfew violations. Expenditures include Drug Abuse Resistance Education and Juvenile Aid Bureau .
To account for police fees collected to finance police officers' continuing education , training , and supplies and equipment.
To account for compensatory or exemplary damage payments from third parties arising from loss or damage to City tangible or intangible property.
To account for 9-1-1 revenues from the county as well as state grants
To account for operation and maintenance of local and arterial road and street systems. Financing is provided by state gasoline tax distributions.
108

Excess Welfare Distribution -
Human RightsFederal-
East Race Waterway-
Morris and Palais Marketing -
Police Block Grants -
Economic Development Commission -
Hazmat-
Indiana River Rescue-
COPS Block Grant II -
Regional Police Academy-
COPS MORE Grant-
Federal Drug Enforcement -
Gift-
Urban Development Action Grant-
NONMAJOR GOVERNMENTAL FUNDS (Continued)
To account for a special distribution from the County that can only be spent on public safety expenditures.
To account for expenditures to prevent discrimination and to promote human rights. Financing is provided by federal grants.
To account for donations for the promotion and development of the East Race Waterway.
To account for marketing and promotion expenditures. financed by spon
sorship solicitations and donations.
To account for federal grants which provide financing for police activities.
To account for administrative expenditures of the Economic Development Commission. Financing is provided by fees from businesses applying for Economic Development Revenue Bonds.
To account for monies generated by the South Bend Fire Department's response to hazardous materials incidents. Funds are used to purchase, repair, or replace haz-mat equipment, or for training and supplies .
To account for expenditures related to river rescue training. Financing is provided by registration fees.
To account for federal grants which provide financing for police activities.
To account for revenues (tuition) and expenditures (seminars, travel, lectures, and career days) related to the advancement of present and future police officers .
To account for a COPS MORE grant which provides financing for police activities.
To account for expenditures for drug enforcement. Financing is provided by distributions from the authorized federal agencies' confiscated property sale .
To account for donations, gifts, or bequeaths for purposes designated by the donor.
To account for economic development expenditures which are financed by federal grants and loan repayments.
109

Leaf Collection and Removal-
Police K-9 Unit -
Rainy Day-
Industrial Revolving-
Debt Service Funds
College Football Hall of Fame Debt Service-
Redevelopment Bond -Airport Taxable-
Coveleski Bond Debt Service Reserve -
Redevelopment Bond -Palais Royale
Redevelopment Authority Debt Service -
NONMAJOR GOVERNMENTAL FUNDS (Continued)
-- ------ ----------
To account for the expenditures of a program to remove leaves from the City each fall. Financing is provided by a monthly service fee charged to all City residents .
To account for donations for development and maintenance of the K-9 unit.
To account for unused and unencumbered funds that are transferred from a fund that has a tax levy. Revenues in this fund also include special distributions of county option income tax (COlT) and county economic development income tax (CEDIT) .
To account for the revenue and expenditures of providing special loans to qualifying local firms. Financing was originally provided by a $5,000,000 Economic Adjustment Assistance Grant from the U.S. Department of Commerce.
To accumulate monies for the payment of Redevelopment Authority bonds issued to refinance bonds issued for construction of the College Football Hall of Fame. Financing is to be provided by an annual property tax levy.
To accumulate monies as a reserve for the payment of Redevelopment Authority bonds for the airport taxable project.
To accumulate monies as a reserve for the payment of the Coveleski Stadium recovery zone economic development bonds. Financing for debt payments is to be provided by professional sports and convention development area taxes (PSCDA) and county option income tax revenues if PSCDA revenues are insufficient.
To accumulate monies as a reserve for the payment of Redevelopment Authority bonds for the Palais Royale project.
To accumulate monies for the payment of Redevelopment Authority bonds issued to refinance bonds issued for construction of a parking garage facility, bonds issued for central development area land acquisition and construction of public improvements, bonds issued to purchase the Palais Royale, bonds issued to refinance bonds issued for construction of Century Center improvements, and bonds issued to refinance bonds issued for renovations to the Morris Performing Art Center.
110

South Bend Building Corporation Debt Service-
TIF Erskine Village Debt Service -
NONMAJORGOVERNMENTALFUNDS (Continued)
To account for debt retirement of the Building Corporation's Mortgage Bonds. Funding is provided by transfers from other City funds.
To account for Erskine Village project debt retirement of the south side tax incremental financing (TIF) district. -Financing is provided by transfers from the TIF South Side Development fund.
Capital Projects Funds
Emergency Medical Services-
Professional Sports Development -
Coveleski Stadium Capital-
Zoo Endowment -
Park Non-Reverting Capital-
Cumulative Capital Development -
Cumulative Capital Improvement -
Morris Performing Art Center Capital -
To account for purchases of necessary equipment for the Fire Department and Emergency Medical Services Department. Financing is provided by ambulance fees.
To account for Hotel/Motel Tax and Professional Sports Development Tax revenues dedicated towards the College Football Hall of Fame. Based on an agreement with the National Football Foundation (NFF), the City pays the NFF to assist with the operation and capital costs.
To account for expenditures related to the maintenance and improvement of the baseball stadium. Financing is provided by a rental paid by the semi-pro baseball team.
To account for construction projects at the City's zoo. Financing is provided by gifts and donations.
To account for specific revenues used to finance capital improvements at the City parks.
To account for expenditures relating to the purchase or lease of capital improvements in the City. Financing is provided by a specific property tax levy.
To account for state cigarette tax distributions used for improvement projects.
To accumulate monies for major repairs and capital improvements to the Morris Civic Auditorium. .Financing is provided by a surcharge on ticket sales for events held at the auditorium.
111

Tax Incremental Financing (TIF)- Downtown -
Tax Incremental Financing (TIF)- Leighton Plaza-
Tax Incremental Financing (TIF)- West Washington-
Redevelopment General -
Community Revitalization Enhancement District -
Tax Incremental Financing (TIF) No. 1 -Southside Development -
Tax Incremental Financing (TIF) No. 3 -Southside Development -
Tax Incremental Financing (TIF)- Central Medical Service Area -
NONMAJOR GOVERNMENTAL FUNDS (Continued)
To account for expenditures for public improvements in the central business tax incremental district. Also, transfers are made to debt service funds to meet debt obligations as they mature. Financing is provided by property tax proceeds in excess of those attributable to the assessed valuation of the property in the district before redevelopment.
To account for expenditures for public improvement projects in the Leighton Plaza tax incremental district. Financing is provided by property tax proceeds in excess of those attributable to the assessed value of the property in the district before redevelopment.
To account for expenditures for public improvement projects in the West Washington Economic Development Area. Financing is provided by property tax proceeds in excess of those attributable to the assessed value of the property in the district before redevelopment.
To account for eligible redevelopment activities in the Studebaker Corridor financed by proceeds from land sales or leases.
To account for public improvements in the Studebaker/Oliver Community Revitalization Enhancement District. Financing is provided by income tax and gross retail tax increments in the district.
To account for expenditures for improvements in the Southside Development Tax incremental district no. 1. Financing is provided by property tax proceeds in excess of those attributable to the assessed valuation of the property in the district before redevelopment.
To account for expenditures for improvements in the Southside Development Tax incremental district no. 3. Financing is provided by property tax proceeds in excess of those attributable to the assessed valuation of the property in the district befor-e redevelopment.
To account for expenditures for public improvements in the central business tax incremental district, medical service area. Financing is provided by property tax proceeds in excess of those attributable to the assessed valuation of the property in the district before redevelopment.
112

Football Hall of Fame Capital-
Major Moves -
Tax Incremental Financing (TIF)- Northeast Development -
Tax Incremental Financing (TIF) -Douglas Road-
Tax Incremental Financing (TIF)- Northeast Residential -
Certified Technology Park -
Palais Royale Historic Preservation-
Airport Urban Enterprise Zone-
Equipment Leasing -
NONMAJOR GOVERNMENTAL FUNDS (Continued)
To account for capital expenditures for the College Football Hall of Fame. Financing was provided by a transfer from the City's Professional Sports Development fund . This fund also accounts for the advance from the General fund which may be repaid from future operating surpluses.
To account for .state distributions used for road construction and other uses authorized by Indiana statute.
To account for expenditures for improvements in the northeast development tax incremental district. Financing is provided by property tax proceeds in excess of those attributable to the assessed valuation of the property in the district before redevelopment.
To account for expend itures for improvements in the Douglas Road development tax incremental district. Financing is provided by property tax proceeds in excess of those attributable to the assessed valuation of the property in the district before redevelopment.
To account for expenditures for improvements in the Northeast Neighborhood Residential development tax incremental district. Financing is provided by property tax proceeds in excess of those attributable to the assessed valuation of the property in the district before redevelopment
To account for expenditures related to acqu isition , improvements, construction and maintenance of public facilities, debt service and other permitted uses under Indiana Code 36-7-32-23 in connection with a certified technology park. Financing is provided by property tax proceeds, state gross retail and uses taxes, and other revenues.
To account for expenditures financed by a 2 percent fee charged for all Palais Royale services .
To account expenditures for improvements in the Zone area, financed by property taxes on qualifying properties in the Zone.
To account for proceeds from cap.ital lease-purchase agreements used to finance major equipment needs of the City.
113

CITY OF SOUTH BEND COMBINING BALANCE SHEET-
NONMAJOR GOVERNMENTAL FUNDS December 31, 2013
Special Revenue
Studebaker
Motor Oliver Economic Community
Vehicle Recreation Revitalization Development DCI Investment
Hiehwa:t Nonreverting Grants State Grants Operating Grants
Assets
Cash and cash equivalents $ 937,790 $ 198,328 $ 276,090 $ 88,927 $ 231,221 $ 150,397
Cash with fiscal agent - - - . - -Investments 2,735,795 578,581 805,433 259,424 674,534 438,750
Receivables (net of allowances for uncollectibles): Interest 3,959 834 1,161 388 975 704
Taxes - - - . - -Accounts 5,232 6,972 - . 3,050 105,009
Intergovernmental 386,597 - - . . -Loans - . - 482,021 - 340,477
lnterfund receivable: lnterfund services provided and used - 1,487
Advances to other funds - - 500,000
Property held for sale - . 3,551 - 3,155,452
......
...... Total assets $ 4,069,373 $ 786,202 $ 1,586,235 $ 830,760 $ 909,780 $ 4,190,789
.J:=o
Liabilities and Fund Balances
Liabilities: Accounts payable $ 105,146 $ 9,425 $ - $ . $ 9,973 $ 203,083
Accrued payroll payable 138,460 7,485 - - 62,301
lnterfund payable: lnterfund services provided and used 598 - . - - 15,765
· Other current payables - . - - 3,592
Advances from other funds
Total liabilities 244,204 16,910 - . 72,274 222,440
Fund balances: Nonspendable:
Property held for resale - 3,551 . - 3,155,452
Restricted 3,825,169 769,292 1,082,684 830,760 - 812,897
Committed - 500,000 . -Assigned - - - . 837,506
Unassigned
Total fund balances 3,825,169 769,292 1,586,235 830,760 837,506 3,968,349
Total liabilities and fund balances $ 4,069,373 $ 786,202 $ 1,586,235 $ 830,760 $ 909,780 $ 4,190,789
(Continued on next page)

CITY OF SOUTH BEND COMBIN ING BALANCE SH EET-
NONMAJOR GOVERNMENTAL FUNDS December 31,2013
(Continued)
S~ecia l Revenue
Law Juvenile Enforcement Emergency
Police Positive Continuing Loss Telephone State Se izure Assistance Education Recove!Y ~stem
Assets
Cash and cash equivalents $ 40,435 $ 2,943 $ 250,056 $ 2,022,421 $ Cash wi th fiscal agent Investments 117,959 8,585 729,482 5,899,962 Receivables (net of allowances for uncollectibles):
Interest 170 12 1,05 1 8,503 Taxes Accounts 16,384 Intergovernmental 215,000 Loans
lnterfund receivable: lnterfund services provided and used
Advances to other funds Property held for sale
__. __.
Total assets $ 158,564 $ 11,540 $ 996,973 $ 7,930,886 $ 215,000 c.n
Liabili ties and Fund Balances
Liabilities: Accounts payable $ - $ - $ 40 $ 11 ,958 $
Accrued payroll payable lnterfund payable:
lnterfund services provided and used Other current payables Advances from other funds
Total liabilit ies 40 ___ 1_1,958
Fund balances: Nonspendable:
Property held for resale Restricted 158,564 996,933 215,000 Committed 11,540 7,918,928 Assigned Unassigned
Total fund balances 158,564 11 ,540 996,933 7,918,928 ~.ooo
Total liabilities and fund balances $ 158,564 $ 11 ,540 $ 996,973 $ 7,930,886 ~000
(Continued on nex1 page)

CITY OF SOUTH BEND COMBINING BALANCE SHEET-
NONMAJOR GOVERNMENTAL FUNDS December 31, 2013
(Continued)
S~ecial Revenue
Excess Morris and
Local Road Welfare Human Rights East Race Palais
and Street Distribution Federal Waterwa~ Marketing
Assets
Cash and cash equivalents $ 494,740 $ 293 $ 118,953 $ 3,663 $ 7,132
Cash with fiscal agent - - - - -Investments 1,443,295 855 347,019 10,685 20,806
Receivables (net of allowances for uncollectibles): Interest 2,080 1 501 15 30
Taxes Accounts Intergovernmental 86,900
Loans lnterfund receivable:
lnterfund services provided and used Advances to other funds Property held for sale
......
...... Total assets $ 2,027,015 $ 1,149 $ 466,473 $ __ 14,363 $ 27,968
en
Liabilities and Fund Balances
Liabilities: Accounts payable $ 31,522 $ - $ 6,347 $ - $
Accrued payroll payable - - 3,629
lnterfund payable: lnterfund services provided and used
Other current payables Advances from other funds
Total liabilities 31,522 9,976
Fund balances: Nonspendable:
Property held for resale Restricted 1,995,493 1,149 456,497
Committed - - . 14,363 27,968
Assigned Unassigned
Total fund balances 1,995,493 1,149 456,497 14,363 27,968
Total liabilities and fund balances $ 2,027,015 $ 1,149 $ 466,473 $ 14,363 $ 27,968
(Continued on next page)

CITY OF SOUTH BEND COMBINING BALANCE SHEET-
NONMAJOR GOVERNMENTAL FUNDS December 31, 2013
(Continued)
Special Revenue
Police Economic Block Development Indiana COPS Block
~Is Commission Hazmat River Rescue Grant II
Assets
Cash and cash equivalents $ 973 $ 6,913 $ 4,130 $ 24,393 $ 52,117
Cash with fiscal agent - - - - -Investments 2,838 20,168 12,049 71,161 152,040
Receivables (net of allowances for uncollectibles): Interest 4 29 17 103 210
Taxes Accounts Intergovernmental Loans
lnterfund receivable: lnterfund services provided and used
Advances to other funds Property held for sale
......
...... Total assets _$ __ 3_,815 $ 27,110 $ 16,196 $ 95,657 $ 204,367
-.1
Liabilities and Fund Balances
Liabilities: Accounts payable · $ - $ - $ - $ 1,259 $
Accrued payroll payable lnterfund payable:
lnterfund services provided and used Other current payables Advances from other funds
Total liabilities - - - 1,259
Fund balances: Nonspendable:
Property held for resale Restricted 3,815 - - - 204,367
Committed - 27,110 16,196
Assigned - - 94,398
Unassigned
Total fund balances 3,815 27,110 16,196 94,398 204,367
Total liabilities and fund balances $ 3,815 $ 27,110 $ 16,196 $ 95,657 $ 204,367
(Continued on next page)

CITY OF SOUTH BEND COMBINING BALANCE SHEET-
NON MAJOR GOVERNMENTAL FUNDS December 31, 2013
(Continued)
S~ecial Revenue
Regional Urban
Police COPS MORE Federal Drug Development
Academy Grant Enforcement Gift Action Grant
Assets
Cash and cash equivalents $ 17,350 $ 28,884 $ 385,160 $ 19,045 $ 7,030
Cash with fiscal agent Investments 50,617 84,264 55,560 20,509
Receivables (net of allowances for uncollectibles): Interest 73 121 91 80 30
Taxes Accounts 2,250 30
Intergovernmental Loans 1,768,852
lnterfund receivable: lnterfund services provided and used
Advances to other funds Property held for sale
_., _., Total assets $ 70.290 $ 113,299 $ 385,251 $ 74,685 $ 1,796,421
00
Liabilities and Fund Balances
Liabilities : Accounts payable $ 136 $ - $ 2,044 $ $
Accrued payroll payable lnterfund payable:
lnterfund services provided and used Other current payables Advances from other funds 2,027,973
Total liabilities 136 2,044 2,027,973
Fund balances: Nonspendable:
Property held for resale· Restricted 113,299 383,207 74,685 1,768,852
Committed 70,154
Assigned Unassigned (2,000,404)
Total fund balances 70,154 113,299 383,207 74,685 (231 ,552)
Total liabilities and fund balances $ .70,290 $ 113,299 $ 385,251 $ 74,685 $ 1,796,421
(Continued on nex1 page)

CITY OF SOUTH BEND COMBIN ING BALANCE SHEET-
NON MAJOR GOVERNMENTAL FUNDS December31, 2013
(Continued)
S ecial Revenue
Leaf Collection Police Industrial
and Removal K-9 Unit Rain~ Da~ Revolving Totals
Assets
Cash and cash equivalents $ 239,187 $ 335 $ 2,196,138 $ 2,674,180 $ 10,479,224 Cash with fiscal agent Investments 697,776 976 6,406,744 21,645,867 Receivables (net of allowances for uncollectibles):
Interest 1,005 2 9,233 7,450 38,832 Taxes Accounts 37,154 - 176,081 Intergovernmental . 688,497 Loans 4,419,860 7,01 1,210
lnterfund receivable: lnterfund services provided and used 1,487
Advances to other fu nds 500,000 Property held for sale 97,800 3,256,803
..... ..... Total assets $ 975,122 $ 1,31 3 $ 8,612,115 $ 7,199,290 $ 43,798,00 1 co
Liabilities and Fund Balances
Liabili ties: Accounts payable $ - $ - $ $ 4,218 $ 385,151 Accrued payroll payable 1,309 213,184 lnterfund payable:
lnterfund services provided and used 16,363 Other current payables 3,592 Advances from other funds 2,027,973
Total liabilities 1,309 4,218 2,646,263
Fund balances: Nonspendable:
Property held for resale 97,800 3,256,803 Restricted 7,097,272 20,789,935 Committed 8,586,259 Assigned 973,813 1,313 8,612,115 10,519,145 Unassigned (2,000,404)
Total fund balances 973,813 1,313 8,612,115 7,195,072 41 ,151,738
Total liabilities and fund balances $ 975,122 $ 1,313 $ 8,612,115 $ 7,199,290 $ 43,798,001
(Continued on next page)
- -

...... N 0
Assets
Cash and cash equivalents Cash with fiscal agent Investments
CITY OF SOUTH BEND COMBINING BALANCE SHEET
NON MAJOR GOVERNMENTAL FUNDS December 31,2013
(Continued)
Debt Service
Redevelopment Coveleski College Football
Hall of Fame Debt Service
Bond- Bond Airport Debt Service
Taxable Reserve
Redevelopment BondPalais Royale
$ 185,046 $ 264,755 $ 128,305 $ 442,362
530,371 772,362 374,301 1,290,492
Receivables (net of allowances for uncollectibles): 540 1,860 Interest
Taxes Accounts Intergovernmental Loans
lnterfund receivable: lnterfund services provided and used
Advances to other funds Property held for sale
Total assets
Liabilities and Fund Balances
Liabilities: Accounts payable Accrued payroll payable lnterfund payable:
lnterfund services provided and used Other current payables Advances from other funds
Total liabilities
Fund balances: Nonspendable:
Property held for resale Restricted Committed Assigned Unassigned
Total fund balances
T otalliabilities and fund balances
$
$
$
732 6,349
722,498 $
- $
722,498
722,498
722,498 $
980
1,038,097 $ 503,146 1,734,714
- $ - $
223
223
1,038,097 503,146 1,734,491
1,038,097 503,146 1,734,491
1,038,097 $ 503,146 $ 1,734,714
(Continued on next page)

......
"' ......
Assets
Cash and cash equivalents Cash with fiscal agent Investments
CITY OF SOUTH BEND COMBINING BALANCE SHEET
NON MAJOR GOVERNMENTAL FUNDS December 31, 2013
(Continued)
Debt Service
Redevelopment Authority
Debt Service
South Bend Building
Corporation Debt Service
$ 3,980,899 $ 595,831 $
TIF Erskine Village
Debt Service
561,102 $
Totals
'6,158,300
2,967,526
Receivables·(net of allowances for uncollectibles): 6 4,118
6,349 Interest Taxes Accounts Intergovernmental Loans
lnterfund receivable: lnterfund services provided and used
Advances to other funds Property held for sale
Total assets
Liabilities and Fund Balances
Liabilities: Accounts payable · , Accrued payroll payable lnterfund payable:
lnterfund services provided and used Other current payables Advances from other funds
Total liabilities
Fund balances: Nonspendable:
Property held for resale Restricted Committed Assigned Unassigned
Total fund balances
Total liabilities and fund balances
$ 3,980,899 $ 595,831 $ 561,108 ·$ 9,136,293
$ - $ - $ - $
223
223
3,980,899 595,831 561,108 9-,136,070
3,980,899 595,831 561,108 9,136,070
$ 3,980,899 $ 595,831 $ 561,108 $ 9,136,293
(Continued on next page)
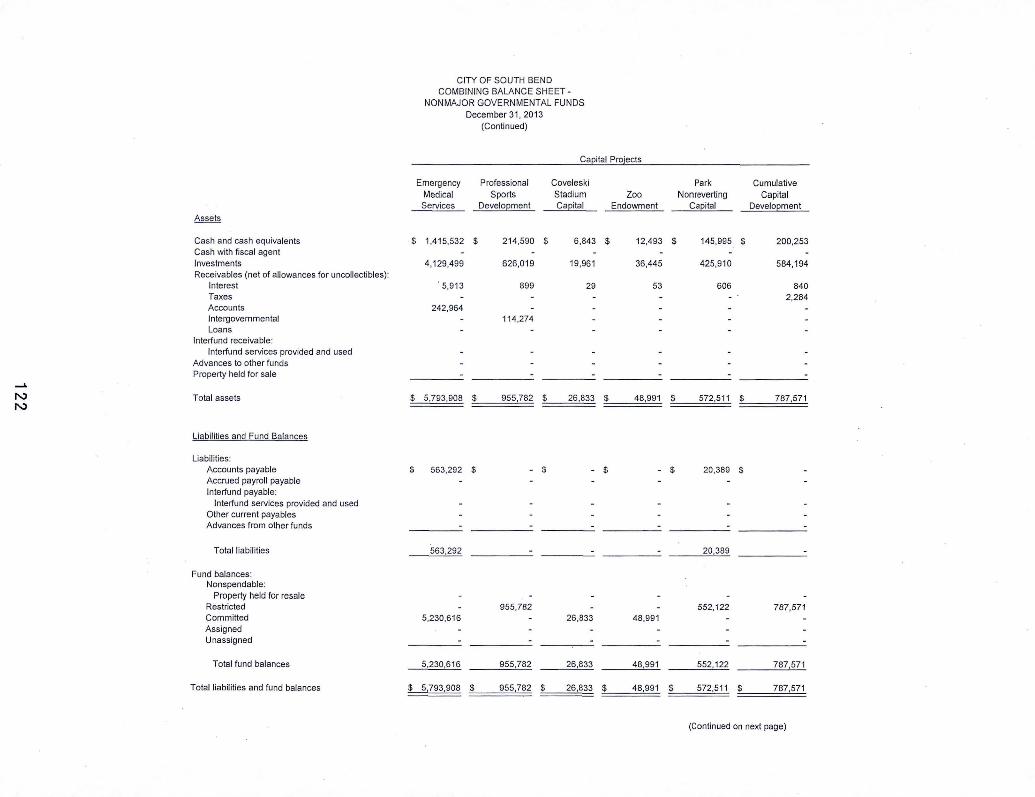
CITY OF SOUTH BEND COMBIN ING BALANCE SHEET-
NON MAJOR GOVERNMENTAL FUNDS December 31 , 2013
(Continued)
Ca~ital Projects
Emergency Professional Coveleski Park Cumulative Medical Sports Stadium Zoo Nonreverting Capital Services Develo~ment Ca~ita l Endowment Ca~ital Develo~ment
Assets
Cash and cash equivalents $ 1,415,532 $ 214,590 $ 6,843 $ 12,493 $ 145,995 $ 200,253 Cash with fiscal agent Investments 4,129,499 626,019 19,961 36,445 425,910 584,194 Receivables (net of allowances for uncollectibles):
Interest . 5,913 899 29 53 606 840 Taxes 2,284 Accounts 242,964 Intergovernmental 114,274 Loans
lnterfund receivable: lnterfund services provided and used
Advances to other funds Property held for sale _..
N Total assets $ 5,793,908 $ 955,782 $ 26 ,833 $ 48,991 $ 572,511 $ 787,571 N
Liabilities and Fund Balances
Liabilities: Accounts payable $ 563,292 $ - $ - $ - $ 20,389 $
Accrued payroll payable lnterfund payable:
lnterfund services provided and used Other current payables Advances from other funds
Total liabilities ~292 - 20,389
Fund balances: Nonspendable:
Property held for resale Restricted 955,782 552,122 787,571 Committed 5,230,616 26,833 48,991 Assigned Unassigned
Total fund balances 5,230,616 955,782 26,833 48,991 552,122 787,571
Total liabilities and fund balances $ 5,793,908 $ 955,782 $ 26,833 $ 48,991 $ 572,511 $ 787,571
(Continued on next page)

CITY OF SOUTH BEND COMBIN ING BALANCE SHEET-
NONMAJOR GOVERNMENTAL FUNDS December 31, 2013
(Continued)
Ca~ital Projects Morris
Cumulative Performing TIF Capital Arts Center TIF Leighton T IF - West Redevelopment
lm~rovement Ca~ital Downtown Plaza Washington Genera l
Assets
Cash and cash equivalents $ 45,036 $ 116,414 $ 663,725 $ 22,618 $ 156,207 $ 6,561 Cash with fiscal agent 50,162 Investments 131 ,384 339,611 1,936,270 65,985 455,700 19,142 Receivables (net of allowances for uncollectibles):
Interest 189 489 2,761 95 649 27 Taxes 982,818 62,044 Accounts 3,705 2,192 Intergovernmental Loans 683,474
lnterfund receivable: lnterfund services provided and used 223
Advances to other funds Property held for sale 5,399,940 436,690
__, N Total assets $ 176,609 $ 460,219 $ 9,669,211 $ 141 ,052 $ 1,11 1,290 $ 25,730 w
Liabilities and Fund Balances
Liabilities: Accounts payable $ - $ - $ 54,059 $ - $ 319 $ 6,072 Accrued payroll payable lnterfund payable:
lnterfund services provided and used 3,150 Other current payables 12,273 Advances from other funds
Total liabilities 57,209 12,273 319 6,072
Fund balances: Nonspendable:
Property held for resale 5,399,940 436,690 Restricted 176,609 4,212,062 128,779 674,281 Committed 460,219 Assigned 19,658 Unassigned
Total fund balances 176,609 460,219 9,612,002 128,779 1,110,971 19,658
Total liabilities and fund balances $ 176,609 $ 460,219 $ 9,669,211 $ 141 ,052 $ 1,111,290 $ 25,730
(Continued on next page)

CITY OF SOUTH BEND COMBINING BALANCE SHEET -
NON MAJOR GOVERNMENTAL FUNDS December 31,2013
(Continued)
Caeital Projects
Community TIF-Central Revitalization TIF No.1- TIF No. 3 - Medical Football
Enhancement Southside Southside Service Hall of Fame
District Develoement Development Area Capital
Assets
Cash and cash equivalents $ 9,537 $ 876,561 $ 1,632,913 $ 823,749 $ 167,789
Cash with fiscal agent Investments 2,557,171 4,763,660 2,403,103 489,486
Receivables (net of allowances for uncollectibles): Interest 30 3,671 6,844 3,448 705
Taxes 83,236 800,613
Accounts Intergovernmental Loans
lnterfund receivable: lnterfund services provided and used
Advances to other funds Property held for sale 105,000
........
"" Total assets $ 114,567 $ 3,520,639 $ 6,403.417 $ 4,030,913 $ 657,980
~
Liabilities and Fund Balances
Liabilities: Accounts payable $ - $ 81 ,949 $ 656 $ 1,701,457 $ 445
Accrued payroll payable lnterfund payable:
lnterfund services provided and used 687
Other current payables Advances from other funds - 656,848
Total liabilities 81 ,949 656 1,701 ,457 657,980
Fund balances: Nonspendable:
Property held for resale 105,000
Restricted 9,567 3,438,690 6,402,761 2,329,456
Committed Assigned Unassigned
Total fund balances 114,567 3,438,690 6,402,761 2,329,456
Total liabilities and fund balances $ 114,567 $ 3,520,639 $ 6,403,417 $ 4,030,913 $ 657,980
(Continued on nex1 page)

CITY OF SOUTH BEND COMBINING BALANCE SHEET-
NONMAJOR GOVERNMENTAL FUNDS December 31,2013
(Continued)
Ca~ital Projects
Certified Major TIF - Northeast TIF TIF- Northeast Technology Moves Develo12ment Douglas Road Residential Park
Assets
Cash and cash equivalents $ 1,820,553 $ 766,761 $ 75,076 $ 650,882 $ 938,474 Cash with fiscal agent - - - - -Investments 5,311,057 2,236,854 219,018 1,898,804 2,737,788 Receivables (net of allowances for uncollectibles):
Interest 7,655 3,211 310 2,707 3,945 Taxes - 253,587 - 214,435 Accounts Intergovernmental Loans
lnterfund receivable: lnterfund services provided and used
Advances to other funds 5,912,837 Property held for sale
--1.
N Total assets $ 13,052,102 $ 3,260,413 $ 294,404 $ 2,766,828 $ 3,680,207 (11
Liabilities and Fund Balances
Liabilities: Accounts payable $ 29,594 $ 616 $ 160 $ - $ Accrued payroll payable lnterfund payable:
lnterfund services provided and used Other current payables Advances from other funds - - 923,829 4,989,008 -
Total liabilities 29,594 616 923,989 4,989,008
Fund balances: Nonspendable:
Property held for resale Restricted 7,109,671 3,259,797 - - 3,680,207 Committed 5,912,837 Assigned -Unassigned - - (629,585) (2,222, 1 BO)
Total fund balances 13,022,508 3,259,797 (629,585) {2,222,.180) 3,680,207
Total liabilities and fund balances $ 13,052,102 $ 3,260,413 $ 294,404 $ 2,766,828 $ 3,680,207
(Continued on next page)

CITY OF SOUTH BEND COMBINING BALANCE SHEET-
NON MAJOR GOVERNMENTAL FUNDS December 31, 2013
(Continued)
Caeital Projects Total
Palais Royale Airport Urban Non major
Historic Enterprise Equipment Governmental
__E!:eservation Zone Leasing Totals Funds
Assets
Cash and cash equivalents $ 13,607 $ 95,915 $ 431,603 $ 11,309,687 $ 27,947,211
Cash with fiscal agent - - - 50,162 50,162
Investments 39,690 279,810 - 31,706,561 56,319,954
Receivables (net of allowances for uncollectibles): Interest 57 434 - 45,567 88,517
Taxes - - - 2,399,017 2,405,366
Accounts 1,758 - - 250,619 426,700
Intergovernmental - - - 114,274 802,771
Loans - - - 683,474 7,694,684
lnterfund receivable: lnterfund services provided and used - - - 223 1,710
Advances to other funds - - - 5,912,837 6,412,837
Property held for sale - - - 5,941,630 9,198,433 __. N Total assets $ 55,112 $ 376,159 $ 431,603 $ 58,414,051 $ 111,348,345 0')
Liabilities and Fund Balances
Liabilities: Accounts payable $ - $ - $ - $ 2,459,008 $ 2,844,159
Accrued payroll payable - - - - 213,184
lnterfund payable: lnterfund services provided and used - - - 3,837 20,423
Other current payables _, - - 12,273 15,865
Advances from other funds - - - 6,569,685 8,597,658
Total liabilities - - - 9,044,803 11,691,289
Fund balances: Nonspendable:
Property held for resale - - - 5,941,630 9,198,433
Restricted - - 431,603 34,148,958 64,074,963
Committed 55,112 376,159 - 12,110,767 20,697,026
Assigned - - 19,658 10,538,803
Unassigned - - - (2, 851 '765) (4,8~~,1~9)
Total fund balances 55,112 376,159 431,603 49,369,248 99,657,056
Total liabilities and fund balances $ 55,112 $ 376,159 $ 431,603 $ 58,414,051 $ 111,348,345

CITY OF SOUTH BEND COMBINING STATEMENT OF REVENUES, EXPENDITURES, AND OTHER CHANGES IN FUND BALANCES -
NONMAJOR GOVERNMENTAL FUNDS For the Year Ended December 31,2013
Seecial Revenue Studebaker
Motor Oliver Economic Community Vehicle Recreation Revitalization Development DCI Investment Highwa~ Nonreverting Grants State Grants Operating Grants
Revenues: Taxes:
Property $ - $ $ - $ - $ Professional sports development Community revi talization enhancement district
Intergovernmental 4,924.283 467,180 4,099,370 Charges for services 451,013 889,028 306,605
Fines and forfeits Interest 7,468 1,610 2,081 17,740 1,522 1,335 Donations Sale of property 8,786 Other 17,259 74,427 79,606 747 436,398
Total revenues ~809 965,065 2,081 97,346 776,054 4,537,103
Expenditures: Current:
General government Public safety Highways and streets 7,584,403
..... Economic development 1 2,168,088 4,893,418
"' Culture and recreation 885,429
....... Debt service: Principal 110,844 402,633
Interest and fiscal charges 6,711 42,600 Bond issuance costs
Capital outlay: General government Public safety Highways and streets Economic development Culture and recreation
Total expenditures 7,701,958 885,429 1 445,233 2,168,088 4,893,418
Excess (deficiency) of revenues over (under) expenditures (2,293, 149) 79,636 2,080 (347,887) (1 ,392,034) (356,315)
Other financing sources (uses): Transfers in 3,626,882 1,717,519 Transfers out Debt issuance 5,559
Premium (Discount) on debt issuance Issuance of refunding bonds Payment to refunded bond escrow agent
Total other financing sources and uses 3,632.441 1,717,519
Net change in fund balances 1,339,292 79,636 2,080 (347,887) 325,485 (356,315)
Fund balances - beginning (restated) 2,485,877 689,656 1,584,155 1,178,647 512,021 4,324,664
Fund balances - ending $ 3,825,169 $ 769,292 $ 1,586,235 $ 830,760 $ 837.506 $ 3,968,349
(Continued on next page)
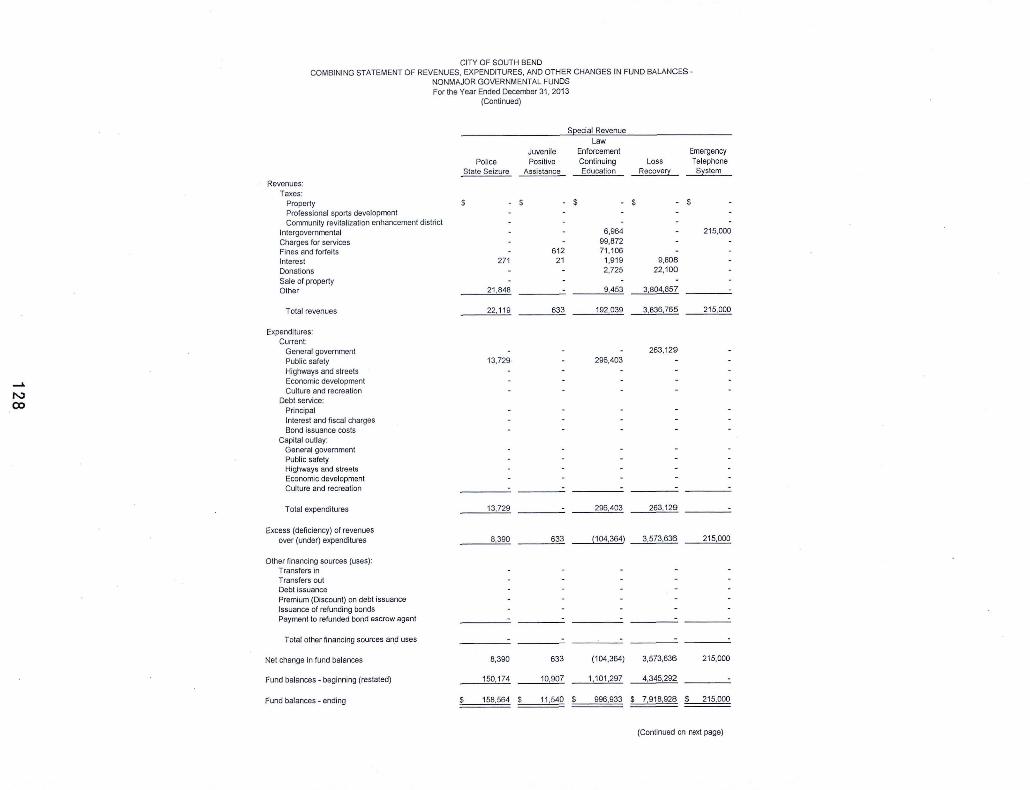
CITY OF SOUTH BEND COMBINING STATEMENT OF REVENUES, EXPENDITURES, AND OTHER CHANGES IN FUND BALANCES-
NONMAJOR GOVERNMENTAL FUNDS For the Year Ended December 31. 2013
(Continued)
S ~?:ecia l Revenue Law
Juvenile Enforcement Emergency
Police Positive Continuing Loss Telephone State Seizure Assistance Education RecoveSl _§ystem
Revenues: Taxes:
Property $ - $ - $ - $ - $
Professional sports development Community revitalization enhancement district
Intergovernmental 6,964 215,000
Charges for services 99,872 Fines and forfeits 612 71,106 Interest 271 21 1,919 9,808
Donations 2,725 22,100
Sale of property Other 21,848 9.453 3,804,857
Total revenues ___ 2_2,1 19 633 192,039 3,836,765 215,000
Expenditures: Current:
General government 263,129
Public safety 13,729 · 296.403
Highways and streets
~ Economic development
N Culture and recreation
(X) Debt service: Principal Interest and fiscal charges Bond issuance costs
Capital outlay: General government Public safety Highways and streets Economic development Culture and recreation
Total expenditures 13,729 296.403 263,129
Excess (deficiency) of revenues over (under) expenditures 8,390 633 (104,364) 3,573,636 215,000
Other financing sources (uses): Transfers in Transfers out Debt issuance Premium (Discount) on debt issuance Issuance of refunding bonds Payment to refunded bond escrow agent
Total other financing sources an_d uses
Net change in fund balances 8,390 633 (104,364) 3,573,636 215,000
Fund balances - beginning (restated) 150,174 10,907 1,101,297 ~292
Fund balances - ending $ 158,564 $ 11 ,540 $ 996,933 $ 7,918,928 $ 215,000
(Continued on next page)

CITY OF SOUTH BEND COMBINING STATEMENT OF REVENUES, EXPENDITURES, AND OTHER CHANGES IN FUND BALANCES·
NONMAJOR GOVERNMENTAL FUNDS For the Year Ended December31, 2013
(Continued)
S~ecial Revenue
Excess Morris and Local Road Welfare Human Rights East Race Palais
2r!!! Street Distribution Federal Waterway Marketing
Revenues: Taxes:
Property $ - $ - $ - $ - $
Professional sports development Community revitalization enhancement district
Intergovernmental 1,005,803 146,650
Charges for services - 7,010
Fines and forfeits Interest 3,514 2 873 28 53
Donations Sate of property Other 825 ___ 2~9,890
Total revenues 1,010,142 2 177,413 28 7,063
Expenditures: Current:
General government 202,243
Public safety Highways and streets 804,041
...... Economic development
I') Culture and recreation 5,842
co Debt service: · Principal Interest and fiscal charges Bond issuance costs
Capital outlay: General government Public safety Hlghwa~s and streets Economic development Culture and recreation
Total expenditures 804,041 202,243 - 5,842
Excess (deficiency} of revenues over(under) expenditures 206,101 2 (24,830j 28 1,221
Other financing sources (uses}: Transfers In Transfers out Debt issuance Premium (Discount) on debt issuance Issuance of refunding bonds Payment to refunded bond escrow agent
Total other financing sources and uses
Net change in fund balances 206,101 2 (24,830) 28 1,221
Fund balances -beginning (restated} 1,789,392 1,147 481,327 14,335 __ l2l47
Fund balances - ending $ 1,995,493 $ 1149 $ 456,497 $ 14,363 $ 27,968
(Continued on next page)

CITY OF SOUTH BEND COMBINING STATEMENT OF REVENUES, EXPENDITURES, AND OTHER CHANGES IN FUND BALANCES-
NONMAJOR GOVERNMENTAL FUNDS For the Year Ended December 31, 2013
(Continued)
S ecial Revenue
Police Economic Block Development Indiana COPS Block
___Qrants Commission Hazmat River Rescue Grant II
Revenues: Taxes:
Property Professional spor:ts development Community·revitalization enhancement district
Intergovernmental 162,838
Charges for services 16,722 65,700
Fines and forfeits Interest 7 52 27 203
Donations Sale of property Other
Total revenues 7 52 16,749 65,903 162,838
Expenditures: Current:
General government Public safety 3,238 72,274 56,672
Highways and streets
~ Economic development
w Culture and recreation
0 Debt service: Principal Interest and fiscal charges Bond issuance costs
Capital oullay: General government Public safety Highways and streets Economic development Culture and recreation
Total expenditures 3,238 72,274 56,672
Excess (deficiency) of revenues over (under) expenditures 7 52 13,511 (6,37 1) 106,166
Other financing sources (uses): Transfers in Transfers out Debt issuance Premium( Discount) on debt issuance Issuance of refunding bonds Payment to refunded bond escrow agent
Total other financing sources and uses
Net change in fund balances 7 52 13,511 (6,371) 106, 166
Fund balances - beginning (restated) 3,808 27,058 2,685 . 100,769 ___ 9_8,201
Fund balances - ending $ 3,815 $ 27,110 $ 16,196 $ 94,398 $ 204,367
(Continued on next page)

CITY OF SOUTH BEND COMBINING STATEMENT OF REVENUES, EXPENDITURES, AND OTHER CHANGES IN FUND BALANCES-
NONMAJOR GOVERNMENTAL FUNDS For the Year Ended December 31, 2013
(Continued)
S~ecial Revenue
Regional Urban
Police COPS MORE Federal Drug Development
~ Grant Enforcement Gift Action Grant
Revenues: Taxes:
Property $ $ $ $ $
Professional sports development Community revitalization enhancement district 142
Intergovernmental Charges for services 22,995
Fines and forfeits Interest 161 198 934 129 57
Donations 250 - 11,219
Sale of property - 9,775
Other 22,394 183 847 2,746.
Tolal revenues 23,156 22,842 194,556 11,348 2,945
Expenditures: Current:
General government Public safety 26,382 16,879 140,361
Highways and streets
....... Economic development - 590,000
(.1) Culture and recreation
....... Debt service: Principal Interest and fiscal charges Bond issuance costs
Capital outlay: . General government Public safety Highways and streets Economic development Culture and recreation
Total expenditures 26,382 16,879 140,361 590,000
Excess (deficiency) of revenues over (under) expenditures (3,226) 5,963 54,195 11,348 (587,055)
Other financing sources (uses): Transfers in Transfers out Debt issuance Premium (Discount) on debt issuance Issuance of refunding bonds Payment to refunded bond escrow agent
Total other financing sources and uses
Net change in fund balan~es (3,226) 5,963 54,195 11,348 (587,055)
Fund balances- beginning (restated) 73380 107,336 329,012 63,337 355,503
Fund balances- ending $ 70,154 $ 113299 $ 383,207 $ 74,685 $ (231,552)
(Continued on next page)

CITY OF SOUTH BEND COMBINING STATEMENT OF REVENUES, EXPENDITURES, AND OTHER CHANGES IN FUND BALANCES-
NONMAJOR GOVERNMENTAL FUNDS For the Year Ended December 31, 2013
(Continued)
S ecial Revenue
Leaf Collection Police Industrial
and Removal K-9 Unit Rain:t Da:t Revolving Totals
Revenues: Taxes:
Properly $ $ $ $ $
Professional sports development Community revitalization enhancement district 142
Intergovernmental 11,028,088
Charges for services 433,026 2,291 ,971
Fines and forfei ts 71,718
Interest 1,566 4 16,554 202,815 270,952
Donations 36,294
Sale of property 18,561
Other 1 41 ,393 4,725,691
T alai revenues 434,592 5 16,554 244.208 18,443.417
Expenditures: Current:
General government 84,578 549,950
Public safety 625 626,563
Highways and streets 8,388,444
___. Economic development 416,951 8,068,458
(..) Culture and recreation 891,271
N Debt service:
Principal 22. 103 535,580
Interest and fiscal charges 1,135 50,446
Bond issuance costs Capital oullay:
General government Public safety Highways and streets Economic development Culture and recreation
Total expenditures 107,816 625 416,951 19,110,712
Excess (deficiency) of revenues over (under) expenditures 326,776 (620) 16,554 (172,743) (667,295)
Other fi nancing sources (uses): Transfers in 5,344,401
Transfers out (250,000) (250,000)
Debt issuance 5,559
Premium (Discount) on debt issuance Issuance of refunding bonds Payment to refunded bond escrow agent
Total other financing sources and uses (250,000) 5,099,960
Net change in fund balances 76,776 (620) 16,554 (172,743) 4,432,665
Fund balances - beginning (restated) 897,037 1,933 8,595,561 ~815 36,719,073
Fund balances - ending $ 973,813 $ 1,313 $ 8,612,115 $ 7.195,072 $ 41 ,151,738
(Continued on next page)

...... (,o) (,o)
CITY OF SOUTH BEND COMBINING STATEMENT OF REVENUES, EXPENDITURES, AND OTHER CHANGES IN FUND BALANCES
NONMAJOR GOVERNMENTAL FUNDS For the Year Ended December31, 2013
Revenues: Taxes:
Property Professional sports development Community revitalization enhancement district
Intergovernmental Charges for services Fines and forfeits Interest Donations Sale of property Other
Total revenues
Expenditures: Current:
General government Public safety Highways and slreels Economic development Culture and recreation
Debt service: Principal Interest and fiscal charges Bond issuance costs
Capital outlay: General government Public safety Highways and streets Economic development Culture and recreation
Total expenditures
Excess (deficiency} of revenues over (under} expenditures
Other financing sources (uses}: Transfers In Transfers out Debt issuance Premium (Discount} on debt issuance Issuance of refunding bonds Payment to refunded bond escrow agent
Total other financing sources and uses
Net change in fund balances
Fund balances - beginning (restated}
Fund balances- ending
(Continued}
College Football Hall of Fame Debt Service
1,274,527
67,317
1,341,844
1,115,000 153,632
1,268,632
73,212
71,468
71,468
144,680
577,818
Debt Service Redevelopment
BondAirport
Taxable
- $
2,000
2,000
2,000
(3,167}
Coveleski Bond
Debt Service Reserve
- $
967
967
967
__ ....1!(3"-",16"'-'7) ----
(1,167} 967
1,039,264 502,179
Redevelopment BondPalais Royale
3,342
3,342
3,342
(5,292}
(5,292)
(1,950}
1,736,441
722,498 $ 1,038,097 $ 503,146 1,734,491
(Continued on ne><l page)

CITY OF SOUTH BEND COMBINING STATEMENT OF REVENUES, EXPENDITURES, AND OTHER CHANGES IN FUND BALANCES -
NONMAJOR GOVERNMENTAL FUNDS For lhe Year Ended December 31, 2013
(Continued)
Debl Service
South Bend Redevelopment Building TIF Erskine
Au thority Corporation Village Debt Service Debt Service Debt Service Totals
Revenues: Taxes:
Property $ $ $ $ 1,274,527 Professional sports development Community revitalization enhancement district
Intergovernmental 67,317 Charges for services Fines and forfeits Interest 1,891 173 15 8,388 Donations 1 1 Sale of property Other
Total revenues 1,891 174 15 1,350,233
Expenditures: Current:
General government Public safety Highways and streets
_.. Economic development
w Culture and recreation
.::. Debt service: Principal 2,400,000 1,672,885 5,187,885 Interest and fiscal charges 2,351,707 552,342 3,057,681 Bond issuance costs 127,125 192,884 320,009
Capital out lay: General government Public safety 9,335 9,335 Highways and streets Economic development Culture and recreation 3,000 3,000
Total expenditures 4,881,832 2,427,446 8,577,910
Excess (deficiency) of revenues over (under) expenditures (4,879,941) (2,427,272) 15 (7,227,677)
Other financing sources (uses): Transfers in 4,755,324 2,237,291 7,064,083 Transfers out (8,459) Debt issuance 244,463 244,463 Premium (Discount) on debt issuance 21,576 21,576 Issuance of refunding bonds 3,990,000 - 3,990,000 Payment to refunded bond escrow agent (4,376,769) (4,376,769)
Total other financing sources and uses 4,390, 131 2,481 754 6,934,894
Net change in fund balances (489,810) 54,482 15 (292,783)
Fund balances - beginning (restated) 4,470,709 541,349 561,093 9,428,853
Fund balances- ending $ 3,980,899 $ 595,831 $ 561,108 $ 9,136,070
(Continued on next page)

CITY OF SOUTH BEND COMBINING STATEMENT OF REVENUES, EXPENDITURES, AND OTHER CHANGES IN FUND BALANCES -
NONMAJOR GOVERNMENTAL FUNDS For the Year Ended December 31, 2013
(Continued)
Ca~ital Projects
Emergency Professional Coveleski Park Cumulative Medical Sports Stadium Zoo Nonreverting Capital Services Develoement Ca~ital Endowment caeital Develoement
Revenues: Taxes:
Property $ $ $ - $ - $ - $ 456,875 Professional sports development 649,996 Community revitalization enhancement district
Intergovernmental 39,849 Charges for services 2,823,802 - - 4,085 Fines and forfeits 8,869 -Interest 8,064 1,299 52 94 583 1,472 Donations 8 Sale of property 8,689 Other ~ 77851 13405 211
Total revenues 2,854,753 729,146 52 102 18,073 498,407
Expenditures: Current:
General government Public safety Highways and streets ..... Economic development
c,.) Culture and recreation
0'1 Debt service: Principal 38,681 595,000 5.66,652 Interest and fiscal charges 1,986 181,470 34,962 Bond issuance costs
Capital outlay: General government - 504 Public safety 7,653,648 Highways and streets Economic development Culture and recreation 100,000 160,325 ---Total expenditures 7,694,315 876,470 160,325 602,118
Excess (deficiency) otrevenues over (under) expenditures (4,839,562) (147,324) 52 102 (142,252) (103,711)
Other financing sources (uses): Transfers In 209,824 46,054 Transfers out (1 ,000,000) Debt issuance 5,335,537 Premium (Discount) on debt issuance Issuance of refunding bonds Payment to refunded bond escrow agent
Total other financing sources and uses 4 335,537 209,824 46,054
Net change in fund balances (504,025) (147,324) 52 102 67,572 (57,657)
Fund balances- beginning (restated) 5 734,641 1103 106 26,781 48889 484 550 845228
Fund balances- ending $ 5,230,616 $ 955,782 $ 26,833 $ 48,991 $ 552,122 $ 787,571
(Continued on next page)

CITY OF SOUTH BEND COMBINING STATEMENT OF REVENUES, EXPENDITURES, AND OTHER CHANGES IN FUND BALANCES-
NONMAJOR GOVERNMENTAL FUNDS For the Year Ended December 31, 2013
(Continued)
Ca~ital Projects Morris
Cumulative Performing TIF Capital Arts Center TIF Leighton TIF -West Redevelopment
~ovement Capital Downtown Plaza Washington General
Revenues: Taxes:
Property $ - $ - $ 3,573,627 $ - $ 518,833 $
Professional sports development Community revitalization enhancement district
Intergovernmental 421,457 398,500
Charges for services 104,240 33,994
Fines and forfeits Interest 775 55,521 169 641 60
Donations Sale of property 8,727
Other 24,923 - 188,531 ~728
Total revenues 446,380 105,015 4,258,900 155,897 519,474 60
Expenditures: Current:
General government Public safety Highways and streets
....... Economic development (A) Culture and recreation
en Debt service: Principal 1,676,667
Interest and fiscal charges 805,754
Bond issuance costs Capital outlay:
General government Public safety Highways and streets Economic development - 990,356 132,154 323,963 11,871
Culture and recreation 41175
Total expenditures - 41,175 3,472,777 132,154 323,963 11,871
Excess (deficiency) of revenues over (under) expenditures 446,380 63,840 786,123 23,743 195,511 (11,811)
Other financing sources (uses): Transfers in 5,291
Transfers out (367,575) (398,500)
Debt issuance Premium (Discount) on debt issuance Issuance of refunding bonds Payment to refunded bond escrow agent
Total other financing sources and uses (367,575) (393,209)
Net change In fund balances 78,805 63,840 392,914 23,743 195,511 (11,811)
Fund balances -beginning (restated) 97,804 396 379 9,219,088 105,036 915,460 31,469
Fund balances - ending $ -176,609 $ 460,219 $ 9,612,002 $ 128,779 $ 1,110,971 $ 19,658
(Continued on next page)

,. CITY OF SOUTH BEND
COMBINING STATEMENT OF REVENUES, EXPENDITURES, AND OTHER CHANGES IN FUND BALANCES-NONMAJOR GOVERNMENTAL FUNDS For the Year Ended December31, 2013
(Continued)
Caeltal Projects
Community TIF-Central
Revitalization TIF No.1- TIF No.3 - Medical Football Enhancement Southside Southside Service Hall of Fame
District Develoement Development Area Capital
Revenues: Taxes:
Property $ $ 2.475,377 $ 1,311,129 $ 1,640,705 $ Professional sports development Community revitalization enhancement district 244,481
Intergovernmental Charges for services Fines and forfeits Interest 342 10,341 9,881 6,814 1,371
Donations Sale of property Other 42
Total revenues 244,823 2,485,718 1,321,010 1,647,519 1,413
Expenditures: Current:
General government Public safety Highways and streets
__. Economic development
w Culture and recreation
...... Debt service: Principal 385,000 195,000
Interest and fiscal charges 73,949 293,848
Bond issuance costs Capital outlay:
General government Public safety Highways and streets Economic development 4,329,259 1,813 1,747,719 62,474
Culture and recreation
Total expenditures 458,949 4,329,259 490,661 1,747,719 62,474
Excess (deficiency) of revenues over (under) expenditures (214,126) -- (1,843,541) 830,349 (100,200) (61,061)
Other financing sources (uses): Transfers in 61,061
Transfers out Debt issuance Premium (Discount) on debt Issuance Issuance of refunding bonds Payment to refunded bond escrow agent
Total other financing sources and uses - - 61,061
Net change in fund balances (214,126) (1,843,541) 830,349 (100,200)
Fund balances - beginning (restated) 328,693 5,282,231 5,572,412 2 429,656
Fund balances- ending $ 114567 $ 3,438,690 $ 6,402,761 ~9,456 $
(Continued on next page)

CITY OF SOUTH BEND COMBINING STATEMENT OF REVENUES, EXPENDITURES, AND OTHER CHANGES IN FUND BALANCES·
NONMAJOR GOVERNMENTAL FUNDS For the Year Ended December 31,2013
(Continued)
Ca~ital Projects
Certified Major TIF. Northeast TIF TIF. Northeast Technology Moves Develo~ment Douglas Road Residential Park
Revenues: Taxes:
Property $ - $ 845,052 $ 76,627 $ 2,477,200 $
Professional sports development Community revitalization enhancement district
Intergovernmental 1,412,953
Charges for services Fines and forfeits Interest 250,450 4,185 120 3,728 4,117
Donations Sale of property Other 23,437
T ota\ revenues 273,887 849,237 76,747 2,480,928 ' 1,417,070
Expenditures: Current:
General government Public safety Highways and streets
...... Economic development
(.A) Culture and recreation
00 Debt service:
Principal 87,119
Interest and fiscal charges . 67,980 180,490
Bond Issuance costs Capital outlay:
General government Public safety Highways and streets 1,195,578 Economic development 51,652 418 33,392
Culture and recreation
Total expenditures 1,195,578 51,652 155,517 213,882
Excess (deficiency) of revenues over (under) expenditures (921,691} 797,585 (78,ZZQ) 2,267,046 1,417,070
Other financing sources (uses): Transfers in Transfers out (2,824,324}
Debt issuance Premium (Discount) on debt issuance Issuance of refunding bonds Payment to refunded bond escrow agent
Total other financing sources and uses !2,824,324)
Net change in fund balances (921,691) 797,585 {78,770) (557,278) 1,417,070
Fund balances- beginning (restated) 13 944,199 2,462,212 !550,815) (1,664,902) 2,263,137
Fund balances- ending $ 13,022,508 $ 3,259,797 $ (629,585) $ (2,222,180) $ 3,680,207
(Continued on next page)

CITY OF SOUTH BEND COMBINING STATEMENT OF REVENUES, EXPENDITURES, AND OTHER CHANGES IN FUND BALANCES·
NONMAJOR GOVERNMENTAL FUNDS Forihe Year Ended December 31, 2013
(Continued)
CaBital Projects Total
Palais Royale Airport Urban Nonmajor
Historic Enlerprise Equipment Governmental
_fleservatlon Zone Leasing Totals Funds
Revenues: Taxes:
Property $ $ $ - $ 13,375,429 $ 14,649,952
Professional sports development 649,996 649,996
Community revitalization enhancement district 244,481 244,623
Intergovernmental 15,911 2,288,670 13,364,075
Charges for services 2,966,121 5,258,092
Fines and forfeits 8,869 80,587
Interest 125 754 385 361,343 640,683
Donations 8 36,303
Sale of property .17,416 35,977
Olher 489,457 5,215148
Total revenues 16,036 754 385 20,401,786 40,195,436
Expenditures: Current:
General government 549,950
Public safety - 626,563
Highways and streets 8,388,444
...... Economic development 8,068,458
(.a Culture and recreation 891,271
Debl service: co Principal 3,544,119 9,267,584
Interest and fiscal charges - 1,640,439 4,748,566
Bond Issuance costs 320,009
Capital outlay: General government 233 737 737
Public safety 1,089,719 8,743,367 8,752,702
Highways and streets 643,543 1,839,121 1,839,121
Economic development 7,685,071 7,685,071
Culture and recreation 20470 321970 324,970
Total expenditures 20,470 1,733,495 23,774,824 51,463,446
Excess (deficiency) of revenues over (under) expenditures (4,434) 754 (1 .I~~.11Ql (3,373,038) (11 ,268,010)
Other financing sources (uses): Transfers in 322,230 12,730,714
Transfers out (4,590,399) (4,848,858)
Debt issuance 2,162,750 7,498,287 7,748,309
Premium (Discount) on debt issuance 21,576
Issuance of refunding bonds 3,990,000
Payment to refunded bond escrow agent (4,376,769)
Total other financing sources and uses 2,162,750 3,230,118 15,264,972
Net change in fund balances (4,434) 754 429,640 (142,920) 3,996,962
Fund balances - beginning (restated) 59,546 375,405 1,963 49,512,168 95,660,094
Fund balances -ending $ 55,112 $ 376,159 $ 431,603 $ 49,369,248 $ 99,657,056

-.J:o 0
CITY OF SOUTH BEND SCHEDULES OF REVENUES, EXPENDITURES, AND CHANGES IN FUND BALANCES
BUDGET AND ACTUAL- MAJOR GOVERNMENTAL FUNDS CAPITAL PROJECTS FUNDS- TIF AIRPORT
For the Year Ended December 31,2013
Variance Actual With Final
Budgetary Budget Budgeted Amounts Basis Positive
al Final Amounts {Negative)
Revenues: Property Taxes $ 11,200,000 $ 11,200,000 $ 13,340,354 $ 2,140,354
Other 218 401 2,536,269 2,406,779 {129,490)
Total revenues ~401 13,736,269 15,747,133 2,010,864
Expenditures: Current:
Economic development: Other services and charges 4,356,441 9,944,113 8,128,308 1,815,805
Capital outlay 17,317,559 15,300,479 8,060,859 7,239,620
Total expenditures 21,674,000 25,244,592 16,189,167 9,055,425
Other financing sources (uses): Transfers in 326,000 281,000 279,530 (1L4J0)
Net change in fund balances (9,929,599) (11,227,323) (162,504) 11,064,819
Fund balances - beginning 18,429,252 18,429,252 18,429,252
Fund balances- ending $ 8,499,653 $ 7,201,929 $ 18,266,747 $ 11,064,819
Budget/GAAP Reconciliation Net change in fund balance, budget basis $ (162,504) To adjust revenues for accruals 1,712,596 To adjust expenditures for accruals 888,801 To adjust expenditures for encumbrances 6,961,261
Net change in fund balance, GAAP basis $ 9,400,154

CITY OF SOUTH BEND SCHEDULES OF REVENUES, EXPENDITURES, AND CHANGES IN FUND ifALANCES-
BUDGET AND ACTUAL- NON MAJOR GOVERNMENTAL FUNDS SPECIAL REVENUE FUNDS- MOTOR VEHICLE HIGHWAY
For the Year Ended December 31,2013
Variance Actual With Final
Budgetary Budget Bud9eted Amounts Basis Positive
__Q!lg_inal Final Amounts (Negative)
Revenues: Intergovernmental $ 4,910,000 $ 4,749,789 $ 5,051,334 $ 301,545 Charges for services 172,000 172,000 324,494 152,494
Other 143 300 143,300 127,627 (15,673)
Total revenues _2.225,300 5,065,089 5,503,455 438,366
Expenditures: Current:
...... Highways and streets: Personnel services 3,845,935 3,845,935 3,461,070 384,865
~ ...... Supplies 2,940,130 3,018,469 2,877,597 140,872
Other services and charges 1,812,617 2,080,152 1,764,321 315,831 Capital outlay 253,500 231,940 229,877 2,063
Other uses - - - -Total expenditures 8,852,182 9,176,496 8,332,865 843,631
Other financing sources (uses): Transfers in 3,626,882 3,626,882 3,635,668 8,786
Net change in fund balances - (484,525) 806,258 1,290,783
Fund balances- beginning 2,271,733 2,271,733 2,271,733
Fund balances - ending $ 2,271,733 $ 1,787,208 $ 3,077,991 $ 1,290,783
Budget/GAAP Reconciliation Net change in fund balance, budget basis $ 806,258 To adjust revenues for accruals (103,432) To adjust expenditures for accruals 33,589 To adjust expenditures for encumbrances 602,877
Net change in fund balance, GAAP basis $ 1,339,292

CITY OF SOUTH BEND SCHEDULES OF REVENUES, EXPENDITURES, AND CHANGES IN FUND BALANCES-
BUDGET AND ACTUAL- NON MAJOR GOVERNMENTAL FUNDS SPECIAL REVENUE FUNDS- RECREATION NON REVERTING
For the Year Ended December 31. 2013
Variance Actual With Final
Budgetary Budget Budgeted Amounts Basis Positive
~ina! Final Amounts (Negative)
Revenues: Charges for services $ 1,632,943 $ 1,632,943 $ 886,739 $ (746,204)
Other ___ 4,000 4,000 116,580 112,580
Total revenues __ 1 ,636;943 1,636,943 1,003,316 (633,625)
Expenditures: Current:
Culture and recreation:
..... Personnel services 668,209 668,209 438,880 229,329
-'=" Supplies 281,493 288,211 221,475 66,736
N Other services and charges 485,357 485,357 228,447 256,910
Capital ouUay 119,000 119,000 - 119,000
Total expenditures __ 1 ,554,059 1,560,777 888,802 671,975
Other financing sources (uses):
Transfers out - - 10,375 10,375
Net change in fund balances 82,884 76,166 124,891 48,725
Fund balances - beginning 671,132 671,132 671,132
Fund balances- ending $ 754,016 $ 747,298 $ 796,023 $ 48,725
Budge!IGMP Reconciliation Net change in fund balance, budget basis $ 124,891
To adjust revenues for accruals (59,304) To adjust expenditures for accruals 11,073 To adjust expenditures for encumbrances 2,976
Net change in fund balance, GMP basis $ 79,636
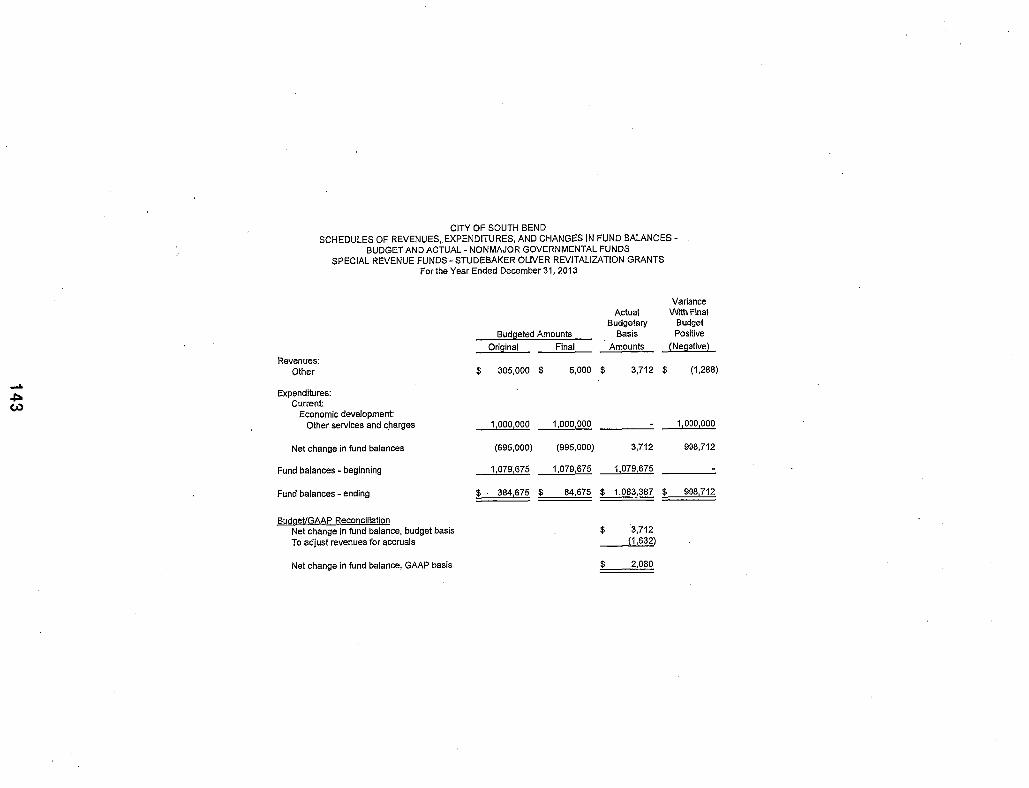
~
,.J::ao ~
CITY OF SOUTH BEND SCHEDULES OF REVENUES, EXPENDITURES, AND CHANGES IN FUND BALANCES
BUDGET AND ACTUAL- NON MAJOR GOVERNMENTAL FUNDS SPECIAL REVENUE FUNDS- STUDEBAKER OLIVER REVITALIZATION GRANTS
For the Year Ended December 31,2013
Actual Budgetary
Budeeted Amounts Basis
~ina! Final Amounts
Revenues: Other $ 305,000 $ 5,000 $ 3,712 $
Expenditures: Current:
Economic development: Other services and charges 1,000,000 1,000,000 -
Net change in fund balances (695,000) (995,000) 3,712
Fund balances - beginning 1,079,675 1,079,675 1,079,675
Fund balances - ending $ 384,675 $ 84,675 $ 1,083,387 $
6udget/GAAP Reconciliation Net change in fund balance, budget basis $ 3,712
To adjust revenues for accruals (1,632)
Net change in fund balance, GMP basis $ 2,080
Variance With Final
Budget Positive
(Negative)
(1,288}
1,000,000
998,712
998,712

'"""' ~ ~
CITY OF SOUTH BEND SCHEDULES OF REVENUES, EXPENDITURES, AND CHANGES IN FUND BALANCES
BUDGET AND ACTUAL- NON MAJOR GOVERNMENTAL FUNDS SPECIAL REVENUE FUNDS- ECONOMIC DEVELOPMENT STATE GRANTS
For the Year Ended December 31, 2013
Variance Actual With Final
Budgetary Budget Budgeted Amounts Basis Positive
___Qri_g_inal Final Amounts (Negative)
Revenues: Other $ 1,624,187 $ 1,646,262 $ 238,066 $ (1,408,196)
Expenditures: Current:
Economic development: Other services and charges 1,260,777 1,260,777 807,570 ~207
Net change in fund balances 363,410 385,485 (569,505) (954,990)
Fund balances - beginning 918,455 ~455 918,455
Fund balances - endil)g $ 1,281,865 $ 1,303,940 $ 348,950 $ (954,990)
Budget/GAAP Reconciliation Net change in fund balance, budget basis $ (569,505) To adjust revenues for accruals (140,721) To adjust expenditures for accruals 362,338
Net change in fund balance, GAAP basis $ (347,887)

CITY OF SOUTH BEND SCHEDULES OF REVENUES, EXPENDITURES, AND CHANGES IN FUND BALANCES·
BUDGET AND ACTUAL- NON MAJOR GOVERNMENTAL FUNDS SPECIAL REVENUE FUNDS- DCI OPERATING
For the Year Ended December 31, 2013
Variance Actual With Final
Budgetary Budget Bud~jeted Amounts Basis Positive
___Qr!g_inal Final Amounts (Negative)
Revenues: Intergovernmental $ 421,787 $ 471,887 $ 467,180 $ (4,707)
Other 202,500 296,601 306,912 10,311
Total revenues 624,287 768,488 774,092 5,604
Expenditures: Current:
Economic development: ...... Personnel services 1,938,047 1,921,547 1,780,056 141,491
.::.. Supplies 30,352 44,061 34,106 9,955
0'1 Other services and charges 373,407 384,003 370,334 13,669
Capital outlay - 4,720 4,720
Other uses - - -
Total expenditures 2,341,806 2,354,331 2,189,216 165,115
Other financing sources (uses): Transfers in 1,717,521 1,717,521 1,717,519 (2)
Net change in fund balances 2 131,678 302,395 170,717
Fund balances- beginning 584,037 584,037 584,037
Fund balances - ending $ 584,039 $ 715,715 $ 886,432 $ 170,717
Budget/GAAP Reconciliation Net change in fund balance, budget basis $ 302,395
To adjust revenues for accruals 1,763
To adjust expenditures for accruals 244
To adjust expenditures for encumbrances 21,083
Net change in fund balance, GAAP basis $ 325,485

__. ..j::a. (7)
CITY OF SOUTH BEND SCHEDULES OF REVENUES, EXPENDITURES, AND CHANGES IN FUND BALANCES
BUDGET AND ACTUAL- NON MAJOR GOVERNMENTAL FUNDS SPECIAL REVENUE FUNDS- COMMUNITY INVESTMENT GRANTS
For the Year Ended December 31, 2013
Variance Actual With Final
Budgetary Budget Budgeted Amounts Basis Positive
___ Q.[ig}nal Final Amounts (Negativel
Revenues: Intergovernmental $ 3,525,000 $ 8,148,705 $ 3,995,268 $ (4,153,437)
Other 286,000 652,480 488,173 (164,307)
Total revenues 3,811,000 8,801,185 4,483,441 (4,317,741)
Expenditures: Current:
Economic development: Personnel services - 2,565 2,565
Other services and charges 3,811,000 _8,954,707 7,503,546 1,451,161
Total expenditures 3,811,000 8,957,272 7,506,111 1,451,161
Net change in fund balances - (156,087) {3,022,670) (2,866,583) .
Fund balances - beginning 514,341 514,341 514,341
Fund balances - ending $ 514,341 $ 358,254 $ (2,508229) $ (2,866,58~
Budge!IGMP Reconciliation Net change in fund balance, budget basis $ (3,022,670)
To adjust revenues for accruals (528,815)
To adjust expenditures for accruals 95,389
To adjust expenditures for encumbrances 3,099,781
Net change in fund balance, GMP basis $ (356,315)

CITY OF SOUTH BEND SCHEDULES OF REVENUES, EXPENDITURES, AND CHANGES IN FUND BALANCES-
BUDGET AND ACTUAL- NONMAJOR GOVERNMENTAL FUNDS SPECIAL REVENUE FUNDS- POLICE STATE SEIZURE
For the Year Ended December 31, 2013
Variance Actual With Final
Budgetary Budget Budgeted Amounts Basis Positive
____Qrtg_inal Final Amounts (Negative)
Revenues: Other $ 35,900 $ 35,900 $ 27,470 $ (8,430}
Expenditures: Current: _..
Public safety: .j::o Supplies 10,000 10,000 - 10,000 ......... Other services and charges 22,500 22,500 2,729 19,771
Capital ouUay ___ 3,400 13.400 11,000 2,400
Total expenditures 35,900 45,900 13,729 32,171
Net change in fund balances - (10,00!i) 13,741 23,741
Fund balances- beginning · 144,925 144,925 144,925
Fund balances - ending $ 144,925 $ 134,925 $ 158,667 $ 23,741
Budget/GMP Reconciliation Net change in fund balance, budget basis $ 13,741 To adjust revenues for accruals (5,351)
Net change in fund balance, GMP basis $ 8,390

CITY OF SOUTH BEND SCHEDULES OF REVENUES, EXPENDITURES, AND CHANGES IN FUND BALANCES-
BUDGET AND ACTUAL- NON MAJOR GOVERNMENTAL FUNDS SPECIAL REVENUE FUNDS- JUVENILE POSITIVE ASSISTANCE
For the Year Ended December 31, 2013
Variance Actual With Final
Budgetary Budget
Budgeted Amounts Basis Positive
~ina! Final Amounts (Negative)
Revenues: Fines and fees $ 1,025 $ 1,025 $ 625 $ (400)
Other - - 38 38
Total revenues 1,025 1,025 663 (362)
~
-'=" Expenditures:
00 Current: Public safety:
Supplies 500 500 - 500
Other services and charges 500 500 - 500
Total expenditures 1,000 1,000 - 1,000
Net change in fund balances 25 25 663 638
Fund balances - beginnin!J 10,885 10,885 10,885
Fund balances - ending $ 10,910 $ 10,910 $ 11,548 $ 638'
BudgeVGAAP Reconciliation Net change in fund balance, budget basis $ 663
To adjust revenues for accruals (30)
Net change in fund balance, GAAP basis $ 633

CITY OF SOUTH BEND SCHEDULES OF REVENUES, EXPENDITURES, AND CHANGES IN FUND BALANCES-
BUDGET AND ACTUAL- NONMAJOR GOVERNMENTAL FUNDS SPECIAL REVENUE FUNDS- LAW ENFORCEMENT. CONTINUING EDUCATION
For the Year Ended December 31, 2013
Va riance Actual With Final
Budgetary Budget Budgeted Amounts Basis Positive
~ina! Final Amounts (Negative)
Revenues: Intergovernmental $ 108,000 $ 108,000 $ 6,964 $ (101 ,036)
Charges for services 100,000 100,000 100,128 128
Fines and fees 80,000 80,000 71,768 (8,232)
Other 59,000 59,000 15,669 (43,331)
Total revenues 347,000 347,000 194,528 (152 ,472)
__. Expenditures:
.;:... Current:
co Public safety: Supplies 50,500 155,512 142,642 12,870
Other services and charges 119,500 11 6,500 45,602 70,898
Capital outlay 177,000 206,119 137,066 69,053
Total expenditures 347,000 478, 131 325,311 152,820
Net change in fund balances (131,131) (130,783) 348
Fund balances - beginning 1,087 ,207 1,087,207 1,087,207
Fund balances- ending $ 1,087,207 $ 956,076 $ 956 ,424 $ 348
Budget/GAAP Reconci liation Net change in fund balance, budget basis $ (130 ,783)
To adjust revenues for accruals (2,094)
To adjust expenditures for accruals 3,711
To adjust expenditures for encumbrances 24,802
Net change in fund balance, GAAP basis $ (104,364)

__, 0'1 0
CITY OF SOUTH BEND SCHEDULES OF REVENUES, EXPENDITURES, AND CHANGES IN FUND BALANCES
BUDGET AND ACTUAL- NON MAJOR GOVERNMENTAL FUNDS SPECIAL REVENUE FUNDS- LOSS RECOVERY
For the Year Ended December 31, 2013
Variance Actual With Final
Budgetary Budget Budgeted Amounts Basis Positive
___Q!:!rl.i na I Final Amounts (Negative)
Revenues: Other $ 26,000 $ 3,851,957 $ 3,845,642 $ (6,315)
Expenditures: Current:
General government: Supplies 208,000 Other services and charges 300,000 1,124,033 1,066,976 57,057
Capjtal outlay - 152,152 150,000 . :!,152
Total expenditures ~000 1,276,185 1,216,976 59,209
Net change in fund balances (482,000) 2,575,772 2,628,666 52,894
Fund balances - beginning 4,341,561 4,341,561 4,341,561
Fund balances- ending $ 3,859,561 $ 6,917,333 $ 6,970,227 $ 52,894
Budget/GMP Reconciliation Net change in fund balance, budget basis $ 2,628,666
To adjust revenues for accruals (8,877)
To adjust expenditures for accruals (11,958)
To adjust expenditures for encumbrances 965,805
Net change in fund balance, GMP basis $ 3,573,636

- - - - - - - - - - - ~
CITY OF SOUTH BEND SCHEDULES OF REVENUES, EXPENDITURES, AND CHANGES IN FUND BALANCES -
BUDGET AND ACTUAL - NON MAJOR GOVERNMENTAL FUNDS SPEC IAL REVENUE FUNDS- LOCAL ROAD AND STREET
For the Year Ended December 31 , 2013
Variance
Actual With Final Budgetary Budget
Budgeted Amounts Basis Positive
___Qr:!g_ina I Fina l Amounts (Negative)
Revenues: Intergovernmental $ 1,040,000 $ 1,052,643 $ 1,001,871 $ (50,772)
Other 8,500 8,500 7,071 (1,429)
Total revenues 1,048 ,500 1,061,143 1,008,943 {52,200)
Expenditures: ...... Current: (}'I Highways and streets: ...... Supplies 400,000 400,000 400,000
Other services and charges 77,500 7,500 70,000
Capital outlay 648,500 758,424 416,385 342,039
Total expenditures 1,048,500 1,235,924 823,885 412,039
Net change in fund balances (174,781) 185,058 359,839
Fund balances- beginning 1,714,298 1,714,298 1,714,298
Fund balances- ending $ 1,714,298 $ 1,539,517 $ 1,899,356 $ 359,839
Budge!IGAAP Reconci liation Net change in fund balance, budget basis $ 185,058
To adjust revenues for accruals 1,199
To adjust expenditures for accruals (22,175)
To adjust expenditures for encumbrances 42,019
Net change in fund balance, GAAP basis $ 206,101

...... 0"1 N
CITY OF SOUTH BEND SCHEDULES OF REVENUES, EXPENDITURES, AND CHANGES IN FUND BALANCES
BUDGET AND ACTUAL- NON MAJOR GOVERNMENTAL FUNDS
Revenues:
SPECIAL REVENUE FUNDS- EXCESS WELFARE DISTRIBUTION For the Year Ended December 31, 2013
Budgeted Amounts
Original ~
Actual Budgetary
Basis
Amounts
Variance With Final
Budget Positive
(Negative)
Other $ -$ -$ 4$ 4
Expenditures: Current:
Public safety: Capital outlay
Net change in fund balances
Fund balances - beginning
Fund balances - ending
Budget/GAAP Reconciliation Net change in fund balance, budget basis To adjust revenues for accruals
Net change in fund balance, GAAP basis
$
4 4
1,146 1,146 1,146
1,146 $ 1,146 $ 1,150 $ 4
$ 4 (2)
$ 2

CITY OF SOUTH BEND SCHEDULES OF REVENUES, EXPENDITURES, AND CHANGES IN FUND BALANCES-
BUDGET AND ACTUAL- NON MAJOR GOVERNMENTAL FUNDS SPECIAL REVENUE FUNDS- HUMAN RIGHTS FEDERAL
For the Year Ended December31, 2013
Variance Actual With Final
Budgetary Budget
Bud11eted Amounts Basis Positive
~ina I Final Amounts (Negative}
Revenues: Intergovernmental $ 199,000 $ 199,000 $ 146,650 $ (52,350)
Other ___ 38_,250 38,250 31,499 (6,751)
Total revenues 237,250 237,250 178,149 (59,101)
..... Expenditures:
C11 Current:
(A) General government:
Personnel services 105,514 107,714 105,880 1,834
Supplies 4,550 4,668 3,801 867
Other services and charges 117,000 152,426 87,857 64,569
Capital outlay ___ 1,500 1,500 - 1,500
Total expenditures ~564 266,308 197,538 68,770
Net change in fund balances 8,686 (29,058) (19,389) 9,669 ..._
Fund balances - beginning ~164 486,164 486,164
Fund balances - E!nding $ 494,850 $ 457,106 $ 466,775 $ - 9,669
Budget/GAAP Reconciliation Net change in fund balance, budget basis $ (19,389)
To adjust revenues for accruals (735)
To adjust expenditures for accruals (4,706)
Net change in fund balance, GAAP basis $ (24,83_0

CITY OF SOUTH BEND SCHEDULES OF REVENUES, EXPENDITURES, AND CHANGES IN FUND BALANCES-
BUDGET AND ACTUAL- NON MAJOR GOVERNMENTAL FUNDS SPECIAL REVENUE FUNDS- EAST RACE WATERWAY
For the Year Ended December 31,2013
Variance Actual With Final
Budgetary Budget
Budeeted Amounts Basis Positive
__Qr!g_inal Final Amounts (Negative)
Revenues: Other $ 100 $ 100 $ 49 $ (51)
Expenditures:
...... Current:
CJ1 Culture and recreation:
_.:::,. Supplies - 346 346
Other services and charges
Total expenditures - 346 346
Net change in fund balances 100 (246) (297) (51)
Fund balances - beginning 14,323 ~4.323 14,323
Fund balances- ending $ 14,423 $ 14,077 $ 14,026 $ (51)
Budget/GAAP Reconciliation Net change in fund balance, budget basis $ (297)
To adju.st revenues for accruals (21)
To adjust expenditures for encumbrances 346
Net change in fund balance, GAAP basis $ 28

___, CJ1 CJ1
CITY OF SOUTH BEND SCHEDULES OF REVENUES, EXPENDITURES, AND CHANGES IN FUND BALANCES
BUDGET AND ACTUAL- NON MAJOR GOVERNMENTAL FUNDS SPECIAL REVENUE FUNDS- MORRIS AND PALAIS MARKETING
For the Year Ended December31, 2013
Variance Actual With Final
Budgetary Budget Budgeted Amounts Basis Positive
~inal Final Amounts (Negative)
Revenues: Other $ 8,100 $ 8,100 $ 7,113 $ (987)
Expenditures: Current:
Culture and recreation: Other services and charges 8,100 10,149 7,891 2,258
Net change in fund balances (2,049) (777) 1,272
Fund balances - beginning 28,763 ~763 28,763
Fund balances- ending $ 28,763 $ 26,714 $ 27,985 $ 1,272
Budget!GAAP Reconciliation Net change in fund balance, budget basis $ (777)
To adjust expenditures for accruals 1,998
Net change in fund balance, GAAP basis $ 1,221

- I
CITY OF SOUTH BEND SCHEDULES OF REVENUES, EXPENDITURES, AND CHANGES IN FUND BALANCES-
BUDGET AND ACTUAL- NON MAJOR GOVERNMENTAL FUNDS SPECIAL REVENUE FUNDS- POLICE BLOCK GRANTS
For the Year Ended December 31, 2013
Variance Actual With Final
Budgetary Budget
Budgeted Amounts Basis Positive
~inal Final Amounts (Negative}
Revenues: Intergovernmental $ 185,000 $ 185,000 $ $ (185,000)
Other 300 300 13 (287)
Total revenues 185,300 185,300 13 (185,287)
..... Expenditures: 0'1 Current: en Public safety :
Supplies 45,000 45,000 45,000
Other srvices and charges 40,000 40,000 40,000
Capital outlay ____!_QQ, 000 100,000 100,000
Total expenditures 185,000 ~000 185,000
Net change in fund balances 300 300 13 (287)
Fund balances- beginning 3,804 3,804 3,804
Fund balances - ending $ 4,104 $ 4.104 $ 3,817 $ (287)
Budget/GAAP Reconcilia tion Net change in fund balance, budget basis $ 13
To adjust revenues for accruals (6)
Net change in fund balance, GAAP basis $ 7

_.. (11 -1
CITY OF SOUTH BEND SCHEDULES OF REVENUES, EXPENDITURES, AND CHANGES IN FUND BALANCES
BUDGET AND ACTUAL- NONMAJOR GOVERNMENTAL FUNDS SPECIAL REVENUE FUNDS- ECONOMIC DEVELOPMENT COMMISSION
For the Year Ended December 31, 2013
Variance Actual With Final
Budgetary Budget Bud9eted Amounts Basis Positive
~inal Final Amounts (Negative)
Revenues: Other $ 100 $ 100 $ 93 $ (7)
Expenditures: Other uses 27,102 27,132 - 27,132
Total expenditures 27,102 27,132 - 27,132
Net change in fund balances (27,002) (27,032) 93 27,125
Fund balances - beginning 27,035 27,035 27,035
Fund balances - ending $ 33 $ 3 $ 27,128 $ 27,125
Budget!GAAP Reconciliation Net change in fund balance, budget basis $ 93
To adjust revenues for accruals (41)
Net change in fund balance, GAAP basis $ 52

CITY OF SOUTH BEND SCHEDULES OF REVENUES, EXPENDITURES, AND CHANGES IN FUND BALANCES-
BUDGET AND ACTUAL- NONMAJOR GOVERNMENTAL FUNDS SPECIAL REVENUE FUNDS- HAZMAT For the Year Ended December 31, 2013
Variance Actual With Final
Budgetal)' Budget ._,I
Budgeted Amounts Basis Positive
al Final Amounts {Negative)
Revenues: Charges for services $ 3,000 $ 3,000 $ 16,722 $ 13,722
Other - - 40 40
_.. Total revenues 3,000 3,000 16,762 13,762
c.n (X)
Expenditures: Current:
Public safety: Capital outlay 3,000 3,500 3,238 262
Net change in fund balances - (500) 13,524 14,024
Fund balances- beginning 2,683 2,683 2,683
Fund balances - ending $ 2,683 $ 2,183 $ 16,207 $ 14,024
Budget/GAAP Reconciliation Net change in fund balance, budget basis $ 13,524
To adjust revenues for accruals (13)
Net change in fund balance, GAAP basis $ 13,511

CITY OF SOUTH BEND SCHEDULES OF REVENUES, EXPENDITURES, AND CHANGES IN FUND BALANCES-
BUDGET AND ACTUAL- NONMAJOR GOVERNMENTAL FUNDS SPECIAL .REVENUE FUNDS- INDIANA RIVER RESCUE
For the Year Ended December 31, 2013
Variance Actual With Final
Budgetary Budget
Budgeted Amounts Basis Positive
__Q[!g_inal Final Amounts (Negative)
Revenues: Charges for services $ 31,300 $ 31,300 $ 65,700 $ 34,400
Other 200 200 368 168
Total revenues 31,500 31,500 66,068 34,568
Expenditures: __. Current: (J'1 Public safety: co Personnel services 2,000 2,000 1,508 492
Supplies 6,500 37,166 36,820 346
Other services and charges 20,700 25,500 23,985 1,515
Capital outlay 2,300 27,460 27,460
Total expenditures 31,500 92,126 89,773 2,353
Net change in fund balances - (60,626) (23,705) 36,921
Fund balances - beginning ~423 119,423 119,423
Fund balances - ending $ 119,423 $ 58,797 $ 95,718 $ 36,921
Budget/GMP Reconciliation Net change in fund balance, budget basis $ (23,705)
To adjust revenues for accruals (163)
To adjust expenditures for accruals 17,497
Net change in fund balance, GMP basis $ (6,371)

CITY OF SOUTH BEND SCHEDULES OF REVENUES, EXPENDITURES, AND CHANGES IN FUND BALANCES-
BUDGET AND ACTUAL- NON MAJOR GOVERNMENTAL FUNDS SPECIAL REVENUE FUNDS- COPS BLOCK GRANT II
For the Year Ended December 31, 2013
. Variance Actual With Final
Budgetary Budget
Budgeted Amounts Basis Positive
~ina I Final Amounts (Negative)
Revenues: Intergovernmental $ 110,000 $ 110,000 $ 162,838 $ 52,838
Expenditures: ....... Current: 0') Public safety:
0 Other services and charges 10,000 10,000 - 10,000
·Supplies - 36,950 36,911 39
Capital outlay 100,000 63,050 19,543 43,507
Total expenditures 110,000 110,000 56,454 53,546
Net change in fund balances - - 106,384 106,384
Fund balances- beginning 98,125 98,125 98,125
Fund balances - ending $ 98,125 $ 98,125 $ 204,509 $ 106,384
Budget/GMP Reconciliation Net change in fund balance, budget basis $ 106,384
To adjust revenues for accruals (218)
Net change in fund balance, GAAP basis $ 106,166

_... en _...
CITY OF SOUTH BEND SCHEDULES OF REVENUES, EXPENDITURES, AND CHANGES IN FUND BALANCES
BUDGET AND ACTUAL- NONMAJOR GOVERNMENTAL FUNDS SPECIAL REVENUE FUNDS- REGIONAL POLICE ACADEMY
For. the Year Ended December 31, 2013
Variance Actual With Final
Budgetary Budget Bud9eted Amounts Basis Positive
__Qr)g_inal Final Amounts (Negative)
Revenues: Intergovernmental . $ - $ . $ - $ Charges for services 26,250 26,250 20,745 (5,505)
Other 2,250 2,250 268 (1,982)
Total revenues 28,500 28,500 21,013 (7,487)
Expenditures: Current:
Public safety: Supplies 1,500 1,500 169 1,331
Other services and charges 27,000 27,000 26,575 425
Total expenditures 28,500 28,500 26,744 1,756
Net change in fund balances - . (5,731) (5,731)
Fund balances- beginning 73,815 73,815 73,815
Fund balances - ending $ 73,815 $ 73,815 $ 68,084. $ (5,731)
Buclget/GAAP Reconciliation Net change in fund balance, budget basis $ (5,731) To adjust revenues for accruals 2,143 To adjust expenditures for accruals 362
)
Net change in fund balance, GAAP basis $ (3,226)

CITY OF SOUTH BEND SCHEDULES OF REVENUES, EXPENDITURES, AND CHANGES IN FUND BALANCES •
BUDGET AND ACTUAL- NON MAJOR GOVERNMENTAL FUNDS SPECIAL REVENUE FUNDS- COPS MORE GRANT
For the Year Ended December 31, 2013
Variance Actual With Final
Budgetary Budget Budgeted Amounts Basis Positive
___Q!!g_inal Final Amounts {Negali\le}
Revenues: Other $ 41,600 $ 41,600 $ 23,068 $ (18,532}
Expenditures: Current: ......
en Public safety:
N Supplies 13,650 13,480 5,635 7,845
Other seNices and charges 17,375 17,925 11,379 6,546
Capital outlay ___ 10_,575 10,575 - 10,575
Total expenditures 41,600 ___ 4_1,980 17,014 24,966
Net change in fund balances - (380} 6,054 6,434
Fund balances - beginning 107,289 107,289 107,289
Fund balances- ending $ 107,289 $ 106,909 $ 113,343 $ 6,434
Budget/GAAP Reconciliation . Net change in fund balance, budget basis $ 6,054
To adjust revenues for accruals (226}
To adjust expenditures for accruals 135'
Net change in fund balance, GAAP basis $ 5,963

CITY OF SOUTH BEND SCHEDULES OF REVENUES, EXPENDITURES, AND CHANGES IN FUND BALANCES-
BUDGET AND ACTUAL- NONMAJOR GOVERNMENTAL FUNDS SPEC IAL REVENUE FUNDS- FEDERAL DRUG ENFORCEMENT
For the Year Ended December 31 , 2013
Variance Actual With Final
Budgetary Budget Budgeted Amounts Basis Positive
~ina! Final Amounts (Negative)
Revenues: Intergovernmental $ 100,000 $ 100,000 $ 160,829 $ 60,829
Other 2,000 2,000 33,740 31,740
Total revenues 102,000 102,000 194,569 92,569
Expenditures: _. Current:
Cj)
w Public safety: Supplies 37,000 60,867 53,1 36 7,731
Other seNices and charges 45,000 45,000 10,455 34,545
Capital outlay 20,000 82,706 82,658 48
Total expenditures ~000 188,573 146,249 42,324
Net change in fund balances (86,573) 48,320 134,893
Fund balances - beginning 335,341 335,341 335,341
Fund balances- ending $ 335,341 $ 248,768 $ 383,661 $ 134,893
BudgeVGAAP Reconciliation Net change in fund balance , budget basis $ 48,320
To adjust revenues for accruals (13) To adjust expenditures for accruals 4,389
To adjust expenditures for encumbrances 1,499
Net change in fund balance, GAAP basis $ 54,195

...... m ~
CITY OF SOUTH BEND SCHEDULES OF REVENUES, EXPENDITURES, AND CHANGES IN FUND BALANCES
BUDGET AND ACTUAL- NONMAJOR GOVERNMENTAL FUNDS SPECIAL REVENUE FUNDS- GIFT
For the Year Ended December 31, 2013
Variance Actual With Final
Budgetary Budget Bud9eted Amounts Basis Positive
___Qr!g_inal Final Amounts (Negative)
Revenues: Other $ 7,150 $ 17,011 $ 11,501 $ (5,510)
Expenditures:
Supplies - 3,441 - 3,441
Other services and charges - 7,311 1,310 6,001
Total expenditures - 10,752 1,310 9,442
Net change in fund balances 7,150 6,259 10,191 3,932
Fund balances - beginning 63,233 ~233 63,233
Fund balances- ending $ 70,383 $ 69,492 $ 73,424 $ 3,932
Budqet/GMP Reconciliation Net change in fund balance, budget basis $ 10,191
To adjust revenues for accruals (153) To adjust expenditures for encumbrances 1,310
Net change in fund balance, GMP basis $ 11,348

...... m c.n
CITY OF SOUTH BEND SCHEDULES OF REVENUES, EXPENDITURES, AND CHANGES IN FUND BALANCES
BUDGET AND ACTUAL- NON MAJOR GOVERNME::NTAL FUNDS SPECIAL REVENUE FUNDS- URBAN DEVELOPMENT ACTION GRANT
For the Year Ended December 31,2013
Variance Actual With Final
Budgetary Budget Budgeted Amounts Basis Positive
___Q!:!ainal Final Amounts (N_E!gativ~
Revenues: Other $ 69,962 $ 70,117 $ 3,834 $ (66,283)
Expenditures: Current:
Economic development: Other services and charges 268,146 _168,146 - 268,146
Net change in fund balances (198,184) (198,029) 3,834 201,863
Fund balances - beginning 23,753 23,753 23,753
Fund balances- ending $ (174,431) $ (174,276) $ 27,587 $ 201,863
Budget/GMP Reconciliation Net change in fund balance, budget basis $ 3,834 To adjust revenues for accruals (590,889)
Net change in fund balance, GMP basis $ (587,055)
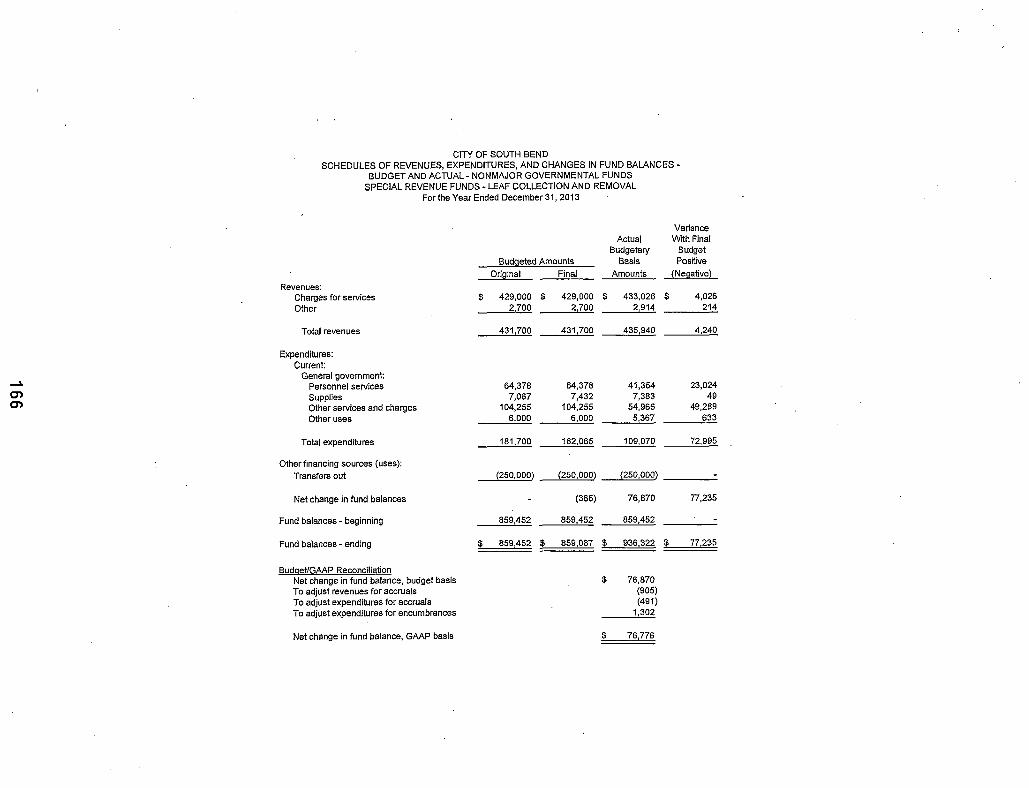
CITY OF SOUTH BEND SCHEDULES OF REVENUES, EXPENDITURES, AND CHANGES IN FUND BALANCES-
BUDGET AND ACTUAL- NONMAJOR GOVERNMENTAL FUNDS SPECIAL REVENUE FUNDS- LEAF COLLECTION AND REMOVAL
For the Year Ended December 31, 2013
Variance Actual With Final
Budgetary Budget Budgeted Amounts Basis Positive
____QE!g_inal Final Amounts (Negative)
Revenues: Charges for services $ 429,000 $ 429,000 $ 433,026 $ 4,026
Other 2,700 2,700 2,914 214
Total revenues 431700 ~700 435,940 4,240
Expenditures: Current:
General government __, Personnel services 64,378 64,378 41,354 23,024
m Supplies 7,067 7,432 7,383 49 m Other services and charges 104,255 104,255 54,966 49,289
Other uses 6,000 6,000 5,367 633
Total expenditures 181,700 182,065 109,070 72,995
Other financing sources (uses): Transfers out (250,QQQ) (250,000) (250,000)
Net change in fund balances - (365) 76,870 77,235
Fund balances- beginning 859,452 859,452 859,452
Fund balances- ending $ 859,452 $ 859,087 $ 936,322 $ 77,235
Budget/GAAP Reconciliation Net change in fund balance, budget basis $ 76,870 To adjust revenues for accruals (905) To adjust expenditures for accruals (491) To adjust expenditures for encumbrances 1,302
Net change in fund balance, GAAP basis $ 76,776

~
en .......
CITY OF SOUTH BEND SCHEDULES OF REVENUES, EXPENDITURES, AND CHANGES IN FUND BALANCES -
BUDGET AND ACTUAL- NONMAJOR GOVERNMENTAL FUNDS SPECIAL REVENUE FUNDS- POLICE K-9 UNIT
For the Year Ended December 31, 2013
Variance Actual With Final
Budgetary Budget Budgeted Amounts Basis Positive
___Qr!D.inal Final Amounts (Negative)
Revenues: Other $ 2,000 $ 2,000 $ 8 $ (1,992)
Expenditures: Current:
Public safety: Other services and charges ___ 2_,000 2,000 625 1,375
Net change in fund balances - - (617) (617)
Fund balances - beginning 1,931 1,931 1,931
Fund balances- ending $ 1,931 $ 1,931 $ 1,313 $ (617)
Budgei/GMP Reconciliation Net change in fund balance, budget basis $ (617)
To adjust revenues for accruals (3)
Net change in fund balance, GMP basis $ (620)

...... en 00
CITY OF SOUTH BEND SCHEDULES OF REVENUES, EXPENDITURES, AND CHANGES IN FUND BALANCES
BUDGET AND ACTUAL- NONMAJOR GOVERNMENTAL FUNDS SPECIAL REVENUE FUNDS- RAINY DAY
For the Year Ended December 31, 2013
Variance Actual With Final
Budgetary Budget Bud~jeted Amounts Basis Positive
___Qr:!g_inal Final Amounts (Negative)
Revenues: Other $ 52,000 $ 52,000 $ 29,524 $ (22,476)
Net change in fund balances 52,000 52,000 29,524 (22,476)
Fund balances- beginning 8,588,180 8,588,180 8,588,180
Fund balances- ending $ 8,640,180 $ 8,640,180 l__ 8,617,704 $ (22,476)
Budget/GMP Reconciliation Net change in fund balance, budget basis $ 29,524
To adjust revenues for accruals (12,970)
Net change in fund balance, GMP basis $ 16,554

CITY OF SOUTH BEND SCHEDULES OF REVENUES, EXPENDITURES, AND CHANGES IN FUND BALANCES-
BUDGET AND ACTUAL- NON MAJOR GOVERNMENTAL FUNDS DEBT SERVICE FUNDS -COLLEGE FOOTBALL HALL OF FAME DEBT SERVICE
For the Year Ended December 31, 2013
Variance Actual With Final
Budgetary Budget Budgeted Amounts Basis Positive
~inal Final Amounts (Negative)
Revenues: Taxes:
Property $ 1,118,460 $ 1,118,460 $ 1,268,179 $ 149,719
Intergovernmental 151,818 139,329 138,784 (545)
Other
...~. Total revenues ~278 1,257,789 1,406,963 149,174
m co Expenditures:
Debt service: Principal 1,115,000 1,115,000 1,115,000 Interest and fiscal agent fees 155,278 153,000 153,000
Total expenditures 1,270,278 __ 1,268,000 1,268,000
Net change in fund balances - (10,211) 138,963 149,174
Fund balances - beginning 574,439 574,439 574,439
Fund balances - ending $ 574,439 $ 564,228 $ 713,402 $ 149,174
Budget/GMP Reconciliation Net change in fund balance, budget basis $ 138,963 To adjust revenues for accruals 5,717
Net change in fund balance, GMP basis $ 144,680

__. ..... C)
CITY OF SOUTH BEND SCHEDULES OF REVENUES, EXPENDITURES, AND CHANGES IN FUND BALANCES
BUDGET AND ACTUAL- NONMAJOR GOVERNMENTAL FUNDS DEBT SERVICE FUNDS- REDEVELOPMENT BOND- AIRPORT TAXABLE
For the Year Ended December 31, 2013
Variance Actual With Final
Budgetary Budget Budgeted Amounts Basis Positive
___Q!:!g_inal Final Amounts (Negative)
Revenues: Other $ 5,000 $ 5,000 $ 3,567 $ {1,433)
Other financing sources (uses): Transfers out 5,000 5,000 (3,567) (8,567)
Net change in fund balances 10,000 10,000 - (10,000)
Fund balances- beginning 1,038,904 ~904 1,038,904
Fund balances - ending $ 1,048,904 $ 1,048,904 $ 1,038,904 $ (10,000)
Budget/GAAP Reconciliation Net change in fund balance, budget basis $ To adjust revenues for accruals (1,167)
Net change in fund balance, GAAP basis $ (1,167)

.....
....,J .....
CITY OF SOUTH BEND SCHEDULES OF REVENUES, EXPENDITURES, AND CHANGES IN FUND BALANCES
BUDGET AND ACTUAL- NON MAJOR GOVERNMENTAL FUNDS DEBT SERVICE FUNDS- COVELESKI BOND DEBT SERVICE RESERVE
For the Year Ended December 31, 2013
c Variance
Actual With Final Budgetary Budget
Budgeted Amounts Basis Positive
___Q!:!ll.inal Final Amounts (Negative)
Revenues: Other $ 3,500 $ 3,500 $ 1,725 $ (1,775)
Net change in fund balances 3,500 3,500 1,725 (1,775)
Fund balances- beginning 501,748 501,748 501,748
Fund balances - ending $ 505,248 $ 505,248 $ 503,473 $ (1,775)
Budget/GAAP Reconciliation Net change in fund balance, budget basis $ 1,725 To adjust revenues for accruals (758)
Net change in fund balance, GAAP basis $ 967

_... ...,J N
CITY OF SOUTH BEND SCHEDULES OF REVENUES, EXPENDITURES, AND CHANGES IN FUND BALANCES
BUDGET AND ACTUAL- NONMAJOR GOVERNMENTAL FUNDS DEBT SERVICE FUNDS- REDEVELOPMENT BOND- PALAIS ROYALE
For the Year Ended December 31, 2013
Variance Actual With Final
Budgetary Budget Budgeted Amounts Basis Positive
~ina! Final Amounts (Negative)
Revenues: Other $ 6,000 $ 6,000 $ 5,959 $ (41)
Other financing sources (uses): Transfers out (6,000) (6,000) (5,9~9) 41
Net change in fund balances
Fund balances - beginning 1,735,840 1,735,840 1,735,840
Fund balances - ending $ 1,735,840 $ 1,735,840 $ 1,735,840 $
Budqet/GMP Reconciliation Net change in fund balance, budget basis $ To adjust revenues .for accruals (1,950)
Net change in fund balance, GMP basis $ (1,950)

_.. ...... w
CITY OF SOUTH BEND SCHEDULES OF REVENUES, EXPENDITURES, AND CHANGES IN FUND BALANCES
.BUDGET AND ACTUAL- NON MAJOR GOVERNMENTAL FUNDS CAPITAL PROJECTS FUNDS- EMERGENCY MEDICAL SERVICES
For the Year Ended December 31, 2013
Variance Actual With Final
Budgetary Budget Budgeted Amounts Basis Positive
__Qr!g_inal Final Amounts (Negative)
Revenues: Intergovernmental $ - $ - $ - $ Charges for services 3,690,084 2,947,084 2,957,086 10,002
Other 40 000 5,375,537 5,365,946 (9,591)
Total revenues ~084 8,322,621 8,323,032 411
Expenditures: Public safety:
Supplies 90,000 223,539 214,277 9,262 Other services and charges 2,312,596 1,286,364 311,961 974,403 Capital outlay 415,000 9,018,260 8,668,367 349,893
Other uses - - - -
Total expenditures 2,817,596 10,528,163 9,194,606 1,333,557
Other financing sources (uses): Transfers out (1 ,000,000) (1 ,000,000) (1,000,000)
Net change in fund balances (87,512) (3,205,542) (1,871,574) 1,333,968
Fund balances- beginning 5,522,335 5,522,335 5,522,335
Fund balances - ending $ 5,434,823 $ 2,316,793 $ 3,650,761 $ 1,333,968
Budget/GMP Reconciliation Net change in fund balance, budget basis $ (1,871 ,574) To adjust revenues for accruals (127,119) To adjust expenditures for accruals (403,441} To adjust expenditures for encumbrances _1L898,109
Net change in fund balance, GMP basis $ _(504,0~

...... """"' ~
CITY OF SOUTH BEND SCHEDULES OF REVENUES, EXPENDITURES, AND CHANGES IN FUND BALANCES
BUDGET AND ACTUAL- NON MAJOR GOVERNMENTAL FUNDS CAPITAL PROJECTS FUNDS- PROFESSIONAL SPORTS DEVELOPMENT
For the Year Ended December 31, 2013
Variance Actual With Final
Budgetary Budget Budgeted Amounts Basis Positive
___Qdg_inal Final Amounts (Negative)
Revenues: Taxes:
Professional sports development $ - $ - $ - $ Intergovernmental 600,000 600,000 597,111 (2,889)
Other 87,801 87,801 80,594 (7,207)
Total revenues 687,801 687,801 677,705 (10,096)
Expenditures: Culture and recreation:
Other services and charges 776,671 776,671 776,470 201
Other uses 100,000 100,000 100,000
Total expenditures 876,671 876,671 876,470 201
Net change in fund balances (188,870) (188,870) (198,765) (9,895)
Fund balances - beginning __ 1 ,040,822 1,040,822 1,040,822
Fund balances - ending $ 851,952 $ 851,952 $ 842,057 $ (9,895)
Budget/GMP Reconciliation Net change in fund balance, budget basis $ (198,765)
To adjust revenues for accruals 51,441
Net change in fund balance, GMP basis $ (147,324)

CITY OF SOUTH BEND SCHEDULES OF REVENUES, EXPENDITURES, AND CHANGES IN FUND BALANCES-
BUDGET AND ACTUAL- NON MAJOR GOVERNMENTAL FUNDS CAPITAL PROJECT FUNDS -·COVELESKI STADIUM CAPITAL
For the Year Ended December 31, 2013
Variance Actual With Final
Budgetary Budget Budgeted Amounts Basis Positive
___Q!!9.imil Final Amounts (Negative}
Revenues: Other $ 500 $ 500 $ 92 $ (40_ID
Expenditures: ....... Culture and recreation:
........ Supplies - 2,002 2,002
0'1 Other services and charges - - 1,538, (1,538)
Capital outlay
Total expenditures - ___ 2,002 3,540 (1,538)
Net change in fund balances 500 (1,502) (3,448) (1,946)
Fund balances - beginning ~758 26,758 26,758
Fund balances - ending $ 27,258 $ 25,256 $ 23,310 $ (1,946)
Budget/GAAP Reconciliation Net change in fund balance, budget basis $ (3,448)
To adjust revenues for accruals (40)
To adjust expenditures for encumbrances 3,540
Net change in fund balance, GAAP basis $ 52

~
-J 0)
--- --- ------,
CITY OF SOUTH BEND SCHEDULES OF REVENUES, EXPENDITURES, AND CHANGES IN FUND BALANCES
BUDGET AND ACTUAL- NON MAJOR GOVERNMENTAL FUNDS CAPITAL PROJECT FUNDS· ZOO ENDOWMENT
For the Year Ended December 31, 2013
Bud9eted Amounts
___Q!!ainal Final
Revenues: Other $ 2,900 $ 2 900
Net change in fund balances 2,900 2,900
Fund balances - beginning 48,846 48,846
Fund balances • ending $ 51,746 $ 51,746
Budget/GMP Reconciliation Net change in fund balance, budget basis To adjust revenues for accruals
Net change in fund balance, GMP basis
Actual Budgetary
Basis
Amounts
$ 176
176
48,846
$ 49,022
$ 176 (74)
$ 102
$
$
Variance With Final
Budget Positive
(Negative)
(2,724)
(2,724)
(2,724)

CITY OF SOUTH BEND SCHEDULES OF REVENUES, EXPENDITURES, AND CHANGES IN FUND BALANCES-
BUDGET AND ACTUAL- NONMAJOR GOVERNMENTAL FUNDS CAPITAL PROJECTS FUNDS- PARK NONREVERTING CAPITAL
For the Year Ended December 31, 2013
Variance Actual With Final
Budgetary Budget Budgeted Amounts Basis Positive
......Q!:!ainal Final Amounts (Negative)
Revenues: Charges for services $ 3,000 $ 3,000 $ 4,105 $ 1,105 Other 2,200 2,200 14,791 12,591
Total revenues ___ 5,200 5,200 18,897 13,697
Expenditures: Culture and recreation: ....... Supplies - 149,495 128,051 21,444 .....,
Other services and charges - 24,950 11,850 13,100 ....., Capital outlay 203,500 42,871 36,731 6,140
Total expenditures 203,500 217,316 176,632 40,684
Other financing sources (uses): Transfers in 198,300 198,300 209,824 11,524
Net change in fund balances . (13,816) 52,089 65,905
Fund balances - beginning 492,385 492,385 492,385
Fund balances - ending $ 492,385 $ 478,569 $ 544,474 $ 65,905
Budget/GMP Reconciliation Net change in fund balance, budget basis $ 52,089 To adjust revenues for accruals (823) To adjust expenditures for accruals (12, 111) To adjust expenditures for encumbrances 28,417
Net change in fund balance, GMP basis $ 67,572

CITY OF SOUTH BEND SCHEDULES OF REVENUES, EXPENDITURES, AND CHANGES IN FUND BALANCES-
BUDGET AND ACTUAL- NON MAJOR GOVERNMENTAL FUNDS CAPITAL PROJECTS FUNDS- CUMULATIVE CAPITAL DEVELOPMENT
For the Year Ended December 31, 2013
Variance Actual With Final
Budgetary Budget Budgeted Amounts Basis Positive
___Q!:!g_inal Final Amounts (Negative}
Revenues: Taxes:
Property $ 530,000 $ 530,000 $ 463,331 $ (66,669} Intergovernmental 88,126 80,325 85,904 5,579 Other 4,000 4,000 2,913 (1,087)
...... Total revenues 622,126 614,325 552,148 (62,177}
....... CD Expenditures:
General government: Other services and charges 875,220 875,220 602,118 273,102 Capital outlay 36,000 36,000 - 36,000 Other uses - -
Total expenditures 911,220 911,220 602,118 309,102
Net change in fund balances (289,094} (296,895} (49,970} 246,925
Fund balances - beginning 835,769 835,769 835,769
Fund balances·- ending $ 546,675 $ 538,874 $ 785,799 $ 246,925
Budget/GAAP Reconciliation Net change in fund balance, budget basis $ (49,970} To adjust revenues for accruals (7,687}
Net change in fund balance, GAAP basis $ (57,657)

...... -....1 co
CITY OF SOUTH BEND SC HEDULES OF REVENUES, EXPENDITURES, AND CHANGES IN FUND BALANCES
BUDGET AND ACTUAL- NON MAJOR GOVERNMENTAL FUNDS CAPITAL PROJECTS FUNDS- CUMULATIVE CAPITAL IMPROVEMENT
For the Year Ended December 31, 2013
Variance Actual With Final
Budgetary Budget
Budgeted Amounts Basis Positive
~inal Final Amounts (Negative)
Revenues: Intergovernmental $ 403,000 $ 408,990 $ 421,457 $ 12,467
Other 25,100 25,100 25,122 22
Total revenues 428,100 434,090 446,578 12,488
Expenditures: General government:
Other services and charges 367,575 367,575 367,575
Net change in fund balances 60,525 66,515 79,003 12,488
Fund balances- beginning 97,720 97,720 97,720
Fund balances- ending $ 158,245 $ 164,235 $ 176,724 $ 12,488
BudgeVGMP Reconciliation Net change in fund balance, budget basis $ 79,003
To adjust revenues for accruals (198)
Net change in fund balance, GMP basis $ 78,805

CITY OF SOUTH BEND SCHEDULES OF REVENUES, EXPENDITURES, AND CHANGES IN FUND BALANCES-
BUDGET AND ACTUAL- NON MAJOR GOVERNMENTAL FUNDS CAPITAL PROJECT FUNDS- MORRIS PERFORMING ARTS CENTER CAPITAL
For the Year Ended December 31, 2013
Variance Actual With Final
Budgetary Budget Budgeted Amounts Basis Positive
~inal Final Amounts (Negative)
Revenues: Charges for services $ 100,000 $ 100,000 $ 100,535 $ 535
Other 1,500 1,500 1,412 (88)
Total revenues 101,500 101,500 101,947 447
_., Expenditures:
(X)
0 Culture and .recreation:
Supplies 25,500 25,500 13,632 11,868
Other services and charges 15,000 20,970 11,945 9,025
Capital outlay - 26,196 15,828 10,368
Total expenditures 40,500 72,666 ___ 41_,405 31,261
Net change in fund balances 61,000 28,834 60,542 31,708
Fund balances - beginning 396,268 ~268 396,268
Fund balances- ending $ 457,268 $ 425,102 $ 456,810 $ 31,708
Budget!GAAP Reconciliation Net change in fund balance, budget basis· $ 60,542 To adjust revenues for accruals 3,068 To adjust expenditures for accruals 230
Net change in fund balance, GAAP basis $ 63,840

CITY OF SOUTH BEND " SCHEDULES OF REVENUES, EXPENDITURES, AND CHANGES IN FUND BALANCES-
BUDGET AND ACTUAL- NONMAJOR GOVERNMENTAL FUNDS CAPITAL PROJECTS FUNDS- TIF DOWNTOWN
For the Year Ended December 31, 2013
Variance Actual With Final
Budgetary Budget Bud!leted Amounts Basis Positive
____Qrtg_inal Final Amounts (Negative)
Revenues: Taxes $ 3,650,000 $ 3,650,000 $ 2,590,808 $ (1,059,192)
Intergovernmental 398,500 398,500 398,500 -Charges for services 34,000 36,000 34,021 (1,979)
Other 479,747 608,754 434,777 {173,977)
Total revenues ____.i.562,247 4,693,254 3,458,106 (1 ,235, 148)
..... Expenditures:
co Economic development: ..... Other services and charges 2,750,755 3,520,474 3,448,671 71,803
Capital outlay 2,349,245 1,781,628 410,351 1,371,277
Total expenditures 5,100,000 5,302,102 3,659,022 1,443,080
Other financing sources (uses): Transfers in - 6,100 5,959 (141)
Net change in fund balances (537,753) (602,748) (394,957) 207,791
Fund balances - beginning 2,843,357 2,843,357 2,843,357
Fund balances- ending $ 2,305,604 $ 2,240,609 $ 2,448,400 $ 207,791
Budget/GAAP Reconciliation Net change in fund balance, budget basis $ (394,957)
To adjust revenues for accruals 630,512
To adjust expenditures for accruals (4,190)
To adjust expenditures for encumbrances ~549
Net change in fund balance, GAAP basis $ 392,914
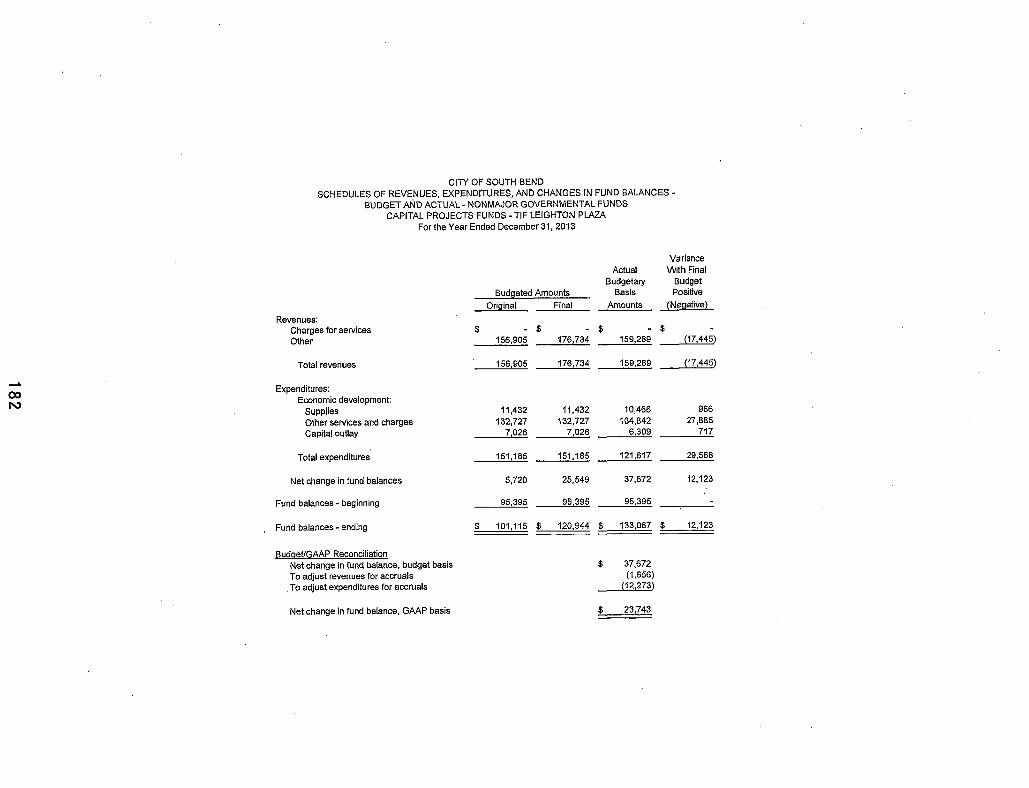
....I.
co N
CITY OF SOUTH BEND SCHEDULES OF REVENUES, EXPENDITURES, AND CHANGES IN FUND BALANCES
BUDGET AND ACTUAL- NONMAJOR GOVERNMENTAL FUNDS CAPITAL PROJECTS FUNDS- TIF LEIGHTON PLAZA
For the Year Ended De.cember 31, 2013
Variance Actual With Final
Budgetary Budget Budgeted Amounts Basis Positive
~inal Final Amounts (Negative)
Revenues: Charges for services $ - $ - $ - $ Other 156,905 176,734 159,289 (17,445)
Total revenues 156,905 176,734 159,289 (17,445)
Expenditures: Economic development:
Supplies 11,432 11,432 10,466 966
Other services and charges 132,727 132,727 104,842 27,885
Capital outlay 7,026 7,026 6,309 717
Total expenditures 151,185 151,185 121,617 29,568
Net change in fund balances 5,720 25,549 37,672 12,123
Fund balances- beginning 95,395 95,395 95,395
Fund balances- ending $ 101 '115 $ 120,944 $ 133,067 $ 12,123
Budget/GMP Reconciliation Net change in fund balance, budget basis $ 37,672 To adjust revenues for accruals (1,656)
. To adjust expenditures for accruals (12,273)
Net change in fund balance, GMP basis $ 23,743

CITY OF SOUTH BENQ SCHEDULES OF REVENUES, EXPENDITURES, AND CHANGES IN FUND BALANCES-
BUDGET AND ACTUAL- NONMAJOR GOVERNMENTAL FUNDS CAPITAL PROJECTs' FUNDS- TIF- VvEST WASHINGTON
For the Year Ended December 31, 2013
Variance Actual \IIIith Final
Budgetary Budget
Budgeted Amounts Basis Positive
~inal Final Amounts (Negativ~
Revenues: Taxes $ 440,000 $ 440,000 $ 493,608 $ 53,608
Other 4 000 4,000 1,435 (2,565)
Total revenues 444,000 444,000 495,043 51,043
...... Expenditures: (X) (A)
Economic development: Other services and charges 10,000 11,796 2,627 9,169
Capital outlay ~000 657,019 339,802 317,217
Total expenditures ~000 668,815 342,429 326,386
Net change in fund balances (6,000) (224,815) 152,614 377,429
Fund balances- beginning ~729 451,729 451,729
Fund balances - ending $ 445,729 $ 226,914 $ 604,343 $ _17?,429
Budget/GAAP Reconciliation Net change in fund balance, budget basis $ 152,614
To adjust revenues for accruals 24,430
To adjust expenditures for accruals 9,847
To adjust expenditures for encumbrances 8,620
Net change in fund balance, GAAP basis $ 195,511

__. (X) _J:o,
CITY OF SOUTH BEND SCHEDULES OF REVENUES, EXPENDITURES, AND CHANGES IN FUND BALANCES
BUDGET AND ACTUAL - NONMAJOR GOVERNMENTAL FUNDS CAPITAL PROJECTS FUNDS - REDEVELOPMENT GEN ERAL
For the Year Ended December 31, 2013
Variance Actual With Final
Budgetary Budget Budgeted Amounts Basis Positive
____Qr:!_g_ in a I Fina l Amounts (Negative)
Revenues: Other $ 150 $ 150 $ 104 $ (46)
Expenditures: Economic development:
Other services and charges _ _ _ 6_,787 5,798 989
Net change in fund balances 150 (6,637) (5,694) 943
Fund balances- beginning 31,443 31,443 31,443
Fund balances - ending $ 31,593 $ 24,806 $ 25,749 $ 943
BudqeUGAAP Reconcil iation Net change in fund balance, budget basis $ (5,694)
To adjust revenues for accruals (45)
To adjust expend itures for accruals (6,072)
Net change in fund balance, GAAP basis $ (11 ,811)

CITY OF SOUTH B~ND SCH~DUL~S OF R~VENUES, EXPENDITURES, AND CHANG~S IN FUND BALANCES-
BUDGET AND ACTUAL- NON MAJOR GOV~RNMENTAL FUNDS CAPITAL PROJECT FUNDS- COMMUNITY REVITALIZATION ENHANCEMENT DISTRICT
For the Year Ended December 31, 2013
Variance Actual With Final
Budgetary Budget Budgeted Amounts Basis Positive
Original Final Amounts (Negative}
Revenues: Intergovernmental $ 740,000 $ 650,000 $ 244,481 $ (405,519) Other ___ 1,000 1,000 416 (582)
..... (X) Total revenues 741,000 651,000 244,899 (406,101)
U1 Expenditures:
Economic development: Other services and charges 873,949 673,949 458,949 415,000
Net change in fund balances (132,949) (222,949) (214,050) 8,899
Fund balances- beginning 223,587 223,587 223,587
Fund balances- ending $ 90,638 $ 638 $ 9,537 $ 8,899
Budqet!GAAP Reconciliation Net change in fund balance, budget basis $ (214,050) To adjust revenues for accruals (76)
Net change in fund balance, GAAP basis $ (214,126)

CITY OF SOUTH BEND SCHEDULES OF REVENUES, EXPENDITURES, AND CHANGES IN FUND BALANCES -
BUDGET AND ACTUAL- NONMAJOR GOVERNMENTAL FUNDS CAPITAL PROJECTS FUNDS- TlF NO.1- SOUTHSIDE DEVELOPMENT
For the Year Ended December 31, 2013
Variance Actual WilhFinal
Budgetary Budget Budgeted Amounts Basis Positive
__ Q.r!.9}nal Final Amounts (Negative)
Revenues: Taxes $ 1,820,000 $ 1,820,000 $ 2,404,416 $ 584,416
lnterfund transfers - - - -Other 20,000 20,000 17,222 (2,778)
Total revenues ~000 1,840,000 2,421,638 581,638
...... 00 Expenditures:
O'l Economic development: Other services and charges 7,500 806,455 775,069 31,386
Capital outlay 5,692,500 5,316,430 4,389,653 926,777
Total expenditures ~000 6,122,885 5,164,722 958,163
Net change in fund balances (3,860,000) (4,282,885) (2,743,084) 1,539,801
Fund balances- beginning 5,394,777 5,394,777 5,394,777
Fund balances - ending $ 1,534,777 $ 1,111,892 $ 2,651,692 $ 1,539,801
Budget/GMP Reconciliation Net change in fund balance, budget basis $ (2,743,084) To adjust revenues for accruals. 64,080
To adjust expenditures for accruals 47,507
To adjust expenditures for encumbrances 787,956
Net change in fund balance, GMP basis :j>_(1,843,541)

........ (X) ....,J
- -
CITY OF SOUTH BEND SCHEDULES OF REVENUES, EXPENDITURES, AND CHANGES IN FUND BALANCES
BUDGET AND ACTUAL - NON MAJOR GOVERNMENTAL FUNDS CAPITAL PROJECTS FUNDS - TIF NO.3- SOUTHSIDE DEVELOPMENT
For the Year Ended December 31, 2013
Variance Actual With Final
Budgetary Budget Budgeted Amounts Basis Positive
~ina\ Final Amounts (Negative)
Revenues: Other $ 1,346,000 $ 1,350,200 $ 1,329,971 $ (20,229)
Expenditures: Economic development:
Other services and charges ~000 501,268 490,661 10,607
Net change in fund balances 846,000 848,932 839,310 (9,622)
Fund balances - beginning ~627 5,567,627 5,567,627
Fund balances- ending $ 6,413,627 $ 6,416,559 $ 6,406,937 $ (9,622)
BudgeUGAAP Reconciliation Net change in fund balance, budget basis $ 839,310
To adjust revenues for accruals (8,96 1)
To adjust expenditures for accruals (656)
To adjust expenditures for encumbrances 656
Net change in fund balance, GAAP basis $ 830,349

CITY OF SOUTH BEND SCHEDULES OF REVENUES, EXPENDITURES, AND CHANGES IN FUND BALANCES-
BUDGET AND ACTUAL- NON MAJOR GOVERNMENTAL FUNDS CAPITAL PROJECTS FUNDS - TIF- CENTRAL MEDICAL SERVICE AREA
For the Year Ended December 31, 2013
Variance Actual With Final
Budgetary Budget Budgeted Amounts Bas is Positive
~ina I Final Amounts (Nega_tive)
Revenues: Taxes $ 1,720,000 $ 1,720,000 $ 1,221,676 $ (498,324) Other 10,000 12,600 12,242 (358)
Total revenues 1,730,000 __ 1 ,732,600 1,233,919 (498,681)
__. Expenditures:
(X) (X)
Economic development: Other services and charges 2,500 304,172 302,592 1,580
Capital outlay 3,597,500 4,466,372 1,959,020 2,507,352
Total expenditures 3,600,000 4,770,544 2,261,611 2,508,933
Net change in fund balances (1 ,870,000) (3 ,037,944) (1 ,027,693) 2,010,251
Fund balances- beginning (restated) 2,429,656 2,429,656 2,429,656
Fund balances- ending $ 559,656 $ (608,288) $ 1,401 ,963 $ 2,010,251
BudqeUGAAP Reconciliation Net change in fund balance, budget basis $ (1 ,027,693) To adjust revenues for accruals 413,600 To adjust expenditures for accruals 112,889 To adjust expenditures for encumbrances 401,004
Net change in fund ba lance, GAAP basis $ (100,200)

CITY OF SOUTH BEND SCHEDULES OF REVENUES, EXPENDITURES, AND CHANGES IN FUND BALANCES-
BUDGET AND ACTUAL- NON MAJOR GOVERNMENTAL FUNDS CAPITAL PROJECT FUNDS- FOOTBALL HALL OF FAME CAPITAL
For the Year Ended December 31, 2013
Variance Actual ·with Final
Budgetary Budget Budgeted Amounts Basis Positive
__Qtiginal Final Amounts (Negative)
Revenues: Other !.____1.500 $ 4,542 $ 2,458 $ (2,084)
Expenditures: ___.. Culture and recreation:
co Supplies 15,000 15,000 3,242 11,758
co Other services and charges 162,527 164,322 68,803 95,519
Total expenditures 177,527 179,322 72,045 107,277
Net change in fund balances (173,027) (174,780) (69,587) 105,193
Fund balances - beginning 719,086 719,086 719,086
Fund balances- ending $ 546,059 $ 544,306 $ 649,499 $ 105,193
Budget/GAAP Reconciliation Net change in fund balance, budget basis $ (69,587) To adjust revenues for accruals (1,045) To adjust expenditures for accruals 61,724 To adjust expenditures for encumbrances 8,908
Net change in fund balance, GAAP basis $

_. co 0
CITY OF SOUTH BEND SCHEDULES OF REVENUES, EXPENDITURES, AND CHANGES IN FUND BALANCES
BUDGET AND ACTUAL- NON MAJOR GOVERNMENTAL FUNDS CAPITAL PROJECTS FUNDS- MAJOR MOVES
For the Year Ended December 31, 2013
Variance Actual With Final
Budgetary Budget Budgeted Amounts Basis Positive
____Qrlg_inal Final Amounts (Negative)
Revenues: Other $ 528,662 $ 528,662 $ 500,882 $ (27,780)
Expenditures: Highways and streets:
Capital ouUay 2,280,000 3,395,846 2,577,410 ~436
Net change in fund balances (1,751,338) (2,867,184) (2,076,528) 790,656
Fund balances- beginning 7,896,696 7,896,696 7,896,696
Fund balances - ending $ 6,145,358 $ 5,029,512 $ 5,620,168 $ 790,656
Budget/GMP Reconciliation Net change in fund balance, budget basis $ (2,076,528) To adjust revenues for accruals (226,996) To adjust expenditures for accruals 58,103 To adjust expenditures for encumbrances 1,323,730
Net change in fund balance, GMP basis $ (921,691)

CITY OF SOUTH BEND SCHEDULES OF REVENUES, EXPENDITURES, AND CHANGES IN FUND BALANCES-
BUDGET AND ACTUAL- NONMAJOR GOVERNMENTAL FUNDS CAPITAL PROJECTS FUNDS- TIF- NORTHEAST DEVELOPMENT
For the Year Ended December 31, 2013
Variance Actual With Final
Budgetary Budget Budgeted Amounts Basis Positive
Original Final Amounts (Negative)
Revenues: Taxes $ 820,000 $ 820,000 $ 841,627 $ 21,627.
Other 3,000 8,300 8,057 (243)
Total revenues 823,000 828,300 849,684 21,384
..... co Expenditures:
..... Economic development: Other services and charges 20,000 80,655 66,634 14,021
Capital outlay 2,330,000 2,308,340 - 2,308,340
Total expenditures 2,350,000 2,388,995 66,634 2,322,361
Net change in fund balances (1 ,527 ,000) (1 ,560,695) 783,050 2,343,745
Fund balances- beginning 2,219,623 2,219,623 ~623
Fund balances- ending $ . 692,623 $ 658,928 $ 3,002,673 $ 2,343,745
BudgeUGAAP Reconciliation Net change in fund balance, budget basis $ 783,050 To adjust revenues for accruals (447)
To adjust expenditures for accruals 8,865 To adjust expenditures for encumbrances ~117
Net change in fund balance, GAAP basis $ 797,585

CITY OF SOUTH BEND SCHEDULES OF REVENUES, EXPENDITURES, AND CHANGES IN FUND BALANCES-
BUDGET AND ACTUAL- NONMAJOR GOVERNMENTAL FUNDS CAPITAL PROJECTS FUNDS- TIF- DOUGLAS ROAD
For the Year Ended December 31, 2013
Variance Actual With Final
Budgetary Budget Budgeted Amounts Basis Positive
al Final Amounts (Negative)
Revenues: Taxes $ 320,000 $ 320,000 $ 323,939 $ 3,939 Other 1,000 1,000 454 (546)
Total revenues 321,000 --~21.000 324,393 3,393
....~. Expenditures: c.o N
Economic development: Other services and charges 190,461 195,384 195,079 305 Capital outlay 259,539 259,398 - 259,398
Total expenditures 450,000 454,782 195,079 259,703
Net change in fund balances (129,000) (133,782) 129,314 263,096
Fund balances - beginning 160,926 160,926 160,926
Fund balances - ending $ 31,926 $ 27,144 $ 290,240 $ 263,096
Budget/GAAP Reconciliation Net change in fund balance, budget basis $ 129,314 To adjust revenues for accruals (247,646) To adjust expenditures for accruals 35,202 To adjust expenditures for encumbrances 4,360
Net change in fund balance, GAAP basis $ (78,J70)

_. co (A)
CITY OF SOUTH BEND SCHEDULES OF REVENUES, EXPENDITURES, AND CHANGES IN FUND BALANCES
BUDGET AND ACTUAL - NONMAJOR GOVERNMENTAL FUNDS CAPITAL PROJECTS FUNDS- TIF- NORTHEAST RESIDENTIAL
For the Year Ended December 31, 2013
Va riance Actu al With Final
Budgetary Budget Budgeted Amounts Basis Positive
____Qci_g_ i n a I Final Amounts (Negative)
Revenues: Taxes $ 2,450,000 $ 2,450,000 $ 2,262,765 $ (187,235)
Other 10,000 10,000 8,423 (1 ,577)
Tolal revenues 2,460,000 2,460,000 2,271,188 (188,812)
Expenditures: Economic development:
Other services and charges 3,228,500 3,229,957 3,218,420 11,537
Net change in fund balances (768,500) (769,957) (947,232) (177,275)
Fund balances- beginning 3,501,311 3,501,311 3,501 ,31 1
Fund balances- ending $ 2,732,811 $ 2,731,354 $ 2,554,079 $ (177,275)
Budget!GAAP Reconciliation Net change in fund balance, budget basis $ (947,232) To adjust revenues for accruals 209,740
To adjust expenditures for accruals 180,214
Net change in fund balance, GAAP basis $ (557,278)

~
co ~
CITY OF SOUTH BEND SCHEDULES OF REVENUES, EXPENDITURES, AND CHANGES IN FUND BALANCES
BUDGET AND ACTUAL- NONMAJOR GOVERNMENTAL FUNDS CAPITAL PROJECTS FUNDS- CERTIFIED TECHNOLOGY PARK
For the Year Ended December 31, 2013
Variance Actual With Final
Budgetary Budget Budeeted Amounts Basis Positive
__ Q!:!9_inal Final Amounts (Negative)
Revenues: Other $ 817,000 $ 2,861,027 $_ 2,866,234 $ 5,207
Expenditures: Economic development:
Capital outlay
Net change in fund balances 817,000 2,861,027 2,866,234 5,207
Fund balances - beginning 816,362 816,362 816,362
Fund balances - ending $ 1,633,362 $ 3,677,389 $ 3,682,596 $ 5,207
Budget/GAAP Reconciliation Net change in fund balance, budget basis $ 2,866,234 To adjust revenues for accruals (1 ,449, 164)
Net change in fund balance, GAAP basis $ 1,417,070
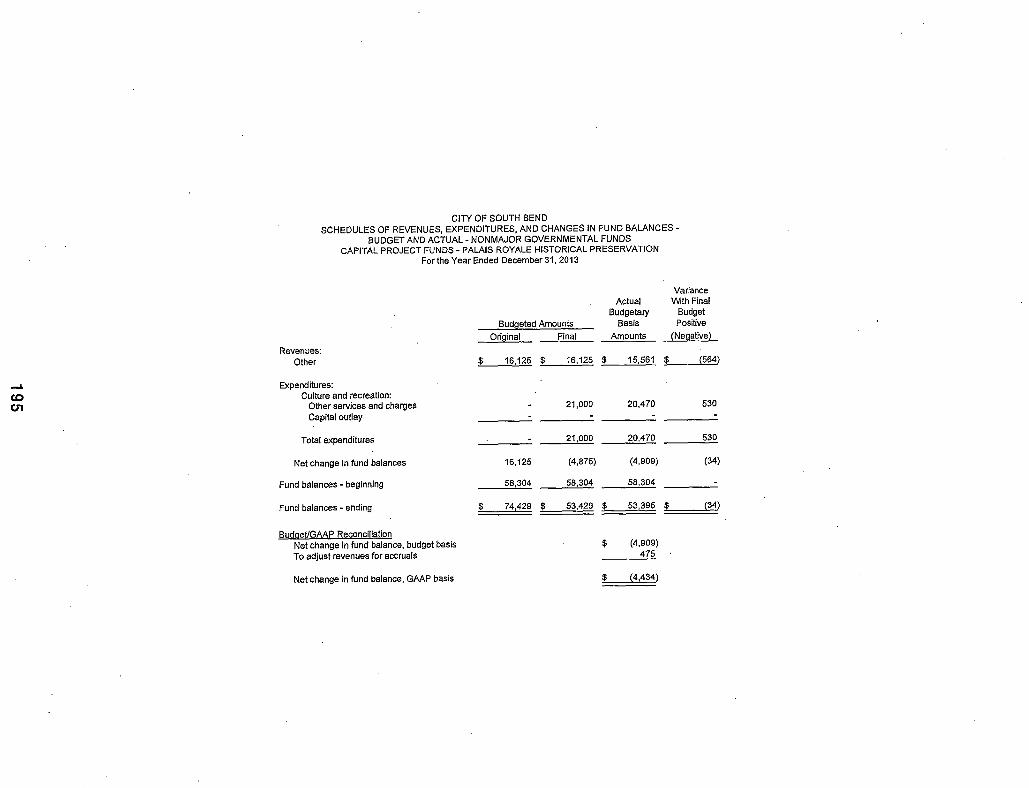
CITY OF SOUTH BEND SCHEDULES OF REVENUES, EXPENDITURES, AND CHANGES IN FUND BALANCES-
BUDGET AND ACTUAL- NON MAJOR GOVERNMENTAL FUNDS CAPITAL PROJECT FUNDS- PAL.AIS ROYALE HISTORICAL PRESERVATION
For the Year Ended December 31, 2013
Variance Actual With Final
Budgetary Budget Budgeted Amounts Basis Positive
___Q[!g_inal Final Amounts (Negative)
Revenues: Other $ 16,125 $ 16,125 $ 15,561 $ (564)
~ Expenditures:
CD Culture and recreation:
c:.n Other services and charges - 21,000 20,470 530
Capital outlay
Total expenditures - 21,000 20,470 530
Net change in fund balances 16,125 (4,875) (4,909) (34)
Fund balances - beginning ___ 5_8,304 58,304 58,304
Fund balances - ending $ 74,429 $ 53,429 $ 53,395 $ (3_4)
Budqet/GAAP Reconciliation Net change in fund· balance, budget basis $ (4,909)
To adjust revenues for accruals 475
Net change in fund balance, GAAP basis $ (4,434)

_., co CJ)
CITY OF SOUTH BEND SCHEDULES OF REVENUES, EXPENDITURES, AND CHANGES IN FUND BALANCES
BUDGET AND ACTUAL- NON MAJOR GOVERNMENTAL FUNDS CAPITAL PROJECTS FUNDS- AIRPORT URBAN ENTERPRISE ZONE
For the Year Ended December 31,2013
Variance Actual With Final
Budgetary Budget Budaeted Amounts Basis Positive
~ina I Final Amounts (Negative)
Revenues: Taxes $ - $ - $ - $ Other 1,000 1,300 1,289 (11)
Total revenues 1,000 1,300 1,289 (11)
Expenditures: Economic development:
Other services and charges
Net change in fund balances 1,000 1,300 1,289 (11)
Fund balances- beginning ~082 375,082 375,082
Fund balances - ending $ 376,082 $ 376,382 $ 376,371 $ (11)
Budget/GMP Reconciliation Net change in fund balance, budget basis $ 1,289 To adjust revenues for accruals (535)
Net change in fund balance, GMP basis $ 754

IV Non Major Enterprise Funds
197

---------------- ------ -- -- -- - - -- - -- -------------
Consolidated Building -
Parking Garage -
Solid Waste -
Blackthorn Golf Course-
NONMAJOR ENTERPRISE FUNDS
To account for the operation of the consolidated St. Joseph County/ South Bend Building Department.
To account for the operation and maintenance of the City's parking garages.
To account for the provision of solid waste services.
To account for the operation and maintenance of the City's Blackthorn Golf Course.
198

CITY OF SOUTH BEND COMBINING STATEMENT OF NET POSITION- NON MAJOR ENTERPRISE FUNDS
December 31 , 2013
Consolidated Parking Solid Blackthorn Building Garage Waste Golf Course Totals
Assets
Current assets: Cash and cash equivalents $ 38,670 $ 225,327 $ 795,275 $ 52,362 $ 1,111,634
Investments 112,810 657,340 591,239 38,766 1,400,155
Interest receivable 163 949 120 53 1,285
Accounts receivable (net of allowance) 14,663 1,520 421,007 4,444 441,634
Inventories - - 22,038 22,038
Restricted assets:
Cash and cash equivalents: Capital outlay accounts - - 118,441 - 118,441
~ Cash with fiscal agent - - 552,342 - 552,342.
tO Investments:
tO Capital outlay accounts - - 88,053 - 88,053
Total current assets 166,306 885,136 2,566,477 117,663 - - 3,735,582
Noncurrent assets: Capital assets:
.Land and construction in progress - 1,132,020 - 448,469 1,580,489
Other capital assets (net of accumulated depreciation) 63,920 3,953,686 2,329,551 1,860,932 8,208,089
Total noncurrent assets 63,ft20 5,085,706 2,329,551 2,309,401 9,788,578
Total assets 230,226 5,970,842 4,896,028 2,427,064 13,524,160
Deferred outflows of resources: Unamortized loss on sale/leaseback - 1,125,301 - - 1,125,301
Total deferred outflow of resources - 1,125,301 - - 1,125,301
(Continued on next page)

CITY OF SOUTH BEND COMBINING STATEMENT OF NET POSITION- NONMAJOR ENTERPRISE FUNDS
December 31, 2013 (Continued)
Consolidated Parking Solid Blackthorn
Liabilities Bullding Garage Waste Golf Course Totals
Current liabilities: Accounts payable 11,671 96,837 209,826 3,406 321,740
lnterfund payables: lnterfund services provided and used 7,356 - - - 7,356
Accrued payroll payable 56,229 - 54,420 - 110,649
Compensated absences payable 111,489 - 50,131 - 161,620
Performance deposits payable 37,437 - - - 37,437
Current liabilities payable from restricted assets: Capital leases payable 14,628 - 700,136 52,087 766,851
Accrued interest payable 155 - 11,019 - 11,174
N 0 Total current liabilities 238,965 96,837 1,025,532 55,493 1,416,827
0 Noncurrent liabilities:
Advances from other funds - - - 1,742,115 1,742,115
Capital leases payable 32,978 - 1,894,497 54,716 1,982,191
Total noncurrent liabilities 32,978 1,894,497 1,796,831 3,724,306
Total liabilities 271,943 96,837 2,920,029 1,852,324 ·5,141,133
Deferred inflows or resources:
Unamoritzed gain on saleneaseback 10,277 - - 10,277
Net Position
Net investment in capital assets - 5,085,706 (265,082) 2,202,598 7,023,222
Restricted for capital asset outlays - - 206,494 - 206,494
Unrestricted (41,717) 1,903,323 2,034,587 (1,627,858) 2,268,335.
Total net position $ (41,717) $ 6,989,029 $ 1,975,999 $ 574,740 $ 9,498,051

-
CITY OF SOUTH BEND COMBINING STATEMENT OF REVENUES, EXPENSES, AND CHANGES IN NET POSITION
NONMAJOR ENTERPRISE FUNDS For the Year Ended December 31, 2013
Consolidated Parking Solid Blackthorn Building ~e Waste Golf Course Totals
Operating revenues: Licenses and permits $ 964,240 $ - $ $ $ 964,240 Parking fees 948,722 948,722 Solid waste fees 4,800,454 4,800,454 Golf course fees 1,530,402 1,530.402 Other 3,427 20,146 598,590 622,163
Total operating revenues 967,667 968,868 5,399,044 1,530,402 8,865,981
Operating expenses: Operating and maintenance 1,089,316 4,395,179 1,194,830 6,679,325 Administrative and general expense: 17,376 463,756 332,856 127,077 941,065
"" Depreciation 24 ,144 260,960 331 ,220 157,513 773,837 0 ...... Total operating expenses 1,130,836 724,716 5,059,255 1,479,420 8,394,227
Operating income (loss) (163,169) 244,152 339,789 50,982 471,754
Nonoperating revenues (expenses): Interest and investment revenue 394 1,131 2,300 146 3,971 Interest expense (979) (32,333) (18,093) (51,405) Amortization expense _{560,310) (560,340)
Total nonoperating revenue (expenses) (585) (559,209) (30,033) (17,947) (607,774)
Income (loss) before contributions and transfers (163,754) (315,057) 309,756 33,035 (136,020)
Transfers out (207,879) (207,879) ---
Change in net position (163,754) (315,057) 309,756 (174,844) (343,899)
' Total net position- beginning 122,037 7,304,086 1,666,243 749,584 9,841 ,950 -
Total net position - ending $ (41,717) $ 5,989,029 $ 1,975,999 $ 574,740 $ 9,498,051
--- - - - - - -

----- - - - ----------------------------------------------------------------------------------------~
CITY OF SOUTH BEND COMBINING STATEMENT OF CASH FLOWS- NONMAJOR ENTERPRISE FUNDS
For The Year Ended December 31, 2013
Consolidated Parking Solid Blackthorn Building ~e Waste Golf Course Totals
Cash flows from operating activities: Receipts from customers and users $ 953,561 $ 968,614 $ 5,424,977 $ 1,525,958 $ 8,873,110
Payments to suppliers (107,851) (435,292) (2,664,790) (709,098) (3,917,031)
Payments to employees (865,254) (1,664,959) (609,143) (3,139,356) Payments for intertund services used (22.417) . (23,7QO) (386,520) (6,136) (438,773)
Net cash provided (used) by operating activities (41 ,961) 509,622 708,708 201 ,581 1,377,950
Cash flows from noncapital financing activities: Principal paid on interfund loan (10,759) (10,759) Transfers to other funds (207,879) (207,879)
Net cash provided (used) by noncapital financing activities (218,638) (218,638)
N Cash flows from capital and related financing activities:
0 Acquisition and construction of capital assets (483,31 5) (1,696,427) (2,179,742)
N Proceeds from capital debt issued 4,094 800,686 804,780 Principal paid on capital debt (13,919) (614,1 11) (666,170) (1,294,200) Interest paid on capital debt (990) (33,841) (25,636) {60,467)
Net cash provided (used) by capital and related financing activities (10,815) (483,315) (1 ,54:3,693) (691,806) (2 , 729,629)
Cash flows from investing activities: Investments sold 13,895 135,977 202,630 352,502
Investments purchased (125,628) (87,986) (38,428) (252,042) Interest received 393 858 3,555 352 5,158
Net cash provided (used) by investing activities 14,288 (124,770) 51 ,546 164,554 105,618
Net decrease in cash and cash equivalents (38,488) (98,463) (783,439) (544,309) (1,464,699)
Cash and cash equivalents, January 1 (Including $551,638 and $41 for the revenue bond covenants and capital outlays, respectively, reported in restricted accounts) 77,158 323,790 2,249,497 596,671 3,247,116
Cash and cash equivalents, December 31 (Including $118.441 for capital outlays reported in restricted accounts) $ 38,670 $ 225,327 $ 1,466,058 $ 52,362 $ 1,782,417
(Continued on next page)

CITY OF SOUTH BEND COMBINING STATEMENT OF CASH FLOWS- NONMAJOR ENTERPRISE FUNDS
For The Year Ended December 31, 2013 (Continued)
Consolidated Parking Solid Blackthorn Building Garage Waste Golf Course Totals
Reconciliation of operating income (loss) to net cash provided by operating activities:
Operating income (loss) $ (163,169) $ 244,152 $ 339,789 $ 50,982 $ 471,754
Adjustments to reconcile operating income (loss) to N net cash provided by operating activities: 0 Depreciation expense 24,144 260,960 331,220 157,513 773,637 (A) Bad debt expense - 75,204 - 75,204
(Increase) decrease in assets: Accounts receivable (14,104) (254) (53,605) (4,444) (72,407)
lnterfund receivable - 4,333 - 4,333
Inventories - - - (3,965) (3,965)
Increase (decrease) in liabilities: Accounts payable 10,160 4,764 67,610 1,662 84,396
lnterfund payable 5,903 - (53,664) (167) "(47,928)
Accrued payroll payable 30,018 - 3,034 - 33,052
Compensated absence payable - -- 65,087 - (5,413) - 59,674
Total adjustments 121,208 _265,470 368,919 150,599 906,196
Net cash provided (used) by operating activities $ (41,961) $ 509,622 $ 708,708 $ 201,581 $ 1,377,950

V Internal Service Funds
204

Liability Insurance Premium Reserve -
Self-Funded Employee Benefits-
Central Services -
Police Take Home Vehicle -
Unemployment Compensation Insurance-
- - - -------------
INTERNAL SERVICE FUNDS
To account for expenses related to maintaining the City's self-funded liability insurance including administrative costs, claims and premiums. Funding is provided by assessments to certain other City funds.
To account for employer and employees' contributions for a medical insurance plan.
To account for expenses related to fuel, vehicle repairs and various supplies provided to City departments on a cost-reimbursement basis.
To account for expenses associated with claims arising from use of program vehicles occurring while officers are not on duty. Funding is provided by officers participating in the program.
To account for payment of unemployment claims to the Indiana Department of Workforce Development. Financing is provided by. allocating costs to user departments to cover the estimated costs of claims.
205

CITY OF SOUTH BEND COMBINING STATEMENT OF NET POSITION -INTERNAL SERVICE FUNDS
December 31, 2013
Liability Self-Insurance Funded Police Unemployment
Premium Employee Central Take Home Compensation
Reserve Benefits Services Vehicle Insurance Totals
Assets
Current assets: Cash and cash equivalents $ 1,321,474 $ 1,462,227 $ 373,521 $ 115,431 $ 66,265 $ 3,338,918
Investments 3,855,105 4,189,527 1,089,665 336,743 193,317 9,664,357
Interest receivable 5,562 6,050 1,551 485 279 13,927
Accounts receivable - 7,928 31,555 - - 39,463
lnterfund receivables; lnterfund services provided and used - - 3,135 - - 3,135
Inventories - - 859,536 - - 859,536
Total current assets 5,182,141 5,665,732 2,356,963 452,659 259,661 13,919,356
Capital assets: Other capital assets (net of
accumulated depreciation) 40 986 - ~554 - - 1,379,540
N 0 Total assets 5,223,127 5,665,732 3,697,517 452,659 259,861 15,298,896
en Liabilities
Current liabilities: Accounts payable 4,525 1,118,314 623,083 - 24,693 1,770,615
I nterfund payables: lnterfund services provided and used - 1,487 861 - - 2,348
Accrued payroll payable 5,669 - 195,632 - - 201,501
Compensated absences 12,007 - - - - 12,007
Capital leases payable - - 5,802 - - 5,802
Interest payable - - 136 - - 136
Estimate of unfiled claims 2,791,134 100,000 - - - 2,891,134
Total current liabilities 2,813,535 1,219,801 825,514 - 24,693 4,883,543
Noncurrent liabilities:
Capital leases payable - - 6,266 - - 6,268
Total liabilities 2,813,535 1,219,801 831,782 - 24,693 4,889,811
Net Position
Investment in capital assets 40,986 - 1,326,464 - - 1,367,470
Unrestricted 2,366,606 4,445,931 1,539,251 452,659 235,168 9,041,615
Total net position $ 2,409,592 $ 4,445,931 $ 2,665,735 $ 452,659 $ 235,166 $ 10,409,085

CITY OF SOUTH BEND COMBINING STATEMENT OF REVENUES, EXPENSES AND CHANGES IN NET POSITION
INTERNAL SERVICE FUNDS For the Year Ended December 31, 2013
Liability Self-Insurance Funded Police Unemployment Premium Employee Central Take Home Compensation
_B.eserve Benefits Services Vehicle Insurance Totals
Operating revenues: Employee/employer contributions $ 2,988,576 $ 11,857,011 $ - $ 123,413 $ 252,383 $ 15,221 ,383 Charges for sales and services - - 7,199,304 - - 7,199,304
Other 2,512 - 9,798 - - 12,310
Total operating revenues 2,991,088 11,857,011 7,209,102 123,413 252,383 22,432,997
N Operating expenses:
0 Operation and maintenance - - 7,242,586 - - 7,242,586
...... Administration 202,935 565,535 201,148 63,700 - 1,033,318
Insurance claims and premiums 44,210 13,583,715 - - 75,700 13,703,625
Depreciation 8,006 - 107,775 - - 115,781
Total operating expenses 255,151 14,149,250 7,551,509 63,700 75,700 22,095,310
Operating income (loss) 2,735,937 (2,292,239) (342,407) 59,713 176,683 337,687
Nonoperating revenues (expenses): Interest and investment revenue 10,733 15,346 1,514 804 293 28,690
Interest expense - - 1,396 - - 1,396
Total nonoperating revenue (expenses) 10,733 15,346 2,910 804 293 ~086
Change in net position 2,746,670 (2,276,893) (339,497) 60,517 176,976 367,773
Total net position - beginning (337,078) 6,722,824 3,205,232 392,142 58,192 10,041,312
Total net position - ending $ 2,409,592 $ 4,445,931 $ 2,865,735 $ 452,659 $ 235,168 $ 10,409,085

-- ---------------------------------------------------------------------------------------~
CITY OF SOUTH BEND COMBINING STATEMENT OF CASH FLOWS -INTERNAL SERVICE FUNDS
For the Year Ended December 31, 2013
Liabi lity Self-Insurance Funded Police Unemployment Premium Employee Central Take Home Compensation Reserve Benefits Services Vehicle Insurance Totals
Cash flows from operating activities: Receipts from customers and users $ 2,991,249 $ 12,131 ,296 $ 78,107 $ 123,413 $ 252,383 $ 15,576,448 Receipts from in terfund services provided 1,487 7,668,270 7,669,757' Payments to suppliers {3,049,608) (13 ,924,879) (4,847,679) (63,700) (65,443) (21 ,951 ,309) Payments to employees 2,409 (2,473,255) (2,470,846) Payments for interfund services used (128) 567 439
Net cash provided (used) by operating activities (56,078) (1,792,096) 426,010 59,713 186,940 (1 ,175,511)
Cash flows from capital and related financing activi ties : Acquisition and construction of capital assets (40,986) (53,980) (94,966) Proceeds from sale of capital assets 18,552 18,552 Principal paid on capital debt (1,754) (1,754) Interest paid on capi tal debt (42) (42)
Net cash provided (used) by capital and related
financing activities _(2_2_.434) --- - (55,77_§) - (78 ,210)
Cash flows from investing activit ies: Sale of Investments 411,329 411,329
"' Purchases of Investments (594 ,749) (41 1,753) (93,21 1) (148,213) (1 ,247,926) Interest received 9,318 15,150 2,221 629 71 __ 2_7,389
0 (X)
Net cash provided (used) by investing activities (585,431) 426,479 (409,532) (92,582) (148,142) (809,208)
Net increase (decrease) in cash and cash equivalents (663,943) (1 ,365,617) (39,298) (32,869) 38,798 (2,062,929)
Cash and cash equivalents. January 1 1,985,417 2,827 ,844 412,819 148,300 27,467 5,401,847
Cash and cash equivalents. December 31 $ 1,321 ,474 $ 1.462,227 $ 373,521 $ 11 5,431 $ 66,265 $ 3,338,918
Reconciliation of operating income (loss) to net cash provided (used) by operating activities:
Operating income (loss) $ 2,735,937 $ (2 ,292,239) $ (342,407) $ 59,713 $ 176,683 $ 337,687
Adjustments to reconcile operating income (loss) to net cash provided (used) by operating activities:
Depreciation expense 8,006 107,775 115,781 (Increase) decrease in assets:
Accounts receivable 161 274,285 875 275,321 lnterfund receivables (128) 536,400 536,272 Inventories (56,996) (56 ,996)
Increase {decrease) in liabilities: Accounts payable (9,121) 224,371 180,590 10 ,257 406,097 lnlerfund payables 1,487 567 2,054 Accrued payroll payable 352 115,664 116,016 Compensated absences payable 2,057 (116,458) (114,401) Estimated unfiled claims (2,793 ,342) (2,793,342)
Total adjustments (2,792,015) 500,143 768,417 10,257 (1,513,198)
Net cash provided (used) by operating activities $ ~078) $ (1,792,096) _$_426,01Q $ 59,713 $ 186,940 $ (1,175,511)

VI Fiduciary Funds
209

Pension Trust Funds
1925 Police Pension -
1937 Firefighters' Pension-
Agency Funds
Payroll-
Morris Palais Royale Box Office-
FIDUCIARY FUNDS
To account for the provision of retirement and disability benefits to police officers hired prior to May 1, 1977. Financing is provided by mandatory contributions by active members, and state pension relief distributions.
To account for the provision of retirement and disability benefits to firefighters hired prior to May 1, 1977. Financing is provided by mandatory contributions by active members and state pension relief distributions.
To account for the payroll of City employees and pension benefits of the Police and Firefighters' Pension Funds. Gross payroll and pension benefits are treated as expenditures in other City funds and transferred into this fund , which serves as a clearing account.
To account for Morris Entertainment Center and Palais Royale event advance deposits and related expenses.
210

I'-) ...... ......
-- -- -- --------------------------------------------------- --------------------------------------------------------------- ---
CITY OF SOUTH BEND COMBINING STATEMENT OF FIDUCIARY NET POSITION- PENSION TRUST FUNDS
December 31, 2013
1937 Total 1925 Police Firefighters' Pension
Pension Pension Trust Funds
Assets
Cash and cash equivalents $ 435,434 $ 239,066 $ 674,500 Investments 1,270,283 697,421 1,967,704 Receivables:
Interest 1,845 1,018 2,863
Total assets 1,707,562 937,505 2,645,067
Liabilities
Current liabilities:
Accounts payable - 12,0QO 12,000 Accrued payroll payable - 620 620
Total liabilities - 12,620 12,620
Net Position
Net position held in trust for: Employees' pension benefits $ 1,70Z,562 $ 924,885 $ 2,632,447
I
I
I
I

- -- --- --------------------------------------------------------------------------------------
CITY OF SOUTH BEND COMBINING STATEMENT OF CHANGES IN FIDUCIARY NET POSITION-
PENSION TRUST FUNDS For the Year Ended December 31,2013
1937 Total 1925 Police Firefighters' Pension
Pension ~sion Trust Funds
Additions
Contributions: On behalf $ 5,863,697 $ 5,035,292 $ 10,898,989 Plan members 881 - 881 Other 4854 - 4,854
Total contributions 5,869,432 5,035,292 10,904,724
N Net investment income: __., N
Interest 2,355 1,164 3,519
Total additions 5,871,787 5,036,456 10,908,243
Deductions
Benefits 6,463,447 5,458,690 11,922,137 Administrative expense 11,300 1,212 12,512
Total deductions 6,474,747 5,459,902 11,934,649
Changes in net position (602,960) (423,446) ( 1 • 026,406)
Net position - beginning 2,310,522 1,348,331 3,658,853
Net position - ending $ 1,707,562 $ 924,885 $ 2,632,447

CITY OF SOUTH BEND STATEMENT OF CHANGES IN ASSETS AND LIABILITIES-
AGENCY FUNDS For the Year Ended December 31, 2013
Morris Total Palais Royale Agency
~roll Box Office Funds
Assets: Cash and cash equivalents, January 1 $ 1,054,365 $ 1,363,306 $ 2,437,671 Additions 100,659,874 3,336,240 104,196,114 Deductions (101,615,542) (3,379,946) (1 04,995,490)
N Cash and cash equivalents, December 31 298,697 1,339,59~ 1,638,295
...... (A) Total assets, December 31 $ ~98,697 $ 1,339,598 $ 1,638,295
Liabilities Accrued payroll and withholdings payable, January 1 $ 1,054,365 $ - $ 1,054,365 Additions 100,859,874 - 100,859,874 Deductions (1 01,615,542) . - (101,615,542)
Accrued payroll and withholdings payable, December 31 298,697 - 298,697
Customer deposits, January 1 - 1,383,306 1,383,306 Additions - 3,336,240 3,336,240
Deductions - (3,379,948) (3,379,948)
Customer deposits, December 31 - 1,339,598 1,339,598
Total liabilities, December 31 $ 298,697 $ - 1 ,33_9,598 $ - 1,638,295

,.....-----------~--- -- --- - - ----------------
VII Statistical Section
214

FINANCIAL TRENDS
These schedules contain trend information to help the reader understand how the City of South Bend's financial position and performance have changed over time.
215

City of South Bend, Indiana
Net Position by Component Last Ten I<iscal Y cal's
2004 2005 2006 (1) 2007 2008 2009 2010 2011 2012 2013
Governmenta l activities Invested in capital assets, net of related debt 7,383,902 35,777,247 208,509,577 200,634,954 178, 178,047 178,483,535 186,771 ,216 196,265,413 2 10,282 ,574 192, 190,446
Restricted I ,966,388 6, 138,257 5,225,642 5,370,627 II ,077,687 12,825,227 8,840,610 9,354,772 8,050,4 18 7,990, 172
Unrestricted 59,250,28 1 26,957,659 24 ,900,036 47, 150,229 56,786,2 14 82,877,695 96,539,932 82,27 1,482 74,298;23 1 86,4 13,227
Total governmental activities net position 68,600,571 68,873 ,163 238,635,255 253 ,155,810 246,04 1,948 274,186,457 292, 15 1,758 287,89 1,667 292,63 1,223 286,593,845
Business-type activities Invested in capita l assets, net of related debt 93,370,899 94 ,833,960 97,670,533 I 12, 194,45 1 I 24,705,327 I 19,607,643 122,108,095 I 03,463,004 11 3,193,929 1 14,506,252
Rest ricted 13,254,447 17,942,700 22,535,858 8,273,257 8,630,542 14,075 ,339 13,320,967 12,937,988 29,259,933 48,267,664
Unrestricted 19,0 I 5,375 8 751 ,584 7 168,852 15,793 782 9,209,9 I 7 12,597,138 19,262, 192 45 ,733,630 26 ,957 ,505 7,906,258
Totn1 business-type activities net position 125 ,640,72 1 I 2 1,528,244 127,375,243 136,26 I ,490 142,545,786 I 46,280, 120 154,69 I ,254 I 62, 134,622 I 69,4 11 ,367 I 70,680, I 74
Primary government Invested in capital assets, net of related debt 100,754,801 130,6 11 ,207 306, 180,110 3 I 2,829,405 302,883,374 298,09 I ,178 308,879,3 I I 299,728,4 17 323,476,503 306,696,698
Restricted 15,220,835 24 ,080,957 27,76 1,500 13,643,884 19,708,229 26,900 ,566 22,161,577 22,292,760 37,310,35 1 56,257,836
Unrestricted 78,265,656 35,709,243 32 068 ,888 62 ,944 ,0 II 65,996, 13 1 95,474,833 11 5,802, 124 128,005, 11 2 I 0 I ,255,736 94,319,485
Totnl primary government net positiou I 94,24 I ,292 190,40 I ,407 366,0 I 0,498 389,417,300 388,587,734 420,466,577 - 446,843 ,0 12 450,026,289 462,042,590 457,274,019 rv ....... 0')
Sou.-cc - City of So ulh llcntl Compr-chcnsv ic Annual Fin:IIICiitl ftc11orls (includes pr·io r· pcriod :u.J.iustmcnls)
( I) The City implemented the retroacti ve reporting of infrastructure assets requ ired by GASB Statcntcnt No. 34 during 2006.
Net position is defined as the diflCrcncc bet ween to tal assets and deferred outflows of resources less tota l li abi lities and deferred inflows of resources and can generally be !hough I of as the net worth of t he City of South Bend.
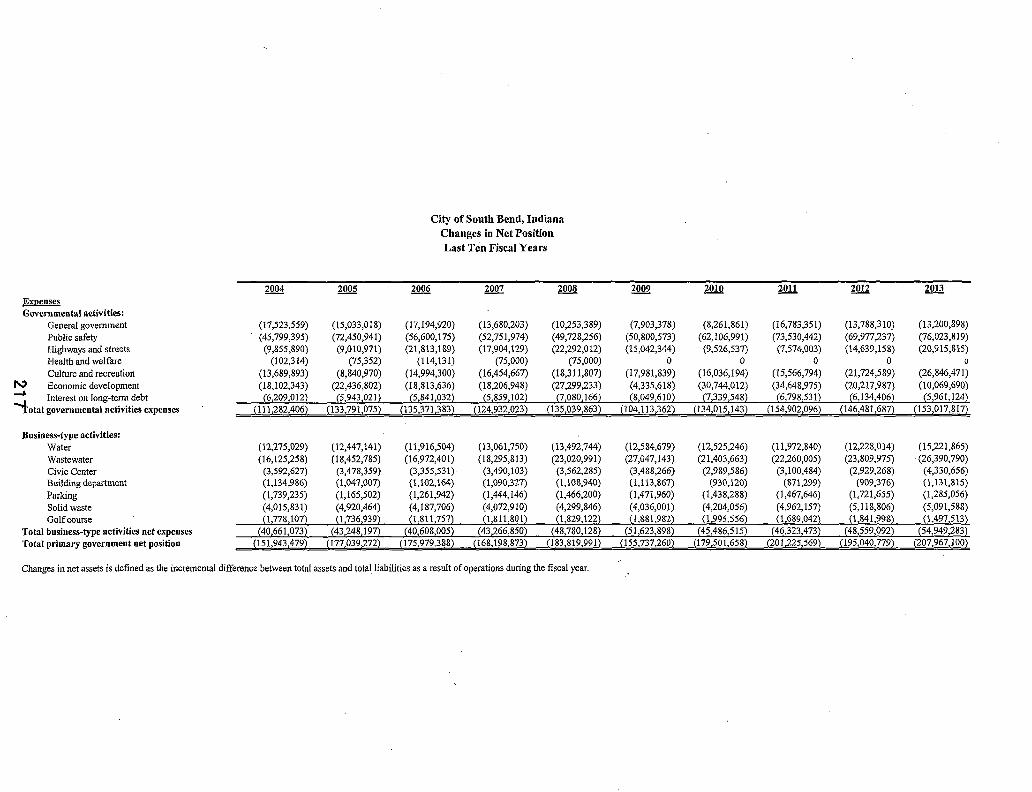
Expenses Guvemmental activities:
General govermnent Public safety Highways and streets Health and welfare Culture and recreation
N Economic development ......, Interest on long-term debt 'total governmental activities expenses
Business-type activities: Water Wastewater Civic Center Building department Parking Solid waste Golf course
Total business-type activities net expenses Total primary government net position
2004 2005
City of South Bend, Indiana Changes in Net Position Last Ten Fiscal Years
12M 2007 2008 M!Q2. 2010 2011 2012 Wl
(17,523,559) (15,033,018) (17,194,920) (13,680,203) (10,253,389) (7,903,378) (8,261,861) (16,783,351) (13,788,310) (13,200,898) (45,799,395) (72,450,941) (56,600,175) (52,751,974) (49,728,256) (50,800,573) (62,106,991) (73,530,442) (69,977,237) (76,023,819) (9,855,890) (9,010,971) (21,813,189) (17,904,129) (22,292,012) (15,042,344) (9,526,537) (7,574,003) (14,639,158) (20,915,815)
(102,314) (75,352) (114,131) (75,000) (75,000) 0 0 0 0 0 (13,689,893) (8,840,970) (14,994,300) (16,454,667) (18,311,807) (17,981,839) (16,036,194) (15,566,794) (21,724,589) (26,846,471) (18,102,343) (22,436,802) (18,813,636) (18,206,948) (27,299,233) (4,335,618) (30,744,012) (34,648,975) (20,217,987) (10,069,690) (6,209,Ql2) (5,943,@1) _ (5,841,0R) ___ (5,8l2,1~ _ _(7,08QJ_6QL__(_8,042,61()L__(D39,248L____l6,798,531} (6,134,406) (5,961,124)
(111,282,406) (133,791,075) (135,371,383) (124,932,023) (135,039,863) (104,113,362) (134,015,143) (154,902,096) (146,481,687) (153,017,817)
(12,275,029) (12,447,141) (11,916,504) (13,061,750) (13,492,744) (12,584,679) (12,525,246) (11,972,840) (12,228,014) (15,221,865) (16,125,258) (18,452,785) (16,972,401) (18,295,813) (23,020,991) (27,047,143) (21,403,663) (22,260,005) (23,809,975) '(26,390,790)
(3,592,627) (3,478,359) (3,355,531)' (3,490,103) (3,562,285) (3,488,266) (2,989,586) (3,100,484) (2,929,268) (4,330,656) (1,134,986) (1,047,007) (1,102,164) (1,090,327) (1,108,940) (1,113,867) (930,120) (871,299) (909,376) (1,131,815) (1,739,235) (1,165,502) (1,261,942) (1,444,146) (1,466,200) (1,471,960) (1,438,288) (1,467,646) (1,721,655) (1,285,056) (4,015,831) (4,920,464) (4,187,706) (4,072,910) (4,299,846) (4,036,001) (4,204,056) (4,962,157) (5,118,806) (5,091,588) (1,778,107) (1,736,9]9) - - (1,8~1,7& __ (1,8ll,80ll____ {l,l!29,12~__il,~8~l_ __ Q_,jl95,556L__~,Qm {1,841,998) (1,497,513)
(40,661,073) (43,248,197) (40,608,005) (43,266,850) (48,780,128) (51,623,898) (45,486,515) (46,323,473) (48,559,092) (54,949,283) (151,943,479) (177,039,272) (175,979,388) (168,198,873) (183,819,991) (155,737,260) (179,501,658) (201,225,569) (195,040,779) (207,967,100)
Changes in net assets is defined as the incremental difference between total assets and total liabilities as a result of operations during the fiscal year.
L-------------------------------------------------------- -

City of South Bend, Indiana Changes in Net J>osition, Last Ten F iscal Years (continued)
2004 2005 2006 2007 2008 2009 2010 2011 2012 2013 Governm ental activiti es :
Charges fo r services : General government $6,054 ,637 $148,150 $6,883, 104 $6,553, 12 1 $6,647,223 $6,855,830 $6,964,269 $1,165,018 $2, 100,103 $ 1,939,865 Public safety 2,075,522 2,239,368 5, 132,285 4,228,405 5,035,433 5,05 1,827 4,916,958 4,096,566 5,079, 182 5,2 10,272 Highways and streets 0 135,3 13 44,250 0 0 5,152 28,110 227,000 29 1,840 45 1,363 Economic development 168,523 5 16,570 562,807 604 ,873 636,722 332,454 283,420 683,503 27 1,366 444,839 Culture and recreation I ,044,5 12 3,784,176 4,940,629 5,057,076 5,300,818 5,063,896 4,995,049 4,681,536 5,224,543 5, 11 2,019
Operating grants and cont ributions 10,7 18,149 12,916,362 12,452,463 15,628,287 11 ,356,682 12,199,444 29,467,573 32,09 1,246 24,937,596 2 1,466,622 Capital grants and contribut ions 10,326,795 9,447,723 13,793,363 960,502 1,176,783 780,137 1,472,233 2,328,468 2,468,120 1,867,2 13
To ta l governmenta l activities prog ram revenues 30,388, 138 29, 187,662 _<Q,808,90 I 33,032 ,264 30ll53,66 1 30,288,740 48,1272612 45 ,273,337 40,372,750 _36~492, 193
~usiness-type activities :
00 Charges for services: Water 12,5 13,333 12, 130,549 14,757,8 19 15,336,891 14,926,833 14, 151,289 14,194,442 14,080,592 15,409,171 15,102,462 Wastewater 14,773,65 1 14,830,607 18,725,903 2 1,349,40 I 23 ,567,973 25,0 12,163 26,00 1, 156 29,407,263 30,657,698 32,474,743 Civic Center I ,837,763 1,604,352 3,113,264 3,37 1,553 3,370,802 2,873,966 2,869,010 2,894,9 13 2,680,076 3,463,8 13 Building Department 983 , 102 1,125,31 2 1,039,405 1,078,258 1, 169,788 977,050 875,481 899,397 1,000,38 1 9f,7,667 Parking 768,503 763,58 1 799,350 86 1,307 1,003 ,889 1,070,5 19 1,047,784 1,07 1,078 92 1,044 968,868 So lid Waste 3,964,487 3,764,229 <1, 177,897 4,187,82 1 4,343, 120 4,759 ,530 4,745,547 4,830,342 5,08 1,99 1 5,399,044 Golf Course 1,689,984 1,546,244 I ,565,649 1,5 12, 150 1,493,5 19 1,557,95 1 1,479,41 5 1,392,999 1,669,372 1,530,402
Operating grants and contributions 1,165 ,243 I ,282,780 0 0 0 0 0 0 0 0 Capital grants and contributions 118,953 I 479,58 1 1,413 ,86 1 I ,253,332 I ,209,380 4,038,412 1,889,165 4,291 ,73 1 2,0 10,253 697,916
Tota l business-type activites program revenues 37,815,0 19 38,527,235 45,593, 148 48,950,713 5 1,085 ,304 54,440,880 53, 102,000 58,868,315 59,429,986 60,604,9 15 Tota l primary govemment progra m revenu es 68,203 , 157 67,7 14,897 89,402 ,049 8 1,982,977 8 1,238,965 84,729,620 I 01,229,612 104,14 1,652 99,802,736 97,097,108
Net CEx pensel/Revenu c Governmental act ivities (103,402,937) ( 106, 183,721) (8 1,123, 122) ( 102,007,599) (73,959,70 1) ( 103 ,726,403) (106,774,484) 45,273,337 (106, 108,937) (1 16,525,624) Business-type activities (5 ,433 , 178) (2 ,080,770) 2,326,298 170,585 (538,594) 8,954 ,365 6,778,527 58,868,3 15 10,870,894 5,655,632 Tota l primal'y govcl'nrn cnt net expense ( I 08 ,836, I 15) ( I 08,264 ,49 1 L______Qil,796,824J (10 1,837,014) (74,498)95) (94,772,038) (99 ,99~,957) 104,141,652 (95 ,238,043) (110,869,992)

General Revenues a nd Other Changes in Net !' osition Governmenta l activities :
Taxes Property taxes County Opti on Income Tax Economic Developmen t Income Tax
Professional Sports Development Tax Community Revitalization District Tax
Unrestricted gra nts and contr ibutions Unrestricted Investment earnings Other Transfers
l'..l'otal governmenta l acti vities ..... C!:husiness-type activities:
Unrestri cted Investment earnings Other Transfers
Tota l business-type ac tivities Tota l primary govcmment
Specia l Item (Governmental activities): Well fie ld contam ination sett lement
Change in Net l'osition Governmental activit ies Business-type activit ies Tota l prima r y governm ent
Excludes prior period adj ustments
-
City of South Bend, Indiana Changes in Net Position, Last Ten Fiscal Years (contin ued)
2004 2005 2006 2007 2008 2009 2010 2011 201 2 2013
$62,279,784 $72,743,697 $68,256,602 $77, 120,683 $76, 109,499 $73,882, 128 $77,3\5,641 $76,445,349 $7 1,775,415 $72,0 18,650
7,00 1,198 5,695,618 6,4 10,405 8,072,623 5,8 13,846 10,270,179 11 ,502,052 13,219,723 13,748,824 13,739,325
3,448,688 3,464, 152 4,0 13,475 4,68 1, 134 3,788,754 4,536,245 7,335, 113 8,044,773 8,324,878 8, 177,352
378,099 385,553 336,28\ 435,79 \ 453,268 522,788 597,406 558,268 633,904 649,996
655,269 965,052 1,000,000 1,000,000 955,3 15 605,623 416, 149 733 ,100 653, 185 244,623
5, 133,838 5,160,298 5,063,54 1 4,032,300 5,664,0 II 7,597,883 4,883 ,08 \ 3,964,336 3,89 1,8 10 5,893,924
\ ,660,720 3,543,469 4,762,484 6,247, \1 3 4,961,410 859,135 868,023 1,050,768 1,3 17,443 762,270 598,600 10,790,170 3,520, 138 5,0 16,902 2,007,821 2,781,368 2,627,34 1 3,483,054 6,623,313 14,285,314
14,873 33,589 44 ,200 3,735 34,970 (645,992) (648,823) 3,04 1,176 3,879,721 4,525,187
81,171 ,0_62 102 ,78 I ,598 93 ,407 ,126 1 06,61 0,28 \ 99,788,_894 _I 00,402,357 I 04,892,983 \ \0,540,547 \ I 0,848,493 120,296,64 1
362,676 745,966 906,056 1,30\ ,348 \,5\4,287 271 ,360 146,826 206,409 285,572 \38,362 0 I ,990,5 15 0 0 0 0 0 0 0 0
( \4,873) (33,589) (44,200) - · (3 ,735) _____(34,970) 645 ,992 648,823 (3 ,04 \ , \ 76) (3,879,72 1) (4,525, 187) 347,8Q3 2,702,892 86 1,856 \ ,297,6 \3 1,479,3 \7 9 \7,352 795,649 (2,834,767) (3,55>.4, \ 49) - (4,386,825)
81,5 18,872 J 05 ,484 ,490 94 ,268,982 107,907,894 10 1,268,2 11 \0 \ ,326,709 \05 ,69 1,632 \07,705 ,780 \07,254,344 I \ 5,909,8 \6
0 0 0 0 4,462,2 14 0
(25,0 12,652) 21,658,476 (8,600,473) 32,650,580 524,705 (6,365,127) ( I, 732 ,967) 5,029, \90 \ ,032,44 1 _ 759,Q_19 ____IQ,_433 ,682 -----.l&2~879
(g6, 745,619) $26,687,666 ($7,568,032) $33 ,409,599 $ 10,958,387 $ 1,330,752
0
150,169,320 59,663,964
$209,833,284
0
91\,788 9,7 \0,075
$ I 0,62 1,863
0
4,739,556 7,276,745
$12,0 16,30 \
0
3,771,016 \ ,268,807
$5,039,823
Source : City of South Bend Comprehensive Annua l Fi nancial Reports

N N 0
2004 ~ General fund
Reserved 2,365,669 10,581,739 Unreserved 19,656,024 18,162,455 Nonspendable -Restricted Committed Assigned -Unassigned -
Total- General Fund 22,021,693 28,744,194
Other Governmental Funds Reserved 39,224,425 38,498,351 Unreserved, reported in:
Special revenue funds 10,159,432 14,134,371 Capital projects funds 43,815,737 40,624,644 Debt service funds
Nonspendable -Restricted - -Committed -Assigned -Unassigned - -
Total - Other Governmental Funds 93,199,594 93,257,366
Grand Total- Governmental Funds 115,221,287 122,001,560
City of South Bend, Indiana Fund Balances, Governmental Funds
Last Ten Fiscal Years
2006 2007 ~
4,162,853 2,213,970 3,245,271 21,688,442 21,546,783 24,171,313
- --
- -- -
25,851,295 23,760,753 27,416,584
34,251,520 36,374,517 60,213,915
19,348,846 25,703,180 32,054,329 60,447,079 66,593,906 87,571,056
(7,828) - - -- - -- -- -
- -114,039,617 128,671,603 179,839,300
139,890,912 152,432,356 207,255,884
2009 2010
1,516,159 1,824,454 23,102,296 26,912,688
--
24,618,455 28,737,142
56,819,802 62,230,229
36,398,024 31,996,398 78,214,132 85,237,947
- -- -
--
171,431,958 179,464,574
196,050,413 208,201,716
(1)- The City of South Bend adopted Statement No. 54 of the Governmental Accounting Standards Board requiring new classfications for Fund Balance reporting for fiscal year 2011.
Source: City of South Bend Comprehensive Annual Financial Reports
\
2011 (1) 2012 2013
1,115,025 958,341 656,848 327,267
255,287 165,389 516,506 26,233,637 27,671,353 26,495 559 27,931,216 28,795,083 27,668,913
37,036,839 38,857,510 22,828,476 44,754,037 78,326,567 95,387,879 ll,829,074 11,142,045 20,697,026 77,460,284 35,180,652 35,455,190 (2,777,3742 (4,219,066) (4,852,169)
168,302,860 159,287,708 169,516,402
196,234,076 188,082,791 197,185,315

,...., ,...., .....
Revenues Taxes
Licenses, fees and pennits Fines and forfeits Charges for services Intergovenunental InvesUnent earnings Other revenues
Total revenues
Expenditures General govenunent Public Safety Highways and Streets Health and Welfare Culture and Recreation Economic Development Capital Outlay Debt Service
Interest and Fiscal Charges Principal
Total expenditures
Excess of revenues over (under) expenditures
Other Financing Sources (Uses)
Proceeds from debt issuance
Premium (discount) on debt issuance Proceeds from refunding Payments to refunded bond escrow agent Transfers in Transfers out Other Total other fmancing
sources (uses)
StJecial Item: Well field contamination settlement
Net change in fund balances
Debt seo-vice as a percentage of noncapital expenditures (1)
Excludes prior period adjustroents
2004 2005
City of South Bend, Indiana Changes in Fund Balances, Governmental Funds
Last Ten Fiscal Years
2006 lliZ 2008 2009 2010 lli1 2012 2013
75,289,946 78,650,044 84,049,414 88,695,023 96,930,953 89,139,585 10!,785,765 99,001,213 95,136,206 94,829,947 223,006 246,780 186,470 173,604 177,329 206,594 192,397 190,943 189,714 177,019 302,376 245,680 444,861 437,732 412,707 423,981 409,775 636,749 334,767 660,841
15,187,711 15,293,779 16,931,744 15,832,139 17,030,160 16,678,584 16,585,634 13,990,267 12,442,553 12,320,498 17,968,454 18,665,828 31,275,541 21,400,166 18,196,118 20,577,464 35,822,886 34,419,714 31,297,526 29,227,759 1,668,050 3,543,469 4,762,484 6,248,605 4,962,768 859,135 868,023 1,050,768 1,317,443 762,270 2,732,127 10,791,5~-- 3,414,731 ~9_,:31L_bQ07,821 3,046,791 2J677,796 3,587,518 __ 6,660,875 13,174,140
113,371,670 127,437,135 141,065,245 137,826,642 139,717,856 130,932,134 158,342,276 152,877,172 147,379,084 151,152,474
6,814,675 7,828,275 11,244,734 9,611,354 6,902,426 5,969,141 5,214,424 6,680,855 6,390,585 7,154,965 44,371,673 49,010,645 51,050,640 53,203,005 50,413,055 48,790,068 62,586,177 69,612,754 67,138,414 64,041,549 12,638,026 9,874,281 13,583,761 13,257,781 13,369,611 11,716,810 10,702,555 5,079,041 9,288,682 9,769,942
75,000 75,000 75,000 75,000 75,000 0 0 0 0 0 14,347,497 14,226,463 13,849,622 13,469,798 14,542,481 12,733,094 12,841,596 13,816,699 18,557,986 13,956,025 13,208,131 7,531,650 9,752,254 7,710,242 9,726,718 8,938,134 17,408,376 9,698,611 3,543,180 8,068,458 30,722,396 29,299,053 16,391,192 17,293,302 26,695,208 37,485,105 21,952,522 46,691,030 39,984,127 30,748,663
5,287,658 5,793,386 6,144,611 5,718,572 7,258,201 8,053,995 7,499,683 7,186,494 6,734,305 6,113,043 5,597,711 7,0]4,887 7,435,n2 ____1&10,_l§§__u_9,040,095 9,276 363 12,552,681 _13,632,195 __ 10~,Til_ u,Q<l8,!05
133,062,773 130,713,640 129,527,536 128,209,220 138,022,795 142,962,710 150,758,014 172,397,679 162,460,000 152,860,750
(19,691,1 03) (3,276,505) ll,537,709 9,617,422 1,695,061 (12,030,576) 7,584,262 (19,520,507) (15,080,916) (1,708,276)
613,767 !0,023,189 14,050,557 2,920,287 45,622,808 1,771,318 5,280,314 3,478,239 5,660,897 7,80!,455 0 0 0 0 1,626,186 80,950 146,030 26,877 1,236,364 21,576 0 0 0 0 0 7,210,000 5,327,775 38,307,431 13,595,000 3,990,000 0 0 (8,371, 711) 0 0 (7,591,171) (5,538,255) (37,300,856) (14,613,147) (4,376,769)
6,571,247 8,332,742 8,928,540 7,872,575 10,574,625 8,687,172 16,314,577 22,483,564 25,368,413 26,365,239 (6,556,374) (8,299,153) (8,884,340) (7,868,840) (10,539,655) (9,333,164) (16,963,400) (19,442,388) (21,488,692) (21,840,052)
0 0 0 0 0 0 0 0 0 0
628,640 10,056,778 5,723,046 2,924,022 47,283,964 825,105 4,567,041 7,552,867 9,758,835 11,961,449
0 0 0 0 0 4,462,214 0 0 0
{19,062,46:!) 6,780,27_3- _17,260,755 _g,5j1M4 ___ 48,979,025 _((),143,257) _12,15!,:303 (11,9~,640)_ - (5,322,08!) 10,253,173
9.8% 11.1% 10.8% 11.4% 12.1% 17.6% 15.4% 13.8% 12.9% 13.4%
(I) Formula= Deb service payments (principal and interest) I (Total Governmental Fund expenditures- Govenunental Fund capital outlay per reconciliation)
Source: City of South Bend Comprehensive Annual Financial Reports

REVENUE CAPACITY
These schedules contain information to help the reader assess the factors affecting the City of South Bend's ability to generate and maintain revenue.
222

N N w
CITY OF SOUTH BEND, INDIANA PROPERTY TAX LEVIES AND COLLECTIONS
LAST TEN YEARS
Estimated Adjusted Current Tax Total Tax (1) Outstanding
PerDLGF Circuit Breal•er Current Tax Collections Delinquent Collections as Outstanding Delinquent Taxes
Tax Year/ Current Levy Levy Current Tax as a Pe1·cent of Tax Total Tax a Percent of Delinquent as a Percent of
Collection Year Tax Levy Reduction (County Abstract) Collections Adjusted Tax Levy Collections Collections Adjusted Tax Levy Taxes Adjusted Tax Levy
2003/2004 $ 59,875,358 $ - $ 59,875,358 $ 56,031,449 93.58 % $ 2,914,419 $ 58,945,868 98.45 % $ 6,189,942 10.34%
2004/2005 60,833,109 - 60,833,109 56,114,865 92.24 2,335,278 58,450,143 96.08 8,093,237 13.30
2005/2006 62,058,519 - 62,058,519 58,849,337 94.83 3,847,872 62,697,209 101.03 5,495,442 8.86
2006/2007 62,723,113 62,723,113 57,979,187 92.44 2,289,138 60,268,325 96.09 7,411,505 11.82
2007/2008 65,534,282 - 65,534,282 59,589,537 90.93 4,113,095 63,702,632 97.21 2,831,650 4.32
2008/2009 64,546,050 7,863,846 56,682,204 47,497,697 83.80 3,355,161 50,852,858 89.72 5,810,503 10.25
2009/2010 66,929,179 14,346,110 52,583,069 41,813,442 79.52 6,380,600 48,194,042 91.65 10,026,236 19.07
2010/2011 68,662,101 17,692,787 50,969,314 40,876,844 80.20 5,791,920 46,668,764 91.56 8,165,775 16.02
2011/2012 70,756,844 23,965,911 46,790,933 47,728,794 102.00 5,111,380 52,840,174 112.93 9,550,891 20.41
2012/2013 72,696,497 27,863,156 44,833,341 43,943,006 98.01 9,790,520 53,733,526 119.85 11,146,473 24.86
Source- St. Joseph County Auditor's Settlement Worksheets and Abstract. City of South Bend budget forms approved by the Department of Local Government Finance (DLGF).
Data provided for General Fund, Parks & Recreation, Cumulative Capital Development, Fire Pension and Police Pension Funds. Excludes College Football Hall of Fame and Tax Increment Financing Funds.
Delinquent tax collections are not broken out by individual taxing unit. A calculation of South Bend's share of delinquent taxes has been made based on proportionate tax rates.
Total collections may exceed 100% of adjusted tax levy as prior year collections are not broken out separately by the St. Joseph County Auditor.
(1) Outstanding Delinquent Taxes are reported in the aggregate as of the end of each year and are not cumulative.

City of South Bend, ludiaua Direct and Overlapping Property Tax Rates
Last Ten Fiscal Years (rate per $100 of net assessed value)
City Direct Rates
Cumulative Tax Year/ General Parks/ Firefighters' Police Capital Total St. Joseph
Collection Yenr Fund __ Recreation Pension Pension Dcveloement Direct Coun!I
200312004 1.6871 0.2859 0.0532 0.0477 0.0376 2.lll5 0.7652 2004/2005 1.6845 0.2902 0.0540 0.0485 0.0376 2.1148 0.7831 2005/2006 1.7386 0.2981 0.0554 0.0498 0.0376 2.1795 0.9899 2006/2007 1.6838 0.2858 0.0531 0.0477 0.0342 2.1046 0.8711 2007/2008 1.7924 0.2979 0.0579 0.0572 0.0342 2.2396 0.7576 2008/2009 1.9777 0.3656 0.0117 0.0189 0.0342 2.4081 0.5693 2009/2010 (2) 2.2536 0.4401 0.0000 0.0000 0.0342 2.7279 0.5866 2010/2011 2.4381 0.4818 0.0000 0.0000 0.0342 2.9541 0.5424 201112012 2.4954 0.4957 0.0000 0.0000 0.0328 3.0239 0.6212 2012/2013 2.5678 0.5102 0.0000 0.0000 0.0328 3.1108 0.6731
Source: St. Joseph County Auditor's Office- Certified Tax Rnte Schedules- Rnies presented for Portage Township in South Bend
N N (I) lncludes State oflndiana, Redevelopment Commission (Hall of Fame), South Bend Transportation and South Bend Regional Airport . .j::lo
(2) Firefighters' Pension and Police Pension no longer tax burden for the City of South Bend as the State oflndiana has assumed responsibity for funding these programs.
(3) Information provided for Portage Township in the City of South Bend. Property tax rates applied to net assessed valuation. Property tax billings are also subject to "circuit breaker" property tax caps on grossed assessed valuation of 1% (homestead residential property), 2% (other residentiaVrental property), and 3% (nonresidential real and personal property). Therefore, an increase in stated property tax rates will not result in higher property taxes paid for many taxpayers who have reached their cap.
Schools Districts
1.6201 1.5969 1.6033 1.5419 1.5417 1.0297 1.0728 1.2211 1.1931 1.3493
Overlapping Rates (3)
Total Grand Townshil! Libra!! Other (I) OverJn.eein& Total
0.0923 0.1830 0.2209 2.8815 4.9930 0.0276 0.1854 0.1828 2.7758 4.8906 0.0269 0.2027 0.1501 2.9729 5.1524 0.0285 0.1957 0.1737 2.8109 4.9155 0.0482 0.2216 0.1944 2.7635 5.0031 0.0537 0.2257 0.1733 2.0517 4.4598 0.0406 0.2657 0.1835 2.1492 4.8771 0.0438 0.3027 0.1958 2.3058 5.2599 0.0464 0.2941 0.1817 2.3365 5.3604 0.0453 0.3227 0.1971 2.5875 5.6983

Value of land Value of improvements
Total value of real estate Less: Mortgage, veterans, blind, age
65 & other exemptions Tax-exempt property Investment Deduction Tax increment financing Tax abatements
Net value of real estate
Gross personal property assessments Less: Tax abatements
Tax-exempt property N Investment deduction ~ Tax increment financing
Net value of personal property
Net value of utilities
Total net assessed valuation
Percentage of Total
Summary
Total value Deductions & exemptions Tax exempt property Tax increment financing Tax abatements
Total net assessed valuation
Percent
South Bend CcntreTwp
$112,649,600 477,640,200 590,289,800
CITY OF SOUTH BEND, INDIANA DETAIL OF NET ASSESSED VALUATION
(Assessment For the Year 2012 Payable in 2013)
South Bend South Bend South Bend ClayTwp GermanTwp PennTwp
$24,480,200 $69,431,600 $16,784,300 122,403,400 434,165,900 91,189,100 146,883,600 503,597,500 107,973,400
South Bend Warren Twp
$2,174,300 26,117,900 28,292,200
South Bend Portae:e Twn
$392,663,300 2,683,188,170 3,075,851,470
Totals
$618,183,300 3,834,704,670 4,452,887,970
(234,399,434) (34,719,574) (81,887,303) (27,092,434) 0 (1;017,117,465) (1,395,216,210) (41,023,590) (7,986,942) (32,058,380) (9,400,300) 0 (298,961,578) (389,430,790)
0 0 0 0 0 (1,918,700) (1,918,700) (94,770,861) (8,513,401) (257,726,946) 0 (25,818,670) (363,550,241) (750,380,119)
(6,835,9_§3) - (203,58~ (l8,83~,488)~ (3,007,~5) (2,4_73,530) (26,368,506) (57,728,970) 213,259,952 95,4~0,09~ 1_!3,085,383 ~ _ 68,472,'Z7J o 1,367,93",980 1,858,213,181
26,717,540 7,923,880 155,011,460 2,064,030 6,455,040 339,328,540 537,500,490 0 0 (6,092,993) 0 0 (8,864,874) (14,957,867)
(1,574,950) (201,740) (2,987 ,960) (929,160) 0 (93,837,377) (99,531,187) 0 0 0 0 0 0 0 0 0 0 0 0 (10,969,3702 {1 0,969,370)
25,142,590 7,722,140 145,930,507 1,134,870 6,455,040 225,656,919 412,042,066
10,996,270 4,668,400 9,919,770 1,210,340 -~ ---470,61~ 73,567,060 100,832,450
249,398,812 107,850,635 268,935,660 - 70,817,981 6,9]5,650 1,667,158,959 2,371,087,697
10.52% 4.55% 11.34%
Real Personal Property/ Property Utiltics Total
4,452,887,970 638,332,940 5,091,220,910 (1,397,134,910) 0 (1,397,134,910)
(389,430,790) (99,531,187) (488,961,977) (750,380,119) (10,969,370) (761,349,489) (57,728,970) (14,9TI,il67l _ (72,686,837)
1,858,213,181 512,874,516 2,371,087,697
78.37% 21.63% 100.00%
2.99%
Pet·cent
100.00% -27.44%
-9.60% -14.95% -1.43%
46.57%
0.29% 70.31% 100.00%
Source: St. Joseph County Auditor's Office- Information from the County Abstract pt·epared by the Indiana Department of Local Government Finance.
~-
Pet·cent
78.37%
17.38%
4.25%
100.00%

N N en
City of South Bend, Indiana Assessed Value and Actua l Value of Taxable Property
Last Ten F iscal Years
Gross Assessed Values Less : Total Net Tax Year/ Rea l Persona l Utilities T otal Non-Taxed Taxable
Collection Yea t· Pt·operty P t·oper ty Property Value Propet·ty (1) Value
2002/2003 3,849,091,300 816,672,723 74,065,200 4,739,829,223 1,771,726,609 2,968, 102,614 2003/2004 3,73 J ,377,160 659,263,940 103, 129,3 10 4,493 ,770,410 I ,685,920,064 2,807,850,346 2004/2005 3, 764,507,180 689,4 19,365 1 05 ,604,270 4,559,530,815 1,740,625,997 2,818,904,818 2005/2006 3,789,447, 190 655,066,40 I 98,165,420 4,542,679,011 1,707,413, 121 2,835,265,890 2006/2007 4,374,43 1,4 15 544,460, I 52 90,443,780 5,009,335 ,347 1,986,978,200 3,022,357,147 2007/2008 4,420,513,240 527,383 ,785 92,736,090 5,040,633,115 2,064,552,3 17 2,976,080, 798 2008/2009 4,698,989,240 592,538,950 95 ,89 1,770 5,387,419,960 2,7 18,532,541 2,668,887,4 19 2009/2010 4,368,497,000 604,951 ,450 98,433 ,750 5,071 ,882,200 2,618,376,627 2,453,505,573 2010/2011 4,339,037 ,300 551 ,819,290 10 1,009,760 4,991,866,350 2,667,414,488 2,324,451 ,862 2011 /2012 4,255,23 8,900 560,331 ,660 95 , 165 ,650 4,910,736,2 10 2,529,861,602 2,380,874,608 2012/2013 4,452,887,970 537,500,490 I 00,832,450 5,091,220,9 10 2,720,133,2 13 2,37 1,087,697
(1) Non-taxed pt·opet·ty includes adjustments for deductions & exemptions, tax exempt pt·oper ty, tax inct·ement financing 1n·operty, and tax a batements.
(2) Excludes Red evelo11ment Commission (Ha ll of Fame) tax ra te.
Sout·ce: St. Joseph County Auditor's Office
---- - - --- -·- - --
(2) C ity T ax o/o
Rate Taxable
1.9606 62.62% 2.111 5 62.48% 2.1148 61. 82% 2.1 795 62.41% 2.1046 60.33% 2.2396 59.04% 2.4081 49.54% 2.7279 48.37% 2.954 1 46.56% 3.0239 48.48% 3. 11 08 46.57%

1'.) 1'.)
........
Tax Year/ Collection Year
2003/2004 2004/2005 2005/2006 2006/2007 2007/2008 2008/2009 2009/2010 2010/2011 2011/2012 2012/2013
CITY OF SOUTH BEND, INDIANA NET ASSESSED VALUE OF TAXABLE PROPERTY
LAST TEN YEARS
Real Personal Utilities Total Net Assessed Net Assessed Net Assessed Net Assessed
Value Value Value Value
2,215,693 ,906 489,027,130 103,129,310 2,807,850,346 2,179,070,901 534,229,647 105,604,270 2,818,904,818 2,200,118,689 536,981 ,781 98,165,420 2,835,265,890 2,520,098,365 411,815,002 90,443,780 3,022,357,147 2,493,481 ,003 3 89,863 '705 92,736,090 2,976,080,798 2,137,129,242 435 ,866,407 95,891,770 2,668,887,419 1,911 ,818,036 443 ,253,787 98,433,750 2,453,505,573 1,809,523 ,734 413 ,918,368 101 ,009,760 2,324,45 1,862 1,858,836,588 426,872,370 95 ,165,650 2,3 80,87 4,608 1,858,213 ,18 1 412,042,066 100,832,450 2,371,087,697
Source: St. Joseph County Auditor's office
Percent Change
-5.40% 0.39% 0. 58% 6.60%
-1.53% -10 .32%
-8.07% -5.26% 2.43%
-0.41%

City of South Bend, Indiana
Property Tax Collections - Cash Basis
2004-2013
Fund 2004 2005 2006 2007 2008 2009 2010 2011 2012 2013 Fund Name Number Actual Actual Actual Actual Actual (2} Actual (32 Actual Actual Actual Actual
General Fund 101 $44,149,333 $44,999,550 $48,768,150 $48,720,726 $14,574,480 $79,162,937 $38,780,847 $38,514,550 $39,368,431 $36,251,397 Parks & Recreation 201 7,479,711 7,754,973 8,363,955 8,271,741 2,461,101 13,919,096 7,591,932 7,613,760 7,824,056 7,207,060 Redevelopment Bonds Studebaker Corridor 310 609,732 565,420 0 ll,590 0 0 0 0 0 0 College Football Hall of Fame Debt Service 313 1,300,588 1,246,067 899,472 1,127,140 360,682 2,362,057 1,488,453 1,549,954 1,133,205 1,268,179 Airport TIF District (1) 324 5,588,045 6,246,028 7,515,744 8,851,077 33,400 10,808,912 21,508,430 11,187,768 11,631,287 13,340,354 Cumulative Capital Development 406 984,945 1,004,779 1,054,963 989,824 291,600 1,420,833 587,063 540,454 517,710 463,331 Sample-Ewing TIF District(!) 414 533,304 525,671 732,356· 778,093 0 0 0 0 0 0 South Bend Central Development Area TIF 420 2,606,365 2,359,430 3,283,075 3,276,169 12,696 3,870,188 7,336,117 3,633,473 3,671,478 2,590,808 West Washington Street TIF District 422 216,948 193,911 255,510 287,095 1,785 358,844 860,049 431,085 422,715 493,608 Central Medical Service Area TIF District 426 337,721 329,269 333,585 928,113 2,793 919,174 3,524,962 1,704,238 1,606,915 1,221,676 Northeast TIF District 429 0 0 0 13,468 0 22,191 195,400 715,063 1,351,048 841,627 Southside Development Area TIF District 430 0 25,351 28,565 457,985 1,756 355,596 4,094,135 1,808,952 2,466,203 2,404,416 Erskine Commons TIF District (5) 431 0 548 2,585 2,891 10 1,240,184 5,978,592 784,373 0 0 Erskine Village TIF District 432 0 109,248 305,399 775,622 2,713 1,531,403 3,759,287 1,603,182 0 1,3ll,129 Douglas Road TIF District 435 0 0 0 13,941 0 125,294 460,760 306,053 285,713 323,939
N Northeast Residential TIF 436 0 0 0 0 0 0 1,815,829 2,446,103 2,514,048 2,262,765 N 00 Airport Urban Enterprise 454 0 0 0 0 0 0 301,430 123,165 ll1,721 0
Fire Department Employees Pension (4) 701 1,293,471 1,443,033 1,554,387 1,536,839 462,375 1,437,539 (5,867) 0 0 0 Police Department Employees Pension ( 4) 702 1,128,733 1,296,055 1,397,265 1;380,555 425,760 1,609,905 (9,479) Q Q Q Total $66,228,896 $68,099,332 $74,495,010 $77,422,867 $18,631,150 $119,144,153 $98,267,940 $72,962,173 $72,904,530 $69,980,289
Source - City Accounting System
(1) Fund 414 closed out during 2008 into Fund 324.
(2) Delays in sending out property tax bills until December 19, 2008 (with an on-time due date of February 20, 2009) resulted in interfund borrowing in the General Fund (1 01), Parks and Recreation Fund (201) and the College Football Hall of Fame Debt Service Fund (313) at year end. The remainder of property tax revenue was received during the first half of 2009 with final settlement with the St. Joseph County Auditor in July, 2009
(3) Includes collections of2008 taxes as noted above. Tax Increment Financintg (TIF) 2009 property tax collections were received from the County Auditor ort January 21, 2010.
(4) Property tax levy for Police and Fire pension plans eliminated. Funding provided by the State oflndiana.
(5) Erskine Commons Tll' District funds were released and outstanding bonds were paid off.

City of South Bend, Indiana Principal Prope•·ty Taxpayers- Cu...-ent a nd Nine Yea rs Ago
DECEMBER 31, 2013 ($'s whole)
2013 2004 Net Assessed Percent Net Assessed Percent
Taxpaye•· Type of Business Value Rani{ of Total Value Rank of Total
Memorial Hospital Healthcare $ 54,796,356 1 2.34% Honeywell International, Inc. Airplane and Auto Parts 48,305,825 2 2.07 $ 10,815,100 4 0.39%
Edward Rose oflndiana Apartments and Real Estate 44,136,800 " 1.89 57,511 ,000 1 2.05 .J
Indiana Michigan Power Company Utility 41,768,792 4 1.79 The Tire Rack Automotive Parts 31,986,100 5 1.37
Indiana Bell Uti lity 28,6 11,100 6 1.22
Federal-Mogul Powertrain Systems Automotive Parts 22,782,730 7 0.97
Com cast Communications 21,630,010 8 0.93 KSK Scottsdale Mall Commercial Real Estate 21,545,600 9 0 .92
N NIPS CO Utility 19,816,040 10 0.85 N Home Properties Maple Lane II LLC Apartments and Real Estate 57,087,800 2 2.03 co
Dwellco II Limited Partnership Apartments and Real Estate 12,784,600 3 0.46
Meijer Stores Limited Partnership Depmtment Store 9,329,400 5 0 .33
Wal Mart Real Estate Business Trust Depmtment Store 9,189,400 6 0.33
Erskine Plaza LLC Real Estate 8,084,800 7 0.29
BontaDayne Real Estate 8,039,200 8 0.29
Can-American South Bend Limited Apmtments and Real Estate 7,945,800 9 0.28
Beacon Heights Real Estate 7,043,600 10 0.25
Total Net Assessed Value- Ten Largest Taxpayers $ 335,379,353 14.35% $ 187,830,700 6.70%
Total Net Assessed Value $ 2,336,906,810 100.00 % $ 2,807,850,346 100.00 %
Source: St. Joseph County Auditor
2013 Budget Order 2004 Comprehensive Aruma! Financial Report

"' "' 0
Distribution Year
2004 2005 2006 2007 2008 2009
2010(2) 2011
2012 (3) 2013
Total
CITY OF SOUTH BEND, INDIANA LOCAL OPTION INCOME TAX REVENUE
LAST TEN YEARS
COUNTY ECONOMIC DEVELOPMENT INCOME TAX (CEDIT) REVENUE
Total Est South Bend South Bend EDIT (1) County EDIT Rate of EDIT Rate of as a Percent Tax Rate Collections Growth Distribution Growth of Total
0.20% 9,106,517 -2.90% 3,448,688 -6.52% 37.87% 0.20% 8,984,150 -1 .34% 3,464,152 0.45% 38.56% 0.20% 10,610,460 18.10% 4,013,475 15.86% 37.83% 0.20% 10,558,004 -0.49% 3,702,467 -7.75% 35.07% 0.20% 11,136,493 5.48% 3,997,997 7.98% 35.90% 0.20% 11 ,93 8,605 7.20% 4,612,694 15.38% 38.64%
0.40% 22,789,919 90.89% 8,321,633 80.41% 36.51% 0.40% 18,826,685 -17.39% 7,300,866 ~12.27% 38.78% 0.40% 20,611,415 -9.56% 8,324,626 0.04% 40.39% 0.40% 20,611 ,415 9.48% 8,177,352 12.01% 39.67%
$154,552,358 $59,053,152 38.21%
Actual City Collections
Durin!! Year
3,448,688 3,464,152 4,013,475 3,702,467 3,997,997 3,843,912 9,090,415 7,300,866 9,068,785 8,177,352
$59,797,311
(1) This tax was first enacted as of July 1, 1995 at the rate of 0.1% of City residents' adjusted gross income. The rate was increased to 0.2% effective July 1, 1997.
(2) The CEDIT tax rate for 2010 and subsequent years was increased by City of South Bend Common Council and the Saint Joseph County Common Council.
(3) 2012 actual CEDIT payments includes $744,159 underpaid in 2011 due to a State ofindiana accounting error
Source- State of Department of Local Government Finance CEDIT Distribution Reports Actual City Collections During Year per City Accounting System

N (..) ......
Distribution COlT Year Tax Rate (1)
2004 0.60% 2005 0.60% 2006 0.60% 2007 0.60% 2008 0.60% 2009 0.60% 2010 0.60% 2011 0.60%
2012(2) 0.60% 2013 0.60%
Total
CITY OF SOUTH BEND, INDIANA LOCAL OPTION INCOME TAX REVENUE
LAST TEN YEARS (continued)
COUNTY OPTION INCOME TAX (COlT) REVENUE
Total South Bend County COlT Rate of COlT Rate of Distributions Growth Distribution Growth
21 ,977,497 13 .37% 7,089,689 7.80% 16,628,131 -24.34% 5,490,218 -22.56% 21 ,276,623 27.96% 6,950,396 26.60% 16,993,346 -20.13% 5,160,903 -25.75% 20,689,958 21.75% 6,382,478 23 .67% 26,973 ,887 30.37% 8,952,424 40.27% 25,147,806 -6.77% 7,855,776 -12.25% 19,907,430 -20.84% 6,458,586 -17.79% 22,536,457 -10.38% 7,696,766 -2.02% 22,923 ,958 15.15% 7,846,939 21.50%
$234,441,240 $76,461,160
South Bend Actual City as a Percent Collections
of Total Durin2: Year
32.26% 7,001 ,198 33.02% 5,695 ,618 32.67% 6,410,405 30.37% 5,816,766 30.85% 6,192,452 33.19% 8,302,694 31.24% 7,648,824 32.44% 7,097,462 34.15% 8,610,742 34.23% 7,846,939
32.61% $78,638,402
(1) This tax was first enacted as of July 1, 1997 at the rate of0.2% of City residents' adjusted gross income. The COIT rate increased 0.1% each year until it reached 0.6% as of July 1, 2001. The above collections/distribution amounts are net of the additional homestead credits that accompanied the passage of tllis income tax.
(2) 2012 actual COIT collections includes $918,751 underpaid in 2011 due to a State ofindiana accounting eiTor.
Source - State of Indiana Department of Local Government Finance COlT Distribution Reports Actual City Collections During Year per City Accounting System

"" w
""
Distribution Year
2010 (1)
2011 2012 (2)
2013
Total
CITY OF SOUTH BEND, INDIANA LOCAL OPTION INCOME TAX REVENUE
LAST TEN YEARS (continued)
PUBLIC SAFETY LOCAL OPTION INCOME TAX REVENUE
Total South Bend South Bend PS LOIT County LOIT Rate of LOIT Rate of as a Percent Tax Rate Distri butions Growth Distrib_utiQJl GrQwth of Total
0.25% 13,846,267 100.00% 6,078,454 100.00% 43.90% 0.25% 11,371,882 -17.87% 5,293,619 -12.91% 46.55% 0.25% 12,457,864 -10.03% 6,056,334 -0.36% 48.61% 0.25% 12,457,864 0.00% 5,892,356 -2.71% 47.30%
$50,133,877 $23,320,763 46.52%
(1) This tax was effective in October 2009 at the rate of0 .25% of City residents' adjusted gross income. The measure is being used to support the Public Safety operations consisting of the Police Department and the Fire Department, to keep the staffing levels at their full complement.
- - -
Actual City Collections
During Year
6,078,454 5,293,619 6,605,601 5,892,386
$23,870,060
(2) 2012 actual Public Safety LOIT collections includes $549,267 underpaid in 2011 due to a State oflndiana accounting enor.
Source - State of Indiana Department of Local Government Finance LOIT Public Safety Distribution Reports Actual City Collections During Year per City Accounting System

CITY OF SOUTH BEND, INDIANA TOTAL COUNTY OPTION INCOME TAX DISTRIBTUIONS BY TAXING UNIT
LAST TEN YEARS 2004-2013
Unit of Government 2004 2005 2006 2007 2008 2009 2010 2011 2012 20 13
Total County Certified Distribution 26,536,784 26,484,3 16 3 1,044 ,322 30,859,812 32,574,042 34,80 I ,729 33,23 1,04 1 27,292,5 16 29,898,874 29,898,874
Less: Homestead Credit ( I) (4,559 ,287) (9,856, 185) (9,767 ,699) (13,866,466) (11,884,084) (7 ,827 ,842) (8,083,235) (7,385,086) (7,362 ,417) (6 ,974 ,9 18)
Total Distributive Shares 21 ,977,497 16,628, !3 1 21,276,623 16,993,346 20,689,958 26,973,887 25,147,806 19,907,430 22,536,457 22,923,956
Distributive SharcsfTo tal County Dis tribution 82.82 "/o, 62.78'Y,, 68.54% 55.07% 63.52% 77.51% 75.68% 72.94% 75.38% 76.67%
A mount
St. Joseph County 8,578,046 6,427 ,640 8,440,988 7,376,623 8,825 ,206 10,358,300 9,819,576 7,383,180 7,986,750 8,460, 192
Townships I ,002 ,449 759,050 834,727 648,364 820,241 1,180,913 1,168,352 1,054,827 1,244,48 1 954 ,332
City of South Bend- Ci vi l City 6,849,450 5,306,680 6,733, 129 5,077,450 6,266,38 1 8,748,506 7,677 ,730 6,304,224 7,5 11 ,976 7,71 1,609
City of Soutl1 Bend - Redevelopment 240,239 183,538 2 17,267 83,453 11 6,097 203 ,918 178,046 154,363 184,790 135,330
Other Cities & Towns 2,658,984 2,028,358 2,6 16,698 1,982,192 2,367 ,929 3,592,330 3,462,786 2,667 ,400 3,077,335 3, 137,086
Libraries 1,699,4 59 1,3 19,023 1,706,495 I ,285,029 I ,646 ,819 2,007,809 2,042,942 1,762,365 1,879,376 1,849,933
Special Dist ricts 948,870 603,842 727,3 19 540,235 647,285 882, 11 1 798,374 58 1,07 1 65 1,749 675.474
Total 2 1,977,497 16,628, 13 1 21,276,623 16,993,346 20,689,958 26,973,887 25,147,806 19,907,430 22,536,457 22,923,956
~'crccntagc of Dis tributi on
t. Joseph County 39.03% 38.66% 39.67% 43.41 % 42.65% 38.40% 39.05 % 37 09% 35.44% 36.9 1%
"Townships 4 .56% 4.56% 3.92% 3.82% 3.96% 4.38% 4.65% 5.30% 5.52% 4. 16% City of South Bend - Civil City 3 1.17% 3 1.9 1% 3 1.65% 29 .88% 30.29% 32.43% 30.53% 31.67% 33.33% 33.64% City of South Bend - Redevelopment 1.09% 1.1 0% 1.02% 0.49% 0.56% 0.76% 0.7 1% 0.78% 0.82% 0.59%
Other Cities & Towns 12. 10% 12.20% 12.30% 11.66% 11.44% 13.32% 13.77% 13.40% 13.65% 13.68%
Librmies 7.73% 7.93% 8.02% 7.56% 7.96% 7.44% 8.12% 8.85% 8.34% 8.07%
Special D istricts 4.32% 3.63% 3.42% 3. 18% 3. 13% 3.27% 3.1 7% 2.92% 2.89% 2.95%
Total 100.00% 100.00% 100.00% 100.00% 100.00% 100.00 % !00.00% 100.00% 100.00% 100.00%
(1) A portion of the county option income tax is used for property tax rel ief through homestead credits to r residential property owners.
Source- State of Indiana Department uf Luc;ll Governm ent Fim111cc COlT Dis tribution ll.cpo •·ts

N w ~
CITY OF SOUTH BEND, INDIANA TEN LARGEST WATER CUSTOMERS
DECEMBER 31, 2013
Percentage of Total Water
2013 Operating Name Revenue Revenue
Memorial Health System $ 104,657 0.76% Allied Signal Aerospace Co. 79,458 0.58% Irish Hills Apartments 86,349 0.63% Park Jefferson LLC 43,356 0.31% Pioneer Metal Finishing 36,832 0.27% Castle Point Realty LLC 43 ,036 0.31% Amarak Uniform Services, Inc. 34,279 0.25% Federal Mogul South Bend, Inc. 26,459 0.19% Steel Warehouse Co LLC 26,042 0.19% Countryside Association 21 ,160 0.15%
Total ofTen Largest Water Customers $ 501,628 3.64%
Total for Operating Revenue for Water Wor ks $ 13,783,701 100.00%
*Hundreds of Cubic Feet
Usage CCF*
96,836 75,760 71 ,729 56,102 46,795 45 ,414 43,154 31,998 26,575 24,438

I'.J w (11
- - -
CITY OF SOUTH BEND, INDIANA TEN LARGEST SEW AGE WORKS CUSTOMERS
DECEMBER 31, 2013
Percentage of Total Water
Total Sewer Name Revenue Revenue
I/N TEK Plant $ 1,994,134 6.25% University ofNotre Dame 1,149,408 3.60% Memorial Health System 376,582 1.18% Allied Signal Aerospace Co 311 ,684 0.98% Aramark Uniform Services, Inc. 146,182 0.46% Town ofNew Carlisle 131,572 0.41% South Bend Community Schools 127,211 0.40% New Energy Company Oflndiana 69,221 0.22% Unifrax Corporation 29,401 0.09% Sisters ofthe Holy Cross 39,945 0.13%
Total of Ten Largest Sewer Customers $ 4,375,340 13.70%
Total Operating Revenue for Wastewater $ 31,926,078 100.00%
*Hundreds of Cubic Feet
Usage CCF*
812,267 520,881
96,836 71,063 43,181 41,929 20,732 19,116 9,268 6,419

N (,.:> en
City of South Bend, Indiana Gasoline Tax Collections - Cash Basis
Last Ten Fiscal Years
LR&S MVH Total Gas % Year Fund Fund Tax Change -2004 1,192,574 3,461,563 4,654,137 2.96% 2005 1,212,413 3,397,433 4,609,846 -0.95% 2006 1,201,538 3,327,314 4,528,852 -1.76% 2007 1,171,732 3,243,818 4,415,549 -2.50% 2008 1,104,260 3,016,198 4,120,458 -6.68% 2009 1,045,477 2,954,086 3,999,562 -2.93% 2010 1,064,149 2,922,165 3,986,314 -0.33% 2011 1,030,958 2,951,072 3,982,030 -0.11% 2012 1,022,508 2,786,592 3,809,100 -4.34% 2013 1,001,871 3,006,122 4,007,993 5.22%
Distributions of gas tax revenue are made monthly by the Indiana Department of Revenue to the Local Road and Street (LR&S) and Motor Vehicle Highway (MVH) funds for use in construction and maintenance of streets and highways. Distributions are based on a complex formula developed by the state which takes into account population, road and street mileage and other factors. Gas tax revenue was declining in prior years d~e to the economy and more fuel efficient vehicles. Due to an improvement in the economy, total gas tax increased in 2013.
Source: City Accounting Records
$5,000,000 $4,500,000
$4,000,000 $3,500,000 $3,000,000 $2,500,000 $2,000,000
$1,500,000 $1,000,000
$500,000
$0
Gasoline Tax - --......._
-"" ....
- --- .....
~ ~ ~ ~ ~ ~ ~ ~ ~ ~ ~ ~ ~ ~ ~ ~ ~ ~ ~ ~
-LR&SFund
-MVHFund
-Total Gas Tax

N (.A) .....,J
City of South Bend, Indiana Wheel and Excise Surtax Collections - Cash Basis
Last Ten Years
LR&S MVH Total Wheel o;o
Year Fund Fund Tax Change
2004 1,953,079 0 1,953,079 100.00%
2005 1,914,530 0 1,914,530 -1.97%
2006 1,849,924 0 1,849,924 -3.37%
2007 1,966,003 0 1,966,003 6.27%
2008 0 2,040,751 2,040,751 3.80%
2009 0 1,893,982 1,893,982 -7.19%
2010 0 1,975,397 1,975,397 4.30%
2011 0 1,863,283 1,863,283 -5.68%
2012 0 1,795,538 1,795,538 -3.64%
2013 0 2,045,213 2,045,213 13 .91%
Effective January 1, 2004, St. Joseph County enacted a wheel tax and annual license excise surtax as allowed by State law to provide additional funding for road maintenance and repair. State law allows an annual wheel tax of $5-40 per vehicle and an annual license excise surtax of 2-10%. St. Joseph County has enacted a $25 County Excise swtax. The tax applies to all passenger cars, trucks less than 11,000 pounds, buses, tractors and motorcycles registered in the County. (Other rates apply to recreational vehicles, semitrailers and trucks exceeding 11,000 pounds.) The tax is collected by the Indiana Bureau of Motor Vehicles, remitted to the County and distributed monthly to the local units based on population and road ·
During 2004-2007, the City of South Bend deposited the wheel tax and excise SUltax in its Local Road and Street (LR&S) fund . During 2008 and thereafter, the City will deposit the taxes in its Motor Vehicle Highway (MVH) fund, as required by the Indiana State Board of Accounts.
Source: City Accounting Records

N w 00
.Yea•·
2004 2005 2006 2007 2008 2009 2010 2011 2012 2013
City of South Bend, Indiana Hotel/Motel Tax Revenue - Cash Basis - City Distributions
Last Ten Fiscal Years
----------------------Paid to City of South Bend------------------------------ ---------Direct Payments-----------Century Professional Cumulative 2008 Subtotal: 1992 Centm-y 2008 Other Cente•· Sports Develop. Capital Impr. Century Center Paid to City Center Century Center South Bend Fund Fund Fund Bonds of South Bend Bonds Bonds Projects
1,164,493 461,423 150,000 0 1,775,916 365,892 0 46,466 1,235,849 465,177 150,000 0 1,851,026 360,087 0 46,931 1,247,928 473,258 150,000 0 1,871,186 357,135 0 364,150 1,361,263 507,585 150,000 0 2,018,848 354,916 0 136,330 1,497,390 589,620 150,000 0 2,237,010 356,918 0 694,135 1,347,651 530,137 150,000 0 2,027,788 0 198,500 265,258 1,313,152 521,800 150,000 399,000 2,383,952 0 0 97,000 1,313,436 494,325 150,000 400,000 2,357,761 0 0 0 1,313,436 489,152 150,000 398,000 2,350,588 0 0 0 1,313,436 0 150,000 398,500 1,861,936 0 0 0
Total Hotel! % Motel Tax Change
2,188,274 1.73% 2,258,044 3.19% 2,592,471 14.81% 2,510,094 -3.18% 3,288,063 30.99% 2,491,546 -24.22% 2,480,952 -0.43% 2,357,761 -4.97% 2,350,588 -0.30% 1,861,936 -20.79%
The hotel/motel tax was enacted in 1973 and the current tax rate is 6%. The tax is accounted for in a fund of the Saint Joseph County government and is administered by the I I member Saint Joseph County Board of Managers for Hotel-Motel Tax. Appointments to the Board of Managers are made by the mayors of South Bend and Mishawaka and the Saint Joseph County Commissioners.
Proceeds from the hotel/motel tax fund are budgeted and distributed annually to important economic development and tourism projects in the County. South Bend receives distributions for the operations, maintenance and debt service of Century Center (convention center), Professional Sports Development Fund (used primarily for operations of the College Football Hall of Fame), the Cumulative Capital Development Fund (used for repayment of I 994 Century Center Bonds), repayment of a I 992 Century Center bond directly from the fund, repayment of a 2008 Century Center Bond and other capital projects.
The hotel/motel tax fund also supports other activities not included in the City of South Bend's financial statements such as the South Bend/Mishawaka Convention and Visitors Bureau. The total distribution of hotel/motel tax during 2013 to .all organizations was $3,399,758. The cash balance in the County Hotel/Motel Tax Fund was $1,858,502 at December 3 I, 2013.
Source: City Accounting Records and Saint Joseph County Auditor's Office
Cumulative Capital Impr.
Fund
Sp01ts Develop. Fund
Centmy Center Fund
2008 Century Center
Bonds
I

......, c,.:) (0
City of South Bend, Indiana Professional Sports Development (PSDA) Tax- Cash Basis
Last Ten Fiscal Years
TotalPSDA % Year Tax Change
2004 370,013 9.61% 2005 384,906 4.02% 2006 370,556 -3.73% 2007 387,813 4.66% 2008 396,873 2.34% 2009 617,304 55.54% 2010 640,760 3.80% 2011 409,020 -36.17% 2012 721,763 76.46% 2013 597,111 -17.27%
The Professional Sports Development Area (PSDA) tax is a combination of state income tax withholding, local income tax withholding and sales tax withholding from businesses and employees in South Bend's designated PSDA area, which includes the College Football Hall of Frune, Centtuy Center, Coveleski Stadium, Morris Perfonning Arts Center, Palais Royale Ballroom and Studebaker National Museum. South Bend's PSDA area was formed on November 3, 1997 and expires on December 31, 2027. PSDA capture of state sales ru1d income taxes ends in 2018.
The PSDA taxes are collected by the Indiana Department of Revenue and are remitted on a monthly basis to Saint Joseph Cow1ty which issues a check to the City of South Bend. T11ere are currently four professional sports development areas in t11e State-South Bend, hldianapolis!Marion County, Evansville and Ft. Wayne .
PSDA tax revenue increased in 2009 primarily due to tl1e increase in the State of Indiana sales tax rate from 6% to 7% and the increase in local option income taxes fi·om .8% to 1.75% as a consequence of property tax refom1. PSDA tax revenue decreased in 2011 due to delays in payments in arnoWlts owed by the State tmtil2012. PSDA tax revenues in 2013 were due to a delay in payments from the state.
In prior years, PSDA tax revenue has been used to fund tl1e College Football Hall of Fame Capital Fund and the Centtuy Center Capital Account. Beginning in 2011, PSDA tax revenue will continue to fund tl1e Centtuy Center Capital Account and has also been pledged to pay debt service on 2010 Coveleski Stadiun1 Taxable Revenue bonds in the amotmt of $4,980,000 issued on December 23, 2010. The bond proceeds were used to make certain capital improvements to the City-owned facility. The operations of the ntinor league baseball team (South Bend Silverhawks) in the stadiwn accounts for the majority ofPSDA tax revenue eamed each year.
Source: City Accounting Records
PSDA Tax Collections - Ten Year Trend
800,000
700,000
600,000
~ 500,000 ,g 400,000 0 ~ 300,000
I. . ~ --;TJ 'r • • 7 Sf •
200,000
100,000
0 2004 2005 2006 2007 2008 2009 2010 2011 2012 2013
Year

N ~ 0
City of South Bend, Indiana Cable Television Franchise Fee Collections - Cash Basis
Last Ten Years
Total % Year Com cast AT&T Franchise Fees Change
2004 629,681 0 629,681 5.76%
2005 636,416 0 636,416 1.07% 2006 790,111 0 790,111 24.15% 2007 692,548 0 692,548 -12.35% 2008 694,387 0 694,387 0.27% 2009 702,048 41,043 743,091 7.01% 2010 817,023 131,263 948,286 27.61% 2011 677,949 176,586 854,535 -9.89% 2012 691 ,586 192,621 884,207 3.47% 2013 736,071 191 ,529 927,600 4.91%
Pursuant to State law, the City of South Bend receives video franchise fees in the amount of 5% of gross revenue for cable operations in the City. The payments are made to the City on a quarterly basis. The franchise agreement with Comcast was effective October 19, 1998 and the franchise agreement with AT&T was effective January 1, 2009.
The video fi·anchise fee revenue is deposited in the General Fund and is used for general operating costs. A portion of the proceeds (2013 - $43,000) are spent on support of the local public access channel.
Under State law, the City is required to submit an Annual Franchise Fee Report (State Form 55122) summarizing franchise fee revenue received during the year and the purpose for which the revenue was expended. The report must be file with the Indiana Utility Regulatory Commission by March 1st of the following year.
Source: City Accounting Records

DEBT CAPACITY
These schedules present information to help the reader to assess the afford ability of the City of South Bend's current level of outstanding debt and the ability of the City of South Bend to issue additional debt in the future.
241

N .r::. N
Civil City
CITY OF SOUTH BEND, INDIANA COMPUTATION OF LEGAL DEBT MARGIN
DECEMBER 31, 2013 ($'s whole)
Net Assessed Valuation (2012 pay 2013) of Taxable Property in South B
Debt limit: 2% of one third thereof
Less Bonds subject to limitation: County Economic Development Income Tax Refunding Revenue Bonds, Series 2006 A
County Economic Development Income Tax Refunding Revenue Bonds, Series 2006 B
Redevelopment District Taxable Revenue Bonds, Series 20 10
Issuance Margin
Percentage of Debt to Debt Limit
Redevelopment District
Net Assessed Valuation (2012 pay 2013) of Taxable Property in South B
Debt limit: 2% of one third thereof
Less Bonds subject to limitation: Special Taxing District Bonds of 2002
Issuance Margin
Percentage of Debt to Debt Limit
$2,336,906,810
15,579,379
(1,455,000)
(1,360,000)
(3,520,000)
$9,244,379
40.66%
$2,336,906,810
15,579,379
(3,405,000)
$12,174,379
21.86%
A 2% debt limit is established by the Constitution of the State of Indiana. This limit is established for general obligation bonds, Economic Development Income Tax revenue bonds, tax revenue notes and other types of indebtedness. This limitation does not include revenue bonds payable from governmental funds (excluding EDIT bonds) shown in the general long term debt account group. Indiana law allows the creation of separate municipal corporations to provide vital governmental functions. Each of these municipal corporations (including the Redevelopment Authority and Redevelopment Commission) has its own 2% debt limit, even if they have the same or similar boundaries.

City of South Bend, Indiana Legal Debt Margin Information Last Ten Fiscal Years ($'s whole)
2004 2005 2006 2007 2008 2009 2010 2011 2012 2013
Civil City
Debt Limit (1) $18,719,002 $18,792,699 $18,901,773 $20,149,048 $19,840,538 $17,792,583 $16,356,704 $15,495,323 $15,599,467 $15,579,379
Total Net Debt Applicable To Limit 8,937,500 8,395,000 7,367,825 6,685,000 6,105,000 5,500,000 9,850,000 8,910,000 7,650,000 6,335,000
Debt Margin 9,781,502 10,397,699 11,533,948 13,464,048 13,735,538 12,292,583 6,506,704 6,585,323 7,949,467 9,244,379
Percentage of Debt Limit 47.75% 44.67% 38.98% 33.18% 30.77% 30.91% 60.22% 57.50% 49.04% 40.66%
Redevelopment District
Debt Limit (1) $18,719,002 $18,792,699 $18,901,773 $20,149,048 $19,840,538 $17,792,583 $16,356,704 $15,495,323 $15,599,467 $15,579,379 I')
t}otal Net Debt Applicable To Limit 6,998,000 6,115,000 5,850,000 5,580,000 5,300,000 5,010,000 4,715,000 4,085,000 4,085,001 3,405,000
Debt Margin 11,721,002 12,677,699 ' 13,051,773 14,569,048 14,540,538 12,782,583 11,641,704 11,410,323 11,514,466 12,174,379
Percentage of Debt Limit 37.38% 32.54% 30.95% 27.69% 26.71% 28.16% 28.83% 26.36% 26.19% 21.86%
(1) A 2% of net assessed value debt limit has been established by the Constitution of the State oflndiana for certain type of debt including general obligation bonds, Economic Development Income Tax bonds and tax revenue notes. This limitation does not apply to revenue bonds payable from governmental or proprietary funds.

N -l==o -l==o
City of South Bend, Indiana Ratios of Outstanding Debt. by Type
Last Ten Fiscal Years
Governmental Activities Business-Tx~e Activities
General Fiscal Obligation Revenue Mortgage Notes/Loans Capital Revenue Mortgage Notes/Loans Year Bonds Bonds Bonds Pn;tnble Lenses Bonds Bonds Pa;table
2004 935,000 82,135,000 29,525,289 7,948,868 2,971,007 39,815,000 1,058,415 21,730,271
2005 320,000 84,225,000 28,994,057 9,539,771 3,454,627 35,990,000 1,015,980 20,659,864
2006 0 82,445,000 27,337,124 11,758,552 3,533,187 44,345,000 972,315 19,258,433
2007 0 78,570,000 25,957,839 7,900,658 7,695,487 73,145,000 926,805 18,380,491
2008 0 115,240,000 24,534,464 9,543,790 7,388,443 67,535,000 878,835 17,031,649
2009 0 113,975,000 23,061,148 8,470,308 6,214,206 68,225,000 829,020 16,145,358
2010 0 111,510,000 21,117,295 6,323,199 5,299,341 72,655,000 717,705 16,755,369
2011 0 101,472,431 19,724,490 4,431,871 7,510,749 88,655,000 660,510 15,542,372
2012 0 96,410,000 17,883,530 4,953,639 8,336,120 117,650,000 601,470 13,848,901
2013 0 90,172,826 23,079,781 3,030,554 8,777,238 118,118,539 551,602 4,121,010
Percent of Total Debt 0.00% 35.83% 9.17% 1.20% 3.49% 46.93% 0.22% 1.64%
Sources: City of South Bend Comprehensive Annual Financial Reports Population statistics obtained from the U.S. Census Bureau. . City of South Bend estimated personal income is computed as estimated City population :x 2012 South Bend Metro Area Per Capita Income (see Demographic Statistics)
Governmental Activities Debt
100% 100%
"90%
80% OCapilal Leases
90%.
80%
70% •Notes/Loans Payable 70%
60% 60%
50% •Mortgage Bonds
50%
40% •Revenue Bonds 40%.
30% 30%
20% C General Obligation Bonds 20%.
10% 10%-
0% 2004 2005 2006 2007 2008 2009 2010 20 II 2012 2013
0% 2004 2005
South Bend South Bend
Total Debt Estimated Debt Capital Primary Estimated Per Personal Percent of Leases Government Po~nlntion Ca~ita Income Income
520,389 186,639,239 105,206 1,774 3,297,156,040 5.66%
1,710,033 185,909,332 105,743 1,758 3,418,459,704 5.44%
1,523,594 191,173,205 104,457 1,830 3,450,632,538 5.54%
1,127,394 213,703,674 104,069 2,053 3,511,183,991 6.09%
628,427 242,780,608 104,905 2,314 3,709,126,085 6.55%
893,233 237,813,273 106,192 2,239 3,679,658,992 6.46%
799,402 235,177,311 101,168 2,325 3,505,572,368 6.71%
1,077,642 239,075,065 101,168 2,363 3,371,120,096 7.09%
3,641,362 263,325,022 101,168 2,603 3,371,120,096 7.81%
3,830,728 251,682,278 101,168 2,488 3,371,120,096 7.47%
1.52% 100.00%
Business-TyiJcActivities Debt
0 Capital Leases
a Notes/Loans Payable
•Mortgage Bonds
aRevenue Bonds
2006 2007 2008 2009 2010 20!! 2012 2013

N ,J:::o CJ1
CITY OF SOUTH BEND, INDIANA
COMPUTATION OF DIRECT AND OVERLAPPING DEBT
DECEMBER 31, 2013 ($'s w hole)
J>ercentage
G ross Applicable to
Debt South Bend
Dil·ect Debt:
City of South Bend General Obligation Bonds
Revenue Bonds - Governmental Activities $ 89,622 ,021 100.00%
Mortgage Bonds - Governmental Activities 22,330,000 100.00
Notes Payab le - Governmental Activiti es 4,505,000 100.00
Capita l Leases - Governmental Act iviti es 8,777,239 100.00
Tota l Direct Debt and Lease Obligatio n Debt
Ove rla pping Debt (1)(2)
South Bend Communi ty School Corporation $ 168,273,370 56.35%
S t. Joseph County Publi c Li brary 8,945,000 52.97
South Bend Regional Airport Authori ty 12,790,000 30.58
St. Joseph County 22,025,000 30.58
Penn-Harris-Madison School Corporation 57 ,438,994 3.06
Mishawaka-Penn-Harris Public Li brary 4,030,000 2.44
Total Overla pping and Und erlying Direct Debt and Lease Obligations
Total Direct Debt a nd Lease Obligation Debt a nd Ovedauuing a nd Underlying Direct Uebt and Lease Obligations
Ratio Factors
Net Assessed Valuation (201 2 payable 2013)
Population- 20 I 0 US Census Bureau
South Bend Metropolitan Area 2012 Per Capita Inco Estimated South Bend Total Personal Income (3 x 4)
2,371,087,697
101 ,168 (3)
38, 152 (4)
3,859,76 1,536
Amoun t
Applicab le to South Bend
$ 89,622,02 1
22,330,000
4,505,000 8,777,239
$ 125,234,260
$ 94,822,044 4,738, 167
3,9 11 ,182
6,73 5,245
1,757,633
98,332
$ 112,062,603
$ 237.12fi.863_
(1) Overlapping debt information and schedule prepared by Crowe Horwath LLP, Indianapolis, Indiana.
DebtPc1· Capita
$ 1,238
$ 1,108
$ 2.3411_
Rat io of Debt/
Net Assessed Value
5.28 %
4.73 %
lO.OL %
(2) Overlapping debt percentages are based on the net assessed value of South Bend properties in proportion to the to tal ne t assessed value.
(3) Population statistics obtained from the U.S. Census Bureau (http://factfinder.census/gov/servlet).
(4) South Bend-M ishawaka, IN Metropoli tan Area Profi le (www.stats.indiana.edu).
Ratio of Debt/
Persona l Income
3.24 %
2.90 %
li.15_%

N -'='" m
Fiscal Year
2004 2005 2006 2007 2008 2009 2010 2011 2012 20 13
CITY OF SOUTH BEND, INDIANA RATIO OF ANNUAL DEBT SERVICE EXPENDITURES FOR GENERAL OBLIGATION BONDED DEBT
TO TOTAL GOVERNMENTAL FUND EXPENDITURES LAST TEN YEARS
Total Ratio of Debt Service Total Debt Governmental Fund To Governmental Fund
Principal Interest Service Expenditures Expenditures
590,000 66,260 656,260 133,062,773 0.49% 615,000 39,445 654,445 130,713,640 0.50% 320,000 8,160 328,160 129,527,536 0.25%
0 0 0 128,209,220 0.00% 0 0 0 138,022,795 0.00%
0 0 0 142,962,710 0.00% 0 0 0 150,758,014 0.00% 0 0 0 172,397,679 0.00% 0 0 0 162,460,000 0.00% 0 0 0 152,889,475 0.00%
The City of South Bend has no General Obligation Bonds outstanding. The 1977 Studebaker Conidor bonds were paid off during 2006.
Source - C ity of South Bend Comprehensive Annual Financial Reports

CITY OF SOUTH BEND, INDIANA RATIO OF NET GENERAL BONDED DEBT TO NET ASSESSED VALUATION AND NET BONDED DEBT PER CAPITA
LAST TEN YEARS
Percent of Net Debt Service Bonded Debt Net
Tax Year/ Net Assessed Gross Monies Net To Net Assessed Bonded Debt
Collection Year Population (1) Va lue Bonded Debt Available Bonded Debt Value Per Capita
2003 /2004 105,206 2,807,850,346 935 ,000 305,000 630,000 0.02% 5.99
2004/2005 105,743 2,818,940,818 320,000 320,000 0 0.00% 0.00
2005/2006 104,457 2,83 5,265 ,890 0 0 0 0.00% 0.00
2006/2007 104,069 3,022,157,147 0 0 0 0.00% 0.00
2007/2008 104,905 2,976,080,798 0 0 0 0.00% 0.00
2008/2009 106,192 2,668,887,419 0 0 0 0.00% 0.00
2009/2010 101 ,168 2,453 ,505,573 0 0 0 0.00% 0.00
I'.) 2010/2011 101,168 2,324,451 ,862 0 0 0 0.00% 0.00
+=- 2011 /2012 101,168 2,380,874,608 0 0 0 0.00% 0.00 ....,J
2012/2013 101,168 2,371,087,697 0 0 0 0.00% 0.00
(1) Population statistics obtained from the U.S. Census Bureau (htt p://factfinder.eensus/gov/serv1et).

N ~ 00
Gross Operating
Year Revenue
2004 $ 11 ,323 ,882
2005 11,926,479
2006 13,166,166
2007 13,748,213 2008 13 ,343 ,210 2009 13 ,471 ,890 2010 13,513,995
2011 14,032,074 2012 14,190,243 2013 13 ,783,701
CITY OF SOUTH BEND, INDIANA SCHEDULE OF REVENUE BOND COVERAGE
WATER UTILITY BONDS LAST TEN YEARS ($ 's whole)
Net Revenue Debt Service Requirements Operating Availa ble for
Expenses (1) Debt Service Principal Interest Total
$7,256,695 $ 4,067,187 $1,935,000 $ 795,540 $2,730,540
7,770,464 4,156,015 2,040,000 708,030 2,748,030 7,369,035 5,797,131 2,485,622 1,042,309 3,527,93 1 8,296,075 5,452,138 2,764,265 1,015,524 3,779,789 8,528,933 4,814,277 2,908,014 888,199 3,796,213 8,838,405 4,633 ,485 2,481 ,871 754,108 3,235 ,979 8,560,390 4,953,605 2,605,840 937,293 3,543,133
9,301 ,552 4,730,522 2,729,925 823 ,265 3,553,190 9,021 ,274 5,168,969 821,847 823,944 1,645,79 1
10,665,913 3,11 7,788 1,241 ,768 809,673 2,051,44 1
(I) Operating expenses exclude depreciation and payment in lieu of taxes.
Debt Coverage
149%
151 164 144 127 143 140
133 . 314
152
Operating revenue used to make debt service payments is obtained primarily through monthly user charges to water customers.
Source- City of South Bend Comprehensive Annual Financial Report and Annual Report (CTAR-2). 2013 Debt service requirements provided by Crowe Horwath LLP.
----

Gross Operating
Year Revenue
2004 $ 14,124,695
2005 14,639,963
2006 18,058,615 N 2007 20,685 ,490 ~ co 2008 (2) 22,941 ,734
2009 24,313 ,147
2010 25 ,444,404
2011 29,023,547
2012 30,963,483 2013 31 ,926,078
CITY OF SOUTH BEND, INDIANA SCHEDULE OF REVENUE BOND COVERAGE
WASTEWATER UTILITY BONDS LAST TEN YEARS ($ 's whole)
Net Revenue · Debt Service Requirements Operating Available for
Expenses (1) Debt Service Principal Interest Total -
$ 9,337,324 $ 4,787,371 $ 705,000 $ 266,586 $ 971 ,586
11 ,200,692 3,439,271 1,180,000 577,943 1,757,943
9,650,301 8,408,314 2,481 ,626 1,273,423 3,755,049 10,389,691 10,295,799 2,863,218 1,364,272 4;227,490
14,079,734 8,862,000 3,701 ,524 2,647,324 6,348,848 17,504,825 6,808,322 3,130,000 2,557,940 5,687,940 12,193,363 13 ,251 ,041 3,385,205 2,314,275 5,699,480
14,869,660 14,153,887 3,867,584 2,737,027 6,604,61 1
13,777,728 17,185,755 4,736,450 3,489,057 8,225,507
8,751 ,000 23 ,175,078 5,080,425 3,354,156 8,434,58 1
(1) Operating expenses exclude depreciation and payment in lieu of taxes.
Debt Coverage
493%
196
224 244 140 120 232 214
209 275
(2) Two large Sewage Works revenue bonds were issued during 2007 with principal and interests payments beginning in 2008.
These bonds are part of the City of South Bend's long term combined sewer overflow (CSO) control plan.
Operating revenue used to make debt service payments is obtained primarily tlu·ough monthly user charges to sewer customers .
Source - City of South Bend Comprehensive Annual Financial Report and Annual Report (CTAR-2) 2013 debt service requirements provided by Crowe Horwath LLP.

N CJ1 0
City of South Bend, Indiana SOUTH BEND MUNICIPAL SEWAGE WORKS
Annual Wastewater Flow Data
2006 2007 2008 2009 2010 2011
Capacity (MGD) 48 48 48 48 48 48
Average Daily Flow 31.67 32.45 37.80 38.42 30.86 35.80
Peak Flow 50.70 60.30 75.00 68.80 62.00 72.50
Annual Flow (MG) 11,559 11,845 13,835 14,024 11,264 13,068
Number of Customers- South Bend Municipal Sewage Works
Total Number of Customers
39,124 37,018 38,282 36,664 38,455 39,027 39,068 39,322
Source: City of South Bend Environmental Services Department
2012 2013
48 48
31.77 30.69 63.70 62.50
11,596 11,203
Year
2006 2007 2008 2009 2010 2011 2012 2013
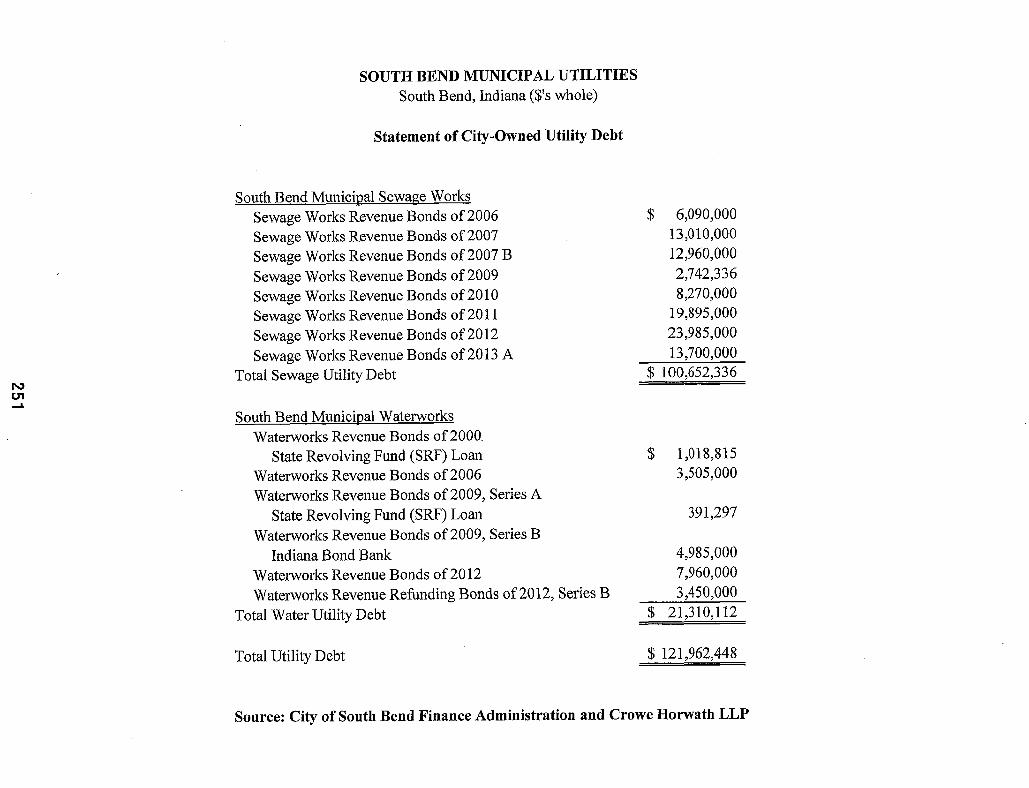
N U'l .....
SOUTH BEND MUNICIPAL UTILITIES South Bend, Indiana ($'s whole)
Statement of City-Owned Utility Debt
South Bend Municipal Sewage Works Sewage Works Revenue Bonds of 2006 Sewage Works Revenue Bonds of2007 Sewage Works Revenue Bonds of 2007 B Sewage Works Revenue Bonds of 2009 Sewage Works Revenue Bonds of 2010 Sewage Works Revenue Bonds of2011 Sewage Works Revenue Bonds of2012 Sewage Works Revenue Bonds of2013 A
Total Sewage Utility Debt
South Bend Municipal Waterworks Waterworks Revenue Bonds of2000
State Revolving Fund (SRF) Loan Waterworks Revenue Bonds of 2006 Waterworks Revenue Bonds of2009, Series A
State Revolving Fund (SRF) Loan Waterworks Revenue Bonds of2009, Series B
Indiana Bond Bank Waterworks Revenue Bonds of2012 Waterworks Revenue Refunding Bonds of2012, Series B
Total Water Utility Debt
Total Utility Debt
$ 6,090,000 13,010,000 12,960,000 2,742,336 8,270,000
19,895,000 23,985,000 13,700,000
$ 100,652,336
$ 1,018,815 3,505,000
391,297
4,985,000 7,960,000 3,450,000
$ 21,310,112
$ 121,962,448
Source: City of South Bend Finance Administration and Crowe Horwath LLP

N CJ1 N
SOUTH BEND MUNICIPAL SEW AGE WORKS South Bend, Indiana ($'s whole)
Estimated Debt Service Coverage Calculation
Operating Revenues Less: Operation and Maintenance Expenses (Net of Depreciation) Net Revenues Available for Debt Service
Estimated Combined Annual Debt Service
Coverage-$
Coverage-%
$ 31,926,078 (8,751 ,000) 23,175,078
8,434,581
$ 14,740,497
275%

N c.n CAl
SOUTH BEND MUNICIPAL WATER UTILITY South Bend, Indiana ($'s whole)
Estimated Debt Service Coverage Calculation
Operating Revenues Less: Operation and Maintenance Expenses (Net of Depreciation) Net Revenues Available for Debt Service
Estimated Combined Maximum Annual Debt Service
Coverage-$
Coverage - o/o
$ 13,783,701 (10,665,913)
3,117,788
2,051,441
$ 1,066,347
152%

N 0'1 -l=:r.
CITY OF SOUTH BEND BUILDING CORPORATION
Projected City of South Bend COlT Revenues ($'s whole) .6°/o COlT Tax Rate
Levy is used to Distribute COlT
Projected St. Joseph County Projected COlT Amount
Year of Projected COlT Available For
Collection Distribution Debt Service -
2013 $ 22,923,958 33.64% $ 7,711,609
2014 25,275,541 (I) 33.57 8,483,839 (1)
2015 25,275,541 33.57 8,483,839
2016 25,275,541 33.57 8,483,839
2017 25,275,541 33.57 8,483,839
2018 25,275,541 33.57 8,483,839 2019 25,275,541 33.57 8,483,839 2020. 25,275,541 33.57 8,483,839
2021 25,275,541 33.57 8,483,839 2022 25,275,541 33.57 8,483,839 -
Total $ 84,066,160
(1) Kept constant based on 2014.
Source: Crowe Horwath LLP and Depmiment of Local Government Finance (DLGF)

CITY OF SOUTH BEND BUILDING CORPORATION
Statement of Estimated Cash Flow and Debt Service Coverage ($ 's whole)
Projected Redevelopment COIT First Mortgage City of South Bend District Lease Rental Revenue Revenue Refunding Estimated
COIT Taxable Revenue Refunding Bonds of2010Bonds, Series 2012 Excess Estimated Year Revenues Bonds, Series 201 0 Lease Payments Lease Payments Funds Coverage
2014 $ 8,483 ,839 $ 762,646 $ 676,000 $ 1,570,000 $ 5,475,193 2.82 2015 8,483,839 746,318 680,000 1,572,000 5,485,521 2.83
N 2016 8,483 ,839 732,604 673,000 1,572,000 5,506,235 2.85 en
201 7 8,483,839 720,905 675,000 1,570,000 5,517,934 2.86 en
2018 8,483,839 706,650 675,000 1,564,000 5,538,189 2.88 2019 8,483,839 - 673,000 1,562,000 6,248,839 3.80 2020 8,483,839 - 678,000 1,567,000 6,238,839 3.78 2021 8,483,839 - - 1,567,000 6,916,839 5.41 2022 8,483,839 - - 1,563,000 6,920,839 5.43
Total $ 76,354,551 $ 3,669,123 $ 4,730,000 $ 14,1 07,000 $ 53,848,428 3.39
Source: Crowe Horwath LLP

N U1 en
Tax Year I Collection Year
2012/2013
CITY OF SOUTH BEND, INDIANA Ersldne Village Project ($'s whole)
Estimated Tax Increment Revenues
Estimated Tax
Increment ( 1)
$
12/13 Net Tax Rate (2)
$ 3.6197
Estimated Tax Increment
Revenue
$
(1) The City passed back incremental assessed value for payable year 2013. The City will make a yearly decision on the pass back of incremental assessed value.
(2) Circuit Breaker rate of$3.00 and exempt rate of0.6197
Source: Crowe Horwath LLP

DEMOGRAPHIC AND ECONOMIC INFORMATION
These schedules present various demographic and economic indicators to help the reader understand the environment within the City of South Bend that affects the City's financial activities.
257

CITY OF SOUTH BEND, INDIANA DEMOGRAPIDC STATISTICS
LAST TEN YEARS
South Bend South Bend
Metropolitan Metro Area South Bend City of
City of Percent Area Percent Total Personal Percent Metro Area Percent City of South Bend Percent
South Bend Increase/ Median Family Increase/ Income (3) Increase/ Per Capita Increase/ South Bend Public School Increase/
Year Population (1) (Decrease) Income (4) (Decrease) (Millions) (Decrease) Income (3) (Decrease) Median Age (4) Enrollment (2) (Decrease)
2004 105,206 -0.3% 39,940 7.5% 8,295 5.2% 31,340 5.2% 32.7 22,140 0.7%.
2005 105,743 0.5% 37,971 -4.9% 8,565 3.3% 32,328 3.2% 34.5 22,100 -0.2%
2006 104,457 -1.2% 39,046 2.8% 8,958 4.6% 33,034 2.2% 34.6 21,926 -0.8%
2007 104,069 -0.4% 44,400 13.7% 8,978 0.2% 33,739 2.1% 34.6 21,715 -1.0%
2008 104,905 0.8% 40,684 -8.4% 9,396 4.7% 35,357 4.8% 34.6 20,800 -0.6%
2009 106,192 1.2% 43,403 6.7% 9,466 0.7%. 34,651 -2.0% 32.3 20,451 -1.5%
2010 101,168 -4.7% 40,789 -6.0% 9,289 -1.9% 34,286 -1.1% 33.4 20,066 -1.9%
2011 101,168 0.0% 40,873 0.2% 9,768 5.2% 33,322 -2.8% 33.3 19,467 -3.0%
2012 101,168 0.0% 40,873 0.2% 9,768 5.2% 33,322 -2.8% 33.3 18,982 -5.4%
2013 101,168 0.0% 40,873 0.0% 10,162 4.0% 38,152 14.5% 33.3 19,680 1.1%
N 01 Sources: CD (1) U.S. Census Bureau 2010 Census information (http:f/factfinder2.census.gov). No 2013 information available.
(2) South Bend Community School Corporation Administration office for enrollment on October 1, 2013.
(3) South Bend-Mishawaka, IN_MI Metropolitan Area Profile (http://www.stats.indiana.edu). (4) U.S. Census Bureau (http://factfinder2.census.gov). No 2013 information available.

"" 01 (0
CITY OF SOUTH BEND, INDIANA DEMOGRAPHIC STATISTICS (CONTINUED)
LAST TEN YEARS
December December December
South Bend South Bend South Bend
Metropolitan J>ercent Metropolitan Percent Metropolitan
Area Labor· Increase/ Area Increase/ Unemployment
Year Force (1) (Decrease) Unemployment (1) (Decrease) Rate (1)
2004 132,981 1.3% 6,669 6.1% 5.0%
2005 134,033 0.8% 6,956 4.3% 5.2%
2006 134,651 0.5% 6,501 -6.5% 4.8%
2007 132,693 -1.5% 6,291 -3 .2% 4.7%
2008 133,433 0.6% 12,476 98.3% 9.4%
2009 123,792 -7.2% 13,474 8.0% 10.9%
2010 125,853 -5 .7% 12,648 1.4% 10.0%
2011 129,438 4.6% 12,366 -8.2% 9.6%
2012 124,968 0.9% 12,108 -10 .1% 9.7%
2013 124,145 -1.4% 9,211 -27.2% 7.4%
Sour·ce: (1) South Bend-Mishawaka, IN _MI Metropo litan Area Profile (http://www.stats.indiana.edu). "Labor Force Overview" employment stati stics annual averages.

N en 0
-- ----
CITY OF SOUTH BEND, INDIANA COMPARISON OF GROWTH RATES IN PERSONAL INCOME FOR ST. JOSEPH COUNTY,
THE STATE OF INDIANA AND U.S. PERSONAL INCOME LAST TEN YEARS
Amount in Amount in Millions Billions Annual Percentage Increase
St. Joseph Co. Indiana u.s. St. Joseph Co. Indiana u.s. Calendar Personal Personal Personal Personal Personal Personal
Year Income Income Income Income Income Income
2004 8,295 186,21 0 9,711 5.17% 4.22% 6.13% 2005 8,565 193,348 10,284 3.25% 3.83% 5.90% 2006 8,958 203,502 10,968 4.59% 5.25% 6.65% 2007 8,978 204,877 11 ,074 0.22% 0.68% 0.97% 2008 9,396 210,447 11 ,634 4.66% 2.72% 5.06% 2009 9,466 220,670 12,225 0.74% 4.86% 5.08% 2010 9,289 218,527 12,168 -1.87% -0.97% -0.47% 2011 9,678 232,586 12,949 4.19% 6.43% 6.42% 2012 10,162 249,198 13,729 5.00% 7.14% 6.02% 2013 10,162 249,198 13,729 0.00% 0.00% 0.00%
Average Annual Growth - Most Recent 5 Years 2.54% 4.04% 4.42% Average Annual Growth - Most Recent 10 Years 2.60% 3.42% 4.18%
Source ST ATS Indiana, a website sponsored by the Indiana Business Research Center at Indiana University's Kelley School of Business. Website address: www.stats.indiana.edu. Accessed May 13, 2014. No 2013 information available.

City of South Bend, Indiana Principal Employers - Current and Nine Years Ago
DECEMBER 31, 2013 ($'s whole)
2013 Number of Percent
Employer · Type of Business Employees of Total
University of Notre Dame College/University 5,590 3.74%
BeaconHealth System Health Care 3,450 2.31
South Bend Community School Corporation Public Schools 2,880 1.93
AM General Corporation Manufacturing/ Assembly 2,858 1.91
Trinity Health/Saint Joseph Regional Medical Center Health Care 2,597 1.74
Martin's Super Markets Grocery/Retail 1,555 1.04
Meijer, Inc. Grocery/Retail 1,450 0.97
Indiana University South Bend College/University 1,445 0.97
r-:JVV almart Retail 1,245 0.83
~ity of South Bend Government 1,131 0.75
Saint Joseph Regional Medical Center, Inc. Health Care
St. Joseph County Govermnent
Madison Center Health Care
Honeywell International, Inc. Airplane and Auto Parts
Total Number of Employees 24,201 16.19%
Total Employees - South Bend Metropolitan Area Labor Force 149,499 100.00%
Source: St. Joseph County Chamber of Commerce 2013 Economic Profile South Bend Cmmnunity School Corporation Bonds of2005 Official Statement Indiana Department of Workforce Development Research and Analysis for 2013 and 2004
2004 Number of Percent
Rank Employees of Total Rank
1 4,802 3.01% 1
2 3,470 2.18 3
3 3,781 2.37 2
4 5 6 7 1,205 0.76 8
8 1,300 0.82 6
9 10 1,298 0.81 7
2,851 1.79 4 1,750 1.10 5 1,180 0.74 9 1,000 0.63 10
22,637 14.21%
159,315 100.00%

OPERATING AND OTHER INFORMATION
These schedules contain information about the City of South Bend's operations and resources to help the reader understand how the City's financial information relates to the services the City provides and the activities it performs. Included in this section is other nonrequired information that the City has determined is relevant and useful to the reader of the financial statements.
262

City of South Bend, Indiana Operating Indicators by Function/Program
Last Ten Fiscal Years
Fiscal Year
2004 2005 2006 2007 2008 2009 2010 2011 2012 2013
Function/program Police
Physical arrests 5,041 5,056 5,932 4,589 4,091 3,785 3,077 3,626 3,174 2,959
Parking violations 688 722 515 1,820 1,672 1,479 979 904 1,051 1,019
Traffic violations 14,052 13,411 16,583 1;626 5,901 11,746 14,163 4,236 7,561 2,180
Fire Emergency responses 12,907 13,444 14,297 14,822 15,123 14,341 15,578 15,408 15,720 15,865
Fires extinguished 182 220 227 279 264 264 225 251 214 220
Inspections 4,820 5,585 4,875 4,302 4,467 4,205 4,233 3,553 3,325 2,273
Refuse collection ,...., Refuse collected (tons per day) (I) 266 238 269 267 137 70 120 123 128 122 0' Other public works CoAl
Street resurfacing (miles) 30.20 29.30 15.00 16.50 14.70 14.50 20.30 18.10 16.90 21.00
Potholes repaired (tonnage) 560.41 372.06 239.88 923.00 898.00 629.22 380.00 332.32 117.21 691.00
Parks and recreation Athletic field pennits issued 700 750 700 1,000 738 700 381 227 133 93
Fitness Center Admissions 35,426 37,247 61,452 63,088 70,193 74,438 60,118 67,408 61,002 63,671
Water New billable housing starts 427 445 471 321 299 194 179 144 160 242
Water mains breaks 78 80 54 105 72 87 76 60 66 80
Average daily consumption 19,461 20,071 17,704 19,042 18,280 16,100 15,955 15,600 16,600 15,300
(thousands of gallons) Wastewater
Average daily sewage treatment 31,800 31,800 32,800 35,970 37,800 41,200 30,861 35,800 31,770 30,690
(thousands of gallons)
Sources: Various city departments
N/ A - infonnation not available (1) 2007 and pri01· years were in cubic yards

City of South Bend, Indiana Capital Asset and Infrastructure Statistics by Function/Program
Last Ten Fiscal Years
Fiscal Year
2004 2005 2006 2007 2008 2009 2010 2011 2012 2013 Function/program Police
Stations 1 1 1 1 1 1 1 1 1 1
Patrol units 25 25 25 25 25 25 25 19 19 19
Fire Stations 11 11 11 11 11 11 11 11 11 11
Rescue units 31 31 31 32 32 33 33 33 33 33
Refuse collection
Collection trucks 21 23 22 22 22 21 23 23 19 19
Other public works Streets (miles) 498 498 500 500 500 532 532 499 525 525
Streetlights 963 966 1,060 1,170 1,242 2,500 2,500 2,500 2,700 2,700 N Traffic signals 163 164 167 160 m 160 162 162 164 165 167 ,.f:lo Parks and recreation
Acreage 1,292 1,292 1,292 1,292 1,292 1,292 1,292 1,292 1,292 1,292
Playgrounds 47 47 47 47 47 47 47 47 47 47
Baseball/softball diamonds 26 26 26 27 27 27 27 27 27 27
Soccer/football fields 17 17 17 17 17 17 17 17 19 19
Swimming pools 2 2 2 2 2 2 2 2 2 2
Community center 5 5 5 5 5 5 5 5 5 5
Water Water mains (miles) 538 547 553 558 560 560 580 582 583 584
Fire hydrants 4,819 4,914 5,013 4,000 5,081 5,317 5,345 5,377 5,401 5,436
Storage capacity (thousands of gallons) 17,300 17,300 17,300 17,300 17,300 17,300 17,300 17,300 17,300 17,300-
Wastewater Sanitary sewers (miles) 540 540 540 540 540 534 534 534 528 526
Stann sewers (miles) 200 200 200 200 200 200 127 127 133 133
Treatment capacity (thousands of gallons) 48,000 48,000 48,000 48,000 48,000 48,000 48,000 48,000 48,000 48,000
Sources: Various city departments

N en c.n
CITY OF SOUTH BEND, INDIANA NEW CONSTRUCTION- NUMBER OF PERMITS AND PROPERTY VALUES
Last Ten Fiscal Years (Dollar Amounts in OOO's)
Residential Public Residential Residential Value Commercial Commercial Public Utility Manufacturing
Number of Value Increase/ Number of Value Utility Number Value Number of
Year Permits (in OOO's) (Decrease) Permits (in OOO's) of Permits (in OOO's) Permits
2004 147 20,203 3.2% 20 24,340 2,823 50,910 3
2005 !66 25,123 24.4% 17 28,578 2,611 39,435 1
2006 102 17,241 -31.4% 21 36,749 2,282 34,836 2
2007 103 18,314 6.2% 28 27,082 1,907 28,720 5
2008 55 10,032 -45.2% 15 44,678 1,662 29,685 . I
2009 48 8,467 -15.6% 10 29,451 1,627 28,785 0
2010 35 7,450 -12.0% 5 28,283 1,221 25,998 0
2011 33 6,300 -15.4% 14 10,737 880 20,265 1
2012 45 9,827 31.9% 11 21,247 0 0 2
2013 50 15,136 140.3% 8 4,954 0 0 I
Source - Consolidated City/County Building Department and City Engineering Department.
Commercial, Public Utility and
Manufact Manufacturing Total Value
Value Total Value Increase/ (in OOO's) (in OOO's) (Decrease)
847 76,097 35.7% 6,000 74,013 -2.7% 7,927 79,512 7.4% 6,612 62,414 -21.5% 2,416 76,779 23.0%
0 58,236 -24.2%
0 54,281 -6.8% 2,023 33,025 -39.2% 2,291 23,538 -56.6%
160 5,114 -84.5%
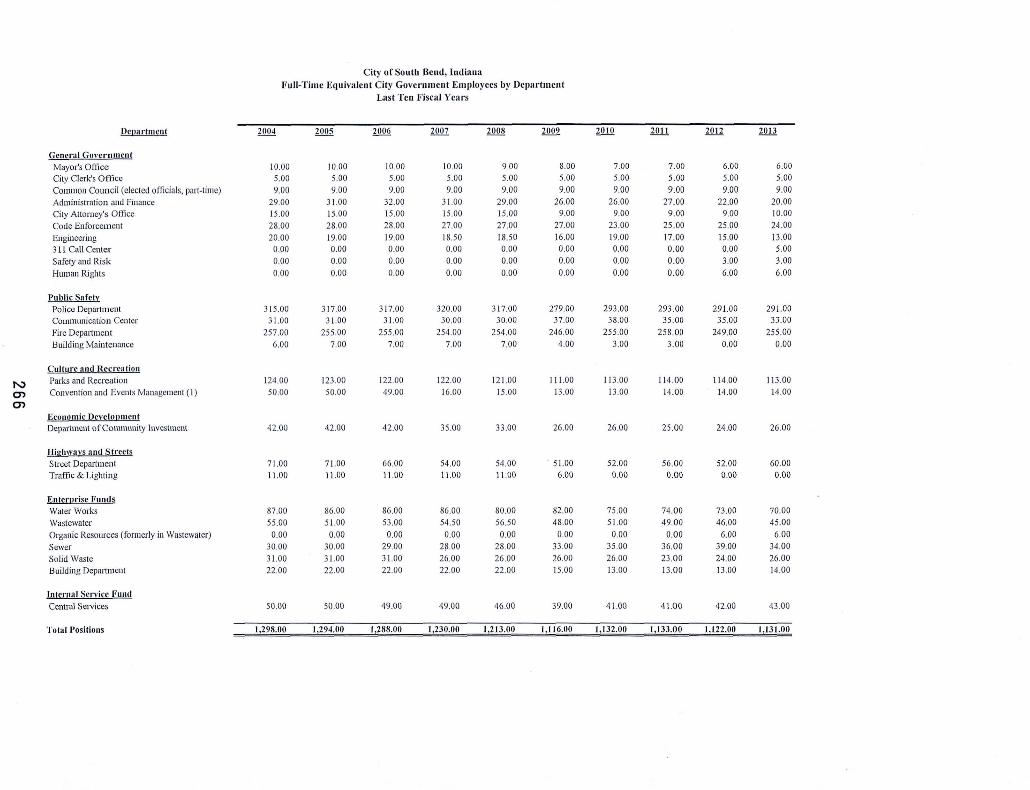
City of Soutll Bend, Indiana
Full-Time Equ ivalent City Government E mployees by Department
Last Ten Fisca l Y cars
Dcl):trlmcnt 2004 2005 2006 2007 2008 2009 2010 llil lli1 2013
General Govc1·nmcnl Mayor's Oftice 10.00 10.00 10.00 10.00 9.00 8.00 7.00 7.00 6.00 6.00
City Clerk's Office 5.00 5.00 5.00 5.00 5.00 5.00 5.00 5.00 5.00 5.00
Conunon Council (elected officials, part-time) 9.00 9.00 9.00 9.00 9.00 9.00 9.00 9.00 9.00 9.00
Administration and Finance 29 .00 31.00 32.00 3 1.00 29.00 26 .00 26 .00 27.00 22.00 20 .00
City Anorney's Office 15.00 15.00 15.00 15.00 15 .00 9.00 9.00 9.00 9.00 10.00
Code Enforcem ent 28.00 28 .00 28.00 27.00 27.00 27.00 23 .00 25 .00 25.00 24 .00
Engineering 20.00 19.00 19.00 18.50 18.50 16.00 19.00 17.00 15.00 13.00
3 11 Call Cente r 0.00 0.00 0.00 0.00 0.00 0.00 0.00 0.00 0.00 5.00
Sa fety and Risk 0.00 0.00 0.00 0.00 0.00 0.00 0.00 0.00 3.00 3.00
Human Rights 0.00 0.00 0.00 0.00 0.00 0.00 0.00 0.00 6.00 6.00
Public Sa fety Police Department 3 15.00 3 17.00 3 17.00 320.00 3 17.00 279.00 293.00 293.00 291.00 291.00 Communication Center 31.00 3 1.00 3 1 00 30.00 30.00 37.00 38.00 35 .00 35.00 33.00
Fire Depa11mcnt 257.00 255.00 255.00 254 .00 254 .00 246 .00 255.00 258.00 249.00 255.00
Bu ilding Ma intenance 6.00 7.00 7.00 7.00 7.00 4.00 3.00 3.00 0.00 0.00
Culture and Rccrca lion
)'..;) Parks and Recreat ion 124.00 123.00 122.00 122.00 12 1.00 111.00 11 3.00 114 .00 11 4.00 113 .00
0) Convention and Events Management ( I) 50.00 50.00 49.00 16.00 15 .00 13.00 13.00 14.00 14.00 14.00
0)
Economic Dcvclonmcnf Depat1ment of Community Investment 42.00 <12.00 42.00 35.00 33.00 26.00 26 .00 25 .00 24.00 26.00
Highways and Streets
Street Department 7 1.00 7 1.00 66.00 54 .00 5<1.00 . 5 1.00 52.00 56.00 52.00 60.00
Traffic & Lighting 11.00 11.00 11.00 11.00 11 .00 6.00 0.00 0. 00 000 0.00
Entcn>risc Funds WaterWorks 87 .00 86.00 86.00 86 .00 80.00 82.00 75 .00 74.00 73.00 70.00
Wastewater 55.00 51.00 53.00 54.50 56.50 48.00 51.00 49.0 0 46.00 45.00
Organic Resources (formerly in Wastewater) 0.00 0.00 0.00 0.00 0.00 0.00 0.00 0.00 6.00 6.00
Sewer 30.00 30.00 29.00 2?.00 28.00 33.00 35.00 36.00 39.00 34.00
Solid Waste 3 1.00 3 1.00 3 1.00 26.00 26 .00 26.00 26.00 23.00 24.00 26 .00
Building Dcpmtmcnt 22 .00 22 .00 22.00 22.00 22.00 !5.00 13.00 13.00 13.00 14 .00
Internal Service Fund
Central Services 50 .00 50 .00 49.00 49.00 46 .00 39.00 41.00 41.00 42.00 43.00
Total Positions 1,298.00 1,294.00 1,288.00 1,230.00 1,2 13.00 1, 11 6.00 1, 132.00 1,133.00 1,122.00 1,131.00

N 0') ~
Department
Summary by Activity General Govenunent Public Safety Culture and Recreation Economic Development Highways and Streets Enterprise Funds Intemal Service Fund
City of South Bend, Indiana Full-Time Equivalent City Government Employees by Department
Last Ten Fiscal Years
2004 2005 2006 ZQQ1 2008 2009
116.00 117.00 118.00 115.50 112.50 100.00 609.00 610.00 610.00 611.00 608.00 566.00 174.00 173.00 171.00 138.00 136.00 124.00 42.00 42.00 42.00 35.00 33.00 26.00 82.00 82.00 77.00 65.00 65.00 57.00
225.00 220.00 221.00 216.50 212.50 204.00 50.00 50.00 49.00 49.00 46.00 39.00
lli..!! 1!!11 2012 2013
98.00 99.00 100.00 101.00 589.00 589.00 575.00 579.00 126.00 128.00 128.00 127.00 26.00 25.00 24.00 26.00 52.00 56.00 52.00 60.00
200.00 195.00 201.00 195.00 41.00 41.00 42.00 43.00
Total Positions 1,29~.00 1,2914.00 1,288.00 1,230.00 1,213.00 1,116.00 1,1_32.00 1,133.00 ·1,122.00 1,131.00
Excludes seasonal, part-time and temporary positions
(!)Includes reduction of34 positions in the City's convention facility (Century Center) during 2007. Century Center is being managed by a private company under an agreement with the City of South Bend.
Source: City of South Bends Performance Based Budgets and personnel records
1,400.00 --1,200.00
1,000.00
800.00
600.00
400.00
200.00 • • • 0.00
~~ "'"'"''"' "'"'"''o
• "'"'"'"
Summary of Employees by Activity
-•
"'"''b '))
• "'<§! '))
• • "'"'""' "'"'""
• ~:v-
-•
"'" '))
--Total Positions
....., Public Safety
--. Eutcrprjse Funds
Culture and Recreation 186.00 181.87 179.00 176.00
-General Government
-Highways and Slrcets
- littemal Service Fwtd
-Economic Development

City of South Bend, Indiana Salary Rate Comparison
1990-2013
-----1st Class Patrol Officer----- ---1st Class Fire Fighter---Year Percent Base Salarv Percent Base Salarv Ngn..,baJ'I!ainin~?: Teamsters
1990 3.62% 20,071 4.74% 19,869 3.00-4.00% .25 per hour
1991 0.92% 20,256 2.52% 20,369 3.00% .25 per hour
1992 4.69% 21,206 2.45% 20,869 3.00% .30 per hour
1993 0.44% 21,300 5.00% 21,912 4.24% 0.00%
1994 2.35% 21,800 0.00% 21,912 1.50% + $300 bonus .15 per hour
1995 4.82% 22,850 3.00% 22,569 1.50% + $300 bonus .30 per hour
1996 4.38% 23,850 5.00% 23,697 3.00% .27 per hour
1997 4.19% 24,850 4.87% 24,850 3.00% .33 per hour
N 1998 4.63% 26,000 0.60% 25,000 3.00% .37 per hour 0')
1999 3.85% 27,000 2.60% 25,650 3.25% 3.50% 00
2000 5.56% 28,500 9.34% 28,045 3.50% 3.50%
2001 9.74% 31,275 11.52% 31,275 3.50% 4.00%
2002 4.50% 32,682 4.03% 32,534 4.00% 4.00%
2003 5.57% 34,504 4.04% 33,850 4.00% 4.00%
2004 6.01% 36,578 5.17% 35,600 4.00% 4.00%
2005 9.36% 40,000 12.36% 40,000 4.00% 4.00%
2006 2.50% 41,000 2.00% 40,800 2.00% 4.25%
2007 2.50% 42,025 2.50% 41,820 $750/0% .38 per hour
2008 3.50% 43,496 3.50% 43,285 3.00% 3.00%
2009 2.20% 44,453 2.00% 44,150 2.00% 2.00%
2010 0.00% 44,453 6.80% 47,150 2.00% 2.00% 2011 11.50% 49,563 4.06% 49,066 2.00% 0.00%
2012 2.00% 50,554 2.00% 50,047 2.00% 2.00%
2013 2.50% 51,818 3.00% 51,550 2.00% 2.00%
Source - City of South Bend personnel records

N en (0
Type of Coverage
LIABILITY Comprehensive General Liability Police Professional Liability Ambulance Malpractice Liability Premises Liability
(Clay Utilities, Century Center, Parking Garages)
CGL - Stadium Liquor Liability
CRIME Public Employee Dishonesty
PROPERTY All risk blanket building & contents
Business Income Machinery Breakdown Fine Arts Valuable Papers & Records Contractors Equipment
CITY OF SOUTH BEND, INDIANA mSURANCECOVERAGE
2013
4/26/13- 14
12/31/13- 14
7/1/13- 14
Limits of Liability .
Statutory Statutory Statutory Statutory
Statutory $1,000,000
$1,000,000
$579,877' 793 Included in above Included in above Included in above Included in above Included in above
Flood Insurance - Pump station & contents 1/15/13- 14 $622,200
Eddy Street Commons Parking Garage 3/2/13- 14 Building & Infrastructure $36,000,000
Business Income & Rental Value $15,000,000 Flood $25,000,000
Earthquake $25,000,000
OTHER 111/13- 14 Workers Compensation Statutory Third Party Fee Statutory
Excess Over Self-insured Statutory $400,000 Retention Each Accident
Source: City of South Bend Administration & Finance Department Gibson Insurance Company
Estimated Annual Premium
Self-Insured Self-Insured Self-Insured Self-Insured
Self-Insured $1,778 Premium
$9,128 Premium
$357,187 Premium Included in above Included in above Included in above _ · Included in above Included in above
$5,837 Premium
$24,888 Premium Included in above Included in above.
Included in above
Self-Insured $65,000 Fee
$106,185 Premium/Fee

Police Deuartment 2012
Authorized Officers 260 Vehicles 350 S12ecial Officer Grou12s:
K-9 Patrols 8 SWAT Team 17 Metro Drug Task Force (of20 total) 15 NEST- Special Neighborhood Unit 7 Motorcycle Patrol Officers 6 Bomb Squad 6 Crime Prevention Officers 3
Crime Data: Murders 18 Rapes 55 Robbery 316 Aggravated Assault 235 Residential Burglary 1,318 Non-residential Burglary 426 Larceny 2,798
N Auto Theft 283 ...... Arson 34 0 Calls for Service 89,615
Dispatches 89,615 Miles Driven 3,549,725 Arrests 3,174
Fh·e Deuartment Paid Department established 1887
2012 Sworn Firefighters (51 of which are Paramedics) 251
Fire Apparatus 20 Hazardous Materials Truck 1 Reserve Pumper Trucks 3 Reserve Ladder Trucks 2
River Rescue Boats 3 Ambulances 7 Neonatal (Newborn) Units 3 Fire Runs 3,224 Ambulance Runs 12,496
City of South Bend, Indiana Miscellaneous Statistics
December 31,2013
Deuartment of Public Wori<S 2013 2012
260 Traffic Signals 165 358 Street Lights (City maintained) 2,700
Miles of Streets 525
8 Miles of Sidewalks 695 17 Miles of Alleys 398 13 Miles of Sanitary Sewers and Storm Drains 661 7 City Owned Vehicles & Related Units 1,146 6 Trash Picked Up Per Week (in tons) 512/wk 5 4 Si~n Sho11
2012 9 Work orders for sign maintenance,
93 installation or removal 1,508 363 Miles of yellow and white paint 88 199 Pre-formed plastic arrows used for
1,171 street markings 62 297 Crosswalk painting at intersections 230
3,095 Turn arrows in turn lanes 82 326 Detour routes 64 27 Temporary No Parking postings 418
89,707 Built Portables 150 89,707 Railroad Crossings 39
3,461,374 Special Signs Built 1250 2,961
Barricades set up for events (# of events): 98 Block Parties 26
2013
251 Sewer Utili!l:: 20 2012
I Customers 39,068 3 Dry Tons of Sludge produced per year 3,041 2 Miles of Sanitary Sewer Lines 528 3 Miles of Storm Sewer Lines 133 7 3 Water Utili!l::
3,178 2012 12,834 Customers/Meters 39,596
Irrigation Customers 2,779 Wells/Pumps in service 30 Pumping Capacity 60m.g.d. Daily Consumption 16.6m.g.d. Peak Demand 36.6m.g.d. Miles of Distribution Systems 583 Fire Hydrants 5,401
2013 167
2,700 525 695 398 661
1,127 488/wk
2013
1,719 306
40 378 20 41
503 250 39
1050
126 10
2013 39,322 2,490
528 133
2013 39,954 2,815
30 60m.g.d.
15.3 m.g.d. 27.1 m.g.d.
584 5,436

N ...... .....
South Bend International Airport
Passenger Year Volume 2004 780,033 2005 693,675 2006 729,619 2007 779,356 2008 704,418 2009 625,077 2010 626,597 2011 599,127 2012 589,030 2013 629,287
The South Bend Regional Airport had 33,122 take-offs and landings during 2013. Approximately 36 commercial airline flights per day fly to 10 hub airports.
Commercial airlines with operations at South Bend International Airp01t (market share):
2012 2013 Allegiant Air 26.14% 29.30% Delta Connection 45.06% 40.17% United Express 26.33% 23.36% Frontier 1.80% 5.42% Charters 0.67% 1.75% Total 100.00% 100.00%
Bus Passengers (to O'Hare/Midway) 33,668 31,058 Train Passengers (South Shore) 272,364 257,997
Transpo South Bend Public Transportation Corporation
Motor Bus (Fixed Route) Route Miles Ridership Miles of Service Revenue Miles
Demand Response (ACCESS) Ridership Total Miles Revenue Miles
2012 2013
264.8 2,250,083 1,445,521 1,344,053
54,808 314,083 279,216
286.8 2,239,076 1,318,612 1,245,780
57,831 313,022 280,904
City of South Bend, Indiana Miscellaneous Statistics
December 31,2013
Convention Fncilities
Century Center
Morris Performing Arts Center
Motels
75,000 square feet of exhibit space
2,590 available seating 750 seat theater
2,500 available seating
31 motels/hotels 6 Bed and Breakfasts Over 4,200 available rooms
Major motels and meeting rooms: Magnuson Grand Hotel facilities to seat 200 Double Tree facilities to seat 300
Othet· Transpot·tation
43 Trucking Lines, 33 Terminals 2 Interstate Bus Lines 4 Major Rail Systems (freight and passenger)
Health Care
The City of South Bend has excellent health care access at costs below the national average and the lowest in the Midwest region. The City has one major hospital:
Memorial Health Systems 526 beds
Other
- Incorporated in 1865 -County Seat of St. Joseph Cow1ty - South Bend officially began wider the name South Hold but the name was changed by the Post Office in 1830 to avoid confusion with other communities that used that name. The name South Bend was used because the City is located at the southernmost point of the St. Joseph River.
- Average High Temperature: January July
27.7 degrees Fahrenheit 81.0 degrees Fahrenheit
Colleges and Universities
Universities and Colleges
University ofNotre Dame Indiana University at South Bend Bethel College St. Mary's College Holy Cross College Trine University- South Bend Brown Mackie College - South Bend Purdue University South Bend
Technical Colleges
IVY Tech Community College
Communications
Access to:
Enrollment 2012 2013 12,100 8,490 1,963 1,380
450 100 674 200
12,088 8,490 1,804 1,479
525 154 448 200
Enrollment 2012 2013
6,000 8,003
4 Major Television Networks (WNDU, WSN, WSBT, WBND)
I Public Broadcasting Television Station (WNIT) 2 Local Television Stations (WHME, WMWB) 1 Major Newspaper (The South Bend Tribune) 25 Radio Stations
Famous Residents
South Bend has been the home to the many distinguished individuals including the following persons:
Schuyler Colfax, 17th U.S. Vice President John Fogerty, singer Michael Warren, actor Chad Everett, actor Sidney Pollack, actor/director Knute Rockne, football coach John Wooden, basketball coach Joe Kernan, fonner South Bend Mayor and Indiana Governor Ryan Newman, racecar driver Skylar Diggins, woman's basketball player

- - - - - - - - -----------
BY THE NUMBERS from the City of South Bend
VACANT AND ABANDONED HOUSING INmATIVE GOAL: ADDRESS 1000 HOUSES IN 1000 DAYS
1000HOMU -
S75 HOM U -
750HCM[S -
UPOATEO: JUNE 2014
1,000 Homes in 1,000 Days: 11 9 houses repaired, 128 houses demolished, 129 houses under contract for demolition.
The City saw over $69 .9 million in construction investment in 2013.
AA BOND RATING
=#1 of oi l of Indiana 's
Second Closs Cities
109,724 calls to 311, South Bend's customer-service line.
O ver l ,OOOjobs were created in 201 3. The Department of Community Investment assisted with the development
of l out of 3 of these jobs.
Through the efforts of the Department of Community Investment, 330 jobs were created in 201 3.
An additional 489 jobs were retained.
The City has paired up with Enfocus, which encourages graduates of Notre Dame's ESTEEM program to spend a postgraduate year in our community solving problems and
working on issues of civic importance. In 2013, Enfocus fellows h elp e d save the S o uth B end community, including the
South Bend Fire Depa rtment, $3 .2 million though innovative initiatives.
The City refinanced its Century Center and Sevver Bonds, saving over $1 million and $970,000 respectively.
In 201 3, the South Bend's Parks and R ecreation volunteer program generated 21,892 volunteer
hours valued at $460,128.
Energizing Indiana presented the City of South Bend with $93,550 in rebate checks for the effi ciency achieved in three downtown parking garages from replacing 775 light fixtures with T5 fluorescent bulbs, a change which saved $35,433 in
electricity costs. The City will get a full return on its $250,000 investment in just over 1. 5 years.

City of South Bend
Contact Information:
Office of the Mayor 574 235 9261
227 W. Jefferson Blvd. Suite 1400
South Bend, IN 46601
www.southbendin.gov
Copyright © 2022 FDOKUMEN