Budgets, Tax Rates, & Selected Statistics Fiscal Year 2014
61
Budgets, Tax Rates, & Selected Statistics Fiscal Year 2014
-
Upload
khangminh22 -
Category
Documents
-
view
0 -
download
0
Transcript of Budgets, Tax Rates, & Selected Statistics Fiscal Year 2014

Budgets, Tax Rates, & Selected Statistics
Fiscal Year 2014

Maryland Association of Counties—Budget, Tax Rates, and Selected Statistics—FY 2014
2

FISCAL YEAR 2014
REPORT OF COUNTY
BUDGETS, TAX RATES
&
SELECTED STATISTICS
PREPARED BY THE
MARYLAND ASSOCIATION OF COUNTIES
(MACO)
169 CONDUIT STREET
ANNAPOLIS, MD 21401
410.269.0043 (BALTIMORE METRO)
301.261.1140 (WASHINGTON METRO)
410.268.1775 (FAX)
WWW.MDCOUNTIES.ORG

Maryland Association of Counties—Budget, Tax Rates, and Selected Statistics—FY 2014
5
Acknowledgments
This report contains data assembled from survey responses from the finance and
budget offices of each Maryland county and Baltimore City. Without these county
officials’ cooperation and hard work, this report’s preparation would be impossible.
MACo appreciates their assistance, and thanks each of them for their contributions.
Several State agencies also provided information presented herein. MACo thanks the
Office of the Comptroller, the State Department of Assessments and Taxation, the
Maryland Department of Legislative Services, the State Emergency Number Systems
Board, and the Maryland Department of Planning, Data and Product Development for
their help and contributions.
MACo would also like to thank the staff of the Department of Legislative Services
(DLS). In the past, DLS and MACo have each conducted a survey concerning local tax
rates, tax differentials and rebates, and various other county budget data. With this
survey, DLS and MACo collobarated to send out one combined survey to make this
process easier for all concerned, save time, and eliminate duplicative data collection.
This document was created by the staff of the Maryland Association of Counties in
Annapolis, Maryland. Andrea Mansfield served as project coordinator.
MACo strives to maintain the quality and utility of each of its publications. Readers
with corrections to the data contained in this document, or suggestions for
improvements in the content or presentation of future publications, are invited to
contact the Maryland Association of Counties with any comments:
Maryland Association of Counties
Attn: Budget and Tax Rate Publication
169 Conduit Street
Annapolis, Maryland 21401
www.mdcounties.org
MACo will make available any updates or corrections to the information in this
publication via its website. On ourweb site, go to Publications and select the “Budget
and Tax Rate Survey” tab.

Maryland Association of Counties—Budget, Tax Rates, and Selected Statistics—FY 2014
6

Maryland Association of Counties—Budget, Tax Rates, and Selected Statistics—FY 2014
7
Table of Contents Section 1 Overview and Summary Data .............................................................. 11 Table 1.1 County Tax Rates in Brief ................................................................................. 12
Table 1.2 County Revenues in Brief ................................................................................. 13
Section 2 Population Data ....................................................................................... 14 Table 2.1 Estimated Population and Population Growth .............................................. 15
Table 2.2 Estimated Population Density .......................................................................... 16
Section 3 County Budget Data ............................................................................... 17 Table 3.1 Total County Operating Budgets ..................................................................... 18
Table 3.2 County General Fund Operating Budgets Summary .................................... 19
Table 3.3 County General Fund Operating Budgets Detail .......................................... 20
Table 3.4 County Capital Budgets .................................................................................... 21
Table 3.5 County Bond Ratings ......................................................................................... 22
Section 4 Property Taxes ......................................................................................... 23 Table 4.1 County Property Tax Rates ............................................................................... 26
Table 4.2 County Property Tax Rates & Constant Yield Tax Rates .............................. 27
Table 4.3 Assessed Value of Real and Personal Property .............................................. 28
Table 4.4 Total Assessable Revenue Yields ..................................................................... 29
Table 4.5 Assessed Value of Real Property ..................................................................... 30
Table 4.6 Real Property Assessable Revenue Yields ...................................................... 31
Table 4.7 Taxation of Personal Property .......................................................................... 32
Table 4.8 Assessed Value of Personal Property .............................................................. 33
Table 4.9 Personal Property Assessable Revenue Yields ............................................... 34
Section 5 Property Tax Administration ................................................................ 35 Table 5.1 Property Tax Payment Discounts ..................................................................... 36
Table 5.2 Property Tax Penalties and Interest ................................................................. 37
Table 5.3 County Homestead Property Tax Credit Percentages .................................. 38
Section 6 Income Taxes ............................................................................................. 39 Table 6.1 Local Income Tax Rates ..................................................................................... 40
Table 6.2 Local Income Tax Revenue Yields ................................................................... 41
Table 6.3 Net and Per Capita Taxable Income ................................................................ 42
Section 7 Recordation and Transfer Taxes ........................................................... 43 Table 7.1 Recordation Tax Rates and Yields ................................................................... 44
Table 7.2 Transfer Tax Rates and Yields .......................................................................... 45
Section 8 Other County Taxes ................................................................................. 46 Table 8.1 Admissions and Amusement Taxes ................................................................ 48
Table 8.2 Cable Television Fees and Franchises ............................................................. 49
Table 8.3 Public, Education, and Government (PEG) Access Channel Fees ................ 50
Table 8.3 Hotel and Motel Taxes ....................................................................................... 51
Table 8.4 Trailer Park Taxes .............................................................................................. 52
Table 8.5 Sales and Service Taxes ..................................................................................... 53
Section 9 Service Fees and Charges ........................................................................ 55 Table 9.1 Impact Fees/Excise Taxes on New Development .......................................... 57
Table 9.2 Emergency “911” Fees and System Information ............................................ 58
Table 9.3 Solid Waste, Recycling, and Tipping Fees ...................................................... 59

Maryland Association of Counties—Budget, Tax Rates, and Selected Statistics—FY 2014
8

Maryland Association of Counties—Budget, Tax Rates, and Selected Statistics—FY 2014
9
Foreword
The data contained in this publication largely reflects the input received by MACo
from county budget and finance officers, through a survey conducted in August of
2013. Throughout the document, data is presented for years up to and including Fiscal
Year 2014. Please note that in every case, the data presented for Fiscal Year 2014 is
estimated data, based on the best projections at the time of the survey.
FY 2013 figures are the working appropriation at the time the local jurisdiction
approved its FY 2014 budget. Actuals will be collected in the FY 2015 survey. Unless
otherwise indicated, figures presented for years prior to Fiscal Year 2013 are actual
past year data.

Maryland Association of Counties—Budget, Tax Rates, and Selected Statistics—FY 2014
10

Maryland Association of Counties—Budget, Tax Rates, and Selected Statistics—FY 2014
11
Section 1 - Overview and Summary Data
This report contains a wide range of information on county taxes, tax rates, and
revenues. Each major area of revenue is detailed in its own section within this
document. To facilitate usage of current year data, Section 1 provides an overview of
the current tax rates and revenue for each county’s major taxes.
Table 1.1 shows each county’s FY 2014 rates for property taxes, income taxes,
recordation taxes, transfer taxes, hotel/motel taxes, and admissions and amusements
taxes.
Table 1.2 shows each county’s FY 2014 revenue yield from its primary revenue
sources—property taxes, income taxes, recordation and transfer taxes, and hotel/motel
taxes.
In each case, more detailed, comparative, and historical information is available
in the appropriate section of this report.

Maryland Association of Counties—Budget, Tax Rates, and Selected Statistics—FY 2014
12
TABLE 1.1
FY 2014 COUNTY TAX RATES IN BRIEF
Property Income Hotel/
Tax Rates Tax Rates Recordation Transfer Motel Adm &
(non-municipal) CY13 CY14 Tax Tax Tax Amusements
Allegany 0.9800 3.05% 3.05% $3.50 0.5% 8% 7.5%
Anne Arundel 0.9500 2.56% 2.56% $3.50 1.0% 7% 10%
Baltimore City 2.2480 3.20% 3.20% $5.00 1.5% 9.5% 10%
Baltimore County 1.1000 2.83% 2.83% $2.50 1.5% 8% 10%
Calvert 0.8920 2.80% 2.80% $5.00 - 5% 1%
Caroline 0.9400 2.63% 2.73% $5.00 0.5% 5% -
Carroll 1.0180 3.05% 3.04% $5.00 - 5% 10%
Cecil 0.9907 2.80% 2.80% $4.10 $10/deed 3% 6%
Charles 1.1410 2.90% 3.03% $5.00 - 5% 10%
Dorchester 0.9760 2.62% 2.62% $5.00 0.75% 5% 0.5%
Frederick 1 1.0640 2.96% 2.96% $6.00 - 3% -
Garrett 0.9900 2.65% 2.65% $3.50 1.0% 6% 4.5%
Harford 1.0420 3.06% 3.06% $3.30 1.00% N/A 5.0%
Howard 1.0140 3.20% 3.20% $2.50 1.0% 7% 7.5%
Kent 1.0220 2.85% 2.85% $3.30 0.5% 5% 4.5%
Montgomery 1.0090 3.20% 3.20% $3.45 1.0% 7% 7%
Prince George's 0.9600 3.20% 3.20% $2.75 1.4% 5% 10%
Queen Anne's 0.8471 3.20% 3.20% 4.95/500 0.5% 5% 5%
St. Mary's 0.8570 3.00% 3.00% $4.00 1.0% 5% 2%
Somerset 0.9150 3.15% 3.15% $3.30 - 5% 4%
Talbot 0.5120 2.40% 2.40% $6.00 1.0% 4% 5%
Washington 0.9480 2.80% 2.80% $3.80 0.5% 6% 3 - 5%
Wicomico 0.9086 3.20% 3.20% $3.50 - 6% 6%
Worcester 0.7700 1.25% 1.25% $3.30 0.5% 4.5% 3%
The data contained in this chart is presented in more detail in the respective sections of this report. 1 Real Property and Fire District Tax Consolidated in FY 2014, Fire District Tax is .128
SOURCE: Maryland Association of Counties/Department of Legislative Services, Budget and Tax Rate Survey, August 2013

Maryland Association of Counties—Budget, Tax Rates, and Selected Statistics—FY 2014
13
TABLE 1.2
FY 2014 COUNTY TAX REVENUES IN BRIEF
Property Local Recordation
Taxes Income & Transfer Hotel and
(Real and Personal) Tax Taxes Motel Tax
Allegany 40,764,629 24,534,600 1,400,000 948,125
Anne Arundel 601,749,000 417,300,000 73,000,000 13,670,000
Baltimore City 827,196,000 274,386,334 48,315,000 28,497,000
Baltimore County 920,851,355 604,292,819 77,500,000 8,850,000
Calvert 137,227,392 71,723,000 6,000,000 810,000
Caroline 24,442,955 10,800,000 1,310,842 45,000
Carroll 195,488,370 133,803,415 9,750,000 290,720
Cecil 101,764,421 52,139,853 4,800,000 75,000
Charles 213,904,600 106,240,200 10,500,000 1,067,000
Dorchester 30,154,734 9,809,329 2,184,386 330,000
Frederick 258,668,903 176,363,100 22,453,062 1,204,000
Garrett 48,116,651 11,125,000 3,150,000 1,900,000
Harford 285,541,515 190,600,000 19,800,510 -
Howard 542,022,652 370,000,000 47,098,864 4,200,000
Kent 30,267,675 10,800,000 1,590,000 118,500
Montgomery 1,504,875,000 1,299,191,344 184,059,787 17,752,800
Prince George's 693,725,100 530,761,200 101,588,500 5,481,200
Queen Anne's 62,739,716 38,984,963 3,250,000 435,000
St. Mary's 101,669,371 82,000,000 9,450,000 850,000
Somerset 14,470,866 6,100,000 350,000 55,000
Talbot 33,293,000 26,000,000 7,550,000 1,250,000
Washington 120,107,660 68,730,000 6,400,000 2,000,000
Wicomico 61,683,755 42,593,604 2,516,123 1,047,289
Worcester 117,680,468 12,200,000 8,750,000 11,250,000
Statewide Total 6,968,405,788 4,570,478,761 652,767,074 102,126,634
The data contained in this chart is presented in more detail in the respective sections of this report.
SOURCE: Maryland Association of Counties/Department of Legislative Services, Budget and Tax Rate Survey,
August 2013

Maryland Association of Counties—Budget, Tax Rates, and Selected Statistics—FY 2014
14
Section 2 - Population Data
Table 2.1 displays the estimated population of the state as of July 1, 2014 by
geographic region and political subdivision. Montgomery County continues to be the
most populous of the 24 subdivisions, followed by Prince George’s County, Baltimore
County and Baltimore City, respectively. Kent County remains the least populated
Maryland county.
Table 2.2 records the estimated population density of each subdivision as of
July 1, 2014. Baltimore City is the most densely populated subdivision with 7,694
persons per square mile, followed by Montgomery County with 2,103 persons per
square mile. Garrett County, with 46 persons per square mile, remains the least
densely populated county.

Maryland Association of Counties—Budget, Tax Rates, and Selected Statistics—FY 2014
15
TABLE 2.1 ESTIMATED POPULATION & POPULATION GROWTH
JULY 1, 2013 to JULY 1, 2014
Population Population Total Percent 2014
Region & Subdivision July 1, 2013 July 1, 2014 Change Change % of Total Rank
NORTHWESTERN AREA 494,897 497,197 2,300 0.46% 8.31%
Allegany 73,567 73,124 (443) -0.60% 1.22% 16
Frederick 242,041 244,525 2,484 1.03% 4.09% 8
Garrett 29,649 29,446 (203) -0.68% 0.49% 22
Washington 149,640 150,102 462 0.31% 2.51% 11
BALTIMORE-METRO AREA 2,723,952 2,743,567 19,615 0.72% 45.88%
Anne Arundel 556,326 562,226 5,900 1.06% 9.40% 5
Baltimore City 622,258 623,175 917 0.15% 10.42% 4
Baltimore County 822,590 827,757 5,167 0.63% 13.84% 3
Carroll 167,161 167,105 (56) -0.03% 2.79% 9
Harford 250,529 252,451 1,922 0.77% 4.22% 7
Howard 305,088 310,853 5,765 1.89% 5.20% 6
NATIONAL CAPITAL AREA 1,907,187 1,928,781 21,594 1.13% 32.26%
Montgomery 1,018,564 1,032,610 14,046 1.38% 17.27% 1
Prince George's 888,623 896,171 7,548 0.85% 14.99% 2
SOUTHERN AREA 352,600 356,029 3,429 0.97% 5.95%
Calvert 90,019 90,411 392 0.44% 1.51% 15
Charles 152,109 153,641 1,532 1.01% 2.57% 10
St. Mary's 110,472 111,977 1,505 1.36% 1.87% 12
EASTERN SHORE 453,229 454,142 913 0.20% 7.59%
Caroline 32,518 32,319 (199) -0.61% 0.54% 21
Cecil 101,821 101,946 125 0.12% 1.70% 14
Dorchester 32,444 32,338 (106) -0.33% 0.54% 20
Kent 20,141 20,091 (50) -0.25% 0.34% 24
Queen Anne's 48,832 49,070 238 0.49% 0.82% 18
Somerset 26,151 26,050 (101) -0.39% 0.44% 23
Talbot 38,242 38,387 145 0.38% 0.64% 19
Wicomico 101,381 102,120 739 0.73% 1.71% 13
Worcester 51,699 51,821 122 0.24% 0.87% 17
TOTAL 5,931,865 5,979,716 47,851 0.81% 100.00%
Source: Maryland Department of Legislative Services, November 2013

Maryland Association of Counties—Budget, Tax Rates, and Selected Statistics—FY 2014
16
TABLE 2.2
ESTIMATED POPULATION DENSITY Population - July 1, 2014
Population Square Miles Estimated Density Density
SUBDIVISION July 1, 2014 (Land Only) Per Square Mile Rank
ALLEGANY 73,124 424 172 16
ANNE ARUNDEL 562,226 415 1,355 5
BALTIMORE CITY 623,175 81 7,694 1
BALTIMORE COUNTY 827,757 598 1,384 4
CALVERT 90,411 213 424 8
CAROLINE 32,319 319 101 20
CARROLL 167,105 447 374 9
CECIL 101,946 346 295 14
CHARLES 153,641 458 335 11
DORCHESTER 32,338 541 60 23
FREDERICK 244,525 660 370 10
GARRETT 29,446 647 46 24
HARFORD 252,451 437 578 7
HOWARD 310,853 251 1,238 6
KENT 20,091 277 73 22
MONTGOMERY 1,032,610 491 2,103 2
PRINCE GEORGE'S 896,171 483 1,855 3
QUEEN ANNE'S 49,070 372 132 18
ST. MARY'S 111,977 357 314 13
SOMERSET 26,050 319 82 21
TALBOT 38,387 268 143 17
WASHINGTON 150,102 458 328 12
WICOMICO 102,120 374 273 15
WORCESTER 51,821 468 111 19
Source: Maryland Department of Legislative Services, November 2013;
Overview of Maryland Local Governments, Finances and Demographic Information, January 2013

Maryland Association of Counties—Budget, Tax Rates, and Selected Statistics—FY 2014
17
Section 3 - County Budget Data
Each year’s publication of Budgets, Tax Rates, and Selected Statistics includes budget data
received through MACo’s annual survey. This data is typically useful in general
terms—however, gathering budget data that is comparable across jurisdictions is
especially difficult. MACo also recognizes that this publication’s relatively rapid
availability is both an asset and a liability—the data is timely, but often subject to later
adjustment. For the most accurate historic reference, MACo suggests using data
available in the Department of Legislative Services’ annual publication Local
Government Finances, which provides audited and re-categorized information
presented after each year’s books are settled.
Table 3.1 shows the total operating budgets for Fiscal Years 2010 through 2014, the
change from FY 2013 to FY 2014, and the average rate of change from FY 2010 to FY
2014.
Table 3.2 shows a summary of county general fund operating budgets for
FY 2012 - 2014.
Table 3.3 is a table detailing the county general fund operating budgets.
It should again be noted that the figures in Table 3.1, 3.2, and 3.3 are only comparable
across jurisdictions in general terms, as the functions and funds contained within
operating budgets vary significantly across jurisdictions. Generally, in requesting data
for this publication, MACo sought to normalize data to the extent possible by
excluding enterprise funds and other self-supporting operations. However, with the
numerous different county governmental fiscal structures - use of different special
funds, dedicated revenues, and varying budgetary structures - completely accurate
comparisons are very difficult.
Table 3.4 provides a summary of each county’s FY 2014 capital budgets. General areas
of capital spending are shown for comparison.
Table 3.5 details the bond ratings granted for each county’s most recent issuances by
the three major bond rating firms, Standard & Poor’s, Moody’s, and Fitch.
Bonds are the mechanisms through which long-term improvements are financed.
Bond ratings range from “AAA” for the best quality and smallest investment risk, to
“C”, for lowest quality and poorest risk—generally, a lower bond rating will require a
higher interest rate paid to investors. (Specific classification systems are used by each
rating agency, but the letter-grade systems generally follow these norms.) The ratings
are assigned based upon the overall “creditworthiness” of the issuer. For county
governments, measurements such as size and growth in tax bases are a key factor in
determining the bond rating. Prudent fiscal management and planning can also
enhance a government’s standing.

Maryland Association of Counties—Budget, Tax Rates, and Selected Statistics—FY 2014
18
TA
BL
E 3
.1
TO
TA
L C
OU
NT
Y O
PE
RA
TIN
G B
UD
GE
TS
FIS
CA
L Y
EA
R 2
010 T
HR
OU
GH
FIS
CA
L Y
EA
R 2
014
A
ctual
A
ctual
A
ctual
A
pp
rop
riat
ion
A
pp
roved
C
han
ge
Av
g A
nn
ual
Chg
SU
BD
IVIS
ION
F
Y 2
01
0
FY
20
11
FY
20
12
FY
20
13
FY
20
14
F
Y 1
3-1
4
FY
10
-14
AL
LE
GA
NY
9
6,3
63
,65
2
10
0,9
42
,97
0
96
,971
,44
6
98
,851
,21
9
10
4,8
00
,76
7
6.0
2%
2
.12
%
AN
NE
AR
UN
DE
L
1,7
96,0
83
,500
1
,21
5,2
86
,907
1
,22
4,5
58
,583
1
,29
0,2
93
,100
1
,35
3,4
49
,300
4
.89
%
-6.8
3%
BA
LT
IMO
RE
CIT
Y1
2
,00
7,8
09
,826
1
,82
1,5
46
,484
1
,97
1,5
46
,123
1
,98
9,9
81
,433
2
,06
9,1
52
,834
3
.98
%
0.7
6%
BA
LT
IMO
RE
CO
UN
TY
2
,50
9,5
46
,742
2
,51
0,8
65
,795
2
,55
7,2
79
,409
2
,70
8,7
78
,004
2
,78
2,9
38
,667
2
.74
%
2.6
2%
CA
LV
ER
T
26
0,3
50
,44
4
25
1,8
57
,61
5
27
4,3
06
,14
2
27
0,6
11
,98
9
27
6,0
65
,26
5
2.0
2%
1
.48
%
CA
RO
LIN
E
5
3,2
03
,28
0
50
,098
,24
1
46
,496
,41
6
49
,591
,77
6
48
,385
,85
6
-2.4
3%
-2
.34
%
CA
RR
OL
L
45
1,9
24
,22
7
42
6,7
14
,56
7
33
2,6
32
,45
6
36
2,0
10
,00
0
36
7,3
25
,00
0
1.4
7%
-5
.05
%
CE
CIL
16
2,9
81
,36
9
16
1,6
30
,02
0
16
5,4
81
,53
3
16
6,7
48
,80
7
17
3,5
32
,77
2
4.0
7%
1
.58
%
CH
AR
LE
S
38
4,9
31
,08
6
36
8,0
29
,62
2
39
5,9
74
,71
9
38
4,4
22
,39
1
39
5,2
39
,60
9
2.8
1%
0
.66
%
DO
RC
HE
ST
ER
5
0,8
03
,46
0
49
,610
,97
1
48
,472
,66
7
49
,723
,81
8
51
,289
,92
5
3.1
5%
0
.24
%
FR
ED
ER
ICK
8
31
,76
5,6
49
8
39
,67
3,6
99
5
30
,42
3,1
04
5
70
,46
8,5
27
5
70
,93
9,9
01
0
.08
%
-8.9
8%
GA
RR
ET
T
68
,444
,60
1
67
,938
,69
5
70
,975
,45
4
74
,282
,20
2
73
,091
,40
6
-1.6
0%
1
.66
%
HA
RF
OR
D
52
0,9
66
,43
5
49
1,9
47
,01
1
53
9,8
82
,48
0
65
3,3
91
,13
3
57
7,7
92
,29
2
-11
.57
%
2.6
2%
HO
WA
RD
9
74
,06
2,1
27
1
,05
2,5
31
,356
1
,14
8,6
33
,066
1
,19
6,2
22
,777
1
,20
1,0
52
,671
0
.40
%
5.3
8%
KE
NT
5
2,7
03
,43
4
50
,216
,50
2
39
,038
,34
5
41
,651
,80
2
42
,027
,55
2
0.9
0%
-5
.50
%
MO
NT
GO
ME
RY
2
4,0
33,4
79
,891
3
,94
1,8
55
,580
4
,02
4,9
74
,707
4
,28
2,0
34
,540
4
,47
6,4
42
,161
4
.54
%
2.6
4%
PR
INC
E G
EO
RG
E'S
3
2,9
85,1
25
,600
2
,94
8,7
24
,430
2
,97
9,1
79
,600
3
,07
4,9
86
,800
3
,11
2,5
09
,400
1
.22
%
1.0
5%
QU
EE
N A
NN
E'S
1
29
,27
2,0
41
1
31
,94
3,3
10
1
12
,49
3,1
27
1
11
,84
6,5
58
1
17
,78
4,3
68
5
.31
%
-2.3
0%
ST
. M
AR
Y'S
1
83
,62
0,2
28
1
84
,06
9,4
19
1
91
,57
0,6
98
2
14
,27
9,4
95
2
25
,62
7,3
33
5
.30
%
5.2
9%
SO
ME
RS
ET
4
34
,987
,37
5
36
,216
,68
9
32
,388
,66
2
35
,935
,67
8
37
,289
,38
2
3.7
7%
1
.61
%
TA
LB
OT
1
70
,263
,77
2
70
,566
,22
2
74
,850
,91
0
72
,513
,38
3
74
,605
,51
6
2.8
9%
1
.51
%
WA
SH
ING
TO
N
21
7,2
09
,23
9
20
6,4
96
,48
5
20
9,0
53
,00
8
21
8,8
75
,76
0
22
4,5
17
,19
0
2.5
8%
0
.83
%
WIC
OM
ICO
1
26
,37
3,6
98
1
22
,28
0,0
56
1
04
,27
8,4
34
1
15
,10
3,2
49
1
21
,59
9,0
49
5
.64
%
-0.9
6%
WO
RC
ES
TE
R
17
5,1
97
,08
3
16
3,2
05
,81
1
16
4,7
72
,65
6
16
5,9
04
,25
6
16
8,6
43
,65
4
1.6
5%
-0
.95
%
TO
TA
L
18
,177
,46
8,7
59
1
7,2
64
,24
8,4
57
1
7,3
36
,23
3,7
45
1
8,1
98
,50
8,6
97
1
8,6
46
,10
1,8
70
2
.46
%
0.6
4%
1 E
xcl
ud
es P
arkin
g E
nte
rpri
se,
Wat
er a
nd
Was
tew
ater
, C
ond
uit
, an
d L
oan
and
Guar
ante
e fu
nd
s
2
Excl
ud
es o
per
atin
g b
ud
get
fo
r W
ashin
gto
n S
ub
urb
an S
anit
ary C
om
mis
sio
n (
WS
SC
)
3
Excl
ud
es e
nte
rpri
se f
und
an
d o
per
atin
g b
ud
get
fo
r b
i-co
un
ty a
genci
es
(Mar
yla
nd
-Nat
ion
al C
apit
al P
ark &
Pla
nnin
g C
om
mis
sio
n a
nd
WS
SC
) 4
B
ud
get
s in
clud
e ca
pit
al p
roje
cts,
pay-g
o t
ransf
er
SO
UR
CE
: M
ary
lan
d A
ssoci
ati
on
of
Co
un
ties
/Dep
art
men
t of
Leg
isla
tive
Ser
vic
es,
Bu
dg
et a
nd
Tax
Rate
Su
rvey
, A
ug
ust
20
13
an
d p
rio
r y
ear
data

Maryland Association of Counties—Budget, Tax Rates, and Selected Statistics—FY 2014
19
TABLE 3.2
TOTAL COUNTY GENERAL FUND OPERATING BUDGETS
FISCAL YEAR 2012 THROUGH FISCAL YEAR 2014
Actual Appropriation Approved Change
SUBDIVISION FY 2012 FY 2013 FY 2014 FY 13-14
ALLEGANY 82,297,707 81,386,772 82,667,432 1.57%
ANNE ARUNDEL 1,170,738,891 1,230,753,400 1,274,319,400 3.54%
BALTIMORE CITY 1 1,552,806,391 1,561,364,107 1,571,676,679 0.66%
BALTIMORE COUNTY 1,586,583,232 1,657,479,154 1,724,491,528 4.04%
CALVERT 223,637,295 226,740,337 227,050,698 0.14%
CAROLINE 41,087,630 42,529,726 42,638,761 0.26%
CARROLL 332,632,456 362,010,000 367,325,000 1.47%
CECIL 143,823,888 147,583,060 152,618,609 3.41%
CHARLES 339,628,503 319,369,470 333,712,700 4.49%
DORCHESTER 47,485,252 48,571,401 50,221,773 3.40%
FREDERICK 409,538,153 444,285,205 494,253,178 11.25%
GARRETT 70,975,454 74,282,202 73,091,406 -1.60%
HARFORD 488,102,552 585,562,926 511,723,888 -12.61%
HOWARD 860,574,560 898,680,542 960,176,219 6.84%
KENT 39,038,345 41,651,802 42,027,552 0.90%
MONTGOMERY 891,919,401 1,009,467,726 1,087,574,730 7.74%
PRINCE GEORGE'S 2,626,854,500 2,677,274,200 2,712,344,300 1.31%
QUEEN ANNE'S 106,653,738 107,969,509 113,924,180 5.52%
ST. MARY'S 189,372,428 211,678,778 222,665,317 5.19%
SOMERSET 2 32,388,662 35,935,678 37,289,382 3.77%
TALBOT 71,626,895 69,651,600 72,450,000 4.02%
WASHINGTON 191,779,926 196,312,520 201,189,270 2.48%
WICOMICO 104,278,434 115,103,249 121,599,049 5.64%
WORCESTER 164,772,656 165,904,256 168,643,654 1.65%
TOTAL 11,768,596,949 12,311,547,620 12,645,674,705 2.71%
1 Starting in Fiscal 2013, Motor Vehicle Fund merged into the General Fund 2 Budgets include capital projects, pay-go transfer SOURCE: Maryland Association of Counties/Department of Legislative Services, Budget and Tax Rate Survey,
August 2013

Maryland Association of Counties—Budget, Tax Rates, and Selected Statistics—FY 2014
20
TA
BL
E 3
.3
CO
UN
TY
OP
ER
AT
ING
BU
DG
ET
S -
GE
NE
RA
L F
UN
D O
NL
Y
FO
R S
EL
EC
TE
D C
AT
EG
OR
IES
IN
FIS
CA
L Y
EA
R 2
01
4
JUR
ISD
ICT
ION
Gen
era
l
Govern
ment
Pub
lic
Safe
ty
Pub
lic
Work
s H
ealt
h
So
cia
l
Ser
vic
es
Pri
mary
&
Sec
ond
ary
Ed
uca
tio
n
Co
mm
un
ity
Co
lleges
Par
ks,
Rec
reat
ion
& C
ult
ure
L
ibra
ries
Co
nse
rvati
on
of
Nat
ura
l
Res
ourc
es
Co
mm
unit
y
Dev
. &
Pub.
Ho
usi
ng
Eco
no
mic
Dev
. &
Opport
unit
y D
ebt
Ser
vic
e
Inte
rgo
v.
Mis
c.
Expend
iture
s
Tota
l -
Gener
al
Funds
AL
LE
GA
NY
7,7
65,3
82
15,3
40,1
63
9,8
39,7
95
1
,79
1,6
18
1
,34
9,0
63
2
9,7
70
,04
5
7,5
55
,00
0
82
9,3
73
9
40
,00
0
260,5
06
8,0
00
1,2
16,8
96
3,0
00,2
65
1,2
03,5
21
1,7
97,8
05
82,6
67,4
32
AN
NE
AR
UN
DE
L
155,7
57,0
00
258,6
22,3
00
31,4
90,3
00
3
2,7
43
,60
0 1
3,2
70
,60
0
59
6,4
54
,60
0
31
,43
7,7
00
2
0,1
81
,80
0
16
,55
8,7
00
991,1
00
270,0
00
3,0
36,9
00 1
13,5
04,8
00
0
1,2
74,3
19,4
00
BA
LT
IMO
RE
CIT
Y
163,3
76,8
45
673,5
44,2
75
162,7
88,7
06
1
9,5
37
,56
9
6,7
44
,45
3
26
8,2
03
,74
9
1,0
00
,00
0
35
,21
3,1
22
2
2,8
14
,76
3
6,5
13,4
73
27,6
44,5
29
49,9
91,2
94 1
20,0
04,6
61
14,2
99,2
40
1,5
71,6
76,6
79
BA
LT
IMO
RE
CO
UN
TY
82,8
78,9
15
328,5
45,7
85
95,4
19,8
19
1
9,3
37
,57
2
6,8
66
,47
7
75
7,6
09
,85
6
44
,61
5,5
57
1
7,9
54
,75
2
35
,26
3,6
10
5
,112,5
90
0
1,2
49,2
60
89,7
54,8
98
22,9
43,1
58
216,9
39,2
79
1,7
24,4
91,5
28
CA
LV
ER
T
18,0
64,6
89
27,7
10,7
53
9,1
45,1
45
2
,77
0,3
07
1
,48
6,3
21
1
13
,39
4,4
29
4
,23
8,2
19
6
,21
7,1
43
3
,70
3,2
23
1
,201,3
72
1,6
69,7
21
1,2
69,3
53
16,5
90,1
77
0
19,5
89,8
46
227,0
50,6
98
CA
RO
LIN
E1
4,7
94,2
80
12,3
05,6
97
3,5
54,6
04
4
49
,74
8
14
1,5
63
0
0
8
36
,02
6
1,0
90
,00
0
129,5
71
6,0
00
242,8
50
3,3
88,0
31
15,0
99,1
56
601,2
35
42,6
38,7
61
CA
RR
OL
L
61,3
74,0
20
34,2
50,3
20
11,2
24,1
50
4
,31
6,9
70
1
,22
5,5
60
1
70
,60
9,8
60
7
,24
0,9
90
2
,32
0,2
00
8
,92
9,3
50
864,6
30
0
3,4
70,8
40
40,9
49,1
60
3,0
21,6
90
17,5
27,2
60
367,3
25,0
00
CE
CIL
14,1
51,9
83
32,3
22,0
91
10,2
89,2
04
5
2,4
00
2
,24
2,5
74
3
,35
6
46
,21
2
1,1
57
,57
9
0
595,4
95
0
987,4
31
0
90,7
60,2
84
10,0
00
152,6
18,6
09
CH
AR
LE
S1
29,4
17,8
00
91,1
35,2
00
6,6
03,9
00
3
,07
4,2
00
2
,82
8,5
00
0
0
5
,33
3,6
00
0
643,1
00
985,7
00
1,0
92,7
00
20,0
61,3
00
172,5
36,7
00
0
333,7
12,7
00
DO
RC
HE
ST
ER
3,5
82,9
21
10,3
36,2
25
3,3
36,0
20
1
,13
3,6
41
1
31
,61
4
18
,35
9,6
80
1
,29
1,8
18
4
64
,82
5
51
3,0
00
428,2
75
0
656,9
91
3,8
61,3
94
0
6,1
25,3
69
50,2
21,7
73
FR
ED
ER
ICK
1
45,3
34,7
29
99,3
58,6
88
13,3
41,3
91
5
,46
1,8
47
4
,77
5,3
87
0
0
6
,04
5,1
67
0
589,2
93
445,6
70
1,8
95,3
80
37,0
47,6
43
273,3
20,4
77
6,6
37,5
06
494,2
53,1
78
GA
RR
ET
T1
5,8
24,9
59
9,7
57,8
44
17,0
46,7
00
0
2
81
,70
0
0
0
61
,50
0
0
207,4
94
0
3,7
18,0
32
36,9
00
34,4
31,3
81
1,7
24,8
96
73,0
91,4
06
HA
RF
OR
D
46,7
30,1
74
101,4
07,6
39
15,6
95,8
93
4
,02
8,3
18
9
,62
2,7
20
2
21
,30
0,7
29
1
4,9
61
,61
2
9,9
10
,84
0
16
,15
8,3
10
639,3
78
524,3
11
2,4
55,6
87
50,9
89,9
13
0
17,2
98,3
64
511,7
23,8
88
HO
WA
RD
44,8
86,7
02
112,2
36,2
63
57,4
95,8
77
9
,48
4,8
38
26
,25
8,2
10
5
00
,76
7,7
19
2
9,2
33
,68
3
17
,04
6,0
21
1
7,6
76
,12
4
1,8
64,6
48
0
2,1
13,8
10
97,0
87,3
24
2,0
00,0
00
42,0
25,0
00
960,1
76,2
19
KE
NT
5,2
25,7
92
8,7
52,0
21
3,7
06,4
55
4
16
,28
1
31
1,2
87
1
7,1
96
,31
2
52
5,0
08
1
,28
7,9
32
5
54
,01
8
335,3
51
0
359,0
21
2,8
64,2
84
68,0
22
425,7
68
42,0
27,5
52
MO
NT
GO
ME
RY
2
143,6
79,5
07
352,4
27,6
69
42,1
32,9
40
1
93
,22
5,2
17
0
0
0
0
3
4,7
69
,58
4
1,5
68,8
31
4,7
97,1
78
8,7
69,5
15
0
0
306,2
04,2
89
1,0
87,5
74,7
30
PR
INC
E G
EO
RG
E'S
58,8
50,5
00
564,6
69,4
00
7,0
19,0
00
1
9,7
40
,70
0
5,3
15
,10
0
1,6
87
,80
7,8
00
10
6,0
25
,10
0
- 2
7,1
31
,40
0
12
,216,5
00
3,4
68,6
00
4,5
46,0
00
90,2
11,6
00 -
125,3
42,6
00
2,7
12,3
44,3
00
QU
EE
N A
NN
E'S
5,5
33,1
31
21,1
97,3
68
9,8
41,8
76
2
,06
9,5
87
1
,52
1,7
87
4
6,7
30
,39
8
1,6
67
,52
2
3,0
65
,79
1
1,3
10
,25
0
631,9
20
452,9
23
331,3
75
10,6
88,3
40
435,9
55
8,4
45,9
57
113,9
24,1
80
ST
. M
AR
Y'S
21,2
87,2
75
40,7
82,9
88
10,6
59,1
71
6
,75
2,3
82
4
,01
2,2
04
9
2,1
02
,44
8
3,8
73
,94
3
3,8
05
,54
2
2,4
76
,56
4
477,4
75
0
1,7
88,8
20
9,9
60,0
63
50,4
71
24,6
35,9
71
222,6
65,3
17
SO
ME
RS
ET
7,2
24,0
29
7,1
06,5
91
4,3
55,8
64
9
24
,00
0
32
,18
8
10
,21
7,1
39
3
58
,57
6
69
6,6
77
1
,03
6,5
62
101,0
47
0
175,0
00
2,3
24,8
51
2,7
36,8
58
37,2
89,3
82
TA
LB
OT
5,2
68,1
23
12,0
65,0
22
3,4
88,8
00
2
,06
9,1
24
5
06
,45
5
38
,52
2,6
99
1
,64
0,0
48
3
62
,90
5
1,0
10
,90
6
258,3
29
0
586,5
50
62,4
18
927,5
35
5,6
81,0
86
72,4
50,0
00
WA
SH
ING
TO
N
16,0
37,6
90
36,2
81,9
00
4,7
47,1
00
2
,33
9,2
70
3
24
,45
0
94
,45
3,5
80
8
,96
5,0
10
2
,65
7,7
50
2
,75
2,3
30
556,0
20
0
587,9
60
14,4
40,5
30
11,5
65,0
80
5,4
80,6
00
201,1
89,2
70
WIC
OM
ICO
10,6
22,0
08
24,8
79,8
66
7,4
14,9
13
3
,30
1,5
64
6
93
,89
6
40
,52
0,4
65
3
,78
6,9
70
3
,12
6,3
89
1
,09
5,1
63
88,9
10
0
155,2
20
11,8
97,8
11
475,2
27
13,5
40,6
47
121,5
99,0
49
WO
RC
ES
TE
R
13,7
25,4
49
28,3
21,2
62
4,0
63,4
39
5
,42
4,3
44
1
,30
6,0
11
7
7,2
79
,07
0
1,4
86
,16
4
2,3
65
,51
2
2,9
35
,60
1
221,1
84
233,1
00
1,6
38,2
67
10,3
13,8
72
19,0
40,3
79
290,0
00
168,6
43,6
54
TO
TA
L
971,3
93,9
03 2
,903,3
57,3
30
544,7
01,0
62
3
40
,44
5,0
97
91
,24
8,1
20
4
,78
1,3
03
,93
4 2
69
,94
9,1
32
14
0,9
40
,44
6
19
8,7
19
,45
8
36
,496,4
92
40,5
05,7
32
92,3
35,1
52 7
49,0
40,2
35
650,6
15,8
94
834,6
22,7
18
12,6
45,6
74,7
05
1 P
rim
ary
/Sec
ond
ary E
duca
tio
n,
Co
mm
unit
y C
oll
eges
, an
d L
ibra
ries
are
rep
ort
ed u
nd
er
Inte
rgo
v.
2 I
nclu
des
the
Was
hin
gto
n S
ub
urb
an S
anit
ary
Co
mm
issi
on,
Hea
lth i
nclu
des
So
cia
l S
erv
ices
; D
ebt
Ser
vic
e,
Par
ks
and
Rec
reat
ion a
re s
pec
ial
fund
s; P
rim
ary
an
d S
eco
ndar
y E
duca
tio
n a
nd C
oll
eges
are
co
mp
onent
unit
s o
f M
ontg
om
ery
Co
unty
go
vern
ment
and
are
not
inclu
ded
in t
he
Co
un
ty's
gener
al
fun
d b
ut
are
inclu
ded w
ith t
he
Co
unty
tax
-sup
po
rted
fu
nd
s fo
r b
ud
get
pu
rpo
ses.
SO
UR
CE
: M
ary
lan
d A
ssocia
tion
of
Cou
nti
es/D
ep
artm
en
t of
Legis
lati
ve
Serv
ices,
Bu
dg
et
an
d T
ax R
ate
Su
rv
ey
, A
ug
ust
20
13

Maryland Association of Counties—Budget, Tax Rates, and Selected Statistics—FY 2014
21
TA
BL
E 3
.4
CO
UN
TY
CA
PIT
AL
BU
DG
ET
S
FO
R S
EL
EC
TE
D C
AT
EG
OR
IES
IN
AP
PR
OV
ED
FIS
CA
L Y
EA
R 2
014
Ed
uca
tio
n
Lib
rari
es &
C
ou
rts
&
Pu
bli
c P
ub
lic
Par
ks
&
E
con
om
ic
Res
ou
rce
JUR
ISD
ICT
ION
(K
-12
on
ly)
Co
mm
Co
lleg
es
Sh
erif
f W
ork
s S
afet
y
Rec
reat
ion
H
ealt
h
Dev
. P
rote
ctio
n
Oth
er
To
tal
AL
LE
GA
NY
0
0
0
2,
059,
500
58
0,00
0
0
0
0
0
829,
835
3,
469,
335
AN
NE
AR
UN
DE
L
129,
386,
600
5,
873,
000
0
43
,901
,800
4,
278,
000
12
,622
,000
0
0
78
,278
,365
22
,859
,000
29
7,19
8,76
5
BA
LT
IMO
RE
CIT
Y
17,0
00,0
00
1,50
0,00
0
0
0
0
4,00
0,00
0
0
7,20
0,00
0
0
20,3
00,0
00
50,0
00,0
00
BA
LT
IMO
RE
CO
UN
TY
1,4
14
8,77
9,74
4
25,3
79,5
45
0
93,9
20,1
16
0
16,9
37,0
46
0
550,
000
18
,028
,806
35
,770
,309
33
9,36
5,56
6
CA
LV
ER
T
8,68
0,38
7
0
0
7,29
7,30
0
11,3
27,7
00
978,
900
0
0
0
1,
218,
900
29
,503
,187
CA
RO
LIN
E
0
54,8
00
155,
081
1,
661,
036
17
4,00
0
882,
319
0
0
0
1,
469,
016
4,
396,
252
CA
RR
OL
L
24,2
47,3
15
1,31
4,00
0
2,55
0,00
0
12,2
35,5
01
19,2
50,0
00
466,
000
0
0
6,
584,
700
1,
852,
500
68
,500
,016
CE
CIL
1,
856,
000
3,
583,
000
93
1,00
0
6,08
5,00
0
1,50
0,00
0
412,
000
0
0
0
0
14
,367
,000
CH
AR
LE
S
24,4
80,0
00
10,7
43,0
00
101,
000
36
,068
,000
1,
813,
000
88
4,00
0
0
662,
000
3,
017,
000
64
8,00
0
78,4
16,0
00
DO
RC
HE
ST
ER
0
0
19
1,10
5
3,71
1,10
5
1,21
3,59
9
34,7
30
0
2,20
0,00
0
0
130,
444
7,
480,
983
FR
ED
ER
ICK
42
,772
,074
51
1,10
0
254,
000
16
,728
,575
39
9,00
0
230,
000
0
0
1,
005,
093
6,
116,
000
68
,015
,842
GA
RR
ET
T
582,
400
29
9,32
2
112,
000
89
8,00
0
35,0
00
0
0
1,60
0,00
0
0
1,75
0,00
0
5,27
6,72
2
HA
RF
OR
D
64,0
19,8
46
15,4
48,4
50
0
20,0
06,5
09
26,9
90,0
00
6,28
1,00
0
0
0
0
29,6
82,0
96
162,
427,
901
HO
WA
RD
83
,502
,000
23
,407
,000
1,
000,
000
19
8,15
0,00
0
13,3
30,0
00
22,8
63,0
00
0
0
55,0
46,0
00
50,6
46,0
00
447,
944,
000
KE
NT
0
96
0,18
6
0
0
0
243,
000
0
0
0
0
1,
203,
186
MO
NT
GO
ME
RY
2
250,
205,
000
66
,876
,000
1,
147,
000
11
6,82
6,00
0
133,
726,
000
27
,859
,000
24
,124
,000
1,
017,
000
38
,236
,000
90
,151
,000
75
0,16
7,00
0
PR
INC
E G
EO
RG
E'S
4
124,
018,
000
30
,452
,000
0
18
2,68
1,00
0
66,1
59,0
00
47,5
31,0
00
219,
150,
000
13
,100
,000
22
,340
,000
54
,904
,000
76
0,33
5,00
0
QU
EE
N A
NN
E'S
11
,400
,000
8,
001,
551
27
6,38
0
869,
000
4,
431,
607
72
0,00
0
0
350,
000
39
5,00
0
16,0
02,5
37
42,4
46,0
75
ST
. MA
RY
'S
25,5
41,0
00
0
2,12
2,00
0
6,56
3,30
1
300,
000
1,
817,
680
0
32
5,00
0
4,34
6,57
1
0
41,0
15,5
52
SO
ME
RS
ET
3
828,
600
57
0,78
7
0
2,31
2,35
6
84,0
00
108,
000
0
0
0
1,
271,
394
5,
175,
137
TA
LB
OT
37
9,00
0
1,76
0,34
1
0
1,20
0,00
0
1,95
9,90
0
0
0
0
0
445,
000
5,
744,
241
WA
SH
ING
TO
N
8,14
7,80
0
213,
200
0
14
,534
,200
55
0,00
0
383,
000
0
0
0
3,
400,
400
27
,228
,600
WIC
OM
ICO
15
,128
,200
0
85
8,00
0
50,0
00
1,23
7,60
0
660,
000
22
,195
45
0,00
0
200,
000
49
7,28
0
19,1
03,2
75
WO
RC
ES
TE
R
500,
000
0
0
1,
570,
310
55
,000
1,
108,
191
0
0
50
9,63
1
32,0
00
3,77
5,13
2
TO
TA
L
981,
453,
966
19
6,94
7,28
2
9,69
7,56
6
769,
328,
609
28
9,39
3,40
6
147,
020,
866
24
3,29
6,19
5
27,4
54,0
00
227,
987,
166
33
9,97
5,71
1
3,23
2,55
4,76
7
1 B
ien
nia
l p
roce
ss m
ay d
isto
rt a
nn
ual
co
ntr
ibu
tio
ns
to c
apit
al p
rog
ram
; Ex
clu
des
Wat
er a
nd
Sew
er
2
Ex
clu
des
th
e W
ash
ing
ton
Su
bu
rban
San
itar
y C
om
mis
sio
n
3 In
clu
ded
in
Op
erat
ing
Bu
dg
et
4 In
clu
des
Sto
rmw
ater
Man
agem
ent

Maryland Association of Counties—Budget, Tax Rates, and Selected Statistics—FY 2014
22
TABLE 3.5
COUNTY BOND RATINGS
FISCAL YEAR 2014
COUNTY S&P Moody’s Fitch
ALLEGANY A+ Aa3 -
ANNE ARUNDEL AAA Aa1 Not used
BALTIMORE CITY AA- Aa2 N/A
BALTIMORE COUNTY AAA Aaa AAA
CALVERT AAA Aa1 AAA
CAROLINE A A3 -
CARROLL AAA Aa1 AAA
CECIL AA Aa2 -
CHARLES AA+ Aa1 AAA
DORCHESTER A A2 -
FREDERICK AA+ Aa1 AAA
GARRETT1 - - -
HARFORD AA+ Aaa AAA
HOWARD AAA Aaa AAA
KENT - - -
MONTGOMERY AAA Aaa AAA
PRINCE GEORGE'S AAA Aaa AAA
QUEEN ANNE'S - - AA+
ST. MARY'S AA Aa2 AA+
SOMERSET - - -
TALBOT - Aa2 AAA
WASHINGTON AA Aa2 AA
WICOMICO AA-/stable Aa2 AA+/stable
WORCESTER AA Aa2 AA 1 Do not apply, no outstanding bonds
SOURCE: Maryland Association of Counties/Department of Legislative Services,
Budget and Tax Rate Survey, August 2013

Maryland Association of Counties—Budget, Tax Rates, and Selected Statistics—FY 2014
23
Section 4 - Property Taxes
The property tax remains the largest single source of revenue for county government.
This section is divided into four parts—the first detailing property tax rates in the
counties, the second showing aggregate data for all property, followed by two
segments containing individual data for the two major classes of property—real and
personal.
Tax Rates
Table 4.1 shows a history of county property tax rates from FY 2004 to FY 2014. The
rates shown are county-wide tax rates that apply to all non-municipal areas. In some
counties, municipal residents enjoy a “tax differential,” resulting in a lower county tax
rate within the municipality to reflect services provided by the municipal government.
In many counties, there are special taxing districts that levy property taxes for
identified purposes - Table 4.1 reflects only special taxes that are “county-wide” in
nature, and does not include taxes levied only in special service areas. For
Montgomery County, which employs a variety of special service taxes, tax rates shown
include county-wide special assessments, but do not include any of the district-wide
taxes levied in various parts of the county.
Table 4.2 compares property tax rates and constant yield tax rates for Fiscal Years 2010
through 2014. Pursuant to Section 2-205 of the Tax-Property Article of the Maryland
Annotated Code, on or before February 14 of each year, the State Department of
Assessments and Taxation (SDAT) notifies each county and Baltimore City of its
“constant yield tax rate.” This rate represents a tax rate sufficient to provide the same
property tax revenue as was generated in the previous taxable year. SDAT calculates
the constant yield tax rate by using the estimated full assessable base as of the date of
finality of the next taxable year, exclusive of properties appearing for the first time on
the assessment records.
All Property (Real and Personal Combined)
Table 4.3 shows the estimated Fiscal Year 2014 total assessable base for county tax
purposes. “Assessable base” is the total assessed value of all taxable real and personal
property in the county. By Maryland State law in place until October 1, 2000, the
assessed value of real property was 40% of cash value; the assessed value of personal
property is 100% of cash value. The assessable base shown is the total of that amount.
Technically, real property assessments have been altered by recent legislation passed
by the General Assembly. The 2000 “Truth in Taxation” law required full-value
assessment of real property, abandoning the previous 40% assessment ratio. Data
presented has been adjusted to fairly reflect assessments before and after this change.

Maryland Association of Counties—Budget, Tax Rates, and Selected Statistics—FY 2014
24
Montgomery County, with a $162.7 billion base, has the largest property tax assessable
base among the 24 subdivisions. It is followed by Baltimore County, Prince George’s
County, Anne Arundel County, Baltimore City, and Howard County respectively.
Somerset County’s assessable base, at $1.49 billion, is the smallest of the subdivisions.
Table 4.4 shows each jurisdiction’s total assessable yield (real and personal property)
and growth for Fiscal Years 2010 through 2014.
Real Property
Table 4.5 compares each jurisdiction relative to the real property assessable base in
Fiscal Year 2014. Specifically, counties are ranked based upon their total
FY 2014 real property assessable base and their per capita base. Amounts representing
the per capita real property assessable base in each jurisdiction are included. (see note
above regarding the transition to full value assessment of real property).
Montgomery, Baltimore, and Prince George’s Counties represent the top three
jurisdictions (from largest to smallest) with respect to total real property assessable
base. However, for per capita real property assessable base, the top two jurisdictions
are Worcester County and Talbot County.
Table 4.6 reflects the net real property tax yields for Fiscal Years 2010 through 2014.
Highlighted is the change in total net revenues generated from each subdivision’s real
property from FY 2013 to FY 2014. “Net” indicates the estimate after adjustments for
additions and abatements, discounts, credits, penalties and interest, collections for
prior year, etc.
Personal Property
In accordance with legislation enacted during the 1967 Session of the General
Assembly, the political subdivisions are permitted to exempt personal property from
property taxation, either partially or completely.
Table 4.7 lists the current exempt status for three categories of personal property by
subdivision. Not shown is the treatment of furniture, fixtures, and equipment.
Previous versions of this publication detailed the county exemptions for farm
implements and livestock—but both are exempted in every jurisdiction by current
State law. Twenty-one counties offer 100% exemptions for all three categories shown.
In addition, five counties (Frederick, Garrett, Kent, Queen Anne’s, and Talbot) levy no
personal property tax. The three remaining subdivisions do not offer 100% exemption
in all categories, but offer exemptions ranging from 0% to 65% for various

Maryland Association of Counties—Budget, Tax Rates, and Selected Statistics—FY 2014
25
commercial inventory, manufacturing inventory, and machinery. No county taxes all
categories of personal property at full value.
Further, it should be noted that many of the subdivisions grant special exemptions or
credits to targeted, new and/or expanding industries, which are not reflected in this
analysis.
Table 4.8 compares jurisdictions relative to the personal property assessable base in FY
2014. Counties are ranked in this table with respect to total personal property
assessable base and per capita base in FY 2014.
Table 4.9 shows the historic and estimated yields from personal property taxes for
each county. The personal property tax is applied differently by different counties (see
Table 4.7), including counties levying no personal property tax at all, and some
counties levying no personal property tax on businesses, but applying the personal
property tax rate to utility and railroad property. Yields from FY 2010 to FY 2012 are
shown, along with estimated yields for FY 2013 and FY 2014.

Maryland Association of Counties—Budget, Tax Rates, and Selected Statistics—FY 2014
26
TA
BL
E 4
.1
CO
UN
TY
PR
OP
ER
TY
TA
X R
AT
ES
(N
ON
-MU
NIC
IPA
L A
RE
AS
)
FO
R F
ISC
AL
YE
AR
S 2
004 T
HR
OU
GH
2014
F
Y
FY
F
Y
FY
F
Y
FY
F
Y
FY
F
Y
FY
F
Y
CO
UN
TY
2
00
4
20
05
20
06
20
07
20
08
20
09
20
10
20
11
20
12
20
13
20
14
AL
LE
GA
NY
1
.00
1.0
01
1.0
01
0.9
829
0
.98
29
0.9
829
0.9
829
0.9
829
0
.98
20
0.9
810
0.9
800
AN
NE
AR
UN
DE
L
0.9
55
0.9
41
0.9
31
0.9
18
0
.89
1
0.8
88
0.8
76
0.8
80
0
.91
0
0.9
41
0.9
50
BA
LT
IMO
RE
CIT
Y
2.3
28
2.3
28
2.3
08
2.2
88
2
.26
8
2.2
68
2.2
68
2.2
68
2
.26
8
2.2
68
2.2
48
BA
LT
IMO
RE
CO
UN
TY
1
.11
5
1.1
15
1.1
15
1.1
00
1
.10
0
1.1
00
1.1
00
1.1
00
1
.10
0
1.1
00
1.1
00
CA
LV
ER
T
0.8
92
0.8
92
0.8
92
0.8
92
0
.89
2
0.8
92
0.8
92
0.8
92
0
.89
2
0.8
92
0.8
92
CA
RO
LIN
E
0.9
52
0.9
52
0.9
10
0.8
70
0
.87
0
0.8
70
0.8
70
0.8
70
0
.87
0
0.8
90
0.9
40
CA
RR
OL
L
1.0
5
1.0
48
1.0
48
1.0
48
1
.04
8
1.0
48
1.0
48
1.0
48
1
.02
8
1.0
18
1.0
18
CE
CIL
0
.98
0.9
8
0.9
8
0.9
6
0.9
60
0.9
60
0.9
40
0.9
153
0
.94
01
0.9
907
0.9
907
CH
AR
LE
S
0.9
52
0.9
62
0.9
62
0.9
62
0
.96
2
0.9
62
0.9
62
0.9
62
1
.00
3
1.0
57
1.1
41
DO
RC
HE
ST
ER
0
.93
0.9
3
0.9
2
0.8
96
0
.89
6
0.8
96
0.8
96
0.8
96
0
.97
6
0.9
76
0.9
76
FR
ED
ER
ICK
1
1.0
0
1.0
0
1.0
0
0.9
36
0
.93
6
0.9
36
0.9
36
0.9
36
0
.93
6
0.9
36
1.0
64
GA
RR
ET
T
1.0
36
1.0
36
1.0
00
1.0
0
1.0
00
1.0
00
0.9
90
0.9
90
0
.99
0
0.9
90
0.9
90
HA
RF
OR
D
1.0
92
1.0
92
1.0
82
1.0
82
1
.08
2
1.0
82
1.0
64
1.0
42
1
.04
2
1.0
42
1.0
42
HO
WA
RD
1
.04
4
1.0
44
1.0
44
1.0
14
1
.01
4
1.0
14
1.0
14
1.0
14
1
.01
4
1.0
14
1.0
14
KE
NT
1
.01
2
1.0
12
0.9
92
0.9
72
0
.97
2
0.9
72
0.9
72
1.0
22
1
.02
2
1.0
22
1.0
22
MO
NT
GO
ME
RY
0
.91
4
0.9
02
0.8
56
0.8
12
0
.81
20
0.8
180
0.9
040
0.9
040
0
.94
6
0.9
91
1.0
09
PR
INC
E G
EO
RG
E'S
0
.96
0.9
6
0.9
60
0.9
60
0
.96
0
0.9
60
0.9
60
0.9
60
0
.96
0
0.9
60
0.9
60
QU
EE
N A
NN
E'S
0
.97
6
0.9
26
0.8
7
0.8
0
0.7
70
0.7
70
0.7
70
0.7
67
0
.84
7
0.8
47
0.8
47
ST
. M
AR
Y'S
0
.90
8
0.8
78
0.8
72
0.8
57
0
.85
7
0.8
57
0.8
57
0.8
57
0
.85
7
0.8
57
0.8
57
SO
ME
RS
ET
1
.01
1.0
1
0.9
9
0.9
4
0.9
40
0.9
20
0.9
00
0.8
84
0
.88
4
0.8
84
0.9
15
TA
LB
OT
0
.55
3
0.5
4
0.5
2
0.5
0
0.4
75
0.4
49
0.4
32
0.4
32
0
.44
8
0.4
91
0.5
12
WA
SH
ING
TO
N
0.9
48
0.9
48
0.9
48
0.9
48
0
.94
8
0.9
48
0.9
48
0.9
48
0
.94
8
0.9
48
0.9
48
WIC
OM
ICO
1
.04
1
1.0
25
0.9
93
0.9
42
0
.88
1
0.8
14
0.7
59
0.7
59
0
.76
9
0.8
40
0.9
09
WO
RC
ES
TE
R
0.7
3
0.7
3
0.7
3
0.7
0
0.7
00
0.7
00
0.7
00
0.7
00
0
.70
0
0.7
70
0.7
70
NO
TE
: M
an
y co
unti
es l
evy
spec
ial
serv
ice
pro
per
ty t
axe
s b
y d
istr
ict.
Tho
se t
axe
s a
re i
n a
dd
itio
n t
o t
ho
se r
epre
sen
ted
on
th
is t
able
.
1 R
eal
Pro
per
ty a
nd F
ire
Dis
tric
t T
ax
Con
soli
da
ted
in
FY
20
14
, F
ire
Dis
tric
t T
ax
is .1
28
SO
UR
CE
: M
ary
lan
d A
ssoci
ati
on
of
Co
un
ties
/Dep
art
men
t of
Leg
isla
tive
Ser
vic
es,
Bu
dg
et a
nd
Tax
Rate
Su
rvey
, A
ug
ust
20
13
an
d p
rio
r y
ear
data

Maryland Association of Counties—Budget, Tax Rates, and Selected Statistics—FY 2014
27
TA
BL
E 4
.2
CO
UN
TY
PR
OP
ER
TY
TA
X R
AT
ES
AN
D C
ON
ST
AN
T Y
IEL
D T
AX
RA
TE
S (
FO
R N
ON
-MU
NIC
IPA
L A
RE
AS
)
FO
R F
ISC
AL
YE
AR
S 2
010 T
HR
OU
GH
2014
FY
20
10
F
Y 2
01
1
F
Y 2
01
2
FY
20
13
FY
20
14
CO
UN
TY
P
.T.R
. C
.Y.T
.R.
%D
iff.
1
P.T
.R.
C.Y
.T.R
. %
Dif
f.1
P
.T.R
. C
.Y.T
.R.
%D
iff.
1
P.T
.R.
C.Y
.T.R
. %
Dif
f.1
P
.T.R
. C
.Y.T
.R.
%D
iff.
1
AL
LE
GA
NY
2
0.9
829
0.9
15
6.9
1%
0
.98
29
0.9
42
4.1
8%
0
.98
20
0.9
652
1
.71
%
0.9
810
0
.97
66
0
.45
%
0.9
800
0
.99
73
-1
.77
%
AN
NE
AR
UN
DE
L2
0
.87
6
0.8
61
1.7
1%
0
.88
0
0.8
61
2.1
6%
0
.91
0
0.9
05
0.5
5%
0
.94
1
0.9
219
2
.03
%
0.9
50
0.9
43
0
.74
%
BA
LT
IMO
RE
CIT
Y
2.2
68
2.0
93
7.7
2%
2
.26
8
2.0
93
7.7
2%
2
.26
8
2.2
55
0.5
7%
2
.26
8
2.3
172
-2
.17
%
2.2
48
2.2
75
-1
.20
%
BA
LT
IMO
RE
CO
UN
TY
1
.10
0
1.0
46
4.9
1%
1
.10
0
1.0
63
4.9
1%
1
.10
0
1.0
94
0.5
5%
1
.10
0
1.1
012
-0
.11
%
1.1
00
1.1
068
-0
.62
%
CA
LV
ER
T2
0.8
92
0.8
25
7.5
1%
0
.89
2
0.8
25
7.5
1%
0
.89
2
0.9
11
-2.1
3%
0
.89
2
0.9
528
-6
.82
%
0.8
92
0.9
32
-4
.48
%
CA
RO
LIN
E2
0.8
70
0.8
16
6.2
1%
0
.87
0
0.8
53
1.9
5%
0
.87
0
0.8
77
-0.8
0%
0
.89
0
0.8
917
-0
.19
%
0.9
40
0.9
26
1
.49
%
CA
RR
OL
L
1.0
48
0.9
78
6.6
8%
1
.04
8
0.9
78
6.6
8%
1
.02
8
1.0
51
-2.2
4%
1
.01
8
1.0
578
-3
.91
%
1.0
18
1.0
36
-1
.77
%
CE
CIL
0
.94
0
0.8
97
4.5
7%
0
.91
5
0.8
97
2.0
0%
0
.94
0
0.9
45
-0.5
2%
0
.99
1
0.9
957
-0
.50
%
0.9
91
1.0
31
-4
.07
%
CH
AR
LE
S2,
3
1.0
26
0.9
66
5.8
5%
1
.02
6
0.9
66
5.8
5%
1
.06
7
1.0
66
0.0
9%
1
.06
7
1.1
171
-4
.70
%
1.1
41
1.1
68
-2
.37
%
DO
RC
HE
ST
ER
0
.89
6
0.8
43
5.9
2%
0
.89
6
0.8
43
5.9
2%
0
.97
6
0.8
88
9.0
2%
0
.97
6
0.9
920
-1
.64
%
0.9
76
1.0
08
-3
.28
%
FR
ED
ER
ICK
0
.93
6
1.0
05
-7.3
7%
0
.93
6
0.8
86
5.3
4%
0
.93
6
0.9
66
-3.2
1%
0
.93
6
0.9
663
-3
.24
%
1.0
64
0.9
52
1
0.5
3%
GA
RR
ET
T2
0.9
90
0.9
46
4.4
4%
0
.99
0
0.9
43
4.7
2%
0
.99
0
0.9
874
0
.26
%
0.9
90
1.0
331
-4
.35
%
0.9
90
0.9
93
-0
.30
%
HA
RF
OR
D 2
1
.06
4
0.9
98
6.2
0%
1
.04
2
1.0
42
4.2
2%
1
.04
2
1.0
60
-1.7
3%
1
.04
2
1.0
658
-2
.28
%
1.0
42
1.0
66
-2
.30
%
HO
WA
RD
1
.01
4
1.0
96
-8.0
9%
1
.01
4
0.9
67
4.6
4%
1
.01
4
1.0
23
-0.8
9%
1
.01
4
1.0
124
0
.16
%
1.0
14
1.0
02
1
.18
%
KE
NT
0
.97
2
0.9
08
6.5
8%
1
.02
2
0.9
08
11
.15
%
1.0
22
1.0
31
-0.8
8%
1
.02
2
1.0
364
-1
.41
%
1.0
22
1.0
26
-0
.39
%
MO
NT
GO
ME
RY
0.9
040
0.8
69
3.8
7%
0
.90
40
0.6
28
30
.53
%
0.9
460
0.7
24
23
.47
%
0.9
91
0.7
436
2
4.9
6%
1
.00
9
0.7
26
2
8.0
5%
PR
INC
E G
EO
RG
E'S
2
0.9
60
1.2
35
-28
.65
%
0.9
60
0.8
99
6.3
5%
0
.96
0
1.0
10
-5.2
1%
0
.96
0
1.0
006
-4
.23
%
0.9
60
0.9
76
-1
.67
%
QU
EE
N A
NN
E'S
0
.77
0
0.7
24
5.9
7%
0
.76
7
0.7
24
5.6
2%
0
.84
7
0.7
79
8.0
4%
0
.84
7
0.8
620
-1
.76
%
0.8
47
0.8
69
-2
.59
%
ST
. M
AR
Y'S
0
.85
7
0.7
98
6.8
8%
0
.85
7
0.8
19
4.4
1%
0
.85
7
0.8
607
-0
.43
%
0.8
57
0.8
608
-0
.44
%
0.8
57
0.8
53
0
.47
%
SO
ME
RS
ET
0
.90
0
0.8
74
2.8
9%
0
.88
4
0.8
84
-0.0
3%
0
.88
4
0.9
11
-3.0
9%
0
.88
4
0.9
75 -
10
.33
%
0.9
150
0
.91
0.5
5%
TA
LB
OT
2
0.4
32
0.4
22
2.3
1%
0
.43
2
0.4
22
2.3
1%
0
.44
8
0.4
49
-0.2
2%
0
.49
1
0.4
604
6
.23
%
0.5
12
0.5
00
2
.34
%
WA
SH
ING
TO
N
0.9
48
0.8
92
5.9
1%
0
.94
8
0.9
53
-0.5
3%
0
.94
8
0.9
36
1.2
7%
0
.94
8
0.9
732
-2
.66
%
0.9
48
0.9
85
-3
.90
%
WIC
OM
ICO
0
.75
9
0.7
58
0.1
3%
0
.75
9
0.7
58
0.1
3%
0
.76
9
0.7
98
-3.7
7%
0
.84
0
0.8
239
1
.96
%
0.9
09
0.8
93
1
.72
%
WO
RC
ES
TE
R
0.7
00
0.7
38
-5.4
3%
0
.70
0
0.7
38
-5.4
3%
0
.70
0
0.7
12
-1.7
1%
0
.77
0
0.7
723
-0
.30
%
0.7
70
0.7
97
-3
.51
%
1 T
he
per
cen
t th
at t
he
actu
al a
dopte
d t
ax r
ate
for
the
coun
ty i
s ab
ove
or
bel
ow
its
cal
cula
ted
co
nst
ant
yie
ld t
ax r
ate.
2 T
hes
e co
un
ties
lev
y a
sep
arat
e co
unty
tax
rat
e ad
just
ed b
y a
"m
un
icip
al t
ax r
ate
dif
fere
nti
al"
that
app
lies
to
ju
st p
rop
erty
lo
cate
d w
ith
in a
par
ticu
lar
mu
nic
ipal
ity.
A
sep
arat
e co
un
ty C
on
stan
t Y
ield
Tax
Rat
e is
cal
cula
ted
.
3 F
or
FY
20
13
, C
har
les
Co
un
ty t
ax r
ate
sho
wn
do
es i
ncl
ud
e a
spec
ial
serv
ice
area
tax
(w
hic
h i
s n
ot
incl
ud
ed i
n T
able
4.1
)
Co
nst
an
t Y
ield
Da
ta,
Ma
ryla
nd
Sta
te D
ep
artm
en
t o
f A
ssess
men
ts a
nd
Ta
xa
tio
n,
da
ted
2/1
4/2
013
- h
ttp
://w
ww
.da
t.st
ate
.md
.us/
sda
tweb
/cy
tr.p
df

Maryland Association of Counties—Budget, Tax Rates, and Selected Statistics—FY 2014
28
TABLE 4.3
ASSESSED VALUE OF REAL AND PERSONAL PROPERTY
(TOTAL ASSESSABLE BASE)
FISCAL YEAR 2014
FY 2014 Total Rank By Per Per Penny on
Assessable Total Capita Capita Tax Rate July 1, 2014
SUBDIVISION Base Base Base Rank Generates Population1
ALLEGANY 3,884,236,544 20 53,118 24 437,992 73,124
ANNE ARUNDEL 72,826,491,000 4 129,532 9 6,564,000 562,226
BALTIMORE CITY 46,581,025,573 5 74,748 21 3,360,149 623,175
BALTIMORE COUNTY 79,203,709,491 2 95,685 15 7,435,914 827,757
CALVERT 12,213,000,000 13 135,083 8 1,363,320 90,411
CAROLINE 2,536,663,585 23 78,488 20 248,951 32,319
CARROLL 20,605,224,937 9 123,307 10 1,792,000 167,105
CECIL 9,586,066,000 16 94,031 16 958,607 101,946
CHARLES 16,464,383,567 10 107,161 12 1,543,933 153,641
DORCHESTER 2,987,386,554 22 92,380 17 282,891 32,338
FREDERICK 27,179,611,000 8 111,153 13 2,431,099 244,525
GARRETT 4,825,749,914 19 163,885 3 502,400 29,446
HARFORD 29,041,937,578 7 115,040 11 2,648,918 252,451
HOWARD 44,204,232,538 6 142,203 7 4,514,802 310,853
KENT 3,018,066,455 21 150,220 6 292,187 20,091
MONTGOMERY 162,736,633,223 1 157,597 4 16,330,548 1,032,610
PRINCE GEORGE'S 76,508,452,000 3 85,373 18 2,890,521 896,171
QUEEN ANNE'S 7,954,908,056 17 162,113 5 742,471 49,070
ST. MARY'S 11,669,204,365 14 104,211 14 1,186,340 111,977
SOMERSET 1,489,940,850 24 57,195 23 160,000 26,050
TALBOT 9,379,230,950 15 244,334 2 635,058 38,387
WASHINGTON 12,492,093,000 12 83,224 19 1,181,259 150,102
WICOMICO 6,305,528,000 18 61,746 22 624,059 102,120
WORCESTER 15,121,107,000 11 291,795 1 1,527,673 51,821
TOTAL $678,814,882,180 113,520 59,655,091 5,979,716
1 Population estimates from Department of Legislative Services, November 2013
SOURCE: Maryland Association of Counties/Department of Legislative Services, Budget and Tax Rate Survey, August 2013

Maryland Association of Counties—Budget, Tax Rates, and Selected Statistics—FY 2014
29
TA
BL
E 4
.4
TO
TA
L A
SS
ES
SA
BL
E R
EV
EN
UE
YIE
LD
S (
INC
LU
DE
S A
LL
RE
AL
AN
D P
ER
SO
NA
L P
RO
PE
RT
Y)
FIS
CA
L Y
EA
RS
2010
-2014
A
ctual
FY
20
10
A
ctual
FY
20
11
A
ctual
FY
20
12
A
ctual
FY
20
13
E
stim
ate
d F
Y 2
01
4
Gro
wth
%
Gro
wth
A
vg.
Gro
wth
SU
BD
IVIS
ION
Y
ield
Y
ield
Y
ield
Y
ield
Y
ield
F
Y 2
01
3-1
4
FY
20
13
-14
FY
20
10
-14
AL
LE
GA
NY
4
2,0
31
,70
4
41
,993
,16
8
41
,307
,39
9
40
,825
,67
4
40
,764
,62
9
(61
,04
5)
-0.1
5%
-0
.76
%
AN
NE
AR
UN
DE
L
52
7,4
79
,00
0
55
1,6
18
,00
0
56
2,3
17
,00
0
58
3,6
77
,00
0
59
9,6
91
,00
0
16
,014
,00
0
2.7
4%
3
.26
%
BA
LT
IMO
RE
CIT
Y
88
4,2
83
,45
6
91
3,1
17
,95
2
89
5,7
72
,29
3
85
8,1
56
,34
8
82
7,1
96
,00
0
(30
,96
0,3
48
) -3
.61
%
-1.6
5%
BA
LT
IMO
RE
CO
UN
TY
1
,03
4,4
01
,901
1
,03
2,1
73
,290
9
79
,20
4,7
78
9
43
,05
6,2
37
9
20
,85
1,3
55
(2
2,2
04
,88
2)
-2.3
5%
-2
.87
%
CA
LV
ER
T
13
3,9
81
,11
4
15
2,5
29
,16
5
14
7,4
62
,34
6
14
0,6
97
,30
6
13
7,2
81
,71
7
(3,4
15
,58
9)
-2.4
3%
0
.61
%
CA
RO
LIN
E
22
,823
,50
4
23
,892
,08
4
23
,932
,02
3
23
,977
,02
4
24
,442
,95
5
46
5,9
31
1
.94
%
1.7
3%
CA
RR
OL
L
20
4,9
73
,87
2
20
8,2
96
,51
2
20
9,8
14
,41
8
20
0,3
20
,00
0
19
6,3
32
,21
8
(3,9
87
,78
2)
-1.9
9%
-1
.07
%
CE
CIL
9
9,0
46
,47
1
10
1,8
11
,47
1
10
1,3
26
,77
3
10
3,0
14
,60
3
10
1,7
64
,41
1
(1,2
50
,19
2)
-1.2
1%
0
.68
%
CH
AR
LE
S
21
5,4
65
,78
1
20
6,9
28
,04
2
20
0,5
40
,11
6
20
6,5
55
,30
0
21
3,9
04
,60
0
7,3
49,3
00
3
.56
%
-0.1
8%
DO
RC
HE
ST
ER
3
2,9
90
,61
5
31
,906
,47
0
33
,051
,63
2
31
,909
,26
5
30
,386
,99
5
(1,5
22
,27
0)
-4.7
7%
-2
.03
%
FR
ED
ER
ICK
3
02
,22
6,3
01
2
81
,62
3,1
86
2
57
,57
8,5
04
2
35
,99
6,4
27
2
65
,18
2,8
03
2
9,1
86
,37
6
12
.37
%
-3.2
2%
GA
RR
ET
T
43
,729
,33
7
46
,294
,29
1
47
,811
,71
0
48
,163
,47
8
48
,116
,65
1
(46
,82
7)
-0.1
0%
2
.42
%
HA
RF
OR
D
27
0,4
51
,63
5
30
6,5
33
,44
1
29
3,1
28
,76
9
28
9,4
98
,15
2
28
5,5
41
,51
5
(3,9
56
,63
7)
-1.3
7%
1
.37
%
HO
WA
RD
4
25
,82
9,5
31
4
37
,59
8,1
05
4
41
,68
0,4
16
4
49
,25
7,0
13
4
60
,00
5,2
10
1
0,7
48
,19
7
2.3
9%
1
.95
%
KE
NT
3
1,2
59
,42
2
38
,108
,81
1
31
,205
,78
7
31
,846
,35
2
31
,387
,69
9
(45
8,6
53)
-1.4
4%
0
.10
%
MO
NT
GO
ME
RY
1
,41
2,5
80
,074
1
,42
0,8
65
,241
1
,44
7,1
88
,462
1
,48
5,8
77
,343
1
,51
7,4
06
,878
3
1,5
29
,53
5
2.1
2%
1
.81
%
PR
INC
E G
EO
RG
E'S
7
17
,49
2,0
10
7
26
,86
7,6
70
7
19
,13
6,5
40
7
01
,51
0,6
00
6
93
,72
5,1
00
-7
,78
5,5
00
-1
.11
%
-0.8
4%
QU
EE
N A
NN
E'S
5
9,2
42
,74
2
59
,832
,38
4
65
,655
,92
1
65
,415
,32
9
63
,889
,71
6
(1,5
25
,61
3)
-2.3
3%
1
.91
%
ST
. M
AR
Y'S
9
4,2
82
,54
5
99
,665
,18
0
10
0,0
50
,65
4
10
0,4
59
,24
1
10
1,6
69
,37
1
1,2
10,1
30
1
.20
%
1.9
0%
SO
ME
RS
ET
1
6,5
29
,52
0
16
,353
,39
8
15
,736
,33
6
14
,313
,92
5
14
,505
,86
6
19
1,9
41
1
.34
%
-3.2
1%
TA
LB
OT
2
8,3
53
,04
5
29
,175
,03
9
30
,002
,02
0
32
,623
,00
0
33
,293
,00
0
67
0,0
00
2
.05
%
4.1
0%
WA
SH
ING
TO
N
12
9,4
59
,61
5
12
5,7
59
,93
9
12
3,9
02
,27
0
12
2,5
83
,11
0
12
0,1
07
,66
0
(2,4
75
,45
0)
-2.0
2%
-1
.86
%
WIC
OM
ICO
6
0,2
11
,12
6
60
,530
,12
4
58
,468
,27
2
60
,006
,24
6
61
,683
,75
5
1,6
77,5
09
2
.80
%
0.6
1%
WO
RC
ES
TE
R
12
6,9
52
,58
7
13
0,0
12
,59
8
12
5,9
48
,74
1
12
5,6
61
,90
1
12
0,0
72
,46
8
(5,5
89
,43
3)
-4.4
5%
-1
.38
%
TO
TA
L Y
IEL
D
6,9
16,0
76
,908
7
,04
3,4
85
,561
6
,95
2,2
23
,180
6
,89
5,4
00
,874
6
,90
9,2
03
,572
1
3,8
02
,69
8
0.2
0%
-0
.02
%
SO
UR
CE
: M
ary
lan
d A
ssoci
ati
on
of
Co
un
ties
/Dep
art
men
t of
Leg
isla
tive
Ser
vic
es,
Bu
dg
et a
nd
Tax
Rate
Su
rvey
, A
ug
ust
20
13
an
d p
rio
r y
ear
data

Maryland Association of Counties—Budget, Tax Rates, and Selected Statistics—FY 2014
30
TABLE 4.5
ASSESSED VALUE OF REAL PROPERTY
FISCAL YEAR 2014
Estimated Rank by Per Capita Per Capta Population
SUBDIVISION FY 2014 FY 2014 Base Base Rank JULY 1, 20141
ALLEGANY 3,553,787,644 20 48,599 24 73,124
ANNE ARUNDEL 70,290,436,000 4 125,022 8 562,226
BALTIMORE CITY 44,837,573,616 5 71,950 21 623,175
BALTIMORE COUNTY 76,197,009,455 2 92,052 16 827,757
CALVERT 11,266,200,000 14 124,611 9 90,411
CAROLINE 2,485,911,585 23 76,918 20 32,319
CARROLL 20,077,137,937 9 120,147 10 167,105
CECIL 9,277,762,000 16 91,007 15 101,946
CHARLES 15,539,750,173 10 101,143 13 153,641
DORCHESTER 2,876,110,554 22 88,939 17 32,338
FREDERICK 25,449,051,000 8 104,075 12 244,525
GARRETT 4,629,412,914 19 157,217 3 29,446
HARFORD 27,994,490,970 7 110,891 11 252,451
HOWARD 42,598,454,560 6 137,037 7 310,853
KENT 2,981,558,455 21 148,403 6 20,091
MONTGOMERY 159,059,156,223 1 154,036 5 1,032,610
PRINCE GEORGE'S 73,477,344,000 3 81,990 18 896,171
QUEEN ANNE'S 7,954,908,056 17 162,113 4 49,070
ST. MARY'S 11,417,265,365 13 101,961 14 111,977
SOMERSET 1,417,597,850 24 54,418 23 26,050
TALBOT 9,320,884,950 15 242,814 2 38,387
WASHINGTON 11,983,444,000 12 79,835 19 150,102
WICOMICO 5,811,032,000 18 56,904 22 102,120
WORCESTER 14,804,627,000 11 285,688 1 51,821
TOTAL 655,300,906,307 109,587 5,979,716
1 Population estimates from Department of Legislative Services, November 2013
SOURCE: Maryland Association of Counties/Department of Legislative Services, Budget and Tax Rate Survey, August 2013

Maryland Association of Counties—Budget, Tax Rates, and Selected Statistics—FY 2014
31
TA
BL
E 4
.6
RE
AL
PR
OP
ER
TY
AS
SE
SS
AB
LE
RE
VE
NU
E Y
IEL
DS
FIS
CA
L Y
EA
RS
2010 -
2014
A
ctual
A
ctual
A
ctual
A
ctual
E
stim
ate
d
Gro
wth
%
Gro
wth
A
vg.
Gro
wth
SU
BD
IVIS
ION
F
Y 2
01
0
FY
20
11
FY
20
12
FY
20
13
FY
20
14
FY
20
13
-14
FY
20
13
-14
FY
20
10
-14
AL
LE
GA
NY
1
31
,534
,47
2
33
,065
,32
7
33
,367
,21
5
32
,924
,80
7
32
,996
,42
0
71
,613
0
.22
%
1.1
4%
AN
NE
AR
UN
DE
L
47
2,1
11
,00
0
49
3,1
75
,00
0
50
4,9
88
,00
0
52
4,7
70
,00
0
54
1,4
86
,00
0
16
,716
,00
0
3.1
9%
3
.49
%
BA
LT
IMO
RE
CIT
Y1
64
0,2
02
,09
5
81
4,8
68
,07
8
78
8,4
15
,37
4
76
7,4
85
,64
2
72
9,2
14
,00
0
(38
,27
1,6
42
) -4
.99
%
3.3
1%
BA
LT
IMO
RE
CO
UN
TY
1
94
8,5
83
,93
0
94
9,0
81
,26
9
89
5,9
73
,58
0
85
7,7
59
,96
0
83
8,1
67
,10
4
(19
,59
2,8
56
) -2
.28
%
-3.0
5%
CA
LV
ER
T
12
2,7
65
,66
3
13
2,4
78
,31
8
12
7,1
66
,34
9
11
9,8
97
,30
6
11
6,4
01
,71
7
(3,4
95
,58
9)
-2.9
2%
-1
.32
%
CA
RO
LIN
E
21
,688
,37
4
22
,796
,74
3
22
,788
,49
2
22
,765
,12
3
23
,288
,95
5
52
3,8
32
2
.30
%
1.8
0%
CA
RR
OL
L
19
0,9
27
,10
5
19
4,4
78
,67
2
19
7,0
37
,62
5
18
6,4
05
,00
0
18
3,6
90
,21
8
(2,7
14
,78
2)
-1.4
6%
-0
.96
%
CE
CIL
9
1,5
52
,13
9
93
,608
,97
8
94
,239
,75
4
95
,195
,68
8
93
,979
,88
6
(1,2
15
,80
2)
-1.2
8%
0
.66
%
CH
AR
LE
S
19
4,0
44
,29
8
18
3,0
11
,95
5
17
7,6
01
,32
2
17
8,6
06
,20
0
18
6,0
47
,10
0
7,4
40,9
00
4
.17
%
-1.0
5%
DO
RC
HE
ST
ER
3
0,0
25
,66
9
29
,851
,23
1
30
,088
,33
0
28
,927
,68
1
27
,671
,86
1
(1,2
55
,82
0)
-4.3
4%
-2
.02
%
FR
ED
ER
ICK
2
95
,27
5,3
66
2
74
,75
3,3
04
2
50
,85
1,8
33
2
29
,48
2,5
27
2
58
,66
8,9
03
2
9,1
86
,37
6
12
.72
%
-3.2
5%
GA
RR
ET
T
40
,930
,72
9
43
,480
,04
6
43
,755
,05
1
43
,272
,66
2
43
,357
,19
9
84
,537
0
.20
%
1.4
5%
HA
RF
OR
D
24
8,1
24
,50
1
28
1,9
49
,55
0
26
9,0
17
,26
9
26
4,9
87
,15
2
25
9,3
54
,61
5
(5,6
32
,53
7)
-2.1
3%
1
.11
%
HO
WA
RD
3
86
,08
9,2
86
3
96
,96
4,5
82
4
01
,96
8,8
84
4
09
,34
0,7
38
4
20
,63
9,2
02
1
1,2
98
,46
4
2.7
6%
2
.17
%
KE
NT
3
0,7
12
,08
8
37
,202
,23
2
30
,280
,61
5
30
,961
,70
9
30
,454
,92
0
(50
6,7
89)
-1.6
4%
-0
.21
%
MO
NT
GO
ME
RY
1
,34
2,4
44
,472
1
,33
9,1
32
,412
1
,35
6,8
69
,750
1
,39
6,5
28
,426
1
,42
9,1
57
,234
3
2,6
28
,80
8
2.3
4%
1
.58
%
PR
INC
E G
EO
RG
E'S
6
54
,43
9,0
62
6
62
,71
4,3
34
6
39
,31
4,6
15
6
30
,33
8,5
00
6
29
,83
5,0
00
(5
03
,50
0)
-0.0
8%
-0
.95
%
QU
EE
N A
NN
E'S
5
7,9
67
,12
8
58
,704
,64
6
64
,498
,50
5
64
,175
,32
9
62
,739
,71
6
(1,4
35
,61
3)
-2.2
4%
2
.00
%
ST
. M
AR
Y'S
8
8,6
19
,78
5
94
,164
,72
8
95
,360
,28
2
94
,945
,60
4
96
,272
,83
8
1,3
27,2
34
1
.40
%
2.0
9%
SO
ME
RS
ET
1
4,8
65
,78
7
14
,783
,19
6
14
,168
,74
1
12
,731
,70
4
12
,851
,02
0
11
9,3
16
0
.94
%
-3.5
8%
TA
LB
OT
2
7,8
01
,09
3
28
,599
,02
1
29
,386
,30
2
32
,023
,00
0
32
,678
,00
0
65
5,0
00
2
.05
%
4.1
2%
WA
SH
ING
TO
N
11
5,5
39
,88
0
11
2,6
92
,88
2
11
1,8
61
,92
1
10
9,7
81
,77
0
10
7,7
02
,08
0
(2,0
79
,69
0)
-1.8
9%
-1
.74
%
WIC
OM
ICO
5
4,9
52
,99
6
52
,679
,30
2
50
,460
,90
0
51
,333
,70
4
52
,880
,80
9
1,5
47,1
05
3
.01
%
-0.9
6%
WO
RC
ES
TE
R
12
1,3
66
,63
7
12
4,7
55
,22
5
12
0,4
46
,74
0
11
9,7
04
,50
7
11
3,9
80
,22
8
(5,7
24
,27
9)
-4.7
8%
-1
.56
%
TO
TA
L Y
IEL
D
6,2
22,5
63
,555
6
,46
8,9
91
,031
6
,34
9,9
07
,449
6
,30
4,3
44
,739
6
,32
3,5
15
,025
1
9,1
70
,28
6
0.3
0%
0
.40
%
1
Thes
e am
oun
ts d
o n
ot
incl
ud
e ta
x e
xem
pt
pro
per
ty.
SO
UR
CE
: M
ary
lan
d A
ssoci
ati
on
of
Co
un
ties
/Dep
art
men
t of
Leg
isla
tive
Ser
vic
es,
Bu
dg
et a
nd
Tax
Rate
Su
rvey
, A
ug
ust
20
13
an
d p
rio
r y
ear
data

Maryland Association of Counties—Budget, Tax Rates, and Selected Statistics—FY 2014
32
TABLE 4.7
TAXATION OF PERSONAL PROPERTY1
(Expressed As The Percentage Exempt From Local Taxation)
Fiscal Year 2014
Commercial Manufacturing and R&D
SUBDIVISION Inventory Inventory Machinery
ALLEGANY 100 100 100
ANNE ARUNDEL2 100 100 100
BALTIMORE3 100 100 100
BALTIMORE COUNTY 100 100 100
CALVERT 100 100 100
CAROLINE 100 100 100
CARROLL 100 100 100
CECIL 100 100 100
CHARLES 100 100 100
DORCHESTER4 100 100 100
FREDERICK5 100 100 100
GARRETT5 100 100 100
HARFORD 100 100 100
HOWARD 100 100 100
KENT5 100 100 100
MONTGOMERY 100 100 100
PRINCE GEORGE'S3 100 100 100
QUEEN ANNE'S5 100 100 100
ST. MARY'S 100 100 100
SOMERSET 100 100 -
TALBOT5 100 100 100
WASHINGTON 100 100 100
WICOMICO 72 100 100
WORCESTER 100 100 -
1 State law has exempted all farm implements and livestock, therefore they are no longer presented here. 2 Exemption for machinery includes laundries 3 Exemption for machinery includes dairies & laundries. 4 All other personal property 80% exempt; being phased out @ 10% per year. 5 All other personal property is 100% exempt.
Source: Department of Assessments and Taxation, July 21, 2013

Maryland Association of Counties—Budget, Tax Rates, and Selected Statistics—FY 2014
33
TABLE 4.8
ASSESSED VALUE OF PERSONAL PROPERTY
FISCAL YEAR 2014
Estimated Rank by Per Capita Per Capita Population
SUBDIVISION FY 2014 FY 2013 Base Base Rank JULY 1, 20141
ALLEGANY 330,448,900 13 4,519 7 73,124
ANNE ARUNDEL 2,536,055,000 4 4,511 8 562,226
BALTIMORE CITY 1,743,451,957 5 2,798 17 623,175
BALTIMORE COUNTY 3,006,700,036 2 3,632 11 827,757
CALVERT 946,800,000 8 10,472 1 90,411
CAROLINE 50,752,000 23 1,570 21 32,319
CARROLL 528,087,000 11 3,160 15 167,105
CECIL 308,304,000 14 3,024 16 101,946
CHARLES 924,633,394 9 6,018 2 153,641
DORCHESTER 111,276,000 19 3,441 12 32,338
FREDERICK 1,730,560,000 16 7,077 24 244,525
GARRETT 196,337,000 18 6,668 5 29,446
HARFORD 1,047,446,608 7 4,149 9 252,451
HOWARD 1,605,777,978 6 5,166 4 310,853
KENT 36,508,000 24 1,817 20 20,091
MONTGOMERY 3,677,477,000 1 3,561 10 1,032,610
PRINCE GEORGE'S 3,031,108,000 3 3,382 14 896,171
QUEEN ANNE'S 0 21 0 23 49,070
ST. MARY'S 251,939,000 17 2,250 19 111,977
SOMERSET 72,343,000 20 2,777 18 26,050
TALBOT 58,346,000 22 1,520 22 38,387
WASHINGTON 508,649,000 10 3,389 13 150,102
WICOMICO 494,496,000 12 4,842 6 102,120
WORCESTER 316,480,000 15 6,107 3 51,821
TOTAL 23,513,975,873 3,932 5,979,716
1 Population estimates Department of Legislative Services, November 2013
SOURCE: Maryland Association of Counties/Department of Legislative Services, Budget and Tax Rate Survey, August 2013

Maryland Association of Counties—Budget, Tax Rates, and Selected Statistics—FY 2014
34
TA
BL
E 4
.9
PE
RS
ON
AL
PR
OP
ER
TY
AS
SE
SS
AB
LE
RE
VE
NU
E Y
IEL
DS
(IN
CL
UD
ING
OP
ER
AT
ING
PR
OP
ER
TY
OF
PU
BL
IC U
TIL
ITIE
S)
FIS
CA
L Y
EA
RS
2010 T
HR
OU
GH
2014
A
ctual
FY
20
10
A
ctual
FY
20
11
A
ctual
FY
20
12
E
stim
ate
FY
20
13
Est
imate
d F
Y
20
14
Gro
wth
%
Gro
wth
A
vg.
Gro
wth
SU
BD
IVIS
ION
Y
ield
Y
ield
Y
ield
Y
ield
Y
ield
2
01
3-1
4
20
13
-14
FY
20
10
-14
AL
LE
GA
NY
1
0,4
96
,23
2
7,9
40,1
84
7
,94
0,1
84
7
,90
0,8
67
7
,76
8,2
09
(1
32
,65
8)
-1.6
8%
-7
.25
%
AN
NE
AR
UN
DE
L
55
,368
,00
0
57
,329
,00
0
57
,329
,00
0
58
,907
,00
0
58
,205
,00
0
(70
2,0
00)
-1.1
9%
1
.26
%
BA
LT
IMO
RE
CIT
Y
96
,875
,00
0
98
,249
,87
4
10
6,1
95
,10
7
10
4,1
12
,99
9
97
,982
,00
0
(6,1
30
,99
9)
-5.8
9%
0
.28
%
BA
LT
IMO
RE
CO
UN
TY
8
3,0
39
,70
9
84
,104
,54
3
83
,231
,19
8
85
,296
,27
7
82
,684
,25
1
(2,6
12
,02
6)
-3.0
6%
-0
.11
%
CA
LV
ER
T
11
,215
,45
1
20
,050
,84
7
20
,295
,99
7
20
,800
,00
0
20
,880
,00
0
80
,000
0
.38
%
16
.81
%
CA
RO
LIN
E
1,1
35,1
30
1
,09
5,3
41
1
,14
3,5
31
1
,21
1,9
01
1
,15
4,0
00
(5
7,9
01
) -4
.78
%
0.4
1%
CA
RR
OL
L
14
,046
,76
7
13
,817
,84
0
12
,776
,79
3
13
,915
,00
0
12
,642
,00
0
(1,2
73
,00
0)
-9.1
5%
-2
.60
%
CE
CIL
7
,49
4,3
32
8
,20
2,4
93
7
,08
7,0
19
7
,81
8,9
15
7
,78
4,5
25
(3
4,3
90
) -0
.44
%
0.9
5%
CH
AR
LE
S
21
,421
,48
4
23
,916
,08
6
22
,938
,79
4
27
,949
,10
0
27
,857
,50
0
(91
,60
0)
-0.3
3%
6
.79
%
DO
RC
HE
ST
ER
2
,96
4,9
45
2
,05
5,2
39
2
,96
3,3
02
2
,98
1,5
84
2
,71
5,1
34
(2
66
,45
0)
-8.9
4%
-2
.18
%
FR
ED
ER
ICK
1
6,9
50,9
35
6
,86
9,8
82
6
,72
6,6
71
6
,51
3,9
00
6
,51
3,9
00
0
0
.00
%
-1.6
1%
GA
RR
ET
T
2,7
98,6
08
2
,81
4,2
46
4
,05
6,6
59
4
,89
0,8
16
4
,75
9,4
52
(1
31
,36
4)
-2.6
9%
1
4.2
0%
HA
RF
OR
D
22
,326
,86
4
24
,583
,89
1
24
,111
,50
0
24
,511
,00
0
26
,186
,90
0
1,6
75,9
00
6
.84
%
4.0
7%
HO
WA
RD
4
0,0
86
,22
5
40
,009
,90
1
39
,711
,53
2
39
,916
,27
5
39
,366
,00
8
(55
0,2
67)
-1.3
8%
-0
.45
%
KE
NT
1
54
7,3
34
9
06
,57
9
92
5,1
72
8
84
,64
3
93
2,7
79
4
8,1
36
5
.44
%
14
.26
%
MO
NT
GO
ME
RY
8
9,1
88
,91
5
84
,732
,82
9
90
,318
,71
3
89
,348
,91
7
88
,249
,64
4
(1,0
99
,27
3)
-1.2
3%
-0
.26
%
PR
INC
E G
EO
RG
E'S
6
3,0
52
,90
0
64
,990
,80
0
79
,821
,92
5
71
,172
,10
0
63
,890
,10
0
(7,2
82
,00
0)
-10
.23
%
0.3
3%
QU
EE
N A
NN
E'S
1
1,2
37,0
04
1
,12
7,7
38
1
,15
7,4
16
1
,24
0,0
00
1
,15
0,0
00
(9
0,0
00
) -7
.26
%
-1.8
1%
ST
. M
AR
Y'S
5
,66
2,7
60
5
,50
0,4
52
4
,69
0,3
72
5
,51
3,6
37
5
,39
6,5
33
(1
17
,10
4)
-2.1
2%
-1
.20
%
SO
ME
RS
ET
1
,66
3,7
33
1
,57
0,2
02
1
,56
7,5
95
1
,58
2,2
21
1
,65
4,8
46
7
2,6
25
4
.59
%
-0.1
3%
TA
LB
OT
1
50
0,0
00
6
15
,00
0
61
5,7
18
6
00
,00
0
61
5,0
00
1
5,0
00
2
.50
%
5.3
1%
WA
SH
ING
TO
N
13
,919
,73
5
13
,580
,27
0
12
,040
,34
9
12
,801
,34
0
12
,405
,58
0
(39
5,7
60)
-3.0
9%
-2
.84
%
WIC
OM
ICO
8
,51
6,4
40
7
,85
0,8
22
8
,00
7,3
72
8
,67
2,5
42
8
,80
2,9
46
1
30
,40
4
1.5
0%
0
.83
%
WO
RC
ES
TE
R
5,5
85,9
50
5
,50
5,7
46
5
,50
2,0
01
5
,95
7,3
94
6
,09
2,2
40
1
34
,84
6
2.2
6%
2
.19
%
TO
TA
L Y
IEL
D
55
8,5
96
,18
4
56
9,6
43
,34
4
59
3,5
02
,07
7
59
7,0
99
,88
5
57
8,2
41
,86
8
(18
,85
8,0
17
) -3
.16
%
0.8
7%
1 O
nly
incl
ud
es u
tili
ty o
per
atin
g p
rop
erty
; P
erso
nal
pro
per
ty t
ax i
s no
t as
sess
ed o
n b
usi
ness
per
sonal
pro
per
ty
No
te:
So
me
da
ta g
ener
ate
d b
y in
terp
ola
tio
n f
rom
cou
nty
surv
ey d
ata
.
SO
UR
CE
: M
ary
lan
d A
ssoci
ati
on
of
Co
un
ties
/Dep
art
men
t of
Leg
isla
tive
Ser
vic
es,
Bu
dg
et a
nd
Tax
Rate
Su
rvey
, A
ug
ust
20
13
an
d p
rio
r y
ear
data

Maryland Association of Counties—Budget, Tax Rates, and Selected Statistics—FY 2014
35
Section 5 - Property Tax Administration
Table 5.1 identifies subdivisions offering discounts for property tax payments received
before the statewide due date in September.
Twelve counties and Baltimore City grant a percentage discount for the payment of
property taxes prior to a particular date. The amount of discount ranges from 0.5% to
2%, depending on how early the payment is made.
Conversely, each subdivision levies a percentage penalty and/or interest rate for late
property tax payments. After October 1st, monthly interest charges vary. Penalties are
imposed in a variety of ways including monthly surcharges or flat rates after a certain
date.
Table 5.2 shows each subdivision’s penalty and/or interest charged for late payment of
property taxes.
Table 5.3 details each county’s Homestead Property Tax Credit percentage. This is a
statutory limit on the amount an assessment increase may affect a taxpayer’s tax
burden. Since 1977, State law provided that owner-occupied dwellings were not taxed
on annual assessment increases that exceed 15%. While the Homestead Credit is not
technically a cap on assessment increases, the provision of a property tax credit against
large assessment increases functions much the same as a cap.
During the 1990 and 1991 Sessions of the General Assembly, significant changes were
made to the Homestead Property Tax Credit Program. For the first time the credit was
applied to the State property tax to limit taxable assessment increases for homeowners
to 10% annually. Additionally, each county was mandated to adopt a local ordinance
or resolution specifying a local percentage of 0% to 10% for purposes of local property
taxation.
Table 5.3 lists the Homestead Credit Percentages set by each county for FY 2009
through FY 2014. The Homestead Credit percentage selected by each county is
expressed as a percentage increase from the prior year’s assessment. If a municipality
disagrees with the Homestead Credit Percentage specified by its county, municipal
officials may set their own limit between 0% and 10%. If a municipality takes no
action, then the county percentage will apply to assessments used to compute
municipal taxes.
Local percentages (county and municipal) remain in effect until changed by local
action. County governments may, in the future, change their Homestead Credit
percentage, but must do so by November 15th preceding the year of the proposed
change. Municipalities may change the percentage before November 25th of the
preceding year.

Maryland Association of Counties—Budget, Tax Rates, and Selected Statistics—FY 2014
36
TABLE 5.1
PROPERTY TAX PAYMENT DISCOUNTS
FISCAL YEAR 2014
Amount of Discount
SUBDIVISION July August September
ALLEGANY 1% 1% -
ANNE ARUNDEL - - -
BALTIMORE CITY 0.5% - -
BALTIMORE COUNTY 1% 0.5% -
CALVERT - - -
CAROLINE - - -
CARROLL 1% 0.5% -
CECIL 2% - -
CHARLES - - -
DORCHESTER - - -
FREDERICK 1% 0.5% -
GARRETT 1% - -
HARFORD 1% 0.5% -
HOWARD 0.5% - -
KENT - - -
MONTGOMERY - - -
PRINCE GEORGE'S - - -
QUEEN ANNE'S - - -
ST. MARY'S - - -
SOMERSET - - -
TALBOT 1% - -
WASHINGTON 0.5% - -
WICOMICO 1% 1% -
WORCESTER 0.5% - -
STATEWIDE TOTAL
SOURCE: Maryland Association of Counties/Department of Legislative
Services, Budget and Tax Rate Survey, August 2013

Maryland Association of Counties—Budget, Tax Rates, and Selected Statistics—FY 2014
37
TABLE 5.2
PROPERTY TAX PENALTIES AND INTEREST
FISCAL YEAR 2014
Late Payment Monthly
SUBDIVISION Penalty Interest
ALLEGANY - 1.5% per month
ANNE ARUNDEL - 1%
BALTIMORE CITY 1% 1%
BALTIMORE COUNTY - 1%
CALVERT - 1%
CAROLINE 3% 1%
CARROLL 0.5% 0.67%
CECIL 3% 1%
CHARLES - 1%
DORCHESTER 1% 1% per month
FREDERICK - 1% per month
GARRETT - 1% per month
HARFORD 6.0% 1.5%
HOWARD 1 see note 1 1.5%
KENT - 1.5% / mo
MONTGOMERY 1% (month) 2/3% (month)
PRINCE GEORGE'S - 1.67%
QUEEN ANNE'S 1% per month
ST. MARY'S 3% 1%
SOMERSET - 1%
TALBOT 5/6 of 1% 2/3 of 1%
WASHINGTON - 1% per month
WICOMICO 0.5% 1%
WORCESTER - 1% per month
STATEWIDE TOTAL 1 The penalty is 2/3 of 1% per month between October 1 and December 30,
and 1.50% per month thereafter.
SOURCE: Maryland Association of Counties/Department of Legislative Services,
Budget and Tax Rate Survey, August 2013

Maryland Association of Counties—Budget, Tax Rates, and Selected Statistics—FY 2014
38
TABLE 5.3
COUNTY HOMESTEAD PROPERTY TAX CREDIT PERCENTAGES
FISCAL YEARS 2009 THROUGH 2014
Percentage Limitation (maximum allowable assessment increase)
SUBDIVISION FY 2009 FY 2010 FY 2011 FY 2012 FY 2013 FY 2014
ALLEGANY 10% 10% 7% 7% 7% 7%
ANNE ARUNDEL 2% 2% 2% 2% 2% 2%
BALTIMORE CITY 4% 4% 4% 4% 4% 4%
BALTIMORE COUNTY 4% 4% 4% 4% 4% 4%
CALVERT 10% 10% 10% 10% 10% 10%
CAROLINE 5% 5% 5% 5% 5% 5%
CARROLL 7% 7% 7% 5% 5% 5%
CECIL 8% 8% 8% 8% 8% 8%
CHARLES 7% 7% 7% 7% 7% 7%
DORCHESTER 5% 5% 5% 5% 5% 5%
FREDERICK 5% 5% 5% 5% 5% 5%
GARRETT 5% 5% 5% 5% 5% 5%
HARFORD 9% 9% 5% 5% 5% 5%
HOWARD 5% 5% 5% 5% 5% 5%
KENT 5% 5% 5% 5% 5% 5%
MONTGOMERY 10% 10% 10% 10% 10% 10%
PRINCE GEORGE'S 3% 5% 0% 1% 4% 2%
QUEEN ANNE'S 5% 5% 5% 0% 5% 5%
ST. MARY'S 5% 5% 5% 5% 5% 5%
SOMERSET 10% 10% 10% 10% 10% 10%
TALBOT 0% 0% 0% 0% 0% 0%
WASHINGTON 5% 5% 5% 5% 5% 5%
WICOMICO 10% 10% 10% 10% 5% 5%
WORCESTER 3% 3% 3% 3% 3% 3%
Maryland State Department of Assessments and Taxation, rates effective July 1, 2013
http://www.dat.state.md.us/sdatweb/homestead_percent.html

Maryland Association of Counties—Budget, Tax Rates, and Selected Statistics—FY 2014
39
Section 6 - Income Taxes
The local income tax, historically referred to as the “piggyback income tax,” was made
available to political subdivisions in an effort to relieve the pressure and reliance on
the local property tax.
Table 6.1 shows each county’s local income tax rate for Calendar Years 2009 through
2014. The income tax has been an area of significant change in recent years, and the
basic nature and structure of the local income tax has been altered.
Prior to 1993, counties had the authority to set a local income tax rate between 20% and
50% of state tax liability. During the 1992 Legislative Session, authority was granted to
counties by the General Assembly to raise the maximum “piggyback” income tax rate
to 60%. Eleven counties have elected to raise their rates above 50% since that time,
including Talbot County, which subsequently reduced the county income tax rate to
40% with an offsetting increase in the property tax rate.
Beginning in CY 1999, the local income tax was “decoupled” from certain provisions of
the state income tax. Tax reductions enacted by the General Assembly in 1997, and
revised in 1999, increased the State’s personal exemption amount and reduced the
highest marginal tax rate. The tax reductions, intended to reduce income taxes by 10%,
were phased in over a five-year period. However, the county income tax was
“decoupled” from these changes—county taxes were calculated as though the state tax
structure had not been changed.
In 1999, the General Assembly revisited the state and local income tax structure to seek
further taxpayer simplicity and compliance. This legislation substantially altered the
nature of the Maryland local income tax. For tax years 1999 and beyond, the taxes are
applied as a flat percentage rate to the taxpayer’s entire Maryland taxable income. This
modification required each county’s tax rates to be restated and adjusted to reflect the
new tax format (stating the tax rate as a percent of taxable income rather than as a
percent of state taxes due). In essence, the “piggyback” tax (a tax based on an amount
of the state tax) was abolished, and replaced with a simpler, flat-rate tax applied to all
taxable income.
Table 6.2 displays estimated yields and property tax equivalents by subdivision for
Fiscal Years 2010 through 2014. The table also reflects the increase or (decrease) in
piggyback tax revenues between Fiscal Years 2013 and 2014 for each subdivision.
Table 6.3 compares and ranks counties based upon their CY 2010 net taxable income
and per capita taxable income. Data from 2011 is the most recently compiled data
available from the Office of the Comptroller.

Maryland Association of Counties—Budget, Tax Rates, and Selected Statistics—FY 2014
40
TABLE 6.1
LOCAL INCOME TAX RATES
Rates as Percentage of Maryland Taxable Income
Tax/Calendar Years 2009 Through 2014
SUBDIVISION CY 2009 CY 2010 CY 2011 CY 2012 CY 2013 CY 2014
ALLEGANY 3.05% 3.05% 3.05% 3.05% 3.05% 3.05%
ANNE ARUNDEL 2.56% 2.56% 2.56% 2.49% 2.56% 2.56%
BALTIMORE CITY 3.05% 3.05% 3.20% 3.20% 3.20% 3.20%
BALTIMORE COUNTY 2.83% 2.83% 2.83% 2.83% 2.83% 2.83%
CALVERT 2.80% 2.80% 2.80% 2.80% 2.80% 2.80%
CAROLINE 2.63% 2.63% 2.63% 2.63% 2.63% 2.73%
CARROLL 3.05% 3.05% 3.05% 3.05% 3.05% 3.04%
CECIL 2.80% 2.80% 2.80% 2.80% 2.80% 2.80%
CHARLES 2.90% 2.90% 2.90% 2.90% 2.90% 3.03%
DORCHESTER 2.62% 2.62% 2.62% 2.62% 2.62% 2.62%
FREDERICK 2.96% 2.96% 2.96% 2.96% 2.96% 2.96%
GARRETT 2.65% 2.65% 2.65% 2.65% 2.65% 2.65%
HARFORD 3.06% 3.06% 3.06% 3.06% 3.06% 3.06%
HOWARD 3.20% 3.20% 3.20% 3.20% 3.20% 3.20%
KENT 2.85% 2.85% 2.85% 2.85% 2.85% 2.85%
MONTGOMERY 3.20% 3.20% 3.20% 3.20% 3.20% 3.20%
PRINCE GEORGE'S 3.20% 3.20% 3.20% 3.20% 3.20% 3.20%
QUEEN ANNE'S 2.85% 2.85% 2.85% 3.20% 3.20% 3.20%
ST. MARY'S 3.00% 3.00% 3.00% 3.00% 3.00% 3.00%
SOMERSET 3.15% 3.15% 3.15% 3.15% 3.15% 3.15%
TALBOT 2.25% 2.25% 2.25% 2.25% 2.40% 2.40%
WASHINGTON 2.80% 2.80% 2.80% 2.80% 2.80% 2.80%
WICOMICO 3.10% 3.10% 3.10% 3.10% 3.20% 3.20%
WORCESTER 1.25% 1.25% 1.25% 1.25% 1.25% 1.25%
SOURCE: Maryland Association of Counties/Department of Legislative Services, Budget and Tax Rate Survey, August 2013

Maryland Association of Counties—Budget, Tax Rates, and Selected Statistics—FY 2014
41
TA
BL
E 6
.2
ES
TIM
AT
ED
LO
CA
L I
NC
OM
E T
AX
YIE
LD
S &
PR
OP
ER
TY
TA
X E
QU
IVA
LE
NT
FIS
CA
L Y
EA
RS
2010 T
HR
OU
GH
2014
Pro
per
ty T
ax E
quiv
.
L
oca
l In
com
e T
ax Y
ield
s C
han
ge
FY
13
to
14
o
f T
ota
l In
com
e T
ax
SU
BD
IVIS
ION
F
Y 2
01
0
FY
20
11
FY
20
12
Est
. F
Y 2
01
3
Est
. F
Y 2
01
4
Am
ou
nt
Per
cent
Yie
ld f
or
FY
20
14
AL
LE
GA
NY
2
3,8
24
,26
8
24
,248
,78
1
24
,854
,12
7
23
,820
,00
0
24
,534
,60
0
71
4,6
00
3
.00
%
$0
.56
AN
NE
AR
UN
DE
L
35
3,4
17
,00
0
36
3,7
98
,66
1
39
4,4
80
,85
6
38
9,4
00
,00
0
41
7,3
00
,00
0
27
,900
,00
0
7.1
6%
$
0.6
4
BA
LT
IMO
RE
CIT
Y
22
2,3
75
,71
7
23
4,9
55
,01
1
26
2,1
75
,88
9
25
6,0
58
,53
6
27
4,3
86
,33
4
18
,327
,79
8
7.1
6%
$
0.8
2
BA
LT
IMO
RE
CO
UN
TY
4
95
,66
5,9
06
5
14
,71
4,4
31
5
93
,20
4,0
19
6
24
,06
0,8
06
6
04
,29
2,8
19
(1
9,7
67
,98
7)
-3.1
7%
$
0.8
1
CA
LV
ER
T
56
,136
,12
8
62
,668
,48
8
64
,199
,04
4
65
,949
,63
2
71
,723
,00
0
5,7
73,3
68
8
.75
%
$0
.53
CA
RO
LIN
E
10
,020
,33
3
10
,627
,73
8
11
,088
,21
0
10
,600
,00
0
10
,800
,00
0
20
0,0
00
1
.89
%
$0
.43
CA
RR
OL
L
10
8,3
85
,44
4
11
6,1
71
,87
1
12
8,9
67
,95
7
12
6,4
60
,00
0
13
3,8
03
,41
5
7,3
43,4
15
5
.81
%
$0
.75
CE
CIL
4
6,8
16
,20
8
46
,835
,94
7
49
,813
,19
8
48
,644
,51
9
52
,139
,85
3
3,4
95,3
34
7
.19
%
$0
.54
CH
AR
LE
S
86
,513
,31
6
92
,049
,62
7
97
,179
,58
2
98
,113
,00
0
10
6,2
40
,20
0
8,1
27,2
00
8
.28
%
$0
.69
DO
RC
HE
ST
ER
8
,63
6,1
62
9
,79
9,8
01
1
0,7
67
,85
8
9,2
27,7
02
9
,80
9,3
29
5
81
,62
7
6.3
0%
$
0.3
5
FR
ED
ER
ICK
1
46
,33
2,3
38
1
57
,82
6,6
35
1
69
,76
0,3
29
1
71
,22
6,3
00
1
76
,36
3,1
00
5
,13
6,8
00
3
.00
%
$0
.73
GA
RR
ET
T
9,8
67,5
43
1
0,1
37
,03
8
10
,808
,27
7
11
,000
,00
0
11
,125
,00
0
12
5,0
00
1
.14
%
$0
.22
HA
RF
OR
D
15
4,1
81
,03
9
16
6,4
83
,04
2
17
9,1
77
,63
7
17
5,0
68
,77
2
19
0,6
00
,00
0
15
,531
,22
8
8.8
7%
$
0.7
2
HO
WA
RD
2
94
,04
2,5
38
3
15
,35
3,6
75
3
57
,34
6,6
74
3
39
,92
9,1
20
3
70
,00
0,0
00
3
0,0
70
,88
0
8.8
5%
$
0.8
2
KE
NT
9
,30
6,2
33
8
,20
0,2
60
1
0,3
35
,24
5
9,0
45,0
00
1
0,8
00
,00
0
1,7
55,0
00
1
9.4
0%
$
0.3
7
MO
NT
GO
ME
RY
1
,04
2,1
06
,679
1
,03
9,2
34
,850
1
,25
5,0
89
,822
1
,23
6,5
85
,546
1
,29
9,1
91
,344
6
2,6
05
,79
8
5.0
6%
$
0.8
0
PR
INC
E G
EO
RG
E'S
1
42
8,1
41
,81
0
47
6,0
37
,37
0
50
0,8
27
,53
0
52
6,9
61
,00
0
53
0,7
61
,20
0
3,8
00,2
00
0
.72
%
$1
.84
QU
EE
N A
NN
E'S
2
9,6
47
,12
5
29
,527
,49
6
35
,969
,87
9
32
,428
,65
6
38
,984
,96
3
6,5
56,3
07
2
0.2
2%
$
0.5
3
ST
. M
AR
Y'S
6
5,1
15
,90
1
71
,984
,22
1
76
,289
,03
6
76
,000
,00
0
82
,000
,00
0
6,0
00,0
00
7
.89
%
$0
.69
SO
ME
RS
ET
6
,22
2,3
01
6
,29
5,5
30
6
,24
6,1
60
6
,06
9,0
00
6
,10
0,0
00
3
1,0
00
0
.51
%
$0
.38
TA
LB
OT
1
9,2
60
,50
3
18
,551
,89
4
20
,269
,34
3
21
,635
,00
0
26
,000
,00
0
4,3
65,0
00
2
0.1
8%
$
0.4
1
WA
SH
ING
TO
N
57
,025
,04
6
59
,279
,43
6
64
,578
,93
9
62
,476
,00
0
68
,730
,00
0
6,2
54,0
00
1
0.0
1%
$
0.5
8
WIC
OM
ICO
3
7,2
06
,31
4
39
,186
,25
0
41
,845
,36
0
40
,472
,22
4
42
,593
,60
4
2,1
21,3
80
5
.24
%
$0
.68
WO
RC
ES
TE
R
10
,921
,11
8
10
,459
,69
9
12
,900
,07
2
11
,200
,00
0
12
,200
,00
0
1,0
00,0
00
8
.93
%
$0
.08
TO
TA
L
3,7
21,1
66
,970
3
,88
4,4
27
,752
4
,37
8,1
75
,043
4
,37
2,4
30
,813
4
,57
0,4
78
,761
1
98
,04
7,9
48
4
.53
%
1 P
rince
Geo
rge'
s nu
mb
ers
incl
ud
e d
isp
arit
y g
rant.
SO
UR
CE
: M
ary
lan
d A
ssoci
ati
on
of
Co
un
ties
/Dep
art
men
t of
Leg
isla
tive
Ser
vic
es,
Bu
dg
et a
nd
Tax
Rate
Su
rvey
, A
ug
ust
20
13

Maryland Association of Counties—Budget, Tax Rates, and Selected Statistics—FY 2014
42
TABLE 6.3
NET AND PER CAPITA TAXABLE INCOME
CALENDAR YEAR 2011
Estimated Total Net Per Capita
SUBDIVISION Population Taxable Rank Net Taxable Rank
July 20111 Income 2 Income
ALLEGANY 73,124 850,042,600 19 11,625 23
ANNE ARUNDEL 562,226 14,188,241,121 3 25,236 4
BALTIMORE CITY 623,175 7,768,185,194 6 12,465 21
BALTIMORE COUNTY 827,757 18,698,682,425 2 22,590 9
CALVERT 90,411 2,134,883,001 13 23,613 5
CAROLINE 32,319 416,262,194 20 12,880 19
CARROLL 167,105 3,923,768,780 9 23,481 6
CECIL 101,946 1,703,408,127 14 16,709 15
CHARLES 153,641 3,060,643,826 10 19,921 12
DORCHESTER 32,338 400,182,945 21 12,375 22
FREDERICK 244,525 5,554,905,733 7 22,717 7
GARRETT 29,446 407,445,057 22 13,837 18
HARFORD 252,451 5,503,511,749 8 21,800 10
HOWARD 310,853 10,025,688,045 5 32,252 2
KENT 20,091 336,342,421 23 16,741 14
MONTGOMERY 1,032,610 35,879,078,661 1 34,746 1
PRINCE GEORGE'S 896,171 14,154,591,723 4 15,795 16
QUEEN ANNE'S 49,070 1,114,657,515 16 22,716 8
ST. MARY'S 111,977 2,327,958,649 11 20,790 11
SOMERSET 26,050 196,499,625 24 7,543 24
TALBOT 38,387 1,014,019,704 17 26,416 3
WASHINGTON 150,102 2,273,798,830 12 15,148 17
WICOMICO 102,120 1,299,300,743 15 12,723 20
WORCESTER 51,821 914,819,943 18 17,653 13
TOTAL IN STATE 5,979,716 134,146,918,611 22,434
OUT OF STATE 6,849,516,391
TOTAL $140,996,435,002
1 Maryland Department of Legislative Services, November 2013 2 Comptroller of the Treasury, Revenue Administration Division,"Income Tax Summary Report, Tax Year 2011"

Maryland Association of Counties—Budget, Tax Rates, and Selected Statistics—FY 2014
43
Section 7 - Recordation and Transfer Taxes
A “recordation tax” is imposed upon defined instruments of writing conveying title to
real or personal property or creating liens or encumbrances upon real or personal
property offered for record. This is recorded with the Clerks of Circuit Courts or, in the
case of Baltimore City, the Clerk of the Superior Court.
The recordation tax rate is imposed on each $500 of the value of the transaction being
recorded. Baltimore and Howard Counties impose the lowest recordation tax rate of
$2.50. The highest rate imposed is $6.00 in Frederick and Talbot Counties, followed by
Baltimore City, Calvert, Caroline, Carroll, Charles, and Dorchester Counties at $5.00.
Table 7.1 lists the recordation tax rates each subdivision levied for the period FY 2010
through FY 2014. The revenues generated in each county by the recordation tax rates
are shown for each year, including an estimate for FY 2014. The increases (or
decreases) in recordation tax revenue between the last two fiscal years are also
highlighted.
Table 7.2 shows the subdivisions that impose local transfer taxes, the various rates,
and the amounts of revenue generated in Fiscal Years 2010 through 2014 by
subdivision.
Eighteen counties, including Baltimore City, exercise their authority to levy a transfer
tax on real property transactions. This is a local levy in addition to the State’s 0.5%
transfer tax rate. The local rates are imposed as a percentage of each property
transaction’s total value.

Maryland Association of Counties—Budget, Tax Rates, and Selected Statistics—FY 2014
44
TABLE 7.1
RECORDATION TAX RATES AND YIELDS
FISCAL YEARS 2010 THROUGH 2014
Recordation Tax rates shown are per $500 of consideration
Change in yield 13-14
SUBDIVISION FY 2010 FY 2011 FY 2012 FY 2013 FY 2014 Amount Percent
ALLEGANY $3.25 $3.25 $3.50 $3.50 $3.50
1,235,868 1,150,655 1,081,251 975,000 1,050,000 75,000 7.69%
ANNE ARUNDEL $3.50 $3.50 $3.50 $3.50 $3.50
28,976,000 28,416,385 28,553,925 30,000,000 36,500,000 6,500,000 21.67%
BALTIMORE CITY $5.00 $5.00 $5.00 $5.00 $5.00
20,942,368 19,425,608 20,137,264 20,197,000 23,367,000 3,170,000 15.70%
BALTIMORE COUNTY $2.50 $2.50 $2.50 $2.50 $2.50
20,027,562 18,344,026 20,397,974 30,578,527 25,500,000 (5,078,527) -16.61%
CALVERT $5.00 $5.00 $5.00 $5.00 $5.00
5,690,348 5,330,746 5,180,576 5,500,000 6,000,000 500,000 9.09%
CAROLINE $5.00 $5.00 $5.00 $5.00 $5.00
1,236,554 1,200,000 977,234 1,100,000 1,100,000 - 0.00%
CARROLL $5.00 $5.00 $5.00 $5.00 $5.00
9,224,371 7,717,490 8,520,674 8,000,000 9,750,000 1,750,000 21.88%
CECIL $4.10 $4.10 $4.10 $4.10 $4.10
4,382,564 3,984,394 3,576,107 4,500,000 4,800,000 300,000 6.67%
CHARLES $5.00 $5.00 $5.00 $5.00 $5.00
9,500,396 9,446,893 8,462,994 10,500,000 10,500,000 - 0.00%
DORCHESTER $5.00 $5.00 $5.00 $5.00 $5.00
1,921,225 1,669,213 1,312,175 1,534,386 1,534,386 - 0.00%
FREDERICK $6.00 $6.00 $6.00 $6.00 $6.00
10,686,142 18,578,790 16,900,106 23,530,293 22,453,062 (1,077,231) -4.58%
GARRETT $3.50 $3.50 $3.50 $3.50 $3.50
2,037,153 2,475,847 2,113,050 2,386,470 2,000,000 (386,470) -16.19%
HARFORD $3.30 $3.30 $3.30 $3.30 $3.30
10,236,128 9,906,952 9,088,761 7,754,000 10,200,510 2,446,510 31.55%
HOWARD $2.50 $2.50 $2.50 $2.50 $2.50
15,267,362 14,599,474 15,944,953 17,000,000 20,098,864 3,098,864 18.23%
KENT $3.30 $3.30 $3.30 $3.30 $3.30
968,716 836,035 831,372 847,368 1,010,000 162,632 19.19%
MONTGOMERY $3.45 $3.45 $3.45 $3.45 $3.45
61,182,682 72,040,593 93,786,339 102,467,436 103,659,110 1,191,674 1.16%
PRINCE GEORGE'S $2.50 $2.50 $2.50 $2.75 $2.75
27,029,000 25,015,958 22,774,565 30,641,400 31,111,500 470,100 1.53%
QUEEN ANNE'S $4.95 $4.95 $4.95 4.95/500 4.95/500
2,489,560 3,609,751 2,553,755 2,331,752 2,650,000 318,248 13.65%
ST. MARY'S $4.00 $4.00 $4.00 $4.00 $4.00
4,974,956 4,858,028 4,692,275 4,900,000 5,100,000 200,000 4.08%
SOMERSET $3.30 $3.30 $3.30 $3.30 $3.30
556,498 413,091 347,707 440,000 350,000 (90,000) -20.45%
TALBOT $3.30 $3.30 $6.00 $6.00 $6.00
2,934,335 2,853,663 4,636,327 4,365,000 5,050,000 685,000 15.69%
WASHINGTON $3.80 $3.80 $3.80 $3.80 $3.80
3,933,626 4,108,107 3,556,946 4,550,000 5,000,000 450,000 9.89%
WICOMICO $3.50 $3.50 $3.50 $3.50 $3.50
2,590,719 2,171,210 2,230,158 2,249,756 2,516,123 266,367 11.84%
WORCESTER $3.30 $3.30 $3.30 $3.30 $3.30
3,254,790 5,987,911 5,328,454 5,750,000 6,000,000 250,000 4.35%
TOTAL YIELD 251,278,924 264,140,820 282,984,942 322,098,388 337,300,555 15,202,167 4.72%
SOURCE: Maryland Association of Counties/Department of Legislative Services, Budget and Tax Rate Survey, August 2013

Maryland Association of Counties—Budget, Tax Rates, and Selected Statistics—FY 2014
45
TABLE 7.2
TRANSFER TAX RATES AND YIELDS1
FISCAL YEARS 2010 THROUGH 2014
Change in Yield 13-14
SUBDIVISION FY 2010 FY 2011 FY 2012 FY 2013 FY 2014 Amount Percent
ALLEGANY 0.50% 0.50% 0.50% 0.50% 0.50%
441,940 475,984 342,354 350,000 350,000 - 0.00%
ANNE ARUNDEL 1.00% 1.00% 1.00% 1.00% 1.00%
30,752,000 29,584,062 30,534,488 30,000,000 36,500,000 6,500,000 21.67%
BALTIMORE CITY 1.50% 1.50% 1.50% 1.50% 1.50%
26,022,596 21,844,845 22,840,024 21,973,000 24,948,000 2,975,000 13.54%
BALTIMORE COUNTY2 1.50% 1.50% 1.50% 1.50% 1.50%
41,005,835 35,669,961 43,517,262 52,962,566 52,000,000 (962,566) -1.82%
CALVERT - - - - -
- - - - - - -
CAROLINE 0.50% 0.50% 0.50% 0.50% 0.50%
373,983 376,210 304,602 365,397 210,842 (154,555) -42.30%
CARROLL - - - - -
- - - - - - -
CECIL $10/deed $10/deed $10/deed $10/deed $10/deed
23,509 23,629 20,530 23,946 20,000 (3,946) -16.48%
CHARLES - - - - -
- - - - - - -
DORCHESTER 0.75% 0.75% 0.75% 0.75% 0.75%
977,338 805,494 646,940 719,115 650,000 (69,115) -9.61%
FREDERICK - - - - -
- - - - - - -
GARRETT 1.00% 1.00% 1.00% 1.00% 1.00%
1,194,788 1,371,460 1,239,497 1,424,217 1,150,000 (274,217) -19.25%
HARFORD 1.00% 1.00% 1.00% 1.00% 1.00%
11,098,307 11,241,950 9,786,317 9,600,000 9,600,000 - 0.00%
HOWARD3 1.00% 1.00% 1.00% 1.00% 1.00%
18,348,856 21,319,656 25,801,012 22,000,000 27,000,000 5,000,000 22.73%
KENT 0.50% 0.50% 0.50% 0.50% 0.50%
481,441 398,271 373,324 355,000 580,000 225,000 63.38%
MONTGOMERY4 0.25% to 6% 0.25 - 6% 0.25 - 6% 1% 1%
77,029,256 71,809,475 76,935,730 81,547,017 86,683,519 5,136,502 6.30%
PRINCE GEORGE'S 1.40% 1.40% 1.40% 1.40% 1.40%
68,767,400 65,629,385 62,294,438 69,475,500 70,477,000 1,001,500 1.44%
QUEEN ANNE'S 0.50% 0.50% 0.50% 0.50% 0.50%
93,002 158,897 1,266,716 400,000 600,000 200,000 50.00%
ST. MARY'S 1.00% 1.00% 1.00% 1.00% 1.00%
4,483,543 4,099,463 4,151,361 3,900,000 4,350,000 450,000 11.54%
SOMERSET - - - - -
- - - - - - -
TALBOT5 1.00% 1.00% 1.00% 1.00% 1.00%
2,848,707 2,829,367 2,602,845 2,250,000 2,500,000 250,000 11.11%
WASHINGTON 0.50% 0.50% 0.50% 0.50% 0.50%
1,417,424 1,504,362 1,331,163 400,000 1,400,000 1,000,000 250.00%
WICOMICO - - - - -
- - - - - - -
WORCESTER 0.50% 0.50% 0.50% 0.50% 0.50%
3,254,790 3,194,074 2,595,376 2,750,000 2,750,000 - 0.00%
TOTAL YIELD 288,614,715 272,336,545 286,583,979 300,495,758 321,769,361 21,273,603 7.08% 1 Local rates are in addition to the State Transfer Tax of 0.5%. 2 The first $22,000 of consideration in residential sales is exempt from transfer tax. 3 In Howard County, all transfer tax revenues are dedicated funds. 4 General Fund Only. 5 The first $50,000 of consideration is exempt from transfer tax.
SOURCE: Maryland Association of Counties/Department of Legislative Services, Budget and Tax Rate Survey, August 2013

Maryland Association of Counties—Budget, Tax Rates, and Selected Statistics—FY 2014
46
Section 8 - Other County Taxes
Counties have varying authority to levy a variety of different taxes in addition to those
already detailed. This Section contains a summary of other significant taxes levied by
counties in Maryland.
Admissions and Amusement Tax
Admissions and Amusement taxes are levied on numerous activities and items in
every subdivision with the exception of Caroline County. In accordance with
legislation enacted during the 1972 Session of the General Assembly, the rates cannot
exceed 10%, and administration and collection of the tax is handled by a division of the
State Comptroller’s Office. Administrative expenses are deducted from the proceeds.
Twenty one counties employ a single rate, ranging from 1% in Calvert County to 10%
in Anne Arundel, Baltimore City, Baltimore County, Carroll, Charles and Prince
George’s Counties.
In some instances, the Admissions and Amusement tax is levied on items that are also
subject to the Maryland Sales and Use tax, which is levied at 6% of sales price. If gross
receipts subject to the Admissions and Amusement tax are also subject to the Sales and
Use tax, a county or a municipal corporation may not set a rate so that, when
combined with the Sales and Use tax, the total tax rate will exceed 11% of the gross
receipts.
Table 8.1 lists each subdivision’s Admissions and Amusement tax rates and compares
the estimated revenues generated by the taxes for Fiscal Years 2009 through 2014.
Cable Television and Public, Education, and Government Access Fees
Table 8.2 provides a listing of the various rates charged by counties to cable
companies. The estimated yield from this source is included for FY 2013 and FY 2014
as is the number of cable companies in each county and whether a franchise agreement
exists with the county. Some counties not indicating a resident cable company have
areas within the county served by out-of-county companies.
Table 8.3 shows the public, education, and government (PEG) access channel fees for
FY 2013 and FY 2014. PEG fees are used by local governments to provide access to
government services and discussions, community events, and educational
programming.

Maryland Association of Counties—Budget, Tax Rates, and Selected Statistics—FY 2014
47
Hotel/Motel Taxes
Table 8.4 details county taxes on hotel and motel accommodations. Hotel/motel taxes
(levied in 23 counties, including Baltimore City) are in addition to the State’s 6% Sales
and Use tax. Many counties have arrangements with municipalities to remit to the
municipal government all or part of hotel/motel tax revenues generated on facilities
within the municipality.
Trailer Park Taxes
Table 8.5 details county taxation of trailer parks, and the yields from these taxes for
Fiscal Years 2009 through 2014. The county authority for taxation of trailer parks is in
Section 9-401 of Article 24 of the Annotated Code of Maryland, which was recodified
in 1989 from the former Article 81.
In accordance with the provisions of Section 12C of Article 81, enacted in 1963, local
governments are authorized to tax the rental, leasing, or use of any space, facilities,
accommodations in, or service rendered by, mobile home courts or parks. The land on
which the improvements are located is taxed in the same manner as all real property.
Under a 1978 amendment to Section 12C of Article 81, the county may not tax spaces
used by “recreational vehicles or temporary camping shelters” so long as they are
rented to the same individual for less than 30 days. In 1989, Section 9-401 of Article 24
was amended to enable county governments to impose the local tax on “recreational
vehicles and camping shelters,” regardless of the period of occupancy. If a county
exercises its authority under that provision, then the overall trailer park rate may not
exceed 3% of the amounts subject to the tax.
The tax rates shown in Table 8.5 will continue to be charged on the rental of
“permanent” mobile home spaces or on spaces rented to the same person for more
than 30 days. Eighteen subdivisions are presently imposing the tax on trailer parks.
The tax rate is either a flat charge per space over a certain time period (anywhere from
$5/month to $20/month) or a percentage of the rent charged (ranging from 7% to 20%).
Other Sales and Service Taxes
Many counties and Baltimore City presently impose a tax on additional sales and
services. Among these subdivisions, the items most commonly taxed locally include
telephone, energy utilities or fuels, parking lots, and boat slips. In most instances, the
local rates imposed are a percentage of the item’s selling price or rental price.
Table 8.6 shows the items taxed in the subdivisions, the rates currently imposed, and
the FY 2013 and estimated FY 2014 revenue yields.
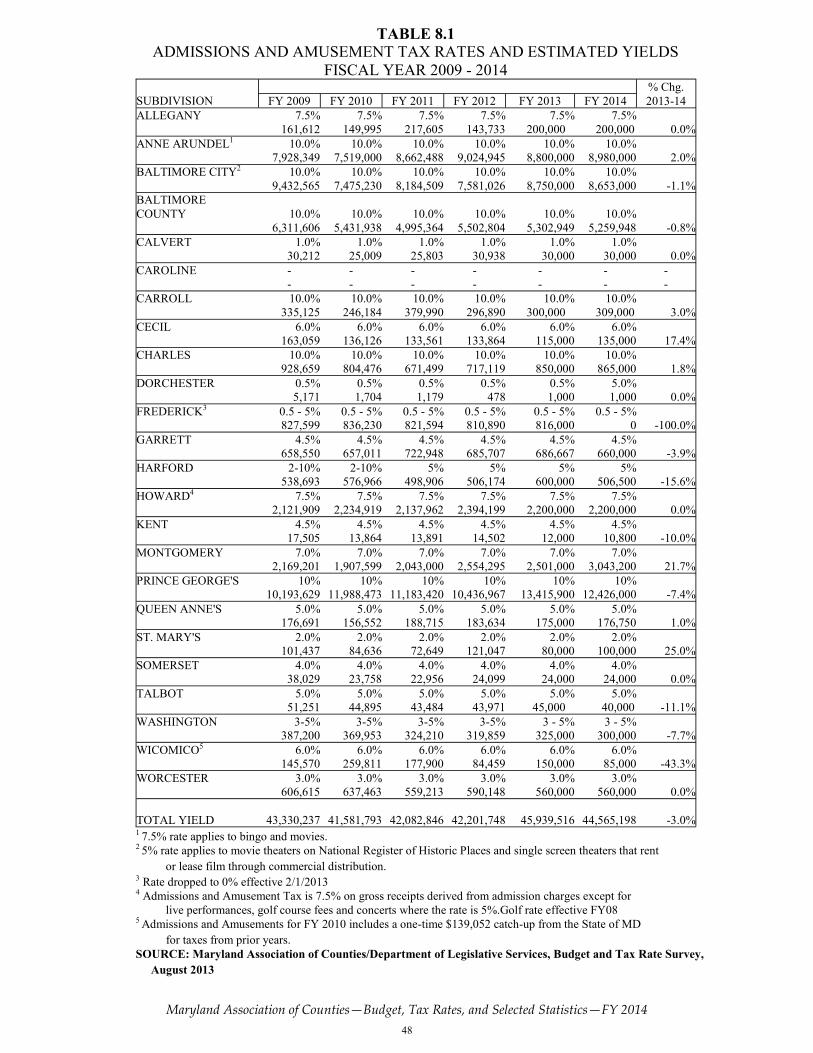
Maryland Association of Counties—Budget, Tax Rates, and Selected Statistics—FY 2014
48
TABLE 8.1
ADMISSIONS AND AMUSEMENT TAX RATES AND ESTIMATED YIELDS
FISCAL YEAR 2009 - 2014
% Chg.
SUBDIVISION FY 2009 FY 2010 FY 2011 FY 2012 FY 2013 FY 2014 2013-14
ALLEGANY 7.5% 7.5% 7.5% 7.5% 7.5% 7.5%
161,612 149,995 217,605 143,733 200,000 200,000 0.0%
ANNE ARUNDEL1 10.0% 10.0% 10.0% 10.0% 10.0% 10.0%
7,928,349 7,519,000 8,662,488 9,024,945 8,800,000 8,980,000 2.0%
BALTIMORE CITY2 10.0% 10.0% 10.0% 10.0% 10.0% 10.0%
9,432,565 7,475,230 8,184,509 7,581,026 8,750,000 8,653,000 -1.1%
BALTIMORE
COUNTY 10.0% 10.0% 10.0% 10.0% 10.0% 10.0%
6,311,606 5,431,938 4,995,364 5,502,804 5,302,949 5,259,948 -0.8%
CALVERT 1.0% 1.0% 1.0% 1.0% 1.0% 1.0%
30,212 25,009 25,803 30,938 30,000 30,000 0.0%
CAROLINE - - - - - - -
- - - - - - -
CARROLL 10.0% 10.0% 10.0% 10.0% 10.0% 10.0%
335,125 246,184 379,990 296,890 300,000 309,000 3.0%
CECIL 6.0% 6.0% 6.0% 6.0% 6.0% 6.0%
163,059 136,126 133,561 133,864 115,000 135,000 17.4%
CHARLES 10.0% 10.0% 10.0% 10.0% 10.0% 10.0%
928,659 804,476 671,499 717,119 850,000 865,000 1.8%
DORCHESTER 0.5% 0.5% 0.5% 0.5% 0.5% 5.0%
5,171 1,704 1,179 478 1,000 1,000 0.0%
FREDERICK3 0.5 - 5% 0.5 - 5% 0.5 - 5% 0.5 - 5% 0.5 - 5% 0.5 - 5%
827,599 836,230 821,594 810,890 816,000 0 -100.0%
GARRETT 4.5% 4.5% 4.5% 4.5% 4.5% 4.5%
658,550 657,011 722,948 685,707 686,667 660,000 -3.9%
HARFORD 2-10% 2-10% 5% 5% 5% 5%
538,693 576,966 498,906 506,174 600,000 506,500 -15.6%
HOWARD4 7.5% 7.5% 7.5% 7.5% 7.5% 7.5%
2,121,909 2,234,919 2,137,962 2,394,199 2,200,000 2,200,000 0.0%
KENT 4.5% 4.5% 4.5% 4.5% 4.5% 4.5%
17,505 13,864 13,891 14,502 12,000 10,800 -10.0%
MONTGOMERY 7.0% 7.0% 7.0% 7.0% 7.0% 7.0%
2,169,201 1,907,599 2,043,000 2,554,295 2,501,000 3,043,200 21.7%
PRINCE GEORGE'S 10% 10% 10% 10% 10% 10%
10,193,629 11,988,473 11,183,420 10,436,967 13,415,900 12,426,000 -7.4%
QUEEN ANNE'S 5.0% 5.0% 5.0% 5.0% 5.0% 5.0%
176,691 156,552 188,715 183,634 175,000 176,750 1.0%
ST. MARY'S 2.0% 2.0% 2.0% 2.0% 2.0% 2.0%
101,437 84,636 72,649 121,047 80,000 100,000 25.0%
SOMERSET 4.0% 4.0% 4.0% 4.0% 4.0% 4.0%
38,029 23,758 22,956 24,099 24,000 24,000 0.0%
TALBOT 5.0% 5.0% 5.0% 5.0% 5.0% 5.0%
51,251 44,895 43,484 43,971 45,000 40,000 -11.1%
WASHINGTON 3-5% 3-5% 3-5% 3-5% 3 - 5% 3 - 5%
387,200 369,953 324,210 319,859 325,000 300,000 -7.7%
WICOMICO5 6.0% 6.0% 6.0% 6.0% 6.0% 6.0%
145,570 259,811 177,900 84,459 150,000 85,000 -43.3%
WORCESTER 3.0% 3.0% 3.0% 3.0% 3.0% 3.0%
606,615 637,463 559,213 590,148 560,000 560,000 0.0%
TOTAL YIELD 43,330,237 41,581,793 42,082,846 42,201,748 45,939,516 44,565,198 -3.0% 1 7.5% rate applies to bingo and movies. 2 5% rate applies to movie theaters on National Register of Historic Places and single screen theaters that rent
or lease film through commercial distribution. 3 Rate dropped to 0% effective 2/1/2013 4 Admissions and Amusement Tax is 7.5% on gross receipts derived from admission charges except for
live performances, golf course fees and concerts where the rate is 5%.Golf rate effective FY08 5 Admissions and Amusements for FY 2010 includes a one-time $139,052 catch-up from the State of MD
for taxes from prior years. SOURCE: Maryland Association of Counties/Department of Legislative Services, Budget and Tax Rate Survey,
August 2013

Maryland Association of Counties—Budget, Tax Rates, and Selected Statistics—FY 2014
49
TABLE 8.2
CABLE TELEVISION FRANCHISE FEES, YIELDS, AND FRANCHISES
FISCAL YEARS 2013 - 2014
Franchise FY 2013 FY 2014 Number of County
SUBDIVISION Fee Yield Yield Companies Franchise
ALLEGANY 5% 350,000 350,000 2 Yes
ANNE ARUNDEL 5% 9,100,000 9,700,000 3 Yes
BALTIMORE CITY 5% 6,000,000 6,224,000 1 Yes
BALTIMORE COUNTY 5% 15,028,069 15,129,156 2 Yes
CALVERT 5% 1,170,000 1,200,000 1 Yes
CAROLINE 5% 136,000 136,000 2 Yes
CARROLL 5% 1,300,000 1,300,000 1 Yes
CECIL 5% 476,688 353,000 3 Yes
CHARLES 5% 1,975,000 2,180,000 2 Yes
DORCHESTER N/A N/A N/A - No
FREDERICK N/A N/A N/A 1 No
GARRETT N/A N/A N/A 3 No
HARFORD 3% 1,468,400 1,691,000 3 Yes
HOWARD 5% 4,800,000 5,100,000 3 Yes
KENT 3% & 5% 20,000 20,000 2 Yes
MONTGOMERY 5% 16,033,956 17,096,369 3 Yes
PRINCE GEORGE'S 5% 11,215,806 9,792,000 2 Yes
QUEEN ANNE'S 5% 320,000 320,000 1 Yes
ST. MARY'S 5% 880,000 950,000 2 Yes
SOMERSET 3% 95,855 95,000 2 Yes
TALBOT 0% - - 2 Yes
WASHINGTON N/A N/A N/A N/A N/A
WICOMICO 5% 820,000 825,000 2 Yes
WORCESTER N/A N/A N/A N/A No
TOTAL YIELD 71,189,774 72,461,525
SOURCE: Maryland Association of Counties/Department of Legislative Services, Budget and Tax Rate Survey, August 2013
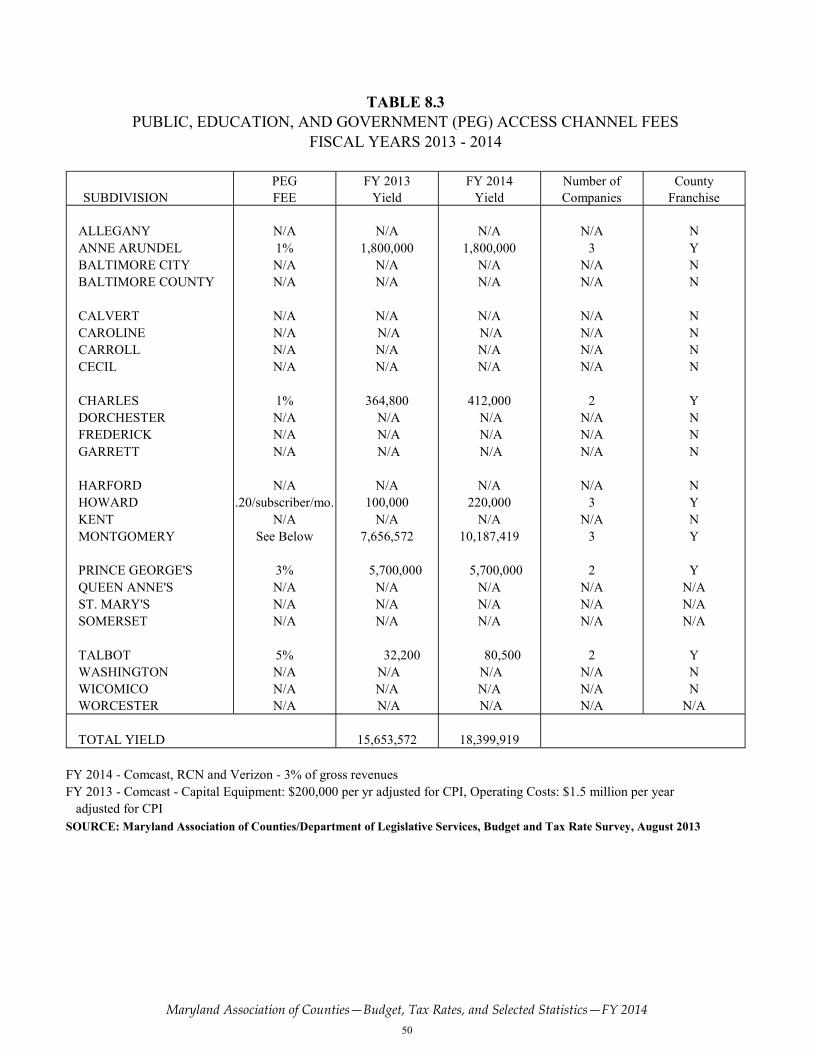
Maryland Association of Counties—Budget, Tax Rates, and Selected Statistics—FY 2014
50
TABLE 8.3
PUBLIC, EDUCATION, AND GOVERNMENT (PEG) ACCESS CHANNEL FEES
FISCAL YEARS 2013 - 2014
PEG FY 2013 FY 2014 Number of County
SUBDIVISION FEE Yield Yield Companies Franchise
ALLEGANY N/A N/A N/A N/A N
ANNE ARUNDEL 1% 1,800,000 1,800,000 3 Y
BALTIMORE CITY N/A N/A N/A N/A N
BALTIMORE COUNTY N/A N/A N/A N/A N
CALVERT N/A N/A N/A N/A N
CAROLINE N/A N/A N/A N/A N
CARROLL N/A N/A N/A N/A N
CECIL N/A N/A N/A N/A N
CHARLES 1% 364,800 412,000 2 Y
DORCHESTER N/A N/A N/A N/A N
FREDERICK N/A N/A N/A N/A N
GARRETT N/A N/A N/A N/A N
HARFORD N/A N/A N/A N/A N
HOWARD .20/subscriber/mo. 100,000 220,000 3 Y
KENT N/A N/A N/A N/A N
MONTGOMERY See Below 7,656,572 10,187,419 3 Y
PRINCE GEORGE'S 3% 5,700,000 5,700,000 2 Y
QUEEN ANNE'S N/A N/A N/A N/A N/A
ST. MARY'S N/A N/A N/A N/A N/A
SOMERSET N/A N/A N/A N/A N/A
TALBOT 5% 32,200 80,500 2 Y
WASHINGTON N/A N/A N/A N/A N
WICOMICO N/A N/A N/A N/A N
WORCESTER N/A N/A N/A N/A N/A
TOTAL YIELD 15,653,572 18,399,919
FY 2014 - Comcast, RCN and Verizon - 3% of gross revenues
FY 2013 - Comcast - Capital Equipment: $200,000 per yr adjusted for CPI, Operating Costs: $1.5 million per year
adjusted for CPI
SOURCE: Maryland Association of Counties/Department of Legislative Services, Budget and Tax Rate Survey, August 2013
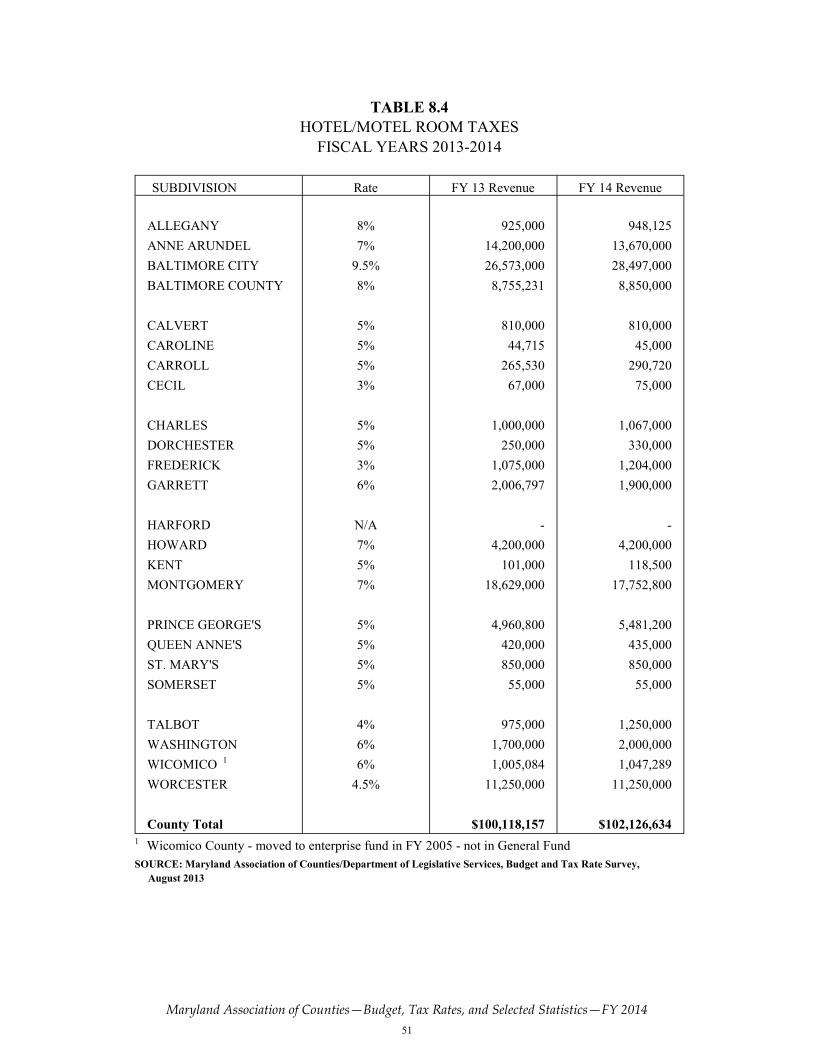
Maryland Association of Counties—Budget, Tax Rates, and Selected Statistics—FY 2014
51
TABLE 8.4
HOTEL/MOTEL ROOM TAXES
FISCAL YEARS 2013-2014
SUBDIVISION Rate FY 13 Revenue FY 14 Revenue
ALLEGANY 8% 925,000 948,125
ANNE ARUNDEL 7% 14,200,000 13,670,000
BALTIMORE CITY 9.5% 26,573,000 28,497,000
BALTIMORE COUNTY 8% 8,755,231 8,850,000
CALVERT 5% 810,000 810,000
CAROLINE 5% 44,715 45,000
CARROLL 5% 265,530 290,720
CECIL 3% 67,000 75,000
CHARLES 5% 1,000,000 1,067,000
DORCHESTER 5% 250,000 330,000
FREDERICK 3% 1,075,000 1,204,000
GARRETT 6% 2,006,797 1,900,000
HARFORD N/A - -
HOWARD 7% 4,200,000 4,200,000
KENT 5% 101,000 118,500
MONTGOMERY 7% 18,629,000 17,752,800
PRINCE GEORGE'S 5% 4,960,800 5,481,200
QUEEN ANNE'S 5% 420,000 435,000
ST. MARY'S 5% 850,000 850,000
SOMERSET 5% 55,000 55,000
TALBOT 4% 975,000 1,250,000
WASHINGTON 6% 1,700,000 2,000,000
WICOMICO 1 6% 1,005,084 1,047,289
WORCESTER 4.5% 11,250,000 11,250,000
County Total $100,118,157 $102,126,634
1 Wicomico County - moved to enterprise fund in FY 2005 - not in General Fund
SOURCE: Maryland Association of Counties/Department of Legislative Services, Budget and Tax Rate Survey,
August 2013

Maryland Association of Counties—Budget, Tax Rates, and Selected Statistics—FY 2014
52
TABLE 8.5
TRAILER PARK TAXES AND ESTIMATED YIELDS
FISCAL YEARS 2009 THROUGH 2014
% Change
SUBDIVISION FY 2009 FY 2010 FY 2011 FY 2012 FY 2013 FY 2014 FY13 - 14
ALLEGANY 15% 15% 15% 15% 15% 15%
72,880 64,421 65,000 70,000 67,000 67,000 0.0%
ANNE ARUNDEL1 7.5% 7.5% 7.5% 7.5% 7.5% 7.5%
941,432 940,514 940,000 940,000 910,000 910,000 0.0%
BALTIMORE CITY - - - - - - -
- - - - - - -
BALTIMORE COUNTY2 7% 7% 7% 7% 7% 7%
614,994 486,710 532,247 607,468 518,163 541,649 4.5%
CALVERT 20% 20% 20% 20% 20% 20%
119,546 114,013 120,000 115,791 113,000 120,000 6.2%
CAROLINE $15.00 $15.00 $15.00 $15.00 $15.00 $15.00
82,754 85,000 76,410 82,000 82,000 82,000 0.0%
CARROLL $10 $10 $10 $10 $10 $10
55,146 57,610 60,000 60,000 60,000 60,000 0.0%
CECIL $20.00 $20.00 $20.00 $20.00 $20.00 $20.00
450,958 430,974 425,993 405,612 435,163 415,000 -4.6%
CHARLES $15/mo. $15/mo. $15/mo $15/mo $15/mo $15/mo
46,605 46,090 46,600 47,900 47,900 46,400 -3.1%
DORCHESTER 15% 15% 15% 15% 15% 15%
30,609 37,468 67,773 86,097 71,956 75,000 4.2%
FREDERICK4 15% 15% 15% 15% 0% 0%
99,580 99,291 84,700 86,400 - - -
GARRETT 15% 15% 15% 15% 15% 15%
44,760 38,755 40,795 40,000 39,027 38,000 -2.6%
HARFORD $10/mo. $10/mo. $10/mo. $10/mo. $10/mo. $10/mo.
220,235 220,965 217,420 216,100 220,000 217,000 -1.4%
HOWARD3 10% 10% 10% 10% 10% 10%
577,657 577,132 600,000 600,000 600,000 580,000 -3.3%
KENT - - - - - - -
- - - - - - -
MONTGOMERY - - - - - - -
- - - - - - -
PRINCE GEORGE'S $5/month $5/month $5/month $5/month $5/month $5/month
40,000 36,936 29,369 40,000 35,000 35,000 0.0%
QUEEN ANNE'S - - - - - - -
- - - - - - -
ST. MARY'S 10% 10% 10% 10% 10% 10%
247,293 258,911 250,000 250,000 275,000 290,000 5.5%
SOMERSET - - - - - - -
- - - - - - -
TALBOT $50/qtr. $50/qtr. $50/qtr. $50/qtr. $50/qtr. $50/qtr.
65,189 64,865 63,000 63,000 63,000 63,000 0.0%
WASHINGTON 15% 15% 15% 15% 15% 15%
436,342 446,056 459,335 475,065 461,753 470,000 1.8%
WICOMICO 15% 15% 15% 15% 15% 15%
387,304 335,754 354,000 364,540 345,604 375,000 8.5%
WORCESTER 18% 18% 18% 15% 15% 15%
154,788 89,341 158,681 119,017 100,000 100,000 0.0%
TOTAL YIELD 4,688,072 4,430,807 4,591,323 4,668,990 4,444,566 4,485,049 0.911% 1 Trailer park tax $25 per month maximum 2 Monthly tax per pad capped at $20 3 The stated 10% on the first $3,600, then 5% of the amount of annual rent charge over $3,600. 4 Trailer Park tax reduced to $0 in FY 2013
SOURCE: Maryland Association of Counties/Department of Legislative Services, Budget and Tax Rate Survey, August 2013

Maryland Association of Counties—Budget, Tax Rates, and Selected Statistics—FY 2014
53
TABLE 8.6
LOCAL SALES AND SERVICE TAXES (INCLUDING TELEPHONE, ENERGY AND PARKING TAXES)
FISCAL YEARS 2013 - 2014 Part I - Telephone Taxes
COUNTY Unit Taxed FY 2014 Tax Rate FY 13 Yield FY 14 Yield
Anne Arundel Residential 8% sales tax 5,900,000 6,300,000
Baltimore City
Residential, non-residential,
and wireless $4.00 per line 33,080,000 34,299,000
Centrex $.40 per line (inc. above) (inc. above)
Baltimore County
Residential and non-
residential 8% sales tax 9,085,099 9,049,000
Montgomery
Monthly tax per land line /
wireless $2.00 / $3.50 per line 45,418,000 45,126,000
Prince George's
Residential, non-residential,
and wireless 8% sales tax 36,926,800 35,000,600
Total Yield 130,409,899 129,774,600
Part II - Energy Taxes
COUNTY Unit Taxed FY 2014 Tax Rate FY 13 Yield FY 14 Yield
Allegany Coal Tax .3 per ton mined 110,000 100,000
Anne Arundel Steam $160/million lbs included below included below
Fuel Oil (non-residential only) $0.02/gallon included below included below
Liquefied Petroleum $0.015/gallon included below included below
Coal (bituminous/anthracite) $2-$4/ton included below included below
Misc. Energies Combined 50,000 50,000
Natural Gas (non-residential
only) $0.008/$0.020/therm 780,000 780,000
Electricity (non-residential
only) $0.0025/$0.0020 5,200,000 4,900,000
Anne Arundel County
Subtotal 6,030,000 5,730,000
Baltimore City Steam - commercial 0.002529 per pound 586,432 578,641
Steam - nonprofit 0.001496 per pound 588,174 580,359
Liquefied petroleum -
commercial 0.145011 per gallon 50,665 63,478
Liquefied petroleum -
residential 0.045933 per gallon 9,196 11,522
Natural gas - commercial 0.103965 per therm 2,304,251 2,298,095
Natural gas - residential 0.030556 per therm 7,657,045 7,636,589
Natural gas - nonprofit 0.082589 per therm 2,830,879 2,823,316
Fuel oil - commercial 0.118821 per gallon 131,357 141,013
Fuel oil - residential 0.049884 per gallon 27,092 29,083
Fuel oil - nonprofit 0.102551 per gallon 365,116 391,957
Electricity - commercial 0.008040 per kWh 9,671,451 9,954,952
Electricity - residential 0.002574 per kWh 5,522,987 5,684,884
Electricity - nonprofit 0.005638 per kWh 9,828,071 10,116,163
Baltimore City Subtotal 39,572,716 40,310,052
Baltimore County1 Electricity (non-residential
only) 0.00530/kwh 15,110,340 14,348,604
Garrett Natural Gas 5.5% whlsl mkt value 4,508 1,500
Coal .3/ton 150,760 160,000
Garrett County Subtotal 155,268 161,500
(footnotes on next page)

Maryland Association of Counties—Budget, Tax Rates, and Selected Statistics—FY 2014
54
COUNTY Unit Taxed FY 2014 Tax Rate FY 13 Yield FY 14 Yield
Montgomery Liquefied Petroleum (residential) .02335 per pound 165,979 156,254
Liquefied Petroleum (non-residential) .025757063 per pound included above included above
Natural Gas (residential) .10802 per therm 20,225,406 19,040,288
Natural Gas (non-residential) .18285 per therm 26,578,871 25,877,266
Electricity (residential) .01225 per kwh 57,159,898 53,810,583
Electricity (non-residential) .02124 per kwh 112,199,331 109,237,593
Fuel Oil (residential) various rates/gal 1,067,722 1,005,159
Fuel Oil (non-residential) various rates/gal 888,287 864,838
Montgomery County Subtotal 218,285,494 209,991,980
Prince George's Natural Gas (residential and non) $.059719/therm 12,226,855 12,454,142
Fuel Oil (residential and non) $.233019/gal 1,454,655 1,590,304
Electricity (residential and non) $.006489/kwh 42,084,862 39,285,605
Propane, Other Misc Fuels $.276350/gal 438,354 467,053
Prince George's County Subtotal 56,204,726 53,797,104
St. Mary's Fuel Oil 1.25% / gallon 193,943 180,089
Liquefied Petroleum 1.25% / lb. 78,387 72,790
Electricity 1.25% / kwh 1,089,328 1,011,518
Natural Gas 1.25% / sales 38,342 35,603
St. Mary's County Subtotal 1,400,000 1,300,000
Total Yield 336,868,544 325,739,240
Part III - Parking Lot/Boat
Slip Taxes
COUNTY Unit Taxed FY 2014 Tax Rate FY 13 Yield FY 14 Yield
Anne Arundel Parking Lots $0.60 vehicle/day 5,500,000 5,500,000
Baltimore City Parking Lots 20% gross receipts 27,124,000 27,653,000
Queen Anne's Boat Slips $600/yr slip, $35/yr landing 0 0
Somerset Boat Slips $100/qtr 43,700 36,000
Talbot Boat Slips $450-550 per year 67,500 70,000
Wicomico Boat Slips Prices vary w/size-location 134,119 122,443
Total Yield 32,869,319 33,381,443
Part IV - Miscellaneous Sales and Service Taxes
COUNTY Unit Taxed FY 2014 Tax Rate FY 13 Yield FY 14 Yield
Baltimore City2 Beverages - per container $0.05 4,998,000 N/A
Worcester 3 Food Tax 0.5% 1,000,000 1,000,000
1 Baltimore County electricity rate for Large Manufacturers is $.00375 per kwh and capped at 160 million kwh. 2 No longer a General Fund revenue source, being allocated to the Public School Construction and Renovation Fund 3 Only applies in Ocean City.
SOURCE: Maryland Association of Counties/Department of Legislative Services, Budget and Tax Rate Survey, August 2013

Maryland Association of Counties—Budget, Tax Rates, and Selected Statistics—FY 2014
55
Section 9 - Service Fees and Charges
In addition to general “taxing” authority, many counties also assess various fees or
charges for certain activities or services. These additional sources of county revenue
are detailed on the following tables.
Impact Fees / Excise Taxes on New Development
Impact fees and excise taxes are levied by local governments to offset or cover some
portion of the cost of new off-site infrastructure needs that result from growth. Current
impact fee applications can include water, sewer, roads, parks, schools, and solid
waste.
Table 9.1 identifies the subdivisions that are granted the authority to levy impact fees
and development excise taxes. Rates and rate schedules vary from county to county, as
does the application of revenues generated. The table shows the level of the fee or tax
applied to a single dwelling unit, for purposes of comparison. Table 9.1 also shows the
estimated revenue generated in the 16 counties currently levying these fees or taxes.
Fiscal Year 2013 and 2014 estimates are included.
Emergency “911” Fees
Table 9.2 details each county’s “911” fee, revenues generated, and system type.
Legislation enacted during the 1979 Session of the General Assembly established “911”
as the primary telephone number for persons seeking the emergency assistance of
police, fire or ambulance anywhere in Maryland. The original legislation created a ten
cent ($0.10) monthly fee to be collected from all telephone subscribers for a three year
period from July 1, 1980 through June 30, 1983. This fee was divided and disbursed to
counties according to population.
While this provided a source of funding for counties to initiate and implement a “911”
emergency system or enhance existing systems, the distribution to counties was
discontinued. The General Assembly addressed this issue in 1983 by amending the law
to allow each county to impose an additional fee, not to exceed $0.30 per month, to
cover necessary “911” operational and upgrade costs to the county.
All 23 counties and Baltimore City have “911” emergency systems in operation as
required. Table 9.2 lists the local monthly “911” fee schedules by subdivision, as well
as the type of system provided. The estimated revenue generated in each county by the
fees in Fiscal Years 2013 and 2014 are also reported. The chart also includes revenue
collected through a new fee placed on pre-paid services. This is further explained on
the next page.

Maryland Association of Counties—Budget, Tax Rates, and Selected Statistics—FY 2014
56
During the 1990 Session of the General Assembly, legislation (Senate Bill 822, Chapter
510) was passed enabling subdivisions to raise the cap on local emergency “911”
monthly charges from $0.30 to $0.50. Under the same 1990 legislation, the State’s $0.10
monthly fee ceased being remitted to the counties after January 1, 1991. After that date,
the revenues from the State’s fee have only been used to reimburse subdivisions for
enhancements to their “911” systems.
In 1995 the General Assembly added “wireless telephone service” to the rate base,
recognizing the rapid growth of this segment of the telephone economy which also
uses “911” services.
In 2003, Maryland enacted HB 780 (Chapter 451), a MACo initiative bill, to supplement
the 9-1-1 Trust Fund to augment services for wireless callers. That legislation increased
the State monthly fee from $0.10 to $0.25, and enabled counties to adjust their local
charge to a new maximum of $0.75.
In 2013, Maryland enacted legislation (Chapter 313) to extend a $0.60 cent fee to
purchases of pre-paid wireless service. These new revenues are being distributed in
the same manner as the existing fees, 75% to counties for costs associated with
maintenance and operations of local systems, and 25% to the enhancement fund.
Solid Waste, Recycling, and Tipping Fees
Table 9.3 lists selected solid waste, recycling and tipping fees by jurisdiction. Also
shown are anticipated yields from these sources for FY 2013 and FY 2014.
Each county and Baltimore City provide waste collection, recycling, and disposal
services through a variety of means. Some counties provide public collection, others
contract for private services to be available to citizens. The variety of services available
and complexity of fee structures permits only a sampling of indicator fees for purposes
of comparison.

Maryland Association of Counties—Budget, Tax Rates, and Selected Statistics—FY 2014
57
TABLE 9.1
IMPACT FEES/EXCISE TAXES ON NEW DEVELOPMENT
FISCAL YEARS 2013 - 2014
Single Dwelling Single Dwelling Total Yield
SUBDIVISION Impact Fee Impact Fee All Impact Fees
FY 2013 FY 2014 FY 2013 FY 2014
ALLEGANY - - - -
ANNE ARUNDEL $11,295 $11,616 $8,266,000 $8,470,000
BALTIMORE CITY - - - -
BALTIMORE COUNTY - - - -
CALVERT $12,950 $12,950 $2,482,121 $3,263,848
CAROLINE 1 $850 to $1500 $850 to $1500 $92,652 $60,000
CARROLL $533 $533 $97,733 $184,650
CECIL - - - -
CHARLES $12,828 $13,139 $7,749,565 $7,510,190
DORCHESTER $3,765 $3,765 $249,177 -
FREDERICK $15,185 $15,185 $7,189,516 $7,653,760
GARRETT - - - -
HARFORD $6,000 $6,000 $1,750,000 $2,499,000
HOWARD $1.08/sq &
$1.121sf $1.13/sf & $1.24/sf $13,918,966 $14,297,000
KENT - - - -
MONTGOMERY regional rates regional rates $41,039,128 $30,989,000
PRINCE GEORGE'S 2 $22,112 / $11,127 $22,355 / $11,249 $27,907,200 $29,625,000
QUEEN ANNE'S $4.36 sq ft $4.50 sq ft - -
ST. MARY'S $4,500 $4,500 $2,249,500 $2,249,500
SOMERSET - - - -
TALBOT 3 $5,572 / $6.451 $5,722 / $6,625 $224,000 $122,000
WASHINGTON $3 per sq ft $1 per sq ft $979,400 $542,900
WICOMICO $5,231 $5,231 $1,261,911 $398,339
WORCESTER - - - -
TOTAL YIELD $115,456,869 $107,865,187
1 Caroline County has two dedicated components: education $5,000; agricultural land preservation $100-$750 2 Higher rate outside of Beltway, lower rate inside of development tier 3 Rate for single family dwelling outside incorporated areas of towns; rate is lower in the towns.
SOURCE: Maryland Association of Counties/Department of Legislative Services, Budget and Tax Rate
Survey, August 2013

Maryland Association of Counties—Budget, Tax Rates, and Selected Statistics—FY 2014
58
TABLE 9.2
EMERGENCY "911" FEES & SYSTEM INFORMATION
FISCAL YEARS 2013 - 2014
Monthly Fees: FY 13 Local FY 14 Local FY 14 Local Type of
SUBDIVISION Local State Total Revenue (ACT) Revenue (EST) Pre-Paid (EST) System
ALLEGANY $0.75 $0.25 $1.00 486,363 495,000 27,383 ENHANCED
ANNE ARUNDEL $0.75 $0.25 $1.00 3,837,893 4,100,000 219,415 ENHANCED
BALTIMORE CITY $0.75 $0.25 $1.00 3,984,739 5,850,000 287,614 ENHANCED
BALTIMORE COUNTY $0.75 $0.25 $1.00 5,680,892 4,805,000 263,566 ENHANCED
CALVERT $0.75 $0.25 $1.00 579,613 630,000 32,891 ENHANCED
CAROLINE $0.75 $0.25 $1.00 183,420 210,000 10,468 ENHANCED
CARROLL $0.75 $0.25 $1.00 1,012,822 1,210,000 58,961 ENHANCED
CECIL $0.75 $0.25 $1.00 583,622 630,000 33,663 ENHANCED
CHARLES $0.75 $0.25 $1.00 991,259 1,020,000 56,312 ENHANCED
DORCHESTER $0.75 $0.25 $1.00 201,337 220,000 11,121 ENHANCED
FREDERICK $0.75 $0.25 $1.00 1,468,437 1,650,000 82,389 ENHANCED
GARRETT $0.75 $0.25 $1.00 257,791 265,000 14,784 ENHANCED
HARFORD $0.75 $0.25 $1.00 1,573,129 1,630,000 90,529 ENHANCED
HOWARD $0.75 $0.25 $1.00 2,115,589 2,125,000 121,484 ENHANCED
KENT $0.75 $0.25 $1.00 127,730 145,000 7,517 ENHANCED
MONTGOMERY $0.75 $0.25 $1.00 6,736,896 7,600,000 399,438 ENHANCED
PRINCE GEORGE'S $0.75 $0.25 $1.00 5,914,226 6,400,000 353,309 EXPANDED
QUEEN ANNE'S $0.75 $0.25 $1.00 297,693 340,000 17,521 ENHANCED
ST. MARY'S $0.75 $0.25 $1.00 594,339 625,000 34,167 ENHANCED
SOMERSET $0.75 $0.25 $1.00 118,464 130,000 6,708 ENHANCED
TALBOT $0.75 $0.25 $1.00 253,231 330,000 14,912 ENHANCED
WASHINGTON $0.75 $0.25 $1.00 870,076 950,000 49,956 ENHANCED
WICOMICO $0.75 $0.25 $1.00 550,469 630,000 30,804 ENHANCED
WORCESTER $0.75 $0.25 $1.00 422,253 510,000 25,087 ENHANCED
PRE-PAID REVENUE1 $0.45 $0.15 $0.60 - $2,250,000
TOTAL LOCAL 911 FEE REVENUE $38,842,283 $44,750,000 $2,250,000 1 Pre-paid phone surcharge imposed in FY 2014
Source: Emergency Numbers Systems Board, and Maryland Association of Counties, Budget and Tax Rate
Survey, November 2013
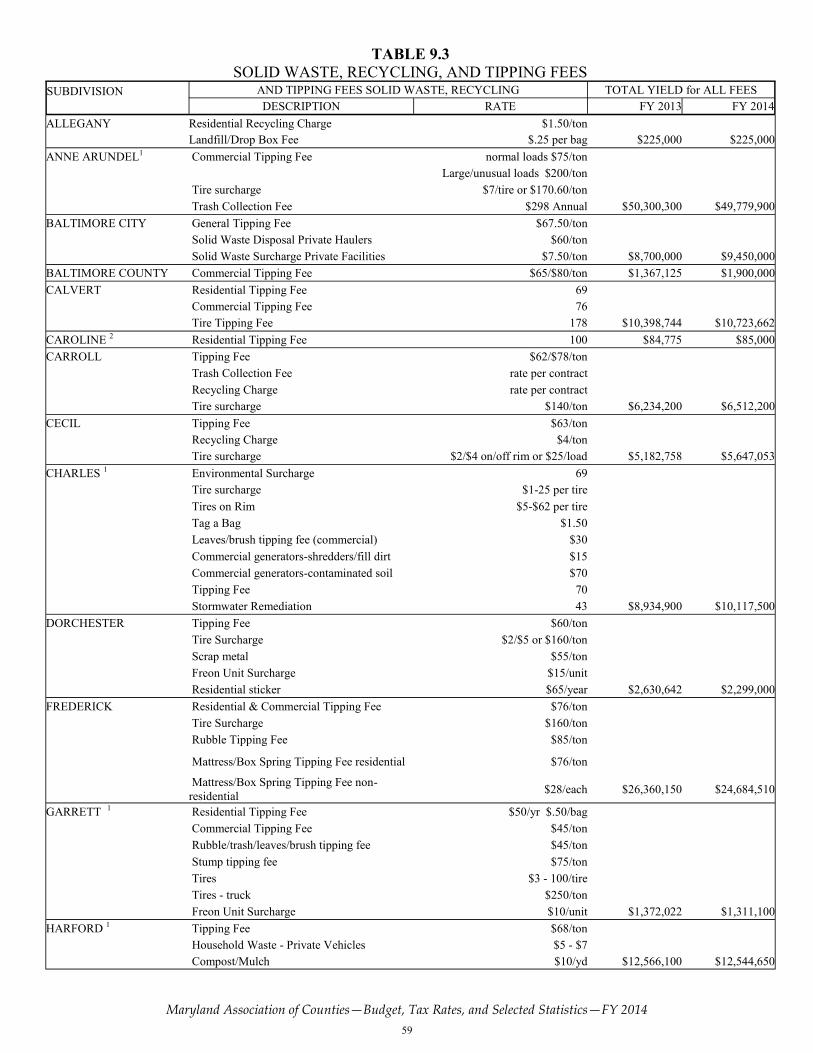
Maryland Association of Counties—Budget, Tax Rates, and Selected Statistics—FY 2014
59
TABLE 9.3
SOLID WASTE, RECYCLING, AND TIPPING FEES SUBDIVISION AND TIPPING FEES SOLID WASTE, RECYCLING TOTAL YIELD for ALL FEES
DESCRIPTION RATE FY 2013 FY 2014
ALLEGANY Residential Recycling Charge $1.50/ton
Landfill/Drop Box Fee $.25 per bag $225,000 $225,000
ANNE ARUNDEL1 Commercial Tipping Fee normal loads $75/ton
Large/unusual loads $200/ton
Tire surcharge $7/tire or $170.60/ton
Trash Collection Fee $298 Annual $50,300,300 $49,779,900
BALTIMORE CITY General Tipping Fee $67.50/ton
Solid Waste Disposal Private Haulers $60/ton
Solid Waste Surcharge Private Facilities $7.50/ton $8,700,000 $9,450,000
BALTIMORE COUNTY Commercial Tipping Fee $65/$80/ton $1,367,125 $1,900,000
CALVERT Residential Tipping Fee 69
Commercial Tipping Fee 76
Tire Tipping Fee 178 $10,398,744 $10,723,662
CAROLINE 2 Residential Tipping Fee 100 $84,775 $85,000
CARROLL Tipping Fee $62/$78/ton
Trash Collection Fee rate per contract
Recycling Charge rate per contract
Tire surcharge $140/ton $6,234,200 $6,512,200
CECIL Tipping Fee $63/ton
Recycling Charge $4/ton
Tire surcharge $2/$4 on/off rim or $25/load $5,182,758 $5,647,053
CHARLES 1 Environmental Surcharge 69
Tire surcharge $1-25 per tire
Tires on Rim $5-$62 per tire
Tag a Bag $1.50
Leaves/brush tipping fee (commercial) $30
Commercial generators-shredders/fill dirt $15
Commercial generators-contaminated soil $70
Tipping Fee 70
Stormwater Remediation 43 $8,934,900 $10,117,500
DORCHESTER Tipping Fee $60/ton
Tire Surcharge $2/$5 or $160/ton
Scrap metal $55/ton
Freon Unit Surcharge $15/unit
Residential sticker $65/year $2,630,642 $2,299,000
FREDERICK Residential & Commercial Tipping Fee $76/ton
Tire Surcharge $160/ton
Rubble Tipping Fee $85/ton
Mattress/Box Spring Tipping Fee residential $76/ton
Mattress/Box Spring Tipping Fee non-
residential $28/each $26,360,150 $24,684,510
GARRETT 1 Residential Tipping Fee $50/yr $.50/bag
Commercial Tipping Fee $45/ton
Rubble/trash/leaves/brush tipping fee $45/ton
Stump tipping fee $75/ton
Tires $3 - 100/tire
Tires - truck $250/ton
Freon Unit Surcharge $10/unit $1,372,022 $1,311,100
HARFORD 1 Tipping Fee $68/ton
Household Waste - Private Vehicles $5 - $7
Compost/Mulch $10/yd $12,566,100 $12,544,650

Maryland Association of Counties—Budget, Tax Rates, and Selected Statistics—FY 2014
60
TABLE 9.3 (continued)
SOLID WASTE, RECYCLING AND TIPPING FEES
SUBDIVISION DESCRIPTION RATE FY 2013 FY 2014
HOWARD3 Commercial Tipping Fee per ton/varies by substance
Tire Surcharge $130 - $190/ton $20,556,000 $20,655,500
KENT Residential Tipping Fee $3/truck load $145,500 $90,000
MONTGOMERY Residential/Commercial Tipping Fee $56/ton
Recycling Fee - Single/multi-family $109.22 - $0.07
Trash Collection Fee $66
Leaf Vacuuming - multi/single family $3.54 - $88.91
Base Systems Benefit Charge - multi/single family $18.31 - $37.41 $94,645,170 $94,684,740
PRINCE GEORGE'S 1 Residential Recycling Charge $31.41-$58.16/unit
Residential/Commercial Tipping Fee $43/ton
Residential Trash Collection Fee $234.33/ton
Environmental Surcharge $16/ton
Tire Surcharge $175/ton
Residential System Benefit Charge $30.84/unit
Commercial System Benefit Charge $4.52-$15.83/100 sq. ft. $86,714,400 $86,389,800
QUEEN ANNE'S 2 Residential Tipping Fee $45/15 trips
Rubble trash tipping fee $5/ton
Tire Surcharge tickets
Freon Unit Surcharge tickets $512,000 $512,000
ST. MARY'S Residential Tipping Fee $10/pickup
Environmental Surcharge $60
Tire Surcharge $158/ton
Commercial $65/ton $2,685,700 $2,773,000
SOMERSET Residential Tipping Fee $52/year
Tire surcharge $4-12/tire
Solid waste removal at Smith Island $52/developed land
Commercial Tipping Fee $62/ton $1,287,900 $1,220,400
TALBOT 2 General Tipping Fees $58/ton
Leaves/brush tipping fee $18.50/ton
Recycling Fee included above - -
WASHINGTON Residential Tipping Fee $130/yr for car/truck
Commercial Tipping Fee $52/ton
Leaves/brush Tipping Fee $63/ton
Tire surcharge $3 each or $162-$250/ton
Refrigerator/freezer/freon surcharge $5/unit
Recycling Permit Fee $36/yr
Yard Debris $15/yr
Rubble Landfill Fee $75/ton $6,376,610 $5,536,320
WICOMICO Tipping Fee $60/ton
Leaves/brush tipping fee $27.50/ton
Freon Surcharge $20/unit
Residential Permit Programs $60/year
Commercial Yard Waste $28
Asbestos $165/ton
Tire surcharge $2 on rim/$5 off rim $5,852,771 $5,471,000
WORCESTER Tipping Fee $70/ton
Tire surcharge $2-$10/tire,$175-$600/ton
Rubble tipping fee $80/ton
Leaves/brush tipping fee $70/ton $3,694,812 $3,800,000
TOTAL YIELD $356,827,579 $356,412,335 1 Yield data includes other fees and interest. 2 Caroline, Queen Anne's, and Talbot Counties participate in the Mid-shore Regional Solid Waste Facility.
Maryland Environmental Service runs the landfill and collects the user fees. 3 Collects fees in difference manner, revenue is reflected
SOURCE: Maryland Association of Counties/Department of Legislative Services, Budget and Tax Rate Survey, August 2013