Carbon budgets and your Carbon legacy
39
Carbon Budgets and Your Carbon Legacy Max Wei, Chris Jones*, Chris Stratton, Jan Porvaznik* Lawrence Berkeley National Laboratory, Sustainable Energy Systems Group *University of California Berkeley, Energy and Resources Group Behavior, Energy and Climate Change Conference, Nov. 18, 2013 1
Transcript of Carbon budgets and your Carbon legacy
Carbon Budgets and Your Carbon Legacy
Max Wei, Chris Jones*, Chris Stratton, Jan Porvaznik*
Lawrence Berkeley National Laboratory, Sustainable Energy Systems Group *University of California Berkeley,
Energy and Resources Group
Behavior, Energy and Climate Change Conference, Nov. 18, 2013 1
Defining Carbon Debt, Footprint, Budget, and Legacy
2
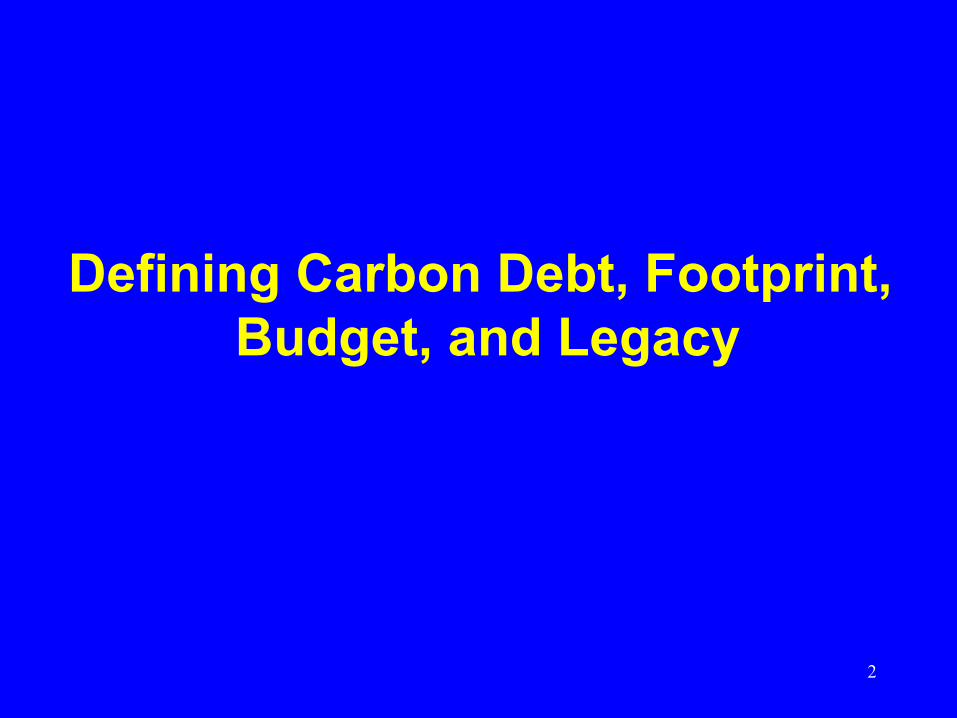
Carbon Debt What we’ve already emitted Carbon Footprint What we’re currently emitting Carbon Budget Limit on cumulative global emissions Carbon Legacy What we’ll emit in our lifetime
“Definitions”
3

Carbon Debt National, (Technology) Carbon Footprint Individual, (Process, Product) Carbon Budget Global è Individual Carbon Legacy Individual
Scope
4

Some Questions • What is the global carbon budget /
U.S. share? • How might this be translated to
individual carbon budgets? • What are the impacts of a small set
of key life decisions on your carbon legacy? – E.g., Housing location, housing type,
family size, vehicle choice, dietary choice 5

Carbon Debt What we’ve already emitted Carbon Footprint What we’re currently emitting Carbon Budget Limit on cumulative global emissions Carbon Legacy What we’ll emit in our lifetime
6
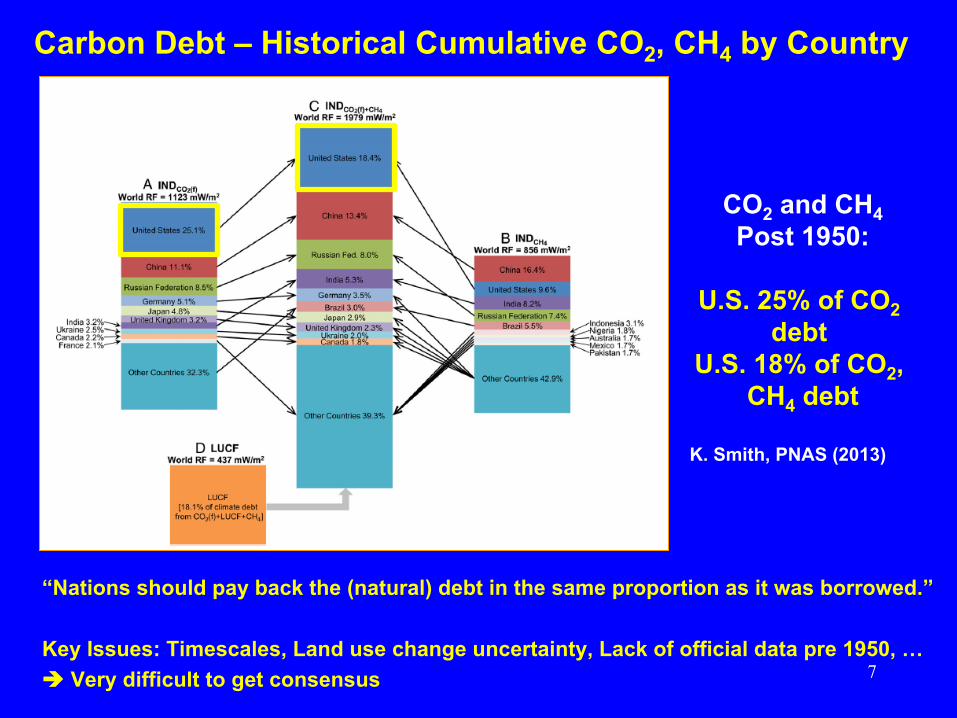
Carbon Debt – Historical Cumulative CO2, CH4 by Country
“Nations should pay back the (natural) debt in the same proportion as it was borrowed.” Key Issues: Timescales, Land use change uncertainty, Lack of official data pre 1950, … è Very difficult to get consensus
CO2 and CH4 Post 1950:
U.S. 25% of CO2
debt U.S. 18% of CO2,
CH4 debt K. Smith, PNAS (2013)
7

Carbon Debt What we’ve already emitted Carbon Footprint What we’re currently emitting Carbon Budget Limit on cumulative global emissions Carbon Legacy What we’ll emit in our lifetime
8
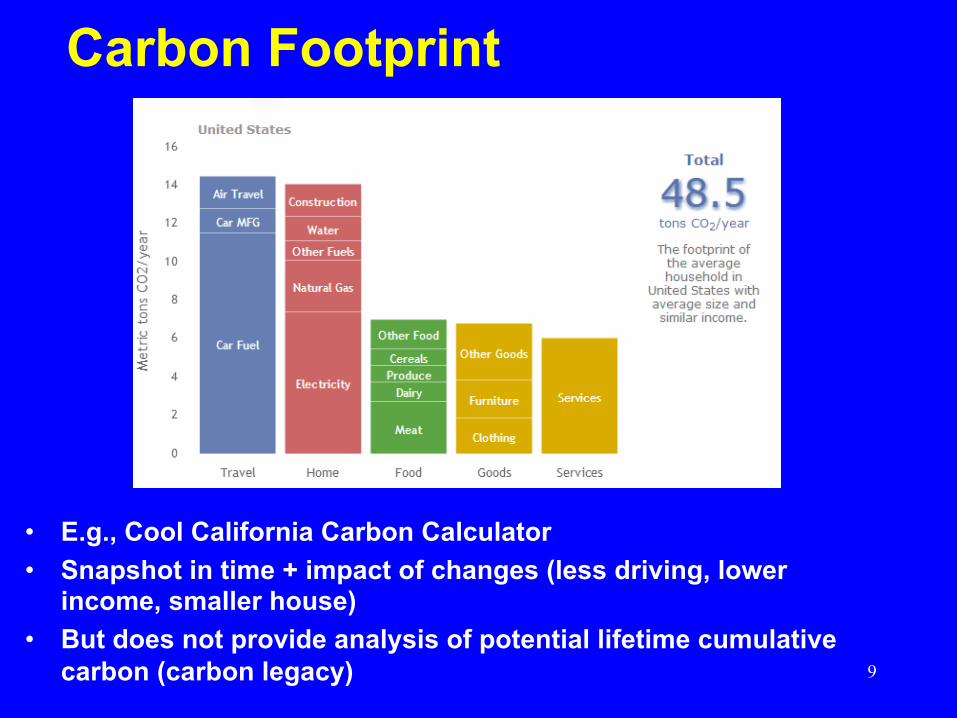
Carbon Footprint
• E.g., Cool California Carbon Calculator • Snapshot in time + impact of changes (less driving, lower
income, smaller house) • But does not provide analysis of potential lifetime cumulative
carbon (carbon legacy) 9

source: CoolClimate Maps: coolclimate.berkeley.edu/maps 10

source: CoolClimate Maps: coolclimate.berkeley.edu/maps 11

!"#!"$!"%!"&!"'!"(!")!"*!"+!"
#!!"
,-.."/012"3#!4567""
3#!483$!4567""
3$!483%!4567""
3%!483&!4567""
3&!483'!4567""
3'!483(!4567""
3(!483*!4567""
3*!483#!!4567""
3#!!483#$!4567""
9:7-"/012"3#$!4567""
/;<$-567"
;17=:2">::/?7@2/."=6"0:A.-0:,B".@C-"12B"@2D:9-"
EF-":7"9:7-"
>:A7"?-7.:2"
/07--"?-7.:2"
/G:"?-7.:2"
:2-"?-7.:2"
Jones, C.M. and Kammen, D.M. Quantifying Carbon Footprint Reduction Opportunities for U.S. Households and Communities. Environ. Sci. Technol., 2011, 45 (9) pp 4088-4095
12

!"!!
!#$!!
!%$!!
!&$!!
!'$!!
!($!!
!)$!!
!*$!!
+,--!./01!2#$3456!!
2#$3"2%$3456!!
2%$3"2&$3456!!
2&$3"2'$3456!!
2'$3"2($3456!!
2($3"2)$3456!!
2)$3"27$3456!!
27$3"2#$$3456!!
2#$$3"2#%$3456!!
896,!./01!2#%$3456!!
.:;%,456!
:06<91!=99.>6?1.-!<5!,8?--?91-!@0.,A965!01B!?1@98,!
C,6D?@,-!E99B-!F?6!G60D,+!H9.96!I,/?@+,-!:91-.6J@K91!L0.,6!M!L0-.,!N98,!O1,6A5!P99B!!
Jones, C.M. and Kammen, D.M. Quantifying Carbon Footprint Reduction Opportunities for U.S. Households and Communities. Environ. Sci. Technol., 2011, 45 (9) pp 4088-4095
13

Carbon Debt What we’ve already emitted Carbon Footprint What we’re currently emitting Carbon Budget Limit on cumulative global emissions Carbon Legacy What we’ll emit in our lifetime
14

Carbon Budget
• The IPCC issued a global carbon budget for the first time (Nov.’13):
< 790 Gtons of carbon to keep warming < 2°C vs. pre-industrial temp*
• About 32% of budget remains
15 * 66% confidence
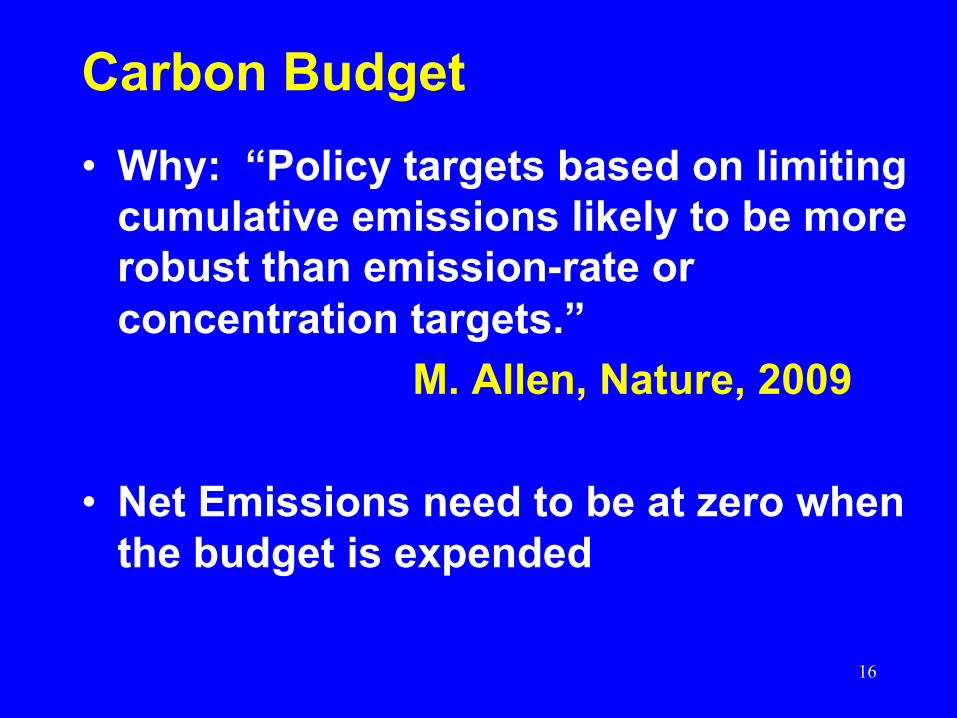
Carbon Budget • Why: “Policy targets based on limiting
cumulative emissions likely to be more robust than emission-rate or concentration targets.”
M. Allen, Nature, 2009
• Net Emissions need to be at zero when the budget is expended
16
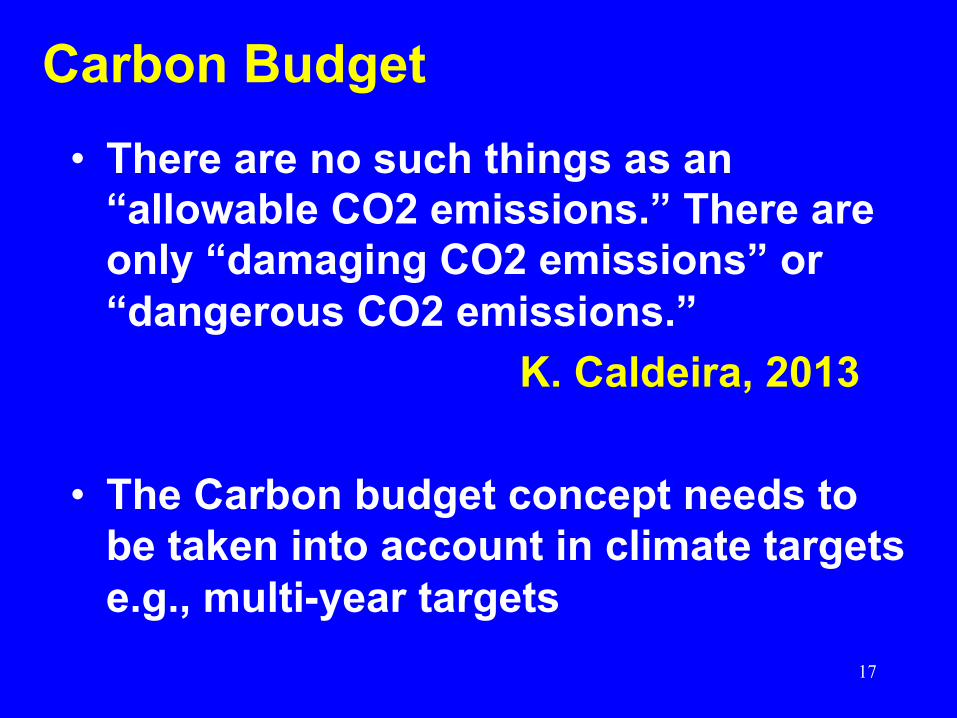
Carbon Budget • There are no such things as an
“allowable CO2 emissions.” There are only “damaging CO2 emissions” or “dangerous CO2 emissions.”
K. Caldeira, 2013 • The Carbon budget concept needs to
be taken into account in climate targets e.g., multi-year targets
17
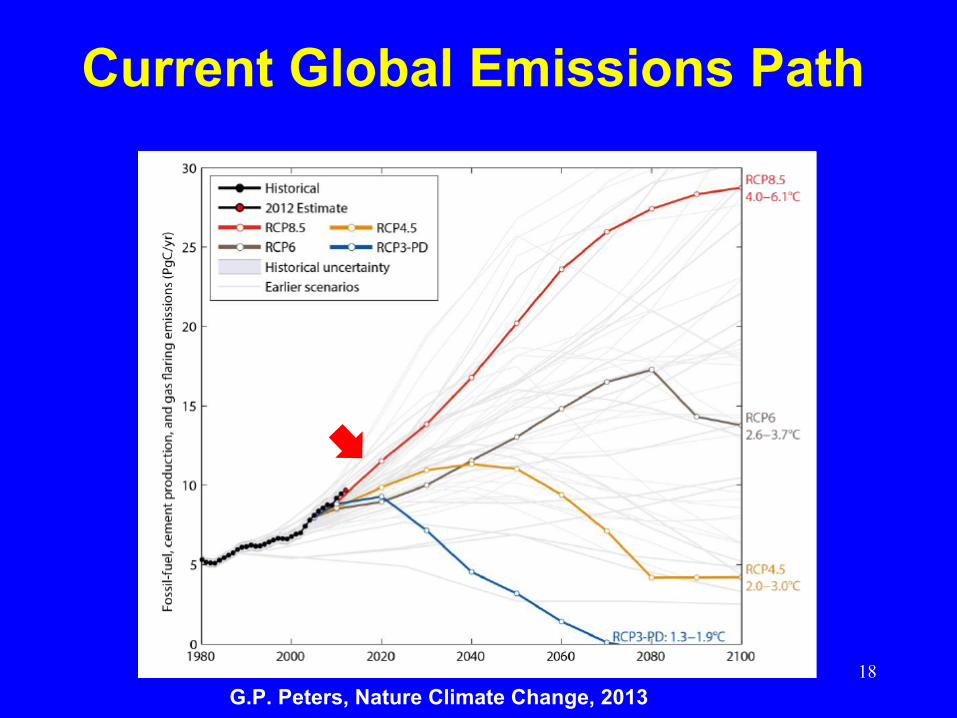
Current Global Emissions Path
G.P. Peters, Nature Climate Change, 2013 18

Carbon Budget Exceeded by 2040 on Current Path
19
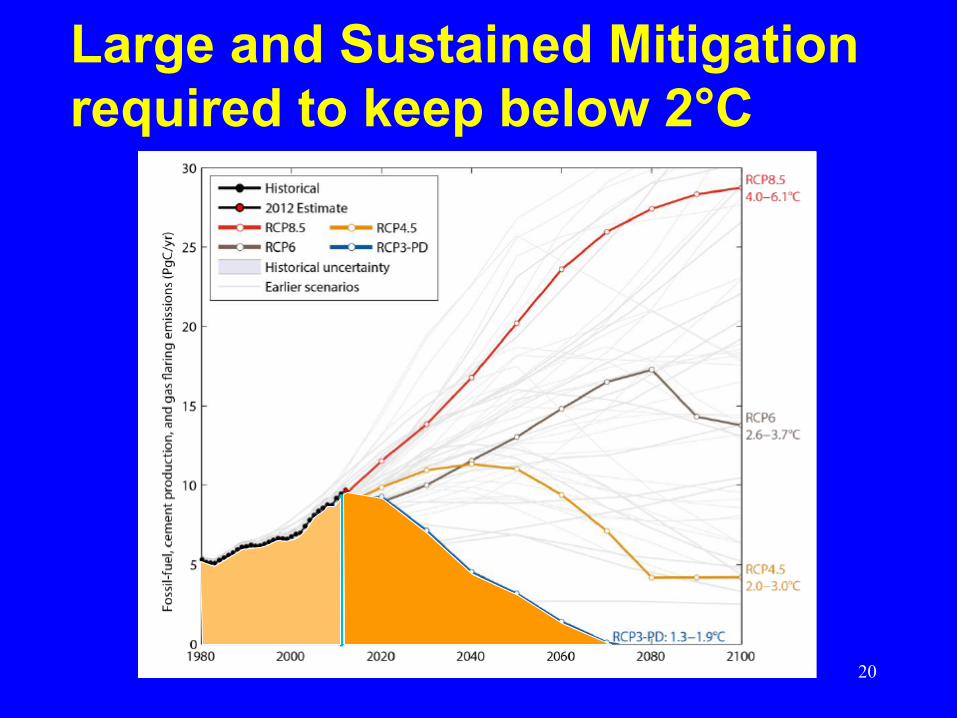
Large and Sustained Mitigation required to keep below 2°C
20
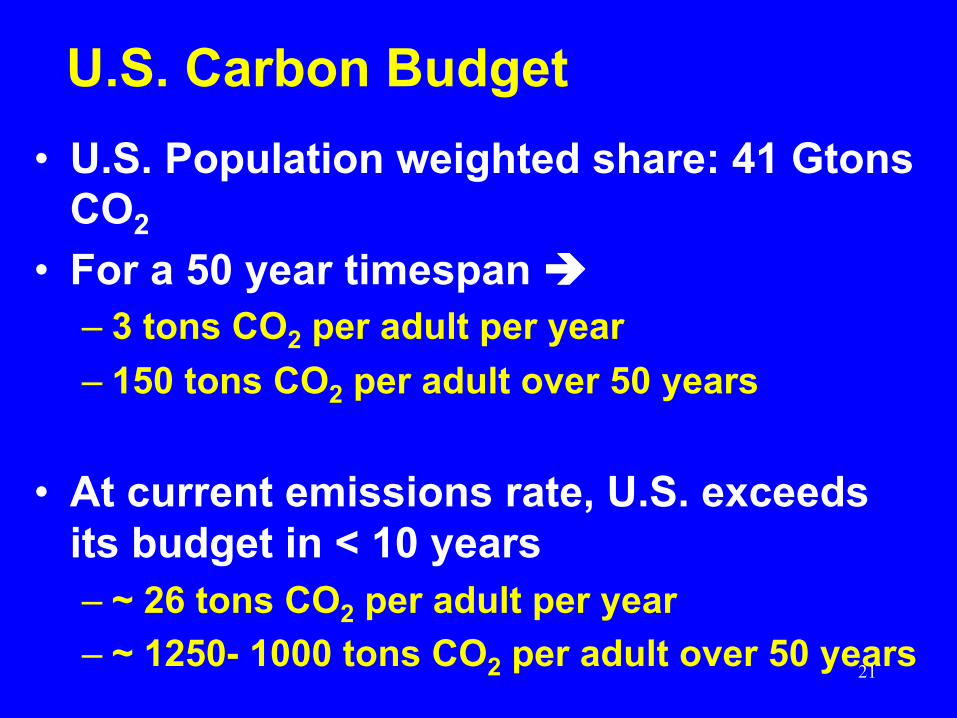
U.S. Carbon Budget • U.S. Population weighted share: 41 Gtons
CO2
• For a 50 year timespan è – 3 tons CO2 per adult per year – 150 tons CO2 per adult over 50 years
• At current emissions rate, U.S. exceeds its budget in < 10 years – ~ 26 tons CO2 per adult per year – ~ 1250- 1000 tons CO2 per adult over 50 years 21

California Greenhouse Gas Targets: Meet 1990 level by 2020; 80% below 1990 by 2050
22
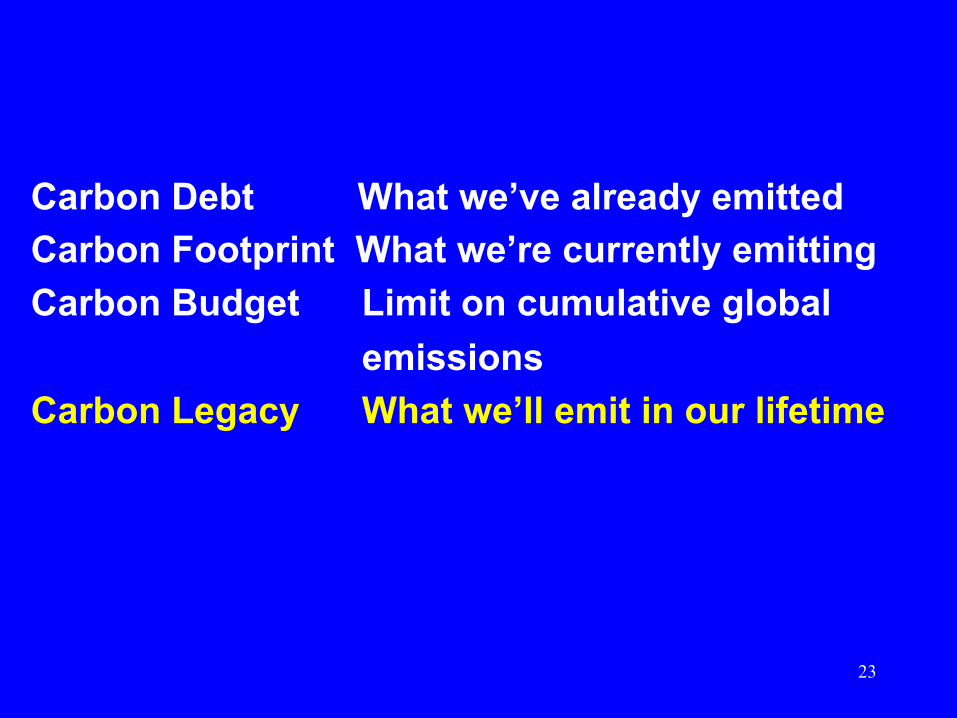
Carbon Debt What we’ve already emitted Carbon Footprint What we’re currently emitting Carbon Budget Limit on cumulative global emissions Carbon Legacy What we’ll emit in our lifetime
23
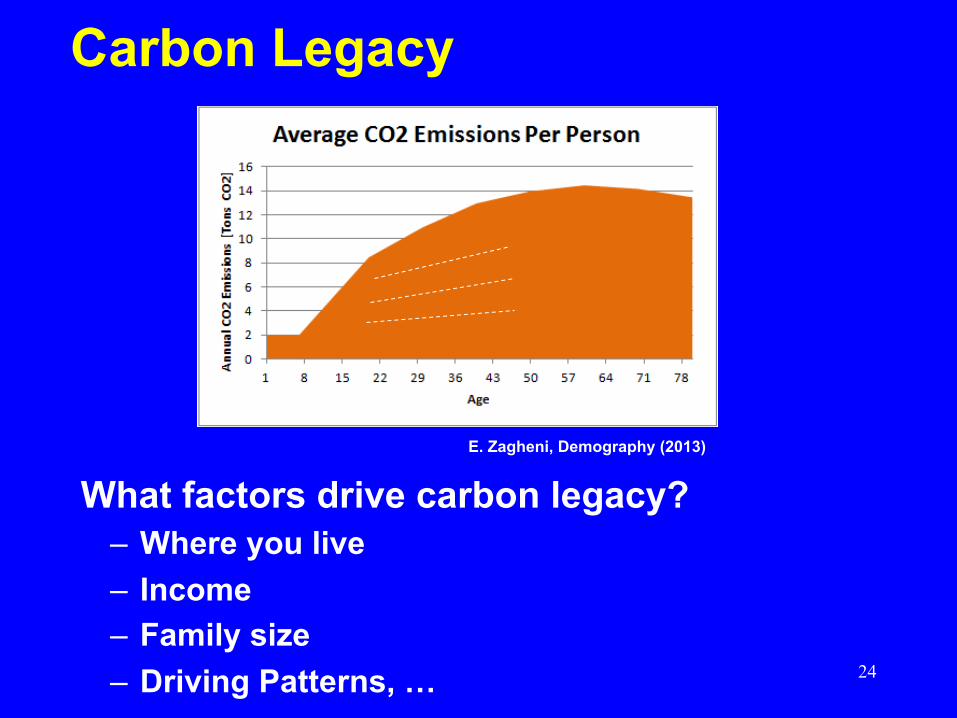
Carbon Legacy
What factors drive carbon legacy? – Where you live – Income – Family size – Driving Patterns, …
E. Zagheni, Demography (2013)
24

Carbon Legacy Factors
Σ Σ Usagei x Energyi x Carbon Intensityi Example:
Σ Annual Miles driven * x vary over time and policy/technology dependent
All travel, Home energy,
Goods and Services
Lifetime Years
Lifetime Years
Mile Gallon Gas
Gallon Gas CO2

California Scenarios - 1
Meet 2050 Target and
Net Zero CO2
Emissions within 50 years
of today (2063)
Wei, ERL 2013; Greenblatt, CCST 2012; Williams, Science 2012 26

California Scenarios - 2
Scenario 2: “Existing Policies + Additional Uncommitted Policies” (Greenblatt, ARB 2013)
27
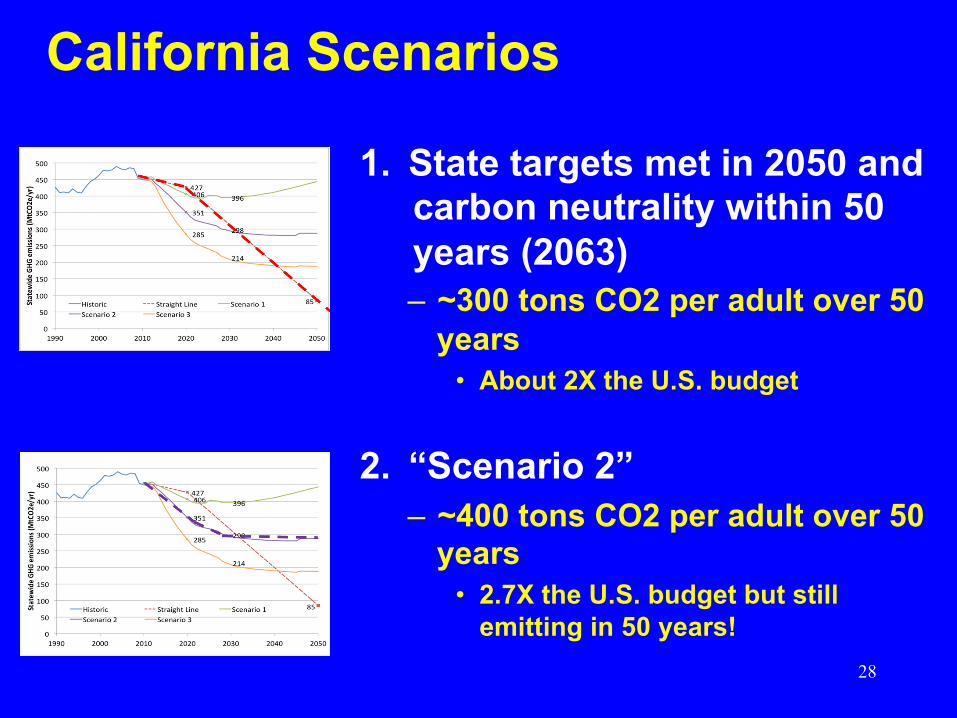
California Scenarios
1. State targets met in 2050 and carbon neutrality within 50 years (2063) – ~300 tons CO2 per adult over 50
years • About 2X the U.S. budget
2. “Scenario 2” – ~400 tons CO2 per adult over 50
years • 2.7X the U.S. budget but still
emitting in 50 years! 28

California Scenarios – Family Size
Scenario 2, “Existing Policies + Additional Uncommitted Policies” Greenblatt, ARB 2013
Each child ~ 480 tons CO2 over 80 yr Lifetime ~ 240 tons CO2 per parent Each child ~50 tons CO2 First 21 years ~ 25 tons CO2 per parent
29

California Scenarios – Personal Vehicles, Bay Area
Median income, Multi-worker, Multi-vehicle household (Brazil, Purvis, MTC BASSTEG Travel Survey, 2000; Greenblatt, ARB 2013, Scenario 2 MPG and biofuels)
Location Effect
Vehicle- Type
Impact
148 tons CO2 saved, 50 yrs 90 tons CO2 saved, 50 yrs ~ 74 tons CO2 per adult ~ 45 tons CO2 per adult
268 tons CO2 saved, 50 yrs 210 tons CO2 saved, 50 yrs ~ 134 tons CO2 per adult ~ 105 tons CO2 per adult
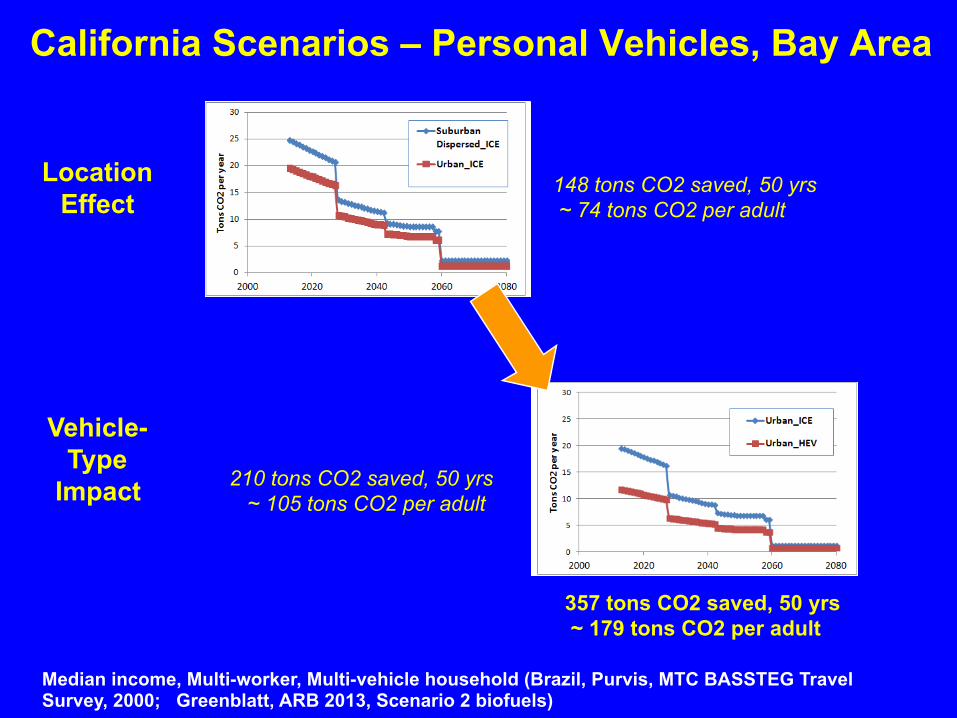
California Scenarios – Personal Vehicles, Bay Area
Median income, Multi-worker, Multi-vehicle household (Brazil, Purvis, MTC BASSTEG Travel Survey, 2000; Greenblatt, ARB 2013, Scenario 2 biofuels)
Location Effect
Vehicle- Type
Impact
148 tons CO2 saved, 50 yrs ~ 74 tons CO2 per adult
210 tons CO2 saved, 50 yrs ~ 105 tons CO2 per adult
357 tons CO2 saved, 50 yrs ~ 179 tons CO2 per adult

Housing Size Impact • Correlation of energy use with single family
housing size is very poor – Controlling for multiple factors (Income, family size and
composition, climate zone, housing age) – Driven by many other factors (including behavior)
Bay Area, Single Family homes, 2 adults, 1 child, $87.5k annual income
California Residential Appliance Saturation Survey (RASS), CEC/KEMA, 2003
Annual Electricity Consumption vs.
Single Family Home Size
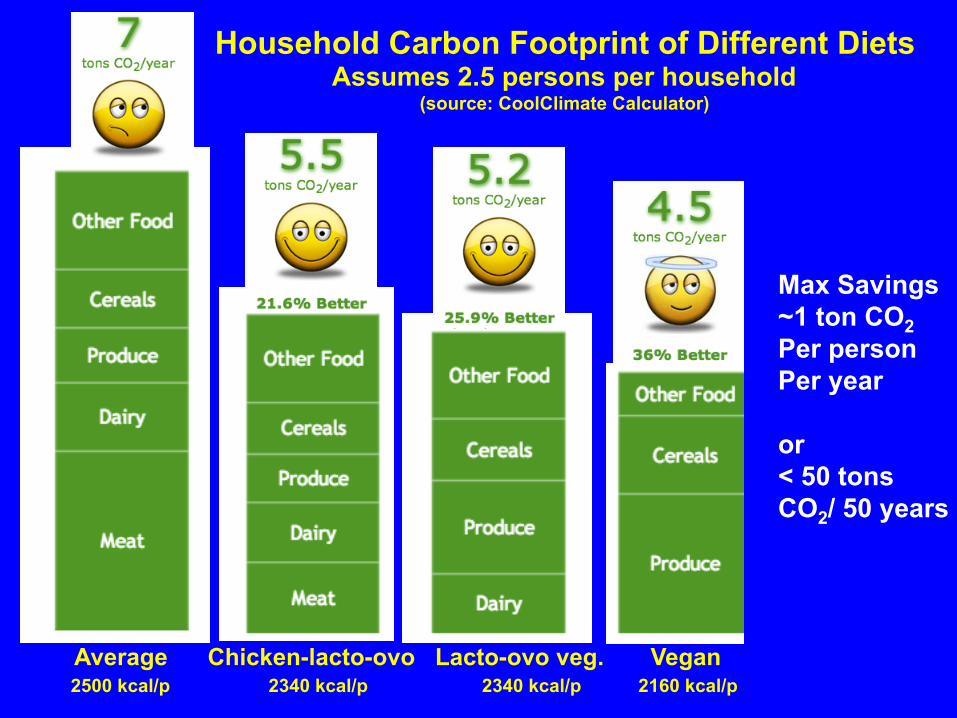
Average Chicken-lacto-ovo Lacto-ovo veg. Vegan
2500 kcal/p 2340 kcal/p 2340 kcal/p 2160 kcal/p
Household Carbon Footprint of Different Diets Assumes 2.5 persons per household
(source: CoolClimate Calculator)
Max Savings ~1 ton CO2 Per person Per year or < 50 tons CO2/ 50 years

Conclusions • A carbon budget of ~ 150 tons CO2 per adult
over next 50 years is derived from the IPCC global budget and U.S. pop.-weighted share
• Cumulative carbon is an important concept to frame carbon reduction activities and decisions – Dependent upon individual actions/choices + future
energy system trajectory set by policies/markets • Preliminary assessment of “key life decisions”
suggest vehicle technology type, housing location, and family size are among the important factors for your carbon legacy
34

Backup Slides
36

Notes
• NB – average VMT by cohort; have overlapping distributions
37

Carbon Debt - Cumulative CO2, CH4 Per Capita by Country - SKIP
Including Methane shifts “accountability” distribution Methane possibly lower hanging fruit – waste management, fossil fuel system
leakage
CO2 (red) and CH4 (blue) Post 1950 U.S. Per cap CO2, CH4 debt: 6X China 13X India K. Smith, PNAS (2013)
38
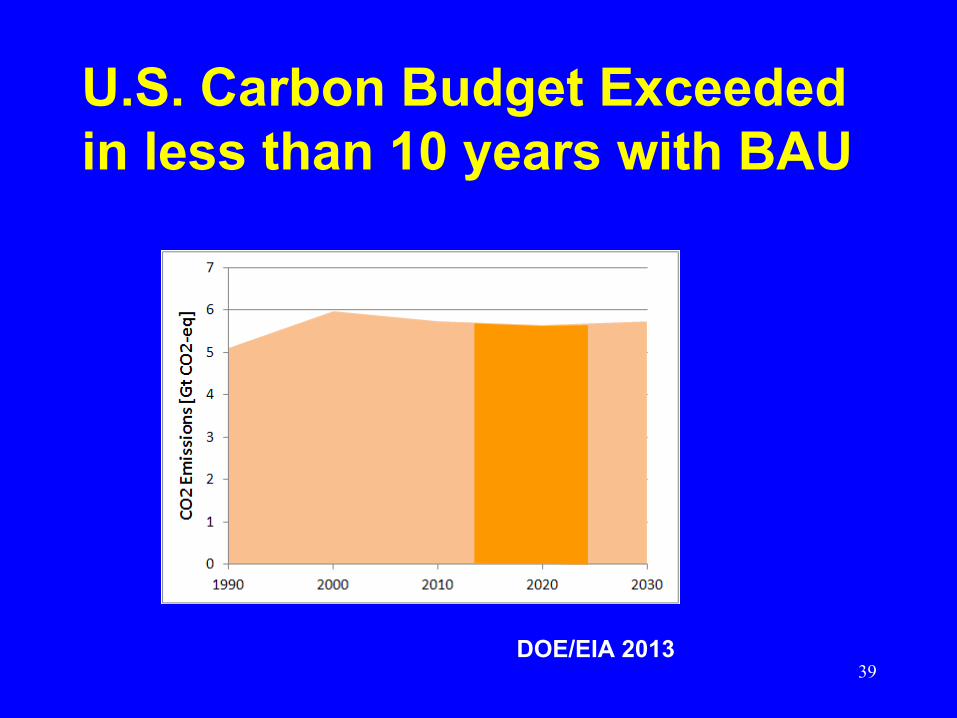
U.S. Carbon Budget Exceeded in less than 10 years with BAU
DOE/EIA 2013 39