Economic Survey 2013 - 14 - Open Budgets India
459
Government of Bihar Finance Department Economic Survey 2013 - 14 February 2014
-
Upload
khangminh22 -
Category
Documents
-
view
0 -
download
0
Transcript of Economic Survey 2013 - 14 - Open Budgets India
Government of Bihar Finance Department
Economic Survey 2013 - 14
February 2014

Government of Bihar
Finance Department
Economic Survey 2013 - 14
February 2014


I
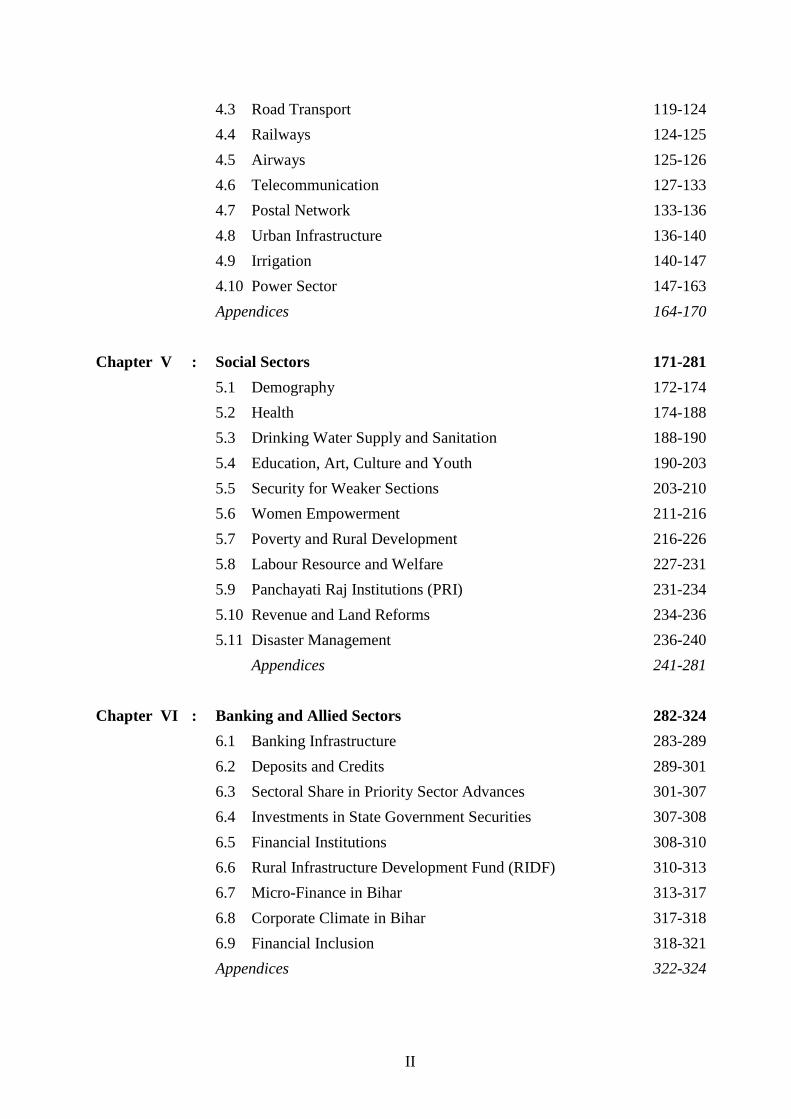
Contents
Chapter Title
Glossary of Abbreviations i-viii
Index of Tables and Appendices ix-xix
Executive Summary xx-xxxvii
Chapter I : Bihar Economy : An Overview 1-25
1.1 State Domestic Product 2-7
1.2 Regional Disparity 7-9
1.3 Wholesale and Consumer Price Indices 9-10
Appendices 11-25
Chapter II : Agriculture and Allied Sectors 26-64
2.1 Rainfall 27-29
2.2 Land Utilisation 29-30
2.3 Production and Productivity 30-37
2.4 Irrigation 37-38
2.5 Agricultural Inputs 38-46
2.6 Agricultural Credit 46-52
Appendices 53-64
Chapter III : Enterprises Sector 65-105
3.1 Annual Survey of Industries (2010-11) 67-73
3.2 Large Scale Industry 73
3.3 Micro, Small and Medium Enterprises (MSME) 73-74
3.4 MSME in Bihar 74-77
3.5 Agro-based Industries 77-84
3.6 Non-Agro Based Industry 84-88
3.7 Support Institutions 88-92
3.8 Information and Communication Technology 92-94
3.9 Investment Climate 95-96
3.10 Tourism 96-98
3.11 Challenges and Prospects 98-99
Appendices 100-105
Chapter IV : Infrastructure and Communications 106-170
4.1 Roads 106-114
4.2 Bridges Sector 114-118
II
4.3 Road Transport 119-124
4.4 Railways 124-125
4.5 Airways 125-126
4.6 Telecommunication 127-133
4.7 Postal Network 133-136
4.8 Urban Infrastructure 136-140
4.9 Irrigation 140-147
4.10 Power Sector 147-163
Appendices 164-170
Chapter V : Social Sectors 171-281
5.1 Demography 172-174
5.2 Health 174-188
5.3 Drinking Water Supply and Sanitation 188-190
5.4 Education, Art, Culture and Youth 190-203
5.5 Security for Weaker Sections 203-210
5.6 Women Empowerment 211-216
5.7 Poverty and Rural Development 216-226
5.8 Labour Resource and Welfare 227-231
5.9 Panchayati Raj Institutions (PRI) 231-234
5.10 Revenue and Land Reforms 234-236
5.11 Disaster Management 236-240
Appendices 241-281
Chapter VI : Banking and Allied Sectors 282-324
6.1 Banking Infrastructure 283-289
6.2 Deposits and Credits 289-301
6.3 Sectoral Share in Priority Sector Advances 301-307
6.4 Investments in State Government Securities 307-308
6.5 Financial Institutions 308-310
6.6 Rural Infrastructure Development Fund (RIDF) 310-313
6.7 Micro-Finance in Bihar 313-317
6.8 Corporate Climate in Bihar 317-318
6.9 Financial Inclusion 318-321
Appendices 322-324

III
Chapter VII : State Finances 325-416
7.1 Overview of Financial Position 327-337
7.2 Fiscal Performance 337-348
7.3 Deficit Management 348-353
7.4 Debt Management 353-357
7.5 Tax : GSDP Ratio 357-358
7.6 Revenue Account: Receipt and Expenditure 359-363
7.7 Resource Management 363-375
7.8 Performance of State Tax Departments 375-381
7.9 Expenditure Management 382-387
7.10 Revenue Expenditure 387-388
7.11 Expenditure on Salary and Pension 388-390
7.12 Quality of Expenditure 390-391
7.13 Sectoral Expenditure 391-395
7.14 Per Capita Expenditure on Social and Economic Services 395-396
7.15 Comparison of State Budgets : 2012-13 and 2013-14 396-399
7.16 Central Funds Bypassing the State Budget 399-401
7.17 State Public Sector Undertakings and Corporations 402-404
7.18 Summarised Results of Public Sector 405-408
7.19 Working Results of Statutory Corporations 409
7.20 Reforms in Power Sector 409-410
Appendices 411-416

i
Glossary of Abbreviations
ACP Annual Credit Plan
ADB Asian Development Bank
ADV Advertisement Tax
AG (A&E) Accountant General (Audit and Examination)
AIBP Accelerated Irrigation Benefit Programme
AICTE All India Council of Technical Education
ANM Auxiliary Nurse-cum-Midwife
APDRP Accelerated Power Development and Reforms Programme
APFAMGS Andhra Pradesh Farmer Managed Ground Water Systems
APHC Additional Primary Health Centre
APL Above Poverty Line
APMB Agricultural Produce Marketing Board
AREP Accelerated Rural Electrification Programme
ASHA Accredited Social Health Activist
ASI Annual Survey of Industries
ATMA Agricultural Technology Management Agency
AWC Anganwadi Centres
AYUSH Ayurveda, Yoga and Naturopathy, Unani, Siddha and Homeopathy
AWW Anganwadi Worker
BCR Balance of Current Revenue
BADP Border Area Development Programme
BAPMC Bihar Agricultural Produce Marketing Corporation
BC Backward Caste
BCR Balance of Current Revenue
BDRM Bihar Disaster Risk Management
BE Budget Estimate
BEPC Bihar Education Project Council
BELTRON Bihar State Electronics Development Corporation
BERC Bihar Electricity Regulatory Commission
BIADA Bihar Industrial Area Development Authority
BIFR Board for Industrial and Financial Reconstruction
BICICO Bihar State Credit and Investment Corporation
BIC British India Corporation
BIGWIS Bihar Ground Water Irrigation Scheme
BIPARD Bihar Institute of Public Administration and Rural Development
BMA Bihar Municipal Act
BMP Bihar Military Police
BOT Build-Operate-Transfer
BPL Below Poverty Line
BPSM Bihar Prashashanik Sudhar Mission
BRAIN DC Bihar Revenue and Integrated Data Centre
BRBN Bihar Rajya Beej Nigam
BREDA Bihar Renewable Energy Development Agency
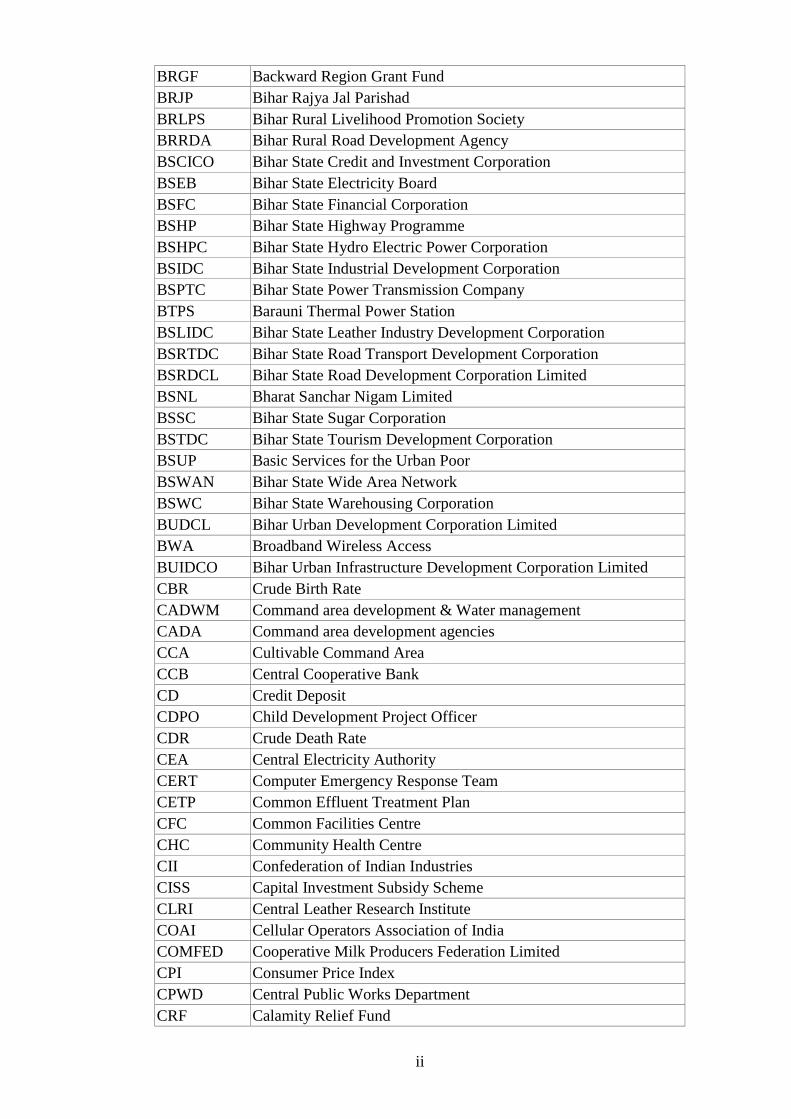
ii
BRGF Backward Region Grant Fund
BRJP Bihar Rajya Jal Parishad
BRLPS Bihar Rural Livelihood Promotion Society
BRRDA Bihar Rural Road Development Agency
BSCICO Bihar State Credit and Investment Corporation
BSEB Bihar State Electricity Board
BSFC Bihar State Financial Corporation
BSHP Bihar State Highway Programme
BSHPC Bihar State Hydro Electric Power Corporation
BSIDC Bihar State Industrial Development Corporation
BSPTC Bihar State Power Transmission Company
BTPS Barauni Thermal Power Station
BSLIDC Bihar State Leather Industry Development Corporation
BSRTDC Bihar State Road Transport Development Corporation
BSRDCL Bihar State Road Development Corporation Limited
BSNL Bharat Sanchar Nigam Limited
BSSC Bihar State Sugar Corporation
BSTDC Bihar State Tourism Development Corporation
BSUP Basic Services for the Urban Poor
BSWAN Bihar State Wide Area Network
BSWC Bihar State Warehousing Corporation
BUDCL Bihar Urban Development Corporation Limited
BWA Broadband Wireless Access
BUIDCO Bihar Urban Infrastructure Development Corporation Limited
CBR Crude Birth Rate
CADWM Command area development & Water management
CADA Command area development agencies
CCA Cultivable Command Area
CCB Central Cooperative Bank
CD Credit Deposit
CDPO Child Development Project Officer
CDR Crude Death Rate
CEA Central Electricity Authority
CERT Computer Emergency Response Team
CETP Common Effluent Treatment Plan
CFC Common Facilities Centre
CHC Community Health Centre
CII Confederation of Indian Industries
CISS Capital Investment Subsidy Scheme
CLRI Central Leather Research Institute
COAI Cellular Operators Association of India
COMFED Cooperative Milk Producers Federation Limited
CPI Consumer Price Index
CPWD Central Public Works Department
CRF Calamity Relief Fund
iii
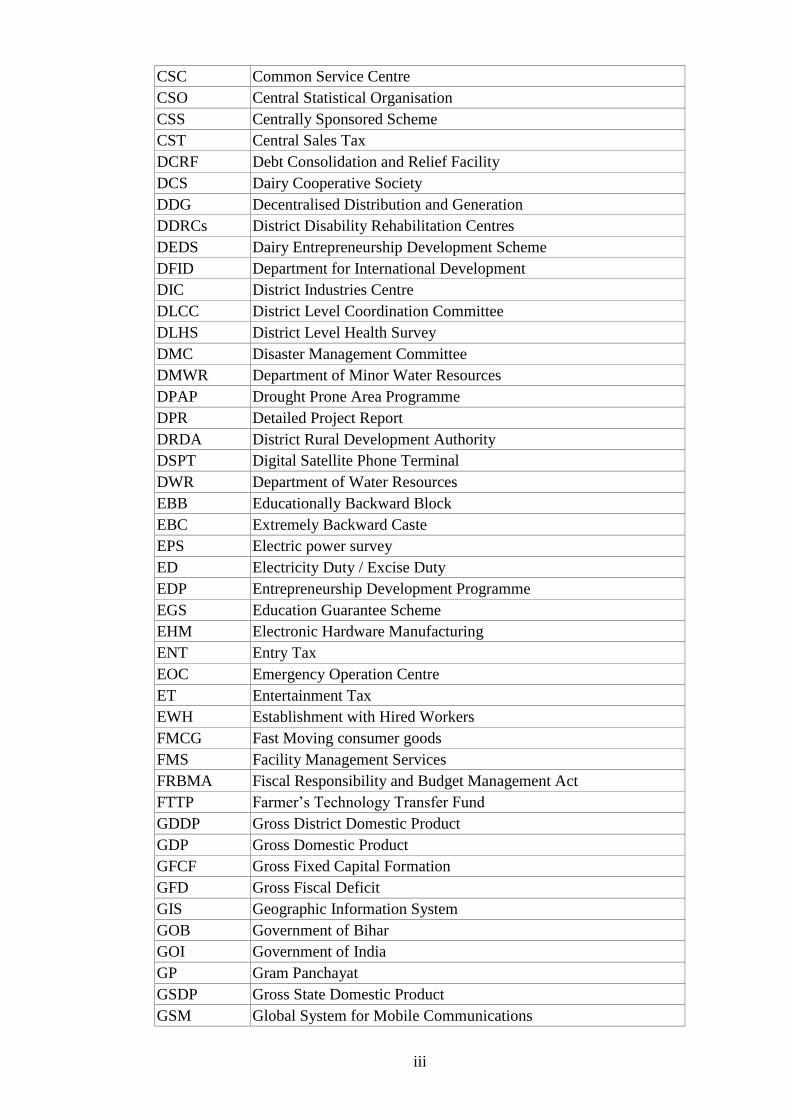
CSC Common Service Centre
CSO Central Statistical Organisation
CSS Centrally Sponsored Scheme
CST Central Sales Tax
DCRF Debt Consolidation and Relief Facility
DCS Dairy Cooperative Society
DDG Decentralised Distribution and Generation
DDRCs District Disability Rehabilitation Centres
DEDS Dairy Entrepreneurship Development Scheme
DFID Department for International Development
DIC District Industries Centre
DLCC District Level Coordination Committee
DLHS District Level Health Survey
DMC Disaster Management Committee
DMWR Department of Minor Water Resources
DPAP Drought Prone Area Programme
DPR Detailed Project Report
DRDA District Rural Development Authority
DSPT Digital Satellite Phone Terminal
DWR Department of Water Resources
EBB Educationally Backward Block
EBC Extremely Backward Caste
EPS Electric power survey
ED Electricity Duty / Excise Duty
EDP Entrepreneurship Development Programme
EGS Education Guarantee Scheme
EHM Electronic Hardware Manufacturing
ENT Entry Tax
EOC Emergency Operation Centre
ET Entertainment Tax
EWH Establishment with Hired Workers
FMCG Fast Moving consumer goods
FMS Facility Management Services
FRBMA Fiscal Responsibility and Budget Management Act
FTTP Farmer’s Technology Transfer Fund
GDDP Gross District Domestic Product
GDP Gross Domestic Product
GFCF Gross Fixed Capital Formation
GFD Gross Fiscal Deficit
GIS Geographic Information System
GOB Government of Bihar
GOI Government of India
GP Gram Panchayat
GSDP Gross State Domestic Product
GSM Global System for Mobile Communications
iv
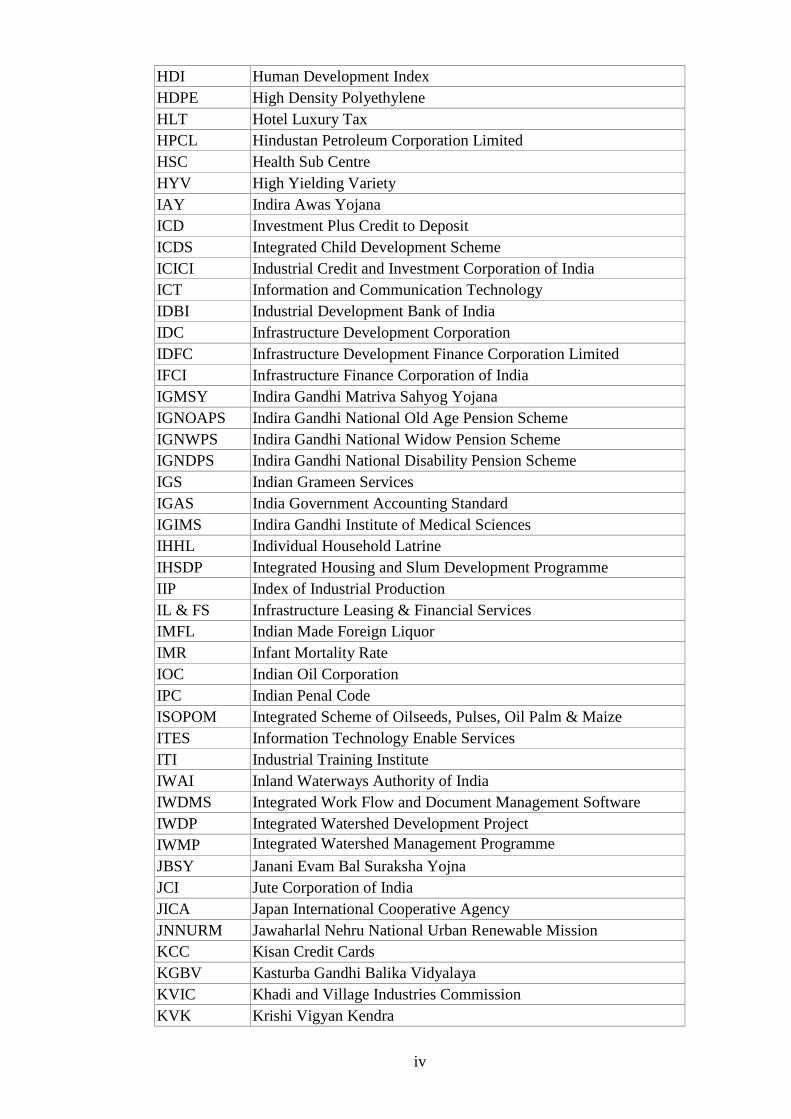
HDI Human Development Index
HDPE High Density Polyethylene
HLT Hotel Luxury Tax
HPCL Hindustan Petroleum Corporation Limited
HSC Health Sub Centre
HYV High Yielding Variety
IAY Indira Awas Yojana
ICD Investment Plus Credit to Deposit
ICDS Integrated Child Development Scheme
ICICI Industrial Credit and Investment Corporation of India
ICT Information and Communication Technology
IDBI Industrial Development Bank of India
IDC Infrastructure Development Corporation
IDFC Infrastructure Development Finance Corporation Limited
IFCI Infrastructure Finance Corporation of India
IGMSY Indira Gandhi Matriva Sahyog Yojana
IGNOAPS Indira Gandhi National Old Age Pension Scheme
IGNWPS Indira Gandhi National Widow Pension Scheme
IGNDPS Indira Gandhi National Disability Pension Scheme
IGS Indian Grameen Services
IGAS India Government Accounting Standard
IGIMS Indira Gandhi Institute of Medical Sciences
IHHL Individual Household Latrine
IHSDP Integrated Housing and Slum Development Programme
IIP Index of Industrial Production
IL & FS Infrastructure Leasing & Financial Services
IMFL Indian Made Foreign Liquor
IMR Infant Mortality Rate
IOC Indian Oil Corporation
IPC Indian Penal Code
ISOPOM Integrated Scheme of Oilseeds, Pulses, Oil Palm & Maize
ITES Information Technology Enable Services
ITI Industrial Training Institute
IWAI Inland Waterways Authority of India
IWDMS Integrated Work Flow and Document Management Software
IWDP Integrated Watershed Development Project
IWMP Integrated Watershed Management Programme
JBSY Janani Evam Bal Suraksha Yojna
JCI Jute Corporation of India
JICA Japan International Cooperative Agency
JNNURM Jawaharlal Nehru National Urban Renewable Mission
KCC Kisan Credit Cards
KGBV Kasturba Gandhi Balika Vidyalaya
KVIC Khadi and Village Industries Commission
KVK Krishi Vigyan Kendra

v
KHPS Koshi Hydel Power Station
LAN Local Area Network
LEB Life Expectancy at Birth
LoI Letter of Intent
MANAGE National Institute of Agricultural Extension Management
MDMS Mid-Day Meal Scheme
MDR Major District Roads
MFC Multi Functional Complex
MGNREGA Mahatma Gandhi National Rural Employment Guarantee Act
MGNREGS Mahatma Gandhi National Rural Employment Guarantee Scheme
MIS Monthly Income Scheme/ Management Information System
MIPB Manufacturing Industry Promotion Board
MMGSY Mukhyamantri Gram Sadak Yojna
MMR Maternal Mortality Rate
MMSNY Mukhyamantri Setu Nirman Yojana
MMSY Mukhyamantri Sadak Yojana
MNSY Mukhyamantri Nari Shakti Yojna
MPLADS Member of Parliament Local Area Development Scheme
MoU Memorandum of Understanding
MSDP Multi Sectoral Development Programme
MSME Micro, Small and Medium Enterprises
MTPS Muzaffarpur Thermal Power Station
MSTP Million Shallow Tubewells Programme
MSY Mahila Samridhi Yojana
MWCD Ministry of Women and Child Development
NABARD National Bank of Agricultural and Rural Development
NBCC National Buildings Construction Corporation
NDMA National Disaster Management Authority
NDRF National Disaster Response Force
NFBS National Family Benefit Scheme
NGO Non – Governmental Organisation
NGRBA National Ganga River Basin Authority
NHDP National Highways Development Project
NHM National Horticulture Mission
NIMZ National Investment Manufacturing Zones
NHO National Highway Organisation
NHPC National Hydro Power Corporation
NIC National Informatics Centre
NIESBUD National Institute of Entrepreneurship and Small Business
Development
NMCP National Manufacturing Competitiveness Programme
NMP National Manufacturing Policy
NPA Non Performing Assets
NPCIL Nuclear Power Corporation of India Limited
NPEGEL National Programme for Education of Girls at Elementary Level

vi
NPK Nitrogen, Phosphorous, Potassium
NRHM National Rural Health Mission
NRLM National Rural Livelihood Mission
NRWDP National Rural Water Drinking Programme
NSDP Net State Domestic Product
NSAP National Social Assistance Programme
NSFDC National Schedule Caste Finance Development Corporation
NSIC National Small Industries Corporation
NSKFDC National Safai Karmachari Finance Development Corporation
NSSF National Small Saving Fund
NSSO National Sample Survey Organisation
NTPC National Thermal Power Corporation
OAE Own Account Establishments
OFPPC On Farm Primary Processing Centre
ONGC Oil and Natural Gas Corporation Limited
OPD Out Patient Departments
OTS One-Time Settlement
PACS Primary Agricultural Cooperative Societies
PCRDB Primary Cooperative Agricultural and Rural Development Bank
PDPP Prevention of Damage to Public Property
PDS Public Distribution System
PGCIL Power Grid Corporation of India Limited
PHC Primary Health Centre
PHED Public Health Engineering Department
PIM Participatory Irrigation Management
PLI Postal Life Insurance
PLF Plant Load Factor
PMEGP Prime Minister Employment Generation Programme
PMGSY Pradhan Mantri Gram Sadak Yojana
PMRY Pradhan Mantri Rozgar Yojana
PoP Point of Presence
PPA Power Purchase Agreement
PPP Public Private Partnership
PQLI Physical Quality of Life Index
PRI Panchayati Raj Institution
PS Panchayat Samiti
PSU Public Sector Undertakings
PT Professional Tax
PURA Provision of Urban Amenities to Rural Areas
QE Quick Estimates
RBI Reserve Bank of India
RCC Reinforced Cement Concrete
REODB Real Estate, Ownership of Dwelling, Legal & Business Services
RFP Request for Proposal
RGSEAG Rajiv Gandhi Scheme for Empowerment of Adolescent Girls
vii
RGGVY Rajiv Gandhi Grameen Vidyutikaran Yojana
RGUMY Rajiv Gandhi Udyami Mitra Yojana
RIDF Rural Infrastructure Development Fund
RIPE Rural Infrastructure Promotion Fund
RPLI Rural Postal Life Insurance
RRB Regional Rural Bank
RSM/PC Rural Sanitary Mart/ Production Centre
RSVY Rashtriya Sam Vikas Yojna
RTI Act Right to Information Act
RUDSETI Rural Development and Self–Training Institution
SAP Special Auxiliary Police
SCA Service Centre Agency
SCARDB State Cooperative Agricultural and Rural Development Bank
SCB Scheduled Commercial Bank
SDC State Data Centre
SDMA State Disaster Management Authority
SDRF State Disaster Response Force
SecLAN Secretariat Local Area Network
SFC State Food Corporation
SFC State Finance Commission
SGRY Sampoorn Gramin Rojgar Yojana
SGSY Swarnajayanti Grameen Swarozgar Yojana
SHDP State Highway Development Programme
SHG Self Help Group
SIDBI Small Industries Development Bank of India
SIPB State Investment Promotion Board
SLBC State Level Bankers Committee
SME Small and Medium Enterprises
SOP Standard Operating Procedure
SPUR Support Programme for Urban Reforms
SPV Special Purpose Vehicles
SRR Seed Replacement Rate
SRI System of Rice Intensification
SRS Sample Registration System
SSA Sarva Shiksha Abhiyan
SSI Small Scale Industries
STPS Super Thermal Power Station
SWAN State Wide Area Network
T&D Transmission and Distribution
TFR Total Fertility Rate
TINXSYS Tax Information Exchange System
UD&HD Urban Development & Housing Department
UIDSSMT Urban infrastructure Development Scheme for Small and Medium
Towns
UIG Urban Infrastructure and Governance

viii
ULB Urban Local Bodies
UNDP United Nations Development Programme
VAT Value Added Tax
VPN Virtual Private Network
VTF Village Task Force
WDC Women Development Corporation
WDF Watershed Development Fund
WISE World Institute of Sustainable Energy
WLL Wireless in Local Loop
WPI Wholesale Price Index
WUA Water Users Association
WTM World Travel Market
ZP Zila Parisad

ix
Index of Tables
Table
No. Title Page No.
Bihar Economy : An Overview
1.1 Compound Annual Growth Rate (CAGR) of GSDP 3
1.2 Per Capita Net State Domestic Product (NSDP) at Current Prices of
Major Indian States
5
1.3 Sectoral Composition of GSDP at Constant (2004-05) Prices 6
1.4 Relatively Prosperous and Backward Districts of Bihar 9
1.5 Wholesale and Consumer Price Indices in Bihar and India 10
Agriculture and Allied Sectors
2.1 Annual Rainfall for Different Seasons (2001 to 2013) 28
2.2 Land Utilization Pattern in Bihar (2008-09 to 2010-11) 29
2.3 Production of Major Crops in Bihar (2008-09 to 2012-13) 32
2.4 Cropping Pattern in Bihar (2007-08 to 2012-13) 33
2.5 Productivity (kgs/ha) of Major Crops in Bihar 34
2.6 Leading Districts for Production and Productivity of Rice, Wheat,
Maize and Pulses in Bihar
37
2.7 Distribution of Certified Seeds and Seed Replacement Rate (SRR)
for Important Crops in Bihar (2010-11 , 2011-12 and 2012-13)
39
2.8 Consumption of Fertilizer in Bihar (2011-12 and 2012-13) 40
2.9 Minikit Demonstration in Bihar (2009-10 to 2012-13) 42
2.10 Number of Farm Implements Distributed on Subsidy 44
2.11 Agriculture Credit Flow in Bihar 46
2.12 Number of Kisan Credit Card issued by Banks (2001-02 to 2012-13) 48
2.13 Livestock and Fish Production of Bihar 50
Enterprises Sector
3.1 Growth in Industrial Sector (July, 2013) 65
3.2 Contribution of Industrial Sectors in GSDP 66
3.3 Annual Growth Rate of Industrial Sector in Bihar 67
3.4 Annual Survey of Industries (2009-10 and 2010-11) 68
3.5 Number of Factories in Operation (2009-10 and 2010-11) 68
3.6 Structural Ratios of Industries in India and Bihar (2010-11) 69
3.7 Fuels Consumed by Factory Sector 70
3.8 Percent Share of Fuel Consumed out of the Value of Output 71
3.9 Percent Share of GVA to Gross Output 71
3.10 Estimate of Employment, Mandays Employed and Emoluments Paid
in the factory sector
72
3.11 Some Key Parameters of Industries in Bihar 73
x
3.12 Large Scale Units Approved during 2012-13 73
3.13 Yearwise Micro, Small and Medium Registered Units set up in Bihar 75
3.14 Percentage Distribution of Medium, Small and Micro Enterprises
Registered in 2012-13
76
3.15 Sanction and Disbursement under PMEGP in Bihar in 2012-13 77
3.16 Performance Level of Sugar Mills in the three crushing years 79
3.17 Marketing of Different Milk Products by COMFED 83
3.18 Major Schemes for Handloom 86
3.19 Revenues from minerals in Bihar in 2012-13 87
3.20 Physical and Financial Achievements of Udyog Mitra 89
3.21 Regionwise Details of BIADA Activities (as on September, 2013) 90
3.22 Achievements of DIC under MSME 92
3.23 Status of BSWAN Project 93
3.24 Status of Sec LAN (Secretariat Local Area Network) 93
3.25 Status of Common Service Centre Project 94
3.26(A) Proposals Approved by SIPB (Upto September 2013) 95
3.26(B) Implementation Stages (2012-13, September 2013) 96
3.27 Yearwise Tourist Arrival (in thousands) 97
3.28 Details of Budget and Expenditure of Tourism Department 98
Infrastructure and Communications
4.1 Average Length of Road in Bihar and India (2011-12 and 2012-13) 107
4.2 Length of Roads in Bihar in 2011-12 and 2012-13 107
4.3 Status of Highways in Bihar (upto September 2013) 108
4.4 Status of Upgradation of NH into four/six Lanning in Bihar 109
4.5 Status of Sanction Limit and Approved Amount for Road
Construction by the Centre
110
4.6 Updated Progress of SH by different Agencies 111
4.7 Scheme wise Roads Constructed by Rural Works Department, upto
September 2013
113
4.8 Details of Digha - Sonepur Rail-cum-Road Bridge 114
4.9 Sanction of the High Level R.C.C. bridges during 2013-14 115
4.10 Bridges Constructed under Mukhyamantri Setu Nirman Yojana
(2012-13)
116
4.11 Number of Completed Bridges 117
4.12 Total Turn-Over of the Bihar Rajya Pul Nirman Nigam Limited 118
4.13 Revenue Collection of the Department of Transport (2009-10 to
2013-14)
119
4.14 Number of Registered Vehicles (2007-08 to 2013-14 - Upto
Sept. 2013)
120
4.15 Number of Passengers 124
4.16 Airlines and Numbers of Flights (Patna Airport) 126

xi
4.17 Aircraft Movements with Number of Passemgers anf Freights at
Patna Airport
126
4.18 Telephone Connections in Bihar (2001-2013) 128
4.19 Teledensity of Major Indian States 130
4.20 BSNL Bihar : Telecom Demography 131
4.21 Growth of BSNL 131
4.22 Postal Facilities in Bihar 134
4.23 Postal Traffic — Inland and Foreign (2011-12 and 2012-13) 134
4.24 Public Complaints Handled in Postal Department (2011-12 and
2012-13)
135
4.25 Number of Live Accounts and Amounts in Deposit 136
4.26 State Plans for 2012-13 137
4.27 Centrally Sponsored on going Schemes 138
4.28 Ultimate, Created and Achieved Irrigation Potential of the State 141
4.29 Physical Progress Creation of Irrigation Potential during 2011-12,
2012-13 and 2013-14 upto September
142
4.30 Water Utilization Efficiency of Major and Medium Irrigation
Schemes
143
4.31 Status of Minor Water Resources in Bihar 145
4.32 Irrigated Area through Minor Irrigation Sources 146
4.33 Districtwise Data on Ahar-Pynes / irrigation Ponds update 147
4.34 Power Supply Position in Bihar 148
4.35 Forecast of Peak Load and Energy Requirement (2013-14 to
2016-17)
148
4.36 Approved Outlay for BSPHCL (2013-14) 150
4.37 Power Generation and Purchase vis-à-vis peak demand 151
4.38 Current Status of Units at BTPS (As on 30/08/2012) 152
4.39 Status of Units at KHPS 152
4.40 Upcoming Projects in Bihar 153
4.41 Existing Infrastructure for Transmission 154
4.42 Bihar Power Sector Improvement Project -Current Status 155
4.43 Approved and Actual T&D Losses (Percentages) 156
4.44 Capital Expenditure of R-APDRP 157
4.45 Financial outlay of capital expenditure planned for distribution under
BRGF
158
4.46 Package-wise Summary of Works with ADB Funds 158
4.47 Operational and Financial Status of BSEB 159
4.48 Achievement for Construction of Power Sub-Stations, Electrification
of Villages and Electrification of BPL Households under RGGVY
160
4.49 Districtwise Allocation of RGGVY among PGCIL, NHPC and
BSPHCL
160

xii
Operational Minor Hydel Projects in Bihar 161
4.50 Status of Proposed Small Hydel Projects 162
4.51 Achievements of BREDA for FY 2011-12 and 2012-13 (until
September 2013)
163
Social Sectors
5.1 Trend of Social Services Expenditure 171
5.2 Demographic Profile of India and Bihar (2001 and 2011) 173
5.3 Classification of Districts by Rate of Urbanisation (2001 and 2011) 174
5.4 Life Expectancy at Birth of Bihar and India 175
5.5 Selected Health Indicators for Bihar and India (2007-2012) 176
5.6 Monthly Average Number of Patients Visiting Government Hospitals
(2007 to 2012) 178
5.7 Overall Status of Health Infrastructure 179
5.8 Districtwise Average Number of Outpatients visiting per Hospital
and per Day 180
5.9 Inpatient Bed Occupancy Rate 181
5.10 Number of Institutional Delivery (2007-08 to 2012-13) 183
5.11 Antigenwise Immunisation Coverage in Bihar 184
5.12 Prevalence of Main Diseases in Bihar (January to September 2013) 185
5.13 Staffing Position in ICDS in Bihar 186
5.14 Resource Utilisation in ICDS 187
5.15 Achievement under Water Supply and Sanitation in Bihar 189
5.16 Financial Progress in State Plan Schemes for Water Supply and
Sanitation 189
5.17 Physical Achievements in State Plan Schemes for Water Supply and
Sanitation 189
5.18 Financial Progress under NRDWP 190
5.19 Districtwise Classification of Literacy Rates in 2011 191
5.20 Trend of Literacy Rates in India and Bihar 192
5.21 Total Enrolment (in Lakhs) in Primary and Upper Primary Levels 193
5.22 Dropout Rates at Primary, Upper Primary, Secondary and Higher
Secondary Levels 196
5.23 Dropout Rates (SC & ST ) at Primary, Upper Primary and Secondary
Levels 197
5.24 Expenditure on Education 198
5.25 Coverage of MDMS in Bihar 199
5.26 Status of Fund Received and Expenditure by BEP (2012-13) 200
5.27 Status of Alternative Innovative Centres 201
5.28 Institutions of Higher Education in Bihar 202
5.29 Physical Targets for Development of Sports 203
5.30 Overview of Outlay Allocation of SC and ST Welfare 204
xiii
5.31 Achievements of Bihar State Scheduled Caste Co-operative
Corporation (2012-13) 207
5.32 Financial Progress of BC and EBC Welfare 207
5.33 Physical and Financial details of BC and EBC Department 209
5.34 Gender Budget Summary 211
5.35 Overview of Gender Budget 212
5.36 Flagship Schemes to Address Gender Disparity 212
5.37 Mukhyamantri Nari Shakti Yojana 213
5.38 Number of Cases registered and disposed under Social
Empowerment 215
5.39 Poverty Ratio of Bihar and India 216
5.40 Average Monthly Per Capita Expenditure of Bihar and India in
2011-12 (in Rs.) 217
5.41 Performance of the SGSY Programme 218
5.42 Performance of the MGNREGS 221
5.43 List of Category wise Completed Works under MGNREGS 222
5.44 Performance of the IAY Scheme 223
5.45 Overview of PDS Dealerships as on 2013 224
5.46 Working of Public Distribution System 225
5.47 Composition of Main Workers in Indian Major States (2011) 227
5.48 Target for Skill Development 229
5.49 Physical & financial progress of schemes for modernization of
employment exchange 230
5.50 Overview of Major Public Initiatives/ Schemes of Labour 231
5.51 Overviews of Panchayati Raj Institutions in Bihar 232
5.52 Overview of Financial Progress of PRIs 234
5.53 Progress under the Scheme of Provision of House Sites to Mahadalit
Families 235
5.54 Various Initiatives by State Government 236
5.55 Progress under Distribution of Bhoodan Land as on 2013 236
5.56 Summary of Assistance sought for drought 2013 in Bihar 239
5.57 Amount Allotted for Floods and Cyclones 240
Banking and Allied Sectors
6.1 Distribution of Commercial Bank Branch Offices in Bihar 284
6.2 Distribution of Branches of Commercial Banks among States
(2012-13)
284
6.3 Number of Branches of State and District Central Cooperative
Banks (As on March 31)
285
6.4 Number of RRBs Branches in Bihar (As on September, 2013) 286
6.5 Deposit and Credit of Regional Rural Banks 286
6.6 Rural Deposits of Scheduled Commercial Banks by Type of Deposit 287

xiv
(as March, 2012)
6.7 Distribution of Employees of SCBs (March 31, 2012) 288
6.8 Distribution of Female Employees of SCBs (March 31, 2012) 289
6.9 Statewise Deposits and Credit of Scheduled Commercial Banks in
India (March 31)
290
6.10 Statewise Per Capita Deposits and Credit of Scheduled Commercial
Banks in India (March 31)
291
6.11 CD Ratio of All Banks in Bihar 293
6.12 Bank Groupwise and Areawise CD Ratio in Bihar (2012-13) 295
6.13 CD Ratio of the Scheduled Commercial Banks as on March 31 296
6.14 ICD Ratios of Scheduled Commercial Banks 297
6.15 Districtwise CD Ratio 298
6.16 CD Ratio of Nationalised Commercial Banks 299
6.17 CD Ratio of Private Commercial Banks (2012-13) 300
6.18 CD and ICD Ratios of RRBs 301
6.19 Sectoral Share of Advances under Annual Credit Plans (2012-13) 301
6.20 ACP Achievement - All Banks 302
6.21 Agencywise Analysis of ACP Achievement (2012-13) 302
6.22 Agriculture Credit Flow 303
6.23 Outstanding Agricultural Advances 303
6.24 Select Indicators of Primary Agricultural Credit Societies (March 31,
2012)
304
6.25 Working Results of State Cooperative Banks 305
6.26 Working Results of SCARDBs (end March) 306
6.27 Number of Kisan Credit Card issued by Banks (2003-04 to 2012-13) 307
6.28 Statewise Distribution of Investments of SCBs 308
6.29 Sectorwise Refinancing by NABARD 309
6.30 Details of Sector-wise Investment Credit Refinance in Bihar by
NABARD
310
6.31 Cumulative Disbursements under RIDF till March 2013 311
6.32 Sanctions and Disbursements in Bihar under RIDF till March, 2013 311
6.33 Estimated Benefits under RIDF –XVIII as on March, 2013 313
6.34 Performance of SHGs in Bihar (March 2013) 314
6.35 SHG Bank Linkage in Selected States of India (March 2013) 315
6.36 Growth of Micro-financing in Bihar 316
6.37 Microfinancing by RRBs during 2012- 2013 317
6.38 Statewise Number of Registration of New Limited Companies
during 2011-12
318
6.39 Roadmap of Financial Inclusion as on September 30, 2013 319
State Finances

xv
7.1 Receipts and Expenditure of the Bihar Government 336
7.2 Major Fiscal Indicators 341-342
7.3 Fiscal and Financial Performance Indicators 347
7.4 Deficit/Surplus position of States 348
7.5 Gross Fiscal Deficit 350
7.6 Decomposition of Gross Fiscal Deficit of Bihar 351
7.7 Financing of Gross Fiscal Deficit of Bihar 352
7.8 Outstanding Liabilities 353
7.9 Composition of Outstanding Liabilities in the Consolidated Fund 355
7.10 Public Debt Repayment Liabilities 355
7.11 Net Public Debt Received 357
7.12 Tax : GSDP Ratio of States (2013-14 BE) 358
7.13 Revenue Account of Bihar 359
7.14 Expenditure Pattern of Bihar Government 361
7.15 Interest Payment and Receipt 362
7.16 Other Parameters of Expenditure 362
7.17 Transfer of Resources from Central Government to Bihar 363
7.18 Revenue Receipts 365
7.19 Tax Revenues under Different Heads 366
7.20 Composition of Tax Revenues 367
7.21 Growth Rates of Tax Revenue 369
7.22 Share of Direct and Indirect Taxes 369
7.23 Major Non-Tax Revenues of Bihar 371
7.24 Composition of Non-Tax Revenues 371
7.25 Growth Rates of Non-Tax Revenues 372
7.26 Variation between the Estimated and Actual Realisation of Tax and
Non-Tax Revenue (2012-13)
372
7.27 Cost of Collection of Taxes 373
7.28 Tax and Non-tax Revenue as Percentage of GSDP 374
7.29 Buoyancy of Important Tax and Non-Tax Revenue Sources 374
7.30 Grants and Contributions from Central Government 375
7.31 Actwise Commercial Tax Collection from (2007-08 to 2012-13) 376
7.32 Yearwise Percentage Share of Commercial Taxes in Total Revenue 376
7.33 Comparative Commodity-wise Collection of Sales Tax 377-378
7.34 Collections of State Excise Duty 379
7.35 Revenue from Stamp Duty and Registration Fees 380
7.36 Districtwise Revenue from Stamp Duty and Registration Fees,
2013-14 (upto Sep., 2013)
381
7.37 Expenditure from Consolidated Fund 382
7.38 Composition of Government Expenditure 383

xvi
7.39 Percentage Composition of Total Expenditure 385
7.40 Growth Rates of Expenditure 386
7.41 Details of Revenue Expenditure 388
7.42 Expenditure on Salaries and Pensions 389
7.43 Quality Parameters of Expenditure 391
7.44 Expenditure on Social Services 392
7.45 Expenditure on Economic Services 394
7.46 Per Capita Expenditure on Social and Economic Services 395
7.47 Summary of Budget, 2012-13 and 2013-14 397
7.48 Percentage Distribution of Consolidated Fund – Receipts and
Expenditure
398
7.49 Details of Central Funds Bypassing the State Budget 2009-10 and
2012-13
400
7.50 State Government Investment in Public Sector 402
7.51 Sectorwise Government Companies and Corporations, 2011-12 403
7.52 Summarised Results of Public Sector as per Their Latest Accounts
(as on 31st March 2012)
406-408
7.53 Milestones in Power Sector Reforms in the State, 2012-13 410
Index of Appendices
Appendix Title Pages
Bihar Economy : An Overview
Table A 1.1 Gross State Domestic Product (GSDP) and Net State Domestic
Product (NSDP) of Bihar At Factor Cost 11
Table A 1.2 Gross State Domestic Product (GSDP) of Bihar at Factor Cost
(Current Prices) 12-13
Table A 1.3 Gross State Domestic Product (GSDP) of Bihar at Factor Cost
(2004-05 Prices) 14-15
Table A 1.4 Net State Domestic Product (NSDP) of Bihar at Factor Cost
(Current Prices) 16-17
Table A 1.5 Net State Domestic Product (NSDP) of Bihar at Factor Cost (2004-
05 Prices) 18-19
Table A 1.6 Yearly Growth Rate of GSDP by Sector 20-21
Table A 1.7 Districtwise Per Capita Gross District Domestic Product at 2004-05
Prices 22
Table A 1.8 Districtwise Consumption of Petroleum Products 23-24
Table A 1.9 Districtwise Small Savings in Post Offices and Public Provident
Fund 25
Agriculture and Allied Sectors
Table A 2.1 Districtwise Annual Rainfall in Bihar for Different Seasons (2012
and 2013) 53
xvii
Table A 2.2 Districtwise Land Utilisation Pattern in Bihar (2010-11) 54-55
Table A 2.3 Districtwise Area, Production and Productivity of Rice in Bihar 56
Table A 2.4 Districtwise Area, Production and Productivity of Wheat in Bihar 57
Table A 2.5 Districtwise Area, Production and Productivity of Maize in Bihar 58
Table A 2.6 Districtwise Area, Production and Productivity of Pulses in Bihar 59
Table A 2.7 Districtwise Cooperative Credit Distribution in Bihar 60
Table A 2.8 Districtwise Achievement Kisan Credit Card (Numbers) 61
Table A 2.9 Districtwise Livestock Wealth in Bihar (2012) 62
Table A 2.10 Districtwise Achievement for Livestock Related Services 63
Table A 2.11 Districtwise Production of Fish and Fish Seed production in Bihar
(2010-11 and 2012-13) 64
Enterprises Sector
Table A 3.1 Value of output and Net value added of selected agro and non-agro
based industries (Bihar and India) (2010-11) 100
Table A 3.2 Structure of Industries in Bihar (2008-09 and 2009-10) 101
Table A 3.3 Social Category-wise Achievement of Micro, Small and Medium
Enterprises in 2012-13 102
Table A 3.4 Types of Minerals Available in Bihar 103
Table A 3.5 Industrial Area/Estate/Growth Centres under BIADA (2013-14, upto
Sept. 2013) 104
Table A 3.6 Plan Outlay for Information Technology Department 105
Infrastructure and Communications
Table A 4.1 District wise Road Network in Bihar (2011-2013) 164
Table A 4.2 District wise approved length and physical achievement of State
Highways (2012-13) under RSVY 165
Table A 4.3 Statistics of Registered Vehicle in Bihar State During the Year
2012-2013 166
Table A 4.4
Urban Development & Housing Department, Bihar — Physical &
Financial Progress of Urban Infrastructure and Governance (UIG) –
(2013-14, Upto sept. 2013)
167-168
Table A 4.5 Execution of Ongoing Major-Medium Irrigation Schemes (2012-17) 169
Table A 4.6 Execution of New Proposed Major-Medium Irrigation Schemes (
2012-17) 170
Social Sectors
Table A 5.1 Districtwise Demographic Profile of Bihar (2001 and 2011) 241
Table A 5.2 Districtwise Demographic Profile of Bihar (2001 and 2011) 242
Table A 5.3 Districtwise Results of Annual Health Survey (2011-12) 243-245
Table A 5.4 Number of Health Institutions in Bihar (September, 2013) 246
Table A 5.5 Districtwise Employment of Regular and Contractual Doctors in
Bihar 247
Table A 5.6 Districtwise Employment of Grade A Nurses in Bihar 248
Table A 5.7 Districtwise Employment of ANM in Bihar 249
Table A 5.8 Districtwise Employment of ASHA Workers in Bihar 250
Table A 5.9 Districtwise Number of Institutional Deliveries 251

xviii
Table A 5.10 District wise Coverage under Janani Bal Suraksha Yojana (JBSY) 252
Table A 5.11 Prevalence of Diseases (Reporting Period : 1st January, to 30
th
September, 2013) 253-254
Table A 5.12 Districtwise Fund Disbursed to Health Societies 255
Table A 5.13 Districtwise Construction of Hand Pumps under National Rural
Drinking Water Programme (NRDWP) 256
Table A 5.14 Districtwise Achievement under Central Rural Sanitation
Programme in Individual Household Lantrine (IHHL) 257
Table A 5.15 Districtwise Achievement under Central Rural Sanitation
Programme (Sanitary Complex, School Toilets, Anganwadi Toilets) 258
Table A 5.16 Districtwise Literacy Rate by Gender in Bihar : 2001 and 2011 259
Table A 5.17 Districtwise Literacy Rate by Residence in Bihar 260
Table A 5.18 Total Enrolment in Primary and Upper Primary Levels (All) 261
Table A 5.19 Total Enrolment in Primary and Upper Primary Levels (SC) 262
Table A 5.20 Total Enrolment in Primary and Upper Primary Levels (ST) 263
Table A 5.21 Districtwise Annual Growth Rate of Enrolment : 2006-07 – 2011-12 264
Table A 5.22 Districtwise Primary and Upper Primary Schools in Bihar (2007-08
and 2010-11) 265
Table A 5.23 Districtwise number of Teachers at the Primary and Upper Primary
Level (2007-08 and 2010-11) 266
Table A 5.24 Districtwise Coverage of MDMS (Class I-V ) 267
Table A 5.25 Districtwise Coverage of MDMS (Class VI-VIII) 268
Table A 5.26 Districtwise Colleges of Bihar 2010-11 269
Table A 5.27 District Level of Overview of SC/ST Welfare 270-271
Table A 5.28 Districtwise Progress under MGNREGA 272-273
Table A 5.29 Districtwise Financial Progress under MGNREGA 274
Table A 5.30 Overview of IAY (2012-13) 275
Table A 5.31 Districtwise Ahievement of Physical Targets and Fund Utilisation
under IAY 276
Table A 5.32 Districtwise Distribution of PDS Dealers by Their Social
Background in Bihar 277
Table A 5.33 Districtwise Alltoment and Lifting of Wheat and Rice for BPL
Households (2012-13) 278
Table A 5.34 Districtwise Alltoment and Lifting of Wheat and Rice for Antoday
Households (2012-13) 279
Table A 5.35 Districtwise Alltoment and Lifting of Wheat and Rice for
Annapurna Households (2012-13) 280
Table A 5.36 Districtwise Lifting Percentage for Wheat and Rice under BPL,
Antoday and Annapurna 281
Banking and Allied Sectors
Table A 6.1 Districtwise Performance Under Annual Credit Plan As On
31.3.2013 322-323
Table A 6.2 Districtwise Achievement Kisan Credit Card (Numbers) 324
xix
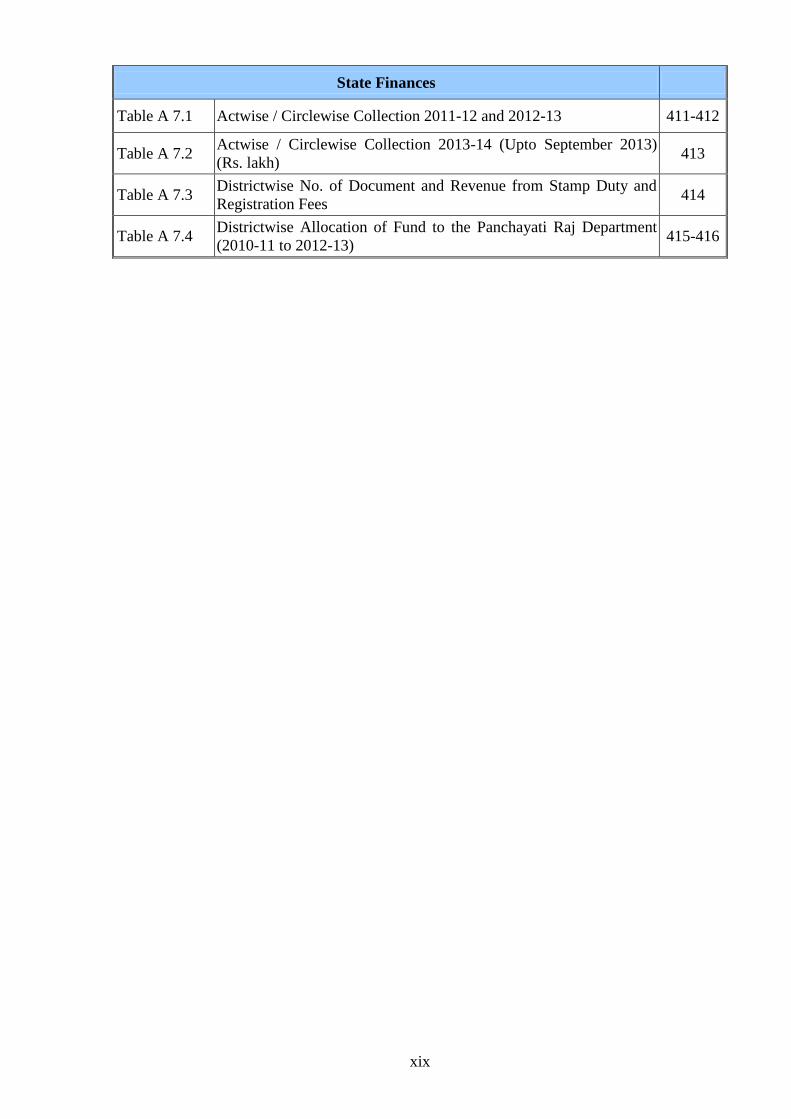
State Finances
Table A 7.1 Actwise / Circlewise Collection 2011-12 and 2012-13 411-412
Table A 7.2 Actwise / Circlewise Collection 2013-14 (Upto September 2013)
(Rs. lakh) 413
Table A 7.3 Districtwise No. of Document and Revenue from Stamp Duty and
Registration Fees 414
Table A 7.4 Districtwise Allocation of Fund to the Panchayati Raj Department
(2010-11 to 2012-13) 415-416
xx
EXECUTIVE SUMMARY
Bihar Economy : An Overview
1. The GSDP of Bihar at 2004-05 prices in 2012-13 is Rs. 1.65 lakh crore, yielding a per
capita income of Rs. 16,537. The estimated GSDP at current prices in 2012-13 is Rs.
3.09 lakh crore, implying a per capita income of Rs. 30,930.
2. During 1999-00 to 2005-06, the state income at constant prices grew at an annual rate
of 5.7 percent. After that, the economy witnessed a turnaround and grew at an annual
rate of 12.0 percent. It should be noted here that the rate of growth achieved by the
economy during 2006-13 is not only much higher than what was achieved in previous
period, but one of the highest among all the Indian states.
3. During the period 2006-13, the sectors recording a growth rate of more than 15 percent
are – Registered Manufacturing (18.2 percent), Construction (21.9 percent),
Communication (38.4 percent), Trade, Hotels and Restaurants (15.1 percent), and
Banking and Insurance (23.5 percent).
4. It is also quite pleasing to note that the rate of growth of Agriculture and Animal
Husbandry sector has been 5.9 percent during 2006-13, compared to only 3.0 percent
during 1999-2006 period. This is of special significance, as nearly 90 percent of the
population living in rural areas depend on this sector for their livelihood.
5. In 2008-09, the per capita income of Bihar (Rs. 13,728) was 33.7 percent of all-India
average (Rs. 40,775), but in 2012-13, this ratio has increased to 41.18 percent (Rs.
28,317 for Bihar and Rs. 68,757 for all-India). It is, thus, clear that the momentum of
growth in Bihar's economy has got to be sustained for many more years if the gap
between the per capita income of Bihar and that of India has to be closed.
6. The share of the primary sector has been showing a decline over the years, and it came
down to 25.9 percent for the triennium ending 2009-10 and then to 22.4 percent for the
triennium ending 2012-13. This shows that the importance of the primary sector has
declined steadily over the years.
7. The problem of low per capita income in Bihar is accentuated by the fact that there
exists considerable disparity across the districts in terms of their per capita income. The
latest estimates of per capita GDDP (Gross District Domestic Product) relate to
xxi
2010-11. In 2010-11, Patna (Rs. 57,483), Munger (Rs. 21,019) and Begusarai (Rs.
18,447) are the most prosperous districts of Bihar. On the other end of the ranking
ladder, the most economically backward districts are Sheohar (Rs. 6209), Banka (Rs.
7764) and Madhepura (Rs. 8102).
Agriculture and Allied Sectors
1. The Agriculture Road Map has ensured that productivity steadily rises in the fields.
This is corroborated by the fact that the state has reached the productivity of 2240
kg/hect for paddy in recent years. The state government is putting in a strong
agricultural monitoring system, so that nothing is left to chance.
2. The average annual rainfall is reasonably adequate for the state’s agricultural
operations. However, it is the year-to-year variation in rainfall which tends to create
flood or draught like situations in the state in some years. This causes serious damage
to crop production which affects the state income, since almost 50 percent of the
farmers depend on monsoon for their agricultural operations.
3. If one considers the net sown area of various districts for 2010-11, there exist 5 districts
whose net sown area is more than 70 percent, whereas the average net sown area for the
entire state is less than 60 percent. These districts are the valuable agrarian tract of
Bihar — Bhojpur (79.9 percent), Buxar (82.7 percent), Siwan (76.7 percent)
Madhepura (73.8 percent), and Gopalganj (72.9 percent).
4. Because of the use of new ‘SRI’ technique and use of newer agricultural implements,
there was enormous rise in rice production. The level of rice production prior to 2010-
11 was not consistent, with much year-to-year variation in the production levels. The
average annual wheat production was around 40-45 lakh tonnes between 2007-08 to
2009-10; thereafter, the production of wheat rose to 49.03 lakh tones in 2010-11 and
still higher at 61.74 lakh tonnes in 2012-13. The annual production of maize varied
around 18 lakh tonnes. But in 2011-12, the maize production touched a new height of
24.86 lakh tonnes, and it was still higher at 27.56 lakh tonnes in 2012-13. The annual
rate of growth of maize production for the period from 2008-09 to 2012-13 works out
to a 15.5 percent.
5. The scheme of 'Mukhyamantri Tibra Beej Vistar Yojana' has helped farmers immensely
in the field of hybrid paddy cultivation. The Seed Replacement Rate (SRR) for major
crops like rice, wheat and maize have increased substantially in recent years. More
xxii
significantly, the SRR has touched the scientific level of 33 percent for self-pollinated
crops. The SRR has exceeded 33 percent for all major crops in 2011-12 and 2012-13.
With the efforts put in by the state government, there has been gradual increase in SRR
for other rabi and kharif crops as well.
6. The consumption of fertilizer has been steadily increasing in Bihar in recent years. In
2009-10, the total consumption of fertilizer was 39.08 lakh tonnes, which rose to 46.21
tonnes in 2012-13 registering an increase of 18.21 percent over the three year period.
The rising trend emphasizes that the farmers are willing to adopt new technology in
agriculture.
7. Under 'Agricultural Road Map' of the present state government, farm mechanization
constitutes an integrated part and is a major thrust programme. The state government is
providing subsidy over and above provided under centrally sponsored scheme for
power tillers, tractors, sprayers, winnowing machine, power weeder and power
threshers. It has specially focused on zero-tillage machine which is more suitable for
small and marginal farmers. These equipments were very uncommon in rural areas
about a decade ago, but are part of agricultural households now mainly because of easy
availability of subsidy.
8. Besides vermi-compost, efforts are being made by the state government for the
promotion of bio-fertilizers like Rhizobium, Azotobacter, Blue-green algae,
Mycorrhiza. The seed producers are given free kit of appropriate bio-fertilizer. During
the rabi season of 2011-12, more than 3 lakh farmers have benefitted through
promotion of bio-fertiliser. To increase production of bio-fertilizer, both farmers and
entrepreneurs would be supported in a big way, so that manufacturing units for such
input may come up in the state. This would lessen the dependence on other states for
such input.
9. Various other sectors which are interlinked with Agricultural development are dealt by
Sub-committees formed in the line departments by Agriculture Cabinet. These sectors
are — Water Management and Irrigation, Energy, Land Resource Management,
Plantation and Environment Protection, Cooperatives, Storage, Marketing and
Processing, Agricultural Research, Agricultural Credit and Communication. In the road
communication sector, unconnected habitation of populations 250+ is planned to be
connected with the approach roads.

xxiii
10. In the new programme of artificial insemination, private parties would also be
associated on the basis of successful calf-born for each NGOs. Under this, 50 lakh
cattles are likely to be assured at a cost of Rs. 1 lakh per year. Apart from this, there is a
proposal to create a modern slaughter house at each of the 38 districts for the
production of clean and hygenic meat at a cost of Rs. 1 crore per unit.
11. In 2004-05, the production of fish in Bihar was 2.67 lakh tonnes. The fish production
increased steadily thereafter and touched the peak of 4.00 lakh tonnes in 2012-13.
During the last two years, the production has been of the order of 3.44 lakh tonnes in
2011-12 and 4.00 lakh tonnes in 2012-13.
Enterprises Sector
1. Against the backdrop of emerging positive trend in the industrial sector during the year
2013, Bihar registered an even better achievement. The contribution of Bihar's
industrial sector to its Gross State Domestic Product (GSDP) has been increasing
during 2009-10 to 2011-12; but it is still smaller compared to any other state.
2. The GSDP of Bihar at 2004-05 prices in 2012-13 worked out to Rs. 165 thousand
crore, in which the annual growth rate of industrial sector was 17.1 percent. After
registering a setback in growth rate (9.5 percent) in 2011-12, the industrial sector in
Bihar appears to be on recovery path, with a growth rate of 17.1 percent in 2012-13.
However, it is still lower than the level of 28.4 percent achieved in 2010-11.
3. Within the industrial sector, the growth rate of construction was very high (34.4
percent) in 2010-11; but it slided down to as low as 9.9 percent in the subsequent year
and again jumped to 21.1 percent in 2012-13. Similarly, manufacturing which recorded
a growth rate of 22.8 percent in 2010-11, in the subsequent two years its growth rates
were 8.9 percent and 9.6 percent respectively.
4. In Bihar, the total number of MSMEs was around 1.95 lakh by September, 2013.
During 2007-08, as many as 7202 units under MSME were registered. However, the
number of units registered showed a decline in 2011-12 when only 3962 units were
registered. In 2012-13, the number was still smaller at 3737. However, the investment
and employment per unit have registered a phenomenal increase over the period.
5. The investment per unit, which was Rs. 1.87 lakh in 2007-08 increased to Rs. 9.73 lakh
in 2011-12, and the employment per unit increased from 2.77 persons in 2007-08 to

xxiv
4.06 persons in 2011-12. In 2012-13, the investment and employment per unit,
however, was reduced to Rs. 6.79 lakh and 2.92 persons respectively. In comparison to
all-India figures, the investment and employment levels are rather low and it indicates
that a overwhelming number of MSME units in Bihar fall under the category of 'small
and tiny'.
6. During 2012-13, under PMEGP, 10,828 units were recommended for margin money
against the target of 6290 units, of which 3150 units (29 percent) were sanctioned the
same. All the sanctioned units had received their assistance, and a total amount of Rs.
76.69 crore were disbursed to them, the disbursed amount per project being Rs. 2.43
lakh. These units were estimated to generate employment for 19.11 thousand workers,
based on which the per project employment works out to 6.1 persons.
7. Bihar produces varieties of fruits and vegetables in large quantities. The area under
fruits is about 298 thousand hectares and, under vegetables, another 853 thousand
hectares. Among the fruits, banana, mango, guava and litchi are important in terms of
production. Out of 3933 thousand metric tonnes of total production of fruits in the state
in 2011-12, around 40.2 percent was banana, 32.0 percent mango, 6.2 percent guava,
6.0 percent litchi, and 3.3 percent pineapple. Makhana is also a unique product of the
state, with an annual production of around 96,000 tonnes.
8. There are in all 28 sugar mills in the state, either under public or private sectors, of
which 12 are working. Of the 12 sugar mills, 10 are in private sector and 2 under public
sector, both handed over to HPCL in 2011 on lease basis. A total of 35.88 lakh quintals
of sugar was produced in 2012-13, compared to 45 lakh quintals in the previous year.
The sugar industry in the state is faced with the challenge of low sugar recovery from
cane at 8.59 percent, which is much lower than Maharashtra’s rate of 12 percent.
9. In more than 25 thousand acres, mostly in Kishanganj and the rest in Purnea, Katihar
and Araria districts, more than 4 million kgs. of tea is grown every year. In Kishanganj
district, around 50 percent of the area is covered under tea crop in Pothia block, There
are only 7 tea processing plants in Kishanganj, with an annual output exceeding 2300
tonnes of tea; however, there is a scope for another 50 new tea processing plants in
Kishanganj. For want of adequate local tea processing plants, a majority of growers
have to ferry their products to the neighbouring north Bengal.
10. In terms of milk procurement, Bihar is among the leading states in the country. The
number of milk cooperative societies organised upto 2012-13 was 13,681, of which

xxv
1196 were Women's Cooperative Societies. The total membership of the dairy
cooperative societies was 7.59 lakh in 2012-13. Through these societies, the total milk
procured during 2012-13 was 12.45 lakh kgs./day. Against the procurement of 12.45
lakh kgs. of milk/day in 2012-13, the average milk marketing was 9.20 lakh kgs. per
day.
11. Handloom units are operational in the state in large numbers which provide
employment to around 1.32 lakh weavers. There are 1089 primary handloom societies,
with around 10,850 handlooms operating under them and, at the apex level, there are
two marketing organisations viz., Bihar State Handloom Cooperative Union and Bihar
State Wool and Sheep Union, both located at Patna. The handloom units are
concentrated in 14 districts in the state. Under powerloom sector, there are more than
11,000 looms, which are mostly concentrated in Bhagalpur, Gaya and Banka.
12. Till September, 2013, the State Investment Promotion Board (SIPB) has approved a
total of 1362 proposals for establishment of industrial units in the state, involving an
investment of Rs. 2.83 lakh crore, with employment potential of 2.01 lakh persons. Of
the total approved proposal, 56 percent are for food processing and power plants,
constituting around 8 percent of the total proposals.
13. The number of foreign tourists recorded more than six times increase in 2012 (11 lakh)
over 2007 (1.77 lakh); simultaneously during the period, the number of domestic
tourists was more than doubled. Of the total foreign tourists arrival in top 10 states in
India, 5 percent visited Bihar, putting the state at the sixth rank among the top ten in
2013. As many as 68 lakh domestic visitors came to Bihar in 2013, till August.
14. Around 92 percent of entrepreneurs, falling under micro, small and medium scale
industries, are not taking benefits from the banking service. The main reason for this
state of affairs is the lack of awareness about the specific schemes of banks. The
banking professionals, both from the public and private sectors, should come forward
to help MSMEs in promoting industrialisation of the state.
15. The big business houses have already started investing in the state for creating
industrial ambience in the state, but more investments are required for faster growth of
industrial sector. The state has thrown open many opportunities for the entrepreneurs in
various sectors like manufacturing, food processing, tourism, dairy, IT, sugar, tea, and
other sectors. The agro-based industries would be a great success in the state because of
its agriculture-based economy.
xxvi
Infrastructure and Communications
1. In 2012-13, Bihar with 174.88 kms. of road length per lakh population lagged much
behind the all-India (387.53 kms) average as before; but, in terms of road length per
100 sq.km., it by-passed all-India (142.67 kms) with a record achievement of 192.78
kms. and recorded a big jump by over 73 kms. over the previous year as against only 15
kms. at all-India level.
2. During October, 2012 and September, 2013, there has been an increase of 466.33 kms.
in the length of National Highway (NH) in the state, registering an increase of 12.5
percent. However, the State Highways registered a decline in road length of about 374
kms. during the period, indicating that this much length of SH has been upgraded as
NH during the year. The Major District Roads (MDR), registered an increase of 4.64
percent over the last year, and the length of rural roads increased by around 32.5
percent.
3. There were in all 28 National Highway in the state upto September 2012; with the
addition of 4 more highways during the year, their number has now become 32,
measuring a total length of 4200.71 kms. The length of National Highways in Bihar is
quite inadequate in view of its strategic location, bordering Nepal. Efforts are underway
to increase the existing length.
4. The total length of State Highways (SH) in Bihar is 4483.19 kms., as on September,
2013. The State Highways have around 62 percent of double lane roads, 22 percent of
single lane and 15 percent of intermediate lane roads. The four lane roads with width of
14 meters constitute a very negligible proportion (0.98 percent) of the total road length
under State Highways.
5. The Major District Roads in the state are 9449.36 kms. in length, with varying widths.
In view of the inadequacy of width (3.05 - 3.50 m.) of a majority of MDRs in the state
and their incapacity to cope with the increasing traffic intensity, the state government is
making endeavours to upgrade these roads to a minimum intermediate lane standard
with a width of 5.50 meters. The upgradation work will be taken up, subject to the
availability of funds; in case such upgradation is not possible, their surface is planned
to be renewed.
6. The total length of rural roads works out to around 1.62 lakh kms. in Bihar, of which a
substantial proportion is unpaved. The Rural Works Department constructs rural roads

xxvii
and bridges under various schemes and has completed about 39,809 kms. of roads at an
expenditure of Rs. 18,743 crore. On an average, this implies laying of 41.47 kms. new
roads per day upto September 2013.
7. The construction of road overbridges at 22 railway crossings in the state was taken up
on cost sharing basis. The work on 14 road overbridges was undertaken by IRCON
International. Till date, 10 of these road overbridges have already been completed and
the work on the remaining four is in progress. Besides, 8 road overbridges on Major
District Roads have been constructed by IRCON International and the approach roads
to 7 out of these 8 have been constructed by the Bihar Rajya Pul Nirman Nigam Ltd.
8. The number of registered vehicles is increasing every year and recorded more than
three fold increase from 1.62 lakh in 2007-08 to around 5 lakh in 2012-13. During the
first six months of 2012-13 (April-September), 2.85 lakh new vehicles have been
registered. All categories of vehicles recorded a phenomenal increase during the recent
years. While the trucks and auto-rickshaws displayed almost a five fold increase, the
vehicles like cars, taxis, tractors and the two-wheelers recorded around three fold
increase during the period.
9. The telecom sector in Bihar also grew tremendously during the last few years. By
March 2012, there were 460.10 lakh telephone connections in Bihar, of which around
90 percent were under private operators. In 2012-13, the number of telephone
connections increased to around 547 lakh, registering an increase of around 19 percent
over the previous year. This is despite a drop in number of BSNL connections by about
8 percent. However, the private operators have successfully maintained the rising trend
in providing connections, and increased their share to around 92 percent of the total
number of connections during the year.
10. Under the State-Plan, various schemes like water supply, drainage construction, roads,
Mukhyamantri Urban Development schemes are being undertaken for which Rs. 26.67
crore, Rs. 18.90 crore, Rs. 48.87 crore and Rs. 40.60 crore respectively have been
budgeted for the year 2012-13. Similarly, under non-plan head, a budget provisioin of
Rs. 264.77 crore was made in the light of Fourth State Finance Commission
recommendation and another Rs. 155 crore as per the Thirteenth Finance Commission
recommendations.
11. Under Integrated Housing and Slum Development Programme (IHSDP), a Centrally
Sponsored Scheme, 32 projects have been approved by the central Government for 28

xxviii
towns of the state and the amounts against 31 projects have already been released. The
work under first phase of the projects in 15 towns is nearing completion. Under
JNNURM, a total of 10 projects have been approved with the share of centre and the
state being 50:50 for Patna and 80:20 for Bodh Gaya. The total cost of these 10 projects
is estimated at Rs. 758.47 crore. A total of 11 projects, with the share of centre and
state being 80:20, has been approved for infrastructure development in small and
medium towns in the state.
12. Against the already created potential of 63.04 lakh hectares through the major, medium
and minor water resources schemes, only 45.47 lakh hectares of irrigation is utilised
annually. From the year 2011-12 upto September, 2013 a total of 29.63 thousand
hectares of irrigation potential in major and medium irrigation sector has been created.
The ultimate potential of minor irrigation is around 64 lakh hectares, of which a little
above 53 percent has been created and 85 percent of this created potential is being
utilised.
13. At 118 kwh. the per capita consumption of electricity in Bihar is the lowest in the
country. The peak deficit has been around 30 percent for several years in the past. The
peak availability has been increasing, but has been just enough to catch up with
increasing peak demand, and not to bridge the deficit.
14. The improvement and expansion of the transmission network is being carried out by the
state in two phases under Rashtriya Sam VikasYojana (RSVY). Bihar State Power
Transmission Company has planned capital expenditure for installation of new
transmission lines and sub-stations, as well as augmentation and R&M works to
strengthen the existing transmission network. A capital investment of Rs. 6845 crore
has been planned for this purpose.
15. The total installed capacity in the state is around 494.3 MW, but the generation has
never exceeded 72.2 MW in recent years; in 2011-12, the generation was only 38.9
MW. This poor situation can be better understood by studying the three generating
units, that were left to present Bihar, after its separation from Jharkhand in 2000.
16. Bihar, with only 11.3 percent urban population, remains the least urbanised state in
India, the national average standing above 30 percent. Thus, improving connectivity of
rural areas to the power grid is of great importance. Taking cognizance of this fact, the
rural electrification work is being carried out in all the 38 districts of the state under

xxix
Rajiv Gandhi Grameen VidyutikaranYojana (RGGVY). In 24 districts, work is being
carried out by the Power Grid Corporation of India, in 6 districts by National
Hydroelectric Power Corporation (NHPC), and in the remaining 8 districts by
BSPHCL. Altogether, 24,858 villages have been electrified and 2395 lakh BPL
families connected to the grid, and 124 power stations could be charged upto November
15, 2013.
Social Sectors
1. The Manav Vikas Mission (MVM) for 2013-17 is an innovative plan of the state
government to improve the human development in the state. Without this special
emphasis on human development, it is not possible to impart an inclusive orientation to
the growth process. Under MVM, the state government has identified six components
— (i) Demography, Health and Nutrition, (ii) Elementary Education and Literacy, (iii)
Drinking Water Supply and Sanitation, (iv) Information Technology, (v) Security for
Weaker Sections and Ultra Poor and (vi) Art, Culture and Sports.
2. Bihar is the third most populated state of India with a population density of 1106
persons per sq. kms., compared to the national average of 382 persons per sq. kms.
With a total population of 104.1 million in 2011, Bihar constitutes 8.6 percent of the
total Indian population. Three demographic features of Bihar which are substantially
different from India are — decadal growth rate of population, density of population and
rate of urbanisatioin. The decadal growth rate of population for Bihar (25.1 percent) is
much higher than for India (17.6 percent)
3. The rate of urbanisation of Bihar was 11.3 percent in 2011 and 10.5 percent in 2001,
implying an increase of barely 0.8 percentage points over the decade. For India as a
whole, this difference was 3.4 percentage points, indicating a much faster growth of
urbanisation in the country.
4. The decentralisation of health services and inter-sectoral convergence in Bihar has led
to improved health status in the state. Better infrastructure, drugs and equipment,
augmentation of human resources for health services have all led to improvement in
delivery of health services. In recent years, Bihar has made significant progress in
meeting challenges of health sector. This may be attributed to increased expenditure on
health, expansion of health infrastructure, as well as constant and effective monitoring
of the health services.
xxx
5. While comparing the Total Fertility Rate (TFR) in Bihar and India, it has been noticed
that the TFR is consistently higher in Bihar. But fortunately, some early indicators of
demographic transitioin is noticed here. The TFR in Bihar has decreased from 3.9
children in 2007-08 to 3.5 children in 2011-12, a drop of 0.4 children. The drop in the
all-India rate is 0.3 children. The other indicator of health is Infant Mortality Rate
(IMR). It is interesting to note that, in spite of being an economically and socially
disadvantaged state, the IMR in Bihar is very close to the all-India average. Further, the
improvement in the IMR during the recent years has been as fast in Bihar as in India as
a whole. In 2012, the IMRs in Bihar were — male (42), female (45) and overall (43).
The corresponding figures for India were — male (41), female (44) and overall (42).
Another remarkable point to be noticed is that the IMR both in case of India and Bihar
have registered continuous decline over the years.
6. The number of institutional deliveries in Bihar has increased phenomenally in recent
years. In 2008-09, there was a spurt in institutional delivery when 11.4 lakh children
were born in some health institutions, recording an increase of 36.3 percent over the
previous year. After that, there was moderate but steady increase in institutional
deliveries every year. In 2012-13, the institutional deliveries had numbered 14.7 lakh.
7. The budget provisions for ICDS has steadily increased from Rs. 483.59 crore in 2007-
08 to Rs. 1393.30 crore in 2012-13, implying an annual growth rate of 23.43 percent. In
2012-13, the funds released by the central government are 82.40 percent of the
budgetary amount, which is higher than that in the previous year. Secondly, 92.62
percent of released fund has been spent in 2012-13, which clearly indicates the
effective utilisation of this fund.
8. In 2012-13, as many as 31.9 thousand hand pumps have been installed under the
National Rural Drinking Water Programme (NRDWP). A major achievement is also
recorded in the construction of Individual Household Latrine (IHHL), with around 8
lakh such latrines being constructed in 2012-13. In addition, 17.0 thousand school
toilets and 4822 Anganwadi toilets have also been constructed in this year.
9. Under Mukhyamantri Chapakal Yojana, 40,741 handpumps were installed out of the
sanctioned 55,240 handpumps in 2012-13. Rs. 240.42 crore was sanctioned for the
installation of 55,221 handpumps in 2013-14. Under DFID-health project, work
started in 100 solar energy operated mini pipe water supply schemes in four blocks

xxxi
of Gaya district (Bodhgaya, Dobhi, Nagar and Manpur) in scheduled caste
dominated habitations.
10. The state has improved significantly in increasing its literacy rate during the last
decade, from 47.0 percent in 2001 to 61.8 percent in 2011. This implies an increase
of 14.8 percentage points during the decade. It is worthwhile to note that this decadal
increase is not only the highest among all the decadal growth rates in Bihar since
1961, it is also the highest among all the states for the decade 2001-11. In Bihar, the
2011 Census recorded male literacy at 71.2 percent and female literacy at 51.5
percent, recording a gender disparity of 20 percentage points.
11. The total enrolment in primary level was 156.50 lakhs in 2011-12, which had
increased from 146.3 lakhs in 2007-08. At the upper primary level also, the
enrolment has risen during the last four years. The total enrolment at this level in
2011-12 was 50.55 lakhs, with an annual growth rate of 14.4 percent; for the SC and
ST students, the growth rate was higher.
12. The total number of primary and upper primary schools in Bihar rose to 68,323 in
2010-11, from 67,865 in 2007-08. During this period, many primary schools have
been upgraded to upper primary school.
13. The effective implementation of MDMS can play a significant role in ensuring the
universal coverage of education. This is particularly important for poor states like
Bihar. There are many concerns regarding the proper implementation of MDMS.
Some of them are – wide variation in the enrolment and attendance, less control over
the quantity and quality of food and irregular supply of foodgrains. To overcome
these problems, monitoring and evaluation system needs to be more effective.
14. The state government has undertaken several targeted schemes based on the report of
the State Mahadalit Commission for the welfare of the most deprived amongst the
scheduled castes. The Commission observed that, out of the 22 scheduled castes in
Bihar, 21 are acutely deprived in terms of, economic, social, cultural and political
status, and population belonging to these castes have not benefited significantly from
affirmative actions meant for the SC population.
15. The drop in sex ratio from 919 in 2001 to 918 in 2011 in Bihar, as against an
improvement in sex ratio from 933 to 943 in India, is a matter of serious concern for
the state government. The gender inequality arising out of social norms and cultural
xxxii
traditions is now being addressed both directly and indirectly. The progress towards
gender equality and women’s empowerment in Bihar have been built upon strong
commitments of the state government. In order to empower women, the state
government has been publishing its gender budget since 2008-09.
16. Along with economic and social empowerment, cultural empowerment is also an
essential part of personality development. Therefore, Women Development
Corporation is playing an active role in cultural empowerment of women of the state.
To strengthen the artistic and craft-based skills through training, enterprise, marketing
etc. it is proposed that the cultural events be organized primarily in all 9 Divisional
headalquarters by the panel of selected agencies. A detailed plan of action regarding
logistics, participation. events, convergence strategy would be worked out in a phased
manner.
17. As estimated by the Tendulkar Committee, the poverty ratio of Bihar is higher in
both 2004-05 and 2011-12, compared to all-India level. The ratio for Bihar is 34.1
percent for rural and 31.2 percent for urban households in 2011-12, implying an
overall poverty ratio of 33.7 percent. It may also be seen that, between 2004-05 and
2011-12, the poverty ratio declined by 20.7 percent for Bihar as against 15.3 percent
for all-India. The pace of reduction of rural poverty has been faster than that of the
urban poverty, in both Bihar and India.
18. The Bihar Rural Livelihoods Promotion Society has been designated as State Rural
Livelihoods Mission by the state government under the overall framework of
National Rural Livelihoods Mission. It will scale up its JEEViKA model of poverty
alleviation throughout the state in a phased manner. The programme will be
operational in all the blocks by 2014. Overall, 1.5 crore rural poor families would be
organised into 10 lakh SHGs, 65 thousand Village Organisations (VO), 1600 Custer
Level Federations (CLF) and 534 Block Level Federations (BLF).
19. The Public Distribution System (PDS), a target group strategy to alleviate poverty, is
an instrument to make available essential commodities to people, particularly those
living below the poverty line. In Bihar, the PDS is extremely necessary as there exist
wide poverty and inequality. The PDS also plays a crucial role as an anti-inflationary
measure and keep the foodgrain prices depressed. Four essential commodities
(wheat, rice, sugar and kerosene oil) are distributed through PDS outlets.

xxxiii
20. To enhance the skill of the youth of the state, an autonomous society has been
constituted under the chairmanship of Hon’ble Chief Minister – ‘Bihar Skill
Development Mission (BSDM)’ to develop skill of one crore youth by 2017. This
target has been distributed yearwise among several line departments. The role of the
line departments and BSDM has been defined clearly to avoid any confusion and
difficulty in achieving the targets. The role of the line departments is to identify the
trades in demand, select the trainees, select quality trainers, monitor the training
programmes and also arrange for the required budget.
21. Redistributive justice is one of the main planks of the present government. Towards
this, in recent years, a special focus of the revenue administration of the state has
been provision of 3 decimals of land for house sites to each Mahadalit family which
do not have such site. According to survey, 1.98 lakh Mahadalit families live in
Bihar and, till March 2013, the number of landless Mahadalit families benefitting
from this scheme is 1.70 lakh, involving 4915 acres land.
22. The state government has created the State Disaster Management Authority (SDMA)
on the lines of National Disaster Management Authority (NDMA). The NDMA has
set up a battalion of National Disaster Response Force (NDRF) at Bihta, near Patna.
It had procured 74.47 acres of land for housing this battalion. On its part, the state
government has also created a battalion of its own State Disaster Response Force
(SDRF), comprising retired army officers and naval personnel. The retired persons
of central police force are also eligible to be engaged in SDRF. Till date, 302 persons
have already been appointed and the process of appointing 625 more is on.
Banking and Allied Sectors
1. The financial sector in India has always been dominated by the Scheduled Commercial
Banks (SCBs), accounting for major chunk of the total financial flows in the economy.
These banks also play a major role in financial inclusion, and this is especially
important for the rural sector. In the near absence of a capital market, the financial
sector in a state like Bihar is almost entirely driven by the SCBs.
2. At the end of March 2013, 54.0 percent of the total 5008 branches of commercial banks
in Bihar were located in rural areas, compared to 61.6 percent in 2008. The decline in
the share of rural branches has been continuing unabated since 2008.

xxxiv
3. It can be noted that Bihar accounted for only 4.6 percent of all the bank branches in the
country in March 2013, though its share in country's population was 8.6 percent.
Bihar’s share in the total bank branches in the country has also practically remained the
same over the past few years.
4. Bihar accounted for only 3.2 percent of all the employees of scheduled commercial
banks in India in March, 2012. Female employees of scheduled commercial banks in
Bihar account for a share of only 1.4 percent of all female employment in the scheduled
commercial banks in the country.
5. Credit-Deposit (CD) ratio of scheduled commerical banks in Bihar in 2012-13 was the
lowest (30.10 percent) among all major states in India, as in the previous years. It was
nowhere near the national average of 78.09 percent, not to mention the high CD ratios
of Tamil Nadu (122.99 percent), Andhra Pradesh (109.94 percent), Rajasthan (92.17
percent) or Maharashtra (88.32 percent).
6. The total involvement of the banks in the economic activities of a state is truly reflected
not by CD ratios alone, but by the Investment plus Credit to Deposit (ICD) ratios. As of
March 2012, Bihar had an ICD ratio of 38.5 percent by utilisation, compared to its ICD
ratio of 36.5 percent by sanction. The ICD ratio of Bihar, however, is much lower
compared to that of states like Rajasthan (110.5 percent), Tamil Nadu (128.7 percent),
Gujarat (89.3 percent) or Karnataka (79.0 percent), as well as the national average (85.2
percent) in March 2012. The ICD ratio in Bihar has actually dropped from its high level
of 52.8 percent in 2008 to less than 40 percent in 2012.
7. The share of agriculture in the total advances within the state was 49.42 percent, up
from 46.14 percent in the previous year. It can be seen that the advances made to the
small and medium scale industries were only 6.61 percent of the total loans disbursed
in 2012-13, which was significantly less than 8.86 percent registered in 2011-12.
8. Under the Annual Credit Plan of banks in Bihar, the total credit flow in the state has
gone up from Rs 32,416 crore in 2011-12 to Rs 44,521 crore in 2012-13, registering a
37.3 percent growth which was higher than the 27 percent growth registered a year
before.
9. The poor resource base of the Primary Agricultural Credit Societies, their poor
management and low level of participation of their members are major bottlenecks to
increase the credit flow through PACS. As indicated by NABARD, the capacity of the

xxxv
PACS is limited to meet only the credit requirements of its members to some extent; in
order to enable them to provide more services to their members and generate income
for themselves, it is necessary to develop them as Multi-service Centres to provide
ancillary services to their members and diversify its activities.
10. The cumulative number of Kisan Credit Card (KCC) issued by banks in Bihar in
2012-13 was 22.3 lakh. The achievement figures were consistently high, exceeding 80
percent till 2006-07, after which there was a visible decline, with the achievement rate
dropping to only 56.9 percent in 2010-11. It later recovered and, in 2012-13, the figure
stood at a respectable 77.2 percent.
11. Till the end of March, 2013, 18 tranches of RIDF have been released covering a total
cumulative sanction for Rs.1,62,083 crore for the entire country, out of which only Rs
1,10,963 crore (68.5 percent) have been disbursed. For Bihar, however, only Rs 3969
crore (56.5 percent) of the total sanctions of Rs 7025 crore could be disbursed till
March 2013. As Bihar was able to utilise only 66 percent of the total disbursed fund,
the actual resource support through RIDF was limited in Bihar.
12. Bihar, a slow starter, is gradually catching up with other states in both formation of
SHGs and ensuring their bank linkages. As of March, 2013, SHG coverage in rural
Bihar was 35.22 lakh households, roughly 48 percent of total rural households.
State Finances
1. The revenue surplus of Bihar had slumped to its lowest level in 2009-10, but 2010-11
was a year of recovery, when the state’s revenue surplus had climbed to its hitherto
highest level of Rs 6316 crore, compared to only Rs 2943 crore in the previous year.
However, 2011-12 had witnessed the beginning of the slowing down of national
economy, and in that year the revenue surplus again decreased to Rs 4820 crore.
2. The salary payments to the state government employees also accounted for substantial
increases in revenue expenditure — by Rs 1364 crore in 2012-13, compared to Rs.
1644 crore in 2011-12. In the current fiscal, it is projected to go up by more than Rs
4100 crore.
3. The developmental revenue expenditure on social and economic services increased by
Rs 7050 crore in 2012-13 over that in the last fiscal. Between 2008-09 to 2012-13, the
developmental revenue expenditure increased from Rs. 17,978 crore to Rs. 35,817

xxxvi
crore. The non-developmental revenue expenditure grew at a lower rate, rising from Rs.
10,530 crore to Rs. 18,645 crore, bulk of it owing to pension as well as interest
payments.
4. The tax revenue of the state government has increased substantially from Rs. 23,865
crore in 2008-09 to Rs. 48,153 crore in 2012-13, growing annually at 20 percent during
the period. The own tax revenue of the state government grew from Rs 6,172 crore to
Rs 16,253 crore during this period, at a much higher annual rate of 27 percent. As
indicated earlier, the growth in own tax revenues has picked up in recent years and,
during the last two years, it grew by 28 and 29 percent respectively.
5. The interest payments constitute a perennial burden on governments' finances of most
of the states, because of their high indebtedness. For Bihar, however, interest payments
have been consuming progresively lesser proportion of the revenue expenditure since
2004-05. It was 15.7 percent in 2007-08 and came down steadily to 8.6 percent in
2012-13. Nearly all states, except Jharkhand Madhya Pradesh, Karnataka and
Chhattisgarh, had this ratio above 10 percent in 2012-13, the highest being 31.1 percent
for Rajasthan.
6. State's Own Tax Receipts/ GSDP is an important indicator of the gap between the state
government's tax efforts and tax potential. A low ratio also indicates low tax
compliance. For Bihar, the ratio of its own tax receipts to GSDP has stagnated at
around 4 percent till 2008-09 and, since then, has grown just above 5 percent in 2011-
12. In 2012-13, the ratio improved marginally to 5.3 percent. Since this ratio is much
lower compared to other states, there is further scope for tapping the entire tax potential
of the state.
7. It is noted that the fiscal position of the state government has definitely improved,
compared to what it was in 2009-10. The fiscal situation worsened in 2011-12 due to
the adverse macro-economic scenario in the country as a whole, and it did not fully
recover even in 2012-13. While the key fiscal indicators point to a marked
improvement in the fiscal position of the state government over the recent years, there
still remain some areas of concern.
8. In 2012-13, the total repayment of principal by the state government amounted to Rs.
4582 crore, while the interest payment was higher at Rs 4428 crore. The annual interest
burden has increased by Rs 675 crore over the past 5 years, due to substantial past

xxxvii
borrowings. The total annual debt service burden has increased from Rs. 6444 crore in
2008-09 to Rs. 9010 crore in 2012-13, growing at an annual rate of 9.3 percent.
9. The total revenue of the state government, including grants and its share of taxes from
the central government, increased from Rs. 32,981 crore in 2008-09 to Rs 59,567 crore
in 2012-13, at an impressive annual growth rate of 15.9 percent; compared to this, state
government's total own revenue receipts increased during the period at an higher annual
rate of 24.1 percent and its tax revenues grew at an even higher annual rate of 27.4
percent. During this period, the grants from the central government increased at a very
modest rate of 6.6 percent only. Due to the higher growth of state government's own
revenues compared to the growth of all other components of state government
revenues, the share of the state government's own revenue in total revenues has also
gone up from 22.2 percent in 2008-09 to 29.2 percent in 2012-13.
10. The per capita expenditure on social and economic services for the years 2008-09 to
2013-14 shows good signs. During this period, the growth in per capita expenditure on
social services was substantial, as it increased from Rs 1263 to Rs 2941 and the growth
in economic services was still higher (from Rs 590 to Rs 1450). The per capita capital
outlay has almost doubled from Rs 664 (2008-09) to Rs. 1305 (2013-14).
____________

1
CHAPTER I
BIHAR ECONOMY : AN OVERVIEW
The economy of Bihar, despite global meltdown and slower growth of the overall Indian
economy, was able to continue its growth momentum in 2012-13. In spite of moderate deficit
in rainfall, particularly during the south-west monsoon, the economy is likely to register a high
growth performance in the current fiscal (2013-14) also. This strong growth process, together
with the success of various welfare programmes of the state government, has now created a
new atmosphere of confidence in Bihar. It is, therefore, not surprising that the development
achievement of the state has drawn attention not only in India, but outside the country as well.
With the support of the central government through transfer of more financial resources,
particularly a higher award from the 14th Finance Commission, Bihar could continue its
growth momentum, gradually narrowing the gap between the state and the national average.
The recent data on state income shows that the economy of Bihar has grown steadily during
the period (2006-13). During the period 1999-2006, the economy had grown at an annual rate
of 5.7 percent at constant prices. This was the period immediately after the bifurcation of the
state in November, 2000. However, the economy witnessed a turnaround due to the policies
pursued by the state government thereafter and, as a result, the annual growth rate was much
higher at 12.0 percent during 2006-13 period. One can, therefore, term the recent growth
process as a 'revival of a stagnant economy'. During this period, the investment level had also
increased substantially. From an average annual plan size of Rs. 4200 crore during the Tenth
Plan period (2002-07), the average plan size climbed to more than Rs. 16,700 crore during the
Eleventh Plan period (2007-12). Besides the size of the investment, the pattern also has
undergone major changes, with considerable emphasis now on infrastructural development and
social delivery system.
For a proper understanding of the challenges facing Bihar's economic development, it should
be kept in mind that, with a population of 104.0 million in 2011, Bihar is a densely populated
region, with no less than 1106 persons living per sq. km. of its area. As per the Planning
Commission figures, in 2009-10, 53.5 percent of its population lived below the poverty line in
Bihar. Nearly nine-tenths of its population live in the villages, where the poverty ratio is higher
at 55.3 percent. Bihar had to overcome all these challenges to move ahead in a new growth
path. Bihar falls in the Gangetic basin area with fertile alluvial soil and abundant ground water

2
resources. With the bifurcation of the state, the vast mineral sector and other big industries
went to Jharkhand. The present Bihar was left with only agriculture to depend upon. But with a
prudent development strategy, the state could overcome these challenges. The state is now
experiencing a development process that is not only very strong, but inclusive as well.
The present economic survey is an attempt to present in detail the current status of the state’s
economy, as well as its various sectors. The sectoral analysis will highlight the efforts made by
the state government for the different sectors and their respective achievements. It will
simultaneously point out the hindrances that the economy is facing to maintain its growth
momentum. Apart from this Introductory chapter on the overview of the state’s economy, the
survey has six more chapters – Agriculture and Allied Sectors, Enterprises Sector,
Infrastructure and Communications, Social Sector, Banking and Allied Sector and, finally,
State Finances.
1.1 State Domestic Product
The estimates of State Domestic Product of Bihar are prepared separately for Gross State
Domestic Product (GSDP) and Net State Domestic Product (NSDP), both at current and
constant prices. In Table A 1.1 (Appendix), the estimates of GSDP and NSDP are presented
for the period 1999-00 to 2012-13. In Tables A 1.2 and A 1.3 (Appendix), the sectorwise
estimates of GSDP are presented at current and constant (2004-05) prices respectively for the
period from 1999-00 to 2012-13. Further, the sectorwise estimates of NSDP at current and
constant (2004-05) prices for the period from 1999-00 to 2012-13 are presented in Tables A
1.4 and A 1.5 (Appendix), respectively. It should be noted here that up to 2010-11, the final
estimates have been presented; the estimate for 2011-12 is provisional and that for 2012-13 is a
quick estimate. The GSDP of Bihar at 2004-05 prices in 2012-13 is Rs. 1.65 lakh crore,
yielding a per capita income of Rs. 16,537. The estimated GSDP at current prices in 2012-13 is
Rs. 3.09 lakh crore, implying a per capita income of Rs. 30,930.
The growth rate of Bihar's economy has not been uniform over the period 1999-2000 to
2012-13. During the 1999-2000 to 2005-06, the state income at constant prices grew at an
annual rate of 5.7 percent. After that, the economy witnessed a turnaround and grew at an
annual rate of 12.0 percent, which was not only much higher than what was achieved in
previous period, but one of the highest among all the Indian states.

3
Table 1.1 : Compound Annual Growth Rate (CAGR) of GSDP
No. Sector
1999-2000 to 2005-06 2006-07 to 2012-13
Current
Prices
Constant
2004-05
Prices
Current
Prices
Constant
2004-05
Prices
1 Agriculture/Animal Husbandry 6.1 3.0 19.8 5.9
2 Forestry / Logging 32.2 1.2 5.1 -1.9
3 Fishing 2.9 0.5 19.2 3.8
4 Mining/Quarrying 16.2 2.2 8.7 11.2
Sub-Total (Primary) 7.7 2.7 18.6 5.2
5
Manufacturing 7.2 0.8 11.8 6.8
5.1 Registered -12.9 -18.4 20.9 18.2
5.2 Un-registered 12.4 5.9 8.7 2.7
6 Construction 39.5 23.4 30.6 21.9
7 Electricity / Water Supply / Gas 11.7 3.7 13.3 7.7
Sub-Total (Secondary) 22.1 11.7 23.9 16.2
8
Transport / Storage /
Communication 10.0 6.6 16.5 19.2
8.1 Railways 2.8 2.3 6.4 5.0
8.2 Other Transport 13.7 4.3
20.6 11.0
8.3 Storage 17.6 6.3
8.4 Communication 16.2 18.1 21.1 38.4
9 Trade / Hotel / Restaurant 14.3 7.3 26.7 15.1
Sub-Total (8 and 9) 13.2 7.2 24.8 16.1
10 Banking / Insurance 2.6 8.8 27.5 23.5
11
Real Estate/ Ownership of
Dwelling/Business Services 18.7 7.0 17.5 10.1
Sub-Total (10 and 11) 11.7 7.7 21.1 16.3
12 Public Administration 8.6 3.9 23.1 11.7
13
Other Services 10.1 3.7 16.4 6.1
Sub-Total (Tertiary) 11.7 6.0 22.2 13.7
Total GSDP 11.6 5.7 21.5 12.0
Per Capita GSDP 9.7 3.9 19.8 10.4
Source : Directorate of Economics and Statistics, GOB
An analysis of the sectoral rates of growth, as presented in Table 1.1, throws light on the major
contributors to the growth of the state economy. During the period 2006-2013, the sectors
recording a growth rate of more than 15 percent are – Registered Manufacturing (18.2 percent),
Construction (21.9 percent), Communication (38.4 percent), Trade, Hotels and Restaurants
(15.1 percent), and Banking and Insurance (23.5 percent). During 1999-2006, the major
contributors to growth were Construction (23.4 percent), Communication (18.1 percent),
Banking and Insurance (8.8 percent) and Trade, Hotel and Restaurants (7.3 percent).
4
Therefore, we can find that registered manufacturing has entered as a leading contributor to the
growth process during the period 2006-2013, in addition to the 3 sectors that were leading
during 1999-2006.
It should also be noted from Table 1.1 that nearly all the sectors registered a higher growth rate
during the period (2006-13), as compared to those in the period 1999-2006. It is also quite
pleasing to note that the rate of growth of Agriculture and Animal Husbandry sector has been
5.9 percent during 2006-13, compared to only 3.0 percent during 1999-2006 period. This is of
special significance, as nearly 90 percent of the population living in rural areas depend on this
sector for their livelihood.
Although, there has been remarkable increase in the rate of growth of Bihar's economy, the
yearly growth rates show wide fluctuations. From the analysis of year-to-year growth rates of
the state economy from 2006-07 onwards, presented in Table A 1.6 (Appendix), one can notice
these fluctuations. For the overall economy, the growth rate has varied from 5.75 percent in
2007-08 to as high as 15.03 percent in 2010-11 considering the period 2007-13. Agriculture
and Animal Husbandry sector, which recorded a growth rate of (–) 13.21 percent in 2009-10,
had grown at the high rate of 27.35 percent in 2006-07. In 2010-11, the growth of this sector
was also very high at 19.44 percent. One of the most likely source of this wide fluctuation in
the rate of agricultural growth happens to be the vagaries of monsoon, which tend to cause
upswing and downswing in agricultural production. This fluctuation in the agriculture
production, in turn, causes fluctuation in the growth rates of other sectors of the economy. It is,
therefore, necessary to stabilise the rate of growth of the agriculture sector in order to stabilise
the growth of the overall economy, so that the rate becomes sustainable. Once the rate of
growth of the agriculture sector is stabilized, it would provide a positive impact on the rate of
growth of other sectors through backward and forward linkages, resulting in a stable growth
process for the entire state economy.
To know more about the comparative status of economic growth of Bihar vis-à-vis other states,
one has to look into the comparable estimates of per capita NSDP of different states. In Table
1.2, such comparative estimates of per capita income at current prices of major Indian states
are presented for the period 2008-09 to 2012-13. It is observed from the table that Bihar still
continues to be at the bottom of the ranking of states with respect to per capita income. But the
impact of the strong growth process in recent years can be felt when one considers the gap
between the per capita income of Bihar with that of all-India. In 2008-09, the per capita income
of Bihar (Rs. 13,728) was 33.7 percent of all-India average (Rs. 40,775), but in 2012-13, this

5
ratio has increased to 41.18 percent (Rs. 28,317 for Bihar and Rs. 68,757 for all-India). It is,
thus, clear that the momentum of growth in Bihar's economy has got to be sustained for many
more years if the gap between the per capita income of Bihar and that of India has to be closed.
Table 1.2 : Per Capita Net State Domestic Product (NSDP) at Current Prices of Major Indian States
State / UT Per Capita NSDP (Rs.)
2008-09 2009-10 2010-11 2011-12 2012-13
Andhra Pradesh 46345 (9) 51114 (9) 60703 (9) 68970 (8) 78177 (6)
Assam 24099 (15) 28383 (14) 33348 (14) 37250 (15) 42036 (12)
Bihar 13728 (17) 15457 (17) 19205 (17) 22890 (17) 28317 (14)
Gujarat 55068 (4) 64097 (4) 78802 (3) 89668 (3) -
Haryana 67405 (1) 82037 (1) 94798 (1) 108345 (1) 122660 (1)
Himachal Pradesh 49903 (7) 58402 (7) 67475 (7) 74694 (7) 82611 (5)
Jharkhand 25046 (14) 28223 (15) 34721 (13) 38258 (13) 43384 (11)
Karnataka 48084 (8) 51364 (8) 62251 (8) 68423 (9) 77015 (7)
Kerala 53046 (6) 60226 (6) 69465 (6) 80924 (5) -
Madhya Pradesh 25278 (13) 28712 (13) 32223 (15) 37994 (14) 43864 (10)
Maharashtra 62234 (2) 69765 (2) 83395 (2) 95339 (2) 107670 (2)
Odisha 31416 (11) 33029 (12) 38878 (12) 41896 (12) 49489 (9)
Punjab 55315 (3) 61805 (5) 69580 (5) 78633 (6) 88783 (4)
Rajasthan 31279 (12) 35254 (11) 44709 (11) 53735 (11) -
Tamilnadu 54137 (5) 64338 (3) 78473 (4) 88697 (4) 98550 (3)
Uttar Pradesh 20422 (16) 23671 (16) 26692 (16) 29785 (16) 33269 (13)
West Bengal 35487 (10) 41039 (10) 47389 (10) 54125 (10) 62831 (8)
All India 40775 46249 54151 61564 68757
Source : Central Statistical Organisation, Delhi
Note : Figures in parentheses denote rank
Chart 1.1 : Per Capita NSDP at Current Prices (in Rs.)
0
20000
40000
60000
80000
100000
120000
140000
2008-09 2009-10 2010-11 2011-12 2012-13
Bihar Haryana All India

6
With economic development, it is historically observed that structure of any economy also
undergoes changes. This is true of Bihar also. This is because the pace of development of
various sectors are different, leading to changes in their relative size over the years. The
growth rates of different sectors vary because of shifting demand patterns, a consequence of
rising income. Labour force also tends to shift from primary sector to more prosperous industry
and services. In Table 1.3 the structure of Bihar's economy has been presented for the period
2003-04 to 2012-13. Instead of presenting yearwise shares of sectoral outputs, the 3 columns
of the table present triennium average for shares of sectoral output. The 3 choosen trienniums
are 2003-06 in the beginning of the previous decade, 2007-10 at the end of that decade, and
2010-13 at the beginning of the present decade. These triennium averages are also more stable
in nature, making the comparisons more meaningful.
Table 1.3 : Sectoral Composition of GSDP at Constant (2004-05) Prices
Sl.
No. Sector
2003-06
(TA)
2007-10
(TA)
2010-13
(TA)
1 Agriculture/Animal Husbandry 25.8 22.3 19.8
2 Forestry / Logging 3.6 2.4 1.6
3 Fishing 1.5 1.2 1.0
4 Mining/Quarrying 0.1 0.1 0.1
Sub-Total (Primary) 30.9 25.9 22.4
5
Manufacturing 5.6 5.8 5.8
5.1 Registered 1.2 1.7 2.6
5.2 Un-registered 4.4 4.1 3.2
6 Construction 6.7 10.7 14.2
7 Electricity / Water Supply / Gas 1.5 1.4 1.3
Sub-Total (Secondary) 13.8 17.9 21.2
8
Transport / Storage /
Communication 6.2 7.0 7.7
8.1 Railways 2.0 2.0 1.7
8.2 Other Transport 2.7 2.5 2.6
8.3 Storage 0.1 0.1 0.1
8.4 Communication 1.5 2.4 3.3
9 Trade / Hotel / Restaurant 19.8 21.9 22.3
Sub-Total (8 and 9) 26.0 28.9 30.0
10 Banking / Insurance 3.5 4.2 5.1
11
Real Estate/ Ownership of
Dwelling/Business Services 5.5 5.5 5.1
Sub-Total (10 and 11) 9.0 9.8 10.3
12 Public Administration 6.8 5.9 5.4
13
Other Services 13.5 11.6 10.7
Sub-Total (Tertiary) 55.3 56.2 56.4
Total GSDP 100.0 100.0 100.0
Source : Directorate of Economics and Statistics, GOB
Note : TA = Triennium Average

7
In the beginning of the last decade, the average share of 3 major sectors in total GSDP stood at
30.9 percent (primary), 13.8 percent (secondary) and 55.3 percent (tertiary). Thereafter, the
share of the primary sector has been showing a decline over the years, and it came down to
25.9 percent for the triennium ending 2009-10 and then to 22.4 percent for the triennium
ending 2012-13. This shows that the importance of the primary sector has declined steadily
over the years. Since secondary and tertiary sectors recorded tremendous growth rate in the last
decade, their shares of outputs are much higher than those in the triennium ending 2005-06.
The relative share for the triennium ending 2012-13 now stands thus : primary (22.4 percent),
secondary (21.2 percent) and tertiary (56.4 percent).
Chart 1.2 : Sectoral Composition of GSDP (in percent)
Within the three major sectors, some sub-sectors have also recorded substantial change in their
share. For example, in the primary sector, Agriculture and Animal husbandry recorded
substantial decrease in its share. Within secondary sector, the sub-sector which showed
substantial change is construction, whose share in GSDP increased from 6.7 percent in the
triennium 2003-06 to 14.2 percent in the triennium 2010-13. Within the tertiary sector, the sub-
sector which recorded higher growth and caused its share to rise was trade, hotel and
restaurants. Organised sub-sectors like Public Administration and other services lost in terms
of their shares in GSDP.
1.2 Regional Disparity
The problem of low per capita income in Bihar is accentuated by the fact that there exists
considerable disparity across the districts in terms of their per capita income. The latest
estimates of per capita GDDP (Gross District Domestic Product) relate to 2010-11 and these
30.9
13.8 55.3
Primary Secondary Tertiary
2003-06
22.4
21.2 56.4
Primary Secondary Tertiary
2010-13

8
estimates have been presented in Table A 1.7 (Appendix), along with estimates for 2006-07 to
2010-11. It can be seen from the table that, in 2010-11, Patna (Rs. 57,843), Munger (Rs.
21,019) and Begusarai (Rs. 18,447) are the most prosperous districts of Bihar. On the other end
of the ranking ladder, the most economically backward districts are Sheohar (Rs. 6209), Banka
(Rs. 7764) and Madhepura (Rs. 8102). Even if we exclude Patna which has the benefit of being
the state capital, the per capita income of Munger, the second most prosperous district, is more
than 3 times that of Sheohar.
Chart 1.3 : Districtwise Per Capita Income in 2012-13 (in Rs.)
Apart from per capita GDDP, consumption levels of petroleum products (Petrol, Diesel and
Cooking gas) can also indicate the varying level of economic disparity of the districts of the
state. In Table A 1.8 (Appendix), data relating to consumption of petroleum products in the
different districts, along with average consumption level for the triennium ending 2012-13, are
presented. In the triennium average column, the figures in the brackets indicate the share of
each district in the total consumption of the state. This percentage share is compared with
percentage share of population of each district to find out the deviations. If the share of any
district is more than its percentage share in population, it would then indicate the relative
prosperity of the district and vice-versa.
Based on these differences, one can identify 3 most prosperous and 3 most backward districts
of Bihar in respect of each of the petroleum products and the names of such districts have been
presented in Table 1.4. Patna happens to be the most prosperous one according to all the four
0
10000
20000
30000
40000
50000
60000
Pa
tna
Mu
ng
er
Beg
us
ara
i
Bh
ag
alp
ur
Mu
zaff
arp
ur
Bih
ar
Ro
hta
s
La
kh
isara
i
Va
ish
ali
Bh
ojp
ur
Sa
hars
a
Nala
nd
a
Darb
ha
ng
a
Kati
ha
r
Sa
msti
pu
r
Ma
dh
ub
an
i
W. C
ha
mp
ara
n
Gaya
Go
palg
an
g
Ja
mu
i
Bu
xar
Kh
ag
ari
a
Sa
ran
Bh
ab
hu
a
Pu
rne
a
Jeh
an
ab
ad
Au
ran
gab
ad
Siw
an
Kis
ha
ng
an
g
E.
Ch
am
pa
ran
Ara
ria
Naw
ad
a
Sh
ekh
pu
ra
Sit
am
arh
i
Su
pa
ul
Arw
al
Ma
dh
ep
ura
Ban
ka
Sh
eo
har

9
indicators. Compared to a population share of 5.6 percent, the share in consumption of
petroleum products are — petrol (17.2 percent), diesel (10.8 percent) and cooking gas (20.7
percent). In case of Petrol, Patna is followed by Muzaffarpur (6.4 percent against a population
share of 4.6 percent) and Bhagalpur (3.5 percent against a population share of 2.9 percent). In
case of Diesel, Patna is followed by Muzaffarpur (5.6 percent as against a population share of
4.6 percent), East Champaran (5.5 percent as against a population share of 4.9 percent), Rohtas
(4.5 percent against a population share of 3.8 percent) and Begusarai (5.3 percent as against a
population share of 2.8 percent). In case of Cooking Gas, Patna is followed by Muzaffarpur
(5.4 percent as against a population share of 4.6 percent) and Bhagalpur (3.8 percent as against
a population share of 2.9 percent) and in the case of consumption of Petrol, Diesel and
Cooking Gas, the above criterion was above used to find out backward districts.
Table 1.4 : Relatively Prosperous and Backward Districts of Bihar
Criteria Top 3 Districts Bottom 3 Districts
Per Capita GDDP Patna, Munger and
Begusarai
Sheohar, Banka and
Madhepura
Consumption of Petrol Patna, Muzaffarpur and
Bhagalpur
Sheohar, Arwal and
Lakhisarai
Consumption of Diesel Patna, Muzaffarpur and
East Champaran
Sheohar, Arwal and
Lakhisarai
Consumption of LPG Patna, Muzaffarpur and
Bhagalpur
Sheohar, Arwal, and
Sheikhpura
The deposits in small savings kept in post offices and public provident fund across the districts
can also be considered a shadow measure of relative prosperity of a particular district. The
figures of such deposits are shown in Table A 1.9 (Appendix). In the table, we have derived
the triennium average of such deposits for the years 2010-11, 2011-12 and 2012-13, along with
percentage share of district in total savings. Higher the percentage share of the district vis-à-vis
its population share, higher is the prosperity count of the district. The relatively prosperous
districts on this count are — Saran, Bhojpur and Patna. At the other end, the relatively
backward districts using this criterion are – Banka, Sheohar and Araria.
1.3 Wholesale and Consumer Price Indices
To know about the real value of GDP or GSDP, one must have an idea about the movement of
price levels over the years. The wholesale and consumer indices try to indicate the trend of
price movement over the years. Comparison of indices over time gives an overall idea about
the rate of inflation in some particular year with respect to the base year on which index
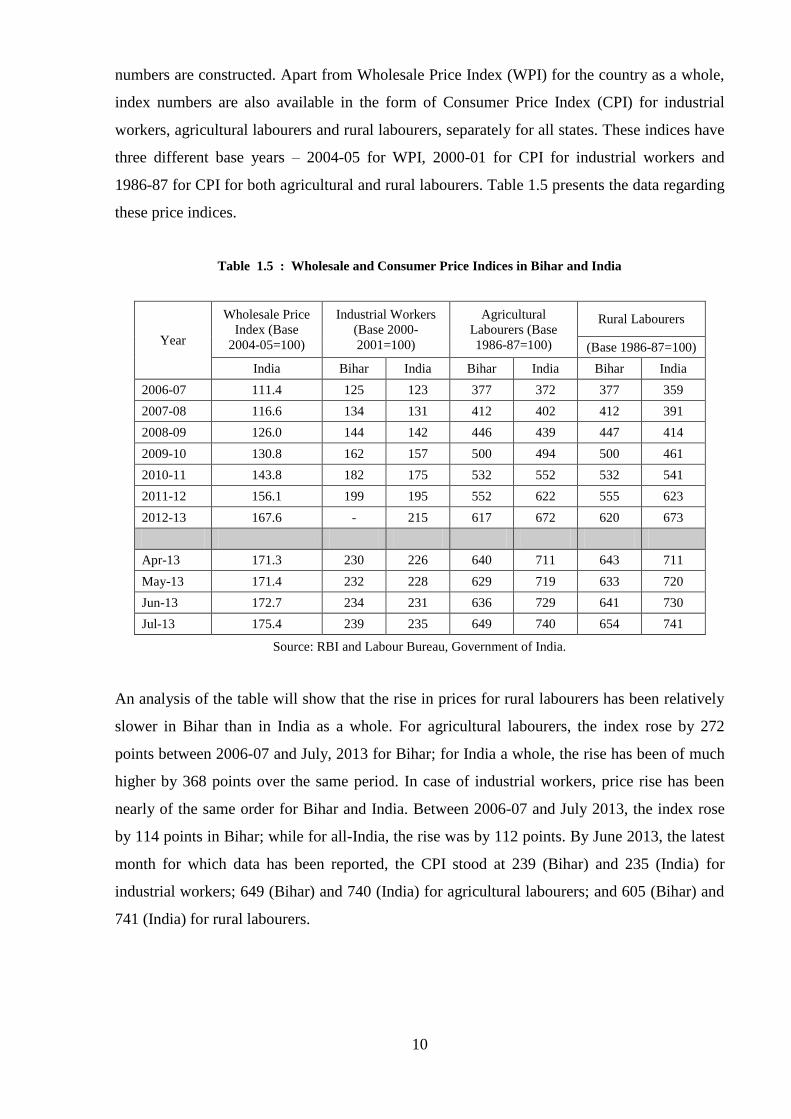
10
numbers are constructed. Apart from Wholesale Price Index (WPI) for the country as a whole,
index numbers are also available in the form of Consumer Price Index (CPI) for industrial
workers, agricultural labourers and rural labourers, separately for all states. These indices have
three different base years – 2004-05 for WPI, 2000-01 for CPI for industrial workers and
1986-87 for CPI for both agricultural and rural labourers. Table 1.5 presents the data regarding
these price indices.
Table 1.5 : Wholesale and Consumer Price Indices in Bihar and India
Year
Wholesale Price
Index (Base
2004-05=100)
Industrial Workers
(Base 2000-
2001=100)
Agricultural
Labourers (Base
1986-87=100)
Rural Labourers
(Base 1986-87=100)
India Bihar India Bihar India Bihar India
2006-07 111.4 125 123 377 372 377 359
2007-08 116.6 134 131 412 402 412 391
2008-09 126.0 144 142 446 439 447 414
2009-10 130.8 162 157 500 494 500 461
2010-11 143.8 182 175 532 552 532 541
2011-12 156.1 199 195 552 622 555 623
2012-13 167.6 - 215 617 672 620 673
Apr-13 171.3 230 226 640 711 643 711
May-13 171.4 232 228 629 719 633 720
Jun-13 172.7 234 231 636 729 641 730
Jul-13 175.4 239 235 649 740 654 741
Source: RBI and Labour Bureau, Government of India.
An analysis of the table will show that the rise in prices for rural labourers has been relatively
slower in Bihar than in India as a whole. For agricultural labourers, the index rose by 272
points between 2006-07 and July, 2013 for Bihar; for India a whole, the rise has been of much
higher by 368 points over the same period. In case of industrial workers, price rise has been
nearly of the same order for Bihar and India. Between 2006-07 and July 2013, the index rose
by 114 points in Bihar; while for all-India, the rise was by 112 points. By June 2013, the latest
month for which data has been reported, the CPI stood at 239 (Bihar) and 235 (India) for
industrial workers; 649 (Bihar) and 740 (India) for agricultural labourers; and 605 (Bihar) and
741 (India) for rural labourers.

11
APPENDIX
Table A 1.1 : Gross State Domestic Product (GSDP) and Net State Domestic Product
(NSDP) of Bihar At Factor Cost
Year
GSDP
(Rs. crore)
NSDP
(Rs. crore)
Per Capita
GSDP (Rs.)
At
constant
(2004-05)
prices
At
current
prices
At
constant
(2004-05)
prices
At
current
prices
At
constant
(2004-05)
prices
At
current
prices
1999–00 50174 59157 46071 54052 6301 7429
2000–01 57242 67942 52519 62062 6992 8298
2001–02 57657 65080 52323 58839 6832 7712
2002–03 64965 72556 59302 65931 7592 8479
2003–04 66174 69268 59701 62728 7595 7950
2004–05 77781 77781 70167 70167 8773 8773
2005–06 82490 77908 74144 69861 9149 8641
2006–07 100737 90096 91331 81514 10994 9832
2007–08 113680 95275 102853 85916 12215 10237
2008–09 142279 106857 129690 96730 15060 11311
2009–10 162923 113247 148151 102027 16998 11815
2010–11 204463 130272 186653 117605 21037 13404
2011-12(P) 246995 144149 225482 130281 25074 14634
2012-13 (Q) 308640 165018 282562 149621 30930 16537
Source : Directorate of Economics and Statistics, GOB
Note: P -Provisional, Q – Quick

12
Table A 1.2 : Gross State Domestic Product (GSDP) of Bihar at Factor Cost (Current Prices)
(Rs. crore)
Sl.
No. Sector 1999-00 2000-01 2001-02 2002-03 2003-04 2004-05 2005-06
1 Agriculture/Animal Husbandry 15203 19732 17666 21144 19040 20673 20827
2 Forestry / Logging 911 1008 1084 1151 1243 2724 2794
3 Fishing 697 825 1032 1127 1190 1132 1164
4 Mining/Quarrying 94 109 166 51 45 42 97
Sub-Total (Primary) 16904 21674 19947 23474 21518 24572 24883
5
Manufacturing 3614 3470 3236 3686 3683 4379 4256
5.1 Registered 1151 871 749 1026 738 1123 643
5.2 Un-registered 2463 2599 2487 2660 2944 3256 3613
6 Construction 1903 1914 2205 2654 2734 5138 6649
7
Electricity/Water Supply/Gas 719 1008 727 740 907 1146 1162
Sub-Total (Secondary) 6236 6393 6168 7080 7323 10664 12067
8
Transport / Storage /
Communication 3724 3905 3899 4191 3969 4612 5099
8.1 Railways 1564 1711 1716 1823 1414 1451 1580
8.2 Other Transport
1393 1472 1496 1622 1720
1997 2213
8.3 Storage 62 66
8.4 Communication 768 722 687 746 835 1102 1241
9
Trade / Hotel / Restaurant 7541 8614 9582 11936 12761 16286 16079
Sub-Total (8 and 9) 11265 12519 13481 16127 16730 20898 21178
10 Banking / Insurance 1819 2056 2736 2723 2890 2586 2731
11
Real Estate/ Ownership of
Dwelling/Business Services 2096 2359 2584 2900 3402 4041 4778
Sub-Total (10 and 11) 3915 4415 5319 5624 6291 6626 7509
12 Public Administration 3794 4114 4540 4085 4903 5179 5471
13
Other Services 8060 8128 8200 8576 9408 9842 11383
Sub-Total (Tertiary) 27033 29175 31541 34412 37333 42545 45540
Total GSDP 50174 57242 57657 64965 66174 77781 82490
Per Capita GSDP 6301 6992 6832 7592 7595 8773 9149
(Contd…)

13
Table A 1.2 : Gross State Domestic Product (GSDP) of Bihar at Factor Cost (Current Prices) (Contd.)
(Rs. crore)
Sl.
No. Sector 2006-07 2007-08 2008-09 2009-10 2010-11
2011-12
(P)
2012-13
(Q)
1 Agriculture/Animal Husbandry 27148 27049 36660 35476 48142 58113 68497
2 Forestry / Logging 3105 3112 3215 3241 3510 3744 3939
3 Fishing 1317 1442 2352 2436 2366 3244 3953
4 Mining/Quarrying 74 78 143 122 117 116 116
Sub-Total (Primary) 31643 31681 42369 41275 54135 65217 76504
5
Manufacturing 4856 6429 8363 8281 11047 12705 14648
5.1 Registered 550 1385 3050 2593 4718 5566 6591
5.2 Un-registered 4306 5044 5313 5688 6328 7139 8057
6 Construction 8992 11557 14497 19003 27592 32889 43072
7 Electricity / Water Supply / Gas 1137 1391 1460 1365 1661 2502 2809
Sub-Total (Secondary) 14985 19378 24320 28649 40300 48096 60529
8
Transport / Storage /
Communication 5956 6775 7776 9318 10325 11562 13246
8.1 Railways 1983 2299 2357 2845 2807 3103 3459
8.2 Other Transport 2597 2981 3676 4297 5358 6503 8004
8.3 Storage 78 92 109 132 158 185 216
8.4 Communication 1297 1403 1633 2044 2001 1771 1568
9 Trade / Hotel / Restaurant 20730 25201 31072 38464 46445 58695 76008
Sub-Total (8 and 9) 26686 31976 38848 47782 56770 70256 89254
10 Banking / Insurance 3192 3526 3953 4935 6363 7814 9151
11
Real Estate/ Ownership of
Dwelling/Business Services 5770 6844 7954 9945 12441 15638 19719
Sub-Total (10 and 11) 8962 10369 11906 14880 18803 23452 28871
12 Public Administration 5846 6376 8556 10111 12040 13590 16720
13
Other Services 12615 13900 16279 20226 22415 26383 36761
Sub-Total (Tertiary) 54109 62621 75590 92999 110028 133681 171606
Total GSDP 100737 113680 142279 162923 204463 246995 308640
Per Capita GSDP 10994 12215 15060 16998 21037 25074 30930
Source : Directorate of Economics and Statistics, GOB (Concluded)
Note : P – Provisional, Q – Quick

14
Table A 1.3 : Gross State Domestic Product (GSDP) of Bihar at Factor Cost (2004-05 Prices)
(Rs. crore)
Sl.
No. Sector 1999-00 2000-01 2001-02 2002-03 2003-04 2004-05 2005-06
1 Agriculture/Animal Husbandry 16183 22207 17338 21999 17989 20673 19300
2 Forestry / Logging 2221 2349 2410 2496 2601 2724 2671
3 Fishing 720 795 1018 1106 1128 1132 1183
4 Mining/Quarrying 86 121 220 62 50 42 70
Sub-Total (Primary) 19211 25472 20985 25662 21769 24572 23224
5 Manufacturing 4566 4215 3898 4223 4052 4379 4106
5.1 Registered 1634 1116 963 1195 883 1123 622
5.2 Un-registered 2931 3099 2935 3028 3169 3256 3484
6 Construction 2773 2805 3104 3703 3613 5138 6374
7 Electricity / Water Supply / Gas 1259 1363 1055 1078 1106 1146 1189
Sub-Total (Secondary) 8598 8382 8056 9005 8771 10664 11668
8 Transport / Storage /
Communication 3936 4285 4285 4586 4293 4612 5105
8.1 Railways 1527 1714 1760 1794 1351 1451 1609
8.2 Other Transport 1732 1870 1863 1959 1967
1997 2065
8.3 Storage 62 61
8.4 Communication 677 701 662 834 975 1102 1371
9 Trade / Hotel / Restaurant 8847 10207 11180 13324 13402 16286 14862
Sub-Total (8 and 9) 12782 14492 15464 17910 17695 20898 19972
10 Banking / Insurance 1940 2148 2638 2524 2448 2586 2941
11 Real Estate/ Ownership of
Dwelling/Business Services 3211 3385 3530 3676 3843 4041 4403
Sub-Total (10 and 11) 5151 5533 6168 6200 6290 6626 7343
12 Public Administration 4282 4661 5036 4342 4925 5179 5107
13 Other Services 9134 9400 9369 9439 9818 9842 10598
Sub-Total (Tertiary) 31349 34087 36038 37890 38728 42545 43016
Total GSDP 59157 67942 65080 72556 69268 77781 77908
Per Capita GSDP 7429 8298 7712 8479 7950 8773 8641
(Contd…)
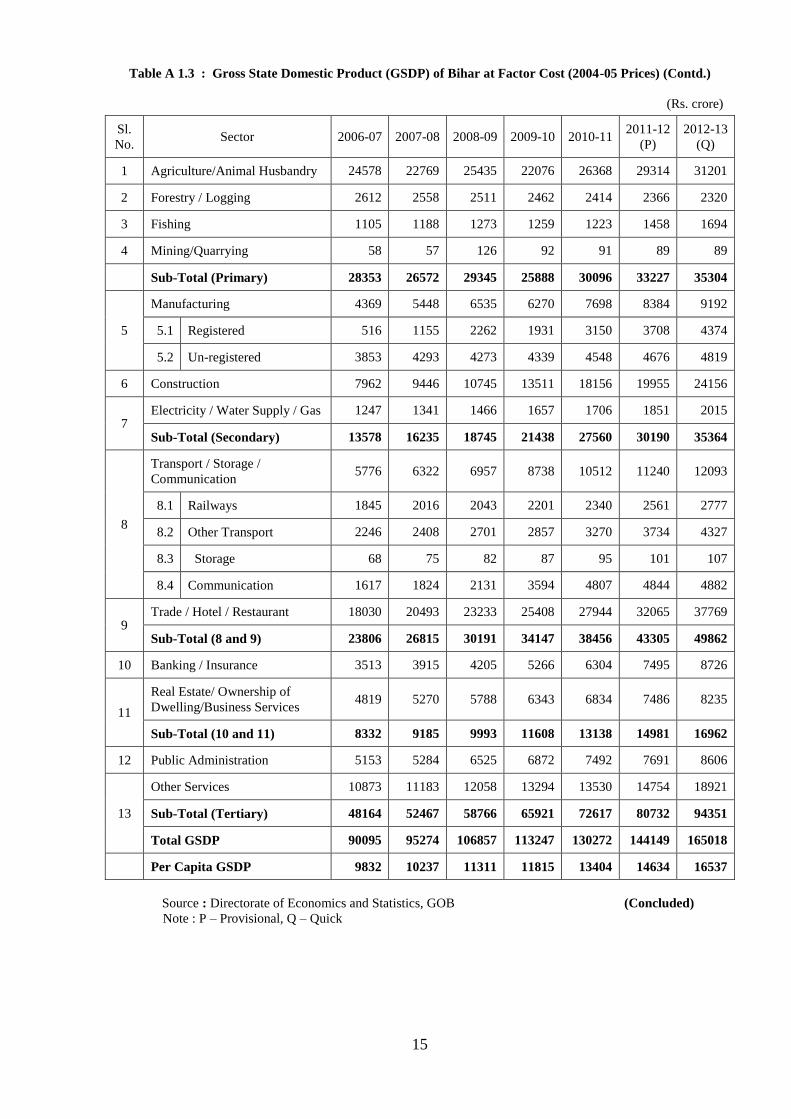
15
Table A 1.3 : Gross State Domestic Product (GSDP) of Bihar at Factor Cost (2004-05 Prices) (Contd.)
(Rs. crore)
Sl.
No. Sector 2006-07 2007-08 2008-09 2009-10 2010-11
2011-12
(P)
2012-13
(Q)
1 Agriculture/Animal Husbandry 24578 22769 25435 22076 26368 29314 31201
2 Forestry / Logging 2612 2558 2511 2462 2414 2366 2320
3 Fishing 1105 1188 1273 1259 1223 1458 1694
4 Mining/Quarrying 58 57 126 92 91 89 89
Sub-Total (Primary) 28353 26572 29345 25888 30096 33227 35304
5
Manufacturing 4369 5448 6535 6270 7698 8384 9192
5.1 Registered 516 1155 2262 1931 3150 3708 4374
5.2 Un-registered 3853 4293 4273 4339 4548 4676 4819
6 Construction 7962 9446 10745 13511 18156 19955 24156
7 Electricity / Water Supply / Gas 1247 1341 1466 1657 1706 1851 2015
Sub-Total (Secondary) 13578 16235 18745 21438 27560 30190 35364
8
Transport / Storage /
Communication 5776 6322 6957 8738 10512 11240 12093
8.1 Railways 1845 2016 2043 2201 2340 2561 2777
8.2 Other Transport 2246 2408 2701 2857 3270 3734 4327
8.3 Storage 68 75 82 87 95 101 107
8.4 Communication 1617 1824 2131 3594 4807 4844 4882
9 Trade / Hotel / Restaurant 18030 20493 23233 25408 27944 32065 37769
Sub-Total (8 and 9) 23806 26815 30191 34147 38456 43305 49862
10 Banking / Insurance 3513 3915 4205 5266 6304 7495 8726
11
Real Estate/ Ownership of
Dwelling/Business Services 4819 5270 5788 6343 6834 7486 8235
Sub-Total (10 and 11) 8332 9185 9993 11608 13138 14981 16962
12 Public Administration 5153 5284 6525 6872 7492 7691 8606
13
Other Services 10873 11183 12058 13294 13530 14754 18921
Sub-Total (Tertiary) 48164 52467 58766 65921 72617 80732 94351
Total GSDP 90095 95274 106857 113247 130272 144149 165018
Per Capita GSDP 9832 10237 11311 11815 13404 14634 16537
Source : Directorate of Economics and Statistics, GOB (Concluded)
Note : P – Provisional, Q – Quick

16
Table A 1.4 : Net State Domestic Product (NSDP) of Bihar at Factor Cost (Current Prices)
(Rs. crore)
Sl.
No. Sector 1999-00 2000-01 2001-02 2002-03 2003-04 2004-05 2005-06
1 Agriculture/Animal Husbandry 14323 18736 16522 19896 17671 18623 18575
2 Forestry / Logging 879 973 1047 1110 1198 2689 2758
3 Fishing 628 737 902 975 1013 990 1022
4 Mining/Quarrying 75 87 132 43 37 35 79
Sub-Total (Primary) 15905 20534 18603 22024 19918 22336 22435
5 Manufacturing 3153 2947 2655 3050 2953 3437 3292
5.1 Registered 1000 700 557 819 510 609 160
5.2 Un-registered 2153 2247 2098 2231 2443 2828 3132
6 Construction 1864 1858 2138 2586 2648 4906 6349
7 Electricity / Water Supply / Gas 408 569 322 384 470 652 645
Sub-Total (Secondary) 5425 5375 5116 6020 6071 8996 10285
8 Transport / Storage /
Communication 3039 3239 3228 3439 3183 3885 4319
8.1 Railways 1207 1350 1360 1446 1022 990 1099
8.2 Other Transport 1240 1314 1319 1415 1499
1912 2122
8.3 Storage 61 64
8.4 Communication 592 574 548 578 662 922 1034
9 Trade / Hotel / Restaurant 7428 8483 9455 11804 12611 16106 15862
Sub-Total (8 and 9) 10467 11722 12682 15242 15793 19991 20182
10 Banking / Insurance 1767 1989 2650 2645 2808 2541 2682
11 Real Estate/ Ownership of
Dwelling/Business Services 1357 1493 1496 1633 1920 2470 3004
Sub-Total (10 and 11) 3124 3482 4146 4278 4728 5010 5687
12 Public Administration 3228 3446 3777 3386 4048 4196 4423
13 Other Services 7921 7962 7999 8351 9142 9637 11133
Sub-Total (Tertiary) 24740 26611 28604 31258 33712 38835 41424
Total NSDP 46071 52519 52323 59302 59701 70167 74144
Per Capita NSDP 5786 6415 6200 6930 6852 7914 8223
(Contd…)

17
Table A 1.4 : Net State Domestic Product (NSDP) of Bihar at Factor Cost (Current Prices) (Contd.)
(Rs. crore)
Sl.
No. Sector 2006-07 2007-08 2008-09 2009-10 2010-11
2011-12
(P)
2012-13
(Q)
1 Agriculture/Animal Husbandry 24607 24116 33268 31426 43093 52018 61313
2 Forestry / Logging 3067 3072 3173 3199 3468 3700 3892
3 Fishing 1152 1249 2022 2070 2018 2767 3371
4 Mining/Quarrying 59 62 114 94 94 93 93
Sub-Total (Primary) 28884 28499 38577 36789 48672 58577 68668
5
Manufacturing 3822 5350 7255 6893 9506 10930 12598
5.1 Registered 62 889 2603 1959 3998 4716 5585
5.2 Un-registered 3760 4460 4652 4934 5508 6214 7013
6 Construction 8561 10986 13767 18008 26150 31171 40821
7 Electricity / Water Supply / Gas 613 739 773 760 923 1390 1561
Sub-Total (Secondary) 12996 17074 21795 25661 36580 43491 54980
8
Transport / Storage /
Communication 5108 5855 6686 8043 8896 10057 11630
8.1 Railways 1446 1737 1697 2152 2012 2223 2479
8.2 Other Transport 2493 2864 3555 4138 5165 6269 7716
8.3 Storage 77 89 107 128 153 179 209
8.4 Communication 1092 1165 1328 1625 1565 1385 1226
9 Trade / Hotel / Restaurant 20469 24884 30626 37979 45823 57908 74990
Sub-Total (8 and 9) 25577 30740 37313 46022 54719 67966 86620
10 Banking / Insurance 3136 3467 3890 4858 6271 7701 9019
11
Real Estate/ Ownership of
Dwelling/Business Services 3713 4419 5015 6519 8376 10529 13276
Sub-Total (10 and 11) 6849 7886 8905 11376 14647 18230 22296
12 Public Administration 4713 5118 7170 8519 10114 11416 14045
13
Other Services 12312 13536 15931 19784 21922 25803 35953
Sub-Total (Tertiary) 49452 57280 69318 85700 101401 123414 158913
Total NSDP 91331 102853 129690 148151 186653 225482 282562
Per Capita NSDP 9967 11051 13728 15457 19205 22890 28317
Source : Directorate of Economics and Statistics, GOB (Concluded)
Note : P – Provisional, Q – Quick
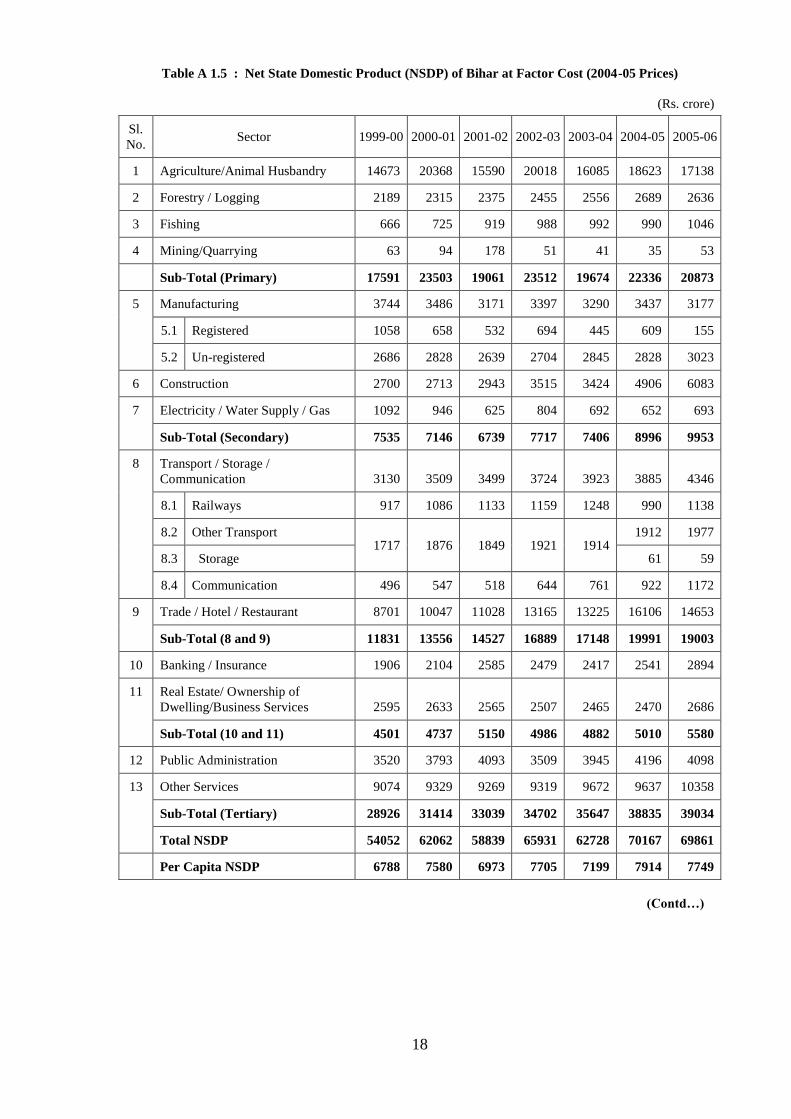
18
Table A 1.5 : Net State Domestic Product (NSDP) of Bihar at Factor Cost (2004-05 Prices)
(Rs. crore)
Sl.
No. Sector 1999-00 2000-01 2001-02 2002-03 2003-04 2004-05 2005-06
1 Agriculture/Animal Husbandry 14673 20368 15590 20018 16085 18623 17138
2 Forestry / Logging 2189 2315 2375 2455 2556 2689 2636
3 Fishing 666 725 919 988 992 990 1046
4 Mining/Quarrying 63 94 178 51 41 35 53
Sub-Total (Primary) 17591 23503 19061 23512 19674 22336 20873
5 Manufacturing 3744 3486 3171 3397 3290 3437 3177
5.1 Registered 1058 658 532 694 445 609 155
5.2 Un-registered 2686 2828 2639 2704 2845 2828 3023
6 Construction 2700 2713 2943 3515 3424 4906 6083
7 Electricity / Water Supply / Gas 1092 946 625 804 692 652 693
Sub-Total (Secondary) 7535 7146 6739 7717 7406 8996 9953
8 Transport / Storage /
Communication 3130 3509 3499 3724 3923 3885 4346
8.1 Railways 917 1086 1133 1159 1248 990 1138
8.2 Other Transport 1717 1876 1849 1921 1914
1912 1977
8.3 Storage 61 59
8.4 Communication 496 547 518 644 761 922 1172
9 Trade / Hotel / Restaurant 8701 10047 11028 13165 13225 16106 14653
Sub-Total (8 and 9) 11831 13556 14527 16889 17148 19991 19003
10 Banking / Insurance 1906 2104 2585 2479 2417 2541 2894
11 Real Estate/ Ownership of
Dwelling/Business Services 2595 2633 2565 2507 2465 2470 2686
Sub-Total (10 and 11) 4501 4737 5150 4986 4882 5010 5580
12 Public Administration 3520 3793 4093 3509 3945 4196 4098
13 Other Services 9074 9329 9269 9319 9672 9637 10358
Sub-Total (Tertiary) 28926 31414 33039 34702 35647 38835 39034
Total NSDP 54052 62062 58839 65931 62728 70167 69861
Per Capita NSDP 6788 7580 6973 7705 7199 7914 7749
(Contd…)

19
Table A 1.5 : Net State Domestic Product (NSDP) of Bihar at Factor Cost (2004-05 Prices) (Contd.)
(Rs. crore)
Sl.
No. Sector 2006-07 2007-08 2008-09 2009-10
2010-
11
2011-
12 (P)
2012-
13 (Q)
1 Agriculture/Animal Husbandry 22283 20261 22746 19176 23048 25623 27272
2 Forestry / Logging 2578 2524 2478 2433 2388 2340 2294
3 Fishing 950 1015 998 966 957 1141 1325
4 Mining/Quarrying 44 43 102 69 73 72 72
Sub-Total (Primary) 25855 23843 26324 22644 26466 29176 30964
5
Manufacturing 3413 4481 5588 5121 6471 7036 7701
5.1 Registered 59 704 1875 1400 2567 3022 3565
5.2 Un-registered 3353 3777 3713 3721 3904 4014 4137
6 Construction 7557 8925 10113 12685 17005 18690 22624
7 Electricity / Water Supply / Gas 768 766 892 1182 1155 1253 1364
Sub-Total (Secondary) 11738 14173 16593 18988 24631 26979 31689
8
Transport / Storage /
Communication 4988 5513 6068 7702 9416 10062 10827
8.1 Railways 1346 1528 1520 1633 1728 1891 2051
8.2 Other Transport 2148 2300 2595 2723 3113 3555 4119
8.3 Storage 66 73 80 84 92 97 104
8.4 Communication 1428 1613 1874 3262 4484 4519 4553
9 Trade / Hotel / Restaurant 17792 20220 22877 25032 27489 31543 37154
Sub-Total (8 and 9) 22780 25734 28945 32735 36905 41605 47981
10 Banking / Insurance 3462 3862 4151 5201 6231 7409 8625
11
Real Estate/ Ownership of
Dwelling/Business Services 2972 3260 3556 3850 4079 4468 4915
Sub-Total (10 and 11) 6433 7122 7708 9052 10310 11876 13540
12 Public Administration 4115 4183 5391 5669 6140 6302 7052
13
Other Services 10594 10861 11768 12940 13153 14343 18394
Sub-Total (Tertiary) 43922 47900 53811 60395 66508 74126 86967
Total NSDP 81514 85915 96729 102027 117605 130281 149621
Per Capita NSDP 8896 9231 10239 10645 12100 13226 14994
Source : Directorate of Economics and Statistics, GOB (Concluded)
Note : P – Provisional, Q – Quick

20
Table A 1.6 : Yearly Growth Rate of GSDP by Sector
Sl.
No. Sector 2000-01 2001-02 2002-03 2003-04 2004-05 2005-06
1 Agriculture/Animal Husbandry 37.22 -21.92 26.88 -18.23 14.92 -6.64
2 Forestry / Logging 5.75 2.57 3.59 4.19 4.76 -1.96
3 Fishing 10.42 28.02 8.58 2.08 0.35 4.49
4 Mining/Quarrying 41.28 81.78 -71.98 -18.02 -16.54 66.71
Sub-Total (Primary) 32.59 -17.61 22.28 -15.17 12.88 -5.49
5 Manufacturing -7.68 -7.52 8.35 -4.05 8.07 -6.24
5.1 Registered -31.71 -13.71 24.12 -26.12 27.13 -44.58
5.2 Un-registered 5.71 -5.29 3.17 4.66 2.76 6.98
6 Construction 1.12 10.67 19.30 -2.43 42.22 24.05
7 Electricity / Water Supply /
Gas 8.28 -22.61 2.25 2.60 3.62 3.67
Sub-Total (Secondary) -2.51 -3.89 11.77 -2.59 21.57 9.42
8 Transport / Storage /
Communication 8.87 -0.01 7.04 -6.40 7.43 10.69
8.1 Railways 12.24 2.69 1.90 -24.69 7.38 10.90
8.2 Other Transport 7.99 -0.40 5.18 0.42 1.52
3.42
8.3 Storage -2.90
8.4 Communication 3.54 -5.60 25.98 16.96 13.04 24.36
9 Trade / Hotel / Restaurant 15.38 9.53 19.18 0.59 21.52 -8.74
Sub-Total (8 and 9) 13.38 6.71 15.81 -1.20 18.10 -4.43
10 Banking / Insurance 10.73 22.80 -4.32 -3.02 5.65 13.71
11 Real Estate/ Ownership of
Dwelling/Business Services 5.43 4.28 4.13 4.54 5.15 8.96
Sub-Total (10 and 11) 7.43 11.47 0.52 1.46 5.34 10.82
12 Public Administration 8.85 8.04 -13.80 13.43 5.16 -1.39
13 Other Services 2.92 -0.33 0.74 4.02 0.25 7.68
Sub-Total (Tertiary) 8.73 5.72 5.14 2.21 9.86 1.11
Total GSDP 14.85 -4.21 11.49 -4.53 12.29 0.16
Per Capita GSDP 11.70 -7.07 9.95 -6.24 10.35 -1.50
(Contd…)
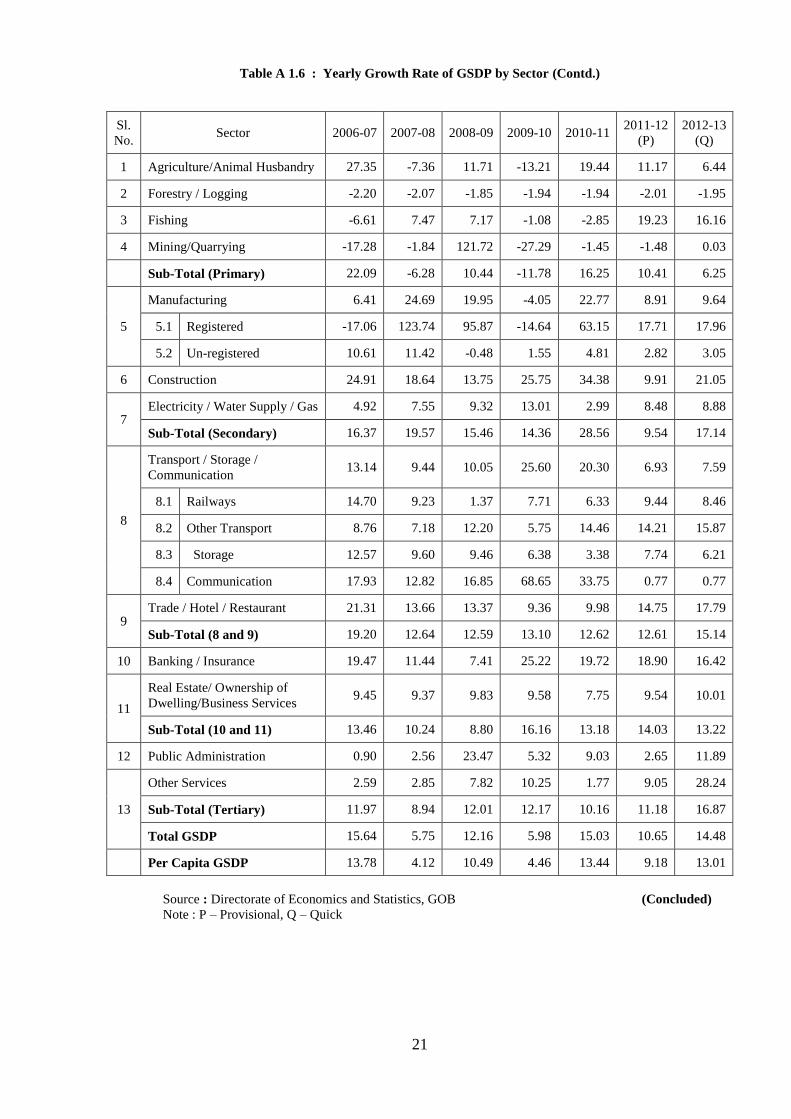
21
Table A 1.6 : Yearly Growth Rate of GSDP by Sector (Contd.)
Sl.
No. Sector 2006-07 2007-08 2008-09 2009-10 2010-11
2011-12
(P)
2012-13
(Q)
1 Agriculture/Animal Husbandry 27.35 -7.36 11.71 -13.21 19.44 11.17 6.44
2 Forestry / Logging -2.20 -2.07 -1.85 -1.94 -1.94 -2.01 -1.95
3 Fishing -6.61 7.47 7.17 -1.08 -2.85 19.23 16.16
4 Mining/Quarrying -17.28 -1.84 121.72 -27.29 -1.45 -1.48 0.03
Sub-Total (Primary) 22.09 -6.28 10.44 -11.78 16.25 10.41 6.25
5
Manufacturing 6.41 24.69 19.95 -4.05 22.77 8.91 9.64
5.1 Registered -17.06 123.74 95.87 -14.64 63.15 17.71 17.96
5.2 Un-registered 10.61 11.42 -0.48 1.55 4.81 2.82 3.05
6 Construction 24.91 18.64 13.75 25.75 34.38 9.91 21.05
7 Electricity / Water Supply / Gas 4.92 7.55 9.32 13.01 2.99 8.48 8.88
Sub-Total (Secondary) 16.37 19.57 15.46 14.36 28.56 9.54 17.14
8
Transport / Storage /
Communication 13.14 9.44 10.05 25.60 20.30 6.93 7.59
8.1 Railways 14.70 9.23 1.37 7.71 6.33 9.44 8.46
8.2 Other Transport 8.76 7.18 12.20 5.75 14.46 14.21 15.87
8.3 Storage 12.57 9.60 9.46 6.38 3.38 7.74 6.21
8.4 Communication 17.93 12.82 16.85 68.65 33.75 0.77 0.77
9 Trade / Hotel / Restaurant 21.31 13.66 13.37 9.36 9.98 14.75 17.79
Sub-Total (8 and 9) 19.20 12.64 12.59 13.10 12.62 12.61 15.14
10 Banking / Insurance 19.47 11.44 7.41 25.22 19.72 18.90 16.42
11
Real Estate/ Ownership of
Dwelling/Business Services 9.45 9.37 9.83 9.58 7.75 9.54 10.01
Sub-Total (10 and 11) 13.46 10.24 8.80 16.16 13.18 14.03 13.22
12 Public Administration 0.90 2.56 23.47 5.32 9.03 2.65 11.89
13
Other Services 2.59 2.85 7.82 10.25 1.77 9.05 28.24
Sub-Total (Tertiary) 11.97 8.94 12.01 12.17 10.16 11.18 16.87
Total GSDP 15.64 5.75 12.16 5.98 15.03 10.65 14.48
Per Capita GSDP 13.78 4.12 10.49 4.46 13.44 9.18 13.01
Source : Directorate of Economics and Statistics, GOB (Concluded)
Note : P – Provisional, Q – Quick

22
Table A 1.7 : Districtwise Per Capita Gross District Domestic Product at 2004-05 Prices
(Rupees)
District 2006-07 2007-08 2008-09 2009-10 2010-11
Patna 39702 (1) 43542 (1) 48683 (1) 53434 (1) 57843 (1)
Nalanda 7798 (18) 8362 (14) 9101 (12) 9795 (11) 10985 (11)
Bhojpur 8488 (10) 8956 (9) 10079 (8) 10145 (8) 11549 (9)
Buxar 7948 (17) 8610 (12) 8914 (15) 8823 (18) 9741 (20)
Rohtas 9344 (6) 9750 (6) 10873 (6) 10920 (7) 12272 (6)
Kaimur 7346 (24) 7821 (18) 8363 (22) 7797 (27) 9549 (23)
Gaya 8372 (11) 8802 (10) 9091 (13) 9526 (15) 10514 (17)
Jehanabad 7294 (25) 7639 (23) 8531 (19) 8485 (22) 9332 (25)
Arwal 6366 (36) 6621 (33) 6981 (35) 7290 (35) 8148 (35)
Nawada 6534 (34) 6893 (31) 7359 (32) 7610 (30) 8449 (31)
Aurangabad 7471 (20) 7797 (19) 7862 (28) 8200 (23) 9303 (26)
Saran 7019 (26) 7648 (22) 7901 (27) 8565 (20) 9588 (22)
Siwan 8208 (13) 7533 (25) 8795 (16) 8049 (25) 9200 (27)
Gopalganj 7462 (21) 7830 (17) 8004 (26) 8553 (21) 10396 (18)
W. Champaran 9157 (8) 8726 (11) 9395 (10) 9721 (12) 10586 (16)
E. Champaran 7017 (27) 6353 (35) 8377 (21) 7581 (31) 8799 (29)
Muzaffarpur 9629 (5) 9934 (5) 11546 (5) 12168 (5) 14097 (5)
Sitamarhi 6484 (35) 6288 (37) 7251 (33) 7464 (32) 8282 (33)
Sheohar 5097 (38) 5736 (38) 6064 (38) 5446 (38) 6209 (38)
Vaishali 8076 (16) 7857 (16) 9542 (9) 9947 (10) 11601 (8)
Darbhanga 7383 (23) 7726 (20) 8475 (20) 9042 (16) 10809 (12)
Madhubani 6773 (30) 6332 (36) 7585 (30) 7463 (33) 10615 (15)
Samastipur 8346 (12) 7715 (21) 8665 (18) 8852 (17) 10717 (14)
Begusarai 11350 (4) 12566 (3) 14959 (3) 14244 (4) 18447 (3)
Munger 13660 (2) 15926 (2) 16993 (2) 18562 (2) 21019 (2)
Sheikhpura 6759 (32) 7374 (28) 8046 (24) 7783 (28) 8383 (32)
Lakhisarai 9172 (7) 9731 (7) 10153 (7) 10958 (6) 11889 (7)
Jamui 8587 (9) 9080 (8) 9348 (11) 10006 (9) 9821 (19)
Khagaria 6771 (31) 7425 (27) 7706 (29) 7879 (26) 9644 (21)
Bhagalpur 11588 (3) 12241 (4) 13298 (4) 14262 (3) 15886 (4)
Banka 6953 (28) 7092 (30) 7524 (31) 7737 (29) 7764 (37)
Saharsa 8123 (15) 8348 (15) 8686 (17) 9602 (14) 11274 (10)
Supaul 6677 (33) 6587 (34) 6726 (36) 7054 (36) 8202 (34)
Madhepura 6874 (29) 7160 (29) 6540 (37) 6990 (37) 8102 (36)
Purnea 7389 (22) 7613 (24) 8162 (23) 8756 (19) 9365 (24)
Kishanganj 7655 (19) 7532 (26) 8043 (25) 8097 (24) 9135 (28)
Araria 6335 (37) 6831 (32) 7183 (34) 7388 (34) 8542 (30)
Katihar 8208 (14) 8452 (13) 8995 (14) 9606 (13) 10731 (13)
Total 9832 10237 11311 11815 13404
Source : Directorate of Economics and Statistics, GOB
Note : Figures in Parentheses denote ranking of the districts

23
Table A 1.8 : Districtwise Consumption of Petroleum Products
(Fig in MT)
Districts
Share
of
populat
-ion
Petrol Diesel
2010-11 2011-12 2012-13 Triennium
Average 2010-11 2011-12 2012-13
Triennium
Average
Patna 5.6 45357 45357 49727 46814 (17.2) 179859 177112 184913 180628 (10.8)
Nalanda 2.8 4884 4884 5927 5232 (1.8) 47797 50360 50677 49611 (2.8)
Bhojpur 2.6 6120 6120 7095 6445 (2.3) 42564 42156 47592 44104 (2.6)
Buxar 1.6 4749 4749 4714 4737 (1.8) 34232 33644 32533 33470 (2.1)
Rohtas 2.9 8472 8472 9374 8773 (3.2) 73081 77038 76121 75413 (4.5)
Kaimur 1.6 2805 2805 3875 3162 (1) 25338 33524 31075 29979 (1.7)
Gaya 4.2 10175 10175 11790 10713 (3.9) 72923 70069 81825 74939 (4.3)
Jehanabad 1.1 1919 1919 2231 2023 (0.6) 18963 20393 19295 19550 (1.1)
Arwal 0.7 907 907 1132 982 (0.3) 6241 6522 6523 6429 (0.3)
Nawada 2.1 2743 2743 3447 2978 (1) 30142 32680 33025 31949 (1.8)
Aurangabad 2.4 5015 5015 5842 5291 (1.9) 47479 46953 50120 48184 (2.8)
Saran 3.8 9992 9992 12413 10799 (3.7) 53433 59724 61351 58169 (3.4)
Siwan 3.2 9626 9626 12485 10579 (3.6) 42878 47216 49438 46511 (2.7)
Gopalganj 2.5 7863 7863 9727 8484 (3) 33185 38999 40105 37430 (2.2)
W Champaran 3.8 8453 8453 10586 9164 (3.1) 50702 56336 60458 55832 (3.2)
E Champaran 4.9 12648 12648 15703 13666 (4.8) 89170 94768 108861 97600 (5.5)
Muzaffarpur 4.6 17263 17263 19858 18128 (6.4) 91836 96159 102479 96825 (5.6)
Sitamarhi 3.3 5725 5725 6950 6133 (2.1) 33385 35189 42309 36961 (2)
Sheohar 0.6 599 599 874 691 (0.2) 2805 3607 4326 3579 (0.2)
Vaishali 3.4 10802 10802 13127 11577 (4.1) 59987 67015 69352 65451 (3.6)
Darbhanga 3.8 8928 8928 10545 9467 (3.3) 44496 46793 51738 47676 (2.7)
Madhubani 4.3 8426 8426 11011 9288 (3.2) 35297 39177 48766 41080 (2.2)
Samastipur 4.1 8932 8932 10359 9408 (3.3) 53947 61477 63547 59657 (3.3)
Begusarai 2.8 7475 7475 8293 7748 (2.8) 85616 87989 79886 84497 (5.3)
Munger 1.3 3297 3297 3705 3433 (1.3) 14484 14217 15733 14811 (1)
Sheikhpura 0.6 1198 1198 1336 1244 (0.4) 15533 14672 12440 14215 (0.9)
Lakhisarai 1 1130 1130 1537 1266 (0.4) 14009 14609 19149 15922 (0.8)
Jamui 1.7 2651 2651 3096 2799 (0.9) 16412 18236 19484 18044 (0.9)
Khagaria 1.6 2254 2254 2914 2474 (0.8) 23560 24687 27202 25150 (1.5)
Bhagalpur 2.9 8957 8957 9535 9150 (3.5) 66957 70962 69793 69237 (4.1)
Banka 2 3004 3004 3736 3248 (1) 18958 20182 22301 20480 (1.1)
Saharsa 1.8 3419 3419 4128 3655 (1.4) 22168 23781 24266 23405 (1.4)
Supaul 2.1 3777 3777 5151 4235 (1.3) 19730 23541 25464 22912 (1.1)
Madhepura 1.9 4242 4242 5196 4560 (1.6) 27585 28544 31524 29218 (1.6)
Purnea 3.2 7521 7521 9967 8336 (2.9) 61411 63552 70326 65096 (3.8)
Kishanganj 1.6 3956 3956 5075 4329 (1.4) 14554 15443 17480 15826 (0.9)
Araria 2.7 5967 5967 7793 6576 (2.2) 33284 35564 47388 38745 (2)
Katihar 3 5706 5706 7434 6282 (2.1) 36481 39015 40799 38765 (2.1)
Total 100 266957 266957 317690 283868 (100) 1640482 1731905 1839664 1737350 (100)
Source : Indian Oil Corporation (Continued)
Note : Figures in Parentheses denote Share in the district to the total

24
Table A 1.8 : Districtwise Consumption of Petroleum Products (Contd.)
(Fig in MT)
Districts Share of
population
LPG
2010-11 2011-12 2012-13 Triennium
Average
Patna 5.6 76933 85368 86586 82962 (20.7)
Nalanda 2.8 10262 13523 13977 12587 (2.9)
Bhojpur 2.6 13044 15498 15752 14765 (3.6)
Buxar 1.6 5908 6997 7051 6652 (1.6)
Rohtas 2.9 10778 13887 13994 12886 (3.1)
Kaimur 1.6 2774 3894 4525 3731 (0.8)
Gaya 4.2 13112 15704 16966 15261 (3.6)
Jehanabad 1.1 5012 6083 6886 5994 (1.4)
Arwal 0.7 585 780 746 704 (0.2)
Nawada 2.1 5700 7373 8711 7261 (1.6)
Aurangabad 2.4 6947 8615 8834 8132 (1.9)
Saran 3.8 14965 18609 19526 17700 (4)
Siwan 3.2 7478 10718 14093 10763 (2.2)
Gopalganj 2.5 8690 11079 12790 10853 (2.4)
W Champaran 3.8 10265 11349 13192 11602 (2.7)
E Champaran 4.9 13089 15115 18162 15455 (3.4)
Muzaffarpur 4.6 19870 24080 7626 17192 (5.4)
Sitamarhi 3.3 10162 12280 13343 11928 (2.8)
Sheohar 0.6 280 136 506 307 (0.1)
Vaishali 3.4 13342 17321 18919 16527 (3.7)
Darbhanga 3.8 14330 17393 19763 17162 (3.9)
Madhubani 4.3 11614 13867 13684 13055 (3.1)
Samastipur 4.1 10245 12724 14057 12342 (2.8)
Begusarai 2.8 11178 13360 13823 12787 (3)
Munger 1.3 8045 9064 9422 8844 (2.2)
Sheikhpura 0.6 1596 1882 1883 1787 (0.4)
Lakhisarai 1 2716 3241 3402 3120 (0.6)
Jamui 1.7 2673 3641 4105 3473 (0.8)
Khagaria 1.6 3269 3547 3832 3549 (0.9)
Bhagalpur 2.9 13962 16376 16847 15728 (3.8)
Banka 2 3990 4552 4642 4395 (1.1)
Saharsa 1.8 5358 6550 7429 6446 (1.4)
Supaul 2.1 2157 2730 2984 2624 (0.7)
Madhepura 1.9 4086 5169 5686 4980 (1.1)
Purnea 3.2 10690 11469 12152 11437 (2.8) Kishanganj 1.6 1466 1868 1954 1763 (0.4)
Araria 2.7 4862 5661 5756 5426 (1.3)
Katihar 3 7739 8986 9044 8590 (2)
Total 100 369172 440489 452651 420771 (100)
Source : Indian Oil Corporation (Concluded)
Note : Figures in Parentheses denote Share in the District to the total

25
Table A 1.9 : Districtwise Small Savings in Post Offices and Public Provident Fund
(Rs. Crore)
District Share of
population
2010-11 2011-12 2012-13 Trinium
Average of
Achieve-
ments
(2010-13)
Share of
Achieve-
ments (%) Target Achive-
ment Target
Achive-
ment Target
Achive-
ment
Patna 5.6 495 255 425 -31 144 65 96 6.9
Nalanda 2.8 167 102 143 82 98 67 84 6.0
Bhojpur 2.6 107 136 92 74 78 98 103 7.3
Buxar 1.6 49 50 42 33 34 31 38 2.7
Rohtas 2.9 80 67 69 32 47 17 39 2.8
Kaimur 1.6 34 33 29 16 20 8 19 1.4
Total 17.1 932 643 800 206 421 287 379 27.1
Gaya 4.2 109 78 94 31 64 23 44 3.1
Jehanabad 1.1 23 21 20 13 15 12 15 1.1
Arwal 0.7 15 14 13 9 11 8 10 0.7
Nawada 2.1 63 92 54 63 72 65 73 5.2
Aurangabad 2.4 76 66 65 32 44 7 35 2.5
Total 10.5 286 271 246 148 206 116 178 12.7
Saran 3.8 160 155 137 121 129 117 131 9.4
Siwan 3.2 83 86 71 68 74 38 64 4.6
Gopalganj 2.5 53 53 46 40 45 45 46 3.3
Total 9.5 296 295 254 230 248 200 242 17.3
E. Champaran 3.8 75 65 65 22 30 29 39 2.8
W. Champaran 4.9 40 39 35 27 44 14 27 1.9
Muzaffarpur 4.6 122 138 106 37 72 36 70 5.0
Sitamarhi 3.3 34 36 30 5 20 8 16 1.2
Sheohar 0.6 7 8 6 1 4 2 4 0.3
Vaishali 3.4 97 83 83 53 57 58 65 4.6
Total 20.6 375 368 325 145 227 147 220 15.7
Darbhanga 3.8 100 75 86 35 59 42 51 3.6
Madhubai 4.3 63 45 55 25 38 17 29 2.1
Samastipur 4.1 53 57 46 32 34 32 40 2.9
Total 12.2 216 177 187 92 131 91 120 8.6
Begusarai 2.8 68 68 58 20 40 31 40 2.8
Munger 1.3 49 34 42 25 29 18 26 1.8
Sheikhpura 0.6 13 9 11 7 8 5 7 0.5
Lakhisarai 1.0 13 9 11 7 9 6 7 0.5
Jamui 1.7 17 15 15 13 14 11 13 0.9
Khagaria 1.6 14 14 12 5 8 8 9 0.6
Total 9.0 174 148 149 76 108 77 100 7.2
Bhagalpur 2.9 71 74 61 40 42 63 59 4.2
Banka 2.0 15 7 13 -2 5 3 3 0.2
Total 4.9 86 81 74 38 47 65 61 4.4
Saharsa 1.8 37 28 32 19 22 20 22 1.6
Supaul 2.1 28 21 24 14 16 15 17 1.2
Madhepura 1.9 28 21 24 15 16 15 17 1.2
Total 5.8 93 69 80 47 54 51 56 4.0
Purnea 3.2 37 25 32 6 22 10 14 1.0
Kishanganj 1.6 18 10 9 5 6 5 7 0.5
Araria 2.7 15 10 13 2 9 4 5 0.4
Katihar 3.0 36 20 31 14 21 18 17 1.2
Total 10.5 106 65 85 26 58 37 43 3.0
Grand Total 100.1 2564 2116 2200 1009 1500 1070 1398 100.0
Department of Finance, GOB
______________
26
CHAPTER II
AGRICULTURE AND ALLIED SECTORS
The standard economic theories maintain that agriculture and industry are the two wheels of
progress, one strengthening the other; at one end, the agricultural sector provides food for
industrial workers and a surplus to be invested in industry and, on the other, the surplus from
the industrial sector can create social overheads, helping the government to pursue welfare
activities for the population as a whole. This was a possibility for the Bihar economy prior to
the bifurcation of the state. But thereafter, the industrial and mineral sector went to the newly
created Jharkhand state and the present Bihar became highly disadvantaged, losing one of the
wheels of progress. The present government has, therefore, to focus mainly on agriculture so
that it could generate enough surplus to strengthen the industrial sector and overall economy.
Bihar is endowed with fertile Gangetic alluvial soil with abundant water resources, particularly
ground water resources. With varied soil categories associated with different agro-climatic
zones, the farmers grow a variety of crops. Apart from foodgrains, the state produces oilseeds,
pulses fibre crops, sugarcane, fruits, vegetables and other crops. Recently, there has been a
diversification in production, as floriculture has caught the imagination of the farmers because
of its increasing demand. The state government is trying utmost to bridge the rural-urban
divide by promoting higher agricultural growth. The Agriculture Road Map has ensured that
productivity steadily rises in the fields. This is corroborated by the fact that the state has
reached the productivity of 2240 kg/hect for paddy in recent years. The state government is
putting in a strong agricultural monitoring system, so that nothing is left to chance. The support
services in irrigation, seeds, fertilizer, farm mechanization, agricultural credit and awareness
programmes are being stressed to make agriculture more productive.
Bihar has a geographical area of 93.6 lakh hectares with three distinct important agro-climatic
zones — North-West, North-East and South. The North-West zone has 13 districts. This zone
receives an annual rainfall of 1040-1450 mms. The soil is mostly loam and sandy loam. The
North-East zone has 8 districts and it receives rainfall ranging from 1200-1700 mms. The soil

27
here is loam and clay loam. Finally, the South zone, having 17 districts, receives an average
annual rainfall of 990-1300 mms and the soil consist sandy loam, loam, clay and clay loam.
The details of agriculture and allied sectors are presented in this Chapter under the following
major heads — Rainfall, Land Utilization, Production and Productivity, Irrigation, Agricultural
Inputs (seed, fertilizer, agricultural equipment and extension services), and Agricultural
Credit. Under Allied Activities, the Chapter presents the performance in Animal Husbandry
and Fishery.
2.1 Rainfall
The average annual rainfall in Bihar is 1033 mms. This rainfall in Bihar is largely due to south-
west monsoon, which accounts for around 85 percent of the total rainfall in the state. Winter
rain, hot weather rain and north-west monsoon account for the remaining 15 percent. The
average annual rainfall is reasonably adequate for the state’s agricultural operations. However,
it is the year-to-year variation in rainfall which tends to create flood or draught like situations
in the state in some years. This causes serious damage to crop production which affects the
state income, since almost 50 percent of the farmers depend on monsoon for their agricultural
operations.
During the period 2001 to 2012, the annual rainfall has varied between 677.85 mms in 2010 to
1506.08 in 2007. In 2010, the average rainfall was only 65.6 percent of the normal rainfall, the
lowest in the last decade; on the other hand, the rainfall was 145.8 percent of normal rainfall in
2007, the highest in the last decade. In 2007, the rainfall from south west monsoon was 153.4
percent of the normal rainfall which created flood in many districts of the state. During the last
5 years, the total rainfall had been substantially lower than the normal in 4 years — 2009 (84.1
percent), 2010 (65.6 percent), 2012 (77.2 percent), and 2013 (61.04), taking into account the
rainfall upto September for 2013. The rainfall pattern of the state in presented in Table 2.1.

28
Table 2.1 : Annual Rainfall for Different Seasons (2001 to 2013)
(Rainfall in mm.)
Year Winter Rain Hot-Weather
Rain
Southwest
Monsoon
Northwest
Monsoon Total
2001 20.90 (132.6) 86.70 (120.7) 908.20 (102.4) 192.20 (330.2) 1208.00 (117.0)
2002 48.90 (310.3) 66.80 (93.0) 896.90 (101.1) 33.20 (57.0) 1045.80 (101.3)
2003 19.20 (121.9) 93.00 (129.5) 767.60 (86.5) 128.90 (221.5) 1008.70 (97.7)
2004 23.70 (150.4) 41.40 (57.6) 906.10 (102.2) 60.10 (103.3) 1031.30 (99.9)
2005 0.10 (0.6) 89.50 (124.6) 777.60 (87.7) 30.20 (51.9) 897.40 (86.9)
2006 0.10 (0.6) 88.97 (123.9) 925.86 (104.4) 27.77 (47.7) 1042.69 (101.0)
2007 28.34 (179.9) 76.40 (106.4) 1360.85 (153.4) 40.49 (69.6) 1506.08 (145.8)
2008 30.61 (194.3) 61.78 (86.0) 1084.27 (122.3) 19.31 (33.2) 1195.97 (115.8)
2009 0.09 (0.6) 98.22 (136.7) 699.17 (78.8) 71.13 (122.2) 868.61 (84.1)
2010 0.74 (4.7) 49.30 (68.6) 584.40 (65.9) 43.41 (74.6) 677.85 (65.6)
2011 5.20 (33.0) 79.40 (110.5) 1028.00 (115.9) 0.50 (0.9) 1113.10 (107.8)
2012 11.20 (71.1) 31.30 (42.5) 704.20 (79.4) 51.20 (88.0) 797.00 (77.2)
2013 (upto
September ) 17.10 64.70 541.40 —
623.20
Average
(2001-2012) 15.76 71.83 886.92 58.20 1032.71
Note : Figures in parentheses denote actual rainfall as percentage of average
Source : Directorate of Economics and Statistics, GOB
Chart 2.1 : Annual Rainfall in Bihar
The rainfall pattern of the various districts of Bihar in 2012 and 2013 (upto September) can be
observed from Table A 2.1 (Appendix). To have a comparative view and variation therein,
total rainfall for the district for a particular year can be compared with the average rainfall of
the state for that year. In 2012, the rainfall in 17 out of 38 districts exceeded the average
rainfall. The remaining districts which were deficient were Bhojpur, Buxar, Rohtas, Gaya,
0.00
200.00
400.00
600.00
800.00
1000.00
1200.00
1400.00
1600.00
2001 2002 2003 2004 2005 2006 2007 2008 2009 2010 2011 2012
Rai
nfa
ll in
mm

29
Arwal, Nawadah, Sitamarhi, Vaishali, Darbhanga, Madhubani, Samastipur, Begusarai,
Munger, Lakhisarai, Jamui, Khagaria, Bhagalpur, Banka, Saharsa, Supaul and Madhepura. The
year 2013, as mentioned before, had deficit rainfall and one can see from Table A 2.1
(Appendix) that, except for 4 districts (West Champaran, Saharsa, Kishanganj and Araria), all
others had received less than 900 mm of rainfall upto September of the year.
2.2 Land Utilisation
Bihar falls in the riverine plain of the Ganga basin area. Because of this topographical nature,
the proportion of total land put to agricultural use is high in the state, compared to other states
of India. The Table 2.2 presents the land use pattern of the state from 2008-09 to 2010-11. A
glance at the data would instantly reveal that this pattern has remained nearly the same over the
years.
Table 2.2 : Land Utilization Pattern in Bihar (2008-09 to 2010-11)
(Area in '000 hectares)
Land use 2008-09 2009-10 2010-11
Geographical area 9359.57 (100.0) 9359.57 (100.0) 9359.57 (100.0)
(1) Forests 621.64 (6.6) 621.64 (6.6) 621.64 (6.6)
(2) Barren and Unculturable Land 431.77 (4.6) 431.72 (4.6) 431.72 (4.6)
(3) Land put to Non-agricultural use 1670.45 (17.8) 1689.72 (18.1) 1699.74 (18.2)
Land Area 1312.94 (14.0) 1332.51 (14.2) 1342.69 (14.3)
Water Area 357.51 (3.8) 357.21 (3.8) 357.05 (3.8)
(4) Culturable Waste 45.43 (0.5) 45.38 (0.5) 45.34 (0.5)
(5) Permanent Pastures 15.87 (0.2) 15.78 (0.2) 15.73 (0.2)
(6) Land Under Tree Crops 242.86 (2.6) 243.98 (2.6) 244.56 (2.6)
(7) Fallow Land (excl. current fallow) 122.30 (1.3) 122.00 (1.3) 121.88 (1.3)
(8) Current Fallow 655.17 (7.0) 857.62 (9.2) 920.27 (9.8)
Total Unculturable Land (1 to 8) 3805.48 (40.6) 4027.84 (43.0) 4100.87 (43.8)
Net Sown Area 5554.08 (59.4) 5331.73 (57.0) 5279.0 (55.0)
Gross Sown Area 7670.95 7295.81 7196.3
Cropping Intensity 1.38 1.37 1.36
Source : Directorate of Economics and Statistics, GOB
Note : The figures in parentheses denote percentage share in total geographical area
The area under forests has remained unchanged at 6.6 percent and so has the area under
permanent pastures at 0.2 percent. The area under net sown area has shown a marginal decline.
In 2008-09, net area sown was 59.4 percent and it declined to 55.0 percent in 2010-11.

30
Simultaneously, there has also been a marginal decline in gross sown area between 2008-09
(7671 thousand hectares) and 2010-11 (7196 thousand hectares). The cropping intensity has
remained almost unchanged in these three years.
The land use pattern for different districts of Bihar for the latest year 2010-11 is presented in
Table A 2.2 (Appendix). In the table, the figures in the brackets denote percentage of each
category with respect to total geographical area of the district. An analysis would indicate that
pattern of land use exhibits substantial variation across the districts. This is due to the fact that
districts of Bihar belong to different agro-climatic zones. If one considers the net sown area of
various districts for 2010-11, there exist 5 districts whose net sown area is more than 70
percent, whereas the average net sown area for the entire state is less than 60 percent. These
districts are the valuable agrarian tract of Bihar — Bhojpur (79.9 percent), Buxar (82.7
percent), Siwan (76.7 percent) Madhepura (73.8 percent), and Gopalganj (72.9 percent). On the
other hand, there are 7 districts where net sown area is less than 50 percent of its geographical
area. These districts are — Kaimur (44.6 percent), Gaya (22.0 percent), Nawada (42.7 percent),
Jamui (12.4 percent), Lakhisarai (42.3 percent), Munger (32.8 percent) and Banka (32.0
percent). These are the districts where the cropping intensity is also very low compared to the
state average. Despite serious efforts by farmers to increase cropping intensity in these areas, it
could not be increased as the irrigation facility is minimal. The cropping intensity is the lowest
at 1.14 in Darbhanga.
2.3 Production and Productivity
The fertility of soil and the abundant ground water resources enable the farmers of Bihar to
produce a variety of crops, both food and non-food. Apart from major cereals and pulses,
farmers of Bihar also produce oilseeds, fibres, fruits and vegetables. Of late, the farmers have
also taken interest in growing flowers in view of its increasing demand.

31
In Table 2.3, the volume of production of 34 most important crops of Bihar for the period
2008-09 to 2012-13 has been presented. From that table, it can be seen that the total cereal
production in 2012-13 was 172.86 lakh tonnes, compared to 98.09 lakh tonnes in 2010-11.
This quantum jump in production figure is due to high rise in rice production in 2012-13, as
compared to 2010-11. Because of the use of new ‘SRI’ technique and use of newer agricultural
implements, there was enormous rise in rice production. The level of rice production prior to
2010-11 was not consistent, with much year-to-year variation in the production levels. This is
due to the fact that around 50 percent of net sown area is bereft of irrigation and dependent on
rain. Similarly, the production levels of wheat and maize have also recorded a positive trend.
The average annual wheat production was around 40-45 lakh tonnes between 2007-08 to 2009-
10; thereafter, the production of wheat rose to 49.03 lakh tones in 2010-11 and still higher at
61.74 lakh tonnes in 2012-13. This is due to the introduction of ‘zero tillage method’ and use
of ‘SRI’ technique. The annual growth rate of wheat production was 8.1 percent during the
period from 2008-09 to 2012-13. During the period from 2007-08 to 2010-11, the annual
production of maize varied around 18 lakh tonnes. But in 2011-12, the maize production
touched a new height of 24.86 lakh tonnes, and it was still higher at 27.56 lakh tonnes in
2012-13. The annual rate of growth of maize production for the period from 2008-09 to
2012-13 works out to a 15.5 percent. The production level of pulses increased from 4.60 lakh
tonnes in 2009-10 to 5.43 lakh tonnes in 2012-13, implying a growth rate of 1.8 percent per
annum. Taking into account the overall foodgrains situation, it is observed that, during the last
5 years, the production level of cereals has grown annually at 13.8 percent and that of pulses at
1.8 percent, improving the food security of the state’s population.

32
Table 2.3 : Production of Major Crops in Bihar (2008-09 to 2012-13)
(Production in '000 tonnes)
Crops 2008-09 2009-10 2010-11 2011-12 2012-13* CAGR
Total Cereals 12143.0 9616.3 9809.4 17245.11 17286.7 13.8
Total Rice 5771.4 3640.2 3102.1 8187.6 8322.0 16.7
Autumn Rice
5603.8 3463.6 2917.1 8055.4 8036.2 16.9 Aghani Rice
Summer Rice 167.6 176.7 185.0 132.2 285.8 8.1
Wheat 4638.9 4403.8 4903.3 6531.0 6174.3 10.1
Total Maize 1701.9 1544.4 1759.0 2486.2 2756.0 15.5
Kharif maize 349.1 401.5 417.8 622.4 926.3 27.0
Rabi Maize
1352.9 1143.0 1341.3 1863.8 1829.6 11.5 Summer Maize
Total Coarse Cereals 30.8 27.8 45.0 40.4 34.5 6.2
Barley 15.7 12.4 25.1 16.7 15.2 2.4
Jowar 1.8 1.7 3.3 5.0 2.8 22.0
Bajra 3.2 3.3 5.4 5.0 4.8 13.3
Ragi 7.1 8.1 7.2 9.4 9.4 7.3
Small Millets 3.0 2.4 3.9 4.3 2.2 -0.3
Total Pulses 527.5 459.8 537.7 519.3 542.7 1.8
Total Kharif Pulses 69.7 73.8 67.8 69.3 76.6 1.3
Arhar 36.0 36.6 36.5 42.1 47.1 7.0
Urad 17.3 19.8 12.6 11.9 12.2 -11.5
Bhadai Moong 4.2 5.5 5.9 4.7 7.2 9.5
Kulthi 11.1 10.6 9.7 8.2 7.8 -9.2
Other Kharif Pulses 1.0 1.2 3.1 2.5 2.4 27.9
Total Rabi Pulses 457.8 386.0 470.0 450.0 466.1 1.9
Gram 72.2 58.3 60.3 76.8 86.2 6.5
Lentil 163.6 159.2 214.7 171.6 183.2 3.1
Pea 23.3 20.0 21.0 19.2 19.3 -4.1
Khesari 95.5 81.7 73.7 92.1 83.8 -1.4
Summer Moong 100.8 64.9 98.2 88.4 92.1 1.3
Other Rabi Pulses 2.4 1.9 2.1 1.9 1.5 -8.6
Total Oilseeds 122.4 140.6 136.2 174.5 165.3 8.5
Castor seed 0.2 0.2 0.2 0.1 0.1 -19.0
Safflower (Kusum) 0.1 0.3 0.1 0.2 0.1 -4.5
Sesamum 1.8 1.8 2.1 2.2 1.9 3.8
Sunflower 25.6 25.6 23.2 22.9 4.8 -29.2
Mustard & Rapeseed 73.4 91.4 89.5 127.9 138.5 17.4
Linseed 20.6 19.2 20.8 20.3 19.0 -1.0
Ground Nut 0.8 2.1 0.4 0.8 0.8 -9.5
Total Fibre Crops 1127.3 1271.0 1310.4 1738.8 1717.7 12.3
Jute 971.3 1147.3 1164.6 1490.7 1490.2 11.8
Mesta 155.9 123.7 145.8 248.1 227.5 15.6
Sugarcane 4811.2 3443.7 12763.6 11288.6 12741.4 36.8
Source : Directorate of Economics and Statistics, GOB
* Provisional
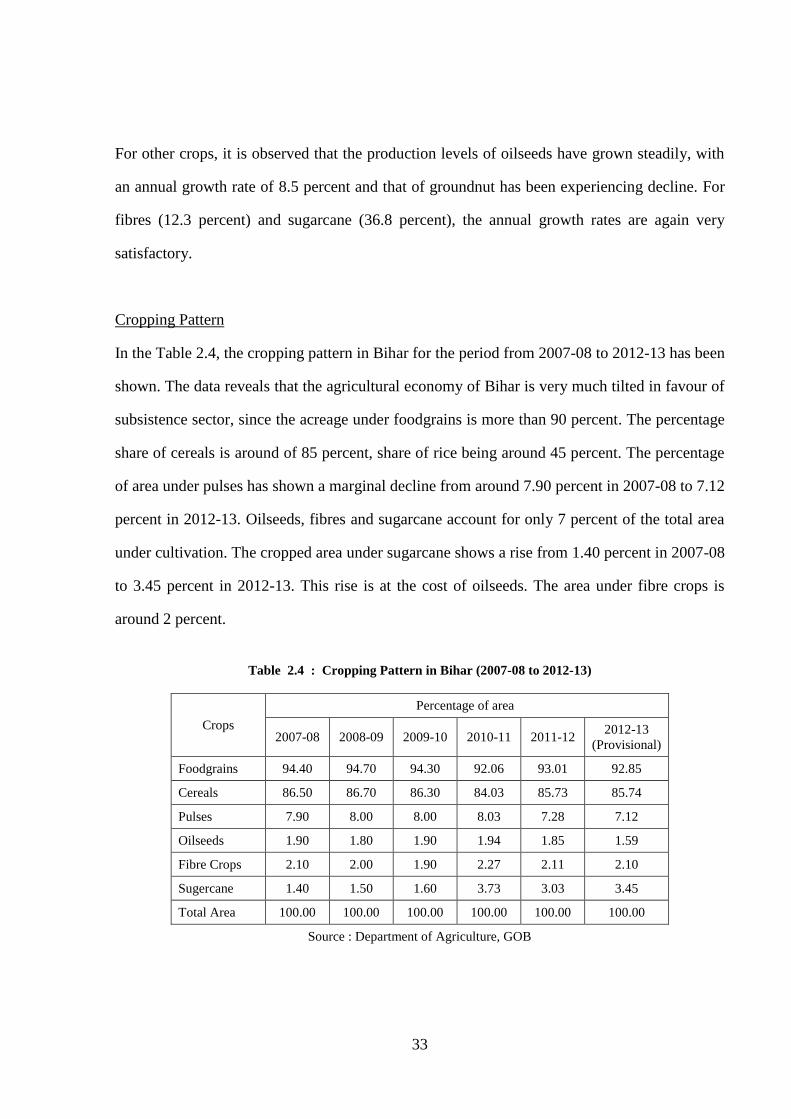
33
For other crops, it is observed that the production levels of oilseeds have grown steadily, with
an annual growth rate of 8.5 percent and that of groundnut has been experiencing decline. For
fibres (12.3 percent) and sugarcane (36.8 percent), the annual growth rates are again very
satisfactory.
Cropping Pattern
In the Table 2.4, the cropping pattern in Bihar for the period from 2007-08 to 2012-13 has been
shown. The data reveals that the agricultural economy of Bihar is very much tilted in favour of
subsistence sector, since the acreage under foodgrains is more than 90 percent. The percentage
share of cereals is around of 85 percent, share of rice being around 45 percent. The percentage
of area under pulses has shown a marginal decline from around 7.90 percent in 2007-08 to 7.12
percent in 2012-13. Oilseeds, fibres and sugarcane account for only 7 percent of the total area
under cultivation. The cropped area under sugarcane shows a rise from 1.40 percent in 2007-08
to 3.45 percent in 2012-13. This rise is at the cost of oilseeds. The area under fibre crops is
around 2 percent.
Table 2.4 : Cropping Pattern in Bihar (2007-08 to 2012-13)
Crops
Percentage of area
2007-08 2008-09 2009-10 2010-11 2011-12 2012-13
(Provisional)
Foodgrains 94.40 94.70 94.30 92.06 93.01 92.85
Cereals 86.50 86.70 86.30 84.03 85.73 85.74
Pulses 7.90 8.00 8.00 8.03 7.28 7.12
Oilseeds 1.90 1.80 1.90 1.94 1.85 1.59
Fibre Crops 2.10 2.00 1.90 2.27 2.11 2.10
Sugercane 1.40 1.50 1.60 3.73 3.03 3.45
Total Area 100.00 100.00 100.00 100.00 100.00 100.00
Source : Department of Agriculture, GOB

34
Table 2.5. : Productivity (kgs/ha) of Major Crops in Bihar
Crops
Triennium
Average
(2000- 03)
2010-11 2011-12 2012-13
Triennium
Average
(2010-13)
Percentage
change
between
trienniums
Total Cereals 1732 1838 2794 2779 2470 42.6
Total Rice 1457 1094 2463 2523 2027 39.1
Autumn Rice 1247 897 1603 1776 1425 14.3
Aghani Rice 1488 1106 2660 2667 2144 44.1
Summer Rice 1758 1930 1912 2719 2187 24.4
Wheat 2036 2426 3049 2797 2757 35.4
Total Maize 2384 3225 3683 4020 3643 52.8
Kharif maize 1765 1998 2358 3549 2635 49.3
Rabi Maize 2934 3880
4534 4309 - - Summer Maize 2765 3952
Total Coarse Cereals 979 1072 1173 1227 1157 18.2
Barley 1186 1327 1542 1460 1443 21.7
Jowar 923 1060 1065 1071 1065 15.4
Bajra 861 1118 1125 1140 1128 31.0
Ragi 879 982 1214 1161 1119 27.3
Small Millets 681 769 763 765 766 12.4
Total Pulses 819 868 991 1052 970 18.5
Total Kharif Pulses 901 1121 1246 1368 1245 38.2
Arhar 1215 1546 1901 2132 1860 53.1
Urad 682 872 866 864 867 27.2
Bhadai Moong 529 654 608 813 692 30.7
Kulthi 788 944 952 968 955 21.2
Other Kharif Pulses 544 677 750 810 746 37.1
Total Rabi Pulses 806 835 961 1014 937 16.2
Gram 1001 1044 1295 1402 1247 24.6
Lentil 886 939 1018 1147 1035 16.8
Pea 947 1035 1031 1041 1036 9.4
Khesari 847 984 1265 1179 1143 34.9
Summer Moong 596 539 600 624 588 -1.4
Other Rabi Pulses 662 743 1110 1101 985 48.7
Total Oilseeds 818 1094 1308 1432 1278 56.2
Castor seed 944 954 961 960 958 1.5
Safflower(Kusum) 802 800 801 808 803 0.1
Sesamum 629 788 879 882 850 35.1
Sunflower 1401 1434 1437 1391 1421 1.4
Mustard & Rapeseed 799 1109 1416 1595 1373 71.9
Linseed 712 818 865 867 850 19.4
Ground Nut 716 1030 1021 1022 1024 43.1
Total Fibre Crops 7131 9040 12699 12212 11317 58.7
Jute 7317 9121 12753 2180 8018 9.6
Mesta 6858 8446 12351 2325 7707 12.4
Sugarcane 43586 46996 51713 50896 49868 14.4
Source : Directorate of Economics and Statistics, GOB

35
Chart 2.2 : Productivity of Major Crops in Bihar
Area and Production of Rice
In Bihar, agro-climate conditions vary from one region to another. Because of this, cropping
pattern would tend to vary over the regions. In the following sections, a detailed discussion on
districtwise production of three important crops (rice, wheat and maize) for the last two years
has been presented. Table A 2.3 (Appendix) presents the districtwise production and
productivity of rice in Bihar for two years, 2009-10 and 2010-11. The shares of each district in
area and production are given in bracket. In the productivity column, the rank of each district
has been presented alongside the productivity figure.
From the districtwise shares in area of rice in 2011-12, it is found that top rice producing
districts in terms of area are – Madhubani (5.4 percent), Rohtas (5.1 percent), East Champaran
(5.8 percent), West Champaran (5.2 percent) and Aurangabad (5.3 percent). In terms of share
in area, the lowest ranking districts are – Lakhisarai (0.5 percent), Khagaria (0.6 percent),
Bhagalpur (0.8 percent) and Arwal (0.8 percent).
If one considers the production of rice in 2011-12, the highest ranking districts in terms of
share in production are – Rohtas (9.0 percent), Aurangabad (7.1 percent) Kaimur (4.7 percent)
and West Champaran (5.1 percent). Similarly, the lowest ranking districts are — Lakhisarai
(0.4 percent), Sheikhpura (0.9 percent), Sheohar (0.9 percent), Khagaria (0.4 percent) and
Munger (0.8 percent). According to productivity rankings in 2011-12, the top ranking districts
1457
2036
2384
819
2027
2757
3643
970
0 500 1000 1500 2000 2500 3000 3500 4000
Rice
Wheat
Maize
Pulses
Productivity ( kgs/ha) Triennium Average (2010-13)
Triennium Average (2000- 03)

36
are Rohtas, Banka, Buxar, Kaimur and Aurangabad. In 2011-12, the highest level of
productivity was 4326 kgs/hectare in Rohtas.
Area and Production of Wheat
For an analysis of production levels in wheat, the same methodology has been followed as in
the case of rice. The districtwise shares of area and production of wheat for 2010-11 and 2011-
12 have been presented in Table A2.4 (Appendix). The productivity figures of wheat for each
district with ranks have been presented in brackets along with productivity.
Considering the share in area of each district in 2011-12, one finds that the top wheat
producing districts are – Rohtas (6.7 percent) East Champaran (5.2 percent), Siwan (4.2
percent), Madhubani (4.2 percent) and Muzaffarpur (4.1 percent). The bottom districts with
low share in area are – Jamui (0.4 percent), Arwal (0.5 percent), Munger (0.7 percent), Sheohar
(0.7 percent) and Kishanganj (0.4 percent). However, if one considers the districtwise share in
production, the top districts are – Rohtas (6.0 percent), East Champaran (5.5 percent),
Gopalganj (4.2 percent), Saran (4.2 percent) and Muzaffarpur (5.4 percent). The bottom
districts in terms of production are – Jamui (0.3 percent), Kishanganj (0.4 percent), Munger
(0.7 percent) Arwal (0.4 percent) and Sheohar (0.8 percent). According to productivity
rankings in 2011-12, the top districts are Muzaffarpur, Vaishali, Samastipur, Khagaria, and
Begusarai. The highest productivity level in 2011-12 was 4047 kg/hectare, recorded by
Muzaffarpur.
Area and Production of Maize
The shares of various districts of Bihar in the area and production of maize for 2010-11 and
2011-12 are presented in Table A2.5 (appendix). As before, in the productivity column, the
rankings of each district have been shown in brackets. If one considers the districtwise share in
area, the top districts are – Begusarai (8.6 percent), Khagaria (8.5 percent), East Champaran
(7.6 percent) and Bhagalpur (7.2 percent). The bottom districts are – Jehanbad (0.1 percent),
Arwal (0.1 percent), Sheikhpura (0.1 percent) and Sheohar (0.3 percent). Considering the share
in production, the top districts in 2011-12, are – Madhepura (11.1 percent), Khagaria (10.7
percent), Saharsa (9.7 percent), Sheikhpura (8.0 percent) and Bhagalpur (8.2 percent). The
low-performing districts in terms of share of production are – Jehanabad (0.1 percent), Arwal
(0.1 percent), Buxar (0.2 percent) and Sheohar (0.2 percent). As per productivity ranking, the
top performing district in 2011-12 are — Madhepura, Saharsa, Khagaria and Sitamarhi. The
highest productivity in 2011-12 was achieved by Madhepura (6367 kg / hectare).

37
Area and Production of Pulses
The area, production and productivity of pulses have been presented districtwise for the year
2010-11 and 2011-12 in Table A2.6 (Appendix). Considering the relative shares of the districts
in the total area under production in 2011-12, the top districts are– Patna (8.6 percent),
Aurangabad (8.1 percent), Muzaffarpur (5.4 percent) and Bhojpur (4.7 percent). If one
consider shares of each district in production the top performing district in 2011-12 would be –
Patna (12.6 percent), Aurangabad (9.0 percent), Bhojpur (7.0 percent). (As per productivity
ranking, the top districts are — Rohtas, Patna, Bhojpur, Buxar and The highest productivity in
2011-12 was obtained by Rohtas (1565 kg/hectare).
On the basis of discussions above, Table 2.6 has been prepared to indicate the achievement of
different districts in terms of production and productivity of four different crops — rice, wheat,
maize and pulses.
Table 2.6 : Leading Districts for Production and Productivity of Rice, Wheat, Maize and Pulses in Bihar
Crop Production /
Productivity
Top 3 Districts
2010-11 2011-12
Rice Production Rohtas, Bhojpur, Aurangabad
Rohtas, Aurangabad, West
Champaran
Productivity Bhojpur, Banka,Kaimur Rohtas, Bhojpur, Banka
Wheat Production
Rohtas, East Champaran,
Gopalganj
Rohtas, East Champaran,
Muzaffarpur,
Productivity Gopalganj, Vaishali, Katihar Muzaffarpur, Vaishali, Samastipur
Maize Production Saharsa, Samastipur, Khagaria Madhepura, Khagaria, Saharsa
Productivity Araria, Saharsa, Supaul Madhepura, Saharsa, Khagaria
Pulses
Production Patna, Bhojpur, Aurangabad Patna, Aurangabad, Bhojpur
Productivity Gopalganj, Bhojpur, East
Champaran Rohtas, Patna, Bhojpur
2.4 Irrigation
One of the foremost input requirements of agriculture is the timely availability of water for
agricultural operations. Newer and modern techniques of agriculture to boost farm production
can succeed only when there exists facilities for assured irrigation. The present government has
taken several initiatives to increase the total irrigated area in the state. During the recent years,
the irrigated area for kharif crops has increased to 16.13 lakh hectares in 2012-13 from 12.61
hectares in 2001-02. In the same year, irrigation for rabi crop was made available to 3.42 lakh
hectares against the total demand for 3.93 lakh hectares.
38
Between 2001-02 and 2012-13, total irrigated area increased from 44.6 lakh hectares to 46.61
lakh hectares. It implies that over long period of a decade, the irrigated area could increase by
less than 5 percent. Therefore, the state government under Agriculture Road Map II would
make concerted efforts to enhance irrigation potential of the state during the 12th Plan (2012-
17). The following strategy of water management and irrigation would be adopted during this
period.
1. There would be a strategy for enhancing the present irrigation potential of 46.61 lakh
hectares to 101.09 lakh hectares by March, 2017.
2. The summer irrigation potential of 3.3 lakh hectares is planned to increase to 30.0 lakh
hectares by March 2017.
3. It is proposed to establish 14.64 lakh private tube wells by the end of the Second
Agricultural Road Map (March 2022)
4. There is a proposal for extensive renovation of about 1770 Ahar/Pyne by March 2017.
5. There is also a proposal for interlinking of river schemes to transfer surplus water of
North Bihar rivers by pumping through the Ganga during the Second Agriculture Road
Map.
2.5 Agricultural Inputs
Besides irrigation and quality agricultural land, agriculture also requires adequate and quality
inputs which include seeds, fertiliser, farm equipment and highly professional extension
services. One should also remember here that all these inputs in agriculture need to be supplied
at the proper time, matching the agricultural calendar.
Seeds
One of the major requirements of agriculture operation is quality seed. The 'Agriculture Road
Map' of Bihar, therefore, stressed the need of supply of quality seed to farmers in time. Proper
application of HYV seeds and maintaining a desired level of Seed Replacement Rate (SRR)
are important determinants of productivity. Since there is a dearth of firms for the supply of
certified seeds, the SRR have been often low in Bihar in the past. The state government is
making concerted efforts for the supply of certified seeds in the state in recent years.
Under the Agriculture Road Map, the production of certified seed of the recently evolved crop
varieties has been emphasized. As many as 23 crops were identified and their promotion
programmes have been initiated by the state government. Other programmes include Chief

39
Minister's Crash Seed Programme, Seed Village Programme (Beej Gram Yojana) and
provision of subsidy for production and purchase of certified seeds. There has also been the
revival of hitherto dormant Bihar Rajya Beej Nigam (BRBN), strengthening of Bihar seed
certification agency, and multiplication of foundation and breeder seeds by state farms. Under
these, 3 new seed processing plants were set up at Hajipur, Bhagalpur and Begusarai.
All these steps taken by the state government have resulted into increase in crop productivity in
the state. Recently, the scheme of 'Mukhyamantri Tibra Beej Vistar Yojana' has helped farmers
immensely in the field of hybrid paddy cultivation. The SRR for major crops like rice, wheat
and maize have increased substantially in recent years. More significantly, the SRR has
touched the scientific level of 33 percent for self-pollinated crops. Table 2.7 below reveals that
SRR has exceeded 33 percent for all major crops in 2011-12 and 2012-13. With the efforts put
in by the state government, there has been gradual increase in SRR for other rabi and kharif
crops as well.
Table 2.7 : Distribution of Certified Seeds and Seed Replacement Rate (SRR) for Important Crops in
Bihar (2010-11 , 2011-12 and 2012-13)
(Requirement and supply in '000 qntl./SRR in percentage)
Crops
2010-11 2011-12 2012-13
Require
ment Supply SRR
Require
ment Supply SRR
Require
ment Supply SRR
Kharif Crops
Paddy 423.1 232.7 31.0 493.6 349.1 38.0 297.0 279.7 40.2
Maize 49.1 33.0 65.0 49.1 41.7 82.0 75.0 61.5 82.0
Arhar 2.2 1.9 13.0 3.0 0.9 11.2 3.8 4.1 27.1
Urad 1.1 1.2 18.5 1.5 0.3 22.1 1.1 5.7 65.9
Moong 0.5 0.7 19.5 0.7 0.1 20.2 0.6 3.6 82.5
Rabi Crops
Wheat 630.0 672.5 29.2 840.0 783.2 34.8 840.0 849.9 35.4
Maize 90.0 92.6 92.0 60.0 61.9 100.0 130.0 114.8 85.0
Gram 14.9 9.6 13.5 20.8 11.4 15.8 17.3 13.1 16.5
Masoor 11.8 3.8 14.5 16.5 9.0 15.0 12.9 7.3 11.4
Rape/Mustard 3.5 2.4 56.5 3.7 2.9 67.3 3.3 5.1 100
Source : Department of Agriculture, GOB
Among kharif crops, it can be seen from the table that SRR has increased from 31.0 percent in
2010-11 to 40.2 percent in 2012-13 for paddy; the rise has been even higher for maize over the
same period from 65.0 to 82.0 percent. An increase can also be seen for urad and moong, but
for arhar, there has been a marginal fall. For rabi crops, SRR for wheat increased from 29.2
percent is 2010-11 to 35.4 percent in 2012-13. For rabi maize, SRR is 85 percent which is a
record. For other rabi crops, one can observe a gradual increase in SRR. Thus, replacement of

40
old and local varieties of seeds by recently evolved seeds would have a long-time impact in the
productivity of crops in the state.
Fertilizer
From the inception of 'Green Revolution' in India, fertilizer has always played a key role in
increasing farm productivity. In Bihar, alongside the use of better quality seeds, application of
chemical fertiliser in optimum proportion (with proper water management) has played the
vital role in raising agricultural productivity, so that it competed favourably with other
agriculturally prosperous states. The consumption of fertilizer has been steadily increasing in
Bihar in recent years (Table 2.8). In 2009-10, the total consumption of fertilizer was 39.08 lakh
tonnes, which rose to 46.21 tonnes in 2012-13 registering an increase of 18.21 percent over the
three year period. The rising trend emphasizes that the farmers are willing to adopt new
technology in agriculture.
Table 2.8 : Consumption of Fertilizer in Bihar (2011-12 and 2012-13)
('000 tonnes)
Type of Fertilizer 2011-12 2012-13
Kharif Rabi Total Kharif Rabi Total
Urea 798.56 1012.94 1811.50 903.03 1192.93 2095.95
DAP 176.80 264.39 441.19 216.52 325.16 541.68
SSP 19.88 22.38 42.26 37.13 27.42 64.55
MOP 15.23 111.09 126.32 44.53 69.30 113.83
Complex 152.91 203.15 356.06 98.83 178.83 277.66
Total (NPK) 567.08 799.93 1367.01 631.78 895.12 1526.90
N 423.76 546.51 970.26 470.89 640.39 1111.28
P 118.99 170.61 289.60 128.67 196.92 325.59
K 24.33 82.81 107.14 32.21 57.81 90.03
Grand Total 1730.46 2413.88 4144.33 1931.82 2688.76 4620.58
Consumption of
fertilizer (kg/ha.) 138.24 188.53 163.81 158.53 207.01 183.76
Source : Department of Agriculture, GOB
From Table 2.8, one may also observe a more balanced trend in the use of fertilizers in last two
years. The N:P:K (Nitrogen, Phosphorous and Potassic) ratio for the last six years has been
11:2:1 (2007-08), 6:2:1 (2008-09), 5:1:1 (2009-10), 7:2:1 (2010-11), 7:2:1 (2011-12) and 7:2:1
(2012-13). This would mean that there has been rationalization in the use of fertilizer
components by the farmer. If one observes the ratios for the last three years, we would find that
the ratios has nearly stabilised at 7:2:1 for NPK.
From Table 2.8, it would be clear that urea takes the prime place and constitute around 45
percent of the total consumption of chemical fertilizers. It can also be noted that although

41
kharif is the more important crop in Bihar, the use of chemical fertilizer is comparatively
higher in rabi season. In 2011-12, although the farmer used 138.45 kg/ha for kharif crops, they
could use 188.53 kg/ha in case of rabi crops. Similarly, for 2012-13, the average consumption
was 158.53 kg/ha for kharif crops against 207.01 kg/ha for rabi crops.
Besides NPK, the government is making conscious efforts to promote bio-fertilisers and green
manure technique on a larger scale. Apart from the central government subsidy available for
chemical fertilizers, the state government on its own is providing subsidy for the use of micro-
nutrients from state resources. Under 'Agriculture Road Map', the state government is stressing
the cultivation of the green manure plant 'Dhaicha', by distributing its seeds on a large scale.
The process has evoked immense interest among farmers and they are using bio-fertilizers on a
larger scale recently.
Extension Services
A successful team of extension workers for the state would go a long way in transferring the
available technology to the field level. They work as a catalyst for seed management, use of
optimum mix of chemical fertilisers depending on the available soil category, adoption of new
cropping pattern and use of new of HYV seeds. With the induction of subject-matter specialist
at the sub-block level and 'Kisan Salahakar' at the Panchayat level, the outreach of hitherto
dormant extension services has increased manifold in Bihar in recent years.
A massive training programme to modernize the knowledge of farmers through 'Kisan
Pathshalas' has gained momentum. They are flocking to these 'pathshalas' to have a first hand
knowledge of soil testing methods, vermi-compost, and new 'SRI' technique of paddy
cultivation. A continuous organization of 'Kisan Vikash Shibirs' have not only become
successful in imparting modern knowledge, but also become a platform for exchange of ideas
between experts and farmers. The 'Rabi and Kharif Mahotsavs' at block level are being
organised before the onset of the crop season. During 2011-12, for the introduction of 'SRI'
technique for rice, 16 districts were selected where demonstrations were arranged using 'zero
tillage' technique. During 2011-12, SRI technique for wheat cultivation were demonstrated in
those districts. The farmers are now attracted to this new technique and the cultivation of
'Dhaicha' manure.
The Kisan Vikas Shibirs involve distribution of all inputs and subsidies. The farmers may
purchase inputs like seed, bio-fertilizers or farm implements of their choice in these camps.

42
During kharif 2011 and 2012, several activities were undertaken to promote agriculture on a
fast track. In recent times, Dhaicha seeds are given free of cost. The implementation of this
scheme of green manure will have tremendous effect on the soil fertility of the state. During
kharif 2011, SRI technique was used for paddy cultivation and hybrid varieties of paddy was
cultivated on 10.13 lakh acres. During kharif 2013, paddy farming using SRI technique was
undertaken in 15.15 lakh acres, registering an increase of 41.73 percent over the kharif season
of previous year. In Rabi 2012-13, wheat farming using SRI technique was done in around
3.83 lakh acres. These interventions resulted into record rice and wheat production in the state.
The productivity of paddy rose to a high of 22.4 quintals per hectare.
One of the continuous efforts by the state government in extension services is to arrange
minikit distributions at the Panchayat or village level. Several crops are covered during kharif,
rabi and garma seasons. In Table 2.9, the progress of such schemes are depicted.
Table 2.9 : Minikit Demonstration in Bihar (2009-10 to 2012-13)
Season / Crops Number of demonstrations
2009-10 2010-11 2011-12 2012-13
Kharif Season - -
Paddy (20 kg) - - - -
Paddy (HYV) (10 kg) - - - -
Paddy (5 kg) 30203 18516 - -
Paddy (HYV) (6kg) 8014 3631 - -
Paddy (HYV) (2 kg) - - - -
Maize (2 kg) 10000 - 14,992 1000
Arhar (4 kg) 10000 - - -
Urad (4 kg) 15000 - - -
Moong (4 kg) 4000 - - -
Castor (2 kg) - - - -
Sesamum (1 kg) - - 500 -
Rabi Season
Wheat (40 kg) 5634 4796 - -
Wheat (10 kg) 130871 28371 - -
Wheat (5 kg) - -
Maize (2 kg) 150000 7000 -
Gram (8 kg) Isopom 29125 - -
Masoor (4 kg) 2125 - -
Pea (8 kg) 19375 - -
Rai/ Tori (2 kg) Isopom 83000 325000 47100 20000
Rajmah (8 kg) - -
Rajmah (3 kg) - -
Garma Season -
Maize (2 kg) Isopom 2969 - - -
Urad (4 kg) 25000 - - -
Moong (4 kg) 16875 - - -
Sesamum (1 kg) - - -
Safflower (2kg) - - -
Source : Department of Agriculture, GOB
43
One can see from the table that, during 2012-13, only two items appeared in the minikit
distributions. This is because, on the seed front, the state government machinery is doing the
job through a number of seed-related programmes, mentioned before. These programmes have
contributed immensely for the enhancement of production and productivity of different crops
in the state.
Farm Mechanization
The productivity in agriculture depends on efficient labour use and capital intensity in
agricultural operations. Whenever mechanization takes place, the economies of scale start to
operate and cost of cultivation tends to diminish. So the optimal level of mechanization,
without major displacement of family labour, paves the way for low cost agriculture to be
completed on time. Such mechanization also lessens drudgery of manual agriculture
operations.
Under 'Agricultural Road Map' of the present state government, farm mechanization
constitutes an integrated part and is a major thrust programme. The state government is
providing subsidy over and above provided under centrally sponsored scheme for power tillers,
tractors, sprayers, winnowing machine, power weeder and power threshers. It has specially
focused on zero-tillage machine which is more suitable for small and marginal farmers. These
equipments were very uncommon in rural areas about a decade ago, but are part of agricultural
households now mainly because of easy availability of subsidy.
In Table 2.10, progress of farm mechanization on subsidy has been depicted, for the period
from 2008-09 to 2012-13. It can be seen from the table that in 2008-09, only 4678 power tillers
were distributed, but the number rose to 6445 in 2012-13. There is also an increase in the use
of pumpsets — the number of pumpsets distributed was 25,520 in 2012-13, against only
11,288 in 2008-09. Because of the earnestness of the present generation of extension workers,
there was a huge jump in the number of zero-tillage machines to 7701 in 2012-13, as against a
paltry 126 in 2008-09. There has also been an increase is the use of combine harvesters, but the
growth was rather slow initially. In 2012-13, the use of combine harvesters picked up and as
many as 322 machines were distributed.

44
Table 2.10 : Number of Farm Implements Distributed on Subsidy
(In numbers)
Farm Implements 2008-09 2009-10 2010-11 2011-12 2012-13
Tractor 3543 3672 3644 3848 8158
Combine Harvestors 55 42 65 109 322
Zero Tillage 126 860 301 3787 7701
Pumpsets 11288 37293 30340 28615 25520
Power Tiller 4678 4635 5330 7567 6445
Manually operated
tools/implements 71063 245969 179790 146849 485209
Threshers 8323 5723 4316 4857 4984
Source : Department of Agriculture, GOB
Organic Farming
Throughout the world, agricultural scientists are taking interest in organic farming on the
ground of health and environment. Bihar is not trailing behind in this sphere. The process of
organic farming has been made a part of 'Agricultural Road Map' of Bihar. Under this Road
Map, the state government is taking all possible steps to retain the inherent fertility of soil for
future generation through a project of organic farming, spanning 5 years at a cost of Rs. 255
crores. The vermi-compost production has been made demand-based with 50 percent subsidy.
Earlier, the production of atleast 3000 tonnes of vermi-compost by any commercial unit used
to be subsidised. Now, the ceiling has been made lower to atleast 1000 tonnes. The state
government has also allowed subsidy for the purchase of vermi-compost from 2011-12. For
commercial production of vermi-compost, the provisional requirement of bank loan has now
been lifted. For the success of organic farming, new soil testing laboratories has been set up in
16 districts.
Besides vermi-compost, efforts are being made by the state government for the promotion of
bio-fertilizers like Rhizobium, Azotobacter, Blue-green algae, Mycorrhiza. The seed producers
are given free kit of appropriate bio-fertilizer. During the rabi season of 2011-12, more than 3
lakh farmers have benefitted through promotion of bio-fertiliser. To increase production of bio-
fertilizer, both farmers and entrepreneurs would be supported in a big way, so that
manufacturing units for such input may come up in the state. This would lessen the
dependence on other states for such input.

45
Horticulture Development
Bihar is one of the largest producers of fruits and vegetables in the country. Easy availability of
quality planting material is most critical for horticultural development. So, the strategy of the
state government is to make mother plants available in the agricultural universities and other
departmental nurseries. Depending on the agro-climatic situation, one specific horticulture
crop has been identified for each district. A cluster approach would be undertaken for such
crops in each districts. Apart from important fruit crop, the universities would set up progeny
nursery for less common fruits like Bael, Ber, Jamun, Amla etc.
Tissue culture technique is extensively used for the multiplication of agricultural plants like
banana and flowers. More and more tissue culture laboratories would be set up in the state in
the next Agriculture Road Map for 2012-17. The establishment of 'papaya gaon' and 'flower
gaon' would likely to have a significant impact on the income of the rural households.
Agriculture Road Map
With the launching of Agriculture Road Map in 2008, Bihar had embarked on an innovative
approach for agriculture planning and growth. Under Agriculture Road Map (2008), stress was
given to availability of certified seeds for 23 crops. These certified seeds were distributed on a
subsidy. The Seed Replacement Ratio (SRR) for some crops was as high as 83 percent in
2011-12. Stress was also given on bio-farming, farm mechanization and new technique of SRI
cultivation. To give a new impetus to development, an Agricultural Cabinet, headed by Chief
Minister was constituted. This landmark initiative is the first of its kind in India. The Cabinet
set up expert committees for preparation of a new road map for 2012-17. The Cabinet then
thoroughly discussed the report and farmers' suggestions were gathered in a Kisan Samagam in
February 2012. On October 3, 2012, Hon'ble President of India, Sri Pranab Mukherjee, had
launched the second Agricultural Road Map, 2012-17, for Bihar.
The six-point goal of the new Agriculture Road Map is — (i) Food security, (ii) Nutrition
security, (iii) Increase in the income of farmers, (iv) Employment generation and control on
migration of workers, (v) Inclusive human base of agricultural development and extensive
participation of women and (vi) Conservation of natural resources and their sustainable use.
The main strategy of this Road Map include :
(a) To ensure the availability of high quality agricultural input materials at farmers’ end in
proper time and at a low cost.
(b) To make the agricultural operation more cost effective and to ensure higher income for
farmers with the use of modern farm equipments and agricultural management technique.

46
(c) To ensure a sustainable agriculture through the use of optimum mix of soil, water, crop
and other agricultural components, even in the face of climate change.
(d) To develop both on-farm and off-farm agriculture-based enterprises by transforming the
agricultural knowledge into skill.
(e) To promote special programmes for Tal, Diara and other areas with specific
geographical conditions.
(f) To establish agriculture as a prestigious occupation, to attract the educated youth towards
the sector and to reward them for their contribution
Various other sectors which are interlinked with Agricultural development are dealt by Sub-
committees formed in the line departments by Agriculture Cabinet. These sectors are — Water
Management and Irrigation, Energy, Land Resource Management, Plantation and Environment
Protection, Co-operatives, Storage, Marketing and Processing, Agricultural Research,
Agricultural Credit and Communication. In the road communication sector, unconnected
habitation of populations 250+ is planned to be connected with the Approach Roads.
2.6 Agricultural Credit
Besides physical inputs like seed, water, fertiliser and agricultural implements, agricultural
operation cannot progress without adequate credit support. The credit support becomes all the
more indispensable as modern inputs need to be procured from the market at a proper time.
However, data related to agricultural credit would indicate that required supply of credit is far
from adequate in Bihar. In Table 2.11 the bankwise details are presented for agricultural credit.
Table 2.11 : Agriculture Credit Flow in Bihar
(Rs. crore)
Year Commercial Bank RRBs CCB Total
Target Achievement Target Achievement Target Achievement Target Achievement
2007-08 3004 2447 (81.5) 1256 952 (75.8) 620 356 (57.4) 4880 3755 (76.9)
2008-09 4355 3943 (90.5) 1822 1438 (78.1) 899 317 (35.3) 7076 5697 (80.5)
2009-10 5425 4960 (91.4) 2220 1851 (84.0) 1082 353(32.6) 8727 7163 (82.1)
2010-11 9111 7058 (77.5) 5228 3188 (61.0) 1529 422 (27.6) 15868 10667 (67.2)
2011-12 12241 9689 (79.2) 7013 4882 (69.6) 1848 387 (20.9) 21102 14958 (70.9)
2012-13 14674 13203 (90.0) 8407 8035 (95.6) 2319 328 (14.2 25401 21566 (84.9)
Source : State Level Bankers' Committee
Figures in bracket indicate percentage of achievement

47
The table covers the period from 2007-08 to 2012-13. The flow of agricultural credit comprises
three major sources commercial banks, regional rural banks (RRB) and central co-operative
bank (CCB). Beginning 2007-08, the achievements levels has been around 80 percent till
2009-10. However, the level came down to 67.2 percent in 2010-11, but fortunately rose to
84.9 percent in 2012-13. In absolute terms, the flow of credit to agriculture has increased to
cater to the growing need of agricultural operations. From a very modest sum of Rs. 3755 crore
in 2007-08, it has grown about 6 times to Rs. 21,566 crore in 2012-13. However, keeping in
view the inflation and volume of demand coming from modern agricultural operations, the
supply of credit is not adequate. The share of three different sources in 2012-13 stood at
Commercial Banks (61.2 percent), RRBs (38.2 percent) and CCB (0.6 percent). In other words,
Commercial Banks are the major supplier of agricultural credit in Bihar. Since Commercial
Banks and RRBs are not very keen to supply credit to agricultural sections as they seek
collaterals in time of disbursing credits, the cooperation were supposed to play a big role in
advancing agricultural credit in Bihar. But, unfortunately, their presence is very limited in
Bihar.
The districtwise position of target and achievement of co-operative credit are presented in
Table A2.7 (Appendix). It is clear from the table that, in 2012-13, no district could fulfil the
targets. The level of agricultural credit was relatively higher in districts like Nalanda, Patna,
Rohtas, Aurangabad, Samastipur, Begusarai, Khagaria and Purnea. In districts like Saharsa,
Supaul, Madhepura, Darbhanga and Saran co-operative credit operations are either nil or
negligible.
Recently, for crop loan, an amount as interest subsidy has been sanctioned by the state
government. This would help the farmers to get loan on 4 percent interest. NABARD will
come to help the state government to finance the projects. This will lead to an increased flow
of institutional credit to the farmers for timely procurement of inputs.
Kisan Credit Card (KCC)
Kisan Credit Card (KCC) has been one of the important instruments through which credit is
being channelized to farmers for agricultural operations. The scheme was introduced in 1999
and farmers are allowed a maximum credit limit of Rs. 50,000 to procure necessary
agricultural inputs like seed, fertilizer, pesticides, etc. In 2009-10, an estimated number of
13.40 lakh farmers could reap the benefit of the scheme (Table 2.12). In 2011-12, the number
rose to 18.47 lakhs. In 2012-13, 22.32 lakh farmers got the benefit of the KCC scheme. The
achievement level of KCC has been of the order of 60 percent. In 2009-10, the achievement

48
level was as high as 89.3 percent. In 2012-13, the level came down to 82.7 percent. There is
urgent need to increase the network of KCC to cover almost all the farmers of the state,
otherwise there will arise a situation where the rural money-lenders would entrap the farmers.
This would hurt the small and marginal farmers most.
Table 2.12 : Number of Kisan Credit Card issued by Banks (2001-02 to 2012-13)
Year Commercial Bank RRBs
Target Achievement Percentage Target Achievement Percentage
2001-02 110207 123465 112 52738 14256 27
2002-03 98180 77543 79 60918 24441 40.1
2003-04 105530 95587 90.6 64535 30864 47.8
2004-05 174850 140793 80.5 150500 76891 51.1
2005-06 143866 131618 91.5 129719 66332 51.1
2006-07 250000 203935 81.6 190000 140071 73.7
2007-08 300000 222478 74.2 228000 168529 73.9
2008-09 861429 505008 58.6 478571 310257 64.8
2009-10 861429 660997 76.7 478571 397420 83
2010-11 1148574 653484 56.9 638093 475636 74.5
2011-12 1352013 969763 71.7 778467 674095 86.6
2012-13 1460172 1126753 77.2 840746 950259 113
CCB Total
2001-02 277204 42086 15.2 440149 179807 40.8
2002-03 600000 112580 18.8 759098 214564 28.3
2003-04 425839 229051 53.8 595904 355502 59.7
2004-05 470350 245907 52.3 795700 463591 58.3
2005-06 293166 120653 41.2 566751 318603 56.2
2006-07 160000 55374 34.6 600000 399380 66.6
2007-08 160000 75533 47.2 688000 466540 67.8
2008-09 160000 81725 51.1 1500000 896990 59.8
2009-10 160000 281122 175.7 1500000 1339539 89.3
2010-11 213333 273710 128.3 2000000 1402830 70.1
2011-12 369520 203579 55.1 2500000 1847437 73.9
2012-13 399082 154774 38.8 2700000 2231786 82.7
Source: State Level Bankers' Committee
The districtwise achievement under KCCs for the period from 2006 to 2013 are presented in
Table A2.8 (Appendix). It can be observed that there exists wide variation in terms of the
achievement across the districts during the period from 2005-06 to 2012-13. In 2012-13, the
three districts with the largest number of KCCs are Muzaffarpur (0.53 lakh), East Champaran
(0.45 lakh), Rohtas (0.41 lakh). The districts with lower numbers of KCCs are Sheikhpura
(0.07 lakh), Sheohar (0.05 lakh) and Arwal (0.04 lakh).

49
Animal Husbandry
Besides agriculture, animal husbandry is one of the key sectors for livelihood and employment
opportunities for the rural masses, which contributes about one-fifth of the total rural income.
This sector also generates large scale employment to women, belonging to the marginalised
sections of the society. Further, since about 89 percent of the population live in rural areas,
where many households are either landless or landpoor, animal husbandry sector provides
opportunities for supplementing their low agricultural income. The state government has taken
several steps during the recent years to strengthen the sector.
According to livestock census of 2012, the total livestock population of Bihar is 366.31 lakh.
Of this, as presented in Table A2.9 (Appendix), 54 percent are milch animals, with a cow
population of 117.05 lakh and a buffalo population of 65.48 lakhs. The state has also a
substantial proportion of goat population (111.29 lakh) which are popularly known as poor
man's cow. The size of poultry population is high at 64.58 lakhs. With such a high livestock
sector, the growth potential of animal husbandry sector is rather high. As most of the rural
households are landless and marginal farmers, the sector functions, more or less, as a
subsistence sector. Several initiative have been taken by the present government for the
development of the sector, taking due cognizance of its economic potential. They include breed
upgradation, health and nutrition, insurance scheme for milch animals, and marketing of
animal husbandry and dairy products.
If one analyses the districtwise figure as provided by the livestock census Table A2.9
(Appendix), it emerges that there exists a large degree of variation in livestock population
across the districts. For bovine population (cows and buffaloes), the districts with relatively
larger share are — Patna, Bhojpur, Rohtas, Gaya, Banka, Muzaffarpur, West Champaran,
Madhubani and Purnea. For goats and poultry, there is a higher degree of concentration in
north-eastern part of the state, where the climate is rather suitable for such animals. These
districts are Purnea, Araria, Kishanganj and Katihar.
In Table 2.13, the production levels of various animal husbandry products have been depicted
for the period 2007-08 to 2012-13. Milk takes the prime position among various products of
this sector. The production of milk has increased from 56.67 lakh tonnes in 2007-08 to 68.45
lakh tonnes in 2012-13. However, during the same period, the production of eggs has
decreased from 106.80 crore to 83.72 crores in 2012-13.
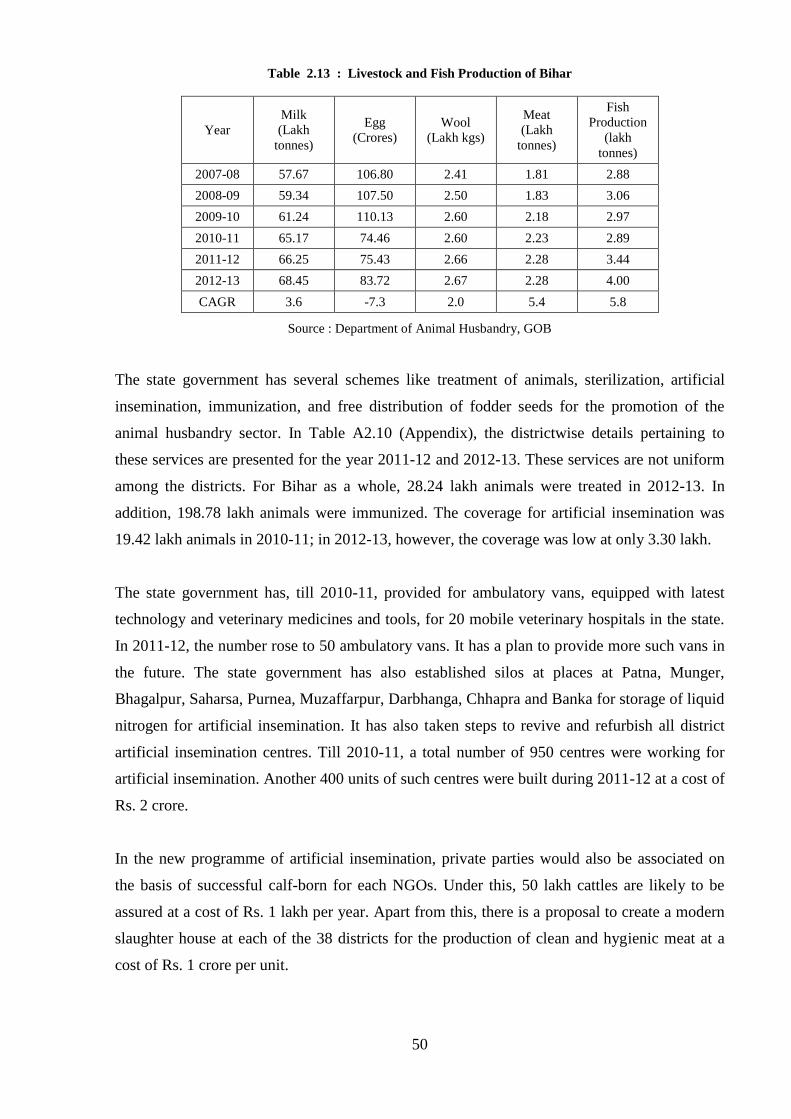
50
Table 2.13 : Livestock and Fish Production of Bihar
Year
Milk
(Lakh
tonnes)
Egg
(Crores)
Wool
(Lakh kgs)
Meat
(Lakh
tonnes)
Fish
Production
(lakh
tonnes)
2007-08 57.67 106.80 2.41 1.81 2.88
2008-09 59.34 107.50 2.50 1.83 3.06
2009-10 61.24 110.13 2.60 2.18 2.97
2010-11 65.17 74.46 2.60 2.23 2.89
2011-12 66.25 75.43 2.66 2.28 3.44
2012-13 68.45 83.72 2.67 2.28 4.00
CAGR 3.6 -7.3 2.0 5.4 5.8
Source : Department of Animal Husbandry, GOB
The state government has several schemes like treatment of animals, sterilization, artificial
insemination, immunization, and free distribution of fodder seeds for the promotion of the
animal husbandry sector. In Table A2.10 (Appendix), the districtwise details pertaining to
these services are presented for the year 2011-12 and 2012-13. These services are not uniform
among the districts. For Bihar as a whole, 28.24 lakh animals were treated in 2012-13. In
addition, 198.78 lakh animals were immunized. The coverage for artificial insemination was
19.42 lakh animals in 2010-11; in 2012-13, however, the coverage was low at only 3.30 lakh.
The state government has, till 2010-11, provided for ambulatory vans, equipped with latest
technology and veterinary medicines and tools, for 20 mobile veterinary hospitals in the state.
In 2011-12, the number rose to 50 ambulatory vans. It has a plan to provide more such vans in
the future. The state government has also established silos at places at Patna, Munger,
Bhagalpur, Saharsa, Purnea, Muzaffarpur, Darbhanga, Chhapra and Banka for storage of liquid
nitrogen for artificial insemination. It has also taken steps to revive and refurbish all district
artificial insemination centres. Till 2010-11, a total number of 950 centres were working for
artificial insemination. Another 400 units of such centres were built during 2011-12 at a cost of
Rs. 2 crore.
In the new programme of artificial insemination, private parties would also be associated on
the basis of successful calf-born for each NGOs. Under this, 50 lakh cattles are likely to be
assured at a cost of Rs. 1 lakh per year. Apart from this, there is a proposal to create a modern
slaughter house at each of the 38 districts for the production of clean and hygienic meat at a
cost of Rs. 1 crore per unit.

51
Fisheries
Bihar has a span of 237.3 thousand hectares of water area and 3200 km of river length. This
costitutes about 3.9 percent of the total geographical area. There exist, therefore, a vast scope
for fisheries sector to provide gainful employment to rural households. The sector has grown
steadily in recent years and contribution of fisheries sector to total GSDP has more than
doubled over the last decade.
In 2004-05, the production of fish in Bihar was 2.67 lakh tonnes. The fish production increased
steadily thereafter and touched the peak of 4.00 lakh tonnes in 2012-13. During the last two
years, the production has been of the order of 3.44 lakh tonnes in 2011-12 and 4.00 lakh tonnes
in 2012-13.
Chart 2.3 : Production of Milk in Bihar
Chart 2.4 : Production of Fish in Bihar
52.00
54.00
56.00
58.00
60.00
62.00
64.00
66.00
68.00
70.00
2007-08 2008-09 2009-10 2010-11 2011-12 2012-13
Pro
du
ctio
n in
Lak
h T
on
ne
s
0.00
0.50
1.00
1.50
2.00
2.50
3.00
3.50
4.00
2007-08 2008-09 2009-10 2010-11 2011-12 2012-13
Pro
du
ctio
n in
Lak
h T
on
ne
s
52
Recent initiatives of the state government has been to empower the fish farmers through on-
site training and exposure visits to various places throughout India to develop technical,
managerial and participatory skills. The fishermen have been sent to Andhra Pradesh and West
Bengal for upgradation of their knowledge in modern fish farming methods. During 2012-13,
1552 fishermen were trained within and outside the state. In 2011-12, a new insurance scheme
was introduced in the state for the benefit of the fish farmers. The scheme is being
implemented with the help of Oriental Insurance Company, a public sector enterprise. Under
this scheme a premium of Rs. 3200 is fixed per hectare of fishing area which is being shared
by the beneficiary and the state government on 50:50 basis. During 2011-12, one lakh
fishermen were covered under this scheme.
The schemes undertaken by the state government like distribution of fingerlings on subsidies,
distribution of easy loans to farmers for maintenance and reservation of private ponds for fish,
and free housing for fisherman have all immensely benefitted the fishermen of the state. The
scheme of ponds and chaur development has enhanced the fishing land. In 2012-13, a record
number of 4738.3 lakh seeds were produced and distributed in the state. The districtwise
picture of distribution of fish seed can be seen from Table A2.11 (Appendix). The data would
indicate that the districts falling in the Darbhanga Division (Darbhanga, Madhubani and
Samastipur) are major producer of fish. The leading fish producing districts in 2012-13 are
Madhubani (20.4 thousand tonnes), East Champaran (19.9 thousand tonnes), Muzaffarpur
(19.9 thousand tonnes) and Darbhanga (19.0 thousand tonnes). For fish seed, Madhubani
topped the list with 640 lakh seeds, followed by Darbhanga with 518 lakh seeds.
Recently, several new schemes has been undertaken by the state government for the upliftment
of poor fishermen in the state. A scheme of stocking of reservoirs with fingerlings have been
taken up by the state government. The National Fisheries Development Board is assisting the
process of stocking. The required credit was given to farmer for creation of hatcheries who
have the requisite capacity to grow 8-10 million fries. The unit cost for such a project of 8-10
million fries is Rs. 15.00 lakh with a provision of 20 percent subsidy for fish farmers. There is
a proposal to establish a fish research centre at Mithapur (Patna) at a cost of Rs. 129.37 lakh.
There is also a proposal to set up Sonaru fish seed farm at Fatuha at a cost of Rs. 99.68 lakh.

53
APPENDIX
Table A 2.1 : Districtwise Annual Rainfall in Bihar for Different Seasons (2012 and 2013)
(Rainfall in mm.)
District
2012 2013 (upto September)
Winter
Rain
Hot
Weather
Rain
South
West
Monsoon
North
West
Monsoon
Total Winter
Rain
Hot
Weather
Rain
South-
West
Monsoon
Total
Patna 6.8 3.8 773.6 75.0 859.2 26.9 59.1 473.0 559.0
Nalanda 16.3 27.1 854.0 61.5 958.9 7.6 98.8 358.2 464.6
Bhojpur 1.1 0.4 633.9 26.4 661.8 6.6 26.8 502.5 535.9
Buxar 13.4 16.3 658.5 25.9 714.1 52.4 31.1 392.9 476.4
Rohtas 1.9 13.8 617.4 11.3 644.4 48.8 1.6 768.5 818.9
Kaimur 9.0 19.3 847.7 6.2 882.2 68.1 9.7 680.4 758.2
Gaya 13.0 13.9 644.1 56.8 727.8 4.8 40.2 407.7 452.7
Jehanabad 14.5 40.2 743.7 77.6 876.0 21.1 103.8 210.9 335.8
Arwal 16.8 29.6 702.8 22.9 772.1 0.0 0.0 243.7 243.7
Nawada 20.3 18.8 577.3 63.5 679.9 2.4 75.6 273.4 351.4
Augangabad 9.7 12.5 805.8 44.6 872.6 32.8 10.2 562.4 605.4
Saran 14.0 19.3 859.5 25.8 918.6 41.1 121.6 435.1 597.8
Siwan 19.6 6.6 798.2 4.0 828.4 21.3 74.5 478.8 574.6
Gopalganj 19.1 7.9 908.1 0.0 935.1 46.1 91.4 373.3 510.8
W. Champaran 38.3 41.4 823.9 0.0 903.6 7.7 125.7 778.6 912.0
E. Champaran 16.1 9.4 870.7 38.1 934.3 24.9 131.8 417.6 574.3
Muzaffarpur 20.3 36.6 858.7 42.5 958.1 38.5 156.0 342.5 537.0
Sitamarhi 8.9 36.2 682.6 15.2 742.9 0.0 0.0 461.5 461.5
Sheohar 5.9 57.5 749.4 11.0 823.8 38.5 2.6 562.7 603.8
Vaishali 2.8 6.3 671.3 76.2 756.6 0.0 0.0 189.7 189.7
Darbhanga 11.0 32.3 641.3 97.5 782.1 1.1 0.0 586.7 587.8
Madhubani 6.1 47.1 537.4 50.8 641.4 30.2 110.9 355.2 496.3
Samastipur 16.3 19.8 621.5 44.4 702.0 27.3 27.5 503.6 558.4
Begusarai 13.2 13.2 466.0 73.5 565.9 6.0 28.5 810.4 844.9
Munger 11.2 25.0 567.8 79.5 683.5 7.4 58.1 709.8 775.3
Sheikhpura 6.9 38.4 703.9 98.7 847.9 5.6 64.9 261.6 332.1
Lakhisarai 11.2 16.5 605.7 91.7 725.1 0.0 0.0 612.7 612.7
Jamui 14.8 28.2 498.2 82.2 623.4 3.8 87.3 272.7 363.8
Khagaria 15.9 13.3 615.5 72.0 716.7 8.3 98.5 763.2 870.0
Bhagalpur 11.4 32.3 505.4 47.5 596.6 15.7 156.4 471.9 644.0
Banka 9.1 36.5 628.8 25.3 699.7 0.0 67.8 533.6 601.4
Saharsa 1.1 15.3 568.0 75.9 660.3 10.6 213.5 762.3 986.4
Supaul 3.3 0.0 557.3 21.3 581.9 0.0 23.8 807.0 830.8
Madhepura 9.3 64.5 612.9 50.2 736.9 0.0 0.0 694.1 694.1
Purnea 0.0 66.0 732.7 72.7 871.4 0.0 0.0 856.5 856.5
Kishanganj 2.8 129.9 1255.7 107.7 1496.1 12.2 186.6 772.9 971.7
Araria 3.4 88.5 793.8 47.9 933.6 20.0 133.0 1346.7 1499.7
Katihar 10.0 79.2 724.6 125.1 938.9 10.6 43.1 540.2 593.9
Bihar 11.2 31.3 704.2 51.3 798.0 17.1 64.7 541.4 623.2
Source : Directorate of Economics and Statistics, GOB

54
Table A 2.2 : Districtwise Land Utilisation Pattern in Bihar (2010-11)
(Area in ‘000 hectares)
Districts
Geographical
area
(1)
Forests
(2)
Barren/
Unculturable
Land
(3)
Non-Agricultural Use (4) Culturable
Waste
(5) Land Area Water
Area Total
Patna 317.2 (100.0) 0.1 (0.0) 12.4 (3.9) 65.3 (20.6) 12.7 (4.0) 78 (24.6) 0.8 (0.2)
Nalanda 232.7 (100.0) 4.6 (2.0) 1.2 (0.5) 35.1 (15.1) 10.1 (4.4) 45.2 (19.4) 0.2 (0.1)
Bhojpur 237.3 (100.0) 0.0 (0.0) 6.7 (2.8) 29.9 (12.6) 4.2 (1.8) 34.2 (14.4) 0.6 (0.3)
Buxar 167.0 (100.0) 0.0 (0.0) 2.2 (1.3) 13 (7.8) 4.6 (2.7) 17.5 (10.5) 0.7 (0.4)
Rohtas 390.7 (100.0) 66.7 (17.1) 16.8 (4.3) 38.7 (9.9) 9.3 (2.4) 48.0 (12.3) 1.1 (0.3)
Kaimur 342.4 (100.0) 113.0 (33.0) 19.3 (5.6) 30.9 (9.0 3.8 (1.1) 34.7 (10.1) 1.9 (0.5)
Gaya 493.8 (100.0) 77.8 (15.8) 27.5 (5.6) 62.9 (12.7) 10.6 (2.1) 73.5 (14.9) 3.3 (0.7)
Jehanabad 94.0 (100.0) 0.6 (0.7) 3.3 (3.5) 13.7 (14.6) 1.3 (1.3) 15 (16) 0.1 (0.2)
Arwal 62.6 (100.0) 0 .0(0.0) 2.2 (3.5) 9.1 (14.6) 1.2 (1.9) 10.3 (16.5) 0.1 (0.1)
Nawada 248.7 (100.0) 63.8 (25.6) 11.2 (4.5) 25.7 (10.3) 10.3 (4.1) 35.9 (14.4) 1.1 (0.5)
Aurangabad 330.0 (100.0) 18.8 (5.7) 16.4 (5.0) 51.9 (15.7) 3.4 (1.0) 55.3 (16.7) 1.9 (0.6)
Saran 264.9 (100.0) 0.0 (0.0) 17.9 (6.8) 28.1 (10.6) 6.3 (2.4) 34.5 (13) 0.2 (0.1)
Siwan 224.4 (100.0) 0 .0(0.0) 8.7 (3.9) 28.9 (12.9) 3.5 (1.6) 32.4 (14.4) 0.8 (0.3)
Gopalganj 203.8 (10.0) 0.0 (0.0) 5.5 (2.7) 31.2 (15.3) 2.5 (1.2) 33.7 (16.5) 1.4 (0.7)
W. Champaran 484.4 (100.0) 91.7 (18.9) 2.9 (0.6) 70.9 (14.6) 25.9 (5.3) 77.3 (16) 0.3 (0.1)
E. Champaran 431.7 (100.0) 0.1 (0.0) 8.1 (1.9) 51.4 (11.9) 23.7 (5.5) 94.6 (21.9) 1.3 (0.3)
Muzaffarpur 315.4 (100.0) 0.0 (0.0) 5.3 (1.7) 51.1 (16.2) 12.3 (3.9) 63.4 (20.1) 0.3 (0.1)
Sitamarhi 221.9 (100) 0.0 (0.0) 1.8 (0.8) 45.1 (20.3) 18.1 (8.2) 63.3 (28.5) 0.1 (0.1)
Sheohar 43.5 (100) 0.0 (0.0) 0.4 (0.9) 9.8 (22.6) 3.2 (7.3) 13 (29.9) 0 (0.1)
Vaishali 201.4 (100) 0.0 (0.0) 24.1 (12.0) 30.1 (14.9) 7.8 (3.9) 37.9 (18.8) 0.1 (0.1)
Darbhanga 254.1 (100.0) 0.0 (0.0) 1.3 (0.5) 44.2 (17.4) 16.6 (6.5) 60.8 (23.9) 0.1 (0.1)
Madhubani 353.5 (100.0) 0.0 (0.0) 2.2 (0.6) 71.2 (20.1) 15.7 (4.4) 86.9 (24.6) 0.5 (0.1)
Samastipur 262.4 (100.0) 0.0 (0.0) 3.8 (1.5) 54.6 (20.8) 9.1 (3.5) 63.7 (24.3) 0.0 (0.0)
Begusarai 187.8 (100) 0.0 (0.0) 18 (9.6) 30.2 (16.1) 11.6 (6.2) 41.8 (22.2) 0 (0)
Munger 139.8 (100) 28.5 (20.4) 11.4 (8.2) 20.5 (14.7) 11.1 (7.9) 31.6 (22.6) 0.9 (0.7)
Sheikhpura 62.1 (100) 0.0 (0.0) 1 (1.6) 7.7 (12.4) 3 (4.8) 10.7 (17.3) 0.2 (0.4)
Lakhisarai 128.6 (100.0) 13.4 (10.5) 7 (5.5) 8.9 (6.9) 5.8 (4.5) 14.7 (11.4) 0.7 (0.5)
Jamui 305.3 (100.0) 92.9 (30.4) 28.6 (9.4) 39.1 (12.8) 5 (1.6) 44.1 (14.5) 10.3 (3.4)
Khagaria 149.3 (100.0) 0.0 (0.0) 13.6 (9.1) 19.2 (12.9) 12 (8.0) 31.2 (20.9) 0.6 (0.4)
Bhagalpur 254.3 (100.0) 0.1 (0.0) 22.4 (8.8) 54.1 (21.3) 16.2 (6.4) 70.3 (27.7) 2.3 (0.9)
Banka 305.6 (100.0) 46.3 (15.2) 43 (14.1) 36.5 (11.9) 5.9 (1.9) 42.5 (13.9) 7.9 (2.6)
Saharsa 164.6 (100.0) 0.0 (0.0) 10.8 (6.6) 22.1 (13.4) 7 .0(4.2) 29.1 (17.7) 0.5 (0.3)
Supaul 238.6 (100.0) 0.0 (0.0) 20.2 (8.5) 39.2 (16.4) 12.7 (5.3) 51.8 (21.7) 1.5 (0.6)
Madhepura 179.6 (100.0) 0.0 (0.0) 3.9 (2.2) 26.8 (14.9) 4.9 (2.7) 31.7 (17.7) 0.0 (0.0)
Purnea 313.9 (100.0) 0.1 (0.0) 12.3 (3.9) 37.8 (12.1) 8.3 (2.6) 46.1 (14.7) 1.1 (0.4)
Kishanganj 189.1 (100.0) 0.4 (0.2) 11.2 (5.9) 25.5 (13.5) 9.9 (5.2) 35.3 (18.7) 1.2 (0.6)
Araria 271.7 (100.0) 0.8 (0.3) 5.0 (1.8) 40.3 (14.8) 11.3 (4.1) 51.6 (19) 0.5 (0.2)
Katihar 291.3 (100.0) 1.8 (0.6) 22.1 (7.6) 41.8 (14.4) 16.2 (5.5) 58 (19.9) 0.6 (0.2)
Bihar 9359.6 (100.0) 621.6 (6.6) 431.7 (4.6) 1342.7 (14.3) 357 (3.8) 1699.7 (18.2) 45.3 (0.5)
Source : Directorate of Economics and Statistics, GOB
Note : Figure in parentheses denote percentage to total geographical area. (Contd.)

55
Table A 2.2 : Districtwise Land Utilisation Pattern in Bihar (2010-11) (Contd.)
(Area in ‘000
hectares)
District Permanent
Pastures (6)
Tree Crops
(7)
Fallow Land
(8)
Current Fallow
(9)
Total
Unculturable
Land (10)
(2 to 9)
Net Sown
Area (11)
Gross
Sown
Area
(12)
Cropping
Intensity
(13)
Patna 0.1 (0.0) 1.0 (0.3) 1.6 (0.5) 66.5 (21) 160.4 (50.6) 156.8 (49.4) 188.1 1.20
Nalanda 0.0 (0.0) 1.3 (0.5) 0.2 (0.1) 29.1 (12.5) 81.8 (35.2) 150.9 (64.8) 184 1.22
Bhojpur 0.1 (0.0) 2 (0.9) 2.6 (1.1) 6.3 (2.7) 52.5 (22.1) 184.9 (77.9) 235.1 1.27
Buxar 0.0 (0.0) 0.7 (0.4) 0.6 (0.4) 7.1 (4.3) 28.9 (17.3) 138.1 (82.7) 172.7 1.25
Rohtas 0.1 (0) 2.9 (0.7) 0.8 (0.2) 4.5 (1.2) 140.9 (36.1) 249.8 (63.9) 329.7 1.32
Kaimur 0.1 (0) 0.7 (0.2) 0.2 (0.1) 19.8 (5.8) 189.7 (55.4) 152.7 (44.6) 188.1 1.23
Gaya 2.1 (0.4) 3.9 (0.8) 11.5 (2.3) 185.6 (37.6) 385.1 (78) 108.6 (22) 133.5 1.23
Jehanabad 0.1 (0.1) 0.7 (0.8) 0.2 (0.3) 22.9 (24.4) 43 (45.7) 51 (54.3) 64.5 1.26
Arwal 0.2 (0.2) 0.9 (1.4) 1.6 (2.6) 9.2 (14.6) 24.4 (39.0) 38.2 (61.0) 46.1 1.21
Nawada 0.9 (0.4) 0.6 (0.2) 2.7 (1.1) 26.3 (10.6) 142.6 (57.3) 106.2 (42.7) 129.2 1.22
Aurangabad 0.6 (0.2) 0.6 (0.2) 1.2 (0.4) 52.9 (16) 147.5 (44.7) 182.5 (55.3) 226.8 1.24
Saran 0.2 (0.1) 8.6 (3.2) 3.7 (1.4) 37.4 (14.1) 102.4 (38.7) 162.5 (61.3) 203.2 1.25
Siwan 0.2 (0.1) 8.6 (3.8) 1.5 (0.7) 0.2 (0.1) 52.3 (23.3) 172.1 (76.7) 233 1.35
Gopalganj 0.2 (0.1) 7.4 (3.7) 2.4 (1.2) 4.5 (2.2) 55.1 (27.1) 148.6 (72.9) 237.7 1.60
W. Champaran 0.4 (0.1) 27.1 (5.6) 3 (0.6) 58 (12) 174.2 (36) 257.5 (53.2) 308.9 1.20
E. Champaran 1.1 (0.2) 6.5 (1.5) 2.6 (0.6) 4.9 (1.1) 205.7 (47.6) 278.7 (64.6) 402.7 1.44
Muzaffarpur 0.0 (0.0) 17.4 (5.5) 1.5 (0.5) 8.4 (2.7) 96.4 (30.6) 219 (69.4) 309.8 1.41
Sitamarhi 1.4 (0.6) 13.9 (6.3) 0.6 (0.3) 2.2 (1) 83.2 (37.5) 138.7 (62.5) 225.5 1.63
Sheohar 0.0 (0.0) 3.6 (8.4) 0.9 (2.1) 0.7 (1.6) 18.7 (43) 24.8 (57) 54.7 2.21
Vaishali 0.3 (0.2) 9.7 (4.8) 0.3 (0.1) 3 (1.5) 75.5 (37.5) 125.9 (62.5) 167 1.33
Darbhanga 0.1 (0.1) 12.2 (4.8) 2.2 (0.9) 16.8 (6.6) 93.6 (36.8) 160.5 (63.2) 183.5 1.14
Madhubani 1.3 (0.4) 22.9 (6.5) 2.9 (0.8) 8.3 (2.4) 125.1 (35.4) 228.4 (64.6) 324.2 1.42
Samastipur 0.1 (0.0) 8.3 (3.2) 1 (0.4) 12.7 (4.8) 89.6 (34.1) 172.8 (65.9) 266.9 1.54
Begusarai 0.0 (0.0) 3.7 (2) 0.8 (0.5) 6.6 (3.5) 71 (37.8) 116.9 (62.2) 176.9 1.51
Munger 0.2 (0.1) 0.6 (0.4) 1.9 (1.4) 18.7 (13.4) 93.9 (67.2) 45.9 (32.8) 54.1 1.18
Sheikhpura 0.0 (0.0) 0.3 (0.5) 1.7 (2.7) 14.5 (23.3) 28.4 (45.7) 33.7 (54.3) 40.4 1.20
Lakhisarai 0.1 (0.0) 0.3 (0.2) 6.3 (4.9) 31.6 (24.6) 74.2 (57.7) 54.4 (42.3) 81.7 1.50
Jamui 1.7 (0.5) 2.1 (0.7) 16.1 (5.3) 71.7 (23.5) 267.4 (87.6) 37.9 (12.4) 51.3 1.35
Khagaria 0.2 (0.1) 3.1 (2.1) 2.2 (1.5) 4.9 (3.3) 55.8 (37.4) 93.5 (62.6) 132.8 1.42
Bhagalpur 0.6 (0.2) 6.7 (2.6) 5 (2) 18.1 (7.1) 125.5 (49.4) 128.8 (50.6) 153.7 1.19
Banka 1.1 (0.4) 7.4 (2.4) 11.1 (3.6) 48.7 (15.9) 207.9 (68) 97.7 (32) 131.6 1.35
Saharsa 1.2 (0.8) 4.4 (2.7) 3.8 (2.3) 2.2 (1.4) 51.9 (31.6) 112.6 (68.4) 205.7 1.83
Supaul 0.3 (0.1) 3.1 (1.3) 9.5 (4) 6.3 (2.7) 92.8 (38.9) 145.8 (61.1) 217.6 1.49
Madhepura 0.0 (0.0) 7.1 (4) 1 (0.6) 3.3 (1.8) 47.1 (26.2) 132.5 (73.8) 206.5 1.56
Purnea 0.0 (0.0) 8.9 (2.8) 4.7 (1.5) 63.5 (20.2) 136.8 (43.6) 177.3 (56.5) 238.3 1.34
Kishanganj 0.4 (0.2) 5.1 (2.7) 3 (1.6) 24.6 (13) 81.3 (43) 107.8 (57) 152.4 1.41
Araria 0.2 (0.1) 19 (7) 2.9 (1.1) 5.8 (2.1) 85.9 (31.6) 185.8 (68.4) 296.1 1.59
Katihar 0.1 (0) 11.1 (3.8) 6 (2.1) 12.4 (4.3) 112.2 (38.5) 199.2 (68.4) 242.3 1.22
Bihar 15.7 (0.2) 244.6 (2.6) 121.9 (1.3) 920.3 (9.8) 4100.9 (43.8) 5279.0 (55) 7196.3 1.36
Source : Directorate of Economics and Statistics, GOB
Note : Figure in parentheses denote percentage to total geographical area. (Concluded)

56
Table A 2.3 : Districtwise Area, Production and Productivity of Rice in Bihar
(Area in ‘000 hectare/Production in’000 tonnes/ Productivity in kg/ha)
Districts 2010-11 2011-12
Area Production Productivity Area Production Productivity
Patna 47.7 (1.7) 61.3 (2.0) 1285 (10) 60.1 (1.8) 167.3 (2.0) 2783 (12)
Nalanda 68.4 (2.4) 74.3 (2.4) 1085 (18) 126.5 (3.8) 347.7 (4.2) 2749 (13)
Bhojpur 106.4 (3.7) 216.4 (7.0) 2034 (01) 106.3 (3.2) 350.4 (4.3) 3295 (06)
Buxar 54.7 (1.9) 95.8 (3.1) 1751 (05) 73.3 (2.2) 258.1 (3.2) 3524 (03)
Rohtas 173.3 (6.1) 286.5 (9.2) 1653 (06) 170.2 (5.1) 736.3 (9.0) 4326 (01)
Kaimur 94.8 (3.3) 171.3 (5.5) 1806 (03) 110.9 (3.3) 387.3 (4.7) 3496 (04)
Gaya 48.9 (1.7) 53.3 (1.7) 1091 (16) 88.2 (2.7) 284.2 (3.5) 3221 (07)
Jehanabad 11.5 (0.4) 15.1 (0.5) 1310 (09) 53.7 (1.6) 151.6 (1.9) 2822 (00)
Arwal 25.8 (0.9) 46.0 (1.5) 1785 (04) 26.3 (0.8) 80.6 (1.0) 3066 (08)
Nawada 44.4 (1.6) 45.9 (1.5) 1035 (20) 66.3 (2.0) 194.7 (2.4) 2939 (10)
Aurangabad 125.7 (4.4) 178.0 (5.7) 1417 (08) 176.2 (5.3) 582 (7.1) 3304 (05)
Saran 71.3 (2.5) 89.3 (2.9) 1253 (13) 77.7 (2.3) 136.1 (1.7) 1752 (32)
Siwan 87.6 (3.1) 78.9 (2.5) 901 (24) 103.3 (3.1) 197.4 (2.4) 1910 (30)
Gopalganj 88.6 (3.1) 84.1 (2.7) 949 (23) 90.4 (2.7) 184.5 (2.3) 2041 (23)
West Champaran 129.4 (4.5) 159.9 (5.1) 1236 (14) 173.2 (5.2) 416.6 (5.1) 2405 (15)
East Champaran 132.3 (4.6) 82.4 (2.6) 623 (27) 193.3 (5.8) 384.6 (4.7) 1989 (26)
Muzaffarpur 120.2 (4.2) 60.5 (1.9) 504 (31) 132.7 (4.0) 302.2 (3.7) 2278 (16)
Sitamarhi 107.4 (3.8) 37.7 (1.2) 351 (37) 104.9 (3.2) 169 (2.1) 1611 (24)
Sheohar 27.7 (1.0) 7.6 (0.2) 276 (38) 29.8 (0.9) 76.1 (0.9) 2554 (14)
Vaishali 38.0 (1.3) 25.5 (0.8) 671 (26) 46.1 (1.4) 104.5 (1.3) 2267 (17)
Darbhanga 78.2 (2.7) 75.0 (2.4) 959 (21) 63.5 (1.9) 114.5 (1.4) 1804 (31)
Madhubani 179.7 (6.3) 101.3 (3.3) 564 (28) 179.1 (5.4) 292.8 (3.6) 1635 (34)
Samastipur 88.4 (3.1) 47.0 (1.5) 532 (30) 109.3 (3.3) 223 (2.7) 2041 (24)
Begusarai 29.8 (1.0) 11.9 (0.4) 403 (36) 29.2 (0.9) 51.1 (0.6) 1748 (33)
Munger 26.0 (0.9) 11.8 (0.4) 453 (33) 29.4 (0.9) 62.3 (0.8) 2122 (20)
Sheikhpura 8.9 (0.3) 4.2 (0.1) 475 (32) 30.9 (0.9) 69.7 (0.9) 2253 (18)
Lakhisarai 3.5 (0.1) 1.5 (0.1) 444 (34) 17.1 (0.5) 32.9 (0.4) 1921 (29)
Jamui 35.8 (1.3) 14.9 (0.5) 419 (35) 49.1 (1.5) 102.4 (1.3) 2083 (21)
Khagaria 24.6 (0.9) 13.4 (0.4) 545 (29) 20.4 (0.6) 30 (0.4) 1469 (36)
Bhagalpur 30.8 (1.1) 29.4 (0.9) 957 (22) 26.6 (0.8) 81.1 (1.0) 3043 (09)
Banka 80.1 (2.8) 159.9 (5.1) 1995 (02) 99.8 (3.0) 390.6 (4.8) 3915 (02)
Saharsa 92.3 (3.2) 100.6 (3.2) 1090 (17) 98.4 (3.0) 190.8 (2.3) 1938 (28)
Supaul 90.4 (3.2) 114.1 (3.7) 1262 (12) 98 (2.9) 141.3 (1.7) 1443 (37)
Madhepura 76.7 (2.7) 61.4 (2.0) 800 (25) 71.2 (2.1) 100.2 (1.2) 1406 (38)
Purnea 92.2 (3.2) 116.9 (3.8) 1269 (11) 98 (2.9) 195.6 (2.4) 1995 (25)
Kishanganj 78.4 (2.8) 81.7 (2.6) 1042 (19) 78.9 (2.4) 168.4 (2.1) 2133 (19)
Araria 130.6 (4.6) 147.9 (4.8) 1132 (15) 138.8 (4.2) 271.1 (3.3) 1953 (27)
Katihar 94.9 (3.3) 149.1 (4.8) 1571 (07) 76.6 (2.3) 158.6 (1.9) 2069 (22)
Bihar 2845.4
(100.0)
3112.6
(100.0) 1094
3323.9
(100.0)
8187.6
(100.0) 2463
Source : Department of Agriculture, GOB
Note : Figure in parentheses denote percentage
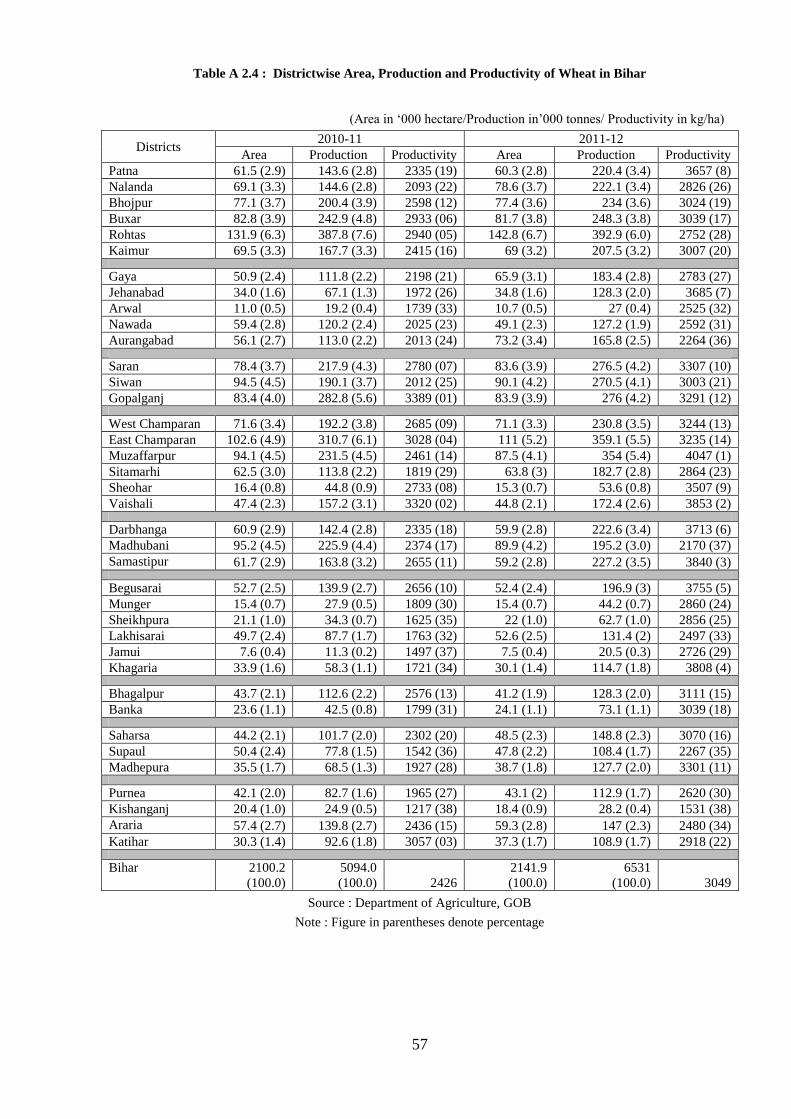
57
Table A 2.4 : Districtwise Area, Production and Productivity of Wheat in Bihar
(Area in ‘000 hectare/Production in’000 tonnes/ Productivity in kg/ha)
Districts 2010-11 2011-12
Area Production Productivity Area Production Productivity
Patna 61.5 (2.9) 143.6 (2.8) 2335 (19) 60.3 (2.8) 220.4 (3.4) 3657 (8)
Nalanda 69.1 (3.3) 144.6 (2.8) 2093 (22) 78.6 (3.7) 222.1 (3.4) 2826 (26)
Bhojpur 77.1 (3.7) 200.4 (3.9) 2598 (12) 77.4 (3.6) 234 (3.6) 3024 (19)
Buxar 82.8 (3.9) 242.9 (4.8) 2933 (06) 81.7 (3.8) 248.3 (3.8) 3039 (17)
Rohtas 131.9 (6.3) 387.8 (7.6) 2940 (05) 142.8 (6.7) 392.9 (6.0) 2752 (28)
Kaimur 69.5 (3.3) 167.7 (3.3) 2415 (16) 69 (3.2) 207.5 (3.2) 3007 (20)
Gaya 50.9 (2.4) 111.8 (2.2) 2198 (21) 65.9 (3.1) 183.4 (2.8) 2783 (27)
Jehanabad 34.0 (1.6) 67.1 (1.3) 1972 (26) 34.8 (1.6) 128.3 (2.0) 3685 (7)
Arwal 11.0 (0.5) 19.2 (0.4) 1739 (33) 10.7 (0.5) 27 (0.4) 2525 (32)
Nawada 59.4 (2.8) 120.2 (2.4) 2025 (23) 49.1 (2.3) 127.2 (1.9) 2592 (31)
Aurangabad 56.1 (2.7) 113.0 (2.2) 2013 (24) 73.2 (3.4) 165.8 (2.5) 2264 (36)
Saran 78.4 (3.7) 217.9 (4.3) 2780 (07) 83.6 (3.9) 276.5 (4.2) 3307 (10)
Siwan 94.5 (4.5) 190.1 (3.7) 2012 (25) 90.1 (4.2) 270.5 (4.1) 3003 (21)
Gopalganj 83.4 (4.0) 282.8 (5.6) 3389 (01) 83.9 (3.9) 276 (4.2) 3291 (12)
West Champaran 71.6 (3.4) 192.2 (3.8) 2685 (09) 71.1 (3.3) 230.8 (3.5) 3244 (13)
East Champaran 102.6 (4.9) 310.7 (6.1) 3028 (04) 111 (5.2) 359.1 (5.5) 3235 (14)
Muzaffarpur 94.1 (4.5) 231.5 (4.5) 2461 (14) 87.5 (4.1) 354 (5.4) 4047 (1)
Sitamarhi 62.5 (3.0) 113.8 (2.2) 1819 (29) 63.8 (3) 182.7 (2.8) 2864 (23)
Sheohar 16.4 (0.8) 44.8 (0.9) 2733 (08) 15.3 (0.7) 53.6 (0.8) 3507 (9)
Vaishali 47.4 (2.3) 157.2 (3.1) 3320 (02) 44.8 (2.1) 172.4 (2.6) 3853 (2)
Darbhanga 60.9 (2.9) 142.4 (2.8) 2335 (18) 59.9 (2.8) 222.6 (3.4) 3713 (6)
Madhubani 95.2 (4.5) 225.9 (4.4) 2374 (17) 89.9 (4.2) 195.2 (3.0) 2170 (37)
Samastipur 61.7 (2.9) 163.8 (3.2) 2655 (11) 59.2 (2.8) 227.2 (3.5) 3840 (3)
Begusarai 52.7 (2.5) 139.9 (2.7) 2656 (10) 52.4 (2.4) 196.9 (3) 3755 (5)
Munger 15.4 (0.7) 27.9 (0.5) 1809 (30) 15.4 (0.7) 44.2 (0.7) 2860 (24)
Sheikhpura 21.1 (1.0) 34.3 (0.7) 1625 (35) 22 (1.0) 62.7 (1.0) 2856 (25)
Lakhisarai 49.7 (2.4) 87.7 (1.7) 1763 (32) 52.6 (2.5) 131.4 (2) 2497 (33)
Jamui 7.6 (0.4) 11.3 (0.2) 1497 (37) 7.5 (0.4) 20.5 (0.3) 2726 (29)
Khagaria 33.9 (1.6) 58.3 (1.1) 1721 (34) 30.1 (1.4) 114.7 (1.8) 3808 (4)
Bhagalpur 43.7 (2.1) 112.6 (2.2) 2576 (13) 41.2 (1.9) 128.3 (2.0) 3111 (15)
Banka 23.6 (1.1) 42.5 (0.8) 1799 (31) 24.1 (1.1) 73.1 (1.1) 3039 (18)
Saharsa 44.2 (2.1) 101.7 (2.0) 2302 (20) 48.5 (2.3) 148.8 (2.3) 3070 (16)
Supaul 50.4 (2.4) 77.8 (1.5) 1542 (36) 47.8 (2.2) 108.4 (1.7) 2267 (35)
Madhepura 35.5 (1.7) 68.5 (1.3) 1927 (28) 38.7 (1.8) 127.7 (2.0) 3301 (11)
Purnea 42.1 (2.0) 82.7 (1.6) 1965 (27) 43.1 (2) 112.9 (1.7) 2620 (30)
Kishanganj 20.4 (1.0) 24.9 (0.5) 1217 (38) 18.4 (0.9) 28.2 (0.4) 1531 (38)
Araria 57.4 (2.7) 139.8 (2.7) 2436 (15) 59.3 (2.8) 147 (2.3) 2480 (34)
Katihar 30.3 (1.4) 92.6 (1.8) 3057 (03) 37.3 (1.7) 108.9 (1.7) 2918 (22)
Bihar 2100.2
(100.0)
5094.0
(100.0) 2426
2141.9
(100.0)
6531
(100.0) 3049
Source : Department of Agriculture, GOB
Note : Figure in parentheses denote percentage

58
Table A 2.5: Districtwise Area, Production and Productivity of Maize in Bihar
(Area in ‘000 hectare/Production in’000 tonnes/ Productivity in kg/ha)
Districts 2010-11 2011-12
Area Production Productivity Area Production Productivity
Patna 7.1 (1.1) 10.6 (0.5) 1488 (37) 8.06 (1.2) 17.97 (0.7) 2228 (33)
Nalanda 7.4 (1.1) 17.3 (0.8) 2348 (27) 6.1 (0.9) 23.52 (0.9) 3854 (09)
Bhojpur 4.9 (0.8) 13.5 (0.6) 2736 (17) 4.94 (0.7) 9.72 (0.4) 1967 (36)
Buxar 1.9 (0.3) 2.9 (0.1) 1530 (36) 2.13 (0.3) 4.68 (0.2) 2190 (34)
Rohtas 0.2 (0.0) 0.3 (0.0) 1597 (35) 0.09 (0.0) 0.22 (0.0) 2326 (32)
Kaimur 0.2 (0.0) 0.3 (0.0) 1120 (38) 0.23 (0.0) 0.58 (0.0) 2452 (29)
Gaya 3.5 (0.5) 8.9 (0.4) 2509 (20) 5.15 (0.8) 12.43 (0.5) 2412 (31)
Jehanabad 0.8 (0.1) 1.9 (0.1) 2487 (21) 1.28 (0.2) 3.29 (0.1) 2561 (26)
Arwal 0.8 (0.1) 2.4 (0.1) 3035 (15) 0.75 (0.1) 2.55 (0.1) 3376 (13)
Nawada 2.4 (0.4) 5.7 (0.3) 2350 (26) 2.9 (0.4) 7.93 (0.3) 2736 (22)
Aurangabad 0.3 (0.0) 0.5 (0.0) 1817 (33) 0.49 (0.1) 0.88 (0.0) 1814 (38)
Saran 28.4 (4.3) 54.5 (2.6) 1917 (31) 29.18 (4.3) 75.07 (3.0) 2572 (24)
Siwan 21.1 (3.2) 43.0 (2.0) 2040 (30) 16.27 (2.4) 49.45 (2.0) 3038 (17)
Gopalganj 16.4 (2.5) 39.3 (1.9) 2402 (24) 13.86 (2.1) 38.7 (1.6) 2791 (21)
West Champaran 11.2 (1.7) 30.9 (1.5) 2773 (16) 9.99 (1.5) 32.06 (1.3) 3207 (15)
East Champaran 15.9 (2.4) 33.1 (1.6) 2089 (29) 51.44 (7.6) 184.19 (7.4) 3580 (12)
Muzaffarpur 29.2 (4.5) 74.9 (3.6) 2570 (18) 25.24 (3.7) 92.98 (3.7) 3684 (11)
Sitamarhi 4.8 (0.7) 15.9 (0.8) 3304 (10) 6.01 (0.9) 25.77 (1.0) 4284 (04)
Sheohar 1.1 (0.2) 3.7 (0.2) 3411 (09) 1.75 (0.3) 4.79 (0.2) 2724 (23)
Vaishali 32.7 (5.0) 75.7 (3.6) 2319 (28) 31.99 (4.7) 95.89 (3.9) 2998 (18)
Darbhanga 20.5 (3.1) 62.9 (3.0) 3066 (13) 19.6 (2.9) 50.36 (2.0) 2569 (25)
Madhubani 1.6 (0.2) 6.3 (0.3) 3942 (05) 1.09 (0.2) 3.34 (0.1) 3069 (16)
Samastipur 52.8 (8.1) 226.2 (10.7) 4285 (04) 40.28 (6.0) 114.84 (4.6) 2851 (20)
Begusarai 57.1 (8.7) 137.6 (6.5) 2409 (23) 57.72 (8.6) 139.86 (5.6) 2423 (30)
Munger 5.7 (0.9) 9.8 (0.5) 1715 (34) 5.44 (0.8) 10.26 (0.4) 1884 (37)
Sheikhpura 0.4 (0.1) 1.0 (0.0) 2376 (25) 0.51 (0.1) 1.11 (0.0) 2176 (35)
Lakhisarai 2.7 (0.4) 5.1 (0.2) 1875 (32) 7.66 (1.1) 24.87 (1.0) 3247 (14)
Jamui 2.8 (0.4) 7.2 (0.3) 2561 (19) 2.81 (0.4) 7 (0.3) 2492 (28)
Khagaria 55.7 (8.5) 201.9 (9.6) 3622 (07) 57.23 (8.5) 266.67 (10.7) 4659 (03)
Bhagalpur 39.5 (6.0) 137.9 (6.5) 3493 (08) 48.92 (7.2) 203.97 (8.2) 4169 (06)
Banka 11.3 (1.7) 35.6 (1.7) 3159 (11) 11.2 (1.7) 42.85 (1.7) 3825 (10)
Saharsa 46.1 (7.1) 246.5 (11.7) 5349 (02) 42.31 (6.3) 241.02 (9.7) 5697 (02)
Supaul 12.3 (1.9) 60.6 (2.9) 4921 (03) 12.29 (1.8) 52.12 (2.1) 4241 (05)
Madhepura 42.2 (6.5) 129.6 (6.1) 3072 (12) 43.35 (6.4) 276.04 (11.1) 6367 (01)
Purnea 38.1 (5.8) 94.4 (4.5) 2477 (22) 38.7 (5.7) 97.64 (3.9) 2523 (27)
Kishanganj 2.7 (0.4) 8.3 (0.4) 3038 (14) 2.82 (0.4) 8.25 (0.3) 2920 (19)
Araria 20.5 (3.1) 109.7 (5.2) 5354 (01) 27.08 (4.0) 110.02 (4.4) 4062 (07)
Katihar 51.5 (7.9) 192.4 (9.1) 3733 (06) 37.94 (5.6) 153.12 (6.2) 4036 (08)
Bihar 653.7
(100.0)
2108.2
(100.0) 3225
674.98
(100.0)
2486.17
(100.0) 3683
Source : Department of Agriculture, GOB
Note : Figure in parentheses denote percentage

59
Table A 2.6: Districtwise Area, Production and Productivity of Pulses in Bihar
(Area in ‘000 hectare/Production in’000 tonnes/ Productivity in kg/ha)
Districts
2010-11 2011-12
Area Production Productivity Area Production Productivity
Patna 46.1 (8.6) 54.8 (11.7) 1190 (04) 45.13 (8.6) 65.61 (12.6) 1454 (02)
Nalanda 23.8 (4.4) 26.4 (5.6) 1108 (08) 24.03 (4.6) 20.25 (3.9) 843 (28)
Bhojpur 25.5 (4.7) 32.8 (7.0) 1286 (02) 24.95 (4.8) 36.16 (7.0) 1449 (03)
Buxar 8.9 (1.7) 10.2 (2.2) 1145 (07) 9.33 (1.8) 13.21 (2.5) 1416 (04)
Rohtas 15.1 (2.8) 17.8 (3.8) 1174 (05) 14.69 (2.8) 23 (4.4) 1565 (01)
Kaimur 17.1 (3.2) 15.6 (3.3) 914 (16) 16.19 (3.1) 16.33 (3.1) 1009 (16)
Gaya 12.7 (2.4) 12.7 (2.7) 1001 (11) 14.36 (2.7) 14.56 (2.8) 1014 (15)
Jehanabad 16.3 (3.0) 15.4 (3.3) 944 (15) 17.11 (3.3) 17.09 (3.3) 998 (17)
Arwal 5.4 (1.0) 4.2 (0.9) 775 (26) 5.39 (1.0) 5.88 (1.1) 1090 (12)
Nawada 12.0 (2.2) 12.6 (2.7) 1048 (09) 10.33 (2.0) 10.01 (1.9) 968 (20)
Aurangabad 35.4 (6.6) 32.3 (6.9) 912 (17) 42.28 (8.1) 46.62 (9.0) 1102 (11)
Saran 3.6 (0.7) 2.7 (0.6) 741 (28) 3.99 (0.8) 2.78 (0.5) 695 (32)
Siwan 3.9 (0.7) 4.5 (1.0) 1170 (06) 4.74 (0.9) 5.77 (1.1) 1218 (9)
Gopalganj 3.1 (0.6) 4.2 (0.9) 1351 (01) 2.67 (0.5) 2.33 (0.4) 871 (27)
West Champaran 22.4 (4.2) 17.7 (3.8) 787 (25) 18.14 (3.5) 24.13 (4.6) 1330 (05)
East Champaran 11.5 (2.1) 14.8 (3.2) 1285 (03) 11.57 (2.2) 14.19 (2.7) 1227 (08)
Muzaffarpur 28.9 (5.4) 16.3 (3.5) 564 (36) 28.21 (5.4) 13.4 (2.6) 475 (37)
Sitamarhi 14.2 (2.6) 12.8 (2.7) 899 (18) 8.27 (1.6) 5.42 (1.0) 655 (34)
Sheohar 2.9 (0.5) 2.4 (0.5) 811 (21) 3.33 (0.6) 3.11 (0.6) 933 (24)
Vaishali 9.7 (1.8) 6.8 (1.5) 702 (29) 8.5 (1.6) 4.48 (0.9) 527 (36)
Darbhanga 11.4 (2.1) 7.3 (1.6) 643 (33) 11.48 (2.2) 12.03 (2.3) 1048 (13)
Madhubani 18.3 (3.4) 11.7 (2.5) 641 (35) 16.99 (3.2) 13.34 (2.6) 785 (30)
Samastipur 14.2 (2.6) 11.5 (2.5) 809 (22) 15.74 (3.0) 12.18 (2.3) 774 (31)
Begusarai 4.4 (0.8) 4.5 (1.0) 1025 (10) 4.37 (0.8) 5.5 (1.1) 1258 (07)
Munger 3.7 (0.7) 3.5 (0.8) 946 (14) 3.49 (0.7) 3.45 (0.7) 989 (18)
Sheikhpura 6.0 (1.1) 5.2 (1.1) 862 (20) 6.29 (1.2) 7.1 (1.4) 1129 (10)
Lakhisarai 20.8 (3.9) 16.5 (3.5) 792 (24) 23.71 (4.5) 22.58 (4.3) 952 (23)
Jamui 1.6 (0.3) 1.5 (0.3) 992 (12) 2.12 (0.4) 2.15 (0.4) 1015 (14)
Khagaria 7.7 (1.4) 7.3 (1.6) 947(30) 7.59 (1.4) 7.48 (1.4) 986 (19)
Bhagalpur 13.9 (2.6) 10.9 (2.4) 793 (13) 10.39 (2.0) 9.58 (1.8) 922 (25)
Banka 6.6 (1.2) 4.6 (1.0) 687 (23) 7.31 (1.4) 6.01 (1.2) 822 (29)
Saharsa 16.5 (3.1) 10.6 (2.3) 646 (32) 16.53 (3.2) 11.16 (2.1) 675 (33)
Supaul 30.1 (5.6) 12.5 (2.7) 415 (38) 26.95 (5.1) 12.32 (2.4) 457 (38)
Madhepura 21.8 (4.1) 11.5 (2.5) 528 (37) 21.79 (4.2) 13.33 (2.6) 612 (35)
Purnea 10.4 (1.9) 6.8 (1.4) 652 (31) 8.74 (1.7) 8.39 (1.6) 960 (22)
Kishanganj 9.3 (1.7) 5.9 (1.3) 642 (34) 8.23 (1.6) 10.68 (2.1) 1298 (06)
Araria 14.5 (2.7) 10.9 (2.3) 754 (27) 13.65 (2.6) 13.14 (2.5) 963 (21)
Katihar 8.7 (1.6) 7.5 (1.6) 864 (19) 5.57 (1.1) 4.96 (1.0) 890 (26)
Bihar 538.3
(100.0)
467.3
(100.0) 868
524.34
(100.0)
519.86
(100.0) 991
Source : Department of Agriculture, GOB
Note : Figure in parentheses denote percentage

60
Table A 2.7 : Districtwise Cooperative Credit Distribution in Bihar
District Target ( Rs. Lakh) Achievement ( Rs. lakh)
2010-11 2011-12 2012-13 2010-11 2011-12 2012-13
Patna 6500 19322 24256 1739.80 (4.1) 1406.80 (3.6) 711.75 (2.2)
Nalanda 4500 18540 23286 697.77 (1.7) 1104.66 (2.9) 1481.01 (4.5)
Bhojpur 6000 22070 27720 1009.44 (2.4) 984.33 (2.5) 496.38 (1.5)
Buxar —* 32002 40196 538.89 (1.3) 655.60 (1.7) 327.37 (1.0)
Rohtas 2600 10030 12598 860.93 (2.0) 1071.70 (2.8) 1011.48 (3.1)
Kaimur 900 5768 7244 489.28 (1.2) 546.87 (1.4) 342.69 (1.0)
Gaya 865 12566 15784 356.27 (0.8) 326.43 (0.8) 258.66 (0.8)
Jehanabad 145 0 0 24.54 (0.1) 31.19 (0.1) 8.98 (0.0)
Arwal 90 0 0 14.79 (0.0) 18.11 (0.0) 0.71 (0.0)
Nawada 4000 11832 14862 1525.92 (3.6) 727.69 (1.9) 48.9 (0.1)
Aurangabad 4000 13202 16582 4349.15 (10.3) 3339.60 (8.6) 2518.27 (7.7)
Saran 0 0.00 (0.0)
Siwan 3200 12436 16876 860.83 (2.0) 728.78 (1.9) 610 .00 (1.9)
Gopalganj 5000 4144 5204 1856.57 (4.4) 1466.28 (3.8) 1089.32 (3.3)
W. Champaran 3500 13780 17434 829.35 (2.0) 760.12 (2.0) 313.72 (1.0)
E. Champaran 5000 7100 9044 4210.40 (10.0) 1037.07 (2.7) 1173.33 (3.6)
Muzaffarpur 2500 8532 10716 581.16 (1.4) 451.01 (1.2) 385.6 (1.2)
Sitamarhi 3600 6882 8644 736.19 (1.7) 648.22 (1.7) 177.67 (0.5)
Sheohar 400 946 1164 189.04 (0.4) 105.08 (0.3) 43.99 (0.1)
Vaishali 1000 3800 4772 423.25 (1.0) 350.75 (0.9) 240.91 (0.7)
Darbhanga 0 0 .00 (0.0)
Madhubani 4000 25808 32416 2566.42 (6.1) 2221.59 (5.7) 4658.84 (14.2)
Samastipur 4500 15104 18846 4160.44 (9.9) 4088.08 (10.6) 3382.75 (10.3)
Begusarai 4400 31000 38936 4449.97 (10.6) 6338.99 (16.4) 5195.82 (15.8)
Munger 650 1870 2348 157.66 (0.4) 174.70 (0.5) 126.57 (0.4)
Sheikhpura 100 3158 3942 46.31 (0.1) 40.87 (0.1) 69.84 (0.2)
Lakhisarai 100 6840 8592 100.36 (0.2) 144.06 (0.4) 171.73 (0.5)
Jamui 150 3166 3976 449.22 (1.1) 457.43 (1.2) 779.23 (2.4)
Khagaria 3000 15534 19512 3200.03 (7.6) 3450.40 (8.9) 3211.86 (9.8)
Bhagalpur 2260 5409 6806 687.44 (1.6) 393.87 (1.0) 109.85 (0.3)
Banka 1740 6100 7662 368.35 (0.9) 103.96 (0.3) 35.33 (0.1)
Saharsa 0 0 .00 (0.0)
Supaul 0 0.00 (0.0)
Madhepura 0 0.00 (0.0)
Purnea 2109 15274 16544 1652.65 (3.9) 2000.84 (5.2) 1661.81 (5.1)
Kishanganj 1060 14060 17660 436.35 (1.0) 857.68 (2.2) 749.63 (2.3)
Araria 1831 7996 10044 1474.15 (3.5) 1844.10 (4.8) 1337.87 (4.1)
Katihar 1000 8134 10216 1045.78 (2.5) 807.56 (2.1) 88.55 (0.3)
Bihar
80700 362405 453882
42088.70
(100.0)
38684.42
(100.0)
32820.42
(100.0)
Source : Department of Cooperative, GOB
* Figure is included in Bhojpur
Note : Figure in parentheses denote percentage
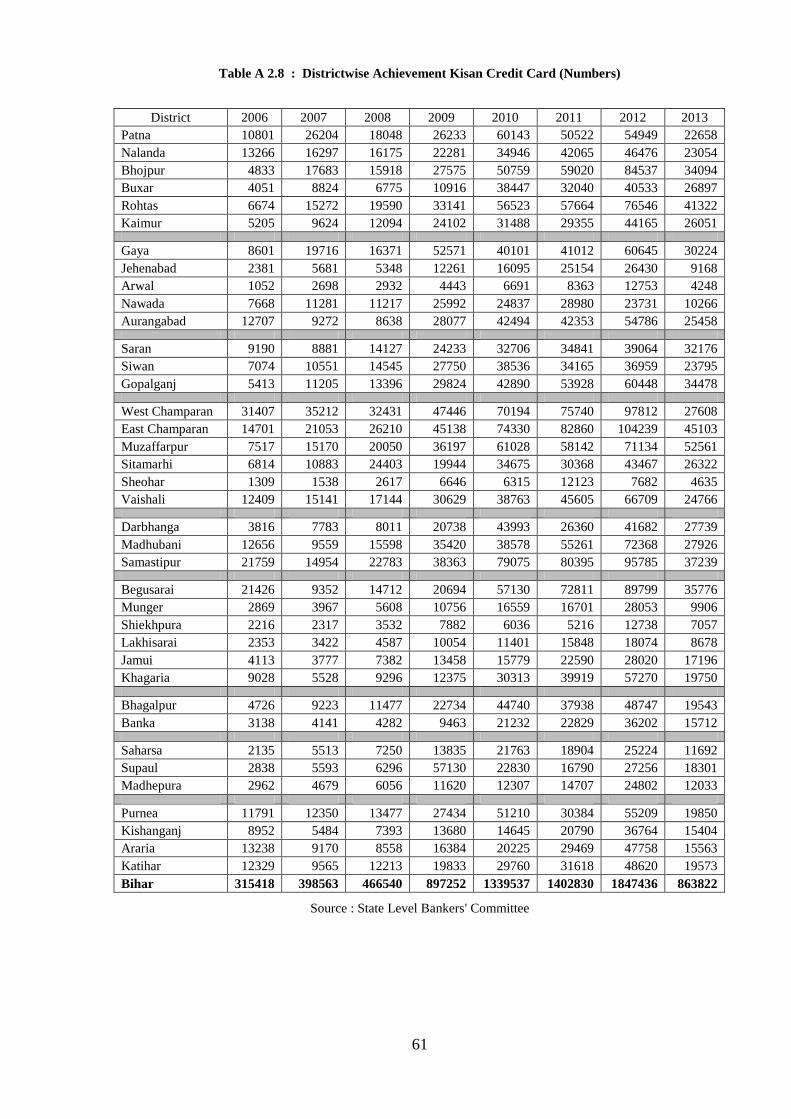
61
Table A 2.8 : Districtwise Achievement Kisan Credit Card (Numbers)
District 2006 2007 2008 2009 2010 2011 2012 2013
Patna 10801 26204 18048 26233 60143 50522 54949 22658
Nalanda 13266 16297 16175 22281 34946 42065 46476 23054
Bhojpur 4833 17683 15918 27575 50759 59020 84537 34094
Buxar 4051 8824 6775 10916 38447 32040 40533 26897
Rohtas 6674 15272 19590 33141 56523 57664 76546 41322
Kaimur 5205 9624 12094 24102 31488 29355 44165 26051
Gaya 8601 19716 16371 52571 40101 41012 60645 30224
Jehenabad 2381 5681 5348 12261 16095 25154 26430 9168
Arwal 1052 2698 2932 4443 6691 8363 12753 4248
Nawada 7668 11281 11217 25992 24837 28980 23731 10266
Aurangabad 12707 9272 8638 28077 42494 42353 54786 25458
Saran 9190 8881 14127 24233 32706 34841 39064 32176
Siwan 7074 10551 14545 27750 38536 34165 36959 23795
Gopalganj 5413 11205 13396 29824 42890 53928 60448 34478
West Champaran 31407 35212 32431 47446 70194 75740 97812 27608
East Champaran 14701 21053 26210 45138 74330 82860 104239 45103
Muzaffarpur 7517 15170 20050 36197 61028 58142 71134 52561
Sitamarhi 6814 10883 24403 19944 34675 30368 43467 26322
Sheohar 1309 1538 2617 6646 6315 12123 7682 4635
Vaishali 12409 15141 17144 30629 38763 45605 66709 24766
Darbhanga 3816 7783 8011 20738 43993 26360 41682 27739
Madhubani 12656 9559 15598 35420 38578 55261 72368 27926
Samastipur 21759 14954 22783 38363 79075 80395 95785 37239
Begusarai 21426 9352 14712 20694 57130 72811 89799 35776
Munger 2869 3967 5608 10756 16559 16701 28053 9906
Shiekhpura 2216 2317 3532 7882 6036 5216 12738 7057
Lakhisarai 2353 3422 4587 10054 11401 15848 18074 8678
Jamui 4113 3777 7382 13458 15779 22590 28020 17196
Khagaria 9028 5528 9296 12375 30313 39919 57270 19750
Bhagalpur 4726 9223 11477 22734 44740 37938 48747 19543
Banka 3138 4141 4282 9463 21232 22829 36202 15712
Saharsa 2135 5513 7250 13835 21763 18904 25224 11692
Supaul 2838 5593 6296 57130 22830 16790 27256 18301
Madhepura 2962 4679 6056 11620 12307 14707 24802 12033
Purnea 11791 12350 13477 27434 51210 30384 55209 19850
Kishanganj 8952 5484 7393 13680 14645 20790 36764 15404
Araria 13238 9170 8558 16384 20225 29469 47758 15563
Katihar 12329 9565 12213 19833 29760 31618 48620 19573
Bihar 315418 398563 466540 897252 1339537 1402830 1847436 863822
Source : State Level Bankers' Committee

62
Table A 2.9 : Districtwise Livestock Wealth in Bihar (2012)
(Figures in '000)
District Cow Buffalo Pig Sheep Goat Poultry
Patna 300 (2.6) 282 (4.3) 37 (6.8) 14 (5.9) 177 (1.6) 287 (4.4)
Nalanda 166 (1.4) 248 (3.8) 20 (3.7) 8 (3.3) 156 (1.4) 352 (5.5)
Bhojpur 196 (1.7) 190 (2.9) 20 (3.6) 17 (7.2) 110 (1.0) 120 (1.9)
Buxar 152 (1.3) 162 (2.5) 12 (2.2) 24 (9.9) 77 (0.7) 5 (0.1)
Rohtas 233 (2.0) 285 (4.4) 10 (1.9) 19 (7.7) 160 (1.4) 132 (2.0)
Kaimur 198 (1.7) 209 (3.2) 7 (1.3) 41 (17.0) 108 (1.0) 13 (0.2)
Gaya 623 (5.3) 251 (3.8) 93 (17) 15 (6.2) 426 (3.8) 66 (1.0)
Jehanabad 80 (0.7) 129 (2.0) 17 (3.1) 2 (0.7) 72 (0.6) 55 (0.9)
Arwal 52 (0.4) 70 (1.1) 4 (0.7) 0 (0.0) 52 (0.5) 116 (1.8)
Nawada 317 (2.7) 132 (2.0) 41 (7.5) 3 (1.4) 221 (2.0) 172 (2.7)
Aurangabad 358 (3.1) 192 (2.9) 11 (2.1) 27 (11.4) 187 (1.7) 334 (5.2)
Saran 303 (2.6) 179 (2.7) 8 (1.5) 5 (2.0) 183 (1.6) 333 (5.2)
Siwan 258 (2.2) 152 (2.3) 10 (1.9) 3 (1.1) 224 (2.0) 114 (1.8)
Gopalganj 185 (1.6) 112 (1.7) 7 (1.2) 1 (0.5) 201 (1.8) 87 (1.3)
W. Champaran 337 (2.9) 253 (3.9) 28 (5.0) 2 (0.9) 546 (4.9) 161 (2.5)
E. Champaran 369 (3.2) 344 (5.3) 18 (3.2) 2 (0.7) 757 (6.8) 413 (6.4)
Muzaffarpur 314 (2.7) 269 (4.1) 5 (1.0) 1 (0.5) 541 (4.9) 587 (9.1)
Sitamarhi 145 (1.2) 175 (2.7) 6 (1.0) 0 (0.1) 357 (3.2) 75 (1.2)
Sheohar 51 (0.4) 43 (0.7) 1 (0.2) 0 (0.0) 88 (0.8) 31 (0.5)
Vaishali 212 (1.8) 171 (2.6) 1 (0.3) 1 (0.5) 311 (2.8) 854 (13.2)
Darbhanga 255 (2.2) 219 (3.3) 8 (1.5) 0 (0.2) 300 (2.7) 297 (4.6)
Madhubani 445 (3.8) 294 (4.5) 16 (2.9) 3 (1.4) 370 (3.3) 69 (1.1)
Samastipur 454 (3.9) 226 (3.4) 3 (0.6) 3 (1.2) 376 (3.4) 638 (9.9)
Begusarai 365 (3.1) 93 (1.4) 7 (1.2) 0 (0.1) 266 (2.4) 231 (3.6)
Munger 153 (1.3) 50 (0.8) 7 (1.3) 0 (0.0) 155 (1.4) 48 (0.7)
Sheikhpura 68 (0.6) 46 (0.7) 5 (0.9) 1 (0.6) 65 (0.6) 39 (0.6)
Lakhisarai 125 (1.1) 58 (0.9) 4 (0.7) 1 (0.6) 107 (1.0) 15 (0.2)
Jamui 463 (4.0) 73 (1.1) 4 (0.7) 1 (0.3) 39 (0.4) 0 (0.0)
Khagaria 270 (2.3) 97 (1.5) 5 (0.9) 0 (0.0) 242 (2.2) 112 (1.7)
Bhagalpur 460 (3.9) 194 (3.0) 9 (1.5) 0 (0.2) 497 (4.5) 214 (3.3)
Banka 520 (4.4) 139 (2.1) 22 (4.0) 13 (5.6) 361 (3.2) 40 (0.6)
Saharsa 303 (2.6) 161 (2.5) 11 (2.0) 0 (0.0) 341 (3.1) 78 (1.2)
Supaul 454 (3.9) 232 (3.5) 8 (1.4) 15 (6.4) 423 (3.8) 23 (0.4)
Madhepura 395 (3.4) 222 (3.4) 7 (1.4) 3 (1.1) 479 (4.3) 120 (1.9)
Purnea 503 (4.3) 173 (2.6) 20 (3.7) 0 (0.2) 529 (4.8) 73 (1.1)
Kishanganj 415 (3.5) 49 (0.7) 12 (2.2) 0 (0.0) 415 (3.7) 19 (0.3)
Araria 653 (5.6) 277 (4.2) 20 (3.6) 3 (1.4) 610 (5.5) 47 (0.7)
Katihar 556 (4.8) 99 (1.5) 23 (4.3) 9 (3.8) 602 (5.4) 88 (1.4)
Bihar 11705
(100.0)
6549
(100.0)
550
(100.0)
240
(100.0)
11129
(100.0)
6458
(100.0)
Source : Directorate of Animal Husbandry, GOB
Note : Figure is parentheses denote percentage

63
Table A 2.10 : Districtwise Achievement for Livestock Related Services
Districts Animal Treated (lakh)
Immunisation
(lakh)
Artificial
Insemination (lakh)
Free Distribution of
Fodder Seed (Qntls.)
2011-12 2012-13 2011-12 2012-13 2011-12 2012-13 2011-12 2012-13
Patna 1.41 1.35 4.00 7.97 0.48 0.44 149.63 Fodder
has not
been
distributed
in
2012-13
Nalanda 1.08 0.92 2.50 4.95 0.14 0.14 77.44
Bhojpur 0.82 0.69 3.19 5.61 0.14 0.16 91.57
Buxar 0.20 0.18 2.00 4.29 0.07
99.93
Rohtas 1.38 1.12 4.00 6.00 0.19 0.21 123.57
Kaimur 0.52 0.48 3.30 5.50 0.06
72.37
Gaya 1.20 1.70 5.48 8.75 0.15 0.17 89.00
Jehanabad 0.47 0.52 1.00 1.94 0.06 0.08 33.80
Arwal 0.23 0.23 1.00 1.30 0.05 0.05 33.75
Nawada 0.93 0.80 3.70 6.74 0.15 0.16 91.35
Aurangabad 1.13 1.08 3.50 5.72 0.13 0.17 72.15
Saran 0.78 0.80 4.48 5.62 0.07 0.08 141.00
Siwan 0.50 0.54 0.00 5.74 0.00
0.00
Gopalganj 0.48 0.42 0.00 4.10 0.04 0.06 0.00
W. Champaran 0.65 0.59 4.00 5.97 0.03 0.05 56.78
E. Champaran 1.00 0.90 5.00 6.73 0.05 0.08 269.25
Muzaffarpur 1.02 1.09 3.00 5.34 0.09 0.04 28.72
Sitamarhi 0.41 0.35 3.00 4.50 0.01 0.00 0.00
Sheohar 0.06 0.82 0.50 0.89 0.00 0.00 0.00
Vaishali 0.75 0.58 2.50 4.19 0.09 0.07 53.30
Darbhanga 1.28 0.97 4.00 5.73 0.09 0.09 121.30
Madhubani 1.29 1.01 5.65 8.15 0.00 0.02 140.92
Samastipur 1.52 1.04 4.00 6.00 0.15 0.13 134.00
Begusarai 0.80 0.72 3.48 5.14 0.03 0.04 97.22
Munger 0.43 0.34 2.23 2.90 0.14 0.08 60.99
Sheikhpura 0.42 0.43 0.86 1.23 0.07 0.04 38.55
Lakhisarai 0.21 0.17 1.20 2.19 0.03 0.02 40.19
Jamui 0.33 0.36 4.50 7.28 0.02 0.02 68.60
Khagaria 0.70 0.57 3.50 4.00
0.04 46.68
Bhagalpur 1.00 0.94 4.00 6.50 0.21 0.26 104.55
Banka 0.70 0.61 3.60 6.89 0.07 0.05 72.04
Saharsa 0.58 0.53 4.00 5.09 0.03 0.02 74.00
Supaul 0.65 0.59 4.00 6.50 0.06 0.02 81.00
Madhepura 0.68 0.56 4.00 5.95 0.03 0.04 87.00
Purnea 0.98 2.59 4.00 5.00 0.21 0.33 92.31
Kishanganj 0.34 0.44 4.00 5.73 0.02 0.03 47.82
Araria 0.51 0.57 5.48 8.15 0.07 0.09 61.17
Katihar 0.69 0.64 3.00 4.50 0.04 0.02 100.17
Bihar 28.13 28.24 121.65 198.78 3.274 3.304 2952.12
Source : Department of Animal Husbandry, GOB

64
Table A 2.11 : Districtwise Production of Fish and Fish Seed production in Bihar (2010-11 and 2012-13)
Districts
Fish
Production
(000 tonne)
Fish Seeds
(Lakh)
Fish
Production
(000 tonne)
Fish Seeds
(Lakh)
Fish
Production
(000 tonne)
Fish Seeds
(Lakh)
2010-11 2011-12 2012-13
Patna 8.7 140.5 11.0 20.7 14.6 147.6
Nalanda 13.6 93.0 14.8 72.5 16.8 181.5
Bhojpur 8.3 0.0 9.0 10.0 11.8 54.5
Buxar 4.1 0.0 6.0 10.0 7.0 67.8
Rohtas
8.5 80.0 8.8 40.0 9.4 139.9 Kaimur
Gaya 2.7 0.0 5.6 20.0 7.1 88.9
Jehanabad
0.5 0.0 4.5 0.0 7.7 43.8 Arwal
Nawada 3.5 62.3 4.1 111.0 6.0 0.0
Aurangabad 2.5 0.0 4.9 0.0 5.5 41.5
Saran 14.9 536.4 19.1 700.0 18.5 272.6
Siwan 6.1 121.5 10.4 45.0 14.0 243.0
Gopalganj 7.8 74.3 8.2 50.0 11.5 60.0
West Champaran 14.2 113.2 14.0 134.3 17.8 480.0
East Champaran 15.5 21.2 18.2 79.0 19.9 32.2
Muzaffarpur 12.8 80.0 16.6 75.0 19.9 9.4
Sitamarhi
15.8 157.1 17.0 0.0 24.1 142.5 Sheohar
Vaishali 9.0 50.0 13.0 40.0 15.5 0.0
Darbhanga 15.4 105.7 16.5 900.0 19.0 518.0
Madhubani 13.1 94.1 19.2 75.0 20.4 640.0
Samastipur 6.1 101.5 9.3 60.8 11.4 105.6
Begusarai 12.8 132.5 12.1 0.0 14.3 280.0
Munger
9.8 12.0 8.1 43.7 10.5 57.9
Sheikhpura
Lakhisarai
Jamui 2.1 2.3 3.1 0.0 5.6 0.0
Khagaria 6.5 150.4 7.1 800.0 7.3 133.5
Bhagalpur 7.7 39.8 10.9 0.0 11.0 0.0
Banka 4.0 59.5 4.9 130.0 5.5 40.0
Saharsa 11.0 38.9 14.0 0.5 12.9 185.2
Supaul 8.0 30.0 8.1 45.0 8.2 181.0
Madhepura 10.6 15.0 9.5 22.0 7.1 101.4
Purnea 11.6 160.0 12.4 60.0 13.6 223.3
Kishanganj 5.4 85.0 6.6 60.0 7.9 249.5
Araria 4.4 41.1 5.4 0.0 7.0 17.9
Katihar 12.4 165.0 12.6 0.0 11.8 0.0
Bihar 288.9 2762.3 344.5 3604.6 400.1 4738.3
Source : Department of Animal Husbandry, GOB
____________

65
CHAPTER III
ENTERPRISES SECTOR
The inflationary trend had adversely impacted the investment scenario in the Indian economy
in recent years and, consequently, its growth rate slowed to 6.2 percent in 2011-12 and 5.0
percent in 2012-13. This drop in growth rate has been primarily due to weakness in industrial
sector which registered a growth rate of only 3.5 percent in 2011-12 and 3.1 percent in
2012-13. The manufacturing sector registered even lower growth rates of 2.7 percent and 1.9
percent in these two years respectively. It is widely feared that, in 2013-14 too, the industry
may not recover and grow at earlier rates. Though in July 2013, the industrial production
registered a growth of 2.6 percent, the sector is still hit hard by several factors, including high
interest rates, slowing investments, stubborn inflation, high input cost, rising wages and
slowdown in domestic and global economy. However, the increase in industrial output data
brought a relief and this positive rise is attributed to an increase in growth rate of 15.6 percent
in capital goods, 5.2 percent in electricity and 6.8 in consumer non-durables (Table 3.1).
Table 3.1 : Growth in Industrial Sector (July, 2013)
Sl.
No. Sectoral Percentage
Sl.
No. Sectoral Percentage
1 Overall 2.6 1 Basic Goods 1.7
2 Mining (-) 2.3 2 Capital Goods 15.6
3 Manufacturing 3.0 3 Intermediate Goods 2.4
4 Electricity 5.2 4 Consumer Goods (-) 0.9
5 Consumer Durables (-) 9.3
6 Consumer non-durables 6.8
Source : Directorate of Economics and Statistics, GOB
A comparison of the sectoral data for July 2013 with July 2012 confirms a partial recovery in
manufacturing sector. The growth rate of industrial production was (-)0.1 in July 2012,
whereas for manufacturing it was zero; but both these sectors recorded a phenomenal increase
in growth a year later. Electricity also registered almost a two-fold increase in growth rate (5.2
percent) in July 2013 over 2.8 percent in July a year before. However, the mining sector,
continued to have a negative growth in both the periods.

66
Chart 3.1 : Index of Industrial Growth
Though the industry appears to be on the path of recovery during July, 2013, the fact remains
that the growth in investment decelerated both in 2011-12 and 2012-13. The slower growth in
investment may be attributed to decline in profitability and poor growth in credit flow to the
industrial sector.
In the backdrop of emerging positive trend in the industrial sector, Bihar registered an even
better achievement. The contribution of Bihar's industrial sector to its Gross State Domestic
Product (GSDP) has been increasing during 2009-10 to 2011-12; but it is still smaller than in
any other state. As is observed from Table 3.2, the share of industrial sector in GSDP of Bihar
increased from 18.8 percent in 2009-10 to 20.7 percent in 2011-12. But on the contrary, most
other states reporting higher share in their GSDP, showed a decline in their shares; in Gujarat
and Goa, the shares remained almost stagnant during the period.
Table 3.2 : Contribution of Industrial Sectors in GSDP
State Share of Industrial Sector in GSDP
2009-10 2010-11 2011-12
Bihar 18.8 19.8 20.7
Uttar Pradesh 24.5 24.2 23.4
Maharashtra 30.9 30.8 31.0
Gujarat 41.5 41.1 41.1
Goa 45.9 43.6 43.5
Haryana 30.4 29.6 29.0
Jharkhand 40.1 39.1 38.1
Andhra Pradesh 26.0 25.9 25.7
Tamil Nadu 31.2 31.0 30.7
Karnataka 29.7 29.4 28.8
India 28.3 28.2 27.5
Source : Directorate of Economics and Statistics, GOB
-4.0
-3.0
-2.0
-1.0
0.0
1.0
2.0
3.0
4.0
5.0
6.0
Overall Manufacturing Electricity Mining-0.1
0.0
2.8
-3.5
2.6 3.0
5.2
-2.3
Gro
wth
in P
erc
en
t
2012July 2013July
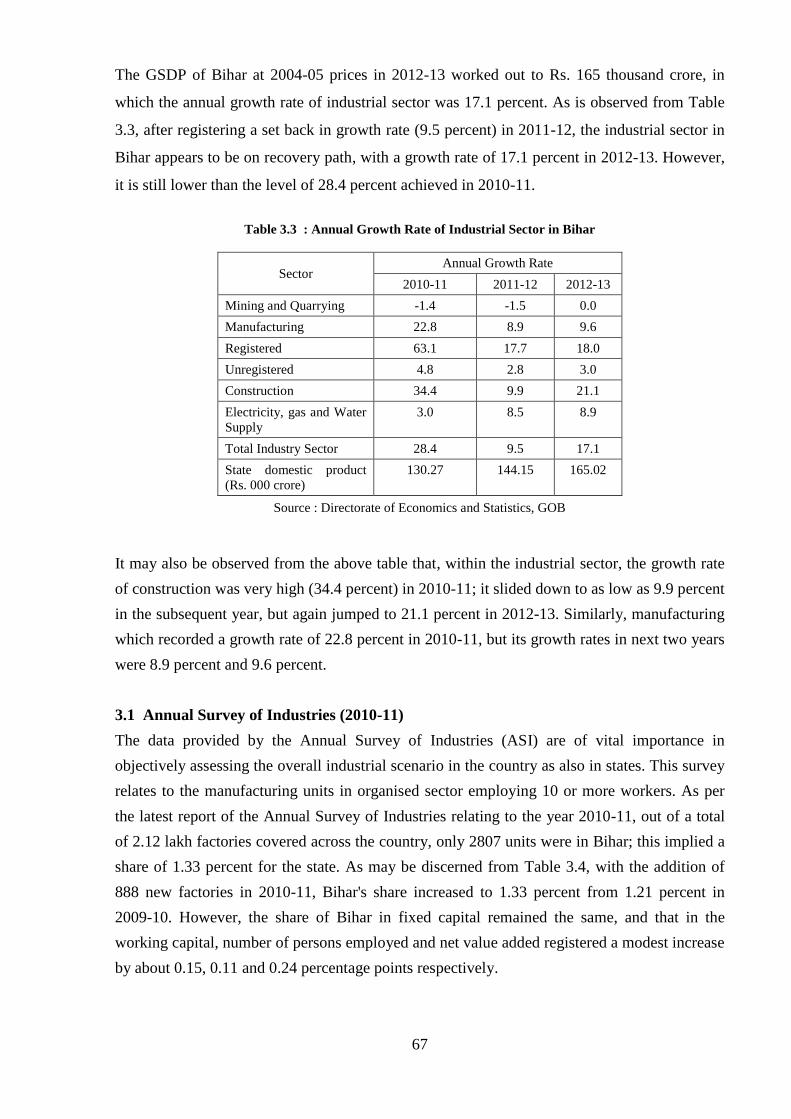
67
The GSDP of Bihar at 2004-05 prices in 2012-13 worked out to Rs. 165 thousand crore, in
which the annual growth rate of industrial sector was 17.1 percent. As is observed from Table
3.3, after registering a set back in growth rate (9.5 percent) in 2011-12, the industrial sector in
Bihar appears to be on recovery path, with a growth rate of 17.1 percent in 2012-13. However,
it is still lower than the level of 28.4 percent achieved in 2010-11.
Table 3.3 : Annual Growth Rate of Industrial Sector in Bihar
Sector Annual Growth Rate
2010-11 2011-12 2012-13
Mining and Quarrying -1.4 -1.5 0.0
Manufacturing 22.8 8.9 9.6
Registered 63.1 17.7 18.0
Unregistered 4.8 2.8 3.0
Construction 34.4 9.9 21.1
Electricity, gas and Water
Supply
3.0 8.5 8.9
Total Industry Sector 28.4 9.5 17.1
State domestic product
(Rs. 000 crore)
130.27 144.15 165.02
Source : Directorate of Economics and Statistics, GOB
It may also be observed from the above table that, within the industrial sector, the growth rate
of construction was very high (34.4 percent) in 2010-11; it slided down to as low as 9.9 percent
in the subsequent year, but again jumped to 21.1 percent in 2012-13. Similarly, manufacturing
which recorded a growth rate of 22.8 percent in 2010-11, but its growth rates in next two years
were 8.9 percent and 9.6 percent.
3.1 Annual Survey of Industries (2010-11)
The data provided by the Annual Survey of Industries (ASI) are of vital importance in
objectively assessing the overall industrial scenario in the country as also in states. This survey
relates to the manufacturing units in organised sector employing 10 or more workers. As per
the latest report of the Annual Survey of Industries relating to the year 2010-11, out of a total
of 2.12 lakh factories covered across the country, only 2807 units were in Bihar; this implied a
share of 1.33 percent for the state. As may be discerned from Table 3.4, with the addition of
888 new factories in 2010-11, Bihar's share increased to 1.33 percent from 1.21 percent in
2009-10. However, the share of Bihar in fixed capital remained the same, and that in the
working capital, number of persons employed and net value added registered a modest increase
by about 0.15, 0.11 and 0.24 percentage points respectively.

68
Table 3.4 : Annual Survey of Industries (2009-10 and 2010-11)
Characteristics
2009-10 2010-11
India Bihar
Percentage
share of
Bihar
India Bihar
Percentage
share of
Bihar
Number of Factories 158878 1919 1.21 211660 2807 1.33
Fixed Capital (Rs. crore) 1352184 4452 0.33 1607007 5262 0.33
Working Capital (Rs. crore) 387745 951 0.25 620363 2471 0.40
Total Persons Engaged (No.) 11792055 86620 0.73 12694853 106213 0.84
Value of Output (Rs. crore) 3733036 2825 0.76 4676217 36051 0.77
Net Value Added (Rs. crore) 592114 2321 0.39 704576 4415 0.63
Source : Annual Survey of Industries, 2009-10 and 2010-11
It is also noticed from Table 3.5 that Bihar recorded an appreciable increase in respect of
factories in operation in 2010-11 over 2009-10, both in agro-based and non-agro-based
categories. Secondly, while the percentage of factories in operation was lower in Bihar
compared to all India for both agro-based and non-agro-based units in 2009-10, the situation
was reversed a year later with Bihar recording relatively higher percentage for factories in
operation.
Table 3.5 : Number of Factories in Operation (2009-10 and 2010-11)
Categories of
Industry
No. of factories Factories in operation Percentage in
Operation
India Bihar
Bihar's
share
(%)
India Bihar
Bihar's
share
(%)
All
India Bihar
2009-10
Agro based 65409 510 0.78 62299 454 0.73 95.25 89.02
Non-agro based 93469 1409 1.51 90336 1271 1.41 96.65 90.21
Total 158878 1919 1.21 152635 1725 1.13 96.07 89.89
2010-11
Agro based 87520 918 1.05 69249 822 1.19 79.12 89.54
Non-agro based 117011 1889 1.61 97387 1725 1.77 83.23 91.32
Total 204531 2807 1.37 166636 2547 1.53 81.47 90.74
Source : Annual Survey of Industries, 2009-10 and 2010-11
The net value added in 2010-11 was Rs. 4415 crore, barely 12.2 percent of the gross value of
output (Rs. 36051 crore). (Table A3.1 in Appendix). However, between agro and non-agro-
based industries, the net value added to value of output was lower for the non-agro based
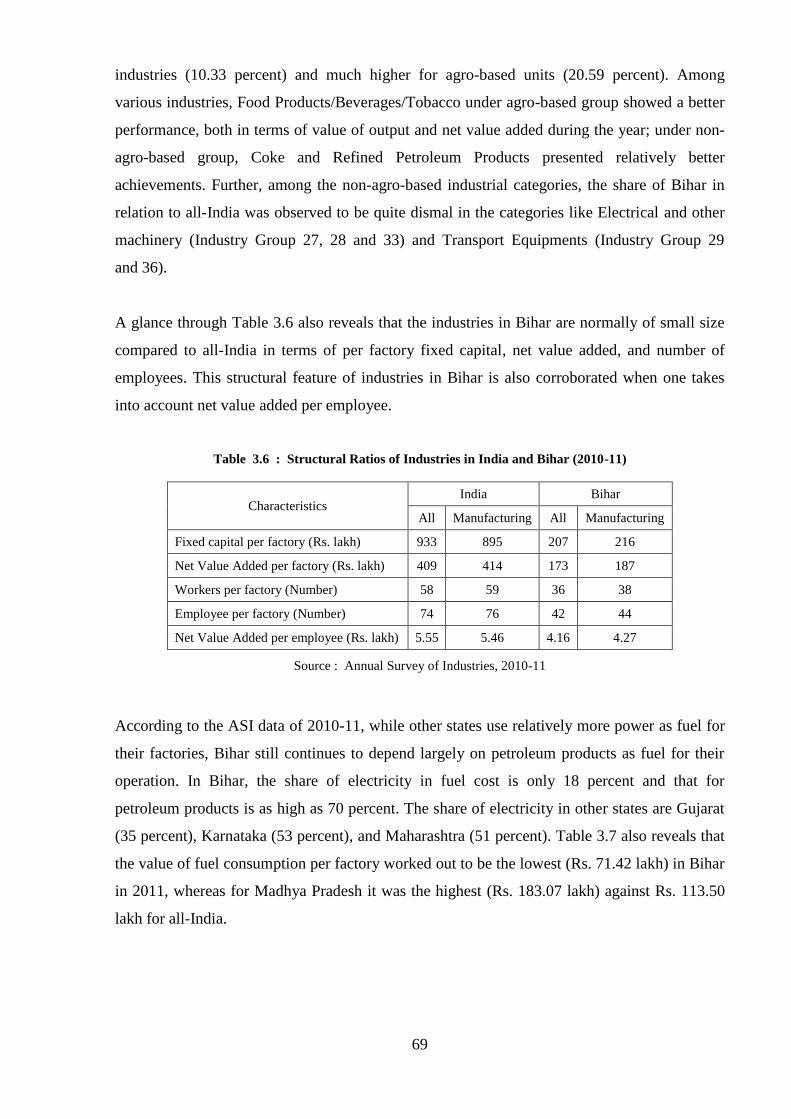
69
industries (10.33 percent) and much higher for agro-based units (20.59 percent). Among
various industries, Food Products/Beverages/Tobacco under agro-based group showed a better
performance, both in terms of value of output and net value added during the year; under non-
agro-based group, Coke and Refined Petroleum Products presented relatively better
achievements. Further, among the non-agro-based industrial categories, the share of Bihar in
relation to all-India was observed to be quite dismal in the categories like Electrical and other
machinery (Industry Group 27, 28 and 33) and Transport Equipments (Industry Group 29
and 36).
A glance through Table 3.6 also reveals that the industries in Bihar are normally of small size
compared to all-India in terms of per factory fixed capital, net value added, and number of
employees. This structural feature of industries in Bihar is also corroborated when one takes
into account net value added per employee.
Table 3.6 : Structural Ratios of Industries in India and Bihar (2010-11)
Characteristics India Bihar
All Manufacturing All Manufacturing
Fixed capital per factory (Rs. lakh) 933 895 207 216
Net Value Added per factory (Rs. lakh) 409 414 173 187
Workers per factory (Number) 58 59 36 38
Employee per factory (Number) 74 76 42 44
Net Value Added per employee (Rs. lakh) 5.55 5.46 4.16 4.27
Source : Annual Survey of Industries, 2010-11
According to the ASI data of 2010-11, while other states use relatively more power as fuel for
their factories, Bihar still continues to depend largely on petroleum products as fuel for their
operation. In Bihar, the share of electricity in fuel cost is only 18 percent and that for
petroleum products is as high as 70 percent. The share of electricity in other states are Gujarat
(35 percent), Karnataka (53 percent), and Maharashtra (51 percent). Table 3.7 also reveals that
the value of fuel consumption per factory worked out to be the lowest (Rs. 71.42 lakh) in Bihar
in 2011, whereas for Madhya Pradesh it was the highest (Rs. 183.07 lakh) against Rs. 113.50
lakh for all-India.

70
Table 3.7 : Fuels Consumed by Factory Sector
(Value in Rs. lakh)
States
Type of Fuel
Total No. of
factories
in
operation
Value
per
factory
Coal Electricity Petroleum
Products
Other
Fuels
Quantity
Th.
Tonne
value
(%)
Quantity
Th. Kwh
value
(%) value (%)
value
(%)
Value
(Rs. `000)
2010-11
Bihar 378 11.34 408942 17.82 69.59 1.25 181759.43 (100.00) 2547 71.42
Gujarat 11858 18.57 15090481 35.24 12.61 33.57 2585568.09(100.00) 16931 152.71
Karnataka 4174 18.64 10964875 53.37 20.12 7.86 943230.84(100.00) 8857 106.50
Madhya Pradesh 5697 32.26 5819172 45.77 9.14 12.84 685418.61(100.00) 3744 183.07
Maharashtra 4229 6.85 22639889 51.25 17.95 23.95 2669329.53(100.00) 21865 122.08
Uttar Pradesh 2974 7.97 14443068 42.13 25.51 24.39 1295222.63(100.00) 11312 114.50
All India 78759 18.02 187050811 47.09 19.31 15.58 19542403.22(100.00) 172177 113.50
2009-10
Bihar 245 6.70 705998 27.17 65.03 1.1 164925.37 (100.00) 1725 95.61
Gujarat 11186 18.06 14016436 37.99 12.26 31.69 2290864.71 (100.00) 15339 149.35
Karnataka 3401 20.88 5051755 41.14 24.54 13.44 682640.94 (100.00) 8353 81.72
Madhya Pradesh 6216 35.78 4666958 45.87 9.24 9.11 532923.72 (100.00) 3315 160.76
Maharashtra 3986 7.00 21190313 50.43 20.18 22.4 2272709.61 (100.00) 18839 120.64
Uttar Pradesh 2751 9.95 12772281 42.77 21.97 25.31 1030751.09 (100.00) 10696 96.37
All India 79344 17.99 154733915 45.14 19.43 17.45 16160000.69 (100.00) 152633 105.87
Source : Annual Survey of Industries ( 2009-10 and 2010-11)
A comparison of a few years ASI data on fuel consumption reveals that the industries have, by
and large, become more conscious of fuel efficiency. As may be discerned from Table 3.8, the
fuel consumption as a percentage of total output at all-India level has registered a decline from
4.7 percent in 2007-08 to 4.2 percent in 2010-11. Bihar has also registered a similar decline,
but fuel cost in Bihar still remains very high, compared to other stares. The states of Gujarat,
Karnataka, Maharashtra and Uttar Pradesh have been fuel efficient, with Bihar and Madhya
Pradesh falling behind.

71
Table 3.8 : Percent Share of Fuel Consumed out of the Value of Output
(Rs. '000 Lakh)
States
2007-08 2008-09 2009-10 2010-11
Value of
Output
Fuel
Consumed
Value of
Output
Fuel
Consumed
Value of
Output
Fuel
Consumed
Value of
Output
Fuel
Consumed
Bihar 2187.36 123.95
(5.7) 2953.97
159.96
(5.4) 2825.48
164.93
(5.8) 3605.13
181.76
(5.0)
Gujarat 44824.32 1908.76
(4.3) 50808.79
2430.41
(4.8) 64265.76
2290.87
(3.6) 80678.35
2585.57
(3.2)
Karnataka 18425.77 683.70
(3.7) 22581.28
592.09
(2.6) 23325.41
682.64
(2.9) 28594.97
943.23
(3.3)
Madhya Pradesh 7872.16 464.55
(5.9) 9040.20
522.88
(5.8) 8693.86
532.92
(6.1) 11589.80
685.42
(5.9)
Maharashtra 51993.93 1791.91
(3.4) 6001.74
2036.42
(3.4) 62404.92
2272.71
(3.6) 78536.27
2669.33
(3.4)
Uttar Pradesh 19381.50 946.47
(4.9) 20046.27
937.99
(4.7) 22568.13
1030.75
(4.6) 29221.56
1295.22
(4.4)
All India 277570.90 12956.17
(4.7) 327279.79
15216.20
(4.6) 373303.59
16160.00
(4.3) 467621.70
19542.40
(4.2)
Source: Annual Survey of Industries, GOI (compiled)
The gross value added (GVA) as a percentage of gross value of output shows a decline from
18.7 percent in 2009-10 to 17.6 percent in 2010-11 in case of all-India (Table 3.9). In Bihar, it
increased from 9.5 percent in 2009-10 to 13.4 percent in 2010-11. It should, however, be noted
that, even after the increase, the share of gross value added in gross value of output is the
lowest in Bihar.
Table 3.9 : Percent Share of GVA to Gross Output
(Rs. lakh)
States
2009-10 2010-11
Gross
Output
Gross Value
Added
Gross
Output
Gross Value
Added
Bihar 2825481 267779 (9.5) 3605131 484283 (13.4)
Gujarat 64265756 10826974 (16.8) 80678350 10962242 (13.6)
Karnataka 23325405 4353188 (18.7) 28594965 4893278 (17.1)
Madhya Pradesh 8693863 1771357 (20.4) 11589804 2027989 (17.5)
Maharashtra 62404918 13498304 (21.6) 78536268 16846749 (21.5)
Uttar Pradesh 22568130 3713497 (16.5) 29221560 5132623 (17.6)
All India 373303593 69718259 (18.7) 467621696 82513335 (17.6)
Source : ASI, GOI
Figures in parentheses are percentages to Gross Output

72
A positive feature noticeable from Table 3.10 is that the total number of persons engaged in
industrial units has shown an upward trend. The total number of persons engaged in industries
at all-India level increased from 118 lakh in 2009-10 to 127 lakh in 2010-11, indicating an
increase of about 8 percent during the year; similarly, Bihar also recorded a significant increase
of around 23 percent in the number of persons engaged in the year. In terms of number of
persons per factory, Bihar showed a drop by 8 persons in 2010-11; at all-India level, the drop
per factory was smaller, only 3 persons. The different states, by and large, followed the same
trend, except for Karnataka, where number of persons engaged declined by around 51
thousand, resulting into a significant drop in number of persons per factory. This may be on
account of automation adopted by some of the factories. A further analysis of the table also
reveals that, both in Bihar and all-India level, an increase of around Rs. 2000 in wages/salaries
paid per person was recorded.
Table 3.10 : Estimate of Employment, Mandays Employed and Emoluments Paid in the factory sector
States
No. of
factories
in
operation
No. of
persons
engaged
No. of
unpaid
family
workers
No. of
paid
workers
Total
mandays
employed
('000)
Wages,
salaries
& Bonus
(Rs. lakh)
No. of
person
per
factory
Wages,
salaries
& Bonus
per paid
person
annually
(Rs.)
2010-11
Bihar 2547 106213 1821 104392 24338 85604 42 82002
Gujarat 16931 1295334 4110 1291224 402929 1947460 77 150823
Karnataka 8857 781716 1191 780525 239524 1325360 88 169804
Madhya
Pradesh 3744 310944 516 310428 96713 453081 83 145954
Maharashtra 21865 1698122 4036 1694086 531153 3514289 78 207445
Uttar Pradesh 11312 808666 2918 805748 242376 1121446 71 139181
All India 172177 12694853 77163 12617690 3884964 18329574 74 145269
2009-10
Bihar 1725 86620 1385 85235 19619 53469 50 62731
Gujarat 15339 1159239 4949 115429 360106 1558915 76 135054
Karnataka 8353 886706 1652 881757 270221 1050929 106 119185
Madhya
Pradesh 3315 279902 1036 27866 89147 368400 84 132104
Maharashtra 18839 1514069 7998 1506071 471483 2810052 80 186581
Uttar Pradesh 10696 762599 5782 756817 224444 877763 71 115980
All India 158878 11792055 69423 11722632 3574683 14700696 77 125404
Source: Annual Survey of Industries, 2009-10 and 2010-11
The input to output ratio is a major indicator to assess the health of the industrial sector and
Bihar (87 percent) stands above the all-India level (82 percent) in 2010-11 in this aspect (Table
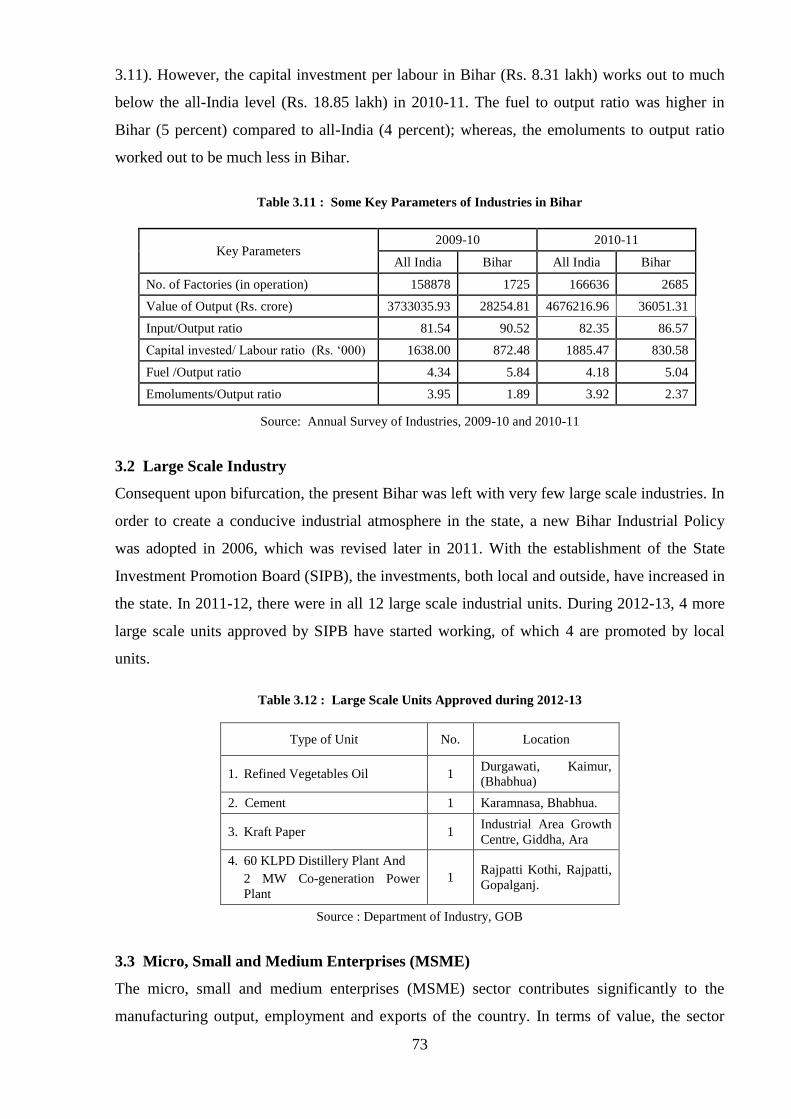
73
3.11). However, the capital investment per labour in Bihar (Rs. 8.31 lakh) works out to much
below the all-India level (Rs. 18.85 lakh) in 2010-11. The fuel to output ratio was higher in
Bihar (5 percent) compared to all-India (4 percent); whereas, the emoluments to output ratio
worked out to be much less in Bihar.
Table 3.11 : Some Key Parameters of Industries in Bihar
Key Parameters 2009-10 2010-11
All India Bihar All India Bihar
No. of Factories (in operation) 158878 1725 166636 2685
Value of Output (Rs. crore) 3733035.93 28254.81 4676216.96 36051.31
Input/Output ratio 81.54 90.52 82.35 86.57
Capital invested/ Labour ratio (Rs. ‘000) 1638.00 872.48 1885.47 830.58
Fuel /Output ratio 4.34 5.84 4.18 5.04
Emoluments/Output ratio 3.95 1.89 3.92 2.37
Source: Annual Survey of Industries, 2009-10 and 2010-11
3.2 Large Scale Industry
Consequent upon bifurcation, the present Bihar was left with very few large scale industries. In
order to create a conducive industrial atmosphere in the state, a new Bihar Industrial Policy
was adopted in 2006, which was revised later in 2011. With the establishment of the State
Investment Promotion Board (SIPB), the investments, both local and outside, have increased in
the state. In 2011-12, there were in all 12 large scale industrial units. During 2012-13, 4 more
large scale units approved by SIPB have started working, of which 4 are promoted by local
units.
Table 3.12 : Large Scale Units Approved during 2012-13
Type of Unit No. Location
1. Refined Vegetables Oil 1 Durgawati, Kaimur,
(Bhabhua)
2. Cement 1 Karamnasa, Bhabhua.
3. Kraft Paper 1 Industrial Area Growth
Centre, Giddha, Ara
4. 60 KLPD Distillery Plant And
2 MW Co-generation Power
Plant
1 Rajpatti Kothi, Rajpatti,
Gopalganj.
Source : Department of Industry, GOB
3.3 Micro, Small and Medium Enterprises (MSME)
The micro, small and medium enterprises (MSME) sector contributes significantly to the
manufacturing output, employment and exports of the country. In terms of value, the sector

74
accounts for around 45 percent of the manufacturing output and 40 percent of total exports of
the country. It is estimated that this sector provides employment to around 595 lakh persons
across the country. Based on the fourth all-India MSME Survey, the size of registered MSMEs
was around 15.84 lakh units in the country, of which 94.9 percent were micro enterprises, 4.89
percent small and 0.17 percent medium enterprises. It a known fact that the MSMEs provide
better opportunities for both self-employment and wage employment with relatively less
capital involvement.
The Development Commissioner's office under the Ministry of MSME functions as a catalyst
for the development of small enterprises with a network of 30 MSME Development Institutes
and 28 of its Branch offices all over the country. In Bihar, there are two MSME Development
Institutes — at Patna and Muzaffarpur, which provide assistance to prospective entrepreneurs,
besides organising a number of entrepreneurship/skill development programmes and
preparation of project profiles, production index, etc.
The MSME sector covers both the registered and unregistered enterprises. The classification of
micro, small and medium enterprises is based on the quantum of investment in plant and
machinery. In order to boost the MSME sector, several schemes are under operation, which
include (i) procurement policy, (ii) MSE-cluster development programme, (iii) Credit
Guarantee Scheme, and (iv) Credit Linked Capital Subsidy scheme for micro and small
enterprises.
As per the fourth all-India MSME Survey conducted in 2006-07, out of a total of 22.48 lakh
registered units in the country, only 69.6 were in operations, 22.1 percent were closed and 8.3
percent were not traceable. A similar position was obtained in Bihar too where, out of a total of
70.67 thousand units, 70.8 percent were working, 23.1 percent were closed and 6.1 percent
were not traceable. Of the total working units, as much as 67 percent were engaged in
manufacturing / assembly / processing. However, the employment per factory in Bihar was
only 2.95 persons, which shows that most of the units here are owned and operated by families.
3.4 MSME in Bihar
In Bihar, during 2007-08, as many as 7202 units under MSME were registered. However, the
number of units registered showed a decline in 2011-12 when only 3962 units were registered.
In 2012-13, the number was still smaller at 3737, registering a negative growth rate. During the
first half of 2013-14 too, the emerging picture does not appear to be promising. However, the

75
investment and employment per unit have registered a phenomenal increase over the period.
As may be seen from Table 3.13, the investment per unit, which was Rs. 1.87 lakh in 2007-08
increased to Rs. 9.73 lakh in 2011-12, and the employment per unit increased from 2.77
persons in 2007-08 to 4.06 persons in 2011-12. In 2012-13, the investment and employment
per unit, however, was reduced to Rs. 6.79 lakh and 2.92 persons, respectively. In comparison
to all-India figures, the investment and employment levels are rather low and it indicates that a
overwhelming number of MSME units in Bihar fall under the category of 'small and tiny'.
Table 3.13 : Yearwise Micro, Small and Medium Registered Units set up in Bihar
Year Medium SSI Tiny/
micro Total
Investment
(Rs. crore)
Investment
per unit
(Rs. lakh)
Employment
(in No.)
Employment
per unit
Upto 2006-07 1433 162063 163496 801.15 536890
2007-08 4 42 7156 7202 134.83 1.87 19963 2.77
2008-09 7 25 6122 6154 118.86 1.93 17474 2.84
2009-10 2 41 5048 5091 128.64 2.53 16011 3.14
2010-11 3 33 4799 4835 185.57 3.84 17365 3.59
2011-12 2 56 3904 3962 385.64 9.73 16079 4.06
2012-13 3 53 3681 3737 253.85 6.79 10894 2.92
2013-14, upto
September 6 13 457 476 200.95 42.22 9823 20.64
Total 27 1696 193230 194953 2209.40 1.13 644499 3.31
CAGR -12.8 10.1 -12.6 -12.4 22.4 - -8.7 -
Source : Department of Industry, GOB
Note: Since 2008-09 artisans have been merged with micro units
Chart 3.2 : Total Micro, Small and Medium Registered Units in Bihar
0% 1%
99%
Medium SSI Tiny/ micro

76
Of the total MSME units registered in 2012-13, Patna division accounted for 30 percent,
whereas other divisions of the state remained far behind. Among the divisions in the state,
Patna remained at the top in terms of number of units registered during 2012-13 with 951
MSMEs, followed by Magadh (474), Tirhut (462) and Munger (408). The Bhagalpur division
registered the least number of units. It is worth mentioning that out of a total of 3753 units
registered in 2012-13, 3.2 percent were owned by the scheduled castes/tribes, 4.20 percent by
the minority community. (Table A 3.3) (Appendix).
Table 3.14 : Percentage Distribution of Medium, Small and Micro Enterprises Registered in 2012-13
Divisions Percentage
Micro Small Medium Total
Patna 24.9 47.8 100.0 25.3
Munger 10.6 26.1 0.0 10.9
Bhagalpur 5.8 0.0 0.0 5.7
Purnea 9.0 1.4 0.0 8.9
Magadh 12.7 11.6 0.0 12.6
Darbhanga 9.8 0.0 0.0 9.6
Kosi 7.7 0.0 0.0 7.6
Tirhut 12.3 11.6 0.0 12.3
Saran 7.1 1.4 0.0 7.0
Total 100.0 100.0 100.0 100.0
Total No. of Units 3681 69 3 3753
Source: Department of Industry, GOB
Prime Minister Employment Generation Programme (PMEGP)
The PMEGP is a credit-linked subsidy scheme implemented through Khadi and Village
Industries Commission (KVIC) under which the beneficiary has to invest 10 percent of the
project cost and the remaining 90 percent is granted as term loan by the banks. For SC/ST and
other weaker sections, the beneficiary share is 5 percent is provided by the banks. During
2012-13, under PMEGP, 10,828 units were recommended for margin money, against the target
of 6290 units, of which 3150 units (29 percent) were sanctioned the same (Table 3.15). All the
sanctioned units had received their assistance, and a total amount of Rs. 76.69 crore were
disbursed to them, the disbursed amount per project being Rs. 2.43 lakh. These units were
estimated to generate employment for 19.11 thousand workers, based on which the per project
employment works out to be 6.1 persons.

77
Table 3.15 : Sanction and Disbursement under PMEGP in Bihar in 2012-13
Agency
Applications
Recommended
Applications
Sanctioned Disbursement
No.
Money
involved
(Rs. crore)
No.
Money
involved
(Rs. crore)
No.
Money
involved
(Rs. crore)
Employ-
ment (No).
KVIC 590
(5.4)
17.96
(6.7)
284
(9.0)
7.74
(10.1)
284
(9.0)
7.74
(10.1)
2340
(12.2)
KVI Board 1124
(10.4)
33.44
(12.6)
305
(9.7)
9.23
(12.0)
305
(9.7)
9.23
(12.0)
2919
(15.3)
DIC 9114
(84.2)
214.88
(80.7)
2561
(81.3)
59.72
(77.9)
2561
(81.3)
59.72
(77.9)
13847
(72.5)
TOTAL 10828
(100.0)
266.28
(100.0)
3150
(100.0)
76.69
(100.0)
3150
(100.0)
76.69
(100.0)
19106
(100.0)
Source : Udyog Mitra GOB
Parenthesis : The figures in the bracket denote percentage.
The agencies involved in promotion of the PMEGP are KVIC, KVI Board and District
Industries Centres (DIC). Of the agencies involved, the DICs played the most crucial role, as it
had handled around 81 percent of the applicants in 2012-13.
3.5 Agro-based Industries
Agro-based industries, particularly the food processing industry, is considered as a ‘sunrise
industry’ in India, having huge potential for uplifting agricultural economy through creation of
large scale units for food processing, promotion of food chain facilities and the resultant
employment generation and export earnings.
Bihar is the seventh largest economy in the country in terms of food and vegetables
production; therefore, there are immense opportunities for agro-based industries in the state.
Among the Indian states, Bihar is the largest producer of vegetables and the second largest in
terms of fruits production. There exists enormous opportunities for investment in the food
processing sector in the state. In view of huge potential in the state, a Directorate of Food
Processing Industries has been set up for promotion of basic infrastructure for post-harvest
operations and processing. The food processing, beverages, tobacco, etc. cover a large number
of products, with high potential of net value addition and employment. In recent years, the
agro-based industries, particularly tea and dairy, have started recording positive growth trend
in Bihar.

78
Bihar produces varieties of fruits and vegetables in large quantities. The area under fruits is
about 298 thousand hectares and, under vegetables, another 853 thousand hectares. Among the
fruits, banana, mango, guava and litchi are important in terms of production. Out of 3933
thousand metric tonnes of total production of fruits in the state in 2011-12, around 40.2 percent
was banana, 32.0 percent mango, 6.2 percent guava, 6.0 percent litchi, and 3.3 percent
pineapple. Makhana is also a unique product of the state, with an annual production of around
96,000 tonnes. The vegetables cover an area of around 853 thousand hectares in the state,
almost three times the area under fruits. Among the vegetables grown in the state, potato,
onion, tomato, cauliflower and brinjal are important crops, involving more than 70 percent of
the total vegetables production.
In food processing sector, a total of 229 projects have been approved with the total project cost
being Rs. 2856.57 crore. The subsidy amounting to Rs. 59 crore has been released during the
current financial year against 72 projects only. Under mega food park scheme, one food park
has been sanctioned at Buxar.
Sugar Industry
Sugar industry is the largest agro-based industry providing sizeable employment directly in the
farm sector and indirectly through ancillary industries and related activities in the state. It is
estimated that about 5 lakh farmers are engaged in the cultivation of sugarcane and,
approximately, another half a lakh as unskilled and skilled workers. There are also trained
technologists, directly engaged in sugar industry in the state. Bihar has immense potential for
sugar and allied industries, particularly in ethanol and captive power generation. Keeping in
view the vast scope of its expansion, the state government has decided to encourage the
sugarcane based industries in the state, which will go a long way in strengthening the rural
economy. Of the total cultivable area of 52.58 lakh hectares in the state, only 5.55 percent is
covered under the sugarcane cultivation, and there is ample scope for increasing the area under
sugarcane cultivation. Before independence, there were 33 sugar mills in the state, which
produced 40 percent of the country’s total production of sugar. Presently, the state’s share in
sugar production has dropped to less than 5 percent.
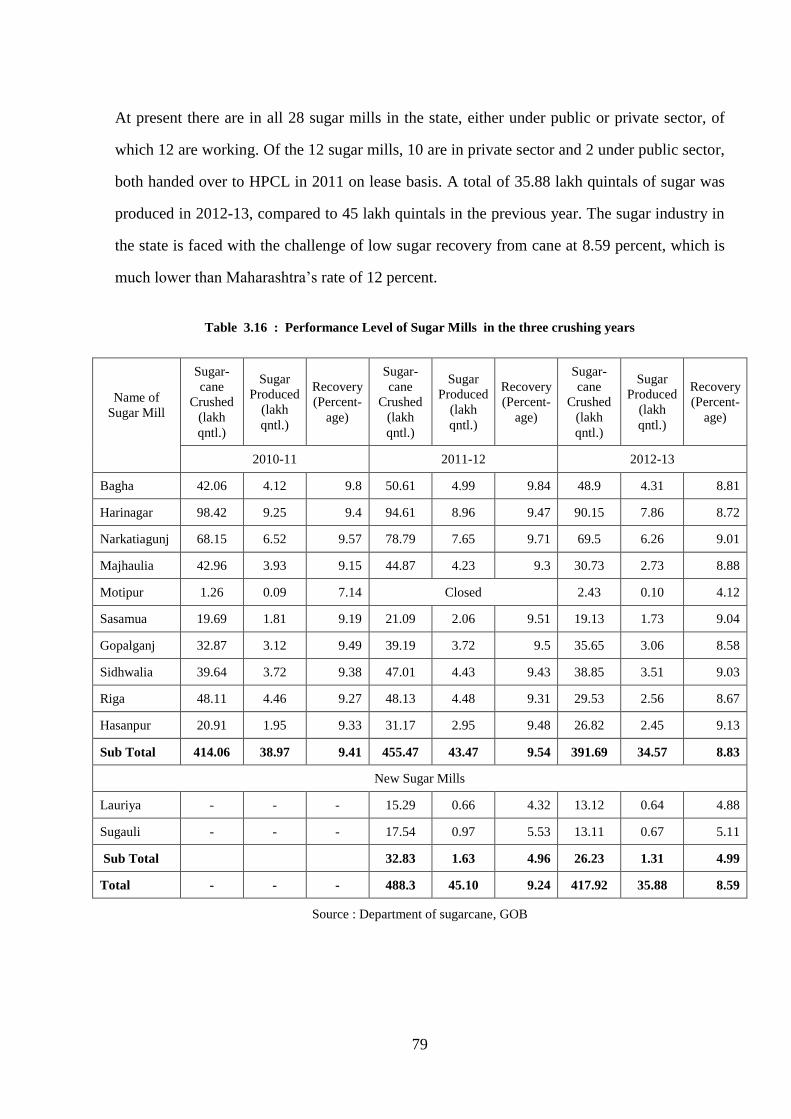
79
At present there are in all 28 sugar mills in the state, either under public or private sector, of
which 12 are working. Of the 12 sugar mills, 10 are in private sector and 2 under public sector,
both handed over to HPCL in 2011 on lease basis. A total of 35.88 lakh quintals of sugar was
produced in 2012-13, compared to 45 lakh quintals in the previous year. The sugar industry in
the state is faced with the challenge of low sugar recovery from cane at 8.59 percent, which is
much lower than Maharashtra’s rate of 12 percent.
Table 3.16 : Performance Level of Sugar Mills in the three crushing years
Name of
Sugar Mill
Sugar-
cane
Crushed
(lakh
qntl.)
Sugar
Produced
(lakh
qntl.)
Recovery
(Percent-
age)
Sugar-
cane
Crushed
(lakh
qntl.)
Sugar
Produced
(lakh
qntl.)
Recovery
(Percent-
age)
Sugar-
cane
Crushed
(lakh
qntl.)
Sugar
Produced
(lakh
qntl.)
Recovery
(Percent-
age)
2010-11 2011-12 2012-13
Bagha 42.06 4.12 9.8 50.61 4.99 9.84 48.9 4.31 8.81
Harinagar 98.42 9.25 9.4 94.61 8.96 9.47 90.15 7.86 8.72
Narkatiagunj 68.15 6.52 9.57 78.79 7.65 9.71 69.5 6.26 9.01
Majhaulia 42.96 3.93 9.15 44.87 4.23 9.3 30.73 2.73 8.88
Motipur 1.26 0.09 7.14 Closed 2.43 0.10 4.12
Sasamua 19.69 1.81 9.19 21.09 2.06 9.51 19.13 1.73 9.04
Gopalganj 32.87 3.12 9.49 39.19 3.72 9.5 35.65 3.06 8.58
Sidhwalia 39.64 3.72 9.38 47.01 4.43 9.43 38.85 3.51 9.03
Riga 48.11 4.46 9.27 48.13 4.48 9.31 29.53 2.56 8.67
Hasanpur 20.91 1.95 9.33 31.17 2.95 9.48 26.82 2.45 9.13
Sub Total 414.06 38.97 9.41 455.47 43.47 9.54 391.69 34.57 8.83
New Sugar Mills
Lauriya - - - 15.29 0.66 4.32 13.12 0.64 4.88
Sugauli - - - 17.54 0.97 5.53 13.11 0.67 5.11
Sub Total 32.83 1.63 4.96 26.23 1.31 4.99
Total - - - 488.3 45.10 9.24 417.92 35.88 8.59
Source : Department of sugarcane, GOB

80
Chart 3.3 : Performance Level of Sugar Mills in the two crushing years
The central government extends facilities for promotion of sugar industry and has already
announced that the exporters would be exempt from the mandatory levy for the quantity of
sugar exported. The sugar industry has asked for a revision of Sugar Incentive Policy, 2006 to
bring it at par with the provisions and incentives offered by the New Industrial Policy, 2011.
The major concerns include immediate revision of existing sugar incentive policy, revision of
prices of rectified sprit, and imposition of entry tax. The state government has agreed to come
up with an integrated policy this year to provide a level playing field for local entrepreneurs. It
is granting incentive packages for new sugar mills, distillery and ethanol units, and for setting
up of co-generation power units.
In order to strengthen the sugar industry in the state, a Sugarcane Survey Policy, 2013 has been
announced. Under this, a survey of 5.60 lakh acres of sugarcane cultivation has been
completed by all the working 12 sugar factories through GPS technique. The Chief Minister
Sugarcane Development Programme is being implemented at a cost of Rs. 44.30 crore with a
view to increase the acreage, production, productivity and recovery rate of sugar. The Bihar
Sugarcane Information Management System (BSIMS) has been introduced for informing the
farmers about the existing stage of sugarcane supply and status of payment of sugarcane
supplied to the mills.
0 2 4 6 8 10
Bagha
Harinagar
Narkatiag…
Majhaulia
Motipur
Sasamua
Gopalganj
Sidhwalia
Riga
Hasanpur
Lauriya
Sugauli
Recovery Percentage
Su
ga
r M
ills
in
Bih
ar
2012-13 2011-12
81
Tea Industry
The tea plantation in Bihar had started three decades earlier by a tea company on a small piece
of land in Pothia block of Kishanganj district. Afterwards, it spread to other areas in the district
and now the tea industry is growing fast in the state. In more than 25 thousand acres, mostly in
Kishanganj and the rest in Purnea, Katihar and Araria districts, more than 4 million kgs. of tea
is grown every year. In Kishanganj district, around 50 percent of the area is covered under tea
crop in Pothia block, followed by Thakurganj (40 percent) and Kishanganj (13 percent). There
are only 7 tea processing plants in Kishanganj, with an annual output exceeding 2300 tonnes of
tea; however, there is a scope for another 50 new tea processing plants in Kishanganj. For want
of adequate local tea processing plants, a majority of growers have to ferry their products to the
neighbouring north Bengal. There is vast scope of tea industry in the state and a Tea Promotion
Policy for advancement of this industry is under formulation. The state government has already
announced subsidies and an incentive package for new tea processing plants. It is actively
considering to increase the rate of subsidy from 15 to 25 percent, in line with the neighbouring
state of West Bengal.
Dairy
The dairy industry in Bihar is most successful and touching new heights every year. Bihar
State Cooperative Milk Producers Federation (COMFED) is the implementing agency which
played a commendable role in promoting dairy development in the state on the pattern of
Anand in Gujarat. In terms of milk procurement, Bihar is among the leading states in the
country. COMFED procures milk through the dairy cooperative societies, spread throughout
the state which help small and marginal farmers enhance their income. From outside state also,
COMFED procures milk from Ranchi in Jharkhand, though the quantity is relatively less. The
number of milk cooperative societies organised upto 2012-13 was 13,681, of which 1196 were
Women's Cooperative Societies. The total membership of the dairy cooperative societies was
7.59 lakh in 2012-13. Through these societies, the total milk procured during 2012-13 was
12.45 lakh kgs./day.

82
Chart 3.4 : Dairy Cooperative Societies and Membership
Against the procurement of 12.45 lakh kgs. of milk/day in 2012-13, the average milk
marketing was 9.20 lakh kgs. per day. Besides Bihar, the milk is being marketed in Ranchi,
Bokaro and Jamshedpur in Jharkhand, and in the neighbouring parts of Uttar Pradesh and West
Bengal.
Chart 3.5 : Average Milk Collection
The milk products under ‘Sudha’ brand, marketed by COMFED, is in great demand. As may
be seen from Table 3.17, besides milk, other milk products are also touching new heights each
year in terms of marketing.
0.00
100.00
200.00
300.00
400.00
500.00
600.00
700.00
800.00
2009-10 2010-11 2011-12 2012-13
8.56 9.76 11.64 13.69
463.16 533.17
629.20
759.06
(In
'00
0)
Dairy Coop. Societies Membership
0
2
4
6
8
10
12
14
2006-07 2007-08 2008-09 2009-10 2010-11 2011-12 2012-13
6.08
4.79 4.17
7.39
11.01 10.75
12.45
Ave
rage
Milk
Co
llect
ion
( la
kh k
ilo p
er
day
)

83
Table 3.17 : Marketing of Different Milk Products by COMFED
(In metric tonnes)
Milk Products 2009-10 2010-11 2011-12 2012-13
Ghee 981.79 1270.14 1322.73 1716.93
Table Butter 74.45 66.00 58.39 106.18
Ice-Cream 472.32 584.82 663.3 1083.23
Lassi 3216.88 4093.98 3242.49 6426.01
Misti Dahi 820.21 1219.10 1217.65 1503.49
Peda 735.73 769.70 745.33 1241.53
Paneer 1701.48 1936.35 2090.10 3022.00
Sudha Special 870.39 1603.45 1101.24 1193.34
Plain Curd 2723.03 2856.7 3251.69 4628.10
Kalakand 152.76 167.83 173.10 184.36
Rasogulla 497.06 731.93 672.71 1278.42
Gulabjamun 335.75 462.59 565.93 1104.59
Source : COMFED, GOB
The COMFED and its constituent units had a total turnover of Rs. 1564 crore in 2011-12
which increased to Rs. 2058 crore in 2012-13, registering an increase of 31 percent over the
year. The COMFED with its constituents is making profit each year, before interest and
depreciation. As may be seen, against a gross profit of Rs. 38.11 crore earned in 2010-11, it
made a profit of Rs. 58.09 crore in 2011-12 and Rs. 55.78 in 2012-13. The profit is distributed
among its share holders i.e. milk producers.
Chart 3.6 : Total Turn Over
571.9 587.8
858.9 999.0
1358.0
1564.2
2058.4
0.0
500.0
1000.0
1500.0
2000.0
2500.0
2006-07 2007-08 2008-09 2009-10 2010-11 2011-12 2012-13
Tota
l Tu
rn O
ver
( R
s. C
rore
)

84
Chart 3.7 : Profit before Interest and Depreciation
Under the Bihar Agriculture Road Map (2012-17), a development plan for milch animals has
been prepared with the objective to (i) increase the productivity of milch animals, (ii)
improvement in health and upkeep of animals, (iii) extension in the areas of milk cooperative,
(iv) more facilities for milk processing and marketing and (v) strengthening of human
resources. Under the scheme, a sanction of Rs. 100 crore has been made for increasing the milk
production. This scheme carries a facility of 50 percent subsidy.
3.6 Non-Agro Based Industry
Silk
In Bihar, Bhagalpur region has the great potential of silk industry and, as such, there is a
demand that Bhagalpur city be named ‘Silk City of India’. In the silk sector, the Chief Minister
Tussar Development Scheme (2012-17) has been started in 2012-13 under which a sum of Rs.
170.90 crore has been approved for tussar area development covering the districts of Banka,
Munger, Nawada and Kaimur. The ambitious scheme will be completed during the Twelfth
Plan period, under which 13,525 hectares of land will be covered under tussar plantation with a
view to augment the income of tussar farmers through self-employment. During 2012-13, a
sum of Rs. 10.70 crore has been sanctioned under this scheme and tussar trees were planted in
647 hectares of private land against a target of 1109 hectares and the mulberry trees were
planted on around 63 acres of land, against a target of 481 hectares. During the year, 530
persons have been imparted training in mulberry silk worm rearing. In Begusarai district, 200
insect rearers were trained, after which rearing equipments were distributed among the
trainees.
0.0
10.0
20.0
30.0
40.0
50.0
60.0
2009-10 2010-11 2011-12 2012-13
46.0 43.4
58.1 55.8
Rs.
cro
re

85
For the development of mulberry and eri in the state, a Catalytic Development Programme has
been sponsored by the central government under which a sum of Rs. 264.96 lakh has been
released by the Central Silk Board and the states' share of Rs. 155.02 lakh has been released.
This scheme is being implemented in the districts of Kishanganj, Araria, Supaul, Saharsa,
Vaishali and Begusarai. During the period, 3.91 lakh mulberry, 1.29 lakh tasar and 0.57 lakh
eri silk worm were reared from which 83.99 lakh mulberry, 8.04 lakh tasar and 3.83 lakh eri
cocoon were produced.
Handloom
Handloom units are operational in the state in large numbers which provide employment to
around 0.38 lakh weavers. There are 1089 primary handloom societies, with around 10,850
handlooms operating under them and, at the apex level, there are two marketing organisations
viz., Bihar State Handloom Cooperative Union and Bihar State Wool and Sheep Union, both
located at Patna. The handloom units are concentrated in 14 districts in the state, important
among them being Madhubani, Siwan, Gaya, Bhagalpur, Banka, Nalanda and Patna.
According to one study, only 54 percent of the weavers owned their handlooms and the rest
were supplied looms by the traders. Under powerloom sector, there are more than 11,000
looms, which are mostly concentrated in Bhagalpur, Gaya and Banka. The main products in
the powerloom sector are – staple, chaddar and furnishings.
Various schemes have been taken up during the last two years for the development of
handloom sector. For the overall development of weavers engaged in handloom sector, an
ambitious programme of 'Chief Minister Integrated Handloom Development Scheme' has been
started in 2012-13 under state plan fund. This programme is to be completed in the first four
years (2012-16) of the Twelfth Plan, under which 24 thousand weavers will be provided with a
sum of Rs. 15,000 and Rs. 5000 each for purchase of new looms and raw materials,
respectively. First installment of Rs. 12,000 per weaver has been provided to 4895 weavers for
purchase of new looms at the total cost was Rs. 587.40 lakh. Again, a sum of Rs. 40,000 will
be directly transferred to the bank account of each of 8000 weavers for construction of
worksheds enabling them to work in an appropriate environment. Besides, for providing the
pre-loom and post-loom facilities, 40 common facility centres will be established in weaver-
dominated clusters for easy availability of services to them. Along with this, 6 weavers' hats
will be established — one with 100 stalls and five with 50 stalls each – for supply of yarn at
subsidised rate and marketing of the products. Under this scheme, a sum of Rs. 17.82 crore has
been sanctioned for the year 2012-13.

86
A centrally sponsored Revival and Reorganisation Package has been started under which
viable and potential handloom weavers of primary weavers cooperative societies and Apex
societies, individual handloom weavers, master weavers, and self-help groups who obtained
loans for handloom weaving, will be granted funds towards repayment of 100 percent of
principal amount and 25 percent of interest which have been overdue. This fund will be
granted, provided the banks also provide a new loan of Rs. 20,000 and above to the
beneficiaries. During 2012-13, a sum of Rs. 56.75 lakh was spent towards the state share under
this package. 1606 individual weavers have been benefited. Under Mahatma Gandhi Bunkar
Bima Yojana, 870 weaver have been covered. 912 credit cards have been issued and loan of
Rs. 2.80 crore has been made available to weavers. Major schemes for handloom development
during 2011-12 and 2012-13 are enumerated in Table 3.18.
Table 3.18 : Major Schemes for Handloom
(Amount in Rs. lakh)
Sl.
No. Scheme
2011-12 2012-13
Amount No.
Benefitted Amount
No.
Benefitted
1 Power Tariff Grant 4.91 112 15.00 208
2 Mukhyamantri Integrated Handloom
Development Scheme for purchase of
new looms
– – 587.40 4895
3 Scholarship for Powerloom Service
Centre, Bhagalpur
0.32 76 0.10 71
4 Scholarship for Central Design
Centre, Patna
0.41 22 0.45 25
5 Establishment of Jute Park at
Maranga, Purnea
16.73 – 16.73 1
6 Stipend to the trainees of 6 weavers
Training Centres
4.17 119 3.51 106
Source : Handloom, Department of Industry, GOB
Under another scheme, approval has been granted by the state government for establishment of
a Jute Park at Maranga in Purnea district at an estimated cost of Rs. 42.36 crore. For this, 44.30
acres of land has been allotted and the work is under progress. For the year 2012-13, a sum of
Rs. 16.73 lakh has been approved. A Jute training-cum-production scheme was initiated in
2010-11, under which training programmes will be organised in two sessions of six months
each and, in each session, 15 persons will be imparted training.

87
Khadi and Village Industries (KVI)
The khadi and village industries also provide sustainable non-farm employment opportunities
in rural areas, and comes under the purview of Khadi and Village Industries Commission
(KVIC), which functions under the administrative control of Ministry of Micro, Small and
Medium Enterprises of the central government. The Commission has 36 state / divisional
offices, spread all over the country to facilitate speedy implementation of KVI programmes. It
also coordinates the functions of training, marketing, funding, economic research and Prime
Minister’s Employment Generation Programme (PMEGP). The Khadi and Village Industries
Board (KVIB) at the state level has its district level offices, through which it operates to
promote village industries. For encouraging the sales of khadi for the benefit of khadi
weavers/societies/institutions, rebates are allowed on khadi clothes and garments.
For promotion of KVI sector, an outlay of Rs. 19 crore is proposed for 2013-14. Rs. 44.46
crore is being sanctioned for revival of KVI institutions. For pending Khadi rebate, a sum of
Rs. 416.30 lakh has been sanctioned during 2013-14.
Mines and Minerals
The minerals are non-renewable natural resources and constitute vital raw material for a
number of basic industries. A large quantity of economically useful minerals is produced in
India, which is about one-fourth of world’s known mineral resources. However, the present
Bihar has only minor minerals — sand, stone and soil; the limited major minerals of the state
include pyrite, limestone and mica. (Table A3.4) (Appendix). Though a very small proportion
of minerals is left in the state, the revenue collection from this sector almost doubled from Rs.
263.77 crore in 2009-10 to Rs. 499.27 crore in 2012-13. During the first half of 2013-14, the
revenue return from mines and minerals has been to the tune of Rs. 220.77 crore.
Table 3.19 : Revenues from minerals in Bihar in 2012-13
Sources
Amount
(Rs. In lakh) Sources
Amount
(Rs. In lakh)
1. Major Minerals 238.76 (vi) Works Deptt. 23155.84
2. Minor Minerals (vii) Transit Pass 35.02
(i) bricks 3742.42 (viii) Others 335.66
(ii) sand 17716.97 3. Arrears 862.44
(iii) stone 2734.68
(iv) morum 15.36
(v) soil 1089.86 Total 49927.01
Source: Department of Mines and Geology, GOB

88
Chart 3.8 : Target and Revenue Collection
3.7 Support Institutions
A number of support institutions have been constituted in the state for development of
industries. Over a period of time, some of the support institutions have become weak; however,
the state government is making an all out effort to rehabilitate them to improve the industrial
climate in the state. Some new institutions have also been set up to improve the industrial
ambience and attract investments, both from within and outside the state.
Udyog Mitra
Udyog Mitra provides relevant information pertaining to investment profiles for different
industries to the investors. It acts as a facilitator and assists the investors in many ways.
Besides providing guidance to the entrepreneurs to establish units, Udyog Mitra also helps
entrepreneurs through helping them to prepare project reports, and solving the problems
coming in their way of establishment of industries. It also helps the entrepreneurs in selection
of the type of industry, and providing other assistance at the preliminary stage. It participates in
the international trade fairs, state level industrial fairs, and organises seminars/discussions and
publishes book/bulletins etc. It provides latest information on patent, design, trade marking,
etc. under Intellectual Property Right to the entrepreneurs. It also prepares the programmes for
the training of entrepreneurs. During 2012-13, altogether 596 entrepreneurs have been
provided proper guidance and necessary information. A sum of Rs. 104 lakh was approved
towards the establishment cost for the year 2012-13. The yearwise physical and financial
achievements of Udyog Mitra are presented in Table 3.20.
0
100
200
300
400
500
600
700
20
08
-09
20
09
-10
20
10
-11
20
11
-12
20
12
-13
20
13
-04
,up
toSe
pte
mb
er
160 200
294 315
470
641
182 264
314 377 499
221
Target ( Rs. Crore) Revenue Collection ( Rs. Crore)

89
Table 3.20 : Physical and Financial Achievements of Udyog Mitra
Year
Amount
Allotted
(Rs. lakh)
Amount
spent
(Rs. lakh)
No. of
Entrepreneurs
benefited
2008-09 25.00 25.00 685
2009-10 60.00 60.00 679
2010-11 66.00 66.00 630
2011-12 100.00 67.48 753
2012-13 104.00 78.73 596
2013-14* 120.00 296
Source : Udyog Mitra, GOB
Chart 3.9 : Physical Achievement of Udyog Mitra
Land Bank
The land acquisition is an important programme for industrialisation of the state. Under this,
the lands are acquired and allotted for industrial purpose and other development programmes
like establishment of public institutions. In this context, it has been decided to establish a
corpus fund upto a limit of Rs. 1500 crore for the Land Bank Programme. A resolution has
been passed to prepare a guideline for acquisition and allotment of the land, and administration
of fund. During 2012-13, a sum of Rs. 30 crore has been sanctioned under this programme.
0
100
200
300
400
500
600
700
800
20
08
-09
20
09
-10
20
10
-11
20
11
-12
20
12
-13
20
13
-14
, up
tosep
temb
erN
o. o
f e
ntr
ep
ren
eu
rs b
en
efi
tte
d
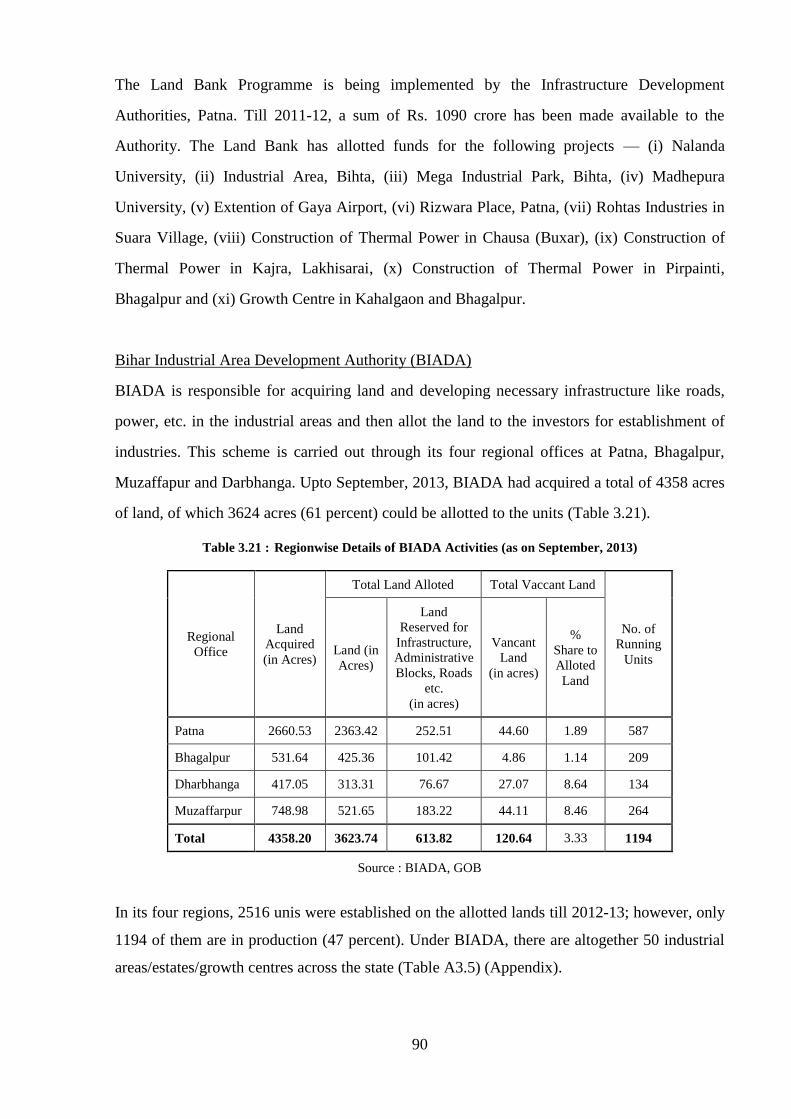
90
The Land Bank Programme is being implemented by the Infrastructure Development
Authorities, Patna. Till 2011-12, a sum of Rs. 1090 crore has been made available to the
Authority. The Land Bank has allotted funds for the following projects — (i) Nalanda
University, (ii) Industrial Area, Bihta, (iii) Mega Industrial Park, Bihta, (iv) Madhepura
University, (v) Extention of Gaya Airport, (vi) Rizwara Place, Patna, (vii) Rohtas Industries in
Suara Village, (viii) Construction of Thermal Power in Chausa (Buxar), (ix) Construction of
Thermal Power in Kajra, Lakhisarai, (x) Construction of Thermal Power in Pirpainti,
Bhagalpur and (xi) Growth Centre in Kahalgaon and Bhagalpur.
Bihar Industrial Area Development Authority (BIADA)
BIADA is responsible for acquiring land and developing necessary infrastructure like roads,
power, etc. in the industrial areas and then allot the land to the investors for establishment of
industries. This scheme is carried out through its four regional offices at Patna, Bhagalpur,
Muzaffapur and Darbhanga. Upto September, 2013, BIADA had acquired a total of 4358 acres
of land, of which 3624 acres (61 percent) could be allotted to the units (Table 3.21).
Table 3.21 : Regionwise Details of BIADA Activities (as on September, 2013)
Regional
Office
Land
Acquired
(in Acres)
Total Land Alloted Total Vaccant Land
No. of
Running
Units Land (in
Acres)
Land
Reserved for
Infrastructure,
Administrative
Blocks, Roads
etc.
(in acres)
Vancant
Land
(in acres)
%
Share to
Alloted
Land
Patna 2660.53 2363.42 252.51 44.60 1.89 587
Bhagalpur 531.64 425.36 101.42 4.86 1.14 209
Dharbhanga 417.05 313.31 76.67 27.07 8.64 134
Muzaffarpur 748.98 521.65 183.22 44.11 8.46 264
Total 4358.20 3623.74 613.82 120.64 3.33 1194
Source : BIADA, GOB
In its four regions, 2516 unis were established on the allotted lands till 2012-13; however, only
1194 of them are in production (47 percent). Under BIADA, there are altogether 50 industrial
areas/estates/growth centres across the state (Table A3.5) (Appendix).
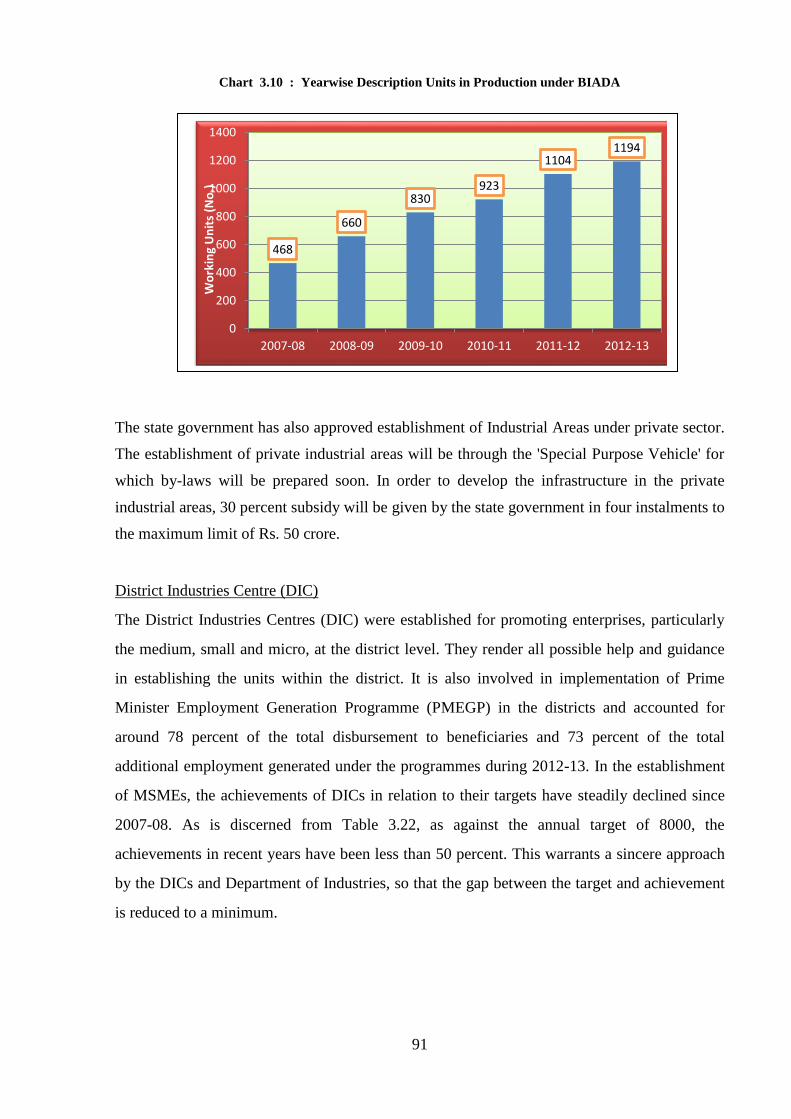
91
Chart 3.10 : Yearwise Description Units in Production under BIADA
The state government has also approved establishment of Industrial Areas under private sector.
The establishment of private industrial areas will be through the 'Special Purpose Vehicle' for
which by-laws will be prepared soon. In order to develop the infrastructure in the private
industrial areas, 30 percent subsidy will be given by the state government in four instalments to
the maximum limit of Rs. 50 crore.
District Industries Centre (DIC)
The District Industries Centres (DIC) were established for promoting enterprises, particularly
the medium, small and micro, at the district level. They render all possible help and guidance
in establishing the units within the district. It is also involved in implementation of Prime
Minister Employment Generation Programme (PMEGP) in the districts and accounted for
around 78 percent of the total disbursement to beneficiaries and 73 percent of the total
additional employment generated under the programmes during 2012-13. In the establishment
of MSMEs, the achievements of DICs in relation to their targets have steadily declined since
2007-08. As is discerned from Table 3.22, as against the annual target of 8000, the
achievements in recent years have been less than 50 percent. This warrants a sincere approach
by the DICs and Department of Industries, so that the gap between the target and achievement
is reduced to a minimum.
468
660
830 923
1104 1194
0
200
400
600
800
1000
1200
1400
2007-08 2008-09 2009-10 2010-11 2011-12 2012-13
Wo
rkin
g U
nit
s (N
o.)

92
Table 3.22 : Achievements of DIC under MSME
Year Target
(No.)
Achievement
No.
Amount
Loans/
Invest-
ments
(Rs. Lakh)
Achieve-
ment as %
of target
Establishment of MSME
2007-08 7000 7202 13482.98 102.89
2008-09 8000 6154 11886.06 76.93
2009-10 8000 5091 12864.46 63.64
2010-11 8000 4835 18556.77 60.44
2011-12 8000 3962 38563.91 49.53
2012-13 8000 3737 24173.19 46.71
2013-14, upto
September 13 8000 476 20094.80
Source : Department of Industry, GOB
Exports
Bihar has a very negligible share in India’s export. As per the fourth MSME census, only 726
enterprises in Bihar, which constituted 1.56 percent of India’s total exporting units, were
exporting items worth Rs. 7.98 crore. The items included silk, handicrafts, handloom clothes,
soft leather, litchi, mango pulp, makhana and more recently rice. But in the absence of a port,
these were being handled at destinations outside the state, and hence specific data on exports
from Bihar is not available.
3.8 Information and Communication Technology
The information and communication technology industry is growing fast in India. The growth
of the sector has led to tremendous pay-offs in terms of wealth creation and generation of high
quality employment. However, this rapid growth is confined mostly to a few states and Bihar
has largely been by-passed. However, IT-related infrastructure is coming up fast in the state
and IT sector has started growing here. In 2012-13, the plan outlay for IT sector in the state
was around Rs. 198 crore and, for 2013-14, it was Rs. 199 crore (Table A3.6) (Appendix). In
2012-13, many schemes for the development of IT sector have been taken up in the state.
SWAN (Statewide Area Network)
With the central government assistance, a total of 533 Points of Presence (PoP) are operational
in the state under SWAN — 1 at state headquarters, 37 at the district headquarters and 495 at
the block headquarters. Bihar State Electronics Development Corporation (BELTRON), Patna,
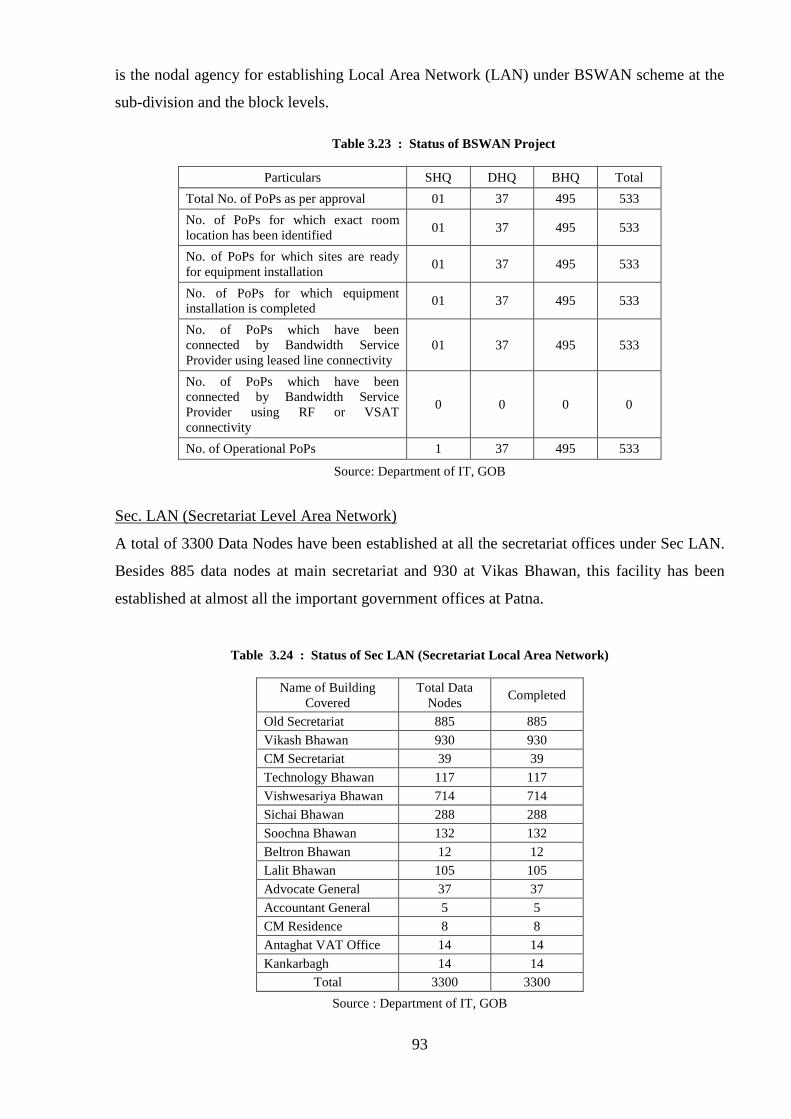
93
is the nodal agency for establishing Local Area Network (LAN) under BSWAN scheme at the
sub-division and the block levels.
Table 3.23 : Status of BSWAN Project
Particulars SHQ DHQ BHQ Total
Total No. of PoPs as per approval 01 37 495 533
No. of PoPs for which exact room
location has been identified 01 37 495 533
No. of PoPs for which sites are ready
for equipment installation 01 37 495 533
No. of PoPs for which equipment
installation is completed 01 37 495 533
No. of PoPs which have been
connected by Bandwidth Service
Provider using leased line connectivity
01 37 495 533
No. of PoPs which have been
connected by Bandwidth Service
Provider using RF or VSAT
connectivity
0 0 0 0
No. of Operational PoPs 1 37 495 533
Source: Department of IT, GOB
Sec. LAN (Secretariat Level Area Network)
A total of 3300 Data Nodes have been established at all the secretariat offices under Sec LAN.
Besides 885 data nodes at main secretariat and 930 at Vikas Bhawan, this facility has been
established at almost all the important government offices at Patna.
Table 3.24 : Status of Sec LAN (Secretariat Local Area Network)
Name of Building
Covered
Total Data
Nodes Completed
Old Secretariat 885 885
Vikash Bhawan 930 930
CM Secretariat 39 39
Technology Bhawan 117 117
Vishwesariya Bhawan 714 714
Sichai Bhawan 288 288
Soochna Bhawan 132 132
Beltron Bhawan 12 12
Lalit Bhawan 105 105
Advocate General 37 37
Accountant General 5 5
CM Residence 8 8
Antaghat VAT Office 14 14
Kankarbagh 14 14
Total 3300 3300
Source : Department of IT, GOB

94
Common Service Centre (CSC)
The CSC is a core infrastructure of the national e-governance. The Common Service Centres
have been established in all the 9 divisions of the state. As may be discerned from Table 3.25,
out of a total of 8463 CSCs approved, 8274 centres have already been established and the
remaining will be established shortly.
Table 3.25 : Status of Common Service Centre Project
Name of Division Total CSC Total CSC
Established
Patna 1347 1319
Bhagalpur 427 427
Darbhanga 1110 1110
Kosi 504 496
Saran 857 831
Munger 774 740
Magadh 883 861
Tirhut 1728 1708
Purnia 833 782
Total 8463 8274
Source : Department of IT, GOB
e-District
This project is approved and implemented in 4 districts of Nalanda, Aurangabad, Gaya and
Madhubani on pilot basis, and a total of 94 e-Districts have been established. Under this
project, a provision has been made to render services like providing certificates, pensions and
other facilities through Common Facilitation Centres (CFC) established at the blocks and
Vasudha Kendras at Panchayats. The charges for various categories of services rendered have
also been recommended.
e-Governance
This ambitious project has been approved under the state plan. The e-Governance scheme is
being implemented through all the 533 PoPs under SWAN, 8274 CSCs, 94 e-District and all
3300 Data Points established in the state. Ten departments of the Government of Bihar have
started e-Procurement and 7579 tenders have been hosted during 2012-13.
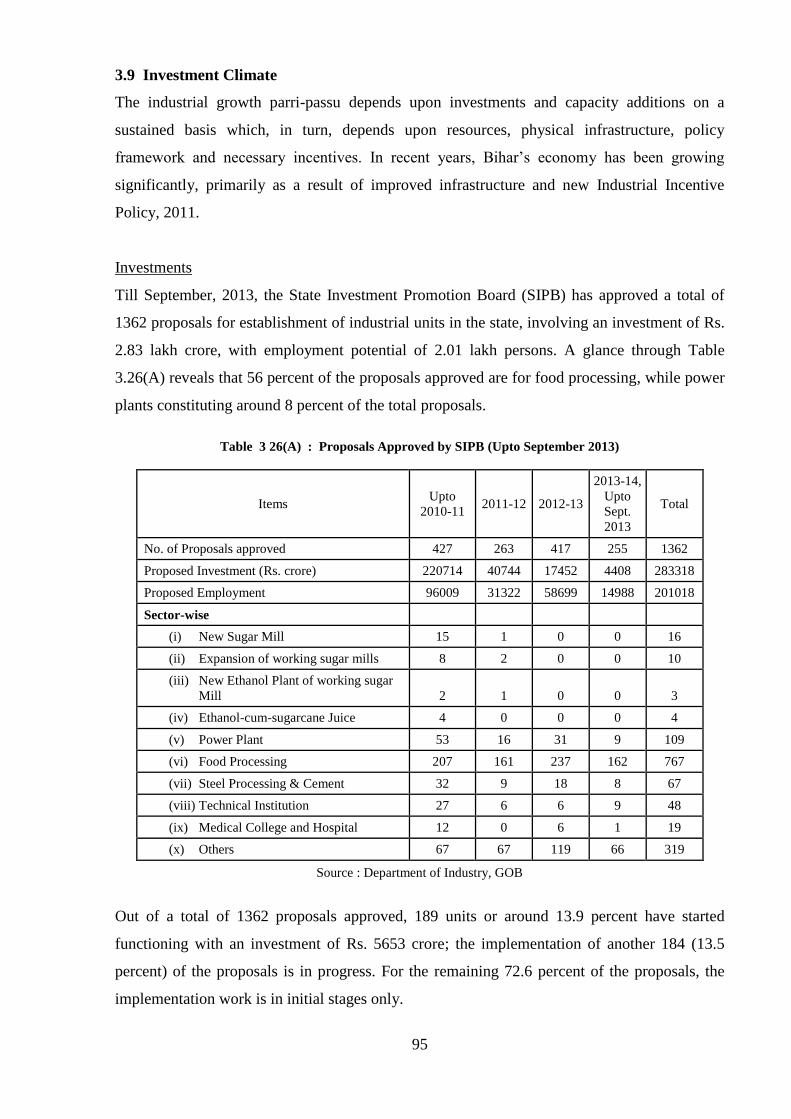
95
3.9 Investment Climate
The industrial growth parri-passu depends upon investments and capacity additions on a
sustained basis which, in turn, depends upon resources, physical infrastructure, policy
framework and necessary incentives. In recent years, Bihar’s economy has been growing
significantly, primarily as a result of improved infrastructure and new Industrial Incentive
Policy, 2011.
Investments
Till September, 2013, the State Investment Promotion Board (SIPB) has approved a total of
1362 proposals for establishment of industrial units in the state, involving an investment of Rs.
2.83 lakh crore, with employment potential of 2.01 lakh persons. A glance through Table
3.26(A) reveals that 56 percent of the proposals approved are for food processing, while power
plants constituting around 8 percent of the total proposals.
Table 3 26(A) : Proposals Approved by SIPB (Upto September 2013)
Items Upto
2010-11 2011-12 2012-13
2013-14,
Upto
Sept.
2013
Total
No. of Proposals approved 427 263 417 255 1362
Proposed Investment (Rs. crore) 220714 40744 17452 4408 283318
Proposed Employment 96009 31322 58699 14988 201018
Sector-wise
(i) New Sugar Mill 15 1 0 0 16
(ii) Expansion of working sugar mills 8 2 0 0 10
(iii) New Ethanol Plant of working sugar
Mill 2 1 0 0 3
(iv) Ethanol-cum-sugarcane Juice 4 0 0 0 4
(v) Power Plant 53 16 31 9 109
(vi) Food Processing 207 161 237 162 767
(vii) Steel Processing & Cement 32 9 18 8 67
(viii) Technical Institution 27 6 6 9 48
(ix) Medical College and Hospital 12 0 6 1 19
(x) Others 67 67 119 66 319
Source : Department of Industry, GOB
Out of a total of 1362 proposals approved, 189 units or around 13.9 percent have started
functioning with an investment of Rs. 5653 crore; the implementation of another 184 (13.5
percent) of the proposals is in progress. For the remaining 72.6 percent of the proposals, the
implementation work is in initial stages only.
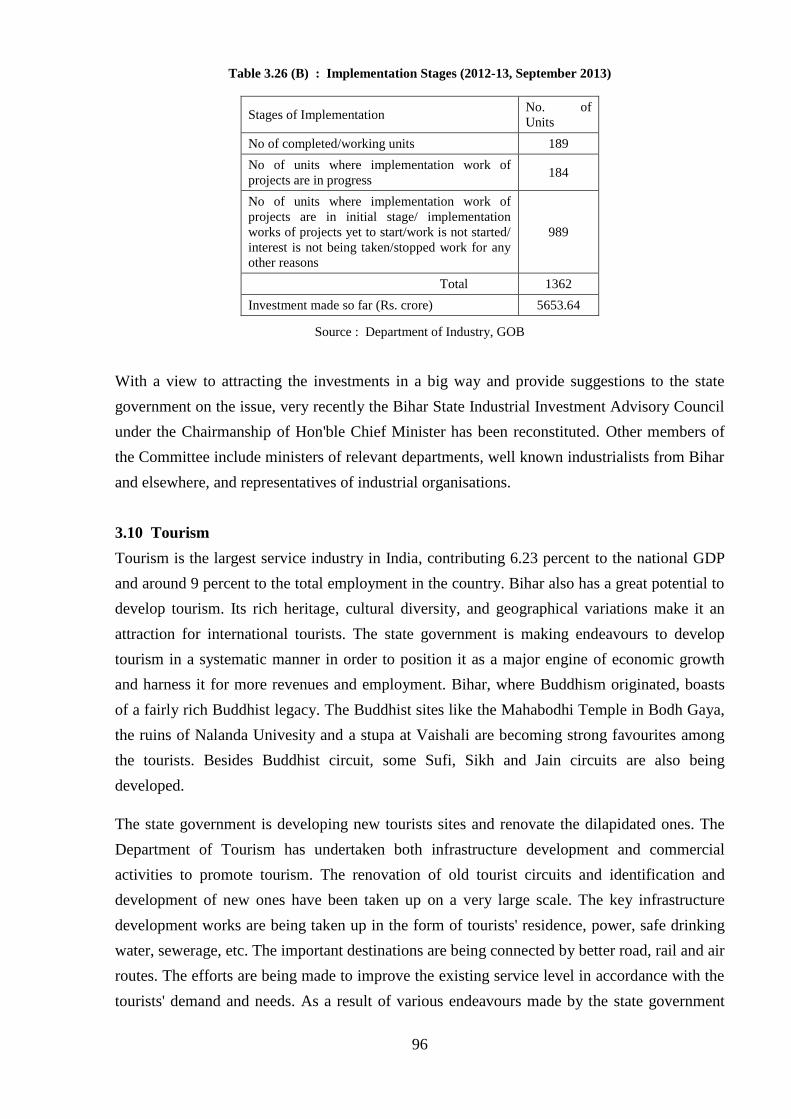
96
Table 3.26 (B) : Implementation Stages (2012-13, September 2013)
Stages of Implementation No. of
Units
No of completed/working units 189
No of units where implementation work of
projects are in progress 184
No of units where implementation work of
projects are in initial stage/ implementation
works of projects yet to start/work is not started/
interest is not being taken/stopped work for any
other reasons
989
Total 1362
Investment made so far (Rs. crore) 5653.64
Source : Department of Industry, GOB
With a view to attracting the investments in a big way and provide suggestions to the state
government on the issue, very recently the Bihar State Industrial Investment Advisory Council
under the Chairmanship of Hon'ble Chief Minister has been reconstituted. Other members of
the Committee include ministers of relevant departments, well known industrialists from Bihar
and elsewhere, and representatives of industrial organisations.
3.10 Tourism
Tourism is the largest service industry in India, contributing 6.23 percent to the national GDP
and around 9 percent to the total employment in the country. Bihar also has a great potential to
develop tourism. Its rich heritage, cultural diversity, and geographical variations make it an
attraction for international tourists. The state government is making endeavours to develop
tourism in a systematic manner in order to position it as a major engine of economic growth
and harness it for more revenues and employment. Bihar, where Buddhism originated, boasts
of a fairly rich Buddhist legacy. The Buddhist sites like the Mahabodhi Temple in Bodh Gaya,
the ruins of Nalanda Univesity and a stupa at Vaishali are becoming strong favourites among
the tourists. Besides Buddhist circuit, some Sufi, Sikh and Jain circuits are also being
developed.
The state government is developing new tourists sites and renovate the dilapidated ones. The
Department of Tourism has undertaken both infrastructure development and commercial
activities to promote tourism. The renovation of old tourist circuits and identification and
development of new ones have been taken up on a very large scale. The key infrastructure
development works are being taken up in the form of tourists' residence, power, safe drinking
water, sewerage, etc. The important destinations are being connected by better road, rail and air
routes. The efforts are being made to improve the existing service level in accordance with the
tourists' demand and needs. As a result of various endeavours made by the state government
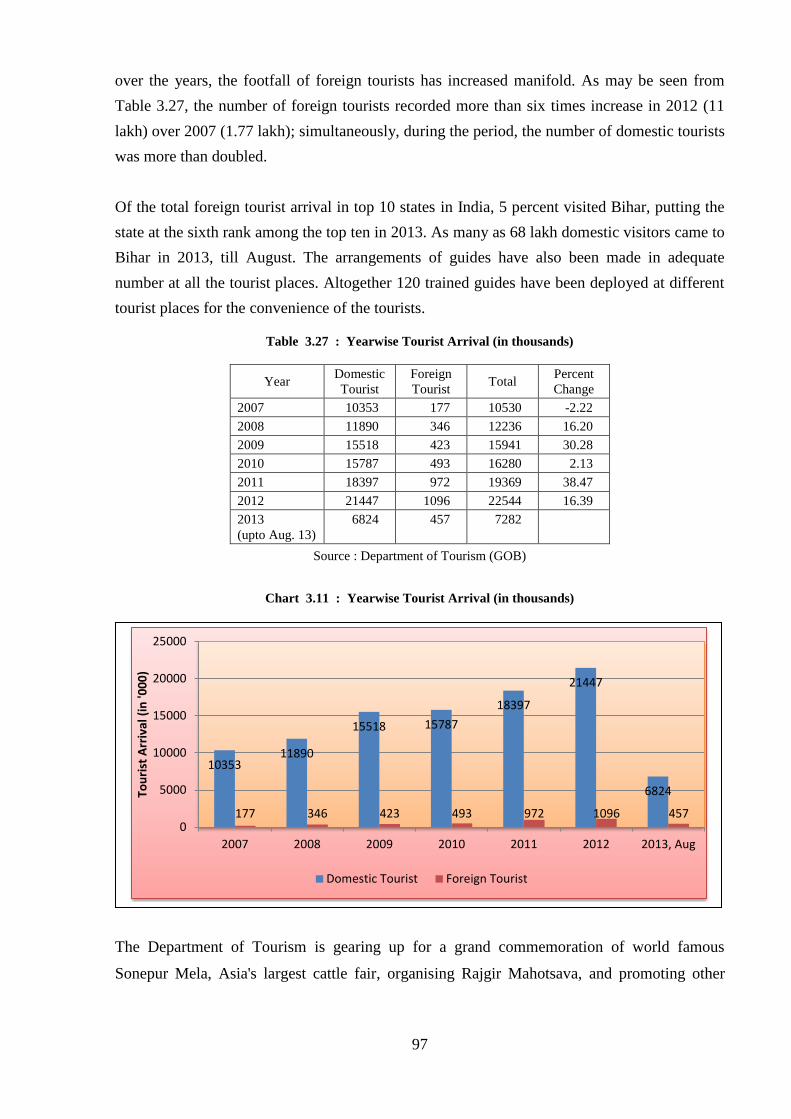
97
over the years, the footfall of foreign tourists has increased manifold. As may be seen from
Table 3.27, the number of foreign tourists recorded more than six times increase in 2012 (11
lakh) over 2007 (1.77 lakh); simultaneously, during the period, the number of domestic tourists
was more than doubled.
Of the total foreign tourist arrival in top 10 states in India, 5 percent visited Bihar, putting the
state at the sixth rank among the top ten in 2013. As many as 68 lakh domestic visitors came to
Bihar in 2013, till August. The arrangements of guides have also been made in adequate
number at all the tourist places. Altogether 120 trained guides have been deployed at different
tourist places for the convenience of the tourists.
Table 3.27 : Yearwise Tourist Arrival (in thousands)
Year Domestic
Tourist
Foreign
Tourist Total
Percent
Change
2007 10353 177 10530 -2.22
2008 11890 346 12236 16.20
2009 15518 423 15941 30.28
2010 15787 493 16280 2.13
2011 18397 972 19369 38.47
2012 21447 1096 22544 16.39
2013
(upto Aug. 13)
6824 457 7282
Source : Department of Tourism (GOB)
Chart 3.11 : Yearwise Tourist Arrival (in thousands)
The Department of Tourism is gearing up for a grand commemoration of world famous
Sonepur Mela, Asia's largest cattle fair, organising Rajgir Mahotsava, and promoting other
10353 11890
15518 15787
18397
21447
6824
177 346 423 493 972 1096 457 0
5000
10000
15000
20000
25000
2007 2008 2009 2010 2011 2012 2013, Aug
Tou
rist
Arr
ival
(in
'00
0)
Domestic Tourist Foreign Tourist

98
shortlisted Melas and festivals. It has also planned every aspect of the International Trade Fair,
2013, organised in New Delhi.
In order to attract more foreign tourists, the Department of Tourism has an ambitious plan to
develop one hotel in Patna and three others at Gaya, Muzaffarpur and Rajgir into four star
enterprises. The lands are also being acquired for more hotels in the state. The Department also
plans to develop water, health and rural tourism in the state and altogether 66 projects worth
Rs. 12.5 crore are awaiting the Departments' clearance. The Bihar State Tourism Development
Corporation is the government undertaking responsible for the commercial activities and
infrastructure development for promoting tourism in the state. It also runs various hotels and
provides transportation facilities along with devising a variety of tour package for different
destinations to attract tourists to Bihar.
The Department of Tourism has utilised almost the whole of its total budget in all the recent
years. For example, in 2012-13, against an approved budget of Rs. 10006.66 lakh, a sum of Rs.
9930.54 lakh was utilised, with utilisation percentage working out to almost 100 percent.
Table 3.28 : Details of Budget and Expenditure of Tourism Department
(Rs. in lakh)
Sl.
No. Year
Approved
Budget Expenditure % Share
1 2007-08 2679.42 2673.54 99.78
2 2008-09 2513.02 2512.78 99.99
3 2009-10 2978.00 2978.00 100.00
4 2010-11 2975.18 2954.81 99.31
5 2011-12 3043.89 2994.08 98.36
6 2012-13 10006.66 9930.54 99.24
7 2013-14
to Sep' 13
14308.42 4810.00 33.62
Source : Department of Tourism (GOB)
3.11 Challenges and Prospects
Despite positive turnaround in the recent years, Bihar cannot be considered as a developed
state in the country owing to poor industrialization in the state. Normally, the factors leading to
industrial growth in any state are investments, human resource and quality infrastructure. The
state government is making constant endeavours to make improvements in these sectors.
However, investors do not come forward mainly on account of non-availability of land and
poor banking services to industry, particularly micro, small and medium enterprises. Around
92 percent of entrepreneurs, falling under micro, small and medium scale industries, are not
99
taking benefits from the banking service. The main reason for this state of affairs is the lack of
awareness about the specific schemes of banks. The banking professionals, both from the
public and private sectors, should come forward to help MSMEs in promoting industrialisation
of the state.
Moving to tea industry in the state, there are only seven processing plants in Kishanganj,
although, there is a need for 50 such plants. Due to inadequacy of processing plants in the area,
a majority of growers have to ferry their green leaves to neighbouring north Bengal. Again, the
area in and around Kishanganj district does not figure prominently on the tea map of the
country. Besides, there has not been any tea policy and there are no incentives like subsidy,
etc. Loans are also not available to growers and irrigation remains a major concern. However,
the state government is working on tea policy and would soon come out with it.
The challenge before the state government is to instil a sense of confidence among the
investors to invest in the state. The state government has already indentified the problems and
made required moves to promote the industrialization process in the state. Towards this, some
key infrastructures like roads, power, skill development training, etc. have been started on a
massive scale. For skill development training, the National Institute of Entrepreneurship and
Small Business Development (NIESBUD), an autonomous institute under the Union Ministry
of MSME, is going to set up soon modern vocational skill development centres in all the
districts of Bihar. To begin with, such centres would be set up in 14 districts and the remaining
districts will be covered later. At such centres, the different trades to students will be allotted
based on their aptitude tests. The state government has also started a dialogue with the central
government to remove the bottlenecks in power sector. Besides, the state government has
adopted attractive industrial policies, under which several measures have been taken to
promote industrial infrastructure like better roads, improved power situation and provision of
water and drainage system. The big business houses have already started investing in the state
for creating industrial ambience in the state, but more investments are required for faster
growth of industrial sector. The state has thrown open many opportunities for the entrepreneurs
in various sectors like manufacturing, food processing, tourism, dairy, IT, sugar, tea, and other
sectors. The agro-based industries would be a great success in the state because of its
agriculture-based economy.
The present state government is removing all misconceptions about Bihar and working as a
catalyst to promote industrialisation. The constitution of Bihar State Industrial Investment
Advisory Council, with big industrialists as its members, will help the state in successfully
attracting the investors and big investments.
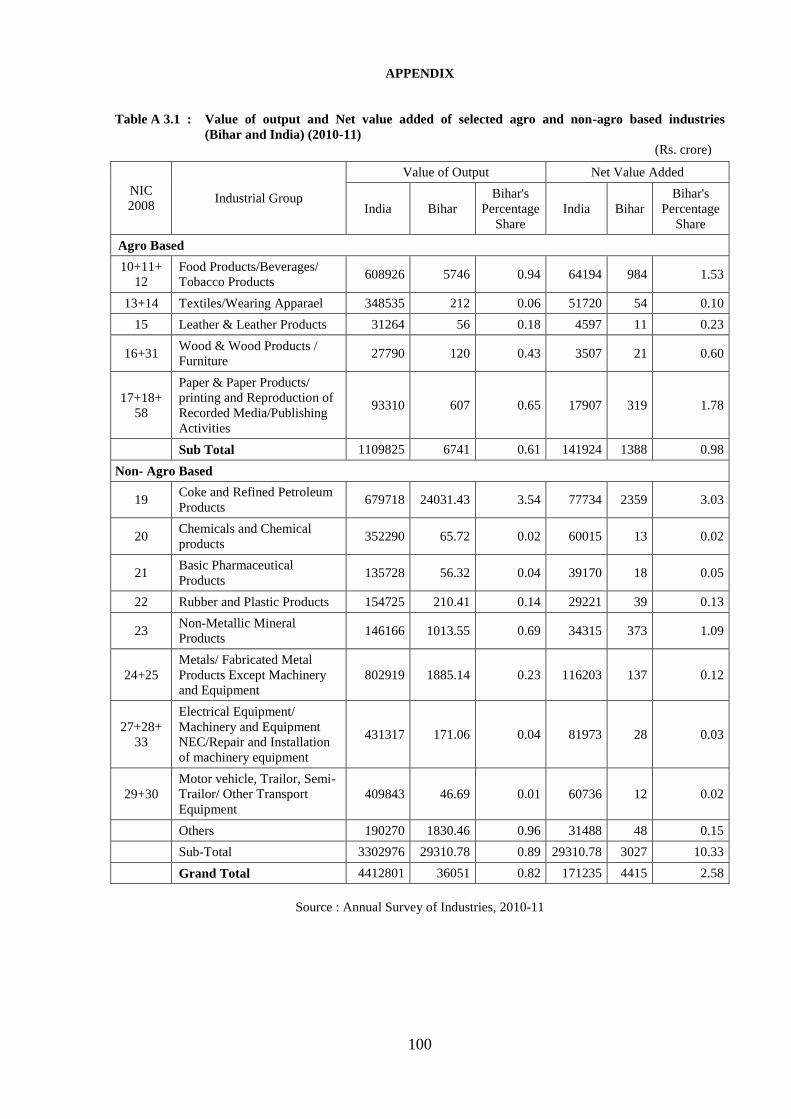
100
APPENDIX
Table A 3.1 : Value of output and Net value added of selected agro and non-agro based industries
(Bihar and India) (2010-11)
(Rs. crore)
NIC
2008 Industrial Group
Value of Output Net Value Added
India Bihar
Bihar's
Percentage
Share
India Bihar
Bihar's
Percentage
Share
Agro Based
10+11+
12
Food Products/Beverages/
Tobacco Products 608926 5746 0.94 64194 984 1.53
13+14 Textiles/Wearing Apparael 348535 212 0.06 51720 54 0.10
15 Leather & Leather Products 31264 56 0.18 4597 11 0.23
16+31 Wood & Wood Products /
Furniture 27790 120 0.43 3507 21 0.60
17+18+
58
Paper & Paper Products/
printing and Reproduction of
Recorded Media/Publishing
Activities
93310 607 0.65 17907 319 1.78
Sub Total 1109825 6741 0.61 141924 1388 0.98
Non- Agro Based
19 Coke and Refined Petroleum
Products 679718 24031.43 3.54 77734 2359 3.03
20 Chemicals and Chemical
products 352290 65.72 0.02 60015 13 0.02
21 Basic Pharmaceutical
Products 135728 56.32 0.04 39170 18 0.05
22 Rubber and Plastic Products 154725 210.41 0.14 29221 39 0.13
23 Non-Metallic Mineral
Products 146166 1013.55 0.69 34315 373 1.09
24+25
Metals/ Fabricated Metal
Products Except Machinery
and Equipment
802919 1885.14 0.23 116203 137 0.12
27+28+
33
Electrical Equipment/
Machinery and Equipment
NEC/Repair and Installation
of machinery equipment
431317 171.06 0.04 81973 28 0.03
29+30
Motor vehicle, Trailor, Semi-
Trailor/ Other Transport
Equipment
409843 46.69 0.01 60736 12 0.02
Others 190270 1830.46 0.96 31488 48 0.15
Sub-Total 3302976 29310.78 0.89 29310.78 3027 10.33
Grand Total 4412801 36051 0.82 171235 4415 2.58
Source : Annual Survey of Industries, 2010-11
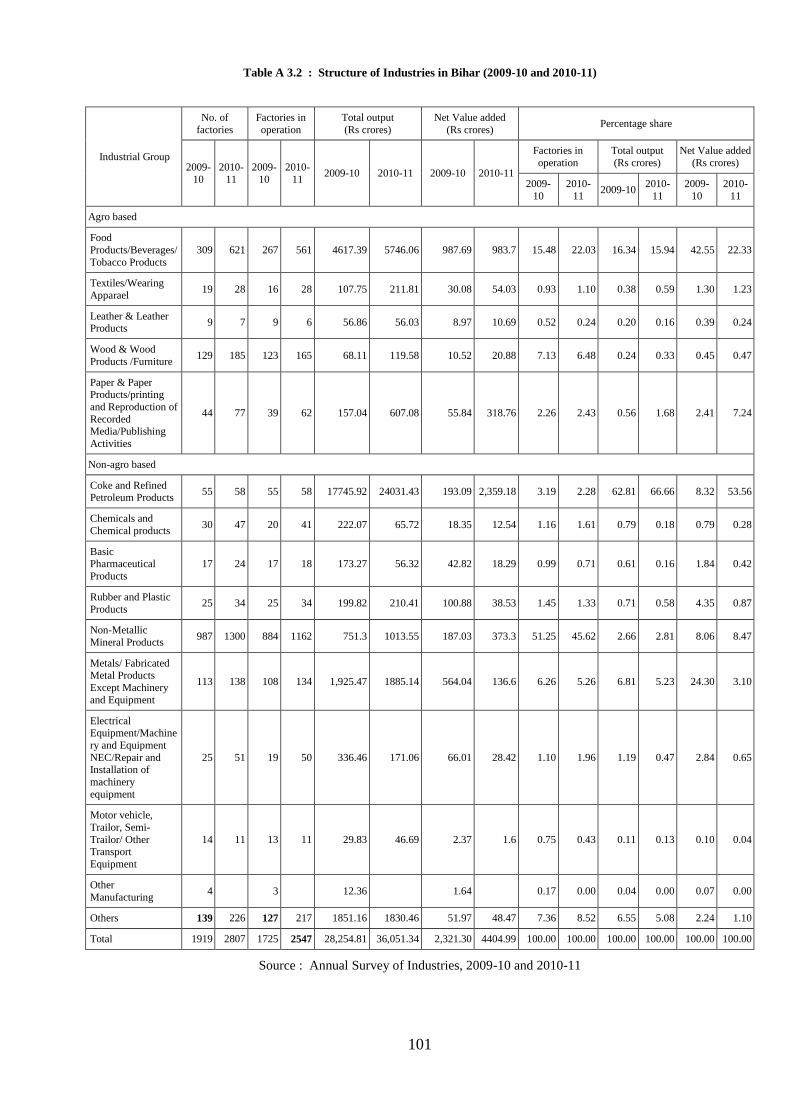
101
Table A 3.2 : Structure of Industries in Bihar (2009-10 and 2010-11)
Industrial Group
No. of
factories
Factories in
operation
Total output
(Rs crores)
Net Value added
(Rs crores) Percentage share
2009-
10
2010-
11
2009-
10
2010-
11 2009-10 2010-11 2009-10 2010-11
Factories in
operation
Total output
(Rs crores)
Net Value added
(Rs crores)
2009-
10
2010-
11 2009-10
2010-
11
2009-
10
2010-
11
Agro based
Food
Products/Beverages/
Tobacco Products
309 621 267 561 4617.39 5746.06 987.69 983.7 15.48 22.03 16.34 15.94 42.55 22.33
Textiles/Wearing
Apparael 19 28 16 28 107.75 211.81 30.08 54.03 0.93 1.10 0.38 0.59 1.30 1.23
Leather & Leather Products
9 7 9 6 56.86 56.03 8.97 10.69 0.52 0.24 0.20 0.16 0.39 0.24
Wood & Wood
Products /Furniture 129 185 123 165 68.11 119.58 10.52 20.88 7.13 6.48 0.24 0.33 0.45 0.47
Paper & Paper Products/printing
and Reproduction of
Recorded Media/Publishing
Activities
44 77 39 62 157.04 607.08 55.84 318.76 2.26 2.43 0.56 1.68 2.41 7.24
Non-agro based
Coke and Refined Petroleum Products
55 58 55 58 17745.92 24031.43 193.09 2,359.18 3.19 2.28 62.81 66.66 8.32 53.56
Chemicals and
Chemical products 30 47 20 41 222.07 65.72 18.35 12.54 1.16 1.61 0.79 0.18 0.79 0.28
Basic Pharmaceutical
Products
17 24 17 18 173.27 56.32 42.82 18.29 0.99 0.71 0.61 0.16 1.84 0.42
Rubber and Plastic
Products 25 34 25 34 199.82 210.41 100.88 38.53 1.45 1.33 0.71 0.58 4.35 0.87
Non-Metallic
Mineral Products 987 1300 884 1162 751.3 1013.55 187.03 373.3 51.25 45.62 2.66 2.81 8.06 8.47
Metals/ Fabricated Metal Products
Except Machinery
and Equipment
113 138 108 134 1,925.47 1885.14 564.04 136.6 6.26 5.26 6.81 5.23 24.30 3.10
Electrical Equipment/Machine
ry and Equipment
NEC/Repair and Installation of
machinery
equipment
25 51 19 50 336.46 171.06 66.01 28.42 1.10 1.96 1.19 0.47 2.84 0.65
Motor vehicle,
Trailor, Semi-
Trailor/ Other Transport
Equipment
14 11 13 11 29.83 46.69 2.37 1.6 0.75 0.43 0.11 0.13 0.10 0.04
Other
Manufacturing 4 3 12.36 1.64 0.17 0.00 0.04 0.00 0.07 0.00
Others 139 226 127 217 1851.16 1830.46 51.97 48.47 7.36 8.52 6.55 5.08 2.24 1.10
Total 1919 2807 1725 2547 28,254.81 36,051.34 2,321.30 4404.99 100.00 100.00 100.00 100.00 100.00 100.00
Source : Annual Survey of Industries, 2009-10 and 2010-11

102
Table A 3.3 : Social Category-wise Achievement of Micro, Small and Medium Enterprises in 2012-13
Category
Divisions
Total
Invest-
ment/
Empl-
oyment per unit Items Patna Munger Bhagalpur Purnea Magadh Darbhanga Koshi Tirhut Saran
Total
(No.)
Micro 915 390 215 332 466 362 284 454 263 3681
Small 33 3 0 1 7 0 0 8 1 53
Medium 3 0 0 0 0 0 0 0 0 3
Total 951 393 215 333 473 362 284 462 264 3737
Investment
(in Rs. lakhs) 17091.60 2522.21 4 341.16 9917.49 492.18 188.55 828.24 1874.6 33260.03 6.44
Employment 4503 1660 15 696 2064 414 337 581 1294 12124 3.08
General
(No.)
Micro 894 322 215 289 397 359 276 454 212 3418
Small 33 3 0 1 7 0 0 8 1 53
Medium 3 0 0 0 0 0 0 0 0 3
Total 930 325 215 290 404 359 276 462 213 3474
Investment
(in Rs. lakhs) 7982.89 2466.07 4 310.93 4323.51 489.83 179.35 828.24 1615.3 18200.12 5.24
Employment 4388 1483 15 553 1772 408 320 581 1081 10601 3.05
SC/ST
(No.)
Micro 6 59 0 2 31 3 3 0 17 121
Small 0 0 0 0 0 0 0 0 0 0
Medium 0 0 0 0 0 0 0 0 0 0
Total 6 59 0 2 31 3 3 0 17 121
Investment
(in Rs. lakhs) 1.23 25.73 0 1.18 61.29 2.35 1.2 0 44.63 137.61 1.14
Employment 20 101 0 6 92 6 6 0 58 289 2.39
Minorit
y (No.)
Micro 15 9 0 41 38 0 5 0 34 142
Small 0 15 0 0 1 0 0 0 0 16
Medium 0 0 0 0 0 0 0 0 0 0
Total 15 24 0 41 39 0 5 0 34 158
Investment
(in Rs. lakhs) 20.67 30.41 0 29.05 5532.69 0 8 0 214.67 5835.49 36.93
Employment 95 76 0 137 200 0 11 0 155 674 4.27
Source : Department of Industry, GOB

103
Table A3.4 : Types of Minerals Available in Bihar
District Availability of Minerals
Bhagalpur Red Soil, Brick, Sand, Stone, Mica
Banka Granite, Galena, Brick, Sand, Stone, Mica
Munger Quartzite, Bauxite, Asbestos, Slate, China clay
Jamui
Gold, Magnetite, Soapstone, Quarzite, brick,
Stone, Mineral Water, Sand
Lakhisarai Quartzite, Sand,Brick
Sheikhpura Stone,Brick, Moram
Rohtas
Limestone, Sandstone, Sail, Pyrite, Brick,
Stone, Sand
Kaimur Brick, Stone, Sand
Gaya Brick, Stone, Sand, Magnetite,Moram
Aurangabad Brick, Stone, Sand, Moram
Jehanabad/ Arwal Brick, Sand
Patna Brick, Sand
Bhojpur Brick, Sand
Nalanda Quartzite, Brick, Stone, Sand
Nawada Mica, Beryl, Brick, Sand, Stone
Siwan Brick
Saran Brick, Sand
Gopalganj Brick
Betiah Brick, Stone, Sand, Petroleum
Motihari Brick, Gold
Muzaffarpur Brick, Sand
Vaishali Brick, Sand
Darbhanga Brick, Sand
Madhubani Brick
Samastipur Brick, Sand
Sitamarhi Brick
Begusarai Brick
Khagaria Brick
Purnea Brick, Sand, Petroleum
Katihar Brick
Saharsa,Supaul Brick, Sand, Petroleum
Madhepura Brick, Sand
Source : Department of Mines and Geology, GOB
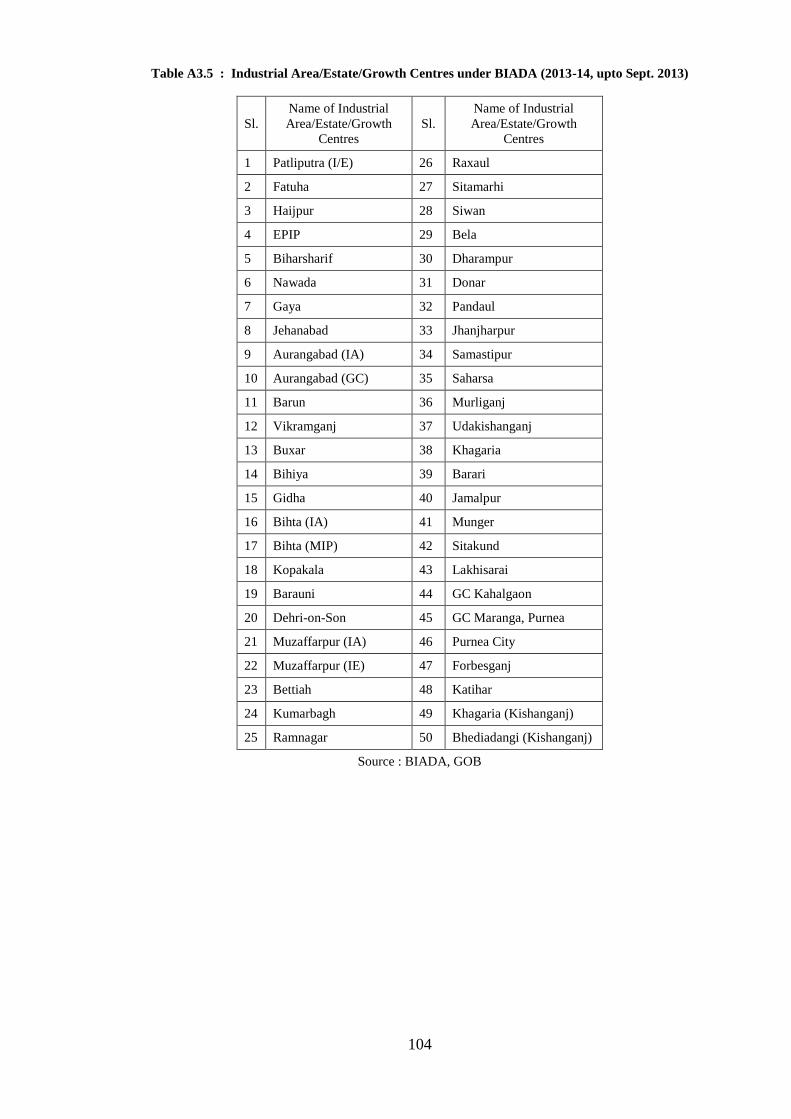
104
Table A3.5 : Industrial Area/Estate/Growth Centres under BIADA (2013-14, upto Sept. 2013)
Sl.
Name of Industrial
Area/Estate/Growth
Centres
Sl.
Name of Industrial
Area/Estate/Growth
Centres
1 Patliputra (I/E) 26 Raxaul
2 Fatuha 27 Sitamarhi
3 Haijpur 28 Siwan
4 EPIP 29 Bela
5 Biharsharif 30 Dharampur
6 Nawada 31 Donar
7 Gaya 32 Pandaul
8 Jehanabad 33 Jhanjharpur
9 Aurangabad (IA) 34 Samastipur
10 Aurangabad (GC) 35 Saharsa
11 Barun 36 Murliganj
12 Vikramganj 37 Udakishanganj
13 Buxar 38 Khagaria
14 Bihiya 39 Barari
15 Gidha 40 Jamalpur
16 Bihta (IA) 41 Munger
17 Bihta (MIP) 42 Sitakund
18 Kopakala 43 Lakhisarai
19 Barauni 44 GC Kahalgaon
20 Dehri-on-Son 45 GC Maranga, Purnea
21 Muzaffarpur (IA) 46 Purnea City
22 Muzaffarpur (IE) 47 Forbesganj
23 Bettiah 48 Katihar
24 Kumarbagh 49 Khagaria (Kishanganj)
25 Ramnagar 50 Bhediadangi (Kishanganj)
Source : BIADA, GOB

105
Table A3.6 : Plan Outlay for Information Technology Department
Sl.
No. Name of Project
Outlay (Rs. lakh)
2012-13 2013-14
1. Common Service Centre 900.00 600.00
2. SC sub-Plan for CSC 131.00 100.00
3. Chief Minister's Public Grievances 64.56 200.00
4. D.P.R. Preparation 300.00 300.00
5. e-Purchase 100.00 100.00
6. State Portal 200.00 200.00
7. Knowledge City 2500.00 2500.00
8. Capacity Building 380.00 380.00
9. SC sub-Plan for Capacity Building 120.00 2358.92
10. State Data Centre 772.00 1900.00
11. SC sub-Plan for State Data Centre 120.00 196.00
12. e-Governance State Plan 6500.00 4761.08
13. SC sub-Plan for e-Governance State Plan 500.00 307.08
14. e-District Plan 100.00 100.00
15. Sec.LAN 2000.00 1500.00
16. Modernization of I.T. Building 370.00 300.00
17. SWAN 4500.00 4000.00
18. SC sub-Plan for SWAN 200.00 100.00
Total ` 19757.56 19903.08
Source: Department of IT, GOB
_______________
106
CHAPTER IV
INFRASTRUCTURE AND COMMUNICATIONS
Infrastructure and communications play a strategic role in the growth of any economy.
Keeping its importance in view, the Twelfth Plan lays great emphasis on the development of
the infrastructure sector. Not only the availability of infrastructure, but its quality is equally
important in achieving a sustained and inclusive growth. The opening of infrastructure sector
for private sector has increased its participation in such projects from 22 percent in the Tenth
Plan to 38 percent in the Eleventh Plan, and it is expected to rise further to 48 percent during
the Twelfth Plan period. In infrastructural investment, it is extremely important to avoid time
overruns, since delays in completion escalate the cost and widen the availability gap. Equally
important is their regular maintenance, in the absence of which the projects run into disuse
much before their expected life.
4.1 Roads
The roads are important basic infrastructure, playing a crucial role in development of other
essential infrastructure in a region. For this, not only the trunk roads are needed, but equally
important is the wide network of arteries for better connectivity to take the developmental
activities to the remote areas. The state government has taken up the construction of roads and
bridges on a large scale in keeping with its resolution of connecting the state capital with the
remotest area so as to cover the distance within a maximum time of 6 hours. Besides, with a
view to ensuring better maintenance of roads in the state, a Bihar Road Resource Protection
Policy has been prepared in 2013-14. However, despite all these endeavours, the state
continues to remain much behind the all-India average in terms of road length both per lakh of
population and per 100 sq. kms. Against a road length of 347.05 kms per lakh of population at
all-India level in 2011-12, Bihar presented a very dismal picture with only 108.60 kms. Even
the road length per 100 sq. kms. was much less in Bihar (119.72 kms.), compared to all India
(127.76 kms.). In 2012-13, Bihar with 174.88 kms. of road length per lakh population lagged
much behind the all-India (387.53 kms) average as before; but, in terms of road length per 100
sq.km., it by-passed all-India (142.67 kms) with a record achievement of 192.78 kms. As is
discerned from the Table 4.1, in 2012-13, Bihar recorded a big jump by over 73 kms. over the
previous year, as against only 15 kms. at the all-India level.

107
Table 4.1 : Average Length of Road in Bihar and India (2011-12 and 2012-13)
Year
Road Length
per lakh population (Kms.)
Road Length
per 100 sq. kms.
Bihar India Bihar India
2011-12 108.60 347.05 119.72 127.76
2012-13 174.88 387.53 192.78 142.67
Source : Department of Road Construction, GOB
During the period October, 2012 and September, 2013, there has been an increase of 466.33
kms. in the length of National Highway (NH) in the state, registering an increase of 12.5
percent. However, the State Highways registered a decline in road length of about 374 kms.
during the period, indicating that this much length of SH has been upgraded as NH during the
year. The Major District Roads (MDR), registered an increase of 4.64 percent over the last
year, and the length of rural roads increased by around 32.5 percent (Table 4.2).
Table 4.2 : Length of Roads in Bihar in 2011-12 and 2012-13
Category
Road Length (km.)
September 2012 September 2013
Increase/
Decrease over
the year
National Highway (NH) 3734.38 4200.71 466.33
State Highway (SH) 4857.00 4483.19 -373.81
Major District Roads (MDR) 9030.59 9449.36 418.77
Rural Roads(RR) 122598.00 162407.15 39809.15
Total 140219.97 180540.41 40320.44
Source : Departments of Road Construction & Rural Works, GOB

108
Chart 4.1 : Length of Roads in Bihar (2012-13)
The highways and roads in the state are constructed under different categories, based on width.
As may be observed from Table 4.3, while National Highways (NH) and State Highways (SH)
reportedly has the higher proportion in double lane category of 7.00 meter width, the Major
District Roads mostly consist of single lane category (3.75 m. width). The districtwise road
network in Bihar is given in Table A4.1 (Appendix).
Table 4. 3 : Status of Highways in Bihar (upto September 2013)
Category of Highways
National Highways State Highways Major District Road
Length
(Km)
Percentage
share
Length
(Km)
Percentage
share
Length
(Km)
Percentage
share
Single Lane (3.75m. Width) 604.71 14.40 988.88 22.06 4758.24 50.36
Intermediate Lane (5.50m. Width) 847.39 20.17 679.59 15.16 3258.92 34.49
Double Lane (7.00m. Width) 1587.65 37.79 2770.74 61.80 1248.03 13.21
More than 7.00m. Width 1136.46 27.05 43.98 0.98 184.17 1.95
Missing Link 24.5 0.58
Total 4200.71 4483.19 9449.359
Source : Department of Road Construction, GOB
2% 3%
6%
89%
National Highway (NH) State Highway (SH)
Major District Roads (MDR) Rural Roads(RR)

109
National Highways (NH)
The National Highways connect the state with other states and hence assume great importance
for its development. There were in all 28 National Highways in the state upto September 2012;
with the addition of 4 more highways during the year, their number has now become 32,
measuring a total length of 4200.71 kms. The National Highways are constructed under
various categories, comprising of single, double, or multiple lanes, depending on the width of
roads ranging from 3.75 m. to more than 7.00 m. During October, 2012 to September 2013,
though the share of intermediate lane (5.50 m.) and double lane (7.00 m.) to the total NH
length decreased, it showed an increase by around 6 percent in the share of NH with a width of
more than 7 m.
The length of National Highways in Bihar is quite inadequate in view of its strategic location,
bordering Nepal. Efforts are underway to increase the existing length. Under Phase I to VI, the
works have been taken up for four lanning/six lanning of National Highways in Bihar, of
which Golden Quadrilateral Project of 205.70 kms. is complete and the remaining are in
progress (Table 4.4).
Table 4.4 : Status of Upgradation of NH into four/six Lanning in Bihar
Phase Project Length (kms.) Remarks
I Golden Quadrilateral 205.70 Completed
II East-West Corridor 488.00 438 kms. Completed
III NHD Project 1012.88 In Progress
IV NHD Project 468.00 Work Allotted/Tendering Process
V NHD Project Bordering
U.P./Jharkhand
120.00
85.00
In progress
Tendering Process
VI NHD Project Patna Ring Road NHAI Preparing DPR
Source : Department of Road Construction, GOB
During the period 2006-07 to 2012-13, against the sanction limit by the state government, the
yearly amount approved for road construction by the Ministry of Road Transport and
Highways (MoRTH), the expenditure incurred and physical achievements against the approved
amount are given in the Table 4.5.

110
Table 4.5 : Status of Sanction Limit and Approved Amount for Road Construction by the Centre
(Rs. crore)
Year Sanction
Limit
Amount
Approved by
Ministry
Expenditure
Physical
Progress
(kms.)
2006-07 243.00 112.29 120.77 337.00
2007-08 239.00 174.72 95.99 191.00
2008-09 316.00 276.07 104.23 216.00
2009-10 284.81 201.58 268.43 378.17
2010-11 109.00 86.97 288.87 383.35
2011-12 0.00 0.00 226.03 186.29
2012-13 427.51 267.34 74.07 28.00
Total 1619.32 1118.97 1178.39 1719.81
Source : Department of Road Construction, GOB
State Highway
The total length of State Highways (SH) in Bihar is 4483.19 kms., as on September, 2013. The
State Highways have around 62 percent of double lane roads, 22 percent of single lane and 15
percent of intermediate lane roads. The four lane roads with width of 14 meters constitute a
very negligible proportion (0.98 percent) of the total road length under State Highways.
State Highways under Rashtriya Sam Vikas Yojana (RSVY)
The state government has initiated an ambitious programme to develop the total length of State
Highways to 2-lane standard under State Highways Development Programme (SHDP), with
funding from Rashtriya Sam Vikas Yojana (RSVY). Accordingly, the upgradation work on
2045 kms. of State Highways was taken up under RSVY through a tripartite agreement signed
in 2005 with the Central Public Works Department (CPWD) and M/s IRCON International
(Table 4.6). The CPWD and IRCON were assigned 1715 kms. and 330 kms. of road lengths
respectively. Out of 37 districts in which the works were located, the works in 4 districts
(Vaishali, Samastipur, Darbhanga and Madhubani) were assigned to IRCON and in the
remaining 30 districts to CPWD. The CPWD has completed the work on 1715 kms. and
IRCON has completed 330 kms. of State Highways (Table A4.2 Appendix).

111
Table 4.6 : Updated Progress of SH by different Agencies
Agencies
Total
Approved
Length
(kms.)
No. of
Packages
Revised
Administrat
ive
Approved
Fund
(Rs. crore)
Released
Fund
(Rs. crore)
Physical
Progress
(Kms.)
IRCON 330.00 17 888.79 880.03 329.57
CPWD 1715.00 35 2727.89 2716.95 1705.00
Total 2045.00 52 3616.68 3596.98 2034.57
Source: Department of Road Construction, GoB
Further, upgradation of two State Highways (44.4 kms of SH 79 and 24 kms of SH 104) with a
total length of 68.4 kms. is being executed by CPWD and IRCON from the savings and
interest accrued on deposits.
Bihar State Highways Projects (BSHP)
The state government has declared 2581.42 kms. of road of State Highways for their
upgradation to 2-lane standard under Bihar State Highways Project (BSHP) and the Asian
Development Bank (ADB) has in principle agreed to provide loans for the same.
Under BSHP Phase-I, upgradation of 820 kms. of State Highways was taken up at a cost of Rs.
1654.69 crore and the work was started in 2008. Of this, 658 kms. have been completed, and
the remaining length is likely to be completed in 2013-14. The loan share for the project is 90
percent of the project cost, with remaining 10 percent to be borne by the state government. The
total loan amount is US$420 million (Rs. 2600 crore). Under Phase-II of BSHP, the
upgradation of 386.67 kms. of State Highways was taken up at a total cost of Rs. 1814.73
crore. The work is in progress and is likely to be completed by June, 2015. Out of the total cost
of the project, 70 percent is to be met from ADB loan and the remaining 30 percent to be borne
by the state government. The total loan amount is US$300 million (Rs. 1860 crore).
Under Phase-II (Additional Financing) of BSHP, upgradation of 254.51 kms. of State
Highways has been taken up at a total cost of Rs. 1658.69 crore. The tenders have been
awarded and work is likely to commence soon. Out of the total cost of the project, 80 percent is
to be met from ADB loan, and the remaining 20 percent will be borne by the state government.
The total loan is of the order of US$300 million (Rs. 1860 crore).

112
Major District Roads (MDR)
The Major District Roads in the state are 9449.36 kms. in length, with varying widths.
However, in view of the inadequacy of width (3.05-3.50 m.) of a majority of MDRs in the state
and their incapacity to cope with the increasing traffic intensity, the state government is
making endeavours to upgrade these roads to a minimum intermediate lane standard with a
width of 5.50 meters. The upgradation work will be taken up, subject to the availability of
funds; in case such upgradation is not possible, their surface is planned to be renewed. In
addition to various on-going projects, in 2013, a sum of Rs. 959.136 crore has been approved
for renewal/widening of 1135 kms. of roads under plan head; and another Rs. 357.55 crore
under non plan head for similar work in 964 kms. of roads.
Normally, the funds for the work are made available under state-plan, NABARD (RIDF),
Central Road Fund, Indo-Nepal Border Parallel Road Development Programme and funds for
economic importance as recommended by the Thirteenth Finance Commission. The length of
MDRs constructed from 2006-07 to 2013-14 is presented graphically in Chart 4.2.
Chart 4.2 : Roads constructed under Major District Roads
For the year 2013-14, there is a target to complete 1100 kms. of roads. Besides, there is also a
target to complete 150 kms. of roads in the Scheduled Castes dominated areas, for which there
is a separate budget provision of Rs. 263.714 crore in 2013-14.
210.0
1212.0
1983.0 1870.0
1410.0 1293.2
1156.8 1296.9
0
500
1000
1500
2000
2500
2006-0
7
2007-0
8
20
08-0
9
2009-1
0
2010-1
1
2011-1
2
2012-1
3
2013-1
4,
Sep
t.2013
Road
Len
gth
( K
ms)
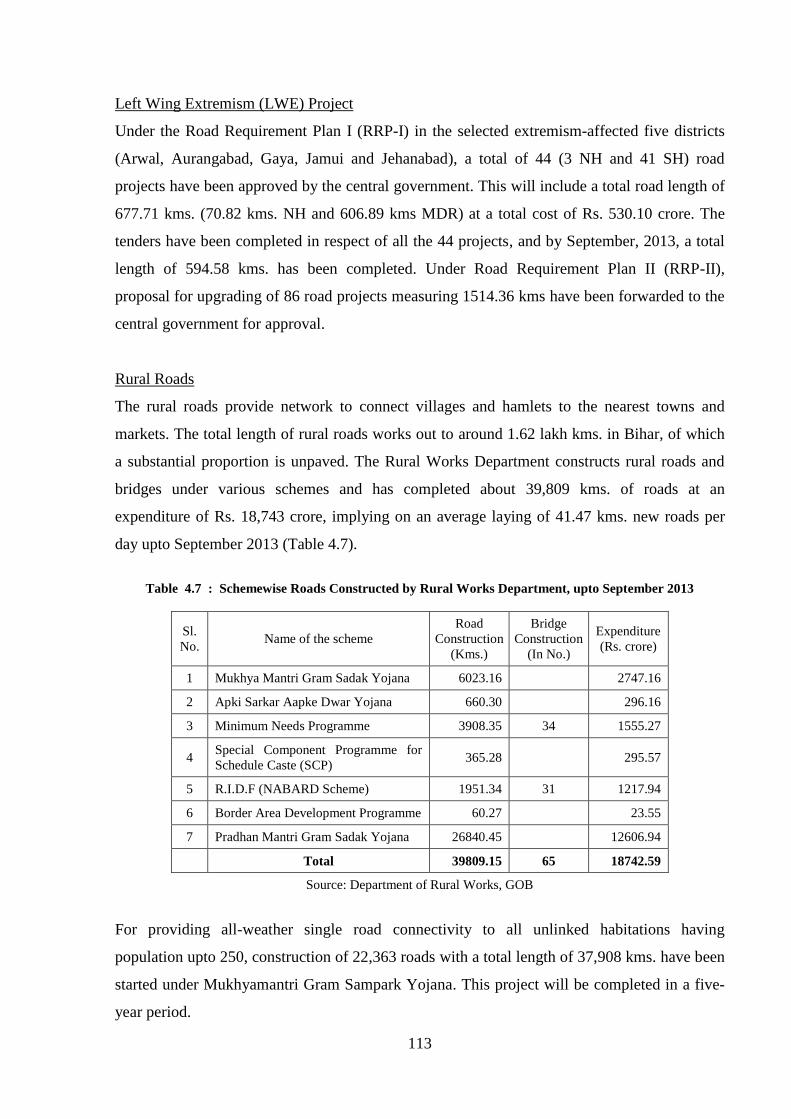
113
Left Wing Extremism (LWE) Project
Under the Road Requirement Plan I (RRP-I) in the selected extremism-affected five districts
(Arwal, Aurangabad, Gaya, Jamui and Jehanabad), a total of 44 (3 NH and 41 SH) road
projects have been approved by the central government. This will include a total road length of
677.71 kms. (70.82 kms. NH and 606.89 kms MDR) at a total cost of Rs. 530.10 crore. The
tenders have been completed in respect of all the 44 projects, and by September, 2013, a total
length of 594.58 kms. has been completed. Under Road Requirement Plan II (RRP-II),
proposal for upgrading of 86 road projects measuring 1514.36 kms have been forwarded to the
central government for approval.
Rural Roads
The rural roads provide network to connect villages and hamlets to the nearest towns and
markets. The total length of rural roads works out to around 1.62 lakh kms. in Bihar, of which
a substantial proportion is unpaved. The Rural Works Department constructs rural roads and
bridges under various schemes and has completed about 39,809 kms. of roads at an
expenditure of Rs. 18,743 crore, implying on an average laying of 41.47 kms. new roads per
day upto September 2013 (Table 4.7).
Table 4.7 : Schemewise Roads Constructed by Rural Works Department, upto September 2013
Sl.
No. Name of the scheme
Road
Construction
(Kms.)
Bridge
Construction
(In No.)
Expenditure
(Rs. crore)
1 Mukhya Mantri Gram Sadak Yojana 6023.16
2747.16
2 Apki Sarkar Aapke Dwar Yojana 660.30
296.16
3 Minimum Needs Programme 3908.35 34 1555.27
4 Special Component Programme for
Schedule Caste (SCP) 365.28
295.57
5 R.I.D.F (NABARD Scheme) 1951.34 31 1217.94
6 Border Area Development Programme 60.27
23.55
7 Pradhan Mantri Gram Sadak Yojana 26840.45
12606.94
Total 39809.15 65 18742.59
Source: Department of Rural Works, GOB
For providing all-weather single road connectivity to all unlinked habitations having
population upto 250, construction of 22,363 roads with a total length of 37,908 kms. have been
started under Mukhyamantri Gram Sampark Yojana. This project will be completed in a five-
year period.

114
4.2 Bridge Sector
A rail-cum-road bridge, over the river Ganga, is under construction between Munger and
Sahebpur Kamal. The initial cost of construction of this bridge was Rs. 921 crore, which has
since been revised to Rs. 2361.87 crore. The foundation and sub-structure work is completed
and the work on remaining super-structure and approach roads is in progress. There is a
proposal to connect the approach road to this bridge to NH-80 in the south near Safiabad and in
north to NH-31 near Umesh Nagar.
Similarly, the construction of rail-cum-road bridge is going on over the Ganga river between
Digha and Sonepur, near Patna. The state share for construction of this bridge is met from the
state fund under BRGF. Of the approved cost of Rs. 2921 crore for this bridge, a sum of Rs.
839 crore has been released by the Planning Commission on the state government
recommendation. The work on foundation and sub-structure is completed. Again, the work on
guide bund is nearly complete and 22 spans out of 36 have also been completed. The work is
likely to be completed by March, 2015. This bridge will be connected to NH-98 in the south
and NH-19 in the North (Table 4.8).
Table 4.8 : Details of Digha - Sonepur Rail-cum-Road Bridge
Sl.
No. Job Description
Approved Amount
( Rs. crore)
Revised Approved Amount
(Rs. Crore) Physical
progress Railway
Share
State
Share Total
Railway
Share
State
Share Total
1 Main Bridge 516.00 394.00 910.00 1096.91 810.30 1907.21
Foundation -
100% Sub
- structure -
100% Super -
structure -
40%
2 Guide Dam 46.00 46.00 92.00 37.70 37.70 75.40 95%
3 Railway Approach Road 273.00 0.00 273.00 546.39 0.00 546.39 40%
4 Road Approach 0.00 114.00 114.00 0.00 392.00 392.00 0.20%
Total 835.00 554.00 1389.00 1681.00 1240.00 2921.00
Source : Department of Road Construction, GOB
Overbridge Projects
Under the tripartite agreement among the Government of Bihar, IRCON International and the
Railways executed in 2005, the construction of road overbridges at 22 railway crossings in the
state was taken up on cost sharing basis. The work on 14 road overbridges was undertaken by

115
IRCON International, at an estimated cost of Rs. 848.73 crore (state share Rs. 398.04 crore and
land acquisition worth Rs. 186.78 crore). Till date, 10 of these road overbridges have already
been completed and the work on the remaining four is in progress. Besides, 8 road overbridges
on Major District Roads have been constructed by IRCON International and the approach
roads to 7 out of these 8 have been constructed by the Bihar Rajya Pul Nirman Nigam Ltd. The
approach to one road overbridge (Bariyarpur-Kharagpur-Jamui Road LC no. 15B) is
incomplete due to line alignment issues. The estimated cost is Rs. 241.82 crore, with a share
Rs. 120.91 crore for the state government and land acquisition cost of Rs. 16 crore.
Apart from above mentioned road overbridges, construction of 11 new road overbridges on
railway crossings has been approved at an estimated cost of Rs. 1054.26 crore (state share Rs.
796.985 crore, including Rs. 187.80 crore for land acquisition).
The proposal for construction of another 22 road overbridges at level crossings have been
approved by the railways. The preparation of Detailed Project Report (DPR) of these road
overbridges have been initiated. The construction of road overbridge in the 1st km of Manpur
Bypass (SH-4) in Gaya district has been approved by state government (estimated cost is Rs.
95.468 crore, including land acquisition cost of Rs. 9.73 crore). The work is likely to be started
shortly.
High Level RCC Bridges
The state government has sanctioned an ambitious mega-bridge project over major rivers of the
state during the year 2013-14, as detailed in the Table 4.9 below.
Table 4.9 : Sanction of the High Level R.C.C. bridges during 2013-14
Sl.
No. Schemes
Cost
(Rs. crore)
1
4 lane bridge on river Ganga between Sultanganj ( Bhagalpur
district) and Aguwani Ghat ( Khagaria district) 1710.77
2
On Sone river between Daudnagar ( Aurangabad district) and
Nasriganj ( Rohtas district) 619.28
3 On Gandak River at Bangara Ghat in Gopalganj district 508.97
4
Extension of Mithapur R.O. B. via station to Chirayantanr
Overbridge and Exhibition Road in Patna 167.85
5
On Budhi Gandak River near Jagannath Mishra College in
Muzaffarpur district 43.30
6 121 Bridges under Indo-Nepal Border Scheme 983.80
Source : Bihar Rajya Pul Nirman Nigam Ltd., GoB.
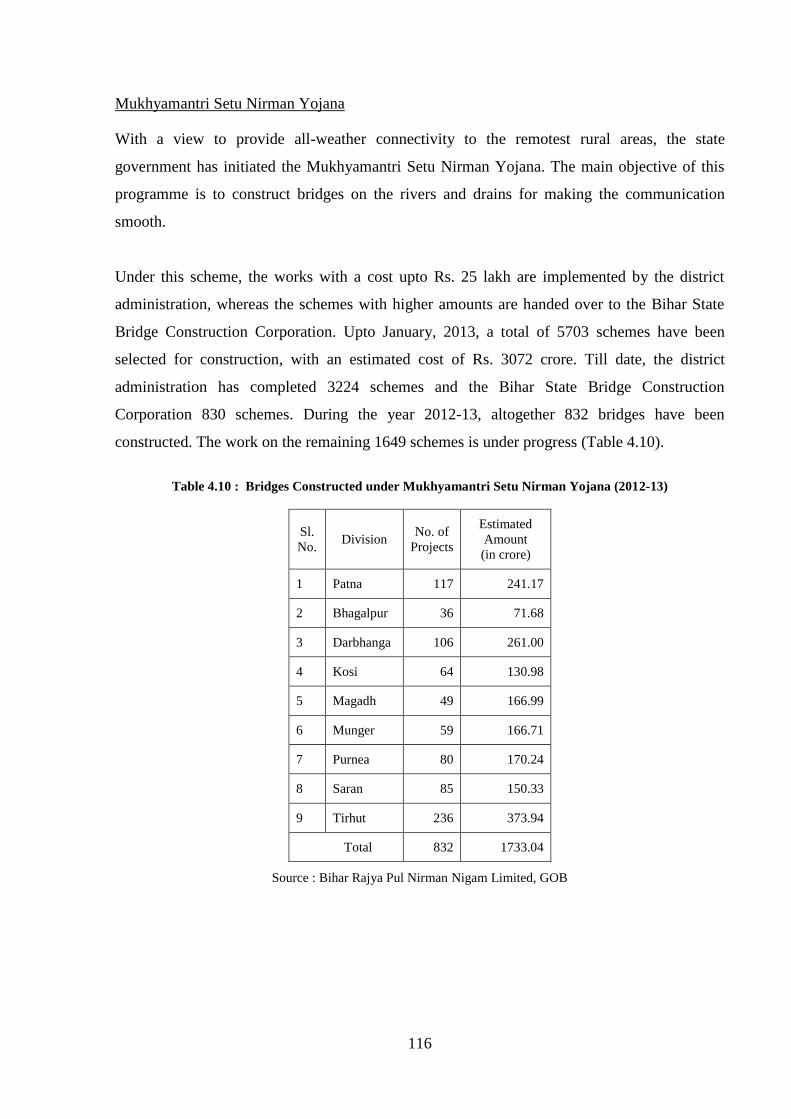
116
Mukhyamantri Setu Nirman Yojana
With a view to provide all-weather connectivity to the remotest rural areas, the state
government has initiated the Mukhyamantri Setu Nirman Yojana. The main objective of this
programme is to construct bridges on the rivers and drains for making the communication
smooth.
Under this scheme, the works with a cost upto Rs. 25 lakh are implemented by the district
administration, whereas the schemes with higher amounts are handed over to the Bihar State
Bridge Construction Corporation. Upto January, 2013, a total of 5703 schemes have been
selected for construction, with an estimated cost of Rs. 3072 crore. Till date, the district
administration has completed 3224 schemes and the Bihar State Bridge Construction
Corporation 830 schemes. During the year 2012-13, altogether 832 bridges have been
constructed. The work on the remaining 1649 schemes is under progress (Table 4.10).
Table 4.10 : Bridges Constructed under Mukhyamantri Setu Nirman Yojana (2012-13)
Sl.
No. Division
No. of
Projects
Estimated
Amount
(in crore)
1 Patna 117 241.17
2 Bhagalpur 36 71.68
3 Darbhanga 106 261.00
4 Kosi 64 130.98
5 Magadh 49 166.99
6 Munger 59 166.71
7 Purnea 80 170.24
8 Saran 85 150.33
9 Tirhut 236 373.94
Total 832 1733.04
Source : Bihar Rajya Pul Nirman Nigam Limited, GOB
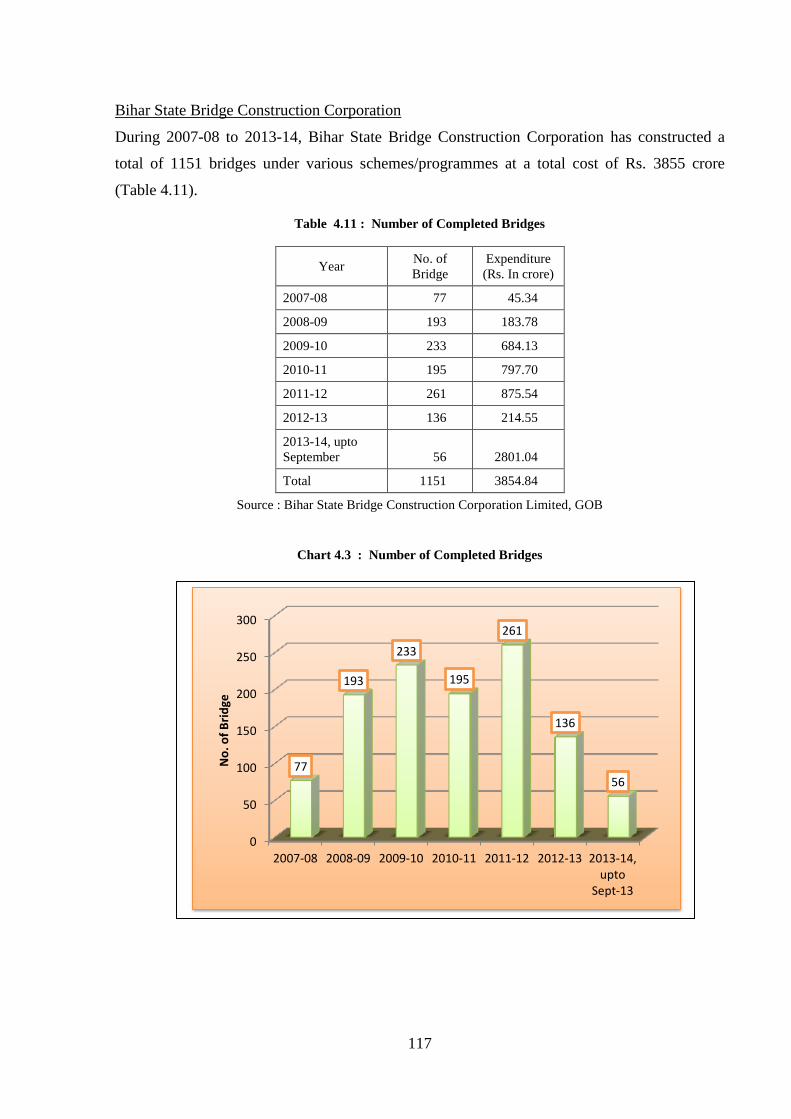
117
Bihar State Bridge Construction Corporation
During 2007-08 to 2013-14, Bihar State Bridge Construction Corporation has constructed a
total of 1151 bridges under various schemes/programmes at a total cost of Rs. 3855 crore
(Table 4.11).
Table 4.11 : Number of Completed Bridges
Year No. of
Bridge
Expenditure
(Rs. In crore)
2007-08 77 45.34
2008-09 193 183.78
2009-10 233 684.13
2010-11 195 797.70
2011-12 261 875.54
2012-13 136 214.55
2013-14, upto
September 56 2801.04
Total 1151 3854.84
Source : Bihar State Bridge Construction Corporation Limited, GOB
Chart 4.3 : Number of Completed Bridges
0
50
100
150
200
250
300
2007-08 2008-09 2009-10 2010-11 2011-12 2012-13 2013-14,upto
Sept-13
77
193
233
195
261
136
56
No
. of
Bri
dge

118
During a short span of 6 years (2006-07 to 2012-13), the Corporation has displayed an
excellent financial management, and increased its turnover from just Rs. 96 crore in 2006-07 to
Rs. 1300 crore in 2012-13.
Table 4.12 : Total Turn-Over of the Bihar Rajya Pul Nirman Nigam Limited
(Rs. crore)
Year
Total
Expenditure
on Projects
Total
Revenue
Personnel and
Administrative
Expenditure
Total Profit
2006-07 95.89 28.38 11.16 (+) 17.22
2007-08 417.48 88.26 12.21 (+) 76.05
2008-09 756.01 110.73 20.30 (+) 90.43
2009-10 853.84 111.59 23.79 (+) 87.81
2010-11 1158.42 114.68 44.05 (+) 70.63
2011-12 1294.36 175.62 49.62 (+) 125.99
2012-13 1300.00 143.00 40.00 (+) 103.00
(expected)
Source: Bihar Rajya Pul Nirman Nigam Limited, GOB
Chart 4.4 : Total Expenditure on Projects by Bihar Rajya Pul Nirman Nigam Limited
95.89
417.48
756.01
853.84
1158.42
1294.36 1300.00
0
200
400
600
800
1000
1200
1400
2006-07 2007-08 2008-09 2009-10 2010-11 2011-12 2012-13
Exp
en
dit
ure
( R
s. c
rore
)
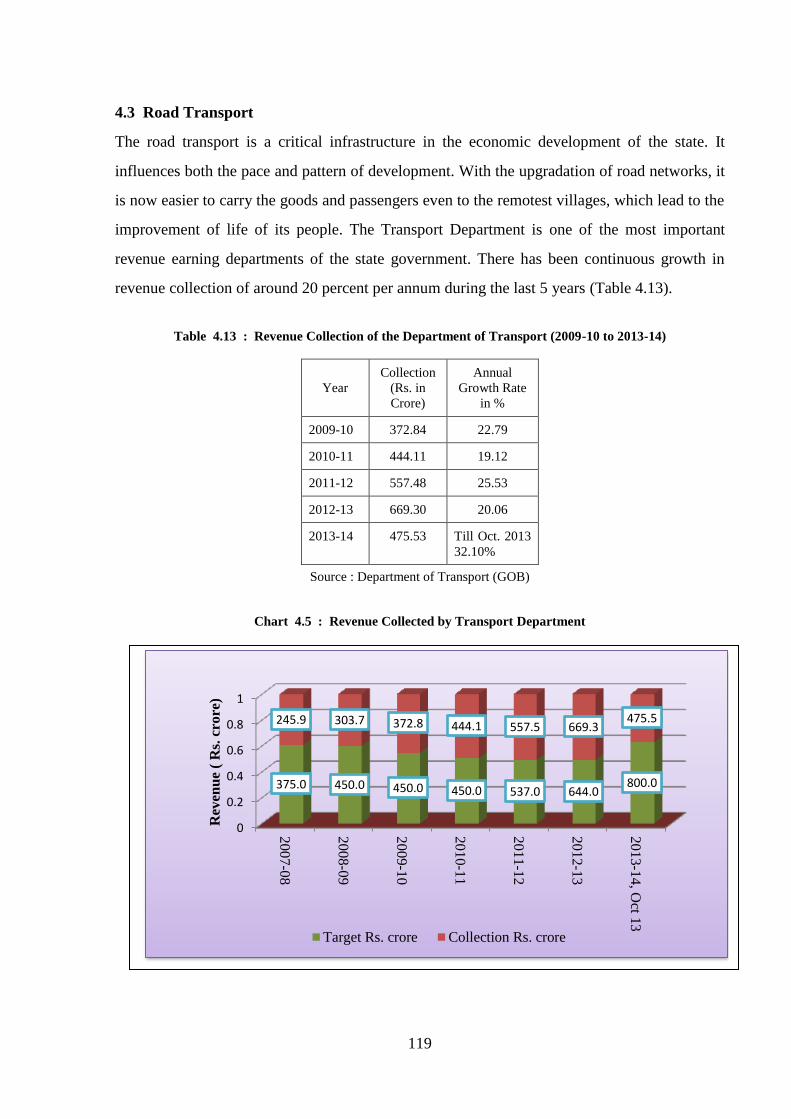
119
4.3 Road Transport
The road transport is a critical infrastructure in the economic development of the state. It
influences both the pace and pattern of development. With the upgradation of road networks, it
is now easier to carry the goods and passengers even to the remotest villages, which lead to the
improvement of life of its people. The Transport Department is one of the most important
revenue earning departments of the state government. There has been continuous growth in
revenue collection of around 20 percent per annum during the last 5 years (Table 4.13).
Table 4.13 : Revenue Collection of the Department of Transport (2009-10 to 2013-14)
Year
Collection
(Rs. in
Crore)
Annual
Growth Rate
in %
2009-10 372.84 22.79
2010-11 444.11 19.12
2011-12 557.48 25.53
2012-13 669.30 20.06
2013-14 475.53 Till Oct. 2013
32.10%
Source : Department of Transport (GOB)
Chart 4.5 : Revenue Collected by Transport Department
0
0.2
0.4
0.6
0.8
1
200
7-0
8
200
8-0
9
200
9-1
0
201
0-1
1
201
1-1
2
201
2-1
3
201
3-1
4, O
ct 13
375.0 450.0 450.0 450.0 537.0 644.0 800.0
245.9 303.7 372.8 444.1 557.5 669.3 475.5
Rev
enu
e (
Rs.
cro
re)
Target Rs. crore Collection Rs. crore

120
Under the Central Motor Vehicles Act, 1988, every motor vehicle in the state is required to be
registered. The annual growth rate of number of registered vehicles during the last 5 years
varied between 10 percent in 2007-08 to as high as 49 percent in 2009-10, which corroborates
the high growth rate of the state economy during the period. The number of registered vehicles
is increasing every year and recorded more than three fold increase from 1.62 lakh in 2007-08
to around 5 lakh in 2012-13. During the first six months of 2013-14 (April-September), 2.85
lakh new vehicles have been registered. As may be seen from Table 4.14, all categories of
vehicles recorded a phenomenal increase during the recent years. While the trucks and auto-
rickshaws displayed almost a five fold increase, the vehicles like cars, taxis, tractors and the
two-wheelers recorded around three fold increase during the period.
Table 4.14 : Number of Registered Vehicles (2007-08 to 2013-14 - Upto Sept. 2013)
Year Truck Bus Car Taxi Jeep Auto Two
Wheeler Tractor Trailer Others Total
2007-08 2409 1341 8223 3042 4229 6030 120296 8164 5358 2665 161757
2008-09 3598 1121 10549 3791 5748 8423 166882 11203 7510 1588 220413
2009-10 8473 1555 14954 7347 9862 12392 241856 19496 10529 969 327433
2010-11 6987 1494 18814 5419 9746 17422 293204 21055 10942 1940 387023
2011-12 9719 1394 23495 8595 9071 20698 331052 22954 11404 1289 439671
2012-13 10190 1895 24452 14346 9815 30387 362068 30478 10854 2333 496818
2013-14,
Sept. 2013 5322 1041 10705 6737 4646 18484 219232 14548 3576 1115 285406
Total 46698 9841 111192 49277 53117 113836 1734590 127898 60173 11899 2318521
Source : Department of Transport, GOB

121
Chart 4.6 : Number of Registered Vehicles in Bihar
The district-wise data on vehicle registration for 2012-13, given at Table A 4.3 (Appendix),
shows quite an uneven pattern among the districts, ranging from a high of around 86 thousand
vehicles in Patna to the low of 1708 in Lakhisarai and 1966 in Shekhpura.
Chart 4.7 : Growth in Types of registered Vehicles in Bihar (2012-13)
0
100000
200000
300000
400000
500000
600000
2007-08 2008-09 2009-10 2010-11 2011-12 2012-13
No
. of
Re
gist
ere
d V
eh
icle
s
0
100000
200000
300000
400000
Truck
Bu
s
Car
Taxi
Jeep
Au
to
Two
Wh
eeler
Tractor
Trailer
Oth
ers
No
. of
Re
gist
ere
d V
eh
icle
s
Types of Registered Vehicles
122
Major Programmes Initiated
Construction of Integrated Check Posts
Integrated Check posts have been established on important entry points of the state, viz., Dobhi
(Gaya), Rajauli (Nawada), Karmnasha (Kaimur), Jalalpur (Gopalganj), Dalkohla (Purnea) and
Buxar. These check posts have become functional and help in augmenting the revenue
collection of the Department and preventing the illegal plying of vehicles. With a view to
discourage the overloading, a check post at the northern end of Ganga Bridge (Hajipur) has
been established.
System of E-payment of Vehicle Taxes
To make tax payment of vehicles more convenient, e-payment of taxes for commercial
vehicles has been introduced. To start with, this system was introduced in Patna, Muzaffarpur,
Gaya, Purnea and Bhagalpur districts of the state. The E-payment of taxes in another six
districts, viz., Saran, Nalanda, Bhojpur, Nawada, Vaishali and Samastipur have also been
commenced.
Pollution Check
In view of the adverse impact of the emission of gases by the vehicles on the health of the
people, special teams have been constituted for pollution control. Since June 2013, special
drive has been started in Patna to check the vehicles. Till October 2013, a total 13,239 vehicles
have been checked and green sticker affixed on the vehicles. A total of 828 vehicles were fined
for violating the norms of pollution control and a sum of Rs. 15.77 lakh realised from the
vehicle owners.
Boat Rules
Model Boat rules have been framed under the Bengal Ferries Act, 1885.
Registration of boat indicating its specifications have been made mandatory.
Load Line has to be marked on the boat by the owner after assessment of maximum
carrying capacity of the boat.
Norms for crew members have been prescribed.
For safety of the passengers, provision of life saving equipments and reversing
mechanism in the mechanised boats have been made mandatory.

123
As per the above rules, around 1000 boats have been registered till August 2013.
Bihar Inland Water Vessels Rules, 2013
Bihar Inland Water Vessels Rules, 2013 have been approved by the cabinet and notified. The
following are the important provisions and benefits of the rules :
Safe navigation of inland vessels and protection of passengers.
Inland vessels will get surveyed and registered in Bihar itself. Presently, the inland
vessels are being registered in other states and then registered in Bihar as well.
National Inland Navigation Institute (NINI), Patna, will be able to conduct
examinations and issue certificates of competency to the vessel staff such as Lasker,
Greaser, Master, Engineers, etc.
The industry of inland vessels construction along with its accessories units will be
promoted in Bihar which will provide opportunities of employment.
Bihar State Road Transport Corporation (BSRTC)
The Corporation is a statutory commercial body, established in 1959, to provide safe and
adequate bus services to the people. After bifurcation of the state in November, 2000, the
Corporation was left with only 135 vehicles on road. After repairing of vehicles on a large
scale, the number of vehicles on road increased to 224. However, by 2009-10, the number of
vehicles on road was again reduced to 135. Therefore, the public-private partnership (PPP) was
started in 2009-10 with a view to improving the financial position of the Corporation.
Under the PPP mode, the number of vehicles was increased after making agreement with the
private bus operators on the specified terms and conditions. In 2011-12, the city bus services
were started in Patna, Muzaffarpur, Gaya, Darbhanga, Purnea and Biharsharif with 136 buses.
During 2012-13, as many as 370 buses were plying on PPP basis and presently, the number of
buses have increased to 594 under this scheme.
The Volvo/Mercedes buses of improved category are also being operated under the PPP mode.
After making necessary agreement, 19 Volvo-Mercedes buses are plying between Patna and
different cities of Bihar and Jharkhand. The process will continue to gradually extend the
services to Chhattisgarh, West Bengal and Odisha under interstate bus services scheme.

124
As a result of constant efforts made by the Road Transport Corporation, there has been an
appreciable increase in the number of passengers. During 2012-13, it had increased to around
1.46 crore, more than double the number achieved in 2009-10 (0.66 crore) (Table 4.15).
Table 4.15 : Number of Passengers
Year
No. of
Passengers
(lakh)
2009-10 66.43
2010-11 89.53
2011-12 137.67
2012-13 146.6
Source : Road Transport Corporation, GoB
Chart 4.8 : Number of Passengers
4.4 Railways
The state of Bihar is connected with major towns and cities in the country with a network of
more than 5400 kms of rail length. The headquarters of East Central Region of the Railways in
located at Hajipur in north-Bihar. Some units of wheel factory, coach maintenance workshop,
railway slipper factory, etc. were announced for Bihar. While some of them have been made
functional, others are still in the process. After clearance from the Railway Board, the wheel
0
20
40
60
80
100
120
140
160
2009-10 2010-11 2011-12 2012-13
66.43
89.53
137.67 146.6
Nu
mb
er o
f P
ass
enger
s (
in L
ak
h)

125
factory located at Belapur in Chhapra, which is second in the country after the Bangalore
wheel factory, started trial production last year. It successfully carried out wheel casting
process. However, it is proving to be a major worry to the railway on account of a very high
rate of rejection of wheels, manufactured in Belapur. So far, over 4500 wheels have been
prepared and the rejection rate is over 75 percent, as against the approved rate of below 25-30
percent. The Rail Wheel factory Bangalore has a rejection rate of around 15 percent. It is
apprehended that this may be due to faulty operations or poor quality of raw materials like
sand, resins or other chemicals. However, the plant is working in full capacity with around 700
persons working there. It has the capacity to produce about one lakh wheels for goods,
passenger coaches, and locomotives to fulfill the needs of the entire eastern and northern
regions.
Very recently, the central government has given its approval for setting up of an electric
locomotive factory at Madhepura and a diesel locomotive factory at Marhaura at an estimated
cost of Rs. 1294 crore and Rs. 2053 crore respectively. Within a 10 year period, these two
factories will provide the railways with 800 electric locomotives of 12,000 horsepower (HP)
each and a mix of 1000 diesel locomotives of 4500 and 6000 HP with a guarantees of
international level performance.
4.5 Airways
After witnessing the constant fall in the last three years, the Indians have resumed the domestic
air travel. In September, 2013, there were 45.50 lakh domestic fliers, which is 13.4 percent
more than 40.2 lakh fliers in September a year before. With hike in air fares in September,
2013, the peak travel months of October-December are likely to witness only a moderate rise.
While the low cost carrier (LCC) Indigo remained the market leader with 30.30 percent share
in domestic travel, the Air India reported the highest aircraft occupancy for the second
consecutive month in September, 2013.
Bihar too witnessed the all-India trend and, during 2013-14 (upto September), there have been
17 flights per day at Patna airport which included 6 flights of Indigo and 5 flights of Air-India.

126
Table 4.16 : Airlines and Numbers of Flights (Patna Airport)
Airlines
Number of Flight per day
2011-12 2012-13
2013 -14,
upto Sept.
2013
Air India 3 3 5
Jet Airways / Jet Connect 4 5 3
Air Deccan / Kingfisher 3 NIL NIL
Go Air 3 3 3
Indigo 4 5 6
Total 17 16 17
Source : Airport Authority of India, Patna
There has not been any international flight at Patna airport in recent years. As regards domestic
flights, the movement of aircrafts kept on fluctuating and, against 10,369 in 2011-12, it
dropped to 9972 in 2012-13. There was also a small drop in the number of passengers. As may
be observed from Table 4.17, the freight also dropped from 3425 tonnes in 2011-12 to 2251
tonnes in 2012-13.
Table 4.17 : Aircraft Movements with Number of Passemgers anf Freights at Patna Airport
Year
Aircraft Movements
(in no.)
Passengers
(in no.)
Freight
(in tonnes)
International Domestic International Domestic International Domestic
2007-08 0 12604 0 444458 0 1770
2008-09 0 9666 0 369408 0 1943
2009-10 8 10726 0 552542 0 2532
2010-11 4 9547 0 838509 0 3279
2011-12 0 10369 0 1021544 0 3425
2012-13 0 9972 0 1003169 0 2251
2013-14,
Sept. 2013 0 6901 0 512360 0 2288
Source : Air port Authority of India, Patna

127
4.6 Telecommunication
A liberal policy enabling the private sector's involvement has completely transformed the
telecommunication sector of the country. This is the fastest growing sector in the recent years.
The teledensity, which represents the number of telephone per 100 persons in the country, was
as high as 77 by October, 2012. With the exponential growth of mobile telephony, consequent
on easy access and affordability, the number of landline telephones declined from 32.17
million in March, 2012 to 30.95 million in March, 2013. The wireless telephones now account
for 96.70 percent of all telephones. The share of private sector in the total number of
subscribers was placed at 86.1 percent in October, 2012. With the announcement of Broadband
Policy in 2004, several measures have been taken to promote broadband penetration in the
country. As a result, by March, 2012, there were 22.86 million internet subscribers, including
13.79 million broadband subscribers. The broadband subscribers increased to 14.81 million in
October 2012. The efforts are on to increase the penetration of broadband, particularly in rural
and remote areas.
With the objective of promoting rural telephony, the central government constituted a
Universal Service Obligation Fund (USDF) and, through this fund, 7310 towers were set up by
the end of November, 2012. Under another scheme for Village Public Telephones (VPT),
about 98.0 percent villages have been covered by the end of November, 2012.
The telecom sector in Bihar also grew tremendously during the last few years. By March 2012,
there were 460.10 lakh telephone connections in Bihar, of which around 90 percent were under
private operators. In 2012-13, the number of telephone connections increased to around 547
lakh, registering an increase of around 19 percent over the previous year. This is despite a drop
in number of BSNL connections by about 8 percent. However, the private operators have
successfully maintained the rising trend in providing connections, and increased their share to
around 92 percent of the total number of connections during the year.

128
Table 4.18 : Telephone Connections in Bihar (2001-2013)
(In lakh)
Year BSNL Private Operators
Total Landline WLL Mobile Total Landline Mobile Total
2001-02 8.05 0.40 0.08 8.53 — 1.15 1.15 9.68
2002-03 9.66 0.79 0.76 11.21 — 1.84 1.84 13.05
2003-04 11.10 0.89 2.58 14.57 — 2.58 2.58 17.15
2004-05 12.89 0.98 4.05 17.92 — 5.65 5.65 23.57
2005-06 17.38 1.30 9.28 27.96 — 14.18 14.18 42.14
2006-07 9.86 1.53 12.68 24.07 — 34.5 34.5 58.57
2007-08 9.73 1.88 16.3 27.91 — 68.03 68.03 95.94
2008-09 9.63 2.38 26.92 38.93 0.05 133.69 133.74 172.67
2009-10 9.61 2.82 43.44 55.87 0.10 251.25 251.35 307.22
2010-11 9.66 2.84 55.82 68.32 0.13 379.5 379.63 447.95
2011-12 3.80 2.84 41.47 48.11 0.10 411.89 411.99 460.10
2012-13 2.17
42.23 44.4 0.15 502.02 502.17 546.57
Source : BSNL and TRAI Reports
Note : For Mobile only GSM figures have been used
Chart 4.9 : Telephone Connections in Bihar (2001-2013)
0
100
200
300
400
500
600
20
01
-02
20
02
-03
20
03
-04
20
04
-05
20
05
-06
20
06
-07
20
07
-08
20
08
-09
20
09
-10
20
10
-11
20
11
-12
20
12
-13
10 13 17 24 42 59 96
173
307
448 460
547
Tele
ph
on
e C
on
ne
ctio
ns
(lak
h)

129
BSNL Private Operators
Teledensity
There has been a substantial rise in teledensity in the country in recent years, though it
remained heavily tilted towards the urban areas. In 2011, the urban teledensity at all-India level
worked out to 163.13 as against 35.60 in rural areas. In 2012, both the urban and rural
teledensity increased to 169.55 and 39.22 connections respectively. In 2013, however, it
registered a drop in urban areas by about 20 connections, along with a modest increase by
about 2 connections in rural areas. Thus, the year 2013 witnessed a drop in total teledensity by
about 5 connections at all-India level. It is further observed that, during 2013, though nearly all
the states registered a decline in both urban and total teledensity, most of the states (including
Bihar) showed an increase in rural teledensity. It is worth mentioning that though Bihar
remained at the bottom in respect of rural and overall density, it was ahead of many developed
states like Gujarat, Haryana, Maharashtra, Punjab and Tamil Nadu in terms of urban
teledensity.
2.17
42.23
Landline Mobile
0.15
502.02
Landline Mobile

130
Table 4.19 : Teledensity of Major Indian States
Service Area
2012 2013
Rural
Teledensity
Urban
Teledensity
Total
Teledensity
Rural
Teledensity
Urban
Teledensity
Total
Teledensity
Andhra Pradesh 39.21 189.26 80.87 41.83 169.00 77.19
Bihar 25.58 196.24 48.9 27.54 160.28 45.72
Gujarat 53.89 145.51 91.14 53.12 136.39 87.23
Haryana 55.92 153.97 89.42 56.78 113.51 76.44
Karnataka 44.08 185.62 97.22 43.00 170.38 91.24
Kerala 61.94 237.08 106.61 61.93 196.11 96.09
Madhya Pradesh 25.9 130.37 53.81 30.91 115.09 53.55
Maharashtra 52.03 147.56 96.8 52.64 128.64 88.56
Odisha 35.24 215.58 65.84 38.72 164.01 60.21
Punjab 64.59 180.95 113.13 66.90 152.31 102.99
Tamil Nadu 56.2 164.4 116.61 66.33 139.94 108.17
Uttar Pradesh 31.98 161.32 60.93 33.34 137.69 56.83
West Bengal 43.42 171.45 79.91 42.01 138.03 69.43
All India 39.22 169.55 78.66 41.02 149.96 73.32
Source : Telecom Regulatory Authority of India
Note : Teledensity refers to the number of telephone per 100 population
Chart 4.10 : Teledensity of Bihar and India
BSNL
We have seen that the BSNL, a public sector body, also plays an important role in
telecommunications and it covers all the 38 districts of Bihar. In 2011, while its coverage is
56.04 percent in term of area, it is around 85 percent in terms of population.
0.00
50.00
100.00
150.00
200.00
Rural Teledensity Urban Teledensity Total Teledensity
2013
27.54
160.28
45.72
41.02
149.96
73.32
Bihar All India

131
Table 4.20 : BSNL Bihar : Telecom Demography
Item Total Coverage
(Percentage)
Area (sq. km) 94163 56.04
Population (2011) (crore) 10.41 84.68
Revenue District 38 100.00
Revenue Sub-Division 102 100.00
Block HQ 534 100
Inhabited Villages (2001) 39015 54.44
Inhabited villages (2001) with VPTs facilities 38941 99.74
National Highway (km) 3734 94.00
State Highway (km) 3989 75.71
Note : 1650 Mobile BTSs are now under installation which will provide
seamless coverage across whole N.H/S.H./Rail route in Bihar
state.
As may be seen from Table 4.21, there were as many as 44.31 lakh total wireless connections
in the state in 2011-12, which has shown a moderate decline in 2012-13 as a result of data
cleaning for long inactive wireless pre-paid subscribers. It is discerned from Table that the total
wireless connections almost doubled from 21.85 lakh in 2008-09 to 44.31 lakh in 2011-12 and
42.23 lakh in 2012-13. On the contrary, the wireline connections which remained at around 10
lakh for three years from 2008-09 to 2010-11, drastically declined to 2.17 lakh in 2012-13.
Table 4.21 : Growth of BSNL
(in Lakh)
Particulars 2008-09 2009-10 2010-11 2011-12 2012-13 2013-14*
No. of Wireline Exch. (Nos.) 1235 1242 1214 1197 1193 1193
Total Wireline connections 9.63 9.61 9.66 3.8 2.17 2.15
No. of DSLAMs for Wireline
Broadband (Nos.) 1040 1193 1193 1193 1253 1279
No. of Wireline Internet
Connections 0.43 0.6 0.61 0.62 0.68 0.68
Total Wireless Connections 21.85 34.32 43.33 44.31 42.23 21.30**
Source : Bharat Sanchar Nigam Limited
Note: ** Due to data cleaning for long Inactive Wireless Prepaid subscribers, overall subscriber
base came down despite adding about 8 lakh new wireless customers since 1.4.2012.
* Provisional figure up to September, 2013

132
The BSNL is the forerunner in providing the digital connectivity in Bihar through the
following programmes:
(i) High Speed Broadband on demand through WiMAX (4G) in whole Bihar State
WiMAX is a unique technology deployed by BSNL for the first time in the whole of
Bihar. This technology provides fixed as well as fully mobile high speed broadband
connectivity along with roaming feature. It provides users a very useful internet browsing
experience at lightening speed upto 2 mbps. Bihar BSNL has already covered 8423 Gram
Panchayats and all urban areas to provide high speed broadband facilities to all on
demand.
(ii) Very High Speed Broadband by Providing Fibre to the Home (FTTH)
Fibre to the Home (FTTH) is a very useful technology introduced by BSNL for the first
time in Patna, the capital of Bihar. In Patna, 17,600 capacity is available for FTTH. The
optical fibre connectivity, having unlimited bandwidth and the state of art technology,
provides fixed access platform to deliver the very high speed broadband from 256 kbps to
100 mbps, IPTV having different types of contents like HDTV and 3D TV, and a range
of voice telephony services. It provides a comprehensive solution for the IP leased line,
internet, Close User Group (CUG), MPLS-VPN, VoIP, video conferencing, video calls
etc.
(iii) National Optical Fibre Network (NOFN) Project
The central government has set-up Bharat Broadband Network Limited (BBNL) in
February, 2012 for the establishment, management and operation of National Optical
Fibre Network (NOFN) to provide optic fibre connectivity to all the 2,50,000 Gram
Panchayats (GPs) in the country. It ensures broadband connectivity of 100 mbps to each
GP.
In Bihar, BSNL is executing NOFN project to provide optic fibre connectivity to 8297
Gram Panchayats in 38 districts, as per the MOU signed between the state government

133
and BSNL in December, 2012. The BSNL has targeted to connect 4265 Gram
Panchayats by March, 2014.
(iv) Broadband to Rural areas through Wireline Rural Broadband Kiosk
To provide general access to rural population for wireline broadband facilities at
affordable rate, BSNL has planned for 1000 Broadband Kiosks in Rural Telephone
Exchanges of Bihar with the support of Universal Service Obligation Fund (USOF) of
the central government. The BSNL has installed 392 such Rural Broadband Kiosks, till
September, 2013 in the state.
(v) Increasing Rural Broadband Density
The BSNL, through its 595 Rural Telephone Exchanges with DSLAMs in Bihar, has
already provided 6357 Wireline Broadband connections till September, 2013. It has
devised affordable and special USO tariffs suitable for rural public. The modems are
offered free and no security deposit for Broadband Plan are taken from customers in the
rural areas. The BSNL is making sincere efforts to bridge the digital divide between the
urban and rural areas in Bihar.
4.7 Postal Network
India Posts have the largest postal network in the world. In March, 2013, there were 1.55 lakh
post offices across the country. Each post office on an average serves 7,814 persons. The rural
India has a total of 1.39 lakh post offices, as against only 15,826 in urban areas. There are also
1155 franchisee outlets in the areas where it is not possible to open post offices. The Postal
Department has got the 'National Award for e-Governance for 2012-13' for Mail Network
Optimization Project (MNOP).
Under Bihar circle, there are 31 head post offices, 1015 sub-post offices, 8014 branch post
offices, and 6 night post offices as on March, 2013. Around 90 percent of branch post offices,
which are mainly functional in rural areas, are run by the Gramin Dak Sewaks (GDS) and
around 10 percent are run by the departmental staff. The number of letter boxes were a little
above 25 thousand, with rural share being 89 percent. As may be observed from Table 4.22, 95
percent of the post offices are located in rural areas of the state.

134
Table 4.22 : Postal Facilities in Bihar
(In Number)
Postal Facilities March, 2012 March, 2013
Urban Rural Total Urban Rural Total
Head Post Offices 30 1 31 30 1 31
Sub Post Offices 398 616 1014 398 617 1015
Total Departmental Post Offices 428 617 1045 428 618 1046
Branch Post Offices 45 7966 8011 45 7969 8014
Night Post Offices 6 - 6 6 - 6
Letter Boxes 2851 22159 25010 2851 22163 25014
Post Boxes 1442 - 1442 1439 - 1439
Source: Chief Postmaster General, Bihar Circle
With the launching of Project Arrow in 2008, Mail Network Optimization Project in 2010 and
IT Modernisation Project in 2012, all postal operations are being upgraded, that include mail
delivery, remittance and banking services. The Indian Posts are emerging as a one-stop-shop
for retail products and offer a single window facility for banking, money remittances and other
financial products. Under Bihar Circle, all head post offices and 87 sub-post offices have been
modernised under the Project Arrow. The post offices are also given the responsibility of
disbursing wages to beneficiaries under Mahatma Gandhi National Rural Employment
Guarantee Act (MNREGA), through post office savings bank accounts. The Department of
Posts is going to launch Express Parcel Service (Air lifted) for the benefit of the people.
The details of postal traffic for 2011-12 and 2012-13 are presented in Table 4.23, which
indicate that the registered, unregistered and foreign postal unregistered articles sent through
the post offices recorded decrease in 2012-13 over 2011-12. However, the speed post, both
domestic and foreign, increased substantially.
Table 4.23 : Postal Traffic — Inland and Foreign (2011-12 and 2012-13)
Sl.
No. Articles 2011-12 2012-13
Percent
Change
1 Registered (000) 4118.79 4116.95 -0.04
Unregistered (crore) 8.32 7.49 -11.11
2 Speed Post (000) 7262.97 11647.64 37.64
4 International Speed Post (000) 0.67 2.47 72.85
5 Foreign Postal Unregistered (000) 4403.42 3657.91 -20.38
(i) To Foreign Counters(000) 2166.96 1814.62 -19.42
(ii) From Foreign Counters(000) 2236.46 1843.29 -21.33
Source : Chief Postmaster General, Bihar Circle
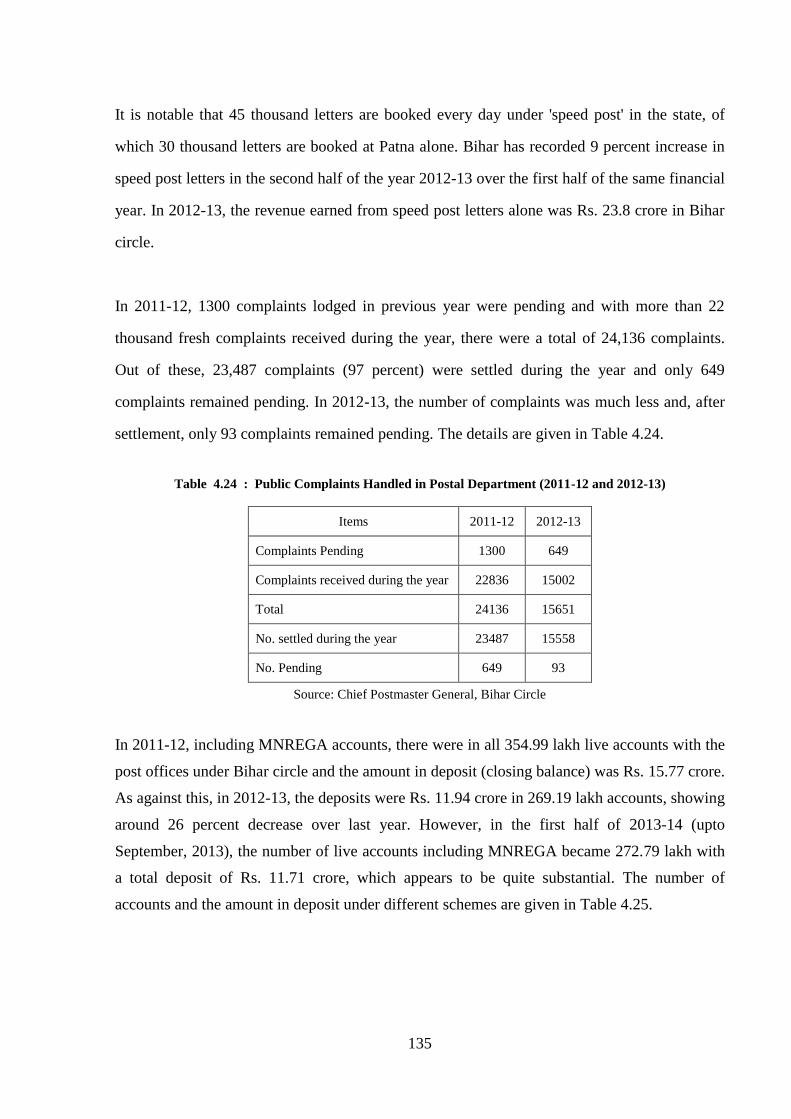
135
It is notable that 45 thousand letters are booked every day under 'speed post' in the state, of
which 30 thousand letters are booked at Patna alone. Bihar has recorded 9 percent increase in
speed post letters in the second half of the year 2012-13 over the first half of the same financial
year. In 2012-13, the revenue earned from speed post letters alone was Rs. 23.8 crore in Bihar
circle.
In 2011-12, 1300 complaints lodged in previous year were pending and with more than 22
thousand fresh complaints received during the year, there were a total of 24,136 complaints.
Out of these, 23,487 complaints (97 percent) were settled during the year and only 649
complaints remained pending. In 2012-13, the number of complaints was much less and, after
settlement, only 93 complaints remained pending. The details are given in Table 4.24.
Table 4.24 : Public Complaints Handled in Postal Department (2011-12 and 2012-13)
Items 2011-12 2012-13
Complaints Pending 1300 649
Complaints received during the year 22836 15002
Total 24136 15651
No. settled during the year 23487 15558
No. Pending 649 93
Source: Chief Postmaster General, Bihar Circle
In 2011-12, including MNREGA accounts, there were in all 354.99 lakh live accounts with the
post offices under Bihar circle and the amount in deposit (closing balance) was Rs. 15.77 crore.
As against this, in 2012-13, the deposits were Rs. 11.94 crore in 269.19 lakh accounts, showing
around 26 percent decrease over last year. However, in the first half of 2013-14 (upto
September, 2013), the number of live accounts including MNREGA became 272.79 lakh with
a total deposit of Rs. 11.71 crore, which appears to be quite substantial. The number of
accounts and the amount in deposit under different schemes are given in Table 4.25.

136
Table 4.25 : Number of Live Accounts and Amounts in Deposit
Scheme
No. of
Accounts
(lakh)
Amount
(in Rs. lakh)
No. of
Accounts
(lakh)
Amount
(in Rs. lakh)
No. of
Accounts
(lakh)
Amount
(in Rs. lakh)
2012 2013 2013-14,upto Sept. 2013
Saving Bank 180.24 815.22 146.77 244.46 150.03 253.58
MNREGS 61.54 260.08 65.92 150.05 66.37 52.66
MIS 7.86 118.00 11.09 427.29 10.82 445.30
SCSS 68.53 139.80 0.25 4.01 0.26 5.47
1 yr TD 4.58 98.33 6.90 180.57 7.01 211.25
2 yrTD 0.89 1.87 1.13 5.27 1.08 6.44
3 yr TD 1.59 14.58 2.23 20.24 2.26 22.14
5 yr TD 2.12 5.66 2.93 18.28 2.97 22.76
RD 27.25 116.81 31.50 105.12 31.52 111.48
PPF 0.40 7.15 0.46 38.32 0.47 39.91
10 yr CTD – – 0.01 0.07 0.01 0.07
Total 354.99 1577.49 269.19 1193.69 272.79 1171.05
Source : Chief Postmaster General, Bihar Circle
As is discerned, as on March 2013, there were 65.92 lakh live accounts with the post offices
under MNREGA Scheme in Bihar circle, with a deposited amount of Rs. 1.50 crore. The
number of live accounts became 66.36 lakh by September, 2013 showing an increase over the
previous year. However, the deposits did not keep pace with the increase in number of
accounts and remained at only about one-third of the last year's deposits.
4.8 Urban Infrastructure
Jawaharlal Nehru National Urban Renewal Mission (JNNURM)
The Jawaharlal Nehru National Urban Renewal Mission (JNNURM) was launched by the
Ministry of Urban Development for a seven year period, ending in March 2012. It aimed at
encouraging the cities to initiate steps for improvements in civic services in a phased manner.
The government later extended the tenure of the Mission for two more years, upto March,
2014. Under the Urban Infrastructure and Governance (UIG) component of JNNURM, 65
cities have been selected from across the country, of which 2 cities (Patna and Bodh Gaya) are
from Bihar. The components under the sub-mission Urban Infrastructure and Governance
(UIG) include urban renewal, water supply, sanitation, sewerage and solid waste management,

137
urban transport, preservation of water bodies, etc. The JNNURM has also emphasised the
implementation of three key mandatory pro-poor reforms which include (a) internal
earmarking within the local body budgets for basic services for urban poor, (b) at least 20-25
percent of developed land in all housing projects earmarked for economically weaker sections/
low income category, and (c) implementation of seven point charter for provisioning of seven
basic services of urban renewal, water supply, sanitation, etc.
State-Plan
Under the State-Plan, various schemes like water supply, drainage construction, roads,
Mukhyamantri Urban Development schemes are being undertaken for which Rs. 26.67 crore,
Rs. 18.90 crore, Rs. 48.87 crore and Rs. 40.60 crore respectively have been budgeted for the
year 2012-13. Similarly, under non-plan head, a budget provisioin of Rs. 264.77 crore was
made in the light of Fourth State Finance Commission recommendation and another Rs. 155
crore as per the Thirteenth Finance Commission recommendations.
Table 4.26 : State Plans for 2012-13
Sl.
No. Plans
Budget
(Rs. crore)
1 Water Supply 26.67
2 Drain Construction 18.90
3 Civil Amenities 50.70
4 Road Construction 48.87
5 Mukhyamantri Urban Development Scheme 140.60
6 Fixed Allowances to Elected Representatives 1.46
7
Construction of Administrative Buildings for
Nagar Parishad and Nagar Panchayats 8.48
8 Non-Plan
a Fourth State Finance Commission 264.77
b 13th Finance Commission 155.00
Source : Department of Urban Development and Housing, GOB

138
Centrally Sponsored Scheme
Under Integrated Housing and Slum Development Programme (IHSDP), a Centrally
Sponsored Scheme, 32 projects have been approved by the central Government for 28 towns of
the state and the amounts against 31 projects have already been released. The work under first
phase of the projects in 15 towns is nearing completion. The work is to start shortly in another
16 towns.
Table 4.27 : Centrally Sponsored ongoing Schemes
Sl.
No. Name of the City
Project
Cost
(Rs. crore)
Approved
Units
1 Nagar Parishad , Barh 34.66 1154
2 Nagar Parishad , Kishanganj Phase-2 30.55 1255
3 Nagar Parishad , Jamui 25.3 960
4 Nagar Parishad , Forbesganj 21.53 870
5 Nagar Parishad , Munger 20.19 784
6 Nagar Parishad , Araria 21.26 728
7 Nagar Parishad , Madhepura Phase-2 2.32 776
8 Nagar Parishad , Saharsa 19.32 820
9 Nagar Parishad , Barh Phase-2 20.29 500
10 Nagar Parishad ,Belsand 50.54 1487
11 Nagar Parishad , Mokamah 69.54 1950
12 Nagar Parishad , Navinagar 43.66 1277
13 Nagar Parishad , Purnea Phase-2 50.86 1615
14 Nagar Parishad , Naubatpur 49.07 1500
15 Nagar Parishad , Thakurganj 42.04 1323
Source : Department of Urban Development and Housing, GOB
The execution of the above mentioned projects is taken up by the Hindustan Pre-fab Ltd.
(HPL) and the Bihar Urban Infrastructure Development Corporation Ltd. (BUIDCO). The HPL
is constructing 3405 residential units, of which 2690 are complete, and a sum of Rs. 81.89
crore has been spent till date.
Basic Services for Urban Poor (BSUP)
For Patna agglomeration area (Patna Municipal Corporation, Khagaul, Phulwarisharif and
Danapur), 20,372 residential units at a total cost of Rs. 655.41 crore have been sanctioned.

139
Similarly, for Bodh Gaya town, approval has been accorded for 2000 residential units at a cost
of Rs. 54.57 crore. In Patna urban agglomeration, 384 units have been completed at a cost of
Rs. 12.57 crore.
Urban Infrastructure
Under JNNURM, a total of 10 projects have been approved with the share of centre and the
state being 50:50 for Patna and 80:20 for Bodh Gaya. The total cost of these 10 projects is
estimated at Rs. 758.47 crore, of which the main projects relate to water supply and solid waste
management of Patna town, and water supply only in Danapur, Khagaul, Phulwarisharif and
Bodh Gaya. In Bodh Gaya town, the work on drainage construction has also been taken up and
on 6 such projects, almost 60 percent work is over. In Patna agglomeration and Bodh Gaya, the
work on plying of city buses is being taken up. (Table A4.4 Appendix).
Urban Infrastructure Development Scheme for Small and Medium Towns (UIDSSMT)
A total of 11 projects, with the share of centre and state being 80:20, has been approved for
infrastructure development in small and medium towns in the state. A sum of Rs. 261.14 crore
will be spent on these 11 projects. Of the total cost, a sum of Rs. 152.57 crore is earmarked for
road-cum-drainage construction in 9 towns, viz., Fatuha, Murliganj, Narkatiaganj, Rosera,
Barbigha, Bhabhua, Bakhtiarpur, Lalganj and Chakia. Besides, Rs. 98.72 crore is earmarked
for water-supply in Muzaffarpur and Rs. 9.84 crore for solid waste management in Ara town.
Under this scheme, a total of Rs. 77.44 crore has been spent till date.
National Ganga River Basin Authority (NGRBA)
The Ministry of Environment and Forests, Government of India has approved the above
scheme for four towns of Hajipur, Begusarai, Buxar and Munger at a total cost of Rs. 441.86
crore. For this, an amount of Rs. 35.37 crore has been released by the Government of India as
the first instalment of its share, along with an amount of Rs. 15.16 crore as the first installment
of state share. Till date, an amount of Rs. 44.80 crore has been spent on these schemes. The
work is being executed by the Bihar Urban Infrastructure Development Corporation Ltd. The
shares of the centre and state for this scheme is 70:30. Likewise, approval has been accorded
by the Government of India for the development of the bank of the Ganga river with the
140
assistance of the World Bank. Under this scheme, 20 banks on the Ganga river will
constructed, which will help in keeping the river clean and pollution free.
Swarn Jayanti Shahri Rozgar Yojana (SJSRY)
The revised guidelines on SJSRY by the central government are under operation since April
2009. This programme is meant for the persons under BPL category, as defined by the
Planning Commission. There are five components of the programme, (i) Urban Self-
Employment Programme (USEP), (ii) Urban Women Self-Help Programme (UWSHP), (iii)
Skill Development Training for Employment Promotion amongst Urban Poor (STEPUP), (iv)
Urban Wage Employment Programme (UWEP), and (v) Urban Community Development
Network (UCDN). The financial support for these programmes is in the proportion of 75:25
between the centre and the state. The employment orientated training to 34,500 beneficiaries is
being imparted in as many as 17 trades through 65 listed state level institutions.
4.9 Irrigation
The irrigation system and watershed management are important infrastructure for rural
economy. This is primarily because assured irrigation facilities boost up agriculture production
and thereby enhance the income of the rural population. Besides, this also helps ensuring food
security, both for Bihar and entire country.
Bihar is extremely rich in water resources, and has enough water to irrigate virtually the whole
of its cultivable area. Yet the irrigated area here is only 49 percent, and only around 50 percent
of the cultivated area is sown more than once. In several states of India, the proportion of the
net irrigated area and the cropping intensity are much higher. The inadequate and inefficient
utilization of water resources in Bihar can be ascribed mainly to continued neglect of the
operation and maintenance (O&M) of canals and water bodies. The other important reason is
the lack of participation of the beneficiary farmers in the management of irrigation resources in
several areas. Bihar has witnessed some noteworthy examples of participatory management of
irrigation; however, their replication has been slow, mainly because the water users have not
been given the responsibility of managing the water resources.

141
Bihar has the total ultimate irrigation potential of 117.54 lakh hectares, including major,
medium and minor irrigation schemes, using both surface and ground water sources. While
major and medium irrigation schemes have an ultimate potential of 53.53 lakh hectares, the
minor irrigation has a potential of 64.01 lakh hectares.
Table 4.28 : Ultimate, Created and Achieved Irrigation Potential of the State
(Area in Lakh Ha.)
Type of Irrigation Potential Ultimate
Potential
Created
Potential
Utilised
Potential
(a) Major and Medium Irrigation 53.53 28.86 16.36
(b) Minor Irrigation
(i) Surface Irrigation (Including Ahars & Pynes) 15.44 5.19 2.36
(ii) Ground Water (mostly private shallow tube well) 48.57 28.99 26.75
Total 117.54 63.041 45.468
Source : Department of Water Resources, GOB
As is discerned from Table 4.28, against the already created potential of 63.04 lakh hectares,
through the major, medium and minor water resources schemes, only 45.47 lakh hectares of
irrigation is utilised annually and an irrigation potential of about 17.57 lakh hectares has been
lost, which need to be restored. It is further observed that the lost irrigation potential in respect
of major and medium irrigation is as high as 12.5 lakh hectares, as against only 5.1 lakh
hectares in case of minor irrigation. As per the Agriculture Road Map of Bihar, in order to
achieve the proposed agricultural production, 158 percent irrigation intensity is required by the
year 2017, and 209 percent by the year 2022. This will ensure that irrigation could be provided
in 99.00 lakh hectares by 2017 and 130.90 lakh hectares by 2022.
From the year 2011-12 upto September, 2013 a total of 29.63 thousand hectares of irrigation
potential in major and medium irrigation sector has been created (Table 4.29).

142
Table 4.29 : Physical Progress of Creation of Irrigation Potential during 2011-12, 2012-13 and 2013-14
upto September
Sl.
No. Name of Scheme
Irrigation
Potential
Created
(in Ha)
2011-12
1 Western Kosi Canal Scheme 2000
2 North Kosi Resevoir Scheme 2000
3 Bachhraja Weir 2530
Total 6530
2012-13
1 Western Kosi Canal Scheme 7000
2 Jamania Pump Canal Scheme 8700
3 Sammat Bigha Morhar Weir 3800
4 Kachnama Weir 300
5 Mor Weir 700
6 Solhanda Weir 200
Total 20700
2013-14 (upto September, 2013)
1 Jamania Pump Canal Scheme 400
2 Sugarwey Weir Scheme 500
3 Kachnama Weir 1200
4 Mor Weir 300
Total 2400
Grand Total 29630
Source : Department of Water Resources, GOB
Major and Medium Irrigation
There has been a vast gap between the irrigation potential created and the total area irrigated
under major and medium irrigation. The utilisation efficiency registered a sharp decline from
around 63 percent in 2005-06 to around 42 percent in 2010-11. However, it improved to 52
percent in 2011-12. It is an admitted fact that, on account of heavy sedimentation and
breach in the canal systems, full utilisation of irrigation potential becomes very difficult.
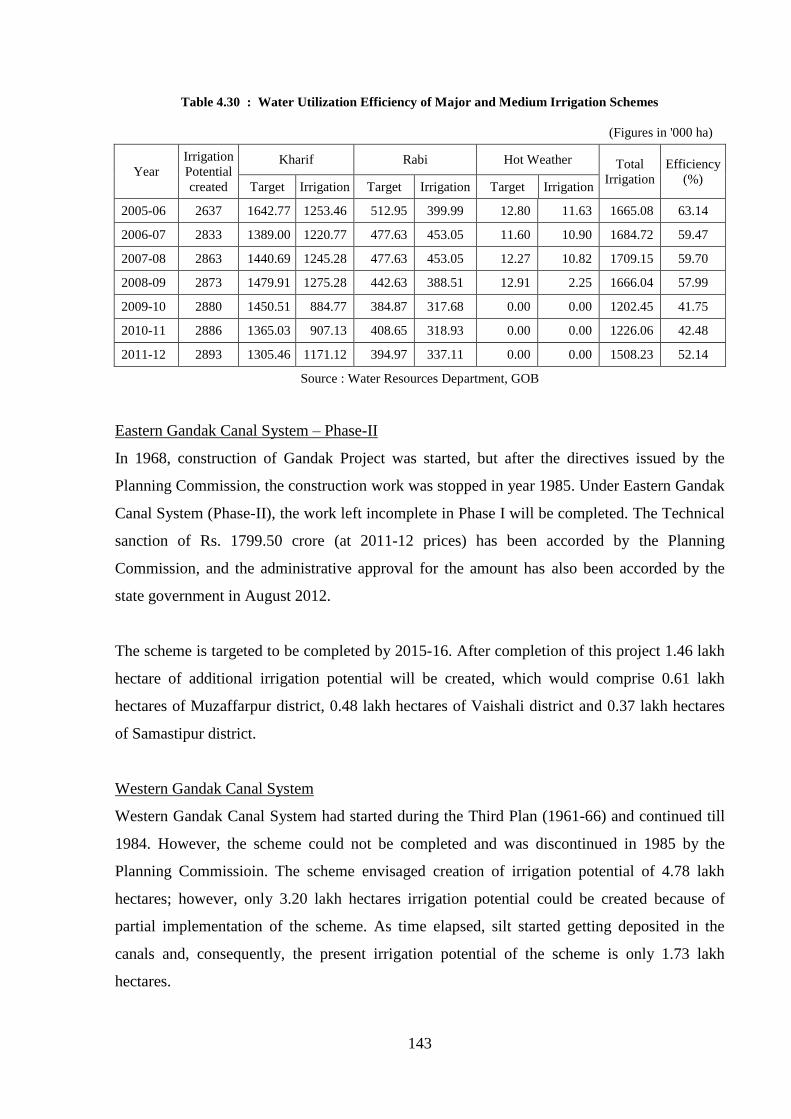
143
Table 4.30 : Water Utilization Efficiency of Major and Medium Irrigation Schemes
(Figures in '000 ha)
Year
Irrigation
Potential
created
Kharif Rabi Hot Weather Total
Irrigation
Efficiency
(%) Target Irrigation Target Irrigation Target Irrigation
2005-06 2637 1642.77 1253.46 512.95 399.99 12.80 11.63 1665.08 63.14
2006-07 2833 1389.00 1220.77 477.63 453.05 11.60 10.90 1684.72 59.47
2007-08 2863 1440.69 1245.28 477.63 453.05 12.27 10.82 1709.15 59.70
2008-09 2873 1479.91 1275.28 442.63 388.51 12.91 2.25 1666.04 57.99
2009-10 2880 1450.51 884.77 384.87 317.68 0.00 0.00 1202.45 41.75
2010-11 2886 1365.03 907.13 408.65 318.93 0.00 0.00 1226.06 42.48
2011-12 2893 1305.46 1171.12 394.97 337.11 0.00 0.00 1508.23 52.14
Source : Water Resources Department, GOB
Eastern Gandak Canal System – Phase-II
In 1968, construction of Gandak Project was started, but after the directives issued by the
Planning Commission, the construction work was stopped in year 1985. Under Eastern Gandak
Canal System (Phase-II), the work left incomplete in Phase I will be completed. The Technical
sanction of Rs. 1799.50 crore (at 2011-12 prices) has been accorded by the Planning
Commission, and the administrative approval for the amount has also been accorded by the
state government in August 2012.
The scheme is targeted to be completed by 2015-16. After completion of this project 1.46 lakh
hectare of additional irrigation potential will be created, which would comprise 0.61 lakh
hectares of Muzaffarpur district, 0.48 lakh hectares of Vaishali district and 0.37 lakh hectares
of Samastipur district.
Western Gandak Canal System
Western Gandak Canal System had started during the Third Plan (1961-66) and continued till
1984. However, the scheme could not be completed and was discontinued in 1985 by the
Planning Commissioin. The scheme envisaged creation of irrigation potential of 4.78 lakh
hectares; however, only 3.20 lakh hectares irrigation potential could be created because of
partial implementation of the scheme. As time elapsed, silt started getting deposited in the
canals and, consequently, the present irrigation potential of the scheme is only 1.73 lakh
hectares.

144
The Western Gandak Canal System takes off from the Valmikinagar Barrage. The designed
discharge at the take-off point is 18,800 cusecs. The main canal enters Uttar Pradesh 19 kms
downstream from Valmikinagar Barrage, and after flowing 131.20 kms, it re-enters Bihar at
Sukhdeopatti in Kuchaikot block of Gopalganj district. Thereafter, it is known as Saran Main
Canal.
The proposed scheme shall ensure irrigation in 14 blocks of Gopalganj district, 20 of Saran
district and 19 of Siwan district. The proposed scheme provides for restoration of lost irrigation
potential of 1.47 lakh hectares and creation of additional irrigation potential of 1.58 lakh
hectares. The work on the proposed scheme is planned to be taken up during the period 2012-
13 to 2016-17 with the target of completion being March 2017. The estimated cost of the
scheme is Rs. 2169.51 crore which has been examined and approved by the Central Water
Commission in 2012. The scheme has been granted administrative approval in November,
2012.
Construction of Barrage on Dardha river near village Lavaich- Rampur
The administrative approval of the above barrage at a cost of Rs. 25.88 crores has been
accorded in September, 2012. The construction of the barrage is proposed on the river Dardha
between the villages Lavaich and Rampur under Dhanarua Block of Patna district. The scheme
is proposed to be completed by May 2014. On completion of the scheme, 8 thousand hectares
of additional irrigation potential will be created.
Construction of Malai Barrage
The construction of Malai barrage at a cost of Rs. 2.67 crores was sanctioned in the year 1987,
but the project could not start. Later, an administrative approval has been accorded for the
project in May, 2012, for which the revised cost estimate is Rs. 58.26 crore. The construction
of this barrage is proposed on the river Kaw near Batasa village of Davath Block in Rohtas
district. The scheme is to be completed by the end of 2016. On completion of scheme, an
additional irrigation potential of 5630 hectares would be created.
Construction of Barrage in place of Kunder Weir
The administrative approval for the construction of the barrage in place of old and damaged
Kunder Weir under Lower Kiul River Valley Weir Irrigation Scheme at a cost of Rs. 22.52
crore has been accorded by Water Resources Department in May 2013. The irrigation potential
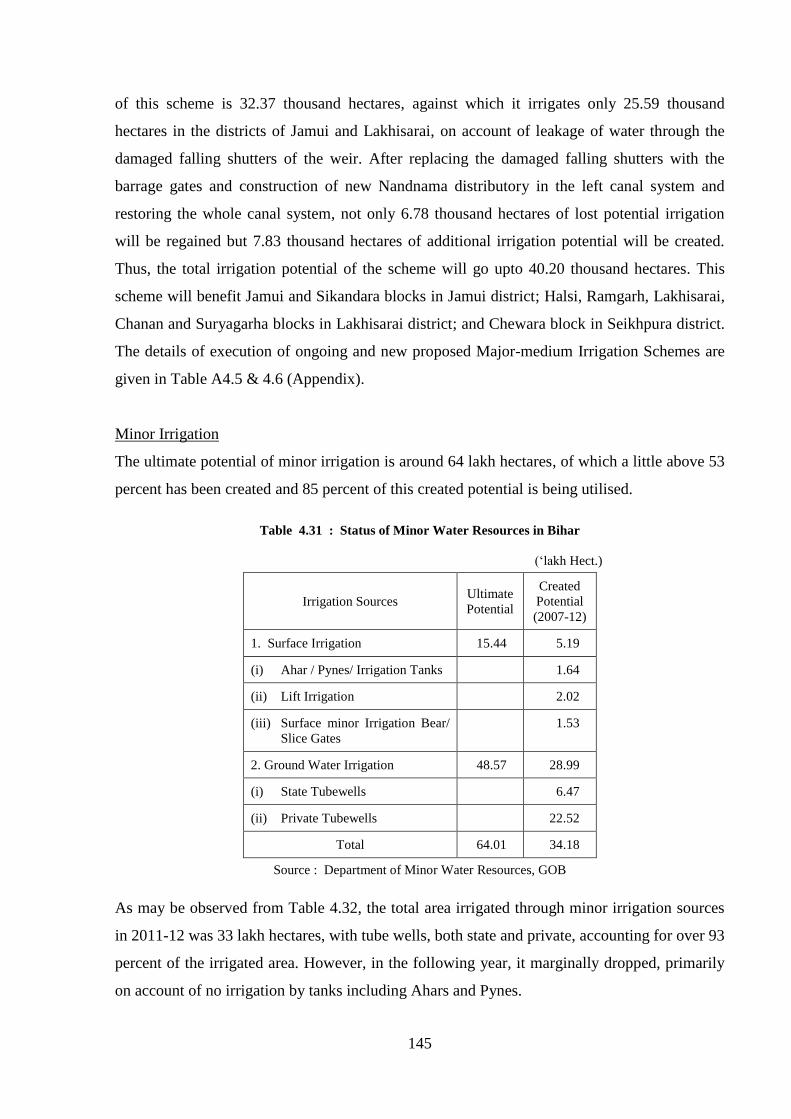
145
of this scheme is 32.37 thousand hectares, against which it irrigates only 25.59 thousand
hectares in the districts of Jamui and Lakhisarai, on account of leakage of water through the
damaged falling shutters of the weir. After replacing the damaged falling shutters with the
barrage gates and construction of new Nandnama distributory in the left canal system and
restoring the whole canal system, not only 6.78 thousand hectares of lost potential irrigation
will be regained but 7.83 thousand hectares of additional irrigation potential will be created.
Thus, the total irrigation potential of the scheme will go upto 40.20 thousand hectares. This
scheme will benefit Jamui and Sikandara blocks in Jamui district; Halsi, Ramgarh, Lakhisarai,
Chanan and Suryagarha blocks in Lakhisarai district; and Chewara block in Seikhpura district.
The details of execution of ongoing and new proposed Major-medium Irrigation Schemes are
given in Table A4.5 & 4.6 (Appendix).
Minor Irrigation
The ultimate potential of minor irrigation is around 64 lakh hectares, of which a little above 53
percent has been created and 85 percent of this created potential is being utilised.
Table 4.31 : Status of Minor Water Resources in Bihar
(‘lakh Hect.)
Irrigation Sources Ultimate
Potential
Created
Potential
(2007-12)
1. Surface Irrigation 15.44 5.19
(i) Ahar / Pynes/ Irrigation Tanks 1.64
(ii) Lift Irrigation 2.02
(iii) Surface minor Irrigation Bear/
Slice Gates
1.53
2. Ground Water Irrigation 48.57 28.99
(i) State Tubewells 6.47
(ii) Private Tubewells 22.52
Total 64.01 34.18
Source : Department of Minor Water Resources, GOB
As may be observed from Table 4.32, the total area irrigated through minor irrigation sources
in 2011-12 was 33 lakh hectares, with tube wells, both state and private, accounting for over 93
percent of the irrigated area. However, in the following year, it marginally dropped, primarily
on account of no irrigation by tanks including Ahars and Pynes.
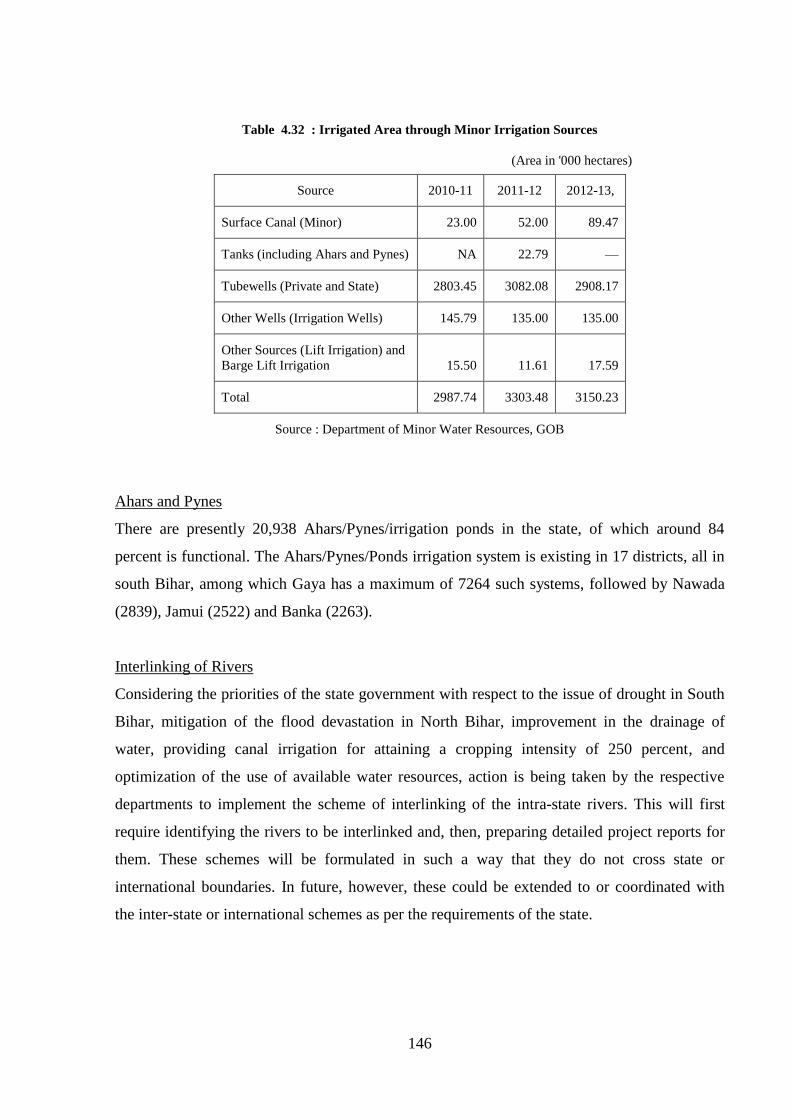
146
Table 4.32 : Irrigated Area through Minor Irrigation Sources
(Area in '000 hectares)
Source 2010-11 2011-12 2012-13,
Surface Canal (Minor) 23.00 52.00 89.47
Tanks (including Ahars and Pynes) NA 22.79 —
Tubewells (Private and State) 2803.45 3082.08 2908.17
Other Wells (Irrigation Wells) 145.79 135.00 135.00
Other Sources (Lift Irrigation) and
Barge Lift Irrigation 15.50 11.61 17.59
Total 2987.74 3303.48 3150.23
Source : Department of Minor Water Resources, GOB
Ahars and Pynes
There are presently 20,938 Ahars/Pynes/irrigation ponds in the state, of which around 84
percent is functional. The Ahars/Pynes/Ponds irrigation system is existing in 17 districts, all in
south Bihar, among which Gaya has a maximum of 7264 such systems, followed by Nawada
(2839), Jamui (2522) and Banka (2263).
Interlinking of Rivers
Considering the priorities of the state government with respect to the issue of drought in South
Bihar, mitigation of the flood devastation in North Bihar, improvement in the drainage of
water, providing canal irrigation for attaining a cropping intensity of 250 percent, and
optimization of the use of available water resources, action is being taken by the respective
departments to implement the scheme of interlinking of the intra-state rivers. This will first
require identifying the rivers to be interlinked and, then, preparing detailed project reports for
them. These schemes will be formulated in such a way that they do not cross state or
international boundaries. In future, however, these could be extended to or coordinated with
the inter-state or international schemes as per the requirements of the state.
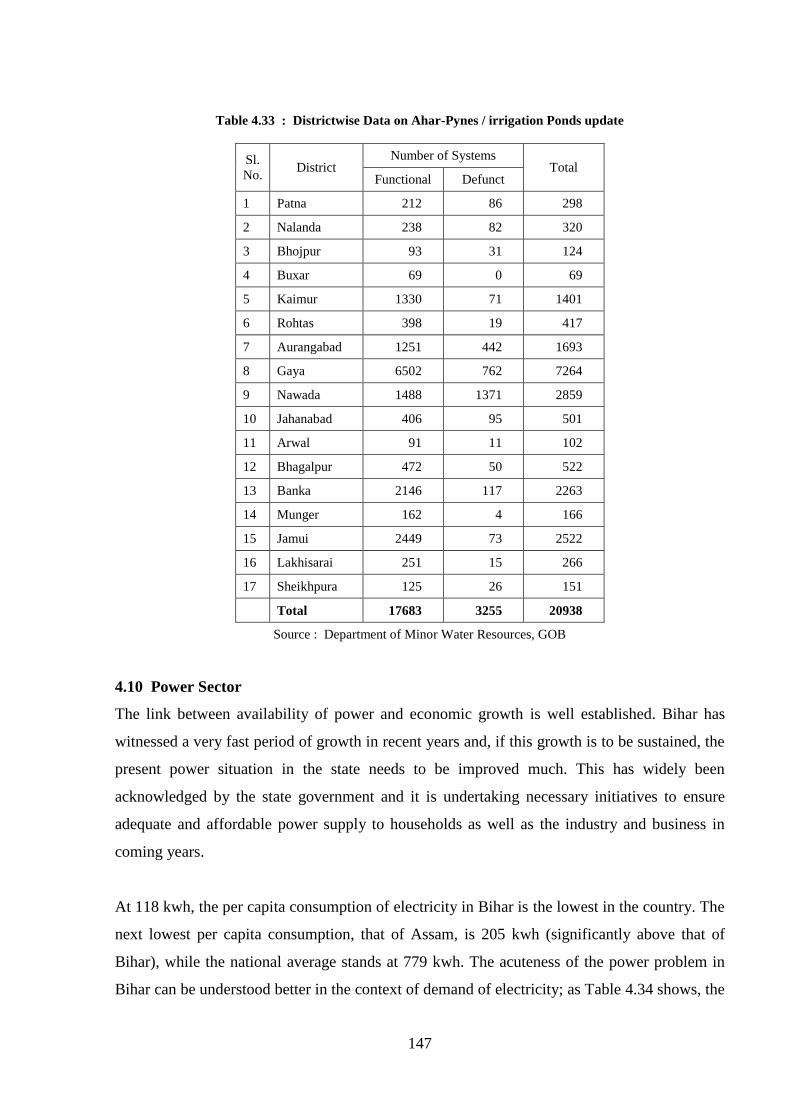
147
Table 4.33 : Districtwise Data on Ahar-Pynes / irrigation Ponds update
Sl.
No. District
Number of Systems Total
Functional Defunct
1 Patna 212 86 298
2 Nalanda 238 82 320
3 Bhojpur 93 31 124
4 Buxar 69 0 69
5 Kaimur 1330 71 1401
6 Rohtas 398 19 417
7 Aurangabad 1251 442 1693
8 Gaya 6502 762 7264
9 Nawada 1488 1371 2859
10 Jahanabad 406 95 501
11 Arwal 91 11 102
12 Bhagalpur 472 50 522
13 Banka 2146 117 2263
14 Munger 162 4 166
15 Jamui 2449 73 2522
16 Lakhisarai 251 15 266
17 Sheikhpura 125 26 151
Total 17683 3255 20938
Source : Department of Minor Water Resources, GOB
4.10 Power Sector
The link between availability of power and economic growth is well established. Bihar has
witnessed a very fast period of growth in recent years and, if this growth is to be sustained, the
present power situation in the state needs to be improved much. This has widely been
acknowledged by the state government and it is undertaking necessary initiatives to ensure
adequate and affordable power supply to households as well as the industry and business in
coming years.
At 118 kwh, the per capita consumption of electricity in Bihar is the lowest in the country. The
next lowest per capita consumption, that of Assam, is 205 kwh (significantly above that of
Bihar), while the national average stands at 779 kwh. The acuteness of the power problem in
Bihar can be understood better in the context of demand of electricity; as Table 4.34 shows, the

148
peak deficit has been around 30 percent for several years in the past. The table also shows that
while peak availability has been increasing, it has been just about enough to catch up with
increasing peak demand, but not to bridge the deficit. This deficit is only likely to widen in the
near future, as the recent submission of the Bihar State Power Holding Company to the Central
Electricity Authority (CEA) show that the peak load is expected to increase at least 14 percent
per annum, if not more (Table 4.35).
Table 4.34 : Power Supply Position in Bihar
Year
Peak
Demand
(MW)
Peak
Availability
(MW)
Deficit
(MW) Deficit (%)
2007-08 1,800 1,244 556 30.9
2008-09 1,900 1,348 552 29.1
2009-10 2,200 1,508 692 31.5
2010-11 2,250 1,664 586 26.0
2011-12 2,500 1,712 788 31.5
2012-13 2,650 1,802 848 32.0
2013-14
(Sept. 2013-
present)
3,150 2,190 960 30.5
Source: Bihar State Power Holding Company
Table 4.35 : Forecast of Peak Load and Energy Requirement (2013-14 to 2016-17)
Year Peak Load
(MW)
Energy
Requirement
(MU)
2013-14 3,194 19,478
2014-15 3,873 23,214
2015-16 4,472 26,330
2016-17 5,108 29,539
Source: Department of Energy, Government of Bihar
There are three key organisations in the energy sector in Bihar — Bihar State Electricity Board
(BSEB), Bihar State Hydroelectric Power Corporation Limited (BSHPC) and Bihar Renewable
Energy Development Agency (BREDA). The next sections briefly describes the
responsibilities of each of these organisations.

149
Bihar State Electricity Board (BSEB) and its unbundling
The BSEB was originally constituted on 1st April, 1958 under Section 5 of the Electricity
(Supply) Act, 1948 and was mandated for management of generation, transmission,
distribution of electricity and related activities in Bihar. With effect from November 1, 2012,
under the new Bihar State Electricity Reforms Transfer Scheme 2012, the BSEB has been
unbundled into five companies — Bihar State Power (Holding) Company Limited (holding
company) (BSPHCL), Bihar State Power Generation Company, Bihar State Power
Transmission Company, South Bihar Power Distribution Company and North Bihar Power
Distribution Company.
Chart 4.11 : Unbundling of BSEB
Before analysing the current state of the energy sector in Bihar, the roles and responsibilities of
the newly formed companies are described below:
Bihar State Power (Holding) Company Limited (BSHPCL) is the holding company of the 4
other companies. It is vested with the assets, interest in property, rights and liabilities of
erstwhile BSEB. The Company will primarily be an investment company. It will coordinate the
activities of 4 other companies, handle disputes and provide all necessary support to them.
Bihar State Power Generating Company (BSPGC) Limited is responsible for coordinating and
advising other companies and concerns, including subsidiaries, engaged in the generation of
electricity, and on all matters concerning the construction, operation and maintenance of
generating stations and associated facilities. It is also responsible for procuring fuel and its
transportation to various sites and settling of pending disputes.
Bihar State Power Transmission Company (BSPTC) Limited is responsible for transmission of
electricity and it is vested with the transmission assets, interest in property, and rights and
liabilities of the erstwhile BSEB. It will undertake planning and coordination activities with
Bihar State
Power
(Holding)
Company Ltd.
Bihar State
Electricity
Board
Bihar State Power Generating Company Ltd.
Bihar State Power Transmission Company Ltd.
Ltd.d.Ltd.
North Bihar Power Distribution Company Ltd.
South Bihar Power Distribution Company Ltd.

150
regard to intra-state transmission and develop an efficient and economical system of intra-state
transmission lines for smooth transmission of electricity from generating stations to load
centres.
North and South Bihar Power Distribution Companies Limited undertake the activities of
distribution to all consumers, trading of electricity, implementation of rural electrification
schemes and introduce open access in distribution as per the Electricity Act 2003 and the
directions of the regulator. They also tender, finalise and execute Power Purchase Agreements
and other agreements for sale or purchase of electricity.
The allocation for BSEB in 2013-14 amounts to Rs. 1,884.4 crore; the division of this amount
across various heads is given in Table 4.36, including the funds for Restructured Accelerated
Power Development and Reforms Project (R-APDRP).
Table 4.36 : Approved Outlay for BSPHCL (2013-14)
Heads Outlay
(Rs. crore)
BRGF 957.5
Generation ---
Transmission 133.6
Distribution 439.5
R-APDRP/APDRP 128.8
EAP 225
Total 1884.4
Source : Annual Plan Document for Bihar
Generation
Bihar is almost completely dependent on central sector allocations to meet its energy demand
at present. Although the state has an annual allocation of about 1,772 MW of power, it receives
only around 900-1000 MW per year on an average. This further deteriorates the power supply
condition in Bihar. The acute dependence of Bihar on the centre for availability of power is
primarily because the installed capacity of its own is only 440 MW in thermal power plants
and 54.3 MW in hydel power. The situation is made worse as the actual generation in the state
is well below the installed capacity. This can be seen from Table 4.37 that demonstrates power
generated and purchased by the state.

151
Table 4.37 : Power Generation and Purchase vis-à-vis peak demand
(MW)
Year Peak
Demand
Met by
Total Peak
Deficit
Peak
Deficit as
% of
Peak
Demand
Own
Generati
on as %
of Peak
Demand
Own
Generation
Import
(purchase)
2005-06 1,175 42.7 1,052.3 1,095 80 6.8 3.6
2006-07 1,275 37.5 1,175.5 1,213 62 4.9 2.9
2007-08 1,800 64.2 1,179.8 1,244 556 30.9 3.6
2008-09 1,900 72.2 1,275.9 1,348 552 29.1 3.8
2009-10 2,500 56.4 1,451.7 1,508 992 39.7 2.3
2010-11 1,902 51.3 1,253 1,304 598 31.4 2.7
2011-12 2,226 38.9 1,386 1,425 801 36 1.8
2012-13 2,642 NA 1,515 1,515 1127 42.7 NA
Source : BSPHCL
As can be seen from the table, although the total installed capacity is around 494.3 MW, the
generation has never exceeded 72.2 MW in recent years; in 2011-12 (the last year for which
generation data is available as of now), the generation was only 38.9 MW. This poor situation
can be better understood by studying the three generating units, that were left to present Bihar,
after its separation from Jharkhand in 2000.
(1) Barauni Thermal Power Station (BTPS) : This is the only power station under the state’s
control. Although BTPS has 7 different units, 5 of them have already run through their
working life and are not available for operation anymore. As far as units 6 and 7 are
concerned, they have an installed capacity of 110 MW each, but they are both currently
shut for Renovation and Modernisation (R&M) work.
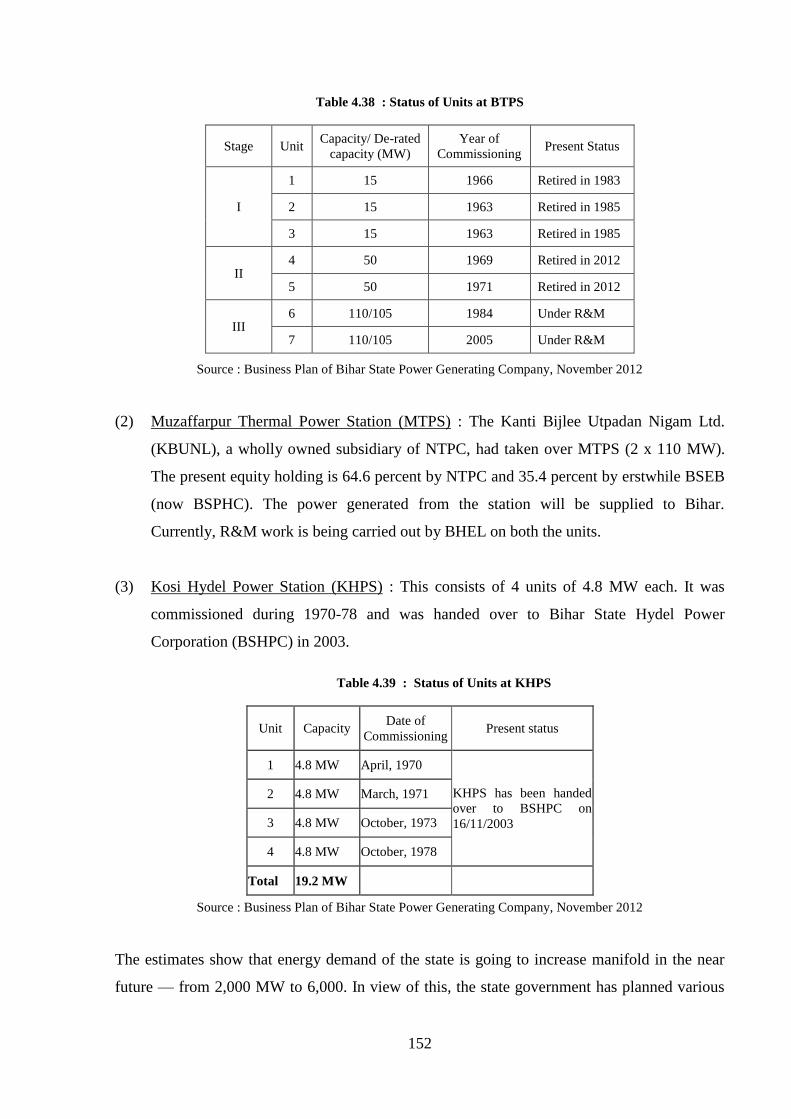
152
Table 4.38 : Status of Units at BTPS
Stage Unit Capacity/ De-rated
capacity (MW)
Year of
Commissioning Present Status
I
1 15 1966 Retired in 1983
2 15 1963 Retired in 1985
3 15 1963 Retired in 1985
II 4 50 1969 Retired in 2012
5 50 1971 Retired in 2012
III 6 110/105 1984 Under R&M
7 110/105 2005 Under R&M
Source : Business Plan of Bihar State Power Generating Company, November 2012
(2) Muzaffarpur Thermal Power Station (MTPS) : The Kanti Bijlee Utpadan Nigam Ltd.
(KBUNL), a wholly owned subsidiary of NTPC, had taken over MTPS (2 x 110 MW).
The present equity holding is 64.6 percent by NTPC and 35.4 percent by erstwhile BSEB
(now BSPHC). The power generated from the station will be supplied to Bihar.
Currently, R&M work is being carried out by BHEL on both the units.
(3) Kosi Hydel Power Station (KHPS) : This consists of 4 units of 4.8 MW each. It was
commissioned during 1970-78 and was handed over to Bihar State Hydel Power
Corporation (BSHPC) in 2003.
Table 4.39 : Status of Units at KHPS
Unit Capacity Date of
Commissioning Present status
1 4.8 MW April, 1970
KHPS has been handed
over to BSHPC on
16/11/2003
2 4.8 MW March, 1971
3 4.8 MW October, 1973
4 4.8 MW October, 1978
Total 19.2 MW
Source : Business Plan of Bihar State Power Generating Company, November 2012
The estimates show that energy demand of the state is going to increase manifold in the near
future — from 2,000 MW to 6,000. In view of this, the state government has planned various

153
other projects for enhancing the capacity for power generation. A list of the upcoming projects
in Bihar under the private sector, or public sector or through a joint venture, is presented in
Table 4.40.
Table 4.40 : Upcoming Projects in Bihar
Place Capacity
(MW) Agency Remarks
(A) Under BSEB
(i) Extension of Barauni TPS, District-
Begusarai 2X250 MW BSEB
Work in progress, being executed
by BHEL
(B) Under Joint Venture of BSEB &
NTPS
(i) Extention of KTPS, Kanti,
Muzaffapur 2X195 MW KBUNL
Work in progress, being executed
by BHEL
(ii) Nabinager Power Genarating CO, at
NabinagarDistric-Aurangabad 3X660 MW NPGCPL
Physical possession of land is
going on.
(C) Under Private/Public Sector
through Tariff Based Bidding
(i) Buxar Thermal Power Station, Chausa
(Buxar) 2X660 MW
Pvt-
BPICPL
Land acquisition under process
(ii) Lakhisarai Thermal Power Kajra,
(Lakhisarai) 2X660 MW
Pvt-
BPICPL
Land acquisition under process
(iii) Pirpainti Thermal Power Station,
Pirpainti, (Bhagalpur) 2X660 MW
Pvt-
BPICPL
Land acquisition under process
(D) Under Private Sector
(i) M/s JAS Infrastructure, Nagpur, at
Banka (Bhagalpur) 4X660 MW Pvt- JAS
Land acquisition under process
(ii) M/s Nalanda Power Company,
Kolkata, at Pirpaiti (Bhagalpur) 2000 MW
Pvt-
Nalanda
Land acquisition under process
(iii) M/s Ganga Power and Natural
Resources, Kolkata at Pirpainti
(Bhagalpur)
2X660 MW Pvt-
Adhunik
Land acquisition under process
(iv) M/s India Power Corporation, Kolkata
at East Champaran. 2X660 MW
Pvt-India
power
Land acquisition under process
(v) M/s Triton Energy, Gurgaon,
Haryana, at Barun (Aurangabad) 2X660 MW Pvt- Triton
(vi) M/s Essar Power, Ranchi at Pirpainti
(Bhagalpur) 3X660 MW
Pvt- Essar
Power
(vii) M/s Usha Martin, New Delhi at
Pirpainti (Bhagalpur)
1200-1320
MW
Pvt- Usha
Martin
(viii) M/s Sarvottam Infrastructure Finance,
Kolkata at Khalgaon. 54MW
Pvt-
Sarvottam
(ix) M/s Arrison Power, Kolkata at Banka. 2X660 MW
Pvt-
Arrison
Land acquisition under process
(x) M/s Global Powmin, Kolkata at
Nawada. 4X660 MW
Pvt-
Global
(xi) M/s Mirach Power, Hyderabad at
Lakhisarai. 2X660 MW
Pvt-
Mirach
Land identified.
(xii) M/s AES India, Gurgaon at Jagdispur
(Bhagalpur) 2X660 MW Pvt- AES
Land acquisition to be started
shortly.
(E) Nuclear Power Project.
(i) NPCIL has been requested for
installation of Nuclear Power Plant at
Rajauli.
4X700 MW NPCIL
Sufficient water is not available.
So, additional TPS to be taken.
Source : Bihar State Electricity Board
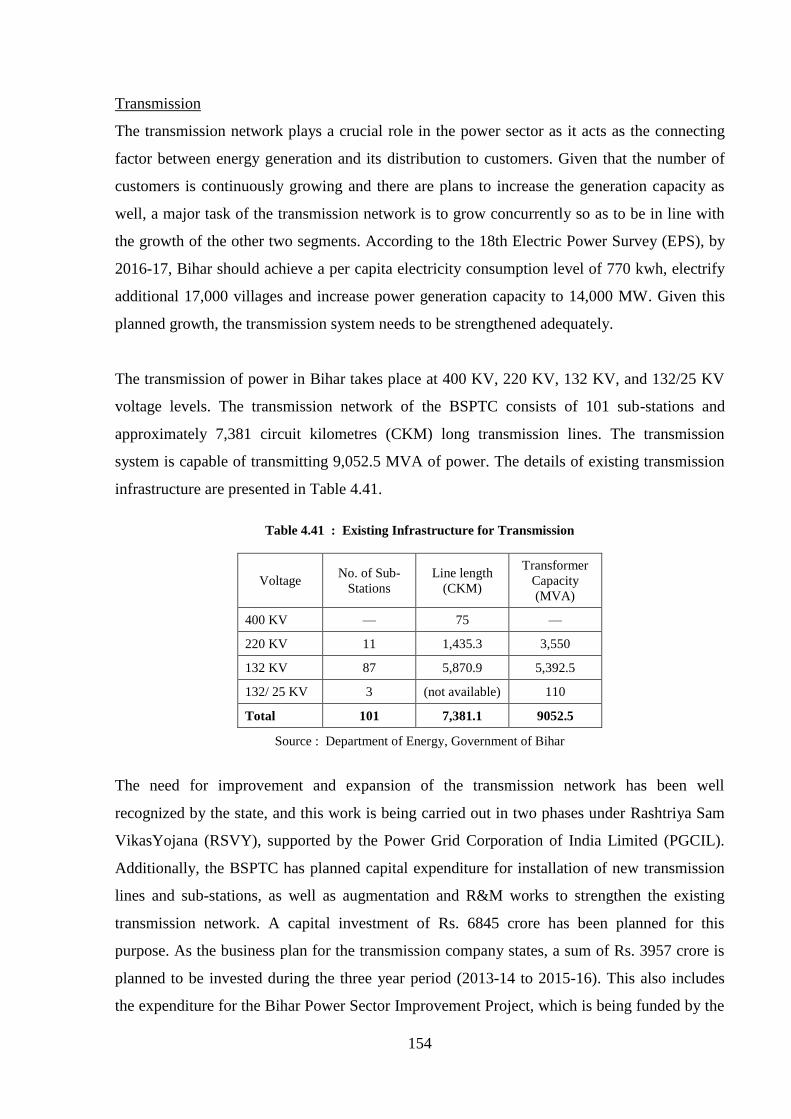
154
Transmission
The transmission network plays a crucial role in the power sector as it acts as the connecting
factor between energy generation and its distribution to customers. Given that the number of
customers is continuously growing and there are plans to increase the generation capacity as
well, a major task of the transmission network is to grow concurrently so as to be in line with
the growth of the other two segments. According to the 18th Electric Power Survey (EPS), by
2016-17, Bihar should achieve a per capita electricity consumption level of 770 kwh, electrify
additional 17,000 villages and increase power generation capacity to 14,000 MW. Given this
planned growth, the transmission system needs to be strengthened adequately.
The transmission of power in Bihar takes place at 400 KV, 220 KV, 132 KV, and 132/25 KV
voltage levels. The transmission network of the BSPTC consists of 101 sub-stations and
approximately 7,381 circuit kilometres (CKM) long transmission lines. The transmission
system is capable of transmitting 9,052.5 MVA of power. The details of existing transmission
infrastructure are presented in Table 4.41.
Table 4.41 : Existing Infrastructure for Transmission
Voltage No. of Sub-
Stations
Line length
(CKM)
Transformer
Capacity
(MVA)
400 KV — 75 —
220 KV 11 1,435.3 3,550
132 KV 87 5,870.9 5,392.5
132/ 25 KV 3 (not available) 110
Total 101 7,381.1 9052.5
Source : Department of Energy, Government of Bihar
The need for improvement and expansion of the transmission network has been well
recognized by the state, and this work is being carried out in two phases under Rashtriya Sam
VikasYojana (RSVY), supported by the Power Grid Corporation of India Limited (PGCIL).
Additionally, the BSPTC has planned capital expenditure for installation of new transmission
lines and sub-stations, as well as augmentation and R&M works to strengthen the existing
transmission network. A capital investment of Rs. 6845 crore has been planned for this
purpose. As the business plan for the transmission company states, a sum of Rs. 3957 crore is
planned to be invested during the three year period (2013-14 to 2015-16). This also includes
the expenditure for the Bihar Power Sector Improvement Project, which is being funded by the

155
Asian Development Bank (ADB). The transmission component of the project includes
construction of new transmission sub-station capacity, renovation and modernization of
existing sub-station capacity, and the addition of new or upgraded transmission lines (Table
4.42).
Table 4.42 : Bihar Power Sector Improvement Project -Current Status
Source : Business Plan for Bihar State Power Transmission Company, November 2012
Distribution
The distribution is an extremely important component of the whole electricity supply chain, as
this is the only arm that generates revenue that can be utilized towards improving the entire
supply chain, and also enable the state to purchase more electricity from the center. Thus, a
major challenge of the power sector reforms lies in the efficient management of the distribution
sector.
Sl.
No. Project
Cost
(Rs. crore)
1 Construction of 2x50 MVA, 132/33 KV Grid Subs-station at Dhanha
(West Champaran) on turnkey basis
49.15
2 Construction of 2x50 MVA, 132/33 KV Grid Sub-Station at
Gangwara (Darbhanga) on turnkey basis
3 Construction of 132 KV bay one each at Bettiah, Sasaram, Mohnia,
Dinara, Lakhisarai and Seikhpura G.S.S.
4 Construction of 4 no. 33 KV bay at remote end 33/11 KV Power
substations for down linking
5 Construction of 2x150 MVA 220/132 KV Grid Sub-Station at Pusauli
(Kaimur) 47.98
6 2 nos. 220 KV bay extensions at 220/132 KV Dehri Grid sub station
132 KV line (202 KM) 48.61
7 LILO of 132 kV Pandaul Line at Gangwara - 10 KMs (approx.) 2.41
8 Pusauli (New) - Sasaram DCCS line -50 KMs (approx.) 12.03
9 Pusauli (New) - Bhabhua DCCS line -15 KMs (approx.) 3.61
10 Pusauli (New) - Dinara DCCS line -45 KMs (approx.) 10.83
11 Lakhisarai - Shekhpura DCCS line-32 KMs (approx.) 7.70
12 Bettiah - Dhanha DCCS line-50 KMs (approx.) 12.03
33 KV line (40 KM) 9.63
13 New Line from132 kV Sub Station Dhanha (New) - 20 KMs
(approx.) 4.81
14 New Line from132 kV Sub Station Gangwara (New) - 20 KMs
(approx.) 4.81
15 LILO of both ckts of Sasaram (PGCIL)- Ara (PGCIL) 220 KV D/C
line at New Sub Station at Pusauli (New)- 6 KM 41.53 16 Pusauli (New)-Dehri (BSEB) 220 KV D/C line - 8 KM
Grand Total 196.89
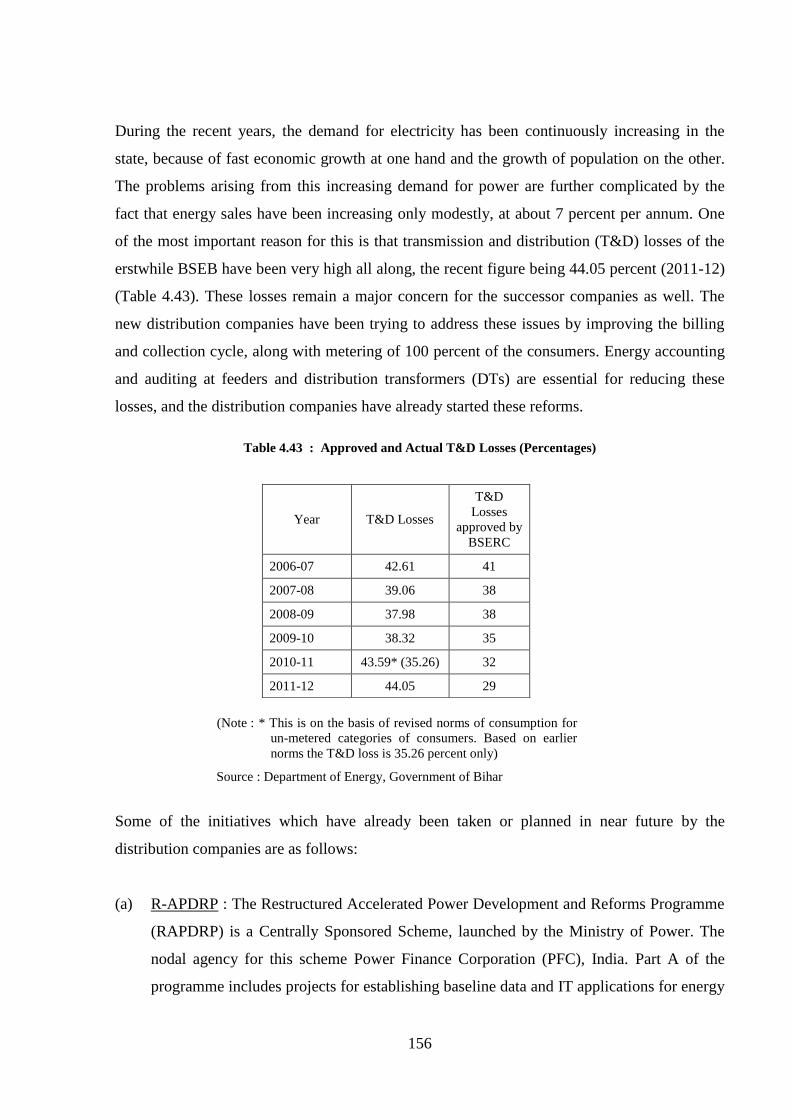
156
During the recent years, the demand for electricity has been continuously increasing in the
state, because of fast economic growth at one hand and the growth of population on the other.
The problems arising from this increasing demand for power are further complicated by the
fact that energy sales have been increasing only modestly, at about 7 percent per annum. One
of the most important reason for this is that transmission and distribution (T&D) losses of the
erstwhile BSEB have been very high all along, the recent figure being 44.05 percent (2011-12)
(Table 4.43). These losses remain a major concern for the successor companies as well. The
new distribution companies have been trying to address these issues by improving the billing
and collection cycle, along with metering of 100 percent of the consumers. Energy accounting
and auditing at feeders and distribution transformers (DTs) are essential for reducing these
losses, and the distribution companies have already started these reforms.
Table 4.43 : Approved and Actual T&D Losses (Percentages)
(Note : * This is on the basis of revised norms of consumption for
un-metered categories of consumers. Based on earlier
norms the T&D loss is 35.26 percent only)
Source : Department of Energy, Government of Bihar
Some of the initiatives which have already been taken or planned in near future by the
distribution companies are as follows:
(a) R-APDRP : The Restructured Accelerated Power Development and Reforms Programme
(RAPDRP) is a Centrally Sponsored Scheme, launched by the Ministry of Power. The
nodal agency for this scheme Power Finance Corporation (PFC), India. Part A of the
programme includes projects for establishing baseline data and IT applications for energy
Year T&D Losses
T&D
Losses
approved by
BSERC
2006-07 42.61 41
2007-08 39.06 38
2008-09 37.98 38
2009-10 38.32 35
2010-11 43.59* (35.26) 32
2011-12 44.05 29

157
accounting/auditing as well as IT-based consumer service centres. In all, 71 towns have
been selected under Part-A. It also envisages installation of SCADA (Supervisory
Control and Data Acquisition) and DMS (Distribution Management System) projects in
Patna. The aim is providing real time monitoring and control, minimizing loss, balancing
load, and improving voltage profiles. Within Part B of this scheme, funds have been
allocated to strengthen networks for reducing aggregate technical and commercial losses
(AT&C) in it. The Detailed Project Report (DPR) of all 64 towns selected under Part B
of the programme have been approved by the Steering Committee of the Ministry of
Power. This programme seeks to reduce the AT&C losses of the towns to 15 percent. The
details of expenditure under R-APDRP are presented in Table 4.44.
Table 4.44 : Capital Expenditure of R-APDRP
Project Component under R-APDRP Outlay
(Rs. crore)
R-APDRP—Part B 1155.21
R-APDRP—Part A 253.68
R-APDRP—SCADA 36.00
Total 1444.89
Source: Combined Business Plan for North Bihar
Power Distribution Company and South Bihar
Power Distribution Company, November
2012
(b) BRGF : Under the Backward Region Grant Fund (BRGF) scheme, R&M of old power
sub-stations, distribution sub-stations and associated lines in rural areas has been
planned. These projects will help in efficient load management and improved operational
efficiency.
Segregation of rural loads by providing dedicated Agriculture Feeder for improving
load management and ensuring reliable supply for irrigation. It aims to regulate the
free supply of electricity to agricultural pump-sets and thereby limiting excess
groundwater mining.
This project also aims at improving technical performance and reduce technical
losses of the sub-station, through required repair and maintenance work.
Non-R-APDRP: This project plans to implement IT applications and strengthen
distribution networks of 49 small towns that are not covered under R-APDRP to
reduce AT&C losses. The capital expenditure planned in these areas is similar to
the activities in the R-APDRP works (Table 4.45).

158
Table 4.45 : Financial outlay of capital expenditure planned for distribution under BRGF
Year 2012-13 2013-14 2014-15 2015-16 2016-17
Planned Capital Expenditure (Rs. crore) 88 1,075 1,100 1,100.25 100
Source : Combined Business Plan for North Bihar Power Distribution Company and South Bihar
Power Distribution Company, November 2012
(c) Consumer Metering of 12 lakh consumers : Under this programme, about 12 lakh
consumer meters are to be installed by 2012-13. This is part of the 100 percent metering
initiative of the erstwhile BSEB.
(d) Reconductoring of 72,000 kms of LT and HT lines : In this project, old and dilapidated
infrastructure will be replaced to reduce technical losses.
(e) Externally Aided Project : The distribution components included in the ADB funded
Bihar Power System Improvement Project have been designed to fit into the R-APDRP
distribution investment programme, and cover 7 towns in four distribution circles in the
state (Table 4.46).
Table 4.46 : Package-wise Summary of Works with ADB Funds
Package Town
Proposed
Outlay
(Rs. Crore)
Package A Bihar Sharif 38.16
Package B Motihari and Bettiah 34.48
Package C Samastipur and Begusarai 56.29
Package D Ara and Buxar 49.01
Total 177.94
Additional Outlay 250
Grand Total 427.94
Source: Combined Business Plan for North Bihar Power
Distribution Company and South Bihar Power
Distribution Company, November 2012
Given the increasing sales of electricity, the revenue collection increased annually at 18.6
percent over 2006-07 to 2011-12, despite the huge T&D losses. However, the financial losses
have constantly been high at more than 40 percent, which is partly explained by the fact that
rates of electricity have not been increasing commensurately with the costs. The per unit power
procurement costs has risen to about 3 times during the period 2005-06 and 2011-12, whereas
the average billing rate has increased to less than 2 times. Besides power purchase costs, the
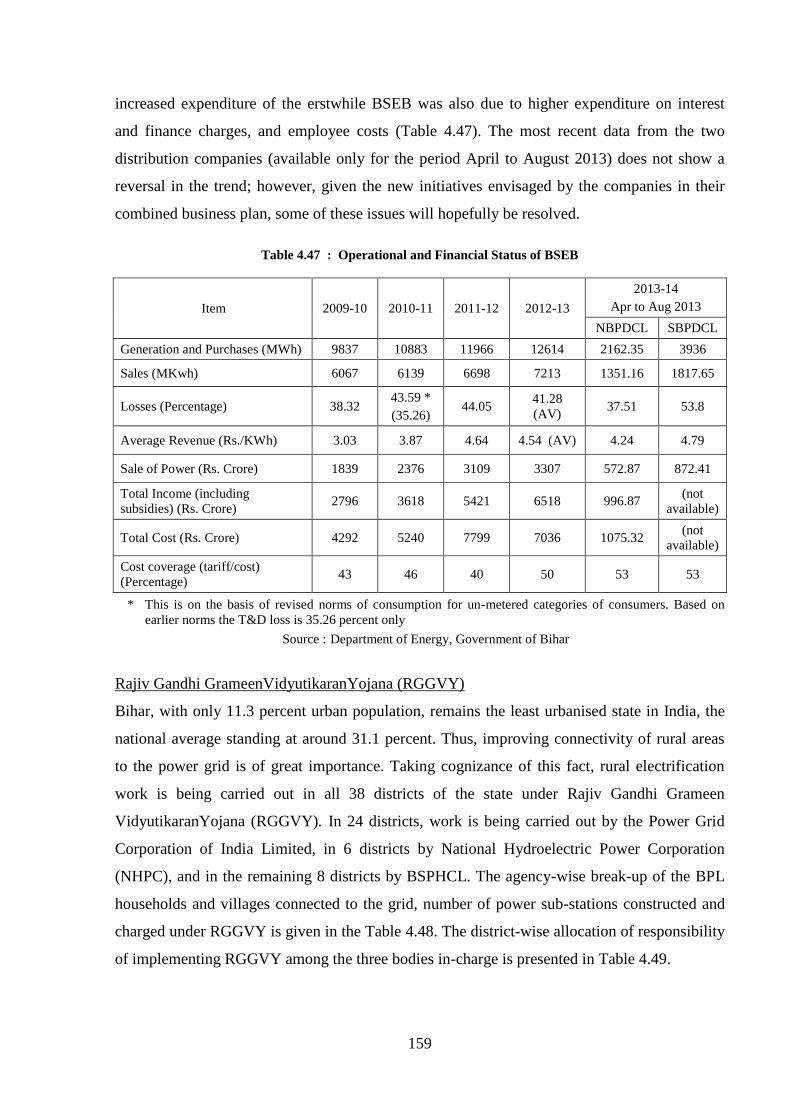
159
increased expenditure of the erstwhile BSEB was also due to higher expenditure on interest
and finance charges, and employee costs (Table 4.47). The most recent data from the two
distribution companies (available only for the period April to August 2013) does not show a
reversal in the trend; however, given the new initiatives envisaged by the companies in their
combined business plan, some of these issues will hopefully be resolved.
Table 4.47 : Operational and Financial Status of BSEB
Item 2009-10 2010-11 2011-12 2012-13
2013-14
Apr to Aug 2013
NBPDCL SBPDCL
Generation and Purchases (MWh) 9837 10883 11966 12614 2162.35 3936
Sales (MKwh) 6067 6139 6698 7213 1351.16 1817.65
Losses (Percentage) 38.32 43.59 *
(35.26) 44.05
41.28
(AV) 37.51 53.8
Average Revenue (Rs./KWh) 3.03 3.87 4.64 4.54 (AV) 4.24 4.79
Sale of Power (Rs. Crore) 1839 2376 3109 3307 572.87 872.41
Total Income (including
subsidies) (Rs. Crore) 2796 3618 5421 6518 996.87
(not
available)
Total Cost (Rs. Crore) 4292 5240 7799 7036 1075.32 (not
available)
Cost coverage (tariff/cost)
(Percentage) 43 46 40 50 53 53
* This is on the basis of revised norms of consumption for un-metered categories of consumers. Based on
earlier norms the T&D loss is 35.26 percent only
Source : Department of Energy, Government of Bihar
Rajiv Gandhi GrameenVidyutikaranYojana (RGGVY)
Bihar, with only 11.3 percent urban population, remains the least urbanised state in India, the
national average standing at around 31.1 percent. Thus, improving connectivity of rural areas
to the power grid is of great importance. Taking cognizance of this fact, rural electrification
work is being carried out in all 38 districts of the state under Rajiv Gandhi Grameen
VidyutikaranYojana (RGGVY). In 24 districts, work is being carried out by the Power Grid
Corporation of India Limited, in 6 districts by National Hydroelectric Power Corporation
(NHPC), and in the remaining 8 districts by BSPHCL. The agency-wise break-up of the BPL
households and villages connected to the grid, number of power sub-stations constructed and
charged under RGGVY is given in the Table 4.48. The district-wise allocation of responsibility
of implementing RGGVY among the three bodies in-charge is presented in Table 4.49.

160
Table 4.48 : Achievement for Construction of Power Sub-Stations, Electrification of Villages and
Electrification of BPL Households under RGGVY
Activities PGCIL NHPC BSPHCL Total
Constriction of Power Sub-Station’s 86 40 45 171
Covered under Tenth Plan 75 11 NIL 86
Covered under Eleventh Plan 11 29 45 85
Number of Power Sub-station Charged 74 28 22 124
Electrification of Villages
No. of Villages Electrification till March,
2012 16,032 4,862 1,758 22,652
No.of Villages Electrification upto March,
2013 (2012-13) 1,128 249 829 2,206
Total no. of villages electrified 17,160 5,111 2,587 24,858
Electrification of BPL Households
No. of households (000) electrified till March,
2012 954.5 975 403.1 2332.6
No. of households (000) to be electrified
during 2012-13 (Target) 49.7 125.2 199.4 374.3
No. of household (000) electrified during
2013-14 (upto 15.11.2013) 6.5 1.1 54.4 62
Achievement % (2013-14) 13.06 0.97 27.25 16.56
Total No. of household (000) electrified up to
15.11.2013 (2013-14) 961 976.2 457.5 2394.7
Source : Department of Energy, Government of Bihar
Table 4.49 : Districtwise Allocation of RGGVY among PGCIL, NHPC and BSPHCL
PGCIL (24 districts)
Patna Nalanda Bhojpur Buxer Rohtas
Kaimur Gaya Nawadah Aurangabad Jehanabad
Arwal Munger Lakhisarai Jamui Bhagalpur
Banka Vaishali Muzaffarpur Saran Siwan
Gopalgunj Purnea Kishanganj Araria
NHPC (6 districts)
Darbhanga Sheohar E. Champaran W. Champaran Sitamarhi
Madhubani
BSPHCL (8 districts)
Samastipur Saharsa Supaul Madhepura Khagaria
Katihar Begusarai Sheikhpura
Source : Bihar State Electricity Board
Bihar State Hydroelectric Power Corporation Limited (BSHPC)

161
Aside from thermal power, Bihar also has potential for generating power from water resources,
and, presently, this is being exploited to some extent. The Bihar State Hydroelectric Power
Corporation Limited (BSHPC) was established to oversee expansion of hydroelectric power
projects in the state. During the Tenth Plan, BSHPC started exploring possibilities for major
hydel projects, besides its earlier mandate for minor hydel projects. There are 13 minor hydel
projects that are currently operational in the state, with an installed capacity of 54.3 MW. The
details of these projects are given in Table 4.50.
Table 4.50 : Operational Minor Hydel Projects in Bihar
Sl.
No. Name of Project District
Installed
Capacity
1 Eastern Gandak Canal H.E. Project, Valmikinagar West Champaran 15
2 Sone Western Link Canal H.E. Project, Dehri Rohtas 6.6
3 Sone Western Link Canal H.E. Project, Barun Aurangabad 3.3
4 KosiHydel Power Station Supaul 19.2
5 Agnoor Small Hydel Project Arwal 1
6 Dhelabagh Small Hydel Project Rohtas 1
7 Nasriganj Small Hydel Project Rohtas 1
8 Triveni Link Canal HEP West Champaran 1
9 Jainagra Small Hydel Project Rohtas 1
10 Sebari Small Hydel Project Rohtas 1
11 Sirkhinda Small Hydel Project Rohtas 0.7
12 Arwal Small Hydel Project Arwal 0.5
13 Belsar Small Hydel Project Arwal 1
Total 54.3
Source : Annual Report 2012-13, Department of Energy, Government of Bihar
As mentioned before, presently BSHPC is also engaged in exploring the possibilities of minor
hydel power projects in the state. There are 17 such schemes where the exploration work is in
progress (Table 4.51).

162
Table 4.51 : Status of Proposed Small Hydel Projects
Sl.
No. Name of Project
Capacity
(MW)
Estimated
Completion
Date
1 Tejpura Small Hydel Project 1.5 March 2014
2 Amethi Small Hydel Project 0.5 March 2014
3 Katwar Small Hydel Project 0.25 March 2014
4 Rampur Small Hydel Project 0.25 March 2014
5 Rajapur Small Hydel Project 0.7 March 2014
6 Paharma Small Hydel Project 1 March 2014
7 Bathnaha Small Hydel
Project
8 March 2014
8 Nirmali Link Canal HEP 7 March 2015
9 Katanya Small Hydel Project 2 March 2014
10 Mathauli Small Hydel
Project
0.8 March 2014
11 Barwal Small Hydel Project 1.6 March 2014
12 Belidad Small Hydel Project 0.7 March 2014
13 Dehra Small Hydel Project 1 March 2014
14 Sipaha Small Hydel Project 1 March 2014
15 Ararghat Small HydelProject 7 March 2015
Total 33.3 MW
Source: Annual Report 2012-13, Department of Energy, Government of Bihar
In the first year of the Eleventh Plan, the Corporation had identified potential for a major hydel
projects at Dagmara. In the current year, the work on the long delayed Indrapuri Reservoir
project has started. There are also 4 more schemes where the pre-feasibility reports (PFR) have
been prepared — Sinafdar Pumped Storage Scheme (345 MW), Hathiahdah-Durgawati
Pumped Storage Scheme (1,600 MW), Panchgotia Pumped Storage Scheme (225 MW), and
Telharkund Pumped Storage Scheme (400 MW).
The state government has requested the central government to make an allocation of 1500 MW
of power from Bhutan to Bihar. There is also a need to attract private sector players to develop
the hydropower potential in the state.

163
Bihar Renewable Energy Development Agency (BREDA)
As mentioned before, most of Bihar’s installed generation capacity is concentrated in thermal
power plants. This leads not only to concern about clean generation of electricity, but also puts
a fiscal burden on the state given that prices of coal can be hugely volatile. Thus, aside from
hydel power projects mentioned in the last section, the state has also created an agency called
Bihar Renewable Energy Development Agency (BREDA) that is responsible for development
of projects that would use non-conventional energy sources in the state for production of
electricity. Some of the projects undertaken by BREDA until September 2013 are listed in
Table 4.52.
Table 4.52 : Achievements of BREDA for FY 2011-12 and 2012-13 (until September 2013)
Sl.
No. Scheme Name
Physical
Achievement
Financial
Outlay
(lakh Rs.)
1 Solar Photovoltaic Scheme
Solar Water Pumping Systems installation under
Bihar Saur Kranti ‘s irrigation scheme
560 pumping
systems
660
Solar electrification of Honourable Chief Minister’s
House, Janata Durbar, and residential office
100 KWP 450
Distribution of Solar Lanterns (across all districts) 2,000 Solar
Lanterns
30
Distribution of Solar Lanterns to Women’s self-
help groups in Tirhut Area
4,000 Solar
Lanterns
60
2 BEE (Bureau of Energy Efficiency) Schemes
LED street light installation in various places in
Patna by Patna Nagar Nigam
236 LED Street
Lights
70.9
Installation of LED bulbs and street lights in
NepuramPilkhi, Sarilchak, and Nahub villages
(Nalanda) under the LED Village Campaign
1257 bulbs, 22
LED street lights
13.1
Source: Bihar Renewable Energy Development Agency
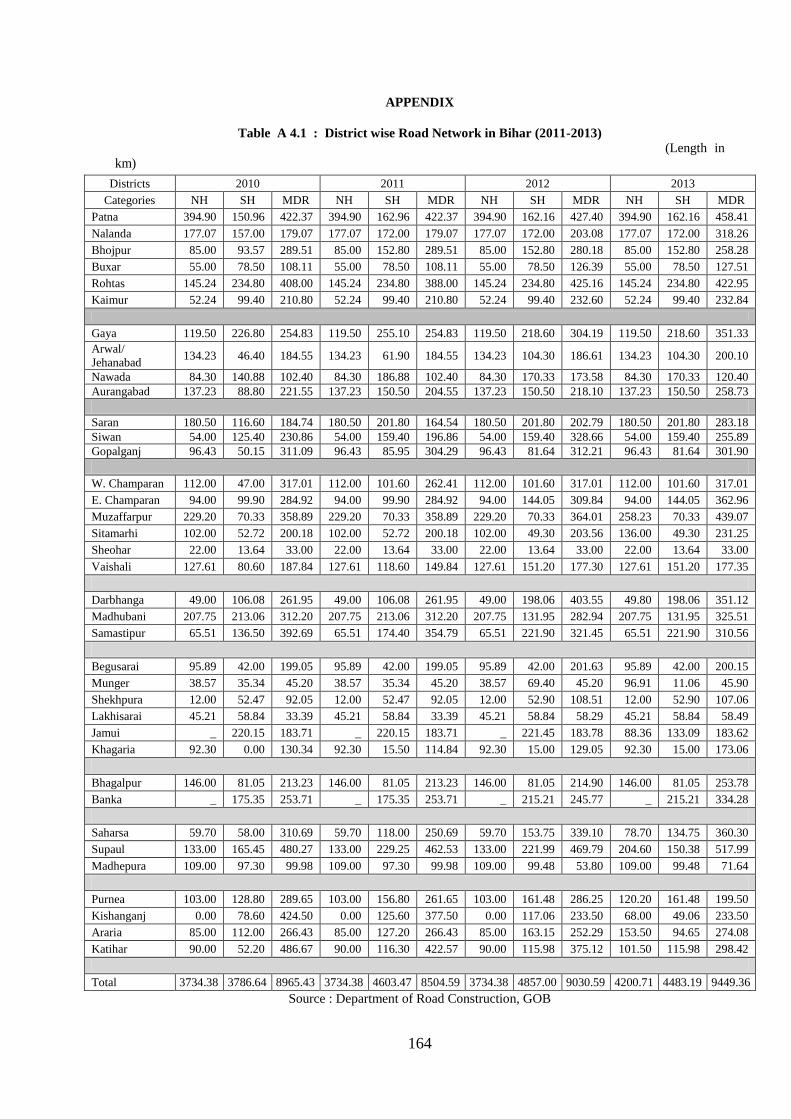
164
APPENDIX
Table A 4.1 : District wise Road Network in Bihar (2011-2013)
(Length in
km)
Districts 2010 2011 2012 2013
Categories NH SH MDR NH SH MDR NH SH MDR NH SH MDR
Patna 394.90 150.96 422.37 394.90 162.96 422.37 394.90 162.16 427.40 394.90 162.16 458.41
Nalanda 177.07 157.00 179.07 177.07 172.00 179.07 177.07 172.00 203.08 177.07 172.00 318.26
Bhojpur 85.00 93.57 289.51 85.00 152.80 289.51 85.00 152.80 280.18 85.00 152.80 258.28
Buxar 55.00 78.50 108.11 55.00 78.50 108.11 55.00 78.50 126.39 55.00 78.50 127.51
Rohtas 145.24 234.80 408.00 145.24 234.80 388.00 145.24 234.80 425.16 145.24 234.80 422.95
Kaimur 52.24 99.40 210.80 52.24 99.40 210.80 52.24 99.40 232.60 52.24 99.40 232.84
Gaya 119.50 226.80 254.83 119.50 255.10 254.83 119.50 218.60 304.19 119.50 218.60 351.33
Arwal/
Jehanabad 134.23 46.40 184.55 134.23 61.90 184.55 134.23 104.30 186.61 134.23 104.30 200.10
Nawada 84.30 140.88 102.40 84.30 186.88 102.40 84.30 170.33 173.58 84.30 170.33 120.40
Aurangabad 137.23 88.80 221.55 137.23 150.50 204.55 137.23 150.50 218.10 137.23 150.50 258.73
Saran 180.50 116.60 184.74 180.50 201.80 164.54 180.50 201.80 202.79 180.50 201.80 283.18
Siwan 54.00 125.40 230.86 54.00 159.40 196.86 54.00 159.40 328.66 54.00 159.40 255.89
Gopalganj 96.43 50.15 311.09 96.43 85.95 304.29 96.43 81.64 312.21 96.43 81.64 301.90
W. Champaran 112.00 47.00 317.01 112.00 101.60 262.41 112.00 101.60 317.01 112.00 101.60 317.01
E. Champaran 94.00 99.90 284.92 94.00 99.90 284.92 94.00 144.05 309.84 94.00 144.05 362.96
Muzaffarpur 229.20 70.33 358.89 229.20 70.33 358.89 229.20 70.33 364.01 258.23 70.33 439.07
Sitamarhi 102.00 52.72 200.18 102.00 52.72 200.18 102.00 49.30 203.56 136.00 49.30 231.25
Sheohar 22.00 13.64 33.00 22.00 13.64 33.00 22.00 13.64 33.00 22.00 13.64 33.00
Vaishali 127.61 80.60 187.84 127.61 118.60 149.84 127.61 151.20 177.30 127.61 151.20 177.35
Darbhanga 49.00 106.08 261.95 49.00 106.08 261.95 49.00 198.06 403.55 49.80 198.06 351.12
Madhubani 207.75 213.06 312.20 207.75 213.06 312.20 207.75 131.95 282.94 207.75 131.95 325.51
Samastipur 65.51 136.50 392.69 65.51 174.40 354.79 65.51 221.90 321.45 65.51 221.90 310.56
Begusarai 95.89 42.00 199.05 95.89 42.00 199.05 95.89 42.00 201.63 95.89 42.00 200.15
Munger 38.57 35.34 45.20 38.57 35.34 45.20 38.57 69.40 45.20 96.91 11.06 45.90
Shekhpura 12.00 52.47 92.05 12.00 52.47 92.05 12.00 52.90 108.51 12.00 52.90 107.06
Lakhisarai 45.21 58.84 33.39 45.21 58.84 33.39 45.21 58.84 58.29 45.21 58.84 58.49
Jamui _ 220.15 183.71 _ 220.15 183.71 _ 221.45 183.78 88.36 133.09 183.62
Khagaria 92.30 0.00 130.34 92.30 15.50 114.84 92.30 15.00 129.05 92.30 15.00 173.06
Bhagalpur 146.00 81.05 213.23 146.00 81.05 213.23 146.00 81.05 214.90 146.00 81.05 253.78
Banka _ 175.35 253.71 _ 175.35 253.71 _ 215.21 245.77 _ 215.21 334.28
Saharsa 59.70 58.00 310.69 59.70 118.00 250.69 59.70 153.75 339.10 78.70 134.75 360.30
Supaul 133.00 165.45 480.27 133.00 229.25 462.53 133.00 221.99 469.79 204.60 150.38 517.99
Madhepura 109.00 97.30 99.98 109.00 97.30 99.98 109.00 99.48 53.80 109.00 99.48 71.64
Purnea 103.00 128.80 289.65 103.00 156.80 261.65 103.00 161.48 286.25 120.20 161.48 199.50
Kishanganj 0.00 78.60 424.50 0.00 125.60 377.50 0.00 117.06 233.50 68.00 49.06 233.50
Araria 85.00 112.00 266.43 85.00 127.20 266.43 85.00 163.15 252.29 153.50 94.65 274.08
Katihar 90.00 52.20 486.67 90.00 116.30 422.57 90.00 115.98 375.12 101.50 115.98 298.42
Total 3734.38 3786.64 8965.43 3734.38 4603.47 8504.59 3734.38 4857.00 9030.59 4200.71 4483.19 9449.36
Source : Department of Road Construction, GOB
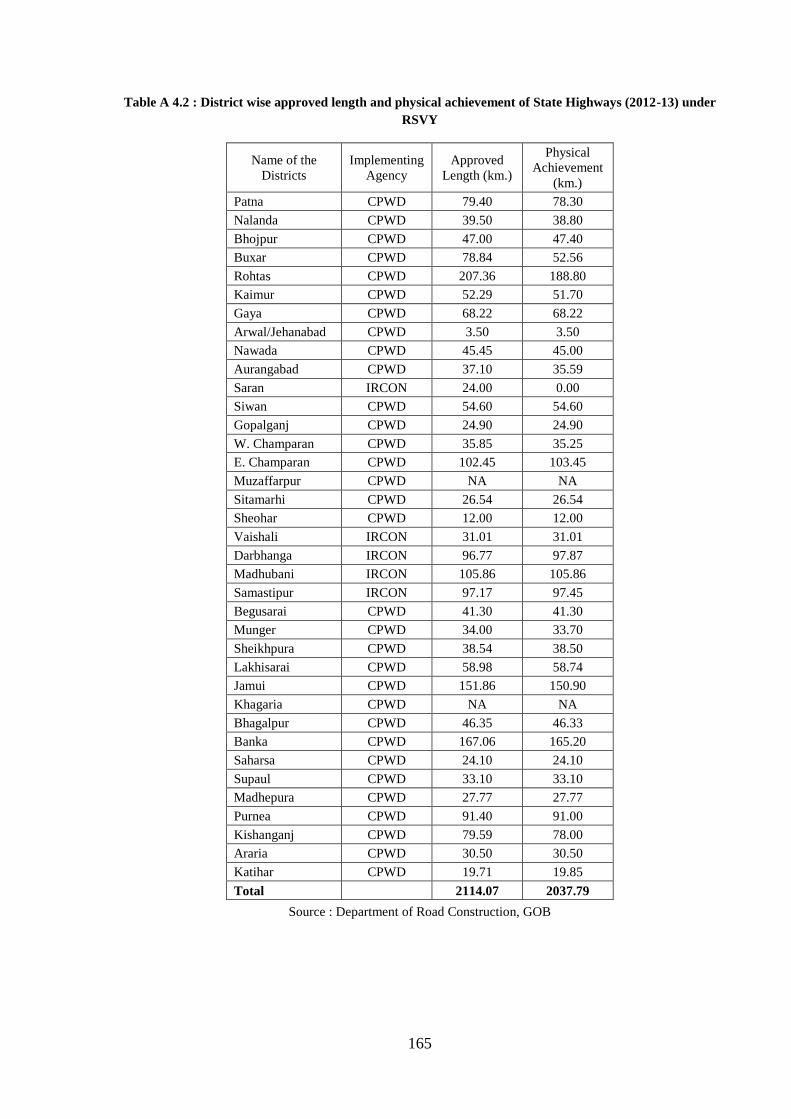
165
Table A 4.2 : District wise approved length and physical achievement of State Highways (2012-13) under
RSVY
Name of the
Districts
Implementing
Agency
Approved
Length (km.)
Physical
Achievement
(km.)
Patna CPWD 79.40 78.30
Nalanda CPWD 39.50 38.80
Bhojpur CPWD 47.00 47.40
Buxar CPWD 78.84 52.56
Rohtas CPWD 207.36 188.80
Kaimur CPWD 52.29 51.70
Gaya CPWD 68.22 68.22
Arwal/Jehanabad CPWD 3.50 3.50
Nawada CPWD 45.45 45.00
Aurangabad CPWD 37.10 35.59
Saran IRCON 24.00 0.00
Siwan CPWD 54.60 54.60
Gopalganj CPWD 24.90 24.90
W. Champaran CPWD 35.85 35.25
E. Champaran CPWD 102.45 103.45
Muzaffarpur CPWD NA NA
Sitamarhi CPWD 26.54 26.54
Sheohar CPWD 12.00 12.00
Vaishali IRCON 31.01 31.01
Darbhanga IRCON 96.77 97.87
Madhubani IRCON 105.86 105.86
Samastipur IRCON 97.17 97.45
Begusarai CPWD 41.30 41.30
Munger CPWD 34.00 33.70
Sheikhpura CPWD 38.54 38.50
Lakhisarai CPWD 58.98 58.74
Jamui CPWD 151.86 150.90
Khagaria CPWD NA NA
Bhagalpur CPWD 46.35 46.33
Banka CPWD 167.06 165.20
Saharsa CPWD 24.10 24.10
Supaul CPWD 33.10 33.10
Madhepura CPWD 27.77 27.77
Purnea CPWD 91.40 91.00
Kishanganj CPWD 79.59 78.00
Araria CPWD 30.50 30.50
Katihar CPWD 19.71 19.85
Total 2114.07 2037.79
Source : Department of Road Construction, GOB

166
Table A 4.3 : Statistics of Registered Vehicle in Bihar State During the Year 2012-2013
(in No.)
District Name Truck Bus Car Taxi Jeep Thr_
whl
Two_
whl Tractor Trailor Other Total
Patna 3167 244 12537 1488 1740 6205 58134 1649 693 5 85862
Nalanda 130 78 52 222 99 625 6964 715 128 131 9144
Bhojpur 88 53 97 263 375 823 6968 814 673 262 10416
Buxar 60 22 42 38 90 75 4147 516 413 42 5445
Rohtas 212 73 328 64 157 569 7254 1172 438 39 10306
Kamur/
Bhabhua 103 42 58 78 110 86 3394 462 221 42 4596
Gaya 772 115 1091 1022 877 2018 16875 734 494 51 24049
Jehanabad 61 35 15 30 74 426 1263 408 342 40 2694
Arwal 7 4 2 12 27 155 571 132 113 13 1036
Nawada 64 34 103 262 139 255 4376 549 356 204 6342
Aurangabad 127 67 47 149 127 858 4406 747 97 87 6712
Saran/ Chapra 120 49 446 352 494 1570 6411 779 165 30 10416
Siwan 333 40 141 247 530 510 13598 868 23 0 16290
Gopalganj 27 29 436 155 0 273 10102 600 14 166 11802
W.Champarn/
Betiah 17 16 47 371 363 515 16409 1336 679 123 19876
E.Champarn/
Motihari 148 28 90 612 424 740 9292 1006 1 0 12341
Muzaffarpur 2739 254 2987 3419 1022 2402 43313 1948 121 27 58232
Sitamarhi 42 15 66 45 52 1094 9237 1012 101 1 11665
Sheohar 0 0 0 50 44 191 1275 580 25 0 2165
Vaishali 129 42 1478 259 484 1469 20507 1976 854 255 27453
Darbhanga 158 29 346 646 87 1137 10732 997 487 198 14817
Madhubani 5 9 19 163 121 349 10949 1651 462 49 13777
Samastipur 230 166 829 331 88 847 9304 621 276 60 12752
Begusarai 515 123 441 989 104 158 11745 823 359 0 15257
Munger 71 5 66 213 24 223 4301 125 84 1 5113
Shekhpura 19 13 43 63 35 22 1303 229 203 36 1966
Lakhisarai 122 19 13 243 53 24 774 238 222 0 1708
Jamui 16 13 105 481 0 333 3240 293 294 0 4775
Khagaria 58 14 23 106 8 182 3636 766 252 0 5045
Bhagalpur 149 90 1036 280 890 1920 12849 1220 641 440 19515
Banka 23 17 19 31 28 14 2186 101 23 5 2447
Saharsa 117 43 38 167 71 341 4806 990 443 0 7016
Supaul 64 27 30 161 99 141 4346 490 130 0 5488
Madhepura 0 0 0 0 0 0 0 0 0 0 0
Purnea 258 68 1041 1259 790 2907 9396 2293 629 16 18657
Kishanganj 1 2 38 35 0 71 7271 98 75 0 7591
Araria 17 4 121 0 148 635 5360 828 131 0 7244
Katihar 21 13 181 40 41 224 15374 712 192 10 16808
10190 1895 24452 14346 9815 30387 362068 30478 10854 2333 496818
Source : Department of Transport, GOB
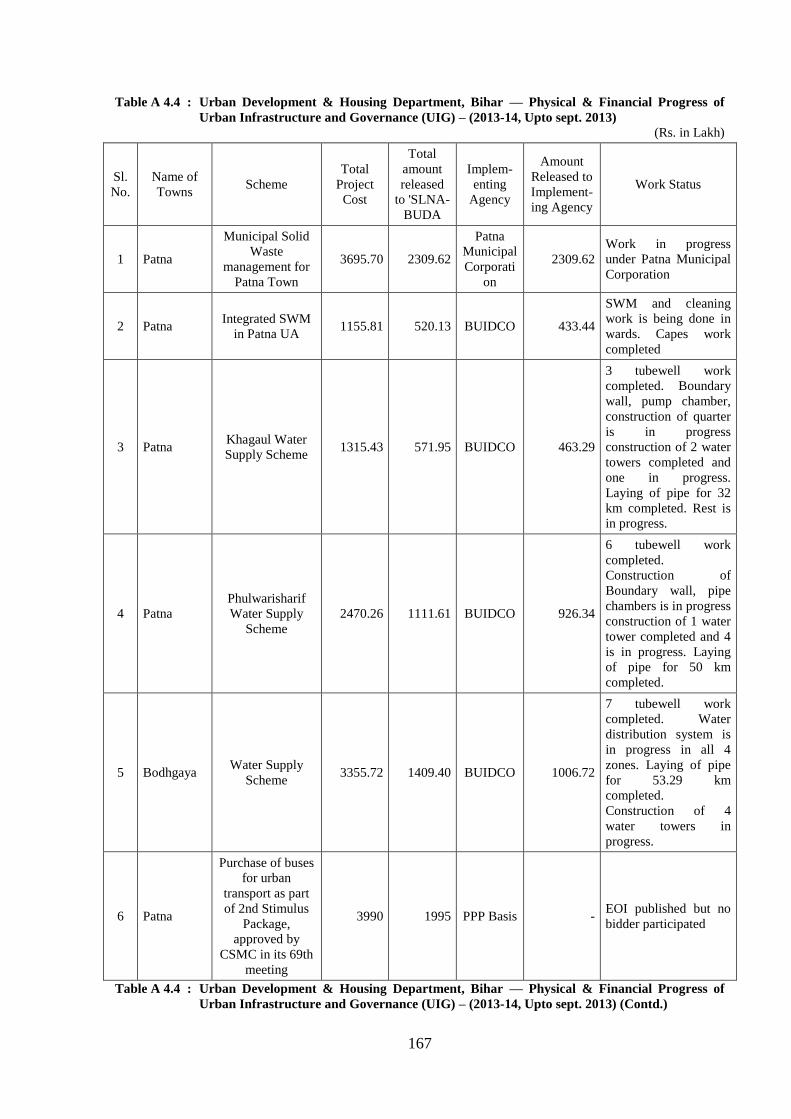
167
Table A 4.4 : Urban Development & Housing Department, Bihar — Physical & Financial Progress of
Urban Infrastructure and Governance (UIG) – (2013-14, Upto sept. 2013)
(Rs. in Lakh)
Sl.
No.
Name of
Towns Scheme
Total
Project
Cost
Total
amount
released
to 'SLNA-
BUDA
Implem-
enting
Agency
Amount
Released to
Implement-
ing Agency
Work Status
1 Patna
Municipal Solid
Waste
management for
Patna Town
3695.70 2309.62
Patna
Municipal
Corporati
on
2309.62
Work in progress
under Patna Municipal
Corporation
2 Patna Integrated SWM
in Patna UA 1155.81 520.13 BUIDCO 433.44
SWM and cleaning
work is being done in
wards. Capes work
completed
3 Patna Khagaul Water
Supply Scheme 1315.43 571.95 BUIDCO 463.29
3 tubewell work
completed. Boundary
wall, pump chamber,
construction of quarter
is in progress
construction of 2 water
towers completed and
one in progress.
Laying of pipe for 32
km completed. Rest is
in progress.
4 Patna
Phulwarisharif
Water Supply
Scheme
2470.26 1111.61 BUIDCO 926.34
6 tubewell work
completed.
Construction of
Boundary wall, pipe
chambers is in progress
construction of 1 water
tower completed and 4
is in progress. Laying
of pipe for 50 km
completed.
5 Bodhgaya Water Supply
Scheme 3355.72 1409.40 BUIDCO 1006.72
7 tubewell work
completed. Water
distribution system is
in progress in all 4
zones. Laying of pipe
for 53.29 km
completed.
Construction of 4
water towers in
progress.
6 Patna
Purchase of buses
for urban
transport as part
of 2nd Stimulus
Package,
approved by
CSMC in its 69th
meeting
3990 1995 PPP Basis - EOI published but no
bidder participated
Table A 4.4 : Urban Development & Housing Department, Bihar — Physical & Financial Progress of
Urban Infrastructure and Governance (UIG) – (2013-14, Upto sept. 2013) (Contd.)
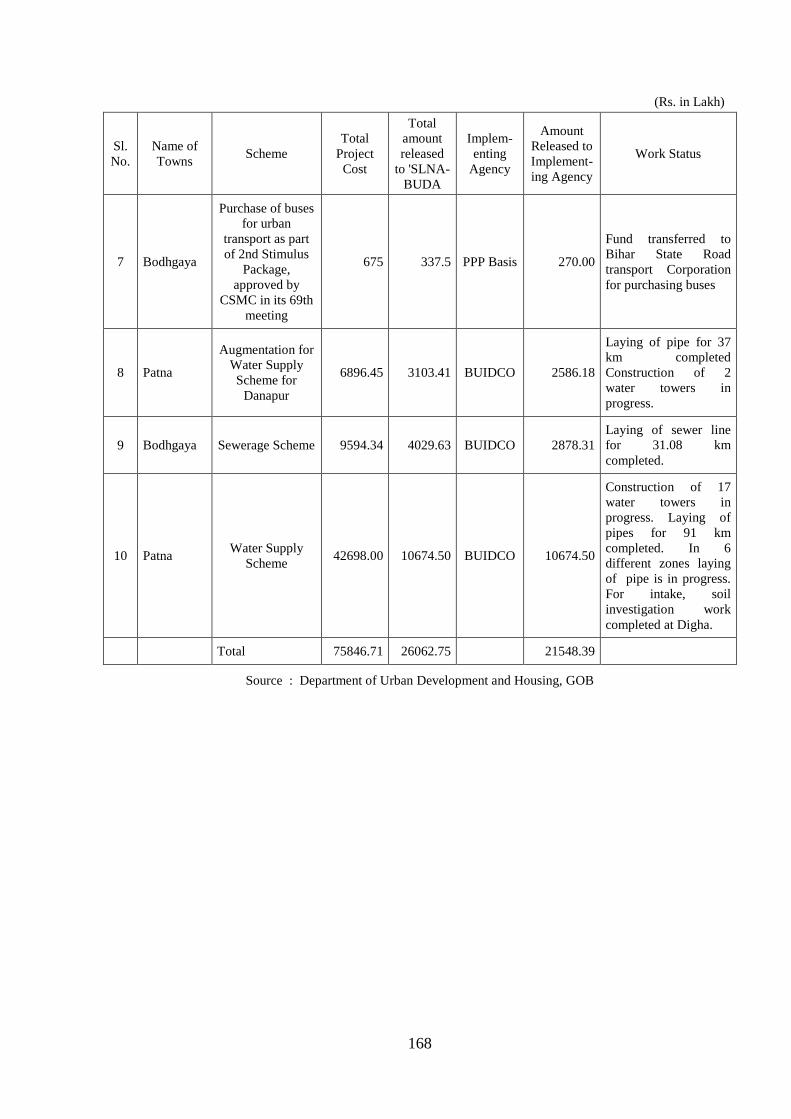
168
(Rs. in Lakh)
Sl.
No.
Name of
Towns Scheme
Total
Project
Cost
Total
amount
released
to 'SLNA-
BUDA
Implem-
enting
Agency
Amount
Released to
Implement-
ing Agency
Work Status
7 Bodhgaya
Purchase of buses
for urban
transport as part
of 2nd Stimulus
Package,
approved by
CSMC in its 69th
meeting
675 337.5 PPP Basis 270.00
Fund transferred to
Bihar State Road
transport Corporation
for purchasing buses
8 Patna
Augmentation for
Water Supply
Scheme for
Danapur
6896.45 3103.41 BUIDCO 2586.18
Laying of pipe for 37
km completed
Construction of 2
water towers in
progress.
9 Bodhgaya Sewerage Scheme 9594.34 4029.63 BUIDCO 2878.31
Laying of sewer line
for 31.08 km
completed.
10 Patna Water Supply
Scheme 42698.00 10674.50 BUIDCO 10674.50
Construction of 17
water towers in
progress. Laying of
pipes for 91 km
completed. In 6
different zones laying
of pipe is in progress.
For intake, soil
investigation work
completed at Digha.
Total 75846.71 26062.75 21548.39
Source : Department of Urban Development and Housing, GOB
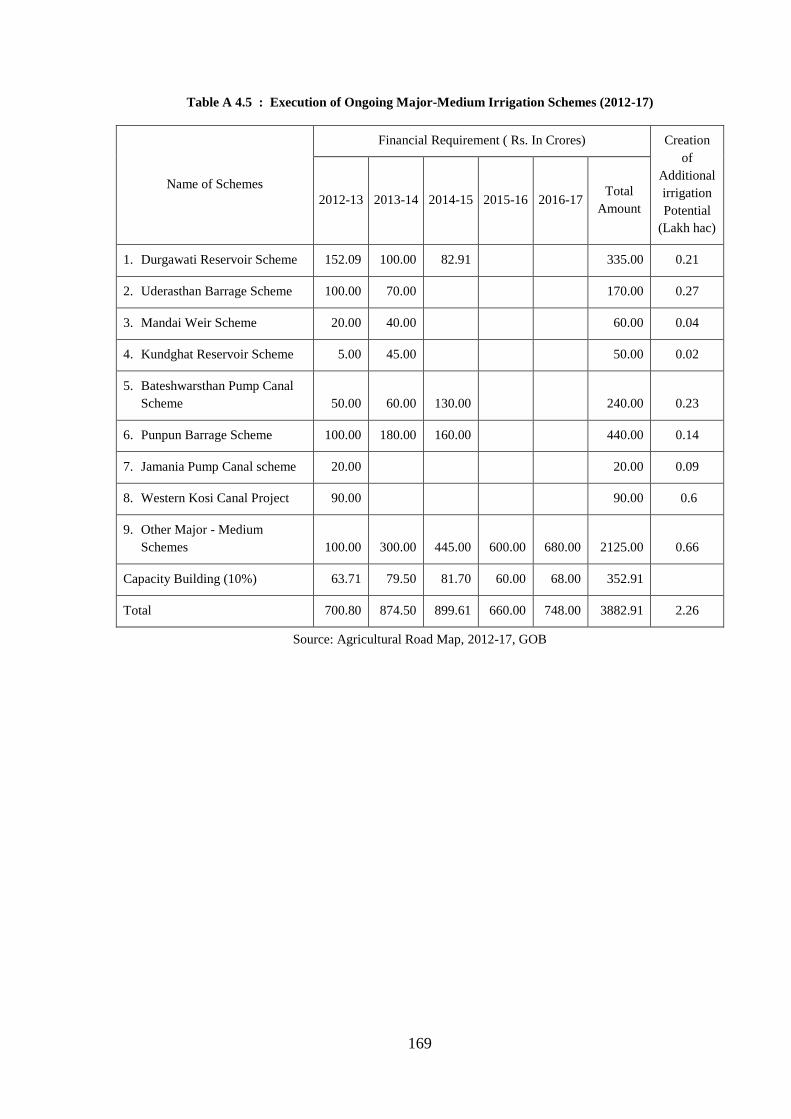
169
Table A 4.5 : Execution of Ongoing Major-Medium Irrigation Schemes (2012-17)
Name of Schemes
Financial Requirement ( Rs. In Crores) Creation
of
Additional
irrigation
Potential
(Lakh hac)
2012-13 2013-14 2014-15 2015-16 2016-17 Total
Amount
1. Durgawati Reservoir Scheme 152.09 100.00 82.91 335.00 0.21
2. Uderasthan Barrage Scheme 100.00 70.00 170.00 0.27
3. Mandai Weir Scheme 20.00 40.00 60.00 0.04
4. Kundghat Reservoir Scheme 5.00 45.00 50.00 0.02
5. Bateshwarsthan Pump Canal
Scheme 50.00 60.00 130.00 240.00 0.23
6. Punpun Barrage Scheme 100.00 180.00 160.00 440.00 0.14
7. Jamania Pump Canal scheme 20.00 20.00 0.09
8. Western Kosi Canal Project 90.00 90.00 0.6
9. Other Major - Medium
Schemes 100.00 300.00 445.00 600.00 680.00 2125.00 0.66
Capacity Building (10%) 63.71 79.50 81.70 60.00 68.00 352.91
Total 700.80 874.50 899.61 660.00 748.00 3882.91 2.26
Source: Agricultural Road Map, 2012-17, GOB

170
Table A 4.6 : Execution of New Proposed Major-Medium Irrigation Schemes ( 2012-17)
Name of Schemes
Financial Requirement ( Rs. In Crores) Creation
of
Additional
irrigation
Potential
(Lakh
hac)
2012-13 2013-14 2014-15 2015-16 2016-17 Total
Amount
1. Extension of Eastern
Gandak Canal System
(Phase-II) 9.00 190.00 400.00 600.00 600.50 1799.50 1.22
2. Extension ofWestern
Gandak Canal System
(Phase-II) 450.00 600.00 600.00 619.51 2169.51 0.80
3. Construction of 2nd Gandak
Barrage near Areraj 1.00 199.00 400.00 600.00 800.00 2000.00 3.75
4. Bagmati irrigation &
Drainage Project (Phase-I) 50.00 250.00 450.00 525.00 1275.00 1.03
5. Drainage Improvement and
Economic Use of Water in
Mokama Tal 50.00 150.00 200.00 291.00 691.00 1.06
6. Medium Schemes of Weir/
Sluice Gates on South Bihar
Rivers 77.00 300.00 500.00 600.00 700.00 2177.00 1.20
7. Medium Schemes of
Barrage/ Weirs on Small
Perennial River of North
Bihar 50.00 150.00 200.00 304.00 350.00 1054.00 0.24
8. Capacity Building (10%) 13.70 138.90 240.00 335.40 388.60 1116.60
Total 150.70 1527.90 2640.00 3689.40 4274.61 12282.61 9.30
Source: Agricultural Road Map, 2012-17, GOB
_______________

171
CHAPTER V
SOCIAL SECTORS
The ultimate goal of economic development is welfare of all sections of the people. Towards
this goal, the endeavour of the state government has been to include all people, particularly
under-priviledged section of the society, as beneficiary of a buoyant growth process. And this
needs the development of the social sector and ensuring an efficient service delivery
mechanism. As a result of bifurcation of the state, the present Bihar is devoid of mineral
resources and an industrial base. Thus, for continued economic and social development, it has
to depend on its fertile land and human resources. For developing its human resource, the state
government is trying to strengthen the social sector which includes health, education and some
essential welfare programmes like Public Distribution System (PDS). All these services
together ensure that the growing population of Bihar is healthy, educated, skilled, and
empowered both socially and economically, to ultimately become productive workers and
responsible citizens.
The pace of economic growth in Bihar has been very high during the recent years. During the
period 2006-07 to 2012-13, the economy has grown at 12.0 percent annually. Simultaneously,
the state government has also enhanced its development expenditure in recent years. In
consequence, human development in the state has shown steady growth, particularly in the
field of education and health, the two most important dimensions of human development.
Because of limited resources of the state government, the Per Capita Development Expenditure
(PCDE) in Bihar has been low compared to the national average. However, the PCDE of Bihar
has shown a steady upward trend during 2009-10 to 2012-13. Compared to the growth of
PCDE in India at around 16 percent, Bihar’s PCDE has grown at a rate of 17.1 percent in these
4 years (Table 5.1).
Table 5.1 : Trend of Social Services Expenditure
Year
Total Expenditure
on Social Services
(in Crore)
Total Expenditure
(in Crore)
Percentage share
of Social Services
in Total
Expenditure
Per Capita
Expenditure on
Social Services
All
States Bihar
All
States Bihar
All
States Bihar
All
States Bihar
2009-10 343753 14309 1015330 42795 33.86 33.44 2934 1438
2010-11 480168 16161 1158730 50705 41.44 31.87 4032 1588
2011-12 510183 19536 1433084 60180 35.60 32.46 4214 1877
2012-13 581501 24438 1632293 69205 35.62 35.31 4726 2295
Source : State Finances, A Study of Budgets, RBI (different issues)

172
Chart 5.1 : Trend of Per Capita Expenditure on Social Services
The Manav Vikas Mission (MVM) for 2013-17 is an innovative plan of the state government to
improve the human development in the state. Without this special emphasis on human
development, it is not possible to impart an inclusive orientation to the growth process. Under
MVM, the state government has identified six components — (i) Demography, Health and
Nutrition, (ii) Elementary Education and Literacy, (iii) Drinking Water Supply and Sanitation,
(iv) Information Technology, (v) Security for Weaker Sections and Ultra Poor and (vi) Art,
Culture and Sports.
In the following sections of this Chapter, a detailed analysis is presented on the social sector
development based on the components of Manav Vikas Mission.
5.1 Demography
Bihar is the third most populated state of India with a population density of 1106 persons per
sq. kms., compared to the national average of 382 persons per sq. kms. With a total population
of 104.1 million in 2011, Bihar constitutes 8.6 percent of the total Indian population. Three
demographic features of Bihar which are substantially different from India are — decadal
growth rate of population, density of population and rate of urbanisatioin. The decadal growth
rate of population for Bihar (25.1 percent) is much higher than for India (17.6 percent),
indicating the absence of demographic transition that many parts of India have already
experienced. The population pressure is a major challenge in Bihar. This high degree of
population pressure demands higher resources for the state’s development. Finally, Table 5.2
also underlines the fact that Bihar is a highly ruralised state, with only 11.3 percent of its
population living in its urban areas, compared to 31.2 percent for the entire country. Between
2001 and 2011, the child sex ratio shows declines of 8 and 7, for India and Bihar respectively.
2934
4032 4214 4726
1438 1588 1877 2295
0
1000
2000
3000
4000
5000
2009-10 2010-11 2011-12 2012-13
Per Capita Expenditure on Social Services
All States Bihar
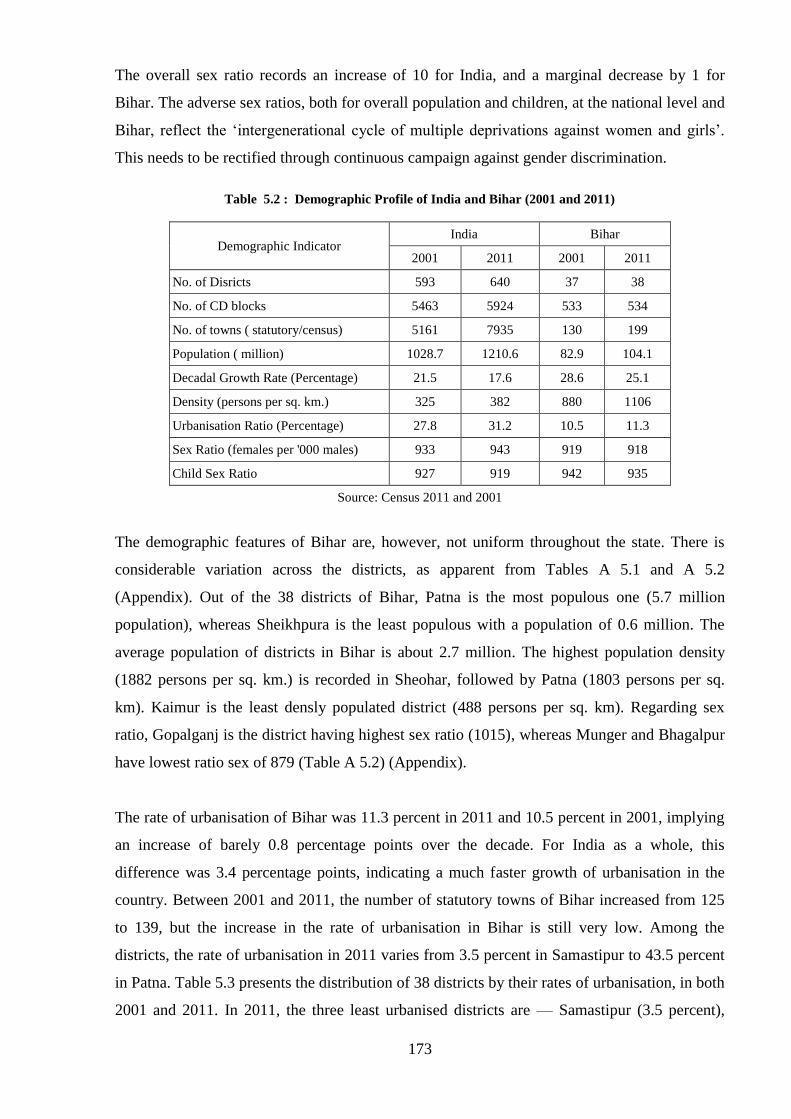
173
The overall sex ratio records an increase of 10 for India, and a marginal decrease by 1 for
Bihar. The adverse sex ratios, both for overall population and children, at the national level and
Bihar, reflect the ‘intergenerational cycle of multiple deprivations against women and girls’.
This needs to be rectified through continuous campaign against gender discrimination.
Table 5.2 : Demographic Profile of India and Bihar (2001 and 2011)
Demographic Indicator India Bihar
2001 2011 2001 2011
No. of Disricts 593 640 37 38
No. of CD blocks 5463 5924 533 534
No. of towns ( statutory/census) 5161 7935 130 199
Population ( million) 1028.7 1210.6 82.9 104.1
Decadal Growth Rate (Percentage) 21.5 17.6 28.6 25.1
Density (persons per sq. km.) 325 382 880 1106
Urbanisation Ratio (Percentage) 27.8 31.2 10.5 11.3
Sex Ratio (females per '000 males) 933 943 919 918
Child Sex Ratio 927 919 942 935
Source: Census 2011 and 2001
The demographic features of Bihar are, however, not uniform throughout the state. There is
considerable variation across the districts, as apparent from Tables A 5.1 and A 5.2
(Appendix). Out of the 38 districts of Bihar, Patna is the most populous one (5.7 million
population), whereas Sheikhpura is the least populous with a population of 0.6 million. The
average population of districts in Bihar is about 2.7 million. The highest population density
(1882 persons per sq. km.) is recorded in Sheohar, followed by Patna (1803 persons per sq.
km). Kaimur is the least densly populated district (488 persons per sq. km). Regarding sex
ratio, Gopalganj is the district having highest sex ratio (1015), whereas Munger and Bhagalpur
have lowest ratio sex of 879 (Table A 5.2) (Appendix).
The rate of urbanisation of Bihar was 11.3 percent in 2011 and 10.5 percent in 2001, implying
an increase of barely 0.8 percentage points over the decade. For India as a whole, this
difference was 3.4 percentage points, indicating a much faster growth of urbanisation in the
country. Between 2001 and 2011, the number of statutory towns of Bihar increased from 125
to 139, but the increase in the rate of urbanisation in Bihar is still very low. Among the
districts, the rate of urbanisation in 2011 varies from 3.5 percent in Samastipur to 43.5 percent
in Patna. Table 5.3 presents the distribution of 38 districts by their rates of urbanisation, in both
2001 and 2011. In 2011, the three least urbanised districts are — Samastipur (3.5 percent),
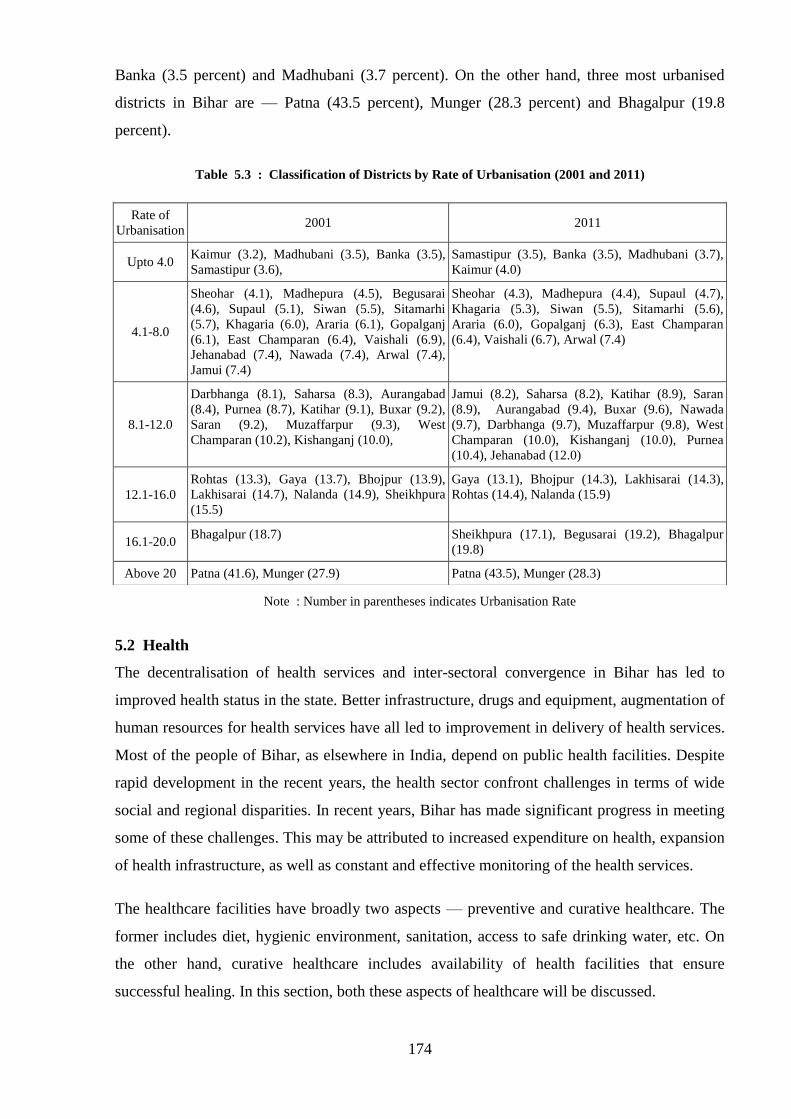
174
Banka (3.5 percent) and Madhubani (3.7 percent). On the other hand, three most urbanised
districts in Bihar are — Patna (43.5 percent), Munger (28.3 percent) and Bhagalpur (19.8
percent).
Table 5.3 : Classification of Districts by Rate of Urbanisation (2001 and 2011)
Note : Number in parentheses indicates Urbanisation Rate
5.2 Health
The decentralisation of health services and inter-sectoral convergence in Bihar has led to
improved health status in the state. Better infrastructure, drugs and equipment, augmentation of
human resources for health services have all led to improvement in delivery of health services.
Most of the people of Bihar, as elsewhere in India, depend on public health facilities. Despite
rapid development in the recent years, the health sector confront challenges in terms of wide
social and regional disparities. In recent years, Bihar has made significant progress in meeting
some of these challenges. This may be attributed to increased expenditure on health, expansion
of health infrastructure, as well as constant and effective monitoring of the health services.
The healthcare facilities have broadly two aspects — preventive and curative healthcare. The
former includes diet, hygienic environment, sanitation, access to safe drinking water, etc. On
the other hand, curative healthcare includes availability of health facilities that ensure
successful healing. In this section, both these aspects of healthcare will be discussed.
Rate of
Urbanisation 2001 2011
Upto 4.0 Kaimur (3.2), Madhubani (3.5), Banka (3.5),
Samastipur (3.6),
Samastipur (3.5), Banka (3.5), Madhubani (3.7),
Kaimur (4.0)
4.1-8.0
Sheohar (4.1), Madhepura (4.5), Begusarai
(4.6), Supaul (5.1), Siwan (5.5), Sitamarhi
(5.7), Khagaria (6.0), Araria (6.1), Gopalganj
(6.1), East Champaran (6.4), Vaishali (6.9),
Jehanabad (7.4), Nawada (7.4), Arwal (7.4),
Jamui (7.4)
Sheohar (4.3), Madhepura (4.4), Supaul (4.7),
Khagaria (5.3), Siwan (5.5), Sitamarhi (5.6),
Araria (6.0), Gopalganj (6.3), East Champaran
(6.4), Vaishali (6.7), Arwal (7.4)
8.1-12.0
Darbhanga (8.1), Saharsa (8.3), Aurangabad
(8.4), Purnea (8.7), Katihar (9.1), Buxar (9.2),
Saran (9.2), Muzaffarpur (9.3), West
Champaran (10.2), Kishanganj (10.0),
Jamui (8.2), Saharsa (8.2), Katihar (8.9), Saran
(8.9), Aurangabad (9.4), Buxar (9.6), Nawada
(9.7), Darbhanga (9.7), Muzaffarpur (9.8), West
Champaran (10.0), Kishanganj (10.0), Purnea
(10.4), Jehanabad (12.0)
12.1-16.0
Rohtas (13.3), Gaya (13.7), Bhojpur (13.9),
Lakhisarai (14.7), Nalanda (14.9), Sheikhpura
(15.5)
Gaya (13.1), Bhojpur (14.3), Lakhisarai (14.3),
Rohtas (14.4), Nalanda (15.9)
16.1-20.0 Bhagalpur (18.7) Sheikhpura (17.1), Begusarai (19.2), Bhagalpur
(19.8)
Above 20 Patna (41.6), Munger (27.9) Patna (43.5), Munger (28.3)

175
Selected Health Indicators of Bihar
Life expectancy at birth (LEB) is one of the sensitive indicators of the health status of
population. The relevant data on this indicator, both for Bihar and India, has been presented in
Table 5.4. It emerges from the table that the gap between India and Bihar which was 2.1 years
in 2001-05 has narrowed down to 0.3 years in 2006-10. When one compares the LEB for male
and female, it is usually found to be higher for females, because of biological reasons. In case
of India, this general pattern was observed, in both 2001-05 and 2006-10. Remarkably, in case
of Bihar, the LEB for female was lower than that of male in 2001-05, indicating severe levels
of gender disparity; however, in 2006-10, this disparity has disappeared and now LEB for
females for Bihar is a little higher than that of males.
Table 5.4 : Life Expectancy at Birth of Bihar and India
State/India
2001-05 2006-10
Male Female Total Male Female Total
Bihar 62.0 60.1 61.0 65.5 66.2 65.8
India 62.3 63.9 63.1 64.6 67.7 66.1
Source : Sample Registration System (SRS), Office of the Registrar General,
India, Ministry of Home Affairs, GOI
Besides LEB, four other indicators of health for which there exists comparable data are —
Crude Birth Rate (CBR), Crude Death Rate (CDR), Total Fertility Rate (TFR) and Infant
Mortality Rate (IMR). The relevant data on these four indicators, for both Bihar and India, is
presented in Table 5.5, covering the period 2007-08 to 2011-12. For Crude Birth Rate (CBR),
the figures are consistently higher for Bihar; in 2011-12, it was 27.7 for Bihar compared to
21.6 for India, registering a difference of 6.1. As mentioned before, this indicates the absence
of demographic transition in Bihar. Between, 2007-08 to 2011-12, however, the difference
between CBR of Bihar and India has been slightly reduced. When one compares the Crude
Death Rate (CDR), quite interestingly, it emerges that, in 2011-12, it was lower in Bihar (6.6)
than in India (7.0). Earlier, in 2007-08, the CDR in Bihar (7.5) was marginally higher than that
for India (7.4). A low CDR obviously implies a better health status. But unfortunately, the
combined effect of higher birth rate and lower death rate is higher growth rate of population
which is undesirable.
While comparing the Total Fertility Rate (TFR) in Bihar and India, it has been noticed that the
TFR is consistently higher in Bihar. But fortunately, some early indicators of demographic
transition is noticed here. The TFR in Bihar has decreased from 3.9 children in 2007-08 to 3.5
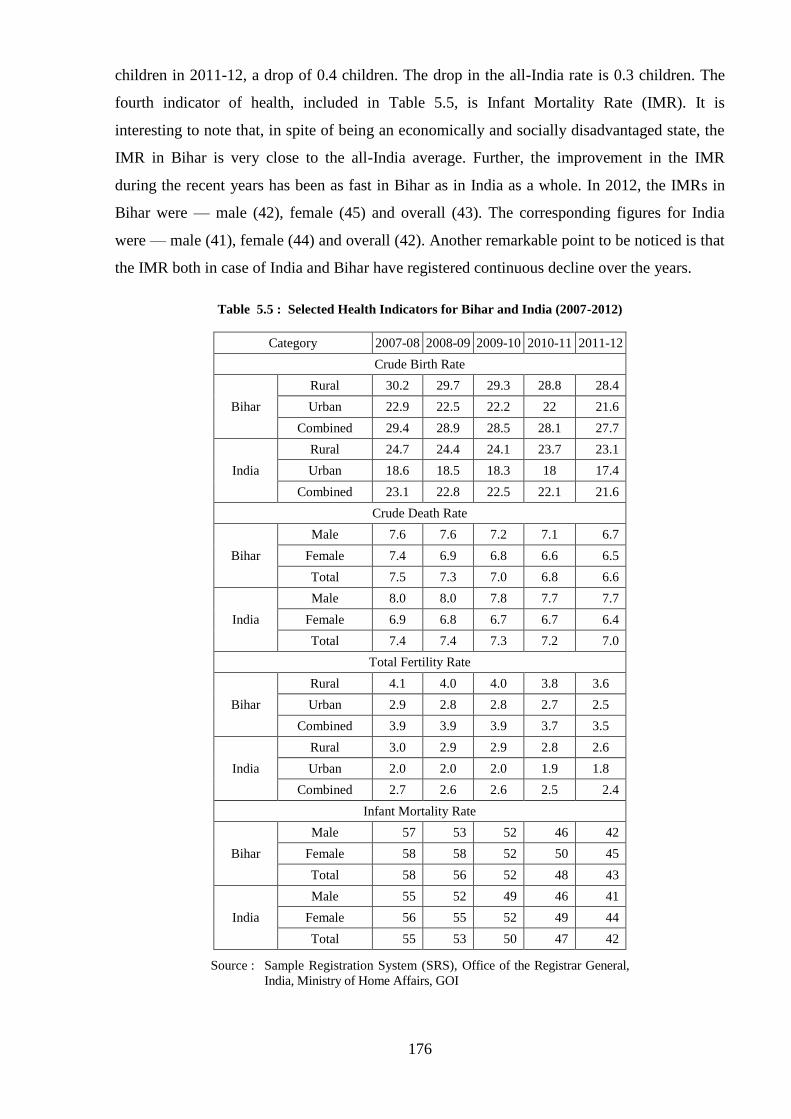
176
children in 2011-12, a drop of 0.4 children. The drop in the all-India rate is 0.3 children. The
fourth indicator of health, included in Table 5.5, is Infant Mortality Rate (IMR). It is
interesting to note that, in spite of being an economically and socially disadvantaged state, the
IMR in Bihar is very close to the all-India average. Further, the improvement in the IMR
during the recent years has been as fast in Bihar as in India as a whole. In 2012, the IMRs in
Bihar were — male (42), female (45) and overall (43). The corresponding figures for India
were — male (41), female (44) and overall (42). Another remarkable point to be noticed is that
the IMR both in case of India and Bihar have registered continuous decline over the years.
Table 5.5 : Selected Health Indicators for Bihar and India (2007-2012)
Category 2007-08 2008-09 2009-10 2010-11 2011-12
Crude Birth Rate
Bihar
Rural 30.2 29.7 29.3 28.8 28.4
Urban 22.9 22.5 22.2 22 21.6
Combined 29.4 28.9 28.5 28.1 27.7
India
Rural 24.7 24.4 24.1 23.7 23.1
Urban 18.6 18.5 18.3 18 17.4
Combined 23.1 22.8 22.5 22.1 21.6
Crude Death Rate
Bihar
Male 7.6 7.6 7.2 7.1 6.7
Female 7.4 6.9 6.8 6.6 6.5
Total 7.5 7.3 7.0 6.8 6.6
India
Male 8.0 8.0 7.8 7.7 7.7
Female 6.9 6.8 6.7 6.7 6.4
Total 7.4 7.4 7.3 7.2 7.0
Total Fertility Rate
Bihar
Rural 4.1 4.0 4.0 3.8 3.6
Urban 2.9 2.8 2.8 2.7 2.5
Combined 3.9 3.9 3.9 3.7 3.5
India
Rural 3.0 2.9 2.9 2.8 2.6
Urban 2.0 2.0 2.0 1.9 1.8
Combined 2.7 2.6 2.6 2.5 2.4
Infant Mortality Rate
Bihar
Male 57 53 52 46 42
Female 58 58 52 50 45
Total 58 56 52 48 43
India
Male 55 52 49 46 41
Female 56 55 52 49 44
Total 55 53 50 47 42
Source : Sample Registration System (SRS), Office of the Registrar General,
India, Ministry of Home Affairs, GOI

177
As expected, the health status in various districts of Bihar varies considerably. Table A 5.3
(Appendix) presents the data on six indicators of health in different districts of Bihar — Crude
Birth Rate (CBR), Crude Death Rate (CDR), Natural Growth Rate, Infant Mortality Rate
(IMR),Total Fertility Rate (TFR) and Under-5 Mortality Rate. Taking Crude Birth Rate (CBR)
first, it is observed that the rate varies from 21.4 in Patna to 31.5 in Saharsa. Three best
performing districts are — Patna (21.4), Lakhisarai (23.5) and Bhojpur (24.0). At the other
end, three districts with the highest CBRs are — Araria (30.7), Sheohar (30.8) and Saharsa
(31.5). The relative position of different districts in terms of Infant Mortality Rate (IMR), often
considered as the most sensitive indicator of health status, can also be judged from Table A 5.3
(Appendix). The IMR varies from 37 in Patna to 68 in Madhepura. Three relatively better
performing districts are — Patna (37), Begusarai (43) and Bhojpur (44). At the other end, three
most disadvantaged districts are — Khagaria (63), Sitamarhi (64) and Madhepura (68).
Chart 5.2 : Crude Birth Rate, Crude Death Rate and IMR of Bihar (2007-2012)
Health Infrastructure
The state acclaims its achievements in creating basic health infrastructure which consists of
the district hospitals, referral hospitals, sub-division hospitals and health centres; within the last
category, there are three types — Primary Health Centres (PHCs), Sub-centres and Additional
PHCs (APHCs). The low income of the majority of population in Bihar leads to their
29.4 28.9 28.5 28.1 27.7
7.5 7.3 7.0 6.8 6.6
58 56 52
48 43
0
10
20
30
40
50
60
70
2007-08 2008-09 2009-10 2010-11 2011-12
Crude Birth Rate Crude Death Rate Infant Mortality Rate

178
dependence on public health services. In recent years, the state government has taken a number
of steps to improve the functioning of the public health institutions and, consequently the
number of patients visiting government hospitals has increased significantly (Table 5.6). The
average number of patients visiting government hospitals per month was 3077 in 2007, which
has become 9863 in 2012, registering a compounded annual growth of 28.1 percent.
Table 5.6 : Monthly Average Number of Patients Visiting Government Hospitals (2007 to 2012)
Year 2007 2008 2009 2010 2011 2012
No. of patients visiting
government hospitals 3077 3855 3826 4675 9317 9863
Source : State Health Society
Chart 5.3 : Monthly Average Number of Outpatient Visits
Table 5.7 presents the number of health service units under each category in Bihar. During last
six years, there has been an expansion in the health infrastructure with the establishment of 3
new district hospitals, 8 new sub-divisional hospitals, 49 PHCs, 108 Sub-centres and 87
APHCs. At present, there are 36 district hospitals, 71 referral hospitals, 63 Sub-division
hospitals and 11,559 health centres of different hospitals. A broad calculation indicates that a
health institution in Bihar serves about 8.9 thousand people on an average.
0
2000
4000
6000
8000
10000
2007 2008 2009 2010 2011 2012
30773855 3826
4675
93179863
No.
of V
isiti
ng P
atie
nts

179
Table 5.7 : Overall Status of Health Infrastructure
Year Dist.
Hospital
Referral
Hospital
Sub-
Divisional
Hospital
Health Centres
PHC Sub-
centre APHC Total
2008 33 70 45 484 9588 1243 11315
2009 33 70 46 533 9588 1243 11364
2010 36 70 46 533 9598 1243 11470
2011 36 70 55 533 9696 1330 11559
2012 36 70 55 533 9696 1330 11559
2013 36 71 63 533 9696 1330 11559
Source : State Health Society
From the data on number of health institutions of different districts of Bihar, as presented in
Table A 5.4 (Appendix), it is obvious that there is considerable variation across the districts in
terms of availability of health infrastructure. The average size of population served by a
hospital / PHC varies from as high as 15.6 thousand in Sheohar district to 5.2 thousand in
Jamui. The best three districts in terms of availability of health infrastructure are — Jamui
(5165), Nawada (5598) and Sheikhpura (5772). On the other hand, the three most
disadvantaged districts are — East Champaran (12,581), Sitamarhi (12,712) and Sheohar
(15,641).
In 2012-13, three districts with the highest average number of outpatients visiting hospitals per
day are — Arwal (573), Muzaffarpur (525) and Aurangabad (504) (Table 5.8). At the other
end, three districts with the lowest average number of outpatients visiting hospitals per days
are — Begusarai (207), East Champaran (223) and Nawada (224). Along with the services
provided to outpatients, the hospitals also admit people with serious illness for their treatment.
The extent of such services for the in-patient can be judged from the occupancy rate of hospital
beds. Table 5.9 presents the in-patient bed occupancy rate for three years —2010-11, 2011-12
and 2012-13 for the entire state as well as in all 38 districts.

180
Table 5.8 : Districtwise Average Number of Outpatients visiting per Hospital and per Day
Districts
Average no. of
Outpatient visits per
Hospital
Average no. of
Outpatient visits per
day
April’12
to Mar’13
Jan’13 to
Sept’13
April’12
to Mar’13
Jan’13 to
Sept’13
Patna 107349 57794 294 316
Nalanda 123697 53542 339 293
Bhojpur 114583 61497 314 336
Buxar 93448 54904 256 300
Rohtas 108076 54870 296 300
Kaimur 93978 54920 257 300
Gaya 98241 57966 269 317
Jehanabad 105918 65896 290 360
Arwal 151534 104861 415 573
Nawada 73166 40931 200 224
Aurangabad 166846 92161 457 504
Saran 104451 56480 286 309
Siwan 128044 68480 351 374
Gopalganj 73199 41237 201 225
West Champaran 90296 50657 247 277
East Champaran 84953 40877 233 223
Muzaffarpur 155645 96053 426 525
Sitamarhi 103081 64769 282 354
Sheohar 102061 52631 280 288
Vaishali 121703 62408 333 341
Darbhanga 100887 67013 276 366
Madhubani 93311 56790 256 310
Samastipur 136145 78002 373 426
Begusarai 82583 37922 226 207
Munger 94326 54633 258 299
Sheikhpura 93371 45356 256 248
Lakhisarai 83372 46920 228 256
Jamui 88182 55048 242 301
Khagaria 154106 83949 422 459
Bhagalpur 89672 54854 246 300
Banka 89061 50946 244 278
Saharsa 118405 61898 324 338
Supaul 130226 70845 357 387
Madhepura 116308 53157 319 290
Pumea 117442 74498 322 407
Kishanganj 154207 89588 422 490
Araria 91907 49620 252 271
Katihar 109276 55421 299 303
Bihar 107259 59513 294 325
Source : State Health Society

181
Table 5.9 : Inpatient Bed Occupancy Rate
Districts Inpatient Bed Occupancy rate
2010-11 2011-12 2012-13
Patna 49.1 39.4 103.3
Nalanda 81.5 98.1 105.8
Bhojpur 56.8 30.3 78.5
Buxar 40.1 56.8 75.6
Rohtas 69.2 60.7 64.3
Kaimur 33.8 43.9 78.7
Gaya 133.1 56.4 87.0
Jehanabad - 64.8 63.9
Arwal 21.8 62.3 69.2
Nawada 42.2 31.8 68.9
Aurangabad 68.2 70.1 104.8
Saran 53.5 64.6 69.7
Siwan 33.2 64.1 92.4
Gopalganj 46.4 62.1 67
West Champaran 115.9 74.5 73.6
East Champaran 39.6 140 105
Muzaffarpur 30.1 59.6 76.0
Sitamarhi 25.7 54.2 64.8
Sheohar 14.6 173.8 82.2
Vaishali 100.9 78.2 91.2
Darbhanga 75.0 46.2 57.0
Madhubani 86.0 27.6 82.7
Samastipur 77.9 62.6 95
Begusarai 76.5 21.8 49.3
Munger 51.8 48.5 84.1
Sheikhpura 19.9 33.9 90.7
Lakhisarai 26.3 55.9 56
Jamui 19.4 82.2 69.8
Khagaria 64.0 64.0 90.8
Bhagalpur 39.0 236.8 277.5
Banka 24.4 20.0 73.9
Saharsa 245.6 133 111.4
Supaul 88.5 131.1 111.1
Madhepura 104.0 85.0 120.4
Purnea 49.2 148.2 109.8
Kishanganj 29.9 102.2 107.9
Araria 57.4 194.2 112.6
Katihar 20.4 52.7 91.0
Bihar 58.9 77.1 90.6
Source : State Health Society

182
For the state as a whole, the occupancy rate has increased from 58.9 percent in 2010-11 to as
high as 90.6 percent in 2012-13. The demand for health services is so high that, in no less than
10 districts, the bed occupancy rates exceed 100 percent. This is a clear pointer to the need for
major expansion of beds in different health institutions in Bihar.
One of the important dimension of health infrastructure is availability of health personnel —
doctors, nurses, Auxiliary Nurse-Cum-Mid-wife (ANM), Accredited Social Health Activist
(ASHA). The availability of such personnel for the entire state as well as the districts is
presented in four tables in the appendix — Table A 5.5 (Doctors), Table A 5.6 (Nurses), Table
A 5.7 (ANM) and Table A 5.8 (ASHA). As regards doctors, there are now 2461 regular
doctors in Bihar against 4851 sanctioned posts, indicating that nearly half the posts are yet to
be filled up. In addition, there is also sanction for 2375 contractual doctors, of which 1594
posts have been filled up, indicating a vacancy ratio of 33 percent. It is also found that the
state government has not been able to fill up all the sanctioned posts for Grade A nurses, either
regular or contractual. For the state as a whole, the vacancy rate is more than 50 percent. In
some of the districts, the vacancy rates are much higher. In contrast to the situation of doctors
and nurses, the strength of health personnel is much higher for ANM and ASHA. In March,
2013 the strength of regular ANM was 9406, against the sanctioned strength of 11,479. This
implies that 82 percent of the sanctioned posts are filled up. In addition to regular ANMs, the
state government has also sanctioned posts of 11,479 contractual ANMs and 8226 of them
have already been employed. The working strength of ANM in different districts is not
uniform, but fortunately, inter-district variation is moderate. When it comes to the ASHA
workers, it is found that there are in all 84.4 thousand of them working in the entire state,
against a sanctioned strength of 87.1 thousand. This implies that vacancy ratio is less than 5
percent. Out of these, 49 percent of ASHA workers were trained once in 2012-13.
Overall, it should be noted that due to improved health infrastructure, the utilization of health
services by the people have increased, during the recent years. However, the physical
infrastructure and personnel for health services are still not enough for the large and needy
population of Bihar, particularly in rural areas, where the private medical services are
extremely limited.
Institutional Delivery
The number of institutional deliveries in Bihar has increased phenomenally in recent years. In
2008-09, there was a spurt in institutional delivery when 11.4 lakh children were born in some

183
health institutions, recording an increase of 36.6 percent over the previous year. After that,
there was moderate but steady increase in institutional deliveries every year. In 2012-13, the
institutional deliveries had numbered 14.7 lakh (Table 5.10). In Table A 5.9 (Appendix), the
information is presented for number of institutional deliveries in different districts of Bihar. It
is interesting to observe from the table that many of the districts where the extent of
institutional deliveries is relatively higher are in north Bihar like West Champaran, Purnea,
Vaishali and Madhubani. It should be noted here that one of the principal reasons for steady
increase in institutional deliveries is successful implementation of Janani Evam Bal Suraksha
Yojana (JBSY). Under this programme, there is a provision of cash transfer to the mothers who
come to health institutions for the delivery of their children. The large number of ASHA
workers whose services reach upto the village level have contributed appreciately in the
effective implementation of JBSY. That the ASHA workers have worked effectively for
promoting institutional delivery is indicated when one notices the relevant figures in different
districts, as presented Table A5.10 (Appendix).
Table 5.10 : Number of Institutional Delivery (2007-08 to 2012-13)
Year Number Percentage
Change
2007-08 838481 --
2008-09 1144677 36.52
2009-10 1246494 8.89
2010-11 1384791 11.09
2011-12 1431960 3.41
2012-13 1469126 2.60
Source : State Health Society
Chart 5.4 : Number of Institutional Delivery
0.00
5.00
10.00
15.00
2007-08 2008-09 2009-10 2010-11 2011-12 2012-13
8.38
11.45 12.46
13.85 14.32 14.69
Inst
itu
tio
nal
De
live
ry (
Lak
h)

184
Immunisation
The coverage of immunisation of children is another component of health services. The
immunisation programme covers BCG, polio vaccination, DPT and measles. In India, nearly
1.7 million children die every year without seeing their fifth birthday. In most of these cases,
the children die due to a disease which is quite preventable. It is possible to avoid this high
infant mortality through immunization. Along with other states in India, Bihar has also made
substantial progress towards universal immunisation in recent years. The relevant data in this
regard is presented in Table 5.11. This data refers to five components of immunisation – TT
(Anti-tetanus), BCG, OPV, DPT and measles. Looking at the most recent figures (2012-13),
one notices that Bihar has achieved complete immunization for TT (128.1 percent). For BCG
and measles, the coverage again is substantial, 86.3 and 93.4 percent respectively.
Unfortunately, for OPV (Polio) and DPT, the present coverage is low. Thus, the health
administration is making additional efforts so that immunisation coverage is hundred percent
for all its five components.
Table 5.11 : Antigenwise Immunisation Coverage in Bihar
Antigen
name
2010-11 2011-12 2012-13
Target
('000)
Achie-
vement
('000)
Percentage
of achiev-
ement
Target
('000)
Achie-
vement
('000)
Percentage
of achiev-
ement
Target
('000)
Achie-
vement
('000)
Percentag
e of
achiev-
ement
TT (P.W) 3085 3812 123.5 3254 4063 124.9 3129 4008 128.1
BCG 2805 2398 85.5 2958 2376 80.3 2845 2454 86.3
OPV 0 2805 1594 56.8 2958 1377 46.5 2845 1655 58.2
OPV 1 2805 2318 82.6 2958 1706 57.7 2845 2216 77.9
OPV 2 2805 2264 80.7 2958 1600 54.1 2845 2078 73.1
OPV 3 2805 1986 70.8 2958 1488 50.3 2845 1921 67.5
DPT 1 2805 2429 86.6 2958 2299 77.7 2845 2504 88.0
DPT 2 2805 2299 82 2958 2188 74.0 2845 2390 84.0
DPT 3 2805 2116 75.4 2958 2047 69.2 2845 2240 78.7
Measles 2805 1942 69.2 2958 2111 71.4 2845 2657 93.4
Source : State Health Society
Prevalence of Main Diseases in Bihar
The information on main diseases in Bihar is presented in Table 5.12. It is observed from the
table that, in 2013, it was the Acute Respiratory Infection (ARI) that was the most important
cause of illness in Bihar, accounting 16.3 lakh patients. The next important category was fever
of unknown origin, accounting for 12.5 lakh patients. It also emerges from the table that the
cases for diarrhoea or dysentry are very large in the state, underlining the phenomenon that
availability of safe drinking water is far from adequate in the state. The districtwise figures are
provided in Table A 5.11 (Appendix).

185
Table 5.12 : Prevalence of Main Diseases in Bihar (January to September 2013)
Diseases Number of
patients
Acute Diarrheal Disease 515461
Bacillary Dysentery 292448
Viral Hepatitis 9984
Enteric Fever 215822
Malaria 26687
Fever of Unknown Origin (FUO) 1253511
Acute Respiratory Infection (ARI) 1635240
Pneumonia 53522
Dog bite 331874
Any other State Specific Disease 39961
Unusual Syndromes not captured above 103959
Source : State Health Society
MANAV VIKAS MISSION : HEALTH COMPONENT
Under MVM, the state government has set 8 targets for the health component. These 8
targets, all to be achieved by 2017, are:
To reduce the Infant Mortality Rate (IMR) to less than 27, from the present level of
43
To reduce the Maternal Morality Rate (MMR) to 120, from the present level of 261
To reduce Total Fertility Rate (TFR) to 2.9, from the present level of 3.6
To reduce the percentage of children (<3 years) suffering from malnutrition to 29
percent, from the present level of 58.4 percent (NFHS-3)
To reduce the prevalence of anemia among women (15-49 years) to 34 percent, from
the present level of 68.3 percent
To improve the Life Expectancy at Birth (LEB) to 68.7 years for women from the
present level of 66.2 years, and 68.6 for men from the present level of 65.5 years
To improve the sex ratio in the population to 930 females per 1000 males, from the
present (2011) level of 918
To reduce the prevalence of child marriage to 14 percent, from the present level of
20.2 percent

186
Integrated Child Development Scheme (ICDS)
In pursuance of National Policy for Children, which emphasises integrated delivery of health
services to expectant mothers and children, the scheme of ICDS was launched in 1975. The
objective of the scheme is the holistic development of children below 6 years of age and proper
nutrition and health education of pregnant and lactating mothers. The target group of ICDS,
comprising children, expectant mothers and nursing mothers is reached through Anganwadi
Centres. The personnel for ICDS includes Child Development Project Officer (CDPO), Lady
Supervisor, Anganwadi Worker and Anganwadi Helper. The scheme greatly contributes to
attain the goal of universal primary education and targeted nutritional standard for the children.
Presently, 544 ICDS projects are operational in Bihar, covering all development blocks in 38
districts. A total of 91,677 Anganwadi Centres (AWC) are functioning under those 544
projects. Table 5.13 presents the staffing position for ICDS in Bihar, during 2009-10 to 2012-
13. At the end of 2012-13, there are 37 vacant posts of CDPOs, implying that 93.2 percent of
the sanctioned strength has been filled up. Compared to the previous year, there has been fall in
the number of Anganwadi Workers and Anganwadi Helpers; but there is an increase in the
number of Lady Supervisors. The vacancy ratios in 2012-13 were — CDPO (6.8 percent),
Lady Supervisor (11.3 percent), Anganwadi Worker (18.0 percent) and Anganwadi Helper
(21.4 percent).
Table 5.13 : Staffing Position in ICDS in Bihar
Year Posts CDPO Lady
Supervisor
Anganwadi
Worker
Anganwadi
Helper
2009-10
Sanctioned 544 3288 80797 80797
Working 508 254 80211 80211
Vacant 36 3034 586 586
Percentage of Vacant Post 6.62 92.27 0.73 0.73
2010-11
Sanctioned 544 3288 91677 86237
Working 508 254 80211 80211
Vacant 36 3034 11466 6026
Percentage of Vacant Post 6.6 92.3 12.5 7.0
2011-12
Sanctioned 544 3288 91677 86237
Working 536 2754 81817 81817
Vacant 8 534 9860 4420
Percentage of Vacant Post 1.5 16.2 10.8 5.1
2012-13
Sanctioned 544 3288 91677 86237
Working 507 2916 75183 67753
Vacant 37 372 16494 18484
Percentage of Vacant Post 6.8 11.3 18.0 21.4
Source : Directorate, ICDS, GOB
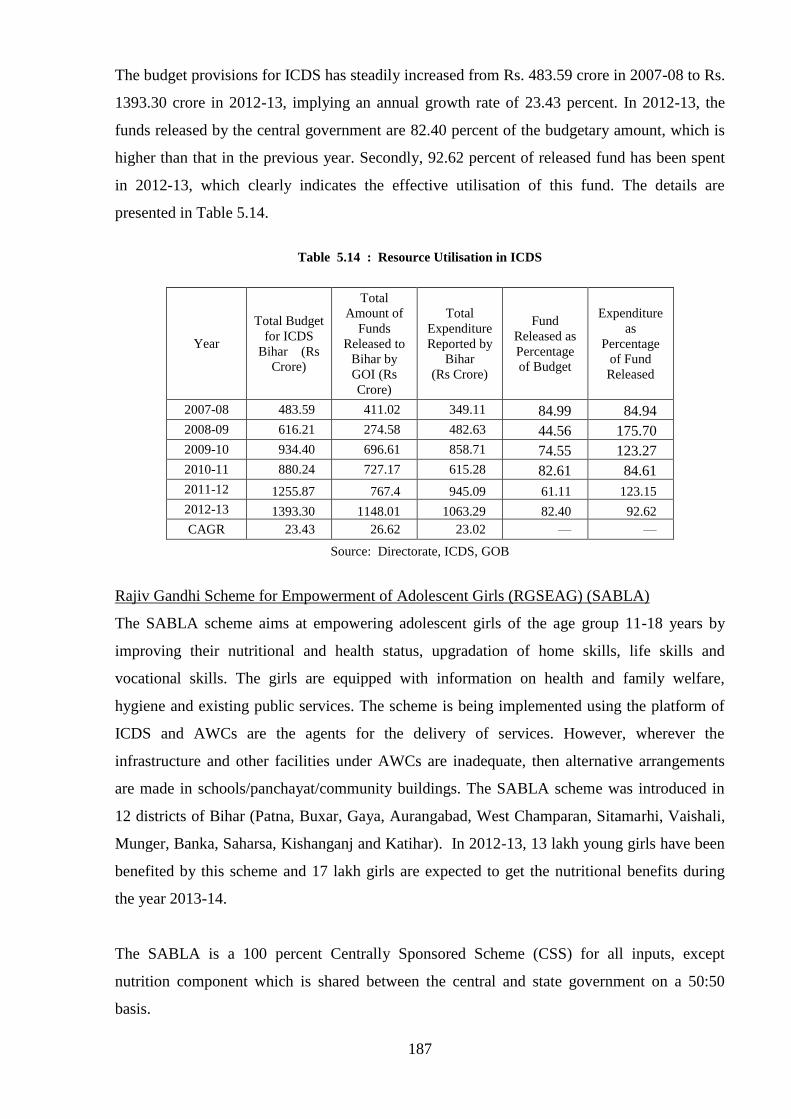
187
The budget provisions for ICDS has steadily increased from Rs. 483.59 crore in 2007-08 to Rs.
1393.30 crore in 2012-13, implying an annual growth rate of 23.43 percent. In 2012-13, the
funds released by the central government are 82.40 percent of the budgetary amount, which is
higher than that in the previous year. Secondly, 92.62 percent of released fund has been spent
in 2012-13, which clearly indicates the effective utilisation of this fund. The details are
presented in Table 5.14.
Table 5.14 : Resource Utilisation in ICDS
Year
Total Budget
for ICDS
Bihar (Rs
Crore)
Total
Amount of
Funds
Released to
Bihar by
GOI (Rs
Crore)
Total
Expenditure
Reported by
Bihar
(Rs Crore)
Fund
Released as
Percentage
of Budget
Expenditure
as
Percentage
of Fund
Released
2007-08 483.59 411.02 349.11 84.99 84.94
2008-09 616.21 274.58 482.63 44.56 175.70
2009-10 934.40 696.61 858.71 74.55 123.27
2010-11 880.24 727.17 615.28 82.61 84.61
2011-12 1255.87 767.4 945.09 61.11 123.15
2012-13 1393.30 1148.01 1063.29 82.40 92.62
CAGR 23.43 26.62 23.02 — —
Source: Directorate, ICDS, GOB
Rajiv Gandhi Scheme for Empowerment of Adolescent Girls (RGSEAG) (SABLA)
The SABLA scheme aims at empowering adolescent girls of the age group 11-18 years by
improving their nutritional and health status, upgradation of home skills, life skills and
vocational skills. The girls are equipped with information on health and family welfare,
hygiene and existing public services. The scheme is being implemented using the platform of
ICDS and AWCs are the agents for the delivery of services. However, wherever the
infrastructure and other facilities under AWCs are inadequate, then alternative arrangements
are made in schools/panchayat/community buildings. The SABLA scheme was introduced in
12 districts of Bihar (Patna, Buxar, Gaya, Aurangabad, West Champaran, Sitamarhi, Vaishali,
Munger, Banka, Saharsa, Kishanganj and Katihar). In 2012-13, 13 lakh young girls have been
benefited by this scheme and 17 lakh girls are expected to get the nutritional benefits during
the year 2013-14.
The SABLA is a 100 percent Centrally Sponsored Scheme (CSS) for all inputs, except
nutrition component which is shared between the central and state government on a 50:50
basis.

188
Indira Gandhi Matritva Sahyog Yojana (IGMSY)
Undernutrition continues to be a severe problem for majority of women in India, as every third
woman here is undernourished and every second woman is anaemic. In view of this, the
Ministry of Women and Child Development (MWCD) of the central government has
formulated a new scheme for pregnant and lactating mothers, called Indira Gandhi Matritva
Sahyog Yojana (IGMSY). Under this scheme, a cash incentive of Rs 6000 is provided directly
to the age-group 19 years and above for the first two live births, subject to the woman fulfilling
specific conditions relating to maternal, child health and nutrition. The cash incentive is
provided in two installments, till the infant completes 6 months of age. In Bihar, it is being
implemented in 2 districts of Vaishali and Saharsa. So far, 69 thousand pregnant women have
enrolled by the scheme. The districtwise fund disbursed to Healh Societies is presented in
Table A 5.12 (Appendix).
5.3 Drinking Water Supply and Sanitation
Better water supply and sanitation services have important external benefits to promote
improved public health. The preventive healthcare system depends on the accessability of safe
drinking water and hygienic sanitation. The provision of clean drinking water and sanitation is,
therefore, viewed as one of the principal factors to improve the health status of a population.
An adequate allocation of resources to improve the accessability of clean water and sanitation
needs to be prioritised.
The progresss of work under water supply and sanitation is presented in Table 5.15. In 2012-
13, as many as 31.9 thousand hand pumps have been installed under the National Rural
Drinking Water Programme (NRDWP). A major achievement is also recorded in the
construction of Individual Household Latrine (IHHL), with around 8 lakh such latrines being
constructed in 2012-13. In addition, 17.0 thousand school toilets and 4822 Anganwadi toilets
have also been constructed in this year. The number of Sanitary Complexes has also increased
during this year. Out of these three, highest achievement is recorded in Anganwadi toilets
which is almost thrice the number which was constructed in 2011-12. The districtwise
coverage of habitations for water supply and sanitation through state and central schemes is
presented in Table A5.13, A5.14 and A5.15 (Appendix).
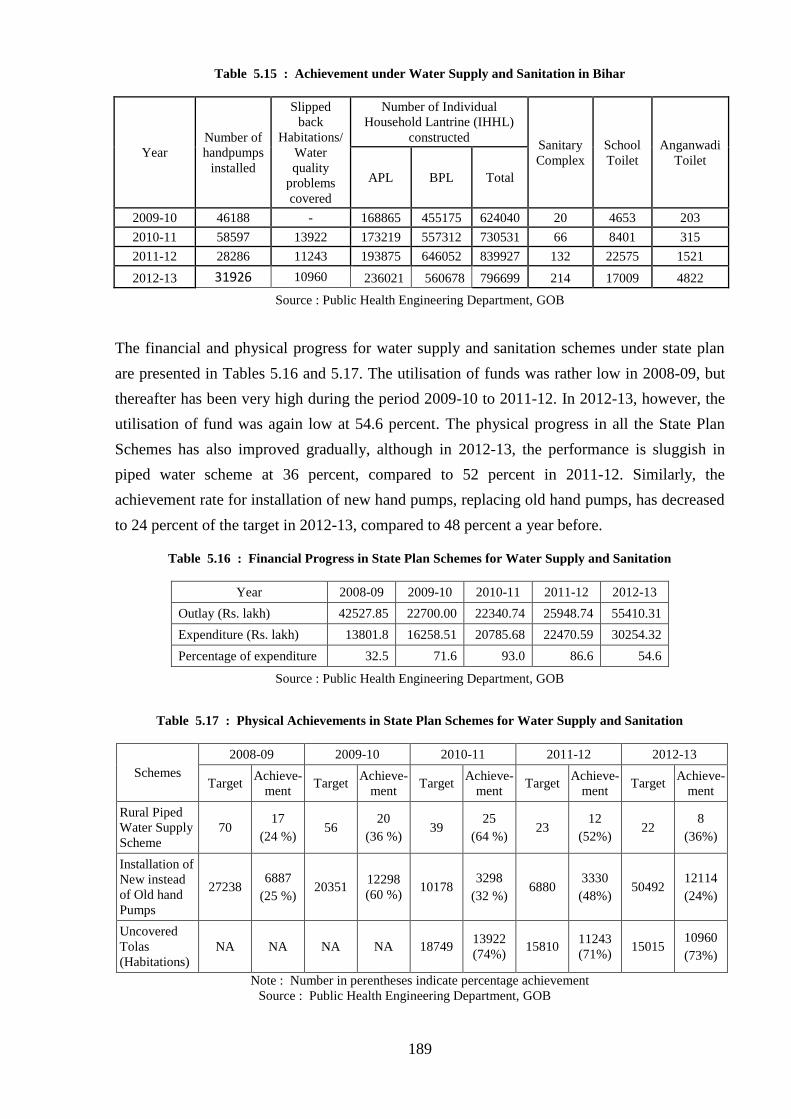
189
Table 5.15 : Achievement under Water Supply and Sanitation in Bihar
Year
Number of
handpumps
installed
Slipped
back
Habitations/
Water
quality
problems
covered
Number of Individual
Household Lantrine (IHHL)
constructed Sanitary
Complex
School
Toilet
Anganwadi
Toilet
APL BPL Total
2009-10 46188 - 168865 455175 624040 20 4653 203
2010-11 58597 13922 173219 557312 730531 66 8401 315
2011-12 28286 11243 193875 646052 839927 132 22575 1521
2012-13 31926 10960 236021 560678 796699 214 17009 4822
Source : Public Health Engineering Department, GOB
The financial and physical progress for water supply and sanitation schemes under state plan
are presented in Tables 5.16 and 5.17. The utilisation of funds was rather low in 2008-09, but
thereafter has been very high during the period 2009-10 to 2011-12. In 2012-13, however, the
utilisation of fund was again low at 54.6 percent. The physical progress in all the State Plan
Schemes has also improved gradually, although in 2012-13, the performance is sluggish in
piped water scheme at 36 percent, compared to 52 percent in 2011-12. Similarly, the
achievement rate for installation of new hand pumps, replacing old hand pumps, has decreased
to 24 percent of the target in 2012-13, compared to 48 percent a year before.
Table 5.16 : Financial Progress in State Plan Schemes for Water Supply and Sanitation
Year 2008-09 2009-10 2010-11 2011-12 2012-13
Outlay (Rs. lakh) 42527.85 22700.00 22340.74 25948.74 55410.31
Expenditure (Rs. lakh) 13801.8 16258.51 20785.68 22470.59 30254.32
Percentage of expenditure 32.5 71.6 93.0 86.6 54.6
Source : Public Health Engineering Department, GOB
Table 5.17 : Physical Achievements in State Plan Schemes for Water Supply and Sanitation
Schemes
2008-09 2009-10 2010-11 2011-12 2012-13
Target Achieve-
ment Target
Achieve-
ment Target
Achieve-
ment Target
Achieve-
ment Target
Achieve-
ment
Rural Piped
Water Supply
Scheme
70 17
(24 %) 56
20
(36 %) 39
25
(64 %) 23
12
(52%) 22
8
(36%)
Installation of
New instead
of Old hand
Pumps
27238 6887
(25 %) 20351
12298
(60 %) 10178
3298
(32 %) 6880
3330
(48%) 50492
12114
(24%)
Uncovered
Tolas
(Habitations)
NA NA NA NA 18749 13922
(74%) 15810
11243
(71%) 15015
10960
(73%)
Note : Number in perentheses indicate percentage achievement
Source : Public Health Engineering Department, GOB
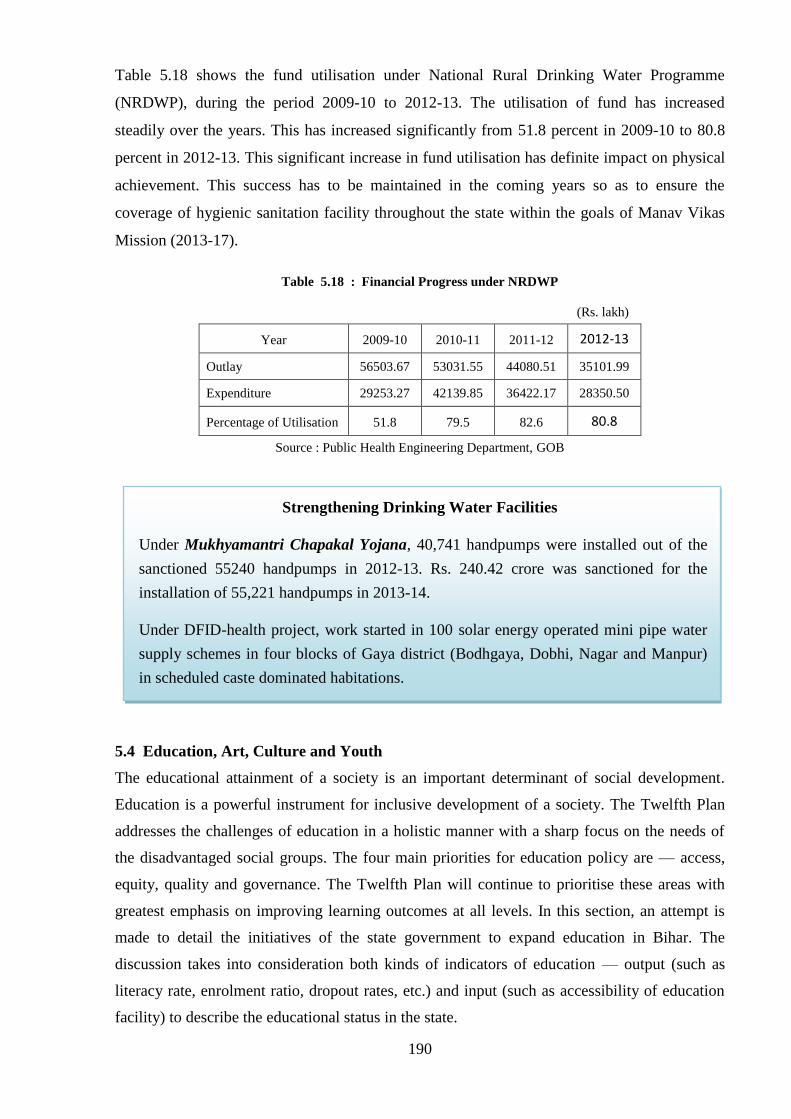
190
Table 5.18 shows the fund utilisation under National Rural Drinking Water Programme
(NRDWP), during the period 2009-10 to 2012-13. The utilisation of fund has increased
steadily over the years. This has increased significantly from 51.8 percent in 2009-10 to 80.8
percent in 2012-13. This significant increase in fund utilisation has definite impact on physical
achievement. This success has to be maintained in the coming years so as to ensure the
coverage of hygienic sanitation facility throughout the state within the goals of Manav Vikas
Mission (2013-17).
Table 5.18 : Financial Progress under NRDWP
(Rs. lakh)
Year 2009-10 2010-11 2011-12 2012-13
Outlay 56503.67 53031.55 44080.51 35101.99
Expenditure 29253.27 42139.85 36422.17 28350.50
Percentage of Utilisation 51.8 79.5 82.6 80.8
Source : Public Health Engineering Department, GOB
Strengthening Drinking Water Facilities
Under Mukhyamantri Chapakal Yojana, 40,741 handpumps were installed out of the
sanctioned 55240 handpumps in 2012-13. Rs. 240.42 crore was sanctioned for the
installation of 55,221 handpumps in 2013-14.
Under DFID-health project, work started in 100 solar energy operated mini pipe water
supply schemes in four blocks of Gaya district (Bodhgaya, Dobhi, Nagar and Manpur)
in scheduled caste dominated habitations.
5.4 Education, Art, Culture and Youth
The educational attainment of a society is an important determinant of social development.
Education is a powerful instrument for inclusive development of a society. The Twelfth Plan
addresses the challenges of education in a holistic manner with a sharp focus on the needs of
the disadvantaged social groups. The four main priorities for education policy are — access,
equity, quality and governance. The Twelfth Plan will continue to prioritise these areas with
greatest emphasis on improving learning outcomes at all levels. In this section, an attempt is
made to detail the initiatives of the state government to expand education in Bihar. The
discussion takes into consideration both kinds of indicators of education — output (such as
literacy rate, enrolment ratio, dropout rates, etc.) and input (such as accessibility of education
facility) to describe the educational status in the state.

191
Literacy Rate
The state has improved significantly in increasing its literacy rate during the last decade, from
47.0 percent in 2001 to 61.8 percent in 2011. This implies an increase of 14.8 percentage
points during the decade. It is worthwhile to note that this decadal increase is not only the
highest among all the decadal growth rates in Bihar since 1961, it is also the highest among all
the states for the decade 2001-11. In Bihar, the 2011 Census recorded male literacy at 71.2
percent and female literacy at 51.5 percent, recording a gender disparity of 20 percentage
points. The district-wise literacy rates by gender and residence is presented in Table A 5.16
and A 5.17 (Appendix), respectively. The highest decadal increase has been recorded in
Kishanganj (24.4 percentage points). Patna (7.8 percentage points) has registered the lowest
increase in literacy rate, mainly because it was already a high literacy district in 2001.
Kishanganj and Patna have also recorded the highest and the lowest increase in female literacy
rate. The districts Kishanganj (25.9 percentage points) and Patna (11.0 percentage points) have
registered the highest and the lowest increase in literacy rate for rural areas in 2011. In 2011,
21 districts are placed above the state average in literacy rate and 17 districts are below state
average category.
Table 5.19 classifies the districts on the basis of literacy rates in 2011 by area and gender. It is
clear from the table that the top of 5 districts in terms of literacy rate are almost all in south
Bihar. It also emerges from the table that the districts in the north-eastern region of the state are
severely disadvantaged in terms of literacy rate, in spite of some progress in the last decade.
Table 5.19 : Districtwise Classification of Literacy Rates in 2011
Area/Gender Top Five Districts Bottom Five Districts
Rural Rohtas (72.5), Aurangabad (69.4),
Bhojpur (69.2), Buxar (69.1), Siwan (68.9)
Purnea (48.4), Katihar (49.6), Sitamarhi
(50.8), Saharsa (51.1), Madhepura (51.2)
Urban
Kaimur (82.6), Munger (81.0), Patna
(81.0), Samastipur (80.7), Muzaffarpur
(80.2)
Sheohar (62.0), Sheikhpura (71.0), West
Champaran (71.1), Madhubani (71.1),
Kishanganj (71.2)
Male Rohtas (82.9), Bhojpur (81.7), Buxar
(80.7), Siwan (80.2), Aurangabad (80.1)
Madhepura (61.8), Sheohar (61.3), Sitamarhi
(60.6), Katihar (59.4), Purnea (59.1)
Female Rohtas (63.0), Munger (62.1), Patna
(62.0), Aurangabad (59.7), Siwan (58.7)
Saharsa (41.7), Madhepura (41.7), Purnea
(42.3), Sitamarhi (42.4), Kishanganj (43.9)
Combined Rohtas (73.4), Patna (70.7), Bhojpur
(70.5), Munger (70.5), Aurangabad (70.3)
Purnea (51.1), Sitamarhi (52.1), Katihar
(52.2), Madhepura (52.3), Saharsa (53.2)
Note : Number in parentheses indicates Literacy Rate.
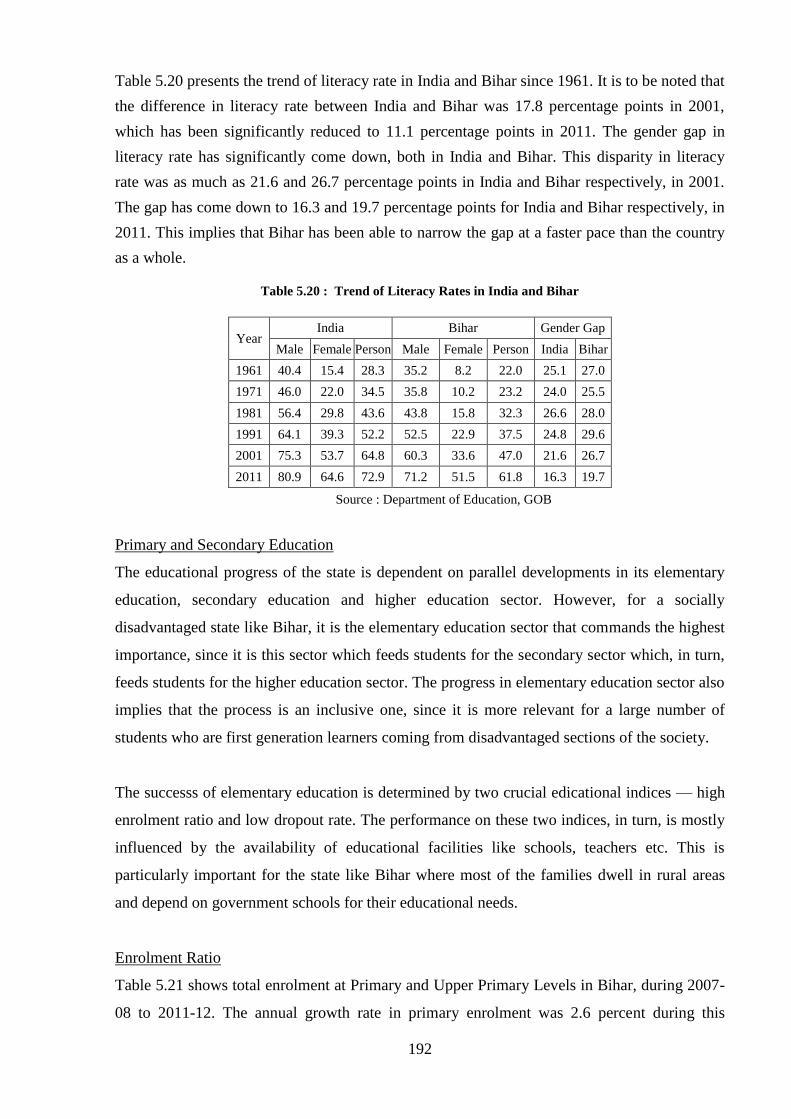
192
Table 5.20 presents the trend of literacy rate in India and Bihar since 1961. It is to be noted that
the difference in literacy rate between India and Bihar was 17.8 percentage points in 2001,
which has been significantly reduced to 11.1 percentage points in 2011. The gender gap in
literacy rate has significantly come down, both in India and Bihar. This disparity in literacy
rate was as much as 21.6 and 26.7 percentage points in India and Bihar respectively, in 2001.
The gap has come down to 16.3 and 19.7 percentage points for India and Bihar respectively, in
2011. This implies that Bihar has been able to narrow the gap at a faster pace than the country
as a whole.
Table 5.20 : Trend of Literacy Rates in India and Bihar
Year India Bihar Gender Gap
Male Female Person Male Female Person India Bihar
1961 40.4 15.4 28.3 35.2 8.2 22.0 25.1 27.0
1971 46.0 22.0 34.5 35.8 10.2 23.2 24.0 25.5
1981 56.4 29.8 43.6 43.8 15.8 32.3 26.6 28.0
1991 64.1 39.3 52.2 52.5 22.9 37.5 24.8 29.6
2001 75.3 53.7 64.8 60.3 33.6 47.0 21.6 26.7
2011 80.9 64.6 72.9 71.2 51.5 61.8 16.3 19.7
Source : Department of Education, GOB
Primary and Secondary Education
The educational progress of the state is dependent on parallel developments in its elementary
education, secondary education and higher education sector. However, for a socially
disadvantaged state like Bihar, it is the elementary education sector that commands the highest
importance, since it is this sector which feeds students for the secondary sector which, in turn,
feeds students for the higher education sector. The progress in elementary education sector also
implies that the process is an inclusive one, since it is more relevant for a large number of
students who are first generation learners coming from disadvantaged sections of the society.
The successs of elementary education is determined by two crucial edicational indices — high
enrolment ratio and low dropout rate. The performance on these two indices, in turn, is mostly
influenced by the availability of educational facilities like schools, teachers etc. This is
particularly important for the state like Bihar where most of the families dwell in rural areas
and depend on government schools for their educational needs.
Enrolment Ratio
Table 5.21 shows total enrolment at Primary and Upper Primary Levels in Bihar, during 2007-
08 to 2011-12. The annual growth rate in primary enrolment was 2.6 percent during this

193
period. The total enrolment in primary level was 156.50 lakhs in 2011-12, which had increased
from 146.3 lakhs in 2007-08. At the upper primary level also, the enrolment has risen during
the last four years. The total enrolment at this level in 2011-12 was 50.55 lakhs, with an annual
growth rate of 14.4 percent; for the SC and ST students also, the growth rate was high. As a
whole, the total enrolment, taking primary and upper primary together, rose to 207.25 lakhs in
2011-12 from 176.64 lakhs in 2007-08, with an annual growth rate of 5.0 percent. The SC
enrolment during this period has grown at a higher rate of 6.7 percent.
Table 5.21 : Total Enrolment (in Lakhs) in Primary and Upper Primary Levels
Level/Type of
Students 2007-08 2008-09 2009-10 2010-11 2011-12 CAGR
Primary
Boys
Total 78.19 74.27 77.56 80.76 82.29 1.9
SC 14.28 13.13 13.68 15.23 16.1 4.0
ST 1.93 0.89 1.31 1.07 1.34 -5.3
Girls
Total 68.11 57.74 61.52 68.57 74.21 3.5
SC 11.52 9.35 9.85 12.17 13.29 5.6
ST 1.62 0.6 0.73 0.73 1.14 -4.9
All
Total 146.3 132.01 139.08 149.34 156.50 2.6
SC 25.81 22.49 23.54 27.4 29.39 4.7
ST 3.55 1.5 2.03 1.81 2.48 -5.2
Upper Primary
Boys
Total 17.28 20.66 23.42 26.65 27.04 12.2
SC 2.39 3.08 3.24 3.82 4.26 14.7
ST 0.28 0.19 0.36 0.25 0.36 8.1
Girls
Total 13.06 14.56 17.85 22.14 23.51 17.3
SC 1.56 1.83 2.09 2.78 3.37 21.6
ST 0.2 0.12 0.18 0.18 0.3 12.9
All
Total 30.34 35.22 41.27 48.8 50.55 14.4
SC 3.94 4.92 5.33 6.61 7.63 17.6
ST 0.48 0.31 0.54 0.44 0.66 10.4
Total
Boys
Total 95.47 94.93 100.98 107.41 109.33 4.0
SC 16.67 16.21 16.92 19.05 20.36 5.8
ST 2.21 1.08 1.67 1.32 1.7 -3.2
Girls
Total 81.17 72.3 79.37 90.71 97.92 6.2
SC 13.08 11.18 11.94 14.95 16.66 8.1
ST 1.82 0.72 0.91 0.91 1.44 -2.3
All
Total 176.64 167.23 180.35 198.14 207.25 5.0
SC 29.75 27.41 28.87 34.01 37.02 6.7
ST 4.03 1.81 2.57 2.25 3.14 -2.8
Source: Department of Education, GOB

194
It is encouraging to note that the enrolment of girls is increasing at a faster rate than that of the
boys. The annual growth rate of girls was 3.5 percent during 2007-08 to 2011-12, compared to
the annual growth rate of boys which is only 1.9 percent. The total enrolment of boys (82.29
lakhs) at the primary level was higher than that of the girls (74.21 lakhs) in 2011-12. The ratio
of girls’ enrolment to boys’ was 0.87 in 2007-08, and this ratio shifted to 0.90 in 2011-12. The
same picture is emerging at the upper primary level as well. There is a difference of 5.1
percentage points between the annual growth rate of girls’ enrolment compared to that of the
boys during this period. Taking primary and upper primary together, boys’ enrolment
accounted for 54.0 percent of the total enrolment in 2007-08; but in 2011-12, this share was
52.7 percent. This indicates progress towards gender parity in the enrolment in Bihar. A similar
trend is observed in the enrolment of SC girls at both primary and upper primary levels during
the said period.
The district-wise total enrolment for all, SC and ST categories is given in Table A5.18, A5.19
and A5.20 (Appendix), respectively. There exists high variation among the districts at both
primary and upper primary level in 2011-12. East Champaran (15.48 lakh) has registerd the
highest number of enrolment at primary level, followed by Muzaffarpur (9.91 lakh) in 2011-
12. East Champaran (4.51 lakh) has registerd the highest number of enrolment at upper
primary level as well, followed by Nalanda (2.52 lakh) in 2011-12. However, Sheikhpura and
Sheohar, like the previous year, have again registered the lowest number of enrolment (1.25
lakh) and (1.27 lakh) respectively at both the levels in 2011-12.
The districtwise annual growth rate of enrolment is presented in Table A 5.21 (Appendix). The
best three districts recording the highest annual growth in enrolment at primary classes are —
East Champaran (15.2 percent), Saharsa (8.8 percent) and Jamui (8.7 percent). At the upper
primary level, East Champaran (41.2 percent), Kishanganj (30.8 percent) and Madhepura (28.1
percent) are the best three districts. In general, a higher annual growth rate is observed in those
districts where literacy rate is relatively low. The universal coverage of enrolment at the
primary level is almost achieved for the children in age-group of 6-14 years in Bihar. This is
one of the reasons for a higher growth rate of enrolment at the upper primary level. Now, more
attention needs to be given on the retention of the students and reducing the dropout rate.

195
Dropout Rate
The success with respect to high enrolment becomes meaningful if the enrolled children are
retained in the school. But substantial dropout before completing a certain education level is a
problem in Bihar. All the factors behind such dropout may be broadly clubbed into three
categories – (a) economic factors, (b) social and cultural factors and (c) school environment
and infrastructure. In case of Bihar, all these factors are operative in varying degrees. Under
economic factors, the opportunity costs such as wage income, domestic work, etc., prevent
parents from sending their children to schools.
The dropout rates at primary, upper primary, secondary and higher secondary levels during
2006-07 to 2011-12 in Bihar are presented in Table 5.22. At all levels of education, these rates
have continuously decreased during the recent years. At the primary level, dropout rate
registered a decrease of 11.3 percentage points between 2006-07 to 2011-12. At the upper
primary level, this decrease during the same time period was 6.32 percentage points. This
implies that decrease in dropout rate of children in primary level is higher compared to the
Intervention in the Elementary Education
Under Manav Vikas Mission (MVM) (2013-17), the targets and time frames have been set
separately for Elementary Education and Literacy.
Learning Achievement in Language/ Mathematics : 85 percent students upto Class
VIII to achieve 90 percent proficiency for that Class in Language and Mathematics by
2017.
Attendance Percentage against enrolment: 90 percent in Primary and Upper Primary
Levels by 2017.
Transition Rate of children – SC / ST / Girls / Minorities: 92 percent for children in all
categories by 2017.
Teacher Pupil Ratio in Elementary Education: 40:1 based on enrolment and 30:1
based on attendance by 2017.
Student- Class Room Ratio in Elementary Education: 45:1 based on enrolment and
35:1 based on attendance by 2017.
Percentage of children/ women from Mahadalit/ EBC/ Minority covered by Tola
Sewak/ Talim-I Markaj volunteer in feeder area: 100 percent coverage of all children.
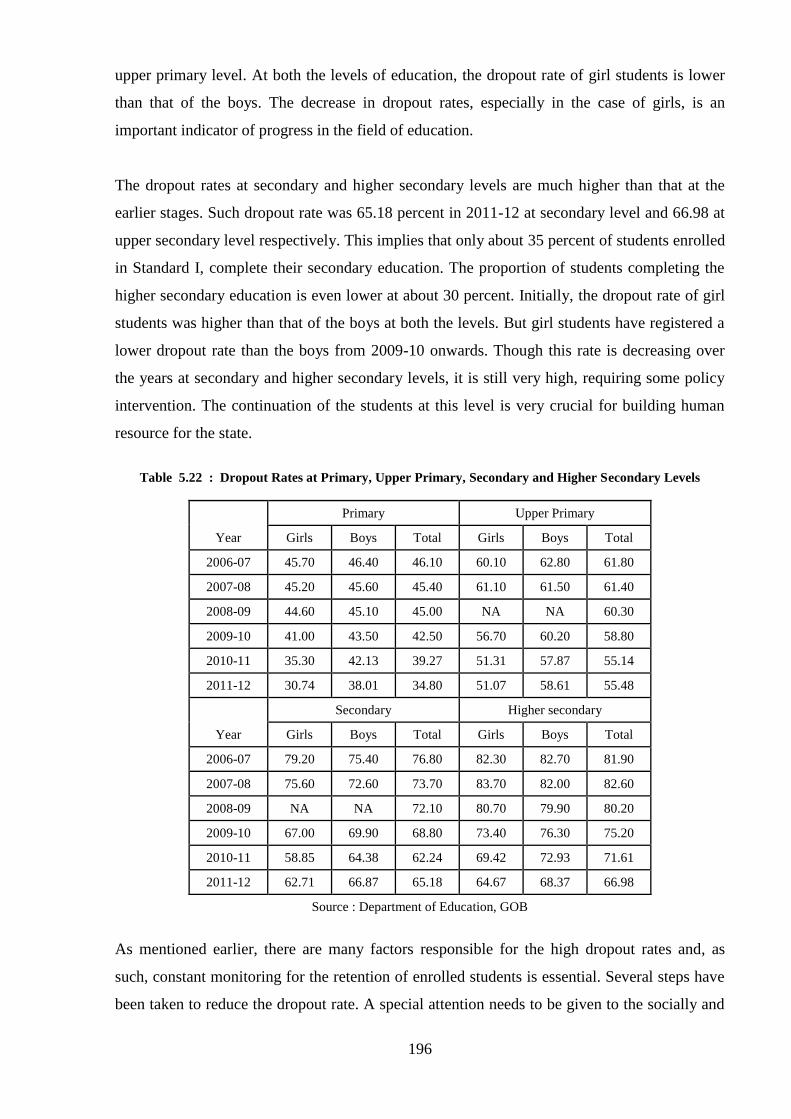
196
upper primary level. At both the levels of education, the dropout rate of girl students is lower
than that of the boys. The decrease in dropout rates, especially in the case of girls, is an
important indicator of progress in the field of education.
The dropout rates at secondary and higher secondary levels are much higher than that at the
earlier stages. Such dropout rate was 65.18 percent in 2011-12 at secondary level and 66.98 at
upper secondary level respectively. This implies that only about 35 percent of students enrolled
in Standard I, complete their secondary education. The proportion of students completing the
higher secondary education is even lower at about 30 percent. Initially, the dropout rate of girl
students was higher than that of the boys at both the levels. But girl students have registered a
lower dropout rate than the boys from 2009-10 onwards. Though this rate is decreasing over
the years at secondary and higher secondary levels, it is still very high, requiring some policy
intervention. The continuation of the students at this level is very crucial for building human
resource for the state.
Table 5.22 : Dropout Rates at Primary, Upper Primary, Secondary and Higher Secondary Levels
Year
Primary Upper Primary
Girls Boys Total Girls Boys Total
2006-07 45.70 46.40 46.10 60.10 62.80 61.80
2007-08 45.20 45.60 45.40 61.10 61.50 61.40
2008-09 44.60 45.10 45.00 NA NA 60.30
2009-10 41.00 43.50 42.50 56.70 60.20 58.80
2010-11 35.30 42.13 39.27 51.31 57.87 55.14
2011-12 30.74 38.01 34.80 51.07 58.61 55.48
Year
Secondary Higher secondary
Girls Boys Total Girls Boys Total
2006-07 79.20 75.40 76.80 82.30 82.70 81.90
2007-08 75.60 72.60 73.70 83.70 82.00 82.60
2008-09 NA NA 72.10 80.70 79.90 80.20
2009-10 67.00 69.90 68.80 73.40 76.30 75.20
2010-11 58.85 64.38 62.24 69.42 72.93 71.61
2011-12 62.71 66.87 65.18 64.67 68.37 66.98
Source : Department of Education, GOB
As mentioned earlier, there are many factors responsible for the high dropout rates and, as
such, constant monitoring for the retention of enrolled students is essential. Several steps have
been taken to reduce the dropout rate. A special attention needs to be given to the socially and
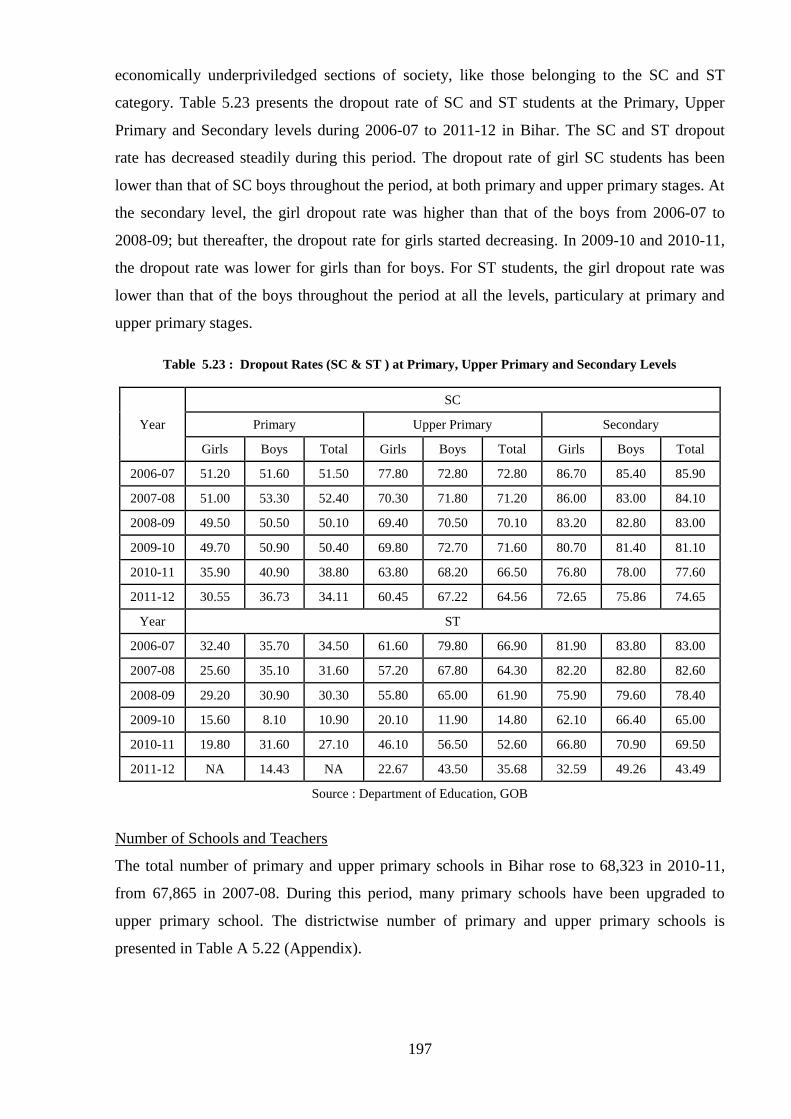
197
economically underpriviledged sections of society, like those belonging to the SC and ST
category. Table 5.23 presents the dropout rate of SC and ST students at the Primary, Upper
Primary and Secondary levels during 2006-07 to 2011-12 in Bihar. The SC and ST dropout
rate has decreased steadily during this period. The dropout rate of girl SC students has been
lower than that of SC boys throughout the period, at both primary and upper primary stages. At
the secondary level, the girl dropout rate was higher than that of the boys from 2006-07 to
2008-09; but thereafter, the dropout rate for girls started decreasing. In 2009-10 and 2010-11,
the dropout rate was lower for girls than for boys. For ST students, the girl dropout rate was
lower than that of the boys throughout the period at all the levels, particulary at primary and
upper primary stages.
Table 5.23 : Dropout Rates (SC & ST ) at Primary, Upper Primary and Secondary Levels
Year
SC
Primary Upper Primary Secondary
Girls Boys Total Girls Boys Total Girls Boys Total
2006-07 51.20 51.60 51.50 77.80 72.80 72.80 86.70 85.40 85.90
2007-08 51.00 53.30 52.40 70.30 71.80 71.20 86.00 83.00 84.10
2008-09 49.50 50.50 50.10 69.40 70.50 70.10 83.20 82.80 83.00
2009-10 49.70 50.90 50.40 69.80 72.70 71.60 80.70 81.40 81.10
2010-11 35.90 40.90 38.80 63.80 68.20 66.50 76.80 78.00 77.60
2011-12 30.55 36.73 34.11 60.45 67.22 64.56 72.65 75.86 74.65
Year ST
2006-07 32.40 35.70 34.50 61.60 79.80 66.90 81.90 83.80 83.00
2007-08 25.60 35.10 31.60 57.20 67.80 64.30 82.20 82.80 82.60
2008-09 29.20 30.90 30.30 55.80 65.00 61.90 75.90 79.60 78.40
2009-10 15.60 8.10 10.90 20.10 11.90 14.80 62.10 66.40 65.00
2010-11 19.80 31.60 27.10 46.10 56.50 52.60 66.80 70.90 69.50
2011-12 NA 14.43 NA 22.67 43.50 35.68 32.59 49.26 43.49
Source : Department of Education, GOB
Number of Schools and Teachers
The total number of primary and upper primary schools in Bihar rose to 68,323 in 2010-11,
from 67,865 in 2007-08. During this period, many primary schools have been upgraded to
upper primary school. The districtwise number of primary and upper primary schools is
presented in Table A 5.22 (Appendix).
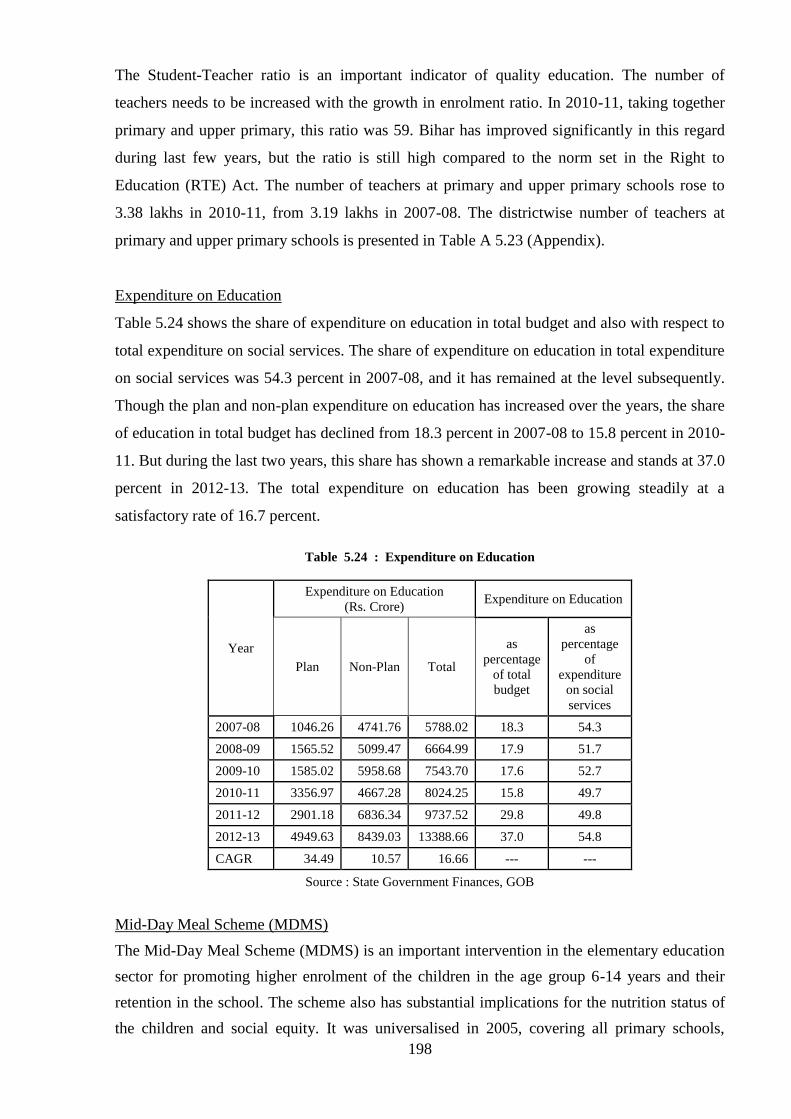
198
The Student-Teacher ratio is an important indicator of quality education. The number of
teachers needs to be increased with the growth in enrolment ratio. In 2010-11, taking together
primary and upper primary, this ratio was 59. Bihar has improved significantly in this regard
during last few years, but the ratio is still high compared to the norm set in the Right to
Education (RTE) Act. The number of teachers at primary and upper primary schools rose to
3.38 lakhs in 2010-11, from 3.19 lakhs in 2007-08. The districtwise number of teachers at
primary and upper primary schools is presented in Table A 5.23 (Appendix).
Expenditure on Education
Table 5.24 shows the share of expenditure on education in total budget and also with respect to
total expenditure on social services. The share of expenditure on education in total expenditure
on social services was 54.3 percent in 2007-08, and it has remained at the level subsequently.
Though the plan and non-plan expenditure on education has increased over the years, the share
of education in total budget has declined from 18.3 percent in 2007-08 to 15.8 percent in 2010-
11. But during the last two years, this share has shown a remarkable increase and stands at 37.0
percent in 2012-13. The total expenditure on education has been growing steadily at a
satisfactory rate of 16.7 percent.
Table 5.24 : Expenditure on Education
Year
Expenditure on Education
(Rs. Crore) Expenditure on Education
Plan Non-Plan Total
as
percentage
of total
budget
as
percentage
of
expenditure
on social
services
2007-08 1046.26 4741.76 5788.02 18.3 54.3
2008-09 1565.52 5099.47 6664.99 17.9 51.7
2009-10 1585.02 5958.68 7543.70 17.6 52.7
2010-11 3356.97 4667.28 8024.25 15.8 49.7
2011-12 2901.18 6836.34 9737.52 29.8 49.8
2012-13 4949.63 8439.03 13388.66 37.0 54.8
CAGR 34.49 10.57 16.66 --- ---
Source : State Government Finances, GOB
Mid-Day Meal Scheme (MDMS)
The Mid-Day Meal Scheme (MDMS) is an important intervention in the elementary education
sector for promoting higher enrolment of the children in the age group 6-14 years and their
retention in the school. The scheme also has substantial implications for the nutrition status of
the children and social equity. It was universalised in 2005, covering all primary schools,

199
including learning centres. Later, its coverage has been extended to upper primary classes. The
overall position regarding the coverage of the scheme is indicated in Table 5.25.
Table 5.25 elucidates the scenario of the MDMS in Bihar during 2008-09 to 2012-13. In 2012-
13, the coverage of MDMS was 58.3 percent at the primary level. This coverage has,
unfortunately, decreased over the years. This decrease in coverage is attributable to enhanced
enrolment in primary schools during these years. For the upper primary classes, a similar trend
is recorded during the period. In 2008-09, the coverage of MDMS was 81.2 percent, but in
2012-13 it was only 55.1 percent.
Table 5.25 : Coverage of MDMS in Bihar
Year
Class I to V Class VI to VIII
Total
Enrolment
(in lakhs)
No. of
Children
Availing
MDM
(per day)
(in lakhs)
Coverage
Percentage
Total
Enrolment
(in lakhs)
No. of
Children
Availing
MDM
(per day)
(in lakhs)
Coverage
Percentage
2008-09 138.7 98.27 70.9 38.80 31.51 81.2
2012-13 142.82 83.25 58.3 53.45 29.46 55.1
Source : MDMS, GOB
The districtwise coverage of MDMS at primary and upper primary levels is presented in Table
A 5.24 and A 5.25 respectively (Appendix). During 2012-13, there are only 14 districts where
the coverage of MDMS is less than the state average of 58.3 percent at the primary level,
compared to 23 districts in the previous year. The coverage of MDMS is above 70 percent in
five districts — Arwal (76.9 percent), Bhagalpur (74.1 percent), Lakhisarai (73.8 percent),
Jehanabad (72.8 percent) and Kaimur (71.2 percent). The lowest coverage is recorded in
Madhubani (41.4 percent). At the upper primary level, there are 18 districts where the MDMS
coverage was below the state average of 55.1 percent. The best three districts in terms of
coverage are — Arwal (70.7 percent), Jehanabad (62.8 percent) and Madhepura (62.5 percent).
The lowest coverage is recorded in Lakhisarai (48.6 percent).
The effective implementation of MDMS can play a significant role in ensuring the universal
coverage of education. This is particularly important for poor states like Bihar. There are many
concerns regarding the proper implementation of MDMS. Some of them are – wide variation
in the enrolment and attendance, less control over the quantity and quality of food, irregular
supply of foodgrains, etc. To overcome these problems, monitoring and evaluation system
needs to be more effective.

200
Sarva Shiksha Abhiyan (SSA)
The Sarva Shiksha Abhiyan (SSA) is a flagship programme of the central government to
ensure the universalisation of elementary education for the children in the age group of 6-14. It
is jointly funded by the central and state government with a share of 65:35 respectively. To
ensure education for all, SSA has fixed the following objectives: (i) capacity building of
teachers; (ii) providing adequate number of teachers and bringing teacher-student ratio to the
desired level; (iii) strengthening school infrastructure and (iv) ensuring community
participation by forming Village Education Committee (VEC) at the second level. It also aims
at bridging the social, regional and gender gaps in literacy and elementary education.
The SSA in Bihar is being implemented through the Bihar Education Project (BEP) Council.
Along with SSA, the BEP is also responsible for other programmes like National Programme
for Education of Girls at Elementary Level (NPEGEL), a special component of SSA which
provides additional support for enhancing girl’s education over and above the normal SSA
inerventions. The programme provides for setting up of a model school in every cluster with
more intense community mobilization and supervision of girls’ enrolment in schools. This
scheme is implemented in Educationally Backward Blocks (EBBs) where the level of rural
female literacy is less than the national average and gender gap is above the national average.
The NPEGEL also covers those blocks which are not under EBB but where at least 5 percent
of population is SC/ST and SC/ST female literacy is below 10 per cent and also selected urban
slums. Kasturba Gandhi Balika Vidyalaya (KGBV) is another scheme for setting up residential
schools at upper primary level for girls belonging to the SC/ST, OBC and minority community.
The scheme was merged with SSA with effect from April 1, 2007. Table 5.26 shows that, out
of the total approved budget of Rs. 10615 crore of BEP, 51.5 percent has been spent on SSA
during the year 2012-13.
Table 5.26 : Status of Fund Received and Expenditure by BEP (2012-13)
(Rs. crore)
Programmes Approved
AWP&B
13th Finance
Commission
Award
Fund Releases
Total
Expenditure
% of
Exp.
Against
AWP
& B
13th
Finance GOI GOB Total
SSA 10349.46 818.00 818.00 2680.98 1966.51 5465.49 5329.08 51.5
NPEGEL 45.57 0.00 0.00 16.47 7.38 23.85 21.92 48.1
KGBV 220.13 0.00 0.00 57.17 26.11 83.28 93.90 42.7
Total:: 10615.16 818.00 818.00 2754.62 2000.00 5572.62 5444.90 51.3
Source: Bihar Education Project, GoB

201
Out-of-School Children
Apart from strengthening the infrastructure for elementary education and providing additional
teachers, the BEP has also been engaged in making a number of innovations which could bring
out-of-school children back to the schooling system. These initiatives include Utthan Kendras
(for children belonging to the Mahadalit categories), Talimi Markaj (for Muslim children in 6-
10 years age group), Utpreran Kendra (for children in the age group 11-14 years) and Maktab
Madarsa Kendra (for non-residential and residential bridge courses for Muslim children). Table
5.27 presents the details about number of such centres and number of children covered by
them. During 2011-12 and 2012-13, there has been decrease in the number of Utthan Kendras.
A declining trend has also been observed in all the innovative centres for Utpreran and Maktab
Madarsa Kendras. This may be explained by the fact that all these centres are non-formal
centres and, with the expansion of infrastructure for formal schools, the students are moving
from the non-formal to formal institutions. So, the decrease in the number of children in
alternative innovative centres is a positive signal for the educational scenario in the state. On
the other hand, the number of children covered by the centres such as non-resident bridge
course has increased during this period. The total number of children covered by all these
alternative innovative centres, has decreased to 6.97 lakh in 2012-13 from 8.12 lakh in
2011-12.
Table 5.27 : Status of Alternative Innovative Centres
Intervention
2011-12 2012-13
No. of
Centres
Children
covered
No. of
Centres
Children
covered
Utthan Kendra 19962 620200 18334 546422
Talimi Markaj 3851 84456 3089 72109
Utpreran Kendras 933 49650 836 54763
Maktab Madrasa Kendras 2381 52382 37 823
Innovative NRBC by NGO 70 3965 270 3986
RBC by NGOs 262 1950 191 19000
Total 27459 812603 22757 697103
Source : Bihar Education Project (BEP) Council, GOB
Higher Education
The higher education sector in Bihar comprises college and university education, both for
general and technical streams. The apex institutions for higher education are the universities in
the state (Table 5.28). Presently, 21 universities are functioning in the state, of which 20 are
traditional universities and 1 of them is an open university. There are 815 colleges which are
distributed among 20 traditional universities. Out of these colleges, 273 are government

202
colleges, and they constitute one-fourth of the total number of colleges. Apart from the
government colleges, there are 336 local body colleges and 206 colleges of other types.
Providing professional training to the prospective school teachers is another component of the
higher education system. Presently, there are 35 teacher training centres in Bihar. Compared to
the number of institutions for general education, the number of institutions for technical
education is rather limited in Bihar, and there are only 10 colleges for engineering and
technical education. Of these 10 colleges, 2 have been established in 2009 widening the
opportunity for technical education in Bihar.
Table 5.28 : Institutions of Higher Education in Bihar
Type of Institutions/Year 2010 2011 2012
Universities 13 20 20
Open Universities 2 1 1
Research Institute 15 15 15
Colleges/ Institute 628 815 815
Government Colleges 273 273 273
Local Body Colleges 258 336 336
Other Colleges 97 206 206
Education/Teacher Training Centres 33 35 35
Engineering /Technical college 10 10 10
Others 251 252 252
Source : Department of Education, GOB
Due to resource constraints, state government alone is not able to fulfill the demand for higher
education. Thus, a number of private educational institutes have been set up in Bihar, which
are generally institutes of technical, medical and vocational education. The districtwise details
of affiliated and constituent colleges for 2010-11 is given in Table A5.26 ( Appendix).
Art, Culture and Youth
Under Manav Vikas Mission (MVM), the basic objective relating to Art, Culture and Youth
are — (i) Physical and mental development, (ii) Enhancement of efficiency through healthy
and recreational activities, (iii) Achievement through skills in sports, (iv) Employment and
income generation through performance in sports, and (v) Exchange youth views and culture
through national level sports competitions/ programmes.

203
For the sub-component of sports, the state government has specific plans which include — (a)
Construction of stadium/ play fields at Patna (international standard), divisional headquarters,
534 block headquarters and 8406 Gram Panchayat levels, (b) Establishment of sports hostel
(along with stadium and coaching centres) at each of 38 districts, (c) Establishment of Sports
Academy (d) Provision of financial help to sport persons, and (e) Organise district/ state/
national/ international competitions. The physical targets for this programme are presented in
Table 5.29.
Table 5.29 : Physical Targets for Development of Sports
Year
International
Stadium
Stadium
at block
level
Play field Indoor
Stadium
Stadium
and
coaching
Centre
Sports
Academy
2013-14 1 100 2000 2 9 1
2014-15 1 100 2206 4 15 -
2015-16 - 134 2200 3 14 -
2016-17 - - 2000 - - -
Total 2 334 8406 9 38 1
Source: Department of Art, Culture and Youth
5.5 Security for Weaker Sections
Scheduled Caste and Scheduled Tribe
The state government had created a separate Department in 2007 for the welfare of scheduled
castes and tribes in Bihar. There are 22 castes in Bihar which are listed as Scheduled Castes
(SC) which account for 15.9 percent of its population, while communities listed as Scheduled
Tribes (ST) make up 1.3 percent of the state’s population, according to 2011 census. The
Department of Scheduled Caste and Scheduled Tribe runs various programmes for their
economic, educational and social upliftment which are listed below:
In 2012-13, 18,603 students received benefits under the Chief Minister’s SC & ST Merit
Scholarship Scheme. In 2013-14, 19,957 students have been benefited uptill now with an
expenditure of Rs. 19.95 crore.
The state government has made provision for scholarships and stipends for pre-matric
and post-matric students.
For distribution of scholarships among Mushahars and Bhuiyas, the state government has
made a provision of Rs. 18.04 crore under plan head and Rs. 1.10 crore in non-plan head
in 2013-14.
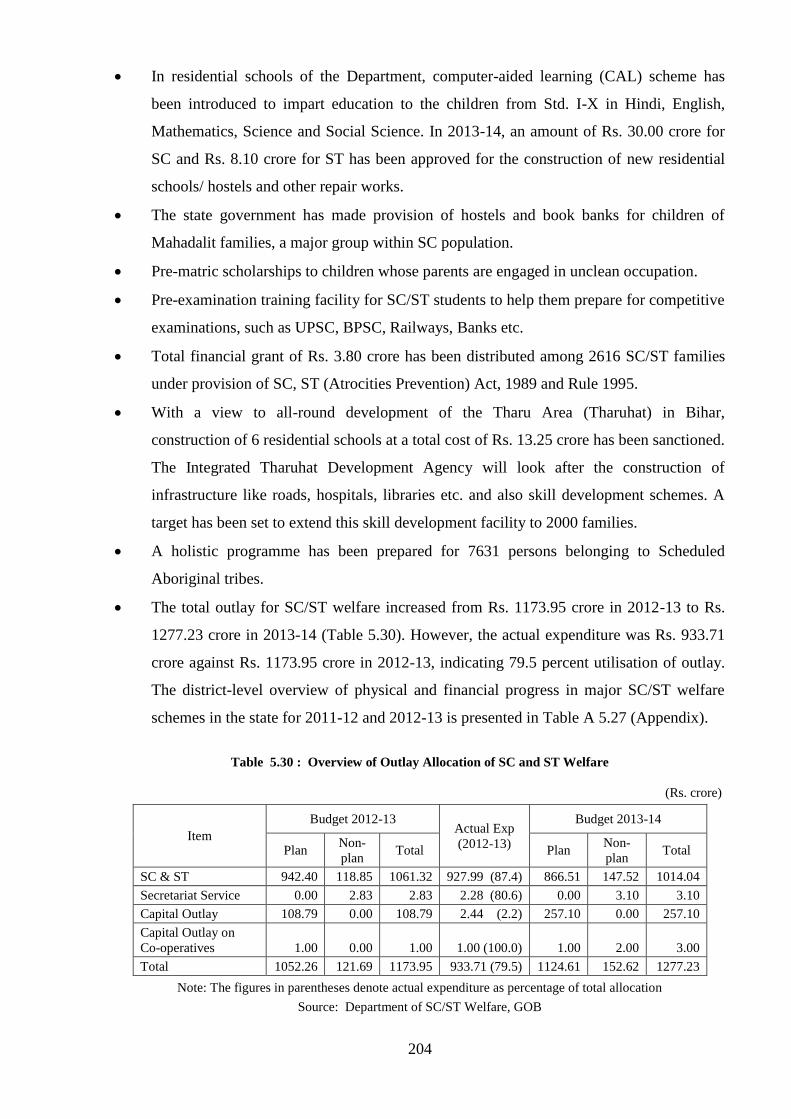
204
In residential schools of the Department, computer-aided learning (CAL) scheme has
been introduced to impart education to the children from Std. I-X in Hindi, English,
Mathematics, Science and Social Science. In 2013-14, an amount of Rs. 30.00 crore for
SC and Rs. 8.10 crore for ST has been approved for the construction of new residential
schools/ hostels and other repair works.
The state government has made provision of hostels and book banks for children of
Mahadalit families, a major group within SC population.
Pre-matric scholarships to children whose parents are engaged in unclean occupation.
Pre-examination training facility for SC/ST students to help them prepare for competitive
examinations, such as UPSC, BPSC, Railways, Banks etc.
Total financial grant of Rs. 3.80 crore has been distributed among 2616 SC/ST families
under provision of SC, ST (Atrocities Prevention) Act, 1989 and Rule 1995.
With a view to all-round development of the Tharu Area (Tharuhat) in Bihar,
construction of 6 residential schools at a total cost of Rs. 13.25 crore has been sanctioned.
The Integrated Tharuhat Development Agency will look after the construction of
infrastructure like roads, hospitals, libraries etc. and also skill development schemes. A
target has been set to extend this skill development facility to 2000 families.
A holistic programme has been prepared for 7631 persons belonging to Scheduled
Aboriginal tribes.
The total outlay for SC/ST welfare increased from Rs. 1173.95 crore in 2012-13 to Rs.
1277.23 crore in 2013-14 (Table 5.30). However, the actual expenditure was Rs. 933.71
crore against Rs. 1173.95 crore in 2012-13, indicating 79.5 percent utilisation of outlay.
The district-level overview of physical and financial progress in major SC/ST welfare
schemes in the state for 2011-12 and 2012-13 is presented in Table A 5.27 (Appendix).
Table 5.30 : Overview of Outlay Allocation of SC and ST Welfare
(Rs. crore)
Item
Budget 2012-13 Actual Exp
(2012-13)
Budget 2013-14
Plan Non-
plan Total Plan
Non-
plan Total
SC & ST 942.40 118.85 1061.32 927.99 (87.4) 866.51 147.52 1014.04
Secretariat Service 0.00 2.83 2.83 2.28 (80.6) 0.00 3.10 3.10
Capital Outlay 108.79 0.00 108.79 2.44 (2.2) 257.10 0.00 257.10
Capital Outlay on
Co-operatives 1.00 0.00 1.00 1.00 (100.0) 1.00 2.00 3.00
Total 1052.26 121.69 1173.95 933.71 (79.5) 1124.61 152.62 1277.23
Note: The figures in parentheses denote actual expenditure as percentage of total allocation
Source: Department of SC/ST Welfare, GOB

205
Mahadalit
The state government has undertaken several targeted schemes based on the report of the State
Mahadalit Commission for the welfare of the most deprived amongst the scheduled castes. The
Commission observed that, out of the 22 scheduled castes in Bihar, 21 are acutely deprived in
terms of economic, social, cultural and political status, and population belonging to these
castes have not benefited significantly from affirmative actions meant for the SC population.
The specific attempt of the state government for the welfare of Mahadalits include :
In 2012-13, under Mahadalit Alpasankhyak Evam Ati-pichhada Varg Akshar Anchal
Yojana, against the target of 30 thousand, 23,320 centres have been started to benefit
people from Mahadalit category.
Out of 1.8 lakh shelterless Mahadalit families, land has been given to 26.3 thousand
families for housing purposes.
Under ‘Mukhyamantri Mahadalit Radio Scheme’, radios were given to 10.6 lakh families
in 26 districts of Bihar till September, 2013.
The state government is contemplating to establish ‘Community Radio Stations’ in rural
areas of Bihar for social and cultural upliftment of Mahadalit community. The
programmes to be broadcasted by these stations would also be prepared by people from
this community.
Upto 2010-11, nearly cent percent of total allocation has been utilized for mahadalit welfare;
but in the last two years, there is fall in utilisation percentage. The chart below shows the
allocation and expenditure of funds for mahadalit welfare:
Chart 5.5 : Budget Allocation for Development of Mahadalits
0
50
100
150
200
2008-09 2009-10 2010-11 2011-12 2012-13
13.0
66.8
98.0
118.0
191.9
13.0
66.8
91.0 83.3
72.3 (Rs.
cro
re)
Allocation Expenditure

206
National Safai Karmachari Finance and Development Corporation (NSKFDC)
Mahila Samriddhi Yojana (MSY) - An amount of Rs. 10,000 is provided as subsidy and Rs.
20,000 as loan to the families of SC community to empower them through self-employment. Only
a modest 4 percent rate of interest is charged on this loan which is collected in 36 equal
installments. Upto 2012-13, Rs. 47.70 lakh have been provided to 159 female workers for self-
employment.
Micro Credit Finance Scheme (MCFS) - Under MCFS, the amount for loan and subsidy are
same as in MSY, but instead of 4 percent, the rate of interest is 5 percent which is recovered in 36
equal installments. Under this, in 2012-13, 114 people have availed Rs. 34.20 lakh of assistance
for self-employment.
Mahila Adhikarita Yojana (MAY) – Under this scheme, the female safai workers are provided
a loan amount of Rs. 40,000 and subsidy amount of Rs. 10,000 with a rate of interest of 5 percent
which will be collected in 60 regular installments. In 2012-13, 10 female workers have got a total
of Rs. 5.0 lakhs for self-employment.
Term Loan (Rs. 50 thousand) – An amount of Rs. 10,000 is provided as subsidy and Rs. 40,000
as loan for the families of SC community to empower them through self-employment. Only a
modest 6 percent rate of interest is charged for this loan which is collected in 60 equal
installments. In 2012-13, 78 people have availed Rs. 39.00 lakh as assistance for self-
employment.
Term Loan (Rs. 1.00 lakh) – An amount of Rs. 10,000 is provided as subsidy and Rs. 90,000 as
loan for the families of SC community to empower them through self-employment. Only a
modest 6 percent rate of interest is charged for this loan which is collected in 60 equal
installments. In 2012-13, 27 people have availed Rs. 25.65 lakh as assistance for self-
employment.
The Bihar State Schedule Caste Cooperative Development Corporation, Patna was established
in 1978 under the Cooperative Act for all round development of scheduled castes. The district
offices of the Corporation are working in 35 districts of Bihar. In the financial year 2012-13,
Corporation has benefited 4147 people with a loan and subsidy amount of Rs. 12.66 crore. The
details are given in Table 5.31.
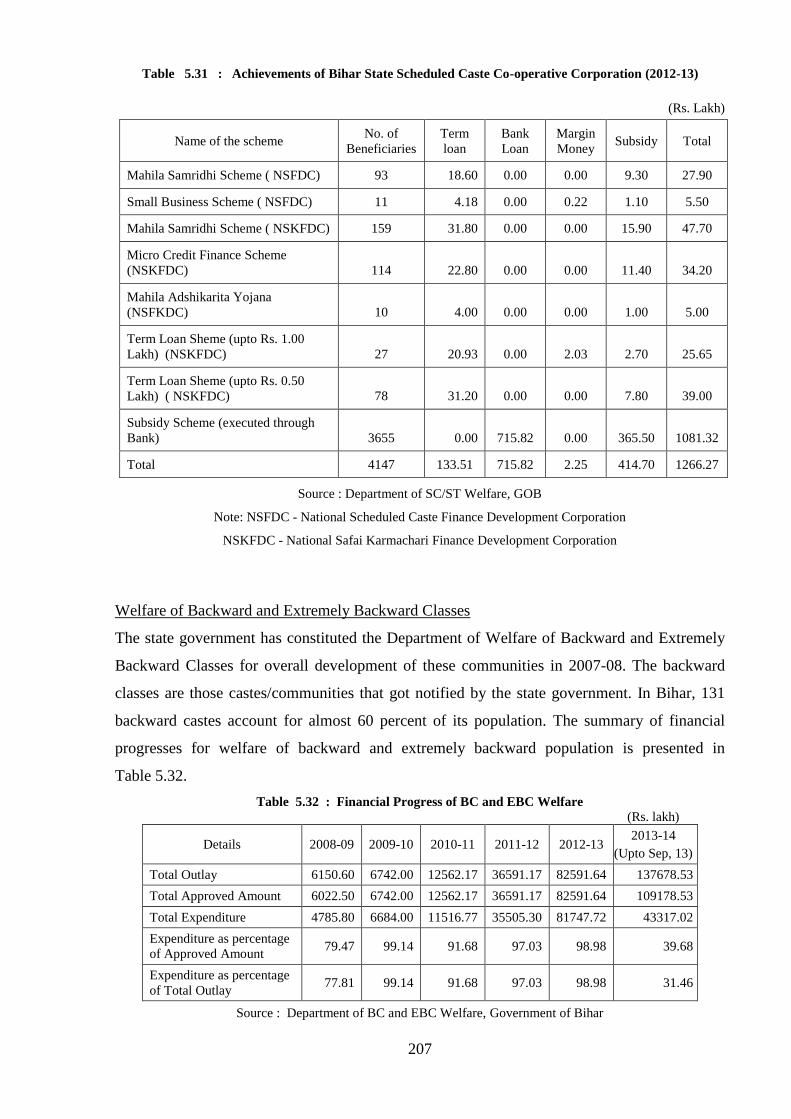
207
Table 5.31 : Achievements of Bihar State Scheduled Caste Co-operative Corporation (2012-13)
(Rs. Lakh)
Name of the scheme No. of
Beneficiaries
Term
loan
Bank
Loan
Margin
Money Subsidy Total
Mahila Samridhi Scheme ( NSFDC) 93 18.60 0.00 0.00 9.30 27.90
Small Business Scheme ( NSFDC) 11 4.18 0.00 0.22 1.10 5.50
Mahila Samridhi Scheme ( NSKFDC) 159 31.80 0.00 0.00 15.90 47.70
Micro Credit Finance Scheme
(NSKFDC) 114 22.80 0.00 0.00 11.40 34.20
Mahila Adshikarita Yojana
(NSFKDC) 10 4.00 0.00 0.00 1.00 5.00
Term Loan Sheme (upto Rs. 1.00
Lakh) (NSKFDC) 27 20.93 0.00 2.03 2.70 25.65
Term Loan Sheme (upto Rs. 0.50
Lakh) ( NSKFDC) 78 31.20 0.00 0.00 7.80 39.00
Subsidy Scheme (executed through
Bank) 3655 0.00 715.82 0.00 365.50 1081.32
Total 4147 133.51 715.82 2.25 414.70 1266.27
Source : Department of SC/ST Welfare, GOB
Note: NSFDC - National Scheduled Caste Finance Development Corporation
NSKFDC - National Safai Karmachari Finance Development Corporation
Welfare of Backward and Extremely Backward Classes
The state government has constituted the Department of Welfare of Backward and Extremely
Backward Classes for overall development of these communities in 2007-08. The backward
classes are those castes/communities that got notified by the state government. In Bihar, 131
backward castes account for almost 60 percent of its population. The summary of financial
progresses for welfare of backward and extremely backward population is presented in
Table 5.32.
Table 5.32 : Financial Progress of BC and EBC Welfare
(Rs. lakh)
Details 2008-09 2009-10 2010-11 2011-12 2012-13 2013-14
(Upto Sep, 13)
Total Outlay 6150.60 6742.00 12562.17 36591.17 82591.64 137678.53
Total Approved Amount 6022.50 6742.00 12562.17 36591.17 82591.64 109178.53
Total Expenditure 4785.80 6684.00 11516.77 35505.30 81747.72 43317.02
Expenditure as percentage
of Approved Amount 79.47 99.14 91.68 97.03 98.98 39.68
Expenditure as percentage
of Total Outlay 77.81 99.14 91.68 97.03 98.98 31.46
Source : Department of BC and EBC Welfare, Government of Bihar

208
The welfare measures taken for backward and extremely backward classes are as follows:
Scholarships are provided to students from backward and extremely backward classes in
primary and upper primary schools, colleges and technical institutes.
An amount of Rs. 587.0 crore was disbursed as stipend of 43 lakh students of primary,
middle and high school in 2012-13, as compared to Rs. 22.0 crore in 2009-10 for 3.0 lakh
students.
Post-Matric Scholarship Scheme is a Centrally Sponsored Scheme, with 50 percent
contribution from the state government. During 2012-13, a total of 2.3 lakh students could
avail this facility, compared to only 75 thousand students in 2009-10. The amount
disbursed was Rs. 246.3 crore in 2012-13, compared to Rs. 25.2 crore in 2009-10.
A sum of Rs. 4.9 crore has been sanctioned for 12 girls' higher secondary residential school
for 800 backward class student in 2012-13.
Under Mukhyamantri EBC Merit Scholarship Scheme, a sum of Rs. 42.0 crore has been
sanctioned during 2012-13, which benefitted 42,000 students.
In 2012-13, Rs. 30 lakh has been disbursed as stipend to 1650 students studying technical
courses.
The construction work of 38 Jannayak Karpuri Thakur hostels for EBC students is likely to
be completed soon.
The physical and financial details of allocation for different welfare schemes for the backward
and extremely backward population is presented in Table 5.33.

209
Table 5.33 : Physical and Financial details of BC and EBC Department
Name of the Schemes Year No. of
beneficiaries
Finance
Allocation
(Rs. Lakh)
Stipend for students of
primary, middle and high
school
2009-10 296315 2200.00
2010-11 312630 2400.00
2011-12 323313 2516.66
2012-13 4300000 58696.46
Post-Matric Scholarship 2009-10 75483 2522.55
2010-11 86210 4000.00
2011-12 126938 15206.88
2012-13 225000 24628.17
OBC Girls’ Higher
Secondary Residential
School (12 nos.)
2009-10 2400 300.00
2010-11 2440 512.00
2011-12 3080 485.00
2012-13 800 100.00
Mukhyamantri Medhavriti
Yojana for EBC students
2009-10 9000 900.00
2010-11 46943 4694.34
2011-12 53000 5300.00
2012-13 42000 4200.00
Provision of share capital to
Backward Class
Development Corporation
2009-10 - 100.00
2010-11 - 100.00
2011-12 - 100.00
2012-13 - 100.00
Stipend for students in
technical courses
2009-10 830 17.40
2010-11 830 17.40
2011-12 850 17.40
2012-13 1650 30.00
Construction of 38 Jannayak
Karpuri Thakur Hostels for
Extremely Backward class
students
2009-10 Under
Construction
1791.27
2010-11 1073.77
2011-12 160.44
2012-13 187.00
Source : Department of Backward and Extremely Backward Class Welfare, GOB
Minority Welfare
The religious minorities constitute 16.71 percent of the population of Bihar, with 16.53 percent
Muslims, 0.03 percent Christians and 0.21 percent belonging to other religions. Muslims
constitute a large part of the population in Kishanganj (67.58 percent), Katihar (42.53 percent),
Araria (41.14 percent) and Purnea (36.76 percent). The lowest share of Muslims in total
population is in Lakhisarai (4.4 perecent). Kishanganj and Katihar also have the largest share
of Christians in the population. For the welfare of the minorities, the Department of Minority

210
Welfare was established in Bihar in 1991. The achievements of the Department in recent years
is as follows :
In 2012-13, under Mukhyamantri Alpsankhayak Vidyarthi Protsahan Yojana, 19,876
minority students were benefitted.
The state government provide financial aid to Sunni Waqf Board for promoting self-
employment to the deserted Muslim women. A sum of Rs. 10 thousand is provided to each
for such activities. A total of 8088 women got help under this scheme till 2012-13.
A scheme for construction of hostels for minority students in all the districts of Bihar is
planned, and 28 such hostels have already been constructed, including Mother Teresa Girls
Hostel at Patna.
The amounts of Rs. 38.4 lakh as grant and Rs. 65.0 lakh for development of Bihar Urdu
Academy, Rs 8.0 lakh for Anzuman Tarraki-e-Urdu, Rs. 50.0 lakh for Bihar Rajya Sunni
Waqf Board, Rs. 20.0 lakh for Bihar Rajya Shiya Waqf Board and Rs. 40.0 lakh for the
Bihar Rajya Haz Samiti have been released in 2013-14.
An amount of Rs. 200.5 lakh has been disbursed to 246 beneficiary students as loan, under
Mukhyamantri Alpsankhyak Shiksha Rin Yojna.
Under Mukhyamantri Alpsankhyak Rojgar Rin Yojna, Rs. 346.5 lakh was disbursed to 358
unemployed youth, belonging to the minority community.
The state government has launched a scheme of Mukhyamantri Shram Shakti Yojna to
provide special training to the workers, belonging to minority communities. Under the
scheme, the minority workers get training in highly reputed training institutes. Currently,
120 minority workers have enrolled themselves in the Central Institute of Plastic
Engineering Technology (CIPET), Hajipur, and another 150 minority workers have been
selected for training in tailoring, to be provided by the Modern Training House of
Raymond Company, Patna.
In 2012-13, 4353 minority students were benefited under Merit-cum-Income based
scholarship for vocational courses.
In 2012-13, 26,911 minority students were benefitted under pre-matric scholarship and
80,622 under post-matric scholarship schemes.
Under Multisectoral Development Scheme, 75 blocks and 8 cities of 20 districts have been
selected. A sum of 10.0 crore will be provided for development of each block/city. The
total allocation for this project is Rs. 830.0 crore.
Minority Welfare Officers have been recruited in every district.

211
5.6 Women Empowerment
The drop in sex ratio from 919 in 2001 to 918 in 2011 in Bihar, as against an improvement in
sex ratio from 933 to 943 in India, is a matter of serious concern for the state government. The
gender inequality arising out of social norms and cultural traditions is now being addressed
both directly and indirectly. The progress towards gender equality and women’s empowerment
in Bihar have been built upon strong commitments of the state government. In order to
empower women, the state government has been publishing its gender budget since 2008-09. A
brief overview of the gender budget for 2012-13 and 2013-14 is presented in Table 5.34.
Table 5.34 : Gender Budget Summary
(Rs. crore)
Details 2012-13 2013-14
Percent
Change
Category 1 schemes for Women (100 % beneficiaries) 2293.84 2722.68 18.70
Category II schemes for Women (30 % beneficiaries) 5541.79 6879.69 24.14
Total outlays for women 7835.63 9602.37 22.55
Total Outlays for related departments 34615.35 40217.41 16.18
Outlays for women as a percentage of total outlays of
relevant departments 22.65 23.88 5.43
Total size of the state budget 78686.82 92087.93 17.03
Share of outlays in the state budget (%) 9.96 10.43 4.72
GSDP 263876 314155 19.05
Outlays for women as percentage of GSDP (%) 2.97 3.06 2.93
Source : Gender Budget, Department of Finance, GOB
Table 5.35 shows considerable increase in outlays in Category II schemes between 2012-13
and 2013-14. It must be noted that the entire set of figures for Category II has been calculated
on the assumption that all welfare schemes that are gender-neutral would have at least 30
percent women beneficiaries. The table also shows that, in 2013-14, there may be significant
increases in outlays for departments like Public Health and Engineering, Education, Minority
Welfare, Urban Development and Housing, Panchayati Raj, Planning and Development, and
Backward Class and Extremely Backward Class Welfare. For Departments like Rural
Development and SC/ST Welfare, there has been a decrease in outlays in 2013-14. The
Category II outlays were 16.61 percent of the total outlay in 2012-13 which increased
marginally to 17.62 percent in 2013-14.

212
Table 5.35 : Overview of Gender Budget
(Rs. crore)
Name of Department
2012-13 2013-14 (BE)
Total
Budget
Outlay
Category I
Outlays
Category
II
Outlays
Total
Budget
Outlay
Category I
Outlays
Category II
Outlays
Social Welfare 3580.76 601.01 1424.21 4142.81 715.68 1553.00
Scheduled Caste and
Scheduled Tribes Welfare 1002.88 0.00 308.23 1017.92 0.00 301.15
Public Health Engineering 700.29 0.00 99.49 939.47 0.00 144.19
Minority Welfare 584.51 1.50 44.19 333.91 2.00 75.62
Education Department 15054.12 266.16 3191.27 18280.78 327.97 4172.86
Health 3085.99 383.15 17.99 3356.84 418.02 20.19
Rural Development 1746.33 784.74 294.00 1789.92 1059.53 109.40
Urban Development and
Housing 1553.86 0.00 18.80 2115.91 0.00 75.80
Panchayati Raj 3156.41 0.00 65.79 3317.04 0.00 87.73
Labor Resource 202.89 0.55 1.26 211.96 0.70 1.06
Planning and Development 2037.01 0.00 33.00 1905.87 0.00 45.00
Backward Class and
Extremely Backward
Class Welfare 129.18 18.88 36.91 866.29 8.37 268.94
Revenue and Land
Reforms Department 491.04 32.86 0.00 631.44 30.50 0.00
Total 33325.27 2088.85 5535.14 38910.16 2562.77 6854.94
Source : Gender Budget, Department of Finance, GOB
Table 5.36 : Flagship Schemes to Address Gender Disparity
(Rs. lakh)
Scheme 2009-10
Actual
2010-11
Actual 2011-12
Actual
2012-13
RE
2013-14
BE
Lakshmibai Social Security
Pension Scheme (2007) 6176.26 8592.01 10643.20
16800.00 14462.61
Nari Shakti Yojana 1000.00 1000.00 3000.00 3000.00 1020.00
Mukhyamantri Kanya Vivah
Yojana 7753.22 7000.00 8848.53
8600.00 8520.00
Mukhyamantri Kanya
Suraksha Yojana 6700.00 10541.10 10000.00
7200.00 6000.00
Source : Gender Budget, Department of Finance, GOB
The direct interventions by the state government to address gender disparity can be clubbed
under two main heads: child protection (Kanya Suraksha Yojana to stop female foeticide) and
social and economic security (Lakshmibai Social Security Pension scheme, Kanya Vivah
Yojana and Nari Shakti Yojana) (Table 5.36). With an objective to check the foeticide of a girl
child to improve sex ratio and encourage birth registration, Mukhyamantri Kanya Suraksha
Yojana, was launched in 2007. Under this scheme, the state government contributes Rs. 2000
for every girl child belonging to the BPL category and born on or after November 22, 2007.
The benefit of the scheme is limited to two girls per family. In 2013-14, upto September 2013,
14.8 lakh beneficiaries availed this facility.

213
Till the end of 2011-12, the Mukhyamantri Nari Shakti Yojana (MNSY) covered 6324 villages
from 1561 panchayats in 165 Blocks of 27 districts, reaching out to 5,16,587 households. Out
of these, 1649 villages of 272 panchayats have been saturated and target households have been
brought under the SHG fold. The programme envisages holistic empowerment of women in
economic, social and cultural spheres. Their work is focused on understanding rural poverty,
analyzing situation of SHGs, village and social mobilization of women, understanding the
livelihood and micro financing, social and institutional support, make provisions for women
victims of violence etc. Table 5.37 shows that, upto 2012-13, the total expenditure of MNSY
was 69.5 percent of the funds received. Out of the three heads i.e. economic, social and
cultural, the utilisation of expenditure is the highest on economic empowerment (84.78
percent) and the lowest on cultural empowerment (46.73 percent).
Table 5.37 : Mukhyamantri Nari Shakti Yojana
(Rs. In lakh)
Particulars
Total
Fund
Received
upto
2012-13
Total Expenses upto
2012-13
Amount
Percent Share
of the Total
fund received
Economic empowerment 4812.95 4080.62 84.78
SHG formation, nurturing & Capacity building 2273.78 2449.54 107.73
Initial capitilization fund 1201 1039.43 86.55
Community assets for development 701.22 318.52 45.42
Training & action research in service sector 249.00 174.81 70.20
Study & research 130.00 10.19 7.84
Monitoring & Evaluation 257.95 88.13 34.17
Social empowerment 2645.50 1309.93 49.52
Helpline 680.68 456.62 67.08
Short Stay Home 744.32 558.88 75.09
Protection home 63.99 1.11 1.73
Working women hostel 378.43 0.87 0.23
Creche 100.50 0.53 0.53
Social awareness 677.58 291.92 43.08
Social rehabilitation fund 200.00 100.10 50.05
Cultural empowerment 385.32 180.05 46.73
Women Resource Centre 266.23 158.61 59.58
Innovative scheme 300.00 151.48 50.49
Total 8610.00 5980.79 69.46
Source : Bihar State Women Development Corporation, GOB
Economic Empowerment
Between 2007-08 and September 2013, there were 4740 villages from 910 panchayats in 69
blocks of 19 districts which were covered under SHG programme. Over the same period,
the Women Development Corporation has constituted 54,793 SHGs. Initial capitalisation
214
fund is an important component under MNSY. By means of this, SHGs can borrow money
from banks and, till 2013-14, an amount of Rs. 5237.94 lakh have been disbursed to 13,925
SHGs as loan amount.
Women Development Corporation is concurrently running various programmes for training
and capacity building of young girls and women, belonging to the poor community. Under
this scheme, the selected candidates are provided training free of cost on housekeeping, as a
beautician, computer operation and sales management by reputed training institutes.
Lac cultivation is encouraged among women to make them self-employed and, till now, 12
female farmers have already started cultivating lac.
Under vocational training, 50 poor urban females have been trained to take up nursing as
livelihood, and 37 other females have also been trained for preparing artificial jewelleries,
out of which 11 have become master trainers.
Social Empowerment
At present, women helplines are functional in 34 districts in which a total of 5621 cases
were registered in 2012-13 and 2783 in 2013-14. Out of those registered cases, 4162 cases
in 2012-13 and 2108 cases in 2013-14 have been disposed of. Short-stay homes are
operating in 21 districts of Bihar.
Under MNSY, Women Development Corporation has planned to establish 50 bed working
women hostels in district headquarters at Patna, Gaya, Muzaffarpur, Darbhanga and
Bhagalpur to provide safe and suitable accommodation for working women. The state
government has selected 5 NGOs to carry out this project.
Under Creche Scheme, 11 NGOs have been selected and financed to run 26 units of crèche
in 11 districts of the state which are helping 260 beneficiaries.
The Social Awareness Programmes of Women Development Corporation is aimed at
dealing with social evils like dowry system, child marriage, witch craft, sexual harassment
at work place etc. Folk Media, documentary films, posters and banners are used as medium
of campaign. As an innovative scheme, a cultural group of beggars was formed in 2011-12
to campaign against various social evils.
Table 5.38 shows that there has been increase in the number of cases registered and
disposed of relating to offences against women. Out of all the cases, the registration of
cases is the highest for domestic violence. In 2012-13, it is interesting to note that more
than 70 percent of cases were disposed of under all the heads.

215
Table 5.38 : Number of Cases registered and disposed under Social Empowerment
Types of Cases 2011-12 2012-13 2013-14, upto Sept. 2013
Registered Disposed Registered Disposed Registered Disposed
Domestic Violence 2843 2043 (71.9) 3052 2192 (71.8) 1443 1112 (74.7)
Dowry Abused 650 426 (65.5) 623 452 (72.6) 313 198 (63.9)
Dowry Death 22 16 (72.7) 14 14 (100.0) 9 8 (88.9)
Second Marriage 163 116 (71.2) 172 121 (70.3) 68 46 (80.8)
Assets Related 276 222 (80.4) 260 206 (79.2) 103 82 (62.3)
Rape & Trafficking
Cases 116 68 (58.6)
85 85 (100.0) 61 48 (64.4)
Sexual abuse at office
and other places 78 68 (87.2) 44 39 (88.6) 16 15 (93.8)
Others 1120 792 (70.7) 1371 1049 (76.5) 770 599 (77.3)
Total Cases 5268 3751 (71.2) 5621 4162 (74.0) 2783 2108 (73.8)
Note : Figures in parentheses denote the percentage of cases disposed
Source : Bihar State Women Development Corporation, GOB
Cultural Empowerment
Along with economic and social empowerment, cultural empowerment is also an essential part
of personality development. Therefore, Women Development Corporation is playing an active
role in cultural empowerment of women of the state.
To strengthen the artistic and craft-based skills through training, enterprise, marketing etc.
it is proposed that the cultural events be organized primarily in all 9 Divisional
headquarters by the panel of selected agencies. A detailed plan of action regarding
logistics, participation. events, convergence strategy would be worked out in a phased
manner.
The Women Development Corporation has started a campaign ‘Hamari Munia’ under
which awareness is created among women and adolescent girls on issues related to health
and hygiene for girls, and discrimination against girl child.
The exposure of cultural values and tradition is very important for development of gender
friendly environment and confidence level of adolescent girls. It is proposed to organise
motivational events, primarily in all women’s colleges and Kasturba Gandhi Schools of
Bihar to make girls more culturally empowered.
Bihar has a rich tradition of diverse folk forms, deeply embedded in life of rural people.
Unfortunately, with rapid spread of urbanization and change in life style, these folk art

216
forms are in a state of extinction. Many of the artist families are in a state of abject poverty,
with their traditional livelihood being at stake. The art forms are also losing relevance. As
part of a unique initiative to empower women of these families, one or two folk art forms
of Bihar may be revived and revitalized, so that they become sustainable livelihoods for the
relevant artists.
In 15 women’s colleges in 5 districts (Nalanda, Nawada, Samastipur, Begusarai and East
Champaran), exhibition-cum-gender fairs under ‘Sapno Ko Chali Chhoone’ programme
have been organised. The organisers have selected 30 ‘Champions of Change’ from these
colleges who would carry the baton of cultural change further.
5.7 Poverty and Rural Development
Poverty is a key issue in all the developing economies of the world. Apart from the hardship
that it causes to the poor people, it also entails social and political instability. For measuring
poverty, the Planning Commission has adopted the Tendulkar Committee estimates which,
apart from the caloric consumption, has also included expenditure on health and education.
Table 5.39 presents the poverty ratios in Bihar and India, for the years 2004-05 and 2011-12,
as estimated by the Tendulkar Committee. The poverty ratio of Bihar is higher in both 2004-05
and 2011-12, compared to all-India level. The ratio for Bihar is 34.1 percent for rural and 31.2
percent for urban households in 2011-12, implying an overall poverty ratio of 33.7 percent.
These poverty ratios are much higher than that for India. From the table, it is also seen that,
between 2004-05 and 2011-12, the poverty ratio declined by 20.7 percentage points for Bihar
as against 15.3 percentage points for all-India. The pace of reduction of rural poverty has been
faster than that of the urban poverty, in both Bihar and India.
Table 5.39 : Poverty Ratio of Bihar and India
State 2004-05 2011-12
Reduction in poverty Ratio
(in % Point)
Rural Urban Total Rural Urban Total Rural Urban Total
Bihar 55.7 43.7 54.4 34.1 31.2 33.7 21.6 12.5 20.7
India 42.0 25.5 37.2 25.7 13.7 21.9 16.3 11.8 15.3
Note : Poverty Ratio as per Tendulkar Committee Methodology
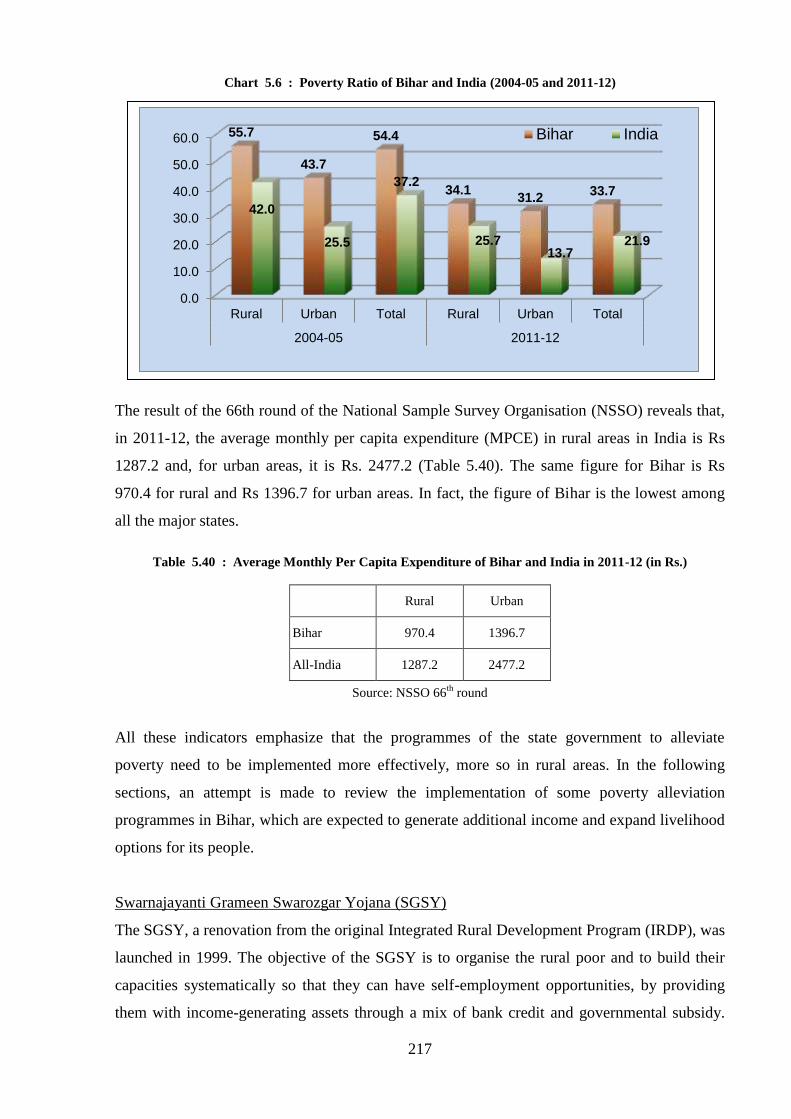
217
Chart 5.6 : Poverty Ratio of Bihar and India (2004-05 and 2011-12)
The result of the 66th round of the National Sample Survey Organisation (NSSO) reveals that,
in 2011-12, the average monthly per capita expenditure (MPCE) in rural areas in India is Rs
1287.2 and, for urban areas, it is Rs. 2477.2 (Table 5.40). The same figure for Bihar is Rs
970.4 for rural and Rs 1396.7 for urban areas. In fact, the figure of Bihar is the lowest among
all the major states.
Table 5.40 : Average Monthly Per Capita Expenditure of Bihar and India in 2011-12 (in Rs.)
Rural Urban
Bihar 970.4 1396.7
All-India 1287.2 2477.2
Source: NSSO 66th
round
All these indicators emphasize that the programmes of the state government to alleviate
poverty need to be implemented more effectively, more so in rural areas. In the following
sections, an attempt is made to review the implementation of some poverty alleviation
programmes in Bihar, which are expected to generate additional income and expand livelihood
options for its people.
Swarnajayanti Grameen Swarozgar Yojana (SGSY)
The SGSY, a renovation from the original Integrated Rural Development Program (IRDP), was
launched in 1999. The objective of the SGSY is to organise the rural poor and to build their
capacities systematically so that they can have self-employment opportunities, by providing
them with income-generating assets through a mix of bank credit and governmental subsidy.
0.0
10.0
20.0
30.0
40.0
50.0
60.0
Rural Urban Total Rural Urban Total
2004-05 2011-12
55.7
43.7
54.4
34.1 31.2
33.7
42.0
25.5
37.2
25.7 13.7
21.9
Bihar India

218
The assisted rural poor families are organised into Self Help Groups (SHGs). The achievement
of the programme in Bihar is presented in Table 5.41.
Table 5.41 : Performance of the SGSY Programme
Year
No. of Members of
SHGs assisted for
Economic activities
No. of Individual
Swarojgaris assisted
for Economic
Activities
No. of SHGs formed
Total Women Total Women Total Women
2007-08 85355 43872 (51.4) 18205 4007 (22.0) 14036 8120 (57.9)
2008-09 120402 69949 (58.1) 4976 1281 (25.7) 20407 11791 (57.8)
2009-10 158061 98695 (62.4) 6090 1266 (20.8) 30701 19073 (62.1)
2010-11 184225 120901 (65.6) 15398 3937 (25.6) 31453 28576 (90.9)
2011-12 127567 91836 (72.0) 8698 2122 (24.4) 12017 9297 (77.4)
2012-13 178900 165600 (92.6) 7685 6143 (79.9) 25531 25531 (100.0)
Source : Department of Rural Development, GOB, Note : Figures in parentheses denote percentage
Chart 5.7 : Overview of New SHGs formation in Bihar
During 2011-12, a total of 1.27 lakh members of SHGs have been assisted for economic
activities. The coverage has decreased compared to the previous year, when 1.84 lakh members
were assisted. One should note that it is still higher, compared to the earlier ones. Out of the
total number of SHG members, 72 percent are women. The number of woman members has
increased gradually over the years. In 2012-13, 1.79 lakh members got assistance as against
0
5000
10000
15000
20000
25000
30000
35000
2008-09 2009-10 2010-11 2011-12 2012-13
Total
Women

219
1.27 lakh members in 2011-12. This is a massive increase in a single year. This shows that
families are availing the benefits of this programme to acquire economic gains. The share of
women beneficiaries is very high at 92.6 percent in 2012-13, compared to 72.0 percent in
2011-12. The women are taking interest in this programme as it lifts their spirit, and they feel a
sense of emancipation. The number of new SHGs formed has decreased to 12,017 in 2011-12,
compared to 31,453 in 2010-11. In 2012-13, the number of new SHGs formed has again
increased to 25,531. If one looks at the table, it is also found that women accounted for cent
percent of the participants in 2012-13.
JEEViKA – State Rural Livelihoods Mission
The Ministry of Rural Development, Government of India has launched National Rural
Livelihood Mission (NRLM) by restructuring Swarnajayanti Gram Swarozgar Yojana (SGSY)
effective from April 1, 2013. The objective of the programme is to provide gainful self-
employment opportunity for the skilled and semi-skilled labourers in rural areas by organising
them into community groups, and thereby uplift them from their present poverty level.
The Bihar Rural Livelihoods Promotion Society has been designated as State Rural
Livelihoods Mission by the state government under the overall framework of National Rural
Livelihoods Mission. It will scale up its JEEViKA model of poverty alleviation throughout the
state in a phased manner. The programme will be operational in all the blocks by 2014.
Overall, 1.5 crore rural poor families would be organised into 10 lakh SHGs, 65 thousand
Village Organisations (VO), 1600 Custer Level Federations (CLF) and 534 Block Level
Federations (BLF). Nearly 3 lakh Community Professionals and 75 thousand Community
Resource Persons (CRP) would be identified and trained. It is envisaged that the households
would cumulatively save nearly Rs 3100 crore, access Rs 5800 crore of CLF, and Rs. 12,000
crore of credit from banks.

220
KEY ACHEIVEMENTS OF JEEViKA
JEEViKA has its presence in 295 blocks across 38 Districts.
14 lakh poor households have been mobilized into 1.15 lakh Self-Help Groups,
federated into 6420 Village Organizations (VO) and 145 CLFs.
81235 SHGs bank a/c opened and 65173 SHGs credit linked with banks. 3 lakh
SHG households covered under Janani Bal Suraksha Yojana (JBSY).
Own funds of Rs 62 crore managed by SHGs, leveraging Rs 307 crore from the
commercial banks.
Out of the total 6420 VOs, 4633 VOs are managing the Food Security Fund
Intervention and Health Risk Fund Intervention amounting to Rs 107.75 crore.
More than 3.37 lakh farmers have adopted modern farming techniques such as
System of Rice/ Wheat Intensification and increased yields by 2 times.
500 new Dairy Cooperative Society (DCS) are formed, mobilizing 33780 dairy
farmers.
42893 youth trained and 35,029 placed in the organised sector. 44 Training
Centres are running and 2696 youths are undergoing training.
Mahatma Gandhi National Rural Employment Guarantee Scheme (MGNREGS)
The MGNREGS is designed to solve the rural unemployment problem, widely prevalent in
both Bihar and India. In Bihar, the problem exists because of the skewed land distribution in
rural areas, resulting in a mass of agricultural labourers and marginal farmers who need
additional employment opportunities. This programme aims at providing a guaranted 100 days
of employment to unskilled labourers. Simultaneously, the scheme is designed to create
community assets for the benefit of the rural society. This is expected to derease distress
migration and would have multiplier effect on the rural economy.
The details about the performance of the programme are provided in Table 5.42. The Job Cards
have been issued to 133.49 lakh households till 2012-13, and 18.47 percent of job card holders
were provided with employment. Out of those provided with employment, only 6.4 percent
were provided 100 days of employment in 2012-13, the corresponding figure being 5.1 percent
in 2011-12. Nearly 82 percent of fund was utilised in 2012-13, which is much higher compared
to the previous year. The total employment generated was 965.42 lakh persondays in 2012-13,

221
compared to 866.38 lakh persondays in 2011-12. Till 2012-13, 107.10 lakh bank and post-
office accounts have been opened for payment of wages under this programme.
Table 5.42 : Performance of the MGNREGS
Year 2008-09 2009-10 2010-11 2011-12 2012-13
No. of Job Cards Issued (lakh) 102.99 124.06 130.45 133.82 133.49
No. of Households provided with
employment (lakh)
38.42
(37.3)
41.27
(33.3)
46.85
(35.9)
26.8
(20.1)
24.66
(18.47)
No. of Households obtaining 100 days of
employment
100891
(2.6)
287019
(7.0)
260919
(5.6)
137649
(5.1)
156935
(6.4)
Employment generated (lakh Person days) 991.22 1137.53 1597.49 866.38 965.412
Percentage share of women in total
employment generated 29.8 30 29.6 28.20 29.9
Average employment per household 25.8 27.6 34.1 32.3 39.1
Number of Completed works 53939 70491 83593 54589 64846
Fund utilized (percentage) 60 75.8 82.7 65.02 82.9
No. of accounts opened (in lakh) 48.78 84.91 102.57 107.55 107.10
Note : Figures in parentheses denote percentages with respect to total job-cards issued.
Source : Department of Rural Development, GOB
Chart 5.8 : Overview of Employment provided to Households in Bihar
Source : Department of Rural Development, GOB
The districtwise details about the implementation of MGNREGS is presented in Table A 5.28
(Appendix). In that table, one observes wide inter-district variation in the performance of
MGNREGS. In 2012-13, the maximum number of job cards was issued in Madhubani (6.91
lakhs), followed by Muzaffarpur (6.4 lakhs). Less than one lakh job cards were issued in small
districts of Sheohar (0.88 lakhs), Sheikhpura (0.95 lakhs) and Arwal (0.95 lakhs). The SC
households represent 38.52 percent of the households with job cards. The percentage of
0
20
40
60
80
100
120
140
160
2007-08 2008-09 2009-10 2010-11 2011-12 2012-13
No. of Job Cards Issued (lakh)
No. of Households provided with employment (lakh)

222
households demanding employment was the highest in West Champaran (40.64 percent),
followed by Sheohar (40.32 percent). Less than 10 percent of households had demanded job in
Darbhanga (9.59 percent). East Champaran ranked first (32.27 percent) in providing 100 days
of employment to those who had demanded it, followed by West Champaran (15.19 percent)
and Gopalganj (10.99 percent). Begusarai (48.79 percent), Katihar (41.94), Sheohar (40.95
percent) have registered the highest participation of women in MGNREGS, each one recording
more than 40 percent participation of women in 2012-13. Less than 10 percent participation of
women has been registered in Buxar (5.03 percent). There is also wide inter-district variation
as regards the total employment generation in 2012-13. East Champaran (82.0 lakhs) is the best
district in employment generation, followed by Gaya (80.15 lakhs) and West Champaran
(51.89 lakhs). The two districts with the lowest employment generation in 2012-13 were Arwal
(5.38 lakhs) and Munger (7.88 lakhs). The districtwise financial progress under MGNREGS is
shown in Table A 5.29 (Appendix). Jamui (94.48 percent) is the best district in the utilisation
of fund in 2012-13. Katihar (91.05 percent), Banka (94.47 percent), Purnea (90.43 percent)
also utilized more than 90 percent of the MGNREGS fund.
Table 5.43 lists the categorywise completed works under MGNREGS, during 2008-09 to 2012-
13. The rural connectivity project has dominated the scheme during this period, accounting for
nearly 40 percent of the total projects. The second most important category is water
conservation. These two types of projects help in developing the rural infrastructure, expanding
livelihood options for the rural people.
Table 5.43 : List of Category wise Completed Works under MGNREGS
Year / Categories 2008-09 2009-10 2010-11 2011-12 2012-13
Water conservation 9271 (17.2) 8637 (12.3) 11424 (13.7) 6059 (11.1) 7009(10.8)
Drought proofing 1515 (2.8) 6601 (9.4) 6609 (7.9) 5360 (9.8) 16246(25.1)
Micro irrigation works 5479 (10.2) 6552 (9.3) 7368 (8.8) 4605 (8.4) 4335(6.7)
Provision of irrigation facility 1135 (2.1) 1489 (2.1) 1841 (2.2) 1902 (3.5) 1813(2.8)
Renovation of traditional
water bodies 5472 (10.1) 7593 (10.8) 7650 (9.1) 5065 (9.3) 6828(10.5)
Land development 2139 (4.0) 2575 (3.7) 4674 (5.6) 3229 (5.9) 4090(6.3)
Flood control and protection 5307 (9.8) 5175 (7.3) 5072 (6.1) 2554 (4.7) 2265(3.5)
Rural connectivity 23621 (43.8) 31869 (45.2) 38955 (46.6) 25521 (46.8) 22056(34.0)
Any other activity 0 0 0 294 (0.5) 204(0.3)
Total Works Completed 53939 (100.0) 70491 (100.0) 83593 (100.0) 54589 (100.0) 64846(100.0)
Source : Department of Rural Development, GOB

223
Indira Awas Yojana (IAY)
The IAY, a flagship scheme of the central government, was started to provide shelters to BPL
families for construction/upgradation of houses. The scheme is a significant step towards
improving the basic amenities for rural people. The summary of the performance of IAY over
the last five years is presented in Table 5.44.
Table 5.44 : Performance of the IAY Scheme
Year
Annual
Physical
Target
Houses Completed Percentage of
Fund
Utilisation Total SC & ST
2008-09 567125 673658 (118.8) 394885 (58.6) 77.3
2009-10 1098001 645621 (58.8) 335675 (52.0) 69.5
2010-11 758904 529392 (69.8) 259867 (49.1) 66.4
2011-12 737486 450248 (61.1) 200393 (44.5) 68.02
2012-13 835925 839515(100.4) 372409 (44.3) 75.9
Source : Department of Rural Development, GOB,
Note : Figures in parentheses denote percentages with respect to previous column
In 2012-13, cent per cent of physical targets were achieved in Bihar under IAY, compared to
61.1 percent in 2011-12. The share of SCs and STs in the total houses completed has declined
over the years. The detailed information of IAY is presented in Table A 5.30 (Appendix),
recording achievements for each of its components.
The districtwise information on performance under IAY is presented in Table A 5.31
(Appendix). It indicates the wide inter-district variation both in fund utilisation and
achievement of physical targets. The physical achievement was 100 percent in 2012-13 for the
entire state. There are 16 districts where achievement is above 100 percent. The lowest
achievement is recorded in Araria (50.76 percent) in 2012-13, while the highest achievement is
registered by Gaya (396.17 percent). There are 4 districts which registered more than 125
percent achievement – Gaya (396.17 percent), Sitamarhi (130.28 percent), Nawada (126.60
percent) and Kishanganj (126.80 percent). The extent of fund utilisation has increased to 75.9
percent in 2012-13 from 68.02 percent in 2011-12. There are 19 districts where the fund
utilisation was more than the state average. The best three districts in fund utilisation are –
Lakhisarai (98.77 percent), Madhepura (97.25 percent) and Sheohar (93.25 percent). The

224
lowest percentage of fund utilisation was recorded in Madhubani (59.45 percent), Katihar
(61.05 percent) and Kishanganj (61.14 percent) in 2012-13.
Food Security and Public Distribution System
The Public Distribution System (PDS), a target group strategy to alleviate poverty, is an
instrument to make available essential commodities to people, particularly those living below
the poverty line. In Bihar, the PDS is extremely necessary as there exist wide poverty and
inequality. The PDS also plays a crucial role as an anti-inflationary measure and keep the
foodgrain prices depressed. Four essential commodities (wheat, rice, sugar and kerosene oil)
are distributed through PDS outlets.
The social backgrounds of PDS dealers are summarised in Table 5.45. The total number of
PDS dealers is 43,238 as on September, 2013. The share of backward and extremely backward
castes is about 36.7 percent, that of scheduled castes 16.3 percent, and general castes 19.4
percent. The distribution of PDS dealers by their social background in different districts is
presented in Table A 5.32 (Appendix). The ownership pattern of PDS outlets at the district
levels is nearly the same as in the state level.
Table 5.45 : Overview of PDS Dealerships as on 2013
Social Background of
PDS Dealers
No of PDS
Outlets
Percentage
Share
Scheduled Caste 7053 16.3
Scheduled tribes 336 0.8
Backward Caste 12919 29.9
Extremely Backward Caste 2944 6.8
Minority 3080 7.1
Women 3343 7.7
Women Self Help Groups 220 0.5
Other Self Help Groups 163 0.4
Co-operative Society (Ex-Army Personnel) 4647 10.7
Handicapped 144 0.3
General 8389 19.4
Total 43238 100.0
Source : Department of Food and Consumer Protection, GOB
The PDS is carried out under three schemes : (1) BPL - 25 kgs. of rice and 10 kgs of wheat are
provided to each BPL family per month, (2) Antyoday – providing 35 kgs. of foodgrains per
month to extremely poor BPL families, out of which 21 kgs of rice at the rate of Rs 2 per kg
and 14 kgs. of wheat at the rate of Rs 3 per kg; and (3) Annapurna – providing homeless senior

225
citizens with 4 kgs. of rice and 6 kgs. of wheat free of cost. The central government allocates
foodgains to the state for 65.23 lakh BPL families, whereas the state government survey has
revealed that the total number of BPL families is 1.35 crores. Since there is a shortfall in the
supply of foodgrains from the central government, the state government has decided to provide
25 kgs. of foodgrains to each family, instead of 35 kgs. per family per month.
The operational details of PDS in Bihar for the years 2010-11 to 2012-13 are presented in
Table 5.46. It would show that the lifting of foodgrains under BPL scheme have risen
continuously over the years. The lifting percentage for wheat is 34.9 percent in 2012-13, much
lower than that for 2010-11. But allotment amount in absolute figures has increased in 2012-
13, compared to 2010-11. The lifting percentage of rice under BPL scheme was 52.7 percent in
2012-13, which was higher than that for wheat in 2012-13. The lifting percentage of foodgrains
was much high under Antyoday for all the years. One of the reasons for this is that foodgrains
are highly subsidised under Antyoday. Though this percentage has been lower in 2011-12
compared to 2010-11, it is still above 90 percent in 2012-13. Under Annapurna, the allotment
of foodgrains has increased substantially in 2012-13, but the lifting percentage of both the
foodgrains was a little higher in 2012-13 compared to the previous years.
Table 5.46 : Working of Public Distribution System
(Figures in ‘000 tonnes)
Year
Wheat Rice
Allotment Lifting Lifting
Percentage Allotment Lifting
Lifting
Percentage
BPL
2010-11 610.8 559.6 91.6 1495.1 1217.0 81.3
2011-12 985.9 638.4 64.8 2187.7 1500.2 68.6
2012-13 1348.4 470.5 34.9 2022.6 1065.9 52.7
Antyoday
2010-11 417.1 408.6 97.9 625.7 595.2 95.1
2011-12 420.2 395.7 94.2 630.2 573.5 91.0
2012-13 420.2 407.5 97.0 630.3 593.8 94.2
Annapurna
2010-11 106.2 65.1 61.3 70.8 44.2 62.4
2011-12 106.2 62.7 59.0 70.8 39.1 55.2
2012-13 114.2 76.4 66.9 76.1 53.4 70.1
Source: Department of Food and Consumer Protection, GOB

226
The districtwise information on allotment and lifting of foodgrains under BPL, Antyoday and
Annapurna scheme in 2012-13 are presented in Tables A 5.33, A 5.34 and A 5.35 (Appendix)
respectively. For all three schemes, considerable amount of inter-district variation could be
seen in terms of lifting of foodgrains. The information on districtwise lifting percentage for
wheat and rice under BPL, Antoday and Annapurna is presented in Table A 5.36 (Appendix)
for 2011-12 and 2012-13. Under BPL scheme, Muzaffarpur (47.8 percent) tops the list
followed by Nawada (46.5 percent) in case of lifting of wheat in 2012-13. Under Antyoday, in
2012-13, all districts, except Sheohar, Begusarai, Samastipur and Purnea, have lifted more than
80 percent of wheat. Under Annapurna scheme, Munger, Siwan, Kishanganj, Araria and
Katihar have not lifted any amount of wheat. In case of rice, Aurangabad (91.5 percent) has
lifted the highest amount under the BPL scheme. For Antyoday scheme, most of the districts
have lifted more than 80 percent of their allotment in 2012-13.
Intervention in the Public Distribution System
423 godowns are targeted to be built, having a total capacity of 2.84 lakh tonnes,
under NABARD and RIDF loan. 55 godowns have already been built by BSFC. The
rest of the godowns will be constructed by this year.
Transportation vehicles are being fitted with GPS devices in 9 districts to ensure the
arrival of the foodgrain at the desired location and to prevent the diversion and black
marketing.
The programmes discussed in this section on rural development and poverty alleviation, are
schemes which can have far reaching consequences for poverty alleviation, if they are properly
implemented. The state government has recently adopted many measures to control the leakage
at the grassroot level. The convergence of various schemes meant for same target group could
be done to bring higher degree of implementation. The Twelfth Plan also puts emphasis on this
issue of optimal use of scarce resource. The B K Chaturvedi Committee, appointed by the
Planning Commission, has made several suggestions to restructure the Centrally Sponsored
Schemes (CSSs) and has recommended for greater flexibility to the states in the
implementation of the schemes. This flexibility may allow the state government to implement
the schemes more effectively and provide more benefits to the poor people.

227
5.8 Labour Resource and Welfare
The labour force in Bihar is mainly unorganised. They are mostly engaged in agriculture and
allied activities. According to 2011 census, 70.0 percent of the main labour force in Bihar is
doing agricultural and related work, which is the highest in the country, as compared to only
50.2 percent at the all-India level. Between 2001 and 2011, there was not much change in the
share of labour force engaged in agricultural labour and household industry. However, there
was a decrease in share of cultivators and increase in the share of other workers. This reflects
labour migration across the sector which is a positive sign for development, as workers from
farm sector move to non-farm sector. But Bihar is far away from diversification of labour force
of the organised sector, because of low rate of industrialization and urbanisation. Table 5.47
portrays the composition of labour force in the major states of India.
Table 5.47 : Composition of Main Workers in Indian Major States (2011)
(in percentage)
State Cultivators Agricultural
Labourers
Household
Industry
Workers
Other
Workers
Total Main
Workers
(No. in Lakh)
Andhra Pradesh 18.4 40.0 3.5 38.1 330.4
Bihar(2011) 25.3 44.7 3.6 26.4 213.6
Bihar(2001) 32.2 42.8 3.6 21.4 210.5
Chhattisgarh 36.9 30.4 1.7 31.1 82.4
Gujarat 23.3 22.1 1.2 53.4 203.7
Haryana 28.0 12.7 2.9 56.4 70.2
Jharkhand 29.4 18.2 3.7 48.8 68.2
Karnataka 25.8 21.9 3.0 49.3 234.0
Kerala 5.8 9.9 2.1 82.2 93.3
Madhya Pradesh 36.2 29.2 2.9 31.8 227.0
Maharashtra 26.2 25.3 2.3 46.2 437.6
Odisha 30.6 22.6 4.1 42.6 107.1
Punjab 21.3 13.8 3.6 61.3 84.5
Rajasthan 46.8 10.4 2.4 40.4 210.6
Tamil Nadu 13.8 25.9 4.0 56.3 279.4
Uttar Pradesh 34.9 21.8 5.4 37.9 446.4
West Bengal 16.4 22.9 5.9 54.9 256.9
India 26.4 23.8 3.4 46.4 3624.5
Source : Primary Census Abstract, 2011, Census of India
228
Training and Skill Development
To enable the human resource to compete in the era of globalisation, development of their skill
is extremely important. For this, Industrial Training Institute (ITI) has been established in all
38 districts and 9 women ITIs in all divisional headquarters. There are 59 government ITIs,
including 12 women ITIs and 596 non-government ITIs in the state as on September 2013.
BIHAR SKILL DEVELOPMENT PROGRAMME
To enhance the skill of the youth of the state, an autonomous society has been constituted
under the chairmanship of Hon’ble Chief Minister – ‘Bihar Skill Development Mission
(BSDM)’ to develop skill of one crore youth by 2017. This target has been distributed
yearwise among several line departments. The role of the line departments and BSDM has
been defined clearly to avoid any confusion and difficulty in achieving the targets. The role
of the line departments is to identify the trades in demand, select the trainees, select quality
trainers, monitor the training programmes and also arrange for the required budget. On the
other hand, the role of BSDM is to assess the gap in demand and supply of different skills,
formulation of training curriculum and design, training of trainers, identification of state
resource centre, arrangement of equipments, coordination with industries, identification of
certifying agency and other miscellaneous activities. The planned target group of BSDM
include (a) unemployed, unskilled, semi-skilled schools passouts and dropouts in the age-
group 15+ years, (b) workers with informally acquired skill desiring certification, (c)
employed/unemployed ITI-passouts desirous of multi-skill addition, (d) rescued and
rehabilitated ex-child labour, (e) members of SHGs and those working in unorganised
sectors, (f) jail inmates, and (g) those seeking self-employment.
The ambitious target of imparting skill training to one crore youth of the state during 2013-18
has set the following yearly targets — 16, 18, 21, 22 and 23 lakhs respectively for five years.
To help the trained manpower acquire desired employment, a well structured Labour
Information and Management System (LMIS) is proposed to be maintained at the state level.
It will have functional links with training institutions, industries, employment exchange and
other stakeholders. The line departments that have been identified to implement this skill
development programme are — Labour Resource, Information Technology, Rural
Development, Agriculture, Health, Science and Technology, Animal Husbandry Directorate,
Fisheries Directorate, Dairy Directorate (including COMFED), Minority Welfare, Urban
Development & Housing, Education, Social Welfare, SC/ST Welfare, Industry, Tourism, and
Home (Jail).

229
The yearwise physical targets for each of these departments are presented in Table 5.48.
Table 5.48 : Target for Skill Development
(In lakhs)
Sl. No. Departments 2013-14 2014-15 2015-16 2016-17 2017-18 Total
1 Labour Resource 3.25 3.66 4.27 4.47 4.67 20.31
2 Information Technology 1.00 1.13 1.31 1.38 1.44 6.25
3 Rural Development 2.00 2.25 2.63 2.75 2.88 12.50
4 Agriculture 3.00 3.38 3.94 4.13 4.31 18.75
5 Health 0.20 0.23 0.26 0.28 0.29 1.25
6 Science & Technology 0.50 0.56 0.66 0.69 0.72 3.13
7a Animal Husbandry Directorate 0.50 0.56 0.66 0.69 0.72 3.13
7b Fisheries Directorate 0.10 0.11 0.13 0.14 0.14 0.63
7c Dairy Directorate including
COMFED 0.25 0.28 0.33 0.34 0.36 1.56
8 Minority Welfare 0.25 0.28 0.33 0.34 0.36 1.56
9 Urban Development and Housing 0.50 0.56 0.66 0.69 0.72 3.13
10 Education 1.50 1.69 1.97 2.06 2.16 9.38
11 Social Welfare 1.40 1.58 1.84 1.93 2.01 8.75
12 SC/ST Welfare 0.60 0.68 0.79 0.83 0.86 3.75
13 Industries 0.80 0.90 1.05 1.10 1.15 5.00
14 Tourism 0.15 0.17 0.20 0.21 0.22 0.94
15 Home (jail) 0.12 0.12 0.12 0.12 0.12 0.12
Total 16.00 18.00 21.00 22.00 23.00 100.00
Source: Department of Labour Resource, Government of Bihar;
Employment
The district and state level employment-cum-guidance fairs have been organised under
vocational guidance programme. This programme provided 66,594 jobs in 2012-13 and 23,637
in 2013-14 as on September 2013. The state government has taken several initiatives to create
job opportunity for the unemployed. Table 5.49 depicts the initiatives taken by the state
government for computerization and online facilities in the employment exchange.

230
Table 5.49 : Physical & financial progress of schemes for modernization of employment exchanges
(Amount in Rs. lakh)
2011-12 2012-13 2013-14
Budget
outlay
Finacial
Achieve
ment
Physical
Achieve
ment
Budget
outlay
Finacial
Achieve
ment
Physical
Achieve
ment
Budget
outlay
Finacial
Achieve
ment
Physical
Achieve
ment
Expansion of
Employment
services
229.8 50.90 54112 8.00 7.86 8.80 0.30 -
E- Process of
Employment
Services operation
Nil Nil Nil 50.00 43.61 20.00 - -
Strengthening of
vocational guidance
programme
Nil Nil Nil 35.00 31.68 66594 67.00 7.74 23637
Study Evaluation
Research and
documentation &
E.M.I promotion and
Area skill Survey
Nil Nil Nil 5.00 - - 17.00 - -
Establishment of
Overseas Bureau Nil Nil Nil 15.00 15.00 - 15.00 - -
Scheme for
development of
weaker section
Nil Nil Nil 15.00 13.66 - 12.00 0.63 -
Construction of
Buildings combined
Labour
Nil Nil Nil 474.7 Nil
Amount
Surrende
red by
B.C.D
362.9 - -
Total 229.8 50.90 54112 602.7 111.82 66594 502.7 8.67 23637
Source : Department of Labour Resource, Government of Bihar
Other than the above programmes, the state government has also taken a number of strides for
the welfare of the labourers, and these include ‘Bihar Centenary Social Security Scheme for
Unorganised and Craft Labour, 2011’, ‘Inter-State Migratory Workers Scheme’,
‘Rehabilitation of Bonded Labour’, ‘Rural Training Camps’, ‘Bidi Worker House Construction
Scheme’, ‘Rehabilitation of Child Labour’, ‘Employee Insurance Schemes’, The budgeted
outlay for the Departmnt of Labour in 2012-13 is Rs. 11.58 crore, which is more than double of
that for 2010-11. In 2011-12, financial achievement was only 68.6 percent, but it has increased
to 87.0 percent in 2012-13. The physical achievements for various schemes for 2011-12 and
2012-13 are presented in Table 5.50.

231
Table 5.50 : Overview of Major Public Initiatives/ Schemes of Labour
(Outlay / Expenditure in Rs. lakh)
Scheme
2011-12 2012-13 2013-14
Budget
Outlay
Financial
Achievement
Physical
Achievement
Budget
Outlay
Financial
Achievement
Physical
Achievement
Budget
Outlay
Organisation of Rural
Training Camps 32.8 28.5
8442 Labour
Trained 36.0
30.0 7882 Labour
Trained 39.2
Strengthening Child Labour
Rehabilitation System 116.0 55.7 500 Benefited 131.6
77.5 976
Benefited 103.1
Establishment of Bihar
State Child Labour
Commission
122.0 113.7 Estt. 110.3
98.6
Estt. 108.6
Rehabilitation of Bonded
Labour 25.5 23.0 230 Benefited 35.0
23.0 230
Benefited 36.0
Bidi Worker House
Construction Scheme 40.0 20.6 515 Benefited 61.6
59.0 1476
Benefited 40.0
Inter State Migratory
Workers' Scheme 125.0 87.6 83 Benefited 208.0
183.0 183
Benefited 170.0
Common Man Insurance
Scheme 45.0 1.5 — —
- — -
Strengthening of
Enforcement of Labour
Acts
97.7 44.5 — 75.5
36.5
— 64.5
Social Security Scheme for
Unorganised and Craft
Labour
126.0 126.0
Deposited to
Labour
Welfare
Corpus Fund
500.0
500.0 Deposited to
Labour
Welfare
Corpus Fund
496.6
Total 730.0 501.0 — 1158.0 1007.6 — 1058.0
Source : Department of Labour Resource, Government of Bihar
Towards social security of labourers, two insurance schemes have been initiated by the state
government – Employee State Insurance Scheme (ESIS) and National Health Insurance
Scheme (NHIS). As on September 2013, 1.40 lakh employees have been insured under ESIS
and 182.98 lakh families under NHIS.
5.9 Panchayati Raj Institutions (PRI)
The three-tier Panchayati Raj Institutions in Bihar consist of a Gram Panchayat at the lowest
level, Panchayat Samiti at the block level and Zila Parishad at the district level. The
Chairpersons of the Gram Panchayat, the Panchayat Samiti and the Zila Parishad are called
Mukhiya, Pramukh and Adhyaksha respectively. According to 73rd
constitutional amendment,
Bihar Panchayat Raj Act, 2006 was enacted to strengthen the three-tier panchayat system in the
state. Presently, in 38 districts of Bihar, there are 531 Panchayat Samities, and 8398 Gram

232
Panchayats. There is a provision of 50 percent reservation for women, including the
reservation on single posts (Table 5.51).
Table 5.51 : Overviews of Panchayati Raj Institutions in Bihar
Details No. Details No.
Zilla Parishad 38 Gram Kachhari Members 115876
Panchayat Samiti 531 Gram Panchayat Sarpanch 8398
Gram Panchayat 8398 Gram Panchayat Secretary 8463
Gram Kachahari 8398 Nyaya Mitra 8398
Gram Panchayat Members 115876 Gram Kachhari Secretary 8398
Gram Panchayat Mukhia 8398 Zilla Panchayat Raj Officers 38
Panchayat Samiti Members 11566 Panchayat Raj Officers 528
Zilla Parishad Members 1162
Source : Department of Panchayati Raj, GOB
The state government has taken several steps to strengthen the PRIs :
(a) Construction of Panchayat Sarkar Bhawan : With the help of grants from the Thirteenth
Finance Commission and state government's own grants, 1435 Panchayat Sarkar
Bhawans are in the process of construction. In the coming years, the state government
proposes to build 500 more such Bhawans which will greatly improve the functioning of
Gram Panchayats. Further, 330 Panchayat Sarkar Bhawans are being constructed under
Bihar Panchayat Strengthening Project through Building Construction Deparrment.
(b) Capacity Building Programme through Training : During the coming years, the state
government has planned to establish State Panchayat Training and Resource Centres, one
at the state level, 38 at the district level, and 534 at block level.
(c) State Level Activities :
(i) Workshop for identification of issues related to PRI
(ii) Workshop for identifying training needs of PRI institution
(iii) Stakeholder workshop for developing a common vision among all stakeholders
(iv) Designing of Training modules for Training of Trainers (TOT) for District
Resource Persons (DRP).
(v) Designing of course material for sectoral training
(vi) Establishment of State Project Management Unit
(vii) Formation of Capacity Building and Training Cell at the department level
(viii) Designing of communication strategy and developing Information, Education and
Communication (IEC) material
(ix) Developing a pool of resource persons at the state level and district level
(x) Establishing Panchayat Resource Centre and training institute at the state level

233
(xi) Establishment of an 8 hour helpline in order to support the PRIs in the state
(xii) Policy research and network support
(d) District Level Activities:
(i) Provision of adequate functionaries for planning and implementation at Zila
Parishad level
(ii) Divisional level PRI sensitization workshop
(iii) Inter-state exposure programme for PRI members
(iv) Capacity building of District Planning Committee
(v) Establishment of District Panchayat Resource Centre (DPRC)
(vi) District Project Management Unit (E-Governance)
(e) Block Level Acitivities :
(i) Creation of Information Technology Cell at Panchayat Samiti Level for
E-governance
(ii) Establishment and maintenance of the accounting and auditing system
(iii) Establishment of satellite receiving station at Panchayat Samiti level in order to
promote interactive learning.
(iv) Establishment of Block Resource Centre.
(f) Gram Panchayat Level Activities :
(i) Provision of adequate functionaries including IT Personnel
(ii) Providing sufficient office infrastructure for Gram Panchayats including Computer.
(iii) Telephone linkages to Gram Panchayats
Presently, there are 216 Master Resource Persons for carrying out the training programme
proposed under BRGF plan. Most of them have been imparted a 60-day training by the Bihar
Institute of Public Administration and Rural Development (BIPARD). The Department has
further created a pool of Master Resource Persons for IT to impart training to IT personnels
and implement the e-Panchyat Mission Mode Project.
Majority of the schemes implemented by PRIs are financed by Backward Region Grants Fund
(BRGF), grants from Union Finance Commission, and grants from State Finance Commission.
These funds account for more than 80 percent of the fund available to the PRIs. In 2012-13, a
total amount of Rs. 2945 crore was approved for the PRIs, compared to Rs. 2447 crore in the
previous year implying a growth of 20.4 percent. The actual expenditure was almost 90 percent
of the approved outlay in both 2011-12 and 2012-13. The financial progress of Panchayati Raj
Institutions are illustrated in Table 5.52.
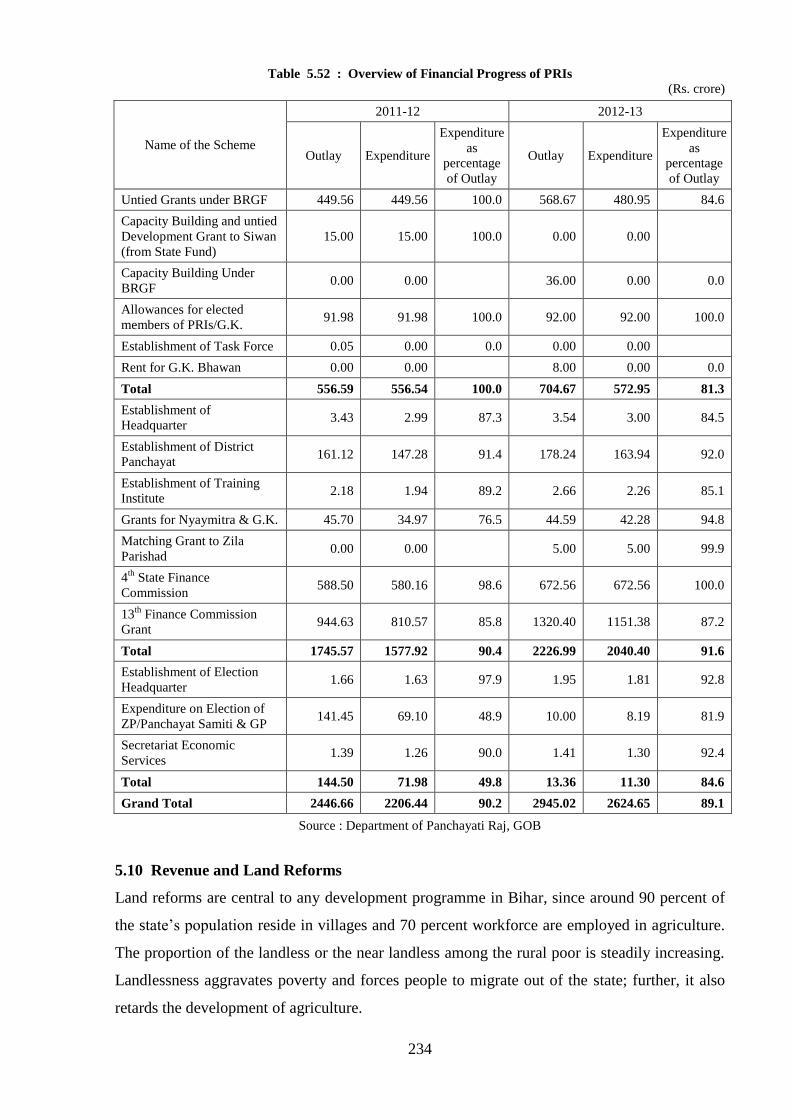
234
Table 5.52 : Overview of Financial Progress of PRIs
(Rs. crore)
Name of the Scheme
2011-12 2012-13
Outlay Expenditure
Expenditure
as
percentage
of Outlay
Outlay Expenditure
Expenditure
as
percentage
of Outlay
Untied Grants under BRGF 449.56 449.56 100.0 568.67 480.95 84.6
Capacity Building and untied
Development Grant to Siwan
(from State Fund)
15.00 15.00 100.0 0.00 0.00
Capacity Building Under
BRGF 0.00 0.00 36.00 0.00 0.0
Allowances for elected
members of PRIs/G.K. 91.98 91.98 100.0 92.00 92.00 100.0
Establishment of Task Force 0.05 0.00 0.0 0.00 0.00
Rent for G.K. Bhawan 0.00 0.00 8.00 0.00 0.0
Total 556.59 556.54 100.0 704.67 572.95 81.3
Establishment of
Headquarter 3.43 2.99 87.3 3.54 3.00 84.5
Establishment of District
Panchayat 161.12 147.28 91.4 178.24 163.94 92.0
Establishment of Training
Institute 2.18 1.94 89.2 2.66 2.26 85.1
Grants for Nyaymitra & G.K. 45.70 34.97 76.5 44.59 42.28 94.8
Matching Grant to Zila
Parishad 0.00 0.00 5.00 5.00 99.9
4th
State Finance
Commission 588.50 580.16 98.6 672.56 672.56 100.0
13th
Finance Commission
Grant 944.63 810.57 85.8 1320.40 1151.38 87.2
Total 1745.57 1577.92 90.4 2226.99 2040.40 91.6
Establishment of Election
Headquarter 1.66 1.63 97.9 1.95 1.81 92.8
Expenditure on Election of
ZP/Panchayat Samiti & GP 141.45 69.10 48.9 10.00 8.19 81.9
Secretariat Economic
Services 1.39 1.26 90.0 1.41 1.30 92.4
Total 144.50 71.98 49.8 13.36 11.30 84.6
Grand Total 2446.66 2206.44 90.2 2945.02 2624.65 89.1
Source : Department of Panchayati Raj, GOB
5.10 Revenue and Land Reforms
Land reforms are central to any development programme in Bihar, since around 90 percent of
the state’s population reside in villages and 70 percent workforce are employed in agriculture.
The proportion of the landless or the near landless among the rural poor is steadily increasing.
Landlessness aggravates poverty and forces people to migrate out of the state; further, it also
retards the development of agriculture.

235
Redistributive justice is one of the main planks of the present government. Towards this, in
recent years, a special focus of the revenue administration of the state has been provision of 3
decimals for house sites to each Mahadalit family which do not have such site. According to
survey, 1.98 lakh landless Mahadalit families live in Bihar and, till March 2013, the number of
landless Mahadalit families benefitting from this scheme is 1.70 lakh, involving 4915 acres
land. The Department sought to provide land to the target group by following four land streams
— (a) Gair Mazarua malik/khas land, (b) Gair Mazarua aam land, (c) land under Bihar
Privileged Persons Homestead Tenancy Act, 1947, and (d) in the absence of the above lands,
Raiyati land purchased under the Bihar Raiyati Land Purchase Policy, 2010. The progress
under this scheme is presented in Table 5.53.
Table 5.53 : Progress under the Scheme of Provision of House Sites to Mahadalit Families
Type of Land
Number of Mahadalit families Area of
land
distributed
(acres)
To be
covered
Already
covered
Percentage of
achievement
Gair Mazarua Malik /
Khas land
66167 64544 97.6 1938.51
Gair Mazarua Aam land 36655 30525 83.3 749.45
Bihar Priviledged Person
Homestead Tenancy Act
41374 42294 102.2 1237.70
Purchase of Raiyati land 53649 32961 61.4 988.91
Total 197845 170324 86.1 4914.57
Source : Department of Revenue and Land Reforms (GOB)
Along with this, the Department is also running other land-related schemes for SC, ST, BC and
EBC households. Some of the important programmes of the Department are as follows:
Under Griha-Sthal Scheme, in 2012-13, Rs. 5.00 crore has been allocated to different
districts, and 351 families have already been benefited till now.
Under Approach Road Construction Scheme, in 2012-13, Rs. 5.00 crore has been allocated
and, 120 tolas and mohallas have been connected.
In 2012-13, there were 104 cases of land transfer which have been approved, and a total
area of 603.63 acres of government land has been transferred under this activity.
Under homestead land scheme, 543.09 acres of land was acquired for 1.37 thousand
beneficiaries in 2012-13.
Under land consolidation scheme, in 2010-11, 43.98 acres of land were distributed among
111 beneficiaries. No land was distributed in 2011-12 and 2012-13.
Under Bhudan scheme, 256 acre land has already been distributed.

236
Table 5.54 presents an overview of the initiatives for land related issues, like revenue
collection, settlement of homestead land, settlement of government land etc. According to the
table, the number of beneficiaries issued revenue receipts for homestead land is more than 10
thousand in each year. The land revenue collected shows an upward trend, and the collection in
2012-13 is more than three times the amount in 2011-12. There is a continuous increase in the
number of settled Sairats, whereas the settlement of government land is showing a decrease in
these years.
Table 5.54 : Various Initiatives by State Government
Year
Revenue Receipts
Issued for Homestead
Land Land Revenue
Collection
(Rs. crore)
Settlement of
Government Land Settlement of Sairats
No. of
Benefic-
iaries
Area of
Distributed
Land
(acres)
Area
Involved
(acres)
No. of
Benefici-
aries
Total No.
of Sairats
Total No.
of Sairats
who have
been
settled
Total
Amount
from
Sairats
(Rs. crore)
2010-11 15558 532.51 19.61 921.91 10030 6927 3368 9.46
2011-12 10292 433.46 28.03 373.07 14547 6903 3607 1.02
2012-13 13747 543.09 87.02 316.18 7024 6115 4157 14.02
Source : Department of Revenue and Land Reforms, GOB
Under the Bihar Bhoodan Yagna Act, 1954, a committee is functioning in the state which is
responsible for the distribution of donated land among the weaker sections of the society. The
status under this scheme is presented in Table 5.55.
Table 5.55 : Progress under Distribution of Bhoodan Land as on 2013
(‘000 acres)
Year
Collected
Area
from
Bhoodan
Confirmed
land
Land not fit
for
distribution
Distributed
land
Remaining
Land
available for
Distribution
2012-13 649 345 385 256 7
Source : Department of Revenue and Land Reforms (GOB)
5.11 Disaster Management
Due to its topographic and climatic conditions, Bihar is vulnerable to several disaster
conditions on a continuing basis, covering floods, droughts, heat waves, storms, hailstorms and
cyclone in summer. Persistent cold wave conditions in winter season also sometimes takes toll
of both human and animals. Bihar also lies in high and moderate seismic zones and hence

237
prone to earthquakes. Considering all these, a new Department of Disaster Management was
created in the state. The basic objective of this initiative is to become suitably prepared before
a disaster or a calamity strikes.
The state government has created the State Disaster Management Authority (SDMA) on the
lines of National Disaster Management Authority (NDMA). The NDMA has set up a battalion
of National Disaster Response Force (NDRF) at Bihta, near Patna. It had procured 74.47 acres
of land for housing this battalion. On its part, the state government has also created a battalion
of its own State Disaster Response Force (SDRF), comprising retired army officers and navel
personnel. The retired persons of central police force are also eligible to be engaged in SDRF.
Till date, 302 persons have already been appointed and the process of appointing 625 more is
on. Some of the important activities to strengthen the Department of Disaster Management are
the following :
(a) To combat flood disaster, Standard Operating Procedure (SOP) has been formulated by
the Department of Disaster Management for preparedness, early response, relief and
rehabilitations during flood and other kind of disasters.
(b) A novel scheme of 'Shatabdi Anna Kalash Yojana' was started to provide a helping hand
to poor, old, infirm people, widows and other underprivileged people to prevent
starvation deaths in the state. Under this scheme, the state government guarantees
disbursement of 10 kgs. of foodgrains per adult and 7 kgs. of foodgrains per child upto
one month until they are covered by other relief schemes of the state government. A sum
of Rs. 10.00 crore has already been provided for this scheme in 2011-12.
(c) A Standard Operating Procedure (SOP) has also been formulated to combat drinking
water crisis, caused by irregular monsoon and receding ground under level in some areas
of the state.
(d) A state Emergency Operation Centre (EOC) building has been constructed and it has
been equipped with the state of the art technology. Such EOC's have also been created for
all 38 districts of the state, at a cost of Rs. 10.00 lakh per centre.
To strengthen the Department further, the additional activities of the state government during
2012-13 have been :
(i) A sum of Rs. 67.09 crore was made available under different heads to all the districts to
fight against calamities like fire, flood, cyclone, lightning and other calamities.
(ii) The construction of Emergency Operation Centres (EOC) at district levels was planned in
each of the 38 districts of Bihar, at the unit cost of Rs. 10.00 lakh. The construction of

238
such centres is complete in 27 districts and the work is in progress in the remaining 11
districts. All these centres will be made operational with the state-of-the-art technology.
(iii) In each of the 28 flood prone districts of the state, 10 jawans of Home Guards and
volunteers have been imparted the training of swimming and searching of the victims. So
far, 1023 such swimmers have been trained. Apart from this, another 10 jawans of Home
Guard in each of those flood prone districts have been given the training of motor boat
driving. Till now, 25 districts have been covered and 212 such jawans have got the
training.
(iv) The training programmes of the Department of Disaster Management include both
Training of Trainers (TOT), and training of functionaries and community members. More
than 13,000 community members have been trained for Search and Rescue (SAR)
operations in flood situation. The Training of Trainers has been completed for Incident
Response System (IRS). The training of community members for SAR in earthquakes
has been commenced and there is a plan to train 5 community members in all the 8500
panchayats of the state. In order to reach quick medical help during disasters, the
Department has started training of Quick Medical Response Teams and provided advance
life support ambulances to the health department to respond to the medical emergencies
during disasters and other situations. In addition, the Department has also trained a large
number of divers and motor boat drivers in all districts.
Drought
The average annual rainfall in Bihar is 1054 mms. But the actual rainfall varies greatly,
seriously affecting its rural economy and population. Indeed, in the last 5 years, the most parts
of the state had to face drought or drought-like situations in as many as 4 years (2009, 2010,
2012 and 2013). The deficits in rainfall in these years have been — 17.6 percent (2009), 35.7
percent (2010), 19.6 percent (2012) and approximately 37 percent (2013). Unlike floods, which
generally cover a relatively smaller number of districts, droughts are a wide phenomenon. The
state had to declare 26 districts as drought-affected in 2009, 38 districts in 2010, and the
current drought (2013) covers no less than 33 districts out of a total 38 in the state. The
monsoon was very bad in 2013 and drought-like situation prevailed in most parts of the state.
A detailed exercise regarding the current drought (2013) was done by the state government and
a memorandum was submitted to the central government, seeking financial assistance to the
tune of Rs. 12,564 crore to meet this challenge (Table 5.56).
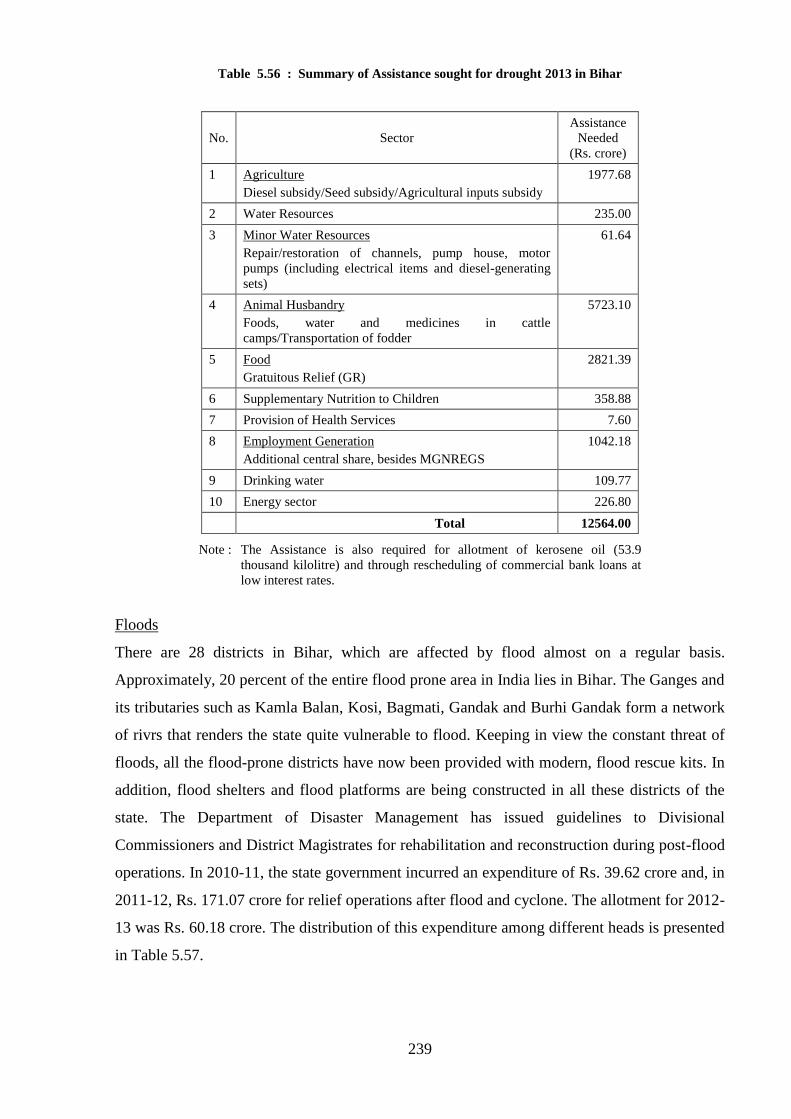
239
Table 5.56 : Summary of Assistance sought for drought 2013 in Bihar
No. Sector
Assistance
Needed
(Rs. crore)
1 Agriculture
Diesel subsidy/Seed subsidy/Agricultural inputs subsidy
1977.68
2 Water Resources 235.00
3 Minor Water Resources
Repair/restoration of channels, pump house, motor
pumps (including electrical items and diesel-generating
sets)
61.64
4 Animal Husbandry
Foods, water and medicines in cattle
camps/Transportation of fodder
5723.10
5 Food
Gratuitous Relief (GR)
2821.39
6 Supplementary Nutrition to Children 358.88
7 Provision of Health Services 7.60
8 Employment Generation
Additional central share, besides MGNREGS
1042.18
9 Drinking water 109.77
10 Energy sector 226.80
Total 12564.00
Note : The Assistance is also required for allotment of kerosene oil (53.9
thousand kilolitre) and through rescheduling of commercial bank loans at
low interest rates.
Floods
There are 28 districts in Bihar, which are affected by flood almost on a regular basis.
Approximately, 20 percent of the entire flood prone area in India lies in Bihar. The Ganges and
its tributaries such as Kamla Balan, Kosi, Bagmati, Gandak and Burhi Gandak form a network
of rivrs that renders the state quite vulnerable to flood. Keeping in view the constant threat of
floods, all the flood-prone districts have now been provided with modern, flood rescue kits. In
addition, flood shelters and flood platforms are being constructed in all these districts of the
state. The Department of Disaster Management has issued guidelines to Divisional
Commissioners and District Magistrates for rehabilitation and reconstruction during post-flood
operations. In 2010-11, the state government incurred an expenditure of Rs. 39.62 crore and, in
2011-12, Rs. 171.07 crore for relief operations after flood and cyclone. The allotment for 2012-
13 was Rs. 60.18 crore. The distribution of this expenditure among different heads is presented
in Table 5.57.
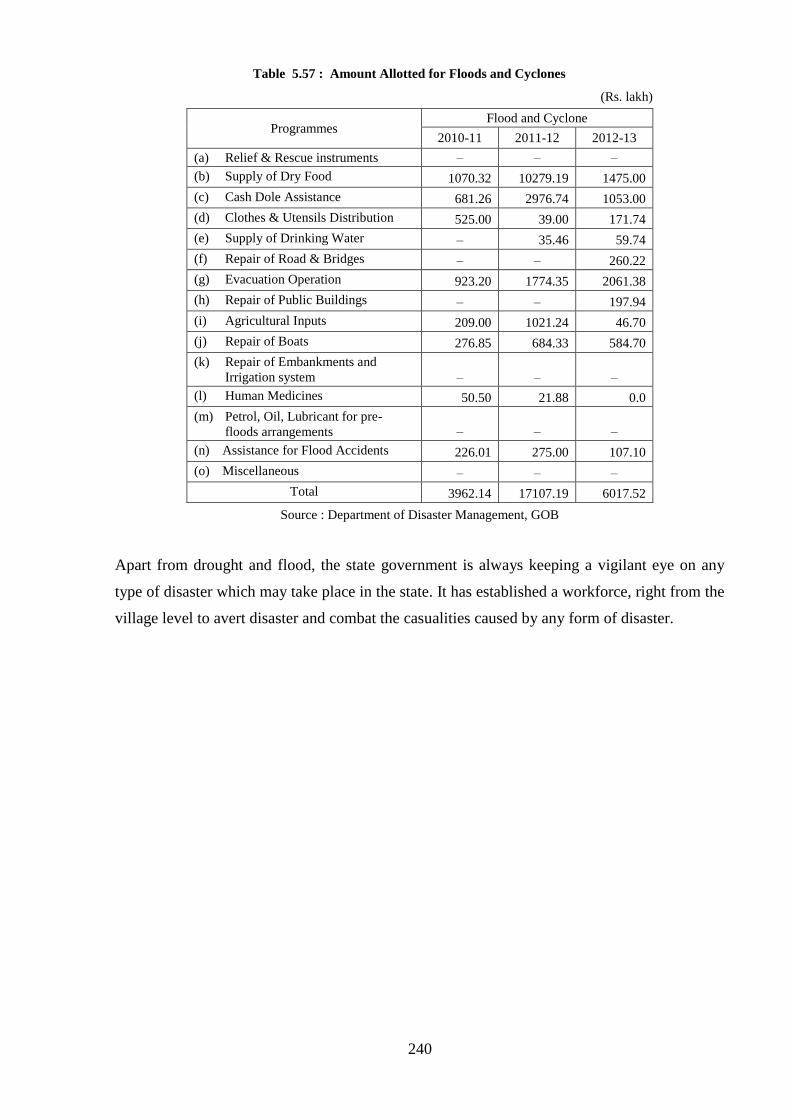
240
Table 5.57 : Amount Allotted for Floods and Cyclones
(Rs. lakh)
Programmes Flood and Cyclone
2010-11 2011-12 2012-13
(a) Relief & Rescue instruments – – –
(b) Supply of Dry Food 1070.32 10279.19 1475.00
(c) Cash Dole Assistance 681.26 2976.74 1053.00
(d) Clothes & Utensils Distribution 525.00 39.00 171.74
(e) Supply of Drinking Water – 35.46 59.74
(f) Repair of Road & Bridges – – 260.22
(g) Evacuation Operation 923.20 1774.35 2061.38
(h) Repair of Public Buildings – – 197.94
(i) Agricultural Inputs 209.00 1021.24 46.70
(j) Repair of Boats 276.85 684.33 584.70
(k) Repair of Embankments and
Irrigation system – – –
(l) Human Medicines 50.50 21.88 0.0
(m) Petrol, Oil, Lubricant for pre-
floods arrangements – – –
(n) Assistance for Flood Accidents 226.01 275.00 107.10
(o) Miscellaneous – – –
Total 3962.14 17107.19 6017.52
Source : Department of Disaster Management, GOB
Apart from drought and flood, the state government is always keeping a vigilant eye on any
type of disaster which may take place in the state. It has established a workforce, right from the
village level to avert disaster and combat the casualities caused by any form of disaster.
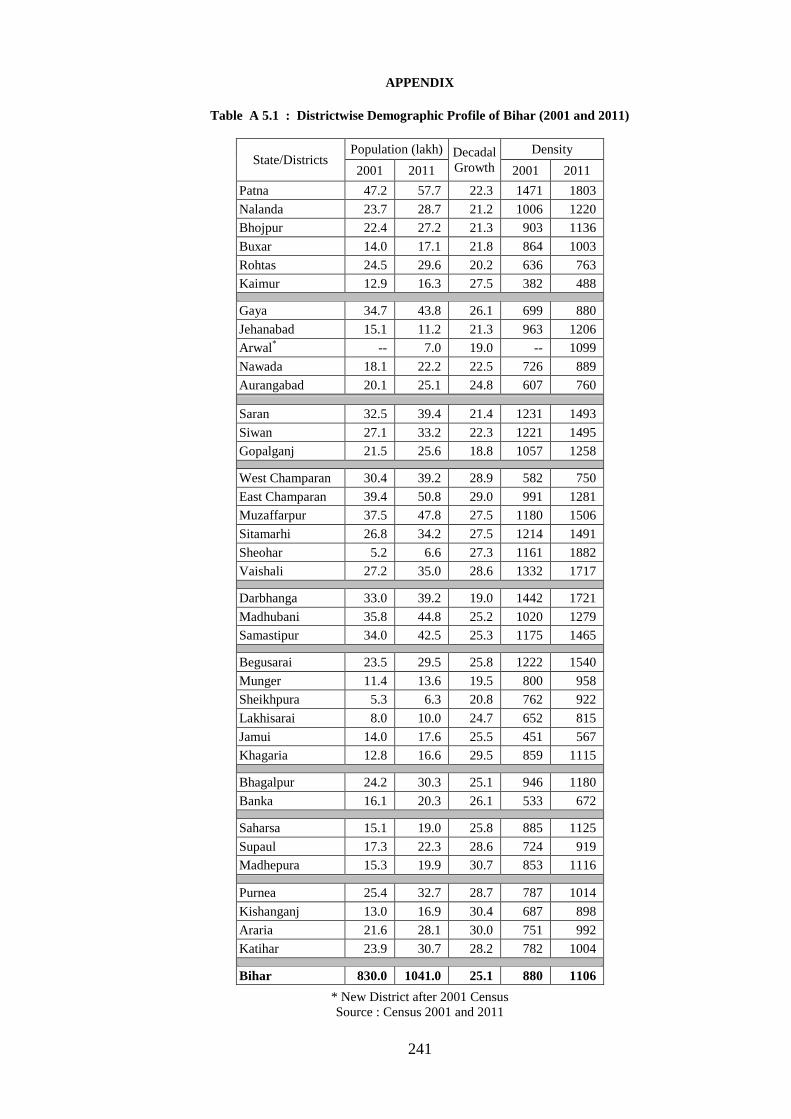
241
APPENDIX
Table A 5.1 : Districtwise Demographic Profile of Bihar (2001 and 2011)
State/Districts Population (lakh) Decadal
Growth
Density
2001 2011 2001 2011
Patna 47.2 57.7 22.3 1471 1803
Nalanda 23.7 28.7 21.2 1006 1220
Bhojpur 22.4 27.2 21.3 903 1136
Buxar 14.0 17.1 21.8 864 1003
Rohtas 24.5 29.6 20.2 636 763
Kaimur 12.9 16.3 27.5 382 488
Gaya 34.7 43.8 26.1 699 880
Jehanabad 15.1 11.2 21.3 963 1206
Arwal*
-- 7.0 19.0 -- 1099
Nawada 18.1 22.2 22.5 726 889
Aurangabad 20.1 25.1 24.8 607 760
Saran 32.5 39.4 21.4 1231 1493
Siwan 27.1 33.2 22.3 1221 1495
Gopalganj 21.5 25.6 18.8 1057 1258
West Champaran 30.4 39.2 28.9 582 750
East Champaran 39.4 50.8 29.0 991 1281
Muzaffarpur 37.5 47.8 27.5 1180 1506
Sitamarhi 26.8 34.2 27.5 1214 1491
Sheohar 5.2 6.6 27.3 1161 1882
Vaishali 27.2 35.0 28.6 1332 1717
Darbhanga 33.0 39.2 19.0 1442 1721
Madhubani 35.8 44.8 25.2 1020 1279
Samastipur 34.0 42.5 25.3 1175 1465
Begusarai 23.5 29.5 25.8 1222 1540
Munger 11.4 13.6 19.5 800 958
Sheikhpura 5.3 6.3 20.8 762 922
Lakhisarai 8.0 10.0 24.7 652 815
Jamui 14.0 17.6 25.5 451 567
Khagaria 12.8 16.6 29.5 859 1115
Bhagalpur 24.2 30.3 25.1 946 1180
Banka 16.1 20.3 26.1 533 672
Saharsa 15.1 19.0 25.8 885 1125
Supaul 17.3 22.3 28.6 724 919
Madhepura 15.3 19.9 30.7 853 1116
Purnea 25.4 32.7 28.7 787 1014
Kishanganj 13.0 16.9 30.4 687 898
Araria 21.6 28.1 30.0 751 992
Katihar 23.9 30.7 28.2 782 1004
Bihar 830.0 1041.0 25.1 880 1106
* New District after 2001 Census
Source : Census 2001 and 2011

242
Table A 5.2 : Districtwise Demographic Profile of Bihar (2001 and 2011)
State/Districts Sex Ratio Child Sex Ratio Urbanisation
2001 2011 2001 2011 2001 2011
Patna 873 892 923 899 41.6 43.5
Nalanda 914 921 942 929 14.9 15.9
Bhojpur 902 900 940 915 13.9 14.3
Buxar 899 922 925 925 9.2 9.6
Rohtas 909 914 951 925 13.3 14.4
Kaimur 902 919 940 939 3.2 4.0
Gaya 938 932 968 959 13.7 13.1
Jehanabad 929 918 917 918 7.4 12.0
Arwal -- 927 -- 941 -- 7.4
Nawada 946 936 978 985 7.4 9.7
Aurangabad 934 916 943 945 8.4 9.4
Saran 966 949 949 922 9.2 8.9
Siwan 1031 984 934 934 5.5 5.5
Gopalganj 1001 1015 964 945 6.1 6.3
West Champaran 901 906 953 950 10.2 10.0
East Champaran 897 901 937 923 6.4 7.9
Muzaffarpur 920 898 928 917 9.3 9.8
Sitamarhi 892 899 924 932 5.7 5.6
Sheohar 885 890 916 925 4.1 4.3
Vaishali 920 892 937 894 6.9 6.7
Darbhanga 914 910 915 928 8.1 9.7
Madhubani 942 925 939 931 3.5 3.7
Samastipur 928 909 938 941 3.6 3.5
Begusarai 912 894 946 911 4.6 19.2
Munger 872 879 914 925 27.9 28.3
Sheikhpura 918 926 955 940 15.5 17.1
Lakhisarai 921 900 951 915 14.7 14.3
Jamui 918 921 963 956 7.4 8.2
Khagaria 885 883 932 912 6 5.3
Bhagalpur 876 879 966 934 18.7 19.8
Banka 908 907 965 939 3.5 3.5
Saharsa 910 906 912 928 8.3 8.2
Supaul 920 925 925 942 5.1 4.7
Madhepura 915 914 927 923 4.5 4.4
Purnea 915 930 967 953 8.7 10.4
Kishanganj 936 946 947 966 10 9.7
Araria 913 921 963 954 6.1 6.0
Katihar 919 916 966 956 9.1 8.9
Bihar 919 918 942 935 10.5 11.3
Source : Census 2001 and 2011
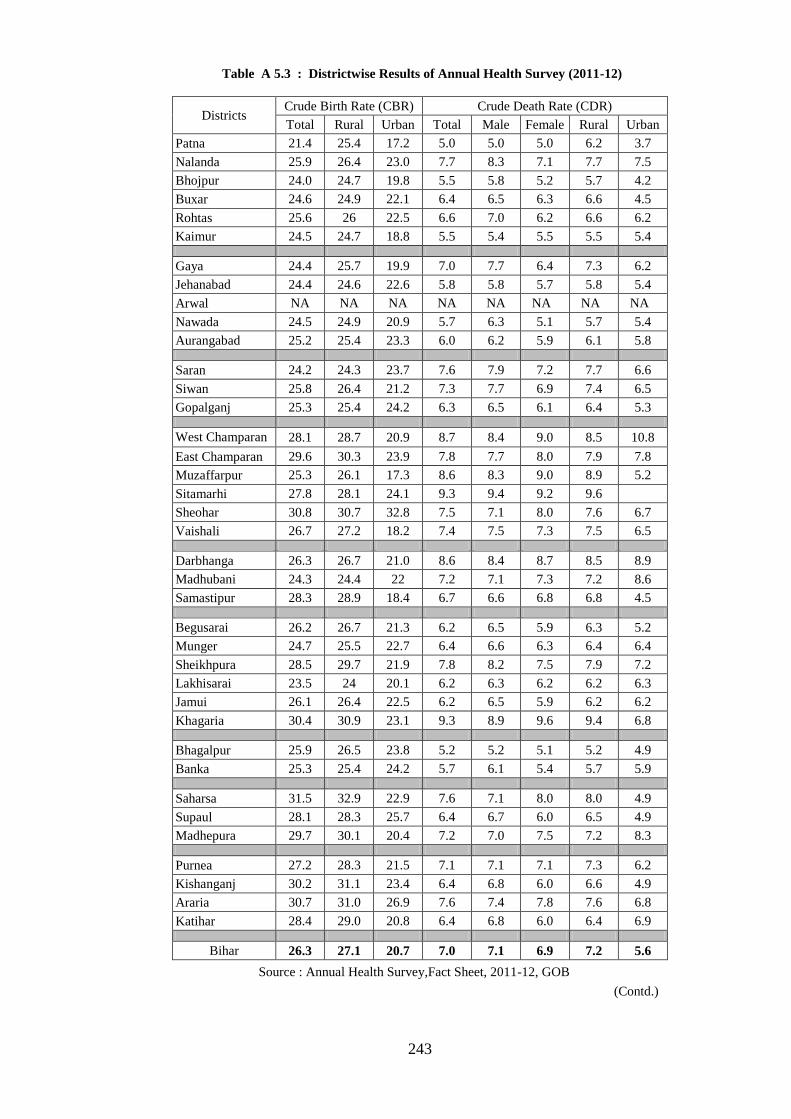
243
Table A 5.3 : Districtwise Results of Annual Health Survey (2011-12)
Districts Crude Birth Rate (CBR) Crude Death Rate (CDR)
Total Rural Urban Total Male Female Rural Urban
Patna 21.4 25.4 17.2 5.0 5.0 5.0 6.2 3.7
Nalanda 25.9 26.4 23.0 7.7 8.3 7.1 7.7 7.5
Bhojpur 24.0 24.7 19.8 5.5 5.8 5.2 5.7 4.2
Buxar 24.6 24.9 22.1 6.4 6.5 6.3 6.6 4.5
Rohtas 25.6 26 22.5 6.6 7.0 6.2 6.6 6.2
Kaimur 24.5 24.7 18.8 5.5 5.4 5.5 5.5 5.4
Gaya 24.4 25.7 19.9 7.0 7.7 6.4 7.3 6.2
Jehanabad 24.4 24.6 22.6 5.8 5.8 5.7 5.8 5.4
Arwal NA NA NA NA NA NA NA NA
Nawada 24.5 24.9 20.9 5.7 6.3 5.1 5.7 5.4
Aurangabad 25.2 25.4 23.3 6.0 6.2 5.9 6.1 5.8
Saran 24.2 24.3 23.7 7.6 7.9 7.2 7.7 6.6
Siwan 25.8 26.4 21.2 7.3 7.7 6.9 7.4 6.5
Gopalganj 25.3 25.4 24.2 6.3 6.5 6.1 6.4 5.3
West Champaran 28.1 28.7 20.9 8.7 8.4 9.0 8.5 10.8
East Champaran 29.6 30.3 23.9 7.8 7.7 8.0 7.9 7.8
Muzaffarpur 25.3 26.1 17.3 8.6 8.3 9.0 8.9 5.2
Sitamarhi 27.8 28.1 24.1 9.3 9.4 9.2 9.6
Sheohar 30.8 30.7 32.8 7.5 7.1 8.0 7.6 6.7
Vaishali 26.7 27.2 18.2 7.4 7.5 7.3 7.5 6.5
Darbhanga 26.3 26.7 21.0 8.6 8.4 8.7 8.5 8.9
Madhubani 24.3 24.4 22 7.2 7.1 7.3 7.2 8.6
Samastipur 28.3 28.9 18.4 6.7 6.6 6.8 6.8 4.5
Begusarai 26.2 26.7 21.3 6.2 6.5 5.9 6.3 5.2
Munger 24.7 25.5 22.7 6.4 6.6 6.3 6.4 6.4
Sheikhpura 28.5 29.7 21.9 7.8 8.2 7.5 7.9 7.2
Lakhisarai 23.5 24 20.1 6.2 6.3 6.2 6.2 6.3
Jamui 26.1 26.4 22.5 6.2 6.5 5.9 6.2 6.2
Khagaria 30.4 30.9 23.1 9.3 8.9 9.6 9.4 6.8
Bhagalpur 25.9 26.5 23.8 5.2 5.2 5.1 5.2 4.9
Banka 25.3 25.4 24.2 5.7 6.1 5.4 5.7 5.9
Saharsa 31.5 32.9 22.9 7.6 7.1 8.0 8.0 4.9
Supaul 28.1 28.3 25.7 6.4 6.7 6.0 6.5 4.9
Madhepura 29.7 30.1 20.4 7.2 7.0 7.5 7.2 8.3
Purnea 27.2 28.3 21.5 7.1 7.1 7.1 7.3 6.2
Kishanganj 30.2 31.1 23.4 6.4 6.8 6.0 6.6 4.9
Araria 30.7 31.0 26.9 7.6 7.4 7.8 7.6 6.8
Katihar 28.4 29.0 20.8 6.4 6.8 6.0 6.4 6.9
Bihar 26.3 27.1 20.7 7.0 7.1 6.9 7.2 5.6
Source : Annual Health Survey,Fact Sheet, 2011-12, GOB
(Contd.)

244
Table A 5.3 : Districtwise Results of Annual Health Survey (2011-12) (Contd.)
Districts Infant Mortality Rate (IMR) Total
Fertility
Rate Total Male Female Rural Urban
Patna 37 36 38 43 27 2.7
Nalanda 49 49 49 50 42 3.4
Bhojpur 44 42 47 46 36 3.1
Buxar 53 52 53 54 38 3.4
Rohtas 49 46 51 49 44 3.4
Kaimur 53 52 54 53 46 3.4
Gaya 52 51 54 54 46 3.2
Jehanabad 51 50 52 52 39 3.3
Arwal NA NA NA NA NA NA
Nawada 47 48 45 46 - 3.2
Aurangabad 44 44 43 43 - 3.3
Saran 51 48 55 51 53 3.3
Siwan 46 46 45 47 - 3.6
Gopalganj 48 46 50 49 37 3.6
West Champaran 53 48 57 51 - 4.1
East Champaran 53 53 53 51 75 4.2
Muzaffarpur 57 54 61 60 - 3.6
Sitamarhi 64 64 63 66 - 3.9
Sheohar 47 40 55 48 - 4.6
Vaishali 47 45 49 44 102 3.5
Darbhanga 48 47 48 47 63 3.9
Madhubani 52 46 59 52 - 3.4
Samastipur 52 47 58 53 - 3.8
Begusarai 43 42 44 44 - 3.5
Munger 48 46 51 50 44 3.3
Sheikhpura 56 53 60 57 45 3.7
Lakhisarai 50 48 53 52 38 3.1
Jamui 54 52 55 54 45 3.3
Khagaria 63 63 63 64 - 4.4
Bhagalpur 51 53 50 53 43 3.5
Banka 45 46 44 45 - 3.3
Saharsa 59 58 60 59 - 4.4
Supaul 61 61 61 63 - 3.8
Madhepura 68 66 69 68 - 4.0
Purnea 58 56 61 56 - 3.9
Kishanganj 58 57 59 60 - 4.4
Araria 56 53 58 57 41 4.4
Katihar 55 57 54 56 - 4.1
Bihar 52 50 53 53 43 3.6
Source : Annual Health Survey,Fact Sheet, 2011-12, GOB
(Contd.)
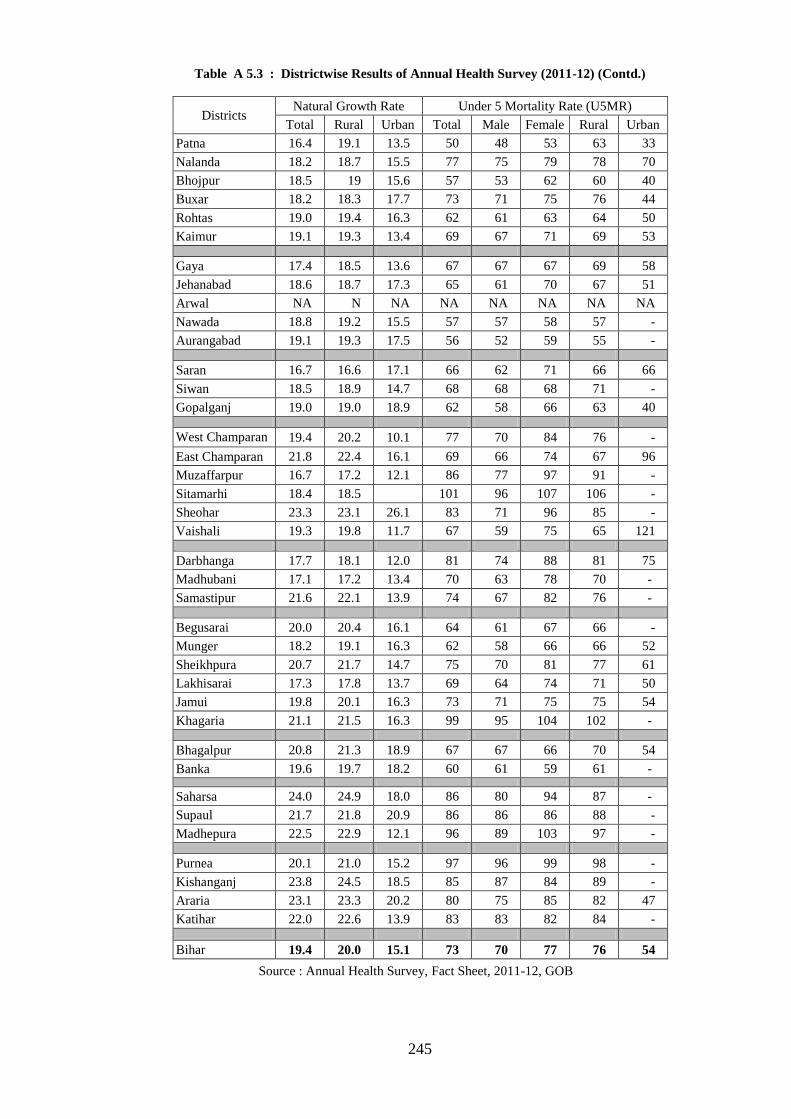
245
Table A 5.3 : Districtwise Results of Annual Health Survey (2011-12) (Contd.)
Districts Natural Growth Rate Under 5 Mortality Rate (U5MR)
Total Rural Urban Total Male Female Rural Urban
Patna 16.4 19.1 13.5 50 48 53 63 33
Nalanda 18.2 18.7 15.5 77 75 79 78 70
Bhojpur 18.5 19 15.6 57 53 62 60 40
Buxar 18.2 18.3 17.7 73 71 75 76 44
Rohtas 19.0 19.4 16.3 62 61 63 64 50
Kaimur 19.1 19.3 13.4 69 67 71 69 53
Gaya 17.4 18.5 13.6 67 67 67 69 58
Jehanabad 18.6 18.7 17.3 65 61 70 67 51
Arwal NA N NA NA NA NA NA NA
Nawada 18.8 19.2 15.5 57 57 58 57 -
Aurangabad 19.1 19.3 17.5 56 52 59 55 -
Saran 16.7 16.6 17.1 66 62 71 66 66
Siwan 18.5 18.9 14.7 68 68 68 71 -
Gopalganj 19.0 19.0 18.9 62 58 66 63 40
West Champaran 19.4 20.2 10.1 77 70 84 76 -
East Champaran 21.8 22.4 16.1 69 66 74 67 96
Muzaffarpur 16.7 17.2 12.1 86 77 97 91 -
Sitamarhi 18.4 18.5 101 96 107 106 -
Sheohar 23.3 23.1 26.1 83 71 96 85 -
Vaishali 19.3 19.8 11.7 67 59 75 65 121
Darbhanga 17.7 18.1 12.0 81 74 88 81 75
Madhubani 17.1 17.2 13.4 70 63 78 70 -
Samastipur 21.6 22.1 13.9 74 67 82 76 -
Begusarai 20.0 20.4 16.1 64 61 67 66 -
Munger 18.2 19.1 16.3 62 58 66 66 52
Sheikhpura 20.7 21.7 14.7 75 70 81 77 61
Lakhisarai 17.3 17.8 13.7 69 64 74 71 50
Jamui 19.8 20.1 16.3 73 71 75 75 54
Khagaria 21.1 21.5 16.3 99 95 104 102 -
Bhagalpur 20.8 21.3 18.9 67 67 66 70 54
Banka 19.6 19.7 18.2 60 61 59 61 -
Saharsa 24.0 24.9 18.0 86 80 94 87 -
Supaul 21.7 21.8 20.9 86 86 86 88 -
Madhepura 22.5 22.9 12.1 96 89 103 97 -
Purnea 20.1 21.0 15.2 97 96 99 98 -
Kishanganj 23.8 24.5 18.5 85 87 84 89 -
Araria 23.1 23.3 20.2 80 75 85 82 47
Katihar 22.0 22.6 13.9 83 83 82 84 -
Bihar 19.4 20.0 15.1 73 70 77 76 54
Source : Annual Health Survey, Fact Sheet, 2011-12, GOB
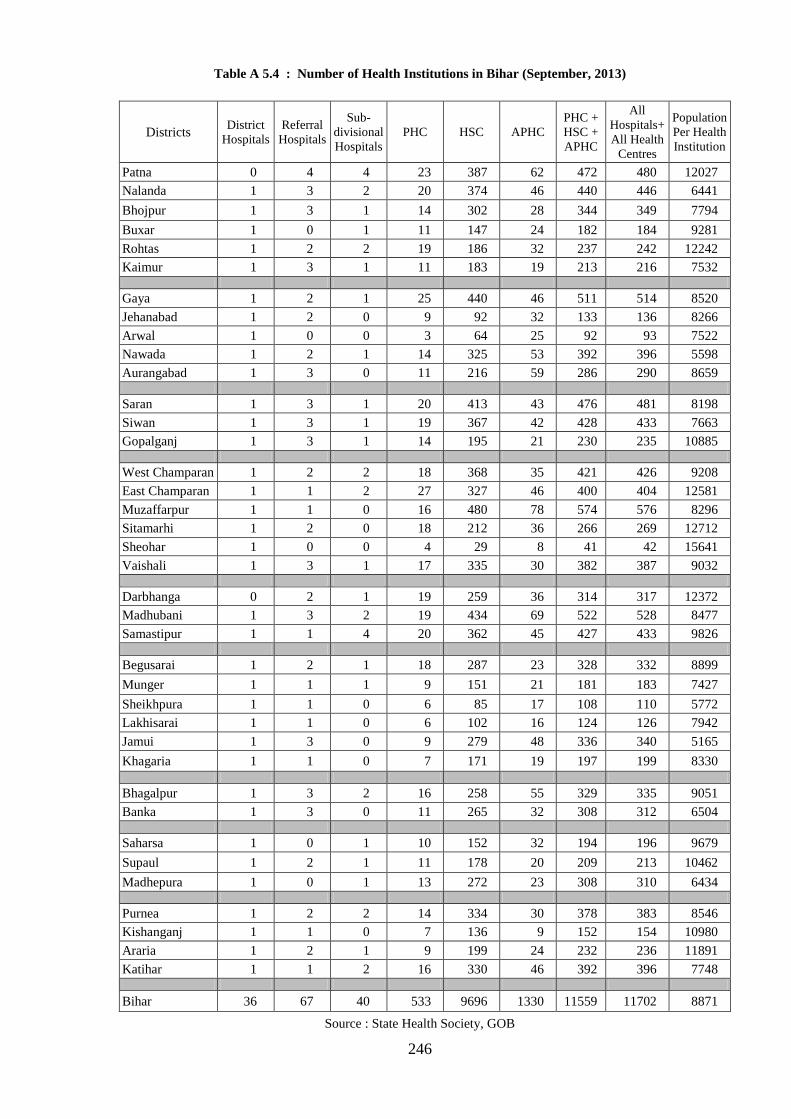
246
Table A 5.4 : Number of Health Institutions in Bihar (September, 2013)
Districts District
Hospitals
Referral
Hospitals
Sub-
divisional
Hospitals
PHC HSC APHC
PHC +
HSC +
APHC
All
Hospitals+
All Health
Centres
Population
Per Health
Institution
Patna 0 4 4 23 387 62 472 480 12027
Nalanda 1 3 2 20 374 46 440 446 6441
Bhojpur 1 3 1 14 302 28 344 349 7794
Buxar 1 0 1 11 147 24 182 184 9281
Rohtas 1 2 2 19 186 32 237 242 12242
Kaimur 1 3 1 11 183 19 213 216 7532
Gaya 1 2 1 25 440 46 511 514 8520
Jehanabad 1 2 0 9 92 32 133 136 8266
Arwal 1 0 0 3 64 25 92 93 7522
Nawada 1 2 1 14 325 53 392 396 5598
Aurangabad 1 3 0 11 216 59 286 290 8659
Saran 1 3 1 20 413 43 476 481 8198
Siwan 1 3 1 19 367 42 428 433 7663
Gopalganj 1 3 1 14 195 21 230 235 10885
West Champaran 1 2 2 18 368 35 421 426 9208
East Champaran 1 1 2 27 327 46 400 404 12581
Muzaffarpur 1 1 0 16 480 78 574 576 8296
Sitamarhi 1 2 0 18 212 36 266 269 12712
Sheohar 1 0 0 4 29 8 41 42 15641
Vaishali 1 3 1 17 335 30 382 387 9032
Darbhanga 0 2 1 19 259 36 314 317 12372
Madhubani 1 3 2 19 434 69 522 528 8477
Samastipur 1 1 4 20 362 45 427 433 9826
Begusarai 1 2 1 18 287 23 328 332 8899
Munger 1 1 1 9 151 21 181 183 7427
Sheikhpura 1 1 0 6 85 17 108 110 5772
Lakhisarai 1 1 0 6 102 16 124 126 7942
Jamui 1 3 0 9 279 48 336 340 5165
Khagaria 1 1 0 7 171 19 197 199 8330
Bhagalpur 1 3 2 16 258 55 329 335 9051
Banka 1 3 0 11 265 32 308 312 6504
Saharsa 1 0 1 10 152 32 194 196 9679
Supaul 1 2 1 11 178 20 209 213 10462
Madhepura 1 0 1 13 272 23 308 310 6434
Purnea 1 2 2 14 334 30 378 383 8546
Kishanganj 1 1 0 7 136 9 152 154 10980
Araria 1 2 1 9 199 24 232 236 11891
Katihar 1 1 2 16 330 46 392 396 7748
Bihar 36 67 40 533 9696 1330 11559 11702 8871
Source : State Health Society, GOB

247
Table A 5.5 : Districtwise Employment of Regular and Contractual Doctors in Bihar
Districts
No. of sanctioned
posts currently Number of doctors employed
No. of
doctors per
lakh of
population Regular Contractual
Regular Contractual
March
2012
March
2013
March
2012
March
2013
March
2013
Patna 304 92 279 262 81 83 5.98
Nalanda 137 95 84 84 75 73 5.47
Bhojpur 127 60 78 86 58 53 5.11
Buxar 82 54 59 58 33 38 5.61
Rohtas 162 89 49 49 45 46 3.21
Kaimur 93 48 46 46 21 19 3.99
Gaya 198 106 73 82 88 76 3.61
Jehanabad 99 45 54 55 43 38 8.30
Arwal 67 20 38 25 18 18 6.14
Nawada 113 45 52 49 22 15 2.88
Aurangabad 177 49 67 68 33 28 3.82
Saran 142 94 79 83 70 60 3.63
Siwan 137 89 53 47 48 44 2.74
Gopalganj 101 69 50 52 46 37 3.48
West Champaran 132 83 71 71 55 57 3.27
East Champaran 184 128 83 83 102 111 3.82
Muzaffarpur 172 70 95 89 65 52 2.95
Sitamarhi 124 52 73 72 37 70 4.15
Sheohar 75 19 42 33 15 15 7.27
Vaishali 131 69 127 121 67 53 4.97
Darbhanga 146 72 68 62 72 57 3.04
Madhubani 218 81 75 75 52 55 2.90
Samastipur 192 95 91 105 51 51 3.67
Begusarai 122 94 69 63 49 55 4.00
Munger 69 44 46 48 32 33 5.96
Sheikhpura 80 24 30 28 20 13 6.51
Lakhisarai 58 30 33 34 18 20 5.40
Jamui 99 38 29 36 27 27 3.58
Khagaria 101 44 30 31 34 30 3.67
Bhagalpur 152 64 62 72 58 51 4.06
Banka 103 47 48 46 28 26 3.55
Saharsa 95 45 45 36 25 23 3.11
Supaul 109 48 64 61 29 28 3.99
Madhepura 106 67 35 33 25 28 3.07
Purnea 135 64 79 79 53 52 4.01
Kishanganj 68 28 31 21 9 8 1.72
Araria 121 36 38 47 18 13 2.14
Katihar 120 78 60 60 45 38 3.19
Bihar 4851 2375 2472 2461 1664 1594 3.90
Source : State Health Society, GOB

248
Table A 5.6 : Districtwise Employment of Grade A Nurses in Bihar
Districts
No. of sanctioned posts
currently Number of Grade A Nurses employed
Regular Contractual Regular Contractual
March 2012 March 2013 March 2012 March 2013
Patna 41 120 26 (63.4) 27 (65.9) 72 (60.0) 68 (56.7)
Nalanda 37 86 28 (75.7) 28 (75.7) 80 (93.0) 80 (93.0)
Bhojpur 12 54 6 (50.0) 6 (50.0) 29 (53.7) 27 (50.0)
Buxar 2 30 2 (100.0) 3 (150) 29 (96.7) 16 (53.3)
Rohtas 20 88 8 (40.0) 7 (35.0) 21 (23.9) 27 (30.7)
Kaimur 44 38 6 (13.6) 4 (9.1) 7 (18.4) 14 (36.8)
Gaya 25 146 17 (68.0) 17 (68.0) 50 (34.2) 67 (45.9)
Jehanabad 13 62 8 (61.5) 2 (15.4) 39 (62.9) 36 (58.1)
Arwal 25 56 0 (0.0) 5 (20.0) 11 (19.6) 21 (37.5)
Nawada 125 82 9 (7.2) 9 (7.2) 53 (64.6) 47 (57.3)
Aurangabad 22 128 6 (27.3) 5 (22.7) 70 (54.7) 52 (40.6)
Saran 25 86 10 (40.0) 7 (28.0) 28 (32.6) 30 (34.9)
Siwan 16 110 6 (37.5) 3 (18.8) 10 (9.1) 9 (8.2)
Gopalganj 18 84 7 (38.9) 7 (38.9) 21 (25.0) 19 (22.6)
West Champaran 37 120 28 (75.7) 14 (37.8) 63 (52.5) 41 (34.2)
East Champaran 24 164 15 (62.5) 15 (62.5) 52 (31.7) 48 (29.3)
Muzaffarpur 32 152 16 (50.0) 16 (50.0) 19 (12.5) 19 (12.5)
Sitamarhi 17 116 12 (70.6) 9 (52.9) 59 (50.9) 51 (44.0)
Sheohar 9 34 1 (11.1) 6 (66.7) 23 (67.6) 13 (38.2)
Vaishali 26 118 20 (76.9) 8 (30.8) 79 (66.9) 67 (56.8)
Darbhanga 8 154 4 (50.0) 4 (50.0) 26 (16.9) 9 (5.8)
Madhubani 34 114 14 (41.2) 14 (41.2) 12 (10.5) 10 (8.8)
Samastipur 24 146 22 (91.7) 22 (91.7) 88 (60.3) 72 (49.3)
Begusarai 23 102 23 (100.0) 22 (95.7) 67 (65.7) 66 (64.7)
Munger 20 38 20 (100.0) 19 (95.0) 26 (68.4) 29 (76.3)
Sheikhpura 32 34 4 (12.5) 1 (3.1) 34 (100) 27 (79.4)
Lakhisarai 10 61 10 (100.0) 9 (90.0) 37 (60.7) 30 (49.2)
Jamui 34 85 11 (32.4) 15 (44.1) 65 (76.5) 60 (70.6)
Khagaria 13 48 8 (61.5) 10 (76.9) 35 (72.9) 47 (97.9)
Bhagalpur 18 108 16 (88.9) 13 (72.2) 66 (61.1) 64 (59.3)
Banka 18 64 8 (44.4) 8 (44.4) 58 (90.6) 43 (67.2)
Saharsa 30 48 21 (70.0) 21 (70.0) 33 (68.8) 33 (68.8)
Supaul 28 107 2 (7.1) 2 (7.1) 34 (31.8) 31 (29.0)
Madhepura 9 58 3 (33.3) 3 (33.3) 13 (22.4) 12 (20.7)
Purnea 32 110 16 (50.0) 16 (50.0) 92 (83.6) 92 (83.6)
Kishanganj 34 44 5 (14.7) 4 (11.8) 19 (43.2) 19 (43.2)
Araria 39 96 5 (12.8) 5 (12.8) 23 (24.0) 21 (21.9)
Katihar 28 104 17 (60.7) 17 (60.7) 76 (73.1) 76 (73.1)
Bihar 1004 3395 440 (43.8) 398 (39.6) 1619 (47.7) 1491 (43.9)
Note: Figure in perentheses denotes percentage.
Source: State Health Society, GOB
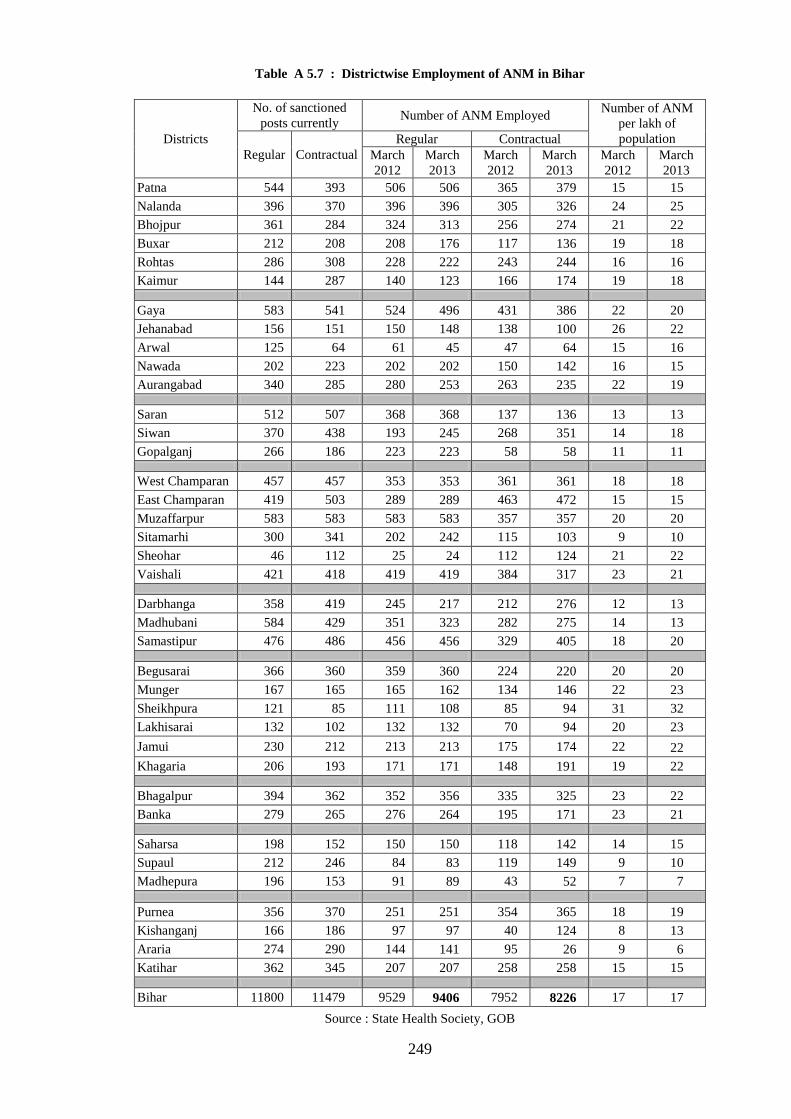
249
Table A 5.7 : Districtwise Employment of ANM in Bihar
Districts
No. of sanctioned
posts currently Number of ANM Employed
Number of ANM
per lakh of
population
Regular Contractual
Regular Contractual
March
2012
March
2013
March
2012
March
2013
March
2012
March
2013
Patna 544 393 506 506 365 379 15 15
Nalanda 396 370 396 396 305 326 24 25
Bhojpur 361 284 324 313 256 274 21 22
Buxar 212 208 208 176 117 136 19 18
Rohtas 286 308 228 222 243 244 16 16
Kaimur 144 287 140 123 166 174 19 18
Gaya 583 541 524 496 431 386 22 20
Jehanabad 156 151 150 148 138 100 26 22
Arwal 125 64 61 45 47 64 15 16
Nawada 202 223 202 202 150 142 16 15
Aurangabad 340 285 280 253 263 235 22 19
Saran 512 507 368 368 137 136 13 13
Siwan 370 438 193 245 268 351 14 18
Gopalganj 266 186 223 223 58 58 11 11
West Champaran 457 457 353 353 361 361 18 18
East Champaran 419 503 289 289 463 472 15 15
Muzaffarpur 583 583 583 583 357 357 20 20
Sitamarhi 300 341 202 242 115 103 9 10
Sheohar 46 112 25 24 112 124 21 22
Vaishali 421 418 419 419 384 317 23 21
Darbhanga 358 419 245 217 212 276 12 13
Madhubani 584 429 351 323 282 275 14 13
Samastipur 476 486 456 456 329 405 18 20
Begusarai 366 360 359 360 224 220 20 20
Munger 167 165 165 162 134 146 22 23
Sheikhpura 121 85 111 108 85 94 31 32
Lakhisarai 132 102 132 132 70 94 20 23
Jamui 230 212 213 213 175 174 22 22
Khagaria 206 193 171 171 148 191 19 22
Bhagalpur 394 362 352 356 335 325 23 22
Banka 279 265 276 264 195 171 23 21
Saharsa 198 152 150 150 118 142 14 15
Supaul 212 246 84 83 119 149 9 10
Madhepura 196 153 91 89 43 52 7 7
Purnea 356 370 251 251 354 365 18 19
Kishanganj 166 186 97 97 40 124 8 13
Araria 274 290 144 141 95 26 9 6
Katihar 362 345 207 207 258 258 15 15
Bihar 11800 11479 9529 9406 7952 8226 17 17
Source : State Health Society, GOB
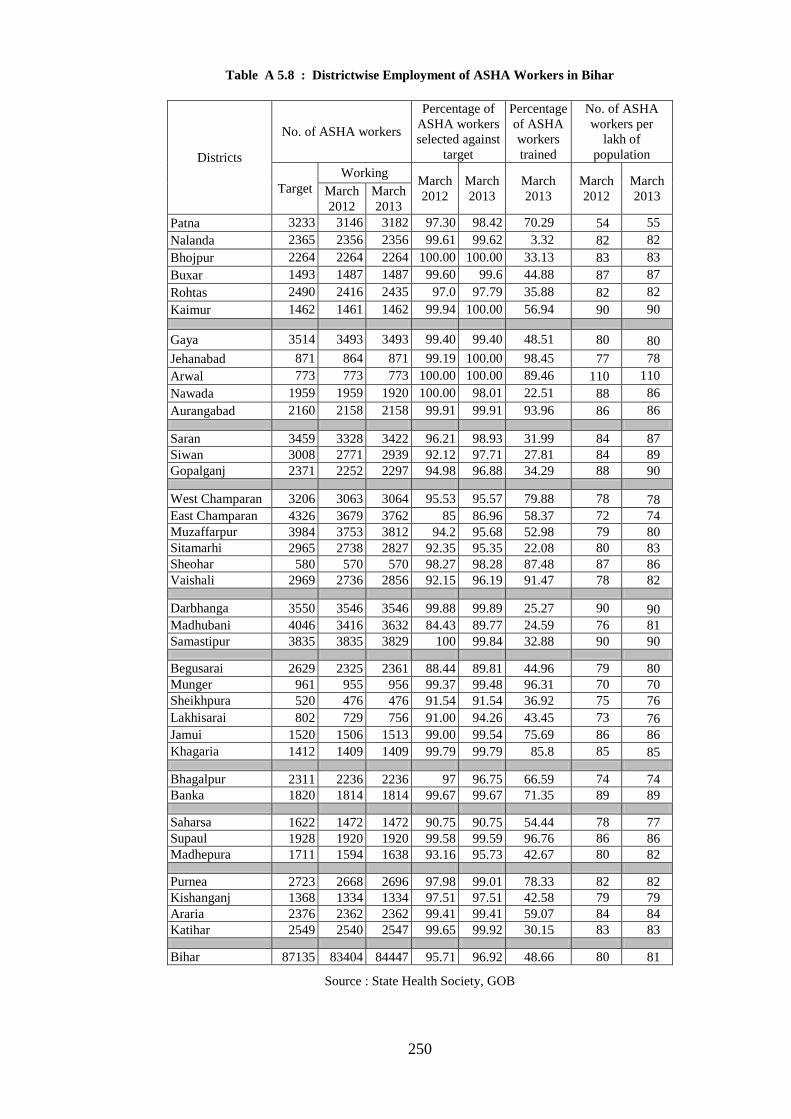
250
Table A 5.8 : Districtwise Employment of ASHA Workers in Bihar
Districts
No. of ASHA workers
Percentage of
ASHA workers
selected against
target
Percentage
of ASHA
workers
trained
No. of ASHA
workers per
lakh of
population
Target
Working March
2012
March
2013
March
2013
March
2012
March
2013 March
2012
March
2013
Patna 3233 3146 3182 97.30 98.42 70.29 54 55
Nalanda 2365 2356 2356 99.61 99.62 3.32 82 82
Bhojpur 2264 2264 2264 100.00 100.00 33.13 83 83
Buxar 1493 1487 1487 99.60 99.6 44.88 87 87
Rohtas 2490 2416 2435 97.0 97.79 35.88 82 82
Kaimur 1462 1461 1462 99.94 100.00 56.94 90 90
Gaya 3514 3493 3493 99.40 99.40 48.51 80 80
Jehanabad 871 864 871 99.19 100.00 98.45 77 78
Arwal 773 773 773 100.00 100.00 89.46 110 110
Nawada 1959 1959 1920 100.00 98.01 22.51 88 86
Aurangabad 2160 2158 2158 99.91 99.91 93.96 86 86
Saran 3459 3328 3422 96.21 98.93 31.99 84 87
Siwan 3008 2771 2939 92.12 97.71 27.81 84 89
Gopalganj 2371 2252 2297 94.98 96.88 34.29 88 90
West Champaran 3206 3063 3064 95.53 95.57 79.88 78 78
East Champaran 4326 3679 3762 85 86.96 58.37 72 74
Muzaffarpur 3984 3753 3812 94.2 95.68 52.98 79 80
Sitamarhi 2965 2738 2827 92.35 95.35 22.08 80 83
Sheohar 580 570 570 98.27 98.28 87.48 87 86
Vaishali 2969 2736 2856 92.15 96.19 91.47 78 82
Darbhanga 3550 3546 3546 99.88 99.89 25.27 90 90
Madhubani 4046 3416 3632 84.43 89.77 24.59 76 81
Samastipur 3835 3835 3829 100 99.84 32.88 90 90
Begusarai 2629 2325 2361 88.44 89.81 44.96 79 80
Munger 961 955 956 99.37 99.48 96.31 70 70
Sheikhpura 520 476 476 91.54 91.54 36.92 75 76
Lakhisarai 802 729 756 91.00 94.26 43.45 73 76
Jamui 1520 1506 1513 99.00 99.54 75.69 86 86
Khagaria 1412 1409 1409 99.79 99.79 85.8 85 85
Bhagalpur 2311 2236 2236 97 96.75 66.59 74 74
Banka 1820 1814 1814 99.67 99.67 71.35 89 89
Saharsa 1622 1472 1472 90.75 90.75 54.44 78 77
Supaul 1928 1920 1920 99.58 99.59 96.76 86 86
Madhepura 1711 1594 1638 93.16 95.73 42.67 80 82
Purnea 2723 2668 2696 97.98 99.01 78.33 82 82
Kishanganj 1368 1334 1334 97.51 97.51 42.58 79 79
Araria 2376 2362 2362 99.41 99.41 59.07 84 84
Katihar 2549 2540 2547 99.65 99.92 30.15 83 83
Bihar 87135 83404 84447 95.71 96.92 48.66 80 81
Source : State Health Society, GOB

251
Table A 5.9 : Districtwise Number of Institutional Deliveries
Districts
Percentage of
total population
(Census 2011)
Number of institutional deliveries
2009-10 2010-11 2011-12 2012-13
Patna 5.6 50209 (4.0) 60796 (4.4) 74704 (5.2) 68557 (4.7)
Nalanda 2.8 33171 (2.7) 42025 (3.0) 45754 (3.2) 46747 (3.2)
Bhojpur 2.6 31674 (2.5) 33088 (2.4) 38708 (2.7) 40846 (2.8)
Buxar 1.6 13880 (1.1) 22392 (1.6) 26772 (1.9) 27227 (1.9)
Rohtas 2.9 32938 (2.6) 30134 (2.2) 32284 (2.3) 32567 (2.2)
Kaimur 1.6 27316 (2.2) 22507 (1.6) 24000 (1.7) 22174 (1.5)
Gaya 4.2 35029 (2.8) 39423 (2.8) 42936 (3.0) 43840 (3.0)
Jehanabad 1.1 20777 (1.7) 20816 (1.5) 17092 (1.2) 18604 (1.3)
Arwal 0.7 8140 (0.7) 12470 (0.9) 10123 (0.7) 9645 (0.7)
Nawada 2.1 24886 (2.0) 28876 (2.1) 28915 (2.0) 29319 (2.0)
Aurangabad 2.4 29058 (2.3) 30775 (2.2) 39018 (2.7) 36628 (2.5)
Saran 3.8 39940 (3.2) 54257 (3.9) 51666 (3.6) 53740 (3.7)
Siwan 3.2 36966 (3) 41917 (3) 43509 (3) 41348 (2.8)
Gopalganj 2.5 35135 (2.8) 35563 (2.6) 39807 (2.8) 37756 (2.6)
West Champaran 3.8 53014 (4.3) 58858 (4.3) 62077 (4.3) 66070 (4.5)
East Champaran 4.9 83664 (6.7) 79239 (5.7) 57629 (4) 54881 (3.7)
Muzaffarpur 4.6 43552 (3.5) 53583 (3.9) 51933 (3.6) 52071 (3.5)
Sitamarhi 3.3 20530 (1.6) 29016 (2.1) 22580 (1.6) 31046 (2.1)
Sheohar 0.6 3220 (0.3) 8692 (0.6) 7052 (0.5) 7513 (0.5)
Vaishali 3.4 43726 (3.5) 51010 (3.7) 58105 (4.1) 61597 (4.2)
Darbhanga 3.8 38921 (3.1) 41904 (3) 33541 (2.3) 44175 (3)
Madhubani 4.3 40254 (3.2) 48550 (3.5) 47066 (3.3) 50875 (3.5)
Samastipur 4.1 82876 (6.6) 79018 (5.7) 81921 (5.7) 80857 (5.5)
Begusarai 2.8 37260 (3.0) 42910 (3.1) 51178 (3.6) 51134 (3.5)
Munger 1.3 18848 (1.5) 27116 (2) 21907 (1.5) 19899 (1.4)
Sheikhpura 0.6 13206 (1.1) 16138 (1.2) 12994 (0.9) 14006 (1.0)
Lakhisarai 1.0 10134 (0.8) 12250 (0.9) 11021 (0.8) 13017 (0.9)
Jamui 1.7 22300 (1.8) 20605 (1.5) 21430 (1.5) 24577 (1.7)
Khagaria 1.6 33973 (2.7) 32121 (2.3) 29133 (2) 29210 (2)
Bhagalpur 2.9 36917 (3) 32465 (2.3) 42941 (3) 40748 (2.8)
Banka 2.0 24235 (1.9) 28915 (2.1) 29423 (2.1) 30678 (2.1)
Saharsa 1.8 26813 (2.2) 31742 (2.3) 35971 (2.5) 35565 (2.4)
Supaul 2.1 30607 (2.5) 34754 (2.5) 40564 (2.8) 42736 (2.9)
Madhepura 1.9 26065 (2.1) 31650 (2.3) 32881 (2.3) 31937 (2.2)
Purnea 3.2 54126 (4.3) 53257 (3.8) 57157 (4) 62121 (4.2)
Kishanganj 1.6 22033 (1.8) 26017 (1.9) 27985 (2) 23588 (1.6)
Araria 2.7 36350 (2.9) 38881 (2.8) 40368 (2.8) 40099 (2.7)
Katihar 3.0 24751 (2) 31061 (2.2) 39815 (2.8) 51728 (3.5)
Bihar 100.0 1246494 (100.0) 1384791 (100.0) 1431960 (100.0) 1469126 (100.0)
Note: Number in perentheses indicate percentage number of institutional deliveries
Source: State Health Society, GOB

252
Table A 5.10 : District wise Coverage under Janani Bal Suraksha Yojana (JBSY)
Districts 2011 2012 2013
(upto Sept.)
Patna 67941 69543 45135
Nalanda 44323 46472 31794
Bhojpur 37354 39613 29938
Buxar 26189 24185 20319
Rohtas 31524 56561 21718
Kaimur 23250 21813 17110
Gaya 42360 42149 34254
Jehanabad 16116 18081 13632
Arwal 9714 9567 7076
Nawada 27638 29584 21891
Aurangabad 36475 37659 23009
Saran 50721 51732 38338
Siwan 42048 42061 31335
Gopalganj 39237 38049 27620
W Champaran 70542 67063 47664
E Champaran 60373 56195 43072
Muzaffarpur 44088 49210 39376
Sitamarhi 22496 26950 29388
Sheohar 6705 7366 6433
Vaishali 55193 61944 44806
Darbhanga 38587 40332 31033
Madhubani 47690 47157 39251
Samastipur 79087 81729 63367
Begusarai 49780 50572 39522
Munger 23986 20427 14956
Sheikhpura 12835 13266 9602
Lakhisarai 11092 11337 11559
Jamui 20804 23143 20209
Khagaria 28316 29085 23751
Bhagalpur 39277 40830 32407
Banka 27855 31310 21980
Saharsa 35107 35469 27283
Supaul 39698 40239 32414
Madhepura 32062 31792 24518
Pumia 51964 56561 52423
Kishanganj 25479 23818 18550
Araria 41232 38084 35160
Katihar 35380 43146 43456
Bihar 1394518 1454094 1115349
Source : State Health Society, GOB
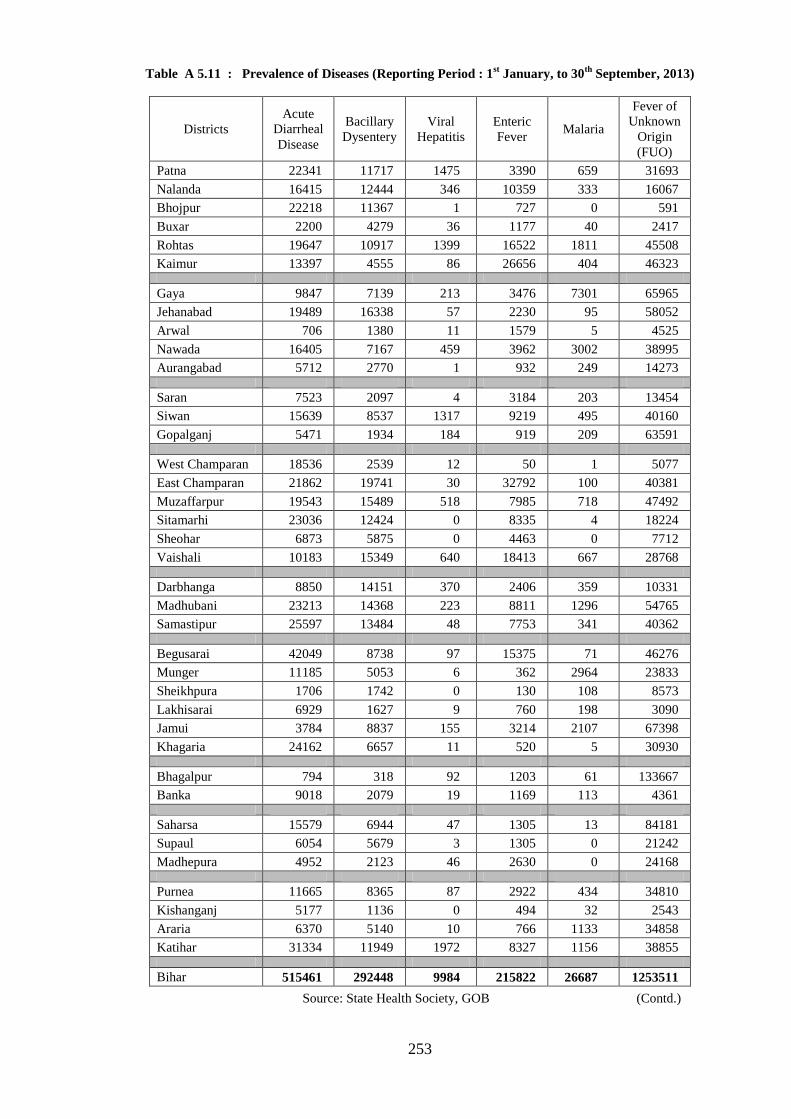
253
Table A 5.11 : Prevalence of Diseases (Reporting Period : 1st January, to 30
th September, 2013)
Districts
Acute
Diarrheal
Disease
Bacillary
Dysentery
Viral
Hepatitis
Enteric
Fever Malaria
Fever of
Unknown
Origin
(FUO)
Patna 22341 11717 1475 3390 659 31693
Nalanda 16415 12444 346 10359 333 16067
Bhojpur 22218 11367 1 727 0 591
Buxar 2200 4279 36 1177 40 2417
Rohtas 19647 10917 1399 16522 1811 45508
Kaimur 13397 4555 86 26656 404 46323
Gaya 9847 7139 213 3476 7301 65965
Jehanabad 19489 16338 57 2230 95 58052
Arwal 706 1380 11 1579 5 4525
Nawada 16405 7167 459 3962 3002 38995
Aurangabad 5712 2770 1 932 249 14273
Saran 7523 2097 4 3184 203 13454
Siwan 15639 8537 1317 9219 495 40160
Gopalganj 5471 1934 184 919 209 63591
West Champaran 18536 2539 12 50 1 5077
East Champaran 21862 19741 30 32792 100 40381
Muzaffarpur 19543 15489 518 7985 718 47492
Sitamarhi 23036 12424 0 8335 4 18224
Sheohar 6873 5875 0 4463 0 7712
Vaishali 10183 15349 640 18413 667 28768
Darbhanga 8850 14151 370 2406 359 10331
Madhubani 23213 14368 223 8811 1296 54765
Samastipur 25597 13484 48 7753 341 40362
Begusarai 42049 8738 97 15375 71 46276
Munger 11185 5053 6 362 2964 23833
Sheikhpura 1706 1742 0 130 108 8573
Lakhisarai 6929 1627 9 760 198 3090
Jamui 3784 8837 155 3214 2107 67398
Khagaria 24162 6657 11 520 5 30930
Bhagalpur 794 318 92 1203 61 133667
Banka 9018 2079 19 1169 113 4361
Saharsa 15579 6944 47 1305 13 84181
Supaul 6054 5679 3 1305 0 21242
Madhepura 4952 2123 46 2630 0 24168
Purnea 11665 8365 87 2922 434 34810
Kishanganj 5177 1136 0 494 32 2543
Araria 6370 5140 10 766 1133 34858
Katihar 31334 11949 1972 8327 1156 38855
Bihar 515461 292448 9984 215822 26687 1253511
Source: State Health Society, GOB (Contd.)

254
Table A 5.11 : Prevalence of Diseases (Reporting Period: 1st January, to 30
th September, 2013) (Contd.)
Districts ARI/ ILI Pneumonia Dog bite
Any other
State
Specific
Disease
Unusual
Syndromes
Total
(in lakh)
No. of
Cases per
lakh
population
Patna 52392 1670 31730 3107 24912 1.85 3208
Nalanda 32173 2639 15630 0 30 1.06 3709
Bhojpur 83472 430 10639 587 0 1.30 4781
Buxar 35722 372 7020 0 0 0.53 3115
Rohtas 52854 1438 12152 4 1475 1.64 5531
Kaimur 38121 822 5077 0 886 1.36 8364
Gaya 59171 1962 10379 6866 0 1.72 3934
Jehanabad 38777 3345 6711 0 205 1.45 12973
Arwal 15846 425 5488 0 0 0.30 4281
Nawada 24557 2687 3639 5245 5141 1.11 5012
Aurangabad 13782 3110 5641 372 0 0.47 1866
Saran 23000 1254 8377 31 8 0.59 1501
Siwan 56512 1967 14412 1040 2136 1.51 4561
Gopalganj 64097 678 8513 0 0 1.46 5687
West Champaran 52998 1333 14886 18 36 0.95 2436
East Champaran 18380 11109 7704 0 0 1.52 2994
Muzaffarpur 43908 533 27444 14446 756 1.79 3741
Sitamarhi 47303 3265 14724 318 0 1.28 3732
Sheohar 4029 0 5267 0 0 0.34 5185
Vaishali 57386 1587 12130 111 4700 1.50 4284
Darbhanga 62633 1077 10822 239 3230 1.14 2920
Madhubani 85771 540 12572 1457 0 2.03 4532
Samastipur 67857 587 13765 2200 14 1.72 4047
Begusarai 135483 1116 16490 216 0 2.66 9014
Munger 31331 525 4377 234 68 0.80 5878
Sheikhpura 29563 68 1325 0 641 0.44 6961
Lakhisarai 24402 222 2438 0 729 0.40 4040
Jamui 72676 665 2907 4 0 1.62 9190
Khagaria 29500 504 1307 0 11463 1.05 6329
Bhagalpur 22088 2188 7607 574 2546 1.71 5648
Banka 38631 1800 3324 1013 10 0.62 3031
Saharsa 85025 390 3125 6 7 1.97 10349
Supaul 5740 277 3943 602 40 0.45 2013
Madhepura 20074 174 1785 0 10731 0.67 3351
Purnea 37766 466 9973 0 19883 1.26 3865
Kishanganj 27789 31 2308 50 1815 0.41 2448
Araria 3231 362 3681 849 3617 0.60 2136
Katihar 41200 1904 2562 372 8880 1.49 4837
Bihar 1635240 53522 331874 39961 103959 44.78 4302
Source : State Health Society, GOB
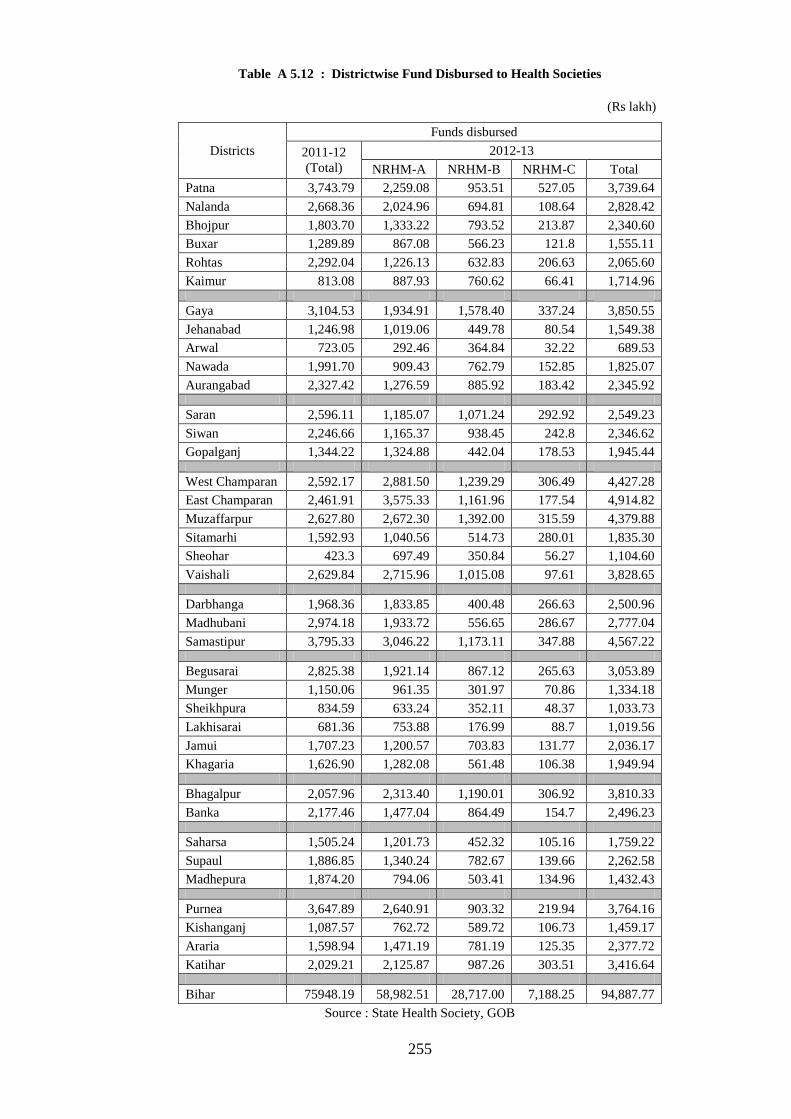
255
Table A 5.12 : Districtwise Fund Disbursed to Health Societies
(Rs lakh)
Districts
Funds disbursed
2011-12
(Total)
2012-13
NRHM-A NRHM-B NRHM-C Total
Patna 3,743.79 2,259.08 953.51 527.05 3,739.64
Nalanda 2,668.36 2,024.96 694.81 108.64 2,828.42
Bhojpur 1,803.70 1,333.22 793.52 213.87 2,340.60
Buxar 1,289.89 867.08 566.23 121.8 1,555.11
Rohtas 2,292.04 1,226.13 632.83 206.63 2,065.60
Kaimur 813.08 887.93 760.62 66.41 1,714.96
Gaya 3,104.53 1,934.91 1,578.40 337.24 3,850.55
Jehanabad 1,246.98 1,019.06 449.78 80.54 1,549.38
Arwal 723.05 292.46 364.84 32.22 689.53
Nawada 1,991.70 909.43 762.79 152.85 1,825.07
Aurangabad 2,327.42 1,276.59 885.92 183.42 2,345.92
Saran 2,596.11 1,185.07 1,071.24 292.92 2,549.23
Siwan 2,246.66 1,165.37 938.45 242.8 2,346.62
Gopalganj 1,344.22 1,324.88 442.04 178.53 1,945.44
West Champaran 2,592.17 2,881.50 1,239.29 306.49 4,427.28
East Champaran 2,461.91 3,575.33 1,161.96 177.54 4,914.82
Muzaffarpur 2,627.80 2,672.30 1,392.00 315.59 4,379.88
Sitamarhi 1,592.93 1,040.56 514.73 280.01 1,835.30
Sheohar 423.3 697.49 350.84 56.27 1,104.60
Vaishali 2,629.84 2,715.96 1,015.08 97.61 3,828.65
Darbhanga 1,968.36 1,833.85 400.48 266.63 2,500.96
Madhubani 2,974.18 1,933.72 556.65 286.67 2,777.04
Samastipur 3,795.33 3,046.22 1,173.11 347.88 4,567.22
Begusarai 2,825.38 1,921.14 867.12 265.63 3,053.89
Munger 1,150.06 961.35 301.97 70.86 1,334.18
Sheikhpura 834.59 633.24 352.11 48.37 1,033.73
Lakhisarai 681.36 753.88 176.99 88.7 1,019.56
Jamui 1,707.23 1,200.57 703.83 131.77 2,036.17
Khagaria 1,626.90 1,282.08 561.48 106.38 1,949.94
Bhagalpur 2,057.96 2,313.40 1,190.01 306.92 3,810.33
Banka 2,177.46 1,477.04 864.49 154.7 2,496.23
Saharsa 1,505.24 1,201.73 452.32 105.16 1,759.22
Supaul 1,886.85 1,340.24 782.67 139.66 2,262.58
Madhepura 1,874.20 794.06 503.41 134.96 1,432.43
Purnea 3,647.89 2,640.91 903.32 219.94 3,764.16
Kishanganj 1,087.57 762.72 589.72 106.73 1,459.17
Araria 1,598.94 1,471.19 781.19 125.35 2,377.72
Katihar 2,029.21 2,125.87 987.26 303.51 3,416.64
Bihar 75948.19 58,982.51 28,717.00 7,188.25 94,887.77
Source : State Health Society, GOB

256
Table A 5.13 : Districtwise Construction of Hand Pumps under National Rural Drinking Water
Programme (NRDWP)
Districts Number of handpumps constructed
Slipped back
Habitations /Water
quality problems
covered
2008-09 2009-10 2010-11 2011-12 2012-13 2011-12 2012-13
Patna 620 3118 2557 1422 1481 407 852
Nalanda 347 1846 2813 1473 1122 457 300
Bhojpur 270 679 1334 1299 830 214 280
Buxar 53 1014 1886 63 425 75 121
Rohtas 294 390 1145 1641 1024 328 97
Kaimur 261 397 1116 409 426 164 28
Gaya 357 1931 4890 1869 1315 738 300
Jehanabad 142 119 712 599 769 67 84
Arwal NA NA NA 738 132 47 50
Nawada 201 1537 1417 842 464 372 136
Aurangabad 829 835 1556 1407 468 183 239
Saran 54 1970 3528 592 1719 458 451
Siwan 949 2451 1442 961 1452 355 628
Gopalganj 579 1557 721 342 829 170 273
West Champaran 0 970 1418 1154 1616 156 88
East Champaran 143 1122 2348 1268 3397 536 851
Muzaffarpur 1603 2964 2766 1245 108 347 104
Sitamarhi 27 792 1303 1197 541 171 230
Sheohar 158 170 342 181 94 67 39
Vaishali 1171 1922 1828 477 1082 396 343
Darbhanga 1168 1537 1105 981 2134 131 432
Madhubani 180 2277 4576 2891 1885 237 529
Samastipur 691 2812 1878 983 1046 447 183
Begusarai 1597 767 1767 533 858 413 375
Munger 440 531 609 334 220 80 24
Sheikhpura 214 245 439 235 523 75 30
Lakhisarai 392 881 428 177 450 169 260
Jamui 823 759 1320 742 639 416 568
Khagaria 450 452 462 39 299 80 30
Bhagalpur 1682 1489 1912 549 1199 301 90
Banka 284 1666 2316 355 780 325 323
Saharsa 590 647 935 0 639 112 375
Supaul 652 871 886 307 736 298 769
Madhepura 414 860 1251 24 273 288 267
Purnea 0 2039 1146 317 143 1101 595
Kishanganj 0 761 933 447 216 345 243
Araria 387 967 623 193 387 534 341
Katihar 530 843 889 0 205 183 32
Bihar 18552 46188 58597 28286 31926 11243 10960
Source : Public Health Engineering Department, GOB

257
Table A 5.14 : Districtwise Achievement under Central Rural Sanitation Programme in Individual
Household Lantrine (IHHL)
Districts
Percentage
of total
population
Number of IHHLs constructed
2011-12 2012-13
APL BPL Total APL BPL Total
Patna 5.6 4762 22756 27518 (3.3) 8290 17973 26263 (3.3)
Nalanda 2.8 5388 14230 19618 (2.3) 3551 6440 9991 (1.3)
Bhojpur 2.6 9592 19669 29261 (3.5) 10073 14493 24566 (3.1)
Buxar 1.6 1514 2265 3779 (0.4) 3341 8994 12335 (1.5)
Rohtas 2.9 9750 15957 25707 (3.1) 9420 10422 19842 (2.5)
Kaimur 1.6 8775 6891 15666 (1.9) 5497 10297 15794 (2.0)
Gaya 4.2 9402 22512 31914 (3.8) 6808 11141 17949 (2.3)
Jehanabad 1.1 3802 9122 12924 (1.5) 545 1314 1859 (0.2)
Arwal 0.7 1878 8179 10057 (1.2) 2866 5276 8142 (1.0)
Nawada 2.1 3469 21905 25374 (3.0) 977 4627 5604 (0.7)
Aurangabad 2.4 1588 15961 17549 (2.1) 2546 7776 10322 (1.3)
Saran 3.8 9536 24891 34427 (4.1) 6320 13497 19817 (2.5)
Siwan 3.2 16512 23813 40325 (4.8) 12284 23980 36264 (4.6)
Gopalganj 2.5 8627 10765 19392 (2.3) 8422 16780 25202 (3.2)
West Champaran 3.8 8562 25335 33897 (4.0) 10238 22203 32441 (4.1)
East Champaran 4.9 5108 38651 43759 (5.2) 10280 33868 44148 (5.5)
Muzaffarpur 4.6 7479 38319 45798 (5.5) 3713 11721 15434 (1.9)
Sitamarhi 3.3 3454 5471 8925 (1.1) 11497 18379 29876 (3.7)
Sheohar 0.6 5735 9108 14843 (1.8) 4606 8444 13050 (1.6)
Vaishali 3.4 2445 23313 25758 (3.1) 5974 31058 37032 (4.6)
Darbhanga 3.8 9341 47608 56949 (6.8) 16233 30984 47217 (5.9)
Madhubani 4.3 6960 0 6960 (0.8) 3983 0 3983 (0.5)
Samastipur 4.1 438 39588 40026 (4.8) 11515 50652 62167 (7.8)
Begusarai 2.8 3179 19114 22293 (2.7) 4860 23793 28653 (3.6)
Munger 1.3 716 3189 3905 (0.5) 1215 4948 6163 (0.8)
Sheikhpura 0.6 1373 3643 5016 (0.6) 5326 5545 10871 (1.4)
Lakhisarai 1 5884 9957 15841 (1.9) 5655 6245 11900 (1.5)
Jamui 1.7 2491 9952 12443 (1.5) 5393 15098 20491 (2.6)
Khagaria 1.6 3970 12429 16399 (2.0) 4324 10328 14652 (1.8)
Bhagalpur 2.9 4521 20164 24685 (2.9) 8387 13790 22177 (2.8)
Banka 2 6891 8918 15809 (1.9) 5788 7992 13780 (1.7)
Saharsa 1.8 2316 12496 14812 (1.8) 2999 12807 15806 (2)
Supaul 2.1 2474 20462 22936 (2.7) 4685 15849 20534 (2.6)
Madhepura 1.9 4544 21249 25793 (3.1) 3522 15920 19442 (2.4)
Purnea 3.2 3559 23769 27328 (3.3) 9772 21279 31051 (3.9)
Kishanganj 1.6 2247 9488 11735 (1.4) 2970 14377 17347 (2.2)
Araria 2.7 765 10012 10777 (1.3) 2139 12202 14341 (1.8)
Katihar 3 4828 14901 19729 (2.3) 10007 20186 30193 (3.8)
Bihar 100 193875 646052 839927 (100.0) 236021 560678 796699 (100.0)
Source : Public Health Engineering Department, GOB
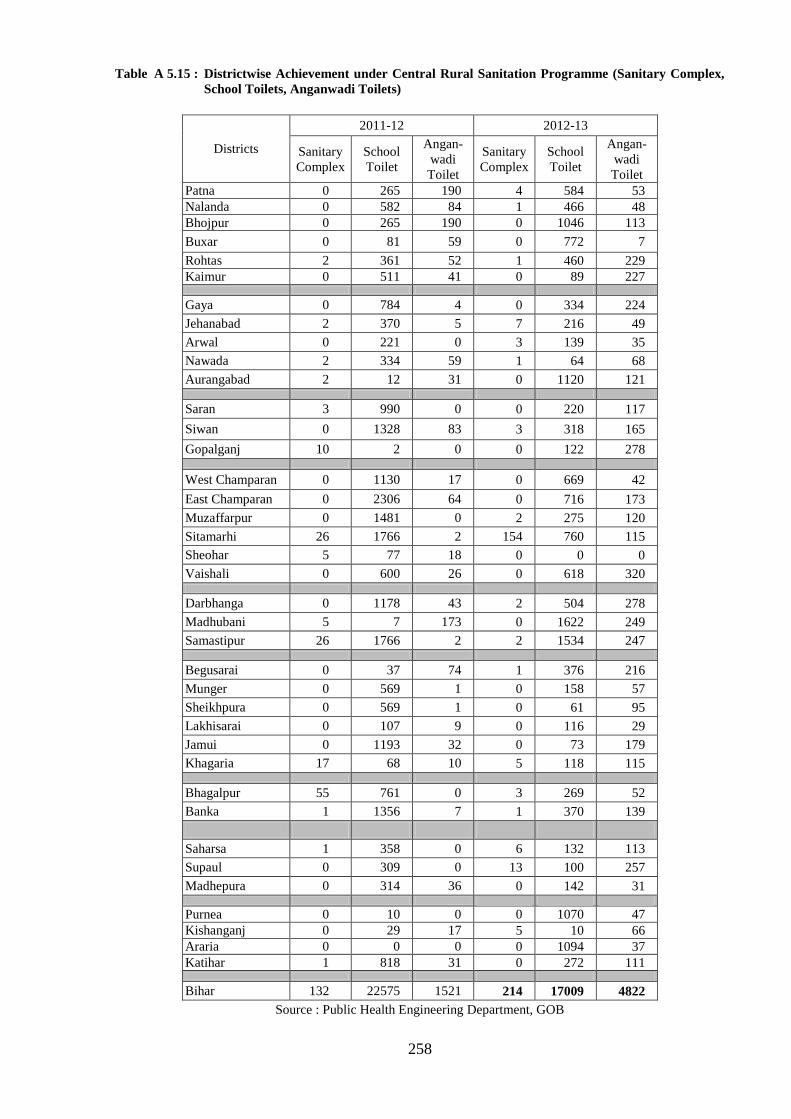
258
Table A 5.15 : Districtwise Achievement under Central Rural Sanitation Programme (Sanitary Complex,
School Toilets, Anganwadi Toilets)
Districts
2011-12 2012-13
Sanitary
Complex
School
Toilet
Angan-
wadi
Toilet
Sanitary
Complex
School
Toilet
Angan-
wadi
Toilet
Patna 0 265 190 4 584 53
Nalanda 0 582 84 1 466 48
Bhojpur 0 265 190 0 1046 113
Buxar 0 81 59 0 772 7
Rohtas 2 361 52 1 460 229
Kaimur 0 511 41 0 89 227
Gaya 0 784 4 0 334 224
Jehanabad 2 370 5 7 216 49
Arwal 0 221 0 3 139 35
Nawada 2 334 59 1 64 68
Aurangabad 2 12 31 0 1120 121
Saran 3 990 0 0 220 117
Siwan 0 1328 83 3 318 165
Gopalganj 10 2 0 0 122 278
West Champaran 0 1130 17 0 669 42
East Champaran 0 2306 64 0 716 173
Muzaffarpur 0 1481 0 2 275 120
Sitamarhi 26 1766 2 154 760 115
Sheohar 5 77 18 0 0 0
Vaishali 0 600 26 0 618 320
Darbhanga 0 1178 43 2 504 278
Madhubani 5 7 173 0 1622 249
Samastipur 26 1766 2 2 1534 247
Begusarai 0 37 74 1 376 216
Munger 0 569 1 0 158 57
Sheikhpura 0 569 1 0 61 95
Lakhisarai 0 107 9 0 116 29
Jamui 0 1193 32 0 73 179
Khagaria 17 68 10 5 118 115
Bhagalpur 55 761 0 3 269 52
Banka 1 1356 7 1 370 139
Saharsa 1 358 0 6 132 113
Supaul 0 309 0 13 100 257
Madhepura 0 314 36 0 142 31
Purnea 0 10 0 0 1070 47
Kishanganj 0 29 17 5 10 66
Araria 0 0 0 0 1094 37
Katihar 1 818 31 0 272 111
Bihar 132 22575 1521 214 17009 4822
Source : Public Health Engineering Department, GOB
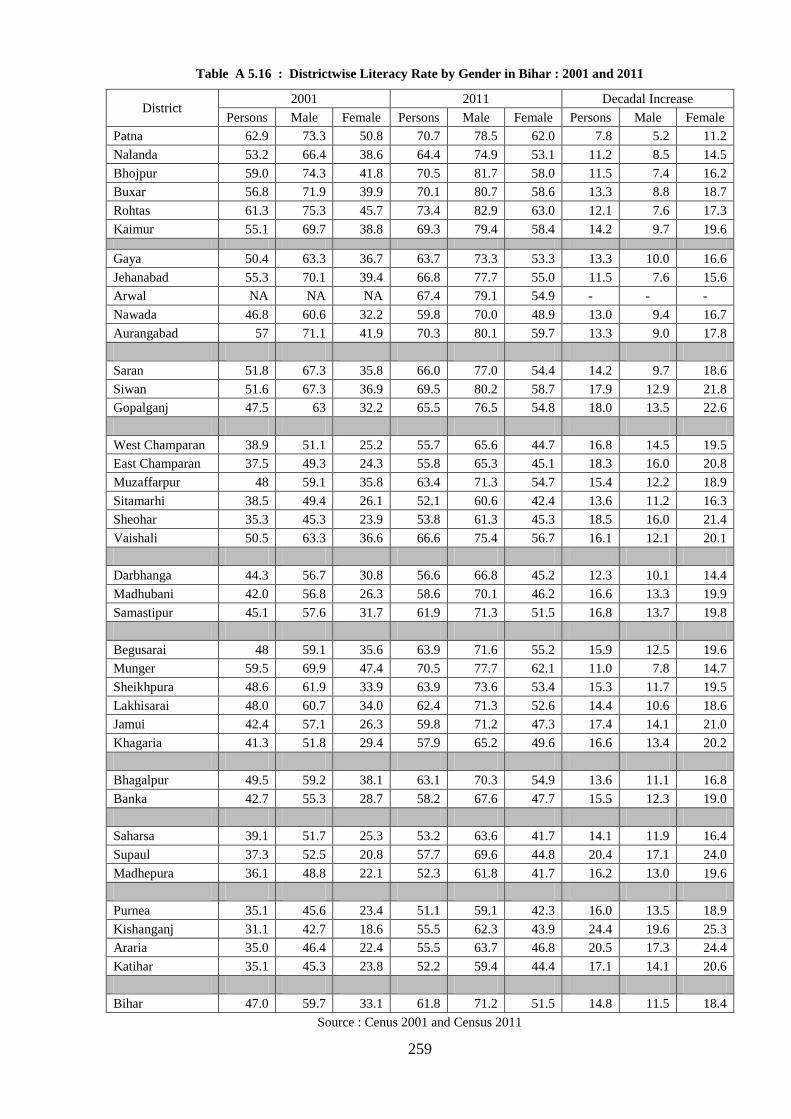
259
Table A 5.16 : Districtwise Literacy Rate by Gender in Bihar : 2001 and 2011
District 2001 2011 Decadal Increase
Persons Male Female Persons Male Female Persons Male Female
Patna 62.9 73.3 50.8 70.7 78.5 62.0 7.8 5.2 11.2
Nalanda 53.2 66.4 38.6 64.4 74.9 53.1 11.2 8.5 14.5
Bhojpur 59.0 74.3 41.8 70.5 81.7 58.0 11.5 7.4 16.2
Buxar 56.8 71.9 39.9 70.1 80.7 58.6 13.3 8.8 18.7
Rohtas 61.3 75.3 45.7 73.4 82.9 63.0 12.1 7.6 17.3
Kaimur 55.1 69.7 38.8 69.3 79.4 58.4 14.2 9.7 19.6
Gaya 50.4 63.3 36.7 63.7 73.3 53.3 13.3 10.0 16.6
Jehanabad 55.3 70.1 39.4 66.8 77.7 55.0 11.5 7.6 15.6
Arwal NA NA NA 67.4 79.1 54.9 - - -
Nawada 46.8 60.6 32.2 59.8 70.0 48.9 13.0 9.4 16.7
Aurangabad 57 71.1 41.9 70.3 80.1 59.7 13.3 9.0 17.8
Saran 51.8 67.3 35.8 66.0 77.0 54.4 14.2 9.7 18.6
Siwan 51.6 67.3 36.9 69.5 80.2 58.7 17.9 12.9 21.8
Gopalganj 47.5 63 32.2 65.5 76.5 54.8 18.0 13.5 22.6
West Champaran 38.9 51.1 25.2 55.7 65.6 44.7 16.8 14.5 19.5
East Champaran 37.5 49.3 24.3 55.8 65.3 45.1 18.3 16.0 20.8
Muzaffarpur 48 59.1 35.8 63.4 71.3 54.7 15.4 12.2 18.9
Sitamarhi 38.5 49.4 26.1 52.1 60.6 42.4 13.6 11.2 16.3
Sheohar 35.3 45.3 23.9 53.8 61.3 45.3 18.5 16.0 21.4
Vaishali 50.5 63.3 36.6 66.6 75.4 56.7 16.1 12.1 20.1
Darbhanga 44.3 56.7 30.8 56.6 66.8 45.2 12.3 10.1 14.4
Madhubani 42.0 56.8 26.3 58.6 70.1 46.2 16.6 13.3 19.9
Samastipur 45.1 57.6 31.7 61.9 71.3 51.5 16.8 13.7 19.8
Begusarai 48 59.1 35.6 63.9 71.6 55.2 15.9 12.5 19.6
Munger 59.5 69.9 47.4 70.5 77.7 62.1 11.0 7.8 14.7
Sheikhpura 48.6 61.9 33.9 63.9 73.6 53.4 15.3 11.7 19.5
Lakhisarai 48.0 60.7 34.0 62.4 71.3 52.6 14.4 10.6 18.6
Jamui 42.4 57.1 26.3 59.8 71.2 47.3 17.4 14.1 21.0
Khagaria 41.3 51.8 29.4 57.9 65.2 49.6 16.6 13.4 20.2
Bhagalpur 49.5 59.2 38.1 63.1 70.3 54.9 13.6 11.1 16.8
Banka 42.7 55.3 28.7 58.2 67.6 47.7 15.5 12.3 19.0
Saharsa 39.1 51.7 25.3 53.2 63.6 41.7 14.1 11.9 16.4
Supaul 37.3 52.5 20.8 57.7 69.6 44.8 20.4 17.1 24.0
Madhepura 36.1 48.8 22.1 52.3 61.8 41.7 16.2 13.0 19.6
Purnea 35.1 45.6 23.4 51.1 59.1 42.3 16.0 13.5 18.9
Kishanganj 31.1 42.7 18.6 55.5 62.3 43.9 24.4 19.6 25.3
Araria 35.0 46.4 22.4 55.5 63.7 46.8 20.5 17.3 24.4
Katihar 35.1 45.3 23.8 52.2 59.4 44.4 17.1 14.1 20.6
Bihar 47.0 59.7 33.1 61.8 71.2 51.5 14.8 11.5 18.4
Source : Cenus 2001 and Census 2011

260
Table A 5.17 : Districtwise Literacy Rate by Residence in Bihar
District 2001 Census 2011Census Decadal Change
Total Rural Urban Total Rural Urban Total Rural Urban
Patna 62.9 51.4 78.1 70.7 62.4 81.0 7.8 11.0 2.9
Nalanda 53.2 50.4 68.5 64.4 62.4 74.6 11.2 12.0 6.1
Bhojpur 59.0 56.8 71.6 70.5 69.2 78.1 11.5 12.4 6.5
Buxar 56.8 55.0 73.6 70.1 69.1 79.4 13.3 14.1 5.8
Rohtas 61.3 59.2 74.1 73.4 72.5 78.4 12.1 13.3 4.3
Kaimur 55.1 54.3 76.9 69.3 68.8 82.6 14.2 14.5 5.7
Gaya 50.5 46.2 75.7 63.7 61.0 80.2 13.2 14.8 4.5
Jehanabad 55.2 53.2 69.5 66.8 65.5 76.3 11.6 12.3 6.8
Arwal 55.3 55.3 0.0 67.4 66.8 75.3 12.1 11.5 75.3
Nawada 46.8 44.7 71.1 59.8 58.1 75.1 13.0 13.4 4.0
Aurangabad 57.0 55.5 73.5 70.3 69.4 79.1 13.3 13.9 5.6
Saran 51.8 50.3 66.1 66.0 65.0 75.1 14.2 14.7 9.0
Siwan 51.7 50.5 69.7 69.5 68.9 77.9 17.8 18.4 8.2
Gopalganj 47.5 46.5 62.0 65.5 64.8 75.1 18.0 18.3 13.1
West Champaran 38.9 36.0 63.5 55.7 53.9 71.1 16.8 17.9 7.6
East Champaran 37.5 35.4 67.1 55.8 54.4 71.6 18.3 19.0 4.5
Muzaffarpur 48.0 44.7 77.3 63.4 61.5 80.2 15.4 16.8 2.9
Sitamarhi 38.5 36.7 66.2 52.1 50.8 72.4 13.6 14.1 6.2
Sheohar 35.3 34.9 43.7 53.8 53.4 62.0 18.5 18.5 18.3
Vaishali 50.5 49.3 65.6 66.6 66.0 74.2 16.1 16.7 8.6
Darbhanga 44.3 41.5 74.9 56.6 54.4 75.7 12.3 12.9 0.8
Madhubani 42.0 41.2 63.1 58.6 58.1 71.1 16.6 16.9 8.0
Samastipur 45.1 43.9 75.7 61.9 61.1 80.7 16.8 17.2 5.0
Begusarai 48.0 46.5 77.7 63.9 61.8 72.4 15.9 15.3 -5.3
Munger 59.5 52.8 76.0 70.5 66.2 81.0 11.0 13.4 5.0
Sheikhpura 48.6 46.0 62.4 63.9 62.3 71.0 15.3 16.3 8.6
Lakhisarai 48.0 45.6 61.1 62.4 60.9 71.3 14.4 15.3 10.2
Jamui 42.4 40.3 68.8 59.8 58.4 74.9 17.4 18.1 6.1
Khagaria 41.4 39.5 69.8 57.9 56.8 76.7 16.5 17.3 6.9
Bhagalpur 49.5 44.4 70.7 63.1 59.8 75.9 13.6 15.4 5.2
Banka 42.7 42.1 59.9 58.2 57.6 72.6 15.5 15.5 12.7
Saharsa 39.1 36.1 70.8 53.2 51.1 75.6 14.1 15.0 4.8
Supaul 37.3 35.9 61.4 57.7 56.9 72.7 20.4 21.0 11.3
Madhepura 36.1 34.5 66.9 52.3 51.2 73.5 16.2 16.7 6.6
Purnea 35.1 31.4 70.9 51.1 48.4 72.7 16.0 17.0 1.8
Kishanganj 31.1 27.8 59.3 55.5 53.7 71.2 24.4 25.9 11.9
Araria 35.0 33.2 61.4 53.5 52.3 72.1 18.5 19.1 10.7
Katihar 35.1 31.1 72.3 52.2 49.6 77.3 17.1 18.5 5.0
Bihar 47.0 43.9 71.9 61.8 59.8 76.9 14.8 15.9 5.0
Source: Cenus 2001 and Census 2011

261
Table A 5.18 : Total Enrolment in Primary and Upper Primary Levels (All)
District
2010-11 (in lakh) 2011-12 (in lakh)
Primary Upper
Primary Total Primary
Upper
Primary Total
Patna 5.48 1.79 7.27 5.63 1.83 7.46
Nalanda 4.34 2.72 7.06 4.99 2.52 7.51
Bhojpur 4.64 1.34 5.98 4.73 1.37 6.10
Buxar 3.01 1.18 4.19 3.01 1.22 4.23
Rohtas 3.09 1.01 4.1 3.13 1.03 4.16
Kaimur 2.67 1.03 3.7 2.72 1.06 3.78
Gaya 6.59 2.03 8.62 7.00 2.09 9.09
Jehanabad 1.70 0.5 2.2 1.79 0.56 2.35
Arwal 1.06 0.35 1.41 1.07 0.35 1.42
Nawada 2.19 0.95 3.14 2.32 1.02 3.34
Aurangabad 2.77 1.35 4.12 4.07 1.29 5.36
Saran 5.50 3.80 9.03 5.81 2.10 7.91
Siwan 3.29 0.99 4.28 4.50 1.72 6.22
Gopalganj 3.20 1.41 4.61 3.24 1.43 4.67
West Champaran 5.91 2.01 7.92 5.71 1.23 6.94
East Champaran 10.96 4.05 15.01 10.97 4.51 15.48
Muzaffarpur 7.29 2.01 9.3 7.80 2.11 9.91
Sitamarhi 4.56 1.46 6.02 4.74 1.55 6.29
Sheohar 0.95 0.25 1.2 0.94 0.33 1.27
Vaishali 5.02 1.73 6.75 5.04 1.74 6.78
Darbhanga 5.39 1.41 6.8 5.40 1.66 7.06
Madhubani 6.74 1.75 8.49 6.77 1.77 8.54
Samastipur 5.28 1.17 6.45 5.35 1.23 6.58
Begusarai 5.01 0.84 5.85 4.91 1.71 6.62
Munger 1.91 0.68 2.59 2.02 0.79 2.81
Sheikhpura 0.95 0.29 1.24 0.95 0.30 1.25
Lakhisarai 1.54 0.42 1.96 1.60 0.47 2.07
Jamui 3.03 1.39 4.42 3.06 0.85 3.91
Khagaria 1.85 0.4 2.25 2.39 0.78 3.17
Bhagalpur 4.14 1.44 5.58 4.32 1.48 5.80
Banka 2.93 0.85 3.78 3.16 1.02 4.18
Saharsa 3.52 0.61 4.13 3.55 0.62 4.17
Supaul 3.85 0.94 4.79 3.92 0.96 4.88
Madhepura 3.85 0.99 4.84 3.08 1.62 4.70
Purnea 5.13 0.91 6.04 5.40 1.22 6.62
Kishanganj 1.51 0.54 2.05 1.70 1.14 2.84
Araria 4.38 0.76 5.14 4.49 0.80 5.29
Katihar 3.93 0.82 4.75 5.21 1.07 6.28
Bihar 149.16 48.62 197.78 156.49 50.55 207.04
Source : Department of Education, GOB

262
Table A 5.19 : Total Enrolment in Primary and Upper Primary Levels (SC)
District
2010-11 (in lakh) 2011-12 (in lakh)
Primary Upper
Primary Total Primary
Upper
Primary Total
Patna 0.90 0.23 1.13 0.95 0.24 1.19
Nalanda 1.02 0.4 1.42 1.12 0.43 1.55
Bhojpur 0.62 0.29 0.91 0.63 0.30 0.93
Buxar 0.39 0.16 0.55 0.39 0.17 0.56
Rohtas 0.47 0.11 0.58 0.49 0.11 0.60
Kaimur 0.51 0.17 0.68 0.56 0.18 0.74
Gaya 2.52 0.56 3.08 2.63 0.63 3.26
Jehanabad 0.41 0.08 0.49 0.46 0.11 0.57
Arwal 0.25 0.08 0.33 0.26 0.10 0.36
Nawada 1.03 0.18 1.21 1.08 0.20 1.28
Aurangabad 0.93 0.18 1.11 1.20 0.30 1.50
Saran 1.23 0.44 1.67 1.26 0.45 1.71
Siwan 0.26 0.08 0.34 0.71 0.22 0.93
Gopalganj 0.43 0.20 0.63 0.44 0.20 0.64
West Champaran 1.38 0.44 1.82 1.03 0.20 1.23
East Champaran 1.26 0.17 1.43 1.26 0.17 1.43
Muzaffarpur 1.33 0.30 1.63 1.43 0.32 1.75
Sitamarhi 0.75 0.14 0.89 0.76 0.24 1.00
Sheohar 0.13 0.04 0.17 0.10 0.05 0.15
Vaishali 1.29 0.36 1.65 1.29 0.36 1.65
Darbhanga 0.94 0.19 1.13 1.04 0.25 1.29
Madhubani 1.18 0.22 1.4 1.19 0.23 1.42
Samastipur 0.81 0.11 0.92 0.82 0.12 0.94
Begusarai 0.80 0.10 0.09 0.86 0.4 1.26
Munger 0.35 0.10 0.45 0.37 0.12 0.49
Sheikhpura 0.23 0.05 0.28 0.23 0.06 0.29
Lakhisarai 0.30 0.12 0.42 0.31 0.06 0.37
Jamui 0.43 0.06 0.49 0.63 0.13 0.76
Khagaria 0.28 0.06 0.34 0.31 0.14 0.45
Bhagalpur 0.39 0.06 0.45 0.48 0.14 0.62
Banka 0.38 0.09 0.47 0.90 0.12 1.02
Saharsa 0.71 0.06 0.77 0.72 0.07 0.79
Supaul 0.68 0.10 0.78 0.71 0.11 0.82
Madhepura 0.59 0.12 0.71 0.60 0.20 0.80
Purnea 0.71 0.09 0.08 0.71 0.21 0.92
Kishanganj 0.14 0.02 0.16 0.14 0.03 0.17
Araria 0.67 0.12 0.79 0.72 0.13 0.85
Katihar 0.53 0.14 0.67 0.57 0.15 0.72
Bihar 27.23 6.42 33.65 29.36 7.65 37.01
Source : Department of Education, GOB

263
Table A 5.20 : Total Enrolment in Primary and Upper Primary Levels (ST)
District
2010-11 (in lakh) 2011-12 (in lakh)
Primary Upper
Primary Total Primary
Upper
Primary Total
Patna 0.02 0.03 0.05 0.03 0.004 0.034
Nalanda 0.00 0.00 0.00 0.002 0.0005 0.0025
Bhojpur 0.01 0.01 0.02 0.02 0.01 0.03
Buxar 0.01 0.01 0.02 0.018 0.007 0.025
Rohtas 0.01 0.01 0.02 0.02 0.007 0.027
Kaimur 0.07 0.02 0.09 0.08 0.02 0.1
Gaya 0.00 0.00 0.00 0.0006 0.0005 0.0011
Jehanabad 0.00 0.00 0.00 0.001 0.003 0.004
Arwal 0.00 0.00 0.00 0 0 0
Nawada 0.03 0.01 0.04 0.04 0.006 0.046
Aurangabad 0.04 0.01 0.05 0.008 0.003 0.011
Saran 0.01 0.00 0.01 0.17 0.05 0.22
Siwan 0.00 0.00 0.00 0.2 0.08 0.28
Gopalganj 0.00 0.00 0.00 0 0 0
West Champaran 0.30 0.11 0.41 0.44 0.1 0.54
East Champaran 0.03 0.00 0.03 0.03 0.002 0.032
Muzaffarpur 0.02 0.01 0.03 0.03 0.007 0.037
Sitamarhi 0.00 0.00 0.00 0 0 0
Sheohar 0.00 0.00 0.00 0 0 0
Vaishali 0.00 0.00 0.00 0.001 0.0002 0.0012
Darbhanga 0.00 0.00 0.00 0.001 0.0001 0.0011
Madhubani 0.01 0.00 0.01 0.01 0.002 0.012
Samastipur 0.00 0.00 0.00 0.002 0.001 0.003
Begusarai 0.00 0.00 0.00 0.002 0.001 0.003
Munger 0.05 0.02 0.07 0.05 0.02 0.07
Sheikhpura 0.00 0.00 0.00 0 0 0
Lakhisarai 0.04 0.02 0.06 0.03 0.003 0.033
Jamui 0.12 0.01 0.13 0.24 0.05 0.29
Khagaria 0.00 0.00 0.00 0.0006 0.0003 0.0009
Bhagalpur 0.11 0.03 0.14 0.21 0.05 0.26
Banka 0.16 0.03 0.19 0.18 0.05 0.23
Saharsa 0.01 0.00 0.01 0.01 0.001 0.011
Supaul 0.02 0.00 0.02 0.02 0.005 0.025
Madhepura 0.03 0.01 0.04 0.04 0.01 0.05
Purnea 0.23 0.04 0.27 0.25 0.09 0.34
Kishanganj 0.07 0.02 0.09 0.07 0.02 0.09
Araria 0.06 0.01 0.07 0.07 0.02 0.09
Katihar 0.28 0.05 0.33 0.21 0.03 0.24
Bihar 1.75 0.44 2.19 2.4862 0.6536 3.1398
Source : Department of Education, GOB

264
Table A 5.21 : Districtwise Annual Growth Rate of Enrolment : 2006-07 – 2011-12
District
ALL SC ST
Primary Upper
Primary Total Primary
Upper
Primary Total Primary
Upper
Primary Total
Patna 0.11 7.51 1.68 -5.15 7.35 -3.22 2.37 NA 6.75
Nalanda 7.05 25.58 11.98 8.14 25.95 11.82 NA NA NA
Bhojpur 0.78 5.22 1.73 -10.85 5.42 -7.08 NA NA NA
Buxar 6.94 12.89 8.47 -1.17 8.33 1.18 NA NA NA
Rohtas -1.83 -1.38 -1.72 -9.98 -9.36 -9.87 -22.42 1.12 -16.81
Kaimur 1.95 9.99 3.95 -0.93 3.95 0.05 1.97 24.43 5.06
Gaya 5.11 15.29 7.04 8.30 23.06 10.39 NA NA NA
Jehanabad -6.20 -1.75 -5.25 -2.07 4.21 -1.06 NA NA NA
Arwal 2.83 3.86 3.08 3.94 23.02 7.98 NA NA NA
Nawada -2.58 20.49 2.08 13.44 27.25 14.96 24.21 NA 26.93
Aurangabad 1.71 10.35 3.83 6.53 11.85 7.44 -15.40 -12.21 -14.68
Saran 3.60 21.34 7.98 14.98 35.12 18.91 NA NA NA
Siwan -0.46 5.72 0.98 -1.55 7.87 0.29 NA NA NA
Gopalganj -1.11 14.31 2.46 -2.97 21.02 1.92 NA NA NA
West Champaran 5.67 15.04 7.37 13.22 31.62 15.94 7.06 25.94 10.07
East Champaran 15.17 41.21 20.29 9.78 12.27 10.05 -7.00 NA -9.01
Muzaffarpur 3.41 10.11 4.66 6.61 15.89 8.02 18.46 51.53 23.66
Sitamarhi 2.41 21.01 5.67 6.32 32.01 9.82 NA NA NA
Sheohar 2.48 22.79 5.86 NA NA NA NA NA NA
Vaishali 2.37 13.06 4.61 5.36 22.96 8.11 NA NA NA
Darbhanga 5.93 14.14 7.52 7.78 21.08 9.68 NA NA NA
Madhubani 3.08 7.97 4.00 7.52 15.28 8.58 -22.16 NA -21.42
Samastipur -4.86 -0.27 -4.10 -12.41 -12.07 -12.36 NA NA NA
Begusarai 3.36 14.22 5.43 8.34 33.60 12.77 NA NA NA
Munger 3.67 14.53 6.10 11.43 22.13 13.52 6.04 41.09 11.79
Sheikhpura 6.89 19.08 9.21 10.39 31.51 13.28 NA NA NA
Lakhisarai 6.99 11.67 7.94 11.87 32.68 15.32 28.40 114.02 34.93
Jamui 8.74 26.98 12.25 10.64 19.04 11.77 11.85 38.17 14.17
Khagaria 2.13 11.93 3.97 1.28 28.18 5.80 NA NA NA
Bhagalpur 4.34 26.92 8.18 4.42 18.48 6.57 10.79 27.47 13.31
Banka 5.49 20.55 8.20 22.62 27.72 23.45 -6.61 40.03 2.70
Saharsa 8.85 7.06 8.57 18.50 14.68 18.12 -4.38 NA -6.33
Supaul 8.49 17.29 9.95 10.93 19.84 11.93 7.64 NA 7.26
Madhepura 5.35 28.06 10.07 0.43 21.40 3.58 9.37 20.05 11.32
Purnea 2.86 14.73 4.48 3.62 23.63 6.31 -6.76 13.74 -3.66
Kishanganj -5.48 30.83 2.21 -16.48 -11.60 -15.68 -27.78 -4.75 -24.87
Araria 1.72 12.40 2.81 1.65 16.80 3.27 -34.43 -21.43 -32.76
Katihar 3.91 9.36 4.74 2.68 15.92 4.80 -4.80 1.56 -4.05
Bihar 3.60 15.26 5.91 4.74 17.50 6.75 -3.88 14.01 -1.28
Note : For Arwal District, data of 2008-09, 2009-10 , 2010-11 and 2011-12 are considered.

265
Table A 5.22 : Districtwise Primary and Upper Primary Schools in Bihar (2007-08 and 2010-11)
District Name
2007-08 2010-11
Primary
Primary
with
Upper
primary
Primary
with
Upper
Primary
sec /
higher
sec.
Upper
Primary
Only
Upper
Primary
with
sec./hig
her sec.
Total Primary
Primary
with
Upper
primary
Primary
with
Upper
Primary
sec /
higher
sec.
Upper
Primary
Only
Upper
Primary
with
sec. /
higher
sec.
Total
Patna 2209 1129 0 0 3 3341 2165 1162 0 14 0 3341
Nalanda 1489 648 1 3 6 2147 1335 835 1 5 6 2182
Bhojpur 1343 512 19 15 39 1928 1279 728 8 21 5 2041
Buxar 828 352 12 0 63 1255 725 449 1 10 1 1186
Rohtas 1461 532 34 17 10 2054 1240 758 31 10 0 2039
Kaimur 888 289 1 0 0 1178 755 423 0 1 0 1179
Gaya 2018 944 12 17 11 3002 1764 1256 0 3 0 3023
Jehanabad 1043 273 12 7 5 1340 542 338 3 4 1 888
Arwal NA NA NA NA NA NA 338 184 1 2 0 525
Nawada 1270 337 0 6 1 1614 938 649 0 2 0 1589
Aurangabad 1453 486 2 7 1 1949 1053 847 1 12 2 1915
Saran 1831 584 13 4 3 2435 1565 941 23 0 0 2529
Siwan 1550 534 1 20 13 2118 1224 847 3 20 4 2098
Gopalganj 1215 373 3 6 2 1599 1006 653 0 5 0 1664
West Champaran 1905 507 43 12 64 2531 1535 909 6 12 11 2473
East Champaran 2312 731 25 6 1 3075 1946 1150 0 0 1 3097
Muzaffarpur 2305 803 18 1 65 3192 1921 1131 0 1 0 3053
Sitamarhi 1470 470 28 10 5 1983 1207 859 15 8 4 2093
Sheohar 317 93 5 4 1 420 220 188 1 1 1 411
Vaishali 1520 502 1 1 2 2026 1100 927 4 1 2 2034
Darbhanga 1757 520 88 6 56 2427 1395 866 25 0 7 2293
Madhubani 2132 814 91 0 10 3047 2077 878 76 8 2 3041
Samastipur 1866 613 1 0 2 2482 1502 957 11 15 2 2487
Begusarai 1166 373 2 5 0 1546 907 635 1 0 0 1543
Munger 706 288 0 4 7 1005 619 424 0 2 0 1045
Sheikhpura 314 132 0 2 0 448 226 220 0 2 0 448
Lakhisarai 530 135 0 0 10 675 492 264 0 0 0 756
Jamui 1003 336 0 0 0 1339 972 744 0 0 0 1716
Khagaria 802 208 0 2 0 1012 530 508 0 5 0 1043
Bhagalpur 1365 453 3 7 5 1833 1072 752 1 7 14 1846
Banka 1437 356 71 7 7 1878 1123 778 3 3 0 1907
Saharsa 949 281 2 4 3 1239 747 495 0 4 0 1246
Supaul 1331 310 17 16 16 1690 1049 638 3 13 0 1703
Madhepura 1149 294 0 10 0 1453 792 611 0 9 1 1413
Purnea 1380 320 1 0 0 1701 1279 634 0 0 0 1913
Kishanganj 911 311 84 1 12 1319 866 310 2 0 0 1178
Araria 1204 391 28 3 28 1654 1068 515 1 1 0 1585
Katihar 1439 475 0 0 16 1930 1207 592 0 1 0 1800
Bihar 49868 16709 618 203 467 67865 41781 26055 221 202 64 68323
Source : District Information System for Education (http://www.dise.in)

266
Table A 5.23 : Districtwise number of Teachers at the Primary and Upper Primary Level (2007-08 and
2010-11)
District Name
2007-08 2010-11
Primary
Primary
with
Upper
primary
Primary
with
Upper
Primary
sec /
higher
sec.
Upper
Primary
Only
Upper
Primary
with
sec./hig
her sec.
Total Primary
Primary
with
Upper
primary
Primary
with
Upper
Primary
sec /
higher
sec.
Upper
Primary
Only
Upper
Primary
with
sec. /
higher
sec.
Total
Patna 6222 6296 0 0 0 12518 5871 6853 0 75 0 12799
Nalanda 3599 3652 4 14 54 7323 3620 4258 15 31 77 8001
Bhojpur 4537 3629 129 103 203 8601 3941 4538 59 136 33 8707
Buxar 2771 2950 74 0 384 6179 2383 3558 18 79 4 6042
Rohtas 4181 3627 10 34 13 7865 4127 5572 143 83 0 9925
Kaimur 3551 2775 13 0 0 6339 2458 3255 0 5 0 5718
Gaya 6629 5558 53 111 9 12360 5620 7648 0 37 0 13305
Jehanabad 3784 3008 102 81 40 7015 1604 2588 21 58 6 4277
Arwal NA NA NA NA NA NA 1015 1591 13 16 0 2635
Nawada 3979 2107 0 38 3 6127 2792 3456 0 25 0 6273
Aurangabad 4791 3612 20 53 7 8483 3089 5155 4 102 8 8358
Saran 941 823 0 14 0 1778 6143 7705 76 0 0 13924
Siwan 5120 2742 126 109 101 8198 4627 6436 14 220 13 11310
Gopalganj 5217 3654 25 53 15 8964 3661 5616 0 41 0 9318
West Champaran 5705 6463 49 80 104 12401
East Champaran 8954 5590 115 32 2 14693 8310 9339 0 0 11 17660
Muzaffarpur 8768 6642 139 4 451 16004 6737 8226 0 4 0 14967
Sitamarhi 6943 4748 3 196 40 11930 3397 6382 121 73 73 10046
Sheohar 4886 3999 199 87 40 9211 644 1317 13 7 10 1991
Vaishali 6925 3856 320 70 285 11456 4084 8224 33 17 16 12374
Darbhanga 7311 4491 206 54 59 12121 5919 7118 113 0 18 13168
Madhubani 8556 7131 579 0 66 16332 8054 7258 370 81 19 15782
Samastipur 8026 5052 91 22 12 13203 5568 7881 74 135 13 13671
Begusarai 5629 4704 6 63 0 10402 3948 6856 7 0 0 10811
Munger 2101 1863 0 32 49 4045 1866 2794 0 8 0 4668
Sheikhpura 1204 886 26 30 10 2156 625 1253 0 13 0 1891
Lakhisarai 2555 1444 0 0 105 4104 1891 2461 0 0 0 4352
Jamui 2930 2368 0 0 0 5298 1917 3992 0 0 0 5909
Khagaria 3364 2060 0 21 0 5445 1745 4145 0 56 0 5946
Bhagalpur 4903 3508 19 59 16 8505 3744 5178 7 54 99 9082
Banka 3506 1620 251 29 43 5449 2631 2863 9 17 0 5520
Saharsa 7607 5467 11 0 12 13097 2597 5154 0 34 0 7785
Supaul 6312 5742 5 9 38 12106 3113 4423 16 66 0 7618
Madhepura 4770 2747 0 58 0 7575 2589 4785 0 66 8 7448
Purnea 5357 3163 0 0 0 8520 4130 4824 0 0 0 8954
Kishanganj 3824 2299 478 6 89 6696 3408 2708 4 0 0 6120
Araria 4933 2984 215 20 142 8294 4443 3999 16 8 0 8466
Katihar 6441 4021 0 0 72 10534 5576 5651 0 6 0 11233
Bihar 181127 130818 3219 1402 2360 318926 143592 191523 1195 1633 512 338455
Source : District Information System for Education (http://www.dise.in)

267
Table A 5.24 : Districtwise Coverage of MDMS (Class I-V )
District
2011-12 2012-13
Total
Enrolment
(in lakhs)
No. of
Children
Availing
MDM
(perday)
(in lakhs)
Coverage
Percentage
Total
Enrolment
(in lakhs)
No. of
Children
Availing
MDM
(perday)
(in lakhs)
Coverage
Percentage
Patna 6.32 2.21 35.0 5.27 2.92 55.4
Nalanda 3.35 1.95 58.1 3.43 2.01 58.8
Bhojpur 3.68 0.99 26.9 3.24 1.88 58.0
Buxar 2.82 1.19 42.1 2.48 1.46 59.0
Rohtas 3.97 1.94 48.8 3.71 2.22 59.7
Kaimur 2.48 1.60 64.4 2.37 1.69 71.2
Gaya 5.28 3.57 67.5 5.73 3.53 61.6
Jehanabad 1.82 0.87 47.4 1.60 1.17 72.8
Arwal 1.13 0.82 72.3 1.01 0.77 76.9
Nawada 3.35 1.94 57.8 3.06 2.05 67.1
Aurangabad 4.00 0.70 17.5 3.73 2.32 62.2
Saran 6.15 2.97 48.3 5.41 2.79 51.7
Siwan 4.54 2.33 51.3 4.05 2.40 59.3
Gopalganj 3.70 1.81 49.0 3.56 2.11 59.3
W. Champaran 5.57 3.02 54.2 5.37 3.10 57.8
E.Champaran 7.57 4.00 52.9 7.20 4.03 55.9
Muzaffarpur 8.21 4.60 56.1 6.11 3.41 55.8
Sitamarhi 5.09 2.41 47.4 5.03 2.96 58.7
Sheohar 1.07 0.32 29.6 1.04 0.63 60.5
Vaishali 5.56 1.91 34.4 4.15 2.36 56.8
Darbhanga 5.04 1.99 39.4 5.11 2.61 51.1
Madhubani 6.93 1.40 20.2 6.27 2.59 41.4
Samastipur 6.04 2.54 42.0 5.86 3.26 55.6
Begusarai 4.88 2.12 43.5 4.23 2.56 60.5
Munger 2.14 1.73 81.0 1.71 1.09 63.4
Sheikhpura 1.02 0.60 58.2 0.86 0.56 65.4
Lakhisarai 1.44 1.28 88.6 1.27 0.94 73.8
Jamui 2.87 1.06 36.8 2.74 1.49 54.3
Khagaria 2.72 0.98 36.1 2.49 1.36 54.5
Bhagalpur 3.90 2.18 55.8 3.93 2.91 74.1
Banka 2.84 1.06 37.3 2.66 1.59 59.9
Saharsa 2.36 1.48 62.6 3.65 1.93 52.9
Supaul 3.87 1.18 30.5 3.23 2.02 62.4
Madhepura 3.26 1.93 59.2 3.41 2.01 58.8
Purnea 4.67 1.97 42.3 5.09 2.78 54.6
Kishanganj 2.89 1.39 48.1 2.89 1.85 63.9
Araria 5.02 1.39 27.7 4.38 2.61 59.7
Katihar 5.59 1.45 25.8 5.49 3.30 60.1
Bihar 153.16 68.85 45.0 142.82 83.25 58.3
Source : Directorate of Mid Day Meal Scheme, GOB

268
Table A 5.25 : Districtwise Coverage of MDMS (Class VI-VIII)
District
2011-12 2012-13
Total
Enrolment
(in lakhs)
No. of
Children
Availing
MDM
(perday) (in
lakhs)
Coverage
Percentage
Total
Enrolment
(in lakhs)
No. of
Children
Availing
MDM
(perday) (in
lakh)
Coverage
Percentage
Patna 2.74 0.80 29.1 2.12 1.12 52.6
Nalanda 1.20 0.81 67.7 1.29 0.65 50.3
Bhojpur 1.16 0.67 58.0 1.39 0.75 54.1
Buxar 1.24 0.44 36.0 1.10 0.60 54.4
Rohtas 1.32 0.68 51.2 1.76 0.99 56.3
Kaimur 1.11 1.07 96.8 1.00 0.59 59.1
Gaya 1.96 0.93 47.5 2.22 1.24 55.9
Jehanabad 0.54 0.36 65.8 0.64 0.40 62.8
Arwal 0.35 0.26 72.4 0.45 0.32 70.7
Nawada 0.95 0.65 68.0 1.00 0.54 53.8
Aurangabad 1.66 0.75 45.0 1.47 0.86 58.5
Saran 1.33 0.44 33.4 2.30 1.22 52.9
Siwan 2.21 1.12 50.4 1.88 0.95 50.2
Gopalganj 1.00 0.53 53.4 1.45 0.79 54.8
W.Champaran 1.20 0.74 61.7 1.64 1.00 60.9
E. Champaran 1.81 0.94 51.9 2.50 1.40 56.1
Muzaffarpur 1.75 0.91 51.8 2.49 1.21 48.8
Sitamarhi 1.04 0.63 60.5 1.61 0.93 57.6
Sheohar 0.18 0.10 53.1 0.28 0.15 54.4
Vaishali 1.30 0.79 60.8 1.97 0.96 48.8
Darbhanga 1.32 0.62 47.3 1.88 0.97 51.7
Madhubani 1.36 1.04 76.0 2.49 1.44 57.8
Samastipur 1.35 0.44 32.9 2.31 1.34 58.0
Begusarai 1.41 0.63 45.0 1.67 0.88 52.6
Munger 0.63 0.35 56.2 0.73 0.41 55.6
Sheikhpura 0.78 0.14 17.6 0.34 0.20 59.3
Lakhisarai 0.51 0.28 55.3 0.51 0.25 48.6
Jamui 0.65 0.21 32.5 0.98 0.49 49.9
Khagaria 0.70 0.17 24.6 0.94 0.53 56.1
Bhagalpur 1.23 0.41 33.8 1.54 0.91 58.9
Banka 0.62 0.23 36.6 1.06 0.59 55.4
Saharsa 1.10 0.70 63.8 0.87 0.51 58.2
Supaul 0.85 0.24 28.6 1.28 0.66 51.6
Madhepura 1.16 0.34 29.6 1.21 0.76 62.5
Purnea 1.06 0.61 58.0 1.57 0.85 54.4
Kishanganj 0.79 0.36 45.3 0.89 0.47 52.3
Araria 0.76 0.25 33.7 1.28 0.74 57.6
Katihar 1.05 0.29 27.3 1.33 0.81 60.9
Bihar 43.37 20.94 48.3 53.45 29.46 55.1
Source : Directorate of Mid Day Meal Scheme, GOB

269
Table A 5.26 : Districtwise Colleges of Bihar 2010-11
District Name Affiliated
College
Constiuent
College Total
Patna 46 36 82
Nalanda 20 6 26
Bhojpur 14 6 20
Buxar 11 5 16
Rohtas 25 8 33
Kaimur 7 2 9
Gaya 22 7 29
Jehanabad 7 3 10
Arwal 3 1 4
Nawada 5 4 9
Aurangabad 8 5 13
Saran 18 12 30
Siwan 6 7 13
Gopalganj 4 5 9
W.Champaran 6 4 10
E. Champaran 3 9 12
Muzaffarpur 12 18 30
Sitamarhi 5 5 10
Sheohar 0 0 0
Vaishali 9 7 16
Darbhanga 22 20 42
Madhubani 14 18 32
Samastipur 12 15 27
Begusarai 4 6 10
Munger 2 7 9
Sheikhpura 3 2 5
Lakhisarai 3 2 5
Jamui 2 2 4
Khagaria 1 5 6
Bhagalpur 9 13 22
Banka 7 2 9
Saharsa 4 9 13
Supaul 4 3 7
Madhepura 8 5 13
Purnea 10 6 16
Kishanganj 4 2 6
Araria 8 2 10
Katihar 7 4 11
Bihar 355 273 628
Source : Department of Education, GOB

270
Table A 5.27 : District Level of Overview of SC/ST Welfare
Districts
Maint. Of Res. School (SC) Hostel Maint. (SC)
Allotment
(Financial)
(Rs. in Lakh)
Achievement
(Physical) (No.)
Allotment
(Financial)
(Rs. in Lakh)
Achievement
(Physical)
(No.)
2011-12 2012-13 2011-12 2012-13 2011-12 2012-13 2011-12 2012-13
Patna 380.25 369.19 745 745 56.68 50.26 670 670
Nalanda 195.12 227.36 489 489 9.28 12.34 50 50
Bhojpur 259.39 272.64 517 517 12.35 33.5 375 375
Buxar 130.35 130.95 243 243 6.38 9.78 50 50
Rohtas 239.17 234.4 518 518 17.27 30.41
Kaimur 252.49 204.28 421 421 14.38 12.22 175 175
Gaya 901.35 888.23 1957 1957 7.33 12.75 543 543
Jehanabad 24.88 43.01 106 106 8.12 8.03 106 106
Arwal 24.31 43.01 0 0
Nawada 193.78 205.67 496 496 13.45 21.521
Aurangabad 24.31 43.01 97 97 5.93 5.96 60 60
Saran 119.09 117.53 274 274 10.63 11.06 156 156
Siwan 24.31 85.91 105 105 13.64 15.85 150 150
Gopalganj 115.26 105.9 272 272 15.83 15.55 211 211
West Champaran 188.02 161.49 524 524 9.21 15.81 163 163
East Champaran 111.41 114.45 290 290 19.88 25.6 100 100
Muzaffarpur 307.89 305.45 776 776 23.28 24.54 317 317
Sitamarhi 84.23 90.64 275 275 14.78 17.47 190 190
Sheohar 17.78 43.01 0.36 0.99
Vaishali 117.26 111.53 270 270 5.09 12.92 0 0
Darbhanga 24.31 45.48 99 99 22.62 29.48 318 318
Madhubani 325.22 335.84 833 833 2.05 18.53 50 50
Samastipur 126.61 154.29 374 374 10.81 15.01 104 104
Begusarai 115.42 88.09 267 267 0.37 0.99 105 105
Munger 108.7 109.45 269 276 11.12 11.70 100 100
Sheikhpura 24.31 43.01 95 157 0.36 0.99 25 25
Lakhisarai 25.61 43.01 69 69 3.02 3.94
Jamui 23.47 43.01 76 76 0.81 0.99 50 50
Khagaria 107.2 115.23 269 269 11.02 16.97
Bhagalpur 126.93 143.76 369 369 24.74 19.83 211 211
Banka 20.43 43.01 81 81 11.24 14.59 50 50
Saharsa 107.48 98.85 281 281 7.45 9.09 75 75
Supaul 24.31 23.01 102 102 2.44 15.33 25 25
Madhepura 24.31 43.01 70 70 5.25 6.94 75 75
Purnea 125.03 157.22 289 289 9.82 21.7 407 407
Kishanganj 100.16 130.36 276 276 3.68 3.28 15 15
Araria 99.77 111.95 273 273 5.58 10.77 55 55
Katihar 103.55 137.36 261 261 12.25 18.55 100 100
Bihar 5323.47 5663.60 12728 12797 408.50 555.21 5081 5081
Source : Department of SC/ST Welfare, GOB (Contd.)

271
Table A 5.27 : District Level of Overview of SC/ST Welfare (Contd.)
Districts
Stipend SC & ST
Allotment (Financial)
(Rs. in Lakh)
Achievement
(Physical) (No.)
2011-12 2012-13 2011-12 2012-13
Patna 5038.94 3966.34 204680 164495
Nalanda 2386.68 2552.94 164020 105018
Bhojpur 1075.76 1103.72 98113 84691
Buxar 1088.40 1379.05 93772 47981
Rohtas 2131.95 1763.35 167670 87908
Kaimur 1712.12 1731.78 122086 83292
Gaya 4244.00 4493.19 210299 229581
Jehanabad 763.94 776.38 50559 47005
Arwal 385.08 397.40 36261 24231
Nawada 1538.65 1476.07 160136 97822
Aurangabad 1829.19 1655.26 120352 106322
Saran 2527.80 2175.73 190935 83333
Siwan 1706.55 1560.59 103668 62669
Gopalganj 1008.07 1324.72 73801 70033
West Champaran 2448.51 3003.30 259830 162035
East Champaran 1883.15 1790.09 132933 100393
Muzaffarpur 2015.51 3131.19 144025 108638
Sitamarhi 869.90 1078.32 80839 61195
Sheohar 259.35 318.35 22170 18489
Vaishali 1898.70 1885.84 204993 105253
Darbhanga 1656.67 2008.37 93556 89647
Madhubani 1806.30 1945.41 132126 144181
Samastipur 1981.91 2230.03 130677 114556
Begusarai 947.75 982.53 72879 64095
Munger 754.10 855.38 63536 38912
Sheikhpura 347.45 444.54 20581 19159
Lakhisarai 430.91 548.30 34232 30968
Jamui 957.11 1266.82 71914 89772
Khagaria 673.93 741.57 52102 25441
Bhagalpur 1186.25 1727.08 110704 75255
Banka 996.85 766.02 64045 47807
Saharsa 844.09 810.30 62848 56712
Supaul 689.93 945.92 60724 56402
Madhepura 1169.48 974.35 78580 68924
Purnea 1401.37 1632.84 58647 77247
Kishanganj 353.82 383.32 34236 28644
Araria 665.22 606.88 52462 37237
Katihar 1109.78 1116.02 87425 35688
Bihar 54785.17 57549.29 3922416 2951031
Source : Department of SC/ST Welfare, GOB
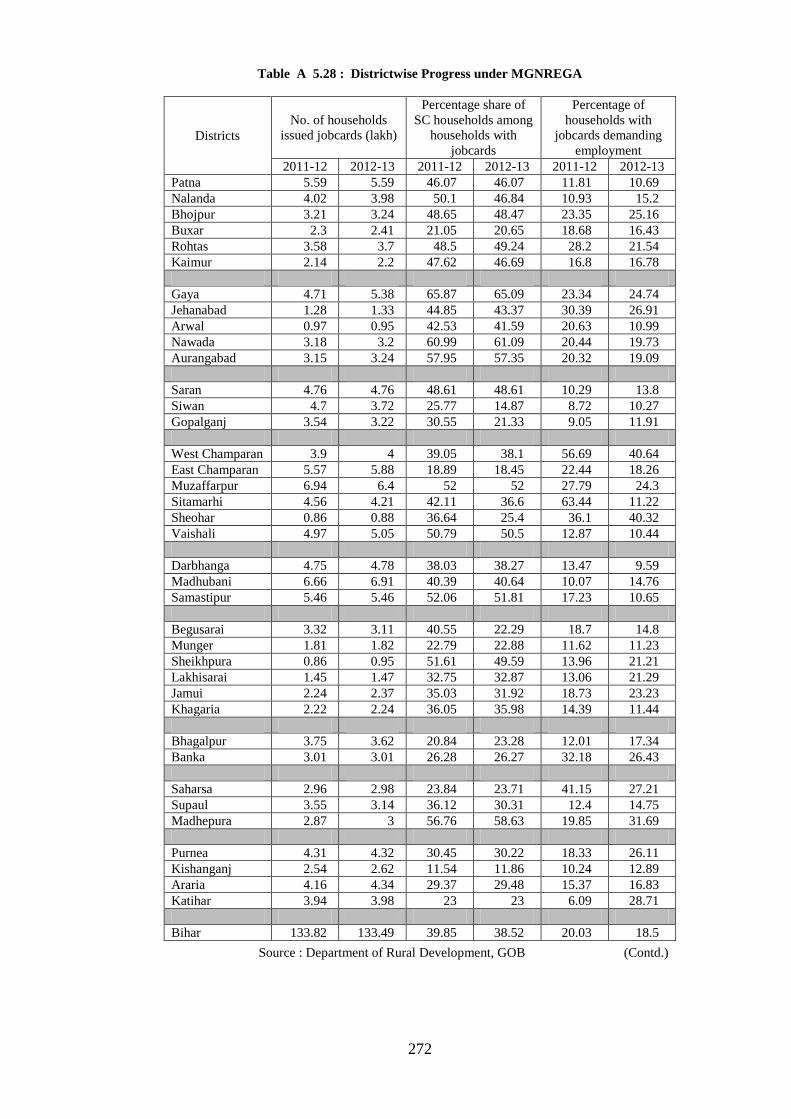
272
Table A 5.28 : Districtwise Progress under MGNREGA
Districts
No. of households
issued jobcards (lakh)
Percentage share of
SC households among
households with
jobcards
Percentage of
households with
jobcards demanding
employment
2011-12 2012-13 2011-12 2012-13 2011-12 2012-13
Patna 5.59 5.59 46.07 46.07 11.81 10.69
Nalanda 4.02 3.98 50.1 46.84 10.93 15.2
Bhojpur 3.21 3.24 48.65 48.47 23.35 25.16
Buxar 2.3 2.41 21.05 20.65 18.68 16.43
Rohtas 3.58 3.7 48.5 49.24 28.2 21.54
Kaimur 2.14 2.2 47.62 46.69 16.8 16.78
Gaya 4.71 5.38 65.87 65.09 23.34 24.74
Jehanabad 1.28 1.33 44.85 43.37 30.39 26.91
Arwal 0.97 0.95 42.53 41.59 20.63 10.99
Nawada 3.18 3.2 60.99 61.09 20.44 19.73
Aurangabad 3.15 3.24 57.95 57.35 20.32 19.09
Saran 4.76 4.76 48.61 48.61 10.29 13.8
Siwan 4.7 3.72 25.77 14.87 8.72 10.27
Gopalganj 3.54 3.22 30.55 21.33 9.05 11.91
West Champaran 3.9 4 39.05 38.1 56.69 40.64
East Champaran 5.57 5.88 18.89 18.45 22.44 18.26
Muzaffarpur 6.94 6.4 52 52 27.79 24.3
Sitamarhi 4.56 4.21 42.11 36.6 63.44 11.22
Sheohar 0.86 0.88 36.64 25.4 36.1 40.32
Vaishali 4.97 5.05 50.79 50.5 12.87 10.44
Darbhanga 4.75 4.78 38.03 38.27 13.47 9.59
Madhubani 6.66 6.91 40.39 40.64 10.07 14.76
Samastipur 5.46 5.46 52.06 51.81 17.23 10.65
Begusarai 3.32 3.11 40.55 22.29 18.7 14.8
Munger 1.81 1.82 22.79 22.88 11.62 11.23
Sheikhpura 0.86 0.95 51.61 49.59 13.96 21.21
Lakhisarai 1.45 1.47 32.75 32.87 13.06 21.29
Jamui 2.24 2.37 35.03 31.92 18.73 23.23
Khagaria 2.22 2.24 36.05 35.98 14.39 11.44
Bhagalpur 3.75 3.62 20.84 23.28 12.01 17.34
Banka 3.01 3.01 26.28 26.27 32.18 26.43
Saharsa 2.96 2.98 23.84 23.71 41.15 27.21
Supaul 3.55 3.14 36.12 30.31 12.4 14.75
Madhepura 2.87 3 56.76 58.63 19.85 31.69
Purnea 4.31 4.32 30.45 30.22 18.33 26.11
Kishanganj 2.54 2.62 11.54 11.86 10.24 12.89
Araria 4.16 4.34 29.37 29.48 15.37 16.83
Katihar 3.94 3.98 23 23 6.09 28.71
Bihar 133.82 133.49 39.85 38.52 20.03 18.5
Source : Department of Rural Development, GOB (Contd.)
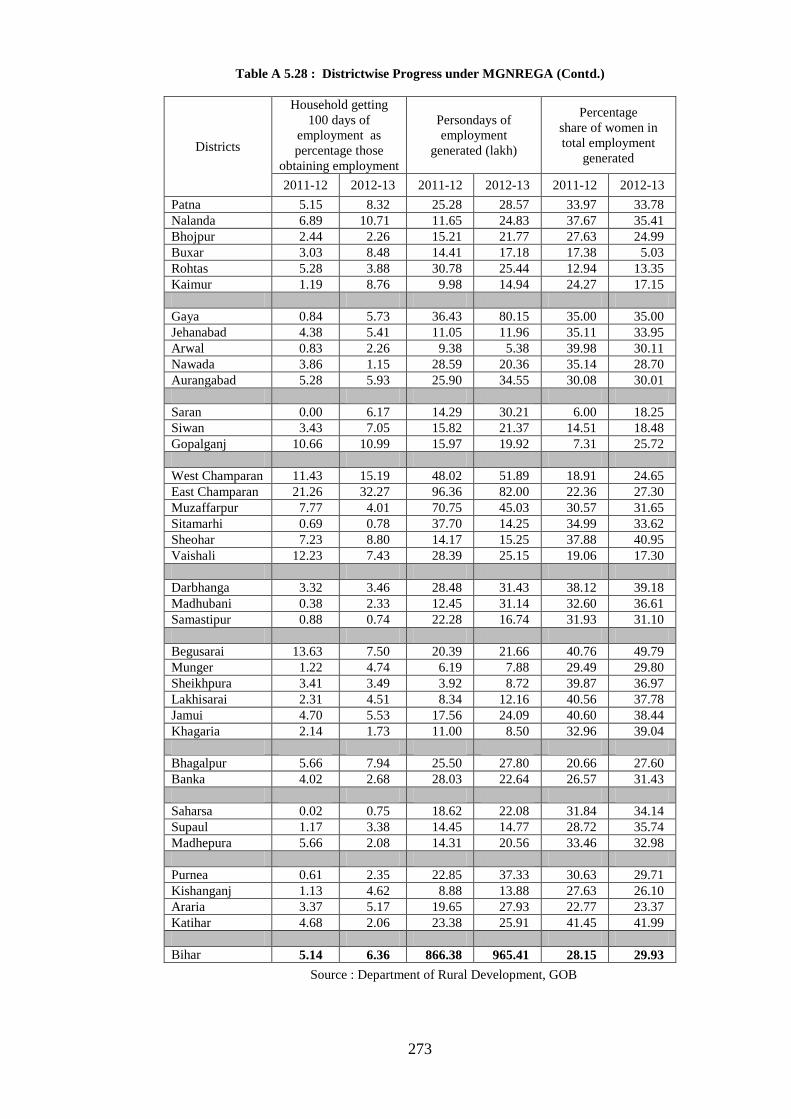
273
Table A 5.28 : Districtwise Progress under MGNREGA (Contd.)
Districts
Household getting
100 days of
employment as
percentage those
obtaining employment
Persondays of
employment
generated (lakh)
Percentage
share of women in
total employment
generated
2011-12 2012-13 2011-12 2012-13 2011-12 2012-13
Patna 5.15 8.32 25.28 28.57 33.97 33.78
Nalanda 6.89 10.71 11.65 24.83 37.67 35.41
Bhojpur 2.44 2.26 15.21 21.77 27.63 24.99
Buxar 3.03 8.48 14.41 17.18 17.38 5.03
Rohtas 5.28 3.88 30.78 25.44 12.94 13.35
Kaimur 1.19 8.76 9.98 14.94 24.27 17.15
Gaya 0.84 5.73 36.43 80.15 35.00 35.00
Jehanabad 4.38 5.41 11.05 11.96 35.11 33.95
Arwal 0.83 2.26 9.38 5.38 39.98 30.11
Nawada 3.86 1.15 28.59 20.36 35.14 28.70
Aurangabad 5.28 5.93 25.90 34.55 30.08 30.01
Saran 0.00 6.17 14.29 30.21 6.00 18.25
Siwan 3.43 7.05 15.82 21.37 14.51 18.48
Gopalganj 10.66 10.99 15.97 19.92 7.31 25.72
West Champaran 11.43 15.19 48.02 51.89 18.91 24.65
East Champaran 21.26 32.27 96.36 82.00 22.36 27.30
Muzaffarpur 7.77 4.01 70.75 45.03 30.57 31.65
Sitamarhi 0.69 0.78 37.70 14.25 34.99 33.62
Sheohar 7.23 8.80 14.17 15.25 37.88 40.95
Vaishali 12.23 7.43 28.39 25.15 19.06 17.30
Darbhanga 3.32 3.46 28.48 31.43 38.12 39.18
Madhubani 0.38 2.33 12.45 31.14 32.60 36.61
Samastipur 0.88 0.74 22.28 16.74 31.93 31.10
Begusarai 13.63 7.50 20.39 21.66 40.76 49.79
Munger 1.22 4.74 6.19 7.88 29.49 29.80
Sheikhpura 3.41 3.49 3.92 8.72 39.87 36.97
Lakhisarai 2.31 4.51 8.34 12.16 40.56 37.78
Jamui 4.70 5.53 17.56 24.09 40.60 38.44
Khagaria 2.14 1.73 11.00 8.50 32.96 39.04
Bhagalpur 5.66 7.94 25.50 27.80 20.66 27.60
Banka 4.02 2.68 28.03 22.64 26.57 31.43
Saharsa 0.02 0.75 18.62 22.08 31.84 34.14
Supaul 1.17 3.38 14.45 14.77 28.72 35.74
Madhepura 5.66 2.08 14.31 20.56 33.46 32.98
Purnea 0.61 2.35 22.85 37.33 30.63 29.71
Kishanganj 1.13 4.62 8.88 13.88 27.63 26.10
Araria 3.37 5.17 19.65 27.93 22.77 23.37
Katihar 4.68 2.06 23.38 25.91 41.45 41.99
Bihar 5.14 6.36 866.38 965.41 28.15 29.93
Source : Department of Rural Development, GOB
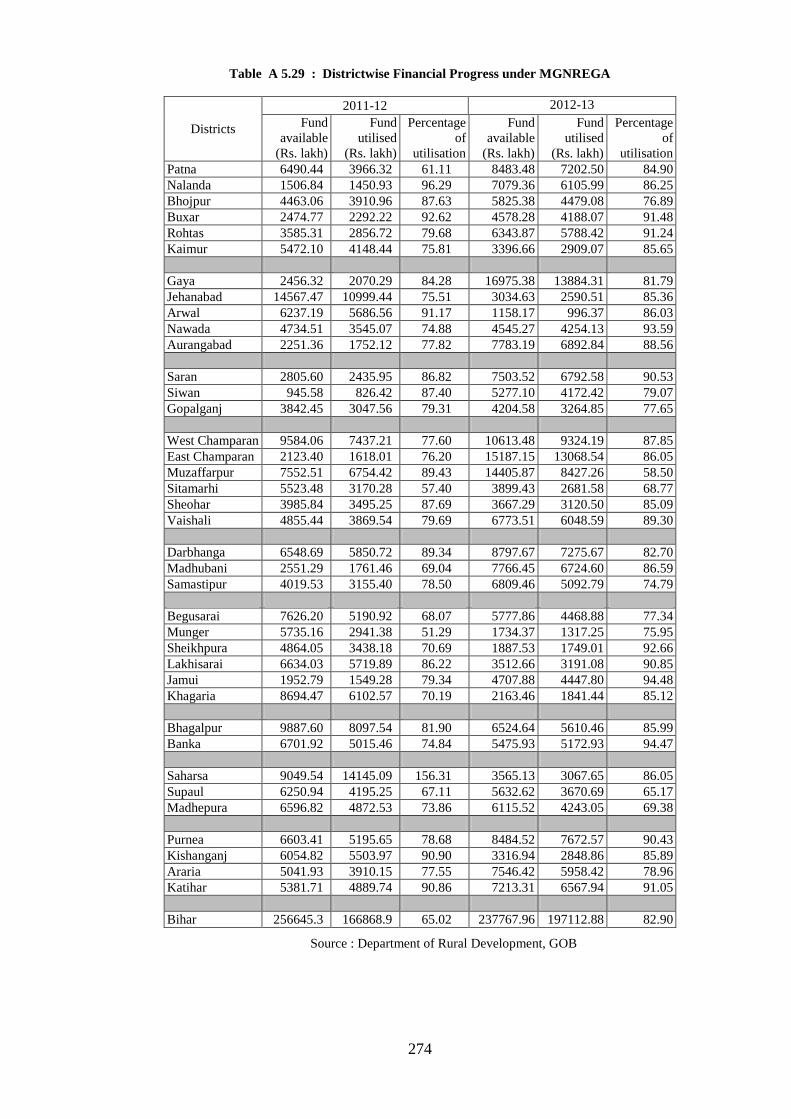
274
Table A 5.29 : Districtwise Financial Progress under MGNREGA
Districts
2011-12 2012-13
Fund
available
(Rs. lakh)
Fund
utilised
(Rs. lakh)
Percentage
of
utilisation
Fund
available
(Rs. lakh)
Fund
utilised
(Rs. lakh)
Percentage
of
utilisation
Patna 6490.44 3966.32 61.11 8483.48 7202.50 84.90
Nalanda 1506.84 1450.93 96.29 7079.36 6105.99 86.25
Bhojpur 4463.06 3910.96 87.63 5825.38 4479.08 76.89
Buxar 2474.77 2292.22 92.62 4578.28 4188.07 91.48
Rohtas 3585.31 2856.72 79.68 6343.87 5788.42 91.24
Kaimur 5472.10 4148.44 75.81 3396.66 2909.07 85.65
Gaya 2456.32 2070.29 84.28 16975.38 13884.31 81.79
Jehanabad 14567.47 10999.44 75.51 3034.63 2590.51 85.36
Arwal 6237.19 5686.56 91.17 1158.17 996.37 86.03
Nawada 4734.51 3545.07 74.88 4545.27 4254.13 93.59
Aurangabad 2251.36 1752.12 77.82 7783.19 6892.84 88.56
Saran 2805.60 2435.95 86.82 7503.52 6792.58 90.53
Siwan 945.58 826.42 87.40 5277.10 4172.42 79.07
Gopalganj 3842.45 3047.56 79.31 4204.58 3264.85 77.65
West Champaran 9584.06 7437.21 77.60 10613.48 9324.19 87.85
East Champaran 2123.40 1618.01 76.20 15187.15 13068.54 86.05
Muzaffarpur 7552.51 6754.42 89.43 14405.87 8427.26 58.50
Sitamarhi 5523.48 3170.28 57.40 3899.43 2681.58 68.77
Sheohar 3985.84 3495.25 87.69 3667.29 3120.50 85.09
Vaishali 4855.44 3869.54 79.69 6773.51 6048.59 89.30
Darbhanga 6548.69 5850.72 89.34 8797.67 7275.67 82.70
Madhubani 2551.29 1761.46 69.04 7766.45 6724.60 86.59
Samastipur 4019.53 3155.40 78.50 6809.46 5092.79 74.79
Begusarai 7626.20 5190.92 68.07 5777.86 4468.88 77.34
Munger 5735.16 2941.38 51.29 1734.37 1317.25 75.95
Sheikhpura 4864.05 3438.18 70.69 1887.53 1749.01 92.66
Lakhisarai 6634.03 5719.89 86.22 3512.66 3191.08 90.85
Jamui 1952.79 1549.28 79.34 4707.88 4447.80 94.48
Khagaria 8694.47 6102.57 70.19 2163.46 1841.44 85.12
Bhagalpur 9887.60 8097.54 81.90 6524.64 5610.46 85.99
Banka 6701.92 5015.46 74.84 5475.93 5172.93 94.47
Saharsa 9049.54 14145.09 156.31 3565.13 3067.65 86.05
Supaul 6250.94 4195.25 67.11 5632.62 3670.69 65.17
Madhepura 6596.82 4872.53 73.86 6115.52 4243.05 69.38
Purnea 6603.41 5195.65 78.68 8484.52 7672.57 90.43
Kishanganj 6054.82 5503.97 90.90 3316.94 2848.86 85.89
Araria 5041.93 3910.15 77.55 7546.42 5958.42 78.96
Katihar 5381.71 4889.74 90.86 7213.31 6567.94 91.05
Bihar 256645.3 166868.9 65.02 237767.96 197112.88 82.90
Source : Department of Rural Development, GOB

275
Table A 5.30 : Overview of IAY (2012-13)
IAY Components IAY (New) IAY
(Upgraded)
IAY
(C & S) Total
Total Target 605550 0.00 0.00 605550
House Completed 422881 0.00 0.00 422881
House Completed (SC) 176618 0.00 0.00 176618
House Completed (ST) 10206 0.00 0.00 10206
House Completed
(Others) 156021 0.00 0.00 156021
House Completed
(Minority) 80036 0.00 0.00 80036
Total Funds Available
(Rs in Lakh) 360206.31 0.00 0.00 360206.31
Total Funds Utilised
(Rs in Lakh) 272270.38 0.00 0.00 272270.38
Percentage of Utilisation 75.59 0.00 0.00 75.59
Source : Department of Rural Development, GOB

276
Table A 5.31 : Districtwise Ahievement of Physical Targets and Fund Utilisation under IAY
District
2011-12 2012-13
Annual
Target
('000)
No. of
Houses
Completed
('000)
Percentage
of achieve-
ment
Percentage
of fund
utilisation
Annual
Target
('000)
No. of
Houses
Completed
('000)
Percentage
of achieve-
ment
Percentage
of fund
utilisation
Patna 12304 8378 68.09 75.45 14178 12586 88.77 68.91
Nalanda 8078 6773 83.85 69.14 9308 7902 84.89 69.84
Bhojpur 9377 10250 109.31 89.02 10804 8314 76.95 75.60
Buxar 5709 5533 96.92 87.01 6579 4827 73.37 67.30
Rohtas 7964 8363 105.01 70.03 8824 8519 96.54 89.90
Kaimur 5474 5280 96.46 67.27 5853 4498 76.85 67.77
Gaya 16231 26812 165.19 78.50 18703 74096 396.17 80.93
Jehanabad 2934 2146 73.14 76.99 3250 3742 115.14 73.45
Arwal 2063 1996 96.75 71.46 2376 3008 126.60 57.95
Nawada 6710 10540 157.08 75.30 7732 8056 104.19 81.98
Aurangabad 7788 8990 115.43 59.52 8974 7083 78.93 71.73
Saran 18400 15093 82.03 74.44 21202 17336 81.77 83.75
Siwan 16601 3172 19.11 70.31 18394 16886 91.80 63.69
Gopalganj 20746 15447 74.46 69.82 23905 26007 108.79 67.5
West Champaran 41400 27434 66.27 61.13 45871 37570 81.90 91.39
East Champaran 44626 33550 75.18 72.46 51423 61524 119.64 83.60
Muzaffarpur 45596 34471 75.60 66.99 52540 58506 111.36 81.04
Sitamarhi 30868 9188 29.77 91.13 34202 44557 130.28 72.20
Sheohar 10159 10142 99.83 59.68 11707 14011 119.68 93.25
Vaishali 24808 15302 61.68 63.23 28586 30510 106.73 78.46
Darbhanga 28894 18380 63.61 88.78 33294 35370 106.24 63.81
Madhubani 48520 27615 56.91 43.78 53760 59775 111.19 59.45
Samastipur 30168 10243 33.95 81.00 33426 20265 60.63 91.36
Begusarai 15379 10694 69.54 59.27 17721 12478 70.41 86.67
Munger 4868 5353 109.96 57.24 5205 3810 73.20 64.75
Sheikhpura 1642 2679 163.15 77.38 1892 1827 96.56 88.00
Lakhisarai 3046 3846 126.26 67.66 3510 3830 109.12 98.77
Jamui 5634 3938 69.90 60.86 6243 7040 112.77 69.36
Khagaria 13060 3984 30.51 76.35 15049 12049 80.07 73.11
Bhagalpur 12597 11439 90.81 62.47 14515 11750 80.95 61.24
Banka 6162 6713 108.94 63.82 7101 7147 100.65 87.32
Saharsa 23691 9091 38.37 68.49 27300 21639 79.26 89.02
Supaul 34440 7302 21.20 64.57 38159 35888 94.05 72.50
Madhepura 28291 9890 34.96 78.96 32599 31831 97.64 97.25
Purnea 49924 19658 39.38 56.70 57528 51108 88.84 90.07
Kishanganj 18016 10328 57.33 59.55 20759 26322 126.80 61.14
Araria 44194 12134 27.46 70.32 48967 24858 50.76 80.93
Katihar 31124 18101 58.16 79.27 34486 22990 66.66 61.05
Bihar 737486 450248 61.05 68.02 835925 839515 100.43 75.93
Source : Department of Rural Development, GOB

277
Table A 5.32 : Districtwise Distribution of PDS Dealers by Their Social Background in Bihar
District
Need of
PDS
Dealers
as per
2001
Census
No. of
PDS
Dealers
(Septe-
mber,
2013)
Percentage of Dealers belonging to
Scheduled
Castes/
Tribes
Baclward
Caste /
Extremely
Backward
Castes
Minority Women
Women
/Other
SHG
Helper
Samiti/
PAC/ Samiti
of Ex-Army
Personnel
General Total
Patna 3607 2605 18.0 45.9 2.8 10.7 0.5 7.1 14.9 100.0
Nalanda 1435 1248 14.6 40.5 3.9 9.8 1.6 14.8 12.2 100.0
Bhojpur 1344 1427 13.5 37.9 3.6 8.1 0.0 10.7 26.0 100.0
Buxar 934 822 19.2 25.2 2.7 4.9 0.1 16.8 31.1 100.0
Rohtas 1601 1025 23.9 36.9 5.0 2.7 0.0 14.3 17.2 100.0
Kaimur 866 633 23.5 40.6 6.6 8.4 0.0 4.3 16.6 100.0
Gaya 2071 1927 31.0 33.0 5.4 5.3 1.1 10.5 13.5 100.0
Jehanabad 544 529 18.0 31.0 3.2 8.1 0.9 14.9 23.8 100.0
Arwal 382 329 20.1 36.8 4.6 5.8 0.3 20.4 12.2 100.0
Nawada 1194 913 14.7 33.2 4.8 10.2 0.9 14.0 21.8 100.0
Aurangabad 1363 1178 17.0 36.5 1.3 4.0 0.1 11.0 30.2 100.0
Saran 2147 2430 10.4 30.9 2.3 14.0 0.0 12.0 30.5 100.0
Siwan 1691 1588 12.8 37.8 8.6 5.9 0.1 6.6 27.6 100.0
Gopalganj 1385 1225 13.0 28.2 5.3 7.3 0.1 16.5 29.6 100.0
West
Champaran 2149 2027 20.3 36.5 11.8 6.3 0.0 10.7 14.5 100.0
East Champaran 2722 2233 13.3 38.6 8.9 5.1 0.3 9.6 24.0 100.0
Muzaffarpur 2897 2032 17.1 31.2 4.2 9.2 0.6 11.6 25.5 100.0
Sitamarhi 1618 1015 16.8 41.6 7.7 7.0 0.3 12.0 14.0 100.0
Sheohar 346 238 11.3 32.4 4.6 5.9 0.4 10.1 35.3 100.0
Vaishali 1889 1463 19.1 36.9 1.8 6.5 0.5 15.8 19.3 100.0
Darbhanga 1770 1291 11.1 32.1 10.6 10.1 0.4 8.4 27.0 100.0
Madhubani 2384 1594 19.3 36.0 7.8 5.1 1.6 12.4 17.9 100.0
Samastipur 2267 1442 18.4 37.6 2.6 5.5 0.4 11.6 21.3 100.0
Begusarai 1660 1092 26.6 29.3 4.8 12.8 0.0 4.5 22.0 100.0
Munger 700 597 8.4 49.2 5.5 9.5 0.0 11.9 15.4 100.0
Sheikhpura 359 289 16.6 36.3 2.4 6.6 0.0 12.5 25.6 100.0
Lakhisarai 527 422 13.0 34.1 2.4 10.9 0.2 12.3 26.8 100.0
Jamui 913 761 19.6 33.6 3.3 4.5 0.1 13.8 25.1 100.0
Khagaria 890 656 17.7 53.2 4.3 5.0 3.5 6.3 8.5 100.0
Bhagalpur 1712 1320 16.0 43.6 9.4 8.2 0.0 11.3 11.5 100.0
Banka 1082 823 15.7 46.2 8.1 8.4 1.7 5.3 13.2 100.0
Saharsa 814 715 17.3 39.6 9.2 3.8 0.7 15.7 12.9 100.0
Supaul 1195 759 11.2 50.1 8.8 4.1 0.0 13.7 12.1 100.0
Madhepura 1068 718 17.0 39.1 9.5 3.8 0.7 15.9 13.2 100.0
Purnea 1588 1154 17.7 38.4 16.4 9.6 1.7 6.3 9.3 100.0
Kishanganj 927 648 12.5 19.6 39.0 15.3 0.2 10.2 3.1 100.0
Araria 1290 1026 18.3 32.7 22.3 11.5 0.0 8.5 6.6 100.0
Katihar 1567 1044 17.6 33.2 17.8 5.8 1.1 12.7 11.6 100.0
Bihar 54898 43238 17.1 36.7 7.1 7.7 0.5 11.1 19.4 100.0
Source : Department of Food and Consumer Protection, GOB
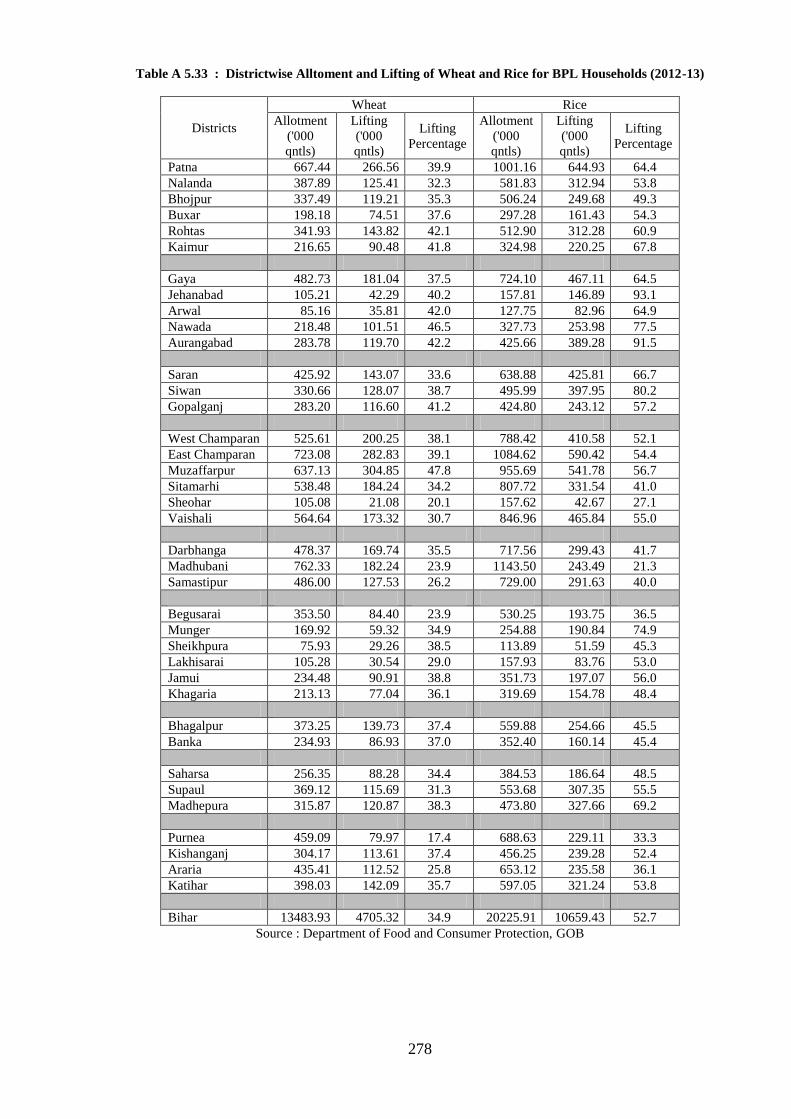
278
Table A 5.33 : Districtwise Alltoment and Lifting of Wheat and Rice for BPL Households (2012-13)
Districts
Wheat Rice
Allotment
('000
qntls)
Lifting
('000
qntls)
Lifting
Percentage
Allotment
('000
qntls)
Lifting
('000
qntls)
Lifting
Percentage
Patna 667.44 266.56 39.9 1001.16 644.93 64.4
Nalanda 387.89 125.41 32.3 581.83 312.94 53.8
Bhojpur 337.49 119.21 35.3 506.24 249.68 49.3
Buxar 198.18 74.51 37.6 297.28 161.43 54.3
Rohtas 341.93 143.82 42.1 512.90 312.28 60.9
Kaimur 216.65 90.48 41.8 324.98 220.25 67.8
Gaya 482.73 181.04 37.5 724.10 467.11 64.5
Jehanabad 105.21 42.29 40.2 157.81 146.89 93.1
Arwal 85.16 35.81 42.0 127.75 82.96 64.9
Nawada 218.48 101.51 46.5 327.73 253.98 77.5
Aurangabad 283.78 119.70 42.2 425.66 389.28 91.5
Saran 425.92 143.07 33.6 638.88 425.81 66.7
Siwan 330.66 128.07 38.7 495.99 397.95 80.2
Gopalganj 283.20 116.60 41.2 424.80 243.12 57.2
West Champaran 525.61 200.25 38.1 788.42 410.58 52.1
East Champaran 723.08 282.83 39.1 1084.62 590.42 54.4
Muzaffarpur 637.13 304.85 47.8 955.69 541.78 56.7
Sitamarhi 538.48 184.24 34.2 807.72 331.54 41.0
Sheohar 105.08 21.08 20.1 157.62 42.67 27.1
Vaishali 564.64 173.32 30.7 846.96 465.84 55.0
Darbhanga 478.37 169.74 35.5 717.56 299.43 41.7
Madhubani 762.33 182.24 23.9 1143.50 243.49 21.3
Samastipur 486.00 127.53 26.2 729.00 291.63 40.0
Begusarai 353.50 84.40 23.9 530.25 193.75 36.5
Munger 169.92 59.32 34.9 254.88 190.84 74.9
Sheikhpura 75.93 29.26 38.5 113.89 51.59 45.3
Lakhisarai 105.28 30.54 29.0 157.93 83.76 53.0
Jamui 234.48 90.91 38.8 351.73 197.07 56.0
Khagaria 213.13 77.04 36.1 319.69 154.78 48.4
Bhagalpur 373.25 139.73 37.4 559.88 254.66 45.5
Banka 234.93 86.93 37.0 352.40 160.14 45.4
Saharsa 256.35 88.28 34.4 384.53 186.64 48.5
Supaul 369.12 115.69 31.3 553.68 307.35 55.5
Madhepura 315.87 120.87 38.3 473.80 327.66 69.2
Purnea 459.09 79.97 17.4 688.63 229.11 33.3
Kishanganj 304.17 113.61 37.4 456.25 239.28 52.4
Araria 435.41 112.52 25.8 653.12 235.58 36.1
Katihar 398.03 142.09 35.7 597.05 321.24 53.8
Bihar 13483.93 4705.32 34.9 20225.91 10659.43 52.7
Source : Department of Food and Consumer Protection, GOB

279
Table A 5.34 : Districtwise Alltoment and Lifting of Wheat and Rice for Antoday Households (2012-13)
Districts
Wheat Rice
Allotment
('000
qntls)
Lifting
('000
qntls)
Lifting
Percentage
Allotment
('000
qntls)
Lifting
('000
qndtls)
Lifting
Percentage
Patna 205.94 215.04 104.4 308.91 327.90 106.1
Nalanda 143.84 137.17 95.4 215.76 194.21 90.0
Bhojpur 110.52 109.77 99.3 165.78 175.79 106.0
Buxar 51.15 51.15 100.0 76.72 67.23 87.6
Rohtas 88.19 85.74 97.2 132.28 129.50 97.9
Kaimur 72.21 71.04 98.4 108.31 108.12 99.8
Gaya 151.39 154.41 102.0 227.08 225.10 99.1
Jehanabad 40.02 39.98 99.9 60.03 59.98 99.9
Arwal 30.50 30.39 99.6 45.76 45.58 99.6
Nawada 78.44 80.17 102.2 117.66 112.13 95.3
Aurangabad 92.11 89.50 97.2 138.16 138.16 100.0
Saran 170.31 162.32 95.3 255.47 253.81 99.3
Siwan 90.44 81.82 90.5 135.65 131.75 97.1
Gopalganj 107.40 108.43 101.0 161.10 160.62 99.7
West Champaran 199.66 205.47 102.9 299.50 300.81 100.4
East Champaran 236.47 283.37 119.8 354.71 395.30 111.4
Muzaffarpur 236.06 239.05 101.3 354.09 335.55 94.8
Sitamarhi 127.81 123.11 96.3 191.71 177.82 92.8
Sheohar 23.53 17.01 72.3 35.30 26.73 75.7
Vaishali 142.15 139.66 98.2 213.22 164.79 77.3
Darbhanga 155.21 144.55 93.1 232.82 221.02 94.9
Madhubani 267.90 260.79 97.3 401.85 382.69 95.2
Samastipur 178.37 141.33 79.2 267.56 205.88 76.9
Begusarai 124.99 74.62 59.7 187.49 116.86 62.3
Munger 65.80 60.27 91.6 98.70 91.53 92.7
Sheikhpura 20.09 23.11 115.0 30.13 24.77 82.2
Lakhisarai 26.75 22.26 83.2 40.12 28.74 71.6
Jamui 81.52 81.43 99.9 122.28 111.95 91.6
Khagaria 81.29 70.65 86.9 121.93 104.93 86.1
Bhagalpur 93.84 84.02 89.5 140.76 107.30 76.2
Banka 59.28 69.25 116.8 88.92 95.90 107.9
Saharsa 65.65 65.52 99.8 98.47 98.01 99.5
Supaul 79.44 87.48 110.1 119.16 129.71 108.8
Madhepura 68.33 77.29 113.1 102.50 115.83 113.0
Purnea 110.15 82.47 74.9 165.22 133.68 80.9
Kishanganj 109.38 108.88 99.5 164.07 153.78 93.7
Araria 125.21 112.93 90.2 187.82 163.72 87.2
Katihar 90.85 83.28 91.7 136.28 121.01 88.8
Bihar 4202.18 4074.72 97.0 6303.28 5938.18 94.2
Source : Department of Food and Consumer Protection, GOB
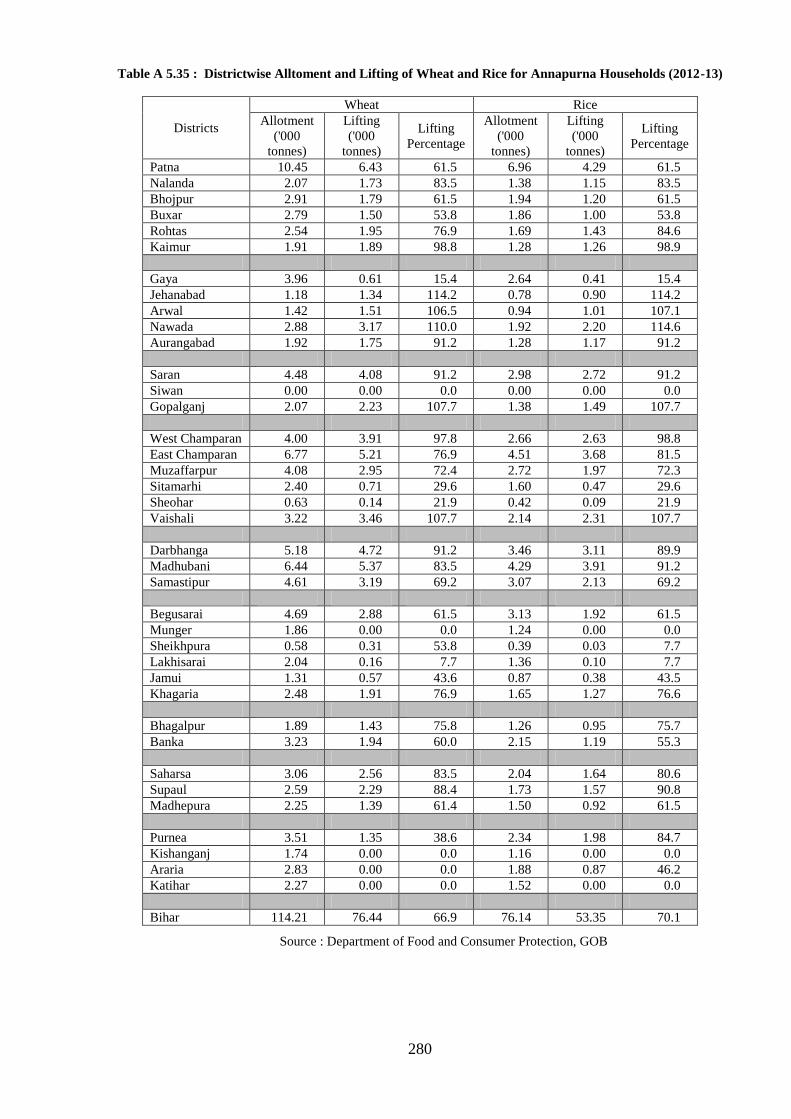
280
Table A 5.35 : Districtwise Alltoment and Lifting of Wheat and Rice for Annapurna Households (2012-13)
Districts
Wheat Rice
Allotment
('000
tonnes)
Lifting
('000
tonnes)
Lifting
Percentage
Allotment
('000
tonnes)
Lifting
('000
tonnes)
Lifting
Percentage
Patna 10.45 6.43 61.5 6.96 4.29 61.5
Nalanda 2.07 1.73 83.5 1.38 1.15 83.5
Bhojpur 2.91 1.79 61.5 1.94 1.20 61.5
Buxar 2.79 1.50 53.8 1.86 1.00 53.8
Rohtas 2.54 1.95 76.9 1.69 1.43 84.6
Kaimur 1.91 1.89 98.8 1.28 1.26 98.9
Gaya 3.96 0.61 15.4 2.64 0.41 15.4
Jehanabad 1.18 1.34 114.2 0.78 0.90 114.2
Arwal 1.42 1.51 106.5 0.94 1.01 107.1
Nawada 2.88 3.17 110.0 1.92 2.20 114.6
Aurangabad 1.92 1.75 91.2 1.28 1.17 91.2
Saran 4.48 4.08 91.2 2.98 2.72 91.2
Siwan 0.00 0.00 0.0 0.00 0.00 0.0
Gopalganj 2.07 2.23 107.7 1.38 1.49 107.7
West Champaran 4.00 3.91 97.8 2.66 2.63 98.8
East Champaran 6.77 5.21 76.9 4.51 3.68 81.5
Muzaffarpur 4.08 2.95 72.4 2.72 1.97 72.3
Sitamarhi 2.40 0.71 29.6 1.60 0.47 29.6
Sheohar 0.63 0.14 21.9 0.42 0.09 21.9
Vaishali 3.22 3.46 107.7 2.14 2.31 107.7
Darbhanga 5.18 4.72 91.2 3.46 3.11 89.9
Madhubani 6.44 5.37 83.5 4.29 3.91 91.2
Samastipur 4.61 3.19 69.2 3.07 2.13 69.2
Begusarai 4.69 2.88 61.5 3.13 1.92 61.5
Munger 1.86 0.00 0.0 1.24 0.00 0.0
Sheikhpura 0.58 0.31 53.8 0.39 0.03 7.7
Lakhisarai 2.04 0.16 7.7 1.36 0.10 7.7
Jamui 1.31 0.57 43.6 0.87 0.38 43.5
Khagaria 2.48 1.91 76.9 1.65 1.27 76.6
Bhagalpur 1.89 1.43 75.8 1.26 0.95 75.7
Banka 3.23 1.94 60.0 2.15 1.19 55.3
Saharsa 3.06 2.56 83.5 2.04 1.64 80.6
Supaul 2.59 2.29 88.4 1.73 1.57 90.8
Madhepura 2.25 1.39 61.4 1.50 0.92 61.5
Purnea 3.51 1.35 38.6 2.34 1.98 84.7
Kishanganj 1.74 0.00 0.0 1.16 0.00 0.0
Araria 2.83 0.00 0.0 1.88 0.87 46.2
Katihar 2.27 0.00 0.0 1.52 0.00 0.0
Bihar 114.21 76.44 66.9 76.14 53.35 70.1
Source : Department of Food and Consumer Protection, GOB

281
Table A 5.36 : Districtwise Lifting Percentage for Wheat and Rice under BPL, Antoday and Annapurna
Districts
Wheat Rice
BPL Antoday Annapurna BPL Antoday Annapurna 2011-12 2012-13 2011-12 2012-13 2011-12 2012-13 2011-12 2012-13 2011-12 2012-13 2011-12 2012-13
Patna 71.9 39.9 116.2 104.4 118.7 61.5 85.3 64.4 105.9 106.1 91.7 61.5
Nalanda 62.7 32.3 100.0 95.4 40.4 83.5 83.1 53.8 100.0 90.0 40.4 83.5
Bhojpur 102.2 35.3 97.1 99.3 25.0 61.5 80.6 49.3 99.5 106.0 33.3 61.5
Buxar 89.2 37.6 100.0 100.0 25.0 53.8 82.6 54.3 100.0 87.6 25.0 53.8
Rohtas 60.0 42.1 81.5 97.2 33.3 76.9 63.2 60.9 77.2 97.9 33.3 84.6
Kaimur 57.7 41.8 98.9 98.4 82.1 98.8 62.5 67.8 96.2 99.8 82.1 98.9
Gaya 79.4 37.5 100.1 102.0 40.4 15.4 76.3 64.5 97.7 99.1 40.4 15.4
Jehanabad 59.2 40.2 92.7 99.9 75.0 114.2 60.1 93.1 94.7 99.9 75.0 114.2
Arwal 69.3 42.0 98.1 99.6 75.0 106.5 86.4 64.9 92.9 99.6 75.0 107.1
Nawada 75.9 46.5 82.9 102.2 75.0 110.0 68.8 77.5 84.6 95.3 72.6 114.6
Aurangabad 53.4 42.2 104.3 97.2 23.8 91.2 68.0 91.5 92.6 100.0 23.7 91.2
Saran 58.1 33.6 71.1 95.3 15.4 91.2 56.6 66.7 72.2 99.3 15.4 91.2
Siwan 79.0 38.7 96.0 90.5 -- 0.0 71.3 80.2 83.2 97.1 -- 0.0
Gopalganj 91.9 41.2 99.9 101.0 77.9 107.7 89.0 57.2 99.8 99.7 73.7 107.7
West Champaran 42.9 38.1 87.2 102.9 58.3 97.8 52.2 52.1 81.3 100.4 58.3 98.8
East Champaran 61.9 39.1 99.6 119.8 66.7 76.9 84.6 54.4 98.7 111.4 66.7 81.5
Muzaffarpur 68.9 47.8 86.3 101.3 29.3 72.4 66.6 56.7 88.0 94.8 27.9 72.3
Sitamarhi 51.4 34.2 100.2 96.3 23.7 29.6 62.5 41.0 96.3 92.8 23.8 29.6
Sheohar 90.5 20.1 96.3 72.3 23.8 21.9 97.8 27.1 99.0 75.7 23.8 21.9
Vaishali 56.3 30.7 93.2 98.2 58.9 107.7 55.4 55.0 72.2 77.3 49.2 107.7
Darbhanga 84.1 35.5 100.0 93.1 98.8 91.2 84.1 41.7 100.0 94.9 69.8 89.9
Madhubani 79.4 23.9 91.4 97.3 73.8 83.5 52.8 21.3 94.7 95.2 73.7 91.2
Samastipur 85.2 26.2 100.0 79.2 183.3 69.2 78.0 40.0 96.6 76.9 183.3 69.2
Begusarai 85.5 23.9 100.0 59.7 66.7 61.5 90.0 36.5 100.0 62.3 66.7 61.5
Munger 22.7 34.9 84.3 91.6 0.0 0.0 18.3 74.9 83.9 92.7 8.1 0.0
Sheikhpura 97.7 38.5 86.2 115.0 16.7 53.8 100.6 45.3 87.7 82.2 16.7 7.7
Lakhisarai 62.2 29.0 95.5 83.2 14.7 7.7 81.5 53.0 89.5 71.6 14.7 7.7
Jamui 74.0 38.8 93.5 99.9 41.7 43.6 87.8 56.0 93.3 91.6 41.7 43.5
Khagaria 61.1 36.1 92.0 86.9 50.0 76.9 46.8 48.4 86.5 86.1 50.0 76.6
Bhagalpur 85.6 37.4 100.0 89.5 25.0 75.8 80.2 45.5 100.0 76.2 25.0 75.7
Banka 67.1 37.0 100.0 116.8 25.0 60.0 83.4 45.4 100.0 107.9 25.0 55.3
Saharsa 49.4 34.4 101.0 99.8 73.7 83.5 62.1 48.5 104.4 99.5 73.7 80.6
Supaul 71.0 31.3 95.6 110.1 30.0 88.4 86.1 55.5 93.5 108.8 30.0 90.8
Madhepura 55.0 38.3 85.5 113.1 0.0 61.4 67.1 69.2 77.6 113.0 0.0 61.5
Purnea 68.4 17.4 86.1 74.9 66.7 38.6 63.5 33.3 83.7 80.9 66.7 84.7
Kishanganj 48.7 37.4 119.0 99.5 33.3 0.0 54.2 52.4 82.3 93.7 33.3 0.0
Araria 79.1 25.8 98.5 90.2 8.3 0.0 84.1 36.1 89.8 87.2 8.3 46.2
Katihar 86.8 35.7 100.0 91.7 16.7 0.0 86.6 53.8 100.0 88.8 16.7 0.0
Bihar 68.1 34.9 94.2 97.0 59.0 66.9 70.0 52.7 91.0 94.2 55.2 70.1
Source : Department of Food and Consumer Protection, GOB
_______________

282
CHAPTER VI
BANKING AND ALLIED SECTORS
If the year 2011-12 was characterized by slowing growth, high inflation and deteriorating
macro-economic situation, both in the domestic and the global economy, the year 2012-13 was
far worse. Macroeconomic conditions deteriorated further, flowing from structural constraints
as well as from weak demand. The year was marked by widening Current Account Deficit
(CAD), sharp fall in the value of rupee, from which it has not yet recovered. The problem of
high inflation, especially food inflation, and slow growth of the economy had also persisted.
Inflation stayed at near double digits, prompting the RBI to tighten its monetary policy
“through a cumulative increase in effective policy rate by 525 basis points (bps) (from reverse
repo rate of 3.25 percent to repo rate of 8.50 percent) and an increase in the Cash Reserve
Ratio (CRR) by 100 bps from 5.0 percent to 6.0 percent”, as stated by the Annual Report of
Reserve Bank of India, 2012-13. These measures were partially successful in arresting the
unpredictable and extreme volatility of the rupee during the second quarter of the year, though
these had failed to make the rupee appreciate anywhere near the last year's level. The growth
rate of the economy during the year had decelerated to a 10-year low of 5.0 percent. In
particular, the manufacturing sector was hit hard, registering a dismal 1.0 per cent growth
during 2012-13, due to structural and governance issues impacting both mining and
infrastructure sectors.
The financial sector in India has always been dominated by the Scheduled Commercial Banks
(SCBs), accounting for major chunk of the total financial flows in the economy. These banks
also play a major role in financial inclusion, and this is especially important for the rural sector.
In the near absence of a capital market, the financial sector in a state like Bihar is almost
entirely driven by the SCBs. Any adverse development in the international and national
banking scenario, therefore, is likely to impact the financial sector in Bihar as well. As
observed by the RBI’s Report on Trends and Progress of Banking in India, 2012-13, “The
weakening domestic macroeconomic conditions combined with continuing subdued global
growth and its increasing spillover risks posed challenges to the banking sector during 2012-
13.” The global economy also registered subdued growth of 3.2 percent in 2012 compared with
3.9 percent in the previous year, as it was yet to recover from the impact of the global financial
crisis. It is no wonder that the slowdown in both domestic and global economy had resulted in
the slowdown of the Indian banking sector as well for the second consecutive year in 2012-13.
As the RBI’s Report on Trends and Progress of Banking in India, 2012-13, states, “There was

283
also a decline in the growth of profits of scheduled commercial banks (SCBs) as credit off-take
slowed down and interest rates softened. The asset quality also deteriorated, more perceptibly
for public sector banks….. In the short-term, the Indian banking sector needs to lend support to
productive sectors facilitating economic recovery, while remaining vigilant about asset quality.
In the medium to long-term, sustained improvements in efficiency and inclusiveness remain
key areas of concern.”
The financial system is driven by the flow of finances through intermediaries like banks,
insurance companies, securities firms, mutual funds, finance companies and pension funds, all
the institutions that channel resources from those who save to those who invest. The
commercial banks, together with cooperative banks, account for nearly 70 percent of the total
assets of the financial institutions in India. The following analysis of the financial sector in
Bihar takes into account three kinds of institutions functioning in the state: (1) Banks that
include Commercial Banks, Regional Rural Banks, Cooperative Banks as well as other
Cooperative institutions, (2) State financial institutions and (3) National financial institutions.
The Cooperative banks generally look after the requirements of only agriculture sector;
commercial banks provide finance for industry as well as agriculture; state financial
institutions help to promote industrial development in the state; and national financial
institutions cater to the interest of industrial sector and provide large scale finance.
6.1 Banking Infrastructure
Commercial Banks
Table 6.1 shows the distribution of commercial bank branches in Bihar from 2008 to 2013 and
their growth. At the end of March 2013, 54.0 percent of the total 5008 branches of commercial
banks in Bihar were located in rural areas, compared to 61.6 percent in 2008. The decline in
the share of rural branches has been continuing unabated since 2008. In 2012-13, 307 new
branches were added compared to 313 in the previous year, and the growth rate of 6.53 per
cent in bank expansion in that year was marginally lower than the highest rate (7.13 percent),
achieved in 2011-12. However, out of 307 new branches opened in 2012-13, all but 128
branches were opened in either urban (64 branches) or semi-urban areas (115 branches). As of
2013, the private non-nationalised banks have 155 urban and semi-urban and only 12 rural
branches. The banks obviously wanted to take advantage of the demand-driven growth and
increase in purchasing power in urban and semi-urban areas, but the purpose of financial
inclusion would not be achieved if the rural areas are ignored. From Table 6.2, it can be noted
that Bihar accounted for only 4.6 percent of all the bank branches in the country in March

284
2013, though its share in country's population was 8.6 percent. Bihar’s share in the total bank
branches in the country has also practically remained the same over the past few years.
Table 6.1 : Distribution of Commercial Bank Branch Offices in Bihar
Years
(End March) Total
Percentage
Growth
Rate
Percentage distribution of branches by location
Rural Semi-
urban Urban All
2008 3792 2.16 61.6 21.0 17.4 100.0
2009 3942 3.96 59.7 21.7 18.6 100.0
2010 4180 5.43 57.4 22.8 19.8 100.0
2011 4388 4.98 56.2 23.6 20.2 100.0
2012 4701 7.13 54.8 24.4 20.8 100.0
2013 5008 6.53 54.0 25.2 20.8 100.0
Source : Statistical Tables Relating to Banks in India, 2012-13, RBI
Table 6.2 : Distribution of Branches of Commercial Banks among States (2012-13)
States
Percentage Share in State Total State
Total
Percentage
Share in
India Rural Semi
Urban Urban
Andhra Pradesh 34.0 25.0 41.0 9165 8.3
Bihar 54.0 25.2 20.8 5008 4.6
Gujarat 32.4 25.2 42.4 6094 5.5
Haryana 33.1 24.2 42.6 3431 3.1
Himachal Pradesh 73.5 20.1 6.4 1265 1.2
Jharkhand 48.5 24.4 27.1 2384 2.2
Karnataka 34.3 21.7 44.0 7827 7.1
Kerala 6.9 67.3 25.8 5452 5.0
Madhya Pradesh 38.5 27.6 33.9 5105 4.6
Maharashtra 24.8 20.6 54.7 10314 9.4
Odisha 53.5 25.3 21.2 3568 3.2
Punjab 35.5 31.6 32.9 4905 4.5
Rajasthan 39.5 29.4 31.2 5389 4.9
Tamil Nadu 27.1 32.7 40.1 8281 7.5
Uttar Pradesh 45.6 20.6 33.8 13167 12.0
Uttarakhand 46.9 31.0 22.1 1593 1.5
West Bengal 41.4 14.5 44.0 6413 5.8
India 39439 28691 41681 109811 100.0
Source : Statistical Tables Relating to Banks in India, 2012-13, RBI
Cooperative Banks
The data for the State and District Central Cooperative Banks are shown in Table 6.3. It
emerges from the table that the growth in the number of State and District Central Cooperative
Banks in the country as a whole has been minimal; however, in Bihar, there has been no
expansion at all. The total number of cooperative bank branches in Bihar was 295, both in
2011 and 2012.

285
Table 6.3 : Number of Branches of State and District Central Cooperative Banks (As on March 31)
State
State Co-operative
Banks
District Central
Co-operative Banks Total
2011 2012 2011 2012 2011 2012
Andhra Pradesh 26 24 569 571 595 595
Bihar 16 16 279 279 295 295
Gujarat 1 1 1182 1191 1183 1192
Haryana 13 13 594 594 607 607
Himachal
Pradesh 175 175 183 187 358 362
Jharkhand $ $ 114 114 114 114
Karnataka 38 40 608 605 646 645
Kerala 20 20 670 670 690 690
Madhya Pradesh 20 20 807 835 827 855
Maharashtra 53 53 3705 3728 3758 3781
Odisha 14 14 322 323 336 337
Punjab 20 20 807 805 827 825
Rajasthan 13 16 409 414 422 430
Tamil Nadu 46 46 738 738 784 784
Uttar Pradesh 29 29 1302 1350 1331 1379
Uttarakhand 15 15 205 232 220 247
West Bengal 43 43 281 322 324 365
India 987 999 13118 13302 14105 14301
Source : Statistical Tables Relating to Banks in India, 2012-13, RBI
Regional Rural Banks (RRBs)
With the promulgation of Regional Rural Banks (RRB) Act of 1976, the regional rural banks
came into existence to channel resources towards agricultural and rural credit. With equity
holdings by the central government, the concerned state governments and the sponsoring banks
in the proportion of 50:15:35 respectively, the RRBs provide a multi-agency approach for
agricultural and rural credit in India.
The data for RRBs are shown in Tables 6.4 and 6.5. At the end of March, 2012, Bihar had
1594 RRB branches; by September, 2013, the number had increased to 1718. Uttar Bihar
Gramin Bank alone accounted for 58 percent of the total RRB branches in the state. While the
total number of branches of RRBs had increased by 7.8 percent over the previous year, the
deposits of RRBs in Bihar increased by Rs 948 crore (6.3 percent), and credits increased by Rs
823 crore (11.7 percent), as shown in Table 6.5. In 2011-12, the deposits and credits grew at
much higher rates of 9.8 percent and 11.8 percent respectively. Further, the growth rates in
both deposits and credits in Bihar were among the lowest in the country. The growth of
deposits and credits in 2012-13 was also much less than the peak achieved in 2008-09, when
deposits had increased by Rs 3200 crore and credits by Rs 1600 crore. It is to be noted that less

286
than 50 percent of what the rural economy of Bihar deposits with the RRBs flows back to it in
the form of credit. After 2008-09, the growth in deposits of RRBs has slowed down steeply;
from a high growth of about 23 percent in 2008-09, it had fallen to 6.3 percent in 2012-13.
Table 6.4 : Number of RRBs Branches in Bihar (As on September, 2013)
Rural Semi-
Urban Urban Total
Madhya Bihar Gramin Bank 407 42 25 474
Bihar Kshetriya Gramin Bank 178 59 6 243
Uttar Bihar Gramin Bank 860 94 47 1001
Total 1445 195 78 1718
Table 6.5 : Deposit and Credit of Regional Rural Banks
(Rs. crore)
State
2011-12 2012-13 Percentage Increase
Total
Deposits
Total
Credit
Total
Deposits
Total
Credit
Total
Deposits
Total
Credit
Andhra Pradesh 15258 16756 17403 20555 14.1 22.7
Bihar 15076 7044 16024 7867 6.3 11.7
Gujarat 5427 2506 6122 3195 12.8 27.5
Haryana 7027 4873 8485 5546 20.7 13.8
Himachal Pradesh 1914 819 2073 898 8.3 9.6
Jharkhand 3702 1295 3961 1471 7.0 13.6
Karnataka 15009 13053 17728 15143 18.1 16.0
Kerala 5508 6127 6821 7560 23.8 23.4
Madhya Pradesh 11172 5931 12686 7110 13.6 19.9
Maharashtra 5569 3312 6208 4275 11.5 29.1
Odisha 9703 5643 10073 6149 3.8 9.0
Punjab 3501 2620 3878 3094 10.8 18.1
Rajasthan 11375 8230 12415 9270 9.1 12.6
Tamil Nadu 3372 4343 3941 5262 16.9 21.2
Uttar Pradesh 39227 20364 44349 23261 13.1 14.2
Uttarakhand 1837 1011 2163 1245 17.7 23.1
West Bengal 10865 5248 12178 5978 12.1 13.9
India 183009 116567 206461 136690 12.8 17.3
Source : Statistical Tables Relating to Banks in India, 2012-13, RBI
The deposits of RRBs equalled for 31.9 percent of the total rural deposits of all scheduled
commercial banks in India as of March 2012, compared to 33.2 percent a year ago; for Bihar,
this ratio stood at 43.3 percent (2012), compared to 45.7 percent (2011) (Table 6.6). The rural
deposits of the scheduled commercial banks constituted only 24.7 percent of the total bank
deposits in Bihar in 2011-12, compared to 21.0 percent in 2010-11. Bihar accounted for about
6.1 percent of all rural deposits of the scheduled commercial banks in the country in both these
years and the total amount of rural deposits of such banks in Bihar amounted to Rs. 34,840
crore. The volume of rural deposits with scheduled commercial banks in Bihar in March 2012
was much more than in many states, including Andhra Pradesh, Gujarat, Maharashtra and

287
Tamil Nadu; but way behind those of Uttar Pradesh and West Bengal. The deposits in the
savings bank constituted bulk (65.9 percent) of the total rural deposits of scheduled
commercial banks in Bihar (March 2012).
Table 6.6 : Rural Deposits of Scheduled Commercial Banks by Type of Deposit (as March, 2012)
STATE No. of
Branch
Current Savings Term Total
No. of
Accounts
(lakh)
Amount
(Rs
crore)
No. of
Accounts
(lakh)
Amount
(Rs
crore)
No. of
Accounts
(lakh)
Amount
(Rs
crore)
No. of
Accounts
(lakh)
Amount
(Rs crore)
Andhra Pradesh 2560 3.76 1511 193.28 11991 26.23 16557 223.26 30059
Bihar 2435 7.61 2019 170.88 22947 18.66 9874 197.16 34840
Gujarat 1591 2.05 1198 78.15 12731 22.31 19988 102.51 33918
Haryana 813 3.59 916 48.67 9010 5.34 7615 57.60 17541
Himachal Pradesh 798 4.24 875 37.37 7558 13.88 12021 55.49 20453
Jharkhand 1024 1.24 768 69.68 9460 10.05 6688 80.97 16916
Karnataka 2198 2.53 1505 135.72 10819 25.34 16316 163.58 28639
Kerala 353 0.53 206 20.16 2793 4.20 4776 24.89 7774
Madhya Pradesh 1766 2.63 933 115.34 10516 13.04 8418 131.01 19867
Maharashtra 2226 3.27 2655 122.73 14516 17.29 17090 143.29 34261
Odisha 1722 2.44 1404 123.57 14531 19.48 10064 145.48 25999
Punjab 1284 9.10 1156 69.17 16055 13.36 18690 91.62 35902
Rajasthan 1835 4.20 852 98.42 11456 14.62 10273 117.23 22581
Tamil Nadu 1792 2.88 1546 141.24 13629 18.87 18839 162.99 34014
Uttar Pradesh 5083 13.33 3665 552.04 55993 40.93 27716 606.31 87374
Uttarakhand 611 1.64 478 31.96 6752 7.43 5683 41.03 12912
West Bengal 2435 4.63 1676 194.81 23149 37.92 22776 237.35 47601
India 33367 76.74 28561 2413.95 286002 340.03 258623 2830.72 573186
Source : Basic Statistical Returns of Scheduled Commercial Banks in India, RBI
Employees of Scheduled Commercial Banks
From Table 6.7, it can be seen that there were 37,091 bank employees in Bihar in March 2012
(36,362 in March 2011) and 42.6 percent of them belonged to the category of officers, up from
41.4 percent in the previous year. Bihar accounted for only 3.2 percent of all the employees of
scheduled commercial banks in India in March, 2012. From Table 6.8, it is seen that the total
number of female employees of scheduled commercial banks in Bihar in 2012 was 3108, an
improvement over 2011 when it was 2443 only. Female employees of scheduled commercial
banks in Bihar account for a share of only 1.4 percent of all female employment in the
scheduled commercial banks in the country.
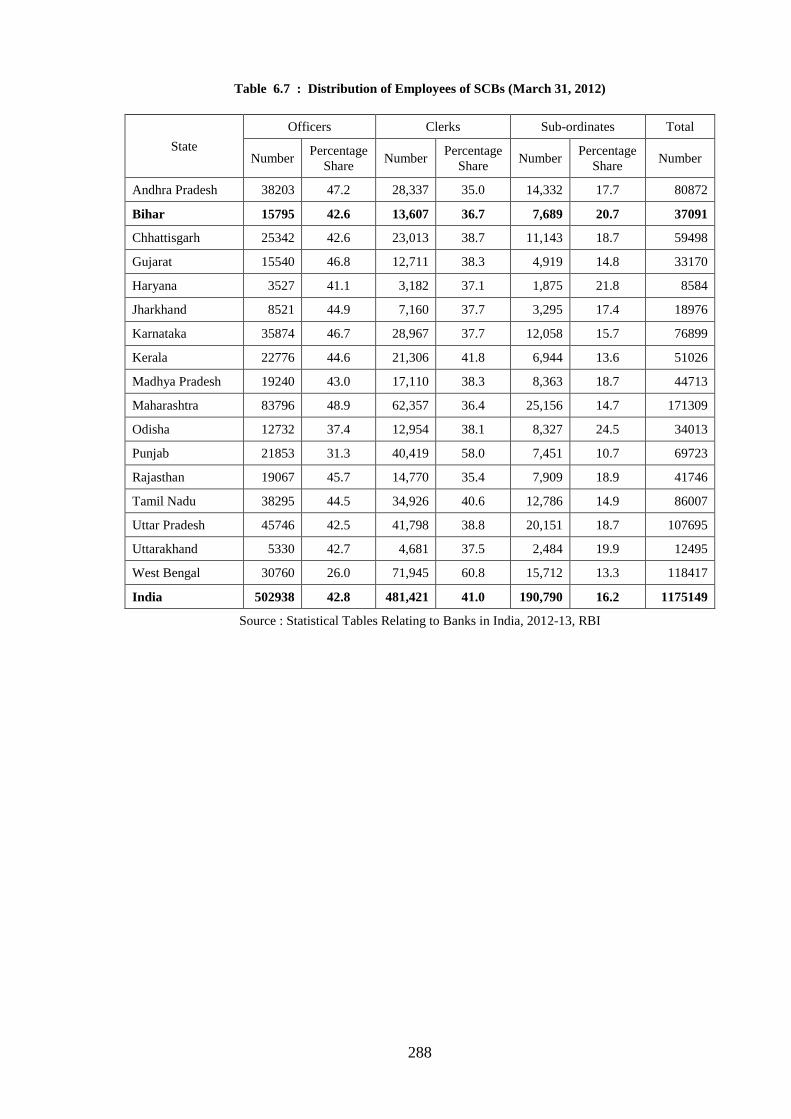
288
Table 6.7 : Distribution of Employees of SCBs (March 31, 2012)
State
Officers Clerks Sub-ordinates Total
Number Percentage
Share Number
Percentage
Share Number
Percentage
Share Number
Andhra Pradesh 38203 47.2 28,337 35.0 14,332 17.7 80872
Bihar 15795 42.6 13,607 36.7 7,689 20.7 37091
Chhattisgarh 25342 42.6 23,013 38.7 11,143 18.7 59498
Gujarat 15540 46.8 12,711 38.3 4,919 14.8 33170
Haryana 3527 41.1 3,182 37.1 1,875 21.8 8584
Jharkhand 8521 44.9 7,160 37.7 3,295 17.4 18976
Karnataka 35874 46.7 28,967 37.7 12,058 15.7 76899
Kerala 22776 44.6 21,306 41.8 6,944 13.6 51026
Madhya Pradesh 19240 43.0 17,110 38.3 8,363 18.7 44713
Maharashtra 83796 48.9 62,357 36.4 25,156 14.7 171309
Odisha 12732 37.4 12,954 38.1 8,327 24.5 34013
Punjab 21853 31.3 40,419 58.0 7,451 10.7 69723
Rajasthan 19067 45.7 14,770 35.4 7,909 18.9 41746
Tamil Nadu 38295 44.5 34,926 40.6 12,786 14.9 86007
Uttar Pradesh 45746 42.5 41,798 38.8 20,151 18.7 107695
Uttarakhand 5330 42.7 4,681 37.5 2,484 19.9 12495
West Bengal 30760 26.0 71,945 60.8 15,712 13.3 118417
India 502938 42.8 481,421 41.0 190,790 16.2 1175149
Source : Statistical Tables Relating to Banks in India, 2012-13, RBI

289
Table 6.8 : Distribution of Female Employees of SCBs (March 31, 2012)
State
Officers Clerks Sub-ordinates Total
Number Percentage
Share Number
Percentage
Share Number
Percentage
Share Number
Andhra Pradesh 5902 36.9 7530 47.1 2568 16.1 16000
Bihar 1377 44.3 1368 44.0 363 11.7 3108
Gujarat 2846 31.5 5099 56.4 1100 12.2 9045
Haryana 2847 50.8 2082 37.2 672 12.0 5601
Himachal Pradesh 356 30.2 453 38.5 368 31.3 1177
Jharkhand 1035 40.4 1302 50.9 222 8.7 2559
Karnataka 6773 33.9 11427 57.2 1771 8.9 19971
Kerala 6223 35.8 9531 54.8 1629 9.4 17383
Madhya Pradesh 2276 33.9 3868 57.7 563 8.4 6707
Maharashtra 19106 42.2 23096 51.0 3041 6.7 45243
Odisha 1346 31.2 2106 48.8 867 20.1 4319
Punjab 3160 40.6 3303 42.4 1320 17.0 7783
Rajasthan 1872 40.7 1960 42.6 765 16.6 4597
Tamil Nadu 7772 34.0 12873 56.4 2187 9.6 22832
Uttar Pradesh 4617 41.3 5030 45.0 1543 13.8 11190
Uttarakhand 588 33.9 863 49.8 283 16.3 1734
West Bengal 3970 40.3 4383 44.5 1486 15.1 9839
India 84375 39.2 107826 50.1 23113 10.7 215314
Source : Statistical Tables Relating to Banks in India, 2012-13, RBI
6.2 Deposits and Credits
Per Capita Deposits and Credits of Scheduled Commercial Banks
Table 6.9 shows the deposits and credits of scheduled commercial banks in Bihar vis-à-vis
other states and their shares in the total deposits and credits in the country. From this table, it is
seen that there has been a significant growth (16.9 percent) in total deposits in Bihar in 2012-
13 (Rs. 1,65,209 crore) over the previous year (Rs. 1,41,308 crore). Simultaneously, credit in
2012-13 has also expanded by more than Rs. 8500 crore, implying a growth of 20.9 percent.
Bihar’s share in the total deposits of scheduled commercial banks increased slightly from 2.29
percent in 2012 to 2.34 percent in 2013, and its share of credit also improved marginally from
0.86 percent to 0.90 percent in this period. Thus, the total bank credit in Bihar does not account
for even 1 percent of the total bank credits in the country.

290
Table 6.9 : Statewise Deposits and Credit of Scheduled Commercial Banks in India (March 31)
State
Deposits Credits
CDR Amount
(Rs.
crore)
Percent
age
Share
Amount
(Rs.
crore)
Percent
age
Share
Amount
(Rs.
crore)
Percen
tage
Share
Amount
(Rs.
crore)
Percenta
ge Share
2012 2013 2012 2013 2013
Andhra Pradesh 346800 5.62 398497 5.65 381406 7.97 438107 7.96 109.94
Bihar 141308 2.29 165209 2.34 41151 0.86 49735 0.90 30.10
Gujarat 306113 4.96 361054 5.12 213447 4.46 260642 4.73 72.19
Haryana 146703 2.38 169911 2.41 115923 2.42 129274 2.35 76.08
Himachal Pradesh 38432 0.62 45528 0.65 14283 0.30 15772 0.29 34.64
Jharkhand 88921 1.44 105701 1.50 29899 0.63 33415 0.61 31.61
Karnataka 411724 6.67 464639 6.59 290806 6.08 331540 6.02 71.35
Kerala 200573 3.25 234217 3.32 151526 3.17 171712 3.12 73.31
Madhya Pradesh 168953 2.74 200820 2.85 94954 1.99 115776 2.10 57.65
Maharashtra 1593694 25.81 1785043 25.31 1387777 29.02 1576489 28.63 88.32
Odisha 125420 2.03 143978 2.04 58846 1.23 66325 1.20 46.07
Punjab 174433 2.83 200680 2.85 142352 2.98 162550 2.95 81.00
Rajasthan 151983 2.46 177139 2.51 136996 2.86 163268 2.97 92.17
Tamil Nadu 401182 6.50 446577 6.33 465897 9.74 549245 9.97 122.99
Uttar Pradesh 434732 7.04 515015 7.30 190455 3.98 224708 4.08 43.63
Uttarakhand 56735 0.92 66453 0.94 20206 0.42 23147 0.42 34.83
West Bengal 378078 6.12 438344 6.22 237330 4.96 269934 4.90 61.58
India 6174147 100.0 7051332 100.0 4782775 100.0 5506496 100.0 78.09
Source : Statistical Tables Relating to Banks in India, 2012-13, RBI
From the above table, one can also note that the Credit-Deposit (CD) ratio of scheduled
commerical banks in Bihar in 2012-13 was the lowest (30.10 percent) among all major states in
India, as in the previous years. It was nowhere near the national average of 78.09 percent, not
to mention the high CD ratios of Tamil Nadu (122.99 percent), Andhra Pradesh (109.94
percent), Rajasthan (92.17 percent) or Maharashtra (88.32 percent).

291
Chart 6.1 : Deposits and Credits of Scheduled Commercial Banks as on March 2013 (Rs Crore)
Table 6.10 : Statewise Per Capita Deposits and Credit of Scheduled Commercial Banks in India (March
31)
State
Population per
office
Per capita deposit
(Rs.)
Deposit per
branch
(Rs. Lakh)
Per capita credit
(Rs.)
Credit per
branch
(Rs. Lakh)
2012 2013 2012 2013 2012 2013 2012 2013 2012 2013
Andhra Pradesh 10773 9909 40507 46029 4364 4561 44549 50604 4799 5014
Bihar 23577 22491 13310 15215 3138 3422 3876 4580 914 1030
Gujarat 11643 10784 49806 57716 5799 6224 34729 41664 4043 4493
Haryana 8961 7988 56806 64591 5090 5160 44888 49143 4022 3926
Himachal Pradesh 6104 5683 55380 64818 3380 3683 20582 22455 1256 1276
Jharkhand 15884 15058 26431 30788 4198 4636 8887 9733 1412 1466
Karnataka 9110 8554 66364 73794 6046 6312 46873 52655 4270 4504
Kerala 7014 6473 59789 69487 4193 4498 45169 50943 3168 3298
Madhya Pradesh 16075 15362 22848 26662 3673 4096 12841 15371 2064 2361
Maharashtra 12600 11846 139715 154165 17604 18263 121663 136154 15329 16129
Odisha 13301 12498 29503 33419 3924 4177 13842 15395 1841 1924
Punjab 6794 6150 62140 70556 4222 4339 50711 57150 3445 3515
Rajasthan 14771 13745 21721 24828 3208 3412 19579 22883 2892 3145
Tamil Nadu 10096 9493 54786 60079 5531 5703 63624 73892 6424 7015
Uttar Pradesh 17575 16399 21385 24873 3758 4079 9369 10852 1647 1780
Uttarakhand 7339 6797 55098 63407 4044 4310 19623 22086 1440 1501
West Bengal 15967 15195 40855 46756 6523 7104 25646 28792 4095 4375
India 12808 11951 50183 56380 6427 6738 38874 44028 4979 5262
Source : Statistical Tables Relating to Banks in India, 2012-13, RBI
0
200000
400000
600000
800000
1000000
1200000
1400000
1600000
1800000
DEPOSIT CREDIT

292
Chart 6.2 : Per capita Deposits and Credit of SCBs as on March 31, 2013 (Rs.)
The per capita deposits and credits of scheduled commercial banks in the major Indian states
are shown in Table 6.10. It is again seen that, both in terms of per capita deposit and per capita
credit, Bihar ranks the lowest among the major Indian states. The average population served by
a bank office in Bihar (22.5 thousand) also remains the highest in the country, and far higher
than the national average (12.0 thousand). While the per capita deposit in scheduled banks of
Bihar has increased by Rs 1905 in 2013 compared to an increase of Rs. 2078 a year before, the
increase in per capita credit was about one-third of this (Rs 704), only a little more than the
previous year’s increase of Rs 619. Again, while the deposits per branch increased by Rs 311
lakh, the credit per branch has increased by only Rs 283 lakh. The credit flowing into any
economy depends on its demand as well as absorption capacity which, in turn, are determined
by various factors including availability of physical infrastructure, skill and education of local
workers, and extent of local entrepreneurial venture. These endowments may not be high in
Bihar, but banks also need to take more pro-active measures in increasing the credit flow by
opening more branches in the unbanked areas, and relaxing some of their stringent credit
norms. It has been noted earlier that the expansion of bank branches in Bihar in 2011-12 has
been skewed in favour of urban and semi-urban areas, which already had relatively better
banking facilities.
Credit Deposit Ratio of All Banks
The Credit-Deposit (CD) ratios in Bihar since 2001-02, according to data released by the State
Level Banker’s Committee (SLBC) chaired by the State Bank of India, are presented in Table
6.11. As per this data, in March 2013, the CD ratio of Bihar was 40.59 percent, higher than
36.70 percent prevailing in March 2012. In September, 2013, it was marginally lower at 40.52
0
20000
40000
60000
80000
100000
120000
140000
160000
Per Capita Deposits (in Rs)
Per Capita Credit (in Rs)
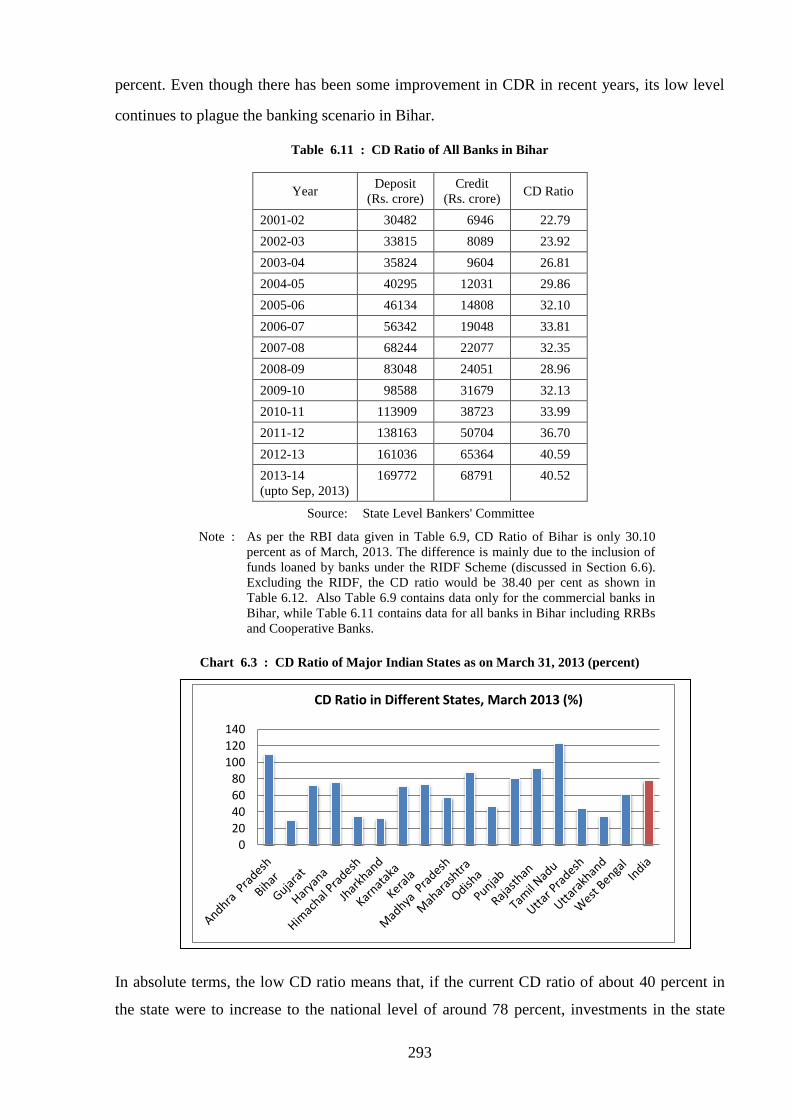
293
percent. Even though there has been some improvement in CDR in recent years, its low level
continues to plague the banking scenario in Bihar.
Table 6.11 : CD Ratio of All Banks in Bihar
Year Deposit
(Rs. crore)
Credit
(Rs. crore) CD Ratio
2001-02 30482 6946 22.79
2002-03 33815 8089 23.92
2003-04 35824 9604 26.81
2004-05 40295 12031 29.86
2005-06 46134 14808 32.10
2006-07 56342 19048 33.81
2007-08 68244 22077 32.35
2008-09 83048 24051 28.96
2009-10 98588 31679 32.13
2010-11 113909 38723 33.99
2011-12 138163 50704 36.70
2012-13 161036 65364 40.59
2013-14
(upto Sep, 2013)
169772 68791 40.52
Source: State Level Bankers' Committee
Note : As per the RBI data given in Table 6.9, CD Ratio of Bihar is only 30.10
percent as of March, 2013. The difference is mainly due to the inclusion of
funds loaned by banks under the RIDF Scheme (discussed in Section 6.6).
Excluding the RIDF, the CD ratio would be 38.40 per cent as shown in
Table 6.12. Also Table 6.9 contains data only for the commercial banks in
Bihar, while Table 6.11 contains data for all banks in Bihar including RRBs
and Cooperative Banks.
Chart 6.3 : CD Ratio of Major Indian States as on March 31, 2013 (percent)
In absolute terms, the low CD ratio means that, if the current CD ratio of about 40 percent in
the state were to increase to the national level of around 78 percent, investments in the state
020406080
100120140
CD Ratio in Different States, March 2013 (%)

294
would go up by as much as Rs. 63,000 crore; this is more than the current annual plan outlay of
the state and it could provide the much-needed impetus to economic activities. Even a modest
CD ratio of 50 percent in Bihar would boost local investments by nearly Rs. 16,000 crore. The
low disbursement of credit also indicates that either the industrial activities are stagnating, or
the credit requirements of the enterprises are being met at higher rates of interest from private
lending agencies, eating into their profitability. This naturally is a serious hindrance to
industrial growth in the state. Further, this also indicates flight of capital away from an already
disadvantaged state.
Chart 6.4 : CD Ratio of Bihar (percent)
The CD ratios in Bihar by the bank groups and bank locations are shown in Table 6.12. The
CD ratios of scheduled commercial banks in different states are shown in Table 6.13. In March
2013, the CD ratio in Bihar was the highest (87.52 percent) for the Cooperative Banks,
followed by Regional Rural Banks (48.51 percent) and trailed by the Commercial Banks
(36.10 percent). Though the volume of business of the Cooperative Banks was much lower
than the Commercial Banks or the RRBs, its CD ratios were the highest in every category, no
doubt in accordance with the objectives of such banks. The respective shares in total credit
were 5.1 percent (Cooperative Banks), 14.3 percent (Regional Rural Banks) and 80.6 percent
(Scheduled Commercial Banks). All the above three categories of banks have improved their
CD ratio in the current year. The combined credits or deposits of the regional rural banks and
cooperative banks were a fraction of the total credits and deposits of the scheduled commercial
banks; consequently, unless the CD ratio of the latter improves significantly, the overall CD
ratio in the state is unlikely to improve. It should, however, be noted here that once investment
is also taken into account along with credit, the ICD, ratios i.e. Investment plus Credit to
Deposit ratios improve significantly for the SCBs because of their high investment portfolios.
22.79 23.92 26.81
29.86 32.1
33.81 32.35 28.96
32.13 33.99
36.7 40.59
0
5
10
15
20
25
30
35
40
45
2001-0
2
2002-0
3
2003-0
4
2004-0
5
2005-0
6
2006-0
7
2007-0
8
2008-0
9
2009-1
0
2010-1
1
2011-1
2
2012-1
3
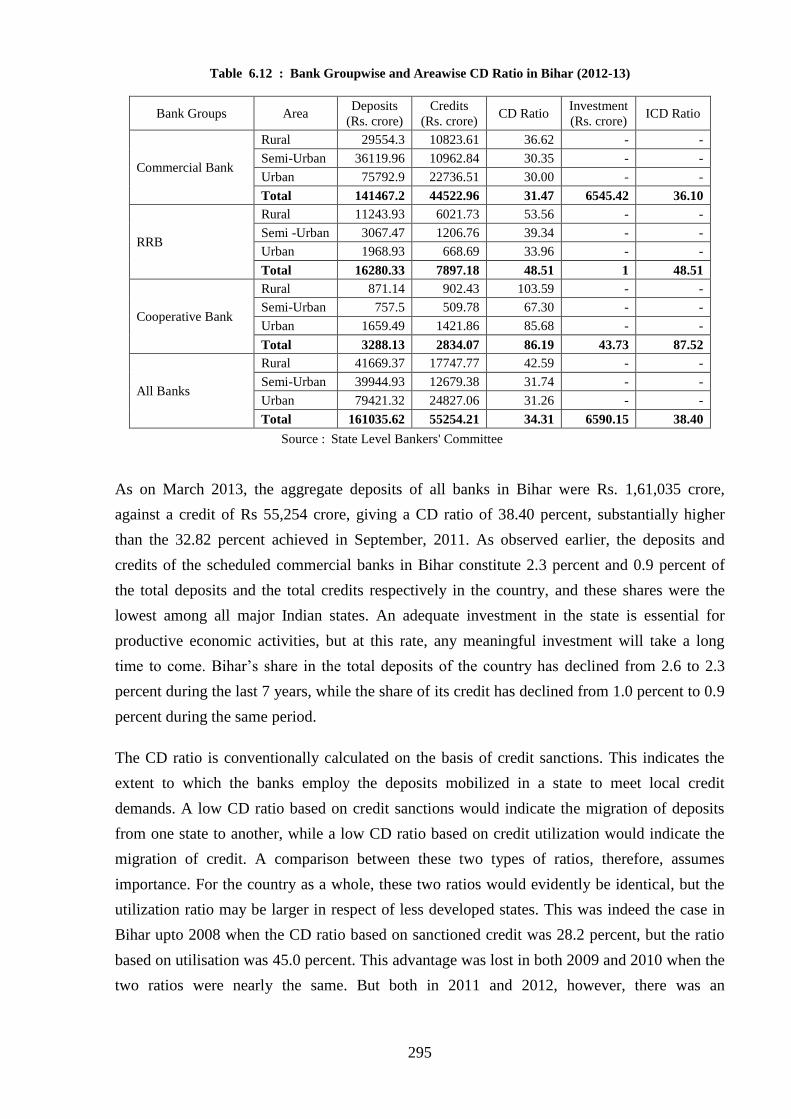
295
Table 6.12 : Bank Groupwise and Areawise CD Ratio in Bihar (2012-13)
Bank Groups Area Deposits
(Rs. crore)
Credits
(Rs. crore) CD Ratio
Investment
(Rs. crore) ICD Ratio
Commercial Bank
Rural 29554.3 10823.61 36.62 - -
Semi-Urban 36119.96 10962.84 30.35 - -
Urban 75792.9 22736.51 30.00 - -
Total 141467.2 44522.96 31.47 6545.42 36.10
RRB
Rural 11243.93 6021.73 53.56 - -
Semi -Urban 3067.47 1206.76 39.34 - -
Urban 1968.93 668.69 33.96 - -
Total 16280.33 7897.18 48.51 1 48.51
Cooperative Bank
Rural 871.14 902.43 103.59 - -
Semi-Urban 757.5 509.78 67.30 - -
Urban 1659.49 1421.86 85.68 - -
Total 3288.13 2834.07 86.19 43.73 87.52
All Banks
Rural 41669.37 17747.77 42.59 - -
Semi-Urban 39944.93 12679.38 31.74 - -
Urban 79421.32 24827.06 31.26 - -
Total 161035.62 55254.21 34.31 6590.15 38.40
Source : State Level Bankers' Committee
As on March 2013, the aggregate deposits of all banks in Bihar were Rs. 1,61,035 crore,
against a credit of Rs 55,254 crore, giving a CD ratio of 38.40 percent, substantially higher
than the 32.82 percent achieved in September, 2011. As observed earlier, the deposits and
credits of the scheduled commercial banks in Bihar constitute 2.3 percent and 0.9 percent of
the total deposits and the total credits respectively in the country, and these shares were the
lowest among all major Indian states. An adequate investment in the state is essential for
productive economic activities, but at this rate, any meaningful investment will take a long
time to come. Bihar’s share in the total deposits of the country has declined from 2.6 to 2.3
percent during the last 7 years, while the share of its credit has declined from 1.0 percent to 0.9
percent during the same period.
The CD ratio is conventionally calculated on the basis of credit sanctions. This indicates the
extent to which the banks employ the deposits mobilized in a state to meet local credit
demands. A low CD ratio based on credit sanctions would indicate the migration of deposits
from one state to another, while a low CD ratio based on credit utilization would indicate the
migration of credit. A comparison between these two types of ratios, therefore, assumes
importance. For the country as a whole, these two ratios would evidently be identical, but the
utilization ratio may be larger in respect of less developed states. This was indeed the case in
Bihar upto 2008 when the CD ratio based on sanctioned credit was 28.2 percent, but the ratio
based on utilisation was 45.0 percent. This advantage was lost in both 2009 and 2010 when the
two ratios were nearly the same. But both in 2011 and 2012, however, there was an

296
improvement, as the CD ratio based on utilisation was higher than the same based on sanction
(Table 6.13).
Table 6.13 : CD Ratio of the Scheduled Commercial Banks as on March 31
2011 2012 2013
As per
Sanction
As per
Utilization
As per
Sanction
As per
Utilization
As per
Sanction
Andhra Pradesh 109.7 114.9 111.3 119.8 109.9
Bihar 29.5 31.6 29.7 31.7 30.1
Gujarat 66.2 74.4 70.4 78.1 72.2
Haryana 71.7 85.6 79.4 94.5 76.1
Himachal Pradesh 41.6 48.6 38.9 45.0 34.6
Jharkhand 34.4 35.6 33.9 34.3 31.6
Karnataka 72.7 76.3 71.4 74.7 71.4
Kerala 73.1 73.8 76.4 75.7 73.3
Madhya Pradesh 55.6 60.1 56.6 60.7 57.7
Maharashtra 83.0 75.0 91.8 82.5 88.3
Odisha 52.5 55.7 47.3 50.6 46.1
Punjab 77.8 92.9 80.9 83.2 81.0
Rajasthan 90.4 95.8 90.9 96.1 92.2
Tamil Nadu 115.1 119.4 116.9 119.5 123.0
Uttar Pradesh 44.0 48.2 44.0 47.4 43.6
Uttarakhand 35.4 39.1 35.6 39.0 34.8
West Bengal 63.7 65.1 63.8 65.1 61.6
India 75.6 75.6 79.0 79.0 78.1
Source : Report on Trend and Progress of Banking in India 2012-13, RBI
Investment Plus Credit to Deposit (ICD) Ratio
The banks assist the economy not simply by giving credit, but also by investing a part of their
investable funds in state government securities and in shares and bonds of state undertakings,
quasi-government bodies and joint stock companies. Therefore, the total involvement of the
banks in the economic activities of a state is truly reflected not by CD ratios alone, but by the
Investment plus Credit to Deposit (ICD) ratios. From Table 6.14, it is seen that, if the ICD ratio
is taken into account, then there is a narrowing down of the inter-state disparities indicated by
CD ratios. The ICD ratios in respect of the relatively less developed states were generally
higher than their respective CD ratios whereas, for the developed states, the differences were
not much. As of March 2012, Bihar had an ICD ratio of 38.5 percent by utilisation, compared
to its ICD ratio of 36.5 percent by sanction. The ICD ratio of Bihar, however, is much lower
compared to that of states like Rajasthan (110.5 percent), Tamil Nadu (128.7 percent), Gujarat
(89.3 percent) or Karnataka (79.0 percent), as well as the national average (85.2 percent) in
March 2012. The ICD ratio in Bihar has actually dropped from its high level of 52.8 percent in
2008 to less than 40 percent in 2012.
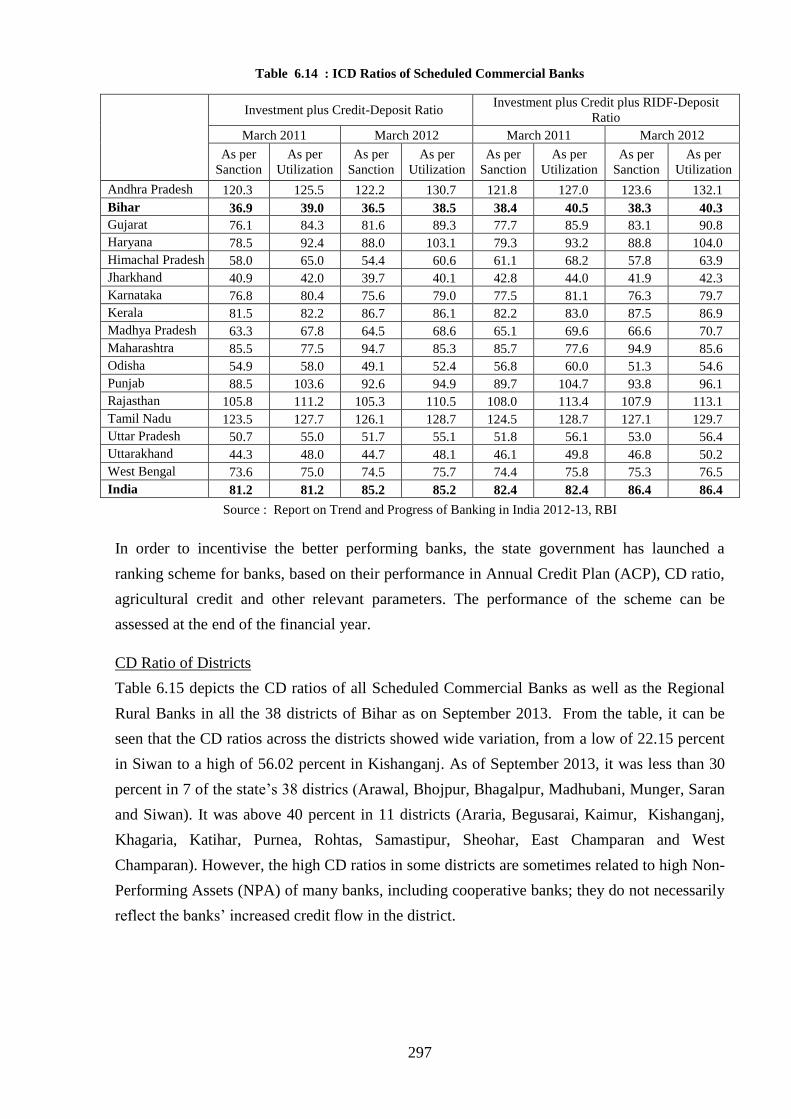
297
Table 6.14 : ICD Ratios of Scheduled Commercial Banks
Investment plus Credit-Deposit Ratio Investment plus Credit plus RIDF-Deposit
Ratio
March 2011 March 2012 March 2011 March 2012
As per
Sanction
As per
Utilization
As per
Sanction
As per
Utilization
As per
Sanction
As per
Utilization
As per
Sanction
As per
Utilization
Andhra Pradesh 120.3 125.5 122.2 130.7 121.8 127.0 123.6 132.1
Bihar 36.9 39.0 36.5 38.5 38.4 40.5 38.3 40.3
Gujarat 76.1 84.3 81.6 89.3 77.7 85.9 83.1 90.8
Haryana 78.5 92.4 88.0 103.1 79.3 93.2 88.8 104.0
Himachal Pradesh 58.0 65.0 54.4 60.6 61.1 68.2 57.8 63.9
Jharkhand 40.9 42.0 39.7 40.1 42.8 44.0 41.9 42.3
Karnataka 76.8 80.4 75.6 79.0 77.5 81.1 76.3 79.7
Kerala 81.5 82.2 86.7 86.1 82.2 83.0 87.5 86.9
Madhya Pradesh 63.3 67.8 64.5 68.6 65.1 69.6 66.6 70.7
Maharashtra 85.5 77.5 94.7 85.3 85.7 77.6 94.9 85.6
Odisha 54.9 58.0 49.1 52.4 56.8 60.0 51.3 54.6
Punjab 88.5 103.6 92.6 94.9 89.7 104.7 93.8 96.1
Rajasthan 105.8 111.2 105.3 110.5 108.0 113.4 107.9 113.1
Tamil Nadu 123.5 127.7 126.1 128.7 124.5 128.7 127.1 129.7
Uttar Pradesh 50.7 55.0 51.7 55.1 51.8 56.1 53.0 56.4
Uttarakhand 44.3 48.0 44.7 48.1 46.1 49.8 46.8 50.2
West Bengal 73.6 75.0 74.5 75.7 74.4 75.8 75.3 76.5
India 81.2 81.2 85.2 85.2 82.4 82.4 86.4 86.4
Source : Report on Trend and Progress of Banking in India 2012-13, RBI
In order to incentivise the better performing banks, the state government has launched a
ranking scheme for banks, based on their performance in Annual Credit Plan (ACP), CD ratio,
agricultural credit and other relevant parameters. The performance of the scheme can be
assessed at the end of the financial year.
CD Ratio of Districts
Table 6.15 depicts the CD ratios of all Scheduled Commercial Banks as well as the Regional
Rural Banks in all the 38 districts of Bihar as on September 2013. From the table, it can be
seen that the CD ratios across the districts showed wide variation, from a low of 22.15 percent
in Siwan to a high of 56.02 percent in Kishanganj. As of September 2013, it was less than 30
percent in 7 of the state’s 38 districs (Arawal, Bhojpur, Bhagalpur, Madhubani, Munger, Saran
and Siwan). It was above 40 percent in 11 districts (Araria, Begusarai, Kaimur, Kishanganj,
Khagaria, Katihar, Purnea, Rohtas, Samastipur, Sheohar, East Champaran and West
Champaran). However, the high CD ratios in some districts are sometimes related to high Non-
Performing Assets (NPA) of many banks, including cooperative banks; they do not necessarily
reflect the banks’ increased credit flow in the district.

298
Table 6.15 : Districtwise CD Ratio
District 2006-07 2007-08 2008-09 2009-10 2010-11 2011-12 2012-13 2013-14
(Sep, 13)
Patna 32.18 27.64 25.11 24.18 26.53 31.33 33.13 31.75
Nalanda 27.44 25.77 24.59 27.13 29.75 30.87 32.22 33.83
Bhojpur 24.95 24.51 20.74 24.5 23.90 25.17 24.53 24.94
Buxar 31.08 30.99 24.17 31.48 31.56 32.23 31.65 32.08
Rohtas 39.79 40.5 36.24 36.02 38.37 40.04 40.20 42.01
Kaimur 46.06 43.04 47.13 48.16 52.16 49.07 54.59 52.74 Gaya 28.37 28.46 28.67 31.45 32.07 31.38 33.37 34.89
Jehanabad 23.62 25.28 23.78 28.84 29.98 32.36 33.72 32.61
Arawal 26.66 26.8 26.35 32.06 45.38 31.50 32.20 27.77
Nawada 27.16 26.06 22.91 31.66 34.44 39.27 37.76 38.98
Aurangabad 26.65 23.76 23.22 27.95 31.82 33.24 34.94 32.09 Saran 26.18 23.12 23.85 26.25 24.35 24.35 22.96 24.94
Siwan 22.07 20.68 18.78 20.08 21.63 21.10 21.68 22.15
Gopalganj 29.12 30.19 25.68 25.65 28.66 28.43 27.71 30.93 West Champaran 51.69 48.99 47.31 47.12 45.69 49.14 45.46 46.85
East Champaran 43.68 42.34 36.87 38.94 44.07 42.25 43.50 46.28
Muzaffarpur 36.21 34.29 43.33 45.34 35.69 33.20 38.88 35.90
Sitamarhi 40.24 35.16 32.23 32.91 34.00 34.65 38.88 38.49
Sheohar 30.06 29.44 38.29 42.31 34.09 36.81 34.90 40.38
Vaishali 31.90 32.17 28.45 30.72 29.90 29.98 30.74 31.29 Darbhanga 29.31 26.45 22.99 26.40 28.54 26.91 36.85 37.54
Madhubani 32.68 30.32 25.55 28.32 29.40 30.59 29.82 29.94
Samastipur 38.5 36.05 37.09 39.69 44.36 42.74 37.41 40.20 Begusarai 44.95 40.32 35.59 37.83 39.63 38.95 45.24 47.60
Munger 23.35 23.17 23.28 21.02 29.64 28.08 21.25 24.00
Sheikhpura 27.61 26.72 24.94 29.77 28.60 28.93 29.82 33.26
Lakhisarai 24.4 24.23 22.83 24.26 24.95 25.25 28.09 32.46
Jamui 29.18 28.30 25.61 25.85 26.79 29.16 29.75 34.69
Khagaria 38.34 32.70 32.37 36.55 36.05 39.84 39.03 50.65 Bhagalpur 37.77 35.79 30.98 30.09 28.97 24.92 28.76 29.83
Banka 44.62 40.55 33.86 35.83 35.15 36.45 38.85 38.96 Saharsa 33.90 36.31 29.03 37.52 34.53 33.53 34.80 37.85
Supaul 32.38 35.66 28.16 31.99 36.10 35.83 39.97 39.00
Madhepura 42.63 42.29 26.43 28.06 43.39 31.78 37.10 35.34 Purnea 51.33 51.53 45.09 49.79 53.12 50.92 54.24 55.26
Kishanganj 53.17 52.77 49.1 49.85 53.34 50.65 52.58 56.02
Araria 51.69 50.72 38.03 38.57 45.84 48.96 48.52 54.50
Katihar 58.19 55.59 43.98 45.59 44.92 44.29 42.37 42.28
Source : State Level Bankers' Committee
CD Ratio of Commercial Banks in Bihar
Tables 6.16 and 6.17 show the CD ratios of nationalized and private commercial banks in
Bihar. Among the Lead Banks, Central Bank of India had the highest CD ratio of 37.12 percent
as on September 2013, followed closely by UCO Bank (35.96 percent) and Bank of Baroda
(35.88 percent). Canara Bank has also maintained a consistently high CD rations since 2006-

299
07. Among the other nationalized banks, two subsidiary banks of the State Bank State India
(Bank of Bikaner & Jaipur and State Bank of Patiala) had the highest CD ratios, close to 70
percent, while Corporation Bank had a CD ratio close to 60 percent as of September 2013.
The Indian Overseas Bank has improved its CD ratio from 17.81 percent in March 2012 to
44.42 percent in September, 2013. Bank of Maharashtra, Indian Bank and Punjab and Sind
Bank had CD ratios less than 20 percent as of September 2013.
Table 6.16 : CD Ratio of Nationalised Commercial Banks
Banks
No. of
Branches
in 2013
2006-07 2007-08 2008-09 2009-10 2010-11 2011-12 2012-13 2013-14
(Sep, 13)
Lead Banks
State Bank of India 772 27.10 27.99 24.72 24.76 28.09 31.21 26.5 34.74
Central Bank of India 410 32.58 30.92 35.52 35.91 34.69 33.91 37.31 37.12
Punjab National Bank 496 26.63 24.98 27.13 32.50 29.74 33.05 30.46 33.38
Canara bank 125 34.88 33.80 30.80 32.28 33.71 39.40 39.07 35.40
UCO Bank 207 41.21 41.10 32.52 27.59 36.05 28.88 36.31 35.96
Bank of Baroda 150 52.04 30.91 31.42 31.14 34.27 33.57 35.08 35.88
Union Bank of India 97 42.17 35.28 26.93 27.51 26.67 36.78 22.29 32.40
Other Banks
Bank of India 281 33.19 33.77 30.38 33.53 35.02 35.02 37.53 38.11
Allahabad Bank 188 38.76 32.92 27.39 27.97 26.62 30.50 34.17 37.28
Andhra Bank 15 20.47 20.35 24.44 23.00 20.18 21.35 23.32 42.81
Bank of Maharastra 10 40.29 24.21 17.18 19.41 14.55 17.18 7.89 5.62
Corporation Bank 16 8.99 NA 16.49 8.84 7.79 75.00 20.44 58.75
Dena Bank 25 24.73 21.33 18.78 19.34 11.64 09.49 41.94 30.45
Indian Bank 44 23.74 27.17 25.15 23.61 20.26 32.33 21.57 17.91
Indian Overseas bank 38 13.11 11.92 11.29 12.15 13.60 17.81 36.77 44.42
Oriental Bank of
Commerce 36 50.07 41.47 37.67 NA 24.40 30.41 42.67 45.22
Punjab and Sind Bank 8 46.82 NA NA NA 10.73 11.10 10.82 19.95
Syndicate Bank 45 57.37 54.23 45.27 44.57 41.67 39.92 41.43 41.71
United Bank of India 83 32.39 28.27 24.36 27.10 27.82 34.48 46.94 48.34
Vijaya Bank 10 23.19 23.43 21.64 20.84 21.28 21.93 22.77 21.94
State Bank of B&J 9 52.41 29.22 25.84 24.80 27.41 41.28 43.19 68.13
State Bank of Patiala 1 46.29 35.85 NA 81.33 86.30 63.29 55.32 67.32
State 5270 33.75 31.62 28.96 30.99 31.37 34.90 40.59 40.52
Source : State Level Bankers' Committee
The CD ratios of private commercial banks in Bihar need a separate mention (Table 6.17).
There are 167 branches of 9 private banks in Bihar, with CD ratios varying from only 1.32
percent to 50.40 percent. Except for 12 rural branches of only two banks (Axis Bank and
IndusInd Bank), all other branches of private commercial banks were either in semi-urban or
urban areas; even their presence in semi-urban was rather limited. The combined CD ratio of
them was 28.64 percent in March 2013.

300
Table 6.17 : CD Ratio of Private Commercial Banks (2012-13)
Banks
Rural Urban and Semi-urban Total
No. of
branches
Deposit
(Rs.
lakh)
Advance
(Rs.
lakh)
No. of
branches
Deposit
(Rs.
lakh)
Advance
(Rs.
lakh)
No. of
branches
Deposit
(Rs.
lakh)
Advance
(Rs.
lakh)
CD
Ratio
ICICI Bank 0 0 0 39 143674 28608 39 143674 28608 19.91
Federal Bank 0 0 0 5 12582 1060 5 12582 1060 8.42
Jammu
Kashmir Bank 0 0 0 1 3917 1285 1 3917 1285
32.81
South Indian
Bank 0 0 0 1 1146 473 1 1146 473
41.27
Ing Vysya
Bank 0 0 0 2 8115 107 2 8115 107
1.32
Axis Bank 9 0 0 40 275049 57775 49 275049 57775 21.01
HDFC Bank 0 0 0 61 181079 91267 61 181079 91267 50.40
Indusind Bank 3 602 3 3 73912 22615 6 74514 22618 30.35
Karnataka
Bank 0 0 0 1 5143 1406 1 5143 1406
27.34
Kotak
Mahindra 0 0 0 2 15218 1739 2 15218 1739
11.43
All banks 12 602 3 155 719835 206335 167 720437 206338 28.64
Source : State Level Bankers' Committee
CD Ratios of Regional Rural Banks (RRB)
There are 3 regional rural banks in Bihar, each serving a particular zone: Madhya Bihar
Kshetriya Gramin Bank sponsored by the Punjab National Bank, Uttar Bihar Kshetriya
Gramin Bank sponsored by the Central Bank of India and Bihar Kshetriya Gramin Bank
sponsored by the UCO Bank. Table 6.18 shows the CD ratios of these 3 regional rural banks.
Bihar Keshtriya Gramin Bank has the highest CD ratio of 63.44 percent in September 2013,
while Madhya Bihar Keshtriya Gramin Bank has the lowest CD ratio of 42.63 percent. Their
relative positions have remained the same since the last year, except for Bihar KGB after the
merger of Samastipur KGB with it during the year. The overall CD ratio of RRBs in the state
in September 2013 was 51.58 percent, an improvement over 48.51 percent recorded in March
2013 and 46.37 percent recorded in March 2012.
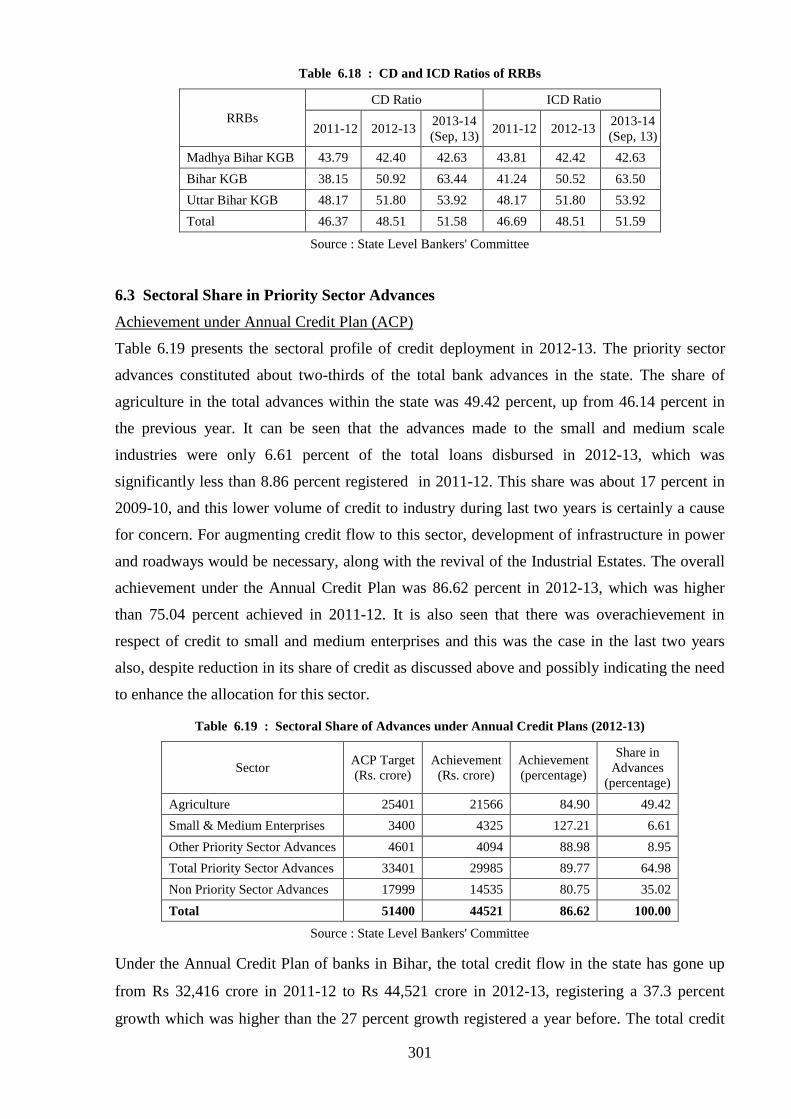
301
Table 6.18 : CD and ICD Ratios of RRBs
RRBs
CD Ratio ICD Ratio
2011-12 2012-13 2013-14
(Sep, 13) 2011-12 2012-13
2013-14
(Sep, 13)
Madhya Bihar KGB 43.79 42.40 42.63 43.81 42.42 42.63
Bihar KGB 38.15 50.92 63.44 41.24 50.52 63.50
Uttar Bihar KGB 48.17 51.80 53.92 48.17 51.80 53.92
Total 46.37 48.51 51.58 46.69 48.51 51.59
Source : State Level Bankers' Committee
6.3 Sectoral Share in Priority Sector Advances
Achievement under Annual Credit Plan (ACP)
Table 6.19 presents the sectoral profile of credit deployment in 2012-13. The priority sector
advances constituted about two-thirds of the total bank advances in the state. The share of
agriculture in the total advances within the state was 49.42 percent, up from 46.14 percent in
the previous year. It can be seen that the advances made to the small and medium scale
industries were only 6.61 percent of the total loans disbursed in 2012-13, which was
significantly less than 8.86 percent registered in 2011-12. This share was about 17 percent in
2009-10, and this lower volume of credit to industry during last two years is certainly a cause
for concern. For augmenting credit flow to this sector, development of infrastructure in power
and roadways would be necessary, along with the revival of the Industrial Estates. The overall
achievement under the Annual Credit Plan was 86.62 percent in 2012-13, which was higher
than 75.04 percent achieved in 2011-12. It is also seen that there was overachievement in
respect of credit to small and medium enterprises and this was the case in the last two years
also, despite reduction in its share of credit as discussed above and possibly indicating the need
to enhance the allocation for this sector.
Table 6.19 : Sectoral Share of Advances under Annual Credit Plans (2012-13)
Sector ACP Target
(Rs. crore)
Achievement
(Rs. crore)
Achievement
(percentage)
Share in
Advances
(percentage)
Agriculture 25401 21566 84.90 49.42
Small & Medium Enterprises 3400 4325 127.21 6.61
Other Priority Sector Advances 4601 4094 88.98 8.95
Total Priority Sector Advances 33401 29985 89.77 64.98
Non Priority Sector Advances 17999 14535 80.75 35.02
Total 51400 44521 86.62 100.00
Source : State Level Bankers' Committee
Under the Annual Credit Plan of banks in Bihar, the total credit flow in the state has gone up
from Rs 32,416 crore in 2011-12 to Rs 44,521 crore in 2012-13, registering a 37.3 percent
growth which was higher than the 27 percent growth registered a year before. The total credit

302
flow in Bihar during the past five years is shown in the Table 6.20. The achievement
percentages have not been uniform, ranging from 69.06 percent in 2010-11 to 86.62 percent in
the current year, but there is an upward trend since 2010-11 in achievement rates. It is also
seen that there were wide variations in achievement rates among the various bank groups,
ranging from as low as 14.55 percent in the case of cooperative banks to 94.85 percent in case
of Regional Rural Banks (Table 6.21).
Table 6.20 : ACP Achievement - All Banks
Year Target
(Rs. crore)
Achievement
(Rs. crore)
Achievement
(percentage)
2007-08 13100 10763 82.16
2008-09 17492 13548 77.45
2009-10 21128 17537 83.00
2010-11 37000 25552 69.06
2011-12 43200 32416 75.04
2012-13 51400 44521 86.62
Source: State Level Bankers' Committee
Table 6.21 : Agencywise Analysis of ACP Achievement (2012-13)
Agencies Target
(Rs. crore)
Achievement
(Rs. crore)
Achievement
(percentage)
Commercial Banks 38028 33701 88.62
Regional Rural Bank 11050 10482 94.85
Cooperative Banks 2322 338 14.55
Total 51400 44521 86.62
Source : State Level Bankers' Committee
Outstanding Agricultural Advances
The data on the extent of credit flow to agriculture in Bihar during the five year period 2008-09
to 2012-13 is presented in Table 6.22. The agricultural credit flow had expanded faster since
2009-10. In 2012-13, except for the Co-operative Banks, achievements have been more than 90
percent in respect of both Commercial Banks and RRBs. It was, of course, the commercial
banks that accounted for the major share in the total credit, which was 61.2 percent in 2012-13.
The outstanding agricultural advances stood at Rs. 22,538 crore at the end of 2012-13. This
implied an annual growth rate of 20.3 percent in total outstanding credit to agriculture during
the period 2008-2013 (Table 6.23).

303
Table 6.22 : Agriculture Credit Flow
(Rs. crore)
Year Commercial Bank RRBs CCB Total
Target Achievement Target Achievement Target Achievement Target Achievement
2008-09 4355 3943 (90.5) 1822 1438 (78.1) 899 317 (35.3) 7076 5697 (80.5)
2009-10 5425 4960 (91.4) 2220 1851 (84.0) 1082 353(32.6) 8727 7163 (82.1)
2010-11 9111 7058 (77.5) 5228 3188 (61.0) 1529 422 (27.6) 15868 10667 (67.2)
2011-12 12241 9689 (79.2) 7013 4882 (69.6) 1848 387 (20.9) 21102 14958 (70.9)
2012-13 14674 13203 (90.0) 8407 8035 (95.6) 2319 328 (14.2) 25401 21566 (84.9)
Source: State Level Bankers' Committee (Figures in bracket indicate percentage of achievement.)
Table 6.23 : Outstanding Agricultural Advances
Year
Outstanding Agricultural Advances (Rs. crore) Annual
Growth
Rate Commercial
Banks RRBs
Cooperative
& LDBs Total
2008-09 6409 2206 308 8923 15.6
2009-10 8521 3104 292 11916 33.5
2010-11 10664 3270 48 13982 17.3
2011-12 12426 3445 2418 18290 30.8
2012-13 15422 4219 2824 22538 23.2
Source: State Level Bankers' Committee
Selected Indicators of Functioning of PACS
Table 6.24 shows some selected indicators of functioning of Primary Agricultural Credit
Societies (PACS) in different states as on 31st March 2012. Though with 8463 PACS, Bihar
accounts for 9.1 percent of all PACS in India, in terms of both deposits and borrowings, Bihar
is much behind the other states. Also, out of the total 8463 PACS in Bihar, as many as 3962
societies are making losses, their total losses being Rs 1 crore, while 1180 societies have
earned a total profit of Rs 6 crore only. The total deposits of all PACS were only Rs 175 crore.
As on March 31, 2012, their total borrowings amounted to Rs 508 crore. There was no
information about their outstanding dues as at the end of 2011-12.

304
Table 6.24 : Select Indicators of Primary Agricultural Credit Societies (March 31, 2012)
State No. of
PACS
Deposits
(Rs crore)
Borrow-
ings
(Rs crore)
Loans and Advances
Outstanding
(Rs crore)
Societies in Profit Societies in Loss
Agricul-
ture
Non-
Agricul-
ture
No.
Amount
(Rs
crore)
No.
Amount
(Rs
crore)
Andhra Pradesh 2807 1260 35043 4237 184 1222 50 1585 440
Bihar 8463 175 508 - - 1180 6 3962 1
Gujarat 8154 1172 9491 4643 225 4784 92 2180 95
Haryana 640 532 8805 5778 430 83 42 557 308
Himachal
Pradesh 2117
829 2351 501 - 1724 23 332 3
Jharkhand 498 77 488 287 - 118 2 380 29
Karnataka 4739 2282 7919 3877 587 2758 109 1760 61
Kerala 1566 31879 34558 2545 20967 771 150 732 304
Madhya Pradesh 4457 817 6456 3400 119 2153 131 2129 178
Maharashtra 21402 142 18096 8098 2002 10079 3 10949 4
Odisha 2452 1074 3888 2639 67 630 25 1792 349
Punjab 1609 434 1206 1183 36 925 199 472 829
Rajasthan 5671 1395 7015 3012 187 4049 83 1113 34
Tamil Nadu 4538 5331 15897 3770 9835 3472 279 1062 568
Uttar Pradesh 8929 68 1259 800 - 4536 18 1968 2
Uttarakhand 758 353 863 355 109 562 38 185 9
West Bengal 7962 1960 4868 1449 - 4571 29 3391 22
India 92432 50252 160508 47238 34862 45433 1405 36375 3427
Source : Report on Trends and Progress of Banking in India 2012-13, RBI
The poor resource base of the PACS, their poor management and low level of participation of
their members are major bottlenecks to increase the credit flow through PACS. As indicated by
NABARD, the capacity of the PACS is limited to meet only the credit requirements of its
members to some extent; in order to enable them to provide more services to their members
and generate income for themselves, it is necessary to develop them as Multi-service Centres
to provide ancillary services to their members and diversify its activities.
Working of State Cooperative Banks
Table 6.25 shows the working results of State Cooperative Banks in the major Indian states.
The recovery percentage for these banks in Bihar improved significantly from 36.0 percent in
2008 to 72.1 percent in both 2011 and 2012; but it was still far lower than the national average
of 93.9 percent. The share of Non-Performing Assets (NPA) in the total outstanding loans in
Bihar was 24.2 percent in 2012; and it was much higher than the national average of only 6.8

305
percent. These banks have been reporting the same working results for the last 3 years without
any changes.
Table 6.25 : Working Results of State Cooperative Banks
State
Profit/Loss
(Rs. crore)
NPAs as percentage
to Loans Outstanding
Recovery (percentage)
As at end-June
2011 2012 2011 2012 2011 2012
Andhra Pradesh 112 92 2.7 1.0 95.6 96.8
Bihar 6 6 24.2 24.2 72.1 72.1
Gujarat 14 14 9.0 2.1 87.8 99.1
Haryana 5 5 - - 99.9 99.9
Himachal Pradesh 40 41 12.5 12.6 67.0 71.9
Karnataka 23 29 4.1 4.9 97.5 97.7
Kerala -66 -101 15.3 12.7 85.8 85.1
Madhya Pradesh 40 64 3.2 1.5 97.3 97.4
Maharashtra -252 175 23.5 21.2 70.6 83.8
Odisha 11 11 5.1 5.9 96.8 97.1
Punjab 26 27 1.1 0.9 99.3 99.4
Rajasthan 24 20 1.1 0.8 98.4 97.0
Tamil Nadu 41 60 2.7 3.3 99.4 98.3
Uttar Pradesh 21 30 7.8 6.2 91.9 93.2
Uttarakhand 3 3 10.1 4.9 95.1 97.2
West Bengal 10 -60 3.1 - 93.3 93.3
India 205 523 8.6 6.8 91.8 93.9
Source : Report on Trends and Progress of Banking in India 2012-13 RBI
Working of SCARDBs
Table 6.26 shows the working results of State Cooperative Agriculture and Rural Development
Banks (SCARDB) in the major Indian states. Here also, the recovery rate in Bihar was very
poor at only 2.0 percent in 2010-11, compared with the national average of 40.2 percent. The
data for recovery rates for 2012 are not available. In Bihar, the Non-Performing Assets (NPA)
constituted as much as 82.8 percent of their total outstanding loans in 2012, little less than 85.3
percent registered in 2011. It was much higher than the national average of only 32.3 and 33.1
percent respectively in these two years. The total losses of these banks in Bihar had shot up
from Rs 5.2 crore in 2010-11 to Rs 503.4 crore in 2011-12.
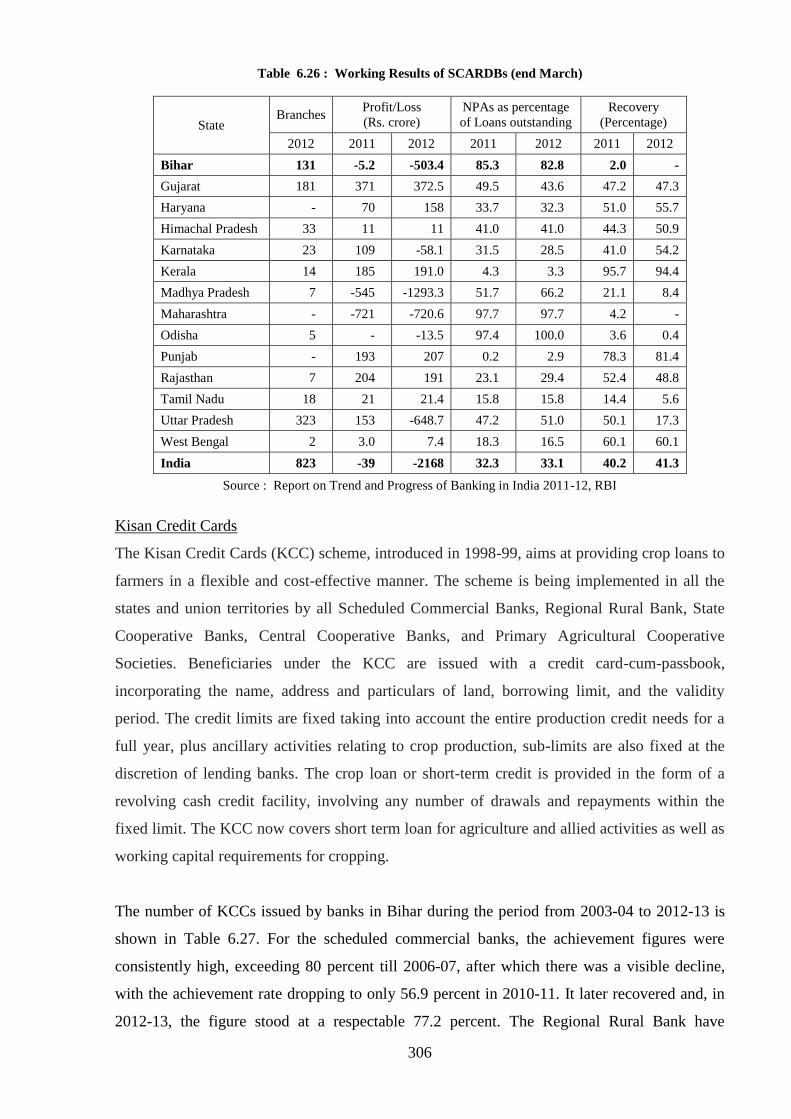
306
Table 6.26 : Working Results of SCARDBs (end March)
State Branches
Profit/Loss
(Rs. crore)
NPAs as percentage
of Loans outstanding
Recovery
(Percentage)
2012 2011 2012 2011 2012 2011 2012
Bihar 131 -5.2 -503.4 85.3 82.8 2.0 -
Gujarat 181 371 372.5 49.5 43.6 47.2 47.3
Haryana - 70 158 33.7 32.3 51.0 55.7
Himachal Pradesh 33 11 11 41.0 41.0 44.3 50.9
Karnataka 23 109 -58.1 31.5 28.5 41.0 54.2
Kerala 14 185 191.0 4.3 3.3 95.7 94.4
Madhya Pradesh 7 -545 -1293.3 51.7 66.2 21.1 8.4
Maharashtra - -721 -720.6 97.7 97.7 4.2 -
Odisha 5 - -13.5 97.4 100.0 3.6 0.4
Punjab - 193 207 0.2 2.9 78.3 81.4
Rajasthan 7 204 191 23.1 29.4 52.4 48.8
Tamil Nadu 18 21 21.4 15.8 15.8 14.4 5.6
Uttar Pradesh 323 153 -648.7 47.2 51.0 50.1 17.3
West Bengal 2 3.0 7.4 18.3 16.5 60.1 60.1
India 823 -39 -2168 32.3 33.1 40.2 41.3
Source : Report on Trend and Progress of Banking in India 2011-12, RBI
Kisan Credit Cards
The Kisan Credit Cards (KCC) scheme, introduced in 1998-99, aims at providing crop loans to
farmers in a flexible and cost-effective manner. The scheme is being implemented in all the
states and union territories by all Scheduled Commercial Banks, Regional Rural Bank, State
Cooperative Banks, Central Cooperative Banks, and Primary Agricultural Cooperative
Societies. Beneficiaries under the KCC are issued with a credit card-cum-passbook,
incorporating the name, address and particulars of land, borrowing limit, and the validity
period. The credit limits are fixed taking into account the entire production credit needs for a
full year, plus ancillary activities relating to crop production, sub-limits are also fixed at the
discretion of lending banks. The crop loan or short-term credit is provided in the form of a
revolving cash credit facility, involving any number of drawals and repayments within the
fixed limit. The KCC now covers short term loan for agriculture and allied activities as well as
working capital requirements for cropping.
The number of KCCs issued by banks in Bihar during the period from 2003-04 to 2012-13 is
shown in Table 6.27. For the scheduled commercial banks, the achievement figures were
consistently high, exceeding 80 percent till 2006-07, after which there was a visible decline,
with the achievement rate dropping to only 56.9 percent in 2010-11. It later recovered and, in
2012-13, the figure stood at a respectable 77.2 percent. The Regional Rural Bank have
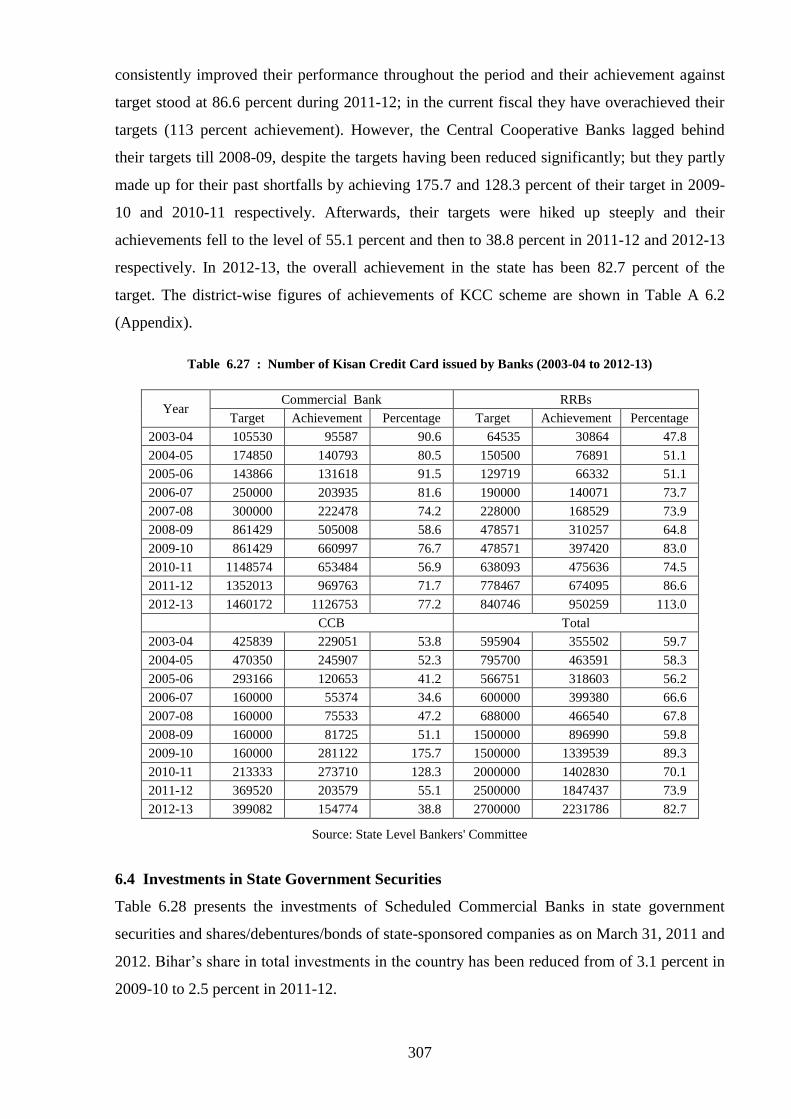
307
consistently improved their performance throughout the period and their achievement against
target stood at 86.6 percent during 2011-12; in the current fiscal they have overachieved their
targets (113 percent achievement). However, the Central Cooperative Banks lagged behind
their targets till 2008-09, despite the targets having been reduced significantly; but they partly
made up for their past shortfalls by achieving 175.7 and 128.3 percent of their target in 2009-
10 and 2010-11 respectively. Afterwards, their targets were hiked up steeply and their
achievements fell to the level of 55.1 percent and then to 38.8 percent in 2011-12 and 2012-13
respectively. In 2012-13, the overall achievement in the state has been 82.7 percent of the
target. The district-wise figures of achievements of KCC scheme are shown in Table A 6.2
(Appendix).
Table 6.27 : Number of Kisan Credit Card issued by Banks (2003-04 to 2012-13)
Year Commercial Bank RRBs
Target Achievement Percentage Target Achievement Percentage
2003-04 105530 95587 90.6 64535 30864 47.8
2004-05 174850 140793 80.5 150500 76891 51.1
2005-06 143866 131618 91.5 129719 66332 51.1
2006-07 250000 203935 81.6 190000 140071 73.7
2007-08 300000 222478 74.2 228000 168529 73.9
2008-09 861429 505008 58.6 478571 310257 64.8
2009-10 861429 660997 76.7 478571 397420 83.0
2010-11 1148574 653484 56.9 638093 475636 74.5
2011-12 1352013 969763 71.7 778467 674095 86.6
2012-13 1460172 1126753 77.2 840746 950259 113.0
CCB Total
2003-04 425839 229051 53.8 595904 355502 59.7
2004-05 470350 245907 52.3 795700 463591 58.3
2005-06 293166 120653 41.2 566751 318603 56.2
2006-07 160000 55374 34.6 600000 399380 66.6
2007-08 160000 75533 47.2 688000 466540 67.8
2008-09 160000 81725 51.1 1500000 896990 59.8
2009-10 160000 281122 175.7 1500000 1339539 89.3
2010-11 213333 273710 128.3 2000000 1402830 70.1
2011-12 369520 203579 55.1 2500000 1847437 73.9
2012-13 399082 154774 38.8 2700000 2231786 82.7
Source: State Level Bankers' Committee
6.4 Investments in State Government Securities
Table 6.28 presents the investments of Scheduled Commercial Banks in state government
securities and shares/debentures/bonds of state-sponsored companies as on March 31, 2011 and
2012. Bihar’s share in total investments in the country has been reduced from of 3.1 percent in
2009-10 to 2.5 percent in 2011-12.

308
Table 6.28 : Statewise Distribution of Investments of SCBs
States
Total Investments
(Rs. crore)
Percentage Share in
India total
2011 2012 2011 2012
Andhra Pradesh 31023 37724 10.19 9.99
Bihar 8830 9424 2.90 2.50
Gujarat 25804 33865 8.48 8.97
Haryana 8785 12582 2.89 3.33
Himachal Pradesh 5307 5905 1.74 1.56
Jharkhand 4884 5144 1.60 1.36
Karnataka 14234 17404 4.68 4.61
Kerala 14354 20735 4.72 5.49
Madhya Pradesh 10593 13188 3.48 3.49
Maharashtra 35903 43655 11.80 11.56
Odisha 2407 2326 0.79 0.62
Punjab 16342 20153 5.37 5.34
Rajasthan 19674 21700 6.46 5.75
Tamil Nadu 28606 36745 9.40 9.73
Uttar Pradesh 25017 33105 8.22 8.77
Uttarakhand 4322 5104 1.42 1.35
West Bengal 31264 39881 10.27 10.56
India 304318 377677 100.00 100.00
Source : Statistical Tables Relating to Banks in India 2012-13 RBI
6.5 Financial Institutions
National Bank for Agriculture and Rural Development (NABARD)
NABARD has a mandate for facilitating credit flow for development of agriculture, agro-
industries, village and cottage industries, handicrafts and other rural crafts by providing
refinance to lending institutions in rural areas. It also coordinates the operations of rural credit
institutions and offers training and research facilities. In addition, it manages the Rural
Infrastructure Development Fund (RIDF), created to compensate for the shortfall in
commercial banks’ lending to agriculture by providing loans to state governments for projects
relating to irrigation, soil conservation, watershed management, drinking water supply, cold
storage chains and other rural infrastructure projects.
The details of sectorwise refinancing by NABARD till Match, 2013 are shown in Table 6.29.
Refinancing by NABARD has been continuously increasing and stood at Rs 2500 crore at the
end of 2012-13. In 2012-13, there were increase in both investment credit refinancing and
RIDF loan, which is almost certain to raise the level of total financial support. More than half
the financial support has been provided by way of RIDF loans, discussed in the next section.
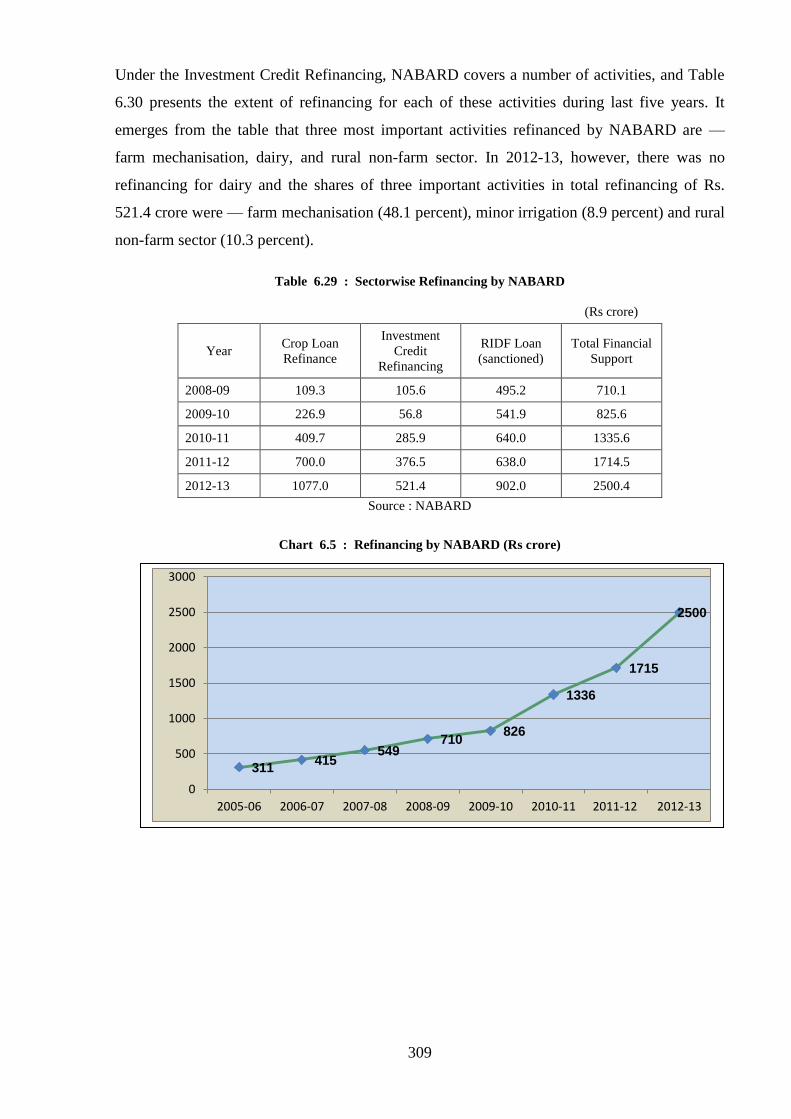
309
Under the Investment Credit Refinancing, NABARD covers a number of activities, and Table
6.30 presents the extent of refinancing for each of these activities during last five years. It
emerges from the table that three most important activities refinanced by NABARD are —
farm mechanisation, dairy, and rural non-farm sector. In 2012-13, however, there was no
refinancing for dairy and the shares of three important activities in total refinancing of Rs.
521.4 crore were — farm mechanisation (48.1 percent), minor irrigation (8.9 percent) and rural
non-farm sector (10.3 percent).
Table 6.29 : Sectorwise Refinancing by NABARD
(Rs crore)
Year Crop Loan
Refinance
Investment
Credit
Refinancing
RIDF Loan
(sanctioned)
Total Financial
Support
2008-09 109.3 105.6 495.2 710.1
2009-10 226.9 56.8 541.9 825.6
2010-11 409.7 285.9 640.0 1335.6
2011-12 700.0 376.5 638.0 1714.5
2012-13 1077.0 521.4 902.0 2500.4
Source : NABARD
Chart 6.5 : Refinancing by NABARD (Rs crore)
311 415
549 710
826
1336
1715
2500
0
500
1000
1500
2000
2500
3000
2005-06 2006-07 2007-08 2008-09 2009-10 2010-11 2011-12 2012-13

310
Table 6.30 : Details of Sector-wise Investment Credit Refinance in Bihar by NABARD
(Rs. crore)
Sectors 2008-09 2009-10 2010-11 2011-12 2012-13
Minor Irrigation 0.00 1.08 39.38 32.72 46.57
Farm Mechanization 26.65 47.41 81.92 97.76 250.84
SGSY 1.55 0.00 3.05 - -
Dairy 0.33 2.89 92.56 70.62 -
SC/ST Action Plan 0.00 0.00 0.05 0.36 -
Self Help Groups 19.31 0.00 40.57 43.66 -
PMRY 5.57 0.00 0.55 0.00 -
Rural Non-Farm Sector 11.68 0.00 22.84 97.80 53.56
Others 40.50 5.42 5.07 33.62 170.46
Total 105.59 56.80 285.99 376.54 521.43
Source : NABARD, Statistical Statement 2012-13
6.6 Rural Infrastructure Development Fund (RIDF)
The RIDF was set up by the central government in 1995-96 for financing ongoing rural
infrastructure projects by providing low cost fund support to state governments and state-
owned corporations for quick completion of ongoing projects in medium and minor irrigation,
soil conservation, watershed management and other forms of rural infrastructure. The fund is
managed by NABARD. The scheduled commercial banks contribute to the fund to the extent
of their shortfall in stipulated priority sector lending to agriculture. Till the end of March, 2013,
18 tranches of RIDF have been released covering a total cumulative sanction for Rs.1,62,083
crore for the entire country, out of which only Rs 1,10,963 crore (68.5 percent) have been
disbursed (Table 6.31). For Bihar, however, only Rs 3969 crore (56.5 percent) of the total
sanctions of Rs 7025 crore could be disbursed till March 2013. As Bihar was able to utilise
only 66 percent of the total disbursed fund, the actual resource support through RIDF was
limited in Bihar.

311
Table 6.31 : Cumulative Disbursements under RIDF till March 2013
(Rs crore)
Sanctions Disbursement Disbursement
Percentage
Utilisation
Percentage
Andhra Pradesh 15413 11435 74.2 85
Bihar 7025 3969 56.5 66
Gujarat 12366 9647 78.0 91
Haryana 3848 2607 67.7 85
Himachal Pradesh 3929 2711 69.0 85
Jharkhand 4352 3124 71.8 85
Karnataka 7797 5729 73.5 89
Kerala 5331 3161 59.3 73
Madhya Pradesh 12042 7604 63.1 81
Maharashtra 10014 7022 70.1 85
Odisha 8621 5088 59.0 75
Punjab 5788 4000 69.1 81
Rajasthan 11467 7378 64.3 69
Tamil Nadu 11208 8570 76.5 91
Uttar Pradesh 14228 10343 72.7 89
Uttarakhand 3325 2180 65.6 106
West Bengal 9931 6047 60.9 89
India 162083 110963 68.5 85
Source : NABARD
The total disbursements made by NABARD under the various tranches of the RIDF in Bihar
are shown in Table 6.32. There was a huge shortfall between sanction and disbursement. Till
March 2012, the disbursements stood at 66.8 percent of the sanctions, which had fallen to 56.5
percent by March 2013. Such shortfall in disbursements of RIDF funds as compared to
sanctions has been a continuing feature and a matter of concern in the implementation of RIDF
in Bihar.
Table 6.32 : Sanctions and Disbursements in Bihar under RIDF till March, 2013
(Rs. crore)
RIDF Tranche Sanction Disbursement Disbursement
Percentage
RIDF I -X 508 353 69.5
RIDF XI 459 418 91.1
RIDF XII 308 222 72.1
RIDF XIII 569 501 88.0
RIDF XIV 752 681 90.6
RIDF XV 813 581 71.5
RIDF XVI 1090 508 46.6
RIDF XVII 1034 436 42.2
RIDF XVIII 1490 269 18.1
Total till March 2012 5535 3700 66.8
Total till March 2013 7025 3969 56.5
Source : NABARD Annual Report, 2013

312
At present, RIDF covers a wide range of 31 activities classified broadly under three categories
— (i) Agriculture and Related sectors, (ii) Social Sectors and (iii) Rural connectivity.
(i) Agriculture and Related Sectors : These include irrigation projects, soil conservation,
flood protection, watershed, reclamation of water-logged areas, animal husbandry,
plantation and horticulture, seed, agriculture and horticulture farms, forest development,
fishing harbour/jetties, riverine fisheries; market yards, godowns, marketing
infrastructure; cold storages; grading/certifying mechanisms; testing laboratories; hydel
projects (up to 10 MW); village knowledge centres; infrastructure for IT in rural areas;
desalination plants in coastal areas and setting up of KVIC industrial estates/centres. The
loans are provided at 95 per cent of project cost to all states.
(ii) Social Sectors : These activities include drinking water projects; public health
institutions; construction of toilet blocks in existing schools (especially for girls) and Pay
& Use toilets in rural areas, and construction of Anganwadi Centres. The loans for the
above sectors are provided at 90 per cent of project cost for North-East Region and hilly
states and at 85 per cent to all other states.
(iii) Rural Connectivity : These projects include rural roads and rural bridges and a loan for
this sector is being provided at 90 per cent of the project cost to North Eastern Region
and hilly states and at 80 per cent to all other states.
The RIDF was created to provide the following benefits: (i) unlocking of sunk investment
already made by the state governments, (ii) creation of additional irrigation potential, (iii)
generation of additional employment for the rural people, (iv) contribution to the economic
wealth of the state economy, (v) improved connectivity to villages and marketing centres, (vi)
improvements in quality of life through facilities in education, health and drinking water
supply. Cumulative benefits generated by the RIDF in Bihar till 31 March 2012 were reported
in the Economic Survey last year where it was mentioned that Bihar had potentially created
recurring employment for 2.32 lakh people so far, besides creating non-recurring employment
potential for 2262 lakh mandays. The benefits included creation of irrigation potential for 6
lakh hectares, besides building 28,227 meters of bridges and 4453 kms of roads. The total
value of all these had amounted to Rs 702 crore. The progress of RIDF during 2012-13 under
tranche XVIII is shown in Table 6.33.
During 2012-13, the 678 RIDF projects operating in the state could create irrigation potential
for 109 lakh hectares, besides building 26,881 meters of bridges and 56 kms of roads, the total
value of all of which had amounted to Rs 26.56 crore. These projects also created employment
potential for 3527 people. However, Bihar’s achievements are very modest, when compared
with the other states like Andhra Pradesh, Gujarat, Odisha, Tamil Nadu or Uttar Pradesh.

313
Table 6.33 : Estimated Benefits under RIDF –XVIII as on March, 2013
State
No. of
Projects
Potential Value of
Production
(Rs crore)
Recurring
Employment
(Nos.) Irrigation
(‘000 ha.)
Bridges
(m.)
Roads
(km.)
Andhra Pradesh 959 15838 4737 978 130.89 83734
Bihar 678 10860 26881 56 26.56 3527
Gujarat 3806 301533 - - - 69400
Jharkhand 133 ---- 12608 264 - --
Maharashtra 827 ---- 4514 1564 - --
Odisha 25894 327184 8940 642 535.29 175554
Punjab 196 124958 - - 416.81 60008
Rajasthan 2391 23246 4319 4621 - 61734
Tamil Nadu 3058 8236 6645 1911 - 138869
Uttar Pradesh 985 373311 - 1093 478.30 167873
West Bengal 392 28689 130 931 98.36 41807
All India 46695 1536504 78630 20079 3112 1232726
Source : NABARD Annual Report, 2013, Statement 5 R
6.7 Micro-Finance in Bihar
The conventional anti-poverty programmes suffer from problems of delivery and are often
unsuccessful in making a serious dent on poverty, especially the kind of poverty caused by the
absence of a credit support for the poor households. This is particularly true in Bihar. In this
scenario, microfinance is a potent alternative for poverty alleviation. The access to timely and
adequate credit and other financial services for the weaker sections of the society at an
affordable cost is essential for the overall economic development of the society. In this
background, the Self Help Groups (SHGs) and the SHG-Bank Linkage Programme (SHG-
BLP), implemented by Scheduled Commercial Banks, Regional Rural Banks and Cooperative
Banks, have emerged as the major microfinance programme in the country.
As of 31 March 2013, there were 73 lakh SHGs in India covering about 9.5 crore households,
out of which more than 59 lakh were exclusively women SHGs. These SHGs were linked to
the formal banking system with their savings balance of over Rs. 8200 crore, compared to Rs
7000 crore in the previous year. The total bank loan disbursed during the year 2012-13
amounted to more than Rs 20,500 crore and the total outstanding loan amounts to more than Rs
39,375 crore. In other words, the SHG-BLP has so far been the most preferred and viable
model for financial inclusion of the hitherto unreached rural poor.
Bihar, a slow starter, is gradually catching up with other states in both formation of SHGs and
ensuring their bank linkages. The performance of SHGs in Bihar till 2012-13 is shown in Table
6.34. As of March, 2013, SHG coverage in rural Bihar was 35.22 lakh households, roughly 48
percent of total rural households. All but three districts in Bihar have been identified as ‘low
coverage districts’. The average savings of Rs 6264 per SHG in Bihar was much below the
national average of Rs 11230 and the average credit of Rs 72.6 thousand per SHG again was

314
far below the national average of Rs 1.69 lakh. The total loans disbursed during 2012-13 to the
SHGs by banks amounted to Rs 222.02 crore, which was substantially lower than Rs 398.61
crore disbursed in the previous year. Their outstanding loans at the end of 2012-13 stood at Rs
932.30 crore, again lower than the corresponding figure one year earlier (Rs 1040.71 crore).
Their non-productive assets reduced from Rs 64.27 crore to Rs 56.97 crore during the year.
NABARD has identified 16 districts in Bihar for promoting and financing women SHGs,
through positioning an anchor NGO in each district.
Table 6.34 : Performance of SHGs in Bihar (March 2013)
1 Potential Rural households to be covered 72.67 lakh
2 Rural households covered (SHG: savings linked) 35.22 lakh
3 Districts with low coverage of SHGs out of 38
districts
35
4 Average savings in Bihar /SHG (Rs) 6264
National Average (Rs.) 11230
Highest Priority State : Uttar Pradesh (Rs.) 12388
5 Average credit disbursed/SHG (Rs) 72616
National Average (Rs) 168757
Highest Priority State : Uttar Pradesh (Rs) 136085
2011-12 2012-13
6.1 Loans issued No. of SHGs (lakh) 0.39 0.31
6.2 Loans issued (Rs crore) 398.61 222.02
7 Loans outstanding (Rs crore) 1040.71 932.30
8 Gross NPA (Rs crore) 64.27 56.97
8.1 SGSY (Rs crore) 40.67 36.48
8.2 SHG (non-SGSY) (Rs crore) 23.60 20.49
9 No. of Women SHG districts 16
Source: Status of Micro Finance in India, 2012-13, NABARD
Table 6.35 shows the growth of SHG Bank Linkage in some selected states in terms of the
cumulative number of credit linked SHGs in those states till 2012-13. Bihar had 2.71 lakh
SHGs at the end of 2012-13, about 3.7 percent of the country’s total. The total savings of these
SHGs were Rs 169.68 crore and total bank credit of about Rs 222 crore were made available to
these SHGs during 2012-13. The outstanding loans of all the SHGs in Bihar amounted to Rs
932.30 crore.

315
Table 6.35 : SHG Bank Linkage in Selected States of India (March 2013)
No of SHGs
Savings of
SHGs with
Banks
(Rs crore)
Bank loans
disbursed
during the year
(Rs crore)
Maharashtra 687717 513.70 578.07
Rajasthan 231763 157.61 210.88
Uttar Pradesh 403932 392.01 450.98
West Bengal 586821 726.95 514.15
Odisha 522837 418.28 473.28
Madhya Pradesh 159457 123.21 137.27
Bihar 270890 169.68 222.02
India 7317551 8217.25 20585.36
Source : Status of micro Finance in India, 2012-13, NABARD, Statement II-A and II-B
Chart 6.6
SHG Coverage in Bihar, 2012-13
Source: Status of Microfinance, NABARD, 2012-13
The year-wise progress made in credit linking of SHGs is shown in Table 6.36. During 2012-
13, banks have credit-linked additional 30,297 SHGs within the state. This is an improved
performance compared to the last year, though it is yet to reach the peak level achieved during
2007-08, when as many as 49,738 new SHGs were linked with the banks in Bihar.

316
Table 6.36 : Growth of Micro-financing in Bihar
Year
Linkage of new
groups
(Number)
2005-06 18206
2006-07 26417
2007-08 49738
2008-09 25696
2009-10 30241
2010-11 26055
2011-12 22714
2012-13 30297
Source : State Level Bankers' Committee
As mentioned before, some major handicaps in the spread of SHG-BLP include the absence of
reputed NGOs and low awareness of the stakeholders about the potential of SHG lending. It is
expected that initiatives taken by NABARD and other implementing banks in organising
sensitisation programmes shall result in a more favourable environment towards the SHGs
movement in the state. However, as noted by NABARD, despite the unique characteristics of
SHGs and their accomplishments so far, the issues that continue to affect the programme
include inadequate outreach in many regions, delays in opening of SHG accounts, delays in
disbursement of loans, impounding of savings by banks as collateral, non-approval of repeat
loans even when the first loans were repaid promptly, multiple membership, limited interface
with bankers, and monitoring.
The State Level Bankers' Committee in Bihar had identified certain factors that have
contributed to the success of SHGs in other states and which are, by and large, absent in Bihar.
These factors are — attitude of the rural people and their education, availability of
professionally-run quality micro-finance institutions, conducive regulatory framework,
government support, and channelising government assistance through SHGs. It will be
necessary to remove the above constraints to ensure the spread of SHG movement in the state.
The SHG-BLP was given a renewed thrust by the NABARD with the launch of SHG-2, to
address some of these bottlenecks. All the SCBs, RRBs and CCBs are part of this renewed
thrust. The focus of SHG-2 would be on voluntary savings, cash credit as a preferred mode of
lending, scope for multiple borrowings by SHG members in keeping with repaying capacity,
avenues to meet higher credit requirements for livelihood creation, SHG Federations as

317
nonfinancial intermediaries, audit and rating of SHGs as part of risk mitigation system, and
strengthening monitoring mechanisms.
RRB Microfinancing
Table 6.37 shows the microfinancing done by the Regional Rural Banks in Bihar in 2012-13.
During that year, the three Regional Rural Banks have together financed 11,880 SHGs for a
total amount of Rs 91.49 crore, which amounts to 41.21 percent of the total credit of Rs. 222
crore to SHGs in Bihar. Of the total number of 11,880 SHGs, as many as 10,330 were
exclusively women SHGs, involving a savings amount of Rs 83.37 crore (91.1 percent).
Table 6.37 : Microfinancing by RRBs during 2012- 2013
RRBs
SHGs with Bank-linkage Women SHGs
Number
Savings
Amount
(Rs crore)
Number
Savings
Amount
(Rs crore)
Bihar KGB 1710 19.14 1674 18.69
Madhya Bihar KGB 4325 34.95 2811 27.28
Uttar Bihar KGB 5845 37.40 5845 37.40
Total 11880 91.49 10330 83.37
Source : SLBC
6.8 Corporate Climate in Bihar
Table 6.38 shows the total number of limited companies registered in various states of India
during 2011-12. From this table, it can be seen that 1603 limited companies (1.6 percent of the
country’s total) had registered themselves in Bihar in 2011-12. Of these, as many as 1548
companies (96.6 percent) belonged to the private sector with a total authorised capital of Rs
206 crore, and only 55 companies (3.4 percent) were in the public sector with a total authorised
capital of Rs 44 crore. As reported in the Economic Survey for 2012-13, there were 11,378
registered companies in Bihar as on 31st March 2011. Including the companies registered
during the year, the total number of companies in Bihar as at the end of March 2012 would be
12,981, of which nearly 90 percent are in the private sector.
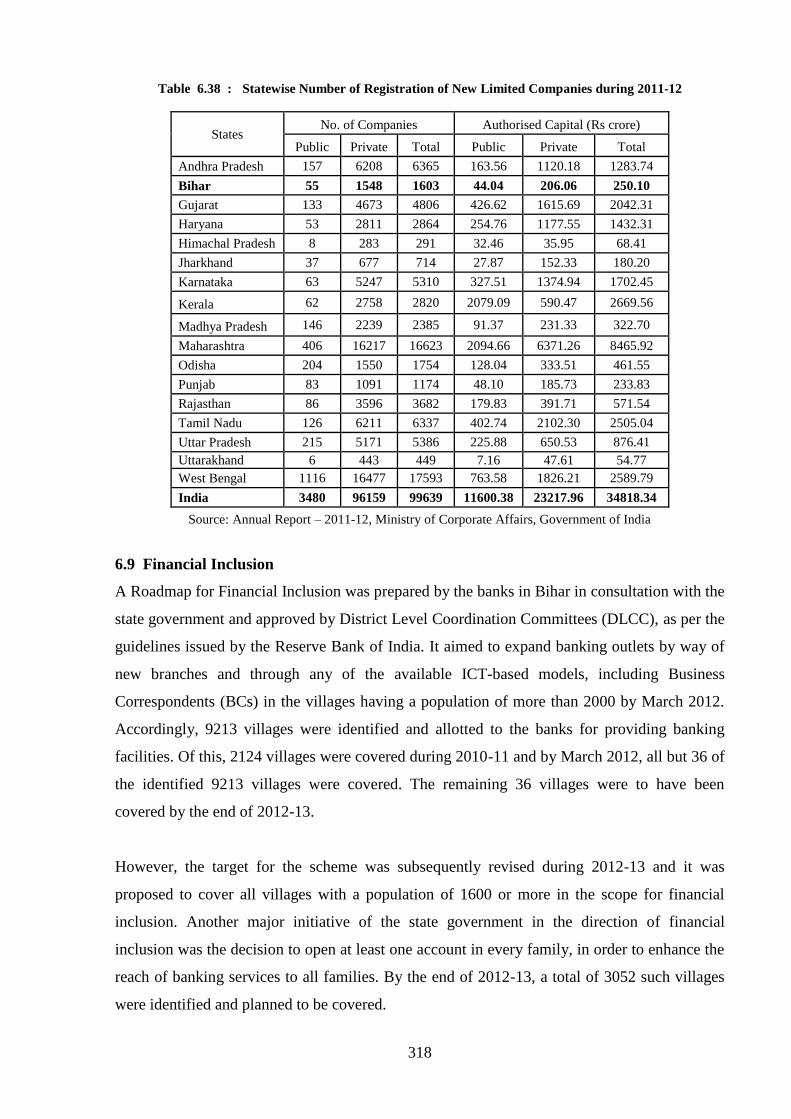
318
Table 6.38 : Statewise Number of Registration of New Limited Companies during 2011-12
States No. of Companies Authorised Capital (Rs crore)
Public Private Total Public Private Total
Andhra Pradesh 157 6208 6365 163.56 1120.18 1283.74
Bihar 55 1548 1603 44.04 206.06 250.10
Gujarat 133 4673 4806 426.62 1615.69 2042.31
Haryana 53 2811 2864 254.76 1177.55 1432.31
Himachal Pradesh 8 283 291 32.46 35.95 68.41
Jharkhand 37 677 714 27.87 152.33 180.20
Karnataka 63 5247 5310 327.51 1374.94 1702.45
Kerala 62 2758 2820 2079.09 590.47 2669.56
Madhya Pradesh 146 2239 2385 91.37 231.33 322.70
Maharashtra 406 16217 16623 2094.66 6371.26 8465.92
Odisha 204 1550 1754 128.04 333.51 461.55
Punjab 83 1091 1174 48.10 185.73 233.83
Rajasthan 86 3596 3682 179.83 391.71 571.54
Tamil Nadu 126 6211 6337 402.74 2102.30 2505.04
Uttar Pradesh 215 5171 5386 225.88 650.53 876.41
Uttarakhand 6 443 449 7.16 47.61 54.77
West Bengal 1116 16477 17593 763.58 1826.21 2589.79
India 3480 96159 99639 11600.38 23217.96 34818.34
Source: Annual Report – 2011-12, Ministry of Corporate Affairs, Government of India
6.9 Financial Inclusion
A Roadmap for Financial Inclusion was prepared by the banks in Bihar in consultation with the
state government and approved by District Level Coordination Committees (DLCC), as per the
guidelines issued by the Reserve Bank of India. It aimed to expand banking outlets by way of
new branches and through any of the available ICT-based models, including Business
Correspondents (BCs) in the villages having a population of more than 2000 by March 2012.
Accordingly, 9213 villages were identified and allotted to the banks for providing banking
facilities. Of this, 2124 villages were covered during 2010-11 and by March 2012, all but 36 of
the identified 9213 villages were covered. The remaining 36 villages were to have been
covered by the end of 2012-13.
However, the target for the scheme was subsequently revised during 2012-13 and it was
proposed to cover all villages with a population of 1600 or more in the scope for financial
inclusion. Another major initiative of the state government in the direction of financial
inclusion was the decision to open at least one account in every family, in order to enhance the
reach of banking services to all families. By the end of 2012-13, a total of 3052 such villages
were identified and planned to be covered.
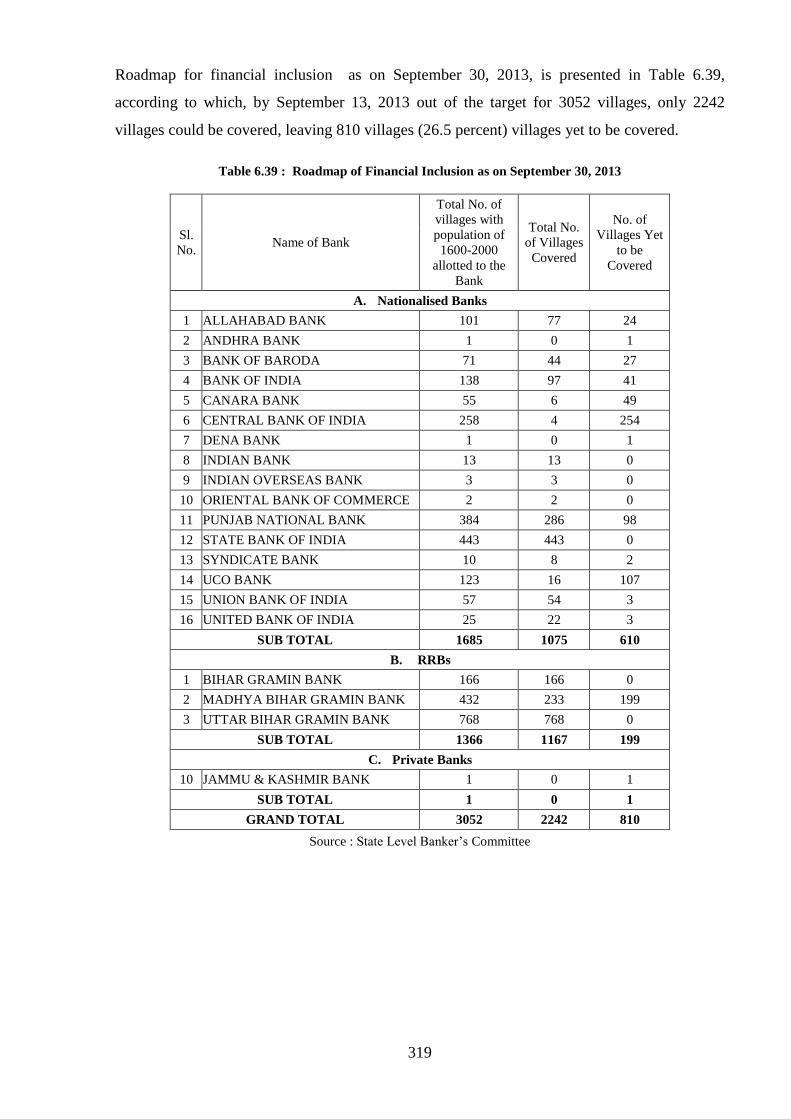
319
Roadmap for financial inclusion as on September 30, 2013, is presented in Table 6.39,
according to which, by September 13, 2013 out of the target for 3052 villages, only 2242
villages could be covered, leaving 810 villages (26.5 percent) villages yet to be covered.
Table 6.39 : Roadmap of Financial Inclusion as on September 30, 2013
Sl.
No. Name of Bank
Total No. of
villages with
population of
1600-2000
allotted to the
Bank
Total No.
of Villages
Covered
No. of
Villages Yet
to be
Covered
A. Nationalised Banks
1 ALLAHABAD BANK 101 77 24
2 ANDHRA BANK 1 0 1
3 BANK OF BARODA 71 44 27
4 BANK OF INDIA 138 97 41
5 CANARA BANK 55 6 49
6 CENTRAL BANK OF INDIA 258 4 254
7 DENA BANK 1 0 1
8 INDIAN BANK 13 13 0
9 INDIAN OVERSEAS BANK 3 3 0
10 ORIENTAL BANK OF COMMERCE 2 2 0
11 PUNJAB NATIONAL BANK 384 286 98
12 STATE BANK OF INDIA 443 443 0
13 SYNDICATE BANK 10 8 2
14 UCO BANK 123 16 107
15 UNION BANK OF INDIA 57 54 3
16 UNITED BANK OF INDIA 25 22 3
SUB TOTAL 1685 1075 610
B. RRBs
1 BIHAR GRAMIN BANK 166 166 0
2 MADHYA BIHAR GRAMIN BANK 432 233 199
3 UTTAR BIHAR GRAMIN BANK 768 768 0
SUB TOTAL 1366 1167 199
C. Private Banks
10 JAMMU & KASHMIR BANK 1 0 1
SUB TOTAL 1 0 1
GRAND TOTAL 3052 2242 810
Source : State Level Banker’s Committee
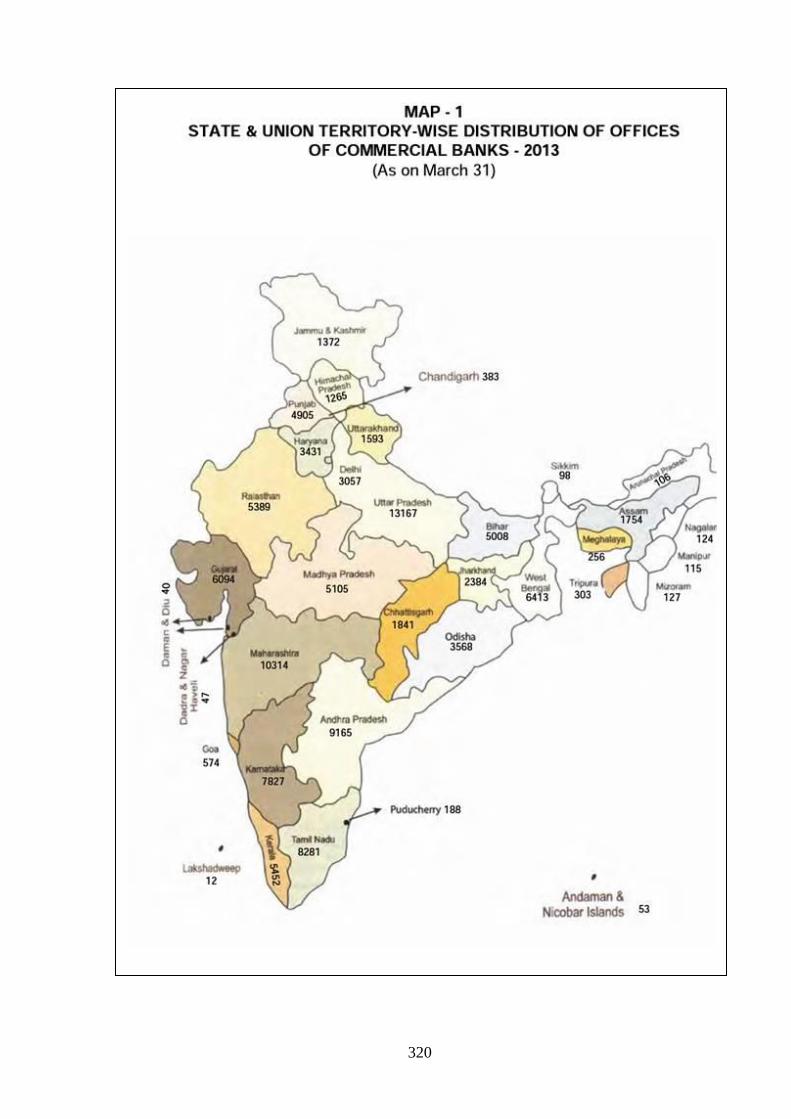
320
Source : Statistical Tables Relating to Banks of India, RBI, 2012

321
Source : Statistical Tables Relating to Banks of India, RBI, 2013.
322
APPENDIX
Table A 6.1 : Districtwise Performance Under Annual Credit Plan As On 31.3.2013
A : Priority Sector Advances
(Rs.
lakh)
District
Agriculture Small & Medium Enterprise Other Priority Sector Total Priority Sector
Target Achieve-
ment
Achieve-
ment
Percent-age
Target Achieve-
ment
Achieve-
ment
Percent-age
Target Achieve-
ment
Achieve-
ment
Percent-age
Target Achieve-
ment
Achieve-
ment
Percent-age
Patna 92120 88484 96.05 54272 107458 198 110549 111515 100.87 256941 307457 119.66
Nalanda 74039 54505 73.62 6387 13641 213.57 6211 7121 114.65 86637 75267 86.88
Bhojpur 109903 84915 77.26 7517 7253 96.49 11675 7703 65.98 129095 99871 77.36
Buxar 109941 87515 79.6 10050 10152 101.01 8306 8144 98.05 128297 105811 82.47
Rohtas 103551 89740 86.66 26907 16654 61.89 11833 7534 63.67 142291 113928 80.07
Kaimur 78310 71163 90.87 4033 4539 112.55 5390 5602 103.93 87733 81304 92.67
Gaya 114162 88799 77.78 11455 13865 121.04 14691 12087 82.27 140308 114751 81.79
Jehanabad 28910 22857 79.06 2428 3332 137.23 4284 3983 92.97 35622 30172 84.7
Arwal 17969 14178 78.9 1049 1181 112.58 1501 1498 99.8 20519 16857 82.15
Nawada 34611 23772 68.68 560 2282 407.5 7292 5896 80.86 42463 31950 75.24
Aurangabad 84882 65763 77.48 6760 7750 114.64 8953 9036 100.93 100595 82549 82.06
Saran 105938 81277 76.72 14756 18475 125.2 12714 14905 117.23 133408 114657 85.94
Siwan 74421 60006 80.63 7593 10272 135.28 13474 11580 85.94 95488 81858 85.73
Gopalganj 96597 74566 77.19 1708 2173 127.22 8686 5437 62.59 106991 82176 76.81
W. Champaran 98116 99910 101.83 32523 11827 36.37 5862 22216 378.98 136501 133953 98.13
E.Champaran 93064 91896 98.74 8800 15074 171.3 20617 7256 35.19 122481 114226 93.26
Muzaffarpur 108259 125016 115.48 19443 27406 140.96 19778 24650 124.63 147480 177072 120.07
Sitamarhi 51394 43104 83.87 4398 7750 176.22 5121 4072 79.52 60913 54926 90.17
Sheohar 8039 7612 94.69 404 465 115.1 821 559 68.09 9264 8636 93.22
Vaishali 57766 47573 82.35 7533 7024 93.24 9610 5817 60.53 74909 60414 80.65
Darbhanga 43315 41319 95.39 3402 12837 377.34 12065 10185 84.42 58782 64341 109.46
Madhubani 78237 66346 84.8 12233 9979 81.57 9930 7000 70.49 100400 83325 82.99
Samastipur 116644 88084 75.52 28237 15664 55.47 14639 9783 66.83 159520 113531 71.17
Begusarai 110450 90034 81.52 11818 26824 226.98 26719 19015 71.17 148987 135873 91.2
Munger 26722 23790 89.03 3669 5803 158.16 14046 8975 63.9 44437 38568 86.79
Sheikhpura 14196 11753 82.79 1081 1774 164.11 1380 2235 161.96 16657 15762 94.63
Lakhisarai 24579 18609 75.71 3979 3865 97.13 4605 4105 89.14 33163 26579 80.15
Jamui 21870 22366 102.27 1768 3626 205.09 8358 4855 58.09 31996 30847 96.41
Khagaria 49172 40986 83.35 5795 7293 125.85 4749 4813 101.35 59716 53092 88.91
Bhagalpur 65600 52304 79.73 5775 21465 371.69 14995 12509 83.42 86370 86278 99.89
Banka 34994 33827 96.67 2887 4050 140.28 12131 8111 66.86 50012 45988 91.95
Saharsa 40182 36407 90.61 2379 2888 121.4 6751 8025 118.87 49312 47320 95.96
Supaul 32869 35613 108.35 2380 1872 78.66 7503 3386 45.13 42752 40871 95.6
Madhepura 40196 33832 84.17 1410 2294 162.7 3608 5786 160.37 45214 41912 92.7
Purnea 85020 72152 84.86 8388 5988 71.39 11605 9349 80.56 105013 87489 83.31
Kishanganj 70618 50975 72.18 3758 4067 108.22 7383 5983 81.04 81759 61025 74.64
Araria 68208 54493 79.89 8860 7279 82.16 4379 2792 63.76 81447 64564 79.27
Katihar 75188 61087 81.25 3608 6363 176.36 7842 5892 75.13 86638 73342 84.65
Bihar 2540052 2156628 84.90 340003 432504 127.21 460056 409410 88.99 3340111 2998542 89.77
Source: State Level Bankers' Committee
323
B : Non-Priority Sector Advances As On 31.3.2013
(Rs. lakh)
District
Non-Priority Sector Grand total
Target Achievement Achievement
Percentage Target Achievement
Achievement
Percentage
Patna 511307 515037 100.73 768248 822494 107.06
Nalanda 37521 19483 51.93 124158 94750 76.31
Bhojpur 39799 28569 71.78 168894 128440 76.05
Buxar 26142 30398 116.28 154439 136209 88.2
Rohtas 35259 28054 79.57 177550 141982 79.97
Kaimur 20248 16980 83.86 107981 98284 91.02
Gaya 62578 34396 54.97 202886 149147 73.51
Jehanabad 12657 9439 74.58 48279 39611 82.05
Arwal 8435 6795 80.56 28954 23652 81.69
Nawada 22449 17930 79.87 64912 49880 76.84
Aurangabad 31022 22248 71.72 131617 104797 79.62
Saran 51114 39481 77.24 184522 154138 83.53
Siwan 53281 32666 61.31 148769 114524 76.98
Gopalganj 33318 44026 132.14 140309 126202 89.95
W. Champaran 48478 32897 67.86 184979 166850 90.2
E.Champaran 57723 34327 59.47 180204 148553 82.44
Muzaffarpur 81236 59172 72.84 228716 236244 103.29
Sitamarhi 40490 30482 75.28 101403 85408 84.23
Sheohar 5469 3770 68.93 14733 12406 84.21
Vaishali 40014 34783 86.93 114923 95197 82.84
Darbhanga 58259 35230 60.47 117041 99571 85.07
Madhubani 52012 40961 78.75 152412 124286 81.55
Samastipur 55607 33961 61.07 215127 147492 68.56
Begusarai 42445 23158 54.56 191432 159031 83.07
Munger 37450 21612 57.71 81887 60180 73.49
Sheikhpura 6211 4910 79.05 22868 20672 90.4
Lakhisarai 12742 9402 73.79 45905 35981 78.38
Jamui 18750 12969 69.17 50746 43816 86.34
Khagaria 18344 19275 105.08 78060 72367 92.71
Bhagalpur 48649 22207 45.65 135019 108485 80.35
Banka 20231 14173 70.06 70243 60161 85.65
Saharsa 23744 19814 83.45 73056 67134 91.89
Supaul 27001 24482 90.67 69753 65353 93.69
Madhepura 25619 24667 96.28 70833 66579 93.99
Purnea 34603 28853 83.38 139616 116342 83.33
Kishanganj 17384 13682 78.7 99143 74707 75.35
Araria 25755 21635 84 107202 86199 80.41
Katihar 56582 41592 73.51 143220 114934 80.25
Bihar 1799928 1453516 80.75 5140039 4452058 86.62
Source : State Level Bankers' Committee
324
Table A 6.2 : Districtwise Achievement Kisan Credit Card (Numbers)
District 2006 2007 2008 2009 2010 2011 2012 2013
Patna 10801 26204 18048 26233 60143 50522 54949 22658
Nalanda 13266 16297 16175 22281 34946 42065 46476 23054
Bhojpur 4833 17683 15918 27575 50759 59020 84537 34094
Buxar 4051 8824 6775 10916 38447 32040 40533 26897
Rohtas 6674 15272 19590 33141 56523 57664 76546 41322
Kaimur 5205 9624 12094 24102 31488 29355 44165 26051
Gaya 8601 19716 16371 52571 40101 41012 60645 30224
Jehenabad 2381 5681 5348 12261 16095 25154 26430 9168
Arwal 1052 2698 2932 4443 6691 8363 12753 4248
Nawada 7668 11281 11217 25992 24837 28980 23731 10266
Aurangabad 12707 9272 8638 28077 42494 42353 54786 25458
Saran 9190 8881 14127 24233 32706 34841 39064 32176
Siwan 7074 10551 14545 27750 38536 34165 36959 23795
Gopalganj 5413 11205 13396 29824 42890 53928 60448 34478
West Champaran 31407 35212 32431 47446 70194 75740 97812 27608
East Champaran 14701 21053 26210 45138 74330 82860 104239 45103
Muzaffarpur 7517 15170 20050 36197 61028 58142 71134 52561
Sitamarhi 6814 10883 24403 19944 34675 30368 43467 26322
Sheohar 1309 1538 2617 6646 6315 12123 7682 4635
Vaishali 12409 15141 17144 30629 38763 45605 66709 24766
Darbhanga 3816 7783 8011 20738 43993 26360 41682 27739
Madhubani 12656 9559 15598 35420 38578 55261 72368 27926
Samastipur 21759 14954 22783 38363 79075 80395 95785 37239
Begusarai 21426 9352 14712 20694 57130 72811 89799 35776
Munger 2869 3967 5608 10756 16559 16701 28053 9906
Shiekhpura 2216 2317 3532 7882 6036 5216 12738 7057
Lakhisarai 2353 3422 4587 10054 11401 15848 18074 8678
Jamui 4113 3777 7382 13458 15779 22590 28020 17196
Khagaria 9028 5528 9296 12375 30313 39919 57270 19750
Bhagalpur 4726 9223 11477 22734 44740 37938 48747 19543
Banka 3138 4141 4282 9463 21232 22829 36202 15712
Saharsa 2135 5513 7250 13835 21763 18904 25224 11692
Supaul 2838 5593 6296 57130 22830 16790 27256 18301
Madhepura 2962 4679 6056 11620 12307 14707 24802 12033
Purnea 11791 12350 13477 27434 51210 30384 55209 19850
Kishanganj 8952 5484 7393 13680 14645 20790 36764 15404
Araria 13238 9170 8558 16384 20225 29469 47758 15563
Katihar 12329 9565 12213 19833 29760 31618 48620 19573
Bihar 315418 398563 466540 897252 1339537 1402830 1847436 863822
Source : State Level Bankers' Committee, Patna
_______________

325
CHAPTER VII
STATE FINANCES
Ever since the global economic crisis that broke out in 2008-09 bringing uncertainty into the
macroeconomic environment, economic growth in the country has been slower, along with
persistent inflation and high deficit in the current account. Since the last fiscal, economy has
deteriorated further, with its rate of growth projected to fall to just around 5 percent during the
current fiscal. Slowing down of foreign direct investment and withdrawal of substantial foreign
funds from the financial markets in India led to extreme volatility in the exchange markets,
plunging the rupee to its lowest level ever. The grim scenario that dominated the national
economic landscape during the year had also affected the economy of most states, including
Bihar. In such a situation, the public finances of the states were also affected.
Prudent management of public finance is essential for transformation of a poor state like Bihar
by raising adequate resources and allocating them according to the priorities of the
government, while ensuring the quality of expenditure. During the last few years, priority for
the state government has been the building of quality physical infrastructure in which it lags
behind all other states and to effect significant improvements in social infrastructure so as to
make a dent in poverty as well as to raise the standards of delivery of all public services. To
generate the resources necessary for all this, the state government has been enforcing strict
fiscal discipline by improving the quality of expenditure and has increased its revenue
substantially. The capital outlay has been increased every year to ensure necessary resources
for the much-needed investments in infrastructure. The economic growth rate in Bihar has also
surpassed the national growth rate and been sustained at that level during the last several years.
As a result of significant increases in social sector spending, the quality of life of ordinary
people has improved as reflected in improvements in most socio-economic indicators. The
poverty scenario is also changing, albeit slowly, especially in the rural areas, and the
historically weak linkages that impede the achievements in terms of social outcomes from the
welfare programmes are slowly getting strengthened. But Bihar still continues to be among the
states with extremely low per-capita income in India and has a low economic base.
The State Legislature passed the Bihar Fiscal Responsibility and Budget Management (FRBM)
Act in February 2006, committing itself to (a) eliminate the revenue deficit by 2008-09 and
build up adequate revenue surpluses thereafter, to bring down fiscal deficit to a level of less
326
than 3 percent of GSDP by 2008-09 and maintain it thereafter; (b) pursue policies to raise non-
tax revenue with due regard to cost and equity; and (c) lay down norms for prioritization of
capital expenditure and pursue expenditure policies that would provide impetus for economic
growth, poverty reduction and human development. These resolutions have largely been
adhered to. However, the upper limit of 3 percent of GDSP for the fiscal deficit, as prescribed
in the Act, has in general limited the scope of all states, especially the economically backward
ones, to borrow more and invest in capital assets essential for accelerating their growth further.
It should, however, be mentioned that raising the resources alone may not be enough to effect
speedy development; it also demands creating the institutional capacities for spending
productively on assets and welfare programmes.
During 2012-13, the Gross Fiscal Deficit (GFD) of Bihar had reached Rs 6545 crore, about Rs
600 crore higher than that in the previous year; but at 2.1 percent, it was still much lower than
the 3 percent limit of FRBM Act, due to the high growth in its GSDP. The capital outlay was
raised by Rs 733 crore during the year, and it enabled the state government to continue the
pace of infrastructure building. Even in the next year, the GFD, though projected to rise
steeply, will still be 2.3 percent of GSDP, well below the FRBM Act limit.
The state government gets its resources from its own tax and non-tax revenues, its share of the
divisible pool of central taxes allocated under recommendations of the Finance Commissions,
grants received from the central government for plan and non-plan purposes, loans raised from
the market, and other borrowings, mainly against the collections of provident fund and other
accounts kept within the state government account. These resources are utilized for either plan
expenditure for development purposes or for non-plan expenditure. The latter head includes
expenditure for administration, payment of interests and servicing of its outstanding debt,
providing grants and loans to local bodies, government companies and corporations, and
advances for various purposes to the state government employees.
As per Article 266 of the Constitution, all revenues received by the state government, all loans
raised by it and all money received by it as repayment of loans are credited to its Consolidated
Fund. No money can be spent out of this fund except with the approval of the Legislature,
through the process of passing of the budget. Other than this, there are two separate funds
managed by the state government. The first is a Contingency Fund of the nature of an imprest
with a fixed corpus that can be created by the legislature under Article 267 of the Constitution
to meet unforeseen expenditure, pending their subsequent authorization by the legislature and

327
recoupment from the Consolidated Fund. All other money received by or on behalf of the state
government are credited to its Public Account, constituted under Article 266(2) of the
Constitution. No legislative authorization is required to withdraw any money from the Public
Account, the balance of which is not held separately, but stands merged with the cash balance
of the state government. The Gross Fiscal Deficit of the state government, after borrowings on
the Consolidated Fund, is met by drawing down the balances in the Public Account.
The financial and fiscal performance of the state government have been analysed below, first
by summarizing its receipts and expenditures (Table 7.1), and then by comparing the trends in
eight major performance indicators relating to Bihar and other major states (Table 7.2). The
actual figures of receipt and expenditure have been used for the period from 2008-09 to 2012-
13, taken from the Finance Accounts of the state prepared by the Accountant General (A&E)
of the state; for 2013-14, the budget estimates have been used. For other states, however, actual
figures have been used only for 2011-12, while Revised Estimates (RE) and Budget Estimates
(BE) have been used for 2012-13 and 2013-14 respectively. The state government finances
have also analysed here mainly with reference to (i) Fiscal Performance, (ii) Deficit
Management; (iii) Debt Management, (iv) Resource Management; (v) Expenditure
Management; (vi) State Budget and (vii) Performance of State Public Sector Undertakings.
7.1 Overview of Financial Position
The revenue surplus of Bihar had slumped to its lowest level in 2009-10, but 2010-11 was a
year of recovery, when the state‘s revenue surplus had climbed to its hitherto highest level of
Rs 6316 crore, compared to only Rs 2943 crore in the previous year. However, 2011-12 had
witnessed the beginning of the slowing down of national economy, and in that year the revenue
surplus again decreased to Rs 4820 crore, leading to a steep rise in the Gross Fiscal Deficit
(GFD) by nearly Rs 2000 crore. In 2012-13, the revenue surplus improved by about Rs 300
crore only to Rs 5100 crore; however, the fiscal deficit increased by more than Rs 600 crore to
Rs 6545 crore due to substantial increases in capital investments (by more than Rs 700 crore).
In spite of this, as pointed out already, the GFD is still comfortably within the FRBM Act
limits. Within these limits, it is expected to go up further in future to generate resources
necessary to meet the requirements of continued capital investments.
The primary surplus of Rs 349 crore in 2010-11 was reversed in 2011-12, recording a primary
deficit of Rs 1611 crore, and this deficit rose further to Rs 2116 crore by the end of the 2012-
13. It is projected to increase further in 2013-14 to nearly Rs 2900 crore by budget estimates.

328
While the revenue receipts increased by Rs 8247 crore during 2012-13 over the previous year,
the revenue expenditure went up by Rs 7966 crore, more of it due to increases in the
development expenditure (Rs 7050 crore).
The 16 percent growth in the revenue receipts witnessed during 2012-13 was nearly the same
as in 2011-12 (15 percent), but both considerably less than the 25 percent growth seen in 2010-
11. The growth in 2012-13 was almost entirely due to the growth in tax receipts by Rs 7606
crore (19 percent), which was expected because the tax receipts constituted more than 80
perecent of the total revenue; non-tax receipts showed an increase of only Rs 245 crore. The
central grants increased only nominally (Rs. 395 crore) over the previous year, unlike in 2010-
11 when it had increased by more than Rs 2000 crore. While the growth of revenue receipts
had remained more or less stagnant at 16 percent, the revenue expenditure registered a decline
in growth during 2012-13 (17 percent), compared to the growth of 21 percent in 2011-12,
resulting in a small increase in revenue surplus in 2012-13. The revenue surplus is projected to
increase substantially in the budget estimates of 2013-14. The capital outlay during 2012-13
increased by Rs 733 crore (by only 8 percent); however, as per budget estimates, it is estimated
to rise substantially in 2013-14 to Rs 4613 crore (by 48 percent). The trend and summary of
state finances during the six year period (2008-14) is shown in Table 7.1.
Revenue Account
Starting with a revenue surplus of Rs 1076 crore for the first time in 2004-05, Bihar has been
showing a continuous revenue surplus ever since. This surplus had increased to Rs 6316 crore
in 2010-11, the highest ever level, before falling to Rs 4821 crore during 2011-12. In 2012-13
it improved marginally to Rs 5101 crore. As pointed out already, the revenue receipts
increased by Rs 8246 crore mainly due to the increase in tax revenues (Rs 7606 crore). Within
the broad head of tax revenue, 52 percent of the increase came from increase in the state‘s
share of central taxes and 48 percent from the state‘s own revenues. In the previous year, these
contributions stood at 60 percent and 40 percent respectively. Thus, in 2012-13, contribution of
the state‘s own revenues to the growth of overall revenues improved compared to the previous
year, which was a welcome development. The own revenues of the state government, tax plus
non-tax, showed a healthy growth rate of more than 29 percent during 2012-13, compared to
24 percent a year before.
The revenue expenditure in 2012-13 increased by Rs 7966 crore over that in 2011-12, of which
social services accounted for Rs 4379 crore (55 percent), and economic services for Rs 2672

329
crore (34 percent). For both these services, the increases were more than the increases in the
previous year. The general services accounted for an increase of more than Rs 915 crore (11
percent) in 2012-13, of which pension payments alone accounted for additional expenditure of
Rs 555 crore. However, the increases in both were much less than the corresponding increases
in the previous year (Rs 2443 crore and 1664 crore respectively). The pension liability of the
state government has been increasing rapidly over the years, from only Rs 2789 crore in 2007-
08 to Rs 8364 crore in 2012-13, averaging an annual growth rate of about 25 percent. The total
pension payment in 2013-14 is estimated to exceed Rs 11,000 crore. The interest payment did
not show any increase during 2011-12; during 2012-13 also, it increased only nominally by Rs
124 crore.
The salary payments to the state government employees also accounted for substantial
increases in revenue expenditure — by Rs 1364 crore in 2012-13, compared to Rs. 1644 crore
in 2011-12. In the current fiscal, it is projected to go up by more than Rs 4100 crore. The
salary and pension expenditure of the state government will be discussed later in this chapter in
greater details. The budget estimates of 2013-14 aims at substantially higher levels of revenue
expenditure as well as capital outlay, to be financed by much higher revenue collection as well
as substantially higher level of central grants. The total expenditure, revenue plus capital, is
budgeted to be about Rs 92,088 crore in 2013-14, an increase of more than one third over the
level of 2012-13.
Development Expenditure and Capital Outlay
The developmental revenue expenditure on social and economic services increased by Rs 7050
crore in 2012-13 over that in the last fiscal. Between 2008-09 to 2012-13, the developmental
revenue expenditure increased from Rs. 17,978 crore to Rs. 35,817 crore, while the non-
developmental revenue expenditure grew at a lower rate, rising from Rs. 10,530 crore to Rs.
18,645 crore, bulk of it owing to pension as well as interest payments. Of the total capital
outlay of Rs 9585 crore in 2012-13, as much as Rs 7536 crore was spent on economic services,
almost half of it (Rs 3313 crore) on creating the transportation infrastructure, roads and
bridges. The capital outlay on social services amounted to Rs 1331 crore. Out of this, 42
percent (Rs 563 crore) was spent on creating and improving health infrastructure, 19 percent
(Rs. 258 crore) on improving the water supply and sanitation, and 27 percent (Rs 364 crore) on
creating educational infrastructure in the state.

330
As pointed out in the last Economic Survey, the surplus in the revenue account has all along
played a substantial role in the growth story of Bihar. The revenue surplus was achieved
primarily due to increase in revenue receipts. Between 2008-09 and 2012-13, the total revenue
receipts of the state government increased at an annual rate of 16.8 percent, while its revenue
expenditure increased at a higher annual rate of 17.9 percent, still leaving a substantial revenue
surplus every year. This sustained phenomenon of revenue surplus has enabled the state
government to increase its capital outlay continuously till 2010-11; however, in 2011-12, due
to the decrease in revenue surplus, the capital outlay was also reduced by Rs 344 crore. But,
the capital outlay had increased again by Rs 733 crore in 2012-13. The total development
expenditure of the state government stood at Rs 45,402 crore in 2012-13, about 65.6 percent of
its total expenditure. The state government has targeted to maintain a high growth rate in
development expenditure, both in revenue and capital account, and this is reflected in the
budget estimates of 2013-14. The expenditure on non-developmental general services
increased by only Rs 915 crore in 2012-13, about 5 percent over that in the last year.
The last Economic Survey had noted that the year 2006-07 had marked the beginning of the
reform process in public finances in Bihar when, for the first time, capital outlay was increased
substantially to Rs 5211 crore from a meagre Rs 2084 crore in the previous year. The state
government has not only kept its focus on investing on capital assets, but accelerated the pace
of investment. In every budget since 2006-07, the capital outlay was increased, which
translated into higher growth for the state's economy. The expenditure on capital assets also
creates a multiplier effect on growth of the economy. During the Eleventh Plan period, the
GSDP of Bihar at current prices had grown annually at 22 percent, compared to the nation‘s
GDP growth rate at 15.6 percent, making the state one of the fastest growing one in the
country. This growth rate was also much higher than that during the Tenth Plan period (12
percent). During the last 5 years from 2007-08 to 2012-13, capital outlay grew annually at 9.4
percent and the total developmental expenditure, revenue plus capital, grew at 17 percent. The
capital outlay of Bihar constituted 3.1 percent of its GSDP in 2012-13, compared to 3.6 percent
in 2011-12. It accounted for 14 percent of total expenditure made by the state in 2011-12,
compared to 15 percent in the previous year. However, the state government is aware that there
is an urgent need to increase the pace of capital expenditure further. During 2011-12, there was
actually a decline in capital outlay by 4 percent, which was reversed in 2012-13, when capital
expenditure increased by 8 percent.

331
Plan and Non-Plan Expenditure
The last Economic Survey had pointed out that the gap between plan and non-plan expenditure
had started closing since 2007-08, the first year of the Eleventh Plan. In that year, non-plan
expenditure was 1.9 times the plan expenditure, compared to 3.6 times in 2005-06. During
2012-13, the non-plan expenditure was 1.4 times the plan expenditure compared to 1.6 times in
2011-12. The total plan and non-plan expenditure during 2012-13 were Rs 28,380 crore and
Rs. 40,825 crore respectively. The last Economic Survey had drawn attention to the report of
the Rangarajan Committee on Efficient Management of Public Expenditure which has
submitted its report in 2011. The Committee had recommended the removal of distinction
between plan and non-plan expenditure on the ground that the budget neither provides a
satisfactory classification of ‗developmental and non- developmental dimensions of
government expenditure‘, nor does it provide ‗an appropriate budgetary framework‘. There is
indeed a logic in removing this artificial distinction that places a bias in favour of plan
expenditure, but the central government has since shelved the report.
Resource Mobilisation
The tax revenue of the state government has increased substantially from Rs. 23,865 crore in
2008-09 to Rs. 48,153 crore in 2012-13, growing annually at 20 percent during the period. The
own tax revenue of the state government grew from Rs 6,172 crore to Rs 16,253 crore during
this period, at a much higher annual rate of 27 percent. As indicated earlier, the growth in own
tax revenues has picked up in recent years and, during the last two years, it grew by 28 and 29
percent respectively. However, the non-tax revenue showed hardly any increase over the
period; it was Rs. 1,153 crore in 2008-09 and Rs. 1,135 crore in 2012-13. The total tax revenue
of the state government registered an increase of 28 percent over the previous year, compared
to the impressive growth of 29 percent in the state government's own tax revenue. During the
five year period from 2008-09 to 2012-13, the state‘s share in the divisible pool of central taxes
grew annually at a 18 percent, while central grants recorded a growth rate of only 8 percent.
The non-tax revenue seemed to have reached a plateau in Bihar, and has actually been on the
decline since 2009-10 when it was Rs 1670 crore. Till that year, it was boosted by the debt
relief available to the state government from the central government, as recommended by the
Twelfth Finance Commission; but it was not available since 2010-11. In 2011-12, it was only
Rs. 890 crore and increased to Rs 1135 crore in 2012-13. The major sources of non-tax
revenue in the state are only two — interest receipts and receipts from non-ferrous mining and
metallurgical industries.

332
The Own Tax: GSDP ratio in Bihar has been around 5 percent for the last few years and it is
much below than that of other states. During the 5 year period 2008-13, it had improved from
4.3 percent to 5.3 percent. But, there still remains a large untapped potential for further
increasing the state government's own tax revenue receipts. In the budget estimates of 2013-14,
the total revenue is projected to be Rs 80,066 crore, an increase of Rs 20,500 crore (34
percent), of which state‘s own tax revenue receipts are estimated to be Rs 20,963 crore, an
increase of 29 percent. The tax revenue is estimated to grow by Rs. 10,790 crore in the current
fiscal, to Rs 58,944 crore; in this amount, the state's own revenues will constitute nearly 36
percent, an improvement over 34 percent registered in 2012-13.
Outstanding Public Debt
The public debt of the state government comprises only two elements — internal debt raised
by the state government from the market including financial institutions and the loans taken
from the central government, The second component has been falling ever since the period
covered by the Twelfth Finance Commission, as a consequence of its recommendations. The
state also acts as a trustee in respect of certain items in the public account which constitute the
other liabilities that will be discussed later.
The state government had an outstanding public debt of Rs. 39,291 crore in 2008-09, equaling
27.6 percent of its GSDP. In 2012-13, the outstanding debt had increased to Rs. 57,474 crore,
but the Debt: GSDP ratio had declined substantially to 18.6 percent, well below the limit of 28
percent, specified by the Twelfth Finance Commission. The ratio of interest payment to
revenue receipts was at 11 percent in 2008-09 which got reduced to 7 percent in 2012-13,
much below the upper limit of 15 percent, recommended by the Commission. This clearly
indicates that the debt problem is well under the control of the state government. The debt
servicing payments rose from Rs 5435 crore to Rs 7498 crore between 2008-09 and 2012-13.
The interest payments accounted for Rs 3753 crore (69 percent of debt service payments) and
Rs 4428 crore (59 percent of debt service payments) in these two years respectively, while
repayment of principal increased from Rs. 1682 crore to Rs. 3070 crore during the same
period. In 2013-14, the outstanding public debt liabilities are projected to rise to Rs 66,055
crore (17.6 percent of GSDP) and interest payments are expected to rise to Rs 5888 crore as
per the budget estimates.
333
The structure of debt has undergone a significant change since 2002-03. This occurred first by
swapping of the high cost central government loans with low cost market loans and then, as a
result of the recommendations made by the Twelfth Finance Commission, by consolidation
and rescheduling of all the central government loans for payment over a 20-year period at 7.5
percent rate of interest. Further, it was left to the state government's discretion to raise loans
from the market as and when necessary, and requiring the central government to give only
grants to the states. As a result, the proportion of central government loans diminished
substantially over the last 10 years. During the period 2008-13, the central loans increased
from Rs 150 crore to Rs 508 crore, its share in the total public debt receipts increasing from 2.5
percent 5.3 percent. The central loans are now being availed only for state‘s plan schemes. The
total receipts of public debt during the period 2008-13 went up from Rs 5928 crore to Rs 9554
crore.
For the treatment of debt liabilities, in this Survey, there is one departure from the practice
followed till the last year. Earlier, the net receipts from Small Savings, Provident Fund and
other Accounts were included in the total debt liabilities of the state government. However, a
new Indian Government Accounting Standard (IGAS) 10, proposed by the Government
Accounting Standards Board (GASAB), has introduced a distinction between the receipts of
debt into the Consolidated Fund and the liabilities that accrue to the state government
automatically by virtue of its Public Account. Though the standard has not yet been formally
adopted, it has redefined the outstanding liabilities of the state government. Earlier, the total
debt of the state government comprised its internal debt, loans from the central government,
and loans from small savings and provident fund account. While the first two are part of the
borrowings against the Consolidated Fund of the state government, the small savings and
provident fund accounts are maintained in its Public Account.
The Small Saving schemes have been always an important source of household savings in
India. The Small savings instruments can be classified under three heads — (i) postal deposits
comprising savings account, recurring deposits, time deposits of varying maturities and
monthly income scheme; (ii) savings certificates (National Small Savings Certificate VIII and
Kisan Vikas Patra); and (iii) social security schemes (public provident fund (PPF) and Senior
Citizens‗ Savings Scheme).

334
Following the Report of the Committee on Small Savings in February 1999, a 'National Small
Savings Fund' (NSSF) has been established in the Public Account of India with effect from
April, 1999. All small savings collections are credited to this Fund. Similarly, all withdrawals
under small savings schemes by the depositors are made out of the accumulations in this Fund.
The balance in the Fund is invested in central and state government securities. The investment
pattern is as per norms decided from time to time by the central government. The Fund is
administered by the central government, under National Small Savings Fund (Custody and
Investment) Rules, 2001, framed under Article 283(1) of the Constitution. The objective of
NSSF is to de-link small savings transactions from the Consolidated Fund of India and ensure
their operation in a transparent and self-sustaining manner. Since NSSF operates in the Public
Account of India, its transactions do not impact the fiscal deficit of the central government
directly. As an instrument in the public account, the balances under NSSF are direct liabilities
and constitute a part of the outstanding liabilities of the central government. The NSSF flows
affect only the cash position of the central government.
All deposits under small savings schemes are credited to NSSF and all withdrawals by the
depositors are made out of accumulations in the Fund. The collections under the small saving
schemes, net of the withdrawals, are the sources of funds for the NSSF. The NSSF invests the
net collections of small savings in the Special State Government Securities (SSGS), as per the
sharing formula decided by the central government. As per the current formula, states have to
borrow 80 percent of the accumulated balances under this fund mandatorily (and hence pay
interest to the central government), with the option to go up to 100 percent. Since 2002-03, the
net collections are being invested only in state government securities and thus states are forced
to borrow the entire proceeds. They carry interest rates higher than the market rates and these
rates are administered by the central government. These borrowings form part of the public
debt (internal debt) of the state government and are used partly to finance the fiscal deficit of
the states.
The remaining amount is invested in Special Central Government securities (SCGS) with the
same terms as that for the state governments. These securities are issued for a period of 25
years, including a moratorium of five years on the principal amount. The special securities
carry a rate of interest fixed by central government from time to time. The rate of interest has
remained unchanged at 9.5 per cent per annum since April 1, 2003. The income of NSSF
comprises of the interest receipts on the investments in central government, state governments
and other securities. While the interest rate on the investments on the central and state share of
net small saving collection is as per the rates fixed from time to time, the interest rate on the
335
reinvestment of redeemed amounts is equal to the market rate for 20 year Government
Securities. The expenditure of NSSF comprises interest payments to the subscribers of Small
Savings and PPF Schemes and the management cost of operating the schemes. The loans from
NSSF outstanding against the state government as at the end of 2012-13 amounted to Rs
19,125 crore, as against Rs 18,832 crore in 2011-12. During 2012-13, the state government had
availed loans against special securities issued to NSSF amounting to Rs 1006 crore (Rs 1113
crore in 2011-12).
As per the new accounting standard, public debt now comprises the borrowings from the
Consolidated Fund only, while the three major public account balances constitute the ‗Other
Liabilities‘ of the state government, since they all stand merged into the cash balance of the
state government. The ‗Other Liabilities‘ thus includes Provident Fund and Other Accounts,
Reserve Funds and Deposits and Advances. The accounts of the state government are already
reflecting this new classification of public debt and other liabilities and the same classification
will be followed in the Economic Surveys from now on. It may be mentioned that public
accounts create a lot of distortions in the government financial system and there is a need to
deal with it at a structural level.
The year 2006-07, being the year of enactment of FRBM legislation, also marked the
beginning of fiscal discipline in Bihar, as seen in the containment of its Gross Fiscal Deficit
(GFD) within the FRBMA limits of 3 percent of GSDP. The GFD: GSDP ratio of Bihar was
brought down to 2.92 percent in 2006-07 from 4.43 percent in the previous year. It was
thereafter kept well within the 3 percent limit in all the subsequent years barring 2009-10, the
year that immediately followed the economic meltdown, when it was just marginally higher at
3.2 percent of GSDP. In 2012-13, the ratio of GFD to GSDP stood at 2.1 percent as pointed out
earlier and is estimated to increase only to 2.3 percent of GSDP as per budget estimates of
2013-14. In absolute terms, the GFD increased from Rs. 2507 crore in 2008-09 to Rs. 6545
crore in 2011-12. It is estimated to rise substantially to Rs 8769 crore as per budget estimates
of 2013-14, but still well within the FRBMA limit of 3 percent. Summing up, it can be said
that, even though the financial consolidation process is suffering setbacks since 2010-11 in
response to adverse macroeconomic situations prevailing in the country, the public finances of
the state government are still being managed prudently, and are in a healthier shape compared
to what it was five years ago.

336
Table 7.1 : Receipts and Expenditure of the Bihar Government
(Rs. crore)
Sl.
No. Item 2008-09 2009-10 2010-11 2011-12 2012-13 2013-14 BE
1 Total Receipts Revenue Account 32981 35527 44532 51320 59567 80066
a Tax Revenue 23866 26293 33848 40547 48153 58944
b Non Tax Revenue 1153 1670 985 890 1135 3416
c Grants in Aid and Contributions 7962 7564 9699 9883 10278 17707
2 Total Exp. Revenue Account 28512 32584 38216 46499 54466 73258
a General Services, of which 10530 12202 15287 17730 18645 25469
Interest Payments 3753 3685 4319 4304 4428 5888
b Social Services 12252 13186 15090 18729 23107 32005
c Economic Services 5726 7088 7836 10038 12710 15780
d Grants-in-aid 4 107 3 3 4 4
3 Revenue Deficit -4469 -2943 -6316 -4821 -5101 -6809
4 Capital Receipts 5939 6147 6044 6651 9579 11833
a Public Debt etc. 5928 6134 6032 6628 9554 11819
b Recovery of Loan and Advances 11 13 12 23 25 13
5 Capital Expenditure, of which 8669 10212 12489 13680 14740 18830
a Capital Outlay 6436 7332 9196 8852 9585 14197
b Loans and Advances 551 897 1103 1906 2086 1394
c Public Debt. 1682 1983 2190 2922 3070 3239
6 Total Expenditure 37181 42796 50705 60181 69206 92088
a Plan Expenditure 13814 16194 20911 23008 28380 39006
b Non Plan Expenditure 23367 26602 29794 37173 40825 53082
7 Gross Fiscal Deficit 2507 5273 3971 5914 6545 8769
8 Primary Deficit -1246 1588 -348 1611 2116 2881
9 Total Borrowings 5928 6134 6032 6628 9554 11819
a Internal Debt Receipt 5778 5370 5251 5801 9046 10393
b Loans from Central Government 150 764 782 827 508 1426
10 Repayment of Public Debt* 1682 1983 2190 2922 3070 3239
11 Public Debt Outstanding 39291 43442 47285 50990 57474 66055
12 GSDP 142279 162923 204463 246995 308640 375638
As percentage of GSDP
1 Total Receipts Revenue Account 23.2 21.8 21.8 20.8 19.3 21.3
a Tax Revenue 16.8 16.1 16.6 16.4 15.6 15.7
b Non Tax Revenue 0.8 1.0 0.5 0.4 0.4 0.9
c Grants in aid and contr. 5.6 4.6 4.7 4.0 3.3 4.7
2 Total Exp. Revenue Account 20.0 20.0 18.7 18.8 17.6 19.5
a General Services, of which 7.4 7.5 7.5 7.2 6.0 6.8
Interest payments 2.6 2.3 2.1 1.7 1.4 1.6
b Social Services 8.6 8.1 7.4 7.6 7.5 8.5
c Economic Services 4.0 4.4 3.8 4.1 4.1 4.2
d Grants-in-aid 0.0 0.1 0.0 0.0 0.0 0.0
3 Revenue Deficit -3.1 -1.8 -3.1 -2.0 -1.7 -1.8
4 Capital Receipts 4.2 3.8 3.0 2.7 3.1 3.2
a Public Debt etc. 4.2 3.8 3.0 2.7 3.1 3.1
b Recovery of Loan and Advances 0.0 0.0 0.0 0.0 0.0 0.0
5 Capital Expenditure, of which 6.1 6.3 6.1 5.5 4.8 5.0
a Capital Outlay 4.5 4.5 4.5 3.6 3.1 3.8
b Loans and Advances 0.4 0.6 0.5 0.8 0.7 0.4
c Public Debt. 1.2 1.2 1.1 1.2 1.0 0.9
6 Total Expenditure 26.1 26.3 24.8 24.4 22.4 24.5
a Plan Expenditure 9.7 9.9 10.2 9.3 9.2 10.4
b Non Plan Expenditure 16.4 16.3 14.6 15.0 13.2 14.1
7 Gross Fiscal Deficit 1.8 3.2 1.9 2.4 2.1 2.3
8 Primary Deficit -0.9 1.0 -0.2 0.7 0.7 0.8
9 Total Borrowing 4.2 3.8 3.0 2.7 3.1 3.1
a Internal Debt Receipt 4.1 3.3 2.6 2.3 2.9 2.8
b Loans from Central Government 0.1 0.5 0.4 0.3 0.2 0.4
10 Repayment of Public Debt 1.2 1.2 1.1 1.2 1.0 0.9
11 Debt Outstanding 27.6 26.7 23.1 20.6 18.6 17.6
GSDP for 2013-14 has been estimated on the basis of CAGR of last 5 years.

337
Chart 7.1
Chart 7.2
7.2 Fiscal Performance
The revenue and capital deficits represent the excess of expenditure over receipts under those
accounts. The conventional deficit is the algebraic sum of the revenue and capital deficits of
the Consolidated Fund of the state government. This, however, does not actually show the total
resource gap, as it includes the borrowings under the capital receipts. The overall resource gap
is reflected by the Gross Fiscal Deficit (GFD) which is bridged by borrowings of one sort or
0
10000
20000
30000
40000
50000
60000
70000
80000
90000
2008-09 2009-10 2010-11 2011-12 2012-13 2013-14 BE
Total Receipts Revenue Account Tax Revenue
Non Tax Revenue Grants in Aid and Contributions
Total Exp. Revenue Account
Revenue Accounts of Bihar Government (Rs. crore)
0
2000
4000
6000
8000
10000
12000
14000
16000
18000
20000
2008-09 2009-10 2010-11 2011-12 2012-13 2013-14 BE
Capital Receipts
Capital Expenditure
Capital Outlay
Capital Accounts of Bihar Government (Rs. crore)

338
another. For analyzing the fiscal performance of the state government during last 3 years
(2011-12 to 2013-14 BE), the present analysis has used the following 8 indicators:
(i) Ratio of Revenue Deficit to GFD
(ii) Ratio of Capital Outlay to GFD
(iii) Ratio of Non-Development Revenue Expenditure to Aggregate Disbursement
(iv) Ratio of Non-Development Revenue Expenditure to Revenue Receipt
(v) Ratio of Interest Payment to Revenue Expenditure
(vi) Ratio of State‘s Own Revenue to Revenue Expenditure
(vii) Ratio of Gross Transfer from Central Government to Aggregate Disbursement
(viii) Ratio of Debt Servicing Expenditure to Gross Transfers from Central Government.
(i) Ratio of Revenue Deficit to GFD : This ratio indicates the extent to which revenue deficit
contributes to GFD. Ideally, the revenue account should leave a surplus for creation of
capital assets. As noted already, there were substantial surpluses in the revenue account
of state government for the last few years, enabling it to increase its capital expenditure
continuously. The revenue surplus increased to Rs 5101 crore in 2012-13 from Rs. 4821
crore in 2011-12, and it constituted 78 percent of GFD during in 2012-13, a decline from
82 percent in 2011-12. Thanks to the Twelfth Finance Commission, most major states in
the country today are revenue surplus states. During the last 3 years, among 17 major
states, other than Bihar, 11 other states (Jharkhand, Odisha, Uttar Pradesh, Madhya
Pradesh, Rajasthan, Maharashtra, Gujarat, Andhra Pradesh, Karnataka, Tamil Nadu and
Chhattisgarh) have consistently maintained reasonable surpluses in their revenue
accounts. Among the states that failed to achieve consistent surpluses in their revenue
accounts are included — West Bengal, Punjab, Haryana, Kerala and Himachal Pradesh.
(ii) Ratio of Capital Outlay to GFD : As an obvious consequence of the improvements in its
revenue accounts, Bihar has had a high capital outlay during the last 3 years. In 2011-12,
the capital outlay was nearly 1.5 times its GFD, and this was the position even in 2012-
13. In 2013-14, the ratio is expected to increase to 1.6. Among the major states, those
which could register a similar high level of capital outlay are — Jharkhand, Odisha,
Maharashtra, Uttar Pradesh, Madhya Pradesh, Rajasthan, Gujarat, Tamil Nadu and
Chhattisgarh.

339
(iii) Ratio of Non-Development Revenue Expenditure to Aggregate Disbursements : The non-
development expenditure, incurred mainly for administrative or general services, should
preferably be a small part of the total disbursements. In Bihar, non-developmental
revenue expenditure constituted 26.9 percent of the total expenditure in 2012-13, less
than 29.5 percent recorded in 2011-12. This was high compared to some of the states
which have managed to curtail their non-developmental revenue expenditure. Most of the
major states also returned comparable figures, while some states like West Bengal,
Punjab, Uttar Pradesh, Kerala and Himachal Pradesh had this ratio above 30 percent.
Only Maharashtra and Chhattisgarh could curtail their non-developmental revenue
expenditure to a level below 20 percent of their total disbursements.
(iv) Ratio of Non-Development Revenue Expenditure to Revenue Receipts : This ratio
indicates the extent to which the state government's revenue receipts could not be utilized
for developmental purposes; it should preferably be low. In Bihar, the non-developmental
revenue expenditure consumed 34.6 percent of total revenue receipts in 2011-12 and, in
2012-13, this ratio was reduced to 31.3 percent. In 2013-14 (BE), this ratio is projected to
increase marginally to 31.8 percent. While many states like West Bengal, Uttar Pradesh,
Punjab, Tamil Nadu and Himachal Pradesh had ratios higher than 40 percent, Kerala had
a ratio of 70 percent in 2012-13. The ratio was less than 30 percent for Jharkhand,
Maharashtra, Andhra Pradesh and Chhattisgarh in 2012-13.
(v) Ratio of Interest Payment to Revenue Expenditure : Interest payments constitute a
perennial burden on governments' finances of most of the states, because of their high
indebtedness. For Bihar, however, interest payments have been consuming progresively
lesser proportion of the revenue expenditure since 2004-05. It was 15.7 percent in 2007-
08 and came down steadily to 8.6 percent in 2012-13. Nearly all states, except Jharkhand
Madhya Pradesh, Karnataka and Chhattisgarh, had this ratio above 10 percent in 2012-
13, the highest being 31.1 percent for Rajasthan.
(vi) Ratios of State‘s Own Revenue to Revenue Expenditure : The ratio of the state‘s own
revenue, that includes both tax and non-tax revenues, to its total revenue expenditure
indicates the self-sufficiency of the state government, vis-à-vis its revenue expenditure
needs. In 2007-08, own tax and non-tax revenue receipts of Bihar together covered barely
24 percent of its total revenue expenditure. The ratio has improved since then, reaching
the peak of nearly 31.9 percent in 2012-13. It is budgeted to increase further to 33.3
percent in 2013-14. This indicates that the state government is on the right track, though
it is still a long way to attain reasonable amount of financial self-sufficiency. The

340
position of all other major states is far better on this count; most of them raised more than
or close to 50 percent of their total revenue expenditure from their own tax and non-tax
receipts in 2012-13, except West Bengal (39.8 percent), Jharkhand (44.5 percent), Uttar
Pradesh (42.5 percent) and Himachal Pradesh (40 percent). While Maharashtra and
Gujarat raised more than 80 percent of their revenue expenditure requirements from their
own resources, Haryana, Andhra Pradesh, Kerala and Tamil Nadu raised more than 70
percent on this account.
(vii) Ratio of Gross Transfers from Central Government to Aggregate Disbursements : This
ratio brings out the state government's dependence on external (central) resources. For
Bihar, such dependence has always been very high. The central transfers always met
more than 60 percent of Bihar‘s total expenditure requirements on revenue and capital
accounts. However, from the peak of almost 72 percent in 2007-08, this ratio had
decreased to 61 percent in 2012-13. In the budget estimates of 2013-14 also, it is
projected to reduce only marginally to 60.5 percent. No other major state has had such a
high dependence on the central government transfers. Among other major states, only
Jharkhand, Odisha, West Bengal, Himachal Pradesh, Uttar Pradesh and Madhya Pradesh
had more than 40 percent of their total expenditure financed by the central transfers; in
case of Jharkhand it was above 50 percent. Even if only central grants are considered,
since states in any case have a statutory right to the share of central taxes, it accounted
for about 15 percent of Bihar‘s aggregate disbursements in 2012-13 (16 percent in 2011-
12). This is a more appropriate indicator of state government's dependence on central
government.
(viii) Ratio of Debt Servicing to Gross Transfers from Central Government : Till 2003-04, debt
servicing used to consume a very substantial portion of the gross transfers from the
central government to Bihar. However, due to the recommendations of the Twelfth
Finance Commission and better financial management, this ratio has been successfully
brought down from more than 100 percent in 2003-04 to only about 27 percent in 2007-
08. It has since been declining continuously and stood at 19.1 percent (2011-12), 17.8
percent (2012-13) and 16.4 percent (2013-14 BE). The performance of Bihar in this
respect is significantly better than many of the major Indian states. In case of Punjab,
Haryana, Kerala, Gujarat and Tamil Nadu, the situation is especially alarming since this
ratio had sometimes exceeded 100 percent or remained close to that, indicating that the
entire central transfers may not be sufficient to discharge the existing debt servicing
obligations of these states. Additional resources from the own revenues of these state
governments or from their market borrowings are, therefore, needed to pay for debt

341
servicing in these states, seriously jeopardizing their ability to undertake development
expenditure.
Table 7.2 : Major Fiscal Indicators
State
A. Revenue Deficit : GFD (%) B. Capital Outlay : GFD (%)
2011-12
(Actuals)
2012-13
(RE)
2013-14
(BE)
2011-12
(Actuals)
2012-13
(RE)
2013-14
(BE)
Bihar -81.5 -77.9 -77.6 149.7 146.4 161.9
Jharkhand -71.4 -129.5 -77.3 157.9 206.0 158.1
West Bengal 82.3 63.6 26.0 15.6 30.8 69.5
Odisha 901.8 -106.0 -32.0 -723.1 205.9 131.9
Uttar Pradesh -76.7 -26.1 -41.2 167.5 123.3 137.0
Madhya Pradesh -171.4 -61.5 -42.7 156.6 106.2 91.0
Rajasthan -92.2 -6.9 -7.9 195.5 104.4 107.9
Maharashtra -849.3 2432.3 -1601.5 934.8 -2260.1 1672.7
Gujarat -29.1 -21.4 -22.5 130.0 122.3 123.2
Punjab 80.2 50.7 18.9 18.8 48.2 78.7
Haryana 20.3 38.8 27.2 75.0 57.4 64.2
Karnataka -37.9 -6.1 -3.4 125.2 97.0 99.9
Andhra Pradesh -20.4 -22.2 -4.2 89.1 99.8 86.9
Kerala 62.6 30.0 19.1 30.0 60.7 72.6
Tamil Nadu -9.1 -2.4 -3.0 109.1 102.4 103.0
Himachal Pradesh 31.9 21.1 38.1 54.5 67.1 53.9
Chhatisgarh -403.3 -47.1 -47.2 505.0 137.3 140.5
Source : State Government Budgets
State
C. Non-Dev. Exp: Agg.
Disbursements (%)
D. Non-Dev. Exp: Revenue
Receipts (%)
2011-12
(Actuals)
2012-13
(RE)
2013-14
(BE)
2011-12
(Actuals)
2012-13
(RE)
2013-14
(BE)
Bihar 29.5 26.9 27.7 34.6 31.3 31.8
Jharkhand 30.1 23.3 25.0 35.0 26.9 29.4
West Bengal 39.1 35.3 34.7 55.8 49.3 43.4
Odisha 27.5 29.9 31.5 28.8 34.0 37.0
Uttar Pradesh 39.2 36.5 34.4 44.5 43.7 42.8
Madhya Pradesh 24.1 26.8 26.8 31.0 32.0 33.7
Rajasthan 29.0 24.7 24.8 33.3 31.2 30.5
Maharashtra 19.5 19.8 20.2 20.9 20.8 22.2
Gujarat 26.5 24.3 26.0 33.4 32.3 34.2
Punjab 40.1 30.9 28.7 66.8 49.9 46.4
Haryana 24.0 21.9 22.2 33.8 33.0 33.5
Karnataka 24.2 25.1 26.1 29.8 30.8 32.3
Andhra Pradesh 26.0 23.3 25.1 32.2 29.1 31.7
Kerala 44.0 39.6 36.5 61.5 70.0 72.4
Tamil Nadu 30.3 28.2 29.9 42.8 40.5 42.8
Himachal Pradesh 32.6 31.1 30.8 42.9 40.7 40.7
Chhatisgarh 22.9 19.7 18.8 25.5 24.2 22.6

342
State
E. Interest Payments: Revenue
Exp (%)
F. State Own Revenue: Revenue
Exp. (%)
2011-12
(Actuals)
2012-13
(RE)
2013-14
(BE)
2011-12
(Actuals)
2012-13
(RE)
2013-14
(BE)
Bihar 9.3 8.1 8.0 29.0 31.9 33.3
Jharkhand 10.8 8.7 8.1 47.6 44.5 47.0
West Bengal 21.7 20.9 21.3 35.8 39.8 45.2
Odisha 7.4 10.6 10.1 57.4 51.1 49.5
Uttar Pradesh 12.5 10.9 10.2 50.7 42.5 43.7
Madhya Pradesh 10.1 9.1 8.8 65.4 56.8 55.1
Rajasthan 14.7 31.1 30.4 64.4 62.6 61.3
Maharashtra 17.6 16.5 17.0 91.2 87.3 86.9
Gujarat 18.3 17.0 16.8 82.9 80.6 82.1
Punjab 19.0 15.9 17.1 61.2 66.4 70.4
Haryana 13.0 13.0 14.3 78.5 71.1 73.4
Karnataka 9.3 8.2 8.7 77.7 68.2 68.3
Andhra Pradesh 12.4 11.5 12.1 71.9 71.1 69.3
Kerala 13.7 13.6 12.7 61.5 70.0 72.4
Tamil Nadu 10.8 10.3 12.1 77.8 79.2 78.7
Himachal Pradesh 13.6 13.0 12.7 38.5 40.0 40.5
Chhatisgarh 5.7 4.9 3.8 65.3 59.7 61.0
State
G. Gross Transfers: Aggregate
Disbursements (%)
H. Debt Servicing: Gross
Transfers (%)
2011-12
(Actuals)
2012-13
(RE)
2013-14
(BE)
2011-12
(Actuals)
2012-13
(RE)
2013-14
(BE)
Bihar 62.9 61.0 60.5 19.1 17.8 16.4
Jharkhand 47.8 53.1 48.7 31.3 20.6 22.2
West Bengal 39.3 39.4 43.4 70.4 63.7 59.0
Odisha 49.0 47.1 45.7 23.8 31.6 28.4
Uttar Pradesh 46.1 49.7 47.4 34.7 27.2 34.0
Madhya Pradesh 36.1 42.1 40.9 29.0 26.2 35.5
Rajasthan 34.9 30.8 33.5 49.9 96.5 85.7
Maharashtra 19.8 24.9 25.1 96.7 72.7 83.2
Gujarat 17.1 18.5 17.2 119.0 100.8 102.4
Punjab 14.0 16.4 17.3 247.8 208.5 205.8
Haryana 12.9 15.5 15.6 165.6 179.7 190.8
Karnataka 23.9 28.4 27.6 45.7 35.5 42.7
Andhra Pradesh 27.0 26.9 26.4 57.3 55.5 56.1
Kerala 18.8 19.7 19.3 91.0 90.4 115.2
Tamil Nadu 17.6 15.7 16.1 122.1 140.3 158.8
Himachal Pradesh 44.9 44.9 42.8 37.9 44.5 41.5
Chhatisgarh 38.7 36.1 36.1 19.2 19.1 14.0

343
Charts 7.2
Charts for Fiscal Parameters of Bihar
(All ratios are depicted in percentages in these charts. Figures for 2013-14 refer to the
Budget Estimates for the year 2013-14; figures for all other years are actuals)
-200
-180
-160
-140
-120
-100
-80
-60
-40
-20
02008-09 2009-10 2010-11 2011-12 2012-13 2013-14
BE
R e v e n u e D e f i c i t : G F D
(%)
0
50
100
150
200
250
300
2008-09
2009-10
2010-11
2011-12
2012-13
2013-14 BE
C a p i t a l O u t l a y : G F D
(%)
0
5
10
15
20
25
30
35
40
2008-09
2009-10
2010-11
2011-12
2012-13
2013-14 BE
Non-Dev. Exp: Agg.
Disbursements (%)
0
5
10
15
20
25
30
35
40
45
2008-09
2009-10
2010-11
2011-12
2012-13
2013-14 BE
Non - Dev. Exp: Revenue
Receipts (%)
0
2
4
6
8
10
12
14
2008-09
2009-10
2010-11
2011-12
2012-13
2013-14 BE
Interest Payments : Revenue
Exp (%)
8
0
5
10
15
20
25
30
35
2008-09
2009-10
2010-11
2011-12
2012-13
2013-14 BE
State Own Revenue : Revenue
Exp. (%)

344
Sustainability, Flexibility and Vulnerability of State Finances
The preceding analysis can be extended further to identify the factors that make a state
financially healthy and ensure its continued development. For development, it is necessary that
a government expands its activities. It would then be necessary to know whether the means of
financing these activities are sustainable, i.e., they meet the increased expenditure needs of the
state government without substantially adding to its debt burden. If the state government
wishes to expand the level of its activity, it would also be pertinent to examine the flexibility of
the means of financing (either by increasing the revenue or by borrowing) and whether the
expanded levels of activity expose the government to more risks and makes it vulnerable to the
sources of funding. The state governments increase their levels of activity primarily through
the Five Year Plans which translate into annual development plans. Thus, it can be broadly
stated that non-plan expenditure represents the maintenance of the existing levels of activity,
while the plan expenditure entails its expansion. Some of the factors which measure the
sustainability, flexibility and vulnerability of the state government finances have been shown
in Table 7.3 and are discussed in the following paragraphs.
(i) Balance of Current Revenue (BCR) : This is calculated as state government's own
revenue receipts, plus share of central taxes, plus non-plan grants, minus non-plan
revenue expenditure. A positive BCR shows that the state government has surplus funds
from its revenues for meeting the plan expenditure. Bihar has a substantially positive
BCR that has been showing an increasing trend for the last 6 years, including the current
54
56
58
60
62
64
66
68
70
2008-09
2009-10
2010-11
2011-12
2012-13
2013-14 BE
Gross Tranfers : Aggregate
Disbursmnts ( % )
0
5
10
15
20
25
2008-09
2009-10
2010-11
2011-12
2012-13
2013-14 BE
Debt Servicing : Gross
Transfers (%)

345
fiscal. It amounted to Rs. 6074 crore in 2009-10 which increased to Rs 14,128 crore in
2012-13 and is expected to go up further to Rs 14,844 crore during the current fiscal.
(ii) Interest Ratio : This is calculated as (Interest payment-Interest receipt) / (Total revenue-
Interest receipt). A higher ratio indicates a reduced ability of the state government to
service any fresh debt and meet its revenue expenditure from its revenue receipts. For
Bihar, the ratio has been falling continuously; it decreased from 12.1 percent in 2009-10
to 8.7 percent in 2012-13.
(iii) Capital Outlay/Capital Receipts : This ratio indicates the extent to which capital receipts
are utilised for capital formation. A ratio of less than 100 percent would not be
sustainable in the long run, as that would indicate that capital receipts are being utilized
for revenue expenditure. For the first time, this ratio for Bihar had touched a healthy level
of 220 percent in 2006-07. The positive trend was sustained and the ratio increased to
373 percent in 2007-08, after which it declined during the next two years before rising
again in 2010-11 to 152 percent. At the end of 2012-13, however, the ratio declined to
100 percent, but still, presently the State‘s entire capital receipts are being used for capital
outlay, a part of the latter being financed by surplus in the revenue account. It must be
mentioned that, prior to 2005-06, this ratio used to remain below 20 percent, mostly due
to the high debt service payments.
(iv) State's Own Tax Receipts/ GSDP : This is an important indicator of the gap between the
state government's tax efforts and tax potential. A low ratio also indicates low tax
compliance. For Bihar, the ratio of its own tax receipts to GSDP has stagnated at around
4 percent till 2008-09 and, since then, has grown just above 5 percent in 2011-12. In
2012-13, the ratio improved marginally to 5.3 percent. Since this ratio is much lower
compared to other states, there is further scope for tapping the entire tax potential of the
state.
(v) Debt Outstanding/ GSDP : This ratio indicates whether the state government has fallen
into a debt trap from which it may not be able to come out on its own. A high ratio leaves
little room for the state government for financial leverage and indicates lack of flexibility.
It can be noted here that the total debt which constituted 26.7 percent of the GSDP in

346
2009-10 has been brought down to only 18.6 percent in 2012-13. As this debt burden is
clearly sustainable, Bihar is safely positioned on this account.
(vi) Capital Repayment / Capital Borrowings : This ratio indicates the extent to which the
capital borrowings could not be utilized for asset creation. A high ratio indicates that
capital receipts are being utilized more for capital repayment, depriving the economy of
additional asset creation. For Bihar, however, in contrast to trends prevailing prior to
2008-09, this ratio has increased from 46.9 percent in 2009-10 to 72.9 percent in 2011-
12. Unfortunately, it decreased to 54 percent in 2012-13 and projected to decrease further
to only 39.2 percent in 2013-14 (BE).
(vii) Primary Deficit : This is the GFD minus interest payments. It measures the impact of the
state government‘s current policies, without consideration of the liabilities created in the
past, for which interest has to be paid now. A necessary condition for long term
sustainability of debt is that the primary account should not be in deficit. In 2008-09,
Bihar had a primary surplus of Rs 1246 crore, but since then, except in 2010-11 when
there was a modest primary surplus of Rs 349 crore, Bihar could not generate any surplus
in its primary account. In 2012-13, it had a primary deficit of Rs 2116 crore which is
estimated to increase further to Rs 2881 crore in 2013-14. This remains a matter of
concern.
(viii) Buoyancy of State‘s Tax and Non-Tax Revenues : The buoyancy of own tax receipts of
the state government shows considerable variation — from 0.9 in 2010-11 to 2.1 in 2009-
10. In case of non-tax revenue, the buoyancy had varied from (-) 1.6 in 2010-11 to 9.3 in
2013-14 (BE). The negative buoyancy in non-tax revenues in 2010-11 was due to the
withdrawal of debt relief as available under the period covered by the Twelfth Finance
Commission, i.e. up to 2009-10. In 2011-12, this buoyancy was again negative due to the
recovery of a part of debt relief that was given to the state in 2009-10 amounting to Rs
384 crore. In case of non-tax revenue, such buoyancy ratios are not very meaningful, as
some one-time transfers from the central government are treated as non-tax revenue.

347
Table 7.3 : Fiscal and Financial Performance Indicators
Indicators 2009-10 2010-11 2011-12 2012-13 2013-14
BE
A. Sustainability
Balance from Current Revenue (Rs. crore) 6074 9442 9987 14128 14844
Interest Ratio (%) 12.07 11.80 9.12 8.67 8.94
Buoyancy of Own Tax Receipts w.r.t. GSDP 2.1 0.9 1.3 1.2 1.3
Buoyancy of Own Non-Tax Receipts w.r.t.
GSDP 3.1 -1.6 -0.5 1.1 9.3
Growth in outstanding debt (%) 10.6 8.8 7.8 12.7 14.9
Growth in total revenue receipts (%) 7.7 25.3 15.2 16.1 34.4
Growth in state‘s own revenue receipts (%) 33.2 11.2 24.4 28.8 40.2
Growth in GSDP (%) 14.5 25.5 20.8 25.0 21.7
B. Flexibility
Capital Repayment / Capital Borrowings (%) 46.9 54.6 72.9 54.0 39.2
Total Tax Receipts / GSDP (%) 16.1 16.6 16.4 15.6 15.7
Capital Outlay / Capital Receipts (%) 119.3 152.1 133.1 100.1 120.0
State‘s Own Tax Receipts / GSDP (%) 5.0 4.8 5.1 5.3 5.6
State‘s Own Non-Tax Receipts / GSDP(%) 1.0 0.5 0.4 0.4 0.9
Debt Outstanding / GSDP (%) 26.66 23.13 20.64 18.62 17.58
C. Vulnerability
Revenue Deficit (Rs. crore) -2943 -6316 -4821 -5101 -6809
Fiscal Deficit (Rs. crore) 5273 3971 5914 6545 8769
Primary Deficit (Rs. crore) 1587 -349 1611 2116 2881
Primary Deficit / Fiscal Deficit (%) 30.1 -8.8 27.2 32.3 32.9
Revenue Deficit / Fiscal Deficit (%) -55.8 -159.1 -81.5 -77.9 -77.6
Source : Finance Accounts of GoB
Summarising, it is noted that the fiscal position of the state government has definitely
improved, compared to what it was in 2009-10, as reflected by the parameters discussed above.
The fiscal situation worsened in 2011-12 due to the adverse macro-economic scenario in the
country as a whole, and it did not fully recover even in 2012-13. While the key fiscal indicators
point to a marked improvement in the fiscal position of the state government over the recent
years, there still remain some areas of concern. While the sustainability parameters including
the BCR have been increasing continuously, freeing larger resources for plan expenditure, the
state‘s own revenues are yet to respond fully to the high growth in the state income. Further,
the revenue receipts have been increasing much faster than the outstanding debt, but the
primary account of the state government still remains in the red. However, given that the
growth rate of GSDP has been more than the growth rate of interest on outstanding debt, the
current debt level seems to be sustainable.

348
With better debt management, the state government has shown increased flexibility over the
years and was in a better position to direct its resources towards improving the standards of
social and economic services and physical infrastructure. In terms of vulnerability, however,
the state government still remains overwhelmingly dependent on the central funds for meeting
its own expenditure needs. This dependence can be lessened as there still remains untapped
potential for increasing its own tax revenues.
7.3 Deficit Management
The position in the revenue account as well as the combined position of the revenue and capital
accounts of some major states for the years from 2010-11 to 2013-14 (BE) are presented in
Table 7.4. Bihar had its highest surplus of Rs 6316 crore in the revenue account in 2010-11,
after which the economic downturn had caused a decline in its revenue surplus. As noted
earlier, 2012-13 had seen a marginal improvement in its revenue surplus position which is
expected to improve substantially in the current fiscal. Consequently, the GFD position has
been worsening since 2010-11; however, in 2012-13, the GFD of Bihar has increased to Rs
6545 crore from Rs 3970 crore in 2010-11. The GFD is likely to increase steeply in the current
fiscal to Rs 8769 crore, i.e. by 34 percent, due to increase in capital outlay by Rs 4600 crore,
an increase of 48 percent. This is in keeping with the government‘s avowed policy of
increasing investments in social and physical infrastructure. All states have been facing nearly
same problems, arising from the phenomenon of economic downturn.
Table 7.4 : Deficit/Surplus position of States
(Rs. crore)
State
Revenue Deficit (+)/ Surplus(-) Conventional Deficit (+)/ Surplus(-)
2011-12
(Actuals)
2012-13
(RE)
2013-14
(BE)
2011-12
(Actuals)
2012-13
(RE)
2013-14
(BE)
Bihar -4821 -5101 -6809 2135 61 189
Jharkhand -1428 -4217 -3164 968 0 0
West Bengal 14571 13308 3488 -20162 -16618 -26604
Orissa -5607 -2958 -1905 352 1805 1960
Uttar Pradesh -6985 -5546 -9856 -2264 13811 5281
Madhya Pradesh -9910 -6420 -5215 2261 2442 378
Rajasthan -3357 -772 -1026 1198 3349 2015
Maharashtra -16244 -20475 -22874 -16082 -15605 -16205
Gujarat -3215 -3897 -4602 -1232 2619 704
Punjab 6811 4759 1746 2568 2191 2291
Haryana 1457 3163 2443 424 1259 433
Karnataka -4691 -943 -596 6262 4237 893
Andhra Pradesh -3138 -4445 -1023 2713 759 -116
Kerala 8034 3406 2270 5909 591 28
Tamil Nadu -1364 -452 -664 4324 4214 1796
Himachal Pradesh 1098 634 1488 2585 1831 2109
Chhatisgarh -3239 -2162 -2429 1232 2080 692
Source : State Government Budgets
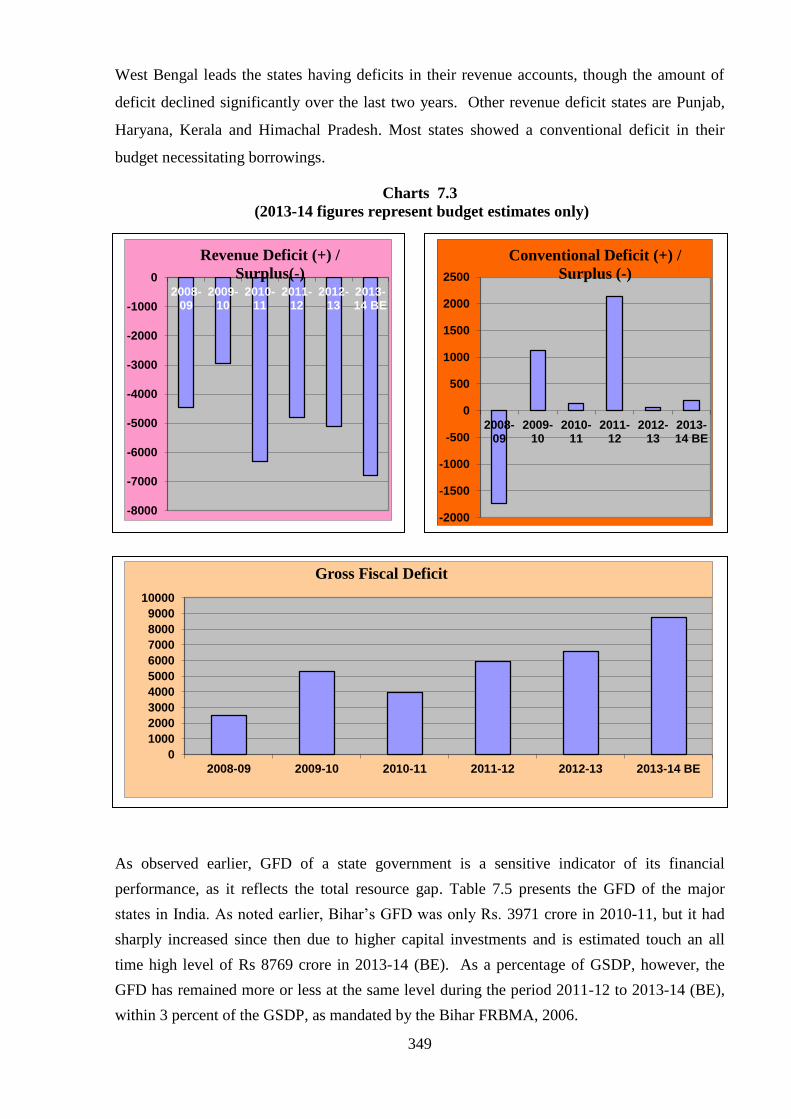
349
West Bengal leads the states having deficits in their revenue accounts, though the amount of
deficit declined significantly over the last two years. Other revenue deficit states are Punjab,
Haryana, Kerala and Himachal Pradesh. Most states showed a conventional deficit in their
budget necessitating borrowings.
Charts 7.3
(2013-14 figures represent budget estimates only)
As observed earlier, GFD of a state government is a sensitive indicator of its financial
performance, as it reflects the total resource gap. Table 7.5 presents the GFD of the major
states in India. As noted earlier, Bihar‘s GFD was only Rs. 3971 crore in 2010-11, but it had
sharply increased since then due to higher capital investments and is estimated touch an all
time high level of Rs 8769 crore in 2013-14 (BE). As a percentage of GSDP, however, the
GFD has remained more or less at the same level during the period 2011-12 to 2013-14 (BE),
within 3 percent of the GSDP, as mandated by the Bihar FRBMA, 2006.
0
1000
2000
3000
4000
5000
6000
7000
8000
9000
10000
2008-09 2009-10 2010-11 2011-12 2012-13 2013-14 BE
Gross Fiscal Deficit
-2000
-1500
-1000
-500
0
500
1000
1500
2000
2500
2008-09
2009-10
2010-11
2011-12
2012-13
2013-14 BE
Conventional Deficit (+) /
Surplus (-)
-8000
-7000
-6000
-5000
-4000
-3000
-2000
-1000
0
2008-09
2009-10
2010-11
2011-12
2012-13
2013-14 BE
Revenue Deficit (+) /
Surplus(-)

350
Table 7.5 : Gross Fiscal Deficit
State
Gross Fiscal Deficit (Rs. crore)
2011-12
(Actuals)
2012-13
(RE)
2013-14
(BE)
Bihar 5914 6545 8769
Jharkhand 2001 3255 4091
West Bengal 17705 20911 13414
Odisha -622 2792 5945
Uttar Pradesh 9101 21210 23913
Madhya Pradesh 5783 10436 12219
Rajasthan 3642 11211 13028
Maharashtra 1913 -842 1428
Gujarat 11037 18191 20496
Punjab 8492 9395 9257
Haryana 7163 8145 8988
Karnataka 12390 15339 17649
Andhra Pradesh 15402 20009 24487
Kerala 12831 11366 11895
Tamil Nadu 14972 18714 21841
Himachal Pradesh 3441 3008 3907
Chhatisgarh 803 4590 5145
Source : State Government Budgets
As regards other major states, West Bengal, Uttar Pradesh, Gujarat, Karnataka, Andhra
Pradesh and Tamil Nadu — all had very high fiscal deficits in 2012-13, exceeding Rs. 15,000
crore, followed by Rajasthan, Kerala and Madhya Pradesh with fiscal deficits of more than Rs
10,000 crore. No state had any fiscal surpluses during the 2012-13, except Maharastra which
had a small fiscal surplus of Rs 842 crore.
Table 7.6 shows the decomposition of the GFD of Bihar, from which one can find that capital
outlay accounted for most of GFD, as it rightly should. This was true throughout the period
from 2009-10 to 2013-14, and more so during the recent years. The fact that the capital outlay
now accounts for almost the entire GFD, after exhausting the revenue surplus, indicates that it
is now being utilised for building the much needed physical infrastructure in Bihar, especially
required to improve living standards in the rural areas. Net lending has always constituted a
small part of the GFD of the state government. The capital outlay has increased in Bihar at an
annual rate of 14 percent during the last 6 years.

351
Table 7.6 : Decomposition of Gross Fiscal Deficit of Bihar
(Rs. crore)
2008-09 2009-10 2010-11 2011-12 2012-13 2013-14
BE
Revenue Deficit -4469 -2943 -6316 -4821 -5101 -6809
Capital Outlay 6436 7332 9196 8852 9585 14197
Net Lending 540 884 1091 1884 2061 1381
GFD 2507 5273 3971 5914 6545 8769
GSDP 142279 162923 204463 246995 308640 375638
GFD: GSDP ratio (%) 1.8 3.2 1.9 2.4 2.1 2.3
Charts 7.4
Table 7.7 shows how the GFD was financed during all these years. The net borrowing mainly
consisted of internal market borrowings of the state government as well as the central loans,
the latter constituting a very small proportion of its total public debt. The internal market
borrowings of the state government now almost wholly finance its GFD; in 2012-13, the net
borrowings of the state government financed as much as 99.1 percent of the GFD. The net
accruals from the Public Account, which constitutes a part of the cash balances of the state
government, amounted to 5.2 percent of the GFD, leading to an increase in cash balance by 4.3
percent of the GFD. The increase in cash balance also indicates that the state government need
not have borrowed Rs. 282 crore (4.3 percent of GFD). But such fine tuning of borrowing
requirements with the availability of cash balances in real time will continue to be a problem
till a higher level of computerization. Once that is achieved, interchange of information among
the treasury, the Finance Department and RBI will ensure that the state government does not
unnecessarily borrow, when some cash balance is available.
0.0
0.5
1.0
1.5
2.0
2.5
3.0
3.5
GFD: GSDP ratio(%)
-10000
-5000
0
5000
10000
15000
20000Net Lending Capital OutlayRevenue Deficit
Decomposition of GFD

352
Table 7.7 : Financing of Gross Fiscal Deficit of Bihar
(Rs crore)
2008-09 2009-10 2010-11 2011-12 2012-13 2013-14
BE
Net Borrowing 4246 4151 3842 3706 6484 8580
Net Public Account -79 -675 2237 2469 343 345
Net Decrease in Cash Balance
(Opening-Closing Balance) -1660 1797 -2108 -333 -282 -156
GFD 2507 5273 3971 5914 6545 8769
Percentage Composition
Net Borrowing 169.4 78.7 96.8 62.6 99.1 97.8
Net Public Account -3.2 -12.8 56.4 41.7 5.2 3.9
Net Decrease in Cash Balance -66.2 34.1 -53.1 -5.6 -4.3 -0.2
100.0 100.0 100.0 100.0 100.0 100.0
Chart 7.5
Cash Management
As of March 31, 2013, the state government had a cash balance of Rs 2263 crore, compared to
Rs 1509 crore on March 31, 2012. Out of this, Rs 2074 crore were invested in Cash Balance
investment account, Rs 188 crore were invested in Treasury Bills with the RBI, Rs 183 crore
were available as cash with departmental officers from Public works and Forest Departments,
Rs 338 crore were held as permanent advances for contingent expenditure with various
departmental officers, and Rs 931 crore were invested in earmarked funds like the Sinking
Fund. An amount of Rs 167 crore were realised as interest on the state government‘s
investments during the year.
-100.0
-50.0
0.0
50.0
100.0
150.0
200.0
2008-09 2009-10 2010-11 2011-12 2012-13 2013-14 BE
Net Decrease in Cash Balance Net Public Account Net Borrowing
Financing of GFD

353
Guarantees by State Government
The outstanding guarantees of the state government at the end of 2012-13 stood at Rs 1089
crore (1.8 percent of total revenue receipts), of which Rs 500 crore were against the loan to the
Bihar State Food and Civil Supplies Corporation, Rs 195 crore to the Bihar State Electricity
Board (BSEB) and Rs 127 crore against the Bihar State Financial Corporation. Further, Credit
Co-operative Societies and Housing Co-operatives accounted for Rs. 169 crore. Due to
increase in investment in the electricity sector, the state is yet to establish any Guarantee
Redemption Fund, as suggested by the Twelfth Finance Commission to discharge any possible
future liabilities. The interest on outstanding guarantees amounted to Rs 112 crore during the
year.
7.4 Debt Management
Table 7.8 shows the outstanding debt liabilities of the state government (excluding guarantees)
from 2008-09 to 2012-13. The outstanding liability as a percentage of GSDP had decreased
consistently from 41 percent in 2008-09 to only 25 percent in 2012-13.
Table 7.8 : Outstanding Liabilities
(Rs crore)
2008-09 2009-10 2010-11 2011-12 2012-13
Public Debt
Internal Debt 31293 35494 39020 42365 48826
Central Loans 7998 7948 8264 8626 8649
Total 39291 43442 47284 50991 57474
Other Liabilities
Small Savings, PF etc. 9574 9310 9563 9561 9346
Reserve Funds 1365 1463 1647 2219 2750
Deposits and Advances 4887 4754 4803 5717 7864
Total 15826 15527 16013 17497 19960
Total (Public Debt +
Other Liabilities) 55117 58969 63297 68488 77434
Outstanding Liability as
% of GSDP 40.5 37.3 31.0 28.7 25.4
The total outstanding liabilities of the state government, as can be seen from Table 7.8, had
accumulated to Rs. 77,434 crore at the end of 2012-13, of which the public debt liability on
account of borrowings on the Consolidated Fund accounts for 74 percent. This figure is the
accumulated effect of past borrowings, growing at an annual rate of 8.0 percent since 2008-09.

354
The liability on account of public debt has been rising at an average annual rate of 9.6 percent
since 2008-09. Table 7.8 also shows that the major part of this outstanding public debt, about
85 percent, is due to the internal loans raised by the state government and about 15 percent is
due to loans from the central government. Thus, the composition of outstanding debt has
undergone a structural change over the years, with the share of central loans coming down
gradually. This has happened mostly because of the recommendations of the Twelfth Finance
Commission. In coming years, the central government loans will probably no longer be a part
of the loan portfolio of the state government.
Liability from Public Account constitute a significant part of the total liability of the state
government, though it is not a debt in the strict sense of the term. But the resources are indeed
used by the state government, and there is a liability to pay back the outstanding balances in
these accounts, which form a part of the cash balance of the state. It may be noted that some of
these liabilities under the Reserve Funds and Deposits and Advances will be non-interest
bearing; here the state government only holds the money in trust. As explained earlier,
National Small Savings Fund (NSSF) contributes significantly to the internal borrowings of the
state government. During 2012-13, the state government had raised Rs 9046 crore (Rs. 5801
crore in 2011-12) from the internal borrowings, of which Rs 1005 crore came from NSSF, Rs
7100 crore were raised from the market and Rs 932 crore were borrowed from financial
institutions. Besides, the state government also took ways and means advances of Rs 9 crore
from the RBI. The central loans borrowed for state plan schemes amounted to Rs 508 crore.
The composition of outstanding liabilities in the Consolidated Fund of the state government as
on March 31, 2013 is shown in Table 7.9, from which it is seen that NSSF accounts for 33
percent and market loans constitute 45 percent of total outstanding internal debt of the state
government. The outstanding central loans are almost entirely on account of loans for state
plan schemes.

355
Table 7.9 : Composition of Outstanding Liabilities in the Consolidated Fund
Nature of Borrowings
Outstanding
Balance as on
31.03.2013
(Rs crore)
Percentage
Composition
of outstanding
balance as on
31.03.13
A. Internal Debt, of which 48,826 84.95
Market Loans 25,938 45.13
WMA from the RBI 0 0.00
Bonds 642 1.12
Loans from Financial Institutions 3,113 5.42
Special Securities Issued to NSSF 19,125 33.28
Others 8 0.01
B. Loans and Advances from Central
Government, of which 8,649 15.05
Non plan loans 62 0.11
Loans for State Plan Schemes 8,540 14.86
Loans for Central Plan Schemes 1 0.00
Loans for Centrally Sponsored Plan Schemes 0 0.00
Other Loans 47 0.08
Total (A+B) 57,474 100
Table 7.10 shows the repayment liabilities of the state government. In 2012-13, the total
repayment of principal by the state government amounted to Rs. 4582 crore, while the interest
payment was higher at Rs 4428 crore. The annual interest burden has increased by Rs 675
crore over the past 5 years, due to substantial past borrowings. The total annual debt service
burden has increased from Rs. 6444 crore in 2008-09 to Rs. 9010 crore in 2012-13, growing at
an annual rate of 9.3 percent. In the budget estimates for 2013-14, it is expected to increase by
nearly 14 percent to Rs 10,264 crore.
Table 7.10 : Public Debt Repayment Liabilities
(Rs. crore)
2008-09 2009-10 2010-11 2011-12 2012-13 2013-14
BE
Discharge of internal debt 1254 1169 1725 2457 2585 2660
Repayment of loans to Centre 428 814 465 465 485 579
Discharge of other liabilities 1009 970 586 1034 1512 1137
Total Repayment 2691 2953 2776 3956 4582 4376
Total Interest Payment 3753 3685 4319 4304 4428 5888
Total Debt Service Burden 6444 6639 7095 8260 9010 10264
Note : Liabilities include receipts and payments of Small Saving and Provident Fund under Public
Accounts of the Government of Bihar.

356
Charts 7.6
Public debt can be a powerful agent of economic growth, if it is utilised for the creation of
productive assets. As can be seen from Table 7.11, the debt resources could not be utilised
much by the state government for creating productive assets till 2011-12, when they were
mostly used to discharge the existing debt obligations. In 2012-13, however, there was a net
accrual to the state exchequer of only 23.5 percent of the total borrowing. In that year, out of
the total borrowed amount of Rs. 9554 crore, Rs 3070 crore were used for repayment of the
principal amounts of the existing public debt, and Rs. 4428 crore for payment of interest.
Taking into account the nominal receipts on account of recoveries of loans and advances given
by the state government as well as interest receipts on such loans, it resulted in net inflow of Rs
2248 crore as resources for the state government. In 2013-14 (BE), this situation is likely to be
improved further and the state government should be in a position to utilize about Rs 3000
0100002000030000400005000060000700008000090000
Other Liabilities Central LoansInternal Debt
Oustanding Liabilities of Bihar
Government (Rs. crore)
0.00
0.05
0.10
0.15
0.20
0.25
0.30
0.35
0.40
0.45
Outstanding Liability as % of
GSDP
0
2000
4000
6000
8000
10000
12000
Total Interest Payment Total Repayment
Debt Servicing by Bihar Government
(Rs. crore)
0
50000
100000
150000
200000
250000
300000
350000
400000
Debt Outstanding GSDP
Growth of Debt Burden vis-a-vis
GSDP (Rs. crore)

357
crore, or 25.8 percent of net borrowings for its own developmental requirements. Though the
overall situation has improved now, it still implies a limited space available to the state
government for fiscal maneuverability.
Table 7.11 : Net Public Debt Received
(Rs. crore)
2008-09 2009-10 2010-11 2011-12 2012-13 2013-14
BE
Gross Central Loans Received 150 764 782 827 508 1426
Internal Debt Recd 5778 5370 5250 5801 9046 10393
Total Debt Received 5928 6134 6032 6628 9554 11819
Recoveries of Loans and Advances 11 13 12 23 25 13
Interest payments 3753 3685 4319 4304 4428 5888
Interest Received 305 353 238 574 167 338
Repayment of Debt 1682 1983 2190 2922 3070 3239
Net Debt Received 809 832 -227 -2 2248 3044
Net Debt Received as percentage
of total borrowing 13.6 13.6 -3.8 0.0 23.5 25.8
7.5 Tax : GSDP Ratio
Table 7.12 shows a comparison among different states with respect to their Tax : GSDP ratios
for the year 2013-14 (BE). It is seen that, for Bihar, this ratio at only 5.6 percent was the lowest
among all major states. Jharkhand, West Bengal, Odisha, Uttar Pradesh, Rajasthan,
Maharastra, Gujarat, Haryana and Himachal Pradesh had tax:GDSP ratios ranging between 7
to 10 percent, while all other states had the ratio exceeding 10 percent, the highest being 13.6
percent for Karnataka, followed by 12.9 percent for Tamil Nadu. As regards the total Revenue:
GSDP ratio which includes the central transfers and grants, Himachal Pradesh, a special
category state, records the highest ratio of 27.7 percent, while for Madhya Pradesh, Uttar
Pradesh and Chhattisgarh, the ratio is above 25 percent. Bihar‘s Own Tax: GSDP ratio of only
5.6 percent indicates that its tax potential remains largely untapped. If its own tax: GSDP ratio
improves, the ratio between its total revenue and GSDP that currently stands at only 21 percent
would also improve automatically.

358
Chart 7.7
Table 7.12 : Tax : GSDP Ratio of States (2013-14 BE)
State
Revenue
Receipts
(Rs. crore)
State's
Own Tax
(Rs. crore)
GSDP
(Rs. crore)
State‘s
Own Tax:
Revenue
Receipts
State's
Own Tax:
GSDP
Total
Revenue:
GSDP
Bihar 80066 20963 375638 26.2 5.6 21.3
Jharkhand 33599 10152 142165 30.2 7.1 23.6
West Bengal 88403 39784 532329 45.0 7.5 16.6
Odisha 51299 17605 215899 34.3 8.2 23.8
Uttar Pradesh 177748 60109 679007 33.8 8.9 26.2
Madhya Pradesh 79603 33382 309687 41.9 10.8 25.7
Rajasthan 77221 34053 416755 44.1 8.2 18.5
Maharashtra 155987 103699 1199548 66.5 8.6 13.0
Gujarat 85752 60208 611767 70.2 9.8 14.0
Punjab 42666 28524 258006 66.9 11.1 16.5
Haryana 43780 28784 305405 65.7 9.4 14.3
Karnataka 97986 62464 460607 63.7 13.6 21.3
Andhra Pradesh 127772 72443 655181 56.7 11.1 19.5
Kerala 58058 38771 315206 66.8 12.3 18.4
Tamil Nadu 118580 86065 665312 72.6 12.9 17.8
Himachal Pradesh 17701 5373 63812 30.4 8.4 27.7
Chhatisgarh 37445 15300 139515 40.9 11.0 26.8
Source : State Government Budgets
4.34
4.97 4.83 5.11 5.27
5.58
0.00
1.00
2.00
3.00
4.00
5.00
6.00
2008-09 2009-10 2010-11 2011-12 2012-13 2013-14 BE
State Own Tax : GSDP ratio (%)

359
7.6 Revenue Account: Receipt and Expenditure
The summary of revenue receipts and expenditure of the state government is shown in Table
7.13. During 2008-09 to 2013-14, the revenue receipts grew annually at 19.1 percent, while
revenue expenditure grew at a higher rate of 20.3 percent. But since in the revenue receipts
were much higher than revenue expenditure in the base year, there is still a steady revenue
surplus. The state government's own revenue, tax and non-tax combined, used to meet just
about a quarter of its revenue expenditure till 2008-09, but it now covers about one-third of its
total revenue expenditure (2013-14). The total revenue of the state government increased by
more than 80 percent during the 5 year period from 2008-09 (Rs. 32,981 crore) to 2012-13 (Rs.
59,567 crore). Simultaneously, its own revenue, tax and non-tax combined, have grown at an
even faster rate, by almost two and a half times, from Rs. 7325 crore (2008-09) to Rs. 17,388
crore (2012-13), during the same period.
Table 7.13 : Revenue Account of Bihar
(Rs. crore)
2008-09 2009-10 2010-11 2011-12 2012-13
2013-14
BE
Revenue Receipt 32981 35527 44532 51320 59567 80066
Revenue Expenditure 28512 32584 38216 46499 54466 73258
Revenue Surplus -4469 -2943 -6316 -4821 -5101 -6809
State‘s own tax + non-tax revenue 7326 9760 10855 13502 17388 24379
State‘s own revenue as % of total
revenue 22.2 27.5 24.4 26.3 29.2 30.4
State‘s share of Central tax as % of
total revenue 53.6 51.2 53.8 54.5 53.6 47.5
Central Grants as % of its total
revenue 24.1 21.3 21.8 19.3 17.3 22.1
State‘s own revenue as % of
revenue expenditure 25.7 30.0 28.4 29.0 31.9 33.3
Charts 7.8
-20000
-10000
0
10000
20000
30000
40000
50000
60000
70000
80000
90000
Revenue ReceiptRevenue ExpenditureRevenue Deficit
Revenue Account of Bihar
(Rs. crore)
0
10000
20000
30000
40000
50000
60000
70000
80000
90000
Revenue Receipt
State’s own tax + non-tax revenue
Revenue Receipts of Bihar
(Rs. crore)
360
In Table 7.13, some more parameters of the state government finances have been presented,
comparing its own tax and non-tax revenues with its total tax and non-tax revenues. The tax
revenues of the state government consist of its own revenues as well as its share from the
divisible pool of central taxes. The share of state government's own tax revenue in total tax
revenue, which was stagnating at 20 percent earlier, had started increasing from 2008-09
onwards and now stands much higher at 35.6 percent (2013-14). It has financed between 22
and 30 percent of its total revenue expenditure from 2008-09 onwards, but the state
government still remains overwhelmingly dependent on the central resources. More than 50
percent of the total revenues of Bihar till 2012-13 came from divisible pool of central taxes
alone; in 2013-14, it is projected to come down to 47.5 percent. The central grants, plan and
non-plan combined which account for almost equal shares, together contribute about 22
percent of the total receipts of the state government (2013-14).
Table 7.14 shows the total expenditure of the state government for developmental and non-
developmental purposes, as well as its plan and non-plan expenditure. The plan expenditure is
mostly developmental, while non-plan expenditure may be either developmental or non-
developmental. In the absence of any clear guideline for classification of expenditure between
plan and non-plan on a rational basis, the distinction continues to remain ambiguous. All
expenditure under non-developmental heads is non-plan expenditure, but non-plan expenditure
may also have a developmental component. With the report of the Rangarajan Committee
submitted in 2011, there was an opportunity to remove this ambiguity, but the central
government is yet to accept its recommendations. This analysis of the expenditure, however, is
restricted to the conventional definition of the terms, and does not necessarily mean that non-
plan expenditure is always unproductive.
Referring to Table 7.14, it is to be noted that the share of development expenditure, both on
revenue and capital accounts, in the total expenditure of the state government had increased
substantially from less than 50 percent in 2005-06 to 65.7 percent in 2007-08; after that, it has
remained nearly unchanged at that level. In absolute terms, there has been 86 percent increase
in it during the five years 2008-09 to 2012-13, indicating its remarkable growth. As already
noted, plan expenditure is undertaken for new development projects. In case of Bihar, about 37
percent of the total expenditure of the state government has been plan expenditure in 2008-09,
after which this share increased steadily and has reached 41 percent in 2012-13. Almost 16
percent of the total non-plan expenditure was solely due to interest payment on outstanding
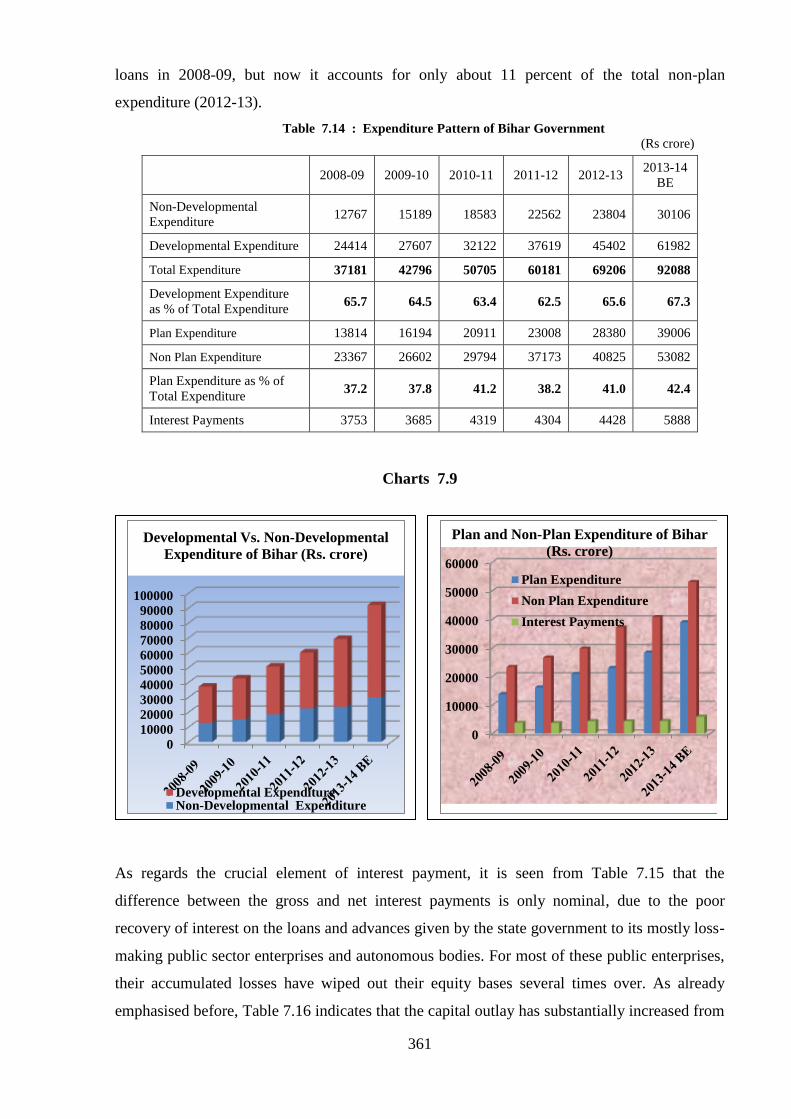
361
loans in 2008-09, but now it accounts for only about 11 percent of the total non-plan
expenditure (2012-13).
Table 7.14 : Expenditure Pattern of Bihar Government
(Rs crore)
2008-09 2009-10 2010-11 2011-12 2012-13 2013-14
BE
Non-Developmental
Expenditure 12767 15189 18583 22562 23804 30106
Developmental Expenditure 24414 27607 32122 37619 45402 61982
Total Expenditure 37181 42796 50705 60181 69206 92088
Development Expenditure
as % of Total Expenditure 65.7 64.5 63.4 62.5 65.6 67.3
Plan Expenditure 13814 16194 20911 23008 28380 39006
Non Plan Expenditure 23367 26602 29794 37173 40825 53082
Plan Expenditure as % of
Total Expenditure 37.2 37.8 41.2 38.2 41.0 42.4
Interest Payments 3753 3685 4319 4304 4428 5888
Charts 7.9
As regards the crucial element of interest payment, it is seen from Table 7.15 that the
difference between the gross and net interest payments is only nominal, due to the poor
recovery of interest on the loans and advances given by the state government to its mostly loss-
making public sector enterprises and autonomous bodies. For most of these public enterprises,
their accumulated losses have wiped out their equity bases several times over. As already
emphasised before, Table 7.16 indicates that the capital outlay has substantially increased from
0
10000
20000
30000
40000
50000
60000
70000
80000
90000
100000
Developmental ExpenditureNon-Developmental Expenditure
Developmental Vs. Non-Developmental
Expenditure of Bihar (Rs. crore)
0
10000
20000
30000
40000
50000
60000
Plan Expenditure
Non Plan Expenditure
Interest Payments
Plan and Non-Plan Expenditure of Bihar
(Rs. crore)

362
Rs. 6436 crore in 2008-09 to Rs. 9585 crore in 2012-13, drawing from the substantial surplus
in the revenue account and reinforcing the state government‘s commitment to development. In
the budget estimates of 2013-14, it is projected to rise further to Rs. 14,197 crore.
Table 7.15 : Interest Payment and Receipt
(Rs. crore)
2008-09 2009-10 2010-11 2011-12 2012-13
2013-14
BE
Gross Interest Payment 3753 3685 4319 4304 4428 5888
Net Interest Payment 3448 3332 4081 3730 4261 5550
Table 7.16 : Other Parameters of Expenditure
(Rs. crore)
2008-09 2009-10 2010-11 2011-12 2012-13
2013-14
BE
Total Tax Revenue 23866 26293 33848 40547 48153 58944
Own Tax Revenue 6173 8090 9870 12612 16253 20963
Total non-tax Revenue 1153 1670 985 890 1135 3416
Own Tax + Non-tax Revenue 7326 9760 10855 13502 17388 24379
Own non-tax Revenue 1153 1670 985 890 1135 3416
Capital Outlay 6436 7332 9196 8852 9585 14197
Capital Outlay as % of Total
Expenditure 17.31 17.13 18.14 14.71 13.85 15.42
Chart 7.10 : Transfer of Resources from Centre (Rs Crore)
The extent of the state government's dependence on central resources can be seen from Table
7.17, showing the gross transfer of resources to Bihar during 2008-09 to 2013-14. The gross
17693 18203 23978 27965 31937 38014 7962 7564
9699 9883
10278
17707
37181 42795
50705
60180
69205
92088
0
10000
20000
30000
40000
50000
60000
70000
80000
90000
100000
2008-09 2009-10 2010-11 2011-12 2012-13 2013-14 BE
Gross Loans from Centre Grants-in-Aid from Centre
Share in Central Tax Aggregate Disbursements

363
transfer of resources includes the state government's share in central taxes, grants-in-aid from
the central government, as well as central loans. The transfer of resources from the central to
state government constituted around 61 percent of its total expenditure in 2012-13; in 2008-09,
such transfers had met 69 percent of the total expenditure of the state government. In 2013-14,
this share is also estimated at 61 percent. As already noted, the contribution of state
government's own resources to total expenditure increased from 19.7 percent to 26.5 percent
during the period; the rest is covered mostly by market borrowings of the state government. In
2012-13, about 46 percent of the total disbursements came from its share of central taxes and
the rest from the central grants (15 percent) and loans from the central government constituted
(1 percent). About 76 percent of the gross transfers to the state government were on account of
state‘s share of central taxes alone; this share varied across the years and is projected to come
down to 60.5 percent in 2013-14.
Table 7.17 : Transfer of Resources from Central Government to Bihar
(Rs crore)
2008-09 2009-10 2010-11 2011-12 2012-13
2013-14
BE
Aggregate Disbursements 37181 42796 50705 60181 69205 92088
Share in Central Tax 17693 18203 23978 27935 31900 37981
Grants-in-Aid from Centre 7962 7564 9699 9883 10278 17707
Gross Loans from Centre 150 764 782 827 508 1426
Gross transfer of Resources 25805 26531 34459 38645 42686 57114
Net Loans from Centre -278 -50 317 362 23 847
Net Transfer of Resources 25227 24953 33211 37382 41731 55142
Own Tax + Non-tax Revenue 7326 9760 10855 13502 17388 24379
7.7 Resource Management
The revenue receipts of the state government come from both tax and non-tax sources. The tax
revenue consists of its own tax revenues and its share in the divisible pool of taxes and duties
of the central government. Similarly, the non-tax revenues consist of the state government‘s
own non-tax revenue as well as central grants for plan and non-plan purposes. The own tax
revenues of the state government are classified into: (i) Taxes on income that include
agricultural income tax, taxes on trades; (ii) Taxes on property and capital transactions which
include land revenues, stamp and registration fees, taxes on urban immovable property; and
(iii) Taxes on commodities and services which by far are the most important sources of the
state government‘s own tax revenue and include a variety of taxes like sales tax or VAT,
turnover tax, state excise duty, taxes on vehicles, taxes on goods and passengers, electricity
duty, taxes on entertainment etc.
364
The share of central taxes consists mainly of the shares of income tax, union excise duty,
customs duty, service tax and wealth tax which are collected by the central government, but the
proceeds of which are shared with the state governments, under recommendations of the
Finance Commissions, constituted every five years.
The non-tax revenues of the state government are collected under general, social and economic
services. These include interest receipts from loans and advances to various government
companies, public sector and quasi-commercial undertakings and other bodies, dividends and
profit from them, interest earned on the investment of cash balances of the state government,
and receipts from various services classified under general, social and economic services.
Economic services contribute more significantly to the non-tax revenues than the other
services.
The grants from central government are for both plan and non-plan purposes. Within the plan
grants, there are separate grants for the state government's own plan schemes, Central Plan
Schemes and also for Centrally Sponsored Schemes. The non-plan grants include the statutory
grants as well as relief on natural calamities and other public purpose grants.
Table 7.18 shows the revenue receipts of the state government from 2008-09 to 2013-14. From
this table, it can be seen that, during all these years, about 70 percent of the total receipts of the
state government now come from the central government by way of state‘s share of divisible
pool of central taxes and grants-in-aid. In 2008-09, these constituted as much as 78 percent of
total revenue of the state government. In 2012-13, the central transfers constituted 71 percent
of total revenue of the state government — 54 percent from the state‘s share of central taxes
and 17 percent from central grants. In the same year, the state government‘s own resources
contributed only 29 percent of total revenue – 27 percent from tax revenues and only 2 percent
from non-tax revenues.
The state government's own tax revenues have grown from Rs. 6172 crore in 2008-09 to Rs.
24,379 crore in 2013-14, while the non-tax revenues have grown from Rs. 1153 crore to Rs.
3416 crore during the same period. However, it should be remembered that the increase in the
non-tax revenue is due to some special transfers from the central government. For example, the
non-tax revenue had increased substantially during 2008-09 (Rs. 385 crore) and 2009-10 (Rs.
770 crore), due to debt relief received in those two years, under recommendations of the
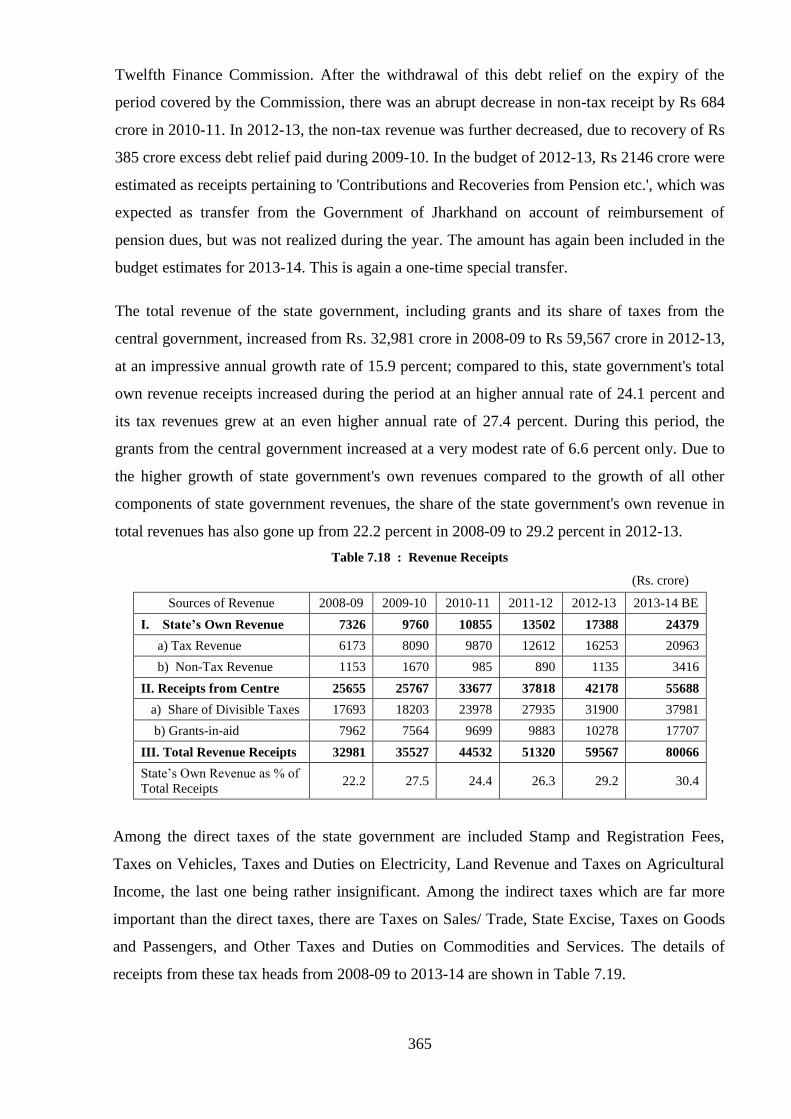
365
Twelfth Finance Commission. After the withdrawal of this debt relief on the expiry of the
period covered by the Commission, there was an abrupt decrease in non-tax receipt by Rs 684
crore in 2010-11. In 2012-13, the non-tax revenue was further decreased, due to recovery of Rs
385 crore excess debt relief paid during 2009-10. In the budget of 2012-13, Rs 2146 crore were
estimated as receipts pertaining to 'Contributions and Recoveries from Pension etc.', which was
expected as transfer from the Government of Jharkhand on account of reimbursement of
pension dues, but was not realized during the year. The amount has again been included in the
budget estimates for 2013-14. This is again a one-time special transfer.
The total revenue of the state government, including grants and its share of taxes from the
central government, increased from Rs. 32,981 crore in 2008-09 to Rs 59,567 crore in 2012-13,
at an impressive annual growth rate of 15.9 percent; compared to this, state government's total
own revenue receipts increased during the period at an higher annual rate of 24.1 percent and
its tax revenues grew at an even higher annual rate of 27.4 percent. During this period, the
grants from the central government increased at a very modest rate of 6.6 percent only. Due to
the higher growth of state government's own revenues compared to the growth of all other
components of state government revenues, the share of the state government's own revenue in
total revenues has also gone up from 22.2 percent in 2008-09 to 29.2 percent in 2012-13.
Table 7.18 : Revenue Receipts
(Rs. crore)
Sources of Revenue 2008-09 2009-10 2010-11 2011-12 2012-13 2013-14 BE
I. State’s Own Revenue 7326 9760 10855 13502 17388 24379
a) Tax Revenue 6173 8090 9870 12612 16253 20963
b) Non-Tax Revenue 1153 1670 985 890 1135 3416
II. Receipts from Centre 25655 25767 33677 37818 42178 55688
a) Share of Divisible Taxes 17693 18203 23978 27935 31900 37981
b) Grants-in-aid 7962 7564 9699 9883 10278 17707
III. Total Revenue Receipts 32981 35527 44532 51320 59567 80066
State‘s Own Revenue as % of
Total Receipts 22.2 27.5 24.4 26.3 29.2 30.4
Among the direct taxes of the state government are included Stamp and Registration Fees,
Taxes on Vehicles, Taxes and Duties on Electricity, Land Revenue and Taxes on Agricultural
Income, the last one being rather insignificant. Among the indirect taxes which are far more
important than the direct taxes, there are Taxes on Sales/ Trade, State Excise, Taxes on Goods
and Passengers, and Other Taxes and Duties on Commodities and Services. The details of
receipts from these tax heads from 2008-09 to 2013-14 are shown in Table 7.19.

366
Table 7.19 : Tax Revenues under Different Heads (Rs. crore)
Sources of Revenue 2008-09 2009-10 2010-11 2011-12 2012-13 2013-14
BE
Taxes on Sales, Trade etc. 3016 3839 4557 7476 8671 12324
Taxes on Goods and Passengers 1279 1613 2006 828 1932 1193
State Excise 679 1082 1523 1981 2430 3680
Stamp and Registration Fees 716 998 1099 1480 2173 2628
Taxes on Vehicles 298 345 455 569 673 800
Land Revenue 102 124 139 167 205 205
Taxes & Duties on Electricity 68 67 65 55 103 66
Other Taxes/ Duties on Comm.
and Services 14 22 25 26 29 34
Taxes on Agricultural Income 0 0 0 30 0 33
Total 6173 8090 9870 12612 16253 20963
Chart 7.11
An analysis of the tax receipts of the state government reveals that its major sources are Sales
Tax (VAT), Stamp and Registration Fees, State Excise Duty, Taxes on Goods and Passengers
and Taxes on Vehicles. These five taxes together account for as much as 98 percent of the state
government‘s total tax receipts. Of these, Sales Tax alone comprised 53.5 percent of the total
tax receipts in 2012-13. This was followed by State Excise Duty (15.0 percent), Stamp and
Registration Fees (13.4 percent) and Taxes on Goods and Passengers (11.9 percent). These
taxes are highly buoyant, their yields increasing steadily with the increase in GSDP. There has
not been any significant change in the composition of tax revenues of the state government
over the past few years, except in 2011-12 when the share of Sales Tax (VAT) increased
abruptly due to increase in the rates of sales tax for various items as well as price increases;
0%
20%
40%
60%
80%
100%
2008-09 2009-10 2010-11 2011-12 2012-13 2013-14 BE
Central Grants-in-aid Share of Divisible Taxes from CentreState's Own Non-Tax Revenue State's Own Tax Revenue
Composition of Revenue Receipts of Bihar (%)
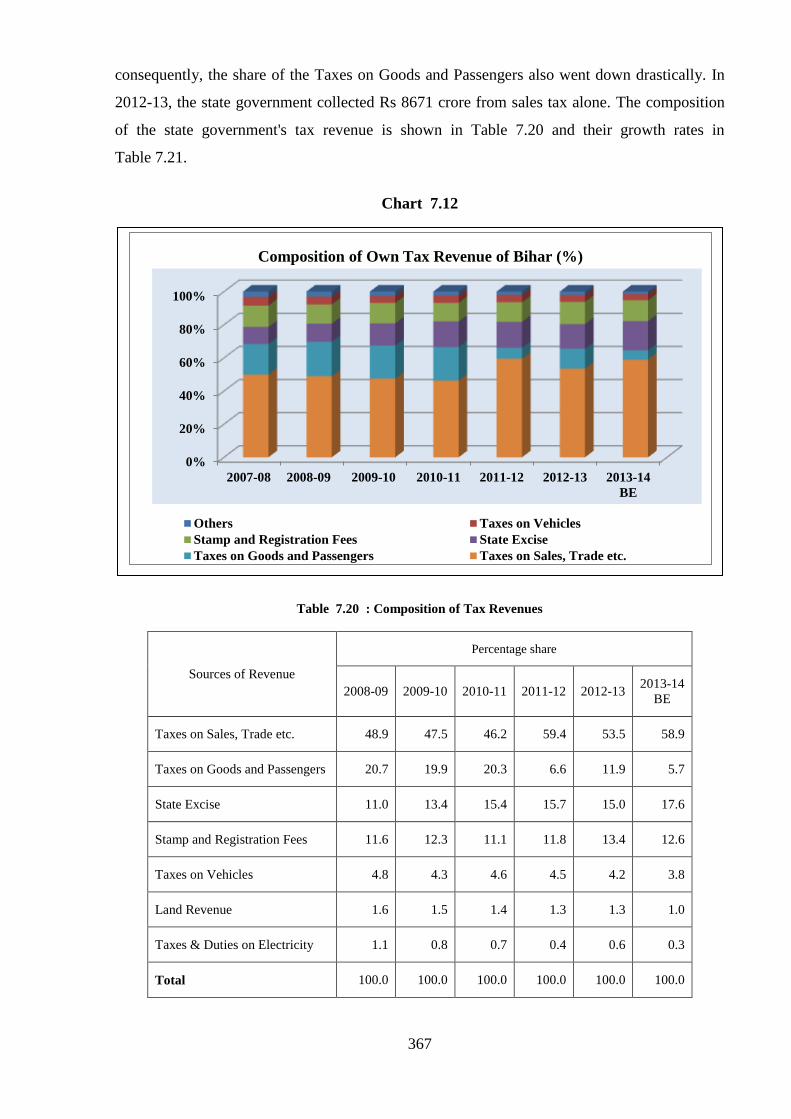
367
consequently, the share of the Taxes on Goods and Passengers also went down drastically. In
2012-13, the state government collected Rs 8671 crore from sales tax alone. The composition
of the state government's tax revenue is shown in Table 7.20 and their growth rates in
Table 7.21.
Chart 7.12
Table 7.20 : Composition of Tax Revenues
Sources of Revenue
Percentage share
2008-09 2009-10 2010-11 2011-12 2012-13 2013-14
BE
Taxes on Sales, Trade etc. 48.9 47.5 46.2 59.4 53.5 58.9
Taxes on Goods and Passengers 20.7 19.9 20.3 6.6 11.9 5.7
State Excise 11.0 13.4 15.4 15.7 15.0 17.6
Stamp and Registration Fees 11.6 12.3 11.1 11.8 13.4 12.6
Taxes on Vehicles 4.8 4.3 4.6 4.5 4.2 3.8
Land Revenue 1.6 1.5 1.4 1.3 1.3 1.0
Taxes & Duties on Electricity 1.1 0.8 0.7 0.4 0.6 0.3
Total 100.0 100.0 100.0 100.0 100.0 100.0
0%
20%
40%
60%
80%
100%
2007-08 2008-09 2009-10 2010-11 2011-12 2012-13 2013-14
BE
Others Taxes on Vehicles
Stamp and Registration Fees State Excise
Taxes on Goods and Passengers Taxes on Sales, Trade etc.
Composition of Own Tax Revenue of Bihar (%)

368
Chart 7.13
The Sales Taxes, apart from being the highest contributor to the state government's own
revenues, has also maintained a very steady growth rate. But during the period from 2008-09 to
2013-14, the maximum annual growth has been registered by State Excise (40.2 percent),
followed by Sales Tax (32.5 percent), and Stamp and Registration Fees (29.7 percent). In
2012-13, Sales Tax has grown by 16 percent and in the current fiscal (2013-14), a much higher
growth of 42.1 percent was estimated due to some change in tax rates. The growth rate of
several taxes like state excise, taxes on vehicles had been less in 2012-13 compared to the
previous year. The growth patterns of most taxes have not been uniform during the five year
period 2008-13.
The taxes on goods and passengers had registered a negative growth of nearly 59 percent
during 2011-12. During 2012-13, it had grown by 133 percent, but still its yield of Rs 1932
crore during the year was short of the 2010-11 level of Rs 2006 crore; however, this high
growth in 2012-13 had compensated to a large extent the negative growth in the previous year.
This tax comprises collections from tolls on roads, collections from passenger tax and goods
tax, tax on entry of goods into local areas for consumption, use or sale of goods therein and
inter-state transit duties. In Bihar, the entire collection under this head is from the entry of
goods into local areas for consumption. This tax is collected under the Bihar Tax on Entry of
Goods into Local Area for Consumption, Use or Sale therein Act, 1993, administered by its
Department of Commercial Taxes.
0
2000
4000
6000
8000
10000
12000
14000
2008-09 2009-10 2010-11 2011-12 2012-13 2013-14
BE
Taxes on Sales, Trade etc. Taxes on Goods and Passengers
State Excise Stamp and Registration Fees
Receipts of Major Taxes (Rs. Crore)
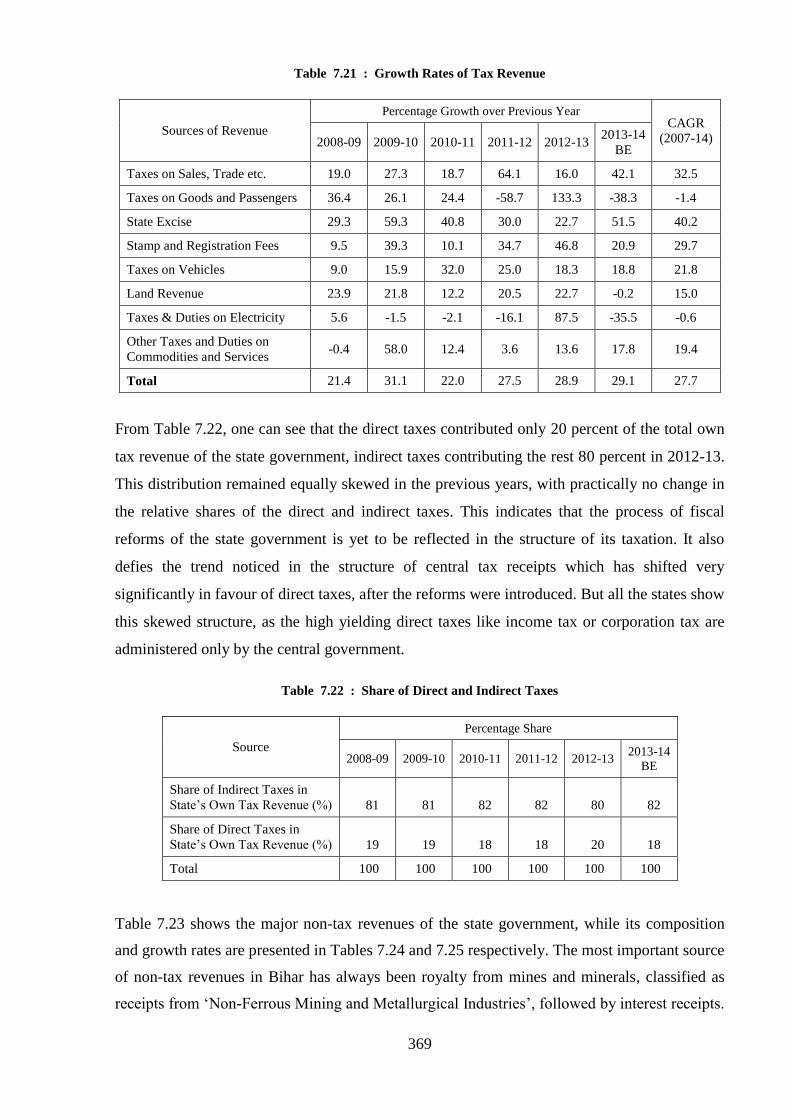
369
Table 7.21 : Growth Rates of Tax Revenue
Sources of Revenue
Percentage Growth over Previous Year CAGR
(2007-14) 2008-09 2009-10 2010-11 2011-12 2012-13 2013-14
BE
Taxes on Sales, Trade etc. 19.0 27.3 18.7 64.1 16.0 42.1 32.5
Taxes on Goods and Passengers 36.4 26.1 24.4 -58.7 133.3 -38.3 -1.4
State Excise 29.3 59.3 40.8 30.0 22.7 51.5 40.2
Stamp and Registration Fees 9.5 39.3 10.1 34.7 46.8 20.9 29.7
Taxes on Vehicles 9.0 15.9 32.0 25.0 18.3 18.8 21.8
Land Revenue 23.9 21.8 12.2 20.5 22.7 -0.2 15.0
Taxes & Duties on Electricity 5.6 -1.5 -2.1 -16.1 87.5 -35.5 -0.6
Other Taxes and Duties on
Commodities and Services -0.4 58.0 12.4 3.6 13.6 17.8 19.4
Total 21.4 31.1 22.0 27.5 28.9 29.1 27.7
From Table 7.22, one can see that the direct taxes contributed only 20 percent of the total own
tax revenue of the state government, indirect taxes contributing the rest 80 percent in 2012-13.
This distribution remained equally skewed in the previous years, with practically no change in
the relative shares of the direct and indirect taxes. This indicates that the process of fiscal
reforms of the state government is yet to be reflected in the structure of its taxation. It also
defies the trend noticed in the structure of central tax receipts which has shifted very
significantly in favour of direct taxes, after the reforms were introduced. But all the states show
this skewed structure, as the high yielding direct taxes like income tax or corporation tax are
administered only by the central government.
Table 7.22 : Share of Direct and Indirect Taxes
Source
Percentage Share
2008-09 2009-10 2010-11 2011-12 2012-13 2013-14
BE
Share of Indirect Taxes in
State‘s Own Tax Revenue (%) 81 81 82 82 80 82
Share of Direct Taxes in
State‘s Own Tax Revenue (%) 19 19 18 18 20 18
Total 100 100 100 100 100 100
Table 7.23 shows the major non-tax revenues of the state government, while its composition
and growth rates are presented in Tables 7.24 and 7.25 respectively. The most important source
of non-tax revenues in Bihar has always been royalty from mines and minerals, classified as
receipts from ‗Non-Ferrous Mining and Metallurgical Industries‘, followed by interest receipts.

370
The mining of minerals in Bihar is governed by the Bihar Minor Mineral Concession Rules,
1972 and Mineral Concession Rules 1960 framed by the state government under the Mines and
Minerals (Regulation and Development) Act, 1957. The minor minerals available in the state
are brick earth, stones, limestone, sand etc. The receipts against this element of non-tax
revenues have always been more than budget estimates and it has grown annually at 21
percent, during the period 2008-09 to 2013-14. In comparison, the growth of interest receipts,
the second most important element of its non-tax revenues, has shown wide fluctuations during
the period. These fluctuations again arise from the nature of the interest receipts.
Till 2007-08, these two heads together had accounted for more than 60 percent of the total non-
tax revenues of the state government; but due to the receipts of substantial debt relief from the
central government which was accounted for under the head ―Miscellaneous General
Services‖, the combined share of these two sources of non-tax revenue came down to 40
percent in 2009-10, but again rose to 65 percent after the withdrawal of the debt relief from the
next year. In 2011-12, there was an abnormally high share of these two heads due to recovery
of excess amount of debt-relief Rs 385 crore paid in 2009-10, even though the collections
against the royalties from mines and minerals improved by Rs 37 crore, over 2010-11. In
2012-13, the total receipts from these two sources of non-tax revenues had in fact declined by
almost one third (Rs 339 crore), compared to 2011-12. In the budget estimates for 2013-14, Rs
2145 crore is budgeted against ‗Contributions and recoveries on account of pension‘, under
'Other Non-Tax Revenues' due from Jharkhand. This amount relates to the pensioners on roll
since the pre-reorganisation period, which was budgeted in both 2011-12 and 2012-13, but
never realized so far.
The share of interest receipts had consistently declined from 34 to 24 percent during the 4
years from 2007-08 to 2010-11; but in 2011-12, there was substantially higher collections
against it by Rs 236 crore compared to the previous year. This was due to contra-adjustment of
Rs 268 crore on account of interest on loans given to the Bihar State Electricity Board, against
its outstanding dues payable by the Water Resources Department. The interest receipts had
registered a marginal growth rate of around 2 percent between 2008-14, due to less interest
received from investment of surplus cash balances in the Cash Balance Investment Account of
the state government. The non-tax revenues of the state government seem to have reached its
plateau, growing at an annual rate of 24 percent during 2008-09 to 2013-14, and there does not
seem to be any pattern in the growth of non-tax revenues of the state government.

371
Table 7.23 : Major Non-Tax Revenues of Bihar
(Rs. crore)
Sources of Revenue 2008-09 2009-10 2010-11 2011-12 2012-13 2013-14
BE
Non-Ferrous Mining and
Metallurgical Industries 245 320 406 443 511 641
Interest Receipts 305 353 238 574 167 338
Miscellaneous General Services 386 770 0 -384 22 1
Other Administrative Services 8 9 20 11 10 65
Police 9 12 12 9 25 71
Major Irrigation 3 3 5 3 3 26
Education, Sports, Arts and Culture 24 17 34 7 8 8
Roads and Bridges 26 30 40 60 33 64
Medical and Public Health 17 14 15 24 41 25
Other Rural Development
Programmes 10 29 22 30 21 32
Social Security and Welfare 1 1 2 1 1 1
Others 119 112 191 111 294 2145
Total 1153 1670 985 890 1135 3416
Table 7.24 : Composition of Non-Tax Revenues
(Percentages)
2008-09 2009-10 2010-11 2011-12 2012-13 2013-14 BE
Non-Ferrous Mining and
Metallurgical Industries 21.2 19.2 41.2 49.8 45.0 18.8
Interest Receipts 26.4 21.1 24.1 64.5 14.7 9.9
Miscellaneous General Services 33.5 46.1 0.0 -43.1 1.9 0.0
Other Administrative Services 0.7 0.6 2.0 1.3 0.9 1.9
Other non-Tax Revenues 18.2 13.0 32.6 27.6 37.4 69.4
Total 100.0 100.0 100.0 100.0 100.0 100.0
Chart 7.14
-500
0
500
1000
1500
2000
2500
2008-09 2009-10 2010-11 2011-12 2012-13 2013-14 BE
Non-Ferrous Mining and Metallurgical Industries
Interest Receipts
Miscellaneous General Services
Others
Major Sources of Non- Tax Revenues (Rs. crore)

372
Table 7.25 : Growth Rates of Non-Tax Revenues
Yearly Growth Rates
2008-09 2009-10 2010-11 2011-12 2012-13 2013-14
BE
CAGR
(2008-14)
Non-Ferrous Mining and
Metallurgical Industries 37.1 30.6 26.8 9.2 15.3 25.4
21.2
Interest Receipts 78.4 16.0 -32.6 141.1 -70.9 102.5 2.1
Miscellaneous General Services 12675.5 99.6 -100.0 -112976.5 -105.7 -96.1 -69.6
Other Administrative Services -32.6 16.4 112.1 -42.5 -12.9 549.4 52.0
Other non-Tax Revenues 81.5 -5.3 71.1 -42.3 164.7 629.8 ---
Total 119.4 44.8 -41.0 -9.7 27.6 200.9 24.3
Comparing the budget estimates of revenues with the actual collections for 2012-13, it is seen
that there was a huge shortfall by about Rs 2000 crore (63.9 percent) against the budget
estimates in respect of non-tax revenues, while in respect of tax revenues there was excess
collections by Rs 552 crore (3.5 percent) (Table 7.26). The shortfall in non-tax revenue was
almost entirely due to the non-tax revenues against ‗Other Non-Tax Revenues‘ under the
General Services, due to non-realisation of dues from the Jharkhand Government as discussed
earlier. The major shortfalls in tax revenues were in respect of taxes on goods and passengers
(Rs 868 crore) and state excise (Rs 335 crore). There was considerable surpluses in respect of
sales tax (Rs 1329 crore or 18.1 percent of budget estimates) and stamp and registration fees
(Rs 317 crore or 18.1 percent of budget estimates). The overall realisation of tax revenues was
close to the target, while there was a huge shortfall in respect of collections against non-tax
revenues as explained above.
Table 7.26 : Variation between the Estimated and Actual Realisation of Tax and Non-Tax Revenue
(2012-13)
(Rs. crore)
Revenue Sources Budget
Estimate
Actual
Receipts Variance
(Actuals -
BE)
% Variation
Excess (+),
shortfall (-) Own Tax Revenue BE Actuals
Taxes on Sales, Trade etc. 7342 8671 1329 18.1
Taxes on Goods and Passengers 2800 1932 -868 -31.0
State Excise 2765 2430 -335 -12.1
Stamp and Registration Fees 1856 2173 317 17.1
Taxes on Vehicles 644 673 29 4.5
Land Revenue 154 205 51 33.1
Taxes & Duties on Electricity 61 103 42 68.9
Other Taxes and Duties on Commodities
and Services 42 29 -13 -31.0
Total 15664 16253 -552 3.5
Own Non Tax Revenue
Non-Ferrous Mining and Metallurgical
Industries 470 511 -41 8.7
Interest Receipts 264 167 97 -36.7
Receipts from Miscellaneous General
Services 0 22 -22
----
Social Security and Welfare 2 1 1 -50.0
Other 2406 434 1972 -82.0
Total 3142 1135 2007 -63.9

373
The cost of collection of major taxes is shown in Table 7.27. It can be seen from the table that,
except for taxes on vehicles, the cost for collection of all major taxes as a percentage of total
taxes collected was brought down significantly in 2011-12, as a result of modernization of the
infrastructure and introduction of technology, but increased marginally in 2012-13. The cost of
collection in respect of taxes on vehicles and stamp and registration fees was much higher than
the other taxes. The streamlining of the collection machinery, further rationalisation of taxation
structure and more user-friendly automation will further bring down the cost of collection.
Table 7.27 : Cost of Collection of Taxes
Year
Collection
(Rs. crore)
Expenditure
on
collection
(Rs. crore)
Cost as
Percentage
of
Collection
Collection
(Rs. crore)
Expenditure
on
collection
(Rs. crore)
Cost as
Percentage
of
Collection
Taxes on sales / trade, etc State excise
2008-09 3016 47 1.5 679 24 3.6
2009-10 3839 48 1.3 1082 44 4.1
2010-11 4557 56 1.2 1523 38 2.5
2011-12 7476 65 0.9 1981 41 2.1
2012-13 8671 78 0.9 2430 43 1.8
2013-14 BE 12324 127 1.0 3680 86 2.3
Stamp duty and registration fee Taxes on Vehicles
2008-09 716 38 5.3 298 7 2.3
2009-10 998 46 4.6 345 10 3.0
2010-11 1099 47 4.2 455 17 3.7
2011-12 1480 43 2.9 569 22 3.9
2012-13 2173 45 2.1 673 25 3.8
2013-14 BE 2628 62 2.4 800 34 4.3
Table 7.28 shows the state government's own tax and non-tax revenues as percentage of GSDP
which is a measure of its capacity to raise resources. The ratio of own tax revenues of the state
government to its GSDP has risen slowly from 4.3 percent in 2008-09 to 5.6 percent in the
budget estimates of 2013-14. This ratio is rather low, compared to other states. There has been
some gradual improvement in this ratio since 2010-11. The total tax and non-tax revenues of
the state, as percentage of its GSDP, was just 6.5 percent in 2013-14, and the total revenue
including central transfers and grants constituted 21.3 percent of its GSDP in that year. While
the own tax to GSDP ratio of Bihar is one of the lowest in the country, the ratio between its
total revenues and GSDP is quite high due to the high volumes of central grants and other
transfers to the state government.

374
Table 7.28 : Tax and Non-tax Revenue as Percentage of GSDP
Indicators 2008-09 2009-10 2010-11 2011-12 2012-13 2013-14 BE
Own Tax Revenue as % of
GSDP 4.3 5.0 4.8 5.1 5.3 5.6
Own Non-Tax Revenue as
% of GSDP 0.8 1.0 0.5 0.4 0.4 0.9
Total Revenue as % of
GSDP 23.2 21.8 21.8 20.8 19.3 21.3
Buoyancy of Total Revenue
w.r.t. GSDP (Ratio) 0.7 0.5 1.0 0.7 0.6 1.6
Buoyancy of State‘s Own
Taxes w.r.t. GSDP(Ratio) 0.8 2.1 0.9 1.3 1.2 1.3
Table 7.29 gives the buoyancy ratios in respect of the state government's major tax and non-tax
revenues with respect to GSDP. From this table, it is noted that, in 2013-14, the sales tax,
stamp and registration fees, and state excise duties are likely to be more buoyant than other tax
revenues of the state government. Given the significant growth trend of GSDP in recent years,
these taxes have a huge potential for higher contribution. The sales tax was not so buoyant in
2012-13, following a very high buoyancy of 3.1 in 2011-12, while the taxes on goods and
passengers showed very high buoyancy, but again after recovering from negative buoyancy in
2011-12. Among the major sources of non-tax revenues, interest receipt showed high
buoyancy in 2011-12, but as explained earlier, this was actually due to book adjustments
without any real collections. In 2012-13, it showed negative buoyancy following a very high
positive buoyancy.
Table 7.29 : Buoyancy of Important Tax and Non-Tax Revenue Sources
2008-09 2009-10 2010-11 2011-12 2012-13 2013-14 BE
Taxes on Sales, Trade etc. 0.8 1.9 0.7 3.1 0.6 1.9
Stamp and Registration Fees 0.4 2.7 0.4 1.7 1.9 1.0
Taxes on Goods and
Passengers 1.4 1.8 1.0 -2.8 5.3 -1.8
State Excise 1.2 4.1 1.6 1.4 0.9 2.4
Taxes on Vehicles 0.4 1.1 1.3 1.2 0.7 0.9
Land Revenue 1.0 1.5 0.5 1.0 0.9 0.0
Taxes & Duties on Electricity 0.2 -0.1 -0.1 -0.8 3.5 -1.6
Total Tax Revenue 0.4 0.7 1.1 1.0 0.8 1.0
Non Ferrous Minerals 1.5 2.1 1.1 0.4 0.6 1.2
Interest Receipts 3.1 1.1 -1.3 6.8 -2.8 4.7
Total Non Tax Revenue 4.7 3.1 -1.6 -0.5 1.1 9.3

375
Table 7.30 shows the trend of revenues from grants and contributions from the central
government. The total grants estimated to be received by the state as per the budget estimates
of 2013-14 stood at Rs 17,707 crore, as against Rs 10,278 crore received in 2012-13. In 2012-
13, about half the total grants (49 percent) were received in respect of state plan schemes,
followed by centrally sponsored schemes (27 percent) and non-plan grants (23 percent). The
total grants have increased 1.3 times during the 5 years from 2008-09 to 2012-13, and a further
substantial increase was projected in the budget estimates for 2013-14. Since 2010-11, total
central grants have been increasing only nominally — during 2011-12 and 2012-13, there were
increases of only Rs 200 crore and Rs 395 crore respectively. The grants for the state plan
schemes remained practically unchanged during 2012-13 over the previous year, while the
grants for centrally sponsored schemes increased by nearly Rs. 600 crore. The non-plan grants
actually decreased marginally during 2012-13 by Rs 150 crore.
Table 7.30 : Grants and Contributions from Central Government
(Rs. crore)
Sources 2008-09 2009-10 2010-11 2011-12 2012-13 2013-14 BE
Grants for State Plan Schemes 3600 3721 5457 5065 5052 10729
Grants for Central Plan Schemes 135 138 176 96 36 242
Grants for Centrally Sponsored
Schemes 1677 1449 2141 2159 2778 4649
Non-plan Grants 2550 2256 1925 2563 2413 2086
Total Grants 7962 7564 9699 9883 10278 17707
7.8 Performance of State Tax Departments
Commercial Taxes Department
The Commercial Taxes Department collects revenue under seven acts — (i) Bihar Value
Added Tax, 2005 (VAT); (ii) Bihar Tax on Entry of Goods into Local Area for Consumption,
Use or Sale therein Act, 1993 (ET); (iii) Central Sales Tax Act, 1956 (CST); (iv) Bihar
Electricity Duty Act, 1948 (ED); (v) Bihar Entertainment Tax Act, 1948 (ENT); (vi) Hotel
Luxury Tax Act, 1988 (HLT) and (vii) Bihar Advertisement Tax Act, 1981 (Advt)
Table 7.31 shows the taxes collected from 2008-09 to 2012-13 and till September for the
current fiscal (2013-14). The VAT that had replaced the Sales Tax is the major contributor and
accounts for about 67.8 percent of the total commercial tax collections by the state government
(2012-13) which was practically the same as in the previous year. Tables A 7.1 and A 7.2
(Appendix) show the trend of collections against this tax head tax-circle-wise.
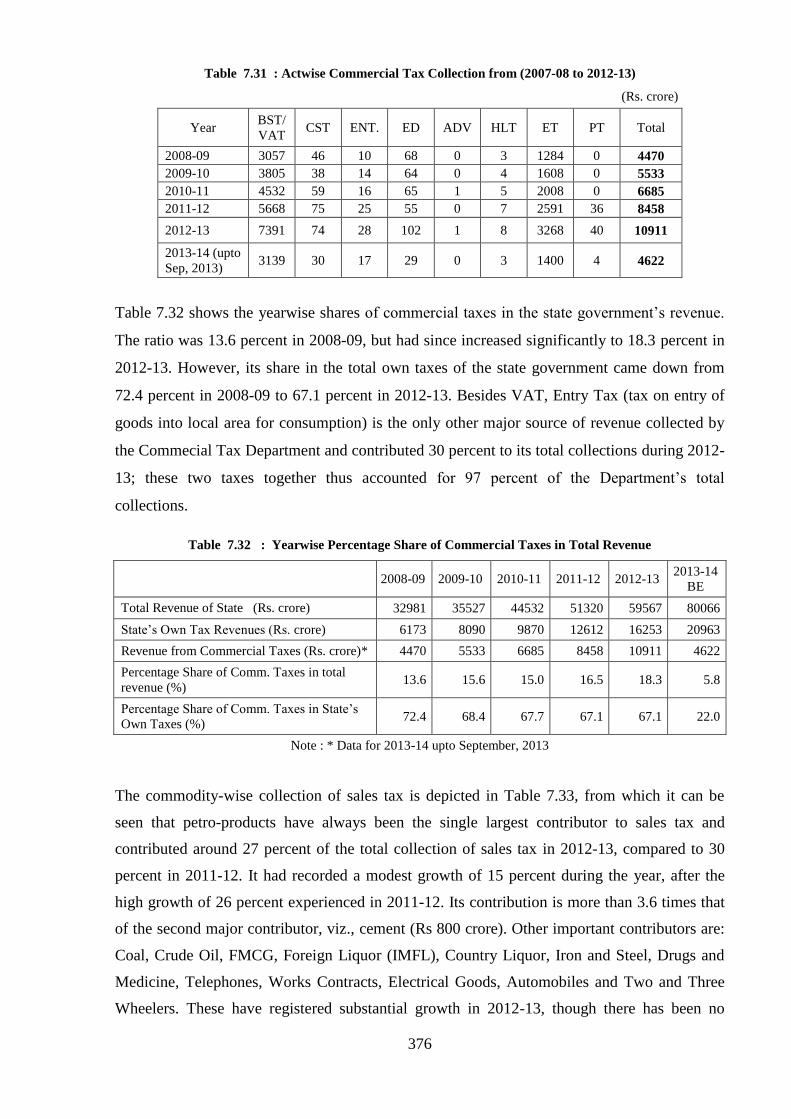
376
Table 7.31 : Actwise Commercial Tax Collection from (2007-08 to 2012-13)
(Rs. crore)
Year BST/
VAT CST ENT. ED ADV HLT ET PT Total
2008-09 3057 46 10 68 0 3 1284 0 4470
2009-10 3805 38 14 64 0 4 1608 0 5533
2010-11 4532 59 16 65 1 5 2008 0 6685
2011-12 5668 75 25 55 0 7 2591 36 8458
2012-13 7391 74 28 102 1 8 3268 40 10911
2013-14 (upto
Sep, 2013) 3139 30 17 29 0 3 1400 4 4622
Table 7.32 shows the yearwise shares of commercial taxes in the state government‘s revenue.
The ratio was 13.6 percent in 2008-09, but had since increased significantly to 18.3 percent in
2012-13. However, its share in the total own taxes of the state government came down from
72.4 percent in 2008-09 to 67.1 percent in 2012-13. Besides VAT, Entry Tax (tax on entry of
goods into local area for consumption) is the only other major source of revenue collected by
the Commecial Tax Department and contributed 30 percent to its total collections during 2012-
13; these two taxes together thus accounted for 97 percent of the Department‘s total
collections.
Table 7.32 : Yearwise Percentage Share of Commercial Taxes in Total Revenue
2008-09 2009-10 2010-11 2011-12 2012-13
2013-14
BE
Total Revenue of State (Rs. crore) 32981 35527 44532 51320 59567 80066
State‘s Own Tax Revenues (Rs. crore) 6173 8090 9870 12612 16253 20963
Revenue from Commercial Taxes (Rs. crore)* 4470 5533 6685 8458 10911 4622
Percentage Share of Comm. Taxes in total
revenue (%) 13.6 15.6 15.0 16.5 18.3 5.8
Percentage Share of Comm. Taxes in State‘s
Own Taxes (%) 72.4 68.4 67.7 67.1 67.1 22.0
Note : * Data for 2013-14 upto September, 2013
The commodity-wise collection of sales tax is depicted in Table 7.33, from which it can be
seen that petro-products have always been the single largest contributor to sales tax and
contributed around 27 percent of the total collection of sales tax in 2012-13, compared to 30
percent in 2011-12. It had recorded a modest growth of 15 percent during the year, after the
high growth of 26 percent experienced in 2011-12. Its contribution is more than 3.6 times that
of the second major contributor, viz., cement (Rs 800 crore). Other important contributors are:
Coal, Crude Oil, FMCG, Foreign Liquor (IMFL), Country Liquor, Iron and Steel, Drugs and
Medicine, Telephones, Works Contracts, Electrical Goods, Automobiles and Two and Three
Wheelers. These have registered substantial growth in 2012-13, though there has been no

377
structural shift in the pattern of distribution during the last few years. The major increases
during 2012-13 have been recorded by petro-products (Rs 384 crore), cement (Rs 244 crore),
IMFL (Rs 169 crore), electrical goods (Rs 136 crore), four wheelers (Rs 92 crore), FMCG (Rs
90 crore) and coal (87 crore).
Table 7.33 : Comparative Commodity-wise Collection of Sales Tax
(Rs. crore)
Sr.
No. Name of commodity
Collection (in crore) Rate of Growth (%)
2008-09 2009-10 2010-11 2011-12 2012-13 2008-09 2009-10 2010-11 2011-12 2012-13
1 Advertisement Tax 0 0 0 0 1 - - - - 84.0
2 Asbestos 13 14 16 20 28 85.7 7.7 16.2 25.1 36.0
3 Autoparts 16 26 29 46 57 0.0 62.5 10.7 60.9 22.7
4 Battery 36 41 50 57 73 16.1 13.9 21.2 15.4 26.5
5 Beverages 15 22 32 41 72 66.7 46.7 47.4 27.1 75.4
6 Bhujia 0 1 1 2 5 - - - 95.7 207.3
7 Bicycle 7 10 14 18 23 16.7 42.9 44.8 23.7 28.5
8 Biscuits 57 69 58 82 112 23.9 21.1 -15.8 41.2 35.9
9 Bricks 8 10 11 17 29 33.3 25.0 8.7 56.5 72.9
10 Cement 255 420 477 556 800 22.6 64.7 13.6 16.6 43.8
11 Coal 88 111 141 195 282 12.8 26.1 27.2 38.1 44.8
12 Computer 14 19 25 44 64 16.7 35.7 31.4 75.6 46.4
13 Consumer Durables 36 50 77 94 124 2.9 38.9 53.1 22.9 31.3
14 Country Liquor 61 99 125 143 158 32.6 62.3 26.5 14.3 10.2
15
Crockery, Cutlery,
Glassware &
Ceramicware
1 1 1 1 2 -50.0 0.0 29.5 7.8 46.9
16 Crude Oil 187 166 213 249 315 21.4 -11.2 28.3 16.8 26.7
17 Diesel Oil 0 1 4 4 1 - - - 21.1 -68.9
18 Drugs and Medicines 152 178 208 295 357 11.8 17.1 17.0 41.7 21.1
19 Dry Fruits 0 0 0 0 2 - - - - 261.0
20 Edible Oil 13 16 22 35 66 30.0 23.1 37.2 60.9 86.9
21 Electrical Goods 113 154 166 205 341 -3.4 36.3 7.9 23.1 66.4
22 Electricity Duty 12 2 2 1 0 500.0 -83.3 -13.1 -18.9 -66.6
23 Electronic Goods 29 43 35 50 80 45.0 48.3 -18.9 44.5 59.6
24 Engine & Motors 6 8 14 19 24 0.0 33.3 81.2 32.0 27.7
25 Entertainment Tax 9 13 11 17 16 0.0 44.4 -12.9 46.0 -5.0
26 Ethanol 1 17 5 9 - - - -69.5 71.6
27 Fast Food & Cooked
Food 23 28 63 90 120 -4.2 21.7 126.0 41.8 33.9
28 Fertiliser & Insecticides 81 82 90 144 198 11.0 1.2 10.2 59.4 37.2
29 Fire Work 0 0 1 1 2 - - - - 117.2
30 FMCG 181 210 237 324 414 22.3 16.0 12.7 36.8 27.9
31 Foodgrains 44 61 78 90 93 25.7 38.6 28.1 15.6 3.5
32 Footwear 7 10 13 18 27 16.7 42.9 31.3 35.1 54.3
33 Four Wheelers &
Chasis of Automobile 158 248 304 423 515 12.1 57.0 22.5 39.1 21.8
34 Furnitures 11 13 15 21 32 57.1 18.2 16.4 38.0 51.5
35 Ghee & Vanaspati 27 31 47 74 100 68.8 14.8 52.3 57.3 34.2
36 Glasses 3 3 5 7 9 50.0 0.0 53.4 42.2 30.5
37 Gun & Rifles 0 1 1 1 1 - - - 13.6 12.6
38 Hardware 6 8 10 15 20 20.0 33.3 28.2 44.0 32.1
39 Hawai Chappals 0 0 0 0 0 - - - - 47.6
40 Hide & Skin 1 0 1 1 1 0.0 -100.0 - -22.7 77.5
41 Hosiery And Ready Made 19 27 35 41 59 26.7 42.1 28.1 19.4 41.7
42 IMFL 163 254 340 416 585 59.8 55.8 33.9 22.1 40.8

378
Sr.
No. Name of commodity
Collection (in crore) Rate of Growth (%)
2008-09 2009-10 2010-11 2011-12 2012-13 2008-09 2009-10 2010-11 2011-12 2012-13
43 Iron & Steel 70 93 126 144 237 18.6 32.9 35.6 13.9 65.2
44 Jewellery 3 3 5 10 15 50.0 0.0 55.1 105.9 52.4
45 Kerosene 4 4 3 2 2 0.0 0.0 -35.3 -23.5 10.3
46 Kirana 11 13 14 19 31 22.2 18.2 10.6 35.5 60.2
47 LPG 2 2 2 5 5 -33.3 0.0 23.5 97.5 -0.2
48 Lubricants 22 32 35 42 47 22.2 45.5 10.8 19.1 10.6
49 Luxury and Hotel 3 4 5 7 8 0.0 33.3 35.6 24.4 11.4
50 Marble and Granites 3 4 6 9 18 50.0 33.3 57.5 43.8 103.2
51 Matches 0 1 1 0 0 - - - -27.6 -7.9
52 Moulded Luggage 2 3 4 6 7 -33.3 50.0 45.3 41.3 15.0
53 Not Available 0
54 Not Tagged 0 0 0 0 0 - - - - 183.3
55 Not Tagged with Any
Commodity 49 10 0 1 8 880.0 -79.6 -97.1 137.1 1133.7
56 Others @ 12.5 14 16 18 27 29 27.3 14.3 9.8 54.0 6.0
57 Others @ 13.5 16
58 Others @ 4 2 3 6 8 7 0.0 50.0 88.9 39.3 -9.2
59 Others @ 5 8
60 Others(Tax Free) 6 4 6 9 13 50.0 -33.3 50.6 45.6 53.9
61 Paints 20 24 34 46 61 17.6 20.0 41.0 37.0 30.8
62 Pan Masala 14 22 24 29 57 180.0 57.1 8.0 23.0 94.3
63 Paper 12 16 18 19 23 33.3 33.3 9.5 11.1 20.3
64 Petro Products 1452 1657 2008 2528 2912 19.3 14.1 21.2 25.9 15.2
65 Petrol 0 0 0 0 1 - - - - 296.1
66 Plastic Goods 8 11 16 22 35 -52.9 37.5 48.6 33.0 60.1
67 Plyboard 1 2 2 3 5 0.0 100.0 -3.2 78.8 57.3
68 Plywood 3 3 4 5 8 0.0 0.0 20.2 45.6 55.5
69 Processed Vegetable &
Food 1 1 1 2 4 - - -1.1 66.5 160.2
70 Professional Tax 0 22 37 - - - - 70.0
71 Sand 1 1 8 - - - - 605.4
72 Sanitary Fittings &
Tiles 9 17 20 24 34 28.6 88.9 18.1 19.4 40.1
73 Shewing Machine 0 0 0 0 0 - - - - 42.2
74 Spectacles 0 0 0 0 0 - - - - 15.5
75 Sport Goods 0 1 1 1 1 - - - -31.8 32.3
76 Staple Yarn 1 1 1 2 2 -50.0 0.0 21.8 38.6 24.3
77 Stationery 4 4 4 6 8 33.3 0.0 2.8 39.2 34.8
78 Stone Chips & Ballast 2 4 4 9 7 0.0 100.0 -1.3 135.5 -27.6
79 Tea & Coffee 4 5 5 7 8 100.0 25.0 6.6 33.2 12.2
80 Telephone 155 150 111 105 100 46.2 -3.2 -25.7 -5.4 -4.9
81 Timber 3 3 4 4 11 0.0 0.0 20.5 19.5 150.0
82 Tobacco 45 57 78 88 151 -6.3 26.7 36.9 12.6 72.3
83 Tools 1 5 5 6 10 - - -4.2 26.8 58.0
84 Tractors 31 53 55 79 106 55.0 71.0 3.6 43.4 34.9
85 Transporter 0 0 0 0 - - - - 1728.8
86 Two &Three Wheelers 103 140 173 218 272 30.4 35.9 23.7 25.6 25.1
87 Tyres & Tubes 48 57 64 84 114 23.1 18.8 13.1 30.0 35.8
88 Unregistered Dealer
Others 192 175 188 235 392 -11.9 -8.9 7.7 24.5 67.1
89 Unregistered Dealer
Works Contractor 179 323 392 413 490 126.6 80.4 21.3 5.4 18.5
90 Utensils 1 2 2 3 4 0.0 100.0 13.0 18.1 37.6
91 Watch & Clock 4 5 7 9 11 0.0 25.0 37.0 30.4 21.4
92 Works Contract &TDS 130 150 200 324 369 31.3 15.4 33.5 62.0 13.8
Total 4467 5534 6645 8446 10907 23.0 23.9 20.1 27.1 29.1
Source : Department of Commercial Tax, GOB
Note : The amounts booked under this head in the Finance accounts are respectively Rs 4557 crore, Rs 7476
crore and Rs 8671 crore for the 3 years 2010-11, 2011-12 and 2012-13 respectvely. The differences have
not yet been reconciled.
Source : Department of Commercial Tax, GOB
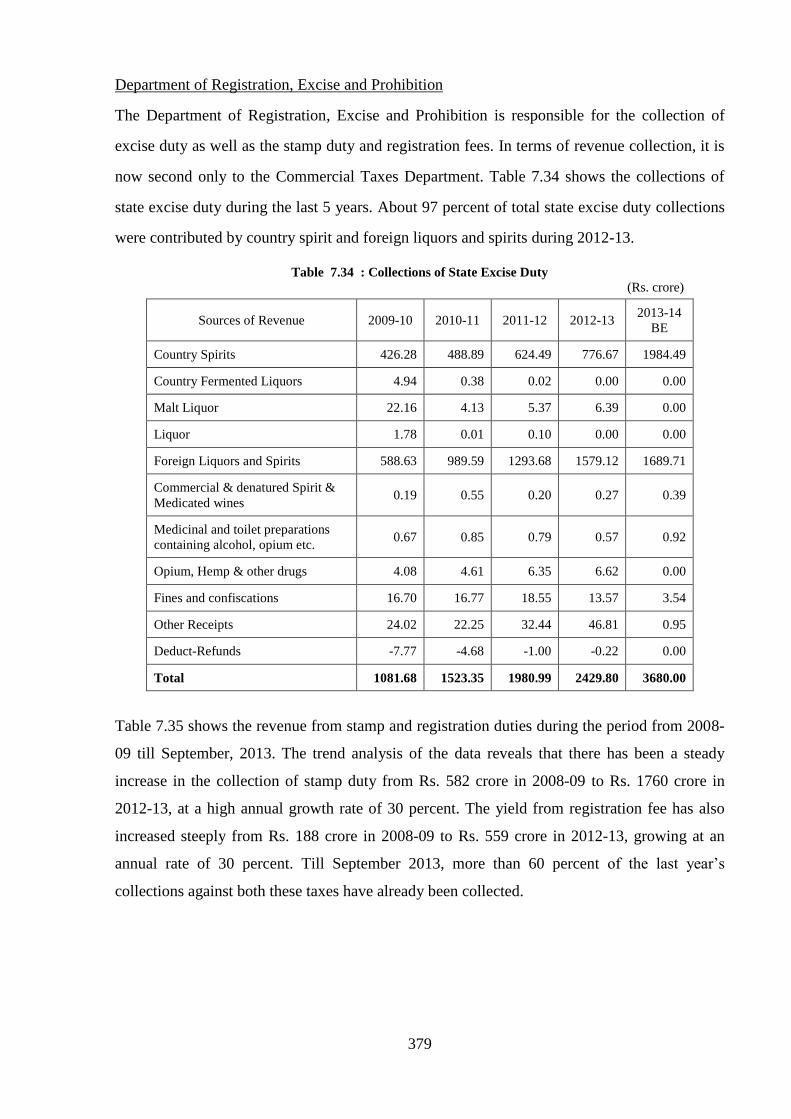
379
Department of Registration, Excise and Prohibition
The Department of Registration, Excise and Prohibition is responsible for the collection of
excise duty as well as the stamp duty and registration fees. In terms of revenue collection, it is
now second only to the Commercial Taxes Department. Table 7.34 shows the collections of
state excise duty during the last 5 years. About 97 percent of total state excise duty collections
were contributed by country spirit and foreign liquors and spirits during 2012-13.
Table 7.34 : Collections of State Excise Duty
(Rs. crore)
Sources of Revenue 2009-10 2010-11 2011-12 2012-13 2013-14
BE
Country Spirits 426.28 488.89 624.49 776.67 1984.49
Country Fermented Liquors 4.94 0.38 0.02 0.00 0.00
Malt Liquor 22.16 4.13 5.37 6.39 0.00
Liquor 1.78 0.01 0.10 0.00 0.00
Foreign Liquors and Spirits 588.63 989.59 1293.68 1579.12 1689.71
Commercial & denatured Spirit &
Medicated wines 0.19 0.55 0.20 0.27 0.39
Medicinal and toilet preparations
containing alcohol, opium etc. 0.67 0.85 0.79 0.57 0.92
Opium, Hemp & other drugs 4.08 4.61 6.35 6.62 0.00
Fines and confiscations 16.70 16.77 18.55 13.57 3.54
Other Receipts 24.02 22.25 32.44 46.81 0.95
Deduct-Refunds -7.77 -4.68 -1.00 -0.22 0.00
Total 1081.68 1523.35 1980.99 2429.80 3680.00
Table 7.35 shows the revenue from stamp and registration duties during the period from 2008-
09 till September, 2013. The trend analysis of the data reveals that there has been a steady
increase in the collection of stamp duty from Rs. 582 crore in 2008-09 to Rs. 1760 crore in
2012-13, at a high annual growth rate of 30 percent. The yield from registration fee has also
increased steeply from Rs. 188 crore in 2008-09 to Rs. 559 crore in 2012-13, growing at an
annual rate of 30 percent. Till September 2013, more than 60 percent of the last year‘s
collections against both these taxes have already been collected.

380
Table 7.35 : Revenue from Stamp Duty and Registration Fees
(Rs. crore)
Source of Revenue 2008-
09
2009-
10
2010-
11
2011-
12
2012-
13
2013-14 (upto
Sep, 2013)
From Printed Non-judicial stamps 333 457 334 356 369 166
From Non-judicial stamp duty
deposited through Bank challan 200 309 571 809 1340 974
Non-Judicial adhesive stamps 22 && 15 17 13 3
Non-judicial special adhesive
stamp – through Franking
machines
1 13 2 8 24 8
Revenue Stamps 2 4 2 2 3 2
Judicial Stamps 24 24 32 32 12 11
Sub-Total 582 807 957 1224 1760 1165
Fees on registration of instruments 170 195 265 356 522 361
Landlord‘s Registration fee 12 15 18 21 27 18
Landlord‘s Process fee 3 13 3 3 4 3
Fee from searches of records &
Non-Encumbrances 2 2 2 2 2 2
Fee from certified copies 1 2 2 2 3 1
Sub-Total 188 226 289 384 559 385
Total 770 1033 1246 1608 2319 1550
Table 7.36 shows the districtwise collection of revenue from stamp and registration fees till
September, 2013 for the year 2013-14. Patna district expectedly contributes the maximum
revenue (about 20 percent of the total revenue) from this source, more than three times the next
highest collection district, namely Muzaffarpur district. The details for the years 2011-12 and
2012-13 are shown in Table A 7.3 (Appendix).
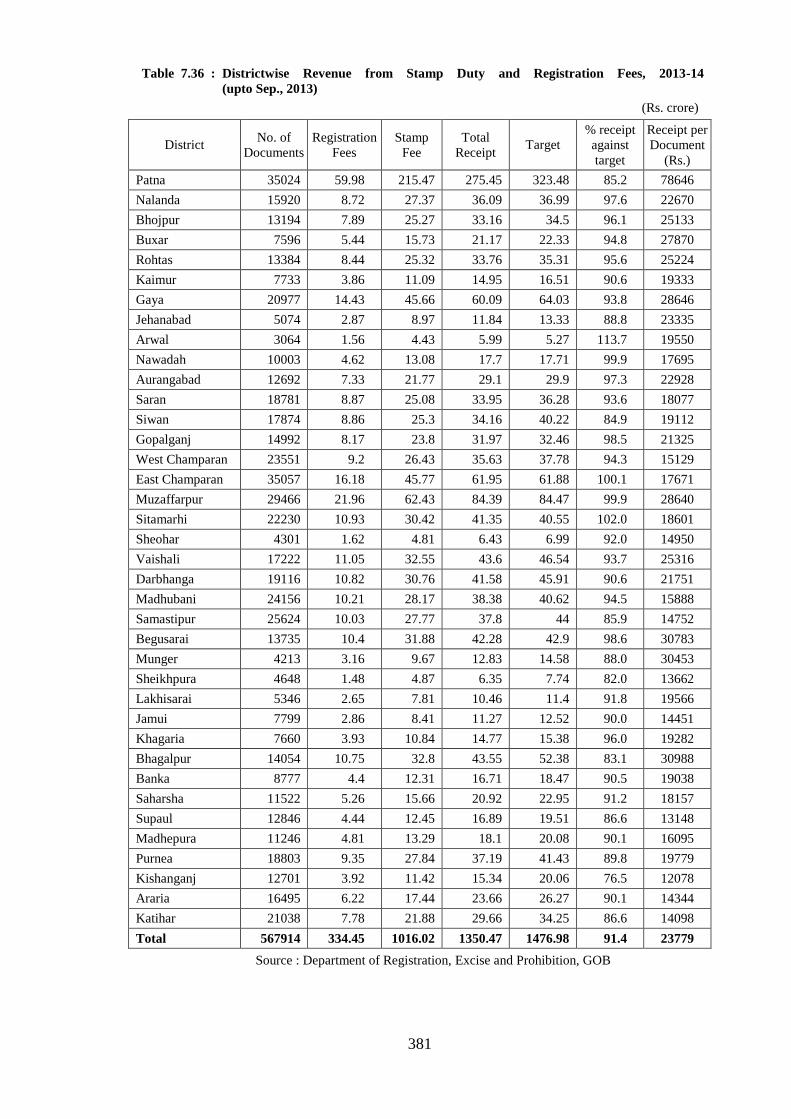
381
Table 7.36 : Districtwise Revenue from Stamp Duty and Registration Fees, 2013-14
(upto Sep., 2013)
(Rs. crore)
District No. of
Documents
Registration
Fees
Stamp
Fee
Total
Receipt Target
% receipt
against
target
Receipt per
Document
(Rs.)
Patna 35024 59.98 215.47 275.45 323.48 85.2 78646
Nalanda 15920 8.72 27.37 36.09 36.99 97.6 22670
Bhojpur 13194 7.89 25.27 33.16 34.5 96.1 25133
Buxar 7596 5.44 15.73 21.17 22.33 94.8 27870
Rohtas 13384 8.44 25.32 33.76 35.31 95.6 25224
Kaimur 7733 3.86 11.09 14.95 16.51 90.6 19333
Gaya 20977 14.43 45.66 60.09 64.03 93.8 28646
Jehanabad 5074 2.87 8.97 11.84 13.33 88.8 23335
Arwal 3064 1.56 4.43 5.99 5.27 113.7 19550
Nawadah 10003 4.62 13.08 17.7 17.71 99.9 17695
Aurangabad 12692 7.33 21.77 29.1 29.9 97.3 22928
Saran 18781 8.87 25.08 33.95 36.28 93.6 18077
Siwan 17874 8.86 25.3 34.16 40.22 84.9 19112
Gopalganj 14992 8.17 23.8 31.97 32.46 98.5 21325
West Champaran 23551 9.2 26.43 35.63 37.78 94.3 15129
East Champaran 35057 16.18 45.77 61.95 61.88 100.1 17671
Muzaffarpur 29466 21.96 62.43 84.39 84.47 99.9 28640
Sitamarhi 22230 10.93 30.42 41.35 40.55 102.0 18601
Sheohar 4301 1.62 4.81 6.43 6.99 92.0 14950
Vaishali 17222 11.05 32.55 43.6 46.54 93.7 25316
Darbhanga 19116 10.82 30.76 41.58 45.91 90.6 21751
Madhubani 24156 10.21 28.17 38.38 40.62 94.5 15888
Samastipur 25624 10.03 27.77 37.8 44 85.9 14752
Begusarai 13735 10.4 31.88 42.28 42.9 98.6 30783
Munger 4213 3.16 9.67 12.83 14.58 88.0 30453
Sheikhpura 4648 1.48 4.87 6.35 7.74 82.0 13662
Lakhisarai 5346 2.65 7.81 10.46 11.4 91.8 19566
Jamui 7799 2.86 8.41 11.27 12.52 90.0 14451
Khagaria 7660 3.93 10.84 14.77 15.38 96.0 19282
Bhagalpur 14054 10.75 32.8 43.55 52.38 83.1 30988
Banka 8777 4.4 12.31 16.71 18.47 90.5 19038
Saharsha 11522 5.26 15.66 20.92 22.95 91.2 18157
Supaul 12846 4.44 12.45 16.89 19.51 86.6 13148
Madhepura 11246 4.81 13.29 18.1 20.08 90.1 16095
Purnea 18803 9.35 27.84 37.19 41.43 89.8 19779
Kishanganj 12701 3.92 11.42 15.34 20.06 76.5 12078
Araria 16495 6.22 17.44 23.66 26.27 90.1 14344
Katihar 21038 7.78 21.88 29.66 34.25 86.6 14098
Total 567914 334.45 1016.02 1350.47 1476.98 91.4 23779
Source : Department of Registration, Excise and Prohibition, GOB

382
7.9 Expenditure Management
The expenditure of the state governments is classified under three major functional
categories — General Services, Social Services and Economic Services. Apart from revenue
expenditure and capital outlay on these services, the other areas of spending are repayment of
loans and advances on the capital account, and grants to local bodies and autonomous
institutions under the state government. The state government also gives loans for various
purposes to its public sector undertakings, Urban Local Bodies, Panchayati Raj Institutions,
and to its own employees for various purposes. It is to be noted that while the repayments of
principal amounts of loans are made from the capital account, interest payment is made from
the revenue account of expenditure, under the General Services.
Table 7.37 presents the expenditure of the state government under various heads for the period
from 2008-09 to 2013-14. Tables 7.38 and 7.39 present the structure of the expenditure of the
state government during this period. Finally, Table 7.40 presents the annual growth rate of
various expenditure items. These four tables together give us an insight into the expenditure
pattern of the state government.
Table 7.37 : Expenditure from Consolidated Fund
(Rs. crore)
Expenditure Heads 2008-09 2009-10 2010-11 2011-12 2012-13 2013-14
BE
General Services 10530 12202 15287 17729 18645 25469
Social Services 12252 13186 15090 18729 23107 32005
Economic Services 5726 7088 7836 10038 12710 15780
Grants in Aid 4 107 3 3 4 4
Capital Outlay 6436 7332 9196 8852 9585 14197
Discharge of Public Debt 1682 1983 2190 2922 3070 3239
Loans and Advances by State 551 897 1103 1906 2086 1394
Total Consolidated Fund 37181 42796 50705 60181 69207 92088
Between 2005-06 and 2008-09, the share of capital outlay in total expenditure of the state
government had increased from 9 to 17 percent, which has since dropped to 14 percent by
2012-13. For the future growth of the state economy, the increase in capital outlay was a most
remarkable development. The capital outlay is likely to be about 15 percent of the total
expenditure at the end of the current fiscal.
The proportion of revenue expenditure on general services (administration of the state
government) which is of non-developmental nature, had also undergone a discernible shift
(Table 7.38). In 2005-06, it used to consume 39 percent of total expenditure of the state
government, but this share was brought down to 28 percent in 2008-09; by 2012-13, its share

383
in total expenditure had increased, but still remained less than 30 percent of the total
expenditure. In 2012-13, the revenue expenditure on social services accounted for 33 percent
of the total expenditure, followed by economic services (18 percent). The capital outlay
accounted for 14 percent of total expenditure during 2012-13, down from 15 percent a year
before. The discharge of public debt accounted for 4 percent of the total expenditure, while
loans and advances by the state government made up for the remaining 3 percent of total
expenditure. The steady increase in capital outlay over the entire period from 2008-09 to
2012-13, save the 3 percent decline in 2011-12, translates into an increase of more than Rs
3100 crore over the period, at an annual growth rate of 10 percent. The increase in capital
outlay has catapulted the stagnant economy of the state to one of the fastest growing among all
major states in India.
Table 7.38 : Composition of Government Expenditure
(Percentage)
Expenditure Heads 2008-09 2009-10 2010-11 2011-12 2012-13 2013-14
BE
General Services 28.3 28.5 30.1 29.5 26.9 27.7
Social Services 33.0 30.8 29.8 31.1 33.4 34.8
Economic Services 15.4 16.6 15.5 16.7 18.4 17.1
Capital Outlay 17.3 17.1 18.1 14.7 13.8 15.4
Discharge of Public Debt 4.5 4.6 4.3 4.9 4.4 3.5
Loans and Advances by State 1.5 2.1 2.2 3.2 3.0 1.5
Total 100.0 100.0 100.0 100.0 100.0 100.0
Charts 7.15
0
20000
40000
60000
80000
100000
2008-09 2009-10 2010-11 2011-12 2012-13 2013-14
BE
Loans and Advances by State Discharge of Public DebtCapital Outlay Grants in AidEconomic Services Social ServicesGeneral Services
Expenditure from Consolidated Fund of Bihar (Rs. crore)

384
0%
20%
40%
60%
80%
100%
2008-09 2009-10 2010-11 2011-12 2012-13 2013-14
BE
Loans and Advances by State Discharge of Public Debt
Capital Outlay Grants in Aid
Economic Services Social Services
General Services
Expenditure from Consolidated Fund of Bihar (%)
General Services.
28%
Social Services.
33%
Economic Services.
15%
Grants in Aid . 0%
Capital Outlay.
17%
Discharge of Public Debt . 5%
Loans and Advances by State.
2%
2008-09

385
From Table 7.39, it is seen that social and economic services, essential for the socio-economic
development of the state, now account for the bulk of the expenditure, reflecting the state
government‘s commitment to improve the social sectors, especially education and health. The
revenue and capital accounts claimed 79 and 21 percent of total expenditure (2012-13). About
66 percent of the total expenditure was of developmental nature and 34 percent non-
developmental in 2012-13, and their relative proportions have not changed markedly over the
last 5 years.
Table 7.39 : Percentage Composition of Total Expenditure
Expenditure Heads 2008-09 2009-10 2010-11 2011-12 2012-13 2013-14
BE
Revenue A/c 76.68 76.14 75.37 77.27 78.70 79.55
Non-Developmental Revenue
Expenditure 28.32 28.51 30.15 29.46 26.94 27.66
Developmental Revenue
Expenditure 48.35 47.38 45.21 47.80 51.75 51.89
Social Services 32.95 30.81 29.76 31.12 33.39 34.75
Economic Services 15.40 16.56 15.45 16.68 18.37 17.14
Capital A/c 23.32 23.86 24.63 22.73 21.30 20.45
Non-Developmental Capital
Expenditure 6.01 6.73 6.49 8.02 7.45 5.03
Discharge of Public Debt 4.52 4.63 4.32 4.86 4.44 3.52
Loans and Advances by State 1.48 2.10 2.17 3.17 3.01 1.51
Developmental Capital
Expenditure 17.31 17.13 18.14 14.71 13.85 15.42
Capital Outlay 17.31 17.13 18.14 14.71 13.85 15.42
Total Non- Developmental
Expenditure 34.34 35.49 36.65 37.49 34.40 32.69
Total Developmental
Expenditure 65.66 64.51 63.35 62.51 65.60 67.31
Total Expenditure 100.00 100.00 100.00 100.00 100.00 100.00
General Services.
27%
Social Services.
33%
Economic Services.
18%
Grants in Aid . 0%
Capital Outlay.
14%
Discharge of Public Debt . 5%
Loans and
Advances by State.
3%
2012-13

386
As observed earlier, the state government has been able to manage its debt problem quite well
by consistently generating substantial surpluses in its revenue account during the last few
years. Enforcing considerable discipline in its financial administration, it could get substantial
debt relief from the central government during the period covered by the Twelfth Finance
Commission (2005-10). The servicing of debt now takes around 4 percent of the total
expenditure. The state government is now much better placed to launch ambitious programmes
aimed at creation of quality infrastructure that alone can further accelerate the pace of
economic growth of the state. From Table 7.40, it is seen that the annual growth rate of capital
outlay is as high as 14 percent during 2008-09 to 2013-14; the expenditure on social and
economic services growing at even higher rates of 21 and 22 percent respectively. On the
whole, the total expenditure of the state government has been growing annually at 19 percent.
Table 7.40 : Growth Rates of Expenditure
Expenditure Heads
Annual Growth Rates CAGR
(2008-14) 2008-09 2009-10 2010-11 2011-12 2012-13 2013-14
BE
General Services 13.8 15.9 25.3 16.0 5.2 36.6 18.1
Social Services 24.2 7.6 14.4 24.1 23.4 38.5 21.1
Economic Services 29.0 23.8 10.6 28.1 26.6 24.2 22.4
Grants in Aid -20.8 2613.6 -97.0 -2.4 17.1 11.0 -24.7
Capital A/c, of which 8.3 17.8 22.3 9.5 7.7 27.7 15.6
Capital Outlay 5.4 13.9 25.4 -3.7 8.3 48.1 14.4
Discharge of Public Debt 3.1 17.9 10.4 33.4 5.0 5.5 14.9
Loans and Advances by State 102.1 62.7 23.0 72.9 9.4 -33.2 24.7
Total Consolidated Fund 17.8 15.1 18.5 18.7 15.0 33.1 19.2
Within general services, expenditure on certain items cannot be much controlled. These are
mostly items of charged expenditure, like pension and interest payment, expenditure in respect
of judiciary, jails, police and the like, which can be curtailed only at a great peril to the state
government. For all these items, the expenditure has been rising steadily. Even though the
share of gereral services in the total expenditure of the state government has been going down,
in absolute terms, it has grown steadily from Rs. 10,530 crore in 2008-09 to Rs 25,469 crore in
2013-14, at an annual growth rate of 18 percent. These increases have been due to increased
expenditure on police and district administration, judiciary and legislature, expenditure of tax
departments and public works. In 2012-13, expenditure on general services increased by 5
percent over the previous year. Within the general services, the expenditure on fiscal services
in particular is likely to increase by more than Rs 1400 crore in 2013-14 over the previous

387
year, while expenditure on police is likely to go up by nearly Rs 1200 crore. The capital outlay
increased by about 8 percent in 2012-13, while expenditure on social and economic services
increased by 23 and 27 percent respectively over the previous year, in keeping with the high
growth rates in these two services. These increases were necessitated not only by the demands
of creating and upgrading physical and social infrastructure, but also by the consideration of
efficiency in administration of various departments through modernization.
Within social services, the revenue expenditure on education, health and family welfare, water
supply and sanitation, and social welfare and nutrition have shown steady increases over the
years. Within economic services, expenditure on special area programmes, power, roads and
bridges, and industry have registered significant increases over the years.
7.10 Revenue Expenditure
Table 7.41 depicts the details of revenue expenditure of the state government, which is
incurred to maintain the present level of activities, not addition to the existing infrastructure.
The non-plan component of revenue expenditure consumes the bulk of it; in 2012-13, it
constituted 74 percent of the total revenue expenditure, and this share had practically remained
the same for the last few years. The shares of plan and non-plan expenditure in total
expenditure had also undergone only minor shifts over the past 5 years, with the share of non-
plan expenditure decreasing from 57 percent to 54 percent during 2008-13. The shares of
revenue and capital expenditure in total expenditure also changed marginally, with share of
revenue expenditure increasing from 77 to 79 percent during the same period. The rate of
growth of plan revenue expenditure has been much more than the growth of non-plan
component; in 2012-13, the non-plan revenue expenditure grew by only 10 percent, compared
to the 35 percent growth rate of plan revenue expenditure. The total revenue expenditure and
the non-plan revenue expenditure respectively constitute 22 percent and 12 percent of the
GSDP of Bihar as in 2012-13. From the buoyancy ratios, it is seen that, during 2008-09 to
2012-13, the revenue expenditure has been increasing at a slower rate than the GSDP except in
2011-12; however, in the budget estimates of 2013-14, revenue expenditure has been projected
to grow at a higher rate than the GSDP, because of much higher expenditure in social as well
as general services.

388
Table 7.41 : Details of Revenue Expenditure
(Rs. crore)
Expenditure Heads 2008-09 2009-10 2010-11 2011-12 2012-13 2013-14
BE
Revenue Expenditure (RE) 28512 32584 38216 46499 54466 73258
Capital Expenditure (CE) 8669 10212 12489 13680 14740 18830
Total Expenditure (TE) 37181 42796 50705 60181 69206 92088
Non Plan Expenditure 23367 26602 29794 37173 40826 53082
Revenue A/c (NPRE) 21231 24145 27316 34013 37574 49602
Capital A/c 2136 2457 2478 3160 3252 3480
Plan Expenditure 13814 16194 20911 23008 28380 39006
Revenue A/c (PRE) 7280 8439 10900 12487 16892 23655
Capital A/c 6534 7755 10011 10521 11488 15351
Rate of growth of NPRE (%) 13.18 13.73 13.13 24.52 10.47 32.01
Rate of growth of PRE (%) 51.55 15.92 29.16 14.56 35.28 40.04
RE/TE(%) 76.68 76.14 75.37 77.27 78.70 79.55
NPRE/TE (%) 57.10 56.42 53.87 56.52 54.29 53.86
TE/GSDP(%) 26.13 26.27 24.8 24.36 22.42 24.52
NPRE/GSDP(%) 14.92 14.82 13.36 13.77 12.17 13.2
Revenue Receipt (RR)/TE (%) 88.7 83.02 87.83 85.28 86.07 86.95
NPRE/RR(%) 64.37 67.96 61.34 66.28 63.08 61.95
Buoyancy of RE w.r.t. GSDP 0.83 0.98 0.68 1.04 0.69 1.59
Buoyancy of RE w.r.t. RR 1.24 1.85 0.68 1.42 1.07 1.00
7.11 Expenditure on Salary and Pension
The salary and pension constitute the two most important items of expenditure for all
governments. The trends in expenditure on salaries, both under plan and non-plan heads, as
well as pension are presented in Table 7.42. The salary of the state government employees
alone accounted for 25 percent of the total revenue expenditure in 2012-13; it was 26 percent
the year before and is likely to reduce to 24 percent in 2013-14. This share has not changed
much during the last 5 years, except in 2009-10 when it rose to nearly 30 percent on account of
payment of Pay Commission arrears. The salary expenses constituted 4 percent of GSDP in
2012-13, down from 5 percent in the previous year. This proportion has remained almost
unchanged, except in 2009-10 and 2012-13. Similarly, pension constituted 15 percent of
revenue expenditure in 2012-13 or 3 percent of GSDP. During 2008-09 to 2012-13, there had
been major increases in expenditure on these accounts by almost Rs. 6000 crore for salary and
Rs. 5000 crore for pension, due to recommendations by the Pay Commission. It was made

389
effective from April, 2007, with arrears disbursed in parts during 2008-09, 2009-10 and 2010-
11. The salary and pension expenditure is projected to increase by about Rs 7000 crore in the
budget estimates of 2013-14. But the salary expenses are still within the norm of 35 percent of
revenue expenditure, as recommended by the Twelfth Finance Commission. The salary and
pension payments had increased annually at the rate of 15 percent and 26 percent respectively
during the period from 2008-09 to 2012-13. The total expenditure on these two accounts
registered an annual growth rate of 19 percent during this period, growing from Rs 11,025
crore in 2008-09 to Rs 21,921 crore in 2012-13. The pension and salary payments together
constituted 7 percent GSDP of the state and as much as 40 percent of the state government's
revenue expenditure in 2012-13.
Table 7.42 : Expenditure on Salaries and Pensions
(Rs. crore)
Heads 2008-09 2009-10 2010-11 2011-12 2012-13 2013-14
BE
Expenditure on Salaries 7546 9659 10550 12194 13558 17676
Non-Plan Head 6996 9001 9953 11495 12865 16837
Plan Head 549 657 596 699 693 839
Salary as percentage of GSDP 5.3 5.9 5.2 4.9 4.4 4.7
Salary as percentage of RR 22.9 27.2 23.7 23.8 22.8 22.1
Salary as percentage of RE 26.5 29.6 27.6 26.2 24.9 24.1
Expenditure on Pensions 3479 4319 6144 7808 8364 11274
Rate of Growth 24.7 24.1 42.3 27.1 7.1 34.8
Pension as percentage of GSDP 2.4 2.7 3.0 3.2 2.7 3.0
Pension as percentage of RR 10.5 12.2 13.8 15.2 14.0 14.1
Pension as percentage of RE 12.2 13.3 16.1 16.8 15.4 15.4
Total expenditure on Salary & Pension 11025 13977 16694 20002 21921 28950
Total as percentage of GSDP 7.7 8.6 8.2 8.1 7.1 7.7
Total as percentage of RR 33.4 39.3 37.5 39.0 36.8 36.2
Total as percentage of RE 38.7 42.9 43.7 43.0 40.2 39.5

390
Charts 7.16
7.12 Quality of Expenditure
The quality of expenditure can be judged by the proportion of expenditure devoted to creation
of social and physical infrastructure, proportion of developmental expenditure on social and
economic services as opposed to non-developmental expenditure on general services, and the
proportion of plan expenditure as opposed to non-plan expenditure. Thus, the important
parameters of quality in expenditure are : (1) ratio of capital outlay to total expenditure; (2)
ratio of capital outlay to GSDP; (3) proportion of revenue expenditure on social and economic
services, (4) proportion of non-salary expenditure incurred in these services and (5) ratio of
plan to non-plan expenditure. The higher are these ratios, the better would be the quality of
expenditure. Table 7.43 shows these ratios during the 6 year period from 2008-09 to 2013-14.
Judged by all the parameters, the quality of expenditure in Bihar has undergone significant
improvement over the recent years. The non-salary component of developmental revenue
expenditure had increased from 71 to 75 percent during this period, while the share of plan
expenditure in total expenditure had increased from 37 to 42 percent. The ratio of plan to non-
plan expenditure has also systematically increased from only 59 percent to a high level of 74
percent. All these ratios reflect that the public finances in Bihar are moving in the right
direction. The results have certainly started showing up in the form of higher growth of GSDP
and improvement in other socio-economic parameters of the state.
0.0
5.0
10.0
15.0
20.0
25.0
30.0
35.0
40.0
45.0
50.0
Total as percentage of GSDP
Total as percentage of RR
Total as percentage of RE
Expenditue on Salary & Pension as % of
GSDP, RR and RE
0
5000
10000
15000
20000
25000
30000
35000
Expenditure on Pensions
Expenditure on Salaries
Expenditue on Salary & Pension
(Rs. Crore)

391
Table 7.43 : Quality Parameters of Expenditure
Expenditure Heads 2008-09 2009-10 2010-11 2011-12 2012-13 2013-14
BE
Capital Outlay (Rs. crore) 6436 7332 9196 8852 9585 14197
Revenue Expenditure (Rs. crore) 28512 32584 38216 46499 54466 73258
Of which Social and Economic Services with 17978 20274 22926 28767 35817 47784
(i) Salary Component (Rs. crore) 5194 6920 7027 8171 9033 11864
Percentage of salary component (%) 28.9 34.1 30.7 28.4 25.2 24.8
(ii) Non salary component (Rs. crore) 12784 13354 15899 20596 26784 35921
Percentage of non-salary component (%) 71.1 65.9 69.3 71.6 74.8 75.2
Capital Outlay/ Total Expenditure (%) 17.3 17.1 18.1 14.7 13.8 15.4
Revenue Expenditure / Total Expenditure (%) 76.7 76.1 75.4 77.3 78.7 79.6
Revenue Expenditure /GSDP (%) 20.0 20.0 18.7 18.8 17.6 19.5
Capital Outlay /GSDP (%) 4.5 4.5 4.5 3.6 3.1 3.8
Plan Expenditure / Non-Plan Expenditure (%) 59.1 60.9 70.2 61.9 69.5 73.5
Plan Expenditure / Total Expenditure (%) 37.2 37.8 41.2 38.2 41.0 42.4
7.13 Sectoral Expenditure
Expenditure on Social Services
Providing better education and health services, safe drinking water, sanitation, housing etc. is
more important to establish the linkage between economic growth and welfare of citizens. The
priority for expenditure on social services is, therefore, essential for judging the overall
improvement in the quality of life. Table 7.44 examines the efficacy of expenditure incurred by
the state government in expanding and strengthening the social services during the period from
2008-09 to 2013-14.

392
Table 7.44 : Expenditure on Social Services
2008-09 2009-10 2010-11 2011-12 2012-13 2013-14
BE
Education, Sports, Arts & Culture
Total Expenditure (Rs. crore) 6882 7750 8244 10214 14445 18717
Revenue Expenditure (Rs. crore) 6706 7416 8101 10157 14080 18323
(a) Salary component (%) 43.0 48.0 45.0 43.5 35.9 36.9
(b) Non-salary component (%) 57.0 52.0 55.0 56.5 64.1 63.1
Capital Outlay (Rs. crore) 177 334 144 56 364 394
Capital Outlay (%) 2.6 4.3 1.7 0.6 2.5 2.1
Health and Family Welfare
Total Expenditure (Rs. crore) 1291 1517 1667 2125 2398 3339
Revenue Expenditure (Rs. crore) 1193 1388 1502 1804 1836 2767
(a) Salary component (%) 61.0 66.0 73.0 72.9 79.6 68.9
(b) Non-salary component (%) 39.0 34.0 27.0 27.1 20.4 31.1
Capital Outlay (Rs. crore) 97 129 165 321 563 572
Capital Outlay (%) 7.5 8.5 9.9 15.1 23.5 17.1
Water Supply, Sanitation, Housing and Urban Development
Total Expenditure (Rs. crore) 1600 1903 2327 2045 2587 4032
Revenue Expenditure (Rs. crore) 1413 1438 1698 1713 2304 3460
(a) Salary component (%) 10.0 11.0 10.0 11.6 8.9 8.9
(b) Non-salary component (%) 90.0 89.0 90.0 88.4 91.1 91.1
Capital Outlay (Rs. crore) 187 465 630 332 282 573
Capital Outlay (%) 11.7 24.4 27.1 16.2 10.9 14.2
Total (Social Services)
Total Expenditure (Rs. crore) 12892 14309 16161 19536 24438 33887
Revenue Expenditure (Rs. crore) 12252 13186 15089 18729 23107 32005
(a) Salary component (%) 32.0 38.0 34.0 33.6 30.7 29.3
(b) Non-salary component (%) 68.0 62.0 66.0 66.4 69.3 70.7
Capital Outlay (Rs. crore) 640 1123 1072 807 1331 1882
Capital Outlay (%) 5.0 7.8 6.6 4.1 5.4 5.6
The state government‘s concern for development of the social sector is amply reflected in the
increased allocation for this sector from Rs. 12,892 crore in 2008-09 to Rs. 33,887 crore in
2013-14. The increase will be most significant during the current fiscal (2013-14), when the
social services expenditure is projected to increase by nearly Rs. 9500 crore. The share of
capital outlay in social services sector also increased from 5 percent of the total expenditure in
2008-09 to 5.6 percent during the 2013-14; in between, the shares were even higher at 7.8
percent in 2009-10 and 6.6 percent in 2010-11.

393
The non-salary component of the revenue expenditure (the amount spent actually on the
maintenance of assets already created) was 69 percent in 2012-13, as against 66 percent in
2011-12. The total capital outlay on social services increased from Rs. 640 crore in 2008-09 to
Rs. 1882 crore in 2013-14, mostly due to increases in capital outlay on health and family
welfare (Rs 475 crore), on water supply, sanitation etc (Rs 386 crore), and on education (Rs.
217 crore). The non-salary component constituted around 70 percent of developmental revenue
expenditure on social services and increased significantly during the period by Rs 14,296
crore; the increases were significant in respect of education (Rs 7739 crore) and water supply,
sanitation, housing and urban development (Rs 1880 crore). The salary component of revenue
expenditure in respect of water supply, sanitation, housing and urban development has in fact
been very small (only 8.9 percent in 2012-13, compared to 11.7 percent in 2008-09), but the
salary component accounted for about 80 percent of total revenue expenditure in respect of
health and family welfare in 2012-13. The total revenue expenditure on social services had
increased from Rs 12,252 crore to Rs 32,005 crore during the period from 2008-09 to 2013-14,
at an annual rate of 18 percent.
Expenditure on Economic Services
Table 7.45 shows the expenditure on economic services which creates additional productive
capacity in the economy. Agriculture and allied activities, irrigation and flood control, energy
and power, industry and minerals and transport together account for nearly 70 percent of the
total expenditure on economic services, taking into account both revenue and capital accounts
(2013-14). About 37 percent of the total expenditure on economic services was made on
capital account in 2012-13; in 2013-14, it is estimated to go up to 41 percent. Irrigation and
flood control and transport together accounted for more than 74 percent of the total capital
outlay on economic services in 2013-14. The non-salary component of the revenue expenditure
in economic services, as in the case of social services, also remained high throughout the
period and was 84.8 percent during 2012-13. In the budget estimates of 2013-14, it was
projected to reduce marginally to 84.1 percent. The salary component was high only in respect
of irrigation and flood control, accounting for nearly 66 percent of total expenditure on this
account in 2012-13, though it is likely to be reduced to around 53 percent in 2013-14.

394
Table 7.45 : Expenditure on Economic Services
2008-09 2009-10 2010-11 2011-12 2012-13 2013-14
BE
Agriculture and Allied Activities
Total Expenditure (Rs. crore) 1284 1505 2035 2032 3262 4551
Revenue Expenditure (Rs. crore) 1273 1504 2018 1914 3170 4175
(a) Salary component (%) 21.0 26.0 20.0 23.8 14.8 13.86
(b) Non-salary component (%) 79.0 74.0 80.0 76.2 85.2 86.1
Capital Outlay (Rs. crore) 11 1 17 117 92 376
Capital Outlay (%) 0.9 0.1 0.8 5.8 2.8 8.3
Irrigation and Flood Control
Total Expenditure (Rs. crore) 1845 2246 2678 3275 2854 4021
Revenue Expenditure (Rs. crore) 704 897 1311 1311 914 1299
(a) Salary component (%) 58.0 69.0 53.0 47.2 65.9 53.0
(b) Non-salary component (%) 42.0 31.0 47.0 52.8 34.1 47.0
Capital Outlay (Rs. crore) 1141 1349 1367 1964 1940 2722
Capital Outlay (%) 61.8 60.0 51.0 60.0 68.0 67.7
Energy and Power
Total Expenditure (Rs. crore) 1123 1244 2223 2270 3374 3579
Revenue Expenditure (Rs. crore) 723 868 1216 2168 3200 2474
(a) Salary component (%) 0.0 0.0 0.0 0.0 0.0 0.0
(b) Non-salary component (%) 100.0 100.0 100.0 100.0 100.0 100.0
Capital Outlay (Rs. crore) 400 376 1007 102 174 1105
Capital Outlay (%) 35.6 30.2 45.3 4.5 5.1 30.9
Transport
Total Expenditure (Rs. crore) 2957 3748 4706 4852 4138 5641
Revenue Expenditure (Rs. crore) 493 690 634 789 826 1390
(a) Salary component (%) 28.0 23.0 26.0 23.3 24.6 20.4
(b) Non-salary component (%) 72.0 77.0 74.0 76.7 75.4 79.6
Capital Outlay (Rs. crore) 2463 3058 4072 4064 3313 4251
Capital Outlay (%) 83.3 81.6 86.5 83.7 80.1 75.4
Industry and Minerals
Total Expenditure (Rs. crore) 503 534 335 429 583 738
Revenue Expenditure (Rs. crore) 226 265 326 363 534 662
(a) Salary component (%) 13.0 17.0 34.0 11.2 15.6 12.5
(b) Non-salary component (%) 87.0 83.0 66.0 88.8 84.4 87.5
Capital Outlay (Rs. crore) 277 269 9 66 49 76
Capital Outlay (%) 55.0 50.3 2.6 15.4 8.4 10.3
Total (Economic Services)
Total Expenditure (Rs. crore) 11316 13023 15564 17475 20246 26645
Revenue Expenditure (Rs. crore) 5726 7088 7836 10038 12710 15780
(a) Salary component (%) 22.0 25.0 20.0 18.7 15.2 15.9
(b) Non-salary component (%) 78.0 75.0 80.0 81.3 84.8 84.1
Capital Outlay (Rs. crore) 5590 5935 7728 7437 7536 10865
Capital Outlay (%) 49.4 45.6 49.7 42.6 37.2 40.8

395
The capital outlay in respect of economic services also increased substantially from Rs 5590
crore in 2008-09 to Rs 10,865 crore in 2013-14. It had increased systematically during the last
few years and was nearly 79 percent of the total capital outlay of Rs 9585 crore of the state
government in 2012-13; capital outlay on social services accounted for only 14 percent of the
state‘s total capital outlay in that year. Out of the total capital outlay on economic services,
transport, i.e, roads and bridges, had taken the largest share (Rs 3313 crore), followed by
various irrigation and flood control projects (Rs 1940 crore) in 2012-13.
7.14 Per Capita Expenditure on Social and Economic Services
Tables 7.46 shows the per capita expenditure on social and economic services for the years
2008-09 to 2013-14. During this period, the growth in per capita expenditure on social services
was substantial, as it increased from Rs 1263 to Rs 2941 and the growth in economic services
was still higher (from Rs 590 to Rs 1450). The per capita capital outlay has almost doubled
from Rs 664 (2008-09) to Rs. 1305 (2013-14).
Table 7.46 : Per Capita Expenditure on Social and Economic Services
2008-09 2009-10 2010-11 2011-12 2012-13
2013-14
BE
Estimated Population (Crore) 9.7 9.9 10.2 10.4 10.6 10.9
Total Expenditure (Rs. crore)
Education, Sports etc. 6706 7416 8101 10157 14080 18323
Medical and Public Health 1193 1388 1502 1804 1836 2767
Water Supply and Sanitation 1413 1438 1698 1713 2304 3460
Social Services 12252 13186 15089 18729 23107 32005
Economic Services 5726 7088 7836 10038 12710 15780
Capital Outlay 6436 7332 9196 8852 9585 14197
General Services 10530 12202 15287 17730 18645 25469
Per Capita Expenditure (Rs.)
Education, Sports etc. 691 749 794 977 1324 1684
Medical and Public Health 123 140 147 173 173 254
Water Supply and Sanitation 146 145 166 165 217 318
Social Services 1263 1332 1479 1801 2172 2941
Economic Services 590 716 768 965 1195 1450
Capital Outlay 664 741 902 851 901 1305
General Services 1086 1233 1499 1705 1753 2341
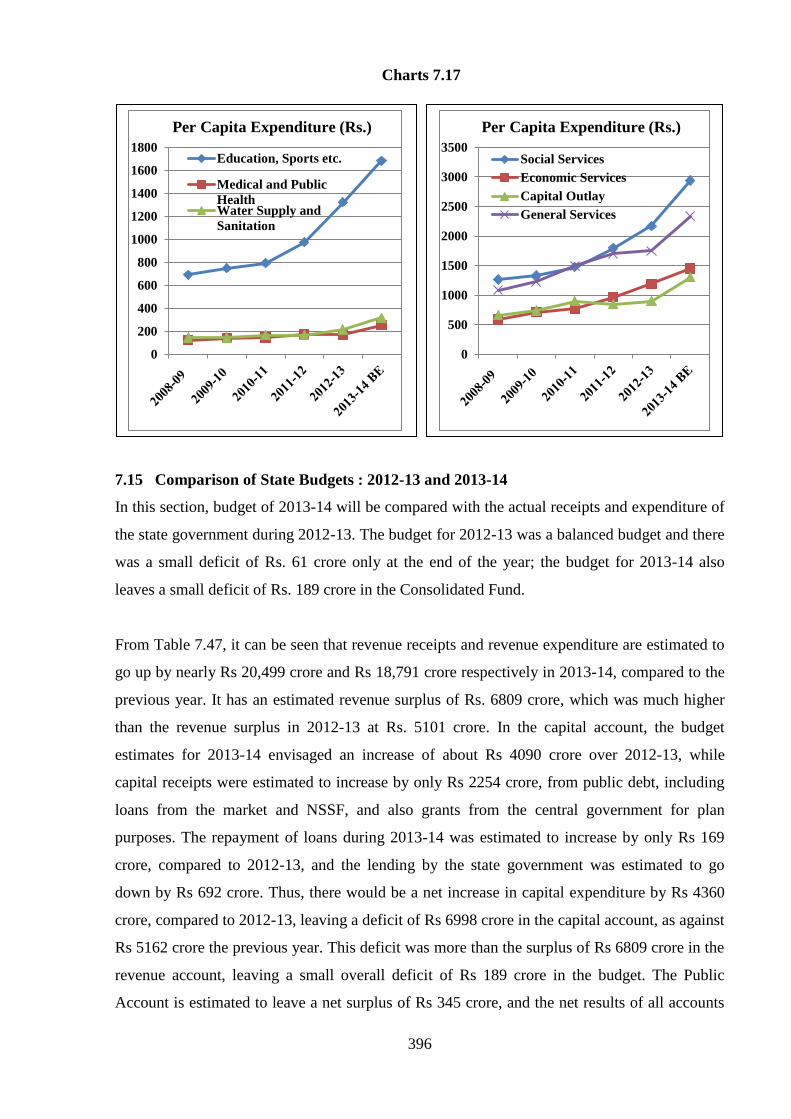
396
Charts 7.17
7.15 Comparison of State Budgets : 2012-13 and 2013-14
In this section, budget of 2013-14 will be compared with the actual receipts and expenditure of
the state government during 2012-13. The budget for 2012-13 was a balanced budget and there
was a small deficit of Rs. 61 crore only at the end of the year; the budget for 2013-14 also
leaves a small deficit of Rs. 189 crore in the Consolidated Fund.
From Table 7.47, it can be seen that revenue receipts and revenue expenditure are estimated to
go up by nearly Rs 20,499 crore and Rs 18,791 crore respectively in 2013-14, compared to the
previous year. It has an estimated revenue surplus of Rs. 6809 crore, which was much higher
than the revenue surplus in 2012-13 at Rs. 5101 crore. In the capital account, the budget
estimates for 2013-14 envisaged an increase of about Rs 4090 crore over 2012-13, while
capital receipts were estimated to increase by only Rs 2254 crore, from public debt, including
loans from the market and NSSF, and also grants from the central government for plan
purposes. The repayment of loans during 2013-14 was estimated to increase by only Rs 169
crore, compared to 2012-13, and the lending by the state government was estimated to go
down by Rs 692 crore. Thus, there would be a net increase in capital expenditure by Rs 4360
crore, compared to 2012-13, leaving a deficit of Rs 6998 crore in the capital account, as against
Rs 5162 crore the previous year. This deficit was more than the surplus of Rs 6809 crore in the
revenue account, leaving a small overall deficit of Rs 189 crore in the budget. The Public
Account is estimated to leave a net surplus of Rs 345 crore, and the net results of all accounts
0
200
400
600
800
1000
1200
1400
1600
1800Education, Sports etc.
Medical and Public
HealthWater Supply and
Sanitation
Per Capita Expenditure (Rs.)
0
500
1000
1500
2000
2500
3000
3500Social Services
Economic Services
Capital Outlay
General Services
Per Capita Expenditure (Rs.)
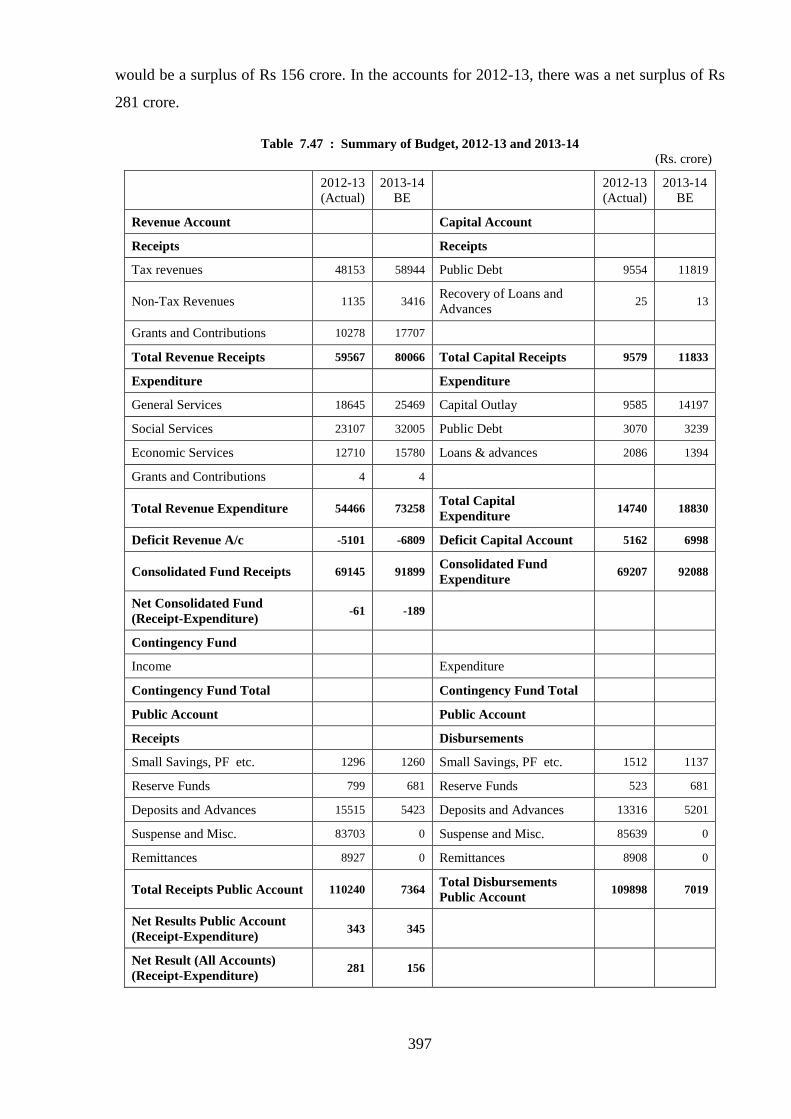
397
would be a surplus of Rs 156 crore. In the accounts for 2012-13, there was a net surplus of Rs
281 crore.
Table 7.47 : Summary of Budget, 2012-13 and 2013-14
(Rs. crore)
2012-13
(Actual)
2013-14
BE
2012-13
(Actual)
2013-14
BE
Revenue Account Capital Account
Receipts Receipts
Tax revenues 48153 58944 Public Debt 9554 11819
Non-Tax Revenues 1135 3416 Recovery of Loans and
Advances 25 13
Grants and Contributions 10278 17707
Total Revenue Receipts 59567 80066 Total Capital Receipts 9579 11833
Expenditure Expenditure
General Services 18645 25469 Capital Outlay 9585 14197
Social Services 23107 32005 Public Debt 3070 3239
Economic Services 12710 15780 Loans & advances 2086 1394
Grants and Contributions 4 4
Total Revenue Expenditure 54466 73258 Total Capital
Expenditure 14740 18830
Deficit Revenue A/c -5101 -6809 Deficit Capital Account 5162 6998
Consolidated Fund Receipts 69145 91899 Consolidated Fund
Expenditure 69207 92088
Net Consolidated Fund
(Receipt-Expenditure) -61 -189
Contingency Fund
Income Expenditure
Contingency Fund Total Contingency Fund Total
Public Account Public Account
Receipts Disbursements
Small Savings, PF etc. 1296 1260 Small Savings, PF etc. 1512 1137
Reserve Funds 799 681 Reserve Funds 523 681
Deposits and Advances 15515 5423 Deposits and Advances 13316 5201
Suspense and Misc. 83703 0 Suspense and Misc. 85639 0
Remittances 8927 0 Remittances 8908 0
Total Receipts Public Account 110240 7364 Total Disbursements
Public Account 109898 7019
Net Results Public Account
(Receipt-Expenditure) 343 345
Net Result (All Accounts)
(Receipt-Expenditure) 281 156

398
The structures of receipts and expenditure of the state government are presented in Table 7.48.
From this table, it can be seen that, except for some minor variations, there was no structural
change in the composition of either receipts or expenditure. The tax revenue accounted for 64.1
percent of the total receipts in the Consolidated Fund, as against 69.6 percent the previous
year. While the share of non-tax revenue was estimated to go up by 4.4 percent, that of public
debt was expected to come down by 0.9 percent. The share of central government grants is
likely to grow by 4.4 percent, from 14.9 percent in 2012-13 to 19.3 percent in 2013-14.
The structure of expenditure was also almost the same in two years. While the share of general
services increased marginally by 1 percent in the budget estimates for 2013-14, that of social
services increased by 2 percent to claim a share of 35 percent of the total expenditure from the
Consolidated Fund. The share of economic services declined by 1 percent over the previous
year, while that of capital outlay increased from 14 to 15 percent. The share of public debt
decreased by 1 percent and that of loans and advances decreased to only 1 percent from 3
percent a year earlier. The budget continued the prevailing trend of increasing social sector
expenditure.
Table 7.48 : Percentage Distribution of Consolidated Fund – Receipts and Expenditure
Receipts 2012-13
(Actual)
2013-14
BE Expenditure
2012-13
(Actual)
2013-14
BE
Revenue Account Revenue Account
Tax Revenue 69.6 64.1 General Services 26.9 27.7
Non-Tax Revenue 1.6 3.7 Social Services 33.4 34.8
Grants-in-Aid and
Contributions 14.9 19.3 Economic Services 18.4 17.1
Capital Account Capital Account
Public Debt 13.8 12.9 Discharge of Public Debt 4.4 3.5
Recovery of Loans
and Advances 0.0 0.0 Loans and Advances 3.0 1.5
Inter State
Settelment 0.0 0.0 Capital Outlay 13.8 15.4
Total 100 100 Total 100 100

399
Charts 7.18
7.16 Central Funds Bypassing the State Budget
Over the years, the central government has been launching new Centrally Sponsored Schemes
(CSS) and the number of such schemes for social sector now stands at 147. Now, increasing
amount of funds from the central government are being transferred directly to the autonomous
state level societies and District Rural Development Authorities (DRDAs) and other bodies/
NGOs which have been appointed as executing agencies for these schemes. In Table 7.49,
funds transferred to some of the state level autonomous bodies from the central government
have been presented for the years 2010-11 to 2012-13. The data relates to the following four
major societies:
Tax Revenu
e 70% Non-
Tax Revenu
e 1%
Grants-in-Aid and
Contributions 15%
Public Debt 14%
Receipts into Consolidated Fund 2012-13 (Actual)
Tax Reven
ue 64%
Non-Tax
Revenue 4%
Grants-in-Aid
and Contribution
s 19%
Public Debt 13%
Receipts into Consolidated Fund 2013-14 (BE)
General Service
s 27%
Social Service
s 33%
Economic
Services
18%
Public Debt 5%
Loans and
Advances 3%
Capital Outlay 14%
Expenditure from Consolidated Fund 2012-13 (Actual)
General
Services
28%
Social Servic
es 35%
Economic
Services
17%
Public Debt 4%
Loans and
Advances 1%
Capital Outlay 15%
Expenditure from Consolidated Fund 2013-14
(BE)

400
(a) Bihar Education Project (BEP) : Sarva Shikshya Abhiyan (SSA), National Program for
Education of Girls at Elementary Level (NPEGEL), Kasturba Gandhi Balika Vidylaya
(KGBV);
(b) State Health Society : National Rural Health Mission (NRHM);
(c) District Rural Development Authority (DRDA) : Mahatma Gandhi National Rural
Employment Guarantee Programme (MGNREGP), Swarnjayanti Gram Swarozgar
Yojana (SGSY), Sampoorna Grameen Rozgar Yojana (SGRY), Indira Awas Yojana (IAY),
Drought Prone Area Programme (DPAP), Member of Parliament Local Area
Development Scheme (MPLADS), Provision of Urban Amenities to Rural Areas
(PURA), Integrated Wasteland Development Project (IWDP), Integrated Watershed
management Programme (IWMP) and funds for DRDA Administration.
(d) Prime Minister‘s Gram Sadak Yojna (PMGSY) : This programme is executed through
registered societies.
Table 7.49 : Details of Central Funds Bypassing the State Budget 2009-10 and 2012-13
(Rs. crore)
Scheme 2010-11 2011-12 2012-13
SSA 1959 1851 2755
NPEGEL 16 0 16
KGBV 73 0 57
Model School 0 0 204
RMSA 0 0 138
Mahila Samakhya 5 6 7
Jan Shikshan Sansthan 5 6 5
National Institute of Pharmaceuticals Education
and Research 1 0 0
IIT, Patna 20 0 0
National Child Labour Project 7 12 0
Science and Technology Programme 1 0 0
Promotion and Dissemination of Art and Culture 1 1 1
Handicraft 0 0 0
Memorials and Others 2 3 0
NRHM 20 6 758
Rastriya Swasthya Bima 56 119 0
DRDA IWMP 1 5 17
DRDA Hariyali 0 0 0
DRDA SGSY 142 68 138
DRDA Admin 32 30 15
DRDA PMGSY 3459 3196 960
DRDA NREGS 2089 1301 1228
DRDA IAY 2256 2171 1685
Intensive Dairy Development Programme(IDDP) 0 0 21
National Food Security Mission 52 75 66
National Mission on Food Processing 0 0 9
Assistance to State for Infrastructure Development
of Export (Food Development Centre) 0 0 4
Catalytic Development Programme for
Development of Sericulture 0 0 3
Off Grid DRPS (BREDA) 3 6 6
MPLADS 112 101 224
Total of GOI funds bypassing State Budget 10309 8958 8314
As Percentage of Revenue Receipts 23.1 17.5 14.0
As Percentage of Total Expenditure 20.3 14.9 12.0

401
From Table 7.49, it is to be noted that a total of Rs. 8314 crore was routed directly to
autonomous societies in 2012-13, outside the state government budget; in 2011-12, it was Rs
8958 crore. This accounted for 14 percent of the total revenue receipts and 12 percent of the
total expenditure of the state government during 2012-13; further, they equalled more than 80
percent of the total central grants received by the state government during the year. Such
transfers obviously have an adverse effect on centre-state financial relations and fiscal
accountability and undermines the spirit of fiscal federalism as enshrined in our Constitution.
For one, the state government has no direct control over the process of utilisation of these
funds as they do not pass through its accounts, but is responsible for its proper use. Thus, its
role as a monitoring authority is rendered ineffective. Secondly, being outside the budget, they
escape not only the financial controls exercised by the Finance Department, but also the
accounting and auditing controls exercised by the Accountant General and the legislative
controls exercised by the Public Accounts Committee. Further, such transfers limit the
possibility of a synergy between the state plan at one hand and targets laid down by the central
government on the other. Finally, these transfers are also in contravention of the FRBM
requirement of transparency in fiscal operations. Routing funds directly to the executing
agencies bypassing the state government‘s financial process goes against the spirit of
devolution and actually leads to centralization of financial management at all India level and
inefficient use of resources at the district and local levels. Indeed, low utilisation of funds in
Centrally Sponsored Schemes has been a major issue for Bihar.
The proponents of such direct transfers through the mechanism of Centrally Sponsored
Schemes have often argued that funds transferred to autonomous societies would lead to higher
and more efficient utilization, but such a claim lacks any evidence. Actually, the emerging
evidence in respect of MNREGA and some other schemes from various studies points to the
contrary. The data regarding proper utilisation and monitoring of such funds are scanty and, as
such, it is difficult to arrive at any objective assessment of the outcome of such expenditure.
The central government should devise a proper mechanism for monitoring and supervision of
such funds in consultation with the state government and the latter must have an important role
in this mechanism. The state government is strongly opposed to such off-budget transfers and
has often requested the central government to stop this practice.

402
7.17 State Public Sector Undertakings and Corporations
Government Investments in Public Sector
The public sector in Bihar presently comprises 62 government companies and 4 statutory
corporations. However, of the 62 government companies, only 22 are working and the rest 40
are non-working. Besides the 66 public sector undertakings (PSU), there are also 7
Departmental Undertakings, which also undertake commercial operations. The total investment
in public sector units as of March 2012 is shown in Table 7.50.
Table 7.50 : State Government Investment in Public Sector
As on
31st
March
Total
number of
Working
PSUs
Total number
of Non-
Working PSUs
Statutory
Corporations
Total Public
Sector
Companies/
Corporations
Total
Equity
(Rs
crore)
Total
Loans
(Rs
crore)
Total
Investment
(Rs crore)
2012 22 40 4 66 633 11,741 12,374
2011 21 40 4 65 625 10,240 10,865
2010 21 40 4 65 585 9037 9,622
2009 19 40 4 63 526 8615 9,141
2008 16 34 4 54 531 8149 8,680
Source : Audit Report (Commercial) of the Principal Accountant General (Bihar)
The state PSUs in Bihar are mostly engaged in power and financial Sectors. The 26 working
companies, that include 4 statutory corporations, generated a total turnover of Rs 7811 crore,
or about 3 percent of the state GSDP in 2011-12, as per their latest finalised accounts. They
incurred a total loss of Rs 2619 crore during the year. As of 31 March 2012, they employed
17,527 employees and their accumulated losses had soared up to Rs 9820 crore, against the
total government investment of Rs 12,374 crore. The working companies alone incurred
accumulated losses of Rs 9649 crore. The accumulated debt of the public sector undertakings
amounted to nearly one and half times their total turnover during the year. The interest liability
on debt amounted to Rs 1574 crore during 2011-12. The losses of the working public sector
companies in Bihar over the 6 years 2006-12 are show in Chart 7.19.
The sector-wise break-up of the public sector units as at the end of March 2012 is presented in
Table 7.51. The majority of the working companies belong to infrastructure and financial
sectors.

403
Table 7.51 : Sectorwise Government Companies and Corporations, 2011-12
Sector
Number of
Statutory
Corporations
Number of
Working
Companies
Number of
Non-Working
Companies
Agriculture 3 12
Power 1 1
Infrastructure 6 1
Manufacturing 3 12
Services 2 3 1
Financing 1 4 4
Others 2 10
Total 4 22 40
Of the 40 non-working PSUs, 7 were under liquidation process as on March 31, 2012, as their
continuance may not serve any useful purpose. During 2011-12, one non-working PSU (Bihar
State Fruits & Vegetables Development Corporation Limited) had incurred expenditure of Rs
12 lakh towards salary, establishment expenditure, etc. As of March 31, 2012, the total
investment of the state government in the 40 non-working PSUs amounted to Rs 732 crore —
Rs 184 crore in equity and Rs 548 crore in loans.
Chart 7.19
As on March, 2012, 94 percent of the state government‘s total investment was in 26 working
PSUs (including statutory corporations), the remaining 6 percent being on non-working PSUs.
Of the total investment, only 5 percent was in equity and the rest was tied up in long term
loans. The growth in investment and the budgetary support given by the state government in
the forms of equity capital, loans, grants, subsidy, guarantees, waiver of loans etc. are shown in
the Chart 7.20.
0
2000
4000
6000
8000
10000
12000
2006-07 2007-08 2008-09 2009-10 2010-11 2011-12
Annual Loss
Accumulated Loss
Losses of Public Sector in Bihar (Rs. crore)
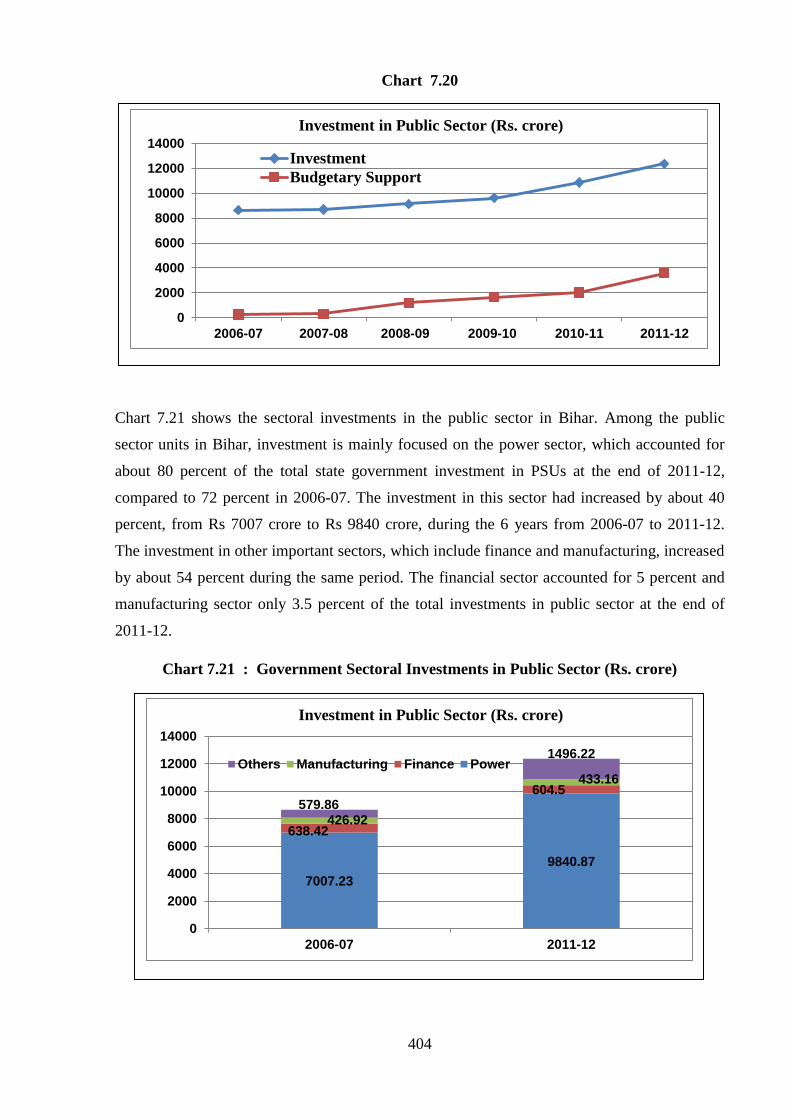
404
Chart 7.20
Chart 7.21 shows the sectoral investments in the public sector in Bihar. Among the public
sector units in Bihar, investment is mainly focused on the power sector, which accounted for
about 80 percent of the total state government investment in PSUs at the end of 2011-12,
compared to 72 percent in 2006-07. The investment in this sector had increased by about 40
percent, from Rs 7007 crore to Rs 9840 crore, during the 6 years from 2006-07 to 2011-12.
The investment in other important sectors, which include finance and manufacturing, increased
by about 54 percent during the same period. The financial sector accounted for 5 percent and
manufacturing sector only 3.5 percent of the total investments in public sector at the end of
2011-12.
Chart 7.21 : Government Sectoral Investments in Public Sector (Rs. crore)
0
2000
4000
6000
8000
10000
12000
14000
2006-07 2007-08 2008-09 2009-10 2010-11 2011-12
Investment
Budgetary Support
Investment in Public Sector (Rs. crore)
7007.23
9840.87
638.42
604.5
426.92
433.16
579.86
1496.22
0
2000
4000
6000
8000
10000
12000
14000
2006-07 2011-12
Others Manufacturing Finance Power
Investment in Public Sector (Rs. crore)

405
7.18 Summarised Results of Public Sector
Table 7.52 gives the paid up capital, investments and loans made by the state government on
the Public Sector Undertakings and Government Companies as on March, 2012, along with
their working results in the latest year for which their accounts were available. The years in
which they have prepared their last accounts are also shown in the table. It can be seen that,
except the one statutory corporation (BSEB) whose accounts are up-to-date till 2011-12 and 7
working companies which had prepared accounts till 2010-11, other companies have not
prepared up-to-date accounts and most of them have been defaulting for years. This is an
indication of the absence of any accountability structure, management and control. Since the
accounts are not up-to-date, return on the investments cannot be calculated. The Board
meetings of most of these companies are not held regularly.
Altogether 12 (all working companies) out of total 62 companies in the state‘s public sector
had prepared their accounts which were not older than 5 years and 3 more companies had
arrears in the preparation of accounts between 5-10 years. In addition, there were 38 companies
(including 2 working companies) which had not prepared their accounts for more than 20
years, and as many as 11 companies have not drawn up their accounts ever since their
inception. As per provisions of the Companies Act, all companies are statutorily required to
finalise their accounts within 6 months of the closure of the financial year. The audited
accounts are also required to be laid before the legislature within 9 months of the closure of the
financial year. The failure to observe these statutory provisions relating to timely finalisation
of accounts would normally attract penal provisions under the Companies Act. Barring a
handful of these companies, most depict a poor state of affairs, with poor turnover, continuous
losses, negative net worth, huge outstanding dues and poor or negative returns on their capital
employed. In view of poor turnover and continuous losses, the state government has to either
improve the performance of these companies or consider their closure/disinvestment. The state
government had already decided to wind up a few working and non-working companies.
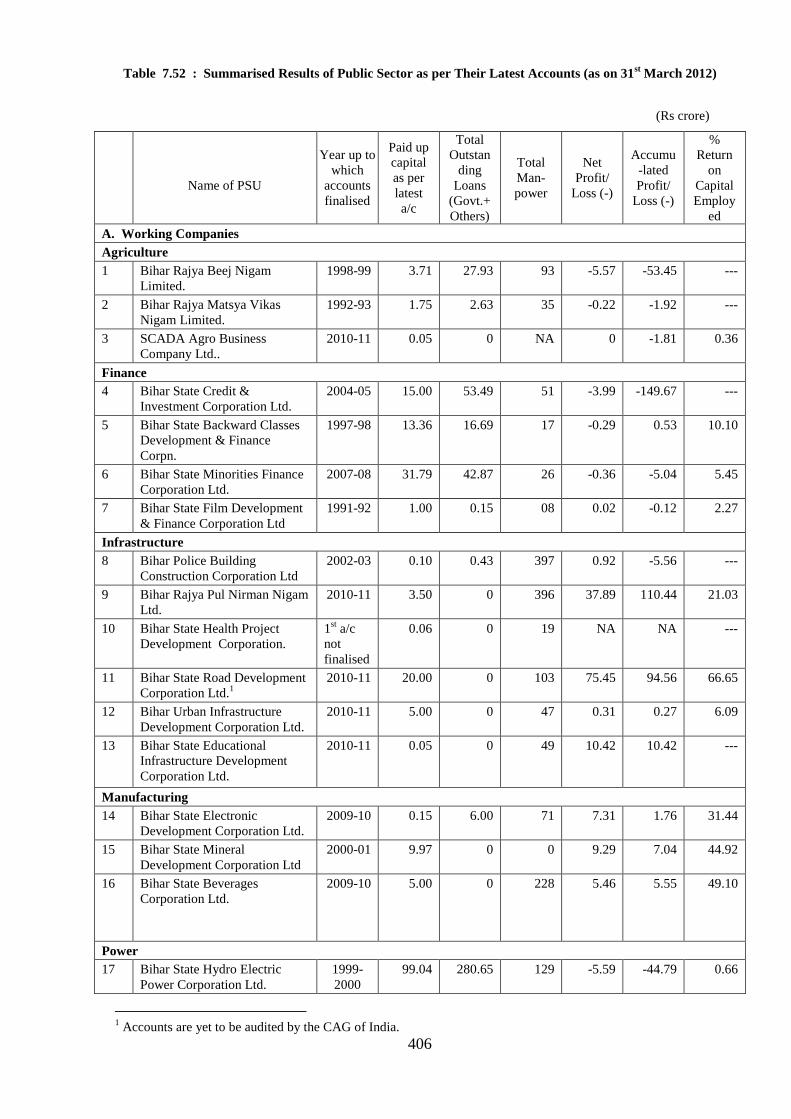
406
Table 7.52 : Summarised Results of Public Sector as per Their Latest Accounts (as on 31st March 2012)
(Rs crore)
Name of PSU
Year up to
which
accounts
finalised
Paid up
capital
as per
latest
a/c
Total
Outstan
ding
Loans
(Govt.+
Others)
Total
Man-
power
Net
Profit/
Loss (-)
Accumu
-lated
Profit/
Loss (-)
%
Return
on
Capital
Employ
ed
A. Working Companies
Agriculture
1 Bihar Rajya Beej Nigam
Limited.
1998-99 3.71 27.93 93 -5.57 -53.45 ---
2 Bihar Rajya Matsya Vikas
Nigam Limited.
1992-93 1.75 2.63 35 -0.22 -1.92 ---
3 SCADA Agro Business
Company Ltd..
2010-11 0.05 0 NA 0 -1.81 0.36
Finance
4 Bihar State Credit &
Investment Corporation Ltd.
2004-05 15.00 53.49 51 -3.99 -149.67 ---
5 Bihar State Backward Classes
Development & Finance
Corpn.
1997-98 13.36 16.69 17 -0.29 0.53 10.10
6 Bihar State Minorities Finance
Corporation Ltd.
2007-08 31.79 42.87 26 -0.36 -5.04 5.45
7 Bihar State Film Development
& Finance Corporation Ltd
1991-92 1.00 0.15 08 0.02 -0.12 2.27
Infrastructure
8 Bihar Police Building
Construction Corporation Ltd
2002-03 0.10 0.43 397 0.92 -5.56 ---
9 Bihar Rajya Pul Nirman Nigam
Ltd.
2010-11 3.50 0 396 37.89 110.44 21.03
10 Bihar State Health Project
Development Corporation.
1st a/c
not
finalised
0.06 0 19 NA NA ---
11 Bihar State Road Development
Corporation Ltd.1
2010-11 20.00 0 103 75.45 94.56 66.65
12 Bihar Urban Infrastructure
Development Corporation Ltd.
2010-11 5.00 0 47 0.31 0.27 6.09
13 Bihar State Educational
Infrastructure Development
Corporation Ltd.
2010-11 0.05 0 49 10.42 10.42 ---
Manufacturing
14 Bihar State Electronic
Development Corporation Ltd.
2009-10 0.15 6.00 71 7.31 1.76 31.44
15 Bihar State Mineral
Development Corporation Ltd
2000-01 9.97 0 0 9.29 7.04 44.92
16 Bihar State Beverages
Corporation Ltd.
2009-10 5.00 0 228 5.46 5.55 49.10
Power
17 Bihar State Hydro Electric
Power Corporation Ltd.
1999-
2000
99.04 280.65 129 -5.59 -44.79 0.66
1 Accounts are yet to be audited by the CAG of India.

407
Services
18 Bihar State Tourism
Development Corporation Ltd.
2003-04 5.00 0 226 0.10 3.38 1.25
19 Bihar State Food & Civil
Supplies Corporation Ltd
1989-90 5.27 520.58 649 -5.66 -34.86 ---
20 Bihar Medical Services &
Infrastructure Corporation Ltd.
2010-11 0 0 9 0 0 0
Misc.
21 Bihar State Forest
Development Corporation Ltd.
2000-01 2.29 0 NA 0.28 0.32 23.93
22 Bihar State Text Book
Publishing Corporation
Limited
1997-98 0.48 0 163 -4.36 -5.97 ---
Total for Working Companies 264.14 991.28 2716 121.41 -68.92 ---
Statutory Corporations
1 Bihar State Electricity Board 2011-12 0 9425.59 10278 -2662.38 -8520.71 ---
2 Bihar State Road Transport
Corporation
2002-03 101.27
547.79
1516 -55.74 -680.17 ---
3 Bihar State Financial
Corporation
2010-11 77.84
228.47
307 1.73 -382.20 8.25
4 Bihar State Warehousing Corpn. 2008-09 6.42 0 215 0.52 3.43 4.35
Total for Statutory Corporations 185.53 10201.85 12316 -2715.87 -9579.65 ---
Grand Total (A) 449.67 11193.13 15032 -2594.46 -9648.57 ---
B. Non-working Government Companies
Agriculture & Allied
1. Bihar State Water Development
Corporation Limited (BSWDCL)
1978-79 10.00 49.68 NA 2.17 11.20 9.06
2. Bihar State Dairy Corporation
Limited (BSDCL)
1995-96 6.72 1.75 - (-) 0.02 (-)10.58 --
3. Bihar Hill Area Lift Irrigation
Corporation Limited (BHALICL)
1982-83 10.82 8.55 NA (-)0.26 (-)0.86 --
4. Bihar State Agro Industries
Development Corporation
Limited (BSAIDCL)
1989-90 7.57 12.60 283 (-)5.70 (-)28.96 --
5. Bihar State Fruit & Vegetables
Development Corporation
Limited (BSFVDCL)
1994-95 1.61 1.12 90 (-)0.92 (-)7.82 --
6. Bihar Insecticide Limited (BIL) 1986-87 0.57 1.54 69 (-)1.03 (-)1.03 --
7. SCADA Agro Business Khagaul
Limited (SABLK)
NA NA NA
8. SCADA Agro Business Limited,
Dehri (SABLD)
NA NA NA
9. SCADA Agro Business Limited,
Arrah (SABLA)
NA NA NA
10. SCADA Agro Business Limited,
Aurangabad (SABLA)
NA NA NA
11. SCADA Agro Business Limited,
Mohania (SABLM)
NA NA NA
12. SCADA Agro Forestry Company
Limited, Khagaul (SAFCLK)
NA NA NA
Finance
13. Bihar Panchayati Raj Finance
Corporation Limited (BPRFCL)
1984-85 1.06 - NA (-)0.01 (-)0.03 3.92
14. Bihar State Handloom and
Handicrafts Corporation Limited
(BSHHCL)
1983-84 10.00 1.16 NA (-)0.10 (-)0.44 0.14

408
15. Bihar State Small Industries
Corporation Limited (BSSICL)
1990-91 7.18 12.23 49 (-)1.42 (-)16.56 --
16. Bihar State Industrial
Development Corporation
Limited (BSIDCL)
1987-88 14.04 66.56 823 (-)3.51 (-)26.42 6.23
Infrastructure
17. Bihar State Construction
Corporation Limited (BSCCL)
1989-90 11.00 - 1086 0.84 (-)0.04 35.29
Manufacturing
18. Bihar Solvent & Chemicals
Limited (BS&CL)
1986-87 1.08 0.89 NA (-)0.32 (-)0.32 --
19. Magadh Mineral Limited (MML) -- 0.36 0.47 05 -- -- --
20. Kumardhubi Metal Casting &
Engineering Limited (KMC&EL)
1994-95 2.17 6.63 NA (-)2.39 (-)8.16 --
21. Beltron Video System Limited
(BVSL)
1987-88 5.05 4.51 NA (-)0.15 (-)0.22 --
22. Beltron Mining System Limited
(BMSL)
1989-90 2.48 - NA (-)0.10 (-)0.49 --
23. Beltron Informatics Limited
(BIL)
-- 0.00 - NA -- -- --
24. Bihar State Sugar Corporation
Limited (BSSCL)
1984-85 20.00 322.95 NA (-)9.20 (-)72.31 --
25. Bihar State Cement Corporation
Limited (BSCCL)
-- 0.00 0.03 NA -- -- --
26. Bihar State Pharmaceuticals &
Chemicals Development
Corporation Limited
(BSP&CDCL)
1985-86 15.76 4.28 52 (-)0.17 (-)0.74 --
27. Bihar Maize Product Limited
(BMPL)
1983-84 0.00 0.02 NA (-)0.03 (-)0.06 --
28. Bihar Drugs & Chemicals
Limited (BD&CL)
1985-86 4.00 1.28 NA (-)0.03 (-)0.16 --
29. Bihar State Textiles Corporation
Limited (BSTCL)
1987-88 10.78 2.27 51 (-)0.09 (-)0.32 --
Services
30. Bihar State Export Corporation
Limited (BSECL)
1991-92 2.00 1.22 23 (-)0.10 (-)0.01 2.67
Miscellaneous
31. Bihar Paper Mills Limited
(BPML)
1985-86 7.77 10.72 NA (-)0.06 (-)0.31 --
32. Bihar State Glazed Tiles &
Ceramics Limited (BSGT&CL)
1985-86 1.15 3.66 32 (-)0.08 (-)0.51 --
33. Vishwamitra Paper Indstries
Limited (VPIL)
1984-85 1.14 0.81 NA (-)0.01 (-)0.01 --
34. Jhanjhanpur Paper Industries 1985-86 1.07 0.46 13 (-)0.01 (-)0.02 --
35. Bihar State Tannin Extract
Limited (BSTEL)
1988-89 1.57 2.14 NA (-)0.32 (-)0.67 --
36. Bihar State Finished Leathers
Corporation Limited (BSFLCL)
1983-84 1.47 9.18 NA (-)1.49 (-)2.13 --
37. Synthetic Resins (Eastern)
Limited (SREL)
1983-84 0.31 1.05 - (-)0.02 (-)0.01 --
38. Bhavani Active Carbon Limited
(BACL)
1985-86 0.09 - NA (-)0.01 (-)0.01 --
39. Bihar State Leather Industries
Development Corporation
Limited (BSLIDCL)
1982-83 17.40 14.13 NA (-)0.37 (-)2.92 --
40. Bihar Scooters Limited (BSL) -- 1.63 6.09 NA -- -- --
Total (B) 177.98 547.98 2495 -24.89 -170.92
Grand Total (A+B) 585.38 11741.11 17527 -2619.35 -9819.49
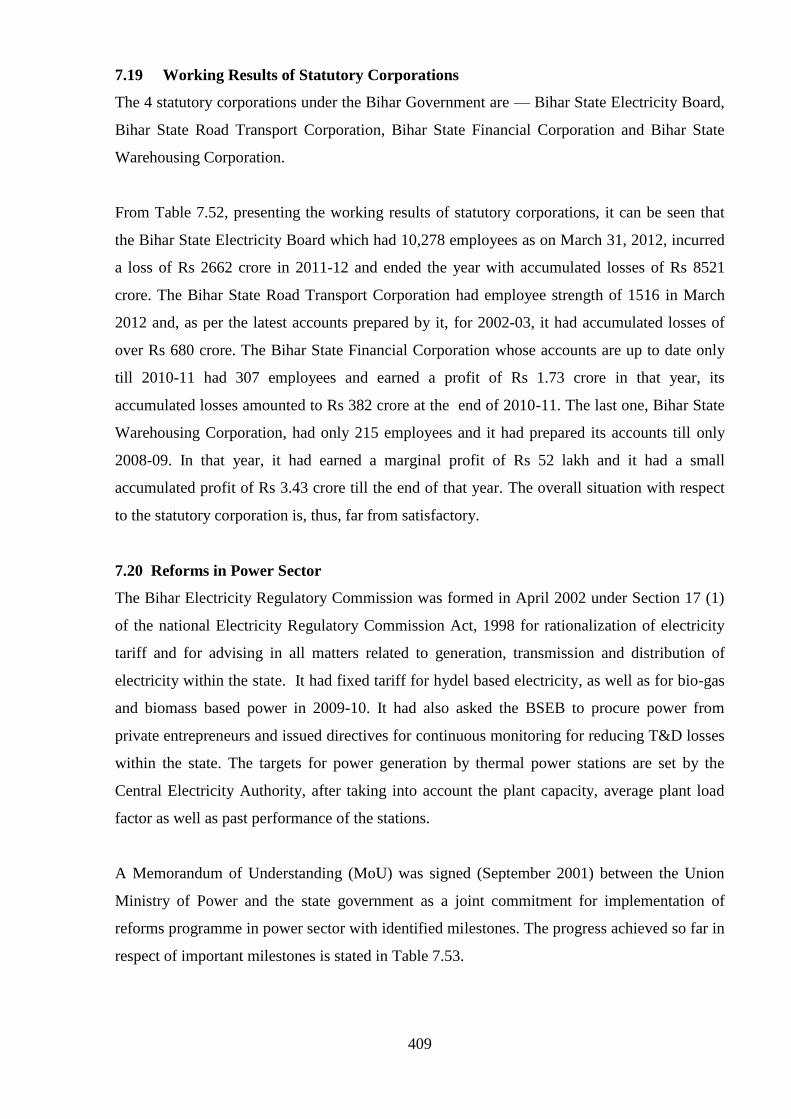
409
7.19 Working Results of Statutory Corporations
The 4 statutory corporations under the Bihar Government are — Bihar State Electricity Board,
Bihar State Road Transport Corporation, Bihar State Financial Corporation and Bihar State
Warehousing Corporation.
From Table 7.52, presenting the working results of statutory corporations, it can be seen that
the Bihar State Electricity Board which had 10,278 employees as on March 31, 2012, incurred
a loss of Rs 2662 crore in 2011-12 and ended the year with accumulated losses of Rs 8521
crore. The Bihar State Road Transport Corporation had employee strength of 1516 in March
2012 and, as per the latest accounts prepared by it, for 2002-03, it had accumulated losses of
over Rs 680 crore. The Bihar State Financial Corporation whose accounts are up to date only
till 2010-11 had 307 employees and earned a profit of Rs 1.73 crore in that year, its
accumulated losses amounted to Rs 382 crore at the end of 2010-11. The last one, Bihar State
Warehousing Corporation, had only 215 employees and it had prepared its accounts till only
2008-09. In that year, it had earned a marginal profit of Rs 52 lakh and it had a small
accumulated profit of Rs 3.43 crore till the end of that year. The overall situation with respect
to the statutory corporation is, thus, far from satisfactory.
7.20 Reforms in Power Sector
The Bihar Electricity Regulatory Commission was formed in April 2002 under Section 17 (1)
of the national Electricity Regulatory Commission Act, 1998 for rationalization of electricity
tariff and for advising in all matters related to generation, transmission and distribution of
electricity within the state. It had fixed tariff for hydel based electricity, as well as for bio-gas
and biomass based power in 2009-10. It had also asked the BSEB to procure power from
private entrepreneurs and issued directives for continuous monitoring for reducing T&D losses
within the state. The targets for power generation by thermal power stations are set by the
Central Electricity Authority, after taking into account the plant capacity, average plant load
factor as well as past performance of the stations.
A Memorandum of Understanding (MoU) was signed (September 2001) between the Union
Ministry of Power and the state government as a joint commitment for implementation of
reforms programme in power sector with identified milestones. The progress achieved so far in
respect of important milestones is stated in Table 7.53.
410
Table 7.53 : Milestones in Power Sector Reforms in the State, 2012-13
Sl.
No. Milestones Achievement till 2012-13
1. Setting up of the State Electricity
Regulatory Commission (SERC)
The State Electricity Regulatory Commission (SERC) was
constituted in April, 2002. The commission had notified last
tariff order for the year 2012-13.
2. Rural Electrification Programme Out of 22,484 numbers of villages, 17,791 (79 per cent) villages
have been electrified (March 2012) through Central agencies -
NHPC and PGCIL (March 2012).
3. Reorganisation of the Board Government of Bihar had appointed Power Finance Corporation
as consultant for reorganization of the Board. 5 New Companies
were formed and they commend their businesses w.e.f. 01
November, 2012. 1
4. Securitization of outstanding dues of
Central Power Sector Undertakings
Securitization of outstanding dues of Central Power Sector
undertakings to the tune of Rs.2075.61 crore has been made by
the Govt. of Bihar.
5. 100 per cent metering of all 11 KV
distribution feeders and 100 per cent
metering of all consumers.
The installation of meters in 11 KV distribution feeders (84 per
cent) and consumers (71 per cent) in all the 16 circles was
completed (September 2012).
6. Energy audit Energy audit could not be implemented as metering of all the
electric connections has not been completed. 5164 meters have
been installed against the target of 7563. Power Finance
Corporation, a Central PSU had appointed a private agency for
conducting third party energy audit under restructured
Accelerated Power Development Reform Programme
(RAPDRP).
7. Reduction in transmission and
distribution (T&D) losses up to 15.5
per cent.
The T&D losses of the Board for the year 2010-11 was 43.59 per
cent which increased to 44.05 per cent during 2011-12.
8. Three per cent return on fixed assets The Board has not achieved three per cent return on fixed assets
till 2011-12.
9. Distribution Information Management
System
Distribution and information management system is operational
through Supervisory Control and Accelerated Data Acquisition
(SCADA) System in Patna; under progress in the rest of Bihar.
10. Minimum agriculture tariff of 50
Paise per unit
The State Electricity Regulatory Commission (SERC) has
approved tariff rates for Irrigation and Agriculture Services (IAS)
for the year 2012-13 as follows:
IAS-I (Unmetered)
Rural Feeder- Rs 120/HP/Month
Urban Feeder – Rs 145/HP/Month
IAS-I (Metered)
Rural Feeder- Rs 1.00 /unit
Urban Feeder – Rs 1.50/unit
Subject to a minimum of
Rural Feeder- Rs 85/HP/Month
Urban Feeder – Rs 130/HP/Month
IAS-II State Tubewells & LI (Unmetered)
Rural Feeder- Rs 900/HP/Month
Urban Feeder – Rs 1000/HP/Month
IAS-II (Metered)
Rural Feeder- Rs 6.00 /unit
Urban Feeder – Rs 7.00/unit
1 The Government had planned for total restructuring of the power sector within the state, by unbundling the BSEB into
seprate companies for generation, transmission and distribution of power within the state. It had taken the decision first in
January 2006 to reconstitute the BSEB into 8 different companies including a holding company which were then incorporated
in October 2007. However, in August 2011, it was decided to run only the following 5 companies:
1. Bihar Rajya Bidyut Company (Holding Company)
2. Bihar Rajya Bidyut Utpadan Company to take care of generation of electricity in the state;
3. Bihar Rajya Sancharan Company to take care of transmission of electricity within the state;
4. Dakshin Bihar Bidyut Aapurti Company to take care of distribution of electricity in South Bihar and
5. Uttar Bihar Bidyut Aapurti Company to take care of distribution of electricity in North Bihar.

411
APPENDIX
Table A 7.1 : Actwise / Circlewise Collection 2011-12 and 2012-13
(Rs. lakh)
Division / Circle VAT C.S.T ENT. Tax E.D. ADV Tax
2011-12 2012-13 2011-12 2012-13 2011-12 2012-13 2011-12 2012-13 2011-12 2012-13
Patna Special 292456 372241 4464 4315 0 0 5156 10111 0 0
Patliputra 88825 116755 760 898 843 1222 76 0 0 0
Central Division 381281 488995 5224 5213 843 1222 5233 10111 0 0
Patna West 9896 11870 24 56 597 582 0 0 17 38
Patna Central 8438 9833 107 120 2 5 0 0 8 17
Patna North 9281 12157 56 70 169 96 0 0 3 0
Gandhi Madan 3218 4617 122 115 0 0 0 0 11 11
Patna South 9129 12232 67 60 4 2 0 0 0 3
Kadam Kuan 4423 5832 26 59 1 1 0 0 0 0
Patna City East 5370 7934 63 34 2 3 0 0 0 0
Patna City West 7534 10635 89 120 3 7 0 0 0 0
Danapur 15356 20982 58 48 15 17 0 0 0 0
Barh 11545 13288 193 162 13 13 1 0 0 0
Shahabad 2041 3045 18 21 20 19 5 0 0 0
Buxar 1368 1681 9 4 21 14 0 0 0 0
Biharshariff 3215 4157 7 2 31 38 0 0 0 0
Patna Division 90814 118264 839 871 877 796 6 0 40 70
Sasaram 5557 7239 41 60 21 17 0 0 0 0
Bhabhua 1111 2561 4 15 8 5 0 0 0 0
Gaya 5523 9176 238 221 58 64 0 0 0 0
Jehanabad 1140 1537 0 0 1 1 0 0 0 0
Nawada 1988 2450 1 0 12 13 0 6 0 0
Aurangabad 2790 3632 3 7 9 14 0 0 0 0
Gaya Division 18109 26595 288 304 109 115 0 6 0 0
Saran 3001 3682 0 1 23 24 0 0 0 0
Siwan 2209 3126 8 23 15 13 0 0 0 0
Gopalganj 2114 3038 3 15 11 14 0 0 0 0
Muzaffarpur West 7374 8941 220 95 29 25 5 2 0 0
Muzaffarpur East 3647 6162 62 66 31 34 1 1 0 0
Hajipur 7734 11252 119 153 59 51 0 0 0 0
Sitamarhi 2909 5560 11 14 57 49 0 0 0 0
Motihari 3183 3974 5 6 36 39 0 0 0 0
Raxaul 535 777 11 19 9 10 0 0 0 0
Bettiah 3193 4721 15 14 35 39 8 6 0 0
Bagaha 1286 1999 3 15 6 10 0 0 0 0
Tirhut Division 37185 53232 458 422 311 308 14 9 0 0
Darbhanga 3851 5690 7 11 61 60 0 0 0 0
Samastipur 3391 4104 215 163 32 30 6 9 1 2
Madhubani 1861 2670 7 4 23 26 0 0 0 0
Janjharpur 559 766 1 1 1 1 1 0 0 0
Begusarai 2969 3243 112 41 31 27 96 0 0 0
Teghara 319 330 75 52 7 8 0 0 0 0
Darbhanga Division 12951 16803 417 271 154 152 103 9 1 2
Saharsa 3161 4265 0 2 27 26 0 0 0 0
Madhepura 960 1726 0 0 6 8 0 0 0 0
Purnea 4107 5654 57 105 50 58 0 0 0 0
Katihar 3895 4748 33 40 48 48 1 0 0 0
Forbesganj 2018 2281 15 24 10 11 0 0 0 0
Kishanganj 1431 1932 108 52 6 6 0 0 0 0
Khagaria 1032 1419 2 2 9 9 0 0 0 0
Purnea Division 16605 22026 214 224 155 166 1 0 0 0
Bhagalpur 5594 7687 36 65 61 61 69 13 0 0
Lakhisarai 987 1292 3 8 5 4 0 0 0 0
Munger 1926 2293 11 19 9 8 32 33 0 0
Jamui 1340 1878 0 1 4 3 0 0 0 0
Bhagalpur Division 9848 13150 51 93 79 76 101 46 0 0
State 566792 739066 7490 7397 2529 2834 5458 10181 41 72
(Contd….)

412
Table A 7.1 : Actwise / Circlewise Collection 2011-12 and 2012-13 (Contd.) (Rs. lakh)
Division / Circle LUX Tax ENTRY Tax Professional Tax TOTAL TARGET
2011-12 2012-13 2011-12 2012-13 2011-12 2012-13 2011-12 2012-13 2011-12 2012-13
Patna Special 0 0 103697 118711 185 197 405958 505575 411446 503388
Patliputra 0 0 48586 54755 88 94 139179 173724 157500 175366
Central Division 0 0 152283 173467 273 291 545137 679298 568946 678754
Patna West 255 282 1503 2877 350 292 12643 15998 13735 17049
Patna Central 36 51 3144 5080 234 334 11971 15440 14205 16095
Patna North 72 81 1637 3292 380 143 11597 15838 12944 15656
Gandhi Madan 115 108 1079 1560 61 65 4607 6476 4536 6450
Patna South 3 6 4440 5282 23 46 13665 17631 14567 19813
Kadam Kuan 13 13 645 936 12 13 5120 6854 4285 7419
Patna City East 0 0 2761 5310 5 5 8201 13286 8013 12345
Patna City West 3 8 1551 2788 17 20 9197 13577 9658 13575
Danapur 0 1 2180 3875 84 102 17694 25026 17352 26772
Barh 0 0 18479 18135 16 21 30247 31619 29596 37809
Shahabad 2 6 459 788 47 94 2593 3973 2827 3500
Buxar 0 1 146 177 32 48 1576 1924 2041 2128
Biharshariff 32 37 451 693 75 96 3811 5025 4440 5145
Patna Division 532 593 38475 50792 1337 1281 132921 172666 138200 183756
Sasaram 1 2 977 1368 68 70 6665 8757 6549 9650
Bhabhua 2 2 307 392 26 34 1458 3008 1834 1822
Gaya 120 157 2232 2962 102 142 8274 12723 8616 12283
Jehanabad 0 0 18 51 38 56 1197 1645 1430 1697
Nawada 0 0 56 173 54 45 2110 2688 1832 3847
Aurangabad 0 0 1639 11608 44 63 4486 15325 3440 9190
Gaya Division 123 162 5230 16554 332 410 24190 44146 23701 38489
Saran 3 4 588 745 104 139 3719 4595 3657 5728
Siwan 2 2 649 824 63 61 2946 4050 3330 4271
Gopalganj 1 1 326 746 39 43 2495 3856 2400 3942
Muzaffarpur West 6 11 5855 7699 141 159 13630 16932 13697 18841
Muzaffarpur East 8 9 493 1194 92 90 4334 7556 4239 6487
Hajipur 2 1 1584 2696 84 102 9582 14255 9465 13788
Sitamarhi 2 1 346 531 58 73 3383 6228 3958 4612
Motihari 1 1 1073 1463 68 63 4366 5547 4743 6152
Raxaul 0 0 37 115 11 14 604 935 590 923
Bettiah 3 2 580 776 44 56 3879 5614 5301 5493
Bagaha 0 0 203 67 15 17 1514 2107 1121 2164
Tirhut Division 29 32 11734 16854 719 817 50451 71674 52500 72401
Darbhanga 5 5 730 1014 95 109 4749 6888 6074 6886
Samastipur 1 1 688 1454 116 127 4450 5889 4579 6230
Madhubani 1 2 557 461 51 58 2500 3221 3087 3624
Janjharpur 0 0 4 16 19 24 584 809 738 841
Begusarai 1 1 27409 37705 94 103 30711 41121 36057 38389
Teghara 2 2 153 320 4 4 561 715 665 777
Darbhanga Division 10 11 29541 40970 378 425 43555 58642 51200 56747
Saharsa 3 3 258 468 75 85 3524 4849 4600 5026
Madhepura 0 0 118 230 38 38 1122 2004 1330 1669
Purnea 4 7 2570 3664 48 63 6834 9550 8050 9589
Katihar 8 10 1462 1332 70 83 5517 6259 5670 7722
Forbesganj 1 1 159 340 31 35 2233 2692 2620 3126
Kishanganj 0 0 745 1190 21 26 2312 3207 2280 3256
Khagaria 0 1 162 280 41 48 1247 1759 1850 1744
Purnea Division 16 22 5473 7504 324 378 22788 30320 26400 32132
Bhagalpur 13 15 14308 17993 130 161 20210 25995 22622 28892
Lakhisarai 0 0 126 214 35 41 1157 1561 1382 1619
Munger 1 2 1896 2281 75 122 3951 4757 6579 5130
Jamui 0 1 50 158 23 31 1419 2073 1417 2087
Bhagalpur Division 14 18 16381 20647 263 356 26736 34385 32000 37728
State 724 836 259116 326787 3626 3957 845778 1091132 892947 1100007
Source : Department of Commercial Tax, GOB (Concluded)
413
Table A 7.2 : Actwise / Circlewise Collection 2013-14 (Upto September 2013) (Rs. lakh)
Division / Circle VAT C.S.T ENT.
Tax E.D.
ADV
Tax
LUX
Tax
Entry
Tax P. Tax Total Target
Patna Special 144189 1128 0 2850 0 0 58023 14 206205 231968
Patliputra 43381 355 757 0 0 0 18149 15 62657 81989
Central Division 187570 1484 757 2850 0 0 76171 29 268861 313957
Patna West 5900 12 336 1 7 94 1136 109 7595 7359
Patna Central 4706 63 2 0 3 19 2586 16 7395 7545
Patna North 6615 30 38 0 0 41 1486 143 8352 7215
Gandhi Maidan 2092 46 0 0 4 54 876 4 3076 2805
Patna South 5753 40 1 0 1 2 2458 8 8262 8662
Kadamkua 2442 23 0 0 0 6 666 3 3142 3254
Patna City East 4517 30 1 0 0 0 2033 0 6581 5171
Patna City West 5780 77 0 0 0 3 1721 1 7583 6678
Danapur 9061 49 10 0 0 1 2300 1 11421 12223
Barh 6872 90 6 0 0 0 2877 1 9847 14229
Shahabad 1595 21 7 0 0 4 541 4 2172 1585
Buxar 863 2 5 0 0 0 81 1 954 938
Biharshariff 2059 2 15 0 0 9 385 2 2472 1968
Patna Division 58255 485 420 1 15 233 19148 293 78851 79633
Sasaram 3857 46 7 0 0 1 835 3 4749 3903
Bhabhua 2496 28 2 0 0 1 338 0 2864 940
Gaya 4781 180 30 0 0 24 1719 3 6737 5331
Jehanabad 802 0 0 0 0 0 53 2 859 689
Nawada 998 0 6 1 0 0 155 0 1160 1286
Aurangabad 1987 16 6 0 0 0 2186 0 4196 3573
Gaya Division 14921 270 51 1 0 26 5287 10 20565 15722
Saran 1649 0 12 0 0 2 386 6 2056 2653
Siwan 1886 7 5 0 0 1 548 2 2449 2023
Gopalganj 1592 4 6 0 0 0 344 2 1948 1526
Muzaffarpur West 4257 101 9 1 0 7 3786 6 8167 7335
Muzaffarpur East 2577 42 19 0 0 4 981 8 3631 3634
Hajipur 5970 127 30 0 0 4 1776 3 7910 6880
Sitamarhi 3014 7 24 0 0 1 316 0 3361 2131
Motihari 2069 8 20 0 0 1 690 1 2789 2681
Raxaul 362 8 6 0 0 0 59 0 435 372
Bettiah 2224 8 15 1 0 1 452 16 2717 2359
Bagaha 775 4 5 0 0 0 70 0 855 934
Tirhut Division 26375 316 151 2 0 22 9408 44 36317 32529
Saharsa 3179 6 25 0 0 3 650 2 3865 3034
Madhepura 2396 114 11 7 1 0 591 3 3122 2513
Purnea 1309 3 13 0 0 1 247 3 1577 1421
Katihar 368 0 0 0 0 0 22 3 393 336
Forbesganj 1813 23 124 0 0 1 15717 4 17681 19371
Kishanganj 224 11 2 0 0 0 139 1 377 330
Khagaria 9289 157 175 7 1 6 17367 14 27016 27005
Purnea Division 1931 0 15 0 0 2 194 1 2144 2249
Lakhisarai 777 2 5 0 0 0 100 1 884 864
Munger 2801 166 31 0 0 3 2210 6 5218 4470
Jamui 2360 14 19 0 0 4 675 3 3075 2901
Bhagalpur 1139 17 6 0 0 1 243 2 1408 1273
Bhagalpur Division 1142 24 3 0 0 0 626 3 1800 1442
Darbhanga 877 7 4 0 0 0 149 3 1040 842
Samastipur 11029 230 84 0 0 10 4197 19 15569 14040
Madhubani 3823 27 30 6 0 12 7487 10 11395 10742
Janjharpur 510 4 2 0 0 0 138 0 655 497
Begusarai 1304 5 1 19 0 0 663 12 2004 2169
Teghara 850 13 2 0 0 0 99 0 964 742
Darbhanga Division 6487 49 35 25 0 13 8386 22 15017 14151
State 313925 2990 1672 2887 16 310 139964 432 462196 497036
Source : Department of Commercial Tax, GOB
414
Table A 7.3 : Districtwise No. of Document and Revenue from Stamp Duty and Registration Fees
(Rs. crore)
District
No. of Document Registration
Fees Stamp Fee Total Receipt Target
2011-
12
2012-
13
2011
-12
2012
-13
2011-
12
2012-
13
2011-
12
2012-
13
2011-
12
2012-
13
Patna 85195 82116 94 118 243 415 337 533 385 449
Nalanda 28930 34128 9 14 28 42 37 56 47 58
Bhojpur 24229 26821 10 13 27 40 37 53 40 53
Buxar 12633 14205 6 8 17 23 23 32 27 37
Rohtas 17117 27180 7 13 19 41 26 54 44 55
Kaimur 17969 15731 7 6 18 18 25 24 20 30
Gaya 34943 40465 15 22 53 68 68 90 89 107
Jehanabad 13691 10837 6 5 17 14 23 19 16 22
Arwal 6637 5976 2 2 7 6 9 8 7 8
Nawadah 10958 19103 3 6 9 18 12 24 20 30
Aurangabad 18211 23919 6 11 18 34 24 45 36 47
Saran 32440 36879 10 14 28 41 37 55 45 57
Siwan 32289 36516 11 15 31 44 42 59 55 65
Gopalganj 28185 30577 9 12 25 34 34 46 43 54
West
Champaran 48853 48668 13 14 35 41 48 55 55 62
East
Champaran 51526 71969 14 25 40 72 54 97 79 94
Muzaffarpur 51362 58461 25 33 63 97 88 130 95 130
Sitamarhi 23256 43834 8 17 21 47 29 64 47 61
Sheohar 18434 8048 7 3 19 8 26 10 8 10
Vaishali 34375 34482 12 18 35 52 47 69 60 74
Darbhanga 33381 38391 13 18 37 52 51 70 55 72
Madhubani 41147 47815 12 16 32 44 43 60 53 65
Samastipur 42674 47820 12 16 44 49 56 65 56 71
Begusarai 16847 28971 7 16 22 50 29 66 52 66
Munger 7946 8976 3 5 11 16 14 21 14 24
Sheikhpura 7847 8796 2 2 6 8 7 10 9 14
Lakhisarai 12568 10988 4 4 12 13 16 17 13 18
Jamui 19260 15421 7 5 21 15 28 20 16 25
Khagaria 12834 15966 4 7 11 18 15 25 20 31
Bhagalpur 26279 30816 12 20 40 61 52 80 68 81
Banka 13570 15857 5 7 14 19 19 25 21 32
Saharsha 18666 22311 6 9 18 27 24 36 21 34
Supaul 21786 27840 5 8 13 21 18 28 22 32
Madhepura 20893 24641 5 8 15 21 20 29 23 33
Purnea 40341 44640 10 16 29 48 39 64 52 64
Kishanganj 29920 26054 7 7 20 22 27 29 22 33
Araria 26595 34971 6 11 17 31 24 42 26 39
Katihar 34771 45659 8 14 23 40 31 55 38 51
Total
101855
8 116584
8 404 559 1137 1708 1541 2267 1800 2288
Source : Department of Registration, Excise and Prohibition, GOB

415
Table A 7.4 : Districtwise Allocation of Fund to the Panchayati Raj Department (2010-11 to 2012-13)
(Rs. lakh)
District
Zila Parisad Panchayat Samiti
2010-11 2011-12
RE
2012-13
BE 2010-11
2011-12
RE
2012-13
BE
Patna 169 764 794 319 1534 1572
Nalanda 213 498 599 401 1003 1193
Bhojpur 175 472 560 359 957 1136
Buxar 172 345 396 248 696 811
Rohtas 224 527 635 416 1037 1227
Kaimur 196 367 423 388 741 859
Gaya 267 692 836 510 1400 1674
Jehanabad 105 232 275 204 428 499
Arwal 76 170 198 148 316 370
Nawadah 210 447 536 392 858 1002
Aurangabad 231 497 608 419 937 1106
Saran 157 784 831 275 1540 1591
Siwan 60 602 762 56 1104 1329
Gopalganj 195 524 644 343 989 1171
West Champaran 267 654 788 508 1341 1605
East Champaran 256 821 1004 473 1701 2056
Muzaffarpur 268 740 889 532 1564 1890
Sitamarhi 252 614 752 462 1241 1489
Sheohar 147 215 247 280 396 445
Vaishali 247 609 745 445 1237 1487
Darbhanga 255 670 810 490 1354 1625
Madhubani 295 780 946 575 1660 2012
Samastipur 233 742 901 439 1496 1759
Begusarai 185 536 640 358 1079 1281
Munger 137 251 293 280 473 565
Sheikhpura 103 186 207 204 351 391
Lakhisarai 141 232 261 283 450 510
Jamui 188 365 421 375 743 866
Khagaria 182 350 415 347 684 798
Bhagalpur 199 478 570 384 966 1148
Banka 167 416 482 331 834 974
Saharsha 177 379 447 348 749 878
Supaul 198 420 484 401 893 1057
Madhepura 172 393 459 335 810 952
Purnea 147 910 706 256 1460 1567
Kishanganj 140 331 381 278 697 820
Araria 122 594 588 238 1232 2301
Katihar 187 531 634 357 1075 1277
Total 7115 19136 22167 13458 38024 45294
(Continued)
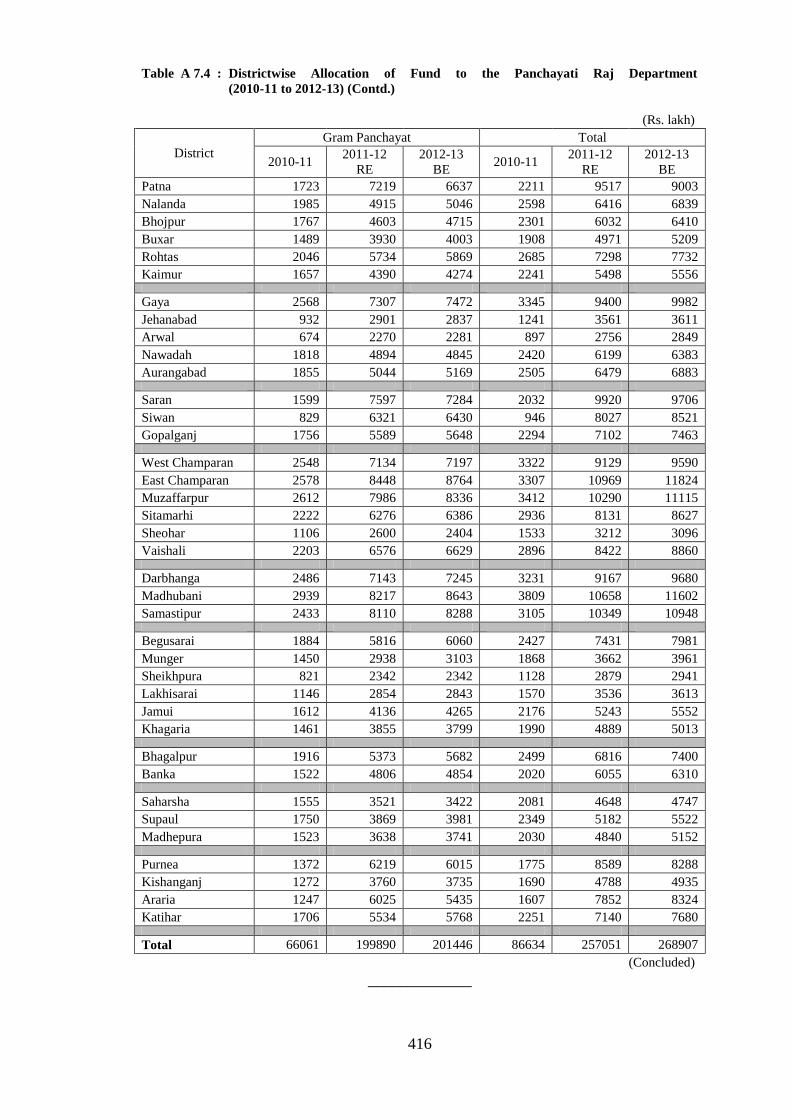
416
Table A 7.4 : Districtwise Allocation of Fund to the Panchayati Raj Department
(2010-11 to 2012-13) (Contd.)
(Rs. lakh)
District
Gram Panchayat Total
2010-11 2011-12
RE
2012-13
BE 2010-11
2011-12
RE
2012-13
BE
Patna 1723 7219 6637 2211 9517 9003
Nalanda 1985 4915 5046 2598 6416 6839
Bhojpur 1767 4603 4715 2301 6032 6410
Buxar 1489 3930 4003 1908 4971 5209
Rohtas 2046 5734 5869 2685 7298 7732
Kaimur 1657 4390 4274 2241 5498 5556
Gaya 2568 7307 7472 3345 9400 9982
Jehanabad 932 2901 2837 1241 3561 3611
Arwal 674 2270 2281 897 2756 2849
Nawadah 1818 4894 4845 2420 6199 6383
Aurangabad 1855 5044 5169 2505 6479 6883
Saran 1599 7597 7284 2032 9920 9706
Siwan 829 6321 6430 946 8027 8521
Gopalganj 1756 5589 5648 2294 7102 7463
West Champaran 2548 7134 7197 3322 9129 9590
East Champaran 2578 8448 8764 3307 10969 11824
Muzaffarpur 2612 7986 8336 3412 10290 11115
Sitamarhi 2222 6276 6386 2936 8131 8627
Sheohar 1106 2600 2404 1533 3212 3096
Vaishali 2203 6576 6629 2896 8422 8860
Darbhanga 2486 7143 7245 3231 9167 9680
Madhubani 2939 8217 8643 3809 10658 11602
Samastipur 2433 8110 8288 3105 10349 10948
Begusarai 1884 5816 6060 2427 7431 7981
Munger 1450 2938 3103 1868 3662 3961
Sheikhpura 821 2342 2342 1128 2879 2941
Lakhisarai 1146 2854 2843 1570 3536 3613
Jamui 1612 4136 4265 2176 5243 5552
Khagaria 1461 3855 3799 1990 4889 5013
Bhagalpur 1916 5373 5682 2499 6816 7400
Banka 1522 4806 4854 2020 6055 6310
Saharsha 1555 3521 3422 2081 4648 4747
Supaul 1750 3869 3981 2349 5182 5522
Madhepura 1523 3638 3741 2030 4840 5152
Purnea 1372 6219 6015 1775 8589 8288
Kishanganj 1272 3760 3735 1690 4788 4935
Araria 1247 6025 5435 1607 7852 8324
Katihar 1706 5534 5768 2251 7140 7680
Total 66061 199890 201446 86634 257051 268907
(Concluded)
_____________