
How to Set Marketing Budgets. - Brandirectory
22
Brand Finance How to Set Marketing Budgets September 2020 1. Whitepaper How to Set Marketing Budgets. Alex Haigh Valuation Director, Brand Finance
-
Upload
khangminh22 -
Category
Documents
-
view
0 -
download
0
Transcript of How to Set Marketing Budgets. - Brandirectory

Brand Finance How to Set Marketing Budgets September 20201.
Whitepaper
How to set and allocate marketing budgetsHow to Set
Marketing Budgets.
Alex HaighValuation Director,
Brand Finance

Brand Finance How to Set Marketing Budgets September 20202.
The reason I pose this question at the start of this article is to highlight that setting budgets and calculating return on marketing investment are dependent on a clear explanation of the purpose for which that investment is taking place and the environment within which it is taking place.
As a starting point, I would offer what seems to be a reasonable, if expansive, view of the purpose of corporate marketing: to seek out markets where there is unaccessed or latent demand, build penetration in those markets, defend from competitors and stimulate higher frequency, price and loyalty among buyers.
With the rise of employer branding, corporate brand reputation and CSR, we could also realistically add an addendum to this purpose: “to generate a positive reputation and interactions among other stakeholders”.
The methods for satisfying this purpose can broadly be separated into the following:
Brand Communication
I. Traditional, Digital and other Advertising
II. Sponsorship & CSR Activities
III. Public Relations, Events & Social Media
IV. Website & Other Content
Price and Distribution
V. Pricing & Sales Promotion
VI. Distribution
Product
VII. Visual Identity & Packaging
VIII. Product (Formulation/Service etc) & Innovation
There is also the tricky question of how much to spend on research to see whether any of this is working. The rule of thumb is that 10%-15% of the overall budget1 should be spent on research, although this of course depends on the relative price of research and the needs of the company and thus this range can differ significantly from around 1-2% up to 25% in some cases.
The role of a marketer is broad, and their activities vary depending on stage of company development (start-up to established), industry, country, strategy and many other factors.
1 https://instituteforpr.org/how-much-of-the-budget-should-be-spent-on-research-and-insights-an-ipr-measurement-commission-roundtable/

Brand Finance How to Set Marketing Budgets September 20203.
A key objective, however, for almost all marketing teams is to build “Brand Equity” which is likely to provide benefits to the brand’s business in the long term.
There is more to be said of the focus on each lever above but the focus of this paper will be specifically on Brand Communication – the most significant area of investment for most marketing departments.
Brand Communication Channels
IWithin Brand Communication – which we are focussing for the remainder of this article – marketers have a series of channels into which they can invest. Typically these include:
• Traditional advertising such as TV, Radio, Out-Of-Home (OOH), Print and Cinema
• Online Advertising (including Mobile Ads and Apps)
• Website
• Search (Pay-Per-Click or Organic)
• Email & Direct Mail
• Events & Seminars
Typically, but not always, these are also complemented by these other investments:
• Public relations and earned media endorsements
• Sponsorships (including paid Celebrity Endorsements, Sports and CSR)
• Promotional content such as thought leadership content
These other investments are often promoted within the original advertising channels to maximise and amplify their effect. Each channel and additional investment have their own benefits and drawbacks and an analysis of those is part of the challenge when setting budgets. In general however, all channels tend to work more effectively when combined into a fully integrated campaign and so most campaigns include investment in many channels.
What is Brand Equity?
Brand Equity refers to the stock of awareness and perceptions of a brand that stakeholders – in particular customers and potential customers – have, that causes them to react positively towards that brand, creating value for it into the future.
The concept has been identified for many years. Some of the most relevant academic definitions are the following:
Srivastava and Shocker (1991) describes brand equity as ‘the aggregation of all accumulated attitudes and behaviour patterns in the extended minds of consumers, distribution channels and influence agents, which will enhance future profits and long term cash flow’.
Keller (1993) defines customer-based brand equity as ‘the differential effect of brand knowledge on customer response to the marketing of the brand’. According to this definition a brand is said to have positive brand equity ‘if consumers react more favourably to the product, price, promotion or distribution of the brand than they do to the same marketing mix element when it is attributed to a fictitiously named or unnamed version of the product or service’.
Farquhar (1989) suggests a relationship between high brand equity and market power asserting that: ‘The competitive advantage of firms that have brands with high equity includes the opportunity for successful extensions, resilience against competitors’ promotional pressures, and creation of barriers to competitive entry’.

Brand Finance How to Set Marketing Budgets September 20204.
When launching these campaigns, the specific initial media objectives would be:
• Reach: the number of different households or individuals exposed to the ads.
• Frequency: the number of times each household or individual is exposed to the ads (also known as the number of impressions).
• Continuity: the timing throughout the year of the ads.
Reach objectives may differ depending on the brand’s target audience – Coca-Cola may target all households whereas ads for Retirement Plans may be more focussed for example.
Frequency will depend principally on the type of product and the end goal of the advertising. Empirically, where the end goal is a sales response, the number of impressions differs by product type , being lower for impulse FMCG products and higher for bigger ticket purchases like kitchen appliances, insurance or B2B goods and services.
The necessary number of exposures for your product/brand will influence the number of ads necessary within a certain period and since ads will be ineffective unless you reach that level of exposure there is a serious cost to underspending as well as to overspending.
In the case of digital marketing, “Engagement” is also a key objective. Engagement refers to the number of interactions that the public has with the campaign. Additional engagement tends to increase frequency.
Continuity might be influenced by consumer patterns (e.g. summer holidays tend to be planned during winter holidays, while ice cream is bought during the summer). It is also influenced by other advertiser behaviour and demand, which might influence pricing and effectiveness, and a number of other factors.
Commercial Effects of Brand Communication
The combination of reach, frequency and continuity is overall exposure. This overall exposure, combined with the quality and relevance of the creative content, is what causes positive effects on sales.
These effects can be broadly broken down in to:
• Shorter-term effects (during or shortly after the advertising);
• Medium term effects as the immediate repeat of behaviour (habit); and
• Longer term effects on base sales volume (closely linked to the concept of brand equity).

Brand Finance How to Set Marketing Budgets September 20205.
In the “short-term”, advertising can inform customers of a product, brand or service and subsequently persuade or remind them to buy or interact with it. For most consumer goods these effects occur within the advertising period (when the ads are active). However for some products and services – especially high involvement B2C products like durables or many B2B products and services – the visible effects can happen shortly after the advertising period, with the principle step (initial intention to buy) happening within the advertising period.
In the “medium-term”, there are often further increases in sales as new purchasers from the initial sales return to purchase again. Many brands invest heavily in CRM and loyalty programmes to maximise these effects when in fact they tend to be rather small.
For example, Simon Peel, Global Media Director of Adidas, noted in his speech at the IPA’s Global Effectiveness Week 2019 that first time buyers were actually responsible for two thirds of sales and that the company had been over-spending on loyalty programmes on the assumption that loyalty and repeat buying would be cheap and easy to stimulate. Various recent pieces of research have, in fact, supported this assertion that loyalty programmes are less useful than market penetration 2.
In the long-term, advertising builds “conversion” of clients and long-term brand equity. Advertising and promotional activities are one of the most effective methods for building awareness and a positive reputation for a brand. Typically, therefore, advertisers seek to find a balance between Brand Building advertising and Performance (short-term, sales-focussed) advertising. The oft-quoted rule of thumb is 60% brand building and 40% for performance is typically considered the best starting point. Les Binet and Peter Field in Effectiveness in Context have provided more clarity on the appropriate split by sector and product type but the range tends not to be far from 60%: 40%.
However, unfortunately for those looking for long-term value gains from advertising, very few advertisers reach 60% according to the same study by Binet and Field. Instead they focus more heavily on short-term performance advertising. An issue which has been made more difficult by digital advertising and its reporting systems’ emphasis on short-term effects like click-through, page views or immediate e-commerce sales.
That being said, despite some advertising being more specifically brand-focussed, all advertising impact has an impact on awareness and brand equity. This is particularly the case, if it triggers an action by a customer since those that have used a product or service tend to understand and rate said product or service more highly than those who have not.
These medium and long-term effects contribute to long-term value characteristics of advertising investment that has led to the concept of “adstock” (Broadbent et al3), heavily used in the modelling of advertising effect. Adstock, also known as the Accumulated Weight of Advertising
2 Binet, L. & Field, P. (2018) “Effectiveness in Context” EffWorks, Institute of Practitioners in Advertising3 Broadbent, S. & Fry, T. (1995) “Adstock modelling for the longer term”, Journal of the Market Research Society (October), 385-403, and earlier papers

Brand Finance How to Set Marketing Budgets September 20206.
(AWA), postulates an amount of advertising effect in a given period which is the product of the ‘decayed advertising effect from previous periods plus the advertising effect in the current period’.
The underlying mathematics assumes an exponential decay rate of effect, variable by category and deduced empirically from market research data on advertising awareness decay. When referring to long-term brand equity, in many cases this can be as low as 20% decay per year. The decay rate is modelled with a base level to which decay occurs which is not zero, reflecting the existence of long-term advertising effects. For strong brands this base level can be quite high.
Source: Brand Finance
Together, short, medium and long-term effects combine to create long-term increases in brand value and return on investment which can be measured. Long-term, it is measured using brand valuation techniques and in the short term by econometrics, combining this concept of adstock as a source of long(er)-term value.
Many companies use benchmarks to begin their discussions, a simple and reasonably effective way for agreeing a budget.
The most typical benchmarks are:
• Industry benchmarks as a % sales
The US Small Business Administration gives advice to new companies to spend around 7-8% of revenue on marketing in order to support growth4. They say this might fall (to around 5-6%) as you grow in size and become “established” and might rise (to around 20%) if you are a high growth start-up.
Beyond general advice like this, there are also reported data from brands. Typically, these are: self-reported by marketing directors, reported by
2. Where to start when setting budgets?
4 https://www.sba.gov/taxonomy/term/15051?page=37

Brand Finance How to Set Marketing Budgets September 20207.
media owners, or reported in financial statements. There are benefits and disadvantages for each type of reporting but together can give a reasonably reliable view.
Gartner’s 2018 CMO Spend Survey for example, finds that the average marketing budget is somewhere be around 11% to 12% of revenue. However, this number changes to around 7% for B2B brands and has strong fluctuations between sector. Brand Finance research also finds similar swings between sectors as follows:
Source: Brand Finance
There are, however, various issues with these sorts of benchmarks. Firstly, it assumes that what your competitors are doing is correct which is certainly not always the case. Secondly, it assumes that all companies are recording their costs in similar ways which is certainly not always the case.
Finally, budgets strongly depend on your circumstances – even if the benchmark is based on industry competitors only. Your specific stage of business development, available media, business strategy, brand strength are all likely to influence what you really should be spending where and cannot be captured in industry wide benchmarks.
Uber, the ride-hailing app, spent 32.6% of their revenue on sales and marketing in 2019. According to the benchmark they spent too much, but were they really wrong to do so?
• Competitive Share of Voice (SOV) & AdStock Benchmarks
Share of voice refers to the relative share of media exposure that one brand has in comparison to its competitors. There have been many studies on share of voice models that show that for every share of market there is a corresponding share of voice. That is, if you invest a certain amount in share of voice you should be fairly sure of your market share. These share percentages tend to be equivalent (i.e. a 1:1 relationship)

Brand Finance How to Set Marketing Budgets September 20208.
however there are some economies of scale benefits to being a larger brand, which tend to be able to underspend a little relative to their size5.
Therefore, if your goal is to maintain share then your SOV (and therefore spend) should be kept at a level that corresponds with your share of market – otherwise known as “equilibrium level of share of voice”. If your goal is to grow share, your SOV should be above the equivalent for share of market, giving you what is referred to as “Extra Share of Voice” (ESOV)6.
From month to month and quarter to quarter, your own share of voice tends to change significantly as campaigns last for some time and then stop for some brands, while they start up for others. Despite this temporary difference in spend, the intertemporal effects of ad spend continue. This creates the need to conduct AdStock (or AWA) modelling as a means to identify effective share of voice as the basis for setting new budgets.
As a result of the fact that effective share of voice takes time to build up (due to AdStock) and large brands have efficiencies of scale on their equilibrium shares of voice, there can be significant negative effects of cutting budgets below maintenance levels. This should not be done without careful consideration. Even in the case of severe recessions, we have found maintaining share of voice (or even increasing it) can be very value-generative as advertising gets cheaper and customers delay rather than cancel purchases.
SOV AdStock models are a very effective benchmark to use for setting overall budgets. However, data on share of voice can at times be difficult to find particularly when your brand is in a market of competitors that do not have identical products, therefore making it difficult to identify the “market” from which to analyse share. This difficulty with data is, in fact, becoming worse as a result of the current unreliability of the measure with digital spend – although there are ongoing steps to improve this.
• Industry Marketing Split % Benchmarks
Usually media channel split is less easy to find than overall sales % benchmarks but they exist. Marketingcharts.com for example published a study on the supposed “Best Allocation” of media according 300 advertisers, agencies and media companies which highlighted that Traditional Advertising, for example, should be the largest allocation with around 16% of total spend. Gartner in its CMO Spend Study tracks what CMOs say they actually spend (as opposed to what they think they should).
Such studies are useful for highlighting glaring errors in marketing spend allocation. For example, when advising a major engineering-led technology company recently, we found that over 50% of their marketing budget was spent on events. We used this benchmark to highlight that the
5 Jones, J.P. (1990) “Ad Spending: maintaining market share”, Harvard Business Review, 68, 1 (January/February)6 Binet, L. & Field, P. (2018) “Effectiveness in Context” EffWorks, Institute of Practitioners in Advertising

Brand Finance How to Set Marketing Budgets September 20209.
typical allocation for events is around 1/10th of that amount (5%), creating an impetus to rethink marketing budgets.
However, as with any benchmarks set with comparables, this suffers from the fact not all brands’ needs are equal and behind these benchmarks lies a lot of variation.
• Customer Expectation Benchmarks
Marketing budgets can also be set simply by reviewing market research on where customers receive their information about new products in the category or where they expect to find that information. For example, video-gamers may be more avid readers of technology magazines and games-review websites which would help suggest an over-indexing on those channels.
These benchmarks can be helpful but, in general, suffer from being highly imprecise.
• Company Historic Benchmarks
Many budgets are set by reviewing those for the previous year, deciding whether the result was reasonably good, doing the same again if so or tweaking some of the totals and allocations if not. If management is generally happy with the previous year’s activities, this can be and often is enough a basis for the current year budget.
Without detailed analysis, however, it is difficult to diagnose issues and disentangle the effects of different types of marketing investments from others. This can cause inefficient spend to become entrenched in an organisation and difficult to stop. In fact, this type of benchmark is what caused the technology company to keep spending 50%+ on events every year despite the strangeness of the allocation in relation to returns.
• Objectives/Tasks Benchmarks
This approach starts by identifying all activities that a marketing department wants to do in a given year, adding up their costs and setting a budget based on that. There are some fairly clear issues with this approach – in particular, a lack of focus on outputs and significant amounts of trust put into subjective assessment of what is necessary.
However, in some specific cases this approach can be useful and in fact necessary. In the case of a rebrand we advised on, it became clear that to drive awareness and brand equity up to a level equivalent with the brand that was being replaced approximately €4m extra investment was needed per year in the media budget. A marketing budget based on the average company would not have taken this need in to account and the business would have lost significant market share.

Brand Finance How to Set Marketing Budgets September 202010.
In summary
Benchmarks like these are all useful starting points for setting budgets and marketing teams should incorporate them into the decision-making process. They do, however, tend to lack an element of specificity and – other than for SOV benchmarks – they also lack a basis in return on investment analysis.
It is therefore strongly recommended that these approaches are complemented by return on investment analyses of some kind as an analytical basis to finetune marketing budgets.
Return on Marketing Investment is a method to determine the financial value attributable to a specific set of marketing initiatives (net of marketing spending), divided by the marketing ‘invested’ or risked for that set of initiatives.
It is widely used in some form in many companies since it: provides an additional level of control and prediction of future cash flows; helps to improve marketing effectiveness and; provides a formulaic approach to marketing accountability that helps to build trust and understanding with finance departments.
The simplest way of explaining ROMI mathematically is as follows:
ROMI =
There are many benefits of ROMI as an approach including:
• Assessing historical and projected marketing productivity;
• Reviewing and approving marketing budgets;
• Allocating limited marketing funds among competing brands, products, markets, customers, marketing mix elements and media, and
• Evaluating specific marketing campaigns for go / no-go decisions.
The measure is widely used, with around 77% of a sample of 194 North American marketing leaders saying they consider it very useful and 49% saying it was “useful in managing and monitoring their business”7.
According to Gartner’s 2018 CMO Survey, ROI was the 6th most picked option for the question “Considering all of the metrics being tracked on your CMO (or senior marketing leadership) dashboard, which are most important to inform marketing strategy?”. This was closely behind Awareness, Share of Wallet, Competitive Benchmarks, Brand Health and Share of Voice – all of which are regular inputs to ROI analyses.
However, it is not as popular as it could or potentially should be mostly as a result of of its broad scope as well as some complexities and confusion when identifying and justifying what is the “financial contribution generated by marketing”.
Incremental financial contribution generated by marketing - Marketing spend
Marketing spend
3. What is Return on Marketing Investment
(ROMI)?
7 Farris, P. W., Bendle, N. T., Pfeifer, P. E. and Reibstein, D. J. (2010) ‘Marketing Metrics: The Definitive Guide to Measuring Marketing Performance’, 2nd edn, Pearson Education, Upper Saddle River, NJ

Brand Finance How to Set Marketing Budgets September 202011.
This is partly because return can be identified in multiple different ways:
+ Total: return on all spending
• This return is most important as a justification for total budgets and a defence against major cuts.
+ Incremental: return on a specified additional spending increment
• This is most useful for analysing a go/no-go decision for a new marketing campaign or activity.
+ Marginal: estimated return on the ‘last dollar’ of marketing spend
• This is an important range to consider profit maximisation (in particular marketing mix considerations) and therefore ROMI maximisation.
Source: Farris, P., Hanssens, D., Lenskold, J., Reibstein, D., “Marketing Return on Investment: Seeking Clarity for Concept and Measurement”, Henry Stewart Publications 2054-7544 (2015), Vol. 1, 3 267–282, Applied Marketing Analytics adapted by Brand Finance

Brand Finance How to Set Marketing Budgets September 202012.
The analysis can also performed on marketing spend within a spectrum of scope between:
+ Campaign or Channel Specific: ROI measures for a specific search advertisement, an e-mail campaign, or the specific offer within a direct mail campaign.
+ Full mix: ROI measures for the full marketing mix, or integrated marketing activities which may even include multi-year costs for market research, logo design and revisions, cooperative advertising rebates and all media.
This complexity and confusion may also have been encouraged by the rise of digital media since online “ROI” measures often fail to understand the counterfactual (i.e. what would happen without the investment).
Simon Peel, Global Media Director of Adidas, identified in his speech to the IPA’s Global Effectiveness Week 2019 that Adidas had lost some trust in ROI as a leading measure since ROI for Pay-Per-Click (PPC) advertising was exaggerating the benefit that PPC was creating. The measure, for example, calculated a click-through from a paid search result from the term “adidas” was being recorded as a return on that campaign despite the fact it is almost certain that click through would have happened organically, without any paid search.
How do you measure the “financial contribution generated by marketing”?
There are three approaches widely considered to be appropriate for an analysis of the financial contribution of marketing: Comparative Cost; Short-Term Profit Lift; and Long-Term Brand Impact Analysis.
• Comparative Cost
This approach refers to the costs saved created by shifting from one medium to another medium while maintaining the same output. Take an example of a company spending $1m in advertising in Cinema with a reach of 20% of the market with an average frequency of 2 ad views per person. If this company were to turn off all advertising in cinemas and switch to radio, retaining the same reach and frequency while paying only $500k, there would have been a $500k saving.
Depending on the way you calculate it, this could indicate a return of 50% ($500k saving/ $1m original cost) or 100% ($500k saving / $500k current cost).
This method can be useful as part of the discussion of marketing mix but costs are often not neatly comparable between media types and it is often difficult to reliably identify whether outputs are the same or similar given different types of reporting and outcomes. In any case, the approach is not focussed on the benefit of the marketing and therefore does not truly identify return.
• Short-Term Profit Lift
These approaches are based on analysis of the short-term returns from marketing investment. This analysis is sometimes a direct modelling of effects of marketing

Brand Finance How to Set Marketing Budgets September 202013.
on sales, which when combined with the profit margin of incremental revenue will provide the return. In this case sales data are the dependent variables from the modelling. Where this is not possible, analysis is completed against a data point with a known relationship to sales – for example website views, click-throughs or footfall.
In some cases – for example B2B brands – this modelling is better applied to acquisition and churn of customers, linking to individual customer value. This in turn, gives a longer term view of value – bearing in mind the more relationship-focussed nature of these types of businesses.
At all times, the best tool to complete this analysis is econometrics – the use of statistical methods to explain the empirical relationships between sets of data. In the case of marketing budget setting, these statistical techniques are often summarised as “Marketing Mix Modelling”.
Marketing Mix Modelling
Marketing Mix Modelling uses econometric analysis to attribute past sales movements to the contributions coming from changes in differing causal drivers.
The attribution process is like weighing many different combinations of ingredients in a cake recipe to work out by implication what impact each ingredient has on the taste, texture and appearance of the cake – and what improvements (or synergies) there may be when ingredients are used together.
The result of the modelling is that we determine what the marketing mix needs to be to get the highest sales uplift or, to extend the metaphor, what is the best recipe to use to bake our cake.
In order to conduct this type of model, there are typically 6 steps
1. Define the objective of the model (the predicted dependent variable)
2. Identify potential sales drivers (or drivers of other dependent variables)
3. Identify sources for, collect and “clean” relevant data
4. Build the modelling database
5. Conduct initial modelling
6. Iteratively refine both data and modelling to get the best model
An example list of independent variables for a Marketing Mix Model for a durable goods brand might include non-marketing spend related drivers such as:
• Average Item Price
• Price Promotions
• Product Mix

Brand Finance How to Set Marketing Budgets September 202014.
• Width & Depth of Range
• Economic Conditions
• Seasonality
• Competitive Spend/Activity
Source: RedRoute International & Brand Finance
But importantly must include marketing activities segmented at the level at which you intend to use the model to segment spend.
• Direct Marketing (offline): Catalogues; and tactical leaflets
• Online Marketing: PPC; SEO; email; display, affinity; conversion & call back
• Short Term offline media & PR activity (TV, Radio, Posters, PR)
Finally, it should also include measures which identify:
• Long Term Brand Equity
These variables are identified after a detailed review of the business and its environment to develop reasonable expectations of drivers of sales. This process is made easier with experience.
The data for the variables (independent and dependent) need to have been tracked for some time (preferably 2 to 3 years or more) and with some regularity (preferably weekly but no less than quarterly), in order to

Brand Finance How to Set Marketing Budgets September 202015.
create reliability and accuracy of the models. The need for this level of data repetition can indeed be a challenge for many brands.
The sources of data are varied but can be media agency investment data, economic forecasters, internal documents, original (or syndicated) market research and many other different sources.
The data should be cleaned so that they respond to the same time periods and are stored in equivalent databases.
A correlation analysis will then be completed to identify multi-collinearity between the data and remove any independent variables that are already explained by other variables in the model. This is done because variables that are already explained by other variables skew the model, making some attributes seem more or less important than they really are.
Modelling of the data using regression analysis follows this data set-up. Usually this involves multiple models to test different types of relationships. Sometimes the relationships will be linear (i.e. as one increases, sales increases at a similar amount) but in many cases this will not be the case. For example, advertising spend tends to reach a point of saturation and diminishes in its effectiveness making it non-linear.
Subsequently, measurement of statistical fit is necessary as well as significance testing of each indicator is necessary to build a robust model. Similarly, common sense checks are also essential such as that higher price reduces volume. As these checks are made and issues identified, the model should be updated and re-calculated.
Reporting of marketing mix modelling usually includes an explanation of the sources of sales volume over time as this simplified model below shows:
Source: RedRoute International & Brand Finance

Brand Finance How to Set Marketing Budgets September 202016.
By understanding the contribution of each channel and its individual relationship with sales, marketers can therefore use the model as a predictive tool to compare different marketing plans in order to maximise profit and (therefore) return on marketing investment.
However, within these models, a large part of volume is explained as “base” sales. This refers to the sales volume generated by long-term brand equity impacts as well other long-term sources of value. In the graph above, “base” sales is constant. In reality, this figure gradually changes as the dynamics of the market (e.g. a shift online by some brands), the brands’ relative strengths or some other relevant predictive variable change.
In order to understand where this value comes from and how to maximise it, a different type of analysis is needed, analysing long-term brand equity and financial data via advanced research techniques – Conjoint and Brand Drivers Analysis.
• Long-term Brand Valuation Analysis (Brand Impact Analysis)
Long-term brand equity is one of the most important drivers of business value, making up an average of 20% of business profitability and value. Understanding how it influences long term business value drivers is essential for good brand management and business planning and its many concrete applications can include:
• Marketing Investment, Content and Creative Planning
• Brand Architecture Assessments
• Brand Positioning and Purpose Refinements
• Brand Licencing Negotiations and Extension Decisions
• Brand Transition Management
In order to identify the commercial value of long-term brand equity, it is necessary to link it to commercial impact. To do this, market research methods are employed to identify how strongly a brand influences choice relative to a conceptual unbranded equivalent (sometimes referred to as a generic or floor brand within the category) in a process known as “Brand Impact Analysis”.
This process is then used to isolate the revenues and profits attributable to the incremental effect of a brand versus the
A robust measure of brand equity is strategically crucial for any branded business. It
may sometimes be difficult to quantify and there is no 100%
consensus on how to measure it, but every business needs to
develop a system for assessing whether their
brands are healthy, enjoy a strong and resilient
reputation, and most importantly, are poised to deliver future growth and
commercial return.Steven Thomson,
Insight Director, Brand Finance

Brand Finance How to Set Marketing Budgets September 202017.
effect that would be achieved if there were no brand to identify the contribution of a brand to the value generated by a branded product or service.
This isolation process is either conducted using Conjoint Research or Drivers Analysis:
Conjoint Research
Conjoint research seeks to link specific perceptual brand attributes held by customers or potential customers to changes in their brand preference and brand choice, by estimating the underlying ‘utility’ customers ascribe to different ‘levels’ of a brand attribute. Research respondents are presented with a series of choices between alternative propositions or products. A balanced experimental design is used to ensure equal representation of different combinations of product features.
The result identifies the different utilities of discrete product/service choices and therefore the incremental increase in choice that the brand brings to purchase decisions.
This in turn can be expressed in terms of either a price effect, a volume effect or a combination of the two. These are used to calculate revenues or “Base Sales” in the volumetric graph of sales drivers in the section above.
Drivers Analysis
This involves analysing data from existing (or specially conducted) brand tracking studies to understand the links between individual attributes, broader factors or groupings of attributes and brand equity (i.e. preference).
Typically, individual attributes are categorised into groups either through statistical analysis (e.g. factor analysis) or logical grouping. This data reduction exercise seeks to eliminate redundancy between the main factors such that instead of having a large number of attributes describing similar or near identical aspects of the brand, the data set is reduced down to a smaller number of statistically independent factors.
Using the research data each subject brand is scored for its performance on each of the key Brand Equity drivers. This research also generates a brand preference score, which is typically used as a proxy for brand equity.
Once these attributes or factors have been identified, regression analysis is applied to the research data to statistically identify the importance weighting of each Brand Equity driver in driving brand preference. This is preferred to “stated” importance weightings which are overly-rational.
Source: Brand Finance

Brand Finance How to Set Marketing Budgets September 202018.
Subsequently, the difference in brand driver performance between target brand vs generic brand is analysed to highlight the impact on preference. The generic brand can either be chosen from the market or constructed hypothetically by setting scores on brand relevant attributes to level of lowest brand score observed on an attribute by attribute basis.
Source: Brand Finance
Having arrived at a Brand Equity score, the next step is to identify its impact on choice. this can be done subject to good market share data availability, by comparing the Brand Equity score with volume market share for all brands in the market and undertaking regression analysis. This is then combined into the company’s income statement to identify the impact on revenue, profitability and cash flow.
Use of Brand Impact Analysis
By analysing the differences in brand utilities/preference and their impact on financial performance, these types of analyses can subsequently be used to understand:
• What is the overall benefit of brand building to the company?
• What elements of brand strength and equity are causing base demand?
The answer to this first question enables marketers to justify budgets more successfully, particularly when there is an issue of short-termism in marketing decision-making.
The answer to the second question helps to refine brand positioning, messaging, creative and content to make marketing more effective. When combined with marketing mix modelling that uses brand equity measures as dependent variables, you can also even identify what best channel mix to optimise long-term performance.

Brand Finance How to Set Marketing Budgets September 202019.
Brand Finance advises clients to set budgets in the way that suits them. What suits them depends on: Data availability; Management Scepticism or Support; Sophistication and Scale of Investment. At the start of any assignment we therefore suggest a Data, Management, Sophistication (DMS) Audit.
Data Availability Assessment
1. Keep good records of marketing spend data, split by channel and segment.
2. Identify and track benchmarks – including from Brand Finance’s and other third party databases – of competitors spend and compare against your own.
3. Conduct a structured review of all the factors driving sales (including Brand Equity).
4. Assess availability of Share of Voice data in the relative marketing channels (or any available proxy measures).
5. Track Brand Health measures in order to track long-term brand value – or use syndicated research like Brand Finance’s Global Brand Equity Monitor.
This step identifies what level of analysis or approach is possible and sets the business up for more advanced techniques later.
Management Scepticism and Support (Workshops and Interviews)
6. Identify all of the different stakeholders involved in marketing investment decisions, their level of involvement and knowledge and their views on total and split of spend.
7. Review historic company budget split benchmarks in comparison with industry benchmarks to identify anomalies that arise as a result of disjointed management.
8. Review marketing objectives of management and prepare a budget based on those objectives to compare with other benchmarks.
9. Provide some basic training to those that need it. This tends to be particularly necessary on the subject of long versus short-term effects of marketing.
This step identifies what level of analysis will be necessary to convince all relevant parties involved in decision-making.
Sophistication and Scale Analysis
10. Review size and importance of marketing budget in comparison with other major company investments and the cost of detailed modelling or analysis.
4. What does this mean for marketing
teams and their businesses?

Brand Finance How to Set Marketing Budgets September 202020.
11. Analyse the level of investment of competitors and their share of voice relative to your own in order to see if you are ahead or should be catching up.
12. Calculate the average value of brands in your industry relative to company value (and your own brand’s value) to see what value could be gained from better marketing.
This step identifies how much return you could be leaving on the table as a result of a less sophisticated approach to marketing spend analysis.
Together these steps help to define whether you stick with only using benchmarks to set budgets or you introduce more advanced techniques in order to squeeze as much value as possible from the investment.
It is important to conduct some form of Return on Investment analysis – Whether this is simple maths with sensible assumptions or more advanced statistical techniques, some way to understand financial performance is essential.
This will help to make sure that you are investing sufficiently and in the correct channels in order to defend from competitors, support new products and services, maintain market share and build brand equity all the while not wasting budget that could be better used elsewhere.
The results of this process will likely be different at every cycle so it should be conducted each time a budget needs to be approved. In the case where more advanced analysis is not conducted, data should be prepared in order to give the opportunity to do so in the future. Where an analysis approach is being conducted this process is necessary to identify improvements and updates to the model to modernise and improve them with new facts from the market and management.
The budget process is one of the most important tasks for marketing teams and it deserves to be done with careful planning. John Wanamaker’s famous phrase was that half of his advertising investment is wasted; he just doesn’t know which half. This issue need no longer cause marketers sleepless nights. The tools are available, it is just time for all marketers to use them.
Brand Finance How to Set Marketing Budgets September 202021.
MARKETING FINANCE TAX LEGAL
We help marketers to connect their brands to business performance by evaluating the return on investment (ROI) of brand-based decisions and strategies.
We provide financiers and auditors with an independent assessment on all forms of brand and intangible asset valuations.
We help brand owners and fiscal authorities to understand the implications of different tax, transfer pricing, and brand ownership arrangements.
We help clients to enforce and exploit their intellectual property rights by providing independent expert advice in- and outside of the courtroom.
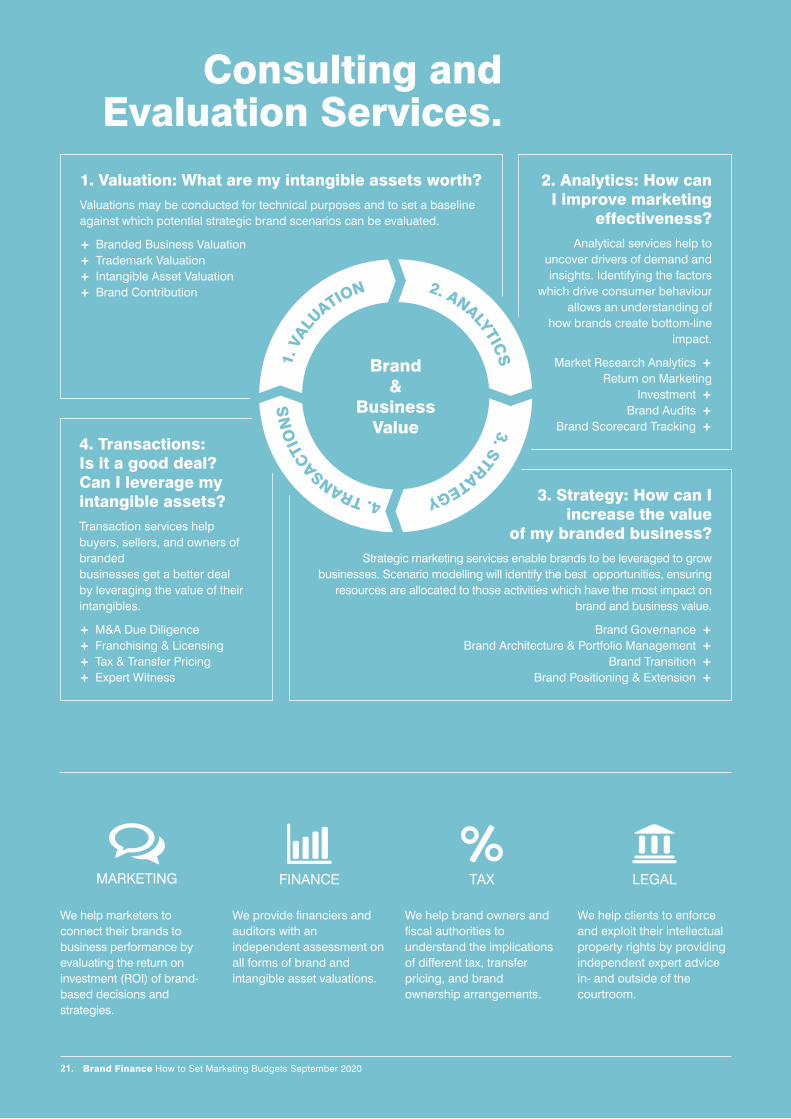
1. Valuation: What are my intangible assets worth?Valuations may be conducted for technical purposes and to set a baseline against which potential strategic brand scenarios can be evaluated.
+ Branded Business Valuation+ Trademark Valuation+ Intangible Asset Valuation+ Brand Contribution
2. Analytics: How can I improve marketing
effectiveness?Analytical services help to
uncover drivers of demand and insights. Identifying the factors
which drive consumer behaviour allows an understanding of
how brands create bottom-line impact.
Market Research Analytics +Return on Marketing
Investment +Brand Audits +
Brand Scorecard Tracking +
4. Transactions: Is it a good deal? Can I leverage my intangible assets?Transaction services help buyers, sellers, and owners of branded businesses get a better deal by leveraging the value of their intangibles.
+ M&A Due Diligence + Franchising & Licensing+ Tax & Transfer Pricing+ Expert Witness
3. Strategy: How can I increase the value
of my branded business?Strategic marketing services enable brands to be leveraged to grow
businesses. Scenario modelling will identify the best opportunities, ensuring resources are allocated to those activities which have the most impact on
brand and business value.
Brand Governance +Brand Architecture & Portfolio Management +
Brand Transition +Brand Positioning & Extension +
2. ANALYTICS
3. STRATEGY 4. TRANSACTI
ON
S1.
VAL
UATION
Brand &
Business Value
Consulting and Evaluation Services.

Brand Finance How to Set Marketing Budgets September 202022.
Brand Finance is the world’s leading independent brand valuation and strategy consultancy.
Brand Finance was set up in 1996 with the aim of ‘bridging the gap between marketing and finance’. For more than 20 years, we have helped companies and organisations of all types to connect their brands to the bottom line.
We pride ourselves on four key strengths:
+ Independence + Technical Credibility
+ Transparency + Expertise
We put thousands of the world’s biggest brands to the test every year, evaluating which are the strongest and most valuable.
Brand Finance helped craft the internationally recognised standard on Brand Valuation – ISO 10668, and the recently approved standard on Brand Evaluation – ISO 20671.
For further information on our services and valuation experience, please contact your local representative:
Market Contact Email Telephone
Africa Jeremy Sampson j.sampson@brandfi nance.com +27 82 885 7300
Asia Pacifi c Samir Dixit s.dixit@brandfi nance.com +65 906 98 651
Australia Mark Crowe m.crowe@brandfi nance.com +61 282 498 320
Brazil Eduardo Chaves e.chaves@brandfi nance.com +55 16 9 9161 7075
Canada Charles Scarlett-Smith c.scarlett-smith@brandfi nance.com +1 514 991 5101
Caribbean Nigel Cooper n.cooper@brandfi nance.com +1 876 825 6598
China Scott Chen s.chen@brandfi nance.com +86 186 0118 8821
France Bertrand Chovet b.chovet@brandfi nance.com +33 6 86 63 46 44
Germany Ulf-Brün Drechsel u.drechsel@brandfi nance.com +49 171 690 6828
India Ajimon Francis a.francis@brandfi nance.com +44 207 389 9400
Indonesia Jimmy Halim j.halim@brandfi nance.com +62 215 3678 064
Ireland Simon Haigh s.haigh@brandfi nance.com +353 087 669 5881
Italy Massimo Pizzo m.pizzo@brandfi nance.com +39 02 303 125 105
Japan Jun Tanaka j.tanaka@brandfi nance.com +81 90 7116 1881
Mexico & LatAm Laurence Newell l.newell@brandfi nance.com +1 214 803 3424
Middle East Andrew Campbell a.campbell@brandfi nance.com +971 508 113 341
Nigeria Tunde Odumeru t.odumeru@brandfi nance.com +234 012 911 988
Romania Mihai Bogdan m.bogdan@brandfi nance.com +40 728 702 705
Spain Teresa de Lemus t.delemus@brandfi nance.com +34 654 481 043
Sri Lanka Ruchi Gunewardene r.gunewardene@brandfi nance.com +94 11 770 9991
Turkey Muhterem Ilgüner m.ilguner@brandfi nance.com +90 216 352 67 29
UK Richard Haigh rd.haigh@brandfi nance.com +44 207 389 9400
USA Laurence Newell l.newell@brandfi nance.com +1 514 991 5101
Vietnam Lai Tien Manh m.lai@brandfi nance.com +84 90 259 82 28
For business enquiries, please contact:
Alex HaighValuation Director
For media enquiries, please contact:
Konrad JagodzinskiCommunications Director
For all other enquiries, please contact:
[email protected]+44 (0)207 389 9400
Follow our social channels:
linkedin.com/company/brand-finance
facebook.com/brandfinance
twitter.com/brandfinance
About Brand Finance.
Get in Touch.