A comparison of HONO budgets for two measurement heights ...
Upload
khangminh22Category
view
0download
0
Loudoun County Public Schools
FY15 Operating Budgets
School Board Questions and Answers
21000 Education Court
Ashburn, VA 20148
February 4, 2014

Loudoun County Public SchoolsFY15 Operating BudgetSchool Board Questions and Answers
# Page1 Hornberger Compensation 1/16/2014 Compensation: How does the proposed compensation
framework compare to our current compensation framework? How far does the proposed framework correct the "sag" in the middle of some of our current pay scales? Please provide comparison charts graphing proposed compensation against 1) FY 14 appropriated levels, and 2) 2% increase over FY 14 levels, and 3) a Step plus 2% over FY 14 levels for all pay scales.
1 1 51
2 Hornberger Lease 1/16/2014 Lease Purchase: Please provide a detailed list of items contained within the FY 15 Lease Purchase Expenditure line item (p. 32 of Executive Summary).
1
3 Hornberger Staffing 1/16/2014 New Positions: Please provide a list of all new positions by dept./type and amount budgeted for each position.
1
4 Hornberger Technology 1/16/2014 Technology: Please provide a detailed budget breakdown of proposed Technology Services O&M budget. What accounts for the near doubling of this line item in the proposed FY 15 budget?
3
5 Hornberger Technology 1/28/2014 Technology: Please provide a more detailed presentation of the distribution of requested 29 new FTEs between the 5 identified initiatives. What is the consequence of not funding each of these new positions?
3 14 113
6 Hornberger Technology 1/16/2014 Technology: How would the current computer refresh initiative be affected by a shift to 1-to-1 devices? Is there any potential that we would be purchasing computers now that would be underutilized in just a couple years, if we were to go with 1-to-1 devices?
3
7 Hornberger Compensation 1/16/2014 Compensation: What budgeting framework was used in establishing proposed FY 15 Co-Curricular Stipends? Are there any new stipends proposed to be added in FY 15?
4
8 Hornberger Co-Curricular 1/16/2014 Co-Curricular: What is the cost of our co-curricular offerings within the budget that are not required to be provided? Please provide a detailed breakdown of all co-curricular costs within the proposed budget and the department in which those costs can be found within that budget.
4
9 Hornberger Transportation 1/16/2014 Transportation: How many new school buses have been added to the fleet in the last 10 years? Please provide a summary of the number of new (additional) school buses added to the fleet in the past 10 year, including the 25 proposed in the FY 15 budget.
4
Question Number
Board Member
Question Category
Date Answer Provided
Question PageAttachment
A-1

Loudoun County Public SchoolsFY15 Operating BudgetSchool Board Questions and Answers
# PageQuestion Number
Board Member
Question Category
Date Answer Provided
Question PageAttachment
10 Hornberger Safety 1/28/2014 Safety: What are the anticipated assignments for each of the 6 requested new Safety & Security Specialists? How do these positions relate to the existing 15 Safety & Security Specialists already employed within the school system? How exactly do these requested positions make our students safer?
5
11 Reed Compensation 1/16/2014 Are there any cost increases or savings attributable to the Affordable Care Act (ACA)?
5
12 Reed Compensation 1/16/2014 Are any additional costs or savings levied on the employee for the ACA?
5
13 Reed Compensation 1/16/2014 Are any ACA increases required by law to be paid by the employer or can they be levied on the employee?
6
14 Reed Technology 1/16/2014 Do any other school districts offer ‘technology’ stipends to employees instead of giving them a device?
6
15 Reed Technology 1/16/2014 Would a stipend have to be included in calculating VRS benefits?
6
16 Reed Technology 1/16/2014 What would be the savings if we gave a $300 per year stipend for teachers and staff instead of purchasing one-to-one devices?
6
17 Reed Technology 1/28/2014 What would be the cost if we only provided one-to-one devices to students on reduced and free meals?
6
18 Reed Technology 1/28/2014 Do you have any statistics on lost/stolen/damaged devices where one-to-one was implemented.
6
19 Reed Technology 1/16/2014 Can we require students to ‘insure’ their one-to-one device against theft or damage?
6
20 Morse Staffing 1/28/2014 Compared to Fairfax, what is the enrollment vs. assistant principal staffing and salaries. Include elementary, middle, and high school student population.
7 9 & 10 73
21 Morse Compensation 1/16/2014 Are we losing teachers at step 16? Just departing regardless of where they are going?
8
22 Fox Cost of Living 1/28/2014 Provide any reports which quantify the difference in cost of living between Fairfax and Loudoun.
8
23 Hornberger Compensation 1/16/2014 What caused the large compensation increases in 2007 and 2008?
8
24 Hornberger Compensation 1/16/2014 Provide the history of health insurance increases. Is the increase always shared by LCPS and employees? Has there been a change in the number of employees who opt out of health insurance?
8
25 Turgeon Technology 1/28/2014 What is the status of computer refresh in schools? What will be the status if the FY15 Budget is funded?
9
26 Turgeon Technology 1/29/2014 What percentage of maintenance is related to old computers needing services? With newer equipment will maintenance costs decrease?
9
27 Fox Technology 1/28/2014 Provide an analysis of how the teachers will use one-to-one devise?
9 15 119
A-2

Loudoun County Public SchoolsFY15 Operating BudgetSchool Board Questions and Answers
# PageQuestion Number
Board Member
Question Category
Date Answer Provided
Question PageAttachment
28 Hornberger Technology 1/29/2014 Provide the pros and cons of BYOD (Bring Your Own Devise).
10
29 Kuesters Technology 1/28/2014 What are the students going to do with the mobile devices? How will it improve education? Provide examples of electronic teaching done at the Academy of Science.
11
30 Rose Compensation 1/28/2014 Provide the position titles, date, and dollar impact of reclasses approved by the Reclassification Committee for FY 13 and YTD FY 14.
12 2 56
31 Rose Budget History 1/28/2014 Provide the Superintendent’s Proposed Budget, Adopted Budget, and Actual for FY11-FY13 for each Department.
12 3 57
32 Rose Class Size 1/29/2014 Cost the reduction in class policy if we change max by reducing elementary by 1 student.
12
33 Reed ELL 1/28/2014 How many new ELL students joined LCPS at the start of this school year?
12
34 Reed ELL 1/28/2014 What are the demographics of our ELL Student and are the demographics of ELL students changing (e.g. 31 percent Hispanic, 15 percent Asian … Fewer ELL students , but Higher percentage of Asian students enrolling)?
12
35 Reed ELL 1/29/2014 Can you break out the ELL levels for new students and our ELL students overall (e.g. 25% Level 1 for new students, 20% overall)?
12
36 Reed Staffing 1/29/2014 Can you explain the duties of a school based secretary and a school based bookkeeper?
13
37 Reed Budget Development
1/29/2014 In developing the budget, to what extent were school based employees, especially teachers, involved in the process?
13
38 Bergel Class Size 1/29/2014 On page 9 of the budget book, #3 class size indicates the "goals" class size. Could you please create the same chart as a comparison but with the "real" numbers.
14
39 Bergel Food Services 1/29/2014 Page 31 - meal prices' increase. Could you remind us of the FY14 prices?
15
40 Bergel Schools to Watch
1/28/2014 Page 14 indicates 11 of 13 middle schools eligible are Schools to watch yet page 271 indicates 10 of 14. Could you please explain the discrepancy?
15
41 Bergel K-12 Insight 1/28/2014 Page 275 Please remind us of the cost of K-12 Insight in the FY14 under Public Information and its FY15 cost under Deputy Superintendent.
15
42 Bergel Class Size 1/28/2014 What is the cost of reducing class size? What is the dollar amount for each student at each level?
15
43 Bergel Immersion Program
1/28/2014 What is the maintenance level for the immersion program for 5 years in the same 3 schools versus an expansion plan?
15 7 67
44 Fox Class Size 1/28/2014 Assess the advantages and disadvantages and the cost to each of the approaches. 1. Average class size by 1; 2. Lower maximum class size by 2 or 3; 3. Lower the trigger for a Teacher Assistant by 2 or 3.
15
A-3
Loudoun County Public SchoolsFY15 Operating BudgetSchool Board Questions and Answers
# PageQuestion Number
Board Member
Question Category
Date Answer Provided
Question PageAttachment
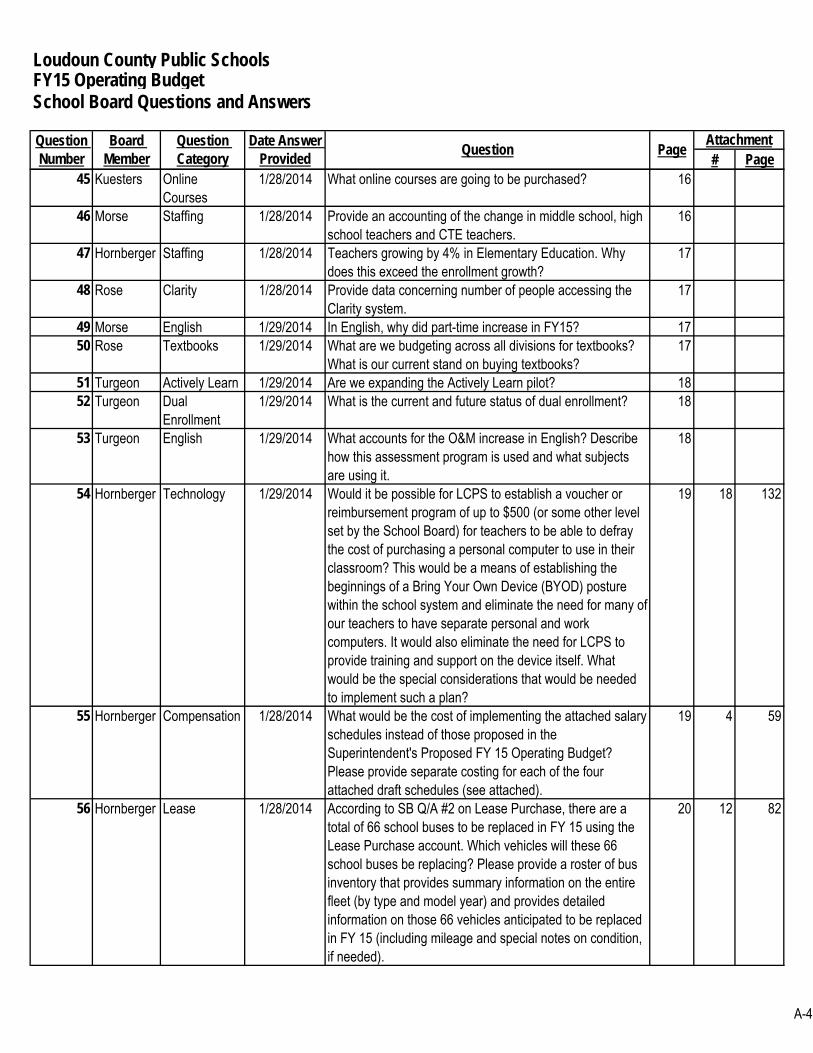
45 Kuesters Online Courses
1/28/2014 What online courses are going to be purchased? 16
46 Morse Staffing 1/28/2014 Provide an accounting of the change in middle school, high school teachers and CTE teachers.
16
47 Hornberger Staffing 1/28/2014 Teachers growing by 4% in Elementary Education. Why does this exceed the enrollment growth?
17
48 Rose Clarity 1/28/2014 Provide data concerning number of people accessing the Clarity system.
17
49 Morse English 1/29/2014 In English, why did part-time increase in FY15? 1750 Rose Textbooks 1/29/2014 What are we budgeting across all divisions for textbooks?
What is our current stand on buying textbooks?17
51 Turgeon Actively Learn 1/29/2014 Are we expanding the Actively Learn pilot? 1852 Turgeon Dual
Enrollment1/29/2014 What is the current and future status of dual enrollment? 18
53 Turgeon English 1/29/2014 What accounts for the O&M increase in English? Describe how this assessment program is used and what subjects are using it.
18
54 Hornberger Technology 1/29/2014 Would it be possible for LCPS to establish a voucher or reimbursement program of up to $500 (or some other level set by the School Board) for teachers to be able to defray the cost of purchasing a personal computer to use in their classroom? This would be a means of establishing the beginnings of a Bring Your Own Device (BYOD) posture within the school system and eliminate the need for many of our teachers to have separate personal and work computers. It would also eliminate the need for LCPS to provide training and support on the device itself. What would be the special considerations that would be needed to implement such a plan?
19 18 132
55 Hornberger Compensation 1/28/2014 What would be the cost of implementing the attached salary schedules instead of those proposed in the Superintendent's Proposed FY 15 Operating Budget? Please provide separate costing for each of the four attached draft schedules (see attached).
19 4 59
56 Hornberger Lease 1/28/2014 According to SB Q/A #2 on Lease Purchase, there are a total of 66 school buses to be replaced in FY 15 using the Lease Purchase account. Which vehicles will these 66 school buses be replacing? Please provide a roster of bus inventory that provides summary information on the entire fleet (by type and model year) and provides detailed information on those 66 vehicles anticipated to be replaced in FY 15 (including mileage and special notes on condition, if needed).
20 12 82
A-4

Loudoun County Public SchoolsFY15 Operating BudgetSchool Board Questions and Answers
# PageQuestion Number
Board Member
Question Category
Date Answer Provided
Question PageAttachment
57 Hornberger Lease 1/28/2014 According to SB Q/A on Lease Purchase, the FY 15 proposed budget anticipates the purchase of 3 additional small 4x4 vehicles for use by the Transportation and Facilities Departments. What is the justification for these requested new vehicles that would be added to our existing fleet? Please provide a roster of all 4x4 vehicles in our fleet that indicates their purpose, type, model year, and mileage.
20 13 109
58 Hornberger Staffing 1/28/2014 Which positions indicated in SB Q/A #3 on New Positions were approved in FY 14?
20
59 Hornberger Staffing 1/29/2014 What is the justification for the request to add 73.5 new teaching positions or a 4.4% increase over FY 14 at the elementary school level (p. 60) when according to information regarding student membership in the Executive Summary (p. 19) clearly indicates an anticipated on a 0.8% increase or 603 additional students at the elementary school level in FY 15 for an average of 8.2 ES students per new teacher?
20
60 Hornberger Enrollment 1/28/2014 According to the Executive Summary (p. 19), there are expected to be a total of 33,826 elementary school students in LCPS in FY 15 or 252 more than the current year. However, according to 2014-15 Enrollment Projections provided in the Supplemental Section (page 376) there are expected a total of 34,826 elementary school students. Which one is it and which is the figure upon which proposed elementary school staffing has been built?
21
61 Hornberger Staffing 1/29/2014 What is the process for determining and assigning Teacher Assistants at the elementary school level? School Board policy appears silent on this issue and School Board goals appear to only proscribe the addition of only one grade-level TA position but indicated at levels that assumed an average class-size of 22 students, 2 students fewer than our current number. Under what conditions is a second (or third) grade level TA added? Wouldn't the addition of 2 Tas in a grade level cost more than simply adding another teacher and classroom at that grade level (provided there is ample space within the facility to do so)?
21
62 Hornberger Compensation 1/28/2014 What positions were reclassified in FY 12 and thus far in FY 14 (7/1/13 - 12/31/13)? SB Q/A #30 already provides this information for FY 13.
21 5 63
63 Hornberger Non-Departmental
1/28/2014 What is included in the Non-Departmental expenses totaling $25,882.385 in FY 15? Please provide a detailed breakdown of costs by major line item.
22
A-5

Loudoun County Public SchoolsFY15 Operating BudgetSchool Board Questions and Answers
# PageQuestion Number
Board Member
Question Category
Date Answer Provided
Question PageAttachment
64 Hornberger Food Services 1/29/2014 Will the proposed 10 cents increase in all LCPS cafeteria meals cover the cost of the addition of 16 new food service positions in the new schools, a new food service coordinator and the increased cost in food served in FY 15? In other words will our Food Services Department continue to operate exclusively on the funds derived from meals served? Will federal subsidies for free and reduced lunch similarly increase by 10 cents per meal? When was the last time meal prices increased? How do LCPS meal prices compare to those in Fairfax and Prince William Counties?
22
65 Hornberger Compensation 1/28/2014 How many employees in each of the last three years received unsatisfactory evaluations, did not receive step increases as a result, and/or would have not received step increases had they been given?
23
66 Hornberger Enrollment 1/29/2014 According to the Executive Summary (p. 19), we anticipate a total of 1,068 students enrolled in Pre-School, or a 7.9% increase in the number of students in FY15. Please indicate where the funding is located in the budget for this initiative (clearly a significant portion is in the form of grants) and the costs of this program (including number of staffing positions).
23
67 Hornberger Enrollment 1/28/2014 According to the Executive Summary (p. 19) there are a total anticipated HS enrollment in FY 15 of 21,224 students. However in the Supplemental Section (p. 376) it indicates anticipated 2014-15 enrollment projections at the HS level of 21,292. Which figure is correct and around which was the budget built?
24
68 Rose Technology 1/28/2014 What would be the budgetary impact across the departments if the school board does not approve the 1-1 initiative? It is my understanding that staff and resources have been requested to support this initiative.
24
69 Turgeon ELL 1/29/2014 What is the ELL teacher/student ratio at each school before the initiative and with the new initiative?
24 11 79
70 Rose ELL 1/29/2014 ELL - What does ELP stand for? 2471 Rose ELL 1/29/2014 ELL - When did the state mandates take effect, how are we
meeting the records requirement, and what is the cost?24
72 Morse Family Life 1/28/2014 Provide a breakdown by grade of the number of students and how many hours they are in Family Life.
25
73 Kuesters Gifted Education
1/29/2014 How many students attended Summer Governor's School last year?
25
74 Kuesters Class Size 1/28/2014 Provide the general education teacher/student ratio for High School.
25
75 Rose Textbooks 1/28/2014 In High School O&M how much is allocated for new textbooks and what subjects are they for?
25
A-6

Loudoun County Public SchoolsFY15 Operating BudgetSchool Board Questions and Answers
# PageQuestion Number
Board Member
Question Category
Date Answer Provided
Question PageAttachment
76 Rose Technology 1/28/2014 How much of the High School O&M would not be necessary if the 1-1 initiative does not make the November ballet?
25
77 Rose Textbooks 1/28/2014 Provide research that was done to decide which subjects would use textbooks instead of a digital device and vise versa.
26
78 Reed Food Services 1/29/2014 What are the component costs that make up the cost of meals (e.g. labor, management, food)?
26
79 Reed Food Services 1/29/2014 I understand that the cost of food should not exceed 30% of the total costs for commercial food service activities. Where is LCPS?
26
80 Reed Food Services 1/29/2014 What percent of meals are served to free and reduced meal eligible students?
26
81 Reed Food Services 1/29/2014 Have the number and percentages of free and reduced meal eligible students increased over the past two or three years?
26
82 Reed Food Services 1/29/2014 How do our meal prices compare to surrounding counties? 2683 Sheridan Full Day K 1/28/2014 Provide a list of those schools who are next for Title I or full-
day Kindergarten and the cost needed to provide it? Do these schools have the room to provide it?
26
84 Hornberger Full Day K 1/28/2014 How many at-risk students do we have in full-day kindergarten? How has it grown in the last 5 years? 10 years?
27
85 Reed Enrollment 1/28/2014 Every budget cycle, concerned citizens ask why we’re teaching illegal immigrants. Can you please provide a copy of Attorney General Jim Gilmore’s determination that the Constitution of Virginia requires that all children of the proper age residing in Virginia be educated
27 6 64
86 Hornberger Full Day K 1/28/2014 FY14 WABE Guide does not indicate that LCPS has full-day kindergarten. Is the FY14 WABE guide incorrect?
28
87 Hornberger Library 1/29/2014 Which elementary schools have triggered the need for an additional library assistant?
28
88 Morse Library 1/29/2014 What is the estimated amount for fees for the library system?
28
89 Morse Library 1/29/2014 How many teachers are assigned to Instructional Resource Center (IRC)? How many teachers are using the online resources?
28
90 Turgeon Math 1/29/2014 What O&M costs will be ongoing in Math? 2991 Bergel Math 1/29/2014 What would the cost of SME be compared to the new
program?29
92 Kuesters Math 1/29/2014 What justifies going to this new model of software in Math? 2993 Fox Math 1/29/2014 What is the difference between Khan Academy which is
free and the new model requested?30
A-7
Loudoun County Public SchoolsFY15 Operating BudgetSchool Board Questions and Answers
# PageQuestion Number
Board Member
Question Category
Date Answer Provided
Question PageAttachment
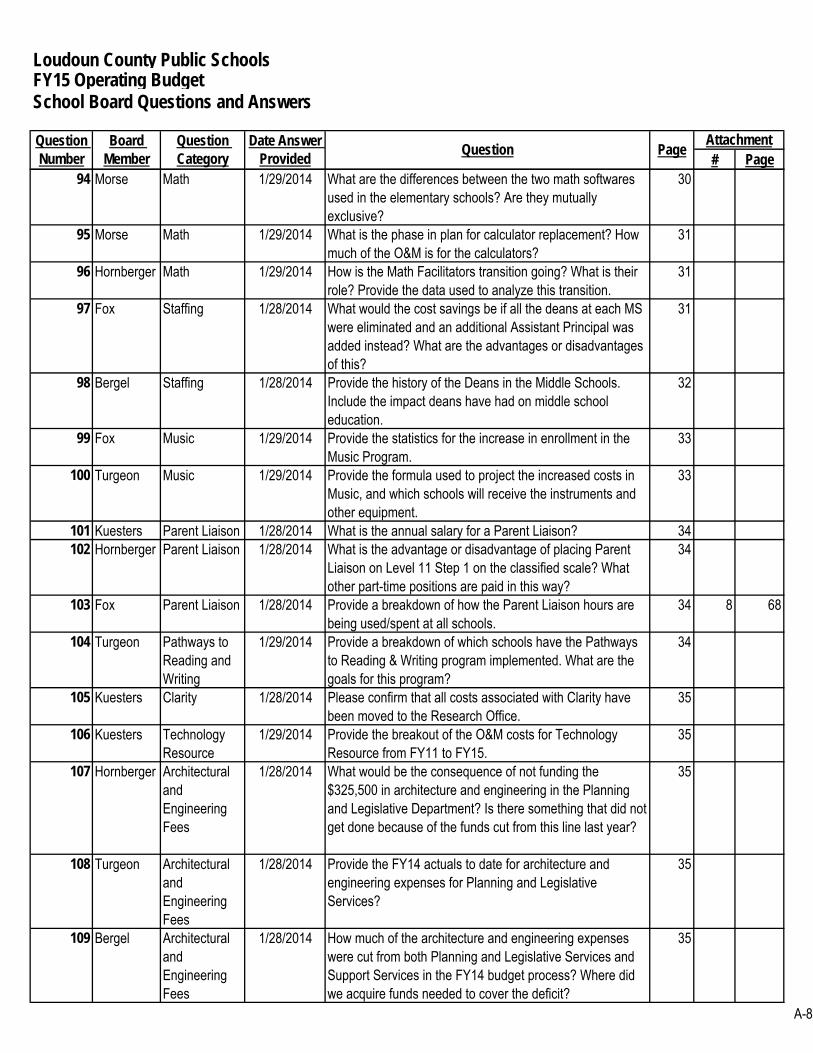
94 Morse Math 1/29/2014 What are the differences between the two math softwares used in the elementary schools? Are they mutually exclusive?
30
95 Morse Math 1/29/2014 What is the phase in plan for calculator replacement? How much of the O&M is for the calculators?
31
96 Hornberger Math 1/29/2014 How is the Math Facilitators transition going? What is their role? Provide the data used to analyze this transition.
31
97 Fox Staffing 1/28/2014 What would the cost savings be if all the deans at each MS were eliminated and an additional Assistant Principal was added instead? What are the advantages or disadvantages of this?
31
98 Bergel Staffing 1/28/2014 Provide the history of the Deans in the Middle Schools. Include the impact deans have had on middle school education.
32
99 Fox Music 1/29/2014 Provide the statistics for the increase in enrollment in the Music Program.
33
100 Turgeon Music 1/29/2014 Provide the formula used to project the increased costs in Music, and which schools will receive the instruments and other equipment.
33
101 Kuesters Parent Liaison 1/28/2014 What is the annual salary for a Parent Liaison? 34102 Hornberger Parent Liaison 1/28/2014 What is the advantage or disadvantage of placing Parent
Liaison on Level 11 Step 1 on the classified scale? What other part-time positions are paid in this way?
34
103 Fox Parent Liaison 1/28/2014 Provide a breakdown of how the Parent Liaison hours are being used/spent at all schools.
34 8 68
104 Turgeon Pathways to Reading and Writing
1/29/2014 Provide a breakdown of which schools have the Pathways to Reading & Writing program implemented. What are the goals for this program?
34
105 Kuesters Clarity 1/28/2014 Please confirm that all costs associated with Clarity have been moved to the Research Office.
35
106 Kuesters Technology Resource
1/29/2014 Provide the breakout of the O&M costs for Technology Resource from FY11 to FY15.
35
107 Hornberger Architectural and Engineering Fees
1/28/2014 What would be the consequence of not funding the $325,500 in architecture and engineering in the Planning and Legislative Department? Is there something that did not get done because of the funds cut from this line last year?
35
108 Turgeon Architectural and Engineering Fees
1/28/2014 Provide the FY14 actuals to date for architecture and engineering expenses for Planning and Legislative Services?
35
109 Bergel Architectural and Engineering Fees
1/28/2014 How much of the architecture and engineering expenses were cut from both Planning and Legislative Services and Support Services in the FY14 budget process? Where did we acquire funds needed to cover the deficit?
35
A-8
Loudoun County Public SchoolsFY15 Operating BudgetSchool Board Questions and Answers
# PageQuestion Number
Board Member
Question Category
Date Answer Provided
Question PageAttachment
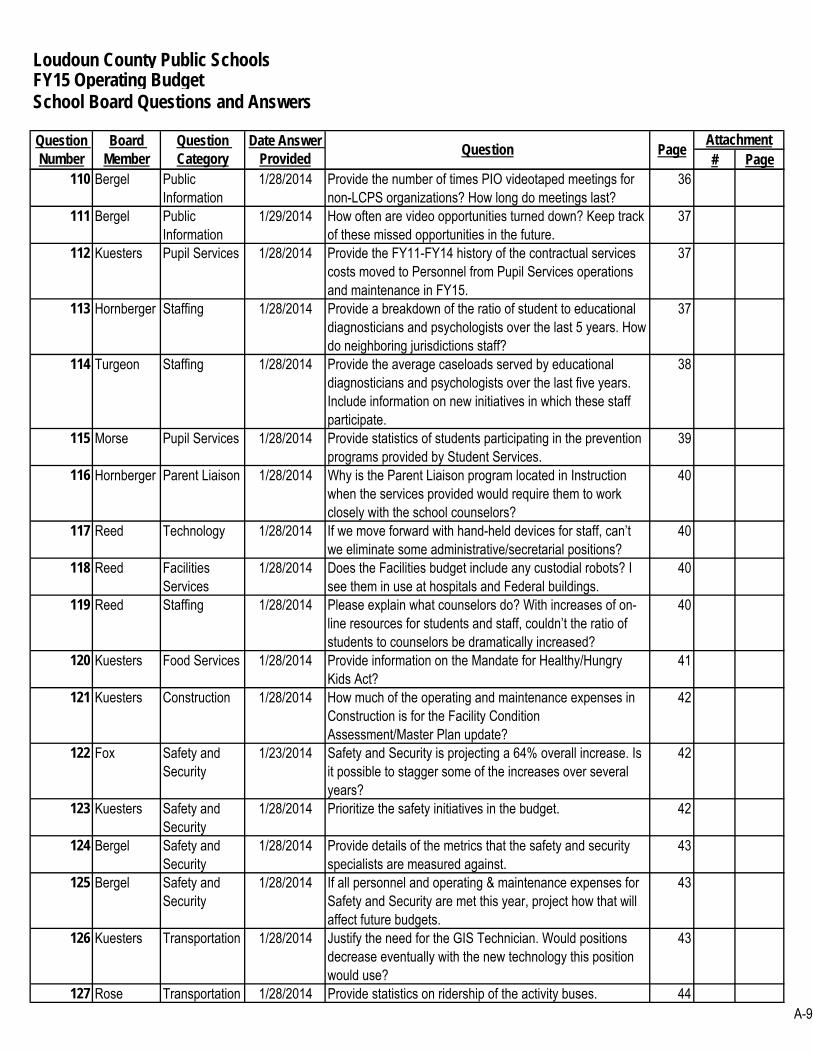
110 Bergel Public Information
1/28/2014 Provide the number of times PIO videotaped meetings for non-LCPS organizations? How long do meetings last?
36
111 Bergel Public Information
1/29/2014 How often are video opportunities turned down? Keep track of these missed opportunities in the future.
37
112 Kuesters Pupil Services 1/28/2014 Provide the FY11-FY14 history of the contractual services costs moved to Personnel from Pupil Services operations and maintenance in FY15.
37
113 Hornberger Staffing 1/28/2014 Provide a breakdown of the ratio of student to educational diagnosticians and psychologists over the last 5 years. How do neighboring jurisdictions staff?
37
114 Turgeon Staffing 1/28/2014 Provide the average caseloads served by educational diagnosticians and psychologists over the last five years. Include information on new initiatives in which these staff participate.
38
115 Morse Pupil Services 1/28/2014 Provide statistics of students participating in the prevention programs provided by Student Services.
39
116 Hornberger Parent Liaison 1/28/2014 Why is the Parent Liaison program located in Instruction when the services provided would require them to work closely with the school counselors?
40
117 Reed Technology 1/28/2014 If we move forward with hand-held devices for staff, can’t we eliminate some administrative/secretarial positions?
40
118 Reed Facilities Services
1/28/2014 Does the Facilities budget include any custodial robots? I see them in use at hospitals and Federal buildings.
40
119 Reed Staffing 1/28/2014 Please explain what counselors do? With increases of on-line resources for students and staff, couldn’t the ratio of students to counselors be dramatically increased?
40
120 Kuesters Food Services 1/28/2014 Provide information on the Mandate for Healthy/Hungry Kids Act?
41
121 Kuesters Construction 1/28/2014 How much of the operating and maintenance expenses in Construction is for the Facility Condition Assessment/Master Plan update?
42
122 Fox Safety and Security
1/23/2014 Safety and Security is projecting a 64% overall increase. Is it possible to stagger some of the increases over several years?
42
123 Kuesters Safety and Security
1/28/2014 Prioritize the safety initiatives in the budget. 42
124 Bergel Safety and Security
1/28/2014 Provide details of the metrics that the safety and security specialists are measured against.
43
125 Bergel Safety and Security
1/28/2014 If all personnel and operating & maintenance expenses for Safety and Security are met this year, project how that will affect future budgets.
43
126 Kuesters Transportation 1/28/2014 Justify the need for the GIS Technician. Would positions decrease eventually with the new technology this position would use?
43
127 Rose Transportation 1/28/2014 Provide statistics on ridership of the activity buses. 44A-9

Loudoun County Public SchoolsFY15 Operating BudgetSchool Board Questions and Answers
# PageQuestion Number
Board Member
Question Category
Date Answer Provided
Question PageAttachment
128 Turgeon Transportation 1/28/2014 Provide information on how the number for new buses was calculated.
46
129 Hornberger Technology 1/29/2014 What other school divisions in Virginia have pursued a standardized 1:1 technology initiative that is being proposed? Please describe their approach, when they began it, and any evidence of its effectiveness. How many are pursuing some sort of alternative BYOD approach?
47
130 Hornberger Safety and Security
1/29/2014 What high school-based designated "safety & security" staffing exists in Fairfax and Prince William Counties? Please describe their structure and staffing ratio as it compares to what currently exists for Loudoun County and what is proposed?
47
131 Hornberger Staffing 1/28/2014 Provide a seven year list of the number of both full-time and part-time FTEs Personnel has hired.
48 17 131
132 Hornberger Personnel 1/28/2014 Did adding the interview process make a difference in the quality of substitutes LCPS hires?
48
133 Reed Personnel 1/29/2014 How many of the Pre Employment Investigations resulted in applicants being denied?
48
134 Reed Staffing 1/29/2014 For all departments, were any of the new proposed positions deferred in previous budgets?
48
135 Reed Oracle 1/28/2014 Are you considering widgets to assist employees with Personnel, Payroll, and Benefits issues?
49
136 Hornberger Compensation 1/28/2014 Compensation: What is the cost of the attached salary scales? (Hornberger/Jan 24, 2014)
49 16 127
137 Morse Compensation 1/29/2014 What would the cost savings be if the salary increase based on Mr. Hornberger’s salary scales was limited to 5%?
50 19 137
138 Kuesters Full Day K Given the proposal to add FDK to Title I eligible schools I would like to know the following: 1. What is the definition of a Title I school? 2. What is the definition of English Language Learner? 3. What is the requirement for Free & Reduced Lunch? 4. What percentage of our ES currently have FDK? 5. What percentage of our ES students are currently enrolled in FDK?
50
A-10
School Board Questions and Answers February 4, 2014
Loudoun County Public Schools – FY 2015 Operating Budget
1. Compensation: How does the proposed compensation framework compare to our current compensation framework? How far does the proposed framework correct the "sag" in the middle of some of our current pay scales? Please provide comparison charts graphing proposed compensation against 1) FY 14 appropriated levels, and 2) 2% increase over FY 14 levels, and 3) a Step plus 2% over FY 14 levels for all pay scales. (Hornberger/Jan 7, 2014) The attached charts (attachment #1) provide a comparison of the FY 14 salary schedules, the FY 14 salary schedules plus 2% and the proposed FY 15 salary schedules. Since “step” is employee movement on the schedule, the salary schedule for scenario 3) would look exactly like scenario 2).
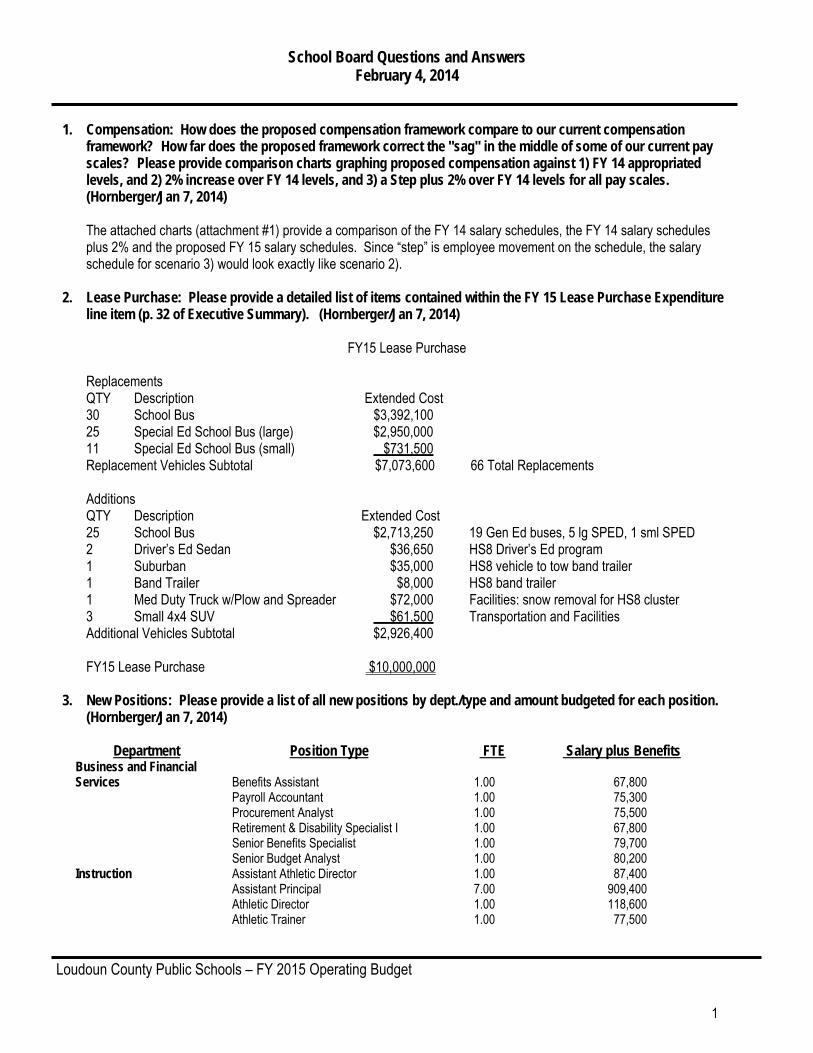
2. Lease Purchase: Please provide a detailed list of items contained within the FY 15 Lease Purchase Expenditure
line item (p. 32 of Executive Summary). (Hornberger/Jan 7, 2014)
FY15 Lease Purchase Replacements QTY Description Extended Cost 30 School Bus $3,392,100 25 Special Ed School Bus (large) $2,950,000 11 Special Ed School Bus (small) $731,500 Replacement Vehicles Subtotal $7,073,600 66 Total Replacements Additions QTY Description Extended Cost 25 School Bus $2,713,250 19 Gen Ed buses, 5 lg SPED, 1 sml SPED 2 Driver’s Ed Sedan $36,650 HS8 Driver’s Ed program 1 Suburban $35,000 HS8 vehicle to tow band trailer 1 Band Trailer $8,000 HS8 band trailer 1 Med Duty Truck w/Plow and Spreader $72,000 Facilities: snow removal for HS8 cluster 3 Small 4x4 SUV $61,500 Transportation and Facilities Additional Vehicles Subtotal $2,926,400 FY15 Lease Purchase $10,000,000
3. New Positions: Please provide a list of all new positions by dept./type and amount budgeted for each position.
(Hornberger/Jan 7, 2014)
Department Position Type FTE Salary plus Benefits Business and Financial Services Benefits Assistant 1.00 67,800 Payroll Accountant 1.00 75,300
Procurement Analyst 1.00 75,500 Retirement & Disability Specialist I 1.00 67,800 Senior Benefits Specialist 1.00 79,700 Senior Budget Analyst 1.00 80,200
Instruction Assistant Athletic Director 1.00 87,400 Assistant Principal 7.00 909,400 Athletic Director 1.00 118,600 Athletic Trainer 1.00 77,500
1

School Board Questions and Answers February 4, 2014
Loudoun County Public Schools – FY 2015 Operating Budget
Instruction (continued) Dean 3.00 262,100 Instructional Specialist 1.00 112,200 Librarian 6.00 537,600 Library Assistant 3.00 120,800 Principal 1.50 219,000 Secretary 12.50 621,200 Teacher 207.50 18,131,500 Teacher Assistant 5.50 270,500
Personnel Personnel Specialist 1.00 112,200 Pre-Employment Investigator 1.00 67,200 Secretary 1.00 59,500
Public Information Office Secretary 1.00 67,200 Videographer 1.00 67,900
Pupil Services Career Center Assistant 1.00 44,400 Director, School Counseling 1.00 118,600 Educational Diagnostician 2.00 172,900 Health Clinic Specialist 1.00 46,600 Nurse 3.00 193,800 Occupational Therapist 1.00 87,400 Psychologist 2.00 172,900 School Counselor 6.00 524,200 Secretary 3.50 201,800 Social Worker 2.00 183,700 Specialist 1.00 112,200 Substance Abuse Prevention Specialist 1.00 81,700 Teacher 39.00 3,407,000 Teacher Assistant 31.00 1,701,000
Support Services Accountant Specialist 1.00 78,800 Administrative Office Assistant 1.00 54,900 Bus Driver 27.00 1,322,500 Communication Engineer 1.00 78,800 Coordinator, Civil Engineering 1.00 118,600 Custodian 1.50 71,500 Custodians 22.25 1,048,250 Dispatcher 1.00 63,800 Distribution Center Asst 2.00 109,700 Environmental Specialist 1.00 63,800 GIS Technician 1.00 67,200 Maintenance Worker 4.00 229,800 Safety Specialist 6.00 472,700 Safety Technician 3.00 201,700 School Plant Engineer 0.75 47,850 Senior Project Manager 1.00 78,800 Telecommunications Analyst 1.00 78,800
Technology Services Administrative Assistant 1.00 78,500 Asset Manager 2.00 149,300 AV Technician 2.00 81,000 Computer Technician 8.00 545,000 Coordinator 2.00 224,400 Data Analyst, Information Management 1.00 78,800 Network Specialist 1.00 67,200 Project Manager 1.00 134,400 Service Desk Analyst 2.00 157,100
2
School Board Questions and Answers February 4, 2014
Loudoun County Public Schools – FY 2015 Operating Budget
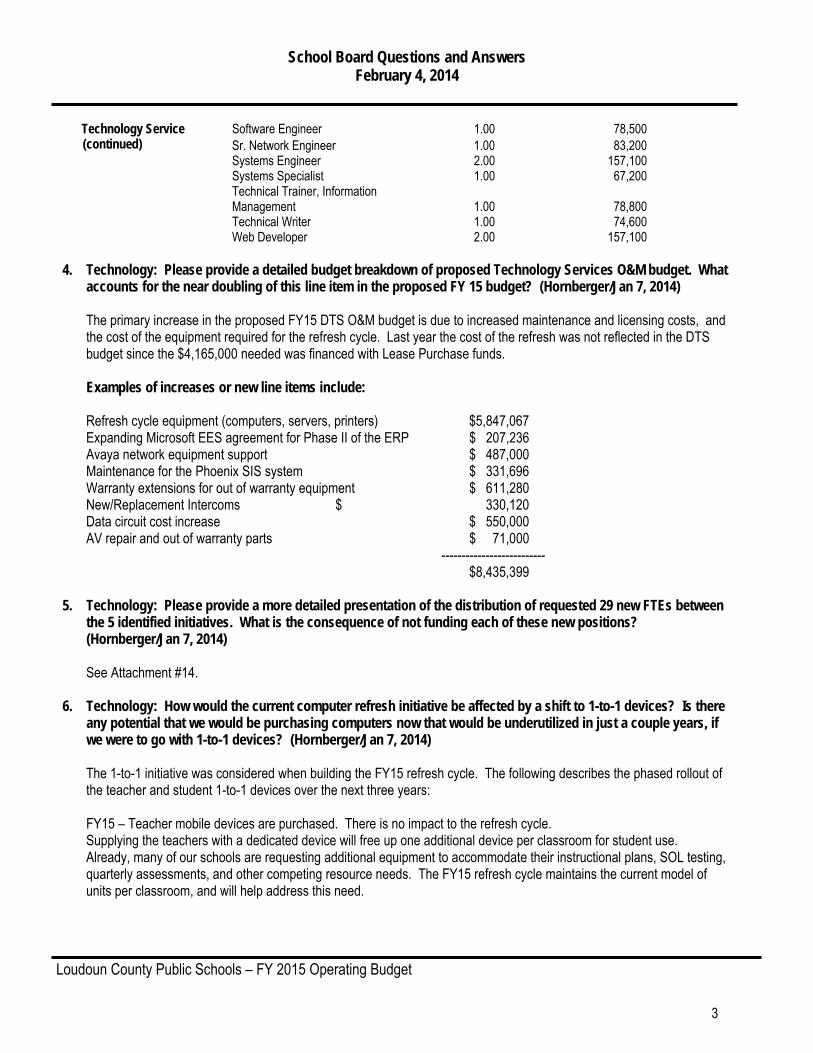
Technology Service Software Engineer 1.00 78,500 (continued)
Sr. Network Engineer 1.00 83,200 Systems Engineer 2.00 157,100
Systems Specialist 1.00 67,200
Technical Trainer, Information Management 1.00 78,800
Technical Writer 1.00 74,600 Web Developer 2.00 157,100
4. Technology: Please provide a detailed budget breakdown of proposed Technology Services O&M budget. What
accounts for the near doubling of this line item in the proposed FY 15 budget? (Hornberger/Jan 7, 2014) The primary increase in the proposed FY15 DTS O&M budget is due to increased maintenance and licensing costs, and the cost of the equipment required for the refresh cycle. Last year the cost of the refresh was not reflected in the DTS budget since the $4,165,000 needed was financed with Lease Purchase funds. Examples of increases or new line items include: Refresh cycle equipment (computers, servers, printers) $5,847,067 Expanding Microsoft EES agreement for Phase II of the ERP $ 207,236 Avaya network equipment support $ 487,000 Maintenance for the Phoenix SIS system $ 331,696 Warranty extensions for out of warranty equipment $ 611,280 New/Replacement Intercoms $ 330,120 Data circuit cost increase $ 550,000 AV repair and out of warranty parts $ 71,000 -------------------------- $8,435,399
5. Technology: Please provide a more detailed presentation of the distribution of requested 29 new FTEs between the 5 identified initiatives. What is the consequence of not funding each of these new positions? (Hornberger/Jan 7, 2014) See Attachment #14.
6. Technology: How would the current computer refresh initiative be affected by a shift to 1-to-1 devices? Is there any potential that we would be purchasing computers now that would be underutilized in just a couple years, if we were to go with 1-to-1 devices? (Hornberger/Jan 7, 2014) The 1-to-1 initiative was considered when building the FY15 refresh cycle. The following describes the phased rollout of the teacher and student 1-to-1 devices over the next three years: FY15 – Teacher mobile devices are purchased. There is no impact to the refresh cycle. Supplying the teachers with a dedicated device will free up one additional device per classroom for student use. Already, many of our schools are requesting additional equipment to accommodate their instructional plans, SOL testing, quarterly assessments, and other competing resource needs. The FY15 refresh cycle maintains the current model of units per classroom, and will help address this need.
3
School Board Questions and Answers February 4, 2014
Loudoun County Public Schools – FY 2015 Operating Budget
FY16 – Secondary student mobile devices are purchased. The refresh cycle will occur only in the scheduled elementary schools using computers reallocated from all secondary schools.
FY17 – Fourth and fifth grade student mobile devices are purchased. Scheduled refresh cycle will occur only in grades K-3 using computers reallocated from fourth and fifth grade classrooms.
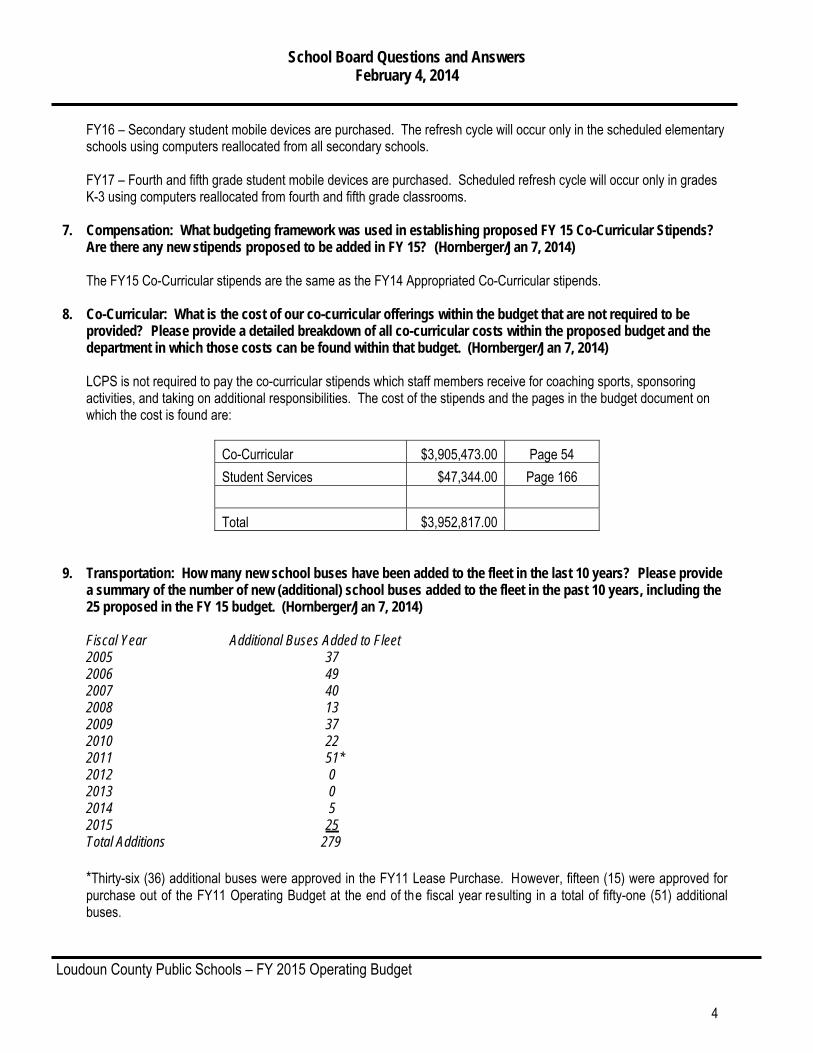
7. Compensation: What budgeting framework was used in establishing proposed FY 15 Co-Curricular Stipends? Are there any new stipends proposed to be added in FY 15? (Hornberger/Jan 7, 2014) The FY15 Co-Curricular stipends are the same as the FY14 Appropriated Co-Curricular stipends.
8. Co-Curricular: What is the cost of our co-curricular offerings within the budget that are not required to be provided? Please provide a detailed breakdown of all co-curricular costs within the proposed budget and the department in which those costs can be found within that budget. (Hornberger/Jan 7, 2014)
LCPS is not required to pay the co-curricular stipends which staff members receive for coaching sports, sponsoring activities, and taking on additional responsibilities. The cost of the stipends and the pages in the budget document on which the cost is found are:
Co-Curricular $3,905,473.00 Page 54 Student Services $47,344.00 Page 166 Total $3,952,817.00
9. Transportation: How many new school buses have been added to the fleet in the last 10 years? Please provide a summary of the number of new (additional) school buses added to the fleet in the past 10 years, including the 25 proposed in the FY 15 budget. (Hornberger/Jan 7, 2014)
Fiscal Year Additional Buses Added to Fleet 2005 37 2006 49 2007 40 2008 13 2009 37 2010 22 2011 51* 2012 0 2013 0 2014 5 2015 25 Total Additions 279
*Thirty-six (36) additional buses were approved in the FY11 Lease Purchase. However, fifteen (15) were approved for purchase out of the FY11 Operating Budget at the end of the fiscal year resulting in a total of fifty-one (51) additional buses.
4

School Board Questions and Answers February 4, 2014
Loudoun County Public Schools – FY 2015 Operating Budget
10. Safety: What are the anticipated assignments for each of the 6 requested new Safety & Security Specialists? (Hornberger/Jan 7, 2014)
One Safety Specialist will be assigned to the Rock Ridge as part of their staffing. The remaining 5 Specialists would be assigned as needed to high schools to address the needs related to the
extended day spanning extracurricular activities before and after the normal school day.
How do these positions relate to the existing 15 Safety & Security Specialists already employed within the school system?
The five (5) Safety and Security Specialists are consistent in terms of duties and responsibilities with
the existing positions and will be assigned as needed to cover extracurricular events in the high schools.
How exactly do these requested positions make our students safer? (Hornberger/Jan 7, 2014)
The students will benefit from the increased protection provided by the extended hours for extracurricular events
11. Are there any cost increases or savings attributable to the Affordable Care Act (ACA)? (Reed/Jan 9, 2014)
Yes.
1) Patient-Centered Outcomes Research Institute Fee (PCORI) - This fee is paid annually, for FY14, Year 1 of the fee, is based on $1 per the average number of covered lives for the plan year. ($20,973) FY14, Year 2 of the fee, will be calculated at a rate of $2. Subsequent years the increases will be based on inflation as provided by a formula that includes projected per capita amount of National Health Expenditures provided by HHS (US Dept of Health & Human Services).
2) Transitional Reinsurance Fee - Beginning in 2014 (and continuing for 2015 and 2016), employers and other sponsors of self-funded health plans, as well as insurance companies offering insured health plan products, are subject to the ACA's transitional reinsurance fee. This fee is designed to fund reinsurance payments to health insurance issuers that cover high-risk individuals in the individual market. The amount of the transitional reinsurance fee for 2014 (FY2015) will be $63 per covered life.
3) Costs associated with monitoring plan compliance - Lack of compliance can result in penalties and fees. a. Minimum Essential Coverage – Penalty can assessed at an annualized rate of $3,000 per full time
employee. b. An Excise tax on benefits in excess of an annual threshold (Cadillac Tax) - can be assessed beginning
in 2018, the threshold for 2018 is $10,200 for individuals and $27,500 for families.
12. Are any additional costs or savings levied on the employee for the ACA? (Reed/Jan 9, 2014)
An individual may incur an additional tax if they choose not to make a health care election either through the employer or health care market place.
5

School Board Questions and Answers February 4, 2014
Loudoun County Public Schools – FY 2015 Operating Budget
13. Are any ACA increases required by law to be paid by the employer or can they be levied on the employee? (Reed/Jan 9, 2014)
See Question #11.
14. Do any other school districts offer ‘technology’ stipends to employees instead of giving them a device?
(Reed/Jan 9, 2014) We surveyed 16 districts in Region IV. All of the districts surveyed indicated they did not offer technology stipends to employees.
15. Would a stipend have to be included in calculating VRS benefits? (Reed/Jan 9, 2014) No.
16. What would be the savings if we gave a $300 per year stipend for teachers and staff instead of purchasing one-to-one devices? (Reed/Jan 9, 2014) Based on the premise that a teacher would receive a $300 stipend per year, there would be no cost savings.
The cost of LCPS providing a 1-to-1 device for teachers with a 4 year warranty is $6,942,150 (including 300 spare units for break fix and the installation services).
The cost of providing a $300 stipend for 4 years to each teacher would be $7,200,000 plus an additional $300,000 for spare units when the personal unit is out of service; bringing the total cost to $7,500,000.
17. What would be the cost if we only provided one-to-one devices to students on reduced and free meals? (Reed/Jan 9, 2014) The cost to provide one-to-one devices only to students on reduced and free meals, based on the current reduced and free meal number of 7,569 students (H-3,083/M-2,498/E-1,988), would be $3,785,160.
18. Do you have any statistics on lost/stolen/damaged devices where one-to-one was implemented? (Reed/Jan 9,
2014) Among other districts using one-to-one models, they generally calculate the anticipated lost/stolen/damaged device number at 5% of the total devices. DTS continues to research this, and will provide more detailed information as it becomes available.
19. Can we require students to ‘insure’ their one-to-one device against theft or damage? (Reed/Jan 9, 2014) No. Generally, in the law of insurance, the insured must have an interest in the subject matter of his or her policy, or such policy will be void and unenforceable since it will be regarded as a form of gambling. An individual ordinarily has an insurable interest when he or she will obtain some type of financial benefit from the preservation of the subject matter, or will sustain pecuniary loss from its destruction or impairment when the risk insured against occurs.
6

School Board Questions and Answers February 4, 2014
Loudoun County Public Schools – FY 2015 Operating Budget
In Virginia, Section 38.2-303 of the Code of Virginia states: “A. No insurance contract on property or on any interest therein or arising therefrom shall be enforceable except for the benefit of persons having an insurable interest in the property insured. B. As used in this section, “insurable interest” means any lawful and substantial economic interest in the safety or preservation of the subject of insurance free from loss, destruction or pecuniary damage.” While Section 22.1-280.4 allows the School Board to bring an action against a parent or pupil for the loss or damage to School Board property, it might not alone be sufficient to establish an insurable interest since it speaks in terms of bringing an action. In order to provide the family with an insurable interest in School Board property for which they could seek insurance on the market, it would be necessary to have a signed agreement (such as a use agreement or rental agreement) with the family that makes them fully responsible for any loss or damage to the device. More importantly, however, another question arises as to whether requiring the family to cover the risk of loss or damage with insurance would be viewed as a student fee or charge which is subject to other rules. Section 22.1-6 states that no fees or charges can be levied except as provided by the State Board or law. Neither State Regulations nor our SB Policies explicitly authorize either the imposition of an insurance requirement or the collection of a pro-rated share of SB insurance costs for anything. Our policy does allow for the charging of replacement costs to an electronic device once the damage or loss occurs. Section 22.1-280.4, cited above, also does not authorize anything except the bringing of a legal action for loss or damage to SB property. Section 22.1-280.4 would need to be modified to require the provision of insurance before the SB could mandate insurance for one-to-one devices it provides to students.
As currently situated, the SB cannot require parents to cover SB property with insurance.
20. Compared to Fairfax, what is the assistant principal staffing standard and salaries? Include middle, and high school student population. (Morse/Jan 9, 2014)
Standard FY14 Salary Fairfax
Middle School 1.5 per school $68,284 to $120,511
2.0 900 or more students
High School 3.0 1,999 or fewer students $71,023 to $125,334 4.0 2,000-2,599 students 5.0 2,600 or more students
Secondary schools also receive 1.0 associate principal.
7

School Board Questions and Answers February 4, 2014
Loudoun County Public Schools – FY 2015 Operating Budget
Loudoun
Middle School 2.0 per school $78,382 to $116,332
High School 2.0 per school up to 999 students
3.0 per school 1,000 or more students $83,818 to $124,476
Please see attachments #9 and #10 for enrollments.
21. Are we losing teachers at step 16? Just departing regardless of where they are going? (Morse/Jan 9, 2014) For the 2012-2013 school year, we lost 11 licensed employees at Step 16.
22. Provide any reports which quantify the difference in cost of living between Fairfax and Loudoun. (Fox/Jan 9, 2014) Staff was unable to find an economic study which provided the cost of living for Fairfax and Loudoun separately. All of the studies grouped Fairfax and Loudoun together.
23. What caused the large compensation increases in 2007 and 2008? (Hornberger/Jan 9, 2014) There was a total compensation increase of $71.5 million from FY07 to FY08. The following is the breakdown of that increase:
Step and scale improvement for all employees $28.3 Group health insurance rate increase $8.9 Part time salary increases 3.5 426.7 positions to provide education to 2,918 additional students $26.4 73.0 positions for the opening of three schools $4.1 Triennial census enumerators $0.3
$71.5
24. Provide the history of health insurance increases. Is the increase always shared by LCPS and employees? Has there been a change in the number of employees who opt out of health insurance? (Hornberger/Jan 9, 2014)
PREMIUM INCREASES
FY 12 10% increase in the premiums charged to employees and retirees FY 13 8% increase in the premiums charged to employees and retirees FY 14 10% increase in the premiums charged to employees and retirees FY 14 Premium share adjusted to reduce employer share for most plans
8

School Board Questions and Answers February 4, 2014
Loudoun County Public Schools – FY 2015 Operating Budget
HEALTHCARE PLAN FY 10 Adjust primary care physician office visit co-pay from $10 to $15 FY 10 Adjust specialist office visit co-pay from $20 to $30 FY 10 Adjust out-of-network deductible from $200/$600 to $500/$1,500
PHARMACY
FY 10 Adjust pharmacy co-pays from $5 / $20 / $40 to $5 / $25 / $45
DENTAL FY 10 Adjust family deductible from $100 to $150 FY 10 Adjust OON coinsurance from 100% preven / 80% restor / 80% major/ 50% ortho to 80/60/50/50
VISION FY 10 Adjust vision co-pays from $10 to $15 for eye exams and material
Premium increases are shared by employer and employee equally. Co-pays and increases to deductibles are borne by the employee only. The percentage of employees who opt out of healthcare each year ranges from 10 to 15 percent.
25. What is the status of computer refresh in schools? What will be the status if the FY15 Budget is funded? (Turgeon/Jan 9, 2014)
Currently the computer refresh cycles are behind schedule. In FY14 we should have completed a total technology replacement in 47 (31E/8M/8H) schools. Due to budget constraints we were able to replace only the computers in the labs and all the classroom AV computers (the PC that connects to the Interactive White Board) in these 47 schools. If the FY15 Budget is funded we will complete the technology replacements in these 47 schools. 19 schools that were scheduled for FY15 replacement have been postponed until FY16.
26. What percentage of maintenance is related to old computers needing services? With newer equipment will maintenance costs decrease? (Turgeon/Jan 9, 2014)
Five percent of the total RMS budget is for old computers needing service and does not reflect internal labor costs. There are no maintenance costs for parts associated with newer equipment because they are covered under warranty.
27. Provide an analysis of how the teachers will use one-to-one devices? (Fox/Jan 9, 2014) Please see attachment #15 for the responses of three teachers that have incorporated 1:1 in the Eagle Ridge Technology
Readiness Assessment. The descriptions by the teachers provide a basis to measure before and after results of using technology in the classroom. As a pilot, the findings will be analyzed at the end of the project and briefed to the School Board.
9
School Board Questions and Answers February 4, 2014
Loudoun County Public Schools – FY 2015 Operating Budget
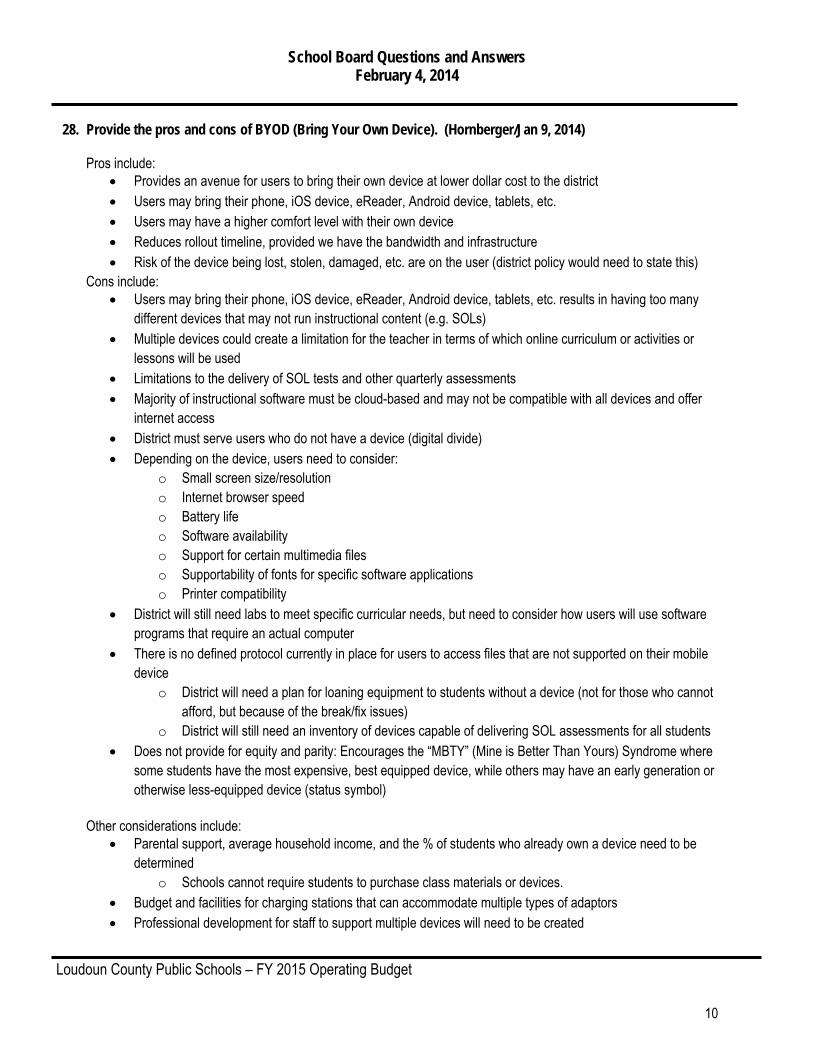
28. Provide the pros and cons of BYOD (Bring Your Own Device). (Hornberger/Jan 9, 2014) Pros include:
Provides an avenue for users to bring their own device at lower dollar cost to the district Users may bring their phone, iOS device, eReader, Android device, tablets, etc. Users may have a higher comfort level with their own device Reduces rollout timeline, provided we have the bandwidth and infrastructure Risk of the device being lost, stolen, damaged, etc. are on the user (district policy would need to state this)
Cons include: Users may bring their phone, iOS device, eReader, Android device, tablets, etc. results in having too many
different devices that may not run instructional content (e.g. SOLs) Multiple devices could create a limitation for the teacher in terms of which online curriculum or activities or
lessons will be used Limitations to the delivery of SOL tests and other quarterly assessments Majority of instructional software must be cloud-based and may not be compatible with all devices and offer
internet access District must serve users who do not have a device (digital divide) Depending on the device, users need to consider:
o Small screen size/resolution o Internet browser speed o Battery life o Software availability o Support for certain multimedia files o Supportability of fonts for specific software applications o Printer compatibility
District will still need labs to meet specific curricular needs, but need to consider how users will use software programs that require an actual computer
There is no defined protocol currently in place for users to access files that are not supported on their mobile device
o District will need a plan for loaning equipment to students without a device (not for those who cannot afford, but because of the break/fix issues)
o District will still need an inventory of devices capable of delivering SOL assessments for all students Does not provide for equity and parity: Encourages the “MBTY” (Mine is Better Than Yours) Syndrome where
some students have the most expensive, best equipped device, while others may have an early generation or otherwise less-equipped device (status symbol)
Other considerations include: Parental support, average household income, and the % of students who already own a device need to be
determined o Schools cannot require students to purchase class materials or devices.
Budget and facilities for charging stations that can accommodate multiple types of adaptors Professional development for staff to support multiple devices will need to be created
10

School Board Questions and Answers February 4, 2014
Loudoun County Public Schools – FY 2015 Operating Budget
Security concerns, including data protection and compliance with the Children’s Internet Protection Act (CIPA) Legal considerations for acceptable use policy in a BYOD environment may include the right of the District to
confiscate personal devices that are misused, violate the confidentiality agreements, violate the student’s rights and responsibilities, and inappropriate material and/or behavior
Investment in infrastructure needed to support BYOD or district provided 1:1 devices which have budgetary impact, both short and long term
Please see references and analysis below:
LCPS Technology Plan 2009 http://www.k12blueprint.com/byod http://esheninger.blogspot.com/2013/03/the-device-conundrum-11-vs-byod.html Grunwald Mobile Study Report Grunwald Associates LLC. (2013). Living and Learning with Mobile Devices: What Parents Think About Mobile Devices for Early Childhood and K–12 Learning.
29. What are the students going to do with the mobile devices? How will it improve education? Provide examples
of electronic teaching done at the Academy of Science. (Kuesters/Jan 9, 2014) K-12 education globally is moving forward in three areas: active personalized learning, technology, and the restructuring of schools. And the lynch pin for all three of these agendas is the technology. Published print textbook material has distinct limitations in education when compared to multimedia resources - digital resources that include hyper-text, audio, video, 2 and 3 D graphics, and simulations – that are provided through both free and fee-based vetted resources. Research in the use of these resources by teachers who then design and engage students in multimodal learning activities points to distinct increases in learning. Students can engage in inquiry work, where they are reading, talking, questioning, analyzing and through a variety of software authoring tools, creating and publishing products that reflect their learning. All of this can happen in a face-to-face or and/or virtual classroom where students might attend a brick and mortar school every day or for part of the day or week. But it requires every student to have ubiquitous access to a mobile computing device as opposed to shared machines that a student might access 3-4 hours per week. There are many things that you might see students doing: chemistry students being able to manipulate a simulated molecule in 3D so as to truly understand how that ionic bond works… math students being able to rapidly enter variables into a graph so as to see a linear regression build… English students writing an essay on a computer where multiple revisions, use of a thesaurus, spell and grammar check, the ability to research a particular point to be made in their essay… high school students attending a blended learning academy in which they attend the brick and mortar school for only half of the week. A visit to the 6th grade team at Eagle Ridge MS can provide a variety of examples in real time. At the AOS, computers are an essential component of students’ research tools. Students use them to take notes in class and communicate electronically with the teacher and classmates. Computers are used as data gathering tools. Probes connect directly to the laptops that allow for electronic analysis and sharing of data sets. Data is stored on a group drive for team collaboration. Individual student access to Mathematica software is required for the AOS mathematics courses.
11

School Board Questions and Answers February 4, 2014
Loudoun County Public Schools – FY 2015 Operating Budget
30. Provide the position titles, date, and dollar impact of reclasses approved by the Reclassification Committee for FY 13 and YTD FY 14. (Rose/Jan 10, 2014) See attachment #2.
31. Provide the Superintendent’s Proposed Budget, Adopted Budget, and Actual for FY11-FY13 for each
Department. (Rose/Jan 14, 2014)
The detail information for the FY11-FY13 Superintendent Proposed Budgets is not available. The final budget and actual expenditures are provided for each department in Attachment #3.
32. Cost the reduction in class policy if we change max by reducing elementary by 1 student. (Rose/Jan 15, 2014)
See question #44.
33. How many new ELL students joined LCPS at the start of this school year? (Reed/Jan 16, 2014)
Grand Total of new ELL students in grades K-12 is 1,474.
34. What are the demographics of our ELL Student and are the demographics of ELL students changing (e.g. 31 percent Hispanic, 15 percent Asian … Fewer ELL students, but higher percentage of Asian students enrolling)? (Reed/Jan 16, 2014)
Race/Ethnicity 2012-2013 Percentage of ELL Students
2013-2014 Percentage of ELL Students
American Indian 2% 2% Asian 24% 23% Black 4% 4% Hispanic, Any Race 59% 58% Multi-Racial .08% .07% Pacific Islander 0% 0% White 11% 12%
35. Can you break out the ELL levels for new students and our ELL students overall (e.g. 25% Level 1 for new students, 20% overall)? (Reed/Jan 16, 2014) New for 2013-2014 ELL K-12 Proficiency Level
Number of Students
1 584 2 661 3 99 4 107 5 23 Grand Total 1474
12

School Board Questions and Answers February 4, 2014
Loudoun County Public Schools – FY 2015 Operating Budget
2013-2014 LCPS Overall ELL K-12 Level Number of
Students 1 1202 2 1344 3 1391 4 1564 5 538 Grand Total
6039
36. Can you explain the duties of a school based secretary and a school based bookkeeper? (Reed/Jan 16, 2014)
School-Based Secretary This is general clerical and secretarial work performed in a school. An employee in this class performs routine to varied office operations requiring general office skills. Assignments typically consist of one or more standard office operations such as phone and visitor reception work, file maintenance, data entry including routine database maintenance, keyboarding including word processing of common office/business documents, mail processing, library clerical work, and similar tasks that are quickly learned on the job. Experienced workers initiate their own daily assignments, follow through on matters, and use independent judgment and training to take appropriate actions to deal with standard recurring situations. Performs related work as required. An individual in this position can work 208, 221, or 254 days per school year, depending on the position and grade level assignment. School-Based Bookkeeper This is technical accounting clerical work in maintaining accounts. An employee in this class is responsible for maintaining activity accounts of schools including creating and maintaining accounts and journals, posting transactions, balancing and reconciling accounts, and preparing periodic and special reports on accounts. Accounting procedures are under the functional control of the School District's central accounting department, which trains school-based bookkeepers and audits their activities. Experienced workers in these positions initiate their own daily assignments, follow through on matters, and use independent judgment and training to take appropriate actions to deal with standard recurring situations. An individual in this position works a 12-month assignment per school year.
37. In developing the budget, to what extent were school based employees, especially teachers, involved in the process? (Reed/Jan 16, 2014) The Department of Instruction solicits budget requests from each principal several weeks ahead of the beginning of the budget process. Principals and teachers work together to formulate the requests that are submitted by subject areas and whole school requests, such as technology. The subject area supervisors evaluate the requests and include the requested items in their budgets. Math and music are examples of budgets that reflect school requests for minor equipment such as calculators and instruments. The technology requests were passed on the Department of Technology Services.
13

School Board Questions and Answers February 4, 2014
Loudoun County Public Schools – FY 2015 Operating Budget
The Department of Personnel Services budgets do not reflect any school-based positions. Three instructional coaches are school-based itinerant positions. They report to an administrator in the Department of Personnel Services. Their salaries and benefits are entirely funded by Title II. The Department of Pupil Services conducts continuous needs assessments at staff meetings with school based staff to determine priority needs based on department goals/initiatives. Supervisors meet with school based staff, such as teachers, counselors, clinic staff, social workers, psychologists, prevention specialists, etc., to discuss needs and receive input . Directors receive all input and meet with the Assistant Superintendent to prioritize department needs within the parameters of the fiscal guidance from the Superintendent. The Department of Support Services solicits budget requests from each principal during September and October, prior to the beginning of the budget process. Principals and their staff work together to determine needs in the areas of furniture and non-instructional equipment, improvements to site/grounds, and improvements to building. The requests are then evaluated by the respective Support Services director/supervisor for inclusion in the operating, CAPP or CIP budgets. Business and Financial Services does not budget for direct school based expenditures. Therefore, no school based input is requested. Department of Technology Services works closely with principals and departments to ensure that the appropriate technology is implemented and supported in schools.
38. On page 9 of the budget book, #3 class size indicates the "goals" class size. Could you please create the same chart as a comparison but with the "real" numbers? (Bergel/Jan 16, 2014) SCHOOL BOARD GOAL (Adopted 2009)
CURRENT (“REAL”) STAFFING LEVEL – FY14
Elementary Secondary
Average Class Size
Max Class Size
Kindergarten 22 25* Grades 6-8 21.6 Grades 1-3 22 25** Grades 9-12 25.9 Grades 4-5 22 27***
* A teacher assistant will be added to each half-day kindergarten class that exceeds 15 students. ** A teacher assistant will be added to the grade level when all classes at the grade level have enrolled 25students and one class enrolls the 26th student. *** A teacher assistant will be added to the grade level when all classes at the grade level have enrolled 27 students and one class enrolls the 28th student.
Elementary Secondary
Average Class Size
Max Class Size
Kindergarten 22 25* Grades 6-8 23.6 Grades 1-3 24 27** Grades 9-12 27.9 Grades 4-5 24 29***
* A teacher assistant will be added to each half-day kindergarten class that exceeds 15 students. ** A teacher assistant will be added to the grade level when all classes at the grade level have enrolled 27students *** A teacher assistant will be added to the grade level when all classes at the grade level have enrolled 29 students
14
School Board Questions and Answers February 4, 2014
Loudoun County Public Schools – FY 2015 Operating Budget
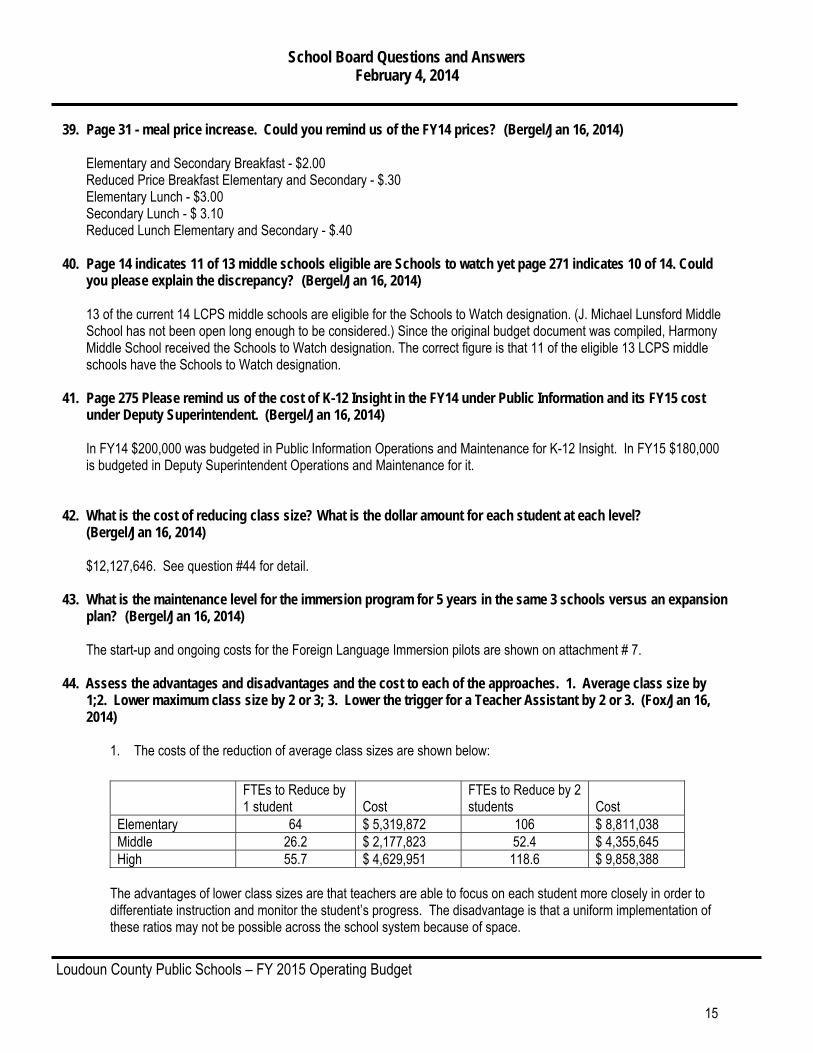
39. Page 31 - meal price increase. Could you remind us of the FY14 prices? (Bergel/Jan 16, 2014) Elementary and Secondary Breakfast - $2.00 Reduced Price Breakfast Elementary and Secondary - $.30 Elementary Lunch - $3.00 Secondary Lunch - $ 3.10 Reduced Lunch Elementary and Secondary - $.40
40. Page 14 indicates 11 of 13 middle schools eligible are Schools to watch yet page 271 indicates 10 of 14. Could you please explain the discrepancy? (Bergel/Jan 16, 2014) 13 of the current 14 LCPS middle schools are eligible for the Schools to Watch designation. (J. Michael Lunsford Middle School has not been open long enough to be considered.) Since the original budget document was compiled, Harmony Middle School received the Schools to Watch designation. The correct figure is that 11 of the eligible 13 LCPS middle schools have the Schools to Watch designation.
41. Page 275 Please remind us of the cost of K-12 Insight in the FY14 under Public Information and its FY15 cost
under Deputy Superintendent. (Bergel/Jan 16, 2014) In FY14 $200,000 was budgeted in Public Information Operations and Maintenance for K-12 Insight. In FY15 $180,000 is budgeted in Deputy Superintendent Operations and Maintenance for it.
42. What is the cost of reducing class size? What is the dollar amount for each student at each level? (Bergel/Jan 16, 2014) $12,127,646. See question #44 for detail.
43. What is the maintenance level for the immersion program for 5 years in the same 3 schools versus an expansion plan? (Bergel/Jan 16, 2014)
The start-up and ongoing costs for the Foreign Language Immersion pilots are shown on attachment # 7.
44. Assess the advantages and disadvantages and the cost to each of the approaches. 1. Average class size by 1;2. Lower maximum class size by 2 or 3; 3. Lower the trigger for a Teacher Assistant by 2 or 3. (Fox/Jan 16, 2014)
1. The costs of the reduction of average class sizes are shown below:
FTEs to Reduce by
1 student Cost
FTEs to Reduce by 2 students
Cost
Elementary 64 $ 5,319,872 106 $ 8,811,038 Middle 26.2 $ 2,177,823 52.4 $ 4,355,645 High 55.7 $ 4,629,951 118.6 $ 9,858,388
The advantages of lower class sizes are that teachers are able to focus on each student more closely in order to differentiate instruction and monitor the student’s progress. The disadvantage is that a uniform implementation of these ratios may not be possible across the school system because of space.
15

School Board Questions and Answers February 4, 2014
Loudoun County Public Schools – FY 2015 Operating Budget
2. The cost of lowering the maximum class size is difficult to project accurately. The proposed elementary staffing in the Superintendent’s FY15 Budget brings down the class sizes to a level that is designed to prevent grade levels from reaching the maximum class sizes, as much as possible. The best estimate for this approach is the costs shown in the chart above. The advantage of this approach is that class sizes would be contained against this new maximum. The disadvantage would be that overflow of students may increase significantly, bringing additional transportation costs and less likelihood that the overflowed students would be able to “get back” to the school that serves their attendance zone. There also may be difficulty in finding a close neighboring school that has not also already met the maximum class size.
3. Lowering the trigger for a teacher assistant by 2 or 3 students is estimated to result in the need for two to three times the number of grade 1-5 teacher assistants projected for FY15 or 78-117 teacher assistants. The advantage of this staffing pattern would be two adults in more of the classrooms. Except for the cost, there are not identified disadvantages.
45. What online courses are going to be purchased? (Kuesters/Jan 16, 2014)
Algebra I Algebra II/Trig Biology Earth Science Economics and Personal Finance English 9 English 10 English 11 English 12 Geometry Health/PE 9 Health/PE 10 Oceanography Physics US Government VA and US History World History II Online Teaching Methodology (Teacher Training Course) World Geography and World History I Astronomy Chemistry Math Analysis
46. Provide an accounting of the change CTE teachers. (Morse/Jan 16, 2014)
The additional 28.3 CTE are to accommodate growth in student enrollment in middle and high school. Of the 28.3, 10.8 FTE will be allocated to middle schools and 17.5 FTE will be allocated to high schools.
16

School Board Questions and Answers February 4, 2014
Loudoun County Public Schools – FY 2015 Operating Budget
47. Teachers growing by 4% in Elementary Education. Why does this exceed the enrollment growth? (Hornberger/Jan 16, 2014) The difference between the increases in percentages in enrollment and staffing is attributable to beginning the school year closer to the target class sizes in the current implementation of the School Board Goal. The additional teachers requested by Elementary Education in the FY15 budget allow us to create the following class sizes to start the 2014-15 school year: Kdg: 90% of all classes will begin the year at or below 22 students per class Gr 1-3: 85% of all classes will begin the year at or below 24 students per class Gr. 4-5: 80% of all classes will begin the year at or below 26 students per class
48. Provide data concerning number of people accessing the Clarity system. (Rose/Jan 16, 2014) Counts of Parents and Students Logging into Clarity as of January 22, 2014
49. In English, why did part-time increase in FY15? (Morse/Jan 16, 2014)
Part-time funds are used to support various functions of the English office including the creation of quarterly assessments to monitor literacy progress, the creation of curriculum resources to support teachers in instruction, and the creation of professional development at all levels. In FY15, we are increasing part-time to expand these services to support recent revisions to the English curriculum as well as to increase the level of job-embedded instructional coaching provided for English teachers and other literacy educators as part of our professional development program. Many of these services are provided by retired English teachers or teachers who are mid-career, who are available to work part time. Their availability during school hours and during the school year allows us work more efficiently as a department. Funds from curriculum development were reduced to mitigate some of the increase in part-time funds.
50. What are we budgeting across all divisions for textbooks? What is our current stand on buying textbooks?
(Rose/Jan 16, 2014) The total budget for textbooks in the Department of Instruction for FY15 is $3,664,724. In anticipation of the implementation of the 1:1 initiative, we have been purchasing used textbooks to match the existing adoptions as an interim step while the instructional supervisors develop digital materials. In addition, there are many resources, both free and fee-based, available to teachers to enhance instruction in the classroom. These resources are used through the Promethean boards and through the shared computers at the schools, or accessed at home by students. Where appropriate, textbooks are issued to students for use during the school year.
Group Total Logged In Parents 33,411 Students 18,018
17

School Board Questions and Answers February 4, 2014
Loudoun County Public Schools – FY 2015 Operating Budget
51. Are we expanding the Actively Learn pilot? (Turgeon/Jan 16, 2014) Currently, English teachers at two schools are piloting Actively Learn. Students and teachers currently using Actively Learn have expressed favorable opinions about their experiences thus far. If the pilot is found to be successful at the end of FY14, the program will be moved to the approved for school purchase software matrix. Based on continued evaluation, funding for district implementation may be requested for FY16.
52. What is the current and future status of dual enrollment? (Turgeon/Jan 16, 2014)
We are currently offering dual enrollment English 12 at two high schools. In FY15, dual enrollment English 12 will expand to eleven high schools. Additional expansion of English 12 dual enrollment will depend on the availability of teachers qualified to teach a dual enrollment course. Funds have been requested in the staff development budget for FY15 to support courses for teachers to gain the credentials necessary. This would enable the District to offer additional sections of dual enrollment English 12 at all schools in the district. The future will include dual enrollment classes in math, science, and social science. At Monroe Technology Center – the dual enrollment course offerings include the following: Principles of Criminal Investigation, Advanced Criminal Investigation, Auto Power Trains I and II, Auto Power Electricity I and II, Human anatomy and Physiology II Online, Computer Aided Modeling and Rendering II, Engineering Graphics, Emergency Med Tech: Basic Clinical, Principals of Emergency Services, LAB for EMS 111, Hazardous Materials Response, Medical Terminology, Intro to Horticulture, Plant Propagation, Greenhouse Crop Production, Help Desk Support Skills, Introduction to Network concepts, Microcomputer Operating Systems, Intro to Medical Lab Technology, Intro to Radiology and Protection, College Success Skills.
53. What accounts for the O&M increase in English? Describe how this assessment program is used and what subjects are using it. (Turgeon/Jan 16, 2014) Operations and maintenance expenditures provide materials and resources to support English instruction, assessment, and professional development in elementary, middle, and high schools. Increases in FY15 are attributed to the following:
Interactive Achievement will be provided for grades 2-11 in English. This allows teachers to create and deliver assessments in a more comprehensive way. This tool better aligns assessment content and cognitive levels for all English standards. Additionally, the District uses this tool for Quarterly Assessments. This allows the District to monitor the literacy progress at each school and intervene early, if necessary. This replaces our assessment costs from two vendors in previous budgets.
TurnItIn.com is a program used by teachers in multiple content areas in high schools across the district to help students strengthen their writing and to avoid plagiarism. In addition, this service allows students to submit and receive feedback on their written work more frequently. This is a program that has been in place in our district for several years. The funds for this program were previously included on the General Education page of the budget. The request for funds has been moved to the English budget beginning in FY15.
18

School Board Questions and Answers February 4, 2014
Loudoun County Public Schools – FY 2015 Operating Budget
54. Would it be possible for LCPS to establish a voucher or reimbursement program of up to $500 (or some other level set by the School Board) for teachers to be able to defray the cost of purchasing a personal computer to use in their classroom? This would be a means of establishing the beginnings of a Bring Your Own Device (BYOD) posture within the school system and eliminate the need for many of our teachers to have separate personal and work computers. It would also eliminate the need for LCPS to provide training and support on the device itself. What would be the special considerations that would be needed to implement such a plan? (Hornberger/Jan 20, 2014) Considerations would include:
Board policy for requirements o Personal device use policy o Mandatory purchase of a suitable device o Timeframe for purchase o Timeframe for reimbursement o Risk management (theft and damage of personal property) o Family Educational Rights and Privacy Act (FERPA) o Search and seizure of personal devices o Legal and privacy issues
Enterprise to individual software licensing cost implications Computer security i.e., anti-virus, patches Tax implications to the employee Support considerations of technician training in a multiple device environment Facility considerations of charging stations that can accommodate multiple devices/adapters District will need a plan for loaning equipment to teachers without a device Affects and requires support from all departments (DTS, HR, Legal, etc.)
A personal device use program does not eliminate the need for staffing, training, or support. Staff will still be required to assist teachers and students in connecting to the LCPS network, accessing printers and peripheral devices, plug-ins, settings (i.e., firewalls), software, and other instructional resources. Please see Attachment #18 regarding “The Security, Privacy and Legal Implications of BYOD (Bring Your Own Device) “
55. What would be the cost of implementing the attached salary schedules instead of those proposed in the Superintendent's Proposed FY 15 Operating Budget? Please provide separate costing for each of the four attached draft schedules (see attached). (Hornberger/Jan 20, 0214) Placing all current employees on the salary scales included with the question (Attachment #4) is as follows:
Teacher $20.7 million Classified $5.5 million Auxiliary $0.3 million Administrator $2.1 million Total $28.6 million
19

School Board Questions and Answers February 4, 2014
Loudoun County Public Schools – FY 2015 Operating Budget
It should be noted that these salary scales do not provide a minimum salary increase of one percent to cover phase 3 of the VRS implementation for all steps. Therefore, the cost of a one percent increase ($6.3 million) would be in addition to the above cost.
56. According to SB Q/A #2 on Lease Purchase, there are a total of 66 school buses to be replaced in FY 15 using the Lease Purchase account. Which vehicles will these 66 school buses be replacing? Please provide a roster of bus inventory that provides summary information on the entire fleet (by type and model year) and provides detailed information on those 66 vehicles anticipated to be replaced in FY 15 (including mileage and special notes on condition, if needed). (Hornberger/Jan 20, 2014) See Attachment #12. 1.Fleet Summary: Summary of bus type, age and quantity of busses in LCPS inventory. 2.FY14 Approved Replacement Buses: Listing of buses to be taken out-of-service by spring 2014, as replacement buses from FY2014 lease arrive 3.FY15 Bus Replacement Request: Listing of 66 buses to be taken out-of-service bin early 2015 as the FY2015 replacement buses arrive. 4.Chart of School Bus Fleet (not including replacements: Listing of entire bus fleet with the exception of those indicated in the FY14 and FY15 replacement schedules.
57. According to SB Q/A on Lease Purchase, the FY 15 proposed budget anticipates the purchase of 3 additional small 4x4 vehicles for use by the Transportation and Facilities Departments. What is the justification for these requested new vehicles that would be added to our existing fleet? Please provide a roster of all 4x4 vehicles in our fleet that indicates their purpose, type, model year, and mileage. (Hornberger/Jan 20, 2014)
The request for three (3) additional small 4x4 vehicles are required to accommodate FTE’s for the SpEd and HS8 Lead Driver positions requested by Transportation and the Specialist position requested by Facilities. See Attachment #13.
58. Which positions indicated in SB Q/A #3 on New Positions were approved in FY 14? (Hornberger/Jan 20, 2014)
The positions listed in the answer to question number 3 are new for FY15. The additional positions approved in FY14 are not included in the list.
59. What is the justification for the request to add 73.5 new teaching positions or a 4.4% increase over FY 14 at the
elementary school level (p. 60) when according to information regarding student membership in the Executive Summary (p. 19) clearly indicates an anticipated on a 0.8% increase or 603 additional students at the elementary school level in FY 15 for an average of 8.2 ES students per new teacher? (Hornberger/Jan 20, 2014) See response to question #47.
20

School Board Questions and Answers February 4, 2014
Loudoun County Public Schools – FY 2015 Operating Budget
60. According to the Executive Summary (p. 19), there are expected to be a total of 33,826 elementary school students in LCPS in FY 15 or 252 more than the current year. However, according to 2014-15 Enrollment Projections provided in the Supplemental Section (page 376) there are expected a total of 34,826 elementary school students. Which one is it and which is the figure upon which proposed elementary school staffing has been built? (Hornberger/Jan 20, 2014) The elementary enrollment on page 19 of the executive summary (33,826) is the projected number of students in grades K through 5 and is the basis for elementary school staffing. The enrollment on page 376 in the supplemental section is the total number of students projected at each of the elementary schools and includes 1,000 pre-school students. The budgeted staffing for the pre-school students is found in the Starting Toward Excellence in Pre-School, Virginia Pre-School Initiative, and Special Education programs.
61. What is the process for determining and assigning Teacher Assistants at the elementary school level? School Board policy appears silent on this issue and School Board goals appear to only proscribe the addition of only one grade-level TA position but indicated at levels that assumed an average class-size of 22 students, 2 students fewer than our current number. Under what conditions is a second (or third) grade level TA added? Wouldn't the addition of 2 TAs in a grade level cost more than simply adding another teacher and classroom at that grade level (provided there is ample space within the facility to do so)? (Hornberger/Jan 20, 2014) School Board policies 5-10 and 5-13 proscribe the conditions that require the addition of a teacher assistant for an individual classroom. The addition of teacher assistants for an entire grade level has been an administrative practice as class sizes have increased in recent years, especially in schools where there is no room to open a new classroom. Teacher assistants have been added to the grade level in the following manner:
If there are up to 3 teachers on the grade level, one teacher assistant is provided. If there are 4-6 teachers at the grade level, two teacher assistants are provided. If there are 7 or more teachers at the grade level, three teacher assistants are provided.
In replacing teacher assistants with fully credentialed teachers, the equivalent is just under three teacher assistant (3.0 FTE) salaries to provide the funding for one teacher (1.0 FTE).
62. What positions were reclassified in FY 12 and thus far in FY 14 (7/1/13 - 12/31/13)? SB Q/A #30 already provides this information for FY 13. (Hornberger/Jan 20, 2014) The positions reclassified in FY12 are listed on Attachment #5. The reclassification for FY13 and FY14 to date were provided in the answer to question #30 in Attachment #2.
21

School Board Questions and Answers February 4, 2014
Loudoun County Public Schools – FY 2015 Operating Budget
63. What is included in the Non-Departmental expenses totaling $25,882.385 in FY 15? Please provide a detailed breakdown of costs by major line item. (Hornberger/Jan 20, 2014)
Leave payments for terminating and retiring employees $2,574,194.00 Self-insured workers compensation $1,975,000.00 Retiree health care including OPEB $18,284,591.00 Unemployment compensation $150,000.00 Short-term disability $1,400,000.00 Property casualty insurance $1,498,600.00
$25,882,385.00
64. Will the proposed 10 cents increase in all LCPS cafeteria meals cover the cost of the addition of 16 new food service positions in the new schools, a new food service coordinator and the increased cost in food served in FY 15? In other words will our Food Services Department continue to operate exclusively on the funds derived from meals served? Will federal subsidies for free and reduced lunch similarly increase by 10 cents per meal? When was the last time meal prices increased? How do LCPS meal prices compare to those in Fairfax and Prince William Counties? (Hornberger/Jan 20, 2014) (a & b) No. The meal price increase is attributed to an increase in personnel costs, operations, food supplies and student participation in the school lunch program. The food service coordinator is a component of the personnel costs; however, the sixteen (16) food service positions are directly related to growth and the opening of three (3) new schools. As with any food service operation revenue and expenses fluctuate with the costs of supplies and sales or student participation. Therefore, LCPS Food Services maintains a fund balance to accommodate fluctuations when revenue does not meet expenses. In FY14, the Food Service Program is expected to utilize fund balance. As a result an extensive analysis is being conducted to confirm that revenue and expenses align. (c) An increase of $0.10 in federal subsidies for FY 2015 is not expected but will remain unknown until June of 2014 when released by the United States Department of Agriculture. (d) Loudoun County Public Schools last increased meal prices approximately $0.30 per category in FY 2012. (e)
District Breakfast Lunch
Paid Reduced Paid Elem Paid Middle Paid High Reduced
Loudoun County $2.00 $0.30 $3.00 $3.10 $3.10 $0.40
Fairfax County $1.50 No charge $2.65 $2.65 $2.65 No charge
Prince William County
$1.40 $0.30 $2.35 $2.50 $2.60 $0.40
22

School Board Questions and Answers February 4, 2014
Loudoun County Public Schools – FY 2015 Operating Budget
65. How many employees in each of the last three years received unsatisfactory evaluations, did not receive step increases as a result, and/or would have not received step increases had they been given? (Hornberger/Jan 20, 2014) Licensed and Administrative employees
Total Unsats Resigned/Term/Retired/Moved to a lower position/Took LWOP
Remained in position - No Step, if one were given
2010-2011 17 10 7 2011-2012 19 12 7 2012-2013 15 11 4
Totals 51 33 18 Over the last three school years, 51 unsatisfactory evaluations were given. Twenty-eight of those people severed employment with LCPS, moved to lower positions or went out on leave without pay. Eighteen employees would not have been eligible for a step if one were given.
Classified employees
Total Unsats Resigned/Term/Retired Remained in position - No Step, if one were given
2010-2011 25 5 20 2011-2012 32 18 14 2012-2013 74 17 57
Totals 131 40 91 Over the last three school years, 131 unsatisfactory evaluations were given. Forty of those people severed employment with LCPS and 91 employees would not have been eligible for a step if one were given.
66. According to the Executive Summary (p. 19), we anticipate a total of 1,068 students enrolled in Pre-School, or a 7.9% increase in the number of students in FY15. Please indicate where the funding is located in the budget for this initiative (clearly a significant portion is in the form of grants) and the costs of this program (including number of staffing positions). (Hornberger/Jan 20, 2014) The portion of the “Preschool” numbers on page 19 related to the Department of Instruction are the 300 students for the STEP program and the 100 students for Head Start. These are the same enrollment figures for these programs in FY14 so there is no growth projected. The grant funding related to these programs is shown on page 191 (Head Start) and 242 (Virginia Pre-School Initiative). The growth is in pre-school special education based on the number of pre-school children identified as eligible for special education services.
23

School Board Questions and Answers February 4, 2014
Loudoun County Public Schools – FY 2015 Operating Budget
67. According to the Executive Summary (p. 19) there are a total anticipated HS enrollment in FY 15 of 21,224 students. However in the Supplemental Section (p. 376) it indicates anticipated 2014-15 enrollment projections at the HS level of 21,292. Which figure is correct and around which was the budget built? (Hornberger/Jan 20, 2014) The high school enrollment on page 19 of the executive summary (21,224) is the projected number of students in grades 9 through 12 and is the basis for high school staffing. The enrollment on page 376 in the supplemental section is the total number of students projected at each of the high schools and includes 68 pre-school students. The budgeted staffing for the pre-school students is found in the Head Start grant.
68. What would be the budgetary impact across the departments if the school board does not approve the 1-1
initiative? It is my understanding that staff and resources have been requested to support this initiative. (Rose/Jan 19, 2014) If the 1-1 initiative is not approved, the Department of Technology Services would withdraw the request for the 6 additional FTEs that have been identified as necessary to move the effort forward. This would result in a reduction of $432,125 to the Personnel section of the DTS budget on page 334 of the FY15 Superintendent’s Proposed Operating Budgets. There would be no change to the DTS O&M or Capital budget request since the funding for the 1-1 initiative is contained in the proposed bond initiative.
69. What is the ELL teacher/student ratio at each school before the initiative and with the new initiative? (Turgeon/Jan 22, 2014) See Attachment #11.
70. ELL - What does ELP stand for? (Rose/Jan 22, 2014)
English Language Proficient
71. ELL - When did the state mandates take effect, how are we meeting the records requirement, and what is the cost? (Rose/Jan 22, 2014) Title III Reporting Requirements Although Federal and State provisions for ELLs began in 1964 under Title VI of the Civil Rights Act of 1964, with additional provisions introduced under the 1968 Elementary and Secondary Education Act (ESEA) and again under the 1974 Lau v. Nichols court case, federal oversight of Title III accountability requirements began in 2001 with the reauthorization of No Child Left Behind. Compliance with Title III Requirements Title III requirements (records and otherwise) are met via federal, state, and local monitoring that takes place on an ongoing basis. Federal and state monitoring of the Title III program occurs on a 5 year cycle. Per 2012-2013 VDOE requirement based on the 2011-2012 federal monitoring of the state of Virginia, monitoring at the local level must occur on a bi-annual basis. Cost of monitoring the LCPS Title III Program The cost of oversight, monitoring and meeting of the Title III requirements and provisions are built into the duties ELL Program Administrative staff. ELL Program Administrative staff duties include the oversight and monitoring of the following: Identification, Screening, and Placement of Limited English Proficient (LEP) Students, data collection and
24

School Board Questions and Answers February 4, 2014
Loudoun County Public Schools – FY 2015 Operating Budget
reporting, assessing the English Language Proficiency of LEP Students, developing the Title III Grant application and management of funding, and accountability results. Likewise, the costs of carrying out the above duties are built into the duties of division ELL teachers.
72. Provide a breakdown by grade of the number of students and how many hours they are in Family Life. (Morse/Jan 22, 2014) 4th Grade FLE students- 5,850 5th grade FLE students- 5,639 6th Grade FLE students- 5,665 7th Grade FLE students- 5,447 8th Grade FLE students- 5,400 9th Grade FLE students- 5,243 10th Grade FLE students- 5,062 Hours of Family Life Education Instruction: Fourth Grade (four 40 minute sessions) Fifth Grade (six 40 minute sessions) Sixth Grade (three 90-minutes classes) Seventh Grade (four 90-minutes classes) Eighth Grade (four 90-minutes classes) Ninth Grade (five 90 minutes classes) Tenth Grade (four 90 minutes classes)
73. How many students attended Summer Governor's School last year? (Kuesters/Jan 22, 2014) A total of 99 students participated in the 2013 Governor’s School and Governor’s Foreign Language Academies.
74. Provide the general education teacher/student ratio for High School. (Kuesters/Jan 22, 2014) 1:27.9
75. In high school O/M how much is allocated for new textbooks and what subjects are they for? (Rose/Jan 22, 2014) $1.8million These are for whatever replacements schools order as well as the addition of inventory for Rock Ridge High School.
76. How much of the high school O/M would not be necessary if the 1-1 initiative does not make the November ballot? (Rose/Jan 22, 2014) The high school O/M budget has nothing allocated to the 1:1 initiative.
25

School Board Questions and Answers February 4, 2014
Loudoun County Public Schools – FY 2015 Operating Budget
77. Provide research that was done to decide which subjects would use textbooks instead of a digital device and vice versa. (Rose/Jan 22, 2014) There are no specific subjects for which textbooks alone or digital media alone have been identified. Currently teachers are using a combination of print and digital resources, as appropriate and as available. The digital resources are being accessed through shared resources (laptop carts or in computer labs), on the Promethean Board, or from home. As the 1:1 initiative is implemented digital content will become the primary source of information for students as traditional textbooks are phased out.
78. What are the component costs that make up the cost of meals (e.g. labor, management, food)? (Reed/Jan 22, 2014)
The percentage of a prices related to personnel (labor and management) is 57%. The cost of food and operating supplies is 43%.
79. I understand that the cost of food should not exceed 30% of the total costs for commercial food service activities. Where is LCPS? (Reed/Jan 22, 2014)
Per the National Food Service Management Institute (NFSMI) there are no research-based industry standards for the K-12 food service industry. LCPS Food Services total food cost percentage for FY 2013 was 36%.
80. What percent of meals are served to free and reduced meal eligible students? (Reed/Jan 22, 2014)
Breakfast for FY 13: 74.81% of the eligible free and reduced students participate in breakfast on average. Lunch for FY 13: 35.68% of the eligible free and reduced students participate in lunch on average.
81. Have the number and percentages of free and reduced meal eligible students increased over the past two or three years? (Reed/Jan 22, 2014)
FY 2012 - 16.47% - 10,990 students eligible FY 2013 - 17.19% - 11,911 students eligible FY 2014 - 17.47% - 12,541 students eligible
82. How do our meal prices compare to surrounding counties? (Reed/Jan 22, 2014)
See chart in question #64 (e).
83. Provide a list of those schools who are next for Title I or full-day Kindergarten and the cost needed to provide it? Do these schools have the room to provide it? (Sheridan/Jan 22, 2014)
Title I Schools with Full-Day Kindergarten Guilford Rolling Ridge Sugarland Sully
26

School Board Questions and Answers February 4, 2014
Loudoun County Public Schools – FY 2015 Operating Budget
Title I “Eligible” Schools to be considered for Full-Day Kindergarten based on Free/Reduced Lunch Middleburg (54%) - 1 class/room available Forest Grove (53%) – 4 classes/rooms available Sterling Elementary (46%)– 3 classes/room available Meadowland (41%) – 3 classes/room available Frederick Douglass (35%) – 4 classes/room available Head Start, STEP and ECSE Sites: Catoctin Round Hill Cedar Lane Sterling ES Countryside Sugarland Dominion HS Sycolin Creek Heritage HS Tuscarora HS Newton-Lee Woodgrove HS Cost to Open a Full-Day Kindergarten for One Class (existing infrastructure, i.e., Promethean Board, computers) already in place Teacher – Salary and Benefits-$83,100 per 1.0 FTE Teacher Assistant – Salary & Benefits-$34,500 per 1.0 FTE Materials and Minor Equipment -$10,709
84. How many at-risk students do we have in full-day kindergarten? How has it grown in the last 5 years? 10 years? (Hornberger/Jan 28, 2014)
There are 537 students in 24 full-day kindergarten classes. The large increase in FY14 is due to converting all kindergarten classes to full-day programs at Guilford, Rolling Ridge, Sugarland, and Sully. 5-YEAR HISTORY OF FULL-DAY KINDERGARTEN
Year Enrollment FY10 151 FY11 159 FY12 163 FY13 158 FY14 537
The numbers in the chart above do not include the 1097 ELL students who stay all day in their home schools where they are provided with services for one-half day ELL and one-half day of the general education kindergarten program.
85. Every budget cycle, concerned citizens ask why we’re teaching illegal immigrants. Can you please provide a
copy of Attorney General Jim Gilmore’s determination that the Constitution of Virginia requires that all children of the proper age residing in Virginia be educated? (Reed/Jan 22, 2014) Jim Gilmore was Attorney General from 1994 to 1997. I could find no opinion of his related to illegal immigrants or aliens. I did, however, find a 1999 opinion of Mark Early (attached) which I believe is what you are seeking. As you know, this area of the law is driven by federal law and cases for the most part.
27

School Board Questions and Answers February 4, 2014
Loudoun County Public Schools – FY 2015 Operating Budget
Education clearly has a “fundamental role in maintaining the fabric of our society.” Plyler v. Doe, 457 U.S. 202, 221 (1982). Children who are illegal aliens may not be presumptively excluded from the free public schools. Id. They may be required, however, as others are required, to establish that they are bona fide residents of a jurisdiction before qualifying for free public schooling in that jurisdiction. Martinez v. Bynum, 461 U.S. 321 (1983). It is constitutionally permissible to presume that residence which is established solely for the purpose of obtaining tuition-free schooling is not bona fide residence, provided such presumption is consistently, not selectively, applied. Id. Earley’s opinion says you cannot inquire into citizenship status for any reason.
Also see Attachment #6.
86. FY14 WABE Guide does not indicate that LCPS has full-day kindergarten. Is the FY14 WABE guide incorrect? (Hornberger/Jan 22, 2014) Page 30 of the FY 2014 WABE Guide is accurate. The WABE Guide survey is intended to determine which jurisdictions are implementing full-day Kindergarten throughout their school division and to what extent that implementation has been accomplished. While it is true that LCPS has full-day Kindergarten classes, those are offered to at risk students and are not a part of a plan to implement a full-day Kindergarten program throughout the division. Therefore, after discussing the LCPS offering with our WABE counter parts, it was determined that the most accurate information for Loudoun is zero schools offering full-day Kindergarten.
87. Which elementary schools have triggered the need for an additional library assistant? (Hornberger/Jan 22, 2014)
There were three elementary schools that have student populations over 1000 students this school year: Legacy, Liberty, and Pinebrook. The Board funded an additional .5 librarian for each of these schools. Because of the current difficulty recruiting and hiring school librarians, Legacy Elementary, instead of hiring a .5 librarian, hired a full time library assistant who is a licensed elementary school teacher and could support some of the teaching functions that would be part of a librarian’s duties.
88. What is the estimated amount for fees for the library system? (Morse/Jan 22, 2014)
CompanionCorp’s Alexandria Library Management System as a web-hosted solution has an estimated annual licensing and hosting fee of $88,516 for all LCPS schools.
89. How many teachers are assigned to Instructional Resource Center (IRC)? How many teachers are using the online resources? (Morse/Jan 22, 2014)
We have no teachers assigned to the IRC. The Library Services online resource databases consisting of Safari Montage (LCPS video-on-demand system), digital encyclopedias (both general and subject-area specific), indexes, netTrekker (K-12 enhanced search engine of educator-curated resources aligned to state standards), and more are used by both staff and students and are accessible from school and home. Note: In the last few days with schools closed, we have had parents emailing staff asking about the at home user ID’s. To see all the database resources go to: http://www.lcps.org/page/750
28

School Board Questions and Answers February 4, 2014
Loudoun County Public Schools – FY 2015 Operating Budget
At the present time, the use of these resources is not authenticated through an individual user’s account. From school, authorization occurs through an IP address (es) and from home, a generic user ID. To the best of our knowledge, in over the course of the year, Safari Montage has been used in excess of 250,000 times. The other resources combined have been used in excess of 12 million times.
90. What O&M costs will be ongoing in Math? (Turgeon/Jan 22, 2014) The annual subscription of a comprehensive mathematics computer intervention program at a cost of $9,000 per elementary school will be an ongoing cost for Math as long as the program is relevant and effective. This subscription cost will be offset by the $209,815 that would have been needed to sustain the current version of Success Maker Enterprise (SME). The other ongoing O and M cost in the mathematics budget is the phased replacement of graphing calculators. The replacement of graphing calculators is on a continuous cycle. Over the course of the past 3 years, the budget was created to replace approximately 30 calculators at a time per school (MS and HS). As the 83s are failing at a much faster rate, our replacement schedule is not matching the rate in which the calculators are failing. In future years, we will need to increase the number of calculators replaced or continue the phased replacement for a longer period of time.
91. What would the cost of SME be compared to the new program? (Bergel/Jan 22, 2014)
For SME, the most recent single school was $91,324 plus a system-wide maintenance cost of $210,000. The FY15 cost of the new program is $9,000 per elementary school.
92. What justifies going to this new model of software in Math? (Kuesters/Jan 22, 2014)
The current elementary school mathematics computer program is Success Maker Enterprise (SME), purchased in the 1990s. This software is the only mathematics program provided to all elementary schools as a mathematics intervention (remediation and enrichment) for students primarily in grades 3 – 5. The current version of SME has been problematic in our schools for several reasons. We have experienced technology issues as our network continues to be updated (i.e. update to Windows 7) while supporting an older computer program. The increased use of SME prior to 2011 was greatly due to the effective use of the software as a predictor of successful SOL performance. This is no longer the case as the old version of SME is not directly aligned to the new mathematics standards that was fully adopted in 2011-2012 and no longer provides a reliable support to students or reliable data to teachers as they work with students. In SY 2012-2013 the Department of Instruction conducted a survey of our principals to collect data on the usage of SME and the other programs that schools implemented to support mathematics instruction. The results of this survey indicate that SME is no longer the best fit for our schools and students, usage has greatly decreased in schools or not used at all, and the most efficient use of funds would be to look for a replacement program instead of paying to maintain the existing program. The cost to sustain the current version of SME across the division is $210,000. The older version of SME is not available by the vendor for installation at new schools. Implementing two different versions of SME is problematic in LCPS because the two platforms are not compatible. Student data is not transferrable between the two different platforms of SME in cases where the student moves between schools. To upgrade all elementary schools to the new version of SME would cost over $1.4 million. The cost to open a new school with the new version of SME is $93,000 per school.
29

School Board Questions and Answers February 4, 2014
Loudoun County Public Schools – FY 2015 Operating Budget
The new programs we are currently piloting have an annual subscription cost of $9,000 per school. The new programs we are currently piloting:
are directly aligned to the new mathematics standards are relevant and engaging for our students extend student support beyond grades 3 – 5, providing access to our K-2 students as well. are accessible at home 24/7 are comprehensive programs providing content for the entire curriculum as opposed to other programs that
support only automaticity of math facts, or programs that provide only banks of practice problems relevant data reports that provide instructional staff with efficient data to guide teacher led interventions provides efficient diagnostic assessments to identify student strengths and areas for improvement are adaptive and provide students with remediation and enrichment content based on diagnostic data
93. What is the difference between Khan Academy which is free and the new model requested? (Fox/Jan 22, 2014)
Khan Academy is developing resources far beyond the brief video tutorials. The Khan Academy is now offering practice problems, assessments, and data reports. These components of the Khan Academy are still new and have not yet been fully reviewed or piloted. It is a good resource for self-directed, self-motivated learners. This is one of the resources we will continue to look at and consider as a resource to support mathematics instruction. Currently, there are components of other math programs that the Khan Academy does not provide. One of these components is a highly interactive component. It is this component that grabs students’ attention and has students eager to log back into the program. The software we are requesting engages students in a learning experience as opposed to lesson videos. The learning experiences are where students develop mathematical thinking and learn the mathematics as they engage and manipulate the given task. The software we are requesting also includes the pedagogy that is appropriate to support early childhood education. The advantage of purchasing annual subscriptions is to provide LCPS the ability to remain flexible when newer, more economically priced or free, programs are developed that better meets the needs of LCPS students.
94. What are the differences between the two math softwares used in the elementary schools? Are they mutually exclusive? (Morse/Jan 22, 2014)
The math software that we are currently piloting provides quality mathematics interventions for students, K-5. The software have been reviewed by the Department of Instruction and piloted at several elementary schools. The software is mutually exclusive and serves a similar purpose with minor differences. They are both self-paced, provide students with interactive learning experiences, are adaptive and differentiate the experience for students based on diagnostic data. The mathematics office has reviewed a number of different programs and selected the two programs that best fits the county needs for mathematics intervention. The goal of the mathematics office is to provide schools with an option of the two recommended programs where the school selects the program that best fits the unique needs of their student population, instead of a one-size fits all intervention.
30

School Board Questions and Answers February 4, 2014
Loudoun County Public Schools – FY 2015 Operating Budget
95. What is the phase in plan for calculator replacement? How much of the O&M is for the calculators? (Morse/Jan 22, 2014)
The replacement of graphing calculators is on a continuous cycle. Over the course of the past 3 years, the budget was created to replace approximately 30 calculators per school (MS and HS), per year. As the 83s are failing at a much faster rate, our replacement schedule is not matching the rate in which the calculators are failing. In future years, we will need to increase the number of calculators replaced or continue the phased replacement for a longer period of time. The amount for the calculators is $80,181.
96. How is the Math Facilitators transition going? What is their role? Provide the data used to analyze this transition. (Hornberger/Jan 22, 2014) The Mathematics Resource Teachers (Math Facilitators) are in year two of their three year evaluation. The eight MRTs follow the school embedded model as directed by the school board. The MRT roles include:
providing job embedded professional development in the areas of mathematics curriculum, instruction, and assessment
providing professional development opportunities for all elementary school teachers in the areas of mathematics curriculum, instruction, and assessment
development of quality mathematics resources to support mathematics instruction for their buildings and sharing these resources with the entire division
providing and facilitating data chats to support mathematics instruction and intervention co-teach and model teach to support the implementation of exemplary practices in mathematics instruction and
assessment As part of the MRT program evaluation, the mathematics office and the research office collaborated to analyze the impact of the MRT program on the following four areas:
MRT delivery of exemplary practices in mathematics instruction MRT development of a collection of exemplary practices for use by all elementary teachers Increase in the prevalence of exemplary practices among math teachers at the eight MRT schools Increase in student mathematics achievement outcomes at the eight MRT schools
The transition is going well and the MRTs are in the second year of their three year evaluation
97. What would the cost savings be if all the deans at each MS were eliminated and an additional Assistant Principal was added instead? What are the advantages or disadvantages of this? (Fox/Jan 22, 2014) The amount saved by eliminating 46 Deans totals $3,858,342. The cost of adding 15 additional Assistant Principals is $1,727,400 The difference is a savings of $2,130,942 Advantages: Grade level house leader is now at the Assistant Principal level and a 12 month employee. Disadvantages: The many duties currently assigned to five staff members (2 Assistant Principals and 3 Deans) will now be divided among three Assistant Principals, who will become the grade level house leader. The grade level house leader is physically located in the house area and is expected to connect with students, families, and grade level staff members. Grade level house leaders specifically meet the needs of adolescent children by addressing affective and/or
31

School Board Questions and Answers February 4, 2014
Loudoun County Public Schools – FY 2015 Operating Budget
social emotional issues in the current model. It is an expectation that these issues are addressed quickly to have minimal disruption to instructional time. Middle School Assistant Principals are already responsible for two major areas: Special Education and Testing, for 1000-1600 students. These two roles require specific training and meetings throughout the year outside of the building, and multiple meetings in the building with parents and teachers. With middle school being a heavily tested level, (all core subjects in every grade level) AP’s are not always readily available for affective concerns most closely associated with middle school aged students. Connections with students, staff, and families will be delayed or not made as Assistant Principal will not be as available to students, staff and families. In addition to working directly with students within a house area on these affective/social issues, deans conduct classroom walk-throughs to monitor instruction, facilitate grade level interdisciplinary team meetings, provide lunch room and hallway supervision, organize before and after school activities, initiate parent contact, facilitate parent conferences, review student grades, conduct child study meetings, and participate in a variety of school level committees. The Assistant Principals work closely with the Principal as the Instructional Leaders of the school. The current School Improvement efforts require that these leaders spend at least 50% of their time working directly with staff to insure the alignment of the written, taught and assessed curriculum. Adding the Dean responsibilities to the Assistant Principal responsibilities will decrease the amount of time spent on instructional leadership.
98. Provide the history of the Deans in the Middle Schools. Include the impact deans have had on middle school education. (Bergel/Jan 22, 2014)
When middle schools were first implemented in Loudoun County in the mid-nineteen seventies, the Dean position was part of that organizational structure. Since the mid-80’s, much national research has been dedicated to the middle school structure. Research at that time and still today supports the concept of dividing large middle schools into smaller “schools within a school.” Most middle schools across the nation house approximately 600-800 students. LCPS middle schools currently house between 1000-1600 students. As adolescent students transition from elementary school, the concept of the dividing the grade levels into smaller groupings or “Interdisciplinary teams” is a foundational practice supported by the Association for Middle Level Education (former National Middle School Association). It is during the middle school years that young adolescents begin experimenting with a range of risky social behaviors. The Dean as the grade level house leader helps students (and their families) to navigate through this time in their development. Families develop a strong relationship with the Dean who follows the children for each year of middle school. The middle school dean position is also a training ground for future middle school administrative positions. Twenty-one of the current twenty-eight LCPS middle school assistant principals were former LCPS middle school deans. Seven of the current fifteen middle school principals were deans and assistant principals for LCPS. The middle school deans have played a crucial role over the past forty plus years in an organizational structure that best supports the adolescent learner. Additionally, they have provided a solid pool of applicants for administrative positions within our middle schools. As middle level educators visit Loudoun County middle schools from across the state and nation, there is always one common thread of feedback regarding our outstanding middle schools, and that is the inclusion of the dean position at each grade level. This one position “pulls together” the middle school concept in Loudoun County by creating an environment most appropriate for this age group. This structure makes our middle schools stand out as exemplary among other middle schools across the state and nation. Eliminating and/or reducing this position would undermine this foundational structure.
32

School Board Questions and Answers February 4, 2014
Loudoun County Public Schools – FY 2015 Operating Budget
99. Provide the statistics for the increase in enrollment in the Music Program. (Fox/Jan 22, 2014)
Total Music enrollment in grades 6-12 has grown from 11,626 in 2007 to 16,144 in 2013-14.
Orchestra Enrollment continues to show substantial increases since its inception in 2006.
100. Provide the formula used to project the increased costs in Music, and which schools will receive the instruments and other equipment. (Turgeon/Jan 22, 2014) As part of developing the budget, the school requests are reviewed to determine which of those requests are appropriate and which requests can be accommodated simply by utilizing existing inventory around the county. For example, if a school requests an extra piece of furniture, or large instrument, we first look at the justification for the request and then check with teachers across the county to see if they have an extra riser, chairs, etc. to loan. We also take into consideration the impact of new school openings and/or rezoning on the real need for the request. In some cases, we will modify the request to simply funding repairs instead of buying a brand new item outright. The process requires direct communication with the teachers who requested the items. In some cases, the site and the teacher are visited to
0
5000
10000
15000
20000
2007‐2008
2008‐2009
2009‐2010
2010‐2011
2011‐2012
2012‐2013
2013‐2014
Total Students In all MS/HS Music
Total StudentsIn all MS/HSMusic
0
1000
2000
3000
2007‐2008
2008‐2009
2009‐2010
2010‐2011
2011‐2012
2012‐2013
2013‐14
Orchestra
Orchestra
33

School Board Questions and Answers February 4, 2014
Loudoun County Public Schools – FY 2015 Operating Budget
evaluate the validity of a request or to seek an alternative solution. Finally, if the need requires funding in order to be addressed, we include the item in the budget. Pricing for most items is calculated based on current bid pricing and totaled. That number goes into the budget request. The following schools have funding requests included in the FY15 budget: Elem: Dominion Trail, Evergreen Mill, Forest Grove, Hutchinson Farm, Leesburg, Liberty, Lucketts, Meadowland, Mill Run, Potowmack, Sully, Catoctin. MS: BRMS, FMS, HMS, HPMS, JLSMS, JMLMS, MMS, SMMS, STMS, SHMS. HS: BWHS, BRHS, DHS, FHS, JCHS, LCHS, LVHS, PFHS and SBHS.
101. What is the annual salary for a Parent Liaison? (Kuesters/Jan 22, 2014) There is no “annual” salary for Parent Liaisons; they are hourly employees. Hours for Parent Liaisons are allocated to each school. The principal is able to employ one or more individuals within the total allocation of hours.
102. What is the advantage or disadvantage of placing Parent Liaison on Level 11 Step 1 on the classified scale? What other part-time positions are paid in this way? (Hornberger/Jan 22, 2014)
Parent Liaisons will not be “placed” on a salary scale. The hourly rate will simply be the same as the first step on Level
11. There is no disadvantage that can be identified, but the advantage will be that the Parent Liaison position will no longer be an outlier that does not receive an increase when all other employees do. The other part-time employees paid in this way are listed on page 372 in the FY15 Budget.
103. Provide a breakdown of how the Parent Liaison hours are being spent at all schools. (Fox/Jan 22, 2014) See Attachment #8.
104. Provide a breakdown of which schools have the Pathways to Reading & Writing program implemented. What are
the goals for this program? (Turgeon/Jan 22, 2014) Breakdown of Schools and Goals Pathways has been implemented in all 55 elementary schools in grades K-2. Grades 3-5
New schools: Catoctin, Evergreen Mill, and Forest Grove There are second-year components, word study and writing workshop, that will be provided to these schools
next year Evergreen Mill designated as “lab school” Some schools are moving forward with 3-5 components, and Pathways is supporting them as capacity allows,
such as the Fall Overview Sessions and PLC training sessions Additional schools will be included next year
Goals Stated in the FY2015 Major Work Plans Initiatives, pg. 107
Extend the K-2 Pathways training model to include the new elementary school and teachers who are new to LCPS
Sustain and support the integrity and quality of the LCPS literacy framework and professional development Train and implement in grades 3-5 the Pathways reading and writing framework and profession development in
additional schools.
34

School Board Questions and Answers February 4, 2014
Loudoun County Public Schools – FY 2015 Operating Budget
105. Please confirm that all costs associated with Clarity have been moved to the Research Office. (Kuesters/Jan 22, 2014) Yes, all of the costs associated with Clarity appear in the budget of the Research Office.
106. Provide the breakout of the O&M costs for Technology Resource from FY11 to FY15. (Kuesters/Jan 22, 2014)
Tech Resources O&M
FY11 Actual FY12 Actual FY13 Actual FY14 Budget FY15 Budget
Total $ 55,955.00 $ 75,720.00 $ 75,689.00 $ 80,857.00 $ 420,225.00
Please refer to page #135 in the FY15 budget for detailed explanation.
107. What would be the consequence of not funding the $325,500 in architecture and engineering in the Planning and Legislative Department? Is there something that did not get done because of the funds cut from this line last year? (Hornberger/Jan 23, 2014) If the $325,500 for the Special Exception is not funded, Planning will work with the Construction Department to secure the funds from their A&E request. If, at the end of the project, we experience a shortfall in funds, staff will seek supplemental funding from the BOS as we have done with the Cardinal Ridge project. As noted in the work session, staff postponed the special exception for the Advanced Technology Academy as a consequence of the initiative to make school a by-right use. Even if schools were converted to a by-right use, the process would still require funding for studies like traffic, rare and endangered species, etc. By right schools would require “less” funding than we are currently budgeting. By-right schools biggest advantage would have been the savings in time. Since schools are likely to remain a special exception use, the process can no longer be delayed. There were no other imminent projects that required funding for legislative action.
108. Provide the FY14 actuals to date for architecture and engineering expenses for Planning and Legislative
Services? (Turgeon/Jan 23, 2014) To date, the department has expended $25,217 for architecture and engineering expenses.
109. How much of the architectural and engineering expenses were cut from both Planning and Legislative Services and Support Services in the FY14 budget process? Where did we acquire funds needed to cover the deficit? (Bergel/Jan 23, 2014)
The following is the history of the budget reductions in Architectural and Engineering and the FY14 year to date expenditures:
Superintendent's Proposed
School Board Proposed
School Board Adopted YTD Actual
Planning $675,000 $275,000 $30,000 $25,217 Support Services $500,000 $500,000 $300,000 $280,590
35

School Board Questions and Answers February 4, 2014
Loudoun County Public Schools – FY 2015 Operating Budget
As of January 2014 there has not been a need to transfer funds to cover expenditures. If the need arises, Business and Financial Services staff will carefully review balances and transfer available funds. Any transfer over $50,000 will be presented to the School Board for approval.
110. Provide the number of times PIO videotaped meetings for non-LCPS organizations? How long do meetings last? (Bergel/Jan 24, 2014) Joint Board of Supervisors and Loudoun County School Board Meetings
Six Meetings Annually 12 Hours - Two Hours Per/Meeting
Chamber of Commerce – State of Education Breakfast Annual Meeting Three hours
Loudoun County Sherriff’s Departmental Awards Banquet Annual Event Two Hours
Loudoun Retired Teachers’ Luncheon
Annual Event Two Hours
Loudoun County Planning Commission Sub-Committee Meeting As Needed – Based Upon Loudoun County Schedule/Meeting Room Conflict Three Hours +
Loudoun Education Foundation – Agnes Meyer Dinner Annual Event Production of Event Video (40 hours +)
Loudoun County Board of Supervisors Meeting Loudoun School Board to Present Operating Budget to Loudoun County Board of Supervisors As Needed – Based Upon Schedule/Meeting Room Conflict Three Hours +
Special Education Advisory Council (SEAC) Awards Ceremony
Annual Event Three Hours
Loudoun County 4-H Youth Development – Ag Day Production of Event Video Six Hours
Loudoun Educational Alliance of Parents (LEAP) Meetings Monthly Meetings Two Hours
36

School Board Questions and Answers February 4, 2014
Loudoun County Public Schools – FY 2015 Operating Budget
TED EX – Ashburn Event Annual Event 20 Hours Pre Production & Production
Virginia Polytechnic Institute& State University Extension Program and Loudoun Education Foundation
Reality Stores in High Schools Production of Event Video Four Hours
Loudoun Education Foundation Golf Tournament Production of Event Video Four Hours
111. How often are video opportunities turned down? Keep track of these missed opportunities in the future.
(Bergel/Jan 23, 2014) The Public Information Office keeps no formal log of video requests it has turned down; any information given to this question would only be anecdotal. The Public Information Office will monitor such requests in the future.
112. Provide the FY11-FY14 history of the contractual services costs moved to personnel line item from Pupil Services operations and maintenance line item in FY15. (Kuesters/Jan 23, 2014) FY15 is the first budget year that we have moved contractual services from operations and maintenance line item to personnel line item. The history of expenditures in the Other Professional Services category is:
Year Expenditures
FY11 $3,155,464 FY12 $2,722,353 FY13 $2,823,088 FY14 $2,279,081 FY15 $2,295,944
113. Provide a breakdown of the ratio of student to educational diagnosticians and psychologists over the last 5 years. How do neighboring jurisdictions staff? (Hornberger/Jan .23, 2014)
Chart 1 provides a five year history of the LCPS student to school psychologist and educational diagnostician ratios.
37

School Board Questions and Answers February 4, 2014
Loudoun County Public Schools – FY 2015 Operating Budget
Chart 2 shows a comparison of the LCPS school psychologist ratio with several neighboring school divisions over the
last five years based on FTEs reported in the approved school division budget manuals. A staffing comparison of educational diagnosticians cannot be conducted with other school divisions due to role differences. That is, the responsibilities of LCPS educational diagnosticians either differ significantly with diagnosticians in neighboring school divisions or their services are performed by other school professionals.
114. Provide the average caseloads served by educational diagnosticians and psychologists over the last five years.
Include information on new initiatives in which these staff participate. (Turgeon/Jan. 23, 2014) Table 1 outlines the average student caseloads of school psychologists and educational diagnosticians over the last five
years in major areas of job responsibility in which data are maintained. The information below does not, however, include other responsibilities including new initiatives that are not conducive to caseload analysis, such as coaching support for the PBIS and Responsive Instruction frameworks, counseling, Depression Awareness/Suicide Prevention and Exploring Mental Health classroom presentations, instructional and behavioral consultation, functional behavioral assessments for general education students, and crisis responding (e.g., suicide screenings, threat assessments, school crisis situations).
2,222 2,339 2,342 2,236 2,177
2,927 3,0802,852 2,965 2,948
0
1,000
2,000
3,000
4,000
2009‐2010 2010‐2011 2011‐2012 2012‐2013 2013‐2014
Chart 1: LCPS Psychologist and Diagnostician Ratios
Psychologist Ratio Diagnostician Ratio
0
500
1,000
1,500
2,000
2,500
2009‐2010 2010‐2011 2011‐2012 2012‐2013 2013‐2014
Chart 2: Comparison of Psychologist Ratios
Loudoun Fairfax Prince William Alexandria City
38

School Board Questions and Answers February 4, 2014
Loudoun County Public Schools – FY 2015 Operating Budget
115. Provide statistics of students participating in the prevention programs provided by Student Services. (Morse/Jan. 23, 2014)
Substance Abuse prevention programs are provided to all students. Additional support is provided to students who are found in violation of the Drug/Alcohol policy as well as students who are referred by school counselors or parents, or those who self-identify and request services. Services include education and small group or individual meetings with a Substance Abuse Prevention Specialist (SAP). There are currently four specialists on staff. Each specialist typically carries a caseload of about 70 students in their assigned schools. Weekly intervention work includes small group and individual, assessments and case management (consulting with parents, other school professionals or other agencies on a weekly basis). Each specialist is assigned on average 3.5 clusters, or 7 secondary schools. Elementary students are seen as requested. Insight Enrollment Numbers (Drug and Alcohol Violation)
2010-2011 110 students 2011-2012 175 students 2012-2013 170 students 2013-2014 177 students (anticipated enrollment) 2014-2015 Projected 187 students
Students who have completed Insight or are referred by counselor, school social worker, parent or other agency. Individual on-going Substance Abuse case
2011-2012 7 students (2.5 cases per SAP) 2012-2013 43 students (14.3 cases per SAP) 2013-2014 65 students anticipated (16 cases per SAP with 4 specialists) 2014-2015 Projected :20 cases per SAP with 4 specialists
Substance Abuse Weekly Group Sessions
2011-2012 10 weekly groups per SAP (50 students) 2012-2013 11 weekly groups per SAP (55students) 2013-2014 12 weekly groups per SAP (60 students)
Table 1: Average Psychologist and Diagnostician Caseloads 2008-2009 2009-2010 2010-2011 2011-2012 2012-2013 Psychologists Evaluations 52 54 53 58 54 Child Study 97 105 92 118 121 Diagnosticians Evaluations 52 50 57 59 60 Child Study 130 139 122 144 160
39
School Board Questions and Answers February 4, 2014
Loudoun County Public Schools – FY 2015 Operating Budget
Restorative Practices Restorative Practices is an alternative positive discipline approach that provides an opportunity for resolution of school disciplinary violations. The process is co-facilitated by two professionals, a Substance Abuse Prevention specialist as the primary facilitator, and another trained Pupil Services staff member.
September 2013-present 19 students 2013-14 projected total 39 students 2014-15 projected total 78 Students
116. Why is the Parent Liaison program located in Instruction when the services provided would require them to
work closely with the school counselors? (Hornberger/Jan 23, 2014) The Parent Liaison program was created in the Department of Instruction in collaboration with the Minority Student Achievement Advisory Committee. Student achievement goals are at the core of the program. Although the Parent Liaisons do work with School Counseling departments very closely in some schools, their interactions extend to principals and teachers for a large portion of the responsibilities. The Parent Liaisons’ role is to help the principal and staff strengthen relationships between the school and home, especially for parents who feel more comfortable talking to another parent before approaching school staff. The Parent Liaisons are also a source of information for parents about community services and how to access those services.
117. If we move forward with hand-held devices for staff, can’t we eliminate some administrative/secretarial positions? (Reed/Jan 23, 2014)
No.
118. Does the Facilities budget include any custodial robots? I see them in use at hospitals and Federal buildings.
(Reed/Jan 23, 2014) No. There is no funding programmed in the FY15 Facilities Services budget for the lease or purchase and sustainment of custodial robots. In N ov 2012, an evaluation of the performance of the Intel liBot Robotics LLC HydroBot was conducted along with an assessment of the manpower savings this equipment would provide for a typical high school custodial staff. At the time, t he cost of a floor cleaning robot was $33,341.00 and it only performed floor scrubbing in unencumbered areas with a part time attendant for up to four hours per battery charge (18 hours are required to fully charge the battery). In ad dition, the robotic manufacture recommends that the fl oor area be dry mopped prior to t he robotic cleaning each evening and based on our assessment, the robotic unit works appro ximately 25% slower than a manually operated model. Due to the high initial cost of the equipment and maintenance service contract, and that fact that a typical high school utilizes the existing manually operated floor scrubbers for less than 20 hours per week to clean the school, it was determined that the custodial robot would not provide the desired manpower savings to justify the purchase of the equipment and replace a custodian.
119. Please explain what counselors do? With increases of on-line resources for students and staff, couldn’t the ratio of students to counselors be dramatically increased? (Reed/Jan 23, 2014) LCPS counselor roles and responsibilities are consistent with the description outlined in the American School Counseling Association including:
Counselors develop a “contract” with their principal detailing how 80% of their time is spent in direct work with students to support academic achievement.
40

School Board Questions and Answers February 4, 2014
Loudoun County Public Schools – FY 2015 Operating Budget
Counselors teach classroom lessons for the VDOE required character education curriculum, VDOE required instruction/training for bullying prevention and to strengthen student skills in problem-solving, resilience and social/emotional competence.
Small groups and individual meetings are offered for students who require additional support for social/emotional concerns.
Academic planning, including the VDOE required Six Year College and Career plans, are completed by secondary school counselors through individual meetings with students in collaboration with other teachers and parents.
Counselors provide support for building and division initiatives including serving as PBIS coaches, SSA family group facilitators, PEER helper sponsors and members of the Crisis Intervention teams.
Counselors at the elementary level meet with weekly with grade level teams to review the twice weekly counseling lessons, to participate in any discussions regarding student concerns and to share input/feedback as needed about individual students or classroom concerns.
Counselors at the secondary level meet with each student individually to plan the course of study so that desired diploma requirements are met and special circumstances are considered. Students have the opportunity to ask questions, raise concerns or provide input. Secondary counselors maintain relationships with colleges and universities and provide input to the students and the schools as applications are completed and submitted.
Utility of online resources for school counseling services: Currently the access to Naviance and other programs provides students with the opportunity to complete self-assessments regarding college/career. Students share this information with counselors electronically and in individual meetings to plan for the student’s course selection. Online resources are best used as informational and supplemental to the school counselor‘s role.
120. Provide information on the Mandate for Healthy/Hungry Kids Act? (Kuesters/Jan 23, 2014) The Healthy Hunger Free Kids Act (HHFKA) mandated new lunch meal patterns for K-12 schools beginning July 2012 and new breakfast meal patterns beginning July 2013. The meal patterns are now broken down into three grade levels – K-5, 6-8 and 9-12. Lunch The HHFKA mandated changes in the reimbursable meal components and includes the following requirements:
Calories (minimum and maximum) Vegetable subgroups (dark green, red/orange, legumes, and starchy) Fruits – (minimum daily and weekly) Meat/meat alternates (minimum daily and weekly) Whole Grains – weekly 50% of the grains offered must be whole grain – 100% by FY 2015 Milk – skim white and flavored, and 1% white Saturated Fat – weekly less than 10% of calories from saturated fat Sodium requirements – weekly No trans-fat – based on nutrition label
The meal pattern for lunch requires that each student take ½ cup of a fruit or vegetable to comprise a reimbursable lunch.
41

School Board Questions and Answers February 4, 2014
Loudoun County Public Schools – FY 2015 Operating Budget
Breakfast The HHFKA mandated changes in the reimbursable meal components and includes the following requirements:
Calories (minimum and maximum) Fruits – FY 2014 – offer ½ cup per day; FY 2015 - offer 1 cup / require ½ cup per day Whole Grains – (minimum daily and weekly) – FY 2015 100% of grains must be whole grain Milk – skim white and flavored, and 1% white Saturated Fat – weekly less than 10% of calories from saturated fat Sodium requirements - weekly No trans-fat – based on nutrition label
121. How much of the operating and maintenance expenses in Construction is for the Facility Condition
Assessment/Master Plan update? (Kuesters/Jan 23, 2014) The Facility Condition Assessment / Master Plan is valued at $600,000.
122. Safety and Security is projecting a 64% overall increase. Is it possible to stagger some of the increases over several years? (Fox/Jan 23, 2014) Yes, however the commitment to continue funding replacement must continue to avert the risk of systemic failures.
1) The Visitor Management System ($400,000) is a phased project over 2-3 years depending on the funding and the final costs of the project.
2) The Radio system will be completed this year, thus eliminating $600,000.00 from next year’s budget. 3) A modified replacement program for all assets can be constructed, however as equipment ages, particularly
around technology, parts become difficult to find thus making what you have obsolete. All of the security, communications and fire alarm equipment that has been purchased a decade ago, has never been in the budget for life cycle costs, thus making the figure seemingly extremely high. If replacement funding is not initiated, a considerable portion of the security infrastructure is at risk for more frequent failure. The rapid shifts in technology make older parts and equipment often obsolete in the market. Safety and Security Techs have been innovative in their efforts to dismantle old equipment and use old parts to keep equipment working, often shopping on “Craig’s list” to keep equipment functioning. However, at some point, this is an impossible task without new investments being made. All of the replacement programs proposed are phased in over years and will be a permanent feature of future budgets to avoid expensive system replacement. The budget for security has been underfunded historically. The FY15 budget sets a more realistic cost for the current security investments that have been made now and into the future.
123. Prioritize the safety initiatives in the budget. (Kuesters/Jan 23, 2014)
Complete the Radio Communications Project and support infrastructure needs Fund Radio, DVR, Camera, Fire Panel replacement programs - extend the quantity to be replaced by an
additional year which will result in some cost reduction. Fund Elementary School Exterior Numbering (complete) Fund Elementary Key Card Access – phased 3 year completion. Comply with State Safety Audit requirements (1 Security Technician,- 1 Administrative Office Assistant)
42

School Board Questions and Answers February 4, 2014
Loudoun County Public Schools – FY 2015 Operating Budget
124. Provide details of the metrics that the safety and security specialists are measured against. (Bergel/Jan 23, 2014)
In 2012/13 the following metrics were put in place in which Security Specialists report on a bi-weekly basis:
Substantial Personal Interactions – Contact with students, parents and staff that goes beyond a casual greeting. Investigations Proactive Patrol of Grounds and Building in support of safety protocol to include: Bus duty Parking lot enforcement Monitoring of cafeteria during lunch and hallways during and between class changes to ensure orderly
transitions After Hour Event support Administration – Reports and disciplinary, threat assessments
The compilation of their metrics indicate that in 2012/13 SSO’s provided over 480 hours a week, in schools engaging with students in face to face dialogues resulting in almost 85% of the student population having contact with a caring adult weekly. While costly these individual interactions are a critical link in student emotional evaluation, and information gathering. These activities have been pivotal in shutting down potential violence and in providing some students with critical mental health and counseling resources before the crisis occurs. Current SSO’s have law enforcement, probation, and counseling backgrounds and integrate well in the current high school environment.
125. If all personnel and operating & maintenance expenses for Safety and Security are met this year, project how that will affect future budgets. (Bergel/Jan 23, 2014) Replacement cycles will stabilize large scale maintenance and eliminate the threat of equipment failure. The Safety and Security budget , with appropriate funding will be predictable and based on new school openings. Estimating larger projects can be done strategically once replacement cycles are in place.
126. Justify the need for the GIS Technician. Would positions decrease eventually with the new technology this position would use? (Kuesters/Jan 23, 2014) As the County continues to develop, it is important to recognize that roads and streets are constantly being added to the community and must also be incorporated into the student transportation routing system. The proposed GIS routing system will interface with the Loudoun County mapping system (OMAGI) which is maintained and updated automatically as changes are made by County staff. Additionally, student status with respect to location, special needs and school assignment, requires continuous maintenance of the database feeding the system. The current system, which replaced the paper method approximately 17 years ago, still requires a manual implementation of the aforementioned revisions to the maps and database. Without changes in the current routing system, additional staffing will be necessary in the future to accommodate the effect of growth. Transitioning from the manually updated system to the GIS based real-time system will require the proposed GIS technician for implementation, database transfer, and routing management while existing routing staff maintains operations in the existing system. The proposed position will then train existing staff in the new system and be incorporated into the routing team. Hiring a GIS Technician, with professional level skill-sets, will eliminate risk associated with reliance on a third-party to update the road network.
43

School Board Questions and Answers February 4, 2014
Loudoun County Public Schools – FY 2015 Operating Budget
127. Provide statistics on ridership of the activity buses. (Reed/Jan 23, 2014)
The average ridership for each school fluctuates on a daily basis. In th e fall and spring when there are many different activities (SOL prep, football, volleyball, cheerleading, cross country, marching band rehearsals, softball, lacrosse, baseball, track, etc.), rid ership increases. However, in the winter months, when few sports (basketball, swimming, wrestling, etc.) are practicing, ridership declines. Also, ridership for the high school students on a daily basis is much lower than for middle school students as high school students often drive themselves home from school activities. The schedule is coordinated with the school staff on as as-needed basis.
Activity Bus Usage High Schools Broad Run HS – Tuesday and Wednesday (2 buses each day) Average ridership Bus 1: 8 Average ridership Bus 2: 13 Briar Woods HS – No activity bus service. Dominion HS – Monday, Tuesday, Wednesday and Thursday (1 bus each day) Average ridership: 8 Freedom HS – Tuesday, Wednesday and Thursday (2 buses each day) Average ridership Bus 1: 13 Average ridership Bus 2: 11 Heritage HS – Tuesday, Wednesday and Thursday (2 buses each day) Average ridership Bus 1: 6 Average ridership Bus 2: 12 John Champe HS – Tuesday and Thursday (2 buses each day) Average ridership Bus 1: 8 Average ridership Bus 2: 5 Loudoun County HS – No activity bus service Loudoun Valley HS – No activity bus service. Park View HS – Monday, Tuesday, Wednesday and Thursday (1 bus each day) Average ridership: 14 Potomac Falls HS – Monday, Wednesday and Thursday (1 bus each day) Average ridership: 7 Stone Bridge HS – Thursday (1 bus) Average ridership: 2 Thomas Jefferson HS – Monday, Tuesday, Wednesday and Thursday (1 bus each day) Average ridership: 16
44

School Board Questions and Answers February 4, 2014
Loudoun County Public Schools – FY 2015 Operating Budget
Tuscarora HS – Tuesday and Thursday (2 buses each day) Average ridership Bus 1: 12 Average ridership Bus 2: 13 Woodgrove HS – Wednesday (3 buses) Average ridership Bus 1: 3 Average ridership Bus 2: 1 Average ridership Bus 3: 1 Middle Schools Belmont Ridge MS – Monday and Wednesday (2 buses each day) Average ridership Bus 1: 19 Average ridership Bus 2: 21 Blue Ridge MS- No activity bus service Eagle Ridge MS – Monday, Wednesday and Thursday (2 buses each day) Average ridership Bus 1: 8 Average ridership Bus 2: 13 Farmwell Station MS – Tuesday, Wednesday and Thursday (2 buses each day) Average ridership Bus 1: 28 Average ridership Bus 2: 20 Harper Park MS – Wednesday and Thursday (2 buses each day) Average ridership Bus 1: 24 Average ridership Bus 2: 1 Harmony MS - No activity bus service J.L. Simpson MS – Monday, Tuesday, and Wednesday (2 buses each day) Average ridership Bus 1: 15 Average ridership Bus 2: 8 J.M. Lunsford MS – Monday, Wednesday, and Thursday (3 buses each day) Average ridership Bus 1: 39 Average ridership Bus 2: 38 Average ridership Bus 3: 39 Mercer MS – Wednesday and Thursday (2 buses each day) Average ridership Bus 1: 25 Average ridership Bus 2: 27 River Bend MS – Monday, Wednesday and Thursday (2 buses each day) Average ridership Bus 1: 7 Average ridership Bus 2: 5
45

School Board Questions and Answers February 4, 2014
Loudoun County Public Schools – FY 2015 Operating Budget
Stone Hill MS – Wednesday and Thursday (3 buses per day) Average ridership Bus 1: 41 Average ridership Bus 2: 45 Average ridership Bus 3: 38 Smart’s Mill MS – Wednesday and Thursday (2 buses per day) Average ridership Bus 1: 27 Average ridership Bus 2: 23 Seneca Ridge MS – Monday, Tuesday and Wednesday (2 buses per day) Average ridership Bus 1: 13 Average ridership Bus 2: 13 Sterling MS – Monday and Thursday (2 buses per day) Average ridership Bus 1: 25 Average ridership Bus 2: 22
128. Provide information on how the number for new buses was calculated. (Turgeon/Jan 23, 2014) It is a generally accepted practice throughout the pupil transportation industry that for every 100 additional students, one additional school bus is required. This standard is derived with respect to the entire fleet as distribution of ridership throughout a particular school division is inherently inconsistent. The entire LCPS bus fleet incorporates approximately 854 vehicles engaged in numerous student transportation activities. Approximately 525 regular education buses transport about 50,400 students and 1,800 special needs students are transported on 153 special needs buses every day. Approximately 145 of the remainder are used to support maintenance activities at one of the two maintenance facilities, are in support of extensive repairs being performed by various vendors, or are used to support student transportation needs that arise on the spur of the moment. 8VAC20-70-380 requires school buses to undergo a preventive maintenance inspection every 45 school days or 5,000 miles. Twice this year peak demand for maintenance rotation has reached nearly 160 buses. 22 others of various types are strategically located throughout the county to accommodate emergency situations such as breakdowns or accidents. Lastly there are currently 9 buses that are completely out of service due to excessive cost of repairs (pending replacement) or as a total loss due to accident damage. LCPS average ridership is in alignment with the aforementioned industry standard with regular and special education buses ranging from 96 (50,400 / 525) students per bus to 12 (1,800 / 153) students per bus, respectively. There are also numerous factors that exacerbate the complicated formulaic process to ensure an adequate inventory to successfully transport all students eligible for transportation. Examples of the factors are:
Geographic area and student density Western Loudoun County –29 students per square mile Dulles South - 163 students per square mile Dulles North – 451 students per square mile Eastern Loudoun – 629 students per square mile Ashburn – 530 students per square mile Central Loudoun – 150 students per square mile
Overflow schools Grandfathering of seniors when a new high school opens Homeless and Foster children Young Adult Program for the County of Loudoun CAST Program
46

School Board Questions and Answers February 4, 2014
Loudoun County Public Schools – FY 2015 Operating Budget
Location of Special Education programs (one or two schools have specialty programs that serve the entire County)
Student behavior issues
129. What other school divisions in Virginia have pursued a standardized 1:1 technology initiative that is being proposed? Please describe their approach, when they began it, and any evidence of its effectiveness. How many are pursuing some sort of alternative BYOD approach? (Hornberger/Jan 23, 2014) We are still in the process of compiling information available from other districts. Information gathered thus far identifies the following districts, who have implemented, or are in the process of implementing, a 1:1 technology initiative:
Henrico Chesterfield Roanoke
Approaches include Bond Referendum, operating or grant funding. The following districts have implemented, or are in the process of implementing, a BYOD or hybrid initiative:
Chesapeake York Hanover Virginia Beach Fairfax Newport News Bristol Williamsburg-James City Prince William
130. What high school-based designated "safety & security" staffing exists in Fairfax and Prince William Counties?
Please describe their structure and staffing ratio as it compares to what currently exists for Loudoun County and what is proposed? (Hornberger/Jan 23, 2014)
System Position Safety Specialist Assistant Safety Specialist School Resource Officer
Loudoun County Public Schools 1 0 1
Fairfax County Public Schools 1 3 - 4 1
Prince William Public Schools 1 1 – 3 1
Staff ratio varies dependent upon capacity at each school. The additional five (5) Safety Specialist positions proposed will be assigned on an as-needed basis.
47
School Board Questions and Answers February 4, 2014
Loudoun County Public Schools – FY 2015 Operating Budget
131. Provide a seven year list of the number of both full-time and part-time FTEs Personnel has hired. (Hornberger/Jan 25, 2014) See Attachment #17.
132. Did adding the interview process make a difference in the quality of substitutes LCPS hires? (Hornberger/Jan 25, 2014)
Anecdotally, we have received fewer complaints regarding issues with substitutes since we implemented the process to interview substitute applicants.
133. How many of the Pre-Employment Investigations resulted in applicants being denied? (Reed/Jan 25, 2014) 3,275 background checks were conducted during SY 13. Of those, 310 (9.5%) did not become LCPS staff members for a variety of reasons. Reasons include candidates who declined offers of employment, new graduates whose references were checked with their cooperating teachers before the school year ended who did not pursue or were not offered employment, and background checks that did not meet our standards for hiring. We do not track how many background checks do not meet standards and cannot supply the requested data.
134. For all departments, were any of the new proposed positions deferred in previous budgets? (Reed/Jan 25, 2014)
Department of Personnel Services The Department of Personnel Services lost 5 positions between FY 10 and FY 11. These positions were lost during budget reconciliation. Department of Instruction No positions in the FY15 budget were previously eliminated. The two positions requested are to meet current needs in the department. Business & Finance – No Department of Support Services
Assistant Superintendent: 1 Telecommunications Analyst FY13 /FY14 2 Distribution Center Assistant FY14-1 Facilities Services: 1 Environmental Specialist FY14 1 Accounting Specialist FY14 4 Maintenance Staff FY13-3, FY14-5 Custodians (32.5 positions reduced in FY14 ) Safety & Security: 6 Safety & Security Specialists FY13-6 / FY14-3 2 Safety Technicians FY13-2 / FY14-2 1 Communications Tech/Engineer FY14
48

School Board Questions and Answers February 4, 2014
Loudoun County Public Schools – FY 2015 Operating Budget
Transportation: 25 Bus Drivers FY13- 56*/FY14-5
*35 deferred in addition 21 reductions in force Department of Technology Services The following lists the total FTE requests from the former ITS and AIT divisions and the Office of Student Information from FY09 through FY14. At the start of the FY09 school year 57,009 students were enrolled in a total of 75 schools. At the start of the FY15 school year, 73,233 students are projected to be enrolled in 88 schools. School Year Enrollment Number of schools FY09 57,009 75 FY15 73,233 88 Growth 16,224 13 Year Positions Requested Positions Approved FY09 5 0 FY10 2 0 FY11 13 0 FY12 5 1 FY13 15 0 FY14 14 4* (Board approved 9/2013)
Total 54 5
5 positions approved since FY09 (3 positions to support new student information system previously supported by DIT, 2 new positions – 1 in FY12, 1 in FY14)
22% (16,224) increase in student enrollment 15% (13) increase in the number of schools The 29 positions requested in the FY15 budget reflect a portion of the unapproved requests and the continued
need to address the subsequent growth over the past six years.
135. Are you considering widgets to assist employees with Personnel, Payroll, and Benefits issues? (Reed/Jan 25, 2014) No.
136. Compensation: What is the cost of the attached salary scales? (Hornberger/Jan 24, 2014) The cost of the attached salary scales (please see Attachment #16) is:
Teacher $21.5 million Classified $5.5 million Auxiliary $0.3 million Administrator $2.3 million Total $29.6 million
49

School Board Questions and Answers February 4, 2014
Loudoun County Public Schools – FY 2015 Operating Budget
137. What would the cost savings be if the salary increase based on Mr. Hornberger’s salary scales was limited to 5%? (Morse/Jan 29, 2014) The cost savings would be approximately $5.9 million. However, implementation of this plan would lower the increases for those employees who are currently on the steps which are in the “sag” and all of the steps below it. Therefore, the sag would not be addressed. In addition, implementation of this plan would be extremely complicated. See attachment #19 for salary scales.
138. Given the proposal to add FDK to Title I eligible schools I would like to know the following: (Kuesters/Jan 29, 2014)
1. What is the definition of a Title I school?
The first section of the Elementary and Secondary Education Act refers to programs aimed at America’s most disadvantaged students. It provides assistance to improve the education of children in high-poverty schools, enabling those children to meet state academic content and performance standards. If the number of low-income students is above 35 percent, the schools may receive Title I funds to create a program to improve achievement.
2. What is the definition of English Language Learner?
See Attachment #19.
3. What is the requirement for Free & Reduced Lunch?
A child may be eligible for free or reduced priced meals if the household income is within the limits on the Federal Income Eligibility Guidelines. See Attachment #20.
4. What percentage of our ES currently have FDK?
7% or 4 of 55 elementary schools currently provide full-day kindergarten services to all students in their attendance zone.
Six (6) additional schools host regional full-day kindergarten sites.
5. What percentage of our ES students are currently enrolled in FDK?
11% of 5,026 kindergarten students are currently enrolled at the four (4) Title I schools and the six regional classes .
50

Attachment #1 Question #1
51

Attachment #1 Question #1
52

Attachment #1 Question #1
53

Attachment #1 Question #1
54

Attachment #1 Question #1
55
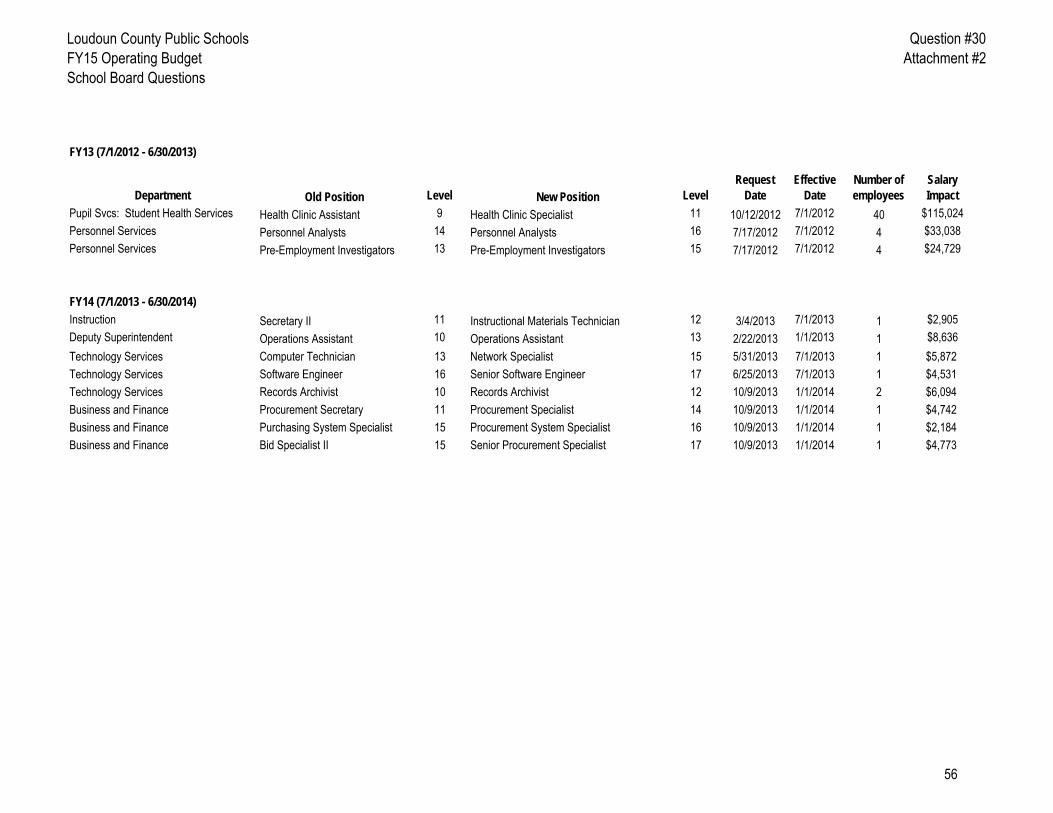
Loudoun County Public SchoolsFY15 Operating BudgetSchool Board Questions
Question #30Attachment #2
FY13 (7/1/2012 - 6/30/2013)
Department Old Position Level New Position LevelRequest
DateEffective
DateNumber of employees
Salary Impact
Pupil Svcs: Student Health Services Health Clinic Assistant 9 Health Clinic Specialist 11 10/12/2012 7/1/2012 40 $115,024 Personnel Services Personnel Analysts 14 Personnel Analysts 16 7/17/2012 7/1/2012 4 $33,038 Personnel Services Pre-Employment Investigators 13 Pre-Employment Investigators 15 7/17/2012 7/1/2012 4 $24,729
FY14 (7/1/2013 - 6/30/2014)
Instruction Secretary II 11 Instructional Materials Technician 12 3/4/2013 7/1/2013 1 $2,905 Deputy Superintendent Operations Assistant 10 Operations Assistant 13 2/22/2013 1/1/2013 1 $8,636 Technology Services Computer Technician 13 Network Specialist 15 5/31/2013 7/1/2013 1 $5,872Technology Services Software Engineer 16 Senior Software Engineer 17 6/25/2013 7/1/2013 1 $4,531Technology Services Records Archivist 10 Records Archivist 12 10/9/2013 1/1/2014 2 $6,094Business and Finance Procurement Secretary 11 Procurement Specialist 14 10/9/2013 1/1/2014 1 $4,742Business and Finance Purchasing System Specialist 15 Procurement System Specialist 16 10/9/2013 1/1/2014 1 $2,184Business and Finance Bid Specialist II 15 Senior Procurement Specialist 17 10/9/2013 1/1/2014 1 $4,773
56

Loudoun County Public SchoolsFY15 Operating BudgetSchool Board Questions
Question #31Attachment #3
Operating FundFY11 Budget FY11 Actual FY12 Budget FY12 Actual FY13 Budget FY13 Actual
Business & Personnel $4,830,016 $4,798,103 $5,229,025 $5,031,093 $5,799,577 $5,725,260Financial Services Operations and Maintenance $571,717 $410,021 $542,072 $484,106 $493,122 $548,740
$5,401,733 $5,208,124 $5,771,097 $5,515,199 $6,292,699 $6,274,001
Deputy Superintendent Personnel $689,764 $707,839 $726,887 $775,251 $816,301 $856,335Operations and Maintenance $245,656 $204,951 $253,227 $193,661 $244,538 $179,489Capital Outlay $0 $0 $0 $0 $0 $158,030
$935,420 $912,790 $980,114 $968,912 $1,060,839 $1,193,854
Grants Personnel $24,413,902 $29,924,112 $13,855,485 $21,256,324 $14,207,235 $15,122,783Operations and Maintenance $4,440,867 $5,221,666 $4,593,640 $2,934,048 $5,161,200 $5,871,004Capital Outlay $325,000 $9,420 $578,700 $76,327 $355,000 $614,996Transfers Out $0 $0 $0 $0 $0 $186,491
$29,179,769 $35,155,198 $19,027,825 $24,266,700 $19,723,435 $21,795,273
Instruction Personnel $381,821,006 $371,254,338 $413,078,867 $405,292,802 $450,575,136 $448,090,848Operations and Maintenance $19,680,170 $18,528,189 $20,987,955 $20,060,178 $20,628,513 $21,122,576Capital Outlay $436,896 $125,221 $524,650 $118,733 $469,500 $128,016
$401,938,072 $389,907,748 $434,591,472 $425,471,714 $471,673,149 $469,341,440
Non-Departmental Personnel $8,052,206 $22,246,467 $8,586,973 $23,961,055 $24,235,528 $19,188,792Operations and Maintenance $953,600 $1,190,874 $1,363,600 $1,225,403 $1,389,974 $1,253,810Transfers Out $0 $7,434,609 $0 $0 $0 $1,700,676
$9,005,806 $30,871,950 $9,950,573 $25,186,458 $25,625,502 $22,143,278
Personnel Services Personnel $3,767,085 $3,062,655 $3,758,269 $3,332,057 $3,907,448 $4,559,015Operations and Maintenance $1,359,424 $1,212,218 $1,254,848 $941,107 $1,239,276 $860,065Capital Outlay $76,258 $0 $76,258 $47,224 $0 $0
$5,202,767 $4,274,874 $5,089,375 $4,320,388 $5,146,724 $5,419,081
Planning & Personnel $1,085,302 $1,060,003 $1,145,780 $1,113,155 $1,056,418 $1,060,322Legislative Services Operations and Maintenance $51,980 $44,280 $479,701 $411,222 $297,494 $275,155
Capital Outlay $0 $7,435 $0 $0 $0 $0$1,137,282 $1,111,719 $1,625,481 $1,524,377 $1,353,912 $1,335,477
57

Loudoun County Public SchoolsFY15 Operating BudgetSchool Board Questions
Question #31Attachment #3
FY11 Budget FY11 Actual FY12 Budget FY12 Actual FY13 Budget FY13 ActualPublic Information Personnel $538,334 $541,895 $599,610 $609,426 $666,784 $685,297Office Operations and Maintenance $359,520 $403,897 $480,270 $453,083 $589,315 $538,278
$897,854 $945,792 $1,079,880 $1,062,509 $1,256,099 $1,223,575
Pupil Services Personnel $115,291,682 $110,631,370 $126,138,282 $128,330,875 $143,442,967 $143,838,394Operations and Maintenance $4,585,205 $5,393,412 $4,326,742 $4,986,600 $4,565,161 $5,357,608Capital Outlay $0 $267,443 $0 $157,898 $0 $33,895
$119,876,887 $116,292,225 $130,465,024 $133,475,373 $148,008,128 $149,229,896
School Board Personnel $329,704 $329,468 $334,517 $360,246 $332,473 $405,303Operations and Maintenance $72,711 $58,593 $76,396 $61,839 $60,176 $57,676
$402,415 $388,061 $410,913 $422,085 $392,649 $462,979
Superintendent Personnel $603,859 $772,040 $714,453 $738,138 $801,909 $747,929Operations and Maintenance $367,422 $188,032 $268,966 $169,185 $258,739 $55,772
$971,281 $960,071 $983,419 $907,323 $1,060,648 $803,700
Support Services Personnel $78,166,175 $70,883,657 $80,714,239 $74,613,754 $78,755,546 $79,780,876Operations and Maintenance $42,080,673 $36,561,841 $42,336,846 $40,868,049 $43,664,598 $41,487,654Capital Outlay $368,750 $236,814 $452,875 $1,714,445 $641,000 $270,363
$120,615,598 $107,682,311 $123,503,960 $117,196,248 $123,061,144 $121,538,892
Technology Services Personnel $6,380,021 $6,302,230 $6,602,224 $6,668,302 $7,612,130 $7,267,782Operations and Maintenance $7,466,257 $11,082,249 $5,423,020 $8,750,474 $8,983,338 $8,790,313Capital Outlay $934,500 $556,536 $442,500 $270,511 $1,821,347 $1,262,114
$14,780,778 $17,941,015 $12,467,744 $15,689,287 $18,416,815 $17,320,208
Food Services FundFY11 Budget FY11 Actual FY12 Budget FY12 Actual FY13 Budget FY13 Actual
Personnel $13,190,278 $11,744,098 $13,635,358 $12,281,447 $15,179,554 $13,323,618Operations and Maintenance $10,818,994 $8,461,578 $11,392,450 $9,925,730 $9,877,069 $11,706,257Capital Outlay $25,000 $0 $25,000 $0 $25,000 $187,248
$24,034,272 $20,205,676 $25,052,808 $22,207,178 $25,081,623 $25,217,123
58

Loudoun County Public SchoolsFY15 Operating BudgetSchool Board Questions
Question #55Attachment #4
Tech Bach Bach + 15 Bach + 30 Master's MS + 30 Doctoral1 47,500$ 47,500$ 49,000$ 50,000$ 53,000$ 54,500$ 59,000$ 12 47,931$ 47,931$ 49,376$ 50,823$ 53,711$ 55,156$ 59,491$ 23 48,267$ 48,267$ 49,719$ 51,173$ 54,075$ 55,527$ 59,882$ 34 49,154$ 49,154$ 50,617$ 52,081$ 55,004$ 56,467$ 60,853$ 45 49,498$ 49,498$ 50,968$ 52,439$ 55,376$ 56,846$ 61,254$ 56 49,847$ 49,847$ 51,324$ 52,802$ 55,753$ 57,230$ 61,658$ 67 50,567$ 50,567$ 52,050$ 53,534$ 56,501$ 57,985$ 62,434$ 78 51,558$ 51,558$ 53,053$ 54,546$ 57,534$ 59,028$ 63,510$ 89 52,557$ 52,557$ 54,061$ 55,565$ 58,575$ 60,080$ 64,592$ 910 53,564$ 53,564$ 55,079$ 56,595$ 59,622$ 61,140$ 65,683$ 1011 54,580$ 54,580$ 56,104$ 57,632$ 60,682$ 62,208$ 66,784$ 1112 56,224$ 56,224$ 57,743$ 59,263$ 62,297$ 63,816$ 68,372$ 1213 57,920$ 57,920$ 59,431$ 60,943$ 63,965$ 65,478$ 70,011$ 1314 59,667$ 59,667$ 61,170$ 62,676$ 65,685$ 67,190$ 71,703$ 1415 61,467$ 61,467$ 62,965$ 64,463$ 67,456$ 68,955$ 73,447$ 1516 63,027$ 63,027$ 64,509$ 65,992$ 68,959$ 70,444$ 74,893$ 1617 64,621$ 64,621$ 66,089$ 67,560$ 70,498$ 71,968$ 76,376$ 1718 66,250$ 66,250$ 67,706$ 69,162$ 72,072$ 73,529$ 77,895$ 1819 67,990$ 67,990$ 69,439$ 70,888$ 73,784$ 75,233$ 79,578$ 1920 69,776$ 69,776$ 71,218$ 72,660$ 75,542$ 76,984$ 81,308$ 2021 71,784$ 71,784$ 73,223$ 74,660$ 77,535$ 78,975$ 83,288$ 2122 73,851$ 73,851$ 75,283$ 76,718$ 79,587$ 81,022$ 85,325$ 2223 75,975$ 75,975$ 77,406$ 78,838$ 81,698$ 83,131$ 87,423$ 2324 78,164$ 78,164$ 79,591$ 81,020$ 83,874$ 85,302$ 89,583$ 2425 80,417$ 80,417$ 81,840$ 83,264$ 86,113$ 87,538$ 91,808$ 2526 82,735$ 82,735$ 84,156$ 85,577$ 88,417$ 89,838$ 94,099$ 2627 85,122$ 85,122$ 86,538$ 87,957$ 90,790$ 92,206$ 96,459$ 2728 87,579$ 87,579$ 88,991$ 90,405$ 93,233$ 94,646$ 98,887$ 2829 90,331$ 90,331$ 91,744$ 93,159$ 95,985$ 97,399$ 101,638$ 2930 92,107$ 90,880$ 92,425$ 94,988$ 97,873$ 99,315$ 103,639$ 30
Teachers' Scale
159
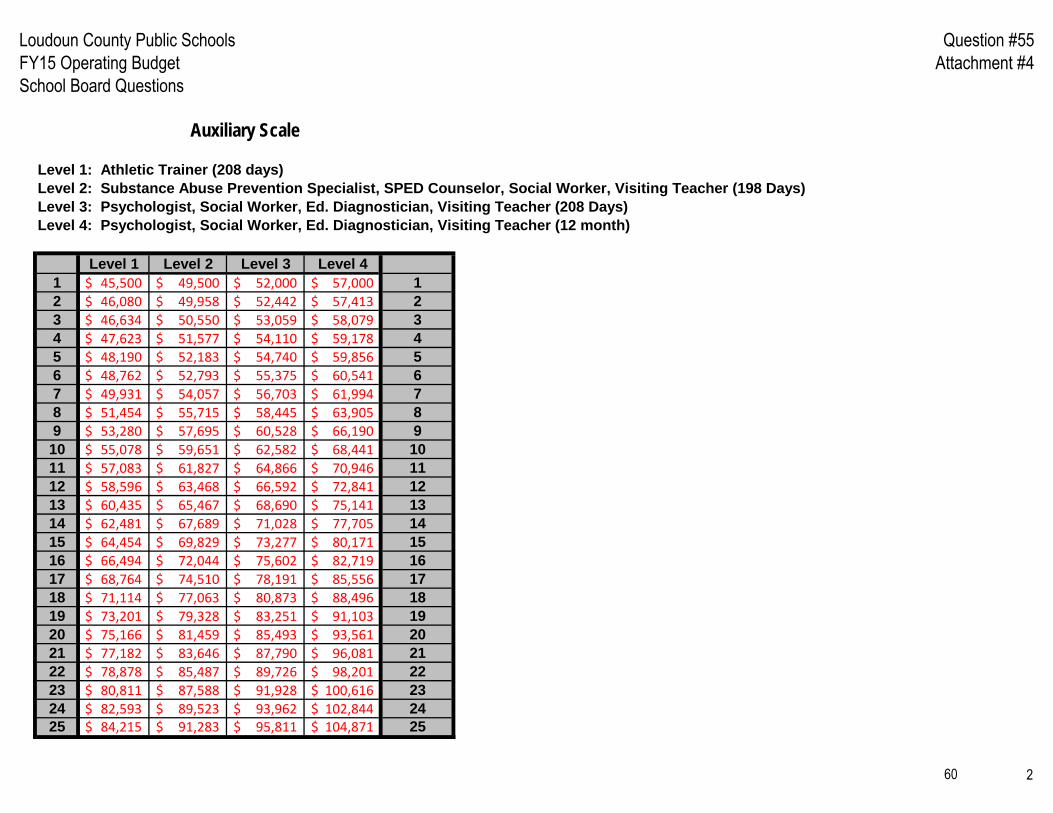
Loudoun County Public SchoolsFY15 Operating BudgetSchool Board Questions
Question #55Attachment #4
Level 1: Athletic Trainer (208 days)Level 2: Substance Abuse Prevention Specialist, SPED Counselor, Social Worker, Visiting Teacher (198 Days)Level 3: Psychologist, Social Worker, Ed. Diagnostician, Visiting Teacher (208 Days)Level 4: Psychologist, Social Worker, Ed. Diagnostician, Visiting Teacher (12 month)
Level 1 Level 2 Level 3 Level 41 45,500$ 49,500$ 52,000$ 57,000$ 12 46,080$ 49,958$ 52,442$ 57,413$ 23 46,634$ 50,550$ 53,059$ 58,079$ 34 47,623$ 51,577$ 54,110$ 59,178$ 45 48,190$ 52,183$ 54,740$ 59,856$ 56 48,762$ 52,793$ 55,375$ 60,541$ 67 49,931$ 54,057$ 56,703$ 61,994$ 78 51,454$ 55,715$ 58,445$ 63,905$ 89 53,280$ 57,695$ 60,528$ 66,190$ 910 55,078$ 59,651$ 62,582$ 68,441$ 1011 57,083$ 61,827$ 64,866$ 70,946$ 1112 58,596$ 63,468$ 66,592$ 72,841$ 1213 60,435$ 65,467$ 68,690$ 75,141$ 1314 62,481$ 67,689$ 71,028$ 77,705$ 1415 64,454$ 69,829$ 73,277$ 80,171$ 1516 66,494$ 72,044$ 75,602$ 82,719$ 1617 68,764$ 74,510$ 78,191$ 85,556$ 1718 71,114$ 77,063$ 80,873$ 88,496$ 1819 73,201$ 79,328$ 83,251$ 91,103$ 1920 75,166$ 81,459$ 85,493$ 93,561$ 2021 77,182$ 83,646$ 87,790$ 96,081$ 2122 78,878$ 85,487$ 89,726$ 98,201$ 2223 80,811$ 87,588$ 91,928$ 100,616$ 2324 82,593$ 89,523$ 93,962$ 102,844$ 2425 84,215$ 91,283$ 95,811$ 104,871$ 25
Auxiliary Scale
260

Loudoun County Public SchoolsFY15 Operating BudgetSchool Board Questions
Question #55Attachment #4
Level 5 Level 6 Level 7 Level 8 Level 9 Level 10 Level 11 Level 12 Level 13 Level 14 Level 15 Level 16 Level 171 12.00$ 12.75$ 13.75$ 14.75$ 15.50$ 16.75$ 17.75$ 19.00$ 20.25$ 21.75$ 23.25$ 24.75$ 26.50$ 12 12.17$ 12.97$ 13.86$ 14.82$ 15.78$ 16.86$ 18.00$ 19.25$ 20.58$ 21.96$ 23.45$ 25.06$ 26.79$ 23 12.31$ 13.13$ 14.03$ 15.00$ 15.97$ 17.06$ 18.22$ 19.48$ 20.83$ 22.22$ 23.73$ 25.36$ 27.10$ 34 12.58$ 13.43$ 14.32$ 15.31$ 16.29$ 17.39$ 18.55$ 19.83$ 21.18$ 22.59$ 24.13$ 25.76$ 27.52$ 45 12.74$ 13.59$ 14.49$ 15.49$ 16.47$ 17.60$ 18.77$ 20.07$ 21.43$ 22.86$ 24.41$ 26.06$ 27.86$ 56 12.88$ 13.75$ 14.66$ 15.67$ 16.66$ 17.80$ 18.98$ 20.30$ 21.69$ 23.13$ 24.69$ 26.36$ 28.17$ 67 13.14$ 14.02$ 14.94$ 15.95$ 16.98$ 18.14$ 19.36$ 20.68$ 22.08$ 23.57$ 25.18$ 26.88$ 28.71$ 78 13.45$ 14.35$ 15.29$ 16.35$ 17.39$ 18.59$ 19.82$ 21.18$ 22.62$ 24.14$ 25.79$ 27.53$ 29.42$ 89 13.76$ 14.68$ 15.65$ 16.72$ 17.82$ 19.04$ 20.30$ 21.71$ 23.17$ 24.74$ 26.40$ 28.23$ 30.13$ 910 14.11$ 15.02$ 16.01$ 17.13$ 18.24$ 19.50$ 20.79$ 22.23$ 23.74$ 25.35$ 27.06$ 28.91$ 30.85$ 1011 14.44$ 15.39$ 16.41$ 17.54$ 18.68$ 19.97$ 21.30$ 22.76$ 24.31$ 25.96$ 27.71$ 29.60$ 31.63$ 1112 14.78$ 15.75$ 16.79$ 17.96$ 19.11$ 20.45$ 21.83$ 23.32$ 24.89$ 26.60$ 28.37$ 30.35$ 32.40$ 1213 15.12$ 16.13$ 17.21$ 18.40$ 19.58$ 20.95$ 22.35$ 23.89$ 25.49$ 27.25$ 29.07$ 31.08$ 33.20$ 1314 15.49$ 16.51$ 17.61$ 18.83$ 20.06$ 21.45$ 22.89$ 24.45$ 26.12$ 27.91$ 29.78$ 31.84$ 34.00$ 1415 15.86$ 16.91$ 18.04$ 19.30$ 20.55$ 21.95$ 23.45$ 25.06$ 26.75$ 28.60$ 30.50$ 32.60$ 34.82$ 1516 16.23$ 17.32$ 18.46$ 19.74$ 21.03$ 22.50$ 24.03$ 25.67$ 27.40$ 29.28$ 31.24$ 33.39$ 35.68$ 1617 16.68$ 17.80$ 18.98$ 20.31$ 21.63$ 23.11$ 24.69$ 26.39$ 28.17$ 30.12$ 32.13$ 34.36$ 36.69$ 1718 17.15$ 18.29$ 19.52$ 20.86$ 22.23$ 23.77$ 25.37$ 27.16$ 28.94$ 30.98$ 33.04$ 35.33$ 37.74$ 1819 17.63$ 18.82$ 20.06$ 21.46$ 22.86$ 24.45$ 26.10$ 27.92$ 29.79$ 31.86$ 33.98$ 36.34$ 38.84$ 1920 18.12$ 19.33$ 20.61$ 22.06$ 23.50$ 25.15$ 26.84$ 28.71$ 30.63$ 32.75$ 34.95$ 37.38$ 39.94$ 2021 18.62$ 19.87$ 21.20$ 22.70$ 24.16$ 25.86$ 27.59$ 29.52$ 31.50$ 33.69$ 35.94$ 38.43$ 41.07$ 2122 19.15$ 20.42$ 21.79$ 23.32$ 24.85$ 26.57$ 28.38$ 30.38$ 32.40$ 34.64$ 36.97$ 39.53$ 42.24$ 2223 19.68$ 20.99$ 22.40$ 23.98$ 25.55$ 27.32$ 29.20$ 31.22$ 33.31$ 35.63$ 38.01$ 40.64$ 43.44$ 2324 20.23$ 21.59$ 23.02$ 24.66$ 26.27$ 28.10$ 30.00$ 32.11$ 34.26$ 36.64$ 39.09$ 41.81$ 44.66$ 2425 20.81$ 22.20$ 23.68$ 25.36$ 27.03$ 28.90$ 30.84$ 33.03$ 35.25$ 37.68$ 40.19$ 43.01$ 45.94$ 2526 21.39$ 22.82$ 24.34$ 26.08$ 27.79$ 29.69$ 31.74$ 33.96$ 36.25$ 38.77$ 41.34$ 44.22$ 47.28$ 2627 21.98$ 23.46$ 25.04$ 26.80$ 28.56$ 30.55$ 32.63$ 34.93$ 37.27$ 39.87$ 42.53$ 45.49$ 48.63$ 2728 22.41$ 23.94$ 25.61$ 27.45$ 29.30$ 31.39$ 33.55$ 35.90$ 38.32$ 40.98$ 43.73$ 46.75$ 49.98$ 28
Classified Scale
361

Loudoun County Public SchoolsFY15 Operating BudgetSchool Board Questions
Question #55Attachment #4
Level 1 Level 2 Level 3 Level 4 Level 5 Level 6 Level 71 73,500$ 78,500$ 84,000$ 90,000$ 96,000$ 103,000$ 115,000$ 12 74,036$ 79,950$ 84,656$ 90,530$ 96,814$ 103,540$ 117,314$ 23 74,769$ 80,836$ 86,016$ 91,977$ 98,354$ 105,180$ 118,518$ 34 76,136$ 82,354$ 87,810$ 93,859$ 100,329$ 107,255$ 120,177$ 45 76,983$ 83,847$ 89,187$ 95,322$ 101,886$ 108,912$ 122,497$ 56 78,021$ 84,951$ 90,569$ 96,792$ 103,449$ 110,575$ 124,273$ 67 80,094$ 87,072$ 92,527$ 98,885$ 105,689$ 112,969$ 127,172$ 78 82,061$ 88,999$ 94,811$ 101,329$ 108,047$ 115,492$ 129,473$ 89 83,878$ 91,401$ 97,151$ 103,835$ 110,458$ 118,073$ 131,808$ 910 85,733$ 93,869$ 99,783$ 106,650$ 113,185$ 120,990$ 134,177$ 1011 88,088$ 96,405$ 102,246$ 109,286$ 115,707$ 123,691$ 137,198$ 1112 90,508$ 99,011$ 104,770$ 111,988$ 118,286$ 126,451$ 140,285$ 1213 92,995$ 101,687$ 107,354$ 114,754$ 120,919$ 129,270$ 143,441$ 1314 95,555$ 104,437$ 110,001$ 117,588$ 123,611$ 132,150$ 146,665$ 1415 98,184$ 107,263$ 112,715$ 120,490$ 126,360$ 135,092$ 149,962$ 1516 100,981$ 110,165$ 115,823$ 123,819$ 129,543$ 138,497$ 153,329$ 1617 103,863$ 113,423$ 118,906$ 127,116$ 132,676$ 141,852$ 156,770$ 1718 106,830$ 116,777$ 122,131$ 130,567$ 135,953$ 145,358$ 160,286$ 1819 109,879$ 119,079$ 124,837$ 133,464$ 138,638$ 148,231$ 163,879$ 1920 111,935$ 121,567$ 127,303$ 136,102$ 141,378$ 151,164$ 166,338$ 20
Administrators' Scale
462

Loudoun County Public SchoolsFY15 Operating BudgetSchool Board Questions
Question #62Attachment #5
FY12 (7/1/2011 - 6/30/2012)
Department Old Position Level New Position LevelRequest
DateEffective
Date# of
EmployeesSalary Impact
Bus & Fin Payroll Spec. II 13 Payroll Spec. III - 14 14 7/12/2011 1/3/2012 2 $3,696Bus & Fin Budget Technician 14 Budget Analyst - 16 16 7/12/2011 1/3/2012 1 $3,585Instruction Secretary II 11 IMT - 12 12 5/18/2012 7/2/2012 1 $4,733Pupil Services Registrar 15 Senior Registrar - 17 17 2/17/2012 7/2/2012 1 $10,364Pupil Services Secretary II 11 Prog. Asst. SHS - 13 13 4/18/2012 7/2/2012 1 $6,298
63
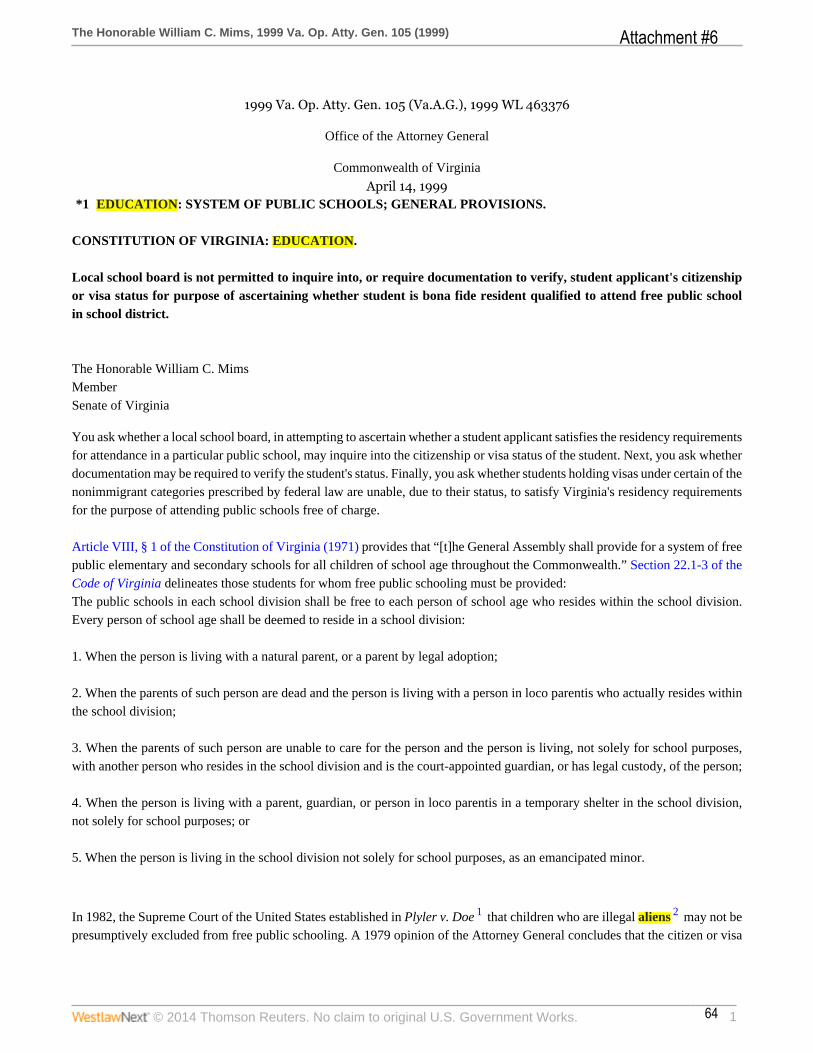
The Honorable William C. Mims, 1999 Va. Op. Atty. Gen. 105 (1999)
© 2014 Thomson Reuters. No claim to original U.S. Government Works. 1
1999 Va. Op. Atty. Gen. 105 (Va.A.G.), 1999 WL 463376
Office of the Attorney General
Commonwealth of Virginia
April 14, 1999*1 EDUCATION: SYSTEM OF PUBLIC SCHOOLS; GENERAL PROVISIONS.
CONSTITUTION OF VIRGINIA: EDUCATION.
Local school board is not permitted to inquire into, or require documentation to verify, student applicant's citizenshipor visa status for purpose of ascertaining whether student is bona fide resident qualified to attend free public schoolin school district.
The Honorable William C. MimsMemberSenate of Virginia
You ask whether a local school board, in attempting to ascertain whether a student applicant satisfies the residency requirementsfor attendance in a particular public school, may inquire into the citizenship or visa status of the student. Next, you ask whetherdocumentation may be required to verify the student's status. Finally, you ask whether students holding visas under certain of thenonimmigrant categories prescribed by federal law are unable, due to their status, to satisfy Virginia's residency requirementsfor the purpose of attending public schools free of charge.
Article VIII, § 1 of the Constitution of Virginia (1971) provides that “[t]he General Assembly shall provide for a system of freepublic elementary and secondary schools for all children of school age throughout the Commonwealth.” Section 22.1-3 of theCode of Virginia delineates those students for whom free public schooling must be provided:The public schools in each school division shall be free to each person of school age who resides within the school division.Every person of school age shall be deemed to reside in a school division:
1. When the person is living with a natural parent, or a parent by legal adoption;
2. When the parents of such person are dead and the person is living with a person in loco parentis who actually resides withinthe school division;
3. When the parents of such person are unable to care for the person and the person is living, not solely for school purposes,with another person who resides in the school division and is the court-appointed guardian, or has legal custody, of the person;
4. When the person is living with a parent, guardian, or person in loco parentis in a temporary shelter in the school division,not solely for school purposes; or
5. When the person is living in the school division not solely for school purposes, as an emancipated minor.
In 1982, the Supreme Court of the United States established in Plyler v. Doe 1 that children who are illegal aliens 2 may not bepresumptively excluded from free public schooling. A 1979 opinion of the Attorney General concludes that the citizen or visa
Attachment #6
64

The Honorable William C. Mims, 1999 Va. Op. Atty. Gen. 105 (1999)
© 2014 Thomson Reuters. No claim to original U.S. Government Works. 2
status of an alien student does not affect his eligibility for tuition-free education. 3 Whether such student is entitled to tuition-
free education in a particular school division “turns on his residence.” 4
With respect to the question of attending public schools tuition-free, “[r]esidence of a child is determined by the child's residencewith a legal guardian, such as a natural or adoptive parent, a court-appointed guardian or, in the case of parental death, a person
in loco parentis.” 5 Furthermore, § 22.1-3 “establishes a legislative presumption that a child residing with a natural parent is
entitled to free admission to the schools of that locality in which the natural parent lives.” 6 Thus, “children who have established
bona fide residence, not necessarily ‘domicile,’ in [a] county are also entitled to attend the schools of the county.” 7 “Residencefor the purpose of free admission to local public schools must be bona fide residence and not merely superficial residence solely
for the purpose of attending school.” 8
*2 The federal Immigration and Nationality Act 9 requires most foreign visitors to apply for a visa before entering the UnitedStates. Visas issued in the B, C, or D categories are among the nonimmigrant visas issued for the specific purpose of the foreign
nationals' temporary visit. 10 Specifically, the B visa allows foreign businessmen to enter the United States for a brief period
(generally, no more than six months per year) in order to conduct limited business activities. 11 The B visa also allows foreign
visitors to enter for a temporary visit for pleasure or tourism purposes. 12 C visas are issued for foreign nationals temporarily in
the United States while in transit to another destination. 13 D visas generally are issued for foreign crewmen serving on boarda vessel or aircraft, who intend to land in the United States temporarily and solely in pursuit of their duties and to depart with
the vessel or aircraft on which they arrived or on another vessel or aircraft. 14
As with legal or illegal aliens, although visa holders may be required, “as others are required, to establish that they are bona
fide residents of a jurisdiction before qualifying for free public schooling in that jurisdiction,” 15 their visa status does notpresumptively exclude them or their children. Thus, so long as a student is “a bona fide resident ... and if his residence was notcontrived for the primary purpose of securing his attendance at [a] political subdivision's public school system, he is entitled to
tuition-free education there,” 16 regardless of his citizenship or his B, C, or D visa status.
Whereas proof of domicile is part of the residency requirements for certain matters, 17 residency for attending public schoolsis prescribed in § 22.1-3 and determined in reference to the legal guardianship of the student. The intent to remain in a place of
abode for a certain period of time is not a necessary condition of residency under that section. 18 Thus, inquiring into a student'scitizenship or his B, C, or D visa status for the purpose of determining residency pursuant to § 22.1-3 is unwarranted.
Accordingly, it is my opinion that a local school board is not permitted to inquire into a student applicant's citizenship or hisB, C, or D visa status, nor may it require documentation to verify such status, for the purpose of ascertaining whether such
applicant is a resident of the school district. 19
Mark L. EarleyAttorney General
Footnotes1 457 U.S. 202 (1982).
2 “The term ‘alien’ means any person not a citizen or national of the United States.” 8 U.S.C.A. § 1101(a)(3) (West 1970).
3 See 1979-1980 Op. Va. Att'y Gen. 292.
4 Id. at 292.
5 1987-1988 Op. Va. Att'y Gen. 374, 375.
Attachment #6
65

The Honorable William C. Mims, 1999 Va. Op. Atty. Gen. 105 (1999)
© 2014 Thomson Reuters. No claim to original U.S. Government Works. 3
6 1982-1983 Op. Va. Att'y Gen. 431, 432.
7 1976-1977 Op. Va. Att'y Gen. 240, 241; see also 1974-1975 Op. Va. Att'y Gen. 378, 379 (stating “[a] residence for the purpose of
free admission to the public schools is not necessarily the same as a domicile”).
8 1982-1983 Op. Va. Att'y Gen., supra note 6, at 432.
9 8 U.S.C.A §§ 1101–1646 (West 1970 & Supp. 1998).
10 See 8 U.S.C.A. § 1101(a)(15)(A)-(S) (West 1970 & Supp. 1998).
11 See 8 U.S.C.A. § 1101(a)(15)(B) (West 1970).
12 See id.
13 See 8 U.S.C.A. § 1101(a)(15)(C) (West 1970).
14 See 8 U.S.C.A. § 1101(a)(15)(D) (West Supp. 1998).
15 1987-1988 Op. Va. Att'y Gen., supra note 5, at 374.
16 1979-1980 Op. Va. Att'y Gen., supra note 3, at 292.
17 See, e.g., Va. Const. art. II, § 1 (providing that “[r]esidence, for all purposes of qualification to vote, requires both domicile and a
place of abode”); § 23-7.4 (defining “domicile” as “the present, fixed home of an individual” and “domiciliary intent” as the “present
intent to remain indefinitely” for purposes of determining eligibility for in-state tuition in higher education programs); § 46.2-341.4
(defining “domicile” as “a person's true, fixed and permanent home and principal residence” for purposes of motor vehicle licensure).
18 Compare § 23-7.4(B) (providing that “[t]o become eligible for in-state tuition [for state-supported higher education institutions], an
independent student shall establish by clear and convincing evidence that for a period of at least one year immediately prior to the
date of the alleged entitlement, he was domiciled in Virginia and had abandoned any previous domicile, if such existed”).
19 You have inquired specifically regarding B, C and D visa statuses. Accordingly, this opinion does not address any other visa status,
such as F visa status which, as you have noted, is subject to certain federally imposed restrictions on public school attendance.
1999 Va. Op. Atty. Gen. 105 (Va.A.G.), 1999 WL 463376
End of Document © 2014 Thomson Reuters. No claim to original U.S. Government Works.
Attachment #6
66
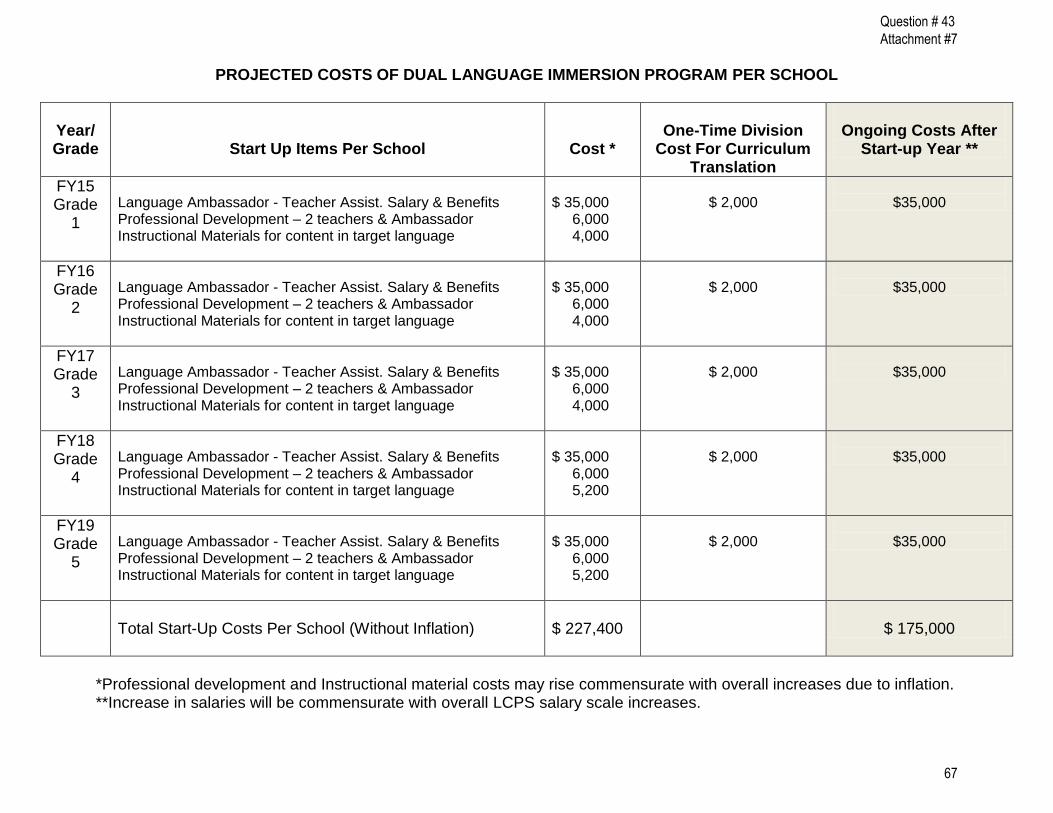
PROJECTED COSTS OF DUAL LANGUAGE IMMERSION PROGRAM PER SCHOOL
Year/ Grade
Start Up Items Per School
Cost *
One-Time Division
Cost For Curriculum Translation
Ongoing Costs After
Start-up Year **
FY15 Grade
1
Language Ambassador - Teacher Assist. Salary & Benefits Professional Development – 2 teachers & Ambassador Instructional Materials for content in target language
$ 35,000 6,000 4,000
$ 2,000
$35,000
FY16 Grade
2
Language Ambassador - Teacher Assist. Salary & Benefits Professional Development – 2 teachers & Ambassador Instructional Materials for content in target language
$ 35,000 6,000 4,000
$ 2,000
$35,000
FY17 Grade
3
Language Ambassador - Teacher Assist. Salary & Benefits Professional Development – 2 teachers & Ambassador Instructional Materials for content in target language
$ 35,000 6,000 4,000
$ 2,000
$35,000
FY18 Grade
4
Language Ambassador - Teacher Assist. Salary & Benefits Professional Development – 2 teachers & Ambassador Instructional Materials for content in target language
$ 35,000 6,000 5,200
$ 2,000
$35,000
FY19 Grade
5
Language Ambassador - Teacher Assist. Salary & Benefits Professional Development – 2 teachers & Ambassador Instructional Materials for content in target language
$ 35,000 6,000 5,200
$ 2,000
$35,000
Total Start-Up Costs Per School (Without Inflation)
$ 227,400
$ 175,000
*Professional development and Instructional material costs may rise commensurate with overall increases due to inflation.
**Increase in salaries will be commensurate with overall LCPS salary scale increases.
67
Question # 43 Attachment #7

Parent Liaison Actual Hours FY13
School EnrollmentActual
HrsTotal
Salary
Aldie ES 120 75 $1,219.92
Algonkian ES 475 257 $4,193.17
Arcola ES 717 398 $6,498.84
Ashburn ES 664 587 $9,586.92
Balls Bluff ES 692 367 $5,992.53
Banneker ES 203 42 $677.28
Belmont Station ES 882 553 $9,023.33
Buffalo Trail ES 676 212 $3,459.75
Catoctin ES 600 466 $7,596.96
Cedar Lane ES 741 465 $7,585.92
Cool Spring ES 668 416 $6,789.12
Countryside ES 719 386 $6,303.60
Culbert ES 516 105 $1,705.44
Creightons Corner ES 1236 856 $13,974.00
Dominion Trail ES 693 401 $6,539.42
Emerick ES 483 181 $2,953.90
Evergreen Mill ES 683 572 $9,341.27
FH Reid ES 734 688 $11,223.88
Frederick Douglass ES 617 346 $5,652.43
Forest Grove ES 564 592 $9,669.27
Hamilton ES 151 283 $4,611.06
Hillsboro ES 65 145 $2,364.32
Hillside ES 713 466 $7,597.24
Horizon ES 741 326 $5,327.17
Hutchinson Farm ES 849 307 $5,013.01
Leesburg ES 632 311 $5,075.52
Legacy ES 1138 421 $6,863.56
Liberty ES 1116 351 $5,722.16
Lincoln ES 134 304 $4,968.38
68
Question #103 Attachment #8

Parent Liaison Actual Hours FY13
School EnrollmentActual
HrsTotal
Salary
Little River ES 802 427 $6,960.50
Lovettsville ES 539 740 $12,068.64
Lowes Island ES 699 302 $4,932.85
Lucketts ES 245 166 $2,706.53
Meadowland ES 476 641 $10,452.96
Middleburg ES 61 134 $2,178.72
Mill Run ES 1021 560 $9,143.26
Mountain View ES 519 453 $7,385.80
Newton-Lee ES 981 532 $8,686.10
Pinebrook ES 1009 383 $6,258.52
Potowmack ES 585 664 $10,834.09
Rosa Lee Carter 931 292 $4,758.10
Round Hill ES 544 404 $6,585.12
S. Weller ES 822 196 $3,197.25
Sanders Corner ES 636 474 $7,735.68
Seldens Landing ES 1069 445 $7,266.48
Sterling ES 556 486 $7,937.76
Sycolin Creek ES 708 453 $7,388.88
Tolbert ES 803 281 $4,577.76
Waterford ES 209 40 $652.80
69
Question #103 Attachment #8

Parent Liaison Actual Hours FY13
School EnrollmentActual
HrsTotal Salary
Belmont Ridge MS 1472 671 $10,954.24
Blue Ridge MS 953 508 $8,295.04
Eagle Ridge MS 1215 481 $7,847.98
Farmwell Station MS 1314 642 $10,481.52
Harmony MS 1122 506 $8,257.92
Harper Park MS 1054 542 $8,849.50
JL Simpson MS 1050 622 $10,155.12
J Michael Lunsford 1308 451 $7,356.64
Mercer MS 809 514 $8,383.12
River Bend MS 1079 541 $8,821.36
Seneca Ridge MS 1055 645 $10,526.32
Smart's Mill MS 1040 437 $7,131.84
Sterling MS 877 724 $11,811.62
Stone Hill MS 1243 644 $10,510.06
70
Question #103 Attachment #8

Parent Liaison Actual Hours FY13
School EnrollmentActual
HrsTotal
Salary
Briar Woods HS 2007 392 $6,392.28
Broad Run HS 1814 901 $14,710.24
Dominion HS 1466 677 $11,040.48
Douglass School 664 $10,828.32
Freedom HS 1597 523 $8,540.52
Heritage HS 1190 417 $6,811.96
John Champe HS 552 538 $8,785.06
Loudoun County HS 1358 311 $5,079.62
Loudoun Valley HS 1145 697 $11,383.00
Monroe Tech Center 678 $11,058.88
Park View HS 1168 642 $10,469.28
Potomac Falls HS 1577 467 $7,625.52
Stone Bridge HS 1691 0 $0.00
Tuscoraora HS 1972 637 $10,396.17
Woodgrove HS 1518 841 $13,725.12
71
Question #103 Attachment #8

Parent Liaison PayrollSummary
Title I
School EnrollmentACTUAL
HRS.Total Salary
Guilford ES 462 906 $14,777.76
Rolling Ridge ES 617 772 $12,590.88
Sugarland ES 558 657 $10,723.38
Sully ES 450 702 $11,464.72
72
Question #103 Attachment #8
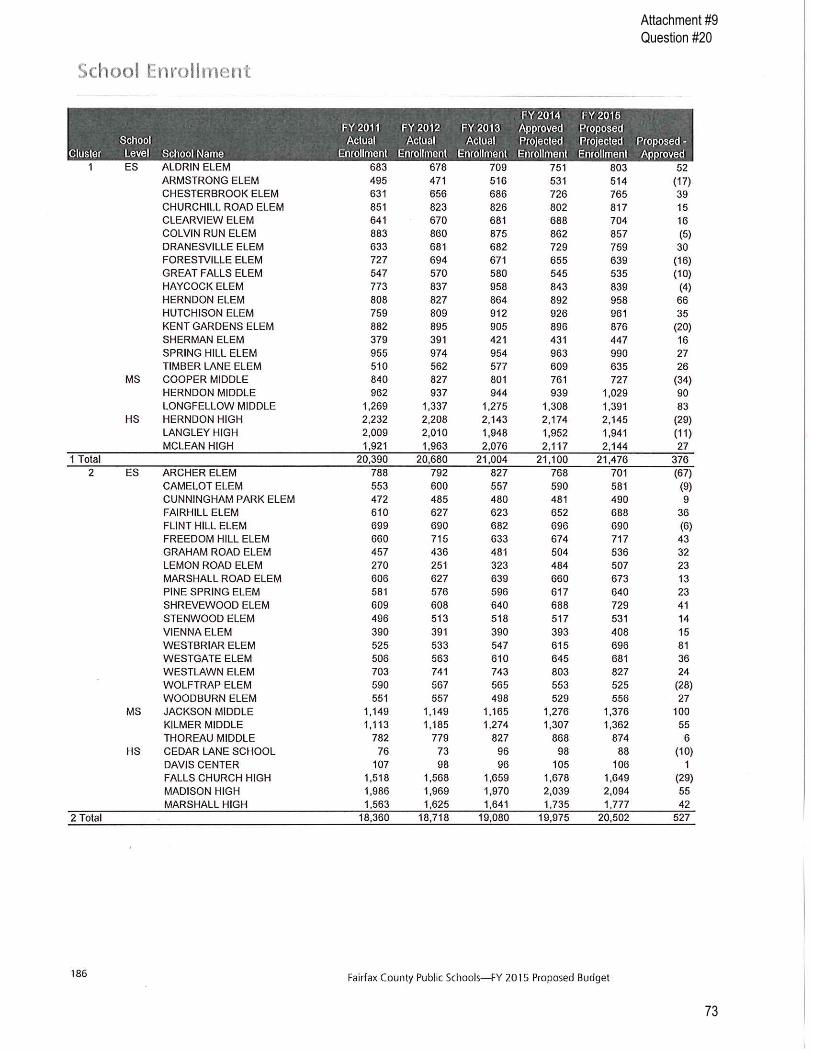
Attachment #9 Question #20
73

Attachment #9 Question #20
74

Attachment #9 Question #20
75
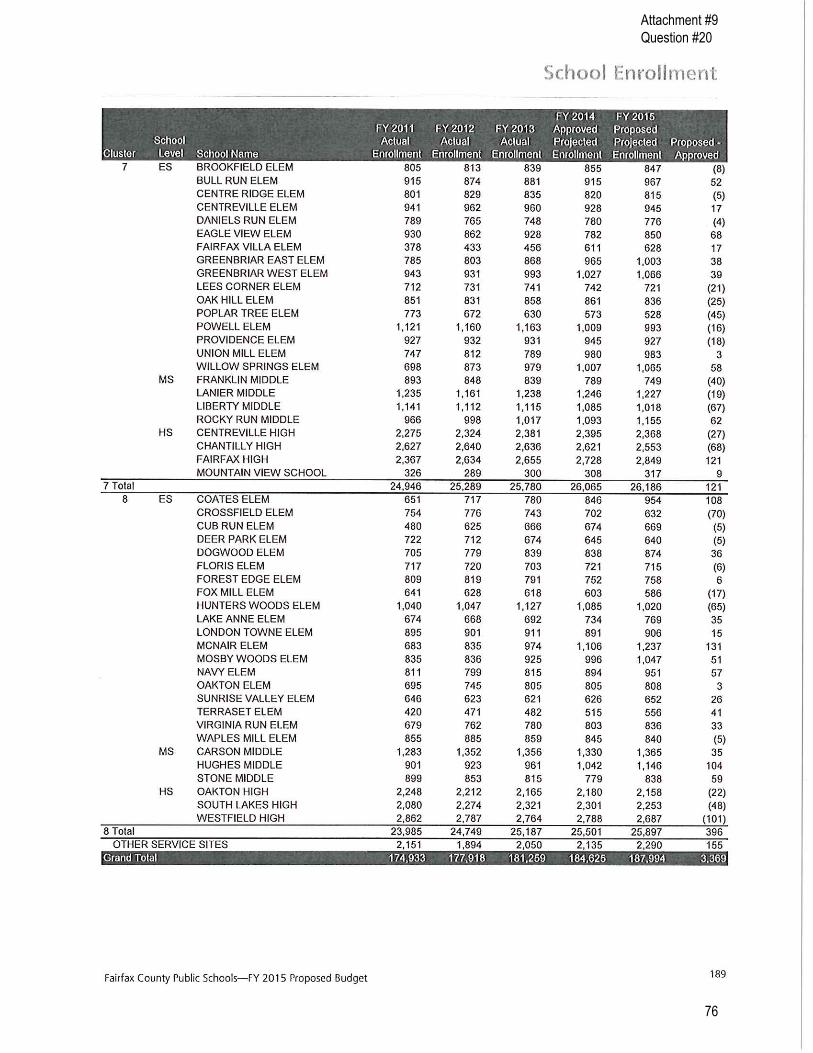
Attachment #9 Question #20
76

SUPPLEMENTAL SECTION
K 1 2 3 4 5 PS ST HS TotalAldie ES 19 23 23 30 25 21 1 142Algonkian ES 53 82 87 89 99 79 5 494Arcola ES 107 173 165 139 133 159 20 896Ashburn ES 83 114 113 104 137 133 24 708Ball's Bluff ES 109 96 105 112 95 103 17 637Banneker ES 19 18 25 20 27 31 1 141Belmont Station ES 101 120 136 138 157 144 8 804Buffalo Trail 105 188 191 180 157 151 22 994Cardinal Ridge ES (ES-21)Catoctin ES 86 105 89 112 95 90 20 597Cedar Lane ES 102 128 102 115 107 124 27 705Cool Spring ES 105 125 90 114 110 112 29 685Countryside ES 105 146 114 107 96 136 23 727Creighton's Corner ES 135 192 174 171 120 117 4 913Discovery ES 81 122 121 133 122 95 31 30 735Dominion Trail ES 86 142 101 109 94 111 3 646Emerick ES 58 69 96 78 81 96 1 479Evergreen Mill ES 89 94 101 103 100 97 26 30 640Forest Grove ES 78 97 103 88 89 91 24 570Frances Hazel Reid ES 81 121 109 126 131 140 25 733Fredrick Douglass ES 86 106 107 106 100 99 25 30 659Guilford ES 98 92 89 93 75 67 1 515Hamilton ES 23 27 32 22 35 27 1 167Hillsboro ES 8 12 10 5 19 8 62Hillside ES 87 93 123 108 124 158 10 703Horizon ES 85 126 118 97 110 150 14 30 730Hutchison Farm ES 112 113 142 128 142 151 5 793John W Tolbert, Jr ES 118 126 125 137 133 140 8 787Kenneth W. Culbert ES 57 60 87 96 110 110 31 551Leesburg ES 83 97 98 105 95 111 3 592Legacy ES 145 188 194 174 188 185 26 1,100Liberty ES 137 207 203 212 200 188 1 1,148Lincoln ES 15 16 26 22 28 31 138Little River ES 93 95 107 117 118 138 43 711Lovettsville ES 70 75 98 80 96 84 4 507Lowes Island ES 78 103 126 95 136 127 3 668Lucketts ES 39 47 54 43 50 46 1 280Meadowland ES 54 74 71 68 59 71 11 30 438Middleburg ES 9 8 7 6 9 9 48Mill Run ES 123 175 141 163 150 166 9 927Moorefield Station ES 127 167 150 141 172 163 31 951Mountain View ES 62 90 86 104 108 97 10 557Newton-Lee ES 106 113 142 138 182 187 18 886Pinebrook ES 148 231 220 234 190 208 5 1,236Potowmack ES 75 100 112 97 114 109 20 627Rolling Ridge ES 79 106 86 88 82 89 2 60 592Rosa Lee Carter ES 104 146 142 149 177 168 1 887
Loudoun County Public Schools - FY15 Superintendent's Proposed Operating Budgets
2014-2015 Enrollment Projections
To Be Determined
Attachment #10 Question #20
77

SUPPLEMENTAL SECTION
K 1 2 3 4 5 PS ST HS TotalRound Hill ES 80 112 91 77 86 98 26 570Sanders Corner ES 81 98 85 113 102 124 1 604Seldens Landing ES 122 152 132 139 149 140 3 837Sterling ES 76 85 75 80 87 80 5 17 505Steuart W. Weller ES 105 137 152 155 156 119 30 854Sugarland ES 96 102 91 78 84 83 27 15 576Sully ES 89 75 91 71 78 51 3 30 488Sycolin Creek ES 99 127 133 122 117 98 9 30 735Waterford ES 19 18 22 18 34 40 151Total Elementary Schools 4,590 5,854 5,813 5,749 5,870 5,950 668 300 32 34,826
6 7 8 PS ST HS TotalBelmont Ridge MS 421 408 364 1,193Blue Ridge MS 293 321 315 929Eagle Ridge MS 436 447 401 1,284Farmwell Station MS 362 359 416 1,137Harmony MS 338 375 371 1,084Harper Park MS 361 362 360 1,083J Lupton Simpson MS 348 335 335 1,018J. Michael Lunsford MS 534 487 489 1,510Mercer MS 392 383 343 1,118River Bend MS 341 408 365 1,114Seneca Ridge MS 360 344 329 1,033Smart's Mill MS 364 353 380 1,097Sterling MS 347 351 316 1,014Stone Hill MS 486 425 389 1,300Trailside MS (MS-6) 420 389 392 1,201Total Middle Schools 5,803 5,747 5,565 0 0 0 17,115
9 10 11 12 PS ST HS TotalBriar Woods HS 375 414 350 646 1,785Broad Run HS 462 476 473 482 1,893Dominion HS 355 351 366 329 17 1,418Freedom HS 467 338 364 304 1,473Heritage HS 324 336 315 314 17 1,306John Champe HS 343 327 240 260 1,170Loudoun County HS 381 352 371 357 1,461Loudoun Valley HS 327 342 328 307 1,304Park View HS 337 353 323 316 1,329Potomac Falls HS 404 402 389 413 1,608Rock Ridge HS (HS-6) 341 370 413 0 1,124Stone Bridge HS 469 495 440 425 1,829Tuscarora HS 618 508 440 454 17 2,037Woodgrove HS 392 408 360 378 17 1,555Total High Schools 5,595 5,472 5,172 4,985 0 0 68 21,292
73,233
Loudoun County Public Schools - FY15 Superintendent's Proposed Operating Budgets
Total 2014-2015 Projected Enrollment
2013-2014 Enrollment Projections
Attachment #10 Question #20
78

Question #69 Attachment #11
ELL STUDENT/TEACHER RATIOS FOR FY13 AND FY14
Note: Teacher Assistant assignments are NOT included in the chart below
SCHOOL FY13 FY14 Aldie 0:0 .3:13 Algonkian 1:40 1:30 Arcola 1:50 1:47 Ashburn 1:37 1:36 Ball’s Bluff 1:39 1:43 Banneker 0:0 .4:16 Belmont Station 1:39 1:35 Buffalo Trail 1:60 1:36 Catoctin 1:31 1:30 Cedar Lane 1:41 1:40 Cool Spring 1:36 1:42 Countryside 1:37 1:34 Creighton’s Corner 1:28 1:48 Culbert 1:32 .5:15 Discovery ---- 1:43 Forest Grove 1:41 1:43 Dominion Trail 1:30 1:34 Emerick 0:0 .6:12 Evergreen Mill 1:34 1:31 F. Douglass 1:40 1:40 F.H. Reid 1:31 1:36 Forest Grove 1:41 1:43 Guilford 1:46 1:48 Hamilton 0:0 .1:3 Hillsboro 0:0 .1:2 Hillside 0:0 .5:20 Horizon 1:34 1:38
Hutchison Farm 1:38 1:47 Leesburg 1:27 1:31 Legacy 1:32 1:34 Liberty 1:38 1:32 Lincoln 0:0 0:0 Little River 1:29 1:30
79

Question #69 Attachment #11
SCHOOL FY13 FY14 Lovettsville 1:35 .4:20 Lowes Island 1:22 .6:15 Lucketts 1:34 1:35 Meadowland 1:38 1:38 Middleburg 1:34 .7:11 Mill Run 1:42 1:32 Moorefield Station ---- 1:38 Mountain View 0:0 1:22 Newton Lee 1:28 1:26 Pinebrook 1:35 1:37 Potowmack 1:35 1:47 Rolling Ridge 1:31 1:32 Rosa Lee Carter 1:31 1:25 Round Hill 0:0 .2:8 Sanders Corner 1:17 1:22 Seldens Landing 1:33 1:38 Sterling 1:35 1:34 Steuart Weller 1:33 1:44 Sugarland 1:36 1:40 Sully 1:40 1:48 Sycolin Creek 1:22 1:34 Tolbert 1:34 1:32 Waterford 0:0 0:0
80

Question #69 Attachment #11
SCHOOL FY13 FY14
Belmont 0:0 .5:18
Blue Ridge 1:11 .4:13
Eagle Ridge 0:0 .5:7
Farmwell 1:31 1:24
Harmony 0:0 0:0
Harper Park 1:31 1:29
JLSMS 1:25 1:48
Lunsford 1:17 .6:27
MMS 1:18 1:33
RBMS 1:30 1:37
SRMS 1:24 1:40
Smart’s 1:25 1:46
SMS 1:36 1:32
SHMS 1:21 1:33
BWHS 1:19 1:29
BRHS 1:28 1:32
JCHS 1:13 .4:28
DHS 1:20 1:30
FHS 1:22 .6:22
HHS 1:18 1:33
LCHS 1:25 1:25
LVHS 1:12 1:17
PVHS 1:28 1:36
PFHS 1:23 1:34
SBHS 1:16 .6:24
THS 1:35 1:35
WHS 0:0 0:0
DCS .4:17 .4:17
81

Fiscal Year In‐
Service*
Type A
SPED
Type A
GenEd
Type C
SPED
Type C
GenEd
Type D
SPED
Type D
GenEdTotal
FY2000 4 1 1 4 4 17 31
FY2001 1 1 0 0 6 62 70
FY2002 2 4 0 0 7 43 56
FY2003 2 1 2 0 17 49 71
FY2004 6 0 0 0 14 62 82
FY2005 5 0 0 0 14 57 76
FY2006 2 0 4 40 10 14 70
FY2007 4 0 23 79 0 0 106
FY2008 0 0 10 2 0 0 12
FY2009 7 0 6 49 0 0 62
FY2010 5 1 7 63 0 0 76
FY2011 8 0 20 41 0 0 69
FY2012 5 0 1 9 0 0 15
FY2013 6 0 11 36 0 4 57
FY2014* 1 1
Totals 57 8 86 323 72 308 854
Type A = Small school bus body applied to a 1 Ton van chassis
Type C = Conventional school bus
Type D = Transit style school bus
*FY2014 ‐ Buses ordered via FY14 Lease ‐ expected delivery and in‐service Spring 2014.
65 409 380
Response: Q‐56 / Attachment 1. ‐ Chart of Fleet Summary
Question #56 Attachment #12
82

Vehicle Year Make Model EngSize Class LTD Miles LTD Maint LTD MCPM Type Points Age Mi/20K Maint/10K
B031 2001 THOMAS ER SAF‐T‐LINR 3126 B48L 203,759 94,107.96 0.46 D 31.68 12.08 10.19 9.41
B072 2001 THOMAS ER SAF‐T‐LINR 3126 B48L 201,762 101,859.79 0.50 D 32.36 12.08 10.09 10.19
B083 2001 THOMAS ER SAF‐T‐LINR 3126 B66L 196,163 113,729.43 0.58 D 33.35 12.17 9.81 11.37
B085 2002 International GC39530 T444E B78 140,549 81,440.46 0.58 D 26.92 11.75 7.03 8.14
B135 2000 Freightliner FS65 3126 B64 158,962 65,628.31 0.41 C 28.18 13.67 7.95 6.56
B136 2000 Freightliner FS65 3126 B64 142,542 46,819.69 0.33 C 25.48 13.67 7.13 4.68
B161 2001 THOMAS ER SAF‐T‐LINR 3126 B75 166,281 73,084.95 0.44 D 27.79 12.17 8.31 7.31
B186 2001 THOMAS MVP SAF‐T‐LINR 3126 B78 136,133 59,158.33 0.43 D 25.81 13.08 6.81 5.92
B193 2001 THOMAS MVP SAF‐T‐LINR 3126 B78 133,338 68,283.79 0.51 D 26.58 13.08 6.67 6.83
B195 2001 THOMAS MVP SAF‐T‐LINR 3126 B78 159,368 90,104.90 0.57 D 30.06 13.08 7.97 9.01
B203 2001 THOMAS ER SAF‐T‐LINR 3126 B75 157,728 88,808.02 0.56 D 28.93 12.17 7.89 8.88
B211 2001 THOMAS ER SAF‐T‐LINR 3126 B66L 187,606 78,285.02 0.42 D 29.79 12.58 9.38 7.83
B303 2001 THOMAS MVP SAF‐T‐LINR 3126 B78 143,739 84,443.85 0.59 D 28.63 13.00 7.19 8.44
B307 2001 THOMAS ER SAF‐T‐LINR 3126 B75 148,290 65,644.32 0.44 D 26.15 12.17 7.41 6.56
B343 2000 THOMAS MVP SAF‐T‐LINR T444E B78 127,156 98,572.46 0.75 D 27.88 11.67 6.36 9.86
B345 2000 THOMAS MVP SAF‐T‐LINR 3126 B78 141,853 76,082.39 0.54 D 28.70 14.00 7.09 7.61
B350 2000 THOMAS MVP SAF‐T‐LINR 3126 B78 138,946 76,507.45 0.55 D 28.60 14.00 6.95 7.65
B353 2000 THOMAS MVP SAF‐T‐LINR 3126 B78 112,821 69,210.69 0.61 D 26.56 14.00 5.64 6.92
B378 2001 THOMAS MVP SAF‐T‐LINR 3126 B78 169,097 94,151.26 0.56 D 30.87 13.00 8.45 9.42
B385 2001 THOMAS MVP SAF‐T‐LINR 3126 B78 129,172 71,811.23 0.56 D 26.81 13.17 6.46 7.18
B386 2001 THOMAS MVP SAF‐T‐LINR 3126 B78 122,872 60,487.84 0.49 D 25.19 13.00 6.14 6.05
B387 2001 THOMAS MVP SAF‐T‐LINR 3126 B78 149,780 79,173.16 0.53 D 28.41 13.00 7.49 7.92
B388 2001 THOMAS MVP SAF‐T‐LINR 3126 B78 151,718 75,261.27 0.50 D 28.11 13.00 7.59 7.53
B390 2001 THOMAS MVP SAF‐T‐LINR 3126 B78 146,292 74,930.40 0.51 D 27.81 13.00 7.31 7.49
B397 2001 International RS3708 T444E B78 150,187 90,584.47 0.60 D 29.48 12.92 7.51 9.06
B400 2001 International RS3708 T444E B78 133,210 86,416.26 0.65 D 28.22 12.92 6.66 8.64
B402 2001 International RS3708 T444E B78 112,325 99,416.94 0.89 D 28.39 12.83 5.62 9.94
B404 2001 THOMAS ER SAF‐T‐LINR 3126 B66L 205,892 123,743.31 0.60 D 35.25 12.58 10.29 12.37
B405 2001 THOMAS ER SAF‐T‐LINR 3126 B66L 218,441 124,772.00 0.57 D 35.98 12.58 10.92 12.48
B406 2001 THOMAS ER SAF‐T‐LINR 3126 B66L 200,022 99,713.95 0.50 D 32.56 12.58 10.00 9.97
B407 2001 THOMAS ER SAF‐T‐LINR 3126 B66L 161,326 116,922.39 0.72 D 32.34 12.58 8.07 11.69
B414 2002 THOMAS ER SAF‐T‐LINR 3126 B48 204,986 133,910.46 0.65 D 35.97 12.33 10.25 13.39
B416 2001 THOMAS MVP SAF‐T‐LINR 3126 B78 135,431 69,570.89 0.51 D 26.81 13.08 6.77 6.96
B438 2001 THOMAS ER SAF‐T‐LINR 3126 B75 128,076 84,875.20 0.66 D 27.06 12.17 6.40 8.49
B442 2002 THOMAS ER SAF‐T‐LINR 3126 B48 209,639 124,447.99 0.59 D 35.01 12.08 10.48 12.44
B497 2004 THOMAS ER SAF‐T‐LINR MBE906 B48 203,038 126,091.73 0.62 D 32.76 10.00 10.15 12.61
B498 2004 THOMAS ER SAF‐T‐LINR MBE906 B48 203,932 134,587.02 0.66 D 33.74 10.08 10.20 13.46
Response: Q‐56 / Attachment 2. ‐ Chart of FY14 Approved Bus Replacements
Question #56 Attachment #12
83

Vehicle Year Make Model EngSize Class LTD Miles LTD Maint LTD MCPM Type Points Age Mi/20K Maint/10K
B007 2003 THOMAS ER SAF‐T‐LINR 3126 B66L 156,559 85,798.69 0.55 D 27.41 11.00 7.83 8.58
B010 2003 THOMAS ER SAF‐T‐LINR 3126 B78 209,264 117,795.41 0.56 D 33.33 11.08 10.46 11.78
B012 2001 THOMAS MVP SAF‐T‐LINR 3126 B66L 135,311 85,492.89 0.63 D 28.65 13.33 6.77 8.55
B016 2003 THOMAS ER SAF‐T‐LINR 3126 B78 173,673 79,397.16 0.46 D 27.71 11.08 8.68 7.94
B026 2003 International GC39530 T444E B66L 171,205 63,666.99 0.37 D 25.09 10.17 8.56 6.37
B034 2001 THOMAS MVP SAF‐T‐LINR 3126 B66L 137,301 67,672.89 0.49 D 26.97 13.33 6.87 6.77
B044 2003 THOMAS ER SAF‐T‐LINR 3126 B66L 180,025 85,839.34 0.48 D 28.59 11.00 9.00 8.58
B051 2000 Freightliner FS65 3126 B64 127,440 52,419.92 0.41 C 25.28 13.67 6.37 5.24
B058 2001 THOMAS ER SAF‐T‐LINR 3126 B48L 156,659 93,987.02 0.60 D 29.23 12.00 7.83 9.40
B059 2001 THOMAS MVP SAF‐T‐LINR 3126 B78 122,012 66,363.76 0.54 D 25.82 13.08 6.10 6.64
B065 2001 THOMAS ER SAF‐T‐LINR 3126 B48L 180,868 95,763.34 0.53 D 30.70 12.08 9.04 9.58
B075 2002 CHEVROLET G3500 5.7L B20 241,219 65,310.11 0.27 A 30.09 11.50 12.06 6.53
B078 2001 THOMAS ER SAF‐T‐LINR 3126 B48L 154,916 99,666.36 0.64 D 29.80 12.08 7.75 9.97
B084 2002 CHEVROLET G3500 5.7L B20 201,422 49,139.99 0.24 A 25.99 11.00 10.07 4.91
B094 2003 THOMAS ER SAF‐T‐LINR 3126 B66L 165,621 72,636.61 0.44 D 26.54 11.00 8.28 7.26
B099 2003 International GC39530 T444E B66L 173,643 66,279.50 0.38 D 25.31 10.00 8.68 6.63
B101 2002 International GC39530 T444E B66L 162,293 87,508.37 0.54 D 27.95 11.08 8.11 8.75
B104 2003 International GC39530 T444E B66L 176,404 78,018.19 0.44 D 26.79 10.17 8.82 7.80
B106 2004 International GC39530 T444E B66L 198,781 64,803.08 0.33 D 26.42 10.00 9.94 6.48
B137 2000 Freightliner FS65 3126 B64 121,876 52,638.26 0.43 C 25.02 13.67 6.09 5.26
B142 2002 GMC G3500 6.5L B13L 164,012 53,215.17 0.32 A 22.86 9.33 8.20 5.32
B147 2000 THOMAS MVP SAF‐T‐LINR 3126 B66L 113,492 49,235.50 0.43 D 24.26 13.67 5.67 4.92
B150 2000 Freightliner FS65 3126 B64 113,719 41,634.27 0.37 C 23.52 13.67 5.69 4.16
B164 2002 International GC39530 T444E B66L 177,217 84,890.20 0.48 D 28.43 11.08 8.86 8.49
B166 2004 International GC39530 T444E B66L 174,505 77,073.96 0.44 D 26.60 10.17 8.73 7.71
B197 2001 THOMAS MVP SAF‐T‐LINR 3126 B78 122,094 82,720.48 0.68 D 27.38 13.00 6.10 8.27
B200 2001 THOMAS ER SAF‐T‐LINR 3126 B75 120,071 99,084.12 0.83 D 28.00 12.08 6.00 9.91
B206 2002 International GC39530 T444E B66L 180,063 84,404.70 0.47 D 28.53 11.08 9.00 8.44
B207 2001 THOMAS ER SAF‐T‐LINR 3126 B48L 183,069 99,814.22 0.55 D 31.13 12.00 9.15 9.98
B209 2002 International GC39530 T444E B66L 170,140 68,220.91 0.40 D 26.41 11.08 8.51 6.82
B231 2002 GMC G3500 6.5L B13L 179,145 44,432.02 0.25 A 22.73 9.33 8.96 4.44
B264 2004 GMC G3500 6.0L B20 255,207 50,120.21 0.20 A 27.27 9.50 12.76 5.01
B342 2000 THOMAS MVP SAF‐T‐LINR 3126 B78 111,798 71,140.55 0.64 D 26.70 14.00 5.59 7.11
B343 2000 THOMAS MVP SAF‐T‐LINR 3126 B78 125,099 88,141.57 0.70 D 28.74 13.67 6.25 8.81
B344 2000 THOMAS MVP SAF‐T‐LINR 3126 B78 95,824 45,491.73 0.47 D 23.34 14.00 4.79 4.55
B349 2000 THOMAS MVP SAF‐T‐LINR 3126 B78 101,268 66,107.71 0.65 D 25.67 14.00 5.06 6.61
Response: Q‐56 / Attachment 3. ‐ Chart of School Bus Replacement Request for FY15
Question #56 Attachment #12
84
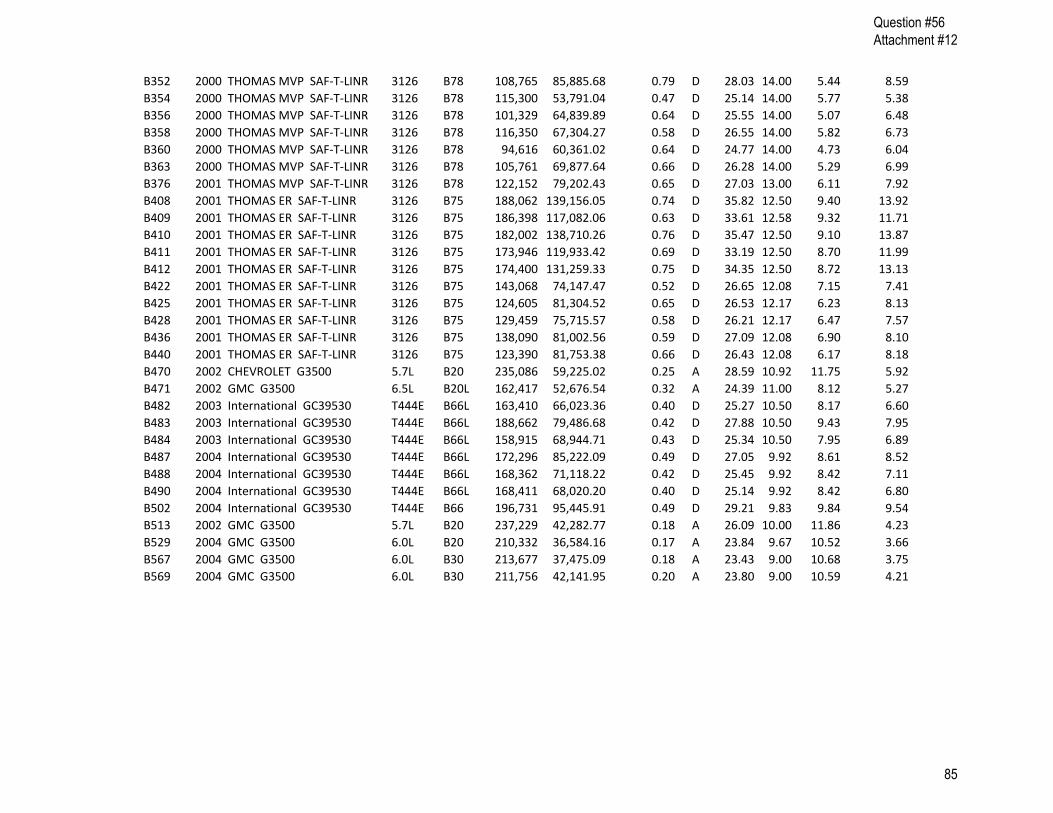
B352 2000 THOMAS MVP SAF‐T‐LINR 3126 B78 108,765 85,885.68 0.79 D 28.03 14.00 5.44 8.59
B354 2000 THOMAS MVP SAF‐T‐LINR 3126 B78 115,300 53,791.04 0.47 D 25.14 14.00 5.77 5.38
B356 2000 THOMAS MVP SAF‐T‐LINR 3126 B78 101,329 64,839.89 0.64 D 25.55 14.00 5.07 6.48
B358 2000 THOMAS MVP SAF‐T‐LINR 3126 B78 116,350 67,304.27 0.58 D 26.55 14.00 5.82 6.73
B360 2000 THOMAS MVP SAF‐T‐LINR 3126 B78 94,616 60,361.02 0.64 D 24.77 14.00 4.73 6.04
B363 2000 THOMAS MVP SAF‐T‐LINR 3126 B78 105,761 69,877.64 0.66 D 26.28 14.00 5.29 6.99
B376 2001 THOMAS MVP SAF‐T‐LINR 3126 B78 122,152 79,202.43 0.65 D 27.03 13.00 6.11 7.92
B408 2001 THOMAS ER SAF‐T‐LINR 3126 B75 188,062 139,156.05 0.74 D 35.82 12.50 9.40 13.92
B409 2001 THOMAS ER SAF‐T‐LINR 3126 B75 186,398 117,082.06 0.63 D 33.61 12.58 9.32 11.71
B410 2001 THOMAS ER SAF‐T‐LINR 3126 B75 182,002 138,710.26 0.76 D 35.47 12.50 9.10 13.87
B411 2001 THOMAS ER SAF‐T‐LINR 3126 B75 173,946 119,933.42 0.69 D 33.19 12.50 8.70 11.99
B412 2001 THOMAS ER SAF‐T‐LINR 3126 B75 174,400 131,259.33 0.75 D 34.35 12.50 8.72 13.13
B422 2001 THOMAS ER SAF‐T‐LINR 3126 B75 143,068 74,147.47 0.52 D 26.65 12.08 7.15 7.41
B425 2001 THOMAS ER SAF‐T‐LINR 3126 B75 124,605 81,304.52 0.65 D 26.53 12.17 6.23 8.13
B428 2001 THOMAS ER SAF‐T‐LINR 3126 B75 129,459 75,715.57 0.58 D 26.21 12.17 6.47 7.57
B436 2001 THOMAS ER SAF‐T‐LINR 3126 B75 138,090 81,002.56 0.59 D 27.09 12.08 6.90 8.10
B440 2001 THOMAS ER SAF‐T‐LINR 3126 B75 123,390 81,753.38 0.66 D 26.43 12.08 6.17 8.18
B470 2002 CHEVROLET G3500 5.7L B20 235,086 59,225.02 0.25 A 28.59 10.92 11.75 5.92
B471 2002 GMC G3500 6.5L B20L 162,417 52,676.54 0.32 A 24.39 11.00 8.12 5.27
B482 2003 International GC39530 T444E B66L 163,410 66,023.36 0.40 D 25.27 10.50 8.17 6.60
B483 2003 International GC39530 T444E B66L 188,662 79,486.68 0.42 D 27.88 10.50 9.43 7.95
B484 2003 International GC39530 T444E B66L 158,915 68,944.71 0.43 D 25.34 10.50 7.95 6.89
B487 2004 International GC39530 T444E B66L 172,296 85,222.09 0.49 D 27.05 9.92 8.61 8.52
B488 2004 International GC39530 T444E B66L 168,362 71,118.22 0.42 D 25.45 9.92 8.42 7.11
B490 2004 International GC39530 T444E B66L 168,411 68,020.20 0.40 D 25.14 9.92 8.42 6.80
B502 2004 International GC39530 T444E B66 196,731 95,445.91 0.49 D 29.21 9.83 9.84 9.54
B513 2002 GMC G3500 5.7L B20 237,229 42,282.77 0.18 A 26.09 10.00 11.86 4.23
B529 2004 GMC G3500 6.0L B20 210,332 36,584.16 0.17 A 23.84 9.67 10.52 3.66
B567 2004 GMC G3500 6.0L B30 213,677 37,475.09 0.18 A 23.43 9.00 10.68 3.75
B569 2004 GMC G3500 6.0L B30 211,756 42,141.95 0.20 A 23.80 9.00 10.59 4.21
Question #56 Attachment #12
85

Vehicle Year Make Model EngSize Class LTD Miles LTD Maint LTD MCPM Type Points Age Mi/20K Maint/10K
B001 2007 THOMAS SAF‐T‐LINER C2 MBE906 B30L 88,205 41,174.46 0.47 C 7.17 15.69 4.41 4.12
B002 2005 International RE300 DT466 B78 180,883 95,593.28 0.53 D 8.67 27.27 9.04 9.56
B003 2001 International GC39530 T444E B78 85,680 54,569.41 0.64 D 22.07 12.33 4.28 5.46
B004 2009 THOMAS SAF‐T‐LINER C2 6.7L B77 96,068 48,899.87 0.51 C 4.92 14.61 4.80 4.89
B005 2008 International CE‐300 DT466 B77 84,775 35,257.24 0.42 C 6.67 14.43 4.24 3.53
B006 2009 THOMAS SAF‐T‐LINER C2 6.7L B77 72,338 44,455.52 0.61 C 4.92 12.98 3.62 4.45
B008 2003 International GC39530 T444E B66L 126,470 62,905.29 0.50 D 22.78 10.17 6.32 6.29
B009 2003 International GC39530 T444E B78 101,216 78,191.46 0.77 D 23.05 10.17 5.06 7.82
B011 2002 THOMAS ER SAF‐T‐LINR 3126 B78 109,839 74,448.70 0.68 D 24.02 11.08 5.49 7.44
B013 2003 THOMAS ER SAF‐T‐LINR 3126 B78 72,626 72,581.18 1.00 D 21.89 11.00 3.63 7.26
B017 2005 International RE300 DT466 B78 136,479 114,896.21 0.84 D 8.67 26.98 6.82 11.49
B018 2010 THOMAS SAF‐T‐LINER C2 6.7L B77 75,988 17,132.88 0.23 C 4.25 9.76 3.80 1.71
B019 2009 THOMAS SAF‐T‐LINER C2 6.7L B77 65,508 52,002.83 0.79 C 4.92 13.39 3.28 5.20
B020 2001 THOMAS ER SAF‐T‐LINR 3126 B75 90,262 51,951.19 0.58 D 21.79 12.08 4.51 5.20
B021 2009 THOMAS SAF‐T‐LINER C2 6.7L B77 63,492 49,859.13 0.79 C 4.92 13.08 3.17 4.99
B022 2014 International CE‐300 6.0L B28L 2,925 667.63 0.23 C 0.33 0.55 0.15 0.07
B023 2003 THOMAS ER SAF‐T‐LINR 3126 B78 80,175 50,713.35 0.63 D 20.16 11.08 4.01 5.07
B024 2003 THOMAS ER SAF‐T‐LINR 3126 B78 97,893 73,675.77 0.75 D 23.26 11.00 4.89 7.37
B025 2008 International CE‐300 DT466 B72 63,132 19,595.52 0.31 C 6.25 11.37 3.16 1.96
B027 2014 THOMAS SAF‐T‐LINER C2 6.7L B77 2,646 1,072.43 0.41 C 0.67 0.91 0.13 0.11
B028 2004 International GC39530 T444E B78 61,988 60,755.88 0.98 D 19.17 10.00 3.10 6.08
B029 2009 THOMAS SAF‐T‐LINER C2 6.7L B77 36,475 37,858.84 1.04 C 4.92 10.53 1.82 3.79
B030 2008 International CE‐300 DT466 B72 96,393 21,780.44 0.23 C 6.25 13.25 4.82 2.18
B032 2003 International GC39530 T444E B78 99,775 52,093.91 0.52 D 20.36 10.17 4.99 5.21
B033 2014 International CE‐300 6.0L B28L 2,872 1,442.06 0.50 C 0.33 0.62 0.14 0.14
B035 2001 THOMAS MVP SAF‐T‐LINR 3126 B78 106,965 88,794.30 0.83 D 27.31 13.08 5.35 8.88
B036 2001 THOMAS MVP SAF‐T‐LINR 3126 B66L 96,314 39,365.57 0.41 D 22.09 13.33 4.82 3.94
B037 2008 International CE‐300 DT466 B77 72,742 19,531.38 0.27 C 6.67 12.26 3.64 1.95
B038 2002 International GC39530 T444E B78 94,728 61,184.38 0.65 D 21.94 11.08 4.74 6.12
B039 2002 International GC39530 T444E B78 131,466 65,041.17 0.49 D 24.16 11.08 6.57 6.50
B040 2006 THOMAS ER SAF‐T‐LINR MBE906 B48 162,102 91,104.60 0.56 D 8.42 25.63 8.11 9.11
Response: Q‐56 / Attachment 4. ‐ Chart of School Bus Fleet (not including replacements) as of Janaury 22, 2014
Question #56 Attachment #12
86

B041 2010 CHEVROLET Express 2500 6.0L B20 64,400 6,938.86 0.11 A 2.58 6.50 3.22 0.69
B042 2003 THOMAS ER SAF‐T‐LINR 3126 B75 104,409 67,919.17 0.65 D 23.10 11.08 5.22 6.79
B043 2002 International GC39530 T444E B78 73,416 41,221.12 0.56 D 18.88 11.08 3.67 4.12
B045 2014 THOMAS SAF‐T‐LINER C2 6.7L B77 7,959 1,306.22 0.16 C 1.50 2.03 0.40 0.13
B046 2008 International CE‐300 DT466 B77 113,622 25,816.87 0.23 C 6.67 14.93 5.68 2.58
B047 2004 International GC39530 T444E B78 105,119 73,337.57 0.70 D 22.59 10.00 5.26 7.33
B048 2001 THOMAS ER SAF‐T‐LINR 3126 B75 91,745 43,779.21 0.48 D 21.05 12.08 4.59 4.38
B049 2006 International CE‐300 DT466 B77 84,423 27,131.96 0.32 C 6.67 13.60 4.22 2.71
B050 2009 International CE‐300 DT‐I6 B28L 71,030 23,259.00 0.33 C 5.58 11.46 3.55 2.33
B052 2002 International GC39530 T444E B78 105,625 65,739.02 0.62 D 22.94 11.08 5.28 6.57
B053 2001 THOMAS MVP SAF‐T‐LINR 3126 B78 105,943 49,901.85 0.47 D 23.37 13.08 5.30 4.99
B054 2002 International GC39530 T444E B78 93,400 58,679.30 0.63 D 21.62 11.08 4.67 5.87
B056 2008 International CE‐300 DT466 B72 45,877 12,553.44 0.27 C 6.42 9.97 2.29 1.26
B057 2001 THOMAS MVP SAF‐T‐LINR 3126 B78 99,379 57,402.34 0.58 D 23.71 13.00 4.97 5.74
B060 2001 THOMAS MVP SAF‐T‐LINR 3126 B78 100,784 67,352.18 0.67 D 24.86 13.08 5.04 6.74
B061 2008 International CE‐300 DT466 B77 38,829 18,304.30 0.47 C 6.17 9.94 1.94 1.83
B062 2000 International GC39530 T444E B78 94,002 78,779.38 0.84 D 24.91 12.33 4.70 7.88
B063 2011 International CE‐300 7.6L B77 46,328 8,598.24 0.19 C 3.33 6.51 2.32 0.86
B064 2001 THOMAS MVP SAF‐T‐LINR 3126 B78 100,931 68,352.50 0.68 D 24.88 13.00 5.05 6.84
B066 2002 International GC39530 T444E B78 128,230 73,245.85 0.57 D 24.82 11.08 6.41 7.32
B067 2002 International GC39530 T444E B78 148,958 66,118.25 0.44 D 25.14 11.08 7.45 6.61
B068 2002 International GC39530 T444E B78 92,640 56,368.61 0.61 D 21.35 11.08 4.63 5.64
B069 2002 International GC39530 T444E B78 96,292 55,097.45 0.57 D 21.41 11.08 4.81 5.51
B070 2011 International CE‐300 7.6L B77 38,450 8,444.41 0.22 C 3.33 6.10 1.92 0.84
B071 2001 THOMAS MVP SAF‐T‐LINR 3126 B78 99,533 48,849.32 0.49 D 22.86 13.00 4.98 4.88
B073 2002 International GC39530 T444E B78 81,769 56,925.07 0.70 D 20.86 11.08 4.09 5.69
B076 2002 International GC39530 T444E B78 127,150 62,043.14 0.49 D 23.65 11.08 6.36 6.20
B077 2002 International GC39530 T444E B78 58,737 56,205.84 0.96 D 19.64 11.08 2.94 5.62
B079 2003 International GC39530 T444E B78 88,233 47,981.80 0.54 D 19.38 10.17 4.41 4.80
B080 2005 International RE300 DT466 B39L 146,680 54,405.55 0.37 D 8.67 21.44 7.33 5.44
B081 2010 CHEVROLET Express 2500 6.0L B20 52,016 6,663.45 0.13 A 2.58 5.85 2.60 0.67
B082 2002 International GC39530 T444E B78 112,902 55,602.61 0.49 D 22.96 11.75 5.65 5.56
B086 2002 International GC39530 T444E B78 109,613 80,349.41 0.73 D 24.60 11.08 5.48 8.03
B087 2003 THOMAS ER SAF‐T‐LINR 3126 B78 85,193 67,500.27 0.79 D 22.09 11.08 4.26 6.75
Question #56 Attachment #12
87

B088 2002 International GC39530 T444E B78 97,764 80,387.24 0.82 D 24.01 11.08 4.89 8.04
B089 2002 International GC39530 T444E B78 60,023 65,370.63 1.09 D 20.62 11.08 3.00 6.54
B090 2005 International RE300 DT466 B39L 143,231 55,674.48 0.39 D 8.67 21.40 7.16 5.57
B091 2002 International GC39530 T444E B48L 158,872 101,527.07 0.64 D 29.76 11.67 7.94 10.15
B092 1998 GMC G3500 6.5L B13L 52,622 37,405.71 0.71 A 21.21 14.83 2.63 3.74
B093 2002 CHEVROLET G3500 5.7L B20 133,953 46,891.40 0.35 A 22.89 11.50 6.70 4.69
B095 2002 International GC39530 T444E B78 71,916 54,182.77 0.75 D 20.10 11.08 3.60 5.42
B096 2003 International IC3S530 T444E B20L 95,509 47,441.57 0.50 C 20.27 10.75 4.78 4.74
B097 2004 International GC39530 T444E B66 95,783 76,874.23 0.80 D 22.31 9.83 4.79 7.69
B098 2003 International IC3S530 T444E B64 126,419 62,937.47 0.50 C 23.28 10.67 6.32 6.29
B100 2002 International GC39530 T444E B78 94,125 81,800.46 0.87 D 23.97 11.08 4.71 8.18
B102 2004 International GC39530 T444E B78 75,290 45,585.49 0.61 D 18.49 10.17 3.76 4.56
B103 2003 International GC39530 T444E B78 99,129 75,224.42 0.76 D 22.65 10.17 4.96 7.52
B105 2004 THOMAS ER SAF‐T‐LINR MBE906 B75 68,602 33,687.62 0.49 D 16.88 10.08 3.43 3.37
B107 2002 International GC39530 T444E B78 109,040 65,040.46 0.60 D 23.71 11.75 5.45 6.50
B108 2004 THOMAS ER SAF‐T‐LINR MBE906 B75 112,287 57,960.86 0.52 D 21.49 10.08 5.61 5.80
B109 2005 International RE300 DT466 B39L 102,430 34,948.66 0.34 D 8.67 17.28 5.12 3.49
B110 2003 International GC39530 T444E B66L 126,112 54,862.16 0.44 D 21.79 10.00 6.31 5.49
B111 2008 International CE‐300 DT466 B72 126,095 30,459.07 0.24 C 6.25 15.60 6.30 3.05
B112 2003 THOMAS ER SAF‐T‐LINR 3126 B78 106,542 57,569.78 0.54 D 22.00 10.92 5.33 5.76
B113 2009 CHEVROLET Express 3500 6.0L B30 87,359 16,196.78 0.19 A 4.25 10.24 4.37 1.62
B114 2003 THOMAS ER SAF‐T‐LINR 3126 B75 119,996 56,494.56 0.47 D 22.73 11.08 6.00 5.65
B115 2014 International CE‐300 6.0L B28L 4,019 997.26 0.25 C 0.33 0.63 0.20 0.10
B116 2014 International CE‐300 6.0L B28L 2,901 932.73 0.32 C 0.33 0.57 0.15 0.09
B117 2002 International GC39530 T444E B78 129,203 79,941.01 0.62 D 26.20 11.75 6.46 7.99
B119 2002 International GC39530 T444E B78 99,723 59,996.72 0.60 D 22.74 11.75 4.99 6.00
B122 2010 International CE‐300 7.6L B77 43,740 12,901.86 0.29 C 4.08 7.56 2.19 1.29
B123 2010 International CE‐300 7.6L B77 35,463 12,724.84 0.36 C 4.08 7.13 1.77 1.27
B124 2010 International CE‐300 7.6L B77 32,705 7,602.22 0.23 C 4.08 6.48 1.64 0.76
B125 2008 International CE‐300 DT466 B72 48,652 13,729.09 0.28 C 6.25 10.06 2.43 1.37
B126 2004 THOMAS ER SAF‐T‐LINR MBE906 B75 77,214 48,888.64 0.63 D 18.83 10.08 3.86 4.89
B127 2014 THOMAS SAF‐T‐LINER C2 6.7L B77 1,980 765.17 0.39 C 0.67 0.84 0.10 0.08
B128 2010 International CE‐300 6.4 DIESEL B77 30,028 11,676.73 0.39 C 4.08 6.75 1.50 1.17
B129 2010 International CE‐300 7.6L B77 36,212 11,983.39 0.33 C 4.08 7.09 1.81 1.20
Question #56 Attachment #12
88

B130 2005 International RE300 DT466 B39L 153,184 63,327.64 0.41 D 8.67 22.66 7.66 6.33
B131 2005 International RE300 DT466 B39L 142,163 47,930.60 0.34 D 8.58 20.48 7.11 4.79
B132 2004 THOMAS ER SAF‐T‐LINR MBE906 B75 115,243 76,539.04 0.66 D 23.50 10.08 5.76 7.65
B133 2001 THOMAS ER SAF‐T‐LINR 3126 B75 94,849 45,126.78 0.48 D 21.42 12.17 4.74 4.51
B134 2014 International CE‐300 6.0L B28L 3,059 874.76 0.29 C 0.33 0.57 0.15 0.09
B138 2010 International CE‐300 6.4 DIESEL B77 32,340 11,444.84 0.35 C 4.08 6.84 1.62 1.14
B139 2010 CHEVROLET Express 2500 6.0L B20 56,868 7,330.25 0.13 A 2.58 6.16 2.84 0.73
B140 2004 THOMAS ER SAF‐T‐LINR MBE906 B78 92,242 51,338.24 0.56 D 19.75 10.00 4.61 5.13
B141 2010 International CE‐300 7.6L B77 41,251 11,350.21 0.28 C 4.08 7.28 2.06 1.14
B144 2009 THOMAS SAF‐T‐LINER C2 6.7L B77 77,998 55,700.80 0.71 C 4.92 14.39 3.90 5.57
B145 2014 THOMAS SAF‐T‐LINER C2 6.7L B77 1,126 1,039.04 0.92 C 0.67 0.83 0.06 0.10
B146 2010 CHEVROLET Express 3500 6.0L B20 56,639 7,193.56 0.13 A 2.58 6.13 2.83 0.72
B148 2012 International CE‐300 DT‐I6 B77 27,430 6,043.08 0.22 C 2.42 4.39 1.37 0.60
B149 2010 International CE‐300 7.6L B77 30,888 8,313.82 0.27 C 4.08 6.46 1.54 0.83
B151 2014 THOMAS SAF‐T‐LINER C2 6.7L B77 1,865 663.40 0.36 C 0.58 0.74 0.09 0.07
B152 2011 International CE‐300 7.6L B77 34,709 8,993.97 0.26 C 3.33 5.97 1.74 0.90
B153 2010 International CE‐300 6.4 DIESEL B77 34,275 11,824.45 0.34 C 4.08 6.98 1.71 1.18
B154 2008 International CE‐300 DT466 B72 46,887 18,586.23 0.40 C 6.25 10.45 2.34 1.86
B155 2002 International GC39530 T444E B66L 137,776 68,476.90 0.50 D 24.82 11.08 6.89 6.85
B157 2004 THOMAS ER SAF‐T‐LINR MBE906 B78 107,909 62,114.12 0.58 D 21.61 10.00 5.40 6.21
B158 2002 International GC39530 T444E B78 108,707 93,636.72 0.86 D 26.47 11.67 5.44 9.36
B159 2002 International GC39530 T444E B78 76,176 62,558.85 0.82 D 21.73 11.67 3.81 6.26
B160 2011 International CE‐300 7.6L B77 42,044 10,941.89 0.26 C 3.33 6.53 2.10 1.09
B162 2005 International RE300 DT466 B39L 80,385 34,382.13 0.43 D 8.58 16.04 4.02 3.44
B163 2001 THOMAS ER SAF‐T‐LINR 3126 B75 113,201 67,077.48 0.59 D 24.53 12.17 5.66 6.71
B165 2009 THOMAS SAF‐T‐LINER C2 6.7L B77 67,112 46,607.85 0.69 C 4.92 12.93 3.36 4.66
B167 2008 International CE‐300 DT466 B72 55,666 18,017.34 0.32 C 6.25 10.84 2.78 1.80
B168 2009 International CE‐300 DT‐I6 B28L 72,495 24,428.26 0.34 C 5.58 11.65 3.62 2.44
B169 2009 THOMAS SAF‐T‐LINER C2 6.7L B77 69,185 64,585.59 0.93 C 4.92 14.83 3.46 6.46
B170 2005 International RE300 DT466 B39L 176,309 63,991.78 0.36 D 8.58 23.80 8.82 6.40
B171 2010 International CE‐300 6.4 DIESEL B77 39,916 11,965.24 0.30 C 4.08 7.28 2.00 1.20
B172 2009 THOMAS SAF‐T‐LINER C2 6.7L B77 67,873 44,793.50 0.66 C 4.92 12.79 3.39 4.48
B173 2004 International GC39530 T444E B78 70,766 52,177.59 0.74 D 18.76 10.00 3.54 5.22
B174 2004 THOMAS ER SAF‐T‐LINR MBE906 B78 49,947 48,071.34 0.96 D 17.30 10.00 2.50 4.81
Question #56 Attachment #12
89

B175 2009 THOMAS SAF‐T‐LINER C2 6.7L B77 77,856 44,753.00 0.57 C 4.92 13.28 3.89 4.48
B176 2009 THOMAS SAF‐T‐LINER C2 6.7L B77 61,415 44,280.45 0.72 C 4.92 12.42 3.07 4.43
B177 2009 THOMAS SAF‐T‐LINER C2 6.7L B77 54,934 39,432.64 0.72 C 4.92 11.61 2.75 3.94
B178 2009 THOMAS SAF‐T‐LINER C2 6.7L B77 51,708 38,870.51 0.75 C 4.92 11.39 2.59 3.89
B183 2011 International CE‐300 7.6L B77 31,226 10,760.36 0.34 C 3.33 5.97 1.56 1.08
B184 2010 THOMAS SAF‐T‐LINER C2 6.7L B77 39,909 12,328.50 0.31 C 4.25 7.48 2.00 1.23
B185 2001 THOMAS MVP SAF‐T‐LINR 3126 B78 96,777 57,911.84 0.60 D 23.63 13.00 4.84 5.79
B187 2001 THOMAS MVP SAF‐T‐LINR 3126 B78 85,422 46,595.13 0.55 D 22.01 13.08 4.27 4.66
B188 2001 THOMAS MVP SAF‐T‐LINR 3126 B78 112,797 74,359.29 0.66 D 26.08 13.00 5.64 7.44
B189 2001 THOMAS MVP SAF‐T‐LINR 3126 B78 117,449 61,413.31 0.52 D 25.01 13.00 5.87 6.14
B190 2001 THOMAS MVP SAF‐T‐LINR 3126 B78 111,596 66,187.90 0.59 D 25.28 13.08 5.58 6.62
B191 2014 THOMAS SAF‐T‐LINER C2 6.7L B77 3,795 844.03 0.22 C 0.67 0.94 0.19 0.08
B192 2001 THOMAS MVP SAF‐T‐LINR 3126 B78 93,196 49,046.86 0.53 D 22.65 13.08 4.66 4.90
B194 2001 THOMAS MVP SAF‐T‐LINR 3126 B78 109,202 57,413.34 0.53 D 24.28 13.08 5.46 5.74
B196 2002 International GC39530 T444E B78 134,590 99,793.52 0.74 D 27.71 11.00 6.7295 9.98
B198 2001 THOMAS MVP SAF‐T‐LINR 3126 B78 117,653 48,613.24 0.41 D 23.83 13.08 5.88 4.86
B199 2001 THOMAS MVP SAF‐T‐LINR 3126 B78 112,005 53,684.81 0.48 D 24.05 13.08 5.60 5.37
B201 2008 International CE‐300 DT466 B72 88,668 25,110.62 0.28 C 6.42 13.36 4.43 2.51
B202 2002 International GC39530 T444E B78 115,918 93,893.92 0.81 D 26.85 11.67 5.80 9.39
B204 2003 THOMAS ER SAF‐T‐LINR 3126 B66L 105,833 74,330.64 0.70 D 23.72 11.00 5.29 7.43
B205 2002 International GC39530 T444E B78 100,025 74,533.00 0.75 D 24.12 11.67 5.00 7.45
B208 2011 International CE‐300 7.6L B77 21,206 7,293.63 0.34 C 3.33 5.12 1.06 0.73
B210 2001 THOMAS ER SAF‐T‐LINR 3126 B75 104,423 55,356.18 0.53 D 22.84 12.08 5.22 5.54
B212 2003 THOMAS ER SAF‐T‐LINR 3126 B78 116,175 48,105.99 0.41 D 21.62 11.00 5.81 4.81
B213 2004 THOMAS ER SAF‐T‐LINR MBE906 B75 104,046 50,885.89 0.49 D 20.37 10.08 5.20 5.09
B214 2004 THOMAS ER SAF‐T‐LINR MBE906 B78 100,384 49,740.91 0.50 D 19.99 10.00 5.02 4.97
B215 2004 THOMAS ER SAF‐T‐LINR MBE906 B75 123,491 59,118.29 0.48 D 22.09 10.00 6.17 5.91
B216 2004 International GC39530 T444E B78 158,922 78,731.97 0.50 D 25.82 10.00 7.95 7.87
B217 2004 International GC39530 T444E B78 117,069 87,686.15 0.75 D 24.54 9.92 5.85 8.77
B218 2008 International CE‐300 DT466 B72 69,957 19,658.01 0.28 C 6.42 11.88 3.50 1.97
B219 2008 International CE‐300 DT466 B72 32,094 13,711.60 0.43 C 6.25 9.23 1.60 1.37
B220 2008 International CE‐300 DT466 B72 104,324 25,506.60 0.24 C 6.42 14.18 5.22 2.55
B221 2007 THOMAS SAF‐T‐LINER C2 MBE906 B77 63,579 30,167.81 0.47 C 7.08 13.28 3.18 3.02
B222 2009 THOMAS SAF‐T‐LINER C2 6.7L B77 61,087 39,526.00 0.65 C 4.92 11.92 3.05 3.95
Question #56 Attachment #12
90

B223 2006 International CE‐300 DT466 B77 42,867 20,635.53 0.48 C 6.75 10.96 2.14 2.06
B224 2004 International GC39530 T444E B78 100,441 67,453.37 0.67 D 21.68 9.92 5.02 6.75
B225 2005 International RE300 DT466 B39L 156,531 53,183.52 0.34 D 8.58 21.73 7.83 5.32
B226 2004 International GC39530 T444E B78 112,806 62,909.89 0.56 D 21.85 9.92 5.64 6.29
B227 2005 International RE300 DT466 B39L 98,255 40,605.18 0.41 D 8.58 17.56 4.91 4.06
B228 2004 International GC39530 T444E B78 71,608 55,275.94 0.77 D 19.02 9.92 3.58 5.53
B229 2004 International GC39530 T444E B78 91,155 46,122.40 0.51 D 19.09 9.92 4.56 4.61
B230 2005 International RE300 DT466 B39L 124,429 53,152.22 0.43 D 8.58 20.12 6.22 5.32
B232 2006 THOMAS ER SAF‐T‐LINR MBE906 B34L 66,818 51,483.81 0.77 D 8.42 16.91 3.34 5.15
B233 2007 THOMAS SAF‐T‐LINER C2 MBE906 B77 81,217 27,586.86 0.34 C 7.17 13.99 4.06 2.76
B234 2005 International RE300 DT466 B78 77,113 36,463.86 0.47 D 8.67 16.17 3.86 3.65
B235 2005 International RE300 DT466 B78 66,581 27,630.26 0.41 D 8.67 14.76 3.33 2.76
B236 2005 International RE300 DT466 B78 101,824 38,753.35 0.38 D 8.67 17.63 5.09 3.88
B237 2005 International RE300 DT466 B78 53,629 40,388.46 0.75 D 8.67 15.39 2.68 4.04
B238 2008 International CE‐300 DT466 B72 86,687 24,317.14 0.28 C 5.83 12.60 4.33 2.43
B239 2007 THOMAS SAF‐T‐LINER C2 MBE906 B77 54,846 23,582.56 0.43 C 7.08 12.18 2.74 2.36
B240 2009 International CE‐300 DT‐I6 B28L 92,904 28,929.32 0.31 C 5.58 13.12 4.65 2.89
B241 2008 International CE‐300 DT466 B72 42,574 15,492.52 0.36 C 5.83 9.51 2.13 1.55
B242 2009 International CE‐300 DT‐I6 B28L 90,216 30,077.13 0.33 C 5.58 13.10 4.51 3.01
B243 2009 International CE‐300 DT‐I6 B28L 111,368 33,868.19 0.30 C 5.58 14.54 5.57 3.39
B244 2009 International CE‐300 DT‐I6 B28L 112,300 30,502.43 0.27 C 5.58 14.25 5.62 3.05
B245 2009 THOMAS SAF‐T‐LINER C2 6.7L B77 83,953 50,055.96 0.60 C 4.92 14.12 4.20 5.01
B246 2009 THOMAS SAF‐T‐LINER C2 6.7L B77 49,786 39,234.90 0.79 C 4.92 11.33 2.49 3.92
B247 2009 THOMAS SAF‐T‐LINER C2 6.7L B77 79,865 44,549.54 0.56 C 4.92 13.36 3.99 4.45
B248 2007 THOMAS SAF‐T‐LINER C2 MBE906 B77 40,663 22,192.50 0.55 C 7.08 11.34 2.03 2.22
B249 2009 THOMAS SAF‐T‐LINER C2 6.7L B77 62,785 47,099.12 0.75 C 4.92 12.77 3.14 4.71
B250 2008 International CE‐300 DT466 B77 48,531 25,669.03 0.53 C 6.67 11.66 2.43 2.57
B251 2009 THOMAS SAF‐T‐LINER C2 6.7L B77 57,993 40,986.13 0.71 C 4.92 11.91 2.90 4.10
B252 2009 THOMAS SAF‐T‐LINER C2 6.7L B77 63,113 39,044.38 0.62 C 4.92 11.98 3.16 3.90
B253 2009 THOMAS SAF‐T‐LINER C2 6.7L B77 61,799 42,684.12 0.69 C 4.92 12.28 3.09 4.27
B254 2009 THOMAS SAF‐T‐LINER C2 6.7L B77 83,619 45,782.99 0.55 C 4.92 13.68 4.18 4.58
B256 2009 THOMAS SAF‐T‐LINER C2 6.7L B77 81,000 45,458.24 0.56 C 4.92 13.51 4.05 4.55
B257 2009 THOMAS SAF‐T‐LINER C2 6.7L B77 71,986 39,508.44 0.55 C 4.92 12.47 3.60 3.95
B258 2009 THOMAS SAF‐T‐LINER C2 6.7L B77 61,301 41,313.74 0.67 C 4.92 12.11 3.07 4.13
Question #56 Attachment #12
91
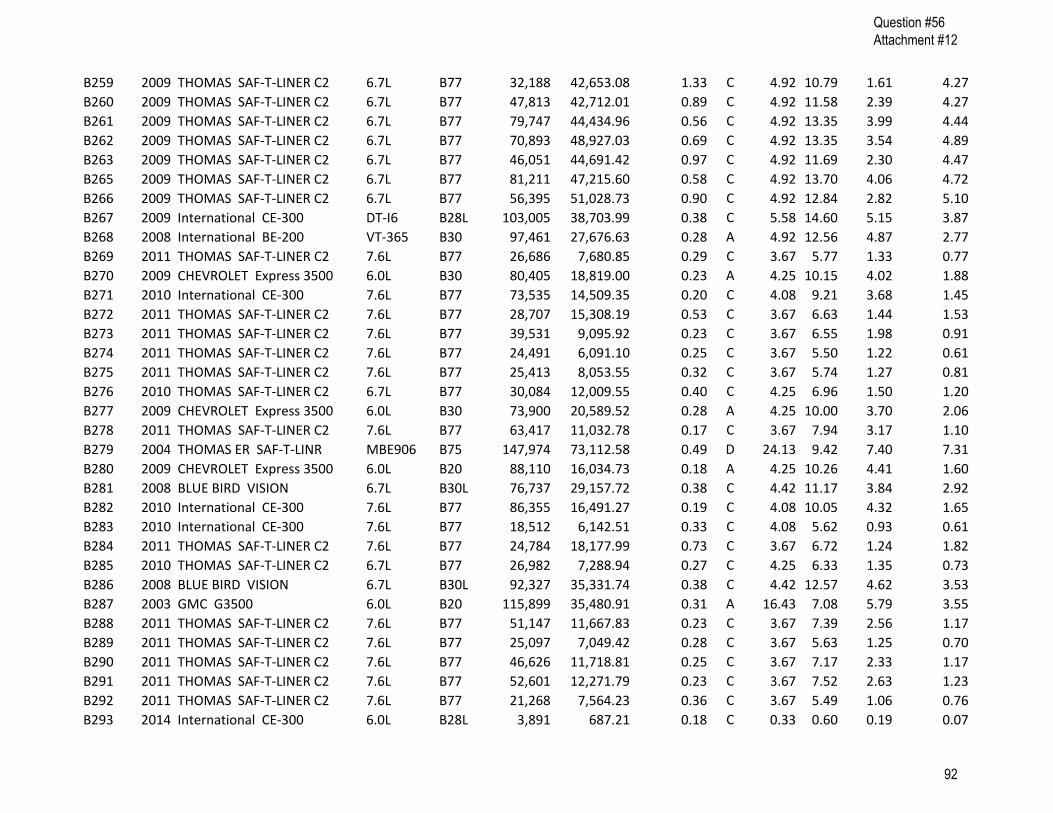
B259 2009 THOMAS SAF‐T‐LINER C2 6.7L B77 32,188 42,653.08 1.33 C 4.92 10.79 1.61 4.27
B260 2009 THOMAS SAF‐T‐LINER C2 6.7L B77 47,813 42,712.01 0.89 C 4.92 11.58 2.39 4.27
B261 2009 THOMAS SAF‐T‐LINER C2 6.7L B77 79,747 44,434.96 0.56 C 4.92 13.35 3.99 4.44
B262 2009 THOMAS SAF‐T‐LINER C2 6.7L B77 70,893 48,927.03 0.69 C 4.92 13.35 3.54 4.89
B263 2009 THOMAS SAF‐T‐LINER C2 6.7L B77 46,051 44,691.42 0.97 C 4.92 11.69 2.30 4.47
B265 2009 THOMAS SAF‐T‐LINER C2 6.7L B77 81,211 47,215.60 0.58 C 4.92 13.70 4.06 4.72
B266 2009 THOMAS SAF‐T‐LINER C2 6.7L B77 56,395 51,028.73 0.90 C 4.92 12.84 2.82 5.10
B267 2009 International CE‐300 DT‐I6 B28L 103,005 38,703.99 0.38 C 5.58 14.60 5.15 3.87
B268 2008 International BE‐200 VT‐365 B30 97,461 27,676.63 0.28 A 4.92 12.56 4.87 2.77
B269 2011 THOMAS SAF‐T‐LINER C2 7.6L B77 26,686 7,680.85 0.29 C 3.67 5.77 1.33 0.77
B270 2009 CHEVROLET Express 3500 6.0L B30 80,405 18,819.00 0.23 A 4.25 10.15 4.02 1.88
B271 2010 International CE‐300 7.6L B77 73,535 14,509.35 0.20 C 4.08 9.21 3.68 1.45
B272 2011 THOMAS SAF‐T‐LINER C2 7.6L B77 28,707 15,308.19 0.53 C 3.67 6.63 1.44 1.53
B273 2011 THOMAS SAF‐T‐LINER C2 7.6L B77 39,531 9,095.92 0.23 C 3.67 6.55 1.98 0.91
B274 2011 THOMAS SAF‐T‐LINER C2 7.6L B77 24,491 6,091.10 0.25 C 3.67 5.50 1.22 0.61
B275 2011 THOMAS SAF‐T‐LINER C2 7.6L B77 25,413 8,053.55 0.32 C 3.67 5.74 1.27 0.81
B276 2010 THOMAS SAF‐T‐LINER C2 6.7L B77 30,084 12,009.55 0.40 C 4.25 6.96 1.50 1.20
B277 2009 CHEVROLET Express 3500 6.0L B30 73,900 20,589.52 0.28 A 4.25 10.00 3.70 2.06
B278 2011 THOMAS SAF‐T‐LINER C2 7.6L B77 63,417 11,032.78 0.17 C 3.67 7.94 3.17 1.10
B279 2004 THOMAS ER SAF‐T‐LINR MBE906 B75 147,974 73,112.58 0.49 D 24.13 9.42 7.40 7.31
B280 2009 CHEVROLET Express 3500 6.0L B20 88,110 16,034.73 0.18 A 4.25 10.26 4.41 1.60
B281 2008 BLUE BIRD VISION 6.7L B30L 76,737 29,157.72 0.38 C 4.42 11.17 3.84 2.92
B282 2010 International CE‐300 7.6L B77 86,355 16,491.27 0.19 C 4.08 10.05 4.32 1.65
B283 2010 International CE‐300 7.6L B77 18,512 6,142.51 0.33 C 4.08 5.62 0.93 0.61
B284 2011 THOMAS SAF‐T‐LINER C2 7.6L B77 24,784 18,177.99 0.73 C 3.67 6.72 1.24 1.82
B285 2010 THOMAS SAF‐T‐LINER C2 6.7L B77 26,982 7,288.94 0.27 C 4.25 6.33 1.35 0.73
B286 2008 BLUE BIRD VISION 6.7L B30L 92,327 35,331.74 0.38 C 4.42 12.57 4.62 3.53
B287 2003 GMC G3500 6.0L B20 115,899 35,480.91 0.31 A 16.43 7.08 5.79 3.55
B288 2011 THOMAS SAF‐T‐LINER C2 7.6L B77 51,147 11,667.83 0.23 C 3.67 7.39 2.56 1.17
B289 2011 THOMAS SAF‐T‐LINER C2 7.6L B77 25,097 7,049.42 0.28 C 3.67 5.63 1.25 0.70
B290 2011 THOMAS SAF‐T‐LINER C2 7.6L B77 46,626 11,718.81 0.25 C 3.67 7.17 2.33 1.17
B291 2011 THOMAS SAF‐T‐LINER C2 7.6L B77 52,601 12,271.79 0.23 C 3.67 7.52 2.63 1.23
B292 2011 THOMAS SAF‐T‐LINER C2 7.6L B77 21,268 7,564.23 0.36 C 3.67 5.49 1.06 0.76
B293 2014 International CE‐300 6.0L B28L 3,891 687.21 0.18 C 0.33 0.60 0.19 0.07
Question #56 Attachment #12
92

B294 2011 THOMAS SAF‐T‐LINER C2 7.6L B77 24,965 7,915.45 0.32 C 3.67 5.71 1.25 0.79
B295 2011 THOMAS SAF‐T‐LINER C2 7.6L B77 27,055 7,705.69 0.28 C 3.67 5.79 1.35 0.77
B296 2004 THOMAS ER SAF‐T‐LINR MBE906 B75 146,699 65,276.33 0.44 D 23.28 9.42 7.33 6.53
B297 2011 THOMAS SAF‐T‐LINER C2 7.6L B77 35,021 8,538.94 0.24 C 4.58 7.19 1.75 0.85
B298 2011 THOMAS SAF‐T‐LINER C2 7.6L B77 28,132 10,602.06 0.38 C 4.58 7.05 1.41 1.06
B299 2011 THOMAS SAF‐T‐LINER C2 7.6L B77 32,774 9,917.95 0.30 C 4.58 7.21 1.64 0.99
B300 2014 THOMAS SAF‐T‐LINER C2 6.7L B77 2,184 929.64 0.43 C 0.50 0.70 0.11 0.09
B301 2011 International CE‐300 7.6L B77 33,867 9,282.39 0.27 C 3.33 5.95 1.69 0.93
B305 2001 THOMAS ER SAF‐T‐LINR 3126 B75 108,137 56,536.82 0.52 D 23.23 12.17 5.41 5.65
B306 2001 THOMAS ER SAF‐T‐LINR 3126 B75 83,888 52,517.61 0.63 D 21.61 12.17 4.19 5.25
B308 1997 GMC G3500 6.5L B20 18,227 14,840.17 0.81 A 17.90 15.50 0.91 1.48
B309 2014 THOMAS SAF‐T‐LINER C2 6.7L B77 1,668 629.99 0.38 C 0.50 0.65 0.08 0.06
B310 2014 THOMAS SAF‐T‐LINER C2 6.7L B77 1,810 741.76 0.41 C 0.58 0.75 0.09 0.07
B311 2014 THOMAS SAF‐T‐LINER C2 6.7L B77 3,769 767.93 0.20 C 0.58 0.85 0.19 0.08
B312 2014 International CE‐300 6.0L B28L 3,539 982.31 0.28 C 0.33 0.61 0.18 0.10
B313 2011 International CE‐300 7.6L B77 20,898 5,264.60 0.25 C 3.33 4.90 1.04 0.53
B314 2014 International CE‐300 6.0L B28L 3,003 728.65 0.24 C 0.33 0.56 0.15 0.07
B315 2014 THOMAS SAF‐T‐LINER C2 6.7L B77 1,517 677.78 0.45 C 0.50 0.64 0.08 0.07
B316 2014 THOMAS SAF‐T‐LINER C2 6.7L B77 846 853.66 1.01 C 0.25 0.38 0.04 0.09
B317 2014 THOMAS SAF‐T‐LINER C2 6.7L B77 3,459 601.55 0.17 C 0.50 0.73 0.17 0.06
B318 2009 BLUE BIRD VISION 6.7L B33L 75,743 26,469.89 0.35 C 4.50 10.93 3.79 2.65
B319 2014 THOMAS SAF‐T‐LINER C2 6.7L B77 2,712 1,289.04 0.48 C 0.50 0.76 0.14 0.13
B320 2014 THOMAS SAF‐T‐LINER C2 6.7L B77 3,790 754.82 0.20 C 0.58 0.85 0.19 0.08
B321 2014 International CE‐300 6.0L B28L 4,521 636.06 0.14 C 0.33 0.62 0.23 0.06
B322 2014 THOMAS SAF‐T‐LINER C2 6.7L B77 2,148 698.72 0.33 C 0.50 0.68 0.11 0.07
B323 2011 THOMAS SAF‐T‐LINER C2 7.6L B77 24,542 6,543.07 0.27 C 4.58 6.46 1.23 0.65
B324 2012 International CE‐300 DT‐I6 B77 70,544 9,708.51 0.14 C 2.42 6.91 3.53 0.97
B325 2011 THOMAS SAF‐T‐LINER C2 7.6L B77 33,370 13,439.49 0.40 C 4.58 7.60 1.67 1.34
B326 2011 THOMAS SAF‐T‐LINER C2 7.6L B77 22,151 6,885.89 0.31 C 4.58 6.38 1.11 0.69
B327 2011 THOMAS SAF‐T‐LINER C2 7.6L B77 48,972 15,155.21 0.31 C 4.58 8.55 2.45 1.52
B328 2014 THOMAS SAF‐T‐LINER C2 6.7L B77 934 556.54 0.60 C 0.58 0.69 0.05 0.06
B329 2014 International CE‐300 6.0L B28L 5,142 675.99 0.13 C 0.33 0.66 0.26 0.07
B330 2014 THOMAS SAF‐T‐LINER C2 6.7L B77 1,883 925.68 0.49 C 0.50 0.69 0.09 0.09
B331 2012 International CE‐300 DT‐I6 B77 18,545 3,987.38 0.22 C 2.42 3.74 0.93 0.40
Question #56 Attachment #12
93
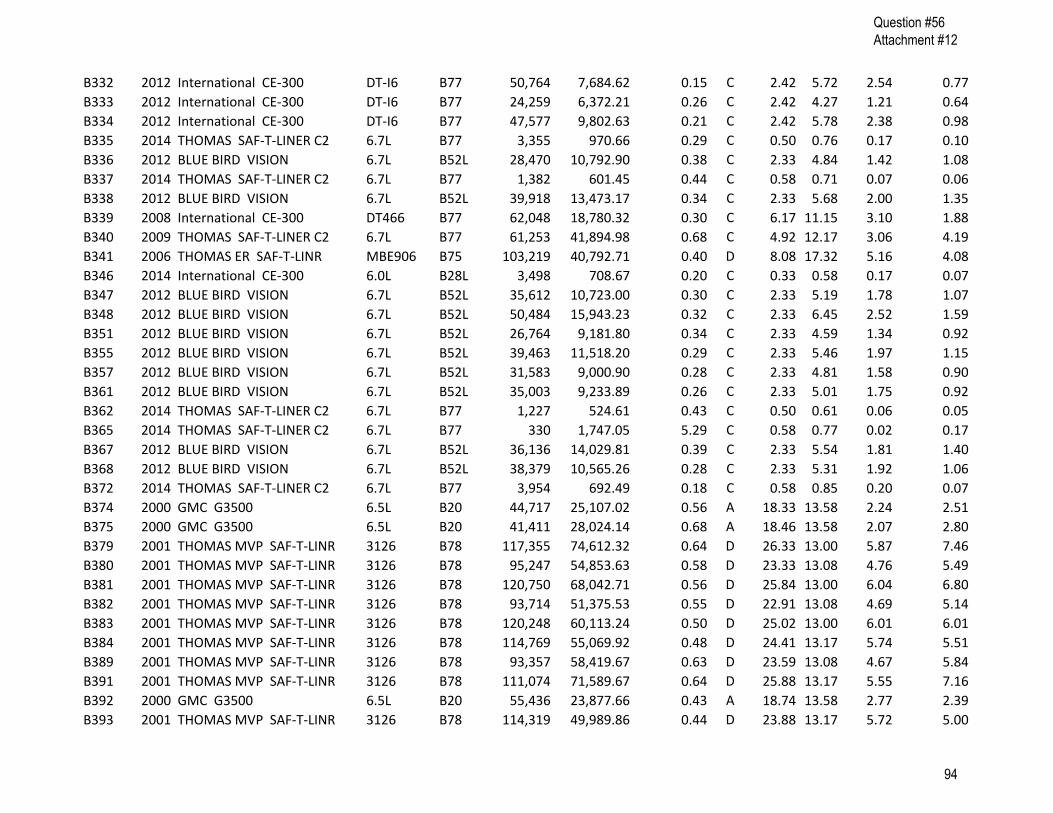
B332 2012 International CE‐300 DT‐I6 B77 50,764 7,684.62 0.15 C 2.42 5.72 2.54 0.77
B333 2012 International CE‐300 DT‐I6 B77 24,259 6,372.21 0.26 C 2.42 4.27 1.21 0.64
B334 2012 International CE‐300 DT‐I6 B77 47,577 9,802.63 0.21 C 2.42 5.78 2.38 0.98
B335 2014 THOMAS SAF‐T‐LINER C2 6.7L B77 3,355 970.66 0.29 C 0.50 0.76 0.17 0.10
B336 2012 BLUE BIRD VISION 6.7L B52L 28,470 10,792.90 0.38 C 2.33 4.84 1.42 1.08
B337 2014 THOMAS SAF‐T‐LINER C2 6.7L B77 1,382 601.45 0.44 C 0.58 0.71 0.07 0.06
B338 2012 BLUE BIRD VISION 6.7L B52L 39,918 13,473.17 0.34 C 2.33 5.68 2.00 1.35
B339 2008 International CE‐300 DT466 B77 62,048 18,780.32 0.30 C 6.17 11.15 3.10 1.88
B340 2009 THOMAS SAF‐T‐LINER C2 6.7L B77 61,253 41,894.98 0.68 C 4.92 12.17 3.06 4.19
B341 2006 THOMAS ER SAF‐T‐LINR MBE906 B75 103,219 40,792.71 0.40 D 8.08 17.32 5.16 4.08
B346 2014 International CE‐300 6.0L B28L 3,498 708.67 0.20 C 0.33 0.58 0.17 0.07
B347 2012 BLUE BIRD VISION 6.7L B52L 35,612 10,723.00 0.30 C 2.33 5.19 1.78 1.07
B348 2012 BLUE BIRD VISION 6.7L B52L 50,484 15,943.23 0.32 C 2.33 6.45 2.52 1.59
B351 2012 BLUE BIRD VISION 6.7L B52L 26,764 9,181.80 0.34 C 2.33 4.59 1.34 0.92
B355 2012 BLUE BIRD VISION 6.7L B52L 39,463 11,518.20 0.29 C 2.33 5.46 1.97 1.15
B357 2012 BLUE BIRD VISION 6.7L B52L 31,583 9,000.90 0.28 C 2.33 4.81 1.58 0.90
B361 2012 BLUE BIRD VISION 6.7L B52L 35,003 9,233.89 0.26 C 2.33 5.01 1.75 0.92
B362 2014 THOMAS SAF‐T‐LINER C2 6.7L B77 1,227 524.61 0.43 C 0.50 0.61 0.06 0.05
B365 2014 THOMAS SAF‐T‐LINER C2 6.7L B77 330 1,747.05 5.29 C 0.58 0.77 0.02 0.17
B367 2012 BLUE BIRD VISION 6.7L B52L 36,136 14,029.81 0.39 C 2.33 5.54 1.81 1.40
B368 2012 BLUE BIRD VISION 6.7L B52L 38,379 10,565.26 0.28 C 2.33 5.31 1.92 1.06
B372 2014 THOMAS SAF‐T‐LINER C2 6.7L B77 3,954 692.49 0.18 C 0.58 0.85 0.20 0.07
B374 2000 GMC G3500 6.5L B20 44,717 25,107.02 0.56 A 18.33 13.58 2.24 2.51
B375 2000 GMC G3500 6.5L B20 41,411 28,024.14 0.68 A 18.46 13.58 2.07 2.80
B379 2001 THOMAS MVP SAF‐T‐LINR 3126 B78 117,355 74,612.32 0.64 D 26.33 13.00 5.87 7.46
B380 2001 THOMAS MVP SAF‐T‐LINR 3126 B78 95,247 54,853.63 0.58 D 23.33 13.08 4.76 5.49
B381 2001 THOMAS MVP SAF‐T‐LINR 3126 B78 120,750 68,042.71 0.56 D 25.84 13.00 6.04 6.80
B382 2001 THOMAS MVP SAF‐T‐LINR 3126 B78 93,714 51,375.53 0.55 D 22.91 13.08 4.69 5.14
B383 2001 THOMAS MVP SAF‐T‐LINR 3126 B78 120,248 60,113.24 0.50 D 25.02 13.00 6.01 6.01
B384 2001 THOMAS MVP SAF‐T‐LINR 3126 B78 114,769 55,069.92 0.48 D 24.41 13.17 5.74 5.51
B389 2001 THOMAS MVP SAF‐T‐LINR 3126 B78 93,357 58,419.67 0.63 D 23.59 13.08 4.67 5.84
B391 2001 THOMAS MVP SAF‐T‐LINR 3126 B78 111,074 71,589.67 0.64 D 25.88 13.17 5.55 7.16
B392 2000 GMC G3500 6.5L B20 55,436 23,877.66 0.43 A 18.74 13.58 2.77 2.39
B393 2001 THOMAS MVP SAF‐T‐LINR 3126 B78 114,319 49,989.86 0.44 D 23.88 13.17 5.72 5.00
Question #56 Attachment #12
94

B395 2001 International RS3708 T444E B78 98,712 56,432.09 0.57 D 23.50 12.92 4.94 5.64
B398 2001 International RS3708 T444E B78 108,706 82,521.70 0.76 D 26.60 12.92 5.44 8.25
B401 2001 International RS3708 T444E B78 136,277 93,591.51 0.69 D 29.09 12.92 6.81 9.36
B403 2001 International RS3708 T444E B78 97,644 72,736.81 0.74 D 24.99 12.83 4.88 7.27
B413 2014 THOMAS SAF‐T‐LINER HDX 6.7L B78 6,955 2,520.87 0.36 D 0.58 1.18 0.35 0.25
B415 2000 GMC G3500 6.5L B20 57,825 33,453.46 0.58 A 19.07 12.83 2.89 3.35
B417 2000 GMC G3500 6.5L B20 41,131 24,532.81 0.60 A 17.59 13.08 2.06 2.45
B418 2010 THOMAS SAF‐T‐LINER C2 6.7L B77 30,468 13,235.45 0.43 C 4.25 7.10 1.52 1.32
B419 2001 THOMAS ER SAF‐T‐LINR 3126 B75 100,820 53,162.01 0.53 D 22.52 12.17 5.04 5.32
B420 2001 THOMAS ER SAF‐T‐LINR 3126 B75 104,468 51,080.28 0.49 D 22.41 12.08 5.22 5.11
B421 2001 THOMAS ER SAF‐T‐LINR 3126 B75 90,039 49,405.10 0.55 D 21.53 12.08 4.50 4.94
B423 2001 THOMAS ER SAF‐T‐LINR 3126 B75 87,247 58,282.78 0.67 D 22.27 12.08 4.36 5.83
B424 2001 THOMAS ER SAF‐T‐LINR 3126 B75 113,733 63,320.69 0.56 D 24.10 12.08 5.69 6.33
B426 2001 THOMAS ER SAF‐T‐LINR 3126 B75 92,341 57,728.14 0.63 D 22.47 12.08 4.62 5.77
B427 2001 THOMAS ER SAF‐T‐LINR 3126 B75 118,967 61,901.01 0.52 D 24.22 12.08 5.95 6.19
B429 2001 THOMAS ER SAF‐T‐LINR 3126 B75 110,977 60,604.80 0.55 D 23.78 12.17 5.55 6.06
B430 2001 THOMAS ER SAF‐T‐LINR 3126 B75 108,391 71,360.97 0.66 D 24.72 12.17 5.42 7.14
B431 2001 THOMAS ER SAF‐T‐LINR 3126 B75 99,191 54,322.93 0.55 D 22.48 12.08 4.96 5.43
B432 2001 THOMAS ER SAF‐T‐LINR 3126 B75 107,823 89,027.48 0.83 D 26.38 12.08 5.39 8.90
B433 2001 THOMAS ER SAF‐T‐LINR 3126 B75 103,588 51,953.09 0.50 D 22.46 12.08 5.18 5.20
B434 2001 THOMAS ER SAF‐T‐LINR 3126 B75 107,474 49,770.56 0.46 D 22.43 12.08 5.37 4.98
B435 2001 THOMAS ER SAF‐T‐LINR 3126 B75 116,091 61,279.69 0.53 D 24.02 12.08 5.80 6.13
B437 2001 THOMAS ER SAF‐T‐LINR 3126 B75 111,748 76,576.40 0.69 D 25.33 12.08 5.59 7.66
B439 2001 THOMAS ER SAF‐T‐LINR 3126 B75 86,145 49,369.50 0.57 D 21.33 12.08 4.31 4.94
B441 2014 THOMAS SAF‐T‐LINER HDX 6.7L B78 9,759 1,810.72 0.19 D 0.58 1.25 0.49 0.18
B443 2014 THOMAS SAF‐T‐LINER HDX 6.7L B78 8,271 2,156.36 0.26 D 0.50 1.13 0.41 0.22
B444 2014 THOMAS SAF‐T‐LINER HDX 6.7L B78 10,094 2,950.98 0.29 D 0.50 1.30 0.50 0.30
B445 2001 CHEVROLET G3500 5.7L B20 32,266 29,538.49 0.92 A 16.48 11.92 1.61 2.95
B446 2001 CHEVROLET G3500 5.7L B20 29,394 16,100.58 0.55 A 15.00 11.92 1.47 1.61
B447 2001 GMC G3500 6.5L B20 19,637 8,590.08 0.44 A 13.84 12.00 0.98 0.86
B448 2001 GMC G3500 6.5L B16 17,514 10,386.45 0.59 A 13.91 12.00 0.88 1.04
B449 2009 CHEVROLET Express 3500 6.0L B20L 10,262 3,026.75 0.29 A 0.75 1.57 0.51 0.30
B450 2008 International CE‐300 DT466 B77 69,411 16,838.21 0.24 C 6.17 11.32 3.47 1.68
B451 2009 CHEVROLET Express 3500 6.0L B20 5,825 3,208.67 0.55 A 0.75 1.36 0.29 0.32
Question #56 Attachment #12
95

B452 2003 THOMAS ER SAF‐T‐LINR 3126 B78 103,595 56,363.00 0.54 D 21.82 11.00 5.18 5.64
B453 2003 THOMAS ER SAF‐T‐LINR 3126 B78 146,078 56,350.56 0.39 D 24.02 11.08 7.30 5.64
B454 2003 THOMAS ER SAF‐T‐LINR 3126 B78 114,806 56,587.67 0.49 D 22.48 11.08 5.74 5.66
B455 2003 THOMAS ER SAF‐T‐LINR 3126 B78 71,837 41,942.73 0.58 D 18.79 11.00 3.59 4.19
B456 2003 THOMAS ER SAF‐T‐LINR 3126 B78 108,351 45,165.88 0.42 D 20.93 11.00 5.42 4.52
B457 2003 THOMAS ER SAF‐T‐LINR 3126 B78 84,826 42,719.77 0.50 D 19.51 11.00 4.24 4.27
B458 2003 THOMAS ER SAF‐T‐LINR 3126 B78 123,546 54,938.41 0.44 D 22.67 11.00 6.18 5.49
B459 2003 THOMAS ER SAF‐T‐LINR 3126 B78 91,027 33,633.52 0.37 D 18.91 11.00 4.55 3.36
B460 2003 THOMAS ER SAF‐T‐LINR 3126 B78 113,822 56,245.11 0.49 D 22.32 11.00 5.69 5.62
B461 2002 THOMAS ER SAF‐T‐LINR 3126 B66L 117,440 98,696.72 0.84 D 27.16 11.42 5.87 9.87
B462 2002 International GC39530 T444E B78 80,412 64,507.06 0.80 D 21.80 11.33 4.02 6.45
B463 2002 International GC39530 T444E B78 89,232 75,301.10 0.84 D 23.33 11.33 4.46 7.53
B464 2003 THOMAS ER SAF‐T‐LINR MBE906 B66 137,021 95,288.04 0.70 D 27.05 10.67 6.85 9.53
B465 2003 THOMAS ER SAF‐T‐LINR MBE906 B66 87,275 71,492.68 0.82 D 22.26 10.75 4.36 7.15
B466 2003 THOMAS ER SAF‐T‐LINR MBE906 B66 121,705 74,230.80 0.61 D 24.26 10.75 6.09 7.42
B467 2003 THOMAS ER SAF‐T‐LINR MBE906 B66 89,603 76,018.77 0.85 D 22.75 10.67 4.48 7.60
B468 2003 THOMAS ER SAF‐T‐LINR MBE906 B66 148,141 85,957.38 0.58 D 26.67 10.67 7.41 8.60
B469 2004 THOMAS ER SAF‐T‐LINR MBE906 B75 103,388 55,562.71 0.54 D 20.23 9.50 5.17 5.56
B472 2003 International GC39530 T444E B78 107,617 67,056.82 0.62 D 22.59 10.50 5.38 6.71
B473 2003 International GC39530 T444E B78 88,868 62,306.43 0.70 D 21.17 10.50 4.44 6.23
B474 2003 International GC39530 T444E B78 101,203 64,877.40 0.64 D 22.05 10.50 5.06 6.49
B475 2003 International GC39530 T444E B78 138,309 61,205.65 0.44 D 23.54 10.50 6.92 6.12
B476 2003 International GC39530 T444E B78 101,203 58,581.99 0.58 D 21.42 10.50 5.06 5.86
B477 2003 International GC39530 T444E B78 105,655 63,983.62 0.61 D 22.18 10.50 5.28 6.40
B478 2003 International GC39530 T444E B78 85,044 74,885.83 0.88 D 22.24 10.50 4.25 7.49
B479 2003 International GC39530 T444E B78 101,657 66,263.96 0.65 D 22.21 10.50 5.08 6.63
B480 2003 International GC39530 T444E B78 134,840 67,342.57 0.50 D 23.98 10.50 6.74 6.73
B481 2003 International GC39530 T444E B78 149,591 77,910.59 0.52 D 25.77 10.50 7.48 7.79
B485 2004 International GC39530 T444E B78 89,355 42,849.55 0.48 D 18.67 9.92 4.47 4.28
B486 2004 International GC39530 T444E B66L 150,278 80,282.00 0.53 D 25.46 9.92 7.51 8.03
B489 2004 International GC39530 T444E B66L 174,567 95,644.85 0.55 D 28.21 9.92 8.73 9.56
B491 2004 International GC39530 T444E B66 141,061 51,576.78 0.37 D 22.04 9.83 7.05 5.16
B492 2004 THOMAS ER SAF‐T‐LINR MBE906 B66L 115,963 36,513.85 0.31 D 19.45 10.00 5.80 3.65
B493 2004 THOMAS ER SAF‐T‐LINR MBE906 B66L 175,557 89,410.70 0.51 D 27.72 10.00 8.78 8.94
Question #56 Attachment #12
96

B494 2004 THOMAS ER SAF‐T‐LINR MBE906 B66L 126,074 67,086.32 0.53 D 23.01 10.00 6.30 6.71
B495 2004 THOMAS ER SAF‐T‐LINR MBE906 B66L 158,286 74,016.80 0.47 D 25.32 10.00 7.91 7.40
B496 2004 THOMAS ER SAF‐T‐LINR MBE906 B66L 161,886 80,028.12 0.49 D 26.10 10.00 8.09 8.00
B499 2004 International GC39530 T444E B66 136,887 59,052.67 0.43 D 22.58 9.83 6.84 5.91
B500 2003 International GC39530 T444E B66L 146,258 95,873.56 0.66 D 26.98 10.08 7.31 9.59
B501 2004 International GC39530 T444E B66 91,214 42,005.40 0.46 D 18.59 9.83 4.56 4.20
B503 2004 International GC39530 T444E B78 76,557 53,993.35 0.71 D 19.14 9.92 3.83 5.40
B504 2004 International GC39530 T444E B78 78,056 45,124.96 0.58 D 18.33 9.92 3.90 4.51
B505 2004 International GC39530 T444E B78 82,857 73,345.77 0.89 D 21.39 9.92 4.14 7.33
B506 2003 International GC39530 T444E B78 78,420 48,130.66 0.61 D 18.65 9.92 3.92 4.81
B507 2004 International GC39530 T444E B78 88,681 75,301.28 0.85 D 21.88 9.92 4.43 7.53
B508 2004 International GC39530 T444E B78 95,785 61,386.91 0.64 D 20.84 9.92 4.79 6.14
B509 2004 International GC39530 T444E B78 97,585 61,595.23 0.63 D 20.96 9.92 4.88 6.16
B510 2004 International GC39530 T444E B78 112,607 70,975.74 0.63 D 22.48 9.75 5.63 7.10
B511 2004 International GC39530 T444E B78 102,852 53,610.97 0.52 D 20.34 9.83 5.14 5.36
B512 2004 International GC39530 T444E B78 107,540 45,035.31 0.42 D 19.71 9.83 5.38 4.50
B514 2004 THOMAS ER SAF‐T‐LINR MBE906 B57 105,859 62,031.76 0.59 D 21.08 9.58 5.29 6.20
B515 2004 THOMAS ER SAF‐T‐LINR MBE906 B57 97,516 35,225.94 0.36 D 17.98 9.58 4.88 3.52
B516 2004 THOMAS ER SAF‐T‐LINR MBE906 B57 139,024 69,248.99 0.50 D 23.46 9.58 6.95 6.92
B517 2004 THOMAS ER SAF‐T‐LINR MBE906 B57 118,580 57,868.09 0.49 D 21.30 9.58 5.93 5.79
B518 2004 THOMAS ER SAF‐T‐LINR MBE906 B57 107,596 54,349.73 0.51 D 20.40 9.58 5.38 5.43
B519 2004 THOMAS ER SAF‐T‐LINR MBE906 B57 113,521 58,692.98 0.52 D 21.13 9.58 5.68 5.87
B520 2004 THOMAS ER SAF‐T‐LINR MBE906 B57 119,915 55,460.05 0.46 D 21.13 9.58 6.00 5.55
B521 2004 THOMAS ER SAF‐T‐LINR MBE906 B57 126,523 52,347.99 0.41 D 21.06 9.50 6.33 5.23
B522 2004 THOMAS ER SAF‐T‐LINR MBE906 B57 95,109 47,585.07 0.50 D 19.01 9.50 4.76 4.76
B523 2004 THOMAS ER SAF‐T‐LINR MBE906 B57 115,868 62,366.93 0.54 D 21.53 9.50 5.79 6.24
B524 2004 THOMAS ER SAF‐T‐LINR MBE906 B75 105,051 53,787.83 0.51 D 20.05 9.42 5.25 5.38
B525 2004 THOMAS ER SAF‐T‐LINR MBE906 B75 74,492 43,668.68 0.59 D 17.51 9.42 3.72 4.37
B526 2004 THOMAS ER SAF‐T‐LINR MBE906 B75 95,212 37,390.15 0.39 D 18.00 9.50 4.76 3.74
B527 2004 THOMAS ER SAF‐T‐LINR MBE906 B75 130,983 66,886.18 0.51 D 22.65 9.42 6.55 6.69
B528 2004 GMC G3500 6.0L B20 183,481 54,439.19 0.30 A 24.28 9.67 9.17 5.44
B530 2004 THOMAS ER SAF‐T‐LINR MBE906 B75 106,895 58,154.02 0.54 D 20.66 9.50 5.34 5.82
B531 2004 THOMAS ER SAF‐T‐LINR MBE906 B75 68,636 49,033.27 0.71 D 17.75 9.42 3.43 4.90
B532 2004 THOMAS ER SAF‐T‐LINR MBE906 B75 79,142 45,606.90 0.58 D 17.93 9.42 3.96 4.56
Question #56 Attachment #12
97

B533 2004 THOMAS ER SAF‐T‐LINR MBE906 B75 69,496 39,552.39 0.57 D 16.85 9.42 3.47 3.96
B534 2004 THOMAS ER SAF‐T‐LINR MBE906 B75 109,906 57,301.74 0.52 D 20.64 9.42 5.50 5.73
B535 2004 THOMAS ER SAF‐T‐LINR MBE906 B75 135,290 77,864.11 0.58 D 23.97 9.42 6.76 7.79
B536 2004 THOMAS ER SAF‐T‐LINR MBE906 B75 150,057 68,221.01 0.45 D 23.74 9.42 7.50 6.82
B537 2005 THOMAS ER SAF‐T‐LINR MBE906 B75 62,832 30,979.45 0.49 D 9.08 15.32 3.14 3.10
B538 2005 THOMAS ER SAF‐T‐LINR MBE906 B75 104,464 59,422.32 0.57 D 9.08 20.25 5.22 5.94
B539 2005 THOMAS ER SAF‐T‐LINR MBE906 B75 64,172 24,765.19 0.39 D 9.08 14.77 3.21 2.48
B540 2005 THOMAS ER SAF‐T‐LINR MBE906 B75 137,685 62,737.13 0.46 D 9.33 22.49 6.88 6.27
B541 2005 THOMAS ER SAF‐T‐LINR MBE906 B75 122,476 36,182.50 0.30 D 9.08 18.83 6.12 3.62
B542 2005 THOMAS ER SAF‐T‐LINR MBE906 B75 87,162 38,975.20 0.45 D 9.08 17.34 4.36 3.90
B543 2005 THOMAS ER SAF‐T‐LINR MBE906 B75 88,325 46,249.67 0.52 D 9.08 18.12 4.42 4.62
B544 2005 THOMAS ER SAF‐T‐LINR MBE906 B75 109,000 53,319.15 0.49 D 9.08 19.87 5.45 5.33
B545 2005 THOMAS ER SAF‐T‐LINR MBE906 B75 60,846 34,475.67 0.57 D 9.08 15.57 3.04 3.45
B546 2005 THOMAS ER SAF‐T‐LINR MBE906 B75 114,921 53,007.43 0.46 D 9.08 20.13 5.75 5.30
B547 2005 THOMAS ER SAF‐T‐LINR MBE906 B75 95,790 37,612.58 0.39 D 9.08 17.63 4.79 3.76
B548 2005 THOMAS ER SAF‐T‐LINR MBE906 B75 95,501 51,085.97 0.53 D 9.08 18.97 4.78 5.11
B549 2005 THOMAS ER SAF‐T‐LINR MBE906 B75 105,418 51,566.84 0.49 D 9.08 19.51 5.27 5.16
B550 2005 THOMAS ER SAF‐T‐LINR MBE906 B75 70,560 29,862.44 0.42 D 9.08 15.60 3.53 2.99
B551 2005 THOMAS ER SAF‐T‐LINR MBE906 B75 72,789 36,823.41 0.51 D 9.08 16.41 3.64 3.68
B552 2005 THOMAS ER SAF‐T‐LINR MBE906 B75 88,643 50,917.03 0.57 D 9.08 18.61 4.43 5.09
B553 2005 THOMAS ER SAF‐T‐LINR MBE906 B75 116,117 64,431.57 0.55 D 9.08 21.33 5.81 6.44
B554 2005 THOMAS ER SAF‐T‐LINR MBE906 B75 113,082 71,244.85 0.63 D 9.08 21.86 5.65 7.12
B555 2005 THOMAS ER SAF‐T‐LINR MBE906 B75 88,315 44,073.56 0.50 D 9.08 17.91 4.42 4.41
B556 2005 THOMAS ER SAF‐T‐LINR MBE906 B75 103,878 67,740.09 0.65 D 9.08 21.05 5.19 6.77
B557 2005 THOMAS ER SAF‐T‐LINR MBE906 B33L 140,087 54,701.47 0.39 D 9.08 21.56 7.00 5.47
B558 2005 THOMAS ER SAF‐T‐LINR MBE906 B33L 129,901 54,080.36 0.42 D 9.08 20.99 6.50 5.41
B559 2005 THOMAS ER SAF‐T‐LINR MBE906 B34L 129,520 70,881.33 0.55 D 9.33 22.90 6.48 7.09
B560 2005 THOMAS ER SAF‐T‐LINR MBE906 B33L 157,727 61,122.61 0.39 D 9.08 23.08 7.89 6.11
B561 2005 THOMAS ER SAF‐T‐LINR MBE906 B33L 146,017 68,789.34 0.47 D 9.08 23.26 7.30 6.88
B562 2005 THOMAS ER SAF‐T‐LINR MBE906 B57 147,815 67,266.03 0.46 D 9.08 23.20 7.39 6.73
B563 2005 THOMAS ER SAF‐T‐LINR MBE906 B57 105,479 46,534.14 0.44 D 9.08 19.01 5.27 4.65
B564 2005 THOMAS ER SAF‐T‐LINR MBE906 B57 116,450 39,429.08 0.34 D 9.08 18.85 5.82 3.94
B565 2005 THOMAS ER SAF‐T‐LINR MBE906 B57 146,940 59,698.39 0.41 D 9.08 22.40 7.35 5.97
B566 2005 THOMAS ER SAF‐T‐LINR MBE906 B57 114,111 61,477.72 0.54 D 9.08 20.94 5.71 6.15
Question #56 Attachment #12
98

B568 2004 GMC G3500 6.0L B30 172,755 31,859.25 0.18 A 20.82 9.00 8.64 3.19
B570 2004 GMC G3500 6.0L B30 148,248 40,952.66 0.28 A 20.42 8.92 7.41 4.10
B571 2004 GMC G3500 6.0L B30 168,985 34,014.61 0.20 A 20.85 9.00 8.45 3.40
B572 2005 International RE300 DT466 B78 71,032 36,397.79 0.51 D 8.67 15.86 3.55 3.64
B573 2005 International RE300 DT466 B78 87,771 29,829.45 0.34 D 8.67 16.04 4.39 2.98
B574 2005 International RE300 DT466 B78 57,277 19,769.32 0.35 D 8.67 13.51 2.86 1.98
B575 2005 International RE300 DT466 B78 99,132 36,262.18 0.37 D 8.67 17.25 4.96 3.63
B576 2005 International RE300 DT466 B78 66,150 46,246.81 0.70 D 8.58 16.52 3.31 4.62
B577 2005 International RE300 DT466 B78 80,742 37,981.38 0.47 D 8.67 16.50 4.04 3.80
B578 2005 International RE300 DT466 B78 139,229 50,178.94 0.36 D 8.67 20.65 6.96 5.02
B579 2005 International RE300 DT466 B78 88,736 46,693.13 0.53 D 8.67 17.77 4.44 4.67
B580 2005 International RE300 DT466 B78 85,582 41,221.29 0.48 D 8.58 16.98 4.28 4.12
B581 2005 International RE300 DT466 B78 117,601 52,939.32 0.45 D 8.58 19.76 5.88 5.29
B582 2005 International RE300 DT466 B78 53,109 30,214.68 0.57 D 8.58 14.26 2.66 3.02
B583 2005 International RE300 DT466 B78 81,174 34,700.82 0.43 D 8.58 16.11 4.06 3.47
B584 2005 International RE300 DT466 B78 87,140 37,936.78 0.44 D 8.58 16.73 4.36 3.79
B585 2005 International RE300 DT466 B78 93,974 51,739.58 0.55 D 8.58 18.46 4.70 5.17
B586 2005 International RE300 DT466 B78 67,299 34,110.69 0.51 D 8.58 15.36 3.36 3.41
B587 2005 International RE300 DT466 B78 107,747 42,131.72 0.39 D 8.58 18.18 5.39 4.21
B588 2005 International RE300 DT466 B78 140,114 53,801.39 0.38 D 8.58 20.97 7.01 5.38
B589 2005 International RE300 DT466 B78 66,242 33,516.43 0.51 D 8.58 15.25 3.31 3.35
B590 2003 International GC39530 T444E B78 102,760 69,295.40 0.67 D 22.23 10.17 5.14 6.93
B591 2005 International RE300 DT466 B78 79,616 41,646.90 0.52 D 8.58 16.73 3.98 4.16
B592 2006 THOMAS ER SAF‐T‐LINR MBE906 B75 84,195 49,514.46 0.59 D 8.08 17.24 4.21 4.95
B593 2006 THOMAS ER SAF‐T‐LINR MBE906 B75 94,282 43,360.34 0.46 D 8.08 17.13 4.71 4.34
B594 2006 THOMAS ER SAF‐T‐LINR MBE906 B75 112,820 64,840.89 0.57 D 8.08 20.21 5.64 6.48
B595 2006 THOMAS ER SAF‐T‐LINR MBE906 B75 110,909 52,554.71 0.47 D 8.08 18.88 5.55 5.26
B596 2006 THOMAS ER SAF‐T‐LINR MBE906 B75 74,714 40,515.51 0.54 D 8.08 15.87 3.74 4.05
B597 2006 THOMAS ER SAF‐T‐LINR MBE906 B75 62,468 29,157.21 0.47 D 8.08 14.12 3.12 2.92
B598 2006 THOMAS ER SAF‐T‐LINR MBE906 B75 78,718 39,486.78 0.50 D 8.00 15.88 3.94 3.95
B599 2006 THOMAS ER SAF‐T‐LINR MBE906 B75 86,554 52,036.75 0.60 D 8.00 17.53 4.33 5.20
B600 2006 THOMAS ER SAF‐T‐LINR MBE906 B75 49,549 26,766.48 0.54 D 8.25 13.40 2.48 2.68
B601 2006 THOMAS ER SAF‐T‐LINR MBE906 B75 58,492 23,844.29 0.41 D 8.25 13.56 2.92 2.38
B602 2006 THOMAS ER SAF‐T‐LINR MBE906 B75 70,279 34,399.55 0.49 D 8.25 15.20 3.51 3.44
Question #56 Attachment #12
99

B603 2006 THOMAS ER SAF‐T‐LINR MBE906 B75 100,948 67,806.27 0.67 D 8.08 19.91 5.05 6.78
B604 2006 THOMAS ER SAF‐T‐LINR MBE906 B75 84,100 38,564.77 0.46 D 8.08 16.14 4.21 3.86
B605 2006 THOMAS ER SAF‐T‐LINR MBE906 B75 90,483 43,133.70 0.48 D 8.08 16.92 4.52 4.31
B606 2006 THOMAS ER SAF‐T‐LINR MBE906 B75 106,317 36,120.15 0.34 D 8.25 17.18 5.32 3.61
B607 2006 THOMAS ER SAF‐T‐LINR MBE906 B75 104,053 51,774.98 0.50 D 8.25 18.63 5.20 5.18
B608 2006 THOMAS ER SAF‐T‐LINR MBE906 B75 135,646 60,874.01 0.45 D 8.25 21.12 6.78 6.09
B609 2005 GMC G3500 6.0L B28 166,366 30,092.91 0.18 A 8.00 19.33 8.32 3.01
B610 2005 GMC G3500 6.0L B28 173,589 33,335.92 0.19 A 8.00 20.01 8.68 3.33
B611 2006 THOMAS SAF‐T‐LINER C2 MBE906 B77 78,704 41,086.64 0.52 C 8.00 16.04 3.94 4.11
B612 2006 THOMAS SAF‐T‐LINER C2 MBE906 B77 55,486 30,224.84 0.54 C 7.75 13.55 2.77 3.02
B613 2006 THOMAS SAF‐T‐LINER C2 MBE906 B30L 76,757 49,182.53 0.64 C 8.00 16.76 3.84 4.92
B614 2006 THOMAS ER SAF‐T‐LINR MBE906 B75 102,438 41,412.61 0.40 D 8.08 17.35 5.12 4.14
B615 2006 THOMAS ER SAF‐T‐LINR MBE906 B75 60,859 32,523.50 0.53 D 8.08 14.38 3.04 3.25
B616 2006 International GC39530 DT466 B30L 163,557 52,441.30 0.32 D 7.58 21.01 8.18 5.24
B617 2006 International GC39530 DT466 B30L 140,544 37,263.36 0.27 D 7.58 18.34 7.03 3.73
B618 2006 International GC39530 DT466 B30L 120,990 56,164.75 0.46 D 7.58 19.25 6.05 5.62
B619 2006 International GC39530 DT466 B30L 107,435 57,914.52 0.54 D 7.58 18.75 5.37 5.79
B620 2006 International GC39530 DT466 B30L 110,484 46,298.02 0.42 D 7.58 17.74 5.52 4.63
B621 2006 International GC39530 DT466 B30L 106,934 52,251.78 0.49 D 7.58 18.16 5.35 5.23
B622 2006 International GC39530 DT466 B30L 126,869 56,710.92 0.45 D 7.58 19.60 6.34 5.67
B623 2006 International GC39530 DT466 B30L 134,753 45,871.92 0.34 D 7.58 18.91 6.74 4.59
B624 2006 International GC39530 DT466 B30L 128,802 53,576.31 0.42 D 7.58 19.38 6.44 5.36
B625 2006 International GC39530 DT466 B33L 117,738 39,868.41 0.34 D 7.58 17.46 5.89 3.99
B626 2007 International BE‐200 VT‐365 B30 135,700 57,187.04 0.42 C 7.67 20.17 6.79 5.72
B627 2006 International CE‐300 DT466 B72 144,533 51,318.72 0.36 C 7.67 20.03 7.23 5.13
B628 2006 International CE‐300 DT466 B72 67,549 24,136.23 0.36 C 7.67 13.46 3.38 2.41
B629 2006 International CE‐300 DT466 B72 55,701 23,834.48 0.43 C 7.67 12.84 2.79 2.38
B630 2006 International CE‐300 DT466 B72 118,344 41,861.37 0.35 C 7.67 17.77 5.92 4.19
B631 2006 International CE‐300 DT466 B72 82,665 30,518.56 0.37 C 7.58 14.77 4.13 3.05
B632 2006 International CE‐300 DT466 B72 58,881 21,419.21 0.36 C 7.58 12.67 2.94 2.14
B633 2006 International CE‐300 DT466 B72 43,713 16,926.87 0.39 C 7.58 11.46 2.19 1.69
B634 2006 International CE‐300 DT466 B72 135,352 41,442.56 0.31 C 7.58 18.50 6.77 4.14
B635 2006 International CE‐300 DT466 B72 85,952 24,377.84 0.28 C 7.58 14.32 4.30 2.44
B636 2006 International CE‐300 DT466 B72 82,273 24,272.21 0.30 C 7.58 14.12 4.11 2.43
Question #56 Attachment #12
100

B637 2006 International CE‐300 DT466 B72 83,693 33,290.96 0.40 C 7.58 15.10 4.18 3.33
B638 2006 International CE‐300 DT466 B72 81,110 31,430.18 0.39 C 7.42 14.62 4.06 3.14
B639 2006 International CE‐300 DT466 B72 87,681 35,269.17 0.40 C 7.58 15.49 4.38 3.53
B640 2006 International CE‐300 DT466 B72 127,082 38,214.63 0.30 C 7.58 17.76 6.35 3.82
B641 2006 International CE‐300 DT466 B72 137,915 49,511.89 0.36 C 7.58 19.43 6.90 4.95
B642 2006 International CE‐300 DT466 B72 113,367 43,465.69 0.38 C 7.58 17.60 5.67 4.35
B643 2006 International CE‐300 DT466 B72 75,698 23,708.30 0.31 C 7.58 13.74 3.78 2.37
B644 2006 International CE‐300 DT466 B72 115,606 36,048.90 0.31 C 7.58 16.97 5.78 3.60
B645 2006 International CE‐300 DT466 B72 62,856 26,952.65 0.43 C 7.58 13.42 3.14 2.70
B646 2006 International CE‐300 DT466 B72 61,648 20,031.00 0.32 C 7.58 12.67 3.08 2.00
B647 2006 International CE‐300 DT466 B72 76,472 26,301.52 0.34 C 7.58 14.04 3.82 2.63
B648 2006 International CE‐300 DT466 B72 100,621 35,581.23 0.35 C 7.58 16.17 5.03 3.56
B649 2006 International CE‐300 DT466 B72 60,960 21,919.50 0.36 C 7.58 12.82 3.05 2.19
B650 2006 International CE‐300 DT466 B72 110,366 33,941.36 0.31 C 7.58 16.50 5.52 3.39
B651 2006 International CE‐300 DT466 B72 101,401 28,589.02 0.28 C 7.50 15.43 5.07 2.86
B652 2006 International CE‐300 DT466 B72 116,645 38,572.90 0.33 C 7.50 17.19 5.83 3.86
B653 2006 International CE‐300 DT466 B72 142,915 45,452.47 0.32 C 7.50 19.19 7.15 4.55
B654 2006 International CE‐300 DT466 B72 98,360 31,896.71 0.32 C 7.50 15.61 4.92 3.19
B655 2006 International CE‐300 DT466 B72 86,518 28,436.88 0.33 C 7.50 14.67 4.33 2.84
B656 2006 International CE‐300 DT466 B72 100,089 27,004.85 0.27 C 7.50 15.20 5.00 2.70
B657 2006 International CE‐300 DT466 B72 80,817 22,472.88 0.28 C 7.50 13.79 4.04 2.25
B658 2007 International CE‐300 DT466 B28L 123,703 34,286.12 0.28 C 7.08 16.70 6.19 3.43
B659 2007 International CE‐300 DT466 B26L 128,530 41,724.97 0.32 C 7.08 17.68 6.43 4.17
B660 2007 International CE‐300 DT466 B26L 96,130 26,523.01 0.28 C 7.08 14.54 4.81 2.65
B661 2007 International CE‐300 DT466 B26L 146,184 36,344.98 0.25 C 7.08 18.03 7.31 3.63
B662 2007 International CE‐300 DT466 B28L 142,858 41,836.37 0.29 C 7.08 18.41 7.14 4.18
B663 2007 International CE‐300 DT466 B28L 154,056 42,468.34 0.28 C 7.08 19.03 7.70 4.25
B664 2007 International CE‐300 DT466 B28L 129,382 35,445.39 0.27 C 7.08 17.10 6.47 3.54
B665 2007 International CE‐300 DT466 B28L 151,984 41,244.61 0.27 C 7.08 18.81 7.60 4.12
B667 2007 International CE‐300 DT466 B28L 133,884 44,880.40 0.34 C 7.08 18.27 6.69 4.49
B668 2006 International CE‐300 DT466 B64 110,979 28,657.39 0.26 C 7.42 15.83 5.55 2.87
B669 2006 International CE‐300 DT466 B64 107,888 33,359.68 0.31 C 7.42 16.15 5.39 3.34
B670 2007 THOMAS SAF‐T‐LINER C2 MBE906 B77 66,320 27,461.36 0.41 C 7.17 13.23 3.32 2.75
B671 2007 THOMAS SAF‐T‐LINER C2 MBE906 B77 84,851 36,717.27 0.43 C 7.17 15.08 4.24 3.67
Question #56 Attachment #12
101

B672 2007 THOMAS SAF‐T‐LINER C2 MBE906 B77 86,534 34,153.27 0.39 C 7.17 14.91 4.33 3.42
B673 2007 THOMAS SAF‐T‐LINER C2 MBE906 B77 60,559 31,263.56 0.52 C 7.08 13.24 3.03 3.13
B674 2007 THOMAS SAF‐T‐LINER C2 MBE906 B77 75,526 32,014.49 0.42 C 7.17 14.14 3.78 3.20
B675 2007 THOMAS SAF‐T‐LINER C2 MBE906 B77 100,664 45,034.70 0.45 C 7.08 16.62 5.03 4.50
B676 2007 THOMAS SAF‐T‐LINER C2 MBE906 B77 76,253 34,783.84 0.46 C 7.08 14.37 3.81 3.48
B677 2007 THOMAS SAF‐T‐LINER C2 MBE906 B77 72,846 29,668.02 0.41 C 7.17 13.78 3.64 2.97
B678 2007 International BE‐200 VT‐365 B30 127,828 46,686.53 0.37 C 7.08 18.14 6.39 4.67
B679 2007 International BE‐200 VT‐365 B30 103,961 44,360.53 0.43 C 7.08 16.72 5.20 4.44
B680 2007 International CE‐300 DT466 B28L 119,892 35,312.50 0.29 C 7.08 16.61 5.99 3.53
B681 2006 International CE‐300 DT466 B77 51,989 14,517.38 0.28 C 6.75 10.80 2.60 1.45
B682 2006 International CE‐300 DT466 B77 65,155 20,174.54 0.31 C 6.75 12.03 3.26 2.02
B683 2006 International CE‐300 DT466 B77 86,124 22,212.75 0.26 C 6.75 13.28 4.31 2.22
B684 2008 International CE‐300 DT466 B77 61,226 21,043.55 0.34 C 6.67 11.83 3.06 2.10
B685 2008 International CE‐300 DT466 B77 121,472 34,309.56 0.28 C 6.75 16.25 6.07 3.43
B686 2008 International CE‐300 DT466 B77 80,126 37,475.56 0.47 C 6.75 14.50 4.01 3.75
B687 2008 International CE‐300 DT466 B77 61,246 21,859.90 0.36 C 6.58 11.83 3.06 2.19
B688 2008 International CE‐300 DT466 B77 87,622 25,500.86 0.29 C 6.75 13.68 4.38 2.55
B689 2008 International CE‐300 DT466 B77 49,540 15,973.27 0.32 C 6.67 10.74 2.48 1.60
B690 2008 International CE‐300 DT466 B77 70,265 19,762.64 0.28 C 6.67 12.16 3.51 1.98
B691 2008 International CE‐300 DT466 B77 65,100 23,643.48 0.36 C 6.67 12.29 3.26 2.36
B692 2008 International CE‐300 DT466 B77 35,822 15,636.65 0.44 C 6.67 10.02 1.79 1.56
B693 2006 International CE‐300 DT466 B77 68,937 19,784.41 0.29 C 6.75 12.18 3.45 1.98
B694 2008 International CE‐300 DT466 B77 91,338 28,698.37 0.31 C 6.67 14.10 4.57 2.87
B695 2008 International CE‐300 DT466 B60 130,228 31,615.82 0.24 C 6.75 16.42 6.51 3.16
B696 2008 International CE‐300 DT466 B60 127,004 31,372.01 0.25 C 6.75 16.24 6.35 3.14
B697 2008 International CE‐300 DT466 B60 58,542 15,430.98 0.26 C 6.75 11.22 2.93 1.54
B698 2008 International CE‐300 DT466 B60 113,254 37,912.35 0.33 C 6.75 16.20 5.66 3.79
B699 2008 International CE‐300 DT466 B77 79,434 17,760.57 0.22 C 6.75 12.50 3.97 1.78
B700 2009 International CE‐300 DT‐I6 B28L 71,885 34,068.18 0.47 C 5.58 12.58 3.59 3.41
B701 2008 International CE‐300 DT466 B28L 110,896 22,352.37 0.20 C 6.58 14.36 5.54 2.24
B702 2008 International CE‐300 DT466 B28L 110,730 27,547.39 0.25 C 6.58 14.87 5.54 2.75
B703 2008 International CE‐300 DT466 B28L 127,727 33,917.71 0.27 C 6.58 16.36 6.39 3.39
B704 2008 International CE‐300 DT466 B28L 103,620 27,838.05 0.27 C 6.58 14.55 5.18 2.78
B705 2008 International CE‐300 DT466 B28L 99,702 29,505.75 0.30 C 6.58 14.52 4.99 2.95
Question #56 Attachment #12
102

B706 2008 International CE‐300 DT466 B28L 171,889 47,062.85 0.27 C 6.58 19.88 8.59 4.71
B707 2008 International CE‐300 DT466 B28L 125,000 38,813.01 0.31 C 6.58 16.71 6.25 3.88
B708 2008 International CE‐300 DT466 B28L 135,034 35,150.27 0.26 C 6.58 16.85 6.75 3.52
B709 2008 International CE‐300 DT466 B28L 139,226 39,367.41 0.28 C 6.58 17.48 6.96 3.94
B710 2008 International CE‐300 DT466 B28L 130,626 55,860.03 0.43 C 6.58 18.70 6.53 5.59
B711 2009 International CE‐300 DT‐I6 B28L 123,769 31,338.94 0.25 C 5.58 14.91 6.19 3.13
B712 2008 THOMAS SAF‐T‐LINER C2 MBE906 B77 94,546 31,775.89 0.34 C 6.25 14.15 4.73 3.18
B713 2008 THOMAS SAF‐T‐LINER C2 MBE906 B77 71,378 34,614.30 0.48 C 6.58 13.61 3.57 3.46
B714 2008 THOMAS SAF‐T‐LINER C2 MBE906 B77 41,619 23,448.80 0.56 C 6.58 11.01 2.08 2.34
B715 2008 THOMAS SAF‐T‐LINER C2 MBE906 B77 46,951 38,148.67 0.81 C 6.58 12.75 2.35 3.81
B716 2008 THOMAS SAF‐T‐LINER C2 MBE906 B77 41,286 29,118.86 0.71 C 6.58 11.56 2.06 2.91
B717 2008 THOMAS SAF‐T‐LINER C2 MBE906 B77 45,340 22,500.00 0.50 C 6.58 11.10 2.27 2.25
B718 2008 THOMAS SAF‐T‐LINER C2 MBE906 B77 59,976 30,875.07 0.51 C 6.58 12.67 3.00 3.09
B719 2008 THOMAS SAF‐T‐LINER C2 MBE906 B77 95,058 46,231.34 0.49 C 6.58 15.96 4.75 4.62
B720 2008 THOMAS SAF‐T‐LINER C2 MBE906 B77 117,770 32,750.27 0.28 C 6.58 15.75 5.89 3.28
B721 2008 THOMAS SAF‐T‐LINER C2 MBE906 B77 64,401 28,785.62 0.45 C 6.17 12.27 3.22 2.88
B722 2008 THOMAS SAF‐T‐LINER C2 MBE906 B77 78,782 31,640.13 0.40 C 6.58 13.69 3.94 3.16
B723 2008 THOMAS SAF‐T‐LINER C2 MBE906 B77 76,377 46,135.84 0.60 C 6.58 15.02 3.82 4.61
B724 2008 THOMAS SAF‐T‐LINER C2 MBE906 B77 77,134 30,567.98 0.40 C 6.58 13.50 3.86 3.06
B725 2008 THOMAS SAF‐T‐LINER C2 MBE906 B77 88,366 47,281.16 0.54 C 6.58 15.73 4.42 4.73
B726 2008 THOMAS SAF‐T‐LINER C2 MBE906 B77 51,106 26,236.32 0.51 C 6.58 11.76 2.56 2.62
B727 2008 THOMAS SAF‐T‐LINER C2 MBE906 B77 81,790 36,774.76 0.45 C 6.58 14.35 4.09 3.68
B728 2008 THOMAS SAF‐T‐LINER C2 MBE906 B77 66,033 29,378.29 0.44 C 6.58 12.82 3.30 2.94
B729 2008 THOMAS SAF‐T‐LINER C2 MBE906 B77 68,380 30,387.25 0.44 C 6.58 13.04 3.42 3.04
B730 2007 THOMAS SAF‐T‐LINER C2 MBE906 B77 60,345 24,276.24 0.40 C 6.42 11.86 3.02 2.43
B731 2008 THOMAS SAF‐T‐LINER C2 MBE906 B77 33,464 22,931.75 0.69 C 6.58 10.55 1.67 2.29
B732 2008 THOMAS SAF‐T‐LINER C2 MBE906 B77 33,713 17,326.17 0.51 C 6.42 9.83 1.69 1.73
B733 2008 THOMAS SAF‐T‐LINER C2 MBE906 B77 53,564 22,616.12 0.42 C 6.42 11.36 2.68 2.26
B734 2007 THOMAS SAF‐T‐LINER C2 MBE906 B77 65,875 27,371.10 0.42 C 6.33 12.36 3.29 2.74
B735 2008 THOMAS SAF‐T‐LINER C2 MBE906 B77 78,457 35,048.99 0.45 C 6.33 13.76 3.92 3.50
B736 2008 THOMAS SAF‐T‐LINER C2 MBE906 B77 42,624 18,725.13 0.44 C 6.42 10.42 2.13 1.87
B737 2009 International CE‐300 DT‐I6 B28L 106,423 32,525.36 0.31 C 5.58 14.16 5.32 3.25
B738 2008 THOMAS SAF‐T‐LINER C2 MBE906 B66 46,690 50,918.30 1.09 C 6.00 13.43 2.33 5.09
B739 2006 FORD E450 6.0 diesel B24 133,835 55,652.74 0.42 A 6.33 18.59 6.69 5.57
Question #56 Attachment #12
103

B740 2006 FORD E450 6.0 diesel B24 137,852 29,141.99 0.21 A 6.33 16.14 6.89 2.91
B741 2006 FORD E450 6.0 diesel B24 107,594 33,496.26 0.31 A 6.33 15.06 5.38 3.35
B742 2008 International CE‐300 DT466 B77 62,587 17,584.32 0.28 C 6.17 11.05 3.13 1.76
B743 2008 International CE‐300 DT466 B77 72,392 22,502.44 0.31 C 6.17 12.04 3.62 2.25
B744 2008 International CE‐300 DT466 B77 69,607 24,955.49 0.36 C 6.17 12.14 3.48 2.50
B745 2008 International CE‐300 DT466 B77 56,260 16,854.75 0.30 C 6.17 10.67 2.81 1.69
B746 2008 International CE‐300 DT466 B77 58,759 15,215.53 0.26 C 6.17 10.63 2.94 1.52
B747 2008 International CE‐300 DT466 B77 48,935 14,864.23 0.30 C 6.17 10.10 2.45 1.49
B748 2008 International CE‐300 DT466 B77 89,764 20,782.39 0.23 C 6.17 12.73 4.49 2.08
B749 2008 International CE‐300 DT466 B77 66,738 19,198.06 0.29 C 6.17 11.42 3.34 1.92
B750 2008 International CE‐300 DT466 B77 54,680 18,324.98 0.34 C 6.17 10.73 2.73 1.83
B751 2012 BLUE BIRD VISION 6.7L B52L 32,375 10,353.27 0.32 C 2.33 4.99 1.62 1.04
B752 2012 BLUE BIRD VISION 6.7L B52L 26,942 8,166.90 0.30 C 2.33 4.50 1.35 0.82
B753 2011 CHEVROLET Express 3500 6.0L B20 53,205 8,807.03 0.17 A 2.33 5.87 2.66 0.88
B754 2011 CHEVROLET Express 3500 6.0L B20 50,227 7,007.10 0.14 A 2.33 5.55 2.51 0.70
B755 2011 CHEVROLET Express 3500 6.0L B20 103,201 9,719.69 0.09 A 2.33 8.47 5.16 0.97
B756 2011 CHEVROLET Express 3500 6.0L B20 64,887 ‐14,638.96 ‐0.23 A 2.33 4.11 3.24 ‐1.46
B757 2009 BLUE BIRD VISION 6.7L B33L 50,166 20,875.32 0.42 C 4.50 9.10 2.51 2.09
B758 2009 BLUE BIRD VISION 6.7L B33L 58,186 20,194.49 0.35 C 4.50 9.43 2.91 2.02
B759 2009 BLUE BIRD VISION 6.7L B33L 75,805 26,251.14 0.35 C 4.50 10.92 3.79 2.63
B760 2008 International BE‐200 DT‐I6 B30 95,730 25,959.54 0.27 A 4.42 11.80 4.79 2.60
B761 2008 International BE‐200 VT‐365 B30 101,154 21,233.89 0.21 A 4.42 11.60 5.06 2.12
B762 2010 International CE‐300 6.4 DIESEL B77 37,158 12,873.91 0.35 C 4.08 7.23 1.86 1.29
B763 2010 International CE‐300 7.6L B77 29,271 7,141.53 0.24 C 4.08 6.26 1.46 0.71
B764 2010 International CE‐300 7.6L B77 39,484 10,538.23 0.27 C 4.08 7.11 1.97 1.05
B765 2010 International CE‐300 7.6L B77 29,320 7,177.23 0.24 C 4.08 6.27 1.47 0.72
B766 2010 THOMAS SAF‐T‐LINER C2 6.7L B77 62,398 24,483.31 0.39 C 4.17 9.73 3.12 2.45
B767 2010 THOMAS SAF‐T‐LINER C2 7.6L B77 84,627 31,635.38 0.37 C 4.17 11.56 4.23 3.16
B768 2010 THOMAS SAF‐T‐LINER C2 6.7L B77 27,904 10,589.63 0.38 C 4.25 6.70 1.40 1.06
B769 2010 THOMAS SAF‐T‐LINER C2 6.7L B77 59,668 12,704.24 0.21 C 4.25 8.50 2.98 1.27
B770 2010 THOMAS SAF‐T‐LINER C2 6.7L B77 62,606 16,572.69 0.26 C 4.25 9.04 3.13 1.66
B771 2010 THOMAS SAF‐T‐LINER C2 6.7L B77 56,981 16,002.92 0.28 C 4.25 8.70 2.85 1.60
B772 2010 THOMAS SAF‐T‐LINER C2 6.7L B77 33,147 10,000.01 0.30 C 4.25 6.91 1.66 1.00
B773 2010 THOMAS SAF‐T‐LINER C2 6.7L B77 43,423 12,424.88 0.29 C 4.25 7.66 2.17 1.24
Question #56 Attachment #12
104

B774 2010 THOMAS SAF‐T‐LINER C2 6.7L B77 39,976 13,579.22 0.34 C 4.25 7.61 2.00 1.36
B775 2010 THOMAS SAF‐T‐LINER C2 6.7L B77 75,394 17,771.97 0.24 C 4.25 9.80 3.77 1.78
B776 2010 THOMAS SAF‐T‐LINER C2 6.7L B77 28,925 9,637.75 0.33 C 4.25 6.66 1.45 0.96
B777 2011 THOMAS SAF‐T‐LINER C2 7.6L B77‐H 26,377 13,609.58 0.52 C 3.67 6.35 1.32 1.36
B778 2011 THOMAS SAF‐T‐LINER C2 7.6L B77 18,612 5,713.83 0.31 C 3.58 5.09 0.93 0.57
B779 2011 THOMAS SAF‐T‐LINER C2 7.6L B77 43,455 13,930.08 0.32 C 3.58 7.15 2.17 1.39
B780 2011 THOMAS SAF‐T‐LINER C2 7.6L B77 20,824 9,302.14 0.45 C 3.58 5.55 1.04 0.93
B781 2011 THOMAS SAF‐T‐LINER C2 7.6L B77 21,159 6,537.57 0.31 C 3.58 5.30 1.06 0.65
B782 2011 THOMAS SAF‐T‐LINER C2 7.6L B77 48,865 11,111.60 0.23 C 3.58 7.14 2.44 1.11
B783 2011 THOMAS SAF‐T‐LINER C2 7.6L B77 62,117 30,730.10 0.49 C 3.67 9.85 3.11 3.07
B784 2011 THOMAS SAF‐T‐LINER C2 7.6L B77 49,720 27,133.43 0.55 C 3.67 8.87 2.49 2.71
B785 2011 THOMAS SAF‐T‐LINER C2 7.6L B77 48,554 25,267.78 0.52 C 3.67 8.62 2.43 2.53
B786 2011 THOMAS SAF‐T‐LINER C2 7.6L B77 53,623 26,251.79 0.49 C 3.67 8.97 2.68 2.63
B787 2011 THOMAS SAF‐T‐LINER C2 7.6L B77 81,263 22,359.33 0.28 C 3.67 9.97 4.06 2.24
B788 2011 THOMAS SAF‐T‐LINER C2 7.6L B77 63,848 22,764.28 0.36 C 3.67 9.14 3.19 2.28
B789 2011 THOMAS SAF‐T‐LINER C2 7.6L B77 46,318 20,833.79 0.45 C 3.67 8.07 2.32 2.08
B790 2011 THOMAS SAF‐T‐LINER C2 7.6L B77 55,484 19,298.17 0.35 C 3.67 8.37 2.77 1.93
B791 2011 THOMAS SAF‐T‐LINER C2 7.6L B77 69,975 21,409.22 0.31 C 3.67 9.31 3.50 2.14
B792 2011 THOMAS SAF‐T‐LINER C2 7.6L B77 61,436 25,622.52 0.42 C 3.67 9.30 3.07 2.56
B793 2011 THOMAS SAF‐T‐LINER C2 7.6L B71L 38,103 9,674.13 0.25 C 3.58 6.46 1.91 0.97
B794 2009 CHEVROLET G3500 6.0L B20L 38,240 8,597.09 0.22 A 4.58 7.36 1.91 0.86
B795 2010 CHEVROLET G3500 6.0 diesel B20 47,235 10,059.30 0.21 A 3.33 6.70 2.36 1.01
B796 2010 CHEVROLET G3500 6.0L B20 41,248 8,295.76 0.20 A 3.33 6.23 2.06 0.83
B797 2010 CHEVROLET G3500 6.0L B20 75,027 11,986.28 0.16 A 3.33 8.28 3.75 1.20
B798 2010 International CE‐300 7.6L B77 53,462 16,140.47 0.30 C 4.08 8.37 2.67 1.61
B799 2010 International CE‐300 7.6L B77 43,831 15,455.36 0.35 C 4.08 7.82 2.19 1.55
B800 2010 CHEVROLET G3500 6.0L B20 43,985 8,728.25 0.20 A 3.33 6.41 2.20 0.87
B801 2009 CHEVROLET G3500 6.0L B20 49,092 11,384.16 0.23 A 3.33 6.93 2.45 1.14
B802 2011 BLUE BIRD VISION 6.7L B52L 55,287 15,120.15 0.27 C 3.08 7.36 2.76 1.51
B803 2011 BLUE BIRD VISION 6.7L B52L 28,590 10,689.04 0.37 C 3.08 5.58 1.43 1.07
B804 2011 BLUE BIRD VISION 6.7L B52L 38,998 17,520.50 0.45 C 3.08 6.79 1.95 1.75
B805 2011 BLUE BIRD VISION 6.7L B52L 42,653 16,822.74 0.39 C 3.08 6.90 2.13 1.68
B806 2011 BLUE BIRD VISION 6.7L B52L 43,320 10,586.35 0.24 C 3.08 6.31 2.17 1.06
B807 2011 BLUE BIRD VISION 6.7L B52L 41,673 15,526.01 0.37 C 3.08 6.72 2.08 1.55
Question #56 Attachment #12
105

B808 2011 BLUE BIRD VISION 6.7L B52L 59,833 16,315.67 0.27 C 3.08 7.71 2.99 1.63
B809 2011 BLUE BIRD VISION 6.7L B52L 50,569 14,295.04 0.28 C 3.08 7.04 2.53 1.43
B810 2011 BLUE BIRD VISION 6.7L B52L 64,750 13,859.18 0.21 C 3.08 7.71 3.24 1.39
B811 2011 BLUE BIRD VISION 6.7L B52L 42,505 16,820.37 0.40 C 3.08 6.89 2.13 1.68
B812 2012 THOMAS SAF‐T‐LINER C2 6.7L B77 24,000 7,919.60 0.33 C 2.58 4.58 1.20 0.79
B813 2012 THOMAS SAF‐T‐LINER C2 6.7L B77 18,700 5,382.58 0.29 C 2.58 4.06 0.94 0.54
B814 2012 THOMAS SAF‐T‐LINER C2 6.7L B77 28,729 6,704.66 0.23 C 2.58 4.69 1.44 0.67
B815 2012 THOMAS SAF‐T‐LINER C2 6.7L B77 26,615 8,406.12 0.32 C 2.58 4.75 1.33 0.84
B816 2012 THOMAS SAF‐T‐LINER C2 6.7L B77 18,151 5,753.78 0.32 C 2.58 4.07 0.91 0.58
B817 2012 THOMAS SAF‐T‐LINER C2 6.7L B77 16,486 4,686.42 0.28 C 2.58 3.88 0.82 0.47
B818 2012 THOMAS SAF‐T‐LINER C2 6.7L B77 21,450 5,305.34 0.25 C 2.58 4.19 1.07 0.53
B819 2012 THOMAS SAF‐T‐LINER C2 6.7L B77 29,127 7,838.84 0.27 C 2.50 4.74 1.46 0.78
B820 2012 THOMAS SAF‐T‐LINER C2 6.7L B77 22,458 5,758.52 0.26 C 2.50 4.20 1.12 0.58
B821 2014 THOMAS SAF‐T‐LINER C2 6.7L B77 3,119 740.23 0.24 C 0.67 0.90 0.16 0.07
B822 2012 THOMAS SAF‐T‐LINER C2 6.7L B77 26,234 9,510.51 0.36 C 2.50 4.76 1.31 0.95
B823 2012 THOMAS SAF‐T‐LINER C2 6.7L B77 15,853 4,717.66 0.30 C 2.50 3.76 0.79 0.47
B824 2012 THOMAS SAF‐T‐LINER C2 6.7L B77 18,340 5,891.22 0.32 C 2.50 4.01 0.92 0.59
B825 2012 THOMAS SAF‐T‐LINER C2 6.7L B77 20,355 5,198.22 0.26 C 2.50 4.04 1.02 0.52
B826 2012 THOMAS SAF‐T‐LINER C2 6.7L B77 23,720 8,838.77 0.37 C 2.50 4.57 1.19 0.88
B827 2012 THOMAS SAF‐T‐LINER C2 6.7L B77 14,754 3,594.75 0.24 C 2.50 3.60 0.74 0.36
B828 2012 THOMAS SAF‐T‐LINER C2 6.7L B77 23,339 6,540.42 0.28 C 2.50 4.32 1.17 0.65
B829 2012 THOMAS SAF‐T‐LINER C2 6.7L B77 21,786 10,280.16 0.47 C 2.50 4.62 1.09 1.03
B830 2012 THOMAS SAF‐T‐LINER C2 6.7L B77 31,076 7,731.85 0.25 C 2.50 4.83 1.55 0.77
B831 2012 THOMAS SAF‐T‐LINER C2 6.7L B77 23,876 9,241.96 0.39 C 2.50 4.62 1.19 0.92
B832 2012 THOMAS SAF‐T‐LINER C2 6.7L B77 22,342 4,562.18 0.20 C 2.33 3.91 1.12 0.46
B833 2012 THOMAS SAF‐T‐LINER C2 6.7L B77 28,963 5,410.22 0.19 C 2.33 4.32 1.45 0.54
B834 2012 THOMAS SAF‐T‐LINER C2 6.7L B77 26,503 6,311.67 0.24 C 2.33 4.29 1.33 0.63
B835 2012 THOMAS SAF‐T‐LINER C2 6.7L B77 16,310 6,982.56 0.43 C 2.33 3.85 0.82 0.70
B836 2012 THOMAS SAF‐T‐LINER C2 6.7L B77 15,763 4,669.32 0.30 C 2.33 3.59 0.79 0.47
B837 2012 THOMAS SAF‐T‐LINER C2 6.7L B77 38,612 8,229.97 0.21 C 2.33 5.09 1.93 0.82
B838 2012 THOMAS SAF‐T‐LINER C2 6.7L B77 15,908 4,445.54 0.28 C 2.33 3.57 0.80 0.44
B839 2012 THOMAS SAF‐T‐LINER C2 6.7L B77 13,690 7,167.08 0.52 C 2.33 3.73 0.68 0.72
B840 2012 THOMAS SAF‐T‐LINER C2 6.7L B77 27,937 6,077.18 0.22 C 2.33 4.34 1.40 0.61
B841 2012 THOMAS SAF‐T‐LINER C2 6.7L B77 11,148 3,904.33 0.35 C 2.50 3.45 0.56 0.39
Question #56 Attachment #12
106

B842 2012 THOMAS SAF‐T‐LINER C2 6.7L B77 35,264 10,578.08 0.30 C 2.33 5.15 1.76 1.06
B843 2012 THOMAS SAF‐T‐LINER C2 6.7L B77 19,884 6,237.97 0.31 C 2.50 4.12 0.99 0.62
B844 2012 THOMAS SAF‐T‐LINER C2 6.7L B77 46,565 8,426.54 0.18 C 2.50 5.67 2.33 0.84
B845 2012 THOMAS SAF‐T‐LINER C2 6.7L B77 33,781 10,501.59 0.31 C 2.50 5.24 1.69 1.05
B846 2012 THOMAS SAF‐T‐LINER C2 6.7L B77 19,906 6,644.23 0.33 C 2.50 4.16 1.00 0.66
B847 2012 THOMAS SAF‐T‐LINER C2 6.7L B77 30,490 9,296.33 0.30 C 2.50 4.95 1.52 0.93
B848 2012 THOMAS SAF‐T‐LINER C2 6.7L B77 21,278 4,725.95 0.22 C 2.58 4.12 1.06 0.47
B849 2012 THOMAS SAF‐T‐LINER C2 6.7L B77 39,411 8,255.48 0.21 C 2.58 5.38 1.97 0.83
B850 2012 THOMAS SAF‐T‐LINER C2 6.7L B77 27,569 7,192.12 0.26 C 2.58 4.68 1.38 0.72
B851 2011 CHEVROLET Express 3500 6.0L B16 45,147 4,586.57 0.10 A 2.08 4.80 2.26 0.46
B852 2011 CHEVROLET Express 3500 6.0L B16 61,838 8,117.95 0.13 A 2.00 5.90 3.09 0.81
B853 2011 CHEVROLET Express 3500 6.0L B16 46,543 5,983.54 0.13 A 2.00 4.93 2.33 0.60
B854 2011 CHEVROLET Express 3500 6.0L B16 52,926 4,620.04 0.09 A 2.00 5.11 2.65 0.46
B855 2011 CHEVROLET Express 3500 6.0L B16 43,997 4,889.14 0.11 A 2.00 4.69 2.20 0.49
B856 2012 THOMAS SAF‐T‐LINER C2 6.7L B77 23,907 5,173.04 0.22 C 2.00 3.71 1.20 0.52
B857 2012 THOMAS SAF‐T‐LINER C2 6.7L B77 18,540 2,877.67 0.16 C 2.00 3.21 0.93 0.29
B858 2012 THOMAS SAF‐T‐LINER C2 6.7L B77 27,563 7,336.89 0.27 C 2.08 4.20 1.38 0.73
B859 2012 THOMAS SAF‐T‐LINER C2 6.7L B77 15,148 4,573.93 0.30 C 2.08 3.30 0.76 0.46
B860 2012 THOMAS SAF‐T‐LINER C2 6.7L B77 19,463 2,892.37 0.15 C 2.00 3.26 0.97 0.29
B861 2012 THOMAS SAF‐T‐LINER C2 6.7L B77 8,295 2,618.28 0.32 C 2.00 2.68 0.41 0.26
B862 2012 THOMAS SAF‐T‐LINER C2 6.7L B77 15,442 7,659.10 0.50 C 2.08 3.62 0.77 0.77
B863 2012 THOMAS SAF‐T‐LINER C2 6.7L B77 10,537 3,433.79 0.33 C 2.08 2.95 0.53 0.34
B864 2012 THOMAS SAF‐T‐LINER C2 6.7L B77 14,046 4,374.79 0.31 C 2.00 3.14 0.70 0.44
B865 2012 THOMAS SAF‐T‐LINER C2 6.7L B77 11,430 4,174.18 0.37 C 2.00 2.99 0.57 0.42
B866 2009 CHEVROLET Express 3500 6.0L B20 14,548 3,585.60 0.25 A 0.75 1.84 0.73 0.36
B867 2013 CHEVROLET Express 3500 6.0L B20 3,902 2,038.50 0.52 A 0.33 0.73 0.20 0.20
B868 2013 CHEVROLET Express 3500 6.0L B20 4,007 2,643.69 0.66 A 0.33 0.80 0.20 0.26
B869 2013 CHEVROLET Express 3500 6.0L B20 1,938 1,586.36 0.82 A 0.33 0.59 0.10 0.16
B870 2014 THOMAS SAF‐T‐LINER C2 6.7L B77 4,703 973.34 0.21 C 0.67 1.00 0.24 0.10
B871 2014 THOMAS SAF‐T‐LINER C2 6.7L B77 5,391 1,435.18 0.27 C 0.67 1.08 0.27 0.14
B872 2014 THOMAS SAF‐T‐LINER C2 6.7L B77 4,262 1,400.14 0.33 C 0.67 1.02 0.21 0.14
B873 2014 THOMAS SAF‐T‐LINER C2 6.7L B77 7,685 1,967.92 0.26 C 0.67 1.25 0.38 0.20
B874 2014 THOMAS SAF‐T‐LINER C2 6.7L B77 3,979 1,292.42 0.32 C 0.50 0.83 0.20 0.13
B875 2014 THOMAS SAF‐T‐LINER C2 6.7L B77 3,187 956.76 0.30 C 0.58 0.84 0.16 0.10
Question #56 Attachment #12
107

B876 2014 THOMAS SAF‐T‐LINER C2 6.7L B77 3,905 1,212.64 0.31 C 0.67 0.98 0.20 0.12
B877 2014 THOMAS SAF‐T‐LINER C2 6.7L B77 2,940 1,209.28 0.41 C 0.67 0.93 0.15 0.12
B878 2014 THOMAS SAF‐T‐LINER C2 6.7L B77 1,950 804.39 0.41 C 0.67 0.84 0.10 0.08
B879 2014 THOMAS SAF‐T‐LINER C2 6.7L B77 6,430 1,684.02 0.26 C 0.58 1.07 0.32 0.17
B880 2014 THOMAS SAF‐T‐LINER C2 6.7L B77 5,473 1,278.86 0.23 C 0.67 1.07 0.27 0.13
B881 2014 THOMAS SAF‐T‐LINER C2 6.7L B77 4,678 1,615.52 0.35 C 0.67 1.06 0.23 0.16
Question #56 Attachment #12
108

Dept Vehicle Year Make Model Type Purpose Mileage
Administration 3089 2006 FORD Escape Hybrid Small SUV Pool Vehicle 98,489
Administration 3150 2013 CHEVROLET EQUINOX Small SUV Deputy Superintendant 8,311
Construction 3008 2003 CHEVROLET SILVERADO 4x4 Pickup Project Manager 109,877
Construction 3067 2005 FORD Escape Hybrid Small SUV Project Manager 30,600
Construction 3068 2005 FORD Escape Hybrid Small SUV Sr. Project Manager 49,289
Construction 3090 2006 FORD Escape Hybrid Small SUV Sr. Project Manager 98,533
Construction 3098 2006 FORD F350 4x4 Pickup Project Manager 98,344
Construction 3099 2006 FORD F350 4x4 Pickup Project Manager 58,206
Construction 3109 2007 FORD F350 4x4 Pickup Project Manager 48,260
Construction 3138 2012 FORD ESCAPE Small SUV Supervisor 4,257
Construction 3148 2012 FORD ESCAPE Small SUV Sr. Project Manager 18,942
Construction 3158 2014 JEEP Compass Small SUV Director of Construction 1,156
Facilities 3003 2010 FORD F350 4x4 Pickup Supervisor 56,823
Facilities 3013 2005 CHEVROLET SILVERADO 4x4 Pickup General Maint 63,321
Facilities 3016 2005 GMC SIERRA 4x4 Pickup General Maint 106,479
Facilities 3017 2005 GMC SIERRA 4x4 Pickup General Maint 107,000
Facilities 3026 2005 CHEVROLET SILVERADO 4x4 Pickup General Maint 120,113
Facilities 3032 2013 FORD F350 4x4 Pickup General Maint 4,109
Facilities 3036 2001 CHEVROLET K2500 4x4 Pickup Carpenter 143,409
Facilities 3038 2013 FORD F350 4x4 Pickup Supervisor 18,036
Facilities 3045 2003 GMC SIERRA 4x4 Pickup General Maint 73,274
Facilities 3053 2013 FORD F350 4x4 Pickup General Maint 8,627
Facilities 3060 2005 GMC SIERRA 4x4 Pickup Lead Custodian 106,737
Facilities 3063 2005 GMC SIERRA 4x4 Pickup Painter 79,568
Facilities 3069 2005 FORD F350 4x4 Pickup General Maint 105,036
Facilities 3070 2005 FORD F350 4x4 Pickup General Maint 119,110
Facilities 3071 2005 FORD F350 4x4 Pickup General Maint 107,069
Facilities 3084 2006 FORD F350 4x4 Pickup General Maint 76,570
Facilities 3086 2006 FORD F350 4x4 Pickup Small Engine Road Service 6,470
Facilities 3097 2006 FORD Escape Hybrid Small SUV Lead Custodian 96,330
Facilities 3100 2006 FORD F350 4x4 Pickup General Maint 43,449
Facilities 3102 2006 FORD F350 4x4 Pickup Supervisor 47,200
Facilities 3103 2007 FORD F350 4x4 Pickup General Maint 78,642
Facilities 3104 2007 FORD F350 4x4 Pickup General Maint 90,635
Facilities 3105 2007 FORD F350 4x4 Pickup General Maint 65,749
Facilities 3106 2007 FORD F350 4x4 Pickup Lead Custodian 66,946
Facilities 3107 2007 FORD F350 4x4 Pickup General Maint 48,371
Facilities 3108 2007 FORD F350 4x4 Pickup General Maint 37,607
Facilities 3110 2007 FORD F350 4x4 Pickup General Maint 72,632
Facilities 3111 2007 FORD F350 4x4 Pickup Carpenter 55,698
Facilities 3112 2007 FORD F350 4x4 Pickup General Maint 23,664
Facilities 3128 2011 CHEVROLET SILVERADO 4x4 Pickup Waste Water Tech 70,290
Facilities 3129 2011 FORD F350 4x4 Pickup Carpenter 48,738
Facilities 3130 2011 FORD F350 4x4 Pickup Carpenter 32,411
Facilities 3131 2011 FORD F350 4x4 Pickup Grounds Maint 28,626
Facilities 3132 2011 FORD F350 4x4 Pickup General Maint 20,092
Facilities 3133 2011 FORD F350 4x4 Pickup Grounds Maint 11,051
Facilities 3134 2011 FORD F350 4x4 Pickup General Maint 28,743
Facilities 3139 2012 FORD ESCAPE Small SUV Supervisor 50,492
Facilities 3140 2012 FORD ESCAPE Small SUV Supervisor 56,407
Facilities 3141 2012 FORD F350 4x4 Pickup General Maint 30,101
Facilities 3142 2012 FORD F350 4x4 Pickup Carpenter 29,964
Facilities 3143 2012 FORD F350 4x4 Pickup Carpenter 26,743
Facilities 3144 2012 FORD F350 4x4 Pickup General Maint 29,207
Facilities 3145 2012 FORD F350 4x4 Pickup General Maint 26,245
Response: Q‐57 / Attachment: Chart of all LCPS 4x4 Vehicles Specifiying Year/Model/Purpose/Mileage
Question #57 Attachment #13
109
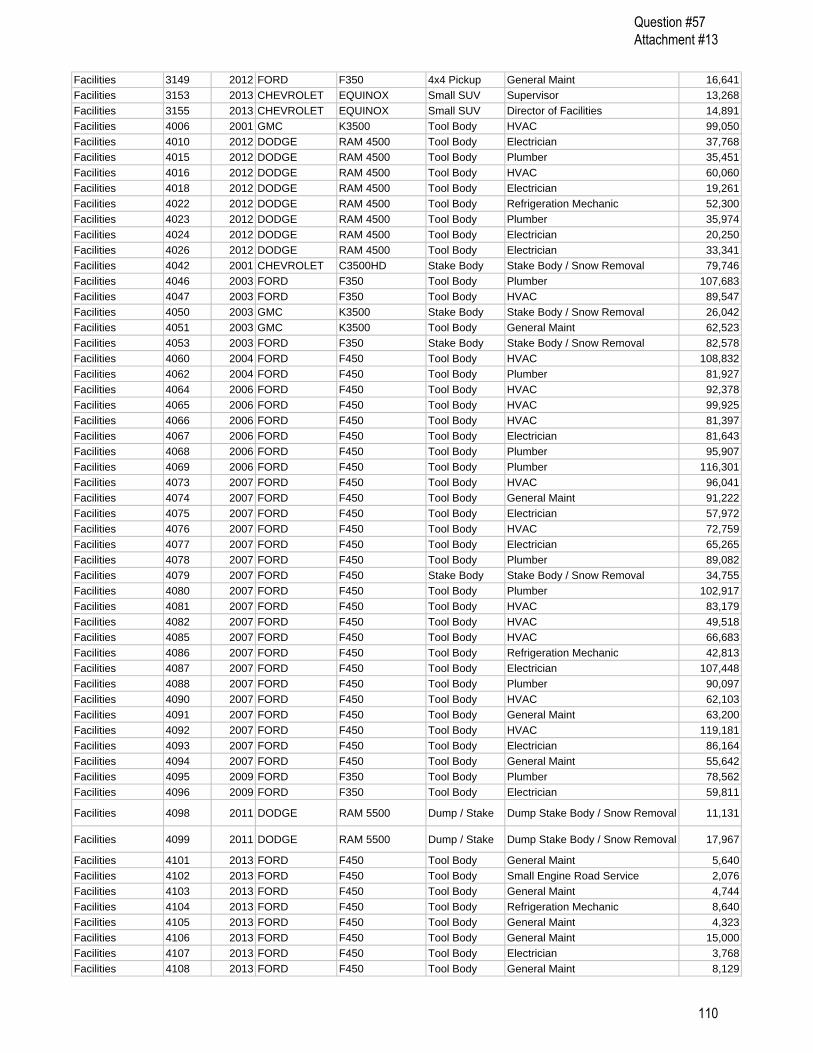
Facilities 3149 2012 FORD F350 4x4 Pickup General Maint 16,641
Facilities 3153 2013 CHEVROLET EQUINOX Small SUV Supervisor 13,268
Facilities 3155 2013 CHEVROLET EQUINOX Small SUV Director of Facilities 14,891
Facilities 4006 2001 GMC K3500 Tool Body HVAC 99,050
Facilities 4010 2012 DODGE RAM 4500 Tool Body Electrician 37,768
Facilities 4015 2012 DODGE RAM 4500 Tool Body Plumber 35,451
Facilities 4016 2012 DODGE RAM 4500 Tool Body HVAC 60,060
Facilities 4018 2012 DODGE RAM 4500 Tool Body Electrician 19,261
Facilities 4022 2012 DODGE RAM 4500 Tool Body Refrigeration Mechanic 52,300
Facilities 4023 2012 DODGE RAM 4500 Tool Body Plumber 35,974
Facilities 4024 2012 DODGE RAM 4500 Tool Body Electrician 20,250
Facilities 4026 2012 DODGE RAM 4500 Tool Body Electrician 33,341
Facilities 4042 2001 CHEVROLET C3500HD Stake Body Stake Body / Snow Removal 79,746
Facilities 4046 2003 FORD F350 Tool Body Plumber 107,683
Facilities 4047 2003 FORD F350 Tool Body HVAC 89,547
Facilities 4050 2003 GMC K3500 Stake Body Stake Body / Snow Removal 26,042
Facilities 4051 2003 GMC K3500 Tool Body General Maint 62,523
Facilities 4053 2003 FORD F350 Stake Body Stake Body / Snow Removal 82,578
Facilities 4060 2004 FORD F450 Tool Body HVAC 108,832
Facilities 4062 2004 FORD F450 Tool Body Plumber 81,927
Facilities 4064 2006 FORD F450 Tool Body HVAC 92,378
Facilities 4065 2006 FORD F450 Tool Body HVAC 99,925
Facilities 4066 2006 FORD F450 Tool Body HVAC 81,397
Facilities 4067 2006 FORD F450 Tool Body Electrician 81,643
Facilities 4068 2006 FORD F450 Tool Body Plumber 95,907
Facilities 4069 2006 FORD F450 Tool Body Plumber 116,301
Facilities 4073 2007 FORD F450 Tool Body HVAC 96,041
Facilities 4074 2007 FORD F450 Tool Body General Maint 91,222
Facilities 4075 2007 FORD F450 Tool Body Electrician 57,972
Facilities 4076 2007 FORD F450 Tool Body HVAC 72,759
Facilities 4077 2007 FORD F450 Tool Body Electrician 65,265
Facilities 4078 2007 FORD F450 Tool Body Plumber 89,082
Facilities 4079 2007 FORD F450 Stake Body Stake Body / Snow Removal 34,755
Facilities 4080 2007 FORD F450 Tool Body Plumber 102,917
Facilities 4081 2007 FORD F450 Tool Body HVAC 83,179
Facilities 4082 2007 FORD F450 Tool Body HVAC 49,518
Facilities 4085 2007 FORD F450 Tool Body HVAC 66,683
Facilities 4086 2007 FORD F450 Tool Body Refrigeration Mechanic 42,813
Facilities 4087 2007 FORD F450 Tool Body Electrician 107,448
Facilities 4088 2007 FORD F450 Tool Body Plumber 90,097
Facilities 4090 2007 FORD F450 Tool Body HVAC 62,103
Facilities 4091 2007 FORD F450 Tool Body General Maint 63,200
Facilities 4092 2007 FORD F450 Tool Body HVAC 119,181
Facilities 4093 2007 FORD F450 Tool Body Electrician 86,164
Facilities 4094 2007 FORD F450 Tool Body General Maint 55,642
Facilities 4095 2009 FORD F350 Tool Body Plumber 78,562
Facilities 4096 2009 FORD F350 Tool Body Electrician 59,811
Facilities 4098 2011 DODGE RAM 5500 Dump / Stake Dump Stake Body / Snow Removal 11,131
Facilities 4099 2011 DODGE RAM 5500 Dump / Stake Dump Stake Body / Snow Removal 17,967
Facilities 4101 2013 FORD F450 Tool Body General Maint 5,640
Facilities 4102 2013 FORD F450 Tool Body Small Engine Road Service 2,076
Facilities 4103 2013 FORD F450 Tool Body General Maint 4,744
Facilities 4104 2013 FORD F450 Tool Body Refrigeration Mechanic 8,640
Facilities 4105 2013 FORD F450 Tool Body General Maint 4,323
Facilities 4106 2013 FORD F450 Tool Body General Maint 15,000
Facilities 4107 2013 FORD F450 Tool Body Electrician 3,768
Facilities 4108 2013 FORD F450 Tool Body General Maint 8,129
Question #57 Attachment #13
110

Facilities 4109 2013 FORD F450 Tool Body Electrician 7,304
Facilities 4110 2013 FORD F450 Tool Body General Maint 6,492
Facilities 4111 2013 FORD F450 Tool Body General Maint 7,761
Facilities 4112 2013 FORD F450 Tool Body General Maint 9,290
Facilities 4114 2013 DODGE RAM 4500 Dump / Stake Dump Stake Body / Snow Removal 1,002
Facilities 4116 2014 FORD F450 Tool Body New Replacement (TBD) 151
Facilities 4117 2014 FORD F450 Tool Body HVAC 1,502
Facilities 4118 2014 FORD F450 Tool Body New Replacement (TBD) 155
Facilities 4119 2014 FORD F450 Tool Body New Replacement (TBD) 150
Facilities 4120 2014 FORD F450 Tool Body HVAC 1,355
Facilities 4121 2014 FORD F450 Tool Body Plumber 2,716
Facilities 4122 2014 FORD F450 Tool Body HVAC 4,216
Facilities 4126 2014 FORD F450 Tool Body New Replacement (TBD) 598
Facilities 4127 2014 FORD F450 Tool Body Plumber 1,647
Food Services 3157 2013 FORD EXPLORER Small SUV Supervisor 6,433
Garage 3002 2000 CHEVROLET K2500 4x4 Pickup Road Service - Central 59,531
Garage 3061 2005 GMC SIERRA 4x4 Pickup Road Service - Central 91,713
Garage 4007 2000 GMC K3500 Tire Body Road Service - Tire Truck 58,790
Garage 4033 2013 FORD F450 Tool Body Road Service - East (Sterling) 5,066
Garage 4036 2013 FORD F450 Tool Body Road Service - South 12,944
Garage 4070 2006 FORD F450 Tool Body Road Service - West 106,313
Garage 4097 2009 FORD F450 Tool Body Road Service - West 93,783
Garage 4100 2013 FORD F450 Tool Body Road Service - East (Ashburn) 8,271
Instruction 3122 2011 FORD ESCAPE Small SUV Asst Superintendent 21,773
Personnel 3054 2005 FORD Escape Hybrid Small SUV Pool Vehicle 63,602
Pupil Svcs 3057 2005 FORD Escape Hybrid Small SUV Asst Superintendent 29,950
Pupil Svcs 3152 2013 CHEVROLET EQUINOX Small SUV Public Information Office 5,966
Safety&Security 3048 2004 FORD F350 4x4 Pickup Communications Engineer 40,497
Safety&Security 3066 2005 FORD Escape Hybrid Small SUV Communications Tech 48,931
Safety&Security 3085 2006 FORD F350 4x4 Pickup Communications Coordinator 53,292
Safety&Security 3092 2006 FORD Escape Hybrid Small SUV Patrol Vehicle 150,030
Safety&Security 3095 2006 FORD Escape Hybrid Small SUV Patrol Vehicle 117,052
Safety&Security 3096 2006 FORD Escape Hybrid Small SUV Patrol Vehicle 56,344
Safety&Security 3119 2009 FORD ESCAPE Small SUV Communications Specialist 71,760
Safety&Security 3136 2011 CHEVROLET TAHOE SUV Supervisor 30,230
Safety&Security 3159 2014 JEEP Compass Small SUV Safety and Security Coordinator 974
Safety&Security 3162 2014 JEEP Compass Small SUV Safety and Security Coordinator 1,896
Safety&Security 4055 2003 GMC K3500 Tool Body Communications Tech 101,438
Safety&Security 4084 2007 FORD F450 Tool Body Communications Tech 79,907
Safety&Security 4115 2013 DODGE RAM 5500 Bucket Truck Communications Tech 277
Safety&Security 4123 2014 FORD F450 Tool Body Communications Tech 2,412
School Use 3006 2010 CHEVROLET SUBURBAN SUV School Use / Trailer Towing 18,667
School Use 3021 2013 CHEVROLET SUBURBAN SUV School Use / Trailer Towing 8,043
School Use 3028 2010 CHEVROLET SUBURBAN SUV School Use / Trailer Towing 36,937
School Use 3050 2012 CHEVROLET SUBURBAN SUV School Use / Trailer Towing 2,773
School Use 3072 2005 CHEVROLET TAHOE SUV School Use / Trailer Towing 50,418
School Use 3073 2005 CHEVROLET TAHOE SUV School Use / Trailer Towing 87,060
School Use 3074 2005 CHEVROLET TAHOE SUV School Use / Trailer Towing 77,000
School Use 3075 2005 CHEVROLET TAHOE SUV School Use / Trailer Towing 71,863
School Use 3076 2005 CHEVROLET TAHOE SUV School Use / Trailer Towing 48,131
School Use 3077 2005 CHEVROLET TAHOE SUV School Use / Trailer Towing 76,751
School Use 3078 2005 CHEVROLET TAHOE SUV School Use / Trailer Towing 58,152
School Use 3079 2005 CHEVROLET TAHOE SUV School Use / Trailer Towing 63,629
School Use 3080 2006 CHEVROLET TAHOE SUV School Use / Trailer Towing 43,285
School Use 3082 2006 CHEVROLET TAHOE SUV School Use / Trailer Towing 56,077
School Use 3101 2006 FORD F350 4x4 Pickup CS Monroe VoTech 22,022
School Use 4017 1996 FORD F350 Stake Body CS Monroe VoTech 22,898
Support Svcs 3094 2006 FORD Escape Hybrid Small SUV Pool Vehicle 26,079
Question #57 Attachment #13
111

Support Svcs 3156 2013 CHEVROLET EQUINOX Small SUV Asst Superintendent 26,800
Technology Svcs 3088 2006 FORD Escape Hybrid Small SUV Technician 103,094
Technology Svcs 3151 2013 CHEVROLET EQUINOX Small SUV Supervisor 14,331
Transportation 3000 2007 FORD ESCAPE Small SUV Director of Transportation 63,436
Transportation 3001 2010 FORD F350 4x4 PickupTransportation Tech / Snow Removal
17,203
Transportation 3010 2005 CHEVROLET SILVERADO 4x4 Pickup Maint. Spare / Snow Removal 64,494
Transportation 3014 2005 CHEVROLET SILVERADO 4x4 Pickup Lead Driver / Snow Removal 27,609
Transportation 3029 2011 FORD ESCAPE Small SUV Lead Driver 30,656
Transportation 3033 2011 FORD ESCAPE Small SUV Transportation Supervisor 9,640
Transportation 3042 2003 FORD EXPLORER Small SUV Maint. Spare & Temp Assignments 52,249
Transportation 3052 2005 FORD Escape Hybrid Small SUV Maint. Spare & Temp Assignments 81,164
Transportation 3055 2005 FORD Escape Hybrid Small SUV Lead Driver 82,238
Transportation 3058 2005 FORD Escape Hybrid Small SUV Lead Driver 61,091
Transportation 3065 2005 FORD Escape Hybrid Small SUV Lead Driver 32,835
Transportation 3081 2006 CHEVROLET TAHOE SUV Maint. Spare / Trailer Towing 120,667
Transportation 3083 2006 FORD F350 4x4 Pickup Maint. Spare / Snow Removal 103,828
Transportation 3087 2006 FORD F350 4x4 PickupTransportation Tech / Snow Removal
47,793
Transportation 3091 2006 FORD Escape Hybrid Small SUV Lead Driver 59,233
Transportation 3093 2006 FORD Escape Hybrid Small SUV Lead Driver 44,751
Transportation 3115 2009 FORD ESCAPE Small SUV Lead Driver 34,206
Transportation 3116 2009 FORD ESCAPE Small SUV Lead Driver 29,185
Transportation 3117 2009 FORD ESCAPE Small SUV Traffic Specialist 32,827
Transportation 3118 2009 FORD ESCAPE Small SUV Lead Driver 20,446
Transportation 3120 2009 FORD ESCAPE Small SUV Area Supervisor - South 33,851
Transportation 3123 2011 FORD ESCAPE Small SUV Lead Driver 18,545
Transportation 3124 2011 FORD ESCAPE Small SUV Area Supervisor - Sped 25,141
Transportation 3125 2011 FORD ESCAPE Small SUV Area Supervisor - Central, West 15,065
Transportation 3126 2011 FORD ESCAPE Small SUV Lead Driver 46,526
Transportation 3127 2011 FORD ESCAPE Small SUV Lead Driver 18,256
Transportation 3135 2011 FORD ESCAPE Small SUV Lead Driver 26,303
Transportation 3137 2012 FORD ESCAPE Small SUV Lead Driver 24,567
Transportation 3146 2012 FORD ESCAPE Small SUV Lead Driver 13,404
Transportation 3147 2012 FORD ESCAPE Small SUV Lead Driver 23,073
Transportation 3154 2013 CHEVROLET EQUINOX Small SUV Operations Supervisor 15,964
Transportation 3160 2014 JEEP Compass Small SUV Lead Driver 1,102
Transportation 3161 2014 JEEP Compass Small SUV Lead Driver 2,400
Question #57 Attachment #13
112

Answer:
Title Requested Existing Justification Consequence of not fundingAdministrative Assistant
1 0 One Administrative Assistant position needed to support the Assistant Superintendent of Technology Services. This position is in line with similar positions that exist in all other departments within LCPS and was not created when the Asst. Superintendent's position was created in 2012.
Not having administrative support for the Assistant Superintendent of Technology Services forces the Assistant Superintendent for Technology Services or other staff members to take ownership of the tasks that would be performed by Administrative Assistant, diminishing the time they have to perform their tasks. A high level position such as an Assistant Superintendent requires administrative support considering the number of meetings, correspondence and organizational items needed daily.
Asset Manager 2 0 Two Asset Manager positions needed to oversee the operational aspects of all LCPS technology asset management. The technology assets DTS manages numbers in the tens of thousands; including computers, laptops, printers, scanners, AV equipment, interactive white boards, monitors, software and other technology assets. The Asset Managers will perform all tasks related to full asset lifecycle management including inventory, audits, licensing compliance, producing warranty and license renewal reports, generating the refresh cycle list for budgeting and deployment, disposal of assets, tracking assets as they move locations, and handling of technology hardware and software requests from LCPS schools and departments. The desire to inventory school purchased devices (iPad, Android, Kindle, Chrome books, etc.) will also increase the complexity and workload for asset management.
Not having these 2 positions will put DTS and LCPS at risk of not having a complete technology asset inventory or control over asset tracking and disposal. This could result in more out of warranty items, licensing infractions and unrecovered or missing assets. When we consider that there are over 38,500 assets that need to be managed with a value well into the millions of dollars, we can not afford to ignore this important need. Other DTS support staff will need to be removed from their current duties in order to provide this critical function. If these positions were to be outsourced the cost would be approximately $98,044 for a 1 year engagement per position. The approximated cost of filling the LCPS position is $70,100 per position.
AV Technician 2 7 Two additional Audio Visual Technicians are needed to support the vast number of AV devices currently in the LCPS system. The current AV inventory includes over 300,000 devices including, interactive white boards (IWB), DVD/CD players, televisions, intercoms, PA systems, cassette players, projectors, microphones, amplifiers, etc. Over the years, 9 schools have opened adding to the standard AV equipment inventory, no new AV support position has been added since 2009. There is simply not enough staff to handle the service requests and support for all the AV devices in the district. The current AV technician to device ratio is well over 1:40,000. This has caused increased wait times for service which inhibits the staff and student's ability to use the AV equipment.
Without these 2 additional AV technicians the time it takes to respond to service requests will continue to increase, especially considering we are opening 3 new schools in FY15. If these positions were to be outsourced the cost would be approximately $85,872 for a 1 year engagement per position. The approximated cost of filling the LCPS position is $62,800 per position.
Question: Technology: Please provide a more detailed presentation of the distribution of requested 29 new FTEs between the 5 identified initiatives. What is the consequence of not funding each of these new positions?
Initiative #1 Reach Appropriate Level of Service
Question #5 Attachment #14
113

Title Requested Existing Justification Consequence of not fundingComputer Technician
3 14 Three technician positions are requested to sustain and improve the current service provided by the field technicians. The existing model of adding field support staff with the opening of each High School has not continued for several years leaving a shortage of support staff to address the ever increasing service requests. To ensure service does not diminish further the three requested technicians are required. Positions are also needed to support the 3 new schools opening in 2014-2015 school year. Note: No new computer tech. position has been added since 2009. Nine new schools have been added during this time and over 5,000 new devices added.
The current field technician ratio to supported equipment is 1:1339. If we do not lower this ratio service delivery will be impacted and systems will remain in a non-functioning state awaiting scarce resources to respond. Our students and staff already have limited access to technology resources and having longer wait times for service is unacceptable. If these positions were to be outsourced the cost would be approximately $79,756 for a 1 year engagement per position. The approximated cost of filling the LCPS position is $62,800 per position. If the Service Desk positions are funded then we would be able to reduce this request from 3 to 2.
Data Analyst 1 3 One position is requested to provide support for the growth in reporting of data collection by the Virginia Department of Education and the U.S. Department of Education. The Office of Information Management continues to inherit an increasing list of state and federal reports. In order to ensure data integrity a Data Analyst dedicated to state and federal reporting is essential to the continued reporting of highly accurate data that result in funding and state and federal ratings.
If no Data Analyst is approved the results will be decreased ability to extract and analyze data requested of other departments or offices within LCPS; decreased technical support for school staff resulting in increased frustration for school based and central office staff who need support; increased reliance upon other staff to perform data extracts and write reports shifting the burden to other departments; increased potential for data entry errors resulting in diminished accuracy, timeliness, security and usefulness of student records; increased potential for errors reported to VDOE may result in loss of funding as student and staff data audited by data analysts are used to determine funding from state. It will also be difficult to outsource for an individual with the level of knowledge needed for State and Federal reporting requirements.
Project Manager 1 0 One position is requested to manage the continued influx of technology projects. The DTS Project Manager will be the first such position in LCPS and will help provide the structure, process and methodology to standardize project management practices for the district. A project manager, and the creation of a Project Management Office, will enable DTS to complete more projects on time and on budget. Creation of a Project Management Office within DTS will aide all technology projects throughout the district which involve technology at any level, not just DTS initiated projects. This will provide the district with a clear project list and cost for each project, resources and funding, as well as a record of how many projects were initiated and completed.
Not having a Project manager approved will cause all departments to continue with the status quo of having non-technical staff attempt to manage technology projects without a thorough knowledge of project management or technology best practices or limitations. If this position was to be outsourced the cost would be approximately $172,720 for a 1 year engagement. The approximated cost of filling an LCPS position is $107,100.
Service Desk Analyst
2 0 Two positions are requested to support the centralized consolidated service desk for all LCPS technology needs. Staff will be responsible for addressing phone requests for support, as well as all incident management and service requests input through the service desk system. Currently the service desk is manned by computer technicians which removes these technically skilled individuals from the field and puts DTS in a position of providing diminished support.
If no Service Desk Analyst positions are approved scarce field-based support staff will continue to man the service desk and answer phone calls and incidents remotely and then passing the issues to a field-based support staff member to be addressed fully, causing a delay in service to the customer.If these positions were to be outsourced the cost would be approximately $81,666 for a 1 year engagement per position. The approximated cost of filling the LCPS position is $59,500 per position.
Question #5 Attachment #14
114

Title Requested Existing Justification Consequence of not fundingSoftware Engineer
1 3 One additional software engineer is needed on the software engineering team to handle the complexity and varied software applications requiring research, testing, updating, deployment and support. The software engineering team is responsible for testing and readying new operating systems such as Win8 as well as supporting over 600 software titles. In the past 5 years we have increased the numbers and complexity of software titles without an increase in staffing on this team.
Without this position we will be required to extend the amount of time required to test, validate, debug software and release software for deployment to an unacceptable level. At this time, the software team is already on a 6 month cycle to release new software updates and systems which does not meet the more aggressive timelines being generated by the requests for new software resources. This limits LCPS's ability to keep current with software updates and restricts the ability to upgrade more than twice a year impacting flexibility as new titles and upgrades become available. If this position were to be outsourced the cost would be approximately $233,680 for a 1 year engagement. The approximated cost of filling an LCPS position is $74,200.
Systems Specialist
1 14 One Systems Specialist position is requested to sustain and improve the current service provided by the field support group. The existing model of adding field support staff with the opening of each High School has not continued for several years, leaving a shortage of support staff to address the ever increasing service requests. To ensure service does not diminish further, one requested Systems Specialist is required. This position is also needed to support the 3 new schools opening in 2014-2015 school year. Note: No new systems specialist position has been added since 2009. Nine new schools have been added during this time and over 5,000 new devices added.
The current ratio of systems specialist to supported equipment is 1:1339. If we do not lower this ratio service delivery will be impacted and systems will remain in a non-functioning state longer, awaiting scarce staff resources to respond. Our students and staff already have limited access to technology resources and having longer wait times for service is unacceptable.If this position were to be outsourced the cost would be approximately $193,040 for a 1 year engagement. The approximated cost of filling an LCPS position is $70,100.
Technical Writer 1 0 One position is requested to create and update documentation for DTS staff as well as end users. DTS technical staff is widely distributed in the field and support a very large number of technologies. Clear and accurate documentation is necessary for DTS to maintain consistency while rolling out new projects, as well as creating efficiencies and reducing the mean time to repair by building a knowledge base accessible by various users.
Currently no such position exists and not having the position has been a detriment to DTS's ability to document processes, installation documentation, create and improve training documentation and project documentation. Currently very little documentation exists or is outdated causing additional work because of a lack of recorded practices and result in a delay in service delivery.If this position were to be outsourced the cost would be approximately $125,984 for a 1 year engagement. The approximated cost of filling an LCPS position is $66,300.
Technology Software Coordinator
1 0 One position is requested to establish a proper structure of support and management within DTS for the Software Engineering team. This position will be the team lead responsible for, the day-to-day work supervision of the other team members, processing emergency requests, setting staff priorities and workloads, handling all escalations, addressing high impact issues and will assess staff performance which the supervisors use in creating performance evaluations. This position provides a career path for staff to move from a classified position to an administrative position while taking on additional tasks and filling a supervisory and leadership role on the team. This request is in line with similar positions that exist in the Support, Service Desk, Security and Service teams.
Not having this position diminishes the team's ability to work as a close unit and the day-to-day work supervision and issue handling falls to high level supervisory staff. The supervisors are already working with several teams and handling higher level prioritization, management and strategic tasks which require their attention. Having the supervisors perform the tasks for a team lead limits their time to perform the duties they are responsible for and has an overall impact on how not just the team but how successful DTS is in service delivery. Each team needs a team lead to ensure the team is cohesive and works together to deliver the best support possible. Team focus to solution delivery is important and this position is key to achieving that.If this position were to be outsourced the cost would be approximately $170,688 for a 1 year engagement. The approximated cost of filling an LCPS position is $107,100.
Question #5 Attachment #14
115

Title Requested Existing Justification Consequence of not fundingTechnology Systems Coordinator
1 0 One position is requested to establish a proper structure of support and management within DTS for the Systems Engineering team. This position will be the team lead responsible for, the day-to-day work supervision of the other team members, processing emergency requests, setting staff priorities and workloads, handling all escalations, addressing high impact issues and will assess staff performance which the supervisors use in creating performance evaluations. This position provides a career path for staff to move from a classified position to an administrative position while taking on additional tasks and filling a supervisory and leadership role on the team. This request is in line with similar positions that exist in the Support, Service Desk, Security and Service teams.
Not having this position diminishes the team's ability to work as a close unit and the day-to-day work supervision and issue handling falls to high level supervisory staff. The supervisors are already working with several teams and handling higher level prioritization, management and strategic tasks which require their attention. Having the supervisors perform the tasks for a team lead limits their time to perform the duties they are responsible for and has an overall impact on how not just the team but how successful DTS is in service delivery. Each team needs a team lead to ensure the team is cohesive and works together to deliver the best support possible. Team focus to solution delivery is important and this position is key to achieving that.If this position were to be outsourced the cost would be approximately $170,688 for a 1 year engagement. The approximated cost of filling an LCPS position is $107,100.
17
Sr. Network Engineer
1 1 One position is required to install and maintain the additional equipment needed to address the Bandwidth limitations faced by LCPS for internet access. The Bandwidth remediation project is key to resolving the current bandwidth constraint which is hampering SOL testing, instruction and the expansion of web based resources for instructional and business use. LCPSs' goal is to have 8 times the currently available bandwidth within 18 months across multiple data centers with built in redundancies and fault tolerance. This will not be possible without this position. This position is required to install and maintain the additional equipment needed to address the bandwidth limitations faced by LCPS for internet access.
If this position is not approved this initiative is in danger of not starting or completing on time. Any delay in bandwidth remediation will result in diminished access to the Internet for staff and students alike. This is a key position to ensure the high level, complex network required to reach our goal is implemented, upgraded and maintained properly.If this position were to be outsourced the cost would be approximately $274,320 for a 1 year engagement. The approximated cost of filling an LCPS position is $78,500.
Systems Engineer
1 5 One position is requested to address the increase in infrastructure server, Active Directory and account administration associated with Phase II of the ERP project. The user base is projected to increase by 3,000, along with additional equipment and support requirements. Currently five Systems Engineers support a user base of 10,000 users for Active Directory and e-mail administration, over 500 virtual and physical servers, and over 70,000 student accounts.
With the approaching Phase II of the ERP project there is a need to support 3,000 additional staff providing them access to Active Directory, e-mail and the Oracle system. Without this position, the ability of DTS staff to address the increased load of these additional positions will diminish the level of service provided to all staff and students and increase the wait time for new account creation and administration. With the new ERP system staff will be required to submit online time sheets, leave requests and other benefits related items which are dependent on their accounts being properly created and managed.If this position were to be outsourced the cost would be approximately $233,680 for a 1 year engagement. The approximated cost of filling an LCPS position is $74,200.
Total FTE Request
Initiative #2 Develop a Robust Infrastructure
Question #5 Attachment #14
116
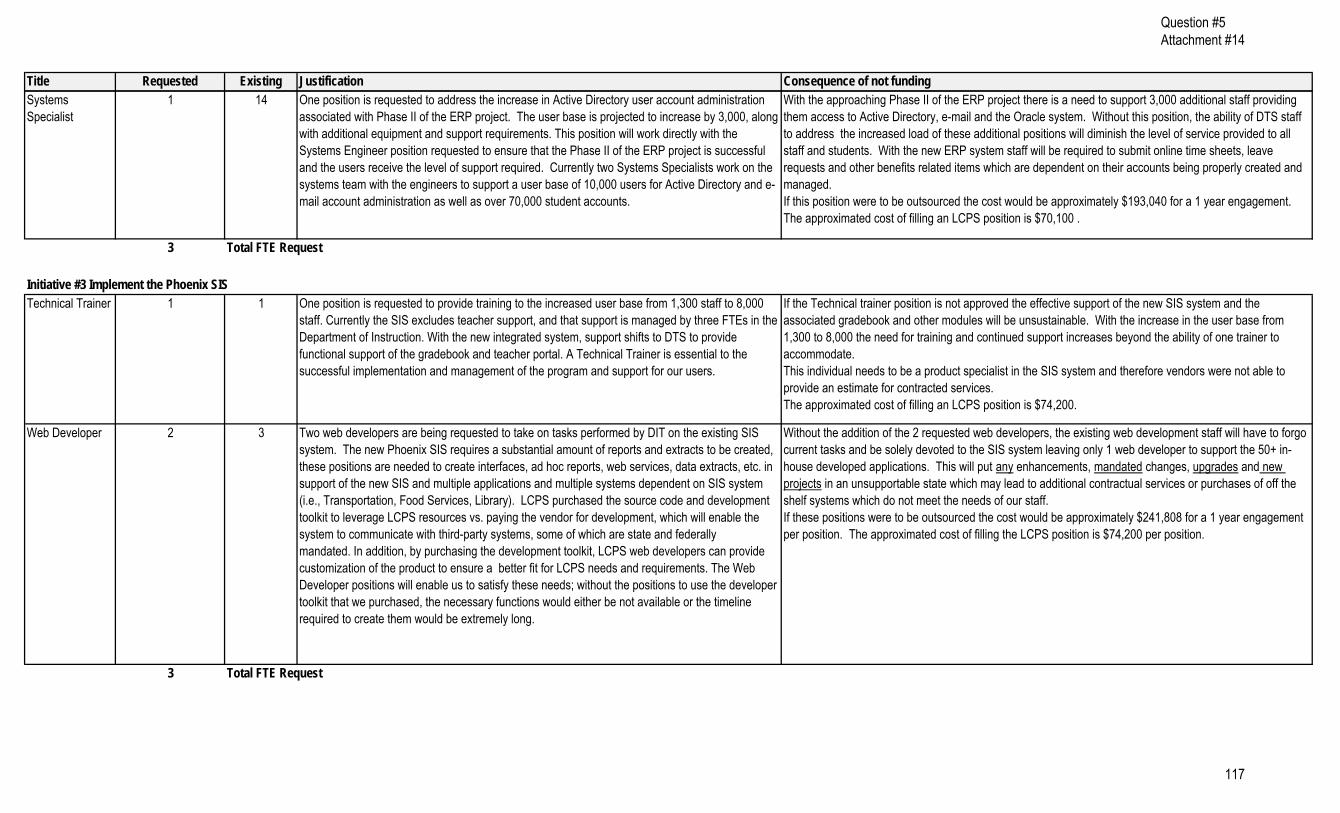
Title Requested Existing Justification Consequence of not fundingSystems Specialist
1 14 One position is requested to address the increase in Active Directory user account administration associated with Phase II of the ERP project. The user base is projected to increase by 3,000, along with additional equipment and support requirements. This position will work directly with the Systems Engineer position requested to ensure that the Phase II of the ERP project is successful and the users receive the level of support required. Currently two Systems Specialists work on the systems team with the engineers to support a user base of 10,000 users for Active Directory and e-mail account administration as well as over 70,000 student accounts.
With the approaching Phase II of the ERP project there is a need to support 3,000 additional staff providing them access to Active Directory, e-mail and the Oracle system. Without this position, the ability of DTS staff to address the increased load of these additional positions will diminish the level of service provided to all staff and students. With the new ERP system staff will be required to submit online time sheets, leave requests and other benefits related items which are dependent on their accounts being properly created and managed.If this position were to be outsourced the cost would be approximately $193,040 for a 1 year engagement. The approximated cost of filling an LCPS position is $70,100 .
3
Technical Trainer 1 1 One position is requested to provide training to the increased user base from 1,300 staff to 8,000 staff. Currently the SIS excludes teacher support, and that support is managed by three FTEs in the Department of Instruction. With the new integrated system, support shifts to DTS to provide functional support of the gradebook and teacher portal. A Technical Trainer is essential to the successful implementation and management of the program and support for our users.
If the Technical trainer position is not approved the effective support of the new SIS system and the associated gradebook and other modules will be unsustainable. With the increase in the user base from 1,300 to 8,000 the need for training and continued support increases beyond the ability of one trainer to accommodate. This individual needs to be a product specialist in the SIS system and therefore vendors were not able to provide an estimate for contracted services.The approximated cost of filling an LCPS position is $74,200.
Web Developer 2 3 Two web developers are being requested to take on tasks performed by DIT on the existing SIS system. The new Phoenix SIS requires a substantial amount of reports and extracts to be created, these positions are needed to create interfaces, ad hoc reports, web services, data extracts, etc. in support of the new SIS and multiple applications and multiple systems dependent on SIS system (i.e., Transportation, Food Services, Library). LCPS purchased the source code and development toolkit to leverage LCPS resources vs. paying the vendor for development, which will enable the system to communicate with third-party systems, some of which are state and federally mandated. In addition, by purchasing the development toolkit, LCPS web developers can provide customization of the product to ensure a better fit for LCPS needs and requirements. The Web Developer positions will enable us to satisfy these needs; without the positions to use the developer toolkit that we purchased, the necessary functions would either be not available or the timeline required to create them would be extremely long.
Without the addition of the 2 requested web developers, the existing web development staff will have to forgo current tasks and be solely devoted to the SIS system leaving only 1 web developer to support the 50+ in-house developed applications. This will put any enhancements, mandated changes, upgrades and new projects in an unsupportable state which may lead to additional contractual services or purchases of off the shelf systems which do not meet the needs of our staff. If these positions were to be outsourced the cost would be approximately $241,808 for a 1 year engagement per position. The approximated cost of filling the LCPS position is $74,200 per position.
3 Total FTE Request
Total FTE Request
Initiative #3 Implement the Phoenix SIS
Question #5 Attachment #14
117

Title Requested Existing Justification Consequence of not funding
Computer Technician
3 0 Three computer technicians are requested to support the 6,000 additional devices for the Teacher mobile device initiative. Currently there is no staff allocated or available to support this initiative.
Not having these positions approved will directly impact the initiative and the initiative will not be able to move forward. The devices must have support to have a successful deployment and experience. If these positions were to be outsourced the cost would be approximately $79,756 for a 1 year engagement per position. The approximated cost of filling the LCPS position is $62,800 per position.
Computer Technician II
2 0 Two Computer Technician II positions are being requested to provide Tier II (higher level support than a Computer Technician) support for the 6,000 additional devices for the teacher mobile device initiative. The Computer Technician II position is responsible for training the Computer Technicians on new equipment, systems, acting as the first level of the escalation process when a Computer Technician needs assistance solving an issue as well as a mentor and resource for all Computer Technician and service desk staff. They also act as specialized trouble shooters for various higher level tasks such as networked printers, print queue management, supporting specialized setups like in transportation or libraries. Currently there is no staff allocated or available to support this initiative.
Not having these positions approved will directly impact the initiative and the initiative will not be able to move forward. The devices must have support to have a successful deployment and experience. The Computer Technician IIs are critical to the support required not only for the devices, but for users and DTS staff to ensure a successful program for teacher mobile devices.If these positions were to be outsourced the cost would be approximately $92,456 for a 1 year engagement per position. The approximated cost of filling the LCPS position is $66,300 per position.
Systems Engineer
1 0 A Systems Engineer is requested to ensure the proper Active Directory integration of the 6,000 additional devices for the teacher mobile device initiative. Each device must be properly configured in Active Directory and be assigned the appropriate rights to function as required. Currently there is no staff allocated or available to support this initiative.
Not having this position approved will directly impact the initiative and the initiative will not be able to move forward. The devices must have support to have a successful deployment and experience. The Systems Engineer is responsible for all rights given to the device and user to ensure appropriate access is provided while maintaining a high level of security.If this position was to be outsourced the cost would be approximately $233,680 for a 1 year engagement. The approximated cost of filling an LCPS position is $74,200.
6
29 Total FTEs requested
Total FTE Request
Initiative #5 Teacher Mobile Device Initiative
Question #5 Attachment #14
118
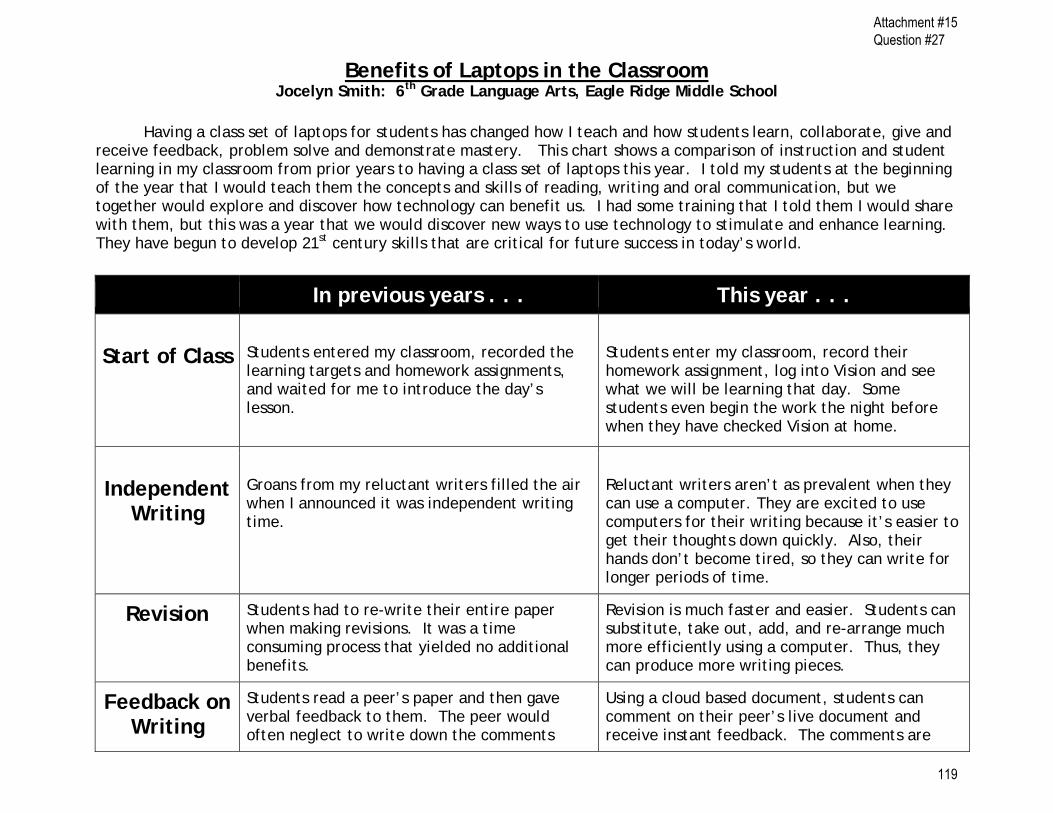
Benefits of Laptops in the Classroom Jocelyn Smith: 6th Grade Language Arts, Eagle Ridge Middle School
Having a class set of laptops for students has changed how I teach and how students learn, collaborate, give and
receive feedback, problem solve and demonstrate mastery. This chart shows a comparison of instruction and student learning in my classroom from prior years to having a class set of laptops this year. I told my students at the beginning of the year that I would teach them the concepts and skills of reading, writing and oral communication, but we together would explore and discover how technology can benefit us. I had some training that I told them I would share with them, but this was a year that we would discover new ways to use technology to stimulate and enhance learning. They have begun to develop 21st century skills that are critical for future success in today’s world.
In previous years . . . This year . . .
Start of Class
Students entered my classroom, recorded the learning targets and homework assignments, and waited for me to introduce the day’s lesson.
Students enter my classroom, record their homework assignment, log into Vision and see what we will be learning that day. Some students even begin the work the night before when they have checked Vision at home.
Independent
Writing
Groans from my reluctant writers filled the air when I announced it was independent writing time.
Reluctant writers aren’t as prevalent when they can use a computer. They are excited to use computers for their writing because it’s easier to get their thoughts down quickly. Also, their hands don’t become tired, so they can write for longer periods of time.
Revision Students had to re-write their entire paper when making revisions. It was a time consuming process that yielded no additional benefits.
Revision is much faster and easier. Students can substitute, take out, add, and re-arrange much more efficiently using a computer. Thus, they can produce more writing pieces.
Feedback on Writing
Students read a peer’s paper and then gave verbal feedback to them. The peer would often neglect to write down the comments
Using a cloud based document, students can comment on their peer’s live document and receive instant feedback. The comments are
Attachment #15 Question #27
119

even when instructed to do so and would not act on or benefit from the feedback. I had writing conferences with my students. The students read their pieces to me and I would provide feedback on an area of strength and an area on which they should spend more time and effort. It was a good day to conference with three students in a class period.
recorded on the document, so the writer can work on one item at a time to make their writing better. They can also comment on more than one peer’s writing. Students from different class periods independently and voluntarily share their writing with each other at home and during resource. (They are working at home on these, even when it’s not assigned as homework!) I still have writing conferences, but I read their writing during class as they are writing, as well. I know what each student is working on and I give feedback via comments. It saves a lot of time allowing me to get to more students in a class period. I can comment on at least half the class this year. Because of the cloud based document, I can read their writing anywhere and give feedback instantly. Last fall, I took a day off to take my daughter to a college interview. While she was interviewing, I got on-line and read my students writing and made comments as they were writing while I was miles away!
Availability of
Computers for Research
and Publication
I reserved laptops or took students to the Computer Lab to do research and to publish their writing. Problems:
1. Students who didn’t finish had to finish at home since we couldn’t get laptops or the Lab again the next day. If they forgot to bring a flash drive, they couldn’t finish at home either. Continuity was lost.
2. We had to print even if they weren’t finished so they’d have the changes they made. Then, they had to re-write another version on paper, taking more
This year, I don’t have any of the problems I’ve had in the past. We use cloud based documents so flash drives aren’t needed. We can move from day to day picking up from the day before without interruption. We save ink and paper since we rarely publish on paper. I grade virtual papers instead of lugging stacks and stacks home with me. Research is both individual and collaborative. We can do this because we have computers every day. We can evaluate on-line sources together in class.
Attachment #15 Question #27
120

time to recopy. 3. On-line research had to be crammed into
the day we could get into the lab or reserve laptop carts. This makes it difficult for students who need to change their topics because of a lack of sources. It’s an important learning experience to realize your topic is too narrow or must be changed for another reason. ***Instructional computers (laptop carts and the Computer Labs) are being used more and more for on-line testing, thus decreasing the availability even more than in previous years. My colleagues who aren’t on the pilot program can’t even get computers for the research paper. Students are supposed to evaluate sources for credibility. How can they do this without computers? ***
Instructional
Materials
I printed out and copied all instructional materials, mentor texts, tests, quizzes, everything. Students who lost their copies and would ask for another. More printing, more ink and paper used.
Since this is a blended classroom, I still print out some materials and assessments. However, the vast majority are available on my Vision course. Students can access the documents at any time. They can review concepts and skills without having to remember to take a binder home.
Absences
Students who were absent from school, would have to see me upon return to learn what was missed.
Students who are absent have access to all the day’s activities and are able to complete assignments through Vision.
Attachment #15 Question #27
121

Benefits of a One to One Classroom Michelle Haseltine: 6th Grade Language Arts, Eagle Ridge Middle School
Having devices for students in my classroom has revolutionized how I teach and how students learn. This
chart shows a comparison of the flow of instruction and student learning in my classroom from prior to having one to one devices to the current one-to one classroom that I have this year. My students have become self-directed, motivated learners who are excited about what they are capable of doing. They project a sense of limitless learning. My job is now to make sure that I provide the opportunity.
In previous years . . . This year . . .
Entering the classroom
Students entered my classroom, gathered necessary materials, and waited for me to introduce the day’s lesson.
Students enter my classroom, log in to Vision and see what we will be learning that day.
Warm-up
Students would begin class with silent reading. It would take a few minutes for everyone to get settled and find a book and begin their reading.
Students begin class with responding to a blog post or creating their own blog post. Students are self-paced in their work. If students are responding to a blog post, it will be connected with the lesson for the day or a review of what happened yesterday.
Introduction
to new material
Students would wait for me to introduce the new material and initiate discussion that would tap in to prior knowledge.
Material is introduced in many different ways. Two examples: Students may watch a video introducing new material. They may participate in a chat about the topic to show me what they already know and create a community within the classroom.
Attachment #15 Question #27
122
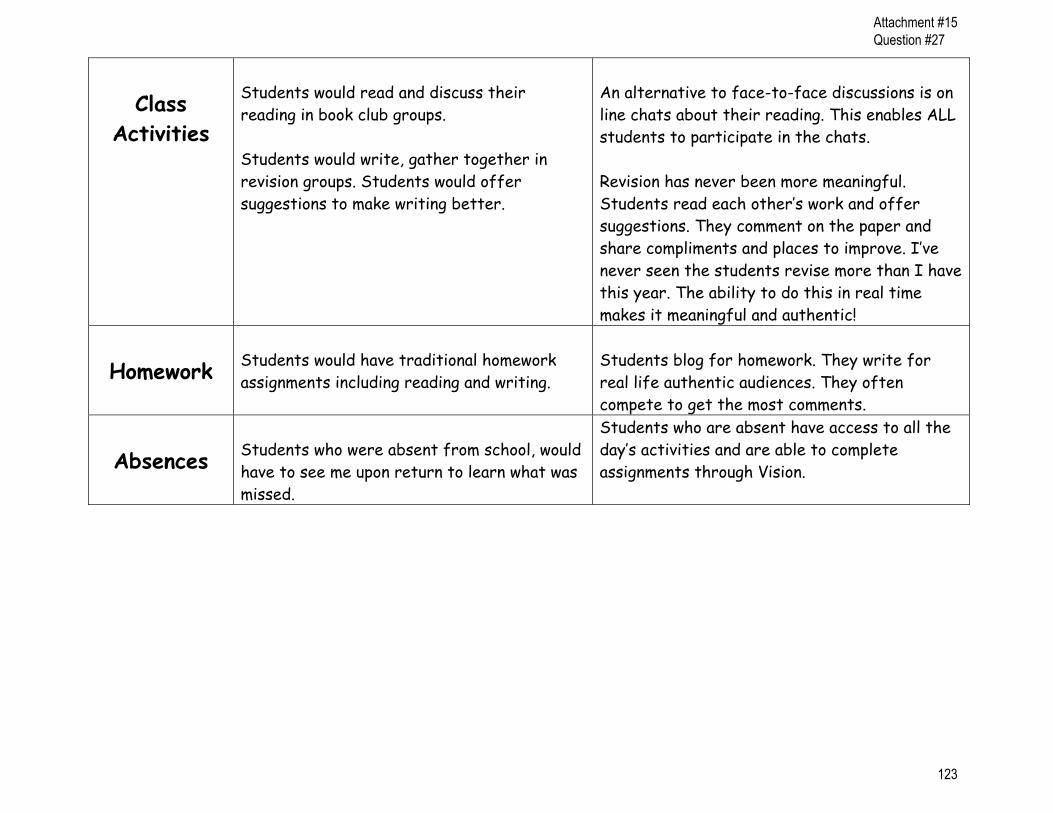
Class
Activities
Students would read and discuss their reading in book club groups. Students would write, gather together in revision groups. Students would offer suggestions to make writing better.
An alternative to face-to-face discussions is on line chats about their reading. This enables ALL students to participate in the chats. Revision has never been more meaningful. Students read each other’s work and offer suggestions. They comment on the paper and share compliments and places to improve. I’ve never seen the students revise more than I have this year. The ability to do this in real time makes it meaningful and authentic!
Homework
Students would have traditional homework assignments including reading and writing.
Students blog for homework. They write for real life authentic audiences. They often compete to get the most comments.
Absences
Students who were absent from school, would have to see me upon return to learn what was missed.
Students who are absent have access to all the day’s activities and are able to complete assignments through Vision.
Attachment #15 Question #27
123

Benefits of a One to One Classroom Maria Crawford: 6th Grade Science, Eagle Ridge Middle School
Having devices for students in my classroom has revolutionized how I teach and how students learn. This
chart shows a comparison of the flow of instruction and student learning in my classroom from prior to having one to one devices to the current one-to one classroom that I have this year. My students have become self-directed, motivated learners who are excited about what they are capable of doing. They project a sense of limitless learning. My job is now to make sure that I provide the opportunity.
In previous years . . . This year . . .
Entering the classroom
Students entered my classroom, recorded their homework assignments, and waited for me to introduce the day’s lesson.
Students enter my classroom, record their homework assignment, log in to Vision and see what we will be learning that day.
Warm-up
Students would wait for me to show the warm-up activity on the promethean board, and then record their answers on a small piece of paper. I would walk around the classroom and collect the warm-up papers. I would then quickly look the papers over and provide feedback to the students on how they did as a whole.
Students begin the warm-up right after recording their homework assignment (no delay). Each student receives immediate feedback on their laptop (through Vision), indicating what they answered correctly and incorrectly and an explanation as to why.
Introduction
to new material
Students would wait for me to introduce the new material and initiate discussion that would tap in to prior knowledge.
Once a student completes the warm-up, he/she goes to the next activity on Vision—the “Pre-lesson.” This “pre-lesson” is designed to allow students to do some research on the new
Attachment #15 Question #27
124
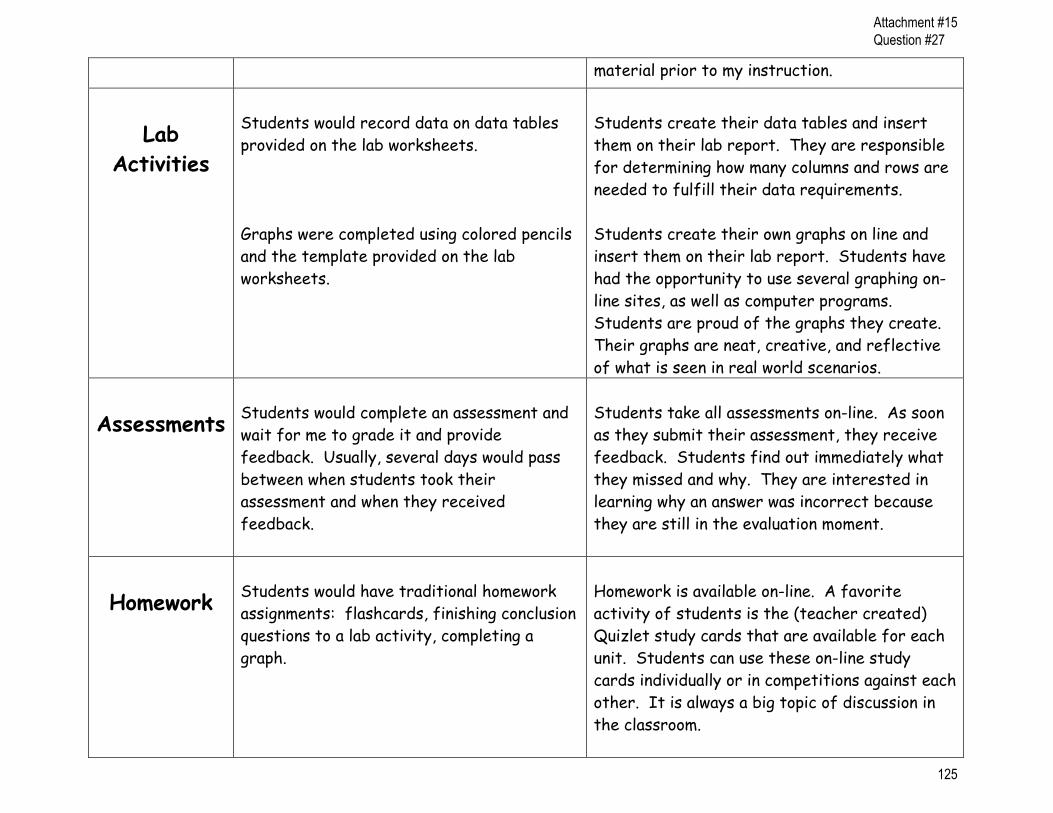
material prior to my instruction.
Lab
Activities
Students would record data on data tables provided on the lab worksheets. Graphs were completed using colored pencils and the template provided on the lab worksheets.
Students create their data tables and insert them on their lab report. They are responsible for determining how many columns and rows are needed to fulfill their data requirements. Students create their own graphs on line and insert them on their lab report. Students have had the opportunity to use several graphing on-line sites, as well as computer programs. Students are proud of the graphs they create. Their graphs are neat, creative, and reflective of what is seen in real world scenarios.
Assessments
Students would complete an assessment and wait for me to grade it and provide feedback. Usually, several days would pass between when students took their assessment and when they received feedback.
Students take all assessments on-line. As soon as they submit their assessment, they receive feedback. Students find out immediately what they missed and why. They are interested in learning why an answer was incorrect because they are still in the evaluation moment.
Homework
Students would have traditional homework assignments: flashcards, finishing conclusion questions to a lab activity, completing a graph.
Homework is available on-line. A favorite activity of students is the (teacher created) Quizlet study cards that are available for each unit. Students can use these on-line study cards individually or in competitions against each other. It is always a big topic of discussion in the classroom.
Attachment #15 Question #27
125
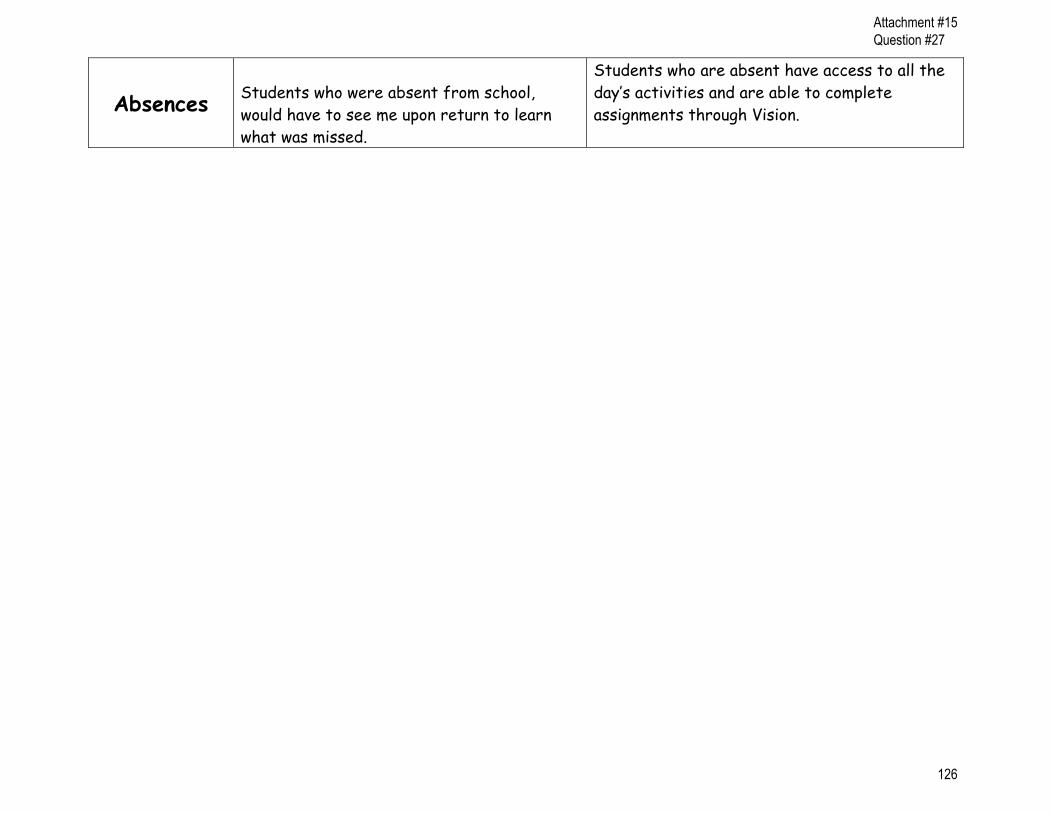
Absences
Students who were absent from school, would have to see me upon return to learn what was missed.
Students who are absent have access to all the day’s activities and are able to complete assignments through Vision.
Attachment #15 Question #27
126

Loudoun County Public SchoolsFY15 Operating BudgetSchool Board Questions
Question #136Attachment #16
Tech Bach Bach + 15 Bach + 30 Master's MS + 30 Doctoral1 47,500$ 47,500$ 48,914$ 50,328$ 53,156$ 54,570$ 58,812$ 12 47,931$ 47,931$ 49,345$ 50,759$ 53,587$ 55,001$ 59,243$ 23 48,267$ 48,267$ 49,681$ 51,095$ 53,923$ 55,337$ 59,579$ 34 49,154$ 49,154$ 50,568$ 51,982$ 54,810$ 56,224$ 60,466$ 45 49,616$ 49,616$ 51,030$ 52,444$ 55,272$ 56,686$ 60,928$ 56 50,555$ 50,555$ 51,969$ 53,383$ 56,211$ 57,625$ 61,867$ 67 51,521$ 51,521$ 52,935$ 54,349$ 57,177$ 58,591$ 62,833$ 78 52,403$ 52,403$ 53,817$ 55,231$ 58,059$ 59,473$ 63,715$ 89 53,290$ 53,290$ 54,704$ 56,118$ 58,946$ 60,360$ 64,602$ 910 54,306$ 54,306$ 55,720$ 57,134$ 59,962$ 61,376$ 65,618$ 1011 55,331$ 55,331$ 56,745$ 58,159$ 60,987$ 62,401$ 66,643$ 1112 57,001$ 57,001$ 58,415$ 59,829$ 62,657$ 64,071$ 68,313$ 1213 58,457$ 58,457$ 59,871$ 61,285$ 64,113$ 65,527$ 69,769$ 1314 59,944$ 59,944$ 61,358$ 62,772$ 65,600$ 67,014$ 71,256$ 1415 61,467$ 61,467$ 62,881$ 64,295$ 67,123$ 68,537$ 72,779$ 1516 63,027$ 63,027$ 64,441$ 65,855$ 68,683$ 70,097$ 74,339$ 1617 64,621$ 64,621$ 66,035$ 67,449$ 70,277$ 71,691$ 75,933$ 1718 66,250$ 66,250$ 67,664$ 69,078$ 71,906$ 73,320$ 77,562$ 1819 67,990$ 67,990$ 69,404$ 70,818$ 73,646$ 75,060$ 79,302$ 1920 69,776$ 69,776$ 71,190$ 72,604$ 75,432$ 76,846$ 81,088$ 2021 71,784$ 71,784$ 73,198$ 74,612$ 77,440$ 78,854$ 83,096$ 2122 73,851$ 73,851$ 75,265$ 76,679$ 79,507$ 80,921$ 85,163$ 2223 75,975$ 75,975$ 77,389$ 78,803$ 81,631$ 83,045$ 87,287$ 2324 78,164$ 78,164$ 79,578$ 80,992$ 83,820$ 85,234$ 89,476$ 2425 80,417$ 80,417$ 81,831$ 83,245$ 86,073$ 87,487$ 91,729$ 2526 82,735$ 82,735$ 84,149$ 85,563$ 88,391$ 89,805$ 94,047$ 2627 85,122$ 85,122$ 86,536$ 87,950$ 90,778$ 92,192$ 96,434$ 2728 87,579$ 87,579$ 88,993$ 90,407$ 93,235$ 94,649$ 98,891$ 2829 90,331$ 90,331$ 91,745$ 93,159$ 95,987$ 97,401$ 101,643$ 2930 92,381$ 92,381$ 93,795$ 95,282$ 98,225$ 99,695$ 104,105$ 30
Teachers' Scale
127

Loudoun County Public SchoolsFY15 Operating BudgetSchool Board Questions
Question #136Attachment #16
Level 1: Athletic Trainer (208 days)Level 2: Substance Abuse Prevention Specialist, SPED Counselor, Social Worker, Visiting Teacher (198 Days)Level 3: Psychologist, Social Worker, Ed. Diagnostician, Visiting Teacher (208 Days)Level 4: Psychologist, Social Worker, Ed. Diagnostician, Visiting Teacher (12 month)
Level 1 Level 2 Level 3 Level 41 45,500$ 49,500$ 52,000$ 57,000$ 12 46,305$ 50,202$ 52,699$ 57,694$ 23 46,861$ 50,796$ 53,317$ 58,361$ 34 48,081$ 52,073$ 54,630$ 59,747$ 45 49,108$ 53,177$ 55,782$ 60,996$ 56 50,142$ 54,287$ 56,943$ 62,254$ 67 51,324$ 55,566$ 58,285$ 63,724$ 78 52,904$ 57,285$ 60,091$ 65,705$ 89 54,411$ 58,919$ 61,813$ 67,595$ 910 55,994$ 60,643$ 63,622$ 69,579$ 1011 57,627$ 62,416$ 65,484$ 71,622$ 1112 59,302$ 64,233$ 67,394$ 73,718$ 1213 61,022$ 66,102$ 69,357$ 75,870$ 1314 62,786$ 68,019$ 71,375$ 78,084$ 1415 64,612$ 69,999$ 73,457$ 80,367$ 1516 66,494$ 72,044$ 75,602$ 82,719$ 1617 68,427$ 74,145$ 77,808$ 85,136$ 1718 70,417$ 76,308$ 80,080$ 87,629$ 1819 72,484$ 78,551$ 82,435$ 90,210$ 1920 74,612$ 80,859$ 84,863$ 92,872$ 2021 76,801$ 83,234$ 87,358$ 95,608$ 2122 78,683$ 85,276$ 89,504$ 97,959$ 2223 80,611$ 87,372$ 91,701$ 100,368$ 2324 82,593$ 89,523$ 93,962$ 102,844$ 2425 84,215$ 91,283$ 95,878$ 105,096$ 25
Auxiliary Scale
128

Loudoun County Public SchoolsFY15 Operating BudgetSchool Board Questions
Question #136Attachment #16
Level 5 Level 6 Level 7 Level 8 Level 9 Level 10 Level 11 Level 12 Level 13 Level 14 Level 15 Level 16 Level 171 12.00$ 12.75$ 13.75$ 14.75$ 15.50$ 16.75$ 17.75$ 19.00$ 20.25$ 21.75$ 23.25$ 24.75$ 26.50$ 12 12.17$ 12.97$ 13.86$ 14.82$ 15.78$ 16.86$ 18.00$ 19.25$ 20.58$ 21.96$ 23.45$ 25.06$ 26.79$ 23 12.31$ 13.13$ 14.03$ 15.00$ 15.97$ 17.06$ 18.22$ 19.48$ 20.83$ 22.22$ 23.73$ 25.36$ 27.10$ 34 12.58$ 13.43$ 14.32$ 15.31$ 16.29$ 17.39$ 18.55$ 19.83$ 21.18$ 22.59$ 24.13$ 25.76$ 27.52$ 45 12.74$ 13.59$ 14.49$ 15.49$ 16.47$ 17.60$ 18.77$ 20.07$ 21.43$ 22.86$ 24.41$ 26.06$ 27.86$ 56 12.88$ 13.75$ 14.66$ 15.67$ 16.66$ 17.80$ 18.98$ 20.30$ 21.69$ 23.13$ 24.69$ 26.36$ 28.17$ 67 13.14$ 14.02$ 14.94$ 15.95$ 16.98$ 18.14$ 19.36$ 20.68$ 22.08$ 23.57$ 25.18$ 26.88$ 28.71$ 78 13.45$ 14.35$ 15.29$ 16.35$ 17.39$ 18.59$ 19.82$ 21.18$ 22.62$ 24.14$ 25.79$ 27.53$ 29.42$ 89 13.76$ 14.68$ 15.65$ 16.72$ 17.82$ 19.04$ 20.30$ 21.71$ 23.17$ 24.74$ 26.40$ 28.23$ 30.13$ 910 14.11$ 15.02$ 16.01$ 17.13$ 18.24$ 19.50$ 20.79$ 22.23$ 23.74$ 25.35$ 27.06$ 28.91$ 30.85$ 1011 14.44$ 15.39$ 16.41$ 17.54$ 18.68$ 19.97$ 21.30$ 22.76$ 24.31$ 25.96$ 27.71$ 29.60$ 31.63$ 1112 14.78$ 15.75$ 16.79$ 17.96$ 19.11$ 20.45$ 21.83$ 23.32$ 24.89$ 26.60$ 28.37$ 30.35$ 32.40$ 1213 15.12$ 16.13$ 17.21$ 18.40$ 19.58$ 20.95$ 22.35$ 23.89$ 25.49$ 27.25$ 29.07$ 31.08$ 33.20$ 1314 15.49$ 16.51$ 17.61$ 18.83$ 20.06$ 21.45$ 22.89$ 24.45$ 26.12$ 27.91$ 29.78$ 31.84$ 34.00$ 1415 15.86$ 16.91$ 18.04$ 19.30$ 20.55$ 21.95$ 23.45$ 25.06$ 26.75$ 28.60$ 30.50$ 32.60$ 34.82$ 1516 16.23$ 17.32$ 18.46$ 19.74$ 21.03$ 22.50$ 24.03$ 25.67$ 27.40$ 29.28$ 31.24$ 33.39$ 35.68$ 1617 16.68$ 17.80$ 18.98$ 20.31$ 21.63$ 23.11$ 24.69$ 26.39$ 28.17$ 30.12$ 32.13$ 34.36$ 36.69$ 1718 17.15$ 18.29$ 19.52$ 20.86$ 22.23$ 23.77$ 25.37$ 27.16$ 28.94$ 30.98$ 33.04$ 35.33$ 37.74$ 1819 17.63$ 18.82$ 20.06$ 21.46$ 22.86$ 24.45$ 26.10$ 27.92$ 29.79$ 31.86$ 33.98$ 36.34$ 38.84$ 1920 18.12$ 19.33$ 20.61$ 22.06$ 23.50$ 25.15$ 26.84$ 28.71$ 30.63$ 32.75$ 34.95$ 37.38$ 39.94$ 2021 18.62$ 19.87$ 21.20$ 22.70$ 24.16$ 25.86$ 27.59$ 29.52$ 31.50$ 33.69$ 35.94$ 38.43$ 41.07$ 2122 19.15$ 20.42$ 21.79$ 23.32$ 24.85$ 26.57$ 28.38$ 30.38$ 32.40$ 34.64$ 36.97$ 39.53$ 42.24$ 2223 19.68$ 20.99$ 22.40$ 23.98$ 25.55$ 27.32$ 29.20$ 31.22$ 33.31$ 35.63$ 38.01$ 40.64$ 43.44$ 2324 20.23$ 21.59$ 23.02$ 24.66$ 26.27$ 28.10$ 30.00$ 32.11$ 34.26$ 36.64$ 39.09$ 41.81$ 44.66$ 2425 20.81$ 22.20$ 23.68$ 25.36$ 27.03$ 28.90$ 30.84$ 33.03$ 35.25$ 37.68$ 40.19$ 43.01$ 45.94$ 2526 21.39$ 22.82$ 24.34$ 26.08$ 27.79$ 29.69$ 31.74$ 33.96$ 36.25$ 38.77$ 41.34$ 44.22$ 47.28$ 2627 21.98$ 23.46$ 25.04$ 26.80$ 28.56$ 30.55$ 32.63$ 34.93$ 37.27$ 39.87$ 42.53$ 45.49$ 48.63$ 2728 22.41$ 23.94$ 25.61$ 27.45$ 29.30$ 31.39$ 33.55$ 35.90$ 38.37$ 41.04$ 43.85$ 46.92$ 50.22$ 28
Classified Scale
129

Loudoun County Public SchoolsFY15 Operating BudgetSchool Board Questions
Question #136Attachment #16
Level 1 Level 2 Level 3 Level 4 Level 5 Level 6 Level 71 73,500$ 78,500$ 84,000$ 90,000$ 96,000$ 103,000$ 115,000$ 12 74,036$ 79,950$ 84,656$ 90,530$ 96,814$ 103,540$ 117,314$ 23 74,769$ 80,836$ 86,016$ 91,977$ 98,354$ 105,180$ 118,518$ 34 76,136$ 82,354$ 87,810$ 93,859$ 100,329$ 107,255$ 120,177$ 45 76,983$ 83,847$ 89,187$ 95,322$ 101,886$ 108,912$ 122,497$ 56 78,021$ 84,951$ 90,569$ 96,792$ 103,449$ 110,575$ 124,273$ 67 80,094$ 87,072$ 92,527$ 98,885$ 105,689$ 112,969$ 127,172$ 78 82,061$ 88,999$ 94,811$ 101,329$ 108,047$ 115,492$ 129,473$ 89 83,878$ 91,401$ 97,151$ 103,835$ 110,458$ 118,073$ 131,808$ 910 85,733$ 93,869$ 99,783$ 106,650$ 113,185$ 120,990$ 134,177$ 1011 88,088$ 96,405$ 102,246$ 109,286$ 115,707$ 123,691$ 137,198$ 1112 90,508$ 99,011$ 104,770$ 111,988$ 118,286$ 126,451$ 140,285$ 1213 92,995$ 101,687$ 107,354$ 114,754$ 120,919$ 129,270$ 143,441$ 1314 95,555$ 104,437$ 110,001$ 117,588$ 123,611$ 132,150$ 146,665$ 1415 98,184$ 107,263$ 112,715$ 120,490$ 126,360$ 135,092$ 149,962$ 1516 100,981$ 110,165$ 115,823$ 123,819$ 129,543$ 138,497$ 153,329$ 1617 103,863$ 113,423$ 118,906$ 127,116$ 132,676$ 141,852$ 156,770$ 1718 106,830$ 116,777$ 122,131$ 130,567$ 135,953$ 145,358$ 160,286$ 1819 109,879$ 119,079$ 124,837$ 133,464$ 138,638$ 148,231$ 163,879$ 1920 111,935$ 121,567$ 127,303$ 136,102$ 141,378$ 151,164$ 166,338$ 20
Administrators' Scale
130

Question #131
Attachment #17
SCHOOL YEAR* NEW HIRES (1) NEW HIRES
PART‐TIME (2) TOTAL
NEW HIRES DPS
FTEs (3) TOTAL FULL‐TIME
EMPLOYEES TOTAL PART‐TIME EMPLOYEES (4)
Total Number of Employees (5)
2013‐14 954 715 1669 39 9834 3967 13801
2012‐13 971 n/a n/a 39 9615 3721 13336
2011‐12 987 n/a n/a 39 9349 3654 13003
2010‐11 703 n/a n/a 39 9029 3942 12971
2009‐10 626 n/a n/a 44 8916 3415 12331
2008‐09 876 n/a n/a 44 8725 3504 12229
2007‐08 1055 n/a n/a 43 8218 3780 11998
*Recruiting Year = October 1‐September 30 (Ex. October 1, 2012‐September 30, 2013 for the 2013‐2014 school year)
1. All full‐time new hires include administrative, licensed, and classified employees. The new hire numbers for 2012‐13 are down from the previous year due to
the exclusion of the FLES program. The new hire numbers for 2013‐14 are lower than the previous year due to the reduction in the custodial FTEs and
reducing the number of ELL Teacher Assistants. Each of these actions to reduce staffing required actions within the Department for Personnel Services that
are not reflected in the new hire numbers.
2. We can only provide data for this year. We have not tracked this number in the past and we cannot go back and re‐create the data for previous years.
3. Number does not include added positions from the mentor/coaching area.
4. Part‐time employees include: substitutes, summer school, non‐faculty coaches, cafeteria monitors, retirees who have returned to work in various capacities
and summer help for various departments.
5. While it is important to consider the increase in the number of new employees added to the system each year, it is also an important consideration that over 50% of the time of DPS administrative staff members is spent on employee relations. This is consistent with national data (HR Executive, 2013). Employee relations
includes every involvement a human resources office has with employees after recruitment and hiring. The volume of employee relations duties is
influenced by the total number of employees. We have included a history of this as well. Examples of these duties include but are not limited to daily or
regular contact with principals, assistant principals, and hiring managers for guidance on the management of employee performance and professional
practices issues (professional practices include any violation of law or policy), investigations on employee matters, and regular contact with employees
regarding concerns from the employee or form the supervisor in which mediated face‐to‐face contact is very beneficial. Other duties include evaluation
procedure development and tracking, workshops for current employees, meetings with employees who are on the December list, reassignment of current
employees to new locations based on new school openings or shifting enrollment, placement of employees returning from leave without pay, meetings with
employees who are interested in changing career paths, tracking of relicensure of all licensed employees, preparation and issuance of contracts for current
employees, and tracking tenure.
131

Question #54 Attachment #18
Reference
Information Lawgroup
The Security, Privacy and Legal Implications of BYOD (Bring Your Own Device)
The dizzying array of personal computing device choices can be disorienting. Smartphones, tablets, laptops, netbooks, desktops, and sometimes all of the above, are amongst the device options individuals have these days (and within each category additional brand [iPhone v. Android], software and operating system choices exist). At the same time, organizations have recognized that mobile devices are crucial to their own success, and many have incurred significant expense purchasing and securing such devices, and equipping their workforce. Nonetheless, employees are increasingly using (or demanding to use) personal devices to store and process their employer’s data, and connect to their networks. The reasons for this vary from avoiding the need to carry and manage multiple devices, to the desire to use the most up-to-date devices that exist, to increased efficiency.
This trend has been named (as is the fashion), and is referred to as “COIT” (the Consumerization of Information Technology”) or BYOD (Bring Your Own Device). Some organizations believe that BYOD will allow them to avoid significant hardware, software and IT support costs. Even if cost-savings is not the goal, most companies believe that processing of company data on employee personal devices is inevitable and unavoidable. Unfortunately, BYOD raises significant data security and privacy concerns, which can lead to potential legal and liability risk. Many companies are having to play catch-up to control these risks. This blogpost identifies and explores some of the key privacy and security legal concerns associated with BYOD, including “reasonable” BYOD security, BYOD privacy implications, and security and privacy issues related to BYOD incident response and investigations.
BYOD “Reasonable Security”
The InfoLawGroup has written frequently on the concept of reasonable security, including posts about “legally defensible” security and court interpretations of reasonable security. Organizations implementing a BYOD strategy need to explore the concept of reasonable security for personal computer devices in the care, custody and control of their employees and contractors. Significant security challenges exist in this context, and most of them arise due to the lack of control companies have over their employees’ devices.
Take the example of company-owned laptop issued to an employee. When it comes to security, the company can:
determine and limit the type of devices that can be used; implement minimum system requirements and configurations; install security-related software to the device; encrypt company data on the device; apply security patches; monitor the use of the device to detect misuse, hacking or malware;
132

Question #54 Attachment #18
dictate how the device connects to the company’s network; install and update anti-virus software; provide support for the device; and obtain/access the device for purposes of an investigation (because the company owns the
device).
When it comes to their employee-owned personal devices, organizations will partially or fully lose the ability to undertake these actions, and in any event will often be relying on its individual employees to secure their devices. Companies lose the consistency, scalability and efficiency they enjoy when they own their hardware, control their data, and can dictate and scale their IT infrastructure and information security.
Moreover, to the extent a company’s employees are unable or unwilling to implement particular security controls, the organization may be increasing its security risk. This can also increase legal and liability risk related to security. Organizations engage in complex decision-making processes when securing their systems and sensitive data and for purposes of maintaining reasonable and legally defensible security. The end result is set of technical, administrative and physical controls (typically reflected in a written security program) that the organization determines is sufficient to reduce its security risk to an appropriate level. From a legal point of view the written security program may also be used to set an organization’s minimum legal standard of care. The failure of an organization to comply with its own security program is a key factor that can (and will) be used by plaintiffs counsel or regulators to argue for liability after a security breach.
This presents a serious problem in the BYOD context. For example, assume an organization’s own mobile device security standard requires encryption of all sensitive data on company-owned computer devices, and the employee’s BYOD mobile device is not achieving this standard. If the employee’s personal device is hacked and the unencrypted sensitive data stolen the company’s Mobile Device Security will likely be used to argue that company did not implement reasonable security.
To reduce legal and liability risk, companies implementing a BYOD strategy need to carefully analyze their existing security policies to determine how they relate to and impact their employees’ use of their personal devices for business purposes. Policies that may be relevant, include (without limitation): mobile device security policies, password policies, encryption policies, data classification policies, acceptable use policies, antivirus software policies, wireless access policies, incident response policies, remote working policies, privacy policies, and others. If a company’s security policies already require certain security measures, it must be determined whether it is possible to match those measures for personal devices. If there are inconsistencies, organizations need to be ready to explain, why, despite the failure to follow policies that apply to similar devices, the security of an employee’s personal device was still reasonable.
Note, there may be reasonable differences between company-owned devices and employee personal devices, and both may be secured even if the methodology is not the same. Additional (but different) controls required on personal devices may compensate for missing controls required in company policies. For example, some companies are requiring employees to install software on their personal devices that provides additional security. Perhaps a lesser set of
133

Question #54 Attachment #18
controls is appropriate in cases where storage of sensitive data on personal devices is prohibited (by policy or otherwise). In any event, for any BYOD implementation, it is important to investigate potential inconsistencies and rationalize why those differences do not equate to unreasonable security on personal devices. This process ultimately results in a Personal Device Use Policy that reflects the security trade-offs and requirements that come out of this analysis.
BYOD and Employee Privacy
The very nature of BYOD highlights the employee privacy challenges at issue. Employees and contractors of organizations will be using the same devices they use for work to engage in personal computing that involves a host of private activities and content, including web surfing history, personal emails, photos, chat histories, personally identifiable information, music, movies, software, user names and passwords and financial account numbers. We have already seen signficant legal activity relating to an employee’s expectation of privacy when using a company-issued device for personal reasons.
The U.S. Supreme Court recently considered this issue in the City of Ontario, California v. Quon (for a closer look at Quon please visit this ILG post). Quon involved a search by a city concerning an employee’s (a police officer in this case) alleged use of the city’s device for personal texting (including sexually explicit materials) both on and off duty. The police officer argued that the city’s actions represented an unreasonable search in violation of the Fourth Amendment of the US Constitution, the privacy clause found in Article I, section 1 of the California constitution, and also the federal Stored Communications Act (SCA).
The key issue in front of the Court was the extent to which the police officer had a reasonable expectation of privacy with respect to private messages sent and received on a city-owned device while on or off duty, and if so, whether the city’s search was unreasonable. Unfortunately, the Court did not rule on whether an expectation of privacy existed, and instead assumed that such an expectation was present for the sake of argument (the Court did note, however, that the city’s policies disclaimed any expectation of privacy, and that this was a factor in determining whether any expectation reasonably existed). It then turned to whether the city’s search was reasonable, and held that the city’s search of text message content was reasonable because it was undertaken for a work-related purpose and was not excessively intrusive under the circumstances. In this case, the city’s review was limited to a two-month sample of messages. In addition, to limit the intrusion into Mr. Quon’s personal life, the city redacted the officer’s messages sent and received while he was off duty.
How does privacy play out in a BYOD context? Again it comes down to looking at how an organization monitors its employees’ behavior when using computer devices owned and issued by the organization. For example, it is not unusual for companies to monitor their employees’ activities while working on the company’s network (regardless of the type of device connected to that network). For company-issued devices, additional monitoring of employee usage may occur at the device level (e.g. key-stroke logging or mobile device management software that tracks the geolocation of mobile devices). However, when it comes to personal devices, because it is known that personal and private activities are likely to take place on the device, for privacy reasons, the same types of monitoring may not be appropriate.
134

Question #54 Attachment #18
As discussed further below, another key privacy-related issue relates to investigations involving personal devices. If an image of a device’s hard drive is needed for an investigation of a security breach or for e-Discovery purposes, the captured data is likely to include private/personal information of the employee. Organizations can try to limit the scope of an investigation or data capture involving a personal device, but if they fail to preserve data that may be evidence in litigation they could face spoliation problems in court or miss key information needed for an investigation or remediation of a breach.
In all, companies need to carefully consider their intended goals when it comes to monitoring their employees’ use of their own devices, and balance those goals against these privacy concerns and potential legal limitations. Organization’s should make their employees aware of the privacy trade-offs and the reasonable expectations of privacy related to their use of a personal device for work. Note, expectations of privacy in this context may be higher because a personal device is at issue, and this should be taken into account by companies considering a BYOD strategy and informing their employees of privacy-related issues. If monitoring or an investigation is necessary, organizations should design their efforts in a manner that seeks to minimize the potential exposure of personal and private information.
BYOD Incident Response and Investigations
BYOD poses significant challenges related to incident response and investigations that impact privacy, security and legal concerns. Since individual employees own and possess their personal devices, when something goes wrong it may be difficult to actually obtain access to or possession of the device. This can be especially true when the employee itself is the subject of an investigation. If data collection and preservation is necessary, the inability to access and possess a physical device can be extremely detrimental. For example, if an organization is not able to preserve data that may constitute evidence in litigation, it could face court sanctions. This issue also poses problems for the individuals themselves who will likely (at least temporarily) be unable to use their personal device while it is being investigated. In addition, as mentioned above, capturing data or images of hard drives related to personal devices implicates potential privacy issues. In developing their BYOD strategies companies need to develop BYOD incident response procedures and inform their employees of those procedures.
Beyond investigations, for security reasons, some organizations may want to enable remote wiping, bricking and blocking of personal devices that are lost or breached. This too may pose challenges. First, it may be necessary to have employees load certain software to their personal devices or configure their devices in a certain manner to allow for remote wiping, bricking and blocking. Employees should be notified of these requirements and consent to them. Second, the wiping, bricking or blocking of a device could damage the device and/or data residing on the device. If a device is remotely wiped to remove sensitive company data from it, that wiping could also wipe out the employee’s personal emails, pictures, videos and software. Again, employees should be notified that damage, loss of use and data loss are all possibilities if they use their personal device for work purposes. Moreover, they should sign a waiver consenting to such activities and holding the organization harmless for any such damage, loss of use or data loss. All of this should be reflected in the organization’s Personal Device Use Policy and accompanying waivers and consent forms.
135

Question #54 Attachment #18
Conclusion
All too often companies considering a BYOD policy find that their employees are already using their personal devices for work purposes and to store sensitive information. This makes it more difficult to manage these issues in a deliberate manner and set up policies that address the security, privacy and legal risks associated with BYOD. Nonetheless, the complex legal implications of BYOD must be carefully considered using a multi-disciplinary approach (e.g. legal, security, privacy, IT, risk management, etc.) that takes the company’s existing infrastructure and risk tolerance into account. The end result should be a Personal Device Use Policy that addresses the various risks and strikes a balance that works for the organization. Also key, because of the personal nature of the devices in this context, is informing, educating and training employees concerning the privacy, security and incident response implications of using their own device for work purposes. Working through these issues can help to reduce the legal and liability risk that companies may face.
Information Lawgroup (2012, March 28). The Security, Privacy and Legal Implications of
BYOD (Bring Your Own Device. Retrieved from http://www.infolawgroup.com/2012/03/articles/byod/the-security-privacy-and-legal-implications-of-byod-bring-your-own-device/
136

Loudoun County Public Schools Question #137FY15 School Board Questions Attachment #19
Step Lane 1 Lane 2 Lane 3 Lane 7 Lane 4 Lane 5 Lane 61 47,500 47,500 48,914 50,328 53,156 54,570 58,812 2 47,931 47,931 49,345 50,759 53,587 55,001 59,243 3 48,267 48,267 49,681 51,095 53,923 55,337 59,579 4 49,154 49,154 50,568 51,982 54,810 56,224 60,466 5 49,498 49,498 50,968 52,439 55,272 56,686 60,928 6 49,610 49,610 51,080 52,551 55,488 56,958 61,366 7 50,090 50,090 51,559 53,029 55,968 57,438 61,845 8 50,713 50,713 52,183 53,652 56,591 58,061 62,469 9 51,335 51,335 52,803 54,272 57,212 58,682 63,090
10 51,956 51,956 53,425 54,896 57,832 59,304 63,711 11 52,577 52,577 54,046 55,517 58,456 59,926 64,334 12 54,410 54,410 55,880 57,351 60,288 61,758 66,167 13 56,312 56,312 57,780 59,250 62,188 63,659 68,066 14 58,279 58,279 59,747 61,218 64,157 65,627 70,035 15 60,318 60,318 61,788 63,258 66,195 67,666 72,074 16 62,432 62,432 63,901 65,370 68,309 69,780 74,187 17 64,621 64,621 66,035 67,449 70,277 71,691 75,933 18 66,250 66,250 67,664 69,078 71,906 73,320 77,562 19 67,990 67,990 69,404 70,818 73,646 75,060 79,302 20 69,776 69,776 71,190 72,604 75,432 76,846 81,088 21 71,784 71,784 73,198 74,612 77,440 78,854 83,096 22 73,851 73,851 75,265 76,679 79,507 80,921 85,163 23 75,975 75,975 77,389 78,803 81,631 83,045 87,287 24 78,164 78,164 79,578 80,992 83,820 85,234 89,476 25 80,417 80,417 81,831 83,245 86,073 87,487 91,729 26 82,735 82,735 84,149 85,563 88,391 89,805 94,047 27 85,122 85,122 86,536 87,950 90,778 92,192 96,434 28 87,579 87,579 88,993 90,407 93,235 94,649 98,891 29 90,331 90,331 91,745 93,159 95,987 97,401 101,643 30 92,381 92,381 93,795 95,282 98,225 99,695 104,105
FY15 DRAFT Teachers' Scale
137

Loudoun County Public Schools Question #137FY15 School Board Questions Attachment #19
Step Level 5 Level 6 Level 7 Level 8 Level 9 Level 10 Level 11 Level 12 Level 13 Level 14 Level 15 Level 16 Level 171 12.00 12.83 13.71 14.66 15.67 16.75 17.91 19.14 20.46 21.88 23.39 25.00 26.75 2 12.17 13.01 13.91 14.87 15.89 16.99 18.16 19.41 20.75 22.18 23.71 25.35 27.10 3 12.31 13.16 14.07 15.04 16.07 17.18 18.37 19.64 20.99 22.44 23.99 25.64 27.41 4 12.58 13.45 14.38 15.37 16.43 17.56 18.73 20.02 21.39 22.81 24.36 26.01 27.78 5 12.74 13.59 14.49 15.49 16.47 17.60 18.77 20.07 21.43 22.86 24.41 26.06 27.86 6 12.76 13.62 14.52 15.52 16.51 17.63 18.81 20.11 21.48 22.91 24.45 26.11 27.91 7 12.89 13.76 14.66 15.66 16.66 17.80 18.99 20.30 21.67 23.13 24.71 26.38 28.17 8 13.26 14.14 15.08 16.12 17.15 18.33 19.54 20.88 22.30 23.80 25.43 27.14 29.00 9 13.63 14.54 15.50 16.56 17.65 18.86 20.11 21.50 22.95 24.51 26.16 27.96 29.84 10 14.04 14.95 15.94 17.05 18.15 19.40 20.70 22.12 23.63 25.23 26.93 28.77 30.70 11 14.44 15.39 16.41 17.54 18.68 19.97 21.30 22.76 24.31 25.96 27.71 29.60 31.63 12 14.78 15.80 16.87 18.05 19.20 20.55 21.93 23.44 25.01 26.72 28.51 30.49 32.55 13 15.12 16.16 17.28 18.47 19.75 21.11 22.57 24.12 25.74 27.51 29.35 31.37 33.52 14 15.49 16.56 17.71 18.93 20.23 21.63 23.12 24.72 26.42 28.25 30.20 32.28 34.51 15 15.86 16.96 18.13 19.38 20.71 22.14 23.67 25.30 27.05 28.92 30.91 33.05 35.33 16 16.23 17.35 18.54 19.82 21.19 22.65 24.21 25.89 27.67 29.58 31.62 33.80 36.14 17 16.68 17.83 19.06 20.38 21.78 23.29 24.89 26.61 28.45 30.41 32.51 34.75 37.15 18 17.15 18.33 19.59 20.95 22.39 23.94 25.59 27.35 29.24 31.26 33.41 35.72 38.18 19 17.63 18.85 20.15 21.54 23.02 24.61 26.31 28.12 30.07 32.14 34.36 36.73 39.26 20 18.12 19.37 20.71 22.14 23.67 25.30 27.05 28.91 30.91 33.04 35.32 37.76 40.36 21 18.62 19.90 21.27 22.74 24.31 25.99 27.78 29.70 31.75 33.94 36.28 38.78 41.46 22 19.15 20.47 21.88 23.39 25.00 26.73 28.57 30.55 32.65 34.91 37.31 39.89 42.64 23 19.68 21.04 22.49 24.04 25.70 27.47 29.37 31.39 33.56 35.87 38.35 41.00 43.82 24 20.23 21.62 23.12 24.71 26.42 28.24 30.19 32.27 34.50 36.88 39.42 42.14 45.05 25 20.81 22.24 23.78 25.42 27.17 29.05 31.05 33.19 35.49 37.93 40.55 43.35 46.34 26 21.39 22.86 24.44 26.13 27.93 29.86 31.92 34.12 36.47 38.99 41.68 44.55 47.63 27 21.98 23.50 25.12 26.86 28.71 30.69 32.81 35.07 37.49 40.08 42.84 45.80 48.96 28 22.41 23.95 25.61 27.37 29.26 31.31 33.50 35.87 38.36 41.02 43.85 46.91 50.22
FY15 DRAFT Classified Scale
138

Loudoun County Public Schools Question #137FY15 School Board Questions Attachment #19
Step Level 2 Level 1 Level 3 Level 41 57,000 52,000 49,500 45,500 2 57,694 52,699 50,202 46,305 3 58,361 53,317 50,796 46,861 4 59,747 54,630 52,073 48,081 5 59,856 54,740 52,183 48,190 6 59,970 54,853 52,295 48,302 7 60,552 55,384 52,800 48,769 8 63,005 57,622 54,931 50,730 9 65,565 59,957 57,150 52,777 10 68,278 62,433 59,510 54,948 11 70,946 64,866 61,827 57,083 12 73,718 67,394 64,233 59,302 13 75,870 69,357 66,102 61,022 14 78,084 71,375 68,019 62,786 15 80,367 73,457 69,999 64,612 16 82,719 75,602 72,044 66,494 17 85,136 77,808 74,145 68,427 18 87,629 80,080 76,308 70,417 19 90,210 82,435 78,551 72,484 20 92,872 84,863 80,859 74,612 21 95,608 87,358 83,234 76,801 22 97,959 89,504 85,276 78,683 23 100,368 91,701 87,372 80,611 24 102,844 93,962 89,523 82,593 25 105,096 95,878 91,283 84,215
FY15 DRAFT Auxiliary Scale
139

Loudoun County Public Schools Question #137FY15 School Board Questions Attachment #19
Step Level 1 Level 2 Level 3 Level 4 Level 5 Level 6 Level 71 73,500 78,500 84,000 90,000 96,000 103,000 115,000 2 74,036 79,950 84,656 90,530 96,814 103,540 115,121 3 74,769 80,836 86,016 91,977 98,354 105,180 115,226 4 76,136 82,354 87,810 93,859 100,329 107,255 115,767 5 76,983 83,056 88,764 94,870 101,403 108,396 115,876 6 78,021 83,168 88,877 94,983 101,515 108,508 115,989 7 78,597 83,985 89,748 95,916 102,515 109,576 117,132 8 80,906 86,455 92,391 98,743 105,289 112,544 120,307 9 83,283 88,999 95,114 101,657 108,140 115,595 123,570
10 85,733 91,619 97,918 104,657 111,069 118,729 126,924 11 88,088 94,319 100,807 107,747 114,078 121,949 130,369 12 90,508 97,099 103,782 110,932 117,171 125,257 133,908 13 92,995 99,963 106,845 114,211 120,346 128,657 137,546 14 95,555 102,912 110,001 117,588 123,611 132,150 141,283 15 98,184 105,950 112,715 120,490 126,360 135,092 145,124 16 100,981 109,081 115,823 123,819 129,543 138,497 149,070 17 103,863 112,304 118,906 127,116 132,676 141,852 153,124 18 106,830 115,625 122,131 130,567 135,953 145,358 157,290 19 109,879 119,045 124,837 133,464 138,638 148,231 161,571 20 111,935 121,392 127,303 136,102 141,378 151,164 164,769
FY15 DRAFT Administrators' Scale
140

Copyright © 2022 FDOKUMEN