SCHEDULED CASTES SUB PLAN 2014-15 - Open Budgets ...
347
SCHEDULED CASTES SUB PLAN 2014-15 GOVERNMENT OF PUNJAB DEPARTMENT OF WELFARE DIRECTORATE OF SCHEDULED CASTES SUB PLAN
-
Upload
khangminh22 -
Category
Documents
-
view
3 -
download
0
Transcript of SCHEDULED CASTES SUB PLAN 2014-15 - Open Budgets ...

SCHEDULED CASTES SUB PLAN
2014-15
GOVERNMENT OF PUNJAB DEPARTMENT OF WELFARE
DIRECTORATE OF SCHEDULED CASTES SUB PLAN

(FOR OFFICAL USE ONLY)
SCHEDULED CASTES SUB PLAN
2014-15
GOVERNMENT OF PUNJAB DEPARTMENT OF WELFARE
DIRECTORATE OF SCHEDULED CASTES SUB PLAN

SCHEDULED CASTES SUB PLAN 2014-15
PART-I
WRITE UP
Contents Page Chapter- I Introduction 1-10
Chapter- II Scheduled Castes Sub Plan 11-26
Chapter- III Special Central Assistance (SCA) Programme 27-40
Chapter- IV 20 Point Programme (SC Families Assisted) 41-43
Chapter- V Empowerment of Scheduled Caste Women/Girls 44-46
SCSP at a Glance 47-48
PART-II
STATEMENTS
Contents
Statement -I Sector-wise Outlay and Expenditure 49-50
Statement -II Sector-wise /Subhead-wise Outlay and Expenditure 51-55
Statement-III Subhead wise percentage of SCSP Outlay to Annual Plan Outlay 56-60
Statement-IV Subhead-wise Divisible Outlay and Expenditure 61-63
Statement-V Scheme-wise Divisible Outlay and Expenditure 64-99
Statement-VI Centrally Sponsored Schemes(Restructured) 100-113
Statement-VII Physical Targets and Achievements 114-117
Statement-VIII Subhead-wise Allocation, Expenditure, Achievements and Physical Targets (SCA)
118
Statement- IX Scheme-wise Allocation and Expenditure (SCA) 119-121
Statement-X Physical Targets and Achievements (SCA) 122-124
Statement- XI 20 Point Programme ( SC families assisted) 125-131
Statement-XII Scheme-wise Outlay and Expenditure (Women Component) 132-141
Statement-XIII Schemes Having SCSP Component From 50% to 100% 142-152
Statement- XIV Exclusive schemes meant for benefit of Scheduled Castes 153-156
PART-III
BASIC DATA FOR SCs IN PUNJAB 157-176
PART-IV
I LIST OF VILLAGES HAVING 100% SC POPULATION 177-179
II DISTRICT-WISE NO. OF VILLAGES HAVING 40% AND ABOVE SC POPULATION
180
III DISTRICT/TEHSILWISE NAME OF VILLAGES HAVING 40% AND ABOVE SC POPULATION
181-292
PART-V
GUIDELINES AND NOTIFICATIONS 293-339

PART – I
WRITE UP

CHAPTER – I
INTRODUCTION As per Census-2011, the State of Punjab, has the highest percentage of
Scheduled Caste population amongst all the States of the Country. The Scheduled Caste
population in Punjab is 88.60 lac which is 31.94% of the total population (277.43 lac) of
the State. Punjab accounts for 2.3% of the total population and 4.3% Scheduled Caste
population of India. The decennial growth rate of SC population in the State was 26.06%
as compared to 13.89 % for the State as a whole. However, a sizeable number of SC
families still live below the poverty line.
1.2 According to the survey conducted by the Department of Rural
Development and Panchayats for rural areas in the year, 2002 and the State urban
Development agency (SUDA) in urban areas in , 2004, out of the total 5.23 lac families
living below the poverty line, 3.21 lac families belong to the Scheduled Castes which
constitutes 61.38% of the total families below the poverty line in the State. As per
Agricultural Census 2010-11, the number of operational holdings with SCs are 63,480
spreading over an area of 1,26,966 hectares comprising 6.02% and 3.20% of the total
land holdings and area of the State, respectively. Major bulk (85.54%) of these holdings
are unviable being less than the size of 5 hectares.
1.3 The Scheduled Caste population is predominantly rural by residence. As
per Census 2011, the majority of the SC people (73.33% ) live in the rural area, whereas,
26.67% SC people reside in the urban area of the State. The distribution of SC population
among the districts of the State indicates that percentage of SC persons is high in the
districts of Shaheed Bhagat Singh Nagar (42.51%), Sri Muktsar Sahib (42.31%), Firozpur
(42.17%), Jalandhar (38.95%), Faridkot (38.92%), Moga (36.50%), Hoshiarpur
(35.14%), Kapurthala (33.94%), Tarn Taran (33.71%), Mansa (33.63%),
Bathinda(32.44%), Barnala (32.24%) and Fatehgarh Sahib (32.07%). This is to say that
in majority of the districts in Punjab have one third or more of their population belongs
to the Scheduled Castes. Out of the total 12,168 inhabited villages in the State, 57
villages have 100% SC population and 4,799 villages (39.44%) have 40% or more SC

2
population. The village/tehsil/district wise detail of villages having 40% or more SC
population is given in Part-IV (II) of the document. Among 217 towns, 175 towns have
20% or more SC population, and majority of them are either small towns or census
towns.
1.4 As per Census 2011, the literacy rate among SCs is 64.81% as compared
to total literacy rate of 75.84% of the State and 73.00% of the Country as a whole. The
female literacy rate of SCs at 58.39% in the State also lags behind that of total 70.73% of
the State. However, it is better than the SC female literacy rate at 56.46% of the Country.
The SC male literacy rate at 70.66% of the State is also lower than the total male literacy
rate of 80.44% in the State.
1.5 Out of the total SC population, SC labour force constitutes 35.88%, out of
which, 79.20% and 20.80% are main and marginal workers respectively. The majority of
this segment of society are agricultural labourers or are engaged in low wage and arduous
occupation. The State Government is committed to uplift this under privileged section of
the society by improving the socio economic and educational development by providing
them with technical skills for vocational jobs and link their present occupation/activity
with the larger activity.
1.6 The comparative demographic detail of SCs as per Census 2011 is given below:-
Scheduled Castes Population
Total Population : 277.43 lac SC Population : 88.60 lac (31.94%) General Population : 188.83 lac (68.06%)
31.94%
68.06%
SC Population
General Population
(Source: Census 2011)

3
Total, Rural and Urban SC population
Total SCs Total 277.43 lac 88.60 lac Rural 173.44 (62.52%) 64.97 (73.33%) Urban 103.99 (37.48%) 23.63 (26.67%)
277.43
173.44
103.9988.6
64.97
23.63
0
50
100
150
200
250
300
Total Rural Urban
Total
SC
(Source: Census 2011)
Total and sex-wise SC population
Total SCs Total 277.43 lac 88.60 lac Male 146.39 (52.77%) 46.40 (52.37%) Female 131.04 (47.23%) 42.20 (47.63%)
277.43
146.39 (52.77%) 131.04
(47.23%)
88.60 46.40 (52.37%)
42.20 (47.63%)
0.00
50.00
100.00
150.00
200.00
250.00
300.00
Total Male Female
Total
SC
(Source: Census 2011)

4
Decennial growth rate of SC Population
Decade Total SCs
1971-1981 23.89% 34.74%
1981-1991 20.80% 27.28%
1991-2001 20.10% 22.39%
2001-2011 13.89% 26.06%
(Source: Census 2011)
Total families vis-à-vis BPL SC families ( In lac)
Total * BPL@
Total 43.48* 5.23@ SC families 12.54 3.21 (61.38%) Non-SC families 30.94 2.02 (38.62%)
43.48
30.94
12.54
5.232.02 3.21
0
5
10
15
20
25
30
35
40
45
50
Total Non-SCfamilies
SC families
In la
c Total
BPL
(Source: *Census 2001, @ Rural Development Department 2002 and SUDA 2004, Punjab)

5
Total , Rural and Urban BPL SC families (in lac)
Total
SCs
Total 5.23 3.21 Rural 3.44 2.34 Urban 1.79 0.87
5.23
3.44
1.79
3.21
2.34
0.87
0.00
1.00
2.00
3.00
4.00
5.00
6.00
Total Rural Urban
Total
SC
(Source: Rural Development Department 2002 and SUDA 2004, Punjab)
Total and sex-wise literacy rate of SC Population (in %age)
All India Punjab Total SCs Total SCs
Total 73.00 66.07 75.84 64.81 Male 80.90 75.17 80.44 70.66
Female 64.60 56.46 70.73 58.39
73.0066.07
75.84
64.81
80.9075.17
80.4470.66
64.6056.46
70.73
58.39
0.00
10.0020.00
30.0040.00
50.0060.00
70.0080.00
90.00
Total SC Total SC
All India Punjab
Total
Male
Female
(Source: Census 2011) `

6
Dropout rate of SC Students in Punjab as on 30.9.2010 (in %age)
Class Total SCs I-V 9.40 22.30 VI-VIII 9.20 - I-X 30.50 55.70
(Source: Statistics of School Education 2010-11- HRD Ministry, 2014)
SC dominating villages
Total inhabited villages : 12168
SC dominating villages : (with 40% and more SC population )
4799 (39.44%)
Other inhabited villages : 7369 (60.56%)
39.44%
60.56%SC dominatingvillages
(Source: Census 2011)
9.40 9.20
30.50
22.30
0
55.70
0
10
20
30
40
50
60
I-V VI-VIII I-X
Total
SC

7
Operational land holdings with SCs
Total Operational land holdings : 10,53,000 Operational land holdings with SCs : 63,480 (6.02%) Operational land holdings with others : 9,89,520 (93.98%)
(Source: Agricultural Census 2010-11)
Mortality rate of SC Children
All India Punjab Total SCs Infant Mortality 66.4% 44.10% 46.20% Neonatal Mortality 46.30% 30.60% 29.50% Child Mortality 23.20% 6.80% 16.00%
66.4%
23.2%
44.10%
6.80%
46.3%
30.6%
16.00%
46.20%
29.5%
0.0%
10.0%
20.0%
30.0%
40.0%
50.0%
60.0%
70.0%
Infant Mortaility NeonatalMortaility
Child Mortaility
All India
Punjab -Total
Punjab -SC
(Source: National Family Health Survey-III- 2005-06)

8
Nutrition deficiency in SCs
All India Punjab Total SCs Weight for height 21.00% 9.20% 13.40% Women with anaemia 58.30% 38.00% 42.60% Anaemic children 72.20% 66.40% 73.80%
21.0%
58.3%
38.0%
66.4%72.2%
9.2%
13.4%
42.6%
73.8%
0.0%
10.0%
20.0%
30.0%
40.0%
50.0%
60.0%
70.0%
80.0%
Weight forheight
AnaemicWomen
Anaemicchildren
All India
Punjab-Total
Punjab-SC
(Source: National Family Health Survey-III- 2005-06) Need for Development of Scheduled Castes
1.7 Article 46 of our Constitution describes that “the State shall promote with special
care, the education and economic interests of the weaker sections of the people, and in
particular of the Scheduled Castes and Scheduled Tribes and shall protect them from
social injustice and all forms of exploitation”. The Scheduled Castes contribute a lot to
the economic development and growth of the national economy. Experience of first four
decades of Planning has revealed that the process of economic development and
modernization has not benefited the weaker sections of the society to the extent it was
envisaged though growth with social justice has been accepted as the main objective for
the Planned Economic Development. The desired fruits of progress and flow of benefits
have not reached the majority of the Scheduled Castes. They have suffered from the dual
disabilities of severe economic exploitation and social discrimination. They are mainly
dependent upon the agricultural pursuits and other low income generating occupations

9
like shoe making, sweeping, basket making, black smithy, weaving, dairy, poultry and
piggery etc.
1.8 In spite of the constitutional directives and a number of legislative and executive
measures taken by the Ministry of Social Justice and Empowerment, Govt. of India and
the State Governments, the conditions of the Scheduled Castes did not improve much
during the period prior to the Sixth Five Year Plan (1980-85) mainly due to lack of
economic support. The fruits of development did not percolate uniformly down for those
for whom they were intended. The SC population, therefore, was deprived of the benefits
and could not get its due share out of development made under the various plan
programmes launched by Govt. of India both under the Macro and Micro Plans. In the
Sixth Five Year Plan, a new approach aiming at Rapid Socio-Economic Development of
Scheduled Castes, in consonance with the Directive Principles, was evolved to ensure
flow of benefits from the general sectors to these people. The State Govt. is committed to
integrate SCs with other social groups, so that there is no discrimination between the two.
This is feasible through increased industrialisation by linking the activity/occupation of
SC population by providing them technical skills for vocational jobs.
The new strategy is a combination of the following two important instruments :-
I. Scheduled Castes Sub Plan (SCSP)
Scheduled Castes Sub Plan is a flow of funds from the overall Plan Outlay of the
State at least in proportion to the percentage of SC population of the State. These
funds are utilized for the socio economic and educational development of SC
people in the State.
II. Special Central Assistance (SCA) to the Scheduled Castes Sub Plan.
Special Central Assistance (SCA) to the Scheduled Castes Sub Plan is a 100%
grant provided by the Ministry of Social Justice and Empowerment, Govt. of
India to the State for the economic development of Scheduled Castes living
below the poverty line in the State.

10
Strategy
1.9 The new strategy was evolved with the broad objective to bring about
comprehensive socio-economic and educational development of Scheduled Caste people
who are the most marginalized, oppressed and deprived section of our society and
constitute nearly one-third of the total population of the State. The State Government is
making efforts for introduction of new schemes and restructuring the existing schemes on
the basis of the actual needs of the Scheduled Castes and earmarking funds under the
State Annual Plan for their socio-economic and educational development. The State
Government is also making efforts to further strengthen the Directorate of SCSP for
formulation, review, evaluation and monitoring of implementation of the programmes
for the development of SCs under the Scheduled Castes Sub Plan in a more effective
manner.

11
CHAPTER – II
SCHEDULED CASTES SUB PLAN
Concept
The concept of Scheduled Castes Sub Plan was envisaged by the Planning
Commission of India at the time of formulation of Sixth Five Year Plan (1980-85) with
the objective to ensure adequate benefits under SCSP for the socio-economic and
educational development of Scheduled Castes both in physical and financial terms by
providing funds, out of total outlays of the State Plan, at least in proportion to the
percentage of SC population in the State. The Planning Commission of India emphasized
that developmental needs and priorities of SCs, because of their historic deprivation,
would require even larger proportion of the plan outlays than their population percentage.
This plan is envisaged to help the poor Scheduled Caste families through composite
income generating programmes by covering all the major occupational groups such as
agricultural labourers, small and marginal farmers, share-croppers, fishermen, sweepers
and scavengers, unorganised urban labourers living below the poverty line etc. The
Scheduled Castes Sub Plan also seeks to improve the living conditions of the Scheduled
Castes through provision of drinking water supply, link roads, house-sites, housing
improvements, basic minimum services such as primary schools, health centres,
veterinary centres, panchayat ghars, community halls, nutrition centres, extension of
electricity and common work places/ facility centres, etc in the Scheduled Caste basties
under the Minimum Needs Programme to improve their access to social, educational
and other community services. Accordingly, efforts are being made by the State Govt.
for the socio-economic and educational development of SCs under the Scheduled Castes
Sub Plan by making new schemes and restructuring the existing schemes on the basis of
their felt needs.
Broad Objectives and Strategy
2.2 The scope of land based activities for Scheduled Castes in the State is very limited
due to small size land holdings. Land being a scarce commodity has a very high price.

12
Therefore, there is hardly any scope to increase the size of the holdings of Scheduled
Castes. Since, major bulk of these holdings is un-economical, un-viable and also spread
over the State and interspersed with the non-SC holdings, the main thrust for the
development of Scheduled Castes is, therefore, economic development through
education, training, skill development, providing necessary linkages and basic
infrastructure development facilities on priority basis in the areas predominantly
inhabited by the Scheduled Castes to enable them to settle in employment/self
employment ventures. Broad objectives for the socio-economic development of SCs are
as follows :-
Objectives
i) Conservation of whatever assets the Scheduled Castes have; ii) Updating and/or providing of new skills to improve their employability or
productivity;
iii) Enabling them to acquire special education/technical qualifications and avail existing as well as the newly emerging opportunities etc;
iv) Economic development through comprehensive and integrated beneficiary oriented programmes for individual/families/group of families for raising their income;
v) Ensuring minimum wages of agricultural labour, preventing their exploitation by others in any way;
vi) Basti/cluster oriented schemes to bring about significant and tangible improvement in the working and living conditions in SC inhabitations;
vii) Substantial reduction in poverty and un-employment;
viii) Human Resources Development of Scheduled Castes by providing adequate educational and health Services;
ix) Diversification of occupation, up-gradation of skills and promotion of
occupational mobilities to remove disproportionate burden on them in occupations like agriculture labour and other unpleasant and strenuous works so that human resources are optimally developed and utilized;
x) Elimination of layer of exploitive middlemen by providing marketing facilities to ensure better prices of products for artisans and other occupational group;

13
xi) Provision of physical and financial security against all types of exploitation and oppression; and
xii) Doing all what is necessary to tackle and eradicate the social problem i.e.
atrocities against the Scheduled Castes.
Strategy
i) Pursuing the indicated objectives, ensuring adequate thrust on economic and educational development of Scheduled Castes;.
ii) The Scheduled Castes Sub Plan of the State should provide for fully meeting the minimum needs/basic amenities of all the Scheduled Castes habitations with a view to improve their standard of life;
iii) The Scheduled Castes Sub Plan should also provide for a judicious mix of beneficiary oriented programmes and human resource development for SCs;.
iv) The schemes taken up should be viable and as far as necessary innovative in a way to diversify Scheduled Castes into newer areas of economic activities;
v) There should be provision for meeting the backward and forward infrastructure needs;
vi) The delivery systems have to be effective;
vii) The organization and association of the beneficiary groups should be given the preference;
viii) One of the identified gaps has been the need for inculcation a sense of commitment and urgency in the policy making and implementing machinery to fulfilling the objective of development of Scheduled Castes on the desired lines and their integration with the main stream; and
ix) The Voluntary Agencies/Registered Societies should be suitably associated to supplement the efforts of the State Govt. for the development/upliftment of SCs in the State.
Policy Decisions
i) A separate Directorate i.e. Directorate of Scheduled Castes Sub Plan has been
set up under the Administrative control of the Welfare Department and made
the nodal department for formulation, and monitoring the implementation of
SCSP/SCA schemes;
ii) The size of the Scheduled Castes Sub Plan will be conveyed by the Planning

14
Department as soon as the size of the State Annual Plan is determined. The
department wise / scheme-wise outlays in respect of various departments for
SCSP will be determined by the Directorate of SCSP in consultation with the
concerned Administrative Departments.
iii) The Scheduled Castes Sub Plan document will be placed in the legislature
alongwith other budget documents. State Plan budget will be presented after
incorporating the SCSP outlays therein.
iv) A separate minor head –789-“SCP for SCs” has been opened to book the
budgeted SCSP allocation to avoid diversion of SCSP funds to the general
sectors;
v) A separate sub-head has been opened under the Receipt Head of the State Govt.
to avoid diversion of SCA funds and to maintain the accountability of the funds
received from Govt. of India;
vi) To have the desired impact under the programmes for the Welfare of SCs,
cluster-cum-saturation approach will be adopted as far as possible. Thus, the
coverage of families should not be in small number spread over large areas with
reference to the existing opportunities. The development package offered
should be made more comprehensive and viable by covering benefits and
facilities available under other schemes also to the identified beneficiaries. This
alone will enable the SC families to consolidate their position and ward off any
threat to their security in an effective manner. This will also ensure better
provision of common facilities and services and their effective implementation,
supervision, monitoring and feed back.
vii) Setting up and upgradation of educational/health/veterinary institutions, adult
education centres, anganwari centres under ICDS, opening of the offices of co-
operative milk producers society and milk collection centres should be located
in or near the vicinity of SC mohallas/localities. Similarly, facilities for basic
minimum needs programmes for the community such as water supply,
sewerage, sanitation etc. should be located in the mohalla/villages/towns/blocks
predominantly inhabited (40% or more) by SC population and the entire
expenditure on this account should be booked under SCSP although the general

15
population of these areas will also avail these facilities.
viii) The ADC (Development) in each district will be the Nodal Officer under the
overall control of Deputy Commissioner of the concerned district for
formulation, implementation, monitoring/review and co-ordination of
programmes and schemes falling under the district level SCSP/SCA for the
respective districts. The concerned District Welfare Officer will provide
necessary secretariat assistance to the ADC (D) as is being done by the Deputy
E.S.A. in case of district plan schemes.
ix) The Concerned District Heads/ District Welfare Officer will intimate the
Welfare Department, the physical targets to be achieved under each SCSP
scheme and also specify the area of operation and beneficiaries/families to be
covered to enable the Welfare Department to have on the spot checking of the
working and implementation of the schemes to see as to whether the schemes
are being implemented in the right spirit and beneficiaries covered are genuine.
x) The District Head of the concerned departments/ District Welfare Officer will
supply the monthly, quarterly and annual physical and financial achievements
under SCSP to ADC (Dev.) who in turn will supply the scheme-
wise/department-wise consolidated statement for the district in the prescribed
proforma to the Director (SCSP)-cum-Joint Secretary, Welfare Department.
xi) The Heads of Departments concerned with the Decentralised Planning are also
required to monitor, supervise and guide the implementation of the district level
schemes of their respective departments and to take appropriate measures to
ensure that the target fixed for each scheme is achieved.
Scheduled Castes Sub Plan-Formulation Process and Budgetary Mechanism
Formulation Process 2.3 As per the detailed guidelines issued by the Planning Commission of India
(Annexure-I, Annexure-II & Annexure- III) regarding the Scheduled Castes Sub Plan,
the objective of SCSP is to channelise the flow of outlays and benefits from the general
sectors of the State Plan for the development of Scheduled Castes at least in proportion
to their population both in physical and financial terms. Further, SCSP should be an

16
integral part of the State Annual Plan as well as Five Year Plan by making non-divertible
provisions, therein, with the clear objective of bridging the gap in socio-economic and
educational development of the Scheduled Castes. To fulfill these objectives, Govt. of
India has recommended the Action Plan as under:-
i) Earmarking of funds for Scheduled Castes Sub Plan from the total State Plan
Outlay at least in proportion to SC population to the total population of the
State/UT.
ii) Making the Social Welfare Department/the Department concerned with the
welfare and development of SCs as the nodal department for formulation and
implementation of SCSP.
iii) Placing the funds earmarked for SCSP at the disposal of the nodal
department concerned which in turn will reallocate these funds to the sectoral
departments for implementing the schemes directly relevant to SC
development.
iv) Placing the funds earmarked for SCSP under a separate budget head/sub-
head for each development department implementing SCSP. In this
connection, it may be noted that the List of Major and Minor Heads of
Accounts of States provides that for Scheduled Castes Sub Plan , 789 may
be opened as a Minor Head below the functional Major Head/Sub Major
Head, wherever necessary.
v) Secretary Welfare will work as nodal officer with planning powers to
reallocate the earmarked SCSP funds to various line departments and
implementing agencies.
vi) Scheduled Castes Sub Plan funds should be non-divertible and non-lapsable.
vii) Special Central Assistance (SCA) for the SCSP is provided by the Ministry
of Social Justice and Empowerment, Govt. of India to the States as a 100%
grant to fill up the critical gaps and missing inputs for family-oriented
income-generating schemes and supporting infrastructure development with
a special focus on BPL SC families. Guidelines issued in this connection
should be strictly followed.

17
Budgetary Mechanism
2.4 To implement the Scheduled Castes Sub Plan in a more effective manner in line
with the guidelines of the Planning Commission of India and the recommendations of the
National Commission for Scheduled Castes, Govt. of India, implementation of
‘Maharashtra Model’ for SCSP (Annexure IV) was approved by the State Cabinet on
6-3-2003.
2.5 The Council of Ministers in its meeting held on 20-1-2014 while reviewing the
decision of CMM dated 6.3.2003 regarding implementation of ‘Maharashtra Model’ in
the State has taken some policy decisions to implement the SCSP in the State in a more
effective manner. A notification in this regard was issued on 10-2-2014 (Annexure V).
2.6 As per notification dated 10.2.2014, the following decisions were taken:-
i) The SCSP size will be made proportionate to the percentage of SC
population of the State out of the total Annual Plan allocation
including the non-budgeted allocation on the pattern of the State
Annual Plan.
ii) The SCSP funds will not be divertible but will be lapsable on the
pattern of the State Annual Plan funds. The funds booked under
SCSP can only be diverted by a committee under the Chairmanship of
Secretary Welfare with one representative each from the finance and
the planning departments. However, no diversion of SCSP funds will
be made to the general sector.
iii) The department of welfare will be the nodal department for
formulation and monitoring of the implementation of SCSP. In case
of schemes exclusively meant for SCs, the implementing departments
will formulate the schemes in consultation with the welfare
department. However, in case of general plan schemes, the
implementing departments will consult the welfare department only
regarding the SCSP components of those schemes.

18
iv) The concerned implementing departments will be fully
responsible for proper implementation of SCSP schemes/
components, audit and reconciliation of accounts for these
schemes/components from the Accountant General (Audit), Punjab
and replies to the Punjab Vidhan Sabha/Public Accounts Committee
and any other function which is required to be performed as a head of
the department for implementation of plan schemes including the
SCSP schemes/ components.
v) The allocation under SCSP schemes/components included in the
SCSP budgeted allocation will continue to be booked in the Minor
Head-789-“SCP for SCs” below the major/sub-major head under the
respective demand of the concerned implementing departments.
a) In case of non beneficiary oriented schemes, a portion equal to SC
population (~32%) will be booked under SCSP.
b) In case of irrigation and agriculture departments, where SC
beneficiaries are substantially less, only half of the portion equal to
SC population (~16%) will be booked under SCSP.
c) The beneficiary oriented schemes will be further put under two
categories. One, where the percentage of SCSP is less than portion
equal to SC population (<32%) and the other, where the percentage
will be equal or more than the portion equal to SC population
(≥32%).
d) As per the guidelines of the Planning Commission, the expenditure
incurred on the infrastructure created in the villages having 40% or
more SC population, can be fully booked under SCSP expenditure.
Therefore, under such schemes, 40% allocation will be booked under
SCSP.
e) The percentages under SCSP schemes/components will be worked
out by the welfare department in consultation with the departments
based on historical data and future trend within the overall SCSP
component determined on the basis of resources finalised by the

19
Planning Commission, GOI/ Finance Department, Punjab.
vi) The concerned administrative departments will seek the concurrence
of the welfare department in accordance with the instructions issued
for the clearance of plan schemes by the planning department from
time to time regarding the beneficiary oriented SCSP
schemes/components, wherein, the direct benefit accrues to the
individual or the families belonging to the Scheduled Castes. The
identification of beneficiaries oriented schemes/components will be
done by the welfare department in consultation with the
implementing departments. However, the approval of both the
general and Special Component Plan (now SCSP) will be accorded
by the Punjab State Planning Board through the usual process being
followed for the approval of Five Year/Annual Plans.
vii) The department of welfare will prepare as many schemes as possible
directly benefitting the SC population. The planning department will
endeavor to include as many schemes as possible in the Annual Plan
with the requisite allocation.
viii) The department of welfare will enhance/reduce the scheme-
wise/component-wise SCSP allocation in consultation with the
departments within the revised plan size indicated by the finance
department, Punjab at the time of finalisation of revised
estimates/supplementary for the Plan Budget.
ix) The inclusion/deletion of SCSP schemes/components will be done by
the welfare department in consultation with the departments within
the revised plan size indicated by the finance department, Punjab at
the time of finalisation of revised estimates/supplementary for the
Plan Budget.
x) The prior approval , if required , for any issue relating to formulation
of SCSP which is within the purview of the finance department as
per Allocation of Business Rules will be obtained.

20
xi) The department of welfare, being the nodal department, in case faces
any problem in formulation and monitoring the implementation of
SCSP, will take necessary action in consultation with the department
of planning and the department of finance
Steps taken by the State Government
2.7 The State Govt. has taken the following steps for the effective implementation of
SCSP:-
i) Out of the total 12,168 inhabited villages in the State, 4799 villages
(39.43%) with 40% or more SC population (on the basis of Census
2011) have been identified to provide infrastructure facilities to the SC
inhabitations on priority basis;
ii) A State Level Review Committee under the Chairmanship of Chief
Minister, Punjab has been constituted for monitoring and review of
schemes under SCSP/SCA (Annexure-VI );
iii) A State Level Standing Tripartite Committee, under the Chairpersonship
of Minister-in-Charge, Welfare of SCs and BCs, has been constituted to
review and monitor the implementation of SCSP/SCA schemes
(Annexure-VII). 10 meetings of this committee have been held so far;
iv) District and Block level Monitoring Committees have been constituted
for review/monitoring of SCSP/SCA schemes at the grass root level
(Annexure-VIII and Annexure-IX). 49 meetings of the Block Level
Monitoring Committees have been held so far;
v) A Monitoring Cell has been established in the Directorate of SCSP to
evaluate the SCSP/SCA schemes on regular basis. This Cell has already
done evaluation of SCA schemes for the years 2008-09 and 2009-10
and the reports in this regard have been submitted to the Ministry of
Social Justice and Empowerment, GOI. The evaluation of SCA schemes
implemented during 2010-11 is under progress.

21
District Planning Committees (DPCs)
2.8 The District Planning Committees have been constituted by the State
Govt. in all the districts of the State. The Department of Planning had issued detailed
guidelines regarding formulation of the District Plan by the District Planning
Committees. However, the work regarding preparation of District Plan is yet to be started
at the district level. To ensure the proper implementation of the district level schemes ,
the Department of Planning had changed the system for release of funds under the district
level schemes from the year 2010-11. The concerned Administrative Departments have
been made fully responsible for the release of funds for the district level schemes from
the Finance Department and, thereafter, issuing sanctions to their field level
implementing agencies. Accordingly, the Department of Welfare had also issued
guidelines to the Administrative Departments concerned with SCSP to ensure that the
SCSP share should be depicted under the minor head -789 while issuing the sanction for
the district level schemes.
Appraisal of the 11th Five Year SCSP (2007-12)
2.9 During 11th Five Year Plan (2007-2012), out of an actual plan allocation
of Rs.40616.00 Crore, an allocation of Rs.11574.00 Crore was earmarked under SCSP for
the socio economic and educational development of Scheduled Castes in the State.
Against this allocation, an expenditure of Rs.7085.35 Crore was incurred during
11th Five Year SCSP. In addition, Rs.38.07 Crore were spent under the Special Central
Assistance Programme during the same period to enable the below poverty line SC
families to cross the poverty line. Against this expenditure, an institutional finance to the
tune of Rs.44.77 Crore was also raised from the different financial institutions for
economic upliftment of BPL SC families. Similarly, an expenditure of Rs. 964.80 Crore
was incurred as central share under SCSP for the Centrally Sponsored Schemes.
Accordingly, total expenditure of Rs. 7638.10 Crore was incurred during the 11th Five
year SCSP including an expenditure of Rs. 798.57 Crore under various poverty
alleviation schemes to assist 3.51 lac SC families.

22
Size and Performance under the Scheduled Castes Sub Plan since 8th Five Year Plan (1992-97)
2.10 As per the guidelines of the Planning Commission of India, the size of the
Scheduled Castes Sub Plan out of the total State Plan outlay should be at least in
proportion to the percentage of SC population of the State. However, the size of SCSP
remained lower than the percentage of Scheduled Castes population in the State up to 9th
Five Year Plan period (1997-02). Since 2003-04, the size of SCSP is being made
proportionate to the percentage of SC population of the State. The financial performance
under the Scheduled Castes Sub Plan during 8th, 9th and 10th Five Year Plan period
remained between 46% and 66%. The performance during 11th Five Year Plan remained
between 52% and 71% . The performance during first two years of 12th Five Year Plan
remained satisfactory at the level of 67% and 72%, respectively. The year-wise detail of
performance under SCSP as compared to the State Plan Outlay since 8th Five Year Plan is
given as under:-
(Rs. in Crore) Year State Plan Scheduled Castes Sub Plan
Outlay Exp. %age performance
Outlay %age of SCSP outlay to Annual Plan outlay
Exp. %age performance
1 2 3 4 5 6 7 8 8th Plan (1992-97)
6570.00 6818.83 103.79 954.06 14.52
447.98 46.46
1992-1993 1150.00 891.88 77.55 164.06 14.27 88.58 53.99
1993-1994 1250.00 1125.42 90.03 195.00 15.60 105.88 54.29
1994-1995 1450.00 1419.46 97.89 200.00 13.79 87.42 43.71
1995-1996 1675.00 1587.68 94.79 200.00 11.94 90.50 45.25
1996-1997 1850.00 1794.39 96.99 205.00 11.08 75.60 36.87
9th Plan (1997-02)
11500.00 10032.84 87.24 1150.00 10.00
759.41 66.03
1997-1998 2100.00 2021.24 95.80 210.00 10.00 134.59 64.09 1998-1999 2500.00 2007.04 80.22 220.00 8.80 57.80 26.27 1999-2000 2680.00 1753.17 65.42 304.00 11.34 173.71 57.14 2000-2001 2700.00 2045.25 75.75 312.00 11.56
194.04 62.60

23
Year State Plan Scheduled Castes Sub Plan Outlay Exp. %age
performance Outlay %age of
SCSP outlay to Annual Plan outlay
Exp. %age performance
1 2 3 4 5 6 7 8 2001-2002 3357.00 2206.14 65.72 472.00 14.06 199.27 42.81
10th Plan (2002-07)
18657.00 13619.42 73.00 2883.60 15.46
1636.44 56.74
2002-2003 2793.00 1768.45 63.32 392.33 14.05 172.39 43.94
2003-2004 2822.00 1587.33 56.25 819.95 29.06
132.30 16.14
2004-2005 3479.80 1960.93 56.35 886.00 25.46 155.21 17.50
2005-2006 3550.00 3754.67 105.77 934.62 26.33 444.52 47.56
2006-2007 4000.00 5751.83 143.80 1154.00 28.85 732.02 63.43
11th Plan (2007-12)
28923.00 - - 8718.00 30.14
- -
2007-2008 5111.00 5023.96 98.30 1330.00 26.02 749.73 56.37
2008-2009 6210.00 6925.00 111.51 1792.00 28.86 1235.87 69.00
2009-2010 8625.00 4974.00 57.66 2488.31 28.85 1316.08 52.98
2010-2011 9150.00 8325.28 91.00 2640.00 28.85
2319.87 87.87
2011-2012 11520.00 7457.45 64.73 3323.52 28.85 2095.04 63.03
12th Plan (2012-17)
92100.00 26570.00 28.85
2012-13 14000.00 9895.71 70.68 4039.00 28.85 2725.65 67.48
2013-14 16125.00 11807.88 73.23 4653.00 28.85 3371.74 72.46
2014-15 20099.83 - - 6432.00 32.00 - -
Strategy for SCSP during 12th Five Year Plan (2012-2017)
2.11 As per Census 2011, Punjab has the highest SC population percentage (31.94%)
in the country as compared to the other States. At present, the size of SCSP is being
determined equivalent to the percentage of SC population in the State, out of the total size
of the State Annual Plan , after quantifying the SCSP component out of the plan schemes
included in the State Annual Plan in consultation with the concerned Administrative
Departments.
2.12 While determining the SCSP outlay under various schemes, the following
factors/criterion have been taken into account :-

24
Earmarking of outlay for indivisible sectors, (5% or actual) as per guidelines of the Planning Commission
SC population of the State,
Enrolment of SC students in the Educational Institutes,
Reservation policy in Admissions/Services,
SC dominated villages having 40% or more SC population and
Actual flow of beneficiaries under the beneficiary oriented schemes etc.
Agricultural land holding owned by Scheduled Castes.
2.13 From the Year 2014-15, efforts shall be made to implement the SCSP as per the
above criterion and decision of the CMM dated 20.01.2014, to the extent possible. Efforts
shall also be made to further rationalize the SCSP schemes as per the requirement in the
near future and also to reduce the notional allocation, to formulate the new schemes and
restructure the existing schemes as per the felt needs of SC people in consultation with
the implementing departments to the extent possible.
Scheduled Castes Sub Plan 2014-15
2.14 The size of SCSP for 2014-15 has been pegged at Rs. 6432.00 Crore which is
32.00% of the total State Plan outlay of Rs. 20099.83 Crore for 2014-15 indicating 38%
increase over the SCSP size for 2013-14. The programme wise break up of allocation
for 12th Five Year Plan (2012-17), 2013-14 and 2014-15 is given below:-
(Rs. in Crore) Sr.No
Programme 12th Plan SCSP
Outlay
SCSP 2013-14 SCSP 2014-15 Approved
outlay Approved
outlay Expenditure
1 2 3 4 5 6 1 Health, Housing &
Environmental improvement and other community development Programme.
17726.90 3365.12 2438.44 4445.92
2 Social Security Programme 2663.43 554.84 401.91 514.73 3 Education, Training and Skill
Development Programme 4917.96 640.33 463.95 916.54
4 Economic Development Programme
1261.71 92.71 67.44 554.81
Total 26570.00 4653.00 3371.74 6432.00
2.15 The detail of budgeted, non-budgeted outlay and expenditure for SCSP
2013-14 and 2014-15 is given in the table on the next page.

25
Detail regarding budgeted and non budgeted outlay of State Annual Plan vis-à-vis SCSP 2013-14 and 2014-15
(Rs. in Crore) Sr. No. Item 2013-14 2014-15
Annual Plan Outlay
%age to Annual Plan Outlay
SCSP Outlay
%age to SCSP Outlay
Annual Plan Outlay
%age to Annual Plan Outlay
SCSP Outlay
%age to SCSP Outlay
1 2 3 4 5 6 7 8 9 10
16122.78 - 4653.00 - 20099.83 - 6432.00 -
I Budgeted Outlay 8338.78 51.72 2515.71 54.07 12584.23 62.60 3982.50 61.92
II Non-budgeted Outlay out of Annual Plan. (Extra Budgetary Resources)
7784.00 48.28 2137.29 45.93 7515.60 37.40 2449.50 38.08
a) Agriculture Marketing Board
243.00 1.51 75.33 1.62 243.00 1.21 97.20 1.51
b) R.D.F 900.00 5.58 279.00 6.00 900.00 4.48 360.00 5.60
c) Power 3209.00 19.90 927.41 19.93 3209.00 15.97 1000.29 15.55
d) PIDB 1600.00 9.92 400.00 8.60 1600.00 7.96 512.00 7.96
e) PUDA 309.00 1.92 61.80 1.33 309.00 1.54 70.16 1.09
f) GMADA 340.00 2.11 68.00 1.46 340.00 1.69 77.18 1.20
g) GLADA 0.00 0.00 0.00 0.00 0.00 0.00 0.00 0.00
h) Rural local Bodies 500.00 3.10 155.00 3.33 500.00 2.49 200.00 3.11
i) Urban Local Bodies 683.00 4.24 170.75 3.66 414.00 2.06 132.67 2.06

26
2.16 During 2014-15, out of SCSP allocation of Rs. 6432.00 crore, the funds
amounting to Rs. 2225.76 Crore are likely to be spent as Centre Share under various
Centrally Sponsored Schemes including the Special Central Assistance of Rs 24.62 crore.
Accordingly, total expenditure of Rs. 6456.62 Crore is likely to be incurred under SCSP
during 2014-15 including Rs.154.98 Crore to assist 129526 Scheduled Caste families
under Point No. 11(i) of 20 Point Programme.

27
CHAPTER III
SPECIAL CENTRAL ASSISTANCE (SCA) PROGRAMME
Concept
The Ministry of Social Justice and Empowerment, Government of India had
launched a Central Sector Scheme “Special Central Assistance (SCA) to Scheduled
Castes Sub Plan (SCSP)” in the year 1979-80. Special Central Assistance is an additive
to the Scheduled Castes Sub Plan (SCSP) of the State and is not linked to any particular
programme or scheme. Under this programme, a lumpsum amount is released to the
States and formulation of schemes and schematic allocation is done by the States at their
own level keeping in view the guidelines of Govt. of India. The only condition with
regard to SCA is that it should be spent on the programmes/schemes for the economic
development of BPL SC families to enable them to cross the poverty line. It is not
possible to make any discernible impact on the conditions of the SCs particularly in the
rural areas as economic development has been recognized as a core solution of the
problems of SCs. SCA should be used in an integrated, optimal and cost effective manner
in conjunction with the flow of outlays/ benefits from various sources of the State or to be
in conjunction with the Scheduled Castes Sub Plan of the State mainly for income
generating schemes for SCs living below the poverty line.
Criteria for allocation of SCA to the States
3.2 The criteria for allocation of Special Central Assistance to the States by Govt. of
India is as under : -
i) On the basis of SC population of the State 40% ii) On the basis of Relative backwardness of the State
(Inverse of State’s per capita domestic product) 10%
iii) On the basis of the percentage of SC families in the State covered by the composite economic development programmes in the Plan to enable them to cross the poverty line.
25%
iv) On the basis of Scheduled Castes Sub Plan to the Annual Plan as compared to the SC population percentage in the State.
25%

28
3.3 Thus, 40% of SCA is distributed on the basis of SC population, 10% on the basis
of relative backwardness and 50% on the basis of effort-based criteria. Out of the total
SCA released to the States, 10% can be utilized for infrastructure development
programmes in the villages having 50% or more SC population, 15% on viable income
generating economic development schemes for SC women, 5% on schemes exclusively
meant for the economic development of disabled persons among the Scheduled Castes,
10% on the skill development training schemes/programmes and 3% for supervision,
monitoring and evaluation of economic development schemes implemented with the
support of SCA funds.
3.4 The detailed guidelines issued by the Ministry of Social Justice and
Empowerment from time to time regarding utilisation of Special Central Assistance are at
Annexure-X.
3.5 The details of SCA received from GOI and utilised by the State Govt. since
Five Year Plan is given in the following table :-
( Rs. in lac) Year Opening
balance SCA released by GOI
Total SCA available (Col. 2+Col. 3)
SCA utilized (out of Col 4)
Unspent balance (Col.4-Col.5)
Physical achievement (Beneficiaries) (against Col. 5)
1 2 3 4 5 6 7 10th Five Year Plan (2002-07)
2002-03 3074.72 - 3074.72 1289.85 1784.87 18,353 2003-04 1784.87 680.03 2464.90 380.28 2084.62 3,369 2004-05 2084.62 - 2084.62 112.56 1972.06 9,127 2005-06 1972.06 - 1972.06 659.16 1312.90 6,435 2006-07 1312.90 864.83 2177.73 848.81 1328.92 8,250
11th Five Year Plan (2007-12) 2007-08 1328.92 375.85 1704.77 1003.25 701.52 12,006 2008-09 701.52 1004.07 1705.59 717.62 987.97 6,996 2009-10 987.97 1075.88 2063.85 555.67 1508.18 5688 2010-11 1508.18 1362.33 2870.51 1057.13 1813.38 11273 2011-12 1813.38 - 1813.38 473.36 1340.02 7075 12th Five Year Plan (2012-17) 2012-13 1340.02 - 1340.02 425.41 914.61 10416 2013-14 914.61 - 914.61 440.48 474.13 7841
3.6 The Ministry of Social Justice and Empowerment, GOI has earmarked Rs. 52.00
Crore as notional allocation for the State of Punjab for the year 2014-15. State Govt. in

29
anticipation of receipt of SCA from the Ministry of Social Justice and Empowerment has
prepared an action plan of Rs. 24.62 Crore for the year 2014-15 to cover 32090
beneficiaries. This allocation will be revised during the course of the year according to
the funds released by the Ministry. The department wise and scheme wise detail
regarding financial and physical achievements during 2012-13 and 2013-14 and proposed
financial and physical targets for 2014-15 is given in the Statement VIII, Statement IX &
X, respectively.
Department-wise write up of schemes to be implemented under SCA Programme during 2014-15
I. WELFARE OF SCHEDULED CASTES
SCA(SC)-1 Setting up of institutes for training in typing & stenography to below poverty line SCs
Approved Outlay-Rs.114.92 Lac
3.7 Under the Scheme, training in Stenography (Punjabi and English) is being
imparted at Stenography Institute at SAS Nagar, (Seating capacity 80) to the unemployed
below the poverty line SC graduates. Two more training institutes at Firozeur and
Patiala were set up in the year 1999 and one training institute at Amritsar in 2002 on the
pattern of SAS Nagar Institute. The sanctioned seats in the training institutes set up at
Firozeur, Patiala and Amritsar is 50 seats each (25 English and 25 Punjabi). These
training Institutes provide shorthand and typing training (Punjabi and English language)
to the unemployed BPL SC graduates. These institutes have also been equipped with the
facility of computers. The duration of the training is one year. In addition, free coaching
and stipend @ Rs. 750 per month is paid to each trainee during the training.
An amount of Rs.78.27 lac has been spent to train 144 SC beneficiaries during
2013-14. An allocation of Rs.114.92 lac has been earmarked for the year 2014-15 to
provide training to 180 beneficiaries under the scheme.

30
SCA(SC)-2 Training of unemployed scheduled castes as driver of light/heavy vehicles
Approved Outlay-Rs.50.00 Lac
3.8 The scheme envisages to provide training to the below poverty line SC
persons for driving light/heavy vehicles with a view to provide them employment/self
employment. The training is imparted in the State run Industrial Training Institutes (ITIs).
Duration of the training is one year and during this period, trainees are provided stipend
@ Rs. 1000 per month. Besides, other expenses relating to training such as Instructor’s
salary, machinery & equipment, repair and maintenance, miscellaneous expenses etc., are
charged from this scheme. After the completion of training, trainees would be awarded a
National Trade Certificate from NCVT or State Trade Certificate from SCVT after they
are tested in All India Trade or State Trade Test. The scheme could not be implemented
during 2013-14 due to non receipt of SCA funds from Govt. of India. An allocation of
Rs.50.00 lac has been earmarked for the year 2014-15 to provide training to 150
beneficiaries under the scheme.
SCA(SC)-3 Providing of equipment /raw material in 24 Training-cum- Production Centres of Welfare Department
Approved Outlay-Rs.20.00 Lac
3.9 The objective of the scheme is to train SC widows/women and girls living
below the poverty line in technical trades so as to enable them to supplement their family
income. 24 Training–Cum-Production Centres of different trades i.e. Readymade
garments-10, Handloom-5, Canning-3, Plastic goods-1, Leather goods-4, Carpet making-
1 are sanctioned and at present only 13 centres are functioning in the State. 25 trainees
are trained in each training centre every year. Funds are provided for the supply of raw
material, maintenance of machines and purchase of furniture etc. Duration of the training
is one year. After completion of training, training will be provided a sewing machine so
that they can adopt self employment. The items prepared by the trainees during the
training are sold in the market at 10% profit by holding exhibitions on different

31
occasions. The profit money is used as revolving fund for purchase of raw material of the
concerned trade. After completion of training, trainees are also provided assistance to
take up self-employment in the respective trades. After completion of one batch, the
training centres are shifted to other villages preferably SC dominated villages having
40% or more SC population. The concerned village panchayat provides rent free building
and also pays the electricity and water charges of the centre running in the village.
3.10 The scheme could not be implemented during 2013-14 due to non receipt
of SCA funds from Govt. of India. An allocation of Rs.20.00 lac has been earmarked for
the year 2014-15 to cover 200 trainees under the scheme.
SCA(SC)-4 Strengthening of 108 Community Centres-providing equipment and raw material
Approved Outlay-Rs.55.00 Lac
3.11 The Scheme is being implemented on the non-plan side. Under the
scheme, one year training in cutting, tailoring and embroidery is provided to the below
poverty line women/girls to enable them to be self employed/self dependent,
economically. The expenditure on the staff is met from the non-plan budget. Funds
required for of raw material, repair and maintenance of machinery etc. are provided under
the scheme to strengthen the existing 108 Community Centres opened in the State.
However, due to lack of required staff, at present, only 45 centres are working and 63
centres have been closed.
3.12 The scheme aims at to remove the stigma of untouchability and to bring
about change in the living standard of the SC women/girls. In each centre 20 BPL SC
women/girls are trained every year. During the training, a stipend of Rs. 500/- P.M. per
trainee is paid. The items prepared by the trainees during the training are sold in the
market at 10% profit by holding exhibitions on different occasions. The profit money is
used as revolving fund for purchase of raw material for the concerned trade. After
completion of one batch, the training centres are shifted to other villages preferable SC
dominated villages having 40% or more SC population. The concerned village panchayat
provides rent free building and also pays the electricity and water charges of the centre
running in the village.

32
3.13 The scheme could not be implemented during 2013-14 due to non receipt
of SCA funds from Govt. of India. An allocation of Rs.55.00 lac has been earmarked for
the year 2014-15 to pay stipend to 760 trainees under the scheme.
SCA(SC)-10 Creation of infrastructure facilities in the Villages having 50% or more SC population
Approved Outlay-Rs.250.00 Lac
3.14 As per the guidelines of the Ministry of Social Justice and
Empowerment, Govt. of India, 10% of the total SCA released to the States can be
utilized on creating infrastructure in the villages having 50% or more SC population.
Under the scheme, infrastructure facilities such as pucca streets, drinking water, drainage,
streets lights, community centres, toilets etc. in the villages having 50% or more SC
population of the State can be provided.
3.15 During 2013-14, the scheme could not be implemented due to non receipt
of SCA funds from Government of India. An allocation of Rs.250.00 lac has been
earmarked for the year 2013-14 to provide basic infrastructure facilities to 2500 families
under the scheme.
SCA(SC)-12 Capital Subsidy to PSCFC under bank tie-up loaning programme
Approved Outlay-Rs 800.00 Lac
3.16 Under this scheme, loan through commercial banks is provided to the SC
families living below the poverty line for self-employment / ventures. Capital Subsidy @
50% of the loan amount subject to the maximum of Rs.10,000 is provided out of SCA.
3.17 An amount of Rs.100.00 lac has been spent during 2013-14 to provide
subsidy to 1000 BPL SC families. An allocation of Rs. 800.00 lac has been earmarked
under the scheme for the year 2014-15 to cover 8000 beneficiaries.

33
II. SCHEDULED CASTES SUB PLAN
SCA(SCSP)-1 Formulation / Implementation/ Monitoring and Review of SCSP
Approved Outlay-Rs 15.00 Lac
3.18 The Directorate of Scheduled Castes Sub Plan was set up by the State
Govt. in the year 1994 for formulation/implementation/monitoring and review of SCSP
in an effective manner. This Directorate is maintaining the data base of Scheduled Castes
in Punjab. For this purpose, a Computer Centre has been set up in the Directorate. The
Department is also developing the independent Website for the Welfare Department and
the complete data base will be uploaded on it. Besides, study tours/training of the
officers of the Directorate are proposed to be organized with the objective to update their
knowledge and skill in the field of economic planning. An amount of Rs. 8.20 lac has
been spent during 2013-14. An amount of Rs. 16.00 lac has been earmarked for this
scheme for the year 2014-15 as per the following details:-
(Rs. lac) (i) Computerisation of Directorate of SCSP 15.00
(ii) Strengthening of Data Base, Study Tours, Training etc. 1.00
Total: 16.00
SCA(SCSP)-2 Implementation of SCA Programmes at the District Level- Placing of funds at the disposal of District Rural Development Agencies (DRDAs) Approved Outlay- Rs 610.00 Lac
3.19 It has been observed that the development programmes being
implemented for the below poverty line Scheduled Castes in the districts tend to get
slow down either because a particular input is not available under the approved schemes
or certain sanctions/formalities take a long time due to procedural constraints and the
matter is referred to the State Headquarters for final approvals. These programmes have
also suffered due to non-availability of funds. The SCA funds are provided to the District
Rural Development Agencies(DRDAs) on adhoc basis keeping in view the performance
of the district(s) and the genuine proposals. DRDAs formulate the schemes for the
economic development of below poverty line scheduled Castes with reference to their

34
occupational pattern which increases productivity and income from their limited
resources. DRDAs send these proposals to the Directorate of Scheduled Castes Sub Plan
for approval and this Directorate after according the necessary approval releases the
funds to the concerned district authorities after getting the sanction and drawing the funds
from the Finance Department and the treasury respectively.
3.20 An amount of Rs. 177.13 lac has been spent during 2013-14 to assist 5117
beneficiaries. An allocation of Rs.610.00 lac has been earmarked for the year 2014-15 to
cover 6100 beneficiaries under the scheme.
SCA(SCSP)-3 Survey/ Evaluation of SCA Schemes
Approved Outlay-Rs 2.70 Lac
3.21 The Ministry of Social Justice and Empowerment, Govt. of India intends
that a survey should be regularly conducted to ascertain the number of families who have
crossed the poverty line after availing the benefits of financial assistance under the SCA
programme.
3.22 As per the requirement of Govt. of India, the work regarding evaluation of
schemes implemented during 10th Five Year Plan period (2002-2007) was assigned to
‘Mahatama Gandhi State Institute of Public Administration, Punjab’. The evaluation
report submitted by the Institute has been further submitted to Govt. of India after the
required amendments. For this purpose, Rs.5.40 lac were to be paid to the Institute. Half
of the amount i.e. Rs. 2.70 lac has already been paid to the Institute during 2010-11
while the remaining amount (2.70 lac) could not be paid due to non release of funds by
the State Finance Department during 2011-12, 2012-13 and 2013-14. The pending
liability of Rs. 2.70 lac will be paid to the Institute during 2014-15.
SCA(SCSP)-4 Setting up of a Monitoring Cell in the Directorate of SCSP for the purpose of surveys/studies and evaluation
Approved Outlay-Rs 30.00 Lac
3.23 As per the guidelines of Ministry of Social Justice and Empowerment,
Govt. of India with regard to implementation of SCA programme, 3% of the total SCA
funds received from Govt. of India can be utilized on staff and infrastructure for proper

35
monitoring of SCA schemes. To know the impact of the Special Central Assistance
Programme, the Ministry of Social Justice and Empowerment, Govt. of India seeks the
information about the number of beneficiaries who have crossed the poverty line after
availing the benefit of SCA every year. To meet the requirement of the Ministry on year
to year basis, a Monitoring Cell was established in the Directorate of Scheduled Castes
Sub Plan during 2010-11. The evaluation reports prepared by this cell for the SCA
schemes implemented during 2007-08, 2008-09 and 2009-10 have already been sent to
the Ministry of Social Justice and Empowerment, Govt of India. The evaluation of the
schemes implemented during 2010-11 is at the final stage and the report in this regard
will be submitted to GOI, shortly. During 2013-14, an amount of Rs. 12.21 lac has been
spent. During 2014-15, the Monitoring Cell will evaluate the schemes implemented
during 2011-12 and for this purpose, an amount of Rs. 30,00 lac has been earmarked.
III. ANIMAL HUSBANDRY
SCA(AH)-1 Scheme for female buffalo calf rearing
Approved Outlay-Rs 50.00 Lac
3.24 The objective of the scheme is to improve the economic status of the
BPL Scheduled Caste landless labourers involved in the Animal Husbandry practices by
providing them young buffalo female calve (5-6 months old) for rearing. When these
calves are fully developed, the beneficiaries can sell them in the market or can keep the
same for milk production. This would help them to generate additional family income to
cross the poverty line. The calve will be selected from the dairy farms around the cities
where buffalo of superior genetical potential are available in abundance.
3.25 Under the scheme, each beneficiary will be given 3 female buffalo calves.
De-worming of these calves will be done by the Animal Husbandry Department free of
cost. The total cost of a unit of 3 female buffalo calve would be Rs.10000/- (maximum)
which includes the insurance of the calve. An expenditure of Rs.4.50 lac has been
incurred during 2013-14 to provide calves to 45 beneficiaries. An allocation of Rs. 50.00

36
lac has been earmarked to provide calves to 500 BPL SC families under the scheme
during 2014-15 .
SCA(AH)-2 Setting up of Goat/Sheep rearing units
Approved Outlay-Rs 20.00 Lac
3.26 Under the scheme, each identified family will be provided a unit of five
goats. A subsidy @ 50% of total cost of the unit subject to a maximum limit of
Rs.10,000/- will be provided to each BPL SC family. Deworming of the goats would be
done by the Animal Husbandry Department free of cost. The scheme could not be
implemented during 2013-14 due to non receipt of SCA funds from Govt. of India. An
allocation of Rs.20.00 lac has been earmarked under the scheme during 2014-15 to
establish 200 goat rearing units.
SCA(AH)-4 Establishment of Turkey units for BPL SCs
Approved Outlay-Rs 9.00 Lac
3.27 Poultry sector provides nutritional security, self-employment and
subsidiary income especially to the rural poor. The department has proposed to provide
financial assistance as well as technical guidance to the BPL SC people interested in
taking up the turkey rearing occupations. The scheme envisage to provide 10 turkey
poults (unsexed) of 6-8 weeks at a total cost of Rs. 1600/- to the selected BPL SC
families. Besides, each family will be provided a sum of Rs. 2000/- for construction of
Shed (8’X8’) and for feed etc. Thus, the total cost of a turkey unit is approximately
Rs.3600/-.
3.28 The scheme could not be implemented during 2013-14 due to non receipt
of SCA funds from Govt. of India. An allocation of Rs. 9.00 lac has been earmarked for
the year 2014-15 to set up 250 Turkey units under the scheme.
SCA(AH)-5 Setting up of Backyard Poultry Units for BPL SCs
Approved Outlay-Rs 20.00 Lac
3.29 The scheme has a dual purpose to produce organic eggs and poultry meat
with the aim to enhance the income of BPL SC families. Under this scheme, Rs. 600/-

37
will be provided to the BPL SC family to purchase 20 chicks of low input technology @
Rs.30 per chick. Also Rs. 1400/- will be provided to the family for preparing shed and
purchasing feed and other required inputs. Thus, the total cost of the unit will be
approximately Rs. 2000/-.The beneficiaries will be able to sell eggs and chicken to
enhance their income. Apart from it, they will also utilize the poultry products at their
home. The scheme could not be implemented during 2013-14 due to non receipt of SCA
funds from Govt. of India. An allocation of Rs. 20.00 lac has been earmarked for the
year 2014-15 to cover 200 families.
SCA(AH)-6 Supply of Hand Driven Chaff Cutter (Toka Machine) to landless/marginal Scheduled Castes families
Approved Outlay-Rs 6.00 Lac
3.30 This scheme was introduced during 2013-14 on trial basis. The
objective of the scheme is to facilitate the landless and marginal below poverty line
Scheduled Caste families by providing them a hand driven chaff cutter at their door step
so that they can feed their milch animals properly and easily.
3.31 The landless agriculture labourers and marginal SC farmers who keep with
them milch animals and other livestock for their domestic need collect the green fodder
from the fields but have no fodder cutter of their own. They have to go to the land
owners/large farmers for cutting their fodder. Under this scheme, each beneficiary will be
given a good quality hand driven chaff cutter at a cost of Rs.6000/-. The scheme could
not be implemented during 2013-14 due to non release of funds by the State Finance
Department. During 2014-15, a budget provision of Rs. 6.00 lac has been made under the
scheme to provide Chaff cutters to 100 BPL SC families.
SCA(AH)-8 Providing insurance cover to milch animals reared by Scheduled Castes families. (New Scheme)
Approved Outlay-Rs 100.00 Lac
3.32 In order to encourage SC families for milk production, the concept of
livestock insurance has been initiated for the purpose of compensation in case of death of

38
the milch animal due to deadly disease. At present, Animal Husbandry Department is
implementing insurance scheme for the general public under which a milch animal is
insured at a premium of Rs. 2000/- per animal. Out of this premium, Animal Husbandry
Department pays Rs. 1000/- while the remaining amount of Rs. 1000/- is charged from
the cattle owner. Under this scheme, it is proposed to pay the beneficiary share out of
SCA in case of BPL SC families.
3.33 During 2014-15, an amount of Rs. 100 lac has been earmarked to provide
insurance cover to 10,000 milch animals owned by BPL SC families.
IV. HORTICULTURE
SCA(H)-1 Subsidy for Sericulture
Approved Outlay-Rs. 18.75 Lac
3.34 This scheme was initiated in the year 1996-97 for the development of
sericulture in the State. The scheme is proposed to be implemented in semi-hill areas of
the State because the climate and environment is most favourable for sericulture in this
area. Under the scheme, out of the total unit cost of Rs. 15000/- for the construction of a
rearing house of 15x12 size, 75% of the cost subject to maximum limit of Rs.10,000/- is
provided as subsidy out of SCA and the remaining amount is contributed by the
beneficiary. The scheme could not be implemented during 2013-14 due to non receipt of
SCA funds from Govt. of India. An allocation of Rs.18.75 lac has been earmarked for
the year 2014-15 to provide benefit to 187 BPL SC families in Ropar, Shaheed Bhagat
Singh Nagar, Gurdaspur and Hoshiarpur districts under the scheme.
V. INDUSTRIES (PUNJAB INFOTECH)
SCA(INFO)-1 Computer Training to 10th & 12th pass BPL SC boys/girls through CAL-C
Approved Outlay-Rs 220.00 Lac
3.35 Punjab Information and Communication Technology Corporation
Limited (Punjab Infotech) is a State Government undertaking which imparts computer
education in the Centre for Advance Learning in Computers (CAL-C). These are
authorized training centres by the State Govt. At present, there are about 80 training

39
centres running through-out the State. These training centres are well equipped with
required staff and infrastructure of the latest technology.
3.36 This scheme was included during 2012-13. Punjab Infotech is providing
training to the SC BPL youth in two modules. First module is One Year (two semesters)
Certificate Course in Computer Application for 10th pass candidates. In the first semester,
training will be imparted in fundamentals, MS-Office, PC Maintenance and Internet
Browsing. The Second semester includes training in MS Access, Computer Programming
using C++, Computer Network and Communication Skills. Second Module includes One
year (two semesters) Diploma in Computer Application for 12th pass candidates. In the
first semester, training will be imparted in Computer Fundamentals and Operating
System, MS-Office, DTP and Communication Skills & Soft Skills. In the second
semester, training will be imparted in Computerized Accounting (Tally), Computer
Programming using C++, PC maintenance, Troubleshooting and Project Work. After
successful training, each candidate will be given a certificate by Punjab Infotech which
will help them to get a job or start their own venture.
3.37 An amount of Rs. 45.45 lac has been spent during 2013-14 and 480 candidates
have been imparted training. 1000 candidates are also being imparted training with Rs.
100.00 lac released to Punjab Infotech at the end of financial year 2013-14. An
allocation of Rs. 220.00 lac has been earmarked to impart training to 2200 candidates in
all the districts of the State during 2014-15 under this scheme.
VI. FISHERIES
SCA(FH)-1 To encourage SC BPL families to adopt Pisiculture
Approved Outlay-Rs 50.00 Lac
3.38 This scheme was introduced for the first time under the Special Central
Assistance programme during 2013-14 on trial basis. The objective of the scheme is to
engage the BPL SC people with the commercial activities like Pisiculture .
3.39 Under this scheme, the BPL SC families interested in Pisiculture will be
covered. In the first phase, they will be provided basic training in Pisiculture. The
beneficiary will be given technical guidance by the department as and when required

40
through out the year. The scheme will be implemented with the existing staff of the
department.
3.40 The scheme could not be implemented during 2013-14 due to non receipt
of funds from Govt. of India. A budget provision of Rs. 50.00 lac has been made during
2014-15 under the scheme to assist 500 beneficiaries at the first instance.
SCA(FH)-2 Providing fishing nets to SC fish farmers/fish sellers (New Scheme)
Approved Outlay-Rs 20.00 Lac 3.41 Under this scheme, fishing nets will be provided to the BPL SC fish
farmers and fish sellers so that they may enhance their family income by selling fish in
the market. Total cost of the fishing net is Rs. 18,700/- out of which Rs. 10,000/- will be
given as subsidy while the remaining amount will be contributed by the beneficiary.
During 2014-15 an amount of Rs. 20.00 lac has been earmarked to provide
subsidy to 200 fish farmers/sellers.

41
CHAPTER – IV
20 POINT PROGRAMME
(SC Families Assisted)
The 20 Point Programme (TPP) was launched by the Government of India
in the year 1975. The programme was first revised in 1982 and again in 1986. It was
further restructured in 2006, keeping in view the challenges of the 21st Century with
particular reference to the ongoing process of economic reforms, liberalization and
globalization of the Indian Economy. The programmes /schemes under the TPP-2006 are
in harmony with the priorities contained in the National Common Minimum Programme
(NCMP). The thrust of TPP-2006 is towards programmes for eradicating poverty and
improving the quality of life of the poor and the under-privileged people all over the
country. The programme covers various socio economic aspects like poverty,
employment, education, housing, health, agriculture, land reforms, irrigation, drinking
water, protection and empowerment of weaker sections, consumer protection,
environment, e-governance, etc. This programme is being monitored by the Ministry of
Statistics and Programme Implementation, Government of India on the basis of
performance report received from the State Governments/UTs and Central Nodal
Ministries.
4.2 The 20 Points further comprises 65 monitorable items which are
synonymous with the programmes/schemes being administered by various
Ministries/Departments of the Government of India and implemented by the State
Governments and UTs. The monitoring mechanism became operational w.e.f. April.
2007. The point No. 10 of this programme relates to ‘Welfare of Scheduled Castes,
Scheduled Tribes, Minorities and OBCs’. This point consists of 10 items from item No.
33 to item No. 42. The item No. 33 relates to “SC Families Assisted” and is monitored
on monthly basis. The Ministry of Social Justice and Empowerment, Government of India
is the concerned Administrative/Nodal Ministry for this item.

42
4.3 The Ministry of Statistics and Programme Implementation, Government of
India in consultation with the nodal Ministry modified the scope of the item No. 33 from
the year 2012-13. Under the modified scope, the targets for item No.33 relate to the
following two sub-parameters:-
Sub-parameter (i)
SC students benefitted under the Post Matric Scholarship Scheme.
Sub-parameter (ii)
SC families assisted for income generating activities under:-
(a) Special Central Assistance (SCA) to Scheduled Castes Sub Plan (SCSP)
(b) Concessional loan scheme of National Scheduled Castes Finance and Development Corporation (NSFDC)
4.4 In Punjab State, the Directorate of Scheduled Castes Sub Plan, Welfare
Department is the nodal department for reporting monthly progress w.r.t. item No. 33-SC
Families Assisted. For the year 2013-14, initially, the State Government had fixed
physical targets of 1,84,580 SC families under the programme, but later on Government
of India conveyed state-wise targets under the programme, under which the physical
targets for item No.33 for the Punjab State were fixed as 1,27,774 SC families. The sub-
parameter wise detail of these targets alongwith achievements during the year 2013-14 is
given as below:-
Sr.
No.
Sub-Parameter Targets (No. of SC
families assisted)
Achievements (No. of SC
families assisted)
i SC students benefitted under the Post Matric Scholarship Scheme
96,936 3,35,000
ii (a) Special Central Assistance (SCA) to Scheduled Castes Sub Plan (SCSP)
30,838
7,383
ii (b) Concessional loan scheme of National Scheduled Castes Finance and Development Corporation (NSFDC)
Total 1,27,774 3,42,383
4.5 The achievements under the sub-parameter (i) i.e. 345.59% are
considerably more than the allotted targets due to the clearance of backlog of previous
43
years. The achievements under the sub-parameter (ii) i.e. 23.94% are less than the
allotted targets because the Ministry of Social Justice & Empowerment, GoI didn't release
the Special Central Assistance to the Punjab State during the year 2013-14. Also, the
unutilized SCA available with the Finance Department, Punjab out of the SCA released
by GoI during the previous years, was not fully released to the implementing
departments/agencies by the Finance Department, Punjab. The State share against
concessional loan scheme of NSFDC too was not released by the government during the
year 2013-14.
4.6 The sub-parameter wise detail of the targets fixed by the State for the item
No. 33-SC Families assisted under the Point No. 10 of the 20-Point programme for the
year 2014-15, is as given below:-
(2014-15) Sr. No. Sub-Parameter Physical Targets (No.
of SC families assisted)
i SC students benefitted under the Post Matric Scholarship Scheme
96,936
ii (a) Special Central Assistance (SCA) to Scheduled Castes Sub Plan (SCSP)
32,590 ii (b) Concessional loan scheme of National Scheduled Castes Finance and Development Corporation (NSFDC)
Total 1,29,526
4.7 The scheme-wise progress during the years 2012-13, 2013-14 alongwith
targets for the year 2014-15 for item No.33 under the Point No. 10 of the 20-Point
programme is given in the STATEMENT-XI.

44
CHAPTER –V
EMPOWERMENT OF SCHEDULED CASTE WOMEN/GIRLS
Status of women in Punjab
The condition of women varies from State to State across the country. Punjab
State is acknowledged to be one of the States where women’s status is not particularly
low. The State is influenced by the preachings of Gurus and Saints, who had particularly
stressed upon the equality of women and preached against the child marriages, female
foeticide, sati pratha and illiteracy among the women. To empower the Schedule Caste
girls/women in the State, various programmes are being implemented/initiated by the
State Govt. to uplift their educational, social and economic status.
Educational Status
5.2 At present, the State Govt. is implementing various schemes for the upliftment of
educational status of women. Attendance scholarship to SC primary girl students is
provided to encourage them to attend the schools regularly and to minimise the drop-out
rate among them. Other schemes like Pre-matric scholarship, Post-matric scholarship,
Grant to SC students studying in the medical/engineering colleges, Award to SC sports
students, Hostel for SC boys/girls, New courses / Vocational training for SC students,
Attendance scholarship to handicapped girl students in rural area, Mid Day Meal,
Coaching for stenography, etc., are being implemented by the State Govt. Free books
are also provided to SC girl students on the non plan side. With the result, literacy rate
and drop out rate of SC girls have improved considerably. However, the drop out rate
among SC girl as compared to SC boys is still higher upto 5th standard, whereas,
the dropout rate of boys is higher than girls up to 10th standard. The detail is given
below:-
Sex wise SC Population and Literacy Rate in the State
Population- Census 2011 Total Male Female SC Population 88.60 lac 46.40 lac 42.20 lac SC Literacy rate 64.81% 70.66% 58.39%
45
Dropout rate of total (boys and girls) vis-a-vis SCs (boys and girls) in the State of Punjab –2010-11(as on 30-9-2010)
Standard Total SCs Total Boys Girls Total Boys Girls
Upto 5th class (Class I-V) 9.4 4.4 14.9 22.3 21.7 23.0 Upto 8th class (Class I-VIII) 9.2 5.2 13.7 - - - Upto 10th class (Class I-X) 30.5 30.2 30.7 55.7 57.3 54.0
(Source:- Statistics of School Education, 2010-11 Ministry of HRD, GoI-2014 )
Economic Status
5.3 The data regarding the economic status of SC women is not presently available in
the State. However, the major chunk of SC women workers are engaged in agriculture as
labourers and look after their livestock at their home and engaged as household workers.
The State Govt. is implementing the programmes like training in typing/stenography,
stitching, embroidery, fashion designing etc. for the economic development of SC
women. Schemes like National Rural livelihood Mission, National Rural Employment
Guarantee, etc., are also being implemented so that they can take-up self employment
ventures independently. The priority is also given to the SC women under various
beneficiary oriented economic development programmes such as ‘Bank tie up loaning’
programme and placing of funds at the disposal of DRDAs, etc being implemented with
the assistance from the State Government and the Central Government.
Social Security
5.4 In order to inculcate the sense of Social Security among the SC girls/women, the
programmes like Mai Bhago Vidya Scheme, Empowerment of Women (Mahila Jagriti
Yojna), Bebe Nanki Ladli Beti Kalyan Scheme, Shagun to SC girls/women/divorcee and
daughters of widows, Financial assistance to widows and destitute women etc. are being
implemented by the State Government.
5.5 During 12th Five Year Plan (2012-17), an outlay of Rs.4705.07 crore has been
earmarked out of total SCSP size for the socio economic development of SC
women/girls against which an expenditure of Rs. 371.58 crore and 392.89 crore has been
incurred during 2012-13 and 2013-14, respectively. An outlay of Rs. 928.58 crore has

46
been earmarked for this purpose for the year 2014-15. The detail of various schemes for
the Empowerment of SC women/girls proposed to be implemented in the year 2014-15 is
at Statement XII.

47
SCSP at a Glance
11th Five Year SCSP Approved Outlay (2007-2012)
8718.00 Crore
11th Five Year SCSP Actual Outlay (2007-2012)
11574.00 Crore
11th Five Year SCSP Actual Expenditure- (2007-2012)
7085.35 (61.21%)
Crore
12th Five Year SCSP Outlay –(2007-2012)
26570.00 Crore
SCSP -2013-14 Approved Outlay 4653.00 Crore
SCSP 2013-14 Revised Outlay 3929.00
Crore
SCSP 2013-14 Expenditure 3371.74 Crore
SCSP 2014-15
SCSP Size 6432.00 Crore
Budgeted outlay 3982.50 (61.92%)
Crore
Non- Budgeted outlay 2449.50 (38.08%)
Crore
Allocation for schemes exclusively meant for SCs out of budgeted outlay
427.06 Crore
Percentage with Annual Plan outlay 2.12%
Percentage with SCSP outlay 6.64%

48
Women Component 928.58 Crore
Centrally Sponsored Schemes :-
Restructured Schemes
State Share 628.14 Crore
Centre Share 1983.01 Crore
Other than Restructured Schemes
Centre Share 218.11 Crore
Allocation for assisting SC families (BPL+Non -BPL)
180.60 Crore
SC families (BPL+Non BPL) likely to be assisted 1,29,526 Nos.
Allocation for Special Central Assistance 24.62 Crore
BPL SC families likely to be assisted with SCA
32,090 Nos.

PART – II
STATEMENTS

CS SS Total CS SS Total
1 2 3 4 5 6 7 8 9 10 11 12 13 14
A BUDGETARY OUTLAYS
I Agriculture and Allied Activities
259767.19 21314.58 2070.82 4906.18 2850.51 74100.50 29301.50 103402.00 6651.61 1867.64 8519.25 1184.32
II Rural Development 392914.57 180291.39 3093.80 14146.30 4649.55 39763.00 15591.00 55354.00 24943.55 7656.25 32599.80 9872.80
III Irrigation and Flood Control
493564.16 28396.06 1905.89 6981.75 1923.75 64684.75 63692.25 128377.00 3999.00 4631.60 8630.60 8630.60
IV Energy 12665.00 926.97 10.00 114.25 0.00 0.00 4.00 4.00 0.00 0.64 0.64 0.00
V Industry and Minerals 237703.00 1125.00 0.00 200.00 0.00 1500.00 0.00 1500.00 0.00 0.00 0.00 0.00
VI Transport 375993.00 17222.00 1058.00 2499.55 1270.00 37203.00 69801.00 107004.00 1860.15 3300.05 5160.20 5160.20
VII Science, Technology and Environment
46170.75 625.00 50.00 175.00 50.00 5703.00 6903.00 12606.00 0.00 60.00 60.00 0.00
VIII General Economic Services
137097.83 35676.40 6735.18 8377.50 3020.00 27451.00 61414.50 88865.50 5600.32 30924.00 36524.32 8444.00
IX Social Services 2997403.87 1350285.19 115125.69 213037.45 115464.88 411016.79 304221.73 715238.52 171459.58 129699.06 301158.64 90329.80
X General Services 128828.62 3200.00 668.00 1133.00 0.00 23482.14 8336.67 31818.81 1000.00 0.00 1000.00 0.00
XI Other than Restructurred CSS
0.00 0.00 0.00 0.00 0.00 14252.86 0.00 14252.86 4598.00 0.00 4598.00 0.00
Total - A (Budgetary Outlays)
5082107.99 1639062.59 130717.38 251570.98 129228.69 699157.04 559265.65 1258422.69 220112.21 178139.24 398251.45 123621.72
Plan Outlay SCSP Outlay
Approved Outlay
SCSP 2013-14
Approved Outlay
Exp.
12th Plan (2012-17) Projected
Annual Plan 2014-15 SCSP 2014-15Sr. No.
STATEMENT - I
SCHEDULED CASTES SUB PLAN 2014-15Sector-wise Outlay and Expenditure
(` Lac)
Approved Outlay Capital Content out of Col.13
Actual Expenditure
2012-13
Sector/Sub-head
49

CS SS Total CS SS Total
1 2 3 4 5 6 7 8 9 10 11 12 13 14
Plan Outlay SCSP Outlay
Approved Outlay
SCSP 2013-14
Approved Outlay
Exp.
12th Plan (2012-17) Projected
Annual Plan 2014-15 SCSP 2014-15Sr. No.
STATEMENT - I
SCHEDULED CASTES SUB PLAN 2014-15Sector-wise Outlay and Expenditure
(` Lac)
Approved Outlay Capital Content out of Col.13
Actual Expenditure
2012-13
Sector/Sub-head
B IEBR:STATE PUBLICSECTOR ENTERPRISES (PSEs)(excluding BudgetarySupport)
3541696.01 856388.41 109272.22 181154.02 175370.00 0.00 660100.00 660100.00 0.00 211681.35 211681.35 211681.35
C IEBR:LOCAL BODIES (excludingBudgetary Support)
586196.00 161549.00 32575.00 32575.00 32575.00 0.00 91460.00 91460.00 0.00 33267.20 33267.20 33267.20
Grand Total (A+B+C) 9210000.00 2657000.00 272564.60 465300.00 337173.69 699157.04 1310825.65 2009982.69 220112.21 423087.79 643200.00 368570.27
50

(` Lac)
CS SS Total CS SS Total
1 2 3 4 5 6 7 8 9 10 11 12 13 14
A BUDGETARY OUTLAYS
I AGRICULTURE & ALLIED ACTIVITIES
1 Crop Husbandry 141276.00 5359.17 917.04 1265.27 1272.72 67619.50 1908.50 69528.00 5117.69 413.37 5531.06 0.002 Soil & Water Conservation 26635.00 2908.60 641.42 663.70 270.62 2000.00 7055.00 9055.00 100.00 326.25 426.25 0.003 Animal Husbandry 28401.00 6528.00 372.36 1952.83 1225.36 3581.00 3028.00 6609.00 1145.92 968.32 2114.24 1184.324 Dairy Development 16000.00 4900.00 140.00 747.00 0.56 900.00 310.00 1210.00 288.00 159.70 447.70 0.005 Fisheries 4125.75 411.70 0.00 102.38 0.00 0.00 0.00 0.00 0.00 0.00 0.00 0.006 Agriculture Research and
Education30000.00 0.00 0.00 0.00 0.00 0.00 17000.00 17000.00 0.00 0.00 0.00 0.00
7 Agriculture Financial Institutions
500.00 0.00 0.00 0.00 0.00 0.00 0.00 0.00 0.00 0.00 0.00 0.00
8 Cooperation 12829.44 1207.11 0.00 175.00 81.25 0.00 0.00 0.00 0.00 0.00 0.00 0.009 Food Processing 0.00 0.00 0.00 0.00 0.00 0.00 0.00 0.00 0.00 0.00 0.00 0.00
Total- I 259767.19 21314.58 2070.82 4906.18 2850.51 74100.50 29301.50 103402.00 6651.61 1867.64 8519.25 1184.32II RURAL DEVELOPMENT
1 Special Programme for Rural Development
143144.17 59707.29 608.19 913.20 243.00 8175.00 1135.00 9310.00 2673.15 367.25 3040.40 838.40
2 Rural Employment 73700.00 58960.00 1627.21 4400.00 1805.00 25588.00 3280.00 28868.00 20470.40 2624.00 23094.40 3294.403 Other Rural Development
Programmes173570.40 60874.10 813.40 8668.10 2601.55 6000.00 10626.00 16626.00 1800.00 4445.00 6245.00 5520.00
4 NRI Affairs 2500.00 750.00 45.00 165.00 0.00 0.00 550.00 550.00 0.00 220.00 220.00 220.00Total-II 392914.57 180291.39 3093.80 14146.30 4649.55 39763.00 15591.00 55354.00 24943.55 7656.25 32599.80 9872.80
III IRRIGATION AND FLOOD CONTROL
1 Major & Medium Irrigation 218249.03 8864.90 354.09 2220.25 2.00 29119.75 15356.25 44476.00 1305.00 918.80 2223.80 2223.802 Minor Irrigation 94586.60 4604.40 297.45 1046.50 229.65 5000.00 13298.00 18298.00 250.00 559.90 809.90 809.90
12th Plan (2012-17) Projected
Actual Expenditure
2012-13 Approved Outlay Approved Outlay
SCSP 2013-14
Plan Outlay SCSP Outlay
Capital Content out of Col.13
Approved Outlay
Exp.
STATEMENT – II
SCHEDULED CASTES SUB PLAN 2014-15 Sector-wise/Subhead-wise Outlay and Expenditure
Annual Plan 2014-15 SCSP 2014-15Sr. No.
Sector/Sub-head
51
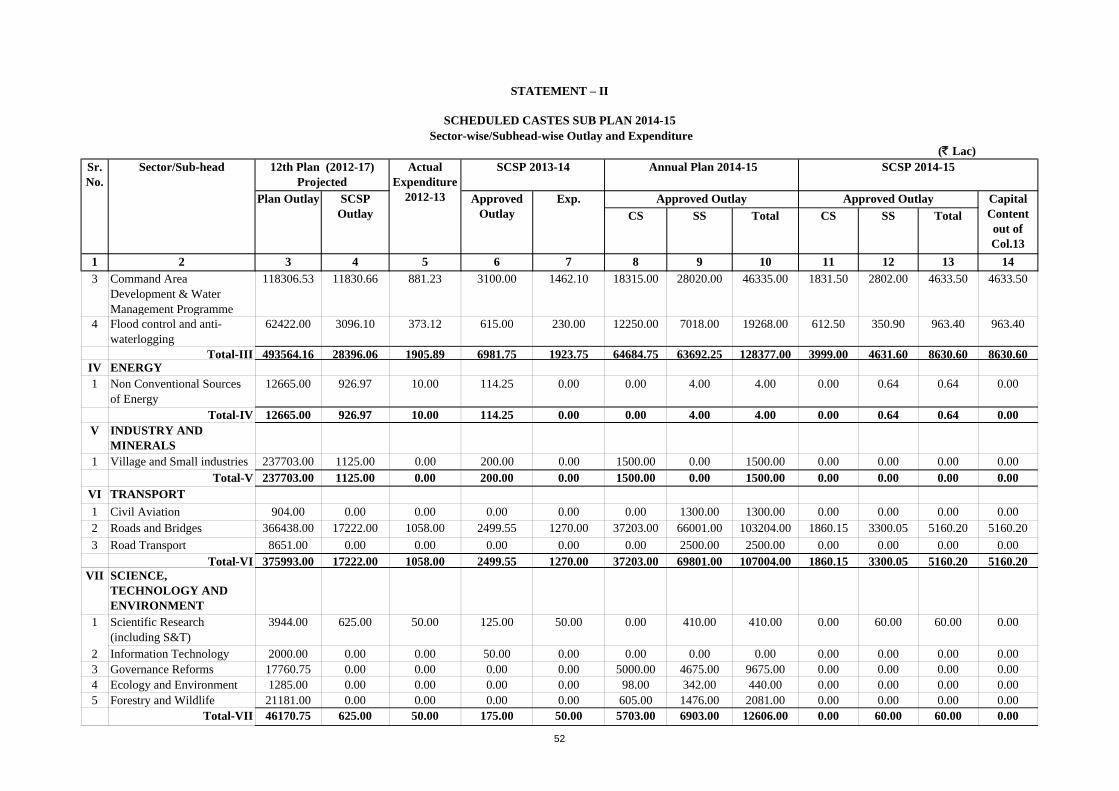
(` Lac)
CS SS Total CS SS Total
1 2 3 4 5 6 7 8 9 10 11 12 13 14
12th Plan (2012-17) Projected
Actual Expenditure
2012-13 Approved Outlay Approved Outlay
SCSP 2013-14
Plan Outlay SCSP Outlay
Capital Content out of Col.13
Approved Outlay
Exp.
STATEMENT – II
SCHEDULED CASTES SUB PLAN 2014-15 Sector-wise/Subhead-wise Outlay and Expenditure
Annual Plan 2014-15 SCSP 2014-15Sr. No.
Sector/Sub-head
3 Command Area Development & Water Management Programme
118306.53 11830.66 881.23 3100.00 1462.10 18315.00 28020.00 46335.00 1831.50 2802.00 4633.50 4633.50
4 Flood control and anti-waterlogging
62422.00 3096.10 373.12 615.00 230.00 12250.00 7018.00 19268.00 612.50 350.90 963.40 963.40
Total-III 493564.16 28396.06 1905.89 6981.75 1923.75 64684.75 63692.25 128377.00 3999.00 4631.60 8630.60 8630.60IV ENERGY1 Non Conventional Sources
of Energy 12665.00 926.97 10.00 114.25 0.00 0.00 4.00 4.00 0.00 0.64 0.64 0.00
Total-IV 12665.00 926.97 10.00 114.25 0.00 0.00 4.00 4.00 0.00 0.64 0.64 0.00V INDUSTRY AND
MINERALS1 Village and Small industries 237703.00 1125.00 0.00 200.00 0.00 1500.00 0.00 1500.00 0.00 0.00 0.00 0.00
Total-V 237703.00 1125.00 0.00 200.00 0.00 1500.00 0.00 1500.00 0.00 0.00 0.00 0.00VI TRANSPORT
1 Civil Aviation 904.00 0.00 0.00 0.00 0.00 0.00 1300.00 1300.00 0.00 0.00 0.00 0.002 Roads and Bridges 366438.00 17222.00 1058.00 2499.55 1270.00 37203.00 66001.00 103204.00 1860.15 3300.05 5160.20 5160.20
3 Road Transport 8651.00 0.00 0.00 0.00 0.00 0.00 2500.00 2500.00 0.00 0.00 0.00 0.00Total-VI 375993.00 17222.00 1058.00 2499.55 1270.00 37203.00 69801.00 107004.00 1860.15 3300.05 5160.20 5160.20
VII SCIENCE, TECHNOLOGY AND ENVIRONMENT
1 Scientific Research (including S&T)
3944.00 625.00 50.00 125.00 50.00 0.00 410.00 410.00 0.00 60.00 60.00 0.00
2 Information Technology 2000.00 0.00 0.00 50.00 0.00 0.00 0.00 0.00 0.00 0.00 0.00 0.003 Governance Reforms 17760.75 0.00 0.00 0.00 0.00 5000.00 4675.00 9675.00 0.00 0.00 0.00 0.004 Ecology and Environment 1285.00 0.00 0.00 0.00 0.00 98.00 342.00 440.00 0.00 0.00 0.00 0.005 Forestry and Wildlife 21181.00 0.00 0.00 0.00 0.00 605.00 1476.00 2081.00 0.00 0.00 0.00 0.00
Total-VII 46170.75 625.00 50.00 175.00 50.00 5703.00 6903.00 12606.00 0.00 60.00 60.00 0.00
52

(` Lac)
CS SS Total CS SS Total
1 2 3 4 5 6 7 8 9 10 11 12 13 14
12th Plan (2012-17) Projected
Actual Expenditure
2012-13 Approved Outlay Approved Outlay
SCSP 2013-14
Plan Outlay SCSP Outlay
Capital Content out of Col.13
Approved Outlay
Exp.
STATEMENT – II
SCHEDULED CASTES SUB PLAN 2014-15 Sector-wise/Subhead-wise Outlay and Expenditure
Annual Plan 2014-15 SCSP 2014-15Sr. No.
Sector/Sub-head
VIII GENERAL ECONOMIC SERVICES
1 Secretariat Economic Services
115945.00 35676.40 6735.18 8377.50 3020.00 17501.00 10916.50 28417.50 5600.32 2924.00 8524.32 8444.00
2 Tourism 17773.85 0.00 0.00 0.00 0.00 6000.00 8497.00 14497.00 0.00 0.00 0.00 0.003 Census Survey and Statistics 1218.98 0.00 0.00 0.00 0.00 950.00 393.00 1343.00 0.00 0.00 0.00 0.004 Civil Supplies 2160.00 0.00 0.00 0.00 0.00 3000.00 41608.00 44608.00 0.00 28000.00 28000.00 0.00
Total-VIII 137097.83 35676.40 6735.18 8377.50 3020.00 27451.00 61414.50 88865.50 5600.32 30924.00 36524.32 8444.00IX SOCIAL SERVICES1 General Education 1001746.27 543724.48 48360.39 66359.87 54648.21 113002.55 74532.72 187535.27 62337.25 33886.53 96223.78 21251.942 Technical Education 26285.00 5155.00 65.00 1052.00 0.00 3710.00 6299.00 10009.00 1187.20 556.48 1743.68 1251.523 Sports and Youth Services 46892.75 5627.25 81.45 1481.45 0.00 1393.25 1924.75 3318.00 312.72 200.56 513.28 0.004 Art and Culture 24185.00 0.00 0.00 0.00 0.00 2500.00 7001.00 9501.00 0.00 0.00 0.00 0.005 Medical and Public Health 264345.85 78667.88 251.19 15187.38 4173.79 62365.28 39812.09 102177.37 19967.24 13165.63 33132.87 4166.856 Water Supply & Sanitation
i) Urban Water Supply 411146.10 102664.50 3168.96 4651.60 617.00 21000.00 12501.00 33501.00 6720.00 4000.00 10720.00 10720.00ii) Rural Water Supply 195975.10 78825.00 10853.13 15645.00 8199.79 12500.00 22500.00 35000.00 5500.00 7396.00 12896.00 12896.00
7 Housing 5700.00 80.00 0.00 0.00 0.00 0.00 1300.00 1300.00 0.00 0.00 0.00 0.008 Urban Development
(including State Capital 197160.00 100821.70 1387.86 21779.20 70.00 77188.26 11104.00 88292.26 24699.25 3573.64 28272.89 26996.89
9 Information and Publicity 9625.00 1130.00 130.05 226.00 267.00 0.00 865.00 865.00 0.00 224.00 224.00 0.0010 Welfare of SCs, BCs &
Minorities139442.30 95329.38 11945.20 25527.00 13755.31 53560.00 27439.17 80999.17 23500.00 19086.00 42586.00 9538.00
11 Social Security & Welfare 490050.00 233877.50 34036.05 41855.50 32156.11 16982.25 70333.00 87315.25 8485.42 34857.77 43343.19 155.0012 Nutrition 137500.00 94650.00 4802.10 17605.00 1313.75 45815.20 19403.00 65218.20 18500.50 11083.15 29583.65 1960.0013 Labour & Labour Welfare
i) Labour 642.50 300.00 0.00 65.00 0.00 0.00 0.00 0.00 0.00 0.00 0.00 0.00ii) Employment Generation 7370.00 1617.50 0.00 432.50 174.00 1000.00 1375.00 2375.00 250.00 188.75 438.75 0.00iii) Industrial Training 31468.00 7277.50 25.56 1024.95 31.92 0.00 4461.00 4461.00 0.00 1441.05 1441.05 1393.60
53

(` Lac)
CS SS Total CS SS Total
1 2 3 4 5 6 7 8 9 10 11 12 13 14
12th Plan (2012-17) Projected
Actual Expenditure
2012-13 Approved Outlay Approved Outlay
SCSP 2013-14
Plan Outlay SCSP Outlay
Capital Content out of Col.13
Approved Outlay
Exp.
STATEMENT – II
SCHEDULED CASTES SUB PLAN 2014-15 Sector-wise/Subhead-wise Outlay and Expenditure
Annual Plan 2014-15 SCSP 2014-15Sr. No.
Sector/Sub-head
14 Defence Services Welfare 7870.00 537.50 18.75 145.00 58.00 0.00 3371.00 3371.00 0.00 39.50 39.50 0.00Total-IX 2997403.87 1350285.19 115125.69 213037.45 115464.88 411016.79 304221.73 715238.52 171459.58 129699.06 301158.64 90329.80
X GENERAL SERVICES1 Home Affairs & Justice 71352.92 3200.00 668.00 1133.00 0.00 20000.00 5700.00 25700.00 1000.00 0.00 1000.00 0.002 Jails 1500.00 0.00 0.00 0.00 0.00 0.00 0.00 0.00 0.00 0.00 0.00 0.003 Police Housing 500.00 0.00 0.00 0.00 0.00 2200.00 1466.67 3666.67 0.00 0.00 0.00 0.004 Hospitality 1500.00 0.00 0.00 0.00 0.00 0.00 0.00 0.00 0.00 0.00 0.00 0.005 Vigilance 600.00 0.00 0.00 0.00 0.00 0.00 500.00 500.00 0.00 0.00 0.00 0.006 Printing & Stationery 1781.76 0.00 0.00 0.00 0.00 0.00 220.00 220.00 0.00 0.00 0.00 0.007 Other Admn. Services
(MGSIPA)6800.00 0.00 0.00 0.00 0.00 0.00 450.00 450.00 0.00 0.00 0.00 0.00
8 Excise & Taxation 24852.00 0.00 0.00 0.00 0.00 0.00 0.00 0.00 0.00 0.00 0.00 0.009 Revenue & Rehabilitation 4755.00 0.00 0.00 0.00 0.00 1282.14 0.00 1282.14 0.00 0.00 0.00 0.0010 Treasury and Accounts 100.00 0.00 0.00 0.00 0.00 0.00 0.00 0.00 0.00 0.00 0.00 0.0011 Personnel 15086.94 0.00 0.00 0.00 0.00 0.00 0.00 0.00 0.00 0.00 0.00 0.00
Total-X 128828.62 3200.00 668.00 1133.00 0.00 23482.14 8336.67 31818.81 1000.00 0.00 1000.00 0.00XI OTHER THAN
RESTRUCTURRED CSS0.00 0.00 0.00 0.00 0.00 14252.86 0.00 14252.86 4598.00 0.00 4598.00 0.00
Total - I (Budgetary Outlays)
5082107.99 1639062.59 130717.38 251570.98 129228.69 699157.04 559265.65 1258422.69 220112.21 178139.24 398251.45 123621.72
II IEBR:STATE PUBLICSECTOR ENTERPRISES(PSEs) (excludingBudgetary Support)
1 Agriculture Marketing Board 139800.00 43338.00 7958.00 7533.00 7533.00 0.00 24300.00 24300.00 0.00 9720.00 9720.00 9720.00
2 Rural Development Fund 250000.00 77500.00 15500.00 27900.00 27900.00 0.00 90000.00 90000.00 0.00 36000.00 36000.00 36000.003 Power 2267379.81 534336.65 56223.82 92741.02 86957.00 0.00 320900.00 320900.00 0.00 100029.05 100029.05 100029.054 PIDB 487516.20 121813.76 15813.00 40000.00 40000.00 0.00 160000.00 160000.00 0.00 51200.00 51200.00 51200.00
54

(` Lac)
CS SS Total CS SS Total
1 2 3 4 5 6 7 8 9 10 11 12 13 14
12th Plan (2012-17) Projected
Actual Expenditure
2012-13 Approved Outlay Approved Outlay
SCSP 2013-14
Plan Outlay SCSP Outlay
Capital Content out of Col.13
Approved Outlay
Exp.
STATEMENT – II
SCHEDULED CASTES SUB PLAN 2014-15 Sector-wise/Subhead-wise Outlay and Expenditure
Annual Plan 2014-15 SCSP 2014-15Sr. No.
Sector/Sub-head
5 PUDA 154500.00 30900.00 4077.40 6180.00 6180.00 0.00 30900.00 30900.00 0.00 7014.30 7014.30 7014.306 GMADA 170000.00 34000.00 6800.00 6800.00 6800.00 0.00 34000.00 34000.00 0.00 7718.00 7718.00 7718.007 GLADA 72500.00 14500.00 2900.00 0.00 0.00 0.00 0.00 0.00 0.00 0.00 0.00 0.00
Total - II (PSEs) 3541696.01 856388.41 109272.22 181154.02 175370.00 0.00 660100.00 660100.00 0.00 211681.35 211681.35 211681.35III IEBR:LOCAL BODIES
(excluding BudgetarySupport)
1 Rural Local Bodies 250000.00 77500.00 15500.00 15500.00 15500.00 0.00 50000.00 50000.00 0.00 20000.00 20000.00 20000.002 Urban Local Bodies 336196.00 84049.00 17075.00 17075.00 17075.00 0.00 41460.00 41460.00 0.00 13267.20 13267.20 13267.20
Total - III (Local Bodies) 586196.00 161549.00 32575.00 32575.00 32575.00 0.00 91460.00 91460.00 0.00 33267.20 33267.20 33267.20Grand Total 9210000.00 2657000.00 272564.60 465300.00 337173.69 699157.04 1310825.65 2009982.69 220112.21 423087.79 643200.00 368570.27
55

(` Lac)
1 2 3 4 5 6 7 8A BUDGETARY OUTLAYS
I AGRICULTURE AND ALLIEDACTIVITIES
1 Crop Husbandry 28087.00 1265.27 4.50 69528.00 5531.06 7.962 Soil & Water Conservation 10962.00 663.70 6.05 9055.00 426.25 4.713 Animal Husbandry 7643.00 1952.83 25.55 6609.00 2114.24 31.994 Dairy Development 2300.00 747.00 32.48 1210.00 447.70 37.005 Fisheries 1116.00 102.38 9.17 0.00 0.00 0.006 Agriculture Research & Education 18000.00 0.00 0.00 17000.00 0.00 0.007 Agriculture Financial Institutions 1.00 0.00 0.00 0.00 0.00 0.008 Cooperation 1701.00 175.00 10.29 0.00 0.00 0.009 Food Processing 1000.00 0.00 0.00 0.00 0.00 0.00
Total-I 70810.00 4906.18 6.93 103402.00 8519.25 8.24II RURAL DEVELOPMENT 1 Special Programme for Rural
Development3352.40 913.20 27.24 9310.00 3040.40 32.66
2 Rural Employment 5500.00 4400.00 80.00 28868.00 23094.40 80.003 Other Rural Development Programmes 18320.20 8668.10 47.31 16626.00 6245.00 37.56
4 NRI Affairs 550.00 165.00 30.00 550.00 220.00 40.00Total-II 27722.60 14146.30 51.03 55354.00 32599.80 58.89
III IRRIGATION AND FLOODCONTROL
1 Major & Medium Irrigation 44919.00 2220.25 4.94 44476.00 2223.80 5.00
Annual Plan Outlay
SCSP Outlay %age of col 7 to col 6
STATEMENT - III
Sub head-wise percentage of SCSP Outlay to Annual Plan Outlay for the year 2013-14 and 2014-15SCHEDULED CASTES SUB PLAN 2014-15
Sr. No.
Sector/ Sub-head 2013-14Annual Plan
Outlay SCSP Outlay %age of
col 4 to col 3
2014-15
56

(` Lac)
1 2 3 4 5 6 7 8
Annual Plan Outlay
SCSP Outlay %age of col 7 to col 6
STATEMENT - III
Sub head-wise percentage of SCSP Outlay to Annual Plan Outlay for the year 2013-14 and 2014-15SCHEDULED CASTES SUB PLAN 2014-15
Sr. No.
Sector/ Sub-head 2013-14Annual Plan
Outlay SCSP Outlay %age of
col 4 to col 3
2014-15
2 Minor Irrigation 19930.00 1046.50 5.25 18298.00 809.90 4.433 Command Area Development & Water
Management Programme31000.00 3100.00 10.00 46335.00 4633.50 10.00
4 Flood control and anti-waterlogging 14503.00 615.00 4.24 19268.00 963.40 5.00Total-III 110352.00 6981.75 6.33 128377.00 8630.60 6.72
IV ENERGY 1 Non Conventional Sources of Energy 1514.00 114.25 7.55 4.00 0.64 0.00
Total-IV 1514.00 114.25 7.55 4.00 0.64 0.00V INDUSTRY AND MINERALS 1 Village and Small industries 28521.35 200.00 0.70 1500.00 0.00 0.00
Total-V 28521.35 200.00 0.70 1500.00 0.00 0.00VI TRANSPORT1 Civil Aviation 4500.00 0.00 0.00 1300.00 0.00 0.002 Roads and Bridges 50101.00 2499.55 4.99 103204.00 5160.20 5.003 Road Transport 1922.00 0.00 0.00 2500.00 0.00 0.00
Total-VI 56523.00 2499.55 4.42 107004.00 5160.20 4.82VII SCIENCE, TECHNOLOGY AND
ENVIRONMENT1 Scientific Research (including S & T) 712.00 125.00 17.56 410.00 60.00 14.632 Information Technology 820.72 50.00 6.09 0.00 0.00 0.003 Governance Reforms 5928.25 0.00 0.00 9675.00 0.00 0.004 Ecology and Environment 726.00 0.00 0.00 440.00 0.00 0.005 Forestry and Wild Life 8237.00 0.00 0.00 2081.00 0.00 0.00
Total-VII 16423.97 175.00 1.07 12606.00 60.00 0.48
57

(` Lac)
1 2 3 4 5 6 7 8
Annual Plan Outlay
SCSP Outlay %age of col 7 to col 6
STATEMENT - III
Sub head-wise percentage of SCSP Outlay to Annual Plan Outlay for the year 2013-14 and 2014-15SCHEDULED CASTES SUB PLAN 2014-15
Sr. No.
Sector/ Sub-head 2013-14Annual Plan
Outlay SCSP Outlay %age of
col 4 to col 3
2014-15
VIII
GENERAL ECONOMIC SERVICES
1 Secretariat Economic Services 28002.75 8377.50 29.92 28417.50 8524.32 30.002 Tourism 3412.00 0.00 0.00 14497.00 0.00 0.003 Census Survey and Statistics 266.60 0.00 0.00 1343.00 0.00 0.004 Civil Supplies 392.50 0.00 0.00 44608.00 28000.00 62.77
Total-VIII 32073.85 8377.50 26.12 88865.50 36524.32 41.10IX SOCIAL SERVICES1 General Education 140703.30 66359.87 47.16 187535.27 96223.78 51.31
2 Technical Education 5823.00 1052.00 18.07 10009.00 1743.68 17.423 Sports and Youth Services 11496.75 1481.45 12.89 3318.00 513.28 15.474 Art and Culture 6706.00 0.00 0.00 9501.00 0.00 0.005 Medical and Public Health 51794.00 15187.38 29.32 102177.37 33132.87 32.43
6 Water Supply & Sanitation
i) Urban Water Supply 20511.20 4651.60 22.68 33501.00 10720.00 32.00ii) Rural Water Supply 39272.00 15645.00 39.84 35000.00 12896.00 36.85
7 Housing 1.00 0.00 0.00 1300.00 0.00 0.00
8 Urban Development (including StateCapital Projects)
29011.00 21779.20 75.07 88292.26 28272.89 32.02
9 Information and Publicity 1979.65 226.00 11.42 865.00 224.00 25.9010 Welfare of SCs, BCs & Minorities 34482.06 25527.00 74.03 80999.17 42586.00 52.5811 Social Security & Welfare 86606.00 41855.50 48.33 87315.25 43343.19 49.64
12 Nutrition 25154.00 17605.00 69.99 65218.20 29583.65 45.36
58

(` Lac)
1 2 3 4 5 6 7 8
Annual Plan Outlay
SCSP Outlay %age of col 7 to col 6
STATEMENT - III
Sub head-wise percentage of SCSP Outlay to Annual Plan Outlay for the year 2013-14 and 2014-15SCHEDULED CASTES SUB PLAN 2014-15
Sr. No.
Sector/ Sub-head 2013-14Annual Plan
Outlay SCSP Outlay %age of
col 4 to col 3
2014-15
13 Labour & Labour Welfare i) Labour 139.72 65.00 46.52 0.00 0.00 0.00ii) Employment Generation 2830.00 432.50 15.28 2375.00 438.75 18.47iii) Industrial Training 3958.80 1024.95 25.89 4461.00 1441.05 32.30
14 Defence Services Welfare 2633.10 145.00 5.51 3371.00 39.50 1.17Total-IX 463101.58 213037.45 46.00 715238.52 301158.64 42.11
X GENERAL SERVICES 1 Home Affairs and Justice 17605.00 1133.00 6.44 25700.00 1000.00 3.89
2 Jails 1000.00 0.00 0.00 0.00 0.00 0.003 Police Housing 3372.00 0.00 0.00 3666.67 0.00 0.004 Hospitality 330.00 0.00 0.00 0.00 0.00 0.005 Vigilance 700.00 0.00 0.00 500.00 0.00 0.006 Printing and Stationery 368.90 0.00 0.00 220.00 0.00 0.007 Other Admn. Services (MGSIPA) 1127.75 0.00 0.00 450.00 0.00 0.008 Excise & Taxation 1001.00 0.00 0.00 0.00 0.00 0.009 Revenue and Rehabilitation 1551.00 0.00 0.00 1282.14 0.00 0.00
10 Treasury and Accounts 1.00 0.00 0.00 0.00 0.00 0.0011 Personnel 1.00 0.00 0.00 0.00 0.00 0.00
Total-X 27057.65 1133.00 4.19 31818.81 1000.00 3.14XI OTHER THAN RESTRUCTURRED
CSS0.00 0.00 0.00 14252.86 4598.00 32.26
Total-A 834100.00 251570.98 30.16 1258422.69 398251.45 31.65
59

(` Lac)
1 2 3 4 5 6 7 8
Annual Plan Outlay
SCSP Outlay %age of col 7 to col 6
STATEMENT - III
Sub head-wise percentage of SCSP Outlay to Annual Plan Outlay for the year 2013-14 and 2014-15SCHEDULED CASTES SUB PLAN 2014-15
Sr. No.
Sector/ Sub-head 2013-14Annual Plan
Outlay SCSP Outlay %age of
col 4 to col 3
2014-15
B IEBR:STATE PUBLIC SECTORENTERPRISES (PSEs) (excludingBudgetary Support)
1 Agriculture Marketing Board 24300.00 7533.00 31.00 24300.00 9720.00 40.002 Rural Development Fund 90000.00 27900.00 31.00 90000.00 36000.00 40.003 Power 320900.00 92741.02 28.90 320900.00 100029.05 31.174 PIDB 160000.00 40000.00 25.00 160000.00 51200.00 32.005 PUDA 30900.00 6180.00 20.00 30900.00 7014.30 22.706 GMADA 34000.00 6800.00 20.00 34000.00 7718.00 22.70
Total-B 660100.00 181154.02 27.44 660100.00 211681.35 32.07C IEBR:LOCAL BODIES (excluding
Budgetary Support)1 Rural Local Bodies 50000.00 15500.00 31.00 50000.00 20000.00 40.002 Urban Local Bodies 68300.00 17075.00 25.00 41460.00 13267.20 32.00
Total-C 118300.00 32575.00 27.54 91460.00 33267.20 36.37Grand Total(A+B+C) 1612500.00 465300.00 28.86 2009982.69 643200.00 32.00
60

(` Lac)
CS SS Total CS SS Total
1 2 3 4 5 6 7 8 9 10 11 12 13 14I BUDGETARY OUTLAYS
1 Agriculture & Horticulture 87951.00 5359.17 917.04 1265.27 1272.72 67387.50 1887.50 69275.00 5117.69 413.37 5531.06 0.00
2 Soil & Water Conservation 26335.00 2908.60 641.42 663.70 270.62 2000.00 7025.00 9025.00 100.00 326.25 426.25 0.00
3 Animal Husbandry 28001.00 6528.00 372.36 1952.83 1225.36 3581.00 3026.00 6607.00 1145.92 968.32 2114.24 1184.32
4 Dairy Development 16000.00 4900.00 140.00 747.00 0.56 900.00 310.00 1210.00 288.00 159.70 447.70 0.00
5 Fisheries 4125.75 411.70 0.00 102.38 0.00 0.00 0.00 0.00 0.00 0.00 0.00 0.00
6 Cooperation 4828.44 1207.11 0.00 175.00 81.25 0.00 0.00 0.00 0.00 0.00 0.00 0.00
7 Rural Development 387289.57 179541.39 3048.80 13981.30 4649.55 39763.00 15040.00 54803.00 24943.55 7436.25 32379.80 9652.80
8 NRI Affairs 2500.00 750.00 45.00 165.00 0.00 0.00 550.00 550.00 0.00 220.00 220.00 220.00
9 Irrigation and Flood control 447470.56 28396.06 1905.89 6981.75 1923.75 64684.75 61592.25 126277.00 3999.00 4631.60 8630.60 8630.60
10 Non Conventional Sources of Energy
6240.00 926.97 10.00 114.25 0.00 0.00 2.00 2.00 0.00 0.64 0.64 0.00
11 Industry and Minerals 3000.00 1125.00 0.00 200.00 0.00 0.00 0.00 0.00 0.00 0.00 0.00 0.00
12 Information Technology 0.00 0.00 0.00 50.00 0.00 0.00 0.00 0.00 0.00 0.00 0.00 0.00
13 Roads and Bridges 344438.00 17222.00 1058.00 2499.55 1270.00 37203.00 66001.00 103204.00 1860.15 3300.05 5160.20 5160.20
14 Science Technology and Environment
1150.00 625.00 50.00 125.00 50.00 0.00 110.00 110.00 0.00 60.00 60.00 0.00
15 Secretariat Economic Services
110410.00 35676.40 6735.18 8377.50 3020.00 17501.00 8950.00 26451.00 5600.32 2924.00 8524.32 8444.00
16 CivilSupplies 0.00 0.00 0.00 0.00 0.00 0.00 40000.00 40000.00 0.00 28000.00 28000.00 0.00
17 General Education 993661.25 543724.48 48360.39 66359.87 54648.21 111610.00 74531.72 186141.72 62337.25 33886.53 96223.78 21251.94
18 Technical Education 19980.00 5155.00 65.00 1052.00 0.00 3710.00 1738.00 5448.00 1187.20 556.48 1743.68 1251.52
19 Sports and Youth Services 22508.75 5627.25 81.45 1481.45 0.00 977.25 626.75 1604.00 312.72 200.56 513.28 0.00
20 Medical and Public Health 259964.70 78667.88 251.19 15187.38 4173.79 62365.30 39697.09 102062.39 19967.24 13165.63 33132.87 4166.85
21 Water Supply & Sanitation 597587.10 181489.50 14022.09 20296.60 8816.79 33500.00 35000.00 68500.00 12220.00 11396.00 23616.00 23616.00
Approved Outlay Capital Content out of Col.13
SCSP Outlay
Approved Outlay
Approved Outlay
Actual Expenditure
2012-13 Expenditure
STATEMENT - IV SCHEDULED CASTES SUB PLAN 2014-15
Subhead-wise Divisible Outlay and Expenditure
SCSP 2013-1412th Plan (2012-17) Projected
Annual Plan 2014-15Sr. No.
Sub-head
Plan Outlay
SCSP 2014-15
61

(` Lac)
CS SS Total CS SS Total
1 2 3 4 5 6 7 8 9 10 11 12 13 14
Approved Outlay Capital Content out of Col.13
SCSP Outlay
Approved Outlay
Approved Outlay
Actual Expenditure
2012-13 Expenditure
STATEMENT - IV SCHEDULED CASTES SUB PLAN 2014-15
Subhead-wise Divisible Outlay and Expenditure
SCSP 2013-1412th Plan (2012-17) Projected
Annual Plan 2014-15Sr. No.
Sub-head
Plan Outlay
SCSP 2014-15
22 Housing 200.00 80.00 0.00 0.00 0.00 0.00 0.00 0.00 0.00 0.00 0.00 0.00
23 Urban Development 195559.00 100821.70 1387.86 21779.20 70.00 76888.26 11002.00 87890.26 24699.25 3573.64 28272.89 26996.89
24 Information and Publicity 7530.00 1130.00 130.05 226.00 267.00 0.00 700.00 700.00 0.00 224.00 224.00 0.00
25 Welfare of SCs 95329.38 95329.38 11945.20 25527.00 13755.31 23500.00 19086.00 42586.00 23500.00 19086.00 42586.00 9538.00
26 Social Security & Welfare 486935.00 233877.50 34036.05 41855.50 32156.11 16982.25 70008.00 86990.25 8485.42 34857.77 43343.19 155.00
27 Nutrition 137500.00 94650.00 4802.10 17605.00 1313.75 45815.20 19403.00 65218.20 18500.50 11083.15 29583.65 1960.00
28 Labour & Labour Welfare 36360.00 9195.00 25.56 1522.45 205.92 1000.00 5336.00 6336.00 250.00 1629.80 1879.80 1393.60
29 Defence Services Welfare 2150.00 537.50 18.75 145.00 58.00 0.00 170.00 170.00 0.00 39.50 39.50 0.00
30 Home Affairs and Justice 15500.00 3200.00 668.00 1133.00 0.00 5000.00 0.00 5000.00 1000.00 0.00 1000.00 0.00
31 Other than Restructurred CSS
0.00 0.00 0.00 0.00 0.00 14252.86 0.00 14252.86 4598.00 0.00 4598.00 0.00
Total - I (Budgetary Outlays)
4340504.50 1639062.59 130717.38 251570.98 129228.69 628621.37 481792.31 1110413.68 220112.21 178139.24 398251.45 123621.72
II IEBR:STATE PUBLICSECTOR ENTERPRISES(PSEs) (excludingBudgetary Support)
32 Agriculture Marketing Board 139800.00 43338.00 7958.00 7533.00 7533.00 0.00 24300.00 24300.00 0.00 9720.00 9720.00 9720.00
33 Rural Development Fund 250000.00 77500.00 15500.00 27900.00 27900.00 0.00 90000.00 90000.00 0.00 36000.00 36000.00 36000.00
34 Power 2267379.81 534336.65 56223.82 92741.02 86957.00 0.00 320900.00 320900.00 0.00 100029.05 100029.05 100029.05
35 PIDB 487516.20 121813.76 15813.00 40000.00 40000.00 0.00 160000.00 160000.00 0.00 51200.00 51200.00 51200.00
36 PUDA 154500.00 30900.00 4077.40 6180.00 6180.00 0.00 30900.00 30900.00 0.00 7014.30 7014.30 7014.30
37 GMADA 170000.00 34000.00 6800.00 6800.00 6800.00 0.00 34000.00 34000.00 0.00 7718.00 7718.00 7718.00
38 GLADA 72500.00 14500.00 2900.00 0.00 0.00 0.00 0.00 0.00 0.00 0.00 0.00 0.00
Total - II (PSEs) 3541696.01 856388.41 109272.22 181154.02 175370.00 0.00 660100.00 660100.00 0.00 211681.35 211681.35 211681.35
62

(` Lac)
CS SS Total CS SS Total
1 2 3 4 5 6 7 8 9 10 11 12 13 14
Approved Outlay Capital Content out of Col.13
SCSP Outlay
Approved Outlay
Approved Outlay
Actual Expenditure
2012-13 Expenditure
STATEMENT - IV SCHEDULED CASTES SUB PLAN 2014-15
Subhead-wise Divisible Outlay and Expenditure
SCSP 2013-1412th Plan (2012-17) Projected
Annual Plan 2014-15Sr. No.
Sub-head
Plan Outlay
SCSP 2014-15
III IEBR:LOCAL BODIES (excluding Budgetary Support)
39 Rural Local Bodies 250000.00 77500.00 15500.00 15500.00 15500.00 0.00 50000.00 50000.00 0.00 20000.00 20000.00 20000.00
40 Urban Local Bodies 336196.00 84049.00 17075.00 17075.00 17075.00 0.00 41460.00 41460.00 0.00 13267.20 13267.20 13267.20
Total - III (Local Bodies) 586196.00 161549.00 32575.00 32575.00 32575.00 0.00 91460.00 91460.00 0.00 33267.20 33267.20 33267.20
IV INDIVISIBLE OUTLAY (Not covered under SCSP)
741603.49 0.00 0.00 0.00 0.00 70535.67 77473.34 148009.01 0.00 0.00 0.00 0.00
Grand Total (I+II+III+IV) 9210000.00 2657000.00 272564.60 465300.00 337173.69 699157.04 1310825.65 2009982.69 220112.21 423087.79 643200.00 368570.27
63

(` Lac)
CS SS Total CS SS Total
1 2 3 4 5 6 7 8 9 10 11 12 13 14
I BUDGETARY OUTLAYSCROP HUSBANDRY
Agriculture
AGR-01 Macro Management Work Plan forAgriculture Department (90:10)
2000.00 100.00 0.00 22.50 0.00 0.00 0.00 0.00 0.00 0.00 0.00 0.00
AGR-02/04 Integrated Scheme of Oilseeds, Pulses,Oilpalm and maize (75:25) (Mergedwith CS(AGR)-23)
700.00 116.67 2.56 28.27 0.00 0.00 0.00 0.00 0.00 0.00 0.00 0.00
AGR-04/06 Intensive Cotton DevelopmentProgramme (75:25) (Merged withCS(AGR)-20)
1000.00 50.00 0.00 12.50 0.00 0.00 0.00 0.00 0.00 0.00 0.00 0.00
AGR-05 Modified National AgricultureInsurance (50:50)
2500.00 125.00 0.00 25.00 0.00 0.00 0.00 0.00 0.00 0.00 0.00 0.00
AGR-07 Setting up of an institution forManagement of Agriculture Extension
500.00 25.00 25.00 25.00 0.00 0.00 0.00 0.00 0.00 0.00 0.00 0.00
AGR-08 Scheme for Subsidy on Replacement ofWheat Seed
2500.00 125.00 12.50 25.00 0.00 0.00 0.00 0.00 0.00 0.00 0.00 0.00
AGR-10 Scheme for Distribution of Fertilizer 2500.00 125.00 0.00 25.00 0.00 0.00 0.00 0.00 0.00 0.00 0.00 0.00
AGR-11/19 Providing Relief Bonus to farmers forpaddy crop - Kharif 2009.
1.00 0.00 0.00 0.00 0.00 0.00 0.00 0.00 0.00 0.00 0.00 0.00
Restructured CSSsCS(AGR)-1 Rashtriya Krishi Vikas Yojna(RKVY) 60000.00 3000.00 565.80 1000.00 1262.72 50000.00 0.00 50000.00 2500.00 0.00 2500.00 0.00
CS(AGR)-20 National Food Security Mission(NFSM)-(NFS-100%GOI) & CDP-75:25)
0.00 0.00 0.00 0.00 0.00 7000.00 250.00 7250.00 350.00 12.50 362.50 0.00
CS(AGR)-23 National Oil Seed and Oil PalmMission (NOOPM) -(75:25)
0.00 0.00 0.00 0.00 0.00 375.00 125.00 500.00 85.17 28.39 113.56 0.00
CS(AGR)-24 National Mission of AgricultureExtension and Technology (NMAET)-(90:10)
0.00 0.00 0.00 0.00 0.00 3000.00 275.00 3275.00 148.75 13.75 162.50 0.00
Horticulture HORT-03 Diversification of Agriculture through
Development of Horticulture 3000.00 150.00 8.80 25.00 10.00 0.00 0.00 0.00 0.00 0.00 0.00 0.00
Plan Outlay
Actual Expenditure
2012-13
Scheme Code SCSP 2013-14
Capital Content out of
Col.13
Expenditure
12th Plan (2012-17) Projected
Approved Outlay
STATEMENT - V
SCHEDULED CASTES SUB PLAN 2014-15 Scheme-wise Divisible Outlay and Expenditure
Annual Plan 2014-15 SCSP 2014-15
SCSP Outlay
Sub-head/Scheme
Approved Outlay Approved Outlay
64

(` Lac)
CS SS Total CS SS Total
1 2 3 4 5 6 7 8 9 10 11 12 13 14
Plan Outlay
Actual Expenditure
2012-13
Scheme Code SCSP 2013-14
Capital Content out of
Col.13
Expenditure
12th Plan (2012-17) Projected
Approved Outlay
STATEMENT - V
SCHEDULED CASTES SUB PLAN 2014-15 Scheme-wise Divisible Outlay and Expenditure
Annual Plan 2014-15 SCSP 2014-15
SCSP Outlay
Sub-head/Scheme
Approved Outlay Approved Outlay
HORT-05 Transmission of Technology &Training in Horticulture Practices
250.00 12.50 0.38 2.00 0.00 0.00 0.00 0.00 0.00 0.00 0.00 0.00
HORT-06/6 Strengthening of Citrus estates 5000.00 250.00 25.00 0.00 0.00 0.00 0.00 0.00 0.00 0.00 0.00 0.00Restructured CSS
CS(HORT)-21
National Horticulture Mission 8000.00 1280.00 277.00 75.00 0.00 7012.50 1237.50 8250.00 2033.77 358.73 2392.50 0.00
Total 87951.00 5359.17 917.04 1265.27 1272.72 67387.50 1887.50 69275.00 5117.69 413.37 5531.06 0.00SOIL AND WATER CONSERVATION
SWC-01 Macro Management-Work plan for SoilConservation (90:10)
500.00 50.00 0.00 0.00 0.00 0.00 0.00 0.00 0.00 0.00 0.00 0.00
SWC-03 Assistance to farmers in Under GroundPipe System (UGPS) for Promotion ofOn-Farm Water Conservation (ACA-2010-11)
7500.00 750.00 79.30 75.00 28.80 0.00 25.00 25.00 0.00 1.25 1.25 0.00
SWC-04 Project for promotion of MicroIrrigation in the Punjab (NABARD)(RIDF-16)
2000.00 320.00 244.70 0.00 56.79 0.00 0.00 0.00 0.00 0.00 0.00 0.00
SWC-05 Project for promotion of MicroIrrigation in the Punjab (RIDF-XIII)(NABARD) (95:5)
85.00 13.60 10.99 0.00 0.00 0.00 0.00 0.00 0.00 0.00 0.00 0.00
SWC-06 Soil & Water Conservation onWatershed basis in Kandi non projectareas
750.00 75.00 0.00 7.50 0.00 0.00 0.00 0.00 0.00 0.00 0.00 0.00
SWC-08 Scheme for Rainwater Harvesting inthe State
1000.00 100.00 0.00 10.00 0.00 0.00 0.00 0.00 0.00 0.00 0.00 0.00
SWC-10 Project for judicious use of availablewater and harvesting of rain water forenhancing irrigation potential inPunjab State (RIDF-XVII) (NABARD)(95:5)
12000.00 1200.00 233.00 240.00 149.96 0.00 2000.00 2000.00 0.00 100.00 100.00 0.00
SWC-11 Community Micro Irrigation Project inKandi-belt of Talwara and Hajipurblocks of District Hoshiarpur(NABARD-RIDF-XVIII)
0.00 0.00 0.00 63.20 0.00 0.00 1000.00 1000.00 0.00 50.00 50.00 0.00
65

(` Lac)
CS SS Total CS SS Total
1 2 3 4 5 6 7 8 9 10 11 12 13 14
Plan Outlay
Actual Expenditure
2012-13
Scheme Code SCSP 2013-14
Capital Content out of
Col.13
Expenditure
12th Plan (2012-17) Projected
Approved Outlay
STATEMENT - V
SCHEDULED CASTES SUB PLAN 2014-15 Scheme-wise Divisible Outlay and Expenditure
Annual Plan 2014-15 SCSP 2014-15
SCSP Outlay
Sub-head/Scheme
Approved Outlay Approved Outlay
SWC-12 Project for laying of UndergroundPipeline for irrigation from SewageTreatment Plants of variousTowns/Cities (NABARD-RIDF-XVIII)
0.00 0.00 0.00 63.20 31.58 0.00 1000.00 1000.00 0.00 50.00 50.00 0.00
SWC-13 Construction of Check Dams & GabionStructures in Talwara of HoshiarpurDistrict
0.00 0.00 0.00 59.80 0.00 0.00 0.00 0.00 0.00 0.00 0.00 0.00
SWC-14 Scheme for conveyance of irrigationwater to the fields at the tail ends ofcanal network in Sangrur and BarnalaDistricts.
0.00 0.00 0.00 0.00 0.00 0.00 2000.00 2000.00 0.00 75.00 75.00 0.00
SWC-16 Project for promotion of MicroIrrigation in Punjab (NABARD-RIDF-20)
0.00 0.00 0.00 0.00 0.00 0.00 500.00 500.00 0.00 25.00 25.00 0.00
Restructured CSS
CS(SWC)-22 National Mission on SustainableAgriculture
2500.00 400.00 73.43 145.00 3.49 2000.00 500.00 2500.00 100.00 25.00 125.00 0.00
Total 26335.00 2908.60 641.42 663.70 270.62 2000.00 7025.00 9025.00 100.00 326.25 426.25 0.00
ANIMAL HUSBANDRY AH-01 Assistance to States for control of
animal diseases - creation of Diseasefree Zone. (merged with CS-AH(26))
450.00 135.00 14.16 37.50 0.00 0.00 0.00 0.00 0.00 0.00 0.00 0.00
AH-04 Establishment and strengthening ofexisting vetrenary hospitals anddispensaries.
1500.00 150.00 0.00 30.00 0.00 0.00 0.00 0.00 0.00 0.00 0.00 0.00
AH-06 Renovation and Upgradation of Vety.Institutions in the State(ACA 2010-11)
2000.00 600.00 0.00 0.00 600.00 0.00 0.00 0.00 0.00 0.00 0.00 0.00
AH-07 Upgradation of Veterinary institutionsin the State under RIDF-XVII(NABARD) (90:10)
2500.00 750.00 0.00 390.00 205.36 0.00 500.00 500.00 0.00 160.00 160.00 160.00
66

(` Lac)
CS SS Total CS SS Total
1 2 3 4 5 6 7 8 9 10 11 12 13 14
Plan Outlay
Actual Expenditure
2012-13
Scheme Code SCSP 2013-14
Capital Content out of
Col.13
Expenditure
12th Plan (2012-17) Projected
Approved Outlay
STATEMENT - V
SCHEDULED CASTES SUB PLAN 2014-15 Scheme-wise Divisible Outlay and Expenditure
Annual Plan 2014-15 SCSP 2014-15
SCSP Outlay
Sub-head/Scheme
Approved Outlay Approved Outlay
AH-08 Construction of Civil Infrastructure forGuru Angad Dev Vety. and AnimalScience University (GADVASU)-
(NABARD) (80:20) & ACA
4000.00 1000.00 0.00 400.00 200.00 0.00 1000.00 1000.00 0.00 320.00 320.00 320.00
AH-09 Setting up of new Polyclinics andStrengthening of Vety. Institutions inthe State under RIDF-XIV Project(NABARD) (90:10)
1500.00 450.00 20.00 180.00 0.00 0.00 1.00 1.00 0.00 0.32 0.32 0.32
AH-10 Upgradation and Strengthening ofexisting Veterinary institutions byproviding infrastructure & equipmentand construction of new Vety.Polyclinics under RIDF- XIII Project(NABARD) (80:20)
100.00 0.00 0.00 0.00 0.00 0.00 0.00 0.00 0.00 0.00 0.00 0.00
AH-11 Plan Assistance to Guru Angad DevVeterinary and Animal SciencesUniversity (GADVASU) at Ludhiana
11500.00 2875.00 325.00 325.00 0.00 0.00 0.00 0.00 0.00 0.00 0.00 0.00
AH-12 Development of Piggery Sector in theState
250.00 50.00 0.00 14.00 0.00 0.00 0.00 0.00 0.00 0.00 0.00 0.00
AH-13 Animal Husbandry Extension andTraining Programme
1100.00 88.00 0.00 43.33 0.00 0.00 0.00 0.00 0.00 0.00 0.00 0.00
AH-14 Development of other live-stock likepoultry, goat, sheep and turkey etc.inthe State.
300.00 90.00 4.20 15.00 0.00 0.00 0.00 0.00 0.00 0.00 0.00 0.00
AH-15 Development of fodder resources andits processing
300.00 90.00 9.00 18.00 0.00 0.00 0.00 0.00 0.00 0.00 0.00 0.00
AH-16 Setting up of new and strengthening ofexisting Veterinary Poly-clinics in theState
1.00 0.00 0.00 0.00 0.00 0.00 0.00 0.00 0.00 0.00 0.00 0.00
AH-17 Grant-in-aid to Animal Welfare Boardof Punjab
2500.00 250.00 0.00 50.00 0.00 0.00 0.00 0.00 0.00 0.00 0.00 0.00
67

(` Lac)
CS SS Total CS SS Total
1 2 3 4 5 6 7 8 9 10 11 12 13 14
Plan Outlay
Actual Expenditure
2012-13
Scheme Code SCSP 2013-14
Capital Content out of
Col.13
Expenditure
12th Plan (2012-17) Projected
Approved Outlay
STATEMENT - V
SCHEDULED CASTES SUB PLAN 2014-15 Scheme-wise Divisible Outlay and Expenditure
Annual Plan 2014-15 SCSP 2014-15
SCSP Outlay
Sub-head/Scheme
Approved Outlay Approved Outlay
AH-18 Construction of buildings of tehsil andblock level Vety.Hospitals and othervety. Hospitals in the State under RIDF-XVIII (NABARD) (95:5)
0.00 0.00 0.00 450.00 220.00 0.00 1000.00 1000.00 0.00 320.00 320.00 320.00
Restructured CSSsCS(AH)-26 National Livestock Health and Disease
control programme0.00 0.00 0.00 0.00 0.00 1998.00 515.00 2513.00 639.36 164.80 804.16 384.00
CS(AH)-27 National livestock Managementprogramme
0.00 0.00 0.00 0.00 0.00 1583.00 10.00 1593.00 506.56 3.20 509.76 0.00
Total 28001.00 6528.00 372.36 1952.83 1225.36 3581.00 3026.00 6607.00 1145.92 968.32 2114.24 1184.32DAIRY DEVELOPMENT
DD-02 Provision of essential staff forremaining districts.
3000.00 600.00 0.00 20.00 0.56 0.00 10.00 10.00 0.00 2.50 2.50 0.00
DD-03 Strengthening of Punjab DairyDevelopment Board
10000.00 3300.00 140.00 462.00 0.00 0.00 10.00 10.00 0.00 3.20 3.20 0.00
DD-04 Mechanization of dairy farms 0.00 0.00 0.00 165.00 0.00 0.00 0.00 0.00 0.00 0.00 0.00 0.00
DD-05 Promotion of Dairy farming aslivelihood for SC beneficiaries
0.00 0.00 0.00 0.00 0.00 0.00 90.00 90.00 0.00 90.00 90.00 0.00
Restructured CSS
CS(DD)25 National Plan for Dairy Development(75:25)
3000.00 1000.00 0.00 100.00 0.00 900.00 200.00 1100.00 288.00 64.00 352.00 0.00
Total 16000.00 4900.00 140.00 747.00 0.56 900.00 310.00 1210.00 288.00 159.70 447.70 0.00FISHERIES
FH-01 Development of Fisheries andAquaculture (75:25)
254.00 25.40 0.00 4.88 0.00 0.00 0.00 0.00 0.00 0.00 0.00 0.00
FH-02 National Scheme for Welfare ofFishermen/fisheries training andextension
7.75 0.00 0.00 0.00 0.00 0.00 0.00 0.00 0.00 0.00 0.00 0.00
FH-03 Development of Fisheries in the State 3863.00 386.30 0.00 22.50 0.00 0.00 0.00 0.00 0.00 0.00 0.00 0.00
FH-04 Assistance to Guru Angad DevVeterinary and Animal SciencesUniversity (GADVASU) to establish thecollege of Fisheries at Ludhiana
1.00 0.00 0.00 75.00 0.00 0.00 0.00 0.00 0.00 0.00 0.00 0.00
Total 4125.75 411.70 0.00 102.38 0.00 0.00 0.00 0.00 0.00 0.00 0.00 0.00
68

(` Lac)
CS SS Total CS SS Total
1 2 3 4 5 6 7 8 9 10 11 12 13 14
Plan Outlay
Actual Expenditure
2012-13
Scheme Code SCSP 2013-14
Capital Content out of
Col.13
Expenditure
12th Plan (2012-17) Projected
Approved Outlay
STATEMENT - V
SCHEDULED CASTES SUB PLAN 2014-15 Scheme-wise Divisible Outlay and Expenditure
Annual Plan 2014-15 SCSP 2014-15
SCSP Outlay
Sub-head/Scheme
Approved Outlay Approved Outlay
CO-OPERATION
CN-01 Financial Assistance to DairyCooperatives to meet out their losses(50:50)
3828.44 957.11 0.00 125.00 81.25 0.00 0.00 0.00 0.00 0.00 0.00 0.00
CN-02 Financial Assistance to DairyCooperatives for Providing Milkingmachines & other equipments to DairyFarms & Cooperative Societies
500.00 125.00 0.00 25.00 0.00 0.00 0.00 0.00 0.00 0.00 0.00 0.00
CN-03 Financial Assistance to DairyCooperatives for making Silage pits forProgressive Dairy Farms and MilkProducers in the State
500.00 125.00 0.00 25.00 0.00 0.00 0.00 0.00 0.00 0.00 0.00 0.00
Total 4828.44 1207.11 0.00 175.00 81.25 0.00 0.00 0.00 0.00 0.00 0.00 0.00
RURAL DEVELOPMENT A Special Programme for Rural
Development
District Level SchemesRDS(D)-01 Swaran Jayanti Gram Swa-Rozgar
Yojna (75:25)3080.00 1848.00 37.52 0.00 0.00 0.00 0.00 0.00 0.00 0.00 0.00 0.00
RDS(D)-02 Integrated Wasteland DevelopmentProject
500.00 0.00 0.00 0.00 0.00 0.00 0.00 0.00 0.00 0.00 0.00 0.00
RDS(D)-04/ RDS(D)-01(i)
Setting up of Rural Haats (75:25)(Direct Release)
1100.00 330.00 114.38 66.00 0.00 0.00 0.00 0.00 0.00 0.00 0.00 0.00
RDS(D)-05/ RDS(D)-01(ii)
Setting up of Haats at Distt.Headquarters (75:25) (Direct Release)
50.00 0.00 0.00 1.60 0.00 0.00 0.00 0.00 0.00 0.00 0.00 0.00
RDS(D)-06/ RDS(D)-01(iii)
Setting up of Haats at State Capital(75:25) (Direct Release)
50.00 0.00 0.00 1.60 0.00 0.00 0.00 0.00 0.00 0.00 0.00 0.00
RDS(D)-09 Mahila Kissan ShasaktikaranPariyojana MKSP(CS:SS) (75:25)
589.17 29.29 0.00 0.00 0.00 0.00 0.00 0.00 0.00 0.00 0.00 0.00
Restructured CSSs
Backward Regions Grant Fund (100%GOI funded)(i) District Component 25000.00 7500.00 449.40 534.00 0.00 2620.00 0.00 2620.00 838.40 0.00 838.40 838.40(ii) State Component 0.00 0.00 0.00 0.00 0.00 100.00 0.00 100.00 32.00 0.00 32.00 0.00
CS(RDS)-05
69

(` Lac)
CS SS Total CS SS Total
1 2 3 4 5 6 7 8 9 10 11 12 13 14
Plan Outlay
Actual Expenditure
2012-13
Scheme Code SCSP 2013-14
Capital Content out of
Col.13
Expenditure
12th Plan (2012-17) Projected
Approved Outlay
STATEMENT - V
SCHEDULED CASTES SUB PLAN 2014-15 Scheme-wise Divisible Outlay and Expenditure
Annual Plan 2014-15 SCSP 2014-15
SCSP Outlay
Sub-head/Scheme
Approved Outlay Approved Outlay
CS(RDS)-06 Integrated Watershed ManagementProgramme (IWMP) (90:10)
10000.00 0.00 0.00 60.00 20.00 2700.00 300.00 3000.00 864.00 96.00 960.00 0.00
CS(RDS)-12 National Rural Livelihood Mission(NRLM) (CS:SS) (75:25) includingDRDA
100000.00 50000.00 6.89 250.00 223.00 2755.00 835.00 3590.00 938.75 271.25 1210.00 0.00
Sub-Total (A) 140369.17 59707.29 608.19 913.20 243.00 8175.00 1135.00 9310.00 2673.15 367.25 3040.40 838.40B Rural Employment
State Level SchemesRestructured CSS
CS(RDE)-9 National Rural Employment GuranteeScheme (90:10)(Direct Release)
66000.00 52800.00 1414.50 3200.00 1710.00 22500.00 2250.00 24750.00 18000.00 1800.00 19800.00 0.00
District Level Scheme
CS(RDE)-8 Indira Awaas Yojana (75:25) (DirectRelease)
7700.00 6160.00 212.71 1200.00 95.00 3088.00 1030.00 4118.00 2470.40 824.00 3294.40 3294.40
Sub-Total (B) 73700.00 58960.00 1627.21 4400.00 1805.00 25588.00 3280.00 28868.00 20470.40 2624.00 23094.40 3294.40
C Other Rural DevelopmentProgramme
RDO(S)-02/ RDO(S)-03
Grant for Strengthening ofInfrastructural & Institutional Works(Discretionary grant of Hon'ble CM)
5000.00 1500.00 300.00 300.00 298.36 0.00 1000.00 1000.00 0.00 320.00 320.00 320.00
RDO(S)-05 Contribution to Village DevelopmentFund out of Grant-in Aid recommendedby State Finance commission for PRIs
0.10 0.00 0.00 0.00 0.00 0.00 0.00 0.00 0.00 0.00 0.00 0.00
RDO(S)-06/ RDO(S)-07
Environmental Improvement of SCBasties/ Villages with Stress onSanitation
0.10 0.10 0.00 0.10 0.00 0.00 0.00 0.00 0.00 0.00 0.00 0.00
RDO(S)-07/ RDO(S)-09
Construction/brick paving ofpassages/drains in Villages/DhaniesACA-2011-12
100000.00 30000.00 450.00 1500.00 750.00 0.00 0.00 0.00 0.00 0.00 0.00 0.00
RDO(S)-08/ RDO(S)-10
Modernization and improvement of SCvillages having more than 50% SCpopulation
2500.00 2500.00 51.60 300.00 0.00 0.00 0.00 0.00 0.00 0.00 0.00 0.00
70

(` Lac)
CS SS Total CS SS Total
1 2 3 4 5 6 7 8 9 10 11 12 13 14
Plan Outlay
Actual Expenditure
2012-13
Scheme Code SCSP 2013-14
Capital Content out of
Col.13
Expenditure
12th Plan (2012-17) Projected
Approved Outlay
STATEMENT - V
SCHEDULED CASTES SUB PLAN 2014-15 Scheme-wise Divisible Outlay and Expenditure
Annual Plan 2014-15 SCSP 2014-15
SCSP Outlay
Sub-head/Scheme
Approved Outlay Approved Outlay
RDO(S)-10/ RDO(S)-12
Upgradation/Repair of subsidiaryhealth centres of Zila Parishads (ACA2010-11)
5000.00 1500.00 0.00 300.00 86.00 0.00 0.00 0.00 0.00 0.00 0.00 0.00
RDO(S)-11/ RDO(S)-13
Construction of Panchayat ghars atGram Panchayat Level under RashtriyaGram Swaraj Yozna (75:25) (DirectRelease)
10000.00 3000.00 0.00 150.00 99.00 0.00 0.00 0.00 0.00 0.00 0.00 0.00
RDO(S)-12/ RDO(S)-14
Construction of toilets in the rural areas(NABARD) (85:15)
24000.00 14400.00 0.00 6000.00 1126.00 0.00 2000.00 2000.00 0.00 1200.00 1200.00 1200.00
RDO(S)-15/ RDO(S)-2
Issue of Yellow Cards for identificationof Weaker Sections
20.00 0.00 0.00 13.00 0.00 0.00 0.00 0.00 0.00 0.00 0.00 0.00
Restructured CSSCS(RDO)-7 Rajiv Gandhi Panchayat Sashaktikaran
Yojna (75:25) (Direct Release)200.00 24.00 0.00 20.00 15.00 3000.00 625.00 3625.00 600.00 125.00 725.00 0.00
District Level Schemes RDO(D)-01 Construction of Toilets in Villages
(ACA 2009-10 and 2010-11)0.10 0.00 0.00 0.00 227.19 0.00 0.00 0.00 0.00 0.00 0.00 0.00
Block GrantsBG-2 / RDO(D)-02
Improvement/Remodeling andrejuvenation of village ponds anddisposal of sullage water (ACA 2013-14)
500.00 150.00 11.80 30.00 0.00 3000.00 7000.00 10000.00 1200.00 2800.00 4000.00 4000.00
RDO(D)-03/ RDO(D)-4
Incentive grants to Gram Panchayatswhere elections were heldunanimously.
0.10 0.00 0.00 25.00 0.00 0.00 0.00 0.00 0.00 0.00 0.00 0.00
RDO(D)-04 Encouragement and improvement ofMahila Mandals for construction ofbuildings
25000.00 7500.00 0.00 0.00 0.00 0.00 0.00 0.00 0.00 0.00 0.00 0.00
RDO(D)-05 Levelling of Panchayat Lands 1000.00 300.00 0.00 30.00 0.00 0.00 0.00 0.00 0.00 0.00 0.00 0.00
Sub-Total (C) 173220.40 60874.10 813.40 8668.10 2601.55 6000.00 10625.00 16625.00 1800.00 4445.00 6245.00 5520.00Total (A+B+C) 387289.57 179541.39 3048.80 13981.30 4649.55 39763.00 15040.00 54803.00 24943.55 7436.25 32379.80 9652.80
71

(` Lac)
CS SS Total CS SS Total
1 2 3 4 5 6 7 8 9 10 11 12 13 14
Plan Outlay
Actual Expenditure
2012-13
Scheme Code SCSP 2013-14
Capital Content out of
Col.13
Expenditure
12th Plan (2012-17) Projected
Approved Outlay
STATEMENT - V
SCHEDULED CASTES SUB PLAN 2014-15 Scheme-wise Divisible Outlay and Expenditure
Annual Plan 2014-15 SCSP 2014-15
SCSP Outlay
Sub-head/Scheme
Approved Outlay Approved Outlay
NRI AffairsNRI-01 Provision of Matching Share for
providing Basic Infrastructure forCommunity Development in theRural/Urban Areas through NRI'sparticipation
2500.00 750.00 45.00 165.00 0.00 0.00 550.00 550.00 0.00 220.00 220.00 220.00
Total 2500.00 750.00 45.00 165.00 0.00 0.00 550.00 550.00 0.00 220.00 220.00 220.00
IRRIGATION AND FLOODCONTROL
A Major and Medium IrrigationIR-05 Lining of Laduka Distributary System-
RIDF XII (95:5)284.03 14.20 0.74 5.00 2.00 0.00 0.00 0.00 0.00 0.00 0.00 0.00
IR-08 Completion of Residual Works andSafety Related Works of Ranjit SagarDam
5475.00 273.75 0.00 25.00 0.00 0.00 0.00 0.00 0.00 0.00 0.00 0.00
IR-09 Lining of Channels Phase-1 (Landcompensation liabilities)
0.00 0.00 0.00 2.50 0.00 0.00 0.00 0.00 0.00 0.00 0.00 0.00
IR-10 Side-lining of Ghaggar Branch RD 0-172000 RIDF XV (95:5)
0.00 0.00 89.73 2.50 0.00 0.00 0.00 0.00 0.00 0.00 0.00 0.00
IR-13 Public Works Information ManagementSystem (PWIMS) in the IrrigationDepartment
520.00 26.00 0.00 6.00 0.00 0.00 0.00 0.00 0.00 0.00 0.00 0.00
Restructured CSS
CS(IR)-17 Accelerated Irrigation BenefitProgramme (AIBP)
171019.00 8550.95 263.62 2179.25 0.00 29119.75 15356.25 44476.00 1305.00 918.80 2223.80 2223.80
Sub Total (A) 177298.03 8864.90 354.09 2220.25 2.00 29119.75 15356.25 44476.00 1305.00 918.80 2223.80 2223.80
B Minor IrrigationMI-01 Converting Banur canal from Non
Perennial to Perennial-RIDF-XII (95:5)
2144.00 214.40 0.00 300.00 0.00 0.00 1.00 1.00 0.00 0.05 0.05 0.05
MI-02 Tubewells and Other schemes fordeep tubewells in Kandi Area-RIDF-X(95:5) (completed)
0.00 0.00 0.00 0.00 0.00 0.00 200.00 200.00 0.00 10.00 10.00 10.00
MI-04 Installation of 280 deep Tubewells and10 other tubewells in Kandi Area(RIDF-XV) (95:5)
0.00 0.00 0.00 150.00 84.65 0.00 6400.00 6400.00 0.00 320.00 320.00 320.00
72

(` Lac)
CS SS Total CS SS Total
1 2 3 4 5 6 7 8 9 10 11 12 13 14
Plan Outlay
Actual Expenditure
2012-13
Scheme Code SCSP 2013-14
Capital Content out of
Col.13
Expenditure
12th Plan (2012-17) Projected
Approved Outlay
STATEMENT - V
SCHEDULED CASTES SUB PLAN 2014-15 Scheme-wise Divisible Outlay and Expenditure
Annual Plan 2014-15 SCSP 2014-15
SCSP Outlay
Sub-head/Scheme
Approved Outlay Approved Outlay
MI-05 Construction of new 9 low Dams RIDF-XIII (95:5)
30000.00 1500.00 43.10 100.00 52.00 0.00 3000.00 3000.00 0.00 150.00 150.00 150.00
MI-07 Artificial recharge to augmentdeclining ground water resources(RIDF-XIII) (95:5)
1100.00 55.00 8.10 30.00 0.00 0.00 0.00 0.00 0.00 0.00 0.00 0.00
MI-08(ii) Other Infrastructure works includingone time ACA
50000.00 2500.00 0.00 175.00 51.00 0.00 1597.00 1597.00 0.00 79.85 79.85 79.85
MI-09 Integrated Utilisation of WaterResources (W+S)
6100.00 305.00 0.00 30.00 0.00 0.00 0.00 0.00 0.00 0.00 0.00 0.00
MI-10 Replacement/Renovation of ExistingTubewells
600.00 30.00 2.25 10.00 0.00 0.00 0.00 0.00 0.00 0.00 0.00 0.00
MI-11 Lining/Construction of Channels andDistributaries RIDF-XIV (95:5)
0.00 0.00 0.00 1.50 0.00 0.00 0.00 0.00 0.00 0.00 0.00 0.00
Restructured CSSBG(MI)-5(i) Remodelling/Construction of
Distributries/ Minors-13th FinanceCommission
0.00 0.00 244.00 250.00 42.00 5000.00 0.00 5000.00 250.00 0.00 250.00 250.00
Sub Total (B) 89944.00 4604.40 297.45 1046.50 229.65 5000.00 11198.00 16198.00 250.00 559.90 809.90 809.90
C Command Area Development andWater Management Programme
CAD-06 Lining of water courses of Aboharbranch(U) Canal system in (RIDF-XV)(95:5)
(i) Faridkot District 12238.00 1223.80 365.82 450.00 94.10 0.00 3000.00 3000.00 0.00 300.00 300.00 300.00
(ii) Other Districts 0.00 0.00 0.00 550.00 135.00 0.00 4000.00 4000.00 0.00 400.00 400.00 400.00
CAD-07 Lining of water courses on BhakraMain Branch (BMB) canal systemRIDF-XVI (95:5)
8940.00 894.00 171.55 500.00 226.00 0.00 2000.00 2000.00 0.00 200.00 200.00 200.00
New SchemesCAD-08 Construction of field channels on
Sirhind Feeder Part-II Canal System(RIDF-XIX) (95:5)
0.00 0.00 0.00 0.00 0.00 0.00 671.00 671.00 0.00 67.10 67.10 67.10
73

(` Lac)
CS SS Total CS SS Total
1 2 3 4 5 6 7 8 9 10 11 12 13 14
Plan Outlay
Actual Expenditure
2012-13
Scheme Code SCSP 2013-14
Capital Content out of
Col.13
Expenditure
12th Plan (2012-17) Projected
Approved Outlay
STATEMENT - V
SCHEDULED CASTES SUB PLAN 2014-15 Scheme-wise Divisible Outlay and Expenditure
Annual Plan 2014-15 SCSP 2014-15
SCSP Outlay
Sub-head/Scheme
Approved Outlay Approved Outlay
CAD-09 Construction of field Channels onBhatinda Branch Part-II Canal System(RIDF XIX) (95:5)
0.00 0.00 0.00 0.00 0.00 0.00 849.00 849.00 0.00 84.90 84.90 84.90
Restructured CSS
CS(CAD)-17 Accelerated Irrigation BenefitProgramme (AIBP)
97128.53 9712.86 343.86 1600.00 1007.00 18315.00 17500.00 35815.00 1831.50 1750.00 3581.50 3581.50
Sub Total (C) 118306.53 11830.66 881.23 3100.00 1462.10 18315.00 28020.00 46335.00 1831.50 2802.00 4633.50 4633.50D Flood Control and Anti-
waterloggingFC-01 Const. of Embankments and Widening
of River Ghaggar from Khanauri toKarail in District Sangrur (RIDF-XII)(95:5)
500.00 25.00 14.66 5.00 15.00 0.00 768.00 768.00 0.00 38.40 38.40 38.40
FC-02 Project for Anti-waterlogging/Drainage and Flood Control Works(RIDF-XIII) (95:5)
100.00 5.00 0.00 15.00 0.00 0.00 0.00 0.00 0.00 0.00 0.00 0.00
FC-08 Link Drains/Waterlogging, floodControl and Drainage works in theState - RIDF-XIV(95:5)
3822.00 191.10 65.81 150.00 0.00 0.00 500.00 500.00 0.00 25.00 25.00 25.00
FC-11 Providing Emergent Flood protectionon river Sutluj, Beas and Ravi (95:5)(RIDF-XVII)
0.00 0.00 0.00 0.00 0.00 0.00 500.00 500.00 0.00 25.00 25.00 25.00
New Schemes
FC-16 Measures to tackle water logging andfloods in Punjab State RIDF-XIX(95:5)
0.00 0.00 0.00 0.00 0.00 0.00 2000.00 2000.00 0.00 100.00 100.00 100.00
FC-17 Cleaning and Upgradation of Drains (OTACA 2013-14)
0.00 0.00 0.00 0.00 0.00 0.00 1500.00 1500.00 0.00 75.00 75.00 75.00
FC-12/ FC (18)
Integrated project to address waterlogging problem in south-westerndistricts of Punjab (ACA) (75:25)
0.00 0.00 0.00 0.00 0.00 3750.00 1250.00 5000.00 187.50 62.50 250.00 250.00
74

(` Lac)
CS SS Total CS SS Total
1 2 3 4 5 6 7 8 9 10 11 12 13 14
Plan Outlay
Actual Expenditure
2012-13
Scheme Code SCSP 2013-14
Capital Content out of
Col.13
Expenditure
12th Plan (2012-17) Projected
Approved Outlay
STATEMENT - V
SCHEDULED CASTES SUB PLAN 2014-15 Scheme-wise Divisible Outlay and Expenditure
Annual Plan 2014-15 SCSP 2014-15
SCSP Outlay
Sub-head/Scheme
Approved Outlay Approved Outlay
Restructured CSSsBG(FC)-05/FC-10
Measures to address the problem ofwater logging in the State-13th FinanceCommission
20000.00 1000.00 250.00 250.00 196.00 5000.00 0.00 5000.00 250.00 0.00 250.00 250.00
CS(FC)-17 Accelerated Irrigation BenefitProgramme (AIBP)
37500.00 1875.00 42.65 195.00 19.00 3500.00 500.00 4000.00 175.00 25.00 200.00 200.00
Sub Total (D) 61922.00 3096.10 373.12 615.00 230.00 12250.00 7018.00 19268.00 612.50 350.90 963.40 963.40
Total (A+B+C+D) 447470.56 28396.06 1905.89 6981.75 1923.75 64684.75 61592.25 126277.00 3999.00 4631.60 8630.60 8630.60NON-CONVENTIONAL SOURCESOF ENERGY
RE-01/NC-03 Solar Photovoltaic DemonstrationProgramme in Punjab (30:30:40)(CS:SS:Ben)
870.00 230.97 10.00 30.00 0.00 0.00 1.00 1.00 0.00 0.32 0.32 0.00
RE-03/NC-09 SPV Water Pumping Programme underJawahar Lal Nehru Solar Mission(CS:SS:Ben) (30:40:30)
1380.00 360.00 0.00 18.00 0.00 0.00 1.00 1.00 0.00 0.32 0.32 0.00
NC-10 Solar Water Heating Scheme(CS:SS:Ben.) (50:25:25)
840.00 336.00 0.00 35.00 0.00 0.00 0.00 0.00 0.00 0.00 0.00 0.00
NC-10(i) Special Area DemonstrationProgramme (CS:SS)(50:50)
3150.00 0.00 0.00 31.25 0.00 0.00 0.00 0.00 0.00 0.00 0.00 0.00
Total 6240.00 926.97 10.00 114.25 0.00 0.00 2.00 2.00 0.00 0.64 0.64 0.00
INDUSTRY AND MINERALS
VSI-07 Setting up of District Artisan HattCentres for providing marketingfacilities to the SC Artisans of the State
500.00 500.00 0.00 200.00 0.00 0.00 0.00 0.00 0.00 0.00 0.00 0.00
VSI-09 Development of Human Resources inthe field of IT/ITES( Shifed to ITdepartment)
2500.00 625.00 0.00 0.00 0.00 0.00 0.00 0.00 0.00 0.00 0.00 0.00
Total 3000.00 1125.00 0.00 200.00 0.00 0.00 0.00 0.00 0.00 0.00 0.00 0.00INFORMATION TECHNOLOGY
IT-03 Development of Human Resources inthe field of IT/ITES. (Shifted fromIndustry and Minerals subhead)
0.00 0.00 0.00 50.00 0.00 0.00 0.00 0.00 0.00 0.00 0.00 0.00
Total 0.00 0.00 0.00 50.00 0.00 0.00 0.00 0.00 0.00 0.00 0.00 0.00
75

(` Lac)
CS SS Total CS SS Total
1 2 3 4 5 6 7 8 9 10 11 12 13 14
Plan Outlay
Actual Expenditure
2012-13
Scheme Code SCSP 2013-14
Capital Content out of
Col.13
Expenditure
12th Plan (2012-17) Projected
Approved Outlay
STATEMENT - V
SCHEDULED CASTES SUB PLAN 2014-15 Scheme-wise Divisible Outlay and Expenditure
Annual Plan 2014-15 SCSP 2014-15
SCSP Outlay
Sub-head/Scheme
Approved Outlay Approved Outlay
ROADS AND BRIDGESRB-01 World Bank Scheme for Road
Infrastructure (75:25)42438.00 2122.00 344.00 1000.00 789.00 0.00 15000.00 15000.00 0.00 750.00 750.00 750.00
RB-02 NABARD assisted projectsConstruction/widening of roads andconstruction of bridges andinfrastructure RIDF-(V-XII)(XIII-XVI)(80:20)
155000.00 7750.00 225.00 999.55 188.00 0.00 1000.00 1000.00 0.00 50.00 50.00 50.00
RB-04 Improvement and widening of existingroads
52000.00 2600.00 33.00 100.00 57.00 0.00 0.00 0.00 0.00 0.00 0.00 0.00
RB-04(ii) State share for upgradation of Roadsunder PMGSY
7500.00 375.00 54.00 25.00 0.00 0.00 0.00 0.00 0.00 0.00 0.00 0.00
RB-04(iii) State share for maintenance of Roadsunder PMGSY
42500.00 2125.00 0.00 25.00 0.00 0.00 0.00 0.00 0.00 0.00 0.00 0.00
New Schemes
RB-05 Upgradation of 380 Rural Roads underRIDF-XIX (80:20) (NABARD)
0.00 0.00 0.00 0.00 0.00 0.00 20000.00 20000.00 0.00 1000.00 1000.00 1000.00
RB-06 Project for link roads and infrastructuredevelopment in rural areas (Fundedthrough RDF)
0.00 0.00 0.00 0.00 0.00 0.00 30000.00 30000.00 0.00 1500.00 1500.00 1500.00
Restructured CSSs
BG-06(RB-03)
Central Road Fund (CRF) 45000.00 2250.00 402.00 350.00 236.00 7000.00 0.00 7000.00 350.00 0.00 350.00 350.00
CS(RB)-11 (i)
Pradhan Mantri Gram Sadak Yojana(PMGSY-I)(100% Centre)
0.00 0.00 0.00 0.00 0.00 30200.00 0.00 30200.00 1510.00 0.00 1510.00 1510.00
CS(RB)-11 (ii)
Pradhan Mantri Gram Sadak Yojana(PMGSY-II)(75:25)(Centre: State)
0.00 0.00 0.00 0.00 0.00 3.00 1.00 4.00 0.15 0.05 0.20 0.20
Total 344438.00 17222.00 1058.00 2499.55 1270.00 37203.00 66001.00 103204.00 1860.15 3300.05 5160.20 5160.20
SCIENCE, TECHNOLOGY AND ENVIRONMENT
SR-07 Subsidy to students of GovernmentSchools visiting the Science City
1150.00 625.00 50.00 125.00 50.00 0.00 100.00 100.00 0.00 50.00 50.00 0.00
76

(` Lac)
CS SS Total CS SS Total
1 2 3 4 5 6 7 8 9 10 11 12 13 14
Plan Outlay
Actual Expenditure
2012-13
Scheme Code SCSP 2013-14
Capital Content out of
Col.13
Expenditure
12th Plan (2012-17) Projected
Approved Outlay
STATEMENT - V
SCHEDULED CASTES SUB PLAN 2014-15 Scheme-wise Divisible Outlay and Expenditure
Annual Plan 2014-15 SCSP 2014-15
SCSP Outlay
Sub-head/Scheme
Approved Outlay Approved Outlay
New SchemeSR-11 Assessment of level of fluoride and
subsequent oxidative stress inpregnant SC women from fluorideendemic zone of Punjab and itsprevention and management
0.00 0.00 0.00 0.00 0.00 0.00 5.00 5.00 0.00 5.00 5.00 0.00
SR-12 Socio-Economic Development ofScheduled Castes community throughtechnology interventions in horticultureand related ventures
0.00 0.00 0.00 0.00 0.00 0.00 5.00 5.00 0.00 5.00 5.00 0.00
Total 1150.00 625.00 50.00 125.00 50.00 0.00 110.00 110.00 0.00 60.00 60.00 0.00SECRETARIAT ECONOMICSERVICESState Level Schemes
PM-06 Assistance to NGOs 2750.00 825.00 108.38 165.00 75.60 0.00 250.00 250.00 0.00 80.00 80.00 0.00PM-10 State Level Initiatives (Punjab Nirman
Programme)500.00 175.00 35.00 700.00 1060.00 0.00 3000.00 3000.00 0.00 960.00 960.00 960.00
New Scheme
PM-20 Upgradation/Restroration ofInfrastructure damaged in waterloggedareas of the state
0.00 0.00 0.00 0.00 0.00 0.00 2000.00 2000.00 0.00 700.00 700.00 700.00
Block Grant(s)BG-5/(PM)-16
Incentive for issuing UIDs(Incentive for issuing UID in Punjab)(13th Finance Commission)
2160.00 626.40 29.00 125.00 0.00 1.00 0.00 1.00 0.32 0.00 0.32 0.00
BG-5/(PM)-17
District Innovation Funds (13thFinance Commission)
5000.00 1550.00 295.90 310.00 0.00 1000.00 0.00 1000.00 320.00 0.00 320.00 320.00
BG-5/(PM)-18
Development of Kandi Area-(13thFinance Commission)
25000.00 6250.00 1548.50 1562.00 310.00 6250.00 0.00 6250.00 2000.00 0.00 2000.00 2000.00
Restructured CSSCS(PM)-19 Border Area Development Programme
(BADP) (ACA)20000.00 7000.00 1577.58 1400.00 213.00 4000.00 0.00 4000.00 1280.00 0.00 1280.00 1280.00
Total (State Level) 55410.00 16426.40 3594.36 4262.00 1658.60 11251.00 5250.00 16501.00 3600.32 1740.00 5340.32 5260.00District Level Schemes
PM-3 Untied Funds of CM/Dy.CM/FM 15000.00 5250.00 524.31 1050.00 520.00 0.00 1500.00 1500.00 0.00 480.00 480.00 480.00
77

(` Lac)
CS SS Total CS SS Total
1 2 3 4 5 6 7 8 9 10 11 12 13 14
Plan Outlay
Actual Expenditure
2012-13
Scheme Code SCSP 2013-14
Capital Content out of
Col.13
Expenditure
12th Plan (2012-17) Projected
Approved Outlay
STATEMENT - V
SCHEDULED CASTES SUB PLAN 2014-15 Scheme-wise Divisible Outlay and Expenditure
Annual Plan 2014-15 SCSP 2014-15
SCSP Outlay
Sub-head/Scheme
Approved Outlay Approved Outlay
PM-5 Untied Funds of DPCs 15000.00 5250.00 295.73 877.50 20.00 0.00 2200.00 2200.00 0.00 704.00 704.00 704.00Restructured CSS
BG-5/(PM)-6 Developmet of Border Areas (BorderArea Development Programme) - 13thFinance Commission
25000.00 8750.00 2320.78 2188.00 821.40 6250.00 0.00 6250.00 2000.00 0.00 2000.00 2000.00
Total (District Level) 55000.00 19250.00 3140.82 4115.50 1361.40 6250.00 3700.00 9950.00 2000.00 1184.00 3184.00 3184.00Total( State + District) 110410.00 35676.40 6735.18 8377.50 3020.00 17501.00 8950.00 26451.00 5600.32 2924.00 8524.32 8444.00
CIVIL SUPPLIESState Level Scheme New Scheme
CS-05 New Atta Dal Scheme 0.00 0.00 0.00 0.00 0.00 0.00 40000.00 40000.00 0.00 28000.00 28000.00 0.00Total 0.00 0.00 0.00 0.00 0.00 0.00 40000.00 40000.00 0.00 28000.00 28000.00 0.00
GENERAL EDUCATIONA Elementary Education
EDE-02 Financial Assistance to the State under13th Finance Commission forimplementation of Sarv ShikshaAbhiyan Programme
14700.00 9114.00 848.16 3100.00 3100.00 5200.00 0.00 5200.00 3224.00 0.00 3224.00 0.00
EDE-04 Implementation of EDUSAT project inthe State (previously NABARD)
36500.00 18250.00 243.50 833.40 233.66 0.00 1000.00 1000.00 0.00 320.00 320.00 288.00
EDE-05 Providing furniture for students atprimary level in Government schools
4000.00 2480.00 0.00 1240.00 0.00 0.00 0.00 0.00 0.00 0.00 0.00 0.00
EDE-06 Provision of utensils for students forMDM
500.00 310.00 62.00 62.00 0.00 0.00 0.00 0.00 0.00 0.00 0.00 0.00
EDE-08 Provision for Deficit Budget to meetthe enhanced honorarium of educationvolunteers (Sikhya Karmies) underSSA programme
0.00 0.00 0.00 299.00 299.00 0.00 653.34 653.34 0.00 163.34 163.34 0.00
EDE-08/ EDE-1.2(i)
Provision for Deficit Budget to meetthe enhanced honorarium of specialtrainers under SSA programme (salary)
0.00 0.00 0.00 47.55 47.55 0.00 3000.00 3000.00 0.00 750.00 750.00 0.00
78

(` Lac)
CS SS Total CS SS Total
1 2 3 4 5 6 7 8 9 10 11 12 13 14
Plan Outlay
Actual Expenditure
2012-13
Scheme Code SCSP 2013-14
Capital Content out of
Col.13
Expenditure
12th Plan (2012-17) Projected
Approved Outlay
STATEMENT - V
SCHEDULED CASTES SUB PLAN 2014-15 Scheme-wise Divisible Outlay and Expenditure
Annual Plan 2014-15 SCSP 2014-15
SCSP Outlay
Sub-head/Scheme
Approved Outlay Approved Outlay
Restructured CSSs
CS(EDE)-13/EDE-03/02
National Programme Nutrition Supportto Primany Education (MDM)
198544.00 123097.28 3180.91 16705.00 16705.00 22500.00 7500.00 30000.00 13950.00 4650.00 18600.00 0.00
CS(EDE)-14/EDE-01
Sarv Shiksha Abhiyan (SSA) 323000.00 200260.00 22024.88 25854.00 14116.00 55000.00 29615.38 84615.38 34100.00 18361.54 52461.54 17487.00
B Secondary Education
EDS-04 Improvement of LaboratoryInfrastructure by providing Sciencematerial in 351 schools upgraded underNABARD-RIDF-XVI (85:15)
1441.00 432.30 0.00 270.00 0.00 0.00 541.00 541.00 0.00 173.12 173.12 0.00
EDS-07 Information and CommunicationTechnology (ICT) Project (Salary)
171088.00 106074.56 15466.30 6161.85 6491.00 0.00 20000.00 20000.00 0.00 5000.00 5000.00 0.00
EDS-08 Creation of posts for 351 schoolsupgraded under NABARD Project-Salary Scheme
35000.00 8750.00 1303.25 875.00 0.00 0.00 0.00 0.00 0.00 0.00 0.00 0.00
EDS-09 Creation of new posts in the schoolsunder Rationalisation policy (Salary)
35000.00 8750.00 1039.25 750.00 0.00 0.00 0.00 0.00 0.00 0.00 0.00 0.00
EDS-10 Opening of Adarsh schools in eachblock of the State (ACA 2007-08)
7214.88 2453.00 0.00 850.00 0.00 0.00 0.00 0.00 0.00 0.00 0.00 0.00
EDS-11 Vocational Education Programme 16046.00 5456.00 0.00 170.00 0.00 0.00 0.00 0.00 0.00 0.00 0.00 0.00
EDS-13 Strengthening of Science Laboratoriesin High and Senior Secondary Schools
5.00 1.75 0.00 25.00 0.00 0.00 0.00 0.00 0.00 0.00 0.00 0.00
EDS-14 Infrastructural Development inGovernment/Adarsh Schools(Education Cess)
5.00 1.75 11.75 35.00 11441.00 0.00 0.00 0.00 0.00 0.00 0.00 0.00
EDS-15 Creation of staff for new districts(Salary)
600.00 150.00 0.00 0.00 0.00 0.00 0.00 0.00 0.00 0.00 0.00 0.00
EDS-17 Free education to girl students fromclass 9th to class 12th
20000.00 5000.00 0.00 125.00 0.00 0.00 0.00 0.00 0.00 0.00 0.00 0.00
79

(` Lac)
CS SS Total CS SS Total
1 2 3 4 5 6 7 8 9 10 11 12 13 14
Plan Outlay
Actual Expenditure
2012-13
Scheme Code SCSP 2013-14
Capital Content out of
Col.13
Expenditure
12th Plan (2012-17) Projected
Approved Outlay
STATEMENT - V
SCHEDULED CASTES SUB PLAN 2014-15 Scheme-wise Divisible Outlay and Expenditure
Annual Plan 2014-15 SCSP 2014-15
SCSP Outlay
Sub-head/Scheme
Approved Outlay Approved Outlay
EDS-18 Infrastructural Development of theschools in rural areas of the State withthe assistance of RIDF-XIII NABARD(85:15)( Completed)
0.00 0.00 0.00 0.00 0.00 0.00 0.00 0.00 0.00 0.00 0.00 0.00
EDS-20 Popularization of Science Education(Science Fairs, Science Seminars andScience Exhibitions) (Revived)
0.00 0.00 0.00 5.00 0.00 0.00 0.00 0.00 0.00 0.00 0.00 0.00
EDS-21 To promote sports in Punjab schools 0.00 0.00 0.00 34.62 0.00 0.00 0.00 0.00 0.00 0.00 0.00 0.00
EDS-22 Dr. Hargobind Khurana scholarship forbrilliant poor students
0.00 0.00 0.00 320.00 198.00 0.00 1000.00 1000.00 0.00 320.00 320.00 0.00
EDS-23 Free tablets to 11th class students 0.00 0.00 0.00 1200.00 0.00 0.00 0.00 0.00 0.00 0.00 0.00 0.00
Restructured CSSsCS(EDS)-40/EDS-02
Rashtriya Madhyamik Shiksha(RMSA) for universalization ofSecondary Education (75:25)
68360.00 36368.78 2754.82 3555.91 1018.00 15000.00 5000.00 20000.00 7500.00 2500.00 10000.00 3133.00
CS(EDS)-41 Support for Educational Developmentincluding teachers training & Adulteducation.
1214.37 364.31 118.18 356.13 224.00 6185.00 1393.00 7578.00 1546.25 348.25 1894.50 218.00
CS(EDS)-42/EDS-05
Scheme for setting up of 6000 ModelSchools at Block Level as Benckmarkof Excellence (50:50)
5000.00 2500.00 31.77 331.25 0.00 1225.00 1225.00 2450.00 392.00 392.00 784.00 0.00
C Higher Education HE-01 Up-gradation of Infrastructure in
Government Colleges (ACA 2011-12 :Rs.20.00 Cr) .
30000.00 7500.00 0.00 1250.00 0.00 0.00 1.00 1.00 0.00 0.32 0.32 0.32
HE-02/HE-15 Establishment of new Model DegreeColleges in the State (where GER islow) (33:67)
6983.00 1745.75 100.00 525.00 0.00 0.00 0.00 0.00 0.00 0.00 0.00 0.00
HE-04 Matching grant to Raja Ram MohanRai Trust Kolkata for supply of booksto Libraries (40% State Share)
100.00 25.00 0.00 5.00 0.00 0.00 0.00 0.00 0.00 0.00 0.00 0.00
HE-06 Establishment of Rajiv GandhiNational University of Law Punjab
7500.00 1875.00 1024.50 696.66 697.00 0.00 1.00 1.00 0.00 0.32 0.32 0.30
80

(` Lac)
CS SS Total CS SS Total
1 2 3 4 5 6 7 8 9 10 11 12 13 14
Plan Outlay
Actual Expenditure
2012-13
Scheme Code SCSP 2013-14
Capital Content out of
Col.13
Expenditure
12th Plan (2012-17) Projected
Approved Outlay
STATEMENT - V
SCHEDULED CASTES SUB PLAN 2014-15 Scheme-wise Divisible Outlay and Expenditure
Annual Plan 2014-15 SCSP 2014-15
SCSP Outlay
Sub-head/Scheme
Approved Outlay Approved Outlay
HE-07 Setting-up of new GovernmentColleges in the State
7500.00 1875.00 123.00 550.00 0.00 0.00 0.00 0.00 0.00 0.00 0.00 0.00
HE-08 Regional Centre, Panjab UniversityChandigarh at Kauni (Sri MuktsarSahib) {Earlier name: Establishmentof Regional Centre at Kauni(Gidderbaha)}
1300.00 325.00 0.00 65.00 0.00 0.00 0.00 0.00 0.00 0.00 0.00 0.00
HE-09 Preparing Rural students of Punjab foradmission to Indian Institute ofTechnology
560.00 140.00 13.12 35.00 17.50 0.00 0.00 0.00 0.00 0.00 0.00 0.00
HE-15 Computer Labs in GovernmentColleges (ACA-2012-13)
0.00 0.00 0.00 0.00 0.00 0.00 1.00 1.00 0.00 0.32 0.32 0.00
HE-16 New Degree Colleges and removal ofgaps in existing infrastructure atMansa, Amargarh (Sangrur), Talwara(Hoshiarpur), Malerkotla (Sangrur)(ACA 2012-13)
0.00 0.00 0.00 0.00 57.50 0.00 1.00 1.00 0.00 0.32 0.32 0.32
Restructured CSS
CS(HE)-44 Rashtriya Ucchtar Sikhsha Abhiyan(RUSA)(65:35)
0.00 0.00 0.00 0.00 0.00 6500.00 3500.00 10000.00 1625.00 875.00 2500.00 125.00
D LanguagesLA-01 Development of Punjabi, Hindi, Urdu,
Sanskrit languages and celebration ofPunjabi week
1000.00 300.00 15.00 15.00 3.00 0.00 100.00 100.00 0.00 32.00 32.00 0.00
LA-02 Publication of Books 500.00 125.00 0.00 12.50 0.00 0.00 0.00 0.00 0.00 0.00 0.00 0.00Total 993661.25 543724.48 48360.39 66359.87 54648.21 111610.00 74531.72 186141.72 62337.25 33886.53 96223.78 21251.94
TECHNICAL EDUCATION
TE-01 Converting Technical institutions ofrural areas of Punjab into multi-purpose academies for enhancement ofskill development and employability ofrural youth under NABARD project(RIDF-XIV) (76:24)
1600.00 560.00 0.00 307.00 0.00 0.00 500.00 500.00 0.00 160.00 160.00 160.00
81
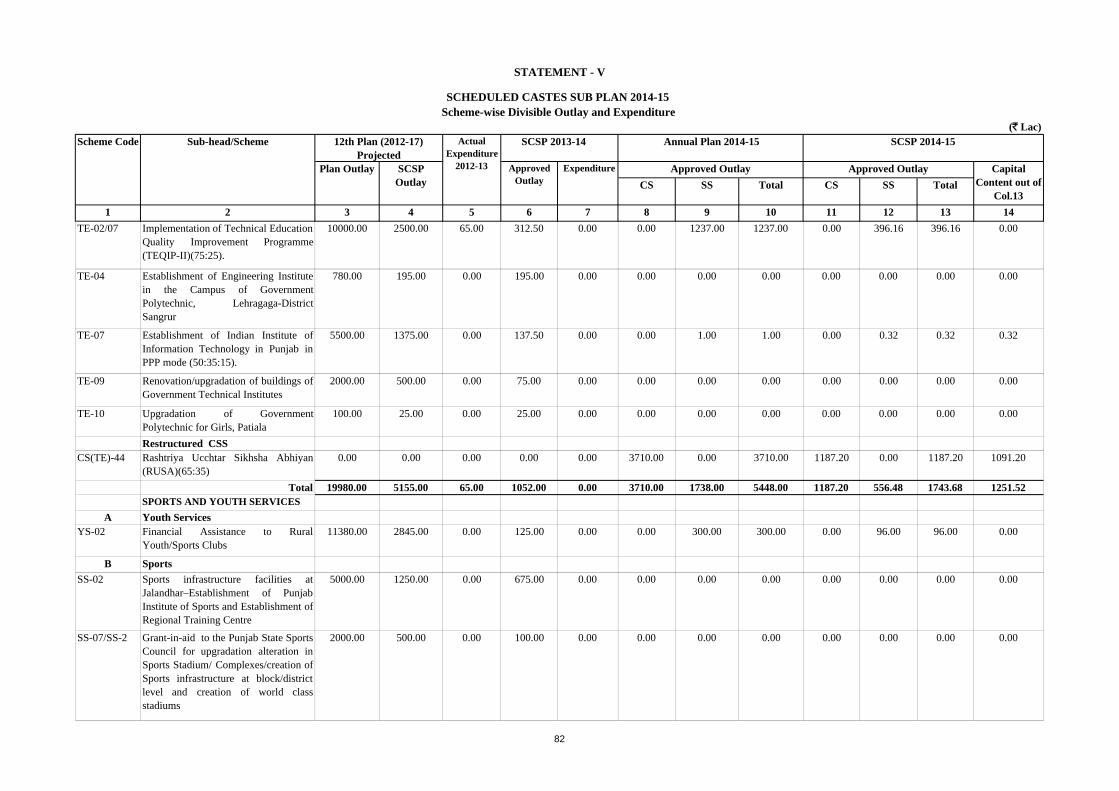
(` Lac)
CS SS Total CS SS Total
1 2 3 4 5 6 7 8 9 10 11 12 13 14
Plan Outlay
Actual Expenditure
2012-13
Scheme Code SCSP 2013-14
Capital Content out of
Col.13
Expenditure
12th Plan (2012-17) Projected
Approved Outlay
STATEMENT - V
SCHEDULED CASTES SUB PLAN 2014-15 Scheme-wise Divisible Outlay and Expenditure
Annual Plan 2014-15 SCSP 2014-15
SCSP Outlay
Sub-head/Scheme
Approved Outlay Approved Outlay
TE-02/07 Implementation of Technical EducationQuality Improvement Programme(TEQIP-II)(75:25).
10000.00 2500.00 65.00 312.50 0.00 0.00 1237.00 1237.00 0.00 396.16 396.16 0.00
TE-04 Establishment of Engineering Institutein the Campus of GovernmentPolytechnic, Lehragaga-DistrictSangrur
780.00 195.00 0.00 195.00 0.00 0.00 0.00 0.00 0.00 0.00 0.00 0.00
TE-07 Establishment of Indian Institute ofInformation Technology in Punjab inPPP mode (50:35:15).
5500.00 1375.00 0.00 137.50 0.00 0.00 1.00 1.00 0.00 0.32 0.32 0.32
TE-09 Renovation/upgradation of buildings ofGovernment Technical Institutes
2000.00 500.00 0.00 75.00 0.00 0.00 0.00 0.00 0.00 0.00 0.00 0.00
TE-10 Upgradation of GovernmentPolytechnic for Girls, Patiala
100.00 25.00 0.00 25.00 0.00 0.00 0.00 0.00 0.00 0.00 0.00 0.00
Restructured CSSCS(TE)-44 Rashtriya Ucchtar Sikhsha Abhiyan
(RUSA)(65:35)0.00 0.00 0.00 0.00 0.00 3710.00 0.00 3710.00 1187.20 0.00 1187.20 1091.20
Total 19980.00 5155.00 65.00 1052.00 0.00 3710.00 1738.00 5448.00 1187.20 556.48 1743.68 1251.52SPORTS AND YOUTH SERVICES
A Youth Services YS-02 Financial Assistance to Rural
Youth/Sports Clubs11380.00 2845.00 0.00 125.00 0.00 0.00 300.00 300.00 0.00 96.00 96.00 0.00
B Sports
SS-02 Sports infrastructure facilities atJalandhar–Establishment of PunjabInstitute of Sports and Establishment ofRegional Training Centre
5000.00 1250.00 0.00 675.00 0.00 0.00 0.00 0.00 0.00 0.00 0.00 0.00
SS-07/SS-2 Grant-in-aid to the Punjab State SportsCouncil for upgradation alteration inSports Stadium/ Complexes/creation ofSports infrastructure at block/districtlevel and creation of world classstadiums
2000.00 500.00 0.00 100.00 0.00 0.00 0.00 0.00 0.00 0.00 0.00 0.00
82

(` Lac)
CS SS Total CS SS Total
1 2 3 4 5 6 7 8 9 10 11 12 13 14
Plan Outlay
Actual Expenditure
2012-13
Scheme Code SCSP 2013-14
Capital Content out of
Col.13
Expenditure
12th Plan (2012-17) Projected
Approved Outlay
STATEMENT - V
SCHEDULED CASTES SUB PLAN 2014-15 Scheme-wise Divisible Outlay and Expenditure
Annual Plan 2014-15 SCSP 2014-15
SCSP Outlay
Sub-head/Scheme
Approved Outlay Approved Outlay
SS-08 Purchase of sports equipment 1500.00 375.00 0.00 75.00 0.00 0.00 0.00 0.00 0.00 0.00 0.00 0.00
SS-13 Grant in Aid to State Sports Councilfor development of Sports
1000.00 250.00 0.00 25.00 0.00 0.00 0.00 0.00 0.00 0.00 0.00 0.00
SS-16 Saheed Baba Deep Singh Centre ofexcellence in sports
0.00 0.00 0.00 400.00 0.00 0.00 1.00 1.00 0.00 0.32 0.32 0.00
Restructured CSS
CS(SS)-63/ SS-01
Panchayati Yuva Krida or KhelAbhiyan (PYKKA) (75:25)
1628.75 407.25 81.45 81.45 0.00 977.25 325.75 1303.00 312.72 104.24 416.96 0.00
Total 22508.75 5627.25 81.45 1481.45 0.00 977.25 626.75 1604.00 312.72 200.56 513.28 0.00MEDICAL AND PUBLIC HEALTH
Research and Medical Education
DRME-01 Establishment of Guru Ravidas Ayur-vedic University Hoshiarpur (50:50)
5000.00 1250.00 0.00 342.50 0.00 0.00 0.00 0.00 0.00 0.00 0.00 0.00
DRME-02 Construction of Nursing Collegebuildings in Government MedicalColleges in the State(ACA 2008-09)
700.00 175.00 52.50 0.00 0.00 0.00 0.00 0.00 0.00 0.00 0.00 0.00
DRME-03 Establishment of Baba Farid Universityof Health Sciences, Faridkot
8700.00 2175.00 0.00 525.00 254.48 0.00 0.00 0.00 0.00 0.00 0.00 0.00
DRME-04 Upgradation of infrastructure inGovernment Medical College andHospital (Patiala)
14300.00 3575.00 0.00 720.00 99.82 0.00 0.00 0.00 0.00 0.00 0.00 0.00
DRME-05 Upgradation of infrastructure inGovernment Medical College andHospital (Amritsar)
4000.00 1000.00 0.00 250.00 0.00 0.00 0.00 0.00 0.00 0.00 0.00 0.00
DRME-06 Upgradation of infrastructure inGovernment Dental Colleges andHospitals (Amritsar, Patiala)
6000.00 1500.00 0.00 375.00 0.00 0.00 0.00 0.00 0.00 0.00 0.00 0.00
DRME-07 Upgradation of infrastructure in GGSMedical College and Hospital, Faridkot(under the control of BFUHS)
15000.00 3750.00 179.34 1000.00 491.39 0.00 0.00 0.00 0.00 0.00 0.00 0.00
83

(` Lac)
CS SS Total CS SS Total
1 2 3 4 5 6 7 8 9 10 11 12 13 14
Plan Outlay
Actual Expenditure
2012-13
Scheme Code SCSP 2013-14
Capital Content out of
Col.13
Expenditure
12th Plan (2012-17) Projected
Approved Outlay
STATEMENT - V
SCHEDULED CASTES SUB PLAN 2014-15 Scheme-wise Divisible Outlay and Expenditure
Annual Plan 2014-15 SCSP 2014-15
SCSP Outlay
Sub-head/Scheme
Approved Outlay Approved Outlay
DRME-08 Construction of Medical Educationand Research Bhawan
2000.00 0.00 0.00 125.00 0.00 0.00 0.00 0.00 0.00 0.00 0.00 0.00
DRME-09 Upgradation/Strengthening ofinfrastructure in GovernmentAyurvedic College and Hospital,Patiala
600.00 150.00 0.00 50.00 0.00 0.00 0.00 0.00 0.00 0.00 0.00 0.00
New Scheme
DRME-14 Setting up of AIIMS like Institute in the State.
0.00 0.00 0.00 0.00 0.00 0.00 10000.00 10000.00 0.00 3200.00 3200.00 3200.00
Block GrantsBG-2 (DRME-13)
Upgradation of infrastructure in Government Medical, dental and Ayurvedic Colleges/Hospitals (OTACA)
0.00 0.00 0.00 0.00 0.00 3000.00 0.00 3000.00 960.00 0.00 960.00 960.00
Director Health ServicesDHS-02 Implementation of Emergency
Response Services in the State10000.00 2500.00 0.50 750.00 750.00 0.00 3900.00 3900.00 0.00 1248.00 1248.00 0.00
DHS-07 Punjab Nirogi Yojna (33:67) 500.00 125.00 0.00 25.00 0.00 0.00 0.00 0.00 0.00 0.00 0.00 0.00
DHS-11 Punjab Urban Health Infrastructure(DHS 10, 11, 13, 15 and 25) (Civilworks + equipment)
9000.00 2250.00 0.00 1500.00 0.00 0.00 1.00 1.00 0.00 0.32 0.32 0.00
DHS-12 Seed Corpus of Cancer Relief Fund 15000.00 3750.00 0.56 1000.00 500.00 0.00 2500.00 2500.00 0.00 800.00 800.00 0.00
DHS-13 Mata Kaushaliya Kalyan Scheme 8000.00 2400.00 0.00 660.00 330.00 0.00 0.00 0.00 0.00 0.00 0.00 0.00
DHS-14 Balri Rakshak Yojana 500.00 150.00 0.07 33.00 1.10 0.00 0.00 0.00 0.00 0.00 0.00 0.00
DHS-15 Establishment of De-addiction centresin the State
252.50 75.75 0.00 45.00 0.00 0.00 0.00 0.00 0.00 0.00 0.00 0.00
DHS-16 Providing hotline facilities in thedistrict and Sub-Divisional Hospitals inthe State
1500.00 375.00 0.00 50.00 0.00 0.00 100.00 100.00 0.00 32.00 32.00 0.00
DHS-17 Setting up of Mobile cancer detectionunits in the State
1500.00 375.00 0.00 116.00 0.00 0.00 0.00 0.00 0.00 0.00 0.00 0.00
DHS-18 Strengthening of Logistics Services inthe State of Punjab
685.00 171.25 0.00 25.00 0.00 0.00 0.00 0.00 0.00 0.00 0.00 0.00
84

(` Lac)
CS SS Total CS SS Total
1 2 3 4 5 6 7 8 9 10 11 12 13 14
Plan Outlay
Actual Expenditure
2012-13
Scheme Code SCSP 2013-14
Capital Content out of
Col.13
Expenditure
12th Plan (2012-17) Projected
Approved Outlay
STATEMENT - V
SCHEDULED CASTES SUB PLAN 2014-15 Scheme-wise Divisible Outlay and Expenditure
Annual Plan 2014-15 SCSP 2014-15
SCSP Outlay
Sub-head/Scheme
Approved Outlay Approved Outlay
DHS-19 Strengthening of Hospital ManagementInformation System and ITinfrastructure in the hospitals
1500.00 375.00 0.00 25.00 0.00 0.00 0.00 0.00 0.00 0.00 0.00 0.00
DHS-21 Assistance to NGOs/DistrictAdministration for enforcement ofPNDT Act, monitoring of pregnancies,helpline etc.
725.00 0.00 0.00 0.00 0.00 0.00 0.00 0.00 0.00 0.00 0.00 0.00
DHS-24 Upgradation/Strengthening of Nursingservices in the State (85:15)
3250.00 0.00 0.00 125.00 0.00 0.00 100.00 100.00 0.00 32.00 32.00 0.00
DHS-40 Incentive grant for reduction in IMRunder 13th Finance Commission
1000.00 0.00 0.00 0.00 0.00 7332.00 0.00 7332.00 2346.24 0.00 2346.24 0.00
DHS-44 Bhagat Puran Singh Medical insurancescheme for poor people
0.00 0.00 0.00 1300.00 650.00 0.00 1500.00 1500.00 0.00 930.00 930.00 0.00
DHS-45 Creation of Cancer and Drug de-addiction treatment infrastructure
0.00 0.00 0.00 0.00 0.00 0.00 5000.00 5000.00 0.00 1600.00 1600.00 0.00
Restructured CSS
CS(DHS)-4 National Health Mission includingNRHM (75:25)
144903.00 50419.82 2.47 5512.25 1097.00 45000.00 15000.00 60000.00 14400.00 4800.00 19200.00 0.00
CS(DHS)-36 National AIDS and STD ControlProgramme ( 50:50)
400.00 100.00 0.00 20.88 0.00 3800.00 200.00 4000.00 1216.00 64.00 1280.00 0.00
CS(DHS)-46 Social Security for unorganisedworkers including Rashtriya SwasthyaBima Yojna (MOL) (75:25 & 50:50)
2000.00 1300.00 0.00 388.00 0.00 1750.00 750.00 2500.00 560.00 240.00 800.00 0.00
AyurvedaAY-04 Upgradation and Extension of Govt.
Ayurvedic Pharmacy and Stores,Patiala
75.00 18.75 0.00 3.75 0.00 0.00 0.00 0.00 0.00 0.00 0.00 0.00
AY-07 Strengthening of District headquarterstaff in newly created Districts
500.00 125.00 15.75 37.50 0.00 0.00 150.00 150.00 0.00 37.50 37.50 0.00
Restructured CSS
CS(AY)-35 National Mission on Ayush includingMission on Medicinal Plants (75:25)
1974.20 482.31 0.00 167.00 0.00 1483.30 432.09 1915.39 485.00 161.33 646.33 0.00
85

(` Lac)
CS SS Total CS SS Total
1 2 3 4 5 6 7 8 9 10 11 12 13 14
Plan Outlay
Actual Expenditure
2012-13
Scheme Code SCSP 2013-14
Capital Content out of
Col.13
Expenditure
12th Plan (2012-17) Projected
Approved Outlay
STATEMENT - V
SCHEDULED CASTES SUB PLAN 2014-15 Scheme-wise Divisible Outlay and Expenditure
Annual Plan 2014-15 SCSP 2014-15
SCSP Outlay
Sub-head/Scheme
Approved Outlay Approved Outlay
HomoeopathyHM-05 Strengthening of existing Govt.
Homoeopathic dispensaries350.00 87.50 0.00 13.75 0.00 0.00 64.00 64.00 0.00 20.48 20.48 6.85
HM-14 Refresher Training for Medical & Para-Medical Staff
50.00 12.50 0.00 2.75 0.00 0.00 0.00 0.00 0.00 0.00 0.00 0.00
Total 259964.70 78667.88 251.19 15187.38 4173.79 62365.30 39697.09 102062.39 19967.24 13165.63 33132.87 4166.85WATER SUPPLY ANDSANITATION Urban Water Supply
UWS-06 Amritsar Sewerage Project funded byJICA
50000.00 15000.00 1668.60 1800.00 0.00 0.00 6000.00 6000.00 0.00 1920.00 1920.00 1920.00
UWS-08 Setting up of Sewerage treatment plantin 14 towns. Now renamed as UWS-6(ii)"Providing Water Supply,Sewerage and setting up STP in varioustowns".
300000.00 75000.00 434.19 1000.00 66.00 0.00 0.00 0.00 0.00 0.00 0.00 0.00
UWS-09/7 Laying of Main Sewerage line to checkcontamination of water in thePhagwara town
0.00 0.00 270.00 0.00 0.00 0.00 0.00 0.00 0.00 0.00 0.00 0.00
UWS-10 Ext. and Aug. W/S and Sewerage forthe towns of District of Mansa andBathinda
6500.00 1625.00 0.00 0.00 0.00 0.00 0.00 0.00 0.00 0.00 0.00 0.00
UWS-12 Water Supply and Sanitation andSewerage Scheme for three Religioustowns Sultanpur Lodhi, Dera BabaNanak and Chamkaur Sahib
583.00 146.00 0.00 0.00 0.00 0.00 0.00 0.00 0.00 0.00 0.00 0.00
UWS-13 Water Supply and Sewerage scheme atPatti (PIDB)
391.00 98.00 0.00 0.00 0.00 0.00 0.00 0.00 0.00 0.00 0.00 0.00
UWS-14 Water Supply and Sewerage scheme atGidderbaha
600.00 150.00 0.00 0.00 0.00 0.00 0.00 0.00 0.00 0.00 0.00 0.00
UWS-16 Provision of Water Supply & Sewerageand STP Ropar and Nangal
1900.00 475.00 0.00 0.00 0.00 0.00 0.00 0.00 0.00 0.00 0.00 0.00
86

(` Lac)
CS SS Total CS SS Total
1 2 3 4 5 6 7 8 9 10 11 12 13 14
Plan Outlay
Actual Expenditure
2012-13
Scheme Code SCSP 2013-14
Capital Content out of
Col.13
Expenditure
12th Plan (2012-17) Projected
Approved Outlay
STATEMENT - V
SCHEDULED CASTES SUB PLAN 2014-15 Scheme-wise Divisible Outlay and Expenditure
Annual Plan 2014-15 SCSP 2014-15
SCSP Outlay
Sub-head/Scheme
Approved Outlay Approved Outlay
UWS-19 Providing storm Water, Sewer onNational Highway at Taran Taran(PIDB)
827.00 207.00 0.00 0.00 200.00 0.00 0.00 0.00 0.00 0.00 0.00 0.00
UWS-20 Providing Water Supply, Sewerage,Sewage Treatment Plant at Tarn Taran
2186.00 546.50 0.00 0.00 0.00 0.00 0.00 0.00 0.00 0.00 0.00 0.00
UWS-22 Providing Water Supply facility inMalout (PIDB)
100.00 27.00 0.00 0.00 0.00 0.00 0.00 0.00 0.00 0.00 0.00 0.00
UWS-23 Laying of 1200 MMI/DRCC risingmain P-I at Abohar
9000.00 1890.00 0.00 0.00 0.00 0.00 0.00 0.00 0.00 0.00 0.00 0.00
UWS-25 Provision of water supply, sewerageand STP facilities at Bhawanigarhdistrict Sangrur and Barnala
0.00 0.00 0.00 351.60 351.00 0.00 500.00 500.00 0.00 160.00 160.00 160.00
Restructured CSS
CS(UWS)-29 Prevention of pollution of rivers in theState now renamed as "National RiverConservation Programme" (70:20:10)
30000.00 7500.00 796.17 1500.00 0.00 21000.00 6000.00 27000.00 6720.00 1920.00 8640.00 8640.00
Total (Urban Water Supply) 402087.00 102664.50 3168.96 4651.60 617.00 21000.00 12500.00 33500.00 6720.00 4000.00 10720.00 10720.00
Rural Water SupplyState Level Schemes
RWS-01 Rajiv Gandhi National Drinking WaterMission including Repair of damagedWater Supply Scheme (NRDWP- StateShare)
7000.00 2100.00 48.73 300.00 123.55 0.00 0.00 0.00 0.00 0.00 0.00 0.00
RWS-02 NABARD Aided Rural Water SupplyScheme (85:15)
40000.00 16000.00 91.88 800.00 91.19 0.00 400.00 400.00 0.00 128.00 128.00 128.00
RWS-03 Rejuvintion of Drinking water supplyscheme
0.10 0.00 0.00 0.00 0.00 0.00 0.00 0.00 0.00 0.00 0.00 0.00
RWS-04 Punjab Rural Water Supply andSanitation project with World BankAssistance.(85:15) Worldbank:GOI:GOP:Community share
90000.00 36000.00 8360.00 13400.00 7985.05 0.00 20000.00 20000.00 0.00 6400.00 6400.00 6400.00
(i) Project Management(ii)Community Development Support(iii) Infrastructure building
87

(` Lac)
CS SS Total CS SS Total
1 2 3 4 5 6 7 8 9 10 11 12 13 14
Plan Outlay
Actual Expenditure
2012-13
Scheme Code SCSP 2013-14
Capital Content out of
Col.13
Expenditure
12th Plan (2012-17) Projected
Approved Outlay
STATEMENT - V
SCHEDULED CASTES SUB PLAN 2014-15 Scheme-wise Divisible Outlay and Expenditure
Annual Plan 2014-15 SCSP 2014-15
SCSP Outlay
Sub-head/Scheme
Approved Outlay Approved Outlay
RWS-09 Provision/Augmentation of watersupply and sewerage facilities in thespecific towns
2500.00 875.00 0.00 175.00 0.00 0.00 0.00 0.00 0.00 0.00 0.00 0.00
RWS-10 Water Supply & Sewerage Scheme atMukatsar (PIDB)
5000.00 1750.00 186.39 0.00 0.00 0.00 0.00 0.00 0.00 0.00 0.00 0.00
RWS-14 Water Supply, Sewerage and Seweragetreatment Plant at Jalalabad
1000.00 350.00 84.99 0.00 0.00 0.00 0.00 0.00 0.00 0.00 0.00 0.00
RWS-15 Water Supply and Sewerage Facilitiesat Bagha-Purana Town(GLADA)
1000.00 350.00 58.08 0.00 0.00 0.00 0.00 0.00 0.00 0.00 0.00 0.00
RWS-16 NABARD Aided Sanitation Project(Construction of IHHL)
10000.00 4000.00 128.67 800.00 0.00 0.00 500.00 500.00 0.00 300.00 300.00 300.00
RWS-17 Improvement of Water Supply andSanitation facilities including varioussustainability measures in villages ofthe State (PIDB)
15000.00 6000.00 499.02 0.00 0.00 0.00 0.00 0.00 0.00 0.00 0.00 0.00
RWS-18 Installation of Reverse Osmosis systemin the State (NABARD-RIDF-XIX)
0.00 0.00 0.00 0.00 0.00 0.00 1400.00 1400.00 0.00 448.00 448.00 448.00
Restructured CSSs
CS(RWS)-02 Nirmal Bharat Abhiyan (NBA)(59:25:16)(CS:SS:Ben)
4000.00 3400.00 160.36 170.00 0.00 2500.00 200.00 2700.00 1500.00 120.00 1620.00 1620.00
CS(RWS)-03 National Rural Drinking WaterProgramme (NRDWP)(100%CS)
0.00 0.00 0.00 0.00 0.00 10000.00 0.00 10000.00 4000.00 0.00 4000.00 4000.00
Total (State level) 175500.10 70825.00 9618.12 15645.00 8199.79 12500.00 22500.00 35000.00 5500.00 7396.00 12896.00 12896.00District Level Scheme
RWS(D)-02 Installation of RO Plants at Districtlevel through PIDB
20000.00 8000.00 1235.01 0.00 0.00 0.00 0.00 0.00 0.00 0.00 0.00 0.00
Total (District level) 20000.00 8000.00 1235.01 0.00 0.00 0.00 0.00 0.00 0.00 0.00 0.00 0.00
Total(Rural Water Supply) 195500.10 78825.00 10853.13 15645.00 8199.79 12500.00 22500.00 35000.00 5500.00 7396.00 12896.00 12896.00
Total (UWS+RWS) 597587.10 181489.50 14022.09 20296.60 8816.79 33500.00 35000.00 68500.00 12220.00 11396.00 23616.00 23616.00
HOUSINGHG-04 Houses for Economically Weaker
Sections100.00 65.00 0.00 0.00 0.00 0.00 0.00 0.00 0.00 0.00 0.00 0.00
88

(` Lac)
CS SS Total CS SS Total
1 2 3 4 5 6 7 8 9 10 11 12 13 14
Plan Outlay
Actual Expenditure
2012-13
Scheme Code SCSP 2013-14
Capital Content out of
Col.13
Expenditure
12th Plan (2012-17) Projected
Approved Outlay
STATEMENT - V
SCHEDULED CASTES SUB PLAN 2014-15 Scheme-wise Divisible Outlay and Expenditure
Annual Plan 2014-15 SCSP 2014-15
SCSP Outlay
Sub-head/Scheme
Approved Outlay Approved Outlay
HG-05 Construction of LIG Houses of theSociety
100.00 15.00 0.00 0.00 0.00 0.00 0.00 0.00 0.00 0.00 0.00 0.00
Total 200.00 80.00 0.00 0.00 0.00 0.00 0.00 0.00 0.00 0.00 0.00 0.00URBAN DEVELOPMENT
UD-07 Municipal Development Fund 5000.00 1500.00 37.50 329.00 70.00 0.00 0.00 0.00 0.00 0.00 0.00 0.00
UD-11 Development works at Moga(PIDB) 1000.00 250.00 0.00 0.00 0.00 0.00 0.00 0.00 0.00 0.00 0.00 0.00
Restructured CSSs
CS(UD)-15 Jawahar Lal Nehru National UrbanRenewal Mission (JNNURM)
i) Urban Infrastructure and Governance(UIG) (50:20:30) (GoI: State: ULBs)
25000.00 7500.00 78.30 1867.00 0.00 22321.00 4000.00 26321.00 7142.72 1280.00 8422.72 8422.72
ii) Basic services to urban poor (BSUP)(50:20:30) (GoI: State: ULBs)
106920.00 53460.00 141.00 2683.00 0.00 903.80 1.00 904.80 289.22 0.32 289.54 289.54
iii) Urban Infrastructure DevelopmentScheme for Small & Medium Towns(UIDSSMT) (80:10:10) (GoI: State:ULBs)
2639.00 791.70 137.00 226.20 0.00 40000.00 5000.00 45000.00 12800.00 1600.00 14400.00 14400.00
iv) Integrated Housing & SlumDevelopment Programme (IHSDP)(80:10:10) (GoI: State: ULBs)
31000.00 31000.00 963.00 15981.00 0.00 1277.46 1.00 1278.46 408.79 0.32 409.11 409.11
v) Purchase of buses and ancillaryinfrastructure urban transportsystem(80:10:10)(New Component2014-15)
0.00 0.00 0.00 0.00 0.00 6886.00 850.00 7736.00 2203.52 272.00 2475.52 2475.52
vi) Comprehensive capacity buildingprogramme (100%CSS) (NewComponent 2014-15)
0.00 0.00 0.00 0.00 0.00 1500.00 0.00 1500.00 375.00 0.00 375.00 0.00
CS(UD)-38 National Urban Livelihood Mission(NULM) (75:25)
4000.00 1320.00 31.06 568.00 0.00 2000.00 650.00 2650.00 680.00 221.00 901.00 0.00
CS(UD-)39 Rajiv Awaas Yojna (RAY) (50:50) 20000.00 5000.00 0.00 125.00 0.00 2000.00 500.00 2500.00 800.00 200.00 1000.00 1000.00
Total 195559.00 100821.70 1387.86 21779.20 70.00 76888.26 11002.00 87890.26 24699.25 3573.64 28272.89 26996.89
89

(` Lac)
CS SS Total CS SS Total
1 2 3 4 5 6 7 8 9 10 11 12 13 14
Plan Outlay
Actual Expenditure
2012-13
Scheme Code SCSP 2013-14
Capital Content out of
Col.13
Expenditure
12th Plan (2012-17) Projected
Approved Outlay
STATEMENT - V
SCHEDULED CASTES SUB PLAN 2014-15 Scheme-wise Divisible Outlay and Expenditure
Annual Plan 2014-15 SCSP 2014-15
SCSP Outlay
Sub-head/Scheme
Approved Outlay Approved Outlay
INFORMATION AND PUBLICITY
IP-01 Purchase/Production of Films andDisplay Advertisement
7500.00 1125.00 130.05 225.00 267.00 0.00 700.00 700.00 0.00 224.00 224.00 0.00
IP-08 Purchase of books for library atheadquarter and purchase/ productionof literature
30.00 5.00 0.00 1.00 0.00 0.00 0.00 0.00 0.00 0.00 0.00 0.00
Total 7530.00 1130.00 130.05 226.00 267.00 0.00 700.00 700.00 0.00 224.00 224.00 0.00WELFARE OF SCs State Level Schemes
WSC-02 Grant-in-aid to PSCFC under OneTime Settlement Scheme
300.00 300.00 89.04 300.00 158.63 0.00 100.00 100.00 0.00 100.00 100.00 0.00
WSC-03 Houses to Houseless SCs in Rural &Urban Areas (ACA-2010-11)( Districtlevel scheme SCH(D)-01 shifted toState level)
25000.00 25000.00 0.00 5000.00 0.00 0.00 1000.00 1000.00 0.00 1000.00 1000.00 1000.00
WSC-04 Financial Assistance to SC youth forFlying Training of Commercial PilotLicense (ACA 2007-08)
500.00 500.00 0.00 100.00 0.00 0.00 0.00 0.00 0.00 0.00 0.00 0.00
WSC-05(i) Attendance scholarship to SC Primarygirl students
15000.00 15000.00 622.83 2500.00 928.43 0.00 1500.00 1500.00 0.00 1500.00 1500.00 0.00
WSC-06(i) Grant in aid to BPL SC students forpurchase of School Uniforms, Shoesand School Bags etc.
5000.00 5000.00 0.00 0.00 0.00 0.00 0.00 0.00 0.00 0.00 0.00 0.00
WSC-07 New Courses/ Vocational Training inITIs for SC Students (Staff expenditure,scholarship to SC students etc.)
5750.00 5750.00 385.78 1150.00 0.00 0.00 1000.00 1000.00 0.00 1000.00 1000.00 0.00
WSC-08 Award to the Village Panchayats forpromoting Education and SocioEconomic Development of SCs
500.00 500.00 0.00 100.00 0.00 0.00 0.00 0.00 0.00 0.00 0.00 0.00
WSC-09(i) Shagun to SC Girls/Widows/ Divorceesand the Daughters of Widows at thetime of their marriages
30500.00 30500.00 10356.55 12200.00 12026.25 0.00 7200.00 7200.00 0.00 7200.00 7200.00 0.00
90

(` Lac)
CS SS Total CS SS Total
1 2 3 4 5 6 7 8 9 10 11 12 13 14
Plan Outlay
Actual Expenditure
2012-13
Scheme Code SCSP 2013-14
Capital Content out of
Col.13
Expenditure
12th Plan (2012-17) Projected
Approved Outlay
STATEMENT - V
SCHEDULED CASTES SUB PLAN 2014-15 Scheme-wise Divisible Outlay and Expenditure
Annual Plan 2014-15 SCSP 2014-15
SCSP Outlay
Sub-head/Scheme
Approved Outlay Approved Outlay
WSC-10 Assistance to NGOs, Trusts and otherSocial Institutions for SolemnizingMass Marriages for SC couples
500.00 500.00 0.00 100.00 100.00 0.00 100.00 100.00 0.00 100.00 100.00 0.00
WSC-11 Setting up of Legal Aid Clinics in allthe districts of Punjab
750.00 750.00 0.00 150.00 0.00 0.00 0.00 0.00 0.00 0.00 0.00 0.00
New scheme
WSC-12 Construction of building for theWelfare Department at the StateHeadquarter
0.00 0.00 0.00 0.00 0.00 0.00 100.00 100.00 0.00 100.00 100.00 100.00
Restructured CSS
CS(WSC)-50 Scheme for Development of ScheduledCastes
2454.38 2454.38 491.00 542.00 542.00 18500.00 6971.00 25471.00 18500.00 6971.00 25471.00 3163.00
New scheme
CS(WSC)-53 Pradhan Mantri Adarash Gram Yojana(100%) (GOI)
0.00 0.00 0.00 0.00 0.00 5000.00 0.00 5000.00 5000.00 0.00 5000.00 5000.00
Total (State Level) 86254.38 86254.38 11945.20 22142.00 13755.31 23500.00 17971.00 41471.00 23500.00 17971.00 41471.00 9263.00District Level Schemes
WSC(D)-01 Construction of Dr. B.R. AmbedkarBhawans and their operation
6000.00 6000.00 0.00 2770.00 0.00 0.00 500.00 500.00 0.00 500.00 500.00 275.00
WSC(D)-02 Award to SC Sports Students (6-12classes)
3075.00 3075.00 0.00 615.00 0.00 0.00 615.00 615.00 0.00 615.00 615.00 0.00
Total (District Level) 9075.00 9075.00 0.00 3385.00 0.00 0.00 1115.00 1115.00 0.00 1115.00 1115.00 275.00Total (State + District) 95329.38 95329.38 11945.20 25527.00 13755.31 23500.00 19086.00 42586.00 23500.00 19086.00 42586.00 9538.00
SOCIAL SECURITY & WELFARE
State Level SchemesSSW-01 Janshree Bima Yojana for BPL families
(Rural & Urban) (50% directly releasedto the LIC by GoI ) (Scheme transferred to Health Deptt.)
1000.00 500.00 0.00 100.00 0.00 0.00 0.00 0.00 0.00 0.00 0.00 0.00
SSW-02 Aam Admi Bima Yojana (50% directlyreleased to the LIC by GoI ). (Schemetransferred to Health Deptt.)
650.00 260.00 0.00 52.00 0.00 0.00 0.00 0.00 0.00 0.00 0.00 0.00
91

(` Lac)
CS SS Total CS SS Total
1 2 3 4 5 6 7 8 9 10 11 12 13 14
Plan Outlay
Actual Expenditure
2012-13
Scheme Code SCSP 2013-14
Capital Content out of
Col.13
Expenditure
12th Plan (2012-17) Projected
Approved Outlay
STATEMENT - V
SCHEDULED CASTES SUB PLAN 2014-15 Scheme-wise Divisible Outlay and Expenditure
Annual Plan 2014-15 SCSP 2014-15
SCSP Outlay
Sub-head/Scheme
Approved Outlay Approved Outlay
SSW-03 Old Age Pension (Social SecurityFund)
262500.00 131250.00 22087.85 23250.00 20091.52 0.00 49500.00 49500.00 0.00 24750.00 24750.00 0.00
SSW-04 Financial Assistance to DisabledPersons (Social Security Fund)
28500.00 14250.00 2140.60 2400.00 2037.40 0.00 4950.00 4950.00 0.00 2475.00 2475.00 0.00
SSW-06 Awareness against Drug abuse 500.00 125.00 3.46 25.00 2.50 0.00 100.00 100.00 0.00 32.00 32.00 0.00
SSW-07 Setting up of Social Security Helplinefor Women, Children, Older andDisabled Persons in each district
100.00 0.00 0.00 5.00 0.00 0.00 100.00 100.00 0.00 32.00 32.00 0.00
SSW-09 Celeberation of World Disabled dayState Award to handicapped
2.50 0.00 0.00 10.00 10.00 0.00 3.20 3.20 0.00
SSW-10 State Award to handicapped (Clubbedscheme with SSW-09)
0.00 0.00 0.00 0.00 0.00 0.00 0.00 0.00 0.00
SSW-11 Setting up of three Beggary Homes andRehabilitation-cum-Vocational Centresfor 50 beggars( Meged with SSW-12)
500.00 250.00 0.00 50.00 0.00 0.00 0.00 0.00 0.00 0.00 0.00 0.00
SSW-12 Assistance to variousHomes/Institutions run by SocialSecurity Department
0.00 0.00 0.00 0.00 0.00 0.00 600.00 600.00 0.00 192.00 192.00 0.00
SSW-13 Setting up of community homes formentally ill persons ( merged with SSW-12)
500.00 0.00 0.00 0.00 0.00 0.00 0.00 0.00 0.00 0.00 0.00 0.00
WCD-02 Financial Assistance to dependentchildren (Social Security Fund)
24000.00 12000.00 1743.26 2025.00 1702.90 0.00 4200.00 4200.00 0.00 2100.00 2100.00 0.00
WCD-03 Financial Assistance to Widows &Destitute Women (Social SecurityFund)
52500.00 26250.00 4229.22 4650.00 4068.86 0.00 9750.00 9750.00 0.00 4875.00 4875.00 0.00
WCD-05 Mai Bhago Vidya (EDU) Scheme(Free Bicycle to all girl studentsstudying in class 9th to 12th)(Renamed Scheme SWCW(S)-3)
37500.00 11250.00 0.00 1500.00 1220.00 0.00 1.00 1.00 0.00 0.32 0.32 0.00
WCD-06 Attendance scholarship to handicappedgirl students in rural area
270.00 135.00 11.63 25.00 0.00 0.00 50.00 50.00 0.00 25.00 25.00 0.00
WCD-07 Empowerment of Women-MahilaJagriti Yojna
500.00 250.00 0.00 50.00 0.00 0.00 0.00 0.00 0.00 0.00 0.00 0.00
25.00 12.50 0.00
92

(` Lac)
CS SS Total CS SS Total
1 2 3 4 5 6 7 8 9 10 11 12 13 14
Plan Outlay
Actual Expenditure
2012-13
Scheme Code SCSP 2013-14
Capital Content out of
Col.13
Expenditure
12th Plan (2012-17) Projected
Approved Outlay
STATEMENT - V
SCHEDULED CASTES SUB PLAN 2014-15 Scheme-wise Divisible Outlay and Expenditure
Annual Plan 2014-15 SCSP 2014-15
SCSP Outlay
Sub-head/Scheme
Approved Outlay Approved Outlay
WCD-08 Implementation of Swawlambanscheme-Vocational training programmefor women
500.00 250.00 0.00 50.00 0.00 0.00 0.00 0.00 0.00 0.00 0.00 0.00
WCD-09 Awareness Programme for improvingadverse sex ratio and Female Foeticide
1000.00 330.00 0.00 45.00 0.00 0.00 0.00 0.00 0.00 0.00 0.00 0.00
WCD-10 Awareness programme for DomesticViolence Act -2005
500.00 250.00 0.00 25.00 0.00 0.00 0.00 0.00 0.00 0.00 0.00 0.00
WCD-12 Distribution of sterilized sanitary padsto rural women
1000.00 500.00 0.00 100.00 0.00 0.00 150.00 150.00 0.00 75.00 75.00 0.00
WCD-13 Scholorship to poor girls for admissionin Professional courses
0.00 0.00 0.00 400.00 0.00 0.00 1.00 1.00 0.00 0.25 0.25 0.00
Block Grant(s)BG(WCD)-5 Bebe Nanki Ladli Beti Kalyan Scheme-
13th Finance Commission Grant formeasures to improve Adverse Sex ratio
39550.00 19775.00 750.00 3125.00 2007.93 6250.00 0.00 6250.00 3125.00 0.00 3125.00 0.00
Restructured CSSs
CS(WCD)-60 National Mission for Empowerment ofWomen including Indira GandhiMattritav Sahyog Yojana (IGMSY)(100% GoI)
0.00 0.00 0.00 0.00 0.00 1578.25 0.00 1578.25 783.42 0.00 783.42 0.00
CS(WCD)-61/WCD-01
Integrated Child Protection Scheme(ICPS)(75:25)
2860.00 0.00 0.00 0.00 0.00 1787.00 596.00 2383.00 893.50 298.00 1191.50 155.00
Total (State Level) 454455.00 217637.50 30966.02 37879.50 31131.11 9615.25 70008.00 79623.25 4801.92 34857.77 39659.69 155.00
District Level Schemes
CS(SSWD)-10 (SSW(D)-01
National Social Assistance Programme(NSAP)
32480.00 16240.00 3070.03 3976.00 1025.00 7367.00 0.00 7367.00 3683.50 0.00 3683.50 0.00
Total (District level) 32480.00 16240.00 3070.03 3976.00 1025.00 7367.00 0.00 7367.00 3683.50 0.00 3683.50 0.00
Total (State + District) 486935.00 233877.50 34036.05 41855.50 32156.11 16982.25 70008.00 86990.25 8485.42 34857.77 43343.19 155.00
NUTRITIONDistrict Level Schemes
NT(D)-03 Nutrition (Kishori Shakti Yojana) 2000.00 1400.00 22.88 210.00 20.54 0.00 1.00 1.00 0.00 0.50 0.50 0.00
93

(` Lac)
CS SS Total CS SS Total
1 2 3 4 5 6 7 8 9 10 11 12 13 14
Plan Outlay
Actual Expenditure
2012-13
Scheme Code SCSP 2013-14
Capital Content out of
Col.13
Expenditure
12th Plan (2012-17) Projected
Approved Outlay
STATEMENT - V
SCHEDULED CASTES SUB PLAN 2014-15 Scheme-wise Divisible Outlay and Expenditure
Annual Plan 2014-15 SCSP 2014-15
SCSP Outlay
Sub-head/Scheme
Approved Outlay Approved Outlay
NT(D)-04 Infrastructure/Basic amenities forAnganwari centres in the State (Onetime ACA 2011-12)
7500.00 5250.00 440.34 680.00 0.00 0.00 400.00 400.00 0.00 128.00 128.00 0.00
Restructured CSSsCS-NT(D)-16 NT(D)-01
Integrated Child Development Services 120000.00 84000.00 3798.46 15595.00 1293.21 44010.00 17402.00 61412.00 17329.50 9834.65 27164.15 1960.00
CS-NT(D)62 NT(D)-02
Rajiv Gandhi Scheme forempowerment of adolescent girls(RGSEAG)- "Sabla"
8000.00 4000.00 540.42 1120.00 0.00 1805.20 1600.00 3405.20 1171.00 1120.00 2291.00 0.00
Total 137500.00 94650.00 4802.10 17605.00 1313.75 45815.20 19403.00 65218.20 18500.50 11083.15 29583.65 1960.00LABOUR & LABOUR WELFARE
A LabourLW-01 Rehabilitation of bonded labourers
(50:50)100.00 50.00 0.00 15.00 0.00 0.00 0.00 0.00 0.00 0.00 0.00 0.00
LW-04 Child Labour-Rehabilitation Funds 500.00 250.00 0.00 50.00 0.00 0.00 0.00 0.00 0.00 0.00 0.00 0.00Sub-Total (A) 600.00 300.00 0.00 65.00 0.00 0.00 0.00 0.00 0.00 0.00 0.00 0.00
B Employment Generation
EG-01 Skill Development and Training 870.00 217.50 0.00 82.50 5.00 0.00 0.00 0.00 0.00 0.00 0.00 0.00
EG-02 Centre for Training and Employment ofPunjab Youth (C-PYTE)
5000.00 1250.00 0.00 225.00 169.00 0.00 675.00 675.00 0.00 168.75 168.75 0.00
EG-03 Maharaja Ranjit Singh Armed ForcesServices Preparatory Institute Mohali(Corpus Fund)
1500.00 150.00 0.00 100.00 0.00 0.00 200.00 200.00 0.00 20.00 20.00 0.00
EG-04 Scholarship to the students of highereducation for upgradation of SpecialSkill Development (transferred toWelfare Department)
0.00 0.00 0.00 25.00 0.00 0.00 0.00 0.00 0.00 0.00 0.00 0.00
Restructured CSS
CS(EG)-45 Skill Development Mission 0.00 0.00 0.00 0.00 0.00 1000.00 0.00 1000.00 250.00 0.00 250.00 0.00Sub-Total (B) 7370.00 1617.50 0.00 432.50 174.00 1000.00 875.00 1875.00 250.00 188.75 438.75 0.00
C Industrial TrainingITI-01 Upgradation of Industrial Training
Institutes into Centres of Excellence inPunjab (75:25)
5000.00 1250.00 0.00 175.00 15.00 0.00 700.00 700.00 0.00 224.00 224.00 200.00
94

(` Lac)
CS SS Total CS SS Total
1 2 3 4 5 6 7 8 9 10 11 12 13 14
Plan Outlay
Actual Expenditure
2012-13
Scheme Code SCSP 2013-14
Capital Content out of
Col.13
Expenditure
12th Plan (2012-17) Projected
Approved Outlay
STATEMENT - V
SCHEDULED CASTES SUB PLAN 2014-15 Scheme-wise Divisible Outlay and Expenditure
Annual Plan 2014-15 SCSP 2014-15
SCSP Outlay
Sub-head/Scheme
Approved Outlay Approved Outlay
ITI-02 Expansion of Vocational TrainingFacilities under National SkillDevelopment Mission (75:25)
5000.00 1250.00 0.00 0.00 0.00 0.00 0.00 0.00 0.00 0.00 0.00 0.00
ITI-03 Upgradation of Infrastructure,Machinery, Equipment andConstruction of new Buildings forexisting Government IndustrialTraining Institutes
15000.00 3750.00 0.00 500.00 13.00 0.00 100.00 100.00 0.00 32.00 32.00 28.80
ITI-04 Providing Training in Driver-cum-mechanic (heavy/light motor vehicle)Trades and Earth Moving Machine andother Heavy Vehicle Trades
500.00 125.00 1.52 20.70 1.50 0.00 0.00 0.00 0.00 0.00 0.00 0.00
ITI-05 Provision of deficit budget under the"Introduction of Hospitality Courses"with the assistance of Ministry ofTourism, Govt. of India
1000.00 250.00 0.00 50.00 0.00 0.00 1.00 1.00 0.00 0.25 0.25 0.00
ITI-06 Deficit Budget for starting of shortterm courses under Skill DevelopmentInitiative (SDI) of DGET (Earliername: To provide Infrastructure to ITIsfor various MES sectors and Funds forSDI cell)
1500.00 375.00 0.00 25.00 0.00 0.00 0.00 0.00 0.00 0.00 0.00 0.00
ITI-07 Provision of Free Text Books and ToolKits to the Scheduled Castes
240.00 240.00 22.95 48.00 2.42 0.00 20.00 20.00 0.00 20.00 20.00 0.00
ITI-08 Training, Re-training, Seminars andStudy Tours of Staff and Trainees
100.00 25.00 0.00 5.00 0.00 0.00 0.00 0.00 0.00 0.00 0.00 0.00
ITI-09 Leather Goods Training Centre inGovernment Industrial TrainingInstitute at Gurdaspur
50.00 12.50 1.09 1.25 0.00 0.00 0.00 0.00 0.00 0.00 0.00 0.00
ITI-12 New and Upgradation of ITIs/SkillDevelopment Centres at Gurdaspur,Ludhiana, Rupnagar, SAS Nagar andFatehgarh Sahib (ACA 2012-13)
0.00 0.00 0.00 0.00 0.00 0.00 3640.00 3640.00 0.00 1164.80 1164.80 1164.80
95

(` Lac)
CS SS Total CS SS Total
1 2 3 4 5 6 7 8 9 10 11 12 13 14
Plan Outlay
Actual Expenditure
2012-13
Scheme Code SCSP 2013-14
Capital Content out of
Col.13
Expenditure
12th Plan (2012-17) Projected
Approved Outlay
STATEMENT - V
SCHEDULED CASTES SUB PLAN 2014-15 Scheme-wise Divisible Outlay and Expenditure
Annual Plan 2014-15 SCSP 2014-15
SCSP Outlay
Sub-head/Scheme
Approved Outlay Approved Outlay
ITI-13 Imparting of Employability Skills asmandatory subject under NCVTcurriculum
0.00 0.00 0.00 100.00 0.00 0.00 0.00 0.00 0.00 0.00 0.00 0.00
ITI-14 Starting of IT Literacy courses in theIndustrial Training Institutes of the State
0.00 0.00 0.00 100.00 0.00 0.00 0.00 0.00 0.00 0.00 0.00 0.00
Sub-Total (C) 28390.00 7277.50 25.56 1024.95 31.92 0.00 4461.00 4461.00 0.00 1441.05 1441.05 1393.60
Total (A+B+C) 36360.00 9195.00 25.56 1522.45 205.92 1000.00 5336.00 6336.00 250.00 1629.80 1879.80 1393.60
DEFENCE SERVICES WELFARE
DSW-01 Incentive for IMA- NDA Cadets (@Rs.1.00 lac per cadet)
400.00 100.00 0.00 25.00 30.00 0.00 20.00 20.00 0.00 2.00 2.00 0.00
DSW-02 Training scheme for the wards of ex-servicemen and others for entry toTechnical/Non-Technical Trades ofDefence/Para military forces
750.00 187.50 18.75 100.00 28.00 0.00 150.00 150.00 0.00 37.50 37.50 0.00
DSW-07 Provision for Grant of Rs. 5.00 lac eachfor purchase of plot/house for the widowsof Martyrs/ 75% to 100% disabledsoldiers during the different operationsfrom the period 1-1-1999 onwards
1000.00 250.00 0.00 20.00 0.00 0.00 0.00 0.00 0.00 0.00 0.00 0.00
Total 2150.00 537.50 18.75 145.00 58.00 0.00 170.00 170.00 0.00 39.50 39.50 0.00
HOME AFFAIRS AND JUSTICE
HAJ-08 Training to unemployed youth at PoliceSecurity Training Institute(PSTI),Jahankhelan for service in securitysector through Punjab Police SecurityCorporation(PPSC) Ltd.
500.00 200.00 20.00 84.00 0.00 0.00 0.00 0.00 0.00 0.00 0.00 0.00
Block Grant(s)BG(HAJ)-05/09
Police training (13th FinanceCommission)
15000.00 3000.00 648.00 1049.00 0.00 5000.00 0.00 5000.00 1000.00 0.00 1000.00 0.00
Total 15500.00 3200.00 668.00 1133.00 0.00 5000.00 0.00 5000.00 1000.00 0.00 1000.00 0.00Other than Restructurred CSS 0.00 0.00 0.00 0.00 0.00 14252.86 0.00 14252.86 4598.00 0.00 4598.00 0.00
Total - I (Budgetary Outlays) 4340504.50 1639062.59 130717.38 251570.98 129228.69 628621.37 481792.31 1110413.68 220112.21 178139.24 398251.45 123621.72
96
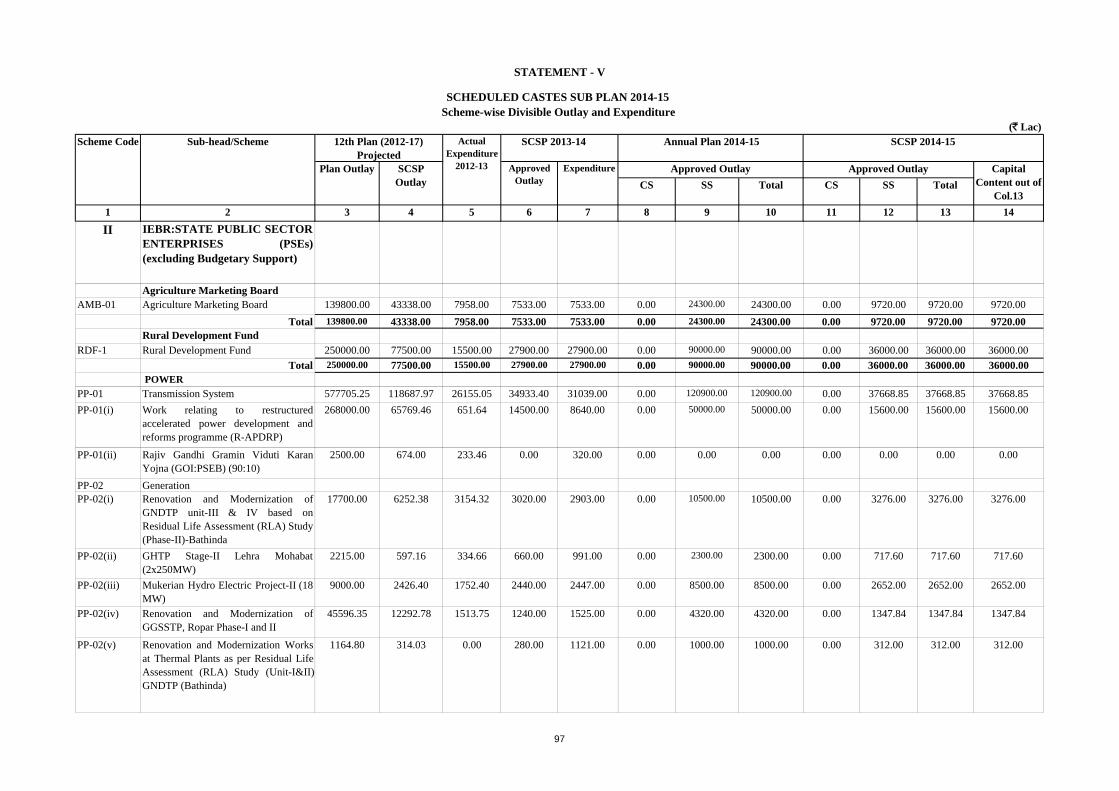
(` Lac)
CS SS Total CS SS Total
1 2 3 4 5 6 7 8 9 10 11 12 13 14
Plan Outlay
Actual Expenditure
2012-13
Scheme Code SCSP 2013-14
Capital Content out of
Col.13
Expenditure
12th Plan (2012-17) Projected
Approved Outlay
STATEMENT - V
SCHEDULED CASTES SUB PLAN 2014-15 Scheme-wise Divisible Outlay and Expenditure
Annual Plan 2014-15 SCSP 2014-15
SCSP Outlay
Sub-head/Scheme
Approved Outlay Approved Outlay
II IEBR:STATE PUBLIC SECTORENTERPRISES (PSEs)(excluding Budgetary Support)
Agriculture Marketing BoardAMB-01 Agriculture Marketing Board 139800.00 43338.00 7958.00 7533.00 7533.00 0.00 24300.00 24300.00 0.00 9720.00 9720.00 9720.00
Total 139800.00 43338.00 7958.00 7533.00 7533.00 0.00 24300.00 24300.00 0.00 9720.00 9720.00 9720.00Rural Development Fund
RDF-1 Rural Development Fund 250000.00 77500.00 15500.00 27900.00 27900.00 0.00 90000.00 90000.00 0.00 36000.00 36000.00 36000.00
Total 250000.00 77500.00 15500.00 27900.00 27900.00 0.00 90000.00 90000.00 0.00 36000.00 36000.00 36000.00 POWER
PP-01 Transmission System 577705.25 118687.97 26155.05 34933.40 31039.00 0.00 120900.00 120900.00 0.00 37668.85 37668.85 37668.85
PP-01(i) Work relating to restructuredaccelerated power development andreforms programme (R-APDRP)
268000.00 65769.46 651.64 14500.00 8640.00 0.00 50000.00 50000.00 0.00 15600.00 15600.00 15600.00
PP-01(ii) Rajiv Gandhi Gramin Viduti KaranYojna (GOI:PSEB) (90:10)
2500.00 674.00 233.46 0.00 320.00 0.00 0.00 0.00 0.00 0.00 0.00 0.00
PP-02 Generation PP-02(i) Renovation and Modernization of
GNDTP unit-III & IV based onResidual Life Assessment (RLA) Study(Phase-II)-Bathinda
17700.00 6252.38 3154.32 3020.00 2903.00 0.00 10500.00 10500.00 0.00 3276.00 3276.00 3276.00
PP-02(ii) GHTP Stage-II Lehra Mohabat(2x250MW)
2215.00 597.16 334.66 660.00 991.00 0.00 2300.00 2300.00 0.00 717.60 717.60 717.60
PP-02(iii) Mukerian Hydro Electric Project-II (18MW)
9000.00 2426.40 1752.40 2440.00 2447.00 0.00 8500.00 8500.00 0.00 2652.00 2652.00 2652.00
PP-02(iv) Renovation and Modernization ofGGSSTP, Ropar Phase-I and II
45596.35 12292.78 1513.75 1240.00 1525.00 0.00 4320.00 4320.00 0.00 1347.84 1347.84 1347.84
PP-02(v) Renovation and Modernization Worksat Thermal Plants as per Residual LifeAssessment (RLA) Study (Unit-I&II)GNDTP (Bathinda)
1164.80 314.03 0.00 280.00 1121.00 0.00 1000.00 1000.00 0.00 312.00 312.00 312.00
97

(` Lac)
CS SS Total CS SS Total
1 2 3 4 5 6 7 8 9 10 11 12 13 14
Plan Outlay
Actual Expenditure
2012-13
Scheme Code SCSP 2013-14
Capital Content out of
Col.13
Expenditure
12th Plan (2012-17) Projected
Approved Outlay
STATEMENT - V
SCHEDULED CASTES SUB PLAN 2014-15 Scheme-wise Divisible Outlay and Expenditure
Annual Plan 2014-15 SCSP 2014-15
SCSP Outlay
Sub-head/Scheme
Approved Outlay Approved Outlay
PP-02(vi) Additional works of GNDTP Bhatinda 17398.06 4690.52 0.00 2220.00 0.00 0.00 7700.00 7700.00 0.00 2402.40 2402.40 2402.40
PP-02(vii) Renovation and Modernization of BhakraPower Houses and Associated Works
6200.00 1671.52 148.32 2070.00 1516.00 0.00 7200.00 7200.00 0.00 2246.40 2246.40 2246.40
PP-02(viii) Shahpur Kandi Dam (HEP 168MW) 205429.00 55383.66 0.00 6940.00 3520.00 0.00 24214.00 24214.00 0.00 7554.77 7554.77 7554.77
PP-02(ix) Renovation and modernization ofPSEB Hydel Projects
13429.00 3620.46 58.45 1305.00 1580.00 0.00 4500.00 4500.00 0.00 1404.00 1404.00 1404.00
PP-02(x) Gas based Power plants at Ropar 0.00 0.00 0.00 47.00 0.00 0.00 166.00 166.00 0.00 51.79 51.79 51.79PP-02(xi) Gidderbaha Thermal Plant 0.00 0.00 0.00 0.00 0.00 0.00 0.00 0.00 0.00 0.00 0.00 0.00PP-02(xii) Renovation and modernization of
GHTP Stage-I 13692.35 3691.46 0.00 720.00 0.00 0.00 2500.00 2500.00 0.00 780.00 780.00 780.00
PP-02(xiii) 1320 MW State Sector Thermal Projectnear Mukerian
591000.00 149333.60 0.00 435.00 80.00 0.00 1500.00 1500.00 0.00 468.00 468.00 468.00
PP-02(xiv) Computerisation of Thermal PowerPlants
500.00 134.80 0.00 28.00 75.00 0.00 100.00 100.00 0.00 31.20 31.20 31.20
PP-02(xv) Institute of Power Management Patiala 1900.00 512.24 0.00 142.62 160.00 0.00 500.00 500.00 0.00 156.00 156.00 156.00
PP-03 Distribution 493950.00 108284.21 22221.77 21760.00 31040.00 0.00 75000.00 75000.00 0.00 23360.20 23360.20 23360.20Total 2267379.81 534336.65 56223.82 92741.02 86957.00 0.00 320900.00 320900.00 0.00 100029.05 100029.05 100029.05
PUNJAB INFRASTRUCTURE DEVELOPMENT BOARD (PIDB)
PIDB-01 Creation of infrastructure in the State 487516.20 121813.76 15813.00 40000.00 40000.00 0.00 160000.00 160000.00 0.00 51200.00 51200.00 51200.00
Total 487516.20 121813.76 15813.00 40000.00 40000.00 0.00 160000.00 160000.00 0.00 51200.00 51200.00 51200.00PUDA
PD-01 PUDA 154500.00 30900.00 4077.40 6180.00 6180.00 0.00 30900.00 30900.00 0.00 7014.30 7014.30 7014.30
Total 154500.00 30900.00 4077.40 6180.00 6180.00 0.00 30900.00 30900.00 0.00 7014.30 7014.30 7014.30GMADA
GM-01 GMADA 170000.00 34000.00 6800.00 6800.00 6800.00 0.00 34000.00 34000.00 0.00 7718.00 7718.00 7718.00Total 170000.00 34000.00 6800.00 6800.00 6800.00 0.00 34000.00 34000.00 0.00 7718.00 7718.00 7718.00GLADA
GL-01 GLADA 72500.00 14500.00 2900.00 0.00 0.00 0.00 0.00 0.00 0.00 0.00 0.00 0.00
Total 72500.00 14500.00 2900.00 0.00 0.00 0.00 0.00 0.00 0.00 0.00 0.00 0.00
Total - II (PSEs) 3541696.01 856388.41 109272.22 181154.02 175370.00 0.00 660100.00 660100.00 0.00 211681.35 211681.35 211681.35
98

(` Lac)
CS SS Total CS SS Total
1 2 3 4 5 6 7 8 9 10 11 12 13 14
Plan Outlay
Actual Expenditure
2012-13
Scheme Code SCSP 2013-14
Capital Content out of
Col.13
Expenditure
12th Plan (2012-17) Projected
Approved Outlay
STATEMENT - V
SCHEDULED CASTES SUB PLAN 2014-15 Scheme-wise Divisible Outlay and Expenditure
Annual Plan 2014-15 SCSP 2014-15
SCSP Outlay
Sub-head/Scheme
Approved Outlay Approved Outlay
III IEBR:LOCAL BODIES(excluding Budgetary Support)Rural Local Bodies
RLB-1 Rural Local Bodies 250000.00 77500.00 15500.00 15500.00 15500.00 0.00 50000.00 50000.00 0.00 20000.00 20000.00 20000.00Total 250000.00 77500.00 15500.00 15500.00 15500.00 0.00 50000.00 50000.00 0.00 20000.00 20000.00 20000.00
URBAN LOCAL BODIESULB-01 Urban Local Bodies 336196.00 84049.00 17075.00 17075.00 17075.00 0.00 41460.00 41460.00 0.00 13267.20 13267.20 13267.20
Total 336196.00 84049.00 17075.00 17075.00 17075.00 0.00 41460.00 41460.00 0.00 13267.20 13267.20 13267.20
Total - III (Local Bodies) 586196.00 161549.00 32575.00 32575.00 32575.00 0.00 91460.00 91460.00 0.00 33267.20 33267.20 33267.20
Grand Total (I+II+III) 8468396.51 2657000.00 272564.60 465300.00 337173.69 628621.37 1233352.31 1861973.68 220112.21 423087.79 643200.00 368570.27
IV INDIVISIBLE OUTLAY (NOT COVERED UNDER SCSP)
741603.49 0.00 0.00 0.00 0.00 70535.67 77473.34 148009.01 0.00 0.00 0.00 0.00
Grand Total (I+II+III+IV) 9210000.00 2657000.00 272564.60 465300.00 337173.69 699157.04 1310825.65 2009982.69 220112.21 423087.79 643200.00 368570.27
99

(` Lac)
CS SS Total CS SS Total1 2 3 4 5 6 7 8 9
CSS-Flagship SchemesRashtriya Krishi Vikas Yojana (RKVY)AGR-06 Rashtriya Krishi Vikas Yojna(RKVY)(ACA) 50000.00 0.00 50000.00 2500.00 0.00 2500.00 0.00
Total 50000.00 0.00 50000.00 2500.00 0.00 2500.00 0.00Nirmal Bharat Abhiyan (NBA)RWS-11/10 Nirmal Bharat Abhiyan (NBA) earlier Total Sanitation Programme (TSC)
2500.00 200.00 2700.00 1500.00 120.00 1620.00 1620.00
Total 2500.00 200.00 2700.00 1500.00 120.00 1620.00 1620.00National Rural Drinking Water Programme (NRDWP)
CS(RWS)-3 National Rural Drinking Water Programme (NRDWP) 10000.00 0.00 10000.00 4000.00 0.00 4000.00 4000.00
Total 10000.00 0.00 10000.00 4000.00 0.00 4000.00 4000.00National Health Mission (NHM) CS 11/CS 4 National Iodine Deficiency Disorder Control Programme 18.00 6.00 24.00 5.76 1.92 7.68 0.00
CS 12/CS 5 National Cancer Control Programme 0.00 0.00 0.00 0.00 0.00 0.00 0.00CS 13/CS 6 Institute of Mental Health, Amritsar 0.00 0.00 0.00 0.00 0.00 0.00 0.00CS 14/CS 35 National Tobacco Control Programme 50.00 25.00 75.00 16.00 8.00 24.00 0.00
CS 15/CS 47 National Programme for Control of Blindness 450.00 150.00 600.00 144.00 48.00 192.00 0.00
CS 16/CS 8 Direction and Administration 1715.00 0.00 1715.00 548.80 0.00 548.80 0.00CS 17/CS 9 Revamping of Organisational Services 25.00 0.00 25.00 8.00 0.00 8.00 0.00CS 18/CS 10 Rural Family Welfare Services (Funding of 2858 Sub-Centres)
12065.00 0.00 12065.00 3860.80 0.00 3860.80 0.00
CS 19/CS 11 Urban Family Welfare Services 388.00 0.00 388.00 124.16 0.00 124.16 0.00CS 20/CS 12 Revamping of Organisational Services of Delivery System
1374.00 0.00 1374.00 439.68 0.00 439.68 0.00
CS 21/CS 13 Training to MPW(F) in Training Schools at Gurdaspur, Sangrur, Nangal, Hoshiarpur, Bhatinda and Moga
259.00 0.00 259.00 82.88 0.00 82.88 0.00
CS 22/CS 14 Strengthening of Training School buildings 138.00 0.00 138.00 44.16 0.00 44.16 0.00
CS 23/CS 15 Training to MPW (Male) in Training schools at Mohali, Amritsar and Nabha
190.00 0.00 190.00 60.80 0.00 60.80 0.00
CS 27 Setting up of Trauma Centres 0.00 0.00 0.00 0.00 0.00 0.00 0.00
4
Approved Outlay
1
2
3
Approved Outlay Capital Content out of col.8
STATEMENT - VI
SCHEDULED CASTES SUB PLAN 2014-15 CENTRALLY SPONSORED SCHEMES (RESTRUCTURRED)
Annual Plan 2014-15 SCSP 2014-15Scheme
No.
Name of the Scheme
100

(` Lac)
CS SS Total CS SS Total1 2 3 4 5 6 7 8 9
Approved OutlayApproved Outlay Capital Content out of col.8
STATEMENT - VI
SCHEDULED CASTES SUB PLAN 2014-15 CENTRALLY SPONSORED SCHEMES (RESTRUCTURRED)
Annual Plan 2014-15 SCSP 2014-15Scheme
No.
Name of the Scheme
DHS 01/DHS12 National Rural Health Mission (NRHM) (75:25) 20547.00 12225.00 32772.00 6575.04 3912.00 10487.04 0.00
DHS 04/DHS 12(ii) Grant to Rogi Kalyan Samities(20:20:60) 0.00 0.00 0.00 0.00 0.00 0.00 0.00
DHS 05/DHS 1 National Malaria Eradication Programme (Rural)- (50:50)
0.00 0.00 0.00 0.00 0.00 0.00 0.00
DHS 06/DHS 2 National Malaria Eradication Programme (Urban) - (50:50)
0.00 0.00 0.00 0.00 0.00 0.00 0.00
DHS 08/DHS 4 Integrated Disease Surveillance Project(IDSP), Punjab -(70:30)
0.00 0.00 0.00 0.00 0.00 0.00 0.00
DHS 10/DHS 12(i) National Urban Health Mission (NUHM) (85:15) 6483.00 2161.00 8644.00 2074.56 691.52 2766.08 0.00
DHS-41 National Programme of Health Care of Elderly (80:20) 675.00 225.00 900.00 216.00 72.00 288.00 0.00DHS-42 National Programme for Prevention and Control of Cancer Diabetes, Cardiovascular Disease and Strokes (NPCDCS) (80:20)
623.00 208.00 831.00 199.36 66.56 265.92 0.00
Total 45000.00 15000.00 60000.00 14400.00 4800.00 19200.00 0.00Backward Region Grant Fund (BRGF)(i) District Component 2620.00 0.00 2620.00 838.40 0.00 838.40 838.40
(ii) State Component 100.00 0.00 100.00 32.00 0.00 32.00 0.00
Total 2720.00 0.00 2720.00 870.40 0.00 870.40 838.40Integrated Watershed Management Programme (IWMP)RDS(D)-07/RDS(D)-02(i) Integrated Watershed Management Programme (IWMP) (90:10)
2700.00 300.00 3000.00 864.00 96.00 960.00 0.00
Total 2700.00 300.00 3000.00 864.00 96.00 960.00 0.00Rajiv Gandhi Panchayat Sashastrikaran Yojana (RGPSY)RDO(S)-13/ RDO(S)-15 Training of Elected representatives and Functionaries of the Panchayati Raj Institutions under Rajiv Gandhi Panchayat Sashaktikaran Abhiyan (75:25) (Direct Release)
3000.00 625.00 3625.00 600.00 125.00 725.00 0.00
Total 3000.00 625.00 3625.00 600.00 125.00 725.00 0.00
5
6
7
101

(` Lac)
CS SS Total CS SS Total1 2 3 4 5 6 7 8 9
Approved OutlayApproved Outlay Capital Content out of col.8
STATEMENT - VI
SCHEDULED CASTES SUB PLAN 2014-15 CENTRALLY SPONSORED SCHEMES (RESTRUCTURRED)
Annual Plan 2014-15 SCSP 2014-15Scheme
No.
Name of the Scheme
Indira Awas Yojana (IAY)
RDE(D)-01 Indira Awaas Yojana 75:25 (Direct Release) 3088.00 1030.00 4118.00 2470.40 824.00 3294.40 3294.40
Total 3088.00 1030.00 4118.00 2470.40 824.00 3294.40 3294.40National Rural Employment Guarantee Scheme (NREGS)
RDE(S)-01 Mahatma Gandhi National Rural Employment Guarantee Scheme 90:10 (Direct Release)
22500.00 2250.00 24750.00 18000.00 1800.00 19800.00 0.00
Total 22500.00 2250.00 24750.00 18000.00 1800.00 19800.00 0.00National Social Assistance Programme (NSAP) 7367.00 0.00 7367.00 3683.50 0.00 3683.50 0.00SSW(D)-01(i) Indira Gandhi National Old Age Pension 0.00 0.00 0.00 0.00
SSW(D)-01(ii) National Family Benefit Scheme 0.00 0.00 0.00 0.00 0.00 0.00
SSW(D)-01(iii) Indira Gandhi National Widow Pension Scheme 0.00 0.00 0.00 0.00 0.00 0.00SSW(D)-01(iv) Indira Gandhi National Disabled Pension Scheme 0.00 0.00 0.00 0.00 0.00 0.00
Total 7367.00 0.00 7367.00 3683.50 0.00 3683.50 0.00Pradhan Mantri Gram Sadak Yojana (PMGSY)CS(RB)-11(i) Pradhan Mantri Gram Sadak Yojana (PMGSY) (100%) 30200.00 0.00 30200.00 1510.00 0.00 1510.00 1510.00
CS(RB)-11(ii) Pradhan Mantri Gram Sadak Yojana (PMGSY) (75:25) 3.00 1.00 4.00 0.15 0.05 0.20 0.20
Total 30203.00 1.00 30204.00 1510.15 0.05 1510.20 1510.20National Rural Livelihood Mission (NRLM)RDS(S)-01 Strengthening/ Administration of DRDAs/Zila Parishads (75:25)(Direct Release)
1755.00 585.00 2340.00 438.75 146.25 585.00 0.00
RDS(D)-08 National Rural Livelihood Mission (NRLM) 75:25 1000.00 250.00 1250.00 500.00 125.00 625.00 0.00
Total 2755.00 835.00 3590.00 938.75 271.25 1210.00 0.00National Programme Nutrition Support Primary Education (MDM)EDE-03/ EDE-2 Mid Day Meal Scheme (MDM) (75:25) 22500.00 7500.00 30000.00 13950.00 4650.00 18600.00 0.00
Total 22500.00 7500.00 30000.00 13950.00 4650.00 18600.00 0.00
8
9
10
11
13
12
102

(` Lac)
CS SS Total CS SS Total1 2 3 4 5 6 7 8 9
Approved OutlayApproved Outlay Capital Content out of col.8
STATEMENT - VI
SCHEDULED CASTES SUB PLAN 2014-15 CENTRALLY SPONSORED SCHEMES (RESTRUCTURRED)
Annual Plan 2014-15 SCSP 2014-15Scheme
No.
Name of the Scheme
Sarva Shiksha Abhiyan (SSA)EDE-01 Sarv Sikhsha Abhiyan including Education Guarantee Scheme (EGS), National Program for Education of Girls at Elementary Level (NPEGEL) & Kasturba Gandhi Balika Vidyalaya (KGBV) (65:35)
55000.00 29615.38 84615.38 34100.00 18361.54 52461.54 17487.00
Total 55000.00 29615.38 84615.38 34100.00 18361.54 52461.54 17487.00Jawaharlal Nehru National Urban Renewal Mission (JNNURM)
UD-01 (i) Urban Infrastructure and Governance (UIG)(50:20:30) (GoI:State:ULBs)
22321.00 4000.00 26321.00 7142.72 1280.00 8422.72 8422.72
UD-01 (ii) Basic Services to Urban Poor (BSUP) (50:20:30) (GoI:State:ULBs)
903.80 1.00 904.80 289.22 0.32 289.54 289.54
UD-01 (iii) Urban Infrastructure Development Scheme for Small & Medium Town (UIDSSMT) (80:10:10) (GoI:State:ULBs)
40000.00 5000.00 45000.00 12800.00 1600.00 14400.00 14400.00
UD-04 (iv) Integrated Housing & Slum Development Programme (IHSDP) (80:10:10) (GoI:State:ULBs)
1277.46 1.00 1278.46 408.79 0.32 409.11 409.11
UD-01(v) Purchase of buses and ancillary infrastructure for urban transport (80:10:10).
6886.00 850.00 7736.00 2203.52 272.00 2475.52 2475.52
UD-01(vi) Comprehensive Capacity Building Programme for ULBs (100%)
1500.00 0.00 1500.00 375.00 0.00 375.00 0.00
UD-05 National Urban Information System (NUIS) (75:25) 0.00 0.00 0.00 0.00 0.00 0.00 0.00
Total 72888.26 9852.00 82740.26 23219.25 3152.64 26371.89 25996.89Integrated Child Development Service (ICDS)NT(D)-01 Nutrition ICDS (50% of Actual Expenditure Reimburses by GoI) (50:50)(SNP)
11250.00 11250.00 22500.00 7875.00 7875.00 15750.00 0.00
NT(D)09- Integrated Child Development Services Scheme(90:10)(75:25) Shifted from Non Plan
29350.00 5150.00 34500.00 7337.50 1287.50 8625.00 0.00
NT(D)-04 Construction of Buildings of Anganwadi Centres under Re-structured ICDS Scheme (75:25).(GoI:GoP)
2100.00 700.00 2800.00 1470.00 490.00 1960.00 1960.00
NT(D)-13- ICDS Training Programme (90:10)( Shifted from Non Plan)
600.00 65.00 665.00 150.00 16.25 166.25 0.00
16
15
14
103

(` Lac)
CS SS Total CS SS Total1 2 3 4 5 6 7 8 9
Approved OutlayApproved Outlay Capital Content out of col.8
STATEMENT - VI
SCHEDULED CASTES SUB PLAN 2014-15 CENTRALLY SPONSORED SCHEMES (RESTRUCTURRED)
Annual Plan 2014-15 SCSP 2014-15Scheme
No.
Name of the Scheme
NT(D)-05 National Nutrition Mission.(75:25) (New Scheme)
710.00 237.00 947.00 497.00 165.90 662.90 0.00
Total 44010.00 17402.00 61412.00 17329.50 9834.65 27164.15 1960.0017 Accelerated Irrigation Benefit Programme (AIBP) & other water
resources programmesIR -01 Extension of Phase-II of Kandi Canal-from Hoshiarpur to Balachaur (AIBP) (25:75)
3019.75 9056.25 12076.00 0.00 603.80 603.80 603.80
IR -02 Construction of Shahpur Kandi Dam (AIBP)(90:10) 9000.00 1000.00 10000.00 450.00 50.00 500.00 500.00IR -3 Providing irrigation facilities to Himachal Area Below Talwara (AIBP) (25:75)
0.00 0.00 0.00 0.00 0.00 0.00 0.00
IR -03/IR -04 Rehabilitation of Channel of First Patiala Feeder and Kotla Branch (AIBP) (25:75)
500.00 1500.00 2000.00 25.00 75.00 100.00 100.00
IR-04/IR-05 Remodelling of Channels of UBDC System to meet the Revised Water Allowance (AIBP) (25:75)
0.00 0.00 0.00 0.00 0.00 0.00 0.00
IR-06/IR -09 Shri Deshmesh Irrigation Project (AIBP) (25:75) 0.00 0.00 0.00 0.00 0.00 0.00 0.00
IR-07 Extension, Renovation and Modernisation of Canals being Fed from River SutlejIR-07(i)/IR-10 Rehabilitation of Bist Doab Canal System (AIBP) (25:75)
25.00 75.00 100.00 1.25 3.75 5.00 5.00
IR-7(ii)/MI-08 Rehabilitation of Bhatinda Branch (AIBP) (25:75) 25.00 75.00 100.00 1.25 3.75 5.00 5.00
IR-07(iii)/MI-09 Rehabilitation of Sidhwan Branch (AIBP) (25:75) 25.00 75.00 100.00 1.25 3.75 5.00 5.00
IR-07(iv)/MI-10 Rehabilitation of Abohar Branch (AIBP) (25:75) 25.00 75.00 100.00 1.25 3.75 5.00 5.00
IR-11/IR-14 Project for relining of Sirhind Feeder from RD 119700-447927 (AIBP) (75:25)
7500.00 2500.00 10000.00 375.00 125.00 500.00 500.00
IR-12/IR-15 Project for relining of Rajasthan Feeder from RD 179000-496000 (AIBP) (90:10)(GoI:Rajasthan)
9000.00 1000.00 10000.00 450.00 50.00 500.00 500.00
Total (A) 29119.75 15356.25 44476.00 1305.00 918.80 2223.80 2223.80
CAD-01 Construction of field Channels on UBDC System (AIBP)/(50:40:10)
815.00 0.00 815.00 81.50 0.00 81.50 81.50
CAD-04/CAD- 06 Construction of field Channels on Sirhind feeder Phase-II Canal System (AIBP)(RIDF-XIII) (50:40:10)
5000.00 5000.00 10000.00 500.00 500.00 1000.00 1000.00
(A)
(B)
104

(` Lac)
CS SS Total CS SS Total1 2 3 4 5 6 7 8 9
Approved OutlayApproved Outlay Capital Content out of col.8
STATEMENT - VI
SCHEDULED CASTES SUB PLAN 2014-15 CENTRALLY SPONSORED SCHEMES (RESTRUCTURRED)
Annual Plan 2014-15 SCSP 2014-15Scheme
No.
Name of the Scheme
CAD-05/CAD-07 Construction of field Channels on Bhatinda Branch Phase-II Canal System (AIBP)/(50:40:10)
2500.00 2500.00 5000.00 250.00 250.00 500.00 500.00
CAD-02/CAD-03 Construction of field Channels on Eastern Canal System (AIBP)/ (50:40:10)
0.00 0.00 0.00 0.00 0.00 0.00 0.00
CAD-03/CAD-05 Construction of field Channels on Sidhwan Canal System (AIBP)/ (50:40:10)
0.00 0.00 0.00 0.00 0.00 0.00 0.00
CAD-10: Construction of field channels on Kotla Branch Phase-II system (AIBP) (50:40:10)
10000.00 10000.00 20000.00 1000.00 1000.00 2000.00 2000.00
Total (B) 18315.00 17500.00 35815.00 1831.50 1750.00 3581.50 3581.50
FC-06/FC-11 Canalization of Sakki/Kiran Nallah (CSS) (75:25)(AIBP)
75.00 25.00 100.00 3.75 1.25 5.00 5.00
FC-07/FC-12 Investment Clearance for Flood Protection works in the State (75:25) (AIBP)
375.00 125.00 500.00 18.75 6.25 25.00 25.00
FC-09/FC-15 Construction of Flood Protection Works along River Ujh, District Gurdaspur (75:25) (AIBP)
300.00 100.00 400.00 15.00 5.00 20.00 20.00
FC-12 Construction of Flood Protection Works along left side and right sides of River Beas in District Gurdaspur, Hoshiarpur and Kapurthala (75:25) (AIBP)
750.00 250.00 1000.00 37.50 12.50 50.00 50.00
FC-13 Consolidated Project Proposal for flood protection works to be executed along Indo Pak Border on River Ravi and it's tributaries ujh, to check erosion of culturable land, village abadies & defence installation. 100% RMABA
2000.00 0.00 2000.00 100.00 0.00 100.00 100.00
Total (C) 3500.00 500.00 4000.00 175.00 25.00 200.00 200.00
Total (A+B+C) 50934.75 33356.25 84291.00 3311.50 2693.80 6005.30 6005.30Border Areas Development Programme (BADP) ACA
CS(PM)-19 Border Area Development Programme (ACA) 4000.00 0.00 4000.00 1280.00 0.00 1280.00 1280.00
Total 4000.00 0.00 4000.00 1280.00 0.00 1280.00 1280.00
(C)
19
105

(` Lac)
CS SS Total CS SS Total1 2 3 4 5 6 7 8 9
Approved OutlayApproved Outlay Capital Content out of col.8
STATEMENT - VI
SCHEDULED CASTES SUB PLAN 2014-15 CENTRALLY SPONSORED SCHEMES (RESTRUCTURRED)
Annual Plan 2014-15 SCSP 2014-15Scheme
No.
Name of the Scheme
National Food Security MissionCS(AGR)-10 National Food Security Mission 6250.00 0.00 6250.00 312.50 0.00 312.50 0.00AGR-04 Intensive Cotton Development (75:25) 750.00 250.00 1000.00 37.50 12.50 50.00 0.00
Total 7000.00 250.00 7250.00 350.00 12.50 362.50 0.00National Horticulture MissionHORT-01 National Horticulture Mission(85:15) 7012.50 1237.50 8250.00 2033.77 358.73 2392.50 0.00
Total 7012.50 1237.50 8250.00 2033.77 358.73 2392.50 0.00National Mission on Sustainable Agriculture
SWC-02 -National Mission on Micro Irrigation (80:20) 2000.00 500.00 2500.00 100.00 25.00 125.00 0.00
Total 2000.00 500.00 2500.00 100.00 25.00 125.00 0.00National Oilseed and Oil Palm MissionAGR-02 Integrated Scheme of Oilseeds, Oil Palm and Maize(75:25) 375.00 125.00 500.00 85.17 28.39 113.56 0.00
Total 375.00 125.00 500.00 85.17 28.39 113.56 0.00National Mission on Agriculture Extension and Technology
CS(AGR)-07 Promotion and strengthening of Agriculture Mechanization through training & demonstration
25.00 0.00 25.00 0.00 0.00 0.00 0.00
AGR-03 Support to State Extension Programme (CS-Direct Release)
2475.00 275.00 2750.00 123.75 13.75 137.50 0.00
CS(AGR)--09 Scheme for Post Harvest Technology & Management(100%)
50.00 0.00 50.00 2.50 0.00 2.50 0.00
CS(AGR)-11 Sub-mission on Agriculture Mechanization(100%) 450.00 0.00 450.00 22.50 0.00 22.50 0.00
Total 3000.00 275.00 3275.00 148.75 13.75 162.50 0.00
National Programme for Dairy DevelopmentDD-01 National Programme for Dairy Development 900.00 200.00 1100.00 288.00 64.00 352.00 0.00
Total 900.00 200.00 1100.00 288.00 64.00 352.00 0.00National Livestock Health and Disease Control Programme
AH-01 Assistance to States for control of Animal diseases -Creation of disease free zone (75:25)
600.00 200.00 800.00 192.00 64.00 256.00 0.00
21
22
23
24
25
26
20
106

(` Lac)
CS SS Total CS SS Total1 2 3 4 5 6 7 8 9
Approved OutlayApproved Outlay Capital Content out of col.8
STATEMENT - VI
SCHEDULED CASTES SUB PLAN 2014-15 CENTRALLY SPONSORED SCHEMES (RESTRUCTURRED)
Annual Plan 2014-15 SCSP 2014-15Scheme
No.
Name of the Scheme
AH-03 Professional Efficiency Development through Strengthening of Punjab Veterinary Council (50:50)
15.00 15.00 30.00 4.80 4.80 9.60 0.00
AH-04 Establishment and Strengthening of Existing Vety Hospitals and Dispensaries(75:25).
900.00 300.00 1200.00 288.00 96.00 384.00 384.00
CS(AH)-06 National Project on Rinderpest Eradication(100%) 20.00 0.00 20.00 6.40 0.00 6.40 0.00CS(AH)-10 Foot and Mouth Disease Control Programme(100%) 200.00 0.00 200.00 64.00 0.00 64.00 0.00
CS(AH)-13 National Control Programme on Brucellosis(100%) 200.00 0.00 200.00 64.00 0.00 64.00 0.00CS(AH)-16 National Animal Disease Reporting System(NADRS)(100%)
13.00 0.00 13.00 4.16 0.00 4.16 0.00
CS(AH)-09 Animal Disease management and regulatory medicines - Establishment of Regional Disease Diagnostic Lab(100%)
50.00 0.00 50.00 16.00 0.00 16.00 0.00
Total 1998.00 515.00 2513.00 639.36 164.80 804.16 384.00National Livestock Management ProgrammeAH-05 Assistance to State Poultry Farm-Strengthening of Government Poultry Farms(80:20)
40.00 10.00 50.00 12.80 3.20 16.00 0.00
CS(AH)-07 Assistance to States for Integrated Piggery Development(100%)
1.00 0.00 1.00 0.32 0.00 0.32 0.00
CS(AH)-11 Conservation of threatened breeds of small ruminants, pigs, pack animals and equines(100%)
50.00 0.00 50.00 16.00 0.00 16.00 0.00
CS(AH)-12 Biotechnology Research Project under Fodder Development(100%)
20.00 0.00 20.00 6.40 0.00 6.40 0.00
CS(AH)-14 Strengthening and Dev of Fodder Resources in the state(100%)
800.00 0.00 800.00 256.00 0.00 256.00 0.00
CS(AH)-15 Rural Backyard Poultry Development(100%) 100.00 0.00 100.00 32.00 0.00 32.00 0.00
CS(AH)-18 Fodder Seed Procurement and Distribution(100%) 572.00 0.00 572.00 183.04 0.00 183.04 0.00
Total 1583.00 10.00 1593.00 506.56 3.20 509.76 0.00National River Conservation Programme (NRCP)
UWS-04/3(i) National River Conservation Programme (70:20:10) 21000.00 6000.00 27000.00 6720.00 1920.00 8640.00 8640.00
Total 21000.00 6000.00 27000.00 6720.00 1920.00 8640.00 8640.00
27
29
107

(` Lac)
CS SS Total CS SS Total1 2 3 4 5 6 7 8 9
Approved OutlayApproved Outlay Capital Content out of col.8
STATEMENT - VI
SCHEDULED CASTES SUB PLAN 2014-15 CENTRALLY SPONSORED SCHEMES (RESTRUCTURRED)
Annual Plan 2014-15 SCSP 2014-15Scheme
No.
Name of the Scheme
National Mission on Ayush including Mission on Medicinal Plants
AY 01/AY 2 Supply of Essential Drugs for Ayurveda, Siddha & Unani Dispensaries situated in Rural & Backward areas.(85:15)
393.00 272.00 665.00 136.03 87.49 223.52 0.00
AY 02/AY 2(b) Upgradation of 5 AYUSH Hospitals(85:15) 19.50 97.00 116.50 6.34 53.65 59.99 0.00
AY 03/AY 6 Establishment of Programme Management Unit (PMU) (85:15).
12.00 4.00 16.00 3.84 1.28 5.12 0.00
AY 05/AY 2(a) Upgradation of 5 AYUSH Hospitals 0.00 0.00 0.00 0.00 0.00 0.00 0.00
AY 10 Establishment of ISM & H wings in district Allopathic Hospitals (85:15)
0.00 0.00 0.00 0.00 0.00 0.00 0.00
AY 11 Co-location and Establishment of OPD Clinics in PHCs (85:15)
0.00 0.00 0.00 0.00 0.00 0.00 0.00
AY 12 Co-location and Establishment of OPD Clinics in CHCs (85:15)
0.00 0.00 0.00 0.00 0.00 0.00 0.00
CS 04/CS 19 Strengthening of Enforcement Mechanism for Quality Control of Ayurveda, Siddha & Unani Drugs
15.00 0.00 15.00 4.80 0.00 4.80 0.00
CS 05/CS 20 Strengthening of Drug Testing Laboratory at Patiala 1.00 0.00 1.00 0.32 0.00 0.32 0.00
CS 06/CS 22 Establishment of ISM Polyclinic with Regimental Therapy of Unani and Panchkarma etc.
5.00 0.00 5.00 1.60 0.00 1.60 0.00
CS 07/CS 23 ISM wings in District Allopathy Hospitals 213.07 0.00 213.07 68.18 0.00 68.18 0.00
CS 08/CS 48 Opening of 121 Specialty Clinics in PHC 453.75 0.00 453.75 145.20 0.00 145.20 0.00
CS 09 Construction of Ayush Bhawan 0.00 0.00 0.00 0.00 0.00 0.00 0.00
CS 13/CS 19 Strengthening of Enforcement Mechanism for Quality Control of Ayurveda, Siddha & Unani Drugs
0.00 0.00 0.00 0.00 0.00 0.00 0.00
CS 14/CS 21 Specialty Clinics of ISM (Ayurveda) in District Allopathy Hospitals
60.00 0.00 60.00 19.20 0.00 19.20 0.00
CS 05/CS 45 National Campaign/Workshop on Homoeopathy in Mother and Child Care
0.00 0.00 0.00 0.00 0.00
CS 14/CS 28 Supply of Essential drugs of ISM and H 0.01 0.00 0.01 0.00 0.00 0.00 0.00
35
108

(` Lac)
CS SS Total CS SS Total1 2 3 4 5 6 7 8 9
Approved OutlayApproved Outlay Capital Content out of col.8
STATEMENT - VI
SCHEDULED CASTES SUB PLAN 2014-15 CENTRALLY SPONSORED SCHEMES (RESTRUCTURRED)
Annual Plan 2014-15 SCSP 2014-15Scheme
No.
Name of the Scheme
CS 15/CS 29 Establishment of Specialty Clinics/Treatment Centres of ISM and H in Allopathy Hospitals
1.82 0.00 1.82 0.00 0.00 0.00 0.00
CS 16/ CS 30 Establishment of ISM & H wings in District Allopathy Hospitals
26.88 0.00 26.88 0.00 0.00 0.00 0.00
CS 17/CS 32 Establishment of specialized therapy Centre with hospitalized facilities for Homoeopathy
6.02 0.00 6.02 0.00 0.00 0.00 0.00
HM 01/HM 3 Co-location in CHCs (OPD Clinic)/ Establishment of Ayush OPD Clinics in CHCs/ SDHs/DHs (85:15).
88.40 15.60 104.00 44.40 0.00 44.40 0.00
HM 02/HM 5 Establishment of ISM & H Wings in District Allopathic Hospitals(85:15).
6.40 1.13 7.53 2.41 0.00 2.41 0.00
HM 03/HM 6 Co-location in PHCs(OPD Clinics)/ Establishment of Ayush OPD Clinics in CHSs/PHs(85:15).
0.00 0.00 0.00 0.00 0.00 0.00 0.00
HM 04/HM 2 Supply of essential drugs of ISM&H (85:15) 86.71 25.64 112.35 22.36 13.56 35.92 0.00
HM 06 Supply of Essential Drugs of ISM&H to NRHM dispensaries (85:15)
0.00 0.00 0.00 0.00 0.00 0.00 0.00
HM 10 Upgradation of AYUSH Homoeopathic Dispensaries.(85:15) 26.29 4.64 30.93 8.41 1.49 9.90 0.00
HM 11 Establishment of specialised therapy centre with hospitalization facility for Homoeopathy- Provision of Staff & Medicines. (85:15)
8.10 1.43 9.53 2.59 0.46 3.05 0.00
HM 12 Establishment of specialty clinic of ISM&H Hospitals - Provision of Medicines. (85:15)
28.05 4.95 33.00 8.98 1.58 10.56 0.00
HM 13 Establishment of ISM & H wing in District Allopathic Hospitals-Provision of Medicines(85:15)
32.30 5.70 38.00 10.34 1.82 12.16 0.00
Total 1483.30 432.09 1915.39 485.00 161.33 646.33 0.00National AIDS & STD Control ProgrammeCS 09/CS 41 Matching Grant to State Blood Transfusion Council under the AIDS Control Society (100% & 50:50)
200.00 200.00 400.00 64.00 64.00 128.00 0.00
CS 09A/41 National AIDS and STD control Programme 3600.00 0.00 3600.00 1152.00 0.00 1152.00 0.00
Total 3800.00 200.00 4000.00 1216.00 64.00 1280.00 0.00
36
109

(` Lac)
CS SS Total CS SS Total1 2 3 4 5 6 7 8 9
Approved OutlayApproved Outlay Capital Content out of col.8
STATEMENT - VI
SCHEDULED CASTES SUB PLAN 2014-15 CENTRALLY SPONSORED SCHEMES (RESTRUCTURRED)
Annual Plan 2014-15 SCSP 2014-15Scheme
No.
Name of the Scheme
National Urban Livelihood MissionCS(UD)-38 National Urban Livelihood Mission (NULM) (75:25) Earlier Swarn Jayanti Shehri Rozgar Yojna.
2000.00 650.00 2650.00 680.00 221.00 901.00 0.00
Total 2000.00 650.00 2650.00 680.00 221.00 901.00 0.00Rajiv Awas Yojana (MOHPUA)UD-13/13 Rajiv Awas Yojana 2000.00 500.00 2500.00 800.00 200.00 1000.00 1000.00
Total 2000.00 500.00 2500.00 800.00 200.00 1000.00 1000.00Rashtriya Madhyamik Shiksha Abhiyan (RMSA)EDS-02/ EDS-13 Rashtriya Madhyamik Shiksha Abhiyan (RMSA) for Universalization of Secondary Education (75:25)
9044.93 3014.97 12059.90 4522.46 1507.48 6029.94 3133.00
EDS-01/ EDS-2 Information and Communication Technology (ICT) in Punjab Schools (75:25)
4472.96 1525.94 5998.90 2236.48 762.97 2999.45 0.00
EDS-06/ EDS-14 Construction and running of girls hostels for students of Secondary & Higher Secondary Schools (90:10)
157.24 17.47 174.71 78.62 8.74 87.36 0.00
EDS-26 Vocationalisation of Education (75:25) (New scheme) 1324.87 441.62 1766.49 662.44 220.81 883.25 0.00
Total 15000.00 5000.00 20000.00 7500.00 2500.00 10000.00 3133.00Support for Educational Development including Teachers Training & Adult EducationCS-09 National means cum Merit Scholarship Scheme (100%) (Non-plan)
473.35 0.00 473.35 118.34 0.00 118.34 0.00
CS-10/CS-11 Incentives to girls for secondary education (100%) 1380.00 0.00 1380.00 345.00 0.00 345.00 0.00
CS-12/CS-18 Assistance for appointment of Urdu teachers (100%) 145.00 0.00 145.00 36.25 0.00 36.25 0.00
EDS-19/CS-08/CS-2 Teacher education establishment of District Institutes of Education and Training (DIETS) (75:25 pattern from 1/4/2012) (Earlier Pattern: 100%)
2625.33 872.56 3497.89 656.33 218.14 874.47 218.00
EDS-03 Sakshar Bharat Mission- 2012 (75:25) (Earlier name: Adult Education Programme 67:33)
1561.32 520.44 2081.76 390.33 130.11 520.44 0.00
Total 6185.00 1393.00 7578.00 1546.25 348.25 1894.50 218.00
38
39
40
41
110

(` Lac)
CS SS Total CS SS Total1 2 3 4 5 6 7 8 9
Approved OutlayApproved Outlay Capital Content out of col.8
STATEMENT - VI
SCHEDULED CASTES SUB PLAN 2014-15 CENTRALLY SPONSORED SCHEMES (RESTRUCTURRED)
Annual Plan 2014-15 SCSP 2014-15Scheme
No.
Name of the Scheme
Scheme for setting up of 6000 Model Schools at Block level as Benchmark of ExcellenceEDS-05/ EDS-15 Setting up of model schools at block level in educationally backward blocks (50:50) (Pattern changed to 50:50 w.e.f. 1/04/2014. Earlier pattern 75:25)
1225.00 1225.00 2450.00 392.00 392.00 784.00 0.00
Total 1225.00 1225.00 2450.00 392.00 392.00 784.00 0.0044 Rashtriya Uchhtar Shiksha Abhiyan
Higher EducationCS(HE)-44 Rashtriya Uchhtar Shiksha Abhiyan (RUSA) (65:35) 6500.00 3500.00 10000.00 1625.00 875.00 2500.00 125.00
Total A 6500.00 3500.00 10000.00 1625.00 875.00 2500.00 125.00
Technical Education CS-03 Setting up of new polytechnics in the districts where no government polytechnic exists at present (100%)
1610.00 0.00 1610.00 515.20 0.00 515.20 515.20
CS-04 Construction of women hostel in existing polytechnics (100%) 300.00 0.00 300.00 96.00 0.00 96.00 96.00
CS-05 Central Assistance for strengthening of existing Polytechnics (100%)
1500.00 0.00 1500.00 480.00 0.00 480.00 480.00
CS-06 Community Development through Polytechnics (CDTP) (100%)
300.00 0.00 300.00 96.00 0.00 96.00 0.00
Total B 3710.00 0.00 3710.00 1187.20 0.00 1187.20 1091.20
Total (A+B) 10210.00 3500.00 13710.00 2812.20 875.00 3687.20 1216.20Skill Development MissionCS(EG)-45 Skill Development Mission 1000.00 0.00 1000.00 250.00 0.00 250.00 0.00
Total 1000.00 0.00 1000.00 250.00 0.00 250.00 0.00Social Security for Unorganized Workers including Rashtriya Swasthaya Bima YojanaDHS-03/DHS-20 Rashtriya Swasthya Bima Yojna for workers covered under BPL(75:25)
1500.00 500.00 2000.00 480.00 160.00 640.00 0.00
CS(DHS)-48 Aam Admi Bima Yojna (50:50) 250.00 250.00 500.00 80.00 80.00 160.00 0.00
Total 1750.00 750.00 2500.00 560.00 240.00 800.00 0.00
B
45
46
A
42
111

(` Lac)
CS SS Total CS SS Total1 2 3 4 5 6 7 8 9
Approved OutlayApproved Outlay Capital Content out of col.8
STATEMENT - VI
SCHEDULED CASTES SUB PLAN 2014-15 CENTRALLY SPONSORED SCHEMES (RESTRUCTURRED)
Annual Plan 2014-15 SCSP 2014-15Scheme
No.
Name of the Scheme
Scheme for Development of Scheduled Castes (i) CS(WSC)01-34- Scholarship for Post Matric Students for Scheduled Castes. (100% GoI)(Shifted from Non Plan).
12229.00 6079.00 18308.00 12229.00 6079.00 18308.00 0.00
(ii) CS(WSC)-02 Babu Jagjivan Ram Chhatrawas Yojana -Construction of Hostels for SC Girls in Schools & Colleges. (100% GoI).
2000.00 0.00 2000.00 2000.00 0.00 2000.00 2000.00
(iii) 03-33 CS(WSC)-03 Babu Jagjivan Ram Chhatrawas Hostels for Boys & Girls in Schools & Colleges. (50:50) (GoI:GoP) (Shifted from Non Plan)
50.00 50.00 100.00 50.00 50.00 100.00 100.00
(iv)10-50 Implementation of Protection of Civil Rights Act -1955 and the Scheduled Caste & the Scheduled Tribes (Prevention of Atrocities Act 1989)(Clubbed Scheme SCOP (S)-1 & SCOP(S)-2. (100% GoI) (Shifted from Non Plan)
300.00 300.00 600.00 300.00 300.00 600.00 0.00
(v)WSC-01 Share Capital Contribution to PSCFC (State Share 51% & GoI 49%) (direct release by GoI)
521.00 542.00 1063.00 521.00 542.00 1063.00 1063.00
(vi) CS(WSC)-04 Pre-Matric Scholarship for Scheduled Caste Students Studying in class IXth & Xth (100% GoI)
3000.00 0.00 3000.00 3000.00 0.00 3000.00 0.00
(vii) Upgradation of Merit of SC Students.(New Scheme)
400.00 0.00 400.00 400.00 0.00 400.00 0.00
Total 18500.00 6971.00 25471.00 18500.00 6971.00 25471.00 3163.00Pradhan Mantri Adarsh Gram Yojana (PMAGY) in SC villages. (100% GoI) (New Scheme)
5000.00 0.00 5000.00 5000.00 0.00 5000.00 5000.00
Total 5000.00 0.00 5000.00 5000.00 0.00 5000.00 5000.00National Mission for Empowerment of Women including Indira Gandhi Matritav Sahyog Yojana (100% GoI)
CS(WCD)-08 Establishment of State Resource Centre for Women under National Mission for Empowerment of Women (100% GoI)
10.00 0.00 10.00 5.00 0.00 5.00 0.00
CS(WCD)-02 Indira Gandhi Matritva Sahyog Yojana (IGMSY)- Conditional Maternity Benefit Scheme (CMB)(100% GoI)
1511.94 0.00 1511.94 756.00 0.00 756.00 0.00
60
50
53
112

(` Lac)
CS SS Total CS SS Total1 2 3 4 5 6 7 8 9
Approved OutlayApproved Outlay Capital Content out of col.8
STATEMENT - VI
SCHEDULED CASTES SUB PLAN 2014-15 CENTRALLY SPONSORED SCHEMES (RESTRUCTURRED)
Annual Plan 2014-15 SCSP 2014-15Scheme
No.
Name of the Scheme
CS(WCD)19-Indira Gandhi Matritva Sahyog Yojana (IGMSY)- Conditional Maternity Benefit Scheme (CMB)(100% GoI) (Shifted from Non Plan)
22.86 0.00 22.86 5.72 0.00 5.72 0.00
CS(WCD)-09 Umbrella Scheme For Protection and development of Women
33.45 0.00 33.45 16.70 0.00 16.70 0.00
Total 1578.25 0.00 1578.25 783.42 0.00 783.42 0.00Integrated Child Protection Scheme (ICPS)CS(WCD)-61/WCD-01 Integrated Child Protection Scheme (ICPS) (75:25) (GoI:GoP)
1787.00 596.00 2383.00 893.50 298.00 1191.50 155.00
Total 1787.00 596.00 2383.00 893.50 298.00 1191.50 155.00Rajiv Gandhi Scheme for Empowerment of Adolescent Girls (SABLA)
(i) NT(D)-02 Rajiv Gandhi Scheme for Empowerment of Adolescent Girls (RGSEAG)-SABLA(SNP 50:50)
1600.00 1600.00 3200.00 1120.00 1120.00 2240.00 0.00
(ii) NT(D)-02(i)/18- Rajiv Gandhi Scheme for Empowerment of Adolescent girls (SABLA) (100% GoI (Shifted from Non Plan)
205.20 0.00 205.20 51.00 0.00 51.00 0.00
Total 1805.20 1600.00 3405.20 1171.00 1120.00 2291.00 0.00Panchayat Yuva Krida aur Khel Abhiyan (PYKKA)
SS-01/SS-11 Panchayati Yuva Krida or Khel Abhiyan PYKKA (75:25)
977.25 325.75 1303.00 312.72 104.24 416.96 0.00
Total 977.25 325.75 1303.00 312.72 104.24 416.96 0.00
Grand Total 550335.51 150221.97 700557.48 198301.15 62814.12 261115.27 86901.39
63
61
62
113
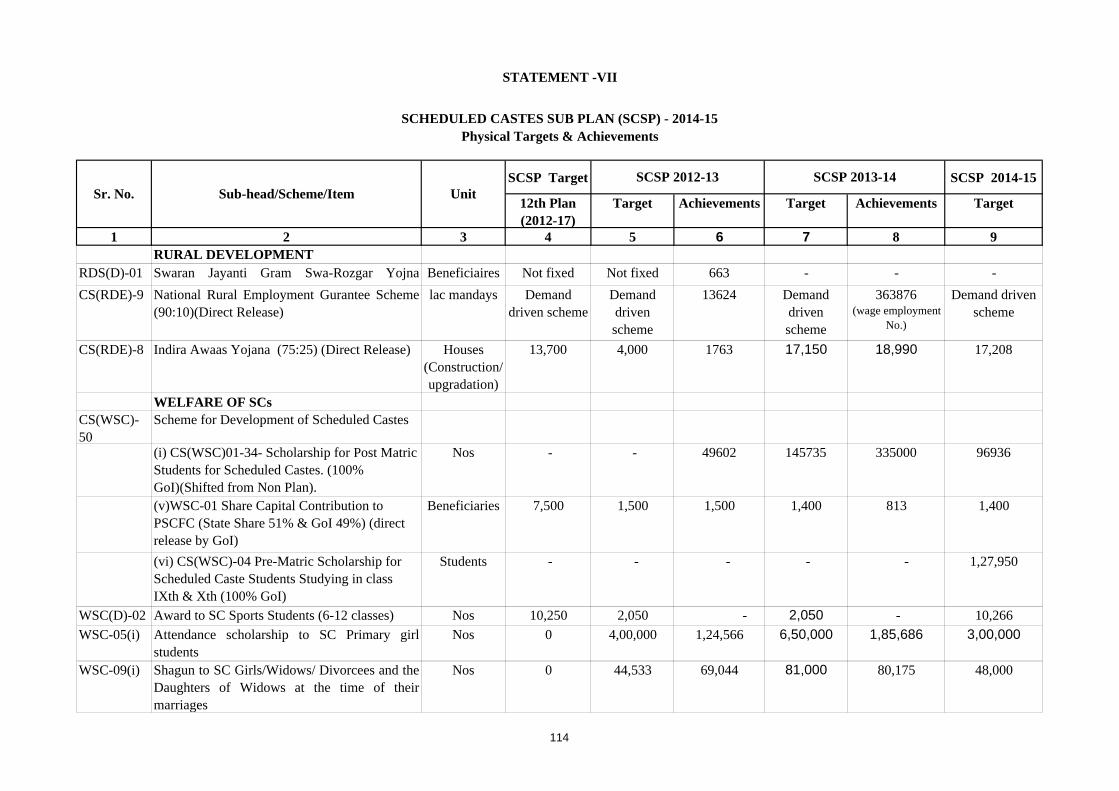
SCSP Target SCSP 2014-15
12th Plan (2012-17)
Target Achievements Target Achievements Target
1 2 3 4 5 6 7 8 9RURAL DEVELOPMENT
RDS(D)-01 Swaran Jayanti Gram Swa-Rozgar Yojna Beneficiaires Not fixed Not fixed 663 - - -
CS(RDE)-9 National Rural Employment Gurantee Scheme(90:10)(Direct Release)
lac mandays Demand driven scheme
Demand driven scheme
13624 Demand driven scheme
363876 (wage employment
No.)
Demand driven scheme
CS(RDE)-8 Indira Awaas Yojana (75:25) (Direct Release) Houses (Construction/ upgradation)
13,700 4,000 1763 17,150 18,990 17,208
WELFARE OF SCs CS(WSC)-50
Scheme for Development of Scheduled Castes
(i) CS(WSC)01-34- Scholarship for Post Matric Students for Scheduled Castes. (100% GoI)(Shifted from Non Plan).
Nos - - 49602 145735 335000 96936
(v)WSC-01 Share Capital Contribution to PSCFC (State Share 51% & GoI 49%) (direct release by GoI)
Beneficiaries 7,500 1,500 1,500 1,400 813 1,400
(vi) CS(WSC)-04 Pre-Matric Scholarship for Scheduled Caste Students Studying in class IXth & Xth (100% GoI)
Students - - - - - 1,27,950
WSC(D)-02 Award to SC Sports Students (6-12 classes) Nos 10,250 2,050 - 2,050 - 10,266
WSC-05(i) Attendance scholarship to SC Primary girlstudents
Nos 0 4,00,000 1,24,566 6,50,000 1,85,686 3,00,000
WSC-09(i) Shagun to SC Girls/Widows/ Divorcees and theDaughters of Widows at the time of theirmarriages
Nos 0 44,533 69,044 81,000 80,175 48,000
SCHEDULED CASTES SUB PLAN (SCSP) - 2014-15Physical Targets & Achievements
STATEMENT -VII
Sr. No.SCSP 2012-13 SCSP 2013-14
Sub-head/Scheme/Item Unit
114

SCSP Target SCSP 2014-15
12th Plan (2012-17)
Target Achievements Target Achievements Target
1 2 3 4 5 6 7 8 9
SCHEDULED CASTES SUB PLAN (SCSP) - 2014-15Physical Targets & Achievements
STATEMENT -VII
Sr. No.SCSP 2012-13 SCSP 2013-14
Sub-head/Scheme/Item Unit
WSC-03 Houses to Houseless SCs in Rural & UrbanAreas
Nos 50,000 10,000 - 25,000 - 2,000
WSC-07 New Courses/ Vocational Training in ITIs forSC Students (Staff expenditure, scholarship toSC students etc.)
Nos 29,330 5,866 1,157 5,866 - 3,000
WSC-04 Financial Assistance to SC youth for FlyingTraining of Commercial Pilot License (ACA2007-08)
Nos 25 5 - 5 - -
WSC-08 Award to the Village Panchayats for promotingEducation and Socio Economic Developmentof SCs
No of villages 1,000 200 - 200 - -
WSC-06(i) Grant in aid to BPL SC students for purchase ofSchool Uniforms, Shoes and School Bags etc.
Beneficiaries 2,00,000 40,000 - - - -
WSC-10 Assistance to NGOs, Trusts and other SocialInstitutions for Solemnizing Mass Marriagesfor SC couples
NGOs 667 133 15 133 133 200
WSC-11 Setting up of Legal Aid Clinics in all thedistricts of Punjab
Legal Aid Clinics
50 10 - 10 - -
SOCIAL SECURITY SSW-01 Janshree Bima Yojna for BPL families (Rural
& Urban) (50:50) (50% directly released to theLIC by GOI)
Nos 5,00,000 10,000 - 1,00,000 - -
SSW-02 Aam Admi Bima Yojana (50:50) (50% directlyreleased to the LIC by GOI)
Nos 26,000 5,200 - 5,200 - -
WCD-05 Mai Bhago Vidya (EDU) Scheme (FreeBicycle to all girl students studying in class 9thto 12th) (Renamed Scheme SWCW(S)-3)
Nos 8,43,750 67,500 - 75,000 61,000 16
115

SCSP Target SCSP 2014-15
12th Plan (2012-17)
Target Achievements Target Achievements Target
1 2 3 4 5 6 7 8 9
SCHEDULED CASTES SUB PLAN (SCSP) - 2014-15Physical Targets & Achievements
STATEMENT -VII
Sr. No.SCSP 2012-13 SCSP 2013-14
Sub-head/Scheme/Item Unit
SSW-04 Financial Assistance to Disabled Persons(Social Security Fund)
Nos 4,75,000 75,000 71,353 80,000 70,280 82,500
WCD-03 Financial Assistance to Widows & DestituteWomen (Social Security Fund)
Nos 8,75,000 1,50,000 1,40,974 1,55,000 1,39,409 1,62,500
WCD-08 Implementation of Swawlamban scheme-Vocational training programme for women
Nos 8,400 1,667 - 1,667 - -
WCD-12 Distribution of sterilized sanitary pads to ruralwomen
Beneficiaries 1,00,000 15,000 - 20,000 - -
SSW-03 Old Age Pension (Social Security Fund) Nos 43,75,000 7,75,000 7,36,250 7,75,000 7,00,912 8,25,000
WCD-02 Financial Assistance to dependent children(Social Security Fund)
Nos 4,00,000 65,000 58,108 67,500 59,666 70,000
CS(SSWD)-10 (SSW(D)-01
National Social Assistance Programme (NSAP) Nos 5,41,333 1,06,000 8,297 1,00,000 2,800 9,955
NUTRITIONCS-NT(D)-16 NT(D)-01
Integrated Child Development Services Nos 51,64,530 10,76,051 3,66,915 10,33,000 7,34,778 44,61,000
CS-NT(D)62 NT(D)-02
Rajiv Gandhi Scheme for empowerment ofadolescent girls (RGSEAG)- "Sabla"
Nos 7,47,120 1,49,424 1,53,093 1,60,000 - 6,49,000
WATER SUPPLY AND SANITATIONNC 300 60 30 Not fixed - -PC 300 60 - Not fixed - -OH 0 0 0 Not fixed - -NC 5 1 1 Not fixed 2 2PC 50 10 - Not fixed - -
RWS-1 Rajiv Gandhi National Drinking Water Missionincluding Repair of damaged Water SupplyScheme (75:25)
RWS-02 NABARD Aided Rural Water Supply Scheme(85:15)
116

SCSP Target SCSP 2014-15
12th Plan (2012-17)
Target Achievements Target Achievements Target
1 2 3 4 5 6 7 8 9
SCHEDULED CASTES SUB PLAN (SCSP) - 2014-15Physical Targets & Achievements
STATEMENT -VII
Sr. No.SCSP 2012-13 SCSP 2013-14
Sub-head/Scheme/Item Unit
NC - - - 20 250 200
PC - - - 100
URBAN DEVELOPMENT Emp.Lac Mandays
1.15 0.23 0.46 0 - _
Trainees (No) 10,000 2,000 4,000 5,540 - _Beneficiaries 2,500 500 1,000 950 - _
DEFENCE SERVICES WELFAREDSW-01 Incentive for IMA- NDA Cadets (@ Rs.1.00 lac
per cadet) (setting up of National DefenceUniversity - replaced)
Cadets 100 63 - 25 - 2
DSW-02 Training scheme for the wards of ex-servicemen and others for entry toTechnical/Non-Technical Trades of
Nos 4,500 900 180 900 940 1,200
DSW-07 Provision for Grant of Rs. 5.00 lac each forpurchase of plot/house for the widows ofMartyrs/ 75% to 100% disabled soldiers duringthe different operations from the period 1-1-1999 onwards
Families 50 10 - 4 - -
EMPLOYMENT GENERATIONEG-02 Centre for Training and Employment of Punjab
Youth (C-PYTE) Trainees 12,500 2,500 - 65 9,273 9,375
CS(UD)-38 National Urban Livelihood Mission (NULM)(75:25)
RWS-04/4 Punjab Rural Water Supply and Sanitationproject with World BankAssistance.(59:16:19:6) (Worldbank:GOI:GOP:Community)
117

(` lac)
Financial Physical (Nos.)
1 2 3 4 5 6 7 8 9I Welfare of SCs A Directorate of Welfare of SCs & BCs 319.93 1105.40 193.00 187.65 1236 1289.92 11790
B Directorate of Scheduled Castes Sub Plan 34.34 550.70 327.11 197.54 5117 658.70 6100
Sub Total I (A+B) 354.27 1656.10 520.11 385.19 6353 1948.62 17890
II Animal Husbandry 50.10 190.15 56.00 4.50 45 205.00 11250
III Horticulture 0.00 18.75 0.00 0.00 0 18.75 50
IV Employment Generation and Training 20.19 0.00 0.00 5.34 963 0.00 0
V Industrial Training 0.00 75.00 0.00 0.00 0 0.00 0
VI Industries (Punjab Infotech) 0.85 220.00 100.00 45.45 480 220.00 2200
VII Fisheries 0.00 90.00 0.00 0.00 0.00 70.00 700
Grand Total (I-VII) 425.41 2250.00 676.11 440.48 7841 2462.37 32090
SPECIAL CENTRAL ASSISTANCE PROGRAMMESCHEDULED CASTES SUB PLAN 2014-15
Revised Outlay
2014-15Approved
Outlay Targets (Nos.)
2013-14Sr. No.
STATEMENT-VIII
Subhead-wise Allocation, Expenditure, Achievements and Physical Targets
Sub-head 2012-13 Expenditure Approved
OutlayAchievement
118

(` lac) 2012-13
Expenditure Approved Outlay
Revised Outlay
Expenditure
1 2 3 4 5 6 7I WELFARE OF SCs A DIRECTORATE OF WELFARE OF SCs & BCs
SCA(SC)-1 Setting up of Institutes for training in typing and Stenography to below povertyline SCs
69.33 90.00 93.00 78.27 114.92
SCA(SC)-2 Training of unemployed Scheduled Castes as driver of light/heavy vehicles 0.00 100.00 0.00 0.00 50.00
SCA(SC)-3 Providing of equipment and raw material in 24 Training–cum- productioncentres of Welfare Department
0.00 16.00 0.00 0.00 20.00
SCA(SC)-4 Strengthening of 108 community centres-Providing of equipment and rawmaterial.
0.00 49.40 0.00 0.00 55.00
SCA(SC)-9 Providing Training to the educated unemployed SC youth in differentVocational/Professional courses.
(i)Professional Air Hostess Travel and Hospitality Management CareerCourses
0.00 50.00 0.00 0.00 0.00
(ii)Vocational Training in Hotel operation services. 0.00 50.00 0.00 0.00 0.00
SCA(SC)-10 Creation of infrastructure facilities in villages having 50% or more SCpopulation.
0.00 250.00 0.00 0.00 250.00
SCA(SC)-12 Capital subsidy to PSCFC under bank tie-up loaning programme. 250.60 300.00 100.00 100.00 800.00
SCA(SC)-13 Special Central Assistance for Loaning Schemes of Punjab Scheduled CastesLand Development & Finance Corporation (PSCFC) to below Poverty LineScheduled Castes in collaboration with National Corporations
0.00 0.00 0.00 9.38 0.00
SCA(SC)-15 Scheme to assist BPL SC students covered under the existing plan scheme"New Courses/Vocational training in Industrial Training Institutes for SCstudents"
0.00 200.00 0.00 0.00 0.00
Sub-Total (A) 319.93 1105.40 193.00 187.65 1289.92
Code No. Subhead/Scheme
STATEMENT-IX
SPECIAL CENTRAL ASSISTANCE PROGRAMMEScheme -wise Allocation and Expenditure
2013-14 2014-15 Approved
Outlay
SCHEDULED CASTES SUB PLAN 2014-15
119

(` lac) 2012-13
Expenditure Approved Outlay
Revised Outlay
Expenditure
1 2 3 4 5 6 7
Code No. Subhead/Scheme
STATEMENT-IX
SPECIAL CENTRAL ASSISTANCE PROGRAMMEScheme -wise Allocation and Expenditure
2013-14 2014-15 Approved
Outlay
SCHEDULED CASTES SUB PLAN 2014-15
B DIRECTORATE OF SCHEDULED CASTES SUB PLAN SCA(SCSP)-1 Formulation/ Monitoring/ Review and Implementation of S.C.S.P.
(i) Computerization of Directorate of SCSP 10.38 16.00 14.00 8.20 15.00
(ii) Strengthening of data base - Study tours and training etc. 0.00 2.00 0.29 0.00 1.00SCA(SCSP)-2 Implementation of SCA Programme at the District Level-Placing of funds at
the disposal of District Rural Development Agencies (DRDAs)23.62 500.00 291.02 177.13 610.00
SCA(SCSP)-3 Survey/Evaluation of SCA schemes 0.00 2.70 2.70 0.00 2.70SCA(SCSP)-4 Setting up of a Monitoring cell in the Directorate of SCSP for the purpose of
survey/studies and evaluation.0.34 30.00 19.10 12.21 30.00
Sub-Total (B) 34.34 550.70 327.11 197.54 658.70
Total-I (A+B) 354.27 1656.10 520.11 385.19 1948.62II ANIMAL HUSBANDRY
SCA(AH)-1 Scheme for female buffalo calf rearing 15.00 50.00 50.00 4.50 50.00SCA(AH)-2 Setting up of Goat/Sheep rearing units 0.00 25.00 0.00 0.00 20.00
SCA(AH)-3 Upgradation of low grade roughages through Ammonia treatment 22.00 22.00 0.00 0.00 0.00SCA(AH)-4 Setting up of Turkey Units for BPL SCs. 8.10 9.00 0.00 0.00 9.00SCA(AH)-5 Establishment of backyard poultry units for BPL SCs 5.00 20.00 0.00 0.00 20.00
SCA(AH)-6 Supply of hand driven chaff-cutter (Toka Machine) to landless/ marginal Scheduled Castes families.
0.00 6.00 6.00 0.00 6.00
SCA(AH)-7 Awareness camps at village level for Scheduled Castes Women for livestock management practices, diseases, feeding, vaccination and deworming etc.
0.00 58.15 0.00 0.00 0.00
New SchemeSCA(AH)-8 Providing insurance cover to milch animals reared by Scheduled Caste
families.0.00 0.00 0.00 0.00 100.00
Total-II 50.10 190.15 56.00 4.50 205.00
120

(` lac) 2012-13
Expenditure Approved Outlay
Revised Outlay
Expenditure
1 2 3 4 5 6 7
Code No. Subhead/Scheme
STATEMENT-IX
SPECIAL CENTRAL ASSISTANCE PROGRAMMEScheme -wise Allocation and Expenditure
2013-14 2014-15 Approved
Outlay
SCHEDULED CASTES SUB PLAN 2014-15
III HORTICULTURE
SCA(H)-1 Subsidy for Sericulture 0.00 18.75 0.00 0.00 18.75
Total-III 0.00 18.75 0.00 0.00 18.75
IV EMPLOYMENT GENERATION AND TRAINING SCA(YS)-1 Pre selection training to SC youth for enrolment into defence forces,
para-military forces and police services through C-PYTE20.19 0.00 0.00 5.34 0.00
Total-IV 20.19 0.00 0.00 5.34 0.00
V INDUSTRIAL TRAININGSCA(ITI)-1 Financial Assistance/Stipend to SC BPL students admitted in Govt. Industrial
Training Institutes0.00 75.00 0.00 0.00 0.00
Total-V 0.00 75.00 0.00 0.00 0.00VI INDUSTRIES (PUNJAB INFOTECH)
SCA(IT)-1 Computer Training to 10th & 12th pass BPL SC boys/girls through CAL-C 0.85 220.00 100.00 45.45 220.00
Total-VI 0.85 220.00 100.00 45.45 220.00
VII FISHERIESSCA(FH)-1 To encourage SC BPL families to adopt Pisciculture 0.00 90.00 0.00 0.00 50.00
New Scheme
SCA(FH)-2 Providing fishing nets to SC fish farmers/fish sellers 0.00 0.00 0.00 0.00 20.00
Total-VII 0.00 90.00 0.00 0.00 70.00Grand Total (I-VII) 425.41 2250.00 676.11 440.48 2462.37
121

Targets Achievements
1 2 3 4 5 6 7I WELFARE OF SCs A DIRECTORATE OF WELFARE OF SCs & BCs
SCA(SC)-1 Setting up of Institutes for training in typing and Stenography to belowpoverty line SCs
Trainees 135 230 144 180
SCA(SC)-2 Training of unemployed Scheduled Castes as driver of light/heavyvehicles
Trainees 0 300 0 150
SCA(SC)-3 Providing of equipment and raw material in 24 Training–cum-production centres of Welfare Department
Trainees 0 270 0 200
SCA(SC)-4 Strengthening of 108 community centres-Providing of equipment andraw material.
Trainees 0 825 0 760
SCA(SC)-9 Providing Training to the educated unemployed SC youth in differentVocation/Professional courses.
(i) Professional Air Hostess Travel and Hospitality Management CareerCourses
Trainees 0 40 0 0
(ii) Vocational Training in Hotel operation services. Trainees 0 80 0 0SCA(SC)-10 Creation of infrastructure facilities in villages having 50% or more
SC population. Beneficiaries 0 2500 0 2500
SCA(SC)-12 Capital subsidy to PSCFC under bank tie-up loaning programme. Beneficiaries 2506 3000 1000 8000
SCA(SC)-13 Special Central Assistance for Loaning Schemes of Punjab ScheduledCastes Land Development & Finance Corporation (PSCFC) to belowPoverty Line Scheduled Castes in collaboration with NationalCorporations
Beneficiaries 0 0 92 0
SCA(SC)-15 Scheme to assist BPL SC students covered under the existing planscheme "New Courses/Vocational training in Industrial TrainingInstitutes for SC students"
Trainees 0 1500 0 0
Total (A) 2641 8745 1236 11790
STATEMENT-X
SPECIAL CENTRAL ASSISTANCE PROGRAMMEPhysical Targets and Achievements
2013-14 2014-15 Targets
2012-13 Achievements
Code No. Subhead/Scheme Unit
SCHEDULED CASTES SUB PLAN - 2014-15
122

Targets Achievements
1 2 3 4 5 6 7
STATEMENT-X
SPECIAL CENTRAL ASSISTANCE PROGRAMMEPhysical Targets and Achievements
2013-14 2014-15 Targets
2012-13 Achievements
Code No. Subhead/Scheme Unit
SCHEDULED CASTES SUB PLAN - 2014-15
B DIRECTORATE OF SCHEDULED CASTES SUB PLAN
SCA(SCSP)-2 Implementation of SCA Programme at District level-Placing of funds atthe disposal of District Rural Development Agencies (DRDAs)
Beneficiaries/ Trainees
1655 8300 5117 6100
Total (B) 1655 8300 5117 6100 Total-I (A+B) 4296 17045 6353 17890
II ANIMAL HUSBANDRY
SCA(AH)-1 Scheme for female buffalo calf rearing Beneficiaries 150 500 45 500SCA(AH)-2 Setting up of Goat/Sheep rearing units Beneficiaries 0 250 0 200SCA(AH)-3 Upgradation of low grade roughages through Ammonia treatment Beneficiaries 3150 4400 0 0SCA(AH)-4 Setting up of Turkey Units for BPL SCs. Beneficiaries 225 300 0 250SCA(AH)-5 Establishment of backyard poultry units for BPL SCs Beneficiaries 20 1000 0 200SCA(AH)-6 Supply of hand driven chaff-cutter (Toka Machine) to landless/
marginal Scheduled Castes families.Beneficiaries
0 100 0 100
SCA(AH)-7 Awareness camps at village level for Scheduled Castes Women forlivestock management practices, diseases, feeding, vaccination anddeworming etc.
Trainees 0 11640 0 0
New Scheme
SCA(AH)-8 Providing insurance cover to milch animals reared by Scheduled Caste families. Beneficiaries
0 0 0 10000
Total (II) 3545 18190 45 11250
III HORTICULTURE
SCA(H)-1 Subsidy for Sericulture Beneficiaries 0 50 0 50
Total (III) 0 50 0 50
123

Targets Achievements
1 2 3 4 5 6 7
STATEMENT-X
SPECIAL CENTRAL ASSISTANCE PROGRAMMEPhysical Targets and Achievements
2013-14 2014-15 Targets
2012-13 Achievements
Code No. Subhead/Scheme Unit
SCHEDULED CASTES SUB PLAN - 2014-15
IV EMPLOYMENT GENERATION AND TRAINING SCA(YS)-1 Pre selection training to SC youth for enrolment into defence forces,
para-military forces and police services through C-PYTE Trainees 2075 0 963 0
Total (IV) 2075 0 963 0
V INDUSTRIAL TRAININGSCA(ITI)-1 Financial Assistance/Stipend to SC BPL students admitted in Govt.
Industrial Training Institute.Trainees 0 850 0 0
Total (V) 0 850 0 0VI INDUSTRIES (PUNJAB INFOTECH)
SCA(IT)-1 Computer Training to 10th & 12th pass BPL SC boys/girls throughCAL-C
Trainees 0 2200 480 2200
Total (VI) 0 2200 480 2200VII FISHERIES
SCA(FH)-1 To encourage SC BPL families to adopt Pisciculture Beneficiaries 0 10 0 500New Scheme
SCA(FH)-2 Providing fishing nets to SC fish farmers/fish sellers Beneficiaries 0 0 0 200Total (VII) 0 10 0 700
Grand Total (I-VII) 9916 38345 7841 32090
124

Financial (CS+SS)
Physical Financial (CS+SS)
Physical CS SS Total
1 2 3 4 5 6 7 8 9 10 11 12 13 14
1 SUB PARAMETER (i) WELFARE OF SCs
DIRECTORATE OF WELFARE OF SCs AND BCsPost matric Scholarship to SCstudents
0.00 0 4722.09 49602 12523.00 145735 34747.00 335000 12334.13 2562.15 14896.28 96936
Total - 1 0.00 0.00 4722.09 49602 12523.00 145735 34747.00 335000 12334.13 2562.15 14896.28 96936
2 SUB PARAMETER (ii)(a) SCA to SCSP SchemesI HORTICULTURE
SCA(H)-1 Subsidy for Sericulture 18.75 187 0.00 0 18.75 50 0.00 0 18.75 0.00 18.75 50 Total - 2a(I) 18.75 187 0.00 0 18.75 50 0.00 0 18.75 0.00 18.75 50
II ANIMAL HUSBANDRYSCA(AH)-1 Scheme for female buffalo calf
rearing50.00 500 15.00 150 50.00 500 4.50 45 50.00 0.00 50.00 500
SCA(AH)-2 Setting up of Goat/Sheep rearingunits
25.00 250 0.00 0 25.00 250 0.00 0 20.00 0.00 20.00 200
SCA(AH)-3 Upgradation of low grade roughagesthrough Ammonia treatment
22.00 4400 22.00 3150 22.00 4400 0.00 0 0.00 0.00 0.00 0
SCA(AH)-4 Setting up of Turkey Units for BPLSCs.
9.00 300 8.10 225 9.00 300 0.00 0 9.00 0.00 9.00 250
SCA(AH)-5 Establishment of backyard poultryunits for BPL SCs
20.00 1000 5.00 20 20.00 1000 0.00 0 20.00 0.00 20.00 200
SCA(AH)-6 Supply of hand driven chaff-cutter(Toka Machine) to landless/marginal Scheduled Castes families
0.00 0 0.00 0 6.00 100 0.00 0 6.00 0.00 6.00 100
Approved OutlaySCSP 2014-15
Targets (Beneficiaries)
AchievementsSCSP 2013-14
STATEMENT - XI
SCHEDULED CASTES SUB PLAN 2014-1520 Point Programme (SC Families Assisted)
(` lac)
Targets (Beneficiaries)
Achievements Approved Outlay
(CS+SS)
Targets (Beneficiaries)
Approved Outlay
(CS+SS)
Code No. Sub-head/Scheme SCSP 2012-13
125

Financial (CS+SS)
Physical Financial (CS+SS)
Physical CS SS Total
1 2 3 4 5 6 7 8 9 10 11 12 13 14
Approved OutlaySCSP 2014-15
Targets (Beneficiaries)
AchievementsSCSP 2013-14
STATEMENT - XI
SCHEDULED CASTES SUB PLAN 2014-1520 Point Programme (SC Families Assisted)
(` lac)
Targets (Beneficiaries)
Achievements Approved Outlay
(CS+SS)
Targets (Beneficiaries)
Approved Outlay
(CS+SS)
Code No. Sub-head/Scheme SCSP 2012-13
SCA(AH)-7 Awareness camps at village level forScheduled Castes Women forlivestock management practices,diseases, feeding, vaccination anddeworming etc.
0.00 0 0.00 0 58.15 11640 0.00 0 0.00 0.00 0.00 0
SCA(AH)-8 Providing insurance cover to milch animals reared by Scheduled Caste families.
0.00 0 0.00 0 0.00 0 0.00 0 100.00 0.00 100.00 10000
Total - 2a(II) 126.00 6450 50.10 3545 190.15 18190 4.50 45 205.00 0.00 205.00 11250III FISHERIES
New SchemeSCA(FH)-1 To encourage SC BPL families to
adopt Pisciculture0.00 0 0.00 0 90.00 10 0.00 0 50.00 0.00 50.00 500
SCA(FH)-2 Providing fishing nets/trolleys to SCfish farmers/fish sellers
0.00 0 0.00 0 0.00 0 0.00 0 20.00 0.00 20.00 200
Total - 2a(III) 0.00 0 0.00 0 90.00 10 0.00 0 70.00 0.00 70.00 700IV INDUSTRIAL TRAINING
SCA(ITI)-1 Financial Assistance/Stipend to SCBPL students admitted in Govt.Industrial Training Institutes
100.00 1100 0.00 0 75.00 850 0.00 0 0.00 0.00 0.00 0
Total - 2a(IV) 100.00 1100 0.00 0 75.00 850 0.00 0 0.00 0.00 0.00 0V INDUSTRIES (PUNJAB
INFOTECH) *SCA(IT)-1 Computer Training to 10th & 12th
pass BPL SC boys/girls throughCAL-C
200.00 2000 0.85 500 220.00 2200 45.45 -20 220.00 0.00 220.00 2200
Total - 2a(V) 200.00 2000 0.85 500 220.00 2200 45.45 -20 220.00 0.00 220.00 2200
126

Financial (CS+SS)
Physical Financial (CS+SS)
Physical CS SS Total
1 2 3 4 5 6 7 8 9 10 11 12 13 14
Approved OutlaySCSP 2014-15
Targets (Beneficiaries)
AchievementsSCSP 2013-14
STATEMENT - XI
SCHEDULED CASTES SUB PLAN 2014-1520 Point Programme (SC Families Assisted)
(` lac)
Targets (Beneficiaries)
Achievements Approved Outlay
(CS+SS)
Targets (Beneficiaries)
Approved Outlay
(CS+SS)
Code No. Sub-head/Scheme SCSP 2012-13
VI EMPLOYMENT GENERATION & TRAINING
SCA(YS)-1 Pre-selection training to SC youth for enrolment into defence forces through C-PYTE
0.00 0 20.19 2075 0.00 0 5.34 963 0.00 0.00 0.00 0
Total - 2a(VI) 0.00 0 20.19 2075 0.00 0 5.34 963 0.00 0.00 0.00 0VII WELFARE OF SCs
(i) DIRECTORATE OF WELFARE OF SCs AND BCs
SCA(SC)-1 Setting up of Institutes for trainingin typing and Stenography to belowpoverty line SCs
90.00 230 69.33 135 90.00 230 78.27 144 114.92 0.00 114.92 180
SCA(SC)-2 Training of unemployed ScheduledCastes as driver of light/heavyvehicles.
100.00 300 0.00 0 100.00 300 0.00 0 50.00 0.00 50.00 150
SCA(SC)-3 Providing of equipment and rawmaterial in 24 Training–cum-production centres of WelfareDepartment.
20.80 325 0.00 0 16.00 270 0.00 0 20.00 0.00 20.00 200
SCA(SC)-4 Strengthening of 108 communitycentres-Providing of equipment andraw material.
56.25 900 0.00 0 49.40 825 0.00 0 55.00 0.00 55.00 760
SCA(SC)-7 Training in IT Sector Job OrientedComputer Courses for educatedunemployed SC youth at AmbedkarInstitutes/Ambedkar Bhawans atdistrict Headquarters.
50.00 200 0.00 0 0.00 0 0.00 0 0.00 0.00 0.00 0
127

Financial (CS+SS)
Physical Financial (CS+SS)
Physical CS SS Total
1 2 3 4 5 6 7 8 9 10 11 12 13 14
Approved OutlaySCSP 2014-15
Targets (Beneficiaries)
AchievementsSCSP 2013-14
STATEMENT - XI
SCHEDULED CASTES SUB PLAN 2014-1520 Point Programme (SC Families Assisted)
(` lac)
Targets (Beneficiaries)
Achievements Approved Outlay
(CS+SS)
Targets (Beneficiaries)
Approved Outlay
(CS+SS)
Code No. Sub-head/Scheme SCSP 2012-13
Providing Training to the educatedunemployed SC youth in differentVocational/Professional courses.
(i)Professional Air Hostess Traveland Hospitality Management CareerCourses
50.00 40 0.00 0 50.00 40 0.00 0 0.00 0.00 0.00 0
(ii)Vocational Training in Hoteloperation services.
50.00 80 0.00 0 50.00 80 0.00 0 0.00 0.00 0.00 0
SCA(SC)-10 Creation of infrastructure facilitiesin villages having 50% or more SCpopulation.
0.00 0 0.00 0 250.00 2500 0.00 0 250.00 0.00 250.00 2500
SCA(SC)-12 Capital subsidy to PSCFC underbank tie-up loaning programme.
500.00 5000 250.60 2506 300.00 3000 100.00 1000 800.00 0.00 800.00 8000
SCA(SC)-13 Special Central Assistance forLoaning Schemes of PunjabScheduled Castes LandDevelopment & Finance Corporation(PSCFC) to below Poverty LineScheduled Castes in collaborationwith National Corporations
0.00 0 0.00 0 0.00 0 9.38 92 0.00 0.00 0.00 0
SCA(SC)-14 Providing coaching to SC studentsfor IAS, PCS, PMT, IIT, AIEEE etc.entrance exams through reputedinstitutes
100.00 280 0.00 0 0.00 0 0.00 0 0.00 0.00 0.00 0
SCA(SC)-9
128

Financial (CS+SS)
Physical Financial (CS+SS)
Physical CS SS Total
1 2 3 4 5 6 7 8 9 10 11 12 13 14
Approved OutlaySCSP 2014-15
Targets (Beneficiaries)
AchievementsSCSP 2013-14
STATEMENT - XI
SCHEDULED CASTES SUB PLAN 2014-1520 Point Programme (SC Families Assisted)
(` lac)
Targets (Beneficiaries)
Achievements Approved Outlay
(CS+SS)
Targets (Beneficiaries)
Approved Outlay
(CS+SS)
Code No. Sub-head/Scheme SCSP 2012-13
SCA(SC)-15 Scheme to assist BPL SC studentscovered under the existing planscheme "New Courses/Vocationaltraining in Industrial TrainingInstitutes for SC students"
300.00 2000 0.00 0 200.00 1500 0.00 0 0.00 0.00 0.00 0
Total - 2a(VII)(i) 1317.05 9355 319.93 2641 1105.40 8745 187.65 1236 1289.92 0.00 1289.92 11790(ii) DIRECTORATE OF SCHEDULED
CASTES SUB PLANSCA(SCSP)-
2Implementation of SCA Programmeat the District Level-Placing offunds at the disposal of DistrictRural Development Agencies(DRDAs)
300.00 5000 23.62 1655 500.00 8300 177.13 5117 610.00 0.00 610.00 6100
Total - 2a(VII)(ii) 300.00 5000 23.62 1655 500.00 8300 177.13 5117 610.00 0.00 610.00 6100Total - 2a(VII) 1617.05 14355.00 343.55 4296 1605.40 17045 364.78 6353 1899.92 0.00 1899.92 17890
Total - 2a 2061.80 24092.00 414.69 10416 2199.30 38345 420.07 7341 2413.67 0.00 2413.67 32090
(b) NSFDC Concessional Loans SchemeWELFARE OF SCs PUNJAB SCHEDULED CASTESLAND DEVELOPMENT &FINANCE CORPORATIONLoan Scheme in collaboration withNSFDC
0.00 0.00 33.20 586 38.00 500 2.22 42 750.00 0.00 750.00 500
Total - 2b 0.00 0.00 33.20 586 38.00 500 2.22 42 750.00 0.00 750.00 500
Total - 2 (2a+2b) 2061.80 24092.00 447.89 11002 2237.30 38845 422.29 7383 3163.67 0.00 3163.67 32590
Total (1+2) 2061.80 24092.00 5169.98 60604 14760.30 184580 35169.29 342383 15497.80 2562.15 18059.95 129526
129

Financial (CS+SS)
Physical Financial (CS+SS)
Physical CS SS Total
1 2 3 4 5 6 7 8 9 10 11 12 13 14
Approved OutlaySCSP 2014-15
Targets (Beneficiaries)
AchievementsSCSP 2013-14
STATEMENT - XI
SCHEDULED CASTES SUB PLAN 2014-1520 Point Programme (SC Families Assisted)
(` lac)
Targets (Beneficiaries)
Achievements Approved Outlay
(CS+SS)
Targets (Beneficiaries)
Approved Outlay
(CS+SS)
Code No. Sub-head/Scheme SCSP 2012-13
3 SCSP SCHEMESI AGRICULTURE AND
HORTICULTUREAGR-01/03 Macro Management Work Plan for
Agriculture Department (90:10)225.00 225 0.00 0 0.00 0 0.00 0 0.00 0.00 0.00 0
AGR-02/04 Integrated scheme of Oil seeds,Pulses, Oilpalm and Maize (75:25)
120.00 120 0.00 0 0.00 0 0.00 0 0.00 0.00 0.00 0
AGR-04/06 Intensive Cotton DevelopmentProgramme (75:25)
50.00 125 0.00 0 0.00 0 0.00 0 0.00 0.00 0.00 0
HORT-03/01
Diversification of Agriculturethrough Development ofHorticulture
25.00 62 0.00 0 0.00 0 0.00 0 0.00 0.00 0.00 0
Total - 3(I) 420.00 532 0.00 0 0.00 0 0.00 0 0.00 0.00 0.00 0II SOIL AND WATER
CONSERVATIONSWC-01/01 Macro Management-Work plan for
Soil Conservation (90:10)100.00 100 0.00 0 0.00 0 0.00 0 0.00 0.00 0.00 0
SWC-06/05 Soil & Water Conservation onWatershed basis in Kandi nonproject areas
15.00 30 0.00 0 0.00 0 0.00 0 0.00 0.00 0.00 0
Total - 3(II) 115.00 130 0.00 0 0.00 0 0.00 0 0.00 0.00 0.00 0III RURAL DEVELOPMENT
RDS(D)-01 Swaran Jayanti Gram Swa-RozgarYojna (75:25)
1161.60 11616 275.50 663 0.00 0 0.00 0 0.00 0.00 0.00 0
RDE(D)-01 Indira Awaas Yojana (75:25) 7040.00 14608 673.70 1763 0.00 0 0.00 0 0.00 0.00 0.00 0RDE(S)-01/ RDE(S)-02
Mahatma Gandhi National RuralEmployment Guarantee Scheme
26400.00 22802 2940.14 13624 0.00 0 0.00 0 0.00 0.00 0.00 0
Total - 3(III) 34601.60 49026 3889.34 16050 0.00 0 0.00 0 0.00 0.00 0.00 0
130

Financial (CS+SS)
Physical Financial (CS+SS)
Physical CS SS Total
1 2 3 4 5 6 7 8 9 10 11 12 13 14
Approved OutlaySCSP 2014-15
Targets (Beneficiaries)
AchievementsSCSP 2013-14
STATEMENT - XI
SCHEDULED CASTES SUB PLAN 2014-1520 Point Programme (SC Families Assisted)
(` lac)
Targets (Beneficiaries)
Achievements Approved Outlay
(CS+SS)
Targets (Beneficiaries)
Approved Outlay
(CS+SS)
Code No. Sub-head/Scheme SCSP 2012-13
IV URBAN DEVELOPMENTUD-02/2 Swarn Jayanti Shehri Rozgar Yojna 1080.00 3280 0.00 0 0.00 0 0.00 0 0.00 0.00 0.00 0
Total - 3(IV) 1080.00 3280 0.00 0 0.00 0 0.00 0 0.00 0.00 0.00 0V WELFARE OF SCs
DIRECTORATE OF WELFARE OF SCs AND BCs
WSC-01 Share Capital Contribution toPSCFC (State Share 51% & GoI49%) (Direct release by GoI)
962.75 2940 127.24 194 0.00 0 0.00 0 0.00 0.00 0.00 0
WSC-03 Houses to houseless SCs inRural/Urban areas(ACA 2010-11)
5000.00 10000 0.00 0 0.00 0 0.00 0 0.00 0.00 0.00 0
Total - 3(V) 5962.75 12940 127.24 194 0.00 0 0.00 0 0.00 0.00 0.00 0
Total - 3 42179.35 65908 4016.58 16244 0.00 0 0.00 0 0.00 0.00 0.00 0
Grand Total (1+2+3) 44241.15 90000 9186.56 76848 14760.30 184580 35169.29 342383 15497.80 2562.15 18059.95 129526
N.B.:- * In the year 2013-14, 20 drop-outs (Col.10) were registered out of the 500 students (Col.6) admitted under the scheme during the year 2012-13.
131

(` Lac) 2012-13
Projected Outlay
Women Component
Women component
Exp
Approved Outlay
Women Component
Women component
Exp
Approved Outlay
Women Component
1 2 3 4 5 6 7 8 9 10 11I SCIENCE, TECHNOLOGY AND
ENVIRONMENT
SR-07 Subsidy to students of GovernmentSchools visiting the Science City
50% 625.00 312.50 25.00 125.00 62.50 25.00 50.00 25.00
SR-11 Assessment of level of fluoride andsubsequent oxidative stress inpregnant SC women from fluorideendemic zone of Punjab and itsprevention and management
100% 0.00 0.00 0.00 0.00 0.00 0.00 5.00 5.00
Total (I) 625.00 312.50 25.00 125.00 62.50 25.00 55.00 30.00II SOCIAL SECURITY &
WELFARE
SSW-01 Janshree Bima Yojana for BPLfamilies (Rural & Urban) (50%directly released to the LIC by GoI ) (Scheme transferred to Health Deptt.)
50% 500.00 250.00 0.00 100.00 50.00 0.00 0.00 0.00
SSW-02 Aam Admi Bima Yojana (50%directly released to the LIC by GoI ).(Scheme transferred to Health Deptt.)
50% 260.00 130.00 0.00 52.00 26.00 0.00 0.00 0.00
SSW-03 Old Age Pension (Social SecurityFund)
50% 131250.00 65625.00 11043.93 23250.00 11625.00 10045.76 24750.00 12375.00
SCSP 2014-15Scheme code
Women Share
SCSP 2013-14
STATEMENT -XII
SCHEDULED CASTES SUB PLAN 2014-15Scheme-wise Outlay and Expenditure (Women Component)
12th Five Year SCSP (2012-17)
Sub-head/Scheme
132

(` Lac) 2012-13
Projected Outlay
Women Component
Women component
Exp
Approved Outlay
Women Component
Women component
Exp
Approved Outlay
Women Component
1 2 3 4 5 6 7 8 9 10 11
SCSP 2014-15Scheme code
Women Share
SCSP 2013-14
STATEMENT -XII
SCHEDULED CASTES SUB PLAN 2014-15Scheme-wise Outlay and Expenditure (Women Component)
12th Five Year SCSP (2012-17)
Sub-head/Scheme
SSW-04 Financial Assistance to DisabledPersons (Social Security Fund)
50% 14250.00 7125.00 1070.30 2400.00 1200.00 1018.70 2475.00 1237.50
SSW-07 Setting up of Social Security Helplinefor Women, Children, Older andDisabled Persons in each district
25% 100.00 0.00 0.00 0.00 0.00 0.00 32.00 8.00
WCD-02 Financial Assistance to dependentchildren (Social Security Fund)
50% 12000.00 6000.00 871.63 2025.00 1012.50 851.45 2100.00 1050.00
WCD-03 Financial Assistance to Widows &Destitute Women (Social Security
d)
100% 26250.00 26250.00 4229.22 4650.00 4650.00 4068.86 4875.00 4875.00
WCD-05 Mai Bhago Vidya (EDU) Scheme(Free Bicycle to all girl studentsstudying in class 9th to 12th)(Renamed Scheme SWCW(S)-3)
100% 11250.00 11250.00 0.00 1500.00 1500.00 1220.00 0.32 0.32
WCD-06 Attendance scholarship tohandicapped girl students in rural area
100% 135.00 135.00 11.63 25.00 25.00 0.00 25.00 25.00
WCD-07 Empowerment of Women-MahilaJagriti Yojna
100% 250.00 250.00 0.00 50.00 50.00 0.00 0.00 0.00
WCD-08 Implementation of Swawlambanscheme-Vocational training
100% 250.00 250.00 0.00 50.00 50.00 0.00 0.00 0.00
WCD-10 Awareness programme for DomesticViolence Act -2005
100% 250.00 250.00 0.00 25.00 25.00 0.00 0.00 0.00
133

(` Lac) 2012-13
Projected Outlay
Women Component
Women component
Exp
Approved Outlay
Women Component
Women component
Exp
Approved Outlay
Women Component
1 2 3 4 5 6 7 8 9 10 11
SCSP 2014-15Scheme code
Women Share
SCSP 2013-14
STATEMENT -XII
SCHEDULED CASTES SUB PLAN 2014-15Scheme-wise Outlay and Expenditure (Women Component)
12th Five Year SCSP (2012-17)
Sub-head/Scheme
WCD-12 Distribution of sterilized sanitary padsto rural women
100% 500.00 500.00 0.00 100.00 100.00 0.00 75.00 75.00
WCD-13 Scholorship to poor girls foradmission in Professional courses
100% 0.00 0.00 0.00 400.00 400.00 0.00 0.25 0.25
Block Grant(s)BG(WCD)-5
Bebe Nanki Ladli Beti KalyanScheme-13th Finance CommissionGrant for measures to improveAdverse Sex ratio
100% 19775.00 19775.00 750.00 3125.00 3125.00 2007.93 3125.00 3125.00
Restructured CSSs
CS(WCD)-60
National Mission for Empowermentof Women including Indira GandhiMattritav Sahyog Yojana (IGMSY)(100% GoI)
100% 0.00 0.00 0.00 0.00 0.00 0.00 783.42 783.42
CS(SSWD)-10 (SSW(D)-01
National Social AssistanceProgramme (NSAP)
48% 16240.00 7795.20 1473.61 3976.00 1908.48 1024.52 3683.50 1768.08
Total (I) 233260.00 145585.20 19450.32 41728.00 25746.98 20237.22 41924.49 25322.57III NUTRITION
NT(D)-03 Nutrition (Kishori Shakti Yojana) 100% 1400.00 1400.00 22.88 210.00 210.00 20.54 0.50 0.50
134

(` Lac) 2012-13
Projected Outlay
Women Component
Women component
Exp
Approved Outlay
Women Component
Women component
Exp
Approved Outlay
Women Component
1 2 3 4 5 6 7 8 9 10 11
SCSP 2014-15Scheme code
Women Share
SCSP 2013-14
STATEMENT -XII
SCHEDULED CASTES SUB PLAN 2014-15Scheme-wise Outlay and Expenditure (Women Component)
12th Five Year SCSP (2012-17)
Sub-head/Scheme
NT(D)-04 Infrastructure/Basic amenities forAnganwari centres in the State (Onetime ACA 2011-12)
50% 5250.00 2625.00 220.17 680.00 340.00 0.00 128.00 64.00
Restructured CSSs
CS-NT(D)-16 NT(D)-
Integrated Child Development Service (ICDS)
NT(D)-01 Nutrition ICDS (50% of Actual Expenditure Reimburses by GoI) (50:50)(SNP)
50% 84000.00 42000.00 1899.23 15595.00 7797.50 646.61 15750.00 7875.00
CS-NT(D)62 NT(D)-02
Rajiv Gandhi Scheme forempowerment of adolescent girls(RGSEAG)- "Sabla"
100% 4000.00 4000.00 540.42 1120.00 1120.00 0.00 2291.00 2291.00
Total (II) 94650.00 50025.00 2682.70 17605.00 9467.50 667.15 18169.50 10230.50IV WELFARE OF SCs
WSC-02 Grant-in-aid to PSCFC under OneTime Settlement Scheme
20% 300.00 60.00 17.81 300.00 60.00 31.73 100.00 20.00
WSC-04 Financial Assistance to SC youthfor Flying Training of CommercialPilot License (ACA 2007-08)
20% 500.00 100.00 0.00 100.00 20.00 0.00 0.00 0.00
WSC-05(i) Attendance scholarship to SC Primarygirl students
100% 15000.00 15000.00 622.83 2500.00 2500.00 928.43 1500.00 1500.00
135

(` Lac) 2012-13
Projected Outlay
Women Component
Women component
Exp
Approved Outlay
Women Component
Women component
Exp
Approved Outlay
Women Component
1 2 3 4 5 6 7 8 9 10 11
SCSP 2014-15Scheme code
Women Share
SCSP 2013-14
STATEMENT -XII
SCHEDULED CASTES SUB PLAN 2014-15Scheme-wise Outlay and Expenditure (Women Component)
12th Five Year SCSP (2012-17)
Sub-head/Scheme
WSC-06(i) Grant in aid to BPL SC students forpurchase of School Uniforms, Shoesand School Bags etc.
50% 5000.00 2500.00 0.00 0.00 0.00 0.00 0.00 0.00
WSC-07 New Courses/ Vocational Training inITIs for SC Students (Staffexpenditure, scholarship to SC
45% 5750.00 2587.50 173.60 1150.00 517.50 0.00 1000.00 1000.00
WSC-09(i) Shagun to SC Girls/Widows/Divorcees and the Daughters ofWidows at the time of their marriages
100% 30500.00 30500.00 10356.55 12200.00 12200.00 12026.25 7200.00 7200.00
WSC(D)-02
Award to SC Sports Students (6-12classes)
50% 3075.00 1537.50 0.00 615.00 307.50 0.00 615.00 307.50
Restructured CSS
CS(WSC)-50
Scheme for Development ofScheduled CastesWSC-01 Share Capital Contribution to PSCFC (State Share 51% & GoI 49%)
26% 2454.38 638.14 127.66 542.00 140.92 140.92 1063.00 276.38
Total (IV) 62579.38 52923.14 11298.45 17407.00 15745.92 13127.33 11478.00 10303.88V MEDICAL AND PUBLIC
HEALTH
DHS-13 Mata Kaushaliya Kalyan Scheme 100% 2400.00 2400.00 0.00 660.00 660.00 330.00 0.00 0.00DHS-14 Balri Rakshak Yojana 100% 150.00 150.00 0.07 33.00 33.00 1.10 0.00 0.00
136

(` Lac) 2012-13
Projected Outlay
Women Component
Women component
Exp
Approved Outlay
Women Component
Women component
Exp
Approved Outlay
Women Component
1 2 3 4 5 6 7 8 9 10 11
SCSP 2014-15Scheme code
Women Share
SCSP 2013-14
STATEMENT -XII
SCHEDULED CASTES SUB PLAN 2014-15Scheme-wise Outlay and Expenditure (Women Component)
12th Five Year SCSP (2012-17)
Sub-head/Scheme
DHS-24 Upgradation/Strengthening ofNursing services in the State (85:15)
100% 0.00 0.00 0.00 125.00 125.00 0.00 32.00 32.00
DHS-07 Punjab Nirogi Yojna (33:67) 50% 125.00 62.50 0.00 25.00 12.50 0.00 0.00 0.00DHS-44 Bhagat Puran Singh Medical
insurance scheme for poor people47% 1300.00 611.00 0.00 1300.00 611.00 305.50 930.00 437.10
CS(DHS)-4 National Health Mission includingNRHM (75:25)DHS 01/DHS12 National Rural Health Mission (NRHM) (75:25)
50% 49301.35 24650.68 0.62 5512.25 2756.13 548.50 10487.04 5243.52
Total (IV) 53276.35 27874.18 0.69 7655.25 4197.63 1185.10 11449.04 5712.62
VI EDUCATION
A Elementary Education
EDE-05 Providing furniture for students atprimary level in Government schools
50% 2480.00 1240.00 0.00 1240.00 620.00 0.00 0.00 0.00
EDE-06 Provision of utensils for students forMDM
50% 310.00 155.00 31.00 62.00 31.00 0.00 0.00 0.00
Restructured CSSs
CS(EDE)-13/EDE-03/02
National Programme NutritionSupport to Primany Education(MDM)
50% 123097.28 61548.64 1590.46 16705.00 8352.50 8352.50 18600.00 9300.00
137

(` Lac) 2012-13
Projected Outlay
Women Component
Women component
Exp
Approved Outlay
Women Component
Women component
Exp
Approved Outlay
Women Component
1 2 3 4 5 6 7 8 9 10 11
SCSP 2014-15Scheme code
Women Share
SCSP 2013-14
STATEMENT -XII
SCHEDULED CASTES SUB PLAN 2014-15Scheme-wise Outlay and Expenditure (Women Component)
12th Five Year SCSP (2012-17)
Sub-head/Scheme
CS(EDE)-14/EDE-01
Sarv Shiksha Abhiyan (SSA) 50% 200260.00 100130.00 11012.44 25854.00 12927.00 7058.00 52461.54 26230.77
B Secondary Education EDS-10 Opening of Adarsh schools in each
block of the State (ACA 2007-08)50% 2453.00 1226.50 0.00 850.00 425.00 0.00 0.00 0.00
EDS-17 Free education to girl students fromclass 9th to class 12th
100% 5000.00 5000.00 0.00 125.00 125.00 0.00 0.00 0.00
EDS-20 Schemes to promote sports in Punjabschools
25% 0.00 0.00 0.00 34.62 8.66 0.00 0.00 0.00
EDS-21 Free tablets to 11th class students 46% 0.00 0.00 0.00 1200.00 552.00 0.00 0.00 0.00
EDS-22 Dr. Hargobind Khurana scholarshipfor brilliant poor students
50% 0.00 0.00 0.00 320.00 160.00 99.00 320.00 160.00
Restructured CSSsCS(EDS)-40/EDS-02
Rashtriya Madhyamik Shiksha(RMSA) for universalization ofSecondary Education (75:25)
EDS-02/ EDS-13 Rashtriya Madhyamik Shiksha Abhiyan (RMSA) for Universalization of Secondary Education (75:25)
50% 25000.00 12500.00 1377.41 3555.91 1777.96 509.00 6029.94 3014.97
138

(` Lac) 2012-13
Projected Outlay
Women Component
Women component
Exp
Approved Outlay
Women Component
Women component
Exp
Approved Outlay
Women Component
1 2 3 4 5 6 7 8 9 10 11
SCSP 2014-15Scheme code
Women Share
SCSP 2013-14
STATEMENT -XII
SCHEDULED CASTES SUB PLAN 2014-15Scheme-wise Outlay and Expenditure (Women Component)
12th Five Year SCSP (2012-17)
Sub-head/Scheme
EDS-06/ EDS-14 Construction and running of girls hostels for students of Secondary & Higher Secondary Schools (90:10)
100% 60.00 60.00 0.00 105.00 105.00 0.00 87.36 87.36
C Higher Education
HE-09 Preparing Rural students of Punjabfor admission to Indian Institute ofTechnology
40% 140.00 56.00 5.25 35.00 14.00 0.00 0.00 0.00
Total (VI) 358800.28 181916.14 14016.55 50086.53 25098.11 16018.50 77498.84 38793.10VII TECHNICAL EDUCATION
TE-10 Upgradation of GovernmentPolytechnic for Girls, Patiala
100% 25.00 25.00 0.00 25.00 25.00 0.00 0.00 0.00
Total (VI) 25.00 25.00 0.00 25.00 25.00 0.00 0.00 0.00
VIII INDUSTRY AND MINERALSVSI-07 Setting up of District Artisan Hatt
Centres for providing marketingfacilities to the SC Artisans of theState
50% 500.00 250.00 0.00 200.00 100.00 0.00 0.00 0.00
VSI-09 Development of Human Resources inthe field of IT/ITES( Shifed to ITdepartment)
50% 625.00 312.50 0.00 0.00 0.00 0.00 0.00 0.00
Total (VIII) 1125.00 562.50 0.00 200.00 100.00 0.00 0.00 0.00
139

(` Lac) 2012-13
Projected Outlay
Women Component
Women component
Exp
Approved Outlay
Women Component
Women component
Exp
Approved Outlay
Women Component
1 2 3 4 5 6 7 8 9 10 11
SCSP 2014-15Scheme code
Women Share
SCSP 2013-14
STATEMENT -XII
SCHEDULED CASTES SUB PLAN 2014-15Scheme-wise Outlay and Expenditure (Women Component)
12th Five Year SCSP (2012-17)
Sub-head/Scheme
IX INFORMATION TECHNOLOGY
IT-03/VSI-09
Development of Human Resources inthe field of IT/ITES. (Shifted fromIndustry and Minerals subhead)
50% 0.00 0.00 0.00 50.00 25.00 0.00 0.00 0.00
Total (IX) 0.00 0.00 0.00 50.00 25.00 0.00 0.00 0.00
X COOPERATION
CN-02 Financial Assistance to DairyCooperatives for Providing Milkingmachines & other equipments toDairy Farms & Cooperative Societies
50% 125.00 62.50 0.00 25.00 12.50 0.00 0.00 0.00
Total (X) 125.00 62.50 0.00 25.00 12.50 0.00 0.00 0.00
XI RURAL DEVELOPMENT
CS(RDE)-9 National Rural Employment GuranteeScheme (90:10)(Direct Release)
50% 52800.00 26400.00 707.25 3200.00 1600.00 855.00 19800.00 9900.00
RDS(D)-09 Mahila Kissan ShasaktikaranPariyojana MKSP(CS:SS) (75:25)
100% 29.29 29.29 0.00 0.00 0.00 0.00 0.00 0.00
RDO(D)-04
Encouragement and improvement ofMahila Mandals for construction ofbuildings
100% 7500.00 7500.00 0.00 0.00 0.00 0.00 0.00 0.00
140
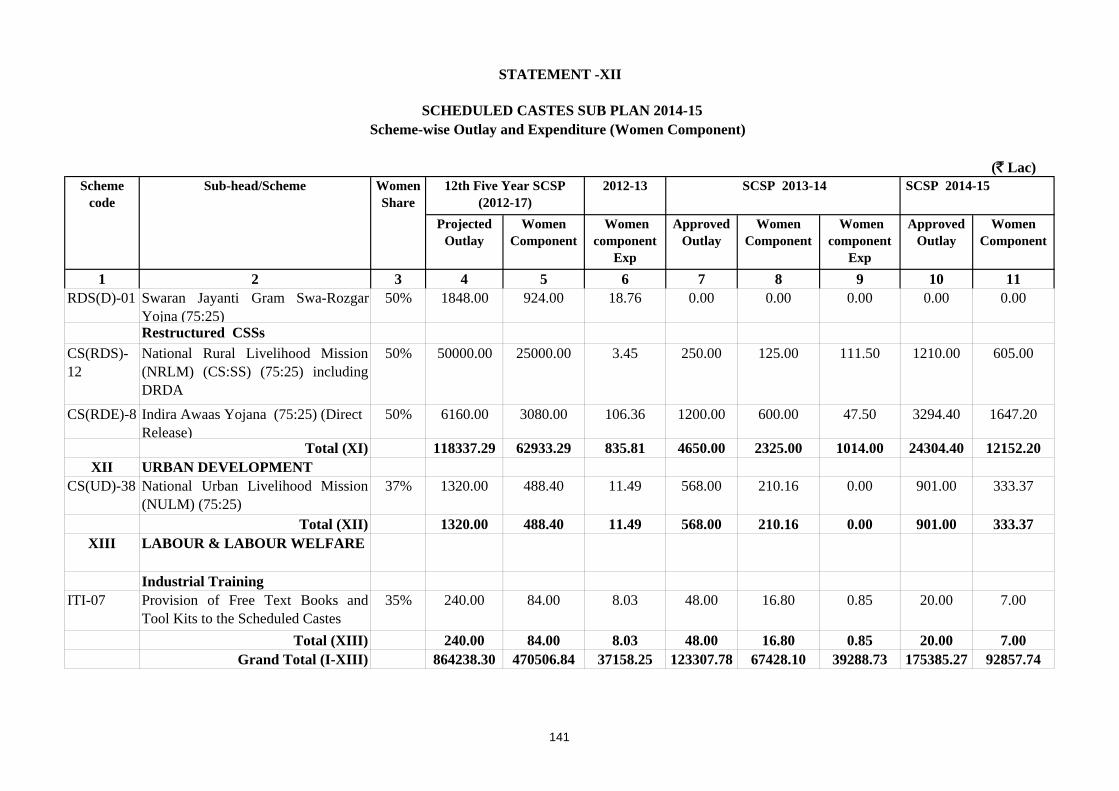
(` Lac) 2012-13
Projected Outlay
Women Component
Women component
Exp
Approved Outlay
Women Component
Women component
Exp
Approved Outlay
Women Component
1 2 3 4 5 6 7 8 9 10 11
SCSP 2014-15Scheme code
Women Share
SCSP 2013-14
STATEMENT -XII
SCHEDULED CASTES SUB PLAN 2014-15Scheme-wise Outlay and Expenditure (Women Component)
12th Five Year SCSP (2012-17)
Sub-head/Scheme
RDS(D)-01 Swaran Jayanti Gram Swa-RozgarYojna (75:25)
50% 1848.00 924.00 18.76 0.00 0.00 0.00 0.00 0.00
Restructured CSSs
CS(RDS)-12
National Rural Livelihood Mission(NRLM) (CS:SS) (75:25) includingDRDA
50% 50000.00 25000.00 3.45 250.00 125.00 111.50 1210.00 605.00
CS(RDE)-8 Indira Awaas Yojana (75:25) (Direct Release)
50% 6160.00 3080.00 106.36 1200.00 600.00 47.50 3294.40 1647.20
Total (XI) 118337.29 62933.29 835.81 4650.00 2325.00 1014.00 24304.40 12152.20XII URBAN DEVELOPMENT
CS(UD)-38 National Urban Livelihood Mission(NULM) (75:25)
37% 1320.00 488.40 11.49 568.00 210.16 0.00 901.00 333.37
Total (XII) 1320.00 488.40 11.49 568.00 210.16 0.00 901.00 333.37XIII LABOUR & LABOUR WELFARE
Industrial TrainingITI-07 Provision of Free Text Books and
Tool Kits to the Scheduled Castes 35% 240.00 84.00 8.03 48.00 16.80 0.85 20.00 7.00
Total (XIII) 240.00 84.00 8.03 48.00 16.80 0.85 20.00 7.00Grand Total (I-XIII) 864238.30 470506.84 37158.25 123307.78 67428.10 39288.73 175385.27 92857.74
141

(` Lac)
Plan Outlay
SCSP Outlay
%age of col. 4 to col. 3
Plan Outlay
SCSP Outlay
%age of col. 7 to col. 6
1 2 3 4 5 6 7 8DAIRY DEVELOPMENT
New SchemeDD-05 Promotion of Dairy farming as livelihood for SC
beneficiaries0.00 0.00 0 90.00 90.00 100
Total 0.00 0.00 0 90.00 90.00 100RURAL DEVELOPMENT
Special Programme for Rural DevelopmentDistrict Level Scheme
RDS(D)-08 National Rural Livelihood Mission (NRLM) (CS:SS)(75:25) {merged in restructured scheme CS(RDS)-12 in2014-15}
500.00 250.00 50 1250.00 625.00 50
Rural Employment
Restructured CSSCS(RDE)-9 National Rural Employment Gurantee Scheme (90:10)
(Direct Release)4000.00 3200.00 80 24750.00 19800.00 80
CS(RDE)-8 Indira Awaas Yojana (75:25) (Direct Release) 1500.00 1200.00 80 4118.00 3294.40 80
Other Rural Development Programme
RDO(S)-06/ RDO(S)-07
Environmental Improvement of SC Basties/Villages withStress on Sanitation
0.10 0.10 100 0.00 0.00 0
SCSP 2014-15
STATEMENT - XIII
SCHEDULED CASTES SUB PLAN 2014-15 Scheme-wise Outlay and Expenditure
(Schemes having SCSP component from 50% to 100%)
Scheme Code Sub-head/Scheme SCSP 2013-14
142

(` Lac)
Plan Outlay
SCSP Outlay
%age of col. 4 to col. 3
Plan Outlay
SCSP Outlay
%age of col. 7 to col. 6
1 2 3 4 5 6 7 8
SCSP 2014-15
STATEMENT - XIII
SCHEDULED CASTES SUB PLAN 2014-15 Scheme-wise Outlay and Expenditure
(Schemes having SCSP component from 50% to 100%)
Scheme Code Sub-head/Scheme SCSP 2013-14
RDO(S)-08/ RDO(S)-10
Modernization and improvement of SC villages havingmore than 50% SC population
300.00 300.00 100 0.00 0.00 0
RDO(S)-12/ RDO(S)-14
Construction of toilets in the rural areas (NABARD)(85:15)
10000.00 6000.00 60 2000.00 1200.00 60
RDO(S)-15/ RDO(S)-2
Issue of Yellow Cards for identification of WeakerSections
20.00 13.00 65 0.00 0.00 0
Total 16320.10 10963.10 67 32118.00 24919.40 78INDUSTRY AND MINERALS
VSI-07 Setting up of District Artisan Hatt Centres for providingmarketing facilities to the SC Artisans of the State
200.00 200.00 100 0.00 0.00 0
Total 200.00 200.00 100 0.00 0.00 0
SCIENCE, TECHNOLOGY AND ENVIRONMENT
SR-07 Subsidy to students of Government Schools visiting theScience City
250.00 125.00 50 100.00 50.00 50
New SchemeSR-11 Assessment of level of fluoride and subsequent oxidative
stress in pregnant SC women from fluoride endemic zoneof Punjab and its prevention and management
0.00 0.00 0 5.00 5.00 100
143

(` Lac)
Plan Outlay
SCSP Outlay
%age of col. 4 to col. 3
Plan Outlay
SCSP Outlay
%age of col. 7 to col. 6
1 2 3 4 5 6 7 8
SCSP 2014-15
STATEMENT - XIII
SCHEDULED CASTES SUB PLAN 2014-15 Scheme-wise Outlay and Expenditure
(Schemes having SCSP component from 50% to 100%)
Scheme Code Sub-head/Scheme SCSP 2013-14
SR-12 Socio-Economic Development of Scheduled Castescommunity through technology interventions inhorticulture and related ventures
0.00 0.00 0 5.00 5.00 100
Total 250.00 125.00 50 110.00 60.00 55CIVIL SUPPLIES New Scheme
CS-05 New Atta Dal Scheme 0.00 0.00 0 40000.00 28000.00 70Total 0.00 0.00 0 40000.00 28000.00 70
GENERAL EDUCATION
A Elementary Education EDE-02 Financial Assistance to the State under 13th Finance
Commission for implementation of Sarv Shiksha AbhiyanProgramme
5000.00 3100.00 62 5200.00 3224.00 62
EDE-04 Implementation of EDUSAT project in the State(previously NABARD)
1666.81 833.40 50 .. .. > 50%
EDE-05 Providing furniture for students at primary level inGovernment schools
2000.00 1240.00 62 0.00 0.00 0
EDE-06 Provision of utensils for students for MDM 100.00 62.00 62 0.00 0.00 0
144

(` Lac)
Plan Outlay
SCSP Outlay
%age of col. 4 to col. 3
Plan Outlay
SCSP Outlay
%age of col. 7 to col. 6
1 2 3 4 5 6 7 8
SCSP 2014-15
STATEMENT - XIII
SCHEDULED CASTES SUB PLAN 2014-15 Scheme-wise Outlay and Expenditure
(Schemes having SCSP component from 50% to 100%)
Scheme Code Sub-head/Scheme SCSP 2013-14
Restructured CSSCS(EDE)-13/EDE-03/02
National Programme Nutrition Support to PrimanyEducation (MDM)
26943.76 16705.00 62 30000.00 18600.00 62
CS(EDE)-14/EDE-01
Sarva Shiksha Abhiyan (SSA) 41700.00 25854.00 62 84615.38 52461.54 62
B Secondary Education
Restructured CSSsCS(EDS)-40/EDS-02
Rashtriya Madhyamik Shiksha (RMSA) foruniversalization of Secondary Education (75:25)
6724.67 3555.91 53 20000.00 10000.00 50
CS(EDS)-42/EDS-05
Scheme for setting up of 6000 Model Schools at BlockLevel as Benckmark of Excellence (50:50)
662.50 331.25 50 .. .. > 50%
Total 84797.74 51681.56 61 139815.38 84285.54 60
MEDICAL AND PUBLIC HEALTH
Director Health ServicesDHS-03/ DHS-20 Rashtriya Swasthya Bima Yojna for workers covered
under BPL(75:25) {merged in restructured scheme CS(DHS)-46 in 2014-15}
597.00 388.00 65 .. .. > 50%
DHS-44 Bhagat Puran Singh Medical insurance scheme for poorpeople
2000.00 1300.00 65 1500.00 930.00 62
Total 2597.00 1688.00 65 1500.00 930.00 62
145

(` Lac)
Plan Outlay
SCSP Outlay
%age of col. 4 to col. 3
Plan Outlay
SCSP Outlay
%age of col. 7 to col. 6
1 2 3 4 5 6 7 8
SCSP 2014-15
STATEMENT - XIII
SCHEDULED CASTES SUB PLAN 2014-15 Scheme-wise Outlay and Expenditure
(Schemes having SCSP component from 50% to 100%)
Scheme Code Sub-head/Scheme SCSP 2013-14
WATER SUPPLY AND SANITATION Rural Water Supply
RWS-16 NABARD Aided Sanitation Project (Construction of IHHL) .. .. > 50% 500.00 300.00 60
Restructured CSSs
CS(RWS)-02 Nirmal Bharat Abhiyan (NBA) (59:25:16)(CS:SS:Ben) 200.00 170.00 85 2700.00 1620.00 60
Total(Rural Water Supply) 200.00 170.00 85 3200.00 1920.00 60URBAN DEVELOPMENTRestructured CSSs
CS(UD)-15 Jawahar Lal Nehru National Urban Renewal Mission(JNNURM)
ii) Basic services to urban poor (BSUP) (50:20:30) (GoI:State: ULBs)
2683.00 2683.00 100 .. .. > 50%
iv) Integrated Housing & Slum Development Programme(IHSDP) (80:10:10) (GoI: State: ULBs)
15981.00 15981.00 100 .. .. > 50%
Total 18664.00 18664.00 100 .. .. > 50%WELFARE OF SCs State Level Schemes
WSC-01 Share Capital Contribution to PSCFC (State Share 51% &GoI 49%) (direct release by GoI) {merged in restructuredscheme CS(WSC)-50 in 2014-15}
542.00 542.00 100 - - -
146

(` Lac)
Plan Outlay
SCSP Outlay
%age of col. 4 to col. 3
Plan Outlay
SCSP Outlay
%age of col. 7 to col. 6
1 2 3 4 5 6 7 8
SCSP 2014-15
STATEMENT - XIII
SCHEDULED CASTES SUB PLAN 2014-15 Scheme-wise Outlay and Expenditure
(Schemes having SCSP component from 50% to 100%)
Scheme Code Sub-head/Scheme SCSP 2013-14
WSC-02 Grant-in-aid to PSCFC under One Time SettlementScheme
300.00 300.00 100 100.00 100.00 100
WSC-03 Houses to Houseless SCs in Rural & Urban Areas (ACA-2010-11)( District level scheme SCH(D)-01 shifted to Statelevel)
5000.00 5000.00 100 1000.00 1000.00 100
WSC-04 Financial Assistance to SC youth for Flying Training ofCommercial Pilot License (ACA 2007-08)
100.00 100.00 100 0.00 0.00 0
WSC-05(i) Attendance scholarship to SC Primary girl students 2500.00 2500.00 100 1500.00 1500.00 100
WSC-06(i) Grant in aid to BPL SC students for purchase of SchoolUniforms, Shoes and School Bags etc.
0.00 0.00 0 0.00 0.00 0
WSC-07 New Courses/ Vocational Training in ITIs for SC Students(Staff expenditure, scholarship to SC students etc.)
1150.00 1150.00 100 1000.00 1000.00 100
WSC-08 Award to the Village Panchayats for promoting Educationand Socio Economic Development of SCs
100.00 100.00 100 0.00 0.00 0
WSC-09(i) Shagun to SC Girls/Widows/ Divorcees and the Daughtersof Widows at the time of their marriages
12200.00 12200.00 100 7200.00 7200.00 100
WSC-10 Assistance to NGOs, Trusts and other Social Institutionsfor Solemnizing Mass Marriages for SC couples
100.00 100.00 100 100.00 100.00 100
147

(` Lac)
Plan Outlay
SCSP Outlay
%age of col. 4 to col. 3
Plan Outlay
SCSP Outlay
%age of col. 7 to col. 6
1 2 3 4 5 6 7 8
SCSP 2014-15
STATEMENT - XIII
SCHEDULED CASTES SUB PLAN 2014-15 Scheme-wise Outlay and Expenditure
(Schemes having SCSP component from 50% to 100%)
Scheme Code Sub-head/Scheme SCSP 2013-14
WSC-11 Setting up of Legal Aid Clinics in all the districts ofPunjab
150.00 150.00 100 0.00 0.00 0
New schemeWSC-12 Construction of building for the Welfare Department at the
State Headquarter0.00 0.00 0 100.00 100.00 100
Restructured CSSCS(WSC)-50 Scheme for Development of Scheduled Castes - - - 25471.00 25471.00 100
New scheme
CS(WSC)-53 Pradhan Mantri Adarash Gram Yojana (100%) (GOI) 0.00 0.00 0 5000.00 5000.00 100
Total (State Level) 22142.00 22142.00 100 41471.00 41471.00 100District Level Schemes
WSC(D)-01 Construction of Dr. B.R. Ambedkar Bhawans and theiroperation
2770.00 2770.00 100 500.00 500.00 100
WSC(D)-02 Award to SC Sports Students (6-12 classes) 615.00 615.00 100 615.00 615.00 100
Total (District Level) 3385.00 3385.00 100 1115.00 1115.00 100Total (State + District) 25527.00 25527.00 100 42586.00 42586.00 100
148

(` Lac)
Plan Outlay
SCSP Outlay
%age of col. 4 to col. 3
Plan Outlay
SCSP Outlay
%age of col. 7 to col. 6
1 2 3 4 5 6 7 8
SCSP 2014-15
STATEMENT - XIII
SCHEDULED CASTES SUB PLAN 2014-15 Scheme-wise Outlay and Expenditure
(Schemes having SCSP component from 50% to 100%)
Scheme Code Sub-head/Scheme SCSP 2013-14
SOCIAL SECURITY & WELFAREState Level Schemes
SSW-01 Janshree Bima Yojana for BPL families (Rural & Urban)(50% directly released to the LIC by GoI ) (Scheme transferred to Health Deptt.)
200.00 100.00 50 0.00 0.00 0
SSW-03 Old Age Pension (Social Security Fund) 46500.00 23250.00 50 49500.00 24750.00 50
SSW-04 Financial Assistance to Disabled Persons (Social SecurityFund)
4800.00 2400.00 50 4950.00 2475.00 50
SSW-09 Celeberation of World Disabled day State Award tohandicapped
5.00 2.50 50 .. .. > 50%
SSW-11 Setting up of three Beggary Homes and Rehabilitation-cum-Vocational Centres for 50 beggars
100.00 50.00 50 0.00 0.00 0
WCD-02 Financial Assistance to dependent children (SocialSecurity Fund)
4050.00 2025.00 50 4200.00 2100.00 50
WCD-03 Financial Assistance to Widows & Destitute Women(Social Security Fund)
9300.00 4650.00 50 9750.00 4875.00 50
WCD-06 Attendance scholarship to handicapped girl students inrural area
50.00 25.00 50 50.00 25.00 50
WCD-07 Empowerment of Women-Mahila Jagriti Yojna 100.00 50.00 50 0.00 0.00 0
149

(` Lac)
Plan Outlay
SCSP Outlay
%age of col. 4 to col. 3
Plan Outlay
SCSP Outlay
%age of col. 7 to col. 6
1 2 3 4 5 6 7 8
SCSP 2014-15
STATEMENT - XIII
SCHEDULED CASTES SUB PLAN 2014-15 Scheme-wise Outlay and Expenditure
(Schemes having SCSP component from 50% to 100%)
Scheme Code Sub-head/Scheme SCSP 2013-14
WCD-08 Implementation of Swawlamban scheme-Vocationaltraining programme for women
100.00 50.00 50 0.00 0.00 0
WCD-10 Awareness programme for Domestic Violence Act -2005 50.00 25.00 50 0.00 0.00 0
WCD-12 Distribution of sterilized sanitary pads to rural women 200.00 100.00 50 150.00 75.00 50
Block Grant(s)BG(WCD)-5 Bebe Nanki Ladli Beti Kalyan Scheme-13th Finance
Commission Grant for measures to improve Adverse Sexratio
6250.00 3125.00 50 6250.00 3125.00 50
Restructured CSSsCS(WCD)-60 National Mission for Empowerment of Women including
Indira Gandhi Mattritav Sahyog Yojana(IGMSY)(100% GoI) 0.00 0.00 0 1578.25 783.42 50
CS(WCD)-61/WCD-01
Integrated Child Protection Scheme (ICPS)(75:25) 0.00 0.00 0 2383.00 1191.50 50
Total (State Level) 71705.00 35852.50 50 78811.25 39399.92 50District Level Schemes
CS(SSWD)-10 (SSW(D)-01
National Social Assistance Programme (NSAP) 7182.00 3976.00 55 7367.00 3683.50 50
Total (District level) 7182.00 3976.00 55 7367.00 3683.50 50Total (State + District) 78887.00 39828.50 50 86178.25 43083.42 50
150

(` Lac)
Plan Outlay
SCSP Outlay
%age of col. 4 to col. 3
Plan Outlay
SCSP Outlay
%age of col. 7 to col. 6
1 2 3 4 5 6 7 8
SCSP 2014-15
STATEMENT - XIII
SCHEDULED CASTES SUB PLAN 2014-15 Scheme-wise Outlay and Expenditure
(Schemes having SCSP component from 50% to 100%)
Scheme Code Sub-head/Scheme SCSP 2013-14
NUTRITIONDistrict Level Schemes
NT(D)-01 Nutrition ICDS (50% of actual expenditure reimbursed byGOI) {merged in restructured scheme CS-NT(D)-16NT(D)-01 in 2014-15}
22054.00 15438.00 70 22500.00 15750.00 70
NT(D)-03 Nutrition (Kishori Shakti Yojana) 300.00 210.00 70 1.00 0.50 50
NT(D)-04 Infrastructure/Basic amenities for Anganwari centres in theState (One time ACA 2011-12)
975.00 680.00 70 .. .. > 50%
NT(D)-04(i) Construction of Buildings of Anganwadi Centres underRestructured ICDS (75:25) {merged in restructured schemeCS-NT(D)-16 NT(D)-01 in 2014-15}
225.00 157.00 70 2800.00 1960.00 70
Restructured CSSsCS-NT(D)62 NT(D)-02
Rajiv Gandhi Scheme for empowerment of adolescent girls(RGSEAG)- "Sabla"
1600.00 1120.00 70 3405.20 2291.00 67
Total 25154.00 17605.00 70 28706.20 20001.50 70LABOUR & LABOUR WELFARE
A Labour
LW-01 Rehabilitation of bonded labourers (50:50) 30.00 15.00 50 0.00 0.00 0
LW-04 Child Labour-Rehabilitation Funds 100.00 50.00 50 0.00 0.00 0
Total 130.00 65.00 50 0.00 0.00 0
151

(` Lac)
Plan Outlay
SCSP Outlay
%age of col. 4 to col. 3
Plan Outlay
SCSP Outlay
%age of col. 7 to col. 6
1 2 3 4 5 6 7 8
SCSP 2014-15
STATEMENT - XIII
SCHEDULED CASTES SUB PLAN 2014-15 Scheme-wise Outlay and Expenditure
(Schemes having SCSP component from 50% to 100%)
Scheme Code Sub-head/Scheme SCSP 2013-14
B Industrial TrainingITI-07 Provision of Free Text Books and Tool Kits to the
Scheduled Castes 48.00 48.00 100 20.00 20.00 100
Total 48.00 48.00 100 20.00 20.00 100
Total A+B 178.00 113.00 63 20.00 20.00 100
Grand Total 252774.84 166565.16 66 374323.83 245895.86 66
152

(` Lac)SCSP 2014-15
Outlay Expenditure Approved Outlay
1 2 3 4 5
DAIRY DEVELOPMENTNew Scheme
DD-05 Promotion of Dairy farming as livelihood for SC beneficiaries 0.00 0.00 90.00
Total 0.00 0.00 90.00RURAL DEVELOPMENT Other Rural Development Programme
RDO(S)-06/ RDO(S)-07
Environmental Improvement of SC Basties/Villages with Stress onSanitation
0.10 0.00 0.00
RDO(S)-08/ RDO(S)-10
Modernization and improvement of SC villages having more than50% SC population
300.00 0.00 0.00
Total 300.10 0.00 0.00INDUSTRY AND MINERALS
VSI-07 Setting up of District Artisan Hatt Centres for providingmarketing facilities to the SC Artisans of the State
200.00 0.00 0.00
Total 200.00 0.00 0.00SCIENCE, TECHNOLOGY AND ENVIRONMENTNew Scheme
SR-11 Assessment of level of fluoride and subsequent oxidative stress inpregnant SC women from fluoride endemic zone of Punjab and itsprevention and management
0.00 0.00 5.00
STATEMENT - XIV
SCHEDULED CASTES SUB PLAN (SCSP)-2014-15 Scheme-wise Outlay and Expenditure
Exclusive Schemes for Scheduled Castes
Scheme Code Sub-head/Scheme SCSP 2013-14
153

(` Lac)SCSP 2014-15
Outlay Expenditure Approved Outlay
1 2 3 4 5
STATEMENT - XIV
SCHEDULED CASTES SUB PLAN (SCSP)-2014-15 Scheme-wise Outlay and Expenditure
Exclusive Schemes for Scheduled Castes
Scheme Code Sub-head/Scheme SCSP 2013-14
SR-12 Socio-Economic Development of Scheduled Castes communitythrough technology interventions in horticulture and relatedventures
0.00 0.00 5.00
Total 0.00 0.00 10.00URBAN DEVELOPMENTRestructured CSSs
CS(UD)-15 Jawahar Lal Nehru National Urban Renewal Mission (JNNURM)
ii) Basic services to urban poor (BSUP) (50:20:30) (GoI: State:ULBs)
2683.00 0.00 ..
iv) Integrated Housing & Slum Development Programme (IHSDP)(80:10:10) (GoI: State: ULBs)
15981.00 0.00 ..
Total 18664.00 0.00 ..WELFARE OF SCs State Level Schemes
WSC-02 Grant-in-aid to PSCFC under One Time Settlement Scheme 300.00 158.63 100.00
WSC-03 Houses to Houseless SCs in Rural & Urban Areas (ACA-2010-11)( District level scheme SCH(D)-01 shifted to State level)
5000.00 0.00 1000.00
WSC-04 Financial Assistance to SC youth for Flying Training ofCommercial Pilot License (ACA 2007-08)
100.00 0.00 0.00
WSC-05(i) Attendance scholarship to SC Primary girl students 2500.00 928.43 1500.00
154

(` Lac)SCSP 2014-15
Outlay Expenditure Approved Outlay
1 2 3 4 5
STATEMENT - XIV
SCHEDULED CASTES SUB PLAN (SCSP)-2014-15 Scheme-wise Outlay and Expenditure
Exclusive Schemes for Scheduled Castes
Scheme Code Sub-head/Scheme SCSP 2013-14
WSC-07 New Courses/ Vocational Training in ITIs for SC Students (Staffexpenditure, scholarship to SC students etc.)
1150.00 0.00 1000.00
WSC-08 Award to the Village Panchayats for promoting Education andSocio Economic Development of SCs
100.00 0.00 0.00
WSC-09(i) Shagun to SC Girls/Widows/ Divorcees and the Daughters ofWidows at the time of their marriages
12200.00 12026.25 7200.00
WSC-10 Assistance to NGOs, Trusts and other Social Institutions forSolemnizing Mass Marriages for SC couples
100.00 100.00 100.00
WSC-11 Setting up of Legal Aid Clinics in all the districts of Punjab 150.00 0.00 0.00
New schemeWSC-12 Construction of building for the Welfare Department at the State
Headquarter0.00 0.00 100.00
Restructured CSSCS(WSC)-50 Scheme for Development of Scheduled Castes
(i) CS(WSC)01-34-
Scholarship for Post Matric Students for Scheduled Castes. (100% GoI)(Shifted from Non Plan).
0.00 0.00 18308.00
(ii) CS(WSC)-02 Babu Jagjivan Ram Chhatrawas Yojana -Construction of Hostels for SC Girls in Schools & Colleges. (100% GoI).
0.00 0.00 2000.00
(iii) 03-33 CS(WSC)-03
Babu Jagjivan Ram Chhatrawas Hostels for Boys & Girls in Schools & Colleges. (50:50) (GoI:GoP) (Shifted from Non Plan)
0.00 0.00 100.00
155

(` Lac)SCSP 2014-15
Outlay Expenditure Approved Outlay
1 2 3 4 5
STATEMENT - XIV
SCHEDULED CASTES SUB PLAN (SCSP)-2014-15 Scheme-wise Outlay and Expenditure
Exclusive Schemes for Scheduled Castes
Scheme Code Sub-head/Scheme SCSP 2013-14
(iv)10-50 Implementation of Protection of Civil Rights Act -1955 and the Scheduled Caste & the Scheduled Tribes (Prevention of Atrocities Act 1989)(Clubbed Scheme SCOP (S)-1 & SCOP(S)-2. (100% GoI) (Shifted from Non Plan)
0.00 0.00 600.00
(v)WSC-01 Share Capital Contribution to PSCFC (State Share 51% & GoI 49%) (direct release by GoI)
542.00 542.00 1063.00
(vi) CS(WSC)-04 Pre-Matric Scholarship for Scheduled Caste Students Studying in class IXth & Xth (100% GoI)
0.00 0.00 3000.00
(vii) Upgradation of Merit of SC Students (New Scheme) 0.00 0.00 400.00
New schemeCS(WSC)-53 Pradhan Mantri Adarash Gram Yojana (100%) (GOI) 0.00 0.00 5000.00
Total (State Level) 22142.00 13755.31 41471.00District Level Schemes
WSC(D)-01 Construction of Dr. B.R. Ambedkar Bhawans and their operation 2770.00 0.00 500.00
WSC(D)-02 Award to SC Sports Students (6-12 classes) 615.00 0.00 615.00
Total (District Level) 3385.00 0.00 1115.00Total (State + District) 25527.00 13755.31 42586.00
LABOUR & LABOUR WELFAREIndustrial Training
ITI-07 Provision of Free Text Books and Tool Kits to the Scheduled Castes 48.00 2.42 20.00
Total 48.00 2.42 20.00
Grand Total 44739.10 13757.73 42706.00
156

PART-III
BASIC DATA FOR SCs IN PUNJAB

157
Table –1
LIST OF SCHEDULED CASTES IN PUNJAB In Punjab, 38 castes have been listed in the Scheduled Castes and Scheduled Tribe
Amendment Act, 1976 (No.108, Dated 18th September, 1976) of the Ministry of Home Affairs,
New Delhi. Now vide notification Amendment Act 31 of 2007 –(w.e.f. 29-8-2007) issued by the
Ministry of Law and Justice, Mahatam, Rai Sikh has been inserted as 39th caste in Scheduled
Castes list of Punjab. No Tribe has been scheduled in the State under the Presidential Orders.
Following Castes are Scheduled Castes in the State of Punjab: -
S.No. Castes S.No. Castes 1 Ad-dharmi 30 Gagra 2 Od 31 Khatik 3 Pasi 32 Kori-Koli 4 Parna 33 Marija,Marecha 5 Pherera 34 Mazhabi, Mazhabi Sikh. 6 Sanhai 35 Megh 7 Sansi, Bhedkut, Manesh 36 Nat 8 Sansoi 37 Sanhal 9 Sapala 38 Mochi 10 Sarera 39 Mahatam, Rai Sikh 11 Sikligar 12 Ganadhila, Gadeil 13 Kabirpanthi, Julaha 14 Sirkiband 15 Balmiki, Chura, Bhangi 16 Bangali 17 Barar, Burar or Berar 18 Batwal 19 Bauria, Bewaria 20 Bazigar 21 Bhanjara 22 Chamar, Jatia Chamar, Rehgar,
Raigar, Ramdasi , Ravidasi, Ramdasia, Ramdasia Sikh, Ravidasia, Ravidasia Sikh,
23 Chanal 24 Dagi 25 Darain 26 Deha,Dhaya,Dhea 27 Dhanak 28 Dhogri,Dhangri,Siggi 29 Dumna,Mahasha,Doom

158
Table –2
POPULATION AND DECENNIAL GROWTH IN PUNJAB / INDIA FROM 1981 TO 2011
Particulars 1981 1991 2001 2011
1 2 3 4 Punjab Total Population 1,67,83,915 2,02,81,969 2,43,58,999 2,77,43,338 Scheduled Castes Population
45,11,703 57,42,528 70,28,723 88,60,179
Percentage of Scheduled Castes Population to total Population
26.90 28.31 28.85 31.94
India Total Population 66,52,87,849 84,63,82,688 1,02,86,10,328 1,21.05,69,573 Scheduled Castes Population 10,47,54,623 13,82,23,277 166635700 20,13,78,086 Percentage of Scheduled Castes Population to total Population
15.73 16.32 16.20 16.60
Decennial Growth Rate of Punjab (in %age)
Total Population 23.89 20.80 20.10 13.89 Scheduled Castes Population 34.74 27.28 22.39 26.06 Decennial Growth Rate of India (in %age)
Total Population 25.00 23.85 21.53 17.70 Scheduled Castes Population 30.95 31.99 20.55
20.85
Source : Census 2011

159
Table-3
DISTRICT WISE DETAIL OF TOTAL POPULATION AND SC POPULATION AS PER CENSUS 2011
Sr. No.
District Total Population
SC Population
Percentage ( col.4 to col.3)
1 2 3 4 5 1 Amritsar 2490656 770864 30.95
2 Barnala 595527 192001 32.24
3 Bathinda 1388525 450473 32.44
4 Faridkot 617508 240328 38.92
5 Fatehgarh Sahib 600163 192493 32.07
6 Firozpur 2029074 855726 42.17
7 Gurdaspur 2298323 580576 25.26
8 Hoshiarpur 1586625 557504 35.14
9 Jalandhar 2193590 854444 38.95
10 Kapurthala 815168 276707 33.94
11 Ludhiana 3498739 923358 26.39
12 Mansa 769751 258878 33.63
13 Moga 995746 363417 36.50
14 Sri Muktsar Sahib 901896 381554 42.31
15 SBS Nagar 612310 260284 42.51
16 Patiala 1895686 465359 24.54
17 Rupnagar 684627 180905 26.42
18 S.A.S. Nagar 994628 216231 21.73
19 Sangrur 1655169 461609 27.87
20 Taran Tarn 1119627 377468 33.71
Total 27743338 8860179 31.94
Source: Census 2011

160
Table -4 DISTRICT-WISE RURAL AND URBAN POPULATION OF SCHEDULED CASTES
Sr. No.
District Scheduled Caste Population %age of SC Population
to Total
Population
Rural Urban Total Total Male Female Total Male Female Population
1 2 3 4 5 6 7 8 9 10 1 Amritsar 464984 244254 220730 305880 161723 144157 770864 30.95
2 Barnala 133435 70636 62799 58566 30933 27633 192001 32.24
3 Bathinda 321533 169244 152289 128940 67692 61248 450473 32.44
4 Faridkot 171199 90303 80896 69129 36264 32865 240328 38.92
5 Fatehgarh Sahib
154570 81690 72880 37923 20192 17731 192493 32.07
6 Firozpur 709922 369036 340886 145804 76425 69379 855726 42.17
7 Gurdaspur 435930 228541 207389 144646 76353 68293 580576 25.26
8 Hoshiarpur 465037 236295 228742 92467 48027 44440 557504 35.14
9 Jalandhar 515342 264466 250876 339102 177658 161444 854444 38.95
10 Kapurthala 212013 110167 101846 64694 33734 30960 276707 33.94
11 Ludhiana 559471 294159 265312 363887 193680 170207 923358 26.39
12 Mansa 217553 114644 102909 41325 21667 19658 258878 33.63
13 Moga 307098 162624 144474 56319 29794 26525 363417 36.50
14 Sri Muktsar
Sahib
295179 155136 140043 86375 45337 41031 381554 42.31
15 SBS Nagar 212889 108494 104395 47395 24541 22854 260284 42.51
16 Patiala 348587 183424 165163 116772 61079 55693 465359 24.54
17 Rupnagar 138597 72349 66248 42308 21985 20323 180905 26.42
18 S.A.S. Nagar 132713 70327 62386 83518 44056 39462 216231 21.73
19 Sangrur 361376 191723 169653 100233
52508
47725 461609 27.88
20 Taran Tarn 339558 178817 160741 37910 19898 18012 377468 33.71
Total 6496986 (73.33%)
3396329 3100657 2363193 (26.67%)
1243546 1119647 8860179 31.94
Figures in the brackets represents the %age with total SC population
Source : Census 2011

161
Table -5
GENERAL VIZ-A-VIZ SC FAMILIES (RURAL AND URBAN) BELOW THE POVERTY LINE IN THE STATE OF PUNJAB
Sr. No
Families Total families (in lac) *
Below Poverty Line families @
(in lac)
% age of BPL SC families to the total BPL families (Col. 8 to Col. 5)
Rural Urban Total Rural Urban Total
1 2 3 4 5 6 7 8 9 I Non SC
families 19.24 11.70 30.94 1.10 0.92 2.02 6.53
II SC families 9.49 3.05 12.54 2.34 0.87 3.21 25.60
Total 28.73 14.75 43.48 3.44 1.79 5.23 12.03
Source : * Census 2001, @ Rural Development Deptt. (2002) and SUDA (2004), Punjab

162
Table -6 NUMBER AND AREA OF OPERATIONAL HOLDINGS WITH
SCHEDULED CASTES Sr. No.
Size class (In hac)
No. of Operational Holdings Area Operated (in hac.)
individual joint institutional Total individual joint institutional Total
1 2 3 4 5 6 7 8 9 10 1 Below 0.5 M 13533 0 0 13533 4260.15 0.00 0.00 4260.15
F 289 0 0 289 87.38 0.00 0.00 87.38
T 13822 0 0 13822 4347.53 0.00 0.00 4347.53 2 (0.5-1.0) M 12019 15 0 12034 8855.61 10.99 0.00 8866.60
F 189 0 0 189 148.69 0.00 0.00 148.69 T 12208 15 0 12223 9004.30 10.99 0.00 9015.29
Marginal M 25552 15 0 25567 13115.76 10.99 0.00 13126.75 F 478 0 0 478 236.07 0.00 0.00 236.07
T 26030 15 0 26045 13351.83 10.99 0.00 13362.82 3 (1.0-2.0) M 14065 15 0 14080 18870.57 20.10 0.00 18890.67
F 160 0 0 160 222.66 0.00 0.00 222.66 T 14225 15 0 14240 19093.23 20.10 0.00 19113.33
Small M 14065 15 0 14080 18870.57 20.10 0.00 18890.67 F 160 0 0 160 222.66 0.00 0.00 222.66
T 14225 15 0 14240 19093.23 20.10 0.00 19113.33 4 (2.0-3.0) M 10547 30 0 10577 23750.69 66.64 0.00 23817.33
F 178 0 0 178 397.49 0.00 0.00 397.49 T 10725 30 0 10755 24148.18 66.64 0.00 24214.82
5 (3.0-4.0) M 3232 5 0 3237 10858.73 18.20 0.00 10876.93 F 25 0 0 25 84.62 0.00 0.00 84.62
T 3257 5 0 3262 10943.35 18.20 0.00 10961.55 Semi Medium M 13779 35 0 13814 34609.42 84.84 0.00 34694.26
F 203 0 0 203 482.11 0.00 0.00 482.11 T 13982 35 0 14017 35091.53 84.84 0.00 35176.37
6 (4.0-5.0) M 3625 0 0 3625 15527.99 0.00 0.00 15527.99 F 34 0 0 34 140.71 0.00 0.00 140.71
T 3659 0 0 3659 15668.70 0.00 0.00 15668.70 7 (5.0-7.5) M 3426 10 0 3436 20949.15 63.18 0.00 21012.33
F 43 0 0 43 252.37 0.00 0.00 252.37
T 3469 10 0 3479 21201.52 63.18 0.00 21264.70 8 (7.5-10.0) M 986 0 0 986 8270.01 0.00 0.00 8270.01
F 15 0 0 15 120.53 0.00 0.00 120.53
T 1001 0 0 1001 8390.54 0.00 0.00 8390.54
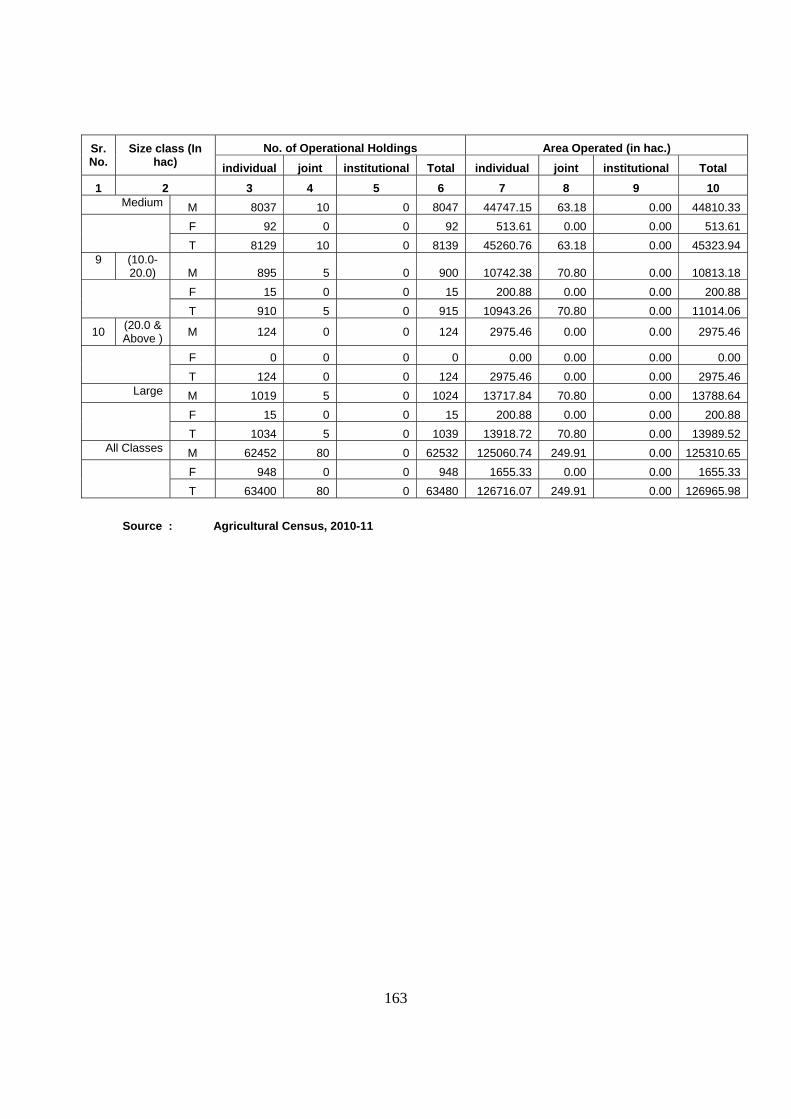
163
Sr. No.
Size class (In hac)
No. of Operational Holdings Area Operated (in hac.) individual joint institutional Total individual joint institutional Total
1 2 3 4 5 6 7 8 9 10 Medium M 8037 10 0 8047 44747.15 63.18 0.00 44810.33 F 92 0 0 92 513.61 0.00 0.00 513.61
T 8129 10 0 8139 45260.76 63.18 0.00 45323.94 9 (10.0-
20.0) M 895 5 0 900 10742.38 70.80 0.00 10813.18 F 15 0 0 15 200.88 0.00 0.00 200.88
T 910 5 0 915 10943.26 70.80 0.00 11014.06
10 (20.0 & Above )
M 124 0 0 124 2975.46 0.00 0.00 2975.46
F 0 0 0 0 0.00 0.00 0.00 0.00
T 124 0 0 124 2975.46 0.00 0.00 2975.46 Large M 1019 5 0 1024 13717.84 70.80 0.00 13788.64
F 15 0 0 15 200.88 0.00 0.00 200.88
T 1034 5 0 1039 13918.72 70.80 0.00 13989.52 All Classes M 62452 80 0 62532 125060.74 249.91 0.00 125310.65
F 948 0 0 948 1655.33 0.00 0.00 1655.33
T 63400 80 0 63480 126716.07 249.91 0.00 126965.98
Source : Agricultural Census, 2010-11

164
Table –7
COMPARATIVE STATISTICS OF LITERACY RATE (1971-2011)
Particulars 1971 1981 1991 2001 2011 1 2 3 4 5 6
LITERACY RATE 1. Punjab
A Total 33.67 49.12 58.51 69.65 75.08 Male 40.40 55.52 65.66 75.24 80.44 Female 25.90 39.64 50.41 63.36
70.70
B Scheduled Castes 16.00 23.86 41.09 56.20 64.81 Male 22.95 33.86. 49.82 63.40 70.66 Female 8.10 16.67 31.03 48.20
58.39
II India :
A Total 29.45 36.17 52.21 64.83. 73.00 Male 39.45 46.74 64.13 75.26 80.90 Female 18.69 24.88 39.29 53.67 64.60
B Scheduled Caste 12.77 21.38 37.41 54.68 66.10
Male 20.04 31.12 49.91 66.64 75.20 Female 5.06 10.93 23.76 41.90 56.50 Source – Census 2011

165
Table-8
DETAIL OF TOTAL VIS-a-VIS SC WORKERS IN PUNJAB
Sr.
No.
Type Total SC
Male Female Total ( 3+4)
%age to total workers
Male Female Total (7+8)
%age to
total SC
workers
1 2 3 4 5 6 7 8 9 10
I Main Worker
i. Cultivator 1691777 112083 1803860 18.23 107715 17829 125544 3.95
ii. Agricultural labourer
1013979 154042 1168021 11.80 698261 106312 804573 25.30
iii. House Hold Industry
215971 84689 300660 3.04 51514 25468 76982 2.43
iv. Others 4342904 835491 5178395 52.32 1270190 240880 1511070 47.52
Total-I 7264631 1186305 8450936 85.39 2127680 390489 2518169 79.20
II Marginal Worker
i. Cultivator 61582 69069 130651 1.32 10414 13187 23601 0.74
ii. Agricultural labourer
225466 194968 420434 4.25 152186 143266 295452 9.29
iii. House Hold Industry
33323 51977 85300 0.86 11777 16669 28446 0.89
iv. Others 489155 320886 810041 8.18 201818 111952 313770 9.86
Total-II 809526 636900 1446426 14.61 376195 285074 661269 20.80
III Total Workers (I+II)
8074157 1823205 9897362 100 2503875 675563 3179438 100
IV. Non-Workers 6565308 11280668 17845976 2136000 3544741 5680741
V Total (III+IV) 14639465
13103873
27743338
4639875
4220304
8860179
Source: Census-2011
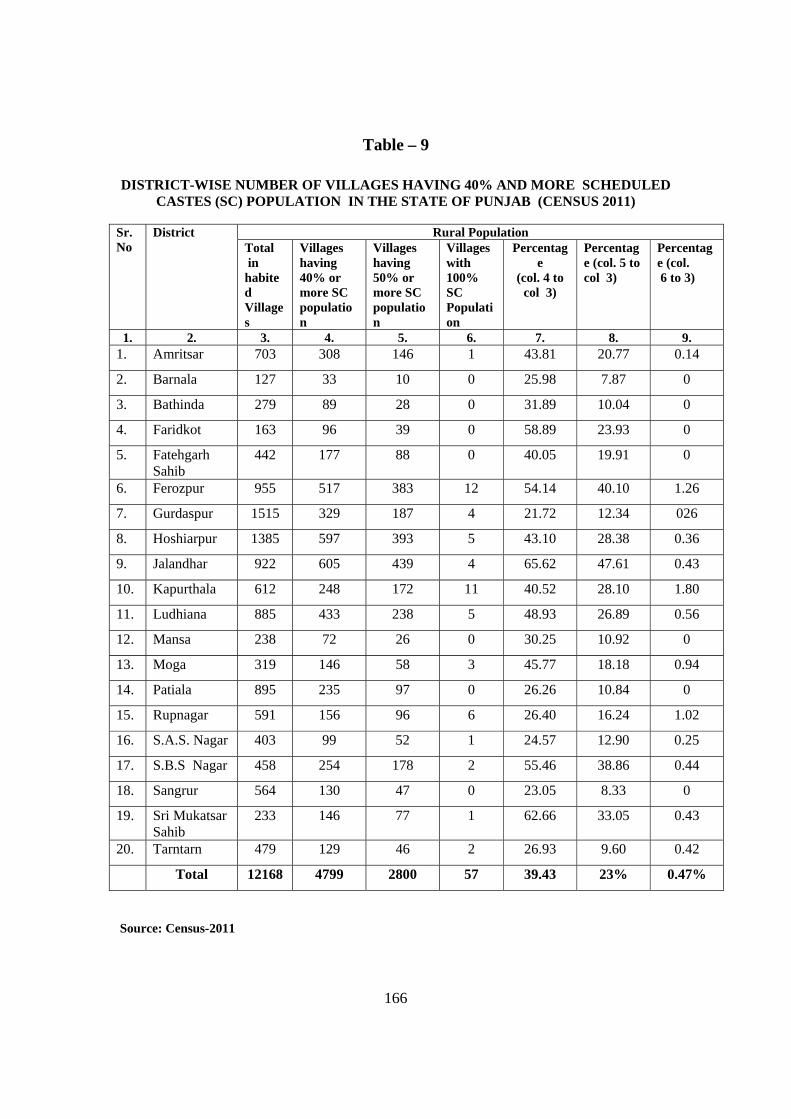
166
Table – 9
DISTRICT-WISE NUMBER OF VILLAGES HAVING 40% AND MORE SCHEDULED CASTES (SC) POPULATION IN THE STATE OF PUNJAB (CENSUS 2011)
Sr. No
District Rural Population Total in habited Villages
Villages having 40% or more SC population
Villages having 50% or more SC population
Villages with 100% SC Population
Percentage
(col. 4 to col 3)
Percentage (col. 5 to col 3)
Percentage (col. 6 to 3)
1. 2. 3. 4. 5. 6. 7. 8. 9. 1. Amritsar 703 308 146 1 43.81 20.77 0.14
2. Barnala 127 33 10 0 25.98 7.87 0
3. Bathinda 279 89 28 0 31.89 10.04 0
4. Faridkot 163 96 39 0 58.89 23.93 0
5. Fatehgarh Sahib
442 177 88 0 40.05 19.91 0
6. Ferozpur 955 517 383 12 54.14 40.10 1.26
7. Gurdaspur 1515 329 187 4 21.72 12.34 026
8. Hoshiarpur 1385 597 393 5 43.10 28.38 0.36
9. Jalandhar 922 605 439 4 65.62 47.61 0.43
10. Kapurthala 612 248 172 11 40.52 28.10 1.80
11. Ludhiana 885 433 238 5 48.93 26.89 0.56
12. Mansa 238 72 26 0 30.25 10.92 0
13. Moga 319 146 58 3 45.77 18.18 0.94
14. Patiala 895 235 97 0 26.26 10.84 0
15. Rupnagar 591 156 96 6 26.40 16.24 1.02
16. S.A.S. Nagar 403 99 52 1 24.57 12.90 0.25
17. S.B.S Nagar 458 254 178 2 55.46 38.86 0.44
18. Sangrur 564 130 47 0 23.05 8.33 0
19. Sri Mukatsar Sahib
233 146 77 1 62.66 33.05 0.43
20. Tarntarn 479 129 46 2 26.93 9.60 0.42
Total 12168 4799 2800 57 39.43 23% 0.47%
Source: Census-2011

167
Table –10
LIST OF TOWNS HAVING 20% OR MORE SC POPULATION IN PUNJAB Sr. No.
District/ Town Population SC Population %age ( col. 7
to col.4) Total Male Female Total Male Female
1 2 3 4 5 6 7 8 9 10 I AMRITSAR 1 1(i) Amritsar
(M.Corp+OG) (Part) 3563 1932 1631 2110 1147 963 59.22
1(ii) Amritsar (M.Corp+OG) (Part)
1155664 613485 542179 250149 132310 117839 21.65
2 2 Baba Bakala(CT) 8946 4697 4249 2430 1296 1134 27.16
3 3 Budha Theh(CT) 10979 6126 4853 3838 1966 1872 34.96
4 4 Chogawan( CT) 5416 2878 2538 1149 626 523 21.21
5 5 Jandiala( M Cl) 29232 15655 13577 9782 5145 4637 33.46
6 6 Khilchian(CT) 4588 2443 2145 2212 1171 1041 48.21
7 7 Majhitha( M Cl) 14503 7639 6864 6331 3293 3038 43.65
8 8 Mudal(C T) 3882 2079 1803 2093 1113 980 53.92
9 9 Nangli(CT) 20440 10924 9516 7971 4225 3746 39.00
10 10 Raja Sansi(NP) 14298 7603 6695 5324 2819 2505 37.24
11 11 Ramdas (M Cl) 6398 3336 3062 2708 1433 1275 42.33
12 12 Rayya(NP) 14506 7583 6923 3649 1892 1757 25.16
II BARNALA
13 1 Barnala (M CI) 116449 62554 53895 30597 16096 14501 26.28
14 2 Bhadaur (M CI) 18561 9836 8725 8585 4549 4036 46.25
15 3 Dhanaula (M CI) 19920 10521 9399 7011 3662 3349 35.20
16 4 Handiaya (NP) 12507 6810 5697 4887 2592 2295 39.07
17 5 Tapa (M CI) 23248 12591 10657 7486 4034 3452 32.20
III BATHINDA
18 1 Bathinda (M Corp.) 285788 151524 134264 71058 37221 33837 24.86
19 2 Bhagta Bhai Ka (NP) 14467 7682 6785 4613 2424 2189 31.89
20 3 Bhucho Mandi (M CI)
14961 7805 7156 5291 2750 2541 35.37
21 4 Goniana (M CI) 15208 8150 7058 4220 2215 2005 27.75
22 5 Kot Fatta (M CI) 7412 3912 3500 3471 1849 1622 46.83
23 6 Maur (M CI) 31849 16902 14947 10337 5422 4915 32.46
24 7 Raman (M CI) 22553 12009 10544 7525 3934 3591 33.37

168
Sr. No.
District/ Town Population SC Population %age ( col. 7
to col.4) Total Male Female Total Male Female
1 2 3 4 5 6 7 8 9 10 25 8 Rampura Phul (M
CI+OG) 51023 27213 23810 12902 6779 6123 25.29
26 9 Sangat(M CI) 2744 1458 1286 620 322 298 22.59
27 10 Talwandi Sabo (NP) 20589 11062 9527 7059 3717 3342 34.29
IV FARDIKOT
28 1 Faridkot (M CI+OG) 87695 47411 40284 25502 13294 12208 29.08
29 2 Jaitu (M CI+OG) 37377 19880 17497 14159 7502 6657 37.88
30 3 Kot Kapura (M CI) 91979 48598 43381 29468 15468 14000 32.04
V FATEHGARH SAHIB
31 1 Amloh (M CI) 14696 7932 6764 3543 1910 1633 24.11
32 2 Bass Pathana (M CI) 20288 10665 9623 5226 2755 2471 25.76
33 3 Khamanon (NP) 10135 5402 4733 3452 1788 1664 34.06
34 4 Sirhind Fatehgarh Sahib (M CI)
58097 30642 27455 12798 6701 6097 22.03
VI FIROZPUR
35 1 Abohar (M CI) 145302
76984 68318 36734 19214 17520 25.28
36 2 Fazilka (M CI) 76492 40306 36186 22349 11711 10638 29.22
37 3 Firazpur (M CI) 110313 58451 51862 27395 14512 12883 24.83
38 4 Guru Har Sahai (M CI)
17192 9124 8068 5343 2792 2551 31.08
39 5 Jalalabad (M CI+OG)
39525 21115 18410 11200 5864 5336 28.34
40 6 Korianwali (CT) 5770 3591 2179 1487 778 709 25.77
41 7 Makhu (NP) 14658 7723 6935 4047 2142 1905 27.61
42 8 Mallanwala Khass (NP)
16183 8443 7740 5670 2937 2733 35.04
43 9 Mudki (NP) 10415 5487 4928 3212 1683 1529 30,84
44 10 Talwandi Bhai (M CI)
17285 9202 8083 5461 2884 2577 31.59
45 11 Zira (M CI+OG) 37498 19610 17888 11848 6136 5712 31.60
VII GURDASPUR
46 1 Baryar (CT) 3520 1827 1693 1792 933 859 50.91
47 2 Batala (M CI+OG) 158621
83655 74966 38348 20380 17968 24.18
48 3 Behrampur (CT) 5432 2770 2662 2107 1057 1050 38.79
49 4 Dera Baba Nanak (M CI)
6394 331 3063 1659 865 794 25.95

169
Sr. No.
District/ Town Population SC Population %age ( col. 7
to col.4) Total Male Female Total Male Female
1 2 3 4 5 6 7 8 9 10 50 5 Dina Nagar (M CI) 23976 12524 11452 7884 4109 3775 32.88
51 6 Fateh Nagar (CT) 7721 4083 3638 2161 1140 1021 27.99
52 7 Ghoh (CT) 6883 3599 3284 2133 1132 1001 30.99
53 8 Gurdaspur (M CI+OG)
77928 41311 36617 16999 8858 8141 21.81
54 9 Jugial (CT) 15210 8244 6966 4270 2301 1969 28.07
55 10 Kot (CT) 5406 2821 2585 1173 610 563 21.70
56 11 Manwal (CT) 6496 3427 3069 1717 930 787 26.43
57 12 Narot Mehra (CT) 8885 4691 4194 3175 1683 1492 35.73
58 13 Pathankot (M CI +OG)
156306
82045 74261 32918 17223 15695 21.06
59 14 Sarna (CT) 5847 3089 2758 2574 1357 1217 44.02
60 15 Sri Hargobindpur (M CI)
8241 4281 3960 2707 1399 1308 32.85
61 16 Sujanpur (M CI) 28270 14843 13427 9874 5186 4688 34.93
62 17 Tharial (CT) 5081 2615 2466 1730 901 829 34.05
VIII HOSHIARPUR
63 1 Chohal (CT) 7304 3989 3315 2246 1165 1081 30.75
64 2 Dasua (M CI) 25192 13047 12145 6180 3185 2995 24.53
65 3 Gardhiwala (M CI) 7593 3893 3700 2319 1182 1137 30.54
66 4 Garhshankar (M CI) 16955 8823 8132 6720 3524 3196 39.63
67 5 Hariana (M CI) 8928 4633 4295 2199 1147 1052 24.63
68 6 Hazipur (CT) 6091 3134 2957 1466 749 717 24.07
69 7 Hoshiarpur (M CI) 168653
88304 80349 45283 23580 21703 26.85
70 8 Mahilpur (NP) 11360 5907 5453 4764 2489 2275 41.94
71 9 Mukerian ( M CI) 29841 15531 14310 6515 3422 3093 21.83
72 10 Rakri (CT) 5722 2908 2814 1265 647 618 22.11
73 11 Sham Chaurasi (M CI)
4426 2341 2085 2667 1379 1288 60.26
74 12 Urmar Tanda (M CI) 23419 11938 11481 7145 3636 3509 30.51
IX JALANDHAR
75 1 Adampur (M CI) 20922 11152 9770 7153 3720 3433 34.19
76 2 Alwalpur (M CI) 7815 4156 3659 4855 2545 2310 62.12
77 3 Apra (CT) 6258 3219 3039 2646 1348 1298 42.28
78 4 Bhogpur (NP) 17549 9032 8517 6181 3160 3021 35.22

170
Sr. No.
District/ Town Population SC Population %age ( col. 7
to col.4) Total Male Female Total Male Female
1 2 3 4 5 6 7 8 9 10 79 5 Chomon (CT) 3704 1956 1748 2090 1088 1002 56.43
80 6 Dhin (CT) 5961 3092 2869 3325 1712 1613 55.78
81 7 Goraya (NP) 16462 8657 7805 4864 2520 2344 29.55
82 8-A Jalandhar ( M Corp+OG)(Part)
868181
460403 407778 236672
124291
112381
27.26
8-B Jalandhar (M Corp +OG) (part)
748 408 340 232 126 106 31.02
83 9 Jandiala (CT) 8487 4395 4092 2865 1484 1381 33.76
84 10 Kartarpur (M CI) 25662 13368 12294 9969 5123 4846 38.85
85 11 Khambra (CT) 5483 2825 2658 3054 1581 1473 55.70
86 12 Lohian Khass (NP) 10362 5398 4964 2852 1498 1354 27.52
87 13 Nakodar (M CI) 36973 19360 17613 13492 6955 6537 36.49
88 14 Nurmahal (M CI) 14560 7540 7020 5585 2907 2678 38.36
89 15 Phillaur (M CI) 24688 12962 11726 11419 6003 5416 46.25
90 16 Raipur Rasulpur (CT)
3916 2042 1874 2047 1052 995 52.27
91 17 Sansarpur (CT) 4657 2379 2278 1030 522 508 22.12
92 18 Sarai Khas (CT) 7044 3830 3214 1710 903 807 24.28
93 19 Shahkot (NP) 14488 7560 6928 3762 1938 1824 25.97
94 20 Sufipind (CT) 9406 4932 4474 3890 2000 1890 41.36
X KAPURTHALA
95 1 Chachoki (CT) 4307 2310 1997 1323 699 624 30.72
96 2 Dhilwan (NP) 8157 4225 3932 2271 1154 1117 27.84
97 3 Hussainpur (CT) 15575 8640 6935 3791 2068 1723 24.34
98 4 Kapurthala (M CI) 98916 53801 45115 20843 10902 9941 21.07
99 5 Phagwara (M CI) 97864 51386 46478 22353 11571 10782 22.84
100 6 Phagwara Sharki (CT)
20102 10665 9437 9014 4665 4349 44.84
XI LUDHIANA
101 1 Akalgarh (CT) 7678 3925 3753 3161 1621 1540 41.17
102 2 Baddowal (CT) 6825 3842 2983 2287 1197 1090 33.51
103 3 Bhamian Kalan (CT) 13174 7092 6082 3330 1803 1527 25.28
104 4 Bhattian (CT) 11066 5762 5304 4856 2500 2356 43.88
105 5 Doraha (M CI)) 25424 14353 11071 6340 3450 2890 24.94
106 6 Gill (CT) 28884 15459 13425 7217 3858 3359 24.99

171
Sr. No.
District/ Town Population SC Population %age ( col. 7
to col.4) Total Male Female Total Male Female
1 2 3 4 5 6 7 8 9 10 107 7 Halwara (CT) 9761 5321 4440 3216 1661 1555 32.95
108 8 Jagraon (M CI) 65240 34387 30853 17270 9017 8253 26.47
109 9 Jodhan (CT) 3845 2012 1833 908 492 416 23.62
110 10 Khanna( M CI) 128137 67801 60336 34441 18149 16292 26.88
111 11 Machhiwara (M CI) 24916 13102 11814 6229 3241 2988 25.00
112 12 Maloud (NP) 7567 3970 3597 2951 1545 1406 39.00
113 13 Mullanpur Dakha (NP)
16356 8595 7761 5827 3034 2793 35.63
114 14 Partap Singh wala (CT)
10843 5691 5152 4588 2405 2183 42.31
115 15 Payal (M CI) 7923 4238 3685 3253 1762 1491 41.06
116 16 Raikot ( M CI) 28734 15138 13596 11828 6211 5617 41.16
117 17 Sahnewal (NP) 22484 11989 10495 5330 2847 2483 23.71
118 18 Samrala (M CI) 19678 10375 9303 5728 3009 2719 29.11
119 19 Tharike (CT) 12294 6412 5882 3373 1718 1655 27.44
XII MANSA
120 1 Bareta (M CI) 17432 9239 8193 5240 2767 2473 30.06
121 2 Bhikhi (NP) 17825 9316 8509 5837 3033 2804 32.75
122 3 Mansa (M CI) 82956 44089 38867 19692 10400 9292 23.74
123 4 Sardulgarh (NP) 19219 10072 9147 5339 2765 2574 27.78
XIII MOGA
124 1 Badhni Kalan (NP) 6786 3596 3190 2042 1099 943 30.09
125 2 Bagha Purana (M CI) 25206 13288 11918 7819 4132 3687 31.02
126 3 Dharamkot (M CI) 19057 10015 9042 5281 2784 2497 27.71
127 4 Kot Ise Khan (CT) 12800 6713 6087 3464 1809 1655 27.06
128 5 Moga (M CI+OG) 163397 86604 76793 37713 19970 17743 23.08
XIV PATIALA
129 1 Alhoran (CT) 10218 5411 4807 4142 2178 1964 40.54
130 2 Bhadson (NP) 7260 3869 3391 1973 1021 952 27.18
131 3 Ghagga (NP) 10162 5340 4822 3832 1994 1838 37.71
132 4 Ghanaur (NP) 6985 3677 3308 1979 1023 956 28.33
133 5 Rurki Kasba (CT) 10509 5614 4895 3057 1639 1418 29.09
134
6 Samana (M CI) 54072 28309 25763 11893 6202 5691 21.99

172
Sr. No.
District/ Town Population SC Population %age ( col. 7
to col.4) Total Male Female Total Male Female
1 2 3 4 5 6 7 8 9 10 XV RUPNAGAR
135 1 Anandpur Sahib (M CI)
16282 8545 7737 4477 2327 2150 27.50
136 2 Chamkaur Sahib (NP)
13920 7258 6662 4486 2336 2150 32.23
137 3 Ghanauli (CT) 4894 2597 2297 1001 532 469 20.45
138 4 Kotla Nihang (CT) 4715 2481 2234 1472 798 674 31.22
139 5 Morinda (M CI) 24022 12648 11374 6437 3343 3094 26.80
140 6 Nangal ( M CI+OG) 48497 25317 23180 12323 6369 5954 24.41
141 7 Nehon (CT) 9439 5191 4248 2036 1090 946 21.57
XVI SAHIBZADA AJIT SINGH NAGAR (SAS NAGAR)
142 1 Banur (M CI) 18775 9889 8886 6750 3538 3212 35.95
143 2 Kharar (M CI) 74460 39218 35242 19091 10026 9065 25.64
144 3 Kurali (M CI) 31060 16510 14550 7097 3694 3403 22.85
145 4 Lalru (CT) 21394 11266 10128 4762 2501 2261 22.26
146 5 Mirpur (CT) 5967 3145 2822 1453 762 691 24.35
147 6 Mullanpur Garib Dass (CT)
6165 3256 2909 1541 793 748 25.00
148 7 Sohana (CT) 9306 4921 4385 2050 1084 966 22.03
XVII SANGRUR
149 1 Amargarh 7339 3864 3475 2265 1175 1090 30.86
150 2 Bhawanigarh (M CI) 22320 11780 10540 5694 3007 2687 25.51
151 3 Cheema (NP) 11615 6241 5374 3026 1585 1441 26.05
152 4 Dhuri (M CI) 55225 29231 25994 14207 7471 6736 25.73
153 5 Dirba (NP) 16952 9011 7941 3629 1921 1708 21.41
154 6 Khanauri (NP) 14096 7348 6748 4602 2335 2267 32.65
155 7 Lehragaga (M CI) 22588 12003 10585 6024 3170 2854 26.67
156 8 Longowal (M CI) 23851 13030 10821 5767 3100 2667 24.18
157 9 Moonak (NP) 18141 9475 8666 4167 2166 2001 22.97
158 10 Sangrur (M CI) 88043 46931 41112 19982 10385 9597 22.70
159 11 Sunam Udham Singh Wala (M CI+OG)
69069 36618 32451 16735 8798 7937 24.23
XVIII SAHID BHAGAT SINGH NAGAR
160 1 Aur (CT) 4063 2020 2043 1908 970 938 46.96

173
Sr. No.
District/ Town Population SC Population %age ( col. 7
to col.4) Total Male Female Total Male Female
1 2 3 4 5 6 7 8 9 10 161 2 Balachaur (M CI) 21631 11180 10451 7516 3888 3628 34.75
162 3 Banga (M CI) 20906 10712 10194 7166 3666 3500 34.28
163 4 Khothran (CT) 5046 2582 2464 3635 1841 1794 72.04
164 5 Nawanshahr (M CI) 46024 23835 22189 16283 8482 7801 35.38
165 6 Rail (CT) 7589 4217 3372 1538 821 717 20.27
166 7 Rohan (M CI) 15676 8267 7409 6125 3183 2942 39.07
167 8 Saloh (CT) 4481 2360 2121 3224 1690 1534 71.95
XIX
SRI MUKATSAR SAHIB
168 1 Bariwala (NP) 8668 4604 4064 3659 1965 1694 42.21
169 2 Gidderbaha (M CI) 45370 23847 21523 16302 8460 7842 35.93
170 3 Malout (M CI) 81406 43244 38162 28033 14794 13239 34.44
171 4 Mukatsar (M CI) 116747 61725 55022 38381 20118 18263 32.88
XX TARN TARAN
172 1 Bhikhiwind (CT) 20526 11038 9488 5993 3134 2859 29.20
173 2 Khem Karan (NP) 13446 73090 6056 5121 2719 2402 38.09
174 3 Patti (M CI) 40976 21668 19308 10346 5460 4886 25.25
175 4 Tarn Taran (M CI) 66847 34951 31896 16450 8585 7865 24.61

174
Table –11
MAIN OCCUPATIONAL PREFERENCE AMONG THE MORE
DEPRESSED SCs IN PUNJAB Sr. No
Caste Populati-on
Census 1991
Percentage of
households below
poverty line
Occupation Agricul-ture & allied
activities
Petty Trading
Tradit-ional
Labour
Service Govt. Job
1 2 3 4 5 6 7 8 9 1 Bengali 5141 80.0% 30.0% 26.7% 0.0% 40.0% 3.3%
2 Bauria 91817 96.7% 76.7% 23.3% 0.0% 0.0% 0.0%
3 Bazigar 192565 73.8% 15.4% 55.4% 1.5% 13.8% 13.9%
4 Bhanjria 6635 96.7% 13.3% 20.0% 20.0% 33.3% 13.4%
5 Dumna/ Mahasha/ Doom
170227 87.7% 12.3% 12.3% 4.6% 21.5% 49.3%
6 Khatic 13424 96.7% 10.0% 26.7% 30.0% 13.3% 20.0%
7 Kori Koli 15530 93.3% 20.0% 33.3% 0.0% 23.3% 23.4%
8 Megh 116852 72.0% 4.0% 24.0% 40.0% 12.0% 20.0%
9 Od 33711 90.0% 26.7% 23.3% 16.7% 16.7% 16.6%
10 Pasi 18261 80.0% 20.0% 33.3% 3.3% 10.0% 33.4%
11 Sansi 98308 92.0% 38.0% 34.0% 4.0% 10.0% 14.0%
12 Sarera 17560 76.7% 23.3% 13.3% 0.0% 0.0% 63.4%
13 Sikligar 12332 93.3% 0.0% 0.0% 100% 0.0% 0.0%
Total 759579 85.4% Source : I.D.C. Survey 1996.

175
Table –12
SOCIAL CONDITIONS OF DEPRESSED SCHEDULED CASTE POPULATION IN PUNJAB
Sr. No. Caste Population
Census 1991
Child Labour
Literacy Rate
Child Enrollment
( 6-14)
Perceived need of education
1 2 3 4 5 6 7 1 Bengali 5141 57.1 10.00 20.00 20.00
2 Bauria 91817 63.7 10.00 13.33 16.67
3 Bazigar 192565 58.9 12.31 18.46 29.33
4 Banjara 6635 41.5 26.67 23.33 50.00
5 Dumna 170227 48.2 26.60 9.23 32.31
6 Khatic 13424 41.3 26.67 36.67 43.33
7 Kori/Koli 15530 51.6 20.00 53.33 40.00
8 Megh 116852 34.3 28.00 46.00 40.00
9 Od 33711 46.1 10.00 6.67 10.00
10 Pasi 98308 57.0 14.00 20.00 22.00
11 Sansi 98308 57.0 14.00 20.00 22.00
12 Surera 17560 25.0 43.33 60.00 63.33
13 Sikligar 12332 63.0 13.30 6.67 13.33 Total 759579 48.4% 20.40% 24.80% 31.16%
Source : I.D.C. Survey 1996.

176
Table –13
ECONOMIC CONDITIONS OF DEPRESSED SCHEDULED CASTES POPULATION IN PUNJAB
Sr. No. Caste Population
Census 1991 Housing Status Animal Owned
Kacha Pacca Total Buffaloes Cow Total 1 2 3 4 5 6 7 8 9 1 Bengali 5141 6.67 0.00 6.67 3.33 13.00 0.0
2 Bauria 91817 3.33 0.00 3.33 3.33 6.73 13.33
3 Bazigar 192565 3.08 0.00 3.08 3.08 3.08 3.08
4 Banjara 6635 6.67 6.67 13.34 0.00 0.00 0.00
5 Dumna 170227 6.15 4.62 10.77 1.54 3.08 0.00
6 Khatic 13424 22.00 6.67 26.67 0.00 0.00 3.33
7 Kori-Koli
15530 10.00 0.00 10.00 0.00 0.00 0.00
8 Megh 116852 12.00 4.00 16.00 0.00 0.00 0.00
9 Od 33711 6.67 0.00 6.67 10.00 0.00 0.00
10 Pasi 18261 6.00 0.00 6.00 0.00 0.00 10.00
11 Sansi 98308 6.67 0.00 6.67 0.00 2.00 4.00
12 Surera 17560 13.33 6.67 20.00 10.00 13.33 0.00
13 Sikligar 12332 6.67 0.00 6.67 0.00 0.00 0.00 Total 759579 7.8% 2.4% 10.00% 2.2% 2.00% 2.4%
Source : I.D.C. Survey 1996.

PART-IV
I. LIST OF VILLAGES HAVING 100% SC POPULATION
II. DISTRICT-WISE NO. OF VILLAGES HAVING 40% AND ABOVE SC POPULATION
III. DISTRICT-WISE NAME OF VILLAGES HAVING 40% AND ABOVE SC POPULATION

(In Nos.)Percentage
Total Sub Total Male Female Total Male Female (Col. 7 to 4)
1 2 3 4 5 6 7 8 9 10
1 1 Kamirpura 63 33 30 63 33 30 100.00
2 1 Rohela Teje Ka 971 476 495 971 476 495 100.00
3 2 Atuwala Hithar 109 55 54 109 55 54 100.00
4 3 Chak Sawai Khurd 108 58 50 108 58 50 100.00
5 4 Chak Sotrian 59 34 25 59 34 25 100.00
6 5 Kaluwara 236 119 117 236 119 117 100.00
7 6 Bura Sarwan 179 91 88 179 91 88 100.00
8 7 Chak Sarkar Mahazi Bahadar Ke 99 58 41 99 58 41 100.00
9 8 Chak Sarkar Mahazi Parbhat Singhwala 68 39 29 68 39 29 100.00
10 9 Illahi Bakhash Bodla 170 86 84 170 86 84 100.00
11 10 Megha Panj Grain Uttar 201 110 91 201 110 91 100.00
12 11 Sawaya Rai Hithar 83 37 46 83 37 46 100.00
13 12 Ruknewala Khurd 8 4 4 8 4 4 100.00
14 1 Bhurian Gujjran 109 59 50 109 59 50 100.00
15 2 Mamka Khizarpur 6 2 4 6 2 4 100.00
16 3 Barwan 49 26 23 49 26 23 100.00
17 4 Kingarian 17 10 7 17 10 7 100.00
18 1 Ambuwara 16 7 9 16 7 9 100.00
19 2 Bassi Qazian 7 4 3 7 4 3 100.00
20 3 Bassi Wahid 436 222 214 436 222 214 100.00
21 4 Dhatt 991 506 485 991 506 485 100.00
22 5 Maker Soli 161 74 87 161 74 87 100.00
23 1 Chak Isharwal 5 3 2 5 3 2 100.00
24 2 Daffarwal 57 28 29 57 28 29 100.00
25 3 Jawinde 74 39 35 74 39 35 100.00
26 4 Bir Shersingh 20 9 11 20 9 11 100.00
DISTRICTWISE VILLAGES HAVING 100% SCHEDULED CASTES (SC) POPULATION IN THE STATE OF PUNJAB (CENSUS 2011)
DISTRICTSub‐District
Sub‐District
Sub‐District
Sub‐District
Sub‐District
Sub‐District
Sub‐District
DISTRICTSub‐District
Sub‐District
Sub‐District
Sub‐District
DISTRICTSub‐District
4. HOSHIARPUR(i) Dasua
(ii) Hoshiarpur
5. JALANDHAR(i) Jalandhar‐I
(ii) Jalandhar‐II
(iii) Nakodar
(iv) Phillaur
(ii) Pathankot
(i) Fazilka
(ii) Firozpur
(iii) Jalalabad
(iv) Zira
(i) Ajnala
2. FIROZPURDISTRICT
3. GURDASPUR(i) Gurdaspur
DISTRICTSub‐District
Village countName of Village
Population SC Population
1. AMRITSAR
177

(In Nos.)Percentage
Total Sub Total Male Female Total Male Female (Col. 7 to 4)
1 2 3 4 5 6 7 8 9 10
DISTRICTWISE VILLAGES HAVING 100% SCHEDULED CASTES (SC) POPULATION IN THE STATE OF PUNJAB (CENSUS 2011)
Village countName of Village
Population SC Population
27 1 Mand Dhakran 7 2 5 7 2 5 100.0028 2 Mand Ibrahimwal Tarf Gulam Nabi Khan 10 7 3 10 7 3 100.00
29 3 Mand Maini Bhagu Purian 7 4 3 7 4 3 100.00
30 4 Mand Miani Jhadduwala 44 19 25 44 19 25 100.00
31 5 Mandi Mand Kulla 15 8 7 15 8 7 100.00
32 6 Bana Malwala 111 51 60 111 51 60 100.00
33 7 Bhaguwal 575 292 283 575 292 283 100.00
34 8 Bir Dhandoli 264 132 132 264 132 132 100.00
35 9 Faridpur 194 95 99 194 95 99 100.00
36 10 Patti Safdarpur 75 33 42 75 33 42 100.00
37 11 Safdarpur 5 4 1 5 4 1 100.00
38 1 Ahingran 88 46 42 88 46 42 100.00
39 2 Gag Kalan 499 257 242 499 257 242 100.00
40 3 Garhi Sheru 155 85 70 155 85 70 100.00
41 4 Bhagwanpura 9 6 3 9 6 3 100.00
42 5 Chakli Kasab 26 15 11 26 15 11 100.00
43 1 Adraman 5 2 3 5 2 3 100.00
44 2 Kambo Khurd 112 57 55 112 57 55 100.00
45 3 Madarpur 456 235 221 456 235 221 100.00
46 1 Beli Kalan 2 1 1 2 1 1 100.00
47 2 Karkhana Bela 25 11 14 25 11 14 100.00
48 3 Lakhewal 39 22 17 39 22 17 100.00
49 4 Manjitpura/Chamar Majra 390 211 179 390 211 179 100.00
50 5 Rambagh 25 16 9 25 16 9 100.00
51 6 Khalidpur 160 89 71 160 89 71 100.00
Sub‐District
Sub‐District
DISTRICTSub‐District
Sub‐District
Sub‐District
DISTRICT
Sub‐District
Sub‐District
DISTRICTSub‐District
(i) Chamkaur Sahib
(ii) Rupnagar
9. RUPNAGAR
(iii) SamralaSub‐District
Sub‐District8. MOGADISTRICT(i) Moga
(i) Jagraon
(ii) Ludhiana (East)
6. KAPURTHALA(i) Bhulath
(ii) Kapurthala
(iii) Phagwara
(iv) Sultanpur Lodhi
7. LUDHIANA
178

(In Nos.)Percentage
Total Sub Total Male Female Total Male Female (Col. 7 to 4)
1 2 3 4 5 6 7 8 9 10
DISTRICTWISE VILLAGES HAVING 100% SCHEDULED CASTES (SC) POPULATION IN THE STATE OF PUNJAB (CENSUS 2011)
Village countName of Village
Population SC Population
52 1 Burana 30 16 14 30 16 14 100.00
53 1 Arazi Darya Bramd BelaTajowal 465 239 226 465 239 226 100.00
54 2 Mubarakpur 76 38 38 76 38 38 100.00
55 1 Chak Dohak 127 65 62 127 65 62 100.00
56 1 Chak Gagrewal 21 11 10 21 11 10 100.00
57 2 Rakh Bhohru 8 3 5 8 3 5 100.00Sub‐District
DISTRICTSub‐District
DISTRICTSub‐District
DISTRICTSub‐District
(ii) Tarn Taran
12. SRI MUKTSAR SAHIB(i) Muktsar
11. SAHID BHAGAT SINGH NAGAR (S B S NAGAR)(i) Balachaur
DISTRICTSub‐District
13. TARN TARAN(i) Khadur Sahib
10. SAHIBZADA AJIT SINGH NAGAR (S A S NAGAR)(i) Kharar
179

No. of Villages
No. of villages with 40% or more SC Population
No. of villages with 100% SC Population out of Col.4
District‐wise total Rural Population (Persons)
District‐wise Rural SC Population (Persons)
Rural SC population to total rural population (Col.7 to 6)
1 2 3 4 5 6 7 8
1 AMRITSAR 703 308 1 1156045 464984 40.22
2 BARNALA 127 33 0 404842 133435 32.96
3 BATHINDA 279 89 0 889308 321533 36.16
4 FARIDKOT 163 96 0 400457 171199 42.75
5 FATEHGARH SAHIB 442 177 0 414681 154570 37.27
6 FEROZEPUR 955 517 12 1476518 709922 48.08
7 GURDASPUR 1515 329 4 1639004 435930 26.60
8 HOSHIARPUR 1385 597 5 1251656 465037 37.15
9 JALANDHAR 922 605 4 1032419 515342 49.92
10 KAPURTHALA 612 248 11 532706 212013 39.80
11 LUDHIANA 885 433 5 1429031 559471 39.15
12 MANSA 238 72 0 606147 217553 35.89
13 MOGA 319 146 3 768500 307098 39.96
14 PATIALA 895 235 0 1132406 348587 30.78
15 RUPNAGAR 591 156 6 506820 138597 27.35
16 S A S NAGAR 403 99 1 450017 132713 29.49
17 S B S NAGAR 458 254 2 486894 212889 43.72
18 SANGRUR 564 130 0 1139204 361376 31.72
19 SRI MUKTSAR SAHIB 233 146 1 649705 295179 45.43
20 TARN TARAN 479 129 2 977832 339558 34.73
TOTAL 12168 4799 57 17344192 6496986 37.46
Sr No.
Name of District
RURAL POPULATION
DISTRICT‐WISE NUMBER OF VILLAGES HAVING 40% AND ABOVE SCHEDULED CASTES (SC) POPULATION IN THE STATE OF PUNJAB (CENSUS 2011)
180

(In Nos.)Percentage
Total Sub Total Male Female Total Male Female (Col. 7 to 4)
1 2 3 4 5 6 7 8 9 10
1 1 Kamirpura 63 33 30 63 33 30 100.00
2 2 Barlas 303 162 141 302 161 141 99.67
3 3 Mujaffarpura 312 162 150 307 159 148 98.40
4 4 Saidpur Khurd 970 488 482 951 476 475 98.04
5 5 Chak Dogran 2585 1304 1281 2501 1266 1235 96.75
6 6 Dalla Rajputan 3596 1929 1667 3454 1854 1600 96.05
7 7 Mandianwala 1291 640 651 1228 607 621 95.12
8 8 Jandiala 61 35 26 58 33 25 95.08
9 9 Tanana 1294 675 619 1215 632 583 93.89
10 10 Burj 1203 613 590 1129 575 554 93.85
11 11 Tera Rajputan 2502 1294 1208 2294 1185 1109 91.69
12 12 Kotli Dasondhi 1723 892 831 1563 801 762 90.71
13 13 Waryah 885 473 412 802 428 374 90.62
14 14 Kotli Koka 663 354 309 600 319 281 90.50
15 15 Bhindi Nain 683 341 342 615 302 313 90.04
16 16 Gill (48) 262 137 125 231 118 113 88.17
17 17 Ballaharwal 5243 2685 2558 4596 2341 2255 87.66
18 18 Bhaggupur Bet 1143 599 544 993 519 474 86.88
19 19 Bhindi Saidan 6791 3533 3258 5862 3061 2801 86.32
20 20 Sarang Dev 4988 2555 2433 4261 2180 2081 85.43
21 21 Khanwal 1440 754 686 1193 628 565 82.85
22 22 Jai Ramkot 314 173 141 254 138 116 80.89
23 23 Dug 1345 680 665 1083 541 542 80.52
24 24 Mahji Meun 382 194 188 303 149 154 79.32
25 25 Niamtabad 158 86 72 124 66 58 78.48
26 26 Kotla Suraj Lohar 706 346 360 548 266 282 77.62
27 27 Awan Basau 1244 633 611 965 482 483 77.57
28 28 Fatehwal 1262 649 613 973 493 480 77.10
29 29 Talwandi Rai Dado 1367 727 640 1051 555 496 76.88
30 30 Panjgrianwala 538 278 260 399 201 198 74.16
31 31 Khushupura 737 393 344 544 289 255 73.81
32 32 Sherpur 130 70 60 95 51 44 73.08
33 33 Jhunj 607 330 277 437 238 199 71.99
34 34 Punga 870 429 441 605 291 314 69.54
35 35 Tapiala 1605 839 766 1057 573 484 65.86
36 36 Dyal 360 175 185 236 113 123 65.56
37 37 Hardo Putli 1149 595 554 738 372 366 64.23
38 38 Chak Aul 1243 667 576 786 420 366 63.23
39 39 Rajjian 972 517 455 613 329 284 63.07
40 40 Chhanna 436 208 228 273 133 140 62.61
41 41 Sarai 1411 751 660 876 473 403 62.08
42 42 Chak Bazid 63 32 31 39 21 18 61.90
Village countName of Village
Population SC Population
1. AMRITSAR(i) Ajnala
DISTRICTSub‐District
DISTRICTWISE VILLAGES HAVING 40% AND ABOVE SCHEDULED CASTES (SC) POPULATION IN THE STATE OF PUNJAB (CENSUS 2011)
181

(In Nos.)Percentage
Total Sub Total Male Female Total Male Female (Col. 7 to 4)
1 2 3 4 5 6 7 8 9 10
Village countName of Village
Population SC Population
DISTRICTWISE VILLAGES HAVING 40% AND ABOVE SCHEDULED CASTES (SC) POPULATION IN THE STATE OF PUNJAB (CENSUS 2011)
43 43 Jajja 483 225 258 297 137 160 61.49
44 44 Panju Kalal 461 246 215 282 148 134 61.17
45 45 Kot Gurbaksh 790 419 371 473 250 223 59.87
46 46 Chawinda Khurd 1299 681 618 768 395 373 59.12
47 47 Tur 896 469 427 529 269 260 59.04
48 48 Ghoga 1015 524 491 588 299 289 57.93
49 49 Nangal Sohal 982 533 449 559 302 257 56.92
50 50 Ladhe 605 307 298 343 173 170 56.69
51 51 Manj 1600 827 773 903 455 448 56.44
52 52 Kot Razada 1406 713 693 792 406 386 56.33
53 53 Bhilowal Kakezai 1229 633 596 692 362 330 56.31
54 54 Thatti 800 423 377 447 242 205 55.88
55 55 Dujowal 1090 556 534 606 303 303 55.60
56 56 Ghumrai 447 234 213 246 128 118 55.03
57 57 Aliwal 693 364 329 375 192 183 54.11
58 58 Urdhan 1002 536 466 529 279 250 52.79
59 59 Kohala 2627 1371 1256 1350 701 649 51.39
60 60 Nepal 1408 752 656 721 382 339 51.21
61 61 Saidopura 928 468 460 473 232 241 50.97
62 62 Boparai Khurd 1928 1009 919 978 516 462 50.73
63 63 Balaggan 1531 808 723 776 421 355 50.69
64 64 Sarangra 3536 1890 1646 1767 952 815 49.97
65 65 Jhander 2299 1223 1076 1147 600 547 49.89
66 66 Nurpur 1075 572 503 530 277 253 49.30
67 67 Saktu Nangal 968 515 453 475 254 221 49.07
68 68 Bhala Pind 3051 1582 1469 1487 758 729 48.74
69 69 Tera Khurd 1474 768 706 715 372 343 48.51
70 70 Bhangwan 1143 600 543 552 288 264 48.29
71 71 Shahliwal 253 139 114 122 65 57 48.22
72 72 Ghukeywali 1595 822 773 768 396 372 48.15
73 73 Othian 3236 1716 1520 1541 829 712 47.62
74 74 Chak Misri Khan 2289 1213 1076 1083 578 505 47.31
75 75 Dhariwal 1444 763 681 683 382 301 47.30
76 76 Thatta 1354 705 649 626 313 313 46.23
77 77 Sheikh Bhatti 756 379 377 346 169 177 45.77
78 78 Isapur 793 406 387 361 180 181 45.52
79 79 Mehlanwala 2610 1389 1221 1180 632 548 45.21
80 80 Rokhey 1490 781 709 671 359 312 45.03
81 81 Gulgarh 278 135 143 124 55 69 44.60
82 82 Bagga 3329 1772 1557 1483 807 676 44.55
83 83 Lanven 356 181 175 158 76 82 44.38
84 84 Kotli Shah Habib 514 266 248 228 125 103 44.36
85 85 Chhiddan 2290 1192 1098 1012 531 481 44.19
86 86 Madu Chhanga 1406 716 690 620 321 299 44.10
182

(In Nos.)Percentage
Total Sub Total Male Female Total Male Female (Col. 7 to 4)
1 2 3 4 5 6 7 8 9 10
Village countName of Village
Population SC Population
DISTRICTWISE VILLAGES HAVING 40% AND ABOVE SCHEDULED CASTES (SC) POPULATION IN THE STATE OF PUNJAB (CENSUS 2011)
87 87 Rudala 1216 634 582 536 281 255 44.08
88 88 Bua Nangali 1192 639 553 525 272 253 44.04
89 89 Bhullar 3727 1977 1750 1641 863 778 44.03
90 90 Galib 811 428 383 355 193 162 43.77
91 91 Nanoke 1196 637 559 523 286 237 43.73
92 92 Talwandi Nahar 1479 753 726 646 323 323 43.68
93 93 Kaulowal 1385 740 645 602 316 286 43.47
94 94 Dial Bharang 1197 625 572 520 277 243 43.44
95 95 Kotli Sakkianwali 626 336 290 271 148 123 43.29
96 96 Mehmadpura 565 286 279 243 130 113 43.01
97 97 Saido Gazi 277 151 126 119 64 55 42.96
98 98 Sangatpura 2337 1238 1099 1003 526 477 42.92
99 99 Jhanjoti 3035 1607 1428 1301 688 613 42.87
100 100 Malakpur 1228 644 584 525 282 243 42.75
101 101 Rakh Kohali 241 136 105 103 57 46 42.74
102 102 Majjupura 1123 586 537 479 245 234 42.65
103 103 Ugar Aulakh 1907 1013 894 810 446 364 42.48
104 104 Miadi Kalan 993 538 455 417 230 187 41.99
105 105 Ranian 1226 655 571 512 264 248 41.76
106 106 Padri 2779 1440 1339 1151 605 546 41.42
107 107 Miadi Khurd 234 118 116 96 51 45 41.03
108 108 Kuttiwala 598 313 285 245 127 118 40.97
109 109 Vanieyke 2509 1331 1178 1027 541 486 40.93
110 110 Dadrai 1629 864 765 666 359 307 40.88
111 111 Kotla Doom 1700 913 787 686 368 318 40.35
112 112 Sehnsra 5048 2657 2391 2036 1078 958 40.33
113 113 Harse Chhina 7727 4084 3643 3112 1626 1486 40.27
114 114 Odhar 1227 633 594 493 248 245 40.18
115 115 Chainpur 1341 719 622 537 281 256 40.04
116 116 Kamirpur 225 116 109 90 45 45 40.00
117 117 Dialpur 2608 1366 1242 2557 1339 1218 98.04
118 118 Galowali 3652 1879 1773 3448 1768 1680 94.41
119 119 Rakh Devi Dasspura 1407 767 640 1176 640 536 83.58
120 120 Kotla Ahangaran 44 23 21 33 15 18 75.00
121 121 Jaintipura 1022 526 496 724 379 345 70.84
122 122 Jathu Nangal 1076 570 506 733 401 332 68.12
123 123 Raipur Kalan 1688 875 813 1138 594 544 67.42
124 124 Sham Nagar 2356 1254 1102 1503 795 708 63.79
125 125 Kotli Dhole Shah 1726 901 825 1100 571 529 63.73
126 126 Wadali Dogran 1422 785 637 905 493 412 63.64
127 127 Ludhar 3076 1623 1453 1947 1029 918 63.30
128 128 Talwandi Dogran 2082 1129 953 1310 716 594 62.92
129 129 Meharbanpur 1743 895 848 1065 550 515 61.10
(ii) Amritsar‐ISub‐District
183

(In Nos.)Percentage
Total Sub Total Male Female Total Male Female (Col. 7 to 4)
1 2 3 4 5 6 7 8 9 10
Village countName of Village
Population SC Population
DISTRICTWISE VILLAGES HAVING 40% AND ABOVE SCHEDULED CASTES (SC) POPULATION IN THE STATE OF PUNJAB (CENSUS 2011)
130 130 Fatehpur Rajputan 4117 2165 1952 2442 1293 1149 59.32
131 131 Mehoka 1432 776 656 847 454 393 59.15
132 132 Nangal Guru 1951 1021 930 1143 606 537 58.59
133 133 Kotla Saidan 1560 823 737 903 479 424 57.88
134 134 Gopalpura 1173 628 545 673 362 311 57.37
135 135 Ram Diwali Hinduan 1291 610 681 721 308 413 55.85
136 136 Jajjiani 1286 652 634 684 351 333 53.19
137 137 Nawan Kot 828 447 381 440 238 202 53.14
138 138 Budha Theh 1068 558 510 567 299 268 53.09
139 139 Chhapa Ramsingh 2390 1245 1145 1258 644 614 52.64
140 140 Nawan Pind 3286 1760 1526 1710 924 786 52.04
141 141 Dhing Nangal 588 213 375 304 112 192 51.70
142 142 Jania 2286 1187 1099 1180 612 568 51.62
143 143 Nag 9352 4917 4435 4808 2542 2266 51.41
144 144 Nangal Dyal Singh 819 422 397 419 217 202 51.16
145 145 Chauhan 2142 1129 1013 1090 570 520 50.89
146 146 Khela 678 367 311 344 177 167 50.74
147 147 Nijjarpura 1296 706 590 656 349 307 50.62
148 148 Burj Nauabad 699 371 328 346 181 165 49.50
149 149 Mago Soe 836 439 397 410 217 193 49.04
150 150 Ajaibwali 1717 871 846 841 416 425 48.98
151 151 Makhan Windi 4190 2194 1996 2042 1076 966 48.74
152 152 Bhangwan 2103 1096 1007 1001 520 481 47.60
153 153 Kotla Khurd 897 440 457 423 201 222 47.16
154 154 Wadala Johal 4345 2297 2048 2042 1084 958 47.00
155 155 Miran Chak 489 255 234 228 115 113 46.63
156 156 Devi Dasspura 2818 1453 1365 1311 671 640 46.52
157 157 Athwal 956 502 454 442 239 203 46.23
158 158 Dhirekot 1348 735 613 620 337 283 45.99
159 159 Rangilpura 410 213 197 188 95 93 45.85
160 160 Gehri 6612 3468 3144 3023 1609 1414 45.72
161 161 Kairon Nangal 702 379 323 319 171 148 45.44
162 162 Jand 1295 697 598 588 316 272 45.41
163 163 Marari Kalan 1968 1034 934 891 483 408 45.27
164 164 Chatiwind Lelan 1910 989 921 859 450 409 44.97
165 165 Bhoma 2830 1474 1356 1268 675 593 44.81
166 166 Dadupura 1201 626 575 536 289 247 44.63
167 167 Qila Jiwan Singh 2210 1184 1026 983 526 457 44.48
168 168 Nizampura 2990 1560 1430 1328 677 651 44.41
169 169 Hamja 1351 707 644 599 313 286 44.34
170 170 Talwandi Ghuman 1876 968 908 826 425 401 44.03
171 171 Akalgarh 3288 1748 1540 1442 792 650 43.86
172 172 Dadian 1151 602 549 497 270 227 43.18
173 173 Dharar 3704 1955 1749 1596 833 763 43.09
184

(In Nos.)Percentage
Total Sub Total Male Female Total Male Female (Col. 7 to 4)
1 2 3 4 5 6 7 8 9 10
Village countName of Village
Population SC Population
DISTRICTWISE VILLAGES HAVING 40% AND ABOVE SCHEDULED CASTES (SC) POPULATION IN THE STATE OF PUNJAB (CENSUS 2011)
174 174 Balia Manjpur 2181 1159 1022 937 507 430 42.96
175 175 Khalhera 531 274 257 228 117 111 42.94
176 176 Thariwal 1080 556 524 462 234 228 42.78
177 177 Thathi 1439 777 662 610 338 272 42.39
178 178 Malakpur 1247 655 592 528 276 252 42.34
179 179 Kotli Mallian 989 482 507 418 210 208 42.26
180 180 Lehrka 1782 907 875 750 388 362 42.09
181 181 Kotla Sultan Singh 1200 624 576 504 265 239 42.00
182 182 Jhande 1204 648 556 505 267 238 41.94
183 183 Mallian 4118 2188 1930 1727 894 833 41.94
184 184 Chande 914 488 426 379 209 170 41.47
185 185 Tarpai 2261 1205 1056 929 499 430 41.09
186 186 Chachowali 2330 1191 1139 953 513 440 40.90
187 187 Taragarh 3620 1890 1730 1475 770 705 40.75
188 188 Borewal Kang 919 481 438 368 194 174 40.04
189 189 Rangarh 1154 609 545 961 508 453 83.28
190 190 Dande 1076 558 518 846 440 406 78.62
191 191 Mallowal 1029 533 496 791 409 382 76.87
192 192 Mandiala 2421 1320 1101 1728 936 792 71.38
193 193 Bhagtupura 1002 532 470 706 381 325 70.46
194 194 Bhaini Gillan 1117 582 535 751 393 358 67.23
195 195 Othian 1649 878 771 1107 581 526 67.13
196 196 Kotli Nasir Khan 1756 906 850 1110 577 533 63.21
197 197 Dhaul Kalan 2860 1527 1333 1793 953 840 62.69
198 198 Sohian Khurd 2960 1577 1383 1821 984 837 61.52
199 199 Kotla Dal Singh 236 129 107 140 77 63 59.32
200 200 Gaunsabad 1848 1012 836 1074 588 486 58.12
201 201 Bhaini Rajputtan 1051 552 499 608 320 288 57.85
202 202 Fatehgarh Shukarchak 5274 2794 2480 3037 1607 1430 57.58
203 203 Rampura 1439 775 664 827 438 389 57.47
204 204 Chatiwind 4723 2515 2208 2705 1442 1263 57.27
205 205 Naushehra 3993 2140 1853 2285 1215 1070 57.23
206 206 Manawala 6029 3096 2933 3445 1800 1645 57.14
207 207 Mulla Behram 962 507 455 545 296 249 56.65
208 208 Mehmud Nagar 390 207 183 212 112 100 54.36
209 209 Kaunke 2326 1233 1093 1234 662 572 53.05
210 210 Pandori Waraich 5966 3267 2699 3134 1695 1439 52.53
211 211 Hoshiar Nagar 1820 921 899 955 482 473 52.47
212 212 Attari 8921 4810 4111 4654 2506 2148 52.17
213 213 Iban Kalan 4645 2433 2212 2417 1295 1122 52.03
214 214 Jagatpur Bajaj 724 360 364 373 201 172 51.52
215 215 But 771 402 369 397 217 180 51.49
216 216 Jethuwal 4093 2141 1952 2103 1099 1004 51.38
(iii) Amritsar‐IISub‐District
185

(In Nos.)Percentage
Total Sub Total Male Female Total Male Female (Col. 7 to 4)
1 2 3 4 5 6 7 8 9 10
Village countName of Village
Population SC Population
DISTRICTWISE VILLAGES HAVING 40% AND ABOVE SCHEDULED CASTES (SC) POPULATION IN THE STATE OF PUNJAB (CENSUS 2011)
217 217 Gharinda 2169 1152 1017 1099 579 520 50.67
218 218 Neshta 1864 987 877 941 496 445 50.48
219 219 Khapar Kheri 4324 2251 2073 2173 1122 1051 50.25
220 220 Kalewala 1273 658 615 629 320 309 49.41
221 221 Loharka Khurd 1121 591 530 551 299 252 49.15
222 222 Mehma 1484 788 696 728 394 334 49.06
223 223 Achint Kot 1135 625 510 553 303 250 48.72
224 224 Mahanian Koharan 1826 982 844 879 469 410 48.14
225 225 Birbalpura 1309 696 613 630 331 299 48.13
226 226 Bal Khurd 3578 1894 1684 1720 894 826 48.07
227 227 Sehchandar 1558 801 757 739 360 379 47.43
228 228 Wadala Bhitewadh 4262 2266 1996 2006 1059 947 47.07
229 229 Jhanjarpur 470 256 214 221 117 104 47.02
230 230 Bhadiar 528 277 251 248 128 120 46.97
231 231 Bashambarpura 1078 596 482 502 277 225 46.57
232 232 Lahorimal 1435 759 676 665 348 317 46.34
233 233 Miran Kot Khurd 1152 621 531 530 293 237 46.01
234 234 Mallowal 1116 595 521 508 262 246 45.52
235 235 Loharka Kalan 2391 1269 1122 1082 577 505 45.25
236 236 Iban Khurd 1806 934 872 807 411 396 44.68
237 237 Dhatal 1375 736 639 612 324 288 44.51
238 238 Nathupura 1165 607 558 513 267 246 44.03
239 239 Dhanoia Kalan 1932 1036 896 850 459 391 44.00
240 240 Heir 553 284 269 243 120 123 43.94
241 241 Khur Manian 3309 1719 1590 1451 746 705 43.85
242 242 Chabba 6537 3523 3014 2855 1528 1327 43.67
243 243 Chakmukand 2688 1392 1296 1164 613 551 43.30
244 244 Sangna 4051 2099 1952 1749 890 859 43.17
245 245 Bal Kalan 4056 2159 1897 1735 929 806 42.78
246 246 Bharopal 702 368 334 299 156 143 42.59
247 247 Rakh Jhita 1513 795 718 644 348 296 42.56
248 248 Ranike 2059 1096 963 875 469 406 42.50
249 249 Naurangpura 1517 806 711 1103 595 508 72.71
250 250 Kotla Bathungarh 1469 790 679 1015 550 465 69.09
251 251 Takapur 943 482 461 620 318 302 65.75
252 252 Madh 1162 619 543 751 403 348 64.63
253 253 Madhepur 677 365 312 435 233 202 64.25
254 254 Sarja 1192 621 571 739 381 358 62.00
255 255 Naraingarh 670 341 329 393 202 191 58.66
256 256 Berianwala 464 253 211 272 156 116 58.62
257 257 Tanel 1844 941 903 1043 531 512 56.56
258 258 Bhorchhi Rajputan 3914 2018 1896 2199 1129 1070 56.18
259 259 Jodhanagri 2148 1135 1013 1206 638 568 56.15
(iv) Baba BakalaSub‐District
186

(In Nos.)Percentage
Total Sub Total Male Female Total Male Female (Col. 7 to 4)
1 2 3 4 5 6 7 8 9 10
Village countName of Village
Population SC Population
DISTRICTWISE VILLAGES HAVING 40% AND ABOVE SCHEDULED CASTES (SC) POPULATION IN THE STATE OF PUNJAB (CENSUS 2011)
260 260 Kohala 1496 780 716 813 434 379 54.34
261 261 Jalluwal 1078 546 532 581 299 282 53.90
262 262 Sheron Nigah 926 490 436 498 259 239 53.78
263 263 Bhaini Badeshan 740 401 339 391 213 178 52.84
264 264 Khabbe Rajputan 3219 1636 1583 1678 864 814 52.13
265 265 Daud 707 377 330 368 199 169 52.05
266 266 Naranjanpur Fattuwal 2235 1161 1074 1162 603 559 51.99
267 267 Ghuhatwind Hinduan 1631 823 808 838 428 410 51.38
268 268 Malowal 1771 953 818 903 486 417 50.99
269 269 Ghanshampur 1451 768 683 738 397 341 50.86
270 270 Ramana Chak 2061 1069 992 1027 544 483 49.83
271 271 Sudhar Rajputan 1855 970 885 907 472 435 48.89
272 272 Talwandi 612 327 285 299 154 145 48.86
273 273 Thothian 1739 991 748 845 461 384 48.59
274 274 Jhalari 1166 609 557 566 297 269 48.54
275 275 Danial 1164 633 531 562 308 254 48.28
276 276 Sangrai 262 142 120 126 66 60 48.09
277 277 Kammonke 1606 798 808 770 389 381 47.95
278 278 Lola 3870 2027 1843 1841 974 867 47.57
279 279 Daulo Nangal 4706 2444 2262 2232 1159 1073 47.43
280 280 Lohgarh 1804 918 886 853 437 416 47.28
281 281 Chung 1557 823 734 729 382 347 46.82
282 282 Khiddowali 1333 686 647 624 330 294 46.81
283 283 Muchhal 4348 2259 2089 2028 1042 986 46.64
284 284 Bala Chak 464 233 231 216 107 109 46.55
285 285 Bhaini Ramdyal 928 479 449 424 216 208 45.69
286 286 Bhorchhi Brahmnan 1434 745 689 651 339 312 45.40
287 287 Singhpura 556 293 263 250 134 116 44.96
288 288 Butari 2473 1322 1151 1105 593 512 44.68
289 289 Wadala Khurd 2698 1450 1248 1198 639 559 44.40
290 290 Rasulpur Khurd 491 278 213 218 122 96 44.40
291 291 Malik Nangal 1101 580 521 483 256 227 43.87
292 292 Rajpura 2059 1083 976 900 475 425 43.71
293 293 Athwal 842 446 396 368 194 174 43.71
294 294 Chimabath 3370 1745 1625 1471 759 712 43.65
295 295 Kaleke 2765 1448 1317 1199 626 573 43.36
296 296 Tangra 3532 1867 1665 1526 827 699 43.20
297 297 Wazir Bhullar 4324 2249 2075 1859 968 891 42.99
298 298 Uchoke Khurd 1717 927 790 738 414 324 42.98
299 299 Ram Dewali Musalmana 2231 1198 1033 958 498 460 42.94
300 300 Lidhar 1943 1009 934 832 439 393 42.82
301 301 Bhalaipur 2082 1086 996 887 451 436 42.60
302 302 Bhinder 3017 1580 1437 1283 679 604 42.53
303 303 Chhapianwali 1944 1015 929 816 419 397 41.98
187

(In Nos.)Percentage
Total Sub Total Male Female Total Male Female (Col. 7 to 4)
1 2 3 4 5 6 7 8 9 10
Village countName of Village
Population SC Population
DISTRICTWISE VILLAGES HAVING 40% AND ABOVE SCHEDULED CASTES (SC) POPULATION IN THE STATE OF PUNJAB (CENSUS 2011)
304 304 Mehtabkot 2099 1107 992 877 459 418 41.78
305 305 Uchoke Kalan 3167 1643 1524 1323 692 631 41.77
306 306 Loharanwala 297 159 138 123 64 59 41.41
307 307 Buttar Siviya 6701 3509 3192 2767 1423 1344 41.29
308 308 Padde 1213 624 589 491 255 236 40.48
309 1 Kirpal Singhwala 1363 715 648 1050 555 495 77.04
310 2 Patti Sohlan 523 282 241 282 147 135 53.92
311 3 Dhaner 2140 1120 1020 1151 608 543 53.79
312 4 Pandori 2357 1212 1145 1260 647 613 53.46
313 5 Bhadalwad 1892 979 913 1007 523 484 53.22
314 6 Amla Singhwala 2104 1092 1012 1106 575 531 52.57
315 7 Naiwala 2302 1218 1084 1183 626 557 51.39
316 8 Lohgarh 2176 1147 1029 1010 555 455 46.42
317 9 Gumti 2235 1179 1056 1026 528 498 45.91
318 10 Kaire 1641 862 779 729 386 343 44.42
319 11 Pharwahi 5047 2700 2347 2229 1175 1054 44.16
320 12 Malian 1267 661 606 554 295 259 43.73
321 13 Bahmania 598 324 274 261 146 115 43.65
322 14 Kalal Majra 2693 1414 1279 1167 625 542 43.33
323 15 Bazidke Kalan 2287 1229 1058 989 534 455 43.24
324 16 Badbar 6842 3639 3203 2945 1526 1419 43.04
325 17 Patti Sekhwan 1157 611 546 492 255 237 42.52
326 18 Raisar(Patiala) 2262 1204 1058 911 482 429 40.27
327 19 Tappa ( R) 72 41 31 45 26 19 62.50
328 20 Draka 2193 1139 1054 1351 688 663 61.61
329 21 Kharak Singhwala 700 380 320 385 212 173 55.00
330 22 Jangiana 3753 1938 1815 1733 903 830 46.18
331 23 Naraingarh Sohian 1147 628 519 510 280 230 44.46
332 24 Sadowal 1287 695 592 562 305 257 43.67
333 25 Gagewal 1379 729 650 594 309 285 43.07
334 26 Talwandi 2405 1270 1135 1029 568 461 42.79
335 27 Dhilwan (Nabha) 5342 2851 2491 2278 1195 1083 42.64
336 28 Nainewala 2758 1472 1286 1159 621 538 42.02
337 29 Ramgarh 2841 1527 1314 1174 624 550 41.32
338 30 Pakho 10376 5393 4983 4283 2244 2039 41.28
339 31 Khudi Khurd 1406 736 670 574 289 285 40.83
340 32 Chhana Gulabsingh 1549 822 727 622 331 291 40.15
341 33 Mehta 2304 1223 1081 925 513 412 40.15
342 1 Birtalab Urf Talab Neehar 7208 3784 3424 6321 3306 3015 87.69
(ii) Tapa
3. BATHINDA(i) Bathinda
2. BARNALA(i) Barnala
DISTRICTSub‐District
Sub‐District
DISTRICTSub‐District
188

(In Nos.)Percentage
Total Sub Total Male Female Total Male Female (Col. 7 to 4)
1 2 3 4 5 6 7 8 9 10
Village countName of Village
Population SC Population
DISTRICTWISE VILLAGES HAVING 40% AND ABOVE SCHEDULED CASTES (SC) POPULATION IN THE STATE OF PUNJAB (CENSUS 2011)
343 2 Dhunike 1225 636 589 801 407 394 65.39
344 3 Chak Ruldu Singhwala 3346 1753 1593 2177 1139 1038 65.06
345 4 Gurusar Sainewala 2744 1397 1347 1648 852 796 60.06
346 5 Phus Mandi 1814 975 839 1080 569 511 59.54
347 6 Warkandi 1484 791 693 842 438 404 56.74
348 7 Burj Kahan Singhwala 2046 1070 976 1156 611 545 56.50
349 8 Kalian Sadda 1943 1005 938 1093 565 528 56.25
350 9 Chak Fateh Singhwala 4299 2243 2056 2390 1241 1149 55.59
351 10 Poohli 4335 2239 2096 2344 1197 1147 54.07
352 11 Karamgarh Sattran 1771 928 843 950 489 461 53.64
353 12 Virk Khurd 2158 1141 1017 1153 614 539 53.43
354 13 Kot Guru 2711 1426 1285 1441 754 687 53.15
355 14 Burj Mehma 4044 2111 1933 2144 1103 1041 53.02
356 15 Bahadargarh Jandian 1794 948 846 946 505 441 52.73
357 16 Lool Bai 1671 867 804 875 459 416 52.36
358 17 Mian 911 467 444 470 235 235 51.59
359 18 Multania 1367 707 660 686 364 322 50.18
360 19 Killi Nihal Singhwali 3054 1601 1453 1529 816 713 50.07
361 20 Buladewala 2642 1405 1237 1307 694 613 49.47
362 21 Lehra Dhul Kot 2965 1546 1419 1466 773 693 49.44
363 22 Behman Dewana 5841 3034 2807 2886 1490 1396 49.41
364 23 Raike Khurd Urf Chak Dana 1239 585 654 599 246 353 48.35
365 24 Bhokhra 4399 2257 2142 2102 1096 1006 47.78
366 25 Gill Patti 3183 1649 1534 1515 757 758 47.60
367 26 Khemuana 3104 1625 1479 1453 754 699 46.81
368 27 Anoopgarh Urf Machhana 1441 765 676 673 361 312 46.70
369 28 Bhaini 3074 1659 1415 1412 753 659 45.93
370 29 Goniana Khurd 2366 1227 1139 1081 567 514 45.69
371 30 Bir Behman 2427 1267 1160 1103 590 513 45.45
372 31 Mehma Sawai 5214 2742 2472 2353 1237 1116 45.13
373 32 Bhucho Khurd 4973 2630 2343 2226 1171 1055 44.76
374 33 Seman 4559 2386 2173 2020 1055 965 44.31
375 34 Akalia Kalan 4622 2431 2191 2024 1091 933 43.79
376 35 Sibian 6021 3127 2894 2610 1358 1252 43.35
377 36 Chak Attar Singhwala 2608 1369 1239 1130 592 538 43.33
378 37 Nandgarh 1832 973 859 782 410 372 42.69
379 38 Sangat Kalan 4404 2413 1991 1879 1023 856 42.67
380 39 Bhagu 2088 1085 1003 888 451 437 42.53
381 40 Sardargarh 2482 1292 1190 1053 541 512 42.43
382 41 Mehma Bhagwana 1463 739 724 617 308 309 42.17
383 42 Khialiwala 3091 1646 1445 1298 681 617 41.99
384 43 Naruana 3954 2079 1875 1646 851 795 41.63
385 44 Raike Kalan 5200 2700 2500 2156 1117 1039 41.46
386 45 Ganga Nathana 2609 1384 1225 1080 561 519 41.40
189

(In Nos.)Percentage
Total Sub Total Male Female Total Male Female (Col. 7 to 4)
1 2 3 4 5 6 7 8 9 10
Village countName of Village
Population SC Population
DISTRICTWISE VILLAGES HAVING 40% AND ABOVE SCHEDULED CASTES (SC) POPULATION IN THE STATE OF PUNJAB (CENSUS 2011)
387 46 Nehianwala 6911 3609 3302 2826 1488 1338 40.89
388 47 Mehma Sarja 7991 4291 3700 3258 1726 1532 40.77
389 48 Jai Singhwala 5108 2626 2482 2070 1050 1020 40.52
390 49 Mari 1203 612 591 486 242 244 40.40
391 50 Dhilwan 2005 1049 956 806 420 386 40.20
392 51 Nathpura 2893 1486 1407 1162 589 573 40.17
393 52 Jodhpur Romana 2348 1215 1133 941 482 459 40.08
394 53 Harnam Singhwala 1321 704 617 1135 597 538 85.92
395 54 Burj Ladha Singhwala 2179 1140 1039 1396 739 657 64.07
396 55 Rajgarh 2057 1089 968 1118 602 516 54.35
397 56 Kesar Singhwala 1263 655 608 682 353 329 54.00
398 57 Burj Gill 2427 1300 1127 1226 645 581 50.52
399 58 Siriewala 4970 2644 2326 2488 1313 1175 50.06
400 59 Kangar 2079 1080 999 1007 538 469 48.44
401 60 Nandgarh Kotra 1524 806 718 703 374 329 46.13
402 61 Allike 2290 1231 1059 1047 556 491 45.72
403 62 Hamirgarh 3212 1655 1557 1450 764 686 45.14
404 63 Pirkot 1556 810 746 702 354 348 45.12
405 64 Mandi Kalan 9098 4874 4224 4026 2165 1861 44.25
406 65 Neor 1825 970 855 805 428 377 44.11
407 66 Gaunspura 694 356 338 303 151 152 43.66
408 67 Maluka 6651 3538 3113 2875 1521 1354 43.23
409 68 Dyalpura Bhaika 5066 2734 2332 2100 1141 959 41.45
410 69 Bugran 2054 1053 1001 844 439 405 41.09
411 70 Burj Thror 1507 796 711 606 324 282 40.21
412 71 Dayalpura Mirza 5058 2663 2395 2026 1078 948 40.06
413 72 Bangi Nihal Singh 3979 2083 1896 2334 1221 1113 58.66
414 73 Sukha Singhwala 861 441 420 485 243 242 56.33
415 74 Burj 2578 1349 1229 1336 690 646 51.82
416 75 Gehri Bara Singh 1536 799 737 756 397 359 49.22
417 76 Maur Charat Singh 2670 1440 1230 1289 709 580 48.28
418 77 Ramnagar Urf Kasaiwara 4266 2233 2033 2016 1050 966 47.26
419 78 Gadhianwala Urf Bhagwanpura 751 402 349 353 198 155 47.00
420 79 Shergarh 1876 983 893 840 434 406 44.78
421 80 Malwala 2737 1433 1304 1217 630 587 44.46
422 81 Gurusar Joga 1555 826 729 691 368 323 44.44
423 82 Kamalu 2069 1074 995 915 464 451 44.22
424 83 Bangi Dipa Singh 1978 1066 912 874 484 390 44.19
425 84 Fatehgarh Nouabad 1748 906 842 757 392 365 43.31
426 85 Jeon Singhwala 3689 1942 1747 1596 845 751 43.26
427 86 Jodhpur Bagga Singh Alias Phalran 2106 1095 1011 907 475 432 43.07
428 87 Behman Koer Singh 2239 1199 1040 954 502 452 42.61
(ii) Rampura Phul
(iii) Talwandi SaboSub‐District
Sub‐District
190

(In Nos.)Percentage
Total Sub Total Male Female Total Male Female (Col. 7 to 4)
1 2 3 4 5 6 7 8 9 10
Village countName of Village
Population SC Population
DISTRICTWISE VILLAGES HAVING 40% AND ABOVE SCHEDULED CASTES (SC) POPULATION IN THE STATE OF PUNJAB (CENSUS 2011)
429 88 Bhai Bakhtour 2772 1466 1306 1166 615 551 42.06
430 89 Chak Hira Singhwala Urf Pakka Khurd 2169 1135 1034 909 476 433 41.91
431 1 Beguwala 1469 745 724 1217 616 601 82.85
432 2 Chanian 1434 712 722 1182 586 596 82.43
433 3 Dhab Sher Singhwala 1443 779 664 1172 629 543 81.22
434 4 Bir Sikhanwala 715 390 325 560 301 259 78.32
435 5 Nathewala 1550 819 731 1141 601 540 73.61
436 6 Koharwala 3000 1598 1402 2195 1170 1025 73.17
437 7 Sandhwan 6080 3203 2877 4441 2329 2112 73.04
438 8 Gujjar 1174 625 549 845 447 398 71.98
439 9 Bhag Singhwala 1025 517 508 737 376 361 71.90
440 10 Saideke 1472 749 723 1044 532 512 70.92
441 11 Deviwala 2151 1138 1013 1483 793 690 68.94
442 12 Bir Chahal 384 203 181 263 146 117 68.49
443 13 Chugewala 394 186 208 239 107 132 60.66
444 14 Arayanwala Kalan 6051 3165 2886 3631 1911 1720 60.01
445 15 Bholuwala 1067 552 515 638 327 311 59.79
446 16 Sadhanwala 2147 1141 1006 1275 681 594 59.39
447 17 Ghugiana 2852 1504 1348 1662 877 785 58.27
448 18 Kingra 1806 948 858 1032 550 482 57.14
449 19 Rajowala 1311 694 617 745 399 346 56.83
450 20 Sibbian 4681 2465 2216 2654 1417 1237 56.70
451 21 Machaki Kalan 3491 1868 1623 1945 1041 904 55.71
452 22 Rupianwala 571 297 274 313 155 158 54.82
453 23 Sikhanwala 2811 1465 1346 1528 807 721 54.36
454 24 Chet Singhwala 1212 630 582 654 338 316 53.96
455 25 Thara 1206 655 551 644 357 287 53.40
456 26 Arayanwala Khurd 876 452 424 462 238 224 52.74
457 27 Machaki Mal Singh 2859 1517 1342 1503 822 681 52.57
458 28 Bagiana 2333 1218 1115 1214 634 580 52.04
459 29 Bhairon‐Ki‐Bhatti 635 336 299 330 172 158 51.97
460 30 Pehluwala 1481 758 723 759 380 379 51.25
461 31 Dana Romana 1245 644 601 633 320 313 50.84
462 32 Qila Nau 4472 2340 2132 2267 1184 1083 50.69
463 33 Dawareana 1812 982 830 909 495 414 50.17
464 34 Simrewala 820 429 391 409 215 194 49.88
465 35 Mehmuana 2729 1437 1292 1341 715 626 49.14
466 36 Sirsari 1767 941 826 859 463 396 48.61
467 37 Phide Khurd 1129 598 531 547 297 250 48.45
468 38 Chak Kalyan 1425 730 695 689 354 335 48.35
469 39 Maur 3228 1736 1492 1553 853 700 48.11
470 40 Chambeli 1052 549 503 494 256 238 46.96
4. FARIDKOT(i) Faridkot
DISTRICTSub‐District
191

(In Nos.)Percentage
Total Sub Total Male Female Total Male Female (Col. 7 to 4)
1 2 3 4 5 6 7 8 9 10
Village countName of Village
Population SC Population
DISTRICTWISE VILLAGES HAVING 40% AND ABOVE SCHEDULED CASTES (SC) POPULATION IN THE STATE OF PUNJAB (CENSUS 2011)
471 41 Janerian 622 317 305 290 153 137 46.62
472 42 Mandwala 1114 586 528 516 268 248 46.32
473 43 Nathalwala 911 464 447 420 209 211 46.10
474 44 Jalaleana 1468 771 697 675 367 308 45.98
475 45 Mani Singhwala 2529 1335 1194 1154 616 538 45.63
476 46 Rattirori 1465 780 685 668 351 317 45.60
477 47 Sangatpura 937 488 449 427 212 215 45.57
478 48 Kaler 1365 735 630 621 328 293 45.49
479 49 Kanianwali 984 506 478 445 237 208 45.22
480 50 Dhilwan Kalan 9210 4835 4375 4153 2192 1961 45.09
481 51 Kamiana 3090 1639 1451 1393 742 651 45.08
482 52 Pakka 4453 2373 2080 2005 1056 949 45.03
483 53 Dhimanwali 2927 1557 1370 1317 710 607 44.99
484 54 Wara Daraka 3292 1726 1566 1466 759 707 44.53
485 55 Dhilwan Khurd 1361 709 652 606 317 289 44.53
486 56 Sadhuwala 548 299 249 238 135 103 43.43
487 57 Chand baja 2566 1353 1213 1105 572 533 43.06
488 58 Bhana 3523 1870 1653 1508 816 692 42.80
489 59 Ghaniewala 1807 976 831 768 432 336 42.50
490 60 Kabalwala 1444 766 678 612 329 283 42.38
491 61 Sangrahur 1195 633 562 506 267 239 42.34
492 62 Virewala Khurd 701 373 328 295 163 132 42.08
493 63 Deep Singhwala 4190 2204 1986 1750 917 833 41.77
494 64 Buttar 641 329 312 267 132 135 41.65
495 65 Dhudi 4165 2209 1956 1733 930 803 41.61
496 66 Pakhi Kalan 4300 2292 2008 1788 968 820 41.58
497 67 Sadiq 7384 3852 3532 3067 1579 1488 41.54
498 68 Bhagthala Kalan 1478 765 713 612 324 288 41.41
499 69 Pipli 3968 2089 1879 1641 878 763 41.36
500 70 Jhariwala 907 491 416 367 198 169 40.46
501 71 Dod 1488 789 699 596 323 273 40.05
502 72 Kasam Bhatti 1684 871 813 1189 618 571 70.61
503 73 Fatehgarh 2721 1419 1302 1628 851 777 59.83
504 74 Sedha Singhwala 1144 602 542 675 357 318 59.00
505 75 Khachran 1501 829 672 834 469 365 55.56
506 76 Chand Bhan 4541 2408 2133 2452 1297 1155 54.00
507 77 Surghuri 2941 1540 1401 1503 795 708 51.11
508 78 Behbal Khurd 2588 1346 1242 1258 650 608 48.61
509 79 Burj Harika 2309 1235 1074 1115 594 521 48.29
510 80 Burj Jawahar Singhwala 1628 861 767 783 422 361 48.10
511 81 Ran Singhwala 2534 1326 1208 1150 606 544 45.38
512 82 Dhaipai 2689 1391 1298 1204 610 594 44.78
513 83 Lambwali 2719 1472 1247 1204 649 555 44.28
(ii) JaituSub‐District
192

(In Nos.)Percentage
Total Sub Total Male Female Total Male Female (Col. 7 to 4)
1 2 3 4 5 6 7 8 9 10
Village countName of Village
Population SC Population
DISTRICTWISE VILLAGES HAVING 40% AND ABOVE SCHEDULED CASTES (SC) POPULATION IN THE STATE OF PUNJAB (CENSUS 2011)
514 84 Bargari 8408 4453 3955 3708 1944 1764 44.10
515 85 Gobindgarh 2858 1525 1333 1244 659 585 43.53
516 86 Gumti Khurd 2330 1249 1081 1013 558 455 43.48
517 87 Chaina 2971 1574 1397 1286 689 597 43.29
518 88 Matta 6121 3241 2880 2643 1409 1234 43.18
519 89 Romana Albel Singh 1894 981 913 817 404 413 43.14
520 90 Ramiana 4799 2526 2273 2070 1104 966 43.13
521 91 Rori Kapura 5046 2620 2426 2101 1092 1009 41.64
522 92 Ajit Gill 2286 1210 1076 945 487 458 41.34
523 93 Dod 4832 2520 2312 1989 1025 964 41.16
524 94 Jhakharwala 3341 1743 1598 1371 701 670 41.04
525 95 Ramgarh 1571 840 731 638 344 294 40.61
526 96 Bish Nandi 3012 1573 1439 1213 642 571 40.27
527 1 Aladadpura 541 288 253 468 251 217 86.51
528 2 Baina Buland 687 343 344 553 273 280 80.49
529 3 Khumna 1558 839 719 1154 605 549 74.07
530 4 Kapurgarh 1753 927 826 1249 659 590 71.25
531 5 Alipur Sandal 606 318 288 428 230 198 70.63
532 6 Nurpura 1104 588 516 769 404 365 69.66
533 7 Kalal Majra 701 379 322 450 244 206 64.19
534 8 Turan 2403 1440 963 1541 802 739 64.13
535 9 Bhagwanpura 909 461 448 572 281 291 62.93
536 10 Munderian 541 264 277 339 164 175 62.66
537 11 Kumbhra 1182 619 563 726 380 346 61.42
538 12 Jallowal 1090 581 509 642 339 303 58.90
539 13 Himmatgarh 204 110 94 120 63 57 58.82
540 14 Lakha Singhwala 801 417 384 468 244 224 58.43
541 15 Shergarh 637 329 308 358 185 173 56.20
542 16 Lallon Khurd 794 414 380 441 235 206 55.54
543 17 Naraingarh 1081 585 496 599 330 269 55.41
544 18 Kumbh 1392 755 637 755 420 335 54.24
545 19 Talwara 1401 741 660 759 394 365 54.18
546 20 Machhrai Khurd 937 492 445 499 267 232 53.26
547 21 Ladpur 1994 1036 958 1059 555 504 53.11
548 22 Machhrai Kalan 955 480 475 494 240 254 51.73
549 23 Raipur Chobdaran 711 384 327 366 193 173 51.48
550 24 Bharpur Garh 1221 650 571 617 329 288 50.53
551 25 Bir Amloh (P) 721 367 354 360 178 182 49.93
552 26 Mianpur 342 188 154 169 87 82 49.42
553 27 Tanda Badha Kalan 1052 543 509 498 256 242 47.34
554 28 Bhambrian 1276 705 571 596 339 257 46.71
555 29 Dargheri 698 364 334 321 159 162 45.99
5. FATEHGARH SAHIBDISTRICT(i) AmlohSub‐District
193

(In Nos.)Percentage
Total Sub Total Male Female Total Male Female (Col. 7 to 4)
1 2 3 4 5 6 7 8 9 10
Village countName of Village
Population SC Population
DISTRICTWISE VILLAGES HAVING 40% AND ABOVE SCHEDULED CASTES (SC) POPULATION IN THE STATE OF PUNJAB (CENSUS 2011)
556 30 Jalalpur 870 462 408 398 204 194 45.75
557 31 Raipur Raian 715 377 338 323 172 151 45.17
558 32 Baraunga Buland 634 335 299 286 143 143 45.11
559 33 Salana Jiwan Singh Wala 3769 2049 1720 1681 908 773 44.60
560 34 Baraichan 1055 566 489 467 256 211 44.27
561 35 Ramgarh 1310 716 594 579 309 270 44.20
562 36 Annian 869 470 399 381 212 169 43.84
563 37 Mandardu 497 245 252 217 110 107 43.66
564 38 Jhambala 863 429 434 376 192 184 43.57
565 39 Kaulgarh 1334 729 605 580 320 260 43.48
566 40 Badinpur 1740 913 827 746 394 352 42.87
567 41 Bugga Kalan 1459 767 692 614 332 282 42.08
568 42 Bud Gujran 851 463 388 357 193 164 41.95
569 43 Ranghera Kalan 1297 701 596 540 302 238 41.63
570 44 Kanjari 549 283 266 227 115 112 41.35
571 45 Kotla Dadheri 2737 1522 1215 1125 624 501 41.10
572 46 Ladpur 971 514 457 392 205 187 40.37
573 47 Majri Raian 659 339 320 266 145 121 40.36
574 48 Rasulpur 436 212 224 363 176 187 83.26
575 49 Mehdoodan 574 295 279 411 215 196 71.60
576 50 Jawanda 691 360 331 469 251 218 67.87
577 51 Dedahran 515 266 249 332 173 159 64.47
578 52 Sirkapra 636 334 302 408 212 196 64.15
579 53 Hajipur 218 109 109 137 72 65 62.84
580 54 Kalaundi 743 379 364 446 231 215 60.03
581 55 Tajpura 386 197 189 225 109 116 58.29
582 56 Mulanpur 586 314 272 340 180 160 58.02
583 57 Sakandarpur 269 136 133 153 76 77 56.88
584 58 Udalpur 467 261 206 265 147 118 56.75
585 59 Shahidgarh 1113 590 523 628 336 292 56.42
586 60 Mehdudan 287 170 117 158 94 64 55.05
587 61 Dafera 923 490 433 508 265 243 55.04
588 62 Thablan 911 496 415 473 264 209 51.92
589 63 Shergarh Bara 517 281 236 260 151 109 50.29
590 64 Khalaspur 1199 627 572 597 325 272 49.79
591 65 Kheri Bir Singh 640 328 312 317 165 152 49.53
592 66 Ladpuri 440 233 207 210 107 103 47.73
593 67 Bhaganpur 509 270 239 239 135 104 46.95
594 68 Kheri Bhai Ki 422 201 221 195 89 106 46.21
595 69 Pawala 1974 1036 938 896 475 421 45.39
596 70 Abdullapur 649 343 306 291 150 141 44.84
597 71 Patton 744 385 359 330 177 153 44.35
598 72 Mustfabad 892 474 418 389 203 186 43.61
(ii) Bassi PathanaSub‐District
194

(In Nos.)Percentage
Total Sub Total Male Female Total Male Female (Col. 7 to 4)
1 2 3 4 5 6 7 8 9 10
Village countName of Village
Population SC Population
DISTRICTWISE VILLAGES HAVING 40% AND ABOVE SCHEDULED CASTES (SC) POPULATION IN THE STATE OF PUNJAB (CENSUS 2011)
599 73 Marwa 866 485 381 373 204 169 43.07
600 74 Garolian 899 499 400 387 221 166 43.05
601 75 Jodhpur 363 185 178 156 84 72 42.98
602 76 Gandwan 916 492 424 393 212 181 42.90
603 77 Niamumajra 313 167 146 134 74 60 42.81
604 78 Sampla 873 445 428 373 181 192 42.73
605 79 Rasoolpur 1372 714 658 583 301 282 42.49
606 80 Shehzadpur 576 298 278 242 120 122 42.01
607 81 Lohari Kalan 1276 674 602 524 289 235 41.07
608 82 Mandlan 1032 532 500 423 213 210 40.99
609 83 Kalaur 2106 1093 1013 858 436 422 40.74
610 84 Kamali 1124 605 519 451 246 205 40.12
611 85 Gadhera 824 426 398 330 179 151 40.05
612 86 Bambe Majra 160 89 71 147 82 65 91.88
613 87 Harnam Nagar 174 89 85 124 61 63 71.26
614 88 Patarsi Khurd 267 133 134 187 96 91 70.04
615 89 Manhera Jattan 734 383 351 511 267 244 69.62
616 90 Naraingarh Chhanna 758 394 364 514 263 251 67.81
617 91 Alipur Sodhian 531 267 264 359 174 185 67.61
618 92 Arain Majra 77 40 37 51 28 23 66.23
619 93 Tarkhan Majra 1674 895 779 1098 595 503 65.59
620 94 Anaitpura 741 397 344 482 251 231 65.05
621 95 Nabipur 1390 713 677 881 445 436 63.38
622 96 Kharrah 463 257 206 293 151 142 63.28
623 97 Majra Nidhewala 310 162 148 194 99 95 62.58
624 98 Mir Pur 545 303 242 337 189 148 61.83
625 99 Kotla Bhaika 394 194 200 242 120 122 61.42
626 100 Sidhupur 433 212 221 262 122 140 60.51
627 101 Wazir Nagar 574 293 281 334 175 159 58.19
628 102 Kotla Bajwara 1394 731 663 803 427 376 57.60
629 103 Jago Chanarthal 808 413 395 460 234 226 56.93
630 104 Rajinder Nagar 759 406 353 431 230 201 56.79
631 105 Fetehpur 390 208 182 216 115 101 55.38
632 106 Madhopur 837 431 406 462 238 224 55.20
633 107 Pir Jain 799 419 380 437 232 205 54.69
634 108 Khanpur 1110 585 525 602 308 294 54.23
635 109 Jallah 1745 923 822 937 496 441 53.70
636 110 Atapur 955 505 450 489 268 221 51.20
637 111 Ditupur Fakiran 342 183 159 174 94 80 50.88
638 112 Randhawa 816 436 380 412 218 194 50.49
639 113 Mandaur 513 278 235 258 143 115 50.29
640 114 Arain Majra 499 254 245 249 127 122 49.90
641 115 Bibipur 765 416 349 371 205 166 48.50
(iii) Fatehgarh SahibSub‐District
195

(In Nos.)Percentage
Total Sub Total Male Female Total Male Female (Col. 7 to 4)
1 2 3 4 5 6 7 8 9 10
Village countName of Village
Population SC Population
DISTRICTWISE VILLAGES HAVING 40% AND ABOVE SCHEDULED CASTES (SC) POPULATION IN THE STATE OF PUNJAB (CENSUS 2011)
642 116 Bagrian 786 420 366 380 203 177 48.35
643 117 Jamiatgarh 742 391 351 355 181 174 47.84
644 118 Saundha 851 441 410 402 211 191 47.24
645 119 Chaleri Kalan 1304 687 617 614 312 302 47.09
646 120 Ferozepur 1367 732 635 641 343 298 46.89
647 121 Dhatonda 1063 590 473 493 275 218 46.38
648 122 Blahri Khurd 613 332 281 280 150 130 45.68
649 123 Sangatpura 1459 785 674 660 365 295 45.24
650 124 Panjoli Kalan 999 538 461 448 241 207 44.84
651 125 Adampur 1106 561 545 495 246 249 44.76
652 126 Narainpura Alias Chorwala 919 502 417 411 227 184 44.72
653 127 Badhochhi Khurd 526 281 245 233 125 108 44.30
654 128 Bhamarsi Buland 1431 754 677 630 330 300 44.03
655 129 Kheri Bhai Ki 723 388 335 317 173 144 43.85
656 130 Buchran 982 531 451 430 232 198 43.79
657 131 Shekhupur 512 266 246 222 119 103 43.36
658 132 Bhat Majra 745 376 369 323 171 152 43.36
659 133 Nalini 1545 799 746 657 331 326 42.52
660 134 Balpur 1223 647 576 519 266 253 42.44
661 135 Khoje Majra 1233 674 559 521 288 233 42.25
662 136 Rampur 1109 585 524 464 243 221 41.84
663 137 Bhaironpur 447 237 210 186 98 88 41.61
664 138 Gunian Majra 659 339 320 274 142 132 41.58
665 139 Pandrali 1194 652 542 487 276 211 40.79
666 140 Jhampur 1318 697 621 537 277 260 40.74
667 141 Jalbehra 1040 562 478 417 223 194 40.10
668 142 Bir Ramgarh 132 75 57 131 74 57 99.24
669 143 Bhattian 317 165 152 228 120 108 71.92
670 144 Mirpur 541 270 271 355 177 178 65.62
671 145 Saidpura 1027 521 506 658 337 321 64.07
672 146 Raipur Raian 1116 580 536 667 348 319 59.77
673 147 Kalewal 964 515 449 550 291 259 57.05
674 148 Ajner 1424 733 691 793 407 386 55.69
675 149 Kotla Ajner 1347 714 633 732 396 336 54.34
676 150 Pohlo Majra 936 560 376 507 287 220 54.17
677 151 Ranwan 1262 687 575 682 371 311 54.04
678 152 Manderan 945 485 460 501 249 252 53.02
679 153 Jatana Niwan 1147 617 530 608 327 281 53.01
680 154 Lohar Majra Khurd 930 503 427 492 263 229 52.90
681 155 Bara Badechh(Kalan) 832 432 400 438 224 214 52.64
682 156 Bhuttan 802 430 372 419 217 202 52.24
683 157 Manpur 889 465 424 464 238 226 52.19
684 158 Dulwan 1025 532 493 521 275 246 50.83
(iv) KhamanonSub‐District
196

(In Nos.)Percentage
Total Sub Total Male Female Total Male Female (Col. 7 to 4)
1 2 3 4 5 6 7 8 9 10
Village countName of Village
Population SC Population
DISTRICTWISE VILLAGES HAVING 40% AND ABOVE SCHEDULED CASTES (SC) POPULATION IN THE STATE OF PUNJAB (CENSUS 2011)
685 159 Chandiala 678 351 327 343 171 172 50.59
686 160 Manela 1325 691 634 670 357 313 50.57
687 161 Sohavi 1125 591 534 566 299 267 50.31
688 162 Panj Koha 1273 691 582 632 348 284 49.65
689 163 Bhambri 1525 819 706 738 391 347 48.39
690 164 Rattangarh 1456 766 690 699 365 334 48.01
691 165 Baur 770 405 365 368 188 180 47.79
692 166 Faraur 2597 1361 1236 1230 643 587 47.36
693 167 Ramgarh 640 345 295 293 153 140 45.78
694 168 Maneli 979 542 437 445 243 202 45.45
695 169 Kheri Naudh Singh 1141 592 549 510 268 242 44.70
696 170 Mohan Majra 895 461 434 389 197 192 43.46
697 171 Amrala 1733 915 818 746 383 363 43.05
698 172 Sidhupur Kalan 1005 423 582 431 168 263 42.89
699 173 Nanowal 1818 970 848 766 415 351 42.13
700 174 Dhianu Majra 535 283 252 225 120 105 42.06
701 175 Maheshpura 1076 571 505 452 238 214 42.01
702 176 Sidhupur Khurd 465 242 223 189 98 91 40.65
703 177 Panechan 916 503 413 367 198 169 40.07
704 1 Tutwala 3204 1687 1517 2615 1360 1255 81.62
705 2 Bahadar Khera 3074 1622 1452 2052 1072 980 66.75
706 3 Abohar (Rural) 19262 10666 8596 10278 5378 4900 53.36
707 4 Panjawa 2905 1550 1355 1502 783 719 51.70
708 5 Sardarpura 3310 1729 1581 1673 879 794 50.54
709 6 Buraj Muhar 2794 1462 1332 1383 736 647 49.50
710 7 Gidranwali 3244 1705 1539 1592 870 722 49.08
711 8 Killianwali 4819 2572 2247 2361 1251 1110 48.99
712 9 Kala Tibba 3963 2086 1877 1909 1004 905 48.17
713 10 Kandhwala Amarkot 5033 2697 2336 2391 1248 1143 47.51
714 11 Daulatpura 2607 1413 1194 1230 668 562 47.18
715 12 Danewala Satkosi 4175 2202 1973 1966 1040 926 47.09
716 13 Gaddan Doab 2018 1082 936 943 506 437 46.73
717 14 Bhangala 2451 1268 1183 1133 612 521 46.23
718 15 Usman Khera 2558 1376 1182 1178 632 546 46.05
719 16 Kikar Khera 5068 2676 2392 2241 1181 1060 44.22
720 17 Khubban 4820 2541 2279 2100 1100 1000 43.57
721 18 Kundal 4603 2400 2203 1987 1035 952 43.17
722 19 Chanan Khera 3375 1763 1612 1440 753 687 42.67
723 20 Jodhpura 2188 1108 1080 925 462 463 42.28
724 21 Gobindgarh 5346 2976 2370 2258 1195 1063 42.24
725 22 Baluana 6645 3451 3194 2744 1410 1334 41.29
726 23 Khatwan 1877 995 882 766 425 341 40.81
6. FIROZPURDISTRICT(i) AboharSub‐District
197

(In Nos.)Percentage
Total Sub Total Male Female Total Male Female (Col. 7 to 4)
1 2 3 4 5 6 7 8 9 10
Village countName of Village
Population SC Population
DISTRICTWISE VILLAGES HAVING 40% AND ABOVE SCHEDULED CASTES (SC) POPULATION IN THE STATE OF PUNJAB (CENSUS 2011)
727 24 Rohela Teje Ka 971 476 495 971 476 495 100.00
728 25 Mambeke 969 485 484 967 485 482 99.79
729 26 Muhar Sona Urf Nakike 537 280 257 535 278 257 99.63
730 27 Walle Shah Hithar 1111 560 551 1105 556 549 99.46
731 28 Chak Rohela 963 468 495 957 467 490 99.38
732 29 Ghurka 1798 908 890 1777 898 879 98.83
733 30 Muhar Jamsher 869 435 434 858 427 431 98.73
734 31 Hasta Kalan 7101 3588 3513 6993 3531 3462 98.48
735 32 Walle Shah Uttar 2118 1073 1045 2084 1057 1027 98.39
736 33 Bakhu Shah 531 260 271 522 256 266 98.31
737 34 Mahatam Nagar 2297 1150 1147 2256 1128 1128 98.22
738 35 Lakhe Ke Uttar 1910 995 915 1875 978 897 98.17
739 36 Muhar Khiwa 1720 882 838 1687 859 828 98.08
740 37 Aliana 2709 1369 1340 2636 1333 1303 97.31
741 38 Muhammad Amira 298 158 140 289 155 134 96.98
742 39 Saido Ke Hithar 1421 731 690 1373 708 665 96.62
743 40 Choohriwala Chishti 2067 1059 1008 1978 1010 968 95.69
744 41 Deepulana 2683 1409 1274 2552 1341 1211 95.12
745 42 Gulam Rasul 923 448 475 876 425 451 94.91
746 43 Nur Muhammad 649 344 305 592 315 277 91.22
747 44 Taro Bari 4749 2424 2325 4293 2183 2110 90.40
748 45 Dona Sakandri 684 361 323 614 324 290 89.77
749 46 Asafwala 1752 926 826 1562 821 741 89.16
750 47 Muazzam 3280 1678 1602 2844 1437 1407 86.71
751 48 Kawanwali 1408 707 701 1203 595 608 85.44
752 49 Halimwala 3033 1557 1476 2525 1284 1241 83.25
753 50 Gagan Ke 448 237 211 365 191 174 81.47
754 51 Qadar Baksh 134 69 65 107 54 53 79.85
755 52 Ghatianwali Bodla 2011 1065 946 1592 834 758 79.16
756 53 Kotha Alias Lukmanpura 1828 944 884 1441 740 701 78.83
757 54 Haujkhas 2168 1137 1031 1693 885 808 78.09
758 55 Naulan 784 424 360 609 328 281 77.68
759 56 Alam Shah 1691 886 805 1286 673 613 76.05
760 57 Muhammad Pira 1361 694 667 1023 517 506 75.17
761 58 Ojhanwali 2424 1225 1199 1790 902 888 73.84
762 59 Kabul Shah Hithar 727 373 354 535 282 253 73.59
763 60 Salem Shah 3548 1871 1677 2548 1356 1192 71.82
764 61 Badha 1454 746 708 1039 529 510 71.46
765 62 Miani Basti 1709 883 826 1217 621 596 71.21
766 63 Chak Kheowali 2119 1101 1018 1504 770 734 70.98
767 64 Muthianwali 2327 1218 1109 1595 832 763 68.54
768 65 Behak Khas 3941 2042 1899 2664 1407 1257 67.60
769 66 Lashkardin Urf Ghaniani 80 44 36 54 30 24 67.50
(ii) FazilkaSub‐District
198

(In Nos.)Percentage
Total Sub Total Male Female Total Male Female (Col. 7 to 4)
1 2 3 4 5 6 7 8 9 10
Village countName of Village
Population SC Population
DISTRICTWISE VILLAGES HAVING 40% AND ABOVE SCHEDULED CASTES (SC) POPULATION IN THE STATE OF PUNJAB (CENSUS 2011)
770 67 Hauj Alias Gander 1479 775 704 981 515 466 66.33
771 68 Pacca Chishti 1932 1002 930 1276 648 628 66.05
772 69 Patrewala 4139 2135 2004 2720 1404 1316 65.72
773 70 Ganjuana 2022 1039 983 1301 664 637 64.34
774 71 Tahliwala Jattan 2395 1263 1132 1508 797 711 62.96
775 72 Chahlanwali 2278 1221 1057 1411 757 654 61.94
776 73 Mulianwali 2604 1378 1226 1605 844 761 61.64
777 74 Muradwala Bhumgar 543 289 254 330 180 150 60.77
778 75 Naukerian 3407 1794 1613 2046 1067 979 60.05
779 76 Mahuana 3519 1860 1659 2106 1101 1005 59.85
780 77 Bakainwala 3647 1895 1752 2182 1111 1071 59.83
781 78 Ghurianan 2885 1517 1368 1700 906 794 58.93
782 79 Karni Khera 3890 1994 1896 2249 1148 1101 57.81
783 80 Islamwala 3014 1589 1425 1736 918 818 57.60
784 81 Muradwala Dalsingh 2452 1323 1129 1369 754 615 55.83
785 82 Awa Urf Waryampura 1080 553 527 602 304 298 55.74
786 83 Behak Hasta Uttar 1951 1007 944 1084 543 541 55.56
787 84 Rana 2259 1160 1099 1254 645 609 55.51
788 85 Laduka 9605 5007 4598 5318 2730 2588 55.37
789 86 Jamal Ke 591 310 281 323 166 157 54.65
790 87 Theh Kalandar 1064 568 496 575 307 268 54.04
791 88 Jhotianwali 4433 2290 2143 2319 1194 1125 52.31
792 89 Rupnagar 3266 1711 1555 1687 888 799 51.65
793 90 Burj Hanumangarh 2787 1458 1329 1433 762 671 51.42
794 91 Arniwala Sheikh Subhan 9353 4908 4445 4773 2476 2297 51.03
795 92 Gharumi 470 243 227 237 118 119 50.43
796 93 Ghallu 5286 2761 2525 2623 1353 1270 49.62
797 94 Chak Pakhi 1567 831 736 773 409 364 49.33
798 95 Banwala Hanwanta 1800 969 831 885 481 404 49.17
799 96 Azamwala 5153 2718 2435 2513 1303 1210 48.77
800 97 Bananwala 2776 1452 1324 1325 710 615 47.73
801 98 Shehtirwala 2739 1457 1282 1303 690 613 47.57
802 99 Koharianwali 2780 1497 1283 1311 706 605 47.16
803 100 Jorki Andhewali 1138 607 531 529 285 244 46.49
804 101 Jore Jand Urf Chimnewala 1260 672 588 572 311 261 45.40
805 102 Kikarwala Rupa 538 272 266 244 124 120 45.35
806 103 Katehra 2987 1578 1409 1347 691 656 45.10
807 104 Saido Ke Uttar Urf Chandmari 1490 759 731 662 333 329 44.43
808 105 Siwana 1515 793 722 668 355 313 44.09
809 106 Sahiwala 526 274 252 231 116 115 43.92
810 107 Dhippanwali 2461 1283 1178 1067 567 500 43.36
811 108 Abhun 1956 1023 933 841 436 405 43.00
812 109 Kirianwala 1154 616 538 496 245 251 42.98
813 110 Ramnagar Urf Jatwali 811 419 392 348 178 170 42.91
199

(In Nos.)Percentage
Total Sub Total Male Female Total Male Female (Col. 7 to 4)
1 2 3 4 5 6 7 8 9 10
Village countName of Village
Population SC Population
DISTRICTWISE VILLAGES HAVING 40% AND ABOVE SCHEDULED CASTES (SC) POPULATION IN THE STATE OF PUNJAB (CENSUS 2011)
814 111 Kabulshah Khuban 4029 2099 1930 1721 889 832 42.72
815 112 Lakhewali Mustal Qabul Shah 2184 1165 1019 906 471 435 41.48
816 113 Roranwala 1615 851 764 661 348 313 40.93
817 114 Patti Puran 472 245 227 193 105 88 40.89
818 115 Sajrana 4742 2504 2238 1910 996 914 40.28
819 116 Dhabwala Kalan 4336 2291 2045 1745 929 816 40.24
820 117 Atuwala Hithar 109 55 54 109 55 54 100.00
821 118 Chak Sawai Khurd 108 58 50 108 58 50 100.00
822 119 Chak Sotrian 59 34 25 59 34 25 100.00
823 120 Kaluwara 236 119 117 236 119 117 100.00
824 121 Gatti Basti Masta ‐ 2 554 286 268 552 285 267 99.64
825 122 Gatti Rahime Ke 2974 1503 1471 2948 1495 1453 99.13
826 123 Weer 3518 1825 1693 3479 1802 1677 98.89
827 124 Rohela Haji Uttar 634 321 313 621 316 305 97.95
828 125 Habib Ke 3113 1566 1547 3024 1521 1503 97.14
829 126 Sultanwala 838 441 397 807 425 382 96.30
830 127 Fatehwala Hithar 728 360 368 701 347 354 96.29
831 128 Hazara Singhwala 3190 1615 1575 3068 1552 1516 96.18
832 129 Chhanga Khurd 1478 733 745 1421 698 723 96.14
833 130 Luther 755 380 375 721 364 357 95.50
834 131 Jama Rakhia Hithar 1453 740 713 1385 700 685 95.32
835 132 Nihalewala 384 197 187 365 186 179 95.05
836 133 Kamalwala 1007 521 486 957 496 461 95.03
837 134 Lakha Haji 1027 549 478 971 521 450 94.55
838 135 Rao Ke Uttar 272 137 135 255 130 125 93.75
839 136 Lakha Singhwala Hithar 1824 967 857 1707 875 832 93.59
840 137 Begu Mahu 484 257 227 448 237 211 92.56
841 138 Habibwala 2909 1462 1447 2669 1329 1340 91.75
842 139 Rao Ke Hithar 2336 1167 1169 2126 1055 1071 91.01
843 140 Pojoke Uttar 1822 956 866 1644 855 789 90.23
844 141 Bhamba Haji 2083 1061 1022 1878 961 917 90.16
845 142 Jama Rakhia Uttar 819 429 390 738 387 351 90.11
846 143 Gandhu Kilcha Uttar 875 452 423 788 405 383 90.06
847 144 Dona Mattar 3293 1660 1633 2924 1475 1449 88.79
848 145 Mattar Hithar 1325 697 628 1173 611 562 88.53
849 146 Chak Dona Rahime Ke 627 317 310 553 274 279 88.20
850 147 Chupati 624 337 287 547 292 255 87.66
851 148 Kalu Arain Hithar 1717 900 817 1482 762 720 86.31
852 149 Dhira Ghara 634 345 289 545 295 250 85.96
853 150 Hamidwala 948 492 456 811 416 395 85.55
854 151 Naurang Ke Lelli 1236 635 601 1051 541 510 85.03
855 152 Atuwala Uttar 552 275 277 469 233 236 84.96
856 153 Gatti Basti Masta ‐1 336 184 152 285 148 137 84.82
(iii) FirozpurSub‐District
200

(In Nos.)Percentage
Total Sub Total Male Female Total Male Female (Col. 7 to 4)
1 2 3 4 5 6 7 8 9 10
Village countName of Village
Population SC Population
DISTRICTWISE VILLAGES HAVING 40% AND ABOVE SCHEDULED CASTES (SC) POPULATION IN THE STATE OF PUNJAB (CENSUS 2011)
857 154 Jalalwala 1414 724 690 1195 606 589 84.51
858 155 Mehmud Ke Hithar 195 94 101 164 80 84 84.10
859 156 Rajiwala 894 473 421 746 397 349 83.45
860 157 Lakha Singhwala Uttar 1129 588 541 938 484 454 83.08
861 158 Dulewala 892 444 448 741 368 373 83.07
862 159 Lakhmir Ke Hithar 401 205 196 328 166 162 81.80
863 160 Inayat Ke 121 62 59 98 50 48 80.99
864 161 Aulake 224 116 108 181 94 87 80.80
865 162 Bare Ke 3583 1850 1733 2887 1469 1418 80.57
866 163 Pharuwala 579 301 278 464 241 223 80.14
867 164 Patti Gairabad 64 36 28 51 29 22 79.69
868 165 Butewala 763 401 362 607 318 289 79.55
869 166 Raja Rai 415 238 177 324 166 158 78.07
870 167 Chak Khundar 342 176 166 267 136 131 78.07
871 168 Nihala Kilcha 1135 599 536 885 465 420 77.97
872 169 Alike Jhungian 628 337 291 483 257 226 76.91
873 170 Ratta Khera Punjab Singhwala 1150 613 537 881 468 413 76.61
874 171 Pojoke Hithar 366 187 179 279 142 137 76.23
875 172 Lakhmir Ke Uttar 1099 561 538 837 426 411 76.16
876 173 Kahan Chandwala 2063 1060 1003 1559 803 756 75.57
877 174 Tali Gulam 574 302 272 431 223 208 75.09
878 175 Fattewala Uttar 32 19 13 24 14 10 75.00
879 176 Mahalam 1510 805 705 1131 603 528 74.90
880 177 Kandawali 833 436 397 621 318 303 74.55
881 178 Lakho Ke Behram 3800 2029 1771 2832 1497 1335 74.53
882 179 Nihala Lawera 648 339 309 482 250 232 74.38
883 180 Kamalwala Khurd 1018 543 475 744 398 346 73.08
884 181 Mallha Rahime Ke Hithar 308 152 156 217 103 114 70.45
885 182 Chak Ghobai Alias Tangan 1217 651 566 855 452 403 70.25
886 183 Wan 802 416 386 560 292 268 69.83
887 184 Gamewala 1708 877 831 1188 608 580 69.56
888 185 Ramewala 768 404 364 531 282 249 69.14
889 186 Chak Malha Kari 42 23 19 29 15 14 69.05
890 187 Pir Ismail Khanwala 1247 638 609 857 436 421 68.72
891 188 Mida Haji 104 49 55 71 33 38 68.27
892 189 Dulchi Ke 5256 2727 2529 3546 1834 1712 67.47
893 190 Khamba 685 363 322 461 234 227 67.30
894 191 Saide Ke Naul 637 325 312 424 217 207 66.56
895 192 Jaimalwala Alias Piareana 1925 997 928 1280 653 627 66.49
896 193 Asal 1458 760 698 963 497 466 66.05
897 194 Khundar Hithar 512 279 233 338 184 154 66.02
898 195 Piranwala 2366 1219 1147 1550 789 761 65.51
899 196 Naurang Ke Sial 2137 1112 1025 1392 709 683 65.14
900 197 Mamdot Hithar 3394 1830 1564 2200 1146 1054 64.82
201

(In Nos.)Percentage
Total Sub Total Male Female Total Male Female (Col. 7 to 4)
1 2 3 4 5 6 7 8 9 10
Village countName of Village
Population SC Population
DISTRICTWISE VILLAGES HAVING 40% AND ABOVE SCHEDULED CASTES (SC) POPULATION IN THE STATE OF PUNJAB (CENSUS 2011)
901 198 Badhni Jaimal Singh 756 402 354 490 267 223 64.81
902 199 Chak Ghobai Urf Taranwala 967 511 456 626 329 297 64.74
903 200 Khilchi Jadid 799 427 372 516 280 236 64.58
904 201 Rahime Ke Hithar 95 52 43 61 35 26 64.21
905 202 Kasubegu 1389 710 679 885 452 433 63.71
906 203 Toor 329 165 164 207 100 107 62.92
907 204 Sawai Bhokhari 886 469 417 552 295 257 62.30
908 205 Kulgarhi 748 390 358 465 249 216 62.17
909 206 Firozpur(Rural) 5293 2721 2572 3283 1698 1585 62.03
910 207 Pattli 1288 685 603 792 420 372 61.49
911 208 Ghulam Hussainwala 672 353 319 413 214 199 61.46
912 209 Haraj 3218 1701 1517 1974 1036 938 61.34
913 210 Alewala 618 319 299 378 196 182 61.17
914 211 Fatuwala 1598 838 760 960 504 456 60.08
915 212 Machhiwara 336 174 162 200 105 95 59.52
916 213 Khilchi Qadim 1771 934 837 1049 551 498 59.23
917 214 Kamaldin Niazi 441 242 199 259 138 121 58.73
918 215 Pir Khan Sheikh 606 334 272 354 194 160 58.42
919 216 Attari 1031 533 498 596 298 298 57.81
920 217 Maste Ke 3875 1999 1876 2218 1136 1082 57.24
921 218 Khane Ke Ahal 227 114 113 129 62 67 56.83
922 219 Rahime Ke Uttar 1216 636 580 688 352 336 56.58
923 220 Saide Ke 472 223 249 264 117 147 55.93
924 221 Bukan Khanwala 1445 753 692 804 417 387 55.64
925 222 Mehmud Ke Mahal Hithar 547 272 275 304 149 155 55.58
926 223 Dhindsa 1128 582 546 626 320 306 55.50
927 224 Nizamwala 1072 530 542 588 287 301 54.85
928 225 Mohre 704 370 334 386 206 180 54.83
929 226 Palha Megha 3008 1559 1449 1649 874 775 54.82
930 227 Kari Kalan 1494 761 733 816 413 403 54.62
931 228 Kari Khurd 112 60 52 61 30 31 54.46
932 229 Theh Gujjar 507 257 250 276 137 139 54.44
933 230 Malwal 4904 2557 2347 2665 1379 1286 54.34
934 231 Machhiwara 186 93 93 101 47 54 54.30
935 232 Gillanwala 811 418 393 440 225 215 54.25
936 233 Nasira Khilchi 879 468 411 476 251 225 54.15
937 234 Bhure Khurd 732 392 340 396 216 180 54.10
938 235 Waryamwala 307 159 148 166 84 82 54.07
939 236 Mehmud Ke Uttar 13 8 5 7 4 3 53.85
940 237 Bhure Kalan 601 324 277 323 177 146 53.74
941 238 Gatti Mattar 554 280 274 297 152 145 53.61
942 239 Nawan Qila 521 259 262 277 137 140 53.17
943 240 Sayianwala 620 323 297 329 176 153 53.06
944 241 Jandwala 1229 637 592 650 325 325 52.89
202

(In Nos.)Percentage
Total Sub Total Male Female Total Male Female (Col. 7 to 4)
1 2 3 4 5 6 7 8 9 10
Village countName of Village
Population SC Population
DISTRICTWISE VILLAGES HAVING 40% AND ABOVE SCHEDULED CASTES (SC) POPULATION IN THE STATE OF PUNJAB (CENSUS 2011)
945 242 Misriwala 1193 613 580 621 315 306 52.05
946 243 Kakar 552 293 259 287 157 130 51.99
947 244 Kaliewala 1097 549 548 569 278 291 51.87
948 245 Alfooke 1539 802 737 796 416 380 51.72
949 246 Ratta Khera baja Kotwal 335 186 149 173 96 77 51.64
950 247 Lalle 1690 898 792 865 464 401 51.18
951 248 Phide 1597 870 727 813 448 365 50.91
952 249 Jhok Tahal Singh 1002 527 475 508 263 245 50.70
953 250 Hussain Shahwala 311 159 152 157 81 76 50.48
954 251 Bahadurwala 462 249 213 233 120 113 50.43
955 252 Jhok Harihar 5441 2872 2569 2733 1434 1299 50.23
956 253 Qutbewala 502 262 240 252 125 127 50.20
957 254 jang 1439 744 695 722 381 341 50.17
958 255 Mehal Singhwala 2156 1333 823 1077 550 527 49.95
959 256 Thethar Kalan 1549 824 725 772 417 355 49.84
960 257 Mattar Uttar 1129 573 556 561 283 278 49.69
961 258 Langiana 1150 598 552 568 282 286 49.39
962 259 Sodhi Nagar Urf Sultan Khanwala 3267 1710 1557 1610 851 759 49.28
963 260 Shahdinwala 1022 554 468 502 267 235 49.12
964 261 Jaimalwala 1051 533 518 516 262 254 49.10
965 262 Khangarh 822 413 409 397 193 204 48.30
966 263 Saidanwala 540 280 260 256 132 124 47.41
967 264 Pir Ahmad Khanwala 574 295 279 271 138 133 47.21
968 265 Chak Rao ke Hithar 474 269 205 221 108 113 46.62
969 266 Achhewala 585 302 283 272 136 136 46.50
970 267 Ittanwali 1204 639 565 559 320 239 46.43
971 268 Khushal Singhwala 2164 1119 1045 994 506 488 45.93
972 269 Dastul Sahibwala 2820 1452 1368 1284 633 651 45.53
973 270 Hakewala 1814 970 844 821 430 391 45.26
974 271 Phularwan 283 154 129 128 64 64 45.23
975 272 Waghewala 1346 735 611 602 334 268 44.73
976 273 Changali Qadim 1597 817 780 714 366 348 44.71
977 274 Sur Singhwala 1232 623 609 541 275 266 43.91
978 275 Wara Jawahar Singhwala 851 445 406 372 197 175 43.71
979 276 Aliwala 479 258 221 209 110 99 43.63
980 277 Killi 703 364 339 306 158 148 43.53
981 278 Buttar 322 176 146 140 80 60 43.48
982 279 Bhabra Azam Shahwala 2267 1186 1081 983 511 472 43.36
983 280 Haji Chhimba 317 174 143 137 71 66 43.22
984 281 Chak Bhangewala 825 414 411 355 175 180 43.03
985 282 Machhi Bugra 1365 705 660 580 299 281 42.49
986 283 Kotwala 408 205 203 172 88 84 42.16
987 284 Sharinwala 632 330 302 265 136 129 41.93
988 285 Mirze Ke 1197 631 566 493 274 219 41.19
203

(In Nos.)Percentage
Total Sub Total Male Female Total Male Female (Col. 7 to 4)
1 2 3 4 5 6 7 8 9 10
Village countName of Village
Population SC Population
DISTRICTWISE VILLAGES HAVING 40% AND ABOVE SCHEDULED CASTES (SC) POPULATION IN THE STATE OF PUNJAB (CENSUS 2011)
989 286 Basti Pathanawali 400 203 197 164 85 79 41.00
990 287 Sudh Singhwala 1481 785 696 607 313 294 40.99
991 288 Bholluwala 1112 584 528 454 236 218 40.83
992 289 Sulhani 1974 1049 925 803 434 369 40.68
993 290 Pharaya Malwala 1097 588 509 446 239 207 40.66
994 291 Dilaram 1804 931 873 729 356 373 40.41
995 292 Bura Sarwan 179 91 88 179 91 88 100.00
996 293 Chak Sarkar Mahazi Bahadar Ke 99 58 41 99 58 41 100.00
997 294 Chak Sarkar Mahazi Parbhat Singhwala 68 39 29 68 39 29 100.00
998 295 Illahi Bakhash Bodla 170 86 84 170 86 84 100.00
999 296 Megha Panj Grain Uttar 201 110 91 201 110 91 100.00
1000 297 Sawaya Rai Hithar 83 37 46 83 37 46 100.00
1001 298 Sher Singhwala 493 247 246 491 245 246 99.59
1002 299 Nathu Chishti 720 359 361 717 357 360 99.58
1003 300 Chak Chhanga Rai 2506 1321 1185 2493 1314 1179 99.48
1004 301 Chak Panje Ke 904 469 435 896 466 430 99.12
1005 302 Bula Rai Uttar 1067 571 496 1056 567 489 98.97
1006 303 Pireke Uttar 1194 629 565 1180 623 557 98.83
1007 304 Gudar Panjgrain 517 266 251 510 263 247 98.65
1008 305 Isa Panjgrain 935 466 469 922 461 461 98.61
1009 306 Megha Panjgrain Hithar 1698 854 844 1672 840 832 98.47
1010 307 Chak Tahliwala 2261 1165 1096 2223 1147 1076 98.32
1011 308 Santokh Singhwala 955 500 455 938 493 445 98.22
1012 309 Parbhat Singhwala Uttar 2087 1071 1016 2048 1052 996 98.13
1013 310 Thara Singhwala Uttar 1540 778 762 1510 762 748 98.05
1014 311 Kathgarh 3527 1788 1739 3458 1752 1706 98.04
1015 312 Chak Bazida 2963 1540 1423 2904 1508 1396 98.01
1016 313 Sawaya Rai Uttar 1720 885 835 1684 866 818 97.91
1017 314 Nure Ke 575 290 285 562 282 280 97.74
1018 315 Shamash Din Chishti 658 345 313 642 335 307 97.57
1019 316 Panjeke Hithar 334 175 159 322 167 155 96.41
1020 317 Bodel Pire Ke 378 187 191 364 180 184 96.30
1021 318 Parbhat Singhwala Hithar 1750 891 859 1678 848 830 95.89
1022 319 Lamochar Khurd 1391 732 659 1333 702 631 95.83
1023 320 Badalke Hithar 185 94 91 177 89 88 95.68
1024 321 Chak Arniwala 2217 1136 1081 2110 1082 1028 95.17
1025 322 Chhanga Rai Uttar 3992 2057 1935 3787 1960 1827 94.86
1026 323 Ram Singhwala 2250 1142 1108 2134 1080 1054 94.84
1027 324 Chak Balochanwala 2792 1454 1338 2647 1377 1270 94.81
1028 325 Megha Rai 3569 1836 1733 3365 1726 1639 94.28
1029 326 Chak Sohna Sandar 945 478 467 885 450 435 93.65
1030 327 Chak Maujdinwala 2205 1130 1075 2064 1054 1010 93.61
(iv) JalalabadSub‐District
204

(In Nos.)Percentage
Total Sub Total Male Female Total Male Female (Col. 7 to 4)
1 2 3 4 5 6 7 8 9 10
Village countName of Village
Population SC Population
DISTRICTWISE VILLAGES HAVING 40% AND ABOVE SCHEDULED CASTES (SC) POPULATION IN THE STATE OF PUNJAB (CENSUS 2011)
1031 328 Sher Mohammad Mahigir 1390 714 676 1298 662 636 93.38
1032 329 Bula Rai Hithar 619 317 302 578 293 285 93.38
1033 330 Dhandi Qadim 4048 2091 1957 3778 1937 1841 93.33
1034 331 Sohna Sandar 1082 571 511 1005 530 475 92.88
1035 332 Chak Khewa 2054 1034 1020 1905 959 946 92.75
1036 333 Mohar Singhwala Hithar 308 162 146 285 147 138 92.53
1037 334 Rana Panjgrain 1138 593 545 1050 542 508 92.27
1038 335 Dhab Khushal Joya 2287 1195 1092 2091 1096 995 91.43
1039 336 Rukna Qasam 848 441 407 773 406 367 91.16
1040 337 Sukhera Bodal 1816 959 857 1655 876 779 91.13
1041 338 Bhamba Wattu Hithar 481 234 247 438 213 225 91.06
1042 339 Chak Maddike 839 414 425 761 376 385 90.70
1043 340 Dona Bhadru 63 37 26 57 34 23 90.48
1044 341 Chak Kandhe Shah 1266 639 627 1145 578 567 90.44
1045 342 Mohan Ke Uttar 5081 2616 2465 4577 2354 2223 90.08
1046 343 Nau baramad Sher Singhwala 1728 889 839 1555 798 757 89.99
1047 344 Dhandi Khurd 1545 831 714 1389 753 636 89.90
1048 345 Ahmad Dhandi 1665 868 797 1472 762 710 88.41
1049 346 Baghe Ke Hithar 1766 911 855 1558 801 757 88.22
1050 347 Ladhuwala Hithar 1194 626 568 1050 551 499 87.94
1051 348 Totianwala 1616 836 780 1420 736 684 87.87
1052 349 Marhe Khurd 722 373 349 632 327 305 87.53
1053 350 Mohar Singhwala Uttar 2204 1152 1052 1924 1002 922 87.30
1054 351 Paliwala 2971 1545 1426 2556 1331 1225 86.03
1055 352 Chak Mohamdewala 1177 611 566 1008 517 491 85.64
1056 353 Mahmud Khanke 130 66 64 111 53 58 85.38
1057 354 Duleke Ghairabad 567 290 277 482 248 234 85.01
1058 355 Chak Sukhera 1145 611 534 973 516 457 84.98
1059 356 Fattuwala 3780 1943 1837 3202 1639 1563 84.71
1060 357 Pireke Hithar 43 21 22 36 17 19 83.72
1061 358 Duleke Nathuwala 3185 1610 1575 2653 1326 1327 83.30
1062 359 Chak Hamid Saidoke 221 114 107 183 95 88 82.81
1063 360 Badalke Uttar 404 219 185 333 179 154 82.43
1064 361 Jala Lakheke Hithar 923 477 446 760 392 368 82.34
1065 362 Balelke Rohela 434 233 201 357 191 166 82.26
1066 363 Sheikh Shaman 362 193 169 291 154 137 80.39
1067 364 Chak Mochanwala 627 331 296 500 267 233 79.74
1068 365 Nadhana 1804 958 846 1436 762 674 79.60
1069 366 Balalke Kamalwala 1221 632 589 944 482 462 77.31
1070 367 Rahme Shah Bodla 725 387 338 557 301 256 76.83
1071 368 Marhe Kalan 1768 932 836 1347 697 650 76.19
1072 369 Bahmaniwala 4670 2415 2255 3510 1798 1712 75.16
1073 370 Chak Arainwala 4486 2528 1958 3362 1743 1619 74.94
1074 371 Bhamba Wattu Uttar 1324 664 660 990 493 497 74.77
205

(In Nos.)Percentage
Total Sub Total Male Female Total Male Female (Col. 7 to 4)
1 2 3 4 5 6 7 8 9 10
Village countName of Village
Population SC Population
DISTRICTWISE VILLAGES HAVING 40% AND ABOVE SCHEDULED CASTES (SC) POPULATION IN THE STATE OF PUNJAB (CENSUS 2011)
1075 372 Lamochar Kalan Hithar 167 83 84 124 59 65 74.25
1076 373 Duleke Abad 89 45 44 66 31 35 74.16
1077 374 Bilimar 308 154 154 228 113 115 74.03
1078 375 Qutabgarh 1141 609 532 842 439 403 73.79
1079 376 Khuranj 1416 749 667 1018 539 479 71.89
1080 377 Chak Khuranj 612 323 289 436 230 206 71.24
1081 378 Chak Megha Wiran 1302 661 641 925 458 467 71.04
1082 379 Kutti 683 372 311 485 262 223 71.01
1083 380 Jalalabad ( R ) 12870 6954 5916 9119 4736 4383 70.85
1084 381 Chhanga Rai Hithar 616 317 299 436 220 216 70.78
1085 382 Dhab Karyal 1668 874 794 1173 594 579 70.32
1086 383 Mida 908 479 429 637 332 305 70.15
1087 384 Arnianwala 1077 553 524 755 387 368 70.10
1088 385 Virak Khurd 689 353 336 481 243 238 69.81
1089 386 Chak Kathgarh 2975 1551 1424 2048 1055 993 68.84
1090 387 Chak Paliwala 2203 1126 1077 1513 775 738 68.68
1091 388 Ghubhaya 4187 2182 2005 2871 1480 1391 68.57
1092 389 Mohkam Arain 3131 1695 1436 2138 1124 1014 68.28
1093 390 Chak Punnawali 1060 560 500 714 371 343 67.36
1094 391 Chak Gulam Rasulwala 1283 688 595 852 461 391 66.41
1095 392 Nunari Khokhar 335 174 161 218 116 102 65.07
1096 393 Chak Sarian 736 370 366 472 237 235 64.13
1097 394 Panj Ke Uttar 5151 2676 2475 3285 1676 1609 63.77
1098 395 Lamochar Kalan Uttar 1896 1010 886 1209 651 558 63.77
1099 396 Guruhar Sahai(Rural) 26221 13689 12532 16641 8607 8034 63.46
1100 397 Balelke Hasal 192 96 96 121 56 65 63.02
1101 398 Chak Sawah Wala 840 423 417 528 266 262 62.86
1102 399 Ghulla 443 229 214 273 139 134 61.63
1103 400 Chak Lamochar 1092 536 556 665 325 340 60.90
1104 401 Chak Romwala 1131 552 579 688 336 352 60.83
1105 402 Mahantanwala 674 365 309 404 221 183 59.94
1106 403 Rukna Bodla 421 213 208 250 121 129 59.38
1107 404 Chak Sohlewala 2913 1529 1384 1721 908 813 59.08
1108 405 Wadi 425 219 206 247 126 121 58.12
1109 406 Chak Jamiat Singhwala 1635 843 792 925 476 449 56.57
1110 407 Khere Ke Uttar 974 507 467 550 286 264 56.47
1111 408 Chak Bhabra 378 199 179 213 111 102 56.35
1112 409 Lakheke Musahib Uttar 886 469 417 494 266 228 55.76
1113 410 Tilu Arain 275 144 131 153 82 71 55.64
1114 411 Chak Sotrian 1396 732 664 775 407 368 55.52
1115 412 Burwala 1116 586 530 611 316 295 54.75
1116 413 Maujewala 591 292 299 321 156 165 54.31
1117 414 Mandiwal 1552 824 728 820 434 386 52.84
1118 415 Chak Manewala 1549 808 741 815 428 387 52.61
206

(In Nos.)Percentage
Total Sub Total Male Female Total Male Female (Col. 7 to 4)
1 2 3 4 5 6 7 8 9 10
Village countName of Village
Population SC Population
DISTRICTWISE VILLAGES HAVING 40% AND ABOVE SCHEDULED CASTES (SC) POPULATION IN THE STATE OF PUNJAB (CENSUS 2011)
1119 416 Kore Singhwala 2401 1238 1163 1221 640 581 50.85
1120 417 Chak Jandwala 903 478 425 457 247 210 50.61
1121 418 Sulla 747 388 359 375 191 184 50.20
1122 419 Amir Khas 2920 1559 1361 1458 773 685 49.93
1123 420 Chak Mabain Hardo Dhandi 921 494 427 456 234 222 49.51
1124 421 Jandwala 2646 1401 1245 1293 687 606 48.87
1125 422 Guddar Dhandi 2234 1169 1065 1068 551 517 47.81
1126 423 Chak Khundwala 964 501 463 459 242 217 47.61
1127 424 Jiwa Arain 2058 1070 988 972 509 463 47.23
1128 425 Chak Rohiwala 606 302 304 284 141 143 46.86
1129 426 Sharinwala 2471 1292 1179 1157 610 547 46.82
1130 427 Alam Ke 961 470 491 449 214 235 46.72
1131 428 Chak Somianwala 1060 549 511 489 258 231 46.13
1132 429 Ratta Khera 3224 1715 1509 1481 791 690 45.94
1133 430 Chak Kherewala 1260 662 598 570 308 262 45.24
1134 431 Chak Dumal 883 464 419 399 207 192 45.19
1135 432 Khereke Hithar 275 143 132 124 69 55 45.09
1136 433 Bahadar Ke 1045 546 499 467 234 233 44.69
1137 434 Chak Bhamba Wattu 780 411 369 347 183 164 44.49
1138 435 Malikzada 900 489 411 396 214 182 44.00
1139 436 Chak Dhab Khushal Joyia 593 307 286 255 125 130 43.00
1140 437 Kahnewala 729 371 358 313 160 153 42.94
1141 438 Baghe Ke Uttar 952 489 463 408 213 195 42.86
1142 439 Kahansinghwala 706 362 344 301 157 144 42.63
1143 440 Janisar 439 235 204 187 101 86 42.60
1144 441 Ruknewala Khurd 8 4 4 8 4 4 100.00
1145 442 Mundi Chhurimaran 2267 1149 1118 2162 1088 1074 95.37
1146 443 Tibbi Ranga 352 181 171 330 169 161 93.75
1147 444 Mannu Machhi 593 303 290 547 277 270 92.24
1148 445 Akbarwala 528 262 266 487 245 242 92.23
1149 446 Gatta Dalel 123 59 64 112 54 58 91.06
1150 447 Manjwala 760 377 383 657 323 334 86.45
1151 448 Wara Kalirana 895 450 445 773 394 379 86.37
1152 449 Bhupewala 554 281 273 478 241 237 86.28
1153 450 Shah Dinwala 29 12 17 25 10 15 86.21
1154 451 Mahlewala 1374 711 663 1159 596 563 84.35
1155 452 Wara Suleman 219 108 111 184 90 94 84.02
1156 453 Behbalwala 31 15 16 26 12 14 83.87
1157 454 Mahmudwala 851 430 421 708 361 347 83.20
1158 455 Tibbi Badra 59 27 32 49 24 25 83.05
1159 456 Madahar Shera 321 163 158 265 134 131 82.55
1160 457 Khiali 252 130 122 205 107 98 81.35
1161 458 Laluwala 808 425 383 657 338 319 81.31
(v) ZiraSub‐District
207

(In Nos.)Percentage
Total Sub Total Male Female Total Male Female (Col. 7 to 4)
1 2 3 4 5 6 7 8 9 10
Village countName of Village
Population SC Population
DISTRICTWISE VILLAGES HAVING 40% AND ABOVE SCHEDULED CASTES (SC) POPULATION IN THE STATE OF PUNJAB (CENSUS 2011)
1162 459 Chak Tibbi Tayab 332 165 167 269 134 135 81.02
1163 460 Tibbi Rang 165 91 74 128 69 59 77.58
1164 461 Silewind 534 258 276 397 183 214 74.34
1165 462 Wara Pohwindian 1397 727 670 1035 545 490 74.09
1166 463 Khanna 1123 567 556 778 388 390 69.28
1167 464 Sudhia 184 99 85 127 68 59 69.02
1168 465 Borawali 1147 586 561 784 404 380 68.35
1169 466 Nawa Zira 532 263 269 360 173 187 67.67
1170 467 Amir Shahwala 680 351 329 450 226 224 66.18
1171 468 Chakkian 1050 543 507 690 355 335 65.71
1172 469 Sharaf Ali Shahwala 468 244 224 306 153 153 65.38
1173 470 Wara Chain Singhwala Alias Ramgarh 1190 619 571 771 402 369 64.79
1174 471 kamalgarh Khurd 344 168 176 219 109 110 63.66
1175 472 Behk Fattu 1666 873 793 1041 545 496 62.48
1176 473 Chabba 1248 650 598 763 401 362 61.14
1177 474 Markhai 1609 867 742 980 542 438 60.91
1178 475 Sukhewala 1345 692 653 786 400 386 58.44
1179 476 Gurali 215 118 97 123 67 56 57.21
1180 477 Ruknewala Kalan 387 192 195 211 104 107 54.52
1181 478 Kasoana 1694 833 861 921 467 454 54.37
1182 479 Ratoul Bet 1213 631 582 659 342 317 54.33
1183 480 Nilewala 632 342 290 342 183 159 54.11
1184 481 Rotal Rohi 1415 739 676 733 387 346 51.80
1185 482 Hardasa 1377 714 663 709 374 335 51.49
1186 483 Pir Mohamad 2392 1218 1174 1225 611 614 51.21
1187 484 Warpal 1090 572 518 549 296 253 50.37
1188 485 Jaura 884 443 441 436 222 214 49.32
1189 486 Shahwala 1458 764 694 709 385 324 48.63
1190 487 Alipur 1228 647 581 583 305 278 47.48
1191 488 Buh Gujran 622 316 306 295 148 147 47.43
1192 489 Pandori Jattan 522 277 245 247 134 113 47.32
1193 490 Valtoha 1078 565 513 510 270 240 47.31
1194 491 Botianwala 1415 728 687 669 351 318 47.28
1195 492 Phemiwala 665 341 324 308 155 153 46.32
1196 493 Qutabpura 515 277 238 236 126 110 45.83
1197 494 Sekhwan 2416 1280 1136 1106 586 520 45.78
1198 495 Talwandi Mange Khan 1856 943 913 843 436 407 45.42
1199 496 Sadhuwala 1589 849 740 721 386 335 45.37
1200 497 Jhanda Bagga Purana 865 466 399 388 212 176 44.86
1201 498 Talwandi Nepalan 2745 1460 1285 1225 640 585 44.63
1202 499 Behk Pasarian 868 434 434 380 189 191 43.78
1203 500 Dhandian 1122 581 541 487 253 234 43.40
1204 501 Mihan Singhwala 1163 612 551 503 263 240 43.25
1205 502 Chamb 972 539 433 419 235 184 43.11
208

(In Nos.)Percentage
Total Sub Total Male Female Total Male Female (Col. 7 to 4)
1 2 3 4 5 6 7 8 9 10
Village countName of Village
Population SC Population
DISTRICTWISE VILLAGES HAVING 40% AND ABOVE SCHEDULED CASTES (SC) POPULATION IN THE STATE OF PUNJAB (CENSUS 2011)
1206 503 Gurdittiwala 1055 537 518 454 229 225 43.03
1207 504 Wariswala Jattan 684 361 323 294 155 139 42.98
1208 505 Mehar Singhwala 1715 880 835 733 391 342 42.74
1209 506 Santuwala 1777 913 864 759 394 365 42.71
1210 507 Malhewala 667 354 313 279 152 127 41.83
1211 508 Bharana 2310 1188 1122 961 489 472 41.60
1212 509 Butewala 829 423 406 340 176 164 41.01
1213 510 Khosa Dalsingh 1201 624 577 492 258 234 40.97
1214 511 Ghuram 284 155 129 116 59 57 40.85
1215 512 Nizam Dinwala 1320 698 622 536 282 254 40.61
1216 513 Bhagoke 1081 561 520 438 223 215 40.52
1217 514 Naurang Singhwala 980 511 469 397 207 190 40.51
1218 515 Pandori Khatrian 1573 822 751 636 341 295 40.43
1219 516 Kachar Bhan 995 520 475 400 224 176 40.20
1220 517 Behk Gujran 3248 1659 1589 1301 673 628 40.06
1221 1 Kathana 296 157 139 224 120 104 75.68
1222 2 Zahidpur 85 46 39 64 36 28 75.29
1223 3 Balrampur 325 170 155 237 126 111 72.92
1224 4 Kishan Kot 782 408 374 540 285 255 69.05
1225 5 Withwan 640 334 306 424 212 212 66.25
1226 6 Mulianwali 2522 1335 1187 1571 844 727 62.29
1227 7 Aliwal Jattan 470 216 254 288 138 150 61.28
1228 8 Sham Sherpur 2558 1325 1233 1553 798 755 60.71
1229 9 Nathpur 2025 1089 936 1217 654 563 60.10
1230 10 Bijliwal 1685 896 789 1006 549 457 59.70
1231 11 Bagha 1076 544 532 627 316 311 58.27
1232 12 Karwalian 773 407 366 449 242 207 58.09
1233 13 Haruwal 551 291 260 309 158 151 56.08
1234 14 Bhoma 1736 913 823 972 505 467 55.99
1235 15 Dhir 1852 974 878 1025 531 494 55.35
1236 16 Momanwal 801 406 395 431 222 209 53.81
1237 17 Kaure 725 381 344 390 205 185 53.79
1238 18 Kala Nangal 1537 811 726 813 426 387 52.90
1239 19 Rasulpur 1287 673 614 680 367 313 52.84
1240 20 Thindh 881 466 415 465 246 219 52.78
1241 21 Kazampur 834 449 385 440 242 198 52.76
1242 22 Hardo Jhanda 2291 1203 1088 1205 654 551 52.60
1243 23 Warsal Chak 690 347 343 360 185 175 52.17
1244 24 Jaitu Sarja 3184 1642 1542 1610 844 766 50.57
1245 25 Chahal Khurd 477 244 233 241 121 120 50.52
1246 26 Sheikhpur 1716 897 819 862 454 408 50.23
1247 27 Sundal 520 275 245 261 151 110 50.19
7. GURDASPUR(i) Batala
DISTRICTSub‐District
209

(In Nos.)Percentage
Total Sub Total Male Female Total Male Female (Col. 7 to 4)
1 2 3 4 5 6 7 8 9 10
Village countName of Village
Population SC Population
DISTRICTWISE VILLAGES HAVING 40% AND ABOVE SCHEDULED CASTES (SC) POPULATION IN THE STATE OF PUNJAB (CENSUS 2011)
1248 28 Machrai 1113 576 537 557 278 279 50.04
1249 29 Chatha 991 542 449 482 268 214 48.64
1250 30 Kotli Bhan Singh 1082 556 526 526 276 250 48.61
1251 31 Chhelowal 968 506 462 467 248 219 48.24
1252 32 Nanak Chak 320 167 153 152 78 74 47.50
1253 33 Teja Kalan 1206 635 571 564 302 262 46.77
1254 34 Gujjarpura 1404 765 639 654 381 273 46.58
1255 35 Missarpura 1717 906 811 798 422 376 46.48
1256 36 Bhalowali 1106 573 533 508 266 242 45.93
1257 37 Bhagtupur 1420 757 663 650 347 303 45.77
1258 38 Nangal Buttar 1047 540 507 478 249 229 45.65
1259 39 Rampur 2058 1052 1006 929 468 461 45.14
1260 40 Chuhewal 1138 598 540 512 263 249 44.99
1261 41 Chhit 1080 552 528 482 254 228 44.63
1262 42 Lalla 565 304 261 252 145 107 44.60
1263 43 Sheikhwan 1592 841 751 707 375 332 44.41
1264 44 Tawandi Lal Singh 2786 1466 1320 1232 654 578 44.22
1265 45 Ladhu Bhana 640 335 305 283 145 138 44.22
1266 46 Parowal 1407 727 680 619 320 299 43.99
1267 47 Damodar 1142 614 528 499 274 225 43.70
1268 48 Sallo Chahal 1167 627 540 504 265 239 43.19
1269 49 Dharamkot 373 202 171 161 87 74 43.16
1270 50 Jangla 2055 1082 973 882 484 398 42.92
1271 51 Muridke 968 519 449 415 224 191 42.87
1272 52 Ammo Nangal 2135 1146 989 913 494 419 42.76
1273 53 Mandiala 1998 1057 941 854 438 416 42.74
1274 54 Veela Bajju 3851 1942 1909 1642 821 821 42.64
1275 55 Talwandi Bha‐rath 3150 1666 1484 1340 701 639 42.54
1276 56 Shankarpura 1524 785 739 630 327 303 41.34
1277 57 Kot Ahmad Khan 211 118 93 87 61 26 41.23
1278 58 Phulke 1034 524 510 426 216 210 41.20
1279 59 Dhadialanatt 3878 2120 1758 1597 871 726 41.18
1280 60 Seera 1726 913 813 706 385 321 40.90
1281 61 Dabanwala 2283 1207 1076 930 491 439 40.74
1282 62 Nathwal 1155 602 553 470 244 226 40.69
1283 63 Manesh 1119 586 533 454 244 210 40.57
1284 64 Dadiala Najara 1670 908 762 677 371 306 40.54
1285 65 Mathola 2403 1258 1145 973 515 458 40.49
1286 66 Kot Khajana 973 498 475 393 198 195 40.39
1287 67 Qila Lal Singh 2141 1151 990 862 464 398 40.26
1288 68 Thirriyewal 1151 606 545 461 243 218 40.05
1289 69 Tarowali 240 129 111 169 88 81 70.42
1290 70 Sadhanwali 359 189 170 205 110 95 57.10
(ii) Dera Baba NanakSub‐District
210

(In Nos.)Percentage
Total Sub Total Male Female Total Male Female (Col. 7 to 4)
1 2 3 4 5 6 7 8 9 10
Village countName of Village
Population SC Population
DISTRICTWISE VILLAGES HAVING 40% AND ABOVE SCHEDULED CASTES (SC) POPULATION IN THE STATE OF PUNJAB (CENSUS 2011)
1291 71 Samrai 1369 742 627 714 392 322 52.15
1292 72 Qadian Gujjran 601 293 308 298 133 165 49.58
1293 73 Mahlowali 729 382 347 328 176 152 44.99
1294 74 Mansur 663 350 313 298 158 140 44.95
1295 75 Chandu Nangal 336 171 165 145 75 70 43.15
1296 76 Dunera 2502 1290 1212 1129 585 544 45.12
1297 77 Darkua Bangla 422 222 200 180 98 82 42.65
1298 78 Bhurian Gujjran 109 59 50 109 59 50 100.00
1299 79 Mamka Khizarpur 6 2 4 6 2 4 100.00
1300 80 Mochpur 1398 739 659 1296 691 605 92.70
1301 81 Khera 107 58 49 99 54 45 92.52
1302 82 Malomowan 230 106 124 204 93 111 88.70
1303 83 Bhabra 594 316 278 515 275 240 86.70
1304 84 Tughial 745 400 345 602 322 280 80.81
1305 85 Lange 179 85 94 143 65 78 79.89
1306 86 Chahia 733 393 340 573 311 262 78.17
1307 87 Mirpur 1524 784 740 1165 607 558 76.44
1308 88 Dalelpur 275 148 127 207 113 94 75.27
1309 89 Jhande Chak 539 285 254 394 206 188 73.10
1310 90 Jattuwal 1305 707 598 946 517 429 72.49
1311 91 Raowal 763 399 364 548 285 263 71.82
1312 92 Gwalia 269 139 130 193 100 93 71.75
1313 93 Babowal 2631 1380 1251 1837 966 871 69.82
1314 94 Siri Rampur 360 179 181 251 123 128 69.72
1315 95 Bara 276 136 140 191 94 97 69.20
1316 96 Munan 551 271 280 373 179 194 67.70
1317 97 Zafarpur 758 386 372 508 264 244 67.02
1318 98 Islampur 678 356 322 449 242 207 66.22
1319 99 Ismailpur 381 188 193 249 121 128 65.35
1320 100 Daliya 320 158 162 208 97 111 65.00
1321 101 Paniar 97 48 49 63 34 29 64.95
1322 102 Hardo Bathwala 5241 2741 2500 3380 1774 1606 64.49
1323 103 Machhrala 435 229 206 279 149 130 64.14
1324 104 Singowal 774 393 381 489 247 242 63.18
1325 105 Bhainsa Becharag 120 63 57 74 39 35 61.67
1326 106 Chak Bhangwan 96 52 44 59 32 27 61.46
1327 107 Bhattian 344 173 171 211 101 110 61.34
1328 108 Sanghour 825 436 389 506 268 238 61.33
1329 109 Gadarian 560 294 266 342 181 161 61.07
1330 110 Gopalia 354 174 180 216 102 114 61.02
1331 111 Bharial 287 156 131 173 94 79 60.28
1332 112 Gandhian 2696 1386 1310 1620 825 795 60.09
(iii) Dhar Kalan
(iv) Gurdaspur
Sub‐District
Sub‐District
211

(In Nos.)Percentage
Total Sub Total Male Female Total Male Female (Col. 7 to 4)
1 2 3 4 5 6 7 8 9 10
Village countName of Village
Population SC Population
DISTRICTWISE VILLAGES HAVING 40% AND ABOVE SCHEDULED CASTES (SC) POPULATION IN THE STATE OF PUNJAB (CENSUS 2011)
1333 113 Meghian 747 395 352 446 234 212 59.71
1334 114 Halla 1110 572 538 656 334 322 59.10
1335 115 Kot Mian Sahib 1575 820 755 928 484 444 58.92
1336 116 Taruwal 185 93 92 109 54 55 58.92
1337 117 Jahangirpur 301 157 144 177 95 82 58.80
1338 118 Baupur Jattan 875 443 432 509 266 243 58.17
1339 119 Hakimpur 391 202 189 227 117 110 58.06
1340 120 Isapur 636 320 316 368 185 183 57.86
1341 121 Dharo Chak 733 386 347 414 225 189 56.48
1342 122 Awankha 9722 5141 4581 5444 2912 2532 56.00
1343 123 Lohgarh 681 359 322 381 200 181 55.95
1344 124 Samu Chak 1693 902 791 931 497 434 54.99
1345 125 Mughlani Chak 274 142 132 150 78 72 54.74
1346 126 Umarpur Kalan 322 171 151 175 91 84 54.35
1347 127 Budha Bala 408 218 190 221 115 106 54.17
1348 128 Thathi 521 265 256 279 140 139 53.55
1349 129 Chuhar Chak 596 310 286 318 167 151 53.36
1350 130 Sadana 1616 834 782 859 446 413 53.16
1351 131 Chak Raja 356 188 168 188 100 88 52.81
1352 132 Manj 167 92 75 88 48 40 52.69
1353 133 Mugrala 2442 1283 1159 1278 663 615 52.33
1354 134 Lahri Viran 312 176 136 162 94 68 51.92
1355 135 Deeda 1729 883 846 895 464 431 51.76
1356 136 Pakhowal 1187 609 578 613 312 301 51.64
1357 137 Alihar Pindi 607 294 313 312 150 162 51.40
1358 138 Faridpur 620 315 305 316 163 153 50.97
1359 139 Jiwanwal 1390 747 643 700 375 325 50.36
1360 140 Pasnawal 2287 1205 1082 1147 604 543 50.15
1361 141 Passiyal 425 225 200 213 121 92 50.12
1362 142 Khichian 932 496 436 466 250 216 50.00
1363 143 Thanewal 1311 684 627 654 337 317 49.89
1364 144 Chhina Retwala 851 454 397 424 225 199 49.82
1365 145 Talwandi 1146 608 538 565 303 262 49.30
1366 146 Bagrian 1257 646 611 617 306 311 49.09
1367 147 Gagowali 788 415 373 378 213 165 47.97
1368 148 Ali Chak 504 263 241 241 127 114 47.82
1369 149 Paniar 4537 2356 2181 2165 1116 1049 47.72
1370 150 Ghurala 3107 1617 1490 1480 766 714 47.63
1371 151 Warah 238 119 119 113 53 60 47.48
1372 152 Bathanwala 869 440 429 408 205 203 46.95
1373 153 Khojepur 1632 850 782 761 400 361 46.63
1374 154 Bala Pindi 1210 632 578 563 297 266 46.53
1375 155 Rasulpur Gagrotian 833 432 401 387 199 188 46.46
1376 156 Bhun 769 416 353 357 196 161 46.42
212

(In Nos.)Percentage
Total Sub Total Male Female Total Male Female (Col. 7 to 4)
1 2 3 4 5 6 7 8 9 10
Village countName of Village
Population SC Population
DISTRICTWISE VILLAGES HAVING 40% AND ABOVE SCHEDULED CASTES (SC) POPULATION IN THE STATE OF PUNJAB (CENSUS 2011)
1377 157 Kot Bhalla 633 330 303 289 161 128 45.66
1378 158 Sahowal 2071 1082 989 944 514 430 45.58
1379 159 Jogar 953 500 453 430 216 214 45.12
1380 160 Japowal 621 292 329 279 135 144 44.93
1381 161 Kaira 1392 755 637 625 341 284 44.90
1382 162 Doaba 566 289 277 250 125 125 44.17
1383 163 Barnala 1119 596 523 494 261 233 44.15
1384 164 Jhakhar Pindi 672 352 320 296 159 137 44.05
1385 165 Akbarpur 166 94 72 73 41 32 43.98
1386 166 Bhangwan 953 506 447 410 205 205 43.02
1387 167 Bhaini Kanian 395 207 188 169 95 74 42.78
1388 168 Gurdas Nangal 3417 1767 1650 1461 745 716 42.76
1389 169 Madhepur 624 320 304 266 141 125 42.63
1390 170 Chechian Chhaurian 1078 544 534 457 234 223 42.39
1391 171 Uchha Dhakala 862 475 387 362 199 163 42.00
1392 172 Bharo Harni 293 161 132 123 63 60 41.98
1393 173 Shahpur Afgana 677 340 337 284 141 143 41.95
1394 174 Bhagwanpur 1395 709 686 585 281 304 41.94
1395 175 Narainpur 413 226 187 173 99 74 41.89
1396 176 Udhipur 1016 540 476 423 233 190 41.63
1397 177 Bhaini Millwan 311 162 149 129 67 62 41.48
1398 178 Pindi Rangran 1665 842 823 690 356 334 41.44
1399 179 Naurangpur 181 85 96 75 39 36 41.44
1400 180 Phulara 882 450 432 363 184 179 41.16
1401 181 Haveli 188 86 102 77 34 43 40.96
1402 182 Bidhipur 1064 554 510 430 225 205 40.41
1403 183 Barwan 49 26 23 49 26 23 100.00
1404 184 Kingarian 17 10 7 17 10 7 100.00
1405 185 Manwal Mangwal 989 520 469 970 512 458 98.08
1406 186 Baironpur 372 187 185 357 181 176 95.97
1407 187 Mirzapur 382 194 188 359 182 177 93.98
1408 188 Khush Nagar 1294 677 617 1208 627 581 93.35
1409 189 Polla 599 317 282 511 264 247 85.31
1410 190 Mirzapur 1457 782 675 1217 650 567 83.53
1411 191 Chhan 1152 607 545 953 503 450 82.73
1412 192 Sharaf Chak 278 147 131 229 119 110 82.37
1413 193 Dalla Balim 2132 1142 990 1729 931 798 81.10
1414 194 Kolian 604 305 299 486 248 238 80.46
1415 195 Chhani 281 144 137 226 116 110 80.43
1416 196 Kharkhara Thuthowala 1780 960 820 1420 769 651 79.78
1417 197 Bahadurpur 1150 620 530 909 494 415 79.04
1418 198 Maira Kalan 312 168 144 245 132 113 78.53
1419 199 Bharoli Khurd 1426 745 681 1117 596 521 78.33
(v) PathankotSub‐District
213

(In Nos.)Percentage
Total Sub Total Male Female Total Male Female (Col. 7 to 4)
1 2 3 4 5 6 7 8 9 10
Village countName of Village
Population SC Population
DISTRICTWISE VILLAGES HAVING 40% AND ABOVE SCHEDULED CASTES (SC) POPULATION IN THE STATE OF PUNJAB (CENSUS 2011)
1420 200 Bhadrali 1274 643 631 996 490 506 78.18
1421 201 Kathlaur 639 317 322 493 242 251 77.15
1422 202 Datyal 817 430 387 627 329 298 76.74
1423 203 Rahimpur 190 103 87 143 77 66 75.26
1424 204 Udipur Aima 635 315 320 473 246 227 74.49
1425 205 Katani 245 132 113 181 94 87 73.88
1426 206 Aima Mughlan 569 294 275 420 217 203 73.81
1427 207 Alikhan 450 231 219 327 172 155 72.67
1428 208 Kunda 725 385 340 525 276 249 72.41
1429 209 Tajpur 1068 544 524 771 384 387 72.19
1430 210 Adam Barwan 515 267 248 367 194 173 71.26
1431 211 Charak 541 284 257 385 200 185 71.16
1432 212 Fatto Chak 467 236 231 332 165 167 71.09
1433 213 Fatehpur 1048 567 481 744 397 347 70.99
1434 214 Malpur 967 515 452 669 354 315 69.18
1435 215 Jhandpur 447 243 204 306 170 136 68.46
1436 216 Bheri Bazurg 798 439 359 546 300 246 68.42
1437 217 Lahri Brahmanan 624 349 275 426 236 190 68.27
1438 218 Dostpur 120 56 64 81 40 41 67.50
1439 219 Man Singhpur 1615 845 770 1071 553 518 66.32
1440 220 Hayati Chak 601 307 294 398 202 196 66.22
1441 221 Muradpur 59 32 27 39 22 17 66.10
1442 222 Ram Kalwan 597 316 281 390 205 185 65.33
1443 223 Sultanpur 950 483 467 617 308 309 64.95
1444 224 Chhotepur 1440 752 688 924 489 435 64.17
1445 225 Gotran Lahri 623 311 312 399 202 197 64.04
1446 226 Jhela Amda Gurdaspur 1464 758 706 936 492 444 63.93
1447 227 Raipur 3559 1881 1678 2268 1199 1069 63.73
1448 228 Deriwala 3425 1857 1568 2182 1183 999 63.71
1449 229 Shahidpur 296 150 146 187 92 95 63.18
1450 230 Datyal 1004 536 468 632 332 300 62.95
1451 231 Malharwan 442 247 195 278 151 127 62.90
1452 232 Balotar 262 137 125 164 88 76 62.60
1453 233 Papial 411 214 197 257 137 120 62.53
1454 234 Kathana 191 104 87 119 65 54 62.30
1455 235 Naroli 1549 830 719 960 520 440 61.98
1456 236 Paharo Chak 822 414 408 509 255 254 61.92
1457 237 Mari 585 299 286 360 184 176 61.54
1458 238 Sahu Chak 412 215 197 253 135 118 61.41
1459 239 Milwan 543 279 264 333 171 162 61.33
1460 240 Man Mangal 486 242 244 298 146 152 61.32
1461 241 Chak Narainian 490 240 250 299 144 155 61.02
1462 242 Bhagwansar 995 496 499 602 300 302 60.50
1463 243 Sokalgarh 1409 732 677 849 434 415 60.26
214

(In Nos.)Percentage
Total Sub Total Male Female Total Male Female (Col. 7 to 4)
1 2 3 4 5 6 7 8 9 10
Village countName of Village
Population SC Population
DISTRICTWISE VILLAGES HAVING 40% AND ABOVE SCHEDULED CASTES (SC) POPULATION IN THE STATE OF PUNJAB (CENSUS 2011)
1464 244 Shahar 1069 571 498 639 344 295 59.78
1465 245 Simbli 613 321 292 365 200 165 59.54
1466 246 Ratarwan 704 354 350 415 215 200 58.95
1467 247 Jhaluia 728 380 348 421 228 193 57.83
1468 248 Bhagwal 358 188 170 207 111 96 57.82
1469 249 Antor 1315 696 619 759 399 360 57.72
1470 250 Gugran 1439 779 660 827 443 384 57.47
1471 251 Ferozepur Khurd 436 235 201 250 137 113 57.34
1472 252 Dholowal 1231 640 591 705 360 345 57.27
1473 253 Kharkhara Tarf Narot 856 457 399 488 255 233 57.01
1474 254 Dalpat Tarf Narot 1713 891 822 971 506 465 56.68
1475 255 Janial 2753 1443 1310 1529 803 726 55.54
1476 256 Khoba 1030 542 488 570 304 266 55.34
1477 257 Anyal 1377 710 667 757 393 364 54.97
1478 258 Bhakhri 352 182 170 193 101 92 54.83
1479 259 Talwara Jattan 456 247 209 249 135 114 54.61
1480 260 Kotli Mughlan 2336 1218 1118 1266 662 604 54.20
1481 261 Bhawani 1103 570 533 594 305 289 53.85
1482 262 Khadawar 4710 2473 2237 2535 1313 1222 53.82
1483 263 Basau Barwan 985 513 472 530 269 261 53.81
1484 264 Barath 1146 604 542 616 313 303 53.75
1485 265 Jaswan 967 493 474 517 265 252 53.46
1486 266 Lado Chak 1549 829 720 824 445 379 53.20
1487 267 Bharial 1703 905 798 905 482 423 53.14
1488 268 Darsopur 1164 590 574 610 316 294 52.41
1489 269 Kilpur 1154 590 564 602 297 305 52.17
1490 270 Palah 553 294 259 286 149 137 51.72
1491 271 Chhani Tola 909 470 439 459 246 213 50.50
1492 272 Ferozepur Kalan 2727 1435 1292 1366 717 649 50.09
1493 273 Chak Man Singhpur 20 9 11 10 4 6 50.00
1494 274 Dhaki Shada 911 473 438 454 234 220 49.84
1495 275 Chashma 901 465 436 447 224 223 49.61
1496 276 Taloor 2032 1060 972 1006 542 464 49.51
1497 277 Jamalpur 1712 914 798 847 457 390 49.47
1498 278 Nala 982 519 463 485 257 228 49.39
1499 279 Bias Lahri 362 191 171 178 92 86 49.17
1500 280 Alyal 333 178 155 163 88 75 48.95
1501 281 Bhagwanpur 689 359 330 337 176 161 48.91
1502 282 Siyonti Tarf Narot 2266 1192 1074 1104 571 533 48.72
1503 283 Akhrota 959 503 456 466 247 219 48.59
1504 284 Kotli Jawahar 442 225 217 214 104 110 48.42
1505 285 Sherpur Giddarpur 587 301 286 283 147 136 48.21
1506 286 Samrala 793 425 368 382 211 171 48.17
1507 287 Kataru Chak 1875 982 893 891 462 429 47.52
215

(In Nos.)Percentage
Total Sub Total Male Female Total Male Female (Col. 7 to 4)
1 2 3 4 5 6 7 8 9 10
Village countName of Village
Population SC Population
DISTRICTWISE VILLAGES HAVING 40% AND ABOVE SCHEDULED CASTES (SC) POPULATION IN THE STATE OF PUNJAB (CENSUS 2011)
1508 288 Anehar 1046 536 510 496 240 256 47.42
1509 289 Nangal 2126 1126 1000 1008 537 471 47.41
1510 290 Gurah Kalan 2834 1478 1356 1343 699 644 47.39
1511 291 Napwal 273 142 131 129 66 63 47.25
1512 292 Nangal Farida 772 391 381 364 186 178 47.15
1513 293 Madarpur 1002 509 493 472 232 240 47.11
1514 294 Sohaura Khurd 1619 837 782 757 394 363 46.76
1515 295 Rajpura 1042 530 512 486 246 240 46.64
1516 296 Turehti 1540 817 723 715 391 324 46.43
1517 297 Pathan Chak 904 474 430 418 216 202 46.24
1518 298 Pharwal 1264 649 615 583 309 274 46.12
1519 299 Mastpur 656 344 312 300 160 140 45.73
1520 300 Muthi 1361 721 640 621 341 280 45.63
1521 301 Khojki Chak 929 471 458 423 213 210 45.53
1522 302 Haibat Pindi 1223 643 580 551 299 252 45.05
1523 303 Lahri 711 382 329 320 181 139 45.01
1524 304 Basroop 1634 893 741 732 398 334 44.80
1525 305 Phangarian 677 348 329 303 163 140 44.76
1526 306 Bhol Chak 971 506 465 433 227 206 44.59
1527 307 Jagatpur 802 413 389 356 186 170 44.39
1528 308 Bani Lodhi 2563 1319 1244 1135 600 535 44.28
1529 309 Harur 77 35 42 34 16 18 44.16
1530 310 Sherpur 1094 572 522 483 243 240 44.15
1531 311 Chakral 460 245 215 203 108 95 44.13
1532 312 Khiyala 1526 797 729 672 368 304 44.04
1533 313 Sharif Chak 1178 618 560 514 267 247 43.63
1534 314 Gobindsar 1660 872 788 724 393 331 43.61
1535 315 Mangial 1030 534 496 448 244 204 43.50
1536 316 Narainpur 571 279 292 246 125 121 43.08
1537 317 Bhor 1513 785 728 651 322 329 43.03
1538 318 Namala 951 464 487 402 199 203 42.27
1539 319 Rajo Beli 138 71 67 58 29 29 42.03
1540 320 Jhako Lahri 514 263 251 216 115 101 42.02
1541 321 Raj Parura 2847 1516 1331 1187 599 588 41.69
1542 322 Madhopur 2265 1457 808 944 501 443 41.68
1543 323 Sailli 1349 711 638 560 301 259 41.51
1544 324 Jaswan Lahri 2055 1076 979 849 451 398 41.31
1545 325 Ghazi Barwan 948 485 463 390 196 194 41.14
1546 326 Parmanand 3192 1616 1576 1313 660 653 41.13
1547 327 Phangoli 1359 702 657 551 290 261 40.54
1548 328 Gurdaspur Bhaian 1213 645 568 491 267 224 40.48
1549 329 Bharoli Kalan 3768 1951 1817 1516 763 753 40.23
216

(In Nos.)Percentage
Total Sub Total Male Female Total Male Female (Col. 7 to 4)
1 2 3 4 5 6 7 8 9 10
Village countName of Village
Population SC Population
DISTRICTWISE VILLAGES HAVING 40% AND ABOVE SCHEDULED CASTES (SC) POPULATION IN THE STATE OF PUNJAB (CENSUS 2011)
1550 1 Ambuwara 16 7 9 16 7 9 100.00
1551 2 Abdullapur 158 80 78 153 79 74 96.84
1552 3 Malhian 229 125 104 221 119 102 96.51
1553 4 Raj Dhan 206 109 97 197 103 94 95.63
1554 5 Chhaurian 284 147 137 268 142 126 94.37
1555 6 Dharamkot 504 251 253 471 236 235 93.45
1556 7 Nangal 345 180 165 316 163 153 91.59
1557 8 Sahu Ka Pind 434 213 221 381 186 195 87.79
1558 9 Ashrafpur 327 161 166 283 138 145 86.54
1559 10 Odrah 600 300 300 507 248 259 84.50
1560 11 Dehriwala 189 93 96 159 79 80 84.13
1561 12 Fatehullapur 464 226 238 386 191 195 83.19
1562 13 Gag Sultan 762 386 376 627 320 307 82.28
1563 14 Mahal 116 66 50 95 50 45 81.90
1564 15 Bagol Kalan 284 153 131 232 126 106 81.69
1565 16 Rajpur 545 283 262 443 233 210 81.28
1566 17 Duggal Dawa Khri 625 336 289 500 269 231 80.00
1567 18 Galowal 481 235 246 380 188 192 79.00
1568 19 Bhattida Pind 307 165 142 242 124 118 78.83
1569 20 Hambran 464 250 214 365 198 167 78.66
1570 21 Garhdiwala 889 446 443 695 352 343 78.18
1571 22 Bagol Khurd 390 189 201 304 149 155 77.95
1572 23 Kaluwal 322 153 169 248 115 133 77.02
1573 24 Katohar 486 243 243 371 182 189 76.34
1574 25 Raja Kalan 622 310 312 474 234 240 76.21
1575 26 Kolian 245 120 125 186 87 99 75.92
1576 27 Mohan 681 355 326 517 269 248 75.92
1577 28 Mahdipur 374 200 174 277 150 127 74.06
1578 29 Baghiari 625 324 301 462 239 223 73.92
1579 30 Kotli 215 109 106 158 79 79 73.49
1580 31 Kaloya 1170 574 596 851 415 436 72.74
1581 32 Keharwali 180 98 82 128 71 57 71.11
1582 33 Mian Ka Pind 575 283 292 408 201 207 70.96
1583 34 Jakowal 383 193 190 268 134 134 69.97
1584 35 Darga Heri 262 142 120 183 99 84 69.85
1585 36 Musa 322 164 158 220 107 113 68.32
1586 37 Baja Chak 1007 518 489 683 344 339 67.83
1587 38 Alar Pind 672 335 337 455 223 232 67.71
1588 39 Takipur 174 92 82 117 62 55 67.24
1589 40 Jia Sahota Kalan 302 148 154 203 103 100 67.22
1590 41 Biru Chak 110 53 57 73 34 39 66.36
1591 42 Khiala Balanda 655 327 328 434 215 219 66.26
8. HOSHIARPUR(i) Dasua
DISTRICTSub‐District
217

(In Nos.)Percentage
Total Sub Total Male Female Total Male Female (Col. 7 to 4)
1 2 3 4 5 6 7 8 9 10
Village countName of Village
Population SC Population
DISTRICTWISE VILLAGES HAVING 40% AND ABOVE SCHEDULED CASTES (SC) POPULATION IN THE STATE OF PUNJAB (CENSUS 2011)
1592 43 Bhatoli 142 78 64 94 55 39 66.20
1593 44 Kan Dhalian 682 349 333 448 233 215 65.69
1594 45 Chipra 660 319 341 432 206 226 65.45
1595 46 Salempur 422 217 205 276 142 134 65.40
1596 47 Khokhar Dawa Khri 859 425 434 553 275 278 64.38
1597 48 Dulminwal 502 244 258 322 158 164 64.14
1598 49 Badial 370 194 176 237 120 117 64.05
1599 50 Kherabad 993 520 473 635 330 305 63.95
1600 51 Haizam 668 364 304 423 231 192 63.32
1601 52 Jia Sahota Khurd 414 220 194 261 134 127 63.04
1602 53 Chotala 1496 787 709 942 501 441 62.97
1603 54 Mehar Bhatoli 727 362 365 457 222 235 62.86
1604 55 Nihalpur 1483 740 743 919 458 461 61.97
1605 56 Baich 1326 711 615 821 438 383 61.92
1606 57 Talla 737 376 361 456 228 228 61.87
1607 58 Sarain 940 469 471 581 292 289 61.81
1608 59 Ballagan 1033 516 517 638 319 319 61.76
1609 60 Jhans 276 144 132 170 88 82 61.59
1610 61 Sajjan 604 297 307 367 177 190 60.76
1611 62 Basa 262 134 128 158 78 80 60.31
1612 63 Nangal Khunga 1212 638 574 729 377 352 60.15
1613 64 Tur 191 89 102 114 53 61 59.69
1614 65 Tulluwal 545 272 273 325 169 156 59.63
1615 66 Mirpur 842 415 427 500 245 255 59.38
1616 67 Birampur 785 366 419 463 216 247 58.98
1617 68 Jaura 1848 945 903 1089 579 510 58.93
1618 69 Nainowal Baid 1280 666 614 751 376 375 58.67
1619 70 Data 290 145 145 170 85 85 58.62
1620 71 Randian 215 121 94 126 71 55 58.60
1621 72 Badala Pukhta 512 258 254 297 150 147 58.01
1622 73 Chhangla 1787 940 847 1034 535 499 57.86
1623 74 Thana 461 233 228 266 132 134 57.70
1624 75 Jhambowal 713 376 337 408 208 200 57.22
1625 76 Khanpur 533 264 269 304 147 157 57.04
1626 77 Mokh 187 88 99 106 49 57 56.68
1627 78 Rupowal 1002 503 499 565 272 293 56.39
1628 79 Bhekhowal 223 108 115 125 61 64 56.05
1629 80 Kathana 579 297 282 321 168 153 55.44
1630 81 Chattowal 749 370 379 414 212 202 55.27
1631 82 Nangal Jamal 470 258 212 259 134 125 55.11
1632 83 Ramdaspur 926 459 467 502 237 265 54.21
1633 84 Kolar 750 375 375 406 200 206 54.13
1634 85 Talwandi Jattan 818 418 400 442 218 224 54.03
1635 86 Morian 477 230 247 257 130 127 53.88
218

(In Nos.)Percentage
Total Sub Total Male Female Total Male Female (Col. 7 to 4)
1 2 3 4 5 6 7 8 9 10
Village countName of Village
Population SC Population
DISTRICTWISE VILLAGES HAVING 40% AND ABOVE SCHEDULED CASTES (SC) POPULATION IN THE STATE OF PUNJAB (CENSUS 2011)
1636 87 Kotli Khurd 1045 523 522 563 287 276 53.88
1637 88 Pandori Malhian 530 266 264 284 145 139 53.58
1638 89 Pandori 1077 531 546 577 294 283 53.57
1639 90 Raju Dawa Khri 288 142 146 154 78 76 53.47
1640 91 Dhadiala 1110 583 527 593 317 276 53.42
1641 92 Dhamian Khurd 468 251 217 249 133 116 53.21
1642 93 Dhurian 571 283 288 300 142 158 52.54
1643 94 Mastiwal 940 461 479 493 244 249 52.45
1644 95 Mohkamgarh 581 297 284 304 152 152 52.32
1645 96 Mand 416 196 220 216 101 115 51.92
1646 97 Mangat 286 151 135 148 78 70 51.75
1647 98 Nangal Farid 1089 551 538 561 288 273 51.52
1648 99 Babak 934 477 457 481 241 240 51.50
1649 100 Kahlwan 710 352 358 364 190 174 51.27
1650 101 Darapur 890 462 428 453 238 215 50.90
1651 102 Bassi Jajal Khan 1668 886 782 848 435 413 50.84
1652 103 Sarhala 622 313 309 314 157 157 50.48
1653 104 Tund 615 312 303 308 155 153 50.08
1654 105 Nandewal 12 5 7 6 3 3 50.00
1655 106 Banial 676 372 304 337 178 159 49.85
1656 107 Ganga Chak 402 207 195 199 95 104 49.50
1657 108 Keshopur 291 142 149 144 67 77 49.48
1658 109 Kandhala Sheikhan 1393 725 668 688 356 332 49.39
1659 110 Kakrali 420 217 203 207 109 98 49.29
1660 111 Shahpur 658 332 326 324 164 160 49.24
1661 112 Dhugga Kalan 1930 961 969 949 467 482 49.17
1662 113 Pindi Khair 287 166 121 141 85 56 49.13
1663 114 Berchha 885 473 412 434 240 194 49.04
1664 115 Kharl Khurd 1073 553 520 520 278 242 48.46
1665 116 Ghanipur Badhan 349 180 169 167 83 84 47.85
1666 117 Makhowal 69 37 32 33 18 15 47.83
1667 118 Rajpur 676 367 309 323 200 123 47.78
1668 119 Manga 763 385 378 361 172 189 47.31
1669 120 Ramtatwali 1104 553 551 520 261 259 47.10
1670 121 Ralhan 1627 810 817 766 383 383 47.08
1671 122 Rana 531 285 246 249 135 114 46.89
1672 123 Kandhala Jattan 3249 1648 1601 1523 770 753 46.88
1673 124 Baranda 498 247 251 233 118 115 46.79
1674 125 Malakpur Bodal 460 243 217 215 120 95 46.74
1675 126 Bajwa 472 220 252 218 96 122 46.19
1676 127 Sikri 2376 1207 1169 1089 556 533 45.83
1677 128 Johal 2060 1050 1010 936 485 451 45.44
1678 129 Bahadurpur 456 223 233 207 104 103 45.39
1679 130 Malhewal 627 309 318 283 140 143 45.14
219

(In Nos.)Percentage
Total Sub Total Male Female Total Male Female (Col. 7 to 4)
1 2 3 4 5 6 7 8 9 10
Village countName of Village
Population SC Population
DISTRICTWISE VILLAGES HAVING 40% AND ABOVE SCHEDULED CASTES (SC) POPULATION IN THE STATE OF PUNJAB (CENSUS 2011)
1680 131 Jhawan 2533 1300 1233 1138 564 574 44.93
1681 132 Jalota 1479 724 755 664 331 333 44.90
1682 133 Kotli 330 176 154 148 78 70 44.85
1683 134 Bodal 2928 1484 1444 1308 662 646 44.67
1684 135 Pandori Atwalan 1817 957 860 808 436 372 44.47
1685 136 Muradpur Narial 1575 793 782 693 345 348 44.00
1686 137 Bagha 986 485 501 431 206 225 43.71
1687 138 Jalal Nangal 408 197 211 177 90 87 43.38
1688 139 Bhatian 577 303 274 249 132 117 43.15
1689 140 Kalra 725 355 370 311 154 157 42.90
1690 141 Mangarh 653 334 319 280 129 151 42.88
1691 142 Thinda 590 307 283 250 134 116 42.37
1692 143 Ghorewaha 860 422 438 364 181 183 42.33
1693 144 Rattre 295 141 154 124 57 67 42.03
1694 145 Sundia 658 346 312 276 140 136 41.95
1695 146 Data 842 411 431 353 175 178 41.92
1696 147 Fatehgarh 607 324 283 254 142 112 41.85
1697 148 Dholowal 492 263 229 205 114 91 41.67
1698 149 Madda 431 221 210 179 97 82 41.53
1699 150 Shehbazpur 1377 709 668 571 295 276 41.47
1700 151 Masit Palkot 1855 953 902 769 393 376 41.46
1701 152 Haler 1018 509 509 419 204 215 41.16
1702 153 Jande 253 126 127 103 48 55 40.71
1703 154 Khepar 86 45 41 35 18 17 40.70
1704 155 Kandhali Naurangpur 1814 914 900 738 361 377 40.68
1705 156 Sehrak 704 352 352 286 146 140 40.63
1706 157 Khun Khun Kalan 2076 1065 1011 841 442 399 40.51
1707 158 Dugari 599 300 299 242 121 121 40.40
1708 159 Korala Khurd 166 89 77 67 35 32 40.36
1709 160 kalajhingar 344 175 169 138 70 68 40.12
1710 161 Mukho Mazara 765 407 358 754 403 351 98.56
1711 162 Badhel 260 137 123 252 133 119 96.92
1712 163 Kalupur 357 186 171 341 176 165 95.52
1713 164 Lehra 539 271 268 496 248 248 92.02
1714 165 Baghaura 1222 628 594 1119 582 537 91.57
1715 166 Aima Muglan 577 300 277 521 270 251 90.29
1716 167 Maira 608 310 298 533 276 257 87.66
1717 168 Nauneetpur 629 329 300 531 276 255 84.42
1718 169 Hyatpur 399 204 195 336 177 159 84.21
1719 170 Chak Musa 185 101 84 154 82 72 83.24
1720 171 Parsota 472 242 230 391 202 189 82.84
1721 172 Saddarpur 453 224 229 371 185 186 81.90
1722 173 Shahpur 447 244 203 361 198 163 80.76
(ii) GarshankarSub‐District
220

(In Nos.)Percentage
Total Sub Total Male Female Total Male Female (Col. 7 to 4)
1 2 3 4 5 6 7 8 9 10
Village countName of Village
Population SC Population
DISTRICTWISE VILLAGES HAVING 40% AND ABOVE SCHEDULED CASTES (SC) POPULATION IN THE STATE OF PUNJAB (CENSUS 2011)
1723 174 Phagon 123 66 57 99 53 46 80.49
1724 175 Rahalli 1171 562 609 936 461 475 79.93
1725 176 Maujo Mazara 729 357 372 579 281 298 79.42
1726 177 Hakumatpur 1280 653 627 993 503 490 77.58
1727 178 Chak Mallan 750 388 362 580 302 278 77.33
1728 179 Sadhowal 907 473 434 674 339 335 74.31
1729 180 Kothi 350 179 171 260 133 127 74.29
1730 181 Denowal Khurd 992 497 495 715 356 359 72.08
1731 182 Mukandpur 273 135 138 194 93 101 71.06
1732 183 Kotla 367 181 186 258 129 129 70.30
1733 184 Kanger 394 198 196 276 134 142 70.05
1734 185 Mehrowal 515 267 248 347 179 168 67.38
1735 186 Bhulewal Rathan 651 322 329 438 212 226 67.28
1736 187 Jiwanpur Jattan 679 332 347 454 226 228 66.86
1737 188 Badesron 1995 991 1004 1332 664 668 66.77
1738 189 Todarpur Urf Theh Pachrali 2075 1066 1009 1382 708 674 66.60
1739 190 Sauli 467 249 218 309 169 140 66.17
1740 191 Raipur Gujjran 435 237 198 286 161 125 65.75
1741 192 Kaindowal 633 325 308 414 214 200 65.40
1742 193 Makhsuspur 1039 521 518 678 335 343 65.26
1743 194 Parowal 1253 646 607 812 407 405 64.80
1744 195 Bhagtupur 832 436 396 532 274 258 63.94
1745 196 Moila 538 268 270 344 174 170 63.94
1746 197 Jiwanpur Gujran 356 187 169 227 125 102 63.76
1747 198 Bhuno 1334 671 663 849 424 425 63.64
1748 199 Fatehpur Khurd 517 269 248 329 169 160 63.64
1749 200 Chak Phullu 1350 666 684 841 417 424 62.30
1750 201 Purkhowal 944 481 463 588 301 287 62.29
1751 202 Dagam 2174 1119 1055 1333 667 666 61.32
1752 203 Pensra 885 443 442 539 267 272 60.90
1753 204 Khararawal Bassi 1856 935 921 1130 561 569 60.88
1754 205 Dugri 663 335 328 401 209 192 60.48
1755 206 Kitna 1675 888 787 1013 547 466 60.48
1756 207 Alawalpur 764 394 370 462 237 225 60.47
1757 208 Daduwal 745 361 384 447 227 220 60.00
1758 209 Mananhana 1641 830 811 981 505 476 59.78
1759 210 Akalgarh 649 340 309 387 204 183 59.63
1760 211 Jassowal 1381 725 656 819 419 400 59.30
1761 212 Rupowal 591 305 286 348 179 169 58.88
1762 213 Chak Kataru 882 422 460 519 245 274 58.84
1763 214 Jaitpur 1078 547 531 632 322 310 58.63
1764 215 Tajewal 663 339 324 388 197 191 58.52
1765 216 Chahar 212 113 99 124 67 57 58.49
1766 217 Ganeshpur 748 364 384 437 207 230 58.42
221

(In Nos.)Percentage
Total Sub Total Male Female Total Male Female (Col. 7 to 4)
1 2 3 4 5 6 7 8 9 10
Village countName of Village
Population SC Population
DISTRICTWISE VILLAGES HAVING 40% AND ABOVE SCHEDULED CASTES (SC) POPULATION IN THE STATE OF PUNJAB (CENSUS 2011)
1767 218 Haluwal 1152 582 570 672 344 328 58.33
1768 219 Mehdud 825 429 396 481 264 217 58.30
1769 220 Ispur 1014 543 471 586 314 272 57.79
1770 221 Kalewal 292 152 140 167 84 83 57.19
1771 222 Khera 1220 593 627 695 340 355 56.97
1772 223 Paddi Sura Singh 2694 1365 1329 1534 771 763 56.94
1773 224 Khanpur 1479 760 719 839 423 416 56.73
1774 225 Bachhohi 2552 1301 1251 1446 729 717 56.66
1775 226 Panam 2277 1124 1153 1281 641 640 56.26
1776 227 Rasulpur 725 397 328 402 224 178 55.45
1777 228 Thandal 193 99 94 107 55 52 55.44
1778 229 Badhana 329 175 154 182 92 90 55.32
1779 230 Nurpur 584 286 298 322 151 171 55.14
1780 231 Gujjarpur 736 369 367 405 205 200 55.03
1781 232 Aima Jattan 1041 547 494 571 304 267 54.85
1782 233 Mazara Dingrian 2028 1006 1022 1111 551 560 54.78
1783 234 Chahalpur 1023 507 516 559 266 293 54.64
1784 235 Lalian 829 425 404 452 223 229 54.52
1785 236 Satnaur 1997 1008 989 1086 551 535 54.38
1786 237 Rawal Pindi 175 100 75 95 55 40 54.29
1787 238 Soni 788 402 386 427 223 204 54.19
1788 239 Bahowal 1298 656 642 703 350 353 54.16
1789 240 Singhpur 953 485 468 516 266 250 54.14
1790 241 Barian Khurd 1185 608 577 640 336 304 54.01
1791 242 Sarhala Kalan 1852 954 898 998 505 493 53.89
1792 243 Jhanjowal 719 380 339 386 207 179 53.69
1793 244 Lalwan 1341 708 633 719 364 355 53.62
1794 245 Kalewal 884 469 415 472 251 221 53.39
1795 246 Alipur 899 490 409 480 261 219 53.39
1796 247 Khabra 492 242 250 262 128 134 53.25
1797 248 Nangal Khilarian 968 501 467 515 279 236 53.20
1798 249 Mehtabpur 917 496 421 486 260 226 53.00
1799 250 Bharowal 975 496 479 516 265 251 52.92
1800 251 Sakruli 1286 634 652 677 336 341 52.64
1801 252 Mularwal 61 32 29 32 16 16 52.46
1802 253 Bambeli 1088 524 564 570 275 295 52.39
1803 254 Marula 861 427 434 446 231 215 51.80
1804 255 Barian Kalan 2462 1262 1200 1275 646 629 51.79
1805 256 Laksihan 1160 569 591 597 283 314 51.47
1806 257 Kalewal Bhagtan 1512 803 709 778 409 369 51.46
1807 258 Nakdipur 631 316 315 323 158 165 51.19
1808 259 Langeri 1365 684 681 697 353 344 51.06
1809 260 Paddi Khutti 1079 524 555 550 262 288 50.97
1810 261 Chak Hajipur 1241 634 607 626 330 296 50.44
222

(In Nos.)Percentage
Total Sub Total Male Female Total Male Female (Col. 7 to 4)
1 2 3 4 5 6 7 8 9 10
Village countName of Village
Population SC Population
DISTRICTWISE VILLAGES HAVING 40% AND ABOVE SCHEDULED CASTES (SC) POPULATION IN THE STATE OF PUNJAB (CENSUS 2011)
1811 262 Khanpur 1363 698 665 683 349 334 50.11
1812 263 Achharwal 982 493 489 485 244 241 49.39
1813 264 Sarhala Khurd 944 460 484 466 219 247 49.36
1814 265 Saila Kalan 1410 723 687 691 352 339 49.01
1815 266 Bhambian 1001 498 503 490 236 254 48.95
1816 267 Moranwali 2838 1481 1357 1379 720 659 48.59
1817 268 Thoana 1108 544 564 538 259 279 48.56
1818 269 Pandori Ladha Singh 938 454 484 451 224 227 48.08
1819 270 Dhada 2453 1259 1194 1176 594 582 47.94
1820 271 Behbalpur 1216 609 607 581 301 280 47.78
1821 272 Chandeli 728 366 362 347 185 162 47.66
1822 273 Pandori Ganga Singh 1006 516 490 479 251 228 47.61
1823 274 Birampur 1759 895 864 834 443 391 47.41
1824 275 Mahal 569 282 287 269 133 136 47.28
1825 276 Dansiwal 954 482 472 450 213 237 47.17
1826 277 Kharaudi 806 401 405 371 181 190 46.03
1827 278 Jangliana 1346 673 673 619 324 295 45.99
1828 279 Mehngerwal 971 496 475 446 239 207 45.93
1829 280 Sakanderpur 794 401 393 360 189 171 45.34
1830 281 Dadewal 622 303 319 282 145 137 45.34
1831 282 Nangal Khurd 1209 609 600 547 276 271 45.24
1832 283 Gondpur 1482 765 717 670 346 324 45.21
1833 284 Dadial 1199 618 581 540 270 270 45.04
1834 285 Dhakon 407 221 186 183 97 86 44.96
1835 286 Dihana 2001 1008 993 896 437 459 44.78
1836 287 Bihran 1299 667 632 577 300 277 44.42
1837 288 Bugra 327 177 150 145 76 69 44.34
1838 289 Dogarpur 535 268 267 237 115 122 44.30
1839 290 Ghamiala 798 424 374 353 182 171 44.24
1840 291 Balaspur 755 380 375 333 166 167 44.11
1841 292 Haibowal 1363 683 680 601 309 292 44.09
1842 293 Mansowal 2954 1526 1428 1302 686 616 44.08
1843 294 Rasulpur 480 253 227 211 108 103 43.96
1844 295 Sherpur 443 229 214 194 101 93 43.79
1845 296 Bhana 355 194 161 155 81 74 43.66
1846 297 Kulewal 291 157 134 127 69 58 43.64
1847 298 Wahidpur 1358 710 648 588 303 285 43.30
1848 299 Chandsu Jattan 1202 600 602 515 256 259 42.85
1849 300 Bagwain 962 492 470 410 209 201 42.62
1850 301 Bharta 1080 549 531 460 233 227 42.59
1851 302 Kot Fatuhi 3454 1756 1698 1455 735 720 42.13
1852 303 Gogon 717 359 358 301 151 150 41.98
1853 304 Nangal Kalan 994 503 491 417 206 211 41.95
1854 305 Mugowal 2186 1089 1097 915 482 433 41.86
223

(In Nos.)Percentage
Total Sub Total Male Female Total Male Female (Col. 7 to 4)
1 2 3 4 5 6 7 8 9 10
Village countName of Village
Population SC Population
DISTRICTWISE VILLAGES HAVING 40% AND ABOVE SCHEDULED CASTES (SC) POPULATION IN THE STATE OF PUNJAB (CENSUS 2011)
1855 306 Kaharpur 957 481 476 399 194 205 41.69
1856 307 Chak Singha 1394 669 725 581 282 299 41.68
1857 308 Nangal 894 476 418 372 197 175 41.61
1858 309 Pakhowal 1105 569 536 458 231 227 41.45
1859 310 Tuto Mazara 2003 1007 996 829 417 412 41.39
1860 311 Manolian 876 458 418 361 188 173 41.21
1861 312 Bhulewal Gujran 341 188 153 137 78 59 40.18
1862 313 Sarangwal 1534 798 736 616 318 298 40.16
1863 314 Dandian 658 316 342 264 128 136 40.12
1864 315 Bassi Qazian 7 4 3 7 4 3 100.00
1865 316 Bassi Wahid 436 222 214 436 222 214 100.00
1866 317 Dhatt 991 506 485 991 506 485 100.00
1867 318 Maker Soli 161 74 87 161 74 87 100.00
1868 319 Kaimpur 390 215 175 388 213 175 99.49
1869 320 Badala 420 218 202 401 207 194 95.48
1870 321 Naurangabad 309 154 155 291 146 145 94.17
1871 322 Saido Patti 874 457 417 821 426 395 93.94
1872 323 Dhirowal 220 108 112 205 98 107 93.18
1873 324 Bassi Ali Khan 508 262 246 469 240 229 92.32
1874 325 Lalpur 506 263 243 467 244 223 92.29
1875 326 Nara 1080 536 544 996 496 500 92.22
1876 327 Dada 1844 955 889 1693 881 812 91.81
1877 328 Chak Sawana 212 109 103 193 98 95 91.04
1878 329 Pandori Mindomind 198 102 96 179 90 89 90.40
1879 330 Kotli 411 222 189 369 197 172 89.78
1880 331 Sada Arain 113 57 56 101 50 51 89.38
1881 332 Shahabudin 724 365 359 644 325 319 88.95
1882 333 Nurpur 945 479 466 838 422 416 88.68
1883 334 Kantian 1206 641 565 1069 569 500 88.64
1884 335 Machhariwal 896 455 441 769 391 378 85.83
1885 336 Satlal 493 243 250 423 209 214 85.80
1886 337 Arniala Shahpur 972 473 499 822 392 430 84.57
1887 338 Galind 800 404 396 674 342 332 84.25
1888 339 Talwandi Kanungoian 956 493 463 801 408 393 83.79
1889 340 Bassi Nau 1263 635 628 1046 521 525 82.82
1890 341 Hazipur 425 214 211 350 176 174 82.35
1891 342 Sahota 362 174 188 298 145 153 82.32
1892 343 Kalian 355 175 180 292 145 147 82.25
1893 344 Chak Gujran 1283 661 622 1052 529 523 82.00
1894 345 Kaluwahar 822 429 393 672 356 316 81.75
1895 346 Manjhi 1202 610 592 976 487 489 81.20
1896 347 Kabirpur 425 223 202 344 172 172 80.94
1897 348 Haji Khanpur 145 59 86 117 46 71 80.69
(iii) HoshiarpurSub‐District
224

(In Nos.)Percentage
Total Sub Total Male Female Total Male Female (Col. 7 to 4)
1 2 3 4 5 6 7 8 9 10
Village countName of Village
Population SC Population
DISTRICTWISE VILLAGES HAVING 40% AND ABOVE SCHEDULED CASTES (SC) POPULATION IN THE STATE OF PUNJAB (CENSUS 2011)
1898 349 Mehmowal 1291 662 629 1041 541 500 80.64
1899 350 Bassi Bahadar 25 12 13 20 8 12 80.00
1900 351 Sarain 350 176 174 280 138 142 80.00
1901 352 Tajowal 1012 521 491 805 416 389 79.55
1902 353 Fattowal 1255 649 606 993 527 466 79.12
1903 354 Dehra 253 123 130 200 96 104 79.05
1904 355 Thathal 641 313 328 503 239 264 78.47
1905 356 Kila Sher Khan 121 60 61 94 47 47 77.69
1906 357 Attalgarh 282 145 137 219 114 105 77.66
1907 358 Kutabpur 571 280 291 442 220 222 77.41
1908 359 Raipur 1018 504 514 787 387 400 77.31
1909 360 Kabirpur 660 341 319 509 259 250 77.12
1910 361 Pandori Bhawa 351 181 170 270 140 130 76.92
1911 362 Takhni 643 319 324 494 245 249 76.83
1912 363 Kana 405 207 198 311 160 151 76.79
1913 364 Nasran 204 111 93 155 83 72 75.98
1914 365 Bassi Jaura 389 196 193 294 149 145 75.58
1915 366 Bassi Maroof Hussainpur 1490 750 740 1125 560 565 75.50
1916 367 Harmoa 1448 761 687 1092 564 528 75.41
1917 368 Daulowal 138 65 73 104 47 57 75.36
1918 369 Dholanwal 979 491 488 736 369 367 75.18
1919 370 Bassi Shah Mohamad 28 14 14 21 11 10 75.00
1920 371 Pandori Bibi 1592 814 778 1194 591 603 75.00
1921 372 Chakowal Shekhan 826 417 409 616 316 300 74.58
1922 373 Raowal 352 175 177 262 128 134 74.43
1923 374 Lohar Kangnan 383 188 195 284 141 143 74.15
1924 375 Dhadda Bawa Mohar Singh 762 400 362 565 300 265 74.15
1925 376 Panjgrain 294 147 147 217 108 109 73.81
1926 377 Bassi Daulat Khan 1733 900 833 1273 674 599 73.46
1927 378 Pandori Bawa Dass 902 428 474 658 310 348 72.95
1928 379 Kattowal 512 269 243 372 199 173 72.66
1929 380 Maruli Brahmanan 1551 809 742 1120 592 528 72.21
1930 381 Ajram 2933 1523 1410 2108 1085 1023 71.87
1931 382 Manan 1358 676 682 975 475 500 71.80
1932 383 Rehsiwal 397 212 185 283 147 136 71.28
1933 384 Bahadarpur Bahian 687 363 324 489 261 228 71.18
1934 385 Hardo Khanpur 3520 1880 1640 2480 1324 1156 70.45
1935 386 Brahmjit 590 307 283 415 213 202 70.34
1936 387 Chalopur 539 280 259 376 201 175 69.76
1937 388 Dherian 567 305 262 390 211 179 68.78
1938 389 Mehlanwali 3332 1701 1631 2287 1174 1113 68.64
1939 390 M ehtiana 1977 1019 958 1354 694 660 68.49
1940 391 Khadiala 611 320 291 418 214 204 68.41
1941 392 Bassi Kikran 1292 648 644 874 444 430 67.65
225

(In Nos.)Percentage
Total Sub Total Male Female Total Male Female (Col. 7 to 4)
1 2 3 4 5 6 7 8 9 10
Village countName of Village
Population SC Population
DISTRICTWISE VILLAGES HAVING 40% AND ABOVE SCHEDULED CASTES (SC) POPULATION IN THE STATE OF PUNJAB (CENSUS 2011)
1942 393 Bagewal 274 140 134 185 94 91 67.52
1943 394 Chak Harnoli 916 449 467 618 300 318 67.47
1944 395 Baroti 998 510 488 671 342 329 67.23
1945 396 Lehli Kalan 1279 635 644 859 422 437 67.16
1946 397 Phuglana 3111 1556 1555 2068 1011 1057 66.47
1947 398 Tejpur Khurd 99 47 52 65 27 38 65.66
1948 399 Pawal 1133 589 544 741 387 354 65.40
1949 400 Bassi Khizar Khan 181 89 92 118 60 58 65.19
1950 401 Herian 867 443 424 564 282 282 65.05
1951 402 Sasoli 1282 645 637 833 416 417 64.98
1952 403 Khanpur 966 488 478 627 323 304 64.91
1953 404 Bhaliala 561 331 230 363 201 162 64.71
1954 405 Patiari 877 424 453 567 280 287 64.65
1955 406 Buray Jattan 941 468 473 608 300 308 64.61
1956 407 Nangal Maruf 402 195 207 258 119 139 64.18
1957 408 Ahar 285 146 139 182 93 89 63.86
1958 409 Bhakal 510 258 252 325 174 151 63.73
1959 410 Talwandi Araian 958 521 437 609 317 292 63.57
1960 411 Sarhala 920 470 450 582 297 285 63.26
1961 412 Bub 176 88 88 111 56 55 63.07
1962 413 Sehjowal 476 240 236 300 149 151 63.03
1963 414 Adamwal Gari 812 429 383 510 268 242 62.81
1964 415 Badial 798 396 402 501 237 264 62.78
1965 416 Phaphial 259 126 133 162 80 82 62.55
1966 417 Shehzadpur 144 67 77 90 38 52 62.50
1967 418 Patiari 558 279 279 348 175 173 62.37
1968 419 Kunt 687 347 340 428 203 225 62.30
1969 420 Jallowal 417 202 215 258 122 136 61.87
1970 421 Bhatrana 1082 548 534 669 332 337 61.83
1971 422 Niazian 313 169 144 193 103 90 61.66
1972 423 Rajowal 650 322 328 400 196 204 61.54
1973 424 Randhawa Brota 1454 728 726 886 425 461 60.94
1974 425 Dhakowal 1229 649 580 744 397 347 60.54
1975 426 Talwandi Goni 417 222 195 252 131 121 60.43
1976 427 Buthgarh 1248 621 627 753 386 367 60.34
1977 428 Tentpal 617 314 303 372 187 185 60.29
1978 429 Bassi Panj Bhaian 178 91 87 107 54 53 60.11
1979 430 Pandori 124 68 56 74 43 31 59.68
1980 431 Man 1101 533 568 657 324 333 59.67
1981 432 Chandpur 128 67 61 76 40 36 59.38
1982 433 Chak Gujran 437 207 230 258 118 140 59.04
1983 434 Badala Mahi 986 506 480 582 300 282 59.03
1984 435 Nanda Chaur 3478 1780 1698 2039 1040 999 58.63
1985 436 Pandori Sumla 935 448 487 546 252 294 58.40
226

(In Nos.)Percentage
Total Sub Total Male Female Total Male Female (Col. 7 to 4)
1 2 3 4 5 6 7 8 9 10
Village countName of Village
Population SC Population
DISTRICTWISE VILLAGES HAVING 40% AND ABOVE SCHEDULED CASTES (SC) POPULATION IN THE STATE OF PUNJAB (CENSUS 2011)
1986 437 Salempur 1210 626 584 706 364 342 58.35
1987 438 Phambra 739 364 375 431 210 221 58.32
1988 439 Nur Talai 284 146 138 165 89 76 58.10
1989 440 Ghasipur 552 288 264 319 167 152 57.79
1990 441 Khunda 253 127 126 146 73 73 57.71
1991 442 Shergarh 2639 1361 1278 1519 770 749 57.56
1992 443 Taragarh 985 504 481 566 293 273 57.46
1993 444 Bassi Hasmat Khan 829 434 395 476 244 232 57.42
1994 445 Dalewal 707 386 321 405 212 193 57.28
1995 446 Aima 14 8 6 8 6 2 57.14
1996 447 Mandial 1259 664 595 715 368 347 56.79
1997 448 Sinan 600 296 304 340 172 168 56.67
1998 449 Sahari 3032 1534 1498 1715 876 839 56.56
1999 450 Nila Naloya 1029 535 494 581 297 284 56.46
2000 451 Kilan Berun 1431 711 720 801 400 401 55.97
2001 452 Nandan 776 377 399 434 203 231 55.93
2002 453 Bassi Kalan 2356 1202 1154 1317 672 645 55.90
2003 454 Bahid 718 387 331 397 206 191 55.29
2004 455 Jatpur 1096 574 522 603 313 290 55.02
2005 456 Khanaura 2714 1434 1280 1493 781 712 55.01
2006 457 Bassi Jamal Khan 231 123 108 127 68 59 54.98
2007 458 Chak Rajusing 1198 612 586 654 338 316 54.59
2008 459 Bajwara 9929 5095 4834 5394 2752 2642 54.33
2009 460 Mirzapur 800 433 367 434 236 198 54.25
2010 461 Pathralian 731 403 328 396 228 168 54.17
2011 462 Fatehpur 410 197 213 222 110 112 54.15
2012 463 Adhkara 584 307 277 315 167 148 53.94
2013 464 Shekhupur 701 373 328 377 200 177 53.78
2014 465 Kailon 446 238 208 237 130 107 53.14
2015 466 Chhauni Kalan 2801 1459 1342 1485 777 708 53.02
2016 467 Chak Khelan 600 295 305 318 155 163 53.00
2017 468 Khusropur 476 236 240 251 121 130 52.73
2018 469 Meghowal 1336 694 642 704 355 349 52.69
2019 470 Nurpur Urf Bakipur 135 66 69 71 32 39 52.59
2020 471 Ahrana 5495 2853 2642 2881 1498 1383 52.43
2021 472 Marnaian Khurd 573 291 282 300 146 154 52.36
2022 473 Sainchan 1048 524 524 548 271 277 52.29
2023 474 Nainowal Jattan 950 470 480 496 247 249 52.21
2024 475 Kandiana 1301 631 670 679 321 358 52.19
2025 476 Kahlwan 552 264 288 288 133 155 52.17
2026 477 Dhut Kalan 2567 1300 1267 1337 660 677 52.08
2027 478 Burey Rajputan 217 124 93 113 64 49 52.07
2028 479 Pandori Khajoor 713 373 340 370 187 183 51.89
2029 480 Sotla 1071 514 557 548 266 282 51.17
227

(In Nos.)Percentage
Total Sub Total Male Female Total Male Female (Col. 7 to 4)
1 2 3 4 5 6 7 8 9 10
Village countName of Village
Population SC Population
DISTRICTWISE VILLAGES HAVING 40% AND ABOVE SCHEDULED CASTES (SC) POPULATION IN THE STATE OF PUNJAB (CENSUS 2011)
2030 481 Daulowal 620 330 290 317 162 155 51.13
2031 482 Sandhra 1287 663 624 658 332 326 51.13
2032 483 Dadupur Goraya 696 357 339 355 181 174 51.01
2033 484 Bassi Kale Khan 327 165 162 165 84 81 50.46
2034 485 Lidder 411 206 205 207 97 110 50.36
2035 486 Mithewal 394 192 202 197 94 103 50.00
2036 487 Pandori Rukman 1279 676 603 639 331 308 49.96
2037 488 Nasrala 2985 1528 1457 1489 769 720 49.88
2038 489 Dagana Kalan 1539 778 761 767 390 377 49.84
2039 490 Fatehgarh Niara 1281 655 626 638 319 319 49.80
2040 491 Tharoli 570 275 295 281 139 142 49.30
2041 492 Shimli 965 465 500 475 224 251 49.22
2042 493 Bassi Babu Khan 524 280 244 257 137 120 49.05
2043 494 Pajjodeota 1428 718 710 699 348 351 48.95
2044 495 Khanoor 1076 532 544 525 263 262 48.79
2045 496 Lehal 517 252 265 251 119 132 48.55
2046 497 Abhowal 817 409 408 394 198 196 48.23
2047 498 Mehngarwal 1237 636 601 596 315 281 48.18
2048 499 Ajjowal 3970 2080 1890 1912 1002 910 48.16
2049 500 Phambian 1237 634 603 595 307 288 48.10
2050 501 Kahri 1309 680 629 627 330 297 47.90
2051 502 Zarab Dial 341 183 158 163 93 70 47.80
2052 503 Mustfapur 724 354 370 346 177 169 47.79
2053 504 Kotli Gounspur 1631 843 788 775 382 393 47.52
2054 505 Dhugga 497 246 251 236 117 119 47.48
2055 506 Mochpur 329 163 166 156 83 73 47.42
2056 507 Badowal 934 473 461 442 220 222 47.32
2057 508 Barial 353 175 178 167 81 86 47.31
2058 509 Dhut Khurd 890 454 436 421 216 205 47.30
2059 510 Kang 1405 670 735 663 301 362 47.19
2060 511 Pandori Mail 794 408 386 374 194 180 47.10
2061 512 Pandori Khangurian 1133 572 561 530 263 267 46.78
2062 513 Pholahi 1073 532 541 500 255 245 46.60
2063 514 Hukran 1018 518 500 474 253 221 46.56
2064 515 Harkhowal 842 450 392 391 194 197 46.44
2065 516 Sherpur 803 419 384 371 203 168 46.20
2066 517 Bhagowal 654 330 324 302 151 151 46.18
2067 518 Adamwal 3429 1744 1685 1578 793 785 46.02
2068 519 Badla 2849 1428 1421 1309 647 662 45.95
2069 520 Nangal Isher 865 432 433 395 197 198 45.66
2070 521 Mona Kalan 1979 1013 966 902 443 459 45.58
2071 522 Jahan Khelan 2429 1273 1156 1104 595 509 45.45
2072 523 Sherpur Kham 553 281 272 251 129 122 45.39
2073 524 Bassi Muda 891 442 449 404 205 199 45.34
228

(In Nos.)Percentage
Total Sub Total Male Female Total Male Female (Col. 7 to 4)
1 2 3 4 5 6 7 8 9 10
Village countName of Village
Population SC Population
DISTRICTWISE VILLAGES HAVING 40% AND ABOVE SCHEDULED CASTES (SC) POPULATION IN THE STATE OF PUNJAB (CENSUS 2011)
2074 525 Dudiana Khurd 899 465 434 407 208 199 45.27
2075 526 Bhatolian 830 413 417 375 181 194 45.18
2076 527 Dhaliwal 444 219 225 200 94 106 45.05
2077 528 Bassi Umer Khan 711 369 342 320 165 155 45.01
2078 529 Susana 711 392 319 318 175 143 44.73
2079 530 Sandhar 861 457 404 385 207 178 44.72
2080 531 Sandher 555 284 271 248 131 117 44.68
2081 532 Nari 412 201 211 184 87 97 44.66
2082 533 Hussainpur Guru 1306 678 628 583 315 268 44.64
2083 534 Kakon 2273 1169 1104 1012 518 494 44.52
2084 535 Dudiana Kalan 1265 639 626 558 280 278 44.11
2085 536 Attowal 1460 736 724 643 319 324 44.04
2086 537 Naru Nangal Khas 2314 1158 1156 1013 518 495 43.78
2087 538 Naugarain 283 156 127 122 68 54 43.11
2088 539 Mundian Jattan 341 161 180 146 71 75 42.82
2089 540 Daulatpur 515 264 251 219 103 116 42.52
2090 541 Singriwala 1800 903 897 762 380 382 42.33
2091 542 Kalkat 610 325 285 258 134 124 42.30
2092 543 Harta 2946 1489 1457 1246 641 605 42.29
2093 544 Nangal Kalan 499 244 255 211 114 97 42.28
2094 545 Tanuli 1663 857 806 702 367 335 42.21
2095 546 Kotla Naudh Singh 1146 558 588 482 243 239 42.06
2096 547 Kotali Bawdass 381 187 194 160 76 84 41.99
2097 548 Mahndipur 408 204 204 170 85 85 41.67
2098 549 Dalamwal 367 201 166 152 84 68 41.42
2099 550 Mehina 833 422 411 343 168 175 41.18
2100 551 Manak Dheri 1476 772 704 607 304 303 41.12
2101 552 Goraya 878 461 417 360 189 171 41.00
2102 553 Dhakki 543 285 258 222 114 108 40.88
2103 554 Sus 1561 785 776 637 320 317 40.81
2104 555 Asalpur 470 240 230 191 101 90 40.64
2105 556 Marnaian Kalan 777 402 375 314 158 156 40.41
2106 557 Lehli Khurd 797 390 407 322 156 166 40.40
2107 558 Pandori Kad 1446 741 705 584 296 288 40.39
2108 559 Naushehra 623 307 316 251 122 129 40.29
2109 560 Deowal 853 444 409 343 177 166 40.21
2110 561 Har Chand 193 98 95 166 83 83 86.01
2111 562 Makha 703 355 348 578 299 279 82.22
2112 563 Passi Karoro 518 261 257 362 179 183 69.88
2113 564 Akam 471 239 232 278 136 142 59.02
2114 565 Sudhari 413 214 199 240 124 116 58.11
2115 566 Mangu Mera 327 171 156 188 98 90 57.49
2116 567 Barnala 766 378 388 432 202 230 56.40
(iv) MukerianSub‐District
229

(In Nos.)Percentage
Total Sub Total Male Female Total Male Female (Col. 7 to 4)
1 2 3 4 5 6 7 8 9 10
Village countName of Village
Population SC Population
DISTRICTWISE VILLAGES HAVING 40% AND ABOVE SCHEDULED CASTES (SC) POPULATION IN THE STATE OF PUNJAB (CENSUS 2011)
2117 568 Alo Bhatti 625 333 292 343 183 160 54.88
2118 569 Jhareriana 685 337 348 373 182 191 54.45
2119 570 Gujjar Katrala 849 429 420 445 227 218 52.41
2120 571 Bachhowali 168 80 88 86 41 45 51.19
2121 572 Pandori Baghel Singh 639 325 314 326 173 153 51.02
2122 573 Dhesian 263 136 127 134 67 67 50.95
2123 574 Nangal Awana 487 241 246 244 115 129 50.10
2124 575 Kharak Balrah 625 294 331 311 140 171 49.76
2125 576 Gaunspur 504 244 260 250 123 127 49.60
2126 577 Khush Nagar 543 288 255 269 139 130 49.54
2127 578 Arthewal 367 200 167 180 98 82 49.05
2128 579 Nikoo Chak 1481 737 744 713 344 369 48.14
2129 580 Langah 419 205 214 199 103 96 47.49
2130 581 Pandori 484 239 245 228 113 115 47.11
2131 582 Bariah 564 272 292 265 124 141 46.99
2132 583 Chak Sarwani 260 134 126 122 61 61 46.92
2133 584 Ghalloowal 443 210 233 206 98 108 46.50
2134 585 Beh Jagan 2341 1191 1150 1074 555 519 45.88
2135 586 Zahidpur 663 332 331 302 143 159 45.55
2136 587 Dhal 476 241 235 216 111 105 45.38
2137 588 Golra 657 331 326 296 159 137 45.05
2138 589 Badial 375 192 183 168 88 80 44.80
2139 590 Basantpur 223 108 115 99 49 50 44.39
2140 591 Siparian 1956 988 968 841 436 405 43.00
2141 592 Biggowal 740 363 377 316 151 165 42.70
2142 593 Pota 659 323 336 277 128 149 42.03
2143 594 Harse Mansar 3307 1669 1638 1378 690 688 41.67
2144 595 Daulowal 859 428 431 352 178 174 40.98
2145 596 Saroya 558 284 274 228 114 114 40.86
2146 597 Jharing 646 348 298 262 147 115 40.56
2147 1 Chak Isharwal 5 3 2 5 3 2 100.00
2148 2 Kasampur 443 213 230 431 208 223 97.29
2149 3 Barsal 796 419 377 733 385 348 92.09
2150 4 Talwara 506 260 246 448 233 215 88.54
2151 5 Mubarakpur 1031 515 516 886 436 450 85.94
2152 6 Hamiri Khera 767 382 385 653 325 328 85.14
2153 7 Lesariwala 2217 1165 1052 1882 995 887 84.89
2154 8 Bhagwanpur 302 159 143 250 129 121 82.78
2155 9 Chhatowali 367 192 175 303 162 141 82.56
2156 10 Dhanal 1487 768 719 1223 636 587 82.25
2157 11 Sherpur 1273 644 629 1046 537 509 82.17
2158 12 Phulpur 1111 556 555 912 461 451 82.09
9. JALANDHAR(i) Jalandhar‐I
DISTRICTSub‐District
230

(In Nos.)Percentage
Total Sub Total Male Female Total Male Female (Col. 7 to 4)
1 2 3 4 5 6 7 8 9 10
Village countName of Village
Population SC Population
DISTRICTWISE VILLAGES HAVING 40% AND ABOVE SCHEDULED CASTES (SC) POPULATION IN THE STATE OF PUNJAB (CENSUS 2011)
2159 13 Khun Khun 750 401 349 588 320 268 78.40
2160 14 Bahudinpur 260 138 122 202 105 97 77.69
2161 15 Aladinpur 734 374 360 570 282 288 77.66
2162 16 Jalbhe 851 429 422 657 334 323 77.20
2163 17 Shekhe Pind 487 255 232 375 198 177 77.00
2164 18 Bambianwali 2040 1039 1001 1553 791 762 76.13
2165 19 Partappur 2524 1300 1224 1908 989 919 75.59
2166 20 Chuharwali 2713 1337 1376 1999 982 1017 73.68
2167 21 Chachowal 679 343 336 499 246 253 73.49
2168 22 Kotli Sheikhan 268 134 134 196 98 98 73.13
2169 23 Kariana 1370 707 663 999 514 485 72.92
2170 24 Alipur 651 337 314 468 243 225 71.89
2171 25 Talwandi Araian 641 304 337 460 220 240 71.76
2172 26 Dhandauri 504 249 255 360 173 187 71.43
2173 27 Mahadipur 787 373 414 557 261 296 70.78
2174 28 Kadianwali 1970 1048 922 1375 746 629 69.80
2175 29 Semi 635 304 331 442 210 232 69.61
2176 30 Daulatpur 637 311 326 439 218 221 68.92
2177 31 Luhar Nangal 331 180 151 225 111 114 67.98
2178 32 Chandpur 1077 555 522 732 388 344 67.97
2179 33 Kot Khurd 738 356 382 499 241 258 67.62
2180 34 Manko 2019 1060 959 1365 710 655 67.61
2181 35 Mohammadpur 897 472 425 601 315 286 67.00
2182 36 Puranpur 1135 585 550 757 388 369 66.70
2183 37 Kotla 583 318 265 380 202 178 65.18
2184 38 Jaitewali 2103 1064 1039 1363 697 666 64.81
2185 39 Shahpur 364 181 183 235 109 126 64.56
2186 40 Udesian 1327 669 658 847 426 421 63.83
2187 41 Kupur 1260 651 609 797 406 391 63.25
2188 42 Chananpur 802 407 395 505 252 253 62.97
2189 43 Karari 1670 840 830 1038 523 515 62.16
2190 44 Talhan 2940 1493 1447 1824 924 900 62.04
2191 45 Kabulpur 1409 722 687 874 431 443 62.03
2192 46 Jethpur 704 358 346 436 221 215 61.93
2193 47 Rehmanpur 1444 798 646 892 490 402 61.77
2194 48 Jandiali 821 415 406 504 249 255 61.39
2195 49 Dolike Sunderpur 1698 866 832 1042 532 510 61.37
2196 50 Lutera Khurd 455 230 225 277 142 135 60.88
2197 51 Nangal Jamalpur 532 295 237 319 173 146 59.96
2198 52 Kapur Pind 2252 1139 1113 1333 669 664 59.19
2199 53 Jagrawan 423 213 210 249 122 127 58.87
2200 54 Arjanwal 1695 873 822 975 504 471 57.52
2201 55 Sangowal 1751 895 856 1005 512 493 57.40
2202 56 Nangal Purdil 294 159 135 168 91 77 57.14
231

(In Nos.)Percentage
Total Sub Total Male Female Total Male Female (Col. 7 to 4)
1 2 3 4 5 6 7 8 9 10
Village countName of Village
Population SC Population
DISTRICTWISE VILLAGES HAVING 40% AND ABOVE SCHEDULED CASTES (SC) POPULATION IN THE STATE OF PUNJAB (CENSUS 2011)
2203 57 Kotli Than Singh 2701 1389 1312 1542 805 737 57.09
2204 58 Naurangpur 925 460 465 527 263 264 56.97
2205 59 Johal 1573 800 773 892 459 433 56.71
2206 60 Khichipur 788 404 384 446 212 234 56.60
2207 61 Nangal Salempur 891 460 431 502 255 247 56.34
2208 62 Dhada 1978 1007 971 1109 557 552 56.07
2209 63 Mazaffarpur 902 453 449 504 246 258 55.88
2210 64 Usmanpur 453 243 210 252 136 116 55.63
2211 65 Kangniwal 2036 1036 1000 1132 575 557 55.60
2212 66 Raipur 1591 770 821 882 435 447 55.44
2213 67 Udhopur 610 317 293 335 174 161 54.92
2214 68 Paras Rampur 1631 832 799 883 446 437 54.14
2215 69 Budhiana 1577 814 763 845 442 403 53.58
2216 70 Saprai 2105 1116 989 1108 581 527 52.64
2217 71 Kot Kalan 1643 837 806 859 437 422 52.28
2218 72 Beas Pind 4203 2125 2078 2196 1103 1093 52.25
2219 73 Bolina 1625 867 758 837 436 401 51.51
2220 74 Khiala 163 84 79 80 41 39 49.08
2221 75 Sikanderpur 1349 670 679 662 333 329 49.07
2222 76 Kala Bakra 2882 1426 1456 1412 720 692 48.99
2223 77 Nauli 977 481 496 471 225 246 48.21
2224 78 Haripur 3292 1704 1588 1575 830 745 47.84
2225 79 Muradpur 275 146 129 131 71 60 47.64
2226 80 Salarpur 1510 760 750 717 370 347 47.48
2227 81 Kukar Pind 2730 1397 1333 1278 648 630 46.81
2228 82 Kotli Jamiat Singh 670 332 338 311 158 153 46.42
2229 83 Nangal Shama 1493 768 725 692 355 337 46.35
2230 84 Chukhiara 1176 580 596 543 277 266 46.17
2231 85 Jalpot 447 228 219 206 107 99 46.09
2232 86 Daulatpur 1046 514 532 479 230 249 45.79
2233 87 Dhepur 822 417 405 374 197 177 45.50
2234 88 Sitalpur 643 315 328 291 141 150 45.26
2235 89 Khurdpur 2877 1475 1402 1295 655 640 45.01
2236 90 Miranpur 294 156 138 131 71 60 44.56
2237 91 Bhojowal 1266 655 611 551 286 265 43.52
2238 92 Khusropur 2250 1171 1079 978 499 479 43.47
2239 93 Sarnana 536 287 249 232 126 106 43.28
2240 94 Kandola 1958 1018 940 846 427 419 43.21
2241 95 Fatehpur 426 224 202 184 100 84 43.19
2242 96 Jamsher 8437 4372 4065 3640 1905 1735 43.14
2243 97 Nizamudinpur 770 404 366 331 181 150 42.99
2244 98 Mander 1139 596 543 487 258 229 42.76
2245 99 Patara 2605 1310 1295 1098 541 557 42.15
2246 100 Chuhan 101 53 48 41 22 19 40.59
232

(In Nos.)Percentage
Total Sub Total Male Female Total Male Female (Col. 7 to 4)
1 2 3 4 5 6 7 8 9 10
Village countName of Village
Population SC Population
DISTRICTWISE VILLAGES HAVING 40% AND ABOVE SCHEDULED CASTES (SC) POPULATION IN THE STATE OF PUNJAB (CENSUS 2011)
2247 101 Goalpind 200 103 97 80 38 42 40.00
2248 102 Daffarwal 57 28 29 57 28 29 100.00
2249 103 Faridpur 663 339 324 654 336 318 98.64
2250 104 Bhikhu Nangal 1013 523 490 950 491 459 93.78
2251 105 Bhathe 632 335 297 578 307 271 91.46
2252 106 Daudpur 205 116 89 182 102 80 88.78
2253 107 Narpur 490 258 232 429 224 205 87.55
2254 108 Shaffipur 493 271 222 428 237 191 86.82
2255 109 Hussainpur 1291 628 663 1111 534 577 86.06
2256 110 Pawar 444 247 197 377 209 168 84.91
2257 111 Sada Chak 675 359 316 568 303 265 84.15
2258 112 Shafipur 1145 604 541 962 512 450 84.02
2259 113 Najka 441 226 215 366 189 177 82.99
2260 114 Aima 437 233 204 360 191 169 82.38
2261 115 Sehjhangi 592 320 272 485 261 224 81.93
2262 116 Shakarpur 602 303 299 491 245 246 81.56
2263 117 Firoz 882 470 412 717 384 333 81.29
2264 118 Chhotapind Alias Barapind 1799 978 821 1451 792 659 80.66
2265 119 Abadan 319 163 156 256 131 125 80.25
2266 120 Dhadda 440 220 220 353 184 169 80.23
2267 121 Shivdaspur 682 345 337 543 271 272 79.62
2268 122 Naranwali 154 81 73 120 62 58 77.92
2269 123 Kotli Sazawar 469 224 245 365 174 191 77.83
2270 124 Basti Ibrahim Khan 757 395 362 586 305 281 77.41
2271 125 Bhattian 335 160 175 259 125 134 77.31
2272 126 Jallowal 1033 537 496 797 406 391 77.15
2273 127 Nahal 512 249 263 393 189 204 76.76
2274 128 Chak Bashesharpur 21 10 11 16 8 8 76.19
2275 129 Sammipur 1664 857 807 1263 656 607 75.90
2276 130 Parapind 1046 551 495 791 410 381 75.62
2277 131 Dhamooli 523 273 250 394 208 186 75.33
2278 132 Salala 1305 653 652 982 478 504 75.25
2279 133 Dhurial 1036 540 496 777 408 369 75.00
2280 134 Rani Bhatti 603 326 277 451 241 210 74.79
2281 135 Ghug 638 336 302 477 251 226 74.76
2282 136 Devi Dasspur 388 201 187 290 152 138 74.74
2283 137 Bhagwanpur 1900 981 919 1387 703 684 73.00
2284 138 Bhikha Nangal 489 252 237 353 188 165 72.19
2285 139 Lambri 644 346 298 463 248 215 71.89
2286 140 Lambra 1969 1027 942 1410 732 678 71.61
2287 141 Kotla 410 221 189 293 154 139 71.46
2288 142 Jalla Singh 914 481 433 653 328 325 71.44
2289 143 Dugri 755 388 367 537 281 256 71.13
(ii) Jalandhar‐IISub‐District
233

(In Nos.)Percentage
Total Sub Total Male Female Total Male Female (Col. 7 to 4)
1 2 3 4 5 6 7 8 9 10
Village countName of Village
Population SC Population
DISTRICTWISE VILLAGES HAVING 40% AND ABOVE SCHEDULED CASTES (SC) POPULATION IN THE STATE OF PUNJAB (CENSUS 2011)
2290 144 Bhel 609 316 293 432 224 208 70.94
2291 145 Rampur Lallian 901 457 444 638 325 313 70.81
2292 146 Wariana 3106 1616 1490 2193 1123 1070 70.61
2293 147 Malko 1233 635 598 869 441 428 70.48
2294 148 Chogawan 1183 617 566 829 432 397 70.08
2295 149 Sondha Chak 532 284 248 372 196 176 69.92
2296 150 Trar 698 371 327 484 255 229 69.34
2297 151 Satowali 802 422 380 554 297 257 69.08
2298 152 Ghorewahi 1926 999 927 1318 672 646 68.43
2299 153 Alamgir 588 303 285 401 207 194 68.20
2300 154 Rasulpur Brahmna 718 362 356 484 241 243 67.41
2301 155 Dhaliwal 1974 987 987 1327 660 667 67.22
2302 156 Ram Singhpur 481 239 242 319 163 156 66.32
2303 157 Tajpur 2168 1161 1007 1429 779 650 65.91
2304 158 Kotli Araian 721 366 355 475 239 236 65.88
2305 159 Fateh Jalal 1467 753 714 966 491 475 65.85
2306 160 Mansurpur 674 352 322 441 235 206 65.43
2307 161 Manan 1009 525 484 654 339 315 64.82
2308 162 Rastgo 1283 660 623 830 441 389 64.69
2309 163 Madar 2168 1105 1063 1394 713 681 64.30
2310 164 Wadala 3933 2013 1920 2526 1280 1246 64.23
2311 165 Kotla 1191 604 587 752 377 375 63.14
2312 166 Singh 1458 736 722 918 472 446 62.96
2313 167 Pachranga 1162 612 550 730 378 352 62.82
2314 168 Bajra 831 449 382 519 275 244 62.45
2315 169 Akhara 1148 597 551 715 377 338 62.28
2316 170 Nahal 1714 884 830 1060 547 513 61.84
2317 171 Muchrowal 375 195 180 229 116 113 61.07
2318 172 Hirapur 1435 732 703 865 446 419 60.28
2319 173 Kandhala Guru 1034 553 481 621 330 291 60.06
2320 174 Mand 417 190 227 249 109 140 59.71
2321 175 Ali Chak 975 496 479 575 296 279 58.97
2322 176 Ghugg 572 295 277 337 182 155 58.92
2323 177 Talwandi Jhandir 372 203 169 219 120 99 58.87
2324 178 Dhogri 4280 2267 2013 2514 1348 1166 58.74
2325 179 Hasan Munda 881 415 466 515 243 272 58.46
2326 180 Sarobad 922 498 424 538 299 239 58.35
2327 181 Kingra Chowala 1746 910 836 1012 533 479 57.96
2328 182 Muridpur 336 171 165 194 101 93 57.74
2329 183 Dingrian 1478 771 707 852 443 409 57.65
2330 184 Jande Sarai 899 457 442 518 271 247 57.62
2331 185 Pattar Khurd 1144 587 557 659 348 311 57.60
2332 186 Nangal Fida 1185 617 568 671 356 315 56.62
2333 187 Passan 417 210 207 234 122 112 56.12
234

(In Nos.)Percentage
Total Sub Total Male Female Total Male Female (Col. 7 to 4)
1 2 3 4 5 6 7 8 9 10
Village countName of Village
Population SC Population
DISTRICTWISE VILLAGES HAVING 40% AND ABOVE SCHEDULED CASTES (SC) POPULATION IN THE STATE OF PUNJAB (CENSUS 2011)
2334 188 Jaffal Jhingar 727 375 352 406 215 191 55.85
2335 189 Sura 947 486 461 525 259 266 55.44
2336 190 Mahaddipur 846 435 411 469 246 223 55.44
2337 191 Pandori Nijran 3121 1654 1467 1727 912 815 55.33
2338 192 Dhirpur 1799 935 864 990 519 471 55.03
2339 193 Nussi 2079 1040 1039 1138 575 563 54.74
2340 194 Dittu Nangal 394 205 189 213 111 102 54.06
2341 195 Dhirowal 900 448 452 486 250 236 54.00
2342 196 Khojkipur 1043 522 521 561 284 277 53.79
2343 197 Sandham 309 162 147 164 91 73 53.07
2344 198 Sagranwali 1246 633 613 659 316 343 52.89
2345 199 Talwandi Bhilan 658 348 310 346 184 162 52.58
2346 200 Malian 1163 619 544 611 323 288 52.54
2347 201 Hailar 1079 544 535 565 291 274 52.36
2348 202 Bullowal 1801 942 859 943 476 467 52.36
2349 203 Randhawa Masandan 3843 2022 1821 2010 1054 956 52.30
2350 204 Brahampur 659 335 324 343 179 164 52.05
2351 205 Lallian Khurd 2104 1084 1020 1092 553 539 51.90
2352 206 Chitti 3276 1720 1556 1695 914 781 51.74
2353 207 Fazilpur 399 231 168 206 110 96 51.63
2354 208 Rahimpur 1712 858 854 875 459 416 51.11
2355 209 Chak Shakur 660 331 329 337 178 159 51.06
2356 210 Mokhe 772 393 379 392 208 184 50.78
2357 211 Mirpur 955 519 436 483 273 210 50.58
2358 212 Gaddowali 702 370 332 354 194 160 50.43
2359 213 Mustfapur 1026 509 517 516 257 259 50.29
2360 214 Badsahpur 437 231 206 219 115 104 50.11
2361 215 Naugajja 2203 1101 1102 1102 545 557 50.02
2362 216 Bashesherpur 1276 636 640 638 310 328 50.00
2363 217 Desalpur 643 318 325 320 158 162 49.77
2364 218 Nurpur 4748 2552 2196 2361 1263 1098 49.73
2365 219 Lohar 889 447 442 442 225 217 49.72
2366 220 Gobindpur 616 319 297 305 167 138 49.51
2367 221 Fazalpur 289 141 148 142 75 67 49.13
2368 222 Sanaura 1100 577 523 537 293 244 48.82
2369 223 Darawan 881 453 428 429 208 221 48.69
2370 224 Kalianpur 2008 1019 989 974 501 473 48.51
2371 225 Tandi 650 326 324 315 156 159 48.46
2372 226 Lohar 799 397 402 386 189 197 48.31
2373 227 Jandu Singha 6334 3284 3050 3032 1591 1441 47.87
2374 228 Behram Srishta 2794 1411 1383 1323 663 660 47.35
2375 229 Nangal Manohar 292 148 144 137 71 66 46.92
2376 230 Khaira Majha 1400 720 680 652 347 305 46.57
2377 231 Kuddowal 1154 568 586 537 276 261 46.53
235

(In Nos.)Percentage
Total Sub Total Male Female Total Male Female (Col. 7 to 4)
1 2 3 4 5 6 7 8 9 10
Village countName of Village
Population SC Population
DISTRICTWISE VILLAGES HAVING 40% AND ABOVE SCHEDULED CASTES (SC) POPULATION IN THE STATE OF PUNJAB (CENSUS 2011)
2378 232 Alampur 1077 563 514 497 257 240 46.15
2379 233 Sangal Sohal 1404 714 690 641 326 315 45.66
2380 234 Ispur 395 201 194 180 89 91 45.57
2381 235 Talwara 253 127 126 115 56 59 45.45
2382 236 Singhpur 467 242 225 212 105 107 45.40
2383 237 Moga 851 428 423 384 198 186 45.12
2384 238 Bhatija Randhawa 1217 620 597 549 286 263 45.11
2385 239 Ambgarh 601 307 294 267 142 125 44.43
2386 240 Barchuhi 341 161 180 151 70 81 44.28
2387 241 Basrampur 810 402 408 358 183 175 44.20
2388 242 Bula 769 387 382 339 170 169 44.08
2389 243 Kohja 968 493 475 423 220 203 43.70
2390 244 Khanke Fatehgarh 882 466 416 384 205 179 43.54
2391 245 Sarmastpur 1310 682 628 567 282 285 43.28
2392 246 Ball 2308 1208 1100 997 526 471 43.20
2393 247 Gill 1308 670 638 565 307 258 43.20
2394 248 Sudana 1385 716 669 596 317 279 43.03
2395 249 Kutlupur 49 26 23 21 11 10 42.86
2396 250 Chamiara 859 421 438 367 181 186 42.72
2397 251 Jalalwal 167 78 89 71 33 38 42.51
2398 252 Kala Bahian 1553 794 759 660 331 329 42.50
2399 253 Chaharke 1547 814 733 656 354 302 42.40
2400 254 Lallian Kalan 1528 786 742 644 340 304 42.15
2401 255 Dasupur 112 60 52 47 29 18 41.96
2402 256 Garhi Bukhsha 1066 571 495 445 237 208 41.74
2403 257 Maur 24 16 8 10 10 0 41.67
2404 258 Nijjran 1643 869 774 683 363 320 41.57
2405 259 Manak rai 2056 1024 1032 841 414 427 40.90
2406 260 Bulandpur 4083 2200 1883 1658 857 801 40.61
2407 261 Momanpur 35 15 20 14 7 7 40.00
2408 262 Jawinde 74 39 35 74 39 35 100.00
2409 263 Chhaula 313 157 156 293 147 146 93.61
2410 264 Gaunsuwal 1040 513 527 903 439 464 86.83
2411 265 Sianiwal 872 454 418 743 389 354 85.21
2412 266 Rasulpur 659 332 327 549 281 268 83.31
2413 267 Behar 776 407 369 646 336 310 83.25
2414 268 Khairulapur 999 510 489 831 416 415 83.18
2415 269 Nawan Pind Araian 1346 695 651 1117 583 534 82.99
2416 270 Bitlan 696 354 342 553 278 275 79.45
2417 271 Pindori Rajputan 506 267 239 399 212 187 78.85
2418 272 Nangal Jiwan 486 256 230 376 196 180 77.37
2419 273 Alewali 603 319 284 466 240 226 77.28
2420 274 Bhodipur 529 275 254 399 208 191 75.43
(iii) NakodarSub‐District
236

(In Nos.)Percentage
Total Sub Total Male Female Total Male Female (Col. 7 to 4)
1 2 3 4 5 6 7 8 9 10
Village countName of Village
Population SC Population
DISTRICTWISE VILLAGES HAVING 40% AND ABOVE SCHEDULED CASTES (SC) POPULATION IN THE STATE OF PUNJAB (CENSUS 2011)
2421 275 Bangiwal 817 432 385 615 325 290 75.28
2422 276 Dherian 1242 645 597 929 469 460 74.80
2423 277 Mahunwal 1564 810 754 1169 621 548 74.74
2424 278 Nakodar (Rural) 481 236 245 352 174 178 73.18
2425 279 Samailpur 1362 713 649 983 516 467 72.17
2426 280 Umrewal 484 256 228 349 185 164 72.11
2427 281 Muzaffarpur 365 180 185 261 129 132 71.51
2428 282 Chak Muglani 1153 584 569 822 412 410 71.29
2429 283 Singhpur 585 310 275 416 217 199 71.11
2430 284 Bath 2416 1198 1218 1718 848 870 71.11
2431 285 Raipur Gujran 596 296 300 421 216 205 70.64
2432 286 Sharakpur 1587 825 762 1112 580 532 70.07
2433 287 Kotla Jangan 898 462 436 624 325 299 69.49
2434 288 Ramunwal 752 390 362 520 264 256 69.15
2435 289 Miranpur 785 414 371 542 282 260 69.04
2436 290 Rasulpur Kalan 1733 871 862 1162 592 570 67.05
2437 291 Khursheidpur 1004 506 498 672 347 325 66.93
2438 292 Bara Aslam 412 206 206 266 133 133 64.56
2439 293 Boparai 3507 1763 1744 2260 1130 1130 64.44
2440 294 Bajuha Kalan 1480 753 727 947 496 451 63.99
2441 295 Gura 855 452 403 547 292 255 63.98
2442 296 Bir Baloki 1423 726 697 903 455 448 63.46
2443 297 Dhadda Lehna 290 138 152 184 88 96 63.45
2444 298 Thabalke 1539 792 747 966 496 470 62.77
2445 299 Gohir 1888 983 905 1178 612 566 62.39
2446 300 Malri 2469 1295 1174 1531 797 734 62.01
2447 301 Sidhwan 1724 883 841 1059 543 516 61.43
2448 302 Mundh 2068 1058 1010 1249 651 598 60.40
2449 303 Kangna 2199 1110 1089 1322 662 660 60.12
2450 304 Sahariwal 599 285 314 353 162 191 58.93
2451 305 Saham 796 396 400 458 233 225 57.54
2452 306 Khaira Mushtarka 775 402 373 433 218 215 55.87
2453 307 Maheru 1740 897 843 968 486 482 55.63
2454 308 Aulak 955 486 469 520 261 259 54.45
2455 309 Qaimwala 979 489 490 533 261 272 54.44
2456 310 Tahli 1889 947 942 1027 521 506 54.37
2457 311 Haripur 1744 873 871 948 471 477 54.36
2458 312 Mehsampur 1287 654 633 696 350 346 54.08
2459 313 Muhem 1739 893 846 940 488 452 54.05
2460 314 Shahpur 166 84 82 88 49 39 53.01
2461 315 Raibwal 541 287 254 286 156 130 52.87
2462 316 Talwandi Bharo 2303 1187 1116 1209 630 579 52.50
2463 317 Bajuha Khurd 2096 1088 1008 1087 554 533 51.86
2464 318 Raipur Araian 1382 703 679 712 342 370 51.52
237

(In Nos.)Percentage
Total Sub Total Male Female Total Male Female (Col. 7 to 4)
1 2 3 4 5 6 7 8 9 10
Village countName of Village
Population SC Population
DISTRICTWISE VILLAGES HAVING 40% AND ABOVE SCHEDULED CASTES (SC) POPULATION IN THE STATE OF PUNJAB (CENSUS 2011)
2465 319 Chak Kalan 2283 1144 1139 1172 606 566 51.34
2466 320 Saidupur 464 231 233 238 118 120 51.29
2467 321 Allowal 752 400 352 384 207 177 51.06
2468 322 Baghela 1822 936 886 925 476 449 50.77
2469 323 Uggi 4117 2117 2000 2063 1070 993 50.11
2470 324 Bagpur 259 128 131 129 59 70 49.81
2471 325 Nawan Pind Dakhni 1353 657 696 673 338 335 49.74
2472 326 Mehatpur 5804 2943 2861 2830 1420 1410 48.76
2473 327 Dhaliwal 3121 1608 1513 1509 796 713 48.35
2474 328 Littran 1815 914 901 876 432 444 48.26
2475 329 Rauli 967 499 468 462 236 226 47.78
2476 330 Akbarpur Khurd 266 135 131 127 65 62 47.74
2477 331 Ladhran 1218 604 614 581 292 289 47.70
2478 332 Bal Hukmi 513 267 246 244 115 129 47.56
2479 333 Rangra 434 228 206 206 104 102 47.47
2480 334 Bir Pind 1615 803 812 761 372 389 47.12
2481 335 Angi Kiri 820 434 386 384 205 179 46.83
2482 336 Jahangir 652 348 304 305 163 142 46.78
2483 337 Singhpur 1035 537 498 478 248 230 46.18
2484 338 Hussainabad 764 395 369 352 182 170 46.07
2485 339 Chak Vendal 1693 859 834 775 388 387 45.78
2486 340 Lohgarh 1095 569 526 491 254 237 44.84
2487 341 Musewal 342 181 161 153 81 72 44.74
2488 342 Mehmudpur 237 128 109 105 60 45 44.30
2489 343 Udhowal 1339 671 668 586 291 295 43.76
2490 344 Chak Khurd 1176 590 586 508 251 257 43.20
2491 345 Nurpur 1993 998 995 846 442 404 42.45
2492 346 Sehowal 545 274 271 228 120 108 41.83
2493 347 Chanian 2164 1074 1090 903 444 459 41.73
2494 348 Gandhran 2039 1026 1013 846 426 420 41.49
2495 349 Sangowal 2591 1362 1229 1060 557 503 40.91
2496 350 Awan Chaharmi 491 247 244 197 96 101 40.12
2497 351 Bir Shersingh 20 9 11 20 9 11 100.00
2498 352 Langrian 337 173 164 320 163 157 94.96
2499 353 Buraj Hassan 764 369 395 705 337 368 92.28
2500 354 Kutbewal 792 405 387 698 359 339 88.13
2501 355 Kat Palon 1665 843 822 1460 744 716 87.69
2502 356 Sangowal 2007 1048 959 1735 904 831 86.45
2503 357 Pawahri 590 302 288 509 259 250 86.27
2504 358 Gohawar 2645 1320 1325 2280 1141 1139 86.20
2505 359 Gadra 355 192 163 302 165 137 85.07
2506 360 Salkiana 1410 734 676 1190 627 563 84.40
2507 361 Achan Chak 138 69 69 113 57 56 81.88
(iv) PhillaurSub‐District
238

(In Nos.)Percentage
Total Sub Total Male Female Total Male Female (Col. 7 to 4)
1 2 3 4 5 6 7 8 9 10
Village countName of Village
Population SC Population
DISTRICTWISE VILLAGES HAVING 40% AND ABOVE SCHEDULED CASTES (SC) POPULATION IN THE STATE OF PUNJAB (CENSUS 2011)
2508 362 Bhoda 824 445 379 669 354 315 81.19
2509 363 Thammanwal 647 340 307 519 267 252 80.22
2510 364 Sidhu Mutsadi 1319 682 637 1049 537 512 79.53
2511 365 Bhadarpur 376 199 177 299 156 143 79.52
2512 366 Bhattian 687 354 333 543 282 261 79.04
2513 367 Khanpur 626 311 315 490 235 255 78.27
2514 368 Dhinpur 398 200 198 311 157 154 78.14
2515 369 Bharuwal 312 146 166 243 110 133 77.88
2516 370 Jand 477 234 243 368 176 192 77.15
2517 371 Sangha Jagir 812 403 409 625 311 314 76.97
2518 372 Hardo Sheikh 1095 558 537 842 433 409 76.89
2519 373 Masani 1617 779 838 1235 591 644 76.38
2520 374 Nathewal 1084 561 523 815 429 386 75.18
2521 375 Ganna Pind 4465 2315 2150 3327 1725 1602 74.51
2522 376 Anihar 1030 517 513 756 377 379 73.40
2523 377 Dosanjh Khurd 786 400 386 575 291 284 73.16
2524 378 Mansurpur 1273 651 622 924 467 457 72.58
2525 379 Rajauri 202 110 92 146 83 63 72.28
2526 380 Chuheki 2062 1096 966 1477 778 699 71.63
2527 381 Begampur 849 446 403 601 316 285 70.79
2528 382 Rajgomal 752 389 363 532 286 246 70.74
2529 383 Matfallu 784 400 384 551 282 269 70.28
2530 384 Kala 876 481 395 615 332 283 70.21
2531 385 Indna Kalaske 1140 571 569 800 400 400 70.18
2532 386 Raipur Araian 1506 753 753 1055 526 529 70.05
2533 387 Kot Garewal 1045 515 530 727 362 365 69.57
2534 388 Gura 1108 603 505 770 424 346 69.49
2535 389 Garha 2869 1565 1304 1969 1053 916 68.63
2536 390 Rasulpur 1556 788 768 1064 528 536 68.38
2537 391 Thala 2251 1192 1059 1539 808 731 68.37
2538 392 Jhungian Mahansingh 201 105 96 135 72 63 67.16
2539 393 Batura 237 117 120 159 81 78 67.09
2540 394 Nangal 4220 2211 2009 2798 1488 1310 66.30
2541 395 Sheikhupur 359 184 175 238 122 116 66.30
2542 396 Lakhanpal 1270 619 651 838 405 433 65.98
2543 397 Bir Bansian 762 382 380 501 246 255 65.75
2544 398 Fatehgarh Lakha 92 51 41 60 32 28 65.22
2545 399 Bhaini 782 417 365 509 275 234 65.09
2546 400 Pabwan 1081 534 547 700 347 353 64.75
2547 401 Sargundi 1131 591 540 726 380 346 64.19
2548 402 Ramgarh 2909 1510 1399 1861 955 906 63.97
2549 403 Muzara 1216 599 617 777 378 399 63.90
2550 404 Mainwal 1963 981 982 1248 627 621 63.58
2551 405 Johal 1187 632 555 754 403 351 63.52
239

(In Nos.)Percentage
Total Sub Total Male Female Total Male Female (Col. 7 to 4)
1 2 3 4 5 6 7 8 9 10
Village countName of Village
Population SC Population
DISTRICTWISE VILLAGES HAVING 40% AND ABOVE SCHEDULED CASTES (SC) POPULATION IN THE STATE OF PUNJAB (CENSUS 2011)
2552 406 Khokhewal 912 461 451 576 292 284 63.16
2553 407 Kariana 1564 805 759 976 492 484 62.40
2554 408 Umarpur 1163 595 568 725 373 352 62.34
2555 409 Sagarpur 927 474 453 573 285 288 61.81
2556 410 Daduwal 3144 1576 1568 1942 966 976 61.77
2557 411 Gursian Piran 1000 545 455 617 340 277 61.70
2558 412 Cholang 435 223 212 266 140 126 61.15
2559 413 Ladian 575 288 287 351 173 178 61.04
2560 414 Landara 1287 642 645 782 389 393 60.76
2561 415 Bhar Singhpur 1845 893 952 1111 547 564 60.22
2562 416 Bakapur 1403 711 692 843 418 425 60.09
2563 417 Fatehpur 2050 1033 1017 1230 614 616 60.00
2564 418 Sidhu Harisingh 545 265 280 326 161 165 59.82
2565 419 Bhullar 253 140 113 151 86 65 59.68
2566 420 Bhangala 1450 710 740 863 429 434 59.52
2567 421 Phillaur 27 17 10 16 9 7 59.26
2568 422 Sherpur 1152 586 566 677 346 331 58.77
2569 423 Haripur 1929 978 951 1130 570 560 58.58
2570 424 Tehang 3620 1860 1760 2118 1084 1034 58.51
2571 425 Khaira 1501 779 722 877 446 431 58.43
2572 426 Ghurka 2924 1513 1411 1695 874 821 57.97
2573 427 Darapur 904 472 432 522 275 247 57.74
2574 428 Dholeta 3008 1536 1472 1719 882 837 57.15
2575 429 Takhar 757 389 368 431 222 209 56.94
2576 430 Gumtala 1226 643 583 697 376 321 56.85
2577 431 Pandori Musharkati 1543 776 767 877 442 435 56.84
2578 432 Cheema Khurd 974 505 469 552 298 254 56.67
2579 433 Gag Alias Dhagara 497 255 242 281 143 138 56.54
2580 434 Nagar 3187 1622 1565 1787 903 884 56.07
2581 435 Takhan Muzara 630 303 327 353 167 186 56.03
2582 436 Sangatpur 1076 533 543 600 294 306 55.76
2583 437 Nat 980 492 488 546 278 268 55.71
2584 438 Dhanda 1612 838 774 893 467 426 55.40
2585 439 Kandola Khurd 904 460 444 498 262 236 55.09
2586 440 Uppal Bhupa 1035 506 529 570 272 298 55.07
2587 441 Bhandal Himmat 942 493 449 518 265 253 54.99
2588 442 Moron 1987 955 1032 1092 535 557 54.96
2589 443 Paddi Khalsa 1364 689 675 749 379 370 54.91
2590 444 Sarhali 3083 1565 1518 1687 860 827 54.72
2591 445 Randhawa 730 346 384 397 190 207 54.38
2592 446 Chak Desraj 1147 582 565 623 309 314 54.32
2593 447 Lehal 1114 559 555 605 306 299 54.31
2594 448 Kang Araian 1122 594 528 609 316 293 54.28
2595 449 Nawan Pind Naicha 968 510 458 523 275 248 54.03
240

(In Nos.)Percentage
Total Sub Total Male Female Total Male Female (Col. 7 to 4)
1 2 3 4 5 6 7 8 9 10
Village countName of Village
Population SC Population
DISTRICTWISE VILLAGES HAVING 40% AND ABOVE SCHEDULED CASTES (SC) POPULATION IN THE STATE OF PUNJAB (CENSUS 2011)
2596 450 Shahpur 1722 890 832 930 474 456 54.01
2597 451 Phalpota 1736 853 883 936 456 480 53.92
2598 452 Dhindsa 1202 634 568 645 340 305 53.66
2599 453 Mau 3096 1582 1514 1658 865 793 53.55
2600 454 Rupowal 997 506 491 531 267 264 53.26
2601 455 Dhesian Sang 2122 1041 1081 1130 556 574 53.25
2602 456 Chak Dhotran 573 294 279 305 147 158 53.23
2603 457 Bachhowal 752 374 378 399 198 201 53.06
2604 458 Bhallowal 479 252 227 254 134 120 53.03
2605 459 Dialpur 1104 546 558 580 289 291 52.54
2606 460 Bath 634 337 297 331 178 153 52.21
2607 461 Bhandal Buta 709 339 370 370 177 193 52.19
2608 462 Danduwal 1287 663 624 668 343 325 51.90
2609 463 Shamsabad 1794 944 850 931 494 437 51.90
2610 464 Surja 690 336 354 355 180 175 51.45
2611 465 Lohgarh 770 415 355 395 214 181 51.30
2612 466 Birk 5264 2725 2539 2684 1376 1308 50.99
2613 467 Saifabad 1668 826 842 849 426 423 50.90
2614 468 Chhokran 2298 1179 1119 1169 595 574 50.87
2615 469 Mehsampur 1634 810 824 830 412 418 50.80
2616 470 Mithra 1579 793 786 798 412 386 50.54
2617 471 Bilga 10125 5182 4943 5094 2604 2490 50.31
2618 472 Muthadda Kalan 2400 1197 1203 1207 608 599 50.29
2619 473 Gursian Nihal 733 376 357 367 188 179 50.07
2620 474 Talwan 6262 3244 3018 3133 1616 1517 50.03
2621 475 Cheema Kalan 520 256 264 258 131 127 49.62
2622 476 Raipur Sagnewal 260 120 140 129 55 74 49.62
2623 477 Nahal 714 364 350 354 188 166 49.58
2624 478 Aujla 1160 587 573 559 287 272 48.19
2625 479 Paddi Jagir 1947 991 956 938 483 455 48.18
2626 480 Kang Jagir 1260 613 647 607 307 300 48.17
2627 481 Rajowal 1040 521 519 499 247 252 47.98
2628 482 Burj Pukhta 510 245 265 244 113 131 47.84
2629 483 Gumtali 1285 657 628 614 309 305 47.78
2630 484 Khela 639 323 316 305 154 151 47.73
2631 485 Tagar 858 454 404 407 218 189 47.44
2632 486 Qadian 346 191 155 164 97 67 47.40
2633 487 Pharwala 1709 883 826 810 436 374 47.40
2634 488 Kandola Kalan 3147 1618 1529 1488 768 720 47.28
2635 489 Cheema Khurd 1105 550 555 521 262 259 47.15
2636 490 Pal Qadiam 1063 546 517 500 263 237 47.04
2637 491 Jaja Kalan 979 495 484 457 235 222 46.68
2638 492 Chak Sahbu 1830 888 942 853 398 455 46.61
2639 493 Bhardwaji 976 492 484 452 232 220 46.31
241

(In Nos.)Percentage
Total Sub Total Male Female Total Male Female (Col. 7 to 4)
1 2 3 4 5 6 7 8 9 10
Village countName of Village
Population SC Population
DISTRICTWISE VILLAGES HAVING 40% AND ABOVE SCHEDULED CASTES (SC) POPULATION IN THE STATE OF PUNJAB (CENSUS 2011)
2640 494 Chachrari 1545 780 765 711 365 346 46.02
2641 495 Jaja Khurd 959 473 486 441 204 237 45.99
2642 496 Samrai 5408 2782 2626 2476 1273 1203 45.78
2643 497 Partappura 2770 1380 1390 1266 635 631 45.70
2644 498 Dosanjh Kalan 3883 1933 1950 1773 880 893 45.66
2645 499 Aujla 1693 869 824 770 413 357 45.48
2646 500 Atta 3093 1585 1508 1400 708 692 45.26
2647 501 Nurewal 215 110 105 96 51 45 44.65
2648 502 Dhesian Kahna 3324 1723 1601 1473 762 711 44.31
2649 503 Mathadda Khurd 1325 671 654 585 305 280 44.15
2650 504 Garhi Mahansingh 1231 596 635 542 270 272 44.03
2651 505 Samrari 2024 1041 983 886 467 419 43.77
2652 506 Sunar Khurd 1040 539 501 455 230 225 43.75
2653 507 Bara Pind 6327 3316 3011 2741 1431 1310 43.32
2654 508 Panj Dhera 3535 1896 1639 1528 829 699 43.22
2655 509 Nagra 596 296 300 257 126 131 43.12
2656 510 Pandori Jagir 711 372 339 296 156 140 41.63
2657 511 Rurka Khurd 3194 1640 1554 1321 670 651 41.36
2658 512 Ramewal 962 490 472 396 201 195 41.16
2659 513 Akalpur 1997 1033 964 822 418 404 41.16
2660 514 Shampur 654 313 341 269 134 135 41.13
2661 515 Saidowal 716 367 349 291 147 144 40.64
2662 516 Nanu Mazara 327 171 156 132 74 58 40.37
2663 517 Uppal Khalsa 1476 769 707 594 303 291 40.24
2664 518 Kangniwal 1180 617 563 473 233 240 40.08
2665 519 Chak Hathiana 370 174 196 365 172 193 98.65
2666 520 Chak Bundala 607 302 305 587 291 296 96.71
2667 521 Bhoyapur 678 346 332 642 327 315 94.69
2668 522 Jamsher 512 273 239 461 248 213 90.04
2669 523 Mundi Chohlian 797 400 397 706 352 354 88.58
2670 524 Thamunwal 802 421 381 690 359 331 86.03
2671 525 Mundi Shehrian 377 190 187 324 163 161 85.94
2672 526 Kakar Kalan 1456 784 672 1204 641 563 82.69
2673 527 Mandala 1699 882 817 1385 714 671 81.52
2674 528 Yusafpur Allewal 179 93 86 145 77 68 81.01
2675 529 Baupur 1407 709 698 1125 568 557 79.96
2676 530 Hazipur 498 255 243 398 204 194 79.92
2677 531 Chak Bahmanian 1029 517 512 820 405 415 79.69
2678 532 Rame 1218 628 590 954 481 473 78.33
2679 533 Burewal 313 165 148 231 124 107 73.80
2680 534 Langewal 262 134 128 190 101 89 72.52
2681 535 Pipli 1496 764 732 1078 546 532 72.06
2682 536 Kasupur 570 297 273 404 212 192 70.88
(v) ShahkotSub‐District
242

(In Nos.)Percentage
Total Sub Total Male Female Total Male Female (Col. 7 to 4)
1 2 3 4 5 6 7 8 9 10
Village countName of Village
Population SC Population
DISTRICTWISE VILLAGES HAVING 40% AND ABOVE SCHEDULED CASTES (SC) POPULATION IN THE STATE OF PUNJAB (CENSUS 2011)
2683 537 Aliwal 359 193 166 249 134 115 69.36
2684 538 Talwandi Butian 2889 1480 1409 1997 1022 975 69.12
2685 539 Billi Chaharmi 1537 770 767 1053 524 529 68.51
2686 540 Fakhruwal 304 157 147 208 106 102 68.42
2687 541 Chak Yusafpur Allewal 297 149 148 202 101 101 68.01
2688 542 Kutbiwal 312 170 142 212 114 98 67.95
2689 543 Saidpur Jhiri 1438 729 709 968 489 479 67.32
2690 544 Ida 864 445 419 578 297 281 66.90
2691 545 Kotli Gazran 1952 1013 939 1289 671 618 66.03
2692 546 Laksian 1357 696 661 887 452 435 65.36
2693 547 Sarangwal 789 414 375 515 277 238 65.27
2694 548 Kanian Khurd 562 285 277 365 185 180 64.95
2695 549 Kang Khurd 897 472 425 576 306 270 64.21
2696 550 Badshahpur 490 251 239 314 155 159 64.08
2697 551 Phul 591 307 284 369 193 176 62.44
2698 552 Kamalpur 533 276 257 330 171 159 61.91
2699 553 Taharpur 309 142 167 191 92 99 61.81
2700 554 Haveli 1324 676 648 810 423 387 61.18
2701 555 Mehmuwal Yusafpur 819 403 416 500 250 250 61.05
2702 556 Mianwal Araian 1093 560 533 667 334 333 61.02
2703 557 Sahlapur 492 254 238 299 154 145 60.77
2704 558 Sand 787 399 388 473 241 232 60.10
2705 559 Mulewal Araian 1002 514 488 602 310 292 60.08
2706 560 Chachowal 187 95 92 111 58 53 59.36
2707 561 Miani 692 372 320 409 219 190 59.10
2708 562 Gehlan 931 494 437 543 290 253 58.32
2709 563 Killi 736 360 376 419 211 208 56.93
2710 564 Balnau 817 443 374 460 245 215 56.30
2711 565 Kanian Kalan 1230 651 579 678 353 325 55.12
2712 566 Chawinda 145 73 72 79 39 40 54.48
2713 567 Raunt 885 472 413 481 257 224 54.35
2714 568 Jakopur Khurd 764 406 358 413 219 194 54.06
2715 569 Aidalpur 457 222 235 247 122 125 54.05
2716 570 Rampur 563 281 282 300 147 153 53.29
2717 571 Muridwal 864 449 415 459 240 219 53.13
2718 572 Salaich 948 489 459 503 265 238 53.06
2719 573 Mulewal Brahmana 683 355 328 362 188 174 53.00
2720 574 Danewal 1172 628 544 619 331 288 52.82
2721 575 Jafarwal 420 218 202 221 116 105 52.62
2722 576 Malliwal 628 331 297 330 180 150 52.55
2723 577 Gatta Mundi Kasu 992 515 477 518 266 252 52.22
2724 578 Parjian Kalan 1569 829 740 816 433 383 52.01
2725 579 Dhandowal 1873 987 886 973 514 459 51.95
2726 580 Nawanpind Akaliwala 566 290 276 290 149 141 51.24
243

(In Nos.)Percentage
Total Sub Total Male Female Total Male Female (Col. 7 to 4)
1 2 3 4 5 6 7 8 9 10
Village countName of Village
Population SC Population
DISTRICTWISE VILLAGES HAVING 40% AND ABOVE SCHEDULED CASTES (SC) POPULATION IN THE STATE OF PUNJAB (CENSUS 2011)
2727 581 Fazalwal 631 313 318 323 167 156 51.19
2728 582 Sadiqpur 1155 609 546 591 316 275 51.17
2729 583 Rupewali 1027 536 491 516 262 254 50.24
2730 584 Parjian Khurd 1227 624 603 607 298 309 49.47
2731 585 Samailpur 1065 551 514 525 268 257 49.30
2732 586 Indowal 1021 523 498 502 255 247 49.17
2733 587 Nangal Ambian 1582 806 776 769 388 381 48.61
2734 588 Bagga 1005 524 481 487 257 230 48.46
2735 589 Kotha 583 298 285 282 140 142 48.37
2736 590 Bhando 982 502 480 472 257 215 48.07
2737 591 Fatehpur 719 359 360 343 173 170 47.71
2738 592 Motipur 364 178 186 169 80 89 46.43
2739 593 Khanpur Rajputan 448 230 218 207 108 99 46.21
2740 594 Budhanwala 678 329 349 305 159 146 44.99
2741 595 Bahmanian 2146 1106 1040 958 490 468 44.64
2742 596 Nawan Qila 801 378 423 356 167 189 44.44
2743 597 Namazipur 402 200 202 178 89 89 44.28
2744 598 Tut Shersingh 571 294 277 249 130 119 43.61
2745 599 Jalalpur Khurd 723 371 352 315 166 149 43.57
2746 600 Mohriwal 372 195 177 160 91 69 43.01
2747 601 Pato Khurd 267 139 128 114 58 56 42.70
2748 602 Sohal Khalsa 568 289 279 237 126 111 41.73
2749 603 Shekhewal 303 162 141 125 64 61 41.25
2750 604 Malsian 1944 1003 941 789 407 382 40.59
2751 605 Sandhanwal 930 457 473 377 183 194 40.54
2752 1 Mand Dhakran 7 2 5 7 2 5 100.00
2753 2 Mand Ibrahimwal Tarf Gulam Nabi Khan 10 7 3 10 7 3 100.00
2754 3 Mand Maini Bhagu Purian 7 4 3 7 4 3 100.00
2755 4 Mand Miani Jhadduwala 44 19 25 44 19 25 100.00
2756 5 Mandi Mand Kulla 15 8 7 15 8 7 100.00
2757 6 Mand Faridkot 43 24 19 36 21 15 83.72
2758 7 Mand Sardar Sahibwala 145 79 66 120 63 57 82.76
2759 8 Mand Gurdaspur 45 25 20 36 19 17 80.00
2760 9 Shadipur 247 131 116 187 101 86 75.71
2761 10 Mand Allahabad 162 88 74 117 59 58 72.22
2762 11 Akbarpur 1175 584 591 564 290 274 48.00
2763 12 Sidhwan Bet 622 308 314 275 132 143 44.21
2764 13 Ballo Chak 1382 741 641 611 317 294 44.21
2765 14 Mubarakpur 675 338 337 297 158 139 44.00
2766 15 Dabulian 930 481 449 372 190 182 40.00
10. KAPURTHALA(i) Bhulath
DISTRICTSub‐District
244

(In Nos.)Percentage
Total Sub Total Male Female Total Male Female (Col. 7 to 4)
1 2 3 4 5 6 7 8 9 10
Village countName of Village
Population SC Population
DISTRICTWISE VILLAGES HAVING 40% AND ABOVE SCHEDULED CASTES (SC) POPULATION IN THE STATE OF PUNJAB (CENSUS 2011)
2767 16 Bana Malwala 111 51 60 111 51 60 100.00
2768 17 Bhaguwal 575 292 283 575 292 283 100.00
2769 18 Boot 3757 1979 1778 3715 1960 1755 98.88
2770 19 Nidoki 108 53 55 105 51 54 97.22
2771 20 Machhipal 303 154 149 292 146 146 96.37
2772 21 Qualpur 367 190 177 349 179 170 95.10
2773 22 Kishan Singhwala 1416 751 665 1338 716 622 94.49
2774 23 Fazlabad 735 397 338 690 373 317 93.88
2775 24 Nurpur Dona 1179 613 566 1101 571 530 93.38
2776 25 Waryah Dona 924 483 441 861 451 410 93.18
2777 26 Alaudi 147 74 73 134 69 65 91.16
2778 27 Jhal Thikriwala 1138 601 537 1016 530 486 89.28
2779 28 Nangal Naraingarh 148 81 67 130 72 58 87.84
2780 29 Mundi 1377 707 670 1151 588 563 83.59
2781 30 Alaudinpur 1171 612 559 953 502 451 81.38
2782 31 Peerewal 596 314 282 485 257 228 81.38
2783 32 Desal 1433 763 670 1161 614 547 81.02
2784 33 Dainwind 892 448 444 713 355 358 79.93
2785 34 Khanpur 1154 609 545 916 486 430 79.38
2786 35 Chuharwal 802 400 402 632 311 321 78.80
2787 36 Mainwan 837 438 399 652 343 309 77.90
2788 37 Kotli 443 220 223 341 176 165 76.98
2789 38 Tayabpur 464 258 206 355 203 152 76.51
2790 39 Behlolpur 603 312 291 461 237 224 76.45
2791 40 Khangah 501 253 248 382 186 196 76.25
2792 41 Bhila 686 364 322 521 273 248 75.95
2793 42 Badshahpur 817 419 398 618 307 311 75.64
2794 43 Rampur 394 213 181 298 155 143 75.63
2795 44 Hothian 560 286 274 423 211 212 75.54
2796 45 Pakhowal 629 337 292 469 257 212 74.56
2797 46 Bijli Nangal 478 252 226 349 177 172 73.01
2798 47 Fatehpur 409 213 196 293 155 138 71.64
2799 48 Talwandi Mehma 1396 715 681 984 510 474 70.49
2800 49 Hussainabad 594 321 273 413 222 191 69.53
2801 50 Gudani 593 308 285 400 209 191 67.45
2802 51 Mand Sangojla 419 228 191 281 158 123 67.06
2803 52 Jhugian Gulam 411 225 186 274 153 121 66.67
2804 53 Dhaliwal Dona 1504 782 722 1000 509 491 66.49
2805 54 Phulewal 590 306 284 392 206 186 66.44
2806 55 Chakoki 1891 987 904 1248 648 600 66.00
2807 56 Sheikhanwala 399 210 189 263 139 124 65.91
2808 57 Burewal 40 24 16 26 16 10 65.00
2809 58 Thigli 684 347 337 439 219 220 64.18
(ii) KapurthalaSub‐District
245

(In Nos.)Percentage
Total Sub Total Male Female Total Male Female (Col. 7 to 4)
1 2 3 4 5 6 7 8 9 10
Village countName of Village
Population SC Population
DISTRICTWISE VILLAGES HAVING 40% AND ABOVE SCHEDULED CASTES (SC) POPULATION IN THE STATE OF PUNJAB (CENSUS 2011)
2810 59 Mansurwal Dona 644 340 304 410 217 193 63.66
2811 60 Razapur 1627 862 765 1028 539 489 63.18
2812 61 Kapurthala (Rural) 4454 2358 2096 2769 1478 1291 62.17
2813 62 Paharipur 702 373 329 431 225 206 61.40
2814 63 Seenpur 855 440 415 523 266 257 61.17
2815 64 Chak 309 167 142 189 106 83 61.17
2816 65 Kadrabad 483 233 250 295 144 151 61.08
2817 66 Manan 585 268 317 355 168 187 60.68
2818 67 Lodhi Bholana 1130 594 536 680 353 327 60.18
2819 68 Kot Karar Khan 1858 954 904 1097 562 535 59.04
2820 69 Talwandi Rajputan 237 121 116 138 71 67 58.23
2821 70 Ghuluwal 122 71 51 71 42 29 58.20
2822 71 Beja 162 81 81 94 45 49 58.02
2823 72 Dulowal 946 504 442 548 299 249 57.93
2824 73 Buh 1526 784 742 882 449 433 57.80
2825 74 Ladhewal 47 24 23 27 14 13 57.45
2826 75 Tajpur 669 345 324 383 201 182 57.25
2827 76 Khukhrain 1576 860 716 900 497 403 57.11
2828 77 Talwandi Pain 630 334 296 358 184 174 56.83
2829 78 Kamewal 132 64 68 75 35 40 56.82
2830 79 Shahpur Pira 1049 627 422 594 308 286 56.63
2831 80 Kadupur 1068 553 515 582 301 281 54.49
2832 81 Bhooi 1178 613 565 641 333 308 54.41
2833 82 Dewlanwala 932 497 435 505 264 241 54.18
2834 83 Banwalipur 713 362 351 386 194 192 54.14
2835 84 Hamira 7727 4234 3493 4158 2223 1935 53.81
2836 85 Fattu Chak 783 407 376 419 213 206 53.51
2837 86 Malian 865 433 432 457 227 230 52.83
2838 87 Dhandal 524 261 263 275 137 138 52.48
2839 88 Jalowal 435 212 223 227 121 106 52.18
2840 89 Jai Rampur 598 309 289 306 163 143 51.17
2841 90 Jawalapur 309 168 141 158 84 74 51.13
2842 91 Daburji 921 468 453 470 245 225 51.03
2843 92 Sheikhupur 1678 862 816 826 429 397 49.23
2844 93 Ratra 452 257 195 220 126 94 48.67
2845 94 Karahal Khurd 315 158 157 153 78 75 48.57
2846 95 Mehmadwal 867 448 419 420 220 200 48.44
2847 96 Ghaniaki 517 277 240 249 129 120 48.16
2848 97 Nihalgarh 479 250 229 228 117 111 47.60
2849 98 Mangewal 574 284 290 273 138 135 47.56
2850 99 Ghug 612 318 294 290 152 138 47.39
2851 100 Nurpur Januhan 707 358 349 331 176 155 46.82
2852 101 Sangojla 1767 893 874 827 425 402 46.80
2853 102 Phiali 576 285 291 269 129 140 46.70
246
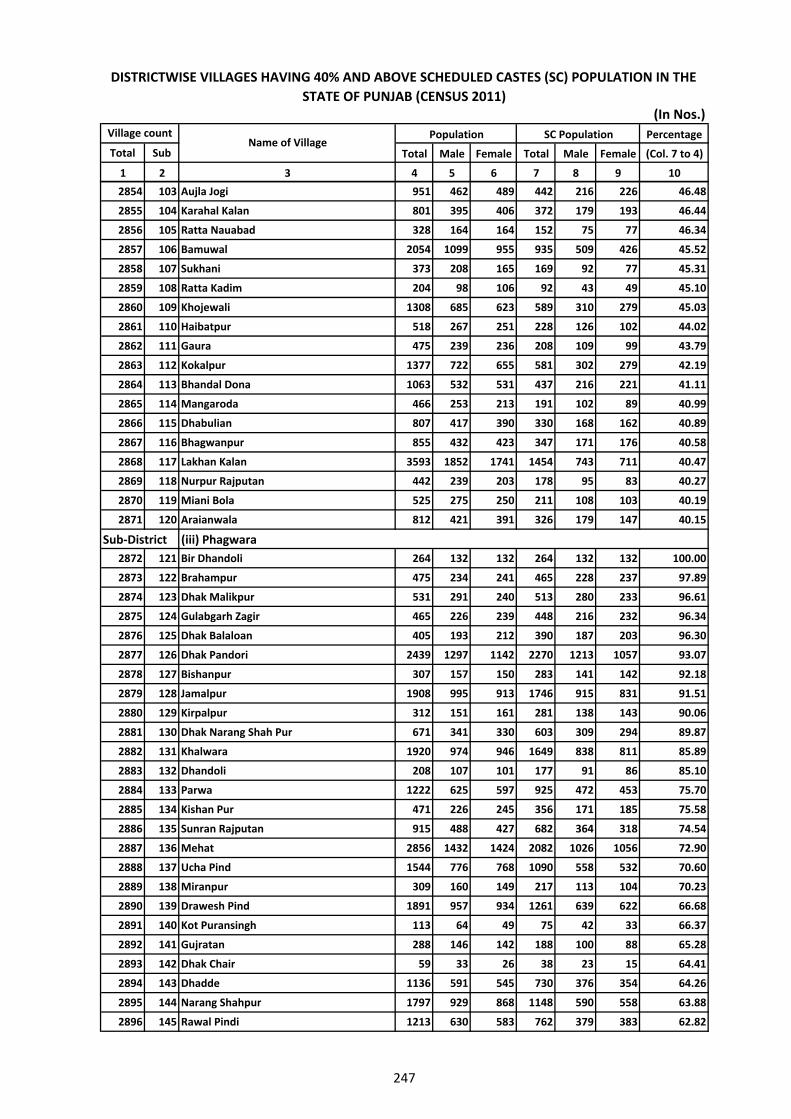
(In Nos.)Percentage
Total Sub Total Male Female Total Male Female (Col. 7 to 4)
1 2 3 4 5 6 7 8 9 10
Village countName of Village
Population SC Population
DISTRICTWISE VILLAGES HAVING 40% AND ABOVE SCHEDULED CASTES (SC) POPULATION IN THE STATE OF PUNJAB (CENSUS 2011)
2854 103 Aujla Jogi 951 462 489 442 216 226 46.48
2855 104 Karahal Kalan 801 395 406 372 179 193 46.44
2856 105 Ratta Nauabad 328 164 164 152 75 77 46.34
2857 106 Bamuwal 2054 1099 955 935 509 426 45.52
2858 107 Sukhani 373 208 165 169 92 77 45.31
2859 108 Ratta Kadim 204 98 106 92 43 49 45.10
2860 109 Khojewali 1308 685 623 589 310 279 45.03
2861 110 Haibatpur 518 267 251 228 126 102 44.02
2862 111 Gaura 475 239 236 208 109 99 43.79
2863 112 Kokalpur 1377 722 655 581 302 279 42.19
2864 113 Bhandal Dona 1063 532 531 437 216 221 41.11
2865 114 Mangaroda 466 253 213 191 102 89 40.99
2866 115 Dhabulian 807 417 390 330 168 162 40.89
2867 116 Bhagwanpur 855 432 423 347 171 176 40.58
2868 117 Lakhan Kalan 3593 1852 1741 1454 743 711 40.47
2869 118 Nurpur Rajputan 442 239 203 178 95 83 40.27
2870 119 Miani Bola 525 275 250 211 108 103 40.19
2871 120 Araianwala 812 421 391 326 179 147 40.15
2872 121 Bir Dhandoli 264 132 132 264 132 132 100.00
2873 122 Brahampur 475 234 241 465 228 237 97.89
2874 123 Dhak Malikpur 531 291 240 513 280 233 96.61
2875 124 Gulabgarh Zagir 465 226 239 448 216 232 96.34
2876 125 Dhak Balaloan 405 193 212 390 187 203 96.30
2877 126 Dhak Pandori 2439 1297 1142 2270 1213 1057 93.07
2878 127 Bishanpur 307 157 150 283 141 142 92.18
2879 128 Jamalpur 1908 995 913 1746 915 831 91.51
2880 129 Kirpalpur 312 151 161 281 138 143 90.06
2881 130 Dhak Narang Shah Pur 671 341 330 603 309 294 89.87
2882 131 Khalwara 1920 974 946 1649 838 811 85.89
2883 132 Dhandoli 208 107 101 177 91 86 85.10
2884 133 Parwa 1222 625 597 925 472 453 75.70
2885 134 Kishan Pur 471 226 245 356 171 185 75.58
2886 135 Sunran Rajputan 915 488 427 682 364 318 74.54
2887 136 Mehat 2856 1432 1424 2082 1026 1056 72.90
2888 137 Ucha Pind 1544 776 768 1090 558 532 70.60
2889 138 Miranpur 309 160 149 217 113 104 70.23
2890 139 Drawesh Pind 1891 957 934 1261 639 622 66.68
2891 140 Kot Puransingh 113 64 49 75 42 33 66.37
2892 141 Gujratan 288 146 142 188 100 88 65.28
2893 142 Dhak Chair 59 33 26 38 23 15 64.41
2894 143 Dhadde 1136 591 545 730 376 354 64.26
2895 144 Narang Shahpur 1797 929 868 1148 590 558 63.88
2896 145 Rawal Pindi 1213 630 583 762 379 383 62.82
(iii) PhagwaraSub‐District
247

(In Nos.)Percentage
Total Sub Total Male Female Total Male Female (Col. 7 to 4)
1 2 3 4 5 6 7 8 9 10
Village countName of Village
Population SC Population
DISTRICTWISE VILLAGES HAVING 40% AND ABOVE SCHEDULED CASTES (SC) POPULATION IN THE STATE OF PUNJAB (CENSUS 2011)
2897 146 Rampur Sunran 1557 795 762 978 509 469 62.81
2898 147 Madhopur 2036 1002 1034 1259 610 649 61.84
2899 148 Maheru 1704 884 820 1042 538 504 61.15
2900 149 Sangatpur 2263 1163 1100 1371 706 665 60.58
2901 150 Dhak Khalwara 1011 510 501 612 310 302 60.53
2902 151 Nangal 3082 1663 1419 1822 967 855 59.12
2903 152 Gandhwan 1454 758 696 858 447 411 59.01
2904 153 Jagatpur Jattan 2488 1287 1201 1456 754 702 58.52
2905 154 Bhabiana 1813 957 856 1048 556 492 57.80
2906 155 Ranipur Rajputan 1595 801 794 914 455 459 57.30
2907 156 Bir Pwahad 440 225 215 249 128 121 56.59
2908 157 Hradaspur 1472 711 761 831 406 425 56.45
2909 158 Akalgarh 1104 561 543 619 318 301 56.07
2910 159 Domeli 2075 1078 997 1152 598 554 55.52
2911 160 Chak Hakim 2386 1339 1047 1304 683 621 54.65
2912 161 Barn 1106 553 553 601 297 304 54.34
2913 162 Khera 2398 1200 1198 1257 652 605 52.42
2914 163 Bhagana 2839 1493 1346 1469 781 688 51.74
2915 164 Chaheru 2458 1248 1210 1264 621 643 51.42
2916 165 Balaloan 133 77 56 68 39 29 51.13
2917 166 Dhak Plahi 263 146 117 134 68 66 50.95
2918 167 Jagpalpur 1676 851 825 818 412 406 48.81
2919 168 Bhanoki 2351 1220 1131 1134 584 550 48.23
2920 169 Mauli 3285 1686 1599 1578 813 765 48.04
2921 170 Nangal Majha 2053 1038 1015 975 476 499 47.49
2922 171 Nihalgarh 590 307 283 279 145 134 47.29
2923 172 Bazindowal 477 243 234 221 119 102 46.33
2924 173 Thakar Ki 733 375 358 334 180 154 45.57
2925 174 Bhullarai 4133 2136 1997 1883 982 901 45.56
2926 175 Chair 753 395 358 343 175 168 45.55
2927 176 Wahid 963 494 469 431 227 204 44.76
2928 177 Bhakhriana 1512 783 729 675 349 326 44.64
2929 178 Bohani 1346 688 658 595 294 301 44.21
2930 179 Plahi 2745 1457 1288 1176 588 588 42.84
2931 180 Saprore 1407 759 648 592 321 271 42.08
2932 181 Rehana Jattan 2621 1386 1235 1102 586 516 42.05
2933 182 Dug 694 366 328 284 158 126 40.92
2934 183 Atholi 1342 705 637 547 287 260 40.76
2935 184 Prempur 546 287 259 221 123 98 40.48
2936 185 Naroor 2846 1446 1400 1140 581 559 40.06
2937 186 Khajurla 1731 881 850 693 356 337 40.03
2938 187 Faridpur 194 95 99 194 95 99 100.00
2939 188 Patti Safdarpur 75 33 42 75 33 42 100.00
(iv) Sultanpur LodhiSub‐District
248

(In Nos.)Percentage
Total Sub Total Male Female Total Male Female (Col. 7 to 4)
1 2 3 4 5 6 7 8 9 10
Village countName of Village
Population SC Population
DISTRICTWISE VILLAGES HAVING 40% AND ABOVE SCHEDULED CASTES (SC) POPULATION IN THE STATE OF PUNJAB (CENSUS 2011)
2940 189 Safdarpur 5 4 1 5 4 1 100.00
2941 190 Bhaini Husekhan 622 335 287 620 333 287 99.68
2942 191 Toti 1207 637 570 1186 627 559 98.26
2943 192 Baja 1210 604 606 1180 587 593 97.52
2944 193 Latianwala 1910 994 916 1856 966 890 97.17
2945 194 Amritpur 1587 815 772 1475 754 721 92.94
2946 195 Kutbewala 493 253 240 434 221 213 88.03
2947 196 Shiv Dayalwala 387 203 184 339 179 160 87.60
2948 197 Pitho Rahal 641 347 294 542 293 249 84.56
2949 198 Hussainpur Dulowal 1238 644 594 1040 535 505 84.01
2950 199 Sech 1215 635 580 1000 523 477 82.30
2951 200 Mand Inderpur 159 78 81 130 61 69 81.76
2952 201 Mullan Baha 473 240 233 378 194 184 79.92
2953 202 Rawal 152 78 74 119 64 55 78.29
2954 203 Lakh Waryah 651 343 308 488 255 233 74.96
2955 204 Sabuwal 870 467 403 649 361 288 74.60
2956 205 Haidrabad Dona 73 38 35 53 28 25 72.60
2957 206 Salehpur 867 431 436 609 297 312 70.24
2958 207 Mandi Alluwal 192 93 99 134 66 68 69.79
2959 208 Jhugian Araian 16 7 9 11 5 6 68.75
2960 209 Dodawazir 301 169 132 203 116 87 67.44
2961 210 Farid Sarai 1505 751 754 984 494 490 65.38
2962 211 Derasaidan 767 420 347 499 276 223 65.06
2963 212 Khijarpur 620 334 286 393 208 185 63.39
2964 213 Masit 1330 715 615 837 454 383 62.93
2965 214 Mirzapur 322 171 151 199 100 99 61.80
2966 215 Shahdullahpur 471 247 224 288 152 136 61.15
2967 216 Ahmedpur 671 345 326 408 211 197 60.80
2968 217 Haidrabad Bet 391 203 188 237 126 111 60.61
2969 218 Ucha 811 423 388 484 247 237 59.68
2970 219 Amanipur 399 202 197 225 113 112 56.39
2971 220 Kalru 1120 579 541 611 313 298 54.55
2972 221 Nasirewal 621 316 305 329 163 166 52.98
2973 222 Maniala 421 210 211 223 107 116 52.97
2974 223 Mullan Kala 258 139 119 136 77 59 52.71
2975 224 Depewal 1248 659 589 646 334 312 51.76
2976 225 Allahditta 1564 814 750 808 437 371 51.66
2977 226 Mand Munda 2 2 0 1 1 0 50.00
2978 227 Bharowana 672 357 315 330 169 161 49.11
2979 228 Alahdad Chak 889 462 427 432 226 206 48.59
2980 229 Kamalpur 2703 1430 1273 1306 689 617 48.32
2981 230 Kabirpur 940 479 461 448 224 224 47.66
2982 231 Alluwal 366 180 186 172 79 93 46.99
2983 232 Mira 287 141 146 133 65 68 46.34
249

(In Nos.)Percentage
Total Sub Total Male Female Total Male Female (Col. 7 to 4)
1 2 3 4 5 6 7 8 9 10
Village countName of Village
Population SC Population
DISTRICTWISE VILLAGES HAVING 40% AND ABOVE SCHEDULED CASTES (SC) POPULATION IN THE STATE OF PUNJAB (CENSUS 2011)
2984 233 Ahli Khurd 412 226 186 189 100 89 45.87
2985 234 Dalla 1557 806 751 713 376 337 45.79
2986 235 Hazipur 300 153 147 137 61 76 45.67
2987 236 Bhago Arain 864 460 404 392 209 183 45.37
2988 237 Miani Bahadur 514 266 248 226 120 106 43.97
2989 238 Pandori Jagir 577 299 278 253 136 117 43.85
2990 239 Talwandi Chaudhrian 7217 3762 3455 3122 1634 1488 43.26
2991 240 Busowal 1208 630 578 520 263 257 43.05
2992 241 Bhagobudha 480 271 209 204 111 93 42.50
2993 242 Jabo Sudhar 614 324 290 260 129 131 42.35
2994 243 Sarai Jattan 678 336 342 286 148 138 42.18
2995 244 Shahwala Indresa 847 432 415 357 178 179 42.15
2996 245 Nurowal 468 249 219 197 101 96 42.09
2997 246 Todarwal 392 192 200 163 75 88 41.58
2998 247 Dadwindi 2284 1174 1110 943 493 450 41.29
2999 248 Khurd 419 210 209 169 87 82 40.33
3000 1 Ahingran 88 46 42 88 46 42 100.00
3001 2 Gag Kalan 499 257 242 499 257 242 100.00
3002 3 Sherewala 855 429 426 850 425 425 99.42
3003 4 Hujra 590 297 293 583 293 290 98.81
3004 5 Akuwal 446 210 236 439 205 234 98.43
3005 6 Hayatewal 61 27 34 60 26 34 98.36
3006 7 Khurshedpur 1095 557 538 1072 543 529 97.90
3007 8 Gorsian Khan Mohammad 921 452 469 893 439 454 96.96
3008 9 Kot Umra 376 194 182 362 186 176 96.28
3009 10 Kanian Hussaini 1495 761 734 1437 729 708 96.12
3010 11 Bhaini Gujjran 784 400 384 753 380 373 96.05
3011 12 Maniewal 273 138 135 260 129 131 95.24
3012 13 Mand Tihara 205 109 96 190 100 90 92.68
3013 14 Talwandi Nauabad 571 302 269 525 274 251 91.94
3014 15 Baghian 1244 648 596 1140 593 547 91.64
3015 16 Bahadarke 901 458 443 803 404 399 89.12
3016 17 Ghumnewal 830 432 398 717 377 340 86.39
3017 18 Tapar Harnian 231 118 113 193 100 93 83.55
3018 19 Baniawal 207 110 97 171 92 79 82.61
3019 20 Sheikh Qutab 462 243 219 364 189 175 78.79
3020 21 Tarf Kotli 489 256 233 383 200 183 78.32
3021 22 Bhaini Araian 884 459 425 688 365 323 77.83
3022 23 Parjian Biharipur 1400 705 695 1080 545 535 77.14
3023 24 Maddepur 1186 620 566 914 474 440 77.07
3024 25 Gorsian Qadar Baksh 651 342 309 497 268 229 76.34
3025 26 Ranke 569 310 259 433 236 197 76.10
11. LUDHIANA(i) Jagraon
DISTRICTSub‐District
250

(In Nos.)Percentage
Total Sub Total Male Female Total Male Female (Col. 7 to 4)
1 2 3 4 5 6 7 8 9 10
Village countName of Village
Population SC Population
DISTRICTWISE VILLAGES HAVING 40% AND ABOVE SCHEDULED CASTES (SC) POPULATION IN THE STATE OF PUNJAB (CENSUS 2011)
3026 27 Aliwal 1047 534 513 794 398 396 75.84
3027 28 Talwara 1438 738 700 1086 557 529 75.52
3028 29 Gagra 1280 671 609 943 501 442 73.67
3029 30 Walipur Khurd 735 368 367 536 268 268 72.93
3030 31 Agwar Lopon Kalan 1230 646 584 884 457 427 71.87
3031 32 Kotli 354 192 162 251 133 118 70.90
3032 33 Agwar Gujjran 5728 3021 2707 4045 2124 1921 70.62
3033 34 Manwarpura 266 137 129 184 93 91 69.17
3034 35 Malsian Bajan 1996 1049 947 1339 708 631 67.08
3035 36 Agwar Ladhai 670 350 320 448 232 216 66.87
3036 37 Kot Mana 1104 564 540 728 359 369 65.94
3037 38 Malsian Bhaike 938 503 435 615 323 292 65.57
3038 39 Bhundri 4131 2138 1993 2634 1372 1262 63.76
3039 40 Fatehgarh Sibian 1094 584 510 667 362 305 60.97
3040 41 Patti Multani 767 396 371 456 239 217 59.45
3041 42 Shafipura 441 235 206 261 140 121 59.18
3042 43 Leelan 3997 2106 1891 2347 1249 1098 58.72
3043 44 Bir Gagra 667 333 334 368 201 167 55.17
3044 45 Bir Akhara 62 32 30 34 17 17 54.84
3045 46 Agwar Khawaja Baju 4667 2484 2183 2541 1332 1209 54.45
3046 47 Bhatha Dhua 1469 772 697 778 408 370 52.96
3047 48 Bodalwala 1500 758 742 788 386 402 52.53
3048 49 Shahid Rachhpal Singh Nagar Urf Aligarh 757 390 367 395 209 186 52.18
3049 50 Bhamal 1013 534 479 523 274 249 51.63
3050 51 Sidhwan Kalan 4132 2173 1959 2100 1127 973 50.82
3051 52 Rasulpur Jandi 1348 705 643 684 368 316 50.74
3052 53 Bharowal Khurd 340 170 170 172 88 84 50.59
3053 54 Sadarpura 1413 756 657 712 388 324 50.39
3054 55 Majri 1333 708 625 668 358 310 50.11
3055 56 Abupura 1735 893 842 864 448 416 49.80
3056 57 Kakar 1564 814 750 778 399 379 49.74
3057 58 Bardeke 1338 701 637 665 343 322 49.70
3058 59 Sherpur Kalan 5471 2869 2602 2676 1404 1272 48.91
3059 60 Kaunke 11081 5847 5234 5380 2840 2540 48.55
3060 61 Walipur Kalan 1053 561 492 508 261 247 48.24
3061 62 Madarpura 676 357 319 324 178 146 47.93
3062 63 Galib Khurd 1359 722 637 649 352 297 47.76
3063 64 Sheikhupura 1727 897 830 814 416 398 47.13
3064 65 Mallah 5114 2712 2402 2394 1263 1131 46.81
3065 66 Malak 4722 2446 2276 2202 1167 1035 46.63
3066 67 Barsal 1952 1023 929 908 477 431 46.52
3067 68 Salempura 2931 1524 1407 1355 691 664 46.23
3068 69 Khosa 1813 899 914 815 396 419 44.95
251

(In Nos.)Percentage
Total Sub Total Male Female Total Male Female (Col. 7 to 4)
1 2 3 4 5 6 7 8 9 10
Village countName of Village
Population SC Population
DISTRICTWISE VILLAGES HAVING 40% AND ABOVE SCHEDULED CASTES (SC) POPULATION IN THE STATE OF PUNJAB (CENSUS 2011)
3069 70 Chhajjawal 2877 1501 1376 1291 653 638 44.87
3070 71 Galib Kalan 6825 3579 3246 3060 1641 1419 44.84
3071 72 Bassian 1661 866 795 744 398 346 44.79
3072 73 Amargarh Urf Kaler 2383 1214 1169 1053 548 505 44.19
3073 74 Chima 1619 833 786 698 355 343 43.11
3074 75 Giddarwindi 2392 1245 1147 1020 535 485 42.64
3075 76 Chachrari 1553 819 734 660 356 304 42.50
3076 77 Hathur 7444 3954 3490 3144 1714 1430 42.24
3077 78 Akhara 4548 2450 2098 1902 1003 899 41.82
3078 79 Sujapur 1478 762 716 605 314 291 40.93
3079 80 Swaddi Kalan 4804 2586 2218 1936 1040 896 40.30
3080 81 Manak Majra 1839 958 881 1603 840 763 87.17
3081 82 Kamma 1065 553 512 825 432 393 77.46
3082 83 Alipur 755 402 353 566 299 267 74.97
3083 84 Ghungrali 2172 1120 1052 1479 759 720 68.09
3084 85 Bhadla Nicha 2141 1124 1017 1441 756 685 67.30
3085 86 Gazipur 437 225 212 280 141 139 64.07
3086 87 Bahu Majra 1268 650 618 797 407 390 62.85
3087 88 Rattanheri 1285 664 621 777 395 382 60.47
3088 89 Raipur 868 452 416 522 272 250 60.14
3089 90 Majri 1475 797 678 848 449 399 57.49
3090 91 Mandiala Kalan 1797 917 880 1033 515 518 57.48
3091 92 Mehandipur 1016 541 475 576 306 270 56.69
3092 93 Turmari 1045 535 510 588 301 287 56.27
3093 94 Ramgarh 1398 758 640 780 418 362 55.79
3094 95 Lalheri 2278 1226 1052 1265 677 588 55.53
3095 96 Gaggar Majra 620 324 296 330 175 155 53.23
3096 97 Fatehpur 300 168 132 158 88 70 52.67
3097 98 Bir Kishan Singh 118 63 55 62 36 26 52.54
3098 99 Faizgarh 1253 673 580 653 356 297 52.11
3099 100 Kishangarh 967 487 480 497 262 235 51.40
3100 101 Ikolaha 4241 2246 1995 2155 1136 1019 50.81
3101 102 Jalajan 1150 604 546 574 288 286 49.91
3102 103 Harion Kalan 1428 735 693 698 358 340 48.88
3103 104 Taunsa 917 468 449 445 238 207 48.53
3104 105 Kauri 2309 1239 1070 1116 584 532 48.33
3105 106 Baghaur 865 478 387 418 236 182 48.32
3106 107 Bibipur 991 540 451 463 264 199 46.72
3107 108 Libra 2226 1154 1072 1034 541 493 46.45
3108 109 Mohanpur 1563 807 756 723 381 342 46.26
3109 110 Rohnon Khurd 1050 557 493 485 262 223 46.19
3110 111 Kot Sheikhon 1194 678 516 549 294 255 45.98
3111 112 Khatra 1404 742 662 641 348 293 45.66
(ii) KhanaSub‐District
252

(In Nos.)Percentage
Total Sub Total Male Female Total Male Female (Col. 7 to 4)
1 2 3 4 5 6 7 8 9 10
Village countName of Village
Population SC Population
DISTRICTWISE VILLAGES HAVING 40% AND ABOVE SCHEDULED CASTES (SC) POPULATION IN THE STATE OF PUNJAB (CENSUS 2011)
3112 113 Kotpanech 974 520 454 443 237 206 45.48
3113 114 Majra Rahaon 1029 532 497 466 248 218 45.29
3114 115 Sahibpura 527 286 241 237 134 103 44.97
3115 116 Jatana 2319 1200 1119 1039 548 491 44.80
3116 117 Chak Sarai 1534 788 746 685 341 344 44.65
3117 118 Bhadla Uncha 1030 535 495 459 242 217 44.56
3118 119 Boothgarh 1190 616 574 528 277 251 44.37
3119 120 Khurd 217 115 102 92 45 47 42.40
3120 121 Bija 3167 1672 1495 1311 696 615 41.40
3121 122 Ikolahi 1874 984 890 775 419 356 41.36
3122 123 Hol 1475 783 692 600 325 275 40.68
3123 124 Naraingarh 1009 537 472 409 218 191 40.54
3124 125 Goh 2879 1471 1408 1165 594 571 40.47
3125 126 Garhi Sheru 155 85 70 155 85 70 100.00
3126 127 Shekhewal 290 148 142 278 142 136 95.86
3127 128 Khanpur Bet 130 65 65 123 62 61 94.62
3128 129 Jhugian Bega 367 191 176 337 173 164 91.83
3129 130 Bhupana 276 138 138 250 125 125 90.58
3130 131 Mallewal 392 222 170 351 201 150 89.54
3131 132 Rawat 472 220 252 419 197 222 88.77
3132 133 Laton Dana 660 358 302 584 316 268 88.48
3133 134 Bahadurpur 359 183 176 313 158 155 87.19
3134 135 Sherian 563 302 261 473 254 219 84.01
3135 136 Gehlewal 418 213 205 348 178 170 83.25
3136 137 Baura 1112 584 528 876 462 414 78.78
3137 138 Kalewal 441 234 207 345 182 163 78.23
3138 139 Paharuwal 591 299 292 462 230 232 78.17
3139 140 Walipur 475 241 234 358 178 180 75.37
3140 141 Salempur 527 273 254 389 200 189 73.81
3141 142 Kariana Kalan 1554 832 722 1145 607 538 73.68
3142 143 Sirah 2085 1149 936 1525 832 693 73.14
3143 144 Balliawal 2008 1063 945 1430 757 673 71.22
3144 145 Saya Kalan 2055 1085 970 1434 761 673 69.78
3145 146 Bhaini Kima 298 158 140 204 107 97 68.46
3146 147 Chaunta 2295 1190 1105 1546 799 747 67.36
3147 148 Hayatpura 446 231 215 298 156 142 66.82
3148 149 Mattewara 1435 753 682 951 500 451 66.27
3149 150 Khawajke 911 491 420 595 324 271 65.31
3150 151 Dholanwal 1914 1040 874 1241 671 570 64.84
3151 152 Hadiwal 408 212 196 264 136 128 64.71
3152 153 Gadapur 332 182 150 205 108 97 61.75
3153 154 Bholapur 1210 623 587 718 374 344 59.34
3154 155 Mangat 2352 1244 1108 1377 734 643 58.55
(iii) Ludhiana (East)Sub‐District
253
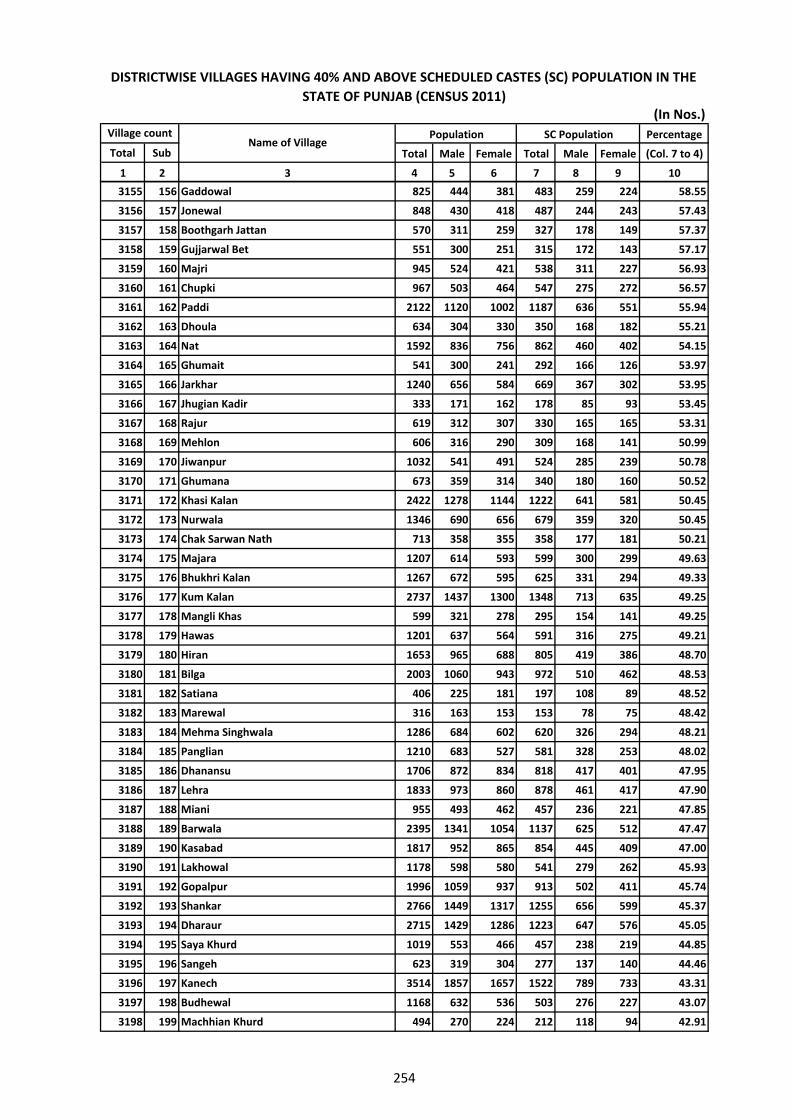
(In Nos.)Percentage
Total Sub Total Male Female Total Male Female (Col. 7 to 4)
1 2 3 4 5 6 7 8 9 10
Village countName of Village
Population SC Population
DISTRICTWISE VILLAGES HAVING 40% AND ABOVE SCHEDULED CASTES (SC) POPULATION IN THE STATE OF PUNJAB (CENSUS 2011)
3155 156 Gaddowal 825 444 381 483 259 224 58.55
3156 157 Jonewal 848 430 418 487 244 243 57.43
3157 158 Boothgarh Jattan 570 311 259 327 178 149 57.37
3158 159 Gujjarwal Bet 551 300 251 315 172 143 57.17
3159 160 Majri 945 524 421 538 311 227 56.93
3160 161 Chupki 967 503 464 547 275 272 56.57
3161 162 Paddi 2122 1120 1002 1187 636 551 55.94
3162 163 Dhoula 634 304 330 350 168 182 55.21
3163 164 Nat 1592 836 756 862 460 402 54.15
3164 165 Ghumait 541 300 241 292 166 126 53.97
3165 166 Jarkhar 1240 656 584 669 367 302 53.95
3166 167 Jhugian Kadir 333 171 162 178 85 93 53.45
3167 168 Rajur 619 312 307 330 165 165 53.31
3168 169 Mehlon 606 316 290 309 168 141 50.99
3169 170 Jiwanpur 1032 541 491 524 285 239 50.78
3170 171 Ghumana 673 359 314 340 180 160 50.52
3171 172 Khasi Kalan 2422 1278 1144 1222 641 581 50.45
3172 173 Nurwala 1346 690 656 679 359 320 50.45
3173 174 Chak Sarwan Nath 713 358 355 358 177 181 50.21
3174 175 Majara 1207 614 593 599 300 299 49.63
3175 176 Bhukhri Kalan 1267 672 595 625 331 294 49.33
3176 177 Kum Kalan 2737 1437 1300 1348 713 635 49.25
3177 178 Mangli Khas 599 321 278 295 154 141 49.25
3178 179 Hawas 1201 637 564 591 316 275 49.21
3179 180 Hiran 1653 965 688 805 419 386 48.70
3180 181 Bilga 2003 1060 943 972 510 462 48.53
3181 182 Satiana 406 225 181 197 108 89 48.52
3182 183 Marewal 316 163 153 153 78 75 48.42
3183 184 Mehma Singhwala 1286 684 602 620 326 294 48.21
3184 185 Panglian 1210 683 527 581 328 253 48.02
3185 186 Dhanansu 1706 872 834 818 417 401 47.95
3186 187 Lehra 1833 973 860 878 461 417 47.90
3187 188 Miani 955 493 462 457 236 221 47.85
3188 189 Barwala 2395 1341 1054 1137 625 512 47.47
3189 190 Kasabad 1817 952 865 854 445 409 47.00
3190 191 Lakhowal 1178 598 580 541 279 262 45.93
3191 192 Gopalpur 1996 1059 937 913 502 411 45.74
3192 193 Shankar 2766 1449 1317 1255 656 599 45.37
3193 194 Dharaur 2715 1429 1286 1223 647 576 45.05
3194 195 Saya Khurd 1019 553 466 457 238 219 44.85
3195 196 Sangeh 623 319 304 277 137 140 44.46
3196 197 Kanech 3514 1857 1657 1522 789 733 43.31
3197 198 Budhewal 1168 632 536 503 276 227 43.07
3198 199 Machhian Khurd 494 270 224 212 118 94 42.91
254
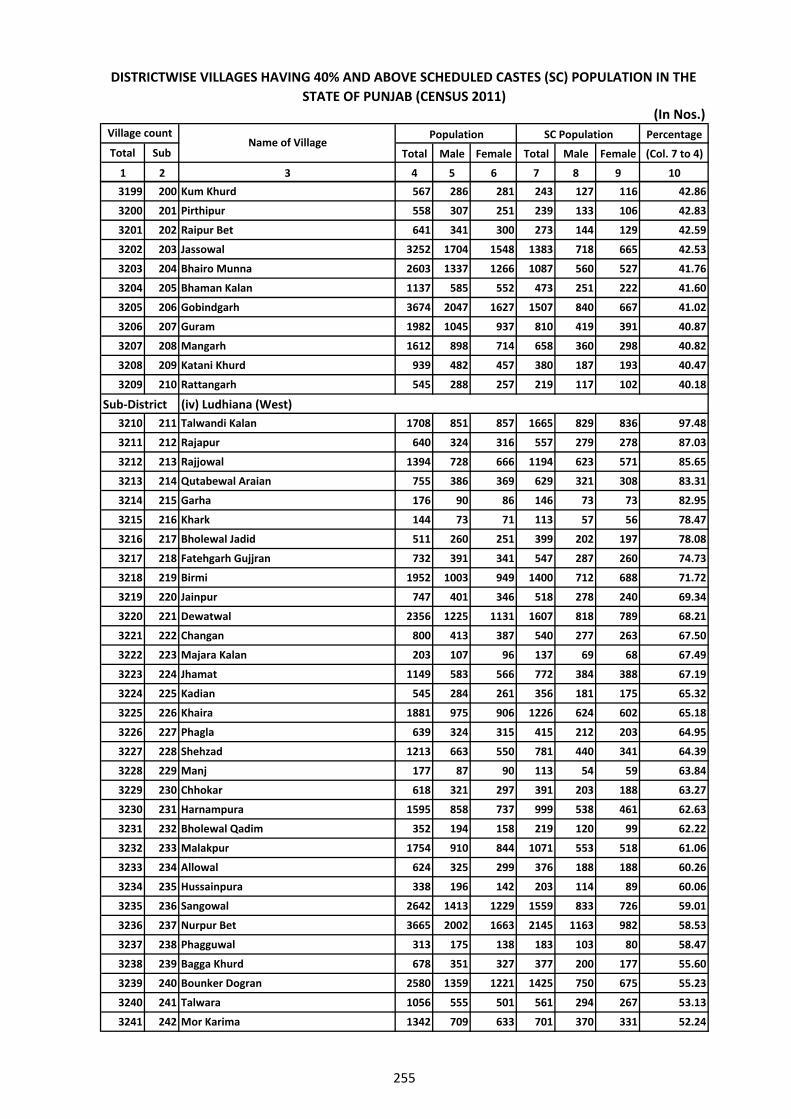
(In Nos.)Percentage
Total Sub Total Male Female Total Male Female (Col. 7 to 4)
1 2 3 4 5 6 7 8 9 10
Village countName of Village
Population SC Population
DISTRICTWISE VILLAGES HAVING 40% AND ABOVE SCHEDULED CASTES (SC) POPULATION IN THE STATE OF PUNJAB (CENSUS 2011)
3199 200 Kum Khurd 567 286 281 243 127 116 42.86
3200 201 Pirthipur 558 307 251 239 133 106 42.83
3201 202 Raipur Bet 641 341 300 273 144 129 42.59
3202 203 Jassowal 3252 1704 1548 1383 718 665 42.53
3203 204 Bhairo Munna 2603 1337 1266 1087 560 527 41.76
3204 205 Bhaman Kalan 1137 585 552 473 251 222 41.60
3205 206 Gobindgarh 3674 2047 1627 1507 840 667 41.02
3206 207 Guram 1982 1045 937 810 419 391 40.87
3207 208 Mangarh 1612 898 714 658 360 298 40.82
3208 209 Katani Khurd 939 482 457 380 187 193 40.47
3209 210 Rattangarh 545 288 257 219 117 102 40.18
3210 211 Talwandi Kalan 1708 851 857 1665 829 836 97.48
3211 212 Rajapur 640 324 316 557 279 278 87.03
3212 213 Rajjowal 1394 728 666 1194 623 571 85.65
3213 214 Qutabewal Araian 755 386 369 629 321 308 83.31
3214 215 Garha 176 90 86 146 73 73 82.95
3215 216 Khark 144 73 71 113 57 56 78.47
3216 217 Bholewal Jadid 511 260 251 399 202 197 78.08
3217 218 Fatehgarh Gujjran 732 391 341 547 287 260 74.73
3218 219 Birmi 1952 1003 949 1400 712 688 71.72
3219 220 Jainpur 747 401 346 518 278 240 69.34
3220 221 Dewatwal 2356 1225 1131 1607 818 789 68.21
3221 222 Changan 800 413 387 540 277 263 67.50
3222 223 Majara Kalan 203 107 96 137 69 68 67.49
3223 224 Jhamat 1149 583 566 772 384 388 67.19
3224 225 Kadian 545 284 261 356 181 175 65.32
3225 226 Khaira 1881 975 906 1226 624 602 65.18
3226 227 Phagla 639 324 315 415 212 203 64.95
3227 228 Shehzad 1213 663 550 781 440 341 64.39
3228 229 Manj 177 87 90 113 54 59 63.84
3229 230 Chhokar 618 321 297 391 203 188 63.27
3230 231 Harnampura 1595 858 737 999 538 461 62.63
3231 232 Bholewal Qadim 352 194 158 219 120 99 62.22
3232 233 Malakpur 1754 910 844 1071 553 518 61.06
3233 234 Allowal 624 325 299 376 188 188 60.26
3234 235 Hussainpura 338 196 142 203 114 89 60.06
3235 236 Sangowal 2642 1413 1229 1559 833 726 59.01
3236 237 Nurpur Bet 3665 2002 1663 2145 1163 982 58.53
3237 238 Phagguwal 313 175 138 183 103 80 58.47
3238 239 Bagga Khurd 678 351 327 377 200 177 55.60
3239 240 Bounker Dogran 2580 1359 1221 1425 750 675 55.23
3240 241 Talwara 1056 555 501 561 294 267 53.13
3241 242 Mor Karima 1342 709 633 701 370 331 52.24
(iv) Ludhiana (West)Sub‐District
255

(In Nos.)Percentage
Total Sub Total Male Female Total Male Female (Col. 7 to 4)
1 2 3 4 5 6 7 8 9 10
Village countName of Village
Population SC Population
DISTRICTWISE VILLAGES HAVING 40% AND ABOVE SCHEDULED CASTES (SC) POPULATION IN THE STATE OF PUNJAB (CENSUS 2011)
3242 243 Gaunspur 743 395 348 387 205 182 52.09
3243 244 Jassian 2673 1407 1266 1384 729 655 51.78
3244 245 Rurka 2235 1175 1060 1155 611 544 51.68
3245 246 Ranian 2117 1142 975 1085 584 501 51.25
3246 247 Jhanda 2075 1102 973 1057 567 490 50.94
3247 248 Lohgarh 1761 921 840 891 468 423 50.60
3248 249 Barewal Dogran 340 189 151 172 94 78 50.59
3249 250 Dhaipai 2637 1418 1219 1320 706 614 50.06
3250 251 Majra Khurd 374 188 186 187 90 97 50.00
3251 252 Dhurkot 3345 1728 1617 1664 851 813 49.75
3252 253 Rajpura Urf Hussainpura 1117 621 496 549 286 263 49.15
3253 254 Bulara 2490 1321 1169 1200 635 565 48.19
3254 255 Mandiani 3326 1774 1552 1596 870 726 47.99
3255 256 Himayunpura 1860 987 873 885 455 430 47.58
3256 257 Jarahan 955 505 450 452 237 215 47.33
3257 258 Baran Hara 1462 748 714 686 360 326 46.92
3258 259 Bhanohar 2404 1281 1123 1123 602 521 46.71
3259 260 Ladian Kalan 802 417 385 368 188 180 45.89
3260 261 Mullanpur 5032 2667 2365 2272 1183 1089 45.15
3261 262 Mansuran 3564 1840 1724 1596 833 763 44.78
3262 263 Bahadarke 3447 1888 1559 1523 792 731 44.18
3263 264 Sahuli 3048 1594 1454 1341 706 635 44.00
3264 265 Thakarwal 1977 1038 939 863 449 414 43.65
3265 266 Burj Man Kaur 193 94 99 84 42 42 43.52
3266 267 Beela 1742 912 830 750 403 347 43.05
3267 268 Chark 1161 594 567 499 255 244 42.98
3268 269 Mohi 4807 2538 2269 2048 1083 965 42.60
3269 270 Hassanpur 2231 1142 1089 945 490 455 42.36
3270 271 Pandori 1523 817 706 644 344 300 42.28
3271 272 Dhat 2039 1061 978 856 443 413 41.98
3272 273 Sarih 2638 1416 1222 1103 588 515 41.81
3273 274 Dolon Khurd 914 486 428 382 205 177 41.79
3274 275 Akalgarh Urf Lalton Khurd 1436 752 684 597 310 287 41.57
3275 276 Mehtabgarh 155 85 70 64 38 26 41.29
3276 277 Ballowal 2139 1131 1008 882 476 406 41.23
3277 278 Kailpur 1785 952 833 730 385 345 40.90
3278 279 Ghungrana 3293 1766 1527 1343 706 637 40.78
3279 280 Chaminda 2236 1178 1058 910 472 438 40.70
3280 281 Dolon Kalan 2925 1569 1356 1181 648 533 40.38
3281 282 Deep Nagar 1583 815 768 1289 672 617 81.43
3282 283 Patti Mangewal 738 386 352 584 301 283 79.13
3283 284 Bishanpura 375 197 178 295 156 139 78.67
3284 285 Jallah 1562 822 740 1189 628 561 76.12
(v) PayalSub‐District
256

(In Nos.)Percentage
Total Sub Total Male Female Total Male Female (Col. 7 to 4)
1 2 3 4 5 6 7 8 9 10
Village countName of Village
Population SC Population
DISTRICTWISE VILLAGES HAVING 40% AND ABOVE SCHEDULED CASTES (SC) POPULATION IN THE STATE OF PUNJAB (CENSUS 2011)
3285 286 Chankoian Kalan 664 350 314 503 262 241 75.75
3286 287 Afzullapur 532 281 251 403 215 188 75.75
3287 288 Rara 1309 668 641 935 467 468 71.43
3288 289 Ferozepur 372 208 164 262 148 114 70.43
3289 290 Hans 1219 656 563 777 409 368 63.74
3290 291 Nanakpur Jagera 2145 1106 1039 1326 675 651 61.82
3291 292 Timbarwal 846 465 381 518 291 227 61.23
3292 293 Kotla Afgana 318 155 163 193 90 103 60.69
3293 294 Malhipur 1658 873 785 1000 529 471 60.31
3294 295 Uksi 1420 751 669 841 443 398 59.23
3295 296 Ramgarh Sardaran 4426 2284 2142 2504 1286 1218 56.57
3296 297 Pandher Kheri 1202 636 566 659 343 316 54.83
3297 298 Bhikhi Khutra 1677 904 773 909 487 422 54.20
3298 299 Ranwan 803 419 384 419 210 209 52.18
3299 300 Burkara 305 158 147 159 84 75 52.13
3300 301 Aluna Tolla 1190 624 566 613 324 289 51.51
3301 302 Babarpur 1608 861 747 826 432 394 51.37
3302 303 Doburji 1293 669 624 661 350 311 51.12
3303 304 Gurditpura 753 389 364 384 197 187 51.00
3304 305 Madnipur 1027 543 484 522 274 248 50.83
3305 306 Sohian 1499 803 696 759 419 340 50.63
3306 307 Daumajra 790 427 363 398 214 184 50.38
3307 308 Unchi Daud 921 484 437 446 238 208 48.43
3308 309 Ber Khurd 1024 554 470 490 258 232 47.85
3309 310 Chomon 1679 880 799 802 430 372 47.77
3310 311 Ghurala 825 422 403 394 199 195 47.76
3311 312 Lapran 1940 1030 910 921 483 438 47.47
3312 313 Jhamat 2144 1127 1017 1004 524 480 46.83
3313 314 Jandali 1936 1029 907 901 480 421 46.54
3314 315 Deva Khosa 343 171 172 159 81 78 46.36
3315 316 Chapra 525 270 255 240 123 117 45.71
3316 317 Rosiana 1297 694 603 590 312 278 45.49
3317 318 Kuhli Kalan 1464 781 683 665 350 315 45.42
3318 319 Bharthala Randhawa 1265 682 583 570 302 268 45.06
3319 320 Rajgarh 3425 1833 1592 1535 812 723 44.82
3320 321 Aluna Pallah 1665 898 767 745 403 342 44.74
3321 322 Daulatpur 837 441 396 374 190 184 44.68
3322 323 Bhathal 723 377 346 322 169 153 44.54
3323 324 Malo Daud 861 456 405 381 200 181 44.25
3324 325 Barmalipur 2171 1158 1013 955 501 454 43.99
3325 326 Karoundian 854 458 396 374 201 173 43.79
3326 327 Jogi Majra 1179 634 545 511 271 240 43.34
3327 328 Mahpur 683 358 325 295 148 147 43.19
3328 329 Alampur Urf Chapra 455 248 207 196 109 87 43.08
257

(In Nos.)Percentage
Total Sub Total Male Female Total Male Female (Col. 7 to 4)
1 2 3 4 5 6 7 8 9 10
Village countName of Village
Population SC Population
DISTRICTWISE VILLAGES HAVING 40% AND ABOVE SCHEDULED CASTES (SC) POPULATION IN THE STATE OF PUNJAB (CENSUS 2011)
3329 330 Dhaul Khurd 1287 689 598 551 296 255 42.81
3330 331 Dudhal 1785 941 844 755 398 357 42.30
3331 332 Chima 1722 880 842 715 364 351 41.52
3332 333 Zirakh 1331 714 617 552 305 247 41.47
3333 334 Jargari 3312 1744 1568 1367 715 652 41.27
3334 335 Balaspur 2894 1558 1336 1184 625 559 40.91
3335 336 Aluna Miana 1185 613 572 478 245 233 40.34
3336 337 Kaddon 3378 1760 1618 1357 715 642 40.17
3337 338 Mullanpur 627 349 278 251 144 107 40.03
3338 339 Badhel 1043 547 496 638 331 307 61.17
3339 340 Sakhana 757 413 344 460 251 209 60.77
3340 341 Burj Hakiman 1228 639 589 746 382 364 60.75
3341 342 Ramgarh Sibian 1386 734 652 831 432 399 59.96
3342 343 Shahjahanpur 822 444 378 489 261 228 59.49
3343 344 Gobindgarh 1320 703 617 779 418 361 59.02
3344 345 Burj Hari Singh 3636 1921 1715 2005 1043 962 55.14
3345 346 Nangal Khurd 1443 753 690 795 419 376 55.09
3346 347 Andlu 2635 1393 1242 1447 770 677 54.91
3347 348 Dangon 2231 1163 1068 1164 609 555 52.17
3348 349 Kaila 1265 679 586 659 349 310 52.09
3349 350 Rajoana Kalan 1511 775 736 769 401 368 50.89
3350 351 Boparai Khurd 2629 1386 1243 1292 687 605 49.14
3351 352 Leel 1970 1025 945 965 500 465 48.98
3352 353 Shehbazpura 2513 1323 1190 1225 642 583 48.75
3353 354 Heran 2820 1483 1337 1334 706 628 47.30
3354 355 Chak Bhai Ka 1838 979 859 866 466 400 47.12
3355 356 Hisowal 2166 1104 1062 996 513 483 45.98
3356 357 Talwandi Rai 3355 1717 1638 1527 790 737 45.51
3357 358 Dhalian 1159 624 535 524 284 240 45.21
3358 359 Abuwal 2660 1437 1223 1193 647 546 44.85
3359 360 Bhaini Rora 1782 951 831 794 440 354 44.56
3360 361 Bhaini Baringan 3056 1579 1477 1340 700 640 43.85
3361 362 Rajgarh 1438 780 658 630 335 295 43.81
3362 363 Mohamadpura 500 275 225 215 124 91 43.00
3363 364 Jatpura 1810 966 844 771 414 357 42.60
3364 365 Littar 1218 628 590 514 264 250 42.20
3365 366 Siloani 1201 611 590 501 255 246 41.72
3366 367 Toosa 3115 1654 1461 1296 688 608 41.61
3367 368 Tungaheri 1047 576 471 435 240 195 41.55
3368 369 Johlan 3727 1947 1780 1498 768 730 40.19
3369 370 Bhagwanpura 9 6 3 9 6 3 100.00
3370 371 Chakli Kasab 26 15 11 26 15 11 100.00
(vi) Raikot
(vii) Samrala
Sub‐District
Sub‐District
258

(In Nos.)Percentage
Total Sub Total Male Female Total Male Female (Col. 7 to 4)
1 2 3 4 5 6 7 8 9 10
Village countName of Village
Population SC Population
DISTRICTWISE VILLAGES HAVING 40% AND ABOVE SCHEDULED CASTES (SC) POPULATION IN THE STATE OF PUNJAB (CENSUS 2011)
3371 372 Mand Fatehgarh 112 59 53 103 55 48 91.96
3372 373 Chakli Manga 574 293 281 482 247 235 83.97
3373 374 Tandajal 72 40 32 60 32 28 83.33
3374 375 Udhowal Khurd 81 41 40 64 31 33 79.01
3375 376 Rattipur 952 501 451 740 384 356 77.73
3376 377 Rahimabad Kalan 545 296 249 413 236 177 75.78
3377 378 Zulfgarh 366 193 173 275 148 127 75.14
3378 379 Mand Jharaudi 443 233 210 329 173 156 74.27
3379 380 Panjgaraian 258 132 126 189 96 93 73.26
3380 381 Khanpur 328 172 156 237 125 112 72.26
3381 382 Chakki 626 331 295 444 236 208 70.93
3382 383 Boundal 665 340 325 458 236 222 68.87
3383 384 Shahbazpur 214 118 96 142 77 65 66.36
3384 385 Shamgarh 1812 979 833 1193 654 539 65.84
3385 386 Shamaspur 267 129 138 165 79 86 61.80
3386 387 Gagra 1040 543 497 637 327 310 61.25
3387 388 Bohapur 735 377 358 446 231 215 60.68
3388 389 Dhilwan 1562 802 760 905 461 444 57.94
3389 390 Lopon 1769 941 828 1024 539 485 57.89
3390 391 Chehlan 1971 1028 943 1124 591 533 57.03
3391 392 Ranwan 1079 580 499 614 327 287 56.90
3392 393 Kulewal 1488 648 840 844 393 451 56.72
3393 394 Gurugarh 683 344 339 382 189 193 55.93
3394 395 Bamb 1192 626 566 662 344 318 55.54
3395 396 Sukhewal 265 147 118 147 84 63 55.47
3396 397 Tandi 150 82 68 82 44 38 54.67
3397 398 Lakhowal Kalan 946 494 452 506 271 235 53.49
3398 399 Dhindsa 1418 743 675 756 402 354 53.31
3399 400 Kalal Majra 1874 1051 823 987 534 453 52.67
3400 401 Billon 145 80 65 75 38 37 51.72
3401 402 Lalauri 2471 1311 1160 1268 681 587 51.32
3402 403 Sarwarpur 1443 773 670 734 392 342 50.87
3403 404 Kotala 1567 848 719 761 400 361 48.56
3404 405 Gharkhanna 1408 730 678 661 340 321 46.95
3405 406 Purba 897 468 429 417 213 204 46.49
3406 407 Salodi 3079 1601 1478 1426 750 676 46.31
3407 408 Ladhran 504 267 237 231 122 109 45.83
3408 409 Takhran 1453 743 710 665 336 329 45.77
3409 410 Hedon 2092 1100 992 948 494 454 45.32
3410 411 Kamalpur 344 170 174 155 82 73 45.06
3411 412 Chakli Adil 373 188 185 168 83 85 45.04
3412 413 Manki 3380 1815 1565 1503 813 690 44.47
3413 414 Rajgarh 628 317 311 275 138 137 43.79
3414 415 Rahimabad Khurd 840 440 400 367 197 170 43.69
259

(In Nos.)Percentage
Total Sub Total Male Female Total Male Female (Col. 7 to 4)
1 2 3 4 5 6 7 8 9 10
Village countName of Village
Population SC Population
DISTRICTWISE VILLAGES HAVING 40% AND ABOVE SCHEDULED CASTES (SC) POPULATION IN THE STATE OF PUNJAB (CENSUS 2011)
3415 416 Lal Kalan 1814 964 850 792 421 371 43.66
3416 417 Harbanspura 1297 690 607 565 296 269 43.56
3417 418 Tamkaudi 568 305 263 247 137 110 43.49
3418 419 Bhourla 1399 748 651 608 325 283 43.46
3419 420 Kotla Bhari 1734 903 831 748 387 361 43.14
3420 421 Dhanda 550 281 269 235 120 115 42.73
3421 422 Bhagwanpura 887 468 419 378 207 171 42.62
3422 423 Todarpur 1520 803 717 647 340 307 42.57
3423 424 Bagli Kalan 2418 1298 1120 1026 550 476 42.43
3424 425 Chak Lohat 971 489 482 412 212 200 42.43
3425 426 Khaira 1150 603 547 479 252 227 41.65
3426 427 Milakwal 681 363 318 279 151 128 40.97
3427 428 Ghulal 2177 1159 1018 888 484 404 40.79
3428 429 Mushkabad 1858 977 881 750 391 359 40.37
3429 430 Goslan 1992 1057 935 804 434 370 40.36
3430 431 Bardhala 553 297 256 223 116 107 40.33
3431 432 Mughlewal 266 140 126 107 53 54 40.23
3432 433 Chak Samun 165 80 85 66 31 35 40.00
3433 1 Reond Kalan 3945 2058 1887 3237 1671 1566 82.05
3434 2 Lakhiwala 705 393 312 534 300 234 75.74
3435 3 Sher Khanwala 2155 1121 1034 1578 822 756 73.23
3436 4 Kasampur Chhina 1551 818 733 1056 551 505 68.09
3437 5 Phuluwala Dogran 1949 1021 928 1295 691 604 66.44
3438 6 Malakpur Bhimra 983 531 452 629 336 293 63.99
3439 7 Faridke 713 379 334 423 220 203 59.33
3440 8 Malkon 1794 945 849 1059 541 518 59.03
3441 9 Hassanpur 1337 725 612 717 391 326 53.63
3442 10 Budhlada (R) 13389 6980 6409 6865 3555 3310 51.27
3443 11 Khatriwala 1702 865 837 867 443 424 50.94
3444 12 Udat Saidewala 1639 885 754 828 445 383 50.52
3445 13 Alampur Mandran 2977 1560 1417 1466 762 704 49.24
3446 14 Todarpur 373 191 182 182 91 91 48.79
3447 15 Mal Singhwala 2087 1113 974 1018 540 478 48.78
3448 16 Bhakhrial 1067 560 507 512 266 246 47.99
3449 17 Chakan 1646 879 767 757 422 335 45.99
3450 18 Akanwali 3525 1889 1636 1607 856 751 45.59
3451 19 Kulana 2823 1474 1349 1278 678 600 45.27
3452 20 Dariapur 1314 689 625 594 298 296 45.21
3453 21 Sanghreri 1003 538 465 445 248 197 44.37
3454 22 Boha 12170 6381 5789 5272 2762 2510 43.32
3455 23 Karipur 2286 1205 1081 982 519 463 42.96
3456 24 Sandli 581 305 276 247 133 114 42.51
12. MANSA(i) Budhlada
DISTRICTSub‐District
260

(In Nos.)Percentage
Total Sub Total Male Female Total Male Female (Col. 7 to 4)
1 2 3 4 5 6 7 8 9 10
Village countName of Village
Population SC Population
DISTRICTWISE VILLAGES HAVING 40% AND ABOVE SCHEDULED CASTES (SC) POPULATION IN THE STATE OF PUNJAB (CENSUS 2011)
3457 25 Reond Khurd 1084 565 519 458 230 228 42.25
3458 26 Hakamwala 2609 1380 1229 1099 590 509 42.12
3459 27 Gamiwala 1760 941 819 727 403 324 41.31
3460 28 Datewas 2621 1379 1242 1081 565 516 41.24
3461 29 Saspali 800 412 388 328 158 170 41.00
3462 30 Phuluwala Dod 1261 660 601 515 263 252 40.84
3463 31 Rampur Mander 2817 1513 1304 1148 618 530 40.75
3464 32 Gurne Khurd 1589 889 700 645 361 284 40.59
3465 33 Dialpura 2539 1374 1165 1029 528 501 40.53
3466 34 Narenderpura Urf Baglianwali 1804 967 837 1274 680 594 70.62
3467 35 Saharna 1708 920 788 888 481 407 51.99
3468 36 Hodla kalan 2541 1329 1212 1309 686 623 51.52
3469 37 Chakerian 2622 1394 1228 1342 709 633 51.18
3470 38 Gagowal 934 502 432 473 250 223 50.64
3471 39 Moola Singhwala 971 520 451 481 261 220 49.54
3472 40 Ram Dittawala 2087 1104 983 1030 536 494 49.35
3473 41 Ubha 5538 2957 2581 2653 1423 1230 47.91
3474 42 Nangal Khurd 2444 1268 1176 1122 581 541 45.91
3475 43 Behniwal 3741 1987 1754 1695 895 800 45.31
3476 44 Ali Sher Khurd 1598 850 748 720 373 347 45.06
3477 45 Deluana 1607 839 768 713 373 340 44.37
3478 46 Bhai Desa 1533 815 718 679 337 342 44.29
3479 47 Khokhar Kalan 3404 1829 1575 1482 784 698 43.54
3480 48 Mohar Singhwala 2151 1164 987 923 500 423 42.91
3481 49 Kishangarh Urf Pharwahi 4121 2218 1903 1715 910 805 41.62
3482 50 Barnala 3444 1820 1624 1418 745 673 41.17
3483 51 Lohgarh 1726 890 836 1693 870 823 98.09
3484 52 Phus Mandi 1289 688 601 873 462 411 67.73
3485 53 Ranjitgarh Bandra 1502 771 731 932 470 462 62.05
3486 54 Ahlupur 5291 2752 2539 3065 1590 1475 57.93
3487 55 Bishanpura Urf Jherianwali 2393 1271 1122 1336 704 632 55.83
3488 56 Hingna Urf Bhagwangarh 1333 693 640 713 370 343 53.49
3489 57 Fatehpur 2752 1451 1301 1468 780 688 53.34
3490 58 Makhewala 1821 981 840 921 505 416 50.58
3491 59 Rajrana 683 341 342 343 163 180 50.22
3492 60 Tibi Hari Singh 1250 662 588 605 321 284 48.40
3493 61 Tandian 1619 854 765 727 379 348 44.90
3494 62 Hirke 2577 1346 1231 1146 595 551 44.47
3495 63 Ghurkni 1999 1078 921 873 473 400 43.67
3496 64 Mirpur Khurd 2256 1200 1056 981 538 443 43.48
3497 65 Sangha 5406 2841 2565 2347 1234 1113 43.41
3498 66 Sadhuwala 881 478 403 380 210 170 43.13
(ii) Mansa
(iii) Sardulgarh
Sub‐District
Sub‐District
261

(In Nos.)Percentage
Total Sub Total Male Female Total Male Female (Col. 7 to 4)
1 2 3 4 5 6 7 8 9 10
Village countName of Village
Population SC Population
DISTRICTWISE VILLAGES HAVING 40% AND ABOVE SCHEDULED CASTES (SC) POPULATION IN THE STATE OF PUNJAB (CENSUS 2011)
3499 67 Kauriwala 1024 546 478 438 240 198 42.77
3500 68 Chotian 1263 672 591 538 287 251 42.60
3501 69 Bhalanwara 767 425 342 321 177 144 41.85
3502 70 Chuhrian 1035 545 490 425 228 197 41.06
3503 71 Jhanda Kalan 5943 3110 2833 2425 1221 1204 40.80
3504 72 Fatehgarh Sahnianwali 1261 663 598 512 272 240 40.60
3505 1 Phulewala 3338 1774 1564 2259 1199 1060 67.68
3506 2 Chand Nawan 4111 2174 1937 2551 1367 1184 62.05
3507 3 Jai Singhwala 1450 776 674 809 425 384 55.79
3508 4 Nathuwala Garbi 4541 2424 2117 2529 1349 1180 55.69
3509 5 Ladhaike 2057 1114 943 1145 612 533 55.66
3510 6 Gajanwala 1448 789 659 806 446 360 55.66
3511 7 Chotia Thoba 883 460 423 475 247 228 53.79
3512 8 Panjgarain Khurd 3244 1730 1514 1726 923 803 53.21
3513 9 Chand Purana 2566 1377 1189 1279 690 589 49.84
3514 10 Budh Singhwala 2801 1464 1337 1380 730 650 49.27
3515 11 Bhagha Purana 2707 1421 1286 1277 676 601 47.17
3516 12 Chhota Ghar 1201 625 576 566 305 261 47.13
3517 13 Jaimalwala 3402 1782 1620 1584 848 736 46.56
3518 14 Sahuke 2400 1262 1138 1114 583 531 46.42
3519 15 Mari Mustafa 8639 4504 4135 3987 2071 1916 46.15
3520 16 Kotla Raika 3002 1578 1424 1331 683 648 44.34
3521 17 Hariewala 1670 888 782 720 380 340 43.11
3522 18 Gholia Kalan 7140 3821 3319 3067 1664 1403 42.96
3523 19 Chanuwala 2957 1596 1361 1249 679 570 42.24
3524 20 Smalsar 11189 5900 5289 4623 2476 2147 41.32
3525 21 Gulabe Singhwala 1457 780 677 590 320 270 40.49
3526 22 Dalluwala 1246 655 591 500 269 231 40.13
3527 23 Adraman 5 2 3 5 2 3 100.00
3528 24 Kambo Khurd 112 57 55 112 57 55 100.00
3529 25 Madarpur 456 235 221 456 235 221 100.00
3530 26 Kambo Kalan 176 90 86 167 85 82 94.89
3531 27 Said Jalalpur 577 305 272 540 285 255 93.59
3532 28 Sanghera 470 244 226 414 213 201 88.09
3533 29 Mandar Kalan 744 385 359 655 336 319 88.04
3534 30 Rehrwan 1878 946 932 1645 825 820 87.59
3535 31 Manjhli 527 258 269 459 222 237 87.10
3536 32 Kanwan 399 219 180 328 181 147 82.21
3537 33 Sherpur Taiban 2481 1278 1203 1949 1001 948 78.56
3538 34 Fatehpur Kanian 501 253 248 388 197 191 77.45
3539 35 Bundala 79 40 39 60 30 30 75.95
Sub‐District
13. MOGA(i) Bagha Purana
DISTRICTSub‐District
(ii) Moga
262

(In Nos.)Percentage
Total Sub Total Male Female Total Male Female (Col. 7 to 4)
1 2 3 4 5 6 7 8 9 10
Village countName of Village
Population SC Population
DISTRICTWISE VILLAGES HAVING 40% AND ABOVE SCHEDULED CASTES (SC) POPULATION IN THE STATE OF PUNJAB (CENSUS 2011)
3540 36 Gatti Jattan 671 363 308 499 268 231 74.37
3541 37 Thuthgarh 1176 615 561 862 443 419 73.30
3542 38 Kamalke 1879 999 880 1360 731 629 72.38
3543 39 Chak Singhpura 470 238 232 340 172 168 72.34
3544 40 Chamb 260 134 126 187 94 93 71.92
3545 41 Nurpur Haqiman 2407 1281 1126 1689 898 791 70.17
3546 42 Daulewala 3113 1622 1491 2181 1122 1059 70.06
3547 43 Bhoepur 916 463 453 614 311 303 67.03
3548 44 Kokri Buttran 1946 990 956 1304 634 670 67.01
3549 45 Sirsari 273 149 124 182 101 81 66.67
3550 46 Chak Tarewala 1145 583 562 742 382 360 64.80
3551 47 Budh Singhwala 1419 737 682 916 482 434 64.55
3552 48 Chotian Kalan 1910 1026 884 1216 652 564 63.66
3553 49 Manawan 3543 1848 1695 2227 1174 1053 62.86
3554 50 Khera Swad 32 26 6 20 16 4 62.50
3555 51 Bhoghewala 500 261 239 310 158 152 62.00
3556 52 Khamba 922 480 442 571 294 277 61.93
3557 53 Nasirpur Janian 1364 719 645 821 447 374 60.19
3558 54 Kot Mohamad Khan 1334 696 638 799 425 374 59.90
3559 55 Kanian Kalan 259 140 119 154 84 70 59.46
3560 56 Masitan 2816 1503 1313 1661 916 745 58.98
3561 57 Mehruwala 89 54 35 52 29 23 58.43
3562 58 Chak Kanian Kalan 957 503 454 558 300 258 58.31
3563 59 Chima 1831 951 880 1065 553 512 58.16
3564 60 Dhurkot Charat Singh 1021 550 471 584 326 258 57.20
3565 61 Khote 365 199 166 206 115 91 56.44
3566 62 Atari 948 507 441 527 289 238 55.59
3567 63 Ferozewala Bada 1492 773 719 821 420 401 55.03
3568 64 Indergarh 3945 2160 1785 2136 1193 943 54.14
3569 65 Sandhwan Wala Urf Churkit 1422 757 665 769 408 361 54.08
3570 66 Daulatpur Ucha 1927 1018 909 984 534 450 51.06
3571 67 Bankhandi 1096 563 533 550 286 264 50.18
3572 68 Singhanwala 5991 3151 2840 2987 1585 1402 49.86
3573 69 Jhugian 133 70 63 66 31 35 49.62
3574 70 Buttar 10519 5564 4955 5210 2786 2424 49.53
3575 71 Madoke 2823 1497 1326 1391 732 659 49.27
3576 72 Korewala Khurd 851 449 402 418 236 182 49.12
3577 73 Dhurkot Kalan 1531 799 732 748 402 346 48.86
3578 74 Daulewala Kalan 390 209 181 190 101 89 48.72
3579 75 Jalalabad 6811 3547 3264 3303 1721 1582 48.50
3580 76 Kaila 2074 1084 990 1001 528 473 48.26
3581 77 Chirag Shahwala 799 413 386 383 195 188 47.93
3582 78 Dholewala 1651 890 761 784 430 354 47.49
3583 79 Singhpur Urf Munan 1248 650 598 587 316 271 47.04
263

(In Nos.)Percentage
Total Sub Total Male Female Total Male Female (Col. 7 to 4)
1 2 3 4 5 6 7 8 9 10
Village countName of Village
Population SC Population
DISTRICTWISE VILLAGES HAVING 40% AND ABOVE SCHEDULED CASTES (SC) POPULATION IN THE STATE OF PUNJAB (CENSUS 2011)
3584 80 Bhodiwala 666 309 357 311 140 171 46.70
3585 81 Patti Sandhwan 1093 576 517 510 266 244 46.66
3586 82 Mehna 4490 2357 2133 2092 1103 989 46.59
3587 83 Dagru 3128 1652 1476 1457 770 687 46.58
3588 84 Bajeke 1159 607 552 532 277 255 45.90
3589 85 Saliana 3844 2019 1825 1763 943 820 45.86
3590 86 Mandar 1800 913 887 816 410 406 45.33
3591 87 Jhandiana Garbi 3587 1889 1698 1619 852 767 45.14
3592 88 Mangewala 2455 1317 1138 1108 601 507 45.13
3593 89 Datta 2260 1207 1053 1018 536 482 45.04
3594 90 Maujgarh 964 501 463 434 234 200 45.02
3595 91 Maheshari 3109 1636 1473 1396 749 647 44.90
3596 92 Rajanwala 532 274 258 238 133 105 44.74
3597 93 Mehal 1314 678 636 585 305 280 44.52
3598 94 Ghal Kalan 9299 4929 4370 4125 2203 1922 44.36
3599 95 Bahona 2945 1542 1403 1298 666 632 44.07
3600 96 Doburji 411 209 202 181 87 94 44.04
3601 97 Bhagpur Alias Gagrah 1406 741 665 618 333 285 43.95
3602 98 Datewal 1554 814 740 681 367 314 43.82
3603 99 Chuhar Singhwala 617 343 274 270 153 117 43.76
3604 100 Talwandi Bhangerian 3541 1824 1717 1540 787 753 43.49
3605 101 Puranewala 980 504 476 425 219 206 43.37
3606 102 Chuharchak 8137 4281 3856 3525 1872 1653 43.32
3607 103 Dala 6933 3680 3253 2998 1595 1403 43.24
3608 104 Kokri Phulasingh 2320 1205 1115 997 520 477 42.97
3609 105 Jogewala 948 516 432 407 223 184 42.93
3610 106 Daroli Bhai 6010 3257 2753 2561 1393 1168 42.61
3611 107 Chak Bhaura 80 47 33 34 18 16 42.50
3612 108 Sosan 1280 675 605 543 291 252 42.42
3613 109 Mothanwali 993 519 474 420 220 200 42.30
3614 110 Daya Kalan 1324 712 612 556 301 255 41.99
3615 111 Daudhar Sharki 7108 3757 3351 2981 1618 1363 41.94
3616 112 Chotian Khurd 617 334 283 258 144 114 41.82
3617 113 Ramuwala Nawan 2547 1343 1204 1058 559 499 41.54
3618 114 Jhandewala 2732 1464 1268 1134 598 536 41.51
3619 115 Nawan Moga Urf Tarewala 1857 1001 856 770 424 346 41.46
3620 116 Chirak 10228 5405 4823 4234 2254 1980 41.40
3621 117 Pandori Araian 1628 852 776 671 352 319 41.22
3622 118 Mandiranwala 2249 1197 1052 919 500 419 40.86
3623 119 Kishanpur Kalan 7557 3974 3583 3081 1630 1451 40.77
3624 120 Matwani 1352 720 632 551 301 250 40.75
3625 121 Qadarwala 1054 548 506 429 224 205 40.70
3626 122 Kot Sardar Khan 2588 1349 1239 1051 546 505 40.61
3627 123 Kokhri Heran 1316 691 625 533 289 244 40.50
264

(In Nos.)Percentage
Total Sub Total Male Female Total Male Female (Col. 7 to 4)
1 2 3 4 5 6 7 8 9 10
Village countName of Village
Population SC Population
DISTRICTWISE VILLAGES HAVING 40% AND ABOVE SCHEDULED CASTES (SC) POPULATION IN THE STATE OF PUNJAB (CENSUS 2011)
3628 124 Darapur 2028 1059 969 819 429 390 40.38
3629 125 Khosa Kotla 4400 2316 2084 1765 918 847 40.11
3630 126 Janer 2647 1406 1241 1061 567 494 40.08
3631 127 Raina 7238 3782 3456 4493 2369 2124 62.08
3632 128 Patto Didarsingh 787 415 372 465 243 222 59.09
3633 129 Badhni Kalan 4843 2604 2239 2645 1404 1241 54.61
3634 130 Ransin Kalan 2715 1469 1246 1429 775 654 52.63
3635 131 Patto Jawaharsingh 968 504 464 484 248 236 50.00
3636 132 Bir Badhni 1083 585 498 531 290 241 49.03
3637 133 Saidoke 7771 4105 3666 3796 2018 1778 48.85
3638 134 Bhagike 3784 1978 1806 1816 952 864 47.99
3639 135 Bode 2357 1258 1099 1117 599 518 47.39
3640 136 Dhulkot Ransin 5765 3076 2689 2643 1421 1222 45.85
3641 137 Bilaspur 7117 3758 3359 3210 1694 1516 45.10
3642 138 Burj Hamira 1848 936 912 822 420 402 44.48
3643 139 Himatpura 7995 4192 3803 3489 1819 1670 43.64
3644 140 Khota 3260 1733 1527 1414 742 672 43.37
3645 141 Nihal Singhwala 10852 5746 5106 4662 2438 2224 42.96
3646 142 Gajiana 1777 944 833 761 410 351 42.82
3647 143 Kussa 2995 1644 1351 1282 709 573 42.80
3648 144 Machhike 6411 3411 3000 2695 1420 1275 42.04
3649 145 Dina 4029 2172 1857 1681 851 830 41.72
3650 146 Patto Hirasingh 6613 3486 3127 2701 1430 1271 40.84
3651 1 Ajnauda Khurd 590 314 276 518 276 242 87.80
3652 2 Gujarheri 746 405 341 632 344 288 84.72
3653 3 Malkon 841 444 397 657 354 303 78.12
3654 4 Hakimpur 456 230 226 339 173 166 74.34
3655 5 Kalhana 456 236 220 322 167 155 70.61
3656 6 Ramgarh 730 387 343 483 252 231 66.16
3657 7 Sadhnauli 938 495 443 614 313 301 65.46
3658 8 Shahpur 448 230 218 279 143 136 62.28
3659 9 Faridpur 789 397 392 491 246 245 62.23
3660 10 Sukhewal 540 280 260 330 172 158 61.11
3661 11 Tarkheri khurd 597 300 297 342 172 170 57.29
3662 12 Dhanauri 642 335 307 352 174 178 54.83
3663 13 Siri Nagar 810 434 376 441 238 203 54.44
3664 14 Udha 487 275 212 265 150 115 54.41
3665 15 Bhilowal 494 260 234 264 136 128 53.44
3666 16 Kalar Majri 1039 552 487 555 295 260 53.42
3667 17 Jatiwal 847 458 389 446 225 221 52.66
3668 18 Nanowal 786 429 357 412 227 185 52.42
(i) Nabha
Sub‐District
DISTRICTSub‐District
(iii) Nihal Singhwala
14. PATIALA
265

(In Nos.)Percentage
Total Sub Total Male Female Total Male Female (Col. 7 to 4)
1 2 3 4 5 6 7 8 9 10
Village countName of Village
Population SC Population
DISTRICTWISE VILLAGES HAVING 40% AND ABOVE SCHEDULED CASTES (SC) POPULATION IN THE STATE OF PUNJAB (CENSUS 2011)
3669 19 Galwati 1650 832 818 853 437 416 51.70
3670 20 Gadaya 1244 651 593 624 320 304 50.16
3671 21 Mansurpur 3332 1750 1582 1660 875 785 49.82
3672 22 Duladi 4099 2160 1939 2037 1068 969 49.70
3673 23 Todarwal 1030 547 483 510 274 236 49.51
3674 24 Bazidpur 908 495 413 449 244 205 49.45
3675 25 Ranjitgarh 510 279 231 252 140 112 49.41
3676 26 Bugga Khurd 776 413 363 383 196 187 49.36
3677 27 Suraajpur 798 425 373 393 196 197 49.25
3678 28 Khurd 390 224 166 192 108 84 49.23
3679 29 Lopa 591 319 272 288 156 132 48.73
3680 30 Halotali 639 338 301 308 168 140 48.20
3681 31 Bauran Khurd 1474 761 713 696 356 340 47.22
3682 32 Labana Teku 2342 1237 1105 1105 579 526 47.18
3683 33 Alipur 1074 569 505 501 264 237 46.65
3684 34 Bhore 1470 782 688 685 365 320 46.60
3685 35 Chahal 1926 1028 898 896 481 415 46.52
3686 36 Chathe 598 318 280 277 150 127 46.32
3687 37 Raj Garh 967 528 439 445 245 200 46.02
3688 38 Rohti Chhanna 803 417 386 368 184 184 45.83
3689 39 Dewangarh 553 299 254 252 140 112 45.57
3690 40 Fatehpur 698 364 334 318 168 150 45.56
3691 41 Kameli 880 467 413 396 208 188 45.00
3692 42 Rohti Basta Singh 911 496 415 407 213 194 44.68
3693 43 Ageta 715 374 341 319 171 148 44.62
3694 44 Mohal Gawara 697 366 331 310 166 144 44.48
3695 45 Ichhewal 1147 615 532 507 266 241 44.20
3696 46 Rajpura 655 327 328 289 148 141 44.12
3697 47 Kularan 670 352 318 294 161 133 43.88
3698 48 Bauran Kalan 1931 1016 915 847 449 398 43.86
3699 49 Barhe 227 118 109 99 49 50 43.61
3700 50 Ghamrouda 1392 725 667 606 305 301 43.53
3701 51 Sakrali 1498 803 695 651 349 302 43.46
3702 52 Bhojo Majri 673 363 310 292 154 138 43.39
3703 53 Choudhri Majra 1361 715 646 587 319 268 43.13
3704 54 Dakaunda 1751 929 822 750 398 352 42.83
3705 55 Birdhano 1672 856 816 716 364 352 42.82
3706 56 Narmana 1638 896 742 701 389 312 42.80
3707 57 Halla 738 382 356 314 161 153 42.55
3708 58 Jhambali sahni 490 267 223 205 107 98 41.84
3709 59 Paidan 1113 600 513 465 261 204 41.78
3710 60 Ladha Heri 887 459 428 360 179 181 40.59
3711 61 Rampur Sahiewal 883 465 418 357 186 171 40.43
3712 62 Pahlia Khurd 911 511 400 368 213 155 40.40
266

(In Nos.)Percentage
Total Sub Total Male Female Total Male Female (Col. 7 to 4)
1 2 3 4 5 6 7 8 9 10
Village countName of Village
Population SC Population
DISTRICTWISE VILLAGES HAVING 40% AND ABOVE SCHEDULED CASTES (SC) POPULATION IN THE STATE OF PUNJAB (CENSUS 2011)
3713 63 Banera Khurd 1186 647 539 478 262 216 40.30
3714 64 Kheri Jattan 957 522 435 384 211 173 40.13
3715 65 Jalal Khera 469 232 237 441 216 225 94.03
3716 66 Khusropur 384 197 187 296 150 146 77.08
3717 67 Dharamkot 425 234 191 322 179 143 75.76
3718 68 Tarain 1606 843 763 1204 619 585 74.97
3719 69 Majal Khurd 539 283 256 382 204 178 70.87
3720 70 Kachhwa 908 479 429 635 337 298 69.93
3721 71 Alampur 1219 646 573 818 444 374 67.10
3722 72 Kauli 2328 1222 1106 1467 770 697 63.02
3723 73 Bir Bahadurgarh 370 201 169 233 128 105 62.97
3724 74 Makhmailpur 550 296 254 341 188 153 62.00
3725 75 Ashabpur 308 157 151 186 102 84 60.39
3726 76 Partapgarh 449 236 213 268 143 125 59.69
3727 77 Hussainpur Jolla 701 355 346 416 214 202 59.34
3728 78 Saniar Heri 1433 775 658 850 456 394 59.32
3729 79 Shadipur 185 93 92 109 54 55 58.92
3730 80 Punian khanan 865 443 422 509 259 250 58.84
3731 81 Devi Nagar 679 373 306 398 214 184 58.62
3732 82 Ram Nagar Alias Bakshiwala 2203 1138 1065 1290 630 660 58.56
3733 83 Balaspur 865 462 403 497 262 235 57.46
3734 84 Tasulpur 381 197 184 217 107 110 56.96
3735 85 Rajgarh 880 460 420 498 260 238 56.59
3736 86 Jodhpur 331 169 162 187 93 94 56.50
3737 87 Bathoi Khurd 2183 1140 1043 1229 640 589 56.30
3738 88 Bir Kule majra 11 7 4 6 4 2 54.55
3739 89 Dharamgarh Urf Kathgarh 1472 753 719 790 393 397 53.67
3740 90 Sanaur ( R ) 2794 1441 1353 1492 759 733 53.40
3741 91 Phagan Majara 2112 1126 986 1126 603 523 53.31
3742 92 Bosar Kalan 1540 807 733 817 412 405 53.05
3743 93 Mithu Majra 623 324 299 327 162 165 52.49
3744 94 Churason 2634 1392 1242 1364 716 648 51.78
3745 95 Randhawa 1062 552 510 541 270 271 50.94
3746 96 Panjeta 1207 619 588 614 314 300 50.87
3747 97 Khaktan Kalan 661 345 316 335 170 165 50.68
3748 98 kheri Gorian 894 488 406 452 246 206 50.56
3749 99 Smashpur 821 408 413 415 205 210 50.55
3750 100 Mandi 687 360 327 341 173 168 49.64
3751 101 Mirjapur 440 223 217 218 111 107 49.55
3752 102 Balipur 385 207 178 190 100 90 49.35
3753 103 Salempur Balian 623 341 282 306 168 138 49.12
3754 104 Shankerpur 1110 592 518 545 298 247 49.10
3755 105 Daun Khurd 1330 702 628 648 339 309 48.72
(ii) PatialaSub‐District
267

(In Nos.)Percentage
Total Sub Total Male Female Total Male Female (Col. 7 to 4)
1 2 3 4 5 6 7 8 9 10
Village countName of Village
Population SC Population
DISTRICTWISE VILLAGES HAVING 40% AND ABOVE SCHEDULED CASTES (SC) POPULATION IN THE STATE OF PUNJAB (CENSUS 2011)
3756 106 Safera 1427 755 672 695 376 319 48.70
3757 107 Sultanpur 994 528 466 484 256 228 48.69
3758 108 Abdulpur 226 130 96 110 65 45 48.67
3759 109 Nanansu 1761 932 829 855 452 403 48.55
3760 110 Dadhera 1301 675 626 626 325 301 48.12
3761 111 Hira Garh 716 379 337 344 177 167 48.04
3762 112 Mardan Heri 2765 1466 1299 1326 700 626 47.96
3763 113 Sehnserwal 757 418 339 359 203 156 47.42
3764 114 Hardaspur 1688 873 815 785 412 373 46.50
3765 115 Maddo Majra 869 467 402 404 211 193 46.49
3766 116 Bhat Heri 806 398 408 374 185 189 46.40
3767 117 Kheri Ranwan 528 276 252 245 133 112 46.40
3768 118 Daulatpur 557 294 263 257 131 126 46.14
3769 119 Hirdapur 697 379 318 321 182 139 46.05
3770 120 Nain Kalan 1333 679 654 613 310 303 45.99
3771 121 Zaffarpur 943 476 467 433 225 208 45.92
3772 122 Bishanpura Chhana 432 233 199 198 107 91 45.83
3773 123 Sher Majra 1858 984 874 843 444 399 45.37
3774 124 Dulbha 425 223 202 192 100 92 45.18
3775 125 Fatehpur Rajputan 1546 833 713 695 367 328 44.95
3776 126 Naraingarh Urf Majra 994 522 472 441 245 196 44.37
3777 127 Mehaun 1694 898 796 742 383 359 43.80
3778 128 Majri Akalian 927 486 441 406 213 193 43.80
3779 129 Tajalpur 827 437 390 361 193 168 43.65
3780 130 Chuharpur Marasian 310 161 149 135 65 70 43.55
3781 131 Alipur jattan 1417 761 656 617 328 289 43.54
3782 132 Faridpur 246 139 107 105 57 48 42.68
3783 133 Chamarheri 939 515 424 400 219 181 42.60
3784 134 Dilawarpur 325 168 157 138 68 70 42.46
3785 135 Amam Nagar Urf Aliwala 1876 977 899 790 411 379 42.11
3786 136 Rourgarh 1461 771 690 608 320 288 41.62
3787 137 Batta 729 398 331 302 160 142 41.43
3788 138 Durd 464 260 204 192 107 85 41.38
3789 139 Multanpur 979 498 481 405 208 197 41.37
3790 140 Chuharpur Kalalan 855 457 398 353 192 161 41.29
3791 141 Jhandi 1807 948 859 735 388 347 40.68
3792 142 Kakrala 788 422 366 320 166 154 40.61
3793 143 Tulewal 1166 613 553 473 240 233 40.57
3794 144 Kachhwi 442 224 218 179 85 94 40.50
3795 145 Mavi Sapan 1472 795 677 594 331 263 40.35
3796 146 Khansan 1718 889 829 690 366 324 40.16
3797 147 Akot 796 432 364 319 176 143 40.08
3798 148 Arnetu 2414 1232 1182 2113 1073 1040 87.53(iii) PatranSub‐District
268

(In Nos.)Percentage
Total Sub Total Male Female Total Male Female (Col. 7 to 4)
1 2 3 4 5 6 7 8 9 10
Village countName of Village
Population SC Population
DISTRICTWISE VILLAGES HAVING 40% AND ABOVE SCHEDULED CASTES (SC) POPULATION IN THE STATE OF PUNJAB (CENSUS 2011)
3799 149 Karim Nagar Alias Chicharwala 2990 1518 1472 2313 1165 1148 77.36
3800 150 Gulahar 5237 2700 2537 4010 2068 1942 76.57
3801 151 Khanewal 2802 1461 1341 2129 1102 1027 75.98
3802 152 Nirmal Kot 950 477 473 640 316 324 67.37
3803 153 Jalalpur 972 513 459 596 326 270 61.32
3804 154 Ganeshpura Alias Seona 1401 768 633 775 420 355 55.32
3805 155 Matauli 1925 1005 920 1029 547 482 53.45
3806 156 Tanbuwala 1125 593 532 598 328 270 53.16
3807 157 Galoli 2772 1442 1330 1416 742 674 51.08
3808 158 Arno 4688 2470 2218 2391 1244 1147 51.00
3809 159 Chunagra 2558 1367 1191 1283 686 597 50.16
3810 160 Badshahpur 2093 1087 1006 1042 532 510 49.78
3811 161 Devgarh 2163 1063 1100 1063 486 577 49.14
3812 162 Khang 2702 1400 1302 1319 679 640 48.82
3813 163 Buta Singhwala Urf Harigarh 999 532 467 485 253 232 48.55
3814 164 Shutrana 12768 6744 6024 6155 3256 2899 48.21
3815 165 Rasauli 1185 641 544 564 321 243 47.59
3816 166 Dotal 4089 2115 1974 1896 963 933 46.37
3817 167 Nagri 1089 577 512 502 272 230 46.10
3818 168 Gobindpura Alias Paind 2076 1071 1005 926 483 443 44.61
3819 169 Jogewala 1377 724 653 599 310 289 43.50
3820 170 Bishanpur Alias Banwala 1601 849 752 686 356 330 42.85
3821 171 Saidewala Alias Naiwala 1357 727 630 577 311 266 42.52
3822 172 Gulzarpur Alias Tharwa 2058 1067 991 872 442 430 42.37
3823 173 Daftriwala 2256 1183 1073 952 495 457 42.20
3824 174 Dugal Khurd 3414 1825 1589 1429 777 652 41.86
3825 175 Parao Ugana 448 236 212 447 235 212 99.78
3826 176 Naraingarh 838 442 396 835 441 394 99.64
3827 177 Safdarpur 703 385 318 698 382 316 99.29
3828 178 Alawal Majra 794 434 360 770 423 347 96.98
3829 179 Jansua 3650 1934 1716 3181 1698 1483 87.15
3830 180 Jabo Majra 1029 532 497 881 447 434 85.62
3831 181 Sural Kalan 1921 1020 901 1625 867 758 84.59
3832 182 Sarai Mughal 475 244 231 387 193 194 81.47
3833 183 Fatehpur Garhi 1152 601 551 915 476 439 79.43
3834 184 Ram Nagar Urf Saunti 321 167 154 254 130 124 79.13
3835 185 Jhansli 932 488 444 737 388 349 79.08
3836 186 Gopalpur 1805 952 853 1371 730 641 75.96
3837 187 Ghungran 229 116 113 158 77 81 69.00
3838 188 Magar 413 220 193 274 146 128 66.34
3839 189 Faridpur 951 501 450 613 334 279 64.46
3840 190 Chattar Nagar 606 321 285 389 214 175 64.19
3841 191 Sarai Banjara 897 465 432 575 300 275 64.10
(iv) RajpuraSub‐District
269
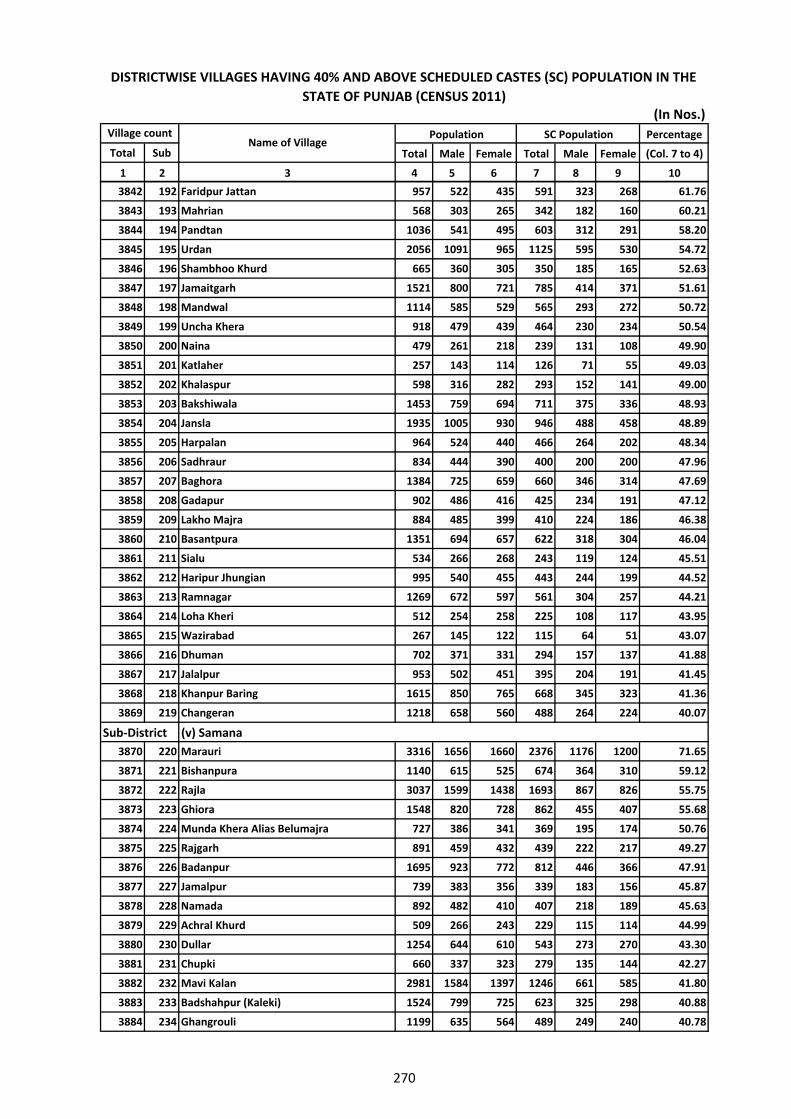
(In Nos.)Percentage
Total Sub Total Male Female Total Male Female (Col. 7 to 4)
1 2 3 4 5 6 7 8 9 10
Village countName of Village
Population SC Population
DISTRICTWISE VILLAGES HAVING 40% AND ABOVE SCHEDULED CASTES (SC) POPULATION IN THE STATE OF PUNJAB (CENSUS 2011)
3842 192 Faridpur Jattan 957 522 435 591 323 268 61.76
3843 193 Mahrian 568 303 265 342 182 160 60.21
3844 194 Pandtan 1036 541 495 603 312 291 58.20
3845 195 Urdan 2056 1091 965 1125 595 530 54.72
3846 196 Shambhoo Khurd 665 360 305 350 185 165 52.63
3847 197 Jamaitgarh 1521 800 721 785 414 371 51.61
3848 198 Mandwal 1114 585 529 565 293 272 50.72
3849 199 Uncha Khera 918 479 439 464 230 234 50.54
3850 200 Naina 479 261 218 239 131 108 49.90
3851 201 Katlaher 257 143 114 126 71 55 49.03
3852 202 Khalaspur 598 316 282 293 152 141 49.00
3853 203 Bakshiwala 1453 759 694 711 375 336 48.93
3854 204 Jansla 1935 1005 930 946 488 458 48.89
3855 205 Harpalan 964 524 440 466 264 202 48.34
3856 206 Sadhraur 834 444 390 400 200 200 47.96
3857 207 Baghora 1384 725 659 660 346 314 47.69
3858 208 Gadapur 902 486 416 425 234 191 47.12
3859 209 Lakho Majra 884 485 399 410 224 186 46.38
3860 210 Basantpura 1351 694 657 622 318 304 46.04
3861 211 Sialu 534 266 268 243 119 124 45.51
3862 212 Haripur Jhungian 995 540 455 443 244 199 44.52
3863 213 Ramnagar 1269 672 597 561 304 257 44.21
3864 214 Loha Kheri 512 254 258 225 108 117 43.95
3865 215 Wazirabad 267 145 122 115 64 51 43.07
3866 216 Dhuman 702 371 331 294 157 137 41.88
3867 217 Jalalpur 953 502 451 395 204 191 41.45
3868 218 Khanpur Baring 1615 850 765 668 345 323 41.36
3869 219 Changeran 1218 658 560 488 264 224 40.07
3870 220 Marauri 3316 1656 1660 2376 1176 1200 71.65
3871 221 Bishanpura 1140 615 525 674 364 310 59.12
3872 222 Rajla 3037 1599 1438 1693 867 826 55.75
3873 223 Ghiora 1548 820 728 862 455 407 55.68
3874 224 Munda Khera Alias Belumajra 727 386 341 369 195 174 50.76
3875 225 Rajgarh 891 459 432 439 222 217 49.27
3876 226 Badanpur 1695 923 772 812 446 366 47.91
3877 227 Jamalpur 739 383 356 339 183 156 45.87
3878 228 Namada 892 482 410 407 218 189 45.63
3879 229 Achral Khurd 509 266 243 229 115 114 44.99
3880 230 Dullar 1254 644 610 543 273 270 43.30
3881 231 Chupki 660 337 323 279 135 144 42.27
3882 232 Mavi Kalan 2981 1584 1397 1246 661 585 41.80
3883 233 Badshahpur (Kaleki) 1524 799 725 623 325 298 40.88
3884 234 Ghangrouli 1199 635 564 489 249 240 40.78
(v) SamanaSub‐District
270

(In Nos.)Percentage
Total Sub Total Male Female Total Male Female (Col. 7 to 4)
1 2 3 4 5 6 7 8 9 10
Village countName of Village
Population SC Population
DISTRICTWISE VILLAGES HAVING 40% AND ABOVE SCHEDULED CASTES (SC) POPULATION IN THE STATE OF PUNJAB (CENSUS 2011)
3885 235 Kulburchha 2690 1456 1234 1076 580 496 40.00
3886 1 Chamrauli 77 35 42 76 34 42 98.70
3887 2 Asalatpur 581 288 293 427 216 211 73.49
3888 3 Rajgiri 1075 554 521 764 384 380 71.07
3889 4 Kumbewal 306 146 160 199 92 107 65.03
3890 5 Pirthipur 929 483 446 580 309 271 62.43
3891 6 Katta 550 292 258 318 176 142 57.82
3892 7 Maura 552 307 245 287 162 125 51.99
3893 8 Banni 594 303 291 293 152 141 49.33
3894 9 Majra 236 121 115 114 63 51 48.31
3895 10 Garh Bagga 1698 920 778 791 428 363 46.58
3896 11 Chandpur 203 109 94 93 46 47 45.81
3897 12 Abiana Khurd 1056 538 518 458 228 230 43.37
3898 13 Rauli 869 459 410 364 195 169 41.89
3899 14 Mussapur 910 466 444 377 192 185 41.43
3900 15 Nurpur Khurd 744 399 345 302 166 136 40.59
3901 16 Beli Kalan 2 1 1 2 1 1 100.00
3902 17 Karkhana Bela 25 11 14 25 11 14 100.00
3903 18 Lakhewal 39 22 17 39 22 17 100.00
3904 19 Manjitpura/Chamar Majra 390 211 179 390 211 179 100.00
3905 20 Rambagh 25 16 9 25 16 9 100.00
3906 21 Morinda ( R ) 947 468 479 946 467 479 99.89
3907 22 Dhumewal 485 265 220 484 265 219 99.79
3908 23 Ramgarh 242 123 119 239 121 118 98.76
3909 24 Ghurkewal 341 194 147 331 189 142 97.07
3910 25 Ranga 170 88 82 163 85 78 95.88
3911 26 Bhauwal 206 95 111 189 87 102 91.75
3912 27 Chhota Daudpur 230 104 126 210 94 116 91.30
3913 28 Adhrera 1049 561 488 924 492 432 88.08
3914 29 Farid 211 110 101 183 96 87 86.73
3915 30 Taprian Gharispur 396 201 195 329 172 157 83.08
3916 31 Chhota Surtanpur 359 181 178 280 140 140 77.99
3917 32 Aurnauli 890 482 408 688 370 318 77.30
3918 33 Chaunta Khurd 305 164 141 234 124 110 76.72
3919 34 Suleman Shikoh 577 295 282 428 218 210 74.18
3920 35 Kulheri 750 396 354 556 296 260 74.13
3921 36 Sarangpur 228 126 102 168 89 79 73.68
3922 37 Bara Surtanpur 493 248 245 362 177 185 73.43
3923 38 Akbarpur 295 152 143 205 111 94 69.49
3924 39 Bara Daudpur 337 178 159 231 123 108 68.55
3925 40 Kulian 336 177 159 222 120 102 66.07
(ii) Chamkaur Sahib
15. RUPNAGAR(i) Anandpur Sahib
DISTRICTSub‐District
Sub‐District
271

(In Nos.)Percentage
Total Sub Total Male Female Total Male Female (Col. 7 to 4)
1 2 3 4 5 6 7 8 9 10
Village countName of Village
Population SC Population
DISTRICTWISE VILLAGES HAVING 40% AND ABOVE SCHEDULED CASTES (SC) POPULATION IN THE STATE OF PUNJAB (CENSUS 2011)
3926 41 Panj Peda 100 54 46 66 34 32 66.00
3927 42 Chhota Gadhram 430 227 203 278 143 135 64.65
3928 43 Kotla Bet 157 83 74 101 50 51 64.33
3929 44 Phassa 225 127 98 142 78 64 63.11
3930 45 Muajudinpur 376 196 180 236 121 115 62.77
3931 46 Jasran 263 137 126 163 80 83 61.98
3932 47 Dumna 1063 548 515 644 341 303 60.58
3933 48 Ban Majra 986 520 466 595 319 276 60.34
3934 49 Dhangrali 1591 832 759 935 499 436 58.77
3935 50 Mohan Majra 582 306 276 342 182 160 58.76
3936 51 Pipal Majra 1082 581 501 633 335 298 58.50
3937 52 Chotamla 1122 597 525 653 351 302 58.20
3938 53 Gagon 650 337 313 373 190 183 57.38
3939 54 Makowal 1455 768 687 832 437 395 57.18
3940 55 Nathwalpur 1279 679 600 727 384 343 56.84
3941 56 Bamnara 1195 613 582 671 354 317 56.15
3942 57 Garhi 577 308 269 323 165 158 55.98
3943 58 Jagatpur 527 288 239 294 169 125 55.79
3944 59 Chhoti Mandauli 915 487 428 500 268 232 54.64
3945 60 Kanjla 766 423 343 417 235 182 54.44
3946 61 Kotli 667 356 311 363 188 175 54.42
3947 62 Dhaulran 515 268 247 276 141 135 53.59
3948 63 Fatehgarh 823 433 390 441 228 213 53.58
3949 64 Assarpur 315 161 154 167 81 86 53.02
3950 65 Rashidpur 1037 537 500 549 274 275 52.94
3951 66 Ramgarh Alias Manda 699 359 340 364 180 184 52.07
3952 67 Malewal 188 101 87 96 51 45 51.06
3953 68 Chhota Makrauna 1104 577 527 561 286 275 50.82
3954 69 Mundian 1323 728 595 671 361 310 50.72
3955 70 Dehar 1093 578 515 551 292 259 50.41
3956 71 Ballan 438 235 203 220 113 107 50.23
3957 72 Mukarabpur 228 113 115 113 61 52 49.56
3958 73 Chalaki 480 254 226 237 128 109 49.38
3959 74 Saheri 1495 808 687 734 403 331 49.10
3960 75 Dugri 940 499 441 461 240 221 49.04
3961 76 Rasulpur 1044 560 484 510 278 232 48.85
3962 77 Badwali 1462 775 687 698 366 332 47.74
3963 78 Sandhuan 1931 1059 872 921 504 417 47.70
3964 79 Samrauli 325 175 150 154 79 75 47.38
3965 80 Chutamali 1241 670 571 588 303 285 47.38
3966 81 Balrampur 721 387 334 340 179 161 47.16
3967 82 Shahpur 247 119 128 116 55 61 46.96
3968 83 Bahbalpur 548 289 259 256 137 119 46.72
3969 84 Boothgarh 178 90 88 83 39 44 46.63
272

(In Nos.)Percentage
Total Sub Total Male Female Total Male Female (Col. 7 to 4)
1 2 3 4 5 6 7 8 9 10
Village countName of Village
Population SC Population
DISTRICTWISE VILLAGES HAVING 40% AND ABOVE SCHEDULED CASTES (SC) POPULATION IN THE STATE OF PUNJAB (CENSUS 2011)
3970 85 Santpur 662 352 310 307 166 141 46.37
3971 86 Barsalpur 2106 1156 950 971 518 453 46.11
3972 87 Sukho Majra 615 327 288 280 145 135 45.53
3973 88 Paprali 1396 736 660 629 318 311 45.06
3974 89 Beli Attalgarh 20 8 12 9 4 5 45.00
3975 90 Khera 36 18 18 16 9 7 44.44
3976 91 Man Kheri 657 339 318 291 149 142 44.29
3977 92 Ramgarh 524 290 234 228 130 98 43.51
3978 93 Chaklan 1327 720 607 577 318 259 43.48
3979 94 Kainaur 2748 1438 1310 1186 624 562 43.16
3980 95 Mahtot 1202 644 558 518 277 241 43.09
3981 96 Zindanpur 387 168 219 166 86 80 42.89
3982 97 Bhaini 737 392 345 313 165 148 42.47
3983 98 Gopalpur 772 412 360 326 166 160 42.23
3984 99 Kotla Sarmukh Singh 474 234 240 199 97 102 41.98
3985 100 Bassi Gujjran 1673 887 786 698 375 323 41.72
3986 101 Kandola 836 433 403 343 170 173 41.03
3987 102 Sarhana 843 450 393 342 180 162 40.57
3988 103 Kakrali 1534 842 692 622 336 286 40.55
3989 104 Pathreri Jattan 1192 633 559 478 254 224 40.10
3990 105 Taprian Rashidpur 60 34 26 24 11 13 40.00
3991 106 Jol 502 256 246 316 163 153 62.95
3992 107 Swamipur 901 469 432 476 243 233 52.83
3993 108 Dubheta 1919 960 959 855 429 426 44.55
3994 109 Jandla 1121 555 566 455 226 229 40.59
3995 110 Barahmpur 3192 1642 1550 1290 680 610 40.41
3996 111 Khalidpur 160 89 71 160 89 71 100.00
3997 112 Bhagalan 649 343 306 636 334 302 98.00
3998 113 Dargah Shah Khalid Binwalid 389 201 188 360 188 172 92.54
3999 114 Chhoti Makori 394 207 187 333 174 159 84.52
4000 115 Fatehpur 474 271 203 393 221 172 82.91
4001 116 Dangauli 796 419 377 603 315 288 75.75
4002 117 Majri 2108 1127 981 1564 819 745 74.19
4003 118 Ladhal 319 173 146 236 125 111 73.98
4004 119 Bairampur 462 233 229 334 166 168 72.29
4005 120 Ahmedpur 226 120 106 160 83 77 70.80
4006 121 Haler 112 62 50 79 45 34 70.54
4007 122 Rautan 59 30 29 38 19 19 64.41
4008 123 Kakaut 543 291 252 342 180 162 62.98
4009 124 Sangatpur 189 109 80 118 67 51 62.43
4010 125 Kheri 933 513 420 566 308 258 60.66
4011 126 Bara 475 263 212 288 162 126 60.63
(iii) Nangal
(iv) Rupnagar
Sub‐District
Sub‐District
273

(In Nos.)Percentage
Total Sub Total Male Female Total Male Female (Col. 7 to 4)
1 2 3 4 5 6 7 8 9 10
Village countName of Village
Population SC Population
DISTRICTWISE VILLAGES HAVING 40% AND ABOVE SCHEDULED CASTES (SC) POPULATION IN THE STATE OF PUNJAB (CENSUS 2011)
4012 127 Dugri 1160 610 550 702 369 333 60.52
4013 128 Bari 310 175 135 187 109 78 60.32
4014 129 Chak Dhera 461 245 216 273 147 126 59.22
4015 130 Gurdaspur 451 229 222 264 140 124 58.54
4016 131 Samrala 339 176 163 196 108 88 57.82
4017 132 Akabarpur 1107 594 513 630 341 289 56.91
4018 133 Bholon Kalewal 411 227 184 232 126 106 56.45
4019 134 Bhagwantpur 914 457 457 501 252 249 54.81
4020 135 Bhaddal 943 516 427 511 276 235 54.19
4021 136 Alampur 506 261 245 271 145 126 53.56
4022 137 Kharota 350 190 160 186 100 86 53.14
4023 138 Bara Bande Mehal 559 287 272 294 151 143 52.59
4024 139 Mado Majra 166 84 82 87 45 42 52.41
4025 140 Kalal Majra 671 354 317 351 182 169 52.31
4026 141 Panjoli 447 227 220 230 117 113 51.45
4027 142 Mansuha Kalan 1195 638 557 589 309 280 49.29
4028 143 Tapal Majra 261 168 93 124 70 54 47.51
4029 144 Nanakpur Alias Sharfabad 464 236 228 217 112 105 46.77
4030 145 Ghanaula 1619 839 780 745 394 351 46.02
4031 146 Bari Makori 418 223 195 192 110 82 45.93
4032 147 Sihon Majra 650 327 323 296 155 141 45.54
4033 148 Siasatpur 420 230 190 190 105 85 45.24
4034 149 Solkhian 1590 821 769 713 373 340 44.84
4035 150 Hussainpur 1055 565 490 472 254 218 44.74
4036 151 Awankot 1149 595 554 497 251 246 43.26
4037 152 Sainfalpur 746 396 350 316 167 149 42.36
4038 153 Lohari 836 440 396 351 189 162 41.99
4039 154 Rampur 828 438 390 345 182 163 41.67
4040 155 Goslan 804 437 367 331 189 142 41.17
4041 156 Sanana 957 503 454 383 196 187 40.02
4042 1 Dandrala 497 262 235 409 216 193 82.29
4043 2 Kauli Majra 563 327 236 413 236 177 73.36
4044 3 Samal Heri 98 54 44 67 38 29 68.37
4045 4 Jagadhri 1179 617 562 788 417 371 66.84
4046 5 Dangdehra 455 232 223 294 155 139 64.62
4047 6 Kasauli 470 241 229 297 150 147 63.19
4048 7 Nimbuan 901 493 408 546 287 259 60.60
4049 8 Haripur kuran 509 271 238 308 161 147 60.51
4050 9 Jeoli 1641 865 776 941 493 448 57.34
4051 10 Jharmari 1357 715 642 773 407 366 56.96
4052 11 Tarrak 934 491 443 519 270 249 55.57
4053 12 Batauli 1305 690 615 725 382 343 55.56
16. SAHIBZADA AJIT SINGH NAGAR (S A S NAGAR)(i) Dera Bassi
DISTRICTSub‐District
274

(In Nos.)Percentage
Total Sub Total Male Female Total Male Female (Col. 7 to 4)
1 2 3 4 5 6 7 8 9 10
Village countName of Village
Population SC Population
DISTRICTWISE VILLAGES HAVING 40% AND ABOVE SCHEDULED CASTES (SC) POPULATION IN THE STATE OF PUNJAB (CENSUS 2011)
4054 13 Mirpur 895 470 425 493 256 237 55.08
4055 14 Mehmadpur 1165 623 542 627 342 285 53.82
4056 15 Bakkarpur 340 182 158 174 93 81 51.18
4057 16 Sadhanpur 1043 558 485 532 280 252 51.01
4058 17 Jarout 3023 1583 1440 1534 787 747 50.74
4059 18 Aganpur 831 446 385 416 219 197 50.06
4060 19 Devinagar 1231 679 552 596 332 264 48.42
4061 20 Dhire Majra 801 426 375 386 210 176 48.19
4062 21 Sangotha 536 285 251 252 142 110 47.01
4063 22 Kurli 1039 550 489 475 248 227 45.72
4064 23 Nagla 1319 705 614 598 311 287 45.34
4065 24 Sundran 2835 1617 1218 1275 707 568 44.97
4066 25 Hassanpur 1111 592 519 491 250 241 44.19
4067 26 Samgauli 2714 1448 1266 1188 638 550 43.77
4068 27 Jhajon 766 409 357 330 171 159 43.08
4069 28 Dhanauni 955 521 434 411 228 183 43.04
4070 29 Fatehpur 1218 649 569 508 266 242 41.71
4071 30 Gulabgarh 791 434 357 326 177 149 41.21
4072 31 Toganpur 971 521 450 397 217 180 40.89
4073 32 Hamayunpur 3068 1714 1354 1245 657 588 40.58
4074 33 Burana 30 16 14 30 16 14 100.00
4075 34 Nabipur 519 286 233 474 260 214 91.33
4076 35 Saini Majra 152 77 75 137 70 67 90.13
4077 36 Sialba 1034 544 490 831 425 406 80.37
4078 37 Tole Majra 291 155 136 215 114 101 73.88
4079 38 Sotal 761 402 359 558 286 272 73.32
4080 39 Majat 1154 616 538 832 448 384 72.10
4081 40 Milak 1059 572 487 743 405 338 70.16
4082 41 Dulwan 476 250 226 327 169 158 68.70
4083 42 Pir Sohana 1062 574 488 723 401 322 68.08
4084 43 Naggal 336 168 168 228 113 115 67.86
4085 44 Ghandauli 893 473 420 592 320 272 66.29
4086 45 Manakpur Sharif 2982 1609 1373 1915 1016 899 64.22
4087 46 Fatehpur 707 380 327 445 238 207 62.94
4088 47 Bansepur 337 168 169 208 104 104 61.72
4089 48 Sil 963 494 469 572 295 277 59.40
4090 49 Dharak Khurd 371 202 169 218 113 105 58.76
4091 50 Ghoga Kheri 723 400 323 423 229 194 58.51
4092 51 Chudiala 1498 793 705 841 440 401 56.14
4093 52 Mundhon Sangtian 1244 655 589 696 369 327 55.95
4094 53 Machhipur 577 309 268 322 163 159 55.81
4095 54 Barauli 1770 936 834 983 513 470 55.54
4096 55 Batta 1152 630 522 638 355 283 55.38
(ii) KhararSub‐District
275

(In Nos.)Percentage
Total Sub Total Male Female Total Male Female (Col. 7 to 4)
1 2 3 4 5 6 7 8 9 10
Village countName of Village
Population SC Population
DISTRICTWISE VILLAGES HAVING 40% AND ABOVE SCHEDULED CASTES (SC) POPULATION IN THE STATE OF PUNJAB (CENSUS 2011)
4097 56 Bharaunjian 1252 668 584 652 347 305 52.08
4098 57 Dharak Kalan 788 416 372 410 214 196 52.03
4099 58 Ranguana 296 174 122 154 94 60 52.03
4100 59 Rasanheri 843 443 400 433 226 207 51.36
4101 60 Chatauli 557 293 264 276 136 140 49.55
4102 61 Mullanpur 496 280 216 243 141 102 48.99
4103 62 Bhagat Majra 526 281 245 251 137 114 47.72
4104 63 Majra 1310 686 624 623 338 285 47.56
4105 64 Bhajauli 1101 599 502 523 286 237 47.50
4106 65 Khera 898 463 435 426 210 216 47.44
4107 66 Paintpur 969 535 434 453 252 201 46.75
4108 67 Cholta Kalan 1165 633 532 531 290 241 45.58
4109 68 Majatri 970 504 466 441 226 215 45.46
4110 69 Fatehgarh 609 331 278 274 153 121 44.99
4111 70 Naglian 677 352 325 299 148 151 44.17
4112 71 Singhpur 177 88 89 78 39 39 44.07
4113 72 Kanauran 345 182 163 152 77 75 44.06
4114 73 Ghataur 1191 631 560 524 279 245 44.00
4115 74 Jhanjheri 3269 1743 1526 1422 758 664 43.50
4116 75 Sheikhpura 356 194 162 153 84 69 42.98
4117 76 Nanheri 449 239 210 192 105 87 42.76
4118 77 Badali 2220 1179 1041 944 506 438 42.52
4119 78 Naggal Faizgarh 480 249 231 204 106 98 42.50
4120 79 Bhago Majra 1600 825 775 674 350 324 42.13
4121 80 Hasanpur 961 518 443 404 216 188 42.04
4122 81 Abhepur 599 302 297 249 133 116 41.57
4123 82 Majri 2633 1387 1246 1067 563 504 40.52
4124 83 Cholta Khurd 1524 791 733 617 326 291 40.49
4125 84 Patran 529 279 250 214 114 100 40.45
4126 85 Garanga 1481 814 667 597 333 264 40.31
4127 86 Chilla 756 419 337 718 396 322 94.97
4128 87 Chapar Chiri Khurd 706 363 343 562 293 269 79.60
4129 88 Kalauli 2030 1082 948 1380 728 652 67.98
4130 89 Saidpur 1310 698 612 799 427 372 60.99
4131 90 Rurka 1062 561 501 598 318 280 56.31
4132 91 Chapar Chiri Kalan 343 179 164 191 100 91 55.69
4133 92 Tangauri 1475 779 696 763 404 359 51.73
4134 93 Sekhan Majra 1165 619 546 541 291 250 46.44
4135 94 Drari 368 186 182 169 89 80 45.92
4136 95 Kambala 1519 834 685 686 376 310 45.16
4137 96 Shafipur 507 245 262 225 105 120 44.38
4138 97 Kailon 1304 679 625 573 285 288 43.94
4139 98 Behlolpur 5153 2720 2433 2239 1184 1055 43.45
(iii) SAS Nagar (Mohali)Sub‐District
276

(In Nos.)Percentage
Total Sub Total Male Female Total Male Female (Col. 7 to 4)
1 2 3 4 5 6 7 8 9 10
Village countName of Village
Population SC Population
DISTRICTWISE VILLAGES HAVING 40% AND ABOVE SCHEDULED CASTES (SC) POPULATION IN THE STATE OF PUNJAB (CENSUS 2011)
4140 99 Nadiali 1284 664 620 539 277 262 41.98
4141 1 Arazi Darya Bramd BelaTajowal 465 239 226 465 239 226 100.00
4142 2 Mubarakpur 76 38 38 76 38 38 100.00
4143 3 Mehndipur 180 97 83 176 95 81 97.78
4144 4 Hedon 672 349 323 640 331 309 95.24
4145 5 Natha Nangal 534 288 246 481 260 221 90.07
4146 6 Kharaur 560 280 280 491 248 243 87.68
4147 7 Alowal 1038 505 533 888 433 455 85.55
4148 8 Bachhwan 523 255 268 437 206 231 83.56
4149 9 Balewal 439 231 208 361 183 178 82.23
4150 10 Balowal Saunkhari 440 243 197 361 195 166 82.05
4151 11 Dalelpur Urf Sarowal 16 7 9 13 6 7 81.25
4152 12 Mandher 126 67 59 100 52 48 79.37
4153 13 Karawar 1102 595 507 837 453 384 75.95
4154 14 Makowal 428 231 197 324 177 147 75.70
4155 15 Auliapur 333 178 155 241 121 120 72.37
4156 16 Jadli 903 436 467 651 311 340 72.09
4157 17 Chankoi 797 415 382 568 298 270 71.27
4158 18 Jogewal 575 303 272 386 208 178 67.13
4159 19 Mehindipur 15 8 7 10 6 4 66.67
4160 20 Siana 234 133 101 148 81 67 63.25
4161 21 Rurki Kalan 673 329 344 425 213 212 63.15
4162 22 Rurki Khurd 785 391 394 478 246 232 60.89
4163 23 Rurki Mughlan 905 445 460 545 263 282 60.22
4164 24 Roohno 250 150 100 150 88 62 60.00
4165 25 Begampur 980 520 460 575 299 276 58.67
4166 26 Garle Dhaha 553 281 272 321 165 156 58.05
4167 27 Mauhar 743 382 361 423 225 198 56.93
4168 28 Bharthala 1190 664 526 667 349 318 56.05
4169 29 Lohgarh 152 74 78 84 38 46 55.26
4170 30 Lalpur 315 154 161 171 85 86 54.29
4171 31 Chankoya 1200 634 566 650 320 330 54.17
4172 32 Nangal 481 249 232 253 133 120 52.60
4173 33 Chahal 1207 630 577 628 327 301 52.03
4174 34 Banga 435 226 209 226 121 105 51.95
4175 35 Ghamour 1562 799 763 803 423 380 51.41
4176 36 Saroa 3712 1917 1795 1904 996 908 51.29
4177 37 Jatpur 568 294 274 288 148 140 50.70
4178 38 Atari 8 3 5 4 2 2 50.00
4179 39 Taunsa 3144 1680 1464 1550 824 726 49.30
4180 40 Lohat 795 414 381 378 203 175 47.55
4181 41 Kangna 1552 820 732 727 374 353 46.84
17. SAHID BHAGAT SINGH NAGAR (S B S NAGAR)(i) Balachaur
DISTRICTSub‐District
277

(In Nos.)Percentage
Total Sub Total Male Female Total Male Female (Col. 7 to 4)
1 2 3 4 5 6 7 8 9 10
Village countName of Village
Population SC Population
DISTRICTWISE VILLAGES HAVING 40% AND ABOVE SCHEDULED CASTES (SC) POPULATION IN THE STATE OF PUNJAB (CENSUS 2011)
4182 42 Jamiatgarh 760 407 353 343 188 155 45.13
4183 43 Bakapur 961 480 481 431 211 220 44.85
4184 44 Thathiala 594 305 289 260 132 128 43.77
4185 45 Jainpur 1694 840 854 739 375 364 43.62
4186 46 Khoja Bet 416 203 213 181 86 95 43.51
4187 47 Mehandpur 1816 940 876 785 400 385 43.23
4188 48 Bagowal 1719 917 802 732 389 343 42.58
4189 49 Niana 571 286 285 243 123 120 42.56
4190 50 Rakran Dhahan 1792 883 909 762 366 396 42.52
4191 51 Paili 864 470 394 359 205 154 41.55
4192 52 Sahiba 1862 952 910 770 401 369 41.35
4193 53 Paragpur 206 113 93 84 52 32 40.78
4194 54 Fatehgarh Alias Sudha Majra 1374 696 678 551 276 275 40.10
4195 55 Kharkuwal 663 344 319 662 343 319 99.85
4196 56 Batuli 54 25 29 53 24 29 98.15
4197 57 Begowal 760 382 378 743 374 369 97.76
4198 58 Lalpur 279 144 135 270 139 131 96.77
4199 59 Mahadipur Kalan 154 85 69 146 79 67 94.81
4200 60 Alowal 217 119 98 200 109 91 92.17
4201 61 Mehndipur 84 48 36 75 42 33 89.29
4202 62 Bairsal 376 189 187 335 172 163 89.10
4203 63 Sheikhe Mazara 393 204 189 347 182 165 88.30
4204 64 Barsian 1088 585 503 927 498 429 85.20
4205 65 Mandhala 99 49 50 84 41 43 84.85
4206 66 Hamirowal 515 257 258 430 217 213 83.50
4207 67 Nilowal 610 318 292 504 268 236 82.62
4208 68 Muna 776 397 379 640 330 310 82.47
4209 69 Bahadurpur 967 512 455 785 418 367 81.18
4210 70 Bagoran 486 246 240 394 196 198 81.07
4211 71 Hussain Chak 439 223 216 355 180 175 80.87
4212 72 Sarhal Qazian 1543 790 753 1238 632 606 80.23
4213 73 Mai Ditta 199 104 95 159 80 79 79.90
4214 74 Sukar 331 169 162 262 130 132 79.15
4215 75 Gohlron 361 183 178 285 145 140 78.95
4216 76 Chakkalal 874 441 433 688 336 352 78.72
4217 77 Mahalon 1862 992 870 1456 774 682 78.20
4218 78 Udhowal 858 479 379 670 366 304 78.09
4219 79 Sal Khurd 405 207 198 315 158 157 77.78
4220 80 Grupar 1074 530 544 834 413 421 77.65
4221 81 Hussainpur 1226 653 573 949 499 450 77.41
4222 82 Gujjarpur Kalan 840 416 424 649 327 322 77.26
4223 83 Khamachon 1468 760 708 1129 586 543 76.91
4224 84 Paragpur 574 283 291 441 213 228 76.83
(ii) NawanshahrSub‐District
278

(In Nos.)Percentage
Total Sub Total Male Female Total Male Female (Col. 7 to 4)
1 2 3 4 5 6 7 8 9 10
Village countName of Village
Population SC Population
DISTRICTWISE VILLAGES HAVING 40% AND ABOVE SCHEDULED CASTES (SC) POPULATION IN THE STATE OF PUNJAB (CENSUS 2011)
4225 85 Burj Kandhari 654 322 332 497 248 249 75.99
4226 86 Ramgarh 292 144 148 218 102 116 74.66
4227 87 Bharo Mazara 1662 881 781 1209 632 577 72.74
4228 88 Karimpur 1180 594 586 855 420 435 72.46
4229 89 Salempur 539 256 283 390 193 197 72.36
4230 90 Lakhpur 836 404 432 598 278 320 71.53
4231 91 Phul Makauri 104 50 54 74 38 36 71.15
4232 92 Lodhipur 1193 590 603 844 413 431 70.75
4233 93 Kamam 1958 982 976 1383 682 701 70.63
4234 94 Heon 2616 1314 1302 1830 915 915 69.95
4235 95 Jandiala 1893 940 953 1319 649 670 69.68
4236 96 Langeri 1526 793 733 1061 559 502 69.53
4237 97 Dhandhua 474 247 227 329 180 149 69.41
4238 98 Gunachaur 3808 1986 1822 2640 1352 1288 69.33
4239 99 Chak Mander 859 428 431 591 290 301 68.80
4240 100 Khatkar Khurd 1310 640 670 901 433 468 68.78
4241 101 Tajowal 483 246 237 332 166 166 68.74
4242 102 Bika 771 363 408 529 247 282 68.61
4243 103 Nangal Chhanga 413 202 211 283 136 147 68.52
4244 104 Talwandi Fattu 1655 848 807 1127 577 550 68.10
4245 105 Garhi Bharti 470 231 239 319 162 157 67.87
4246 106 Daryapur 1218 641 577 823 427 396 67.57
4247 107 Kot Ranjha 1496 772 724 1007 528 479 67.31
4248 108 Kariha 2533 1277 1256 1705 880 825 67.31
4249 109 Mahliana 1299 672 627 872 459 413 67.13
4250 110 Khanpur 999 500 499 670 327 343 67.07
4251 111 Sultanpur 229 120 109 153 82 71 66.81
4252 112 Kultham 2511 1295 1216 1661 874 787 66.15
4253 113 Chakli Shujat 602 313 289 398 204 194 66.11
4254 114 Chak Guru 993 518 475 656 345 311 66.06
4255 115 Saidpur Theh 97 46 51 64 32 32 65.98
4256 116 Bakhlaur 3226 1617 1609 2111 1045 1066 65.44
4257 117 Sotran 858 440 418 558 285 273 65.03
4258 118 Behram 3816 1942 1874 2479 1243 1236 64.96
4259 119 Mahrampur 622 316 306 403 205 198 64.79
4260 120 Jhingran 2616 1347 1269 1694 874 820 64.76
4261 121 Jhander Khurd 823 440 383 529 283 246 64.28
4262 122 Kariam 3053 1582 1471 1954 1013 941 64.00
4263 123 Bulakipur 386 194 192 246 118 128 63.73
4264 124 Atari 628 316 312 398 196 202 63.38
4265 125 Gosal 904 462 442 571 298 273 63.16
4266 126 Thandian 1206 589 617 760 379 381 63.02
4267 127 Baharwal 1256 638 618 791 397 394 62.98
4268 128 Charan 1054 535 519 662 325 337 62.81
279

(In Nos.)Percentage
Total Sub Total Male Female Total Male Female (Col. 7 to 4)
1 2 3 4 5 6 7 8 9 10
Village countName of Village
Population SC Population
DISTRICTWISE VILLAGES HAVING 40% AND ABOVE SCHEDULED CASTES (SC) POPULATION IN THE STATE OF PUNJAB (CENSUS 2011)
4269 129 Jandiali 2115 1115 1000 1325 691 634 62.65
4270 130 Jhungian 16 8 8 10 5 5 62.50
4271 131 Mallah Sodhian 1078 554 524 669 355 314 62.06
4272 132 Soondh 1140 583 557 700 362 338 61.40
4273 133 Dilawarpur 263 128 135 160 76 84 60.84
4274 134 Mubarkpur 1747 894 853 1062 526 536 60.79
4275 135 Khan Khana 2469 1270 1199 1492 767 725 60.43
4276 136 Katarian 1407 716 691 845 429 416 60.06
4277 137 Chak Alahi Bakhash 459 240 219 275 146 129 59.91
4278 138 Mazari 1508 783 725 900 454 446 59.68
4279 139 Mehli 3517 1826 1691 2094 1100 994 59.54
4280 140 Jullah Majra 958 480 478 566 281 285 59.08
4281 141 Ghumman 2619 1329 1290 1546 776 770 59.03
4282 142 Bahar Mazara 1165 610 555 683 352 331 58.63
4283 143 Sahlon 1905 954 951 1114 561 553 58.48
4284 144 Bhagoran 1679 857 822 979 505 474 58.31
4285 145 Kajla 1033 507 526 602 296 306 58.28
4286 146 Janian 604 314 290 351 183 168 58.11
4287 147 Sal Kalan 458 241 217 266 134 132 58.08
4288 148 Gehal Mazari 572 284 288 332 163 169 58.04
4289 149 Barwa 1140 560 580 661 339 322 57.98
4290 150 Ratainda 2780 1385 1395 1609 793 816 57.88
4291 151 Mahdipur 1007 504 503 580 279 301 57.60
4292 152 Balon 704 370 334 405 212 193 57.53
4293 153 Dhingarpur 576 275 301 331 160 171 57.47
4294 154 Niamatpur 396 211 185 227 121 106 57.32
4295 155 Bisla 1296 640 656 742 370 372 57.25
4296 156 Mandhali 3170 1604 1566 1811 937 874 57.13
4297 157 Bahlur Kalan 844 414 430 481 228 253 56.99
4298 158 Mala Bedian 1237 610 627 704 345 359 56.91
4299 159 Sandwan 3181 1637 1544 1790 913 877 56.27
4300 160 Sodhian 870 427 443 488 249 239 56.09
4301 161 Tajpur 696 362 334 389 205 184 55.89
4302 162 Ghataron 1618 829 789 904 452 452 55.87
4303 163 Chahal Kalan 1382 701 681 772 404 368 55.86
4304 164 Bahua 924 487 437 514 278 236 55.63
4305 165 Jasso Mazara 1536 777 759 850 422 428 55.34
4306 166 Dosanjh Khurd 1077 534 543 595 296 299 55.25
4307 167 Lalewal 139 69 70 76 37 39 54.68
4308 168 Shakohpur 1317 681 636 719 383 336 54.59
4309 169 Chak Mai Dass 811 417 394 442 234 208 54.50
4310 170 Godani 428 234 194 233 121 112 54.44
4311 171 Lidhar Kalan 976 497 479 530 271 259 54.30
4312 172 Paddi Matwali 1408 714 694 761 387 374 54.05
280

(In Nos.)Percentage
Total Sub Total Male Female Total Male Female (Col. 7 to 4)
1 2 3 4 5 6 7 8 9 10
Village countName of Village
Population SC Population
DISTRICTWISE VILLAGES HAVING 40% AND ABOVE SCHEDULED CASTES (SC) POPULATION IN THE STATE OF PUNJAB (CENSUS 2011)
4313 173 Mangat Dhingrian 1231 656 575 664 347 317 53.94
4314 174 Bharo Mazara 1244 620 624 666 331 335 53.54
4315 175 Burj Tehal Dass 903 457 446 481 243 238 53.27
4316 176 Ladian 793 398 395 421 212 209 53.09
4317 177 Khoja 940 489 451 499 253 246 53.09
4318 178 Talwandi Jattan 829 421 408 439 225 214 52.96
4319 179 Bajjon 470 251 219 248 131 117 52.77
4320 180 Hapowal 1142 562 580 601 289 312 52.63
4321 181 Malpur 1751 872 879 917 456 461 52.37
4322 182 Thathiala 25 12 13 13 7 6 52.00
4323 183 Bhut 1523 774 749 791 402 389 51.94
4324 184 Rasulpur 1283 626 657 666 332 334 51.91
4325 185 Raipur Daba 1271 631 640 659 328 331 51.85
4326 186 Bains 2064 1058 1006 1064 543 521 51.55
4327 187 Nagra 626 286 340 321 146 175 51.28
4328 188 Jalwaha 810 405 405 415 211 204 51.23
4329 189 Bhukhri 483 248 235 247 116 131 51.14
4330 190 Bhin 1965 1008 957 997 512 485 50.74
4331 191 Nurpur 998 512 486 505 246 259 50.60
4332 192 Garh Padhana 1592 780 812 805 392 413 50.57
4333 193 Malopota 1699 819 880 859 412 447 50.56
4334 194 Mander 602 307 295 302 153 149 50.17
4335 195 Nai Mazara 945 471 474 469 234 235 49.63
4336 196 Mukandpur 3946 2012 1934 1958 998 960 49.62
4337 197 Palli Uchi 1239 602 637 612 303 309 49.39
4338 198 Garhi Ajitsingh 1641 813 828 807 397 410 49.18
4339 199 Kulam 1059 528 531 520 251 269 49.10
4340 200 Jhander Kalan 846 432 414 415 218 197 49.05
4341 201 Bharoli 2202 1132 1070 1074 567 507 48.77
4342 202 Malpur 1683 857 826 819 415 404 48.66
4343 203 Anokharwal 524 276 248 254 133 121 48.47
4344 204 Musapur 2773 1421 1352 1341 699 642 48.36
4345 205 Mehmudpur 921 462 459 445 222 223 48.32
4346 206 Chuharpur 1545 761 784 746 382 364 48.28
4347 207 Mahal Khurd 1275 632 643 613 303 310 48.08
4348 208 Phambra 824 424 400 394 204 190 47.82
4349 209 Rehpa 1378 703 675 652 344 308 47.31
4350 210 Mazara Nauabad 1182 612 570 558 286 272 47.21
4351 211 Jadla 4442 2309 2133 2088 1084 1004 47.01
4352 212 Ibrahimpur 115 62 53 54 26 28 46.96
4353 213 Chahal Khurd 1103 546 557 517 259 258 46.87
4354 214 Amargarh 1451 740 711 680 325 355 46.86
4355 215 Kaleran 1236 628 608 569 294 275 46.04
4356 216 Lal Mazara 598 291 307 275 124 151 45.99
281

(In Nos.)Percentage
Total Sub Total Male Female Total Male Female (Col. 7 to 4)
1 2 3 4 5 6 7 8 9 10
Village countName of Village
Population SC Population
DISTRICTWISE VILLAGES HAVING 40% AND ABOVE SCHEDULED CASTES (SC) POPULATION IN THE STATE OF PUNJAB (CENSUS 2011)
4357 217 Garhi Fateh Khan 887 467 420 407 227 180 45.89
4358 218 Ratnana 427 223 204 195 105 90 45.67
4359 219 Gujjarpur Khurd 204 105 99 93 49 44 45.59
4360 220 Kahma 3320 1690 1630 1513 786 727 45.57
4361 221 Ramraipur 1376 725 651 627 325 302 45.57
4362 222 Hansron 1196 588 608 542 267 275 45.32
4363 223 Garcha 2078 1031 1047 941 474 467 45.28
4364 224 Mirpur Jattan 2383 1221 1162 1077 574 503 45.20
4365 225 Jabbowal 1914 984 930 860 430 430 44.93
4366 226 Muzaffarpur 775 394 381 348 183 165 44.90
4367 227 Soheta 1012 501 511 452 225 227 44.66
4368 228 Herian 992 511 481 443 228 215 44.66
4369 229 Dhahan 1309 643 666 582 292 290 44.46
4370 230 Khatkar Kalan 1811 878 933 798 397 401 44.06
4371 231 Palli Jhikki 1892 970 922 822 433 389 43.45
4372 232 Sanawa 1463 719 744 635 317 318 43.40
4373 233 Shahbazpur 987 487 500 428 215 213 43.36
4374 234 Chak Ramun 1196 612 584 515 239 276 43.06
4375 235 Bhangal Kalan 1890 970 920 811 405 406 42.91
4376 236 Chak Bilgan 1822 903 919 778 392 386 42.70
4377 237 Sheikhupur 2209 1055 1154 943 470 473 42.69
4378 238 Cheta 922 474 448 390 198 192 42.30
4379 239 Jaffarpur 895 457 438 378 191 187 42.23
4380 240 Bhaura 1778 894 884 746 375 371 41.96
4381 241 Birowal 926 468 458 388 202 186 41.90
4382 242 Kahlon 1377 677 700 576 282 294 41.83
4383 243 Ferozepur 357 189 168 149 74 75 41.74
4384 244 Jethu Mazara 1420 732 688 592 302 290 41.69
4385 245 Majhoor 724 366 358 299 161 138 41.30
4386 246 Mahal Gehla 3403 1693 1710 1405 719 686 41.29
4387 247 Mirpur Lakha 1097 552 545 452 238 214 41.20
4388 248 Nangal Jattan 504 241 263 207 97 110 41.07
4389 249 Pharala 3226 1639 1587 1317 690 627 40.82
4390 250 Gobindpur 2072 1076 996 841 441 400 40.59
4391 251 Durgapur 794 407 387 322 170 152 40.55
4392 252 Mangowal 1863 914 949 755 362 393 40.53
4393 253 Naura 2999 1478 1521 1210 599 611 40.35
4394 254 Talwandi Shibu 192 108 84 77 45 32 40.10
4395 1 Belewal 911 487 424 630 341 289 69.15
4396 2 Manwala 807 409 398 432 207 225 53.53
4397 3 Qila Hakiman 2273 1198 1075 1208 632 576 53.15
4398 4 Burj Seda 359 194 165 183 100 83 50.97
18. SANGRUR(i) Dhuri
DISTRICTSub‐District
282

(In Nos.)Percentage
Total Sub Total Male Female Total Male Female (Col. 7 to 4)
1 2 3 4 5 6 7 8 9 10
Village countName of Village
Population SC Population
DISTRICTWISE VILLAGES HAVING 40% AND ABOVE SCHEDULED CASTES (SC) POPULATION IN THE STATE OF PUNJAB (CENSUS 2011)
4399 5 Ruldu Singhwala 972 510 462 494 267 227 50.82
4400 6 Meerheri 755 393 362 361 183 178 47.81
4401 7 Manah 1013 516 497 483 240 243 47.68
4402 8 Kaheru 2412 1253 1159 1113 572 541 46.14
4403 9 Dhura 2207 1180 1027 1009 541 468 45.72
4404 10 Kheri Chahalan 4608 2388 2220 2098 1099 999 45.53
4405 11 Kalabula 1440 786 654 638 351 287 44.31
4406 12 Kanjli 1349 713 636 591 310 281 43.81
4407 13 Jahangir 2139 1122 1017 929 488 441 43.43
4408 14 Harchandpur 1560 848 712 643 356 287 41.22
4409 15 Kheri Jattan 1468 772 696 601 318 283 40.94
4410 16 Lohar Majra 485 261 224 197 110 87 40.62
4411 17 Natt 1551 836 715 625 336 289 40.30
4412 18 Arkbas 1732 907 825 832 430 402 48.04
4413 19 Ladal 2595 1363 1232 1201 658 543 46.28
4414 20 Fatehgarh 2702 1473 1229 1236 667 569 45.74
4415 21 Kalia 2090 1103 987 882 461 421 42.20
4416 22 Rampura Jawarwala 1474 786 688 591 320 271 40.09
4417 23 Bir Amamgarh 714 385 329 699 380 319 97.90
4418 24 Chatriwala 80 45 35 64 37 27 80.00
4419 25 Chandigarh 71 40 31 52 27 25 73.24
4420 26 Mahorana 1541 813 728 1000 524 476 64.89
4421 27 Moranwali 1320 682 638 843 438 405 63.86
4422 28 Faujewala 266 129 137 154 73 81 57.89
4423 29 Mandian 733 384 349 414 223 191 56.48
4424 30 Giga Majra 666 350 316 375 196 179 56.31
4425 31 Bhumsi 1164 615 549 638 341 297 54.81
4426 32 Mahali 535 289 246 293 154 139 54.77
4427 33 Jattuan 611 298 313 332 160 172 54.34
4428 34 Bhatian Khurd 1223 616 607 647 328 319 52.90
4429 35 Asdullapur 1118 581 537 584 308 276 52.24
4430 36 Kalian 2838 1488 1350 1467 769 698 51.69
4431 37 Phalaud Kalan 1310 700 610 666 347 319 50.84
4432 38 Chaproda 200 104 96 101 51 50 50.50
4433 39 Sampurangarh 49 31 18 24 17 7 48.98
4434 40 Langrian 1663 895 768 806 438 368 48.47
4435 41 Mola Badha 1025 542 483 496 259 237 48.39
4436 42 Jagowal 1008 545 463 483 260 223 47.92
4437 43 Farwali 1625 850 775 778 415 363 47.88
4438 44 Dilawargarh 2087 1104 983 999 528 471 47.87
4439 45 Jandali Kalan 1895 992 903 907 484 423 47.86
4440 46 Ratolan 1305 678 627 618 321 297 47.36
(ii) Lehra
(iii) Malerkotla
Sub‐District
Sub‐District
283

(In Nos.)Percentage
Total Sub Total Male Female Total Male Female (Col. 7 to 4)
1 2 3 4 5 6 7 8 9 10
Village countName of Village
Population SC Population
DISTRICTWISE VILLAGES HAVING 40% AND ABOVE SCHEDULED CASTES (SC) POPULATION IN THE STATE OF PUNJAB (CENSUS 2011)
4441 47 Nathoheri 1250 674 576 583 317 266 46.64
4442 48 Kheri Sodhian 854 435 419 397 211 186 46.49
4443 49 Daulowal 644 344 300 297 152 145 46.12
4444 50 Burj Baghel Singhwala 668 358 310 302 159 143 45.21
4445 51 Sehke 960 482 478 434 209 225 45.21
4446 52 Chandu Raian 151 75 76 68 33 35 45.03
4447 53 Manakheri 1331 713 618 596 318 278 44.78
4448 54 Dasaundha Singhwala 2372 1269 1103 1061 564 497 44.73
4449 55 Gajjan Majra 581 292 289 256 122 134 44.06
4450 56 Jhall 1830 934 896 791 408 383 43.22
4451 57 Himtana 1860 983 877 800 423 377 43.01
4452 58 Mahala 679 368 311 291 158 133 42.86
4453 59 Balewal 1383 719 664 587 298 289 42.44
4454 60 Bunga 440 228 212 186 97 89 42.27
4455 61 Sarwarpur 1079 553 526 456 229 227 42.26
4456 62 Manak Majra 2368 1226 1142 995 508 487 42.02
4457 63 Kasba Bhural 2365 1259 1106 991 521 470 41.90
4458 64 Jalwana 1459 761 698 611 320 291 41.88
4459 65 Toga Heri 266 137 129 111 58 53 41.73
4460 66 Bhatian Kalan 741 384 357 306 154 152 41.30
4461 67 Badechaa 760 400 360 311 168 143 40.92
4462 68 Bagrian 4895 2587 2308 1993 1046 947 40.72
4463 69 Bathan 747 406 341 301 164 137 40.29
4464 70 Mehdevi 1496 780 716 602 305 297 40.24
4465 71 Chandu 1604 809 795 1363 685 678 84.98
4466 72 Thaska 847 434 413 590 308 282 69.66
4467 73 Khanauri Khurd 853 441 412 535 277 258 62.72
4468 74 Babangarh Alias Ghamur Ghat 1583 834 749 776 414 362 49.02
4469 75 Mandvi 6105 3207 2898 2657 1388 1269 43.52
4470 76 Rampura Gujran 3050 1569 1481 1287 658 629 42.20
4471 77 Shahpur Nauabad Alias Ther I 912 479 433 382 201 181 41.89
4472 78 Phulad 1720 885 835 710 362 348 41.28
4473 79 Bhathuwan 2331 1236 1095 957 503 454 41.06
4474 80 Maniana 3724 1970 1754 1492 789 703 40.06
4475 81 Hakikatpura 450 241 209 435 231 204 96.67
4476 82 Bhagwanpura 249 131 118 223 117 106 89.56
4477 83 Fatehgarh Chhanna 1672 888 784 1331 696 635 79.61
4478 84 Nakta 1260 674 586 856 465 391 67.94
4479 85 Fatehnagar Alias Munshiwala 1512 821 691 1015 559 456 67.13
4480 86 Santokhpura 449 229 220 281 144 137 62.58
4481 87 Retgarh 1706 917 789 1026 556 470 60.14
4482 88 Sahoke 2000 1049 951 1192 630 562 59.60
(iv) Moonak
(v) Sangrur
Sub‐District
Sub‐District
284

(In Nos.)Percentage
Total Sub Total Male Female Total Male Female (Col. 7 to 4)
1 2 3 4 5 6 7 8 9 10
Village countName of Village
Population SC Population
DISTRICTWISE VILLAGES HAVING 40% AND ABOVE SCHEDULED CASTES (SC) POPULATION IN THE STATE OF PUNJAB (CENSUS 2011)
4483 89 Ramnagar Sibian 1292 679 613 765 395 370 59.21
4484 90 Bibar 1268 655 613 740 381 359 58.36
4485 91 Jolian 1031 543 488 596 317 279 57.81
4486 92 Ramgarh 361 192 169 208 111 97 57.62
4487 93 Bibri 725 377 348 413 219 194 56.97
4488 94 Kammo Majra kalan 943 501 442 530 283 247 56.20
4489 95 Akoi 1640 860 780 884 460 424 53.90
4490 96 Roshanwala 756 383 373 399 202 197 52.78
4491 97 Banganwali 1391 716 675 727 373 354 52.26
4492 98 Nandgarh 749 407 342 382 213 169 51.00
4493 99 Lidran 1210 635 575 611 329 282 50.50
4494 100 Kheri Chandwan 744 388 356 374 195 179 50.27
4495 101 Deh Kalan 808 417 391 400 208 192 49.50
4496 102 Patti Bharaj 1553 834 719 754 401 353 48.55
4497 103 Upli 4021 2145 1876 1908 1033 875 47.45
4498 104 Bakhopir 1176 621 555 538 288 250 45.75
4499 105 Naraingarh 1496 784 712 683 351 332 45.66
4500 106 Sakrodi 1491 783 708 678 351 327 45.47
4501 107 Kheri Gillan 1063 576 487 478 261 217 44.97
4502 108 Rampura 2604 1363 1241 1164 609 555 44.70
4503 109 Sajuma 510 279 231 226 126 100 44.31
4504 110 Matran 896 456 440 397 199 198 44.31
4505 111 Tung 2460 1300 1160 1087 570 517 44.19
4506 112 Laddi 1351 723 628 594 325 269 43.97
4507 113 Togawal 2630 1425 1205 1133 633 500 43.08
4508 114 Bhuraj 925 486 439 394 213 181 42.59
4509 115 Nankiana Sahib 48 30 18 20 9 11 41.67
4510 116 Mander Kalan 2055 1081 974 840 436 404 40.88
4511 117 Kanoi 1478 773 705 594 314 280 40.19
4512 118 Rattangarh Sidhran 1130 617 513 766 422 344 67.79
4513 119 Bharur 1339 682 657 725 367 358 54.14
4514 120 Santpura 858 463 395 435 237 198 50.70
4515 121 Shafipur Khurd 954 504 450 449 231 218 47.06
4516 122 Dhandoli Khurd 1752 905 847 823 416 407 46.97
4517 123 Chatha Nakta 610 323 287 286 151 135 46.89
4518 124 Kheri Naga 805 448 357 360 196 164 44.72
4519 125 Mard Khera 858 459 399 379 209 170 44.17
4520 126 Rattangarh Alias Pattianwali 1263 671 592 543 295 248 42.99
4521 127 Ghanaur Rajputa 1393 737 656 597 322 275 42.86
4522 128 Toor Banjara 2302 1218 1084 984 519 465 42.75
4523 129 Ladbanjara Khurd 1182 609 573 485 242 243 41.03
4524 130 Jakhepalbas 1720 902 818 689 355 334 40.06
(vi) SunamSub‐District
285

(In Nos.)Percentage
Total Sub Total Male Female Total Male Female (Col. 7 to 4)
1 2 3 4 5 6 7 8 9 10
Village countName of Village
Population SC Population
DISTRICTWISE VILLAGES HAVING 40% AND ABOVE SCHEDULED CASTES (SC) POPULATION IN THE STATE OF PUNJAB (CENSUS 2011)
4525 1 Theri 3458 1816 1642 2405 1273 1132 69.55
4526 2 Babania 1501 779 722 972 494 478 64.76
4527 3 Bidowali 1907 980 927 1157 588 569 60.67
4528 4 Chak Giljewala 1476 745 731 828 417 411 56.10
4529 5 Chhatiana 3815 2035 1780 1962 1042 920 51.43
4530 6 Bhundar 2960 1564 1396 1445 765 680 48.82
4531 7 Dhaula 1362 731 631 659 365 294 48.38
4532 8 Khunan Khurd 2109 1094 1015 992 514 478 47.04
4533 9 Giljewala 2753 1451 1302 1287 675 612 46.75
4534 10 Lohara 1669 888 781 766 410 356 45.90
4535 11 Khirkianwala 2846 1481 1365 1299 682 617 45.64
4536 12 Sukha Ablu 5228 2806 2422 2375 1282 1093 45.43
4537 13 Manianwala 945 502 443 424 230 194 44.87
4538 14 Gurri Sangar 2803 1468 1335 1250 652 598 44.60
4539 15 Ghagga 3326 1725 1601 1456 740 716 43.78
4540 16 Doula 3382 1758 1624 1460 754 706 43.17
4541 17 Samagh 1982 1036 946 842 446 396 42.48
4542 18 Tharajwala 4194 2255 1939 1779 961 818 42.42
4543 19 Bhuttiwala 3918 2097 1821 1622 856 766 41.40
4544 20 Doda 13070 6825 6245 5360 2778 2582 41.01
4545 21 Lal Bai 4942 2611 2331 2021 1064 957 40.89
4546 22 Tapa Khera 3566 1846 1720 2630 1351 1279 73.75
4547 23 Mehmud Khera 2251 1176 1075 1653 856 797 73.43
4548 24 Khudian Mohan Singh 1258 674 584 911 481 430 72.42
4549 25 Urang 2435 1254 1181 1635 859 776 67.15
4550 26 Malwala 942 482 460 620 311 309 65.82
4551 27 Deon Khera 2620 1375 1245 1722 902 820 65.73
4552 28 Ghumar Khera 1582 826 756 1036 536 500 65.49
4553 29 Virk Khera 1696 891 805 1083 573 510 63.86
4554 30 Sheikhu 826 438 388 515 276 239 62.35
4555 31 Aspal 2041 1074 967 1269 673 596 62.18
4556 32 Ramnagar Khazan Singh 807 402 405 498 247 251 61.71
4557 33 Khunan Kalan 3977 2125 1852 2400 1292 1108 60.35
4558 34 Adhania 2920 1558 1362 1761 948 813 60.31
4559 35 Chhapianwali 2475 1288 1187 1484 778 706 59.96
4560 36 Khudian Gulab Singh 2261 1181 1080 1353 709 644 59.84
4561 37 Bham 4324 2292 2032 2580 1360 1220 59.67
4562 38 Abul Khurana 6789 3607 3182 4016 2121 1895 59.15
4563 39 Mehna 5072 2655 2417 2957 1566 1391 58.30
4564 40 Channu 6529 3403 3126 3804 1963 1841 58.26
4565 41 Mohlan 3188 1643 1545 1842 945 897 57.78
19. SRI MUKTSAR SAHIB(i) Gidderbaha
(ii) Malout
DISTRICTSub‐District
Sub‐District
286

(In Nos.)Percentage
Total Sub Total Male Female Total Male Female (Col. 7 to 4)
1 2 3 4 5 6 7 8 9 10
Village countName of Village
Population SC Population
DISTRICTWISE VILLAGES HAVING 40% AND ABOVE SCHEDULED CASTES (SC) POPULATION IN THE STATE OF PUNJAB (CENSUS 2011)
4566 42 Kingra 1189 620 569 683 358 325 57.44
4567 43 Middu Khera 2346 1255 1091 1345 733 612 57.33
4568 44 Kolianwali 2782 1469 1313 1590 839 751 57.15
4569 45 Bhullarwala 1317 690 627 744 394 350 56.49
4570 46 Burj Sidhwan 5256 2765 2491 2929 1527 1402 55.73
4571 47 Dabwali Pahurianwali 2544 1364 1180 1416 742 674 55.66
4572 48 Lambi 5053 2602 2451 2793 1425 1368 55.27
4573 49 Alamwala 5254 2746 2508 2891 1514 1377 55.02
4574 50 Bhalerian 1749 905 844 950 488 462 54.32
4575 51 Khane Ki Dhab 2000 1031 969 1082 553 529 54.10
4576 52 Pakki Tibbi 2323 1227 1096 1253 663 590 53.94
4577 53 Sehna Khera 1457 762 695 781 411 370 53.60
4578 54 Patti Karam 1468 791 677 783 417 366 53.34
4579 55 Tarkhanwala 3256 1705 1551 1725 919 806 52.98
4580 56 Kabarwala 2355 1246 1109 1245 648 597 52.87
4581 57 Bhittiwala 4277 2239 2038 2204 1172 1032 51.53
4582 58 Khema Khera 2015 1069 946 1033 547 486 51.27
4583 59 Rathrian 1940 1053 887 984 527 457 50.72
4584 60 Jhorar 5023 2626 2397 2541 1319 1222 50.59
4585 61 Lakkarwala 2649 1364 1285 1323 672 651 49.94
4586 62 Paniwala Fatta 3061 1584 1477 1515 796 719 49.49
4587 63 Jandwala Charat Singh 3726 1944 1782 1838 962 876 49.33
4588 64 Fatuhiwala 2666 1403 1263 1300 679 621 48.76
4589 65 Sikhwala 4425 2342 2083 2151 1143 1008 48.61
4590 66 Mahni Khera 2142 1129 1013 1034 552 482 48.27
4591 67 Ratta Tibba 2032 1084 948 973 527 446 47.88
4592 68 Shamkot 3838 2013 1825 1817 946 871 47.34
4593 69 Fatta Khera 2316 1219 1097 1092 584 508 47.15
4594 70 Fatuhi Khera 2686 1411 1275 1258 657 601 46.84
4595 71 Gaggar 2069 1091 978 960 510 450 46.40
4596 72 Kheowali 2401 1234 1167 1111 557 554 46.27
4597 73 Danewala 3133 1655 1478 1440 754 686 45.96
4598 74 Arniwala Waziran 1494 801 693 682 373 309 45.65
4599 75 Singhewala 2459 1310 1149 1119 581 538 45.51
4600 76 Maan 3198 1662 1536 1442 751 691 45.09
4601 77 Killianwali 13547 7135 6412 6047 3167 2880 44.64
4602 78 Banwala Anu 2305 1209 1096 1027 539 488 44.56
4603 79 Shergarh Gian Singh 1857 954 903 826 420 406 44.48
4604 80 Fatehpur Manianwala 3150 1643 1507 1401 706 695 44.48
4605 81 Katorewala 1855 976 879 824 429 395 44.42
4606 82 Malout (Rural) 8732 4619 4113 3865 2040 1825 44.26
4607 83 Waring Khera 3684 1927 1757 1582 829 753 42.94
4608 84 Sanoke 1316 676 640 545 274 271 41.41
4609 85 Bhagu 1084 589 495 448 248 200 41.33
287

(In Nos.)Percentage
Total Sub Total Male Female Total Male Female (Col. 7 to 4)
1 2 3 4 5 6 7 8 9 10
Village countName of Village
Population SC Population
DISTRICTWISE VILLAGES HAVING 40% AND ABOVE SCHEDULED CASTES (SC) POPULATION IN THE STATE OF PUNJAB (CENSUS 2011)
4610 86 Bodiwala Kharak Singh 3401 1795 1606 1387 740 647 40.78
4611 87 Lohara 1263 666 597 514 274 240 40.70
4612 88 Chak Dohak 127 65 62 127 65 62 100.00
4613 89 Kanianwali 3984 2126 1858 3005 1601 1404 75.43
4614 90 Maan Singhwala 3379 1740 1639 2494 1277 1217 73.81
4615 91 Khunde Halal 2246 1181 1065 1636 875 761 72.84
4616 92 Fattanwala 2413 1254 1159 1726 895 831 71.53
4617 93 Chak Chibranwali 3516 1865 1651 2475 1314 1161 70.39
4618 94 Muktsar(Rural) 1989 1067 922 1337 721 616 67.22
4619 95 Chak Kala Singhwala 1770 928 842 1158 631 527 65.42
4620 96 Chak Gandha Singhwala 1597 825 772 1041 539 502 65.18
4621 97 Chak Tamkot 978 514 464 635 340 295 64.93
4622 98 Samewali 2661 1434 1227 1724 925 799 64.79
4623 99 Barkandi 2750 1482 1268 1767 961 806 64.25
4624 100 Chak Jawahar Singhwala 1550 830 720 986 531 455 63.61
4625 101 Chibranwali 2738 1411 1327 1726 897 829 63.04
4626 102 Chak Mahan Bhaddar 521 246 275 318 150 168 61.04
4627 103 Mahan Bhaddar 4562 2389 2173 2781 1445 1336 60.96
4628 104 Goniana 3729 1943 1786 2255 1177 1078 60.47
4629 105 Dohak 2473 1311 1162 1472 790 682 59.52
4630 106 Samagh 1499 773 726 886 443 443 59.11
4631 107 Sarai Naga 2812 1488 1324 1658 869 789 58.96
4632 108 Chak Duhewala 1690 918 772 992 546 446 58.70
4633 109 Badhai 2511 1297 1214 1473 748 725 58.66
4634 110 Rohurianwali 2727 1399 1328 1593 833 760 58.42
4635 111 Dodanwali 1777 904 873 1029 526 503 57.91
4636 112 Mar Mallu 832 441 391 480 262 218 57.69
4637 113 Bhagsar 7669 4100 3569 4239 2280 1959 55.27
4638 114 Lakhewali 5554 2884 2670 3022 1556 1466 54.41
4639 115 Dabra 1056 575 481 569 321 248 53.88
4640 116 Jamuana 697 382 315 371 210 161 53.23
4641 117 Ranjitgarh 2205 1179 1026 1153 612 541 52.29
4642 118 Rupana 9079 4939 4140 4683 2483 2200 51.58
4643 119 Sakanwali 1430 750 680 736 378 358 51.47
4644 120 Kotli Sangar 2330 1225 1105 1167 605 562 50.09
4645 121 Dhigana 1779 911 868 882 471 411 49.58
4646 122 Mehrajwala 1701 897 804 840 451 389 49.38
4647 123 Jaseana 1687 865 822 828 413 415 49.08
4648 124 Maur 1484 785 699 720 385 335 48.52
4649 125 Charewan 1696 861 835 817 401 416 48.17
4650 126 Warring 3381 1802 1579 1621 884 737 47.94
4651 127 Sangu Dhaun 2607 1384 1223 1233 668 565 47.30
4652 128 Phulewala 2200 1177 1023 1008 535 473 45.82
(iii) MuktsarSub‐District
288
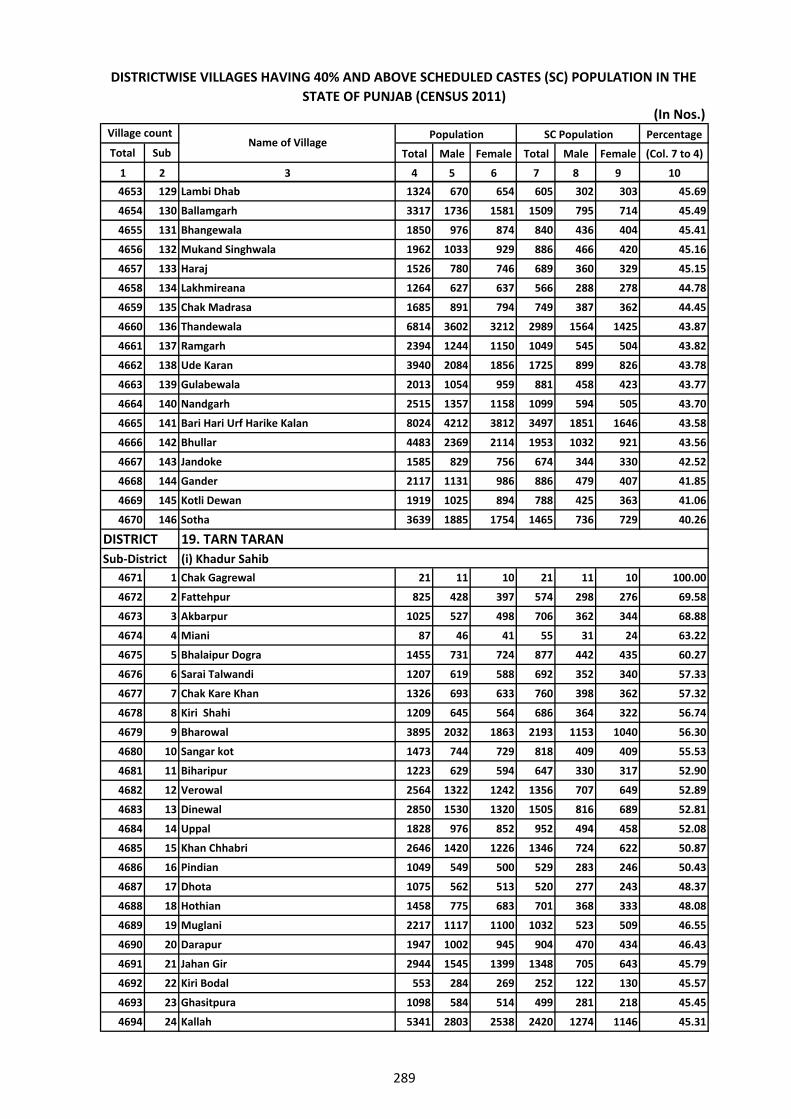
(In Nos.)Percentage
Total Sub Total Male Female Total Male Female (Col. 7 to 4)
1 2 3 4 5 6 7 8 9 10
Village countName of Village
Population SC Population
DISTRICTWISE VILLAGES HAVING 40% AND ABOVE SCHEDULED CASTES (SC) POPULATION IN THE STATE OF PUNJAB (CENSUS 2011)
4653 129 Lambi Dhab 1324 670 654 605 302 303 45.69
4654 130 Ballamgarh 3317 1736 1581 1509 795 714 45.49
4655 131 Bhangewala 1850 976 874 840 436 404 45.41
4656 132 Mukand Singhwala 1962 1033 929 886 466 420 45.16
4657 133 Haraj 1526 780 746 689 360 329 45.15
4658 134 Lakhmireana 1264 627 637 566 288 278 44.78
4659 135 Chak Madrasa 1685 891 794 749 387 362 44.45
4660 136 Thandewala 6814 3602 3212 2989 1564 1425 43.87
4661 137 Ramgarh 2394 1244 1150 1049 545 504 43.82
4662 138 Ude Karan 3940 2084 1856 1725 899 826 43.78
4663 139 Gulabewala 2013 1054 959 881 458 423 43.77
4664 140 Nandgarh 2515 1357 1158 1099 594 505 43.70
4665 141 Bari Hari Urf Harike Kalan 8024 4212 3812 3497 1851 1646 43.58
4666 142 Bhullar 4483 2369 2114 1953 1032 921 43.56
4667 143 Jandoke 1585 829 756 674 344 330 42.52
4668 144 Gander 2117 1131 986 886 479 407 41.85
4669 145 Kotli Dewan 1919 1025 894 788 425 363 41.06
4670 146 Sotha 3639 1885 1754 1465 736 729 40.26
4671 1 Chak Gagrewal 21 11 10 21 11 10 100.00
4672 2 Fattehpur 825 428 397 574 298 276 69.58
4673 3 Akbarpur 1025 527 498 706 362 344 68.88
4674 4 Miani 87 46 41 55 31 24 63.22
4675 5 Bhalaipur Dogra 1455 731 724 877 442 435 60.27
4676 6 Sarai Talwandi 1207 619 588 692 352 340 57.33
4677 7 Chak Kare Khan 1326 693 633 760 398 362 57.32
4678 8 Kiri Shahi 1209 645 564 686 364 322 56.74
4679 9 Bharowal 3895 2032 1863 2193 1153 1040 56.30
4680 10 Sangar kot 1473 744 729 818 409 409 55.53
4681 11 Biharipur 1223 629 594 647 330 317 52.90
4682 12 Verowal 2564 1322 1242 1356 707 649 52.89
4683 13 Dinewal 2850 1530 1320 1505 816 689 52.81
4684 14 Uppal 1828 976 852 952 494 458 52.08
4685 15 Khan Chhabri 2646 1420 1226 1346 724 622 50.87
4686 16 Pindian 1049 549 500 529 283 246 50.43
4687 17 Dhota 1075 562 513 520 277 243 48.37
4688 18 Hothian 1458 775 683 701 368 333 48.08
4689 19 Muglani 2217 1117 1100 1032 523 509 46.55
4690 20 Darapur 1947 1002 945 904 470 434 46.43
4691 21 Jahan Gir 2944 1545 1399 1348 705 643 45.79
4692 22 Kiri Bodal 553 284 269 252 122 130 45.57
4693 23 Ghasitpura 1098 584 514 499 281 218 45.45
4694 24 Kallah 5341 2803 2538 2420 1274 1146 45.31
19. TARN TARAN(i) Khadur Sahib
DISTRICTSub‐District
289

(In Nos.)Percentage
Total Sub Total Male Female Total Male Female (Col. 7 to 4)
1 2 3 4 5 6 7 8 9 10
Village countName of Village
Population SC Population
DISTRICTWISE VILLAGES HAVING 40% AND ABOVE SCHEDULED CASTES (SC) POPULATION IN THE STATE OF PUNJAB (CENSUS 2011)
4695 25 Hansawala 1860 961 899 826 439 387 44.41
4696 26 Goindwal 9095 4756 4339 4029 2091 1938 44.30
4697 27 Ghagge 958 493 465 424 226 198 44.26
4698 28 Fatehabad 8860 4674 4186 3838 2018 1820 43.32
4699 29 Kot Mohammad Khan 2043 1079 964 879 470 409 43.02
4700 30 Ekal Gadda 3318 1743 1575 1385 734 651 41.74
4701 31 Bhalojala 2610 1348 1262 1080 557 523 41.38
4702 32 Bhoian 347 179 168 143 73 70 41.21
4703 33 Jallala Bad 4049 2099 1950 1657 878 779 40.92
4704 34 Vain poin 6087 3218 2869 2439 1302 1137 40.07
4705 35 Hardo Sarli 3420 1726 1694 1369 690 679 40.03
4706 36 Jhugian Kalu 838 455 383 664 364 300 79.24
4707 37 Mughal 825 455 370 615 338 277 74.55
4708 38 Kulla 2122 1090 1032 1559 806 753 73.47
4709 39 Jhugian Nur Mohammad 419 202 217 302 156 146 72.08
4710 40 Fatehpur Sugga 689 343 346 483 239 244 70.10
4711 41 Jindanwala 341 173 168 219 107 112 64.22
4712 42 Basarke 2463 1275 1188 1452 761 691 58.95
4713 43 Dode 1186 615 571 656 335 321 55.31
4714 44 Pahu Wind 3530 1869 1661 1917 1026 891 54.31
4715 45 Gilpan 330 184 146 179 99 80 54.24
4716 46 Pahal Wanke 876 474 402 461 250 211 52.63
4717 47 Asal 1872 974 898 955 499 456 51.01
4718 48 Tung 1123 601 522 543 283 260 48.35
4719 49 Panghri 2470 1287 1183 1186 617 569 48.02
4720 50 Bhaini Massa Singh 1496 780 716 707 374 333 47.26
4721 51 Bhagwanpura 2526 1313 1213 1183 621 562 46.83
4722 52 Mughal Chak 812 412 400 379 194 185 46.67
4723 53 Pan Gota 2134 1118 1016 993 515 478 46.53
4724 54 Kaleke Uttar 848 461 387 394 222 172 46.46
4725 55 Chima Khurd 1954 1054 900 898 494 404 45.96
4726 56 Machhike 1041 539 502 477 246 231 45.82
4727 57 Uboke 1432 743 689 652 341 311 45.53
4728 58 Sito Mah Jhungian 1095 569 526 494 251 243 45.11
4729 59 Dhagana 1152 599 553 517 267 250 44.88
4730 60 Nabipur 1029 556 473 461 255 206 44.80
4731 61 Singhpura 1314 682 632 587 301 286 44.67
4732 62 Narli 4560 2412 2148 2015 1080 935 44.19
4733 63 Thakarpura 2130 1079 1051 929 474 455 43.62
4734 64 Tatle 1128 615 513 489 262 227 43.35
4735 65 Alipur 1180 636 544 504 261 243 42.71
4736 66 Ghurk Wind 2098 1107 991 889 472 417 42.37
4737 67 Dassuwal 2170 1131 1039 919 466 453 42.35
(ii) PattiSub‐District
290

(In Nos.)Percentage
Total Sub Total Male Female Total Male Female (Col. 7 to 4)
1 2 3 4 5 6 7 8 9 10
Village countName of Village
Population SC Population
DISTRICTWISE VILLAGES HAVING 40% AND ABOVE SCHEDULED CASTES (SC) POPULATION IN THE STATE OF PUNJAB (CENSUS 2011)
4738 68 Hardo Chak Bamba 787 422 365 333 183 150 42.31
4739 69 Dialpura 2314 1196 1118 970 506 464 41.92
4740 70 Chung 2137 1178 959 886 488 398 41.46
4741 71 Dhun 1711 896 815 709 360 349 41.44
4742 72 Shahid 1311 670 641 542 283 259 41.34
4743 73 Sarai Valtoha 235 115 120 97 48 49 41.28
4744 74 Beharwal 1129 600 529 464 247 217 41.10
4745 75 Kalsian Khurd 1521 801 720 621 323 298 40.83
4746 76 Kot Data 1167 629 538 472 246 226 40.45
4747 77 Burj Puhla 1000 550 450 401 219 182 40.10
4748 78 Rakh Bhohru 8 3 5 8 3 5 100.00
4749 79 Bhaini Sidhwan 1418 766 652 1087 598 489 76.66
4750 80 Bir Raja Teja Singh 760 388 372 559 288 271 73.55
4751 81 Thatha 1866 1013 853 1258 694 564 67.42
4752 82 Dyal 968 490 478 639 327 312 66.01
4753 83 Burj 1239 654 585 785 417 368 63.36
4754 84 Khair Dinke 2659 1426 1233 1608 860 748 60.47
4755 85 Kazi Kot 2012 1059 953 1170 618 552 58.15
4756 86 Pakhoke 4344 2257 2087 2463 1281 1182 56.70
4757 87 Gandiwind 4544 2391 2153 2574 1361 1213 56.65
4758 88 Khabe Dogran 1750 907 843 984 509 475 56.23
4759 89 Shakri 983 523 460 524 279 245 53.31
4760 90 Daleke 2092 1087 1005 1108 564 544 52.96
4761 91 Jodhpur 2084 1101 983 1091 605 486 52.35
4762 92 Pandori Sidhwan 2272 1213 1059 1176 629 547 51.76
4763 93 Dyal Rajputan 1475 766 709 759 397 362 51.46
4764 94 Palasaur 6214 3321 2893 3165 1680 1485 50.93
4765 95 Kila Kavi Santokh Singh 2842 1498 1344 1430 757 673 50.32
4766 96 Nandpur 3061 1622 1439 1508 805 703 49.26
4767 97 Bugha 2575 1361 1214 1268 673 595 49.24
4768 98 Chhappa 1057 530 527 511 259 252 48.34
4769 99 Piddi 1907 990 917 916 481 435 48.03
4770 100 Gill Waraich 1248 663 585 596 319 277 47.76
4771 101 Kahlwan 1581 816 765 741 388 353 46.87
4772 102 Banwalipur 1866 942 924 869 456 413 46.57
4773 103 Thathgarh 2579 1339 1240 1199 623 576 46.49
4774 104 Wan 1192 647 545 554 301 253 46.48
4775 105 Khabba Rajputan 1128 618 510 521 287 234 46.19
4776 106 Aima Kalan 1463 754 709 665 346 319 45.45
4777 107 Sarai Amanat Khan 3390 1805 1585 1529 810 719 45.10
4778 108 Brahmpur 2273 1228 1045 1022 558 464 44.96
4779 109 Jagatpura 1987 1056 931 893 477 416 44.94
4780 110 Aima Khurd 405 215 190 180 99 81 44.44
(iii) Tarn TaranSub‐District
291

(In Nos.)Percentage
Total Sub Total Male Female Total Male Female (Col. 7 to 4)
1 2 3 4 5 6 7 8 9 10
Village countName of Village
Population SC Population
DISTRICTWISE VILLAGES HAVING 40% AND ABOVE SCHEDULED CASTES (SC) POPULATION IN THE STATE OF PUNJAB (CENSUS 2011)
4781 111 Dhala 1536 807 729 682 372 310 44.40
4782 112 Usman 2145 1128 1017 942 505 437 43.92
4783 113 Bath 3957 2038 1919 1734 893 841 43.82
4784 114 Kaironwal 1579 837 742 687 371 316 43.51
4785 115 Chima Kalan 1759 895 864 760 375 385 43.21
4786 116 Dhand 4008 2125 1883 1727 887 840 43.09
4787 117 Sarai Diwana 705 355 350 303 153 150 42.98
4788 118 Thathian Mahantan 3090 1604 1486 1323 687 636 42.82
4789 119 Chambal 1195 636 559 510 266 244 42.68
4790 120 Kheda 620 332 288 262 142 120 42.26
4791 121 Kishangarh 161 88 73 68 39 29 42.24
4792 122 Pandori Gola 4659 2421 2238 1958 1005 953 42.03
4793 123 Mohanpura 1690 893 797 708 372 336 41.89
4794 124 Naurangabad 3189 1698 1491 1327 710 617 41.61
4795 125 Wring 1501 794 707 621 324 297 41.37
4796 126 Sahabpur 1262 664 598 522 279 243 41.36
4797 127 Naushehra 2566 1381 1185 1038 566 472 40.45
4798 128 None 1761 914 847 708 370 338 40.20
4799 129 Mughal Chak 1264 655 609 508 262 246 40.19
292

PART-V
GUIDELINES AND NOTIFICATIONS

293
Annexure I
R.Sridharan
Joint Secretary(SP)
Telefax:23096598 GOVERNMENT OF INDIA
PLANNING COMMISSION
YOJANA BHAWAN
NEW DELHI-110001
D.O.No.M-13011/3/2005-SP-Co October 31,2005
Dear Shri Talwar
With reference to para 8 of the Deputy Chairman’s letter dated 6th
September ,
2005 addressed to your Chief Minister, I am directed to enclose herewith a note consolidating
the guidelines already issued by the Government of India for the formulation , implementation
and monitoring of Special Component Plan for Scheduled Castes and Tribal Sub-Plan for
scheduled Tribes
I would request you to kindly ensure that the Special Component Plan and Tribal
Sub Plan are drawn up accordingly in Annual Plan 2006-07.
With regards,
Yours sincerely
Sd/-
(R. Sridharan)
Shri A.R.Talwar,
Secretary,
Department of Planning,
Government of Punjab,
Chandigarh-160 017.

294
A note consolidating the existing Guidelines for formulation, implementation and
monitoring of Special Component Plan for the Scheduled Castes and Tribal Sub
Plan for Scheduled Tribes
Detailed guidelines relating to the Special Component Plan for the Scheduled Castes and
the Tribal Sub Plan for the Scheduled Tribes have been issued by the concerned departments
of the Central Government from time to time
The basic objective of both these Sub Plans is to channelise the flow of outlays and
benefits from the general sectors in the Plan of States for the development of Scheduled Castes
and Scheduled Tribes at least in proportion to their population , both in physical and financial
terms. The Mid term appraisal of the Tenth Plan has noted that several State Governments have
not earmarked adequate funds to SCP and TSP, Proportionate to the share of SCs and STs in the
population.
The importance of the SCP and TSP has been again underlined by the Hon’ble Prime
Minister while addressing the 51st Meeting of the National Development Council held on 27
th
June, 2005. The Prime Minister had then stated “that in the mid –1970s, the Special Component
Plan and the Tribal Sub Plan were initiated . Tribal Sub-Plans and Special Component Plans
should be an integral part of Annual Plans as well as Five Year Plans, making provisions therein
non-divertible, with the clear objective of bridging the gap in Socio-Economic Development of
the SCs and STs within a period of 10 years”.
In this context, the following guidelines with respect to SCP and TSP are once again
reiterated so that the same may be followed strictly in the preparation of the Annual Plans for
2006-07.
Objectives:- The following should be the broad objectives of the SCP and TSP
Substantial reduction in poverty and un-employment
Creation of productive assets in favour of Scheduled Castes and Scheduled Tribes to sustain the
growth likely to accrue through development efforts.
Human resources development of the Scheduled Castes and Scheduled Tribes by providing
adequate educational and health services and
Provision of physical and financial security against all types of exploitation and
oppression.
Action Plan :- To fulfil the above objectives the following points may be taken into account for
formulating SCP and TSP.
1. Earmarking of funds for SCP/TSP from total State Plan outlay at least in the proportion
of SC/ST population to the total population of the State/UT.

295
2. Special Component Plan and Tribal Sub Plan funds should be non-divertible
and non – lapsable.
3. Making the Social Welfare Department /the Department concerned with the welfare and
development of SCs/STs as nodal department for formulation and implementation of SCP/TSP.
4. Placing the funds earmarked for SCP/TSP at the disposal of the nodal department
concerned which in turn will reallocate the funds to the sectoral departments for implementing
schemes directly relevant to SC /ST development.
5. Placing the funds earmarked for SCP/TSP under separate budget head /sub head for each
development department implementing SCP and TSP. In this connection it may be noted that
the list of major and minor heads of account of Union and states as issued by the Controller
General of Accounts provides that Tribal Sub Plan (code 796) and Special Component Plan
(789) may be opened as Minor Head below the functional Major head/Sub Major Head wherever
necessary.
6. Special Central Assistance (SCA) both for the SCP and for the TSP is being extended by
the Centre to the states as a 100% grant meant to fill critical gaps and missing inputs for family
oriented income generating schemes and supporting infrastructure development with a Special
focus on BPL families. Guidelines issued in this connection should be strictly followed.
Components of SCP and TSP
1. Only those schemes should be included under SCP/TSP that ensure direct benefits to
individuals or families belonging to Scheduled castes or Scheduled Tribes
2. Outlay for area oriented schemes directly benefiting Scheduled castes hamlets /villages
having a majority of Scheduled castes population/tribal hamlets and villages may be included in
SCP and TSP
3. Priority should be given for providing basic minimum services like primary education,
health , drinking water nutrition , rural housing rural electrification and rural link road.
4. Wage component, especially under rural employment schemes, should not be included
under SCP/TSP.
5. Schemes to develop agriculture and allied activities like animal husbandry, dairy etc. that
provide a source of livelihood to the SC and ST population should be included.
6. Innovative projects that draw upon institutional finance to supplement plan allocations
may be drawn up.
Creation of general awareness of SCP/TSP schemes.
State Government should take initiative to generate awareness among the general public about
the schemes to be implemented /being implemented for the development of SCs and STs by the

296
different department of the State Government through electronic and print media.
Monitoring of SCP and TSP
1. State and District/Block level Monitoring Committee should be constituted to monitor
the implementation of various schemes under SCP and TSP of various development
departments. The District/Block level committees may review the progress of implementation
of schemes and utilisation of funds on monthly basis and the State level committees may review
the progress on quarterly basis.
2. District and Block level committees may be constituted on the pattern of district and
block level committee constituted by the Ministry of Rural Development by involving elected
members (MPs, MLAs and Panchayat members, and other prominent leaders in the districts) or
the same committees may be entrusted with the responsibilities for monitoring of these
programmes
3. The nodal department should ensure timely release of funds to the concerned
development departments who in turn should ensure immediate release of funds soon after the
receipts of funds from nodal department to their field level implementing agencies. Any lapse
on the part of field level implementing agencies in timely utilisation of funds and proper
implementation of the schemes may be viewed seriously.
4. Non-earmarking of funds under SCP and TSP may result in non- approval of plans of the
States /UTs.
5. Ministry of Social Justice and Empowerment and Tribal Affairs will be actively involved
in the process of finalization of Annual Plans of the States/UTs.
6. Evaluation to assess the impact of economic development schemes implemented under
SCP, on the socio economic conditions of SCs may be get conducted by the nodal department on
regular basis Dissemination of information to SCs all over the State/UT about the schemes
programmes available for their development may be the responsibility of the nodal department.
The nodal department may also ensure the follow up of the schemes implemented and
maintenance of proper records on assets created under SCP in district /block etc.

297
Annexure - II
F.No.M-13054/1/2008-SCSP/TSP
Planning Commission
(BC & TD Division)
***
Yojana Bhawan, Sansad Marg,
New Delhi,ated 18th
August,2009
OFFICE MEMORANDUM
Sub: Modification in SCSP/TSP Guidelines.
***
Please refer to Planning Commission’s D.O.No.M-13011/3/2005-SCSP, Dated
31.10.2005 regarding Guidelines for formulation, implementation and monitoring of
Scheduled Castes Sub Plan (SCSP) for Scheduled Castes and Tribal Sub Plan (TSP) for
Scheduled Tribes.
2. In order to expand the coverage of villages for benefiting larger number of
Scheduled Caste beneficiaries, Planning Commission has decided to modify the existing
guidelines of SCSP. The caption under the components of SCSP/TSP quoted in para.2 of
the existing guidelines is “ Outlay for area-oriented schemes directly benefiting
Scheduled Castes hamlets/villages having a majority of Scheduled Castes
population/Tribal hamlets and villages shall be included in SCSP and TSP”. The word
“majority of Scheduled Castes population” is replaced with “having more than 40%
Scheduled Caste population”.
Sd/- (Naini Jayaseelan)
Adviser (SJ)
Chief Secretary
(Kind Attn.Shri Subodh Chandra Agrawal)
Government of Punjab
Punjab Civil Secretariat
Chandigarh-160001
(Tele:-0172-2740156
Fax:-0172-2742488)

298
Annexure - III
D.O.No. M-13054/2/2005-BC
CHANDRA PAL
ADVISER
(MLP/SP(E), SCP & TSP)
Tele Fax:23096584 GOVERNMENT OF INDIA
PLANNING COMMISSION
YOJANA BHAWAN
NEW DELHI-110001
December 29, 2005
Dear Sir,
Special Component Plan (SCP) for Scheduled Castes (SCs) and Tribal Sub Plan (TSP)
for Scheduled Tribes(STs) have been important methods used in the planning process for quite
some time in order to ensure that outlays and benefits from the general sectors of the plans flow
to SCs and STs at least in proportion to their population both in physical and financial terms.
Detailed guidelines have also been issued by the Planning Commission to the States(vide D.O
No. M 13011/3/2005-SP-Co. dated 31.10.2005) by way of reiteration of the existing instructions,
relating to the formulation and implementation of SCP/TSP at the State Level. In this
connection, it may be noted that the list of major and minor heads of account of Union and
States as issued by the Controller General of Accounts provides that TSP(Code 796) and
SCP(Code 789) may be opened as minor head below the functional major head/sub major head
wherever necessary. SCP and TSP funds have to be made as non-divertible and non-lapsable.
2. Planning Commission has set up a dedicated “Special Component Plan(SCP) and Tribal
Sub Plan(TSP) Unit” for Monitoring the implementation of the recommendations of the Inter-
Ministry Task Group Report on the Development of Scheduled Castes and Scheduled Tribes and
to Review and monitor the SCP and TSP of States. I have taken over the charge of this Unit.
3. It is reiterated that only those schemes should be included under SCP/TSP that ensure
direct benefits to individuals or families belonging to SCs & STs. The information regarding the
flow of funds to SCP and TSP of your State(Budget, Allocation, Sanction and Expenditure)
during 9th
Plan and the first four years of Tenth Five Year Plan(2002-06) and the details of the
schemes/programmes covered for the development and welfare of SCs & STs along with their
physical and financial performance may be sent to Planning Commission. In this regard,
additional guidelines for preparing important schemes/programmes and performance for
monitoring physical and financial performance by the State Government are enclosed for ready
reference.

299
4. It may also be ensured that the State allocates SCP and TSP funds in proportion to the SC
and ST population in the State during Annual Plan 2006-07. It is also reiterated that Secretary,
Social Welfare/Tribal Welfare should be the nodal Officer in the designing of
schemes/programmes of SCP and TSP and allocation of funds to the implementing
Departments/agencies. If it is not feasible, a dedicated Unit of SCP and TSP may be constituted
in the Planning Department of the State with the Secretary, Social Welfare/Tribal Welfare as
Nodal Officer for designing, implementing and monitoring of SCP and TSP
schemes/programmes in the State.
With regards,
Yours sincerely,
-Sd/-
(Chandra Pal)
Encl: As above.
Shri Jai Singh Gill,
Chief Secretary, Secretariat,
Chandigarh, Punjab.

300
Additional Guidelines for preparing Schemes/Programmes under Special Component Plan
and Tribal Sub Plan by the State Government.
The State Government should prepare Special Component Plan(SCP) and Tribal Sub-
Plan(TSP) as per the proportion of SC and ST population of the State. The guidelines issued
recently by the Planning Commission to the State Governments for the SCP and TSP
formulation, implementation and monitoring need to be strictly adhered and followed
(D.O.No.M-13011/3/2005-SP-Co dated 31.10.2005).
The State Government should also prepare a detailed report on all the development
indicators for the general population, SCs and STs especially focusing on agriculture,
education(primary, middle, technical and higher), health, industry and service sectors. The gap
of development indicators between the general population, SCs and STs has to be bridged within
a period of 10 years.
State Level Monitoring Committee for SCP/TSP under the Chairmanship of Hon’ble
Minister, Social Welfare/ Tribal Welfare should be constituted with Principal Secretary/
Secretary, Social Welfare/Tribal Welfare as the Member Secretary. A District level Monitoring
Committee for SCP/TSP should also be constituted under the Chairmanship of District
Collector with all the district level officers as its members. Block level Committee may also be
constituted under the Chairmanship of President, Block Samiti where BDO and others will be its
members. Monitoring of SCP/TSP schemes/programmes should be undertaken by these
committees every month and quarterly performance review. Quarterly Performance Review
report should be communicated to the SCP & TSP Unit, Planning Commission. A proforma for
submitting financial and physical progress of the SCP/TSP schemes/programmes is enclosed for
sending the relevant information to Planning Commission.
It is emphasized that, there is a need to implement schemes relating to the Welfare of
SCs and STs under these two components. The details of some of the schemes suggested for
implementation by the State Government are as under:-
1. The villages with 50% and above SC/ST population may be saturated first
and provided with all the development activities under Bharat Nirman,
schools, education, skill development, trainings for self employment, etc.
2. A group of 5-10 SC/ST farmers may be constituted for skill development by
the State Agriculture Department/ Extension Agencies. This group may be
provided a package of small tractors with accessories, tube wells in the
electrified villages and pump sets in non-electrified villages may be provided
with other agricultural inputs like quality seeds, pesticides, fertilizers etc.
This farmers group may also be given training for cultivation of suitable
crops and for undertaking activities in the sectors of fisheries, animal
husbandry, horticulture, etc.
3. An educational complex in the name of educational institute may be set up in
each district. The facilities relating to sports, multi-purpose hall, intermediate
college with sports education may be provided in this institute on the pattern

301
of Navodaya Vidala and Kendriya Vidala. This educational institute will also
have classes from 1 to 12 with hostel facilites for 70% SC/ST boys and girls
and 30% boys and girls from general population. 70% expenditure of this
institute will be provided from the SCP earmarked funds and 30% will come
from the General Plan.
4. In every Divisional Headquarters, a polytechnic may be set up. Further, one
or two training colleges for nursing and para-medical training courses, for
nurses, ANMs, Physiotherapists, technicians, radiologists may be provided
exclusively for SCs & STs. The nursing colleges exclusively for SC/ST girls
may be attached to medical colleges provided. 70% expenditure of this
institute will be provided from the SCP earmarked funds and 30% will come
from the General Plan. The expenditure for running these courses will be
made out of Special Component Plan outlay earmarked in the State.
5. In each district, coaching-cum-guidance centres may be opened in
Universities/Colleges appearing for various competitions. The expenditure of
these coaching-cum-guidance centres may be borne out of SCP/TSP funds.
6. Good quality it is may be established in each District for imparting
employable skill exclusively for the unemployed SC/ST youth for providing
employment opportunities within and outside the State. To tackle the
problem of unemployment, training courses (not routine training courses)
should be started in a big way in the State. These capsule training courses
may consist of 4-5 months theoretical training on personnel management,
material management, financial management, marketing management and 6-
7 months practical training. Such trained personnel should be provided
loans at cheaper interest rates from the Banks/SC/ST Development
Corporation to start production ventures in clusters, in those areas where
infrastructural facilities already exist. There should be a commercial
complex in the main market of District Head Quarter and shops/ outlets to be
allotted to these trained SC/ST entrepreneurs to sell their
produce/manufactured goods.
7. The candidates preparing for various competitive exams like admission in
engineering colleges and medical colleges and other services may be
allowed to take admission in any reputed private training center and their full
fees should be reimbursed by the Government from SCP/TSP funds.
8. Government may also think of providing one time financial support of say
Rs.25 to Rs.40 lakhs to the recognized social institutions for starting
intermediate/degree colleges in each Block exclusively for SC/ST boys and
girls or admitting 70% SC/ST boys and girls and 30% boys and girls from
general population as is being done in U.P.
9. It was suggested that residential schools for SC/ST boys and girls should be
set up in all the districts where percentage of the SC and ST concentration is
high. The residential schools should have the facilities of vocational training,
coaching-cum-guidance center, sports center and cultural center. Under

302
vocational training, training related to trades like electrician, electronics,
fitter, draftsman, mechanic, plumber, fashion design, computer, data entry
operator etc., need to given by starting IITs in SC/ST dominated areas.
Technical education should be given due importance so as to provide self-
employment to SCs and STs.
10. The tuition fee of the SC and ST students studying in private colleges and
institutions should be fully reimbursed by the Social Welfare/Tribal Welfare
department under SCP and TSP funds.
11. The State Government should provide scholarships to SC and ST students
for all income groups studying in classes I to X as in U.P. The rate of
stipend may be worked out realistically by the State.
12. Road and connectivity is another important sector which affect the transport
and communication of the villagers. All the villages having more than 50-
60% of SCs and STs concentration need to be saturated first with road
connectivity. The programmes under Bharat Nirman may be targeted
especially to SC/ST village development.
13. In those villages where no land is available especially in SC and ST
dominated areas, land should be purchased and allotted to homeless for
construction of houses under Indira Awas Yojana.
14. The forest villages in the State need to be converted into revenue villages
where basic minimum services have to be provided like education, housing,
drinking water, health facilities, road connectivity, etc.
15. Conversion of dry toilets to wet toilets may also be taken out of these funds
in a big way so that scavenging colonies should be developed with
rehabilitation programme.
16. There is always food scarcity in SC and ST dominated areas and the State
Government is suggested to select Self-Help Groups of 5-10 SCs and STs
and they may be allotted ration shops for distribution of essential
commodities. Subsidy/loan could also be provided to them on recoverable
terms up to Rs.5 lakhs.
17. Training may also be imparted in the existing Police Training Centres or
Home Guards training centres to SC and ST youth (18-21 years) who have
passed Matriculation for Constables and Home Guards. While the Home
Guards will look after the security of the villages as Village Defence
Committee, the later may be recruited as Constables in the State
Government. Similarly, training may also be given to atleast 5000 SCs/STs
for Conductor and Driver jobs through State Transport Corporation.
18. The State Government was suggested to provide Rs. 25000/- towards Kanya
Dhan for SC/ST girls who passed out Intermediate Examination.
19. In urban slum areas a multi-purpose community shall need to be provided to
cater to the needs of the SC families.

303
nneAnnexure - IV
GOVERNMENT OF PUNJAB
DEPARTMENT OF WELFARE OF SCHEDULED CASTES AND BACKWARD
CLASSES
To
All the Heads of the Department/
All the Divisional Commissioners/Deputy Commissioners /
ADC (Development)-Cum- Nodal Officers Special Component Plan
in the State of Punjab.
No. 3/2/2003-SA II/474
Dated , Chandigarh the 11th
March, 2003
Subject :- Implementation of “Maharashtra Model” for Special Component
Plan (SCP) in the State of Punjab.
****
With a view to checking the diversion of Special Component Plan funds meant
for the Welfare of Scheduled Castes population in the State to the general sectors, the State
Government after due consideration has decided to adopt the “ Maharashtra Model” for the
implementation of the schemes framed under the Special Component Plan by various
Departments with the following stipulations:-
1 The “ Maharashtra Model” for Special Component Plan in the State of Punjab
would be implemented w.e.f. the financial year 2003-2004. The quantification of
Special Component Plan funds would be made proportionate to the percentage
of the scheduled castes population of the State out of the State Plan allocation.
2 The allocation under the Special Component Plan would be provided in
lumpsum under the single budget demand head of the Department of Welfare of
SCs and BCs in proportionate to the percentage of SC population in the State, at
the time of the finalization of the State Plan by the Department of Planning and
in the budget by the Finance Department.
3 A committee consisting of Principal Secretary, Welfare of Scheduled Castes and
Backward Classes, Principal Secretary, Planning and Principal Secretary,
Finance or their representative would allocate/decide the allocations/diversions
of funds from the pooled funds of the Special Component Plan and monitor the
implementation of the Special Component Plan schemes.
4 The Welfare Department will enhance/ reduce the allocations of beneficiary
oriented schemes as per requirement of the particular scheme within the pooled
funds of the Special Component Plan. However, the funds shall not be diverted

304
from the beneficiary oriented schemes to the infrastructure oriented schemes
without the approval of Planning and Finance.
5 The Department of Welfare will approach on a monthly basis to the Finance
Department for release of funds keeping in view the schemes approved so that
any curtailment of Plan during the financial year by Finance Department can be
easily implemented.
In view of the above, all the Department are requested to frame Special
Component Plan Schemes after undertaking detailed exercise with a view to making them
effective for the upliftment of Scheduled Castes population in the State and send the same to the
Directorate of Special Component Plan, Welfare Department , Punjab.
Sd/-
Under Secretary Welfare
Endst. No. No. 3/2/2003-SA II/475 Dated : 11/3/2003
A copy of the above is forwarded to the all Financial Commissioners/Principal
Secretaries/ Administrative Secretaries to Govt. of Punjab for kind information and further
necessary action please.
Sd/-
Under Secretary Welfare

305
AnneAnnexure - V
GOVERNMENT OF PUNJAB
DEPARTMENT OF WELFARE
(DIRECTORATE OF SCHEDULED CASTES SUB PLAN)
Notification
the 10th
February, 2014
No. RO(SCSP)-76/2014/ 712 The Governor of Punjab is pleased to issue the following
guidelines regarding implementation of Scheduled Castes Sub Plan(SCSP) in the State :-
(i) The SCSP size will be made proportionate to the percentage of SC
population of the State out of the total Annual Plan allocation including
the non-budgeted allocation on the pattern of the State Annual Plan.
(ii) The SCSP funds will not be divertible but will be lapsable on the
pattern of the State Annual Plan funds. The funds booked under SCSP
can only be diverted by a committee under the Chairmanship of Secretary
Welfare with one representative each from the finance and the planning
departments. However, no diversion of SCSP funds will be made to the
general sector.
(iii) The department of welfare will be the nodal department for formulation
and monitoring of the implementation of SCSP. In case of schemes
exclusively meant for SCs, the implementing departments will
formulate the schemes in consultation with the welfare department.
However, in case of general plan schemes, the implementing departments
will consult the welfare department only regarding the SCSP components
of those schemes.
(iv) The concerned implementing departments will be fully responsible
for proper implementation of SCSP schemes/ components, audit and
reconciliation of accounts for these schemes/components from the
Accountant General (Audit), Punjab and replies to the Punjab Vidhan
Sabha/Public Accounts Committee and any other function which is
required to be performed as a head of the department for implementation
of plan schemes including the SCSP schemes/ components.
(v) The allocation under SCSP schemes/components included in the SCSP
budgeted allocation will continue to be booked in the Minor Head-789-
“SCP for SCs” below the major/sub-major head under the respective
demand of the concerned implementing departments.
a) In case of non beneficiary oriented schemes, a portion equal to SC
population (~32%) will be booked under SCSP.

306
b) In case of irrigation and agriculture departments, where SC
beneficiaries are substantially less, only half of the portion equal to SC
population (~16%) will be booked under SCSP.
c) The beneficiary oriented schemes will be further put under two
categories. One, where the percentage of SCSP is less than portion equal
to SC population (<32%) and the other, where the percentage will be
equal or more than the portion equal to SC population (≥32%).
d) As per the guidelines of the Planning Commission, the expenditure
incurred on the infrastructure created in the villages having 40% or more
SC population, can be fully booked under SCSP expenditure. Therefore,
under such schemes, 40% allocation will be booked under SCSP.
e) The percentages under SCSP schemes/components will be worked out by
the welfare department in consultation with the departments based on
historical data and future trend within the overall SCSP component
determined on the basis of resources finalised by the Planning
Commission, GOI/ Finance Department, Punjab.
(vi) The concerned administrative departments will seek the concurrence of
the welfare department in accordance with the instructions issued for the
clearance of plan schemes by the planning department from time to time
regarding the beneficiary oriented SCSP schemes/components, wherein,
the direct benefit accrues to the individual or the families belonging to
the Scheduled Castes. The identification of beneficiaries oriented
schemes/components will be done by the welfare department in
consultation with the implementing departments. However, the approval
of both the general and Special Component Plan (now SCSP) will be
accorded by the Punjab State Planning Board through the usual process
being followed for the approval of Five Year/Annual Plans.
(vii) The department of welfare will prepare as many schemes as possible
directly benefitting the SC population. The planning department will
endeavour to include as many schemes as possible in the Annual Plan
with the requisite allocation.
(viii) The department of welfare will enhance/reduce the scheme-
wise/component-wise SCSP allocation in consultation with the
departments within the revised plan size indicated by the finance
department, Punjab at the time of finalisation of revised
estimates/supplementary for the Plan Budget.
(ix) The inclusion/deletion of SCSP schemes/components will be done by the
welfare department in consultation with the departments within the
revised plan size indicated by the finance department, Punjab at the time
of finalisation of revised estimates/supplementary for the Plan Budget.
(x) The prior approval , if required , for any issue relating to formulation of
SCSP which is within the purview of the finance department as per
Allocation of Business Rules will be obtained.
(xi) The department of welfare, being the nodal department, in case faces any
problem in formulation and monitoring the implementation of SCSP,
will take necessary action in consultation with the department of planning
and the department of finance

307
2. This supersedes the instructions issued vide No. 3/2/2003-SA-II/474, dated 11-3-
2003 regarding implementation of Special Component Plan (Now SCSP) in the State on the
basis of 'Maharashtra Model'
Chandigarh
the, 10th
February, 2014
Anurag Agarwal, IAS
Secretary to Govt. of Punjab
Department of Welfare
A copy of the above is forwarded to the followings as a member of the Cabinet
Sub Committee for information.
Secretary Welfare
To
1. Sh. Sarwan Singh Phillaur,
Jail, Tourism, Cultural Affairs, Archives and Museums
and Printing & Stationery Minister.
2. Sh. Adaish Partap Singh Kairon,
Food, Civil Supplies & Consumer Affairs, Information
and Technology and Food Processing Minister.
3. Sh. Gulzar Singh Ranike,
Animal Husbandry & Fisheries, Dairy Development and Welfare of
SCs, & BCs Minister.
4. Sh. Madan Mohan Mittal,
Industries and Commerce, Technical Education and Industrial
Training and Parliamentary Affairs Minister.
5. Sh. Parminder Singh Dhindsa,
Finance & Planning Minister.
U.O. No. RO(SCSP)-76/2014/713-717 Dated 10 February , 2014
Endst. No. RO(SCSP)-76/2014/718 Dated 10 February , 2014
A copy of the above is forwarded to the Chief Secretary, Punjab for information
.
Secretary Welfare
Endst. No. RO(SCSP)-76/2014/719 Dated 10 February , 2014
A copy of the above is forwarded to the PSCM for the kind information of the
Hon'ble Chief Minister, Punjab .
Secretary Welfare

308
Endst. No. RO(SCSP)-76/2014/720 Dated 10 February , 2014
A copy of the above is forwarded to the Principal Secretary, Finance w.r.t. their
I.D No. 11/97/2012-5FE6/627 dated 13.12.2013 for information and necessary action .
Secretary Welfare
Endst. No. RO(SCSP)-76/2014/721 Dated 10 February , 2014
A copy of the above is forwarded to the Principal Secretary, General
Administration, Punjab w.r.t their ID No.1/15/2014-I/Cabinet/337, dated 3-2-2014 for
information.
Secretary Welfare
Endst. No. RO(SCSP)-76/2014/722 Dated 10 February , 2014
A copy of the above is forwarded to the Secretary, Planning w.r.t. their U.O
No.1/10-SCSP-PSPB/RO(W)/2013/7994 dated 28.11.2013 for information and necessary
action.
Secretary Welfare
Endst. No. RO(SCSP)-76/2014/723-725 Dated February , 2014
A copy of the above is forwarded to the following for information and
necessary action :-
1. Secretary, Planning Commission,
Govt. of India, New Delhi.
2. Secretary to Govt. of India,
Ministry of Social Justice & Empowerment,
Shastri Bhawan, New Delhi.
3. Secretary,
National Commission for Scheduled Castes,
Lok Nayak Bhawan, Khan Market, New Delhi.
Secretary Welfare
A copy of the above is forwarded to all the Financial Commissioners/Principal
Secretaries/Administrative Secretaries to Govt. of Punjab for information and necessary action .
Secretary Welfare
To
All the Financial Commissioners/
Principal Secretaries and Administrative Secretaries
U.O. No. RO(SCSP)-76/2014/726-801 Dated 10 February , 2014

309
Endst. No. RO(SCSP)-76/2014/802 Dated 10 February , 2014
A copy of the above is forwarded to the Director, National Commission for
Scheduled Castes, State Office, Chandigarh for information and necessary action.
Director (SCSP)-Cum-Joint Secretary
Endst. No. RO(SCSP)-76/2014/803-807 Dated 10 February , 2014
A copy of the above is forwarded to all the Divisional Commissioners in the State
for information and necessary action.
Director (SCSP)-Cum-Joint Secretary
Endst. No. RO(SCSP)-76/2014/808-933 Dated 10 February , 2014
A copy of the above is forwarded to all the Heads of Departments for information
and necessary action.
Director (SCSP)-Cum-Joint Secretary
Endst. No. RO(SCSP)-76/2014/934-956 Dated 10 February , 2014
A copy of the above is forwarded to all the Deputy Commissioners in the State
for information and necessary action.
Director (SCSP)-Cum-Joint Secretary
Endst. No. RO(SCSP)-76/2014/957 Dated 10 February , 2014
A copy along with C.D. is forwarded to the Controller, Printing & Stationery,
Punjab, Chandigarh with the request to publish this notification in the Punjab State Ordinary
Gazette and 200 copies of the same may kindly be supplied to this department for record.
Director (SCSP)-Cum-Joint Secretary
Endst. No. RO(SCSP)-76/2014/958 Dated 10 February , 2014
A copy of the above is forwarded to the Member Secretary, Punjab State
Commission for Scheduled Castes, Chandigarh for information and necessary action.
Director (SCSP)-Cum-Joint Secretary
Endst. No. RO(SCSP)-76/2014/959-981 Dated 10 February , 2014
A copy of the above is forwarded to all the Chairmen, District Planning
Committees in the State for information and necessary action.
Director (SCSP)-Cum-Joint Secretary

310
Endst. No. RO(SCSP)-76/2014/ 982-1004 Dated 10 February , 2014
A copy of the above is forwarded to all the Additional Deputy Commissioners
(Dev)-cum-Nodal Officers (SCSP) in the State for information and necessary action.
Director (SCSP)-Cum-Joint Secretary
Endst. No. RO(SCSP)-76/2014/1005-1027 Dated 10 February , 2014
A copy of the above is forwarded to all the District Welfare Officers in the State
for information and necessary action.
Director (SCSP)-Cum-Joint Secretary

311
Annexure – VI
GOVERNMENT OF PUNJAB
WELFARE DEPARTMENT
(DIRECTORATE OF SCHEDULED CASTES SUB PLAN)
Notification
The 30th
April, 2010
No. RO(SCSP)-27/2800-A The Governor of Punjab is pleased to constitute a State Level
Review Committee for monitoring and review of schemes under Scheduled Castes Sub Plan
(SCSP) and Special Central Assistance (SCA) programmes, and to take policy decisions on the
guidelines w.r.t. SCSP/SCA issued from time to time by the Planning Commission/Ministry of
Social Justice and Empowerment, Government of India.
The composition of the committee will be as under:-
1. Chief Minister, Punjab : Chairman
2. All (Scheduled Caste) Members of the State Lok
Sabha.
: Member
3. Finance Minister, Punjab : Member
2. Welfare Minister, Punjab : Member
4. Chief Secretary, Punjab : Member
5. Principal Secretary to Chief Minister, Punjab : Member
6 Principal Secretary to Government of Punjab
Department of Finance
: Member
7 Principal Secretary to Government of Punjab
Department of Planning
: Member
8. Principal Secretary to Government of Punjab,
Department of Welfare of SCs/BCs.
: Member
9 All the Financial Commissioners/ Principal
Secretaries/Administrative Secretaries concerning
SCSP
: Members
10. Five Non official SC members to be nominated by
the Government out of which at least one shall be a
woman member
: Members
11. Director, Scheduled Castes Sub Plan : Member Secretary
Terms of Reference of the Committee
1. The committee will make an appraisal on the status of implementation of
guidelines of Government of India and the policy decisions of the State
Government w.r.t. SCSP/SCA and make firm suggestions for removal of the
difficulties being faced in their implementation.

312
2. The committee will monitor the physical and financial performance of
schemes under SCSP and SCA programmes and examine the status of
implementation of these schemes in the State.
3. The committee shall meet atleast two times in a year
Tilak. R. Sarangal, IAS,
Chandigarh Principal Secretary to Government of Punjab,
The 23rd
April, 2010 Department of Welfare of Scheduled Castes and
Backward Classes
Endst. No. RO(SCSP)-27/2801 Dated: Chandigarh the 30-4-2010
A copy is forwarded to the Principal Secretary to Chief Minister, Punjab for kind
information of Hon’ble Chief Minister, Punjab
Principal Secretary Welfare
Endst. No. RO(SCSP)-27/2801 Dated Chandigarh the 30-4-2010
A copy is forwarded to the following for information and necessary action please :-
1. All (Scheduled Caste) Members of the State Lok Sabha
2. Finance Minister, Punjab
3. Welfare Minister, Punjab
4. Chief Secretary to Govt. of Punjab
5. Principal Secretary to Hon’ble Chief Minister Punjab
6. Principal Secretary, Department of Finance
7. Principal Secretary, Department of Planning.
8. Principal Secretary, Department of Welfare of SCs & BCs
9. All the Financial Commissioners/Principal Secretaries/Administrative
Secretaries concerned with SCSP
Principal Secretary Welfare
Copy to:
1. PA/Director (SCSP)

313
Annexure – VII
GOVERNMENT OF PUNJAB
DEPARTMENT OF WELFARE
(WELFARE CELL NON PLAN)
Notification
No. 3/45/99-WC-6/2386 Dated, Chandigarh 15-12-2009
The Governor of Punjab is pleased to constitute the State Level Standing Tripartite
Committee to monitor the implementation of strategies of Scheduled Castes Sub Plan.
2. The composition of the Tripartite Committee will be as given below:-
1 Minister-in-Charge, Welfare of Scheduled Castes
and Backward Classes, Punjab
Chairman
2. Chief Secretary, Punjab
Member
3. Principal Secretary to Government of Punjab,
Department of Finance
Member
4. Principal Secretary to Government of Punjab,
Department of Planning
Member
5. Principal Secretary to Government of Punjab,
Department of Welfare of Scheduled Castes &
Backward Classes
Member
6. Director, National Commission for Scheduled
Castes, Chandigarh
Member
7. Director, Scheduled Castes Sub Plan Member Secretary
Terms of Reference of the Committee :-
I The committee will review the implementation of the guidelines issued by the
Govt. of India and policy decisions taken by the State Govt. concerning
SCSP/SCA and suggest specific measures to remove the difficulties being faced
in their implementation.

314
II The committee, in line with the guidelines of Govt. of India/State Govt. will give
suggestions regarding formulation and implementation of specific new/additional
schemes for socio economic development of Scheduled Castes.
III The committee will review the progress of schemes under the Scheduled castes
Sub Plan (SCSP) and Special Central Assistance (SCA) programme and suggest
measures for their effective implementation.
IV The committee will hold two meetings in a year.
3. This supersedes the order issued vide letter No. 3/45/99-WC6/2950, dated 12-11-
2007.
Tilak.R. Sarangal, IAS,
Principal Secretary to Govt. of Punjab,
Department of Welfare of Scheduled
Castes and Backward Classes
Endst. No. 3/45/99-WC-6/ 2398 Dated: Chandigarh the 15-12.2009
A copy is forwarded to the following for information and necessary action please.:-
1 Welfare Minister, Punjab
2 Chief Secretary, Punjab
3. Principal Secretary, Finance, Punjab
4 Principal Secretary, Welfare of SCs & BCs, Punjab
5. Principal Secretary, Planning, Punjab
6. All the Financial Commissioners/Principal Secretaries/Administrative
Secretaries concerned with SCSP (As per list enclosed)
7. All the Heads of the Departments concerned with SCSP (As per list enclosed)
8 Accountant General, Punjab, Chandigarh
9 Secretary, Planning Commission,
Govt. of India, Yojna Bhawan, New Delhi
10 Secretary to Govt. of India,
Ministry of Social Justice & Empowerment, Shastri Bhawan, New Delhi
11 Director, National Commission for Scheduled Castes, Chandigarh
12 Director, Scheduled Castes Sub Plan, Punjab
Joint Secretary Welfare
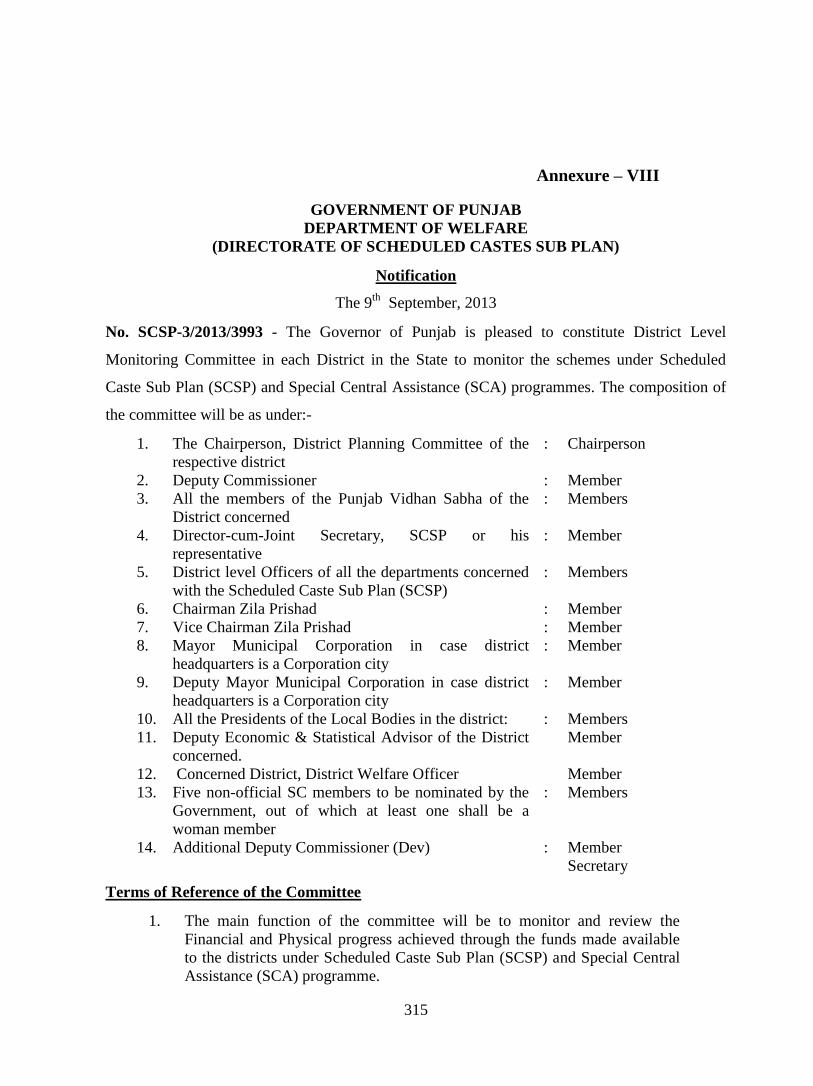
315
Annexure – VIII
GOVERNMENT OF PUNJAB
DEPARTMENT OF WELFARE
(DIRECTORATE OF SCHEDULED CASTES SUB PLAN)
Notification
The 9th
September, 2013
No. SCSP-3/2013/3993 - The Governor of Punjab is pleased to constitute District Level
Monitoring Committee in each District in the State to monitor the schemes under Scheduled
Caste Sub Plan (SCSP) and Special Central Assistance (SCA) programmes. The composition of
the committee will be as under:-
1. The Chairperson, District Planning Committee of the
respective district
: Chairperson
2. Deputy Commissioner : Member
3. All the members of the Punjab Vidhan Sabha of the
District concerned
: Members
4. Director-cum-Joint Secretary, SCSP or his
representative
: Member
5. District level Officers of all the departments concerned
with the Scheduled Caste Sub Plan (SCSP)
: Members
6. Chairman Zila Prishad : Member
7. Vice Chairman Zila Prishad : Member
8. Mayor Municipal Corporation in case district
headquarters is a Corporation city
: Member
9. Deputy Mayor Municipal Corporation in case district
headquarters is a Corporation city
: Member
10. All the Presidents of the Local Bodies in the district: : Members
11. Deputy Economic & Statistical Advisor of the District
concerned.
Member
12. Concerned District, District Welfare Officer Member
13. Five non-official SC members to be nominated by the
Government, out of which at least one shall be a
woman member
: Members
14. Additional Deputy Commissioner (Dev) : Member
Secretary
Terms of Reference of the Committee
1. The main function of the committee will be to monitor and review the
Financial and Physical progress achieved through the funds made available
to the districts under Scheduled Caste Sub Plan (SCSP) and Special Central
Assistance (SCA) programme.

316
2. Based on the monitoring report, the committee will make firm suggestions
for bringing about improvement in implementation of schemes/programmes
for the welfare of SCs.
3. The District Level Monitoring Committees will prepare schemes for the SC
people residing in Panchayati regions of the concerned District keeping in
view the genuine needs for their development and make recommendation for
inclusion of these schemes in the District Plan.
4. The Committee shall meet four times in a year i.e. once in every quarter.
5. The headquarters of the district concerned will be the headquarters of the
committee.
6. No TA/DA will be given to the non-official members.
7. The term of the Committee will depend upon satisfaction of the
Government..
Anurag Aggarwal, IAS
Chandigarh Secretary to Government of Punjab,
The 9th
. Septmeber, 2013 Department of Welfare of Scheduled Castes
and Backward Classes .
Endst. No. SCSP-3/2013/3994 Dated Chandigarh the 9-9-2013
A copy is forwarded to the Special Secretary/Welfare Minister, Punjab for kind
information of Hon’ble Welfare Minister, Punjab.
Director-cum-Joint Secretary
Endst. No. SCSP-3/013/3995 Dated Chandigarh the 9-9-2013
A copy is forwarded to the Private Secretary to Principal Secretary, Welfare, Punjab for
kind information of Hon’ble Principal Secretary, Welfare.
Director-cum-Joint Secretary
Endst. No. SCSP-3/2013/3996-4493 Dated Chandigarh the 9-9-2013
A copy is forwarded to the following for information and necessary action please:-
1. All the Chairpersons, District Planning Committees in the State.
2. All the Deputy Commissioners in the State.
3. Members, Punjab Vidhan Sabha from the concerned district.
4. Director, Scheduled Castes Sub Plan
5 All the heads of the departments concerned with SCSP.
6. All the District Level Heads of the Departments concerned with SCSP
7. Chairpersons of all the Zila Prishads in the State.
8. Vice Chairpersons of all the Zila Prishads in the State
9. Mayors of all the Municipal Corporations in the State.

317
10. Deputy Mayors of all the Municipal Corporations in the State.
11. Presidents of all the Local Bodies/Notified Area Committees in the State
12. All the Deputy Economic & Statistical Advisors in the State.
13. All the District Welfare Officers in the State.
14. All the Additional Deputy Commissioners (Dev.) in the State.
Director-cum-Joint Secretary
Copy to:
1. PA/Director –cum-Joint Secretary.
2. All Deputy Director, SCSP.

318
Annexure - IX
GOVERNMENT OF PUNJAB
DEPARTMENT OF WELFARE
(WELFARE CELL NON PLAN)
Notification
No. 3/45/09-WC6/174 08.01.2010
The Governor of Punjab is pleased to constitute Monitoring Committee in every Block to
monitor the schemes being implemented under Scheduled Caste Sub Plan (SCSP) and Special
Central Assistance (SCA) programme.
The composition of the committee will be as under:-
1. Sub Divisional Magistrate : Chairman
2. Block Development and Panchayat Officer : Member
3. Tehsildar Concerned : Member
4. DSP Concerned : Member
5. Naib Tehsildar : Member
6. Block level S.D.O. Punjab State Electricity Board : Member
7. Child Development & Project Officer : Member
8. SMO Concerned : Member
9 All Members of respective Block Samiti : Members
10. Five SC non official members to be nominated by
the Government, out of which at least one shall be a
woman member
: Members
11 Tehsil Welfare Officer : Member Secretary
Terms of Reference of the Committee
1. The main function of the committee will be to monitor and review the
schemes being implemented at Tehsil/Block level under Scheduled Caste
Sub Plan (SCSP) and Special Central Assistance (SCA) programme.
2. Based on the monitoring report, the committee will make firm
suggestions for bringing about improvement in implementation of
schemes/programmes for the welfare of SCs.
3. The Committee shall meet after every quarter.
4. No TA/DA will be given to the non-official members.
5. The term of the Committee will depend upon satisfaction of the
Government

319
The committee will send the progress report on the implementation of the SCSP schemes
and SCA programme at the Block level to the concerned Deputy Commissioner and Director,
Scheduled Castes Sub Plan (SCSP).
Tilak. R. Sarangal, IAS,
Chandigarh Principal Secretary to Government of Punjab,
25th
Januaryl, 2010 Welfare of Scheduled Castes and Backward Classes
Endst. No. 3/45/09-WC-6/175-183 Dated Chandigarh the 08-1-2010
A copy is forwarded to all the concerned for information and further action, as given below :-
1. All the Sub Divisional Magistrates in the State.
2. All the Block Development & Panchayat Officers in the State.
3. All the Tehsildars in the State.
4. All the DSPs in the State.
5 All the Naib Tehsildars in the State.
6. All the Block Level Sub Divisional Officers of Punjab State Electricity Board
in the State.
7. All the Child Development & Project Officers (CDPO) in the State.
8. All the Senior Medical Officers in the State.
9. Members of all the Block Samities in the State.
10. All Tehsil Welfare Officers in the State.
Joint Secretary Welfare

320
Annexure – X GUIDELINES ON UTILISATION OF SPECIAL CENTRAL ASSISTANCE TO
SCHEDULED CASTES SUB PLAN
A.K CHOUDHARY GOVERNMENT OF INDIA
JOINT SECRETARY MINISTRY OF SOCIAL JUSTICE
TEL NO. 23381643 AND EMPOWERMENT
SHASTRI BHAWAN, NEW DELHI
D.O. 11014/21/97-SCD-II DATED 6TH
OCTOBER 1998.
Subject: Special Central Assistance (SCA) to Special Component Plan (SCP) for
Scheduled Castes (SCs)- Modifications in the criteria for release of SCA to
States/UTs, utilization etc.
…
As you are aware, Special Central Assistance is provided to State Governments/UT
Administrations as an additive to their Special Component Plan for Scheduled Castes. Its main
objective is to give a thrust to the development programmes for Scheduled Castes with reference
to their occupational pattern and the need for increasing the productivity of and income from
their limited resources. It will help in bringing about occupational diversification in the labour
surplus economy. SCA is expected to give thrust to family oriented schemes of economic
development of SCs below the poverty line, by providing resources for filling he critical gaps
and for providing missing vital inputs so that the schemes can be more meaningful. Since the
schemes/programmes for SCs may be depending upon the local occupational pattern and the
economic activities available, the Sates/UTs have been given full flexibility in utilizing SCA
with the only condition that it should be utilized in conjunction with SCP and other resources
available from other sources like various Corporations, financial institution etc.
2. An illustrative list of areas under various sectors of development where SCA could be
utilized has already been circulated vide this Ministry’s d.o. letter No.19020/35/93-SCD-VI
dated 29th
July, 1993 (copy enclosed as Annexure I ). The condition of blocks having 50% or
more of SC population for use of SCA for infrastructural development programmes has been
relaxed and villages having 50% or more of SC population can now be considered for
infrastructural development programmes with the support of SCA funds. Only 10% of the total
SCA released to the State Government/UT Administration in a year should be utilized for
infrastructural development programmes. Copy of the d.o. letter No.19020/35/93-SCD-VI dated
7th September, 1998 issued in this connection is enclosed as Annexure-II.
3. The continuation of the Scheme of Special Central Assistance to Special Component
Plan for SCs during the IX Five Year Plan has been approved by the Cabinet Committee on
Economic Affairs with the following modifications and conditions: -
(i) The SCA will be released to the state Governments/UT Administrations on the basis of
following criteria:-

321
(a) On the basis of SC population of the States/UTs. 40%
(b) On the basis of relative backwardness of he States/UTs 10%
(inverse of State Per Capita Domestic Product)
(c ) On the basis of the percentage of SC families in the States/UTs 25%
covered by composite economic development Programmes in the
Plans to enable them to cross the Poverty line.
(d) On the basis of the Special Component Plan to the Annual Plan 25%
as compared to the SC population percentage in the States/UTs
(ii) 2% of the total budget allocation for he scheme will be earmarked for North Eastern
States, which implement SCP for SCs.
(iii) 15% of the total SCA released to the States/Uts, On the basis of the Criteria a (i) above
will be utilized by State Governments/UTs Administrations exclusively on viable income
generating economic development schemes/Programmes for SC Women.
(iv) 5% of the total SCA released to the States / UTs will be utilized by them exclusively for
the economic development of disabled persons among SCs
(v) 3% of the total SCA released to the States /UTs shall be utilized by the States/UTs for
supervision, monitoring and evaluation of economic development schemes implemented
with the support of SCA funds.
(vi) Second installment of SCA should be released to the States/UTs after ensuring
expenditure of cumulative opening balances of the previous year and 75% of the first
installment for the current year.
4. The limit of SCA permitted for staff meant for supervision implementation, monitoring
and evaluation of Schemes at various levels has been increased from 1`% to 3% taking into
account the requirement of staff and infrastructure for the purpose at all levels of
implementation. Proper and timely utilization of SCA funds on viable schemes for the economic
development of SC families below the poverty line needs greater attention. The State
Governments/UT Administrations should strengthen their monitoring mechanism at State and
district levels. There should be regular feed back through monthly progress report on
implementation and utilization of funds from the implementing agencies to the District Level
Monitoring Committee and from District Level Committee to the State Level Monitoring
Committee on quarterly basis. The Secretary of the Department concerned with the SC welfare
and development should send the quarterly progress report on utilization of SCA within 15 days
after the end of each quarter and he annual progress repot on the utilization of funds within 3
month of the end of each financial year to the Government of India, Ministry of Social Justice
and Empowerment. Based on the progress reports received from the State Governments/UT
Administrations, the Ministry will send consolidated State-wise report on the subject especially
on utilization of funds under SCA to SCP indicating diversion of funds, if any to the Planning
Commission.
5. Late release of funds to the Implementing departments/agencies, non-utilization of funds
sanctioned/released to the implementing departments/agencies for the purpose for which it is
sanctioned, accumulation of unspent balances of funds for considerable long period with the
implementing departments/agencies, keeping funds in Civil Deposits, Fixed deposits, saving
bank accounts, P.L.A. etc. for considerable long period, lack of proper action plan for
implementation of schemes, sanction of funds for schemes without ascertaining their feasibility

322
and viability, leakage of benefit of schemes meant for SCs to Non-SCs, etc. decelerate the
process of economic development of the target group. An effective device needs to be evolved to
remove such shortcomings/loopholes so that the purpose of SCA could be served meaningfully.
Amongst various measures for effective implementation of development schemes for SCs, the
following points may be given more stress: -
i) Release of funds to the implementing agencies without loss of time after getting the
SCA from the Government of India.
ii) Separate Account of SCA released to the implementing agencies may be maintained
and utilization of SCA funds by the implementing agencies may be watched regularly
through periodical progress reports from the implementing agencies.
iii) It may be ensured that Utilization Certificates from the concerned implementing
agencies are obtained in time.
iv) Annual Audit of SCA accounts of State and District/Block Level Implementing
Agencies may be ensured.
v) Keeping SCA funds in civil deposits, fixed deposits, saving bank account, PLA etc.
for long periods by implementing agencies or nodal department may be discouraged.
Delay in identifying schemes & beneficiaries and sanction of schemes and release of
assistance to the beneficiaries often lead to deposit the funds in various accounts.
vi) Release of funds to the implementing agencies without ascertaining the utilization of
funds released to them earlier leads to accumulation of unspent balances and increase
in the deposit in various accounts. Identification of viable schemes as per the
developmental needs of SCs and identification of eligible beneficiaries to be
considered for assistance in a financial year should be completed well before the
commencement of the financial year. Sanction of schemes and release of assistance
can thus be ensured in time soon after the receipt of SCA funds. This will help in
avoiding last minute sanction of schemes at the fag end of the financial year and in
ensuring the full utilization of funds.
6. The Government of India, Ministry of Social Justice and Empowerment will intimate the
tentative allocation of SCA to State Governments/UT Administration at the beginning of the
financial year and will release the first installment of SCA on the basis of SC Population and
relative backwardness of States/UTs during the first quarter of the financial year. The State
Governments/UT Administrations should furnish the information on effort-based criteria {the
criteria at (c) and (d) mentioned in Para 3 (i)} and the utilization of SCA released to them during
the previous year and first installment released during the current year, in the month of August
every year. This will ensure the release of second installment in the beginning of the second half
of the financial year.
7. Utilization of 15% and 5% of total SCA released to the State Governments/UT
Administrations exclusively for the economic development schemes/programmes for SC women
and disabled persons among SCs respectively may be ensured from this year (1998-99) onwards.
The progress on utilization of SCA for SC Women and disabled among SCs indicating the
schemes implemented, funds utilized and the number of beneficiaries covered, may be furnished
to this Ministry within a month after the end of this financial year. From next year onwards the
progress report in this regard may be furnished to this Ministry within one month after the end of
each six months period.

323
8. The skill developing training programmes to be implemented with the support of SCA
funds should be formulated in such a way that after the completion of training, the placement of
trained candidates either in waged employment or in self-employment is ensured.
9. Follow up of the beneficiaries after the schemes are sanctioned to them is necessary to
ascertain whether they have acquired necessary assets and utilizing the assets for income
generating activities. Proper maintenance of records regarding the accounts of funds received,
given to the beneficiaries including subsidy and bank loan, full address of the beneficiaries,
assets created under various schemes sanctioned to the beneficiaries, etc. by the implementation
departments/agencies should be ensured.
10. I shall be grateful, if the various measures for ensuring full utilization of SCA funds and
effective implementation of schemes for the benefit of the target group are given adequate
attention and made into practice.
Yours sincerely,
Sd/-
(A.K. Choudhary)
To
1. The Chief Secretary of 24 States/UTs as per list attached.
2. The Secretary concerned with SC Welfare & development of he 24 States/UTs as per list
enclosed.
Copy to:
1. Adviser (SW&BC), Planning Commission, Yojana Bhavan, New Delhi.
2. Secretary, National Commission for SC/ST, Loknayak Bhavan, New Delhi.
3. Director, Audit, Officer of the C & AG, Indraprastha Estate, ITO, New Delhi
4. Director (Finance), Ministry of Social Justice and Empowerment, Shastri Bhavan, New
Delhi.
(A.K Choudhary)
Joint Secretary

324
Annexure – X(I)
ANNEXURE-I
JOINT SECRETARY GOVERNMENT OF INDIA
TELE NO; 381652 MINISTRY OF WELFARE
SHASTRI BHAWAN
NEW DELHI-110001
D.O. NO.19020/35/93-SCD-VI DATED: 29.7.93
Dear Shri
The scheme of Special Central Assistance (SCA) to Special Component Plan (SCP) for
the Scheduled Castes is linked with the Government of India’s strategy for the development of
Scheduled Castes. The main objective of the scheme is to give a thrust to the economic
development programmes for the Scheduled Castes with reference to their occupational pattern
and secondly, to increase the productivity of and income from their limited resources. A series of
instructions have been issued regarding the purposes for which Special Central Assistance could
be utilized for the development of the Scheduled Castes.
2. On examination of information received from the State Governments/Union Territory
Administrations, it has been found that a large chunk of the Special Central Assistance has been
spent without effective linkage with the viability of the scheme. Some States had also kept the
funds unspent for long intervals.
3. Despite considerable efforts made to extend the benefits of educational and other
developmental programmes to ensure the upper mobility of Scheduled Cases, it is found that
there is much to be desired. The major problem being faced in the area of Scheduled Cases
development continued to be economic, educational and social. The need for special attention for
groups like landless agricultural labourers marginal farmers, artisans, civic sanitation workers,
flayers, tanners and leather workers and other unorganized labour continues to be crucial.
4. Considering all these, in amplification of earlier guidelines, it has been decided that the
scope of the existing Special Central Assistance should include infrastructure development
programmes in blocks having 50% or more of Scheduled Castes population subject to the
condition that the SCA allocation should be made use of in such a way as to encourage larger
efforts on development of Scheduled Castes on the part of States/Union Territories.
5. Accordingly, an illustrative list of items under various developmental sectors is enclosed
herewith for which Special Central Assistance to Special Component Plan could be utilized on
specific viable schemes covering Schedules Cases population individually and/or in clusters,
immediate steps for utilization of the SCA to SCP may be taken according to these revised
guidelines.

325
6. I shall be grateful if you issue necessary directions to all concerned in this regard under
intimation to the Ministry of Welfare and Planning Commission.
With regards,
Yours Sincerely,
(GANGA DAS)
Chief Secretaries of all
States/Union Territories.
No.19020/35/93-SCD-VI Dated the 29th
July 1993
Copy forwarded for necessary action to:-
1. Secretary, Planning Commission, New Delhi
2. Advisor (BC), Planning Commission, New Delhi.Secretary to the Government of India,
All Ministries/Deptt,
Sd/-(GANGA DAS)
JOINT SECRETARY

326
FAMILY ORIENTED CUM INCOME GENERATING SCHEMES FOR
DEVELOPMENT OF SCHEDULED CASTES FAMILIES: -
1. AGRICULTURE (a) Training-Cum-demonstration to Scheduled Castes farmers.
(b) Distribution of seeds/fertilizers, minkits and pesticides to Scheduled Castes
farmers in addition to the usual programmes of Agriculture department.
(c) Commercial crops programme in Scheduled Caste cultivators’ land .
(d) High yielding variety programme in Scheduled Caste cultivators’ land in addition
to the usual programmes of Agriculture department.
(e) Assistance to persons/landless agricultural labourers belonging to Scheduled
Castes for reclamation/development of their lands.
2. HORTICLTURE (a) Taking up fruit and vegetable plantation in Scheduled Castes beneficiary land
(b) Training to Scheduled Castes in growing, marketing of fruits and vegetables
produce
(c) Small nurseries seed farms incidental to the above.
3. LAND REFORMS (a) Assistance to Scheduled Caste families who have been distributed surplus land for
developing and cultivating the land.
(b) Preparation of land records of block having 50% or more Scheduled Caste
population.
4. MINOR IRRIGATION a. Check-dams, diversion channels, water harvesting structures, dug-wells, tube-
wells, cooperative lift points for Scheduled Caste groups/community in areas having
50% or more Scheduled Caste beneficiaries.
b. Subsidy/assistance to individual beneficiaries for dug-wells, tube wells, irrigation
pump sets, farm ponds.
5. SOIL CONSERVATION a. Plantation of food and species as part of soil conservation measures.
6. ANIMALHUSBANDRY (a)Supply of milk cattle, poultry, goat, sheep, pigs and duck units to Scheduled Caste
families.
(b) Assistance to dairy and poultry cooperative societies in the areas with substantial
Scheduled Caste population.
7. FORESTRY a. Development of Social and agro-forestry benefiting Scheduled Caste Families.

327
8. FISHERIES a. Assistance to Scheduled Caste Families for pisiculture.
b. Training of Scheduled Castes in fish production collection etc.
c. Development of Scheduled Caste fishermen cooperative
d. Subsidy/assistance to Scheduled Caste fishermen to purchase fishing boats, nets
etc.
9. VILLAGE & SMALL INDUSTRIES (a) Skill development training to traditional Scheduled Caste artisans in modern
methods of production.
(b) Assistance to Scheduled Caste artisans/craftsmen for setting up of business and
small and cottage industries.
(c) Entrepreneurship development training to Scheduled Castes.
(d) Bee Keeping
(e) Sericulture
(f) Introduction of new craft programmes among Scheduled Caste families.
10. COOPERATIVES a. Formation of new cooperatives and strengthening existing Cooperatives
with substantial Scheduled Caste members for promoting ventures in
traditional occupations like leather works, weaving and brick-making etc.
b. Strengthening of consumer cooperatives, labour cooperatives and other
cooperatives having a substantial number of Scheduled Castes members.
c. Working capital assistance to Scheduled Caste cooperatives engaged in
production of consumable items etc.
d. Training to Scheduled Caste members of cooperatives in management
and administration cooperatives.
e. Processing/marketing cooperatives.
11. EDUCATION a. Establishment and running of residential schools in areas having low level literacy.
b. Repairs and proper upkeep of existing schools/hostels meant for Schedule Castes.
12. SCHEDULED CASTE WOMEN.
a. Assistance to Scheduled Caste Women and their cooperatives for their production
and marketing of consumer goods.
b. Training of Scheduled Caste women in schemes designed to improve family
earning.
13. ECOLOGY AND ENVIRONMENT Programmes of improvement of ecology and environment having a bearing on
family-oriented economic programmes.

328
14. MINIMUM NEEDS PROGRAMME a. Establishment of dispensaries/hospital/ centers for Homeopathic,
Naturopathic and Yogic cures in areas having 50% or more Scheduled
Caste population.
b. Establishment of mobile medical dispensaries so that all areas of SC
concentration can be targeted for the provision of health services.
c. Provision of electric supply and light to the Scheduled Caste habitats.
d. Provision of drinking water to Scheduled Caste habitats where there are
no drinking water facilities.
e. Development of village link roads and small C.D. Works in areas/blocks
having 50% or more Scheduled Caste population.

329
Annexure – X(II)
GANGA DAS
JOINT SECRETARY GOVERNMENT OF INDIA
TELE NO; 381652 MINISTRY OF WELFARE
SHASTRI BHAWAN
NEW DELHI-110001
D.O. NO.19020/35/95-SCD-VI DATED: 27.10.93
Dear Shri
Please refer to my D.O. letter of even number dated 29th
July, 1993, regarding Special
Central Assistance (SCA) to Special Component Plan (SCP) and amplified guidelines thereon
with an illustrative list of items under various developmental sectors where SCA could be
utilized in blocks having 50 per cent or more of Scheduled Caste population.
2. In this connection, it is clarified that the “ amplified guidelines do not alter the principle
of SCA being an additive to SCP and its utilization in conjunction with SCP for filling the
critical gaps and for providing missing inputs on viable schemes for the economic development
of Schedules Caste families. SCA should not be used to substitute the obligations for State
Governments under their Plan and non-plan allocations for Scheduled Castes. Use of SCA
with the SCP for establishing and running residential schools should strictly be in areas
having low literacy, particularly in those areas where literacy level amongst SC female is
below two percent. Similarly utilization of SCA with SCP for the items mentioned under
Minimum Needs Programmes should be in those areas where such facilities are not available for
Scheduled Castes.”
With regards,
Yours sincerely,
Sd/-
(GANGA DAS)
To
Secretary, Social Welfare Of all states/UTs as per the list.

330
Annexure II
A.K. CHOUDHARY
TEL 3381643;
D.O. No.19020/35/93-SCD-VI/II
MINISTRY OF SOCIAL JUSTICE
AND EMPOWERMENT
GOVERNMENT OF INDIA
SHASTRI BHAVAN, NEW DELHI
DATED 7th
SEPTEMBER 1998.
Dear
Kindly refer to this Ministry’s d.o. letter of even number dated 29.7.1993 regarding
amplification of guidelines on Special Central Assistance to Special Component Plan for
Scheduled Castes, extending the scope of its utilization also for infrastructure development
programmes in the blocks having 50 per cent or more of SC population .
2. On the basis of requests from various State Governments for exemption of blocks having
50 percent or more of SC population for utilization of SCA for infrastructural development
programmes, the matter was re-examined and it is found that the benefit of infrastructure
development out of SCA funds is possible only for SCs in a few blocks in the country spread
over in four States. Since most of the villages in the country with high concentration of SC
population are lacking basic infrastructure for providing drinking water facilities, health care
facilities, link roads, educational facilities, etc. to SC population, it has been decided to relax the
condition of blocks having 50 per cent or more of SC population for use of SCA for
infrastructural development programmes. SCA may now be utilized for infrastructural
development programmes in villages with 50% or more of SC population, where infrastructural
facilities for overall development of SCs are lacking.
3. Since the main objective of SCA is the economic development of SC population in order
to bring them above the poverty line, only 10% of the total SCA released to the State/UT in a
year should be utilized for infrastructural development programmes in the villages having 50 per
cent or more of SC population.
4. As you are aware, SCA is an additive to the SCP of State/UT and its utililsation should
primarily be on income generating schemes/programmes of economic development of SCs in
conjuncjtion with SCP as well as resources available from other sources like various
corporations, financial institutions etc. The basic principle of utilization of SCA in conjunction
with SCP for filling the critical gaps and for providing missing inputs on viable schemes may
strictly be followed while utilizing SCA for economic development schemes as well as
infrastructure development programmes. SCA should not be used to substitute the obligations of
State Government/UT Administrations under their plan and non-plan allocations for SCs.

331
5. The details of villages where SCA funds are utilized for the purpose of infrastructural
development and the physical achievement thereon may also be included in the quarterly and
annual progress reports on utilization of SCA to be furnished to this Ministry by the State
Government/UT Administrations.
With regards,
Yours sincerely,
Sd/-
(A.K. CHOUDHARY)
Joint Secretary
To
1. Chief Secretaries of 24 States ( as per list attached)
2. Secretaries in charge of SC Welfare ( as per list attached )
Copy for information to:
1. Advisor (SW&BC), Planning Commission, Yojana Bhavan, New Delhi
2. Secretary, National Commission for SCs & STs, Lok Nayak Bhavan, New Delhi
3. Accountant General in 24 States /UTs
4. Director, Office of the C & AG, New Delhi
Sd/-
(A.K.CHOUDHARY)
Joint Secretary

332
Annexure – X(III)
D.O No.11014/5/98-SCD-II
S K PANDA Ministry of Social Justice and Empowerment .
Government of India, Shastri Bhavan
Tel: 3387924(O) New Delhi-110001
FAX: 3384918 New Delhi-110001 Dated 9.10.2000
Dear
As you are aware, guidelines on provision of Special Central Assistance (SCA) to
Special Component Plan (SCP) of the State Governments/UT Administrations was last revised
and circulated vide d.o. No.11014/21/97-SCD-II dated 6.10.98. As this assistance is provided as
an additive to the SCP for welfare of Scheduled Castes, the amended guidelines provided that
the State Governments/UT Administrations will have full flexibility in utilizing the SCA, subject
to the condition that it should be utilized in conjunction with the SCP and other resources
available from other sources like various corporations, financial institutions etc. The SCA is to
be utilized mainly for assisting SC families, living below the poverty line bridging the critical
gaps and providing missing inputs of vital nature for making the schemes more meaningful.
Utilization of upto 10% of the SCA for development of required infrastructure is provided under
the guidelines.
2. With a view to implement the schemes in a more focused manner, the State
Government/UT Administration have been requested to submit project report for utilization of
admissible SCA during 2000-01 indicating the economic activities proposed to be financed,
provision of required forward and backward linkages, flow of institutional finance and other
details. This Ministry's D.O. letter number 11014/30/99-SCD-II (Pt) dated 25.5.2000 may please
be referred to in this regard. We have not received detailed project reports from your State so far.
The first installment of SCA has been released to your State based on population and relative
backwardness. You are requested to give your personal attention and arrange for sending project
reports and utilization certificate in respect of the amount sanctioned so far at the earliest. It may
please be noted that release of 2nd instalment of SCA would be considered only on getting the
project reports and utilization certificate.
3. Subsequent to issue of the guidelines indicated above, certain clarification on
utilization of the SCA by the State Government/UT Administration have been sought. The
position in respect of the points raised is hereby clarified as follows:
(i) In this Ministry's letter No.16011/1/94-SCD-IV dated 23rd
August, 1994, it was
clarified that SC beneficiaries, living below the poverty line may be provided assistance under
SCA in manner similar to those admissible under the Integrated Rural Development Programme
(IRDP). The Ministry of Rural Development has launched the Swarnajayanti Gram Swarozgar
Yojana (SGSY) in April, 1999, in place of IRDP, as a holistic programme covering all aspects of
self employment, such as organization of poor into self help groups, and provision of training,
credit, technology, infrastructure and marketing etc. to such groups, for enabling the poor

333
families to cross the poverty line. The SGSY adopt a project approach for each key activity. The
poor families are to be assisted for taking up viable income generating activities, through a mix
of institutional finance and subsidy. Guidelines of SGSY provides that credit will be the critical
component and subsidy will be the only a minor and enabling element. In view of the above,
relevant provisions of SGSY, may be adopted as a totality, while utilizing SCA. Amount of
subsidy admissible under SGSY i.e. subject to a maximum of Rs.10, 000 per beneficiary may
accordingly.be adopted in case of Special Central Assistance. The number of SC families
assisted under the Scheme and the number crossing the poverty line may be monitored and
reported to the Ministry on quarterly basis.
(ii) As regards selection of SC families living below poverty line and definition of
poverty line, the guidelines issued by the Planning Commission and the procedure laid down by
the Ministry of Rural Development for selecting the beneficiaries through the Panchayati Raj
Institutions may be adopted.
(iii) Special Central Assistance should be utilized only for the purpose specified under
the guidelines and should not be diverted for any other purpose.
4. We are separately communicating dates for discussing the SCP of your State for
the year 2000-01 as well as the project report for utilization of SCA, some time in Oct-Nov
2000. As the matter relates to welfare of Scheduled Castes, I shall be grateful to you for giving
your personal attention on the matter and arrange to send the project report and SCP document at
the earliest.
Yours sincerely,
Sd/-
(S.K. PANDA)
Secretary
Social Welfare Deptt.
Govt. of (24 States)
(As per list attached)

334
Annexure – X(IV)
No.11014/8/2003-SCD-II
Government of India
Ministry of Social Justice & Empowerment
Shastri Bhavan, New Delhi
Dated 29.3.2007
To,
(27 States/UTs)
Subject: - Guidelines for utilization of Special Central Assistance (SCA) to the Scheduled
Castes Sub Plan (SCSP).
The fundamental objectives and the basic operative principles of the approved
Special Central Assistance scheme are (a) economic development of the SC target groups by
way of employment or self employment either in primary or secondary or tertiary sectors, (b)
Special emphasis on training and skill development with forward linkages for employment and
occupational diversification.
2. It has been the endeavor of this Ministry to serve the larger cause of the target groups
by guiding the State Governments in directing their efforts and initiatives from time to time. As
a further initiative, the Ministry has decided to draw a new road map for the empowerment of the
SC target groups in tune with the opportunities offered by the modern era of globalization and
liberalization. In this exercise the most important component is quality and excellence, both in
professional education and training which have a direct linkage with high -end employment.
3. The need of the hour is to promote sunrise sectors through the Special Central
Assistance mechanism without leaving any scope or possibility for dilution of the qualitative
excellence of the new programmes. While doing so the emphasis would rest on choosing the best
out of the available market by diligent observance of norms of propriety and transparency. It is
thus felt necessary to include capacity building programmes matching the new sunrise high-end
sectors within the existing format of the scheme of Special Central Assistance. An illustrative
list of such sectors is Commercial Pilot Course, Aviation and Hospitality Course, course in
Fashion Technology, General Nursing Course and Hotel Management Course. These are all
income generating activities and fit into the scheme of Special Central Assistance.
4 . The recent public private partnership initiative taken by the Government of Karnataka
in such high-end sunrise sectors have come to the notice of this Ministry. They have started
various training courses after a competitive exercise and deliberate effort to have minimal
possible costs. This Ministry would like similar or better initiatives by other Sates also.
5. The focus of Special Central Assistance is to bring in economic development through
occupational diversification and professalization in a changing market situation. The
development approach of the Governments therefore needs to change with the changing course

335
of Indian economy. The States need to identify the activities according to their felt needs and
support them through Special Central Assistance if they fit into he broad mandate of the scheme.
6. With these amplifications, the State Governments/UT Administrations are requested to
open up more avenues for the SC youth to prove their potential and excellence in high-end
income generating activities.
7. These guidelines will come into effect/introduced from 2007-08
8. This issues with the approval of competent authority.
Yours sincerely,
Sd/-
(Arbind Prasad)
Joint Secretary to
Government of India

336
Annexure – X(V)
No.11014/8/2003-SCD-II
Government of India
Ministry of Social Justice & Empowerment
To
The Secretaries in charge of SC Welfare,
All States/UTs.Shastri Bhavan, New Delhi
Dated 24.8.07
Subject: Guidelines for utilization of Special Central Assistance to
Scheduled Caste Sub Plan.
Sir,
The scheme of Special Central Assistance to Scheduled Caste Sub Plan
was started in 1980 to give a thrust to the development programmes for the Scheduled Castes
(SCs), with particular reference to their occupational pattern and to the need for increasing the
productivity of and income from their limited resources.
2 . In view of the varying needs and availability of opportunities in different
States of the country and even with different regions of the same State, State Govts have been
given flexibility in choice of scheme to be implemented out of SCA. However, this Ministry has
been issuing enabling guidelines from time to time to focus directions of the State Govts towards
newer avenues and to address some of the chronic disabilities suffered by SCs, especially with
respect to lack of access to essential services.
3. Atrocities on SCs is an area of concern. Lack of basic infrastructural
facilities is one of the important factors responsible for incidents of atrocities in the remote and
inaccessible villages/habitations of Scheduled Castes. Further, awareness among SCs about the
legal provisions to check the atrocities is limited by the lack of education.
4. In order to address the concerns stated above, special steps are required to
be taken. As a first step all the State Govts. should identify atrocity prone areas. For
development of these areas, State Govt are requested to undertake following activities out of the
SCA released by the Ministry:
Guidelines for utilizing upto 10% of SCA released in a year on infrastructure
development in SC dominated Blocks/villages were issued vide this Ministry's letters
dated 29.7.93 and 7.9.98. Priority should be given to identify atrocity prone areas in
implementation of infrastructure development schemes.
Setting up of primary schools for Scheduled Castes; and
Coverage of beneficiaries from these identified Districts on priority basis under the
income-generating beneficiary oriented schemes.

337
5. Since SCA is provided as an additive, the funds earmarked for SCSP under
different sectors of the State Plan should be effectively mobilized and pooled together for
deriving optimum outcome.
6. These guidelines will come into effect immediately.
Yours Sincerely,
Sd/-
(Dr. Arbind Prasad)
Joint Secretary to Government of
India

338
Annexure – X(V)
No.11014/22/2012-SCD-II
Government of India,
Department of Social Justice & Empowerment
Shastri Bhavan, New Delhi - 110 15
Dated 2nd
May, 2013
To
Th Principal Secretary/Secretary,
Department of Social Welfare/Scheduled Castes Development,
27 State Govt./UT Administration
Subject:- Guidelines for utilisation of funds in Skill Development Programmes under
the Central Sector Scheme of Special Central Assistance(SCA) to Scheduled
Caste Sub Plan(SCSP). Sir,
Government of India in the Ministry of Social Justice and Empowerment is
implementing a "Central Sector Scheme of Special Central Assistance(SCA) to Scheduled
Castes Sub Plan(SCSP)" since 1980 for the development of Scheduled Castes who form the
major chunk of the country's population living below the poverty line. The main objective of this
scheme is to give a thrust to family oriented schemes of economic development of Scheduled
Castes living below the poverty line. The important provisions of the scheme, inter alia, include
the following: Utilisation of 15% and 5% of total SCA released in a year to be used for the
economic development of SC women and disabled persons among SCs respectively;Upto 10%
of the total SCA released in a year can be utilized for infrastructure development programmes in
villages having more than 50% SC population; Upto 3% of SCA released in a year can be
utilised for monitoring and evaluation of the scheme.
2. This Ministry, vide letter No.11014/8/2003-SCD-II,dated 29.03.2007(copy
enclosed), had also issued guidelines for utilisation of funds for economic development of the
SC target group by laying emphasis on training and skill development, as well as working out
forward linkages for employment and occupational diversification in the primary, secondary and
tertiary sectors. However, so far, there was no earmarking of funds under the Scheme,
specifically for skill development programmes.
3. The State Governments/UT Administrations are, therefore, requested that at least
10% of the funds of SCA to SCSP should be utilised for skill development programmes within
existing framework of the Scheme w.e.f the current financial year 2013-14, in order to enhance
the employability of the target group.
4. This issues with approval of Competent Authority.
Yours faithfully,
Sd/-
(Sanjeev Kumar)
Joint Secretary to Government of India
Encl: As above

339
Annexure – X(VI)
No.11014/22/2012-SCD-II
Government of India
Department of Social Justice and Empowerment
Shastri Bhavan,
New Delhi - 110 115
Dated 6th
June, 2013
To
The Principal Secretary/Secretary,
Department of Social Welfare/Scheduled Castes Development,
27 State Government/UT Administrations
Sir/Madam,
In continuation of this Ministry's letter No. 11014/22/2012-SCD-II dated
2.05.2013(copy enclosed), the undersigned is directed to state that after completion of the
training programmes for skill development of SC beneficiaries, to be implemented with the
support of Special Central Assistance to Scheduled Castes Sub Plan funds, placement of, at least,
70% of the trained candidates either in waged employment or in self employment may please be
ensured.
Yours faithfully,
Sd/-
Maulishree Pande
Tele: 011-23387539
Encl: As above