I PROFILE OF SCHEDULED TRIBES IN TAMILNADU - ::Tribal ...
82
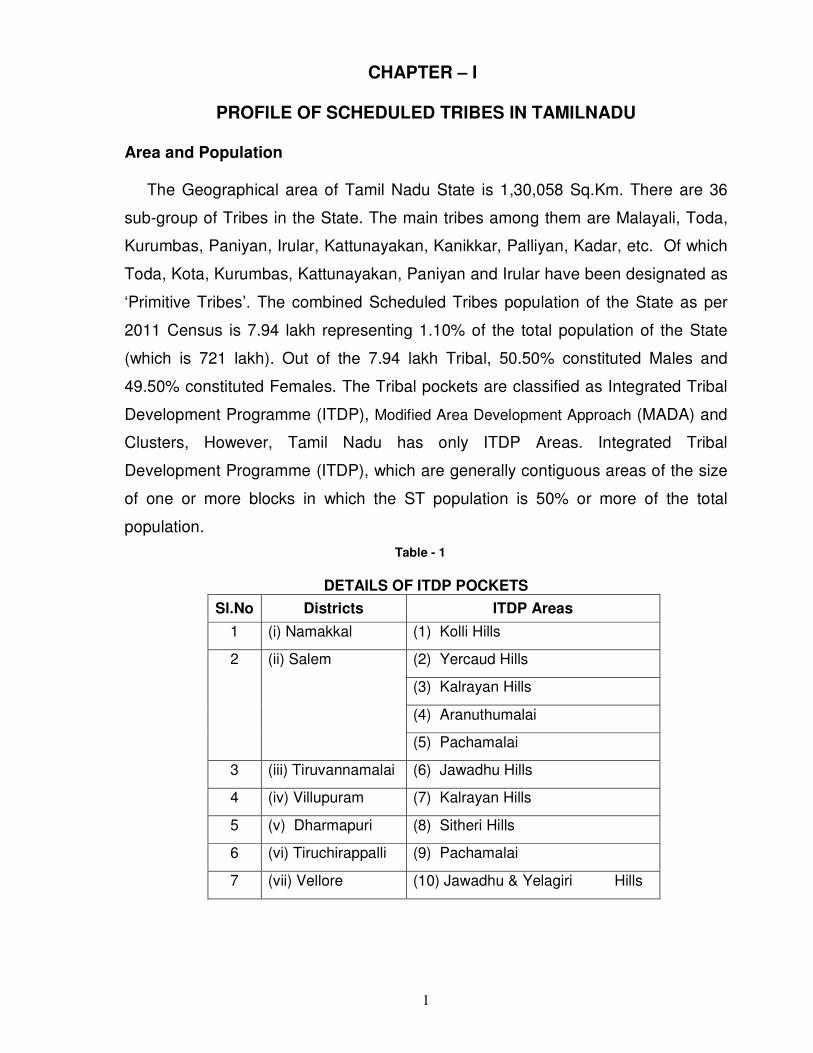
1 CHAPTER – I PROFILE OF SCHEDULED TRIBES IN TAMILNADU Area and Population The Geographical area of Tamil Nadu State is 1,30,058 Sq.Km. There are 36 sub-group of Tribes in the State. The main tribes among them are Malayali, Toda, Kurumbas, Paniyan, Irular, Kattunayakan, Kanikkar, Palliyan, Kadar, etc. Of which Toda, Kota, Kurumbas, Kattunayakan, Paniyan and Irular have been designated as ‘Primitive Tribes’. The combined Scheduled Tribes population of the State as per 2011 Census is 7.94 lakh representing 1.10% of the total population of the State (which is 721 lakh). Out of the 7.94 lakh Tribal, 50.50% constituted Males and 49.50% constituted Females. The Tribal pockets are classified as Integrated Tribal Development Programme (ITDP), Modified Area Development Approach (MADA) and Clusters, However, Tamil Nadu has only ITDP Areas. Integrated Tribal Development Programme (ITDP), which are generally contiguous areas of the size of one or more blocks in which the ST population is 50% or more of the total population. Table - 1 DETAILS OF ITDP POCKETS Sl.No Districts ITDP Areas 1 (i) Namakkal (1) Kolli Hills 2 (ii) Salem (2) Yercaud Hills (3) Kalrayan Hills (4) Aranuthumalai (5) Pachamalai 3 (iii) Tiruvannamalai (6) Jawadhu Hills 4 (iv) Villupuram (7) Kalrayan Hills 5 (v) Dharmapuri (8) Sitheri Hills 6 (vi) Tiruchirappalli (9) Pachamalai 7 (vii) Vellore (10) Jawadhu & Yelagiri Hills
-
Upload
khangminh22 -
Category
Documents
-
view
0 -
download
0
Transcript of I PROFILE OF SCHEDULED TRIBES IN TAMILNADU - ::Tribal ...
1
CHAPTER – I
PROFILE OF SCHEDULED TRIBES IN TAMILNADU
Area and Population
The Geographical area of Tamil Nadu State is 1,30,058 Sq.Km. There are 36
sub-group of Tribes in the State. The main tribes among them are Malayali, Toda,
Kurumbas, Paniyan, Irular, Kattunayakan, Kanikkar, Palliyan, Kadar, etc. Of which
Toda, Kota, Kurumbas, Kattunayakan, Paniyan and Irular have been designated as
‘Primitive Tribes’. The combined Scheduled Tribes population of the State as per
2011 Census is 7.94 lakh representing 1.10% of the total population of the State
(which is 721 lakh). Out of the 7.94 lakh Tribal, 50.50% constituted Males and
49.50% constituted Females. The Tribal pockets are classified as Integrated Tribal
Development Programme (ITDP), Modified Area Development Approach (MADA) and
Clusters, However, Tamil Nadu has only ITDP Areas. Integrated Tribal
Development Programme (ITDP), which are generally contiguous areas of the size
of one or more blocks in which the ST population is 50% or more of the total
population.
Table - 1
DETAILS OF ITDP POCKETS
Sl.No Districts ITDP Areas
1 (i) Namakkal (1) Kolli Hills
2 (ii) Salem (2) Yercaud Hills
(3) Kalrayan Hills
(4) Aranuthumalai
(5) Pachamalai
3 (iii) Tiruvannamalai (6) Jawadhu Hills
4 (iv) Villupuram (7) Kalrayan Hills
5 (v) Dharmapuri (8) Sitheri Hills
6 (vi) Tiruchirappalli (9) Pachamalai
7 (vii) Vellore (10) Jawadhu & Yelagiri Hills
2
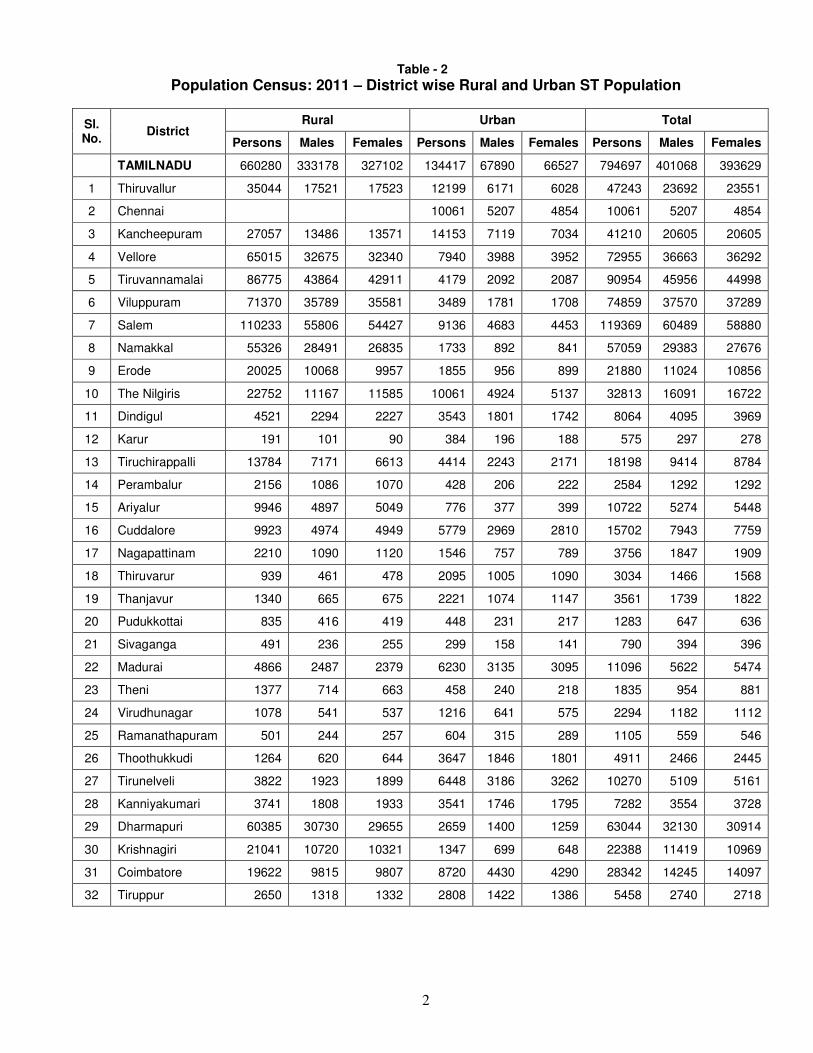
Table - 2 Population Census: 2011 – District wise Rural and Urban ST Population
Sl. No.
District Rural Urban Total
Persons Males Females Persons Males Females Persons Males Females
TAMILNADU 660280 333178 327102 134417 67890 66527 794697 401068 393629
1 Thiruvallur 35044 17521 17523 12199 6171 6028 47243 23692 23551
2 Chennai 10061 5207 4854 10061 5207 4854
3 Kancheepuram 27057 13486 13571 14153 7119 7034 41210 20605 20605
4 Vellore 65015 32675 32340 7940 3988 3952 72955 36663 36292
5 Tiruvannamalai 86775 43864 42911 4179 2092 2087 90954 45956 44998
6 Viluppuram 71370 35789 35581 3489 1781 1708 74859 37570 37289
7 Salem 110233 55806 54427 9136 4683 4453 119369 60489 58880
8 Namakkal 55326 28491 26835 1733 892 841 57059 29383 27676
9 Erode 20025 10068 9957 1855 956 899 21880 11024 10856
10 The Nilgiris 22752 11167 11585 10061 4924 5137 32813 16091 16722
11 Dindigul 4521 2294 2227 3543 1801 1742 8064 4095 3969
12 Karur 191 101 90 384 196 188 575 297 278
13 Tiruchirappalli 13784 7171 6613 4414 2243 2171 18198 9414 8784
14 Perambalur 2156 1086 1070 428 206 222 2584 1292 1292
15 Ariyalur 9946 4897 5049 776 377 399 10722 5274 5448
16 Cuddalore 9923 4974 4949 5779 2969 2810 15702 7943 7759
17 Nagapattinam 2210 1090 1120 1546 757 789 3756 1847 1909
18 Thiruvarur 939 461 478 2095 1005 1090 3034 1466 1568
19 Thanjavur 1340 665 675 2221 1074 1147 3561 1739 1822
20 Pudukkottai 835 416 419 448 231 217 1283 647 636
21 Sivaganga 491 236 255 299 158 141 790 394 396
22 Madurai 4866 2487 2379 6230 3135 3095 11096 5622 5474
23 Theni 1377 714 663 458 240 218 1835 954 881
24 Virudhunagar 1078 541 537 1216 641 575 2294 1182 1112
25 Ramanathapuram 501 244 257 604 315 289 1105 559 546
26 Thoothukkudi 1264 620 644 3647 1846 1801 4911 2466 2445
27 Tirunelveli 3822 1923 1899 6448 3186 3262 10270 5109 5161
28 Kanniyakumari 3741 1808 1933 3541 1746 1795 7282 3554 3728
29 Dharmapuri 60385 30730 29655 2659 1400 1259 63044 32130 30914
30 Krishnagiri 21041 10720 10321 1347 699 648 22388 11419 10969
31 Coimbatore 19622 9815 9807 8720 4430 4290 28342 14245 14097
32 Tiruppur 2650 1318 1332 2808 1422 1386 5458 2740 2718
3
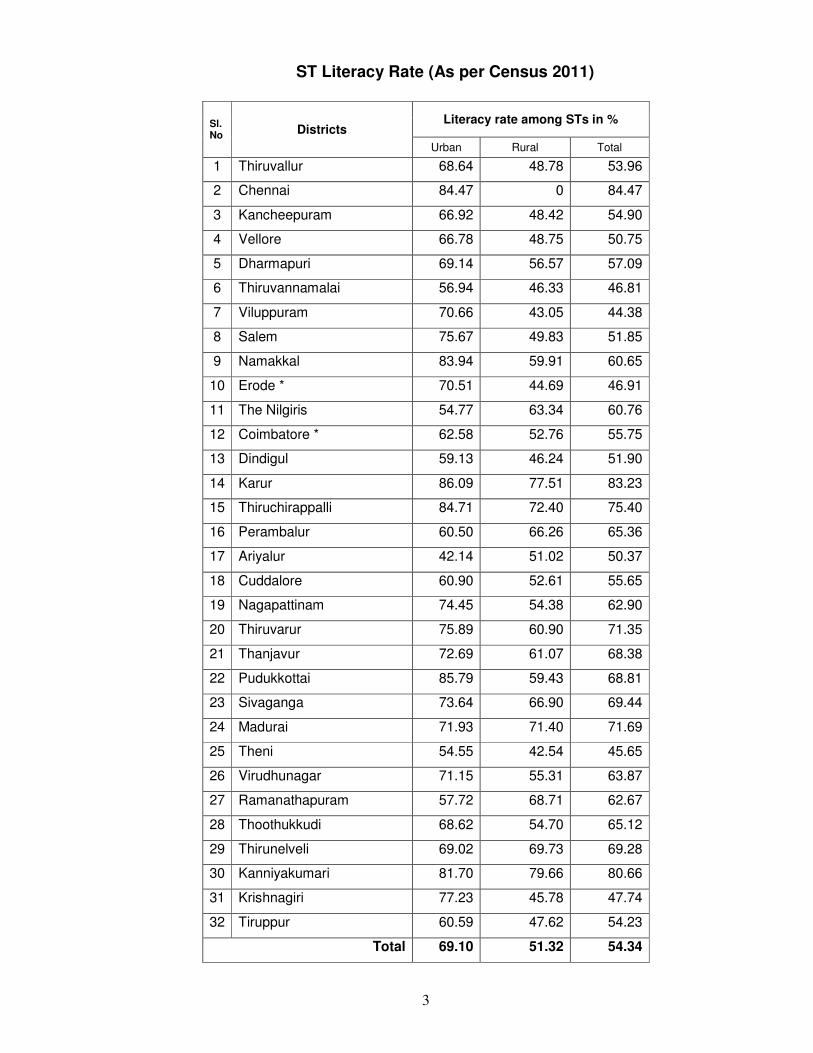
ST Literacy Rate (As per Census 2011)
Sl. No Districts
Literacy rate among STs in %
Urban Rural Total
1 Thiruvallur 68.64 48.78 53.96
2 Chennai 84.47 0 84.47
3 Kancheepuram 66.92 48.42 54.90
4 Vellore 66.78 48.75 50.75
5 Dharmapuri 69.14 56.57 57.09
6 Thiruvannamalai 56.94 46.33 46.81
7 Viluppuram 70.66 43.05 44.38
8 Salem 75.67 49.83 51.85
9 Namakkal 83.94 59.91 60.65
10 Erode * 70.51 44.69 46.91
11 The Nilgiris 54.77 63.34 60.76
12 Coimbatore * 62.58 52.76 55.75
13 Dindigul 59.13 46.24 51.90
14 Karur 86.09 77.51 83.23
15 Thiruchirappalli 84.71 72.40 75.40
16 Perambalur 60.50 66.26 65.36
17 Ariyalur 42.14 51.02 50.37
18 Cuddalore 60.90 52.61 55.65
19 Nagapattinam 74.45 54.38 62.90
20 Thiruvarur 75.89 60.90 71.35
21 Thanjavur 72.69 61.07 68.38
22 Pudukkottai 85.79 59.43 68.81
23 Sivaganga 73.64 66.90 69.44
24 Madurai 71.93 71.40 71.69
25 Theni 54.55 42.54 45.65
26 Virudhunagar 71.15 55.31 63.87
27 Ramanathapuram 57.72 68.71 62.67
28 Thoothukkudi 68.62 54.70 65.12
29 Thirunelveli 69.02 69.73 69.28
30 Kanniyakumari 81.70 79.66 80.66
31 Krishnagiri 77.23 45.78 47.74
32 Tiruppur 60.59 47.62 54.23
Total 69.10 51.32 54.34
4
CHAPTER – II
APPROACH AND STRATEGY FOR THE TSP 2018-19
1. Broad Objectives of the Tribal Sub Plan (TSP)
The Tribal Sub Plan is a part of the State Annual Plan. The basic objective of
this Tribal Sub Plan is to ensure flow of funds from the State Annual Plan in proportion
to Scheduled Tribes population in the State. It was evolved during the year 1976-77,
which now stands at 1.10%. As a result of the proactive policy interventions on the part
of the Government of India and the State Government, the socio-economic condition of
the Scheduled Tribes population continues to improve, but it is still lagging behind in
many aspects as compared to the progress of the general population.
Secondly, as per the guidelines of the Union Planning Commission, it is
expected that all Sectoral Departments need to create productive assets in favour of
Scheduled Tribes population in their localities/villages and the schemes proposed
should be directly relevant to the development of Scheduled Tribes.
(i) As per the guidelines of the Union Planning Commission, New Delhi, the
State Planning, Development & Special Initiatives (SP) Department in its G.O. Ms.
No.134, dated 9.10.2006 has designated the Adi Dravidar & Tribal Welfare
Department as the 'Nodal department' for formulation and implementation of SCSP
and TSP.
� The details of the schemes to be implemented under SCSP and TSP shall be
finalized by the Heads of Departments concerned in consultation with the Nodal
Department wherever such consultation is deemed necessary.
� If consultation is necessary, the Secretary to Government, Adi Dravidar & Tribal
Welfare or his representative may convene and hold discussions with any
Heads of Departments who is formulating and implementing schemes under
which funds are to be debited to Minor Heads- Code 789 for SCSP and 796 for
TSP.
� The Nodal Department shall give its views and recommendations within the
available budget provisions under the SCSP and TSP Minor Heads 789 / 796
and within expected or plan budget provisions under these Minor Heads.
5
� The Nodal Department shall monitor the implementation of schemes under
SCSP and TSP periodically.
� Whenever the Heads of Department concerned not accepting the views and
recommendations of the Nodal Department i.e., Adi Dravidar and Tribal Welfare
Department, it shall be referred to Government in the Administrative Department
concerned. Such cases shall be dealt with, in Government in accordance with
the Tamilnadu Government Business Rules, in consultation with the Adi
Dravidar and Tribal Welfare Department.
(ii) As per G.O(Ms)No. 59, Adi Dravidar & Tribal Welfare Department dated
01.06.07, the Director of Tribal Welfare has been designated as Monitoring Officer to
monitor and review the tribal welfare schemes in all districts.
(iii) The State Government have constituted a State Level Monitoring Committee
(SLMC) under the Chairmanship of the Chief Secretary to Government to review the
performance of all the concerned Sectoral Departments implementing schemes under SCSP
and TSP once in three months vide G.O (Ms.) No.122, Adi Dravidar &Tribal Welfare (MEC-
1) Department dated 6.10.2010.
2. General awareness about Tribal Sub Plan (TSP)
As directed by the Union Planning Commission, all the Sectoral Departments of the
State need to take initiative to generate awareness among the public about the schemes to be
implemented for the development of Scheduled Tribes through publicity methods like
electronic and print media. While doing so, even the officials of the implementing agencies /
departments need to be sensitized about the aims and objectives of this plan and to engage
various methods at the field level for timely utilization of funds and constant monitoring at the
District / State level to ensure achievement of predicted goals under this Sub Plan.
3. Existing Guidelines of Union Planning Commission for formulation of TSP
i) Earmarking of funds under SCSP/TSP from the Central Ministry/Department Plan
outlay at least in the proportion of SC and ST population to the total population of
the Country / State. Non-earmarking of funds under SCSP and TSP may result in
non-approval of Plans of the Central Ministries/Departments.
ii) Scheduled Castes Sub Plan and Tribal Sub Plan funds should be non-divertible.
iii) A dedicated unit may be constituted in every Central Ministry/Department for the
welfare and development of SCs and STs as nodal unit for formulation and
implementation of SCSP and TSP.
6
iv) The nodal dedicated unit should be responsible for ensuring that the funds will
be allocated to the sectoral units in the departments to implement schemes directly
relevant to SC and ST development.
v) Placing the funds earmarked for SCSP/TSP under separate budget head/sub-head
for each Central Ministry / Department for implementing SCSP and TSP. In this
connection it may be noted that the list of Major and Minor Heads of Account of
Union and States as issued by the Comptroller General of Accounts provides that
Tribal Sub Plan (code 796) and Scheduled Caste Sub Plan (789) may be opened
as Minor Head below the functional Major Head/Sub Major Head wherever
necessary.
3(a). The Union Planning Commission has recently issued revised Guidelines for formulation of TSP. Some of the important Guidelines are listed below Objective The objective of the TSP is to bridge the gap between ST population and others by
accelerating the development of STs by securing to them.
i) Human resource development by enchanting their access to education and
health services.
ii) Enhanced quality of life by providing basic amenities in tribal areas/localities
including housing.
iii) Substantial reduction in poverty and unemployment, creation of productive
assets income generating opportunities.
iv) Enhanced capacity to avail opportunities gain rights and entitlements and
improved facilities at par with other States, and
v) Protection against exploitation.
Selection of Schemes / Programmes The Tribal Sub Plan should include only such existing schemes (including additional
components to existing schemes) of new proposed schemes, which fulfill following
criterion.
a. Provide clearly defined direct and quantifiable benefits to ST individuals of
Scheduled Tribe households of Tribal areas. The benefit provided to the STs
alongwith other people at a particular time may not be treated as direct benefit
under TSP
b. Create the potential to accelerate the pace of the development of STs and to bridge
the gaps in social-economic development indicators between STs and other
sections of the society.
7
c. The focus of such schemes should be on education, income generation,
improving access to irrigated land, entrepreneurship, employment and skill
development projects and access to basic amenities.
d. Have in-built mechanisms/surveillance system to endure utilization of funds meant
for the intended purpose
Earmarking / Allocation of funds Nodal Departments shall ensure that concerned departments are providing for STs in
their budget and plans funds and guidelines to the same extent as is available to other
populations, in proportion to their requirement
Approval of Planning Commission may not be accorded to State Plans if funds are nor
earmarked under TSP, in proportion to the population of STs in State
State governments should ensure that TSP funds are placed under the control of the
Nodal Department.
Funds shall be earmarked/allocated to the TSP subject to the following conditions.
i) The expenditure under TSP is meant only for filling the development deficit, as a
financial support, over and above the normal provisions which should be
available to STs. like others, in various schemes including in flagship
programmes.
ii) The funds under TSP are earmarked from the total plan outlays (not excluding
the investments under externally aided projects –EAPs and any other scheme),
not less than the population proportion of ST population.
iii) The funds should be earmarked will in advance, at least six months prior to
commencement of the financial year. The size of the TSP fund thus earmarked
shall be communicated to all departments for commencing process of
preparation of TSP of each department.
iv) There shall not be any notional allocations, that don’t have flows/schemes
directly benefiting STs.
v) Special attention shall be paid to allocate more funds to STs residing in the
Scheduled Areas.
8
vi) Due to physical remoteness and difficult terrain of tribal habitations,
financial norms may need to be higher in tribal areas as compared to general
areas. This should be ensured so that service standards in St areas are not
compromised.
vii) Every State/U shall undertake skill mapping and allocate funds under TSP for
skill development of tribal youth and set targets in the light of the monitorable
targets under poverty and employment in the 12th Five Year Plan. The Target
under 12th Five Year Plan is to generate 50 million new work opportunities
through skill development.
viii) The synergy of inter sectoral programmes and an integrated
approach/convergence with other schemes/programmes are ensured for
efficient utilization of resources.
ix) The departments, in consultation with Nodel department, shall prepare the TSP
to promote equity in development among various social groups
within STs.
x) To ensure non-divertability, funds under TSP shall be earmarked under a
separate Minor Head below the functional major Head / Sub Major heads .
xi) The TSP funds, under Minor Head shall comprise sector wise and scheme wise
allocations and actual expenditures incurred.
xii) To ensure effective and optimum use of resources, the re-appropriation of TSP
funds from one department to another Department should be facilitated after
mid year review. Appropriation of TSP funds from one Department to another
Department shall be with the approval of the Nodal Department.
xiii) The State government may device a mechanism for speedy transfer of funds
directly to field formations under intimation to District Head quarters, instead of
being routed through District Head quarters, by enforcing on them a system of
accountability for effective utilization of the funds.
Establishing standards for service Delivery
For the TSP succeed in its avowed objective of filling critical gaps in the development
of STs within a defined time frame, it is necessary that minimum acceptable standards of
service delivery in each are established and enforced across sectors. across geographies. at
present the rigor and quality of existing service delivery varies greatly from State to State and
also within States, between districts/ITDPs etc. The Nodal department must ensure that all
line departments establish these standards of service delivery and strictly monitor their
enforcement. The Nodal department in concert with the concerned line department, must
9
ensure that the minimum standard of service delivery is maintained at all levels for
activities undertaken through TSP. For example, in case of education at elementary level the
minimum standards as stipulated under the RTE act should be the benchmark. For
Secondary level and above, the State specific norms are to be followed. The efforts should
be made to improve upon the existing standards through innovative exemplar practices. The
standards are to be maintained in infrastructure development, teacher training, meals, support
to students and support to teachers.
Similarly for health sector, it must be ensured that the services being delivered through
the TSP are meeting standard requirement and not inferior to similar services being provided
to other categories. It is also emphasized that the children in Ashram Schools and Hostels
are provided with adequately diverse diet rich in essential nutrients with the appropriate
frequency to ensure their optimal physical growth and cognitive development. A periodic
health check up of these children in conducted as per the guidelines of RBSK. NRHM.
A robust monitoring system to monitor the standards of service delivery if therefore, a
non-negotiable requirement. States/UTs must put in place a system for regular monitoring of
standards of service delivery.
Formulation of TSP
The State, after estimating the gaps in the development of ST, will prioritize their
development needs through a consultative process, and shall formulate the TSP schemes
and prepare the TSP within the State Annual Plan and Five Year Plan.
In the formulation of TSP the States/UTs shall proceed as follows;
I. TSP should be formulated at the District level by the District planning and
Monitoring Committee (DPMC)
II. The DPMC must reflect on the actual demand for the schemes/programmes that
are to benefit STs, giving to equity aspect of their local aspirations and socio
economic backwardness.
III. The annual plan must be approved by the District Planning Committee so that it
has the approval of the highest PRI.
IV. In case of area oriented schemes, a Block level approach should be adopted so
as to facilities the inclusion of ST habitation which remain uncovered under
District level approach.
V. The TSP at ITDP/ITDA District level should form the basis for the State TSP
formulation and implementation. the requirement of funds across DPMC

10
proposals put together would generate demand for TSP requirement at the
State level.
VI. In the States having scheduled Areas, the Gram Sabhas should undertake an
exercise to indentify the areas needing priority attention in villages. These
priority activities may from TSP requirement at the State level.
VII. To prepare a realistic budget, matching sectoral priorities and actual budgetary
flow, the Nodal department should consult all related Departments to:
a. Identify priority areas under TSP
b. examine various ongoing schemes and their budgetary allocations and
c. suggest new schemes
viii. The approval of the Nodal Department is mandatory for introduction of
new schemes.
ix. Service delivery should be standardized and adhered to in time bound
manner.
x. To facilitate the synchronization of the gap filling role of SCA to TSP, gaps
still remaining under the TSP financing pattern must be highlighted for each
ITDPs/ITDAs/MADA/Cluster/State level at the time of TSP financial allocations.
Appraisal and Approval.
The plans prepared by the various departments of States/UTs should have a stringent
appraisal process and only those plans/programmes that pass this appraisal should be
included in the annual TSP of the State/UT. The following steps shall be adopted in the
appraisal and approval process.
1. Schemes/programmes submitted by line departments will be scrutinized by the
Nodal department to ensure that i) Only those scheme/programmes, which fulfill
the criteria of securing direct benefits to ST individuals. households and
localities and are aligned to the strategic objectives of TSP are
processed/cleared: ii) service delivery standards under all levels of delivery.
2. The Nodal department will submit such proposals, with their evaluation, to the
executive committee for appraisal.
3. The executive Committee shall undertake appraisal of the perspective document
and the TSP schemes submitted by the departments for inclusion in annual
TSP. Appraisal shall involve a critical analysis of the following.
a) Extent of gaps and extent to which the proposed schemes will bridge it.
b) are the benefits quantifiable?
11
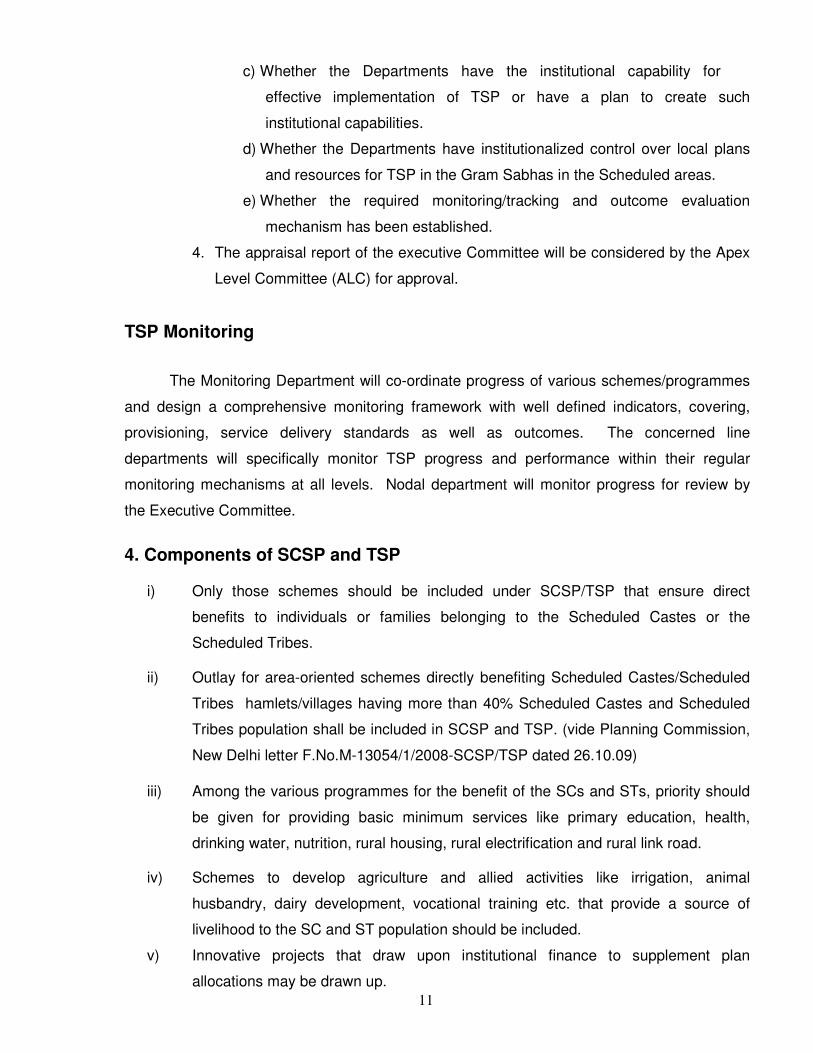
c) Whether the Departments have the institutional capability for
effective implementation of TSP or have a plan to create such
institutional capabilities.
d) Whether the Departments have institutionalized control over local plans
and resources for TSP in the Gram Sabhas in the Scheduled areas.
e) Whether the required monitoring/tracking and outcome evaluation
mechanism has been established.
4. The appraisal report of the executive Committee will be considered by the Apex
Level Committee (ALC) for approval.
TSP Monitoring
The Monitoring Department will co-ordinate progress of various schemes/programmes
and design a comprehensive monitoring framework with well defined indicators, covering,
provisioning, service delivery standards as well as outcomes. The concerned line
departments will specifically monitor TSP progress and performance within their regular
monitoring mechanisms at all levels. Nodal department will monitor progress for review by
the Executive Committee.
4. Components of SCSP and TSP i) Only those schemes should be included under SCSP/TSP that ensure direct
benefits to individuals or families belonging to the Scheduled Castes or the
Scheduled Tribes.
ii) Outlay for area-oriented schemes directly benefiting Scheduled Castes/Scheduled
Tribes hamlets/villages having more than 40% Scheduled Castes and Scheduled
Tribes population shall be included in SCSP and TSP. (vide Planning Commission,
New Delhi letter F.No.M-13054/1/2008-SCSP/TSP dated 26.10.09)
iii) Among the various programmes for the benefit of the SCs and STs, priority should
be given for providing basic minimum services like primary education, health,
drinking water, nutrition, rural housing, rural electrification and rural link road.
iv) Schemes to develop agriculture and allied activities like irrigation, animal
husbandry, dairy development, vocational training etc. that provide a source of
livelihood to the SC and ST population should be included.
v) Innovative projects that draw upon institutional finance to supplement plan
allocations may be drawn up.
12
5. Comprehensive Tribal Development Programme
The State Government has allocated a sum of Rs.25 crore for the Comprehensive
Tribal Development for the year 2019-20. Through this programme Land development
activities, improvement of katcha houses, road work improvement of GTR schools, provision
of drinking water facilities, economic development schemes and training skills are
implemented through TAHDCO for Tribal Development.
13
CHAPTER – III
FLOW OF FUNDS FOR TRIBAL DEVELOPMENTS
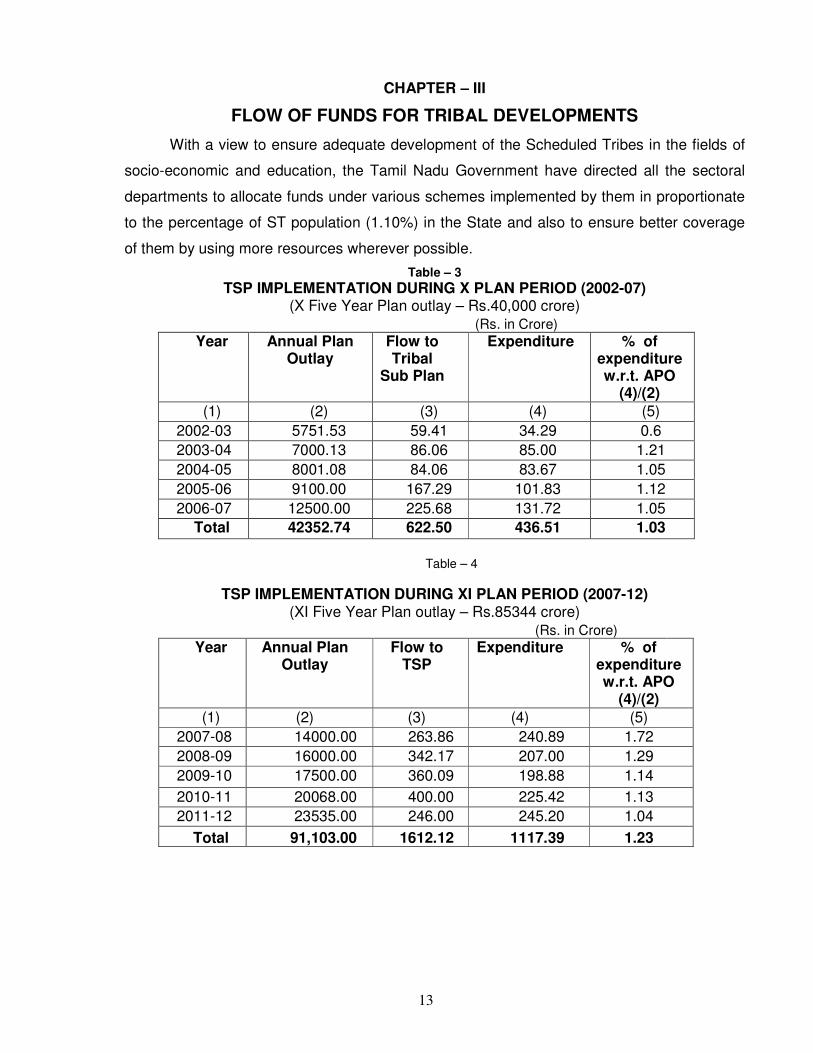
With a view to ensure adequate development of the Scheduled Tribes in the fields of
socio-economic and education, the Tamil Nadu Government have directed all the sectoral
departments to allocate funds under various schemes implemented by them in proportionate
to the percentage of ST population (1.10%) in the State and also to ensure better coverage
of them by using more resources wherever possible.
Table – 3 TSP IMPLEMENTATION DURING X PLAN PERIOD (2002-07)
(X Five Year Plan outlay – Rs.40,000 crore)
(Rs. in Crore)
Year Annual Plan Outlay
Flow to Tribal
Sub Plan
Expenditure % of expenditure w.r.t. APO
(4)/(2)
(1) (2) (3) (4) (5)
2002-03 5751.53 59.41 34.29 0.6
2003-04 7000.13 86.06 85.00 1.21
2004-05 8001.08 84.06 83.67 1.05
2005-06 9100.00 167.29 101.83 1.12
2006-07 12500.00 225.68 131.72 1.05
Total 42352.74 622.50 436.51 1.03
Table – 4
TSP IMPLEMENTATION DURING XI PLAN PERIOD (2007-12) (XI Five Year Plan outlay – Rs.85344 crore)
(Rs. in Crore)
Year Annual Plan Outlay
Flow to TSP
Expenditure % of expenditure w.r.t. APO
(4)/(2)
(1) (2) (3) (4) (5)
2007-08 14000.00 263.86 240.89 1.72
2008-09 16000.00 342.17 207.00 1.29
2009-10 17500.00 360.09 198.88 1.14
2010-11 20068.00 400.00 225.42 1.13
2011-12 23535.00 246.00 245.20 1.04
Total 91,103.00 1612.12 1117.39 1.23
14
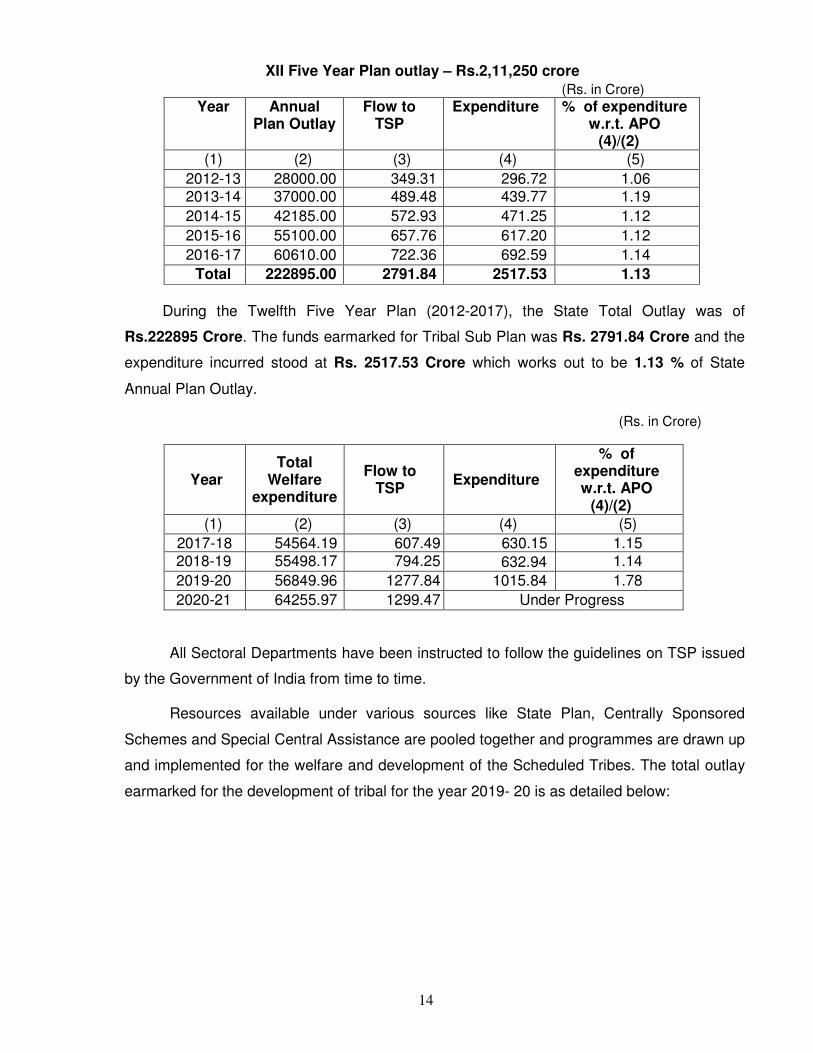
XII Five Year Plan outlay – Rs.2,11,250 crore
(Rs. in Crore)
Year Annual Plan Outlay
Flow to TSP
Expenditure % of expenditure w.r.t. APO
(4)/(2)
(1) (2) (3) (4) (5)
2012-13 28000.00 349.31 296.72 1.06 2013-14 37000.00 489.48 439.77 1.19
2014-15 42185.00 572.93 471.25 1.12
2015-16 55100.00 657.76 617.20 1.12
2016-17 60610.00 722.36 692.59 1.14
Total 222895.00 2791.84 2517.53 1.13
During the Twelfth Five Year Plan (2012-2017), the State Total Outlay was of
Rs.222895 Crore. The funds earmarked for Tribal Sub Plan was Rs. 2791.84 Crore and the
expenditure incurred stood at Rs. 2517.53 Crore which works out to be 1.13 % of State
Annual Plan Outlay.
(Rs. in Crore)
Year Total
Welfare expenditure
Flow to TSP
Expenditure
% of expenditure w.r.t. APO
(4)/(2)
(1) (2) (3) (4) (5)
2017-18 54564.19 607.49 630.15 1.15 2018-19 55498.17 794.25 632.94 1.14
2019-20 56849.96 1277.84 1015.84 1.78
2020-21 64255.97 1299.47 Under Progress
All Sectoral Departments have been instructed to follow the guidelines on TSP issued
by the Government of India from time to time.
Resources available under various sources like State Plan, Centrally Sponsored
Schemes and Special Central Assistance are pooled together and programmes are drawn up
and implemented for the welfare and development of the Scheduled Tribes. The total outlay
earmarked for the development of tribal for the year 2019- 20 is as detailed below:
15
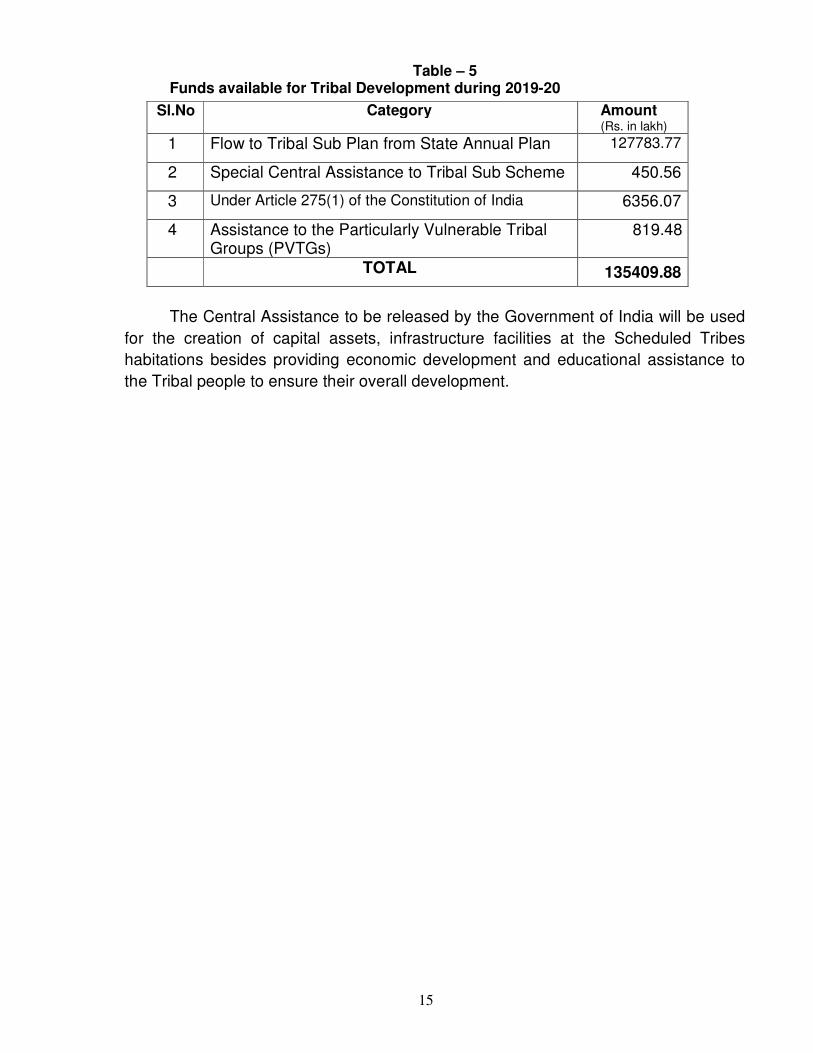
Table – 5 Funds available for Tribal Development during 2019-20
Sl.No Category Amount (Rs. in lakh)
1 Flow to Tribal Sub Plan from State Annual Plan 127783.77
2 Special Central Assistance to Tribal Sub Scheme 450.56
3 Under Article 275(1) of the Constitution of India 6356.07
4 Assistance to the Particularly Vulnerable Tribal Groups (PVTGs)
819.48
TOTAL 135409.88
The Central Assistance to be released by the Government of India will be used
for the creation of capital assets, infrastructure facilities at the Scheduled Tribes
habitations besides providing economic development and educational assistance to
the Tribal people to ensure their overall development.
16
Chapter IV
CENTRAL SECTOR SCHEMES
Every year, Government of India is releasing financial assistance for the development
of STs under the following schemes:-
i) Special Central Assistance to Tribal Sub Scheme (SCA to TSS)
ii) Grants under 1st proviso to Article 275 of the Constitution of India iii) Grants under Development of Particularly Vulnerable Tribal Groups(PVTG) iv) Pre Matric & Post Matric Scholarship
i) Special Central Assistance to Tribal Sub Scheme (SCA to TSS)
a) SCA to TSS is provided by the Ministry of Tribal Affairs to the State Governments
as an additive to the State Plan. It is basically meant for family oriented income generating
activity in sectors like agriculture, horticulture, minor irrigation, soil conservation, animal
husbandry, forest, village and small industries etc.,
The ultimate objective of extending SCA to TSS is to boost the demand based income
generating programmes and thus raise the economic and social status of tribal people. Out
of total SCA allotment, 60% of the SCA funds are expected to be used for economic
development of poor Scheduled Tribes by implementing income-generating schemes with a
special focus on the most vulnerable sections amongst the Scheduled Tribes and 30% of the
Special Central Assistance funds can be used for infrastructure development in Scheduled
Tribe habitations and the remaining 10% can be used for imparting Skill Development
Training to the ST Youths.
b) Incentive under SCA to TSP
The part IV (iv) of the Special Central Assistance to Tribal Sub Plan Guidelines issued
by the Government of India envisages 10% of the total allocation of Special Central
Assistance to Tribal Sub Plan as incentive to the States based upon a system of weighted
Criteria, as listed below:-
• Adoption of the Tribal Sub Plan approach in letter and spirit by ensuring that the entire
Tribal Sub Plan funds at least in equal proportion to the population of tribal in the State
are placed in one Budget Head under the administrative control of the Tribal
Development Department of the State Government for more integrated and focused
planning and implementation of projects / schemes;
17
• Thereafter, at least on an average of 75% of the approved Tribal Sub Plan funds
are actually utilized/released to the implementing agencies in the previous three
financial years through the budget head of the Tribal Development Department of the
State; and
• Funds awarded, as incentives to the State, should be utilized only for employment and
income generating activities benefiting the tribal.
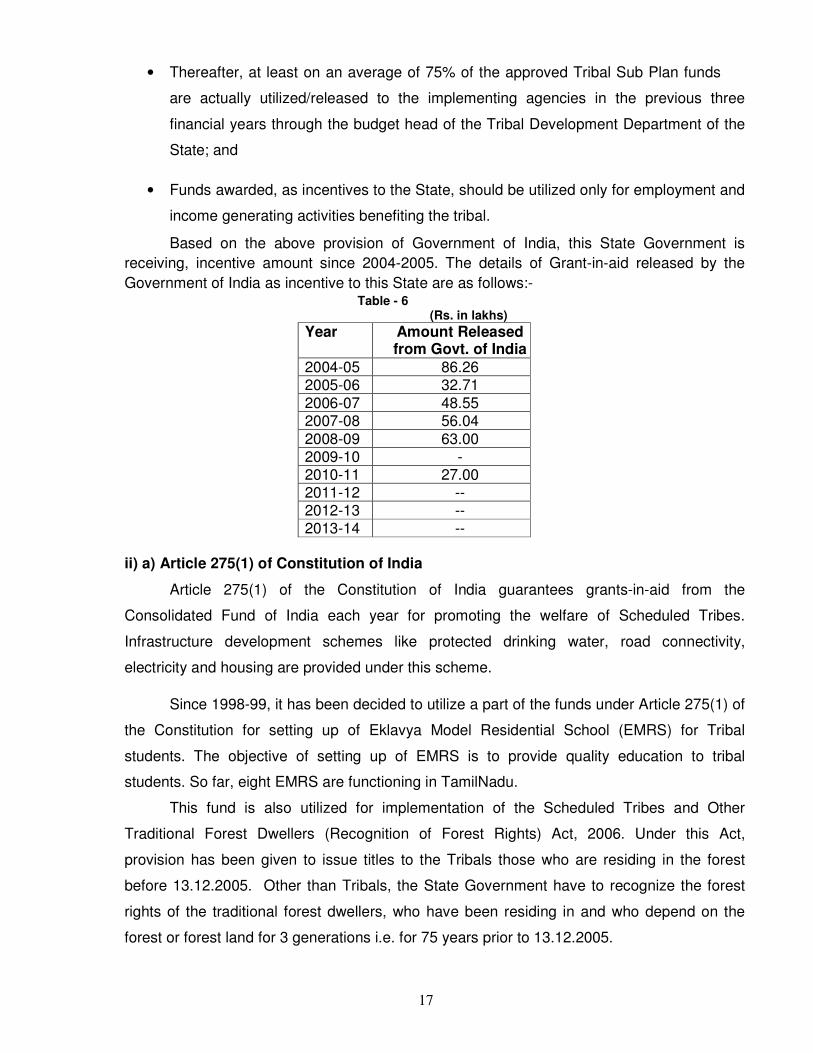
Based on the above provision of Government of India, this State Government is
receiving, incentive amount since 2004-2005. The details of Grant-in-aid released by the
Government of India as incentive to this State are as follows:- Table - 6 (Rs. in lakhs)
Year Amount Released from Govt. of India
2004-05 86.26 2005-06 32.71
2006-07 48.55 2007-08 56.04
2008-09 63.00 2009-10 - 2010-11 27.00 2011-12 -- 2012-13 -- 2013-14 --
ii) a) Article 275(1) of Constitution of India
Article 275(1) of the Constitution of India guarantees grants-in-aid from the
Consolidated Fund of India each year for promoting the welfare of Scheduled Tribes.
Infrastructure development schemes like protected drinking water, road connectivity,
electricity and housing are provided under this scheme.
Since 1998-99, it has been decided to utilize a part of the funds under Article 275(1) of
the Constitution for setting up of Eklavya Model Residential School (EMRS) for Tribal
students. The objective of setting up of EMRS is to provide quality education to tribal
students. So far, eight EMRS are functioning in TamilNadu.
This fund is also utilized for implementation of the Scheduled Tribes and Other
Traditional Forest Dwellers (Recognition of Forest Rights) Act, 2006. Under this Act,
provision has been given to issue titles to the Tribals those who are residing in the forest
before 13.12.2005. Other than Tribals, the State Government have to recognize the forest
rights of the traditional forest dwellers, who have been residing in and who depend on the
forest or forest land for 3 generations i.e. for 75 years prior to 13.12.2005.
18
2. In order to implement this Act, the State Government have constituted the
following Committees:
i) State Level Monitoring Committee headed by the Chief Secretary. ii) District Level Committee headed by the District Collector.
iii) Sub-Divisional Level Committee – headed by the Revenue Divisional Officer.
Till date, 7,473 claims have been processed and distributed title deeds to the claimants.
The recommended title deeds are issued, after the vacation of stay as ordered by the Madras
High Court in W.P.No.4533/2008. Other claims are being processed in the Districts.
b) Incentive received under Article 275(1) of Constitution of India
The Ministry of Tribal Affairs provides Central Assistance to States under Article
275(1) of Constitution of India for promoting the welfare of Scheduled Tribes or for raising the
level of administration in the Scheduled Areas. 10% of the allocation provided under Article
275(1) is set aside as incentive for good performance or for supporting innovative schemes
relating to the development and welfare of Scheduled Tribes in the country.
The Government of India have suggested few examples of schemes such as setting
up of medical units, awareness camps for children on preventive health, introduction of latest
technology in promoting agricultural activities, setting up of sign boards depicting the correct
barter rates for common products since the barter system is still in vogue among Scheduled
Tribes and better communication system for the promotion of development programmes for
Scheduled Tribes are under innovative projects.
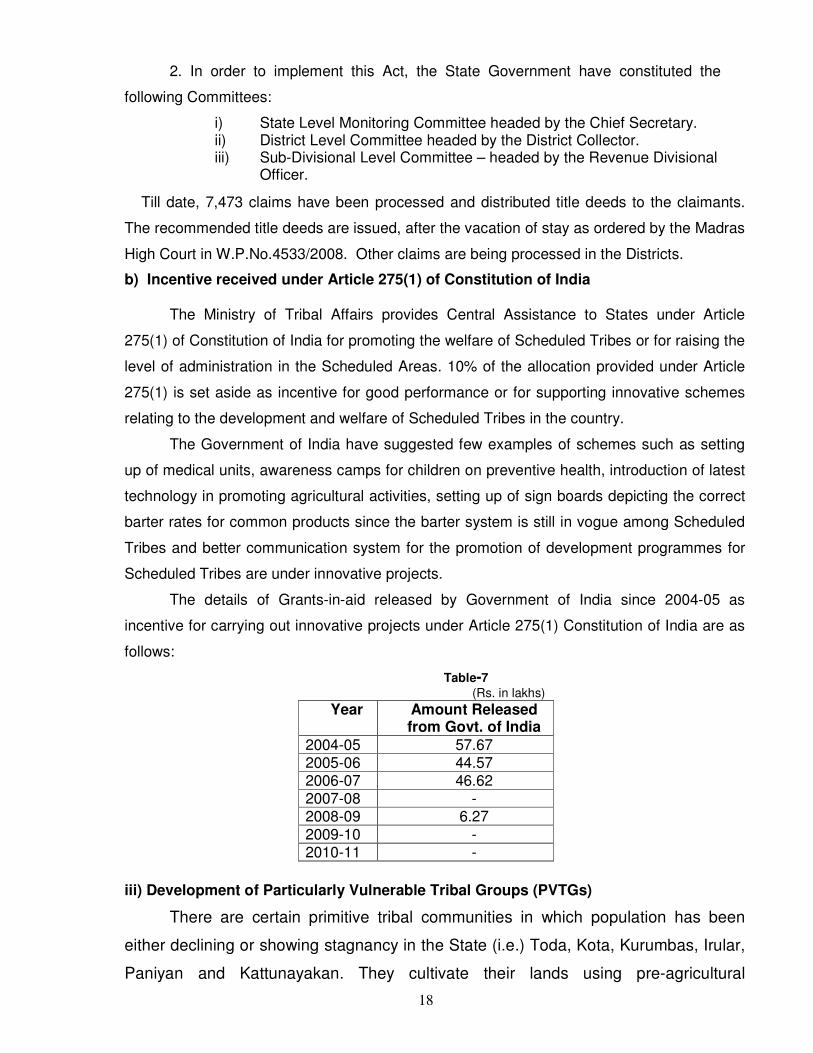
The details of Grants-in-aid released by Government of India since 2004-05 as
incentive for carrying out innovative projects under Article 275(1) Constitution of India are as
follows:
Table-7 (Rs. in lakhs)
iii) Development of Particularly Vulnerable Tribal Groups (PVTGs)
There are certain primitive tribal communities in which population has been
either declining or showing stagnancy in the State (i.e.) Toda, Kota, Kurumbas, Irular,
Paniyan and Kattunayakan. They cultivate their lands using pre-agricultural
Year Amount Released from Govt. of India
2004-05 57.67 2005-06 44.57 2006-07 46.62 2007-08 - 2008-09 6.27
2009-10 - 2010-11 -
19
technology and are economically backward. The level of literacy among them is
also very low.
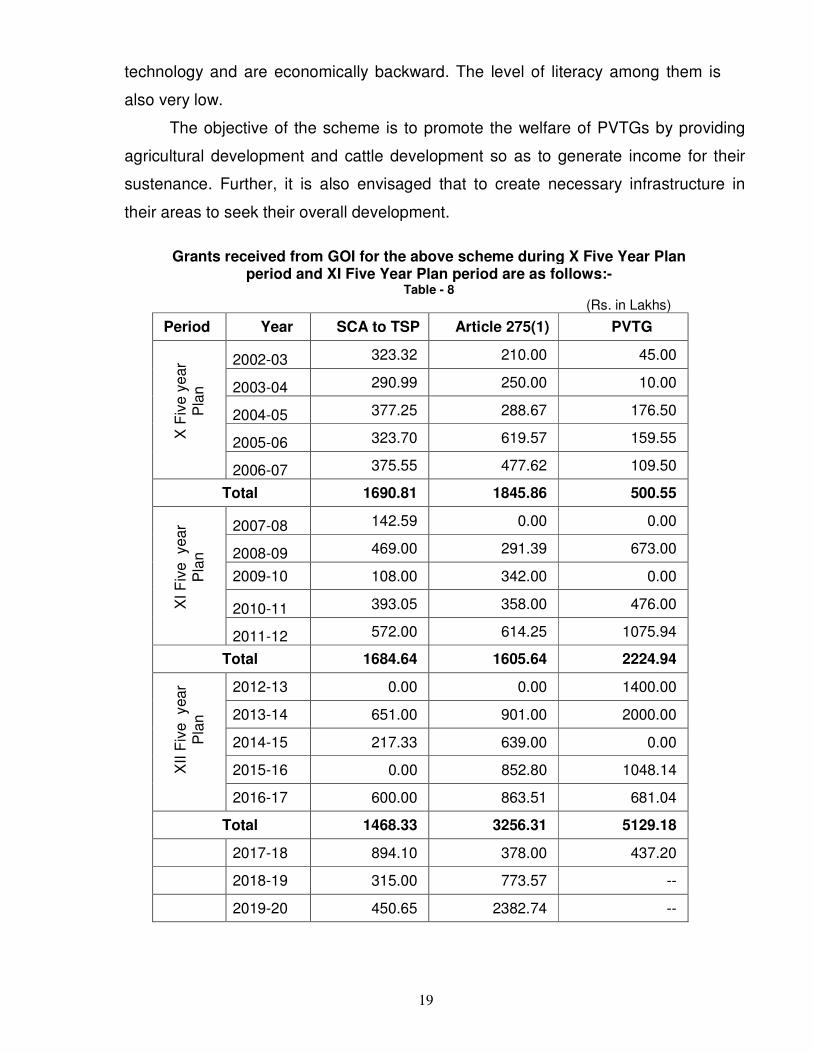
The objective of the scheme is to promote the welfare of PVTGs by providing
agricultural development and cattle development so as to generate income for their
sustenance. Further, it is also envisaged that to create necessary infrastructure in
their areas to seek their overall development.
Grants received from GOI for the above scheme during X Five Year Plan period and XI Five Year Plan period are as follows:-
Table - 8 (Rs. in Lakhs)
Period Year SCA to TSP Article 275(1) PVTG
X F
ive y
ear
P
lan
2002-03 323.32 210.00 45.00
2003-04 290.99 250.00 10.00
2004-05 377.25 288.67 176.50
2005-06 323.70 619.57 159.55
2006-07 375.55 477.62 109.50
Total 1690.81 1845.86 500.55
XI F
ive
year
P
lan
2007-08 142.59 0.00 0.00
2008-09 469.00 291.39 673.00
2009-10 108.00 342.00 0.00
2010-11 393.05 358.00 476.00
2011-12 572.00 614.25 1075.94
Total 1684.64 1605.64 2224.94
XII F
ive year
P
lan
2012-13 0.00 0.00 1400.00
2013-14 651.00 901.00 2000.00
2014-15 217.33 639.00 0.00
2015-16 0.00 852.80 1048.14
2016-17 600.00 863.51 681.04
Total 1468.33 3256.31 5129.18
2017-18 894.10 378.00 437.20
2018-19 315.00 773.57 --
2019-20 450.65 2382.74 --
20
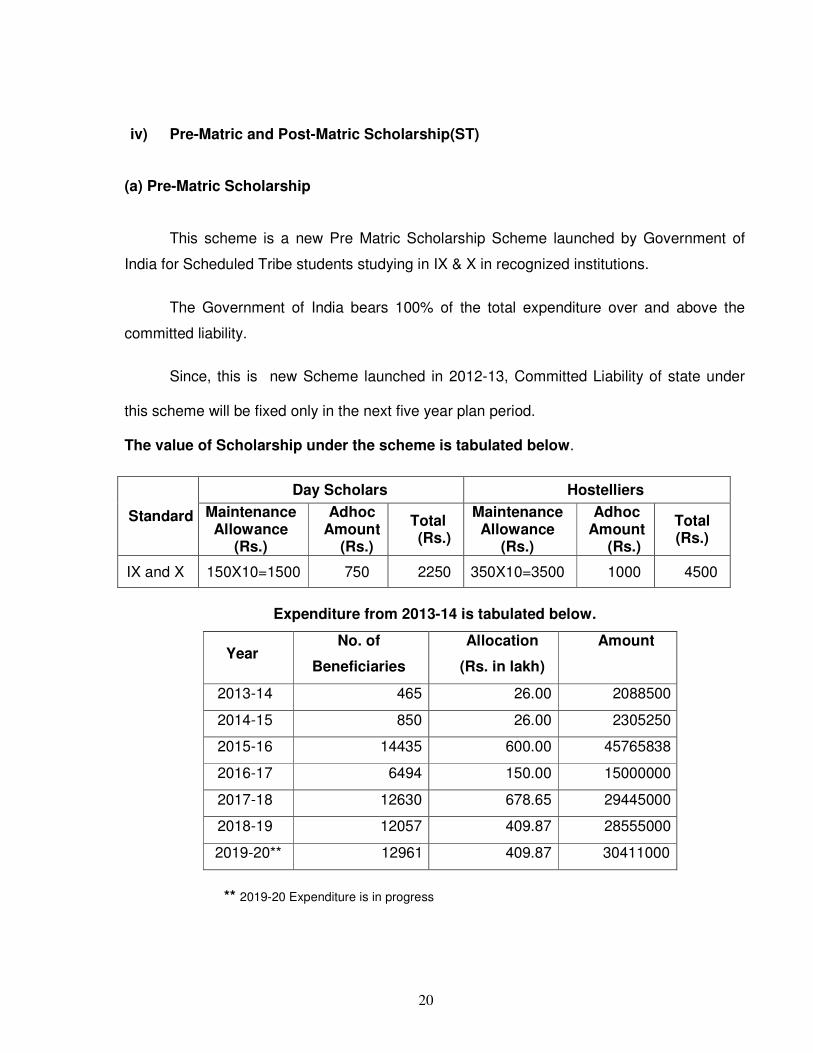
iv) Pre-Matric and Post-Matric Scholarship(ST)
(a) Pre-Matric Scholarship
This scheme is a new Pre Matric Scholarship Scheme launched by Government of
India for Scheduled Tribe students studying in IX & X in recognized institutions.
The Government of India bears 100% of the total expenditure over and above the
committed liability.
Since, this is new Scheme launched in 2012-13, Committed Liability of state under
this scheme will be fixed only in the next five year plan period.
The value of Scholarship under the scheme is tabulated below.
Standard
Day Scholars Hostelliers
Maintenance Allowance
(Rs.)
Adhoc Amount
(Rs.)
Total (Rs.)
Maintenance Allowance
(Rs.)
Adhoc Amount
(Rs.)
Total (Rs.)
IX and X 150X10=1500 750 2250 350X10=3500 1000 4500
Expenditure from 2013-14 is tabulated below.
Year No. of
Beneficiaries
Allocation
(Rs. in lakh)
Amount
2013-14 465 26.00 2088500
2014-15 850 26.00 2305250
2015-16 14435 600.00 45765838
2016-17 6494 150.00 15000000
2017-18 12630 678.65 29445000
2018-19 12057 409.87 28555000
2019-20** 12961 409.87 30411000
** 2019-20 Expenditure is in progress
21
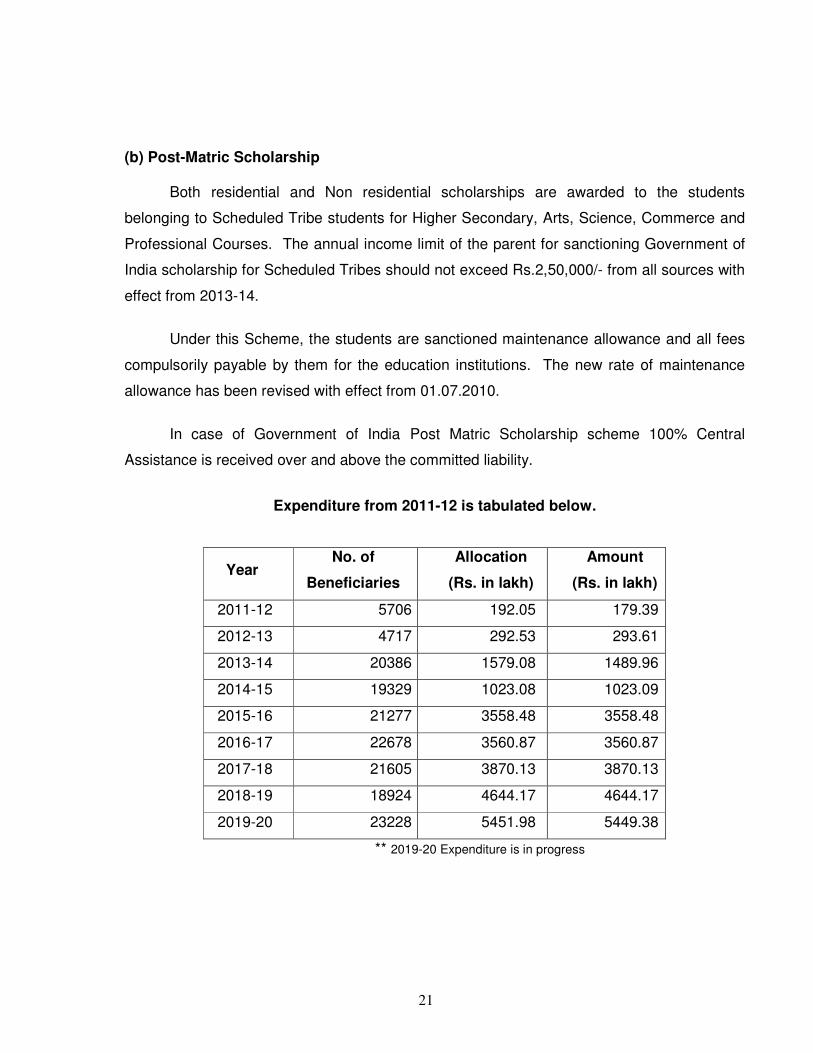
(b) Post-Matric Scholarship
Both residential and Non residential scholarships are awarded to the students
belonging to Scheduled Tribe students for Higher Secondary, Arts, Science, Commerce and
Professional Courses. The annual income limit of the parent for sanctioning Government of
India scholarship for Scheduled Tribes should not exceed Rs.2,50,000/- from all sources with
effect from 2013-14.
Under this Scheme, the students are sanctioned maintenance allowance and all fees
compulsorily payable by them for the education institutions. The new rate of maintenance
allowance has been revised with effect from 01.07.2010.
In case of Government of India Post Matric Scholarship scheme 100% Central
Assistance is received over and above the committed liability.
Expenditure from 2011-12 is tabulated below.
Year No. of
Beneficiaries
Allocation
(Rs. in lakh)
Amount
(Rs. in lakh)
2011-12 5706 192.05 179.39
2012-13 4717 292.53 293.61
2013-14 20386 1579.08 1489.96
2014-15 19329 1023.08 1023.09
2015-16 21277 3558.48 3558.48
2016-17 22678 3560.87 3560.87
2017-18 21605 3870.13 3870.13
2018-19 18924 4644.17 4644.17
2019-20 23228 5451.98 5449.38
** 2019-20 Expenditure is in progress
22
Chapter – V
Problems being faced by Scheduled Tribes
1. Land Alienation
Land alienation by Tribal to Non-Tribal takes place here and there. However, there
has been no law enacted in the State to prohibit change of ownership of lands owned by the
tribal people to non-tribal. Notwithstanding, the State Administration are cautious about this
issue and always protect the interest of STs in the State.
2. Indebtedness
Indebtedness to certain extent was prevalent in the tribal communities till the advent of
Large-sized Multi Purpose (LAMP) societies especially formed for the economic development
of tribal society. After formation of LAMP societies, short term loans for raising crops,
medium term loans for purchase of agricultural implements and long term loans for sinking
of new wells, deepening of existing wells, installation of power pump sets, consumption loans
and loans on pledge of jewels are extended to them since 1970. In the recent years,
interest-free loans were extended for the above purposes. After formation of 19 LAMP
societies, i.e. 17 in ITDP areas and 2 in non-ITDP areas, indebtedness has been reduced
significantly.
3. Relation with Forest and Government Monopoly
The relationship between Forest and Tribal is cordial. They are not at loggerheads.
Forest related works are regular source of income to tribal. In fact the Afforestation
Programmes depend on the support of the local tribal population. Many tribal habitations are
located in the lands assigned or diverted by Forest Department. Tamil Nadu Afforestation
Programme has set up village committees in which the local tribal leader is the president of
that committee. The Tamil Nadu Afforestation Programme has offered many avenues to
improve the quality of life of tribal.
However, the enactment of Scheduled Tribes and Other Forest Dwellers (Recognition
of Forest Rights) Act, 2006 by Government of India presently will be a shot in the arms of the
Tribal who are seeking out livelihood by putting the forest land to productive use both
individually and community-wise as a whole. This has added teeth to a very vital and crucial
need of the Tribal whose destinies are linked with forests from hoary days. This Act legally
confers the right of ownership, access to collect, use and dispose of Minor Forest Produce by
the Scheduled Tribes dwelling in forests traditionally.
The Scheduled Tribes and Other Traditional Forest Dwellers (Recognition of Forest
Rights) Act, 2006 was enacted by Government of India, which came into existence on
29.12.2006. Tribals who have been residing in the forests prior to 13.12.2005. Other than
23
Tribals, the State Government have to recognize the forest rights of the traditional forest
dwellers, who have been residing in and who depend on the forest to forest land for 3
generations, i.e. for 75 years prior to 13.12.2005.
2. In order to implement this Act, the State Government has constituted the following
Committees:
i) State Level Monitoring Committee headed by the Chief Secretary ii) District Level Committee headed by the District Collector. iii) Sub-Divisional Level Committee – headed by the Revenue Divisional Officer.
The Sub Divisional Level Committee the District Level Committee and the State Level
Monitoring Committee consists of officers of the department of Revenue, Forest and Tribal
Affairs of the State Government and three members of the Panchayat Raj Institution at the
appropriate level, appointed by the respective Panchayat Raj Institution of whom who
Scheduled Tribe members and one women as prescribed.
The Hon’ble Supreme Court of India on 02.02.2016 had vacated the stay ordered
W.P.No.45433 of 2008 dated 30.04.2008 in I.A. No.2 of 2015.
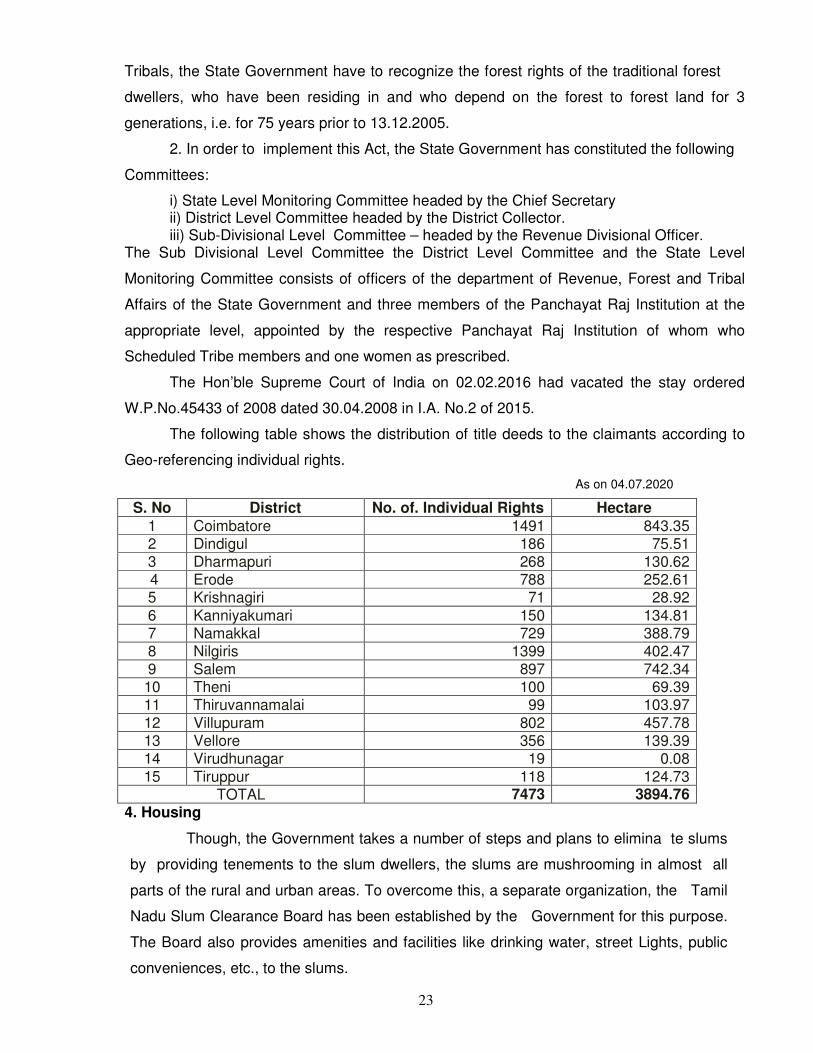
The following table shows the distribution of title deeds to the claimants according to
Geo-referencing individual rights.
As on 04.07.2020
S. No District No. of. Individual Rights Hectare
1 Coimbatore 1491 843.35 2 Dindigul 186 75.51 3 Dharmapuri 268 130.62 4 Erode 788 252.61 5 Krishnagiri 71 28.92
6 Kanniyakumari 150 134.81 7 Namakkal 729 388.79 8 Nilgiris 1399 402.47 9 Salem 897 742.34 10 Theni 100 69.39 11 Thiruvannamalai 99 103.97
12 Villupuram 802 457.78 13 Vellore 356 139.39 14 Virudhunagar 19 0.08
15 Tiruppur 118 124.73 TOTAL 7473 3894.76
4. Housing
Though, the Government takes a number of steps and plans to elimina te slums
by providing tenements to the slum dwellers, the slums are mushrooming in almost all
parts of the rural and urban areas. To overcome this, a separate organization, the Tamil
Nadu Slum Clearance Board has been established by the Government for this purpose.
The Board also provides amenities and facilities like drinking water, street Lights, public
conveniences, etc., to the slums.
24
Chapter – VI
Administration, Monitoring, Evaluation & Implementation
It is a fact that in Tamil Nadu, the concept and strategy of Tribal Sub Plan has
produced very good results. It is because, in project formulations under Tribal Sub Plan,
ground level problems prevalent among the tribal are identified in ITDP Areas. But, still
there are quite a few aspects which need further attention during the implementation of the
programmes successfully. There is a need to consider the culture and customs of the tribal
people and to adopt a planning process without disturbing their cultural heritage. According
to the felt needs of the Tribal, with integrated approach, the Government of Tamil Nadu is
planning many schemes for the development of Tribal.
Monitoring and Evaluation
For monitoring the Tribal Sub Plan Schemes, the Government has appointed the Adi
Dravidar and Tribal Welfare Department as Nodal Department vide G.O.Ms.No.134
Planning, Development and Special Initiatives Department Dated 09.10.2006.
The Adi Dravidar and Tribal Welfare Department has also appointed the Director of
Tribal Welfare as monitoring officer vide G.O.Ms.No.59 AD & TW (MEC.3) Department
dated 01.06.2007 for implementation of the Tribal Sub Plan Schemes in all districts.
The schemes implemented under the Tribal Sub Plan are systematically monitored
and evaluated at regular intervals by the project authorities on the basis of periodical reports
sent by the concerned Sectoral Departments. At the State level, it is consolidated and
analyzed for review by the Secretary to Government, Adi Dravidar and Tribal welfare
Department and the Director of Tribal Welfare. The Tribal Research Centre established at
Ooty on 2nd October 1983 by the Tamil University, Thanjavur was taken over by the
Government of Tamil Nadu (Department of Adi Dravidar and Tribal Welfare) on 13.9.1995.
Since then, the Tribal Research Centre at Ooty conducted many evaluation studies.

25
Government have ordered to undertake an evaluation study on the implementation
SCSP and TSP through the Directorate of Evaluation and Applied Research to ascertain as
to how far the S.C. and S.T. people in the State are benefited from out of the schemes
implemented under SCSP and TSP with reference to the following terms:
(i) Whether the ‘Divisible’ and ‘Indivisible’ funds are properly utilized by the
Sectoral departments scheme wise directly relevant for the development of
Scheduled Tribes as reported by them?
(ii) Whether the assets created under SCSP/TSP are properly utilized for the
welfare of SCs /STs and to verify the quality of assets?
(iii) Whether the implementation of SCSP/TSP has helped the targeted people
to improve their livelihood – i.e. what is the impact of these two plans over
the improvement of their socio-economic condition of the SC/ST people?
(iv) Upto what extent scheme of the ‘Divisible’ and ‘Indivisible’ allocation of
funds is found workable to achieve the objectives of the SCSP/TSP?
(v) Suggestions/Modification for improving Educational and Socio-Economical
conditions for SC/ST population in the State.

26
Chapter – VII
Schemes under Tribal Sub Plan (TSP) 2019-20
1. Tribal Welfare Department
The Tribal Welfare Department has been allocated a sum of
Rs. 47945.23 lakhs in Annual Plan for the development of Tribal. The Schemes include any
viable income generating programme, opening of schools, construction of school and hostel
buildings, construction of teachers quarters, establishment of Tribal Research Centre (TRC)
& Tribal Museum, water supply scheme to tribal areas, development schemes for the
Particularly Vulnerable Tribal Groups and Dispersed Tribes, provision of houses to tribal,
formation of link roads to tribal areas, drinking water to tribal habitations.
Schemes under TSP 2019-20 (Rs. in lakh)
Head of Account
Schemes Flow
222502001AB Tribal Welfare 47945.23
222502102AB Establishment of Vigilance Cell 113.03
222502277AA Tribal Welfare Board 0.01
222502277AF Schools 19669.71
222502277AR Maintenance of Tribal Hostels 1063.73
222502277AW Payment to the Teachers working under Sarva Siksha Abiyan Scheme(SSA)
73.06
222502277AX Opening and maintenance of Tribal Residential schools 1793.93
222502277AY
Award of Prizes to Best Adi-Dravidar Higher Secondary School and Tribal Residential Higher Secondary Schools to improve quality of education 5.00
222502277AZ Tribal Welfare Industrial Training Institues 981.22
222502277BA Assistance to ST for Higher Educational Special Scholarship Scheme
26.46
222502277BB Compensation to Universities 8.50
222502277BC Compensation to Government Aided Polytechnics / Engineering Colleges
0.01
222502277BD Free Education to Students of ST studying in B.A., B.Sc., B.Com., Courses Scholarships and Stipends 4.00
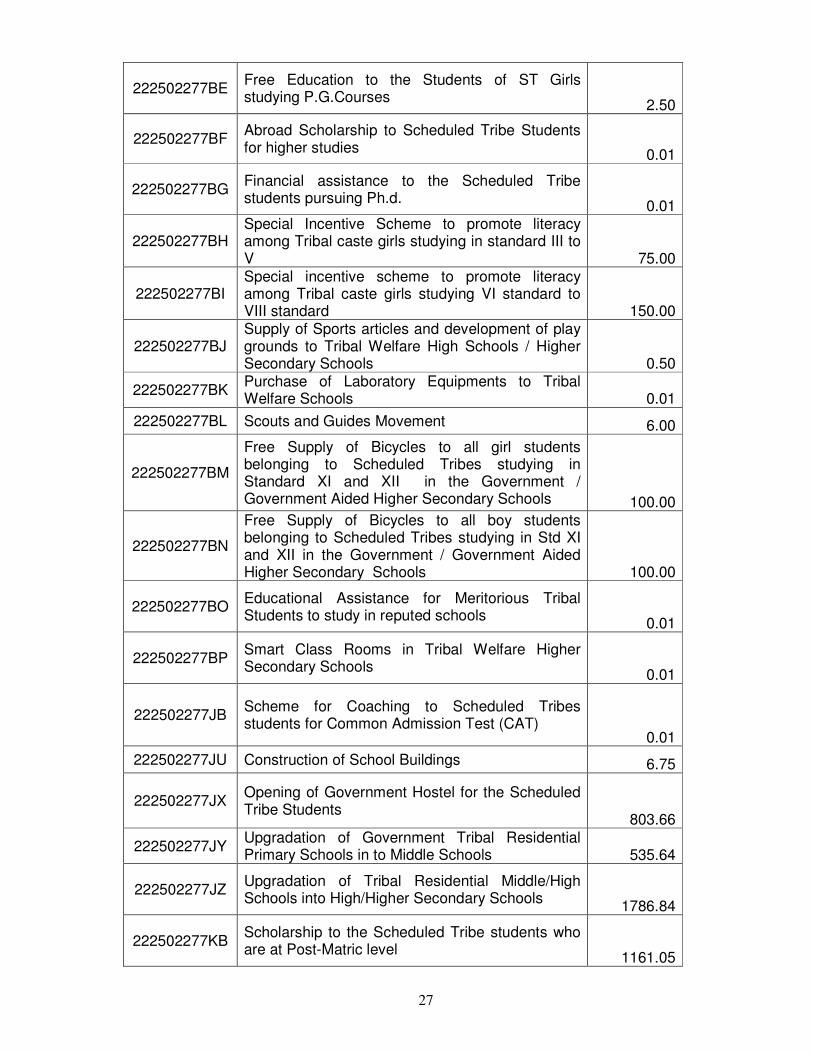
27
222502277BE Free Education to the Students of ST Girls studying P.G.Courses
2.50
222502277BF Abroad Scholarship to Scheduled Tribe Students for higher studies 0.01
222502277BG Financial assistance to the Scheduled Tribe students pursuing Ph.d.
0.01
222502277BH Special Incentive Scheme to promote literacy among Tribal caste girls studying in standard III to V 75.00
222502277BI Special incentive scheme to promote literacy among Tribal caste girls studying VI standard to VIII standard 150.00
222502277BJ Supply of Sports articles and development of play grounds to Tribal Welfare High Schools / Higher Secondary Schools 0.50
222502277BK Purchase of Laboratory Equipments to Tribal Welfare Schools 0.01
222502277BL Scouts and Guides Movement 6.00
222502277BM
Free Supply of Bicycles to all girl students belonging to Scheduled Tribes studying in Standard XI and XII in the Government / Government Aided Higher Secondary Schools 100.00
222502277BN
Free Supply of Bicycles to all boy students belonging to Scheduled Tribes studying in Std XI and XII in the Government / Government Aided Higher Secondary Schools 100.00
222502277BO Educational Assistance for Meritorious Tribal Students to study in reputed schools
0.01
222502277BP Smart Class Rooms in Tribal Welfare Higher Secondary Schools
0.01
222502277JB Scheme for Coaching to Scheduled Tribes students for Common Admission Test (CAT)
0.01
222502277JU Construction of School Buildings 6.75
222502277JX Opening of Government Hostel for the Scheduled Tribe Students
803.66
222502277JY Upgradation of Government Tribal Residential Primary Schools in to Middle Schools 535.64
222502277JZ Upgradation of Tribal Residential Middle/High Schools into High/Higher Secondary Schools
1786.84
222502277KB Scholarship to the Scheduled Tribe students who are at Post-Matric level
1161.05
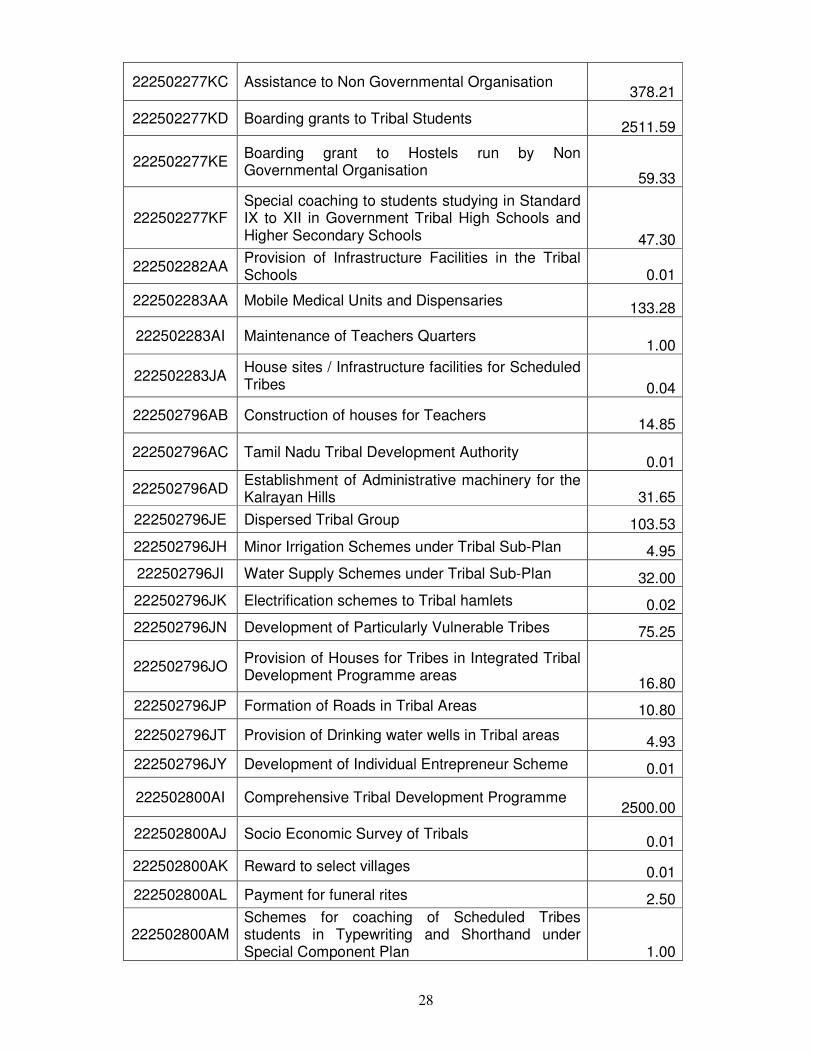
28
222502277KC Assistance to Non Governmental Organisation 378.21
222502277KD Boarding grants to Tribal Students 2511.59
222502277KE Boarding grant to Hostels run by Non Governmental Organisation
59.33
222502277KF Special coaching to students studying in Standard IX to XII in Government Tribal High Schools and Higher Secondary Schools 47.30
222502282AA Provision of Infrastructure Facilities in the Tribal Schools 0.01
222502283AA Mobile Medical Units and Dispensaries 133.28
222502283AI Maintenance of Teachers Quarters 1.00
222502283JA House sites / Infrastructure facilities for Scheduled Tribes 0.04
222502796AB Construction of houses for Teachers 14.85
222502796AC Tamil Nadu Tribal Development Authority 0.01
222502796AD Establishment of Administrative machinery for the Kalrayan Hills 31.65
222502796JE Dispersed Tribal Group 103.53
222502796JH Minor Irrigation Schemes under Tribal Sub-Plan 4.95
222502796JI Water Supply Schemes under Tribal Sub-Plan 32.00
222502796JK Electrification schemes to Tribal hamlets 0.02
222502796JN Development of Particularly Vulnerable Tribes 75.25
222502796JO Provision of Houses for Tribes in Integrated Tribal Development Programme areas
16.80
222502796JP Formation of Roads in Tribal Areas 10.80
222502796JT Provision of Drinking water wells in Tribal areas 4.93
222502796JY Development of Individual Entrepreneur Scheme 0.01
222502800AI Comprehensive Tribal Development Programme 2500.00
222502800AJ Socio Economic Survey of Tribals 0.01
222502800AK Reward to select villages 0.01
222502800AL Payment for funeral rites 2.50
222502800AM Schemes for coaching of Scheduled Tribes students in Typewriting and Shorthand under Special Component Plan 1.00

29
222502800AN Assistance to Technically Trained persons 10.00
222502800AO Construction of Community Halls 0.01
222502800AP Scheme for provision of Pathways and Burial grounds 0.03
222502800JB Dr. Ambedkar award for persons promoting welfare of Scheduled Tribes 0.01
255101108JL Establishment of Tribal Research Institute 164.41
422502277KA Implementation of Tribal Welfare Scheme under Western Ghats Development Programme 0.01
422502277KC Construction of new buildings and repairs to the existing Tribal Hostels / GTR Schools 0.01
422502796JA Upgrading infrastructure facilities in the Schools of Adi-Dravidar and Tribal Welfare Department with loan assistance of NABARD under RIDF 302.34
222502277SA Comprehensive Tribal Development Programme 2500.00
222502277SD Government of India Post-Matric Scholarships 3483.12
222502277SE Development of Particularly Vulnerable Tribal Groups 4000.00
222502794SA Pre Matric Scholarship for Scheduled Tribe students 409.87
222502794SB Welfare Schemes for Scheduled Tribes in Integrated Rural Development Project Blocks under Tribal Sub- Plan 651.00
222502794SC Development of Particularly Vulnerable Tribes - Funds released by the GOI under Art.275(i) of the Constitution of India 1700.00
222502794SD Organising the Tribal Festival by the Tribal Research Centre 0.01
222502794SE Implementation of Van Bandhu Kalyan Yojana Scheme 0.01
222502794SF Implementation of Action Plan for Tribal Research Centre in Udhagamandalam 133.20
222502001AB Integrated Tribal Development Programme Offices 195.46
2. Agriculture Department
In order to bring agriculture as a profitable venture, the government has taken more
efforts to bring major changes in the method of cultivation of crops. The System of Rice
Intensification (SRI) is one such technology capable of enhancing paddy productivity. A
massive programme to adopt Precision Farming technology in clusters by formation of
societies with the participating farmers by providing higher subsidy is expected to bring a
massive change in the agricultural scenario in Tamil Nadu.
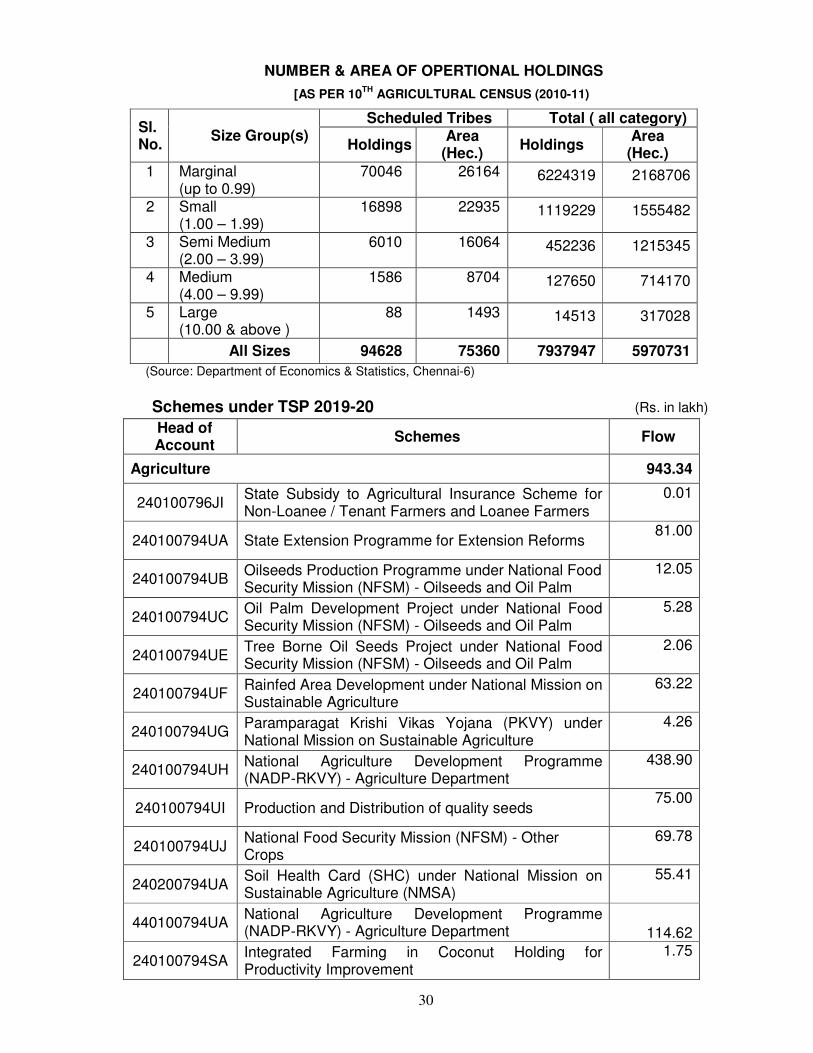
30
NUMBER & AREA OF OPERTIONAL HOLDINGS
[AS PER 10TH
AGRICULTURAL CENSUS (2010-11)
Sl. No.
Size Group(s) Scheduled Tribes Total ( all category)
Holdings Area
(Hec.) Holdings
Area (Hec.)
1 Marginal (up to 0.99)
70046 26164 6224319 2168706
2 Small (1.00 – 1.99)
16898 22935 1119229 1555482
3 Semi Medium (2.00 – 3.99)
6010 16064 452236 1215345
4 Medium (4.00 – 9.99)
1586 8704 127650 714170
5 Large (10.00 & above )
88 1493 14513 317028
All Sizes 94628 75360 7937947 5970731
(Source: Department of Economics & Statistics, Chennai-6)
Schemes under TSP 2019-20 (Rs. in lakh)
Head of Account
Schemes Flow
Agriculture 943.34
240100796JI State Subsidy to Agricultural Insurance Scheme for Non-Loanee / Tenant Farmers and Loanee Farmers
0.01
240100794UA State Extension Programme for Extension Reforms 81.00
240100794UB Oilseeds Production Programme under National Food Security Mission (NFSM) - Oilseeds and Oil Palm
12.05
240100794UC Oil Palm Development Project under National Food Security Mission (NFSM) - Oilseeds and Oil Palm
5.28
240100794UE Tree Borne Oil Seeds Project under National Food Security Mission (NFSM) - Oilseeds and Oil Palm
2.06
240100794UF Rainfed Area Development under National Mission on Sustainable Agriculture
63.22
240100794UG Paramparagat Krishi Vikas Yojana (PKVY) under National Mission on Sustainable Agriculture
4.26
240100794UH National Agriculture Development Programme (NADP-RKVY) - Agriculture Department
438.90
240100794UI Production and Distribution of quality seeds 75.00
240100794UJ National Food Security Mission (NFSM) - Other Crops
69.78
240200794UA Soil Health Card (SHC) under National Mission on Sustainable Agriculture (NMSA)
55.41
440100794UA National Agriculture Development Programme (NADP-RKVY) - Agriculture Department 114.62
240100794SA Integrated Farming in Coconut Holding for Productivity Improvement
1.75
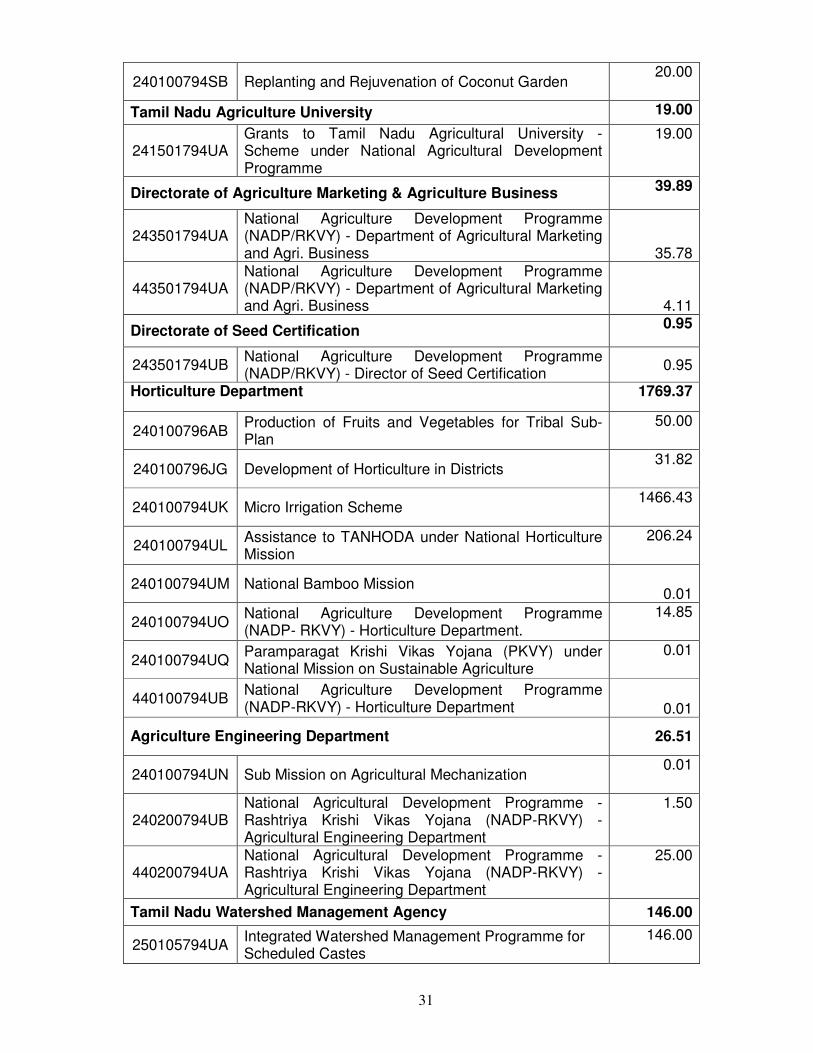
31
240100794SB Replanting and Rejuvenation of Coconut Garden 20.00
Tamil Nadu Agriculture University 19.00
241501794UA Grants to Tamil Nadu Agricultural University - Scheme under National Agricultural Development Programme
19.00
Directorate of Agriculture Marketing & Agriculture Business 39.89
243501794UA National Agriculture Development Programme (NADP/RKVY) - Department of Agricultural Marketing and Agri. Business 35.78
443501794UA National Agriculture Development Programme (NADP/RKVY) - Department of Agricultural Marketing and Agri. Business 4.11
Directorate of Seed Certification 0.95
243501794UB National Agriculture Development Programme (NADP/RKVY) - Director of Seed Certification
0.95
Horticulture Department 1769.37
240100796AB Production of Fruits and Vegetables for Tribal Sub- Plan
50.00
240100796JG Development of Horticulture in Districts 31.82
240100794UK Micro Irrigation Scheme 1466.43
240100794UL Assistance to TANHODA under National Horticulture Mission
206.24
240100794UM National Bamboo Mission 0.01
240100794UO National Agriculture Development Programme (NADP- RKVY) - Horticulture Department.
14.85
240100794UQ Paramparagat Krishi Vikas Yojana (PKVY) under National Mission on Sustainable Agriculture
0.01
440100794UB National Agriculture Development Programme (NADP-RKVY) - Horticulture Department 0.01
Agriculture Engineering Department 26.51
240100794UN Sub Mission on Agricultural Mechanization 0.01
240200794UB National Agricultural Development Programme - Rashtriya Krishi Vikas Yojana (NADP-RKVY) - Agricultural Engineering Department
1.50
440200794UA National Agricultural Development Programme - Rashtriya Krishi Vikas Yojana (NADP-RKVY) - Agricultural Engineering Department
25.00
Tamil Nadu Watershed Management Agency 146.00
250105794UA Integrated Watershed Management Programme for Scheduled Castes
146.00
32
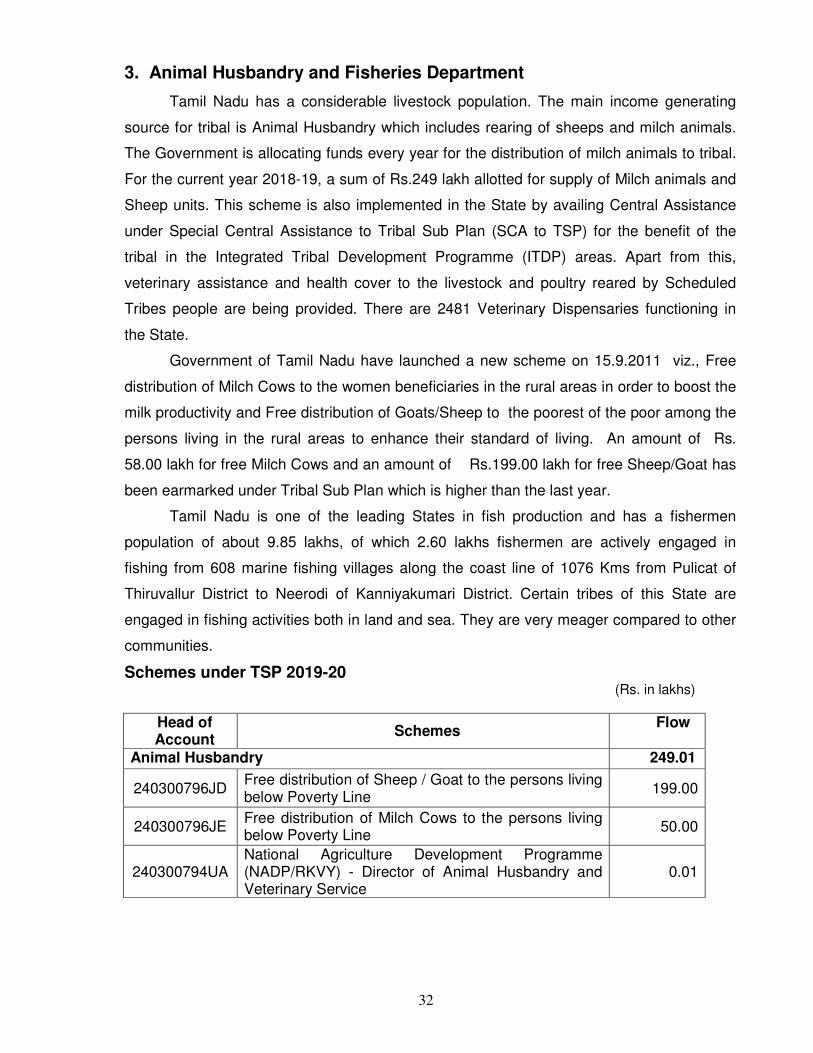
3. Animal Husbandry and Fisheries Department
Tamil Nadu has a considerable livestock population. The main income generating
source for tribal is Animal Husbandry which includes rearing of sheeps and milch animals.
The Government is allocating funds every year for the distribution of milch animals to tribal.
For the current year 2018-19, a sum of Rs.249 lakh allotted for supply of Milch animals and
Sheep units. This scheme is also implemented in the State by availing Central Assistance
under Special Central Assistance to Tribal Sub Plan (SCA to TSP) for the benefit of the
tribal in the Integrated Tribal Development Programme (ITDP) areas. Apart from this,
veterinary assistance and health cover to the livestock and poultry reared by Scheduled
Tribes people are being provided. There are 2481 Veterinary Dispensaries functioning in
the State.
Government of Tamil Nadu have launched a new scheme on 15.9.2011 viz., Free
distribution of Milch Cows to the women beneficiaries in the rural areas in order to boost the
milk productivity and Free distribution of Goats/Sheep to the poorest of the poor among the
persons living in the rural areas to enhance their standard of living. An amount of Rs.
58.00 lakh for free Milch Cows and an amount of Rs.199.00 lakh for free Sheep/Goat has
been earmarked under Tribal Sub Plan which is higher than the last year.
Tamil Nadu is one of the leading States in fish production and has a fishermen
population of about 9.85 lakhs, of which 2.60 lakhs fishermen are actively engaged in
fishing from 608 marine fishing villages along the coast line of 1076 Kms from Pulicat of
Thiruvallur District to Neerodi of Kanniyakumari District. Certain tribes of this State are
engaged in fishing activities both in land and sea. They are very meager compared to other
communities.
Schemes under TSP 2019-20 (Rs. in lakhs)
Head of Account
Schemes Flow
Animal Husbandry 249.01
240300796JD Free distribution of Sheep / Goat to the persons living below Poverty Line
199.00
240300796JE Free distribution of Milch Cows to the persons living below Poverty Line
50.00
240300794UA National Agriculture Development Programme (NADP/RKVY) - Director of Animal Husbandry and Veterinary Service
0.01

33
Schemes under TSP 2019-20 (Rs. in lakhs) [[[[[
Head of Account
Schemes Flow
Fisheries 0.01
240500794UB National Agriculture development Programme (NADP-RKVY) fisheries Department
0.01
Fisheries University 19.00
240500794UA National Agriculture development Programme (NADP-RKVY) TamilNadu fisheries University
15.00
241505794UA National Agriculture development Programme (NADP-RKVY) TamilNadu fisheries University
4.00
4. Forest Department A flow of Rs. 955.83 lakh has been fixed for the schemes like rural livelihood with
focus on small farmers, ensure availability of quality planting material, community
development works, formation and improvement of roads and raising of plantations in tribal
areas.
Schemes under TSP 2019-20 (Rs. in lakh)
Head of Account
Schemes Flow
Forests 955.83
222502277AP Tribal Welfare School – Vellore 736.88
222502277AV Tribal Welfare Schools - Pollachi etc., 42.32
222502796JW Providing assured and safe drinking water to Tribal Areas
19.96
222502796JZ Tribal Eco Cultural Village - A living museum in Sathyamangalam division, Erode
0.01
240601796AB Raising plantation in Tribal areas 18.34
240601796AC Preservation and Development of Forest in Kalrayan Hills
138.31
441506794UA Sub-Mission on Agro Forestry 0.01
5. Handlooms, Handicrafts, Textiles and Khadi Department.
During 2019-20, Rs.525.00 lakh has been earmarked for this scheme under TSP to
Free Distribution of Handloom cloth to the People below Poverty Line.
Schemes under TSP 2019-20 (Rs. in lakh)
Head of Account
Schemes Flow
Handlooms and Textiles 525.00
223560796JB Free distribution of Handloom Cloth to the People Below Poverty Line
525.00
34
6. Health and Family Welfare Department In the hilly and forest terrains, the tribal habitations are lacking in vital medical
facilities. Therefore emphasis is laid on providing health care and medical facilities within
the easy reach of the habitations. The Government of Tamil Nadu have given a thrust to
improve the nutritional value status of the tribal people and also given priority for
immunization programmes.
• The Directorate of Medical and Rural Health are now maintaining dispensaries in the
hilly tribal areas to provide better medical care to the tribal. There are 396 mobile
clinics functioning in the State to cover inaccessible areas like the tribal habitations in
the State. To augment the Mobile Outreach Services in tribal areas additional 20
mobile medical units are also operational through NGOs in tribal blocks. Each Health
Sub Centres (HSCs) covers a population of 5000 in Plain areas & a population of
3000 in hilly areas. There are about 1806 Primary Health Centres (PHCs) and 8706
Health Sub Centres (HSCs) in Tamil Nadu. Tribal Counselors have been placed in
the 10 Government Hospitals in the tribal districts.
• The Directorate of Public Health and Preventive Medicine now maintains 76 Health
Sub Centers (HSC) in the Tribal Areas. As per the norms of Government of India one
health Sub Centre will cater 3,000 populations. Maternity, Child health and other
public health activities are being undertaken for the welfare of tribal people.
• The Directorate of Family Welfare also fixes their schemes to the tribes and the
Director of Indian Medicine and Homeopathy has established 7 Siddha Dispensaries
and one mobile medical unit in tribal areas.
• Tamil Nadu is the first State among the South Indian States to implement this
programme for early detection of Hemoglobinopathies like sickle cell anaemia,
Thalassemia among the tribal population. The programme implemented at a cost of
Rs.216.00 lakh in Dharmapuri, Salem, Krishnagiri, Namakkal, Nilgiris, Coimbatore,
Tiruvannamalai, Villupuram, Vellore, Thiruchirapalli, Dindigul, Erode and
Kanyakumari Districts in phased manner.
• 76 Four Wheel Drive ambulances are in operation in Hilly / Difficult terrain areas
where the normal ambulances cannot travel or in bad road conditions where the
ambulances take much time to reach the emergency site.
35
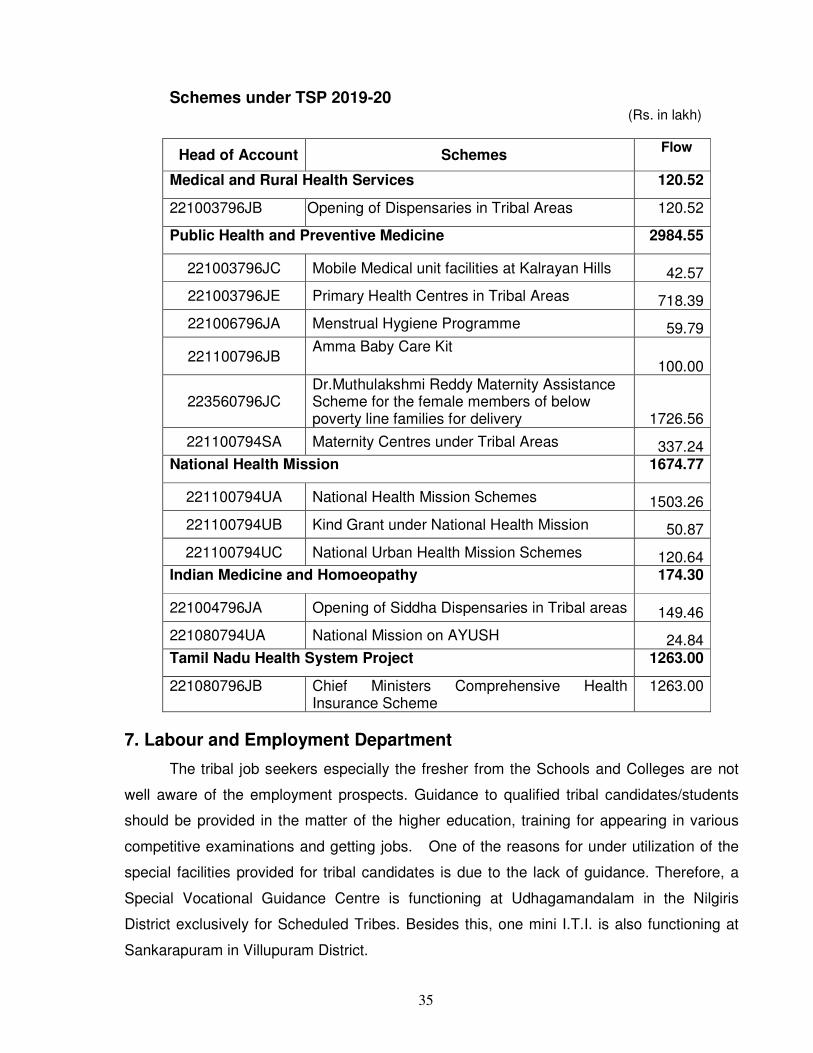
Schemes under TSP 2019-20 (Rs. in lakh)
Head of Account Schemes Flow
Medical and Rural Health Services 120.52
221003796JB Opening of Dispensaries in Tribal Areas 120.52
Public Health and Preventive Medicine 2984.55
221003796JC Mobile Medical unit facilities at Kalrayan Hills 42.57
221003796JE Primary Health Centres in Tribal Areas 718.39
221006796JA Menstrual Hygiene Programme 59.79
221100796JB Amma Baby Care Kit
100.00
223560796JC Dr.Muthulakshmi Reddy Maternity Assistance Scheme for the female members of below poverty line families for delivery 1726.56
221100794SA Maternity Centres under Tribal Areas 337.24 National Health Mission 1674.77
221100794UA National Health Mission Schemes 1503.26
221100794UB Kind Grant under National Health Mission 50.87
221100794UC National Urban Health Mission Schemes 120.64 Indian Medicine and Homoeopathy 174.30
221004796JA Opening of Siddha Dispensaries in Tribal areas 149.46
221080794UA National Mission on AYUSH 24.84 Tamil Nadu Health System Project 1263.00
221080796JB Chief Ministers Comprehensive Health Insurance Scheme
1263.00
7. Labour and Employment Department
The tribal job seekers especially the fresher from the Schools and Colleges are not
well aware of the employment prospects. Guidance to qualified tribal candidates/students
should be provided in the matter of the higher education, training for appearing in various
competitive examinations and getting jobs. One of the reasons for under utilization of the
special facilities provided for tribal candidates is due to the lack of guidance. Therefore, a
Special Vocational Guidance Centre is functioning at Udhagamandalam in the Nilgiris
District exclusively for Scheduled Tribes. Besides this, one mini I.T.I. is also functioning at
Sankarapuram in Villupuram District.
36
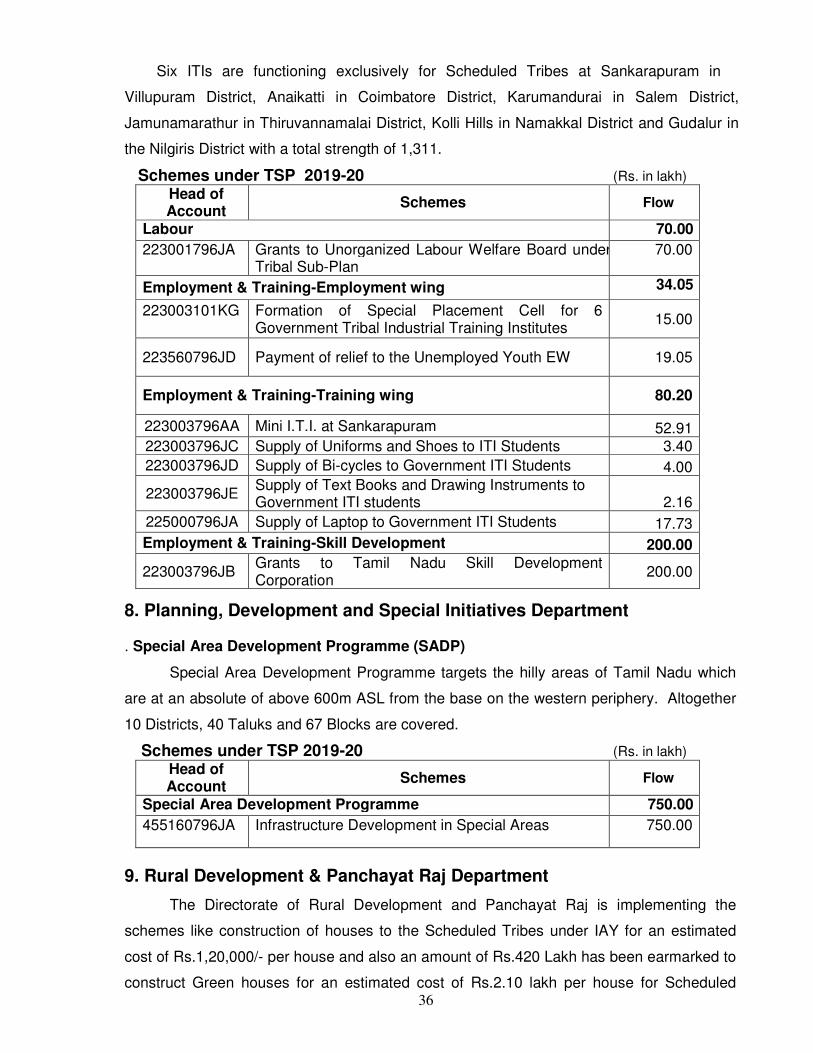
Six ITIs are functioning exclusively for Scheduled Tribes at Sankarapuram in
Villupuram District, Anaikatti in Coimbatore District, Karumandurai in Salem District,
Jamunamarathur in Thiruvannamalai District, Kolli Hills in Namakkal District and Gudalur in
the Nilgiris District with a total strength of 1,311.
Schemes under TSP 2019-20 (Rs. in lakh)
Head of Account
Schemes Flow
Labour 70.00
223001796JA Grants to Unorganized Labour Welfare Board under Tribal Sub-Plan
70.00
Employment & Training-Employment wing 34.05
223003101KG
Formation of Special Placement Cell for 6 Government Tribal Industrial Training Institutes
15.00
223560796JD Payment of relief to the Unemployed Youth EW 19.05
Employment & Training-Training wing 80.20
223003796AA Mini I.T.I. at Sankarapuram 52.91 223003796JC Supply of Uniforms and Shoes to ITI Students 3.40
223003796JD Supply of Bi-cycles to Government ITI Students 4.00
223003796JE Supply of Text Books and Drawing Instruments to Government ITI students 2.16
225000796JA Supply of Laptop to Government ITI Students 17.73
Employment & Training-Skill Development 200.00
223003796JB Grants to Tamil Nadu Skill Development Corporation
200.00
8. Planning, Development and Special Initiatives Department . Special Area Development Programme (SADP)
Special Area Development Programme targets the hilly areas of Tamil Nadu which
are at an absolute of above 600m ASL from the base on the western periphery. Altogether
10 Districts, 40 Taluks and 67 Blocks are covered.
Schemes under TSP 2019-20 (Rs. in lakh)
Head of Account
Schemes Flow
Special Area Development Programme 750.00
455160796JA Infrastructure Development in Special Areas 750.00
9. Rural Development & Panchayat Raj Department
The Directorate of Rural Development and Panchayat Raj is implementing the
schemes like construction of houses to the Scheduled Tribes under IAY for an estimated
cost of Rs.1,20,000/- per house and also an amount of Rs.420 Lakh has been earmarked to
construct Green houses for an estimated cost of Rs.2.10 lakh per house for Scheduled
37
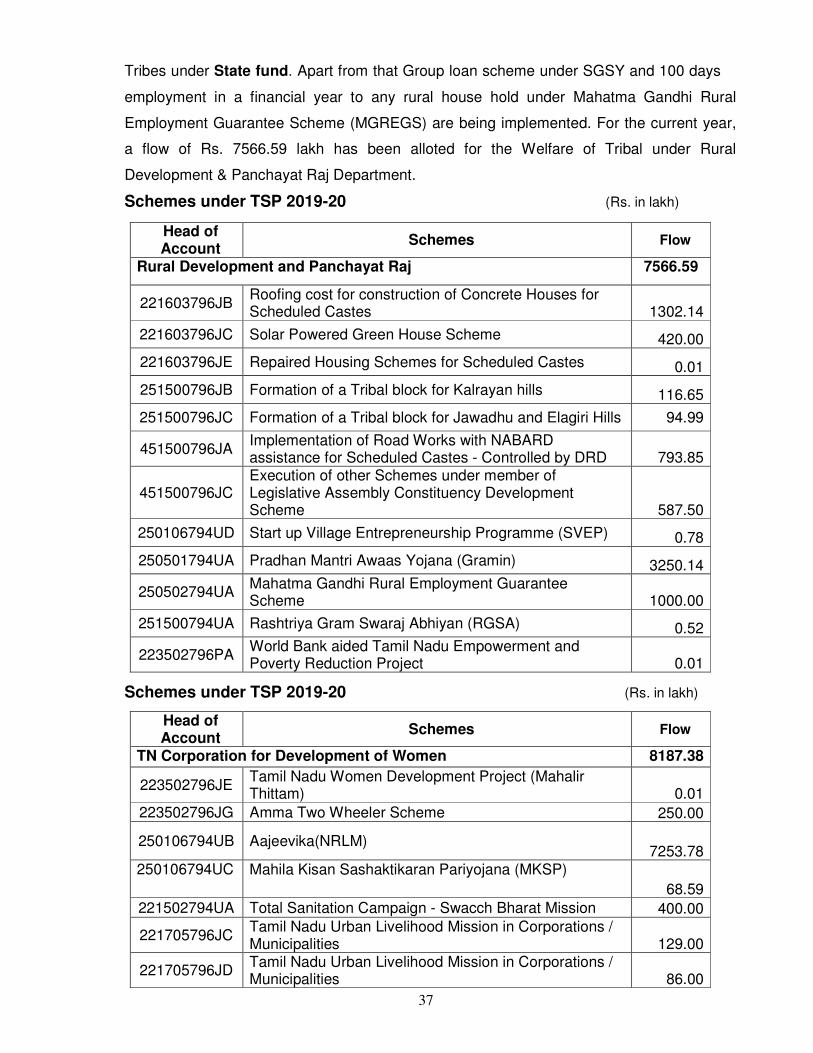
Tribes under State fund. Apart from that Group loan scheme under SGSY and 100 days
employment in a financial year to any rural house hold under Mahatma Gandhi Rural
Employment Guarantee Scheme (MGREGS) are being implemented. For the current year,
a flow of Rs. 7566.59 lakh has been alloted for the Welfare of Tribal under Rural
Development & Panchayat Raj Department.
Schemes under TSP 2019-20 (Rs. in lakh)
Head of Account
Schemes Flow
Rural Development and Panchayat Raj 7566.59
221603796JB Roofing cost for construction of Concrete Houses for Scheduled Castes 1302.14
221603796JC Solar Powered Green House Scheme 420.00
221603796JE Repaired Housing Schemes for Scheduled Castes 0.01
251500796JB Formation of a Tribal block for Kalrayan hills 116.65
251500796JC Formation of a Tribal block for Jawadhu and Elagiri Hills 94.99
451500796JA Implementation of Road Works with NABARD assistance for Scheduled Castes - Controlled by DRD 793.85
451500796JC Execution of other Schemes under member of Legislative Assembly Constituency Development Scheme 587.50
250106794UD Start up Village Entrepreneurship Programme (SVEP) 0.78
250501794UA Pradhan Mantri Awaas Yojana (Gramin) 3250.14
250502794UA Mahatma Gandhi Rural Employment Guarantee Scheme 1000.00
251500794UA Rashtriya Gram Swaraj Abhiyan (RGSA) 0.52
223502796PA World Bank aided Tamil Nadu Empowerment and Poverty Reduction Project 0.01
Schemes under TSP 2019-20 (Rs. in lakh)
Head of Account
Schemes Flow
TN Corporation for Development of Women 8187.38
223502796JE Tamil Nadu Women Development Project (Mahalir Thittam) 0.01
223502796JG Amma Two Wheeler Scheme 250.00
250106794UB Aajeevika(NRLM) 7253.78
250106794UC Mahila Kisan Sashaktikaran Pariyojana (MKSP)
68.59
221502794UA Total Sanitation Campaign - Swacch Bharat Mission 400.00
221705796JC Tamil Nadu Urban Livelihood Mission in Corporations / Municipalities 129.00
221705796JD Tamil Nadu Urban Livelihood Mission in Corporations / Municipalities 86.00
38
Schemes under TSP 2019-20 (Rs. in lakh)
Head of Account
Schemes Flow
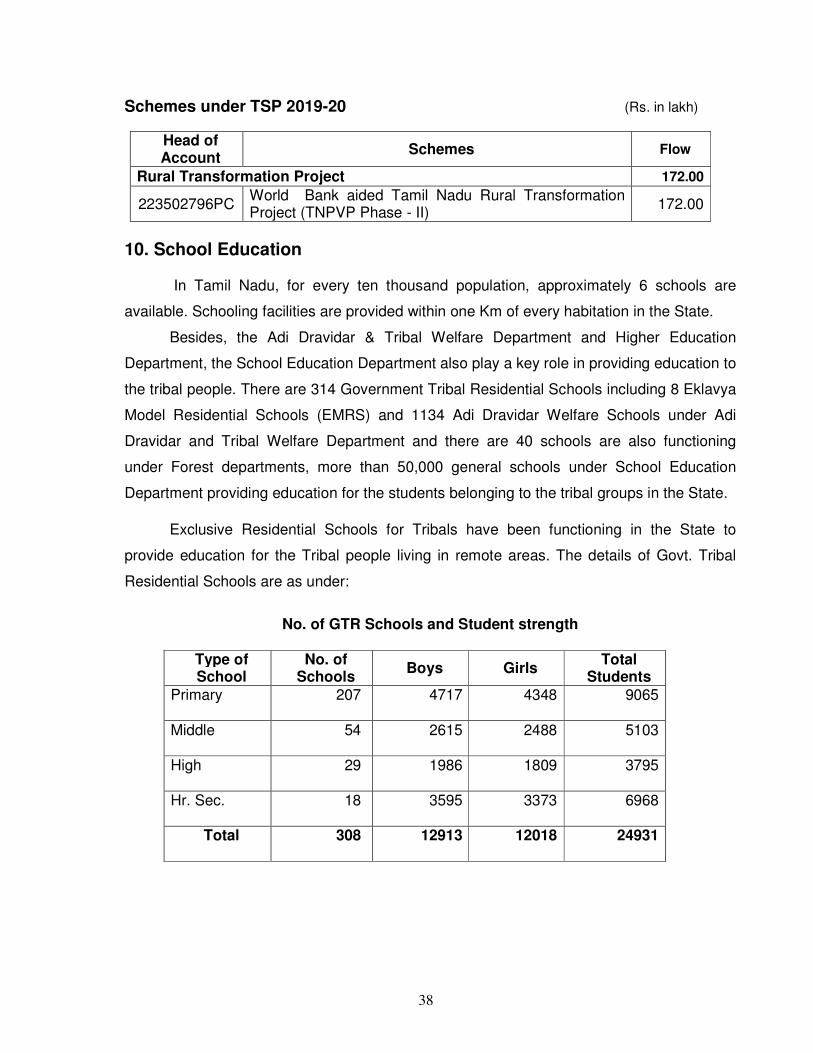
Rural Transformation Project 172.00
223502796PC World Bank aided Tamil Nadu Rural Transformation Project (TNPVP Phase - II)
172.00
10. School Education
In Tamil Nadu, for every ten thousand population, approximately 6 schools are
available. Schooling facilities are provided within one Km of every habitation in the State.
Besides, the Adi Dravidar & Tribal Welfare Department and Higher Education
Department, the School Education Department also play a key role in providing education to
the tribal people. There are 314 Government Tribal Residential Schools including 8 Eklavya
Model Residential Schools (EMRS) and 1134 Adi Dravidar Welfare Schools under Adi
Dravidar and Tribal Welfare Department and there are 40 schools are also functioning
under Forest departments, more than 50,000 general schools under School Education
Department providing education for the students belonging to the tribal groups in the State.
Exclusive Residential Schools for Tribals have been functioning in the State to
provide education for the Tribal people living in remote areas. The details of Govt. Tribal
Residential Schools are as under:
No. of GTR Schools and Student strength
Type of School
No. of Schools
Boys Girls Total
Students
Primary 207 4717 4348 9065
Middle 54 2615 2488 5103
High 29 1986 1809 3795
Hr. Sec. 18 3595 3373 6968
Total 308 12913 12018 24931
39
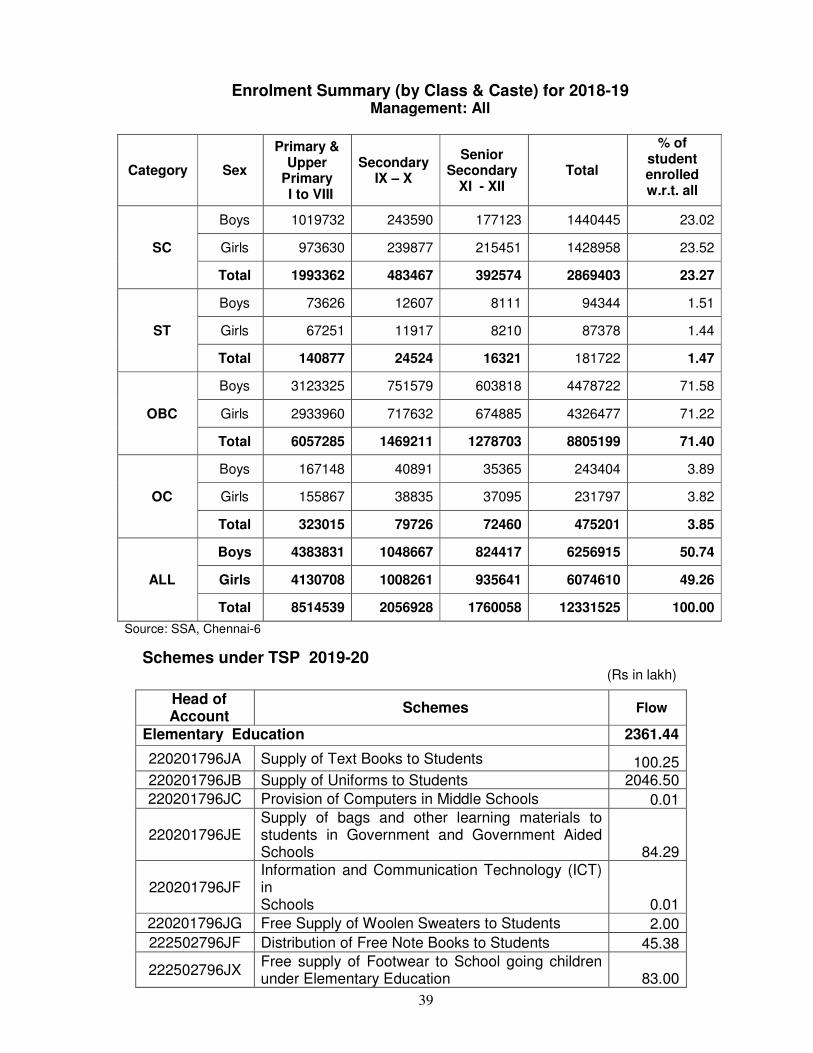
Enrolment Summary (by Class & Caste) for 2018-19
Management: All
Category Sex
Primary & Upper
Primary I to VIII
Secondary IX – X
Senior Secondary
XI - XII Total
% of student enrolled w.r.t. all
SC
Boys 1019732 243590 177123 1440445 23.02
Girls 973630 239877 215451 1428958 23.52
Total 1993362 483467 392574 2869403 23.27
ST
Boys 73626 12607 8111 94344 1.51
Girls 67251 11917 8210 87378 1.44
Total 140877 24524 16321 181722 1.47
OBC
Boys 3123325 751579 603818 4478722 71.58
Girls 2933960 717632 674885 4326477 71.22
Total 6057285 1469211 1278703 8805199 71.40
OC
Boys 167148 40891 35365 243404 3.89
Girls 155867 38835 37095 231797 3.82
Total 323015 79726 72460 475201 3.85
ALL
Boys 4383831 1048667 824417 6256915 50.74
Girls 4130708 1008261 935641 6074610 49.26
Total 8514539 2056928 1760058 12331525 100.00
Source: SSA, Chennai-6
Schemes under TSP 2019-20 (Rs in lakh)
Head of Account
Schemes Flow
Elementary Education 2361.44
220201796JA Supply of Text Books to Students 100.25 220201796JB Supply of Uniforms to Students 2046.50
220201796JC Provision of Computers in Middle Schools 0.01
220201796JE Supply of bags and other learning materials to students in Government and Government Aided Schools 84.29
220201796JF Information and Communication Technology (ICT) in Schools 0.01
220201796JG Free Supply of Woolen Sweaters to Students 2.00
222502796JF Distribution of Free Note Books to Students 45.38
222502796JX Free supply of Footwear to School going children under Elementary Education 83.00
40
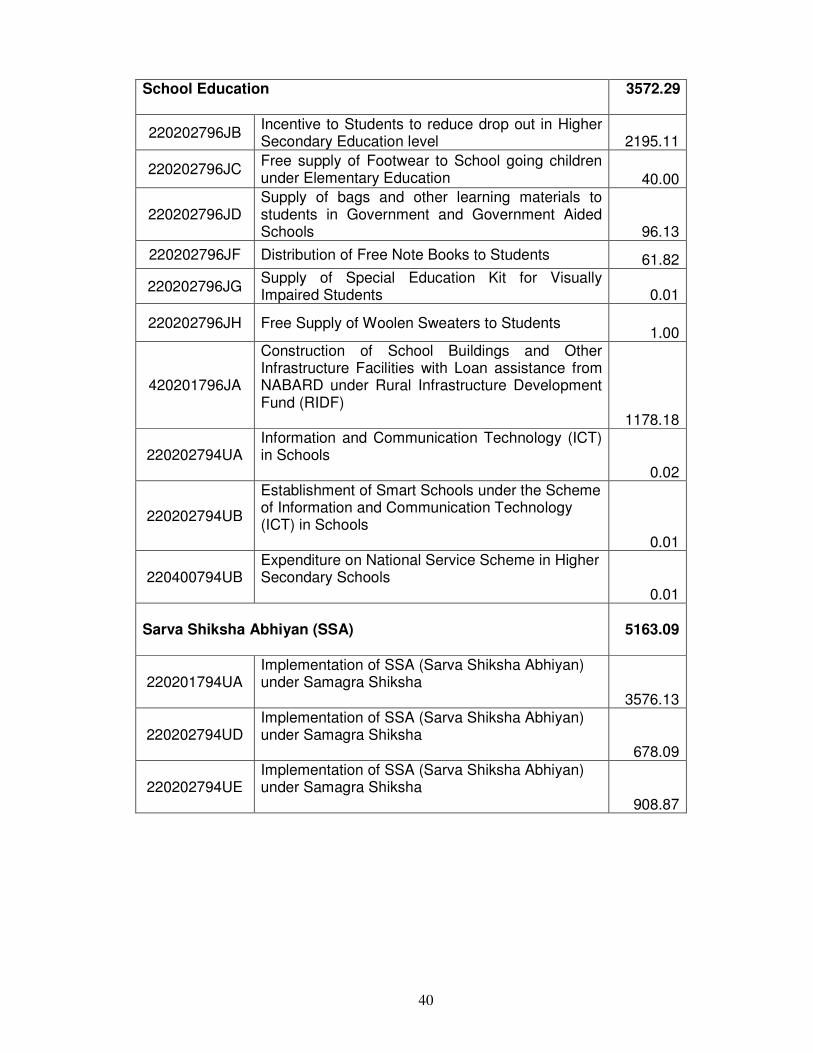
School Education
3572.29
220202796JB Incentive to Students to reduce drop out in Higher Secondary Education level 2195.11
220202796JC Free supply of Footwear to School going children under Elementary Education 40.00
220202796JD Supply of bags and other learning materials to students in Government and Government Aided Schools 96.13
220202796JF Distribution of Free Note Books to Students 61.82
220202796JG Supply of Special Education Kit for Visually Impaired Students 0.01
220202796JH Free Supply of Woolen Sweaters to Students 1.00
420201796JA
Construction of School Buildings and Other Infrastructure Facilities with Loan assistance from NABARD under Rural Infrastructure Development Fund (RIDF) 1178.18
220202794UA Information and Communication Technology (ICT) in Schools 0.02
220202794UB
Establishment of Smart Schools under the Scheme of Information and Communication Technology (ICT) in Schools 0.01
220400794UB Expenditure on National Service Scheme in Higher Secondary Schools 0.01
Sarva Shiksha Abhiyan (SSA)
5163.09
220201794UA Implementation of SSA (Sarva Shiksha Abhiyan) under Samagra Shiksha 3576.13
220202794UD Implementation of SSA (Sarva Shiksha Abhiyan) under Samagra Shiksha 678.09
220202794UE Implementation of SSA (Sarva Shiksha Abhiyan) under Samagra Shiksha 908.87
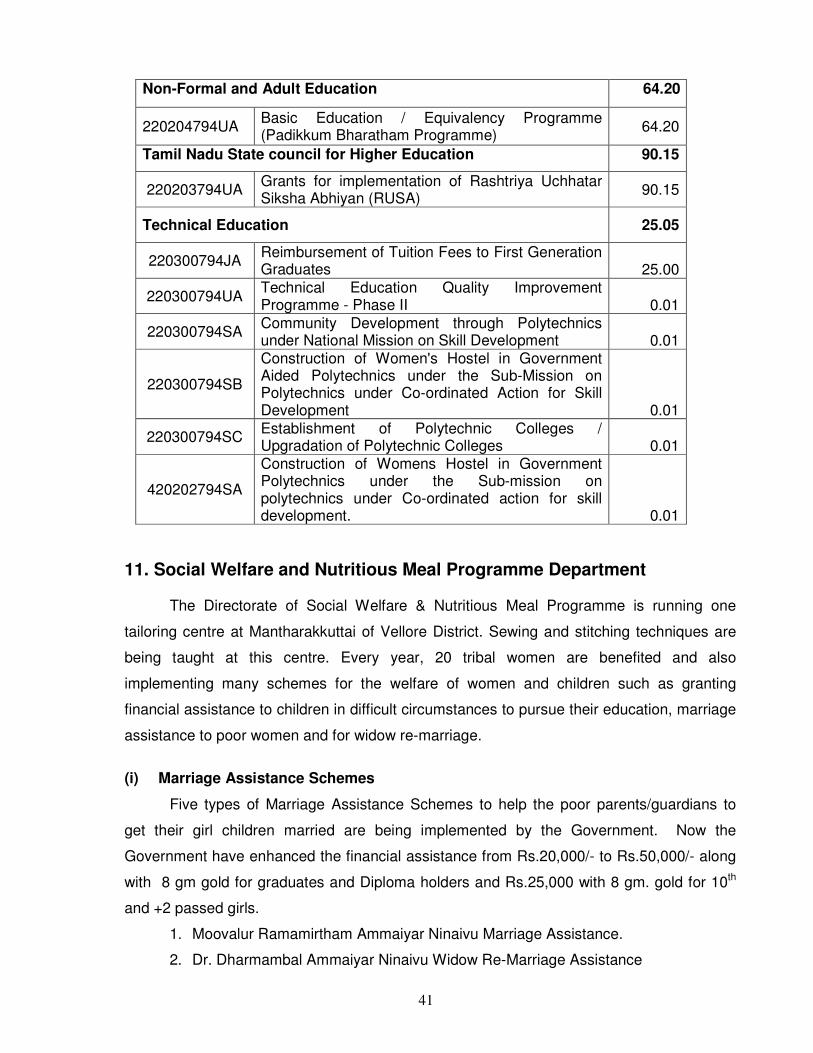
41
Non-Formal and Adult Education 64.20
220204794UA Basic Education / Equivalency Programme (Padikkum Bharatham Programme)
64.20
Tamil Nadu State council for Higher Education 90.15
220203794UA Grants for implementation of Rashtriya Uchhatar Siksha Abhiyan (RUSA)
90.15
Technical Education 25.05
220300794JA Reimbursement of Tuition Fees to First Generation Graduates 25.00
220300794UA Technical Education Quality Improvement Programme - Phase II 0.01
220300794SA Community Development through Polytechnics under National Mission on Skill Development 0.01
220300794SB
Construction of Women's Hostel in Government Aided Polytechnics under the Sub-Mission on Polytechnics under Co-ordinated Action for Skill Development 0.01
220300794SC Establishment of Polytechnic Colleges / Upgradation of Polytechnic Colleges 0.01
420202794SA
Construction of Womens Hostel in Government Polytechnics under the Sub-mission on polytechnics under Co-ordinated action for skill development. 0.01
11. Social Welfare and Nutritious Meal Programme Department The Directorate of Social Welfare & Nutritious Meal Programme is running one
tailoring centre at Mantharakkuttai of Vellore District. Sewing and stitching techniques are
being taught at this centre. Every year, 20 tribal women are benefited and also
implementing many schemes for the welfare of women and children such as granting
financial assistance to children in difficult circumstances to pursue their education, marriage
assistance to poor women and for widow re-marriage.
(i) Marriage Assistance Schemes
Five types of Marriage Assistance Schemes to help the poor parents/guardians to
get their girl children married are being implemented by the Government. Now the
Government have enhanced the financial assistance from Rs.20,000/- to Rs.50,000/- along
with 8 gm gold for graduates and Diploma holders and Rs.25,000 with 8 gm. gold for 10th
and +2 passed girls.
1. Moovalur Ramamirtham Ammaiyar Ninaivu Marriage Assistance.
2. Dr. Dharmambal Ammaiyar Ninaivu Widow Re-Marriage Assistance
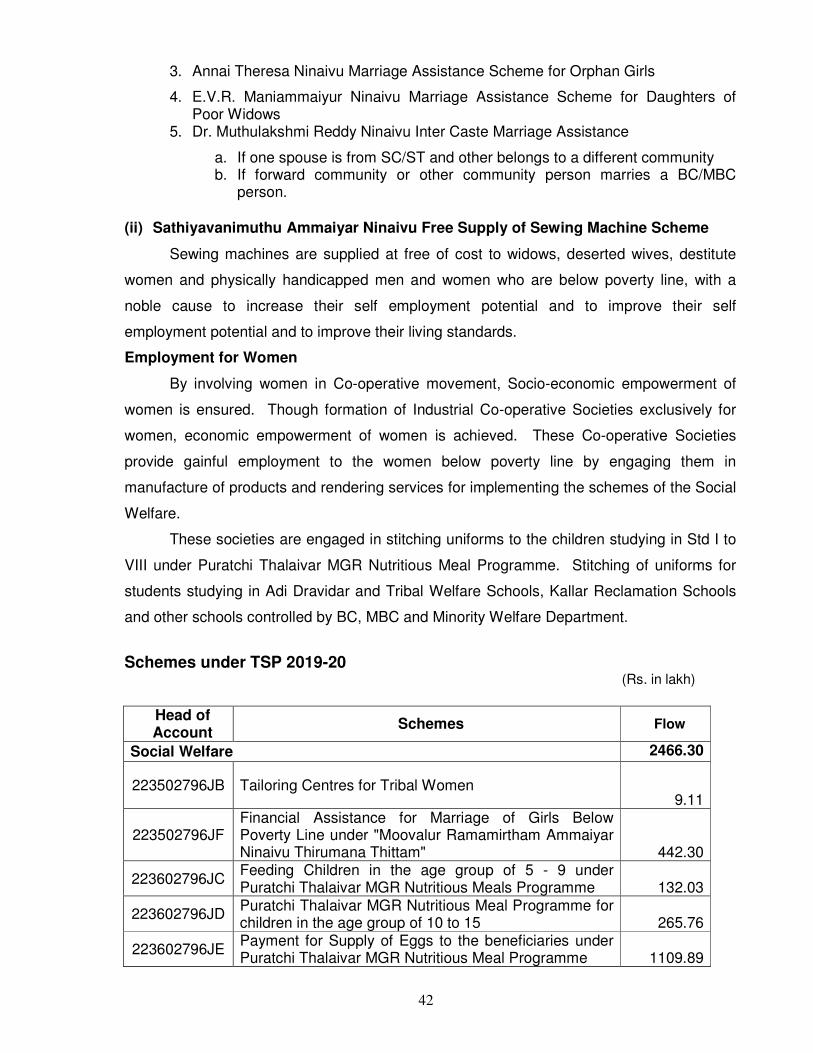
42
3. Annai Theresa Ninaivu Marriage Assistance Scheme for Orphan Girls
4. E.V.R. Maniammaiyur Ninaivu Marriage Assistance Scheme for Daughters of Poor Widows
5. Dr. Muthulakshmi Reddy Ninaivu Inter Caste Marriage Assistance
a. If one spouse is from SC/ST and other belongs to a different community b. If forward community or other community person marries a BC/MBC
person.
(ii) Sathiyavanimuthu Ammaiyar Ninaivu Free Supply of Sewing Machine Scheme
Sewing machines are supplied at free of cost to widows, deserted wives, destitute
women and physically handicapped men and women who are below poverty line, with a
noble cause to increase their self employment potential and to improve their self
employment potential and to improve their living standards.
Employment for Women
By involving women in Co-operative movement, Socio-economic empowerment of
women is ensured. Though formation of Industrial Co-operative Societies exclusively for
women, economic empowerment of women is achieved. These Co-operative Societies
provide gainful employment to the women below poverty line by engaging them in
manufacture of products and rendering services for implementing the schemes of the Social
Welfare.
These societies are engaged in stitching uniforms to the children studying in Std I to
VIII under Puratchi Thalaivar MGR Nutritious Meal Programme. Stitching of uniforms for
students studying in Adi Dravidar and Tribal Welfare Schools, Kallar Reclamation Schools
and other schools controlled by BC, MBC and Minority Welfare Department.
Schemes under TSP 2019-20
(Rs. in lakh)
Head of Account
Schemes Flow
Social Welfare 2466.30
223502796JB Tailoring Centres for Tribal Women 9.11
223502796JF Financial Assistance for Marriage of Girls Below Poverty Line under "Moovalur Ramamirtham Ammaiyar Ninaivu Thirumana Thittam" 442.30
223602796JC Feeding Children in the age group of 5 - 9 under Puratchi Thalaivar MGR Nutritious Meals Programme 132.03
223602796JD Puratchi Thalaivar MGR Nutritious Meal Programme for children in the age group of 10 to 15 265.76
223602796JE Payment for Supply of Eggs to the beneficiaries under Puratchi Thalaivar MGR Nutritious Meal Programme 1109.89
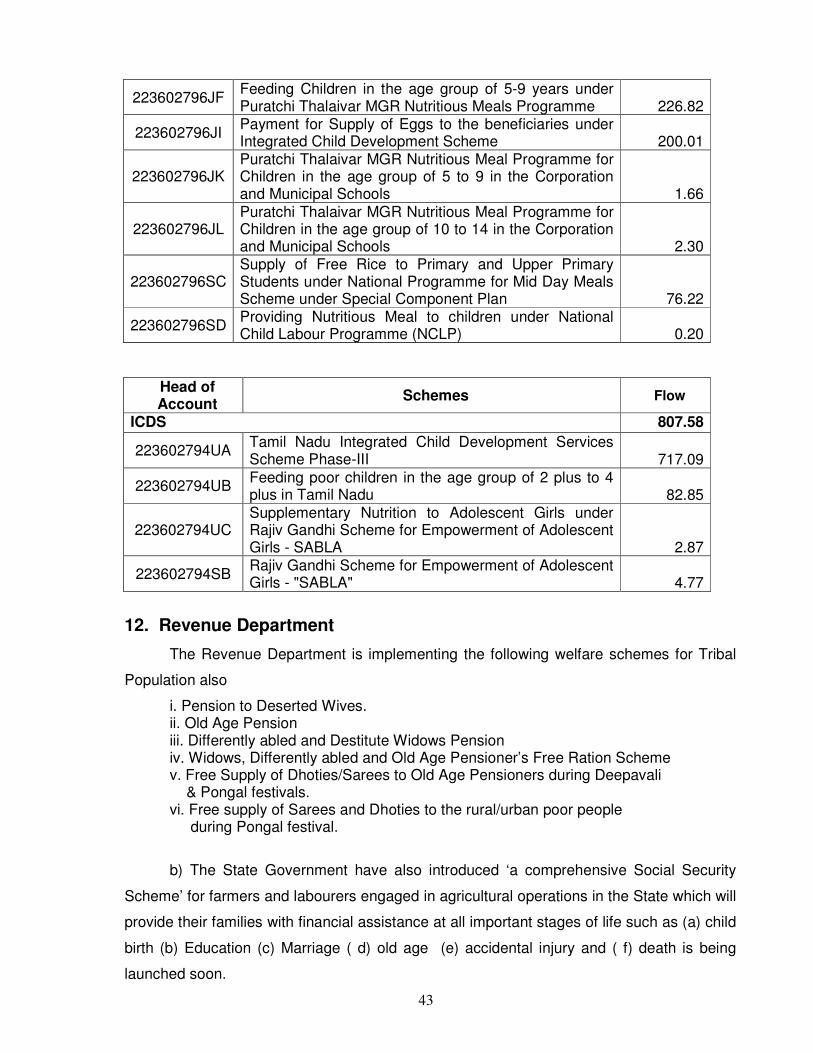
43
223602796JF Feeding Children in the age group of 5-9 years under Puratchi Thalaivar MGR Nutritious Meals Programme 226.82
223602796JI Payment for Supply of Eggs to the beneficiaries under Integrated Child Development Scheme 200.01
223602796JK Puratchi Thalaivar MGR Nutritious Meal Programme for Children in the age group of 5 to 9 in the Corporation and Municipal Schools 1.66
223602796JL Puratchi Thalaivar MGR Nutritious Meal Programme for Children in the age group of 10 to 14 in the Corporation and Municipal Schools 2.30
223602796SC Supply of Free Rice to Primary and Upper Primary Students under National Programme for Mid Day Meals Scheme under Special Component Plan 76.22
223602796SD Providing Nutritious Meal to children under National Child Labour Programme (NCLP) 0.20
Head of Account
Schemes Flow
ICDS 807.58
223602794UA Tamil Nadu Integrated Child Development Services Scheme Phase-III 717.09
223602794UB Feeding poor children in the age group of 2 plus to 4 plus in Tamil Nadu 82.85
223602794UC Supplementary Nutrition to Adolescent Girls under Rajiv Gandhi Scheme for Empowerment of Adolescent Girls - SABLA 2.87
223602794SB Rajiv Gandhi Scheme for Empowerment of Adolescent Girls - "SABLA" 4.77
12. Revenue Department
The Revenue Department is implementing the following welfare schemes for Tribal
Population also
i. Pension to Deserted Wives. ii. Old Age Pension iii. Differently abled and Destitute Widows Pension iv. Widows, Differently abled and Old Age Pensioner’s Free Ration Scheme v. Free Supply of Dhoties/Sarees to Old Age Pensioners during Deepavali & Pongal festivals. vi. Free supply of Sarees and Dhoties to the rural/urban poor people during Pongal festival.
b) The State Government have also introduced ‘a comprehensive Social Security
Scheme’ for farmers and labourers engaged in agricultural operations in the State which will
provide their families with financial assistance at all important stages of life such as (a) child
birth (b) Education (c) Marriage ( d) old age (e) accidental injury and ( f) death is being
launched soon.

44
A sum of Rs.4171.99 lakh has been allotted during the year 2019-20 for the
implementation of the above schemes.
Schemes under TSP 2019-20 (Rs. in lakh)
Schemes under TSP 2019-20 (Rs. in lakh)
13. Special Programme Implementation Department
This Government has created a new Special Programme Implementation
Department to ensure the timely implementation of the schemes promised in the
election manifesto.
Distribution Laptop Computers @ free of cost to +1,+2 and College Students:
The Government will implement the scheme for distribution of Laptop Computers to
Students studying in +1, +2 and College Students of Government and Government Aided
Head of Account
Schemes Flow
Revenue Administration 4171.99
223560796JK Social Security Net - Pension to Deserted Wives 120.78
223560796JM Social Security Net - Pension for the Differently abled 313.57
223560796JO Destitute Widows Pension 465.72
223560796JQ Supply of Dhoties / Sarees to Old Age Pensioners 162.86
223560796JV Chief Minister's Uzhavar Pathukappu Thittam (CMUPT) 361.61
223560794UA Social Security Net - Indira Gandhi National Old Age Pension 1934.41
223560794UB Indira Gandhi National Disabled Pension Scheme 133.42
223560794UC Indira Gandhi National Widow Pension Scheme 661.09
223560794SA Distress Relief Scheme 15.00
223560794SB Widows, Differently abled and Old Age Pensioners' Free Ration Schemes 3.53
Head of Account
Schemes Flow
Land Reforms 308.56
223560796JE Chief Minister's Farmers Security Scheme 124.80
223560796JW Comprehensive Accident - cum - Life Insurance Scheme 183.76
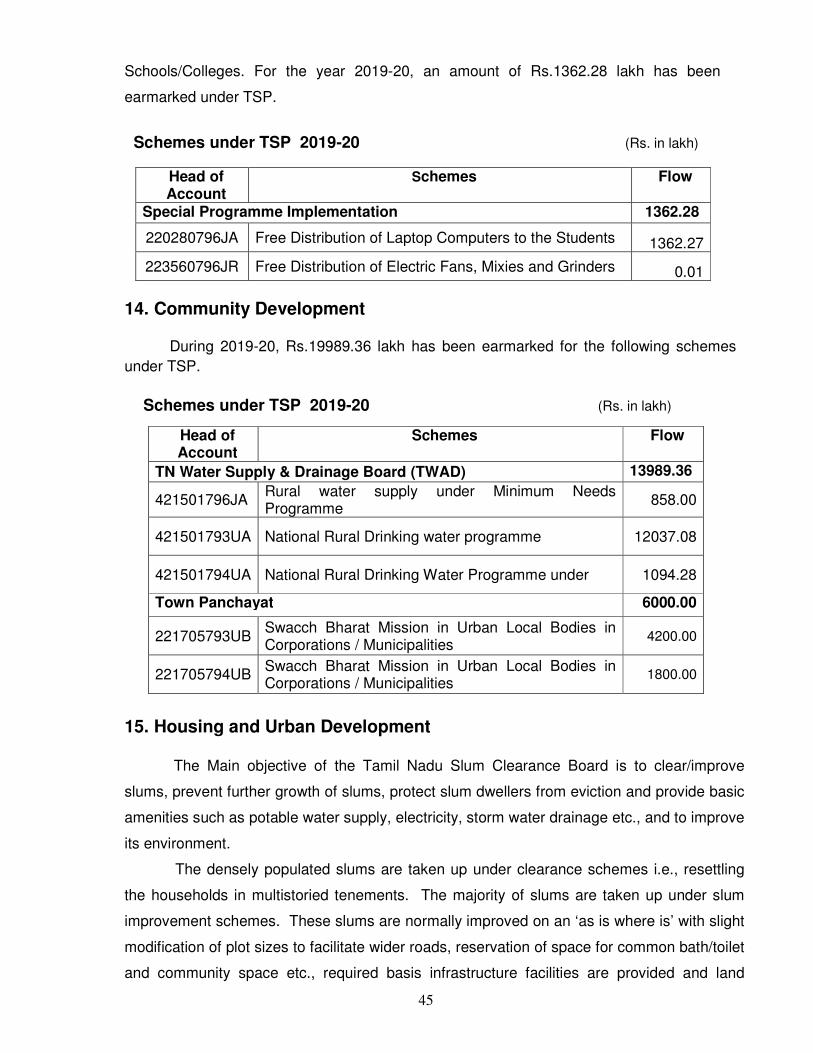
45
Schools/Colleges. For the year 2019-20, an amount of Rs.1362.28 lakh has been
earmarked under TSP.
Schemes under TSP 2019-20 (Rs. in lakh)
Head of Account
Schemes Flow
Special Programme Implementation 1362.28
220280796JA Free Distribution of Laptop Computers to the Students 1362.27
223560796JR Free Distribution of Electric Fans, Mixies and Grinders 0.01
14. Community Development During 2019-20, Rs.19989.36 lakh has been earmarked for the following schemes
under TSP.
Schemes under TSP 2019-20 (Rs. in lakh)
15. Housing and Urban Development The Main objective of the Tamil Nadu Slum Clearance Board is to clear/improve
slums, prevent further growth of slums, protect slum dwellers from eviction and provide basic
amenities such as potable water supply, electricity, storm water drainage etc., and to improve
its environment.
The densely populated slums are taken up under clearance schemes i.e., resettling
the households in multistoried tenements. The majority of slums are taken up under slum
improvement schemes. These slums are normally improved on an ‘as is where is’ with slight
modification of plot sizes to facilitate wider roads, reservation of space for common bath/toilet
and community space etc., required basis infrastructure facilities are provided and land
Head of Account
Schemes Flow
TN Water Supply & Drainage Board (TWAD) 13989.36
421501796JA Rural water supply under Minimum Needs Programme
858.00
421501793UA National Rural Drinking water programme 12037.08
421501794UA National Rural Drinking Water Programme under 1094.28
Town Panchayat 6000.00
221705793UB Swacch Bharat Mission in Urban Local Bodies in Corporations / Municipalities
4200.00
221705794UB Swacch Bharat Mission in Urban Local Bodies in Corporations / Municipalities
1800.00
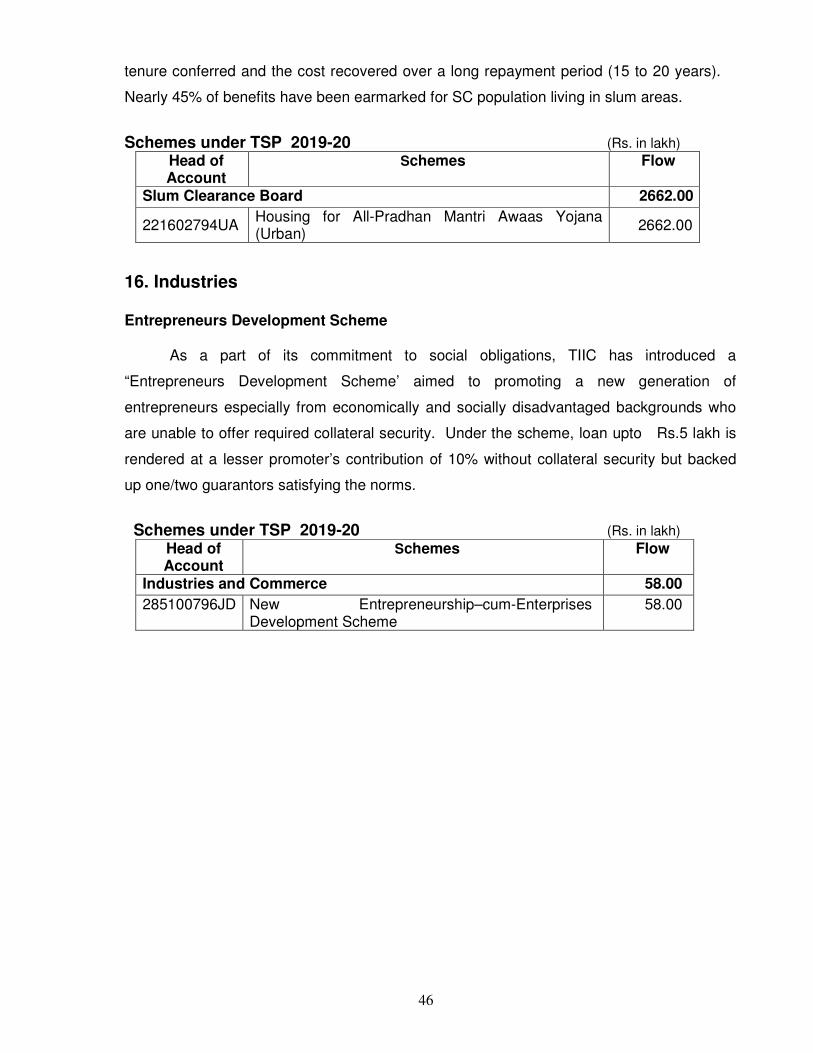
46
tenure conferred and the cost recovered over a long repayment period (15 to 20 years).
Nearly 45% of benefits have been earmarked for SC population living in slum areas.
Schemes under TSP 2019-20 (Rs. in lakh)
Head of Account
Schemes Flow
Slum Clearance Board 2662.00
221602794UA Housing for All-Pradhan Mantri Awaas Yojana (Urban)
2662.00
16. Industries Entrepreneurs Development Scheme As a part of its commitment to social obligations, TIIC has introduced a
“Entrepreneurs Development Scheme’ aimed to promoting a new generation of
entrepreneurs especially from economically and socially disadvantaged backgrounds who
are unable to offer required collateral security. Under the scheme, loan upto Rs.5 lakh is
rendered at a lesser promoter’s contribution of 10% without collateral security but backed
up one/two guarantors satisfying the norms.
Schemes under TSP 2019-20 (Rs. in lakh)
Head of Account
Schemes Flow
Industries and Commerce 58.00
285100796JD New Entrepreneurship–cum-Enterprises Development Scheme
58.00
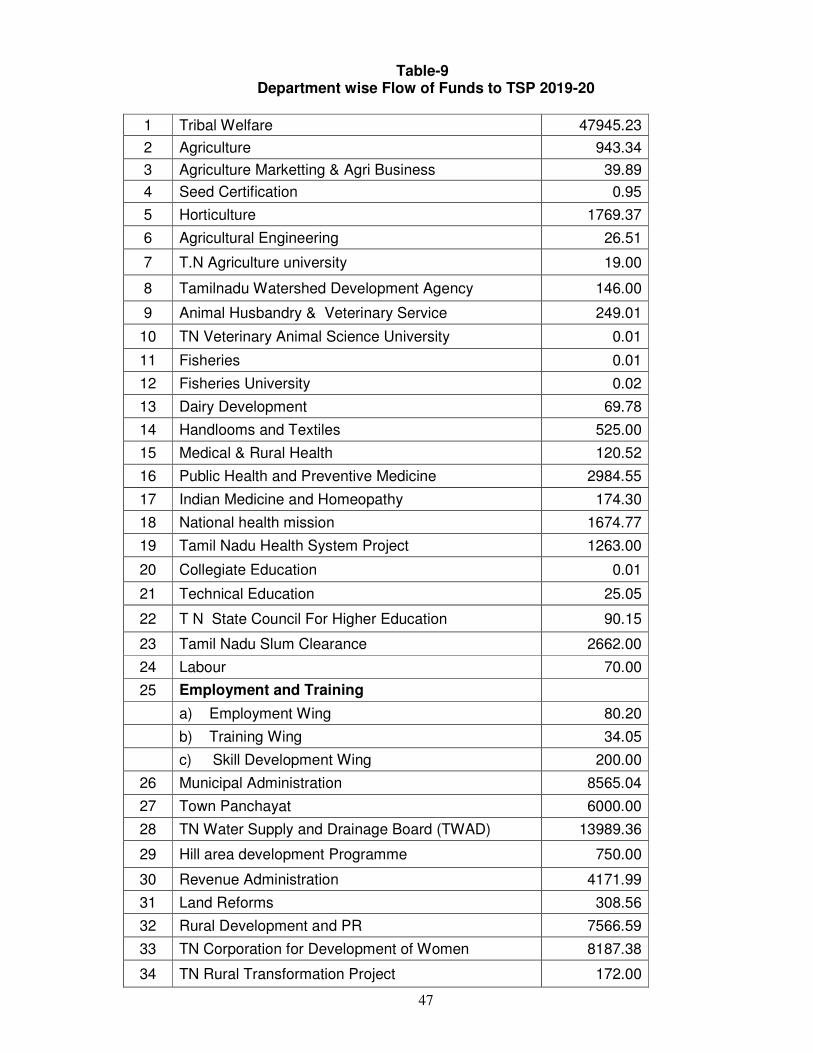
47
Table-9 Department wise Flow of Funds to TSP 2019-20
1 Tribal Welfare 47945.23
2 Agriculture 943.34
3 Agriculture Marketting & Agri Business 39.89
4 Seed Certification 0.95
5 Horticulture 1769.37
6 Agricultural Engineering 26.51
7 T.N Agriculture university 19.00
8 Tamilnadu Watershed Development Agency 146.00
9 Animal Husbandry & Veterinary Service 249.01
10 TN Veterinary Animal Science University 0.01
11 Fisheries 0.01
12 Fisheries University 0.02
13 Dairy Development 69.78
14 Handlooms and Textiles 525.00
15 Medical & Rural Health 120.52
16 Public Health and Preventive Medicine 2984.55
17 Indian Medicine and Homeopathy 174.30
18 National health mission 1674.77
19 Tamil Nadu Health System Project 1263.00
20 Collegiate Education 0.01
21 Technical Education 25.05
22 T N State Council For Higher Education 90.15
23 Tamil Nadu Slum Clearance 2662.00
24 Labour 70.00
25 Employment and Training
a) Employment Wing 80.20
b) Training Wing 34.05
c) Skill Development Wing 200.00
26 Municipal Administration 8565.04
27 Town Panchayat 6000.00
28 TN Water Supply and Drainage Board (TWAD) 13989.36
29 Hill area development Programme 750.00
30 Revenue Administration 4171.99
31 Land Reforms 308.56
32 Rural Development and PR 7566.59
33 TN Corporation for Development of Women 8187.38
34 TN Rural Transformation Project 172.00
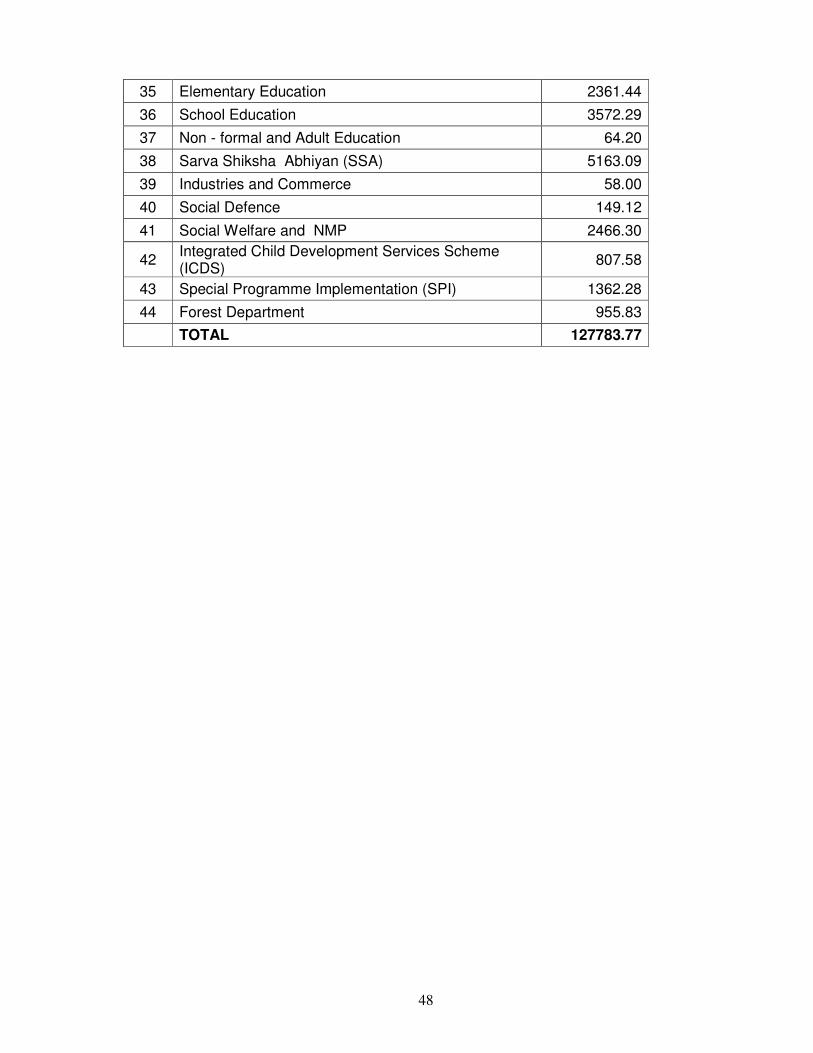
48
35 Elementary Education 2361.44
36 School Education 3572.29
37 Non - formal and Adult Education 64.20
38 Sarva Shiksha Abhiyan (SSA) 5163.09
39 Industries and Commerce 58.00
40 Social Defence 149.12
41 Social Welfare and NMP 2466.30
42 Integrated Child Development Services Scheme (ICDS)
807.58
43 Special Programme Implementation (SPI) 1362.28
44 Forest Department 955.83
TOTAL 127783.77
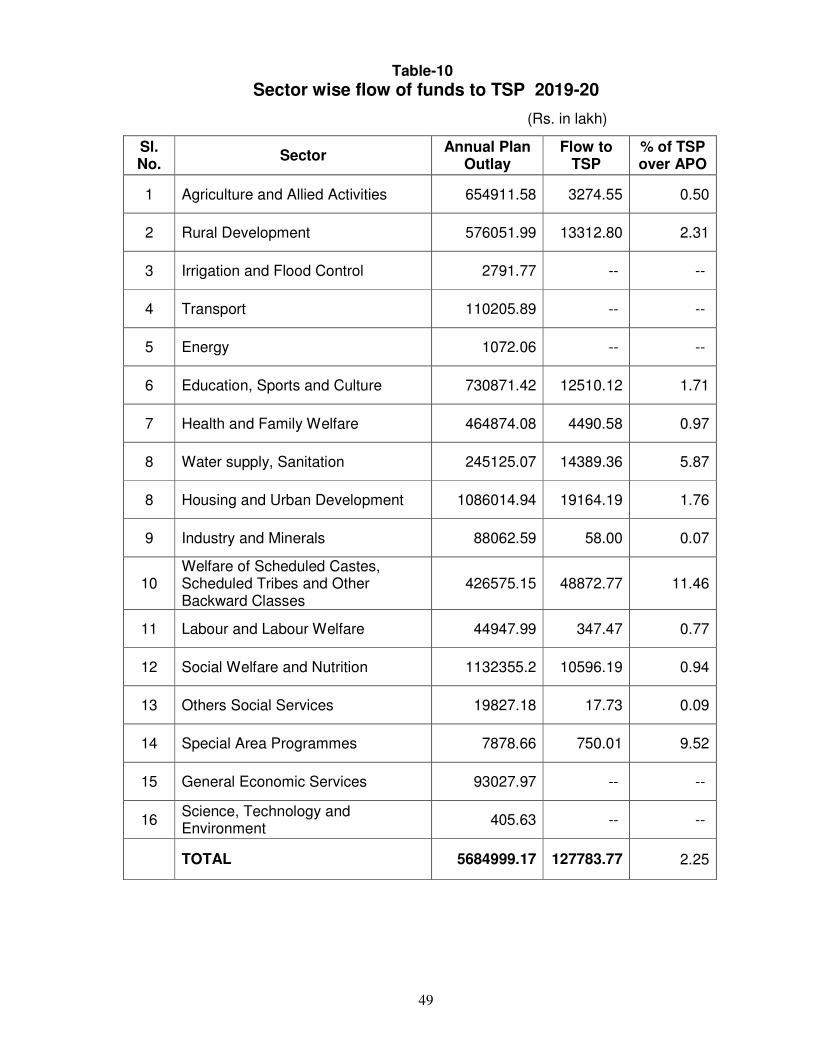
49
Table-10
Sector wise flow of funds to TSP 2019-20
(Rs. in lakh)
Sl. No.
Sector Annual Plan
Outlay Flow to
TSP % of TSP over APO
1 Agriculture and Allied Activities 654911.58 3274.55 0.50
2 Rural Development 576051.99 13312.80 2.31
3 Irrigation and Flood Control 2791.77 -- --
4 Transport 110205.89 -- --
5 Energy 1072.06 -- --
6 Education, Sports and Culture 730871.42 12510.12 1.71
7 Health and Family Welfare 464874.08 4490.58 0.97
8 Water supply, Sanitation 245125.07 14389.36 5.87
8 Housing and Urban Development 1086014.94 19164.19 1.76
9 Industry and Minerals 88062.59 58.00 0.07
10 Welfare of Scheduled Castes, Scheduled Tribes and Other Backward Classes
426575.15 48872.77 11.46
11 Labour and Labour Welfare 44947.99 347.47 0.77
12 Social Welfare and Nutrition 1132355.2 10596.19 0.94
13 Others Social Services 19827.18 17.73 0.09
14 Special Area Programmes 7878.66 750.01 9.52
15 General Economic Services 93027.97 -- --
16 Science, Technology and Environment
405.63 -- --
TOTAL 5684999.17 127783.77 2.25
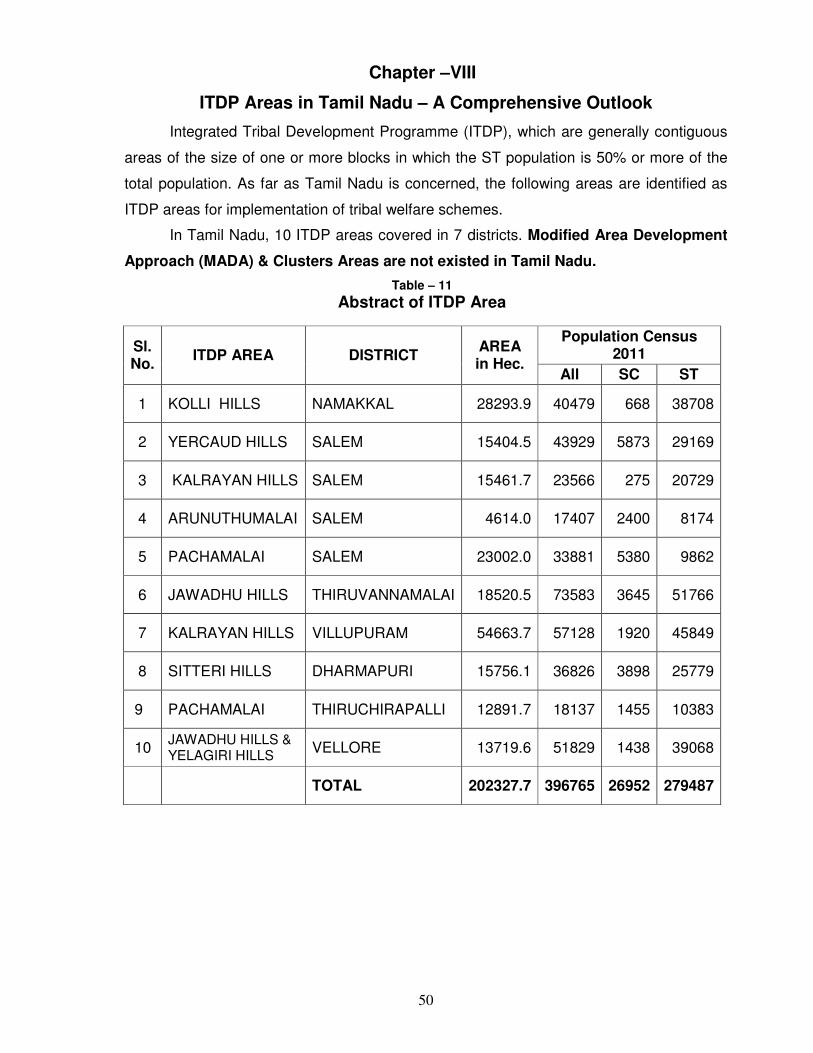
50
Chapter –VIII
ITDP Areas in Tamil Nadu – A Comprehensive Outlook
Integrated Tribal Development Programme (ITDP), which are generally contiguous
areas of the size of one or more blocks in which the ST population is 50% or more of the
total population. As far as Tamil Nadu is concerned, the following areas are identified as
ITDP areas for implementation of tribal welfare schemes.
In Tamil Nadu, 10 ITDP areas covered in 7 districts. Modified Area Development
Approach (MADA) & Clusters Areas are not existed in Tamil Nadu.
Table – 11 Abstract of ITDP Area
Sl. No.
ITDP AREA DISTRICT AREA in Hec.
Population Census 2011
All SC ST
1 KOLLI HILLS NAMAKKAL 28293.9 40479 668 38708
2 YERCAUD HILLS SALEM 15404.5 43929 5873 29169
3 KALRAYAN HILLS SALEM 15461.7 23566 275 20729
4 ARUNUTHUMALAI SALEM 4614.0 17407 2400 8174
5 PACHAMALAI SALEM 23002.0 33881 5380 9862
6 JAWADHU HILLS THIRUVANNAMALAI 18520.5 73583 3645 51766
7 KALRAYAN HILLS VILLUPURAM 54663.7 57128 1920 45849
8 SITTERI HILLS DHARMAPURI 15756.1 36826 3898 25779
9 PACHAMALAI THIRUCHIRAPALLI 12891.7 18137 1455 10383
10 JAWADHU HILLS & YELAGIRI HILLS
VELLORE 13719.6 51829 1438 39068
TOTAL 202327.7 396765 26952 279487
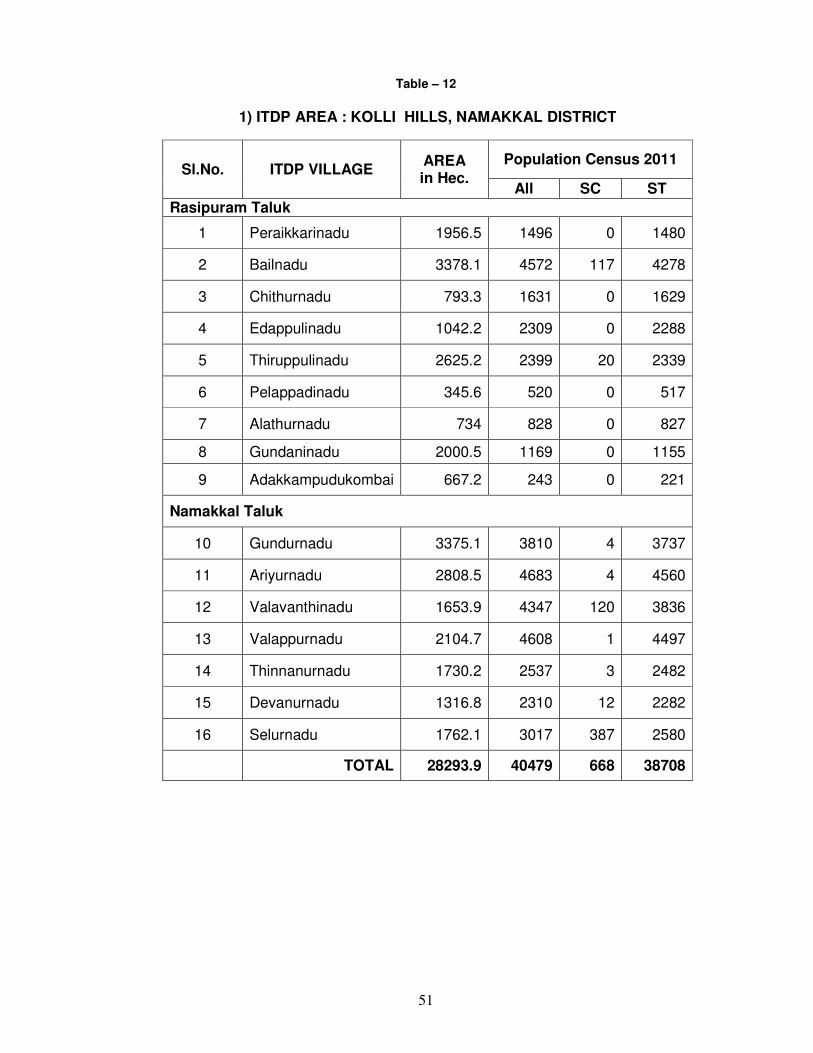
51
Table – 12
1) ITDP AREA : KOLLI HILLS, NAMAKKAL DISTRICT
Sl.No. ITDP VILLAGE AREA in Hec.
Population Census 2011
All SC ST
Rasipuram Taluk
1 Peraikkarinadu 1956.5 1496 0 1480
2 Bailnadu 3378.1 4572 117 4278
3 Chithurnadu 793.3 1631 0 1629
4 Edappulinadu 1042.2 2309 0 2288
5 Thiruppulinadu 2625.2 2399 20 2339
6 Pelappadinadu 345.6 520 0 517
7 Alathurnadu 734 828 0 827
8 Gundaninadu 2000.5 1169 0 1155
9 Adakkampudukombai 667.2 243 0 221
Namakkal Taluk
10 Gundurnadu 3375.1 3810 4 3737
11 Ariyurnadu 2808.5 4683 4 4560
12 Valavanthinadu 1653.9 4347 120 3836
13 Valappurnadu 2104.7 4608 1 4497
14 Thinnanurnadu 1730.2 2537 3 2482
15 Devanurnadu 1316.8 2310 12 2282
16 Selurnadu 1762.1 3017 387 2580
TOTAL 28293.9 40479 668 38708
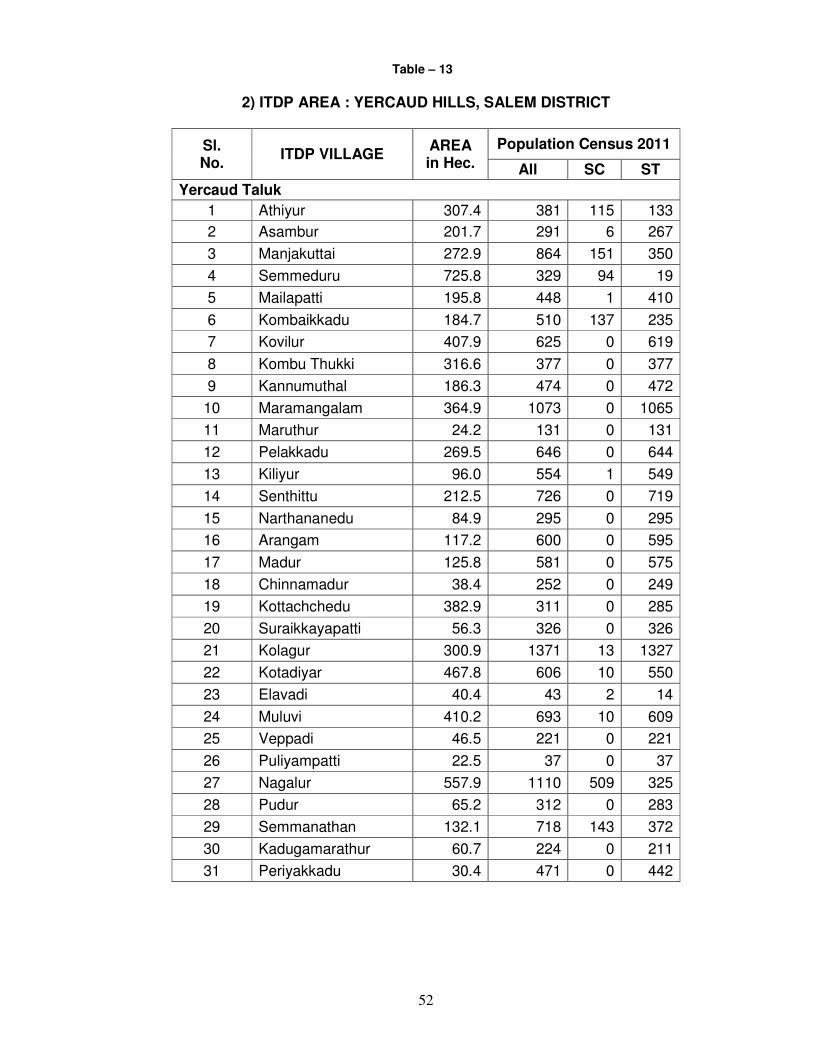
52
Table – 13
2) ITDP AREA : YERCAUD HILLS, SALEM DISTRICT
Sl. No.
ITDP VILLAGE AREA in Hec.
Population Census 2011
All SC ST
Yercaud Taluk
1 Athiyur 307.4 381 115 133
2 Asambur 201.7 291 6 267
3 Manjakuttai 272.9 864 151 350
4 Semmeduru 725.8 329 94 19
5 Mailapatti 195.8 448 1 410
6 Kombaikkadu 184.7 510 137 235
7 Kovilur 407.9 625 0 619
8 Kombu Thukki 316.6 377 0 377
9 Kannumuthal 186.3 474 0 472
10 Maramangalam 364.9 1073 0 1065
11 Maruthur 24.2 131 0 131
12 Pelakkadu 269.5 646 0 644
13 Kiliyur 96.0 554 1 549
14 Senthittu 212.5 726 0 719
15 Narthananedu 84.9 295 0 295
16 Arangam 117.2 600 0 595
17 Madur 125.8 581 0 575
18 Chinnamadur 38.4 252 0 249
19 Kottachchedu 382.9 311 0 285
20 Suraikkayapatti 56.3 326 0 326
21 Kolagur 300.9 1371 13 1327
22 Kotadiyar 467.8 606 10 550
23 Elavadi 40.4 43 2 14
24 Muluvi 410.2 693 10 609
25 Veppadi 46.5 221 0 221
26 Puliyampatti 22.5 37 0 37
27 Nagalur 557.9 1110 509 325
28 Pudur 65.2 312 0 283
29 Semmanathan 132.1 718 143 372
30 Kadugamarathur 60.7 224 0 211
31 Periyakkadu 30.4 471 0 442
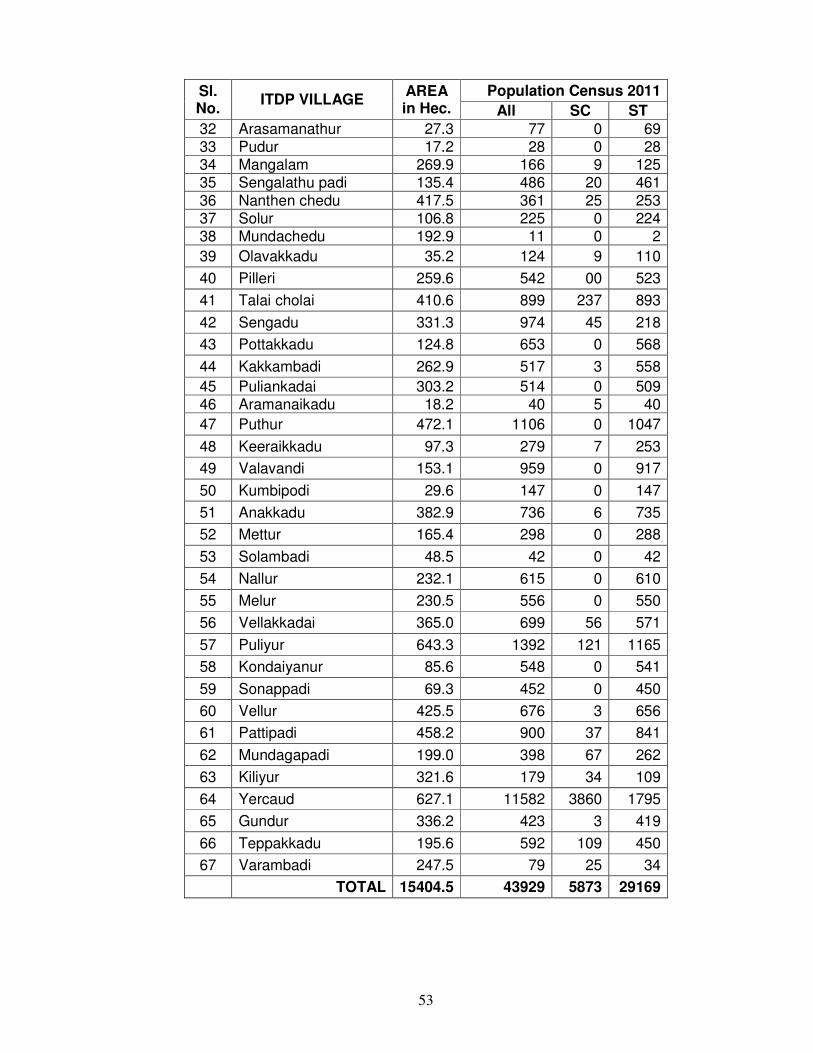
53
Sl. No.
ITDP VILLAGE AREA in Hec.
Population Census 2011
All SC ST
32 Arasamanathur 27.3 77 0 69 33 Pudur 17.2 28 0 28 34 Mangalam 269.9 166 9 125 35 Sengalathu padi 135.4 486 20 461
36 Nanthen chedu 417.5 361 25 253 37 Solur 106.8 225 0 224 38 Mundachedu 192.9 11 0 2
39 Olavakkadu 35.2 124 9 110
40 Pilleri 259.6 542 00 523
41 Talai cholai 410.6 899 237 893
42 Sengadu 331.3 974 45 218
43 Pottakkadu 124.8 653 0 568
44 Kakkambadi 262.9 517 3 558
45 Puliankadai 303.2 514 0 509 46 Aramanaikadu 18.2 40 5 40
47 Puthur 472.1 1106 0 1047
48 Keeraikkadu 97.3 279 7 253
49 Valavandi 153.1 959 0 917
50 Kumbipodi 29.6 147 0 147
51 Anakkadu 382.9 736 6 735
52 Mettur 165.4 298 0 288
53 Solambadi 48.5 42 0 42
54 Nallur 232.1 615 0 610
55 Melur 230.5 556 0 550
56 Vellakkadai 365.0 699 56 571
57 Puliyur 643.3 1392 121 1165
58 Kondaiyanur 85.6 548 0 541
59 Sonappadi 69.3 452 0 450
60 Vellur 425.5 676 3 656
61 Pattipadi 458.2 900 37 841
62 Mundagapadi 199.0 398 67 262
63 Kiliyur 321.6 179 34 109
64 Yercaud 627.1 11582 3860 1795
65 Gundur 336.2 423 3 419
66 Teppakkadu 195.6 592 109 450
67 Varambadi 247.5 79 25 34
TOTAL 15404.5 43929 5873 29169
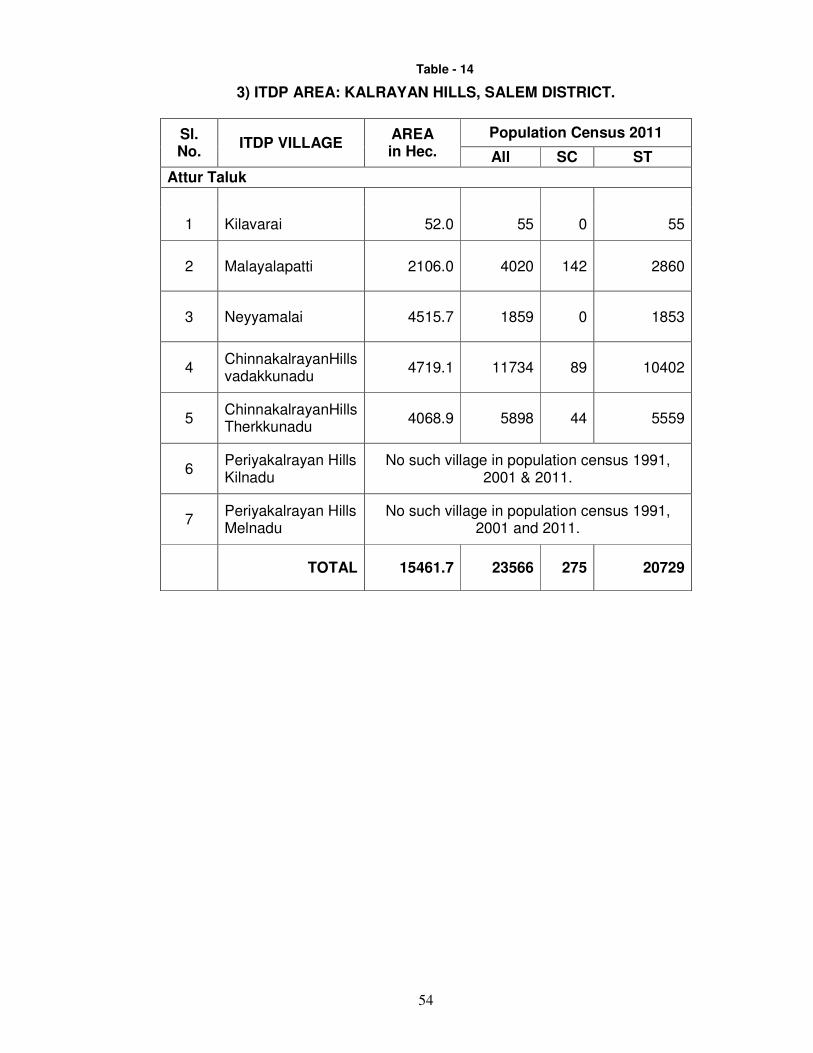
54
Table - 14
3) ITDP AREA: KALRAYAN HILLS, SALEM DISTRICT.
Sl. No.
ITDP VILLAGE AREA in Hec.
Population Census 2011
All SC ST
Attur Taluk
1 Kilavarai 52.0 55 0 55
2 Malayalapatti 2106.0 4020 142 2860
3 Neyyamalai 4515.7 1859 0 1853
4 ChinnakalrayanHills vadakkunadu
4719.1 11734 89 10402
5 ChinnakalrayanHills Therkkunadu
4068.9 5898 44 5559
6 Periyakalrayan Hills Kilnadu
No such village in population census 1991, 2001 & 2011.
7 Periyakalrayan Hills Melnadu
No such village in population census 1991, 2001 and 2011.
TOTAL 15461.7 23566 275 20729
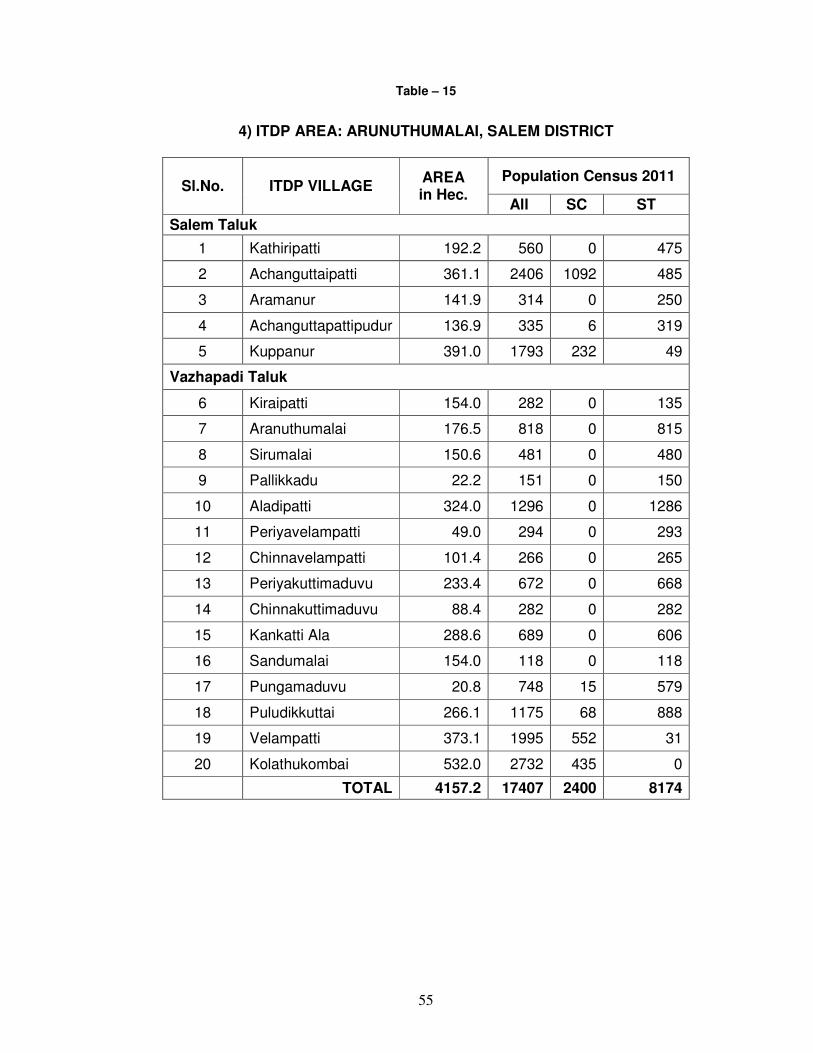
55
Table – 15
4) ITDP AREA: ARUNUTHUMALAI, SALEM DISTRICT
Sl.No. ITDP VILLAGE AREA in Hec.
Population Census 2011
All SC ST
Salem Taluk
1 Kathiripatti 192.2 560 0 475
2 Achanguttaipatti 361.1 2406 1092 485
3 Aramanur 141.9 314 0 250
4 Achanguttapattipudur 136.9 335 6 319
5 Kuppanur 391.0 1793 232 49
Vazhapadi Taluk
6 Kiraipatti 154.0 282 0 135
7 Aranuthumalai 176.5 818 0 815
8 Sirumalai 150.6 481 0 480
9 Pallikkadu 22.2 151 0 150
10 Aladipatti 324.0 1296 0 1286
11 Periyavelampatti 49.0 294 0 293
12 Chinnavelampatti 101.4 266 0 265
13 Periyakuttimaduvu 233.4 672 0 668
14 Chinnakuttimaduvu 88.4 282 0 282
15 Kankatti Ala 288.6 689 0 606
16 Sandumalai 154.0 118 0 118
17 Pungamaduvu 20.8 748 15 579
18 Puludikkuttai 266.1 1175 68 888
19 Velampatti 373.1 1995 552 31
20 Kolathukombai 532.0 2732 435 0
TOTAL 4157.2 17407 2400 8174
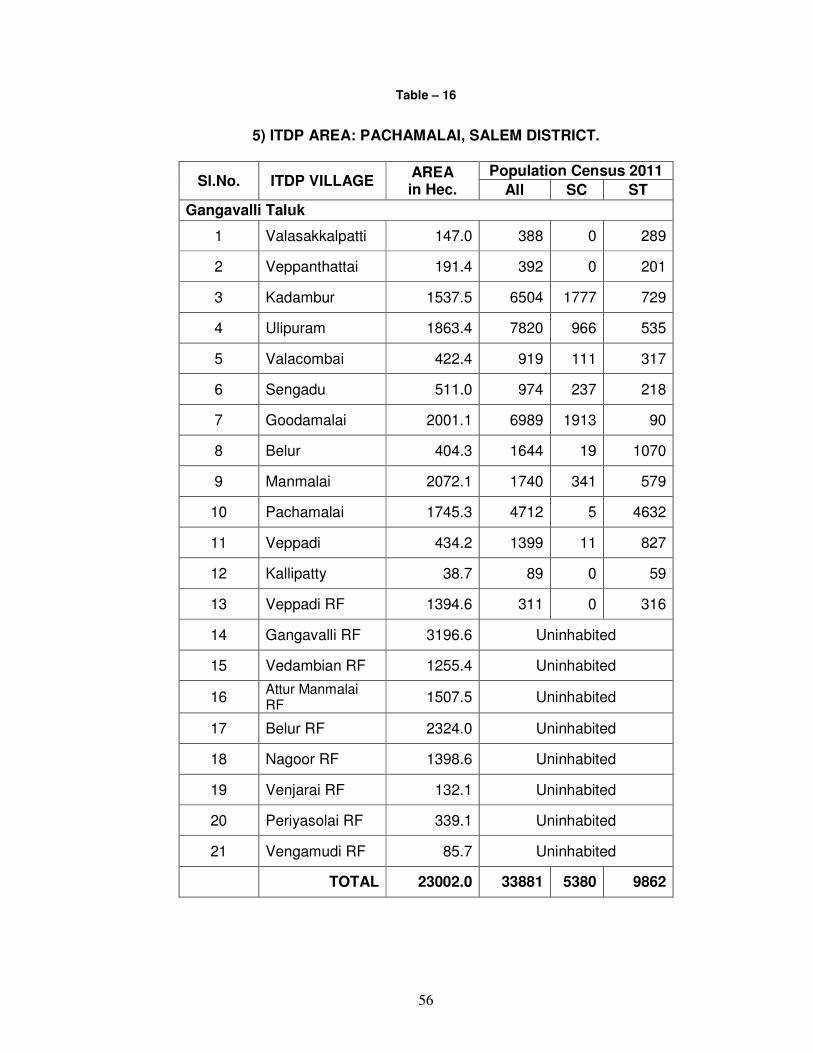
56
Table – 16
5) ITDP AREA: PACHAMALAI, SALEM DISTRICT.
Sl.No. ITDP VILLAGE AREA in Hec.
Population Census 2011
All SC ST
Gangavalli Taluk
1 Valasakkalpatti 147.0 388 0 289
2 Veppanthattai 191.4 392 0 201
3 Kadambur 1537.5 6504 1777 729
4 Ulipuram 1863.4 7820 966 535
5 Valacombai 422.4 919 111 317
6 Sengadu 511.0 974 237 218
7 Goodamalai 2001.1 6989 1913 90
8 Belur 404.3 1644 19 1070
9 Manmalai 2072.1 1740 341 579
10 Pachamalai 1745.3 4712 5 4632
11 Veppadi 434.2 1399 11 827
12 Kallipatty 38.7 89 0 59
13 Veppadi RF 1394.6 311 0 316
14 Gangavalli RF 3196.6 Uninhabited
15 Vedambian RF 1255.4 Uninhabited
16 Attur Manmalai RF
1507.5 Uninhabited
17 Belur RF 2324.0 Uninhabited
18 Nagoor RF 1398.6 Uninhabited
19 Venjarai RF 132.1 Uninhabited
20 Periyasolai RF 339.1 Uninhabited
21 Vengamudi RF 85.7 Uninhabited
TOTAL 23002.0 33881 5380 9862

57
Table –17 6) ITDP AREA : JAWADHU HILLS
(Parts of VELLORE & TIRUVANNAMALAI DISTRICTS)
Sl. No.
ITDP VILLAGE AREA in Hec.
Population Census 2011
All SC ST
Chengam Taluk, Tiruvannamalai District
1 Erukampattu 76.9 248 0 247
2 Kilthathiyapattu 20.1 78 0 76
3 Nellivoy 159.5 320 0 316
4 Bandirev 246.9 872 48 812
5 Urgoundanur 348.5 1116 3 1099
6 Kallathur 476.8 1499 57 990
7 Padapanjamarathur 391.3 1112 36 1068
8 Athipattu 57.9 164 0 164
9 Perumuttam 129.0 247 0 244
10 Kilpattu 165.6 365 0 365
11 Chinnakilpattu 57.4 220 0 229
12 Melpattu 117.4 321 0 320
13 Vannankuttai 68.2 195 0 194
14 Palamarathur 1180.9 3484 133 3305
15 Melsilambadi 1103.4 2575 9 2523
16 Kilaiyur 413.2 1124 182 623
17 Melthathiyapattu 58.8 240 0 240
18 Mallapattu R.F
19 Puliyur 253.6 467 15 449
20 Athipadi 788.0 1291 32 883
21 Beemarapatti 178.1 1207 0 663
22 Melmalachi 26.0 289 0 289
23 Semmanpatti 153.6 484 0 442
24 Puduchekkadi 1938.9 3550 8 2574
25 Kunnukulambu h/a Mothakkal
627.7 3279 548 0
26 Navakottai h/a Perungolathur
2163.3 13119 1986 1102
Polur Taluk, Thiruvannamalai District
27 Kanamalai 223.9 1091 1 1086
28 Amirdee 354.2 1491 40 887
29 Kilkanavayur 72.1 579 0 573
30 Puliyankuppam 258.5 1125 0 1123
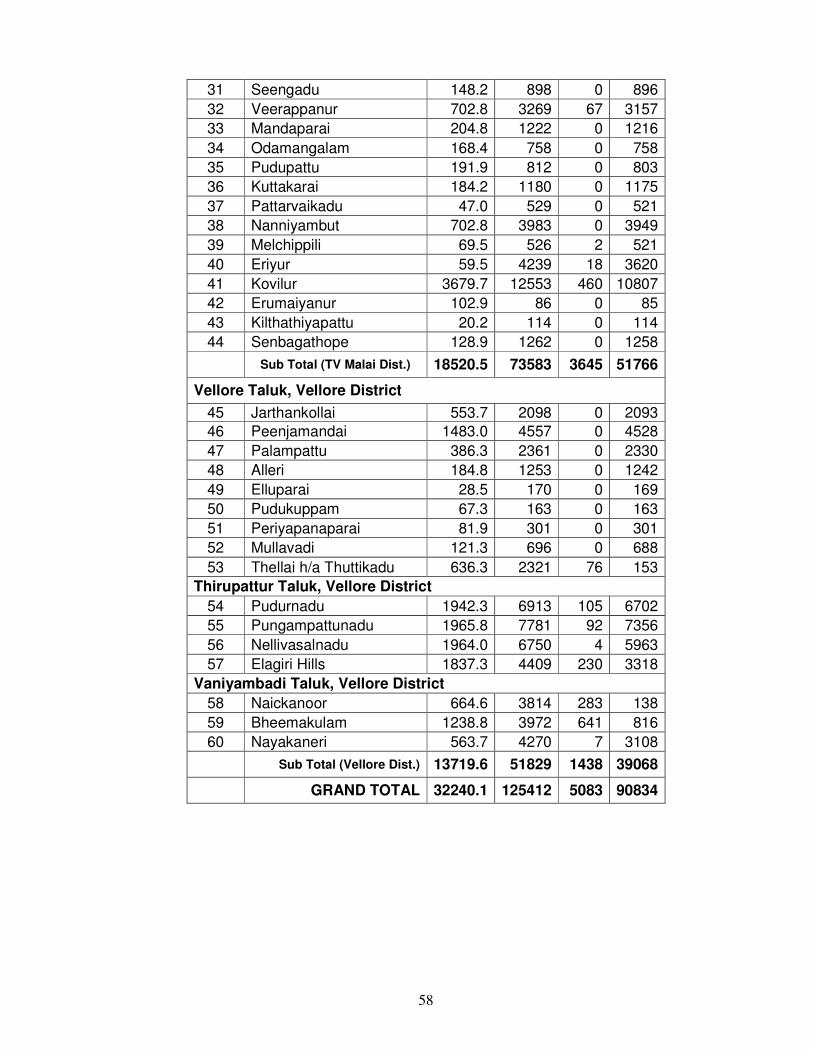
58
31 Seengadu 148.2 898 0 896
32 Veerappanur 702.8 3269 67 3157
33 Mandaparai 204.8 1222 0 1216
34 Odamangalam 168.4 758 0 758
35 Pudupattu 191.9 812 0 803
36 Kuttakarai 184.2 1180 0 1175
37 Pattarvaikadu 47.0 529 0 521
38 Nanniyambut 702.8 3983 0 3949
39 Melchippili 69.5 526 2 521
40 Eriyur 59.5 4239 18 3620
41 Kovilur 3679.7 12553 460 10807
42 Erumaiyanur 102.9 86 0 85
43 Kilthathiyapattu 20.2 114 0 114
44 Senbagathope 128.9 1262 0 1258
Sub Total (TV Malai Dist.) 18520.5 73583 3645 51766
Vellore Taluk, Vellore District
45 Jarthankollai 553.7 2098 0 2093
46 Peenjamandai 1483.0 4557 0 4528
47 Palampattu 386.3 2361 0 2330
48 Alleri 184.8 1253 0 1242
49 Elluparai 28.5 170 0 169
50 Pudukuppam 67.3 163 0 163
51 Periyapanaparai 81.9 301 0 301
52 Mullavadi 121.3 696 0 688
53 Thellai h/a Thuttikadu 636.3 2321 76 153
Thirupattur Taluk, Vellore District
54 Pudurnadu 1942.3 6913 105 6702
55 Pungampattunadu 1965.8 7781 92 7356
56 Nellivasalnadu 1964.0 6750 4 5963
57 Elagiri Hills 1837.3 4409 230 3318
Vaniyambadi Taluk, Vellore District
58 Naickanoor 664.6 3814 283 138
59 Bheemakulam 1238.8 3972 641 816
60 Nayakaneri 563.7 4270 7 3108
Sub Total (Vellore Dist.) 13719.6 51829 1438 39068
GRAND TOTAL 32240.1 125412 5083 90834

59
Table - 18
7) ITDP AREA: KALRAYAN HILLS, VILLUPURAM DISTRICT
Sl.No. ITDP VILLAGE AREA in Hec.
Population Census 2011
All SC ST
Sankarapuram Taluk
1 Gudaram 993.2 954 0 945
2 Alannur 1592.7 1128 0 1126
3 Kurmbalur 2014.7 770 1 769
4 Moolakkadu 2150.3 1725 4 1401
5 Vazhakuli 742.1 203 0 203
6 Vanjikkuli (P) 893.0 767 0 732
7 Sirukkalur (P) 1308.0 422 0 422
8 Serapattu 911.6 1548 23 1243
9 Perumanatham(P) 743.6 522 0 522
10 Kilakkadu (P) 452.6 619 0 524
11 Kalliparai 617.9 463 0 460
12 Vilvathi 950.1 295 0 295
13 Pacheri 1794.6 2045 5 1782
14 Perumbur 1607.2 752 46 701
15 Pudupalapattu 996.8 5778 844 25
16 Vellarikkadu 1714.8 1426 0 1420
17 Vengodu (P) 1094.2 733 0 730
18 Keelnilavur 567.8 335 0 325
19 Melnilavur 634.9 822 0 810
20 Aravankadu 427.5 492 0 490
21 Maniyarpalayam (P) 1125.3 1186 0 1178
22 Keelathukkuli 916.6 697 0 695
23 Melathukkuli 423.2 530 0 528
24 Innadu (P) 591.3 983 0 948
25 Erukkambattu (P) 591.3 629 0 624
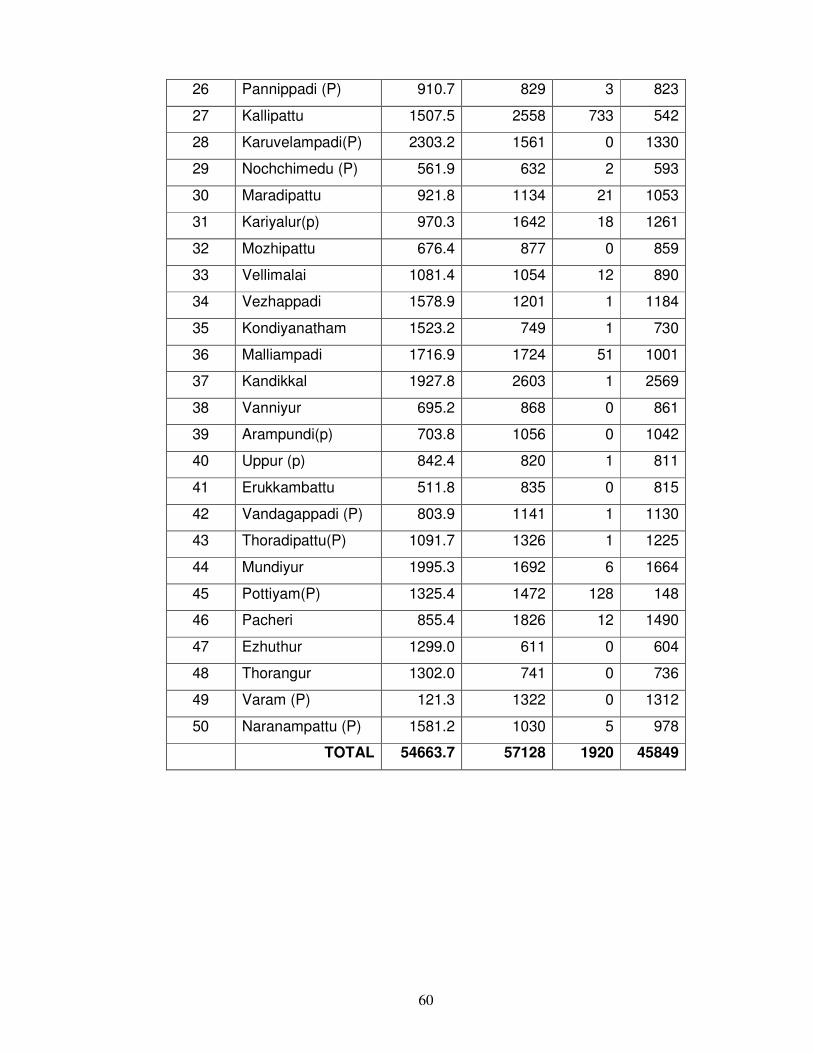
60
26 Pannippadi (P) 910.7 829 3 823
27 Kallipattu 1507.5 2558 733 542
28 Karuvelampadi(P) 2303.2 1561 0 1330
29 Nochchimedu (P) 561.9 632 2 593
30 Maradipattu 921.8 1134 21 1053
31 Kariyalur(p) 970.3 1642 18 1261
32 Mozhipattu 676.4 877 0 859
33 Vellimalai 1081.4 1054 12 890
34 Vezhappadi 1578.9 1201 1 1184
35 Kondiyanatham 1523.2 749 1 730
36 Malliampadi 1716.9 1724 51 1001
37 Kandikkal 1927.8 2603 1 2569
38 Vanniyur 695.2 868 0 861
39 Arampundi(p) 703.8 1056 0 1042
40 Uppur (p) 842.4 820 1 811
41 Erukkambattu 511.8 835 0 815
42 Vandagappadi (P) 803.9 1141 1 1130
43 Thoradipattu(P) 1091.7 1326 1 1225
44 Mundiyur 1995.3 1692 6 1664
45 Pottiyam(P) 1325.4 1472 128 148
46 Pacheri 855.4 1826 12 1490
47 Ezhuthur 1299.0 611 0 604
48 Thorangur 1302.0 741 0 736
49 Varam (P) 121.3 1322 0 1312
50 Naranampattu (P) 1581.2 1030 5 978
TOTAL 54663.7 57128 1920 45849
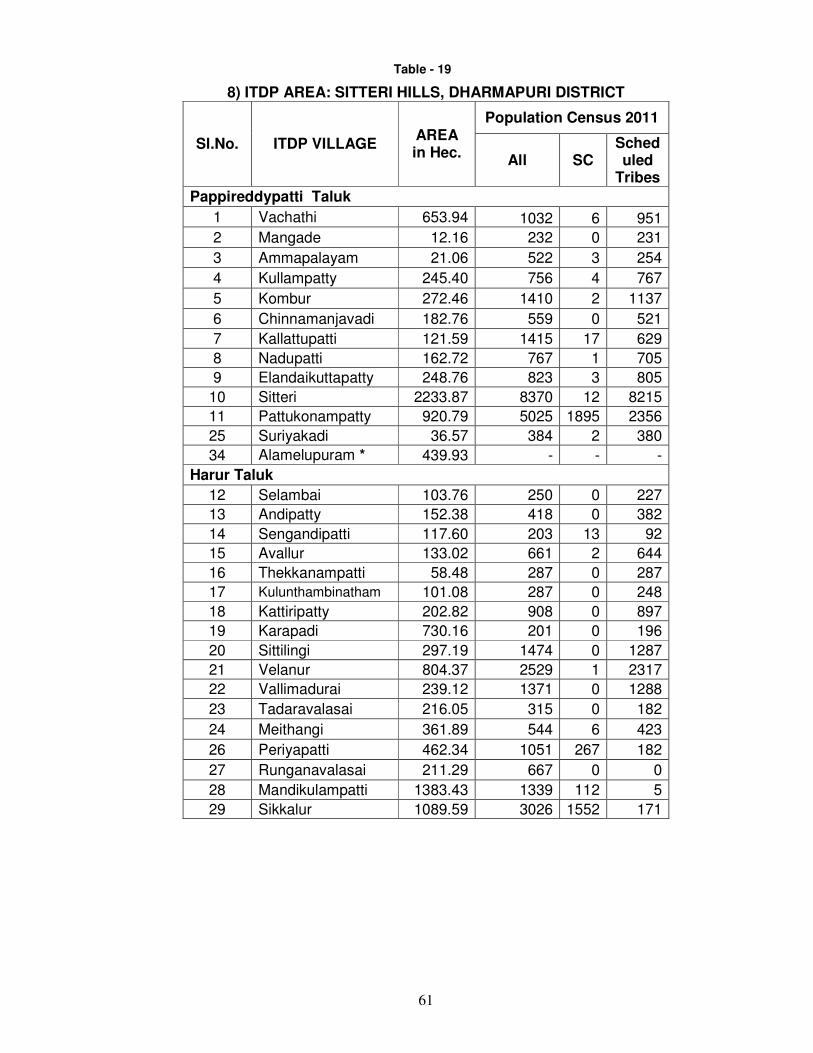
61
Table - 19
8) ITDP AREA: SITTERI HILLS, DHARMAPURI DISTRICT
Sl.No. ITDP VILLAGE AREA in Hec.
Population Census 2011
All SC Scheduled
Tribes
Pappireddypatti Taluk
1 Vachathi 653.94 1032 6 951
2 Mangade 12.16 232 0 231
3 Ammapalayam 21.06 522 3 254
4 Kullampatty 245.40 756 4 767
5 Kombur 272.46 1410 2 1137
6 Chinnamanjavadi 182.76 559 0 521
7 Kallattupatti 121.59 1415 17 629
8 Nadupatti 162.72 767 1 705
9 Elandaikuttapatty 248.76 823 3 805
10 Sitteri 2233.87 8370 12 8215
11 Pattukonampatty 920.79 5025 1895 2356
25 Suriyakadi 36.57 384 2 380
34 Alamelupuram * 439.93 - - -
Harur Taluk
12 Selambai 103.76 250 0 227
13 Andipatty 152.38 418 0 382
14 Sengandipatti 117.60 203 13 92
15 Avallur 133.02 661 2 644
16 Thekkanampatti 58.48 287 0 287
17 Kulunthambinatham 101.08 287 0 248
18 Kattiripatty 202.82 908 0 897
19 Karapadi 730.16 201 0 196
20 Sittilingi 297.19 1474 0 1287
21 Velanur 804.37 2529 1 2317
22 Vallimadurai 239.12 1371 0 1288
23 Tadaravalasai 216.05 315 0 182
24 Meithangi 361.89 544 6 423
26 Periyapatti 462.34 1051 267 182
27 Runganavalasai 211.29 667 0 0
28 Mandikulampatti 1383.43 1339 112 5
29 Sikkalur 1089.59 3026 1552 171
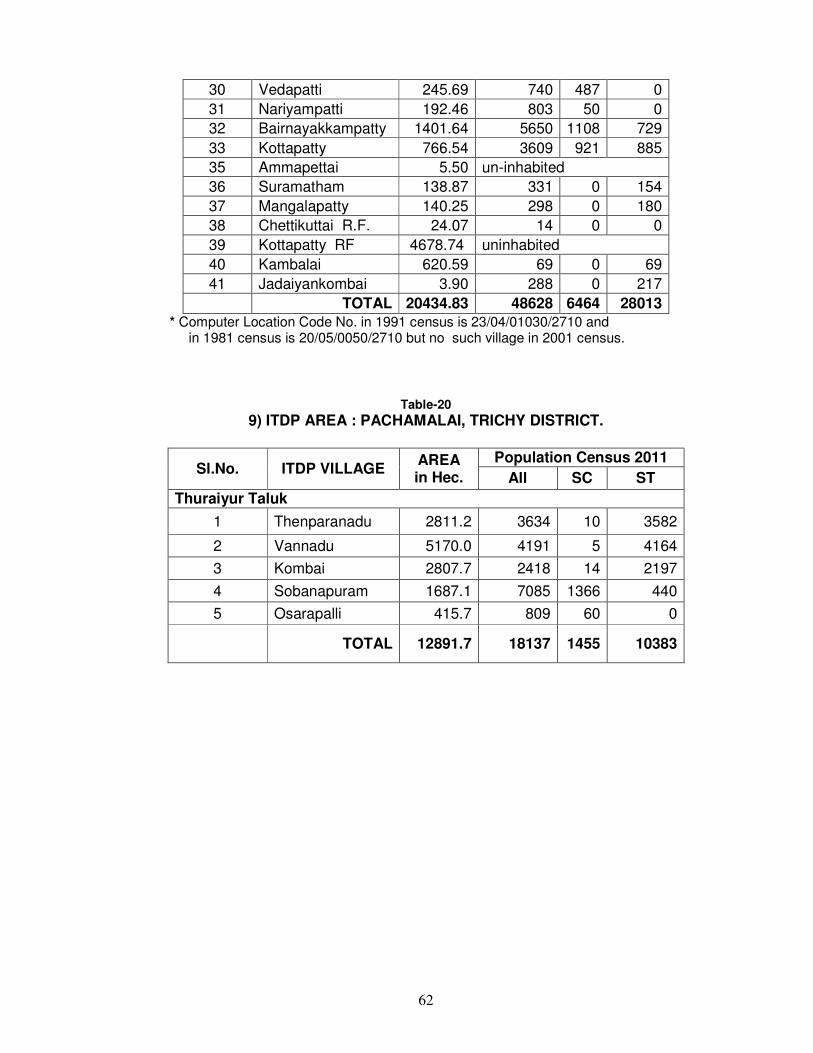
62
30 Vedapatti 245.69 740 487 0
31 Nariyampatti 192.46 803 50 0
32 Bairnayakkampatty 1401.64 5650 1108 729
33 Kottapatty 766.54 3609 921 885
35 Ammapettai 5.50 un-inhabited
36 Suramatham 138.87 331 0 154
37 Mangalapatty 140.25 298 0 180
38 Chettikuttai R.F. 24.07 14 0 0
39 Kottapatty RF 4678.74 uninhabited
40 Kambalai 620.59 69 0 69
41 Jadaiyankombai 3.90 288 0 217
TOTAL 20434.83 48628 6464 28013
* Computer Location Code No. in 1991 census is 23/04/01030/2710 and in 1981 census is 20/05/0050/2710 but no such village in 2001 census.
Table-20
9) ITDP AREA : PACHAMALAI, TRICHY DISTRICT.
Sl.No. ITDP VILLAGE AREA in Hec.
Population Census 2011
All SC ST
Thuraiyur Taluk
1 Thenparanadu 2811.2 3634 10 3582
2 Vannadu 5170.0 4191 5 4164
3 Kombai 2807.7 2418 14 2197
4 Sobanapuram 1687.1 7085 1366 440
5 Osarapalli 415.7 809 60 0
TOTAL 12891.7 18137 1455 10383
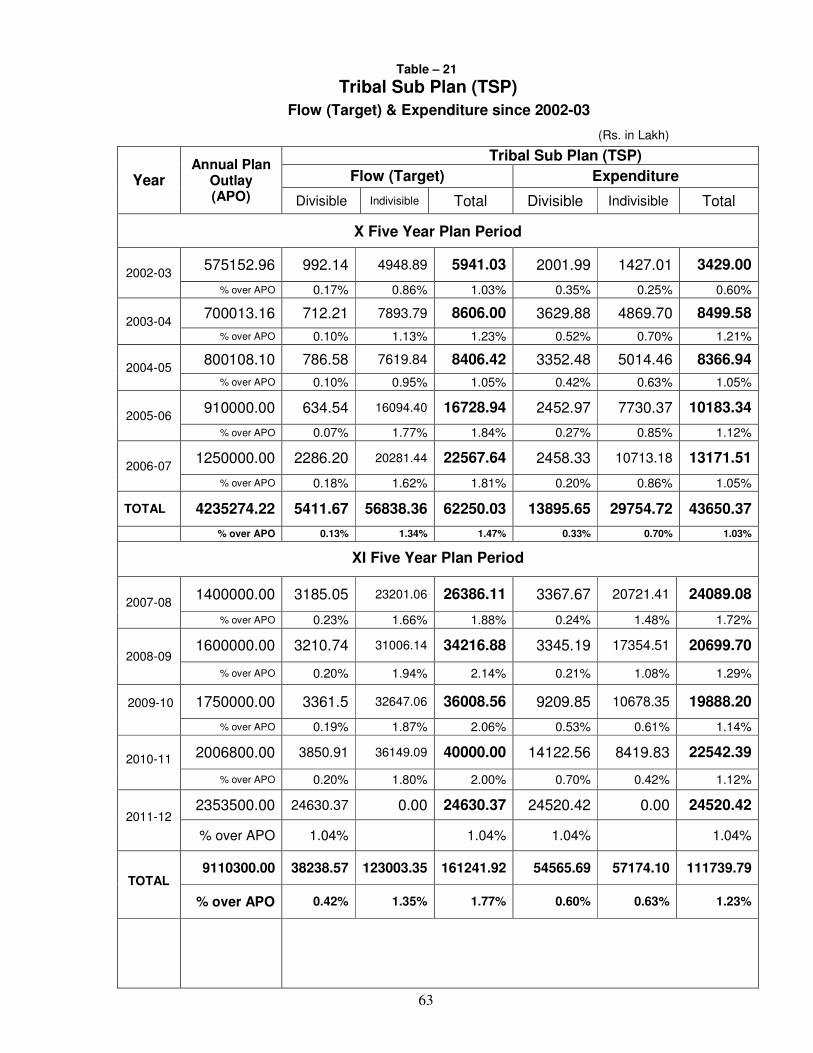
63
Table – 21
Tribal Sub Plan (TSP)
Flow (Target) & Expenditure since 2002-03
(Rs. in Lakh)
Year Annual Plan
Outlay (APO)
Tribal Sub Plan (TSP)
Flow (Target) Expenditure
Divisible Indivisible Total Divisible Indivisible Total
X Five Year Plan Period
2002-03 575152.96 992.14 4948.89 5941.03 2001.99 1427.01 3429.00
% over APO 0.17% 0.86% 1.03% 0.35% 0.25% 0.60%
2003-04 700013.16 712.21 7893.79 8606.00 3629.88 4869.70 8499.58
% over APO 0.10% 1.13% 1.23% 0.52% 0.70% 1.21%
2004-05 800108.10 786.58 7619.84 8406.42 3352.48 5014.46 8366.94
% over APO 0.10% 0.95% 1.05% 0.42% 0.63% 1.05%
2005-06 910000.00 634.54 16094.40 16728.94 2452.97 7730.37 10183.34
% over APO 0.07% 1.77% 1.84% 0.27% 0.85% 1.12%
2006-07 1250000.00 2286.20 20281.44 22567.64 2458.33 10713.18 13171.51
% over APO 0.18% 1.62% 1.81% 0.20% 0.86% 1.05%
TOTAL 4235274.22 5411.67 56838.36 62250.03 13895.65 29754.72 43650.37
% over APO 0.13% 1.34% 1.47% 0.33% 0.70% 1.03%
XI Five Year Plan Period
2007-08 1400000.00 3185.05 23201.06 26386.11 3367.67 20721.41 24089.08
% over APO 0.23% 1.66% 1.88% 0.24% 1.48% 1.72%
2008-09 1600000.00 3210.74 31006.14 34216.88 3345.19 17354.51 20699.70
% over APO 0.20% 1.94% 2.14% 0.21% 1.08% 1.29%
2009-10
1750000.00 3361.5 32647.06 36008.56 9209.85 10678.35 19888.20
% over APO 0.19% 1.87% 2.06% 0.53% 0.61% 1.14%
2010-11 2006800.00 3850.91 36149.09 40000.00 14122.56 8419.83 22542.39
% over APO 0.20% 1.80% 2.00% 0.70% 0.42% 1.12%
2011-12 2353500.00 24630.37 0.00 24630.37 24520.42 0.00 24520.42
% over APO 1.04% 1.04% 1.04% 1.04%
TOTAL 9110300.00 38238.57 123003.35 161241.92 54565.69 57174.10 111739.79
% over APO 0.42% 1.35% 1.77% 0.60% 0.63% 1.23%
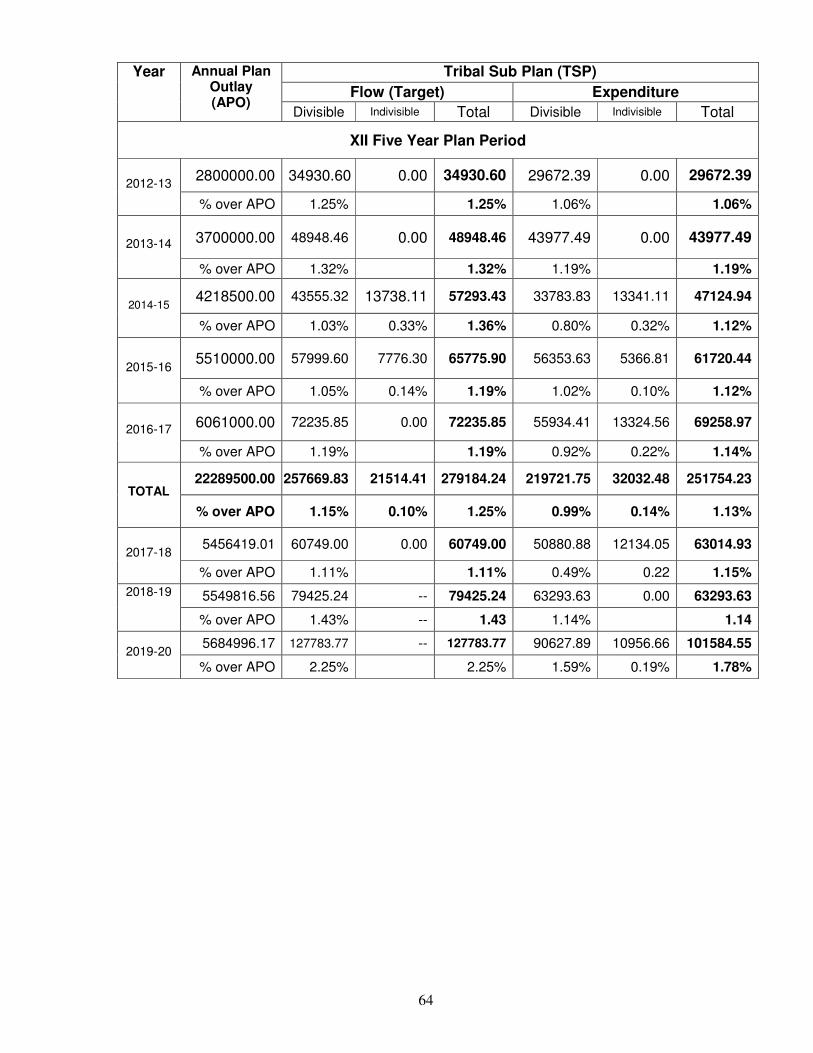
64
Year Annual Plan Outlay (APO)
Tribal Sub Plan (TSP)
Flow (Target) Expenditure
Divisible Indivisible Total Divisible Indivisible Total
XII Five Year Plan Period
2012-13 2800000.00 34930.60 0.00 34930.60 29672.39 0.00 29672.39
% over APO 1.25% 1.25% 1.06% 1.06%
2013-14 3700000.00 48948.46 0.00 48948.46 43977.49 0.00 43977.49
% over APO 1.32% 1.32% 1.19% 1.19%
2014-15 4218500.00 43555.32 13738.11 57293.43 33783.83 13341.11 47124.94
% over APO 1.03% 0.33% 1.36% 0.80% 0.32% 1.12%
2015-16
5510000.00 57999.60 7776.30 65775.90 56353.63 5366.81 61720.44
% over APO 1.05% 0.14% 1.19% 1.02% 0.10% 1.12%
2016-17 6061000.00 72235.85 0.00 72235.85 55934.41 13324.56 69258.97
% over APO 1.19% 1.19% 0.92% 0.22% 1.14%
TOTAL 22289500.00 257669.83 21514.41 279184.24 219721.75 32032.48 251754.23
% over APO 1.15% 0.10% 1.25% 0.99% 0.14% 1.13%
2017-18 5456419.01 60749.00 0.00 60749.00 50880.88 12134.05 63014.93
% over APO 1.11% 1.11% 0.49% 0.22 1.15%
2018-19 5549816.56 79425.24 -- 79425.24 63293.63 0.00 63293.63
% over APO 1.43% -- 1.43 1.14% 1.14
2019-20 5684996.17 127783.77 -- 127783.77 90627.89 10956.66 101584.55
% over APO 2.25% 2.25% 1.59% 0.19% 1.78%

65
Table - 22
Flow & Expenditure on TSP 2002-03 (Rs.in lakh)
Sl. No.
Sector/Head of Department
Annual Plan
Outlay
Flow (Target)
Expen diture
Beneficiaries
1 Agriculture 7193.57 20.64 0.00 3396 families
2 Soil & Water Conservation 6686.21 92.90 92.00 896 farmers
3 Animal Husbandry 975.69 98.33 10.05 1800 persons
4 Minor Irrigation 4215.01 38.55 5.50
5 Forests 11948.30 197.52 121.39 696 families
6 Co-operation 14773.61 90.00 60.00
7 Special Programme for Rural Development
62674.53 0.00 456.19 2648 families
8 Community Development 7190.71 0.00 32.00
9 Power Development 90500.00 92.74 970.82
10 Roads and Bridges 86301.53 690.00 2.86
11 General Education 15276.57 2246.75 23.28 185648 students
12 Sports & Youth Services 479.89 0.00 0.00
13 Medical Services 4696.04 26.00 0.00
14 Public Health 5743.87 203.05 22.91
15 Water Supply & Sanitation 82380.25 32.00 4.00
16 Housing 23745.47 23.12 23.12
17 Labour & Employment 119.83 119.83 7.97
18 Welfare of Scheduled Tribes
9737.71 1825.26 1349.78 21 families
19 Social Welfare 4501.62 6.81 6.64
20 Nutrition 15195.62 134.00 240.49 36560 children
21 Sericulture 73.85 3.93 0.00 85 families
22 Others 120743.08 0.00
Total 575152.96 5941.43 3429.00
% over Annual Plan Outlay 1.03% 0.60%
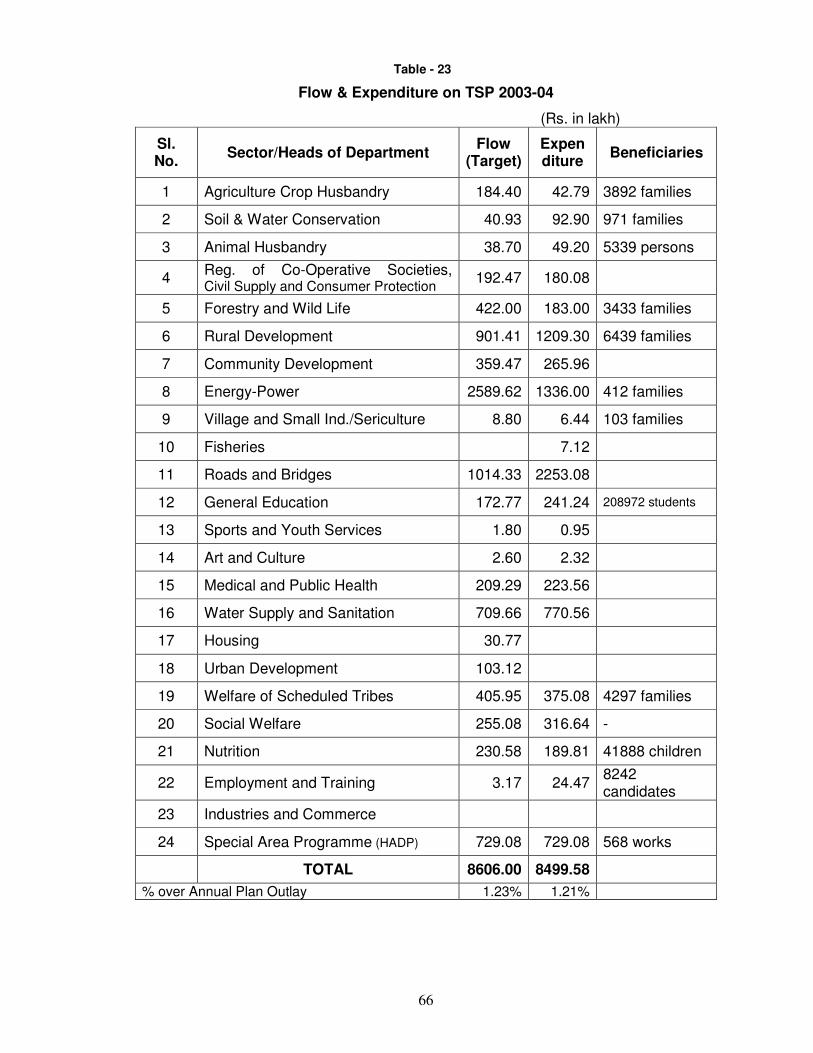
66
Table - 23
Flow & Expenditure on TSP 2003-04
(Rs. in lakh)
Sl. No.
Sector/Heads of Department Flow
(Target) Expen diture
Beneficiaries
1 Agriculture Crop Husbandry 184.40 42.79 3892 families
2 Soil & Water Conservation 40.93 92.90 971 families
3 Animal Husbandry 38.70 49.20 5339 persons
4 Reg. of Co-Operative Societies, Civil Supply and Consumer Protection
192.47 180.08
5 Forestry and Wild Life 422.00 183.00 3433 families
6 Rural Development 901.41 1209.30 6439 families
7 Community Development 359.47 265.96
8 Energy-Power 2589.62 1336.00 412 families
9 Village and Small Ind./Sericulture 8.80 6.44 103 families
10 Fisheries 7.12
11 Roads and Bridges 1014.33 2253.08
12 General Education 172.77 241.24 208972 students
13 Sports and Youth Services 1.80 0.95
14 Art and Culture 2.60 2.32
15 Medical and Public Health 209.29 223.56
16 Water Supply and Sanitation 709.66 770.56
17 Housing 30.77
18 Urban Development 103.12
19 Welfare of Scheduled Tribes 405.95 375.08 4297 families
20 Social Welfare 255.08 316.64 -
21 Nutrition 230.58 189.81 41888 children
22 Employment and Training 3.17 24.47 8242 candidates
23 Industries and Commerce
24 Special Area Programme (HADP) 729.08 729.08 568 works
TOTAL 8606.00 8499.58
% over Annual Plan Outlay 1.23% 1.21%
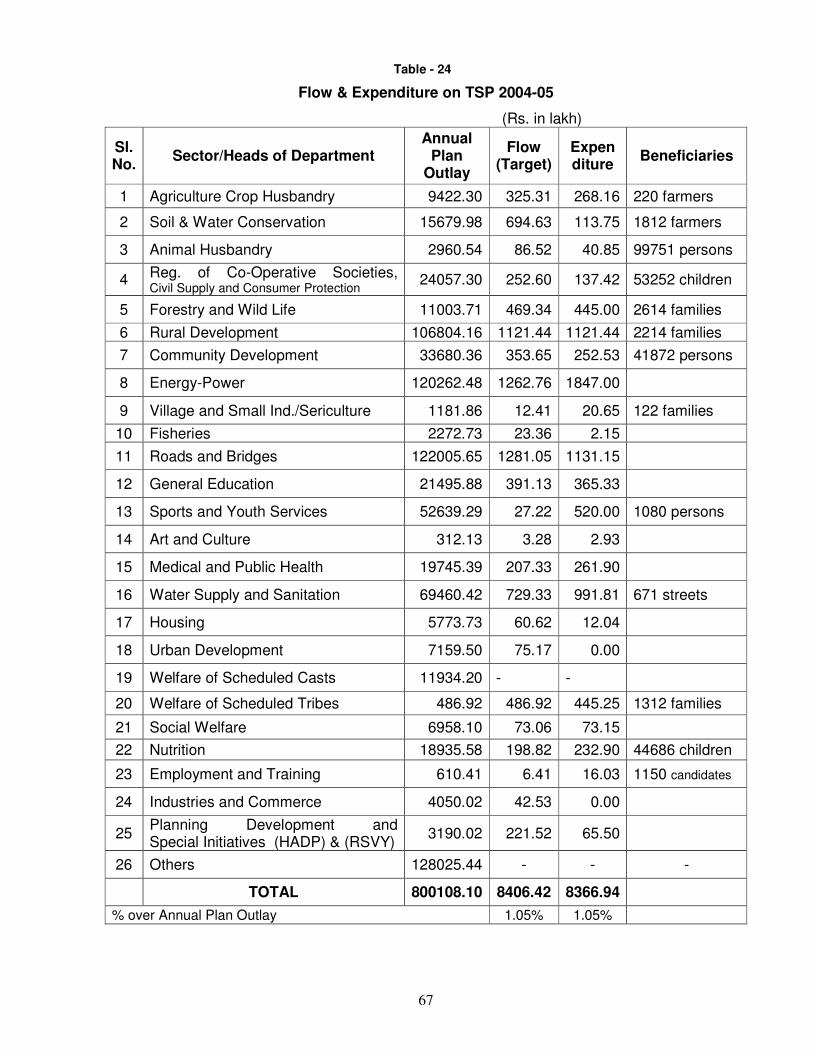
67
Table - 24
Flow & Expenditure on TSP 2004-05
(Rs. in lakh)
Sl. No.
Sector/Heads of Department Annual
Plan Outlay
Flow (Target)
Expen diture
Beneficiaries
1 Agriculture Crop Husbandry 9422.30 325.31 268.16 220 farmers
2 Soil & Water Conservation 15679.98 694.63 113.75 1812 farmers
3 Animal Husbandry 2960.54 86.52 40.85 99751 persons
4 Reg. of Co-Operative Societies, Civil Supply and Consumer Protection
24057.30 252.60 137.42 53252 children
5 Forestry and Wild Life 11003.71 469.34 445.00 2614 families
6 Rural Development 106804.16 1121.44 1121.44 2214 families
7 Community Development 33680.36 353.65 252.53 41872 persons
8 Energy-Power 120262.48 1262.76 1847.00
9 Village and Small Ind./Sericulture 1181.86 12.41 20.65 122 families
10 Fisheries 2272.73 23.36 2.15
11 Roads and Bridges 122005.65 1281.05 1131.15
12 General Education 21495.88 391.13 365.33
13 Sports and Youth Services 52639.29 27.22 520.00 1080 persons
14 Art and Culture 312.13 3.28 2.93
15 Medical and Public Health 19745.39 207.33 261.90
16 Water Supply and Sanitation 69460.42 729.33 991.81 671 streets
17 Housing 5773.73 60.62 12.04
18 Urban Development 7159.50 75.17 0.00
19 Welfare of Scheduled Casts 11934.20 - -
20 Welfare of Scheduled Tribes 486.92 486.92 445.25 1312 families
21 Social Welfare 6958.10 73.06 73.15
22 Nutrition 18935.58 198.82 232.90 44686 children
23 Employment and Training 610.41 6.41 16.03 1150 candidates
24 Industries and Commerce 4050.02 42.53 0.00
25 Planning Development and Special Initiatives (HADP) & (RSVY)
3190.02 221.52 65.50
26 Others 128025.44 - - -
TOTAL 800108.10 8406.42 8366.94
% over Annual Plan Outlay 1.05% 1.05%
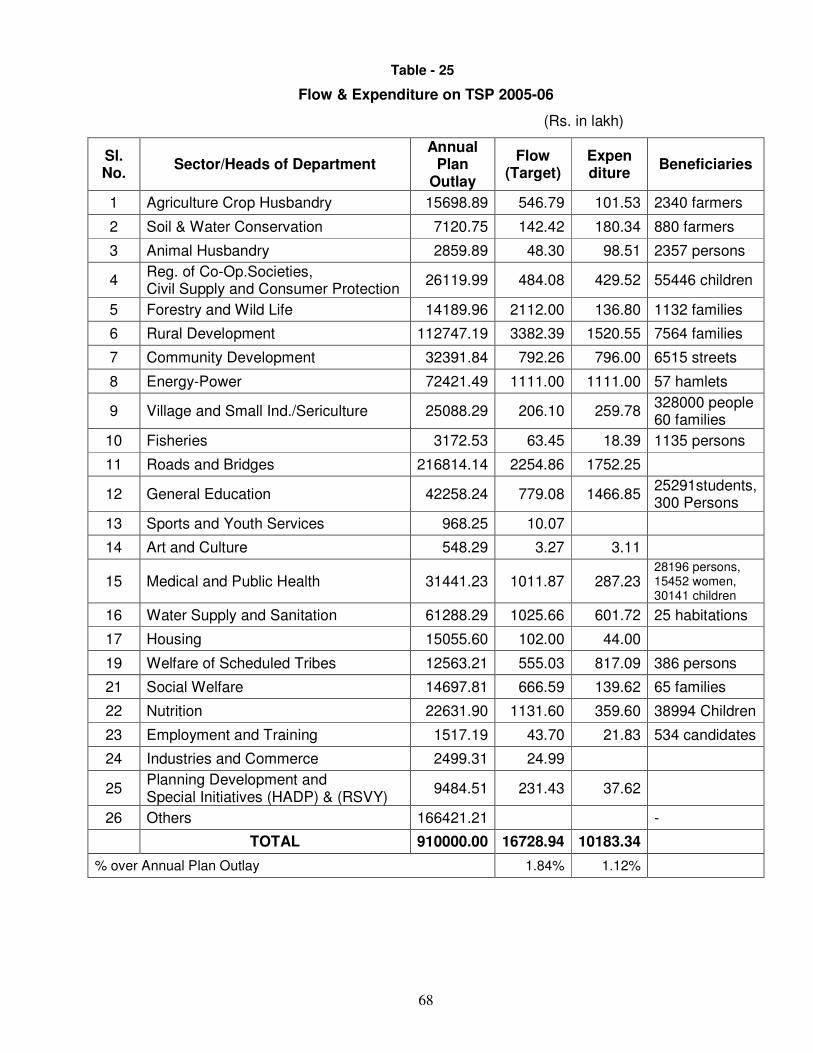
68
Table - 25
Flow & Expenditure on TSP 2005-06
(Rs. in lakh)
Sl. No.
Sector/Heads of Department Annual
Plan Outlay
Flow (Target)
Expen diture
Beneficiaries
1 Agriculture Crop Husbandry 15698.89 546.79 101.53 2340 farmers
2 Soil & Water Conservation 7120.75 142.42 180.34 880 farmers
3 Animal Husbandry 2859.89 48.30 98.51 2357 persons
4 Reg. of Co-Op.Societies, Civil Supply and Consumer Protection
26119.99 484.08 429.52 55446 children
5 Forestry and Wild Life 14189.96 2112.00 136.80 1132 families
6 Rural Development 112747.19 3382.39 1520.55 7564 families
7 Community Development 32391.84 792.26 796.00 6515 streets
8 Energy-Power 72421.49 1111.00 1111.00 57 hamlets
9 Village and Small Ind./Sericulture 25088.29 206.10 259.78 328000 people 60 families
10 Fisheries 3172.53 63.45 18.39 1135 persons
11 Roads and Bridges 216814.14 2254.86 1752.25
12 General Education 42258.24 779.08 1466.85 25291students, 300 Persons
13 Sports and Youth Services 968.25 10.07
14 Art and Culture 548.29 3.27 3.11
15 Medical and Public Health 31441.23 1011.87 287.23 28196 persons, 15452 women, 30141 children
16 Water Supply and Sanitation 61288.29 1025.66 601.72 25 habitations
17 Housing 15055.60 102.00 44.00
19 Welfare of Scheduled Tribes 12563.21 555.03 817.09 386 persons
21 Social Welfare 14697.81 666.59 139.62 65 families
22 Nutrition 22631.90 1131.60 359.60 38994 Children
23 Employment and Training 1517.19 43.70 21.83 534 candidates
24 Industries and Commerce 2499.31 24.99
25 Planning Development and Special Initiatives (HADP) & (RSVY)
9484.51 231.43 37.62
26 Others 166421.21 -
TOTAL 910000.00 16728.94 10183.34
% over Annual Plan Outlay 1.84% 1.12%
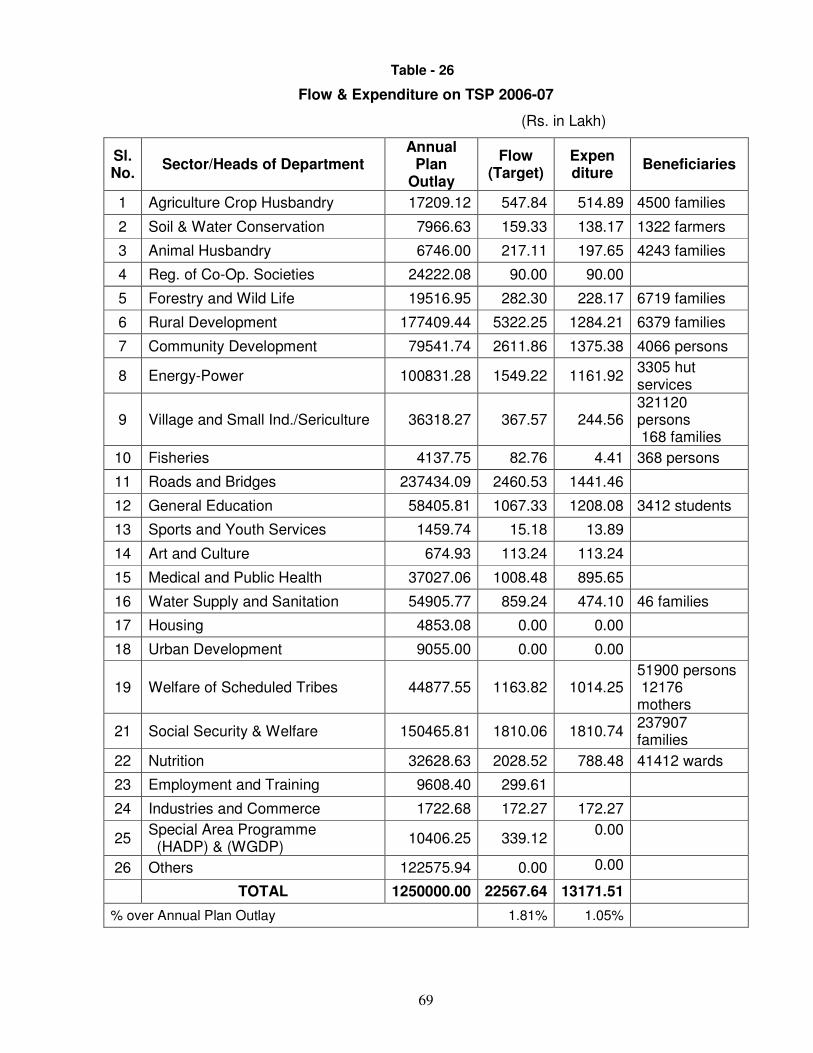
69
Table - 26
Flow & Expenditure on TSP 2006-07
(Rs. in Lakh)
Sl. No.
Sector/Heads of Department Annual
Plan Outlay
Flow (Target)
Expen diture
Beneficiaries
1 Agriculture Crop Husbandry 17209.12 547.84 514.89 4500 families
2 Soil & Water Conservation 7966.63 159.33 138.17 1322 farmers
3 Animal Husbandry 6746.00 217.11 197.65 4243 families
4 Reg. of Co-Op. Societies 24222.08 90.00 90.00
5 Forestry and Wild Life 19516.95 282.30 228.17 6719 families
6 Rural Development 177409.44 5322.25 1284.21 6379 families
7 Community Development 79541.74 2611.86 1375.38 4066 persons
8 Energy-Power 100831.28 1549.22 1161.92 3305 hut services
9 Village and Small Ind./Sericulture 36318.27 367.57 244.56 321120 persons 168 families
10 Fisheries 4137.75 82.76 4.41 368 persons
11 Roads and Bridges 237434.09 2460.53 1441.46
12 General Education 58405.81 1067.33 1208.08 3412 students
13 Sports and Youth Services 1459.74 15.18 13.89
14 Art and Culture 674.93 113.24 113.24
15 Medical and Public Health 37027.06 1008.48 895.65
16 Water Supply and Sanitation 54905.77 859.24 474.10 46 families
17 Housing 4853.08 0.00 0.00
18 Urban Development 9055.00 0.00 0.00
19 Welfare of Scheduled Tribes 44877.55 1163.82 1014.25 51900 persons 12176 mothers
21 Social Security & Welfare 150465.81 1810.06 1810.74 237907 families
22 Nutrition 32628.63 2028.52 788.48 41412 wards
23 Employment and Training 9608.40 299.61
24 Industries and Commerce 1722.68 172.27 172.27
25 Special Area Programme (HADP) & (WGDP)
10406.25 339.12 0.00
26 Others 122575.94 0.00 0.00
TOTAL 1250000.00 22567.64 13171.51
% over Annual Plan Outlay 1.81% 1.05%

70
Table - 27 Flow & Expenditure on TSP 2007-08
(Rs. in Lakh)
Sl. No.
Sector/Heads of Department
Annual Plan
Outlay
Flow (Target)
Expen diture
Beneficiaries
1 Agriculture Crop Husbandry 18036.49 301.02 154.85 4066 persons
2 Soil & Water Conservation 9865.47 197.31 248.55 1188 farmers
3 Animal Husbandry 5432.18 60.55 28.61
4 Reg. of Co-Operatives Societies
5487.01 90.00 90.00 10000 members
5 Forestry and Wild Life 19486.58 2677.21 1779.93 8506 families
6 Rural Development 171406.05 5140.33 4828.04 9622 families
7 Community Development 63797.74 1703.93 1759.95
8 Energy-Power 101153.81 1515.00 0.00
9 Industries and Minerals (Handlooms & Textiles)
37441.68 6.30 260.99 3.28 lakh persons141 families
10 Fisheries 5338.58 106.77 0.00
11 Roads and Bridges 264822.30 2584.77 2060.67
12 General Education 92267.89 1561.14 689.75
13 Sports and Youth Services 1503.25 15.63 9.55
14 Art and Culture 3467.74 2.75 2.47
15 Medical and Public Health 37543.26 1240.49 370.57 23275 mothers, 45274 children and 118401 persons
16 Water Supply and Sanitation 52759.15 836.39 34.89
17 Housing 138.52 0.00 0.00
18 Urban Development 29059.75 126.79 60.72
19 Welfare of Scheduled Tribes 30294.38 1687.31 2040.93
1097 families, 9 habitations, 2631 students, other students of 26 schools
20 Social Security & Welfare 227243.67 3569.68 6804.21 25399 OAPs & 55 persons
21 Nutrition 49525.21 2235.57 2509.70 18511 children
22 Labour & Employment 11746.05 365.67 13.13 95 youths
23 Industries and Commerce 2725.16 27.25 0.00
24 Special Area Programme (HADP) & (WGDP)
5254.00 334.25 341.57
25 Others 154204.08 0.00 0.00
TOTAL 1400000.00 26386.11 24089.08
% over Annual Plan Outlay 1.88% 1.72%
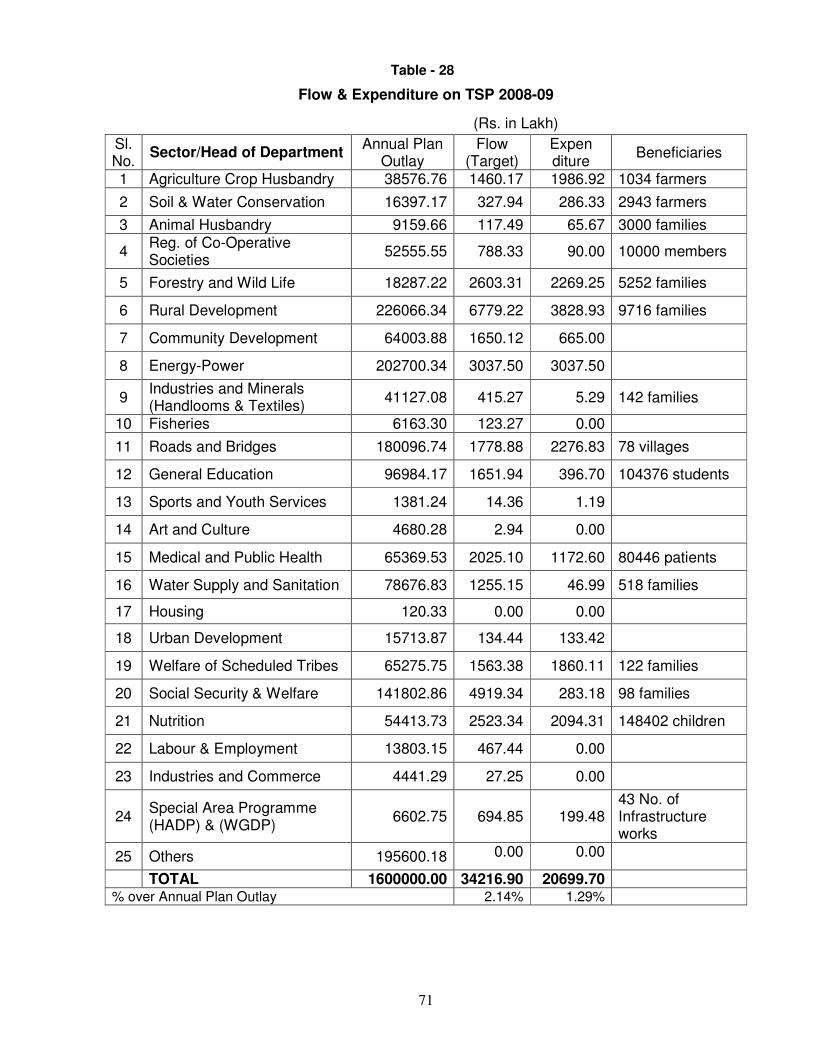
71
Table - 28
Flow & Expenditure on TSP 2008-09
(Rs. in Lakh)
Sl. No.
Sector/Head of Department Annual Plan
Outlay Flow
(Target) Expen diture
Beneficiaries
1 Agriculture Crop Husbandry 38576.76 1460.17 1986.92 1034 farmers
2 Soil & Water Conservation 16397.17 327.94 286.33 2943 farmers
3 Animal Husbandry 9159.66 117.49 65.67 3000 families
4 Reg. of Co-Operative Societies
52555.55 788.33 90.00 10000 members
5 Forestry and Wild Life 18287.22 2603.31 2269.25 5252 families
6 Rural Development 226066.34 6779.22 3828.93 9716 families
7 Community Development 64003.88 1650.12 665.00
8 Energy-Power 202700.34 3037.50 3037.50
9 Industries and Minerals (Handlooms & Textiles)
41127.08 415.27 5.29 142 families
10 Fisheries 6163.30 123.27 0.00
11 Roads and Bridges 180096.74 1778.88 2276.83 78 villages
12 General Education 96984.17 1651.94 396.70 104376 students
13 Sports and Youth Services 1381.24 14.36 1.19
14 Art and Culture 4680.28 2.94 0.00
15 Medical and Public Health 65369.53 2025.10 1172.60 80446 patients
16 Water Supply and Sanitation 78676.83 1255.15 46.99 518 families
17 Housing 120.33 0.00 0.00
18 Urban Development 15713.87 134.44 133.42
19 Welfare of Scheduled Tribes 65275.75 1563.38 1860.11 122 families
20 Social Security & Welfare 141802.86 4919.34 283.18 98 families
21 Nutrition 54413.73 2523.34 2094.31 148402 children
22 Labour & Employment 13803.15 467.44 0.00
23 Industries and Commerce 4441.29 27.25 0.00
24 Special Area Programme (HADP) & (WGDP)
6602.75 694.85 199.48 43 No. of Infrastructure works
25 Others 195600.18 0.00 0.00
TOTAL 1600000.00 34216.90 20699.70 % over Annual Plan Outlay 2.14% 1.29%
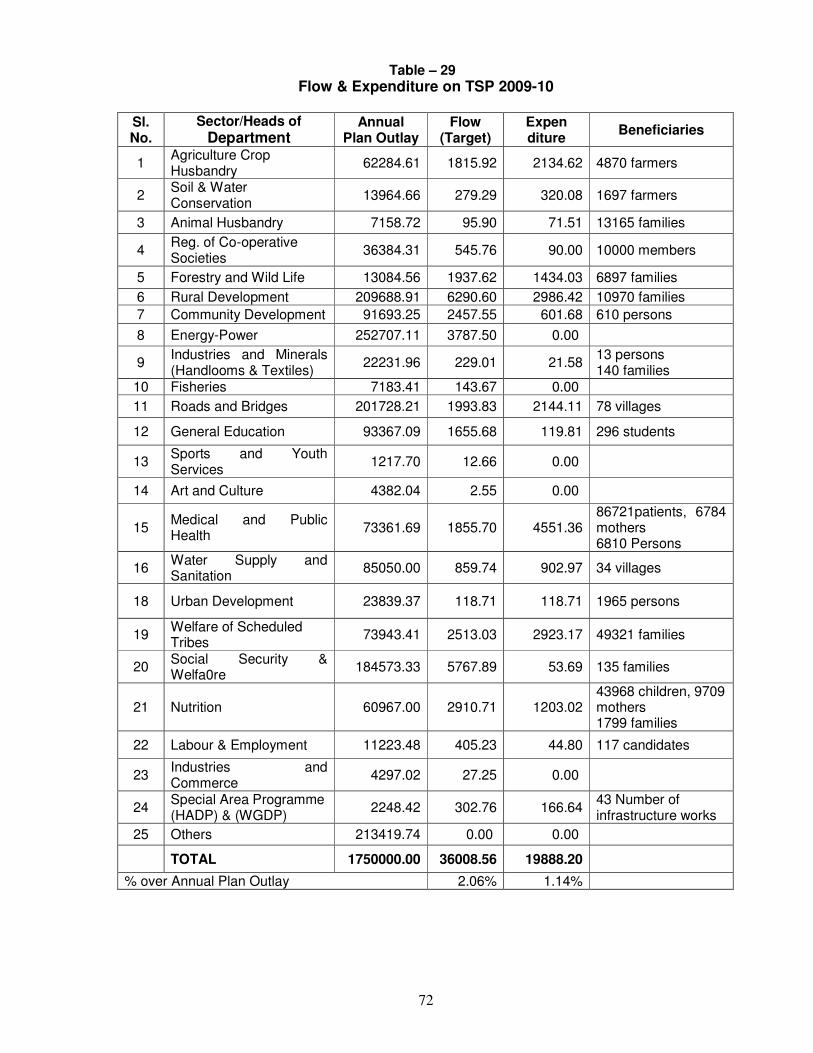
72
Table – 29 Flow & Expenditure on TSP 2009-10
Sl. No.
Sector/Heads of Department
Annual Plan Outlay
Flow (Target)
Expen diture
Beneficiaries
1 Agriculture Crop Husbandry
62284.61 1815.92 2134.62 4870 farmers
2 Soil & Water Conservation
13964.66 279.29 320.08 1697 farmers
3 Animal Husbandry 7158.72 95.90 71.51 13165 families
4 Reg. of Co-operative Societies
36384.31 545.76 90.00 10000 members
5 Forestry and Wild Life 13084.56 1937.62 1434.03 6897 families
6 Rural Development 209688.91 6290.60 2986.42 10970 families
7 Community Development 91693.25 2457.55 601.68 610 persons
8 Energy-Power 252707.11 3787.50 0.00
9 Industries and Minerals (Handlooms & Textiles)
22231.96 229.01 21.58 13 persons 140 families
10 Fisheries 7183.41 143.67 0.00
11 Roads and Bridges 201728.21 1993.83 2144.11 78 villages
12 General Education 93367.09 1655.68 119.81 296 students
13 Sports and Youth Services
1217.70 12.66 0.00
14 Art and Culture 4382.04 2.55 0.00
15 Medical and Public Health
73361.69 1855.70 4551.36 86721patients, 6784 mothers 6810 Persons
16 Water Supply and Sanitation
85050.00 859.74 902.97 34 villages
18 Urban Development 23839.37 118.71 118.71 1965 persons
19 Welfare of Scheduled Tribes
73943.41 2513.03 2923.17 49321 families
20 Social Security & Welfa0re
184573.33 5767.89 53.69 135 families
21 Nutrition 60967.00 2910.71 1203.02 43968 children, 9709 mothers 1799 families
22 Labour & Employment 11223.48 405.23 44.80 117 candidates
23 Industries and Commerce
4297.02 27.25 0.00
24 Special Area Programme (HADP) & (WGDP)
2248.42 302.76 166.64 43 Number of infrastructure works
25 Others 213419.74 0.00 0.00
TOTAL 1750000.00 36008.56 19888.20
% over Annual Plan Outlay 2.06% 1.14%
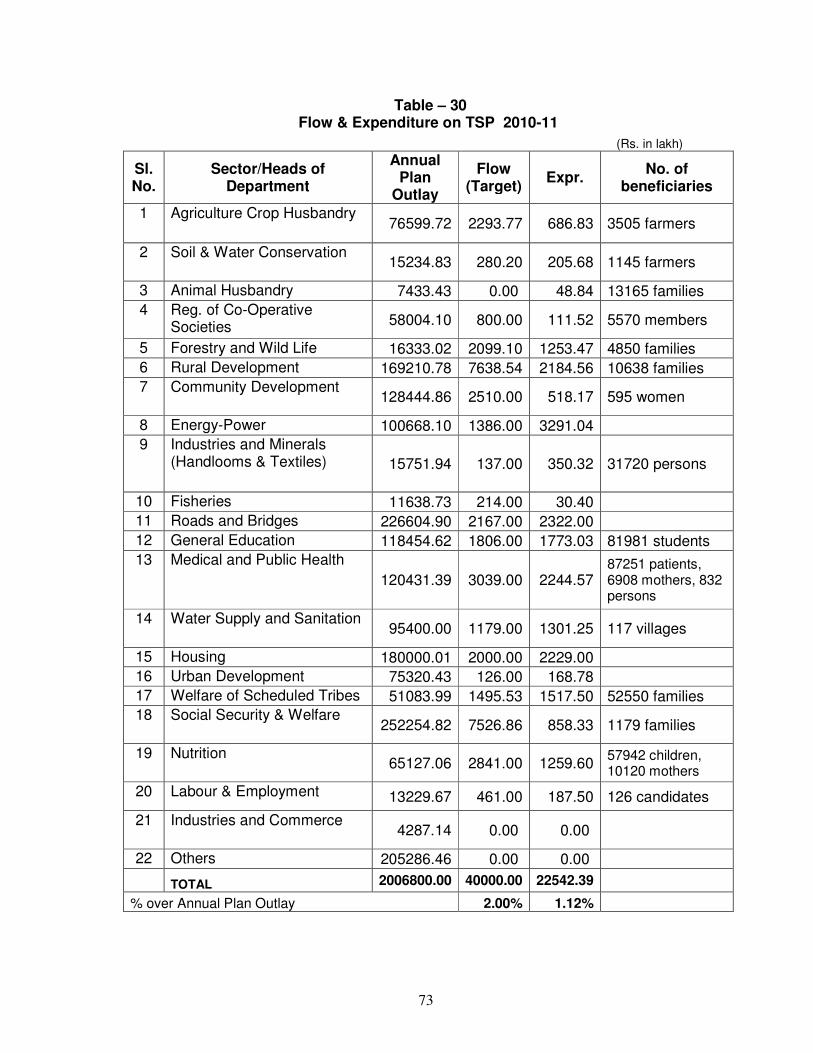
73
Table – 30
Flow & Expenditure on TSP 2010-11
(Rs. in lakh)
Sl. No.
Sector/Heads of Department
Annual Plan
Outlay
Flow (Target)
Expr. No. of
beneficiaries
1 Agriculture Crop Husbandry 76599.72 2293.77 686.83 3505 farmers
2 Soil & Water Conservation 15234.83 280.20 205.68 1145 farmers
3 Animal Husbandry 7433.43 0.00 48.84 13165 families
4 Reg. of Co-Operative Societies 58004.10 800.00 111.52 5570 members
5 Forestry and Wild Life 16333.02 2099.10 1253.47 4850 families
6 Rural Development 169210.78 7638.54 2184.56 10638 families
7 Community Development 128444.86 2510.00 518.17 595 women
8 Energy-Power 100668.10 1386.00 3291.04
9 Industries and Minerals (Handlooms & Textiles) 15751.94 137.00 350.32 31720 persons
10 Fisheries 11638.73 214.00 30.40
11 Roads and Bridges 226604.90 2167.00 2322.00
12 General Education 118454.62 1806.00 1773.03 81981 students
13 Medical and Public Health
120431.39 3039.00 2244.57 87251 patients, 6908 mothers, 832 persons
14 Water Supply and Sanitation 95400.00 1179.00 1301.25 117 villages
15 Housing 180000.01 2000.00 2229.00
16 Urban Development 75320.43 126.00 168.78
17 Welfare of Scheduled Tribes 51083.99 1495.53 1517.50 52550 families
18 Social Security & Welfare 252254.82 7526.86 858.33 1179 families
19 Nutrition 65127.06 2841.00 1259.60
57942 children, 10120 mothers
20 Labour & Employment 13229.67 461.00 187.50 126 candidates
21 Industries and Commerce 4287.14 0.00 0.00
22 Others 205286.46 0.00 0.00
TOTAL 2006800.00 40000.00 22542.39
% over Annual Plan Outlay 2.00% 1.12%
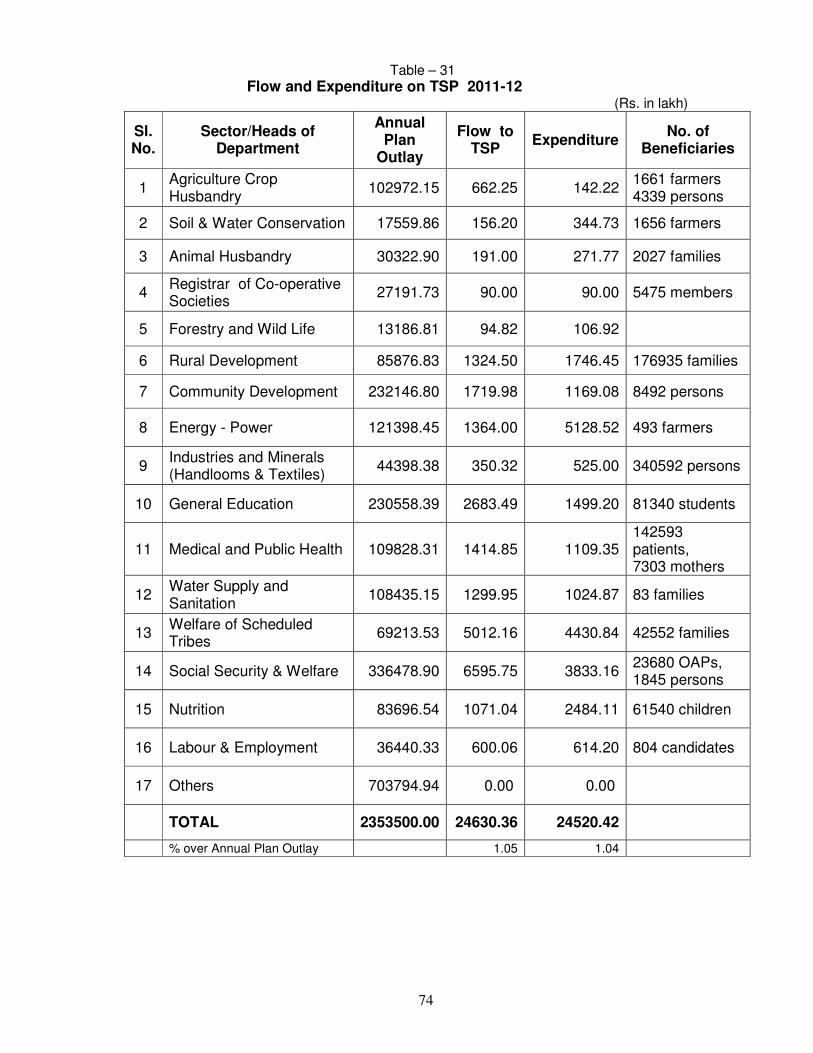
74
Table – 31 Flow and Expenditure on TSP 2011-12 le –
(Rs. in lakh)
Sl. No.
Sector/Heads of Department
Annual Plan
Outlay
Flow to TSP
Expenditure No. of
Beneficiaries
1 Agriculture Crop Husbandry
102972.15 662.25 142.22 1661 farmers 4339 persons
2 Soil & Water Conservation 17559.86 156.20 344.73 1656 farmers
3 Animal Husbandry 30322.90 191.00 271.77 2027 families
4 Registrar of Co-operative Societies
27191.73 90.00 90.00 5475 members
5 Forestry and Wild Life 13186.81 94.82 106.92
6 Rural Development 85876.83 1324.50 1746.45 176935 families
7 Community Development 232146.80 1719.98 1169.08 8492 persons
8 Energy - Power 121398.45 1364.00 5128.52 493 farmers
9 Industries and Minerals (Handlooms & Textiles)
44398.38 350.32 525.00 340592 persons
10 General Education 230558.39 2683.49 1499.20 81340 students
11 Medical and Public Health 109828.31 1414.85 1109.35 142593 patients, 7303 mothers
12 Water Supply and Sanitation
108435.15 1299.95 1024.87 83 families
13 Welfare of Scheduled Tribes
69213.53 5012.16 4430.84 42552 families
14 Social Security & Welfare 336478.90 6595.75 3833.16 23680 OAPs, 1845 persons
15 Nutrition 83696.54 1071.04 2484.11 61540 children
16 Labour & Employment 36440.33 600.06 614.20 804 candidates
17 Others 703794.94 0.00 0.00
TOTAL 2353500.00 24630.36 24520.42
% over Annual Plan Outlay 1.05 1.04
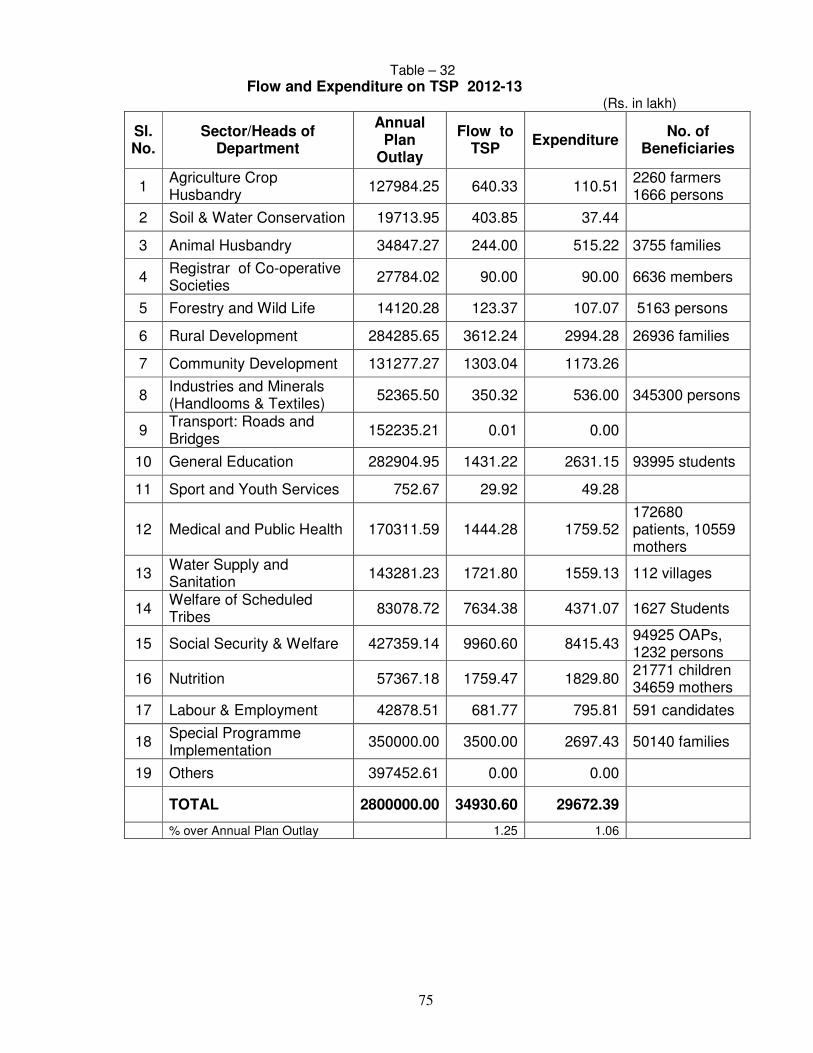
75
Table – 32 Flow and Expenditure on TSP 2012-13 le –
(Rs. in lakh)
Sl. No.
Sector/Heads of Department
Annual Plan
Outlay
Flow to TSP
Expenditure No. of
Beneficiaries
1 Agriculture Crop Husbandry
127984.25 640.33 110.51 2260 farmers 1666 persons
2 Soil & Water Conservation 19713.95 403.85 37.44
3 Animal Husbandry 34847.27 244.00 515.22 3755 families
4 Registrar of Co-operative Societies
27784.02 90.00 90.00 6636 members
5 Forestry and Wild Life 14120.28 123.37 107.07 5163 persons
6 Rural Development 284285.65 3612.24 2994.28 26936 families
7 Community Development 131277.27 1303.04 1173.26
8 Industries and Minerals (Handlooms & Textiles)
52365.50 350.32 536.00 345300 persons
9 Transport: Roads and Bridges
152235.21 0.01 0.00
10 General Education 282904.95 1431.22 2631.15 93995 students
11 Sport and Youth Services 752.67 29.92 49.28
12 Medical and Public Health 170311.59 1444.28 1759.52 172680 patients, 10559 mothers
13 Water Supply and Sanitation
143281.23 1721.80 1559.13 112 villages
14 Welfare of Scheduled Tribes
83078.72 7634.38 4371.07 1627 Students
15 Social Security & Welfare 427359.14 9960.60 8415.43 94925 OAPs, 1232 persons
16 Nutrition 57367.18 1759.47 1829.80 21771 children 34659 mothers
17 Labour & Employment 42878.51 681.77 795.81 591 candidates
18 Special Programme Implementation
350000.00 3500.00 2697.43 50140 families
19 Others 397452.61 0.00 0.00
TOTAL 2800000.00 34930.60 29672.39
% over Annual Plan Outlay 1.25 1.06
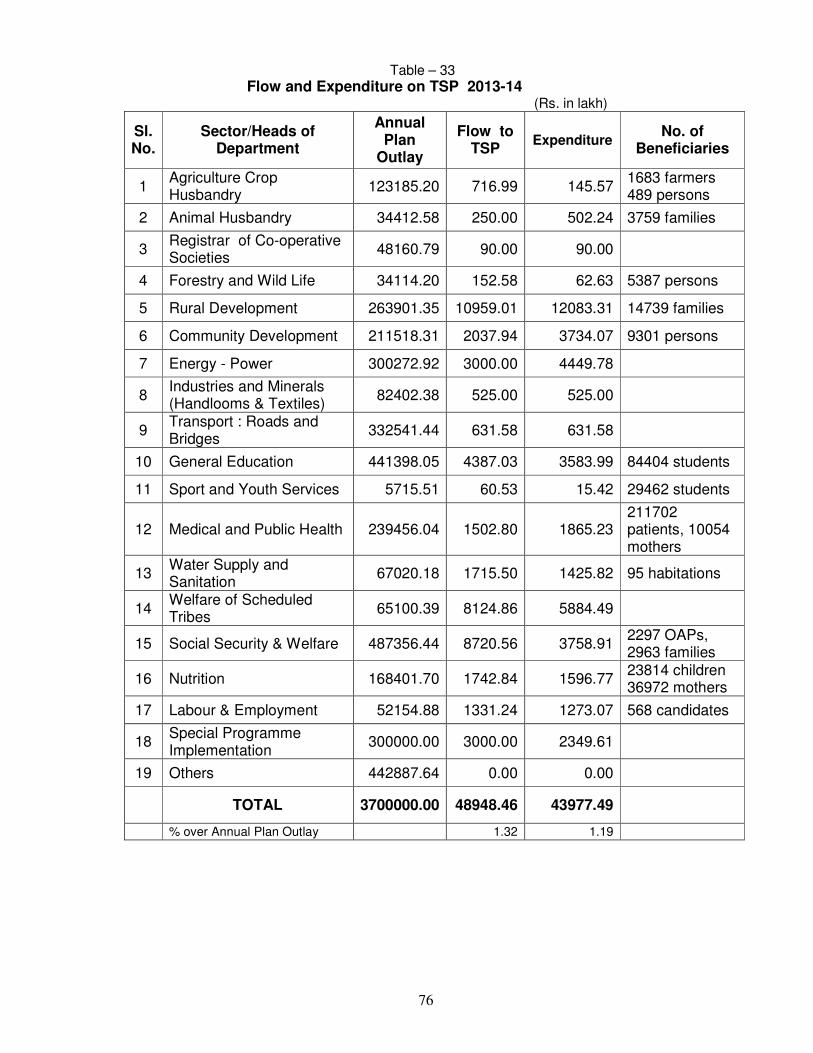
76
Table – 33 Flow and Expenditure on TSP 2013-14 le –
(Rs. in lakh)
Sl. No.
Sector/Heads of Department
Annual Plan
Outlay
Flow to TSP
Expenditure No. of
Beneficiaries
1 Agriculture Crop Husbandry
123185.20 716.99 145.57 1683 farmers 489 persons
2 Animal Husbandry 34412.58 250.00 502.24 3759 families
3 Registrar of Co-operative Societies
48160.79 90.00 90.00
4 Forestry and Wild Life 34114.20 152.58 62.63 5387 persons
5 Rural Development 263901.35 10959.01 12083.31 14739 families
6 Community Development 211518.31 2037.94 3734.07 9301 persons
7 Energy - Power 300272.92 3000.00 4449.78
8 Industries and Minerals (Handlooms & Textiles)
82402.38 525.00 525.00
9 Transport : Roads and Bridges
332541.44 631.58 631.58
10 General Education 441398.05 4387.03 3583.99 84404 students
11 Sport and Youth Services 5715.51 60.53 15.42 29462 students
12 Medical and Public Health 239456.04 1502.80 1865.23 211702 patients, 10054 mothers
13 Water Supply and Sanitation
67020.18 1715.50 1425.82 95 habitations
14 Welfare of Scheduled Tribes
65100.39 8124.86 5884.49
15 Social Security & Welfare 487356.44 8720.56 3758.91 2297 OAPs, 2963 families
16 Nutrition 168401.70 1742.84 1596.77 23814 children 36972 mothers
17 Labour & Employment 52154.88 1331.24 1273.07 568 candidates
18 Special Programme Implementation
300000.00 3000.00 2349.61
19 Others 442887.64 0.00 0.00
TOTAL 3700000.00 48948.46 43977.49
% over Annual Plan Outlay 1.32 1.19
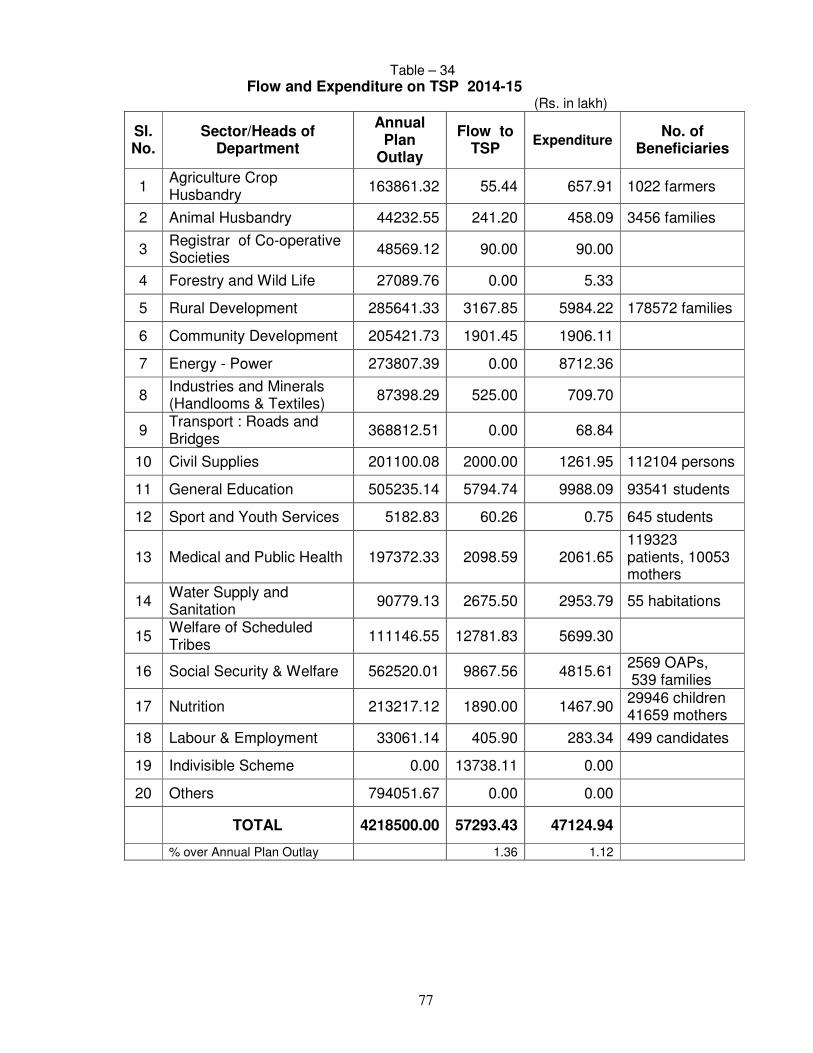
77
Table – 34 Flow and Expenditure on TSP 2014-15 le –
(Rs. in lakh)
Sl. No.
Sector/Heads of Department
Annual Plan
Outlay
Flow to TSP
Expenditure No. of
Beneficiaries
1 Agriculture Crop Husbandry
163861.32 55.44 657.91 1022 farmers
2 Animal Husbandry 44232.55 241.20 458.09 3456 families
3 Registrar of Co-operative Societies
48569.12 90.00 90.00
4 Forestry and Wild Life 27089.76 0.00 5.33
5 Rural Development 285641.33 3167.85 5984.22 178572 families
6 Community Development 205421.73 1901.45 1906.11
7 Energy - Power 273807.39 0.00 8712.36
8 Industries and Minerals (Handlooms & Textiles)
87398.29 525.00 709.70
9 Transport : Roads and Bridges
368812.51 0.00 68.84
10 Civil Supplies 201100.08 2000.00 1261.95 112104 persons
11 General Education 505235.14 5794.74 9988.09 93541 students
12 Sport and Youth Services 5182.83 60.26 0.75 645 students
13 Medical and Public Health 197372.33 2098.59 2061.65 119323 patients, 10053 mothers
14 Water Supply and Sanitation
90779.13 2675.50 2953.79 55 habitations
15 Welfare of Scheduled Tribes
111146.55 12781.83 5699.30
16 Social Security & Welfare 562520.01 9867.56 4815.61 2569 OAPs, 539 families
17 Nutrition 213217.12 1890.00 1467.90 29946 children 41659 mothers
18 Labour & Employment 33061.14 405.90 283.34 499 candidates
19 Indivisible Scheme 0.00 13738.11 0.00
20 Others 794051.67 0.00 0.00
TOTAL 4218500.00 57293.43 47124.94
% over Annual Plan Outlay 1.36 1.12
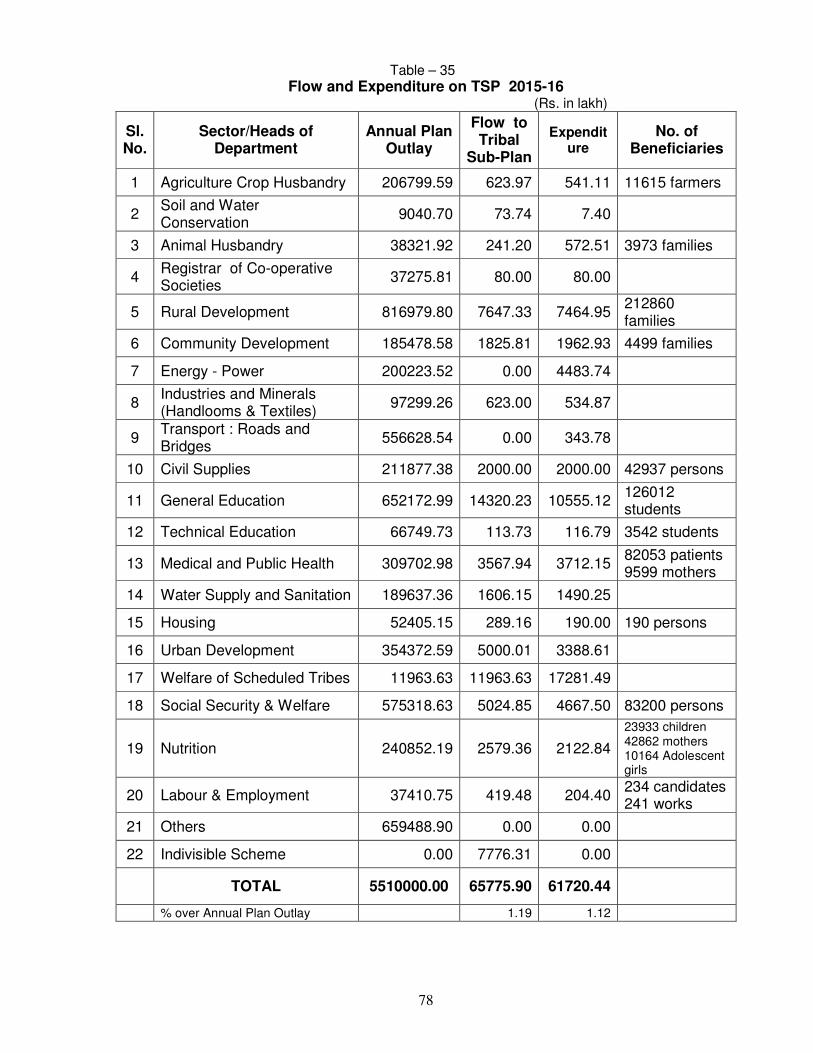
78
Table – 35 Flow and Expenditure on TSP 2015-16
(Rs. in lakh)
Sl. No.
Sector/Heads of Department
Annual Plan Outlay
Flow to Tribal
Sub-Plan
Expenditure
No. of Beneficiaries
1 Agriculture Crop Husbandry 206799.59 623.97 541.11 11615 farmers
2 Soil and Water Conservation
9040.70 73.74 7.40
3 Animal Husbandry 38321.92 241.20 572.51 3973 families
4 Registrar of Co-operative Societies
37275.81 80.00 80.00
5 Rural Development 816979.80 7647.33 7464.95 212860 families
6 Community Development 185478.58 1825.81 1962.93 4499 families
7 Energy - Power 200223.52 0.00 4483.74
8 Industries and Minerals (Handlooms & Textiles)
97299.26 623.00 534.87
9 Transport : Roads and Bridges
556628.54 0.00 343.78
10 Civil Supplies 211877.38 2000.00 2000.00 42937 persons
11 General Education 652172.99 14320.23 10555.12 126012 students
12 Technical Education 66749.73 113.73 116.79 3542 students
13 Medical and Public Health 309702.98 3567.94 3712.15 82053 patients 9599 mothers
14 Water Supply and Sanitation 189637.36 1606.15 1490.25
15 Housing 52405.15 289.16 190.00 190 persons
16 Urban Development 354372.59 5000.01 3388.61
17 Welfare of Scheduled Tribes 11963.63 11963.63 17281.49
18 Social Security & Welfare 575318.63 5024.85 4667.50 83200 persons
19 Nutrition 240852.19 2579.36 2122.84
23933 children 42862 mothers 10164 Adolescent girls
20 Labour & Employment 37410.75 419.48 204.40 234 candidates 241 works
21 Others 659488.90 0.00 0.00
22 Indivisible Scheme 0.00 7776.31 0.00
TOTAL 5510000.00 65775.90 61720.44
% over Annual Plan Outlay 1.19 1.12
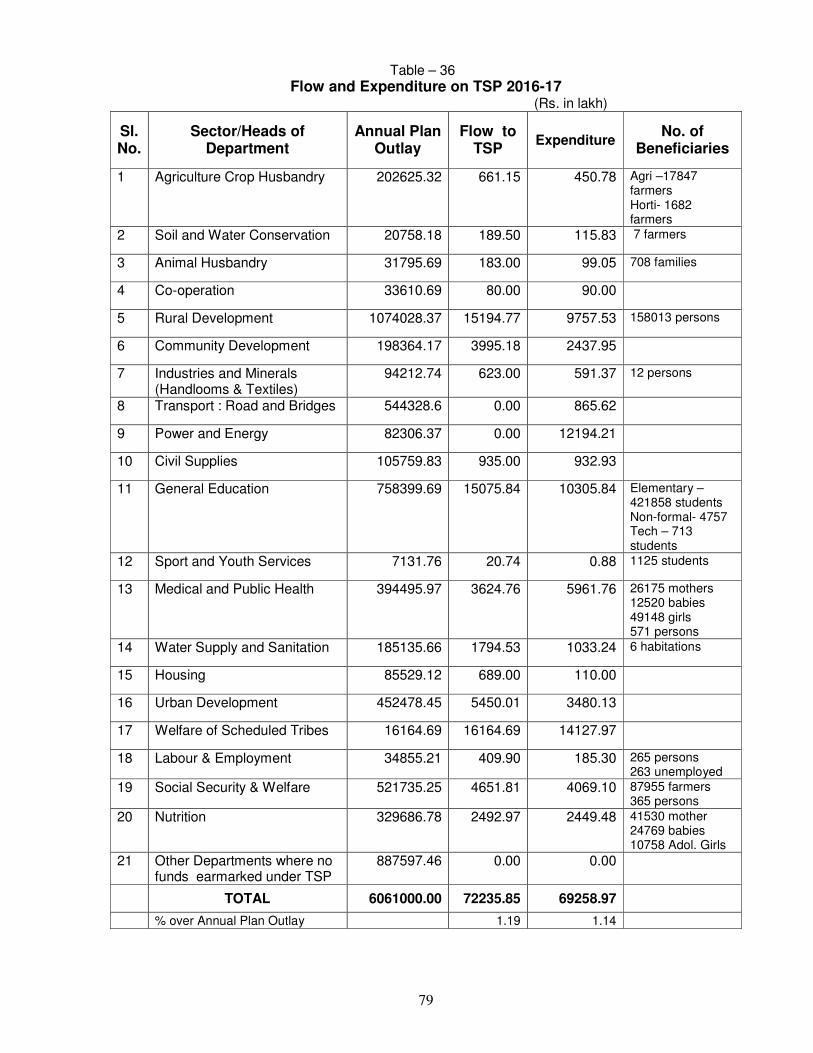
79
Table – 36 Flow and Expenditure on TSP 2016-17
(Rs. in lakh)
Sl. No.
Sector/Heads of Department
Annual Plan Outlay
Flow to TSP
Expenditure No. of
Beneficiaries
1 Agriculture Crop Husbandry 202625.32 661.15 450.78 Agri –17847 farmers Horti- 1682 farmers
2 Soil and Water Conservation 20758.18 189.50 115.83 7 farmers
3 Animal Husbandry 31795.69 183.00 99.05 708 families
4 Co-operation 33610.69 80.00 90.00
5 Rural Development 1074028.37 15194.77 9757.53 158013 persons
6 Community Development 198364.17 3995.18 2437.95
7 Industries and Minerals (Handlooms & Textiles)
94212.74 623.00 591.37 12 persons
8 Transport : Road and Bridges 544328.6 0.00 865.62
9 Power and Energy 82306.37 0.00 12194.21
10 Civil Supplies 105759.83 935.00 932.93
11 General Education 758399.69 15075.84 10305.84 Elementary – 421858 students Non-formal- 4757 Tech – 713 students
12 Sport and Youth Services 7131.76 20.74 0.88 1125 students
13 Medical and Public Health 394495.97 3624.76 5961.76 26175 mothers 12520 babies 49148 girls 571 persons
14 Water Supply and Sanitation 185135.66 1794.53 1033.24 6 habitations
15 Housing 85529.12 689.00 110.00
16 Urban Development 452478.45 5450.01 3480.13
17 Welfare of Scheduled Tribes 16164.69 16164.69 14127.97
18 Labour & Employment 34855.21 409.90 185.30 265 persons 263 unemployed
19 Social Security & Welfare 521735.25 4651.81 4069.10 87955 farmers 365 persons
20 Nutrition 329686.78 2492.97 2449.48 41530 mother 24769 babies 10758 Adol. Girls
21 Other Departments where no funds earmarked under TSP
887597.46 0.00 0.00
TOTAL 6061000.00 72235.85 69258.97
% over Annual Plan Outlay 1.19 1.14
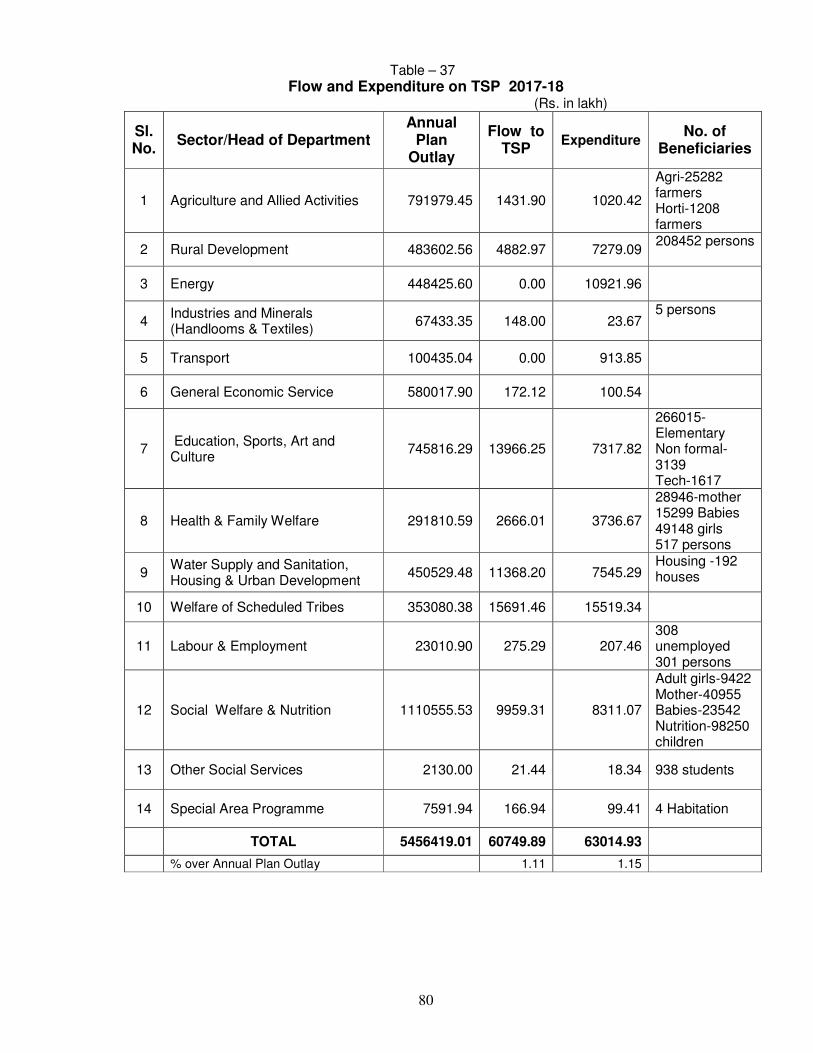
80
Table – 37 Flow and Expenditure on TSP 2017-18
(Rs. in lakh)
Sl. No.
Sector/Head of Department Annual
Plan Outlay
Flow to TSP
Expenditure No. of
Beneficiaries
1 Agriculture and Allied Activities 791979.45 1431.90 1020.42
Agri-25282 farmers Horti-1208 farmers
2 Rural Development 483602.56 4882.97 7279.09 208452 persons
3 Energy 448425.60 0.00 10921.96
4 Industries and Minerals (Handlooms & Textiles)
67433.35 148.00 23.67 5 persons
5 Transport 100435.04 0.00 913.85
6 General Economic Service 580017.90 172.12 100.54
7 Education, Sports, Art and Culture
745816.29 13966.25 7317.82
266015-Elementary Non formal-3139 Tech-1617
8 Health & Family Welfare 291810.59 2666.01 3736.67
28946-mother 15299 Babies 49148 girls 517 persons
9 Water Supply and Sanitation, Housing & Urban Development
450529.48 11368.20 7545.29 Housing -192 houses
10 Welfare of Scheduled Tribes 353080.38 15691.46 15519.34
11 Labour & Employment 23010.90 275.29 207.46 308 unemployed 301 persons
12 Social Welfare & Nutrition 1110555.53 9959.31 8311.07
Adult girls-9422 Mother-40955 Babies-23542 Nutrition-98250 children
13 Other Social Services 2130.00 21.44 18.34 938 students
14 Special Area Programme 7591.94 166.94 99.41 4 Habitation
TOTAL 5456419.01 60749.89 63014.93
% over Annual Plan Outlay 1.11 1.15
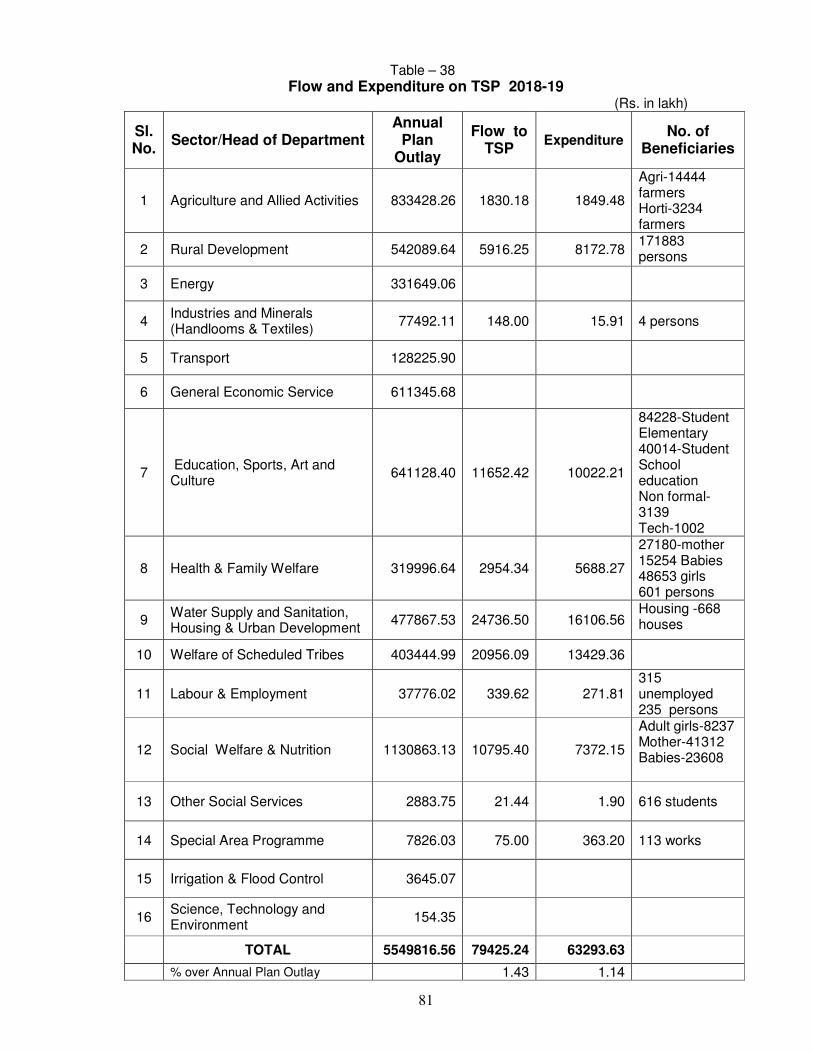
81
Table – 38 Flow and Expenditure on TSP 2018-19
(Rs. in lakh)
Sl. No.
Sector/Head of Department Annual
Plan Outlay
Flow to TSP
Expenditure No. of
Beneficiaries
1 Agriculture and Allied Activities 833428.26 1830.18 1849.48
Agri-14444 farmers Horti-3234 farmers
2 Rural Development 542089.64 5916.25 8172.78 171883 persons
3 Energy 331649.06
4 Industries and Minerals (Handlooms & Textiles)
77492.11 148.00 15.91 4 persons
5 Transport 128225.90
6 General Economic Service 611345.68
7 Education, Sports, Art and Culture
641128.40 11652.42 10022.21
84228-Student Elementary 40014-Student School education Non formal-3139 Tech-1002
8 Health & Family Welfare 319996.64 2954.34 5688.27
27180-mother 15254 Babies 48653 girls 601 persons
9 Water Supply and Sanitation, Housing & Urban Development
477867.53 24736.50 16106.56 Housing -668 houses
10 Welfare of Scheduled Tribes 403444.99 20956.09 13429.36
11 Labour & Employment 37776.02 339.62 271.81 315 unemployed 235 persons
12 Social Welfare & Nutrition 1130863.13 10795.40 7372.15
Adult girls-8237 Mother-41312 Babies-23608
13 Other Social Services 2883.75 21.44 1.90 616 students
14 Special Area Programme 7826.03 75.00 363.20 113 works
15 Irrigation & Flood Control 3645.07
16 Science, Technology and Environment
154.35
TOTAL 5549816.56 79425.24 63293.63
% over Annual Plan Outlay 1.43 1.14
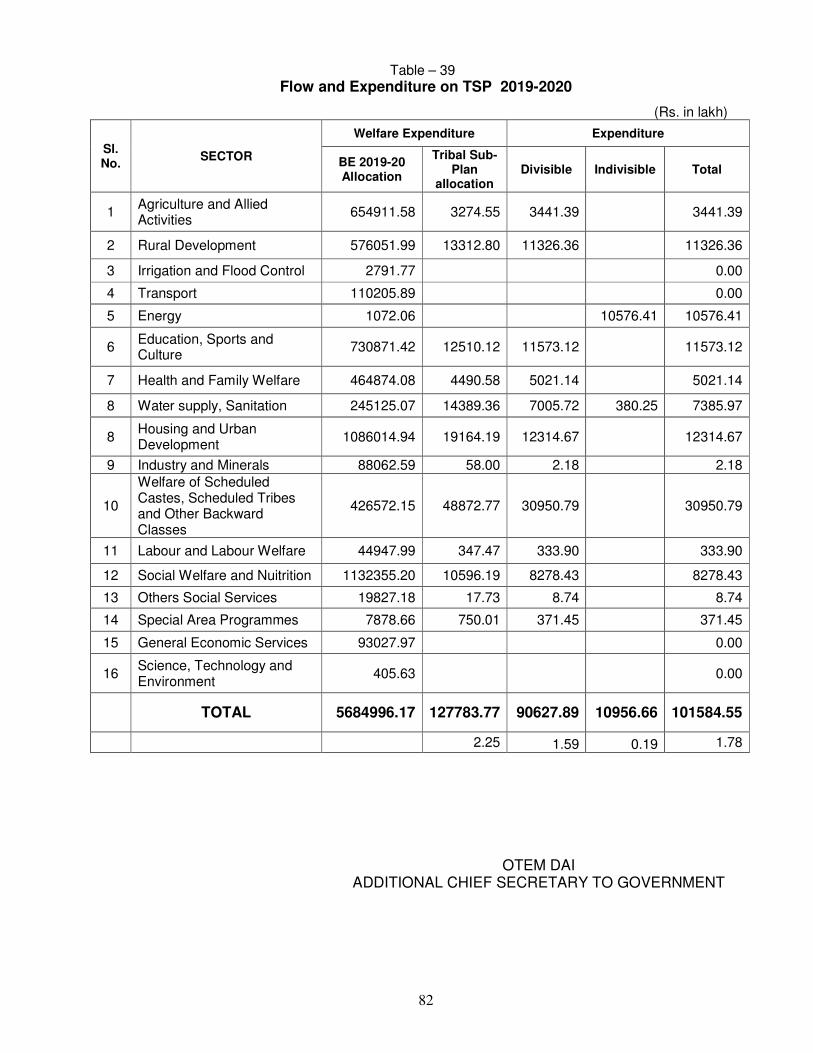
82
Table – 39 Flow and Expenditure on TSP 2019-2020
(Rs. in lakh)
Sl. No.
SECTOR
Welfare Expenditure Expenditure
BE 2019-20 Allocation
Tribal Sub-Plan
allocation Divisible Indivisible Total
1 Agriculture and Allied Activities
654911.58 3274.55 3441.39 3441.39
2 Rural Development 576051.99 13312.80 11326.36 11326.36
3 Irrigation and Flood Control 2791.77 0.00
4 Transport 110205.89 0.00
5 Energy 1072.06 10576.41 10576.41
6 Education, Sports and Culture
730871.42 12510.12 11573.12 11573.12
7 Health and Family Welfare 464874.08 4490.58 5021.14 5021.14
8 Water supply, Sanitation 245125.07 14389.36 7005.72 380.25 7385.97
8 Housing and Urban Development
1086014.94 19164.19 12314.67 12314.67
9 Industry and Minerals 88062.59 58.00 2.18 2.18
10
Welfare of Scheduled Castes, Scheduled Tribes and Other Backward Classes
426572.15 48872.77 30950.79 30950.79
11 Labour and Labour Welfare 44947.99 347.47 333.90 333.90
12 Social Welfare and Nuitrition 1132355.20 10596.19 8278.43 8278.43
13 Others Social Services 19827.18 17.73 8.74 8.74
14 Special Area Programmes 7878.66 750.01 371.45 371.45
15 General Economic Services 93027.97 0.00
16 Science, Technology and Environment
405.63 0.00
TOTAL 5684996.17 127783.77 90627.89 10956.66 101584.55
2.25 1.59 0.19 1.78
OTEM DAI ADDITIONAL CHIEF SECRETARY TO GOVERNMENT