Castes in India: implications of social identity in economics
217
HAL Id: tel-00608674 https://tel.archives-ouvertes.fr/tel-00608674 Submitted on 13 Jul 2011 HAL is a multi-disciplinary open access archive for the deposit and dissemination of sci- entific research documents, whether they are pub- lished or not. The documents may come from teaching and research institutions in France or abroad, or from public or private research centers. L’archive ouverte pluridisciplinaire HAL, est destinée au dépôt et à la diffusion de documents scientifiques de niveau recherche, publiés ou non, émanant des établissements d’enseignement et de recherche français ou étrangers, des laboratoires publics ou privés. Castes in India : implications of social identity in economics Catherine Bros To cite this version: Catherine Bros. Castes in India : implications of social identity in economics. Economics and Finance. Université Panthéon-Sorbonne - Paris I, 2010. English. tel-00608674
-
Upload
khangminh22 -
Category
Documents
-
view
0 -
download
0
Transcript of Castes in India: implications of social identity in economics
HAL Id: tel-00608674https://tel.archives-ouvertes.fr/tel-00608674
Submitted on 13 Jul 2011
HAL is a multi-disciplinary open accessarchive for the deposit and dissemination of sci-entific research documents, whether they are pub-lished or not. The documents may come fromteaching and research institutions in France orabroad, or from public or private research centers.
L’archive ouverte pluridisciplinaire HAL, estdestinée au dépôt et à la diffusion de documentsscientifiques de niveau recherche, publiés ou non,émanant des établissements d’enseignement et derecherche français ou étrangers, des laboratoirespublics ou privés.
Castes in India : implications of social identity ineconomicsCatherine Bros
To cite this version:Catherine Bros. Castes in India : implications of social identity in economics. Economics and Finance.Université Panthéon-Sorbonne - Paris I, 2010. English. �tel-00608674�
Université Paris I Panthéon-SorbonneU.F.R. de Sciences Economiques
N◦ attribué par la bibliothèque2010PA010052
THÈSE
pour obtenir le grade de
Docteur de l’Université Paris I Panthéon Sorbonne
Discipline : Sciences Economiques
Titre:
Castes in India:Implications of Social Identity In Economics.
présentée et soutenue publiquementpar
Catherine Bros
le 6 décembre 2010
Directeur de thèse:Jean-Claude Berthélémy
JuryM. François Gardes, Professeur à l’Université Paris 1, PrésidentMme. Ashwini Deshpande, Professeur à la Delhi School of Economics, RapporteurM. Samuel Bowles, Professeur à l’Université de Sienne, RapporteurM. Basudeb Chaudhuri, Directeur du CSH Delhi, ExaminateurM. Jean-Claude Berthélémy, Professeur à l’Université Paris 1, Directeur de thèse

ii
l’Université Paris I n’entend donner aucune approbation ou improbation auxopinions émises dans cette thèse. Ces opinions doivent être considérées comme
propres à leur auteur.
iii

iv
A ma famille et particulièrement Vincent
v
Acknowledgements
I am grateful to :• Members of the jury for taking the time to read and comment this perfectible
work. My thanks go more particularly to those who traveled from far away ;• Prof. Jean-Claude Berthélémy for his supervision and support ;• The Centre de Sciences Humaines for the welcoming in Delhi and access to va-
luable data ;• Prof. Pradipta Chaudhury for lively discussions about castes ;• Marie-Anne Valfort and Sandra Poncet for their useful comments, advice and
training ;• Laure, Valérie, Vincent and my parents for their caring love that supported me
through the difficult times and looking after Joachim when I was in a rush ;• Jean-Paul and Annouchka for steering me through the intricacies of English syn-
tax ;• Grégory and Stéphane for supporting my career change ;• My thoughts also go to my PhD companions : Josselin, Patrick, Marie, Felipe,
Mathieu and Thomas, with a special thanks to the first three for lively discus-sions and moral support.
• I also thank Elda André for organizing the defense
vi
Résumé
Cette thèse s’inscrit dans le courant de pensée qui vise à réintégrer les institu-tions et l’identité sociales en économie et ce pour trois raisons. Premièrement, denombreuses expériences comportementales ont mis à mal le modèle conventionnelde l’agent égoïste maximisateur en raison notamment du rôle joué par les normessociales. Deuxièmement, les groupes sociaux, et l’identité qui en découle, peuventdéprécier les attentes des individus les plus démunis et limiter leurs "capabilités"selon le terme de A. Sen. Dernièrement, ces institutions peuvent contrecarrer l’al-location efficiente des ressources. Dans cette thèse, nous présentons un modèle quidécrit la ségrégation comme un des équilibres provenant d’une distribution inégaledu pouvoir. L’intérêt de ce modèle réside, premièrement, dans la reconnaissance queles sociétés ségréguées sont aussi celles où le pouvoir est très inégalement réparti,deuxièmement, dans le fait que la ségrégation peut apparaitre en l’absence de préju-gés, troisièmement dans les définitions données du pouvoir et de la ségrégation quisont suffisamment amples pour recouvrir un grand nombre de situations, et enfin,dans le processus qui mène d’une situation neutre à la ségrégation. Dans le secondchapitre nous montrons que la caste détermine considérablement le statut socialperçu des intouchables et des tribus. Néanmoins, d’autres facteurs comme le revenu,la profession et dans une moindre mesure l’éducation ont aussi une importance. Deplus la caste a un effet à la fois direct et indirect, ce dernier s’exprimant par uneinfluence réduite du revenu sur le statut social perçu. Nous interprétons ces résul-tats comme l’internalisation de la discrimination subie depuis des siècles, qui abaissel’image de soi et diminue les attentes. Dans le troisième chapitre, nous mettons enévidence la persistance des pratiques d’intouchabilité. Nous montrons que le nombrede crimes contre les intouchables est positivement relié à une distribution commu-nautaire de l’eau. Les règles de castes prohibent le contact des intouchables avecles sources d’eau des castes supérieures. Bien que ces règles soient anticonstitution-nelles, elles sont encore largement appliquées et de manière violente. A priori, cesrègles ne concernent pas uniquement l’eau mais aussi une grande partie des bienspublics, ce qui laisse à penser que ces derniers sont en réalité des biens de club ou decaste. Ce dernier point est étudié dans le chapitre 4. Nous montrons que si l’indicede fractionalisation a un effet sur la présence dans les villages de biens publics, ceteffet est essentiellement positif. En revanche les indices de polarisation ne semblentpas avoir d’impact. Nous interprétons ce résultat, contraire à bon nombre de ceuxobtenus auparavant, comme le fait qu’il existe du patronage de castes. Cette hypo-thèse est testée à la fin du chapitre. Les résultats semblent indiquer que les castess’approprient l’usage des biens fournis publiquement. En conclusion, nous proposonsdes pistes de recherche, visant, essentiellement, à améliorer la compréhension de laformation des identités sociales et les raisons de leurs mises en exergue.
vii
Abstract
This dissertation relates to the literature on the implications of social institu-tions and identities in economics, through a focus on the institution of castes. Threereasons motivate the analysis of castes in economics.
The Under-socialized Homo Economicus
One of the motives for the analysis of caste lies in the shortcomings of the stan-dard conceptual framework used in economics. The Homo economicus is conventio-nally viewed as a self interested maximizing agent, whose preferences are exogenous.He was not much considered in his environment. As Becker and Murphy (2003) writes"modern economics [...] typically assumes that individual behavior is not directlyinfluenced by the actions of others". However, all the assumed characteristics of theHomo economicus have come under scrutiny impelled by (a) criticisms addressed byother social sciences, (b) the regain of interest for earlier theories that either contes-ted one or more of these characteristics (Bowles and Gintis, 2000) or insisted on theroles of institutions and (c) the "accumulation of abundant anomalies" (Ostrom andAhn, 2003). First, new institutional economics challenged the assumption of cost-less information and modified the instrumental rationality assumption to accountfor cultural differences. However, this set of theories maintained the assumption ofa consequentialist behavior, while economic anthropology tended to refute it on thebasis that choice may not be driven by a scarcity of means but rather by a socialcontext. However, this last discussion was, oddly, confined to anthropology. Theimportant point is that the accounting of institutions led to a modification of theinstrumental rationality hypothesis and the accounting of cultural variations.
In the 1990’s the impressive development of the literature on social capital (Os-trom and Ahn, 2003) was a strongest attempt at recasting the economic agent intohis social environment. Yet, this posed the question of freedom of choice. If socialcapital has such a large impact on agents’ behaviors, then the only space left for freechoices was who to associate with, i.e. the level of social capital (Becker and Murphy,2003). However, many arguments, including the analysis of stratified societies suchas that of castes, could be invoked to show that agents rarely choose their levels ofsocial capital (Bowles, 1973). This points shows how ill at ease economists are whendealing with social interactions.
Another attempt at reintegrating social relationships came with the modifica-tion of the assumption that agents are not concerned with the direct effect of theiractions on others. Indeed, they may include in their decision process the fact that
viii

CHAPITRE 0. ABSTRACT
other individuals may respond to their actions. They are not concerned with theconsequences of their actions out of altruism, but rather out of self interest andbecause others may backfire. Thus, social relationships were viewed in terms ofstrategic interactions (Akerlof, 1976). However, pure self interest is not sufficientto explain why individuals do incorporate the effect of their behaviors on others(Basu, 1997). Basu (1986) argues that virtually any economic behavior and marketsdepend on adherence to some basic social norms. "Self interest and policing cannotalways explain why individuals do not run away without paying after a haircut"(Basu, 1986). Thus norms ought to be taken into account as they are an importantcomponent of behaviors. Many behavioral experiments make that point (Hoffmanet al., 1996; Henrich et al., 2001) when their results conclude that Nash outcomesare rarely observed : behaviors are also driven by a genuine concern for fairness orcultural norms of reciprocity. The centrality of the social norm leads to the followingquestion : "what is a social norm ?" The eclecticism of the answers given probablyemphasize the intricacy of the question. We do not attempt to settle the debate,however the first chapter of this dissertation clearly fits into the debate.
Nevertheless, behavioral experiments clearly show that individuals have "other-regarding" preferences, that may be context dependent. For instance, the experimentled by Hoffman et al. (1996) suggests that norms of reciprocity decrease with socialdistance. Thus, it may be hypothesized that the balance between self and other re-garding preferences actually depends on social identification.
Some fairly recent behavioral experiments stress the role of social identity inbehaviors (Steele and Aronson, 1995; Shih et al., 1999; Hoff and Pandey, 2006; Chenand Li, 2009). This influence may stem from a utility derived from identity andone derived from complying to the norm or ideal set by the group one identifieswith. Psychological experiments have already emphasized the anxiety experiencedby individuals whose behaviors contradict their believes. This anxiety is referred toas "cognitive dissonance" (Festinger et al., 1956) and most of them will endeavorto reduce this anxiety through the adaptation of their believes, i.e. through an aposteriori rationalization. Thus not acting in conformity with a group’s norms mayinduce cognitive dissonance and this may explain why social identity has such astrong influence on behaviors. In the second chapter of this dissertation, we will in-vestigate the influence of caste on perceived social status. Arguably caste has beena strong determinant of social identity in India. The system ascribed a status tosome groups, such as the former untouchables, the Scheduled Castes ("SCs"). Whenprivately asked to rank themselves on a social scale, SCs would pick a rather lowposition because of their castes. This is an example of how a norm has been inter-nalized by individuals. This last point had already been addressed by A. Sen whenhe criticized the utilitarian framework. This is reviewed in the next paragraphs.
Sen’s capability approach
First, let’s recall the ambition of what was once called political economy, thatis, to make it short, the promotion of social welfare. Because utilitarianism asserteditself as the predominant conceptual framework, social welfare was seen as arising
ix
CHAPITRE 0. ABSTRACT
from the maximization of individual utilities. Yet, Sen (1992, 1999a) criticized theuse of utility as a metric on two grounds. First, "a thoroughly deprived person,leading a very reduced life, might not appear to be badly off in terms of the mentalmetric of desire and its fulfilment, if the hardship is accepted with non grumblingresignation". (Sen, 1992). Because individuals may adapt their preferences to whatseems attainable, they may not be dissatisfied with strikingly unfair situations. Thusthe use of utility as a yardstick may lead to an improper assessment of inequality.A. Sen also criticized the focus on income as the main argument of the utility func-tion, for there is a great heterogeneity in individuals’ capacity to convert incomeinto well-being. Such a variance may stem from both individual and groups’ cha-racteristics. Experiments concur on this view by showing that utility derived fromincome largely depends on the group the individual compares to. Sen (1992, 1999a)proposed to substitute utility for the concept of capabilities, that can be summari-zed as the freedom to lead one type of life or another. Inequality is better assessedthrough the distribution of capabilities. Sen (1999a) identified five freedoms thatare instrumental to advancing capabilities and that are : economic facilities or thefreedom to use resources for consumption and production, social opportunities suchas access to health and education, political rights, transparency and security.
This is all fine but what about castes ? First, I would argue, based on recentresearch and experiments, that the institution of castes and the related identity doalter expectations and ambitions. An interesting experiment in that respect is theone conducted by Hoff and Pandey (2006). Children from Northern India were as-ked to solve mazes. When caste identity was made public, either the performancefrom the lower castes children dropped or they withdrew from the game. The authorsargue that once identity is made salient, lower castes children either tend to conformto stereotypes or expect discrimination to occur and conform to it. This is one ofthe many behavioral experiments that evidenced stereotype threat and self discri-mination. Caste identity does modulate individuals expectations. Second, if utilityderived from income is expected to depend upon the comparison group, the rele-vance of social identity in well being is rather obvious. Third, it makes little doubtthat caste rules restrict the set of "functionings", as per Sen’s words, especially forthe lower castes. Untouchability practices prevent lower castes from entering publicfacilities such as schools, hospitals or even village centers. This was acknowledged bythe Constitution of India that stated in its 15th article of the Fundamental Rightsthat "no citizen shall, on grounds of [...] caste [...] be subject to any disability, liabi-lity, restriction or condition with regard to (a) access to shops, public restaurants,hotels and places of public entertainment ; or (b) the use of wells, tanks, bathingghats, roads and places of public resort maintained wholly or partly out of Statefunds or dedicated to the use of the general public [...]". If we acknowledge thatlower castes are excluded from public places and resources, they do not have accessto economic facilities and social opportunities defined by A. Sen. It becomes ratherclear that untouchability do limit capabilities.
The second and third issues are addressed in this dissertation. Chapter 2 inves-tigates the determinants of Hindus’ perceived social status and more particularlythe impact of being from a Scheduled Caste or Tribe. Chapters 3 and 4 addresses
x
CHAPITRE 0. ABSTRACT
the issue of exclusion from public goods usage on caste grounds. They show thatuntouchability practices are still common and violently enforced despite them beingoutlawed. In this case, four of the five instrumental freedoms defined by Sen (1999a)are violated. First, some individuals may be excluded from economic facilities andsocial opportunities by being banned from using public goods. Second, transparencyand security are all but guaranteed if caste based rules are violently enforced regard-less of the law.
Castes Distort Resources Allocation
The last argument for looking into the implications of the institution of castes,is that it interferes with an efficient allocation of resources. This point was firstaddressed by Akerlof (1976, 1980). Employment discrimination against lower castesis an example of the distortions introduced by the institution in the labor marketand of its interference with an efficient resource allocation. Another example, isthe supposedly negative impact of social fragmentation on the provision of publicgoods, discussed in chapters 3 and 4. This is a more practical motive for the studyof castes as it has serious consequences on policy design. For instance, public goodsavailability is a central issue for economic development and a key concern of manydeveloping societies. Results from a voters survey conducted in 1996 in India showthat the second most popular concern was related to public goods1. Nevertheless, ifcaste rules prevent some groups from accessing public goods, development programsand policies, that are often oriented towards an increased coverage of public goods,may miss their targets.
Chapter 1 : Power and Endogenous Segregation
At the beginning of Chapter 1 we question whether segregation may occur evenwithout the intervention of discriminatory norms or preferences. This assumption issomewhat at variance with a large part of the literature on segregation and discri-mination. Indeed, whether Becker (1957) or Arrow (1971), or even Schelling (1969)all posited the existence of prejudice, even in the slightest form, to model discrimi-nation. The model presented in Chapter 1 strives to depart from this assumption.
This chapter models an infinitely repeated prisoner’s dilemma with random mat-ching. A group is assumed to have a power of influence over others. Power is definedas the capacity to give someone else access to opportunities that would be un-reachable otherwise, which in political science, is often referred to as a "power ofinfluence" or "reward power" (Raven and French, 1958). Thus the concept accountsfor a broad array of powers including political, religious or economic. As a resultof this power, the powerless will perceive an additional benefit in cooperating withthe mighty. They will increase their propensity to cooperate and the mighty willrespond by increasing theirs as well, which prompts a new increase in cooperationfrom the powerless, up to a point when they will cooperate for sure with the power-ful. At this point, the mighty’s best response will be to reject any cooperation withthe powerless, who will respond by systematic defection. This systematic refusal to
1In Banerjee and Somanathan (2007)
xi
CHAPITRE 0. ABSTRACT
cooperate is how we define segregation. Hence segregation can be an equilibriumresulting from unequal power distribution.
The mechanism brought forward in this chapter is supported by a couple ofhistorical examples and serves as an explanation of the strong segregation betweencastes. First, some theorists have seen the origin of the caste system in the do-minated Aryans’ willingness to stay away from the conquered. The power captureby the Aryans is likely to have been contemporaneous to the design of segregationrules that would separate the conquerors from the conquered. Although this theoryis disputed on many grounds (Klass, 2004), it remains one of the most commonlyaccepted about the origins of caste. Second, in Vedic times, fire sacrifice was centralas this was the main way to gain the deities’ favors that would ensure worldly suc-cess. Yet the priests had a monopoly over sacrifices and rituals. As such, they had apower of influence that placed them above the crowd. In the vedic texts who codifiedthe vedic religion, many clues can be found indicating that there was already someform of segregation, at least between the priests and the rest of the population. Thereversal of vedic values that occurred between the Vth and the IId centuries B.C.could have jeopardized the priests supremacy. Doniger and Smith (1991) argue thatthe ethos developed by the priests at that time that ensured proper segregation wascoming from the priests efforts to maintain, or even firmed, their superior positions.It is also striking that the top varnas described in the texts are the one endowedwith some sort of power. The Brahmans had had a monopoly over spiritual affairsand the Kshatriyas over political affairs. On a different note, historical recounts ofthe colonization process admit that early European settlers tended to mingle withlocal societies. Yet, when foreign power was more firmly established, condescendingideologies about the "natives" started appearing.
This model has several compelling features. First, it recognizes that segregatedsocieties are often the ones that exhibit a highly unequal power distribution, whichis a point that has been little addressed. Second, the definition given to segregationas a systematic refusal from two groups to cooperate, is large enough to encompassvarious situations from marriage to geographical segregation. Indeed, segregation ifoften thought of as being the geographical separation of two groups. This probablyis only the tip of the iceberg as segregation manifests itself in many aspects of everyday life, such as manners, conversations or jokes, for instance. Similarly, the waypower is defined is large enough to account for various types of segregation such asthe separation between the clergy, the aristocracy and the commoners. Third, theprocess described by the model has an interest in itself and more particularly thatrejection is a result of the powerless striving to cooperate. Many examples drawnfrom day to day life could illustrate this point. Think of a child that desperatelywants to make friend with another one. If the desire is too obvious or intense, hewill likely be turned down.
The model also has a couple of drawbacks and section 6 presents ways for im-provement. First it can not be reasonably claimed that the segregation equilibriumis unique. Second, in an attempt to bring forward the process of segregation forma-tion, the model is not written in a canonical way. Adopting an evolutionary version
xii
CHAPITRE 0. ABSTRACT
of the model might help at tackling both issues. Another envisaged improvementwould be to design the creation of a third group arising from cooperation betweenthe mighty and the powerless and who would be endowed with a fraction of power.Besides, in the model presented,power is left constant, while it could be thought tobe negatively correlated with the number of powerful individuals. Lastly customscould be introduced as a signal or a device aiming at enforcing cooperation within agroup. Indeed, it is striking that constraints imposed by customs on lifestyles, suchas for instance vegetarianism, are much harsher on higher castes than on the lowerones. All these potential improvements are left for future research.
Chapter 2 : Social Identity in India : Caste and Beyond ?
This chapter inquires into the determinants of perceived social class among Hin-dus. More precisely it addresses the following questions : is caste the only determi-nant of perceived social status or are they other relevant factors that could even-tually mitigate its effect ? If there are other determinants, do they have a similareffect across all groups ? For instance, education may be efficient at improving socialstatus, but only so among high castes. The analysis is based on data collected in the1995 and 2001 rounds of the World Values Survey. We are particularly interested inone of the question asked during the survey : "to which of the five social classes doyou think you belong to ?". Data cover 8,543 households although caste is informedonly for the 3,403 Hindu ones. Therefore, results obtained in this chapter can notbe generalized to other religious denominations.
The analysis yields three main results. First, and this is no surprise, being eitherfrom a Scheduled Caste or a Scheduled Tribe is a major determinant of perceivedsocial class, but is not the only one. Both income and occupation, whether super-visory, or involving either human or physical capital do have a significant impact.Education is also relevant although to a lesser extent and the divide lies betweenprimary and secondary or higher education.
Second, the impact of caste on perceived social status is somewhat smaller amongthe Scheduled Castes than among the Scheduled Tribes, although their ritual statusis, arguably, quite close. Large, yet plausible shifts in income or occupation couldmake up for the caste effect, as far as Scheduled Castes are concerned. For instance,the acquisition of land or skills can annul the caste effect. On the other hand, onlyvery unlikely improvements could hardly compensate for the tribe effect. However,this result may be driven by a potential sampling bias. The same analysis ran overa sub-sample conclude that the impact of being from a Scheduled Caste was un-derestimated and that of being from a Scheduled Tribe overestimated. However,concurrent with previous results, the analysis shows that being from a scheduledgroup has a strong effect on perceived social status and that plausible, albeit large,shifts in either occupation or income can compensaye the scheduled group effect.
Third, being from a scheduled group is found to have both a direct and an in-direct effect on perceived social status, the latter being that an increase in incomemay have a reduced effect on perceived social status among Scheduled Castes. The
xiii
CHAPITRE 0. ABSTRACT
group’s effect is actually mainly indirect for the SCs. Once the effect of income isallowed to vary across groups, the direct effect of belonging to a Scheduled Castedisappears. On the other hand, the tribe effect is essentially direct. The indirectcaste effect may be interpreted as a remainder of long lasting discrimination. SCs donot rank according to their wealth probably because they are untouchables. This isnot without echoing the stereotype threat and self discrimination phenomena evokedabove. Group membership may thus lower ambitions and expectations.
It is noted at the end of this chapter that the actual group’s effect may be unde-restimated given that data were collected during face to face interviews. It is likelythat if the social class had been declared publicly, the group’s effect may have beenlarger. Potential discrepancies between the privately and publicly declared socialclass, if they exist, would be worth investigating as it would highlight the pressureput on social identity directly by the immediate environment. It would not measurean internalized social identity as in our analysis, but rather the one imposed byothers. We even could hypothesize that discrimination has three facets : (a) a dimi-nished self image, even when not confronted to the opinions others have about ego,(b) the modification of this percieved self-image when confronted to others’ viewsand (c) how others perceive the individual. Disentangling the three would shed newlight on discrimination. It is left for future research. Moreover, local social composi-tion may be thought of having an effect on the group’s effect. It is plausible that SCswould better rank if they live in predominately SCs villages. Although best effortswere made to control for the local social composition, the analysis comes up againsta lack of data. These challenges are left for future research.
Chapter 3 : Is Blood Thicker Than Water : Untouchability and Public Infrastruc-ture
This chapter addresses the issue of caste based violence. Caste strongly definesthe use of common resources mainly through the prohibition put on the sharing ofthese resources between castes, particularly with outcasts. For instance, Shah et al.(2006) surveyed 565 villages and found that in nearly half of them, untouchables weredenied access to water facilities. In 28% of them they were denied entry into policestations, and in 18% access to the road or primary health centers. This prohibitionis what is referred to as untouchability and is most salient in the case of water. Un-touchability is grounded on the belief that outcasts are impure and that any formof contact with them is tainting. Food and water are the paramount conveyor ofritual pollution. Water is considered tainted if an untouchable or his vessel touchit. Despite a large heterogeneity in the compliance to the caste code, outcasts are,more often than not, banned from using higher castes wells. Indian local newspa-pers abound with stories of untouchables being beaten up for having used highercastes wells. This phenomenon is quantitatively investigated in this chapter, wherethe number of acts of violence against untouchables is shown to be associated withthe way water is distributed. The more common and shared the source, the largerthe number of acts of violence against untouchables.
The analysis is based on data on the number of acts of violence against SCs
xiv
CHAPITRE 0. ABSTRACT
and STs, collected by the National Crimes Record Bureau of the Indian Minsitry ofHome Affairs (based on the complaints filed by the local bureaux). The data cover581 districts for the year 2001. They are then linked to Census data on the per-centage of the population that access water through wells, tanks, tubewells or taps.A principal component is constructed for these four water sources. The componentdecreases with the individualization of the water source. For instance the componentis minimized if the entire district’s population access water through taps. On theother hand, it is maximized if they all access water through wells. Please note thatwhat is meant by individualized source is one that is less sensitive to ritual pollution.For instance, tap does not entail physical contact with the source and as such it isless prone to ritual pollution. It is sad to be individualized. Although, I must admitthat the choice individualized as opposed to common is not very fortunate, I carryon with it for the sake of conciseness.
Results show that there is a positive relationship between the commonality of thewater source and the number of acts of violence against untouchables. This relation-ship is robust to many controls, including caste and religious polarizations, statesmeasures of wealth, human development, fixed effects and measures of other publicinfrastructure. It is noteworthy that the percentage of villages that are connected byroad as well as the number of primary school per district’s inhabitants do seem tosignificantly reduce the number of acts of violence against untouchables, althoughthis result is note definite as the lack of roads may proxy remoteness. Finally, quan-tile regressions show that the effect of the water distribution mode on the numberof acts of violence, is most strongly felt when the level of violence against outcastsis already relatively high.
The results presented in this chapter show that, despite untouchability practicesbeing outlawed, they are still common and violently enforced. Moreover, based on theevidenced relationship, it is argued that water development programs, who primaryaim at improving health, exhibit a nice side effect of reducing caste based violence.It is not claimed that extending tap water will uproot caste conflicts. Rather, it isargued that it would remove a serious bone of contention between castes and providesome relief to the "weaker segments of society" on top of enhanced sanitation, whilemore definite measures must be considered to eradicate castes. This chapter, as wellas other empirical studies such as that of Shah et al. (2006) question whether publicgoods are truly public in India. Indeed, if some individuals are prevented from ac-cessing water sources for instance, one may wonder if these resources do not bettercompare to club goods rather than public goods. This hypothesis is what chapter 4challenges.
Chapter 4 : Social Fragmentation and Public Goods : Polarization and Patronagein Uttar Pradesh and Bihar
Theoretical and empirical results have concluded that there is a negative rela-tionship between social fragmentation and the provision of public goods throughlimited collective action. I argue that this literature exhibit four drawbacks. First,empirical results are mixed, at best, and the relationship has not been firmly establi-
xv

CHAPITRE 0. ABSTRACT
shed. Second, it rests on the implicit assumption that social fragmentation inducesgroups antagonisms. Third, this last relationship has never been firmly establishedand even if it actually existed, polarization indices would be more appropriate thanthe fractionalization index traditionally used to prove that social fragmentation lo-wers public goods provision. Fourth, the intervention of ethnic patronage has littlebeen considered. As Alesina and Ferrara (2005) pointed out "while pure publicgoods may be lower in more fragmented communities, the amount of publicly pro-vided "private" goods - especially those that can be targeted to specific groups -may be larger. We can then have a positive correlation between fragmentation andethnically based patronage".
These four points are addressed in this chapter and more specifically the patro-nage assumption. The analysis uses the data collected by the World Bank duringthe Survey of Living Conditions in the northern Indian states of Uttar Pradesh andBihar in 1997 and 1998. The likelihood for a village to have six public goods presentis assessed depending on the village’s characteristics. These goods are connectionsto the electric, road and bus networks as well as the presence of a waste disposalsystem, a primary health center and primary public school. The fractionalization in-dex exhibits a positive and significant impact on the presence of four of these goods,and a negative significant one on the presence of primary public school. This resultis robust to the inclusion of indicators of caste dominance and state fixed effect.However the significance of the positive coefficients is weakened by the introductionof inequality measures. This positive impact is somewhat at odds with the resultsobtained by previous empirical analysis who largely displayed a negative impact.The fractionalization index is then replaced by polarization indices in order to bet-ter stick to theoretical assumptions and conclusions. Results show that polarizationin almost never found to have an impact on the presence of the goods.
Why would the fractionalization index be relevant when the polarization indexis not ? Let’s recall that the former is closely and positively linked to the numberof groups in the society, while the latter is decreasing in the number of groups andis maximized when the population is clustered into two equally sized groups. Thenthe number of groups seems to positively influence public goods provision whilepotential group antagonisms play little role. A possible explanation might be pa-tronage. Indeed, if every group endeavors to have a "caste good", the larger thenumber of groups, the larger the likelihood to have the good present in the village.I therefore try to evaluate whether the probability for a household to have accessto a specific good, provided it is available in the village, depends on its membershipto the village’s dominant caste. The latter is defined as the caste that collectivelyowns the largest value of land. For instance, does the likelihood for a household tosend their children to school, provided schools are present in the village, depend onbelonging to the dominant backward agricultural caste ("BAC") ? Although resultsdo not clearly and firmly answer the question, they do provide some support tothis assumption. It is found that belonging to a backward agricultural caste doessignificantly reduce the likelihood to have toilets facilities or to attend anganwadicenters, except when the village is dominated by this caste. Similarly, the coefficientfor having electricity at a BAC home when the village is dominated by the BACs is
xvi
CHAPITRE 0. ABSTRACT
positive and close to significance.
This study is rather exploratory and data scarcity is somewhat of a problemgiven that they only cover 120 villages. Nevertheless, it casts some doubts on thefact that social fragmentation may have a negative effect on public goods provision.The idea lurking at the back of the latter assumed relationship is that social frag-mentation induces antagonisms and confrontations. However, this relationship is notfirmly established. As Esteban and Ray (2008) noted "by and large, it is fair to saythat most of the literature fails to find any significant evidence of ethnic fractio-nalization as a determinant of conflict". Moreover, what this assumption sidestepsis the existence of intergroup norms that govern the relationships between groups,such as patronage or exclusivity. What may prompt violence is the challenge of thisnorm as seen in the previous chapter, not fragmentation itself.
These results coupled with the ones found in chapter 3 do strongly suggest thatcaste rules and norms impede universal access to public goods. Publicly providedgoods may be seen as "caste goods". This is quite worrying and even more so ifwe bear in mind that universal public goods availability often is a priority of manydevelopment programs and a key concern.
Conclusions and Agenda for Future Research
Several examples of how the institution of castes limits capabilities were provi-ded. First, long-standing discrimination has influenced the way low caste and tribesperceive their social status in both direct and more insidious ways. Second castebased rules and untouchability practices are still enforced regardless of the law andsomewhat prevent lower castes from accessing public goods. Thus, the institution ofcaste thwarts many freedoms that are instrumental to development such as econo-mic facilities, social opportunities and the need for security. Moreover the conflictbetween legal and caste based rules hampers transparency. From a more practicalpoint of view the influence of castes on public goods access may divert the objectivesof development programs to spread public goods access.
Yet, all is not doom and gloom. The scheduled group effect on perceived socialstatus may be canceled by shifts in occupations or income. Moreover, the resultsdisplayed in Chapter 1, suggest that the redistribution of power might weaken thesegregation that still seems to prevail. Access to primary education was shown to beexempt from patronage and seems effective at reducing caste based violence.
This work has raised many issues that are worth addressing and are left for fu-ture research. First, perceived social status may differ when it is privately expressed,as it is the case in the database used in Chapter 2 and when it has to be publiclydeclared. As a consequence, the caste effect may differ as well. The study of sucha potential discrepancy may prove valuable to assess the amount of discriminationanticipated from others and that would come on top of an internalized diminishedself-image. I would hypothesize that discrimination is the meeting of a diminishedself image and of the opinions others have.
xvii
CHAPITRE 0. ABSTRACT
Second, I propose to investigate the influence of the local social composition onthe constraint put by caste on identity. For instance, would the feeling of alienationdue to group membership experienced by an outcast depend on the outcast popu-lation of the area where he lives ?
Third, there still is work to be done on the conceptualization of a polarizationindex. The one promoted by Montalvo and Reynal-Querol (2002), which appears tobe the most widely used, displays two related inconveniences. It holds intergroupdistance constant and neglects the issue of income distribution. I would argue thatintergroup distance, even if group is defined along ethnic lines, largely depends onthose groups relative and collective wealth. Suppose that there are three groups,A, B and C and that C is extremely poor while A and B enjoy a similar collectivewealth. The social distance perceived between C and A is probably different from theone experienced between A and B. This should be reflected in the index. Moreover,wealth distribution within the ethnic group may alter the sense of identification tothe group. A poor individual in a rich group, may put more stress on his identityas a poor than on his ethnic denomination. Finally, a society that is said to bepolarized because of the structure of the population distribution, is even more so ifthe pattern of the income distribution follows that of the groups and this should bereflected in the index.
Finally, a more general question permeated the dissertation. Why do agents picka trait among many and define themselves according to it ? For instance, in India,there are many factors that may define social identity such as religion, caste, lan-guage, eventually ethnicity, gender just to mention the most obvious ones. Thenthe question is : under what circumstances will individuals stress one identity ra-ther than another ? What factors make the religious denomination more relevantthan caste ? These questions are fraught with consequences. If identities change de-pending on the circumstances, how can we properly assess social fragmentation orpolarization ? This would suggest that strong identity factors such as ethnicity forinstance are not exogenous but constructed. Moreover, how come that an identityfactor that was merely conscious, all of a sudden becomes so marked that it mayprompt violence and conflicts ?
These propositions for future research are by and large not exhaustive. Theymay seem ambitious, although they probably are incommensurate with the ques-tions posed by social institutions and identity. Recent economic literature has drawnattention to them and there is little doubt that it will be a promising area for futureresearch.
xviii

Table of Contents
Résumé . . . . . . . . . . . . . . . . . . . . . . . . . . . . . . . . . . . . . viiAbstract . . . . . . . . . . . . . . . . . . . . . . . . . . . . . . . . . . . viiiTable of Contents . . . . . . . . . . . . . . . . . . . . . . . . . . . . . xixList of Tables . . . . . . . . . . . . . . . . . . . . . . . . . . . . . . . . xxiiiList of Figures . . . . . . . . . . . . . . . . . . . . . . . . . . . . . . . xxv
Introduction 31 Background on Castes . . . . . . . . . . . . . . . . . . . . . . . 4
1.1 Caste, dharma, karma and purity . . . . . . . . . . . . . . . . 51.1.1 The attributes of Castes . . . . . . . . . . . . . . . . 51.1.2 Purity . . . . . . . . . . . . . . . . . . . . . . . . . . 61.1.3 Untouchability . . . . . . . . . . . . . . . . . . . . . 81.1.4 Caste, Power and Wealth : a Tango Dance . . . . . . 11
1.2 Theories About The Origins of Castes . . . . . . . . . . . . . 131.2.1 The "Purity of Descent" Theory . . . . . . . . . . . 141.2.2 Castes as Religious Guilds . . . . . . . . . . . . . . . 161.2.3 Castes Functions as Their Origins . . . . . . . . . . . 171.2.4 Summary and Relationship to Power . . . . . . . . . 19
1.3 Caste Flexibility and Recent Transformations . . . . . . . . . 202 How is The Study of Castes Relevant to Economics . . . . 22
2.1 The Under-socialized Homo Economuicus . . . . . . . . . . . 232.1.1 Instrumental Rationality . . . . . . . . . . . . . . . . 242.1.2 Freedom of Choice . . . . . . . . . . . . . . . . . . . 252.1.3 Embeddedness and Social Interactions . . . . . . . . 262.1.4 Other Regarding Preferences . . . . . . . . . . . . . 272.1.5 The Impact of Social Identity . . . . . . . . . . . . . 282.1.6 What is a Social Norm? . . . . . . . . . . . . . . . . 29
2.2 A. Sen’s Capabilities Approach . . . . . . . . . . . . . . . . . 322.3 Castes Distort Resources Allocation . . . . . . . . . . . . . . . 34
3 Outline of The Dissertation . . . . . . . . . . . . . . . . . . . . 35
1 Power and Endogenous Segregation 371 Introduction . . . . . . . . . . . . . . . . . . . . . . . . . . . . . . 382 Related Literature . . . . . . . . . . . . . . . . . . . . . . . . . 413 The Model . . . . . . . . . . . . . . . . . . . . . . . . . . . . . . . 43
3.1 Basic Assumptions . . . . . . . . . . . . . . . . . . . . . . . . 433.2 Game Lay-out . . . . . . . . . . . . . . . . . . . . . . . . . . . 433.3 Equilibrium Conditions . . . . . . . . . . . . . . . . . . . . . . 44
xix
TABLE OF CONTENTS
3.4 No Deviation Constraint Definition . . . . . . . . . . . . . . . 443.5 Equilibrium Strategies Definitions . . . . . . . . . . . . . . . . 44
4 Formation of a Segregation Equilibrium . . . . . . . . . . . . 464.1 Introduction of an Attractive Feature of Group H . . . . . . . 464.2 Impact of The Parameter z on Relationships Pay-offs . . . . . 46
4.2.1 Pay-off to an H Individual in a H-L Relationship . . 464.2.2 Pay-off from Intragroup Relationships . . . . . . . . 474.2.3 Pay-off to L Individual in an H-L Relationship . . . . 47
4.3 Systematic Cooperation from the Ls Leads to a SegregationEquilibrium . . . . . . . . . . . . . . . . . . . . . . . . . . . . 484.3.1 Equilibrium Stability . . . . . . . . . . . . . . . . . . 50
5 Main Findings and Illustrative Examples . . . . . . . . . . . 516 Limitations of The Model . . . . . . . . . . . . . . . . . . . . . . 527 Concluding Remarks . . . . . . . . . . . . . . . . . . . . . . . . . 54
2 Social Identity in India : Caste and Beyond ? 551 Introduction . . . . . . . . . . . . . . . . . . . . . . . . . . . . . . 562 Data . . . . . . . . . . . . . . . . . . . . . . . . . . . . . . . . . . . . 58
2.1 Presentation of The Data . . . . . . . . . . . . . . . . . . . . 582.2 Sampling Issue . . . . . . . . . . . . . . . . . . . . . . . . . . 622.3 Variables Used . . . . . . . . . . . . . . . . . . . . . . . . . . 642.4 Benchmark Scenario . . . . . . . . . . . . . . . . . . . . . . . 66
3 Discriminant Analysis of The Data . . . . . . . . . . . . . . . 664 Empirical Strategy . . . . . . . . . . . . . . . . . . . . . . . . . . 69
4.1 Base Model . . . . . . . . . . . . . . . . . . . . . . . . . . . . 694.2 Conditional Effects . . . . . . . . . . . . . . . . . . . . . . . . 69
5 Results . . . . . . . . . . . . . . . . . . . . . . . . . . . . . . . . . . 705.1 Base Model . . . . . . . . . . . . . . . . . . . . . . . . . . . . 70
5.1.1 The 1995 Issue . . . . . . . . . . . . . . . . . . . . . 725.1.2 Tests on Coefficients and Thresholds for Each Va-
riable Type . . . . . . . . . . . . . . . . . . . . . . . 735.1.3 Conditional Effects . . . . . . . . . . . . . . . . . . . 79
5.2 Summary of Main Results . . . . . . . . . . . . . . . . . . . . 826 Potential Issues . . . . . . . . . . . . . . . . . . . . . . . . . . . . 82
6.1 Local Environment . . . . . . . . . . . . . . . . . . . . . . . . 826.2 Subjectivity . . . . . . . . . . . . . . . . . . . . . . . . . . . . 836.3 Peer Control . . . . . . . . . . . . . . . . . . . . . . . . . . . . 846.4 Religion . . . . . . . . . . . . . . . . . . . . . . . . . . . . . . 85
7 Conclusions . . . . . . . . . . . . . . . . . . . . . . . . . . . . . . . 85
3 Is Blood Thicker Than Water ? Untouchability and Pu-blic Infrastructure 871 Introduction . . . . . . . . . . . . . . . . . . . . . . . . . . . . . . 882 Ritual Pollution Through Water . . . . . . . . . . . . . . . . 89
2.1 Castes and Ritual Pollution . . . . . . . . . . . . . . . . . . . 892.2 Individualized versus Common Sources . . . . . . . . . . . . . 90
3 Related Literature . . . . . . . . . . . . . . . . . . . . . . . . . 914 Presentation of The Data . . . . . . . . . . . . . . . . . . . . . 92
xx TABLE OF CONTENTS
TABLE OF CONTENTS
4.1 Acts of Violence . . . . . . . . . . . . . . . . . . . . . . . . . . 924.2 Access to Water and Other Public Goods . . . . . . . . . . . . 94
4.2.1 Main Variables . . . . . . . . . . . . . . . . . . . . . 944.2.2 Correlation between water distribution and crimes . 954.2.3 Heterogeneity in water access . . . . . . . . . . . . . 984.2.4 Principal Component Analysis . . . . . . . . . . . . 1004.2.5 Other Public Goods . . . . . . . . . . . . . . . . . . 101
4.3 Polarization . . . . . . . . . . . . . . . . . . . . . . . . . . . . 1015 Estimation Strategy . . . . . . . . . . . . . . . . . . . . . . . . . 102
5.1 Base Specification . . . . . . . . . . . . . . . . . . . . . . . . . 1025.2 Potential Endogeneity Issues . . . . . . . . . . . . . . . . . . . 104
5.2.1 Omitted Variables . . . . . . . . . . . . . . . . . . . 1045.2.2 Reverse Causality . . . . . . . . . . . . . . . . . . . . 105
6 Results . . . . . . . . . . . . . . . . . . . . . . . . . . . . . . . . . . 1066.1 Base Specification . . . . . . . . . . . . . . . . . . . . . . . . . 1066.2 Magnitude of the effects . . . . . . . . . . . . . . . . . . . . . 1086.3 Relevant Crimes . . . . . . . . . . . . . . . . . . . . . . . . . . 1096.4 State Specificities . . . . . . . . . . . . . . . . . . . . . . . . . 1136.5 Other Public Investments . . . . . . . . . . . . . . . . . . . . 1136.6 Violence Inertia . . . . . . . . . . . . . . . . . . . . . . . . . . 116
7 Conclusions . . . . . . . . . . . . . . . . . . . . . . . . . . . . . . . 117
4 Social Fragmentation and Public Goods : Polarizationand Patronage in Uttar Pradesh and Bihar 1191 Introduction . . . . . . . . . . . . . . . . . . . . . . . . . . . . . . 1202 Related Literature . . . . . . . . . . . . . . . . . . . . . . . . . 1213 Data and Main Variables . . . . . . . . . . . . . . . . . . . . . . 123
3.1 Castes and Religions . . . . . . . . . . . . . . . . . . . . . . . 1233.2 Fractionalization and Polarization . . . . . . . . . . . . . . . . 1243.3 Fractionalization and Patronage . . . . . . . . . . . . . . . . . 1263.4 Selected Public Goods . . . . . . . . . . . . . . . . . . . . . . 1273.5 Wealth Inequality . . . . . . . . . . . . . . . . . . . . . . . . . 128
4 Empirical Strategy . . . . . . . . . . . . . . . . . . . . . . . . . . 1294.1 Fractionalization / Polarization Model Specification . . . . . . 1294.2 Patronage Model Specification . . . . . . . . . . . . . . . . . . 1304.3 Identification Issues . . . . . . . . . . . . . . . . . . . . . . . . 131
4.3.1 Reverse Causality . . . . . . . . . . . . . . . . . . . . 1314.3.2 Substitution . . . . . . . . . . . . . . . . . . . . . . . 131
5 Results . . . . . . . . . . . . . . . . . . . . . . . . . . . . . . . . . . 1315.1 Estimation Of The Fractionalization / Polarization Model . . 1315.2 Summary of The Results from The Fractionalization /Polari-
zation Model . . . . . . . . . . . . . . . . . . . . . . . . . . . 1375.3 Patronage Model . . . . . . . . . . . . . . . . . . . . . . . . . 139
6 Concluding Remarks . . . . . . . . . . . . . . . . . . . . . . . . . 141
Conclusions 143
Appendix 151
TABLE OF CONTENTS xxi

REFERENCES
References 179
xxii REFERENCES
List of Tables
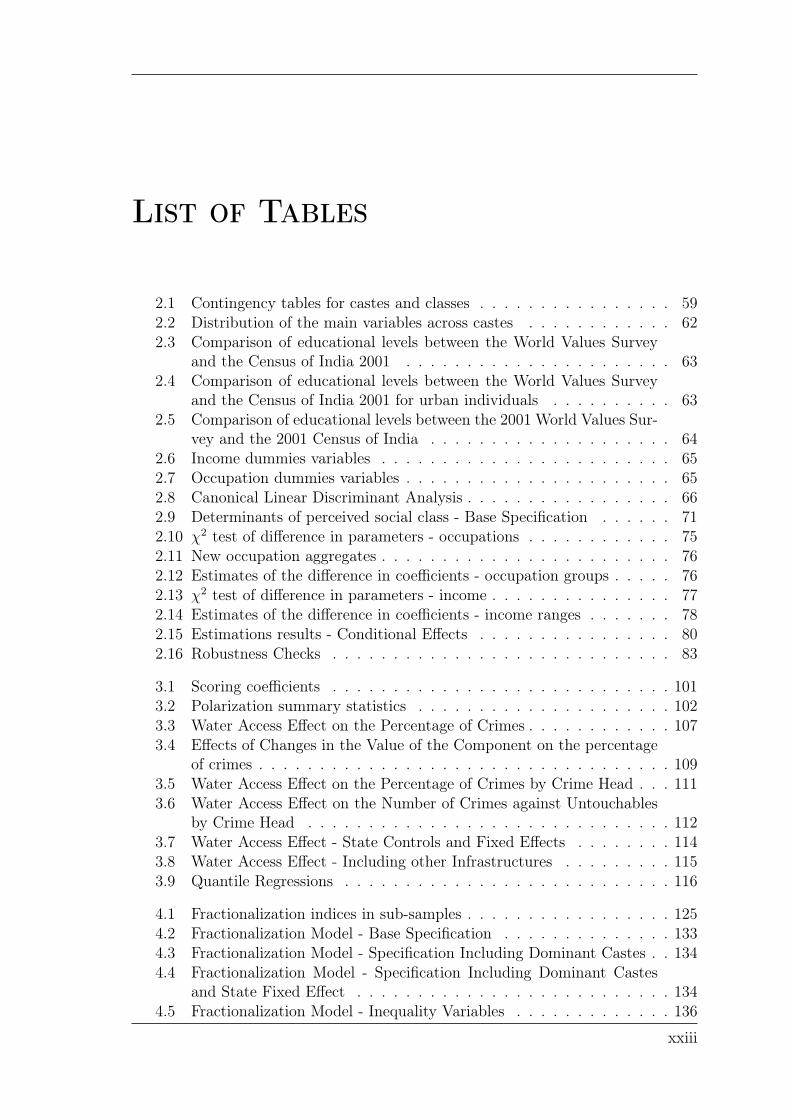
2.1 Contingency tables for castes and classes . . . . . . . . . . . . . . . . 592.2 Distribution of the main variables across castes . . . . . . . . . . . . 622.3 Comparison of educational levels between the World Values Survey
and the Census of India 2001 . . . . . . . . . . . . . . . . . . . . . . 632.4 Comparison of educational levels between the World Values Survey
and the Census of India 2001 for urban individuals . . . . . . . . . . 632.5 Comparison of educational levels between the 2001 World Values Sur-
vey and the 2001 Census of India . . . . . . . . . . . . . . . . . . . . 642.6 Income dummies variables . . . . . . . . . . . . . . . . . . . . . . . . 652.7 Occupation dummies variables . . . . . . . . . . . . . . . . . . . . . . 652.8 Canonical Linear Discriminant Analysis . . . . . . . . . . . . . . . . . 662.9 Determinants of perceived social class - Base Specification . . . . . . 712.10 χ2 test of difference in parameters - occupations . . . . . . . . . . . . 752.11 New occupation aggregates . . . . . . . . . . . . . . . . . . . . . . . . 762.12 Estimates of the difference in coefficients - occupation groups . . . . . 762.13 χ2 test of difference in parameters - income . . . . . . . . . . . . . . . 772.14 Estimates of the difference in coefficients - income ranges . . . . . . . 782.15 Estimations results - Conditional Effects . . . . . . . . . . . . . . . . 802.16 Robustness Checks . . . . . . . . . . . . . . . . . . . . . . . . . . . . 83
3.1 Scoring coefficients . . . . . . . . . . . . . . . . . . . . . . . . . . . . 1013.2 Polarization summary statistics . . . . . . . . . . . . . . . . . . . . . 1023.3 Water Access Effect on the Percentage of Crimes . . . . . . . . . . . . 1073.4 Effects of Changes in the Value of the Component on the percentage
of crimes . . . . . . . . . . . . . . . . . . . . . . . . . . . . . . . . . . 1093.5 Water Access Effect on the Percentage of Crimes by Crime Head . . . 1113.6 Water Access Effect on the Number of Crimes against Untouchables
by Crime Head . . . . . . . . . . . . . . . . . . . . . . . . . . . . . . 1123.7 Water Access Effect - State Controls and Fixed Effects . . . . . . . . 1143.8 Water Access Effect - Including other Infrastructures . . . . . . . . . 1153.9 Quantile Regressions . . . . . . . . . . . . . . . . . . . . . . . . . . . 116
4.1 Fractionalization indices in sub-samples . . . . . . . . . . . . . . . . . 1254.2 Fractionalization Model - Base Specification . . . . . . . . . . . . . . 1334.3 Fractionalization Model - Specification Including Dominant Castes . . 1344.4 Fractionalization Model - Specification Including Dominant Castes
and State Fixed Effect . . . . . . . . . . . . . . . . . . . . . . . . . . 1344.5 Fractionalization Model - Inequality Variables . . . . . . . . . . . . . 136
xxiii
LIST OF TABLES
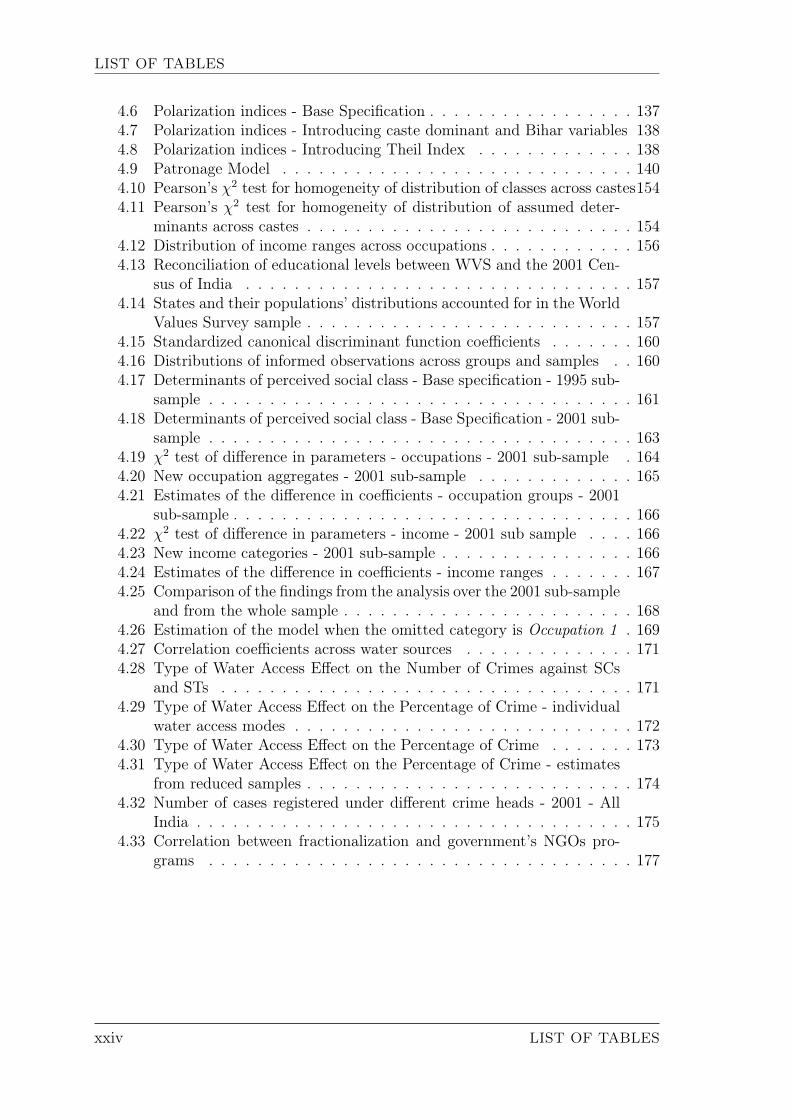
4.6 Polarization indices - Base Specification . . . . . . . . . . . . . . . . . 1374.7 Polarization indices - Introducing caste dominant and Bihar variables 1384.8 Polarization indices - Introducing Theil Index . . . . . . . . . . . . . 1384.9 Patronage Model . . . . . . . . . . . . . . . . . . . . . . . . . . . . . 1404.10 Pearson’s χ2 test for homogeneity of distribution of classes across castes1544.11 Pearson’s χ2 test for homogeneity of distribution of assumed deter-
minants across castes . . . . . . . . . . . . . . . . . . . . . . . . . . . 1544.12 Distribution of income ranges across occupations . . . . . . . . . . . . 1564.13 Reconciliation of educational levels between WVS and the 2001 Cen-
sus of India . . . . . . . . . . . . . . . . . . . . . . . . . . . . . . . . 1574.14 States and their populations’ distributions accounted for in the World
Values Survey sample . . . . . . . . . . . . . . . . . . . . . . . . . . . 1574.15 Standardized canonical discriminant function coefficients . . . . . . . 1604.16 Distributions of informed observations across groups and samples . . 1604.17 Determinants of perceived social class - Base specification - 1995 sub-
sample . . . . . . . . . . . . . . . . . . . . . . . . . . . . . . . . . . . 1614.18 Determinants of perceived social class - Base Specification - 2001 sub-
sample . . . . . . . . . . . . . . . . . . . . . . . . . . . . . . . . . . . 1634.19 χ2 test of difference in parameters - occupations - 2001 sub-sample . 1644.20 New occupation aggregates - 2001 sub-sample . . . . . . . . . . . . . 1654.21 Estimates of the difference in coefficients - occupation groups - 2001
sub-sample . . . . . . . . . . . . . . . . . . . . . . . . . . . . . . . . . 1664.22 χ2 test of difference in parameters - income - 2001 sub sample . . . . 1664.23 New income categories - 2001 sub-sample . . . . . . . . . . . . . . . . 1664.24 Estimates of the difference in coefficients - income ranges . . . . . . . 1674.25 Comparison of the findings from the analysis over the 2001 sub-sample
and from the whole sample . . . . . . . . . . . . . . . . . . . . . . . . 1684.26 Estimation of the model when the omitted category is Occupation 1 . 1694.27 Correlation coefficients across water sources . . . . . . . . . . . . . . 1714.28 Type of Water Access Effect on the Number of Crimes against SCs
and STs . . . . . . . . . . . . . . . . . . . . . . . . . . . . . . . . . . 1714.29 Type of Water Access Effect on the Percentage of Crime - individual
water access modes . . . . . . . . . . . . . . . . . . . . . . . . . . . . 1724.30 Type of Water Access Effect on the Percentage of Crime . . . . . . . 1734.31 Type of Water Access Effect on the Percentage of Crime - estimates
from reduced samples . . . . . . . . . . . . . . . . . . . . . . . . . . . 1744.32 Number of cases registered under different crime heads - 2001 - All
India . . . . . . . . . . . . . . . . . . . . . . . . . . . . . . . . . . . . 1754.33 Correlation between fractionalization and government’s NGOs pro-
grams . . . . . . . . . . . . . . . . . . . . . . . . . . . . . . . . . . . 177
xxiv LIST OF TABLES
List of Figures
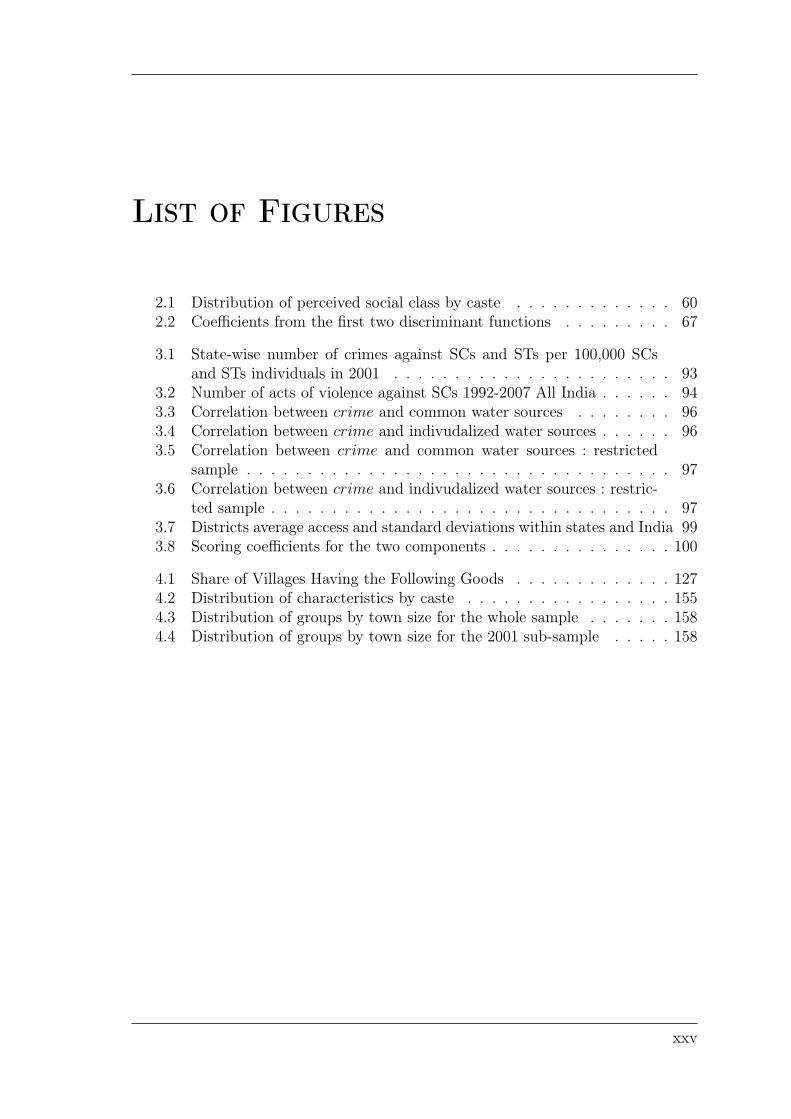
2.1 Distribution of perceived social class by caste . . . . . . . . . . . . . 602.2 Coefficients from the first two discriminant functions . . . . . . . . . 67
3.1 State-wise number of crimes against SCs and STs per 100,000 SCsand STs individuals in 2001 . . . . . . . . . . . . . . . . . . . . . . . 93
3.2 Number of acts of violence against SCs 1992-2007 All India . . . . . . 943.3 Correlation between crime and common water sources . . . . . . . . 963.4 Correlation between crime and indivudalized water sources . . . . . . 963.5 Correlation between crime and common water sources : restricted
sample . . . . . . . . . . . . . . . . . . . . . . . . . . . . . . . . . . . 973.6 Correlation between crime and indivudalized water sources : restric-
ted sample . . . . . . . . . . . . . . . . . . . . . . . . . . . . . . . . . 973.7 Districts average access and standard deviations within states and India 993.8 Scoring coefficients for the two components . . . . . . . . . . . . . . . 100
4.1 Share of Villages Having the Following Goods . . . . . . . . . . . . . 1274.2 Distribution of characteristics by caste . . . . . . . . . . . . . . . . . 1554.3 Distribution of groups by town size for the whole sample . . . . . . . 1584.4 Distribution of groups by town size for the 2001 sub-sample . . . . . 158
xxv

LIST OF FIGURES
xxvi LIST OF FIGURES

LIST OF FIGURES
LIST OF FIGURES 1

LIST OF FIGURES
2 LIST OF FIGURES

Introduction
3
INTRODUCTION
I’d like to start this dissertation with a question frequently asked by my friendsand family when they inquired about the topic of my thesis : "what do castes haveto do with economics ?". The question was usually accompanied by a frown andthe impression that they may not have understood correctly either the title or thespecialty. After all, this is a good question. Why would economists be concernedwith social relations and identities ?
There are many ways to answer this question and this is the objective of thisintroduction. To make it short and broad, a relatively recent economic literaturehas put the emphasis on the fact that the classical utilitarian framework and itsself-interest maximizing agent left social relations and identities as a backgroundnoise. The homo economicus is rather lonely. The hitch is that this backgroundnoise is becoming louder up to the point that some authors argue that the welfarismframework ought to be recast (Sen, 1992, 1973, 1999b,c). More conservatively, otherauthors believe sufficient to include social capital as yet another argument in the uti-lity function (Akerlof and Kranton, 2010; Becker and Murphy, 2003). Whatever theoption chosen, incorporating social identity, of which caste in India is an example,into the economic analysis appears a necessity.
A point needs clarification. One could think, given that this work revolves aroundcastes, that the analysis and the conclusions are limited to India. This view may bechallenged on two grounds. First, many features of the institution of caste such assegregation, deprivation and community self management may be found in variousdegrees elsewhere. What surely makes this institution original is the ideology thatsupports it as well as its amazing resilience. It is no coincidence that authors whohave insisted on its particularity mainly focussed on the ideology (Dumont, 1970).Second, by showing that this social organization has a pervasive influence in theeconomic arena, a case is made for transforming the under-socialized homo econo-micus into an agent whose preferences, motives or behavior are influenced by hissocial environment.
Before delving in more details into arguments justifying the economic interestof castes, which will be done in section 2 of this introduction, I shall provide abrief of castes in section 1. Experts may find it short, novices long but it hopefullycontains all the elements necessary to understand what follows. The last section ofthis introduction discusses how my approach is related to the literature and outlinesthe plan of the dissertation.
1 Background on Castes
"Caste is an institution of great complexity". "The term caste itself requiressome discussion. It has been used to mean different things by different people ina variety of situations. Indeed it is doubtful whether much will be gained in clarityby giving to the word a single rigorous meaning at the outset." So start the twochapters dedicated to castes in Beteille (1974) and written by two of the mostprominent castes sociologists : A. Beteille and M.N. Srinivas respectively. Given thegreat intricacy of this social institution, the scope of this chapter is to modestly
4 1. BACKGROUND ON CASTES
INTRODUCTION
provide some elements necessary to the understanding of the dissertation. It wouldbe presumptuous to say that this is an extensive description of the institution. Anattempt will be made in a first step to define some concepts that underlie part of thefunctioning of the system. In a second step, competing theories about the originsof the institution will be outlined. These will prove quite helpful in the discussioncarried out in Chapter 1 about the potential origins of segregation. Yet, this approachmay set the pitfall of believing that caste is an inflexible institution that has notchanged for the last two millennia and that is deeply rooted in religious believes.Such an impression would be highly incorrect given that, if castes have managedto survive to deep political and economic changes, as well as to the introductionof various religions in the sub-continent, it is thanks to their great flexibility, itssocial and economic rather that purely religious roots as well as their role playedin the local economic and political organizations. A brief account of the recenttransformations undergone by castes will finally be given. One caveat is necessary.Although I endeavor to give the most accurate portrait of both theories and facts, Ifrom time to time will have no choice but to resort to stylized facts and simplificationsto preserve the clarity of the arguments.
1.1 Caste, dharma, karma and purity
1.1.1 The attributes of Castes
Although there is some debate between scholars, most agree on five attributesof a caste summarized by Dutt (1931)2 : "without attempting to make a compre-hensive definition it may be stated that the most apparent features of the presentday caste system are that the members of different castes can not have matrimonialconnections with any but persons of their own caste ; that there are restrictions,though not so rigid as in the matter of marriage, about a member of the caste ea-ting and drinking with that of a different caste ; that in many cases there are fixedoccupations for different castes ; that there is some hierarchical gradation among thecastes, the most recognized position being that of the Brahmins at the top ; thatbirth alone decides a man’s connection with his caste for life, unless expelled forviolation of his caste rules, and that transition from one caste to another, high orlow, is not possible". The five attributes are therefore (a) endogamy, (b) hereditarymembership (c) occupational specialization (d) hierarchy, (e) commensality.
The most central attribute that probably underlies the whole system is endo-gamy and hereditary membership that go hand in hand. The other features deservesome discussion that may enlighten the role played by the concepts of ritual purity,dharma and karma. Caste names often describe castes’ traditional occupation. Forinstance, Bhandari means barber in oryia, Paraiyars means drums players (usuallyduring funerals) in tamil, Bhangi mean garbage men in hindi and Kallar thief intamil3. However, this occupational specialization of a caste is not so much linked tothe actual occupation of its members than it is a founding principle, a determinantof its nature. While the congruence between the caste’s traditional occupation andthe actual professions of its members might have been strong in ancient times, it
2cited by Klass (2004)3This last occupation being considered as a profession requiring specific skills
1. BACKGROUND ON CASTES 5
INTRODUCTION
may have not been the case in recent periods. For instance, the 1911 Census su-perintendent, Edward Blunt, noted that less than 50% of the Dhobis were actuallylaundry workers. 10% of the Brahmins were actually priests and 5% of the Charmarsstill worked as tanners4. One may ask why occupational specialization still is a pro-minent feature of caste, given that its correlation with the actual professions is quiteweak. Some authors would answer by saying that the traditional occupation pro-vides an indication of the degree of purity of the caste and hence a gross informationabout its status. For instance, having contact with death is considered a source ofritual impurity. Castes whose traditional occupation entails such a contact, such astanners, or funeral drum players (Pariyars) are ritually impure. This does not meanthat their occupations make them impure, but rather because they are impure, theyhave a monopoly over these sorts of activity and should dedicate to them. Now thequestion of why they are impure will be touched on in the next section. Note thatthe very idea that some castes are more pure than others implies a hierarchy. Yet,ranking does not only derives from a supposed ritual purity as we shall see later(section 1.1.4). Rules governing commensality, although not as stringent as thosegoverning marriage, also stem from a differentiated level of ritual purity betweencastes. These points all direct attention to the concept of purity which should bedescribed and explained.
1.1.2 Purity
In order to properly assess the centrality of the concept of purity and the impliedhierarchy, we need to go back in time. About 2,000 years ago a population probablycoming from the Iranian plateau or Caucasia, known as the Aryans, began settlingdown in the sub-continent. They brought along a large corpus of religious texts, theVedas. This religion, called vedic laid many foundations for Hinduism and exerted agreat influence on Indian thought. The Vedas put great emphasis on the role of firesacrifices, and highly complex rituals for this purpose was monopolized by priests5.As Doniger and Smith (1991) mentioned in their introduction to a translation of theLaws of Manu, "the importance attributed in the Veda to the fire ritual can hardlybe overestimated. It was from cosmic and primordial sacrifice that the universe wascreated, and it was because of the repeated sacrifices offered by humans that theuniverse continues. The ritual, done correctly and at the proper time was the work-shop for manipulating the cosmic order itself. [...] Personal ends, as well as cosmicones, were the fruit of sacrificial practices". Given the prominent role of sacrifice,individuals who had a monopoly over it could claim superiority. This was reinforced,Doniger and Smith (1991) argue, by a vision of the social world as a food chain,modeled after the "natural" one. "The Vedas depicts a life where I gain only atyour loss, my prosperity entails your ruin, my continued existence depends on yourdeath, my eating requires that you become food [...] and in those texts, the priestsrepeatedly declared themselves the highest class, the ultimate ’eaters’". And priests
4cited in Deliège (2004)5It is interesting to note, as some authors have done, that there are many similarities bet-
ween the Vedic religion and Mazdaism that later developed in Zoroastrianism. This similaritiesinclude a large focus on sacrifice especially through fire, the latter being envisaged as both a deityand a privileged way to communicate with gods, the preeminence of the sacerdotal class and theconsumption of soma a beverage that enhanced contacts with gods.
6 1. BACKGROUND ON CASTES
INTRODUCTION
claimed that superiority on the basis that they controlled over sacrifice. Ritual wasthus the source of social and political power. However, such a superiority might havebeen frail given that it could have been easily overturned by actual physical violence.
Sometimes between the Vth and IId centuries B.C., a complete reversal of theVedic values took place. The sort of Hobbesian view of the world was replaced bya great emphasis on amhisa or non violence, grace, humility, love and renunciation.The new virtuous were vegetarian, devotional, and non-violent. Texts like the Bha-gavad Gita of bhakti or devotionalism, composed around that time, do insist onthese new ideals. Texts composed around the same period, the dharma sutras extolthe virtues of renunciation that should be set up as principles of life (dharma). AsDoniger and Smith (1991) highlight by quoting Zimmermann (1987) "A new typeof opposition between men was introduced. It was no longer a matter of courageand fear, domination and servitude ; it was instead an opposition between the pureand the impure and a hierarchy of castes". Doniger and Smith (1991) add "Vegeta-rianism and non-violence became the principal signifiers of this ’purity’ that jostledpower, the new yardsticks for social ranking in the priestly and ’orthodox’ reforma-tion of Vedism documented in the dharma texts". With the introduction of purity,predominance of the sacerdotal class was firmed, "the ranking order of the socialclasses did not change. But the rationale for the ranking did6".
An important text endeavored to reconcile the Vedic traditions and the newschool of thought, the the Manu Smrti or Laws of Manu. This text is of particularimportance to us as a large part of it is dedicated to castes. It builds on an hymnfound in the Rig Veda that describes the origin of the universe through the sacrificeby divinities of a "cosmic being" who gave birth to four groups or varnas : Brahminsoriginate from his mouth, Kshatriyas from his shoulders and arms, Vaishyas fromhis thighs and Shudras from his feet7. Because Brahmins originate from the noblestpart of the supreme creator, the mouth, they are placed at the top of the hierarchyand are sole authorized to study and teach the Vedas and to perform sacrifices andrites. Khsatriyas, who originate from the arms, is the second best placed group andis dedicated to war and ruling. The Vaishyas main purpose is trade, while Shudrasare made to serve the other varnas. The Laws of Manu also build on the concept ofdharma. "Beginning in Manu, non violence is usually listed among other qualitiesthat comprise universal dharma, applicable to all regardless of class or caste. Thosecastes who follow occupation entailing relatively little violence towards other beingsand who practice vegetarianism were, generally and theoretically speaking, rankedhigher than those who do not8". The Laws of Manu praise a svadharma or a classnuanced duty9. The fact that the svadharma of the priests is the general dharam
6Doniger and Smith (1991)7The varnas are often interpreted as being the castes, yet, as we shall see later, strictly speaking
they are not the groups Indians would refer to as their castes. Indeed, smaller groups called jatisare the "actual" castes
8Doniger and Smith (1991)9Weber (1958) believed that untouchables almost never rebeled because they interiorized the
religious concepts that legitimized their low position. More specifically, untouchables interiorizedthat it was right and moral to follow the duty of their castes, their svadharma, even if this entailsdeprtivation and subjection
1. BACKGROUND ON CASTES 7
INTRODUCTION
ensues a hierarchical order10.
One may question the pertinence of presenting the world-views at the beginningof this era to understand the actual working of castes today. The answer is thatsuch a view introduced notions that were to have enormous ramifications for thehistory of religion in India and a large influence over Indian thought. Concepts suchas non-violence, vegetarianism, the relative purity of a life style and most impor-tantly dharma are all still very operative in modern days India. As Srinivas (1974)noted, "certain Hindu theological notions like karma and dharma have contributedvery greatly to the strengthening of the idea of hierarchy, which is inherent in thecaste system". Birth is the only way to acquire membership to a caste, yet birthis not an accident according to Hinduism. It results from accumulated actions inprevious lives. If these actions were virtuous, a man is to be reincarnated in a highcaste, while misconduct is sanctioned by a low caste reincarnation. "Thus the castehierarchy comes to be an index of the state of an individual’s soul. It also repre-sents certain milestones on the soul’s journey to God" (Srinivas, 1974). This pointunderlines the centrality of the concept of purity that was seen as so fundamentalthat one of the most prominent theorists of castes L. Dumont (1970), put it at thevery center of the system and thought that anything in the social organization is tointerpreted by this yardstick, wealth or power playing very little role. This last pointwill be nuanced by section 1.1.4. Caste prescriptions are reinforced by the importantconcept of dharma which has many meanings, one of which is "that which is rightor moral" or "the universal law" to be followed. As Srinivas (1974) tells "a man whoaccepts the caste system and the rules of his particular sub-castes is living accordingto dharma, while a man who questions them is violating dharma. Living accordingto dharma is rewarded, while violation of dharma is punished both here and after. Ifhe observes the rules of dharma, he will be born in his next reincarnation in a highcaste, rich, whole and well endowed. If he does not observe them he will be born ina low caste, poor, deformed and ill endowed. Worldly position and success indicatethe kind of life a man led in his previous incarnation".
1.1.3 Untouchability
Counterpart to purity is ritual pollution. As seen before, some castes are morepure than others by nature and due to their functions11. Assertions made above maybe summarized by saying that the more violent the functions, the less pure the caste.Yet, I have so far resorted to the word violence, although it would be more accurateto say that contact with ritually polluting elements is the appropriate reference.The more involved with ritually impure elements, the lower the caste. For instance,anything that directly has to do with death is polluting. Thus, a caste whose tradi-tional occupation is to prepare the dead or play music at funerals (Pariyars) are toomuch involved with death to be pure. Yet, it is not clear whether death is a violent
10One may be surprised that Khsatriyas, who are dedicated to war and ruling and thus violentends, are ranked second. This probably is a concession made by theory to reality as power could onlybe ranked at the top. The point of emphasizing non violence is probably to secure the supremacyof the priests over the rulers.
11the two being closely tied if not equivalent
8 1. BACKGROUND ON CASTES
INTRODUCTION
concept. Another example is the barber. Hopefully this occupation is not so muchviolent. Nevertheless, it is seen as impure, as it deals with human waste. Arguablyviolence and impure occupations are symbolically related, however to get a bettersense of the gross hierarchy between castes, reference to the assumed pollution lin-ked to occupations is more relevant. Ritual impurity is derived from the nature ofthe caste but also from ritually polluting elements. Pollution may then be passedon through contact with impure elements, including individuals from impure castes.A strong vector of ritual pollution is physical contact but also food and water. Thisexplains why commensality is a feature of the caste system. Food and water maynot be shared between castes that are too far away in the hierarchy, as this wouldresult in the higher of the two being polluted. Caste prescriptions mainly rest onthe absolute avoidance of contact, which prompts segregation. This last concept, inthe case of caste has a broad acceptation, since it means the prohibition of any sortof relationships. Touching is prohibited. Inter-caste marriage is hardly conceivable.Higher castes must not accept food or drink from lower castes. Anthropologists doassess hierarchical distance between castes by the willingness to accept food and wa-ter by members of another castes. Breaking of these rules would thwart dharma andthe violator would have to go through purificatory rites for minor infringements toexcommunication for more serious ones. The disgrace would also affect his relatives.
Let’s pause for a moment to add one caveat to this description. What has beensaid so far is rather "theoretical" should be understood as principles. In practicethere is a large heterogeneity in their applications. Yet, I am tempted to say thatsuch an heterogeneity depends on the actual social distance between castes. Forinstance, it may be more frequent for Brahmins to accept food or water from a rela-tively close, yet inferior caste, than it will be from the lowest caste. Social scientistswho conducted field works and were most concerned with the actual practices ratherthan the theoretical ones, emphasized the strong divide that exist between a group ofcastes, collectively known as untouchables in reference to the fact that their contactis polluting to anyone. While distance between various castes may not be plain clearand inter-castes rules not stringently respected, distance between untouchables andthe prohibition of their contacts by other castes is rather marked. Beteille (1965) inhis study of a Tanjore village asserted the village’s population could be grouped inthree : Brahmins, untouchables and the rest. He argued that such a classificationmade sociologically the more sense. The point is that, even if castes rules are notstrongly enforced, contact prohibition not so frequent, the "untouchability" barrierclearly stands.
However untouchability does not come down to ritual impurity. As Deliège (1994)mentions untouchability arises from "cumulative domination"12. "Socio-economicdependance, material poverty, social deprivation and a lack of political power com-bine to ritual pollution to make untouchables a special social category13". Economicdependance arises, among other factors, from the traditional system of productionwithin villages. Untouchables’ vocation was to serve other caste by providing ser-
12The term is borrowed from T. Oommen in "Sources of Deprivation and Styles of Protest : theCase of the Dalits in India", Contributions to Indian Sociology, 18, 1984,45-61.
13in Deliège (1994). Translation is mine
1. BACKGROUND ON CASTES 9

INTRODUCTION
vices in relationship with wastes, blood, dirt and death to other castes, who wereprevented from carrying out such activities in fear of being ritually polluted, or tocontribute as agricultural laborers to the grain production. In exchange for theseservices, they had a claim on a share of the harvest. The amounts of services andthe quantity of grains to be exchanged were fixed by tradition. This economic sys-tem is known under the term jajmani. The spreading use of money, among otherthings, progressively suppressed the jajmani system, and it has almost disappearedby now. However, the system left traces of it in the distribution of land ownershipand in villages composition. Indeed untouchables are rarely dominant in villages.As Deliège (1994) recounts14 "in the plains of Northern India, for instance, Cha-mars are together with other rural jatis, one of the most numerous caste. Yet ina sample of 167 villages, they are in a majority in only 16 villages, that may befairly recent". Such an economic oppression was often accompanied with the nega-tion of a political power. As for social deprivation, it arises from untouchables lowritual status that prevented them from entering public space, unless they had goodreasons such as work, for this. Deliège (1994) provides a couple of examples. Forinstance, there was no well or other water sources in untouchables neighborhoods.Moreover untouchables were not allowed to draw water from higher castes wells as,either their direct contact, or that of their vessels would have polluted the well.Thus they had to wait for a higher caste to draw water and to pour it into theirjars. Access to roads were also restricted. In Uttar Pradesh, higher castes shouted towarn that Banghis were coming. In Kerala, Pulaya had to shout every four or fivesteps while walking on a trail to warn that they were coming and when someoneshouted back, they had to step aside. In Poona, untouchables were let inside thecity walls between 9a.m. and 3p.m., when their shadows were short enough not topollute those walking by. All these recounts are fairly old and common sense tells usthat things must have changed and they have. First, the newly independent Indiaenshrined in the Constitution the prohibition of caste based discrimination and ofuntouchability15 and assigned to the State the duty to promote the educational andeconomic interest of the outcasts16. Positive discrimination policies were envisagedin the Constitution and put in place. Seats were reserved to the former outcasts,in the Administration, Assemblies as well as in Universities. The castes who wereto benefit from these reservation policies were said to be "scheduled". Thus untou-chables are administratively referred to as the "Scheduled Castes" ("SC"). SomeTribes were also scheduled for this reservation policy, given that they have sufferedfrom long standing discrimination and deprivation in very much the same way as theSCs. We shall come back to the situation of tribes in a few moments. Whether thislegislation is responsible for the emancipation of untouchables is not discussed here.However, it is hardly disputable that untouchables gained political visibility. Forinstance, the current Chief Minister of Uttar Pradesh is from an untouchable caste.Moreover, many untouchables have benefited from increased social opportunity andmanaged to substantially improve their economic position. Untouchables economic
14Translation is mine15Article 15 and 17 of Fundamental Rights16"The State shall promote with special care the educational and economic interests of the
weaker sections of the people, and in particular, of the Scheduled Castes and Scheduled Tribes,and shall protect them from social injustice and all forms of exploitation". Article 46, DirectivePrinciples of State Policy, Constitution of India
10 1. BACKGROUND ON CASTES

INTRODUCTION
status are now more diversified. However, these successes should not be the detailsthat distract us from the bigger picture. As Deshpande (2000a, 2001) pointed out,being an untouchable is still a strong predictor of economic deprivation and as itwill be shown in Chapter 2 it is still a strong determinant of perceived social class.As far as untouchability practices are concerned, Chapter 3 will show that they stilltake place, despite the passing of many laws and acts. "Cumulative domination"underline the existence of potentially close relationships between power, wealth andcaste. Before turning our attention to this point, which will be done in the nextsection, we need to, in order to close this discussion on untouchability, say a fewwords about the status of tribes.
Tribes in India constitute a fairly distinct group. They usually live in remoteareas and have not mingled much with the rest of the population. They are in a ma-jority in North Eastern states although they are found throughout the country. Tostart, tribes share some features with castes, such as endogamy, hierarchy precludinginter-dining and, in some cases, occupational specialization. However, it should benoted that this is a generalization, given that tribes are very diverse. Nevertheless,it is worth noticing that Bailey (1957) considered castes and tribes as continuum.Yet, are tribes part of a system as castes are ? Two cases may be identified. Eitherthe tribe converted to Hinduism and, in such a case, it very much resembles a caste.A tribe’s position position in the caste hierarchy depends on a large number of fac-tors including the tribe’s history. It may even be the case that members of a tribeallocated differently between castes ? Therefore a hierarchy may be found amongmembers of a same tribe. In a second scenario the tribe kept apart from Hinduismand thus may not be called a caste, given that they lie outside the system. Yet, asmentioned in Carrin (2006) from an Hindu standpoint, the fact that the tribe is notpart of the caste system, makes it "untouchable", in the sense that their contact maybe polluting to a higher caste. Thus in the first case, it is difficult to anticipate theposition of a tribe on a social scale, while in the latter, the tribe is very likely to belocated at the bottom and to suffer from untouchability. Given that the tribes we areconcerned with are the scheduled ones, they were recognized as "weaker segmentsof society" which means that they are likely to be at the bottom of the social scale,either because of their material or social deprivation. Although strictly speaking, wecan not say that tribes are untouchables, it is likely that Scheduled Tribes will alsosuffer from the stigma as well.
1.1.4 Caste, Power and Wealth : a Tango Dance
The jajmani system emphasizes the strong relationship between castes and theeconomic arena, at least as far as agricultural production is concerned. Local politi-cal life was also organized by castes. Caste courts composed of the elders of a castebelonging to different villages were setting the norms to be obeyed within a casteand in inter-caste relationships as well as settling any issue arising in the community.Therefore, caste specialization as well as its influence over the local political life is(a) a tendency for each sub caste "to live in a separate social world" (Srinivas, 1974),although inter-caste and intra-caste solidarities should not be overlooked (Srinivas,1955) and (2) to see a high correlation between castes and wealth. This prompts the
1. BACKGROUND ON CASTES 11
INTRODUCTION
following question : are wealth and power distributed according to caste status ?
Sociology brought diverging views on this question. Louis Dumont (1970), insis-ted on the primacy of the ideology in the caste system. He argued, in a structuralistperspective, that caste was most prominently the materialization of an ideology ba-sed on ritual purity and, as such, status is assumed to be relatively independentfrom political or economic power. He insisted on the fact that while wealth and po-wer have been the dominant forces shaping western societies, in India, religion hasprevailed. His point of view has since been seriously challenged as (a) caste trans-cend religions, (b) religious allusions are rarely made in debates about inter-casterelationships and (c) as Baechler (1988) argued, Pariyars would be equally despisedeven in the absence if a religious ideology of purity.
Alleging that caste is independent from the distribution of power or wealthhad Dumont stressed the concept of dominant caste that he borrows from Srini-vas (1955) : "A caste may be said dominant when it preponderates numericallyover the other castes, and when it also wields preponderant economic and politi-cal". Given the agrarian nature of villages in India, economic power often comesdown to land ownership. Yet, Srinivas (1955) feels necessary to add : "a large andpowerful caste group can be more easily dominant if its position in the local castehierarchy is not too low". Thus, even if the distribution of power and wealth maybe assumed to not directly depend on caste status, it must be reckoned that bothare highly correlated. Bailey (1957) found "a high degree of coincidence betweenpolitico-economic rank and the ritual ranking of caste". For this author caste is asystem of ranks which is "validated not only by ritual and social usage, but alsoby differential control over the productive resources". He adds "but the correlation[between economic and ritual status] is not perfect. For castes groups in betweenthe two extremes, their ritual rank tend to follow their economic rank in the villagecommunity". This correlation between castes and the productive organization hasled many authors to argue that caste was a form of class in the Marxist sense. Ne-vertheless, this interpretation is much disputed on many grounds and one of themis the imperfect correlation between status and wealth. In his study of a Tanjorevillage, Beteille (1974) also observed this imperfect yet quite strong correlation. Up-per castes own the majority of land and even found ways to escape acts passedthat aimed at redistributing land. Nevertheless, he argued that as modernization ofthe economy progressed, upper castes found opportunities in the new sectors beingdeveloped and thanks to a relatively high level of education moved to urban areas.Thus local economic power in rural areas was somehow transferred to middle castes.This is the reason why, middle castes may be found to be more dominant than upperones at the local level.
The process of Sanskritization also stresses the flexibility of the system and therelative importance of wealth in the caste structure. Srinivas (1952) who coined theterm writes "the caste system is far from a rigid system in which the position ofeach component caste is fixed for all time. Movement has always been possible, andespecially in the middle regions of the hierarchy. A caste was able, in a generationor two, to rise to a higher position in the hierarchy by adopting vegetarianism and
12 1. BACKGROUND ON CASTES
INTRODUCTION
teetotalism, and by Sanskritizing its ritual and pantheon. In short, it took over, asfar as possible, the customs, rites, and beliefs of the Brahmins, and adoption of theBrahminic way of life by a low caste seems to have been frequent, though theo-retically forbidden. This process has been called Sanskritization". Many observershave added that such a Sanskritization process was concurrent with an increase inthe group or sub-group wealth. Thus, a group becomes wealthier, it endeavors andsometimes succeed in raising its status. This, again, suggest that status power orwealth are not independent.
To sum up, there are three features that make a caste dominant : population,control over land, and ritual status (as well as education although to a lesser extent).A perfect match between the three is seldom observed, and their distributions maychange over time. These probably are the reasons why a clear answer to the ques-tion asked at the outset of this section can not be given. Nevertheless, please bearin mind that, although not perfect, the correlation between these three features isrelatively high.
The aim of this section was to, if not define, at least characterize castes throughfive main features and to get a better understanding of their backgrounds. This ledus through a historical detour whose main purpose was to present some notions thatunderlie the caste ideology and whose effects are still largely felt today, as well as tohighlight the centrality of ritual purity. Building on the latter we were able to bettertrace the form of untouchability. This will prove quite useful in Chapter 2 where itis shown that, despite the diversification of untouchables’ economic situations, casteremains a strong predictor of perceived social class. The counterpart of purity thatis ritual pollution is also fundamental to sense why some castes and most notablyuntouchables are prevented from accessing public goods, which is the point made inboth Chapters 3 and 4. All the elements necessary to the understanding of Chapters2, 3 and 4 are thus gathered. All that remains is a synopsis of the various theoriesabout the origins of castes, given that we rely on some of them to develop a modelof social distance in Chapter 1.
1.2 Theories About The Origins of Castes
There is no consensus about the origins of caste, largely due to the scarcity ofhistorical records. However, theories may be grouped in two families. The first onelooks into history, as little documented as the concerned period is, while the secondbuilds on the documented characteristics of the institution to infer the potentialfunctions of caste in the political or economic arenas. Not surprisingly, the firstfamily insists on the ideology that underlies castes while the second emphasizes itsfunctioning. Both families will be reviewed alternatively17.
17This section follows quite closely the presentation and the arguments made in Klass (2004)for this author provides a very comprehensive view of all competing theories. Yet, from time totime I allow myself to comment on some of the points he makes
1. BACKGROUND ON CASTES 13
INTRODUCTION
1.2.1 The "Purity of Descent" Theory
"Attempts have been made [...] to derive the caste system from the presumedsocial system of invading ’Aryans’. For Hindus, that system had a divine origin andsanction. Some scholars [...] have concluded that the system developed in the periodjust after the ’Aryan invasion’, as a response to circumstances of that invasion andthe resulting confrontation of ’races’"(Klass, 2004). This is the theory that will beinvestigated below.
As already mentioned, there is strong evidence that a population called Aryanssettled in the sub-continent around the first millennium B.C. They brought alongthe Vedic religion based on sacred texts the Vedas. One of the latter, the Rig-Vedadistinguishes between Arya Varna and Dasa Varna. In Sanskrit, dasa used to havethe primary meaning of enemy and later acquired the connotation of servant orslave. In the Rig Veda the word dasa occurs sometimes in conjunction with theterm black. Varna meaning color in Sanskrit, some specialists consider that thisdistinction between Arya Varna and Dasa Varna was made to separate the fairskin invaders form the darker skin natives. Deliège (2004) outlined the view of therenowned Indian sociologist Ghurye who believed that Aryans had already ascribeda degree of ritual purity and exclusivity rules to these groups. Moreover, the laws ofManu that describe the four varnas, also mention the the Chandalas, the lowest ofthe low men, whose moral degradation is complete and who are to be humiliated.Because, Chandalas are rarely mentioned in sacred texts they are usually not consi-dered part of the system of castes. Although the Laws of Manu describe them asindividuals who broke the code (for instance the offsprings of forbidden marriages),some authors think of the Chandalas as being the natives, the non Aryans18. Becausetheir religion was not Vedism or its later form, Brahminism, they were consideredbeing outside the system of castes and therefore looked down upon.
The distinctions made in sacred texts combined with the centrality of the conceptof purity, led many scientists to believe that earlier versions of castes and the atta-ched endogamous rules came out of a concern from the conquerors to maintain thepurity of blood. This theory found an echo in the common belief in India that ha-ving a fair complexion is a sign of distinction and that Brahmins in general do havefair complexions.19. As Klass (2004) summarizes "let us note at the outset that it issurely one of the most commonly held explanations in India, as well as in Europeand the United States. In sum, the position is taken that the original varnas wereracial categories, set up to maintain ’purity of blood’ with many, if not all, of thepresent castes deriving, in their common rule of marital exclusivity as well as in theirparticular positions in the hierarchy, from attitudes towards ’racial’ intermarriage inthe Vedic period". He later adds "this explanation of caste origin, surely the mostwidely accepted and most influential of all explanations".
18Many tribes call themselves "adivasis" which can be translated as "original habitants of theland" in reference to the theory that sees them as the descendants of the Chandalas. It is dubiousthat one may trace back tribes’ origins up to two millennia ago and it should be stressed that thislabel is fraught with political claims
19this is a remark made by Beteille (1965) in his study of a Tanjore village. Please note that itis the perception people have, albeit it may not be actual
14 1. BACKGROUND ON CASTES
INTRODUCTION
Although the most common theory, Klass (2004) argues that it has major in-consistencies. First, the theory assumes that color refers to skin color whereas itcould be symbolic. For instance, the color of the Khsatriyas or warriors is the redaccording to ancient texts, much in the same manner that red was the color of theEmperor in ancient Rome as it symbolizes martial virtues. Second, we lack histori-cal evidence about the physical traits of the two populations and more importantlyabout the fact that there may have been strong differences between the two. Klass(2004) is probably right in saying that we have no evidence of this, yet it is likelythat the physical traits of Caucasian Aryans and of South East Asian may have beendifferent. Third, "the mere fact of conquest [...] is no proof in itself that conquerorswill hold aloof from intermarriage with the conquered20". This would be convincingif we did not have a set of arguments, although disputable, coming from the Vedasand later texts themselves, that suggests the contrary, as explained earlier. Fourth,the Aryan conquest has been envisaged by the advocates of the "purity of descent"explanation as a civilizing process led by the Aryan "gentleman" of the barbariansnatives. Yet, whether this was a conquest is still debated. It might have been pro-gressive relatively pacific settlements. Second, it is quite likely that the populationsthe Aryan met during their "invasion" were from the Indus civilization, and wereanything but anarchic "uncivilized" hordes of barbarians.Fair enough, but whatever the hypothesis about the level of achievement of thetwo civilizations, the settlement of the Aryans in the sub-continent nevertheless oc-curred. Whether they brutally conquered the land or pacifically settled down doesnot necessarily entail that they might not have wanted to rule out intermarriageswith the "natives". One may argue that given the success of the Aryan conceptualframework and religion, the debate about whether they conquered or settled downis useless, given that, at the end, the Aryan civilization dominated and given thisdomination they did not want to mix with the locals and thus set up the an initialform of castes. This makes sense, unless we question the supposed "continuity [...]between the religion of the people of the Vedas and the belief system of the contem-porary Hindus of India. For some, particularly for many Hindus, it is in fact thesame religion - modified perhaps, evolved, or even degenerated, but not different.The suggestion, therefore, that Hinduism derives to an important extent not onlyfrom the Vedic peoples but also from the earlier, indigenous inhabitants might comeas a shock to some - but not, of course, to Indologists21".
In summary, the Aryan invasion theory is the most common held view aboutthe origin of castes, although it still has some dark sides and can be challenged onvarious grounds. Nevertheless it acquainted us with the Aryan invasion and the factthat segregation might have resulted from such a conquest, a story to which we shallcome back in Chapter 1.
20Klass (2004)21Klass (2004)
1. BACKGROUND ON CASTES 15
INTRODUCTION
1.2.2 Castes as Religious Guilds
Some theorists attempted to extricate the origins of castes out of the "Aryan-Dasyu" confrontations. While the latter mainly focused on endogamy, the formerstress the occupational specialization of castes. The theories hypothesize that castesderive from occupational associations comparable to "guilds", which for various rea-sons became transformed into endogamous groups. Furthermore, in short, it statesthat India, probably like any place in the world, was populated by tribes whoseraison d’etre was common ancestry. Then, at a later stage of development groupsbecame specialized and tribes collapsed. Yet, membership to these groups was nothereditary at this time but later became so for various reasons including one invokedby some theorists that at some point, Brahmins restricted access to priesthood totheir own children "in an effort to preserve for all their descendants the perquisitesand privileges of their occupation22". Given that Brahmins set the example, otheroccupational groups followed the same path and the resulting society was a collectionof hereditary occupational groups, i.e. castes. According to this view, castes stemfrom the particular power of influence of the Brahmins. This view is summarized byMaine (1887) "caste is merely a name for trade or occupation, and the sole tangibleeffect of the Brahminical theory is that it creates a religious sanction for what isreally a primitive and natural distribution of classes"23. Klass (2004) argued thatthis occupational interpretation of castes does not hold against factual evidence.First, occupation is not, in his view the most salient feature of the system and he isprobably right given that, as we have seen, traditional and actual occupations arenowadays uncorrelated, while caste still remains a reality. Second, he argues thatthe "entry of the members into new occupations is rarely the occasion for expulsionfrom the marriage group24. Some men might be expelled because the occupationbeing followed was repulsive to the rest of the group, and others might separatethemselves [..] perhaps because because they believed their new occupation placedthem above their fellows". Klass’ argument however is somewhat disconcerting forhe compares relatively recent accounts of caste fission to what might have happenedcenturies ago, thereby giving the impression that caste has not changed over time.However, the lack of convergence between actual and traditional occupations, parti-cularly centuries ago when agricultural production was the main activity probablyproves him right in his saying that occupational specialization should not be takenas the foremost feature of caste.
A last theory worth mentioning in that vein is that of Sénart (1978). Sénartbuilds both on the "guild" arguments and on the racial antipathy theory. It pro-bably is best summarized in the following excerpt "Nowhere in antiquity have theIndo-Europeans shown any great taste for manual professions. The Greeks and theRomans left them to slaves or intermediate classes, freedmen and members of thehousehold. The Aryans, settled in villages and at first completely pastoral in occu-pation, had even less need to follow them in India than elsewhere. Manual laborwas destined in general to remain the lot of either the aborigines or of the peopleswhose hybrid or doubtful origins related them to the same level. Both these groups,
22Klass (2004)23cited by Klass (2004)24Klass (2004) prefers marriage-group to the term caste
16 1. BACKGROUND ON CASTES
INTRODUCTION
in becoming artisans, brought with them their tradition and the desire to be assimi-lated to the analogous organization of the superior race". In brief he builds on boththeories by saying that invading Aryans already endeavored to separate themselvesfrom indigenes and people with "doubtful origins". Given their reluctance towardsmanual work, they relegated it to non-Aryans. The set of occupations for Aryanswas therefore non manual and within that set, the priests emerged as the dominantsocial and occupational group and restricted access to their group to their own chil-dren. They now constitute a caste that other groups would eventually copy. Onecould say that the same counterargument as the one used against tenants of the oc-cupational explanation could be applied to Sénart (1978). My sentiment is that bysubordinating the occupational specialization to the power gained by the Brahminsand to endogamy, his theory may have overcome elements that appeared dubious inthe "guild" theories.
1.2.3 Castes Functions as Their Origins
The above mentioned theories have three drawbacks according to Klass (2004).First, Brahmins and their power are central to these explanations. Yet it is unlikely,Klass (2004) argues that such a pervasive institution has been imposed by one groupon the others. Second, the absence of historical records confine these explanations tothe rank of hypothesis, not to say speculations. Third, it places too much emphasison the religious aspects of castes, when the system may be viewed as a politicalor economic organization, whose sanction was religious. Therefore another valuableapproach would be to investigate what caste is and how the system works to inferits function and look into its origins.
These theories fall within the functionalist views on institutions. They rest onthe hypothesis that no social organism may last in time if one of its constitutinginstitution is massively dysfunctional, thus institutions, such as the caste systemmust have or had a function. The theory developed by Baechler (1988) may beplaced in this category. Briefly said, this author asserts that kingdoms or empiresin India did not manage to provide society with coherence and cohesion. It seemsthat Indian polities lacked consistency, were instable, short-lived as testified by theabsence of dynastic continuity. Indian rulers failed to implement a local politicalorganization, contrary for instance to the Chinese state, whose bureaucracy extendedto the very local level. In Baechler’s word, the political arena was discredited. Thisposed a threat to the Indian social body that replied by forming jatis as a way toorganize villages’ lives. This theory, unfortunately too briefly summarized, finds anecho in the way caste used to, and in some instances still do, rule communities’ lives,through caste assemblies.
While Baechler’s theory emphasized the political origin of castes, others haveinsisted on their economic functions. These set of theories builds on Polanyi’s sub-stantivist approach, in the sense that they insist on the influence over economicbehaviors and organizations exerted by the relationships with individuals’ naturalenvironments and patterns of interactions. The latter are of three types "Empirically,we find the main patterns to be reciprocity, redistribution and exchange. Reciprocitydenotes movements between correlative points of symmetrical groupings ; redistri-
1. BACKGROUND ON CASTES 17
INTRODUCTION
bution designates appropriational movements towards a center and out of it again ;exchange refers here to vice-versa movements taking place as between ’hands’ un-der a market system. Reciprocity, then, assumes for a background symmetricallyarranged groupings ; redistribution is dependent upon the presence of some mea-sure of centricity in the group ; exchange in order to produce integration requiresa system of price-making markets. It is apparent that the different patterns of in-tegration assume definite institutional supports" (Polanyi, 1957). Now where doesthe caste system fit in this classification ? The jajmani system was briefly descri-bed as an exchange of labor, services or goods between relatively specialized castesfor a share of the harvest. Yet the amount of the "exchange" was fixed by tradi-tion and obligations to provide the services were inherited. Money would not beexchanged. In short this was not a marketplace which prevents from fitting casterelationships in the exchange category as defined by Polanyi (1957). Second, in thejajmani system certain castes, such as that of priests among others, often excludedfrom the exchange low-ranked castes. Thus relationships can not be called recipro-cal. We are then left with redistribution. Gough (1955)25 provides an account of theset up of a village in Tanjore named Kumbapettai. According to the author, theMaratha Raja, willing to set up a village, offered land to four families belonging toa Brahmin sub-caste. Apparently, the land was divided into four equivalent partsthat were rotated every three years. They did not, strictly speaking own the land,given that they had no rights to dispose of it to outsiders, but they and their des-cendants enjoyed the usufruct as long as the Raja received a major share of theharvest. The remaining part of the harvest was the propriety of the four Brahminfamilies. The Brahmins soon "acquired" families to perform the agricultural workthat themselves were forbidden to do. They provided them with construction ma-terials, a garden and the right to fish in village’s bathing pool as well as gifts atmarriages, festivals and death. Men performed various tasks from planting, growingand harvesting the crop, to attending to the Brahmin’s cattle, while women wouldclean the houses’ of their husbands masters. In exchange for these services, men weregiven by their masters a fixed quantity of paddy each month while women and boysreceived a smaller amount. The bottom line is that Brahmins directed and supervi-sed the agricultural production, administered the affairs of the village and were alsogranted by government the supervision of public goods production and of justice.They were the center for redistribution. In this instance, they were the Brahmins,but they may have come from other castes. The important point is "the work ofall of these castes was performed primarily on behalf, and under the authority, ofthe landlords whose villages they served" (Gough, 1955). This story of Kumbapettaistresses the importance of land ownership that is a major factor in the definitionof a dominant caste given by Srinivas (1955). This is where this theory rejoins thatof Baechler (1988). The institution of caste was a redistributive exchange systemwhere the dominant caste controls both agricultural production and the allocationof services, under the relatively weak authority of the government. The absence ofpolitical authority was compensated through an economic system that transformedthe dominant caste into a political center.
25quoted by Klass (2004)
18 1. BACKGROUND ON CASTES
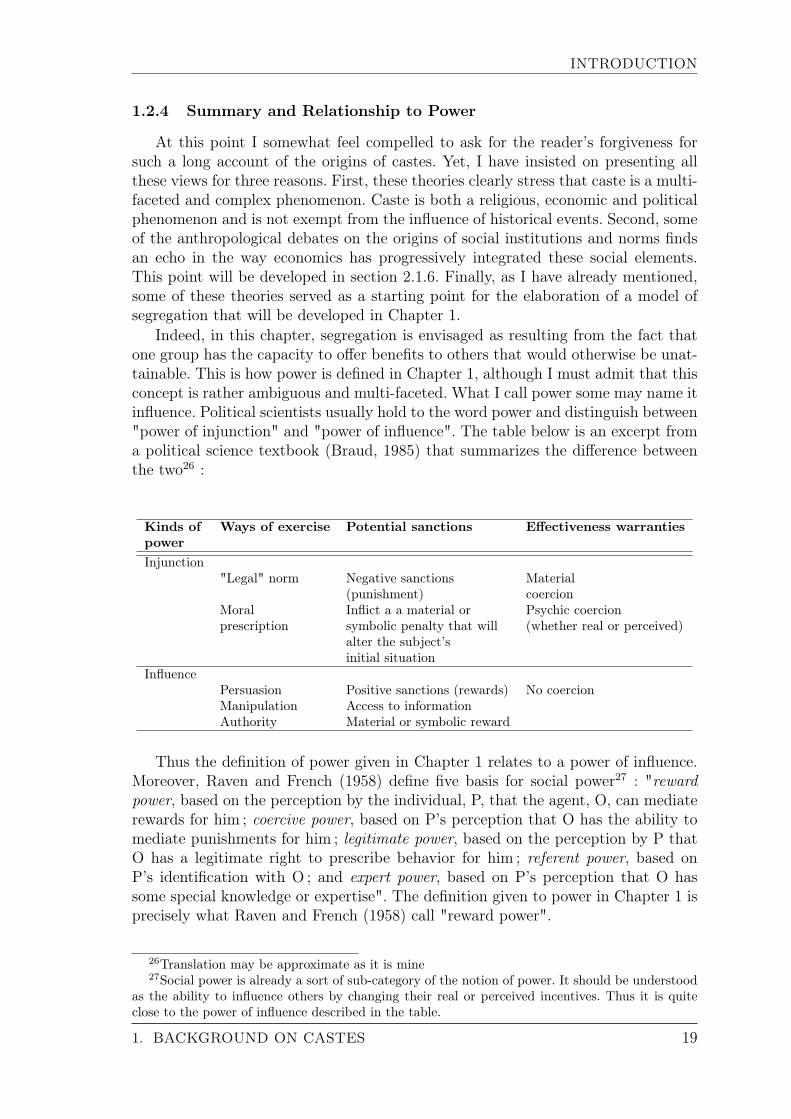
INTRODUCTION
1.2.4 Summary and Relationship to Power
At this point I somewhat feel compelled to ask for the reader’s forgiveness forsuch a long account of the origins of castes. Yet, I have insisted on presenting allthese views for three reasons. First, these theories clearly stress that caste is a multi-faceted and complex phenomenon. Caste is both a religious, economic and politicalphenomenon and is not exempt from the influence of historical events. Second, someof the anthropological debates on the origins of social institutions and norms findsan echo in the way economics has progressively integrated these social elements.This point will be developed in section 2.1.6. Finally, as I have already mentioned,some of these theories served as a starting point for the elaboration of a model ofsegregation that will be developed in Chapter 1.
Indeed, in this chapter, segregation is envisaged as resulting from the fact thatone group has the capacity to offer benefits to others that would otherwise be unat-tainable. This is how power is defined in Chapter 1, although I must admit that thisconcept is rather ambiguous and multi-faceted. What I call power some may name itinfluence. Political scientists usually hold to the word power and distinguish between"power of injunction" and "power of influence". The table below is an excerpt froma political science textbook (Braud, 1985) that summarizes the difference betweenthe two26 :
Kinds of Ways of exercise Potential sanctions Effectiveness warrantiespowerInjunction
"Legal" norm Negative sanctions Material(punishment) coercion
Moral Inflict a a material or Psychic coercionprescription symbolic penalty that will (whether real or perceived)
alter the subject’sinitial situation
InfluencePersuasion Positive sanctions (rewards) No coercionManipulation Access to informationAuthority Material or symbolic reward
Thus the definition of power given in Chapter 1 relates to a power of influence.Moreover, Raven and French (1958) define five basis for social power27 : "rewardpower, based on the perception by the individual, P, that the agent, O, can mediaterewards for him ; coercive power, based on P’s perception that O has the ability tomediate punishments for him ; legitimate power, based on the perception by P thatO has a legitimate right to prescribe behavior for him ; referent power, based onP’s identification with O ; and expert power, based on P’s perception that O hassome special knowledge or expertise". The definition given to power in Chapter 1 isprecisely what Raven and French (1958) call "reward power".
26Translation may be approximate as it is mine27Social power is already a sort of sub-category of the notion of power. It should be understood
as the ability to influence others by changing their real or perceived incentives. Thus it is quiteclose to the power of influence described in the table.
1. BACKGROUND ON CASTES 19

INTRODUCTION
Why can it be argued that, in the case of castes, one group had "reward power"over others ? Please recall that in the Vedic period the priests monopolized sacri-fices, whose importance was crucial in worldly success. They were the only ones whohad access to the deities and divine protections could only be acquired through theintercession of the sacrificers. In this sense, the Brahmins were controlling access tospiritual and the resulting material benefits.
In the same vein, the Aryan domination, is likely to have entailed a power grab,and whether this was political through military supremacy, or land control or spiri-tual is not discussed here. And it may have very well resulted, the "purity of descent"story tells us, in attempts to separate from the dominated natives. Sénart (1978)precisely makes this point when he says that the caste system arose from a reluctanceby one group to perform manual tasks. And if this group was able to confine thosetasks to a different one, it is because they, in a way or another, dominated the otherone. Although, as previously said, the "purity of descent" theory may be challengedon different grounds, it remains the most widespread and influential explanation ofthe theory of caste. Even if one does not subscribe to this theory, sacred texts oncastes, clearly stress the influence one group, the priests, had over others.
Let’s assume that the explanation of castes in religious or historical terms is notsatisfactory and that we may prefer to turn to the functional role of castes. Thedescription of castes as an economic redistributive center highlight that other castesdid actually depend for their livelihood on the land owning caste, who, more oftenthan not, were Brahmins. Such a system placed the landowning caste as both theeconomic center but also the political one. This description stresses the "rewardpower" the landowning caste had. It could be objected that such a power may havebeen a consequence of the caste system and as such it resulted from an alreadyoperative segregation. Thus, the views expressed in Chapter 1 that segregation mayoriginate from a power capture should be reversed. Yet, I would argue that sincewe lack evidence on what preceded what, both points of views are conceivable.However, the Kumbapettai account and the zamindari28 system under British rule,let us believe that the powers granted to the landowning castes have resulted indeeper castes cleavages.
1.3 Caste Flexibility and Recent Transformations
This search for the origins of castes as well as the presentation of the sacredtexts should not lead us to believe that caste has not changed over time and thatit is anything but flexible. I have already mentioned that caste is not independentfrom wealth and power. There has been many castes fissions, generally due to anincreasingly heterogenous economic status within a group. There has been fusionsas well, prompted by various factors ranging from wealth levels to political interestsand so on. Caste is far from being the rigid institution people usually have in mindand given this flexibility it must have largely changed over time. Some authors such
28In Kumbapettai, the Raja turned over land to few families to collect more efficiently taxes.The British resorted to a similar system, when they ascribed to the existing zamindars a taxcollection duty. This system if often viewed as having deepened castes cleavages.
20 1. BACKGROUND ON CASTES
INTRODUCTION
as Bayly (2001) argues that the British Raj reinforced its rigidity. She argues thatwhat is now viewed as the traditional institution and ideology underlying castes,only took shape at the beginning of the XVIIIth century "that is, the period of ra-pid regional state-building which accompanied the collapse of Mughal rule and theexpansion of Western power in the subcontinent". Other authors such as Dehejiaand Dehejia (1993) argue that the caste system in India was quite flexible until theMedieval Times when land or crop granting replaced cash salaries. The caste systemhas undergone deep transformations. For instance, the jajmani system has nearlydisappeared. The increasing access to primary education as well as the developmentof new economic sectors besides agricultural ones might have lowered the correlationbetween caste and wealth. Yet, many authors such as Banerjee and Knight (1985)or Borooah (2005) have evidenced and measured caste-based discrimination, the-reby showing that it is still a reality and not only in rural settings. In Chapter 3we also present some evidence that untouchability practices have not disappeared.Thus even if the caste system has been largely altered, some of its aspects remain.
Among the recent transformations that are worth mentioning, one should be loo-ked into more details, as it may have had repercussion both on the functions of castesand on the data available and those used in this dissertation29. The Constitution ofIndia both outlawed caste based discrimination and set up reservations policies forboth Scheduled Castes and Scheduled Tribes. Yet, the Constitution also envisagedextending these policies to "other backward classes" ("OBCs"), that, roughly spea-king, were low non untouchable castes. In 1953 a commission was set up to identifythis group. It proposed to extend reservations to about 2,000 castes identified asOBCs. The government rejected the proposal on the ground that the list rested toomuch on caste as criteria for social backwardness, at a time when it championed auniversalist conception of the Indian citizen. In the meantime, the identified OBCsbecame conscious of the value of being on the list and of benefiting from reserva-tions. Under their pressure another commission was set up named after its presidentB.P. Mandal. The commission identified 52% of the population as OBCs and re-commended reserving 27% of the administrative positions to them. Higher castesreacted violently and recommendations were not applied nationwide. In reactionOBCs mobilized politically and caste, in a broader sense than that of jati, emergedas a political identity. Thus, according to Jaffrelot (2002), caste in India has becomea political rally.
This classification as SCs, STs, or OBCs has very a very practical consequence.All the statistical information gathered has been adapted to this new classification.Given that OBCs is not an officially recognized group and that there is a debateabout who is in and who is out as well as the size of the group, only few data setswould classify households as OBCs. Most information on caste would come under thecategories of SCs, STs and non scheduled. Arguably, this is an over-simplification aseach group encompasses very heterogenous castes. For instance, as the debate overOBCs has shown, situations may be very heterogenous within the non-scheduledgroup ranging from very low castes to Brahmins. Nevertheless, authors of empiricalwork have little choice but to follow the way data are informed.
29The account that follows is based on Jaffrelot (2002)
1. BACKGROUND ON CASTES 21
INTRODUCTION
Now that foundations have been laid for the comprehension of the nature andpotential origins of caste that will prove necessary in the following chapters, we mayturn back to the initial question : "what do castes have to do with economics ?".
2 How is The Study of Castes Relevant toEconomics
There are three families of arguments to answer this question. The first one dealswith the conceptual framework used in economics. As Becker and Murphy (2003)write "modern economics, whether in textbooks or in the most advanced journalarticles, typically assumes that individual behavior is not directly influenced by theactions of others. Of course, it is understood that every individual is greatly af-fected indirectly [...] Presumably for this reason, anthropologists and sociologistshave repeatedly told economists about the importance of culture, norms and socialstructure. Economists have not listened, however, mainly because these other fieldshave not developed powerful techniques for analyzing social influences on behavior".The rational self-interested maximizing agent, the Homo Economicus was not muchconsidered in his environment. Yet, experiments have shown that norms, culture andvalues play a great role in decisions or preferences. Thus Ostrom and Ahn (2003)write "abundant anomalies accumulated that called for careful examination of thefactors that were left out of earlier theories. Some of the puzzles [...] could not beanswered satisfactorily without seriously studying the omitted factors : trust andnorms of reciprocity, networks and forms of civic engagement, and both formal andinformal institutions". This set of arguments will be detailed in section 2.1.
The second family refers to the purpose of what was once called political eco-nomy, which can be described, with a bit of simplification as the maximization ofwelfare in a society. Failing to account for the limitations imposed by the individualssocial condition on their ambitions or functionings, as per A. Sen’s words, would putthe analyst in the grip of the criticism addressed by this author to welfarism. Thiswill be discussed in section 2.2.
Finally the last set or arguments relates to the economic instruments that arechiefly markets. Because social structures may create large transaction costs or al-ter preferences, they impede the efficient allocation of resources. Suppose, for thesake of the argument, that perfect and fluid markets are a prerequisite of growthand economic development. Then employment discrimination should be studied notonly because it reduces individuals capabilities and is unethical (such a study wouldbe related to the purpose of political economy) but also because it prevents efficientallocation of labor (the instrument of political economy). The same goes with socialnorms or institutions in general and castes in particular. They ought to be studiedbecause they influence the attainment of policy objectives but also the means ofachieving such objectives. Examples of how castes do interfere with the economicinstruments will be evoked in section 2.3.
22 2. HOW IS THE STUDY OF CASTES RELEVANT TO ECONOMICS
INTRODUCTION
Before delving into this matter, let me give here a couple of definitions of concep-tually very close terms that will be extensively used, namely social institution, socialidentity and social norm. Social institution should be understood in a sociologicalsense that is a system of social relationships that is relatively stable in time. Itimplies groupings that, once formed, immediately prompt the formation of socialidentity, at least this is what the results from behavioral experiments suggest. Socialidentity can be defined as a "person’s sense of self"30 as a member of a group. Socialinstitution can be said to be a determinant of social identity. Moreover, both socialrelationships and social groupings imply the creation of norms. Presumably, as soonas groups are formed, codes are be set up to secure both social identity, coopera-tion within the group and to structure relationships with other groups. These threeconcepts are very close and their alternative use in what follows should not come asa surprise.
2.1 The Under-socialized Homo Economuicus
As pointed out at the beginning of this section, the conventional economic agentis isolated from his social environment. This is one of the strongest criticism ad-dressed by other social sciences, chiefly sociology, to economics. While the HomoEconomicus is mainly pulled by instrumental rationality, the Homo Sociologicusis mainly pushed by social norms and institutions as well as social pressure. Forinstance, Durkheim and its followers insisted on viewing economic behavior as a"social fact" i.e. a way of "acting, thinking and feeling external to the individual,which are invested with a coercive power by virtue of which they exercise control overhim"(Durkheim, 1895). Sociology stresses the primacy of social relationships. Thiscan hardly be more opposite to the conventional view held in economics of behaviorsdriven by self-interest based on exogenous preferences and that through unlimitedinformation and instrumental rationality, maximize utility under the constraint ofscarce of means. The Homo Economicus is a self-regarding consequentialist ratherthan a "political animal" as per Aristotle’s words. However, all these characteristicshave come under scrutiny impelled by (a) the criticisms addressed by other socialsciences, (b) the regain of interest for earlier theories that either contested one ormore of the characteristics attributed to Homo Economicus such as A. Marshall(Bowles and Gintis, 2000) or insisted on the role of institutions such as J. Schumpe-ter and T. Veblen and (c) the accumulation of "abundant anomalies" as per Ostromand Ahn (2003) words. Among such anomalies, two are worth mentioning, collec-tive action and discrimination, since they will serve as a thread for the argumentsdeveloped in the chapters. Indeed early theories of collective action (Olson, 1965)concluded that agents left by themselves in a situation where free riding is an option,can not achieve cooperation unless incentives are modified by an external authority.Similarly, how come that individuals who are identical in all their characteristics butskin color do not earn the same wage ? As mentioned by Ostrom and Ahn (2003)these analysis clearly point at the role of social interactions and norms.
30Akerlof and Kranton (2000)
2. HOW IS THE STUDY OF CASTES RELEVANT TO ECONOMICS 23

INTRODUCTION
Naturally the last point leads us to the work undertook by Becker (1976) and towhom we must pay a tribute for reintroducing social relationships in economic beha-viors. Yet, his analysis probably did not go far enough as the behaviors he describedare dependent upon set roles that are exogenously ascribed. As Granovetter (1985)argued "Actors’ behavior results from their named role positions and role sets ; thuswe have arguments of how workers and supervisors, husbands and wives or criminalsand law enforcers will interact with one another, but these relations are not assumedto have individualized context beyond that given by their named roles". Becker’sexplanation of discrimination in the labor market through an exogenous "taste fordiscrimination" immediately prompts the question of the origin of such a taste andpoints towards the necessity to bring social norms and institutions in the picture.
2.1.1 Instrumental Rationality
This is where new institutional economics came in by refuting the assumptionof costless information and insisting on asymmetrical information and transactioncosts. As North (1995) writes "in fact, information is incomplete and there is limitedmental capacity by which to process information. Human beings, in consequence,impose constraints on human interaction in order to structure exchange. There is noimplication that the consequent institutions are efficient. In such a world ideas andideologies play a major role in choices and transaction costs result in imperfect mar-kets. The place to begin a theory of institutions, therefore, is with a modificationof the instrumental rationality assumption". Instrumental rationality assumptionwas modified indeed, rather than swept away for, in this framework, agents stillresort to an optimization of the ends under the constraints of scarce means, giveninformation available to them. Thus out of the characteristics attributed to the neo-classical agent that are self interest, exogenous preferences, instrumental rationalitywith complete information, only the last one was contested, yet without refuting theconsequentialist behaviors of agents. Therefore, institutional economics may comeunder the grip of three kinds of criticism. First, are the retained hypothesis aboutagents behaviors acceptable ? Second, if ideologies and norms are the tools agentsresort to in case of information scarcity, where do they come from? Going back tothe discrimination example cited above, the theory moved from Becker’s taste fordiscrimination to Arrow (1971) statistical discrimination. Agents resorts to discri-mination to compensate for the lack of information about their future employeesproductivity. Thus the norm is a palliative to a lack of information. I argue in Chap-ter 1 that this prompts a similar question to that raised by Becker (1957) theory :where does the inference about someone’s productivity from physical or social traitscome from? In other words, where do prejudice come from?
Let’s turn first to the first question, that is the validity of the characteristicsascribed to agents. Are they consequentialists in the sense that they optimize theirutility given a scarcity of means ? Two types of answers have been brought forwardmostly based on the distinction made by Polanyi (1957) between the "formal" and"substantive" meanings of economics : "the substantive meaning of economic de-rives from man’s dependence for his living upon nature and his fellows. It refers tothe interchange with his natural and social environment, in so far as this results insupplying him with the means of material want satisfaction. The formal meaning
24 2. HOW IS THE STUDY OF CASTES RELEVANT TO ECONOMICS

INTRODUCTION
of economic derives from the logical character of the means-ends relationship, asapparent in such words as "economical" or "economizing". It refers to a definitesituation of choice, namely, that between the different uses of means induced byan insufficiency of those means. If we call the rules governing choice of means thelogic of rational action, then we may denote this variant of logic, with an improvisedterm, as formal economics. The two root meaning of "economic", the substantiveand the formal, have nothing in common. The latter derives from logic, the formerfrom fact. The formal meaning implies a set of rules referring to choice betweenthe alternative uses of insufficient means. The substantive meaning implies neitherchoice nor insufficiency of means : man’s livelihood may or may not involve the ne-cessity of choice and, if choice there be, it need not be induced by the limiting effectof scarcity of means...". The reason for quoting Polanyi (1957) at such length isthat the distinction he made had enormous implications in social sciences and mostprominently in economic anthropology. Surprisingly, the cleavage created between"formalists" and "substantivists" was confined to anthropology. This may be dueto the fact that susbstantivists challenge the hypothesis that all actions derive fromdeliberate choice, which is central to most economic models.
2.1.2 Freedom of Choice
However, when economists start introducing social interactions to explain thepuzzles Ostrom and Ahn (2003) were referring to, choice appears much more limi-ted than what conventional models assume and this seems to be troubling Becker andMurphy (2003) when they write "strong complementarities between social capitaland individual behavior appear to leave little room for individual choice. Althoughat one level there is much validity to these claims, at a more fundamental level socialcapital changes the focus rather than reduces the importance of individual choice. Ifpeer pressure and other forms of social capital have enormous power over choices, itbecomes much more important to make wise decisions in selecting peers and otherdeterminants of such capital". In the model derived by Becker and Murphy (2003)the only space for rational choice is the decision to associate with others."Even whensocial structure and social capital have enormous power over behavior, people stillgreatly influence their behavior by, in effect, choosing their social capital [...] Webelieve that utility maximization and other parts of rational choice theory provideinsight into how people are divided into different categories when some categoriesare in greater demand because they have more attractive members. That is, we hopeto demonstrate that rational choice theory is not inconsistent with the importanceof social structure, but rather is crucial in understanding how this structure getsdetermined". Yet, many instances prove that the freedom to choose social capital israther limited. In highly stratified or ethnically fragmented societies, social capitalis probably imposed on individuals by birth or physical traits. Given what has beensaid before about the system of castes, it would take a lot of energy to show thatindividuals are entirely free to choose their social capital within this context. Ar-guably, even in socially mobile societies the extent of social capital that one is ableto acquire may often be thought as given, owing to the fact that habits are taken in
2. HOW IS THE STUDY OF CASTES RELEVANT TO ECONOMICS 25
INTRODUCTION
the community, norms are inculcated early in the childhood, etc31.
2.1.3 Embeddedness and Social Interactions
What is clear from this abstract is that economists are ill at ease when too muchemphasis is put on social relationships, norms and institutions. However, since theargument made by Granovetter (1985) that "most behavior is closely embedded innetworks of interpersonal relations and that such an argument avoids the extremesof under- and over-socialized views of human action" a middle path seems to haveemerged. Rather than positing the absence of relationships between desired out-comes and scarce means, or the absence of interferences by social relationships inbehaviors, recognizing that behaviors are embedded into social relationships leadsto considering strategic interactions. This is a point made in Akerlof (1976) aboutcastes, when the author asks why virtually no one would break the caste code, whenthe disappearance of castes would make everyone better off. He answers that theexpectation of being out-casted if the individual was to break the code, would makehim much worse off than obeying the code. Thus everyone obeys the caste code,even though everybody would be better off without it. Similarly Basu (1986) recallswhat Vaclav Havel wrote about "dictatorships in which no one or no group playsthe role of dictator. Each citizen, from fear of being labeled disloyal and being ha-rassed, conforms to the rule of the system. Even those who harass do so becausethey are worried that if they do not harass the disloyal, they themselves may belabeled disloyal. So each individual through his own little rational acts help sustaina regime which he might not actually want"(Basu, 1986).
Behaviors are thus considered in terms of strategic relationships. Yet this is notsufficient to explain "Why do we not try to walk off without paying after a taxiride ?" (Basu, 1997). This author argues that it cannot be explained by pure sel-fishness but rather by obedience to norms of fairness. Walking away is not in theagent’s set of actions, because norms exclude certain behaviors32 As Basu (1997)writes "It is obvious, at least to most of us, that much of human behavior is shapedby morals, customs, and social norms. What is less obvious is that an individual’sadherence to certain social norms may be a necessary element in many economicmodels". Behavioral experiments concur on the fact that norms restrict the set ofpossible actions. Dictator’s games rarely yield the outcome that would be expectedunder the assumption of selfishness and utility maximization. For instance, Hoffman
31Please refer to Bowles (1973) and Bowles et al. (2009)32I need to clarify the relationship between norms and preferences. Basu (1986) argues that
norms restrict the set of feasible actions. Thus preferences are likely to lie within the the feasibleset. Given that a behavior that would go against the norm is hardly conceivable, or all in all verycostly, an individual would only weigh his options, i.e. express his preferences within the set offeasible actions. Let’s take a rather crude example. A social norm may state that being more than15 minutes late is extremely rude. Yet, I may choose to be five minutes earlier, if I like to cometo an appointment first or only five minutes late. I still have expressed my preference within theboundaries of a socially acceptable set. Turning to the example of caste. The norm stipulates thatone should marry within my group. Suppose an individual obeys a norm, he still can express hispreferences in terms of partners within a group. This is discussed in more details in section 2.1.6below
26 2. HOW IS THE STUDY OF CASTES RELEVANT TO ECONOMICS
INTRODUCTION
et al. (1996) conclude from dictator’s game experiments that if subjects offer higherpayments than predicted by the Nash equilibrium, even in one shot games, this isdue to the habit of reciprocity, a social norm imported into the laboratory. Moreover,offers decrease with social distance during the experiment, suggesting that as thedistance increases norm compliance loses strength. Henrich et al. (2001) studied thebehaviors in ultimatum, public good and dictator games in 15 small scale societies.One of their conclusions is that predictions based on the self interested maximizingagent is not found in any of the society under study, while "the large variationsacross the different cultural groups suggest that preferences or expectations are af-fected by group-specific conditions, such as social institutions or cultural fairnessnorms"33.
2.1.4 Other Regarding Preferences
Eckel and Gintis (2010) conclude "Experimental economics has found severalvery important cases in which the predictions of the self-regarding actor game theo-retic model are incorrect, and the failures are due precisely to the violation of theassumption of self-regarding behavior". Another kick at the conventional Homo Eco-nomicus : preferences are not exogenous but rather situationally specific as Bowlesand Gintis (2000) write "The primary contribution of the behavioral approach toeconomics is to understanding the diversity and context dependent nature of humanpreferences, how elements of this repertoire of preferences become salient in parti-cular strategic interactions, how they have evolved over the long run, and how indi-viduals form the beliefs that along with their preferences explain what they do. Thebehavioral approach is not a critique of optimizing subject to constraints. It takesfor granted that people are purposeful and have reasons for what they do - althoughit recognizes that individuals may have internal conflicts and time-inconsistent pre-ferences". An example of this, may be the analysis undertook by Voors et al. (n.d.)where the authors show that communities who experienced war in Burundi exhibitmore altruistic and less patient behaviors.
Let’s pause for a short time to briefly summarize what has been said so far.First, the instrumental rationality of the Homo Economicus has been challenged.Yet, limited or asymmetric information came to its rescue by saying that individualsdo optimize subject to constraints, given the limited information available to them.Then the introduction of social institutions came as a reinforcement by stating thatsocial norms do restrict the set of actions available and thus agents do optimizewithin that set, or by assuming that agents do make expectations about the reper-cussions of their actions on other who may backfire. The last two set of argumentsbuild on the idea that behaviors are embedded into social relationships, but stillmaintain the selfishness of the agents. Yet, this last point has been challenged bybehavioral experiments as observed outcomes rarely match the predicted Nash equi-libria, due to the presence of concerns for fairness or the habit of reciprocity. Itseems that agents are genuinely concerned with the effect of their actions on others.They have social preferences and may be less self-regarding than conventional mo-
33For a review of the outcomes in various experimental games, please refer to Bowles (2004)
2. HOW IS THE STUDY OF CASTES RELEVANT TO ECONOMICS 27
INTRODUCTION
dels would assume. Moreover, the impacts of such concerns are dependent uponperceived social distance (Hoffman et al., 1996). So preferences are likely not to beexogenous and rather context dependent. This last point seems to be confirmed byexperiments on the formation of social identity.
2.1.5 The Impact of Social Identity
A number of experiments have shown that social identity influences behaviors(Steele and Aronson, 1995; Shih et al., 1999; Hoff and Pandey, 2006; Chen and Li,2009). How is that so ? "Social identity is commonly defined as a person’s senseof self derived from perceived membership in social groups"(Chen and Li, 2009).Moreover, the social identification process is often tied to the adherence to group’sspecific norms34. We may argue that any behavior that contradicts this sense ofmembership, or the group’s code, jeopardizes part of the individual’s identity andgenerates a feeling of discomfort, that is often referred to as "cognitive dissonance",a term coined by Festinger et al. (1956). Psychological experiments have shown thatindividuals experience anxiety while acting in a way that contradicts self perceptionand believes and that they endeavor to reduce this feeling of discomfort by eitherrationalizing their decisions or adapting their behaviors. Therefore, given that so-cial identification is tied to stereotype formation (Tajfel et al., 1971), not acting inconformity to the stereotyped behavior contradicts social identity and thus createsanxiety. Let’s consider the following examples to be more specific. Steele and Aron-son (1995) conducted an experiment where they gave African-American and whitestudents a test. The pool of subjects was separated into two random groups. Onegroup was told that the test evaluated intellectual performance while the secondgroup did not receive such a message. Performance of African-American in the firstgroup was significantly worse. This under performance was due, the authors argued,to the conforming of race related stereotypes, what they called "stereotype threat".Another striking example is the experiment conducted by Shih et al. (1999). AsianAmerican female undergraduates were grouped in three and given a math test. Inone group, the Asian identity was emphasized. In a second the gender was stressedand in the control group no identity was particularly made salient. Results show thatthe first group outperformed and the second group under-performed compared tothe control group. Thus women performance was altered by the stressed stereotype.There are a couple of other experiments of this sort and most evidence that indivi-duals act in conformity with what others expect of them35. The one conducted byHoff and Pandey (2006) is of particular interest. Children from Northern India wereasked to solve mazes. When caste identity was not made salient, the performance
34One of the examples Akerlof and Kranton (2010) give is the enrollment of cadets at WestPoint. The aim of the training is to promote a military identity by stressing the differentiationbetween insiders (military) and outsiders (civilians). The adherence to a code of honor is supposedto reinforce the identification process. The authors write "In the formal language of social sciences,people divide themselves and others into social categories. And social categories and norms areautomatically tied together : people in different social categories should behave differently. Thenorms also specify how people of different types - different social categories, in our new vocabulary-should treat each other."
35For an extensive review of these experiments please refer to either Akerlof and Kranton (2010)or Chen and Li (2009)
28 2. HOW IS THE STUDY OF CASTES RELEVANT TO ECONOMICS
INTRODUCTION
of both high castes and lower castes children were not very different. Yet, the lowercastes performance dropped dramatically when caste membership was publicly an-nounced. Thus long standing discrimination has shaped self perception and therebyreduced the most vulnerable group’s set of expectations. This is what Bertrand et al.(2005) call "implicit discrimination". As individuals internalize norms and adhere tothem, their social identity strongly influences their behaviors. Hence the necessityto introduce a utility derived from a compliance to the group’s norms as done byAkerlof and Kranton (2000, 2005, 2010). They introduced as an argument in theindividual utility function, a utility derived from identity and a gain or a loss inutility derived from complying to the norm or ideal set for or by the group theindividual belongs to. The model thus captures the fact that behaviors depend onsocial category and on norms.
However, the impact of social identity may go beyond groups’ norms and codesobedience as some authors argue that it modifies preferences. Experiments led byTajfel et al. (1971); Tajfel and John (1979) show that even when groups are for-med arbitrarily, subjects tend to identify with their group and such an identificationbegets intergroup rivalry and discriminatory practices. Chen and Li (2009) conclu-ded that social identification modifies preferences in the sense that experimentsparticipants exhibit more altruistic dispositions towards in-group members. Thusaccounting for social identity stresses that preferences are context dependent andprobably neither fixed nor exogenous. However, what is not clear in this literatureis whether social identity modifies behaviors because it alters preferences or becauseit implies adherence to a code that restrict the set of possible actions. To be morespecific, will individuals be more indulgent or generous towards their fellows becausethey feel a preference for them, or because to be part of the group, they have toadhere to an in group altruistic norm that makes selfish behaviors not an option.
2.1.6 What is a Social Norm?
This is quite a difficult question and I will not attempt to settle it as this wouldlargely be beyond the scope of the dissertation and rather presumptuous. Howe-ver, it is surprising that that every set of theories mentioned so far, seem to havea different idea about the nature of norms. For instance, New Institutional Econo-mics defines an institution as "rules of the game [..] humanly devised constraintsthat shape human interactions" (North, 1990). This definition is broad enough toinclude norms as informal rules of the game. They are viewed as a "humanly devisedconstraints" which suggests that they have a function and arise out of collective opti-mization36. A good example of this may be the prohibition of incest. However, Elster(1989) and Basu (1986) challenge this view on three grounds : first not all normsare Pareto-improvements. The study of castes by Akerlof (1976) clearly makes thispoint. Other authors such as Young (2007) describe norms as way to "coordinatepeople’s expectations in interactions that possess multiple equilibria", a conceptionthat is related to the former, although it departs from the idea that the equilibriumis necessary Pareto optimal. However, most of these views insist on norms being
36For a discussion on this particular point please refer to Elster (1989) or Anderson (2000)
2. HOW IS THE STUDY OF CASTES RELEVANT TO ECONOMICS 29
INTRODUCTION
imposed and sanctioned, while experiments on social identity showed that sanctionsare not necessary for norms to be complied with. As Akerlof and Kranton (2010)put it "they [individuals] internalize the norms and adhere to them. This conceptiondoes not correspond to economists’ usual view. To date, economists have mostlyseen norms as sustained by external forces : people follow a norm because if theydo not, they could be punished in some way". This last point insists on the factthat norms are not obeyed out of a fear of punishment, but rather because normsought to be obeyed. They include a moral injunction. As in the example of the taxiride given in Basu (1997), a taxi’s passenger will pay for the ride not out of fearof getting into trouble with the taxi driver, but rather because he has to. This iswhat Basu (1986) calls "contract-adherence norms". Thus, according to this author,norms serve at restricting agents’ action space. He writes "before asserting that anindividual maximises utility, it is necessary to state clearly the domain over whichthe utility function is defined and the domain is not well-defined by uttering the ma-gic word "everywhere". [...] The reason why in a formal general equilibrium model,an agent does not steal another agent’s initial endowment is simply because such anact is not in his feasible set. [...]. This is where social norms become crucial. It is amethod of policing individual activities without having to maintain a police force".A last definition of norms that is worth mentioning is related to social identity. Itmay be hypothesized that norms serve at reinforcing social identity, as the Cadet’scode of honor reinforces a sense of membership to the Army. They may also serveat conveying information about the interacting partner.
The eclecticism of the answers presented so far is probably commensurate withthe difficulty of answering the question about the origins of norms. This reminds ofthe debate about the origins of castes. It is much easier to identify how a systemworks and what its attributes are rather than how it came about. Moreover, it is verytempting to see in the attributes the origins, albeit nothing proves that because somefeatures are relatively efficient they must be the cause of the system. Let’s try to ap-ply the above points of view to castes based norms. As Akerlof (1976) showed, castescan not be said to stem out of a collective optimization process. It may also be farfetched to see in such a very complex institution a mere coordination problem. Howcan we say that untouchability is a way to coordinate expectations ? Now turningto Basu’s argument, caste based norms restrict the set of feasible action to policeactivities. This is not very far from the point made by Baechler (1988) presented insection 1.2.3. Yet, such an interpretation obliterates many aspects of castes. Thusthe more suitable explanation is the one related to social identity, yet it is neitherentirely satisfactory. If we assume that untouchability practices for instance aim atreinforcing social identity, which it probably does, this says nothing about why arelow castes untouchables ? The point is that very few of the theories invoked so farleave room for ideologies, which is disturbing in the case of castes. We may thushave to turn to political science for an explanation and, as I will do in Chapter 1, toWeber (1978) concept of legitimacy, as the acceptance of an authority. The conceptof legitimacy implies that people sees in this authority an accepted "rules of thegame" as per D. North’s words. Thus norms, may result from an already establishedsituation. This is the assumption that supports the model developed in Chapter 1.Segregation may occur due to a specific political organization and segregation norms
30 2. HOW IS THE STUDY OF CASTES RELEVANT TO ECONOMICS
INTRODUCTION
are only a dress up for making the situation "legitimate" in the sense Weber gave tothis word. Going back to the concept of cognitive dissonance, the social body mayneed an a posteriori rationalization of an already existing segregationist situation.
Let’s leave the debate about the nature of norms aside for the time being. Thepoints is that norms may have a large effect on behaviors and the necessity to ac-count for them stands out clearly when practical issues are addressed. This is thepoint we make in Chapters 3 and 4 when we show that caste based norms, such asuntouchability, have consequences on the way public goods are delivered and used.Unfortunately local norms or customs are seldom considered in economics, probablydue to the universalist ambition of the discipline. This echoes the methodologicalcriticism addressed by the followers of Durkheim to conventional economic modelsthat were seen as deriving a set of actions from disputable behavioral assumptions,whereas facts should be the analysis starting point, as well as the distinction madeby Polanyi (1957) between the substantive and formal meanings of economics. Hope-fully the analysis conducted in the last two Chapters of the thesis make a convincingcase for including local social institutions and norms within the ambit of economicanalysis.
The consideration of social norms by the economic literature allowed to recastthe Homo economicus as a political animal as per Aristotle’s words and to challengeconventional assumptions to bring them closer to reality. "As economics evolved inthe twentieth century, the models grew more sophisticated, but Homo economicuslagged behind.[...] Fairly recently, behavioral economics has introduced cognitivebias and other psychological findings. Identity economics37, in its turn, brings insocial context - with a new economic man and woman who resemble real peoplein real situations". Nevertheless, many questions remain unanswered such as thatrelated to the emergence of norms or the identification process and assertion. Thestudy of social organizations and norms, of which caste is hopefully an instructiveexample, allowed for this improvements, yet there still is much to be done. We maynow turn to the second reason for studying the system of castes in economics thatmainly rests on the arguments brought forward by A. Sen.
37Identity Economics is the title of the book by Akerlof and Kranton (2010)
2. HOW IS THE STUDY OF CASTES RELEVANT TO ECONOMICS 31
INTRODUCTION
2.2 A. Sen’s Capabilities Approach
What was called in the XVIIIth century political economy and later became eco-nomics, was a normative theory of social arrangements. Utilitarianism imposed onpolitical economy its framework and set as a criterion for a desirable social arrange-ment social welfare by the maximization of the individual utilities. A. Sen criticizedthe use of utility as a yardstick on many grounds, two of which are of particularinterest to us : adaptative preferences and the focus on income as the argument forthe utility function. He writes "a thoroughly deprived person, leading a very reducedlife, might not appear to be badly off in terms of the mental metric of desire and itsfulfilment, if the hardship is accepted with non grumbling resignation. In situationsof long-standing deprivation, the victims do not go on grieving and lamenting all thetime, and very often make great efforts to take pleasure in small mercies and to cutdown personal desires to modest - "realistic" - proportions. Indeed in situations ofadversity which the victims cannot individually change, prudential reasoning wouldsuggest that the victims should concentrate their desires on those limited things thatthey can possibly achieve, rather than fruitlessly pining for what is unattainable.The extent of a person’s deprivation, then, may not at all show up in the metric ofdesire fulfilment, even though he or she may be quite unable to be adequately nou-rished, decently clothed, minimally educated, and properly sheltered" (Sen, 1992).Because of the malleability of individuals expectations and mental states, even stri-kingly unfair states of facts may not result in dissatisfaction and as such would notbe counted as unequal. Welfarism can thus result in highly unequal situations. Let’scaricature by saying that if the utterly deprived are not dissatisfied, then all is forthe best.
Moreover, the focus on income as the main argument of the utility function isalso probably not appropriate given that there may be large variations in indivi-duals capacities to transform income into well-being. As Sen (1992) puts it "evenif the parameters of the conversion rates are respectively given , an equal distribu-tion of income may yield very unequal well-being levels - with differences relatedto group specific parameters (such as gender, age, environments) and individualparameters (such as genetic characteristics)". Indeed many theoretical as well asempirical works38 have shown that the relative income level matters almost as muchas the absolute one in shaping well-being. Carlsson et al. (2009) showed in a studyconducted in India that more than half of the marginal utility derived from incomecomes from some kind of relative income effects (what Sen called the group speci-fic parameters). Moreover, the concern for relative income is positively related tolow caste membership and a low level of family income. These authors also showthat "an increase in the mean income of the caste to which the individual belong,everything else held constant, reduces utility for the individual". These studies putthe emphasis on the fact that conversion rates of income into well-being is clearlydependent upon who the individual compares to, or, in short, his social identity.The differences in the relationship between income and well-being plead for the in-tegration of social identity into the economic analysis, if we are to perceive socialwelfare as a function of individual well-being.
38By Blanchflower and Oswald (2004), Carlsson et al. (2007), Clark et al. (2008); Luttmer(2005), among others.
32 2. HOW IS THE STUDY OF CASTES RELEVANT TO ECONOMICS
INTRODUCTION
After having charged at the concept of utility, what kind of metric are we leftwith to assess well-being ? Sen proposes that of capability. Capability "representsthe various combinations of functionings (beings and doings) that the person canachieve. Capability is, thus, a set of vectors of functionings, reflecting the person’sfreedom to lead one type of life or another. Just as the so-called ’budget set’ inthe commodity space represents a person’s freedom to buy commodity bundles, the’capability set’ in the functioning space reflects the person’s freedom to choose frompossible livings" (Sen, 1992). If we retain the distribution of capabilities as the mostrelevant measure of inequality, we still need a lens through which the capabilitiesdistribution is to be analyzed. Should we study the lack of freedom depending onage, gender, social class, geographical zones, individuals ? According to Sen (1992)inequality is probably best assessed in terms of groups and more particularly onthose who experienced stable differentiation such as "class, gender, caste or com-munity"(Sen, 1992). Besides Sen’s suggestion, how do we know that caste is theappropriate dimension to study inequality ? Deshpande (2001) argues "poverty andinequality in India have been extensively researched, but the focus in economic re-search has been on identifying and defining the contours of poverty and redistributivepolicies that target the poor as a group. While this is undoubtedly essential, thishas excluded the study of other ingredients of stratification, most notably caste, andprecludes any inferences about intergroup disparity based upon caste". Sociologicalaccounts presented in the previous sections of this introduction set us thinking thatcaste indeed is an important factor in the distribution of capabilities. Studies thatempirically evidence the importance of castes in the analysis of inequality are few(Borooah, 2005; Deshpande, 2000b,a, 2001), yet they strikingly make a point for theintegration of this institution. As Deshpande (2001) puts it caste should be seen as"an essential ingredient in the study of stratification patterns in India’s population"and that "inter caste disparity continues to underlie overall disparity" (Deshpande,2000a).
Now, how would social institutions such as that of caste have any effect on capa-bility and functionings ? I would argue that there are two ways through which socialgroups may limit capabilities. The first one is related to the rules and behaviorsimposed on other group members (prohibition to share water in the case of castesfor instance). The second one works through social identity and the either collectiveor individual internalization of stereotypes and norms (as an outcast I should notenvisage pursuing prestigious careers because (a) I will not be allowed to and (b) itis at odds with the way I picture myself). As far as the first point is concerned Shahet al. (2006) showed that even 50 years after the Constitution outlawed untoucha-bility outcasts are often denied access to publicly provided goods and services suchas entry into police stations, primary health centers, or access to public roads orwater facilities. This particular point will be reviewed in more details in Chapters3 and 4. Caste-based discrimination in the labor market is quite common and hasbeen assessed, for instance, by Banerjee and Knight (1985) and Ito (2009). Castebased discrimination is pervasive and determines many aspects of economic oppor-tunities from access to education, through wage or employment or even geographicalsettings. The list of channels through which castes reduce capabilities is probably
2. HOW IS THE STUDY OF CASTES RELEVANT TO ECONOMICS 33
INTRODUCTION
endless and these examples coupled with what has been said about caste rules andthe prohibition of contacts should be convincing. For those who are accustomed toreading Indian local newspapers that abound with stories of inter caste clashes, oftenprompted by a willingness to enforce caste rules, saying that this social institutionreduces capabilities and freedoms will probably appear a truism39.
It could be argued that the limiting impact of castes on capabilities works alsothrough a more subtle way than the imposition and the enforcement of rules byothers. Social identity itself may limit the set of expectations and this more indirectroute has often been underestimated. Given what has been said in section 2.1.5 onstereotype threats, it would not be very bold to say that caste limits functioningsthrough a diminished self-image. This is the point made in Chapter 2.
2.3 Castes Distort Resources Allocation
Finally, there is a more conventional reason to be concerned with social ins-titution in general and caste in particular : they may interfere with the efficientallocation of resources. For instance, discrimination may impede an efficient allo-cation of labor. This point is addressed by Akerlof (1976). Akerlof challenges theArrow-Debreu general equilibrium model of perfect competition by refuting the as-sumption of complete and costless information. Rather, in the absence of completeinformation, agents resort to indicators, from which they infer the missing informa-tion. This is close to Arrow’s statistical discrimination whereby potential employeesabilities, that are unobservable, are inferred from stereotypes. The use of such indi-cators leads to equilibria that are not Pareto optimal. Akerlof concludes that "theuse of indicators makes equilibrium income distribution and resources allocationdependent on these [social] divisions". Another example of how social institutionsmay distort resource allocation can be found in the literature on social fractionaliza-tion and the provision of public goods. As far as castes are concerned, Banerjee andSomanathan (2001); Banerjee et al. (2005); Banerjee and Somanathan (2007); Ba-nerjee et al. (2008) and Bardhan (2000) showed that caste fragmented areas exhibita lower level of public goods40. Accounting for social institution, does not only havea theoretical relevance as explained in the above sections, but also has consequenceson policy designs and implementations. For instance, if the provision or use of publicgoods, which is core to many development policies, is hobbled by social fragmenta-tion, the programs may not reach their targets unless they take social divisions intoconsideration. Similarly, if social customs command that some population catego-ries do not need education, how will a nation build a human capital ? If high castesown water irrigation systems and are unwilling to sell them to lower castes, therebyreducing the yield of their land41, how can agricultural production be maximized ?Thus social institutions ought to be taken into consideration if development policiesare to be well targeted and designed.
39On caste atrocities, please refer to the account given by Cabalion (2010), for instance. See alsostories about the Ranvir Sena private militia in Bihar known for its exactions against untouchables.
40This literature is challenged in more details in Chapter 441Such a situation is described in Anderson (2007)
34 2. HOW IS THE STUDY OF CASTES RELEVANT TO ECONOMICS

INTRODUCTION
3 Outline of The Dissertation
The four Chapters contained in this dissertation borrow from the three ap-proaches presented so far. Chapter 1 raises the question of the emergence of asegregation norm even in the absence of prejudice against a particular group. Itis striking to see that a large part of the literature on discrimination and segrega-tion cannot depart from positing that agents do have exogenous preferences aboutwho they interact with. I try to build a model where preferences do not have to bespecified. Building on arguments developed by Weber (1978) and on historical facts,I envisage ideology as an a posteriori justification of an already existing situation. Ifthis is true, then segregation can appear without the help of predefined preferences.Its origin seen in an unequal power distribution. As mentioned in section 2.1.6 theegression of social norms is still to be inquired and there is a debate about whetherthey originate from. Some of the features and conclusions drawn from the model arecompelling such as the account for power, and the fact that it is a strive for associa-tion with the mighty that results in being rejected. Various examples are providedthat support the conclusions. Yet, ways for improvements are provided at the endof the Chapter and the most promising is probably to adopt an evolutionary versionof the model.
In Chapter 2, I investigate how binding being from a Scheduled Caste or Tribe ison perceived social status and question whether other characteristics such as educa-tion, occupation or income could partly or entirely counterbalance the caste effect.Results show that the group’s effect is quite large and may differ between ScheduledCastes and Scheduled Tribes. This analysis is motivated by the fact that, as men-tioned in section 2.2 of this introduction, self perception plays an active role in theforming of expectations and ambitions.
Finally, Chapter 3 and 4 develop the relationship between caste based fragmen-tation and public goods provision and usage and are therefore more policy oriented.Chapter 3 shows that the number of acts of violence against outcasts is positivelyrelated to the way water is distributed. The more common and shared the watersource, the higher the number of violent acts. Two consequences may be inferredfrom this result. First, untouchability practices are still vigorous 50 years after theConstitution provided for its demise and caste norms are violently enforced. Se-cond, publicly provided goods are not that public and individuals may be preventedfrom using them on caste grounds. This is an illustration of fundamental rights andfunctionings being denied. Chapter 4 pushes the investigation a notch further bystudying whether caste fractionalization or polarization has an effect on the localpresence of six publicly provided goods. Results show that if it has an effect it islikely to be a positive one, which is at variance with theoretical conclusions andwith some of the previous empirical works, that exhibited a negative impact. On theother hand, polarization is found irrelevant, which casts doubt on the assumption,implicit in the literature that social fractionalization results in groups antagonisms.The positive relationship between social fractionalization and public goods presenceis envisaged as a sign of potential caste based patronage. This hypothesis is inves-tigated and some evidence is found that belonging to the dominant caste raises thelikelihood for a household to access some of the goods. This tends to confirm that
3. OUTLINE OF THE DISSERTATION 35
INTRODUCTION
caste appropriate publicly provided goods and may turn them into club goods. Thelast Chapter concludes the dissertation and puts forth an agenda for future research.
36 3. OUTLINE OF THE DISSERTATION

Chapter 1
Power and EndogenousSegregation
37
CHAPTER 1. POWER AND ENDOGENOUS SEGREGATION
Every genuine form of domination implies a minimumof voluntary compliance, that is, an interest
(based on ulterior motives or genuine acceptance)in obedience.
Max Weber in Economy and Society (1909)
1 Introduction
The aim of this chapter is to model the emergence of a segregation norm withoutthe interference of a priori prejudice but based solely on the power seize by one group.The idea stems from two sources : first segregated societies are often ones in whichpower is unequally distributed and second, prejudice and discriminatory norms maybe thought of as a justification for an already existing social cleavages, in the spiritof the theory developed by Weber about the sources of political legitimacy1. Thisis also what Doniger and Smith (1991) strongly suggest in their introduction tothe Laws of Manu, where caste’s ideology happened to serve the already prominentpriests either through a monopoly over sacrifice or the idea of ritual purity2. Asfar as castes are concerned, please remind that the religious text founding castes,Manu’s code, mentioned in introduction to the dissertation, was probably written ata time where the Vedic society had already established segregation norms. Thus itmay be an a posteriori justification of an already existing social organization. Thereis still a raging debate about whether social identity such as ethnicity is constructedas a response to institutional or economic incentives, or whether it is exogenous. Byassuming and trying to show that social norms such as segregation may arise evenin the absence of a priori preferences, makes way for the argument that such prefe-rences are a posteriori construction to reinforce segregation or legitime this state.
This last point goes much further than what is modestly shown in this chapterand should be taken as a question raised by this piece of work. Yet, a quick reviewof the theories of discrimination show that it is difficult to address the issue of thevery origin of discrimination. Although the work by Becker (1957) was seminal tostructure and understand the process and consequences of discrimination, it unsa-tisfactorily address the origin of discrimination by referring to a vague "taste fordiscrimination". To his credit, finding the origin of discrimination was not his mainconcern. More informative is Arrow (1971) and the theory of statistical discrimi-nation where prejudice makes up for a lack of information regarding individuals’capacities. Yet, one might wonder why certain criteria such as skin color are usedrather than others ? Moreover, how come that such criteria are common knowledge ?Although these theories were very helpful at breaking down the discriminatory pro-cess, they probably provide too few elements about the root of prejudice, to whomdiscrimination is probably only the right-hand man.
Where do prejudice originate from is a question that has rarely been delved intoby economists, who have given it up to other social scientists such as anthropolo-
1Please refer to section 2.1.6 of the introduction2Please refer to section 1.1.2 of the introduction
38 1. INTRODUCTION
CHAPTER 1. POWER AND ENDOGENOUS SEGREGATION
gists and sociologists. Prejudice is taken here in its sociological acceptance that isthe fact of inferring an individual’s subjective characteristics, especially moral ones,from observable attributes such as sex or ethnic groups, etc. Intuition tells us thatprejudice is indivisible from inequalities. Therefore it may be hypothesized that in-equalities generate such a cleavage within a society that antagonism and rejectionamong groups and as a result prejudice appears, discrimination being a corollary. Iwish to show in this article how one group’s power of influence gives rise to segrega-tion. My assumption is that prejudice and discrimination are the logic outcome ofidentity phenomena, that stems from a deep cleavage in society whose utmost formis segregation. Therefore, through the study of the creation of segregation, we maybe able to understand the source of prejudice and push the discrimination analysisa notch further.
My work aims at showing that segregation may pre-exist prejudice. Works in thewake of Schelling (1969, 1978) theory have shown that a segregationist equilibriummay appear even in the absence of discriminatory dispositions. Such an equilibriumis the product of individuals’ strategic decisions, who do not perceive the generaleffect of the sum of their micro-decisions. This impact may often widely differ fromtheir individual motives. Although I fully concur on Schelling’s view that segrega-tion is the product of individual rational decisions that have nothing to do withdiscrimination, my work differs from Schelling’s in one important way. In Schelling’smodel, individuals do bother even a little about the ethnic composition of their closeneighborhood. Although preferences are weak, they nevertheless have to be specifiedin the model. Saying that segregation arises because white do prefer to live next toat least y% of their likes, more or less amounts to saying that segregation is not in-dependent from discrimination and prejudice. In the model developed in this paper,preferences are endogenized. Therefore, I may be able to show that segregation mayappear even in the total absence of prejudice.
I need to make clear what is understood here by segregation. This term has of-ten been reduced to its spatial definition in economic works. Authors have mainlyfocussed on the fact for example that blacks and whites do not live in the sameneighborhood, do not attend the same schools, etc. However, it can be argued thatthis term should be taken here in a broader sense. I define segregation as a refusalby members of different groups or communities to interact. Such a refusal may ma-nifest itself through marriage decisions or by choosing a neighborhood or friends’company. Spatial segregation is only a specific case of this refusal to interact withmembers of another social or ethnic group.
Given my stand that (a) segregation is a systematic refusal to cooperate and (b)it is an equilibrium that stems from individual strategic decisions, game theory mo-dels seem appropriate tools to analyze the conditions under which this equilibriumappears. The model used in this paper is based on repeated prisoner’s dilemma withrandom matching models that are common in the cooperation literature. Although,the model presented here is technically close to the one used in Eeckhout (2006) itdiffers in two major ways. First, Eeckhout (2006) main objective was not to studythe emergence of a segregation equilibrium but to assess its efficiency. Second, this
1. INTRODUCTION 39
CHAPTER 1. POWER AND ENDOGENOUS SEGREGATION
author gave agents’ segregationist strategies choices as exogenous. My objective istotally different given that I want to explain the emergence of a segregation equili-brium. Consequently agents strategies choices are entirely endogenous in my model.Indeed, segregation may not be explained if agents segregationist strategies are givenas exogenous.
One of the main intuitions is that segregation can be explained by one group’s po-wer of influence on another. Power here is understood as the ability to give someoneelse opportunities that are otherwise unreachable, be these opportunities economic,social, spiritual, etc3. The basic mechanism is as follow. Considering a society withtwo costlessly identifiable groups, whenever one group has a power of influence onanother, members of the second group will perceive additional benefits in buildinglong-term relationships with the mighty. Their propensity to cooperate when mat-ched with powerful individuals will increase until it reaches one. At this point, thepowerless will surely cooperate when matched to powerful individuals. The mightybest response to this situation will be to systematically reject the relationship. Thepowerless will in turn refuse to cooperate. One of the final equilibria will be segre-gation. Therefore segregation’s origin may be found in power capture by one group.One caveat is necessary. Although I fail to show that the segregation equilibriumis unique, the model highlights the process that may lead to segregation. Such aprocess may have an interest of its own.
The originality of this paper lies in (a) the broad definition given to segregationthat allows various forms of segregation, even immaterial ones, to be encompassedin the analysis (b) evidencing that segregation does not come from the mighty’s willto put the deprived group at its mercy but rather is inherent to specific economicor social conditions (c) showing that segregation may be totally independent frompreconceptions (d) breaking down the process through which segregation equili-brium is put in place and analyzing its stability (e) accounting for selected historicalexamples.
This work is related to the literature on cooperation in game theory and to workson segregation. Section 2 provides a short review of these two literature trends.Section 3 gives an account of the model’s main features and depicts equilibriumconditions assuming that social group membership has influence neither on strate-gies nor on pay-offs. Section 4 describes the mechanism through which segregationmay germinate from power capture by one group. It also looks into the stability ofthe segregation equilibrium obtained. Section 5 discusses the findings and providesselected historical examples while section 6 deals with the limitations of the modeland lay out potential ways for improvement whose investigation are left for futureresearch. Section 7 concludes.
3For a discussion about the many facets of the term power and how I use it here, please referto section 1.2.4 of the Introduction
40 1. INTRODUCTION
CHAPTER 1. POWER AND ENDOGENOUS SEGREGATION
2 Related Literature
It is striking that authors who investigated segregation phenomena mainly ad-dressed three kinds of issues : (i) how is segregation perpetuated and why doesn’t itcollapse ? (ii) How could segregation be measured, and what point has it reached ?How has it evolved over time especially in the United States ? (iii) What are theproperties of segregation equilibria ? Works on segregation may be grouped in threekinds along these three types of questions. Studies that intend to explain why doagents choose strategies that allow them to avoid contacts with members of anothercommunities are few.
As far as the first issue is concerned, a couple of economists have tried to showhow a society could move from a segregation equilibria to a more mixed one andvice versa. Akerlof (1976, 1980) identified some of the factors that prevent the castesystem from collapsing but did not look into the forming of the caste institution.Scoville (1996, 2003) followed the same path. Lundberg and Startz (2007) presenteda model that aim at explaining how segregation reinforces itself through prejudice.Chaudhuri and Sethi (2008) showed how neighborhood effects perpetuate segrega-tion, while Loury (2000) emphasized the concept of social capital. Most of theseworks do raise the question of the persistence of segregation but not of its origin.Sethi and Somanathan (2004) did approach this issue. They found that segregation"can be stable when racial income disparities are either very great or very small,but instable in some intermediate range. And small income disparities can give riseto multiple equilibria, with segregation and integration both being stable". Eventhough these authors pointed out factors that make a society move from a segrega-tion equilibrium to integration, their works exhibit one major drawback : they onlydepict movements of an already segregated society. The model fails to explain howsegregation is produced ex nihilo, but shows how a society may return to its originalsituation. These types of analysis focus on societies that have segregation condi-tions already embedded in them and provide little help in explaining the occurrenceof these conditions. However, these studies are helpful at establishing relationshipsbetween levels of segregation and other variables such as income distribution withinand across groups.
The second kind of issue regards segregation measurement and calls for empiricalstudies. These works have mainly focused on either spatial segregation or labormarket discriminations since these are the most tangible forms of segregation andalmost the only viable source of data. Such pieces of work are legion. They provideinteresting case studies but fall short of segregation emergence explanations.
The third group of studies does not address in my view the issue of the se-gregation origin but rather look into the efficiency of segregation equilibria. Thestudy undertook by Cutler et al. (1999, 2008) is a good example. The work un-dertook by Eeckhout (2006) on which my model is based, does push the analysisquite far but finally fails to explain why do agents adopt segregationist strategies.In his article segregationist strategies are exogenous. The author is most concernedwith the stability and Pareto efficiency features of a segregation equilibrium. Themodel constructed by Darity et al. (2006) is actually quite close to achieving mypurpose as it investigates the formation of racial identity as a result of both intraand inter-group interactions. Yet, given that the authors postulate in their model
2. RELATED LITERATURE 41
CHAPTER 1. POWER AND ENDOGENOUS SEGREGATION
that agents can follow racialist strategies, which amounts to saying that they alreadyhave preferences, it is not entirely satisfactory.
Schelling (1978) works are an interesting exception to the three groups men-tioned above. Schelling brilliantly managed to show how a segregation equilibriummay be produced by the junction of decisions made by individuals who do haveonly very mild preferences regarding whom they interact with. Nevertheless, suchpreferences need to be specified in his model. The question as to why do individualsprefer a certain proportion of their likes in their neighborhood is left open. So isalso the question of the selection of a criteria that will define "them" as opposedto "we". Again there seems to be a missing link in the search for the very originof segregation. I firmly share Schelling’s view that segregation is generated by in-dividual strategic decisions that did not intend to be discriminatory. Nevertheless,since agents do have preferences about whom they interact with in Schelling’s model,it is not possible to conclude that segregation is entirely independent from prejudice.
The model used in this paper relates to the literature on random matching andrepeated games. In this research field, the main question is how do individuals createand maintain long term relationships that are at odds with selfish individual motives.This problem is center to the study of segregation, as the latter may be viewed asa systematic rejection of any form of cooperation among two social groups. One so-lution to this problem provided by repeated game theory is that cooperation arisesfrom a punishment threat such as reputation loss or social norms (see Rosenthaland Landau (1979)). Yet, how these norms appear and along which line is still notvery clear. Answering this last question probably is what needs to be done if oneis to explain the emerging of segregation. The present paper aims at showing thatnorms such as ostracism are the consequences and not the origins of a particu-lar equilibrium, contrary to Lundberg and Startz (2007) position. Ellison (1994),Kranton (1996), Ghosh and Ray (1996) provide solutions to the cooperation emer-gence puzzle. Their models show that cooperative equilibrium may arise despite theabsence of information flows among individuals and provided that players are suf-ficiently uncertain about their partners’ valuation of future transactions, and thatcooperation pay-offs increase over time. As already mentioned, the model presentedhere is technically close to Eeckhout (2006). Indeed Eeckhout (2006) resorted torepeated prisoner’s dilemma with random matching as I do to analyze segregationequilibrium. However the objective of this article is totally different as my point isto evidence the process of segregation formation and his is to value the efficiency ofa segregation equilibrium. Secondly, although the base model is identical to Eeck-hout’s it is then significantly altered in section (4) by the introduction of asymmetricpay-offs due to power capture by one group.
42 2. RELATED LITERATURE
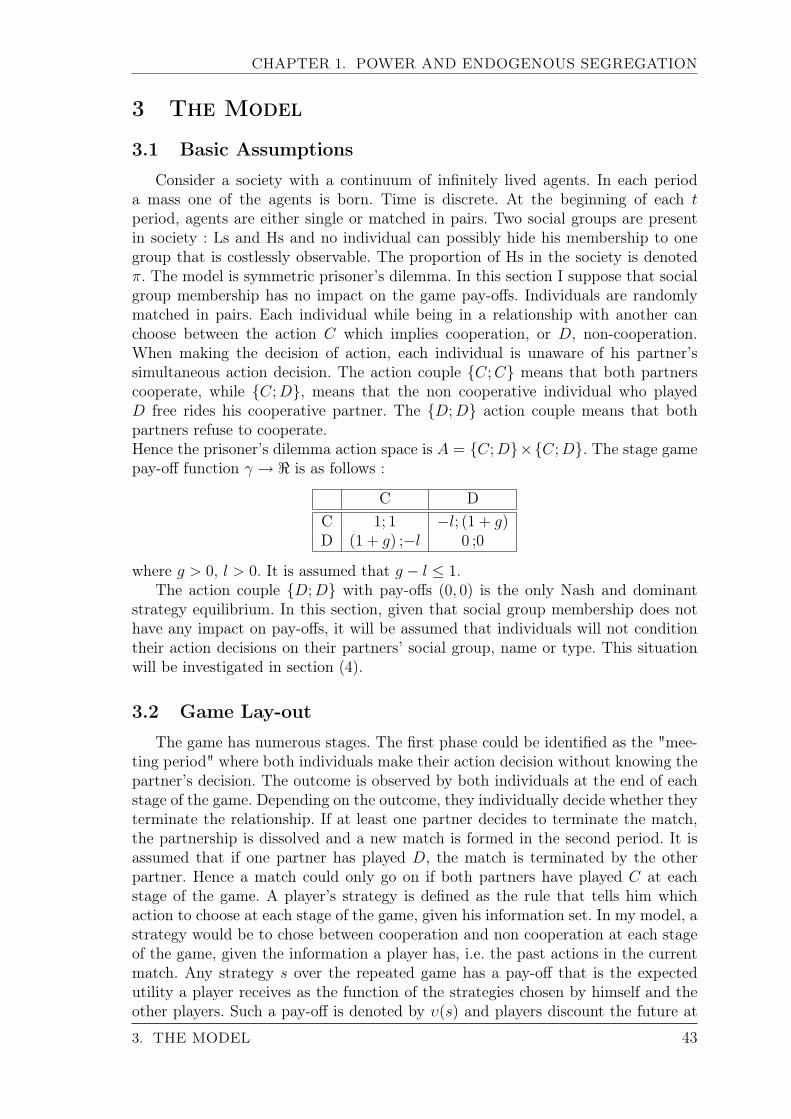
CHAPTER 1. POWER AND ENDOGENOUS SEGREGATION
3 The Model
3.1 Basic Assumptions
Consider a society with a continuum of infinitely lived agents. In each perioda mass one of the agents is born. Time is discrete. At the beginning of each tperiod, agents are either single or matched in pairs. Two social groups are presentin society : Ls and Hs and no individual can possibly hide his membership to onegroup that is costlessly observable. The proportion of Hs in the society is denotedπ. The model is symmetric prisoner’s dilemma. In this section I suppose that socialgroup membership has no impact on the game pay-offs. Individuals are randomlymatched in pairs. Each individual while being in a relationship with another canchoose between the action C which implies cooperation, or D, non-cooperation.When making the decision of action, each individual is unaware of his partner’ssimultaneous action decision. The action couple {C;C} means that both partnerscooperate, while {C;D}, means that the non cooperative individual who playedD free rides his cooperative partner. The {D;D} action couple means that bothpartners refuse to cooperate.Hence the prisoner’s dilemma action space is A = {C;D}×{C;D}. The stage gamepay-off function γ → < is as follows :
C DC 1; 1 −l; (1 + g)D (1 + g) ;−l 0 ;0
where g > 0, l > 0. It is assumed that g − l ≤ 1.The action couple {D;D} with pay-offs (0, 0) is the only Nash and dominant
strategy equilibrium. In this section, given that social group membership does nothave any impact on pay-offs, it will be assumed that individuals will not conditiontheir action decisions on their partners’ social group, name or type. This situationwill be investigated in section (4).
3.2 Game Lay-out
The game has numerous stages. The first phase could be identified as the "mee-ting period" where both individuals make their action decision without knowing thepartner’s decision. The outcome is observed by both individuals at the end of eachstage of the game. Depending on the outcome, they individually decide whether theyterminate the relationship. If at least one partner decides to terminate the match,the partnership is dissolved and a new match is formed in the second period. It isassumed that if one partner has played D, the match is terminated by the otherpartner. Hence a match could only go on if both partners have played C at eachstage of the game. A player’s strategy is defined as the rule that tells him whichaction to choose at each stage of the game, given his information set. In my model, astrategy would be to chose between cooperation and non cooperation at each stageof the game, given the information a player has, i.e. the past actions in the currentmatch. Any strategy s over the repeated game has a pay-off that is the expectedutility a player receives as the function of the strategies chosen by himself and theother players. Such a pay-off is denoted by υ(s) and players discount the future at
3. THE MODEL 43
CHAPTER 1. POWER AND ENDOGENOUS SEGREGATION
a common factor δ < 1. The objective of the player is to maximize the normalizedsum
υ(s) = E(1− δ)∑δtγ(s)
The normalization allows us to compare the repeated game pay-off directly with thestage game pay-off.
3.3 Equilibrium Conditions
I assume that individuals are not allowed to condition their actions on theirhistorical actions in past partnerships and have no information about their partnersactions in previous matches. Therefore, should a partner deviate and play D, thematch is dissolved and the deviator can not be punished for its deviation beyondthe termination of the match. Individuals will therefore be tempted to adopt asystematically non-cooperative strategy (systematically play D) and no cooperationcan occur. In order to reach a certain level of cooperation a no-deviation constraintmust be placed on strategies that is to say, the pay-off from deviating should beinferior to the cooperation pay-off.
3.4 No Deviation Constraint Definition
Given an infinite horizon, pay-off from cooperation is 1. pay-off from deviation(υD) can be written as :
υD = (1 + g)(1− δ) + δυ(s),
In a first period the deviator free rides his partner and receives (1 + g) discountedby the factor (1− δ) and has to start a partnership anew whose pay-off will be υ(s)discounted back by the factor δ. The no deviation constraint requires the pay-offfrom deviation (υD) to be lower than the pay-off from eternal cooperation that is tosay 1. The non deviation constraint can be written thus :
υD ≤ 1 ,or υ(s) ≤ 1− g1− δδ
(1.1)
In other words, a s strategy may be considered as an equilibrium strategy provi-ded its pay-off υ(s) is lower than 1 − g 1−δ
δ= V i.e. provided that the no-deviation
constraint is respected. Should a strategy pay-off be greater than V , then any playerwould systematically deviate from the equilibrium strategy that is play C until a de-viation occurs. A player who adopts a strategy s such as υ(s) > V will systematicallyplay D and no equilibrium can occur.
3.5 Equilibrium Strategies Definitions
Suppose players i and j enter into a relationship. Let’s note for player i thepay-off from playing C by Fi(s) at one stage of the game and the the pay-off fromplaying D by Gi(s), where :
Fi(s) = σj + (1− σj)[(1− δ)(−l) + δυi(s)] (1.2)
44 3. THE MODEL
CHAPTER 1. POWER AND ENDOGENOUS SEGREGATION
As Fi(s) is considered, player i plays C with certainty. His partner j plays C witha probability σj. In this case, the outcome of the stage game would be {C,C} andplayer i will receive a pay-off of 1. Hence the first term on the right side of theequation (σj). Should partner j choose to play D with a probability (1 − σj), theoutcome of the stage game would be {C,D} and player i would be free ridden by hispartner j (j is not cooperative while i is). Player i would receive in a first stage −ldiscounted at a factor (1 − δ). Given that D had been played, a new match wouldbe formed in the future whose pay-off will be υ(s) discounted at the rate δ.
Gi(s) = σj[(1− δ)(1 + g) + δυi(s)] + (1− σj)δυi(s) (1.3)
Similarly, player i is now assumed to playD. His partner j plays C with a probabilityσj, in which case, i would free ride j and receive (1 + g) in a first stage discountedat a factor (1 − δ) and a new partnership would have to be formed given that theoutcome is {C,D}. If partner j decides on playing D (probability 1 − σj), thenthe outcome would be {D,D}, and player i would receive 0 in a first stage and anew partnership would have to be formed in the future which pay-off will be υ(s)discounted at the δ rate.
Then the expected pay-off for a newly matched individual i at the beginning ofthe game is
υ(s) = σiF (s) + (1− σi)G(s) (1.4)
where σi is the probability that individual i will choose to play C. Equilibrium isdefined as a strategy combination that consist of a best strategy for each of the nplayers in the game. Best equilibrium strategies s∗ are the strategies players pick intrying to maximize their individual pay-offs. They are found by solving the followingproblem
s∗ ∈ arg max υ(s),s.t. υ(s) ≤ V
and in addition, supposing indifference between the pay-off of playing C and D ifσj ∈ (0, 1). Note that if the partner j plays C with certainty, i would no longer beindifferent between playing C and D and will choose D with certainty.
I suppose that when at equilibrium, social group membership does not makea difference in the choice of strategies. This equilibrium will be named a "mixedequilibrium". Specifically, the probability for a player to play C or D does notdepend on the social origin of the partner.
3. THE MODEL 45
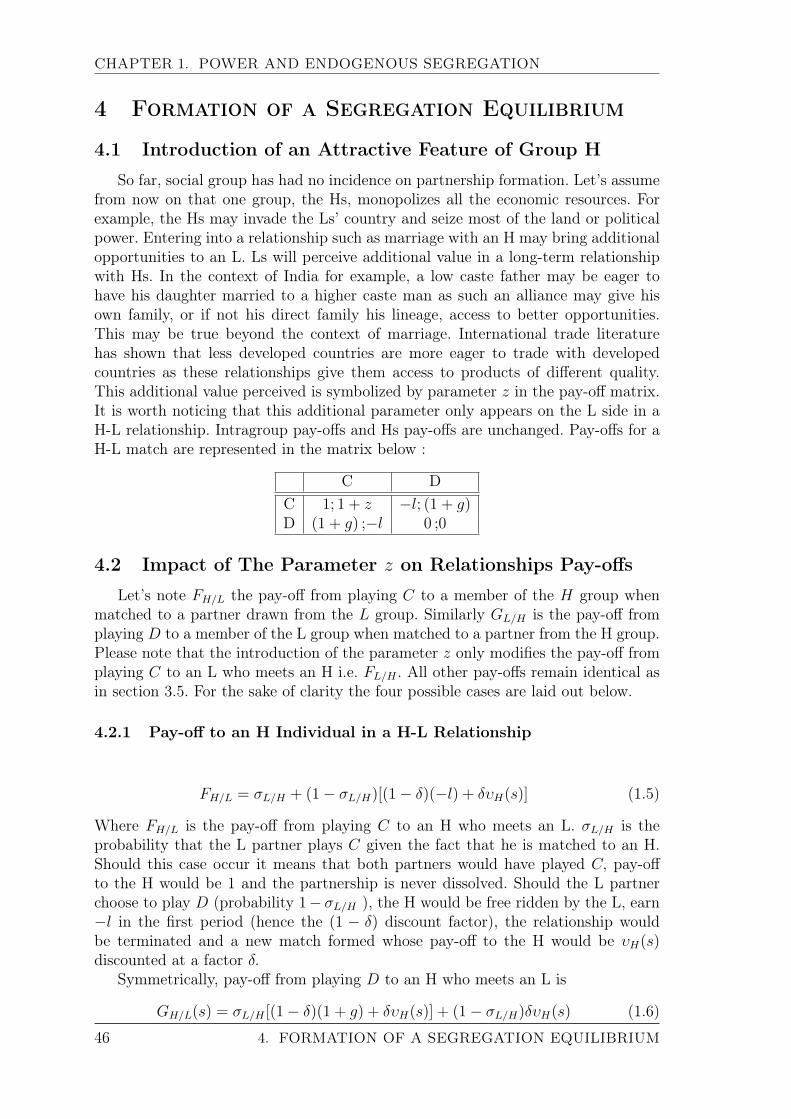
CHAPTER 1. POWER AND ENDOGENOUS SEGREGATION
4 Formation of a Segregation Equilibrium
4.1 Introduction of an Attractive Feature of Group H
So far, social group has had no incidence on partnership formation. Let’s assumefrom now on that one group, the Hs, monopolizes all the economic resources. Forexample, the Hs may invade the Ls’ country and seize most of the land or politicalpower. Entering into a relationship such as marriage with an H may bring additionalopportunities to an L. Ls will perceive additional value in a long-term relationshipwith Hs. In the context of India for example, a low caste father may be eager tohave his daughter married to a higher caste man as such an alliance may give hisown family, or if not his direct family his lineage, access to better opportunities.This may be true beyond the context of marriage. International trade literaturehas shown that less developed countries are more eager to trade with developedcountries as these relationships give them access to products of different quality.This additional value perceived is symbolized by parameter z in the pay-off matrix.It is worth noticing that this additional parameter only appears on the L side in aH-L relationship. Intragroup pay-offs and Hs pay-offs are unchanged. Pay-offs for aH-L match are represented in the matrix below :
C DC 1; 1 + z −l; (1 + g)D (1 + g) ;−l 0 ;0
4.2 Impact of The Parameter z on Relationships Pay-offs
Let’s note FH/L the pay-off from playing C to a member of the H group whenmatched to a partner drawn from the L group. Similarly GL/H is the pay-off fromplaying D to a member of the L group when matched to a partner from the H group.Please note that the introduction of the parameter z only modifies the pay-off fromplaying C to an L who meets an H i.e. FL/H . All other pay-offs remain identical asin section 3.5. For the sake of clarity the four possible cases are laid out below.
4.2.1 Pay-off to an H Individual in a H-L Relationship
FH/L = σL/H + (1− σL/H)[(1− δ)(−l) + δυH(s)] (1.5)
Where FH/L is the pay-off from playing C to an H who meets an L. σL/H is theprobability that the L partner plays C given the fact that he is matched to an H.Should this case occur it means that both partners would have played C, pay-offto the H would be 1 and the partnership is never dissolved. Should the L partnerchoose to play D (probability 1− σL/H ), the H would be free ridden by the L, earn−l in the first period (hence the (1 − δ) discount factor), the relationship wouldbe terminated and a new match formed whose pay-off to the H would be υH(s)discounted at a factor δ.
Symmetrically, pay-off from playing D to an H who meets an L is
GH/L(s) = σL/H [(1− δ)(1 + g) + δυH(s)] + (1− σL/H)δυH(s) (1.6)
46 4. FORMATION OF A SEGREGATION EQUILIBRIUM
CHAPTER 1. POWER AND ENDOGENOUS SEGREGATION
σL/H the probability that the L plays C when matched to an H. In this event, Hwould have playedD and L, C. H would earn (1+g) in the first period and the matchwould break up. If the L individual chooses to play D (probability (1− σL/H)), theaction couple {D,D} would appear. In this case no one would receive any paymentin the first period, the relationship would be terminated and the H would start anew match whose discounted pay-off is δυH(s).
The expected pay-off for an H that is newly matched to an L is therefore
υH/L(s) = σH/LFH/L(s) + (1− σH/L)GH/L(s) (1.7)
where σH/L is the probability that the H chooses to play C given the fact that theother player is drawn from the L group.
4.2.2 Pay-off from Intragroup Relationships
Intragroup relationship pay-offs are derived in the same way as above. For an Hmeeting an H
FH/H(s) = σH/H + (1− σH/H)[(1− δ)(−l) + δυH(s)]GH/H(s) = σH/H [(1− δ)(1 + g) + δυH(s)] + (1− σH/H)δυH(s)υH/H(s) = σH/HFH/H(s) + (1− σH/H)GH/H(s)
For an L meeting an LFL/L(s) = σL/L + (1− σL/L)[(1− δ)(−l) + δυL(s)]GL/L(s) = σL/L[(1− δ)(1 + g) + δυL(s)] + (1− σL/L)δυL(s)υL/L(s) = σL/LFL/L(s) + (1− σL/L)GL/L(s)
4.2.3 Pay-off to L Individual in an H-L Relationship
Pay-off from playing C to an L member matched to an H is somewhat differentdue to the introduction of the parameter z.
FL/H = σH/L(1 + z) + (1− σH/L)[(1− δ)(−l) + δυL(s)] (1.8)
If the L partner chooses to play C and the H partner is also cooperative (probabilityσH/L) then a long-term relationship may be set up and the L individual will gain 1from the partnership plus all the additional opportunities such a partnership mayprovide him with. The value of these additional opportunities is estimated by theparameter z. Note that this parameter plays a role only if the action couple {C;C}is the outcome. Pay-off from playing D to an L matched to an H is similar to thoseoccurring in intragroup matches.
GL/H(s) = σH/L[(1− δ)(1 + g) + δυL(s)] + (1− σH/L)δυL(s) (1.9)
The expected pay-off for an L who is newly matched to an H is therefore
υL/H(s) = σL/HFL/H(s) + (1− σL/H)GL/H(s) (1.10)
I mentioned in section (3) that at the mixed equilibrium, i.e. prior to the intro-duction of the parameter z, players do not condition their strategies on the socialorigin of their partner. Therefore σL/H = σL/L. Now that z has been introduced inthe pay-off matrix, it can be argued that L players will modify their probability toplay C when matched to an H. It is in their interest to do so.
4. FORMATION OF A SEGREGATION EQUILIBRIUM 47

CHAPTER 1. POWER AND ENDOGENOUS SEGREGATION
4.3 Systematic Cooperation from the Ls Leads to a Segrega-tion Equilibrium
It is quite obvious that the introduction of the z parameter increases Ls’ potentialpay-offs. In the event of a match with an H they do not only benefit from the valueof the match itself but also from additional social opportunities such a relationshipmay bring them. The intuition is as follows : Ls individuals have a strong interestin building long-term relationships with H members. They are enticed to cooperatewhen matched to an H in order to maximize the chance of having a long termrelationship. The probability to play C for an L meeting an H increases up to 1 asa consequence of the introduction of the parameter z. Now that the H individualknows for certain that the L partner will cooperate, he has no incentive anymoreto cooperate. He would be better off by systematically free riding his cooperativepartner. In this case, an equilibrium strategy will be for the H to systematicallyreject any cooperation with an L. One of the final equilibria is a situation wherea guaranteed cooperation from one group leads the other group to systematicallyreject any relationship with this group. Perfect segregation has emerged and inthe aftermath prejudice that reinforces segregation. It is rather counter intuitive tothink that segregation germinates from the yearning by one group to cooperate withanother.
Proposition 4.1 The introduction of the parameter z increases the probability foran L to play C when matched to an H up to 1 that is σL/H = 1
Proof I mentioned that an equilibrium condition must be the indifference betweenthe pay-off of playing C or D that is F (s) = G(s). If this condition was not satisfied,a player would modify his probability to play C. For example, if the pay-off fromplaying C increases comparatively to the pay-off from playing D, (F (s) > G(s)) aplayer would adjust upward his propensity σ to play C, until the equality conditionbetween F (s) and G(s) is restored. Let’s note Φ = F (s) − G(s). I assume that∂σ∂Φ
> 0. The introduction of the parameter z alters the pay-off from playing C foran L who is matched to an H. The L individual will therefore alter his probabilityto play C (σL/H) consequently. Let’s note ΦL/H = FL/H(s)−GL/H(s)
then ∂σL/H
∂ΦL/H> 0
The following equation can be written :∂σL/H
∂z=
∂σL/H
∂ΦL/H
∂ΦL/H
∂z
where we know that the first term on the right hand side of the equation is positive.The second term of the equation is also positive since the inclusion of the para-meter z has unilaterally increased FL/H(s) without altering GL/H(s). Introducingthe parameter z increases σL/H i.e. the probability for an L who meets an H tocooperate.
An increase in σL/H will alter the pay-off for the H matched to an L to play Ccomparatively to playing D. Indeed, if the H individual learns that his L partnercooperates more frequently, playing C will be more valuable to him. ΦH/L will bemodified and σH/L will therefore be adjusted. A movement in σH/L will modify inturn σL/H , and so on. So the total effect on σL/H due to the introduction of theparameter z can be written :
48 4. FORMATION OF A SEGREGATION EQUILIBRIUM
CHAPTER 1. POWER AND ENDOGENOUS SEGREGATION
∂σtL/H
∂z=
∂σiL/H
∂z+
∂σiL/H
∂z
n∑j=1
(∂σH/L
∂σL/H
∂σL/H
∂σH/L)j =
∂σiL/H
∂z(1 + n)
Where∂σi
L/H
∂zis the initial impact of z on σL/H and
∂σtL/H
∂zis the total effect of the
introduction of z. The introduction of z has two impacts :- one with the direct increase of σL/H via the increase of ΦL/H
- one with the cumulative effect of a positive shock on σL/H . n is the numberof periods in the game needed for players to adapt their action strategies. It isargued that there exists n∗, so that σL/H will move from its mixed equilibrium level(σL/H = σL/L) to a new equilibrium level σL/H = 1. n∗ is defined by the followingequation :
∂σiL/H
∂z(1 + n∗)dz = 1− σL/L
Proposition 4.2 Whenever σL/H = 1 the only possible equilibrium for an H-Lpartnership is given by σH/L = 0
Proof Recall that in order for a strategy s to be an equilibrium strategy, the nodeviation constraint must be respected that is to sayυ(s) ≤ 1− g (1−δ)
δ.
If σL/H = 1,FH/L = σL/H + (1− σL/H)[(1− δ)(−l) + δυH(s)] = 1GH/L(s) = σL/H [(1− δ)(1 + g) + δυH(s)] + (1− σL/H)δυH(s)GH/L(s) = (1− δ)(1 + g) + δυH(s)
υH/L(s) = σH/LFH/L(s) + (1− σH/L)GH/L(s) ≤ 1− g (1−δ)δ
υH/L(s) = σH/L + (1− σH/L)[(1− δ)(1 + g) + δυH(s)] ≤ 1− g (1−δ)δ
After re-arranging,σH/L[δ − g(1− δ)− δυH(s)] ≤ δ − g(1− δ)− δυH(s)− g (1−δ)
δ
Recall that V = 1− g (1−δ)δ,
then δV = δ − g(1− δ)Thus,
σH/L[δ][V − υH(s)] ≤ [δ][V − υH(s)]− g (1− δ)δ
(1.11)
A strategy s is an equilibrium strategy provided that the above equation holds.Recall that V is the non deviation constraint i.e. the highest attainable pay-off
for any equilibrium strategy. Therefore any player tries to minimize the differenceV −υH(s). However, we know that 0 ≤ σH/L[δ][V −υH(s)] ≤ [δ][V −υH(s)]− g (1−δ)
δ
Therefore, [δ][V − υH(s)] lowest level is g (1−δ)δ
.Minimizing [δ][V − υH(s)] is equivalent to replacing the expression by its minimumg (1−δ)
δin the equation (11) :
σH/L[g (1−δ)δ
] ≤ 0
Since, by definition, [g (1−δ)δ
] > 0 and σH/L ≥ 0, the only way for the above equationto hold is σH/L = 0
The only strategy that maximizes the pay-off while respecting the no deviationconstraint is σH/L = 0 when σL/H = 1. In other words, if a partner cooperates for
4. FORMATION OF A SEGREGATION EQUILIBRIUM 49
CHAPTER 1. POWER AND ENDOGENOUS SEGREGATION
sure, the only strategy that guarantees both an equilibrium and the other partner’spay-off maximization is a systematic non-cooperative behavior.
Once σH/L = 0, i.e. the Hs play with certainty D when matched to an L, Lsmaximize their pay-off in such a match by setting their probability to play C to 0i.e. σL/H = 0.Indeed, if σH/L = 0FL/H = (1− δ)(−l) + δυL(s)GL/H(s) = δυL(s)υL/H(s) = σL/HFL/H(s) + (1− σL/H)GL/H(s)υL/H(s) = σL/H(1− δ)(−l) + δυL(s)Given that σL/H(1− δ)(−l) ≤ 0, υL/H(s) is maximized by setting σL/H = 0.It is worth noticing that whenever one of the partner plays D with certainty, theother partner maximizes his pay-off while respecting the no-deviation constraint bysetting his probability to play C at 0.
4.3.1 Equilibrium Stability
The equilibrium obtained here is a segregation equilibrium where members fromtwo groups systematically refuse to cooperate when matched to each other. Thepath to the segregation equilibrium is as follows :
- one social group captures more power or economic resources. The other group(the Ls) perceive additional benefits from entering into long-term relationships withthe previous group (the Hs) through additional opportunities or may not have muchchoice but to cooperate to survive. The parameter z is introduced in the matrix.
- the introduction of the parameter z increases the propensity of L group membersto cooperate with Hs, which increases the likelihood of a cooperation from the Hs,which in turn raises the probability for Ls to play C, and so on. At the end of n∗periods, Ls cooperate with certainty with Hs. At this time, although the probabilityfor Hs to play C has reached quite high levels, as soon as σL/H = 1, Hs have noequilibrium strategy available but to be systematically non-cooperative with Ls, thusσH/L = 0.
- Whenever σH/L = 0, Ls maximize their pay-offs by choosing never to cooperatewhenever matched to an H, thus σL/H = 0
At the end of the n∗ periods a segregation equilibrium prevails : members of thetwo groups will systematically refuse to cooperate when matched to each other. Asmentioned above, as soon as one partner sets his probability to play C to 0, theother partner will reciprocate by setting his probability to play C to 0 and cannotbe better off. Therefore σL/H = 0, σH/L = 0 is a stable equilibrium on the L-Hmarket.
The path that leads to a segregation equilibrium is rather interesting. Assumingthat one group is deprived of power, it has not much choice but to cooperate withanother. I may conclude that given this systematic cooperation, the latter will refuseany interaction with the first one. Finally the deprived group’s best response will beto refuse any relationship too. This result is rather enlightening when thinking aboutthe ambiguity one may find in the dominated groups attitudes towards dominantgroups. Dominated often wishes to conform to the dominating (translating a will tocooperate) while depreciating them when they feel rejected by the mighty. As the
50 4. FORMATION OF A SEGREGATION EQUILIBRIUM
CHAPTER 1. POWER AND ENDOGENOUS SEGREGATION
fox in Aesop fable who can not reach grapes hanging high up on a vine, that he eyedgreedily retreats and says : "The grapes are sour anyway !".
5 Main Findings and Illustrative Examples
Two interesting points stand out from the demonstration above. Firstly, segre-gation is not reduced to psychological and exogenous factors such as prejudice or ataste for discrimination whose origins are unquestioned. Such a situation is seen asarising from a socioeconomic context in which one group has taken over much of thepower, be this power economic, political or to some extent symbolic. I have tried toshow that an unequal opportunities distribution triggers social strategies that gene-rate a stable segregation equilibrium, independently from exogenous preferences.
Secondly, it has been shown that segregation may not originate from a favoredgroup’s intention to put a deprived group at its mercy, contrary to Roemer (1979).On the contrary, it is the systematic yearning or necessity by the latter to build long-term relationship with the mighty that leads to a rejection by the favored group ofany relationship with the powerless. This last point is particularly important as it isat odds over generally accepted ideas about segregation and discrimination. Indeedit is striking to see that segregation has always been dressed up with ideologies thatsuggest that higher-ups do rightfully despise their subordinates, thereby spreadingthe idea that segregation comes from the dominating group. However, I believe thatsuch an ideology could only entrench where effective segregation is already in place.In my view, segregation may not be the fact of the mighty, but the product of aspecific situation. These results could be compared to La Boetie’s conclusions in hisDiscourse on Voluntary Servitude (de La Boetie (1576)). For La Boetie, tyrants’power comes from an historical shock that made people surrender their freedom.This domination is perpetuated by the ideology. In the same spirit, Weber’s accountof the origins of the authority legitimacy suggests that ideology is a way to legitimatean existing authority.
Power capture is seen as the segregation root. The term power should be takenin a broad acceptance, that is the ability to give someone opportunities that areotherwise unreachable. Note that this definition of power enables to account forvarious forms of segregation. Indeed, priests may be poor, but as they hold the keyto the gods favors, they do have a spiritual power and therefore may be placed abovethe crowd. I have suggested that the process through which segregation occurs startswith a dependence of one group on another to gain access to additional opportunities.The deprived group will start looking for long-term relationships with the morepowerful group who in turn will start setting up barriers. The caste system in Indiais an enlightening example of the segregation emergence.
As discussed in section 1.2.1 of the Introduction, the "purity of descent" theoryplaces the origins of caste, or at least endogamy, in the Aryan domination. As theygained power, either military or culturally or economically, authors argue that theystarted establishing separation rules between the conquerors and the conquered.Even if one des not agree with this theory, whether because of the inconsistenciespointed out by Klass (2004) or because of the lack of historical records, the factthat it is the most influential of all and widely accepted still tells that scientists find
5. MAIN FINDINGS AND ILLUSTRATIVE EXAMPLES 51
CHAPTER 1. POWER AND ENDOGENOUS SEGREGATION
it very tempting to see the origins of a segregationist system such as caste in thepower exerted by one group.
The presentation in section 1.1.2of the textual sources of caste, showed that thesupremacy of the priests in Vedic times was coming from their monopoly over sacri-fices, which was the only way for others to obtain the benevolence of the deities. Thepriests had a spiritual power of influence. Doniger and Smith (1991) argue that whenthe Vedic values were reversed, the Laws of Manu was an attempt by the priests tomore firmly establish their supremacy by extolling the virtues of their group.
Moreover, the correlation often observed between caste status, power and wealthas well as the fission and Sanskritization processes described in section 1.1.4 alsoclearly stress that as a group gains influence, it endeavors to restrict relationshipswith those they want to depart from. All these examples clearly point in the directiongiven by the model. Power exerted by one group over another is tied to restrictedinteractions between the two groups.
Another interesting historical example is colonization. It is striking that Portu-guese colonies contrary to the French and British ones, were not segregated. Whilethe Portuguese mainly set up trading posts, the French and the British led an activepower and wealth takeover policy. In the French and British empires, natives had tobe cooperative with the new masters to secure social opportunities, while in Portu-guese colonies trade enabled locals to make social progress on their own. In the firstcase, segregationist ideologies appeared while in the second a more integrated situa-tion prevailed. Amartya Sen recounts in "The Argumentative Indian : Writings onIndian History, Culture and Identity" an interesting story. At the time when Britishtrading posts were created in India in the XVIIth and early XVIIIth centuries, someBritish actually settled into the sub-continent, married Indian women and somew-hat managed to mingle with the local society. Then came the time of the propercolonization process in the XIXth century, when the Honorable East India Companyand later the British government took over power and wealth in the sub-continent.The locals had then to deal with the new masters to secure social opportunities.At that time, a new ideology started to appear in the Raj according to which In-dia and its civilization were backward and needed to be patronized. Indian andBritish communities were set aside and any admitted relationship between the twowas to be on a teaching mode. The power takeover by the British led to a segrega-tion between Europeans and Indians that is well illustrated by novels from that time.
6 Limitations of The Model
This model brings some interesting points to light. First, segregation may ariseeven in the absence of prejudice from the decentralized interactions of many indivi-duals. Power capture may be the origin of segregation by balancing the distributionof opportunities towards one group. Yet, the framework is unsuccessful at provingthat the segregation equilibrium is one among a limited number. Besides, the inele-gance of the equilibrium definition, comes from the fact that the path that leads froma neutral situation to a segregated one, probably has an interest of its own. This
52 6. LIMITATIONS OF THE MODEL
CHAPTER 1. POWER AND ENDOGENOUS SEGREGATION
is the reason why I tried to describe it. A potential way to fix these two problemswould be to rewrite the model in an evolutionary framework. besides it is probablythe most appropriate way to study the path that leads to segregation, that is, assaid, of great interest. This task is left for future research.
The addition of two features would also give the model more depth and allow itto better catch reality. First, only two groups are modeled and little is said aboutwhat becomes of mixed couples. For instance, what happens to an H who meets anL ? Does he become an L by his marriage, or does the L becomes an H ? Most likely,we can think of the L as becoming an H, otherwise there would be little point for himto cooperate with Hs in the hope to grab the z. Yet, does he have access to power inthe same was as an H ? Wouldn’t the pair be considered as an in between categorybetween the H and L ? Let’s think about Ancient Regime European aristocrats andhow the pedigree of their ancestors was put forward to assert their status. Marryinga bourgeoise was often done out of necessity and probably was considered as an ex-change of status for wealth. Similarly, the South African Apartheid did distinguishbetween the whites, the blacks and the "colored" people. Therefore introducing amixed category that benefit from a fraction of the power would add much to themodel.
Moreover, the power parameter z is held constant throughout the process, whileit is very likely that the value of power will depend on social composition. Assumethat H that are matched for a long period of time with L, become either an L ora mixed category. During the phase where such matches are not only possible, butvery likely due to the increase in the Hs and Ls propensity to cooperate, the powerdevoted to the H is going to be shared by a reduced number of "true" H and theworth of each share may increase. Thus, z would increase and each step of the gamemay shorten the convergence period to a segregation equilibrium.
Lastly, the main cooperation enforcement mechanism is the need for a defec-tor to rematch anew. This probably isn’t sufficient to account for some features ofreality. For instance, social norms and obligations are often thought as signals ofpotential cooperation. For instance, higher castes were constrained in many ways intheir behavior, such as diet restrictions, ritual education. The renowned sociologistSrinivas, noted that in order to rise in the caste hierarchy, castes members were goingthrough a Sanskritization process that mainly consisted of altering their manners,diets and acquiring religious education. The role of these norms are absent from theframework, given the assumption that group membership is costlessly observable.Yet, the introduction of the norms and of a probability that such norms may becorrectly interpreted would also be an interesting adjunction for the model.
All these adds on may largely improve the model and are promising approachesfor future research. I would be particularly keen on translating the model in anevolutionary framework, since this probably is the most appropriate way to find theemergence of norms without specifying preferences as in Axtell et al. (2004). Themodel proposes an explanation of the emergence of social orders, such as segrega-tion, as a result of accidents of history whereby a group of individuals receive a
6. LIMITATIONS OF THE MODEL 53
CHAPTER 1. POWER AND ENDOGENOUS SEGREGATION
distinguishing tags (in this model this would be power). As theses accidents becomereinforced over time, "society may self-organize around distinctions that are quitearbitrary from an a priori standpoint [...] Initially meaningless tags can acquire so-cially organizing salience : tag-based classes emerge". The starting point of the workby Axtell et al. (2004) matches the requirements for an initial situation that verymuch reassembles to a blank page. However, I would depart from their results bysaying that segregation is not, in my view an accident of history. Although it can berandom, chances are that some initial conditions makes its emergence very likely.
7 Concluding Remarks
This paper provides an analytical framework of a phenomenon, namely segre-gation, that is often considered as exogenous and intricate. It aims at identifyingsegregation triggers and breaking up its formation process. In my analysis, segre-gation stems from specific circumstances in which one group seizes power. Domina-ted group members are given little choice but to systematically cooperate with themighty. A natural response to a potential partner’s ensured cooperation is to rejectthe relationship. This is what the powerful group will do. The dominated group willbest reply to this situation by in turn rejecting cooperation. A stable segregationequilibrium is set.
Three interesting points may be drawn from this analysis. First, segregation isseen as entirely independent from psychological factors, prejudice or even exogenouspreferences regarding whom to interact with. This supports the belief that discrimi-nation arises from segregation and not the opposite. Second, the analysis shattersthe generally accepted idea that segregation is deliberately introduced by the mightyto firm up their domination. Indeed, it is shown that specific circumstances createsegregation through the dominated group’s necessity to establish long term relation-ships with the powerful. Third, the analysis is detailed enough to account for varioussocial situations such as the jatis fission process, for example.
Although this demonstration helps at understanding segregation and its conse-quences, it falls short of explaining why some societies exhibit high levels of se-gregation, as it is the case in India through the caste system, and other societieslower levels of segregation. How could a society move from a segregation equilibriumtowards a mixed one is a question that is left for future research. My intuition isthat power distribution within the groups is key. Should members of the deprivedgroup become powerful, the mighty may find interesting to start collaborating again.The rise of the bourgeoisie in Western Europe during the XVIIIth century would bean interesting case study. Besides, the remarkable stability of the segregation equili-brium, mays suggest that segregation could not be uprooted without special externalintervention. Another related issue that would be exciting looking at is the develop-ment of ideologies that aim at justifying already existing segregation and how theybecome accepted as a social norm.
54 7. CONCLUDING REMARKS
Chapter 2
Social Identity in India : Casteand Beyond ?
55
CHAPTER 2. SOCIAL IDENTITY IN INDIA : CASTE AND BEYOND?
1 Introduction
Social identity is becoming an increasingly popular concept among economists.How do individuals categorize themselves and what these groups identifications im-ply are central issues (Akerlof and Kranton (2010)). Although the concept has longbeen known to various disciplines such as psychology, history, political science andanthropology, it had remained for some time outside of the scope of economic analy-sis until Akerlof and Kranton (2000) plead for its integration in the economic corpusand showed how powerful it is to explain many puzzling economic issues. It was firstintroduced in social psychology by Tajfel et al. (1971) to explore discrimination andsocial conflict. Since then the notion has made its way into the economic literature.Akerlof and Kranton (2000, 2005) showed how internalizing norms lead individualsto act in conformity to the stereotype attached to their groups although such actionsmay be detrimental. This phenomenon has been the focus of a growing literaturein social psychology and is often referred to as "stereotype threat". Experimentsclearly evidenced that stressing social identity does modify preferences (Benjaminet al. (2007)), behaviors (Chen and Li (2009); Charness et al. (2007)) or even prices(Ball et al. (2001))1. An experiment that is of particular interest to my study is theone conducted by Hoff and Pandey (2006). Children from Northern India were askedto solve mazes. When caste identity was not revealed, performances across castesdid not significantly differ. Yet, when caste was made salient, performance of thelow caste significantly decreased. Such experiments clearly stress how internalizednorms can lead to "self-discrimination" as individuals obey norms and prejudiceto conform to social identity. This definitely is a breakthrough as discriminationtheories, be they "taste based" or "statistical", tended to view discrimination as aone way act imposed on the victim. This view is now somewhat moderated by theconcept of implicit discrimination developed by Bertrand et al. (2005)
Another more general justification for the study of social identity can be found inSen (1973, 1992) or in Sen (1999c,b). Not only does social identity affects economicprocesses as mentioned, but it also alters inequality in income distribution as wellas opportunities offered by such income. In Sen’s words, social identity may under-mine capabilities and therefore impact social welfare and although Sen particularlystressed gender bias in Sen (1992), not a great deal of imagination is needed to thinkabout castes in the same terms. For instance, not only may a low caste individual beless well endowed with income for instance, but such an income may not bring thesame opportunities in terms of functionings, because of caste membership. Besides,social identity in the context of secular deprivations and oppression, may engender"adaptative preferences", that are preferences formed in response to restricted op-tions. Thus, the absence of dissatisfaction of these individuals with regard to theircondition, that stems from a well anchored social identity, would not from a utilita-rian perspective lead to account for these inequality, while they must not be ignoredfrom a social welfare perspective.
Thus, because social identity is the key to solve many unexplained economicoutcomes, such as self discrimination, or lower educational outcomes in certain com-
1For a more detailed review of these experiments please refer to Chen and Li (2009)
56 1. INTRODUCTION
CHAPTER 2. SOCIAL IDENTITY IN INDIA : CASTE AND BEYOND?
munities, its influence goes much deeper by altering preferences and limiting capa-bilities. For these reasons, social identity ought to be studied in economics.
Caste has molded Indian society in many respects. A couple of works such asBorooah (2005), Deshpande (2000b, 2001), Gang et al. (2008) have shown how im-portant caste is in shaping discrimination, deprivation and inequality. Lawmakersmade no mistake about it, when they outlawed caste-based discrimination in the15th article of Fundamental Rights in the Constitution of India and provided forreservation policies in favor of low castes members in the same text. Laws have beenpassed for the last 50 years aiming at protecting what is discreetly referred as "wea-ker segments of society". Programs have been voted to alleviate the situations ofthe former untouchables, now administratively called the Schedules Castes ("SC")and that of the Scheduled Tribes ("ST"). Yet, caste remains an important groundfor inequality, poverty and discrimination. Inequality comes both from differencesin endowments across castes and differences in treatment linked to discrimination.However, as the experiment conducted by Hoff and Pandey (2006) showed, interna-lized norms and stereotype threat are also powerful factors of stark inequality anda limitation to capabilities.
In India, caste is probably a deep determinant of social identity as many anthro-pologists and sociologists have shown. Caste considerations may be quite pervasive asthe caste code may govern many aspects of Indians’ everyday life such as marriages,rituals, social interactions and even food diets. Despite the large heterogeneity inobedience to the code, caste probably remains a central issue in social identification.Yet, is caste the beginning and the end of social identity in India ? Are there otherfactors, besides castes that could significantly influence the sense of self with respectto others ? For instance, will a rich outcasts relate in the same way to his fellows andother castes as a poor one ? These are questions I wish to dispute and try to answer.I want to identify whether other aspects such as education, occupation or income doalso shape the perceived social status along or instead of caste ? Another hypothesisI wish to test is whether caste also influence the effect of these endowments withregard to perceived social status. For instance, education may be efficient at impro-ving social status, but so only among high castes. In such an event, caste would notonly determine endowments but also the efficiency of such endowments with respectto social sense of self. To test all these hypothesis and try to provide some answersto these questions, the study will focus on a question asked in the World ValuesSurvey : "to which of the following social class do you think you belong to ?".
Despite the heated debate taking place among sociologists and anthropologistsabout the origins and the nature of castes, most social scientists have placed caste atthe center of social identification in India and have underlined, probably followingDumont (1970), caste cleavages and the fact that they are supported by a strongideology that reinforces exclusion and inferiority norms. Yet, a pitfall lies in wait foranyone who addresses the issue of caste in India, that is to consider caste as the onlydeterminant of social identity that no other factor, such as wealth, could mitigate.Such a fault has lead many social scientist to consider caste in a rather monolithicway, when caste is a rather fluid institution. Some sociologists have been aware of
1. INTRODUCTION 57

CHAPTER 2. SOCIAL IDENTITY IN INDIA : CASTE AND BEYOND?
this issue as some of them such as Beteille (1974), Srinivas (1962), or Bailey (1957)have tried to untangle the effect of power, wealth and caste in shaping social identity.
Sen (2004) stressed the plurality of identities and I propose to examine wethercaste is the sole determinant of social identity in India. I will try to identify therelevant factors that influence perceived social status and compare the magnitudeof their effects with that of caste. Results highlight three points : first caste has astronger effect on social identity among Tribes than among Scheduled Castes. Whilesome improvements in earnings or occupational status may be able to cancel theScheduled Caste effect, no such variations may counterbalance the tribe effect. Be-sides, the caste effect manifests itself in both a direct and an indirect ways. Resultsshow, that the effect of income for instance is diminished by low caste membership.It could be hypothesized, although this is beyond the scope of this chapter, thatSCs social identity is less dependent upon caste than STs, because they successfullymobilized politically. Political studies by Jaffrelot (2002) go in that direction.
Before going further in the analysis, some terms need clarification. So far, I havequestioned the relevance of caste in perceived social class. Yet, this study mainlyfocuses on three groups : the non scheduled ones, the Scheduled Castes and theScheduled Tribes. Yet the identification of the latter as a caste is rather complexissue as mentioned in section 1.1.3 of the general Introduction to the dissertation.Given the tricky relationship between castes and tribes, and to be rigorous, whatwas earlier described as a caste effect will from now on be referred to as a "groupeffect".
The paper is organized as follows : section (2) presents the data as well as themodel used. It provides some compelling summary statistics on the social classesdistribution across castes. Section (3) presents a discriminant analysis of the deter-minants of social identity. Section (4) presents the empirical strategy, while section(5) discusses the results. Concluding remarks are found in section (6).
2 Data
2.1 Presentation of The Data
The data are extracted from the Indian section of the World Values Survey("WVS") conducted in 1995 and 2001 2. Please note that the sampling was basedon voting rolls and the method has consequences that will be discussed in section 2.2.
The survey covers 8,543 households, although caste is informed only for 3,403 ofthem. Unfortunately, caste is only informed for individuals of Hindu denomination.The analysis is therefore restricted to this group. I am particularly interested in oneof the question asked during the face to face interviews : "to which of the five socialclasses do you think you belong ?"3. Please note that interviews were conducted in
2Other rounds of the survey are not workable since information about caste is unavailable.3It is important to bear in mind that questions were translated and that the connotation of the
classes’ labels may be quite different from what is commonly understood in English. Very likely,
58 2. DATA
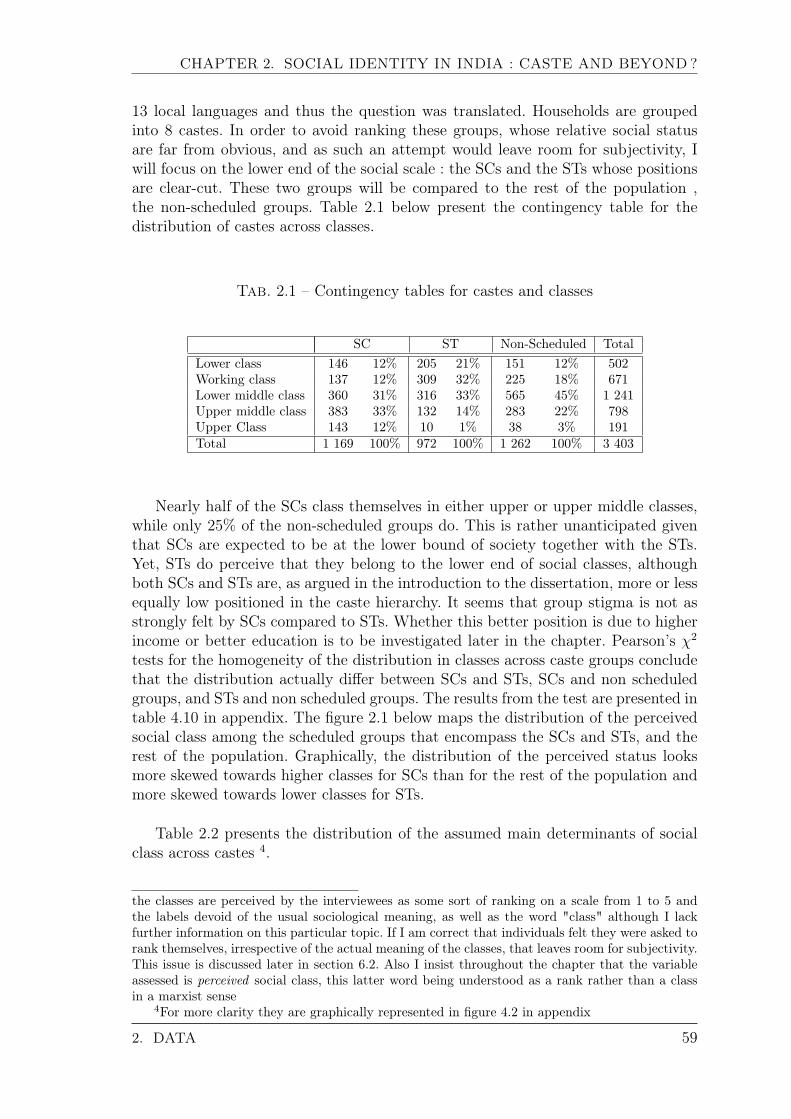
CHAPTER 2. SOCIAL IDENTITY IN INDIA : CASTE AND BEYOND?
13 local languages and thus the question was translated. Households are groupedinto 8 castes. In order to avoid ranking these groups, whose relative social statusare far from obvious, and as such an attempt would leave room for subjectivity, Iwill focus on the lower end of the social scale : the SCs and the STs whose positionsare clear-cut. These two groups will be compared to the rest of the population ,the non-scheduled groups. Table 2.1 below present the contingency table for thedistribution of castes across classes.
Tab. 2.1 – Contingency tables for castes and classes
SC ST Non-Scheduled TotalLower class 146 12% 205 21% 151 12% 502Working class 137 12% 309 32% 225 18% 671Lower middle class 360 31% 316 33% 565 45% 1 241Upper middle class 383 33% 132 14% 283 22% 798Upper Class 143 12% 10 1% 38 3% 191Total 1 169 100% 972 100% 1 262 100% 3 403
Nearly half of the SCs class themselves in either upper or upper middle classes,while only 25% of the non-scheduled groups do. This is rather unanticipated giventhat SCs are expected to be at the lower bound of society together with the STs.Yet, STs do perceive that they belong to the lower end of social classes, althoughboth SCs and STs are, as argued in the introduction to the dissertation, more or lessequally low positioned in the caste hierarchy. It seems that group stigma is not asstrongly felt by SCs compared to STs. Whether this better position is due to higherincome or better education is to be investigated later in the chapter. Pearson’s χ2
tests for the homogeneity of the distribution in classes across caste groups concludethat the distribution actually differ between SCs and STs, SCs and non scheduledgroups, and STs and non scheduled groups. The results from the test are presented intable 4.10 in appendix. The figure 2.1 below maps the distribution of the perceivedsocial class among the scheduled groups that encompass the SCs and STs, and therest of the population. Graphically, the distribution of the perceived status looksmore skewed towards higher classes for SCs than for the rest of the population andmore skewed towards lower classes for STs.
Table 2.2 presents the distribution of the assumed main determinants of socialclass across castes 4.
the classes are perceived by the interviewees as some sort of ranking on a scale from 1 to 5 andthe labels devoid of the usual sociological meaning, as well as the word "class" although I lackfurther information on this particular topic. If I am correct that individuals felt they were asked torank themselves, irrespective of the actual meaning of the classes, that leaves room for subjectivity.This issue is discussed later in section 6.2. Also I insist throughout the chapter that the variableassessed is perceived social class, this latter word being understood as a rank rather than a classin a marxist sense
4For more clarity they are graphically represented in figure 4.2 in appendix
2. DATA 59
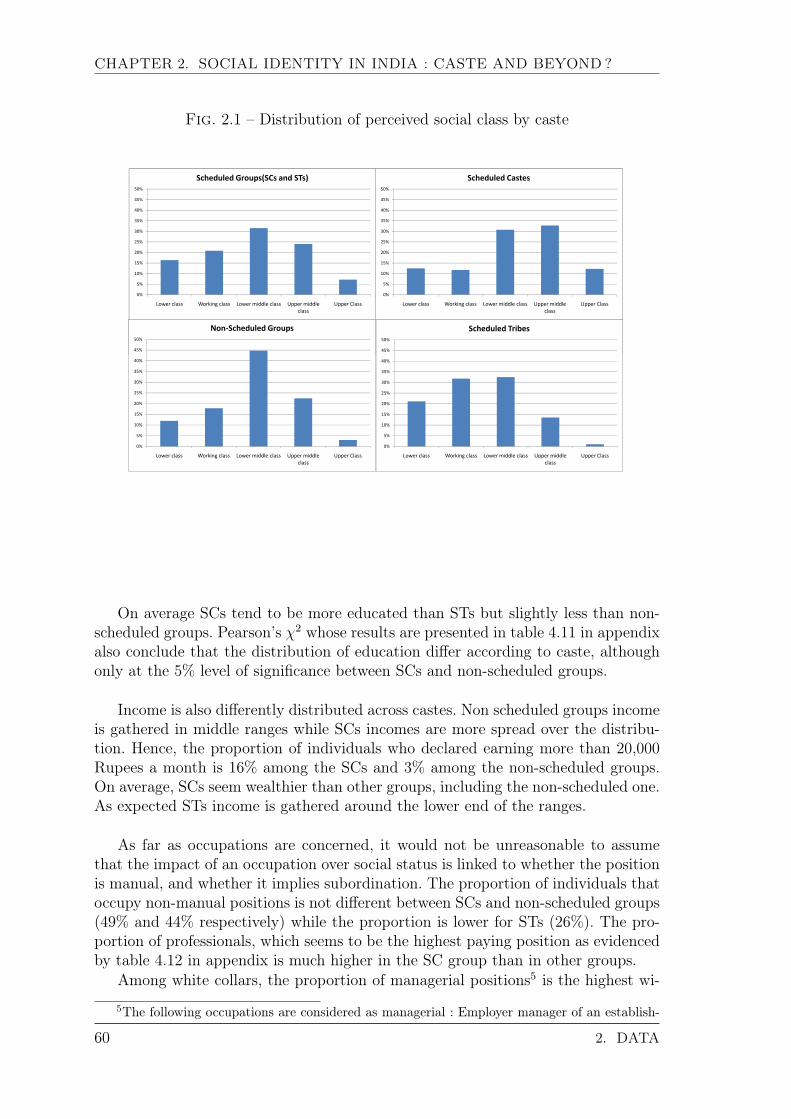
CHAPTER 2. SOCIAL IDENTITY IN INDIA : CASTE AND BEYOND?
Fig. 2.1 – Distribution of perceived social class by caste
45%
50%
Scheduled Tribes
0%
5%
10%
15%
20%
25%
30%
35%
40%
45%
50%
Lower class Working class Lower middle class Upper middle
class
Upper Class
Scheduled Castes
45%
50%
Non-Scheduled Groups
0%
5%
10%
15%
20%
25%
30%
35%
40%
45%
50%
Lower class Working class Lower middle class Upper middle
class
Upper Class
Scheduled Groups(SCs and STs)
0%
5%
10%
15%
20%
25%
30%
35%
40%
45%
50%
Lower class Working class Lower middle class Upper middle
class
Upper Class
Scheduled Tribes
0%
5%
10%
15%
20%
25%
30%
35%
40%
45%
50%
Lower class Working class Lower middle class Upper middle
class
Upper Class
Scheduled Castes
0%
5%
10%
15%
20%
25%
30%
35%
40%
45%
50%
Lower class Working class Lower middle class Upper middle
class
Upper Class
Non-Scheduled Groups
0%
5%
10%
15%
20%
25%
30%
35%
40%
45%
50%
Lower class Working class Lower middle class Upper middle
class
Upper Class
Scheduled Groups(SCs and STs)
On average SCs tend to be more educated than STs but slightly less than non-scheduled groups. Pearson’s χ2 whose results are presented in table 4.11 in appendixalso conclude that the distribution of education differ according to caste, althoughonly at the 5% level of significance between SCs and non-scheduled groups.
Income is also differently distributed across castes. Non scheduled groups incomeis gathered in middle ranges while SCs incomes are more spread over the distribu-tion. Hence, the proportion of individuals who declared earning more than 20,000Rupees a month is 16% among the SCs and 3% among the non-scheduled groups.On average, SCs seem wealthier than other groups, including the non-scheduled one.As expected STs income is gathered around the lower end of the ranges.
As far as occupations are concerned, it would not be unreasonable to assumethat the impact of an occupation over social status is linked to whether the positionis manual, and whether it implies subordination. The proportion of individuals thatoccupy non-manual positions is not different between SCs and non-scheduled groups(49% and 44% respectively) while the proportion is lower for STs (26%). The pro-portion of professionals, which seems to be the highest paying position as evidencedby table 4.12 in appendix is much higher in the SC group than in other groups.
Among white collars, the proportion of managerial positions5 is the highest wi-
5The following occupations are considered as managerial : Employer manager of an establish-
60 2. DATA

CHAPTER 2. SOCIAL IDENTITY IN INDIA : CASTE AND BEYOND?
thin the non-scheduled category although it is close for SCs but much lower for STs(29%, 23% and 13% respectively).
To put it all in a nutshell, SCs do not seem to be less well positioned than thenon-scheduled group with regard to education, wealth or occupation. They are onaverage only slightly less educated, occupy similar types of positions and are onaverage wealthier. The picture for STs is more clear-cut. They are on average poorerand less educated and are overproportioned in manual or subordinate occupations.Given these raw statistics and leaving aside the potential effect of groups, SCs wouldnot be expected to rank very differently than non-scheduled groups, while STs areexpected to position at the lower end of the social scale. These conclusions are ratherpeculiar given the commonly accepted idea that SCs form a largely deprived groupthat is located at the lower end of the social hierarchy together with ScheduledTribes. Yet, these expectations may be troubled by caste considerations that havenot been, so far, accounted for. Moreover, these descriptive statistics clearly exhibita divide between SCs and STs.
ment, supervisory non manual office worker and foreman / supervisor
2. DATA 61
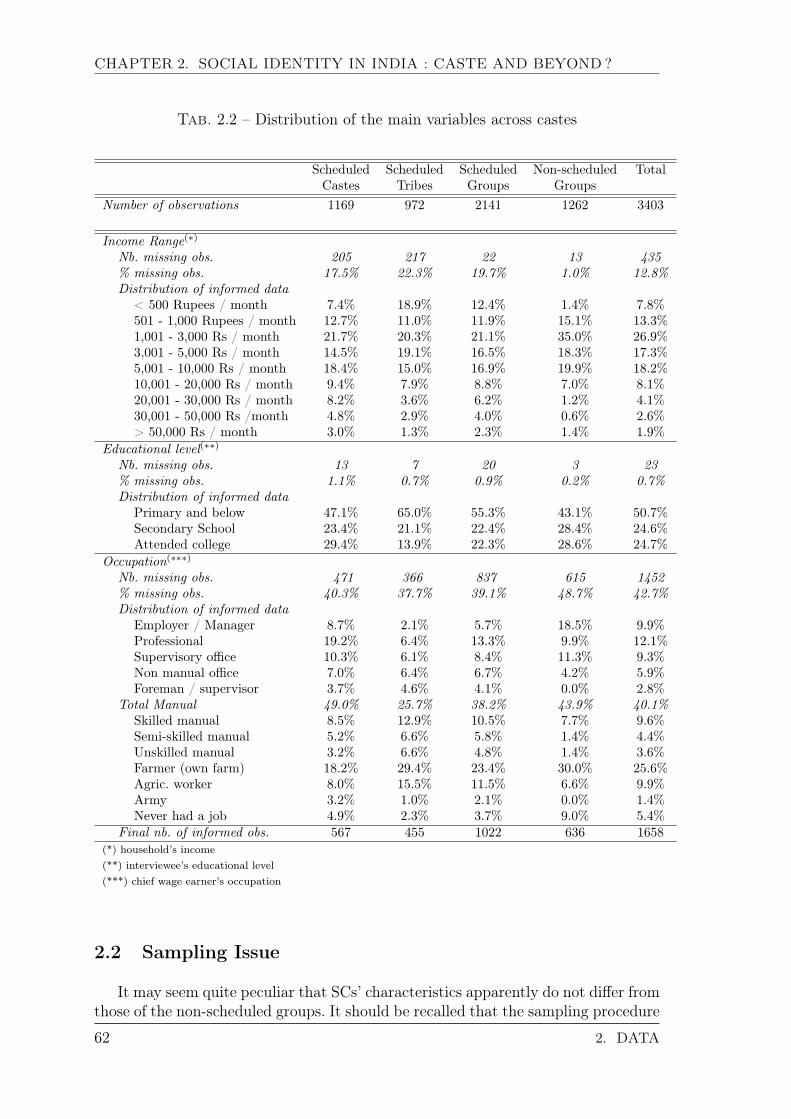
CHAPTER 2. SOCIAL IDENTITY IN INDIA : CASTE AND BEYOND?
Tab. 2.2 – Distribution of the main variables across castes
Scheduled Scheduled Scheduled Non-scheduled TotalCastes Tribes Groups Groups
Number of observations 1169 972 2141 1262 3403
Income Range(∗)
Nb. missing obs. 205 217 22 13 435% missing obs. 17.5% 22.3% 19.7% 1.0% 12.8%Distribution of informed data
< 500 Rupees / month 7.4% 18.9% 12.4% 1.4% 7.8%501 - 1,000 Rupees / month 12.7% 11.0% 11.9% 15.1% 13.3%1,001 - 3,000 Rs / month 21.7% 20.3% 21.1% 35.0% 26.9%3,001 - 5,000 Rs / month 14.5% 19.1% 16.5% 18.3% 17.3%5,001 - 10,000 Rs / month 18.4% 15.0% 16.9% 19.9% 18.2%10,001 - 20,000 Rs / month 9.4% 7.9% 8.8% 7.0% 8.1%20,001 - 30,000 Rs / month 8.2% 3.6% 6.2% 1.2% 4.1%30,001 - 50,000 Rs /month 4.8% 2.9% 4.0% 0.6% 2.6%> 50,000 Rs / month 3.0% 1.3% 2.3% 1.4% 1.9%
Educational level(∗∗)Nb. missing obs. 13 7 20 3 23% missing obs. 1.1% 0.7% 0.9% 0.2% 0.7%Distribution of informed data
Primary and below 47.1% 65.0% 55.3% 43.1% 50.7%Secondary School 23.4% 21.1% 22.4% 28.4% 24.6%Attended college 29.4% 13.9% 22.3% 28.6% 24.7%
Occupation(∗∗∗)
Nb. missing obs. 471 366 837 615 1452% missing obs. 40.3% 37.7% 39.1% 48.7% 42.7%Distribution of informed data
Employer / Manager 8.7% 2.1% 5.7% 18.5% 9.9%Professional 19.2% 6.4% 13.3% 9.9% 12.1%Supervisory office 10.3% 6.1% 8.4% 11.3% 9.3%Non manual office 7.0% 6.4% 6.7% 4.2% 5.9%Foreman / supervisor 3.7% 4.6% 4.1% 0.0% 2.8%
Total Manual 49.0% 25.7% 38.2% 43.9% 40.1%Skilled manual 8.5% 12.9% 10.5% 7.7% 9.6%Semi-skilled manual 5.2% 6.6% 5.8% 1.4% 4.4%Unskilled manual 3.2% 6.6% 4.8% 1.4% 3.6%Farmer (own farm) 18.2% 29.4% 23.4% 30.0% 25.6%Agric. worker 8.0% 15.5% 11.5% 6.6% 9.9%Army 3.2% 1.0% 2.1% 0.0% 1.4%Never had a job 4.9% 2.3% 3.7% 9.0% 5.4%
Final nb. of informed obs. 567 455 1022 636 1658(*) household’s income(**) interviewee’s educational level(***) chief wage earner’s occupation
2.2 Sampling Issue
It may seem quite peculiar that SCs’ characteristics apparently do not differ fromthose of the non-scheduled groups. It should be recalled that the sampling procedure
62 2. DATA

CHAPTER 2. SOCIAL IDENTITY IN INDIA : CASTE AND BEYOND?
was based on voting rolls as already mentioned. Thus, the sample only includeindividuals aged 18 and more. Moreover, the sample does not include any illiterateindividual, which probably is a direct consequence of the sampling procedure. Table2.3 presents the distribution of individuals across the three educational levels in theWVS and the 2001 Census of India6. Please bear in mind that the "attended college"category accounts for all the graduates in the Census while the WVS would recognizein this category anyone who has attended college even without graduating. Threfore,there must be a slight discrepancy between the two samples for this category.
Tab. 2.3 – Comparison of educational levels between the World Values Survey andthe Census of India 2001
World Values Survey ("WVS") Census of India 2001 :individuals aged at leat 19
SC ST Non-scheduled SC ST Non-scheduledgroups groups
Primary and below 47.1% 65.0% 43.1% 73.4% 76.2% 62.1%Secondary 23.4% 21.1% 28.4% 21.1% 19.9% 28.2%Attended college 29.4% 13.9% 28.6% 5.6% 4.0% 9.6%Note : reconciliation of the categories accounted for in the WVS and in the Censusis presented in table 4.13 in appendix
It is noteworthy that individuals are on average more educated in the WVSsample. This may be due to a bias towards urban individuals given that more thanhalf of the sampled individuals live in towns of more than 10,000 inhabitants. Table2.4 below presents a comparison between the WVS sample and the Census of India,for urban individuals aged 19 and more.
Tab. 2.4 – Comparison of educational levels between the World Values Survey andthe Census of India 2001 for urban individuals
World Values Survey ("WVS") Census of India 2001 :urban individuals aged at leat 19
SC ST Non-scheduled SC ST Non-scheduledgroups groups
Primary and below 47.1% 65.0% 43.1% 59.6% 57.2% 45.8%Secondary 23.4% 21.1% 28.4% 29.8% 31.9% 35.3%Attended college 29.4% 13.9% 28.6% 10.6% 10.9% 18.8%
The distribution across educational levels by groups is actually quite close bet-ween the WVS sample and the Census of India, when the latter is restricted to theurban category. It should be noted from graph 4.3 in appendix that SCs on averagelive in larger towns than non-scheduled groups for the whole sample and this biasmay explain why the SCs characteristics do not seem to differ from that of the non-scheduled groups. Yet, when the sample is restricted to the 2001 survey only, the
6The estimates for the Census of India were computed on the same districts’s sample as thosecontained in the WVS. The list of states and the number of districts accounted for in each stateare presented in table 4.14 in appendix
2. DATA 63
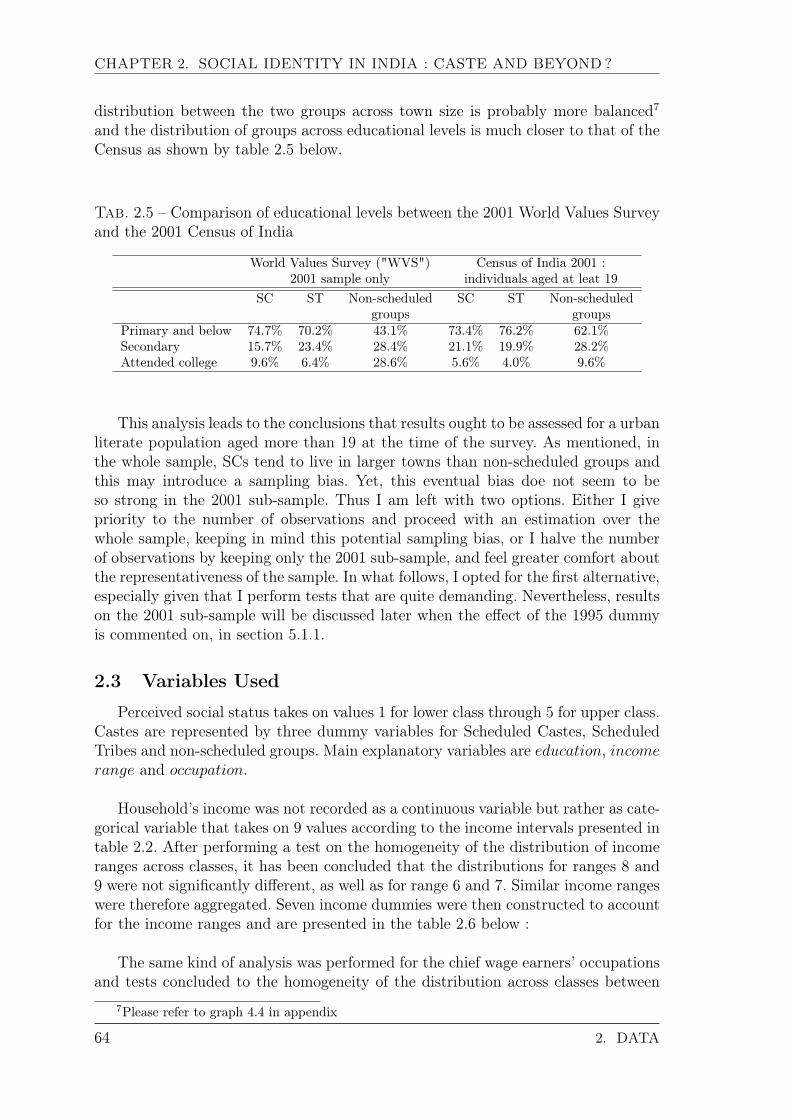
CHAPTER 2. SOCIAL IDENTITY IN INDIA : CASTE AND BEYOND?
distribution between the two groups across town size is probably more balanced7and the distribution of groups across educational levels is much closer to that of theCensus as shown by table 2.5 below.
Tab. 2.5 – Comparison of educational levels between the 2001 World Values Surveyand the 2001 Census of India
World Values Survey ("WVS") Census of India 2001 :2001 sample only individuals aged at leat 19
SC ST Non-scheduled SC ST Non-scheduledgroups groups
Primary and below 74.7% 70.2% 43.1% 73.4% 76.2% 62.1%Secondary 15.7% 23.4% 28.4% 21.1% 19.9% 28.2%Attended college 9.6% 6.4% 28.6% 5.6% 4.0% 9.6%
This analysis leads to the conclusions that results ought to be assessed for a urbanliterate population aged more than 19 at the time of the survey. As mentioned, inthe whole sample, SCs tend to live in larger towns than non-scheduled groups andthis may introduce a sampling bias. Yet, this eventual bias doe not seem to beso strong in the 2001 sub-sample. Thus I am left with two options. Either I givepriority to the number of observations and proceed with an estimation over thewhole sample, keeping in mind this potential sampling bias, or I halve the numberof observations by keeping only the 2001 sub-sample, and feel greater comfort aboutthe representativeness of the sample. In what follows, I opted for the first alternative,especially given that I perform tests that are quite demanding. Nevertheless, resultson the 2001 sub-sample will be discussed later when the effect of the 1995 dummyis commented on, in section 5.1.1.
2.3 Variables Used
Perceived social status takes on values 1 for lower class through 5 for upper class.Castes are represented by three dummy variables for Scheduled Castes, ScheduledTribes and non-scheduled groups. Main explanatory variables are education, incomerange and occupation.
Household’s income was not recorded as a continuous variable but rather as cate-gorical variable that takes on 9 values according to the income intervals presented intable 2.2. After performing a test on the homogeneity of the distribution of incomeranges across classes, it has been concluded that the distributions for ranges 8 and9 were not significantly different, as well as for range 6 and 7. Similar income rangeswere therefore aggregated. Seven income dummies were then constructed to accountfor the income ranges and are presented in the table 2.6 below :
The same kind of analysis was performed for the chief wage earners’ occupationsand tests concluded to the homogeneity of the distribution across classes between
7Please refer to graph 4.4 in appendix
64 2. DATA

CHAPTER 2. SOCIAL IDENTITY IN INDIA : CASTE AND BEYOND?
Tab. 2.6 – Income dummies variables
Range Number of observations1 < 500 Rs / month 2312 501 - 1,000 Rs / month 3943 1,001 - 3,000 Rs / month 7994 3,001 - 5,000 Rs / month 5135 5,001 - 10,000 Rs / month 5396 10,001 - 30,000 Rs / month 3607 > 30,000 Rs / month 132
employer and foreman and between unskilled manual worker and semi-skilled manualworkers. These categories were therefore aggregated. Thus 10 dummies for eachoccupation were constructed and the list is provided in the table 2.7 below :
Tab. 2.7 – Occupation dummies variables
Occupation dummies Number of observationsEmployer / Manager / Foreman 248Professional worker 237Supervisory non-manual office worker 182Non manual office worker 115Skilled manual worker 187Unskilled / semi-skilled manual worker 156Farmer cultivating his own farm 499Agricultural worker 193Member of armed forces 28Never had a job 106
As we shall see later, the last category labeled "never had a job" in the data setis rather intriguing. First, the distribution of income within this category, as shownby table 4.12, is rather spread over the ranges, so this group is unlikely to encompassonly unemployed, students or housewives, especially as "never had a job" is suppo-sed to describe the occupation of the chief wage earner. Within this category, 100%of the respondents declared that they were not the chief wage earner, and 94% ofthem declared that the chief wage earner was employed at the time of the interview.Thus this category probably encompasses temporary jobs and/or self-employmentor at least occupations that were not clear to the respondent.
Three education dummies were created in accordance to the ranges informed inthe database that are : primary education and below, secondary school and attendedcollege. Please bear in mind that the there is no illiterate individual. Other controlvariables are the standard determinants of social capital, such as sex, marital statusage and age squared of the respondent. The size of the town is also included underthe assumption that in smaller towns caste identity is more salient and of commonknowledge. Thus its impact would be greater. Given that data were collected in 1995and 2001, a binary variable equals to 1 for the year 1995 was also included.
2. DATA 65
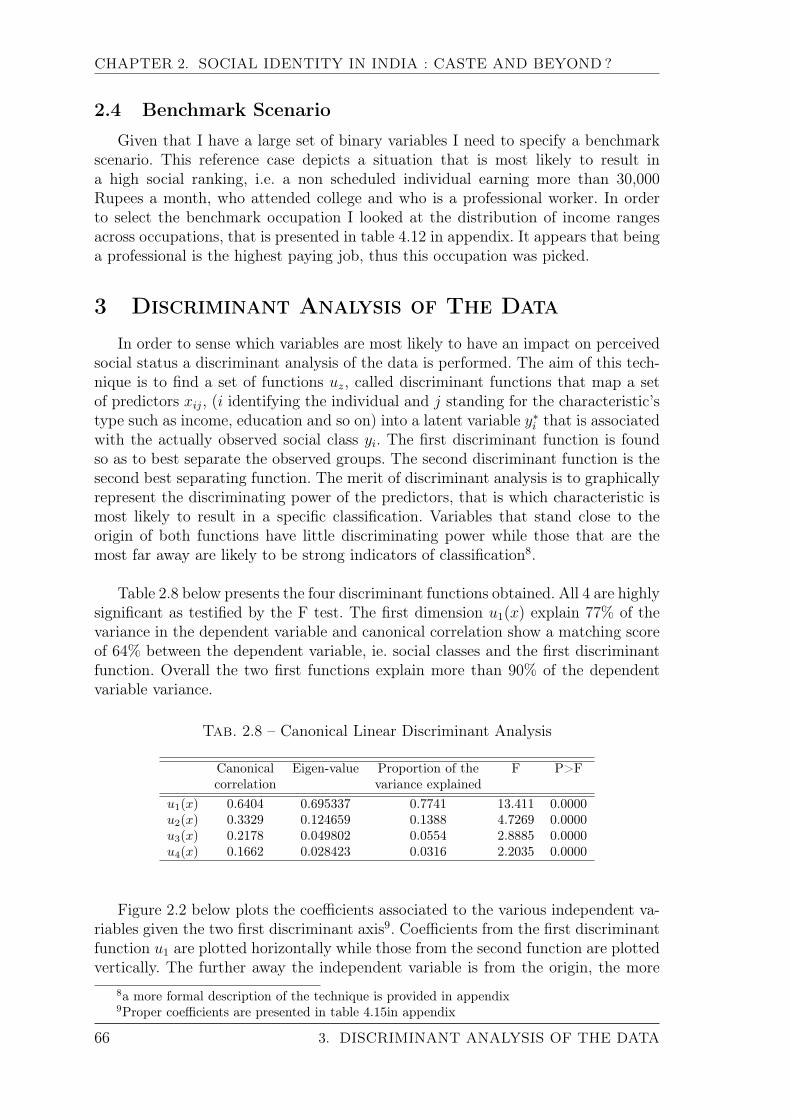
CHAPTER 2. SOCIAL IDENTITY IN INDIA : CASTE AND BEYOND?
2.4 Benchmark Scenario
Given that I have a large set of binary variables I need to specify a benchmarkscenario. This reference case depicts a situation that is most likely to result ina high social ranking, i.e. a non scheduled individual earning more than 30,000Rupees a month, who attended college and who is a professional worker. In orderto select the benchmark occupation I looked at the distribution of income rangesacross occupations, that is presented in table 4.12 in appendix. It appears that beinga professional is the highest paying job, thus this occupation was picked.
3 Discriminant Analysis of The Data
In order to sense which variables are most likely to have an impact on perceivedsocial status a discriminant analysis of the data is performed. The aim of this tech-nique is to find a set of functions uz, called discriminant functions that map a setof predictors xij, (i identifying the individual and j standing for the characteristic’stype such as income, education and so on) into a latent variable y∗i that is associatedwith the actually observed social class yi. The first discriminant function is foundso as to best separate the observed groups. The second discriminant function is thesecond best separating function. The merit of discriminant analysis is to graphicallyrepresent the discriminating power of the predictors, that is which characteristic ismost likely to result in a specific classification. Variables that stand close to theorigin of both functions have little discriminating power while those that are themost far away are likely to be strong indicators of classification8.
Table 2.8 below presents the four discriminant functions obtained. All 4 are highlysignificant as testified by the F test. The first dimension u1(x) explain 77% of thevariance in the dependent variable and canonical correlation show a matching scoreof 64% between the dependent variable, ie. social classes and the first discriminantfunction. Overall the two first functions explain more than 90% of the dependentvariable variance.
Tab. 2.8 – Canonical Linear Discriminant Analysis
Canonical Eigen-value Proportion of the F P>Fcorrelation variance explained
u1(x) 0.6404 0.695337 0.7741 13.411 0.0000u2(x) 0.3329 0.124659 0.1388 4.7269 0.0000u3(x) 0.2178 0.049802 0.0554 2.8885 0.0000u4(x) 0.1662 0.028423 0.0316 2.2035 0.0000
Figure 2.2 below plots the coefficients associated to the various independent va-riables given the two first discriminant axis9. Coefficients from the first discriminantfunction u1 are plotted horizontally while those from the second function are plottedvertically. The further away the independent variable is from the origin, the more
8a more formal description of the technique is provided in appendix9Proper coefficients are presented in table 4.15in appendix
66 3. DISCRIMINANT ANALYSIS OF THE DATA
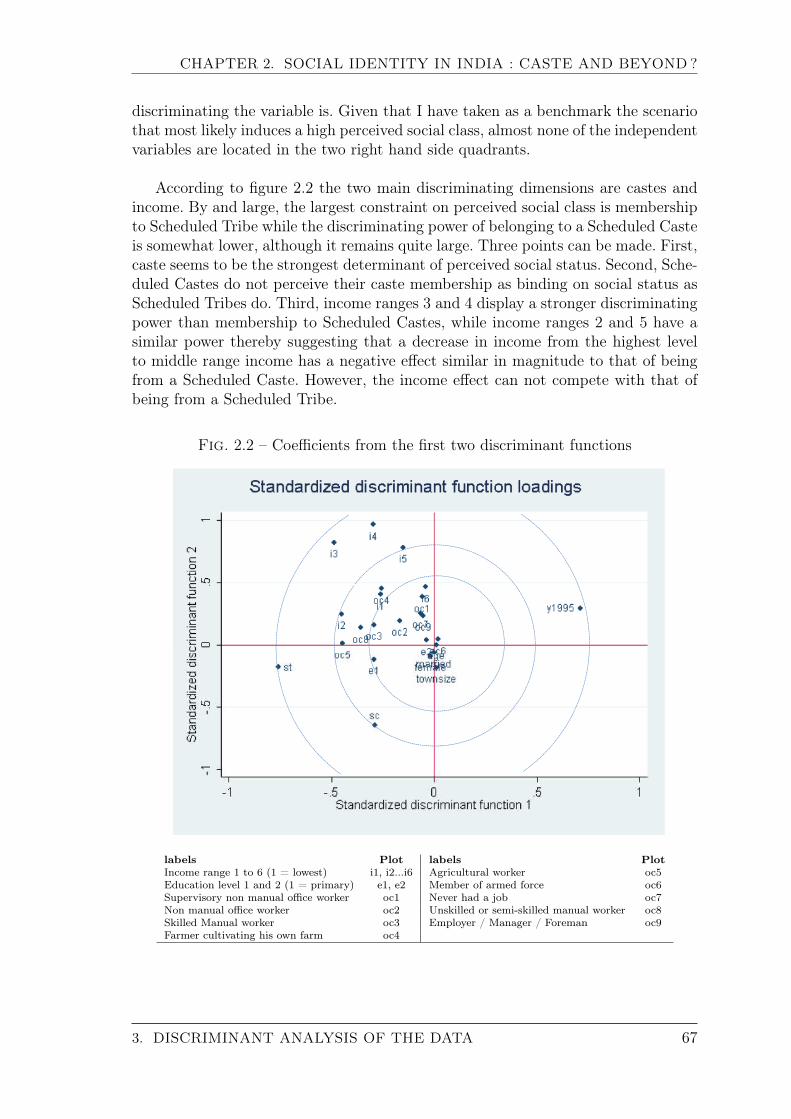
CHAPTER 2. SOCIAL IDENTITY IN INDIA : CASTE AND BEYOND?
discriminating the variable is. Given that I have taken as a benchmark the scenariothat most likely induces a high perceived social class, almost none of the independentvariables are located in the two right hand side quadrants.
According to figure 2.2 the two main discriminating dimensions are castes andincome. By and large, the largest constraint on perceived social class is membershipto Scheduled Tribe while the discriminating power of belonging to a Scheduled Casteis somewhat lower, although it remains quite large. Three points can be made. First,caste seems to be the strongest determinant of perceived social status. Second, Sche-duled Castes do not perceive their caste membership as binding on social status asScheduled Tribes do. Third, income ranges 3 and 4 display a stronger discriminatingpower than membership to Scheduled Castes, while income ranges 2 and 5 have asimilar power thereby suggesting that a decrease in income from the highest levelto middle range income has a negative effect similar in magnitude to that of beingfrom a Scheduled Caste. However, the income effect can not compete with that ofbeing from a Scheduled Tribe.
Fig. 2.2 – Coefficients from the first two discriminant functions
labels Plot labels PlotIncome range 1 to 6 (1 = lowest) i1, i2...i6 Agricultural worker oc5Education level 1 and 2 (1 = primary) e1, e2 Member of armed force oc6Supervisory non manual office worker oc1 Never had a job oc7Non manual office worker oc2 Unskilled or semi-skilled manual worker oc8Skilled Manual worker oc3 Employer / Manager / Foreman oc9Farmer cultivating his own farm oc4
3. DISCRIMINANT ANALYSIS OF THE DATA 67
CHAPTER 2. SOCIAL IDENTITY IN INDIA : CASTE AND BEYOND?
Compared to college attendance, other levels of education as a whole have a re-latively low discriminating power. Out of the two educational levels retained, onlythe first one, i.e. primary and below is not located close to the origin and thus maybe thought of as having a negative effect on perceived social status.
Discriminant analysis is particularly helpful to identifying the most relevant occu-pation with regard to perceived social status. According to the figure 2.2, occupationsare not nearly as discriminant as castes and income. Out of the nine occupations,three have relatively strong discriminating power : agricultural worker (oc5 in thegraph), unskilled or semi-skilled manual worker(oc8), and farmer cultivating his ownfarm (oc4). Next comes skilled manual worker (oc3). It is noteworthy that the mostdiscriminating occupations are all manual, while office types of occupations are notso relevant, all of them being compared to being a professional worker. The relevantdivide in occupations seem therefore to be manual versus non-manual jobs, althoughoccupations in general does not seem to have a strong explaining power.Nearly irrelevant variables include town size, gender, marital status, age of the re-spondent as well as secondary school education, or being enrolled in the army.
Three conclusions may be drawn from the analysis :– Caste strongly binds perceived social identity although the constraint seems
to be harsher on Scheduled Tribes than on Scheduled Castes.– Income, for intermediate levels, may be almost as powerful in shaping perceived
social identity as being from a Scheduled Caste.– The above proposition does not hold for Scheduled Tribes. In this instance no
other determinant seem to be as powerful as the caste effect.– Occupations and education do not seem to be as discriminating as income
and castes are, although manual occupations are generally more binding onperceived social class.
The discriminant analysis presented above is descriptive, yet helpful at putting forthhypothesis, that will be checked through the empirical strategy described in the nextsection.
68 3. DISCRIMINANT ANALYSIS OF THE DATA

CHAPTER 2. SOCIAL IDENTITY IN INDIA : CASTE AND BEYOND?
4 Empirical Strategy
Given that the dependent variable is ordinal, the analysis resorts to a pooledordered probit model, whose details are given below.
4.1 Base Model
Let y∗i be the latent continuous measure of perceived social class by individual idefined by the following relationship :
y∗i = θcastei + βIncomei + γOccupationi + δEducationi + ρzi + εi (2.1)
where castei is the caste to which individual i belong.Income, Education and Occupation together with castes are the variablesof interest as earlier describedzi is a vector of control variables usual to the literature on social capitalsuch as age, sex and marital status of the respondent together with the size ofthe town and a dummy for year 1995. ρ is the vector of associated coefficients.εi a random error term assumed to follow a standard normal distribution.
yi is the observed ordinal variable so that for the jth outcome yi = j for j = 1...5and is determined from the model as follows :
yi =
1 if −∞ ≤ y∗i ≤ µ1
j if µj−1 < y∗i ≤ µj5 if µ4 < y∗i ≤ ∞
where µi are thresholds to be estimated together with the coefficients. The proba-bilities for each ordinal outcome is thereforeP [yi = 1] = φ(µ1 − xiβ)....P [yi = j] = φ(µj − xiβ)− φ(µj−1 − xiβ)...P [yi = 5] = 1− φ(µj−1 − xiβ)for φ the standard normal cumulative distribution function. The ordered probitmodel is estimated for the best and worst case scenarios.
4.2 Conditional Effects
Descriptive statistics have shown that the distribution of assumed determinantsof social status such as income, occupation and education significantly differ acrosscastes 10. In the base specification, I identified the effect of caste controlling forother variables. However, the effect of determinants of perceived social status maydiffer depending on caste. Therefore caste may also have an effect through the diffe-ring weights carried by other determinants. For instance, education may be effectiveat improving the perceived social status among non-scheduled individuals but not
10Please refer to the Pearson’s χ2 test presented in table 4.11 in appendix
4. EMPIRICAL STRATEGY 69
CHAPTER 2. SOCIAL IDENTITY IN INDIA : CASTE AND BEYOND?
among scheduled groups.
In order to investigate this possibility, I first run a likelihood-ratio Chow test tocheck whether the vector of parameters are equal across all three groups : SCs, STsand non-scheduled groups.
Secondly, I test whether each determinant, income, education and occupationinteracted with alternatively and jointly the SC and ST variables are jointly signi-ficant. To do so, I proceed with an incremental likelihood ratio χ2 test.
In the event that one of these determinants, say for instance income, has adiffering effect depending on caste, I estimate the base model defined by equation(1.6) including the income variable interacted with the SC ad ST binary variables.
5 Results
5.1 Base Model
Table 2.9 presented on next page displays the results from the estimation of thebase specification. In specification (1) scheduled groups are compared to non sche-duled groups, while specifications (2) and (3) compares SCs and STs to the rest ofthe population, controls being included in specification (3).
As expected, being from a scheduled group significantly decreases the likelihoodof ranking in high classes. Consistent with the hypothesis brought forward in thediscriminant analysis, being from a Scheduled Tribe has a much larger impact onperceived social class than that of being from a Scheduled Caste, although this pointwill be nuanced in the next section. Group is not the sole determinant of social iden-tity. Income, education and professions seem all to be relevant variables.
Nevertheless, the significance of the coefficients only show that the effect of thevariables differ from omitted variables. Should I change the benchmark scenarios,significance may differ. Therefore I need to test whether each parameter differ fromthe other. For instance, I need to test whether the impact of earning an incomeincluded in the first range is different from earning a second range income. This willbe performed based on specification (3).
70 5. RESULTS
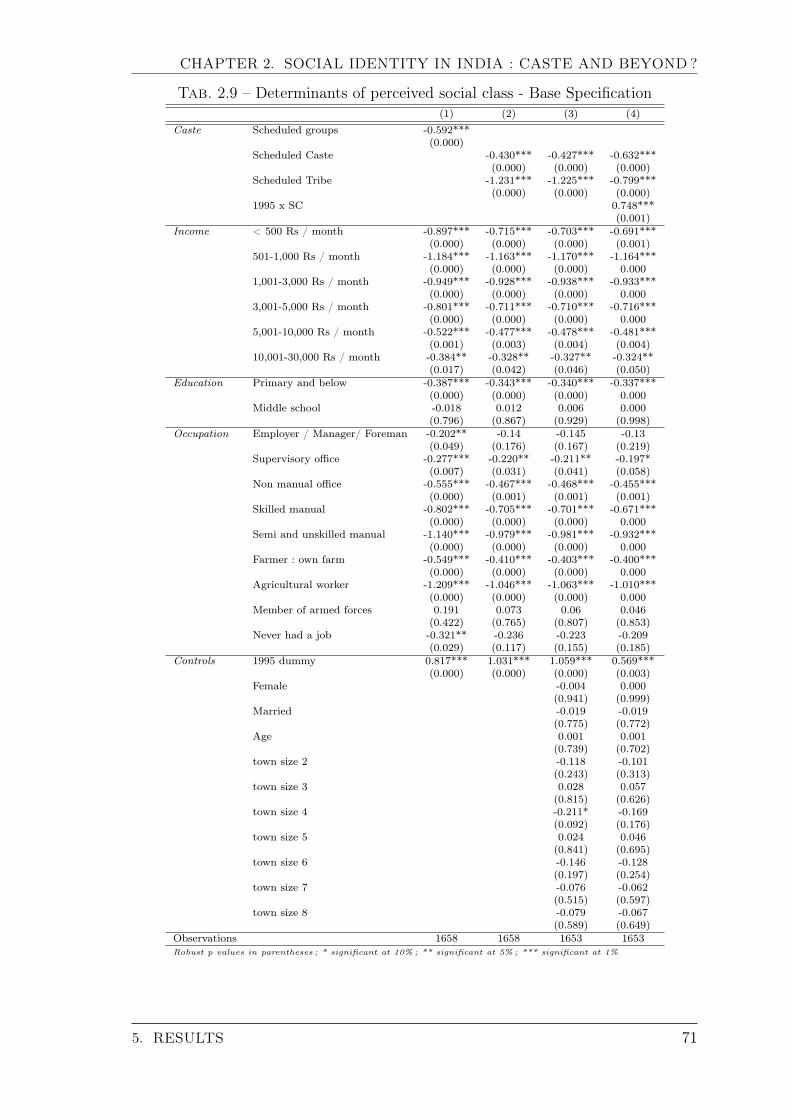
CHAPTER 2. SOCIAL IDENTITY IN INDIA : CASTE AND BEYOND?
Tab. 2.9 – Determinants of perceived social class - Base Specification(1) (2) (3) (4)
Caste Scheduled groups -0.592***(0.000)
Scheduled Caste -0.430*** -0.427*** -0.632***(0.000) (0.000) (0.000)
Scheduled Tribe -1.231*** -1.225*** -0.799***(0.000) (0.000) (0.000)
1995 x SC 0.748***(0.001)
Income < 500 Rs / month -0.897*** -0.715*** -0.703*** -0.691***(0.000) (0.000) (0.000) (0.001)
501-1,000 Rs / month -1.184*** -1.163*** -1.170*** -1.164***(0.000) (0.000) (0.000) 0.000
1,001-3,000 Rs / month -0.949*** -0.928*** -0.938*** -0.933***(0.000) (0.000) (0.000) 0.000
3,001-5,000 Rs / month -0.801*** -0.711*** -0.710*** -0.716***(0.000) (0.000) (0.000) 0.000
5,001-10,000 Rs / month -0.522*** -0.477*** -0.478*** -0.481***(0.001) (0.003) (0.004) (0.004)
10,001-30,000 Rs / month -0.384** -0.328** -0.327** -0.324**(0.017) (0.042) (0.046) (0.050)
Education Primary and below -0.387*** -0.343*** -0.340*** -0.337***(0.000) (0.000) (0.000) 0.000
Middle school -0.018 0.012 0.006 0.000(0.796) (0.867) (0.929) (0.998)
Occupation Employer / Manager/ Foreman -0.202** -0.14 -0.145 -0.13(0.049) (0.176) (0.167) (0.219)
Supervisory office -0.277*** -0.220** -0.211** -0.197*(0.007) (0.031) (0.041) (0.058)
Non manual office -0.555*** -0.467*** -0.468*** -0.455***(0.000) (0.001) (0.001) (0.001)
Skilled manual -0.802*** -0.705*** -0.701*** -0.671***(0.000) (0.000) (0.000) 0.000
Semi and unskilled manual -1.140*** -0.979*** -0.981*** -0.932***(0.000) (0.000) (0.000) 0.000
Farmer : own farm -0.549*** -0.410*** -0.403*** -0.400***(0.000) (0.000) (0.000) 0.000
Agricultural worker -1.209*** -1.046*** -1.063*** -1.010***(0.000) (0.000) (0.000) 0.000
Member of armed forces 0.191 0.073 0.06 0.046(0.422) (0.765) (0.807) (0.853)
Never had a job -0.321** -0.236 -0.223 -0.209(0.029) (0.117) (0.155) (0.185)
Controls 1995 dummy 0.817*** 1.031*** 1.059*** 0.569***(0.000) (0.000) (0.000) (0.003)
Female -0.004 0.000(0.941) (0.999)
Married -0.019 -0.019(0.775) (0.772)
Age 0.001 0.001(0.739) (0.702)
town size 2 -0.118 -0.101(0.243) (0.313)
town size 3 0.028 0.057(0.815) (0.626)
town size 4 -0.211* -0.169(0.092) (0.176)
town size 5 0.024 0.046(0.841) (0.695)
town size 6 -0.146 -0.128(0.197) (0.254)
town size 7 -0.076 -0.062(0.515) (0.597)
town size 8 -0.079 -0.067(0.589) (0.649)
Observations 1658 1658 1653 1653Robust p values in parentheses ; * significant at 10% ; ** significant at 5% ; *** significant at 1%
5. RESULTS 71
CHAPTER 2. SOCIAL IDENTITY IN INDIA : CASTE AND BEYOND?
5.1.1 The 1995 Issue
Before going any further into the analysis of the results, some comments areneeded on the salience of the effect of the 1995 dummy. The 1995 round is ratherunbalanced as shown by table 4.16 in appendix. During that round, the populationonly comprised SCs and STs, the latter representing approximately half of the in-formed observations. This probably explains, only partly as we shall see, the strongeffect of the 1995 dummy. Moreover, in the whole sample, SCs tend to live in largertowns which may induce a sampling bias, while the 2001 sub-sample seems to bemore balanced. Thus, the analysis conducted below is also run over the 2001 sub-sample and the results are presented in appendix11.
It should be noted that although the estimation over the whole sample concludesthat being and ST has a stronger effect than being an SC on perceived social class12,in accordance with the description given in the discriminant analysis, such a gapbetween the two scheduled groups is not found in the 2001 sub-sample (the differencein the coefficients is not significant anymore at conventional levels). Yet when themodel is estimated over the 1995 sub-sample, the SC group being the benchmark,such a gap strongly reappears as shown by table 4.17 in appendix.
When the model is estimated over the whole sample but allowing the effect ofbeing an SC to vary according to survey rounds (specification (4) of table 2.9), theSC coefficient is significantly different from that of the interacted term. On the otherhand, when the 1995 dummy is interacted with the ST variable instead of the SCvariable, its coefficient is not significantly different from the one associated withthe ST dummy. This, unfortunately, supports the hypothesis that there is a sizablesampling bias related to SCs, which probably explains why SCs characteristics werenot very different from those of the non-scheduled group. Indeed the Scheduled Casteeffect is much stronger in the 2001 sub-sample. This bias also may partly explainthe large 1995 effect, given that in specification (4) the coefficient associated withthe 1995 dummy is halved, although its impact remains large and significant, whichsuggests that only a part of the problem has been removed13. This is the reason whyI proceed with the same kind of analysis as below on the 2001 sub-sample. To savespace and clarity, results are presented in appendix, although some comments onthem will be included in the course of the chapter. 14
11pages 162 to 16812The difference in the coefficients associated with the SC and ST variables is significant at a
1% threshold (χ2 at 97.62) and is estimated at 0.797613Another reason for the potential large effect of the 1995 dummy may be that the two rounds
were badly reconciled14The differing effect of being an SC between 1995 and 2001 is not devoid of information.
Assuming that sampled SCs had better characteristics in 1995 than in 2001, as it seems to be thecase, and the fact that caste membership has a smaller effect in the 1995 sample concur with theview that improvements in characteristics may partly cancel the Scheduled Caste effect.
72 5. RESULTS
CHAPTER 2. SOCIAL IDENTITY IN INDIA : CASTE AND BEYOND?
5.1.2 Tests on Coefficients and Thresholds for Each Variable Type
Education
Results show that the impact of secondary school attendance is not differentfrom that of the omitted category, that is university attendance. Having only pri-mary education has a significant negative impact on perceived social status. Thus,the real divide lies between primary education and above. The test of the equalityof coefficients associated with secondary school and primary do conclude that theydiffer (χ2 = 22.02 ; P > χ2 = 0.000). The two upper educational levels may andwill therefore be aggregated into one new variable that will be the omitted one fromnow on15. It should be noted that acquiring education beyond primary can onlycounterbalance half of the effect of being from an SC or an ST. Out of the four at-tributes identified as contributing to perceived social class that are groups, income,occupation and education, the latter has the smallest effect.
Occupation
Being enrolled in the army, an employer and not being occupied are not signifi-cant, meaning that their impact on perceived social status is not different from thatof being a professional worker (the omitted category). The results from the test ofequality of the parameters associated with each of these variables are provided intable 2.10 on next page. From this test it can be concluded that parameters do notdiffer across these three occupations, namely being a professional, an employer, inthe army or without a job. Therefore, they are aggregated into one variable namedoccupation1. This category makes more sense than it appears. As already mentio-ned, being a professional is probably the most well regarded position, given that allother compares unfavorably to it as shown by the negative coefficients associatedwith occupations. It is also the highest paying occupation16. Second, it can easily beunderstood why being in the army or an employer may be valued, besides providingrelatively high incomes. The case of "never had a job" is more peculiar, as mentionedearlier. The fact that its impact is similar to other supervisory occupations supportsthe hypothesis that this category is mainly comprised of self-employed individuals.
The impact of being a supervisory office worker does not significantly differ fromthe occupation1 group when the model is reassessed17 and is therefore incorporatedinto it. occupation1 becomes the omitted category. The reason that prevented fromdoing so in the first step was the significant difference in parameters between thisoccupation and being a professional worker. Yet, such a difference does not provesignificant anymore and I feel authorized to combine the variables.
Table 2.10 shows that the coefficients associated with being a non manual officeworker and cultivating one’s own farm do not differ. They are therefore combined toform a new variable occupation2. Please note that being an office worker does nothave a significantly differing impact compared to cultivating own one’s farm. Yet
15Please note that the analysis over the 2001 sub-sample leads to the same conclusions.16please refer to table 4.12 in appendix for income distribution across occupations17please refer to table 4.26 in appendix
5. RESULTS 73
CHAPTER 2. SOCIAL IDENTITY IN INDIA : CASTE AND BEYOND?
the difference between being a cultivator and a skilled manual is significant. ThusI did not incorporate this last activity into occupation2. For the sake of clarity thevariable skilled manual is renamed occupation3. Table 2.10 also shows that there isno difference in the effect of being a low skilled manual worker and an agricultu-ral laborer. Thus these two occupations are merged to form the variable occupation4.
74 5. RESULTS
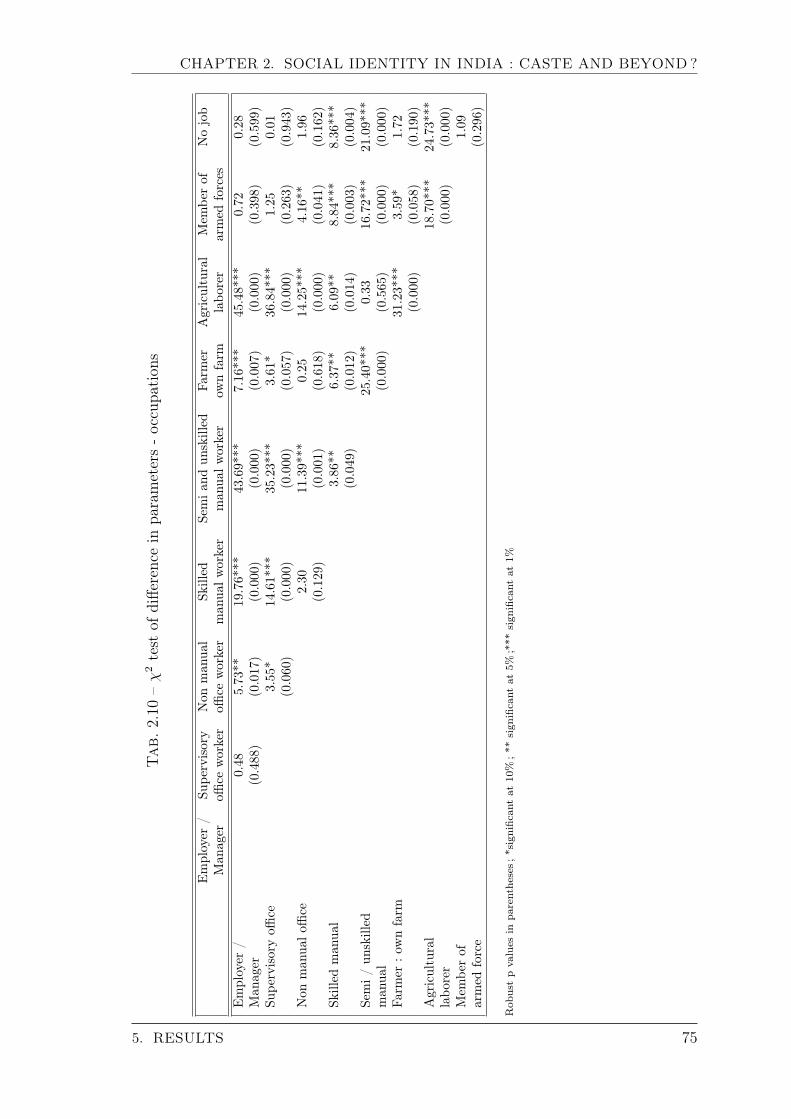
CHAPTER 2. SOCIAL IDENTITY IN INDIA : CASTE AND BEYOND?
Tab.
2.10
–χ
2test
ofdiffe
rencein
parameters-occupa
tion
s
Employer
/Su
pervisory
Non
man
ual
Skilled
Semia
ndun
skilled
Farm
erAgricultural
Mem
berof
Nojob
Man
ager
office
worker
office
worker
man
ualw
orker
man
ualw
orker
ownfarm
labo
rer
armed
forces
Employer
/0.48
5.73**
19.76***
43.69***
7.16***
45.48***
0.72
0.28
Man
ager
(0.488)
(0.017)
(0.000)
(0.000)
(0.007)
(0.000)
(0.398)
(0.599)
Supe
rvisoryoffi
ce3.55*
14.61***
35.23***
3.61*
36.84***
1.25
0.01
(0.060)
(0.000)
(0.000)
(0.057)
(0.000)
(0.263)
(0.943)
Non
man
ualo
ffice
2.30
11.39***
0.25
14.25***
4.16**
1.96
(0.129)
(0.001)
(0.618)
(0.000)
(0.041)
(0.162)
Skilled
man
ual
3.86**
6.37**
6.09**
8.84***
8.36***
(0.049)
(0.012)
(0.014)
(0.003)
(0.004)
Semi/
unskilled
25.40***
0.33
16.72***
21.09***
man
ual
(0.000)
(0.565)
(0.000)
(0.000)
Farm
er:o
wnfarm
31.23***
3.59*
1.72
(0.000)
(0.058)
(0.190)
Agricultural
18.70***
24.73***
labo
rer
(0.000)
(0.000)
Mem
berof
1.09
armed
force
(0.296)
Rob
ustpvalues
inpa
rentheses;
*significan
tat
10%;**
sign
ificant
at5%
;***
sign
ificant
at1%
5. RESULTS 75
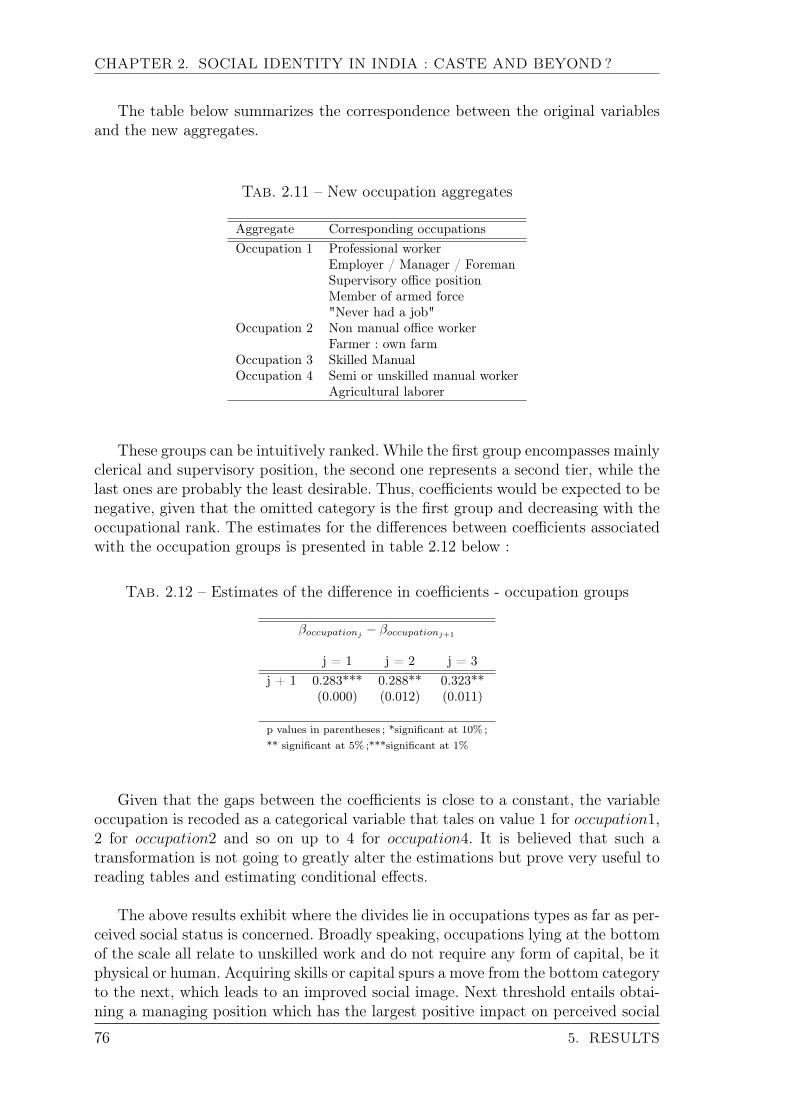
CHAPTER 2. SOCIAL IDENTITY IN INDIA : CASTE AND BEYOND?
The table below summarizes the correspondence between the original variablesand the new aggregates.
Tab. 2.11 – New occupation aggregates
Aggregate Corresponding occupationsOccupation 1 Professional worker
Employer / Manager / ForemanSupervisory office positionMember of armed force"Never had a job"
Occupation 2 Non manual office workerFarmer : own farm
Occupation 3 Skilled ManualOccupation 4 Semi or unskilled manual worker
Agricultural laborer
These groups can be intuitively ranked. While the first group encompasses mainlyclerical and supervisory position, the second one represents a second tier, while thelast ones are probably the least desirable. Thus, coefficients would be expected to benegative, given that the omitted category is the first group and decreasing with theoccupational rank. The estimates for the differences between coefficients associatedwith the occupation groups is presented in table 2.12 below :
Tab. 2.12 – Estimates of the difference in coefficients - occupation groups
βoccupationj− βoccupationj+1
j = 1 j = 2 j = 3j + 1 0.283*** 0.288** 0.323**
(0.000) (0.012) (0.011)
p values in parentheses ; *significant at 10% ;** significant at 5% ;***significant at 1%
Given that the gaps between the coefficients is close to a constant, the variableoccupation is recoded as a categorical variable that tales on value 1 for occupation1,2 for occupation2 and so on up to 4 for occupation4. It is believed that such atransformation is not going to greatly alter the estimations but prove very useful toreading tables and estimating conditional effects.
The above results exhibit where the divides lie in occupations types as far as per-ceived social status is concerned. Broadly speaking, occupations lying at the bottomof the scale all relate to unskilled work and do not require any form of capital, be itphysical or human. Acquiring skills or capital spurs a move from the bottom categoryto the next, which leads to an improved social image. Next threshold entails obtai-ning a managing position which has the largest positive impact on perceived social
76 5. RESULTS
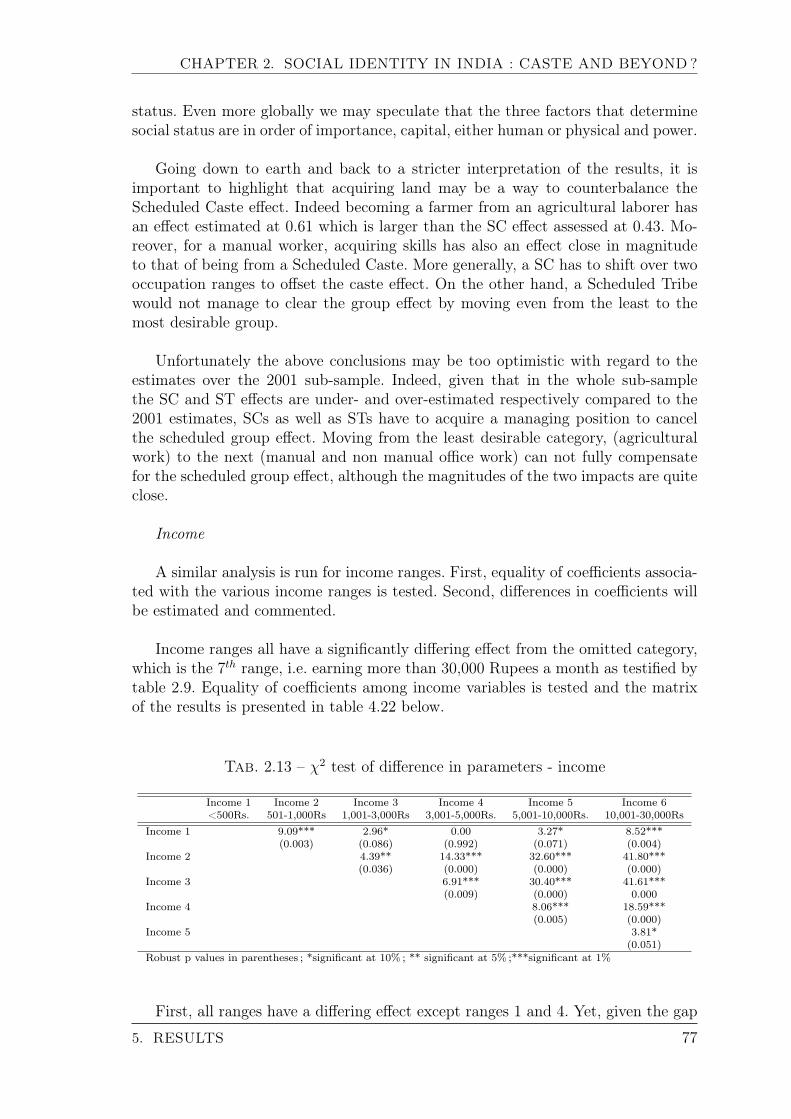
CHAPTER 2. SOCIAL IDENTITY IN INDIA : CASTE AND BEYOND?
status. Even more globally we may speculate that the three factors that determinesocial status are in order of importance, capital, either human or physical and power.
Going down to earth and back to a stricter interpretation of the results, it isimportant to highlight that acquiring land may be a way to counterbalance theScheduled Caste effect. Indeed becoming a farmer from an agricultural laborer hasan effect estimated at 0.61 which is larger than the SC effect assessed at 0.43. Mo-reover, for a manual worker, acquiring skills has also an effect close in magnitudeto that of being from a Scheduled Caste. More generally, a SC has to shift over twooccupation ranges to offset the caste effect. On the other hand, a Scheduled Tribewould not manage to clear the group effect by moving even from the least to themost desirable group.
Unfortunately the above conclusions may be too optimistic with regard to theestimates over the 2001 sub-sample. Indeed, given that in the whole sub-samplethe SC and ST effects are under- and over-estimated respectively compared to the2001 estimates, SCs as well as STs have to acquire a managing position to cancelthe scheduled group effect. Moving from the least desirable category, (agriculturalwork) to the next (manual and non manual office work) can not fully compensatefor the scheduled group effect, although the magnitudes of the two impacts are quiteclose.
Income
A similar analysis is run for income ranges. First, equality of coefficients associa-ted with the various income ranges is tested. Second, differences in coefficients willbe estimated and commented.
Income ranges all have a significantly differing effect from the omitted category,which is the 7th range, i.e. earning more than 30,000 Rupees a month as testified bytable 2.9. Equality of coefficients among income variables is tested and the matrixof the results is presented in table 4.22 below.
Tab. 2.13 – χ2 test of difference in parameters - income
Income 1 Income 2 Income 3 Income 4 Income 5 Income 6<500Rs. 501-1,000Rs 1,001-3,000Rs 3,001-5,000Rs. 5,001-10,000Rs. 10,001-30,000Rs
Income 1 9.09*** 2.96* 0.00 3.27* 8.52***(0.003) (0.086) (0.992) (0.071) (0.004)
Income 2 4.39** 14.33*** 32.60*** 41.80***(0.036) (0.000) (0.000) (0.000)
Income 3 6.91*** 30.40*** 41.61***(0.009) (0.000) 0.000
Income 4 8.06*** 18.59***(0.005) (0.000)
Income 5 3.81*(0.051)
Robust p values in parentheses ; *significant at 10% ; ** significant at 5% ;***significant at 1%
First, all ranges have a differing effect except ranges 1 and 4. Yet, given the gap
5. RESULTS 77
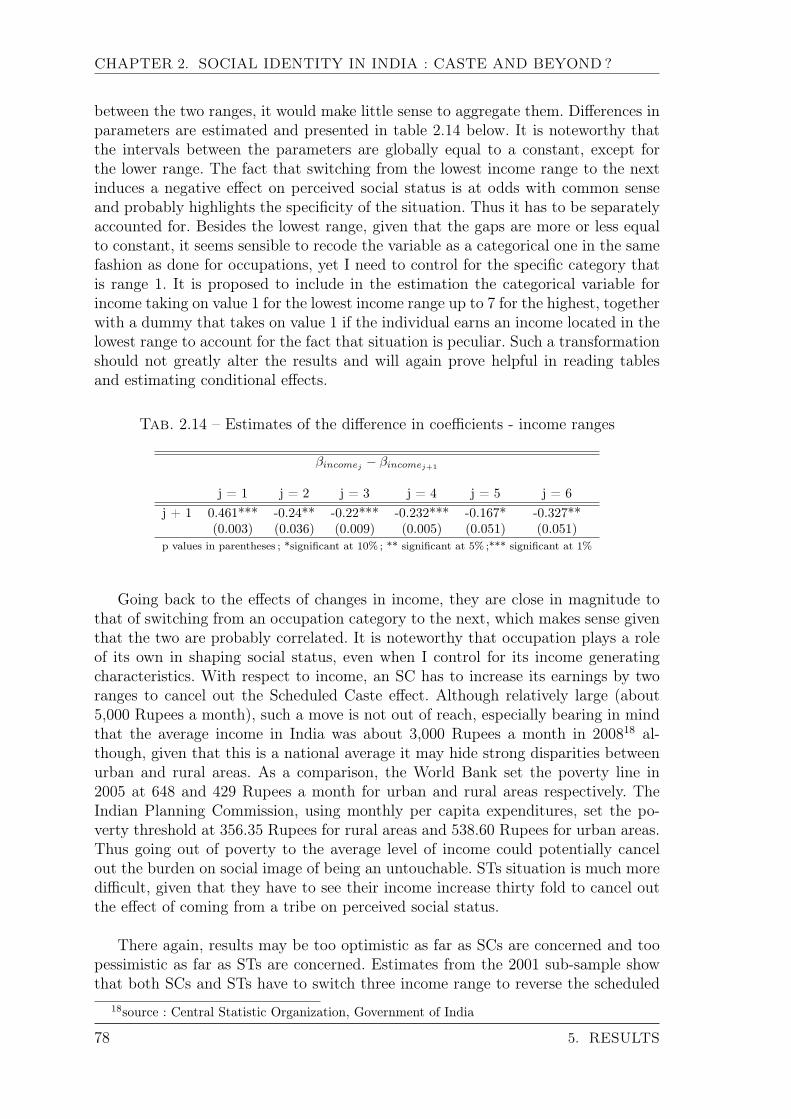
CHAPTER 2. SOCIAL IDENTITY IN INDIA : CASTE AND BEYOND?
between the two ranges, it would make little sense to aggregate them. Differences inparameters are estimated and presented in table 2.14 below. It is noteworthy thatthe intervals between the parameters are globally equal to a constant, except forthe lower range. The fact that switching from the lowest income range to the nextinduces a negative effect on perceived social status is at odds with common senseand probably highlights the specificity of the situation. Thus it has to be separatelyaccounted for. Besides the lowest range, given that the gaps are more or less equalto constant, it seems sensible to recode the variable as a categorical one in the samefashion as done for occupations, yet I need to control for the specific category thatis range 1. It is proposed to include in the estimation the categorical variable forincome taking on value 1 for the lowest income range up to 7 for the highest, togetherwith a dummy that takes on value 1 if the individual earns an income located in thelowest range to account for the fact that situation is peculiar. Such a transformationshould not greatly alter the results and will again prove helpful in reading tablesand estimating conditional effects.
Tab. 2.14 – Estimates of the difference in coefficients - income ranges
βincomej − βincomej+1
j = 1 j = 2 j = 3 j = 4 j = 5 j = 6j + 1 0.461*** -0.24** -0.22*** -0.232*** -0.167* -0.327**
(0.003) (0.036) (0.009) (0.005) (0.051) (0.051)p values in parentheses ; *significant at 10% ; ** significant at 5% ;*** significant at 1%
Going back to the effects of changes in income, they are close in magnitude tothat of switching from an occupation category to the next, which makes sense giventhat the two are probably correlated. It is noteworthy that occupation plays a roleof its own in shaping social status, even when I control for its income generatingcharacteristics. With respect to income, an SC has to increase its earnings by tworanges to cancel out the Scheduled Caste effect. Although relatively large (about5,000 Rupees a month), such a move is not out of reach, especially bearing in mindthat the average income in India was about 3,000 Rupees a month in 200818 al-though, given that this is a national average it may hide strong disparities betweenurban and rural areas. As a comparison, the World Bank set the poverty line in2005 at 648 and 429 Rupees a month for urban and rural areas respectively. TheIndian Planning Commission, using monthly per capita expenditures, set the po-verty threshold at 356.35 Rupees for rural areas and 538.60 Rupees for urban areas.Thus going out of poverty to the average level of income could potentially cancelout the burden on social image of being an untouchable. STs situation is much moredifficult, given that they have to see their income increase thirty fold to cancel outthe effect of coming from a tribe on perceived social status.
There again, results may be too optimistic as far as SCs are concerned and toopessimistic as far as STs are concerned. Estimates from the 2001 sub-sample showthat both SCs and STs have to switch three income range to reverse the scheduled
18source : Central Statistic Organization, Government of India
78 5. RESULTS
CHAPTER 2. SOCIAL IDENTITY IN INDIA : CASTE AND BEYOND?
group effect. In practical terms, this means that they have to see their income in-crease from 1,000Rs or less to more than 5,000Rs per month or to earn more than10,000Rs. As a comparison, Banerjee and Piketty (2005) assessed, based on tax re-turns data in 1999-2000, that the top percentile earned approximately 7,300Rs andmore per month19. The top 0.5% of the population, earn more than 12,000Rs amonth, so the jump needed is quite large.
To summarize the findings of this section20, four points can be made. First, casteseems less a burden on perceived social status for Scheduled Castes than for Sche-duled Tribes, although this may be driven by a potential sampling bias. Second,the most effective way to improve perceived social class and to cancel the scheduledgroup effect is an improvement in the occupational status, and more particularly theacquisition of a managing position. Third, relatively large sifts in income are nee-ded to reverse the scheduled group effect. Fourth, education has a relatively modestimpact on perceived social class and provided it is beyond primary school.
However, by comparing the effects of castes to that of other variables, I made theimplicit assumption that other determinants of social identity have a similar effectacross castes. This assumption may not be tenable. It would be of some interest toinvestigate whether caste may modify the impact of income, education or occupa-tion. In this event, caste would not only have an impact of itself but also throughthe alterations of the effects of other variables.
5.1.3 Conditional Effects
In order to address this issue, I will first test whether the set of coefficients fromthe base model is the same among the three groups, Scheduled Castes, ScheduledTribes and non scheduled groups. A likelihood-ratio Chow test obtained by fittingthe model for each of the three groups and then comparing the results with thoseof the base model estimated over the whole sample concluded that the parametersvectors do significantly differ across castes at the 1% level of significance (likelihoodratio χ2 = 84.24). The same test also concludes that coefficients differ between sche-duled and non scheduled group (likelihood ratio χ2 = 36.08 significant at 1%) andbetween the sc and st ((likelihood ratio χ2 = 48.15 significant at 1%). Determi-nants of perceived social class may therefore not have the same effect within everygroup. For instance, income may be effective at increasing the perceived social statusof members of the non scheduled group but irrelevant for scheduled groups members.
The same test performed on the 2001 sub-sample yield contrary results. Giventhe small sizes of the SCs and STs populations, I was only able to compare scheduledand non-scheduled groups. The test concludes that the effect of other characteristics,besides groups’ membership, does not vary across groups. However, we may havecome up against lack of data.
19The exact number is 87,633Rs a year. Four millions individuals fall into the top percentile20A table comparing the results obtained from the whole sample and the 2001 sub-sample is
presented on page 168
5. RESULTS 79
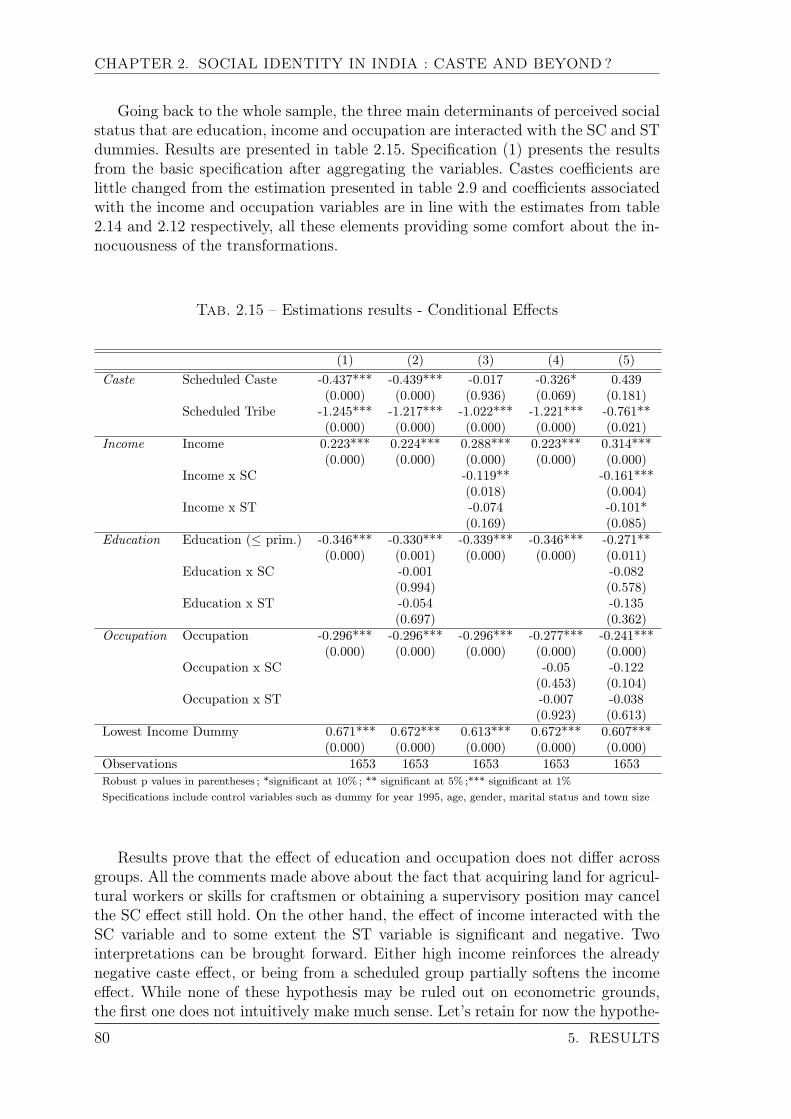
CHAPTER 2. SOCIAL IDENTITY IN INDIA : CASTE AND BEYOND?
Going back to the whole sample, the three main determinants of perceived socialstatus that are education, income and occupation are interacted with the SC and STdummies. Results are presented in table 2.15. Specification (1) presents the resultsfrom the basic specification after aggregating the variables. Castes coefficients arelittle changed from the estimation presented in table 2.9 and coefficients associatedwith the income and occupation variables are in line with the estimates from table2.14 and 2.12 respectively, all these elements providing some comfort about the in-nocuousness of the transformations.
Tab. 2.15 – Estimations results - Conditional Effects
(1) (2) (3) (4) (5)Caste Scheduled Caste -0.437*** -0.439*** -0.017 -0.326* 0.439
(0.000) (0.000) (0.936) (0.069) (0.181)Scheduled Tribe -1.245*** -1.217*** -1.022*** -1.221*** -0.761**
(0.000) (0.000) (0.000) (0.000) (0.021)Income Income 0.223*** 0.224*** 0.288*** 0.223*** 0.314***
(0.000) (0.000) (0.000) (0.000) (0.000)Income x SC -0.119** -0.161***
(0.018) (0.004)Income x ST -0.074 -0.101*
(0.169) (0.085)Education Education (≤ prim.) -0.346*** -0.330*** -0.339*** -0.346*** -0.271**
(0.000) (0.001) (0.000) (0.000) (0.011)Education x SC -0.001 -0.082
(0.994) (0.578)Education x ST -0.054 -0.135
(0.697) (0.362)Occupation Occupation -0.296*** -0.296*** -0.296*** -0.277*** -0.241***
(0.000) (0.000) (0.000) (0.000) (0.000)Occupation x SC -0.05 -0.122
(0.453) (0.104)Occupation x ST -0.007 -0.038
(0.923) (0.613)Lowest Income Dummy 0.671*** 0.672*** 0.613*** 0.672*** 0.607***
(0.000) (0.000) (0.000) (0.000) (0.000)Observations 1653 1653 1653 1653 1653Robust p values in parentheses ; *significant at 10% ; ** significant at 5% ;*** significant at 1%Specifications include control variables such as dummy for year 1995, age, gender, marital status and town size
Results prove that the effect of education and occupation does not differ acrossgroups. All the comments made above about the fact that acquiring land for agricul-tural workers or skills for craftsmen or obtaining a supervisory position may cancelthe SC effect still hold. On the other hand, the effect of income interacted with theSC variable and to some extent the ST variable is significant and negative. Twointerpretations can be brought forward. Either high income reinforces the alreadynegative caste effect, or being from a scheduled group partially softens the incomeeffect. While none of these hypothesis may be ruled out on econometric grounds,the first one does not intuitively make much sense. Let’s retain for now the hypothe-
80 5. RESULTS
CHAPTER 2. SOCIAL IDENTITY IN INDIA : CASTE AND BEYOND?
sis that being from a scheduled group partially neutralizes the income effect. Thiswould mean that caste or tribe may have an impact of its own or/and also througha diminished income effect. This is what seems to be happening. As soon as theincome effect is allowed to vary between groups, the coefficient associated with theScheduled Caste variable looses significance. This would imply that, as far as SCsare concerned, the caste effect mainly runs through a reduced effect of income. Theinsignificance of the coefficient associated with the SC variable pleads in favor of thesecond explanation. A couple of words need to be said about the insignificance ofthe income variable interacted with the ST variable (specification (3)). As alreadymentioned, income may be correlated with occupation and to some extent education.Thus the income variable will probably feel the effects of not allowing education andoccupation to vary across groups. When this last procedure is allowed, (specification(5)), the interaction of income and ST recovers significance, though only at the 10%threshold. This last specification is probably the most relevant of the two and willbe focussed on.
One of the reasons for the canceling out of the SC effect and the negative sign ofincome interacted is that SC do not declare themselves in the high social positionstheir income would induce but rather in lower position due to their caste identity.In this instance the caste effect does not have an impact of its own but rather ma-nifests itself through the reduced likelihood for wealthy SCs to perceive themselvesas belonging to high social classes due to their caste membership. This process isoften referred to as cognitive dissonance in social psychology. The concept describesa situation experienced by an individual that challenges his self-image and as suchgenerates anxiety. Subjects need to move out of the conflict and they may do soby repressing the contradictory situation 21. This process may help at explainingwhy SCs who are as well endowed with wealth or education as scheduled groups,as descriptive statistics suggested, still do declare themselves in a relatively lowposition, compared to the non-scheduled groups. Fortunately, the picture is not sodark. Even if income has an additional negative effect among the SCs, the overallincome effect is likely to be positive, although almost half that of non scheduledgroups. Compared to non scheduled groups, SCs will have to increase twice as muchtheir income to feel that they belong to the same social class as non scheduled groups.
On the contrary, the direct group effect is rather robust for the STs. Coefficientsassociated with the ST variable retains its significance, while the effect of incomeon improving perceived social status is negative when interacted with ST. Thisgroup suffers from a double effect. Not only does the tribal origin imposes a directconstraint on the perceived social status, but it also has a indirect one through thediminished effect of income. ST individuals do declare themselves in a lower positionthan their income would suggest because of their tribal origin.
21for more information on this and the related concept of stereotype threat, please refer tosection 2.1.5 of the general introduction
5. RESULTS 81
CHAPTER 2. SOCIAL IDENTITY IN INDIA : CASTE AND BEYOND?
5.2 Summary of Main Results
Group membership is a strong determinant of perceived social class. Nevertheless,caste or tribe are not the sole determinants of perceived social class and occupation,income and to some extent education all exhibit a relevant impact. Being from aScheduled Caste or Tribe has a relatively strong effect, especially given the fact thatlarge increases in income or the acquisition of a managing position can reverse thegroups’ effects, while education can not. The analysis of the whole sample concludesthat income has a reduced impact on perceived social class among scheduled groups,a result that echoes the findings of the stereotype threat literature. This conclusionis somewhat tempered by the analysis of the 2001 sub-sample, although it may havecome up against data scarcity.
6 Potential Issues
6.1 Local Environment
One of the dimension that is missing in the analysis is the respondent’s envi-ronment and most notably the local composition of the villages. Indeed it could beargued that in villages that are extremely homogenous in terms of castes, say forinstance untouchables villages, social identity rests much more on other economicvariables while caste may be less salient. Unfortunately there is little I can do, giventhat the only information about the respondent’s location available is the state. Asa robustness check state fixed effects were included (specification (2) of table 2.16on next page) and can be compared to the base specification reproduced for conve-nience in column (1). The percentage of SCs and STs in the state’s population22was included in the base equation as a control variable (specification (3)) as well astheir quadratic terms to capture potential non linear effects (specification(4)) andare then interacted with the caste variables (specification (5)).
The inclusion of state fixed effects did not modify the results to a large extent.The results are robust to the inclusion of the state’s percentage of SCs and STsas coefficients are hardly modified by this inclusion. Only the percentage of STsin the population is relevant and has a U-shaped effect as shown by specification(4). However, the coefficient associated with the SC variable largely decreased afterthe inclusion of the interacted terms. This provides some support to the hypothesisthat the caste effect does probably depend on the local social composition. Thecoefficient associated to the interacted term is positive although not significant atconventional levels. The lack of significance probably stems from the crudeness ofthe measure which is the state’s population composition, whereas local informationwould be more appropriate. It would not be too surprising to see finer measuresbecoming significant. Nevertheless, coefficients tend to indicate that the tendencyto rank in high social classes increases with the representation of the individual’scaste or tribe. The lack of information on the local social composition in termsof groups is definitely a limitation of this piece of work. Yet, results probably donot have to be entirely reconsidered since after these robustness checks, signs and
22This information comes from the 2001 Census of India
82 6. POTENTIAL ISSUES
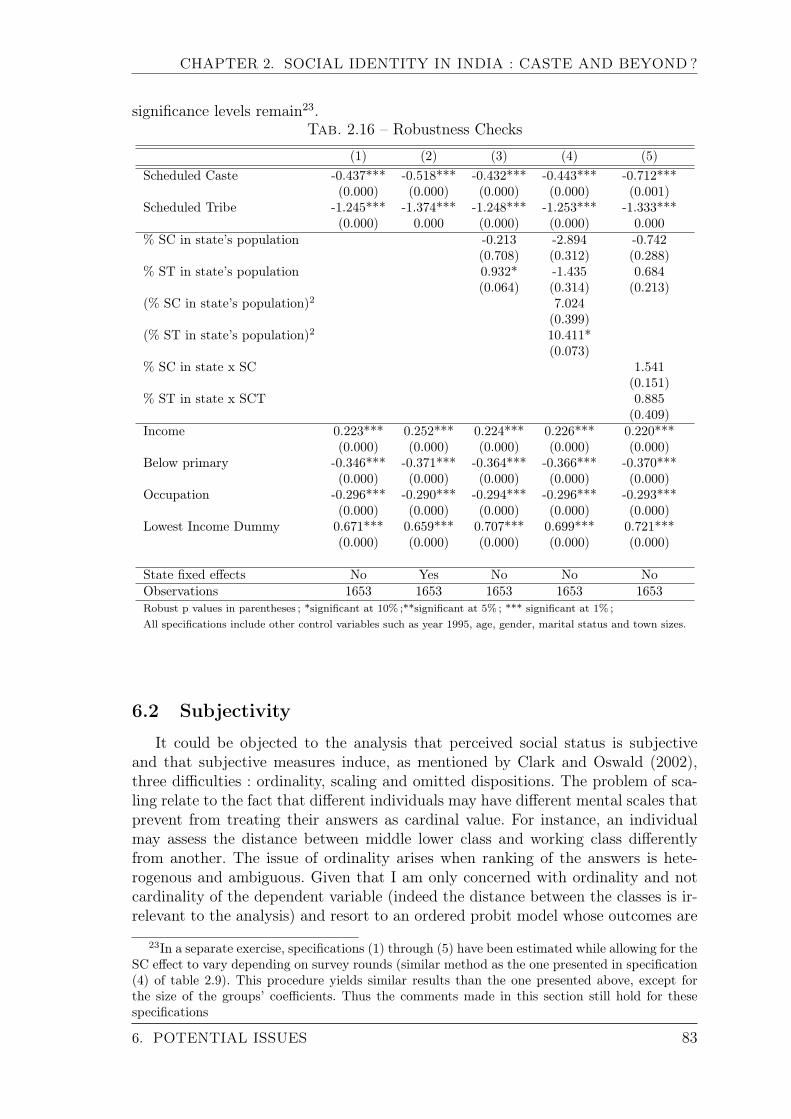
CHAPTER 2. SOCIAL IDENTITY IN INDIA : CASTE AND BEYOND?
significance levels remain23.Tab. 2.16 – Robustness Checks
(1) (2) (3) (4) (5)Scheduled Caste -0.437*** -0.518*** -0.432*** -0.443*** -0.712***
(0.000) (0.000) (0.000) (0.000) (0.001)Scheduled Tribe -1.245*** -1.374*** -1.248*** -1.253*** -1.333***
(0.000) 0.000 (0.000) (0.000) 0.000% SC in state’s population -0.213 -2.894 -0.742
(0.708) (0.312) (0.288)% ST in state’s population 0.932* -1.435 0.684
(0.064) (0.314) (0.213)(% SC in state’s population)2 7.024
(0.399)(% ST in state’s population)2 10.411*
(0.073)% SC in state x SC 1.541
(0.151)% ST in state x SCT 0.885
(0.409)Income 0.223*** 0.252*** 0.224*** 0.226*** 0.220***
(0.000) (0.000) (0.000) (0.000) (0.000)Below primary -0.346*** -0.371*** -0.364*** -0.366*** -0.370***
(0.000) (0.000) (0.000) (0.000) (0.000)Occupation -0.296*** -0.290*** -0.294*** -0.296*** -0.293***
(0.000) (0.000) (0.000) (0.000) (0.000)Lowest Income Dummy 0.671*** 0.659*** 0.707*** 0.699*** 0.721***
(0.000) (0.000) (0.000) (0.000) (0.000)
State fixed effects No Yes No No NoObservations 1653 1653 1653 1653 1653Robust p values in parentheses ; *significant at 10% ;**significant at 5% ; *** significant at 1% ;All specifications include other control variables such as year 1995, age, gender, marital status and town sizes.
6.2 Subjectivity
It could be objected to the analysis that perceived social status is subjectiveand that subjective measures induce, as mentioned by Clark and Oswald (2002),three difficulties : ordinality, scaling and omitted dispositions. The problem of sca-ling relate to the fact that different individuals may have different mental scales thatprevent from treating their answers as cardinal value. For instance, an individualmay assess the distance between middle lower class and working class differentlyfrom another. The issue of ordinality arises when ranking of the answers is hete-rogenous and ambiguous. Given that I am only concerned with ordinality and notcardinality of the dependent variable (indeed the distance between the classes is ir-relevant to the analysis) and resort to an ordered probit model whose outcomes are
23In a separate exercise, specifications (1) through (5) have been estimated while allowing for theSC effect to vary depending on survey rounds (similar method as the one presented in specification(4) of table 2.9). This procedure yields similar results than the one presented above, except forthe size of the groups’ coefficients. Thus the comments made in this section still hold for thesespecifications
6. POTENTIAL ISSUES 83
CHAPTER 2. SOCIAL IDENTITY IN INDIA : CASTE AND BEYOND?
easy to rank (it is believed that the ranking of social classes is obvious), the first twodifficulties of ordinality and scaling are overcome.The omitted disposition problemis somewhat more tricky. If the perceived outcome is assumed to be correlated withindividuals tempers that may in turn affect explanatory variables, I am left withan omitted variable problem. As Clark and Oswald (2002) puts it "cross-sectionequations will be unreliable whenever unobservable characteristics (like a person’snatural cheerfulness) are correlated with observable characteristics (like education)".On this particular point I would rely on Clark and Oswald (2002), whose conclusionsare "in happiness research, the biases in cross section patterns may be less dramaticthan has sometimes been supposed".
It could also be objected that the declared social class may not correspond toreality. Three arguments could be made to tackle this issue. First, I want to insistthat there can not be any sort of objectivity in the definition of social class. Evenwhen researchers in sociology or statisticians try to match populations with socialclasses, they have to make a judgement call about the class segmentation, whichnecessarily brings in subjectivity. It is true that some elements allow to assess thesociological distance between individuals, such as income, lifestyles or education andaccording to such distances, clusters may be identified. Yet, the sociological distanceis a continuum and where one class should start and the other end is a subjective de-cision. Therefore, I would argue that there are no "real" or objective classes. Second,given that the question about classes was translated, it is very likely that respon-dents felt they were asked to rank themselves on a scale did not attach too muchimportance on the strict definition of the word "class". Third, it should be stressedthat my analysis focuses on perceived social class and the question as to whetherthis perception is in conformity with some sort of reality is irrelevant. My interestlies mainly in analyzing whether a determinant of social class has the same effectdepending on identity. So the processes that are investigated are entirely subjective.
6.3 Peer Control
Another important point that is also missing in the analysis is peer control. De-clared perceived social rank may differ when it has to be publicly revealed and whenit is confided to the interviewer potentially due to "stereotype threat" mentionedin introduction. One could easily imagine that an untouchable would depreciate itssocial class if he had to announce it in front of higher castes. My results which arebased on data collected during face to face interviews, where the interviewer didnot reveal his identity, should therefore be interpreted with care and I have tried toinsist on the fact that I am concerned with the individual’s perceived status. Theintuition though is that peer control would exaggerate the caste effect.
It would definitely be of great interest to assess potential discrepancies betweenthe perceived social status and the one publicly declared. Akerlof and Kranton (2000)showed that social identity is highly dependent on the actions undertaken by others.Thus we may think that such a discrepancy between the self perceived social identityand the declared one, probably exists and as noted by previous authors are a source
84 6. POTENTIAL ISSUES
CHAPTER 2. SOCIAL IDENTITY IN INDIA : CASTE AND BEYOND?
of anxiety.
Moreover, it would be valuable to investigate the perception others have of ego.Indeed, I would hypothesize that discrimination is multi faceted and does not uni-quely stem from a one-way act imposed by a discriminator. We may actually thinkof at least three sources of discrimination : (i) an internalized idea about one’s statusthat is not necessarily confronted with others’ opinions (and this is what is inves-tigated in this chapter), (2) an idea an individual may have about himself that isdeclared and thus may be approved or contradicted by others and (3) and how othersassess the identity of this individual. Arguably, these are the three main componentsof discrimination and disentangling the three would prove an interesting area for fu-ture research.
6.4 Religion
As mentioned in section 2.1 the analysis is restricted to the Hindu population,given that information about castes is not available for other denominations. Giventhat presumably caste is not so salient among other denominations, the group’s ef-fect may be overestimated with respect to its effect over the whole population.
The inclusion of religion in the forming of perceived social status poses questionsthat are both compelling and fraught with consequences, especially in the contextof rising religious tensions in India. The first one wonders whether religious identitymay supplant caste identity and under what circumstances. There are many possiblefactors for identity in India such as religion, caste, language, geography etc. Howcome that one becomes more salient than another ? Suppose that religious identityprevails. In this case, analyzing social fractionalization along the lines of caste todetermine its impact on a lack of cooperation does not seem relevant. Secondly,if religious denomination has a strong impact on perceived social status, besideswealth, education, castes or occupations, then claims from religious groups, thatmay prompt social tensions, may be better assessed. To sum up, understanding therise of a specific identity at the expense of others may prove quite fruitful and is leftfor future research.
7 Conclusions
Scheduled Castes do not seem to be less well endowed with education, incomeor prestigious occupations than non-scheduled groups as descriptive statistics haveshown. On the other hand, Scheduled Tribes earn less, are less educated and occupyless prestigious occupations. Logic would command that SCs classify themselves si-milarly to the non-scheduled groups. This would be without accounting for caste.Caste is a strong determinant of social status in India, yet it is not the only one. Oc-cupations, income and to some extent education are all relevant factors of perceivedsocial class. Nevertheless, the caste effect is quite strong given the fact that largeincreases in either income or occupational status are necessary to reverse it. Being aScheduled Tribe has a similar effect as being an SC and the same conclusions hold
7. CONCLUSIONS 85
CHAPTER 2. SOCIAL IDENTITY IN INDIA : CASTE AND BEYOND?
for this group as well, except that the way they perceive their social status, not onlyis depressed by their tribal origins, but also by reduced endowments.
It has been shown that even when social class is declared privately, castes andtribes have a strong effect, which suggests that a depreciated self-image has beeninternalized. I have argued that if class had been declared publicly, the group’s effectwould have been even stronger,as experiments about stereotype threats have shown.We may also inquire what would be the judgements made by others about the socialstatus of the individual be and what would be the impact of castes and tribes onit. It could be hypothesized that the joint influence of these three elements is whatconstitutes discrimination. Discrimination has often been viewed as one-way actimposed by a discriminator, but this may only be the tip of the iceberg and socialidentity ought to be included in the analysis of discrimination. These investigationsare left for future research.
86 7. CONCLUSIONS

Chapter 3
Is Blood Thicker Than Water ?Untouchability and PublicInfrastructure
87
CHAPTER 3. IS BLOOD THICKER THAN WATER? UNTOUCHABILITYAND PUBLIC INFRASTRUCTURE
Untouchability is abolished and its practice in any form is forbidden.The enforcement of any disability arising out of "Untouchability"
shall be an offence punishable in accordance with the law
Constitution of India ; Fundamental Rights ; Article 17
1 Introduction1
The Constitution of India that came into force in 1950, three years after inde-pendence outlawed caste based discrimination and abolished untouchability that hasbeen on for centuries in India. The caste system forbids contacts with lower castes,and has resulted in practices referred to as untouchability, while the so stigmatizedlow castes members are called untouchables that encompass both Scheduled Castesand schedules tribes (hereafter "SCs" and "STs"). The Constitution, on which theIndian legal system rests, has placed on the State the responsibility for improvingthe welfare of untouchables. For more than 60 years, Indian governments have sparedno effort to design and implement policies dedicated to SCs and STs, such as thecontroverted reservation of administrative positions, parliamentary and assemblyseats and access to universities, in accordance with the 46th article of the DirectivePrinciples of State Policy that enounces that "the State shall promote with specialcare the educational and economic interest of the weaker sections of the people and,in particular, of the Scheduled Castes and the Scheduled Tribes, and shall protectthem from social injustice and all form of exploitation". Policies directed at SCsand STs have mainly focussed, besides reservations, on improving access to educa-tion and poverty alleviation programs in the forms of grants and credit. Yet, thesedomains are not the sole where SCs and STs are at a strong disadvantage because oftheir caste membership. They have been often denied access to public infrastructureon the ground that they are untouchables. Although some efforts have been made toimprove SCs and STs access to common infrastructures such as roads, water sourcesor electricity, evidence show that universal and equal access to public goods is farfrom being achieved (Anderson (2007), Tiwary (2006)) and that efficient policies inthis area have been too few. This situation does not only arise from unequal wealthdistribution across castes but also from caste based discrimination. For instance,Shah et al. (2006) presents the results from a survey conducted in 2001-2002, in 565villages of 11 states and show that, in nearly half of the surveyed villages, untou-chables were denied access to water facilities. In 28% of them they were denied entryinto police stations and in 18% access to public roads or entry to primary healthcenters. Indeed, caste prescriptions prohibit the sharing of some common resources,the most salient example being the sharing of water. The Constitution of India,recognized this issue as its 15th article of the Fundamental Rights states that "nocitizen shall, on grounds of religion, race, caste, sex, place of birth or any of them,be subject to any disability, liability, restriction or condition with regard to (a) ac-cess to shops, public restaurants, hotels and places of public entertainment ; or (b)the use of wells, tanks, bathing ghats, roads and places of public resort maintainedwholly or partly out of State funds or dedicated to the use of the general public [...]".
1This chapter was written in collaboration with Mathieu Couttenier, Université Paris 1
88 1. INTRODUCTION
CHAPTER 3. IS BLOOD THICKER THAN WATER? UNTOUCHABILITYAND PUBLIC INFRASTRUCTURE
The aim of this chapter is twofold. First, untouchability practices will be eviden-ced as access to water sources is shown to have an impact on the number of actsof violence against untouchables. This result highlights the necessity to look intountouchables’ access to public goods especially given the constitutional objectivesmentioned above. Second, our results, based on a new database on acts of violenceagainst SCs and STs, collected by the National Crimes Record Bureau show that(i) common water sources, such as tanks and wells increase the proportion of crimescommitted against the SCs and STs, (ii) while more individualized sources such astubewells are effective at reducing the number of violent acts. We shall come backin a subsequent section to what is defined as common and individualized sources.All these results are robust to the inclusion of many district and states controls.These analysis reveals that practices of untouchability are still vigorous and thatgovernments water improvement programs have the nice side effect of alleviating ifnot the causes at least the symptoms of social tensions. This is, to the best of ourknowledge, the first large scale attempt to quantify and evidence the phenomenonof untouchability and caste based restrictions attached to the use of public goods.
The chapter is structured as follows : section (2) explains why water may beviewed as a source of caste based conflicts. Section (3) show how this study fallsin line with research on social identity and its relationship with conflicts and theprovision of public goods. Section (4) presents the data and section (5) the empiricalstrategy, while results are commented in section (6). Section (7) concludes.
2 Ritual Pollution Through Water
2.1 Castes and Ritual Pollution
As briefly mentioned in introduction to this dissertation, the concept of ritualpollution governs relations between different castes. It is central to the institution.As Srinivas (1974) puts it : "every type of inter-caste relation is governed by theconcept of pollution. Contact of any kind, touching, dining, sex and other relationsbetween castes which are structurally distant results in the higher of the two castesbeing polluted [...] Where contact does result in pollution, however, the pollutedmember of the higher caste has to undergo a purificatory rite in order to be restoredto normal ritual status. Such a purificatory rite is fairly simple where the structuraldistance between the castes is not very great and the type of contact is not serious.Sometimes, as when a Brahmin eats food cooked by an Untouchable, the resultantpollution is so great that he or she has to be excommunicated". Given untouchablesvery low status, structural distance between untouchables and the rest of the popu-lation is probably one of the largest.
The ritually polluting nature of Tribes is disputable. As already mentioned, twocases need to be distinguished. Some tribes actually converted to Hinduism and en-tered the caste system. Whether their contact is polluting to higher castes membersdepends on where they managed to place themselves in the local caste hierarchy.In some instance, they did not rank higher than the untouchables and are thereforeas untouchable. In a second case, they remained outside the caste system and as
2. RITUAL POLLUTION THROUGH WATER 89
CHAPTER 3. IS BLOOD THICKER THAN WATER? UNTOUCHABILITYAND PUBLIC INFRASTRUCTURE
such, from a higher caste point of view, their contact is polluting. Given that thetribes we are concerned with are scheduled to benefit from reservations, their socialbackwardness was recognized and they are likely to pertain to the second case2.Although it is important to distinguish between the tribes and the lowest castes, forthey are ethnographically distinct groups, based on the assumption that ScheduledTribes are likely to be outcasts, they may also be called untouchables in the sensethat higher castes would avoid their contacts. We therefore refer to "untouchables"to designate both groups, although this is a simplification, that arguably is not ex-cessive, of an incredibly complex picture.
As stressed by Srinivas (1974), the degree of pollution does vary depending on thekind of contact. For instance, entering a higher caste courtyard may be consideredas an offense while touching an higher caste glass or water results in one of the mostextreme degrees of pollution. Food and water are the paramount conveyors of ritualpollution. The geographical setting of traditional villages in India maps the socialstructure and the ban on caste mingling. The heart of the village is the higher castedistrict, while untouchables usually live in peripheral hamlets and rarely go throughhigher castes neighborhoods Beteille (1965). As a consequence, publicly providedgoods such as water sources are segregated, each hamlet and thus caste groups ha-ving their own sources. Given the ritual pollution attached to untouchables and theban on physical contact with them, they are forbidden access to other castes watersources. It is common knowledge in India that attempts from untouchables to drawwater from higher caste wells sparks rural violence. Nevertheless, this prohibitionmay take different shape depending on the water source.
2.2 Individualized versus Common Sources
Physical contact of an untouchable with water taints the source. Even the contactof a vessel belonging to an untouchable does alter the ritual purity of the water Du-mont (1970). Therefore, untouchables are not allowed access to sources where theirjars have to be immersed. Out of the four distribution types identified in our data(2001 Census of India), that are wells, tanks, tubewells and taps, this prohibitionwould pertain to the first two. These two sources are therefore referred to as com-mon. Of course, we are not able to rule out the possibility for tanks to have taps, inwhich case, little pollution would result from an untouchable using it. Nevertheless,we envisage most tanks as open and water collected with vessels. In villages wheretubewells have been drilled, experience show that untouchables are not banned fromusing them, given that such a use would not imply any direct physical contact ofeither the individual or his vessel with water, but provided that untouchables standlast in lines. Therefore, this sort of water access is considered in our study as indi-vidualized, although it is of common use. Tap distribution is obviously consideredas an individualized source. It may either be of common usage, in which case thesituation resembles that of tubewell or private, in which case it is the utmost indi-vidualized water source.
2At least this is what is argued in chapter XXIII of Carrin (2006)
90 2. RITUAL POLLUTION THROUGH WATER
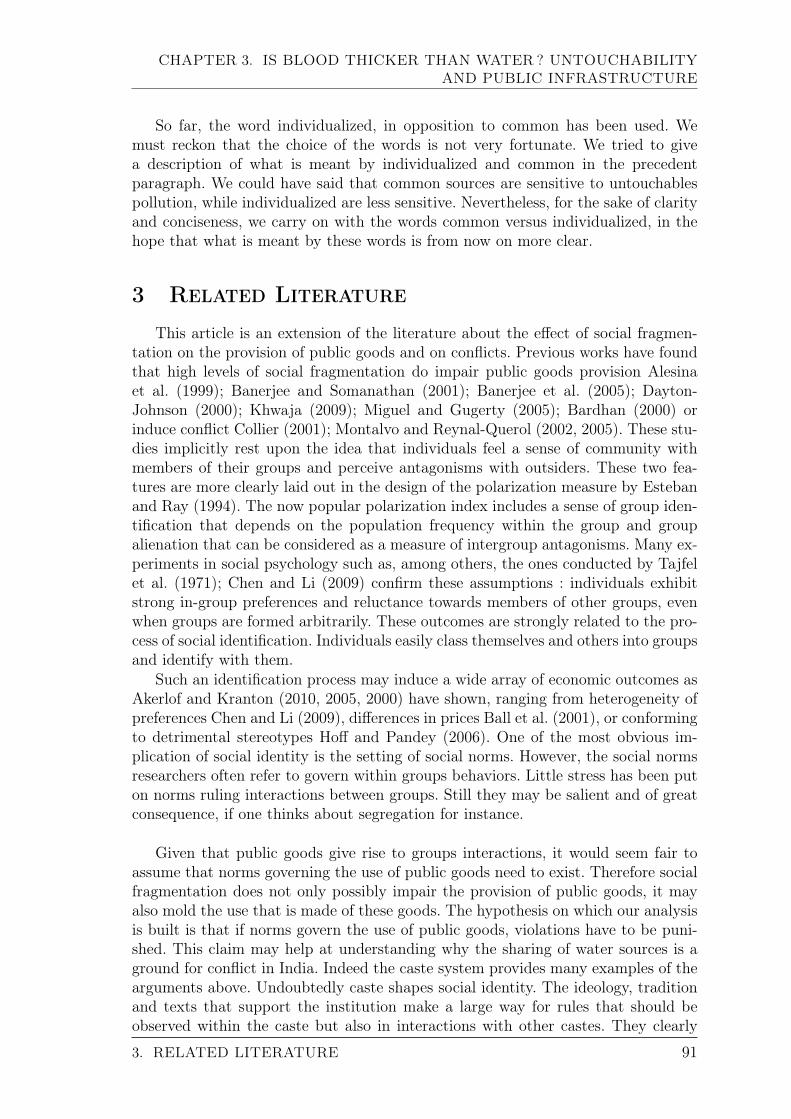
CHAPTER 3. IS BLOOD THICKER THAN WATER? UNTOUCHABILITYAND PUBLIC INFRASTRUCTURE
So far, the word individualized, in opposition to common has been used. Wemust reckon that the choice of the words is not very fortunate. We tried to givea description of what is meant by individualized and common in the precedentparagraph. We could have said that common sources are sensitive to untouchablespollution, while individualized are less sensitive. Nevertheless, for the sake of clarityand conciseness, we carry on with the words common versus individualized, in thehope that what is meant by these words is from now on more clear.
3 Related Literature
This article is an extension of the literature about the effect of social fragmen-tation on the provision of public goods and on conflicts. Previous works have foundthat high levels of social fragmentation do impair public goods provision Alesinaet al. (1999); Banerjee and Somanathan (2001); Banerjee et al. (2005); Dayton-Johnson (2000); Khwaja (2009); Miguel and Gugerty (2005); Bardhan (2000) orinduce conflict Collier (2001); Montalvo and Reynal-Querol (2002, 2005). These stu-dies implicitly rest upon the idea that individuals feel a sense of community withmembers of their groups and perceive antagonisms with outsiders. These two fea-tures are more clearly laid out in the design of the polarization measure by Estebanand Ray (1994). The now popular polarization index includes a sense of group iden-tification that depends on the population frequency within the group and groupalienation that can be considered as a measure of intergroup antagonisms. Many ex-periments in social psychology such as, among others, the ones conducted by Tajfelet al. (1971); Chen and Li (2009) confirm these assumptions : individuals exhibitstrong in-group preferences and reluctance towards members of other groups, evenwhen groups are formed arbitrarily. These outcomes are strongly related to the pro-cess of social identification. Individuals easily class themselves and others into groupsand identify with them.
Such an identification process may induce a wide array of economic outcomes asAkerlof and Kranton (2010, 2005, 2000) have shown, ranging from heterogeneity ofpreferences Chen and Li (2009), differences in prices Ball et al. (2001), or conformingto detrimental stereotypes Hoff and Pandey (2006). One of the most obvious im-plication of social identity is the setting of social norms. However, the social normsresearchers often refer to govern within groups behaviors. Little stress has been puton norms ruling interactions between groups. Still they may be salient and of greatconsequence, if one thinks about segregation for instance.
Given that public goods give rise to groups interactions, it would seem fair toassume that norms governing the use of public goods need to exist. Therefore socialfragmentation does not only possibly impair the provision of public goods, it mayalso mold the use that is made of these goods. The hypothesis on which our analysisis built is that if norms govern the use of public goods, violations have to be puni-shed. This claim may help at understanding why the sharing of water sources is aground for conflict in India. Indeed the caste system provides many examples of thearguments above. Undoubtedly caste shapes social identity. The ideology, traditionand texts that support the institution make a large way for rules that should beobserved within the caste but also in interactions with other castes. They clearly
3. RELATED LITERATURE 91
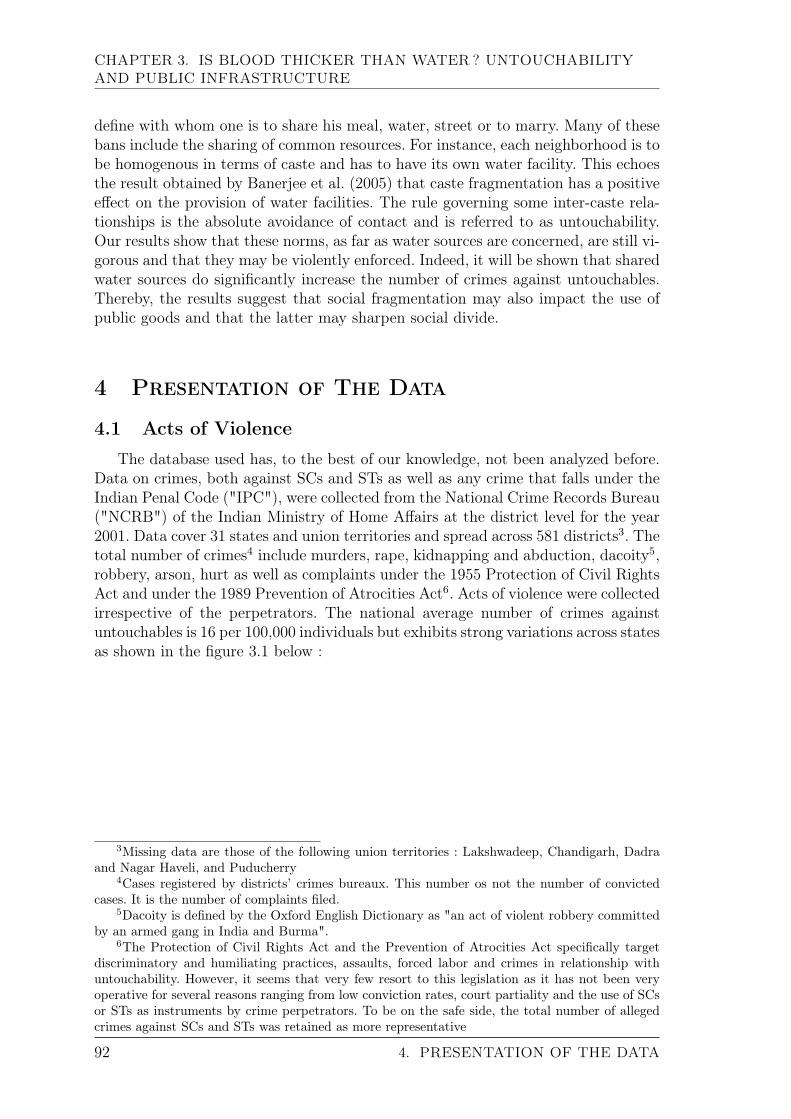
CHAPTER 3. IS BLOOD THICKER THAN WATER? UNTOUCHABILITYAND PUBLIC INFRASTRUCTURE
define with whom one is to share his meal, water, street or to marry. Many of thesebans include the sharing of common resources. For instance, each neighborhood is tobe homogenous in terms of caste and has to have its own water facility. This echoesthe result obtained by Banerjee et al. (2005) that caste fragmentation has a positiveeffect on the provision of water facilities. The rule governing some inter-caste rela-tionships is the absolute avoidance of contact and is referred to as untouchability.Our results show that these norms, as far as water sources are concerned, are still vi-gorous and that they may be violently enforced. Indeed, it will be shown that sharedwater sources do significantly increase the number of crimes against untouchables.Thereby, the results suggest that social fragmentation may also impact the use ofpublic goods and that the latter may sharpen social divide.
4 Presentation of The Data
4.1 Acts of Violence
The database used has, to the best of our knowledge, not been analyzed before.Data on crimes, both against SCs and STs as well as any crime that falls under theIndian Penal Code ("IPC"), were collected from the National Crime Records Bureau("NCRB") of the Indian Ministry of Home Affairs at the district level for the year2001. Data cover 31 states and union territories and spread across 581 districts3. Thetotal number of crimes4 include murders, rape, kidnapping and abduction, dacoity5,robbery, arson, hurt as well as complaints under the 1955 Protection of Civil RightsAct and under the 1989 Prevention of Atrocities Act6. Acts of violence were collectedirrespective of the perpetrators. The national average number of crimes againstuntouchables is 16 per 100,000 individuals but exhibits strong variations across statesas shown in the figure 3.1 below :
3Missing data are those of the following union territories : Lakshwadeep, Chandigarh, Dadraand Nagar Haveli, and Puducherry
4Cases registered by districts’ crimes bureaux. This number os not the number of convictedcases. It is the number of complaints filed.
5Dacoity is defined by the Oxford English Dictionary as "an act of violent robbery committedby an armed gang in India and Burma".
6The Protection of Civil Rights Act and the Prevention of Atrocities Act specifically targetdiscriminatory and humiliating practices, assaults, forced labor and crimes in relationship withuntouchability. However, it seems that very few resort to this legislation as it has not been veryoperative for several reasons ranging from low conviction rates, court partiality and the use of SCsor STs as instruments by crime perpetrators. To be on the safe side, the total number of allegedcrimes against SCs and STs was retained as more representative
92 4. PRESENTATION OF THE DATA
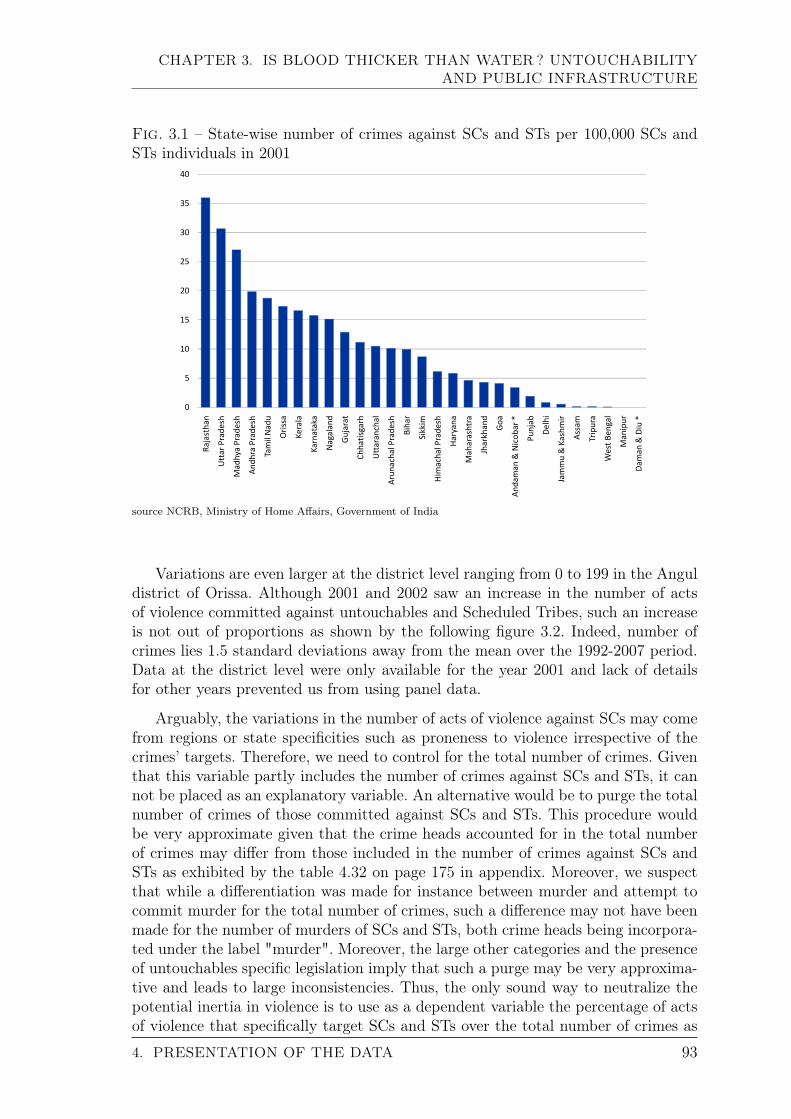
CHAPTER 3. IS BLOOD THICKER THAN WATER? UNTOUCHABILITYAND PUBLIC INFRASTRUCTURE
Fig. 3.1 – State-wise number of crimes against SCs and STs per 100,000 SCs andSTs individuals in 2001
15
20
25
30
35
40
0
5
10
15
Ra
jast
ha
n
Utt
ar
Pra
de
sh
Ma
dh
ya
Pra
de
sh
An
dh
ra P
rad
esh
Tam
il N
ad
u
Ori
ssa
Ke
rala
Ka
rna
taka
Na
ga
lan
d
Gu
jara
t
Ch
ha
tisg
arh
Utt
ara
nch
al
Aru
na
cha
l P
rad
esh
Bih
ar
Sik
kim
Him
ach
al P
rad
esh
Ha
rya
na
Ma
ha
rash
tra
Jha
rkh
an
d
Go
a
An
da
ma
n &
Nic
ob
ar
*
Pu
nja
b
De
lhi
Jam
mu
& K
ash
mir
Ass
am
Trip
ura
We
st B
en
ga
l
Ma
nip
ur
Da
ma
n &
Diu
*
Ma
dh
ya
Pra
de
sh
An
dh
ra P
rad
esh
Aru
na
cha
l P
rad
esh
Him
ach
al P
rad
esh
An
da
ma
n &
Nic
ob
ar
*
Jam
mu
& K
ash
mir
Da
ma
n &
Diu
*
source NCRB, Ministry of Home Affairs, Government of India
Variations are even larger at the district level ranging from 0 to 199 in the Anguldistrict of Orissa. Although 2001 and 2002 saw an increase in the number of actsof violence committed against untouchables and Scheduled Tribes, such an increaseis not out of proportions as shown by the following figure 3.2. Indeed, number ofcrimes lies 1.5 standard deviations away from the mean over the 1992-2007 period.Data at the district level were only available for the year 2001 and lack of detailsfor other years prevented us from using panel data.
Arguably, the variations in the number of acts of violence against SCs may comefrom regions or state specificities such as proneness to violence irrespective of thecrimes’ targets. Therefore, we need to control for the total number of crimes. Giventhat this variable partly includes the number of crimes against SCs and STs, it cannot be placed as an explanatory variable. An alternative would be to purge the totalnumber of crimes of those committed against SCs and STs. This procedure wouldbe very approximate given that the crime heads accounted for in the total numberof crimes may differ from those included in the number of crimes against SCs andSTs as exhibited by the table 4.32 on page 175 in appendix. Moreover, we suspectthat while a differentiation was made for instance between murder and attempt tocommit murder for the total number of crimes, such a difference may not have beenmade for the number of murders of SCs and STs, both crime heads being incorpora-ted under the label "murder". Moreover, the large other categories and the presenceof untouchables specific legislation imply that such a purge may be very approxima-tive and leads to large inconsistencies. Thus, the only sound way to neutralize thepotential inertia in violence is to use as a dependent variable the percentage of actsof violence that specifically target SCs and STs over the total number of crimes as
4. PRESENTATION OF THE DATA 93
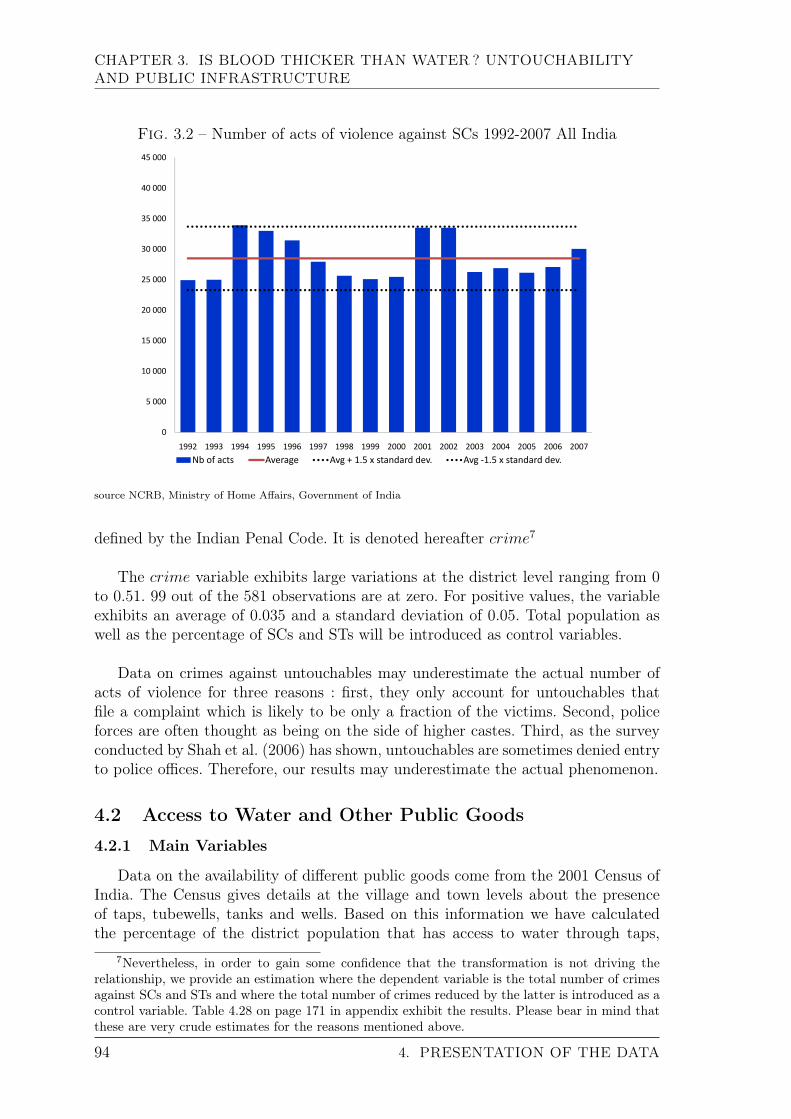
CHAPTER 3. IS BLOOD THICKER THAN WATER? UNTOUCHABILITYAND PUBLIC INFRASTRUCTURE
Fig. 3.2 – Number of acts of violence against SCs 1992-2007 All India
25 000
30 000
35 000
40 000
45 000
0
5 000
10 000
15 000
20 000
1992 1993 1994 1995 1996 1997 1998 1999 2000 2001 2002 2003 2004 2005 2006 2007
Nb of acts Average Avg + 1.5 x standard dev. Avg -1.5 x standard dev.Nb of acts Average Avg + 1.5 x standard dev. Avg -1.5 x standard dev.
source NCRB, Ministry of Home Affairs, Government of India
defined by the Indian Penal Code. It is denoted hereafter crime7
The crime variable exhibits large variations at the district level ranging from 0to 0.51. 99 out of the 581 observations are at zero. For positive values, the variableexhibits an average of 0.035 and a standard deviation of 0.05. Total population aswell as the percentage of SCs and STs will be introduced as control variables.
Data on crimes against untouchables may underestimate the actual number ofacts of violence for three reasons : first, they only account for untouchables thatfile a complaint which is likely to be only a fraction of the victims. Second, policeforces are often thought as being on the side of higher castes. Third, as the surveyconducted by Shah et al. (2006) has shown, untouchables are sometimes denied entryto police offices. Therefore, our results may underestimate the actual phenomenon.
4.2 Access to Water and Other Public Goods
4.2.1 Main Variables
Data on the availability of different public goods come from the 2001 Census ofIndia. The Census gives details at the village and town levels about the presenceof taps, tubewells, tanks and wells. Based on this information we have calculatedthe percentage of the district population that has access to water through taps,
7Nevertheless, in order to gain some confidence that the transformation is not driving therelationship, we provide an estimation where the dependent variable is the total number of crimesagainst SCs and STs and where the total number of crimes reduced by the latter is introduced as acontrol variable. Table 4.28 on page 171 in appendix exhibit the results. Please bear in mind thatthese are very crude estimates for the reasons mentioned above.
94 4. PRESENTATION OF THE DATA
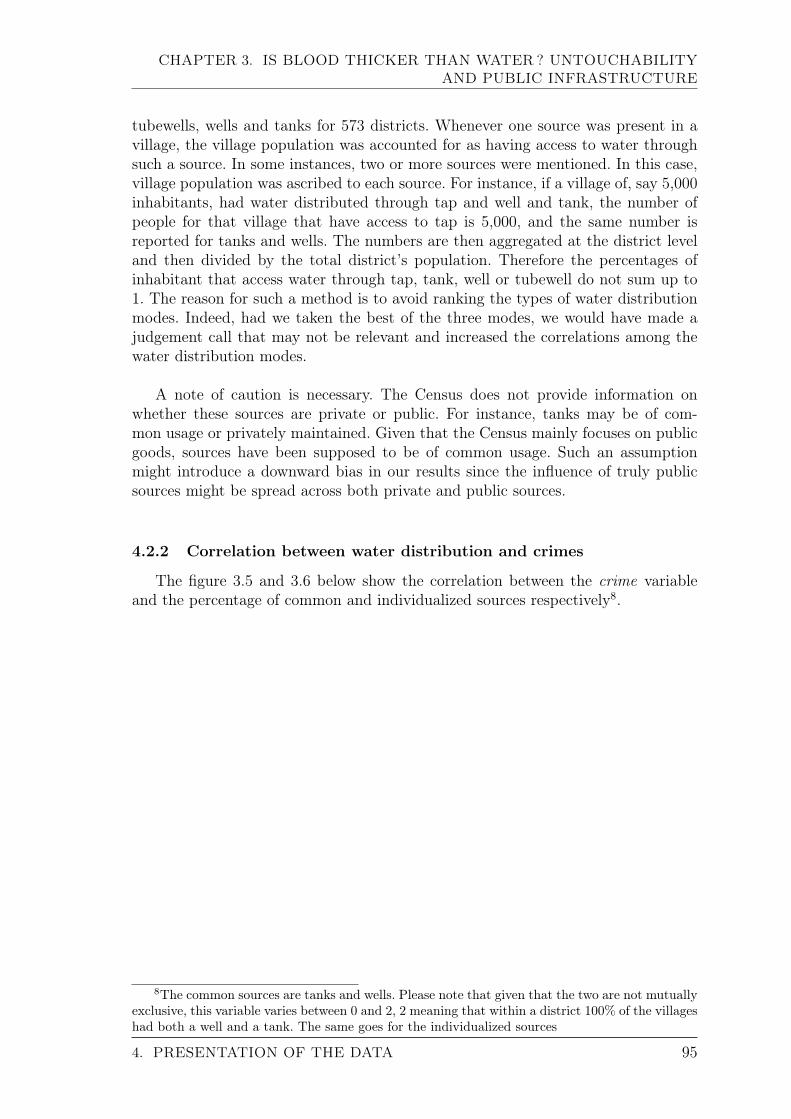
CHAPTER 3. IS BLOOD THICKER THAN WATER? UNTOUCHABILITYAND PUBLIC INFRASTRUCTURE
tubewells, wells and tanks for 573 districts. Whenever one source was present in avillage, the village population was accounted for as having access to water throughsuch a source. In some instances, two or more sources were mentioned. In this case,village population was ascribed to each source. For instance, if a village of, say 5,000inhabitants, had water distributed through tap and well and tank, the number ofpeople for that village that have access to tap is 5,000, and the same number isreported for tanks and wells. The numbers are then aggregated at the district leveland then divided by the total district’s population. Therefore the percentages ofinhabitant that access water through tap, tank, well or tubewell do not sum up to1. The reason for such a method is to avoid ranking the types of water distributionmodes. Indeed, had we taken the best of the three modes, we would have made ajudgement call that may not be relevant and increased the correlations among thewater distribution modes.
A note of caution is necessary. The Census does not provide information onwhether these sources are private or public. For instance, tanks may be of com-mon usage or privately maintained. Given that the Census mainly focuses on publicgoods, sources have been supposed to be of common usage. Such an assumptionmight introduce a downward bias in our results since the influence of truly publicsources might be spread across both private and public sources.
4.2.2 Correlation between water distribution and crimes
The figure 3.5 and 3.6 below show the correlation between the crime variableand the percentage of common and individualized sources respectively8.
8The common sources are tanks and wells. Please note that given that the two are not mutuallyexclusive, this variable varies between 0 and 2, 2 meaning that within a district 100% of the villageshad both a well and a tank. The same goes for the individualized sources
4. PRESENTATION OF THE DATA 95
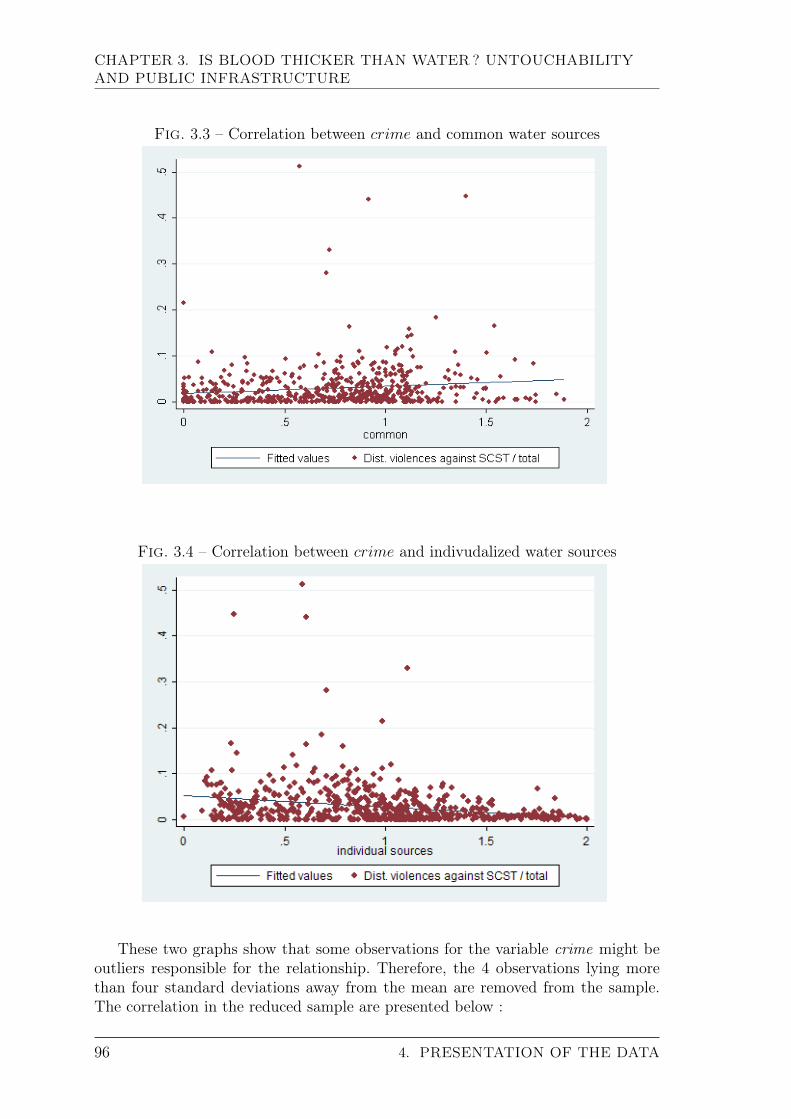
CHAPTER 3. IS BLOOD THICKER THAN WATER? UNTOUCHABILITYAND PUBLIC INFRASTRUCTURE
Fig. 3.3 – Correlation between crime and common water sources
Fig. 3.4 – Correlation between crime and indivudalized water sources
These two graphs show that some observations for the variable crime might beoutliers responsible for the relationship. Therefore, the 4 observations lying morethan four standard deviations away from the mean are removed from the sample.The correlation in the reduced sample are presented below :
96 4. PRESENTATION OF THE DATA
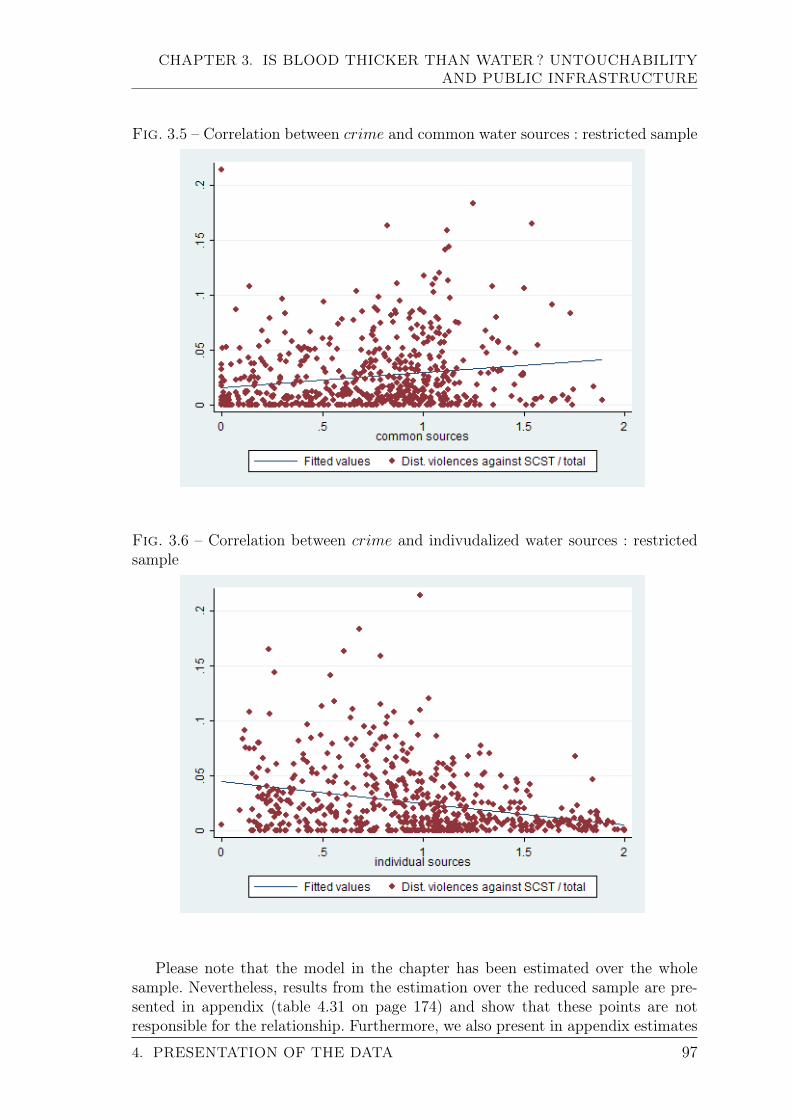
CHAPTER 3. IS BLOOD THICKER THAN WATER? UNTOUCHABILITYAND PUBLIC INFRASTRUCTURE
Fig. 3.5 – Correlation between crime and common water sources : restricted sample
Fig. 3.6 – Correlation between crime and indivudalized water sources : restrictedsample
Please note that the model in the chapter has been estimated over the wholesample. Nevertheless, results from the estimation over the reduced sample are pre-sented in appendix (table 4.31 on page 174) and show that these points are notresponsible for the relationship. Furthermore, we also present in appendix estimates
4. PRESENTATION OF THE DATA 97
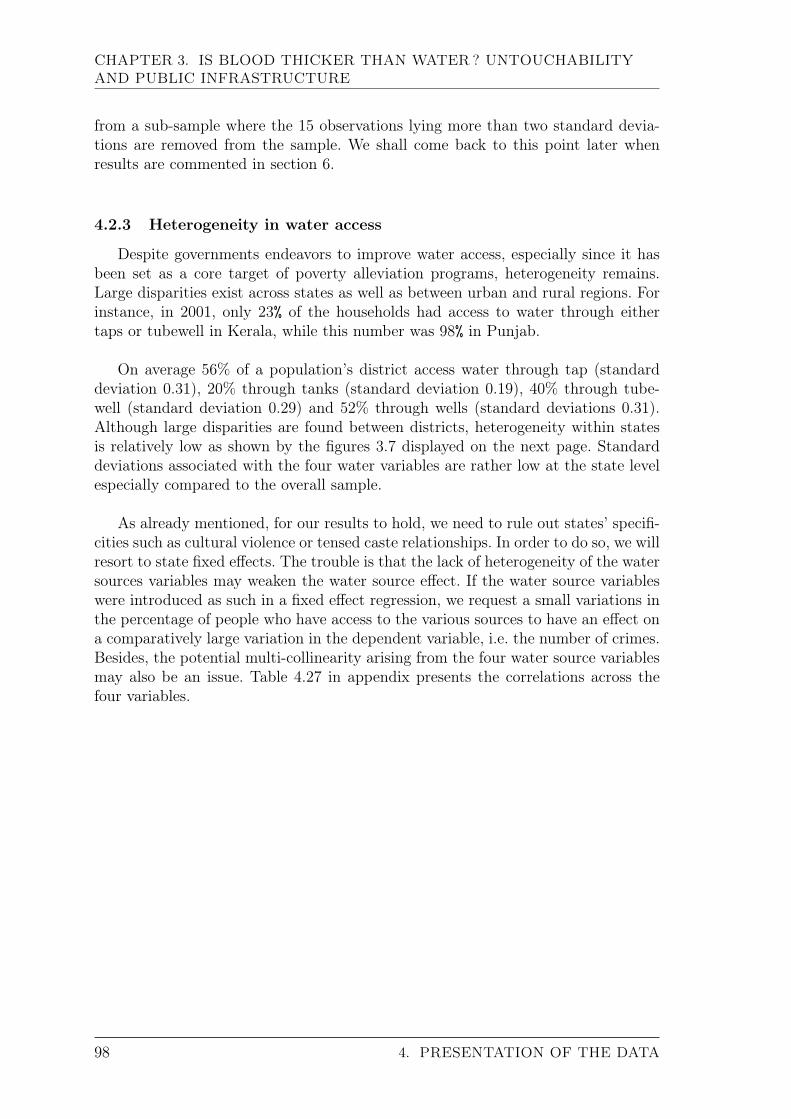
CHAPTER 3. IS BLOOD THICKER THAN WATER? UNTOUCHABILITYAND PUBLIC INFRASTRUCTURE
from a sub-sample where the 15 observations lying more than two standard devia-tions are removed from the sample. We shall come back to this point later whenresults are commented in section 6.
4.2.3 Heterogeneity in water access
Despite governments endeavors to improve water access, especially since it hasbeen set as a core target of poverty alleviation programs, heterogeneity remains.Large disparities exist across states as well as between urban and rural regions. Forinstance, in 2001, only 23% of the households had access to water through eithertaps or tubewell in Kerala, while this number was 98% in Punjab.
On average 56% of a population’s district access water through tap (standarddeviation 0.31), 20% through tanks (standard deviation 0.19), 40% through tube-well (standard deviation 0.29) and 52% through wells (standard deviations 0.31).Although large disparities are found between districts, heterogeneity within statesis relatively low as shown by the figures 3.7 displayed on the next page. Standarddeviations associated with the four water variables are rather low at the state levelespecially compared to the overall sample.
As already mentioned, for our results to hold, we need to rule out states’ specifi-cities such as cultural violence or tensed caste relationships. In order to do so, we willresort to state fixed effects. The trouble is that the lack of heterogeneity of the watersources variables may weaken the water source effect. If the water source variableswere introduced as such in a fixed effect regression, we request a small variations inthe percentage of people who have access to the various sources to have an effect ona comparatively large variation in the dependent variable, i.e. the number of crimes.Besides, the potential multi-collinearity arising from the four water source variablesmay also be an issue. Table 4.27 in appendix presents the correlations across thefour variables.
98 4. PRESENTATION OF THE DATA

CHAPTER 3. IS BLOOD THICKER THAN WATER? UNTOUCHABILITYAND PUBLIC INFRASTRUCTURE
Fig
.3.7–Districts
averag
eaccess
andstan
dard
deviations
withinstates
andIndia
Tapaccess
Tube
wella
ccess
0,4
0
0,6
0
0,8
0
1,0
0
1,2
0
0,0
0
0,2
0
Jammu & Kashmir
Himachal Pradesh
Punjab
Uttaranchal
Haryana
Delhi
Rajasthan
Uttar Pradesh
Bihar
Sikkim
Arunachal Pradesh
Nagaland
Manipur
Mizoram
Tripura
Meghalaya
Assam
West Bengal
Jharkhand
Orissa
Chhatisgarh
Madhya Pradesh
Gujarat
Daman & Diu
Maharashtra
Andhra Pradesh
Karnataka
Goa
Kerala
Tamil Nadu
Andaman & Nicobar
Dis
tric
ts s
tan
da
rd d
ev
iati
on
s w
ith
in s
tate
sS
tate
s a
ve
rag
e
Dis
tric
ts s
tan
da
rd d
ev
iati
on
s w
ith
in I
nd
iaD
istr
icts
sta
nd
ard
de
via
tio
ns
wit
hin
In
dia
Tank
access
Wella
ccess
0,2
0
0,3
0
0,4
0
0,5
0
0,6
0
0,7
0
0,8
0
0,0
0
0,1
0
Jammu & Kashmir
Himachal Pradesh
Punjab
Uttaranchal
Haryana
Delhi
Rajasthan
Uttar Pradesh
Bihar
Sikkim
Arunachal Pradesh
Nagaland
Manipur
Mizoram
Tripura
Meghalaya
Assam
West Bengal
Jharkhand
Orissa
Chhatisgarh
Madhya Pradesh
Gujarat
Daman & Diu
Maharashtra
Andhra Pradesh
Karnataka
Goa
Kerala
Tamil Nadu
Andaman & Nicobar
Dis
tric
ts s
tan
da
rd d
ev
iati
on
s w
ith
in s
tate
sS
tate
s a
ve
rag
e
Dis
tric
ts s
tan
da
rd d
ev
iati
on
s w
ith
in I
nd
iaD
istr
icts
sta
nd
ard
de
via
tio
ns
wit
hin
In
dia
0,4
0
0,6
0
0,8
0
1,0
0
1,2
0
0,0
0
0,2
0
Jammu & Kashmir
Himachal Pradesh
Punjab
Uttaranchal
Haryana
Delhi
Rajasthan
Uttar Pradesh
Bihar
Sikkim
Arunachal Pradesh
Nagaland
Manipur
Mizoram
Tripura
Meghalaya
Assam
West Bengal
Jharkhand
Orissa
Chhatisgarh
Madhya Pradesh
Gujarat
Daman & Diu
Maharashtra
Andhra Pradesh
Karnataka
Goa
Kerala
Tamil Nadu
Andaman & Nicobar
Dis
tric
ts s
tan
da
rd d
ev
iati
on
s w
ith
in s
tate
sS
tate
s a
ve
rag
e
Dis
tric
ts s
tan
da
rd d
ev
iati
on
s w
ith
In
dia
Dis
tric
ts s
tan
da
rd d
ev
iati
on
s w
ith
In
dia
4. PRESENTATION OF THE DATA 99
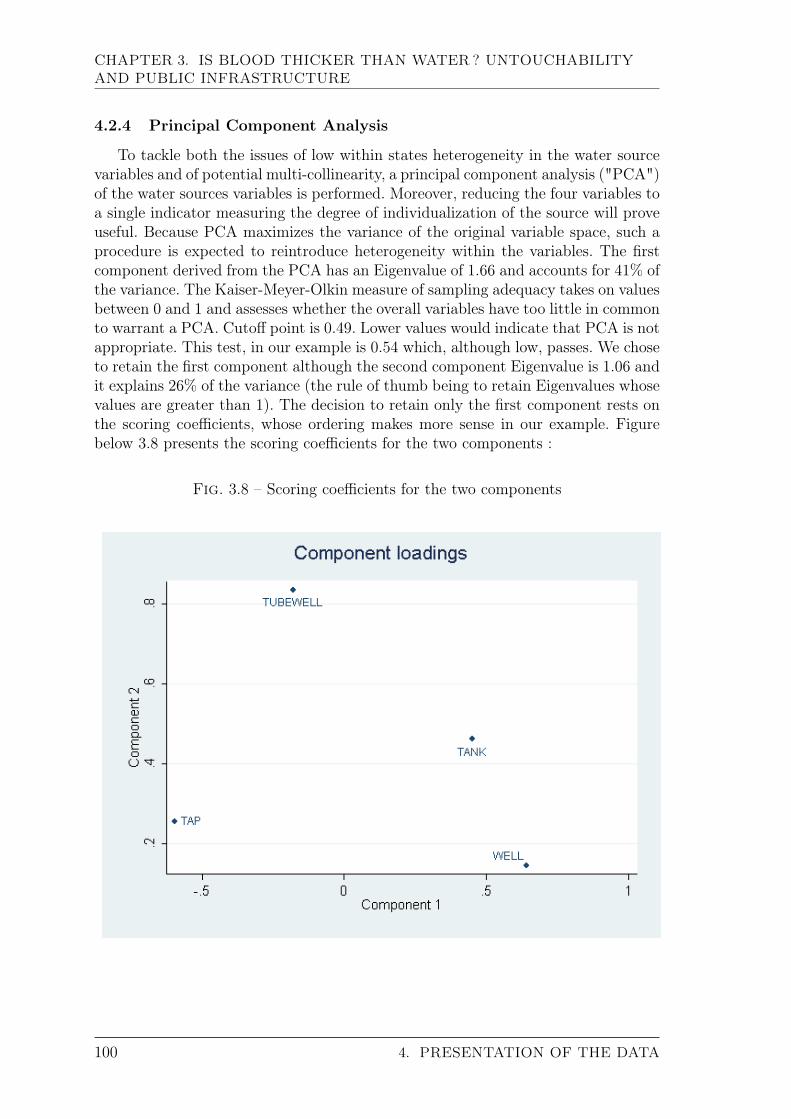
CHAPTER 3. IS BLOOD THICKER THAN WATER? UNTOUCHABILITYAND PUBLIC INFRASTRUCTURE
4.2.4 Principal Component Analysis
To tackle both the issues of low within states heterogeneity in the water sourcevariables and of potential multi-collinearity, a principal component analysis ("PCA")of the water sources variables is performed. Moreover, reducing the four variables toa single indicator measuring the degree of individualization of the source will proveuseful. Because PCA maximizes the variance of the original variable space, such aprocedure is expected to reintroduce heterogeneity within the variables. The firstcomponent derived from the PCA has an Eigenvalue of 1.66 and accounts for 41% ofthe variance. The Kaiser-Meyer-Olkin measure of sampling adequacy takes on valuesbetween 0 and 1 and assesses whether the overall variables have too little in commonto warrant a PCA. Cutoff point is 0.49. Lower values would indicate that PCA is notappropriate. This test, in our example is 0.54 which, although low, passes. We choseto retain the first component although the second component Eigenvalue is 1.06 andit explains 26% of the variance (the rule of thumb being to retain Eigenvalues whosevalues are greater than 1). The decision to retain only the first component rests onthe scoring coefficients, whose ordering makes more sense in our example. Figurebelow 3.8 presents the scoring coefficients for the two components :
Fig. 3.8 – Scoring coefficients for the two components
100 4. PRESENTATION OF THE DATA
CHAPTER 3. IS BLOOD THICKER THAN WATER? UNTOUCHABILITYAND PUBLIC INFRASTRUCTURE
The ordering of the variables according to the first component is in adequacywith the concept of common versus individualized sources. The scoring coefficientdecreases with the individualization of the source. They are presented in table 3.1below.
Tab. 3.1 – Scoring coefficients
Component 1 Component 2Tap -0.5945 0.2564Tubewell -0.1789 0.836Tank 0.4496 0.4624Well 0.6422 0.1465
Given the scoring coefficients, the first component may be thought of as aninverse index of source individualization. The ordering of the sources according tothe second component makes the interpretation more difficult. As a consequenceonly the first component will be retained. The variables, tap, tubewell, tank andwell are then standardized and scoring coefficients are applied according to createthe variable water according to the following formula :
water = −0.5945× tap standardized−0.1789× tubewell standardized+0.4496× tank standardized+0.6422× well standardized
As mentioned, given that the weight attributed to the variables, the water va-riable may be thought of as an index of the collectiveness of the variable. The mini-mum attained by the water variable is -2.74 and occurs when 100% of the populationaccess water through tap and tubewell. Maximum is 3.4 and occurs when 96% ofthe population access water through wells, 77% through tanks and 5% through tapsand tubewells. The variables approximates 0 when access is equally spread betweentaps, tubewells and tanks, wells.
4.2.5 Other Public Goods
In order to clearly mark the specific role of water access on crimes against un-touchables, other measures of access to public goods will be included as controlvariables such as the percentage of the district population that live in villages thatare electrified or connected by paved roads as well as the number of schools per dis-trict inhabitant. On average, 88% of the district population live in electrified areas(standard deviation 0.18), 75% in villages or towns connected by road (standarddeviation 0.20). On average a district has 9 primary and 3 middle schools per 100inhabitants (standard deviation are 0.06 and 0.02 respectively).
4.3 Polarization
In order to control for potential antagonisms between castes, a polarization indexhas been calculated following Montalvo and Reynal-Querol (2002) as :
4. PRESENTATION OF THE DATA 101
CHAPTER 3. IS BLOOD THICKER THAN WATER? UNTOUCHABILITYAND PUBLIC INFRASTRUCTURE
P =∑i
π1+αi πj
where πi is the population’s share of the ith group or caste among N . α is a parame-ter that may be considered as polarization’s sensitivity. It measures the sensitivityto a shift from a low polarized society to highly polarized one. For α = 0, the polari-zation index comes down to the standard fractionalization index that measures theprobability that two randomly chosen individuals belong to the same group. Thefractionalization index increases with the number of groups and is maximized at theuniform population distribution over these groups. Yet, this situation is not the onewhere the greatest level of antagonisms will be found. A situation where two largegroups face each other is rather more conducive to potential conflicts. Polarizationindices account for a such a situation and departs from the standard fractionalizationindex by increasing the weights on population frequencies through the parameter α.α is to lie in the [0 ;1.6] interval to ensure polarization is maximized when populationis concentrated on two equally sized groups. The larger α, the larger the increasein the polarization measure when shifting from a low polarized society to a highlypolarized one.
Caste polarization index has been calculated with i={SCs, STs, Others}. Wemust admit this is quite a rough measure as Indian society is much more fragmentedalong the lines of caste than merely split into three groups. Besides, intergroup socialdistance between SCs and STs may be smaller than between SCs and the rest ofthe population. However, this indicator has the virtue of accounting for the relativesize of each group and to capture a potential non linear relationship between crimesagainst SCs and STs and their relative weights within the population. Summarystatistics for the polarization measures are given in the table below :
Tab. 3.2 – Polarization summary statistics
Mean Standard Minimum MaximumDeviation
Polarization α = 0 0.356 0.13 0.018 0.632Polarization α = 1.6 0.118 0.028 0.009 0.163
A similar index of religious polarization is included to account for the fact thatcaste based antagonisms may vary depending on the relative size of the differentfaiths, although castes transcend religions. The index of religious polarization hasbeen calculated for α = 0 and α = 1.6.
5 Estimation Strategy
5.1 Base Specification
Given that observations are left censored at 0 and that 17% of the observationsare at 0, a Tobit model has been used with left censoring at 0.
102 5. ESTIMATION STRATEGY
CHAPTER 3. IS BLOOD THICKER THAN WATER? UNTOUCHABILITYAND PUBLIC INFRASTRUCTURE
Let y∗i be the latent variable associated with crimei, where crimei is the numberof crimes targeting SCs and STs over the total number of crimes in district i, so that
crimei =
{0 if y∗i ≤ 0y∗i if y∗i > 0
y∗i is assumed to have a normal, homoscedastic distribution with zero conditionalmean. Let’s note Xik the vector of explanatory variables, i standing for the districtand k serves at identifying the explanatory variable. The intercept has been absorbedinto Xik for notational simplicity. The following equation may be written
y∗i = βkXik + εi
εi/Xik ∼ N(0, σ2)(3.1)
Since ε/σ is assumed to be normally distributed and independent from Xk it couldbe written :
P (crimei = 0|Xik) = 1− Φ(Xikβkσ
) (3.2)
where Φ is the standard normal density function.Let’s note
di =
{0 if crimei = 01 if crimei > 0
Hence the likelihood function for each observation i out of a total of N :
L =N∏i=1
[1
σφ
(crimei −Xikβk)
σ]di [1− Φ(
Xikβkσ
)](1−di) (3.3)
where φ is the standard normal cumulative function. The log-likelihood function foreach observation i
ln(L) = `i(β, σ) =N∑i=1
{di(−lnσ+ lnφ(crimei −Xikβk
σ))+(1−di)ln(1−Φ(
Xikβkσ
))}
The vector of explanatory variables Xik encompasses, in addition to the interceptthe following variables for district i :
Wateri is the component obtained from the PCA as described in section 4.2.4ln(population)i is the log of the district’s populationrurali is the percentage of the districts’ population that is ruralliteracyi is the literacy ratecastecompositioni is a measure of the social composition by caste. In a first step,
this measure will be the percentage of SCs and STs in the population togetherwith their quadratic form. In a second step, it will be represented by polari-zation indices for α = 0 (i.e. fractionalization) and α = 1.6 (i.e. the highestpossible level of polarization)
religiouscompositioni is the religious polarization index for α = 0 and α = 1.6
5. ESTIMATION STRATEGY 103
CHAPTER 3. IS BLOOD THICKER THAN WATER? UNTOUCHABILITYAND PUBLIC INFRASTRUCTURE
Equation 3.1 may then be written in full as
y∗i =β0 + β1wateri + β2ln(population)i + β3rurali + β4literacyi
+ β5castecompositioni + β6religiouscompositioni + εi
εi ∼ N(0, σ2)
(3.4)
Naturally, water is the variable of interest and the lower the index, the more dis-tricts inhabitants access water from an individualized source. The higher the index,the more common is the access to water. β1 is therefore anticipated positive givenour main assumption : the more common the water source the higher the numberof acts of violence against untouchables.
Other control variables mainly come from the 2001 Census of India. As far asthe role of caste composition is concerned, we expect an inverse U shape relation-ship between the percentage of untouchables and the crime variable in the spirit ofpolarization. Indeed, literature on polarization Montalvo and Reynal-Querol (2002),Esteban and Ray (1994) show that highest probability of conflicts occurs when twoequally sized group face each other. With respect to the caste polarization indexmeasure, a positive relationship is expected for a high α while fractionalization isanticipated to be hardly relevant. Indeed, as already discussed, fractionalization ismaximized by an equal distribution of the population on a large number of groups, asituation which may not necessarily lead to violence 9. The role of religious composi-tion is far from obvious. Although caste mainly stems from Hinduism, the institutiondoes transcend religions and are found among Muslims, Christians and, although ina much attenuated way, even in religions that originally rejected the system such asSikhism or Jainism. Therefore the expected sign is not clear. Nevertheless, inter faithviolence is unfortunately not a rare phenomenon in India and may be exacerbatedin a polarized context. Religious violence may replace caste based violence in highlyreligiously polarized environments. This hypothesis would lead us to anticipate anegative effect of religious polarization on caste based violence.
5.2 Potential Endogeneity Issues
5.2.1 Omitted Variables
It is a well known fact that some states in India, such as Rajasthan, Bihar orUttar Pradesh for instance, are more prone to caste based violence than others. Avariety of reason may be invoked such as economic backwardness, local traditionsor political representations. For instance, in areas of the state of Bihar, the RanvirSena private militia largely run by upper castes landlords is known for its exactionsagainst untouchables. The role of traditions is particularly strong in Rajasthan. Allthese reasons are potentially correlated with public goods provision such as waterdistribution. This raises the issue of omitted variables. As far as economic back-wardness is concerned, the states 2001 GDPs are introduced as control variables.We had to resort to state indicators, since district level GDPs are notoriously un-reliable or nowhere to be found. We also introduce an human development index
9For an excellent review of why fractionalization is irrelevant to the analysis of conflict, pleaserefer to Montalvo and Reynal-Querol (2005)
104 5. ESTIMATION STRATEGY
CHAPTER 3. IS BLOOD THICKER THAN WATER? UNTOUCHABILITYAND PUBLIC INFRASTRUCTURE
as of 1991, which more broadly accounts for economic development at the state’slevel. Unfortunately, we were not able to control for political representation at thestates parliaments. To be on the safe side, state fixed effects are introduced, which,arguably, would capture all the states specificities.
5.2.2 Reverse Causality
The provision of safe water has been given priority in the Constitution of In-dia, with article 47 conferring the duty of providing clean drinking water. Whatthe Census refers to as safe drinking water is water distributed through either tapsor tubewells/handpumps. Many programs have been designed and implemented toimprove water access. We would be faced with reverse causality if these programswere to take into account the untouchables situation in one way or another. Eitherprograms specifically target regions where untouchables are particularly at a disad-vantage or they neglect zones where most caste based conflicts are found. Giventhat water improvement programs are often part of poverty alleviation programs,the first scenario is the most likely. The 2001 National Human Development Reportpublished by the Indian Planning Commission specifically addresses the SCs andSTs access to safe drinking water and compare them to the rest of the population,thereby showing government’s concerns for these groups. If water improvement pro-grams are to take into account SCs and STs situations, this would be in the senseof favoring them rather than avoiding regions where they are the most at a disad-vantage. Thus, if a reverse causality exists it is most likely to be unfavorable to ourresults and induce a downward bias.
It could be argued that the Indian government policies and programs have putan increasing emphasis on community participation and that such an emphasis mayprompt reverse causality. Steps were initiated in 1999 to institutionalize communityparticipation in the implementation of rural drinking water supply schemes10. Ins-titutional mechanisms have been put in place at the national, state, district, blockand panchayat levels to monitor water access improvement programs. It could bethought that highly violent environments are less likely to show the local coopera-tion necessary to implement such programs. In this case, the reverse causality wouldfavor our results and introduce an upward bias. We have two main reasons to be-lieve that this is not the case. First, the communities empowerment programs onlystarted a year before data were collected. This probably isn’t sufficient to changethe patterns of water distribution modes to an extent that would greatly affect ourresults. Second, communities are not the sole actors. Authorities at the district andstate levels also have a word to say and as mentioned earlier, it is unlikely that thisword will be in disfavor of violent areas.
10Source : Water aid (NGO) report published by the National Urban Water Awards sponsoredby the Government of India
5. ESTIMATION STRATEGY 105
CHAPTER 3. IS BLOOD THICKER THAN WATER? UNTOUCHABILITYAND PUBLIC INFRASTRUCTURE
6 Results
6.1 Base Specification
We wish to examine whether water access does impact the number of crimesagainst untouchables. Table 3.3 presents the results. As expected the index of wa-ter commonality is positive and significant. Shared water sources are significantlyassociated with a larger proportion of violent acts against untouchables. This effectholds for the various specifications presented.
In specification (1) only the percentage of SCs and STs in the district popu-lation are entered together with an index of religious fractionalization. While thepercentage of SCs significantly increases the likelihood of caste based violence, thepercentage of STs is not significant. This may be due to a potential non linear rela-tionship between the percentage of untouchables and the number of acts of violenceas the literature about conflicts and polarization suggest. Indeed, when the qua-dratic term for the percentage of STs is introduced in specification (3), a U-shapedrelationship is found. STs are in majority in North Eastern States such as Mizoram,Tripura, Manipur, Nagaland, Meghalaya and Arunachal Pradesh or in the Andamanand Nicobar Islands. Tribes represent 52% of the population in these states against8% for all India. When these states are removed from the sample, both the simpleand quadratic form of the percentage of STs lose their significance 11. Indeed, instates were they are not so numerous, tribes tend to live in isolated villages anddo not mingle much with the rest of the population. This would explain why, whentribal states are removed from the sample, the percentage of STs is found to beirrelevant.
On the other hand, there is an inverted U-shaped relationship between the per-centage of SCs and the number of acts of violence against them. SCs are morespread across the country. They represent on average 15% of the district’s popu-lation ranging from 0 to 50%, although they account for more than 40% in only29 of the 581 districts sampled. This inverted U-shaped relationship confirms theresults found in the literature that studies the impact of polarization on conflict.The highest probability of conflict occurs when two equally sized groups face eachother. Thus a caste polarization index is introduced in lieu of the percentages ofSCs and STs in specifications (4) and (5). Not surprisingly the polarization indexfor α = 0 (i.e. the fractionalization index) is not found significant while it is andpositive for α = 1.6, which makes sense given that polarization indices are best sui-ted than the fractionalization index to capture potential antagonisms. The religiouspolarization index was introduced for the two values of α (specification (1) versus(2) and next) and both the religious fractionalization and polarization indices arefound significant. Given the previous discussion on the impact of polarization versusfractionalization, we chose to retain the religious polarization index for α = 1.6 insubsequent estimations. The negative sign associated with the religious polarizationindex is difficult to interpret. One explanation could be brought forward, although itis a mere assumption. In religiously polarized contexts, religion based conflicts may
11Results from this estimation are presented in table 4.30 in appendix
106 6. RESULTS
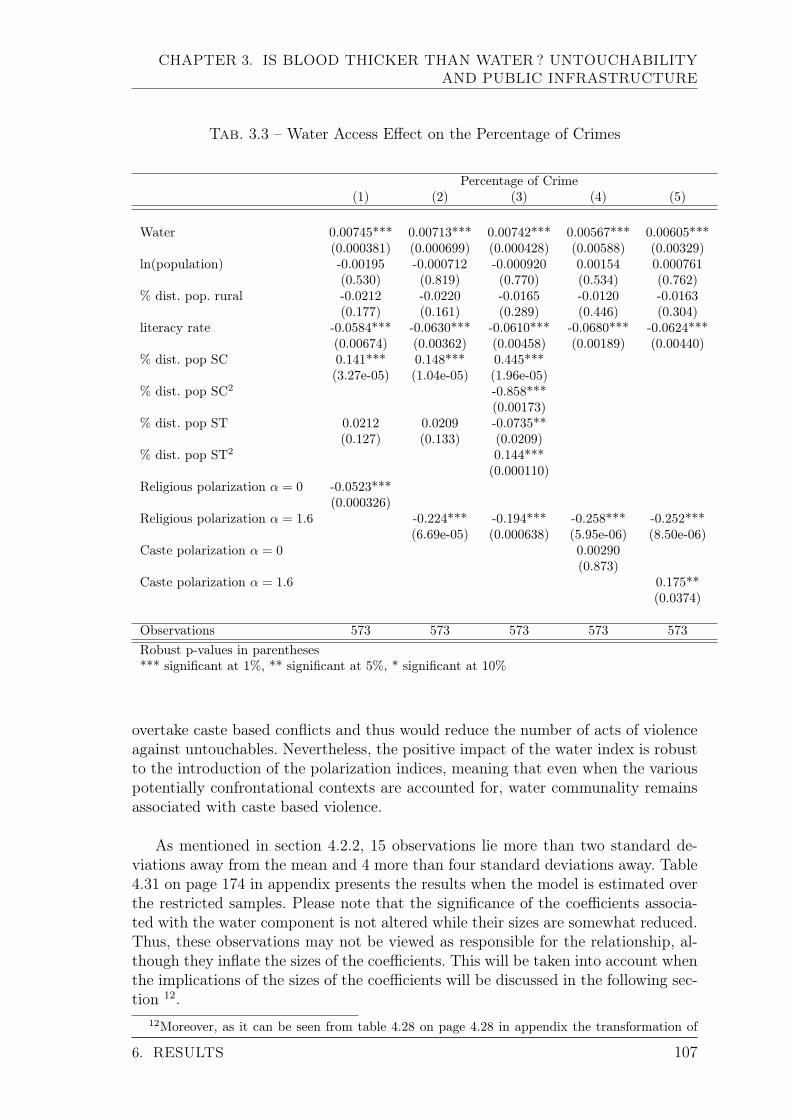
CHAPTER 3. IS BLOOD THICKER THAN WATER? UNTOUCHABILITYAND PUBLIC INFRASTRUCTURE
Tab. 3.3 – Water Access Effect on the Percentage of Crimes
Percentage of Crime(1) (2) (3) (4) (5)
Water 0.00745*** 0.00713*** 0.00742*** 0.00567*** 0.00605***(0.000381) (0.000699) (0.000428) (0.00588) (0.00329)
ln(population) -0.00195 -0.000712 -0.000920 0.00154 0.000761(0.530) (0.819) (0.770) (0.534) (0.762)
% dist. pop. rural -0.0212 -0.0220 -0.0165 -0.0120 -0.0163(0.177) (0.161) (0.289) (0.446) (0.304)
literacy rate -0.0584*** -0.0630*** -0.0610*** -0.0680*** -0.0624***(0.00674) (0.00362) (0.00458) (0.00189) (0.00440)
% dist. pop SC 0.141*** 0.148*** 0.445***(3.27e-05) (1.04e-05) (1.96e-05)
% dist. pop SC2 -0.858***(0.00173)
% dist. pop ST 0.0212 0.0209 -0.0735**(0.127) (0.133) (0.0209)
% dist. pop ST2 0.144***(0.000110)
Religious polarization α = 0 -0.0523***(0.000326)
Religious polarization α = 1.6 -0.224*** -0.194*** -0.258*** -0.252***(6.69e-05) (0.000638) (5.95e-06) (8.50e-06)
Caste polarization α = 0 0.00290(0.873)
Caste polarization α = 1.6 0.175**(0.0374)
Observations 573 573 573 573 573Robust p-values in parentheses*** significant at 1%, ** significant at 5%, * significant at 10%
overtake caste based conflicts and thus would reduce the number of acts of violenceagainst untouchables. Nevertheless, the positive impact of the water index is robustto the introduction of the polarization indices, meaning that even when the variouspotentially confrontational contexts are accounted for, water communality remainsassociated with caste based violence.
As mentioned in section 4.2.2, 15 observations lie more than two standard de-viations away from the mean and 4 more than four standard deviations away. Table4.31 on page 174 in appendix presents the results when the model is estimated overthe restricted samples. Please note that the significance of the coefficients associa-ted with the water component is not altered while their sizes are somewhat reduced.Thus, these observations may not be viewed as responsible for the relationship, al-though they inflate the sizes of the coefficients. This will be taken into account whenthe implications of the sizes of the coefficients will be discussed in the following sec-tion 12.
12Moreover, as it can be seen from table 4.28 on page 4.28 in appendix the transformation of
6. RESULTS 107
CHAPTER 3. IS BLOOD THICKER THAN WATER? UNTOUCHABILITYAND PUBLIC INFRASTRUCTURE
Please recall that the water commonality index, which is the variable of inter-est was obtained through PCA in order both to reintroduce heterogeneity in thedata and to reduce potential multi-collinearity. Yet, in order to dispel doubts aboutthe genuineness of the procedure, estimations with the four variables included in thePCA are presented in table 4.29 in appendix. Results show that access through tanksand wells significantly increase the number of acts of violence against untouchables,while access through tubewells significantly decrease this number. Tap access howe-ver is not significant. The table shows that increasing by 1 unit the percentage ofpeople that can access water by tubewell may reduce by 3% the percentage of actsof violence targeting SCs and STs.
6.2 Magnitude of the effects
The highest value for the water variable is found in the Nayagarh district ofOrissa (3.409084). In this district the most common form of water distribution isthrough common sources. Tap water is available to 5% of the district’s population,water through tubewell to 5%, while wells and tanks are available to 96% and 77%of the population respectively. The proportion of crime targeting SCs and STs is 83every 1,000 crimes.Specification (5) of the model estimated in table 3.3 predicts that the probabilityfor this district to have a strictly positive number of crimes related to SCs and STsis 80.5% given the value of the component and all other factors held constant. Theexpected proportion of crimes targeting SCs and STs in this district, assuming thecrime rate to be strictly positive, given the value of the component and ceteris pa-ribus is 61 per thousand crimes. Hence, the expected number of crimes against SCsand STs is 50 every thousand crimes in this district.
Suppose that in this district the percentage of the population accessing waterthrough tap increases by one standard deviation. This would imply that 36.5% ofthe district’s population has access to tap water instead of the previous 5% . Thisinduces a change in the component from the maximum of 3.41 to 2.81, which inturn modifies the expected proportion of crimes targeting SCs and STs from 50 to47 per thousand crime. Please bear in mind that the average proportion in the wholesample is 29%�. In broad terms, an increase of 30% in tap access induces a decreaseof 10% in the proportion of crimes against SCs and STs.
Following the same procedure, the expected proportion of crimes against SCsand STs in the Chennai district of Tamil Nadu, where the water component takesits minimal value of -2.74513 is 24%�. Thus the difference in expected proportionsbetween the two extreme values taken by the component is 23%�when the actualdifference is 82%�. Table 3.4 summarizes the analysis.
the dependent variable does not seem to be responsible for the relationship. Yet, given all that hasbeen said about the difficulty in reconciling the two numbers for crimes, these results should betaken with circumspection.
13100% of the population has access to tap water and tubewell and there is no well or tank
108 6. RESULTS
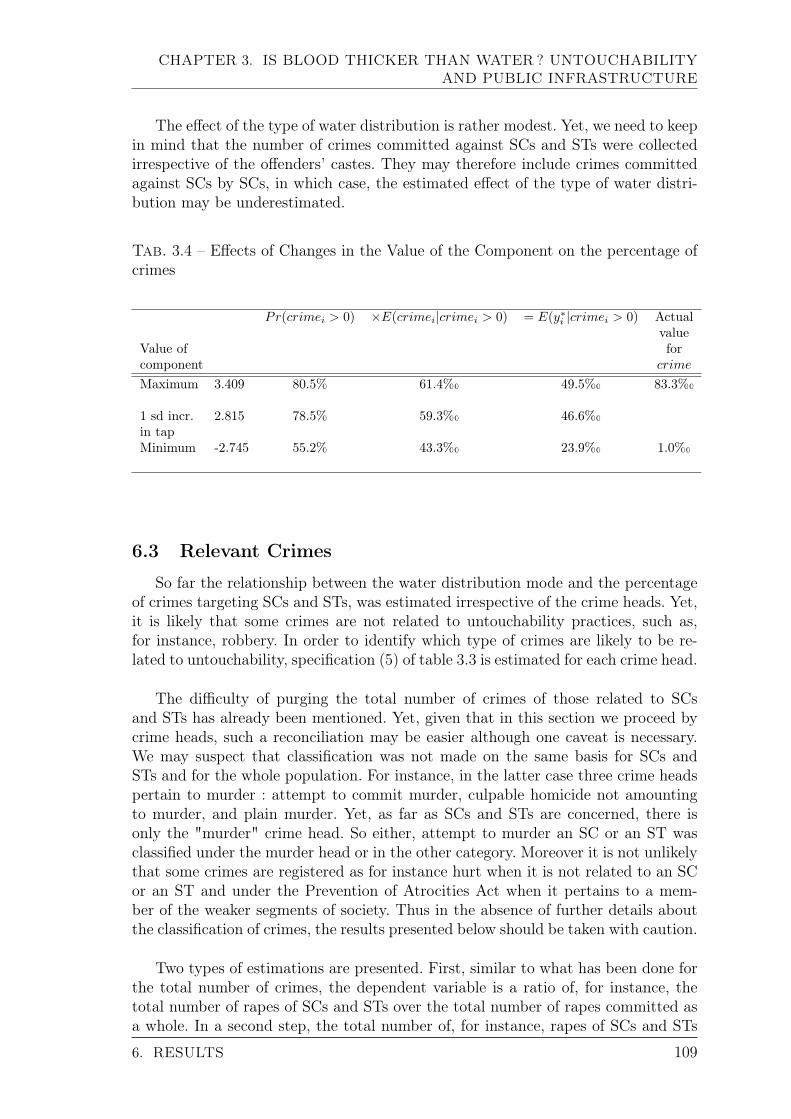
CHAPTER 3. IS BLOOD THICKER THAN WATER? UNTOUCHABILITYAND PUBLIC INFRASTRUCTURE
The effect of the type of water distribution is rather modest. Yet, we need to keepin mind that the number of crimes committed against SCs and STs were collectedirrespective of the offenders’ castes. They may therefore include crimes committedagainst SCs by SCs, in which case, the estimated effect of the type of water distri-bution may be underestimated.
Tab. 3.4 – Effects of Changes in the Value of the Component on the percentage ofcrimes
Pr(crimei > 0) ×E(crimei|crimei > 0) = E(y∗i |crimei > 0) Actualvalue
Value of forcomponent crime
Maximum 3.409 80.5% 61.4%� 49.5%� 83.3%�
1 sd incr. 2.815 78.5% 59.3%� 46.6%�in tapMinimum -2.745 55.2% 43.3%� 23.9%� 1.0%�
6.3 Relevant Crimes
So far the relationship between the water distribution mode and the percentageof crimes targeting SCs and STs, was estimated irrespective of the crime heads. Yet,it is likely that some crimes are not related to untouchability practices, such as,for instance, robbery. In order to identify which type of crimes are likely to be re-lated to untouchability, specification (5) of table 3.3 is estimated for each crime head.
The difficulty of purging the total number of crimes of those related to SCsand STs has already been mentioned. Yet, given that in this section we proceed bycrime heads, such a reconciliation may be easier although one caveat is necessary.We may suspect that classification was not made on the same basis for SCs andSTs and for the whole population. For instance, in the latter case three crime headspertain to murder : attempt to commit murder, culpable homicide not amountingto murder, and plain murder. Yet, as far as SCs and STs are concerned, there isonly the "murder" crime head. So either, attempt to murder an SC or an ST wasclassified under the murder head or in the other category. Moreover it is not unlikelythat some crimes are registered as for instance hurt when it is not related to an SCor an ST and under the Prevention of Atrocities Act when it pertains to a mem-ber of the weaker segments of society. Thus in the absence of further details aboutthe classification of crimes, the results presented below should be taken with caution.
Two types of estimations are presented. First, similar to what has been done forthe total number of crimes, the dependent variable is a ratio of, for instance, thetotal number of rapes of SCs and STs over the total number of rapes committed asa whole. In a second step, the total number of, for instance, rapes of SCs and STs
6. RESULTS 109
CHAPTER 3. IS BLOOD THICKER THAN WATER? UNTOUCHABILITYAND PUBLIC INFRASTRUCTURE
is introduced as the explained variable, while the number of rapes of non scheduledindividuals is introduced as a independent variable14. For untouchables specific le-gislation, such as the Prevention of Atrocities Act ("PAA") and the Protection ofCivil Rights ("PCRA"), the control variable is the total number of crimes, based onthe assumption that the latter does not include the formers. These two proceduresshould provide some comfort about the innocuousness of the transformation of thedependent variable.
Results from the two estimations are presented in tables 3.5 and 3.6 respectively.The type of water distribution is shown to significantly impact the following typesof crimes against SCs and STs : rape, arson, hurt and all the crimes that fall underthe Protection of Civil Rights Act. Oddly enough, the latter is negatively influencedby the "commonality" of the water source, although the significance level of thecoefficient associated with the Water variable is close to the 10% threshold.
14The latter is calculated by subtracting from the total number of cases per crime head, thenumber that is related to untouchables victims.
110 6. RESULTS
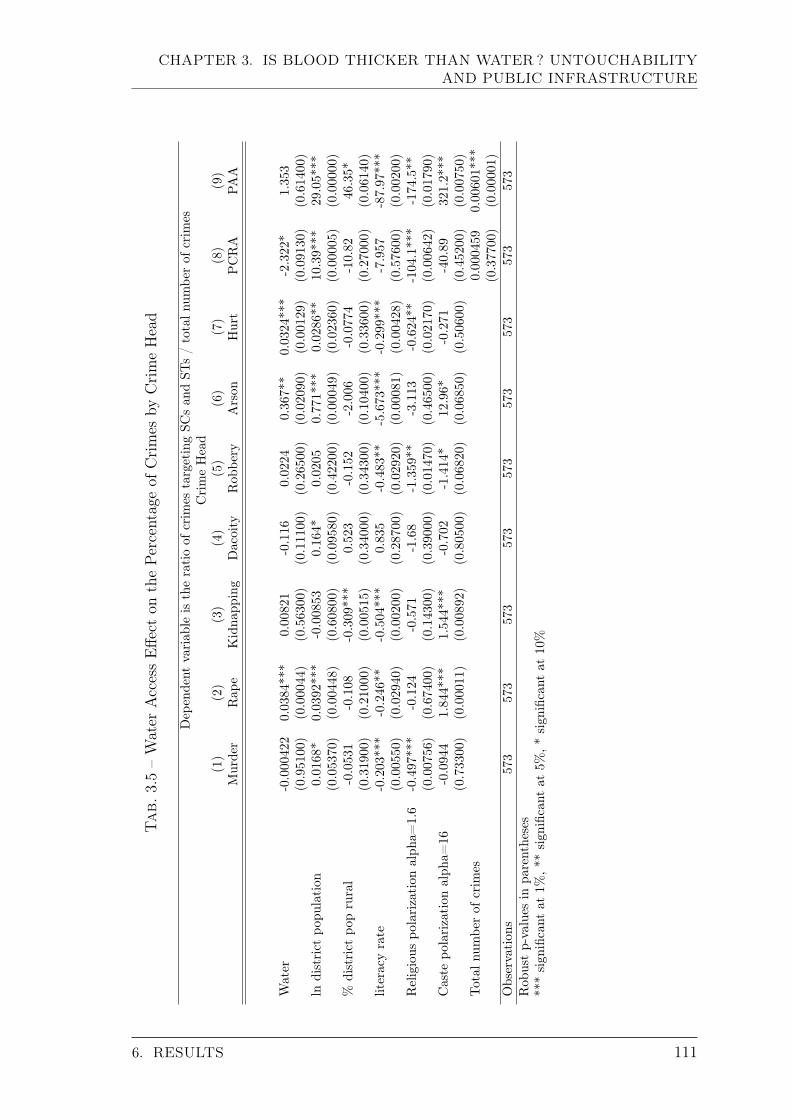
CHAPTER 3. IS BLOOD THICKER THAN WATER? UNTOUCHABILITYAND PUBLIC INFRASTRUCTURE
Tab.
3.5–Water
AccessEffe
cton
thePercentag
eof
Crimes
byCrimeHead
Dep
endent
variab
leis
theratioof
crim
estargetingSC
san
dST
s/totaln
umbe
rof
crim
esCrimeHead
(1)
(2)
(3)
(4)
(5)
(6)
(7)
(8)
(9)
Murder
Rap
eKidna
pping
Dacoity
Rob
bery
Arson
Hurt
PCRA
PAA
Water
-0.000422
0.0384***
0.00821
-0.116
0.0224
0.367**
0.0324***
-2.322*
1.353
(0.95100)
(0.00044)
(0.56300)
(0.11100)
(0.26500)
(0.02090)
(0.00129)
(0.09130)
(0.61400)
lndistrict
popu
lation
0.0168*
0.0392***
-0.00853
0.164*
0.0205
0.771***
0.0286**
10.39***
29.05***
(0.05370)
(0.00448)
(0.60800)
(0.09580)
(0.42200)
(0.00049)
(0.02360)
(0.00005)
(0.00000)
%district
poprural
-0.0531
-0.108
-0.309***
0.523
-0.152
-2.006
-0.0774
-10.82
46.35*
(0.31900)
(0.21000)
(0.00515)
(0.34000)
(0.34300)
(0.10400)
(0.33600)
(0.27000)
(0.06140)
literacyrate
-0.203***
-0.246**
-0.504***
0.835
-0.483**
-5.673***
-0.299***
-7.957
-87.97***
(0.00550)
(0.02940)
(0.00200)
(0.28700)
(0.02920)
(0.00081)
(0.00428)
(0.57600)
(0.00200)
Religious
polarization
alph
a=1.6
-0.497***
-0.124
-0.571
-1.68
-1.359**
-3.113
-0.624**
-104.1***
-174.5**
(0.00756)
(0.67400)
(0.14300)
(0.39000)
(0.01470)
(0.46500)
(0.02170)
(0.00642)
(0.01790)
Caste
polarization
alph
a=16
-0.0944
1.844***
1.544***
-0.702
-1.414*
12.96*
-0.271
-40.89
321.2***
(0.73300)
(0.00011)
(0.00892)
(0.80500)
(0.06820)
(0.06850)
(0.50600)
(0.45200)
(0.00750)
Total
numbe
rof
crim
es0.000459
0.00601***
(0.37700)
(0.00001)
Observation
s573
573
573
573
573
573
573
573
573
Rob
ustp-values
inpa
rentheses
***sign
ificant
at1%
,**sign
ificant
at5%
,*sign
ificant
at10%
6. RESULTS 111
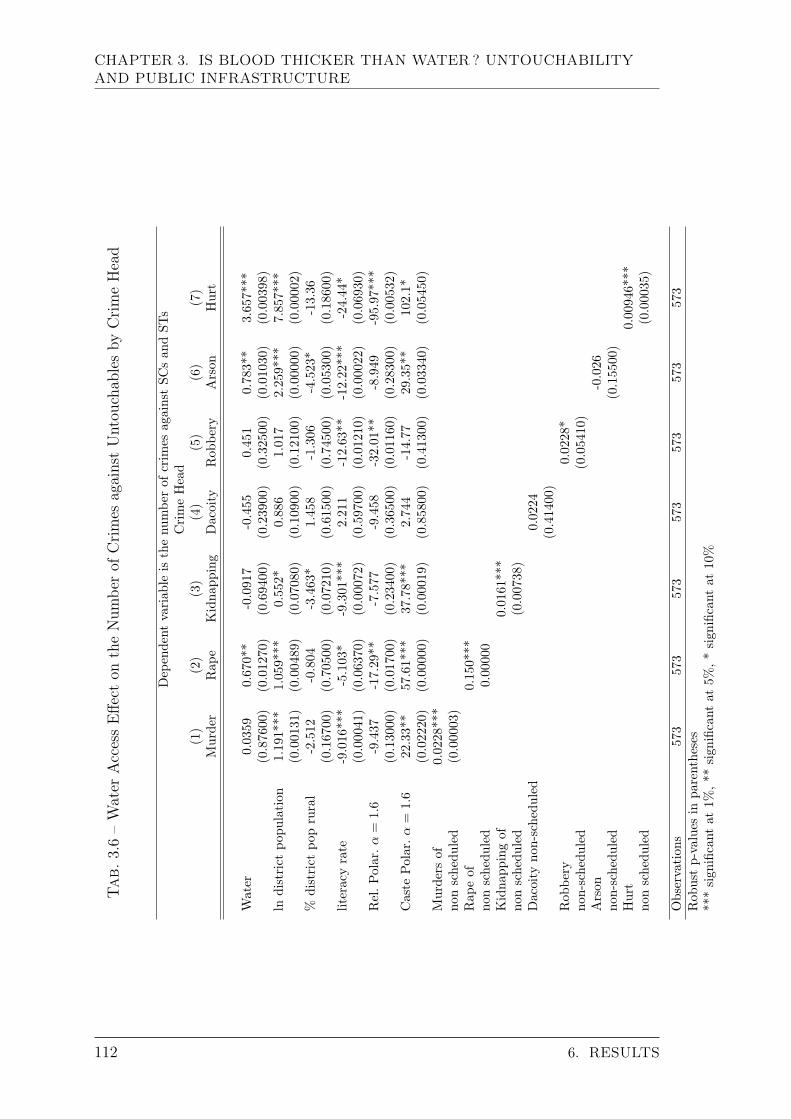
CHAPTER 3. IS BLOOD THICKER THAN WATER? UNTOUCHABILITYAND PUBLIC INFRASTRUCTURE
Tab.
3.6–Water
AccessEffe
cton
theNum
berof
Crimes
againstUntou
chab
lesby
CrimeHead
Dep
endent
variab
leis
thenu
mbe
rof
crim
esagainstSC
san
dST
sCrimeHead
(1)
(2)
(3)
(4)
(5)
(6)
(7)
Murder
Rap
eKidna
pping
Dacoity
Rob
bery
Arson
Hurt
Water
0.0359
0.670**
-0.0917
-0.455
0.451
0.783**
3.657***
(0.87600)
(0.01270)
(0.69400)
(0.23900)
(0.32500)
(0.01030)
(0.00398)
lndistrict
popu
lation
1.191***
1.059***
0.552*
0.886
1.017
2.259***
7.857***
(0.00131)
(0.00489)
(0.07080)
(0.10900)
(0.12100)
(0.00000)
(0.00002)
%district
poprural
-2.512
-0.804
-3.463*
1.458
-1.306
-4.523*
-13.36
(0.16700)
(0.70500)
(0.07210)
(0.61500)
(0.74500)
(0.05300)
(0.18600)
literacyrate
-9.016***
-5.103*
-9.301***
2.211
-12.63**
-12.22***
-24.44*
(0.00041)
(0.06370)
(0.00072)
(0.59700)
(0.01210)
(0.00022)
(0.06930)
Rel.P
olar.α
=1.
6-9.437
-17.29**
-7.577
-9.458
-32.01**
-8.949
-95.97***
(0.13000)
(0.01700)
(0.23400)
(0.36500)
(0.01160)
(0.28300)
(0.00532)
Caste
Polar.α
=1.
622.33**
57.61***
37.78***
2.744
-14.77
29.35**
102.1*
(0.02220)
(0.00000)
(0.00019)
(0.85800)
(0.41300)
(0.03340)
(0.05450)
Murders
of0.0228***
nonschedu
led
(0.00003)
Rap
eof
0.150***
nonschedu
led
0.00000
Kidna
ppingof
0.0161***
nonschedu
led
(0.00738)
Dacoity
non-schedu
led
0.0224
(0.41400)
Rob
bery
0.0228*
non-schedu
led
(0.05410)
Arson
-0.026
non-schedu
led
(0.15500)
Hurt
0.00946***
nonschedu
led
(0.00035)
Observation
s573
573
573
573
573
573
573
Rob
ustp-values
inpa
rentheses
***sign
ificant
at1%
,**sign
ificant
at5%
,*sign
ificant
at10%
112 6. RESULTS
CHAPTER 3. IS BLOOD THICKER THAN WATER? UNTOUCHABILITYAND PUBLIC INFRASTRUCTURE
6.4 State Specificities
As already mentioned other factors may influence the level of public goods supplysuch as economic or human development, politics or tradition. Since these factorsmay be correlated with caste based violence, we need to control for these possibilities.Table 3.7 below presents the results when the state GDP is entered (specification(1), (3) and (4)), when the Human Development Index (hereafter "HDI") is entered(specification (2), (3) and (4)) and state fixed effects (specification (5)). Again, thewater communality index is positive and significant across all specifications. Boththe log of the state’s GDP and the HDI are significant, although this mainly stemsfrom the state of Uttar Pradesh, whose GDP is the second largest of all states’15 andthat is the most populated state, but also one where caste relationships are tensed toput it mildly. When Uttar Pradesh ("UP") is removed from the sample (specification(4)), both GDP and HDI lose significance. The particularity of this state supportsthe necessity to account for state specificities. This is what specification (5) doesby introducing states fixed effects in the equation. Interestingly, caste polarizationloses its significance when states variables are introduced. This probably stems fromthe fact that the index does not sufficiently vary within states. Indeed within statesaverage standard deviation of the index is 0.019 compared to an average of 0.12.Even when state specificities are taken into account, the more common the watersource, the higher the number of acts of violence against untouchables.
6.5 Other Public Investments
There are three reasons to introduce public investments in other types of in-frastructure in the equation. First, it will underline the unique position enjoyed bywater supply. As exposed earlier, public investments in water supply plays a specificrole in crimes against untouchables, due to the Indian sociocultural context. Second,although we have done our best to control for all the usual variables that influencepublic goods provision such as polarization, wealth or state specificities, introducingother types of public goods may help at controlling for potentially omitted factors.Third, other public investments such as education for instance may be thought ofas having an incidence on crimes against untouchables. Table 3.8 below presents theresults when other kind of public investments are introduced without and with statefixed effects (specifications (1) to (4) and (5) to (8) respectively).
The first and fifth specifications introduce the percentage of villages that areelectrified in a district. This does not change the sign of coefficients associated withthe variable of interest although it becomes significant only at the 10% level whenstate fixed effects are introduced. The coefficient for electricity is barely significantwithout fixed effects and loses its significance with fixed effects.
When the percentage of villages accessible by road is introduced, coefficientsassociated with the water variable remain significant, although only at the 10%threshold with fixed effects. The road variable is significant and negative once statesfixed effects are introduced. Presumably, what this variable captures is the district’s
15In 1999 Uttar Pradesh had the second largest GDP behind Maharashtra according to theIndian Ministry of Statistics
6. RESULTS 113

CHAPTER 3. IS BLOOD THICKER THAN WATER? UNTOUCHABILITYAND PUBLIC INFRASTRUCTURE
Tab. 3.7 – Water Access Effect - State Controls and Fixed Effects
Percentage of Crime(1) (2) (3) (4) (5)
Water 0.00626*** 0.00809*** 0.00805*** 0.00874*** 0.00590**(0.00228) (0.000591) (0.000613) (0.000347) (0.0486)
ln(population) -0.00984** -0.000988 -0.0116*** -0.00733* -0.00328(0.0103) (0.710) (0.00498) (0.0917) (0.390)
% dist. pop. rural -0.0198 -0.0274 -0.0293* -0.0356** -0.000232(0.211) (0.104) (0.0821) (0.0408) (0.990)
literacy rate -0.0649*** -0.0369 -0.0401 -0.0241 -0.0237(0.00293) (0.207) (0.169) (0.431) (0.382)
Religious polarization α = 1.6 -0.250*** -0.206*** -0.203*** -0.312*** -0.0892(9.05e-06) (0.000924) (0.00106) (2.52e-06) (0.166)
Caste polarization α = 1.6 0.113 0.172* 0.0976 0.163* 0.124(0.187) (0.0585) (0.295) (0.0929) (0.204)
ln (state GDP) 0.0104*** 0.0105*** 0.00311(0.000589) (0.00151) (0.377)
Human Development Index -0.0895** -0.0864* -0.000626(0.0489) (0.0567) (0.990)
Observations 571 527 525 455 573Fixed Effects No No No No YesSample All All All UP removed AllRobust p-values in parentheses*** significant at 1%, ** significant at 5%, * significant at 10%
level of isolation and backwardness. Therefore, even controlling for this aspect of thedistrict, results concerning water still hold. Please note that the diminished coeffi-cient may stem from a significant correlation of -0.43 between the water index andthe percentage of villages accessible by road.
As mentioned, education could be thought of as having a negative impact oncaste based violence. Presumptive evidence is found with the negative and signi-ficant coefficient associated with the population’s literacy rate in previous tables.Indeed, the numbers of primary and middle schools per inhabitant have a negativesignificant effect on caste based violence, although the effect looses its significancefor middle school once fixed effect are introduced. This may be due to the fact thatmiddle schools are less local. They recruit within a larger radius, which dampens thevariable’s variance within states. Nevertheless, a reassuring result is that infrastruc-ture in primary education are also effective at reducing violence against SCs and STs.Yet, the results associated with the index of water communality are robust to allthese inclusions, thereby stressing the fact that water distribution plays a role of itsown, even when other public investments are also effective at reducing the numberof acts of violence against SCs and STs and when state specificities are accounted for.
We have seen that the number of crimes against untouchables is affected by thewater distribution mode. This result is robust to various specifications including
114 6. RESULTS

CHAPTER 3. IS BLOOD THICKER THAN WATER? UNTOUCHABILITYAND PUBLIC INFRASTRUCTURE
Tab. 3.8 – Water Access Effect - Including other Infrastructures
Percentage of Crime(1) (2) (3) (4)
Water 0.00738*** 0.00685*** 0.00482** 0.00598***(0.000776) (0.00138) (0.0275) (0.00572)
% villages electrified 0.0299*(0.0837)
% villages connect. by road 0.0210 -0.00597 0.0115(0.169) (0.723) (0.463)
Nbr primary school / inhab. -0.239***(0.000442)
Nbr middle school / inhab. -0.356**(0.0214)
Observations 573 573 573 573Fixed Effects No No No No
Percentage of Crime(5) (6) (7) (8)
Water 0.00548* 0.00530* 0.00527* 0.00499*(0.0675) (0.0765) (0.0773) (0.0955)
% villages electrified -0.0360(0.112)
% villages connect. by road -0.0458** -0.0621*** -0.0502**(0.0304) (0.00497) (0.0185)
Nbr primary school / inhab. -0.178**(0.0153)
Nbr middle school / inhab. -0.342(0.108)
Observations 573 573 573 573Fixed effects Yes Yes Yes YesRobust p-values in parentheses*** significant at 1%, ** significant at 5%, * significant at 10%All specifications include ln(population), % rural, literacy, caste and religious polarizations
state specificities and other public investments. Therefore, a nice unexpected sideeffect of the water improvement programs is the reduction in the number of possiblebones of contention across castes. A note of caution is necessary. We do not claimthat generalizing access to tap water will eradicate caste based violence. This wouldbe presumptuous and absurd. What is claimed is that the government’s efforts toprovide safe drinking water (i.e. through taps or tubewells) with the intent of impro-ving public health, have the nice side effect of weakening the role of excuse playedby water for caste based violence. No doubt that caste confrontations will occuron other grounds. Yet given the salience of water in caste prohibitions, eliminatingsuch a bone of contention is of great interest. This recommendation may appearshortsighted and pointless if caste is not to be fought at its base. We fully concurwith this view, yet it would provide some temporary relief to oppressed caste be-sides improving public sanitation. What are results suggest is a side effect of public
6. RESULTS 115

CHAPTER 3. IS BLOOD THICKER THAN WATER? UNTOUCHABILITYAND PUBLIC INFRASTRUCTURE
investments rather than its essential purpose.
6.6 Violence Inertia
The question we now wish to address is : "does the effect of water supply varyaccording to different levels of violence ?". It may very well be the case that the samesource of social tensions, water for instance, has a larger impact in an already violentenvironment. In order to provide some elements, a simultaneous quantile regressionhas been carried out. This methodology considers the error correlation between dif-ferent quantiles thanks to the bootstrapped variance-covariance matrix. It enablescomparison between coefficients in different quantiles (Koenker and Hallock (2001)).The percentage of crimes is split into four quantiles. Results are presented in table3.9.
Tab. 3.9 – Quantile Regressions
Percentage of crimes(1) (2) (3)q25 q50 q75
Water 0.00110 0.00378*** 0.00671***(0.146) (0.000555) (7.55e-05)
ln (population) 0.00135*** 0.00117 -0.000428(0.00157) (0.223) (0.818)
% dist. pop rural -0.00287 -0.00579 -0.00781(0.301) (0.178) (0.406)
literacy rate -0.0153** -0.0479*** -0.109***(0.0192) (2.97e-05) (3.45e-10)
Religious polarization α = 1.6 -0.0733*** -0.0918*** -0.112**(3.09e-06) (0.000809) (0.0363)
Caste polarization α = 1.6 0.0558*** 0.110*** 0.169**(0.00211) (0.00257) (0.0269)
Observations 573 573 573Robust p-values in parentheses*** significant at 1%, ** significant at 5%, * significant at 10%
These results clearly evidence that water is only an excuse for caste basedconfrontations. Indeed, where violence is low, the water distribution mode has noimpact. Yet, in already violent environments, the impact of water increases togetherwith the level of violence. Conclusions that may be drawn from this analysis aretwofold. First, water really is an excuse for already existing caste based violence andas mentioned earlier, investments in public infrastructure would not eradicate theproblem, but rather provide some temporary relief. Second, if a choice has to bemade about which zones should be given priority in terms of water access improve-ments, such a decision would benefit from taking caste based violence as one of thecriteria.
116 6. RESULTS
CHAPTER 3. IS BLOOD THICKER THAN WATER? UNTOUCHABILITYAND PUBLIC INFRASTRUCTURE
7 Conclusions
It has been demonstrated in this chapter that violence targeting untouchables issignificantly linked to the water distribution mode. These results induce many conse-quences. First, they show that untouchability practices are still common in India.In compliance with caste prescriptions, untouchables are denied access to commonwater sources and in accordance with stories of caste based violence recounted innewspapers, this prohibition is violently enforced. One could think that this studyis India specific. Yet, this Indian example encourages us to question the role of so-cial norms on public goods usage. So far, the literature has attempted to show thenegative impact of social fragmentation on the provision of public goods, throughdiminished collective action. Yet, the collective action problem may arguably besolved by the creation of intergroup norms, such as the exclusion of a group in ourcase. In which case, there is not much ground to think that social fragmentationimpacts public goods provision. Rather, publicly provided goods and their attachedsocial norms may sharpen social antagonisms and divides.Another point evoked by the study is the need for policy makers to look into theusage that is made of public goods. Most development programs focus on the levelof public goods and do not attach the necessary importance to what use is made ofthe goods.We shall come back to this point in the next chapter.
Lastly, improving water access does reduce the number of crimes against untou-chables. Although water improvement programs are mainly designed out of publichealth concerns, recognizing that it has a side effect on caste based violence add anargument for increased efforts in this domain. As already mentioned, it is not clai-med that water improvement programs will uproot caste violence and there is littledoubt that confrontations between caste will occur on other grounds. Excuses forcaste based violence do not lack. Yet, given the salience of water in caste traditions,improving water access may provide temporary relief to oppressed castes on top ofimproving sanitation.
7. CONCLUSIONS 117

CHAPTER 3. IS BLOOD THICKER THAN WATER? UNTOUCHABILITYAND PUBLIC INFRASTRUCTURE
118 7. CONCLUSIONS
Chapter 4
Social Fragmentation and PublicGoods : Polarization andPatronage in Uttar Pradesh andBihar
119
CHAPTER 4. SOCIAL FRAGMENTATION AND PUBLIC GOODS :POLARIZATION AND PATRONAGE IN UTTAR PRADESH AND BIHAR
1 Introduction
The previous chapter showed that caste composition has an impact on the use ofpublic goods such as water through the introduction of usage norms and rules thatmay be violently enforced. As far as castes are concerned, such a norm is segregationof the public space and public goods appear closer to club goods. If castes do notshare public goods, social fragmentation along the lines of castes would most proba-bly have an impact on public goods provision. Many theoretical as well as empiricalworks brought to light a negative effect of social fragmentation on public goodsprovision through hampered collective action. Such a negative impact goes mainlythrough three channels. First, heterogenous societies often exhibit strong differencesin preferences regarding public goods characteristics and therefore encounter diffi-culties in voicing their claims on limited public resources. Second, individuals maybe reluctant to work with other groups’ members. The impact of group heteroge-neity on group participation has been analyzed by Alesina and Ferrara (2000). Thethird issue arises from the fact that different groups may disagree on the sharing ofthe private benefits or on the allocation of their effort, due to potential free riding.Moreover, they fail to implement cooperation enforcement devices across groups.
No matter the channel, this literature rests upon the idea that social fragmen-tation induces social tensions and such an assumption may be criticized with twoarguments : first, social fragmentation is most of the time assessed though the nowcommon fractionalization index that does not properly account for potential socialantagonisms. Second, the relationship between social fragmentation and antagonismsis far from being established. By assuming that the former necessarily leads to thelatter, authors have neglected the arising of social norms ruling intergroup rela-tionships. Such rules may weaken potential antagonisms, even in very heterogenoussocieties. For instance, if the rule is that each group is to promote access to publicgoods for its members and refrain from using other groups resources, a norm thatwill be called "patronage" in this chapter, social fragmentation may have a positiveeffect on public provision of common goods. This point has been made by Alesinaand Ferrara (2005). As they rightly point out "while pure public goods may be lowerin more fragmented communities, the amount of publicly provided "private" goods -especially those that can be targeted to specific groups - may be larger. We can thenhave a positive correlation between fragmentation and ethnically based patronage".This precisely is the hypothesis that will be tested in this chapter. Many reasonslead us to believe that caste patronage with respect to public goods is taking placein India. Relationships between castes are based on avoidance, while caste is suppo-sed to provide its members with some support, or at least cohesion. As mentionedin introduction to this dissertation, some sociologists such as Baechler (1988) be-lieved that the need to solve collective action problem was the raison d’être of castes.
The aim of this chapter is to test the impact of caste fragmentation on publicgoods provision. It will be shown in a first step that if fractionalization is to play arole it is likely to be a positive one. Second, I will try to establish that this impactis not linked to potential antagonisms, as the impact of polarization indices is notfound significant. Lastly, the occurrence of patronage activities will be looked intoby showing that a households caste does influence public goods access, depending
120 1. INTRODUCTION
CHAPTER 4. SOCIAL FRAGMENTATION AND PUBLIC GOODS :POLARIZATION AND PATRONAGE IN UTTAR PRADESH AND BIHAR
on the dominant caste in the village. This study is based on data collected by theWorld Bank in the Living Standard and Measurement Survey conducted in 1997and 1998 in the Northern Indian states of Uttar Pradesh and Bihar.
2 Related Literature
To date, theories have established that social heterogeneity hampers collectiveaction through preferences heterogeneity (Alesina et al., 1999), reluctance to workwith members of other groups (Alesina and Ferrara, 2000), or a disagreement onthe sharing of the private benefits or on the allocation of efforts (Banerjee et al.,2005), due to potential free riding as well as a lack of cooperation enforcement de-sign. Banerjee et al. (2008) provided a comprehensive summary of these theoriesand introduced the effect of specific contexts such as an unequal power distributionacross groups, the presence of influential groups or the degree of group cohesionwhile concluding that groups characteristics only account for a small share of thevariations in public goods provision. These authors underline the difficulty expe-rienced by many authors, as we shall see later, in untangling the effect of socialfragmentation and that of inequality. Social fragmentation is supposed to be detri-mental to public goods provision while inequality favors collective action accordingto Bardhan et al. (2007) among others. This echoes the positive role on collectiveaction attributed by Olson (1965) to inequality, through the presence of wealthyindividuals.
Empirically, the impact of social fragmentation on public goods provision wasfirst brought to light by Alesina et al. (1999). Working on US counties, metropoli-tan areas and cities data, the authors evidenced that the most socially fragmentedzones spend less on schools, roads, trash pickup and more on health and police.Oddly enough, these last two goods may be thought of in the U.S. context as so-mewhat related to income, thereby suggesting that social fragmentation may favorthe presence of public goods provided that income comes in the equation.
As Banerjee and Somanathan (2001) rightly pointed out, Alesina et al. (1999)used data for public goods that are contemporaneous to the fractionalization data,and given the high mobility environment of US cities, the analysis may be flawedwith reverse causality due to a sorting effect analyzed by Tiebout (1956). Accor-ding to Tiebout’s model, individuals sort themselves to areas that provide themwith the mostly desired public goods thereby homogenizing the neighborhoods. Forinstance, the poor may converge to areas that provide services valued by the poor.Following Alesina et al. (1999) seminal work, other authors have tried to firmlyestablish the link between fractionalization and collective action or public goods.Miguel and Gugerty (2005) found a negative relationship between ethnic fractiona-lization and school funding and infrastructure in Kenya. One caveat to their workis that it may not be immune from Tiebout’s sorting as well, although the authorsuse different specifications to address this issue. Banerjee and Somanathan (2001)have tried to tackle the issue of reverse causality by using caste fragmentation datafrom the 1931 Census to explain the provision of public goods in the 1970s and the1980s in India, which makes sense given the low level of mobility in the rural parts
2. RELATED LITERATURE 121
CHAPTER 4. SOCIAL FRAGMENTATION AND PUBLIC GOODS :POLARIZATION AND PATRONAGE IN UTTAR PRADESH AND BIHAR
of the subcontinent. Regressing the proportion of villages in districts having accessto a particular good, they found fractionalization had a negative impact on nearlyhalf of the selected public goods, while it had a positive significant effect for 10% ofthem. Interestingly, Banerjee and Somanathan (2001) admit that the fragmentationmeasure may be a proxy for inequality and as the relatively rich can be effectiveat getting the goods to their villages. In a similar analysis, Banerjee et al. (2005)found that caste fragmentation has a significant negative impact on 10 out of 26 pu-blic goods and a positive significant impact on 3, thus providing more mixed resultsabout the relationship. Moreover, Somanathan et al. (2006) found that caste hetero-geneity had no impact on collective action regarding the preservation of a commonforest in the Indian Himalayas. The detrimental role of social fragmentation in theprovision of public goods is not definite, as evidenced by this short literature review.
It is important to note that most of the empirical work cited so far, have beenconducted on a rather aggregate level and has primarily been concerned with thelevel of public goods. Micro data may bring out a different story. Four studies areof particular interest : those of Dayton-Johnson (2000), Bardhan (2000), Khwaja(2009) and Anderson (2007). Their results however should be handled with care dueto data scarcity. Looking at 48 irrigation systems and maintenance indicators inMexico, Dayton-Johnson (2000) found that social heterogeneity has both a directnegative effect by lowering cooperative efforts and a positive indirect one by makinga group less likely to select the poorly performing allocation rule, so that its indirecteffect on cooperation is positive. Economic inequality is found to lower cooperativeeffort, although its impact is U-shaped. Besides, economic inequality has an indirecteffect on cooperation via its effect on the choice of the distributive rule. Bardhan(2000) found similar results looking at 48 irrigation systems maintenance in SouthIndian villages. The social homogeneity variable is hardly found significant, while in-equality is found to have a significant U-shaped impact although it is twofold. On theone hand, inequality’s direct effect is negative, while, on the other hand the indirecteffect, working through the cost sharing rule, is positive. Khwaja (2009) also found aU-shaped effect of land inequality on projects maintenance in rural communities inPakistan, although fragmentation’s negative coefficient remained significant. Microdata analysis do not help at drawing a clearer picture of fragmentation’s detrimentalrole to the provision of public goods, although they stress that inequality and socialfragmentation are closely linked, both having direct and indirect effects that maycontradict each other.
A comment made by Bardhan (2000) draws more particularly the attention. Henoticed during his field study that better off farmers tend to violate water allocationrules crafted by others and respect those defined by the elite. This suggests thatthe latter hold public resources in a strong grip. Similarly, Anderson (2007) showedthat high castes control access to water irrigation systems and are unwilling to sellwater to lower castes. As groups appropriate public goods, fractionalization mayhave a positive impact on their provision levels. In this chapter, the relationshipbetween fractionalization and public goods availability will be tested and then Iwill try to provide some evidence that some groups do capture access to publiclyprovided goods, in the vein of the comment made by Alesina and Ferrara (2005).
122 2. RELATED LITERATURE
CHAPTER 4. SOCIAL FRAGMENTATION AND PUBLIC GOODS :POLARIZATION AND PATRONAGE IN UTTAR PRADESH AND BIHAR
This assumption seems plausible given that caste patronage is commonly found inother areas of Indian economic life (Platteau, 1995; Srinivas, 1955) as well as inpolitics (Chandra, 2004).
3 Data and Main Variables
The analysis is based on data collected during the 1997-1998 Survey of LivingConditions in the northern Indian states of Uttar Pradesh and Bihar. The data setcovers 2,250 households spread across 120 villages. These two states are part of whatis often referred to as Indian’s poverty belt and caste relationships in this region areknown to be confrontational, to put it mildly. As an example, 29% of acts of vio-lence against outcasts committed in 1998 in India took place in these two statesalone1. This section is dedicated to the explanation of variables employed and theirconstructions.
3.1 Castes and Religions
Indian society has long been divided along two lines : caste and religion. After allthat has been said about castes relationships in previous chapters, it probably seemsstraightforward that the institution of castes fosters social fragmentation. Due to po-sitive discrimination policies, the thousands of jatis have been grouped into threecategories by the Census of India : the Scheduled Castes and Tribes that represent16% and 8% of the population and the rest. Within the non-scheduled the NationalSample Survey identifies "other backward classes" ("OBCs") that account for 36%of the overall population2. A similar classification has been used in the data wherecastes are either upper, middle, backward agricultural ("BAC"), other backwardcastes ("OBC") and Scheduled Castes ("SC"). Tribes are not represented. In thesample used these group accounted for respectively 15%, 3%, 30%, 22% and 31%of the Hindu population. Please note that such a classification probably underesti-mates the actual social fragmentation as the so defined clusters encompass groupsthat do not necessarily sense that they belong to the same community. For instancean upper caste may not feel related to another upper caste.
As already mentioned, while caste is a clear-cut and well established institutionamong Hindus, it is also a reality among other religious groups, although not inthe same plain way. Muslims and Christians seem to have inherited from the Hinduancestors’ castes. In the sample used, besides Hindus, only Muslims are representedand they are classified in either upper castes (37% of the Muslims’ population) andlower castes (63%).
Faith is another factor of social fragmentation. India is reputed for its bafflingreligious diversity. Hindus represent 80.5% of the population. Muslims come as the
1Source : National Crime Records Bureau, Government of India. To be fair, these two statesare also the most populated accounting for 24% of India’s total population and 19% of the outcasts.
2The exact number of OBCs is still debated. For instance the 1979 Mandal Commission esti-mated that this group encompassed 52% of the population
3. DATA AND MAIN VARIABLES 123
CHAPTER 4. SOCIAL FRAGMENTATION AND PUBLIC GOODS :POLARIZATION AND PATRONAGE IN UTTAR PRADESH AND BIHAR
second largest community with 138 million members (13.4%) followed by Christians(2.3%) and Sikhs (1.9%). In the states of Uttar Pradesh and Bihar on which thisanalysis focuses, Hindus account for respectively 80.6% and 83.2% of the population,while the rest is Muslim. In our sample 90% of the population is Hindu and 10%Muslim. Religion is an important factor of social division and is becoming increasin-gly so, as the riots that took place in the state of Gujarat in 2002 and its thousandsof deaths have testified. The choice made in this chapter is to treat Muslim castes asyet another caste. Thus the religious divide is incorporated into the caste cleavage.This choice is discussed in section 5.3 later in this chapter.
3.2 Fractionalization and Polarization
Social fractionalization has mainly been approached through the fractionalizationindex calculated as follows :
Fractionalization = 1−n∑i=1
π2i (4.1)
where πi is the population’s share of the ith caste, assuming the population is splitinto n groups.
This index is largely influenced by the number of groups identified as it mea-sures the probability that two randomly chosen individuals belong to the same ethnicgroup. It is a measure of diversity that does poorly at reflecting potential antago-nisms. According to Montalvo and Reynal-Querol (2005) the lack of explanatorypower of ethnic heterogeneity on the incidence of conflict can be attributed to theinadequacy of the fractionalization index to capture social antagonisms. A richer fra-mework would be the one designed by Esteban and Ray (1994) where the concept ofpolarization is defined as the sum of interpersonal antagonisms that can arise from :a sense of group identification : individuals feel more closely tied to their groups
when they are relatively large. This is captured by the parameter α ∈ [0; 1.6]As such, polarization puts the emphasis on the population’s frequency in eachgroup.
a sense of alienation with respect to other groups materialized by intergroup dis-tances, noted bij.
The Esteban and Ray (1994) polarization index can be written as :
PER = P (α, b) = K
n∑i=1
∑j 6=i
π1+αi πjbij (4.2)
where πi is the population’s share of the ith group and K > 0 is used for populationnormalization. If intergroup distance represents the difference in groups’ incomesand for α = 0, the PER index is very close to an intergroup Gini coefficient. Thelarger α the further away the polarization measure moves from the Gini coefficient.
The Esteban and Ray (1994) polarization index was initially designed as a mea-sure of wealth or income polarization. As Montalvo and Reynal-Querol (2002) poin-ted out, the indicator is difficult to implement given that it depends on the iden-tification and the selection of economic groups which may be arbitrary and by all
124 3. DATA AND MAIN VARIABLES

CHAPTER 4. SOCIAL FRAGMENTATION AND PUBLIC GOODS :POLARIZATION AND PATRONAGE IN UTTAR PRADESH AND BIHAR
means far from obvious. For computational simplicity, Montalvo and Reynal-Querol(2002) have derived a special class of polarization index where bij = bi = 1. Thepolarization index can therefore be written as :
PMRQ = P (α, 1) =n∑i=1
π1+αi πj (4.3)
Please note that for α = 0, PMRQ = Fractionalization. The larger α, the weaker thecorrelation between the fractionalization index and the polarization measure. Thecorrelation may even turn negative for large values of α. The parameter α may beviewed as measuring the polarization’s sensitivity. Although the implementation ofPMRQ is much easier, this indicator totally irons out the heterogeneity in intergroupdistances and the fact that such a distance may largely depend on the distributionof income. This last point is particularly touchy when it comes to Indian castes asthe ritual hierarchy may modulate intergroup distance and where the ascendanceenjoyed by a caste is highly dependent upon its relative wealth. For instance, theperceived distance between outcasts and backward caste is likely to be larger thanbetween upper castes and middle castes. A thorough discussion of this point is leftfor future research as it is beyond the scope of this chapter.
In order to test the relationship between social fractionalization and publicgoods provision, PMRQ will be used as an explanatory variable for three valuesof α = 0; 0.8; 1.6. Please bear in mind that the larger α, the more emphasis is puton potential groups antagonisms. The impact of the polarization index is thereforeexpected to increase with α, under the assumption that social heterogeneity under-mines public goods provision through a sharpened opposition between the groups.
The sample is highly fractionalized. The fractionalization index ranges from 0to 0.8 with a mean of 0.6 and a standard deviation of 0.18. As a comparison, theindex value reported by Alesina et al. (1999) in the United States ranges from 0.02to 0.61 with a mean of 0.26 and a standard deviation of 0.14. The index based onthe 1971 Census of India reported by Banerjee and Somanathan (2007) at a districtlevel ranges from 0.2 to nearly 1 and has a mean of 0.9. Fractionalization also seemsto be higher in village where upper castes are dominant a shown in table 4.1 :
Tab. 4.1 – Fractionalization indices in sub-samples
Number of Mean Standard Minimum Maximumobservations Deviation
Villages dominated by upper castes 53 0.64 0.13 0.12 0.80Villages dominated by BAC 37 0.57 0.15 0.00 0.77Other villages 30 0.54 0.25 0.00 0.78Whole Sample 120 0.60 0.18 0.00 0.80
3. DATA AND MAIN VARIABLES 125
CHAPTER 4. SOCIAL FRAGMENTATION AND PUBLIC GOODS :POLARIZATION AND PATRONAGE IN UTTAR PRADESH AND BIHAR
3.3 Fractionalization and Patronage
Patronage is defined here as providing benefits to members of one’s own group,such as access to public goods at the expense of others. This is close to the conceptof parochial altruism developed in Bowles and Choi (2007). Should such a pheno-menon occur, publicly provided goods would resemble more club goods than publicones and untouchability practices investigated in the previous chapter as well as thesurvey by Shah et al. (2006) provide some support to this hypothesis.
If publicly provided goods become "patronage" goods, all the arguments in fa-vor of the negative role played by social fragmentation in public goods provision donot hold. Indeed, if goods are not public anymore and their use is restrained to aparticular group, there is no need anymore for intergroup collective action. All theelements that could undermine cooperation become inoperative. On the other hand,cooperation within the group becomes central. There are many reasons to believethat cooperation within a group is more easily achieved. First, potential sanctionsfor non cooperative behaviors may be more effective due to repeated interactions.Second, behavioral experiments have shown that individuals are more altruistic to-wards in-group members and thus may be more prone to collective actions.3. Third,social antagonisms may even reinforce cooperation within the group. For instance,Voors et al. (n.d.) and Bellows and Miguel (2009) found from field experiments thathaving experienced war does increase local collective action and shifts social prefe-rences towards increased altruism. We may push the analysis a notch further. Let’ssuppose that social heterogeneity does indeed leads to strong groups antagonisms4.As suggested by Bowles and Choi (2007), strong antagonisms may go hand in handwith the preponderance of "parochial altruist" behaviors, a term coined by the au-thors which encompasses the definition given to patronage in this chapter. Thus,this correlation may induce a positive effect of social fragmentation on the provisionof club goods. Whether we posit that social fragmentation induces conflict or not,arguments can be made to say that collective action within an homogenous groupis more easily achieved.
Should each group succeed in creating a collective action for the demand of agood, the larger the number of groups, the higher the likelihood that at least one ofthem obtains satisfaction. The fractionalization index being directly and positivelyrelated to the number of groups, a positive relationship between the presence ofthe goods and the index may be found. On the other hand, the polarization indexwould not have any effect. In short, whenever access to publicly provided goods isrestricted, social fragmentation and public goods provision may increase together.
The relative size of the groups is also important. Alesina et al. (2000) designsa model where public employment is viewed as a redistribution of income in favorof some groups. The authors theoretically show that in a society composed of twogroups for such a redistribution to take place, the size of the minority must be largeenough, which in turns increases the fractionalization index. In an empirical analysis,
3Examples include Hoffman et al. (1996), Chen and Li (2009)4this is for the sake of the argument given that, as mentioned earlier this assumption lacks
actual evidence
126 3. DATA AND MAIN VARIABLES

CHAPTER 4. SOCIAL FRAGMENTATION AND PUBLIC GOODS :POLARIZATION AND PATRONAGE IN UTTAR PRADESH AND BIHAR
the authors find a positive relationship between the fractionalization index and theextent of public employment. Yet, their reasoning rests on vote-catching strategiesthat probably are directly applicable neither to public goods, not to relatively smallvillages in northern India.
To the best of my knowledge, there is no theoretical model that clearly associatespatronage and public goods provision. Thus, the above reasoning rests mainly onintuitions about the relationship that may exist between the two. Nevertheless, thepositive empirical relationship found by Alesina et al. (2000) provides some support.
3.4 Selected Public Goods
The aim of this study is to assess the probability for a village to be connectedby road, bus, to the electric and phone networks or to have an anganwadi center(i.e. child development centers), a public primary school or a waste disposal systemavailable in the village depending on village’s characteristics. Figure 4.1 below showthe distribution of these publicly provided goods in the villages considered.
Fig. 4.1 – Share of Villages Having the Following Goods
54%
24% 24%
53%
32%
79%
30%
40%
50%
60%
70%
80%
90%
17%
24% 24%
0%
10%
20%
30%
Paved Road Bus Station Waste
Disposal
Telephone Electricity Anganwadi Public
Primary
School
It is worth mentioning that our strategy may be thwarted by governments auto-nomy in implementing public goods. Indeed authorities may decide on an allocationindependently from the social composition of the villages or the districts. Given thatpublic goods provision is central to many development programs, authorities maywant to increase their efforts in poor regions that may also be the most fragmentedones. For instance, the Indian state has made an important commitment to pubic
3. DATA AND MAIN VARIABLES 127
CHAPTER 4. SOCIAL FRAGMENTATION AND PUBLIC GOODS :POLARIZATION AND PATRONAGE IN UTTAR PRADESH AND BIHAR
goods provision. "In 1968, the ruling Congress Party brought out the National Po-licy on Education, which made a commitment to universal primary education. TheMinimum Needs Program of 1974-75 set down explicit norms about access to publicgoods in rural areas [...] Indira Gandhi made the removal of poverty (Garibi Hatao)the cornerstone of her successful election campaign in 1971" (Banerjee et al., 2008).Since these campaigns had been on for more than 20 years up to 1997-98 when thedata were collected, governments had time to make those goods available acrossthe country, irrespective of village characteristics. This may be especially true ofeducation, as the spread of educational facilities has long been a priority of manygovernments. Indeed in our sample, 94 out of the 120 villages had primary publicschools. In villages without a public primary school, more than half households haveaccess to it within less than 1km.
3.5 Wealth Inequality
Inequality should be inserted in the analysis on two grounds. First, I need to makesure that the impact of social fractionalization is not proxying that of inequality.Second, a differing effect of within and between group inequality may provide somehints that between group relationships are not as important as the ones within thegroups, which in turn may provide some support to the patronage assumption. In-deed, if access is restricted to members of one group, cooperation between the groupsand its determinants are not relevant any more, as far as public goods provision isconcerned. Only the cooperation within the group matters. Inequality between thegroups would therefore have very little explanatory power. However, it is difficult toanticipate the impact of within group inequality on the presence of publicly providedgoods. On the one hand, greater inequality may undermine collective action withinthe group by increasing its heterogeneity. On the other hand, relatively wealthy in-dividuals may act as patrons and promote collective action in exchange for socialprestige, as underlined by Olson (1965). In this last case, inequality would favor theemergence of patrons.
Wealth concentration is quite significant in our sample. On average, the largestlandowner owns 31% of the village’s lands, ranging from 14% to 92%. In villageswhere land is most equally distributed land value ranges between 0.4 and 0.9 mil-lion rupees, while in villages exhibiting the most unequal distribution, it varies from5,800 rupees to 14 million rupees. The individual Gini coefficient ranges from 0.3to 0.9 with a mean of 0.54 and a standard deviation of 0.11. Please note that thelargest land owners are the upper castes in 45% villages of the sample, backwardagricultural castes in 31%, Muslims in 13%, other backward castes ("OBC") in 8%,Scheduled Castes and Tribes in 38%.
Wealth inequality is measured by a Theil index which can be advantageouslybroken down into between and within group inequality. The Theil index has beencomputed following Deshpande (2000b) and Darity and Deshpande (2000). Supposethat individuals are arranged into n mutually exclusive groups, g1, ..., gn, each withmj individuals. Define yj and πj as group’s j average wealth based on land valueand population’s share respectively and y as the population’s average wealth. Let’s
128 3. DATA AND MAIN VARIABLES
CHAPTER 4. SOCIAL FRAGMENTATION AND PUBLIC GOODS :POLARIZATION AND PATRONAGE IN UTTAR PRADESH AND BIHAR
write Rj =yj
y. Then between group inequality can be written as :
bgi =n∑j=1
πjRj logRj (4.4)
and within group inequality as :
wgi =n∑j=1
πjRjTj (4.5)
with for every individual i belonging to group gj i.e. i ∈ gj
Tj ≡1
mj
∑i∈gj
ri log ri (4.6)
where ri is the ratio of individual wealth to mean wealth for group j. Overallinequality can then be written
Theil = bgi+ wgi (4.7)
This decomposition of the overall inequality into between and within group in-equality will prove useful as it allows to identify which sort prevails. In the event ofpatronage, within group inequality is expected predominate.
4 Empirical Strategy
The analysis comes in three steps. First, the impact of the fractionalization andpolarization indices on the presence of public goods within the 120 villages will betested. A probit model is used and will be detailed in the next paragraph. Second, Iwill check that the relationship does not arise from (i) the dominant caste, (ii) thestate in which the village is located, (iii) a proxy for the impact of inequality. Thisanalysis will be referred to as the fractionalization/polarization models. Lastly, inorder to investigate the possibility of caste based patronage, a probit model will beused to assess whether a household’s likelihood to access a publicly provided goodis influenced by the household’s membership to the dominant caste, provided thegood is available in the village. This model is labeled patronage model.
4.1 Fractionalization / Polarization Model Specification
The model is a probit that assesses the probability for the village i to have thegood j available as :
P (Yij = 1) = F (αPi + βπi + γσi) (4.8)
where F is the standard normal cumulative distribution function, Pi the polarizationindex PMRQ defined in section 3.2 for three levels of α = [0; 0.8; 1.6]. Please recall
4. EMPIRICAL STRATEGY 129
CHAPTER 4. SOCIAL FRAGMENTATION AND PUBLIC GOODS :POLARIZATION AND PATRONAGE IN UTTAR PRADESH AND BIHAR
PMRQ is the fractionalization index for α = 0. πi is a set of village populationcharacteristics such as average income, the number and average size of householdsand the percentage of households whose head is illiterate and whose primary sourceof living is their own farm. The first three population characteristics are expectedto have a positive impact while the effect of the last one is likely to be negative,given that it proxies the village’s remoteness. σi represents the number of thirdparties interventions such as government or NGO programs in the village in the lasttwelve months. The variable is included to account for the institutions’ autonomyin deciding to provide public goods as discussed in section 3.4. This measure isapproximate given that the it only encompasses programs implemented during thelast twelve months. Please note that neither the number of programs nor the averageor total money allocated are significantly correlated with fractionalization (pleaserefer to table 4.33 in appendix).
4.2 Patronage Model Specification
The aim of this model is to appraise whether belonging to the village’s dominantcaste significantly and positively influence households’ access to public goods. Theretained definition for dominant caste is the one that owns the largest share of land5.The sample is restricted to villages where the good considered is available. Let’s notethe main variables as follows :
P (Yhj) the probability that household h has access to good j when this good isavailable in the village
Xhk is a vector of observations for household h on k variables such as the value ofthe land owned, the size of the household, the age of its head and whether heis literate.
Ch is a set of dummy variables that account for household h caste.
Dic is a vector of dummies for the dominant caste c in village i in which householdh lives.
The equation to be estimated is therefore :
P (Yhj = 1) = F (βkXhk + δcDic + γ1Ch + γ2(Ch ×Dic)) (4.9)
where F is the standard normal c.d.f. P (Yhj is the probability for household h to haveelectricity at home when the village is electrified or to send children to school whenschool is existing in the village, for instance. Comparing coefficients γ1 and γ2 shouldgive an indication of whether belonging to the dominant caste alters the probabilityto access public goods. If this turns out to be the case, the assumption that patronageis taking place would be reinforced. A note of caution is necessary. Assume γ2 issignificant. The only conclusion that may be drawn, based on econometric ground isthat either the effect of caste membership differs depending on the dominant caste,or the effect of the dominant caste is altered by the household’s caste. While none ofthese two explanations may be ruled out, the first one makes intuitively more sense.
5The definition of dominance retained follows that given by Beteille (1965)
130 4. EMPIRICAL STRATEGY

CHAPTER 4. SOCIAL FRAGMENTATION AND PUBLIC GOODS :POLARIZATION AND PATRONAGE IN UTTAR PRADESH AND BIHAR
4.3 Identification Issues
4.3.1 Reverse Causality
Many empirical works on the impact of fractionalization on the provision of pu-blic goods have been disturbed by a reverse causality issue evidenced by Tiebout(1956). Together with Miguel and Gugerty (2005) and Banerjee and Somanathan(2007) I believe that this issue is not so manifest in developing countries, given thatgeographical mobility often results in losing the critical advantages taken from localnetworks. Moreover, Rosenzweig and Stark (1989) showed that migrations in Indiaare mainly due to women for the purpose of marriage as their mobility helps atmitigating households’ income risks and at smoothing consumption. The 2001 Cen-sus of India indicates that in the states of Uttar Pradesh and Bihar, 81% and 89%of migrants are women out of which 82% and 87% migrate for marriage purposes,thereby confirming that Tiebout’s sorting may not play a significant role, at leastin this part of India.
4.3.2 Substitution
Banerjee and Somanathan (2007, 2001) brought up the issue of substitutionacross public goods. "Neglected populations may not get less of every public good -they may simply be given less valuable goods. Villages without access to a hospitalmay receive some type of less elaborated health facility for reasons of equity or aspart of a political mechanism aimed at pacifying them". Two reasons lead to believethat substitution is not much of an issue in the analysis : (i) I use the presence of aparticular good in villages rather than budget shares and (ii) selected public goodsdo not provide the same kind of services, that are by no mean comparable. It wouldmake little sense to judge whether electricity is to be preferred to schools. To be onthe safe side, I try to control for the substitution effect by introducing two binaryvariables that represent whether the village is dominated by the upper castes orbackward agricultural castes.
5 Results
5.1 Estimation Of The Fractionalization / Polarization Mo-del
Results from the estimation of 4.8 are presented in table 4.2 on next page. Coeffi-cients associated with the fractionalization index are significant for 5 of the 7 goodsconsidered and positive for 4 of them. These results are at odds with the findingsof previous studies that stressed the null or negative impact of fractionalization onpublic goods provision. Only the availability of public primary schools is negativelyinfluenced by social heterogeneity. As will be shown later, the case of public primaryschool is special given that this type of infrastructure is widespread and its accessexempt from patronage.
5. RESULTS 131
CHAPTER 4. SOCIAL FRAGMENTATION AND PUBLIC GOODS :POLARIZATION AND PATRONAGE IN UTTAR PRADESH AND BIHAR
The effect of a one standard deviation increase from the mean value of the frac-tionalization index is presented at the bottom of table 4.2. For the average value ofthe explanatory variable, including the fractionalization index, the probability fora village to be connected by road is 53.4%. An increase by one standard deviationfrom the average value of the fractionalization index, holding other factors at theirmeans, yields a probability of 68.2%. The effect of such a change is an increase by15% in the likelihood to have a road. A similar analysis is run for the presence ofother goods.
As observed in section 3.2, villages that are dominated by upper castes are alsothe most fractionalized. In order to make sure that the above results for the frac-tionalization index does not stem from the effect of the dominant caste, two binaryvariables indicating whether upper castes or BAC castes are dominant are introdu-ced in equation 4.8. Results are presented in table 4.3 below. This does not modifythe significance of the coefficients associated with the fractionalization index. Goodswhose availability was significantly influenced by fractionalization remain the samebetween table 4.2 and table 4.3. Nevertheless, the dominant caste has a positive si-gnificant impact on the presence of electricity, telephone and public primary schoolin the village. In subsequent estimations, these two binary variables will thereforebe included.
132 5. RESULTS

CHAPTER 4. SOCIAL FRAGMENTATION AND PUBLIC GOODS :POLARIZATION AND PATRONAGE IN UTTAR PRADESH AND BIHAR
Tab.
4.2–Fraction
alizationMod
el-BaseSp
ecification
Road
Bus
Waste
Telep
hon
eElectricity
Anganw
adi
PublicPrimary
Disposal
Centers
Schoo
lFraction
alization
(PM
RQ
forα
=0)
2.120***
0.847
2.396*
2.163**
0.467
1.441**
-1.602*
(0.003)
(0.499)
(0.054)
(0.012)
(0.533)
(0.049)
(0.089)
Average
househ
old’sincome
0.000
0.000
-0.000***
0.000
0.000
0.000
-0.000*
(0.259)
(0.567)
(0.004)
(0.644)
(0.119)
(0.130)
(0.077)
Num
berof
households
inthevilla
ge0.000
0.002**
0.001
0.001
0.001
0.001
0.007***
(0.926)
(0.028)
(0.152)
(0.208)
(0.233)
(0.142)
0.000
Average
househ
old’ssize
-0.091
-0.23
0.330*
-0.179
-0.115
0.093
0.087
(0.530)
(0.194)
(0.059)
(0.240)
(0.430)
(0.525)
(0.603)
Nbof
programs(N
GO)
0.074
-0.419
-0.433
0.274
0.364**
0.182
0.059
(0.691)
(0.101)
(0.239)
(0.156)
(0.030)
(0.342)
(0.819)
Nbof
government’sprograms
0.274**
0.462**
-0.340*
-0.287
0.073
0.449**
0.076
(0.040)
(0.012)
(0.089)
(0.121)
(0.631)
(0.011)
(0.670)
%of
households
livingfrom
theirow
nfarm
-1.547**
-2.447***
-0.338
-1.369*
-0.65
-0.57
-0.072
(0.028)
(0.008)
(0.638)
(0.076)
(0.347)
(0.432)
(0.931)
%of
households
head
silliterate
-1.333*
-1.922*
-1.434
-2.093**
-2.180***
-1.463*
-0.386
(0.099)
(0.061)
(0.195)
(0.013)
(0.010)
(0.083)
(0.711)
Con
stan
t0.791
1.32
-2.116
0.212
0.815
-1.335
0.422
(0.499)
(0.335)
(0.150)
(0.866)
(0.516)
(0.258)
(0.771)
Num
berof
observations
116
116
116
116
116
111
116
Proba
bilityformeanvalues
ofindepe
ndent
53.4%
9.6%
15.0%
16.3%
53.6%
29.5%
88.1%
Impa
ctof
a1sdincrease
infraction
alization
14.7%
12.7%
11.0%
9.6%
-6.6%
Rob
ustpvalues
inpa
rentheses
*sign
ificant
at10%;**
sign
ificant
at5%
;***sign
ificant
at1%
5. RESULTS 133
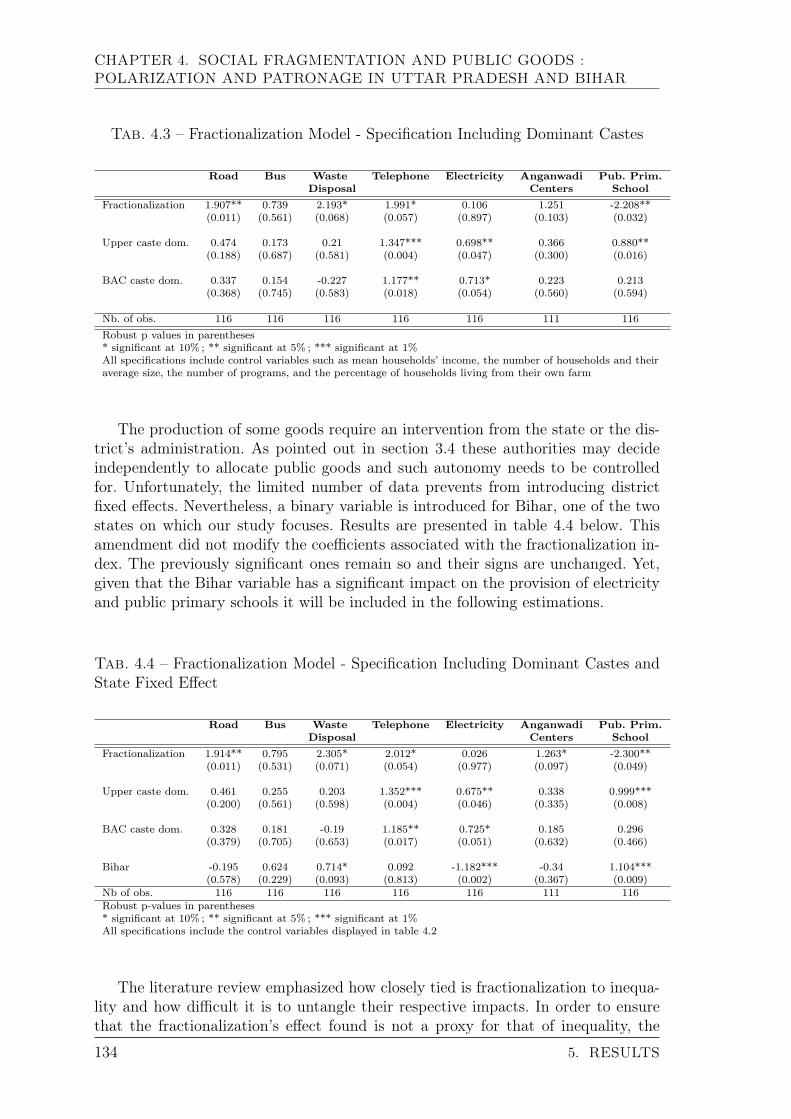
CHAPTER 4. SOCIAL FRAGMENTATION AND PUBLIC GOODS :POLARIZATION AND PATRONAGE IN UTTAR PRADESH AND BIHAR
Tab. 4.3 – Fractionalization Model - Specification Including Dominant Castes
Road Bus Waste Telephone Electricity Anganwadi Pub. Prim.Disposal Centers School
Fractionalization 1.907** 0.739 2.193* 1.991* 0.106 1.251 -2.208**(0.011) (0.561) (0.068) (0.057) (0.897) (0.103) (0.032)
Upper caste dom. 0.474 0.173 0.21 1.347*** 0.698** 0.366 0.880**(0.188) (0.687) (0.581) (0.004) (0.047) (0.300) (0.016)
BAC caste dom. 0.337 0.154 -0.227 1.177** 0.713* 0.223 0.213(0.368) (0.745) (0.583) (0.018) (0.054) (0.560) (0.594)
Nb. of obs. 116 116 116 116 116 111 116Robust p values in parentheses* significant at 10% ; ** significant at 5% ; *** significant at 1%All specifications include control variables such as mean households’ income, the number of households and theiraverage size, the number of programs, and the percentage of households living from their own farm
The production of some goods require an intervention from the state or the dis-trict’s administration. As pointed out in section 3.4 these authorities may decideindependently to allocate public goods and such autonomy needs to be controlledfor. Unfortunately, the limited number of data prevents from introducing districtfixed effects. Nevertheless, a binary variable is introduced for Bihar, one of the twostates on which our study focuses. Results are presented in table 4.4 below. Thisamendment did not modify the coefficients associated with the fractionalization in-dex. The previously significant ones remain so and their signs are unchanged. Yet,given that the Bihar variable has a significant impact on the provision of electricityand public primary schools it will be included in the following estimations.
Tab. 4.4 – Fractionalization Model - Specification Including Dominant Castes andState Fixed Effect
Road Bus Waste Telephone Electricity Anganwadi Pub. Prim.Disposal Centers School
Fractionalization 1.914** 0.795 2.305* 2.012* 0.026 1.263* -2.300**(0.011) (0.531) (0.071) (0.054) (0.977) (0.097) (0.049)
Upper caste dom. 0.461 0.255 0.203 1.352*** 0.675** 0.338 0.999***(0.200) (0.561) (0.598) (0.004) (0.046) (0.335) (0.008)
BAC caste dom. 0.328 0.181 -0.19 1.185** 0.725* 0.185 0.296(0.379) (0.705) (0.653) (0.017) (0.051) (0.632) (0.466)
Bihar -0.195 0.624 0.714* 0.092 -1.182*** -0.34 1.104***(0.578) (0.229) (0.093) (0.813) (0.002) (0.367) (0.009)
Nb of obs. 116 116 116 116 116 111 116Robust p-values in parentheses* significant at 10% ; ** significant at 5% ; *** significant at 1%All specifications include the control variables displayed in table 4.2
The literature review emphasized how closely tied is fractionalization to inequa-lity and how difficult it is to untangle their respective impacts. In order to ensurethat the fractionalization’s effect found is not a proxy for that of inequality, the
134 5. RESULTS
CHAPTER 4. SOCIAL FRAGMENTATION AND PUBLIC GOODS :POLARIZATION AND PATRONAGE IN UTTAR PRADESH AND BIHAR
Theil index and its two parts detailed in section 3.5 are introduced in the equationthat is estimated anew. Results are presented in table 4.5 hereafter.
The fractionalization’s coefficients loose their significance for the presence ofwaste disposal systems and telephone due to the introduction of the Theil index.Yet, in the first case, the coefficient is close to the 10% threshold and recovers itssignificance when the index components are separately introduced in the equation.Thus among the 4 goods whose presence was significantly and positively influencedby fractionalization, three remain so. Please note that inequality has a mere impacton public goods provision and the coefficients pattern does not allow to draw soundconclusions about which sort of inequality prevails. Nevertheless, the fractionaliza-tion’s coefficients seem somewhat robust to controlling for measures of inequality.
5. RESULTS 135
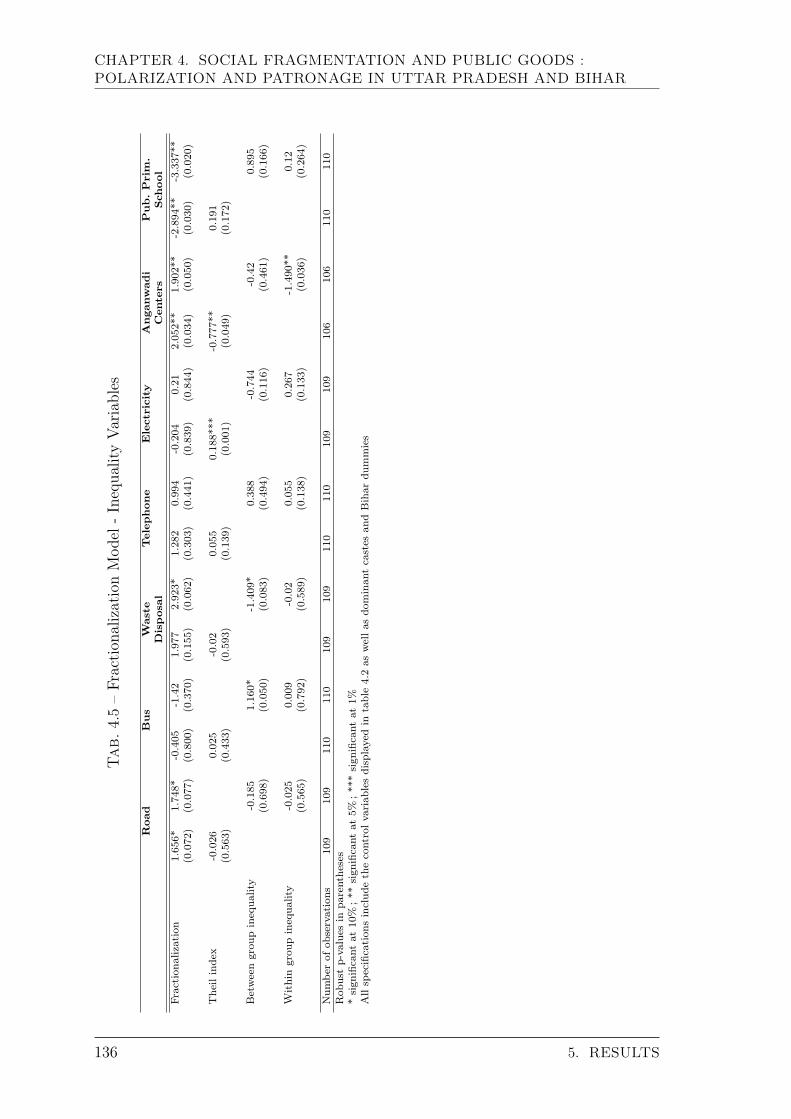
CHAPTER 4. SOCIAL FRAGMENTATION AND PUBLIC GOODS :POLARIZATION AND PATRONAGE IN UTTAR PRADESH AND BIHAR
Tab.
4.5–Fraction
alizationMod
el-Inequa
lityVariables
Roa
dB
us
Was
teTel
ephon
eEle
ctri
city
Anga
nwad
iP
ub.P
rim
.D
ispos
alC
ente
rsSch
ool
Fraction
alization
1.656*
1.748*
-0.405
-1.42
1.977
2.923*
1.282
0.994
-0.204
0.21
2.052**
1.902**
-2.894**
-3.337**
(0.072)
(0.077)
(0.800)
(0.370)
(0.155)
(0.062)
(0.303)
(0.441)
(0.839)
(0.844)
(0.034)
(0.050)
(0.030)
(0.020)
Theilindex
-0.026
0.025
-0.02
0.055
0.188***
-0.777**
0.191
(0.563)
(0.433)
(0.593
)(0.139)
(0.001)
(0.049)
(0.172)
Betweengrou
pinequa
lity
-0.185
1.160*
-1.409*
0.388
-0.744
-0.42
0.895
(0.698)
(0.050)
(0.083)
(0.494)
(0.116)
(0.461)
(0.166)
Withingrou
pinequa
lity
-0.025
0.009
-0.02
0.055
0.267
-1.490**
0.12
(0.565)
(0.792)
(0.589)
(0.138)
(0.133)
(0.036)
(0.264)
Num
berof
observations
109
109
110
110
109
109
110
110
109
109
106
106
110
110
Rob
ustp-values
inpa
rentheses
*sign
ificant
at10%;**
sign
ificant
at5%
;***sign
ificant
at1%
Allspecification
sinclud
ethecontrolvariab
lesdisplayedin
table4.2as
wellas
dominan
tcastes
andBihar
dummies
136 5. RESULTS
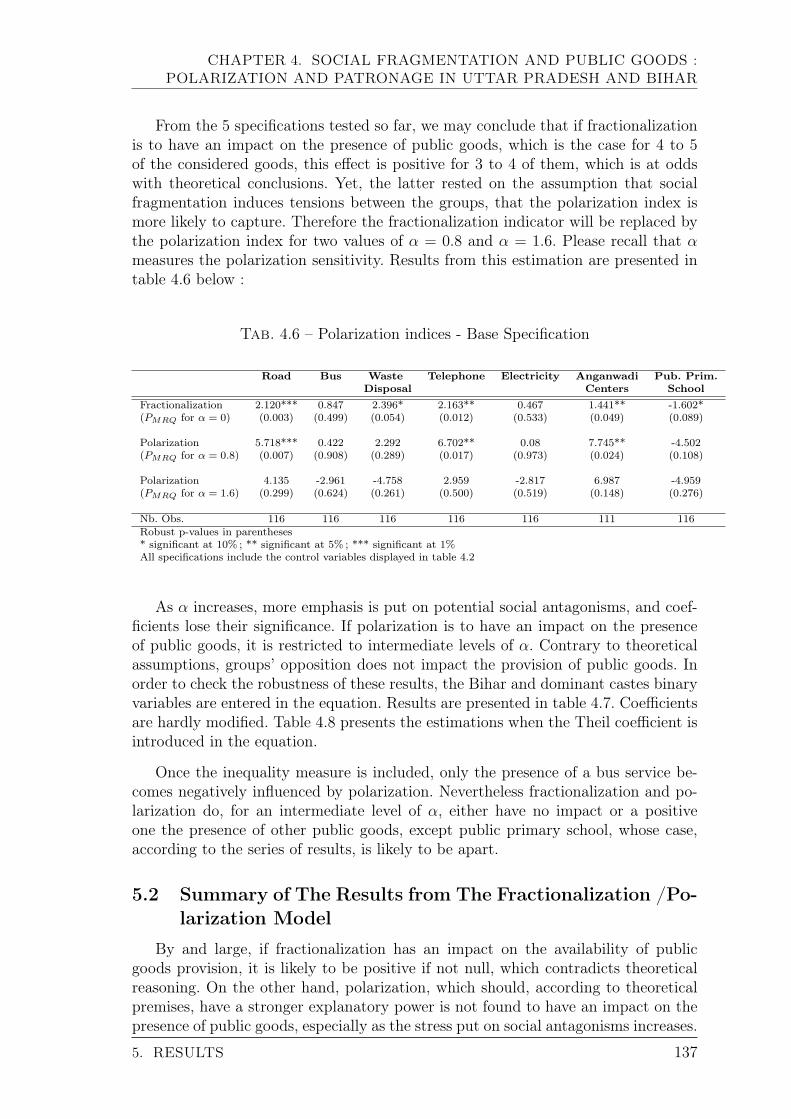
CHAPTER 4. SOCIAL FRAGMENTATION AND PUBLIC GOODS :POLARIZATION AND PATRONAGE IN UTTAR PRADESH AND BIHAR
From the 5 specifications tested so far, we may conclude that if fractionalizationis to have an impact on the presence of public goods, which is the case for 4 to 5of the considered goods, this effect is positive for 3 to 4 of them, which is at oddswith theoretical conclusions. Yet, the latter rested on the assumption that socialfragmentation induces tensions between the groups, that the polarization index ismore likely to capture. Therefore the fractionalization indicator will be replaced bythe polarization index for two values of α = 0.8 and α = 1.6. Please recall that αmeasures the polarization sensitivity. Results from this estimation are presented intable 4.6 below :
Tab. 4.6 – Polarization indices - Base Specification
Road Bus Waste Telephone Electricity Anganwadi Pub. Prim.Disposal Centers School
Fractionalization 2.120*** 0.847 2.396* 2.163** 0.467 1.441** -1.602*(PMRQ for α = 0) (0.003) (0.499) (0.054) (0.012) (0.533) (0.049) (0.089)
Polarization 5.718*** 0.422 2.292 6.702** 0.08 7.745** -4.502(PMRQ for α = 0.8) (0.007) (0.908) (0.289) (0.017) (0.973) (0.024) (0.108)
Polarization 4.135 -2.961 -4.758 2.959 -2.817 6.987 -4.959(PMRQ for α = 1.6) (0.299) (0.624) (0.261) (0.500) (0.519) (0.148) (0.276)
Nb. Obs. 116 116 116 116 116 111 116Robust p-values in parentheses* significant at 10% ; ** significant at 5% ; *** significant at 1%All specifications include the control variables displayed in table 4.2
As α increases, more emphasis is put on potential social antagonisms, and coef-ficients lose their significance. If polarization is to have an impact on the presenceof public goods, it is restricted to intermediate levels of α. Contrary to theoreticalassumptions, groups’ opposition does not impact the provision of public goods. Inorder to check the robustness of these results, the Bihar and dominant castes binaryvariables are entered in the equation. Results are presented in table 4.7. Coefficientsare hardly modified. Table 4.8 presents the estimations when the Theil coefficient isintroduced in the equation.
Once the inequality measure is included, only the presence of a bus service be-comes negatively influenced by polarization. Nevertheless fractionalization and po-larization do, for an intermediate level of α, either have no impact or a positiveone the presence of other public goods, except public primary school, whose case,according to the series of results, is likely to be apart.
5.2 Summary of The Results from The Fractionalization /Po-larization Model
By and large, if fractionalization has an impact on the availability of publicgoods provision, it is likely to be positive if not null, which contradicts theoreticalreasoning. On the other hand, polarization, which should, according to theoreticalpremises, have a stronger explanatory power is not found to have an impact on thepresence of public goods, especially as the stress put on social antagonisms increases.
5. RESULTS 137
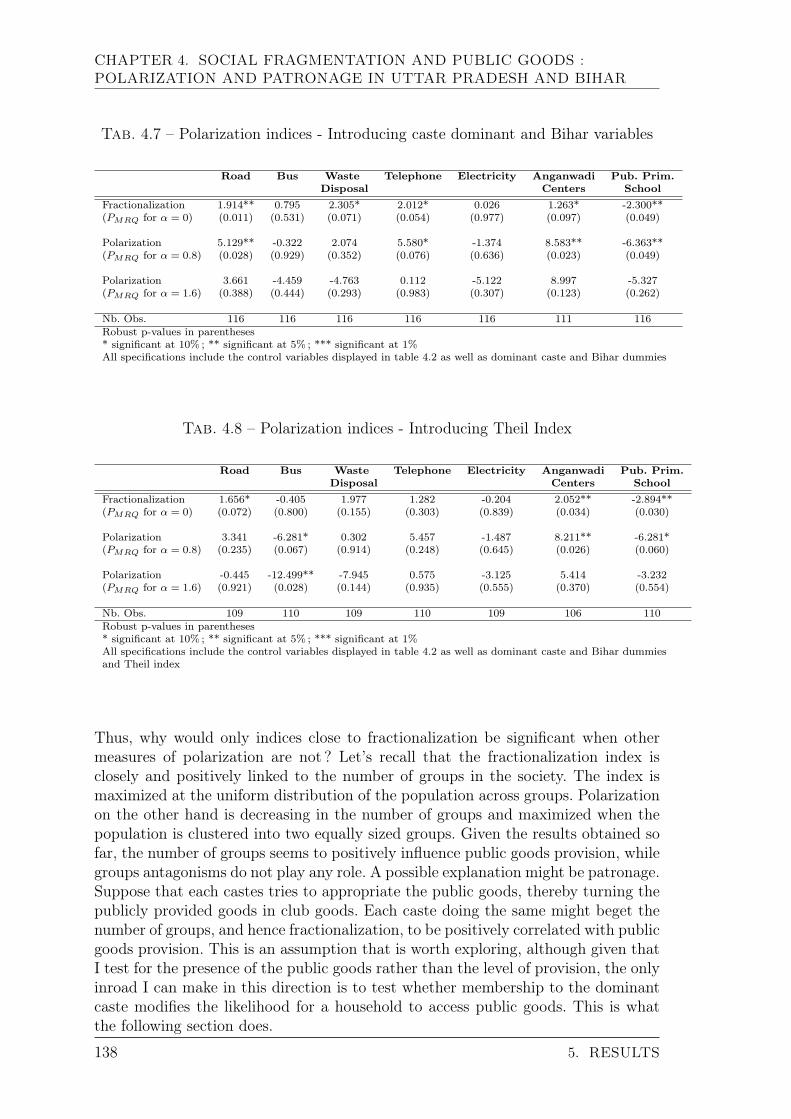
CHAPTER 4. SOCIAL FRAGMENTATION AND PUBLIC GOODS :POLARIZATION AND PATRONAGE IN UTTAR PRADESH AND BIHAR
Tab. 4.7 – Polarization indices - Introducing caste dominant and Bihar variables
Road Bus Waste Telephone Electricity Anganwadi Pub. Prim.Disposal Centers School
Fractionalization 1.914** 0.795 2.305* 2.012* 0.026 1.263* -2.300**(PMRQ for α = 0) (0.011) (0.531) (0.071) (0.054) (0.977) (0.097) (0.049)
Polarization 5.129** -0.322 2.074 5.580* -1.374 8.583** -6.363**(PMRQ for α = 0.8) (0.028) (0.929) (0.352) (0.076) (0.636) (0.023) (0.049)
Polarization 3.661 -4.459 -4.763 0.112 -5.122 8.997 -5.327(PMRQ for α = 1.6) (0.388) (0.444) (0.293) (0.983) (0.307) (0.123) (0.262)
Nb. Obs. 116 116 116 116 116 111 116Robust p-values in parentheses* significant at 10% ; ** significant at 5% ; *** significant at 1%All specifications include the control variables displayed in table 4.2 as well as dominant caste and Bihar dummies
Tab. 4.8 – Polarization indices - Introducing Theil Index
Road Bus Waste Telephone Electricity Anganwadi Pub. Prim.Disposal Centers School
Fractionalization 1.656* -0.405 1.977 1.282 -0.204 2.052** -2.894**(PMRQ for α = 0) (0.072) (0.800) (0.155) (0.303) (0.839) (0.034) (0.030)
Polarization 3.341 -6.281* 0.302 5.457 -1.487 8.211** -6.281*(PMRQ for α = 0.8) (0.235) (0.067) (0.914) (0.248) (0.645) (0.026) (0.060)
Polarization -0.445 -12.499** -7.945 0.575 -3.125 5.414 -3.232(PMRQ for α = 1.6) (0.921) (0.028) (0.144) (0.935) (0.555) (0.370) (0.554)
Nb. Obs. 109 110 109 110 109 106 110Robust p-values in parentheses* significant at 10% ; ** significant at 5% ; *** significant at 1%All specifications include the control variables displayed in table 4.2 as well as dominant caste and Bihar dummiesand Theil index
Thus, why would only indices close to fractionalization be significant when othermeasures of polarization are not ? Let’s recall that the fractionalization index isclosely and positively linked to the number of groups in the society. The index ismaximized at the uniform distribution of the population across groups. Polarizationon the other hand is decreasing in the number of groups and maximized when thepopulation is clustered into two equally sized groups. Given the results obtained sofar, the number of groups seems to positively influence public goods provision, whilegroups antagonisms do not play any role. A possible explanation might be patronage.Suppose that each castes tries to appropriate the public goods, thereby turning thepublicly provided goods in club goods. Each caste doing the same might beget thenumber of groups, and hence fractionalization, to be positively correlated with publicgoods provision. This is an assumption that is worth exploring, although given thatI test for the presence of the public goods rather than the level of provision, the onlyinroad I can make in this direction is to test whether membership to the dominantcaste modifies the likelihood for a household to access public goods. This is whatthe following section does.
138 5. RESULTS
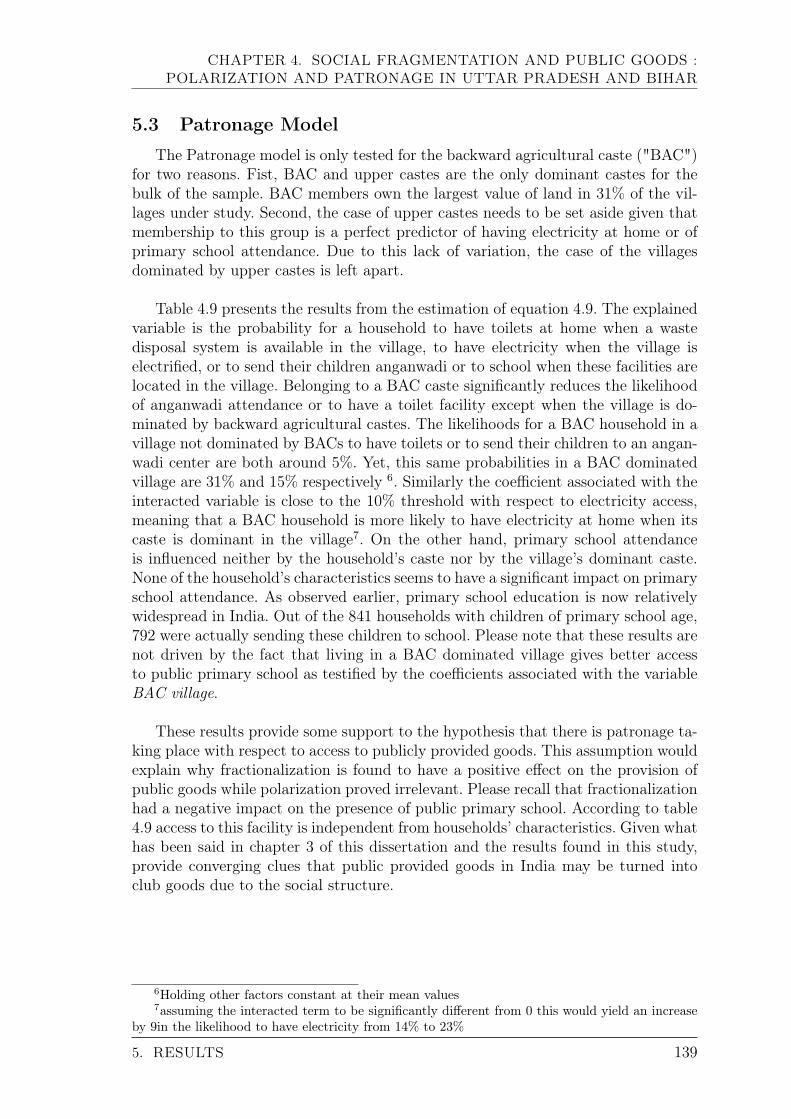
CHAPTER 4. SOCIAL FRAGMENTATION AND PUBLIC GOODS :POLARIZATION AND PATRONAGE IN UTTAR PRADESH AND BIHAR
5.3 Patronage Model
The Patronage model is only tested for the backward agricultural caste ("BAC")for two reasons. Fist, BAC and upper castes are the only dominant castes for thebulk of the sample. BAC members own the largest value of land in 31% of the vil-lages under study. Second, the case of upper castes needs to be set aside given thatmembership to this group is a perfect predictor of having electricity at home or ofprimary school attendance. Due to this lack of variation, the case of the villagesdominated by upper castes is left apart.
Table 4.9 presents the results from the estimation of equation 4.9. The explainedvariable is the probability for a household to have toilets at home when a wastedisposal system is available in the village, to have electricity when the village iselectrified, or to send their children anganwadi or to school when these facilities arelocated in the village. Belonging to a BAC caste significantly reduces the likelihoodof anganwadi attendance or to have a toilet facility except when the village is do-minated by backward agricultural castes. The likelihoods for a BAC household in avillage not dominated by BACs to have toilets or to send their children to an angan-wadi center are both around 5%. Yet, this same probabilities in a BAC dominatedvillage are 31% and 15% respectively 6. Similarly the coefficient associated with theinteracted variable is close to the 10% threshold with respect to electricity access,meaning that a BAC household is more likely to have electricity at home when itscaste is dominant in the village7. On the other hand, primary school attendanceis influenced neither by the household’s caste nor by the village’s dominant caste.None of the household’s characteristics seems to have a significant impact on primaryschool attendance. As observed earlier, primary school education is now relativelywidespread in India. Out of the 841 households with children of primary school age,792 were actually sending these children to school. Please note that these results arenot driven by the fact that living in a BAC dominated village gives better accessto public primary school as testified by the coefficients associated with the variableBAC village.
These results provide some support to the hypothesis that there is patronage ta-king place with respect to access to publicly provided goods. This assumption wouldexplain why fractionalization is found to have a positive effect on the provision ofpublic goods while polarization proved irrelevant. Please recall that fractionalizationhad a negative impact on the presence of public primary school. According to table4.9 access to this facility is independent from households’ characteristics. Given whathas been said in chapter 3 of this dissertation and the results found in this study,provide converging clues that public provided goods in India may be turned intoclub goods due to the social structure.
6Holding other factors constant at their mean values7assuming the interacted term to be significantly different from 0 this would yield an increase
by 9in the likelihood to have electricity from 14% to 23%
5. RESULTS 139
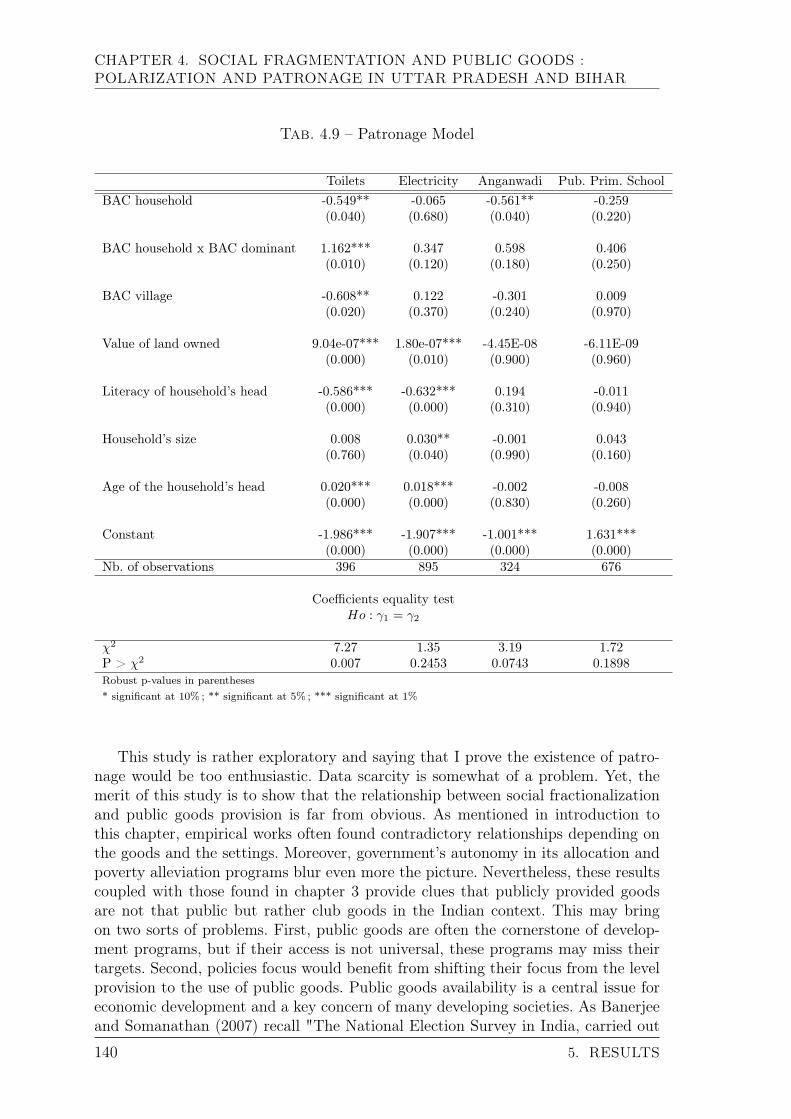
CHAPTER 4. SOCIAL FRAGMENTATION AND PUBLIC GOODS :POLARIZATION AND PATRONAGE IN UTTAR PRADESH AND BIHAR
Tab. 4.9 – Patronage Model
Toilets Electricity Anganwadi Pub. Prim. SchoolBAC household -0.549** -0.065 -0.561** -0.259
(0.040) (0.680) (0.040) (0.220)
BAC household x BAC dominant 1.162*** 0.347 0.598 0.406(0.010) (0.120) (0.180) (0.250)
BAC village -0.608** 0.122 -0.301 0.009(0.020) (0.370) (0.240) (0.970)
Value of land owned 9.04e-07*** 1.80e-07*** -4.45E-08 -6.11E-09(0.000) (0.010) (0.900) (0.960)
Literacy of household’s head -0.586*** -0.632*** 0.194 -0.011(0.000) (0.000) (0.310) (0.940)
Household’s size 0.008 0.030** -0.001 0.043(0.760) (0.040) (0.990) (0.160)
Age of the household’s head 0.020*** 0.018*** -0.002 -0.008(0.000) (0.000) (0.830) (0.260)
Constant -1.986*** -1.907*** -1.001*** 1.631***(0.000) (0.000) (0.000) (0.000)
Nb. of observations 396 895 324 676
Coefficients equality testHo : γ1 = γ2
χ2 7.27 1.35 3.19 1.72P > χ2 0.007 0.2453 0.0743 0.1898Robust p-values in parentheses* significant at 10% ; ** significant at 5% ; *** significant at 1%
This study is rather exploratory and saying that I prove the existence of patro-nage would be too enthusiastic. Data scarcity is somewhat of a problem. Yet, themerit of this study is to show that the relationship between social fractionalizationand public goods provision is far from obvious. As mentioned in introduction tothis chapter, empirical works often found contradictory relationships depending onthe goods and the settings. Moreover, government’s autonomy in its allocation andpoverty alleviation programs blur even more the picture. Nevertheless, these resultscoupled with those found in chapter 3 provide clues that publicly provided goodsare not that public but rather club goods in the Indian context. This may bringon two sorts of problems. First, public goods are often the cornerstone of develop-ment programs, but if their access is not universal, these programs may miss theirtargets. Second, policies focus would benefit from shifting their focus from the levelprovision to the use of public goods. Public goods availability is a central issue foreconomic development and a key concern of many developing societies. As Banerjeeand Somanathan (2007) recall "The National Election Survey in India, carried out
140 5. RESULTS
CHAPTER 4. SOCIAL FRAGMENTATION AND PUBLIC GOODS :POLARIZATION AND PATRONAGE IN UTTAR PRADESH AND BIHAR
by the Center for the study of Developing Societies in 1996, asks 10,000 voters anopen-ended question : "What are the three main problems people like you face to-day ?" Poverty was the most popular response [...] but public goods came in a closesecond. Nearly a fifth of all respondents listed problems associated with differenttypes of public amenities as their main problem".
A last point needs to be made. It has been assumed in this study and in someothers (Banerjee and Somanathan, 2001; Banerjee et al., 2005; Banerjee and Soma-nathan, 2007; Bardhan, 2000) that caste is the relevant divide. However, it couldbe argued that religion is a much stronger source of antagonisms than castes in In-dia and that the polarization index should be constructed along religious lines. Asreligion was treated as yet another caste, the polarization index may have been un-derestimated while the fractionalization index was overestimated. I have to reckonthat this argument makes sense especially given the context of growing religioustensions in India. It would be worth exploring whether religion is a more importantsource of potential antagonisms than castes. This is left for future research.
6 Concluding Remarks
In this chapter I found that the relationship between social fragmentation andthe availability of public goods, if any, is likely to be positive, while polarizationis irrelevant. This contradicts theoretical conclusions. Previous empirical works alsoproduced mixed results about this relationship. One of the reasons for this lackof assent may be the assumed relationship between social heterogeneity and socialtensions that may not hold as suggested by Esteban and Ray (2008). A finer un-derstanding of the links between social diversity and conflicts might prove helpfulin refining the relationship between fractionalization, polarization and public goodsprovision.
Suppose that as groups are formed, the build up of social identities comes withthe shaping of groups opposition, be it only because individuals perceive themselvesas "we" in opposition to "they". Such opposition does not necessarily translate intoconflict. Social norms, a sort of modus vivendi, may be set up to rule intergrouprelationships, even if they are based on avoidance. Such norms are more likely tobe at work in the public space and hence in the use of public goods. Accountingfor such norms is important and prevents from concluding that social heterogeneitycauses antagonisms and conflicts. Naturally clashes and outbursts of violence mayappear, but they may result from challenging the norms. Castes may be considereda good example of this line of reasoning. Baechler (1988) developed a theory mentio-ned in more details in the introduction to this dissertation that caste is the solutionto a collective action problem and that they appeared to ensure social cohesion inthe absence of a strong state. Thus, although caste is prima facie a factor of socialdivision, they do not necessarily spur antagonisms or conflicts.
The argument is, at the stage of intuition but its formal demonstration wouldprobably be very instructive. It is left for future research. Our argument does notmean all is for the best and that caste norms ought not be challenged. Yet, a better
6. CONCLUDING REMARKS 141
CHAPTER 4. SOCIAL FRAGMENTATION AND PUBLIC GOODS :POLARIZATION AND PATRONAGE IN UTTAR PRADESH AND BIHAR
understanding of how intergroup norms appear would help to find ways of com-muting the iniquitous ones with fairer ones acceptable. This also is left for futureresearch.
142 6. CONCLUDING REMARKS
Conclusions
143

CONCLUSIONS
The four essays presented in this dissertation are examples of the implicationsof social institutions and identities, in this case Indian castes, in various areas ofeconomic life.
Summary of Main Results
The effect of caste membership on perceived social identity among Hindus wasinvestigated in Chapter 2. Results show, and this is no surprise, that caste is astrong determinant of perceived social status for both SCs and STs, although it isnot the only one. Both income and the type of occupation, whether supervisory orinvolving human or physical capital do have a significant impact on perceived socialstatus. Education is also relevant, although to a lesser extent and the divide liesbetween primary and secondary or higher education. Moreover, the impact of casteis much smaller among Scheduled Castes than among Scheduled Tribes, althoughtheir ritual status, is, arguably, quite close. Large, yet plausible shifts in income oroccupation could make up for the caste effect as far as SCs are concerned. For ins-tance, the acquisition of land or skills can almost cancel the caste effect. On the otherhand, only very unlikely improvements could hardly compensate for belonging to aScheduled Tribe. Many reasons could be invoked to explain the differing impact ofcaste between SCs and STs, one of them being that SCs better mobilized politicallyand managed to somewhat emancipate from their traditional status. This is only aconjecture that would be worth investigating. The results presented in this chaptermay underestimate the actual effect of caste, as data were not publicly collected. Itseems likely that if individuals had declared publicly their social class, peer pressurewould have reinforced the caste effect. Moreover, the analysis was restricted to Hin-dus due to a lack of data on castes for individuals of other religious denominations.Yet, including a religious dimension to the analysis of perceived social status mayyield compelling results, especially in the context of rising denominational tensionsin India.
The indirect caste effect found in Chapter 2 is interpreted as a remainder ofcenturies of discrimination, through the internalization of social norms. Chapter 1questions the origin of these discriminatory norms. It is noteworthy that a largepart of the theoretical literature on discrimination cannot depart from positing thatindividuals do have preferences about who they interact with. In these theories, pre-judice always lurks at the back. In doing so, I would argue that the question of theorigin of discrimination is not properly addressed. Indeed, how come that agentspick one feature such as skin color for instance, rather than another to form prefe-rences or prejudice ? Sociological analysis, such as the one conducted by Max Weber,suggest that social norms and ideologies come as an a posteriori justification of analready existing situation. As far as castes are concerned, many specialists such asGhurye for instance 8, stressed that the founding text of the institution of castes,Manu’s code, was written at a time when segregation was already in place. Thus,the following question is addressed : can segregation occur even in the absence ofprejudice ? A theoretical model is constructed to answer this question that links po-wer capture and segregation. Power is defined as the ability to provide someone else
8As presented by Deliège (2004)
144 CONCLUSIONS
CONCLUSIONS
with opportunities that would be unattainable otherwise. Because one group seizespower the powerless strive to cooperate with the mighty. In doing so they promptrejection by the latter and, in turn, the powerless refuse to cooperate. The endingsituation pictures a systematic refusal to cooperate by both groups and this howsegregation is defined.
This model has several compelling features. First, it addresses an often neglectedfact, namely that an unequal power distribution is frequent in segregated society. Se-cond, segregation is shown to occur even in the absence of prejudice. Third, the wayboth segregation and power are defined allows to account for a variety of situations.Fourth, the process described has an interest in itself and more particularly thatrejection results from the powerless striving to cooperate. Unfortunately, the modelalso has a couple of drawbacks. Ways for improvement are proposed at the end ofthe chapter such as the adoption of an evolutionary framework, the inclusion of anin between group resulting from groups intermediate cooperation and the definitionof power as a function of the number of powerful. Lastly, lifestyles obligations andcustoms can serve as signalling devices, based on the observation that they are muchmore constraining for some groups than for others.
Finally, Chapters 3 and 4 investigate the role played by caste rules and solidarityin access to publicly provided goods. The institution of caste strongly defines theuse of common resources mainly through the prohibition put on the sharing of theseresources, particularly with outcasts. This prohibition is what is referred to as un-touchability, which is grounded on the belief that outcasts are impure and that anyform of contact with them is tainting. Food and water are the paramount conveyorof ritual pollution. Water is considered tainted if an untouchable or his vessel touchit. Therefore outcasts are often banned from using higher castes wells. Indian localnewspapers abound with stories of untouchables being beaten up for having usedhigher castes wells. The phenomenon is quantitatively investigated in Chapter 3.The number of acts of violence in a district is shown to be associated with the waywater is predominantly distributed. The more common and shared the source, thelarger the number of acts of violence against SCs and STs. This relationship is ro-bust to many controls, including castes and religious polarizations, states measuresof wealth or of human development, fixed effects and measures of other public in-vestments. It is noteworthy that the number of roads and of primary schools arenegatively associated with the number of acts of violence. Finally, quantile regres-sion show that the impact of water distribution on caste based violence is stronger,when the latter has already reached a relatively high level. The results presentedin this chapter show that, despite untouchability practices being outlawed, they arestill quite common and violently enforced. This is in accordance with the resultsfrom the survey undertook by Shah et al. (2006) that shows that untouchables arestill denied access to many public goods, including water. This points towards theidea that some groups may be excluded from using public goods on caste grounds.Publicly provided goods appear more like club or caste goods. This hypothesis isinvestigated in Chapter 4.
Theoretical as well as empirical studies have evidenced, yet with a mild success,
CONCLUSIONS 145
CONCLUSIONS
that social fractionalization has a negative effect on public goods provision, througha restricted collective action. I argue that this literature exhibit four drawbacks.First, empirical results are mixed. Second, the relationship seems to rest on the im-plicit assumption that social fragmentation induces antagonisms or conflicts. Third,this last assumed relationship has never been firmly established and even if it was,then polarization indices would be more appropriate to account for the negative im-pact of social fragmentation on public goods provision than the conventionally usedfractionalization index. Fourth, the intervention of ethnic patronage has hardly beenconsidered. Yet if publicly provided goods are turned private and intended at a spe-cific group, a positive relationship between social fragmentation and public goodsprovision may come to light.
These four points are addressed in this chapter and more specifically the pa-tronage assumption. The analysis show that in the northern Indian states of Ut-tar Pradesh and Bihar, the fractionalization index is positively associated with thepresence of four of the six selected goods. This results is somewhat at odds withthose obtained by previous empirical analysis that displayed a predominantly nega-tive effect. On the other hand, polarization indices are found to be irrelevant. It isconcluded that the number of groups does positively influence the presence of publicgoods, while potential antagonisms between groups play little role. This positive re-lationship may stem from patronage activities. The last part of this chapter looksinto this assumption by assessing whether the likelihood for a household to access aparticular facility, provided it is available in the village, depends on its membershipto the dominant caste. Results, although not definite, do provide some hint in thatdirection. However, data scarcity conduce to taking the results with circumspection.Nevertheless, results from the last two chapters provide some support to the hypo-thesis that publicly provided goods may be turned into caste goods.
Discussion
If development can be seen "as a process of expanding the real freedoms thatpeople enjoy" (Sen, 1999a), these chapters make a case for integrating social insti-tutions and its effect in the analysis of development. Sen highlighted five types offreedoms that are necessary to the advancement of individual capabilities. He la-beled them instrumental freedoms and they are political rights, economic facilities,social opportunities, transparency, and security, which are all different but inter-connected. Chapters 3 and 4 showed that the institution of castes violated at leastfour of these. Because public goods and facilities may be turned into caste or clubgoods, thereby preventing some individuals from using them, social opportunitiesare restricted and so are economic facilities. This would not be as much worryingif it did not bring to light the fact that in modern India, caste rules do sometimessupplant legal ones. Transparency is not achieved. As untouchability practices maystill be violently enforced, the untouchables demand for security is not satisfied,which infringes another instrumental freedom.
Arguing that castes impede freedom and hence development is no big news. Law-makers did recognize it when they crafted the Constitution of India. What is more
146 CONCLUSIONS
CONCLUSIONS
disturbing is that fifty years after the set up of reservation policies and acts aiming atprotecting and promoting the situations of the "weaker segments of society", castesrules still prevail locally regardless of the law. Poverty alleviation programs, that, fora good part of them, rest on the provision of public goods, are diverted from their ob-jectives and caste remain a relevant divide to analyze patterns of inequality in India.On this topic, we might question the suitability of the current increased devolutionof power to village councils (panchayats) that may appear swift in implementingcaste based rules. An assessment of the reservation and panchayats empowermentpolicies is beyond the scope of this work, yet what appears clearly from it, is thestrength of castes and its influence on limiting freedoms.
As worrying such a situation may be, it is not as troublesome as the issue raisedby the influence of caste on social identity. While appropriate policies could argua-bly deal with law disobedience and the capture of public goods access, the fact thatcaste shapes self-perception is fraught with consequences that are less manageable.Chapter 2 showed how determinative caste is in the perception of social class bothdirectly, but more insidiously through a reduced capacity for deprived groups toperceive themselves as socially successful. Results from behavioral experiments sho-wed that identifying to a group that has suffered from long standing despise mayencourage individuals to act in a detrimental way. They may self discriminate eitherto stick to stereotypes or because they expect such a discrimination to occur. Thus,challenging the institution of caste goes through recasting social identities, which istricky, to say the least.
Yet, all is not doom and gloom. Results from Chapter 4 suggest that primaryschools are widely accessible and exempt from the influence of castes. Moreover,results presented in table 3.8 in Chapter 3 indicate that primary education facilitiesare negatively associated with caste based violence and so is road access. The dif-fering impact of caste on perceived social status between SCs and STs presented inChapter 2 indicate that the former were able to detach from their group membership.The influence of caste in the case of SCs is mainly indirect and nowhere as bindingas for STs. Many reasons for this difference can be invoked, one being that SCspolitically mobilized and asserted their rights and claims (Jaffrelot, 2002). On theother hand, the political assertion of STs is more feeble and they seem more trappedin the traditionally low position. Moreover, Chapter 1 showed how an unequal po-wer distribution may induce segregation. Thus, it could be infered that the politicalrise of the long deprived castes might partially lift the yoke of the institution of caste.
Agenda for future researchAt the end of every chapter, I have tried to discuss issues raised by the work and
that would be worth exploring. For instance, an extension of the results found inChapter 2, would be to investigate potential discrepancies between public and pri-vate declarations of perceived social status. Hoff and Pandey (2006) observed thatthe performance of low caste children decreased when their caste identity was madepublic. Such a gap is attributable, the authors argue, to the expectation of discrimi-nation. Similarly, if we were to find any significant discrepancy between publicly andprivately declared social status, we may be able to estimate the amount of expected
CONCLUSIONS 147
CONCLUSIONS
discrimination on top of that generated by a diminished self image.
Moreover, local social composition may be thought of having an influence on thesalience of caste as a component of social identity and this would be worth testingwith a larger set of data than the one used in Chapter 2. Two questions may arisefrom this point. First, does the salience of caste identity depends on local socialcomposition ? For instance, would it be more relevant if the society is highly po-larized, fractionalised, etc. Second, when do other identities such as the religiousone supplants caste identity ? This last point is discussed in more details in the lastparagraph of this conclusion.
Let’s suppose that caste identity is stronger when local society is more polarizedalong the lines of castes. The trouble with the polarization index defined by Mon-talvo and Reynal-Querol (2002), and that is now commonly used, is that it onlyfocuses on the distribution of the population irrespective of the income distribu-tion. It assumes that the distance between all groups is equal to one. However, it ishighly conceivable that inter group distance is not constant and largely depends onthe collective wealth of both groups. As far as castes are concerned, the Sanskritiza-tion process described by many sociologists show that an increase in wealth is oftenaccompanied by a attempt to increase social status and thus move closer to highergroups. It does not require a great deal of imagination to think that a sub-caste whomanaged to grow richer will not perceive the social distance to the next higher upgroup in the same way than than poorer ones. Thus, there is a need to reincorporatea flexible intergroup distance, arguably based on wealth, in the polarization index.
The original index designed by Esteban and Ray (1994) did actually focus onthe wealth distribution. Yet, it was criticized on the grounds that groups design ba-sed on the income criteria is arbitrary and untractable. Both remarks remain valid.They lead to the interpretation of "groups" as ethnic, religious or caste based, which,supposedly, are less arbitrary criteria. However, if we could find and incorporate ametric that accounts for these groups collective wealths, we may be able to modulatethe intergroup distance and better account for the phenomenon. Moreover, I wouldargue that a society that is said to be polarized because of the structure of the popu-lation distribution, is even more so if the pattern of the income distribution followsthat of the ethnic groups and this should be reflected in the index, which is notthe case with the polarization index popularized by Montalvo and Reynal-Querol(2002). In the case studied in Chapter 4, data show a very strong correlation withthe value of the land owned and caste membership. Thus we could have taken thedifference in the average value of land owned as a measure of intergroup distance.This was not done as theoretical foundations for such an index lack. Yet, this maybe a way to address the problem.
Section 6 in Chapter 1 proposed improvements for the model, namely to adoptan evolutionary game framework, the conceptualization of a "mixed" group thatwould lie in between the powerful and the powerless and that would lead to endoge-nizing the power parameter. Moreover, customs or lifestyle such as vegetarianism forinstance, could be included as signals or devices to enforce cooperation within the
148 CONCLUSIONS
CONCLUSIONS
group. As far as the institution of castes is concerned it is noteworthy that lifestyleprescriptions are more stringent for higher castes than for lower castes. This callsfor an interpretation of these customs as a signal for group membership.
A more general question is posed by these four chapters. Why do agents pick atrait and define themselves according to this trait ? Let’s take an example. Thereare many lines along which one could define himself. In India for instance this maybe nationality, caste, religion, gender, age, language, geography, skin color, lifestyle,wealth, occupation and the list is probably endless. Under what circumstances willindividuals stress one identity at the expense of others ? What factors make thereligious denomination more relevant than gender, for instance ? This questions hasmany implications and let’s discuss only those suggested by the dissertation. First,what makes a trait relevant to divide the society and to spur segregation ? For ins-tance, why was segregation in the United States based on skin color, rather than,say, on height ? Why do we have prejudice against some traits rather than others ?
Second, suppose that the determinants of identity change depending on circum-stances. Then how can we assess social fragmentation ? Some authors sidestepped thequestion by assuming that ethnic groups are relevant, probably having the examplesof African civil wars at the back of their minds. What lurks at the back of the litera-ture on ethnicity or social fragmentation is that it necessarily induces antagonismsand conflicts and that the most likely ground for conflict should be taken as the mostsalient identity. Then, how can we explain that ethnic identity changed status froma merely conscious phenomenon up to a reason for civil war ? Arguments have beenbrought forward to say that the marked distinction between the Tutsis and Hutus ofRwanda was a colonialist construction. Nevertheless, such a construction appeareda couple of years later to be sufficiently relevant to prompt the genocide of nearlyhalf a million individuals. Thus, the question is not does ethnic fractionalizationor polarization prompt conflict but rather under what circumstances does ethnicitybecomes a relevant argument for conflict ? It has been suggested in Chapters 3 and4, that caste based fragmentation does not necessarily prompt conflicts, the reasonbeing that norms govern intergroup relationships. Outbursts of caste based violenceare not seldom, but they mainly arise from norms being challenged and enforced(the equity of these norms is not discussed here). The fact that conflict arise be-cause of challenged norms might possibly be a trail worth pursuing. In any event, allthese examples highlight the interest of understanding what makes an identity moreparticularly salient than another. Such an investigation may also fuel the debateabout whether ethnicity or identity, in general, is constructed or exogenously given.
These propositions for future research are by and large not exhaustive. They mayseem ambitious, although they probably are incommensurate with the questionsposed by social identity and institutions. Recent economic literature has drawnattention to them and there is little doubt that it will be a promising area for futureresearch.
CONCLUSIONS 149

CONCLUSIONS
150 CONCLUSIONS

Appendix
151

APPENDIX
152 APPENDIX
APPENDIX
Appendix to Chapter 2 :Social identity in India : Caste and Beyond ?
APPENDIX 153
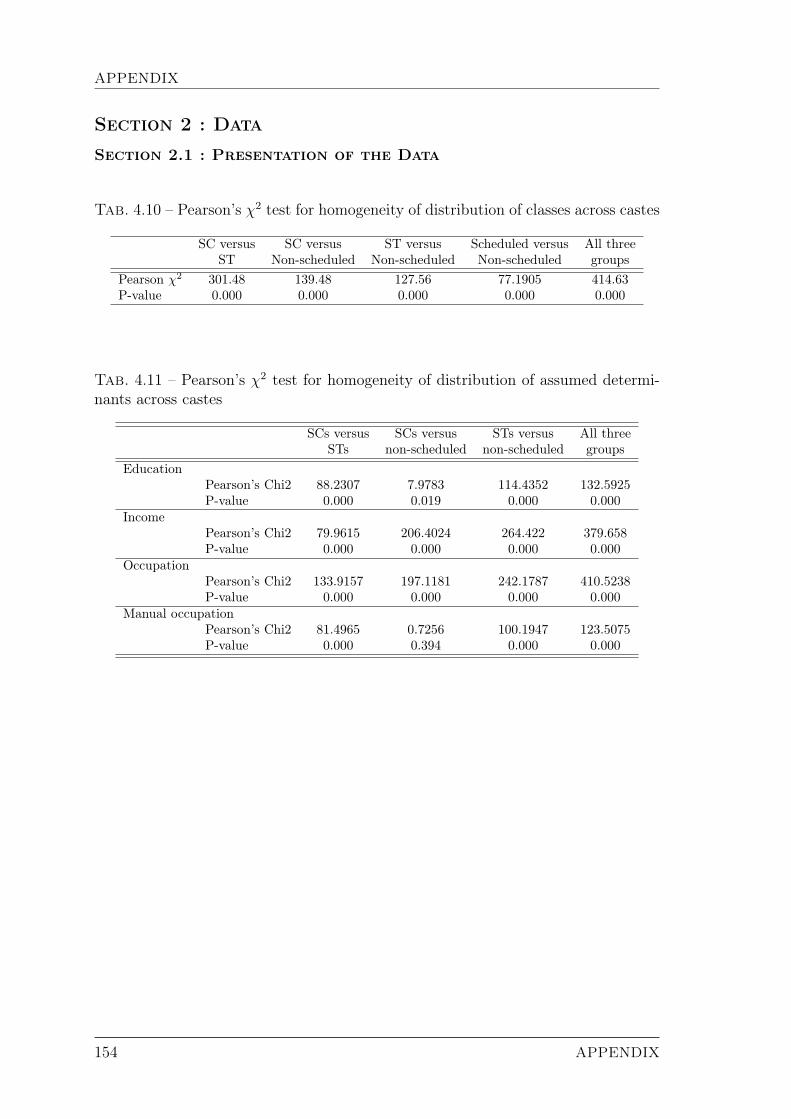
APPENDIX
Section 2 : Data
Section 2.1 : Presentation of the Data
Tab. 4.10 – Pearson’s χ2 test for homogeneity of distribution of classes across castes
SC versus SC versus ST versus Scheduled versus All threeST Non-scheduled Non-scheduled Non-scheduled groups
Pearson χ2 301.48 139.48 127.56 77.1905 414.63P-value 0.000 0.000 0.000 0.000 0.000
Tab. 4.11 – Pearson’s χ2 test for homogeneity of distribution of assumed determi-nants across castes
SCs versus SCs versus STs versus All threeSTs non-scheduled non-scheduled groups
EducationPearson’s Chi2 88.2307 7.9783 114.4352 132.5925P-value 0.000 0.019 0.000 0.000
IncomePearson’s Chi2 79.9615 206.4024 264.422 379.658P-value 0.000 0.000 0.000 0.000
OccupationPearson’s Chi2 133.9157 197.1181 242.1787 410.5238P-value 0.000 0.000 0.000 0.000
Manual occupationPearson’s Chi2 81.4965 0.7256 100.1947 123.5075P-value 0.000 0.394 0.000 0.000
154 APPENDIX
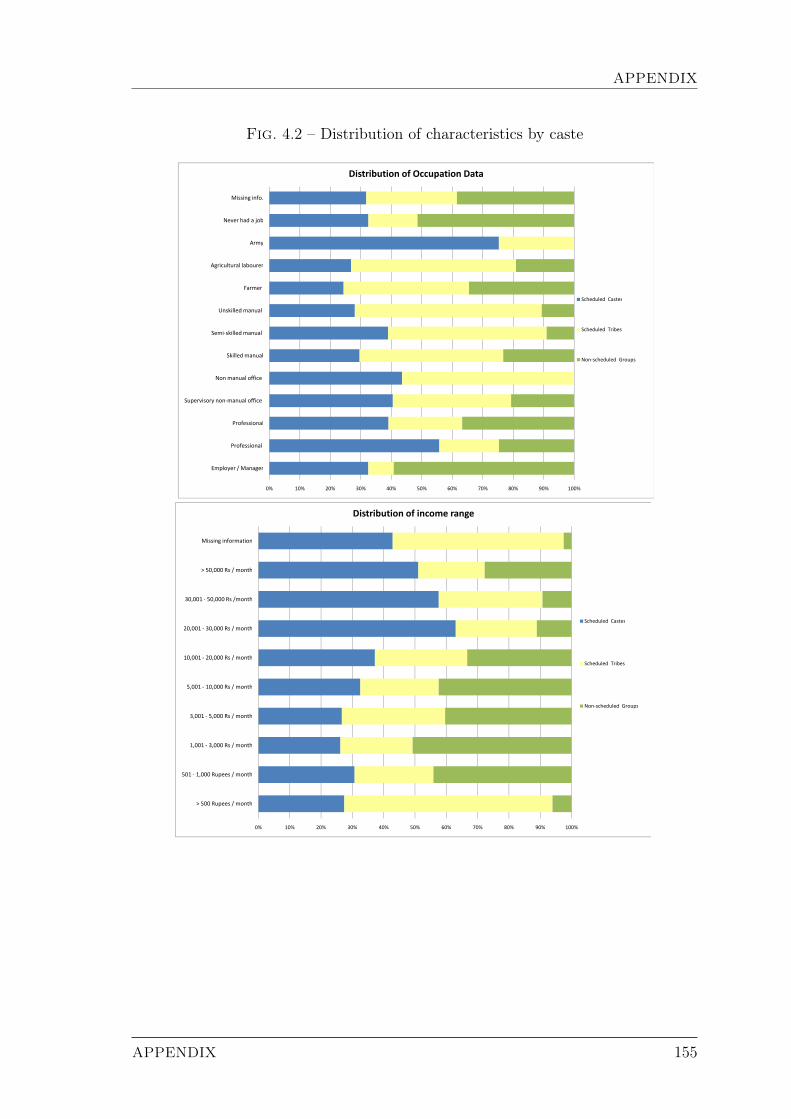
APPENDIX
Fig. 4.2 – Distribution of characteristics by caste
Unskilled manual
Farmer
Agricultural labourer
Army
Never had a job
Missing info.
Distribution of Occupation Data
Scheduled Castes
Employer / Manager
Professional
Professional
Supervisory non-manual office
Non manual office
Skilled manual
Semi-skilled manual
Unskilled manual
Scheduled Tribes
Non-scheduled Groups
0% 10% 20% 30% 40% 50% 60% 70% 80% 90% 100%
Employer / Manager
20,001 - 30,000 Rs / month
30,001 - 50,000 Rs /month
> 50,000 Rs / month
Missing information
Distribution of income range
Scheduled Castes
> 500 Rupees / month
501 - 1,000 Rupees / month
1,001 - 3,000 Rs / month
3,001 - 5,000 Rs / month
5,001 - 10,000 Rs / month
10,001 - 20,000 Rs / monthScheduled Tribes
Non-scheduled Groups
0% 10% 20% 30% 40% 50% 60% 70% 80% 90% 100%
> 500 Rupees / month
APPENDIX 155
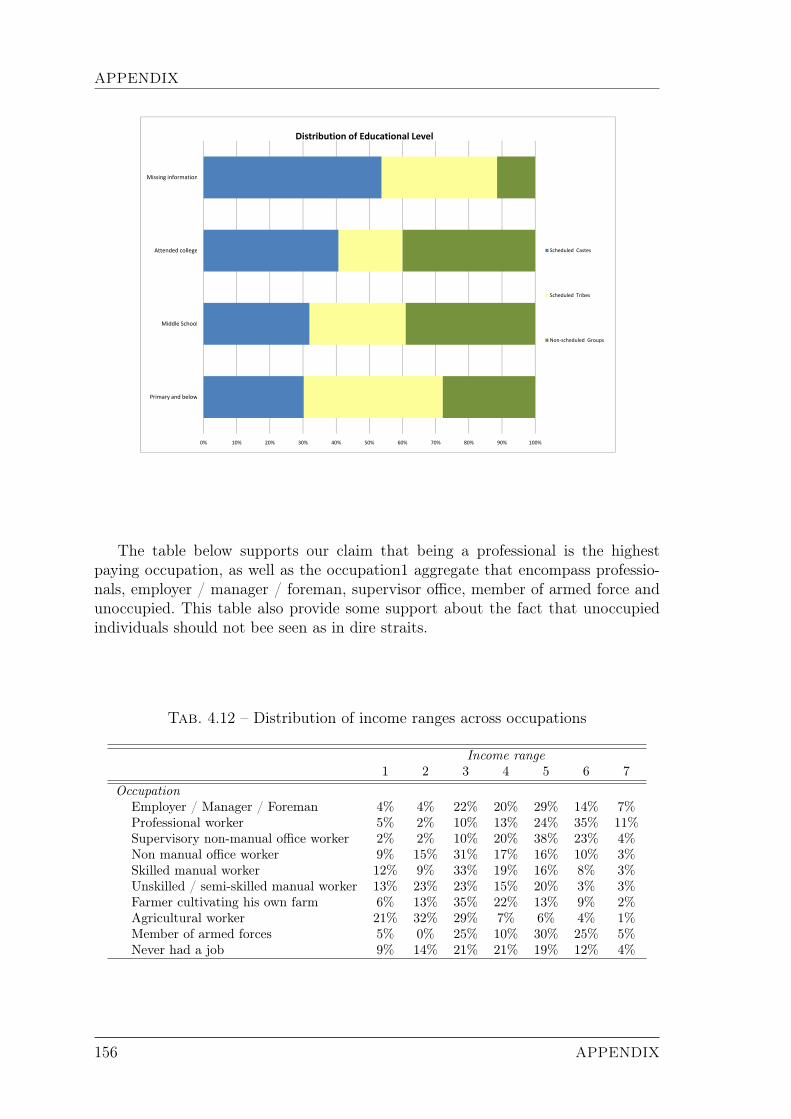
APPENDIX
Attended college
Missing information
Distribution of Educational Level
Scheduled Castes
Primary and below
Middle School
Scheduled Tribes
Non-scheduled Groups
0% 10% 20% 30% 40% 50% 60% 70% 80% 90% 100%
The table below supports our claim that being a professional is the highestpaying occupation, as well as the occupation1 aggregate that encompass professio-nals, employer / manager / foreman, supervisor office, member of armed force andunoccupied. This table also provide some support about the fact that unoccupiedindividuals should not bee seen as in dire straits.
Tab. 4.12 – Distribution of income ranges across occupations
Income range1 2 3 4 5 6 7
OccupationEmployer / Manager / Foreman 4% 4% 22% 20% 29% 14% 7%Professional worker 5% 2% 10% 13% 24% 35% 11%Supervisory non-manual office worker 2% 2% 10% 20% 38% 23% 4%Non manual office worker 9% 15% 31% 17% 16% 10% 3%Skilled manual worker 12% 9% 33% 19% 16% 8% 3%Unskilled / semi-skilled manual worker 13% 23% 23% 15% 20% 3% 3%Farmer cultivating his own farm 6% 13% 35% 22% 13% 9% 2%Agricultural worker 21% 32% 29% 7% 6% 4% 1%Member of armed forces 5% 0% 25% 10% 30% 25% 5%Never had a job 9% 14% 21% 21% 19% 12% 4%
156 APPENDIX
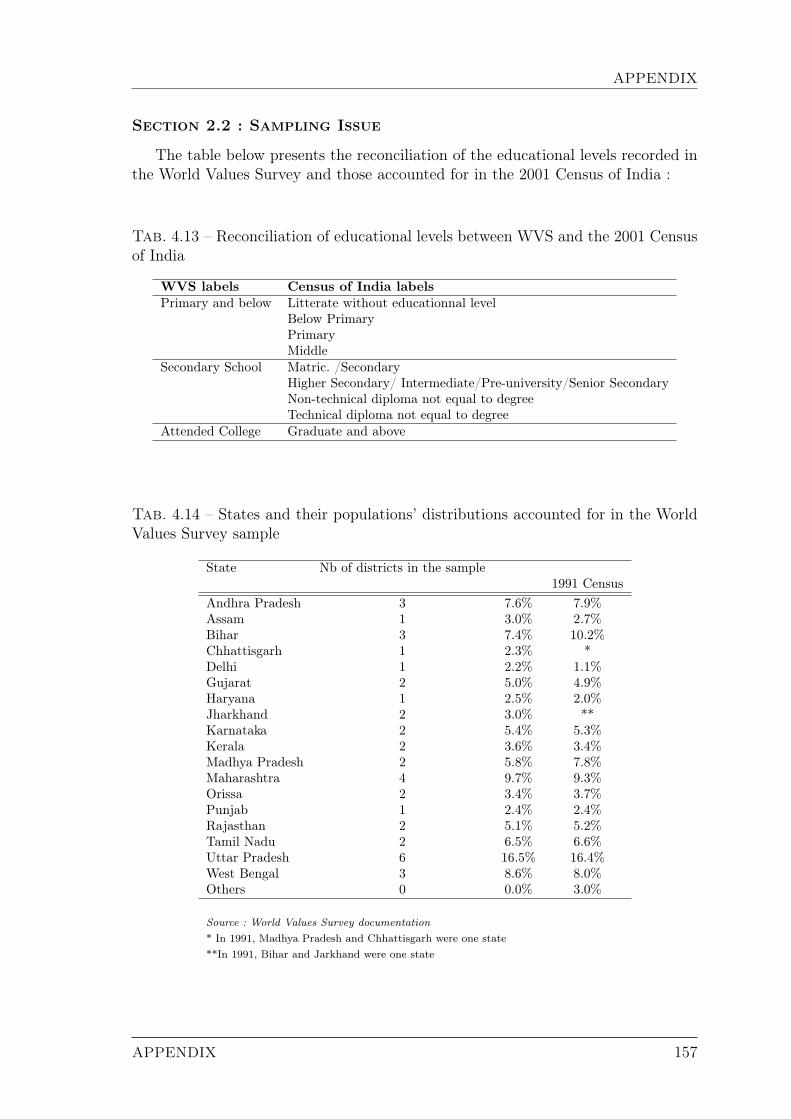
APPENDIX
Section 2.2 : Sampling Issue
The table below presents the reconciliation of the educational levels recorded inthe World Values Survey and those accounted for in the 2001 Census of India :
Tab. 4.13 – Reconciliation of educational levels between WVS and the 2001 Censusof India
WVS labels Census of India labelsPrimary and below Litterate without educationnal level
Below PrimaryPrimaryMiddle
Secondary School Matric. /SecondaryHigher Secondary/ Intermediate/Pre-university/Senior SecondaryNon-technical diploma not equal to degreeTechnical diploma not equal to degree
Attended College Graduate and above
Tab. 4.14 – States and their populations’ distributions accounted for in the WorldValues Survey sample
State Nb of districts in the sample1991 Census
Andhra Pradesh 3 7.6% 7.9%Assam 1 3.0% 2.7%Bihar 3 7.4% 10.2%Chhattisgarh 1 2.3% *Delhi 1 2.2% 1.1%Gujarat 2 5.0% 4.9%Haryana 1 2.5% 2.0%Jharkhand 2 3.0% **Karnataka 2 5.4% 5.3%Kerala 2 3.6% 3.4%Madhya Pradesh 2 5.8% 7.8%Maharashtra 4 9.7% 9.3%Orissa 2 3.4% 3.7%Punjab 1 2.4% 2.4%Rajasthan 2 5.1% 5.2%Tamil Nadu 2 6.5% 6.6%Uttar Pradesh 6 16.5% 16.4%West Bengal 3 8.6% 8.0%Others 0 0.0% 3.0%
Source : World Values Survey documentation* In 1991, Madhya Pradesh and Chhattisgarh were one state**In 1991, Bihar and Jarkhand were one state
APPENDIX 157
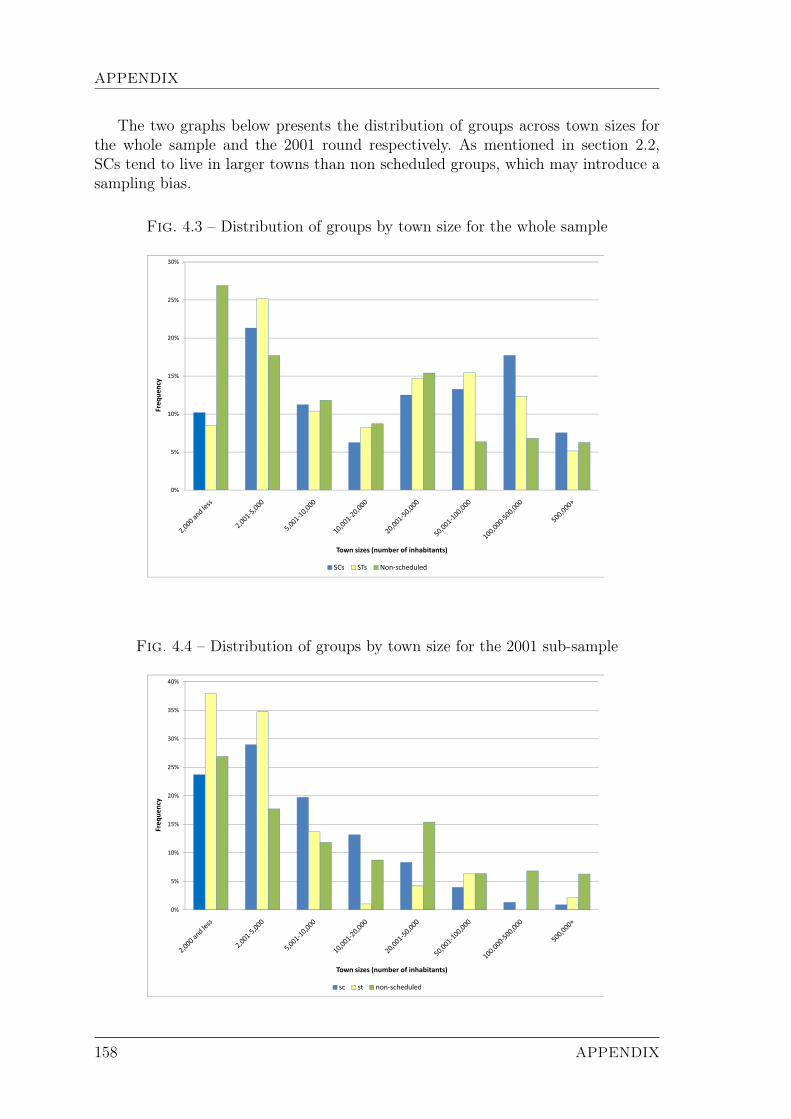
APPENDIX
The two graphs below presents the distribution of groups across town sizes forthe whole sample and the 2001 round respectively. As mentioned in section 2.2,SCs tend to live in larger towns than non scheduled groups, which may introduce asampling bias.
Fig. 4.3 – Distribution of groups by town size for the whole sample
15%
20%
25%
30%
Fre
qu
en
cy
0%
5%
10%
Fre
qu
en
cy
Town sizes (number of inhabitants)Town sizes (number of inhabitants)
SCs STs Non-scheduled
Fig. 4.4 – Distribution of groups by town size for the 2001 sub-sample
20%
25%
30%
35%
40%
Fre
qu
en
cy
0%
5%
10%
15%
Fre
qu
en
cy
Town sizes (number of inhabitants)Town sizes (number of inhabitants)
sc st non-scheduled
158 APPENDIX

APPENDIX
Section 3 : Discriminant Analysis of The DataDescription of The Method
Let n be the number of observations that can be classified into k groups or inthis instance social classes. Population within every class is therefore noted nk. Let ybe the class variable that takes on value y1, y2...yk. Let xij be the vector of characte-ristics for individual i and j the type of individuals’ characteristics such as income,education, occupation etc... Fisher (1936) suggested using a linear combination ofthe observations of the following form
y = u1x1 + u2x2 + ...ujxj + c
where y is a latent variable, xj are independent or discriminating variables, uj arediscriminating coefficients associated with the discriminating variable xj and c aconstant. There exists a function u(x) that maps x and the latent variable y. Sucha function is the discriminant function. The objective of the discriminant analysis isto find a function that best separates the groups or in this instance the social classes.
Let’s define ηk the center of gravity of the observations in group k, η the centerof gravity of the overall distribution, and Wk the variance-covariance matrix forthe kth group. Wk describes the within group dispersion. The overall within groupdispersion can be calculated as :
W =1
n
∑k
nkWk (4.10)
Between group variability can be described as
B =1
n
∑k
nk(ηk − η)(ηk − η)T (4.11)
which represents the sample covariance of the groups means. Total sample variabilitymay be represented by the total covariance matrix V such that :
V = B +W (4.12)
Given that the objective is to find axes that best separate the k groups. Let’s noteu1(x) a vector on which observations will be projected so that
u′1(x)V u1(x) = u′1(x)Bu1(x) + u′1(x)V u1(x) (4.13)
For more convenience, u1(x) is thereafter noted u1. The axis Z1 that best separatesthe group will be defined through the maximization of :
u′1Bu1
u′1Wu1
or u′1Bu1
u′1Wu1
which is solved by the following equation :
W−1Bu1 = λu1 (4.14)
The first axis Z1 and the function that best discriminates u1 is obtained for thelargest value of λ. The second axis Z2 and discriminant function u2 comes from thesecond largest value of λ and so on.
Table below presents the coefficients found for the fist two discriminant functions.These coefficients are the coordinates of the points plotted on graph 2.2.
APPENDIX 159
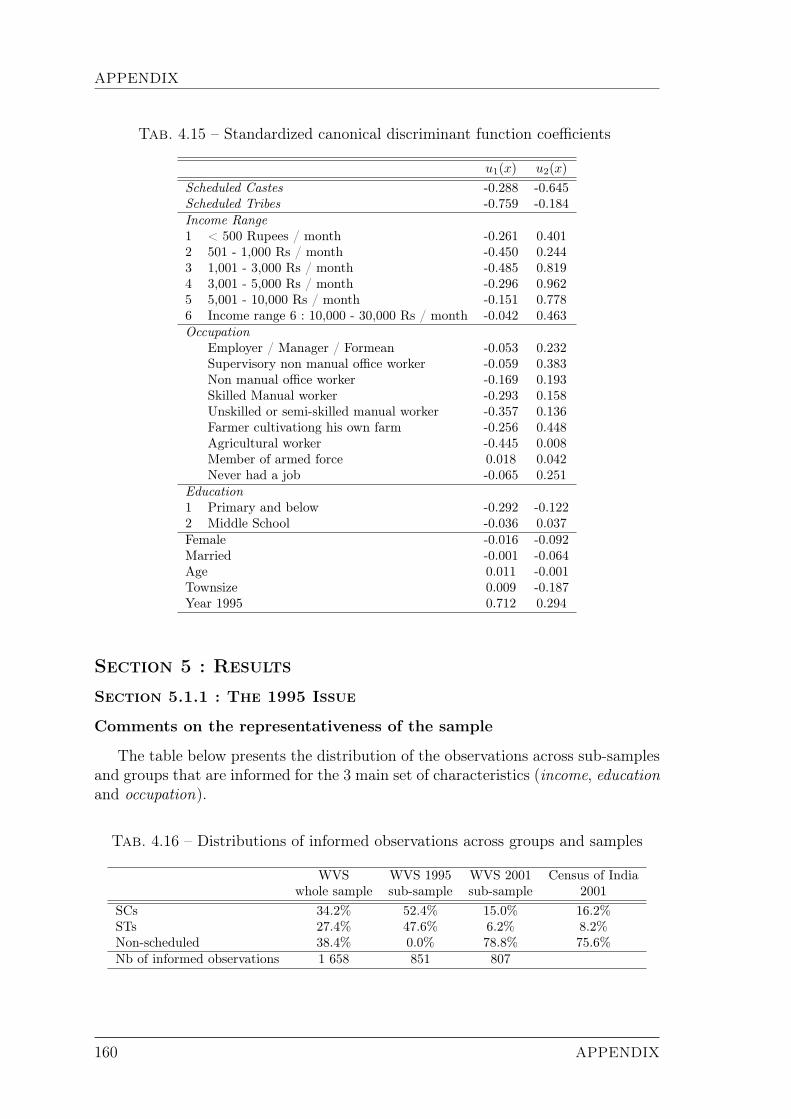
APPENDIX
Tab. 4.15 – Standardized canonical discriminant function coefficients
u1(x) u2(x)Scheduled Castes -0.288 -0.645Scheduled Tribes -0.759 -0.184Income Range1 < 500 Rupees / month -0.261 0.4012 501 - 1,000 Rs / month -0.450 0.2443 1,001 - 3,000 Rs / month -0.485 0.8194 3,001 - 5,000 Rs / month -0.296 0.9625 5,001 - 10,000 Rs / month -0.151 0.7786 Income range 6 : 10,000 - 30,000 Rs / month -0.042 0.463Occupation
Employer / Manager / Formean -0.053 0.232Supervisory non manual office worker -0.059 0.383Non manual office worker -0.169 0.193Skilled Manual worker -0.293 0.158Unskilled or semi-skilled manual worker -0.357 0.136Farmer cultivationg his own farm -0.256 0.448Agricultural worker -0.445 0.008Member of armed force 0.018 0.042Never had a job -0.065 0.251
Education1 Primary and below -0.292 -0.1222 Middle School -0.036 0.037Female -0.016 -0.092Married -0.001 -0.064Age 0.011 -0.001Townsize 0.009 -0.187Year 1995 0.712 0.294
Section 5 : Results
Section 5.1.1 : The 1995 Issue
Comments on the representativeness of the sample
The table below presents the distribution of the observations across sub-samplesand groups that are informed for the 3 main set of characteristics (income, educationand occupation).
Tab. 4.16 – Distributions of informed observations across groups and samples
WVS WVS 1995 WVS 2001 Census of Indiawhole sample sub-sample sub-sample 2001
SCs 34.2% 52.4% 15.0% 16.2%STs 27.4% 47.6% 6.2% 8.2%Non-scheduled 38.4% 0.0% 78.8% 75.6%Nb of informed observations 1 658 851 807
160 APPENDIX
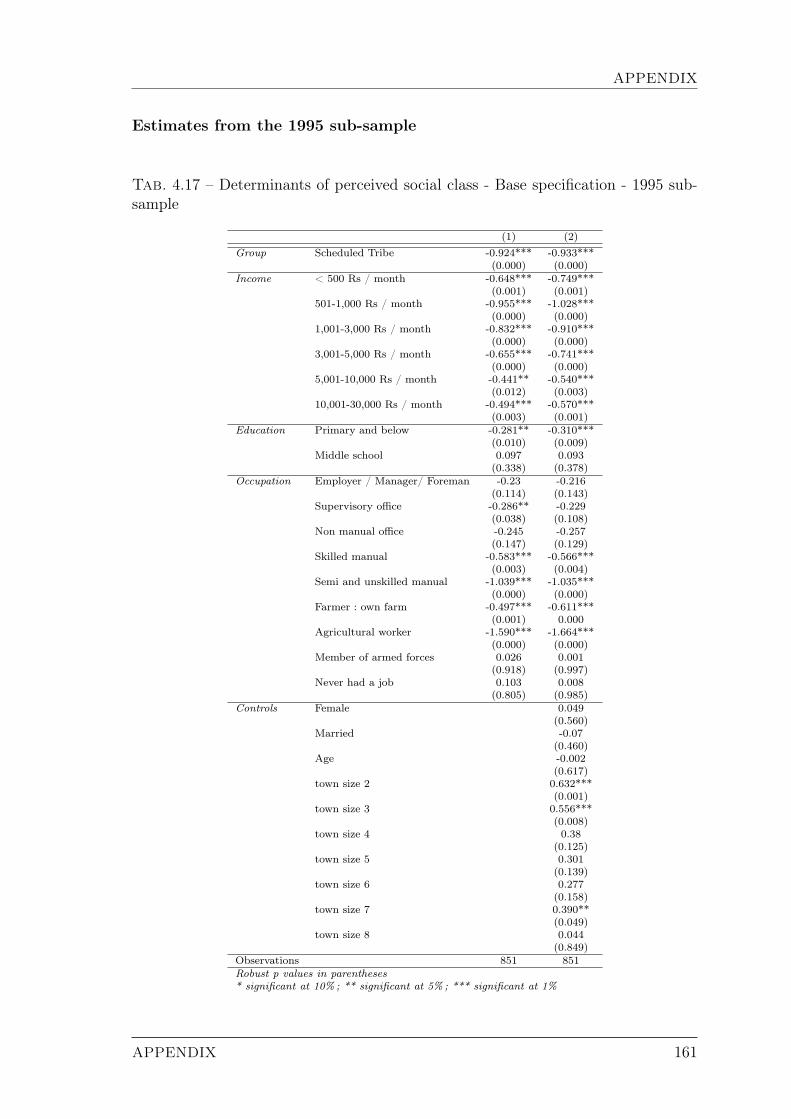
APPENDIX
Estimates from the 1995 sub-sample
Tab. 4.17 – Determinants of perceived social class - Base specification - 1995 sub-sample
(1) (2)Group Scheduled Tribe -0.924*** -0.933***
(0.000) (0.000)Income < 500 Rs / month -0.648*** -0.749***
(0.001) (0.001)501-1,000 Rs / month -0.955*** -1.028***
(0.000) (0.000)1,001-3,000 Rs / month -0.832*** -0.910***
(0.000) (0.000)3,001-5,000 Rs / month -0.655*** -0.741***
(0.000) (0.000)5,001-10,000 Rs / month -0.441** -0.540***
(0.012) (0.003)10,001-30,000 Rs / month -0.494*** -0.570***
(0.003) (0.001)Education Primary and below -0.281** -0.310***
(0.010) (0.009)Middle school 0.097 0.093
(0.338) (0.378)Occupation Employer / Manager/ Foreman -0.23 -0.216
(0.114) (0.143)Supervisory office -0.286** -0.229
(0.038) (0.108)Non manual office -0.245 -0.257
(0.147) (0.129)Skilled manual -0.583*** -0.566***
(0.003) (0.004)Semi and unskilled manual -1.039*** -1.035***
(0.000) (0.000)Farmer : own farm -0.497*** -0.611***
(0.001) 0.000Agricultural worker -1.590*** -1.664***
(0.000) (0.000)Member of armed forces 0.026 0.001
(0.918) (0.997)Never had a job 0.103 0.008
(0.805) (0.985)Controls Female 0.049
(0.560)Married -0.07
(0.460)Age -0.002
(0.617)town size 2 0.632***
(0.001)town size 3 0.556***
(0.008)town size 4 0.38
(0.125)town size 5 0.301
(0.139)town size 6 0.277
(0.158)town size 7 0.390**
(0.049)town size 8 0.044
(0.849)Observations 851 851Robust p values in parentheses* significant at 10% ; ** significant at 5% ; *** significant at 1%
APPENDIX 161

APPENDIX
Analysis on the 2001 sub-sample
Estimates from the base model
The table 4.18 presents the results from the estimation of the base model overthe 2001 sub-sample. These results should be compared to the ones presented intable 2.9 in section 5.1.
Compared to the results obtained over the whole sample, the effect of beingan ST is similar to that of being an SCs. The test of difference in parameters forthese two groups dummies conclude that their effects are not statistically different(χ2 = 0.41). Yet results from table 4.17 show that the two groups’ effects were sta-tistically different. As discussed in section 5.1.1, this difference is probably due to asampling bias.
Compared to the results obtained over the whole sample and with respect to theinfluences of both Scheduled groups, it is noteworthy that the impact of being froma Scheduled Caste is much higher in the 2001 sample (-0.427 vs -0.625) while thatof being from a Scheduled Tribe is lower (-1.225 vs -0.763). Thus comments relatedto the fact that SCs may be able to improve their perceived social status throughlikely shifts in other characteristics may not hold anymore, neither those about theimplausible shifts needed to cancel the tribe effect. This impression will be rectifiedor confirmed in the following paragraph.
Tests on Coefficients and Thresholds for Each Variable Type
Education
As far as education is concerned, the conclusion that primary education is the realdivide still holds. Indeed, the test of equality of coefficients associated with secon-dary school and primary do conclude that they differ (χ2 = 6.44 ; P > χ2 = 0.0112).Results from table 4.18 also show that the impact of secondary education is signi-ficantly different from that of primary but not from that of university attendance.Moreover, there is no differing effect between secondary school and college atten-dance. As before, education plays a relatively little role, given that going beyondprimary education may hardly cancel half of the Scheduled group effect.
Occupation
The table below presents the matrix for the χ2 tests of differences in parametersfor occupations. Please note that no individual is enrolled in the army in this sub-sample.
162 APPENDIX
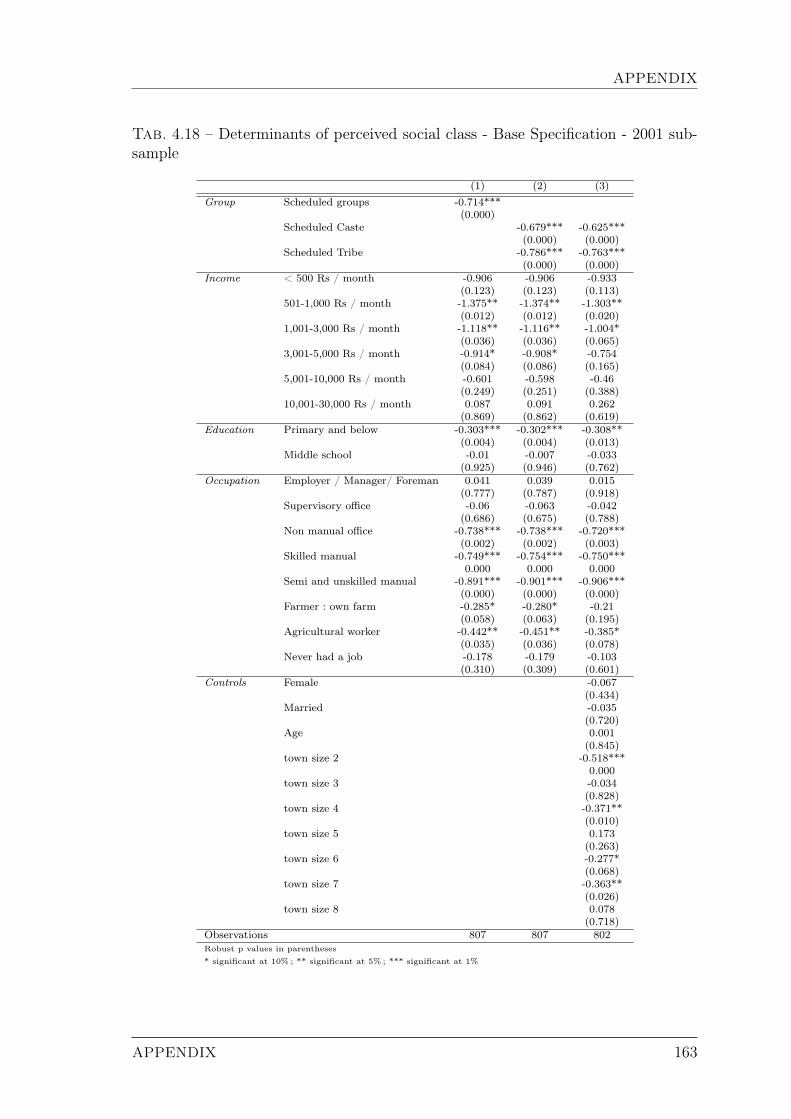
APPENDIX
Tab. 4.18 – Determinants of perceived social class - Base Specification - 2001 sub-sample
(1) (2) (3)Group Scheduled groups -0.714***
(0.000)Scheduled Caste -0.679*** -0.625***
(0.000) (0.000)Scheduled Tribe -0.786*** -0.763***
(0.000) (0.000)Income < 500 Rs / month -0.906 -0.906 -0.933
(0.123) (0.123) (0.113)501-1,000 Rs / month -1.375** -1.374** -1.303**
(0.012) (0.012) (0.020)1,001-3,000 Rs / month -1.118** -1.116** -1.004*
(0.036) (0.036) (0.065)3,001-5,000 Rs / month -0.914* -0.908* -0.754
(0.084) (0.086) (0.165)5,001-10,000 Rs / month -0.601 -0.598 -0.46
(0.249) (0.251) (0.388)10,001-30,000 Rs / month 0.087 0.091 0.262
(0.869) (0.862) (0.619)Education Primary and below -0.303*** -0.302*** -0.308**
(0.004) (0.004) (0.013)Middle school -0.01 -0.007 -0.033
(0.925) (0.946) (0.762)Occupation Employer / Manager/ Foreman 0.041 0.039 0.015
(0.777) (0.787) (0.918)Supervisory office -0.06 -0.063 -0.042
(0.686) (0.675) (0.788)Non manual office -0.738*** -0.738*** -0.720***
(0.002) (0.002) (0.003)Skilled manual -0.749*** -0.754*** -0.750***
0.000 0.000 0.000Semi and unskilled manual -0.891*** -0.901*** -0.906***
(0.000) (0.000) (0.000)Farmer : own farm -0.285* -0.280* -0.21
(0.058) (0.063) (0.195)Agricultural worker -0.442** -0.451** -0.385*
(0.035) (0.036) (0.078)Never had a job -0.178 -0.179 -0.103
(0.310) (0.309) (0.601)Controls Female -0.067
(0.434)Married -0.035
(0.720)Age 0.001
(0.845)town size 2 -0.518***
0.000town size 3 -0.034
(0.828)town size 4 -0.371**
(0.010)town size 5 0.173
(0.263)town size 6 -0.277*
(0.068)town size 7 -0.363**
(0.026)town size 8 0.078
(0.718)Observations 807 807 802Robust p values in parentheses
* significant at 10% ; ** significant at 5% ; *** significant at 1%
APPENDIX 163
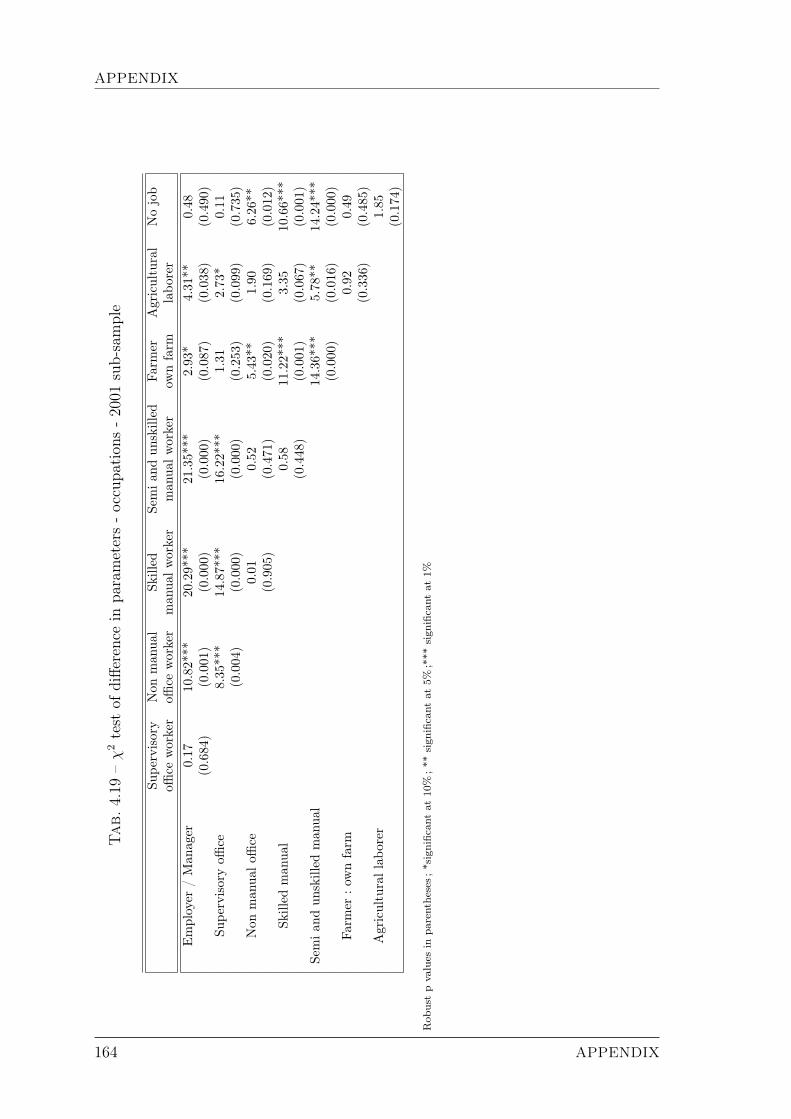
APPENDIX
Tab.
4.19
–χ
2test
ofdiffe
rencein
parameters-occupa
tion
s-20
01sub-sample
Supe
rvisory
Non
man
ual
Skilled
Semia
ndun
skilled
Farm
erAgricultural
Nojob
office
worker
office
worker
man
ualw
orker
man
ualw
orker
ownfarm
labo
rer
Employer
/Man
ager
0.17
10.82***
20.29***
21.35***
2.93*
4.31**
0.48
(0.684)
(0.001)
(0.000)
(0.000)
(0.087)
(0.038)
(0.490)
Supe
rvisoryoffi
ce8.35***
14.87***
16.22***
1.31
2.73*
0.11
(0.004)
(0.000)
(0.000)
(0.253)
(0.099)
(0.735)
Non
man
ualo
ffice
0.01
0.52
5.43**
1.90
6.26**
(0.905)
(0.471)
(0.020)
(0.169)
(0.012)
Skilled
man
ual
0.58
11.22***
3.35
10.66***
(0.448)
(0.001)
(0.067)
(0.001)
Semia
ndun
skilled
man
ual
14.36***
5.78**
14.24***
(0.000)
(0.016)
(0.000)
Farm
er:o
wnfarm
0.92
0.49
(0.336)
(0.485)
Agriculturallab
orer
1.85
(0.174)
Rob
ustpvalues
inpa
rentheses;
*significan
tat
10%;**
sign
ificant
at5%
;***
sign
ificant
at1%
164 APPENDIX
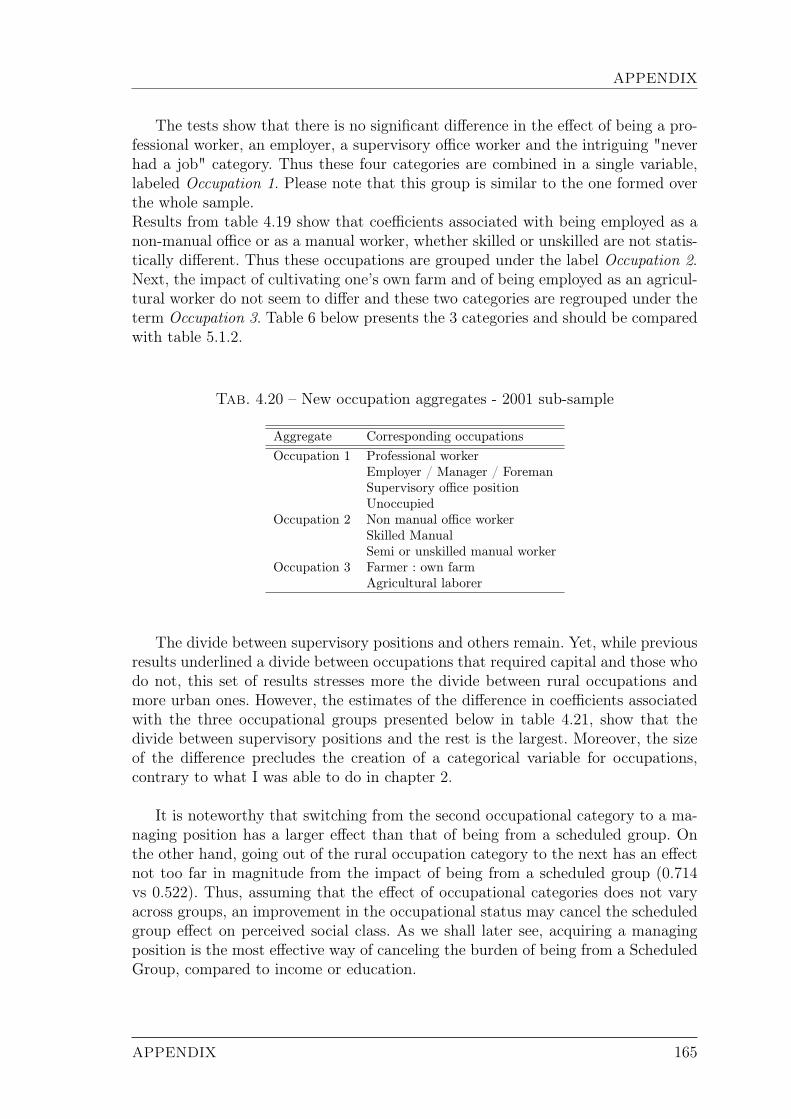
APPENDIX
The tests show that there is no significant difference in the effect of being a pro-fessional worker, an employer, a supervisory office worker and the intriguing "neverhad a job" category. Thus these four categories are combined in a single variable,labeled Occupation 1. Please note that this group is similar to the one formed overthe whole sample.Results from table 4.19 show that coefficients associated with being employed as anon-manual office or as a manual worker, whether skilled or unskilled are not statis-tically different. Thus these occupations are grouped under the label Occupation 2.Next, the impact of cultivating one’s own farm and of being employed as an agricul-tural worker do not seem to differ and these two categories are regrouped under theterm Occupation 3. Table 6 below presents the 3 categories and should be comparedwith table 5.1.2.
Tab. 4.20 – New occupation aggregates - 2001 sub-sample
Aggregate Corresponding occupationsOccupation 1 Professional worker
Employer / Manager / ForemanSupervisory office positionUnoccupied
Occupation 2 Non manual office workerSkilled ManualSemi or unskilled manual worker
Occupation 3 Farmer : own farmAgricultural laborer
The divide between supervisory positions and others remain. Yet, while previousresults underlined a divide between occupations that required capital and those whodo not, this set of results stresses more the divide between rural occupations andmore urban ones. However, the estimates of the difference in coefficients associatedwith the three occupational groups presented below in table 4.21, show that thedivide between supervisory positions and the rest is the largest. Moreover, the sizeof the difference precludes the creation of a categorical variable for occupations,contrary to what I was able to do in chapter 2.
It is noteworthy that switching from the second occupational category to a ma-naging position has a larger effect than that of being from a scheduled group. Onthe other hand, going out of the rural occupation category to the next has an effectnot too far in magnitude from the impact of being from a scheduled group (0.714vs 0.522). Thus, assuming that the effect of occupational categories does not varyacross groups, an improvement in the occupational status may cancel the scheduledgroup effect on perceived social class. As we shall later see, acquiring a managingposition is the most effective way of canceling the burden of being from a ScheduledGroup, compared to income or education.
APPENDIX 165
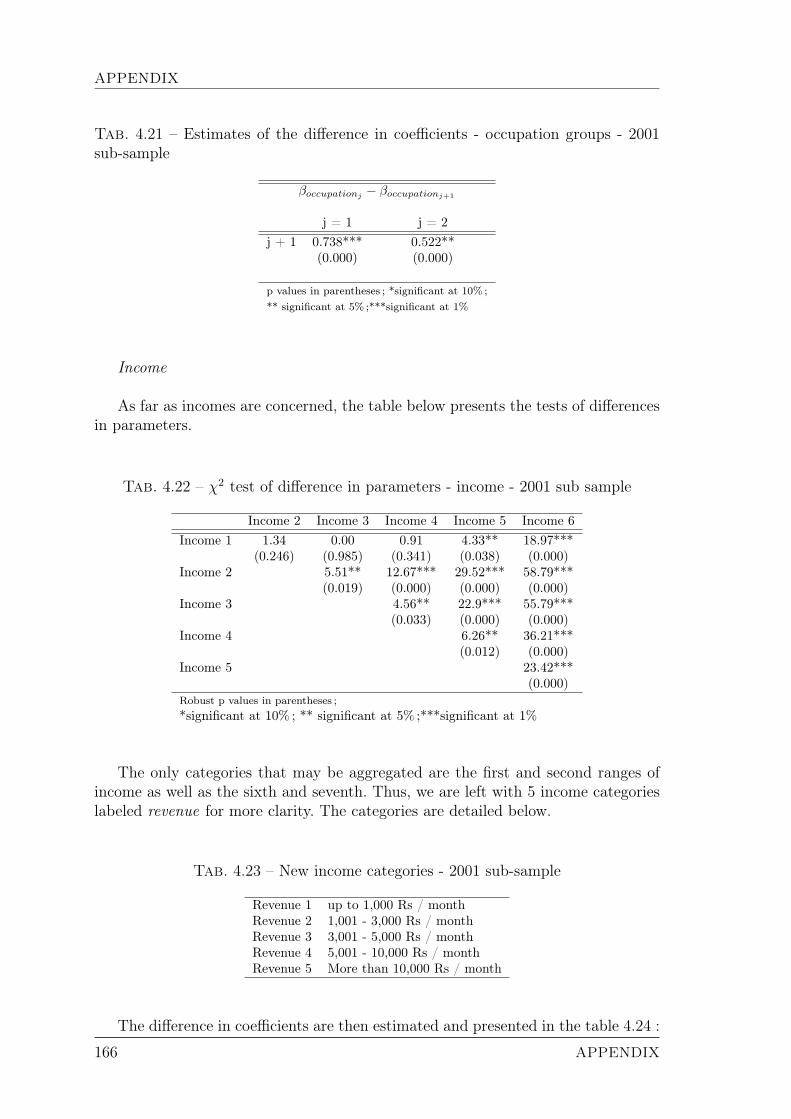
APPENDIX
Tab. 4.21 – Estimates of the difference in coefficients - occupation groups - 2001sub-sample
βoccupationj − βoccupationj+1
j = 1 j = 2j + 1 0.738*** 0.522**
(0.000) (0.000)
p values in parentheses ; *significant at 10% ;** significant at 5% ;***significant at 1%
Income
As far as incomes are concerned, the table below presents the tests of differencesin parameters.
Tab. 4.22 – χ2 test of difference in parameters - income - 2001 sub sample
Income 2 Income 3 Income 4 Income 5 Income 6Income 1 1.34 0.00 0.91 4.33** 18.97***
(0.246) (0.985) (0.341) (0.038) (0.000)Income 2 5.51** 12.67*** 29.52*** 58.79***
(0.019) (0.000) (0.000) (0.000)Income 3 4.56** 22.9*** 55.79***
(0.033) (0.000) (0.000)Income 4 6.26** 36.21***
(0.012) (0.000)Income 5 23.42***
(0.000)Robust p values in parentheses ;*significant at 10% ; ** significant at 5% ;***significant at 1%
The only categories that may be aggregated are the first and second ranges ofincome as well as the sixth and seventh. Thus, we are left with 5 income categorieslabeled revenue for more clarity. The categories are detailed below.
Tab. 4.23 – New income categories - 2001 sub-sample
Revenue 1 up to 1,000 Rs / monthRevenue 2 1,001 - 3,000 Rs / monthRevenue 3 3,001 - 5,000 Rs / monthRevenue 4 5,001 - 10,000 Rs / monthRevenue 5 More than 10,000 Rs / month
The difference in coefficients are then estimated and presented in the table 4.24 :
166 APPENDIX
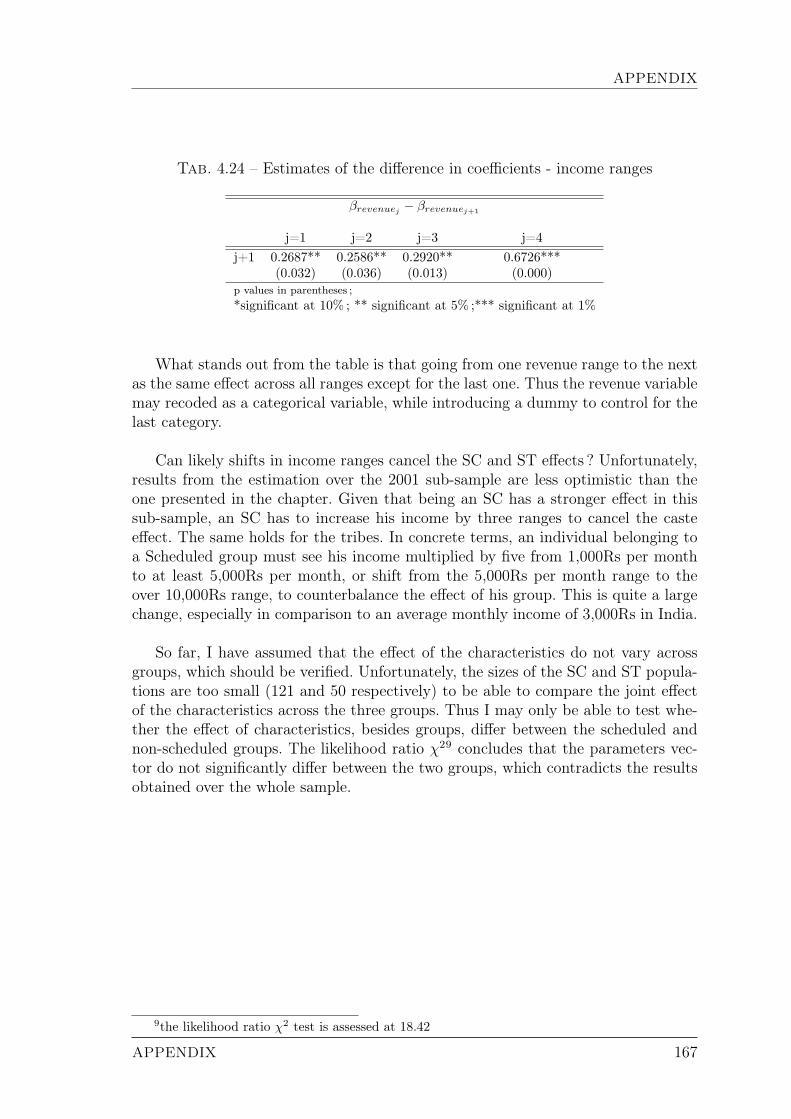
APPENDIX
Tab. 4.24 – Estimates of the difference in coefficients - income ranges
βrevenuej − βrevenuej+1
j=1 j=2 j=3 j=4j+1 0.2687** 0.2586** 0.2920** 0.6726***
(0.032) (0.036) (0.013) (0.000)p values in parentheses ;*significant at 10% ; ** significant at 5% ;*** significant at 1%
What stands out from the table is that going from one revenue range to the nextas the same effect across all ranges except for the last one. Thus the revenue variablemay recoded as a categorical variable, while introducing a dummy to control for thelast category.
Can likely shifts in income ranges cancel the SC and ST effects ? Unfortunately,results from the estimation over the 2001 sub-sample are less optimistic than theone presented in the chapter. Given that being an SC has a stronger effect in thissub-sample, an SC has to increase his income by three ranges to cancel the casteeffect. The same holds for the tribes. In concrete terms, an individual belonging toa Scheduled group must see his income multiplied by five from 1,000Rs per monthto at least 5,000Rs per month, or shift from the 5,000Rs per month range to theover 10,000Rs range, to counterbalance the effect of his group. This is quite a largechange, especially in comparison to an average monthly income of 3,000Rs in India.
So far, I have assumed that the effect of the characteristics do not vary acrossgroups, which should be verified. Unfortunately, the sizes of the SC and ST popula-tions are too small (121 and 50 respectively) to be able to compare the joint effectof the characteristics across the three groups. Thus I may only be able to test whe-ther the effect of characteristics, besides groups, differ between the scheduled andnon-scheduled groups. The likelihood ratio χ29 concludes that the parameters vec-tor do not significantly differ between the two groups, which contradicts the resultsobtained over the whole sample.
9the likelihood ratio χ2 test is assessed at 18.42
APPENDIX 167
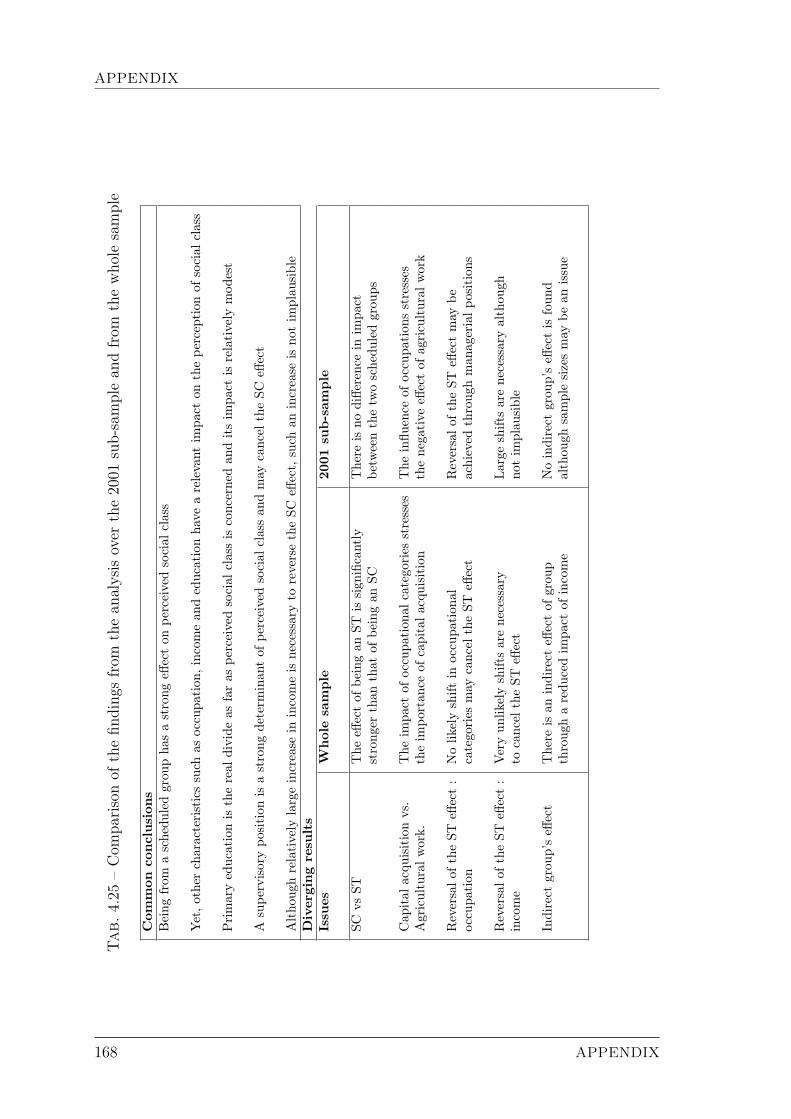
APPENDIX
Tab.
4.25
–Com
parisonof
thefin
ding
sfrom
thean
alysis
over
the20
01sub-samplean
dfrom
thewho
lesample
Com
mon
conclusion
sBeing
from
aschedu
ledgrou
pha
sastrong
effecton
perceivedsocial
class
Yet,o
ther
characteristicssuch
asoccupa
tion
,incom
ean
deducationha
vearelevant
impa
cton
thepe
rception
ofsocial
class
Primaryeducationis
thereal
divide
asfaras
perceivedsocial
classis
concernedan
ditsim
pact
isrelatively
mod
est
Asupe
rvisorypo
sition
isastrong
determ
inan
tof
perceivedsocial
classan
dmay
cancel
theSC
effect
Altho
ughrelatively
largeincrease
inincomeis
necessaryto
reversetheSC
effect,
such
anincrease
isno
tim
plau
sible
Divergingresults
Issues
Wholesample
2001
sub-sam
ple
SCvs
STThe
effectof
beingan
STis
sign
ificantly
There
isno
diffe
rencein
impa
ctstrong
erthan
that
ofbe
ingan
SCbe
tweenthetw
oschedu
ledgrou
ps
Cap
ital
acqu
isitionvs.
The
impa
ctof
occupa
tion
alcategories
stresses
The
influ
ence
ofoccupa
tion
sstresses
Agriculturalw
ork.
theim
portan
ceof
capitala
cquisition
thenegative
effectof
agricultural
work
Reversalo
ftheST
effect:
Nolik
elyshift
inoccupa
tion
alReversalo
ftheST
effectmay
beoccupa
tion
categories
may
cancel
theST
effect
achieved
throug
hman
agerialp
ositions
Reversalo
ftheST
effect:
Veryun
likelyshiftsarenecessary
Largeshiftsarenecessaryalthou
ghincome
tocancel
theST
effect
notim
plau
sible
Indirect
grou
p’seff
ect
There
isan
indirect
effectof
grou
pNoindirect
grou
p’seff
ectis
foun
dthroug
haredu
cedim
pact
ofincome
althou
ghsamplesizesmay
bean
issue
168 APPENDIX

APPENDIX
Section 5.1.2. Tests on Coefficients and Thresholds for EachVariable Type
As mentioned in section 5.1.2 the impact of being a supervisory office worker isnot significantly different from belonging to the occupation1 group, when the latteris omitted, and as testified by the results exhibited in table 4.26 below
Tab. 4.26 – Estimation of the model when the omitted category is Occupation 1
(1)Caste Scheduled Caste -0.425***
0.000Scheduled Tribe -1.233***
0.000Income < 500 Rs / month -0.717***
0.000501-1,000 Rs / month -1.177***
0.0001,001-3,000 Rs / month -0.943***
0.0003,001-5,000 Rs / month -0.721***
0.0005,001-10,000 Rs / month -0.483***
(0.004)10,001-30,000 Rs / month -0.319**
(0.050)Education Primary and below -0.355***
0.000Occupation Supervisory office -0.116
(0.158)Non manual office -0.367***
(0.004)Skilled manual -0.595***
0.000Semi and unskilled manual -0.873***
0.000Farmer : own farm -0.290***
0.000Agricultural worker -0.948***
0.000Observations 1653Robust p values in parentheses* significant at 10% ; ** significant at 5% ; *** significant at 1%Includes control variables such as year 1995 dummy, age, gender, marital statusand town size etc.
APPENDIX 169
APPENDIX
Appendix to chapter 3 :Untouchability and Public Infrastructure
170 APPENDIX
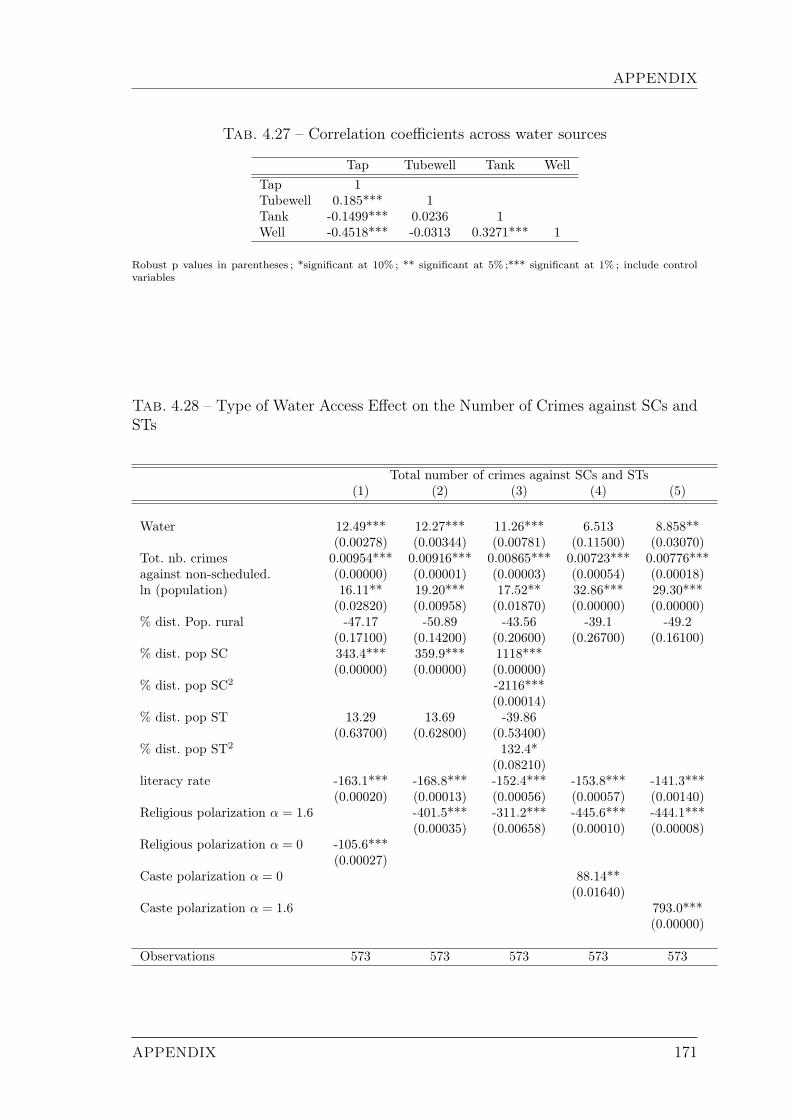
APPENDIX
Tab. 4.27 – Correlation coefficients across water sources
Tap Tubewell Tank WellTap 1Tubewell 0.185*** 1Tank -0.1499*** 0.0236 1Well -0.4518*** -0.0313 0.3271*** 1
Robust p values in parentheses ; *significant at 10% ; ** significant at 5% ;*** significant at 1% ; include controlvariables
Tab. 4.28 – Type of Water Access Effect on the Number of Crimes against SCs andSTs
Total number of crimes against SCs and STs(1) (2) (3) (4) (5)
Water 12.49*** 12.27*** 11.26*** 6.513 8.858**(0.00278) (0.00344) (0.00781) (0.11500) (0.03070)
Tot. nb. crimes 0.00954*** 0.00916*** 0.00865*** 0.00723*** 0.00776***against non-scheduled. (0.00000) (0.00001) (0.00003) (0.00054) (0.00018)ln (population) 16.11** 19.20*** 17.52** 32.86*** 29.30***
(0.02820) (0.00958) (0.01870) (0.00000) (0.00000)% dist. Pop. rural -47.17 -50.89 -43.56 -39.1 -49.2
(0.17100) (0.14200) (0.20600) (0.26700) (0.16100)% dist. pop SC 343.4*** 359.9*** 1118***
(0.00000) (0.00000) (0.00000)% dist. pop SC2 -2116***
(0.00014)% dist. pop ST 13.29 13.69 -39.86
(0.63700) (0.62800) (0.53400)% dist. pop ST2 132.4*
(0.08210)literacy rate -163.1*** -168.8*** -152.4*** -153.8*** -141.3***
(0.00020) (0.00013) (0.00056) (0.00057) (0.00140)Religious polarization α = 1.6 -401.5*** -311.2*** -445.6*** -444.1***
(0.00035) (0.00658) (0.00010) (0.00008)Religious polarization α = 0 -105.6***
(0.00027)Caste polarization α = 0 88.14**
(0.01640)Caste polarization α = 1.6 793.0***
(0.00000)
Observations 573 573 573 573 573
APPENDIX 171

APPENDIX
Tab. 4.29 – Type of Water Access Effect on the Percentage of Crime - individualwater access modes
Percentage of Crime Marginal(1) (2) (3) (4) (5) Effect
% dist. pop water access tanks 0.0231* 0.0198 0.0223* 0.0292** 0.0316** 0.019(0.0128) (0.0127) (0.0127) (0.0129) (0.0134)
% dist. pop water access wells 0.0175* 0.0164* 0.0173* 0.0107 0.0252** 0.017(0.00921) (0.00921) (0.00916) (0.00951) (0.00987)
% dist. pop water access tubewells -0.0319*** -0.0299*** -0.0315*** -0.0339*** -0.0347*** -0.026(0.00914) (0.00915) (0.00901) (0.00915) (0.00950)
% dist. pop water access tap 0.00378 0.00332 0.00493 -0.000719 0.00805 -(0.00911) (0.00916) (0.00915) (0.00917) (0.0103)
ln district population 0.00301 0.00372 0.00232 -0.00765** 0.000662 -(0.00272) (0.00271) (0.00270) (0.00385) (0.00287)
% district pop rural -0.0237 -0.0185 -0.0199 -0.0255 -0.0371** -(0.0161) (0.0160) (0.0159) (0.0160) (0.0171)
literacy rate -0.0672*** -0.0712*** -0.0698*** -0.0670*** -0.0395 -0.056(0.0249) (0.0249) (0.0248) (0.0247) (0.0299)
Religious polarization alpha=1.6 -0.208*** -0.214*** -0.207*** -0.150** -0.174(0.0576) (0.0581) (0.0572) (0.0633)
Caste polarization alpha=16 0.211** 0.146* 0.199** -(0.0844) (0.0857) (0.0909)
Caste polarization alpha=0 0.0113 0.0140 -(0.0182) (0.0181)
Religious polarization alpha=0 -0.0567*** -(0.0146)
ln state GDP 0.0113*** -(0.00312)
Human development index as of 91 -0.121** -(0.0483)
Observations 573 573 573 571 527Robust standard errors in parentheses
*** p<0.01, ** p<0.05, * p<0.1
172 APPENDIX

APPENDIX
Tab. 4.30 – Type of Water Access Effect on the Percentage of Crime
Percentage of Crime(1) (2)
Water 0.00742*** 0.00874***(0.000428) (1.49e-07)
ln district population -0.000920 -0.000695(0.770) (0.791)
% district pop rural -0.0165 -0.0185(0.289) (0.125)
% dist. pop SC 0.445*** 0.467***(1.96e-05) (1.60e-08)
% dist. pop SC2 -0.858*** -0.896***(0.00173) (2.65e-05)
% dist. pop ST -0.0735** -0.0331(0.0209) (0.249)
% dist. pop ST2 0.144*** 0.0509(0.000110) (0.233)
literacy rate -0.0610*** -0.0594***(0.00458) (0.000456)
Religious polarization alpha=1.6 -0.194*** -0.152***(0.000638) (0.000559)
Observations 573 530Sample All states Tribal states removed
Robust standard errors in parentheses*** p<0.01, ** p<0.05, * p<0.1
APPENDIX 173
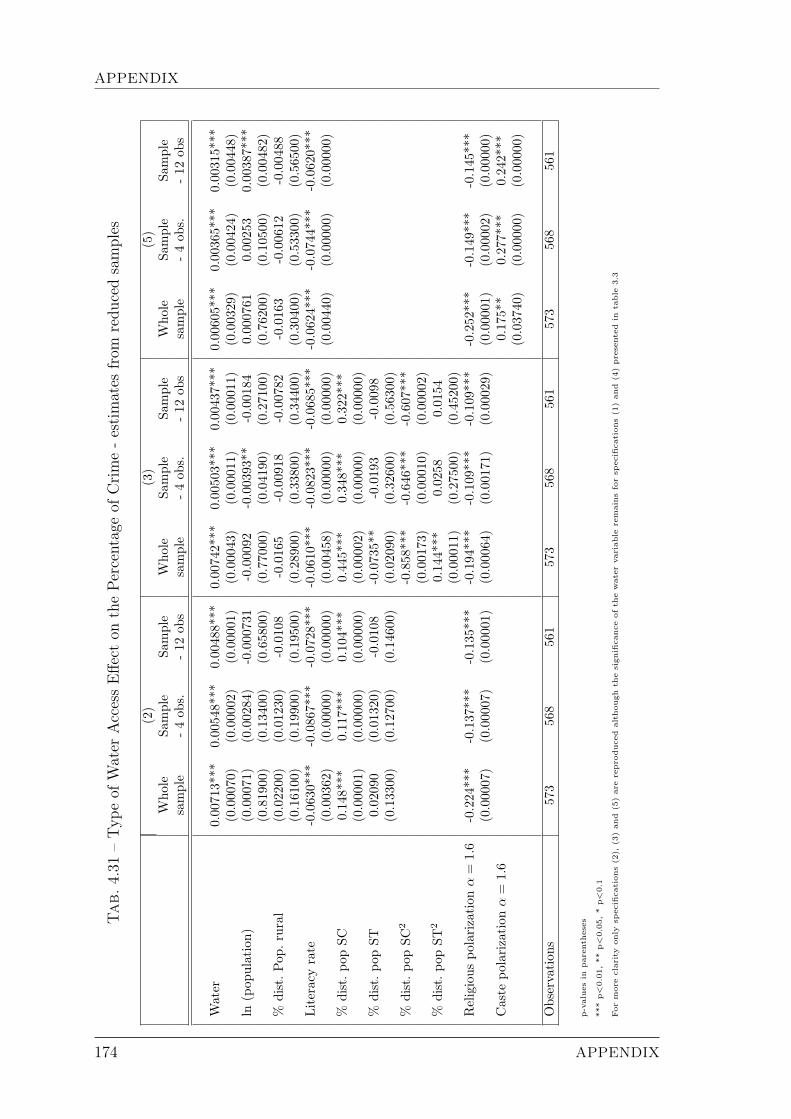
APPENDIX
Tab.
4.31
–Typ
eof
Water
AccessEffe
cton
thePercentag
eof
Crime-estimates
from
redu
cedsamples
(2)
(3)
(5)
Who
leSa
mple
Sample
Who
leSa
mple
Sample
Who
leSa
mple
Sample
sample
-4ob
s.-12
obs
sample
-4ob
s.-12
obs
sample
-4ob
s.-12
obs
Water
0.00713***
0.00548***
0.00488***
0.00742***
0.00503***
0.00437***
0.00605***
0.00365***
0.00315***
(0.00070)
(0.00002)
(0.00001)
(0.00043)
(0.00011)
(0.00011)
(0.00329)
(0.00424)
(0.00448)
ln(pop
ulation)
(0.00071)
(0.00284)
-0.000731
-0.00092
-0.00393**
-0.00184
0.000761
0.00253
0.00387***
(0.81900)
(0.13400)
(0.65800)
(0.77000)
(0.04190)
(0.27100)
(0.76200)
(0.10500)
(0.00482)
%dist.P
op.r
ural
(0.02200)
(0.01230)
-0.0108
-0.0165
-0.00918
-0.00782
-0.0163
-0.00612
-0.00488
(0.16100)
(0.19900)
(0.19500)
(0.28900)
(0.33800)
(0.34400)
(0.30400)
(0.53300)
(0.56500)
Literacy
rate
-0.0630***
-0.0867***
-0.0728***
-0.0610***
-0.0823***
-0.0685***
-0.0624***
-0.0744***
-0.0620***
(0.00362)
(0.00000)
(0.00000)
(0.00458)
(0.00000)
(0.00000)
(0.00440)
(0.00000)
(0.00000)
%dist.p
opSC
0.148***
0.117***
0.104***
0.445***
0.348***
0.322***
(0.00001)
(0.00000)
(0.00000)
(0.00002)
(0.00000)
(0.00000)
%dist.p
opST
0.02090
(0.01320)
-0.0108
-0.0735**
-0.0193
-0.0098
(0.13300)
(0.12700)
(0.14600)
(0.02090)
(0.32600)
(0.56300)
%dist.p
opSC
2-0.858***
-0.646***
-0.607***
(0.00173)
(0.00010)
(0.00002)
%dist.p
opST
20.144***
0.0258
0.0154
(0.00011)
(0.27500)
(0.45200)
Religious
polarization
α=
1.6
-0.224***
-0.137***
-0.135***
-0.194***
-0.109***
-0.109***
-0.252***
-0.149***
-0.145***
(0.00007)
(0.00007)
(0.00001)
(0.00064)
(0.00171)
(0.00029)
(0.00001)
(0.00002)
(0.00000)
Caste
polarization
α=
1.6
0.175**
0.277***
0.242***
(0.03740)
(0.00000)
(0.00000)
Observation
s573
568
561
573
568
561
573
568
561
p-values
inparentheses
***p
<0.01,**
p<0.05,*p
<0.1
For
moreclarityon
lyspecification
s(2),
(3)an
d(5)arereproducedalthou
ghthesign
ificance
ofthewater
variab
leremainsforspecification
s(1)an
d(4)presentedin
table
3.3
174 APPENDIX
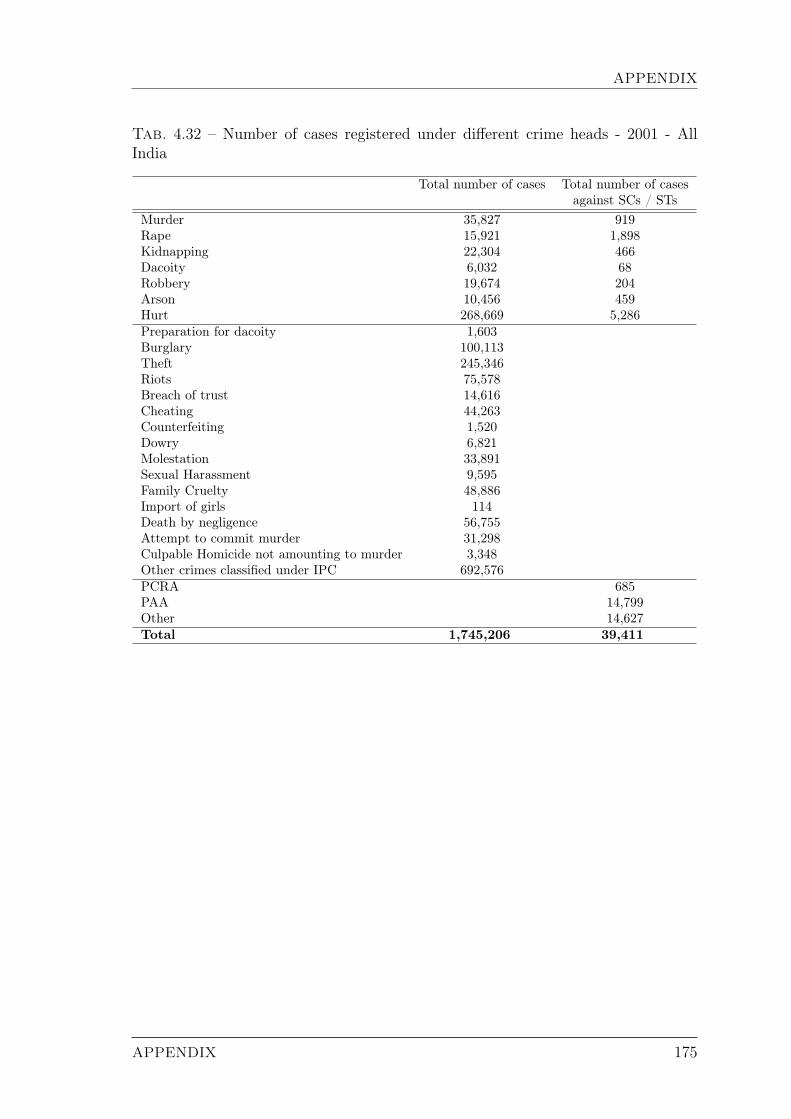
APPENDIX
Tab. 4.32 – Number of cases registered under different crime heads - 2001 - AllIndia
Total number of cases Total number of casesagainst SCs / STs
Murder 35,827 919Rape 15,921 1,898Kidnapping 22,304 466Dacoity 6,032 68Robbery 19,674 204Arson 10,456 459Hurt 268,669 5,286Preparation for dacoity 1,603Burglary 100,113Theft 245,346Riots 75,578Breach of trust 14,616Cheating 44,263Counterfeiting 1,520Dowry 6,821Molestation 33,891Sexual Harassment 9,595Family Cruelty 48,886Import of girls 114Death by negligence 56,755Attempt to commit murder 31,298Culpable Homicide not amounting to murder 3,348Other crimes classified under IPC 692,576PCRA 685PAA 14,799Other 14,627Total 1,745,206 39,411
APPENDIX 175

APPENDIX
Appendix to chapter 4 :Social Fragmentation And Public Goods
176 APPENDIX
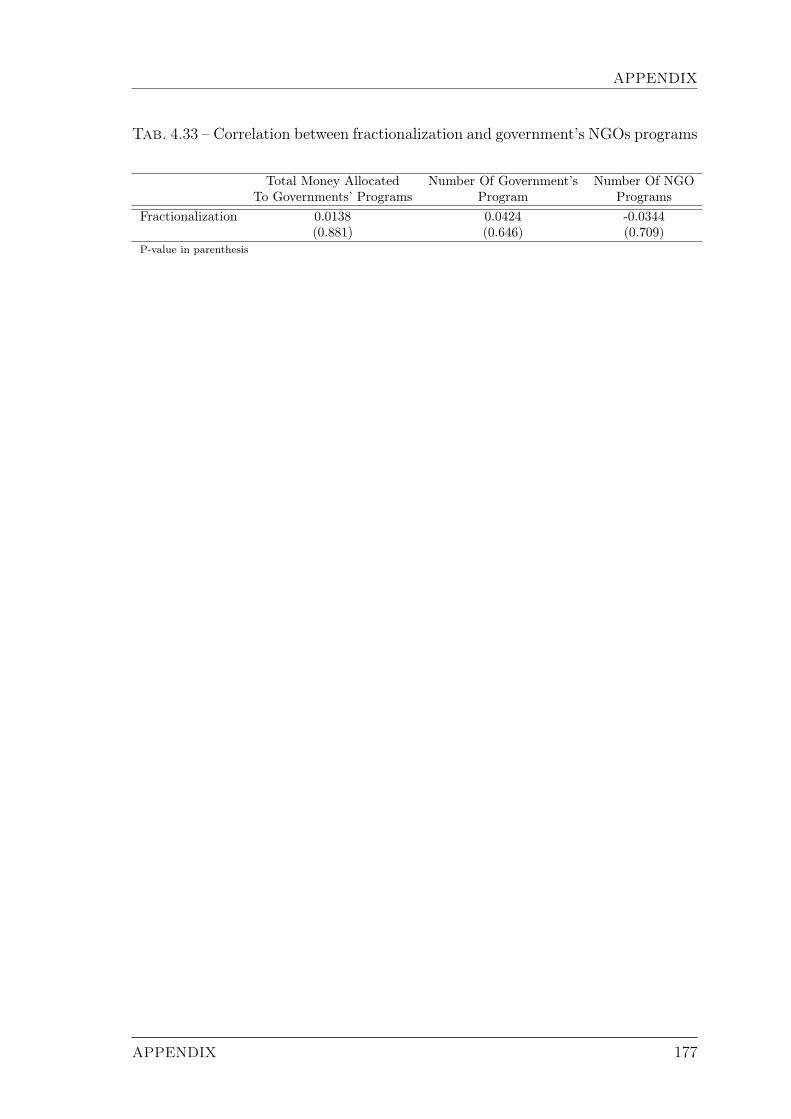
APPENDIX
Tab. 4.33 – Correlation between fractionalization and government’s NGOs programs
Total Money Allocated Number Of Government’s Number Of NGOTo Governments’ Programs Program Programs
Fractionalization 0.0138 0.0424 -0.0344(0.881) (0.646) (0.709)
P-value in parenthesis
APPENDIX 177

APPENDIX
178 APPENDIX

References
Akerlof, George A, “The Economics of Caste and of the Rat Race and OtherWoeful Tales,” The Quarterly Journal of Economics, November 1976, 90 (4), 599–617.
, “A Theory of Social Custom, of Which Unemployment May be One Conse-quence,” The Quarterly Journal of Economics, June 1980, 94 (4), 749–75.
Akerlof, George A. and Rachel E. Kranton, “Economics And Identity,” TheQuarterly Journal of Economics, August 2000, 115 (3), 715–753.
and , “Identity and the Economics of Organizations,” Journal of EconomicPerspectives, Winter 2005, 19 (1), 9–32.
and , Identity Economics : How Our Identities Shape Our Work, Wages, andWell-Being, Princeton University Press, 2010.
Alesina, Alberto and Eliana La Ferrara, “Participation in Heterogenous Com-munities,” Quarterly Journal of Economics, August 2000, 115, 847–904.
and , “Ethnic Diversity and Economic Performance,” Journal of EconomicLiterature, September 2005, 43 (3), 762–800.
, Reza Baqir, and William Easterly, “Public Goods And Ethnic Divisions,”The Quarterly Journal of Economics, November 1999, 114 (4), 1243–1284.
, , and , “Redistributive Public Employment,” Journal of Urban Economics,September 2000, 48 (2), 219–241.
Anderson, Elizabeth, “Beyond Homo Economicus : New Developments in Theo-ries of Social Norms,” Philosophy and Public Affairs, 2000, 29 (2), 170–200.
Anderson, Siwan, “Why Dowry Payments Declined with Modernization in Europebut Are Rising in India ?,” Journal of Political Economy, April 2003, 111 (2), 269–310.
, “Caste as an Impediment to Trade ; Working paper,” 2007.
Aristotle, Nicomachean Ethics, Oxford University Press, 1998.
Arrow, Kenneth, “The Theory of Discrimination,” in Orly Aschenfelter and AlbertRees, eds., Discrimination in Labor Markets, Princeton Univeristy Press 1971.
179
REFERENCES
Axtell, Robert, Joshua Epstein, and Peyton Young, “The Emergence ofClasses in a Multi-Agent Bargaining Model,” in Steven Durlauf and Peyton Young,eds., Social Dynamics, MIT Press, 2004, chapter 7, p. 248p.
Baechler, Jean, La solution indienne. Essai sur les origines du régime des castes,Presses Universitaires de France, 1988.
Bailey, F. G., Caste and The Economic Frontier : A Village in Highland Orissa,Manchester University Press, Manchester :, 1957.
Ball, Sheryl, Catherine Eckel, Philip J. Grossman, and William Zame,“Status In Markets,” The Quarterly Journal of Economics, February 2001, 116(1), 161–188.
Bandiera, Orana, Iwan Barankay, and Imran Rasul, “Cooperation in Collec-tive Action,” Natural Field Experiments, The Field Experiments Website 2005.
Banerjee, Abhijit and Rohini Somanathan, “Caste, Community and Collec-tive Action : The Political Economy of Public Good Provision in India,” mimeo,Massachusetts Institute of Technology, 2001.
and , “The Political Economy of Public Goods : Some Evidence from India,”Journal of Development Economics, March 2007, 82 (2), 287–314.
and Thomas Piketty, “Top Indian Incomes, 1922-2000,” World Bank EconomicReview, 2005, 19 (1), 1–20.
, Lakshmi Iyer, and Rohini Somanathan, “History, Social Divisions, andPublic Goods in Rural India,” Journal of the European Economic Association,April 2005, 3 (2-3), 639–647.
, , and , “Public Action for Public Goods,” in “Handbook of DevelopmentEconomics” Elsevier 2008, pp. 3117–3154.
Banerjee, Biswajit and J. B. Knight, “Caste Discrimination in the Indian UrbanLabour Market,” Journal of Development Economics, April 1985, 17 (3), 277–307.
Bardhan, Pranab, “Irrigation and Cooperation : An Empirical Analysis of 48Irrigation Communities in South India,” Economic Development and CulturalChange, July 2000, 48 (4), 847–65.
, Maitreesh Ghatak, and Alexander Karaivanov, “Wealth Inequality andCollective Action,” Journal of Public Economics, September 2007, 91 (9), 1843–1874.
Basu, Kaushik, “Markets, Power and Social Norms,” Economic and PoliticalWeekly, October 1986, 21 (43), 1893–1896.
, “A Theory of Association : Social Status, Prices and Markets,” Oxford EconomicPapers, October 1989, 41 (4), 653–71.
, Analytical Development Economics, MIT Press, Cambridge Massachusetts, 1997.
180 REFERENCES
REFERENCES
Bayly, Susan, Caste, Society and Politics in India : From the Eighteenth Centuryto the Modern Age, Cambridge University Press, 2001.
Becker, Gary, The Economics of Discrimination, University of Chicago Press,1957.
Becker, Gary S., The Economic Approach to Human Behavior, Chicago : Univer-sity of Chicago Press, 1976.
and Kevin M. Murphy, Social Economics, Belknap Press of Harvard Univer-sity Press, 2003.
Bellows, John and Edward Miguel, “War and local collective action in SierraLeone,” Journal of Public Economics, 2009, 93 (11-12), 1144–1157.
Benjamin, Daniel J., James J. Choi, and A. Joshua Strickland, “Social Iden-tity and Preferences,” NBERWorking Papers 13309, National Bureau of EconomicResearch, Inc August 2007.
Bertrand, Marianne, Dolly Chugh, and Sendhil Mullainathan, “ImplicitDiscrimination,” American Economic Review, May 2005, 95 (2), 94–98.
Beteille, Andre, Caste, Class and Power : Changing Patterns of Stratification ina Tanjore Village, University of California Press, 1965.
, Social Inequality : Selected Readings, Penguin modern sociology readings, 1974.
Blanchflower, David G. and Andrew J. Oswald, “Well-being over Time inBritain and the USA,” Journal of Public Economics, July 2004, 88 (7-8), 1359–1386.
Borooah, Vani K., “Caste, Inequality, and Poverty in India,” Review of Develop-ment Economics, August 2005, 9 (3), 399–414.
Bowles, Samuel, “Understanding Unequal Economic Opportunity,” The AmericanEconomic Review, May 1973, 63 (2), 346–356.
, “Endogenous Preferences : The Cultural Consequences of Markets and OtherEconomic Institutions,” Journal of Economic Literature, 1998, 36 (1), 75–111.
, Microeconomics. Behavior, Institutions, and Evolution, Princeton UniversityPress, 2004.
and Herbert Gintis, “Walrasian Economics In Retrospect,” The QuarterlyJournal of Economics, November 2000, 115 (4), 1411–1439.
and Jung-Kyoo Choi, “The Coevolution of Parochial Altruism and War,”Science, 2007, 318 (5850), 636–640.
, Glenn Loury, and Rajiv Sethi, “Group Inequality,” 2009. Working Paper.
Braud, Philippe, “Du pouvoir en général au pouvoir politique,” in Madeleine Gra-witz and Jean Leca, eds., Traité de science politique, Presse Universitaire de France1985.
REFERENCES 181

REFERENCES
Cabalion, Joel, “La violence de caste en Inde aujourd hui,” La Vie des idèes, 2010.
Carlsson, Fredrik, Gautam Gupta, and Olof Johansson-Stenman, “KeepingUp With The Vaishyas ? Caste and Relative Standing In India,” Oxford EconomicPapers, 2009, 61, 52–73.
, Olof Johansson-Stenman, and Peter Martinsson, “Do You Enjoy HavingMore than Others ? Survey Evidence of Positional Goods,” Economica, November2007, 74 (296), 586–598.
Carrin, Marine, “L’univers des tribus. Repli identitaire et mouvements révolution-naires,” in Christophe Jaffrelot, ed., L’Inde contemporaine de 1950 à nos jours,Fayard, Paris, 2006, chapter XXIII, pp. 543–568.
Chandra, Kanchan, Why Ethnic Parties Succeed. Patronage and Ethnic HeadCounts in India, Cambridge University Press, 2004.
Charness, Gary, Luca Rigotti, and Aldo Rustichini, “Individual Behaviorand Group Membership,” American Economic Review, September 2007, 97 (4),1340–1352.
Chaudhuri, Shubham and Rajiv Sethi, “Statistical Discrimination with PeerEffects : Can Integration Eliminate Negative Stereotypes ?,” Review of EconomicStudies, March 2008, 75, 579–596.
Chen, Yan and Sherry Xin Li, “Group Identity and Social Preferences,” Ameri-can Economic Review, March 2009, 99 (1), 431–57.
Clark, Andrew E. and Andrew J. Oswald, “Well-being in Panels,” December2002. Working Paper.
, Paul Frijters, and Michael A. Shields, “Relative Income, Happiness, andUtility : An Explanation for the Easterlin Paradox and Other Puzzles,” Journalof Economic Literature, March 2008, 46 (1), 95–144.
Collier, Paul, “Implications of Ethnic Diversity,” Economic Policy, April 2001, 16(32), 127–166.
Cutler, David M and Edward L Glaeser, “Are Ghettos Good or Bad ?,” TheQuarterly Journal of Economics, August 1997, 112 (3), 827–72.
Cutler, David M., Edward L. Glaeser, and Jacob L. Vigdor, “The Rise andDecline of the American Ghetto,” Journal of Political Economy, June 1999, 107(3), 455–506.
, , and , “When Are Ghettos Bad ? Lessons from Immigrant Segregation inthe United States,” Journal of Urrban Economics, May 2008, 63, 759–774.
Darity, William Alexander and Ashwini Deshpande, “Tracing the Divide :Intergroup Disparity across Countries,” Eastern Economic Journal, 2000, 26 (1),75–85.
182 REFERENCES
REFERENCES
Darity, William Jr., Patrick L. Mason, and James B. Stewart, “The Econo-mics of Identity : The Origin and Persistence of Racial Identity Norms,” Journalof Economic Behavior & Organization, July 2006, 60 (3), 283–305.
Dayton-Johnson, Jeff, “Determinants of Collective Action on the Local Com-mons : A Model with Evidence from Mexico,” Journal of Development Economics,2000, 62, 181–208.
de La Boetie, Etienne, Discourse on Voluntary Servitude, Columbia UniversityPress, New York, 1576.
Dehejia, Rajeev H and Vivek H Dehejia, “Religion and Economic Activity inIndia : An Historical Perspective,” American Journal of Economics and Sociology,April 1993, 52 (2), 145–153.
Deliège, Robert, Les intouchables en Inde - une caste d’exclus, Imago, 1994.
, Les castes en Inde aujourd’hui, Presses Universitaires de France - PUF, 2004.
Deshpande, Ashwini, “Does Caste Still Define Disparity ? A Look at Inequalityin Kerala, India,” American Economic Review, May 2000, 90 (2), 322–325.
, “Recasting Economic Inequality,” Review of Social Economy, 2000, 58 (3), 381–99.
, “Caste at Birth ? Redefining Disparity in India,” Review of Development Econo-mics, 2001, 5 (1), 130–44.
, “Assets versus Autonomy ? The Changing Face of the Gender-Caste Overlap inIndia,” Feminist Economics, 2002, 8 (2), 19–35.
, “Overlapping Identities under Liberalization : Gender and Caste in India,” Eco-nomic Development and Cultural Change, 2007, 55 (4), 735–760.
Doniger, Wendy and Brian K. Smith, The Laws of Manu, Penguin Books,1991.
Dumont, Louis, Homo Hierarchicus : The Caste System and Its Implications,University of Chicago Press, 1970.
Durkheim, Emile, The Rules of Sociological Method, The Free Press, New York,1895.
Durlauf, Steven N, “A Theory of Persistent Income Inequality,” Journal of Eco-nomic Growth, March 1996, 1 (1), 75–93.
Dutt, Nripendra Kumar, Origin and Growth of Caste in India, London : KeganPaul, Trench, and Trubner, 1931.
Eckel, Catherine and Herbert Gintis, “Blaming the Messenger : Notes on theCurrent State of Experimental Economics,” Journal of Economic Behavior andOrganization, January 2010, 73 (1), 109–119.
REFERENCES 183
REFERENCES
Eeckhout, Jan, “Minorities and Endogenous Segregation,” Review of EconomicStudies, January 2006, 73 (1), 31–53.
Ellison, Glenn, “Cooperation in the Prisoner’s Dilemma with Anonymous RandomMatching,” Review of Economic Studies, July 1994, 61 (3), 567–88.
Elster, Jon, “Social Norms and Economic Theory,” The Journal of Economic Pers-pectives, 1989, 3, 99–117.
Esteban, Joan and Debraj Ray, “Conflict and Distribution,” Journal of Econo-mic Theory, August 1999, 87 (2), 379–415.
Esteban, Joan-Maria and Debraj Ray, “On the Measurement of Polarization,”Econometrica, July 1994, 62 (4), 819–851.
and , “Polarization, Fractionalization and Conflict,” Journal of Peace Research,2008, 45 (2), 163–182.
Festinger, Leon, Henry W. Riecken, and Stanley Schachter, When ProphecyFails : A Social and Psychological Study of A Modern Group that Predicted theDestruction of the World, Harper-Torchbooks, 1956.
Fisher, Ronald Aylmer, “The Use of Multiple Measurements in Taxonomic Pro-blems,” Annals of Eugenics, 1936, 7, 179–88.
Gang, Ira N., Kunal Sen, and Myeong-Su Yun, “Poverty In Rural India :Caste And Tribe,” Review of Income and Wealth, March 2008, 54 (1), 50–70.
Ghosh, Parikshit and Debraj Ray, “Cooperation in Community Interactionwithout Information Flows,” Review of Economic Studies, July 1996, 63 (3), 491–519.
Gintis, Herbert, “Social Norms as Choregraphy,” Politics, Philosophy, and Eco-nomics, 2009. forthcoming.
Gough, Kathleen, “The Social Structure of a Tanjore Village,” in McKim Marriott,ed., Village India. Studies In the Little Community, Chicago University Press1955.
Granovetter, Mark, “Economic Action and Social Structure : The Problem ofEmbeddedness,” The American Journal of Sociology, 1985, 91 (3), 481–510.
Henrich, Joseph, Robert Boyd, Samuel Bowles, Colin Camerer, ErnstFehr, Herbert Gintis, and Richard McElreath, “In Search of Homo Econo-micus : Behavioral Experiments in 15 Small-Scale Societies,” American EconomicReview, May 2001, 91 (2), 73–78.
Hoff, Karla and Priyanka Pandey, “Opportunity is Not Everything,” The Eco-nomics of Transition, 07 2005, 13 (3), 445–472.
and , “Discrimination, Social Identity, and Durable Inequalities,” AmericanEconomic Review, May 2006, 96 (2), 206–211.
184 REFERENCES
REFERENCES
Hoffman, Elizabeth, Kevin McCabe, and Vernon L Smith, “Social Distanceand Other-Regarding Behavior in Dictator Games,” American Economic Review,June 1996, 86 (3), 653–60.
Ito, Takahiro, “Caste Discrimination and Transaction Costs in the Labor Market :Evidence from Rural North India,” Journal of Development Economics, March2009, 88 (2), 292–300.
Jaffrelot, Christophe., India’s Silent Revolution : The Rise of the Lower Castesin North Indian Politics, Permanent Black, Delhi :, 2002.
Kandori, Michihiro, “Social Norms and Community Enforcement,” Review of Eco-nomic Studies, January 1992, 59 (1), 63–80.
Khwaja, Asim Ijaz, “Can Good Projects Succeed in Bad Communities ?,” Journalof Public Economics, August 2009, 93 (7), 899–916.
Klass, Morton, Caste : the emergence of the South Asian social system, ManoharPublishers and Distributors, 2004.
Koenker, Roger and Kevin F. Hallock, “Quantile Regression,” Journal of Eco-nomic Perspectives, 2001, 15 (4), 143–156.
Kranton, Rachel E, “The Formation of Cooperative Relationships,” Journal ofLaw, Economics and Organization, April 1996, 12 (1), 214–33.
Kuran, Timur, Private Truths, Public Lies : The Social Consequences of Prefe-rence Falsification, Harvard University Press, 1997.
Loury, Glenn C., “Social Exclusion and Ethnic Groups : The Challenge to Eco-nomics,” Boston University - Institute for Economic Development 106, BostonUniversity, Institute for Economic Development May 2000.
Lundberg, Shelly and Richard Startz, “Information and Racial Exclusion,”Journal of Population Economics, July 2007, 20 (3), 621–642.
Luttmer, Erzo F. P., “Neighbors as Negatives : Relative Earnings andWell-Being,”The Quarterly Journal of Economics, August 2005, 120 (3), 963–1002.
Maine, Henry Summer, Village Communities in the East and West, London :John Murray, 1887.
Miguel, Edward and Mary Kay Gugerty, “Ethnic Diversity, Social Sanctions,and Public Goods in Kenya,” Journal of Public Economics, December 2005, 89(11-12), 2325–2368.
Montalvo, José Garcia and Marta Reynal-Querol, “Why Ethnic Fractionaliza-tion ? Polarization, Ethnic Conflict and Growth,” Economics Working Papers, De-partment of Economics and Business, Universitat Pompeu Fabra February 2002.
and , “Ethnic Polarization, Potential Conflict, and Civil Wars,” AmericanEconomic Review, June 2005, 95, 796–816.
REFERENCES 185
REFERENCES
North, Douglass C., Institutions, Institutional Change and Economic Perfor-mance, Cambridge University Press, 1990.
, “The New Institutional Economics and Thrid World Development,” in “TheNew Institutional Economics and Thrid World Development,” Routledge, London,1995, chapter NIE : history, Politics and Development, pp. 17–26.
Olson, Mancur, The Logic of Collective Action, Harvard University Press, Cam-bridge, Mass.„ 1965.
Ostrom, Elinor and Toh-Kyeong Ahn, Foundations of Social Capital, EdwardElgar Publishing, 2003.
Platteau, Jean-Philippe, “An Indian Model of Aristocratic Patronage,” OxfordEconomic Papers, October 1995, 47 (4), 636–62.
Polanyi, Karl, “The Economy as Instituted Process,” in “Trade and Market in theEarly Empires : Economies in History and Theory,” Glencoe, Ill., Free Press, 1957,chapter Caste as a Form of Social Inequality, pp. 243–270.
Raven, Bertram H. and Jr. French John R. P., “Legitimate Power, CoercivePower, and Observability in Social Influence,” Sociometry, June 1958, 21 (2), pp.83–97.
Roemer, John E., “Divide and Conquer : Microfoundations of a Marxian Theory ofWage Discrimination,” Bell Journal of Economics, Autumn 1979, 10 (2), 695–705.
Rosenthal, Robert and Martin Landau, “A Game-Theoretic Analysis of Bargai-ning with Reputations,” Journal of Mathematical Psychology, 1979, 20, 235–255.
Rosenzweig, Mark R. and Oded Stark, “Consumption Smoothing, Migrationand Marriage : Evidence from Rural India,” Journal of Political Economy, August1989, 97 (4), 905–26.
Schelling, Thomas C, “Models of Segregation,” American Economic Review, May1969, 59 (2), 488–93.
, Mircomotives and Macrobehavior, WW Norton and Company, 1978.
Scoville, James G., “Labor Market Underpinnings of a Caste Economy : Foilingthe Coase Theorem,” American Journal of Economics and Sociology, October1996, 55 (4), 385–394.
, “Discarding Facts - The Economics of Caste,” Review of Development Economics,August 2003, 7, 378–391.
Sen, Amartya, On Economic Inequality, Oxford University Press, 1973.
, Commodities and Capabilities, Elsevier Science Publisher, 1985.
, Inequality Reexmanied, Oxford, Oxford University Press, 1992.
, Development As Freedom, Oxford University Press, 1999.
186 REFERENCES

REFERENCES
, Development as Freedom, Oxford University Press, 1999.
, L’économie est une science morale, Editions La Decouverte et Syros, Paris, 1999.
, “Social Identity,” Revue de philosophie économique, June 2004, 5 (1), 7–27.
, The Argumentative Indian : Writings on Indian History, Culture and Identity,Farrar, Straus and Giroux, 2005.
Sénart, Emile, Caste in India : The Facts and The System, Asia Book Corporationof America, 1978. Originally published in French in 1896.
Sethi, Rajiv and Rohini Somanathan, “Inequality and Segregation,” Journal ofPolitical Economy, December 2004, 112 (6), 1296–1321.
Shah, Ghanshyam, Harsh Mander, Sukhdeo Thorat, Satish Deshpande,and Amita Baviskar, Untouchability in Rural India, Sage Publications, NewDelhi, 2006.
Shih, Margaret, Todd Pittinsky, and Nalini Ambady, “Stereotype Suscepti-bility : Identity Salience and Shifts in Quantitative Performance,” PsychologicalScience, 1999, 10 (1), 81–84.
Somanathan, E., R. Prabhakar, and B.S. Mehta, “Collective Action for Fo-rest Conservation : Does Heterogeneity Matter ?,” In Inequality, Cooperation andEnvironmental Sustainability, 2006. ed. J.M. Baland, P. Bardhan, and S. Bowles(Princeton Univesrity Press).
Srinivas, Mysore Narasimhachar, Religion and Society among the Coorgs ofSouth India, Clarendon Press, Oxford, 1952.
, “The Social System of a Mysore Village.,” in McKim Marriott, ed., Village India.Studies In the Little Community, Chicago University Press 1955.
, Caste In Modern India And Other Essays, London, Asia Publishing House, 1962.
, “The Caste System in India,” in “Social Inequality : Selected Readings,” Penguinmodern sociology readings, 1974, chapter Caste as a Form of Social Inequality,pp. 265–272.
Steele, Claude and Joshua Aronson, “Stereotype Threat and The IntellectualTest Performance of African Americans,” Journal of personality and social psy-chology, 1995, 69.
Tajfel, Henri and Turner John, “An Integrative Theory of Intergroup Conflict,”in Stephen Worchel and William Austin, eds., The Social Psychology of IntergroupRelations, Monterey, CA : Brooks / Cole, 1979, pp. 33–47.
, Michael Billig, R. Bundy, and Claude Flament, “Social Categorizationand Intergroup Behaviour,” European Journal of Social Psychology, 1971, 1 (2),149–178.
REFERENCES 187
REFERENCES
Tiebout, Charles M., “A Pure Theory of Local Expenditures,” The Journal ofPolitical Economy, 1956, 64 (5), 416–424.
Tiwary, Rakesh, “Explanations in Resource Inequality : Exploring Scheduled CastePosition in Water Access Structure,” International Journal of Rural Management,July 2006, 2 (1), 85–106.
Voors, Maarten, Eleonora Nillesen, Philip Verwimp, Erwin Bulte, RobertLensink, and Daan van Soest, “Does Conflict affect Preferences ? Results fromField Experiments in Burundi,” HiCN Working Papers, Households in ConflictNetwork.
Weber, Max, in “Essays in Sociology,” Routledge and Kegan Paul, Ltd, 1948(1998), chapter Poltics as a Vocation.
, The Religion of India : The Sociology of Hinduism and Buddhism, New York :The Free Press, 1958.
, Economy and Society, University of California Press, 1978.
Young, H. Peyton, “Social Norms,” Economics Series Working Papers 307, Uni-versity of Oxford, Department of Economics 2007.
Zimmermann, Francis, The Jungle and the Aroma of Meats, Berkeley : Universityof California Press, 1987.
188 REFERENCES

Résumé
Cette thèse s’inscrit dans le courant de pensée qui vise à réintégrer les institutionset l’identité sociales en économie et ce pour trois raisons. Premièrement, de nombreusesexpériences comportementales ont mis à mal le modèle conventionnel de l’agent égoïstemaximisateur en raison notamment du rôle joué par les normes sociales. Deuxièmement,les groupes sociaux, et l’identité qui en découle, peuvent déprécier les attentes des indivi-dus les plus démunis et limiter leurs "capabilités" selon le terme de A. Sen. Dernièrement,ces institutions peuvent contrecarrer l’allocation efficiente des ressources. Dans cette thèse,nous présentons un modèle qui décrit la ségrégation comme un des équilibres provenantd’une distribution inégale du pouvoir. L’intérêt de ce modèle réside, premièrement, dansla reconnaissance que les sociétés ségréguées sont aussi celles où le pouvoir est très inéga-lement réparti, deuxièmement, dans le fait que la ségrégation peut apparaitre en l’absencede préjugés, troisièmement dans les définitions données du pouvoir et de la ségrégation quisont suffisamment amples pour recouvrir un grand nombre de situations, et enfin, dans leprocessus qui mène d’une situation neutre à la ségrégation. Dans le second chapitre nousmontrons que la caste détermine considérablement le statut social perçu des intouchableset des tribus. Néanmoins, d’autres facteurs comme le revenu, la profession et dans unemoindre mesure l’éducation ont aussi une importance. De plus la caste a un effet à lafois direct et indirect, ce dernier s’exprimant par une influence réduite du revenu sur lestatut social perçu. Nous interprétons ces résultats comme l’internalisation de la discri-mination subie depuis des siècles, qui abaisse l’image de soi et diminue les attentes. Dansle troisième chapitre, nous mettons en évidence la persistance des pratiques d’intoucha-bilité. Nous montrons que le nombre de crimes contre les intouchables est positivementrelié à une distribution communautaire de l’eau. Les règles de castes prohibent le contactdes intouchables avec les sources d’eau des castes supérieures. Bien que ces règles soientanticonstitutionnelles, elles sont encore largement appliquées et de manière violente. Apriori, ces règles ne concernent pas uniquement l’eau mais aussi une grande partie desbiens publics, ce qui laisse à penser que ces derniers sont en réalité des biens de club oude caste. Ce dernier point est étudié dans le chapitre 4. Nous montrons que si l’indicede fractionalisation a un effet sur la présence dans les villages de biens publics, cet effetest essentiellement positif. En revanche les indices de polarisation ne semblent pas avoird’impact. Nous interprétons ce résultat, contraire à bon nombre de ceux obtenus aupara-vant, comme le fait qu’il existe du patronage de castes. Cette hypothèse est testée à lafin du chapitre. Les résultats semblent indiquer que les castes s’approprient l’usage desbiens fournis publiquement. En conclusion, nous proposons des pistes de recherche, visant,essentiellement, à améliorer la compréhension de la formation des identités sociales et lesraisons de leurs mises en exergue.
Discipline : Sciences Economiques(05)Mots-clefs: Identité sociale, Inde, Castes, , Ségrégation, Discrimination, Biens Pu-blicsIntitulé et adresse du laboratoire: Centre d’Economie de la Sorbonne(UMR 8174 du CNRS), Université Paris 1 Panthéon-Sorbonne. Maison des Sciences Eco-nomiques, 106-112 Bd de l’hôpital, 75674 Paris Cedex 13ISBN : 2010PA010052