Economics Essay
20
Economics Essay Thomas Tynan Individual Coursework Submission Form Specialist Masters Programme Surname: Tynan First Name: Thomas MSc in: Real Estate Investment Student ID number: 130003447 Module Code: SMM174 Module Title: Real Estate Economics – Individual Coursework Essay Lecturer: Tony Key Submission Date: 02/12/2013 Declaration: By submitting this work, I declare that this work is entirely my own except those parts duly identified and referenced in my submission. It complies with any specified word limits and the requirements and regulations detailed in the coursework instructions and any other relevant programme and module documentation. In submitting this work I acknowledge that I have read and understood the regulations and code regarding academic misconduct, including that relating to plagiarism, as specified in the Programme Handbook. I also acknowledge that this work will be subject to a variety of checks for academic misconduct. We acknowledge that work submitted late without a granted extension will be subject to penalties, as outlined in the Programme Handbook. Penalties will be applied for a maximum of five days lateness, after which a mark of zero will be awarded. Marker’s Comments (if not being marked on-line): Deduction for Late Submission: Final Mark: %
Transcript of Economics Essay

Economics Essay Thomas Tynan
1
Individual Coursework Submission Form
Specialist Masters Programme
Surname: Tynan First Name: Thomas
MSc in: Real Estate Investment Student ID number: 130003447
Module Code: SMM174
Module Title: Real Estate Economics – Individual Coursework Essay
Lecturer: Tony Key
Submission Date: 02/12/2013
Declaration: By submitting this work, I declare that this work is entirely my own except those parts duly identified and referenced in my submission. It complies with any specified word limits and the requirements and regulations detailed in the coursework instructions and any other relevant programme and module documentation. In submitting this work I acknowledge that I have read and understood the regulations and code regarding academic misconduct, including that relating to plagiarism, as specified in the Programme Handbook. I also acknowledge that this work will be subject to a variety of checks for academic misconduct. We acknowledge that work submitted late without a granted extension will be subject to penalties, as outlined in the Programme Handbook. Penalties will be applied for a maximum of five days lateness, after which a mark of zero will be awarded. Marker’s Comments (if not being marked on-line):
Deduction for Late Submission: Final Mark:
%
Economics Essay Thomas Tynan
2
Real Estate Economics – Individual Coursework Essay
Question: Draw on theories of rent and urban economics to analyse and
explain the patterns in office rents shown in the Colliers UK Map and
Central London data table.
Monday 2nd
December 2013
Thomas E. Tynan
Student No. 130003447
Word Count: 3,043
(excluding figures & reference list)

Economics Essay Thomas Tynan
3
Contents
1. Introduction 1
2. Background
2.1 Central Place Theory & Urban Hierarchy 2
2.2 Residual Theory of Land & Bid-Rent Theory 3
3. Analysis
3.1 Data Collection 5
3.2 Population Distribution & Rent 6
3.3 Distance, Accessibility & Rent 8
3.4 Floorspace & Rent 11
3.5 A Closer Look at London 12
4. Conclusion 15
5. References 16
Economics Essay Thomas Tynan
1
Section 1 – Introduction
Commercial real estate rental values can dramatically vary across a city, region or
country. When examining the rental value per sq.ft. of grade A office units (prime rents)
across the UK as depicted by the 2012 Colliers International research and forecasting report
(Colliers International Rental Map, 2012) we can immediately see the magnitude of variance.
The difference in rent for physically similar pieces of land is due to space market
segmentation, which is fuelled by supply and demand for a specific location and the type of
usage that location supports (Geltner & Miller, 2007). Additionally, how the urban area
changes over time, or is expected to change will drive business decisions. These changes in
rent can be viewed and analysed at a national level as well as at a more local scale when
examining changes across an individual city.
This study examines and quantitatively analyses the factors affecting changes in
prime office rents at a national level (excluding Ireland). Further investigation then focuses on
the possible cause of local rent variation within a select city (London). For the purpose of the
study I have outlined the main theories of rental and urban economics and then drawn upon
the three variables highlighted within these theories to examine the allocated dataset.
Economics Essay Thomas Tynan
2
Section 2 – Urban and Rental Economic Theories
2.1 Central Place Theory & Urban Hierarchy:
In general, larger more rapidly growing cities will be able to sustain higher rents
(Geltner & Miller, 2007). Therefore the distribution of larger cities at a national level will
inherently determine and explain the spatial variation in values. Furthermore, the location of
cities is not a random phenomenon, and each city resembles a working cog within a national
framework or system of cities. As cities within a system develop and evolve over time
through centralising forces they increase in size (hierarchy) and decrease in frequency
(Beckmann, 1958). Centralising forces revolve around economies of scale and economies of
agglomeration. The production of a good or service is deemed to be more cost effective and
time efficient if completed within a single large-scale environment assuming fixed production
costs. Therefore an increase in the output quantity can be achieved for every unit of required
input (Geltner & Miller, 2007). Economies of agglomeration provide a platform for reduced
cost and or productivity advantages by the physical clustering of companies and businesses
(Catherine & Donald, 1999). Companies normally maximise benefits from economies of
agglomeration by locating near industry similar firms, therefore increasing the free flow of
relevant profitable information. As economies of scale and agglomeration begin to form they
cause cumulative causation and a momentum in growth. Consequently the reverse can happen
when central areas begin to decline. This is normally caused when the cost of locating within
a city exceeds the gains mainly through factors such as congestion, pollution, urban
transportation costs and crime. The centralising forces for companies that inhabit densely
populated cities must be of sufficient strength to overcome high rental value as well as the
factors mentioned above.
Transportation costs underline central place theory and the later extension of urban
hierarchy. The higher the transportation costs, the frequency of cities will increase and
therefore physical distance between them reduces (Geltner & Miller, 2007). In theory, cities
and their hinterlands or service areas will assume hexagonal shapes in order to minimise the
average distance from the city centre to any point within its service area. Higher order cities
producing more specialised goods and services will locate centrally within a group of lower
order cities to enable equal access to the these products on a transportation cost basis.
Therefore the key concept is that cities will form equidistant apart and higher order cities will
be fewer and further apart than lower order cities (Bertaud, 2004).
Economics Essay Thomas Tynan
3
2.2 Residual Theory of Land & Bid-Rent Theory:
The bid-rent model (Alonso, 1964) looks to further explain how land values, and
therefore rent, varies in relation to accessibility (Geltner & Miller, 2007). Land is one of the
main factors of production and this alone underlines its ability to obtain a value, which varies
depending on the derived demand for any given area. The attraction of renting or owning land
is the occupier’s ability to produce goods or services, which in-themselves demand a value.
Location is the driving force behind the variation in price of one area of land in comparison to
another due to factors such as access to additional areas of attraction and minimised
transportation costs (Geltner & Miller, 2007).
When considering all four factors of production; land, labour, capital and materials,
land is the only factor which is not mobile and is unable to be moved. Therefore the
remaining more mobile factors of production are always paid first to prevent them going
elsewhere. The residual income is then available for the landowner; this is the known as the
residual theory of land (Geltner & Miller, 2007). Considering this simplistic theory you can
assume that areas which are required to pay a premium for the mobile factors of production
due to poor location will have less income remaining to pay landowners therefore rents will
be less. Vis versa occurs when the mobile factors of production are cheap to source due to the
ease of access. Therefore assuming all income is split between the factors of production, not
one company should be able to outperform another. Cities have a greater residual value so are
able to sustain and afford higher rents.
The bid-rent curve focuses on transportation costs (the moving of inputs and outputs)
as the determining factor of production which alters rent. These costs are not solely borne by
the land occupier and seller but indirectly by the purchaser of the good or service.
Transportation costs in the eyes of the producer resembles a monetary value whereas for the
consumer it is resembled mainly by the time taken to travel to acquire the product. The bid-
rent is defined as the maximum rent a potential land user would be willing to pay (‘bid’) to
acquire a specific piece of land and / or location (Geltner & Miller, 2007).
Economics Essay Thomas Tynan
4
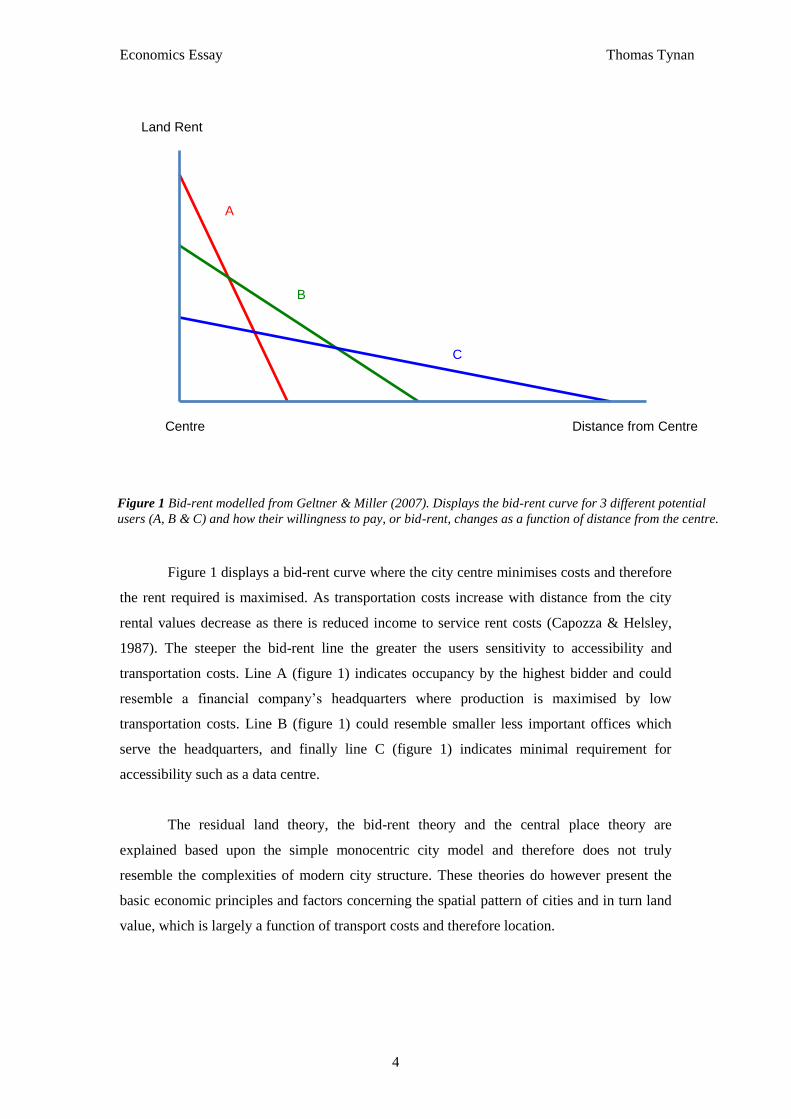
Figure 1 displays a bid-rent curve where the city centre minimises costs and therefore
the rent required is maximised. As transportation costs increase with distance from the city
rental values decrease as there is reduced income to service rent costs (Capozza & Helsley,
1987). The steeper the bid-rent line the greater the users sensitivity to accessibility and
transportation costs. Line A (figure 1) indicates occupancy by the highest bidder and could
resemble a financial company’s headquarters where production is maximised by low
transportation costs. Line B (figure 1) could resemble smaller less important offices which
serve the headquarters, and finally line C (figure 1) indicates minimal requirement for
accessibility such as a data centre.
The residual land theory, the bid-rent theory and the central place theory are
explained based upon the simple monocentric city model and therefore does not truly
resemble the complexities of modern city structure. These theories do however present the
basic economic principles and factors concerning the spatial pattern of cities and in turn land
value, which is largely a function of transport costs and therefore location.
Distance from Centre
Land Rent
Centre
A
B
C
Figure 1 Bid-rent modelled from Geltner & Miller (2007). Displays the bid-rent curve for 3 different potential
users (A, B & C) and how their willingness to pay, or bid-rent, changes as a function of distance from the centre.
Economics Essay Thomas Tynan
5
Section 3 – Analysis
3.1 Data Collection:
The following analysis is based upon the extraction of rental values for prime (grade
A) office space from the Colliers Rent distribution map (Colliers International Rental Map,
2012). The reason I have selected this data is because it represents solely prime office space
and therefore is unbiased towards variation in rental values due to the lesser quality of
buildings. The prime rent data acquired represents England, Wales and Scotland. Ireland has
been excluded from the analysis as the additional cost of travelling across water will distort
the results. This represented a sample size of 129 cities.
Population data was extracted from the Office for National Statistics (ONS, 2011). To
accurately account for the true working population of the larger urban areas and not just the
central core the entire conurbation was included This therefore accounted for commuters
travelling from smaller nearby towns into the CBD.
Distance as a second variable was measured based upon the distance from the centre
of a city or town to any other city or town as depicted by Google maps (Google Directions,
2013). This was deemed an appropriate measure as it calculates the shortest distance (miles)
along the UK road network (not ‘as the crow flies’) and therefore accurately represents travel
time and costs supporting the main economic theory driving land value as discussed
previously. The UK was then segmented in terms of regions and the distance of lower order
cities within the region to the dominant city centre was measured. The dominant city of each
region was selected based up its population size. Lower order towns and cities were assigned
to a neighbouring regions dominant city if they lay along the border of their region and were
geographically closer to the neighbouring dominant city as opposed to their own.
The final factor examined is the total floorspace of each city. This was acquired from
the Valuation Office Agency (VOA, 2012) and represented the total floorspace (m2) of all
grades of office space in the UK for 2011. The data was broken down at various levels from
national to regional and onto county and city.
It is important to note that when quoting coefficient and R² values throughout the
analysis, only limited diagnostic testing has taken place. All three variables have however,
passed the t-test at the 5% percent significance level.
Economics Essay Thomas Tynan
6
3.2 Population Distribution & Rent:
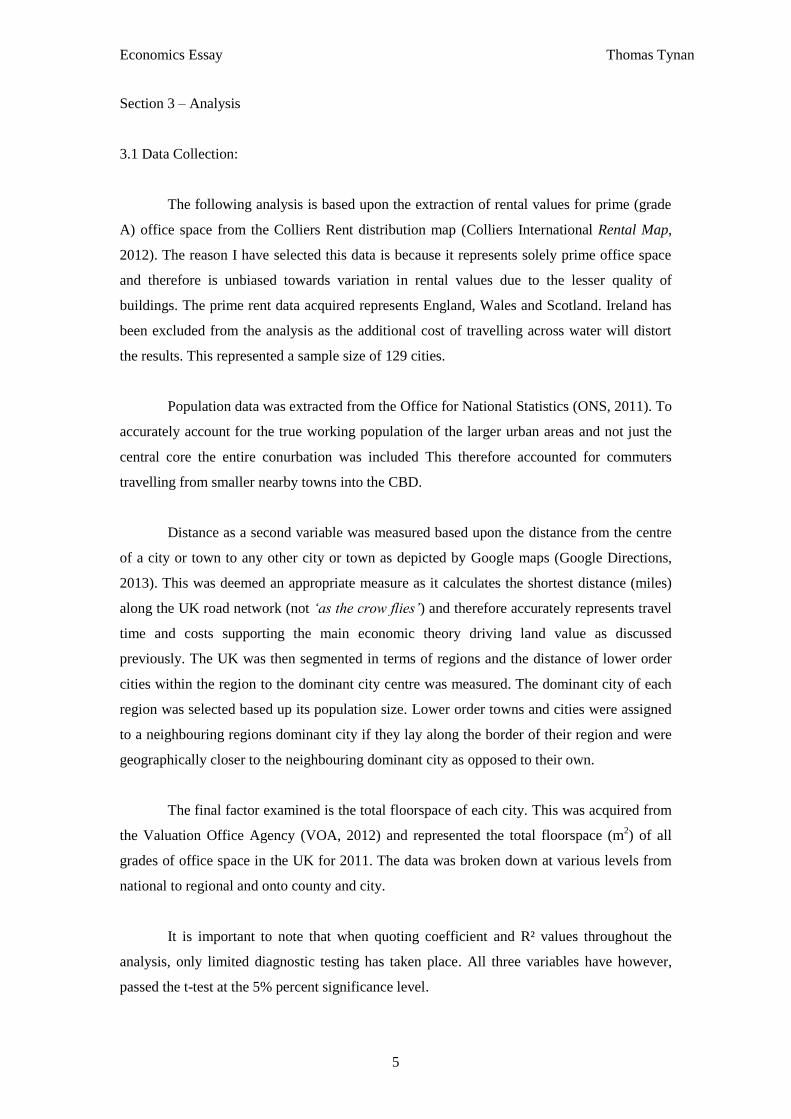
The theory discussed earlier identifies the fact that the larger the city, the greater the
ability of the city to sustain higher rental values. The scatter plot below represents how rent
changes as a function of population. Only the largest twenty UK cities have been selected for
this section of analysis.
Figure 2 demonstrates a positive relationship between rent and population. The
analysis has excluded London as one of the samples due to the sheer magnitude of its
population and the fact it therefore visually distorts the graph. It does however support the
trend that as population increases so does rent. When examining figure 1 it is clear that
Bristol and possibly Cardiff are outliers and do not fit the trend. This could be explained by
the fact that both cities lack nearby surrounding towns feeding the working population whilst
still maintaining their status as high order cities resulting in high rental values. Manchester,
Birmingham and Leeds for example benefit from local commuter towns falling within their
catchment and boosting population. Additionally both Bristol and Cardiff are not situated
centrally within the UK and instead in very close proximity to the coast. This further explains
the lack of ability for a greater number of people to access the cities. The high level of prime
Birmingham
Manchester
Leeds
Liverpool
Sheffield
Newcastle upon Tyne
Bradford
Bristol
Cardiff
Wakefield
Coventry
Nottingham
Leicester
Sunderland Hull
Brighton
Plymouth
Stoke-on-Trent
Wolverhampton
0.00
5.00
10.00
15.00
20.00
25.00
30.00
35.00
0 500,000 1,000,000 1,500,000 2,000,000 2,500,000 3,000,000
Prim
e R
ent per
sq.f
t.
Population
Displays the relationship between prime rent and population of the 19 largest English and Welsh cities (excluding London)
Figure 2 Scatter plot displaying rent as a function of population size for the twenty largest cities
after London in the UK (excluding Ireland).
Economics Essay Thomas Tynan
7
rents in Bristol will also be caused by the status of Bristol as a port city and rents will be
driven by demand for space from companies dependent on shipping as a method of transport.
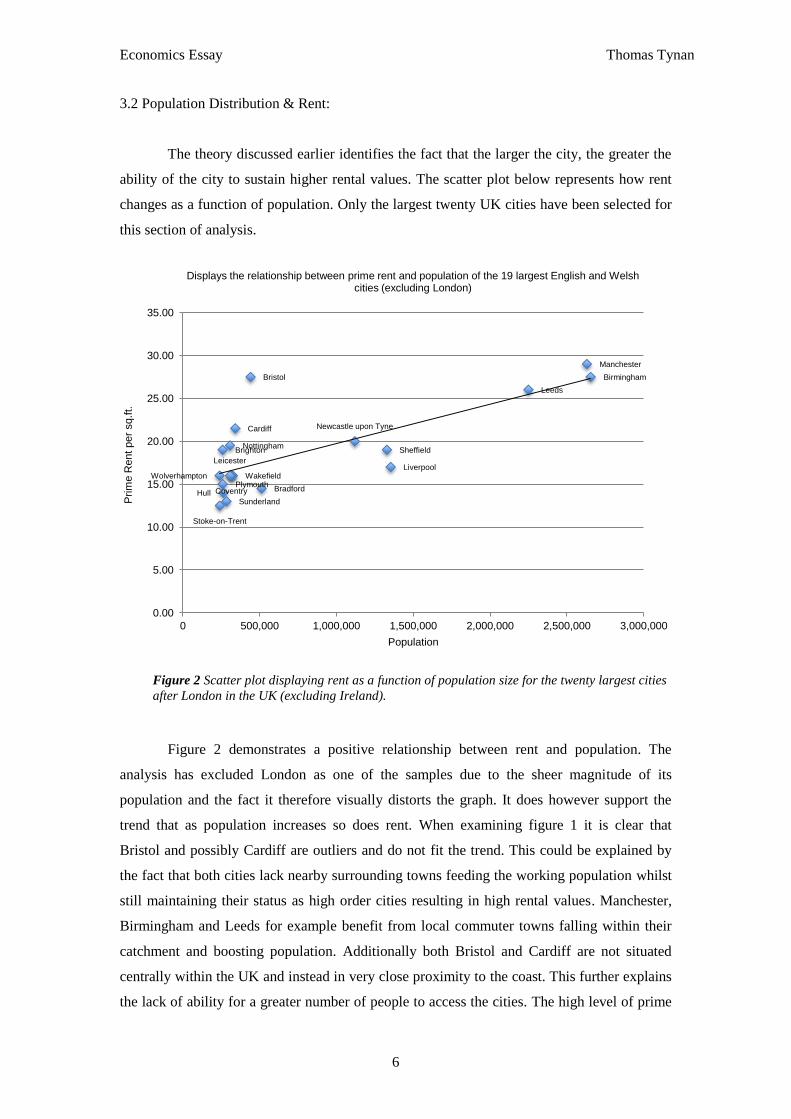
Overall the results support the theories of central place and urban hierarchy in
explaining rental pattern and city size. Furthermore, when examining the distribution of the
four largest UK cities at a national scale (figure 3) we can see that in general the larger cities
are not located within close proximity to one another. This supports the theory that cities
service their surrounding area and the larger the city the larger the surrounding area (Geltner
& Miller, 2007). The theory is slightly constrained as the UK does not assume a featureless
plain and this could explain the collection of large cities in the thin central UK midland area.
London
Birmingham
Leeds Manchester
Figure 3 Displays the spatial distribution of the four largest UK cities (column indicates
population size), which additionally supports high rental values (Note: not to scale).
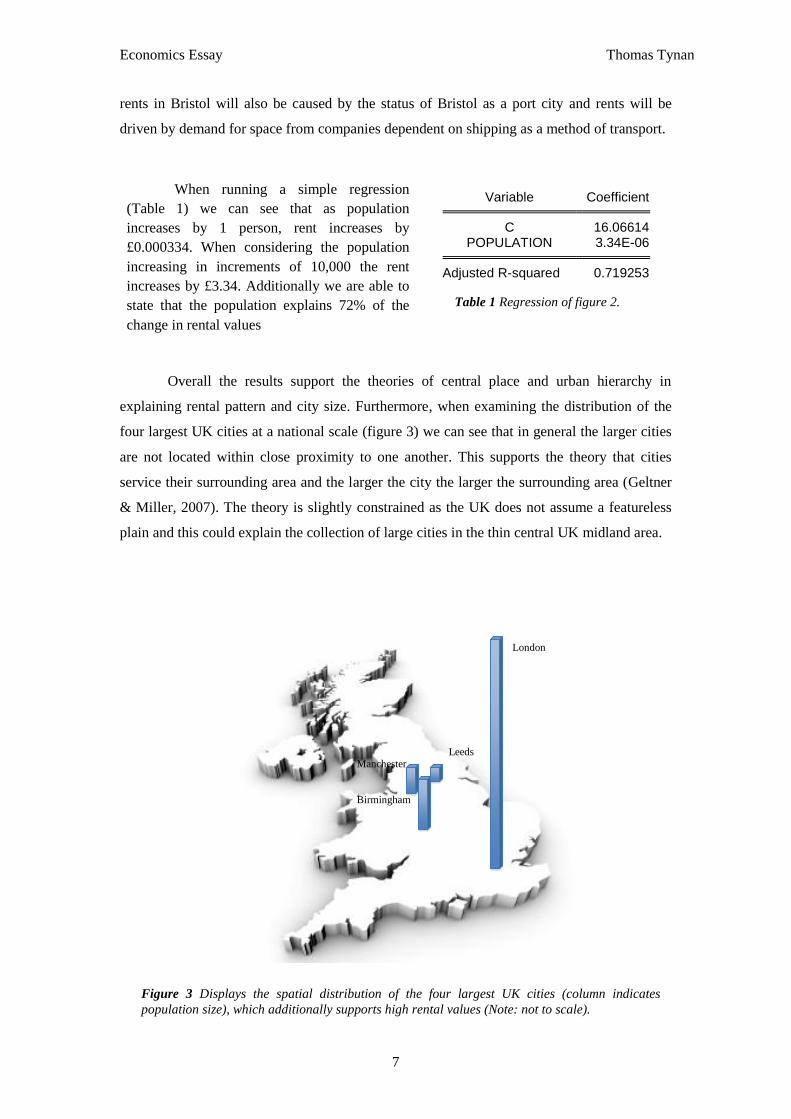
Variable Coefficient C 16.06614
POPULATION 3.34E-06 Adjusted R-squared 0.719253
When running a simple regression
(Table 1) we can see that as population
increases by 1 person, rent increases by
£0.000334. When considering the population
increasing in increments of 10,000 the rent
increases by £3.34. Additionally we are able to
state that the population explains 72% of the
change in rental values
Table 1 Regression of figure 2.
Economics Essay Thomas Tynan
8
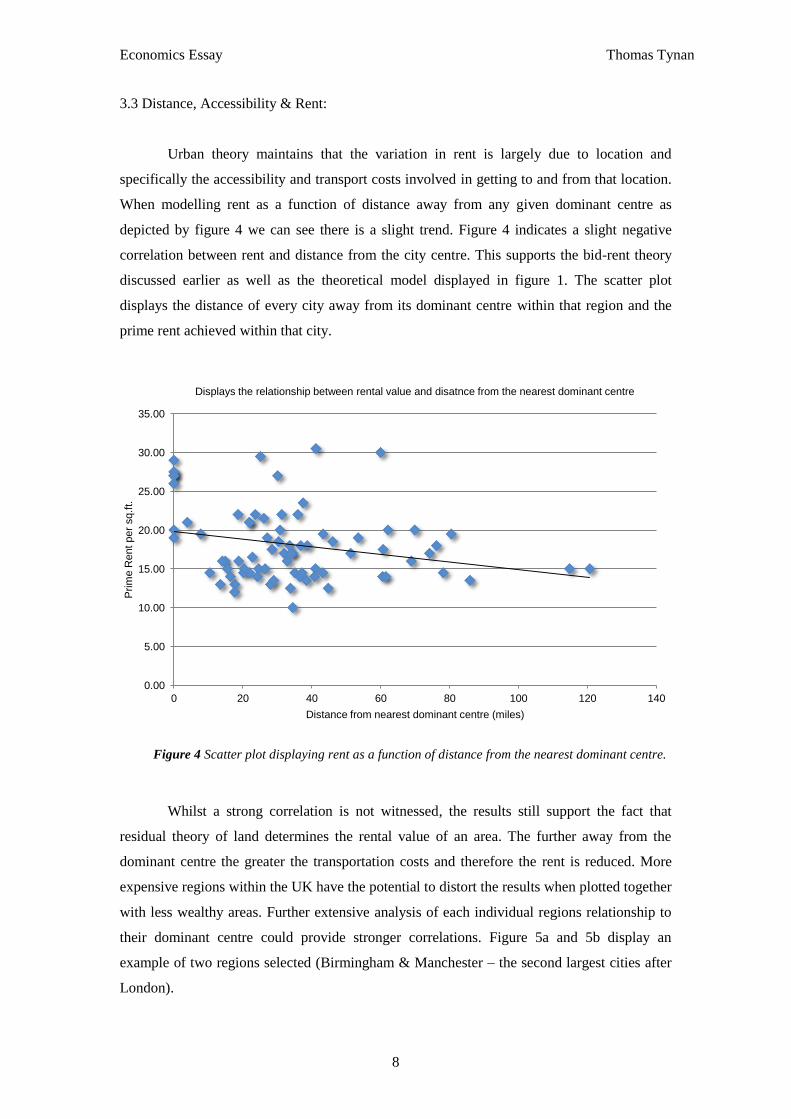
3.3 Distance, Accessibility & Rent:
Urban theory maintains that the variation in rent is largely due to location and
specifically the accessibility and transport costs involved in getting to and from that location.
When modelling rent as a function of distance away from any given dominant centre as
depicted by figure 4 we can see there is a slight trend. Figure 4 indicates a slight negative
correlation between rent and distance from the city centre. This supports the bid-rent theory
discussed earlier as well as the theoretical model displayed in figure 1. The scatter plot
displays the distance of every city away from its dominant centre within that region and the
prime rent achieved within that city.
Whilst a strong correlation is not witnessed, the results still support the fact that
residual theory of land determines the rental value of an area. The further away from the
dominant centre the greater the transportation costs and therefore the rent is reduced. More
expensive regions within the UK have the potential to distort the results when plotted together
with less wealthy areas. Further extensive analysis of each individual regions relationship to
their dominant centre could provide stronger correlations. Figure 5a and 5b display an
example of two regions selected (Birmingham & Manchester – the second largest cities after
London).
0.00
5.00
10.00
15.00
20.00
25.00
30.00
35.00
0 20 40 60 80 100 120 140
Prim
e R
ent per
sq.f
t.
Distance from nearest dominant centre (miles)
Displays the relationship between rental value and disatnce from the nearest dominant centre
Figure 4 Scatter plot displaying rent as a function of distance from the nearest dominant centre.
Economics Essay Thomas Tynan
9
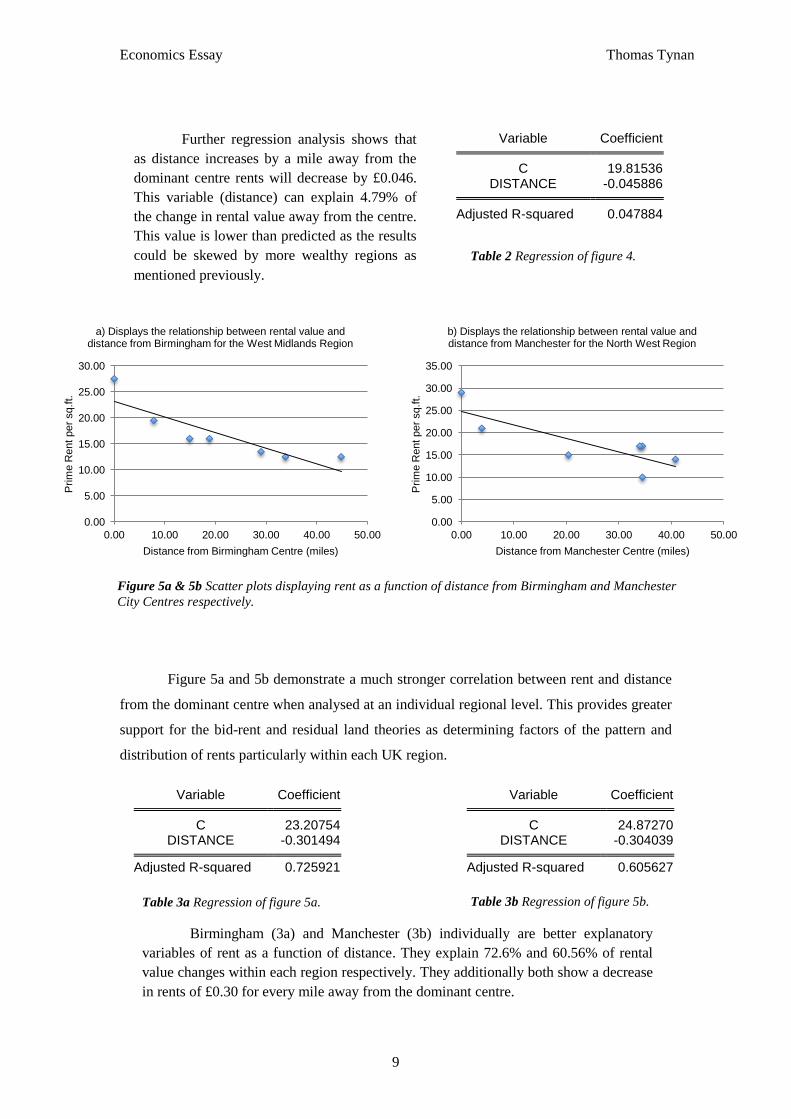
Figure 5a and 5b demonstrate a much stronger correlation between rent and distance
from the dominant centre when analysed at an individual regional level. This provides greater
support for the bid-rent and residual land theories as determining factors of the pattern and
distribution of rents particularly within each UK region.
0.00
5.00
10.00
15.00
20.00
25.00
30.00
0.00 10.00 20.00 30.00 40.00 50.00
Prim
e R
ent per
sq.f
t.
Distance from Birmingham Centre (miles)
a) Displays the relationship between rental value and distance from Birmingham for the West Midlands Region
0.00
5.00
10.00
15.00
20.00
25.00
30.00
35.00
0.00 10.00 20.00 30.00 40.00 50.00
Prim
e R
ent per
sq.f
t.
Distance from Manchester Centre (miles)
b) Displays the relationship between rental value and distance from Manchester for the North West Region
Figure 5a & 5b Scatter plots displaying rent as a function of distance from Birmingham and Manchester
City Centres respectively.
Variable Coefficient C 19.81536
DISTANCE -0.045886 Adjusted R-squared 0.047884
Table 2 Regression of figure 4.
Further regression analysis shows that
as distance increases by a mile away from the
dominant centre rents will decrease by £0.046.
This variable (distance) can explain 4.79% of
the change in rental value away from the centre.
This value is lower than predicted as the results
could be skewed by more wealthy regions as
mentioned previously.
Variable Coefficient
C 24.87270
DISTANCE -0.304039
Adjusted R-squared 0.605627
Variable Coefficient
C 23.20754
DISTANCE -0.301494
Adjusted R-squared 0.725921
Table 3a Regression of figure 5a. Table 3b Regression of figure 5b.
Birmingham (3a) and Manchester (3b) individually are better explanatory
variables of rent as a function of distance. They explain 72.6% and 60.56% of rental
value changes within each region respectively. They additionally both show a decrease
in rents of £0.30 for every mile away from the dominant centre.
Economics Essay Thomas Tynan
10
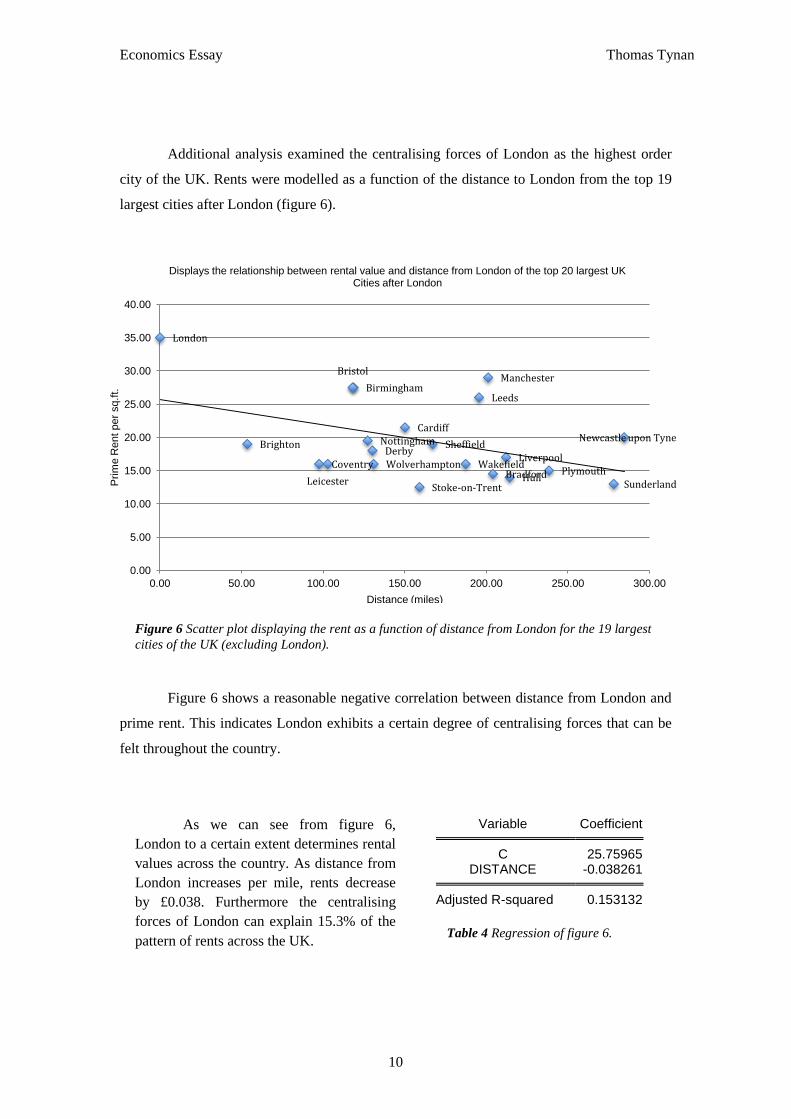
Additional analysis examined the centralising forces of London as the highest order
city of the UK. Rents were modelled as a function of the distance to London from the top 19
largest cities after London (figure 6).
Figure 6 shows a reasonable negative correlation between distance from London and
prime rent. This indicates London exhibits a certain degree of centralising forces that can be
felt throughout the country.
Birmingham Leeds
Sheffield
Bradford
Manchester
Liverpool
Bristol
Cardiff
Wakefield Coventry
Nottingham
Leicester Sunderland
Newcastle upon Tyne
Hull
Brighton
Plymouth
Stoke-on-Trent
Wolverhampton Derby
London
0.00
5.00
10.00
15.00
20.00
25.00
30.00
35.00
40.00
0.00 50.00 100.00 150.00 200.00 250.00 300.00
Prim
e R
ent per
sq.f
t.
Distance (miles)
Displays the relationship between rental value and distance from London of the top 20 largest UK Cities after London
Figure 6 Scatter plot displaying the rent as a function of distance from London for the 19 largest
cities of the UK (excluding London).
Variable Coefficient C 25.75965
DISTANCE -0.038261 Adjusted R-squared 0.153132
Table 4 Regression of figure 6.
As we can see from figure 6,
London to a certain extent determines rental
values across the country. As distance from
London increases per mile, rents decrease
by £0.038. Furthermore the centralising
forces of London can explain 15.3% of the
pattern of rents across the UK.
Economics Essay Thomas Tynan
11
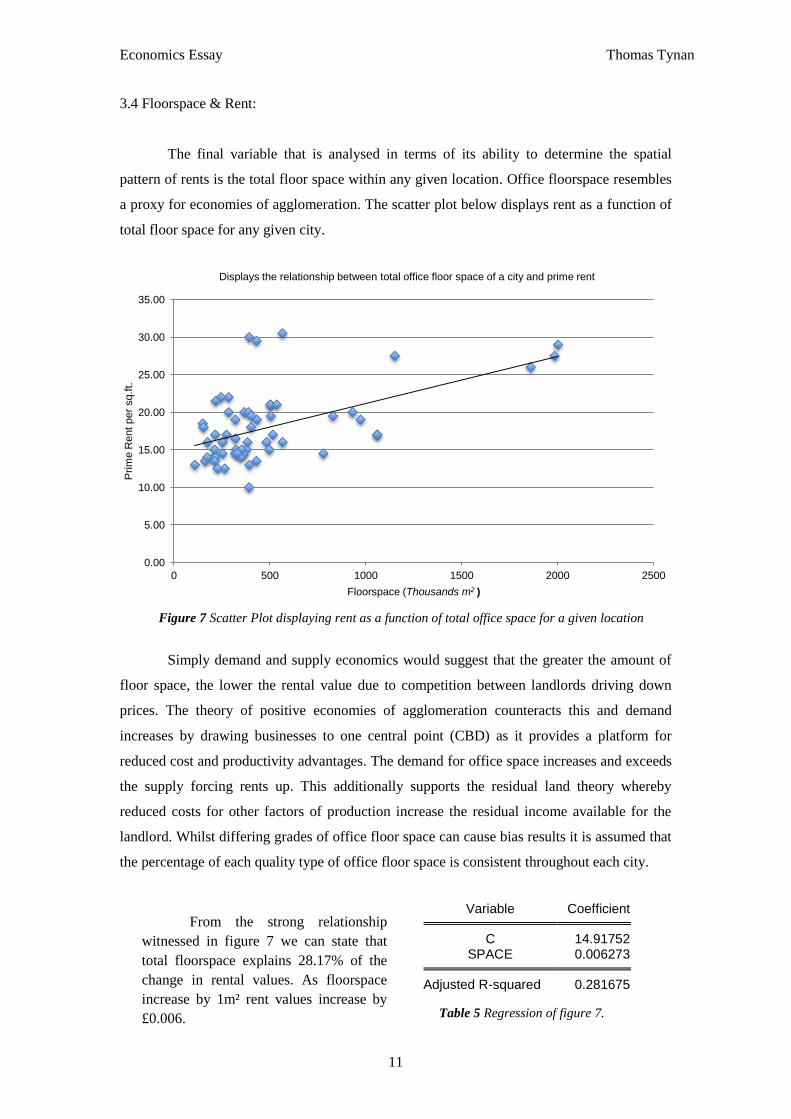
3.4 Floorspace & Rent:
The final variable that is analysed in terms of its ability to determine the spatial
pattern of rents is the total floor space within any given location. Office floorspace resembles
a proxy for economies of agglomeration. The scatter plot below displays rent as a function of
total floor space for any given city.
Simply demand and supply economics would suggest that the greater the amount of
floor space, the lower the rental value due to competition between landlords driving down
prices. The theory of positive economies of agglomeration counteracts this and demand
increases by drawing businesses to one central point (CBD) as it provides a platform for
reduced cost and productivity advantages. The demand for office space increases and exceeds
the supply forcing rents up. This additionally supports the residual land theory whereby
reduced costs for other factors of production increase the residual income available for the
landlord. Whilst differing grades of office floor space can cause bias results it is assumed that
the percentage of each quality type of office floor space is consistent throughout each city.
0.00
5.00
10.00
15.00
20.00
25.00
30.00
35.00
0 500 1000 1500 2000 2500
Prim
e R
ent per
sq.f
t.
Floorspace (Thousands m2 )
Displays the relationship between total office floor space of a city and prime rent
Figure 7 Scatter Plot displaying rent as a function of total office space for a given location
Variable Coefficient C 14.91752
SPACE 0.006273 Adjusted R-squared 0.281675
From the strong relationship
witnessed in figure 7 we can state that
total floorspace explains 28.17% of the
change in rental values. As floorspace
increase by 1m² rent values increase by
£0.006. Table 5 Regression of figure 7.
Economics Essay Thomas Tynan
12
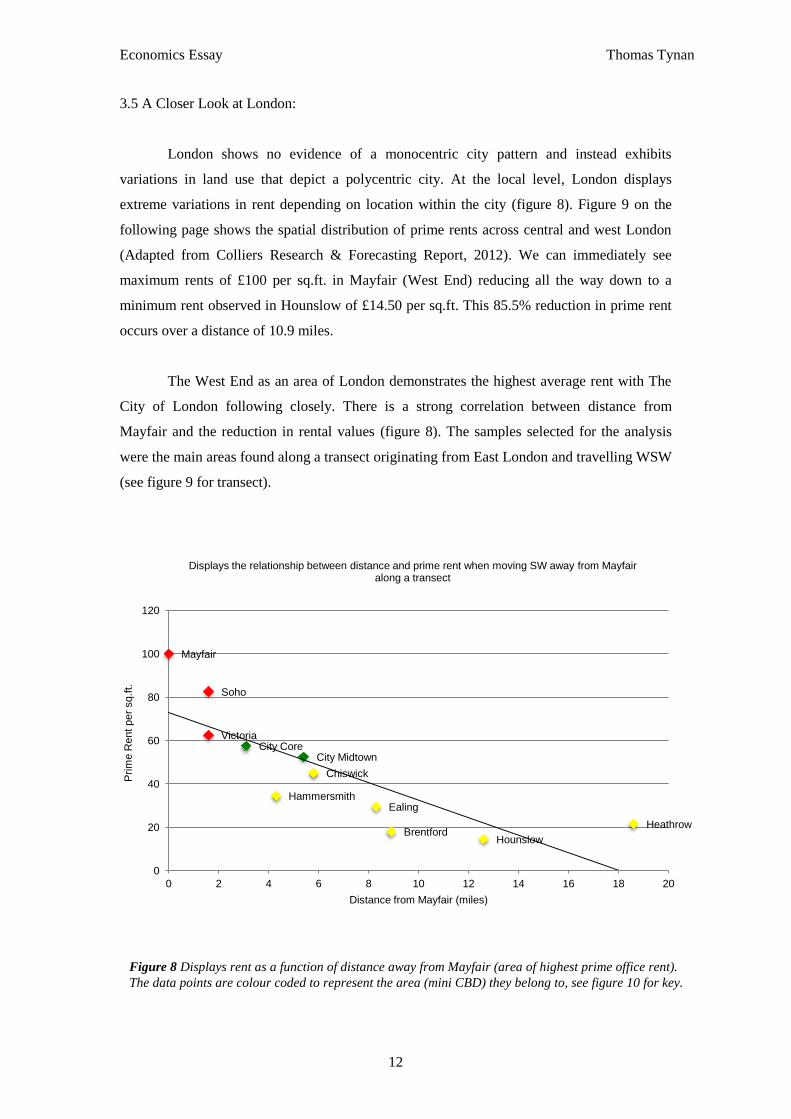
3.5 A Closer Look at London:
London shows no evidence of a monocentric city pattern and instead exhibits
variations in land use that depict a polycentric city. At the local level, London displays
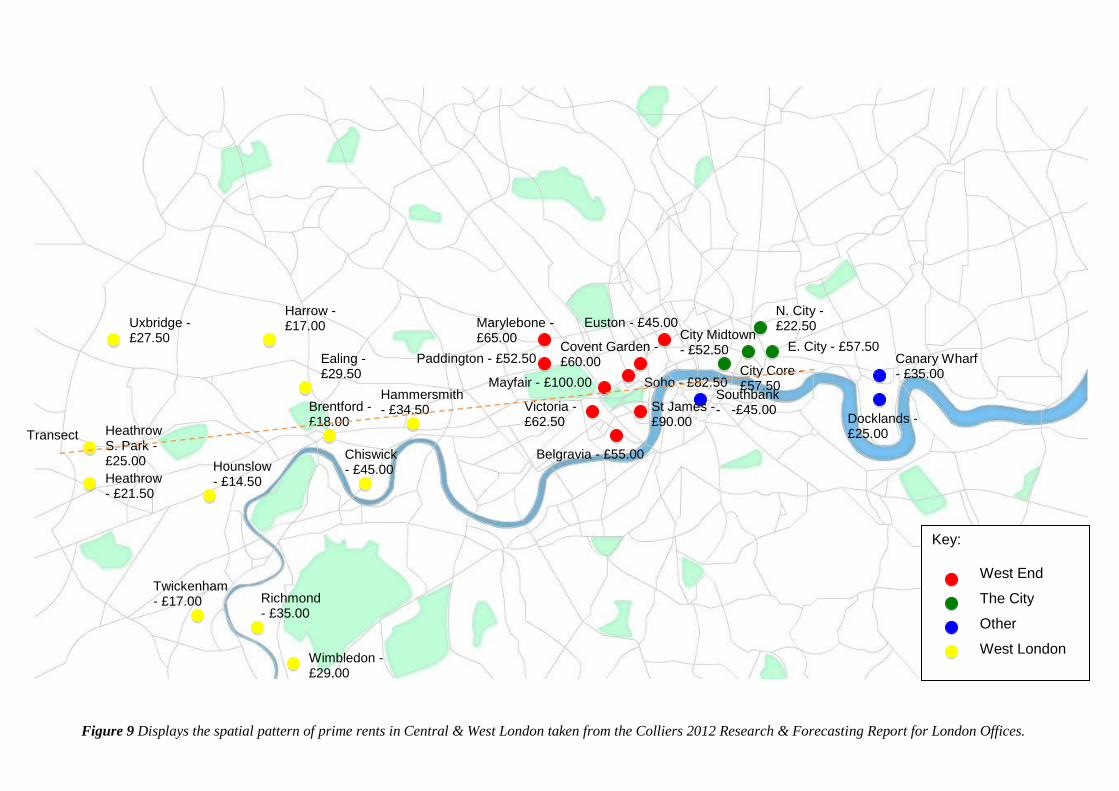
extreme variations in rent depending on location within the city (figure 8). Figure 9 on the
following page shows the spatial distribution of prime rents across central and west London
(Adapted from Colliers Research & Forecasting Report, 2012). We can immediately see
maximum rents of £100 per sq.ft. in Mayfair (West End) reducing all the way down to a
minimum rent observed in Hounslow of £14.50 per sq.ft. This 85.5% reduction in prime rent
occurs over a distance of 10.9 miles.
The West End as an area of London demonstrates the highest average rent with The
City of London following closely. There is a strong correlation between distance from
Mayfair and the reduction in rental values (figure 8). The samples selected for the analysis
were the main areas found along a transect originating from East London and travelling WSW
(see figure 9 for transect).
Mayfair
Victoria
Hammersmith
Brentford Hounslow
Heathrow
Ealing
Soho
City Core City Midtown
Chiswick
0
20
40
60
80
100
120
0 2 4 6 8 10 12 14 16 18 20
Prim
e R
ent per
sq.f
t.
Distance from Mayfair (miles)
Displays the relationship between distance and prime rent when moving SW away from Mayfair along a transect
Figure 8 Displays rent as a function of distance away from Mayfair (area of highest prime office rent).
The data points are colour coded to represent the area (mini CBD) they belong to, see figure 10 for key.
Economics Essay Thomas Tynan
13
City Midtown - £52.50
Figure 9 Displays the spatial pattern of prime rents in Central & West London taken from the Colliers 2012 Research & Forecasting Report for London Offices.
Key: West End
The City
Other
West London
Belgravia - £55.00
Covent Garden - £60.00
Euston - £45.00
St James - £90.00
Soho - £82.50
Paddington - £52.50
Mayfair - £100.00
Marylebone - £65.00
Victoria - £62.50
City Core - £57.50
N. City - £22.50
E. City - £57.50
Docklands - £25.00
Canary Wharf - £35.00
Southbank - -£45.00
Hammersmith - £34.50
Chiswick - £45.00
Uxbridge - £27.50
Brentford - £18.00
Ealing - £29.50
Harrow - £17.00
Richmond - £35.00
Twickenham - £17.00
Hounslow - £14.50 Heathrow
- £21.50
Heathrow S. Park - £25.00
Wimbledon - £29.00
Transect
Economics Essay Thomas Tynan
14
The pattern and distribution of these small scale, high functioning centres within
London, notably the West End and The City, does not support Burgess’s (Burgess, 1925)
concentric ring model. Instead it bears a closer resemblance to Harris and Ullman’s multiple
nuclei model (Harris & Ullman, 1945). This model envisages separate urban zones with
differentiated functions and supporting differing agglomeration factors forming mini-CBD’s
(Harris & Ullman, 1945). In the case of London, The City better represents a financial hub in
terms of the headquarters of large global banks and law firms whilst the West End represents
more client focused businesses such as real estate firms and advertising agencies.
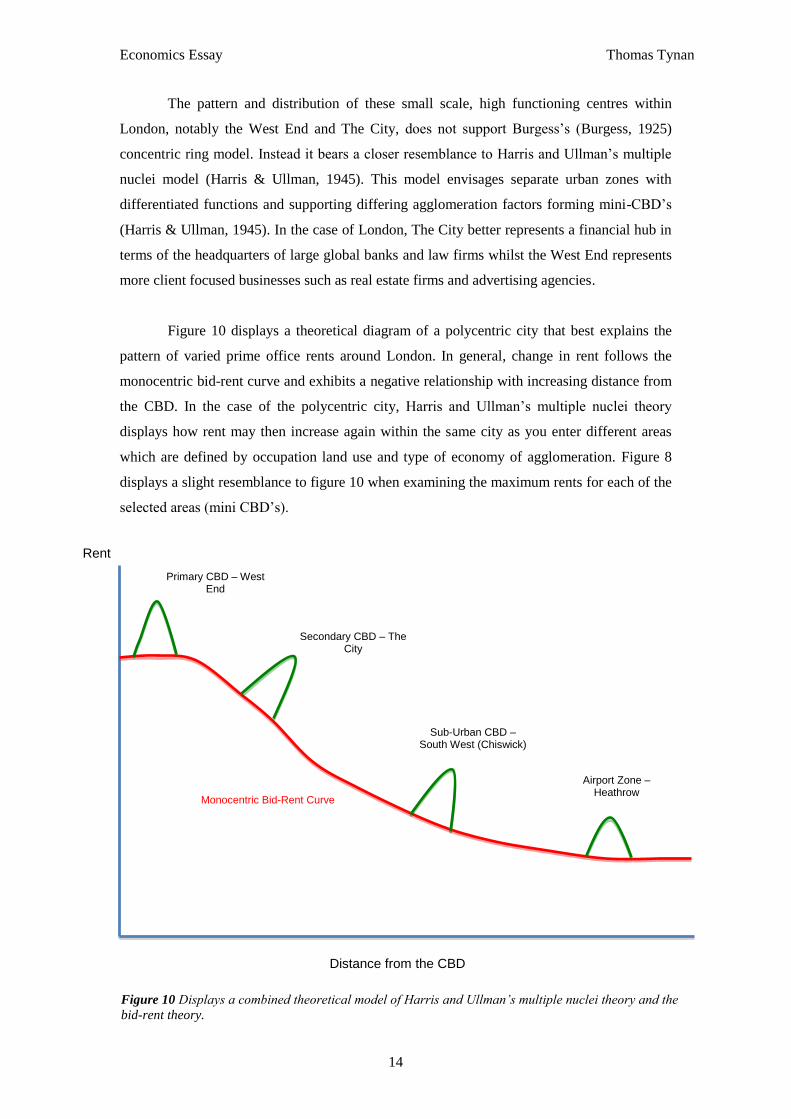
Figure 10 displays a theoretical diagram of a polycentric city that best explains the
pattern of varied prime office rents around London. In general, change in rent follows the
monocentric bid-rent curve and exhibits a negative relationship with increasing distance from
the CBD. In the case of the polycentric city, Harris and Ullman’s multiple nuclei theory
displays how rent may then increase again within the same city as you enter different areas
which are defined by occupation land use and type of economy of agglomeration. Figure 8
displays a slight resemblance to figure 10 when examining the maximum rents for each of the
selected areas (mini CBD’s).
Figure 10 Displays a combined theoretical model of Harris and Ullman’s multiple nuclei theory and the
bid-rent theory.
Distance from the CBD
Primary CBD – West End
Secondary CBD – The City
Sub-Urban CBD – South West (Chiswick)
Airport Zone – Heathrow
Monocentric Bid-Rent Curve
Rent
Economics Essay Thomas Tynan
15
Section 4 – Conclusion:
The urban theories examined in the beginning of this study were used to identify
economic factors that define and determine the spatial pattern of land values and in turn rental
values at a national and then at an individual local city level.
The results from the analysis on rent as a function of population supports the
theory that in general, the larger and higher order cities can sustain higher rental values.
Furthermore, central place theory and urban hierarchy explain the spatial distribution of cities
across the UK. By understanding rent as a function of city size and the principle that cities are
not positioned randomly we can begin to explain why rents vary across the UK.
When examining rent as a function of distance away from a dominant centre there
is a clear negative relationship. As distance from the centre increases, rental values decrease.
This is largely explained by William Alonso’s bid-rent model, which identifies the fact that
demand for space increases in the city centre due to reduced transport costs and higher
profitability.
The final section of analysis investigates rent as a function of office floor space,
which has been utilised as a proxy for economies of agglomeration. A strong correlation was
observed between rent and office floor space. We can therefore state that economies of
agglomeration produce high levels of demand within city centres, which drives up rental
values. Following on from this, when examining London at a local scale we can see that it
adheres to a polycentric, multiple nuclei pattern. It contains a number of smaller economies of
agglomeration within the main city thus explaining the variation in rents over shorter
distances.
Economics Essay Thomas Tynan
16
Section 5 – References
Alonso, William. 1964. Location and Land Use. Cambridge, Mass.: Harvard University
Press.
Beckmann, J., Martin, 1958. City Hierarchies and the Distribution of City Size. Economic
Development and Cultural Change, Vol. 6, No. 3 (Apr., 1958), pp. 243-248 Published
by: The University of Chicago Press.
Bertaud, Alain. 2004. The Spatial Organization of Cities; Deliberate Outcome or Unforeseen
Consequence? IURD Working Paper Series, Institute of Urban and Regional
Development, UC Berkeley.
Burgess, W., Ernest, 1928. Residential Segregation in American Cities. Annals of the
American Academy of Political and Social Science, Vol. 140, The American Negro
(Nov., 1928), pp. 105-115
Catherine J. Morrison Paul & Donald S. Siegel, 1999. Scale Economies and Industry
Agglomeration Externalities: A Dynamic Cost Function Approach. The American
Economic Review, Vol. 89, No. 1 (Mar., 1999), pp. 272-290.
Capozza, D. & Helsley, R., 1987. The Fundamentals of Land Prices and Urban Growth.
Journal of Urban Economics 26, 295-306. Faculty of Commerce and Business
Administration, University of British Columbia.
Colliers International Rental Map, 2012. National Office Rents Map 2012. Available Online
at: http://www.colliers.com/en-gb/uk/insights/offices-rents-map (Accessed between
10th November & 29
th November 2013).
Colliers International Research & Forecasting UK Report Q2, 2012. Available Online at:
http://www.colliers.com/~/media/Files/EMEA/UK/research/offices/201207-central-
london-offices.pdf (Accessed between 10th November & 29th November 2013).
Geltner, D. M., Miller, N. G., Clayton, J. & Eichholtz, P., 2007. Commercial Real Estate:
Analysis & Investments. 2nd
Edition. Mason: South-Western Cengage Learning.
Google Maps Driving Directions, 2013. Available Online at: https://www.maps.google.co.uk/
(Accessed on the 16rd
of November 2013).
Harris, D., Chauncy, & Ullman, L., Edward, 1945. The Nature of Cities. Annals of the
American Academy of Political and Social Science, Vol. 242, Building the Future
City (Nov.,1945), pp. 7-17.
Office for National Statistics (ONS) Population, Mid 2011. Available Online at:
http://www.ons.gov.uk/ons/taxonomy/index.html?nscl=Population#tab-data-tables
(Accessed on the 15rd
November 2013).

Economics Essay Thomas Tynan
17
Valuation Office Agency (VOA), Business Floorspace (Experimental Values), 2012.
Available online at:
http://www.voa.gov.uk/corporate/statisticalReleases/120517_CRLFloorspace.html
(Accessed on the 16th
November 2013).