Do micro ao macro: A conservação da Lagoa da Pampulha a partire do Podilymbus podiceps
Upload
independentCategory
view
0download
0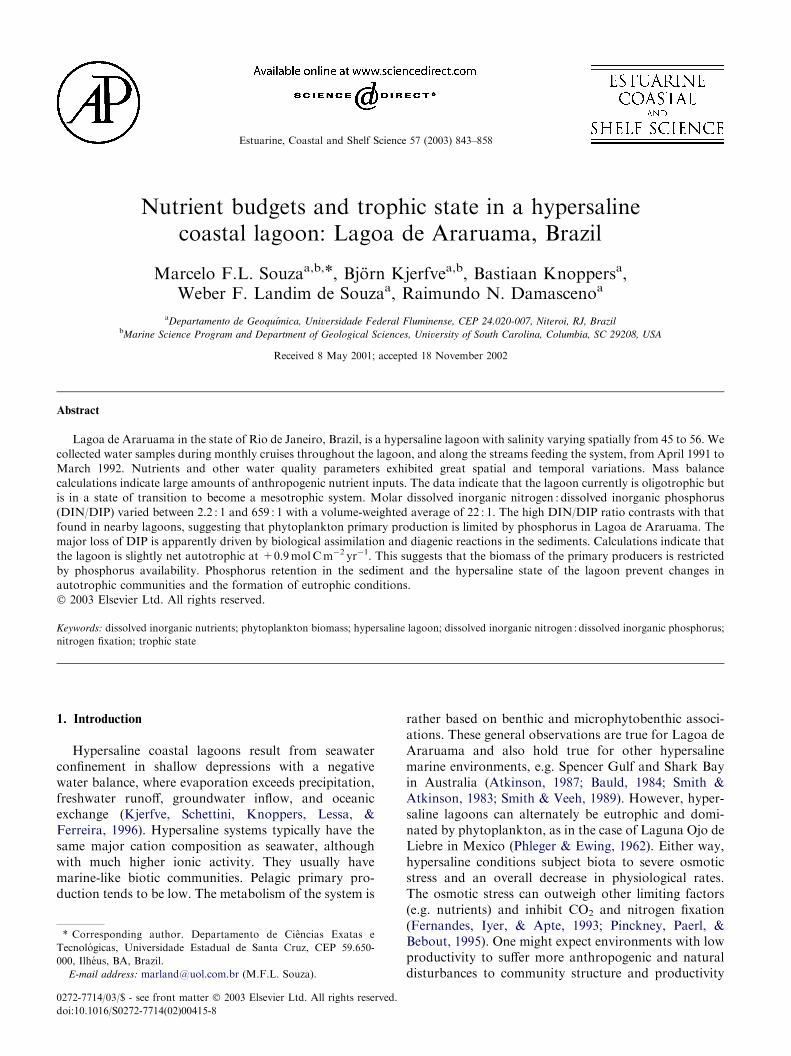
Estuarine, Coastal and Shelf Science 57 (2003) 843–858
Nutrient budgets and trophic state in a hypersalinecoastal lagoon: Lagoa de Araruama, Brazil
Marcelo F.L. Souzaa,b,*, Bjorn Kjerfvea,b, Bastiaan Knoppersa,Weber F. Landim de Souzaa, Raimundo N. Damascenoa
aDepartamento de Geoquımica, Universidade Federal Fluminense, CEP 24.020-007, Niteroi, RJ, BrazilbMarine Science Program and Department of Geological Sciences, University of South Carolina, Columbia, SC 29208, USA
Received 8 May 2001; accepted 18 November 2002
Abstract
Lagoa de Araruama in the state of Rio de Janeiro, Brazil, is a hypersaline lagoon with salinity varying spatially from 45 to 56. We
collected water samples during monthly cruises throughout the lagoon, and along the streams feeding the system, from April 1991 toMarch 1992. Nutrients and other water quality parameters exhibited great spatial and temporal variations. Mass balancecalculations indicate large amounts of anthropogenic nutrient inputs. The data indicate that the lagoon currently is oligotrophic butis in a state of transition to become a mesotrophic system. Molar dissolved inorganic nitrogen : dissolved inorganic phosphorus
(DIN/DIP) varied between 2.2 : 1 and 659 : 1 with a volume-weighted average of 22 : 1. The high DIN/DIP ratio contrasts with thatfound in nearby lagoons, suggesting that phytoplankton primary production is limited by phosphorus in Lagoa de Araruama. Themajor loss of DIP is apparently driven by biological assimilation and diagenic reactions in the sediments. Calculations indicate that
the lagoon is slightly net autotrophic at +0.9molCm�2 yr�1. This suggests that the biomass of the primary producers is restrictedby phosphorus availability. Phosphorus retention in the sediment and the hypersaline state of the lagoon prevent changes inautotrophic communities and the formation of eutrophic conditions.
� 2003 Elsevier Ltd. All rights reserved.
Keywords: dissolved inorganic nutrients; phytoplankton biomass; hypersaline lagoon; dissolved inorganic nitrogen : dissolved inorganic phosphorus;
nitrogen fixation; trophic state
1. Introduction
Hypersaline coastal lagoons result from seawaterconfinement in shallow depressions with a negativewater balance, where evaporation exceeds precipitation,freshwater runoff, groundwater inflow, and oceanicexchange (Kjerfve, Schettini, Knoppers, Lessa, &Ferreira, 1996). Hypersaline systems typically have thesame major cation composition as seawater, althoughwith much higher ionic activity. They usually havemarine-like biotic communities. Pelagic primary pro-duction tends to be low. The metabolism of the system is
* Corresponding author. Departamento de Ciencias Exatas e
Tecnologicas, Universidade Estadual de Santa Cruz, CEP 59.650-
000, Ilheus, BA, Brazil.
E-mail address: [email protected] (M.F.L. Souza).
0272-7714/03/$ - see front matter � 2003 Elsevier Ltd. All rights reserved.
doi:10.1016/S0272-7714(02)00415-8
rather based on benthic and microphytobenthic associ-ations. These general observations are true for Lagoa deAraruama and also hold true for other hypersalinemarine environments, e.g. Spencer Gulf and Shark Bayin Australia (Atkinson, 1987; Bauld, 1984; Smith &Atkinson, 1983; Smith & Veeh, 1989). However, hyper-saline lagoons can alternately be eutrophic and domi-nated by phytoplankton, as in the case of Laguna Ojo deLiebre in Mexico (Phleger & Ewing, 1962). Either way,hypersaline conditions subject biota to severe osmoticstress and an overall decrease in physiological rates.The osmotic stress can outweigh other limiting factors(e.g. nutrients) and inhibit CO2 and nitrogen fixation(Fernandes, Iyer, & Apte, 1993; Pinckney, Paerl, &Bebout, 1995). One might expect environments with lowproductivity to suffer more anthropogenic and naturaldisturbances to community structure and productivity
844 M.F.L. Souza et al. / Estuarine, Coastal and Shelf Science 57 (2003) 843–858
than productive systems, and respond with longerrecovery times (Moore, de Ruiter, & Hunt, 1993).
In most coastal marine ecosystems, primary produc-tion tends to be nitrogen limited (Howarth, 1988). Themain factors determining which nutrient is limiting are(1) N : P loading ratio; (2) differential loss of N or P fromthe photic zone by denitrification, sedimentation of N infecal pellets, or adsorption of P; and (3) compensationfor N deficiency through nitrogen fixation (Howarth,1988). Benthic remineralization often decreases Navailability relative to phosphorus as result of nitrifica-tion and denitrification. Within the water column, de-trital phosphorus may be recycled faster than nitrogen(Bowden, 1984; Klump & Martens, 1981). However,even in estuaries with low N : P ratios, nitrogen fixationby planktonic cyanobacteria seldom occurs (Howarth,1988), possibly because of a discrepancy between therates of nitrogen biochemical reactions and waterrenewal in coastal environments (Smith, 1984). MostN fixation in shallow hypersaline systems occurs inbenthic algal mats (e.g., Spencer Gulf, Smith & Veeh,1983).
It is our objective to describe the nutrient distribution,trophic state, and dominant biogeochemical processes inthe tropical and hypersaline Lagoa de Araruama in Riode Janeiro, Brazil.
2. Materials and methods
2.1. Study area
Choked coastal lagoons (Fig. 1) are common alongthe Fluminense coast from Rio de Janeiro to Cabo Frio,Brazil (Kjerfve, Knoppers, Moreira, & Turcq, 1990;Knoppers, Kjerfve, & Carmouze, 1991). Lagoa deAraruama (latitude 22�409–22�579 S and longitude42�009–42�239 W) is the largest with a surface area of220 km2, average depth of 2.5m, extensive shallow areaswith depths 0.5–1.5m, and occasional deep holes up to17m. The lagoon is permanently hypersaline (Andreet al., 1981; Barroso, 1987; Kjerfve et al., 1996) as aresult of a negative water balance on account of a semi-arid climate and a very small drainage basin. Salinityranges from 35 to 43 in the narrow channel thatconnects with the sea (Canal de Itajuru, Fig. 1) and from46 to 56 in the main body of the lagoon (Kjerfve et al.,1996). Annual rainfall measures only 900mm, whereasannual evaporation measures 1400mm (Barbiere, 1985).Combined with the fact that the watershed covers only320 km2, the runoff from the main tributaries, Rio dasMocas and the Rio Mataruna, yields a mean dischargeof only �67� 103m3 d�1 (Kjerfve et al., 1996). Othertributaries are intermittent and remain completely dry
Fig. 1. Map of the Fluminense coast, Rio de Janeiro, Brazil, showing the location of the 14 sampling stations in Lagoa de Araruama.
845M.F.L. Souza et al. / Estuarine, Coastal and Shelf Science 57 (2003) 843–858
for most of the year. Lack of regional potable water hasresulted in the construction of pipe network and thepumping of �86� 10m3 s�1 since 1977 from Lagoa deJuturnaıba in the watershed to the north (Kjerfve et al.,1996).
Elongated sand spits extend from the restinga (beachridges) to the continental margin and divide the lagooninto five well-defined elliptical compartments. The 14-km long, narrow Canal de Itajuru, which is the onlyconnection to the sea, traverses the densely populatedurban areas of Cabo Frio and Sao Pedro d’Aldeia. Thechannel acts as an efficient filter to remove tidal vari-ability in the lagoon (Kjerfve et al., 1996) and alsoreceives high quantities of domestic sewage.
Extensive areas of the lagoon bottom are coveredby a thin (<0.5 cm) non-stromatolitic microbial mat,dominated by the cyanobacteria Phormidium sp.,Oscillatoria sp., and Lyngbya sp. (Knoppers et al., 1996).In addition, there is a great abundance of the bivalve,Anomalocardia brasiliana, in bottom sediments in shal-low areas. This bivalve, typically smaller than 2 cm, isdredged for the extraction of biogenic calcareous ma-terials for industrial uses.
Artisinal fisheries and salt extraction were the prin-cipal economic activities in the area until the 1950s.However, domestic sewage input and dredging forAnomalocardia brasiliana shells promoted conflicts withthe emerging tourism, which now sustains the economyof the lagoon (Kjerfve et al., 1996).
2.2. Sampling and analysis
Water samples were collected from 14 fixed stations(Fig. 1) during 10 monthly cruises on Lagoa deAraruama between April 1991 and March 1992. Atstations with water depths less than 1m, samples weretaken only at the surface. When the depth was between1 and 3m, samples were collected near the surface andnear the bottom. When the water depth exceeded 3m,samples were collected near the surface and bottom andat mid-depth. Samples were also collected along the Riodas Mocas and Rio Mataruna from freshwater into thelagoon. As the lagoon is devoid of tidal variability, thesampling did not need to be timed according to tidalphase. The main temporal variability is associated withwinds.
The water sampling was done with a van Dorn bottle,stored in 1 l polyethylene bottles pre-washed with HCl1 : 1, rinsed with distilled water and then with samplewater. After collection, samples were kept on ice duringtransport. Water temperature (with mercury thermom-eter) and salinity (with refractometer) were measured foreach sample, and Secchi disk depth, wind speed anddirection, and solar radiation were recorded.
Adequate sample volumes were filtered using glassfiber (Whatmann GF/C) filters, previously heated to
450 �C, cooled, and weighed. Total suspended solids(TSS) (Lenz, 1972), particulate organic carbon (POC)and chlorophyll-a (Strickland & Parsons, 1972), andparticulate organic phosphorus (POP) (Valderrama,1981) were collected by the filters and measured.Aliquots of filtered water samples were frozen in HCl1 : 1 washed polyethylene bottles for further analysis ofreactive phosphorus (dissolved inorganic phosphorus,DIP), ammonium, nitrite, and nitrate (the sum definedas dissolved inorganic nitrogen, DIN) according toGrasshoff, Ehrardt, and Kremling (1983). The completedata set was published in the thesis by Souza (1993).Nutrient standing stocks were estimated by depthintegration of the concentration at each station.
2.3. Statistical analysis
Statistical tests and procedures were used to explorethe relations amongst the variables and stations, andassess the significance of the difference between means.We opted to employ non-parametric tests, since datadistribution strongly deviates from normality, and inseveral instances only a small number of samples wereavailable. A Spearman rank order R was calculatedusing a raw data matrix to explore possible correlationsbetween the analyzed variables. For the test of thedifference between means of two independent samples,the Mann–Whitney U test was used. In the case of k-related samples, a Friedman ANOVA and a Kendallconcordance coefficient were used. The x2 test for kindependent samples was used to aggregate samplingstations with similar chlorophyll-a concentration. A k-means clustering analysis was done with a matrixconstructed with average surface data for each stationto cluster similar stations. This matrix was standard-ized using the z-score (raw data—mean/standard devia-tion). Initially, we defined two groups with all variablesselected based on Spearman R. The number of clusterswas increased gradually, and variables were sequen-tially retired from the analysis. The removal of vari-ables was done after the analysis of variance, since thegoal of this method was to minimize variability withinclusters and maximize variability between clusters.
3. Results
3.1. Distribution of water properties
With the exception of salinity and temperature,all constituents exhibited great spatial and temporalvariabilities (Tables 1 and 2). However, the relativehomogeneity inside each ellipsoidal lagoon compartmentreflects hydrodynamic and morphological controls ofnutrient dispersion.
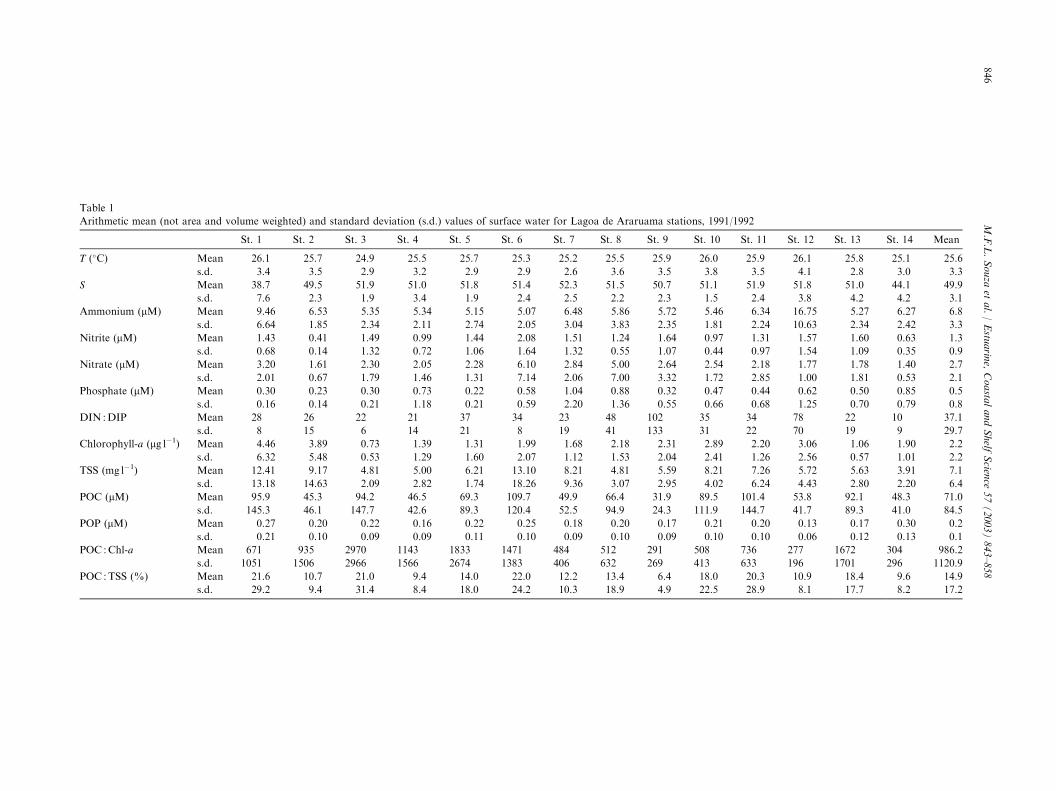
Table 1
Arithmetic mean (not area Araruama stations, 1991/1992
8 St. 9 St. 10 St. 11 St. 12 St. 13 St. 14 Mean
T (�C) M .5 25.9 26.0 25.9 26.1 25.8 25.1 25.6
s .6 3.5 3.8 3.5 4.1 2.8 3.0 3.3
S M .5 50.7 51.1 51.9 51.8 51.0 44.1 49.9
s .2 2.3 1.5 2.4 3.8 4.2 4.2 3.1
Ammonium (lM) M .86 5.72 5.46 6.34 16.75 5.27 6.27 6.8
s .83 2.35 1.81 2.24 10.63 2.34 2.42 3.3
Nitrite (lM) M .24 1.64 0.97 1.31 1.57 1.60 0.63 1.3
s .55 1.07 0.44 0.97 1.54 1.09 0.35 0.9
Nitrate (lM) M .00 2.64 2.54 2.18 1.77 1.78 1.40 2.7
s .00 3.32 1.72 2.85 1.00 1.81 0.53 2.1
Phosphate (lM) M .88 0.32 0.47 0.44 0.62 0.50 0.85 0.5
s .36 0.55 0.66 0.68 1.25 0.70 0.79 0.8
DIN :DIP M 102 35 34 78 22 10 37.1
s 133 31 22 70 19 9 29.7
Chlorophyll-a (lg l�1) M .18 2.31 2.89 2.20 3.06 1.06 1.90 2.2
s .53 2.04 2.41 1.26 2.56 0.57 1.01 2.2
TSS (mg l�1) M .81 5.59 8.21 7.26 5.72 5.63 3.91 7.1
s .07 2.95 4.02 6.24 4.43 2.80 2.20 6.4
POC (lM) M .4 31.9 89.5 101.4 53.8 92.1 48.3 71.0
s .9 24.3 111.9 144.7 41.7 89.3 41.0 84.5
POP (lM) M .20 0.17 0.21 0.20 0.13 0.17 0.30 0.2
s .10 0.09 0.10 0.10 0.06 0.12 0.13 0.1
POC :Chl-a M 291 508 736 277 1672 304 986.2
s 269 413 633 196 1701 296 1120.9
POC :TSS (%) M .4 6.4 18.0 20.3 10.9 18.4 9.6 14.9
s .9 4.9 22.5 28.9 8.1 17.7 8.2 17.2
846
M.F.L.Souza
etal./Estu
arin
e,Coasta
landShelf
Scien
ce57(2003)843–858
and volume weighted) and standard deviation (s.d.) values of surface water for Lagoa de
St. 1 St. 2 St. 3 St. 4 St. 5 St. 6 St. 7 St.
ean 26.1 25.7 24.9 25.5 25.7 25.3 25.2 25
.d. 3.4 3.5 2.9 3.2 2.9 2.9 2.6 3
ean 38.7 49.5 51.9 51.0 51.8 51.4 52.3 51
.d. 7.6 2.3 1.9 3.4 1.9 2.4 2.5 2
ean 9.46 6.53 5.35 5.34 5.15 5.07 6.48 5
.d. 6.64 1.85 2.34 2.11 2.74 2.05 3.04 3
ean 1.43 0.41 1.49 0.99 1.44 2.08 1.51 1
.d. 0.68 0.14 1.32 0.72 1.06 1.64 1.32 0
ean 3.20 1.61 2.30 2.05 2.28 6.10 2.84 5
.d. 2.01 0.67 1.79 1.46 1.31 7.14 2.06 7
ean 0.30 0.23 0.30 0.73 0.22 0.58 1.04 0
.d. 0.16 0.14 0.21 1.18 0.21 0.59 2.20 1
ean 28 26 22 21 37 34 23 48
.d. 8 15 6 14 21 8 19 41
ean 4.46 3.89 0.73 1.39 1.31 1.99 1.68 2
.d. 6.32 5.48 0.53 1.29 1.60 2.07 1.12 1
ean 12.41 9.17 4.81 5.00 6.21 13.10 8.21 4
.d. 13.18 14.63 2.09 2.82 1.74 18.26 9.36 3
ean 95.9 45.3 94.2 46.5 69.3 109.7 49.9 66
.d. 145.3 46.1 147.7 42.6 89.3 120.4 52.5 94
ean 0.27 0.20 0.22 0.16 0.22 0.25 0.18 0
.d. 0.21 0.10 0.09 0.09 0.11 0.10 0.09 0
ean 671 935 2970 1143 1833 1471 484 512
.d. 1051 1506 2966 1566 2674 1383 406 632
ean 21.6 10.7 21.0 9.4 14.0 22.0 12.2 13
.d. 29.2 9.4 31.4 8.4 18.0 24.2 10.3 18
847M.F.L. Souza et al. / Estuarine, Coastal and Shelf Science 57 (2003) 843–858
Table 2
Arithmetic mean (not area and volume weighted) and standard deviation (s.d.) values for surface water of Lagoa de Araruama sampling trips, 1991/
1992
April May June July August October November December January March
T (�C) Mean – 23.6 24.3 21.4 22.3 25.8 29 30.5 28.8 28.1
s.d. – 0.6 0.6 0.6 0.5 0.5 0.8 1.41 1.19 0.6
S Mean 49.7 51.1 49.9 52.9 52.2 49.5 47.9 – 38.3 49
s.d. 1.5 3.9 4.2 4.5 3.3 3.4 2.8 – 14.2 4.4
Ammonium (lM) Mean 8.81 9.25 4.99 4.40 – 6.48 9.06 5.32 9.79 5.67
s.d. 5.12 2.06 1.53 2.51 – 6.36 8.65 3.54 3.14 2.30
Nitrite (lM) Mean 0.78 0.82 1.78 3.06 – 1.33 0.84 0.46 0.73 1.24
s.d. 0.34 0.36 0.50 1.26 – 0.70 0.27 0.21 0.62 0.99
Nitrate (lM) Mean – – – – – 5.56 3.39 1.61 1.73 1.18
s.d. – – – – – 4.83 1.04 0.96 1.18 0.47
Phosphate (lM) Mean 0.14 0.53 0.35 0.95 – 1.77 0.17 0.19 0.24 0.10
s.d. 0.18 0.24 0.40 1.15 – 1.60 0.09 0.22 0.09 0.06
DIN :DIP Mean – – – – – 10 47 63 26 46
s.d. – – – – – 10 43 98 12 26
Chlorophyll-a (lg l�1) Mean 2.6 2.13 1.74 2.26 1.81 0.99 2.21 1.83 7.37 3.06
s.d. 4.9 1.3 1.43 2.07 1.19 0.67 1.65 1.17 7.5 3.13
TSS (mg l�1) Mean 9.11 1.66 7.89 3.27 8.51 7.71 3.28 16.09 7.89 9.05
s.d. 14.07 1.52 8.26 1.01 4.63 3.75 1.83 18.78 3.84 4.6
POC (lM) Mean 48.6 29.7 195.5 96.1 118.3 44.3 27.1 40.0 10.8 62.3
s.d. 66.3 7.4 200.6 39.7 115.3 28.6 6.9 21.8 6.3 68.1
POP (lM) Mean 0.27 0.31 0.25 0.12 0.1 0.28 0.29 0.14 0.24 0.11
s.d. 0.17 0.07 0.04 0.05 0.05 0.05 0.09 0.04 0.07 0.08
POC :Chl-a Mean 666 242 2562 1297 1262 842 346 283 55 1633
s.d. 1166 214 3133 1090 1356 785 421 203 10 2393
POC :TSS (%) Mean 10.1 6.1 48.9 19.4 23.6 8.9 5.5 8 2.7 12.6
s.d. 13.9 1.6 39.3 7.8 23.1 5.8 1.6 4.2 0.6 13.6
The overall mean values (Table 1) indicate that thelagoon has a high dissolved inorganic nutrient concen-tration and a low phytoplankton biomass, estimatedfrom chlorophyll-a for inland waters. The means forTSS, POC, and phosphorus concentrations were alsolow but displayed large deviations.
The salinity in most parts of the lagoon was high andhomogenous. Mean salinity remained fairly constant atmost sampling stations (50–52). The exceptions were theItajuru channel ðS ¼ 38:7Þ and station 1, where abnor-mal amounts of rainfall in January 1992 yielded thelowest salinities ðS ¼ 22:0Þ. Usually, changes in salinityresulted from net evaporation rather than dilution withfresh and oceanic waters. This makes the use of tra-ditional mixing diagrams impossible, since most of thenon-conservative behavior along a salinity gradientoccurs in the lower course of Rio das Mocas (phosphateremoval; Souza, 1993) and in Itajuru channel. Ammo-nium concentrations were also remarkably constant(5.0–6.5 lM), except at stations 1 and 12. At station 12,the concentration reached 30 lM, and was on averagehigher than for the rest of the lagoon (P < 0:01, N ¼ 8).The maximum concentrations of the other inorganicnitrogen species were observed at stations 6 (nitrite andnitrate) and 8 (nitrate). At station 6, low nitrogenconcentration coincided with low ammonium concentra-tion. Both nitrite (P < 0:05, N ¼ 8) and nitrate displayedlower concentrations at station 2 than elsewhere. Low
values of phosphate concentration occurred frequentlyduring the year, although the mean was relatively highwith a maximum at stations 8 and 7, rather than nearthe probable input sources. The mean of DIN/DIPmolar ratio was high overall, reaching 102 : 1 at station9. Station 14, in the channel, was the only site with anaverage ratio below (10 : 1) the Redfield ratio. Themaximum chlorophyll-a concentration occurred at sta-tions 1 and 12, where the variability was higher than atall other stations.
We observed high means of TSS, POC, and POP atstation 6. Elevated means of POC were mostly observedat stations 1, 3, 6, in the embayment of Sao Pedrod’Aldeia (station 10), near the Itajuru canal outlet(stations 11 and 13), and at Massambaba (station 12).There was also a significant deviation of chlorophyll-aand POC concentrations at these stations, although themeans were not significantly different. POP showednegligible spatial variation because it remained in thewater long enough to be dispersed by currents. POPexhibited higher concentrations near the continental(north) margin, in the Itajuru channel, and along thewestern side of the lagoon (station 1), than along thesouth margin near the restinga. The Mann–Whitney Utest for large sample size resulted in a z ¼ 1:75, whichallowed us to reject the null hypothesis at a P < 0:05.
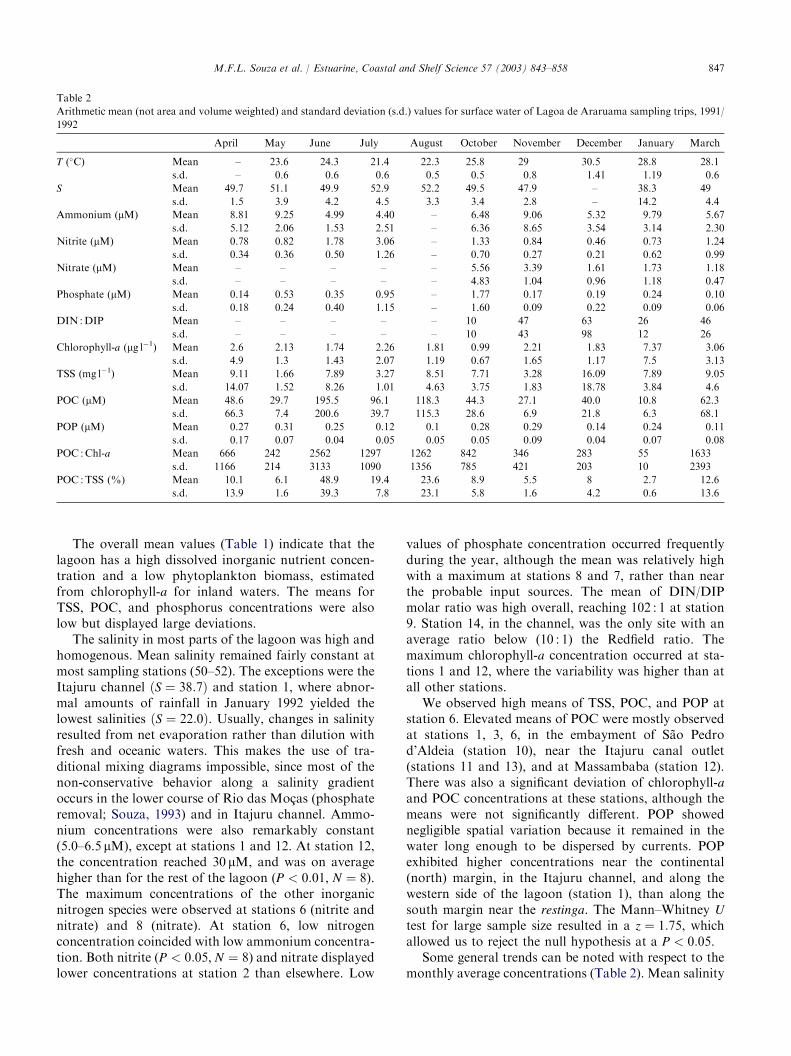
Some general trends can be noted with respect to themonthly average concentrations (Table 2). Mean salinity
848 M.F.L. Souza et al. / Estuarine, Coastal and Shelf Science 57 (2003) 843–858
Table 3
Spearman rank order correlations of surface water for Lagoa de Araruama stations, 1991/1992 (bold values¼P > 0:01; bold and italic¼P > 0:001)
PO43� NH3/NH4
þ NO2� NO3
� S T (�C) POC POP TSS Chl-a
PO43� 1.00 �0.15 0.29 0.54 0.32 �0.64 0.26 0.26 �0.09 �0.09
NH3/NH4þ 1.00 �0.25 0.01 �0.33 0.29 �0.27 0.33 �0.20 0.26
NO2� 1.00 0.42 0.45 �0.61 0.21 �0.07 �0.05 �0.07
NO3� 1.00 0.01 �0.32 �0.02 0.59 �0.14 �0.17
S 1.00 �0.65 0.27 �0.37 0.04 �0.11
T (�C) 1.00 �0.35 0.24 0.12 0.11
POC 1.00 �0.10 0.24 �0.02
POP 1.00 �0.05 �0.01
TSS 1.00 �0.09
Chl-a 1.00
reached its maximum values in July and August anda minimum in January. The lowest mean concentrationof ammonia coincided with the nitrite maximum.Phosphate peak concentrations occurred from July toOctober. In October, chlorophyll-a reached its lowestconcentration. The maximum phytoplankton biomassoccurred in January, when the lowest mean salinity wasrecorded. There was a wide range of TSS and particulateorganic matter concentrations. POC exhibited thegreatest horizontal variation. POC concentrations weregreater in the dry season (April, May, June, July,August 1991, andMarch 1992) as compared with the wetseason (October 1991–January 1992; Mann–WhitneyU ¼ 710, z ¼ 2:93, P < 0:01), shifting independently ofTSS. The months when POC measurements yielded high
Table 4
Descriptive statistic of the variables used in the clusters formed by k-
means clustering analysis (mean concentrations as in Tables 1 and 2)
Cluster Stations Variable Mean s.d. N
A 1 Phosphate 0.30 0.16 8
Ammonia 9.46 6.64 8
Nitrate 3.20 1.70 5
Salinity 38.71 7.57 8
POP 0.27 0.21 9
B 2,3,5,9,10,
11, and 13
Phosphate 0.35 0.49 47
Ammonia 5.70 2.18 47
Nitrate 2.19 1.71 35
Salinity 51.08 2.42 48
POP 0.20 0.10 52
C 12 Phosphate 0.62 1.25 8
Ammonia 16.75 10.63 8
Nitrate 1.77 1.00 5
Salinity 51.80 3.77 8
POP 0.13 0.06 8
D 4,7, and 14 Phosphate 0.88 1.43 21
Ammonia 6.07 2.48 21
Nitrate 2.10 1.26 15
Salinity 49.35 4.82 23
POP 0.22 0.12 23
E 6 and 8 Phosphate 0.74 1.05 15
Ammonia 5.52 3.11 14
Nitrate 5.55 5.70 10
Salinity 51.44 2.22 16
POP 0.22 0.10 17
values coincided with the highest values for the detritalorganic carbon (inferred by POC/chlorophyll-a ratio;Knoppers, 1982), organic carbon percent in the TSS,and the POC/POP ratio. We observed the maximumvalues of chlorophyll-a, minimum values of POC, thePOC/TSS, POC/chlorophyll-a, and POC/POP ratios inJanuary 1992.
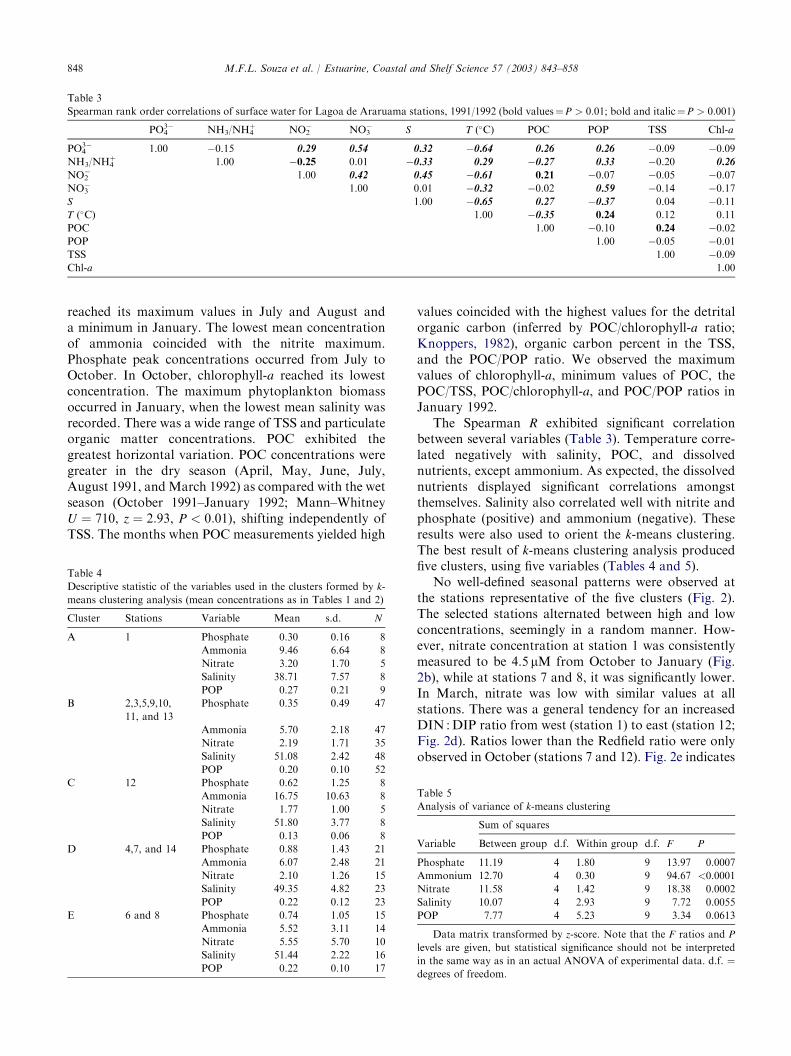
The Spearman R exhibited significant correlationbetween several variables (Table 3). Temperature corre-lated negatively with salinity, POC, and dissolvednutrients, except ammonium. As expected, the dissolvednutrients displayed significant correlations amongstthemselves. Salinity also correlated well with nitrite andphosphate (positive) and ammonium (negative). Theseresults were also used to orient the k-means clustering.The best result of k-means clustering analysis producedfive clusters, using five variables (Tables 4 and 5).
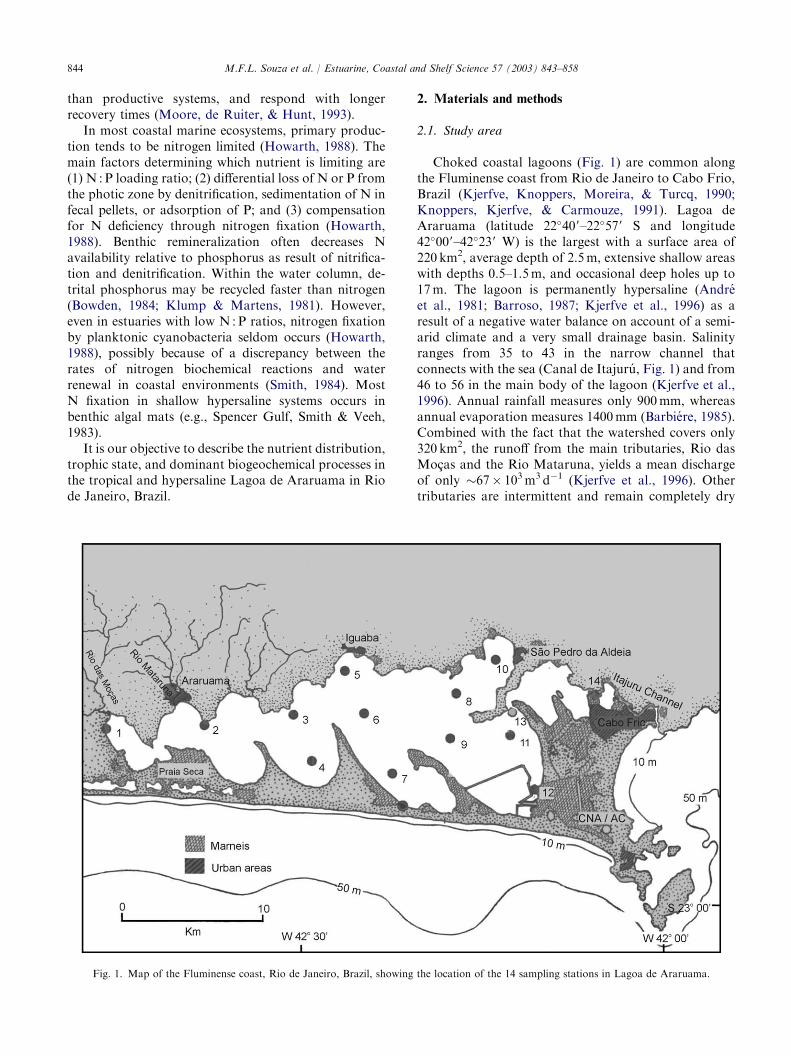
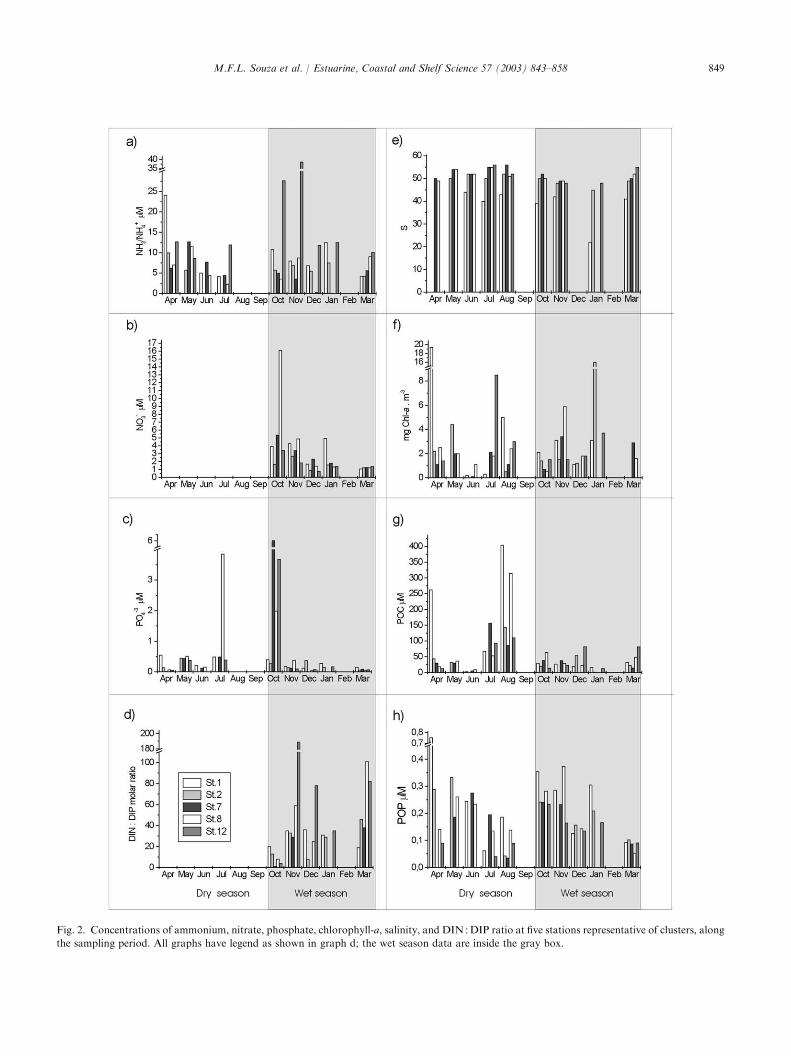
No well-defined seasonal patterns were observed atthe stations representative of the five clusters (Fig. 2).The selected stations alternated between high and lowconcentrations, seemingly in a random manner. How-ever, nitrate concentration at station 1 was consistentlymeasured to be 4.5 lM from October to January (Fig.2b), while at stations 7 and 8, it was significantly lower.In March, nitrate was low with similar values at allstations. There was a general tendency for an increasedDIN :DIP ratio from west (station 1) to east (station 12;Fig. 2d). Ratios lower than the Redfield ratio were onlyobserved in October (stations 7 and 12). Fig. 2e indicates
Table 5
Analysis of variance of k-means clustering
Sum of squares
Variable Between group d.f. Within group d.f. F P
Phosphate 11.19 4 1.80 9 13.97 0.0007
Ammonium 12.70 4 0.30 9 94.67 <0.0001
Nitrate 11.58 4 1.42 9 18.38 0.0002
Salinity 10.07 4 2.93 9 7.72 0.0055
POP 7.77 4 5.23 9 3.34 0.0613
Data matrix transformed by z-score. Note that the F ratios and P
levels are given, but statistical significance should not be interpreted
in the same way as in an actual ANOVA of experimental data. d.f. ¼degrees of freedom.
849M.F.L. Souza et al. / Estuarine, Coastal and Shelf Science 57 (2003) 843–858
Fig. 2. Concentrations of ammonium, nitrate, phosphate, chlorophyll-a, salinity, and DIN :DIP ratio at five stations representative of clusters, along
the sampling period. All graphs have legend as shown in graph d; the wet season data are inside the gray box.
850 M.F.L. Souza et al. / Estuarine, Coastal and Shelf Science 57 (2003) 843–858
that salinity was only affected by freshwater runoff atstation 1. All stations exhibited chlorophyll-a concen-trations higher than 4mgm�3 at least once during theyear (Fig. 2f), except at station 7, which was located farfrom any pollution source. Not even the extremely highphosphate concentration observed in October at thisstation (Fig. 2c) resulted an increased phytoplanktonbiomass. POC was low at all stations for most of theyear (Fig. 2g), but high concentrations were observed inApril (station 1), July, and especially in August (stations1 and 8). POP exhibited what could be described as aspatially uncoupled behavior (Fig. 2h). Except forstation 12, which had a single peak in October, moststations exhibited a bimodal seasonal POP signal.
3.2. Water, salt, and flux calculations for DIN and DIP
To understand how the lagoon functions, we adoptedthe simple mass balance modeling procedure developedby Smith et al. (1987) and Smith, Hollibaugh, Dollar, &Vink (1989), as described in the LOICZ guidelines(Gordon et al., 1996). The budget was modified from anearlier water and salt balance model (Kjerfve et al.,1996) for the same sampling period (Table 6). Addi-tional data from Bonecker et al. (1993) and Landim deSouza (1997) were also used to construct the balanceand assess seasonal variability.
The water balance was calculated from
dV
dt¼ VP þVE þVG þVQ þVO þVC þVR �VM
where VP and VE are rain and evaporation, VG isgroundwater flux (assumed to be zero), VQ is the surfacerunoff, VO is the Juturnaıba pumped discharge, VC isseawater pumped to the barge channel, VR is the residualflux needed to assume dV=dt ¼ 0, and VM is the ap-proximate water loss in the marnel (diked evaporationpond).
The salt balance was obtained by solving
VdS
dt¼ VMSM þVCSC þVRSR þVXðS2 � S1Þ
which includes the main salt fluxes (evaporation pondand barge channel pumping, residual and mixingthrough Itajuru channel). V dS=dt � 259� 103 kg d�1
due to salt mining (Kjerfve et al., 1996). S1 and S2 referto average salinity of the system and ocean, respectively.The exchange flow (VX) was estimated as
VX ¼ VRSRðS1 � S2Þ
Though the Lagoa de Araruama was a net evapo-rative basin on an annual scale, the system exhibited apositive freshwater balance ð�VR ¼ VP þVQ þ VO � VEÞduring 4 months (January, March and November 1991,and January 1992). These shifts in the balance of water
cause a lower salinity at the western portion (station 1,December, 1991, S ¼ 22:0).
The non-conservative constituent budget was calcu-lated from
VdY
dtþ Y
dV
dt¼X
VinYin �X
VoutYout þDY
Rearranging and assuming Y and V are in steady stateon an annual time scale
DY ¼�X
VinYin �X
VoutYout
The DIN and DIP concentrations in the lagoon (Y1)are volume-weighted averages and the values for fresh-water (YQ) are average concentrations in Rio das Mocasand Rio Mataruna. Oceanic concentrations (Y2) arebased on the average of three locations near the lagoonmouth (Bonecker et al., 1993). Contributions to thenutrient fluxes from precipitation, evaporation, andgroundwater were assumed to be negligible. The con-centration used to estimate sewage outfalls (YO) wasobtained by dividing a conservative per capita index of
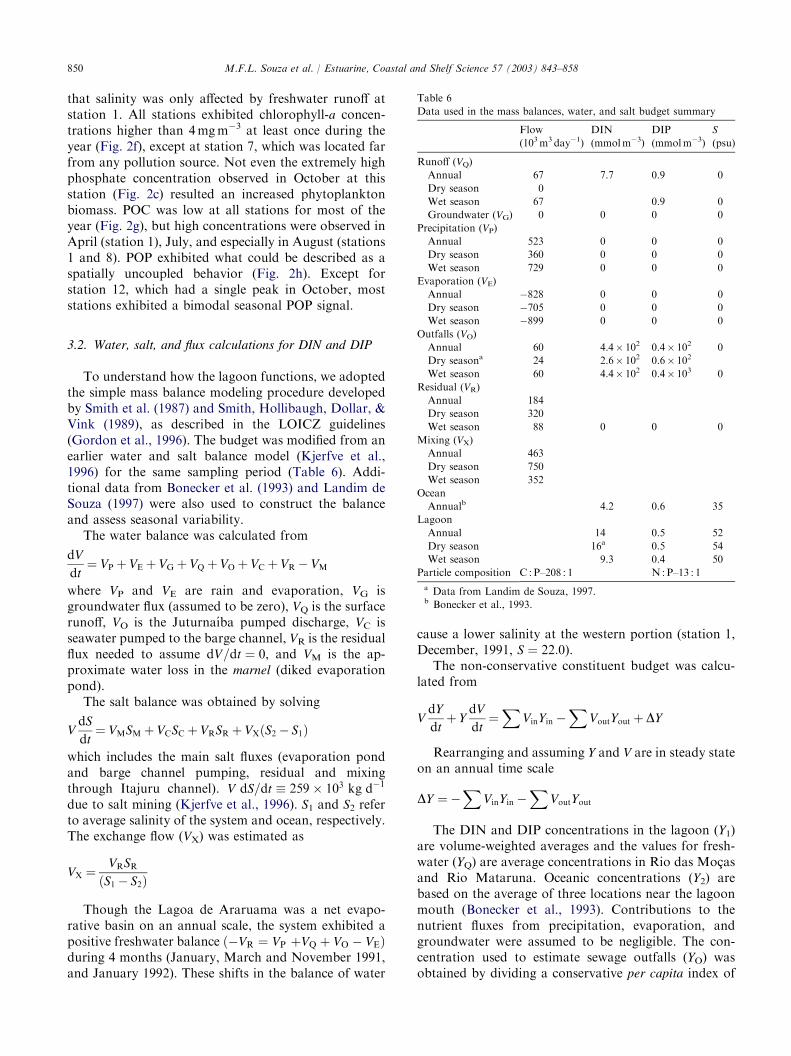
Table 6
Data used in the mass balances, water, and salt budget summary
Flow
(103m3 day�1)
DIN
(mmolm�3)
DIP
(mmolm�3)
S
(psu)
Runoff (VQ)
Annual 67 7.7 0.9 0
Dry season 0
Wet season 67 0.9 0
Groundwater (VG) 0 0 0 0
Precipitation (VP)
Annual 523 0 0 0
Dry season 360 0 0 0
Wet season 729 0 0 0
Evaporation (VE)
Annual �828 0 0 0
Dry season �705 0 0 0
Wet season �899 0 0 0
Outfalls (VO)
Annual 60 4.4� 102 0.4� 102 0
Dry seasona 24 2.6� 102 0.6� 102
Wet season 60 4.4� 102 0.4� 103 0
Residual (VR)
Annual 184
Dry season 320
Wet season 88 0 0 0
Mixing (VX)
Annual 463
Dry season 750
Wet season 352
Ocean
Annualb 4.2 0.6 35
Lagoon
Annual 14 0.5 52
Dry season 16a 0.5 54
Wet season 9.3 0.4 50
Particle composition C : P–208 : 1 N : P–13 : 1
a Data from Landim de Souza, 1997.b Bonecker et al., 1993.
851M.F.L. Souza et al. / Estuarine, Coastal and Shelf Science 57 (2003) 843–858
300 and 20Mperson�1 yr�1 of N and P, respectively, fora population of 70500 (IBGE, 1991). The estimate ofoutfalls in the dry season was estimated by Landimde Souza (1997). The sewage enters septic tanks and se-wage dishes and reaches the lagoon untreated. The as-sumed freshwater discharge was the combined flow fromthe two major streams and Juturnaıba (Kjerfve et al.,1996). Flux results are summarized in Tables 6 and 7and Figs. 3–6.
4. Discussion
4.1. Biogeochemistry of C, N, and P
High nutrient concentration and simultaneous lowphytoplankton biomass are not common occurrencesin a coastal lagoon (Knoppers, 1994; Knoppers,Carmouze, & Moreira-Turcq, 1999). In a hypersalinelagoon it is easy to attribute a causal relationshipbetween low phytoplankton biomass and salinity. But inLagoa de Araruama we did not observe a significantcorrelation between these variables (Table 3). Thereason microphytobenthic mats are the dominantprimary producers, whereas phytoplankton biomass islimited, is due to restricted oceanic exchange and theconsistent hypersaline conditions of the lagoon for manydecades or even centuries.
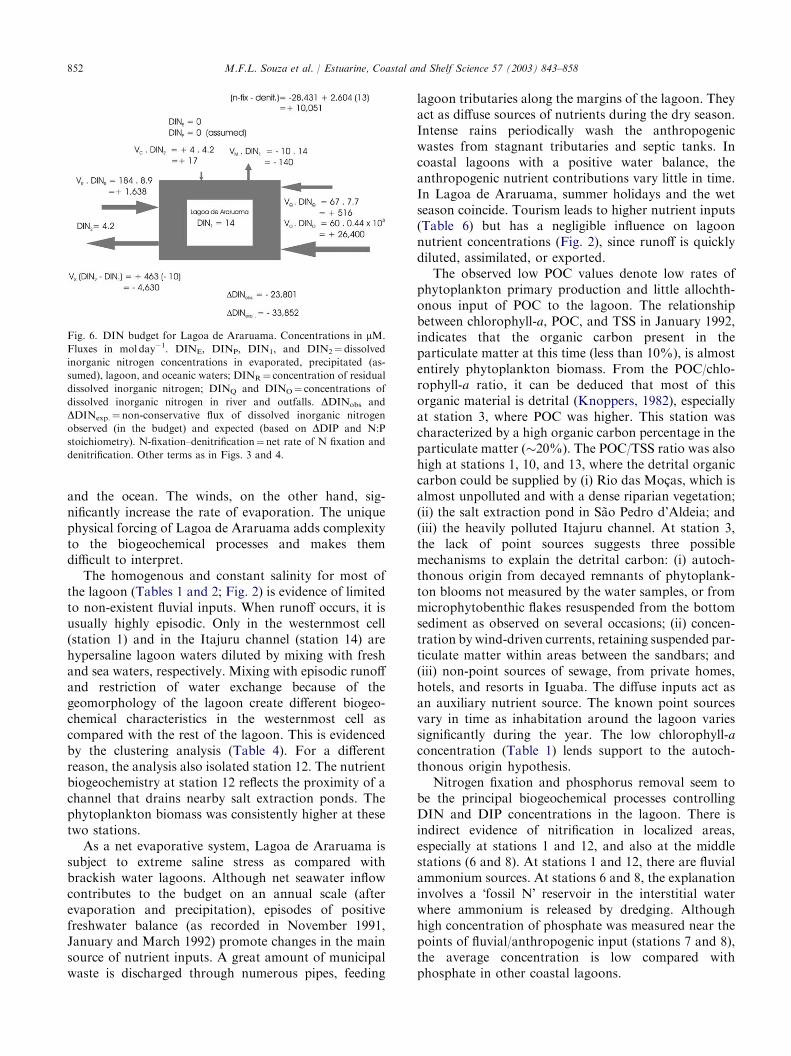
Table 7
Non-conservative fluxes and metabolic rates
DDINobs DDINexp
N-fixation–
denitrification DDIP p� r
mol day�1
Annual �23801 �33852 þ10051 �2604 541632
Dry season �13322 �9441 þ36085 �1751 364208
Wet season �25715 �33462 þ7747 �2574 535392
molm�2 yr�1
Annual �0.04 �0.06 þ0.02 �0.00 0.90
Dry season �0.02 �0.02 þ0.06 �0.00 0.60
Wet season �0.04 �0.03 +0.01 �0.00 0.90
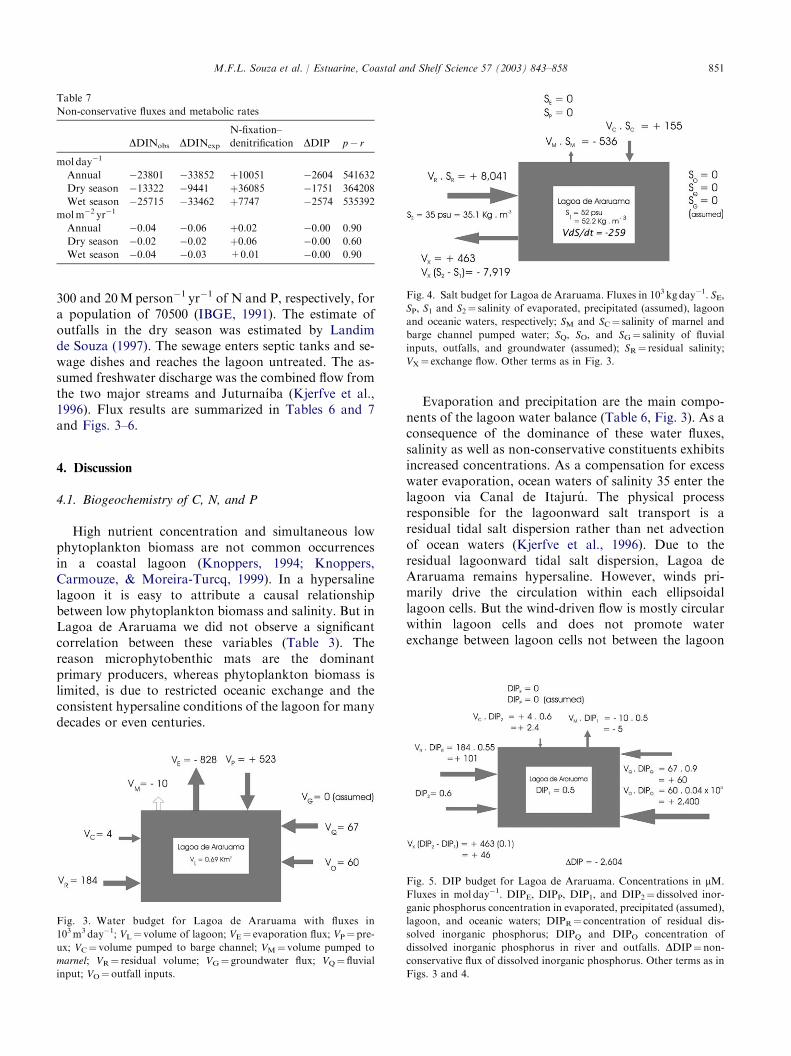
Fig. 3. Water budget for Lagoa de Araruama with fluxes in
103m3 day�1; VL¼ volume of lagoon; VE¼ evaporation flux; VP¼pre-
ux; VC¼ volume pumped to barge channel; VM¼ volume pumped to
marnel; VR¼ residual volume; VG¼ groundwater flux; VQ¼ fluvial
input; VO¼ outfall inputs.
Evaporation and precipitation are the main compo-nents of the lagoon water balance (Table 6, Fig. 3). As aconsequence of the dominance of these water fluxes,salinity as well as non-conservative constituents exhibitsincreased concentrations. As a compensation for excesswater evaporation, ocean waters of salinity 35 enter thelagoon via Canal de Itajuru. The physical processresponsible for the lagoonward salt transport is aresidual tidal salt dispersion rather than net advectionof ocean waters (Kjerfve et al., 1996). Due to theresidual lagoonward tidal salt dispersion, Lagoa deAraruama remains hypersaline. However, winds pri-marily drive the circulation within each ellipsoidallagoon cells. But the wind-driven flow is mostly circularwithin lagoon cells and does not promote waterexchange between lagoon cells not between the lagoon
Fig. 4. Salt budget for Lagoa de Araruama. Fluxes in 103 kg day�1. SE,
SP, S1 and S2¼ salinity of evaporated, precipitated (assumed), lagoon
and oceanic waters, respectively; SM and SC¼ salinity of marnel and
barge channel pumped water; SQ, SO, and SG¼ salinity of fluvial
inputs, outfalls, and groundwater (assumed); SR¼ residual salinity;
VX¼ exchange flow. Other terms as in Fig. 3.
Fig. 5. DIP budget for Lagoa de Araruama. Concentrations in lM.
Fluxes in mol day�1. DIPE, DIPP, DIP1, and DIP2¼dissolved inor-
ganic phosphorus concentration in evaporated, precipitated (assumed),
lagoon, and oceanic waters; DIPR¼ concentration of residual dis-
solved inorganic phosphorus; DIPQ and DIPO concentration of
dissolved inorganic phosphorus in river and outfalls. DDIP¼ non-
conservative flux of dissolved inorganic phosphorus. Other terms as in
Figs. 3 and 4.
852 M.F.L. Souza et al. / Estuarine, Coastal and Shelf Science 57 (2003) 843–858
and the ocean. The winds, on the other hand, sig-nificantly increase the rate of evaporation. The uniquephysical forcing of Lagoa de Araruama adds complexityto the biogeochemical processes and makes themdifficult to interpret.
The homogenous and constant salinity for most ofthe lagoon (Tables 1 and 2; Fig. 2) is evidence of limitedto non-existent fluvial inputs. When runoff occurs, it isusually highly episodic. Only in the westernmost cell(station 1) and in the Itajuru channel (station 14) arehypersaline lagoon waters diluted by mixing with freshand sea waters, respectively. Mixing with episodic runoffand restriction of water exchange because of thegeomorphology of the lagoon create different biogeo-chemical characteristics in the westernmost cell ascompared with the rest of the lagoon. This is evidencedby the clustering analysis (Table 4). For a differentreason, the analysis also isolated station 12. The nutrientbiogeochemistry at station 12 reflects the proximity of achannel that drains nearby salt extraction ponds. Thephytoplankton biomass was consistently higher at thesetwo stations.
As a net evaporative system, Lagoa de Araruama issubject to extreme saline stress as compared withbrackish water lagoons. Although net seawater inflowcontributes to the budget on an annual scale (afterevaporation and precipitation), episodes of positivefreshwater balance (as recorded in November 1991,January and March 1992) promote changes in the mainsource of nutrient inputs. A great amount of municipalwaste is discharged through numerous pipes, feeding
Fig. 6. DIN budget for Lagoa de Araruama. Concentrations in lM.
Fluxes in mol day�1. DINE, DINP, DIN1, and DIN2¼dissolved
inorganic nitrogen concentrations in evaporated, precipitated (as-
sumed), lagoon, and oceanic waters; DINR¼ concentration of residual
dissolved inorganic nitrogen; DINQ and DINO¼ concentrations of
dissolved inorganic nitrogen in river and outfalls. DDINobs and
DDINexp.¼non-conservative flux of dissolved inorganic nitrogen
observed (in the budget) and expected (based on DDIP and N:P
stoichiometry). N-fixation–denitrification¼net rate of N fixation and
denitrification. Other terms as in Figs. 3 and 4.
lagoon tributaries along the margins of the lagoon. Theyact as diffuse sources of nutrients during the dry season.Intense rains periodically wash the anthropogenicwastes from stagnant tributaries and septic tanks. Incoastal lagoons with a positive water balance, theanthropogenic nutrient contributions vary little in time.In Lagoa de Araruama, summer holidays and the wetseason coincide. Tourism leads to higher nutrient inputs(Table 6) but has a negligible influence on lagoonnutrient concentrations (Fig. 2), since runoff is quicklydiluted, assimilated, or exported.
The observed low POC values denote low rates ofphytoplankton primary production and little allochth-onous input of POC to the lagoon. The relationshipbetween chlorophyll-a, POC, and TSS in January 1992,indicates that the organic carbon present in theparticulate matter at this time (less than 10%), is almostentirely phytoplankton biomass. From the POC/chlo-rophyll-a ratio, it can be deduced that most of thisorganic material is detrital (Knoppers, 1982), especiallyat station 3, where POC was higher. This station wascharacterized by a high organic carbon percentage in theparticulate matter (�20%). The POC/TSS ratio was alsohigh at stations 1, 10, and 13, where the detrital organiccarbon could be supplied by (i) Rio das Mocas, which isalmost unpolluted and with a dense riparian vegetation;(ii) the salt extraction pond in Sao Pedro d’Aldeia; and(iii) the heavily polluted Itajuru channel. At station 3,the lack of point sources suggests three possiblemechanisms to explain the detrital carbon: (i) autoch-thonous origin from decayed remnants of phytoplank-ton blooms not measured by the water samples, or frommicrophytobenthic flakes resuspended from the bottomsediment as observed on several occasions; (ii) concen-tration by wind-driven currents, retaining suspended par-ticulate matter within areas between the sandbars; and(iii) non-point sources of sewage, from private homes,hotels, and resorts in Iguaba. The diffuse inputs act asan auxiliary nutrient source. The known point sourcesvary in time as inhabitation around the lagoon variessignificantly during the year. The low chlorophyll-aconcentration (Table 1) lends support to the autoch-thonous origin hypothesis.
Nitrogen fixation and phosphorus removal seem tobe the principal biogeochemical processes controllingDIN and DIP concentrations in the lagoon. There isindirect evidence of nitrification in localized areas,especially at stations 1 and 12, and also at the middlestations (6 and 8). At stations 1 and 12, there are fluvialammonium sources. At stations 6 and 8, the explanationinvolves a �fossil N� reservoir in the interstitial waterwhere ammonium is released by dredging. Althoughhigh concentration of phosphate was measured near thepoints of fluvial/anthropogenic input (stations 7 and 8),the average concentration is low compared withphosphate in other coastal lagoons.
853M.F.L. Souza et al. / Estuarine, Coastal and Shelf Science 57 (2003) 843–858
The ammonium variability in the lagoon can beexplained by the input of ammonium and organicmatter by Rio das Mocas and Rio Mataruna, anddomestic sewage discharge into restricted circulationcompartments. At station 12, near the outlet from a saltevaporation pond, ammonium is likely to be derivedfrom algal mat metabolism (Cohen, Aizenshtat, Stoler,& Jorgensen, 1980). Ammonium could also be releasedthrough the sediment–water interface by remineraliza-tion (Caffrey, 1995; Klump & Martens, 1983), enhancedby bioturbation, dredging (Forja, Blasco, & Gomez-Parra, 1994), and excretion by benthic organisms(Caffrey, 1995; Murphy & Kremer, 1985). The mostsignificant benthic organisms are dense populations ofthe bivalve Anomalocardia, measuring >200 individ-ualsm2. Studies at Sao Pedro d’Aldeia, where thebivalve density is lower, revealed low ammonium fluxesto the water column. Rates were measured to be equal to0.6mMm�2 day�1 (Knoppers et al., 1996).
The small NOx concentrations observed at station 2probably were the result of depletion by primaryproducers. This part of the lagoon showed relativelyhigh chlorophyll-a concentration and thus phytoplank-ton biomass (Table 1). Moreover, large areas of thebottom of the lagoon toward the west are denselycolonized by microphytobenthic communities. The highconcentration of NOx observed in the middle of thelagoon could be due to nitrification. It should be notedthat two calcareous shell-extraction dredges operatedin this area continuously during the entire year ofsampling. The dredging activity could have caused re-lease of ammonium to the water column. Oxidation bynitrifying bacteria, resuspended from the bottomsediment, could explain the high observed nitriteand nitrate concentrations (Paerl & Pinckney, 1996;Rysgaard, Risgaard-Petersen, Sloth, Jensen, & Nielsen,1994), especially at stations 6 and 8. However, the veryhigh concentrations observed at station 12, suggest theexistence of sources of ammonium, probably from thenearby evaporation or salt extraction ponds. Otherpotential sources of NOx are less likely because of lowammonium concentration at stations 13 and 14 (Canalde Itajuru), station 10 (Sao Pedro d’Aldeia), andstations 6–9 (dredging). The high concentrations ofnitrate at stations 6 and 8 agree with the hypothesis ofnitrification of ammonium inputs from station 12, sincecurrents generated by intense and persistent northeast-erly winds easily could have caused currents to trans-port the nitrogen. If dredging had been the source ofthe nitrate, this would imply a very high nitrificationrate.
4.2. Budgets of DIN and DIP
The DIN and phosphorus budgets for Lagoa deAraruama have already been included as a LOICZ
modeling node (http://data.ecology.su.se/MNODE/SouthAmerica/araruama/Araruama1/Araruamabud.htm),as well as an additional budget made with data from1994 (Landim de Souza & Knoppers, 2000; http://data.ecology.su.se/MNODE/South%20America/araruama/arrev2/ar2budrev2.htm).
The results based on the water and salt budgets (Figs.3 and 4) demonstrate that the anthropogenic sourcesdominate the nutrient balance (Figs. 5 and 6). This isone conclusion that can be drawn from the salt budget.Even for this system, with significant salt extraction, thesalt extraction corresponds to only 3% of the saltbudget. Despite the restricted oceanic water exchange,residual flux of seawater into the lagoon easily com-pensates for any salt loss due to extraction. Thus, saltmining represents only a small perturbation in the saltbudget.
As a result of sewage runoff, there is a sink for DIP inthe lagoon, as suggested by the net water inflow to thelagoon and net lagoonward dispersion of salt based onthe salt concentration gradient (Kjerfve et al., 1996;Table 6, Fig. 5). This sink maintains water column DIPconcentrations relatively low. Although the sewage loadis not well defined, the order of magnitude estimate ofsewage suggests that it may determine the rate of the DIPsink. The sediment is the sink, but how much is due tobiological assimilation (microphytobenthos) or retentionin the carbonate-rich sediment is still unresolved.Campos, Queiroz, Lacerda, and Okuda (1979) foundlow concentrations of total phosphorus in the sediment ofLagoa de Araruama, approximately 0.04–0.12mg g�1.These values are consistent with those of Landim deSouza (1997), who found 0.01 and 0.3mgP g�1 in thesurface sediment of cores collected near Iguaba Grandeand Araruama, respectively. Other hypersaline systems,such as Spencer Gulf (Smith and Veeh, 1983) and SharkBay (Atkinson, 1987), also exhibit low water column andsediment DIP concentrations as well as phosphorusremoval by microphytobenthos. Atkinson (1987) pre-sented an explanation of the mechanism for this appar-ent paradox.
Part of the phosphorus could be recycled and releasedto the water column in dissolved organic form. Theavailable concentrations, 0.09–0.57 lM (Andre et al.,1981) do not suggest that the water column is an im-portant reservoir. Particulate burial is also an incon-sistent explanation for phosphorus losses, since both theTSS and POP concentrations were low.
DIN, unlike DIP, was lost to the ocean due to mixingwith nitrogen-poor water. Nitrogen sewage inputs arethree orders of magnitude higher than phosphorus(Table 6; Figs. 5 and 6). As is the case of DIP, almostall DIN added as sewage is taken up by the system. Thisloss of DIN would need to be five times as large as wasobserved for the estimated DIN load from sewage.Thus, it appears that the lagoon is a net nutrient sink.
854 M.F.L. Souza et al. / Estuarine, Coastal and Shelf Science 57 (2003) 843–858
The DDIN observed was higher than the calculatedDDIP and the N : P ratio in the particulate matter(DDINexp). This difference can partially be attributed tothe balance between nitrogen fixation and denitrification(Gordon et al., 1996)
ðN fixation� denitrificationÞ ¼ DN�DPðN : PÞpartWe determined that Lagoa de Araruama primarily
experiences net nitrogen fixation, but two considerationscomplicate this assertion. First, we do not know theexact amount of DDIP used for primary production,which could imply an overestimate. Second, we are notcertain that part of DDIN is recycled and thus trans-ferred at high enough a rate into the DON pool, e.g.19–40 lM (Andre et al., 1981), which could imply anunderestimate of nitrogen fixation. Ammonium inputfrom salt evaporation ponds (station 12) and dredgingwas not included in the budget.
Despite the potential importance of carbonate sed-imentation in the DIP removal, much phosphorus entersthe sedimentary compartment from microphytobenthicassimilation (benthic primary production). Most of theammonium from salt evaporation ponds is, in fact, DINwith the lagoon as a source. Nitrogen regeneration fromthe sediment is already included in the budget as acomponent of DDIN, but the ammonium input due todredging can be considered as �fossil N�, external to thesystem (S.V. Smith, personal communication). Unfortu-nately, we have no way to deal with this issue or the rateof transfer to the DON pool.
The question arises: why is nitrogen fixed in Lagoa deAraruama, which is subjected to a strong anthropogenicDIN input?
If we assume that the budget trends are correct, wecan infer the net ecosystem metabolism, i.e. primaryproduction (p) minus respiration (r), as described byGordon et al. (1996)
ðp� rÞ ¼ �DDIPðC : PÞpart ¼�ð2604Þ:208
¼þ541632 mol C day�1
which implies that the lagoon is net autotrophic with ayield of +0.9Mm�2 yr�1. Similar analysis of morerecent data from the lagoon found a slight net hetero-trophic state (Landim de Souza & Knoppers, 2000). Thissuggests that the lagoon also undergoes long-termchanges of net ecosystem metabolism. These changesare probably more related to modification of terrestrialinputs, while the seasonal shifts between net autotrophyand heterotrophy (Knoppers et al., 1996) depend onwind resuspension of bottom sediment.
This is similar to observations (Smith et al., 1989), inwhich the biomass of the primary producers is enhancedby dissolved inorganic and organic nutrients inputs,but is restricted by phosphorus availability. Nitrogenfixation and organic matter decomposition lead to high
DIN concentrations, composed mainly of ammonium.We observed this in April 1991 (Table 2). Occasionally,the ammonium is also oxidized, producing high nitrateconcentrations, as observed in October 1991 (Table 2).Therefore, there would be no change in net productionalthough an increased rate of recycling. The coupling ofbiogeochemical processes leads to retention of phos-phorus (in the sediment) and nitrogen (in the watercolumn) and intense recycling of the biotic/abiotic sedi-ment components, which prevent the formation of eutro-phic conditions in the lagoon.
�Net nitrogen fixation� and �net heterotrophy� do notimpede the occurrence of nitrification or autotrophy.Also, the evidence of nitrification is limited to a smallarea of the lagoon during one season. This does notexclude the occurrence of nitrogen fixation in most ofthe lagoon, most of the time. Otherwise, nitrification isonly an intermediate step in the nitrogen cycle inaquatic environments. Nitrogen fixation and denitrifi-cation are the only pathways that can cause nitrogen toenter or leave the system. And it must do so to becomenitrified.
One could also argue that the uncertainty in theratios used in stoichiometric relations is a drawbackwhich cannot be resolved. Actually, we do not know thestoichiometry of microphytobenthos or the processesresponsible for diagenesis. As sedimentary fluxes are notan important sink for phosphorus, this does not implythat suspended particulate material is unimportant tothe metabolism of the lagoon. The very long residencetime for water means that any material constituent staysin the lagoon for a long time, thus being available to bemetabolized while, both being suspended and afterdeposition. Moreover, the stoichiometric ratio of themicrophytobenthic communities should not be muchdifferent than the stoichiometric ratio found in theparticulate matter. Hillebrand and Sommer (1999)found experimentally that microphytobenthos growingwithout nutrient limitation has a C :N : P ratio of119 : 17 : 1, ‘‘. . .stable against changes of abiotic con-ditions’’. They also found that phosphorus limitationshifted the C : P and N : P ratios to become larger than130 : 1 and 22 : 1, respectively. These values are verysimilar to our measurements in Lagoa de Araruama.Sensitivity analysis indicates that such high ratios do notchange our conclusions. Whatever the �exact� C : P ratio,it would not change the sign of the p� r rate. In fact, aC : P ratio of 130 : 1 would only reduce p� r by 0.6.Further, the N : P ratio should be lower than 10 toproduce net denitrification, whereas N : P ¼ 22 wouldlead to N-fixation rates three times as high.
4.3. Trophic state assessment
The low nutrient and chlorophyll-a concentrations,along with the quantitative and qualitative features of
855M.F.L. Souza et al. / Estuarine, Coastal and Shelf Science 57 (2003) 843–858
Table 8
Salinity, chlorophyll-a (lg l�1) and dissolved nutrients (lmol l�1) in this and former studies (range and average values in brackets; d.l.¼ below the
detection limit; –¼not analyzed)
Salinity Chl-a NH3/NH4+ NO2
� NO3� PO4
3� Reference
31–89 (58) d.l.–1.0 (0.19) 0.4–11.0 (4.1) – 0.5–8.1 (2.5) 0.2–1.9 (0.4) FEEMA, 1977 (n¼ 39)
30–110 (66) d.l.–7.0 (1.19) 1.4–11.0 (5.0) – 0.7–5.9 (1.7) d.l.–0.3 (0.2) FEEMA, 1978 (n¼ 66)
62–69 (64) – 1.0–2.5 (1.7) 0.01–0.04 (0.03) d.l.–0.8 (0.3) d.l.–0.8 (0.4) Andre et al., 1981 (n¼ 34)
22–56 (50) d.l.–19.0 (2.0) 0.3–39.0 (6.6) 0.2–6.0 (1.4) 0.3–18.0 (3.3) 0.01–6.0 (0.5) This study (n¼ 197)
the suspended matter, allow us to rank Lagoa deAraruama as oligotrophic. However, maximum valuesof dissolved nutrients, chlorophyll-a, POC, and theaverage chlorophyll-a were higher than in previousstudies (Table 8). These observations suggest that thelagoon is in transition to a mesotrophic state.
The average DIN/DIP ratio of 38 : 1 in the lagoonwas more than twice the Redfield ratio of 16 : 1. Theobserved ratio by far exceeds ratios measured in theother Fluminense lagoons (Carmouze, D’Elia Sampaio,& Domingos, 1994; Knoppers et al., 1991). AlthoughDIN/DIP of 38 : 1 alone is not diagnostic of nutrientlimitation (Smith, 1984), it suggests that primary pro-duction in Lagoa de Araruama tends to be limited byphosphorus availability. Our data suggest phospho-rus limitation as a result of preferential release ofammonium by the benthic community (Knoppers et al.,1996).
The low concentration of phosphate in the lagoon(compared with the other Fluminense lagoons) can beexplained by removal from the sediment, either by bio-logical uptake by benthic microalgae or by physico-chemical processes in the carbonate sediments, resultingin diagenetic apatite formation (Balzer, Bodungen, &Pollehne, 1985). Bell-jar experiments (Knoppers et al.,
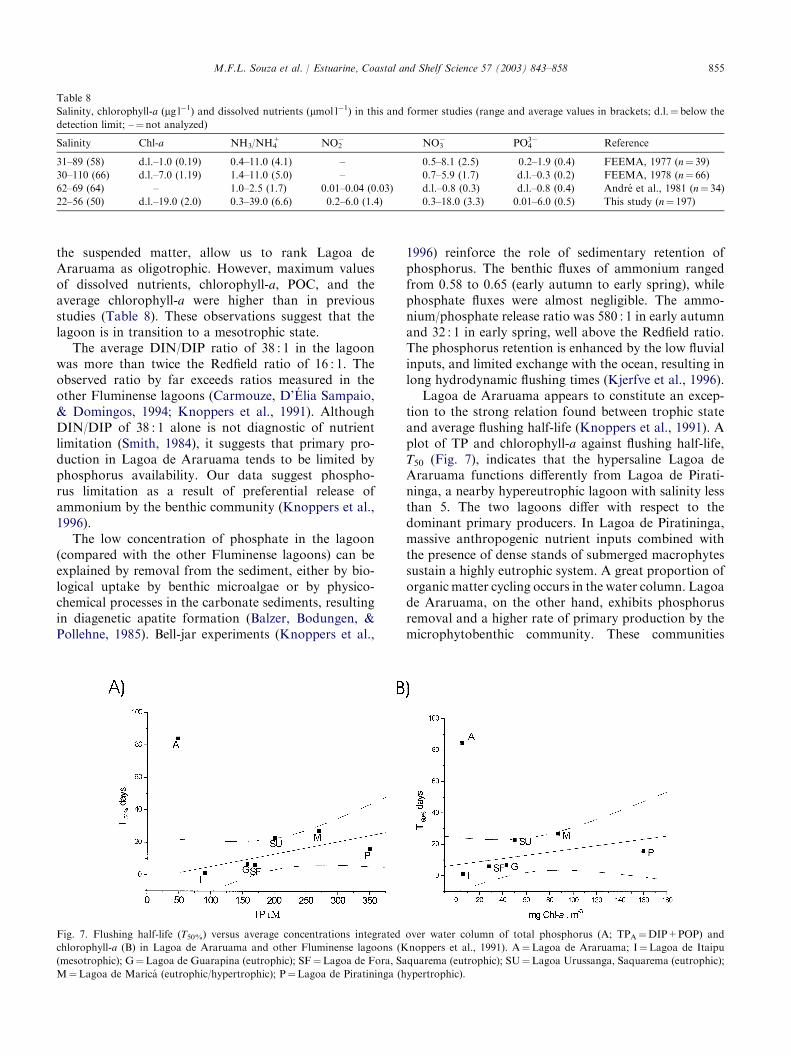
1996) reinforce the role of sedimentary retention ofphosphorus. The benthic fluxes of ammonium rangedfrom 0.58 to 0.65 (early autumn to early spring), whilephosphate fluxes were almost negligible. The ammo-nium/phosphate release ratio was 580 : 1 in early autumnand 32 : 1 in early spring, well above the Redfield ratio.The phosphorus retention is enhanced by the low fluvialinputs, and limited exchange with the ocean, resulting inlong hydrodynamic flushing times (Kjerfve et al., 1996).
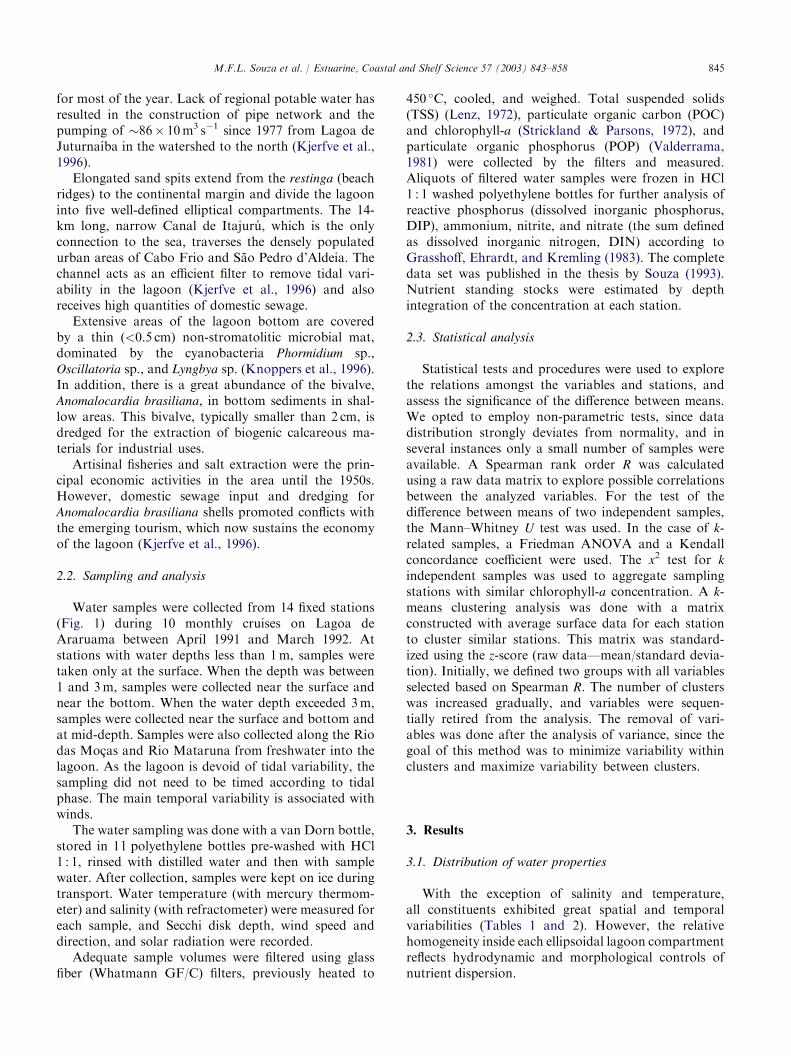
Lagoa de Araruama appears to constitute an excep-tion to the strong relation found between trophic stateand average flushing half-life (Knoppers et al., 1991). Aplot of TP and chlorophyll-a against flushing half-life,T50 (Fig. 7), indicates that the hypersaline Lagoa deAraruama functions differently from Lagoa de Pirati-ninga, a nearby hypereutrophic lagoon with salinity lessthan 5. The two lagoons differ with respect to thedominant primary producers. In Lagoa de Piratininga,massive anthropogenic nutrient inputs combined withthe presence of dense stands of submerged macrophytessustain a highly eutrophic system. A great proportion oforganic matter cycling occurs in the water column. Lagoade Araruama, on the other hand, exhibits phosphorusremoval and a higher rate of primary production by themicrophytobenthic community. These communities
Fig. 7. Flushing half-life (T50%) versus average concentrations integrated over water column of total phosphorus (A; TPA¼DIP+POP) and
chlorophyll-a (B) in Lagoa de Araruama and other Fluminense lagoons (Knoppers et al., 1991). A¼Lagoa de Araruama; I¼Lagoa de Itaipu
(mesotrophic); G¼Lagoa de Guarapina (eutrophic); SF¼Lagoa de Fora, Saquarema (eutrophic); SU¼Lagoa Urussanga, Saquarema (eutrophic);
M¼Lagoa de Marica (eutrophic/hypertrophic); P¼Lagoa de Piratininga (hypertrophic).
856 M.F.L. Souza et al. / Estuarine, Coastal and Shelf Science 57 (2003) 843–858
exert control over biogeochemical fluxes through thesediment–water interface (Bauld, 1984; Javor, 1989). Thelow TSS and organic content in the water column alsosuggest that a greater amount of the organic matter isremineralized in the sediment. Carbonate sedimentationcan also remove phosphorus from water (Atkinson,1987; Smith, 1988; Smith & Atkinson, 1983). In the caseof Lagoa de Araruama, this combines to buffer anthro-pogenic nutrient loading and postpone eutrophication.Although reducing the diversity of the primary pro-ducers, there was no evident relation between chloro-phyll-a and salinity. Salinity does not seem to play afundamental role in limiting phytoplankton biomassgrowth. Hypersalinity is expected to be more restrictiveto the type and size of organisms and communitystructure rather than to primary producer biomass andmetabolic processes and rates. The prevalence of certainorganisms (such as planktonic and benthic N fixingcyanobacteria, and the predominance of the latter asprimary producers) is the result of the ability of thesegroups to survive in hypersaline environments. Thisselection by environmental conditions seems to haveprofound effects on the biogeochemical cycling.
The observation of biogeochemical features of Lagoade Araruama and other hypersaline lagoons dominatedby microphytobenthic communities raises questionsabout the suitability of trophic indices developed basedon plankton systems. Lagoa de Araruama receives highnutrient loads, exhibits extensive microphytobenthiccoverage, and occasional localized phytoplanktonblooms. At the same time, concentration of nutrients,POC, and chlorophyll-a are relatively low. The watercolumn is supersaturated with oxygen, different fromeutrophic lagoons, which misleadingly suggests an oligo-trophic state. Moreira-Turqc (in press) reported highphytoplankton biomass and primary production ratesin Lagoa de Araruama in an anomalous year with lowsalinity. These data seem to suggest that Lagoa deAraruama has reached a threshold between a well-nourished aquatic system, where eutrophication isbuffered by biogeochemical benthic processes, and aneutrophic plankton-dominated ecosystem.
4.4. Conclusions
Hypersalinity restrains the physiological efficiency ofindividual organisms and communities and can impedethe establishment of many species. Biogeochemicalcontrols determine the biological assemblages presentin coastal lagoons, whether a hypersaline or brackishsystem, and favor N-fixing organisms. Environmentalconditions control the settlement of these communities,except in extreme situations, such as the case of Lagoade Araruama with hypersaline conditions apparentlyexisting for at least many centuries (Kjerfve et al., 1996).In most environments, the history of colonization and
subsequent inter and intra-specific relations will deter-mine the ultimate state.
Thus, hypersalinity has only an indirect effect onlimiting the growth of biomass and net primary pro-duction (gross primary production–respiration). Thelong water residence time of Lagoa de Araruama allowsretention of high anthropogenic phosphorus loading inthe sediment. This makes the lagoon an effective sink forterrestrial and marine phosphorus. Although it retains agreat amount of the terrestrial (mainly anthropogenic)inputs, it acts as a source of DIN to coastal waters. Animportant implication of these results is that primaryproduction in estuaries and coastal waters tends towardnitrogen limitation because there is no coupling betweenbiochemical nitrogen reaction rate and water renewal(Smith, 1984). Once a coastal water body, like Lagoa deAraruama, has a water residence time similar to conti-nental lakes and reservoirs, the net system metabolismwill tend towards phosphorus limitation.
The combination of a large water volume and longresidence time, microphytobenthos as the main primaryproducer, and phosphorus removal by benthic algaehas resulted in an oligotrophic water column state mostof the time. But there are signs that this �buffering�capacity has reached a threshold, and that the systemmay become mesotrophic.
Acknowledgements
This study was funded by Conselho Nacional deDesenvolvimento Cientıfico e Tecnologico (CNPq),National Science Foundation (NSF) grant INT9001583, the National Geographic Society grant 3823-88, and Instituto Acqua through the PROLAGOSproject. We extend our thanks to Jose Luiz de SouzaDantas of Hotel Carapeba for providing the 15m MissJuliana for the sampling cruises; Evandro Barbiere,Jean-Pierre Carmouze, Ricardo Coutinho, Pierre Perrin,Sambasiva Rao Patchineelam, and Julio Cesar Wasser-man for helpful comments; Erminda C. GuerreiroCouto for the discussions and support; Carlos AugustoSchettini, Claudia Azevedo (in memoriam), HelderFerreira, Moacir Apolinario da Silva and Jose CarlosSeoane for help in the field during the sampling cruises.The authors also acknowledge valuable comments andsuggestions by Stephen V. Smith and three anonymousreferees, which greatly improved this work. The first andfourth authors acknowledge all people of the LOICZIPO and the Instituto Argentino de Oceanografia,particularly Drs Chris Crossland and Gerardo Perillofor the opportunity to discuss these data and budgetsduring the South America Biogeochemical BudgetingWorkshop held in Bahia Blanca, Argentina, in 1999.The first author was recipient of an MS grant from theConselho Nacional de Desenvolvimento Cientıfico eTecnologico (CNPq).
857M.F.L. Souza et al. / Estuarine, Coastal and Shelf Science 57 (2003) 843–858
References
Andre, D. L., Oliveira, M. C., Okuda, T., Horta, A. M. T. C., Soldan,
A. L., Moreira, I. M. N. S., Rollemberg, M. C. E., & Heinzen, V.
E. F. (1981). Estudo preliminar sobre as condicoes hidroquımicas da
Lagoa de Araruama—Rio de Janeiro (33 pp.). IPqM, Publication.
No. 139.
Atkinson, M. J. (1987). Low phosphorus sediments in a hypersaline
marine bay. Estuarine, Coastal and Shelf Science 24, 335–347.
Balzer, W., Bodungen, B., & Pollehne, F. (1985). Benthic degradation
of organic matter and regeneration of nutrients in shallow water
sediments off Mactan, Philippines. The Philippine Scientist 22,
30–41.
Barbiere, E. B. (1985). Condicoes climaticas dominantes na porcao
oriental da Lagoa de Araruama, e suas implicacoes na diversidade
do teor de salinidade. Caderno de Ciencias da Terra, USP (Sao
Paulo) 59, 1–35.
Barroso, L. V. (1987). Diagnostico ambiental da Lagoa de Araruama-
RJ. Boletim do FBCN 22, 30–65.
Bauld, J. (1984). Microbial mats in marginal marine environments:
Shark Bay,WesternAustralia and SpencerGulf, SouthAustralia. In
Y. Cohen, R. W. Castenholz, & H. O. Halvorson (Eds.), Microbial
mats: stromatolites, MBL lectures in biology Vol. 3. NewYork: Alan
R. Liss.
Bonecker, S. L. C., Nogueira, C. R., Bonecker, A. A. C. T., Santos, L.
H. S., Reynier, M. V., & Tenenbaum, D. R. (1993). Estudo
hidrografico e planctologico da regiao entre Cabo Frio (Rio de
Janeiro) e o Arquipelago de Abrolhos (Bahia)—Brasil. Nerıtica
7(1/2), 71–85.
Bowden, W. B. (1984). Nitrogen and phosphorus in the sediments of
a tidal, freshwater marsh in Massachusetts. Estuaries 7, 108–118.
Caffrey, J. M. (1995). Spatial and seasonal patterns in sediment
nitrogen remineralization and ammonium concentrations in San
Francisco Bay, California. Estuaries 18, 219–233.
Campos, R. C., Queiroz, M. I., Lacerda, R. E. D., & Okuda, T. (1979).
Conteudo de fosforo total, carbono e nitrogenio na forma organica nos
sedimentos da Lagoa de Araruama (17 pp.). Rio de Janeiro: IPqM.
Publication No. 142.
Carmouze, J.-P.,D’Elia Sampaio, C., &Domingos, P. (1994). Evolution
des stocks de matiere organique et de nutriments dans une lagune
tropicale (Bresil) au cours d’une periode marquee par une mortalite
de poissons. Revue d’Hydrobiologie Tropicale 27, 217–234.
Cohen, Y., Aizenshtat, Z., Stoler, A., & Jorgensen, B. B. (1980). The
microbial geochemistry of Solar Lake, Sinai. In P. A. Trudinger,
M. R. Walter, & B. J. Ralph (Eds.), Biogeochemistry of ancient and
modern environments (pp. 167–172). Berlin: Springer.
Fernandes, T., Iyer, V., & Apte, S. (1993). Differential responses of
nitrogen-fixing cyanobacteria to salinity and osmotic stresses.
Applied Environmental Microbiology 59, 899–904.
Forja, J. M., Blasco, J., & Gomez-Parra, A. (1994). Spatial and
seasonal variation of in situ benthic fluxes in the Bay of Cadiz
(South-west of Spain). Estuarine, Coastal and Shelf Science 39, 127–
141.
Gordon, D. C., Jr., Boudreau, P. R., Mann, K. H., Ong, J. E., Silvert,
W. L., Smith, S. V., Wattayakorn, G., Wulff, F., & Yanagi, T.
(1996). LOICZ biogeochemical modelling guidelines (96 pp.). LOICZ
Reports & Studies no. 5. Texel: The Netherlands.
Grasshoff, K., Ehrardt, M., & Kremling, K. (1983). Methods of
seawater analysis (419 pp.). Weinheim: Verlag Chemie.
Hillebrand, H., & Sommer, U. (1999). The nutrient stoichiometry of
benthic microalgal growth: Redfield proportions are optimal.
Limnology and Oceanography 44(2), 440–446.
Howarth, R. W. (1988). Nutrient limitation of net primary production
in marine ecosystems. Annual Reviews in Ecology 19, 89–110.
Instituto Brasileiro de Geografia e Estatıstica (IBGE) (1991). Censo
demografico 1991, resultados do universo relativo as caracterısticas
da populacao e dos domicılios (281 pp.). Technical report, Rio de
Janeiro.
Javor, B. (1989). Hypersaline environments (319 pp.). Berlin: Springer.
Kjerfve, B., Knoppers, B., Moreira, P., & Turcq, B. (1990). Hydro-
logical regimes in Lagoa de Guarapina, a shallow Brazilian coastal
lagoon. Acta Limnologica Brasiliense III, 931–949.
Kjerfve, B., Schettini, C. A. F., Knoppers, B., Lessa, G., & Ferreira, H.
O. (1996). Hydrology and salt balance in a large hypersaline coastal
lagoon: Lagoa de Araruama, Brazil. Estuarine, Coastal and Shelf
Science 42, 701–725.
Klump, J. V., & Martens, C. S. (1981). Biogeochemical cycling in an
organic rich coastal marine basin: II. Nutrient sediment water
exchange processes. Geochimica et Cosmochimica Acta 45, 101–121.
Knoppers, B. A. (1982). Die charakterisierung partikularer, organischer
substanz im meer (47 pp.). Report 66, SFB 95. Universitat Kiel.
Knoppers, B. A. (1994). Aquatic primary production in coastal
lagoons. In B. Kjerfve (Ed.), Coastal lagoon processes (pp. 243–
286). Amsterdam: Elsevier (512 pp.).
Knoppers, B. A., Carmouze, J. P., & Moreira-Turcq, P. (1999).
Nutrient dynamics, metabolism and eutrophication of lagoons
along the east Fluminense coast, State of Rio de Janeiro, Brazil. In
B. Knoppers, E. D. Bidone, & J. J. Abrao (Eds.), Environmental
geochemistry of coastal lagoon systems, Serie Geoquımica Ambiental
Vol. 6 (pp. 123–154).
Knoppers, B. A., Kjerfve, B., & Carmouze, J. P. (1991). Trophic state
and water turn-over time in six choked coastal lagoons in Brazil.
Biogeochemistry 14, 149–166.
Knoppers, B. A., Landim de Souza, W. F., Souza, M. F. L.,
Rodriguez, E. G., Landim, E. C. V., & Vieira, A. R. (1996). In
situ measurements of n benthic primary production, respiration
and nutrient fluxes in a hypersaline coastal lagoon of SE, Brazil.
Revista Brasileira de Oceanografia 44, 155–165.
Landim de Souza, W. F. (1997). Dinamica de nutrientes na laguna
hipersalina de Araruama, RJ. NiteroI (174 pp.). MSc Dissertation,
Departamento de Geoquımica, Universidade Federal Fluminense.
Landim de Souza, W. F., & Knoppers, B. (2000). Araruama Lagoon,
Rio de Janeiro State. In S. V. Smith, V. Dupra, J. I. Marshall
Crossland, & C. J. Crossland (Eds.). Estuarine systems of the South
American region: carbon, nitrogen and phosphorus fluxes (pp. 37–
39.). LOICZ Reports and Studies no. 15, ii+87 pages, LOICZ,
Texel: The Netherlands.
Lenz, J. (1972). Zur methode der sestonbestimmung. Kieler Meer-
esforchung 27, 180–193.
Moore, J., de Ruiter, P., & Hunt, W. (1993). Influence of productivity
on the stability of real and model ecosystems. Science 261, 906–908.
Moreira Turcq, P. (2000). Impact of a low salinity year on the
metabolism of a hypersaline coastal lagoon (Brazil). Hydrobiologia
429(1–3), 133–140.
Murphy, R. C., & Kremer, J. N. (1985). Bivalve contribution to
benthic metabolism in a California lagoon. Estuaries 8, 330–341.
Paerl, H. W., & Pinckney, J. (1996). A mini-review of microbial
consortia: their roles in aquatic production and biogeochemical
cycling. Microbial Ecology 31, 225–247.
Phleger, F. B., & Ewing, G. C. (1962). Sedimentology and ocean-
ography of coastal lagoons in Baja California, Mexico. Geological
Society of America Bulletin 73, 145–182.
Pinckney, J., Paerl, H. W., & Bebout, B. M. (1995). Salinity control of
benthic microbial mat community production in a Bahamian
hypersaline lagoon. Journal of Experimental Marine Biology and
Ecology 187, 223–237.
Rysgaard, S., Risgaard-Petersen,N., Sloth,N. P., Jensen,K., &Nielsen,
L. P. (1994). Oxygen regulation of nitrification and denitrification in
sediments. Limnology and Oceanography 39, 1643–1652.
Smith, S. V. (1984). Phosphorus versus nitrogen limitation in
the marine environment. Limnology and Oceanography 29(6),
1149–1160.
858 M.F.L. Souza et al. / Estuarine, Coastal and Shelf Science 57 (2003) 843–858
Smith, S. V., & Atkinson, M. J. (1983). Mass balance of carbon and
phosphorus in Shark Bay, Western Australia. Limnology and
Oceanography 28, 625–639.
Smith, S. V., & Veeh, H. H. (1983). Mass balance of biogeochemically
active materials (C, N, P) in a hypersaline gulf. Estuarine, Coastal
and Shelf Science 29, 195–215.
Smith, S. V., Hollibaugh, J. T., Dollar, S. J., & Vink, S. (1989).
Tomales Bay, California: a case for carbon-controlled nitrogen
cycling. Limnology and Oceanography 34(1), 37–52.
Smith, S. V., Wiebe, W. J., Hollibaugh, J. T., Dollar, S. J., Hager, S.
W., Cole, B. E., Tribble, G. W., & Wheeler, P. A. (1987).
Stoichiometry of C, N, P and Si fluxes in a temperate-climate
embayment. Journal of Marine Research 45, 427–460.
Souza, M. F. L. (1993). Distribuicao espacial, sazonal e fontes fluviais de
nutrientes na Lagoa de Araruama, RJ. Niteroi. MSc Dissertation,
Departamento de Geoquımica, Universidade Federal Fluminense.
Strickland, J. D. H., & Parsons, T. R. (1972). A practical handbook of
seawater analysis. Bulletin of Fisheries Research Board, Canada No.
167 (311 pp.).
Valderrama, J. C. (1981). The simultaneous analysis of total nitrogen
and total phosphorus in natural waters. Marine Chemistry 10,
109–122.
Copyright © 2022 FDOKUMEN