Determination of the Effects of Different Maillard Reaction ...
Upload
khangminh22Category
view
1download
0
Rates of reactionPractical video
Supporting resources
Registered charity number: 207890

ContentsTeacher notes . . . . . . . . . . . . . . . . . . . . . . . . . . . . . . . . . . . . . . . . . . . . . . . . . . . 1
How to use this video . . . . . . . . . . . . . . . . . . . . . . . . . . . . . . . . . . . . . . . . . . . . . . . . . . . . . . . 1
Notes on running the practical experiment . . . . . . . . . . . . . . . . . . . . . . . . . . . . . . . . . . . . 1
Prior knowledge . . . . . . . . . . . . . . . . . . . . . . . . . . . . . . . . . . . . . . . . . . . . . . . . . . . . . . . . . . .2
Common misconceptions . . . . . . . . . . . . . . . . . . . . . . . . . . . . . . . . . . . . . . . . . . . . . . . . . . .2
Intended outcomes . . . . . . . . . . . . . . . . . . . . . . . . . . . . . . . . . . . . . . . . . . . . . . . . . . . . . . . . 4
How to use the additional resources . . . . . . . . . . . . . . . . . . . . . . . . . . . . . . . . . . . . . . . . . .5
Additional resources . . . . . . . . . . . . . . . . . . . . . . . . . . . . . . . . . . . . . . . . . . . . 6
Pause-and-think questions: teacher version . . . . . . . . . . . . . . . . . . . . . . . . . . . . . . . . . . . 6
Pause-and-think questions: student version . . . . . . . . . . . . . . . . . . . . . . . . . . . . . . . . . . . 8
Prior knowledge check: worksheet . . . . . . . . . . . . . . . . . . . . . . . . . . . . . . . . . . . . . . . . . . . 9
Prior knowledge check: answers . . . . . . . . . . . . . . . . . . . . . . . . . . . . . . . . . . . . . . . . . . . . .10
Follow-up worksheet . . . . . . . . . . . . . . . . . . . . . . . . . . . . . . . . . . . . . . . . . . . . . . . . . . . . . . . 11
Follow-up worksheet: answers . . . . . . . . . . . . . . . . . . . . . . . . . . . . . . . . . . . . . . . . . . . . . . 12
Results tables . . . . . . . . . . . . . . . . . . . . . . . . . . . . . . . . . . . . . . . . . . . . . . . . . . . . . . . . . . . . . 16
© 2021 Royal Society of Chemistry Rates of reaction | Supporting resources

1© 2021 Royal Society of Chemistry Rates of reaction | Supporting resources
Teacher notesThis resource supports the practical video Rates of reaction, available here: rsc.li/3BMJQR2
The value of experiencing live practical work cannot be overstated. Numerous studies provide evidence of its value in terms of learner engagement, understanding, results and the likelihood of continuing to study chemistry or work in a related field. This video can be used to complement live practical work, as well as helping learners to understand the methods, equipment and skills when they cannot access the lab.
How to use this videoThe video and additional resources are designed to be used flexibly, but some suggestions follow.
Flipped learning Learners view the video ahead of the live practical lesson to help it run more smoothly and keep objectives in focus. This may also help build confidence for some learners and improve their outcomes in the lesson. Use questions from the pause-and-think set provided as part of the preparation task.
Consolidation and revision Learners view the video after the practical – this may be directly after the lesson or learners can return to it as part of revision for examinations.
Revisiting a practical with a different focus A practical experiment can support many learning outcomes. Focusing on just one or two of those in a lesson will help ensure that the aims are achieved. The video could be used to revisit the experiment with a different focus.
Home learning Whether it is remote teaching, homework, or individual learner absence, the video provides an opportunity to engage with a practical experiment and the associated skills when learners are not in the lab.
Other tips • Provide your own commentary Mute the voice over and provide your own commentary. This will allow you to better engage with learners
and adapt to the needs and objectives of your lesson. • Use questions A set of pause-and-think questions are provided in two formats, one for teacher-led questions and
discussion and a student worksheet which can be used independently by learners. Select from these or create your own questions to help engage learners and target specific aims.
Notes on running the practical experiment The rate of reaction is simply a measure of how fast a reaction proceeds, which we can determine through monitoring how fast a reactant is used up or how fast a product is formed.
An initial rate method measures how long it takes for a reaction to go to completion or for a specified volume/mass of product to form. A continuous rate method measures the rate of the course of a reaction, usually by making a measurement at regular time intervals.
In most instances, students will be expected to understand how changing the temperature or concentration effects the rate of reaction and how, given the reactants/products of the reaction, a method might be developed to monitor the rate.
This video supports two experiments that can be used to demonstrate each approach:
• initial rate method – investigating the effect of concentration on rate using the iodine clock reaction• continuous monitoring method – investigating the effect of temperature on rate by measuring volume of gas
Technician notes including the equipment list and safety notes are available as a separate document here: rsc.li/3BMJQR2 . If you are planning to carry out the practical in the classroom, you will need to carry out your own risk assessment.

2© 2021 Royal Society of Chemistry Rates of reaction | Supporting resources
Procedure for learnersA student sheet with instructions for carrying out the experiment is available here: rsc.li/3BMJQR2.
Results tables Printable and editable results tables have been provided for the two experiments shown in the video.
Further practical activities & other resourcesMore rates of reaction experiments are included on our Rates of reaction practical videos page for 14–16 learners. For an exciting visual demonstration, Burning milk powder highlights the true impact that increasing the surface area to volume ratio can have on the rate of reaction.
More support is available in this CPD article Teaching rates of reaction post–16. Another article, Rationalising rates, includes tips for teaching rates of reaction using graphs.
Prior knowledge In order for learners to succeed with rates of reaction at post–16, it is essential that they have a good knowledge and understanding of key chemistry concepts met during pre–16 chemistry courses including:• the concept of rate• particle model of matter• collision theory• factors affecting the rate of reaction, such as surface area, temperature and concentration• activation energy• catalysis
In working scientifically students should be able to:• measure the rate of reaction by collecting a gas • measure the rate of reaction monitoring a colour change
They also need to be able to use and apply previously met mathematical ideas in a chemistry context including: • draw a graph with a line/curve of best fit• calculate the gradient of a graph and draw a tangent to the curve.• a good understanding of units
Before meeting these rates of reaction experiments, learners should also understand the rate constant k, the rate equation and orders of reaction from their post–16 studies.
Common misconceptions Learners first meet many of the ideas associated with rates of reactions pre–16 and this may come with a lack of understanding of basic principles. It would be worthwhile spending some time at the start of the topic to make sure that learners are secure in the following concepts:
• application of both the particle and collision theory• the connection between surface area and rates• interpretation of rate graphs
You could use the prior knowledge check worksheet (on page 9), and see how they do.
Another common misconception at pre-16 level is that learners confuse rate of reaction with position of equilibrium. This can then lead to further confusion at post-16 when they are introduced to the rate constant k, and the equilibrium constant Kc. Learners need to be aware that they are not the same constant. This misunderstanding can lead into the further misconception that you can write a rate equation (rate law) using stoichiometry rather than using order of reaction with respect to reactants.

3© 2021 Royal Society of Chemistry Rates of reaction | Supporting resources
Learners need to understand that rate equations are constructed based on empirical experimental data; and that the equation is based on the best fit of data to a mathematical model. It is also important that learners appreciate that the mathematical models are evaluated based on how well they fit empirical data! A good way to illustrate this point is ask the learners to plot out the mathematical models and then relate it to the rate equation. First, they can plot out the mathematical graphs by substituting values for x in the equations, then show the experimental data and link the graphs to the rate equations – see model below.
Relating this to an equation: Rate ∝ [x]n
However, n could take on any value (e.g. 0, 1, 2)
n=0 Rate ∝[x]0 = 1 The rate is not affected by the concentration of x
n=1 Rate ∝ [x]1 = [x] The rate is directly proportional to the concentration of x
n=2 Rate ∝ [x]2 = [x]2 The rate has an exponential relationship with the concentration of x
�
�
������
�����
�����
�
���������∝ �������������������
�����∝ ��� �������������
�����∝�������������������
�
�
�
������
�����
�����
�
���������∝ �������������������
�����∝ ��� �������������
�����∝�������������������
�

4© 2021 Royal Society of Chemistry Rates of reaction | Supporting resources
Intended outcomesIt is important that the purpose of each practical is clear from the outset, defining the intended learning outcomes helps to consolidate this. Outcomes can be categorised as hands on, what learners are going to do with objects, and minds on, what learners are going to do with ideas to show their understanding. We have offered some differentiated suggestions for this practical. You may wish to focus on just one or two, or make amendments based on your learners’ own needs. (Read more at rsc.li/2JMvKa5.)
Consider how you can share outcomes and evaluations with learners, empowering them to direct their own learning.
Hands on Minds on
Effective at a lower level Learners correctly:• follow instructions to carry out
the experimental techniques or procedures
• use a gas syringe and/or upturned measuring cylinder in a trough of water to collect a gas
• accurately measure quantities • make and record accurate
observations
Learners can:• understand that initial rate of
reaction can be calculated from data using different experimental method
• understand the difference between initial rate method and the continuous monitoring method of determining the rate of reaction
Effective at a higher level Learners correctly:• identify and control significant
quantitative variable where applicable, and plan approaches to take account of variables that cannot readily be controlled
• select appropriate equipment and measurement strategies in order to ensure suitably accurate results
• obtain and record accurate, precise and sufficient data to determine the rate and order of reaction
Learners can:• process raw experimental data to
determine the rate of reaction from a graph
• apply knowledge to deduce rate orders and rate equations from experimental data

5© 2021 Royal Society of Chemistry Rates of reaction | Supporting resources
How to use the additional resources Using the pause-and-think questionsPause-and-think questions are supplied in two formats: a teacher version for ‘live’ questioning and a student version which can be used during independent study. The time stamps allow you to pause the video when presenting to a class, or learners to use for active revision.
Teacher version The questions are presented in a table and you can choose to use as many as appropriate for your class and the learning objectives.
Some questions have two timestamps to allow you to adapt the questions for different classes or scenarios. Pause the videos at the earlier timestamp to ask a question before the answer is given, useful for revision or to challenge learners. Pause at the later timestamp to ask a question reflectively and assess whether learners have understood what they have just heard or seen. This would be useful when introducing a topic, in a flipped learning scenario or when additional support and encouragement is needed.
Think about how you will ask for responses. Variation may help to increase engagement – learners could write and hold up short answers; more complex questions could be discussed in groups.
Not all answers to questions are included in the video. Some of the questions will draw on prior learning or extend learners’ thinking beyond the video content.
Student version The same questions are offered as a printable worksheet for learners. Use in situations where there is not a teacher present to guide discussion during the video, for example homework, revision or remote learning.
Using the knowledge check worksheetA knowledge check worksheet has been included as part of the additional resources. This worksheet has been adapted from the Starters for 10: Kinetics – 7.1 collision theory and could be used to check for learner’s prior knowledge or misconceptions before starting the practical.
Using the follow-up worksheetA follow-up worksheet has been included as part of the additional resources. This worksheet could be used to follow up the practical activity, for example as homework or a revision exercise. Learners are asked to plot graphs. Encourage learners to use a spreadsheet or provide graph paper.

6© 2021 Royal Society of Chemistry Rates of reaction | Supporting resources
Additional resourcesPause-and-think questionsTeacher version
Timestamp(s) Question Answer/discussion points
00:11/00:20 Define the rate of reaction. Rate of reaction: the change in the concentration of the reactant or product per unit time.
01:06 Can you think of any other reactions where we could use the initial rate method to measure the rates of reaction?
The thiosulfate–hydrochloric acid reaction, otherwise known as the disappearing cross.The catalytic decomposition of hydrogen peroxide, where a fixed amount of oxygen gas is collected.Or another reaction where a fixed amount of gas is collected, eg the reaction between magnesium and hydrochloric acid.
01:24/01:35 Volume of gas is one property that can be continuously monitored. Can you think of any others?
Other examples include: colour change by colourimetry; pH by using a pH meter or sensor; temperature using a temperature sensor or probe; monitor concentration by periodically taking a sample to determine the concentration, eg by titration.
01:48 Initial rate method: the iodine clock
02:12 The starch doesn’t actually take part in the chemical reaction, so why do you think we are adding it?
As an indicator to show where the end point is. (Reaction is shown in detail at 06:33)
02:46 What other variables could we change in this experiment?
The concentration of potassium iodide or the temperature at which the reaction is carried out.
02:50 What are the other variables in this experiment that must be kept constant?
Examples: volume of all reactants, concentration of the other solutions, temperature, experimental method.
06:10 Why do you think it is important to use a different labelled measuring cylinder for each solution?
To avoid contamination and to make sure that the samples don’t get mixed up.
07:18 Why do you think this is called a clock reaction?
The time for the blue/black colour to appear can be adjusted by varying the amount of thiosulfate in solution x, so a ‘clock’ of any desired time interval can be produced.
07:37/08:28 Draw a table suitable for recording the results of this experiment – and record the results. Solution Time (s)
A (30 cm3 H2O2) 15
B (25 cm3 H2O2) 20
C (20 cm3 H2O2) 25
D (15 cm3 H2O2) 32
E (10 cm3 H2O2) 46

7© 2021 Royal Society of Chemistry Rates of reaction | Supporting resources
Timestamp(s) Question Answer/discussion points
08:30 How could you check the accuracy of your results to make sure that they don’t contain random or systematic errors?
The effect of random errors can be reduced by making more measurements and calculating a mean value. Systematic errors are sources of errors that might involve the equipment or method that is being used. To check if there is a systematic error you could repeat the experiment using a different set of equipment or check the results obtained from other groups carrying out the same experiment.
08:43 During the experiment, how does the concentration of the iodide ions vary with time?
The concentration remains constant, the different rate of reaction is due only to the change in concentration of hydrogen peroxide.
09:14 Continuous monitoring method: volume of gas
09:26 How can a change in concentration be monitored in this reaction?
We can measure the volume of hydrogen gas being produced or the mass loss throughout the reaction.
09:26 The mass-loss method for monitoring the rate of reaction gives better results when carbon dioxide is being monitored as opposed to hydrogen gas. Suggest a reason why?
A carbon dioxide molecule (RFM 44) is 22 times heavier than a hydrogen molecule (RFM 2), therefore a greater ‘mass loss’ will be recorded during the experiment, leading to more accurate results.
10:39 Why do you think we often tie a piece of string around the syringe and plunger?
To prevent the plunger coming out of the syringe if too much gas is produced.
11:22/13:48 Draw a table suitable for recording the results of this experiment. Now record the results.
See below.
14:10/16:04 Record the results at 60°C See below.
16:10/18:26 Record the results at 80°C See below.
Time (s)Volume of hydrogen gas produced (cm3)
25°C 60°C 80°C
0 0 0 0
10 17 32 31
20 30 46 50
30 39 57 60
40 48 61 65
50 56 65 67
60 60 67 70
70 64 69 71
80 66 71 73
90 68 72 74
100 69 72 74
110 70 72 75
120 70 75
130 70 75

8© 2021 Royal Society of Chemistry Rates of reaction | Supporting resources
Pause-and-think questionsStudent versionPause the video at the time stated to test or revise your knowledge of these practical experiments.
Time Question
00:11/00:20 Define rate of reaction.
01:06 Can you think of any other reactions where we could use the initial rate method to measure the rates of reaction?
01:24/01:35 Volume of gas is one property that can be continuously monitored, can you think of any others?
01:48 Initial rate method: the iodine clock
02:12 The start doesn’t actually take part in the chemical reaction, so why do you think we are adding it?
02:46 What other variables could we change in this experiment?
02:50 What are the other variables in this experiment that must be kept constant?
06:10 Why do you think it is important to use a different labelled measuring cylinder for each solution?
07:18 Why do you think this is called a clock reaction?
07:37/08:28 Draw a table suitable for recording the results of this experiment – and record the results.
08:30 How could you check the accuracy of your results to make sure that they don’t contain random or systematic errors?
08:43 During the experiment, how does the concentration of the iodide ions vary with time?
09:26 The mass-loss method for monitoring the rate of reaction gives better results when carbon dioxide is being monitored as opposed to hydrogen gas. Suggest a reason why?
10:39 Why do you think we often tie a piece of string around the syringe and plunger?
11:22/13:48 Draw a table suitable for recording the results of this experiment. Now record the results.
14:10/16:04 Record the results at 60°C
16:10/18:26 Record the results at 80°C

9© 2021 Royal Society of Chemistry Rates of reaction | Supporting resources
Prior knowledge check: worksheet(adapted from Starters for 10: Kinetics – 7.1 collision theory)
This question is all about the reaction between zinc metal and hydrochloric acid to produce zinc chloride and hydrogen gas.
1. Write a balanced symbol equation for the reaction that occurs. 2. The labels below are from reaction flasks. They show the same reaction but under different conditions. The
acid is in excess in all five flasks.
Flask A1g granular zinc,
100cm3 1 mol dm-3 HClat 35°C
Flask B1g granular zinc,
100cm3 2 mol dm-3 HClat 35°C
Flask C0.5g granular zinc,
100cm3 1 mol dm-3 HClat 55°C
Flask D2g powdered zinc,
100cm3 1 mol dm-3 HClat 35°C
Flask E0.5g granular zinc,
100cm3 0.5 mol dm-3 HCl at 35°C
a. In which flask is the reaction rate the slowest?b. The graph below shows how the volume of hydrogen given off changed with time for the reaction that
occurred in flask A. Sketch on the same set of axes, the curves you would expect to get if you repeated the measurements for flasks B, C, D and E.
3. Use your knowledge of the collision theory to explain the shape of the curve you drew for flask B and flask D.
����������������
��
�������
����������

10© 2021 Royal Society of Chemistry Rates of reaction | Supporting resources
Prior knowledge check: answers(adapted from Starters for 10: Kinetics – 7.1 collision theory)
1. Zn + 2HCl → ZnCl2 + H2
2. (a) Flask E would go the slowest.
(b)
3. In flask B, there are twice as many Cl-(aq) ions than in flask B therefore the frequency of successful collisions will increase between Zn and Cl- and so the rate of reaction will be faster at the start. Since the acid is in excess the same volume of hydrogen gas will be produced.
In flask D there is twice as much zinc present so there will be twice as much hydrogen gas produced. Since the particles have a greater surface area, there will be more successful collisions at the start and so the rate of reaction will be faster.
����������������
��
����������
�������
��������
��������
��������
��������
11© 2021 Royal Society of Chemistry Rates of reaction | Supporting resources
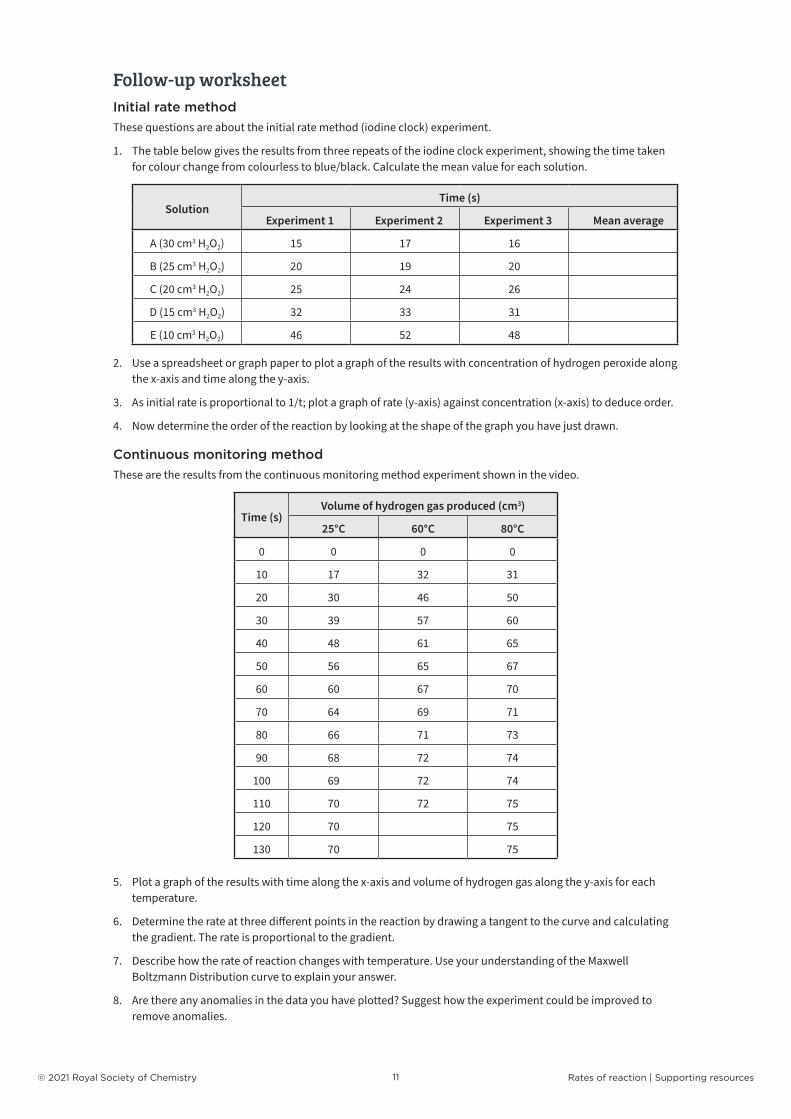
Follow-up worksheetInitial rate methodThese questions are about the initial rate method (iodine clock) experiment.
1. The table below gives the results from three repeats of the iodine clock experiment, showing the time taken for colour change from colourless to blue/black. Calculate the mean value for each solution.
SolutionTime (s)
Experiment 1 Experiment 2 Experiment 3 Mean average
A (30 cm3 H2O2) 15 17 16
B (25 cm3 H2O2) 20 19 20
C (20 cm3 H2O2) 25 24 26
D (15 cm3 H2O2) 32 33 31
E (10 cm3 H2O2) 46 52 48
2. Use a spreadsheet or graph paper to plot a graph of the results with concentration of hydrogen peroxide along the x-axis and time along the y-axis.
3. As initial rate is proportional to 1/t; plot a graph of rate (y-axis) against concentration (x-axis) to deduce order.
4. Now determine the order of the reaction by looking at the shape of the graph you have just drawn.
Continuous monitoring methodThese are the results from the continuous monitoring method experiment shown in the video.
Time (s)Volume of hydrogen gas produced (cm3)
25°C 60°C 80°C
0 0 0 0
10 17 32 31
20 30 46 50
30 39 57 60
40 48 61 65
50 56 65 67
60 60 67 70
70 64 69 71
80 66 71 73
90 68 72 74
100 69 72 74
110 70 72 75
120 70 75
130 70 75
5. Plot a graph of the results with time along the x-axis and volume of hydrogen gas along the y-axis for each temperature.
6. Determine the rate at three different points in the reaction by drawing a tangent to the curve and calculating the gradient. The rate is proportional to the gradient.
7. Describe how the rate of reaction changes with temperature. Use your understanding of the Maxwell Boltzmann Distribution curve to explain your answer.
8. Are there any anomalies in the data you have plotted? Suggest how the experiment could be improved to remove anomalies.

12© 2021 Royal Society of Chemistry Rates of reaction | Supporting resources
Follow-up worksheet: answersInitial rate method
SolutionTime (s)
Experiment 1 Experiment 2 Experiment 3 Mean average
A (30 cm3 H2O2) 15 17 16 16
B (25 cm3 H2O2) 20 19 20 20
C (20 cm3 H2O2) 25 24 26 25
D (15 cm3 H2O2) 32 33 31 32
E (10 cm3 H2O2) 46 52 48 49
1. The mean average values are included in the final column of the table below:
2.

13© 2021 Royal Society of Chemistry Rates of reaction | Supporting resources
3.
4. The reaction is first order with respect to hydrogen peroxide as the graph is a straight line passing through the origin.

14© 2021 Royal Society of Chemistry Rates of reaction | Supporting resources
Continuous monitoring method5. For the purpose of comparison the curves are drawn here on the same graph. For question 6 it may be easier
to draw tangents if each of the curves are drawn on separate graphs.
6. Learners should choose three points of sufficient distance apart on the curve to show a change in rate with respect to time. Here is an example of the gradient calculations that they may have as a result of the tangents they choose to draw.
At 20 seconds:25 °C: 20/20 = 1.00 cm3 s-160 °C: 28/24 = 1.17 cm3 s-180 C: 22/18 = 1.22 cm3 s-1
At 50 seconds:25 °C: 21/36 = 0.58 cm3 s-160 °C: 11/36 = 0.31 cm3 s-180 °C: 12/44 = 0.27 cm3 s-1
At 90 seconds:25 °C: 6/40 = 0.15 cm3 s-160 °C: 3/32 = 0.09 cm3 s-180 °C: 5/56 = 0.09 cm3 s-1

15© 2021 Royal Society of Chemistry Rates of reaction | Supporting resources
7. The rate of reaction increases as the temperature of the reaction increases. This is clearly seen at the start of the reaction. For example, at 20 s we see an increase in rate from 1.00 cm3 s-1 at 25°C to 1.22 cm3 s-1 at 80°C. The Maxwell-Boltzmann curve shows how energy is distributed amongst the particles of a gas at a constant temperature. For a reaction to occur, particles must possess a minimum amount of energy, ie the activation energy. As the temperature is increased, the proportion of particles possessing energy greater than the activation energy increases. Therefore, the frequency of successful collisions increases and we see the rate of reaction increasing.
As the reaction progresses, we see the rate of reaction slowing down as the temperature increases. For example at 50 s, the rate decreases from 0.58 cm3 s-1 at 25°C to 0.27 cm3 s-1 at 80°C. This is due to the reactions at higher temperature being nearer to completion, than that at a lower temperature.
8. The anomalous result is at 10 seconds, when the rate of reaction at 60°C is faster than the rate of reaction at 80°C. It would be expected that the rate of reaction would be faster at the higher temperature. Additionally, learners may identify that the reaction at 80°C completed after the reaction at 60°C as anomalous.
To improve the data collected learners should suggest repeating the experiment at least two more times at each temperature and calculating a mean average.

16© 2021 Royal Society of Chemistry Rates of reaction | Supporting resources
Results tablesInitial rate methodFor use with the video:
Solution Time (s)
A (30 cm3 H2O2)
B (25 cm3 H2O2)
C (20 cm3 H2O2)
D (15 cm3 H2O2)
E (10 cm3 H2O2)
Solution Time (s)
A (30 cm3 H2O2)
B (25 cm3 H2O2)
C (20 cm3 H2O2)
D (15 cm3 H2O2)
E (10 cm3 H2O2)
Solution Time (s)
A (30 cm3 H2O2)
B (25 cm3 H2O2)
C (20 cm3 H2O2)
D (15 cm3 H2O2)
E (10 cm3 H2O2)
Solution Time (s)
A (30 cm3 H2O2)
B (25 cm3 H2O2)
C (20 cm3 H2O2)
D (15 cm3 H2O2)
E (10 cm3 H2O2)
Solution Time (s)
A (30 cm3 H2O2)
B (25 cm3 H2O2)
C (20 cm3 H2O2)
D (15 cm3 H2O2)
E (10 cm3 H2O2)
Solution Time (s)
A (30 cm3 H2O2)
B (25 cm3 H2O2)
C (20 cm3 H2O2)
D (15 cm3 H2O2)
E (10 cm3 H2O2)
For use if completing in class:
SolutionTime (s)
Experiment 1 Experiment 2 Experiment 3 Mean average
A (30 cm3 H2O2)
B (25 cm3 H2O2)
C (20 cm3 H2O2)
D (15 cm3 H2O2)
E (10 cm3 H2O2)
SolutionTime (s)
Experiment 1 Experiment 2 Experiment 3 Mean average
A (30 cm3 H2O2)
B (25 cm3 H2O2)
C (20 cm3 H2O2)
D (15 cm3 H2O2)
E (10 cm3 H2O2)
SolutionTime (s)
Experiment 1 Experiment 2 Experiment 3 Mean average
A (30 cm3 H2O2)
B (25 cm3 H2O2)
C (20 cm3 H2O2)
D (15 cm3 H2O2)
E (10 cm3 H2O2)
17© 2021 Royal Society of Chemistry Rates of reaction | Supporting resources
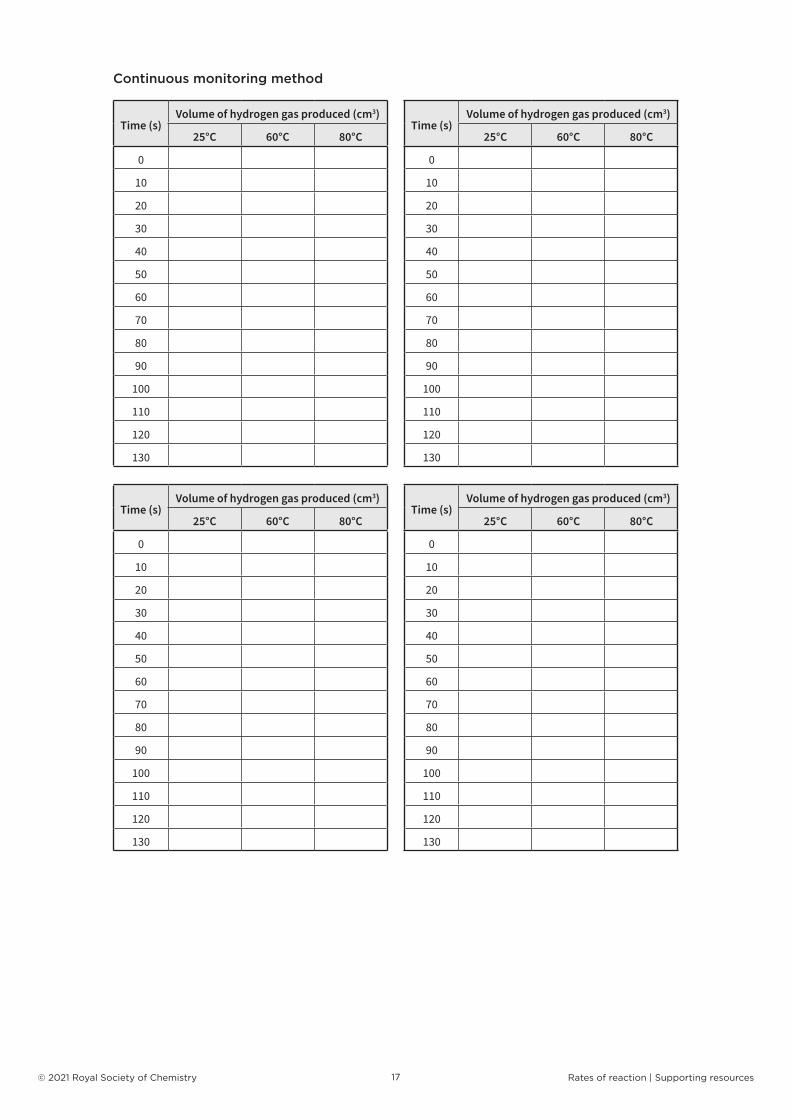
Continuous monitoring method
Time (s)Volume of hydrogen gas produced (cm3)
25°C 60°C 80°C
0
10
20
30
40
50
60
70
80
90
100
110
120
130
Time (s)Volume of hydrogen gas produced (cm3)
25°C 60°C 80°C
0
10
20
30
40
50
60
70
80
90
100
110
120
130
Time (s)Volume of hydrogen gas produced (cm3)
25°C 60°C 80°C
0
10
20
30
40
50
60
70
80
90
100
110
120
130
Time (s)Volume of hydrogen gas produced (cm3)
25°C 60°C 80°C
0
10
20
30
40
50
60
70
80
90
100
110
120
130
Copyright © 2022 FDOKUMEN