
The influence of different kinetic rates on the dynamics of a simple model of catalytic reaction...
32
The influence of different kinetic rates on the dynamics of a simple model of catalytic reaction networks Alessandro Filisetti 1,3 , Alex Graudenzi 2 1 Energy and Environment, interdepartmental centre of industrial research (C.I.R.I), University of Bologna. 2 Department of Computer Science, Systems and Communications, University of Milan Bicocca 3 European Centre for Living Technology WIVACE12 (Italian Workshop for Artificial Intelligence and Evolutionary Computation)
-
Upload
independent -
Category
Documents
-
view
3 -
download
0
Transcript of The influence of different kinetic rates on the dynamics of a simple model of catalytic reaction...
The influence of different kinetic rates on the dynamics of a simple model of catalytic reaction
networks Alessandro Filisetti1,3, Alex Graudenzi2
1Energy and Environment, interdepartmental centre of industrial research (C.I.R.I), University of Bologna.
2 Department of Computer Science, Systems and Communications, University of Milan Bicocca 3 European Centre for Living Technology
WIVACE12 (Italian Workshop for Artificial Intelligence and Evolutionary Computation)
Outline
• Introduction • Autocatalytic sets of molecules • Description of the model • Previous Results • Fragility of ACSs • Simple deterministic model • Conclusions
2
Introduction
• Framework – Complex Systems Biology
• Topic – Emergence of autocatalytic sets of molecules in
catalytic reaction networks • Methods – Consider simple models able to capture general
behaviors
3
Introduction
• Life that is the result of an evolutionary process���
• Whatever it is the right scenario (RNA world, metabolism first, …) a minimal level of complexity was surely necessary���
• Since Eigen (1979) the importance of cycles is a well known property of the living systems
4
Introduction
• Our work is an extension of the original work made by Stuart Kauffman (1986).
• Although autocatalytic sets are frequently seen in models of catalytic networks, they are rarely observed in laboratory.
• Our aim is to relax some limitations and develop a new model attempting to create a bridge between the theoretical and the experimental approach.
5
Autocatalytic Sets of Molecules
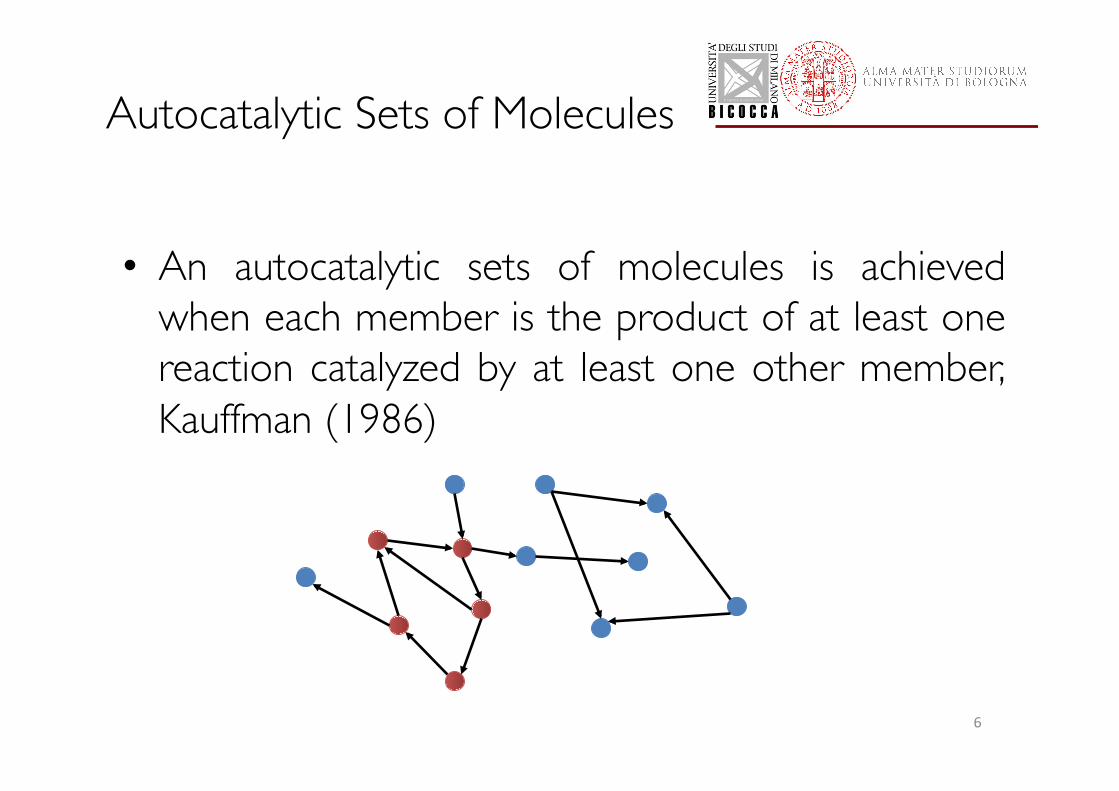
• An autocatalytic sets of molecules is achieved when each member is the product of at least one reaction catalyzed by at least one other member, Kauffman (1986)
6
Description of the model
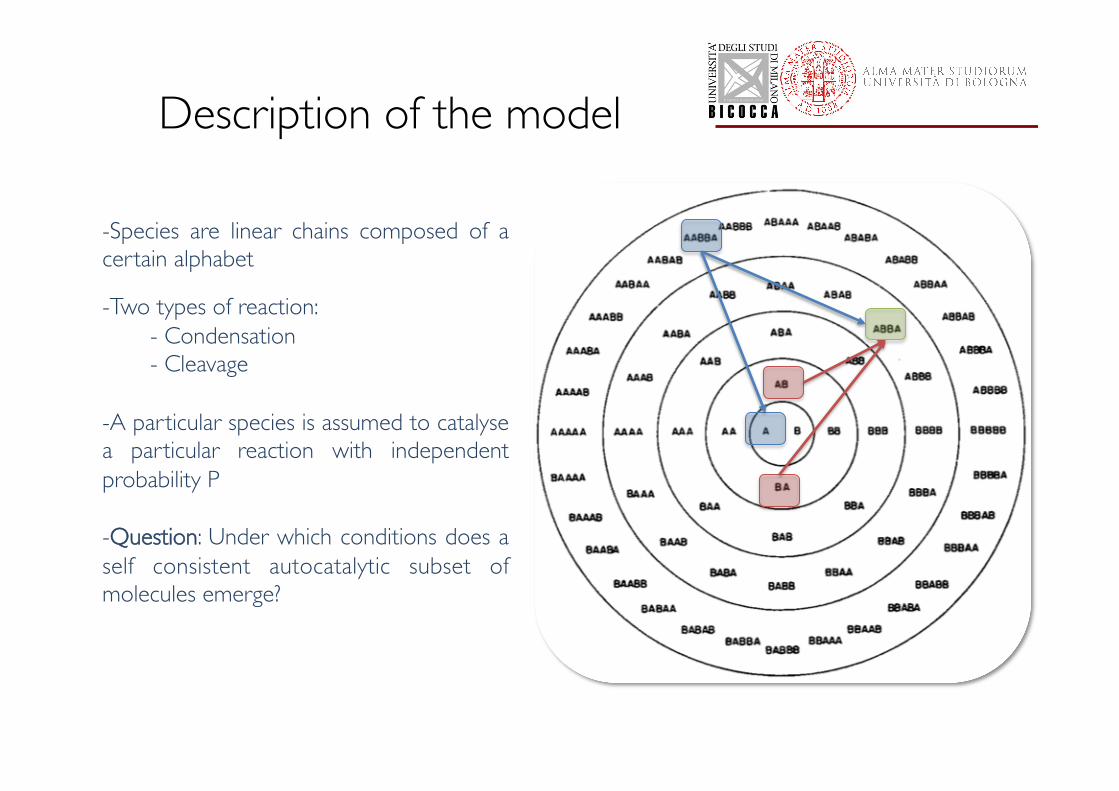
- Species are linear chains composed of a certain alphabet
- Two types of reaction: - Condensation - Cleavage
- A particular species is assumed to catalyse a particular reaction with independent probability P
- Question: Under which conditions does a self consistent autocatalytic subset of molecules emerge?
Kauffman main result
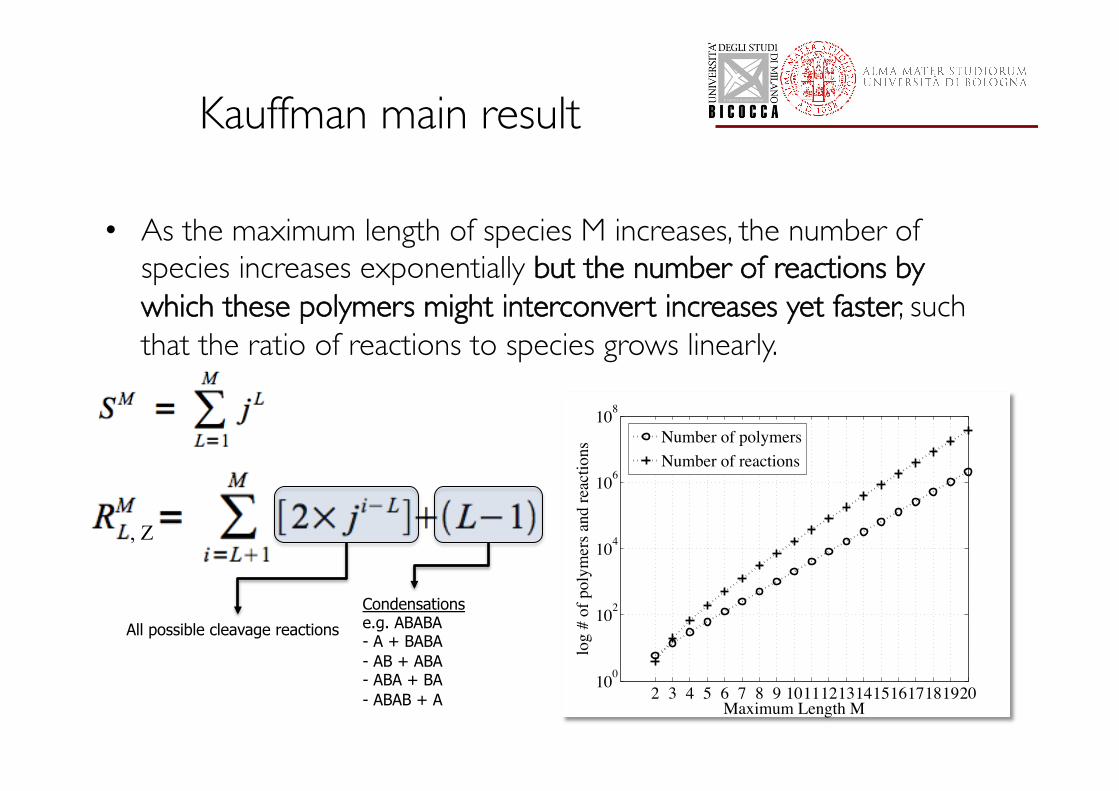
• As the maximum length of species M increases, the number of species increases exponentially but the number of reactions by which these polymers might interconvert increases yet faster, such that the ratio of reactions to species grows linearly.
Condensations e.g. ABABA - A + BABA - AB + ABA - ABA + BA - ABAB + A
All possible cleavage reactions
, Z
2 3 4 5 6 7 8 9 1011121314151617181920100
102
104
106
108
Maximum Length M
log
# of
pol
ymer
s and
reac
tions
Number of polymersNumber of reactions
A bridge between theory and lab
• WHY IS IT SO DIFFICULT TO REPRODUCE THAT IN LABORATORY?
These mathema.cal models are toys
Increase molecules diversity
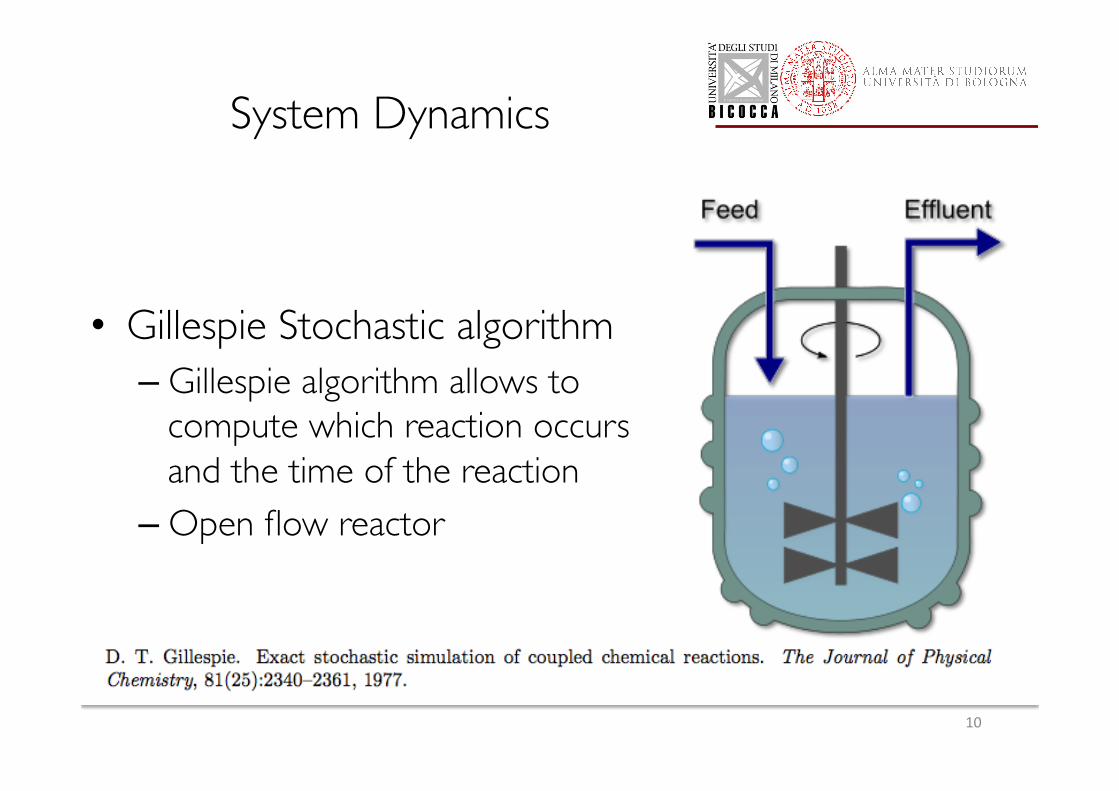
System Dynamics
• Gillespie Stochastic algorithm – Gillespie algorithm allows to
compute which reaction occurs and the time of the reaction
– Open flow reactor
10
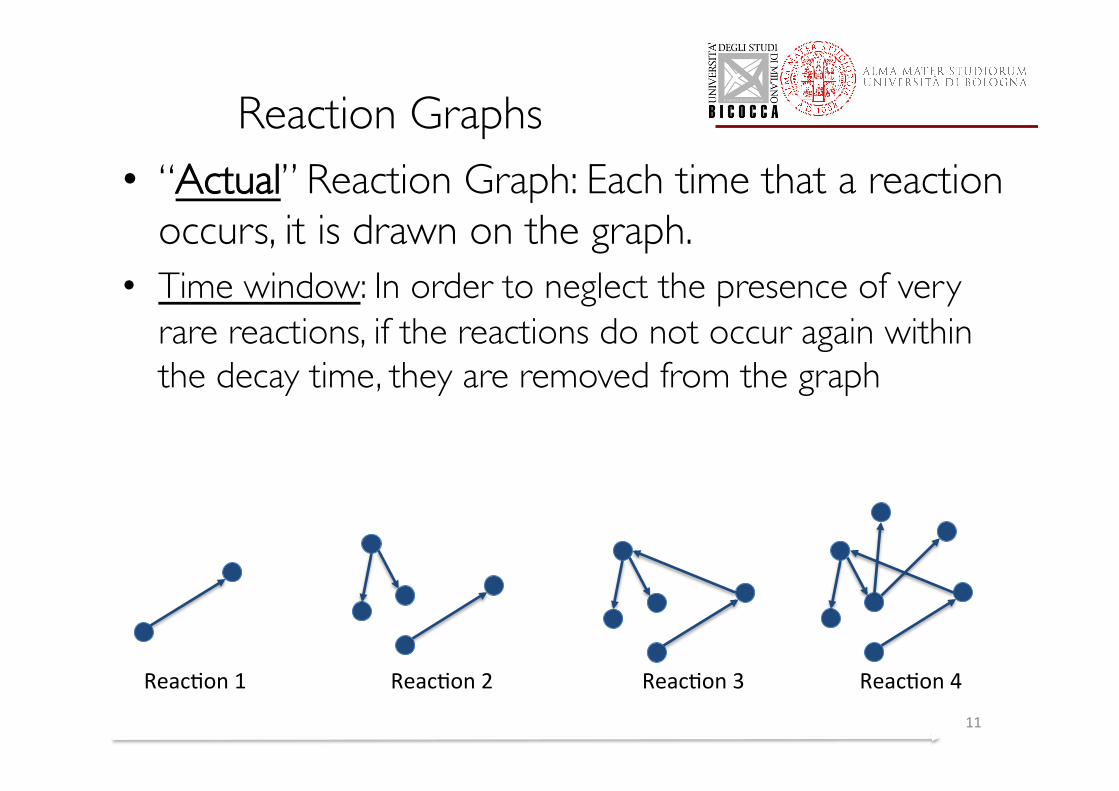
Reaction Graphs • “Actual” Reaction Graph: Each time that a reaction
occurs, it is drawn on the graph. • Time window: In order to neglect the presence of very
rare reactions, if the reactions do not occur again within the decay time, they are removed from the graph
11
Reac.on 1 Reac.on 2 Reac.on 3 Reac.on 4
Time
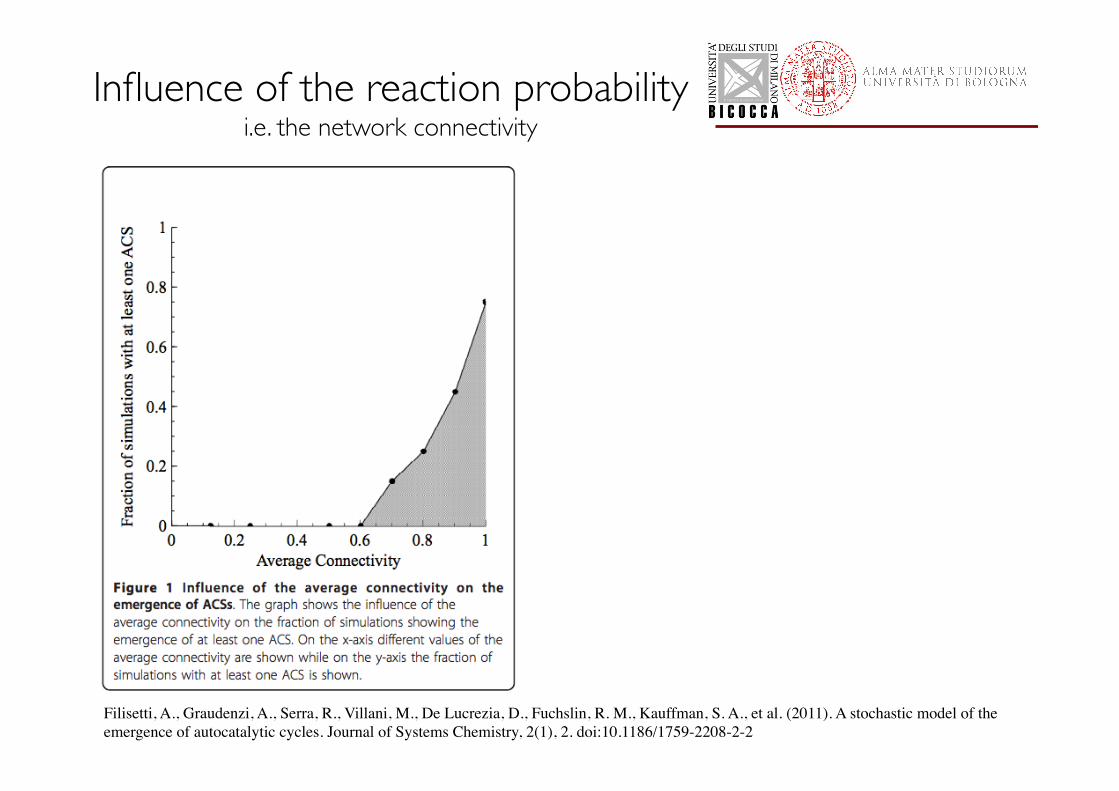
Influence of the reaction probability���i.e. the network connectivity
Filisetti, A., Graudenzi, A., Serra, R., Villani, M., De Lucrezia, D., Fuchslin, R. M., Kauffman, S. A., et al. (2011). A stochastic model of the emergence of autocatalytic cycles. Journal of Systems Chemistry, 2(1), 2. doi:10.1186/1759-2208-2-2
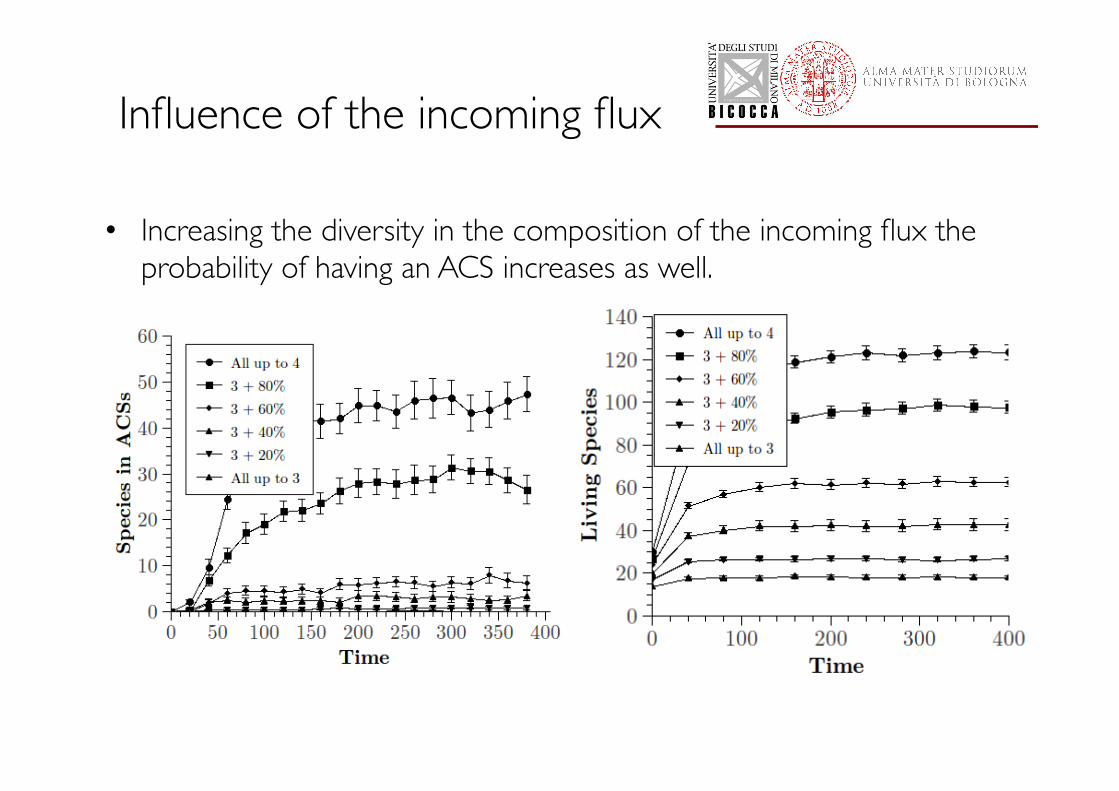
Influence of the incoming flux
• Increasing the diversity in the composition of the incoming flux the probability of having an ACS increases as well.
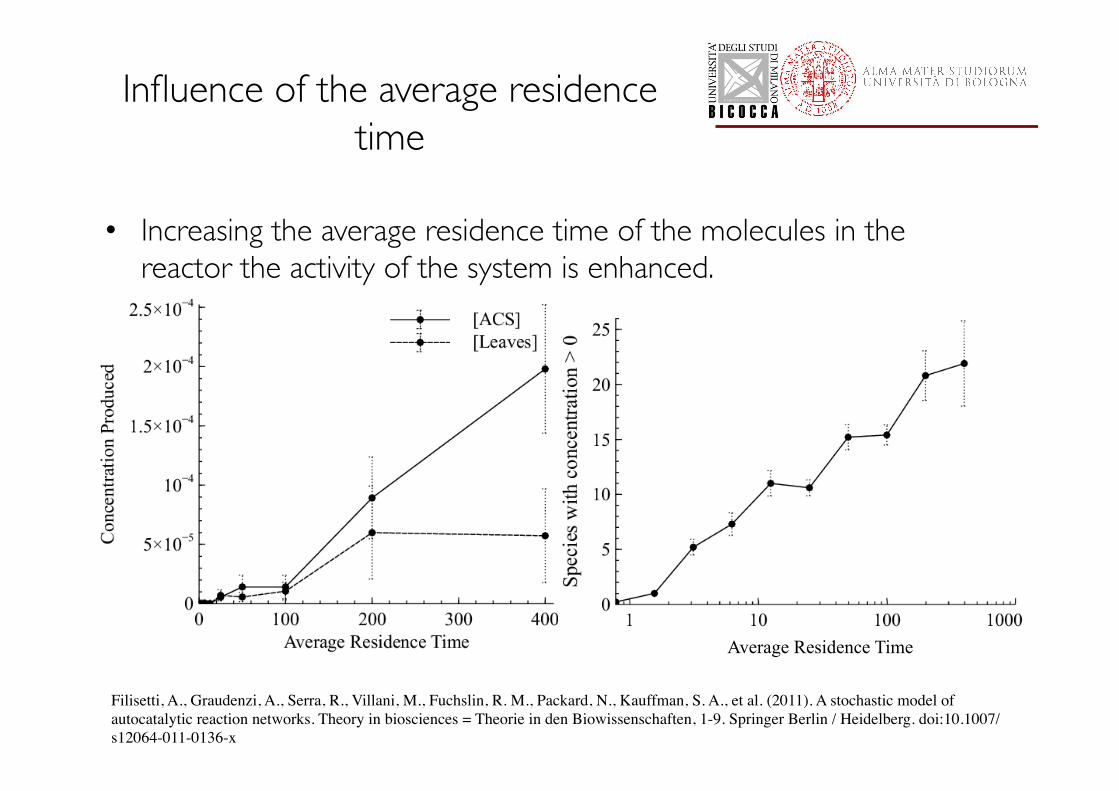
Influence of the average residence time
• Increasing the average residence time of the molecules in the reactor the activity of the system is enhanced.
Average Residence Time
Filisetti, A., Graudenzi, A., Serra, R., Villani, M., Fuchslin, R. M., Packard, N., Kauffman, S. A., et al. (2011). A stochastic model of autocatalytic reaction networks. Theory in biosciences = Theorie in den Biowissenschaften, 1-9. Springer Berlin / Heidelberg. doi:10.1007/s12064-011-0136-x
Introduction of energy constraints
• Endergonic and Exergonic reactions. • Introduction of an energy carrier molecule. • Presence of an incoming flux of energy carriers and
a species energization rate.
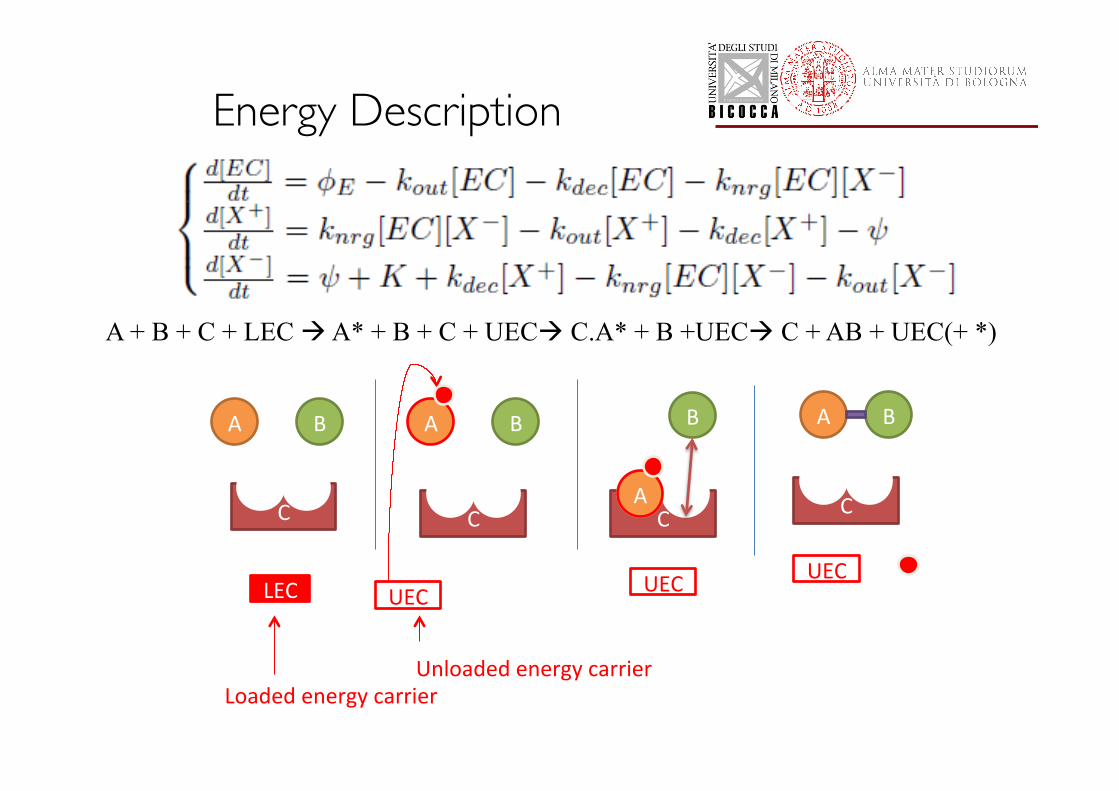
Energy Description
A + B + C + LEC à A* + B + C + UECà C.A* + B +UECà C + AB + UEC(+ *)
A B
LEC
A B
UEC
C AA
C AA
C AAA
B
UEC
C AA
UEC
B A*
*
*
Loaded energy carrier Unloaded energy carrier
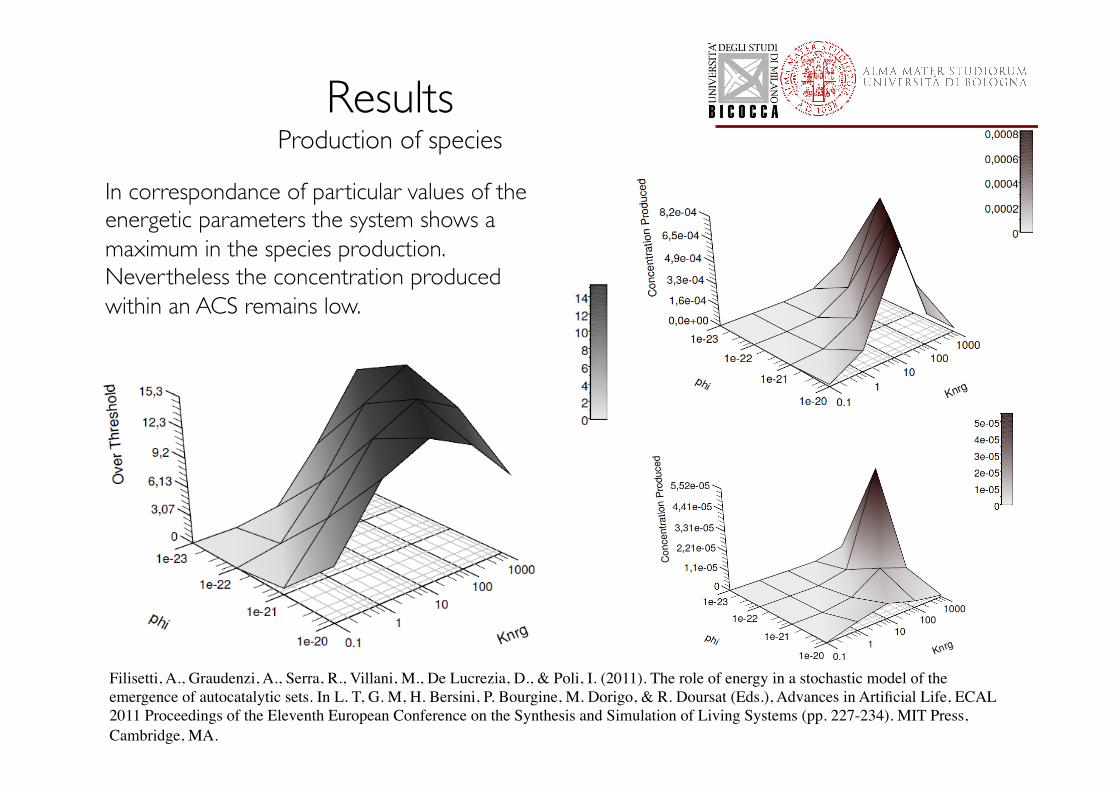
Results���Production of species
In correspondance of particular values of the energetic parameters the system shows a maximum in the species production. Nevertheless the concentration produced within an ACS remains low.
Filisetti, A., Graudenzi, A., Serra, R., Villani, M., De Lucrezia, D., & Poli, I. (2011). The role of energy in a stochastic model of the emergence of autocatalytic sets. In L. T, G. M, H. Bersini, P. Bourgine, M. Dorigo, & R. Doursat (Eds.), Advances in Artificial Life, ECAL 2011 Proceedings of the Eleventh European Conference on the Synthesis and Simulation of Living Systems (pp. 227-234). MIT Press, Cambridge, MA.
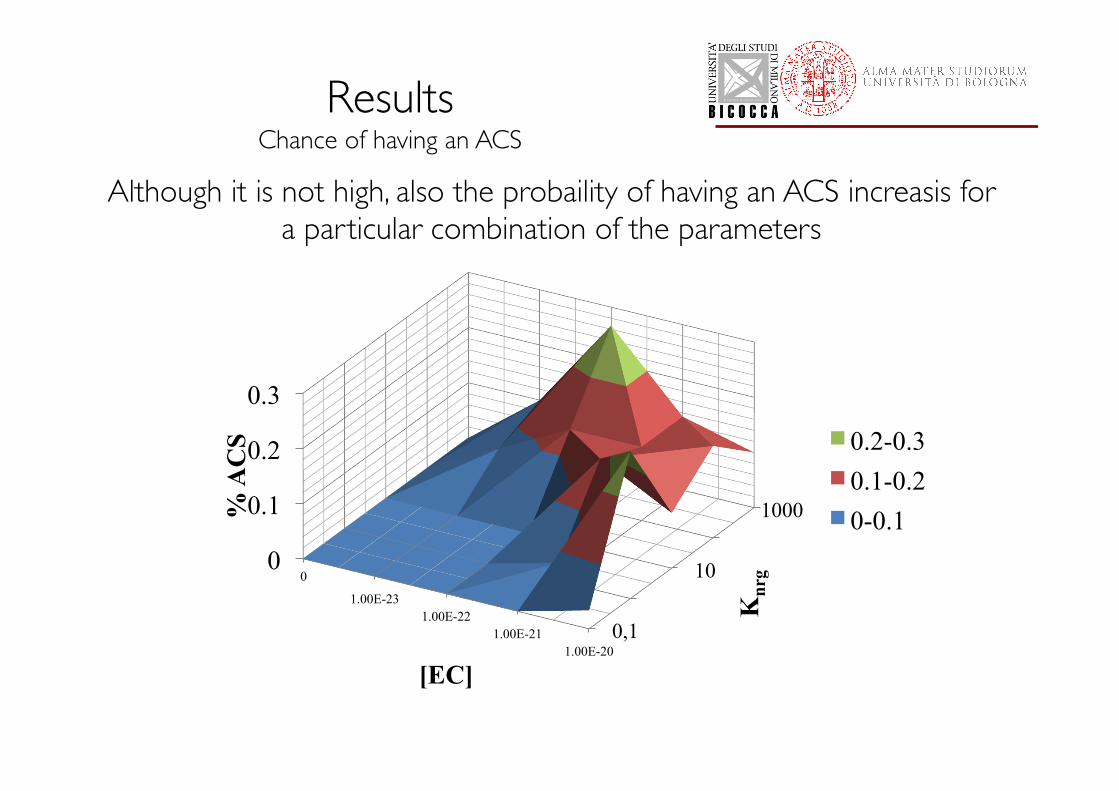
Results���Chance of having an ACS
0,1
10
1000
0
0.1
0.2
0.3
0
1.00E-23 1.00E-22
1.00E-21 1.00E-20
Knr
g
% A
CS
[EC]
0.2-0.3 0.1-0.2 0-0.1
Although it is not high, also the probaility of having an ACS increasis for a particular combination of the parameters
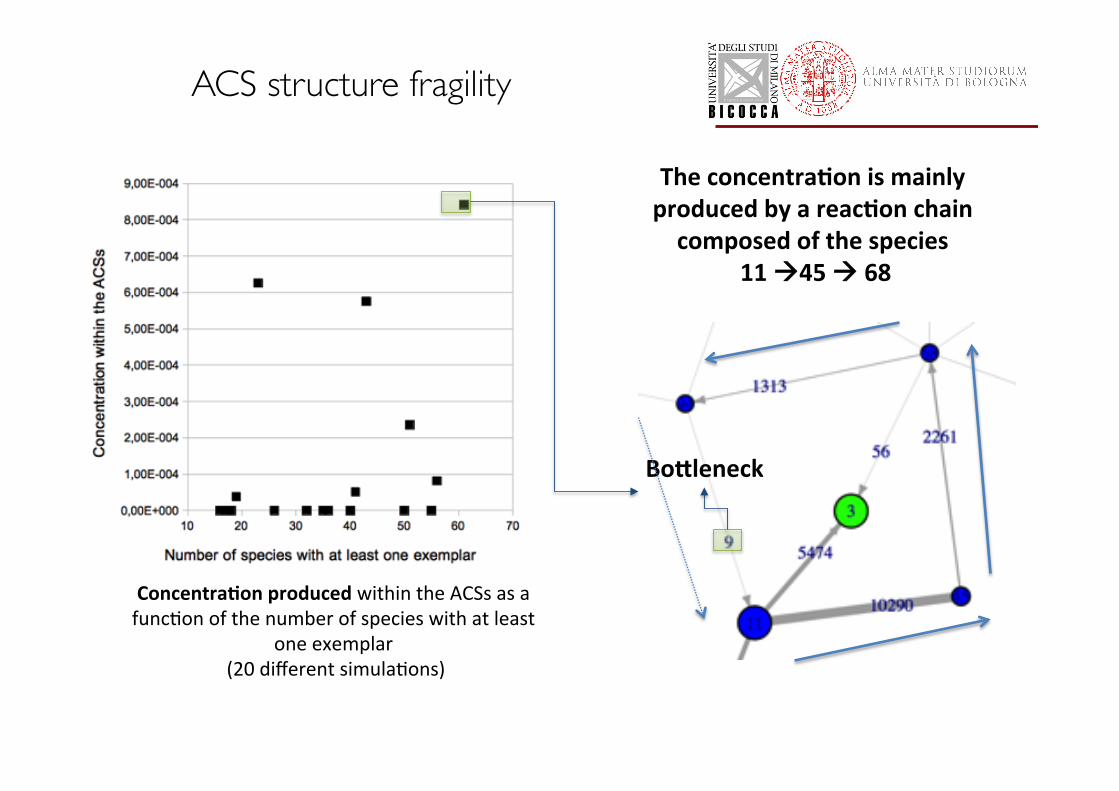
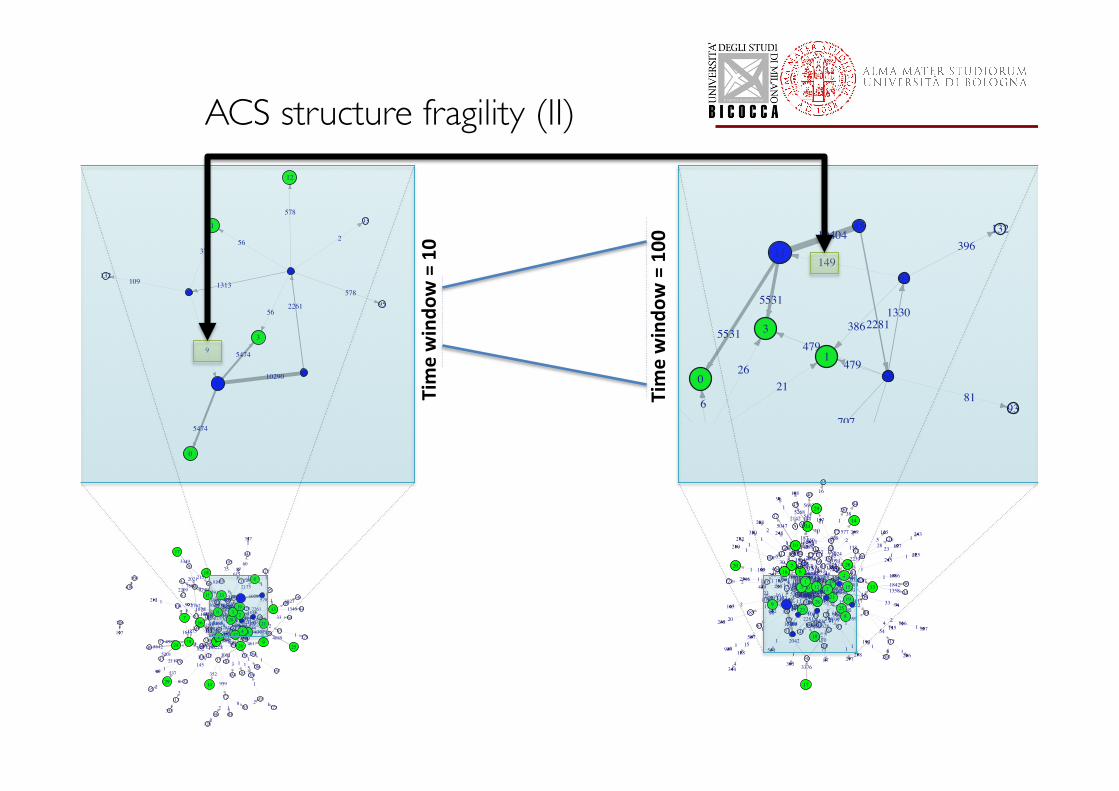
ACS structure fragility
Concentra)on produced within the ACSs as a func.on of the number of species with at least
one exemplar (20 different simula.ons)
Bo/leneck
The concentra)on is mainly produced by a reac)on chain composed of the species
11 à45 à 68
5474
5474
10290
2261
1313578
578
109
56
56
37
9
2
1145
68
94
3
0
95
12
132
1 93
3590
3590
3323
3323
547454741016
10164944
49441645
1645
1461
1461
148168081930562856283397
1346124596939
19175
19175
5520
2791
3349
5749
5642
9119
7600
4988
10290
3532
5201
4089
3001
1827
1089
1089
959
1188
1188
2762
2021
4498
2151
3740
3740
2261
2117
2209
3076
1369
1369
2175
2175
12751275887
1248537
537
1313
733
733
1078
12842017
589589
824
570
712
531
615
654
426
461
578
578
352
352
189
225225
135
150 109
145
6075
56
56
28
3332 32
37
12
8
10
5
9
9
9
8
66
6
9167
3
3
5
5
3
2
2
3 3
2
2
3
4
23
2
21
1
1
1 1
1
2
11 3
3
1
1
22 1
1
2
1
1
1
1
1
1
1
2
1
1
22
1
2
1 2
1
11
1
1
1
1
1 1
26
19
11
13
217
6
2315
2816
18
17
2410
25
39
33
41
31
30
38
45
43
42
63
61
34
70
68
69
67
81
62
132
159
105
107
133
73
88
94
32
89
123
95
72
29
112
187
151
85
218
106 264
86
903478
103113
117
145
104
167
160
149
183
935
20 3
4
44
1
4037
36
9
8
12
14
64
87
109
65
184 185
126
172
35
96
353
206
186
317
212
84
430
278
5531
5531
10404
2281
479479
707
707
1330386
149396
232
42
42132
45
81
32
32
27 26
23
21
85
7
6
11
45
68
94
95123
166
3
0
1
12
132
13
8133
167
93
2
5
774
36403640
3362 3362553155311022
10224998
4998
1665
1665
1482 1482
14916872194456925692
3437
1358126217023
1938519385
5598
2818
3376
5805
5693
9223
7666
5047
10404
3564
5268
4117
3024
1842
1102
1102
2239
968
11981198
2797
2042
674674
4549
2170
37883788
5051384
1384
2281
2142
1299
1299
187
187
3127479479
542
542
2199
2199
894
577
577
265
849
1094
194
599
59996
707
707
138
747747
1330
477
1257
38
626
198198
560
13072056497282
455
299
195195
749
386
149 396
215
574336
433
422
93
140
232
315
140
116
42
42
71
683
175
33
130
54140
140
55
55
38539
47 47
259132
237496
107
157
45
81
7445
236
60
4141
7272
155
5252
43
3232
15
27
20
22
2815
26 23
23
23
20
5072
30
20
21
25
10
11
12
10
23 16
1613
8
8
5
7
44
4
6
16
4
2
25
5
3
7
3
3
4
3 418
3
2
2
6
11
91
1
1
1 2
1
1 4
4
1
2
31
1
1 1
21
113
31 1
1
1
2
2
2
2
11
1
1
12
1
1
1 1
1
1
11
114 4
1
1
1
1
4
1
1
1
11
2 2
1
1
1
1
12
2 3
3 1
2
1
1
1
1
222
132
1 11
3
21
321
1 44
1
2
1
1 11
1
1
1
1
1 11 11
1
1
1
1
1
26
1911
13
21
76
23
15
28
16
18
17
24
10
25
39
42
33
41
31
30
38
45
43
63
34
68
70
61
72
62
67
29
69
89
105
64
32
81
73
133
86
94
132
8895
11285
107
159
123
104
151
65
166
185
167
149
145
103
184
117
118
138
106
139
265
109
317
263
774
218753264903
111
183
297
338
116
642
430
93
507
203
160
127
113
179
429
213
245
187
659
638
478
1574353
1865203
4
44
1
40
37
36
9
8
14
12
84
87
71
238
126
137
115
35
344
208
125
163
369248
108
157
330
20
559
305
929
267
210225
277
17210862516
96
206
212
278
243
Time windo
w = 10
Time windo
w = 100
ACS structure fragility (II)
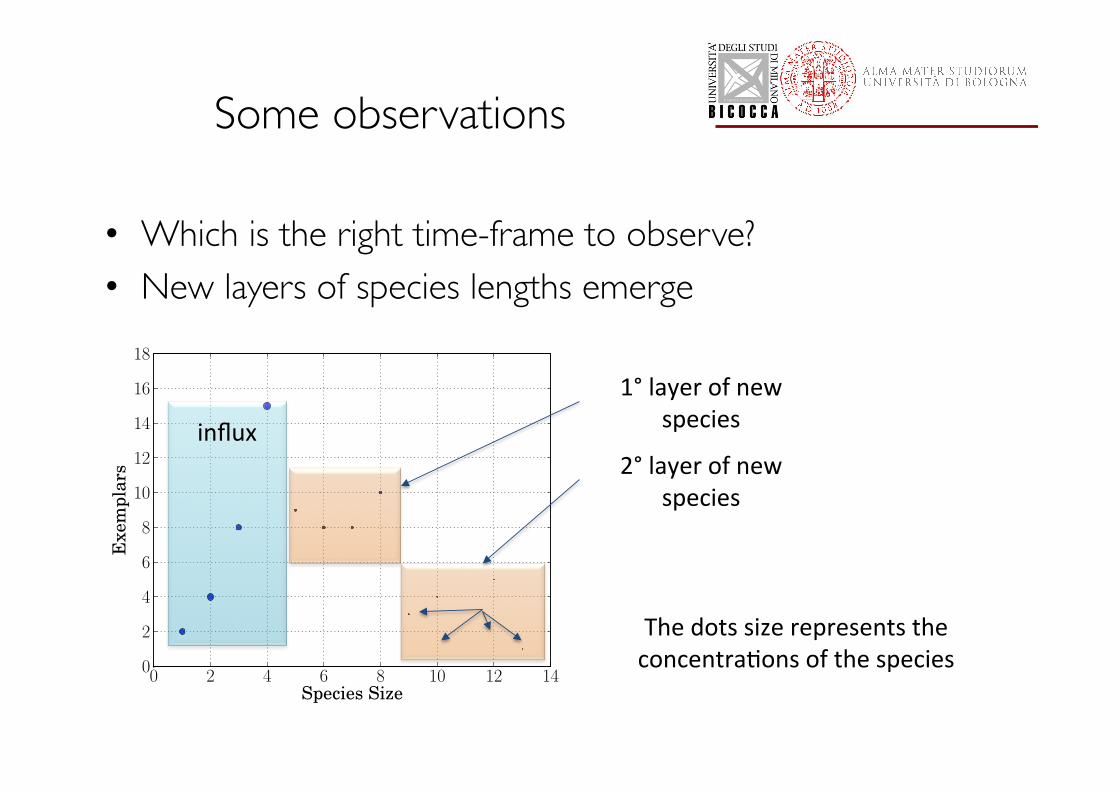
Some observations
• Which is the right time-frame to observe? • New layers of species lengths emerge
influx
The dots size represents the concentra.ons of the species
2° layer of new species
1° layer of new species
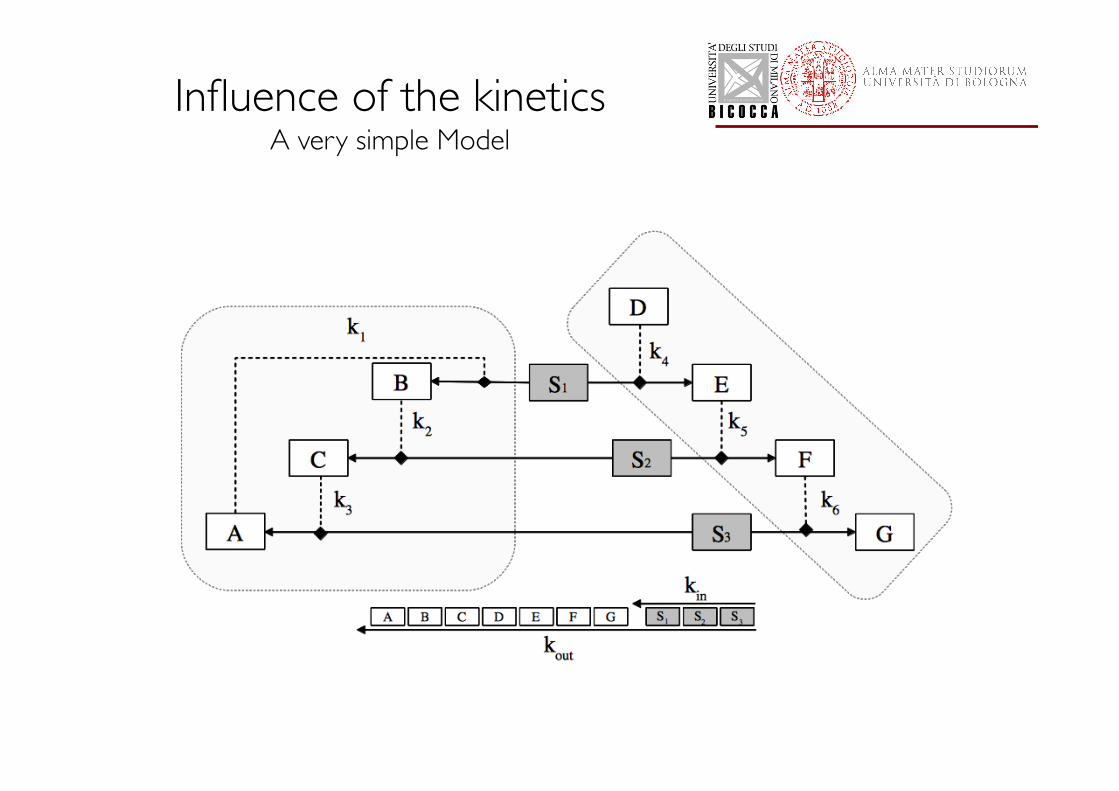
Influence of the kinetics���A very simple Model
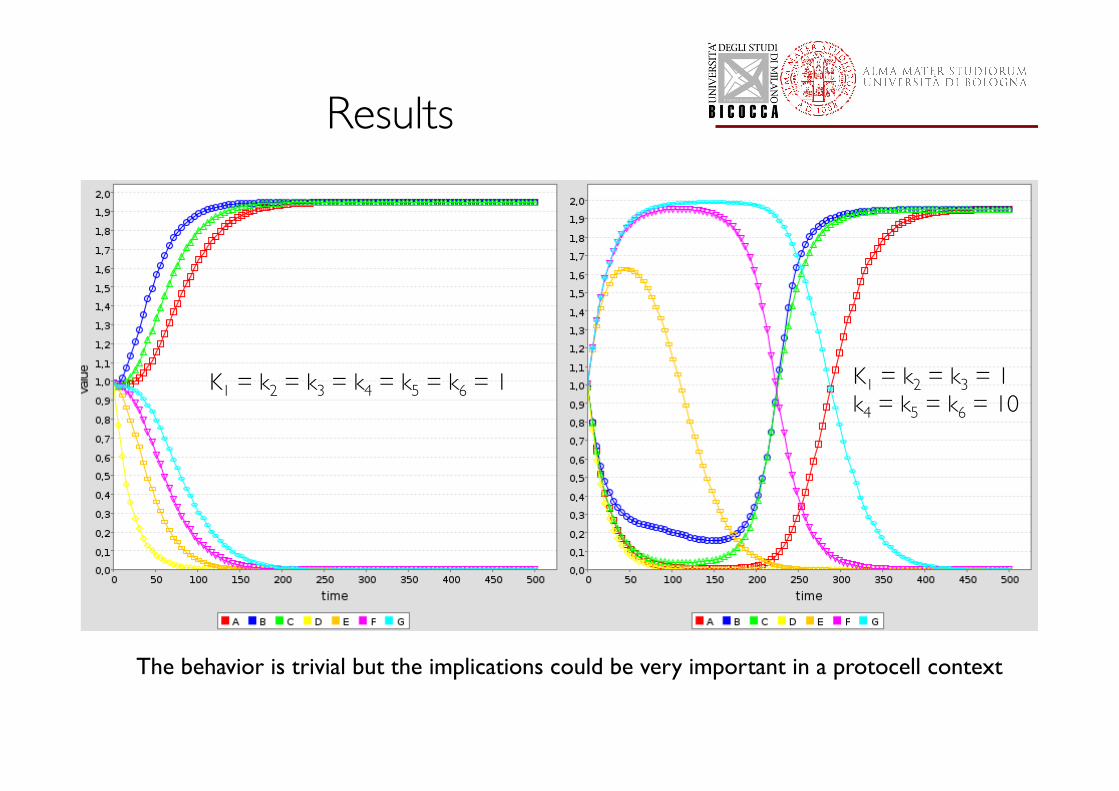
Results
K1 = k2 = k3 = k4 = k5 = k6 = 1 K1 = k2 = k3 = 1 k4 = k5 = k6 = 10
The behavior is trivial but the implications could be very important in a protocell context
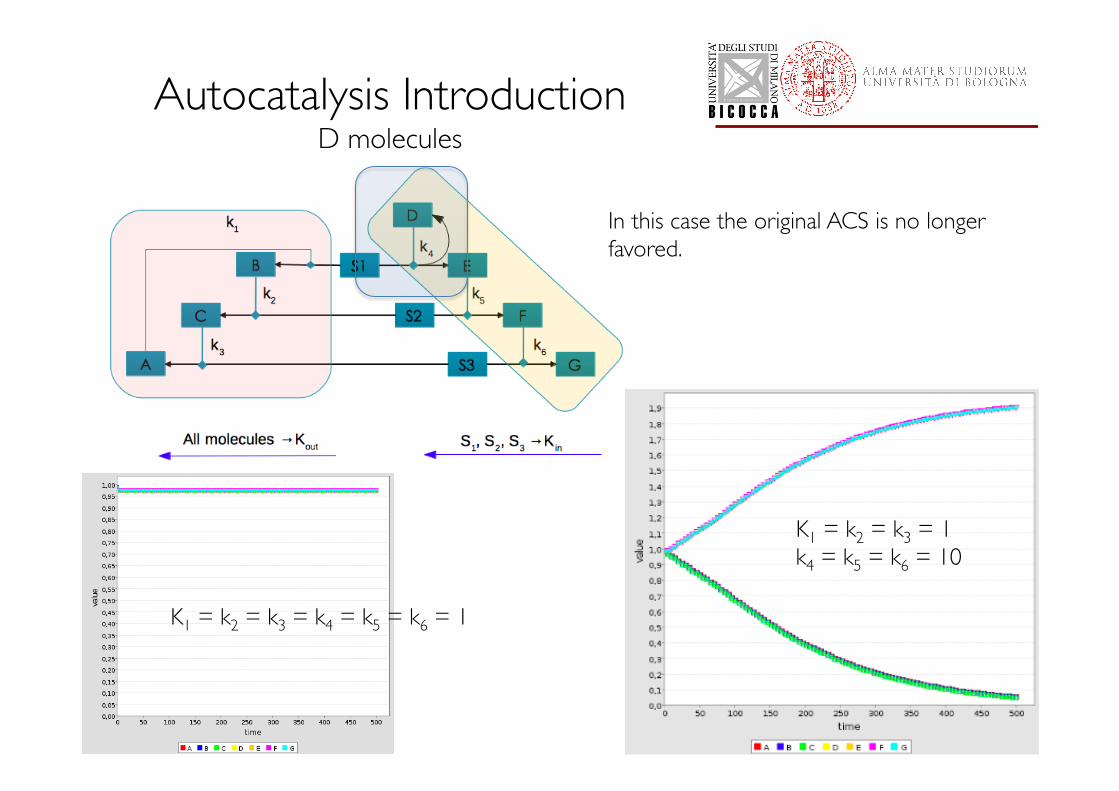
Autocatalysis Introduction ���D molecules
K1 = k2 = k3 = k4 = k5 = k6 = 1
K1 = k2 = k3 = 1 k4 = k5 = k6 = 10
In this case the original ACS is no longer favored.
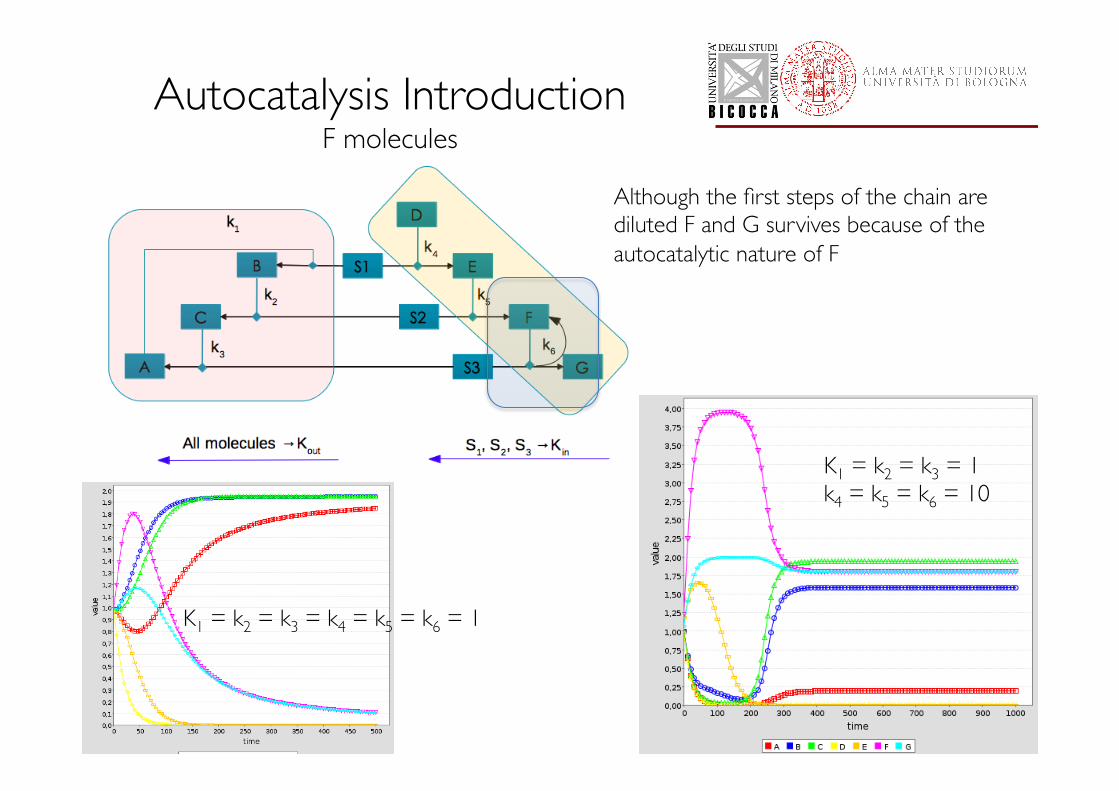
Autocatalysis Introduction ���F molecules
K1 = k2 = k3 = k4 = k5 = k6 = 1
K1 = k2 = k3 = 1 k4 = k5 = k6 = 10
Although the first steps of the chain are diluted F and G survives because of the autocatalytic nature of F
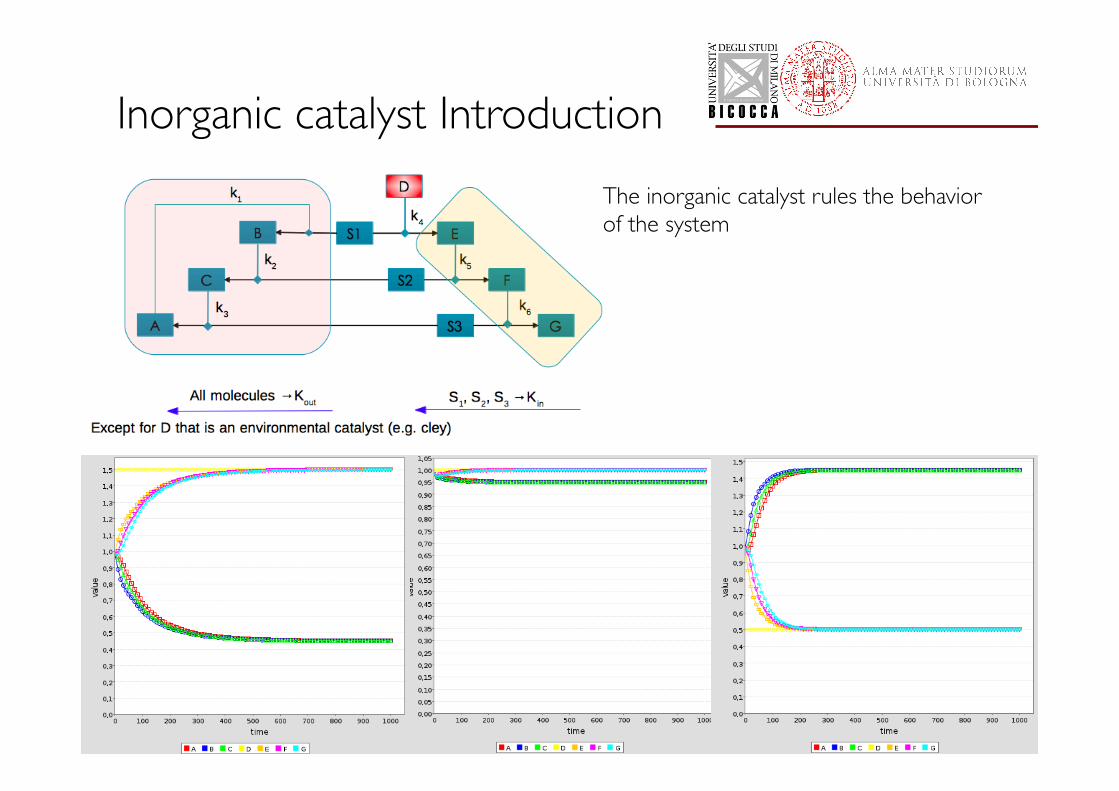
Inorganic catalyst Introduction The inorganic catalyst rules the behavior of the system
Conclusions
• The presence of an autocatalytic set is not sufficient in order to achieve its survival.
• The introduction of the stochasticity changes completely the dynamics.
• Big systems composed of several reaction pathways could suppress the ACS.
• Analytical analysis could be useful in order to decipher the behaviour of the system.
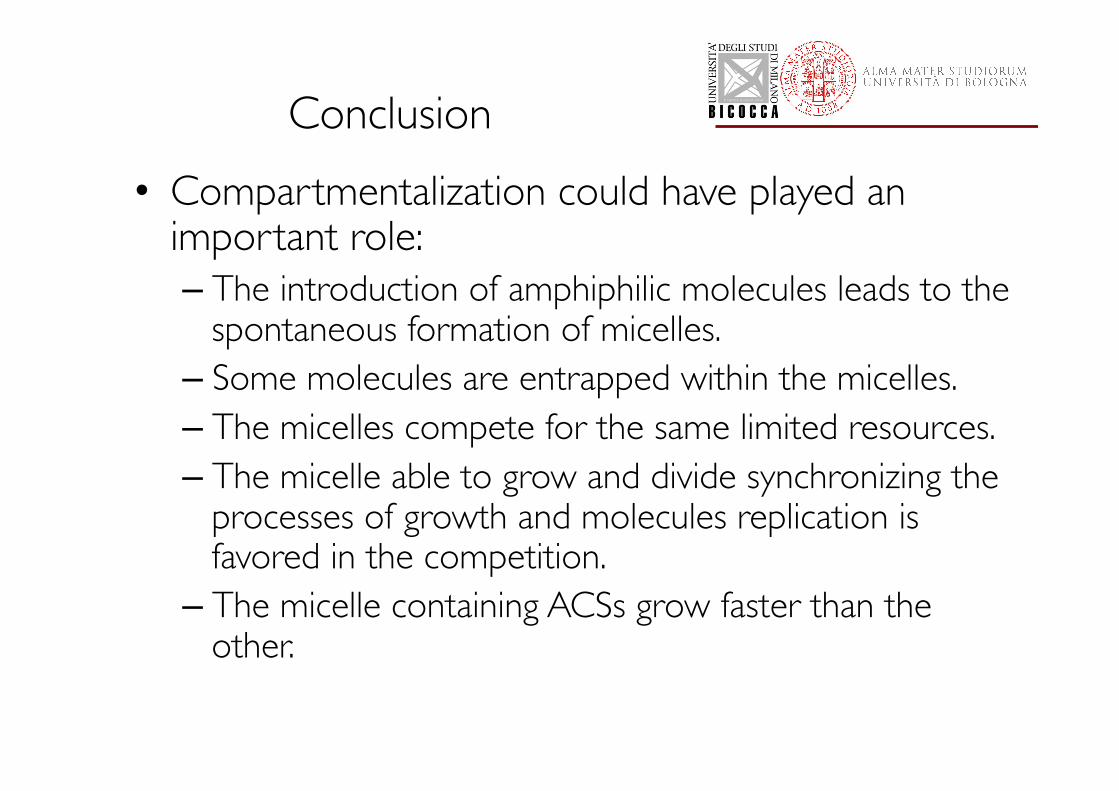
Conclusion • Compartmentalization could have played an
important role: – The introduction of amphiphilic molecules leads to the
spontaneous formation of micelles. – Some molecules are entrapped within the micelles. – The micelles compete for the same limited resources. – The micelle able to grow and divide synchronizing the
processes of growth and molecules replication is favored in the competition.
– The micelle containing ACSs grow faster than the other.
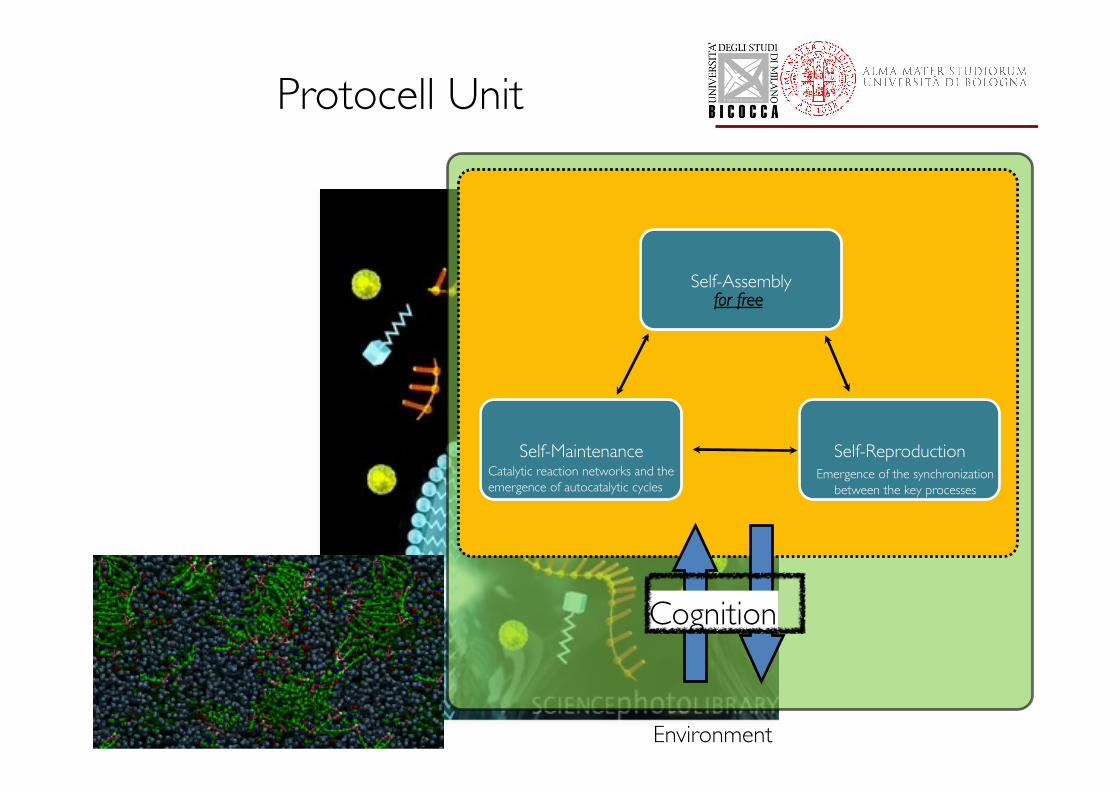
Protocell Unit
Self-Assembly
Self-Reproduction Self-Maintenance Emergence of the synchronization
between the key processes Catalytic reaction networks and the emergence of autocatalytic cycles
Environment
for free
Cognition
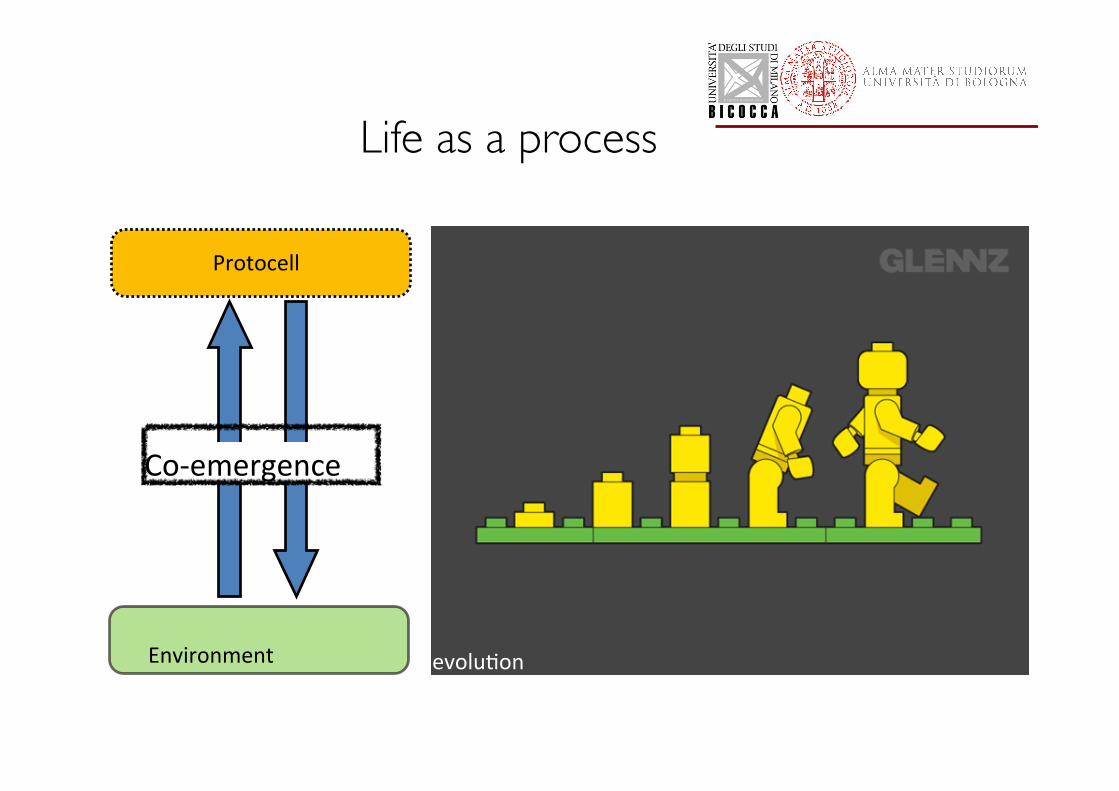
Life as a process
Environment
Protocell
Co-‐emergence
evolu.on
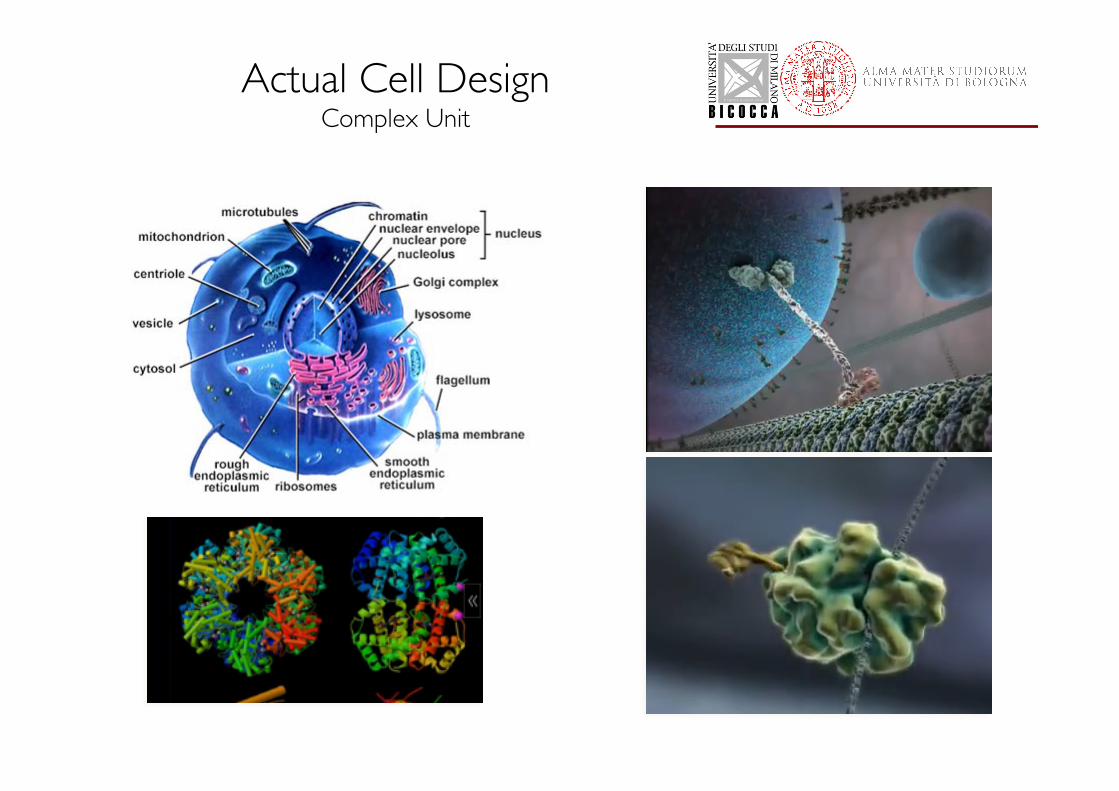
Actual Cell Design ���Complex Unit