Kinetic analysis of autotaxin reveals substrate-specific catalytic pathways and a mechanism for...
25
Kinetic Analysis of Autotaxin Reveals Substrate-specific Catalytic Pathways and a Mechanism for Lysophosphatidic Acid Distribution * □ S Received for publication, April 1, 2011, and in revised form, June 23, 2011 Published, JBC Papers in Press, June 30, 2011, DOI 10.1074/jbc.M111.246884 Lauren P. Saunders ‡1 , Wenxiang Cao ‡ , William C. Chang § , Ronald A. Albright § , Demetrios T. Braddock §2 , and Enrique M. De La Cruz ‡3 From the ‡ Department of Molecular Biophysics and Biochemistry, Yale University, New Haven, Connecticut 06520 and the § Department of Pathology, Yale University School of Medicine, New Haven, Connecticut 06510 Autotaxin (ATX) is a secreted lysophospholipase D that hy- drolyzes lysophosphatidylcholine (LPC) into lysophosphatidic acid (LPA), initiating signaling cascades leading to cancer metastasis, wound healing, and angiogenesis. Knowledge of the pathway and kinetics of LPA synthesis by ATX is critical for developing quanti- tative physiological models of LPA signaling. We measured the individual rate constants and pathway of the LPA synthase cycle of ATX using the fluorescent lipid substrates FS-3 and 12-(N-methyl- N-(7-nitrobenz-2-oxa-1,3-diazol-4-yl))-LPC. FS-3 binds rapidly (k 1 >500 M 1 s 1 ) and is hydrolyzed slowly (k 2 0.024 s 1 ). Release of the first hydrolysis product is random and rapid (>1 s 1 ), whereas release of the second is slow and rate-limiting (0.005– 0.007 s 1 ). Substrate binding and hydrolysis are slow and rate-lim- iting with LPC. Product release is sequential with choline preced- ing LPA. The catalytic pathway and kinetics depend strongly on the substrate, suggesting that ATX kinetics could vary for the various in vivo substrates. Slow catalysis with LPC reveals the potential for LPA signaling to spread to cells distal to the site of LPC substrate binding by ATX. An ATX mutant in which catalytic threonine at position 210 is replaced with alanine binds substrate weakly, favor- ing a role for Thr-210 in binding as well as catalysis. FTY720P, the bioactive form of a drug currently used to treat multiple sclerosis, inhibits ATX in an uncompetitive manner and slows the hydrolysis reaction, suggesting that ATX inhibition plays a significant role in lymphocyte immobilization in FTY720P-based therapeutics. Autotaxin (ATX), 4 also known as nucleotide pyrophospha- tase/phosphodiesterase 2 (NPP2), was identified as a secreted autocrine motility-stimulating factor in melanoma cell cultures (1) and has subsequently been shown to play critical roles in angiogenesis, apoptosis, cancer metastasis, development, neu- ropathic pain, and wound healing (reviewed in Refs. 2–5). ATX displays both nucleotide phosphodiesterase activity (6) and a robust lysophospholipase D activity (lyso-PLD (7)). ATX phos- phodiesterase activity is weak and is not considered relevant for in vivo function (7–9). Rather, the physiological activities of ATX have been attributed to synthesis of lysophosphatidic acid (LPA), a growth factor/chemokine that binds several endothe- lial differential gene family receptors (LPA1–5) (reviewed in Ref. 4), and initiates a variety of signaling cascades (4, 5) from lysophosphatidylcholine. ATX is the primary source of plasma LPA synthesis (10, 11). The plasma LPC concentration (50 –200 M) is comparable with the K M value for steady-state LPC hydrolysis by ATX (7, 12–15). ATX binds LPA product more strongly than LPC sub- strate (12, 16), which has led to the hypothesis that product feedback inhibition regulates ATX activity and LPA production in vivo (16). However, rapid degeneration of serum LPA by lipid phosphate phosphohydrolase 1 (LPP1) (17, 18) would diminish LPA product inhibition of ATX. Rapid LPA degradation upon release from ATX also limits the effective target area of newly synthesized LPA, such that LPA signaling is restricted to within the diffusional area of the ATXlipid complex from substrate binding locations. If LPC binding, hydrolysis, and LPA product release are rapid, LPA release and downstream signaling would be local (i.e. limited to sites of LPC binding). If, however, LPC substrate binding were more rapid than LPA release and bound LPA/LPC were inac- cessible to degradation by LPP1, ATX with bound LPC/LPA could diffuse, thereby spreading LPA signaling to distal sites and cells. Recent in vivo studies show that competitive inhibi- tion of ATX accelerates LPA degradation (19), consistent with the possibility of global ATX/LPA signaling via exclusion from LPP1. In this study, we measured the individual rate constants and pathway of the LPA synthase cycle of ATX using the fluorescent lipid substrates FS-3 (20) and LPC labeled at the fatty acid chain with NBD (NBD-LPC), using steady-state and transient kinetic methods. Our results and analysis indicate that the catalytic * This work was supported, in whole or in part, by National Institutes of Health Grant GM071688 (to E. M. D. L. C.). □ S The on-line version of this article (available at http://www.jbc.org) contains supplemental Equations 1– 60 and an additional reference. 1 Supported in part by American Heart Association Predoctoral Fellowship Award 09PRE2080041. 2 Supported by a grant from Bayer Health Care Pharmaceutical Inc. To whom correspondence may be addressed: Dept. of Pathology, Yale University School of Medicine, 310 Cedar St., New Haven, CT 06510. Tel.: 203-737- 1278; Fax: 203-785-6899; E-mail: [email protected]. 3 American Heart Association Established Investigator 0940075N, recipient of National Science Foundation CAREER Award MCB-0546353, and a Hellman Family Fellow. To whom correspondence may be addressed: Dept. of Molecular Biophysics and Biochemistry, Yale University, P. O. Box 208114, New Haven, CT 06520-8114. Tel.: 203-432-5424; Fax: 203-432-1296; E-mail: [email protected]. 4 The abbreviations used are: ATX, autotaxin; LPC, lysophosphatidylcholine; LPA, lysophosphatidic acid; lyso-PLD, lysophospholipase D; NBD, 12-(N- methyl-N-(7-nitrobenz-2-oxa-1,3-diazol-4-yl)); TF-LPA, Top Fluor-LPA; pNP-TMP, p-nitrophenyl thymidine 5monophosphate. THE JOURNAL OF BIOLOGICAL CHEMISTRY VOL. 286, NO. 34, pp. 30130 –30141, August 26, 2011 © 2011 by The American Society for Biochemistry and Molecular Biology, Inc. Printed in the U.S.A. 30130 JOURNAL OF BIOLOGICAL CHEMISTRY VOLUME 286 • NUMBER 34 • AUGUST 26, 2011 by guest on June 17, 2016 http://www.jbc.org/ Downloaded from by guest on June 17, 2016 http://www.jbc.org/ Downloaded from by guest on June 17, 2016 http://www.jbc.org/ Downloaded from by guest on June 17, 2016 http://www.jbc.org/ Downloaded from by guest on June 17, 2016 http://www.jbc.org/ Downloaded from by guest on June 17, 2016 http://www.jbc.org/ Downloaded from by guest on June 17, 2016 http://www.jbc.org/ Downloaded from by guest on June 17, 2016 http://www.jbc.org/ Downloaded from by guest on June 17, 2016 http://www.jbc.org/ Downloaded from by guest on June 17, 2016 http://www.jbc.org/ Downloaded from by guest on June 17, 2016 http://www.jbc.org/ Downloaded from by guest on June 17, 2016 http://www.jbc.org/ Downloaded from by guest on June 17, 2016 http://www.jbc.org/ Downloaded from by guest on June 17, 2016 http://www.jbc.org/ Downloaded from
Transcript of Kinetic analysis of autotaxin reveals substrate-specific catalytic pathways and a mechanism for...
Kinetic Analysis of Autotaxin Reveals Substrate-specificCatalytic Pathways and a Mechanism for LysophosphatidicAcid Distribution*□S
Received for publication, April 1, 2011, and in revised form, June 23, 2011 Published, JBC Papers in Press, June 30, 2011, DOI 10.1074/jbc.M111.246884
Lauren P. Saunders‡1, Wenxiang Cao‡, William C. Chang§, Ronald A. Albright§, Demetrios T. Braddock§2,and Enrique M. De La Cruz‡3
From the ‡Department of Molecular Biophysics and Biochemistry, Yale University, New Haven, Connecticut 06520 and the§Department of Pathology, Yale University School of Medicine, New Haven, Connecticut 06510
Autotaxin (ATX) is a secreted lysophospholipase D that hy-drolyzes lysophosphatidylcholine(LPC) into lysophosphatidicacid(LPA), initiating signaling cascades leading to cancer metastasis,wound healing, and angiogenesis. Knowledge of the pathway andkinetics of LPA synthesis by ATX is critical for developing quanti-tative physiological models of LPA signaling. We measured theindividual rate constants andpathway of the LPA synthase cycle ofATXusing the fluorescent lipid substratesFS-3 and12-(N-methyl-N-(7-nitrobenz-2-oxa-1,3-diazol-4-yl))-LPC. FS-3 binds rapidly(k1 >500 �M�1 s�1) and is hydrolyzed slowly (k2 � 0.024 s�1).Release of the first hydrolysis product is random and rapid (>1s�1),whereasreleaseof thesecondisslowandrate-limiting(0.005–0.007 s�1). Substrate binding andhydrolysis are slowand rate-lim-iting with LPC. Product release is sequential with choline preced-ingLPA.Thecatalyticpathwayandkineticsdependstronglyonthesubstrate, suggesting that ATX kinetics could vary for the variousin vivo substrates. Slow catalysis with LPC reveals the potential forLPA signaling to spread to cells distal to the site of LPC substratebinding by ATX. An ATX mutant in which catalytic threonine atposition210 is replacedwith alaninebinds substrateweakly, favor-ing a role for Thr-210 in binding as well as catalysis. FTY720P, thebioactive form of a drug currently used to treat multiple sclerosis,inhibitsATXinanuncompetitivemannerandslows thehydrolysisreaction, suggesting that ATX inhibition plays a significant role inlymphocyte immobilization in FTY720P-based therapeutics.
Autotaxin (ATX),4 also known as nucleotide pyrophospha-tase/phosphodiesterase 2 (NPP2), was identified as a secreted
autocrinemotility-stimulating factor inmelanoma cell cultures(1) and has subsequently been shown to play critical roles inangiogenesis, apoptosis, cancer metastasis, development, neu-ropathic pain, and wound healing (reviewed in Refs. 2–5). ATXdisplays both nucleotide phosphodiesterase activity (6) and arobust lysophospholipase D activity (lyso-PLD (7)). ATX phos-phodiesterase activity is weak and is not considered relevant forin vivo function (7–9). Rather, the physiological activities ofATX have been attributed to synthesis of lysophosphatidic acid(LPA), a growth factor/chemokine that binds several endothe-lial differential gene family receptors (LPA1–5) (reviewed inRef. 4), and initiates a variety of signaling cascades (4, 5) fromlysophosphatidylcholine. ATX is the primary source of plasmaLPA synthesis (10, 11).The plasma LPC concentration (50–200 �M) is comparable
with the KM value for steady-state LPC hydrolysis by ATX (7,12–15). ATX binds LPA product more strongly than LPC sub-strate (12, 16), which has led to the hypothesis that productfeedback inhibition regulatesATXactivity and LPAproductionin vivo (16). However, rapid degeneration of serumLPAby lipidphosphate phosphohydrolase 1 (LPP1) (17, 18) would diminishLPA product inhibition of ATX.Rapid LPA degradation upon release from ATX also limits
the effective target area of newly synthesized LPA, such thatLPA signaling is restricted to within the diffusional area of theATX�lipid complex from substrate binding locations. If LPCbinding, hydrolysis, and LPA product release are rapid, LPArelease and downstream signaling would be local (i.e. limited tosites of LPC binding). If, however, LPC substrate binding weremore rapid than LPA release and bound LPA/LPC were inac-cessible to degradation by LPP1, ATX with bound LPC/LPAcould diffuse, thereby spreading LPA signaling to distal sitesand cells. Recent in vivo studies show that competitive inhibi-tion of ATX accelerates LPA degradation (19), consistent withthe possibility of global ATX/LPA signaling via exclusion fromLPP1.In this study, we measured the individual rate constants and
pathway of the LPA synthase cycle ofATXusing the fluorescentlipid substrates FS-3 (20) and LPC labeled at the fatty acid chainwith NBD (NBD-LPC), using steady-state and transient kineticmethods. Our results and analysis indicate that the catalytic
* This work was supported, in whole or in part, by National Institutes of HealthGrant GM071688 (to E. M. D. L. C.).
□S The on-line version of this article (available at http://www.jbc.org) containssupplemental Equations 1– 60 and an additional reference.
1 Supported in part by American Heart Association Predoctoral FellowshipAward 09PRE2080041.
2 Supported by a grant from Bayer Health Care Pharmaceutical Inc. To whomcorrespondence may be addressed: Dept. of Pathology, Yale UniversitySchool of Medicine, 310 Cedar St., New Haven, CT 06510. Tel.: 203-737-1278; Fax: 203-785-6899; E-mail: [email protected].
3 American Heart Association Established Investigator 0940075N, recipient ofNational Science Foundation CAREER Award MCB-0546353, and a HellmanFamily Fellow. To whom correspondence may be addressed: Dept. ofMolecular Biophysics and Biochemistry, Yale University, P. O. Box 208114,New Haven, CT 06520-8114. Tel.: 203-432-5424; Fax: 203-432-1296; E-mail:[email protected].
4 The abbreviations used are: ATX, autotaxin; LPC, lysophosphatidylcholine;LPA, lysophosphatidic acid; lyso-PLD, lysophospholipase D; NBD, 12-(N-
methyl-N-(7-nitrobenz-2-oxa-1,3-diazol-4-yl)); TF-LPA, Top Fluor-LPA;pNP-TMP, p-nitrophenyl thymidine 5�monophosphate.
THE JOURNAL OF BIOLOGICAL CHEMISTRY VOL. 286, NO. 34, pp. 30130 –30141, August 26, 2011© 2011 by The American Society for Biochemistry and Molecular Biology, Inc. Printed in the U.S.A.
30130 JOURNAL OF BIOLOGICAL CHEMISTRY VOLUME 286 • NUMBER 34 • AUGUST 26, 2011
by guest on June 17, 2016http://w
ww
.jbc.org/D
ownloaded from
by guest on June 17, 2016
http://ww
w.jbc.org/
Dow
nloaded from
by guest on June 17, 2016http://w
ww
.jbc.org/D
ownloaded from
by guest on June 17, 2016
http://ww
w.jbc.org/
Dow
nloaded from
by guest on June 17, 2016http://w
ww
.jbc.org/D
ownloaded from
by guest on June 17, 2016
http://ww
w.jbc.org/
Dow
nloaded from
by guest on June 17, 2016http://w
ww
.jbc.org/D
ownloaded from
by guest on June 17, 2016
http://ww
w.jbc.org/
Dow
nloaded from
by guest on June 17, 2016http://w
ww
.jbc.org/D
ownloaded from
by guest on June 17, 2016
http://ww
w.jbc.org/
Dow
nloaded from
by guest on June 17, 2016http://w
ww
.jbc.org/D
ownloaded from
by guest on June 17, 2016
http://ww
w.jbc.org/
Dow
nloaded from
by guest on June 17, 2016http://w
ww
.jbc.org/D
ownloaded from
by guest on June 17, 2016
http://ww
w.jbc.org/
Dow
nloaded from

pathway and kinetics of ATX depend strongly on the substrateidentity, suggesting that ATX could display different kineticprofiles for the various in vivo substrates. The overall catalyticcycle of ATX with LPC substrate is slow and favors long rangeLPA signaling by ATX distal to the site of LPC substratebinding.
MATERIALS AND METHODS
Reagents—All reagents were the highest purity commer-cially available. The fluorescent phospholipid analog FS-3(20) was purchased from Echelon Biosciences (Salt LakeCity, UT); fatty acid-labeled NBD lauroyl (12:0)-LPC (NBD-LPC) and fatty acid-labeled Top Fluor-LPA (TF-LPA) camefromAvanti Polar Lipids (Alabaster, AL), and pNP-TMPwasfrom Sigma. Substrates were freshly dissolved in assay buffer(50 mM Tris-HCl, 5 mM KCl, 140 mM NaCl, 1 mM MgCl2, 1mM CaCl2 (pH 8.0)) immediately before use. The FS-3 fluo-rescent product, FP-3 (choline analog), was purified by mix-ing FS-3 with ATX and equilibrating until completion of thereaction (judged by color change) and then lyophilizing thereactionmixture. The powder was dissolved inmethanol andpassed over a silica gel column equilibrated in methanol. Theabsorbance (494 nm) of eluted product was used to quanti-tate the FS-3 product concentration (�494 � 78,000 M�1
cm�1). The LPA hydrolysis product of NBD-LPC, NBD-LPA, was purified from ATX-cleaved NBD-LPC by HPLCover a C18 column (GraceVydac 90 Å, 5 �m, 4.6 mm innerdiameter � 250 mm) using a 50/50 to 40/60 gradient of 94.9:5:0.1 and 9.9:90:0.1 water/acetonitrile/TFA and monitoredby absorbance at 485 nm.Protein—Full-length human ATX (National Center for
Biotechnology Information accession number BC034961)with a COOH-terminal tobacco etch virus cleavage site and aHis9 purification tag was purified fromHi5 insect cell cultureusing a baculovirus expression system via a nickel-nitrilotri-acetic acid column followed by tobacco etch virus cleavage ofthe His tag and a second nickel-nitrilotriacetic acid columnto remove the tobacco etch virus and His fragment (21).Kinetic Measurements—All experimental measurements
were performed in assay buffer. Steady-state product releasecatalyzed by ATX (100–200 nM) was assayed from changes influorescence intensity (FS-3, �ex � 485 and �em � 520) using aSpectraMax Gemini XPS plate reader at 25° and 37 °C (21) orfrom changes in absorption at 405 nm (pNP-TMP) (20). FS-3 orNBD-LPC steady-state hydrolysis was measured by equilibrat-ing withATX (0.2–2�M) and quenching the reaction at varioustime points with an equal volume of formic acid (3 M). NBD-LPC substrate and hydrolysis products were separated byHPLC over a C18 column under conditions used for NBD-LPApurification. FS-3 substrate and hydrolysis products were sep-arated by HPLC over a C18 column with a water/acetonitrile/TFA gradient (60/40mix of 94.9:5:0.1 and 9.9:90:0.1 and endingwith a 40/60mix), and quantitating by absorbance at 510 nm. Astandard curve of known FS-3 and FP-3 was used to confirm allexperimental measurements were made in the linear range ofdetection sensitivity.Transient kinetic measurements were performed with an
Applied Photophysics SX.20MV-R stopped-flow apparatus
equipped with polarizers and thermostated at 25 °C (�0.1).Time courses of fluorescence (�ex � 485, emission moni-tored through 515 long pass colored glass filters for FS-3 andNBD-LPC) intensity and anisotropy change were monitoredby rapidly mixing lipid substrates or products (Fig. 1) withvarying concentrations of ATX. Inner filter effects are neg-ligible at the fluorophore concentrations used.Time courses of total fluorescence intensity (FI) change
under pseudo-first order conditions (e.g. [ATX] �� [lipid])were generally fitted to a sum of exponentials (e.g. single ordouble). Time courses of fluorescence intensity change inwhich pseudo-first order conditions were not fulfilled were fit-ted to the following quadratic expression (Equation 1) thataccounts for total ATX ([P]t) and FP-3 ([L]t) concentrations(supplemental material) and in which FI0 is the base-line fluo-rescence; FI∞ is themaximal fluorescence at equilibrium; kobs isthe observed rate constant,
FI�t� � FI � �FI � FI0�� r � 1
r � ekobst� (Eq. 1)
and Equation 2,
r �
P�t � L�t �koff
kon� ��P�t � L�t �
koff
kon�2
� 4P�tL�t
P�t � L�t �koff
kon� ��P�t � L�t �
koff
kon�2
� 4P�tL�t
(Eq. 2)
Time courses of fluorescence anisotropy change were globallyfitted with time courses of total fluorescence intensity changeas described by Otto et al. (22) and Henn et al. (23).
Equilibrium FP-3 (choline equivalent product) bindingwas measured from changes in fluorescence intensity (�ex �485 nm and �em � 520 nm) of equilibrated samples contain-ing 300 nM FP-3 and a range of ATX concentrations. Cholinebinding was assayed from inhibition of ATX steady-statephosphodiesterase and lyso-PLD activities quantitated fromtime courses of fluorescence intensity (FS-3, �ex � 485 and�em � 520 nm) or absorbance (pNP-TMP, �ex � 405 nm)(20) change after mixing ATX (100 nM) and FS-3 (4 �M) orpNP-TMP (1500 �M) substrates, respectively, with a range of[choline]. Choline product inhibition was fitted to the com-petitive inhibition Equation 3,
v �kcatE�S�
KS�1 �I�
KI� � S�
(Eq. 3)
in which v is the initial velocity of steady-state product release;kcat is the maximum catalytic turnover rate; S is lipid substrate;I is inhibitor; and KI and KS are the inhibitor equilibrium bind-ing affinities and the substrate Michaelis-Menten constant,respectively, for free ATX.The binding affinity of LPA for ATX was measured by
equilibrium fluorescence anisotropy titration and inhibitionof ATX steady-state phosphodiesterase activity. Equilibriumtitrations were done by measuring the [ATX] dependence of
Kinetic Analysis of Autotaxin
AUGUST 26, 2011 • VOLUME 286 • NUMBER 34 JOURNAL OF BIOLOGICAL CHEMISTRY 30131
by guest on June 17, 2016http://w
ww
.jbc.org/D
ownloaded from
the TF-LPA fluorescence anisotropy and intensity (�ex �485, �em � 504 nm) with a Photon Technologies Alphascanfluorimeter equipped with polarizers. NBD-LPAwas titratedinto a steady-state reaction of ATX (100 nM) and pNP-TMP(1500 �M), and the ATX catalytic activity assayed from therate of change in absorbance at 405 nm was calculated using� � 18.5 mM�1 cm�1 (25). Data were fitted to the competi-tive inhibition Equation 3.Inhibition of the steady-state activity of ATXwith pNP-TMP
substrate was also measured with varying concentrations ofunlabeled oleoyl-LPA and analyzed using the mixed inhibitionEquation 4,
v �kcatE�S�
KS�1 �I�
KI,comp� � S��1 �
I�
KI,uncomp� (Eq. 4)
where KI,comp and KI,uncomp are the binding affinities of theinhibitor for ATX and the ATX�substrate complex,respectively.The FTY720P binding constant and inhibition type were
determined from inhibition of ATX steady-state lyso-PLDactivity as used tomeasure choline binding, with the addition of
1mg/mlBSA. FTY720Pbindingwas fitted to the uncompetitiveinhibition equation, whereKI is the affinity of inhibitor for sub-strate bound ATX as shown in Equation 5,
v �kcatE�S�
KS � S��1 �I�
KI� (Eq. 5)
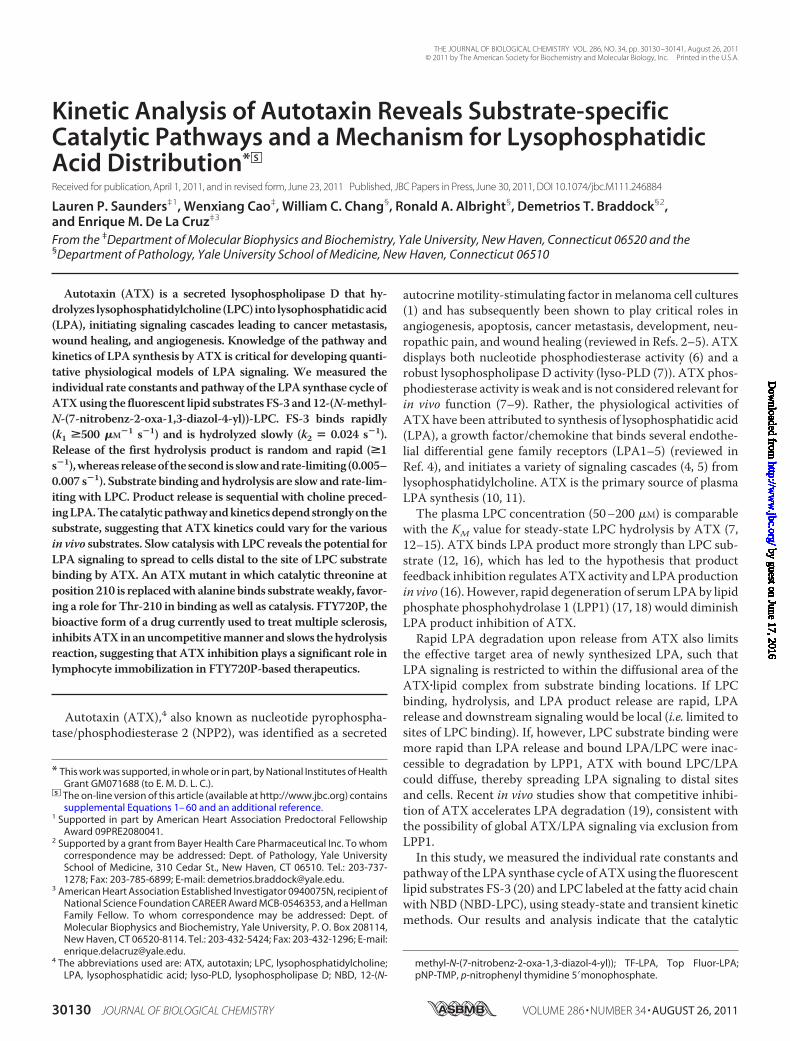
Kinetic Modeling—The reaction Scheme 1 of the ATX cata-lytic cycle (notation is for LPC hydrolysis for simplicity) wasused to interpret and model experimental data acquired fromtransient kinetic experiments.The rate constants are numbered (i � 1, 2,…) such that they
describe progression through the cycle with ki representing theforward reaction and k�i representing the correspondingreverse reaction. We present experimental evidence below ofmultistep FP-3 (choline equivalent) binding, but present it as a
FIGURE 1. Structure of substrates. Top panel, FS-3 differs from the native LPC substrate in that a quencher moiety is present on the fatty acid chain (LPAequivalent) end of the molecule, and a fluorescein is attached to the choline end. The arrow represents the site of chemical cleavage. Bottom panel, NBD-LPC,an NBD fluorophore, is conjugated to the end of the fatty acid chain of native LPC substrate. The arrow represents the site of chemical cleavage.
SCHEME 1
Kinetic Analysis of Autotaxin
30132 JOURNAL OF BIOLOGICAL CHEMISTRY VOLUME 286 • NUMBER 34 • AUGUST 26, 2011
by guest on June 17, 2016http://w
ww
.jbc.org/D
ownloaded from
single biochemical transition in Scheme 1 for simplicity.Kinetic simulations and fitting of experimental data were doneusing Kintek Global Kinetic Explorer (Kintek Co.).
RESULTS
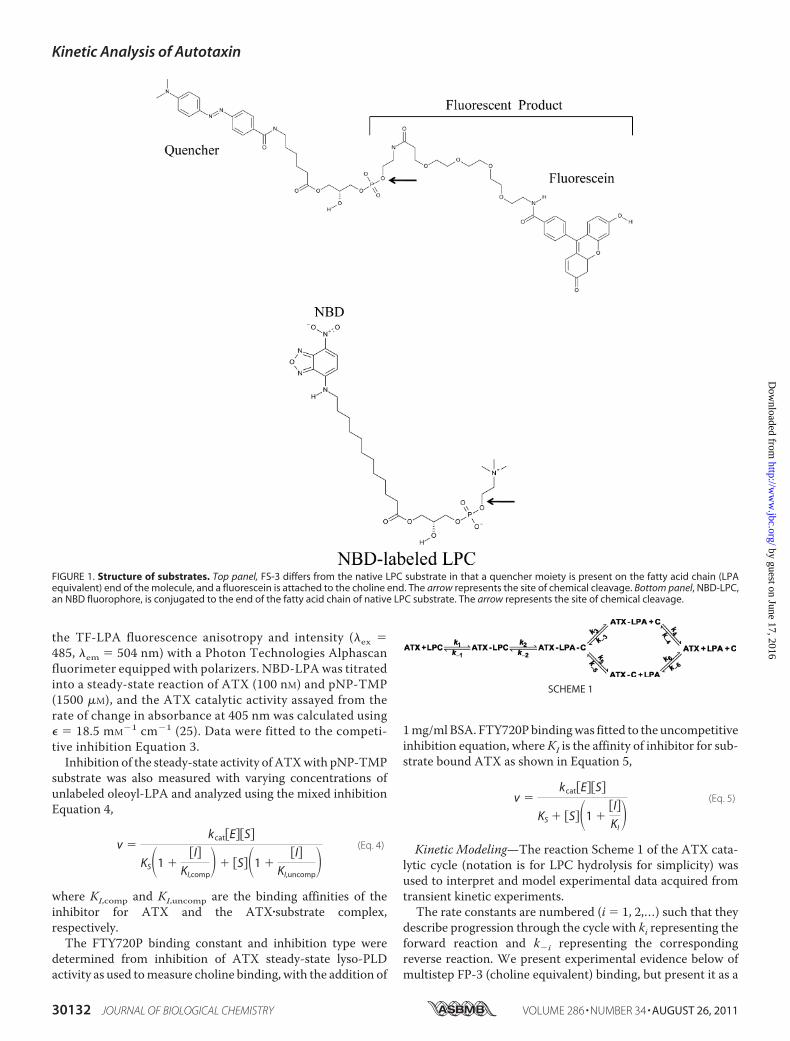
Steady-state FS-3 Hydrolysis—Time courses of fluorescenceincrease corresponding to steady-state FS-3 (Fig. 2A) hydrolysisby ATX at 25 °C are linear over the time scale examined (20)with rates that depend hyperbolically on the [FS-3] (Fig. 2C)yielding a KM value of 1.1 �M and a kcat value of 0.002 � 0.001s�1 (Table 1). The kcat was confirmed bymeasuring the relativeamounts of FS-3 and FP-3 by HPLC (Fig. 2C). The linear timecourses are consistent with the lack of product inhibition dur-ing steady-state hydrolysis of FS-3 over the concentration rangeexamined and indicate that the equilibrium binding affinity ofATX for both products must be weak. At 37 °C, time courses ofFS-3 hydrolysis by ATX display a distinguishable lag phase thatincreases with FS-3 concentration (Fig. 2B). Fits to the linearregime of the time courses representing steady-state hydrolysisyield a kcat value that is �2-fold more rapid and aKM value thatis �4-fold weaker at 37 °C than at 25 °C (Table 1).Single Turnover of FS-3 Hydrolysis—Single turnover kinetic
measurements (i.e. [enzyme] � [substrate]) were performed bysimultaneously recording time courses of fluorescence inten-sity and anisotropy change in a stopped-flow to determine therate constant of the biochemical transitions limiting FP-3 prod-uct release during ATX cycling. FS-3 and FP-3 have higher ani-sotropy and lower fluorescence intensity when bound to ATXthan when free in solution because of the presence of thequencher moiety (Fig. 1, top panel).The initial anisotropy of the experimental data observed after
mixing varying amounts of ATXwith 50–100 nM FS-3 is higherthan that of free FS-3 in solution (Fig. 3A), indicating that aphase associated with FS-3 binding to ATX is completed in theinstrument dead time ( 2 ms). A lower limit of 500 �M�1 s�1
can be placed on the second order association rate constant forATX�FS-3 complex formation (k�1; Table 1) because it is essen-tially completed within 2 ms at all [ATX] examined. This valueis rapid but 10–20 times slower than the theoretical maximalvalue for encounter of molecules free in solution calculatedusing the Smoluchowski Equation 6,
kcollision � 4� �DA � DB��rA � rB�NA
1000(Eq. 6)
and radii of 20 Å for FS-3 and 65 Å for ATX.The observed time courses of fluorescence intensity and ani-
sotropy change are biphasic and globally (22, 23) fitted to two
FIGURE 2. Steady-state hydrolysis of FS-3 by ATX. A, time courses of steady-state hydrolysis of 1, 2, and 4 �M FS-3 by 250 nM ATX at 25 °C. Solid lines are thebest fits of the data to linear functions. B, time courses of steady-state hydro-lysis at 37 °C with 50 nM ATX and 0.5, 2, 4, and 15 �M FS-3. Solid lines are thebest fit an exponential decay followed by a linked linear regime (24). C, [FS-3]dependence of the steady-state FS-3 hydrolysis rate at 25 °C (filled squares)and 37 °C (filled circles). The lines represent the best fits to rectangular hyper-bolae yielding an FS-3 KM value of 4.5 (� 0.3) �M and a kcat of 3.50 (� 0.08) �10�3 s�1 at 37 °C and a KM value of 1.1 (� 0.1) �M and a kcat of 1.83 (� 0.03) �10�3s�1 at 25 °C. The filled triangle corresponds to measurements made byHPLC at 25 °C. Uncertainty bars represent one S.D. from the mean. AU, arbi-trary units.
TABLE 1Rate and equilibrium constants of the ATX catalytic cycle with FS-3 substrate
Parameter Value Method of determination
kcat, 25 °C 0.002 s�1, 0.005 s�1 Steady state (Fig. 2), simulation/calculation (Fig. 7)KM, 25 °C 1.1 �M Steady state (Fig. 2)kcat, 37 °C 0.004 s�1 Steady state (Fig. 2)KM, 37 °C 4.5 �M Steady state (Fig. 2)K1 0.91 �M Single turnover (Fig. 3)k1 500 �M�1 s�1 to 10,000 �M�1 s�1 Simulation (Fig. 7)k�1 455 s�1 to 9,100 s�1 Simulation (Fig. 7)k2 0.024 s�1 Single turnover/chemical cleavage (Figs. 3 and 4)k3 �1 s�1 Single turnover/chemical cleavage (Figs. 3 and 4)k4 �0.005 s�1 Simulation (Fig. 7)k5 �1 s�1 Single turnover (Fig. 3)k6a 0.007 s�1 Product binding (Fig. 5), single turnover (Fig. 3)k�6a �0.04 s�1 Product binding (Fig. 5)K6b �100 �M Equilibrium titration (Fig 5)
Kinetic Analysis of Autotaxin
AUGUST 26, 2011 • VOLUME 286 • NUMBER 34 JOURNAL OF BIOLOGICAL CHEMISTRY 30133
by guest on June 17, 2016http://w
ww
.jbc.org/D
ownloaded from
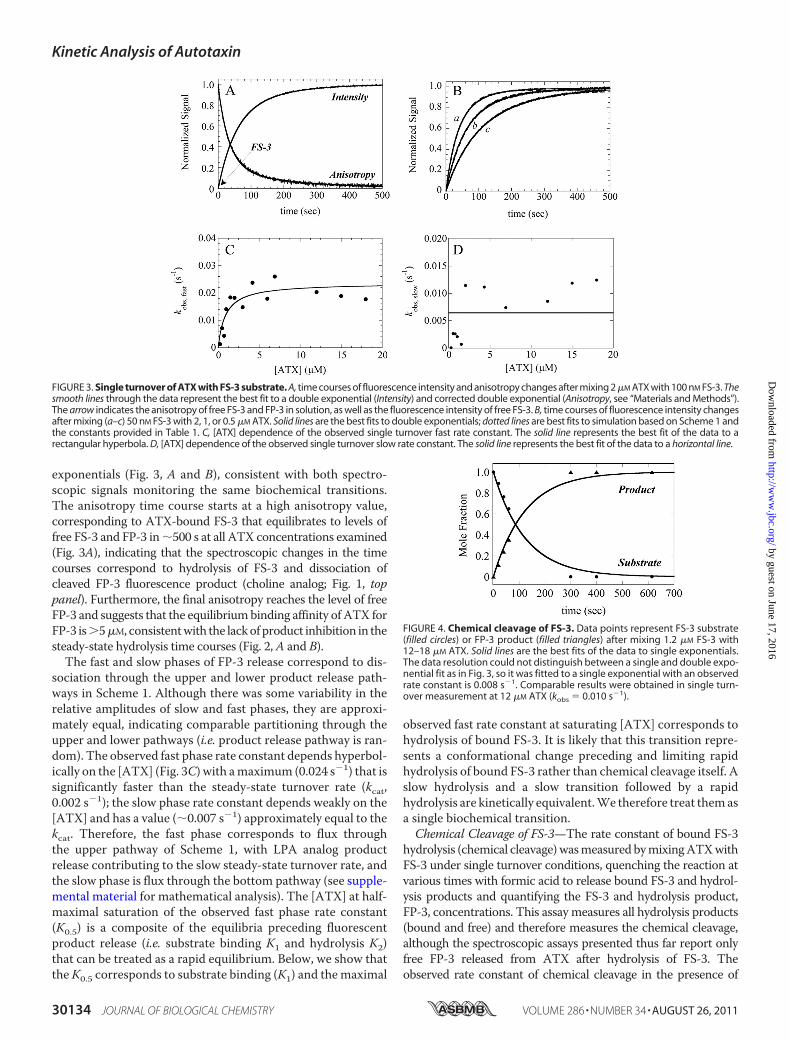
exponentials (Fig. 3, A and B), consistent with both spectro-scopic signals monitoring the same biochemical transitions.The anisotropy time course starts at a high anisotropy value,corresponding to ATX-bound FS-3 that equilibrates to levels offree FS-3 and FP-3 in�500 s at all ATX concentrations examined(Fig. 3A), indicating that the spectroscopic changes in the timecourses correspond to hydrolysis of FS-3 and dissociation ofcleaved FP-3 fluorescence product (choline analog; Fig. 1, toppanel). Furthermore, the final anisotropy reaches the level of freeFP-3 and suggests that the equilibriumbinding affinity ofATX forFP-3 is�5�M, consistentwith the lackofproduct inhibition in thesteady-state hydrolysis time courses (Fig. 2,A and B).
The fast and slow phases of FP-3 release correspond to dis-sociation through the upper and lower product release path-ways in Scheme 1. Although there was some variability in therelative amplitudes of slow and fast phases, they are approxi-mately equal, indicating comparable partitioning through theupper and lower pathways (i.e. product release pathway is ran-dom). The observed fast phase rate constant depends hyperbol-ically on the [ATX] (Fig. 3C) with amaximum (0.024 s�1) that issignificantly faster than the steady-state turnover rate (kcat,0.002 s�1); the slow phase rate constant depends weakly on the[ATX] and has a value (�0.007 s�1) approximately equal to thekcat. Therefore, the fast phase corresponds to flux throughthe upper pathway of Scheme 1, with LPA analog productrelease contributing to the slow steady-state turnover rate, andthe slow phase is flux through the bottom pathway (see supple-mental material for mathematical analysis). The [ATX] at half-maximal saturation of the observed fast phase rate constant(K0.5) is a composite of the equilibria preceding fluorescentproduct release (i.e. substrate binding K1 and hydrolysis K2)that can be treated as a rapid equilibrium. Below, we show thattheK0.5 corresponds to substrate binding (K1) and themaximal
observed fast rate constant at saturating [ATX] corresponds tohydrolysis of bound FS-3. It is likely that this transition repre-sents a conformational change preceding and limiting rapidhydrolysis of bound FS-3 rather than chemical cleavage itself. Aslow hydrolysis and a slow transition followed by a rapidhydrolysis are kinetically equivalent.We therefore treat themasa single biochemical transition.Chemical Cleavage of FS-3—The rate constant of bound FS-3
hydrolysis (chemical cleavage)wasmeasured bymixingATXwithFS-3 under single turnover conditions, quenching the reaction atvarious times with formic acid to release bound FS-3 and hydrol-ysis products and quantifying the FS-3 and hydrolysis product,FP-3, concentrations. This assay measures all hydrolysis products(bound and free) and therefore measures the chemical cleavage,although the spectroscopic assays presented thus far report onlyfree FP-3 released from ATX after hydrolysis of FS-3. Theobserved rate constant of chemical cleavage in the presence of
FIGURE 3. Single turnover of ATX with FS-3 substrate. A, time courses of fluorescence intensity and anisotropy changes after mixing 2 �M ATX with 100 nM FS-3. Thesmooth lines through the data represent the best fit to a double exponential (Intensity) and corrected double exponential (Anisotropy, see “Materials and Methods”).The arrow indicates the anisotropy of free FS-3 and FP-3 in solution, as well as the fluorescence intensity of free FS-3. B, time courses of fluorescence intensity changesafter mixing (a–c) 50 nM FS-3 with 2, 1, or 0.5 �M ATX. Solid lines are the best fits to double exponentials; dotted lines are best fits to simulation based on Scheme 1 andthe constants provided in Table 1. C, [ATX] dependence of the observed single turnover fast rate constant. The solid line represents the best fit of the data to arectangular hyperbola. D, [ATX] dependence of the observed single turnover slow rate constant. The solid line represents the best fit of the data to a horizontal line.
FIGURE 4. Chemical cleavage of FS-3. Data points represent FS-3 substrate(filled circles) or FP-3 product (filled triangles) after mixing 1.2 �M FS-3 with12–18 �M ATX. Solid lines are the best fits of the data to single exponentials.The data resolution could not distinguish between a single and double expo-nential fit as in Fig. 3, so it was fitted to a single exponential with an observedrate constant is 0.008 s�1. Comparable results were obtained in single turn-over measurement at 12 �M ATX (kobs � 0.010 s�1).
Kinetic Analysis of Autotaxin
30134 JOURNAL OF BIOLOGICAL CHEMISTRY VOLUME 286 • NUMBER 34 • AUGUST 26, 2011
by guest on June 17, 2016http://w
ww
.jbc.org/D
ownloaded from
saturating [ATX] (12–18 �M) is �0.008 s�1 (Fig. 4), comparablewith the observed fast rate constant of�0.02 s�1 at the sameATXconcentration measured spectroscopically (Fig. 3C). The similar-ity of the chemical cleavage rate constant with the fast rate con-stant in FP-3 release obtained with a different assay indicates thatthe fluorescent product release in the fast phase of the single turn-over measurement (Fig. 3) is rapid and limited by hydrolysis ofboundFS-3at 0.024 s�1. Essentially 100%of theFS-3 ishydrolyzed(Fig. 4), indicating that either the hydrolysis equilibrium constantlargely favors product formation (K2 �10) and/or a transition(s)after hydrolysis (product release) is rapid and irreversible.Fluorescent FP-3 Product Binding and Release—ATX bind-
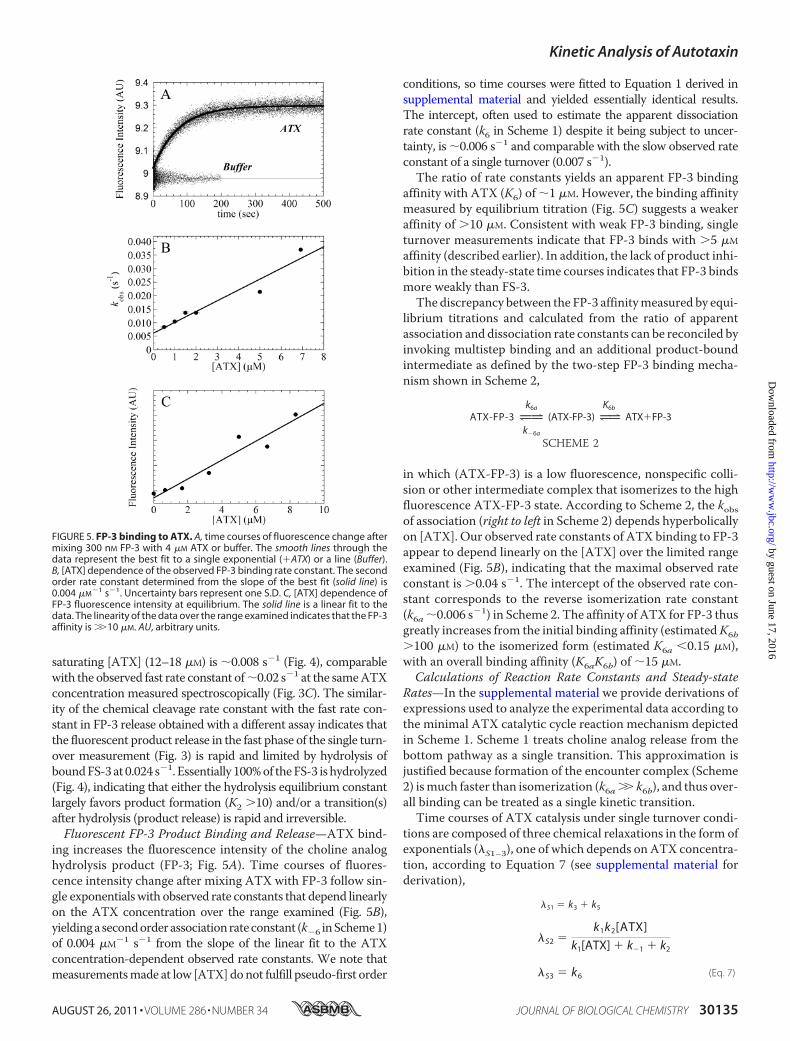
ing increases the fluorescence intensity of the choline analoghydrolysis product (FP-3; Fig. 5A). Time courses of fluores-cence intensity change after mixing ATX with FP-3 follow sin-gle exponentialswith observed rate constants that depend linearlyon the ATX concentration over the range examined (Fig. 5B),yieldingasecondorderassociationrateconstant (k�6 inScheme1)of 0.004 �M�1 s�1 from the slope of the linear fit to the ATXconcentration-dependent observed rate constants. We note thatmeasurementsmade at low [ATX]donot fulfill pseudo-first order
conditions, so time courses were fitted to Equation 1 derived insupplemental material and yielded essentially identical results.The intercept, often used to estimate the apparent dissociationrate constant (k6 in Scheme 1) despite it being subject to uncer-tainty, is �0.006 s�1 and comparable with the slow observed rateconstant of a single turnover (0.007 s�1).
The ratio of rate constants yields an apparent FP-3 bindingaffinity with ATX (K6) of �1 �M. However, the binding affinitymeasured by equilibrium titration (Fig. 5C) suggests a weakeraffinity of �10 �M. Consistent with weak FP-3 binding, singleturnover measurements indicate that FP-3 binds with �5 �M
affinity (described earlier). In addition, the lack of product inhi-bition in the steady-state time courses indicates that FP-3 bindsmore weakly than FS-3.The discrepancy between the FP-3 affinitymeasured by equi-
librium titrations and calculated from the ratio of apparentassociation and dissociation rate constants can be reconciled byinvoking multistep binding and an additional product-boundintermediate as defined by the two-step FP-3 binding mecha-nism shown in Scheme 2,
ATX-FP-3 L|;k6a
k�6a
(ATX-FP-3) L|;K6b
ATX�FP-3
SCHEME 2
in which (ATX-FP-3) is a low fluorescence, nonspecific colli-sion or other intermediate complex that isomerizes to the highfluorescence ATX-FP-3 state. According to Scheme 2, the kobsof association (right to left in Scheme 2) depends hyperbolicallyon [ATX]. Our observed rate constants of ATX binding to FP-3appear to depend linearly on the [ATX] over the limited rangeexamined (Fig. 5B), indicating that the maximal observed rateconstant is �0.04 s�1. The intercept of the observed rate con-stant corresponds to the reverse isomerization rate constant(k6a �0.006 s�1) in Scheme 2. The affinity of ATX for FP-3 thusgreatly increases from the initial binding affinity (estimatedK6b�100 �M) to the isomerized form (estimated K6a 0.15 �M),with an overall binding affinity (K6aK6b) of �15 �M.Calculations of Reaction Rate Constants and Steady-state
Rates—In the supplemental material we provide derivations ofexpressions used to analyze the experimental data according tothe minimal ATX catalytic cycle reaction mechanism depictedin Scheme 1. Scheme 1 treats choline analog release from thebottom pathway as a single transition. This approximation isjustified because formation of the encounter complex (Scheme2) ismuch faster than isomerization (k6a �� k6b), and thus over-all binding can be treated as a single kinetic transition.Time courses of ATX catalysis under single turnover condi-
tions are composed of three chemical relaxations in the form ofexponentials (�S1–3), one of which depends onATX concentra-tion, according to Equation 7 (see supplemental material forderivation),
�S1 � k3 � k5
�S2 �k1k2[ATX]
k1[ATX] � k�1 � k2
�S3 � k6 (Eq. 7)
FIGURE 5. FP-3 binding to ATX. A, time courses of fluorescence change aftermixing 300 nM FP-3 with 4 �M ATX or buffer. The smooth lines through thedata represent the best fit to a single exponential (�ATX) or a line (Buffer).B, [ATX] dependence of the observed FP-3 binding rate constant. The secondorder rate constant determined from the slope of the best fit (solid line) is0.004 �M
�1 s�1. Uncertainty bars represent one S.D. C, [ATX] dependence ofFP-3 fluorescence intensity at equilibrium. The solid line is a linear fit to thedata. The linearity of the data over the range examined indicates that the FP-3affinity is ��10 �M. AU, arbitrary units.
Kinetic Analysis of Autotaxin
AUGUST 26, 2011 • VOLUME 286 • NUMBER 34 JOURNAL OF BIOLOGICAL CHEMISTRY 30135
by guest on June 17, 2016http://w
ww
.jbc.org/D
ownloaded from
Only two exponentials are observed in the experimental timecourses (Fig. 3) as follows: a fast phase with an observed rateconstant (�S2) that depends hyperbolically on ATX concentra-tion, and a slow phase (�S3) that is independent of ATX con-centration and comparable with the apparent FP-3 dissociationrate constant. The first phase (�S1) in Equation 7 is not observedexperimentally because it is limited by the slow chemical cleav-age step preceding (i.e. k3 � k5 �� k2). Themaximum fast phaseobserved rate constant (�S2) corresponds to the forwardhydrolysis rate constant (k2). The slow phase rate constant (�S3)reflects the choline analog release rate constant from ATX-C(k6).The minimum reaction scheme depicted in Scheme 1
accounts for experimental time courses under multiple turn-over conditions, including the observation of a lag phase at37 °C (Fig. 2B). Time courses of product formation (e.g. cholineanalog FP-3) from ATX catalysis under multiple turnover con-ditions are predicted by Equation 8 (see Scheme 1 and supple-mental material for definitions of constants),
[FP�3]
� �
�k6��ATX2 � k4� � �k3k6 � k4k5�����k6 � ����ATX1 � k4�� k3k6� � 2k3
2�2�
��ATX1��ATX1 � �ATX2��1 � e � �ATX1t�
�
�k6��ATX1 � k4� � �k3k6 � k4k5�����k6 � ����ATX2 � k4�� k4k6 � 2k3
2�2�
��ATX2��ATX1 � �ATX2��1 � e��ATX2t�
� �k3 � k5�k4k6t (Eq. 8)
The first two terms are exponentials with their amplitudes inopposite signs that describe the approach to steady state. Thethird term is linear with respect to time and corresponds tosteady-state catalysis. At 25 °C, the first two exponentials arenot observed in the experimental data, presumably becausethey are too rapid to detect, and time courses of product forma-tion are linear (Fig. 2A). In contrast, experimental time coursesat 37 °C display a prominent lag phase (Fig. 2B), indicating thatthe exponential phases are slow enough to be detected experi-mentally. The existence of the lag phase arises because theexponential terms have comparable rate constants (24).The predicted time course of FP-3 product formation (Equa-
tion 8) allows us to define themaximum turnover rate (kcat) andMichaelis constant (KM) in terms of fundamental rate constants(Scheme 1). Because the fast and slow phase amplitudes undersingle turnover conditions are comparable, flux through the topand bottom product release pathways is also comparable,requiring k4 � k6 � 0.007 s�1 (Fig. 3). We emphasize that thisapproximation is supported by the experimental data as fol-lows: if k4 �� k6, the maximum steady-state rate (kcat) would be(partially, if k4 was not �� k2) limited by hydrolysis (k2 � k�2;because k3 is rapid, see above) and approach a value of �0.02s�1, which is about 1 order of magnitude faster than the exper-imental measured kcat. As a result, the kcat value is approxi-mated by (supplemental material) Equation 9,
kcat �k2k4
k4 � k2�
k2k6
k6 � k2(Eq. 9)
The kcat value predicted by the calculated rate constants andEquation 9 is 0.005 s�1, in reasonable agreement with theexperimentally determined value of 0.002 s�1 (Fig. 2 and Table1). The KM value approximated to Equation 10 (supplementalmaterial) is 0.2 �M.
KM � K1D� k4
k4 � k2� (Eq. 10)
This value differs �5-fold from the experimentally determinedvalue of 1.1 �M. Although this difference could reflect experi-mental uncertainty, the deviation is significant and may indi-cate that additional intermediates not included in Scheme 1exist and/or that the approximation of irreversible productrelease made in our modeling does not apply.Kinetic Simulations of FS-3 Substrate Reactions—Kinetic
simulations confirm that the experimentally determined rateand equilibrium constant values (Scheme 1) and analysis reli-ably account for the experimental single turnover time courseswith FS-3 substrate (Fig. 3B) and allow us to refine the overallsteady-state parameters. Kinetic simulations of steady-statetime courses with k4 � 0.002 s�1 predict a small amplitudeburst phase that is not observed in the experimental data.Global fitting (25) of steady-state time courses yields a steady-state kcat of 0.005 s�1 and k4 of 0.007 s�1 (Table 1). We empha-size that the minimal ATX cycle mechanism (Scheme 1) doesnot represent a unique solution, and more complex modelscould also account for the experimental data.The experimentally determined constants defined in Scheme
1 indicate that FS-3 product release from ATX is randomlythrough the two pathways, i.e. flux through the top and bottompathways of product release occur with equal probability, andas a result, LPA analog is released before choline analog approx-imately half of the time. Such a random product release mech-anism predicts two phases of LPA analog release from ATX, arapid phase completed in �40 s and a slower phase of equalamplitude occurring over �500 s.Steady-state NBD-LPC Hydrolysis—Time courses of steady-
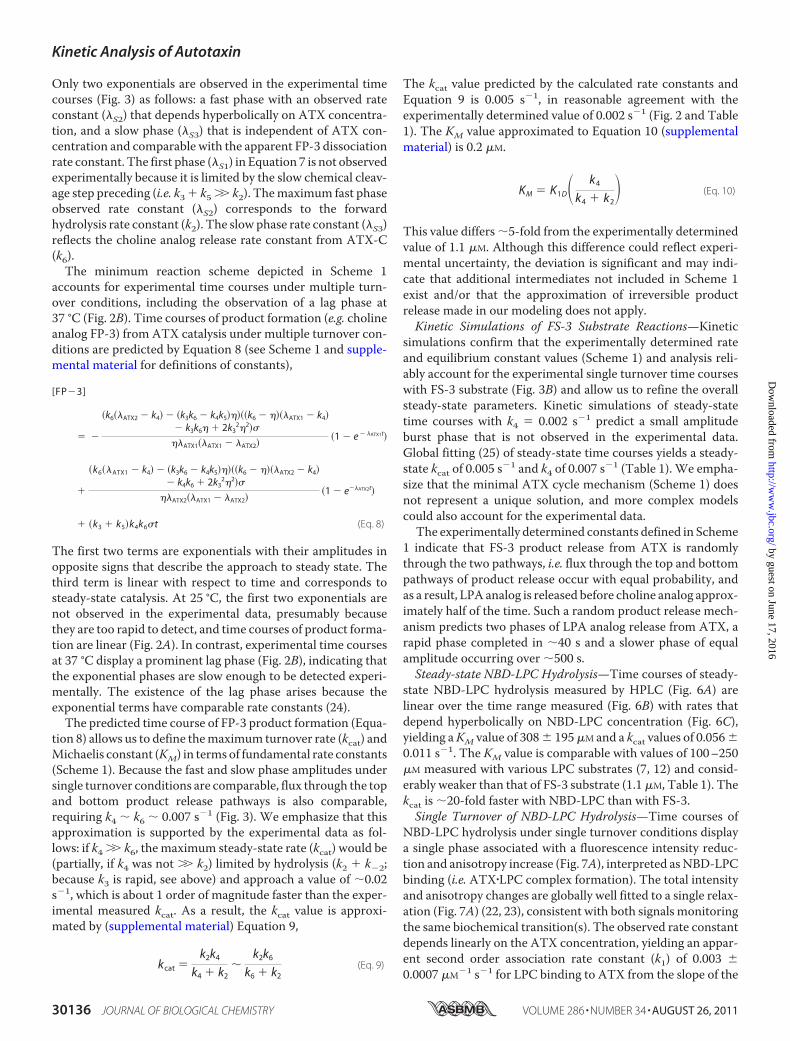
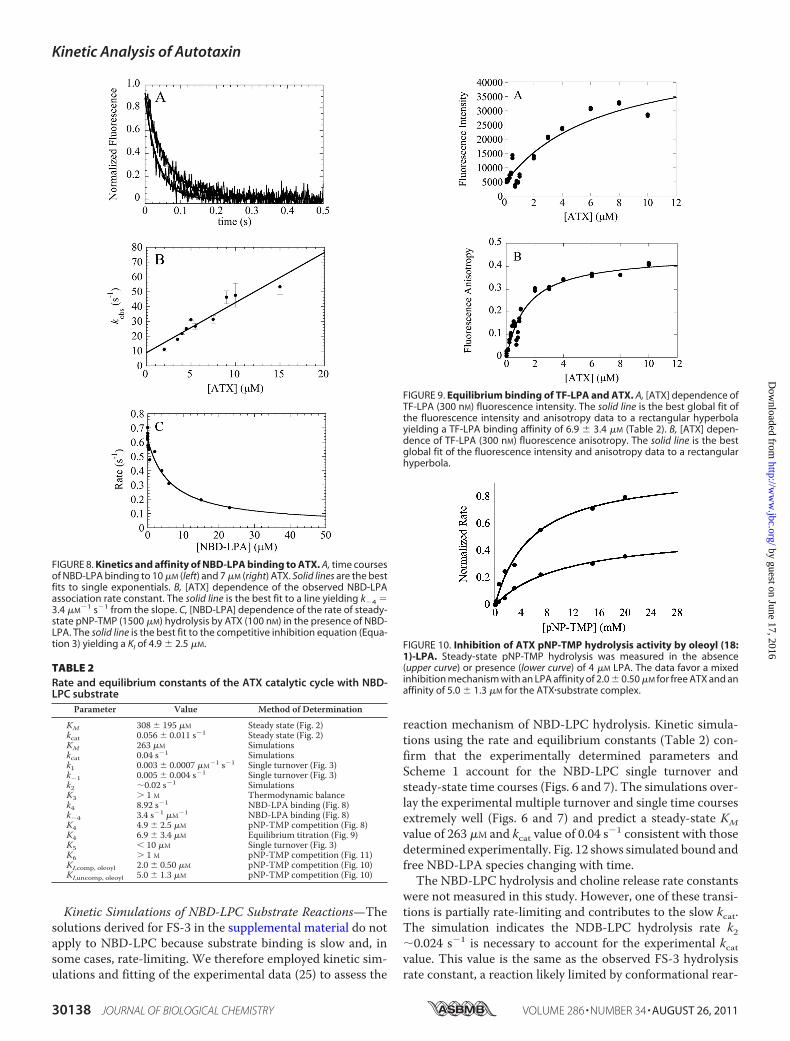
state NBD-LPC hydrolysis measured by HPLC (Fig. 6A) arelinear over the time range measured (Fig. 6B) with rates thatdepend hyperbolically on NBD-LPC concentration (Fig. 6C),yielding aKM value of 308� 195�M and a kcat values of 0.056�0.011 s�1. The KM value is comparable with values of 100–250�M measured with various LPC substrates (7, 12) and consid-erably weaker than that of FS-3 substrate (1.1�M, Table 1). Thekcat is �20-fold faster with NBD-LPC than with FS-3.Single Turnover of NBD-LPC Hydrolysis—Time courses of
NBD-LPC hydrolysis under single turnover conditions displaya single phase associated with a fluorescence intensity reduc-tion and anisotropy increase (Fig. 7A), interpreted asNBD-LPCbinding (i.e. ATX�LPC complex formation). The total intensityand anisotropy changes are globally well fitted to a single relax-ation (Fig. 7A) (22, 23), consistent with both signals monitoringthe same biochemical transition(s). The observed rate constantdepends linearly on the ATX concentration, yielding an appar-ent second order association rate constant (k1) of 0.003 �0.0007 �M�1 s�1 for LPC binding to ATX from the slope of the
Kinetic Analysis of Autotaxin
30136 JOURNAL OF BIOLOGICAL CHEMISTRY VOLUME 286 • NUMBER 34 • AUGUST 26, 2011
by guest on June 17, 2016http://w
ww
.jbc.org/D
ownloaded from
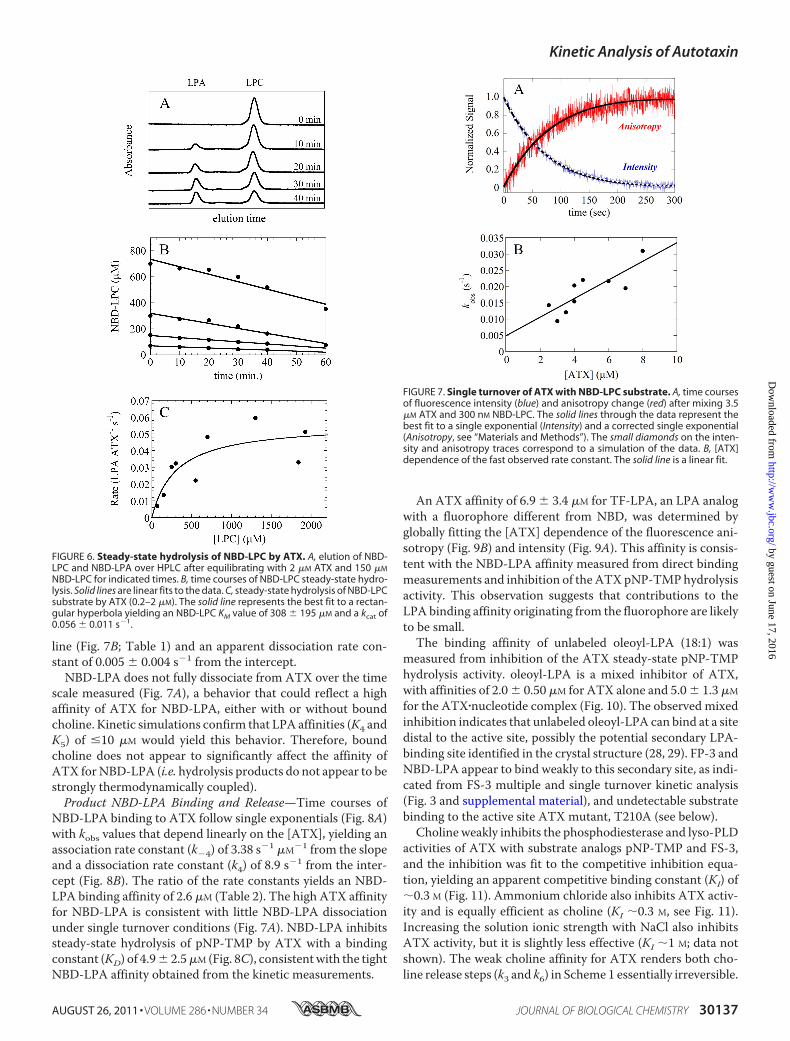
line (Fig. 7B; Table 1) and an apparent dissociation rate con-stant of 0.005 � 0.004 s�1 from the intercept.
NBD-LPA does not fully dissociate from ATX over the timescale measured (Fig. 7A), a behavior that could reflect a highaffinity of ATX for NBD-LPA, either with or without boundcholine. Kinetic simulations confirm that LPA affinities (K4 andK5) of 10 �M would yield this behavior. Therefore, boundcholine does not appear to significantly affect the affinity ofATX forNBD-LPA (i.e. hydrolysis products do not appear to bestrongly thermodynamically coupled).Product NBD-LPA Binding and Release—Time courses of
NBD-LPA binding to ATX follow single exponentials (Fig. 8A)with kobs values that depend linearly on the [ATX], yielding anassociation rate constant (k�4) of 3.38 s�1 �M�1 from the slopeand a dissociation rate constant (k4) of 8.9 s�1 from the inter-cept (Fig. 8B). The ratio of the rate constants yields an NBD-LPA binding affinity of 2.6 �M (Table 2). The high ATX affinityfor NBD-LPA is consistent with little NBD-LPA dissociationunder single turnover conditions (Fig. 7A). NBD-LPA inhibitssteady-state hydrolysis of pNP-TMP by ATX with a bindingconstant (KD) of 4.9� 2.5�M (Fig. 8C), consistentwith the tightNBD-LPA affinity obtained from the kinetic measurements.
An ATX affinity of 6.9 � 3.4 �M for TF-LPA, an LPA analogwith a fluorophore different from NBD, was determined byglobally fitting the [ATX] dependence of the fluorescence ani-sotropy (Fig. 9B) and intensity (Fig. 9A). This affinity is consis-tent with the NBD-LPA affinity measured from direct bindingmeasurements and inhibition of theATXpNP-TMPhydrolysisactivity. This observation suggests that contributions to theLPA binding affinity originating from the fluorophore are likelyto be small.The binding affinity of unlabeled oleoyl-LPA (18:1) was
measured from inhibition of the ATX steady-state pNP-TMPhydrolysis activity. oleoyl-LPA is a mixed inhibitor of ATX,with affinities of 2.0� 0.50 �M for ATX alone and 5.0� 1.3 �M
for the ATX�nucleotide complex (Fig. 10). The observed mixedinhibition indicates that unlabeled oleoyl-LPA can bind at a sitedistal to the active site, possibly the potential secondary LPA-binding site identified in the crystal structure (28, 29). FP-3 andNBD-LPA appear to bind weakly to this secondary site, as indi-cated from FS-3 multiple and single turnover kinetic analysis(Fig. 3 and supplemental material), and undetectable substratebinding to the active site ATX mutant, T210A (see below).Choline weakly inhibits the phosphodiesterase and lyso-PLD
activities of ATX with substrate analogs pNP-TMP and FS-3,and the inhibition was fit to the competitive inhibition equa-tion, yielding an apparent competitive binding constant (KI) of�0.3 M (Fig. 11). Ammonium chloride also inhibits ATX activ-ity and is equally efficient as choline (KI �0.3 M, see Fig. 11).Increasing the solution ionic strength with NaCl also inhibitsATX activity, but it is slightly less effective (KI �1 M; data notshown). The weak choline affinity for ATX renders both cho-line release steps (k3 and k6) in Scheme 1 essentially irreversible.
FIGURE 6. Steady-state hydrolysis of NBD-LPC by ATX. A, elution of NBD-LPC and NBD-LPA over HPLC after equilibrating with 2 �M ATX and 150 �M
NBD-LPC for indicated times. B, time courses of NBD-LPC steady-state hydro-lysis. Solid lines are linear fits to the data. C, steady-state hydrolysis of NBD-LPCsubstrate by ATX (0.2–2 �M). The solid line represents the best fit to a rectan-gular hyperbola yielding an NBD-LPC KM value of 308 � 195 �M and a kcat of0.056 � 0.011 s�1.
FIGURE 7. Single turnover of ATX with NBD-LPC substrate. A, time coursesof fluorescence intensity (blue) and anisotropy change (red) after mixing 3.5�M ATX and 300 nM NBD-LPC. The solid lines through the data represent thebest fit to a single exponential (Intensity) and a corrected single exponential(Anisotropy, see “Materials and Methods”). The small diamonds on the inten-sity and anisotropy traces correspond to a simulation of the data. B, [ATX]dependence of the fast observed rate constant. The solid line is a linear fit.
Kinetic Analysis of Autotaxin
AUGUST 26, 2011 • VOLUME 286 • NUMBER 34 JOURNAL OF BIOLOGICAL CHEMISTRY 30137
by guest on June 17, 2016http://w
ww
.jbc.org/D
ownloaded from
Kinetic Simulations of NBD-LPC Substrate Reactions—Thesolutions derived for FS-3 in the supplemental material do notapply to NBD-LPC because substrate binding is slow and, insome cases, rate-limiting. We therefore employed kinetic sim-ulations and fitting of the experimental data (25) to assess the
reaction mechanism of NBD-LPC hydrolysis. Kinetic simula-tions using the rate and equilibrium constants (Table 2) con-firm that the experimentally determined parameters andScheme 1 account for the NBD-LPC single turnover andsteady-state time courses (Figs. 6 and 7). The simulations over-lay the experimental multiple turnover and single time coursesextremely well (Figs. 6 and 7) and predict a steady-state KMvalue of 263 �M and kcat value of 0.04 s�1 consistent with thosedetermined experimentally. Fig. 12 shows simulated bound andfree NBD-LPA species changing with time.The NBD-LPC hydrolysis and choline release rate constants
were not measured in this study. However, one of these transi-tions is partially rate-limiting and contributes to the slow kcat.The simulation indicates the NDB-LPC hydrolysis rate k2�0.024 s�1 is necessary to account for the experimental kcatvalue. This value is the same as the observed FS-3 hydrolysisrate constant, a reaction likely limited by conformational rear-
FIGURE 8. Kinetics and affinity of NBD-LPA binding to ATX. A, time coursesof NBD-LPA binding to 10 �M (left) and 7 �M (right) ATX. Solid lines are the bestfits to single exponentials. B, [ATX] dependence of the observed NBD-LPAassociation rate constant. The solid line is the best fit to a line yielding k�4 �3.4 �M
�1 s�1 from the slope. C, [NBD-LPA] dependence of the rate of steady-state pNP-TMP (1500 �M) hydrolysis by ATX (100 nM) in the presence of NBD-LPA. The solid line is the best fit to the competitive inhibition equation (Equa-tion 3) yielding a KI of 4.9 � 2.5 �M.
FIGURE 9. Equilibrium binding of TF-LPA and ATX. A, [ATX] dependence ofTF-LPA (300 nM) fluorescence intensity. The solid line is the best global fit ofthe fluorescence intensity and anisotropy data to a rectangular hyperbolayielding a TF-LPA binding affinity of 6.9 � 3.4 �M (Table 2). B, [ATX] depen-dence of TF-LPA (300 nM) fluorescence anisotropy. The solid line is the bestglobal fit of the fluorescence intensity and anisotropy data to a rectangularhyperbola.
FIGURE 10. Inhibition of ATX pNP-TMP hydrolysis activity by oleoyl (18:1)-LPA. Steady-state pNP-TMP hydrolysis was measured in the absence(upper curve) or presence (lower curve) of 4 �M LPA. The data favor a mixedinhibition mechanism with an LPA affinity of 2.0 � 0.50 �M for free ATX and anaffinity of 5.0 � 1.3 �M for the ATX�substrate complex.
TABLE 2Rate and equilibrium constants of the ATX catalytic cycle with NBD-LPC substrate
Parameter Value Method of Determination
KM 308 � 195 �M Steady state (Fig. 2)kcat 0.056 � 0.011 s�1 Steady state (Fig. 2)KM 263 �M Simulationskcat 0.04 s�1 Simulationsk1 0.003 � 0.0007 �M�1 s�1 Single turnover (Fig. 3)k�1 0.005 � 0.004 s�1 Single turnover (Fig. 3)k2 �0.02 s�1 SimulationsK3 � 1 M Thermodynamic balancek4 8.92 s�1 NBD-LPA binding (Fig. 8)k�4 3.4 s�1 �M�1 NBD-LPA binding (Fig. 8)K4 4.9 � 2.5 �M pNP-TMP competition (Fig. 8)K4 6.9 � 3.4 �M Equilibrium titration (Fig. 9)K5 10 �M Single turnover (Fig. 3)K6 � 1 M pNP-TMP competition (Fig. 11)KI,comp, oleoyl 2.0 � 0.50 �M pNP-TMP competition (Fig. 10)KI,uncomp, oleoyl 5.0 � 1.3 �M pNP-TMP competition (Fig. 10)
Kinetic Analysis of Autotaxin
30138 JOURNAL OF BIOLOGICAL CHEMISTRY VOLUME 286 • NUMBER 34 • AUGUST 26, 2011
by guest on June 17, 2016http://w
ww
.jbc.org/D
ownloaded from
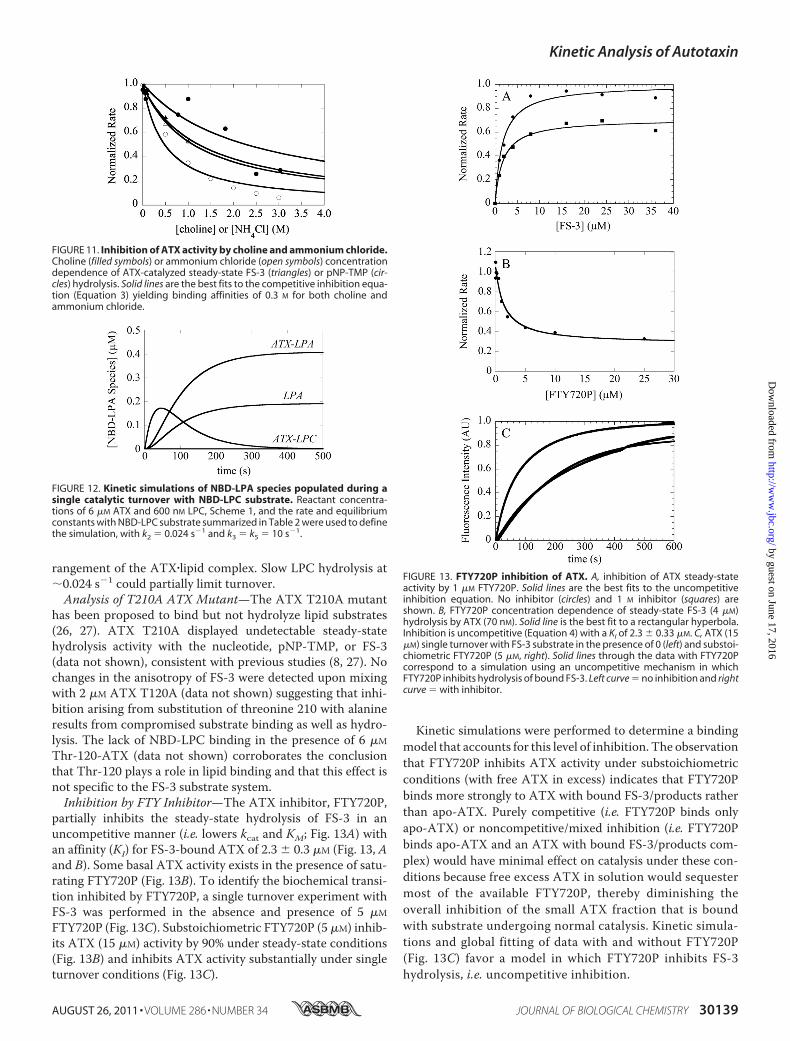
rangement of the ATX�lipid complex. Slow LPC hydrolysis at�0.024 s�1 could partially limit turnover.Analysis of T210A ATX Mutant—The ATX T210A mutant
has been proposed to bind but not hydrolyze lipid substrates(26, 27). ATX T210A displayed undetectable steady-statehydrolysis activity with the nucleotide, pNP-TMP, or FS-3(data not shown), consistent with previous studies (8, 27). Nochanges in the anisotropy of FS-3 were detected upon mixingwith 2 �M ATX T120A (data not shown) suggesting that inhi-bition arising from substitution of threonine 210 with alanineresults from compromised substrate binding as well as hydro-lysis. The lack of NBD-LPC binding in the presence of 6 �M
Thr-120-ATX (data not shown) corroborates the conclusionthat Thr-120 plays a role in lipid binding and that this effect isnot specific to the FS-3 substrate system.Inhibition by FTY Inhibitor—The ATX inhibitor, FTY720P,
partially inhibits the steady-state hydrolysis of FS-3 in anuncompetitive manner (i.e. lowers kcat and KM; Fig. 13A) withan affinity (KI) for FS-3-bound ATX of 2.3 � 0.3 �M (Fig. 13, Aand B). Some basal ATX activity exists in the presence of satu-rating FTY720P (Fig. 13B). To identify the biochemical transi-tion inhibited by FTY720P, a single turnover experiment withFS-3 was performed in the absence and presence of 5 �M
FTY720P (Fig. 13C). Substoichiometric FTY720P (5 �M) inhib-its ATX (15 �M) activity by 90% under steady-state conditions(Fig. 13B) and inhibits ATX activity substantially under singleturnover conditions (Fig. 13C).
Kinetic simulations were performed to determine a bindingmodel that accounts for this level of inhibition. The observationthat FTY720P inhibits ATX activity under substoichiometricconditions (with free ATX in excess) indicates that FTY720Pbinds more strongly to ATX with bound FS-3/products ratherthan apo-ATX. Purely competitive (i.e. FTY720P binds onlyapo-ATX) or noncompetitive/mixed inhibition (i.e. FTY720Pbinds apo-ATX and an ATX with bound FS-3/products com-plex) would have minimal effect on catalysis under these con-ditions because free excess ATX in solution would sequestermost of the available FTY720P, thereby diminishing theoverall inhibition of the small ATX fraction that is boundwith substrate undergoing normal catalysis. Kinetic simula-tions and global fitting of data with and without FTY720P(Fig. 13C) favor a model in which FTY720P inhibits FS-3hydrolysis, i.e. uncompetitive inhibition.
FIGURE 11. Inhibition of ATX activity by choline and ammonium chloride.Choline (filled symbols) or ammonium chloride (open symbols) concentrationdependence of ATX-catalyzed steady-state FS-3 (triangles) or pNP-TMP (cir-cles) hydrolysis. Solid lines are the best fits to the competitive inhibition equa-tion (Equation 3) yielding binding affinities of 0.3 M for both choline andammonium chloride.
FIGURE 12. Kinetic simulations of NBD-LPA species populated during asingle catalytic turnover with NBD-LPC substrate. Reactant concentra-tions of 6 �M ATX and 600 nM LPC, Scheme 1, and the rate and equilibriumconstants with NBD-LPC substrate summarized in Table 2 were used to definethe simulation, with k2 � 0.024 s�1 and k3 � k5 � 10 s�1.
FIGURE 13. FTY720P inhibition of ATX. A, inhibition of ATX steady-stateactivity by 1 �M FTY720P. Solid lines are the best fits to the uncompetitiveinhibition equation. No inhibitor (circles) and 1 M inhibitor (squares) areshown. B, FTY720P concentration dependence of steady-state FS-3 (4 �M)hydrolysis by ATX (70 nM). Solid line is the best fit to a rectangular hyperbola.Inhibition is uncompetitive (Equation 4) with a KI of 2.3 � 0.33 �M. C, ATX (15�M) single turnover with FS-3 substrate in the presence of 0 (left) and substoi-chiometric FTY720P (5 �M, right). Solid lines through the data with FTY720Pcorrespond to a simulation using an uncompetitive mechanism in whichFTY720P inhibits hydrolysis of bound FS-3. Left curve � no inhibition and rightcurve � with inhibitor.
Kinetic Analysis of Autotaxin
AUGUST 26, 2011 • VOLUME 286 • NUMBER 34 JOURNAL OF BIOLOGICAL CHEMISTRY 30139
by guest on June 17, 2016http://w
ww
.jbc.org/D
ownloaded from
DISCUSSION
Substrate-specific Kinetics of ATX—Transient kinetic analy-sis presented in this work indicates that ATX catalysis follows arandom and rate-limiting product release pathway with FS-3substrate. FS-3 binds rapidly and is cleaved slowly (�0.02 s�1),although hydrolysis is not rate-limiting. Such a slow rate con-stant for chemical cleavage suggests major conformationalrearrangement of ATX-FS-3 is required for hydrolysis. It islikely that this transition represents isomerization of the ATX-FS-3 complex to a hydrolysis-competent conformation ofATX-FS-3. The overall cycling of ATX (kcat) reflects contribu-tions from FS-3 hydrolysis and release of the second productalong both dissociation pathways.NBD-LPC substrate, in contrast, has very slow substrate
binding, which is rate-limiting at low substrate concentrations.Hydrolysis (estimated as�0.02 s�1 from kinetic simulations) ispartially rate-limiting at high substrate concentrations. Cholineand LPA release are rapid. The experimental data cannotdistinguish between random or sequential LPA and cholineproduct release. The LPA product affinity is high enoughthat significant rebinding can occur, potentially resulting incompetitive feedback inhibition.There are significant differences in ATX catalysis with FS-3
and LPC substrates. The differences presumably originate frommodification of the choline moiety in FS-3 (Fig. 1); the cholineanalog in FS-3 has a much higher affinity for ATX than cholineitself (Figs. 5 and 11). Tighter binding could contribute to theslower choline analog dissociation observed with FS-3 sub-strate and influence flux through the bottom product releasepathway (i.e. LPA analog released before choline analog).ATX catalysis depends strongly on the substrate identity and
could thus have substantially diverse activities and functionswith different in vivo substrates. ATX has very low substratespecificity, as evidenced by its ability to hydrolyze both nucle-otides and lysophospholipids in its active site. The lack of sub-strate discrimination could be balanced by substrate-specifickinetics tailored for distinct physiological activities. LPC andsphingosylphosphorylcholine are two identified in vivo ATXsubstrates (7, 13, 30), although several more lysophospholipidsare hydrolyzed by ATX in vitro (12, 31). The kinetics and path-way of ATX catalysis with sphingosylphosphorylcholine coulddiffer from those of the two substrates analyzed here, therebyyielding different in vivo signaling activities.Mechanism for Dispersion of Synthesized LPA—Free LPA is
rapidly degraded by lipid phosphate phosphohydrolase 1(LPP1). For synthesized LPA to spread from the site of ATXbinding, mobility of ATX before LPA release is essential. LPArelease fromATX is slow andoccurs on the tens of seconds timescale (Fig. 12).Although themobility of ATX�lipid complex in vivo is uncer-
tain and depends on numerous factors and extracellular loca-tion (i.e. blood, interstitial space, and cerebrospinal fluid), anapproximation of the ATX signaling range can be evaluated byconsidering particular extremes.We consider free diffusion as afirst approximation. The average distance a molecule diffusesover a given time t in three dimensions is determined by itsdiffusion coefficient (D) according to Equation 11,
�d� � �6Dt (Eq. 11)
AnATXdiffusion coefficient (D) of 3.6� 10�7 cm2 s�1 inwater(viscosity,� � 1� 10�3 pascal s) and (T� 25 °C)was calculatedfrom the Stokes-Einstein Equation 12,
D �kBT
6��r(Eq. 12)
using an approximate ATX radius (r) of �65 Å (50–100 Ådepending on orientation) from the crystal structure (28). Acomparable diffusion coefficient of 5.3 � 10�7 cm2 s�1 wasestimated from the molecular mass, using the empirical Equa-tion 13 (33),
D �8.34x10�8T
�M1/3 (Eq. 13)
in whichM is the molecular mass of ATX.These parameters yield a mean displacement of �65 �m for
the ATX�lipid complex before LPA dissociates, indicating thepotential for LPA signaling to spread to cells distal to the site ofLPC substrate binding by ATX. ATX in blood will naturallydisperse to amuch greater extent. Conversely, interactionswiththe extracellular matrix (34) or integrin receptors on cell sur-faces (29) would diminish this range.Analysis of T210A Mutant—The ATX mutant T210A does
not hydrolyze lipid substrates (26, 27). High resolution ATXcrystal structures (28, 29) reveal that Thr-210 coordinates oneof the two catalytic zinc ions and hydrogen bonds with thephosphate or sulfate in the active site (26–29), consistentwith arole in chemical cleavage of lipid substrates. However, theT210A substitution also compromises substrate binding, asindicated by the lack of a change in FS-3 anisotropy with 2 �M
ATX and lack of NBD-LPC fluorescence intensity change with6 �M ATX. We note that the lack of binding to T210A-ATXsuggests that FS-3 and NBD-LPC substrate binding to the sec-ondary lipid binding site identified in the crystal structures (28,29) is also weak, as this interaction is likely to be independent ofthe active site mutation.Inhibition by FTY720P—FTY720P is the bioactive form of
FTY720, a drug currently used to treat multiple sclerosis (35).ATX plays a critical role in demyelination and neuropathicpain, as well as the migration of lymphocytes out of lymphnodes and into the peripheral circulation (2, 36–39). TheATX/LPA pathway may therefore be a second molecular target ofFTY720 (in addition to the S1PR) in multiple sclerosistreatment.FTY720P has been reported to act as a competitive inhibitor
of ATX (32). The reduction in kcat in our experiments favors anuncompetitive inhibitory mechanism, with FTY720P bindingmore strongly to the ATX�lipid complex than free ATX. Potentinhibition of ATX catalysis under single turnover conditions bysubstoichiometric FTY720P (Fig. 13C) supports this interpre-tation. This uncompetitive mechanism allows FTY720P toinhibit ATX in the presence of lipid substrates, in contrast tocompetitive inhibitors, whose effectiveness lessens when sub-strate is available.
Kinetic Analysis of Autotaxin
30140 JOURNAL OF BIOLOGICAL CHEMISTRY VOLUME 286 • NUMBER 34 • AUGUST 26, 2011
by guest on June 17, 2016http://w
ww
.jbc.org/D
ownloaded from
REFERENCES1. Stracke, M. L., Krutzsch, H. C., Unsworth, E. J., Arestad, A., Cioce, V.,
Schiffmann, E., and Liotta, L. A. (1992) J. Biol. Chem. 267, 2524–25292. Ueda, H. (2008)Mol. Pain 4, 113. Liu, S., Murph, M., Panupinthu, N., and Mills, G. B. (2009) Cell Cycle 8,
3695–37014. Choi, J. W., Lee, C. W., and Chun, J. (2008) Biochim. Biophys. Acta 1781,
531–5395. van Meeteren, L. A., and Moolenaar, W. H. (2007) Prog. Lipid Res. 46,
145–1606. Clair, T., Lee, H. Y., Liotta, L. A., and Stracke, M. L. (1997) J. Biol. Chem.
272, 996–10017. Tokumura, A., Majima, E., Kariya, Y., Tominaga, K., Kogure, K., Yasuda,
K., and Fukuzawa, K. (2002) J. Biol. Chem. 277, 39436–394428. Koh, E., Clair, T.,Woodhouse, E. C., Schiffmann, E., Liotta, L., and Stracke,
M. (2003) Cancer Res. 63, 2042–20459. Gijsbers, R., Aoki, J., Arai, H., and Bollen,M. (2003) FEBS Lett. 538, 60–6410. Braddock, D. T. (2010) Curr. Opin. Investig. Drugs 11, 629–63711. van Meeteren, L. A., Ruurs, P., Stortelers, C., Bouwman, P., van Rooijen,
M. A., Pradere, J. P., Pettit, T. R., Wakelam, M. J., Saulnier-Blache, J. S.,Mummery, C. L., Moolenaar, W. H., and Jonkers, J. (2006)Mol. Cell Biol.26, 5015–5022
12. Clair, T., Aoki, J., Koh, E., Bandle, R. W., Nam, S. W., Ptaszynska, M. M.,Mills, G. B., Schiffmann, E., Liotta, L. A., and Stracke, M. L. (2003) CancerRes. 63, 5446–5453
13. Umezu-Goto, M., Kishi, Y., Taira, A., Hama, K., Dohmae, N., Takio, K.,Yamori, T., Mills, G. B., Inoue, K., Aoki, J., and Arai, H. (2002) J. Cell Biol.158, 227–233
14. Okita,M.,Gaudette, D.C.,Mills, G. B., andHolub, B. J. (1997) Int. J. Cancer71, 31–34
15. Croset, M., Brossard, N., Polette, A., and Lagarde, M. (2000) Biochem. J.345, 61–67
16. vanMeeteren, L. A., Ruurs, P., Christodoulou, E., Goding, J.W., Takakusa,H., Kikuchi, K., Perrakis, A., Nagano, T., and Moolenaar, W. H. (2005)J. Biol. Chem. 280, 21155–21161
17. Moolenaar,W.H., vanMeeteren, L. A., andGiepmans, B. N. (2004)BioEs-says 26, 870–881
18. Tomsig, J. L., Snyder, A. H., Berdyshev, E. V., Skobeleva, A., Mataya, C.,Natarajan, V., Brindley, D. N., and Lynch, K. R. (2009) Biochem. J. 419,611–618
19. Albers, H.M., Dong, A., vanMeeteren, L. A., Egan, D. A., Sunkara,M., vanTilburg, E. W., Schuurman, K., van Tellingen, O., Morris, A. J., Smyth,S. S., Moolenaar, W. H., and Ovaa, H. (2010) Proc. Natl. Acad. Sci. U.S.A.107, 7257–7262
20. Ferguson, C. G., Bigman, C. S., Richardson, R. D., van Meeteren, L. A.,
Moolenaar, W. H., and Prestwich, G. D. (2006) Org. Lett. 8, 2023–202621. Saunders, L. P., Ouellette, A., Bandle, R., Chang, W. C., Zhou, H., Misra,
R. N., De La Cruz, E. M., and Braddock, D. T. (2008)Mol. Cancer Ther. 7,3352–3362
22. Otto, M. R., Lillo, M. P., and Beechem, J. M. (1994) Biophys. J. 67,2511–2521
23. Henn, A., Cao, W., Licciardello, N., Heitkamp, S. E., Hackney, D. D., andDe La Cruz, E. M. (2010) Proc. Natl. Acad. Sci. U.S.A. 107, 4046–4050
24. Henn, A., Cao, W., Hackney, D. D., and De La Cruz, E. M. (2008) J. Mol.Biol. 377, 193–205
25. Johnson, K. A. (1986)Methods Enzymol. 134, 677–70526. Gijsbers, R., Ceulemans, H., Stalmans, W., and Bollen, M. (2001) J. Biol.
Chem. 276, 1361–136827. Lee, H. Y., Clair, T., Mulvaney, P. T., Woodhouse, E. C., Aznavoorian, S.,
Liotta, L. A., and Stracke, M. L. (1996) J. Biol. Chem. 271, 24408–2441228. Nishimasu, H., Okudaira, S., Hama, K., Mihara, E., Dohmae, N., Inoue, A.,
Ishitani, R., Takagi, J., Aoki, J., andNureki, O. (2011)Nat. Struct.Mol. Biol.18, 205–212
29. Hausmann, J., Kamtekar, S., Christodoulou, E., Day, J. E., Wu, T., Fulker-son, Z., Albers, H. M., van Meeteren, L. A., Houben, A. J., van Zeijl, L.,Jansen, S., Andries, M., Hall, T., Pegg, L. E., Benson, T. E., Kasiem, M.,Harlos, K., Kooi, C. W., Smyth, S. S., Ovaa, H., Bollen, M., Morris, A. J.,Moolenaar, W. H., and Perrakis, A. (2011) Nat. Struct. Mol. Biol. 18,198–204
30. Ptaszynska, M. M., Pendrak, M. L., Stracke, M. L., and Roberts, D. D.(2010)Mol. Cancer Res. 8, 309–321
31. Aoki, J., Taira, A., Takanezawa, Y., Kishi, Y., Hama, K., Kishimoto, T.,Mizuno, K., Saku, K., Taguchi, R., and Arai, H. (2002) J. Biol. Chem. 277,48737–48744
32. van Meeteren, L. A., Brinkmann, V., Saulnier-Blache, J. S., Lynch, K. R.,and Moolenaar, W. H. (2008) Cancer Lett. 266, 203–208
33. Young, M. E., Carroad, P. A., and Bell, R. L. (1980) Biotechnol. Bioeng. 22,947–955
34. Reitan, N. K., Juthajan, A., Lindmo, T., and de Lange Davies, C. (2008)J. Biomed. Opt. 13, 2117–2128
35. Jeffery, D. R., Markowitz, C. E., Reder, A. T., Weinstock-Guttman, B., andTobias, K. (2010) Expert Rev. Neurother. 11, 165–183
36. Inoue, M., Xie, W., Matsushita, Y., Chun, J., Aoki, J., and Ueda, H. (2008)Neuroscience 152, 296–298
37. Inoue, M., Ma, L., Aoki, J., Chun, J., and Ueda, H. (2008)Mol. Pain 4, 638. Ma, L., Uchida, H., Nagai, J., Inoue, M., Chun, J., Aoki, J., and Ueda, H.
(2009)Mol. Pain 5, 6439. Ma, L., Uchida, H., Nagai, J., Inoue, M., Aoki, J., and Ueda, H. (2010)
J. Pharmacol. Exp. Ther. 333, 540–546
Kinetic Analysis of Autotaxin
AUGUST 26, 2011 • VOLUME 286 • NUMBER 34 JOURNAL OF BIOLOGICAL CHEMISTRY 30141
by guest on June 17, 2016http://w
ww
.jbc.org/D
ownloaded from
1
SUPPLEMENTAL DATA
The following section provides derivations for equations used in our kinetic analysis of autotaxin
(ATX). To our knowledge, these derivations have not been provided elsewhere, and are thus included in
their entirety. The first derivation, 1) Kinetics of general reversible bimolecular reaction, is based on
general mechanisms, while the remaining three derivations, 2) Transient substrate hydrolysis with
[Substrate]tot << [ATX]tot (single turnover conditions), 3) Transient substrate hydrolysis with
[Substrate]tot >> [ATX]tot (multiple turnover conditions), and 4) Steady-state hydrolysis with
[Substrate]tot >> [ATX]tot (multiple turnover conditions), are based on the minimal reaction mechanism of
the ATX catalytic cycle.
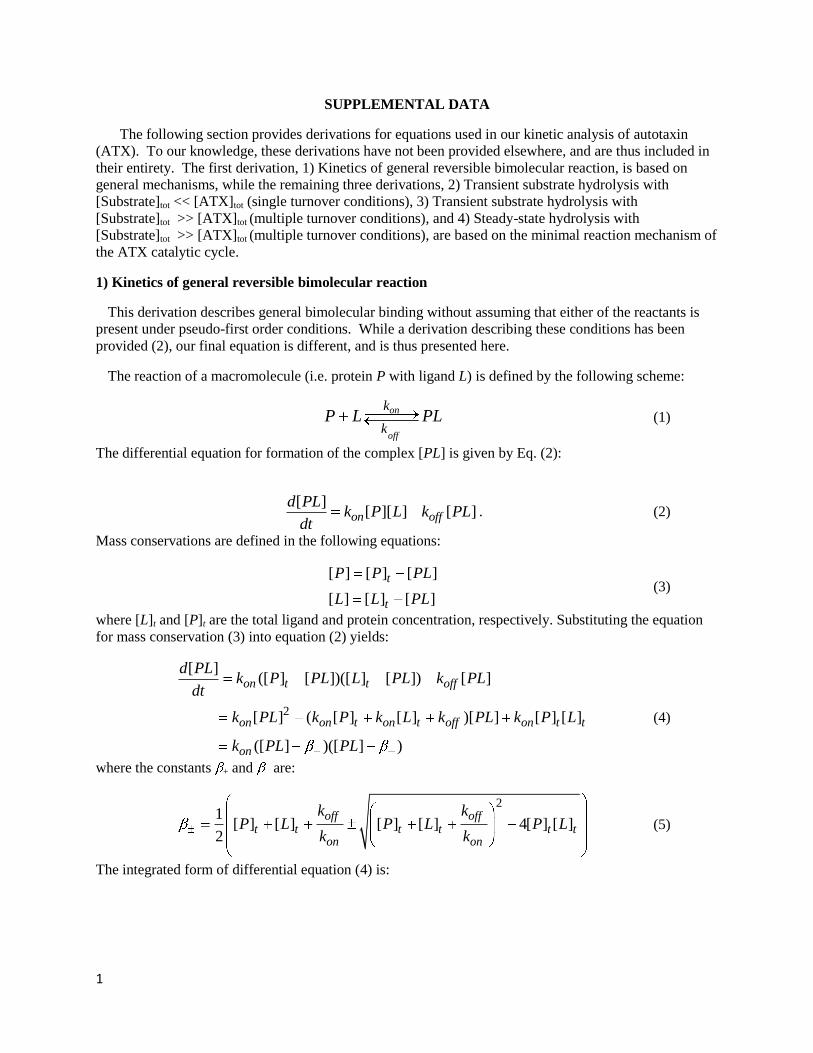
1) Kinetics of general reversible bimolecular reaction
This derivation describes general bimolecular binding without assuming that either of the reactants is
present under pseudo-first order conditions. While a derivation describing these conditions has been
provided (2), our final equation is different, and is thus presented here.
The reaction of a macromolecule (i.e. protein P with ligand L) is defined by the following scheme:
on
off
k
kP L PL (1)
The differential equation for formation of the complex [PL] is given by Eq. (2):
[ ]
[ ][ ] [ ]on off
d PLk P L k PL
dt. (2)
Mass conservations are defined in the following equations:
[ ] [ ] [ ]
[ ] [ ] [ ]
t
t
P P PL
L L PL (3)
where [L]t and [P]t are the total ligand and protein concentration, respectively. Substituting the equation
for mass conservation (3) into equation (2) yields:
2
[ ]([ ] [ ])([ ] [ ]) [ ]
[ ] ( [ ] [ ] )[ ] [ ] [ ]
([ ] )([ ] )
on t t off
on on t on t off on t t
on
d PLk P PL L PL k PL
dt
k PL k P k L k PL k P L
k PL PL
(4)
where the constants + and are:
21
[ ] [ ] [ ] [ ] 4[ ] [ ]2
off offt t t t t t
on on
k kP L P L P L
k k (5)
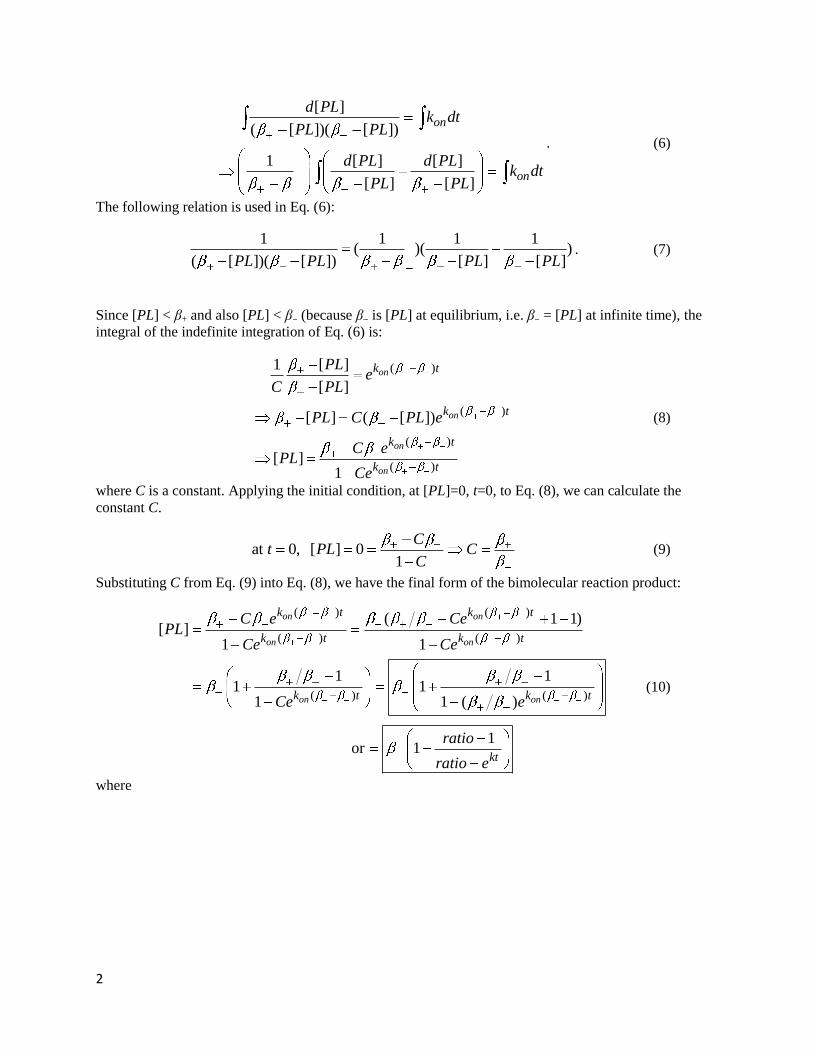
The integrated form of differential equation (4) is:
2
[ ]
( [ ])( [ ])
1 [ ] [ ]
[ ] [ ]
on
on
d PLk dt
PL PL
d PL d PLk dt
PL PL
. (6)
The following relation is used in Eq. (6):
1 1 1 1
( )( )( [ ])( [ ]) [ ] [ ]PL PL PL PL
. (7)
Since [PL] < β+ and also [PL] < β (because β is [PL] at equilibrium, i.e. β = [PL] at infinite time), the
integral of the indefinite integration of Eq. (6) is:
( )
( )
( )
( )
[ ]1
[ ]
[ ] ( [ ])
[ ]1
on
on
on
on
k t
k t
k t
k t
PLe
C PL
PL C PL e
C ePL
Ce
(8)
where C is a constant. Applying the initial condition, at [PL]=0, t=0, to Eq. (8), we can calculate the
constant C.
at 0, [ ] 01
Ct PL C
C (9)
Substituting C from Eq. (9) into Eq. (8), we have the final form of the bimolecular reaction product:
( ) ( )
( ) ( )
( ) ( )
( 1 1)[ ]
1 1
1 1 1 1
1 1 ( )
on on
on on
on on
k t k t
k t k t
k t k t
C e CePL
Ce Ce
Ce e
1 or 1
kt
ratio
ratio e
(10)
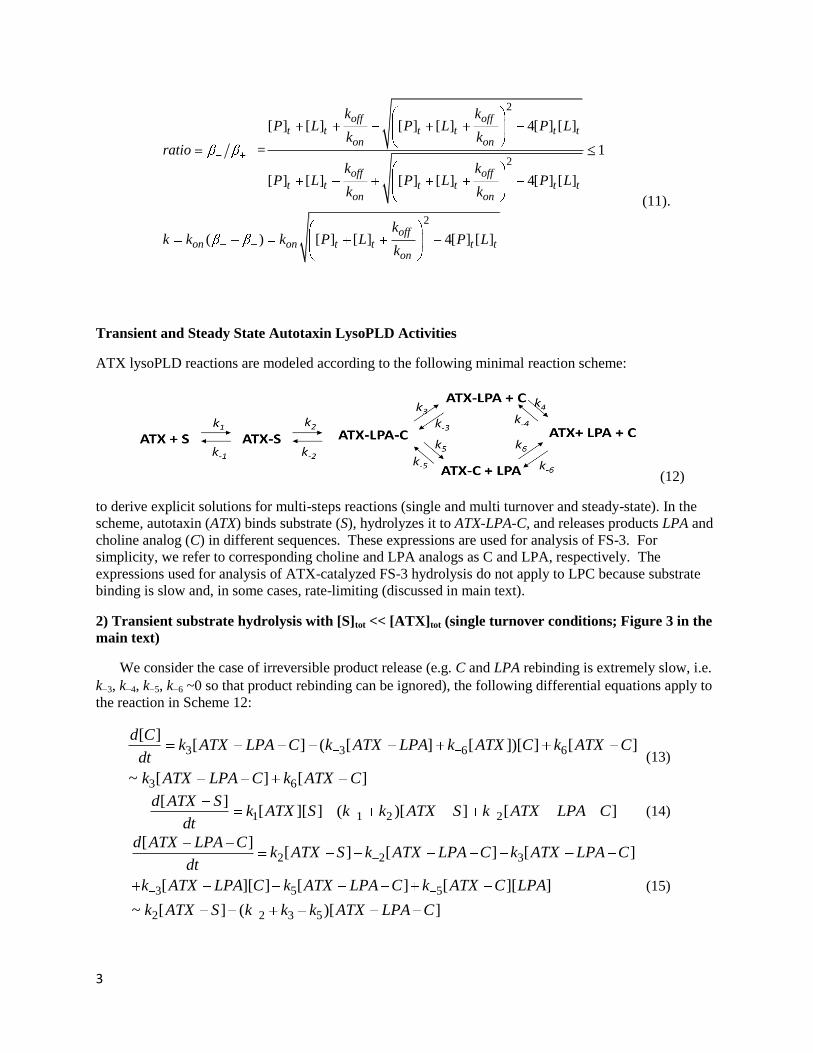
where
3
2
2
2
[ ] [ ] [ ] [ ] 4[ ] [ ]
= 1
[ ] [ ] [ ] [ ] 4[ ] [ ]
( ) [ ] [ ] 4[ ] [ ]
off offt t t t t t
on on
off offt t t t t t
on on
offon on t t t t
on
k kP L P L P L
k kratio
k kP L P L P L
k k
kk k k P L P L
k
(11).
Transient and Steady State Autotaxin LysoPLD Activities
ATX lysoPLD reactions are modeled according to the following minimal reaction scheme:
(12)
to derive explicit solutions for multi-steps reactions (single and multi turnover and steady-state). In the
scheme, autotaxin (ATX) binds substrate (S), hydrolyzes it to ATX-LPA-C, and releases products LPA and
choline analog (C) in different sequences. These expressions are used for analysis of FS-3. For
simplicity, we refer to corresponding choline and LPA analogs as C and LPA, respectively. The
expressions used for analysis of ATX-catalyzed FS-3 hydrolysis do not apply to LPC because substrate
binding is slow and, in some cases, rate-limiting (discussed in main text).
2) Transient substrate hydrolysis with [S]tot << [ATX]tot (single turnover conditions; Figure 3 in the
main text)
We consider the case of irreversible product release (e.g. C and LPA rebinding is extremely slow, i.e.
k 3, k 4, k 5, k 6 ~0 so that product rebinding can be ignored), the following differential equations apply to
the reaction in Scheme 12:
3 3 6 6
3 6
[ ][ ] ( [ ] [ ])[ ] [ ]
~ [ ] [ ]
d Ck ATX LPA C k ATX LPA k ATX C k ATX C
dt
k ATX LPA C k ATX C
(13)
1 1 2 2
[ ][ ][ ] ( )[ ] [ ]
d ATX Sk ATX S k k ATX S k ATX LPA C
dt (14)
2 2 3
3 5 5
2 2 3 5
[ ][ ] [ ] [ ]
[ ][ ] [ ] [ ][ ]
~ [ ] ( )[ ]
d ATX LPA Ck ATX S k ATX LPA C k ATX LPA C
dt
k ATX LPA C k ATX LPA C k ATX C LPA
k ATX S k k k ATX LPA C
(15)
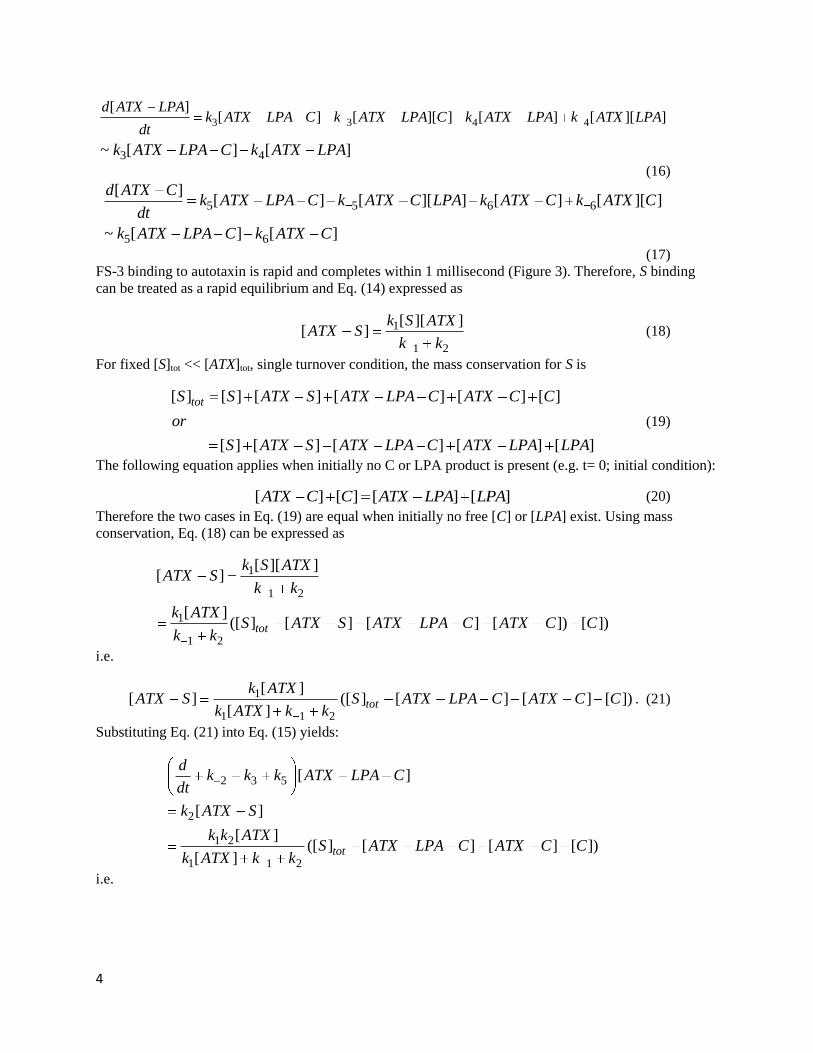
4
3 3 4 4
3 4
[ ][ ] [ ][ ] [ ] [ ][ ]
~ [ ] [ ]
d ATX LPAk ATX LPA C k ATX LPA C k ATX LPA k ATX LPA
dt
k ATX LPA C k ATX LPA
(16)
5 5 6 6
5 6
[ ][ ] [ ][ ] [ ] [ ][ ]
~ [ ] [ ]
d ATX Ck ATX LPA C k ATX C LPA k ATX C k ATX C
dt
k ATX LPA C k ATX C
(17)
FS-3 binding to autotaxin is rapid and completes within 1 millisecond (Figure 3). Therefore, S binding
can be treated as a rapid equilibrium and Eq. (14) expressed as
1
1 2
[ ][ ][ ]
k S ATXATX S
k k (18)
For fixed [S]tot << [ATX]tot, single turnover condition, the mass conservation for S is
[ ] [ ] [ ] [ ] [ ] [ ]
[ ] [ ] [ ] [ ] [ ]
totS S ATX S ATX LPA C ATX C C
or
S ATX S ATX LPA C ATX LPA LPA
(19)
The following equation applies when initially no C or LPA product is present (e.g. t= 0; initial condition):
[ ] [ ] [ ] [ ]ATX C C ATX LPA LPA (20)
Therefore the two cases in Eq. (19) are equal when initially no free [C] or [LPA] exist. Using mass
conservation, Eq. (18) can be expressed as
1
1 2
1
1 2
[ ][ ][ ]
[ ]([ ] [ ] [ ] [ ]) [ ])tot
k S ATXATX S
k k
k ATXS ATX S ATX LPA C ATX C C
k k
i.e.
1
1 1 2
[ ][ ] ([ ] [ ] [ ] [ ])
[ ]tot
k ATXATX S S ATX LPA C ATX C C
k ATX k k. (21)
Substituting Eq. (21) into Eq. (15) yields:
2 3 5
2
1 2
1 1 2
[ ]
[ ]
[ ]([ ] [ ] [ ] [ ])
[ ]tot
dk k k ATX LPA C
dt
k ATX S
k k ATXS ATX LPA C ATX C C
k ATX k k
i.e.
5
1 22 3 5
1 1 2
1 2
1 1 2
[ ][ ]
[ ]
[ ]([ ] [ ] [ ])
[ ]tot
k k ATXdk k k ATX LPA C
dt k ATX k k
k k ATXS ATX C C
k ATX k k
(22)
The eigenvalue equation for the differential equations Eqs. (13), (17), and (22) is
1 2 1 2 1 22 3 5
1 1 2 1 1 2 1 1 2
5 6
3 6
1 2 3 6 1 2 5 6
1 1 2 1 1 2
1 2 3 1 2 5
1 1 2
[ ] [ ] [ ]
[ ] [ ] [ ]
[ ] [ ]
[ ] [ ]
[ ] [ ]
[ ]
0
k k ATX k k ATX k k ATXk k k
k ATX k k k ATX k k k ATX k k
k k
k k
k k ATX k k k k ATX k k
k ATX k k k ATX k k
k k ATX k k k ATX k
k ATX k k k
1 2 62 6 3 6 5 6
1 1 2 1 1 2
2 31 22 3 5 6
1 1 2
0
[ ]
[ ] [ ]
[ ]
[ ]
k k ATX kk k k k k k
ATX k k k ATX k k
ATX k kk k k k
k ATX k k
(23)
There are 3 solutions (eigenvalues, λ) of Eq. (23):
2
1 2 2 3 5 1 2 2 3 5 1 2 1 1 2 3 5
1 2 2 3 5 1 2 2 3 5
1 1 2
S1,S2
( [ ]( ) ( )( )) 4 [ ]( [ ]
S3
)( )
6
1( [ ]( ) ( )( )
2( [ ] )
k ATX k k k k k k k k k k k ATX k ATX k k k k
k ATX k k k k k k k k kk ATX k k
k
(24)
If the reverse hydrolysis rate is very small compared to k3 + k5, i.e. k 2 << k3 + k5, the terms inside the
square root of Eq. (24) can be simplified to the following:
2
1 2 2 3 5 1 2 2 3 5 1 2 1 1 2 3 5
21 2 3 5 1 2 3 5 1 2 1 1 2 3 5
21 2 1 1 2 3 5 1 2 1
( [ ]( ) ( )( )) 4 [ ]( [ ] )( )
~ ( [ ]( ) ( )( )) 4 [ ]( [ ] )( )
( [ ] ( [ ] )( )) 4 [ ](
k ATX k k k k k k k k k k k ATX k ATX k k k k
k ATX k k k k k k k k k ATX k ATX k k k k
k k ATX k ATX k k k k k k ATX k 1 2 3 5
21 1 2 3 5 1 2
[ ] )( )
(( [ ] )( ) [ ])
ATX k k k k
k ATX k k k k k k ATX
(25)
Therefore, at condition, k 2 << k3 + k5, the two faster rate constants in Eq. (24) can be simplified to
6
S1
S2
S
3 5
1 23 51 2
1 1 21
1
S2
1 2
1 2
1 21 1 2 3 5
1 1 23 5
[ ][ ]
[ ][ ]
[ ][ ]
[ ][ ]
if
if
k kk k ATX
k kk k ATXk ATX k k
k ATX k k
k k ATXk k ATX
k ATX k k k kk ATX k k
k k
. (26)
In Eq. (26), the [ATX]tot dependent rate constant depends hyperbolically on [ATX]tot with the maximal
value of k2 and y-intercept of 0. The fact that the observed fast phase in the time courses of choline
analogue release at 25 oC under fixed [S]tot << [ATX]tot, single turnover condition is [ATX]tot dependent
(Figure 3), suggests that in the choline analogue release, k3 + k5 >> k2, and S1 = k3 + k5 is too fast to be
detected since it is after slow hydrolysis step (k2). . S3 corresponds to the slow exponential seen in the
time course of choline release in the single turnover condition, as the slow rate constant from the single
turnover matches the rate constant approximated from the choline product binding experiment. The
general solution for choline release can be constructed by the eigenvalues as the following:
S1 S2 61 2 3[ ] [ ]
t t k ttotC A e A e A e S (27)
Where A1, A2 and A3 are constants to be determined and [S]tot is a special solution of [C] and is calculated
by
1 2 1 22 3 5
1 1 2 1 1 2
5 6
3 6
1 2 1 2 1 22
1 2
3 51 1 2 1 1 2 1 1 2
5
6
1
6
3
1 2
[ ] [ ]
[ ] [ ]
0
[ ] [ ] [ ]
[ ] [ ]
[ ][ ]
[ ]
0
[ ]
[ ]
0
0
totk k ATX k k ATXk
k k ATX S
k ATk k
k ATX k k k ATX k k
k k
k k
k k ATX k k ATX k k ATXk k k
k ATX k k k ATX k k k ATX k k
k k
k
X k
S
k
k
tot
Assuming initially there is no free [C], this expression yields the following initial conditions:
0 0 0[ ] [ ] [ ] 0t t tC ATX LPA C ATX C (28)
Using Eq. (13) and the derivative of Eq. (13) with Eqs. (18), (22), and (28), we obtain the following initial
condition for the first and second order derivative of [C]:
0 3 0 6 0
[ ]| ~ [ ] | [ ] | 0t t t
d Ck ATX LPA C k ATX C
dt (29)
7
2
0 3 0 6 02
1 23 2 3 5 0
1 1 2
1 2 30
1 1 2
25 6 0 6 0
1 2 3
[ ] [ ] [ ]| ~ | |
[ ][ ] |
[ ]
[ ]([ ] [ ] [ ]) |
[ ]
[ ] | [ ] |
t t t
t
tot t
t t
d C d ATX LPA C d ATX Ck k
dt dtdt
k k ATXk k k k ATX LPA C
k ATX k k
k k k ATXS ATX C C
k ATX k k
k k ATX LPA C k ATX C
k k k
1 1 2
[ ][ ]
[ ]
totATX S
k ATX k k
(30)
Applying the initial conditions in Eqs (28)-(30) to Eq. (27), we obtain the following linear algebraic
equations for the amplitudes A1, A2 and A3 of the exponential phases:
1 2 3
1 1 S2 2 6 3
2 2 2 1 2 3S1 1 S2 2 6 3
1 1 2
[ ]
0
[ ][ ]
[ ]
tot
S
tot
A A A S
A A k A
k k k ATX SA A k A
k ATX k k
(31)
The linear equations for A1, A2 and A3 have the following solutions.
1 2 3S2
1 1 21
S1 S1
6
6
6
6
S2
1 2 3S1
1 1 22
S2 S1 S2
1 2 3S1 S2
1 1 23
1 S26 6
[ ][ ]
[ ]
[ ][ ]
[ ]
[ ][ ]
[
( )( )
( )( )
( )( )
]
tot
tot
tot
S
k k k ATXS
k ATX k kA
k k k ATXS
k ATX k kA
k k k ATXS
k ATX k
k
k
k
k
kA
k
k
(32)
3) Transient substrate hydrolysis with [S]tot >> [ATX]tot (multiple turnover conditions)
Since [ATX]tot is kept constant while titrating [S]tot, applying mass conservation for ATX to the fast
equilibrium for S binding (Eq. 18) yields the following equation:
1
1 2
1
1 2
[ ][ ][ ] ~
[ ]([ ] [ ] [ ] [ ] [ ])tot
k S ATXATX S
k k
k SATX ATX S ATX LPA C ATX LPA ATX C
k k
i.e.
8
1
1 1 2
[ ][ ] ([ ] [ ] [ ] [ ])
[ ]tot
k SATX S ATX ATX LPA C ATX LPA ATX C
k S k k.(33)
The experimental data (Figures 3 and 4) suggests that choline release from hydrolyzed FS-3 is much
faster than FS-3 hydrolysis itself, i.e. k3 >> k2. This means the slow hydrolysis and subsequently fast
choline release lead to very little change in the concentration of FS-3 hydrolyzed state. Therefore, we can
safely assume d[ATX-LPA-C]/dt ~ 0. Combining Eq. (33) with Eq. (15) yields:
1 2
1 2 1 1 2 2 3 5
[ ]
[ ]([ ] [ ] [ ])
[ ] ( [ ] )( )
([ ] [ ] [ ])
tot
tot
ATX LPA C
k k SATX ATX LPA ATX C
k k S k S k k k k k
ATX ATX LPA ATX C
(34)
where
1 2
1 2 2 3 5 1 2 2 3 5
[ ]
[ ]( ) ( )( )
k k S
k S k k k k k k k k k. (35)
Substituting Eq. (34) into Eq. (16) and (17) yields:
4 3 3 3[ ] [ ] [ ]tot
dk k ATX LPA k ATX C k ATX
dt (36)
5 6 5 5[ ] [ ] [ ]tot
dk ATX LPA k k ATX C k ATX
dt (37)
The rate constants (eigenvalues) for the linear differential equations Eqs. (36) and (37) are:
21, 2 4 6 3 4 6 35 5 54 6 3 6 4
( ) ( ) (1
( ( ) 4( ))2
)ATX ATX
k k k k k k kk kk k k kk
(38)
Inside the square root can be rearranged as
2
24 6 3 4 6 4 5 3 6
24 6 3 5 53
5( ) 4( ) )
( )
( ) (
( ) 2
k k k kk
k
k k k k k
k k k k k
(39)
At saturating LPC concentration and slow hydrolysis, 2k3k52 ~ 2k2
2 ~ 0. If k5 ~ k3 and k4 ~ k6, Eq. (39)
approaches 0 and the two rate constant expressed in Eq. (38) are comparable. The general solution for the
linear differential equations Eqs. (36) and (37) can be constructed by the two rate constants and a special
solution:
1 2
3 3
1 4 3 23
4 5
4 36
1 2
[ ]' '
[ ]1 1
ATX ATXt tATX ATX
k kATX LPA
k k k kA e A eATX C
k k
k k
(40)
where
4 6 3 6 4 5
[ ]
( )
totATX
k k k k k k (41)
9
The special solution is calculated by
3 3
5 6 5
4 3 3
5 6 5
3 6
4 6 3 6 4 5
1 2
1 2 2 3 5 2 1 2 2 3
3 6
3 6
4 6 3 6 4 5 4 6 5
[ ]
[ ]
[ ]
( )
[ ][ ]
[ ]( ( ( ))) ( )( )
tot
tottot
tot
k ATX k
k ATX k k
k k k
k k k
k k ATX
k k k k k k
k k S ATX
k S k k k k k k
k k
k k
k k k k k k k kk kk k
and
4 3 3
5 5
4 3 3
5 6 5
4 5
4 6 34
6 45
4 5
4 6
5
1 2
1 2 3 62 3 5 2 1 2 24 6 35 4 5
[ ]
[ ]
[ ]
( )
[ ][ ]
[ ]( ( ) ( )(( )) )
tot
tottot
tot
k k k ATX
k k ATX
k k k
k k k
k k ATX
k k k k k k
k k S ATX
k S k k k k k k
k k
k k
k k k k k k k kk kk k
.
From the initial condition, we have
3 3
1 4 3 2 4
5
33 6
41 2' '
1 1
ATX ATX
k k
k k k kA Ak k
k k (42)
Solving Eq. (42) for A’1 and A’2:
6 6 4 5
6 6
3 2 4 3 3 1 4 31
3 1 2
3 1 4 3 3 2 4 32
3
5
1 2
4
( ( ) ( )( )'
( )
( ) ( )( )'
( )
)
( )
ATX ATX
ATX ATX
ATX ATX
ATX ATX
k k k k k kA
k
k k
k k k k
k k k k kA
k k k
k
(43)
Substituting Eq. (43) into Eq. (40):
1
6 6 4 5
6 6 4 5
6 6 4 5
3 2 4 3 3
1 2
3 2 4 3 3 1 4 3
3 1 2
3 1 4 3 3
1 2
( ( ) ( )
( )[ ]
( ( ) ( )( )[ ]
( )
( ) ( )
(
)
)
( )
ATX
ATX
ATX ATX t
ATX ATX
ATX ATX
ATX
ATX ATX
k k k k
k k k k
k k k k
k k k k
ATX LPAe
k k k k k kATX C
k
k k k k
2 3 6
3 1 4 3 4 56 6 3 2 4 3
3 1
4 5
2
( )
)
( ) ( )( )
( )
ATX t
ATX ATX
ATX ATX
ek
k k
k kk kk kk kk k k
k
(44)
Substituting [ATX-LPA] and [ATX-C] in Eq. (44) and Eq. (34) into Eq. (14):
10
1
3 3 6
6 6 4 5
3
3 2 4 3 3
1 2
3 3
3 1 46
3 6
3 6
[ ] [ ] ( [ ]
( ( ) ( )
( )[ ]
)
((
[ ]~ [ ] [ ]
([ ] [ ] [ ]) [ ]
)
ATX
tot
tATX
ATX ATX
tot
ATX
tot
k ATX k ATX LPA k k
k k k k
k
ATX C
k k k ke
k ATX kk k
d Ck ATX LPA C k ATX C
dt
k ATX ATX LPA ATX C k ATX C
2
1
3 3
1 2
3 2 4 3 3 1 4 3
3 1
6 4 53 6
6 6
2
6 3
3 1
4 5
6 6 4 54 3 3 2 4 3
3 1
) ( )
( )
( ( ) ( )( )
( )(
(
)
) ( )( (
)
) )
(
)
ATX
ATX
t
ATX ATX
tATX ATX
ATX ATX
ATX ATX
ATX A
k ke
k k k k k ke
kk k
k
k k kk k
k k k k
k k kk kkk k k
k2
1
4
2
5
2 22 4 3 6 1 4 3 6 3
1 2
2 21 4 3 6 2 4 4
6 6 4 5
6 6 4 5 6 3
1 2
)
( ( ) ( )(( )( ) 2 )
( )
( ) ( )(( )( ) 2
)
)
( ) )
(
ATX
ATX
t
TX
tATX ATX
ATX ATX
ATX ATX
ATX ATX
k ke
ek k k k k kk k k
k k
k k
k k kk kk k k k2
65 43( )
ATX te
k k kk
(45)
Integration of Eq. (45) under initial conditions of zero choline concentration leads to the
following time dependent choline release from autotaxin:
1
2
2 4 3 6 1 4 3 6 3
2
6 4
1 1
6 52 2
2 21 4 3 6 2 4 4 6
2
6 6 4 5 3
2 1
)[
( ( ) ( )(( 2 )
( )]
)( )(1 )
( ) ( )(( )( ) 2 )
(
( )(
)1
ATX
ATX
tATX ATX
ATX ATX ATX
tATX ATX
ATX ATX ATX
k k k k k k ke
e
k k k kC
k k k k k kk k k kk
53 64)
)
(k k k tk
(46)
Eq. (46) indicates that at the condition [S]tot >> [ATX]tot, the time course of choline release from substrate
hydrolysis by autotaxin consists of an initial lag phase followed by a linear steady state choline release.
The rate of steady state choline release is
3 63 6
3
5 45 4
5 4 6
4 6 3 6 4 5
1 2
1 4 6 2 2 3 5 2 3 6 4 5 4 6 1 2 2 3 5
))
)
( [ ](
( )
( [ ] [ ]
[ ]( ( ) ( )) ( )( )
tot
tot
k kk k
k k
k kk k
k k
ATXv
k k k k k k
k k ATX S
k S k k k k k k k k k k k k k k k k k k
(47)
4) Steady state hydrolysis
During steady state turnover, there is no net change in concentration of intermediates. Therefore,
differential equations Eq. (14)-(17) simplify to the following algebraic equations:
11
1 2 2 1
1 2 2
1
1 1 2 1 2
1
[ ]( )[ ] [ ] [ ][ ]
( )[ ] [ ]
[ ]([ ] [ ] [ ] [ ] [ ])
( [ ] )[ ] ( [ ] )[ ]
[ ][
tot
d ATX Sk k ATX S k ATX LPA C k ATX S
dt
k k ATX S k ATX LPA C
k S ATX ATX S ATX LPA C ATX LPA ATX C
k S k k ATX S k S k ATX LPA C
k S ATX LPA 1 1] [ ][ ] [ ][ ]
0
totk S ATX C k S ATX
i.e.
1 1 2 1 2
1 1 1
( [ ] )[ ] ( [ ] )[ ]
[ ][ ] [ ][ ] [ ][ ]tot
k S k k ATX S k S k ATX LPA C
k S ATX LPA k S ATX C k S ATX (48)
2 2 3 5
[ ]~ [ ] ( )[ ] 0
d ATX LPA Ck ATX S k k k ATX LPA C
dt (49)
3 4
[ ][ ] [ ] ~ 0
d ATX LPAk ATX LPA C k ATX LPA
dt (50)
5 6
[ ][ ] [ ] 0
d ATX Ck ATX LPA C k ATX C
dt (51)
The solutions for the linear equations Eq. (48)-(51) are
1
2
3
4
[ ] /
[ ] /
[ ] /
[ ] /
ATX S a
ATX LPA C a
ATX LPA a
ATX C a
(52)
with
1 2 1 1 1
2 3 5
3 4
5 6
1
1 4 2 3 5 6
[ ][ ] [ ] [ ] [ ]
0 ( ) 0 0
0
0
0
0
( ) [ ][ ]
tot
tot
k S ATX k k S k S k S
k k k
k k
k k
a
k k k k k k S ATX
(53)
1 1 2 1 1 1
2
4
6
2
1 2 4 6
( [ ] ) [ ][ ] [ ] [ ]
0
0
0 0 0
0 0
0 0
[ ][ ]
tot
tot
k S k k k S
a
ATX k S k S
k
k
k
k k k k S ATX
(54)
12
1 1 2 2 1 1 1
2 2 3 5
3
5 6
3
1 2 3 6
( [ ] ) [ ] [ ][ ] [ ]
( ) 0
0 0
0 0
0
0
[ ][ ]
tot
tot
k S k k k k S k S ATX k S
k k k k
k
k
a
k
k k k k S ATX
(55)
1 1 2 2 1 1 1
2 2 3
4
5
4
5
3
1 2 4 5
( [ ] ) [ ] [ ] [ ][ ]
( ) 0
0 0
0 0 0
0
[ [] ]
tot
tot
k S k k k k S k S k S ATX
ka
k k k
k k
k
k k k k S ATX
(56)
1 1 2 2 1 1 1
2 2 3 5
3 4
5 6
4 2 3 5 1 2 3 5 6 1 4 2 3 5 6 2 3 6 4 5 4 6
0
0
0 0
( [ ] ) [ ] [ ] [ ]
( ) 0
0
( ( ) ( )) ( ( ) ( ))[ ]
k S k k k k S k S k S
k k k k
k k
k k
k k k k k k k k k k k k k k k k k k k k k k S
(57)
The rate (v) of the choline and LPA product release (Eq. 14) is therefore:
1 2 4 3 5 6
1 4 2 3 5 6 2 3 6 4 5 4 6 4 2 3 5 1 2 3 5 6
3 6
3 2 6 4
[ ] ( ) [ ]
( ( ) ( ))[ ] ( ( ) ( ))
[ ]~ [ ] [ ]
totATX k k k k k k S
k k k k k k k k k k k k k S k k k k k k k k k
d Cv k ATX LPA C k ATX C
dt
k a k a(58)
with KM:
4 2 3 5 1 2 3 5 6
1 4 2 3 5 6 2 3 6 4 5 4 6
( ( ) ( ))
( ( ) ( ))M
k k k k k k k k k
k k k k k k k k k k k k kK
(59)
and kcat:
2 4 3 5 6
4 2 3 5 6 2 3 6 4 5 4 6
( )
( ) ( )cat
k k k k k
k k k k k k k k kk
k k k (60).
The choline steady state release rate obtained directly under steady state condition (Eq. (58)) is the same
as that obtained under the multi-turnover condition (Eq. (47)).
References
1. Malatesta, F. (2005) Biophys Chem. 116, 251-256.
T. Braddock and Enrique M. De La CruzLauren P. Saunders, Wenxiang Cao, William C. Chang, Ronald A. Albright, Demetrios
Mechanism for Lysophosphatidic Acid DistributionKinetic Analysis of Autotaxin Reveals Substrate-specific Catalytic Pathways and a
doi: 10.1074/jbc.M111.246884 originally published online June 30, 20112011, 286:30130-30141.J. Biol. Chem.
10.1074/jbc.M111.246884Access the most updated version of this article at doi:
Alerts:
When a correction for this article is posted•
When this article is cited•
to choose from all of JBC's e-mail alertsClick here
Supplemental material:
http://www.jbc.org/content/suppl/2011/06/30/M111.246884.DC1.html
http://www.jbc.org/content/286/34/30130.full.html#ref-list-1
This article cites 39 references, 18 of which can be accessed free at
by guest on June 17, 2016http://w
ww
.jbc.org/D
ownloaded from