An approach of estimating struvite growth kinetic incorporating thermodynamic and solution...
13
This article appeared in a journal published by Elsevier. The attached copy is furnished to the author for internal non-commercial research and education use, including for instruction at the authors institution and sharing with colleagues. Other uses, including reproduction and distribution, or selling or licensing copies, or posting to personal, institutional or third party websites are prohibited. In most cases authors are permitted to post their version of the article (e.g. in Word or Tex form) to their personal website or institutional repository. Authors requiring further information regarding Elsevier’s archiving and manuscript policies are encouraged to visit: http://www.elsevier.com/copyright
-
Upload
independent -
Category
Documents
-
view
0 -
download
0
Transcript of An approach of estimating struvite growth kinetic incorporating thermodynamic and solution...

This article appeared in a journal published by Elsevier. The attachedcopy is furnished to the author for internal non-commercial researchand education use, including for instruction at the authors institution
and sharing with colleagues.
Other uses, including reproduction and distribution, or selling orlicensing copies, or posting to personal, institutional or third party
websites are prohibited.
In most cases authors are permitted to post their version of thearticle (e.g. in Word or Tex form) to their personal website orinstitutional repository. Authors requiring further information
regarding Elsevier’s archiving and manuscript policies areencouraged to visit:
http://www.elsevier.com/copyright

Author's personal copy
Chemical Engineering Science 63 (2008) 3514 -- 3525
Contents lists available at ScienceDirect
Chemical Engineering Science
journal homepage: www.e lsev ier .com/ locate /ces
An approach of estimating struvite growth kinetic incorporating thermodynamic andsolution chemistry, kinetic and process description
Md. Imtiaj Alia,∗, Philip Andrew Schneiderb,∗,1
aEarth Tech Engineering Pty Ltd, Level 2, North Tower, 527 Gregory Terrace, Bowen Hills, Brisbane QLD 4006, AustraliabSchool of Engineering, James Cook University, Townsville QLD 4811, Australia
A R T I C L E I N F O A B S T R A C T
Article history:Received 12 November 2006Received in revised form 22 March 2008Accepted 15 April 2008Available online 22 April 2008
Keywords:StruviteGrowth modelThermodynamicKineticProcessKinetic estimation
Discharge of untreated nutrient-rich wastewater is a problematic issue, which may cause root burningand the eutrophication of receiving water. It is also a problematic issue due to the formation of crystallinedeposits in waste water systems. The recovery of nutrient using crystallization technique may provide avalue added product. The recovered product is struvite, which is chemically known as magnesium am-monium phosphate hexahydrates. The key focus of this paper is the modeling and simulation of struvitegrowth, incorporating solution chemistry and thermodynamics, growth kinetic and process description ofthe recovery system. An ensemble of experimental data is combined with the dynamic model to estimatestruvite growth kinetics.
© 2008 Elsevier Ltd. All rights reserved.
1. Introduction
Nutrient-rich wastewater comes from various sources includingwastewater from livestock farm, food and beverage industry anddairy industry. The conventional approaches of nutrient manage-ment of livestock wastewater include the spreading of nutrient-richwater on cropland and the dumping of this into receiving waters.Increasing nutrient loads, mainly ammonium and phosphate, causeseutrophication in surface water-bodies and the burning of roots. Eu-trophication causes aquatic diversity by producing toxic algae, whichdevastates fish and other aquatic life. One proposed solution to thisproblem is the recovery of nutrients using crystallization. The keyfeature of this recovery technique is the combined removal of am-monium, phosphate and magnesium from supersaturated solutions.The by-product of this technique is magnesium ammonium phos-phate hexahydrates (MAP), which is commonly known as struvite.Struvite may be utilized as a valuable source of slow release fertilizerdue to its solubility characteristics (Nelson et al., 2003).
Often researchers have conducted kinetic investigation of stru-vite relating to concentration decay and concentration related desu-persaturation. Nelson et al. (2003) studied struvite kinetics relating
∗ Corresponding authors. Tel.: +610437934171.E-mail addresses: [email protected], [email protected] (Md. Im-
tiaj Ali), [email protected] (P.A. Schneider).1 This research was conducted in James Cook University, Townsville QLD, Aus-
tralia.
0009-2509/$ - see front matter © 2008 Elsevier Ltd. All rights reserved.doi:10.1016/j.ces.2008.04.023
to the reduction of experimental phosphate concentration (CPO3−
4−
C∗PO3−
4
) and the rate of phosphate de-supersaturation (dCPO3−
4/dt).
Given that, CPO3−
4is the initial concentration of phosphate and C∗
PO3−4
is the phosphate concentration after experiment (equilibrium con-centration). A first order modified kinetic model (log form) in batchscale was documented by Nelson et al. (2003). A similar model toNelson et al. (2003), struvite kinetic study was also conducted veryrecently (Quintana et al., 2005). The above-mentioned kinetic stud-ies (Nelson et al., 2003; Quintana et al., 2005) showed very simpleconcentration-related struvite kinetics and actual struvite thermo-dynamic was largely ignored. Moreover, particle size distributionof struvite crystal was not considered in the above-mentioned in-vestigations, causing no significant contribution to express struvitegrowth and the relevant solution supersaturation. Harrison's (1999)study is more practical in expressing the struvite growth kinetics,since it incorporates the mean particle size and the relevant growthof struvite crystal as a function of solution supersaturation. However,Harrison's (1999) study suffers a significant setback, since supersat-uration is expressed in terms of total phosphate concentration decayinstead of actual supersaturation. The mathematical presentationof supersaturation as a function of single component concentration(C
Mg2+ or CPO3−
4or CNH+
4) is rather limited, since solution super-
saturation depends on all the reactive concentration (magnesium,ammonium and phosphate) and the relevant solution pH. There-fore, this paper presents a more rigorous growth kinetics model of

Author's personal copy
M.I. Ali, P.A. Schneider / Chemical Engineering Science 63 (2008) 3514 -- 3525 3515
struvite, relating to the growth of mean crystal size as a function ofthermodynamic related solution supersaturation.
2. Thermodynamic modeling
Solution chemistry plays a key role in struvite crystal formation.In a supersaturated solution, struvite forms by the chemical reactionof the free Mg2+, NH+
4 and PO3−4 ions (Eq. (1)).
Mg2+ + NH+4 + PO3−
4 �MgNH4PO4 (1)
Additionally, the formation of struvite crystal normally incorporatessix molecules of water, as the water of hydration: therefore stru-vite is known as magnesium ammonium phosphate hexahydrates(MgNH4PO4 · 6H2O).
Supersaturation of the solution is the key parameter leading tocrystallization, which in turn depends on solution pH and reactive so-lution concentration. Solutions consisting of magnesium, ammoniumand phosphate form ions and complexes including Mg2+, MgOH+,MgH2PO
+4 , MgHPO4,MgPO−
4 , H3PO4, H2PO−4 , HPO
2−4 , PO3−
4 , NH3 andNH+
4 (Bouropoulos and Koutsoukos, 2000; Ohlinger et al., 2000). The
total constituent concentrations for Mg2+, NH+4 and PO3−
4 , denotingCTMg
, CTNH4, CTPO4
, are the sum of the ionic concentration of their
complexes and free ions, which are illustrated in Eqs. (2)--(4). It isworthwhile noting that Eq. (4) is valid under a closed system, whichwas roughly maintained throughout the conducted experiments asdiscussed in Section 4.1. The values of the thermodynamic constantsand the relevant equations for different ions and complexes are givenin Table 1.
CTPO4= [H3PO4] + [H2PO
−4 ] + [HPO2−
4 ] + [PO3−4 ]
+ [MgH2PO+4 ] + [MgHPO4] + [MgPO−
4 ] (2)
CTMg= [Mg2+] + [MgOH+] + [MgH2PO
+4 ]
+ [MgHPO4] + [MgPO−4 ] (3)
CTNH4= [NH3] + [NH+
4 ] (4)
These thermodynamic equilibria (Table 1) further relate to solu-tion pH through the concentration of H+ and OH− ions, providedthat the ionization constant of water (Kw) is equal to 10−14. Eqs. (5)and (6) presents the simplified thermodynamic equilibria for pH−,given that more realistic thermodynamic equilibria between H+ and
Table 1Value of equilibrium constants for complexes
Equilibrium equation Ki References
KMgOH+ = {Mg2+}{OH−}{MgOH+} 10−2.56 Childs (1970)
KNH+4
= {H+}{NH3}{NH+
4 } 10−9.25 Taylor et al. (1963)
KHPO2−4
= {H+}{PO3−4 }
{HPO2−4 } 10−12.35 Morel and Hering (1993)
KH2PO−4
= {H+}{HPO2−4 }
{H2PO−4 } 10−7.20 Morel and Hering (1993)
KH3PO4= {H+}{H2PO
−4 }
{H3PO4} 10−2.15 Martell and Smith (1989)
KMgH2PO+4
= {Mg2+}{H2PO−4 }
{MgH2PO+4 } 10−0.45 Martell and Smith (1989)
KMgHPO4= {Mg2+}{HPO2−
4 }{MgHPO4} 10−2.91 Martell and Smith (1989)
KMgPO−4
= {Mg2+}{PO3−4 }
{MgPO−4 } 10−4.80 Martell and Smith (1989)
Kw = [H+][OH−] 10−14 Snoeyink and Jenkins (1980)
OH− should incorporates activity concentrations instead of ionic con-centrations.
[H+] = 10−pH (5)
Kw = [H+][OH−] (6)
Bulk fluid ionic strength (I) is employed to determine the activitycoefficient (�i) of each component ion (Mg2+, NH+
4 and PO3−4 ). The
solution ionic strength (I) can be calculated by the defined rela-tions, based on each species of ionic concentration, Ci (Mg, NH4 andPO4) and its respective charge, Zi (Eq. (7)). The activity coefficientcan be determined using a variety of empirical relations, includingthe Debye--Hückel equation, Debye--Hückel equation with Güntel-berg approximation, Davies equation and Bromley equation (Sohneland Garside, 1992; Mullin, 1993). In general, this research incorpo-rates the Davies equation (Eq. (8)) to calculate the activity coeffi-cient, since it is capable of performing activity calculations for higherionic strengths, i.e. the maximum computable limit of I is 0.2 molar(Mullin, 1993).
I = 12
∑CiZ
2i (7)
−Log �i = AZ2i
[I1/2
1 + I1/2
]− 0.3I (8)
where �i is the activity of solution, I the ionic strength in molar,Zi the valency of the corresponding elements, A the DeBye--Hückelconstant, has a value of 0.493, 0.499, 0.509 and 0.519 at 5, 15, 25and 35 ◦C, respectively (Mullin, 1993).
The ionization fractions of Mg2+, NH+4 and PO3−
4 (�Mg, �PO4,
�NH4) can be defined by the quotient of free ion concentration and
the total concentration of each chemical component (Eqs. (9)--(11)).
�Mg = �Mg2+�CT,Mg
(9)
�PO4= �PO3−
4 �CT,PO4
(10)
�NH4= �NH+
4 �CT,NH4
(11)
Two types of solubility products describe the solubility status of so-lution, which include the conditional solubility product (Pcs) and theproduct of the analytical molar concentration (Pso) (Snoeyink andJenkins, 1980). The conditional solubility product (Pcs) relates to thesolution properties, including ionization fraction (�i), activity coeffi-cients (�i) and the struvite solubility product (Kso) (Ohlinger, 1999).The Product of the Analytical Molar Concentration relates to the totalconcentrations of reactive constituents (CT,i), where ''i'' representsthe magnesium, ammonium, and phosphate, as required (Snoeyinkand Jenkins, 1980). Relating to above thermodynamic parameters(CT,i, �i and �i) the mathematical relation of the solubility productof struvite is shown in Eq. (12).
Kso = (CT,Mg�Mg�Mg) · (CT,PO4�PO4
�PO4)
· (CT,NH4�NH4
�NH4) (12)
The mathematical formulation of the conditional solubility product(Pcs) and the product of the analytical molar concentration (Pso)
are demonstrated in Eqs. (13) and (14), respectively. Solutions witha higher value of the concentration product than the conditionalsolubility product (Pso > Pcs) refer to a supersaturated solution. Equalnumerical values of Pcs and Pso characterize the saturated condition

Author's personal copy
3516 M.I. Ali, P.A. Schneider / Chemical Engineering Science 63 (2008) 3514 -- 3525
of solution, whereas Pso < Pcs demonstrates the undersaturated con-dition of a solution (Snoeyink and Jenkins, 1980). The negative loga-rithmic value of the struvite solubility product value (pKso) appliedin this thermodynamic modeling is 13.26 (Ohlinger, 1999).
Pcs = Kso�Mg�Mg�NH4
�NH4�PO4
�PO4
(13)
Pso = CT,Mg · CT,PO4· CT,NH4
(14)
The solution thermodynamic properties, described above, specify thestate of saturation, free ion concentrations, molar concentration ofion complexes and the state of precipitation. The precipitation ofstruvite occurs in supersaturated solutions, which is particularly in-fluenced by the pH of the solution and the reactant concentration(Al-Khayat and Garside, 1990; Mullin, 1993). The demonstrated ther-modynamic model of struvite further relates to growth kinetics andprocess modeling as discussed below.
3. Struvite growth kinetics
3.1. Definition of supersaturation
Often, the degree of supersaturation is expressed by the super-saturation ratio (Sc) relating to the thermodynamic conditional sol-ubility product (Pcs) and the concentration product of the reactants(Pso), as shown in Eq. (15) (Snoeyink and Jenkins, 1980; Ohlinger,1999). Based on the chemical formation, the number of species inanhydrous struvite is � = 3.
Sc =(
PsoPcs
)1/�(15)
Sc =⎛⎝ {Mg2+}{NH+
4 }{PO3−4 }
Kso
⎞⎠1/3
(16)
Sc =(IAPKso
)1/3(17)
As demonstrated above, further simplification of Eq. (15) shows thatthe supersaturation ratio (Sc) can also be expressed in terms of theion activity product (IAP) and the solubility product (Kso), which isan established formula, termed as supersaturation ratio, for solutionsupersaturation (Mullin, 1993). However, for the kinetic investiga-tion, this research employed relative supersaturation (Sr) to computesolution supersaturation (Eq. (18)).
Sr = Sc − 1 (18)
Often supersaturation is expressed in terms of the saturation index(SI), as shown in Eqs. (19) and (20) (Allison et al., 1991; Parkhurstand Appelo, 1999).
SI = 13 [Log(IAP) − Log Kso] (19)
SI = Log(IAPKso
)1/3(20)
where IAP is the IAP of magnesium, ammonium and phosphate, Ksothe solubility product of struvite.
However, Eq. (21) is identical to Eq. (19) in expressing the SI,following the simplifying procedure of Eqs. (15)--(22).
SI = 13 [Log(Pso) − Log(Pcs)] (21)
SI = Log(
PsoPcs
)1/3(22)
where Pso is the concentration product of the total magnesium, am-monium and phosphate, Pcs the conditional solubility product ofstruvite.
As described in the previous paragraph of this section, thisresearch employed Eqs. (17) and (18) to compute the solution su-persaturation in the struvite kinetic modeling. This research alsoincorporates investigations of struvite kinetics based on the SI asshown in Eq. (22) to compare the kinetic trends based on SI and S.
3.2. Growth rate expression
In general, the linear growth rate of struvite is presented as afunction of supersaturation (S), temperature (T), mixing intensity(N), and the mean size of crystals as seeds (L), as shown in Eqs.(23) and (24). The constants K and n applied in the Eq. (24) are thestruvite growth kinetic parameters, and depend on the experimentalconditions as described in Eq. (29).
G = dL
dt= KSn (23)
n, K = f(T, L, N, . . .) (24)
Ideally, crystal may grow in a well-mixed vessel in the presence ofseeds of size L0. The newly born clusters diffuse onto exposed seedsand increase the crystal size from L0 to L. It is convenient to assumethat both seeds and growing struvite crystals are spherical. Based onthe preliminary assumption that crystals are spherical in shape, thevolume and mass increase of a single particle is shown in Eqs. (26)and (31), provided that the density of a struvite particle is �c .
V = 16�L3 (25)
dV
dt= d
dt
(16
�L3)
(26)
dV
dt= dV
dL· dL
dt(27)
dV
dt= 1
2�L2
dL
dt(28)
dV
dt= 1
2�L2G (29)
dm
dt= �c
dV
dt= �c
�
2L2G (30)
dm
dt= 1
2��cL
2G (31)
Further substitution of the struvite growth rate expression (Eq. (23))in Eq. (31) offers a more practical expression of the single particlestruvite mass deposition rate (Eq. (32)).
dm
dt= 1
2K��cL
2Sn (32)
The crystal population is characterized by assuming a point-sizeddistribution of crystal, considering a spherical shape. Hence, crystalnumber (N) is a function of the initial mass of seeds (m0), density ofstruvite crystal (�c) and initial size (volume equivalent diameter) ofseeds, L0 (Eq. (33)).
N = m0�
6�cL
30
(33)
dM
dt= 1
2KN��cL
2Snc Ln1 (34)
Total mass deposition, dM/dt, can now be presented by Eq. (34),incorporating single particle mass deposition (dm/dt) and the num-ber of crystals in the crystal population. This paper incorporates the

Author's personal copy
M.I. Ali, P.A. Schneider / Chemical Engineering Science 63 (2008) 3514 -- 3525 3517
Fig. 1. Schematic of continuous-discrete struvite reaction system.
volume equivalent analysis of mean particle size, since particle sizeanalysis was conducted using the Malvern particle-sizer, which mea-sures a spherical equivalent diameter.
3.3. Process modeling
The schematic of a continuous struvite crystallization process isshown in Fig. 1. This system is a continuous flow system in termsof the liquid phase and discrete with respect to the solid phase,since it is assumed that all struvite crystals are retained within thereactor. The assumption of perfect mixing enables a simple set ofordinary differential equations to be used to model this system. Apoint-sized distribution is assumed for the crystal population, which,while incorrect, dramatically simplifies the modeling of the system.Furthermore, it is assumed that the number of crystals in the reactoris constant, after the system is seeded, since nucleation is assumednot to occur.
Eq. (35) describes the volume change of reactive solution in termsof inlet flow (Fin) of feed solution and outlet flow (Fout) of feedsolution.
dV
dt= Fin − Fout (35)
The solution mass balance of Mg2+/NH+4 /PO3−
4 after reaction takesplace (dC ′
i/dt) depends on the inlet and outlet flow rates (Fin, Fout),
inlet and outlet concentrations (Ci,in, Ci,out), and crystallization rateof struvite (dM/dt). Eq. (36) describes the change of reactive solutemass in the continuous system.
dC ′i
dt= FinCi,in − FoutCi,out − dM
dt
(MWci
MWs
)(36)
where dC ′i/dt is the total change of individual solution species in
mg/h (Mg2+, NH+4 and PO3−
4 ), Fin, Fout the inlet and outlet flow rate(l/h), Ci,in, Ci,out the inlet and outlet solution concentration of specificspecies (mg/l), dM/dt the mass deposition of struvite crystal (mg/h),MWs the molecular weight of struvite, MWci the molecular weight
of individual solution species (Mg2+, NH+4 and PO3−
4 ).In a fed-batch process of constant supersaturation, the rate of
crystallization is equal to the rate of feed addition. The discrete na-ture of the fed-batch system retains solution in the reactor, since theoutlet flow (Fout) is set to zero.
dC ′i
dt= FinCi,ini
− dM
dt
(MWci
MWs
)(37)
Therefore, the mass balance of reactive solution in a fed-batch (semi-continuous) system can be presented by Eq. (37). This paper incorpo-rates a fed-batch process model (Eq. (37)), operating at constant su-persaturation. This process is based on feed solutions of NH4H2PO4and MgCl2 as the source of NH+
4 , PO3−4 and Mg2+. For the selected
reagents (NH4H2PO4 and MgCl2), each mole formation of struvite
liberates 2 moles of H+, leading to a drop in the solution pH due tothe reaction (Eq. (38)).
NH4H2PO4 + Mg2+ → MgNH4PO4 + 2H+ (38)
The amount of liberated hydrogen ions (H+) and the change of pHfor an equivalent deposited struvite mass (MMAP) can be predictedfor a known volume of reactor (V) and the molecular weight of stru-vite crystal (MWMAP). For a specified duration of fed-batch reactoroperation, the required volume of NaOH (VNaOH) of known concen-tration (CNaOH) can be quantified by simple stoichiometric relations(Eqs. (39)--(41)). It is worthwhile noting that the H+ and NaOH con-centrations (Eqs. (39)--(41)) aremeasured inmoles/l, mass of struvite(MMAP) is measured in grams, molecular weight of struvite (MWMAP)
is measured in gram molecular weight and the volume of reactivesolution (V) is measured in liter. In terms of the described units ofprocess parameters in Eq. (41), the concentration of hydrogen ion(H+) is measured in moles/l.
dH+dt
= 2 × ddt
(MMAP)
MWMAP · V(39)
pH1 = −Log10{H+} (40)
VNaOH · CNaOH = V · {H+} (41)
Coding of this series of algebraic, differential equations describing thethermodynamic, kinetic and process models was carried out usinggPROMS process simulation software.
It is worthwhile pointing out that the aforementioned kineticmodel has been developed based on the assumption that nucleationand aggregation is negligible. Therefore, overlooking of nucleationand aggregation is the weakness of this model.
4. Parameter estimation modeling
Based on the definition of supersaturation and the additional esti-mated parameter, the growth model of struvite described in Section3 is estimated (Est.) in four different approaches, including Est.type1, Est.type 2, Est.type 3, and Est.type 4. The Est.type 1 and Est.type 2employed relative supersaturation (Sr) to compute solution super-saturation. The simulation Est.type 3 and Est.type 4 employed sat-uration index (SI) to enumerate the solution supersaturation. Briefdescription of the above estimation types is given in the followingparagraphs.
Est.type 1 was simulated to investigate the struvite growth kinet-ics incorporating relative supersaturation (S) as the supersaturationmodel. The fundamental kinetic equation in this case is described byEq. (42).
dL
dt= KSn (42)
Est.type 2 incorporated the initial seed size (L0) as an additionalparameter to be estimated along with the fundamental growth pa-rameters (K and n). The fundamental growth equation is equivalentto Eq. (42). This approach is particularly important, since at the be-ginning of experiments the size of seed is unknown or known sizeseed is slightly altered due to the setup of experimental control.
Est.type 3 incorporated SI into the struvite growth kinetic model.In this case, the fundamental growth model can be described by Eq.(43). Saturation Indices (SI) in Eq. (43) and the relevant estimationsin Est.types 3 and 4 are represented as Si.
dL
dt= KSn
i (43)
Est.type 4 included an additional variable (initial seed size,L0) to be estimated. This approach is similar to Est.type 3, and

Author's personal copy
3518 M.I. Ali, P.A. Schneider / Chemical Engineering Science 63 (2008) 3514 -- 3525
supersaturation was computed in terms of SI. Based on the abovediscussions, the summary of parameter estimation approach is pre-sented in Table 2.
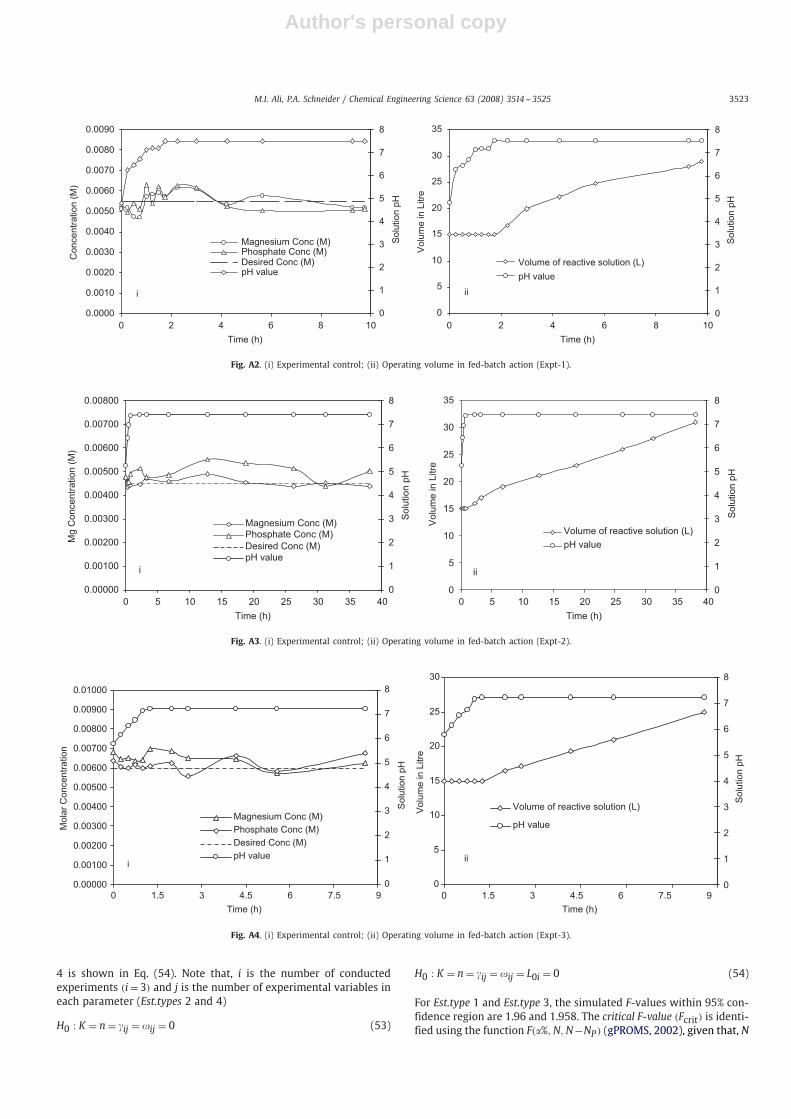
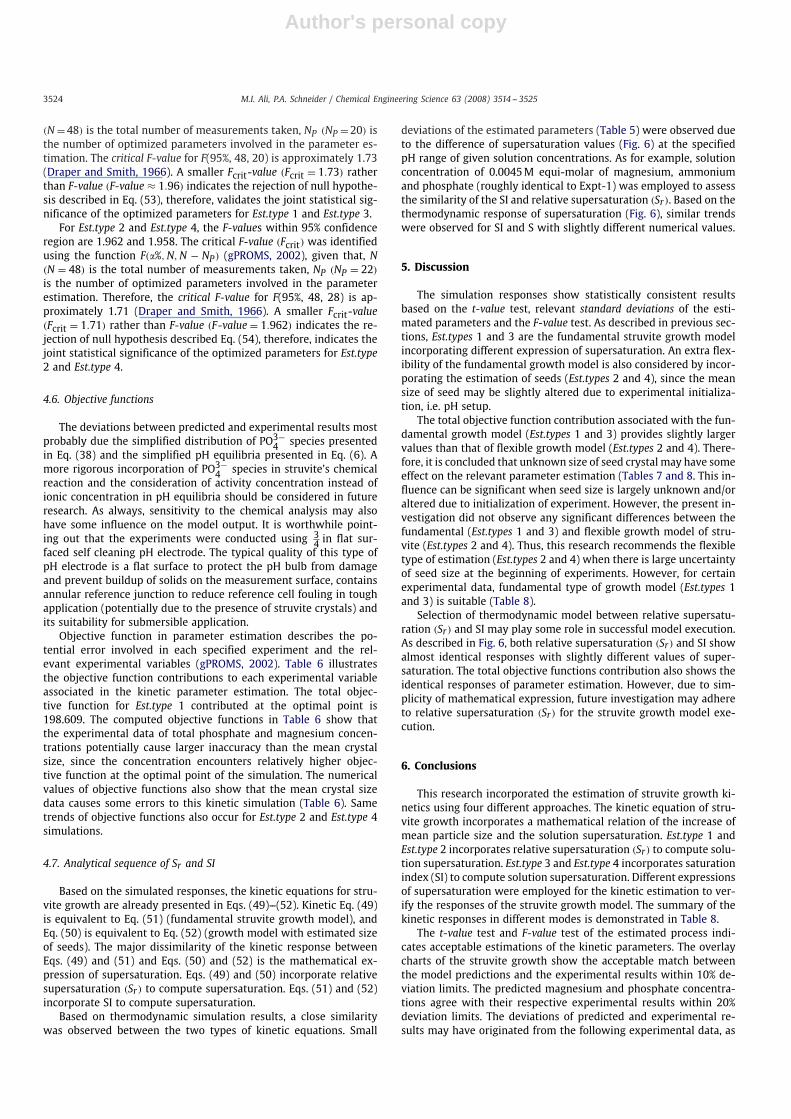
4.1. Experimental investigations
Fed batch experiments were conducted using a pilot scale reactorof 44 l (Fig. A1 in Appendix). An automatic temperature control sys-temwas used to maintain constant temperature of solution in the re-actor. The fed-batch system was maintained using two types of feedsolution, i.e. titrant-1 (NH4H2PO4) and titrant-2 (NaOH+MgCl2). Toavoid settling of Mg(OH)2, gentle stirring of titrant-2 was requiredduring experiments. Synthetic solution of MgCl2 and NH4H2PO4 wasused in the reactor as the source of nutrients (Mg2+, NH+
4 and PO3−4 )
for struvite formation. Previously generated size graded struvite crys-tals are used as seeds. Throughout the experiments constant solu-tion supersaturation was maintained by automatic feed additions oftitrant-1 and titrant-2 through an automatic dosing system, whichincorporates two dosing pumps, together with automatic pH moni-toring system consisting of pHmonitor and pH electrode. Figs. A2--A4in Appendix presents the process monitoring data for concentrationand pH. Detailed description of experimental setup is already pub-lished previously by this research group (Ali and Schneider, 2006).
4.2. Background of parameter estimation and data input
Parameter estimation of a process is conducted by the real timeparameter estimation and the offline parameter estimation (Mendel,1973). This paper describes the offline parameter estimation forstruvite growth kinetics to provide the best fit of the measuredand predicted data using the maximum likelihood method. Objec-tive function is associated with this estimation problem. In general,the process involved in the parameter estimation modelling can be
Table 2Summary of parameter estimation approach
Parameter set Supersaturation model
Oversaturation (S) Saturation index (Si)
K, n Est.type 1 dLdt
= KSn Est.type 3 dLdt
= KSni
K, n, L0 Est.type 2 dLdt
= KSn Est.type 4 dLdt
= KSni
Notes: K---growth rate constant (�m/h), n---growth order due to supersaturation,Est.type---Identification of parameter estimation models.
Table 3Initial volume and concentrations of the experiments
Expt. no Ci,Mg (mg/L) Ci,PO4(mg/L) Ci,NH4
(mg/L) V (Litre) Controlled pH Duration of Expts (h)
1 108 487.25 92.32 16.0 7.35 362 165 594.52 112.64 16.5 7.22 7.323 147 594.52 112.64 16.8 7.51 8
Table 4Key responses of the parameter estimation modeling
Estimated variables Est.type Estimated values Est.type Estimated values
MS = Sa MS = Si
Growth rate constant (K) 1 K = 46.64 ± 8.026 3 K = 47.06 ± 8.521Growth order (n) due to supersaturation n = 1.48 ± 0.162 n = 1.64 ± 0.193Growth rate constant (K) 2 K = 45.21 ± 7.89 4 K = 49.16 ± 8.562Growth order (n) due to supersaturation n = 1.45 ± 0.159 n = 1.68 ± 0.183Initial mean crystal size (L0) L0 = 134.96 ± 1.82 L0 = 135.02 ± 1.833
aMS represents the model of supersaturation.
described by Eq. (44).
f(x(t), x(t), y(t), u(t), �) = 0 (44)
where x(t) is the differential variables, i.e. crystal size (L) in �m, massof crystals (M) in grams, reactive solution concentration (Ci) in mg/l,and operational volume of the reactor (V) in litre, y(t) the algebraicvariables, i.e. pH, feed concentration (Ci,in, CNaOH) in mg/l, supersat-uration (S), x(t) the time derivative of the differential variables, i.e.dL/dt, dMg/dt, dPO4/dt, dNH4/dt, dM/dt and dV/dt, u(t) the timevarying control variables, i.e. NaOH feed rate (FNaOH) in l/h and thereactant feed rate (Fi) in l/h, � the parameters to be estimated, i.e. K(�m/h) and n.
For the purpose of parameter estimation, the initial conditionsof the given system are defined in terms of the initial values of thedifferential variables, i.e. L(0), M(0), V(0) and Ci(0), as shown in theEq. (45).
Subset{L(0), M(0), V(0), Ci(0)} = v (45)
where, the value of component L(0) in the Subset v is the initial crys-tal size, i.e. 140.06, 138.83 and 133.25 �m for experiments 1, 2 and 3,respectively. The initial mass of struvite, M(0), in the Subset v is equalto 30g. The measured initial volume V(0) and the initial reactantconcentrations, Ci(0), are given in Table 3. The average flow-rates ofreactant feed are 0.222, 0.875 and 0.683 l/h, for experiments 1,2 and 3, respectively. Dynamic flow-rates of reactants were in-cluded as model input at each specific sampling interval. Particlessize distributions and concentrations were measured as samplingeach sampling interval. The sampling intervals are shown in eachoverlay charts. Detail experimental plans, design and commis-sioning are already published previously by this research group(Ali and Schneider, 2006). As mentioned in the previous publi-cation of this research group (Ali and Schneider, 2006), combi-nation of feed solution must be maintained by two titrant addi-tions. Titrant 1 consists of NaOH and MgCl2. Titrant 2 consists ofNH4H2PO4.
The overall control variables are the flow-rate of the reactant feed(Fi) and the NaOH feed (FNaOH), measured in l/h. Experimental dataemployed in the parameter estimation are the total concentration ofMg, NH4 and PO4 along with the mean crystal size (L). The includedmathematical form of the experimental data in this modeling is asfollows:
(tij, zijk) (46)

Author's personal copy
M.I. Ali, P.A. Schneider / Chemical Engineering Science 63 (2008) 3514 -- 3525 3519
0
50
100
150
200
Measurement Time (h)
Mea
n P
artic
le S
ize
(mic
ron)
Predicted
Experimental
0
50
100
150
200
250
Measurement Time (h)
Mea
n P
artic
le S
ize
(mic
ron)
PredictedExperimental
0
50
100
150
200
250
Measurement Time (h)
Mea
n P
artic
le S
ize
(mic
ron)
PredictedExperimental
76
86
54
4
32
2
10
0
86420
Fig. 2. Overlay charts of crystal growth for experiments 1--3 (Est.type 1 model).
where zijk is the kth value measured for variable zj (Mg, NH4 andPO4 and L) during experiment i (i = 3), tijk is the time at which themeasurement is taken.
The objective function associated with the parameter estimationcan be described by Eq. (47) (gPROMS, 2002).
� = N
2ln(2�)
+ 12min
�
⎧⎪⎨⎪⎩NE∑i=1
NVj∑j=1
NMij∑k=1
⎡⎣ln
⎛⎝2
ijk+ (zijk − zijk)2
2ijk
⎞⎠
⎤⎦
⎫⎪⎬⎪⎭ (47)
0
40
80
120
160
200
Measurement Time (h)
Mea
n P
artic
le S
ize
(mic
rons
)
PredictedExperimental
076543210
50
100
150
200
Measurement Time (h)
Mea
n P
artic
le S
ize
(mic
rons
)
PredictedExperimental
0
50
100
150
200
250
Measurement Time (h)
Mea
n P
artic
le S
ize
(mic
rons
)
PredictedExperimental
20151050 25
86420
Fig. 3. Overlay charts of crystal growth for experiments 1--3 (Est.type 2 model).
where N is the total number of measurement taken during all exper-iments, � the set of model parameters to be estimated (K and n), NEthe number of experiments performed, NVj the number of variablesmeasured in the ith experiments. The measured experimental vari-ables are the total concentration of Mg, NH4, PO4 and the mean sizeof the growing crystals (L), NMij the number of measurements of the
jth variables, 2ijk
the variance of the kth measurement of variable j
in the experiment i, i.e. variance of the Mg, NH4, PO4 and L in eachspecified experiments. zijk the kth measured value of variable j (Mg,NH4, PO4) in the experiment i, zijk the kth model-predicted value ofvariable j in the experiment i.

Author's personal copy
3520 M.I. Ali, P.A. Schneider / Chemical Engineering Science 63 (2008) 3514 -- 3525
0
50
100
150
200
Measurement Time (h)
Mea
n P
artic
le S
ize
(mic
ron)
PredictedExperimental
0
50
100
150
200
Measurement Time (h)
Mea
n P
artic
le S
ize
(mic
rons
)
PredictedExperimental
0
50
100
150
200
250
Measurement Time (h)
Mea
n P
artic
le S
ize
(mic
ron)
PredictedExperimental
2520151050
76543210
86420
Fig. 4. Overlay charts of crystal growth for experiments 1--3 (Est.type 3 model).
The parameter estimation model includes different types ofestimation procedure including the constant variance model, het-eroscedastic predicted/measured value model, and the least squaremodel (gPROMS, 2002). This paper incorporates the heteroscedasticpredicted value variance model to estimate the struvite growth ki-netics. Based on the heteroscedastic predicted value variance model(Eq. (48)), the measurement error is proportional to z/2.
2 = �2(z2 + ε) (48)
where 2 is the variance, which depends on the measured and pre-dicted value of Ci, L, K and n, � the standard deviation, the param-
0
50
100
150
200
Measurement Time (h)
Mea
n P
artic
le S
ize
(mic
ron)
PredictedExperimental
0
50
100
150
200
Measurement Time (h)
Mea
n P
artic
le S
ize
(mic
ron)
PredictedExperimental
0
50
100
150
200
250
Measurement Time (h)
Mea
n P
artic
le S
ize
(mic
ron)
Predicted
Experimental
2520151050
2520151050
86420
Fig. 5. Overlay charts of crystal growth for experiments 1--3 (Est.type 4 model).
eter employed to optimize the function (maximum value equal to1), ε the absolute tolerance, which depends on the equation solver.
The simulation of the model incorporates experimental data andtheoretical data. The lists of the experimental data are shown above.Assigned parameters present the fixed values of themodel input, andthey are stated as SET value. The defined parameters are the electroncharge of struvite components (Zi), density of struvite in g/cm3,molecular weight of struvite in gram, pH value of experiments, massof seeds in gram, NaOH feed in l/h, and pH values of reactant feeds.

Author's personal copy
M.I. Ali, P.A. Schneider / Chemical Engineering Science 63 (2008) 3514 -- 3525 3521
Table 5Major statistical information of the estimated response
Est.type Parameter Optimal estimate 90% CIa 95% CI 99% CI 95% t-value Standard deviation Reference 95% t-value
1 K 46.64 13.64 16.41 22.12 2.84 8.026 1.70n 1.48 0.28 0.33 0.45 4.47 0.162
2 K 45.21 13.44 16.19 21.86 2.79 7.89 1.70n 1.45 0.27 0.33 0.44 4.42 0.159L0 134.96 3.10 3.73 5.04 36.16 1.82
3 K 47.06 14.48 17.43 23.49 2.70 8.521 1.70n 1.64 0.33 0.39 0.53 4.16 0.193
4 K 49.16 14.54 17.51 23.60 2.81 8.562 1.70n 1.68 0.32 0.38 0.51 4.42 0.183L0 135.02 3.11 3.75 5.05 36.01 1.833
aCI refers to confidence interval.
Table 6Objective function contributed for parameter estimation
Expt. Variables Objective function contribution
Est.type 1 Est.type 2 Est.type 3 Est.type 4
1 L 15.761 14.811 15.782 14.772Total PO3−
4 25.964 25.973 25.885 25.847Total Mg2+ 13.091 12.961 12.949 12.855
2 L 14.292 13.497 14.334 13.483Total PO3−
4 23.966 23.845 23.842 23.745Total Mg2+ 18.748 18.603 18.615 18.465
3 L 12.872 12.663 12.891 12.557Total PO3−
4 15.972 16.002 16.014 15.953Total Mg2+ 13.832 13.691 14.009 13.921
198.609 196.129 198.431 195.706
4.3. Results of parameter estimation model
The parameter estimation model was simulated under the givenexperimental conditions, using the collected experimental data ofanalytical solution concentrations (CMg, CNH4
, CPO4), growing stru-
vite crystal size (L) and controlled feed rate (Fi and FNaOH) to esti-mate the growth parameters K and n for Est.type 1 and 3 as well asK, n and L0 for Est.types 2 and 4. Based on the simulation responses,the values of estimated parameters are shown in Table 4 and theestimated kinetic equations are shown in the following equations:
dL
dt= (46.64 ± 8.026)S1.48±0.162 (49)
dL
dt= (45.21 ± 7.89)S1.45±0.159 (50)
dL
dt= (47.06 ± 8.521)S1.64±0.193
i(51)
dL
dt= (49.16 ± 8.562)S1.68±0.183
i(52)
The overlay charts of crystal growth for experiments 1, 2 and 3of Est.type 1 to Est.type 4 are presented in Figs. 2--5. The overlaycharts of the struvite growth show good agreement between themodel-predicted and experimental values. The model-predicted andmeasured values of struvite growth agree within ±10% deviation.There are also an acceptable agreement of model prediction andexperimental observations (within about ±30% deviation) for totalmagnesium concentrations in maintaining the controlled reactiveconcentration throughout the experimental period. The model-predicted and measured values of the total reactive phosphate
-5
-4
-3
-2
-1
0
1
2
3
4
5Solution pH
Sup
ersa
tura
tion
Sat. IndexRelative supersaturation
131197
Fig. 6. Comparison of supersaturation expressed by relative supersaturation (Sr ) andSI using the solution concentration of Expt 1.
concentration agree within ±20% deviation and most of the pre-dicted total magnesium concentrations agree with the measured to-tal magnesium concentration within ±30% deviation.
4.4. Error analysis
4.4.1. Statistical significance of single parametersAs described in the previous section, the model predictions for
reactive solution concentration and the mean crystal size cover mostof the measured data within the specified deviation limit. The in-dividual consistency of the estimated parameters K and n is evalu-ated by making a comparison between the associated t-value of theestimated parameters and the reference 95% t-value. The model re-sponse for Est.type 1 and Est.type 3 associated the larger 95% t-valuesfor estimated parameters K and n rather than the reference 95% ref-erence t-value (Table 5), which presents an accurate estimation ofthe parameters (gPROMS, 2002). The standard deviations of K and nfor Est.type 1 and Est.type 3 are smaller than the relevant estimatedvalues, which indicates that the estimated values of K and n are in-dividually consistent (Draper and Smith, 1966; Mandel, 1984).
The model responses for Est.type 2 and Est.type 4 also associatedthe larger 95% t-values for estimated parameters K, n and L0 ratherthan the reference 95% reference t-value (Table 5), which presents anaccurate estimation of the parameters (gPROMS, 2002). The standarddeviations of K, n and L0 for Est.type 2 and Est.type 4 are smaller thanthe relevant estimated values, which indicates that the estimated

Author's personal copy
3522 M.I. Ali, P.A. Schneider / Chemical Engineering Science 63 (2008) 3514 -- 3525
Table 7Estimated results of the seed size
Experiment Supersaturation model (S) Supersaturation model (SI)
Approximate seed size (�m) Estimated seed size (�m) Approximate seed size (�m) Estimated seed size (�m)
1 140.06 134.96 140.06 135.022 138.83 138.833 133.25 133.25
Table 8Summary of the parameter estimation results
Supersaturation model (Relative supersaturation, S) Supersaturation model (Saturation Index, Si)
Est.type Estimated values Total objective function Est.type Estimated values Total objective function
1 K = 46.64 ± 8.026 198.609 3 K = 47.06 ± 8.521 198.431n = 1.48 ± 0.162 n = 1.64 ± 0.193
2 K = 45.21 ± 7.89 196.129 4 K = 49.16 ± 8.562 195.706n = 1.45 ± 0.159 n = 1.68 ± 0.183L0 = 134.96 ± 1.82 L0 = 135.02 ± 1.833
Feed titrant-2
Recirculation Pump
pH Controller
Dosing Pump Dosing Pump
Recirculation PVC pipe
Feed titrant-1
Automatic
Cooling Coil
ProcessACT control module
Data logger
Fig. A1. Schematic of controlled struvite crystallization system.
values of K, n and L0 are individually consistent (Draper and Smith,1966; Mandel, 1984; gPROMS, 2002).
4.5. Joint statistical significance
For Est.type 1 and Est.type 3, the joint statistical significance of theoptimized parameters, including growth rate constant (K), growth
order (n), standard deviation (�) and optimization power (�), areexamined using F-value test within 95% confidence region. The nullhypothesis (H0) considered for Est.type 1 and Est.type 3 is shown inEq. (53). For Est.type 2 and Est.type 4, the joint statistical significanceof the optimized parameters, including growth rate constant (K),growth order (n), standard deviation (�) and the estimated size ofseeds (L0) are evaluated using F-value test within 95% confidenceregion. The null hypothesis (H0) considered for Est.type 2 and Est.type
Author's personal copy
M.I. Ali, P.A. Schneider / Chemical Engineering Science 63 (2008) 3514 -- 3525 3523
0.0000
0.0010
0.0020
0.0030
0.0040
0.0050
0.0060
0.0070
0.0080
0.0090
Time (h)
Con
cent
ratio
n (M
)
0
1
2
3
4
5
6
7
8
Sol
utio
n pH
Magnesium Conc (M)Phosphate Conc (M)Desired Conc (M)pH value
0
5
10
15
20
25
30
35
Time (h)
Vol
ume
in L
itre
0
1
2
3
4
5
6
7
8
Sol
utio
n pH
Volume of reactive solution (L)pH value
i ii
1086420 1086420
Fig. A2. (i) Experimental control; (ii) Operating volume in fed-batch action (Expt-1).
0.00000
0.00100
0.00200
0.00300
0.00400
0.00500
0.00600
0.00700
0.00800
Time (h)
Mg
Con
cent
ratio
n (M
)
0
1
2
3
4
5
6
7
8S
olut
ion
pH
Magnesium Conc (M)Phosphate Conc (M)Desired Conc (M)pH value
0
5
10
15
20
25
30
35
Time (h)
Vol
ume
in L
itre
0
1
2
3
4
5
6
7
8
Sol
utio
n pH
Volume of reactive solution (L)pH value
i ii
4035302520151050 4035302520151050
Fig. A3. (i) Experimental control; (ii) Operating volume in fed-batch action (Expt-2).
0.00000
0.00100
0.00200
0.00300
0.00400
0.00500
0.00600
0.00700
0.00800
0.00900
0.01000
Time (h)
Mol
ar C
once
ntra
tion
0
1
2
3
4
5
6
7
8
Sol
utio
n pH
Magnesium Conc (M)Phosphate Conc (M)Desired Conc (M)pH value
i
97.564.531.500
5
10
15
20
25
30
Time (h)
Vol
ume
in L
itre
0
1
2
3
4
5
6
7
8
Sol
utio
n pH
Volume of reactive solution (L)
pH value
ii
97.564.531.50
Fig. A4. (i) Experimental control; (ii) Operating volume in fed-batch action (Expt-3).
4 is shown in Eq. (54). Note that, i is the number of conductedexperiments (i = 3) and j is the number of experimental variables ineach parameter (Est.types 2 and 4)
H0 : K = n = �ij = �ij = 0 (53)
H0 : K = n = �ij = �ij = L0i = 0 (54)
For Est.type 1 and Est.type 3, the simulated F-values within 95% con-fidence region are 1.96 and 1.958. The critical F-value (Fcrit) is identi-fied using the function F(�%, N, N−NP) (gPROMS, 2002), given that, N
Author's personal copy
3524 M.I. Ali, P.A. Schneider / Chemical Engineering Science 63 (2008) 3514 -- 3525
(N =48) is the total number of measurements taken, NP (NP =20) isthe number of optimized parameters involved in the parameter es-timation. The critical F-value for F(95%, 48, 20) is approximately 1.73(Draper and Smith, 1966). A smaller Fcrit-value (Fcrit = 1.73) ratherthan F-value (F-value ≈ 1.96) indicates the rejection of null hypothe-sis described in Eq. (53), therefore, validates the joint statistical sig-nificance of the optimized parameters for Est.type 1 and Est.type 3.
For Est.type 2 and Est.type 4, the F-values within 95% confidenceregion are 1.962 and 1.958. The critical F-value (Fcrit) was identifiedusing the function F(�%, N, N − NP) (gPROMS, 2002), given that, N(N = 48) is the total number of measurements taken, NP (NP = 22)
is the number of optimized parameters involved in the parameterestimation. Therefore, the critical F-value for F(95%, 48, 28) is ap-proximately 1.71 (Draper and Smith, 1966). A smaller Fcrit-value(Fcrit = 1.71) rather than F-value (F-value = 1.962) indicates the re-jection of null hypothesis described Eq. (54), therefore, indicates thejoint statistical significance of the optimized parameters for Est.type2 and Est.type 4.
4.6. Objective functions
The deviations between predicted and experimental results mostprobably due the simplified distribution of PO3−
4 species presentedin Eq. (38) and the simplified pH equilibria presented in Eq. (6). Amore rigorous incorporation of PO3−
4 species in struvite's chemicalreaction and the consideration of activity concentration instead ofionic concentration in pH equilibria should be considered in futureresearch. As always, sensitivity to the chemical analysis may alsohave some influence on the model output. It is worthwhile point-ing out that the experiments were conducted using 3
4 in flat sur-faced self cleaning pH electrode. The typical quality of this type ofpH electrode is a flat surface to protect the pH bulb from damageand prevent buildup of solids on the measurement surface, containsannular reference junction to reduce reference cell fouling in toughapplication (potentially due to the presence of struvite crystals) andits suitability for submersible application.
Objective function in parameter estimation describes the po-tential error involved in each specified experiment and the rel-evant experimental variables (gPROMS, 2002). Table 6 illustratesthe objective function contributions to each experimental variableassociated in the kinetic parameter estimation. The total objec-tive function for Est.type 1 contributed at the optimal point is198.609. The computed objective functions in Table 6 show thatthe experimental data of total phosphate and magnesium concen-trations potentially cause larger inaccuracy than the mean crystalsize, since the concentration encounters relatively higher objec-tive function at the optimal point of the simulation. The numericalvalues of objective functions also show that the mean crystal sizedata causes some errors to this kinetic simulation (Table 6). Sametrends of objective functions also occur for Est.type 2 and Est.type 4simulations.
4.7. Analytical sequence of Sr and SI
Based on the simulated responses, the kinetic equations for stru-vite growth are already presented in Eqs. (49)--(52). Kinetic Eq. (49)is equivalent to Eq. (51) (fundamental struvite growth model), andEq. (50) is equivalent to Eq. (52) (growth model with estimated sizeof seeds). The major dissimilarity of the kinetic response betweenEqs. (49) and (51) and Eqs. (50) and (52) is the mathematical ex-pression of supersaturation. Eqs. (49) and (50) incorporate relativesupersaturation (Sr) to compute supersaturation. Eqs. (51) and (52)incorporate SI to compute supersaturation.
Based on thermodynamic simulation results, a close similaritywas observed between the two types of kinetic equations. Small
deviations of the estimated parameters (Table 5) were observed dueto the difference of supersaturation values (Fig. 6) at the specifiedpH range of given solution concentrations. As for example, solutionconcentration of 0.0045M equi-molar of magnesium, ammoniumand phosphate (roughly identical to Expt-1) was employed to assessthe similarity of the SI and relative supersaturation (Sr). Based on thethermodynamic response of supersaturation (Fig. 6), similar trendswere observed for SI and S with slightly different numerical values.
5. Discussion
The simulation responses show statistically consistent resultsbased on the t-value test, relevant standard deviations of the esti-mated parameters and the F-value test. As described in previous sec-tions, Est.types 1 and 3 are the fundamental struvite growth modelincorporating different expression of supersaturation. An extra flex-ibility of the fundamental growth model is also considered by incor-porating the estimation of seeds (Est.types 2 and 4), since the meansize of seed may be slightly altered due to experimental initializa-tion, i.e. pH setup.
The total objective function contribution associated with the fun-damental growth model (Est.types 1 and 3) provides slightly largervalues than that of flexible growth model (Est.types 2 and 4). There-fore, it is concluded that unknown size of seed crystal may have someeffect on the relevant parameter estimation (Tables 7 and 8. This in-fluence can be significant when seed size is largely unknown and/oraltered due to initialization of experiment. However, the present in-vestigation did not observe any significant differences between thefundamental (Est.types 1 and 3) and flexible growth model of stru-vite (Est.types 2 and 4). Thus, this research recommends the flexibletype of estimation (Est.types 2 and 4) when there is large uncertaintyof seed size at the beginning of experiments. However, for certainexperimental data, fundamental type of growth model (Est.types 1and 3) is suitable (Table 8).
Selection of thermodynamic model between relative supersatu-ration (Sr) and SI may play some role in successful model execution.As described in Fig. 6, both relative supersaturation (Sr) and SI showalmost identical responses with slightly different values of super-saturation. The total objective functions contribution also shows theidentical responses of parameter estimation. However, due to sim-plicity of mathematical expression, future investigation may adhereto relative supersaturation (Sr) for the struvite growth model exe-cution.
6. Conclusions
This research incorporated the estimation of struvite growth ki-netics using four different approaches. The kinetic equation of stru-vite growth incorporates a mathematical relation of the increase ofmean particle size and the solution supersaturation. Est.type 1 andEst.type 2 incorporates relative supersaturation (Sr) to compute solu-tion supersaturation. Est.type 3 and Est.type 4 incorporates saturationindex (SI) to compute solution supersaturation. Different expressionsof supersaturation were employed for the kinetic estimation to ver-ify the responses of the struvite growth model. The summary of thekinetic responses in different modes is demonstrated in Table 8.
The t-value test and F-value test of the estimated process indi-cates acceptable estimations of the kinetic parameters. The overlaycharts of the struvite growth show the acceptable match betweenthe model predictions and the experimental results within 10% de-viation limits. The predicted magnesium and phosphate concentra-tions agree with their respective experimental results within 20%deviation limits. The deviations of predicted and experimental re-sults may have originated from the following experimental data, as

Author's personal copy
M.I. Ali, P.A. Schneider / Chemical Engineering Science 63 (2008) 3514 -- 3525 3525
described below.
• Time varying control variables, i.e. feed rate of reactants (Fi) andfeed rate of NaOH solution (FNaOH);
• Experimental data of crystal size (L), total concentrations of mag-nesium and phosphate.
Simplified distribution of PO3−4 species in struvite forming equation
presented in Eq. (38), ion concentration based pH equilibria pre-sented in Eq. (6) and probably sensitivity of chemical analysis mayencounter some errors leading to the deviations of predicted and ex-perimental results. The objective function contribution of the simu-lation response shows that the experimental data of the reactive to-tal phosphate and total magnesium concentration generated highervariability than the experimental data of crystal size (Table 6). Futureresearch on struvite growth kinetic investigation should incorporateactivity based pH equilibria, more rigorous phosphate distributionfor struvite formation reaction and more variable mean particle sizeof seed.
The tendency of struvite growth kinetic relating to relative su-persaturation (Sr) and the saturation index (SI) are almost identicalin terms of the kinetic response of the estimated parameters andtheir relevant sensitivity, matching of experimental and predicteddata and statistical significance. Therefore, both saturation index (SI)as well as relative supersaturation (Sr) can be used in the struvitegrowth kinetic equation. However, in future this research recom-mends relative supersaturation (Sr) as the mathematical expressionof supersaturation, due to the simplicity of mathematical expression.
Acknowledgements
Authors are indebted to JCU research office, JCU School of Engi-neering for providing scholarships and financial supports. Authorsalso appreciate JCU School of Engineering internal funding for thisresearch. Authors also appreciate the contribution of QueenslandDPI-Toowoomba for external funding to conduct this research.
Appendix A
Schematic of controlled struvite crystallization system is givenin Fig. A1. Experimental control for Experiments 1--3 are given inFigs. A2--A4.
References
Al-Khayat, A., Garside, J., 1990. Calcium carbonate precipitation: the role andimportance of solution chemistry. 11th Symposium of Industrial Crystallization,Garmisch-Partenkirchen.
Ali, M.I., Schneider, P.A., 2006. A fed-batch design approach of struvite system incontrolled supersaturation. Chemical Engineering Science 61 (12), 3951--3961.
Allison, J.D., Brown, D.S., et al., 1991. MINTEQA2/PRODEFA2: a geochemicalassessment model for environmental systems (Version 3.0 User Guide). U.SEnvironmental Protection Agency (EPA), Athens, GA.
Bouropoulos, C.C., Koutsoukos, P.G., 2000. Spontaneous precipitation of struvite fromaqueous solutions. Journal of Crystal Growth 213, 381--388.
Childs, C.W., 1970. A potentiometric study of equilibria in aqueous divalent metalorthophosphate solutions. Journal of Inorganic Chemistry 9 (11), 2465--2469.
Draper, N.R., Smith, H., 1966. Applied Regression Analysis. Wiley, New York.gPROMS, 2002. gPROMS Advanced User Guide. Process Systems Enterprise Ltd.,
London.Mandel, J., 1984. The Statistical Analysis of Experimental Data. Dover Publications
Inc., New York.Martell, A.E., Smith, J.C., 1989. Critical stability constants.Mendel, J.M., 1973. Discrete Techniques of Parameter Estimation: The Equation Error
Formulation. Marcel Dekker Inc., New York.Morel, F.M.M., Hering, J.G., 1993. Principles and Applications of Aquatic Chemistry.
Wiley, New York.Mullin, J.W., 1993. Crystallization. Butterworth-Heinemann Publications, Ipswich, UK.Nelson, N.O., Mikkelsen, R., et al., 2003. Struvite precipitation in anaerobic swine
liquid: effect of pH and Mg:P ratio and determination of rate constant. BiosourceTechnology 89, 229--236.
Ohlinger, K.N., 1999. Kinetics Effects on Preferential Struvite Accumulation inWastewater. School of Science and Engineering, California State University, Davis,CA.
Ohlinger, K.N., Young, T.M., et al., 2000. Postdigestion struvite precipitation using afluidized bed reactor. Journal of Environmental Engineering 126 (4), 361--368.
Parkhurst, L.D., Appelo, C.A.J., 1999. User's Guide to PHREEQC (2)---a computerprogram for speciation, batch-reaction, one-dimensional transport, and inversegeochemical calculations. Denver, CO, U.S. Department of the Interior & U.S.Geological Survey.
Quintana, M., Sanchez, E., et al., 2005. Kinetics of phosphorus removal and struviteformation by the utilization of by-product of magnesium oxide production.Chemical Engineering Journal 11, 45--52.
Snoeyink, V.L., Jenkins, D., 1980. Water Chemistry. Wiley, USA.Sohnel, O., Garside, J., 1992. Precipitation: Basic Principles and Industrial Applications.
Butterworth-Heineman, Ipswich, UK.Taylor, A.W., Frazier, A.W., et al., 1963. Solubility product of magnesium ammonium.
Transaction Faraday Society 59, 1580--1589.