Kinetic Roughening of Glucose Isomerase Crystals
7
Subscriber access provided by Universiteitsbibliotheek | Vrije Universiteit Brussel Crystal Growth and Design is published by the American Chemical Society. 1155 Sixteenth Street N.W., Washington, DC 20036 Article Kinetic Roughening of Glucose Isomerase Crystals Mike Sleutel, Dominique Maes, Lode Wyns, and Ronnie Willaert Cryst. Growth Des., 2008, 8 (12), 4409-4414 • Publication Date (Web): 08 November 2008 Downloaded from http://pubs.acs.org on December 5, 2008 More About This Article Additional resources and features associated with this article are available within the HTML version: • Supporting Information • Access to high resolution figures • Links to articles and content related to this article • Copyright permission to reproduce figures and/or text from this article
-
Upload
independent -
Category
Documents
-
view
3 -
download
0
Transcript of Kinetic Roughening of Glucose Isomerase Crystals
Subscriber access provided by Universiteitsbibliotheek | Vrije Universiteit Brussel
Crystal Growth and Design is published by the American Chemical Society. 1155Sixteenth Street N.W., Washington, DC 20036
Article
Kinetic Roughening of Glucose Isomerase CrystalsMike Sleutel, Dominique Maes, Lode Wyns, and Ronnie Willaert
Cryst. Growth Des., 2008, 8 (12), 4409-4414 • Publication Date (Web): 08 November 2008
Downloaded from http://pubs.acs.org on December 5, 2008
More About This Article
Additional resources and features associated with this article are available within the HTML version:
• Supporting Information• Access to high resolution figures• Links to articles and content related to this article• Copyright permission to reproduce figures and/or text from this article
Kinetic Roughening of Glucose Isomerase Crystals
Mike Sleutel,* Dominique Maes, Lode Wyns, and Ronnie Willaert
Ultrastructure, Flanders InteruniVersity Institute for Biotechnology (VIB),Vrije UniVersiteit Brussel, Belgium
ReceiVed December 12, 2007; ReVised Manuscript ReceiVed April 1, 2008
w This paper contains enhanced objects available on the Internet at http://pubs.acs.org/crystal.
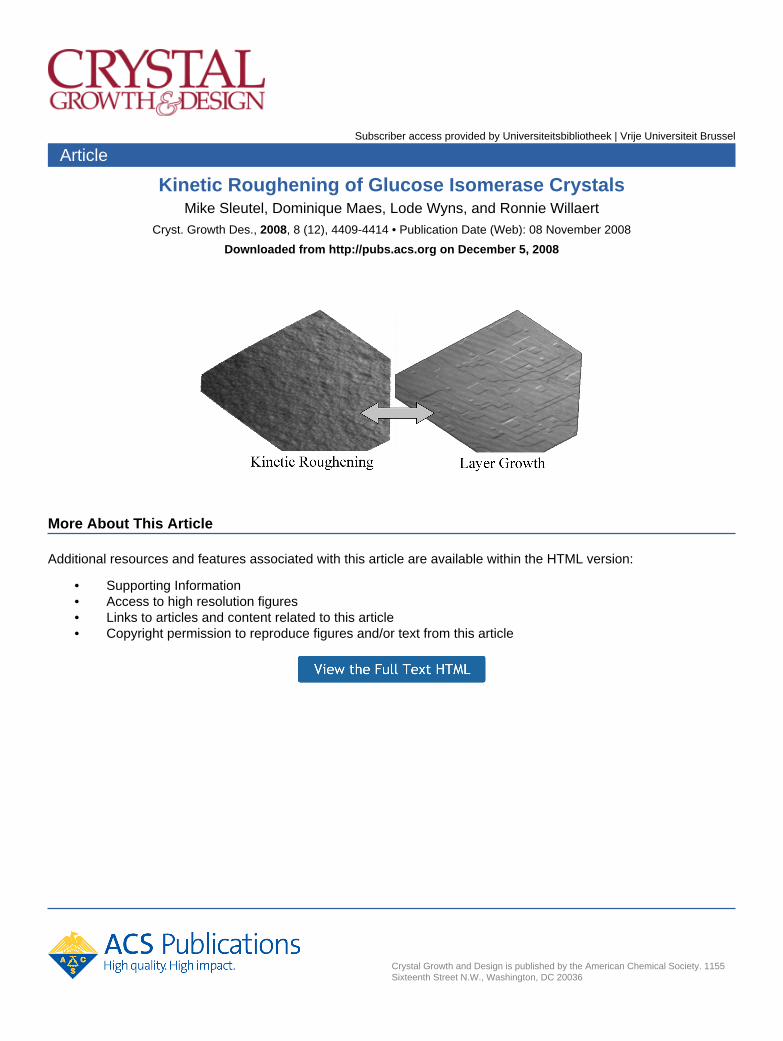
ABSTRACT: Protein crystals grow by the incorporation of growth units from solution into the crystal bulk. At lowsupersaturation, growth sites are kinks at step edges that are generated through the formation of spiral dislocations and/ortwo-dimensional (2D) nucleation. At conditions farther away from equilibrium, a critical supersaturation σR can be reachedwhere the critical 2D nucleus equals a single growth unit. As a result, each surface site becomes a potential growth site,making growth fast and the surface rough. This transition from layer-by-layer growth to a faster random addition of solutemolecules to the surface, that is, kinetic roughening, was visualized using laser confocal microscopy combined with differentialinterference contrast microscopy for the case of glucose isomerase. Evidence for continuous growth is presented at σR: thecritical nucleus is predicted to be the size of 2 glucose isomerase tetramers and normal face growth velocities switch from anonlinear to a linear relationship with the supersaturation. Moreover, at supersaturation higher than σR, rounding of crystalfacets occurs. From this we conclude that glucose isomerase transitions at σR ) 5.0 ( 0.1 to a continuous growth mechanismcharacterized by an energy barrier of 3.74 ( 0.01 × 10⁻¹³ erg/molecule at 20 °C.
Introduction
For the case of macromolecular crystallization, crystal growthtakes place at the crystal-solution interface. The mechanismof crystal growth is unambiguously determined by the structureof the crystal surfaces. Relatively rough surfaces, such as S(stepped) and K (kinked) faces,1,2 offer enough kink sites toensure their growth and hence grow fast. The structure of F(flat) faces2 of perfect crystals, however, offers no kink sitesand rely on kink generating mechanisms to procure their growth.Owing to the substantial kink density in K faces and to a lesserextent in S faces, it follows that during growth these two typesof faces disappear first, giving rise to a crystal fully enclosedby low index F faces.3 Below the roughening temperature TR,the overall crystallographic orientations of these F-faces aregenerally maintained. Faceted interfaces are smooth on amolecular scale and growth proceeds by the attachment of newgrowth units into kink sites along step edges. New step edgesare created by screw dislocations intersecting the interface,through the formation of two-dimensional (2D) nuclei and theincorporation of microcrystals.4-9 If the temperature is equalto or above TR, the step edge free energy vanishes and the crystalsurface becomes rough at a molecular scale and undergoes athermodynamic phase transition, called thermal roughening.10-15
At T < TR, the step edge free energy is larger than zero.Consequently, according to the classical nucleation theory,16 anucleation barrier for the formation of the critical two-dimensional nucleus exists and with it a critical nucleus sizelarger than the crystal’s individual building blocks. The size ofthis critical nucleus is inversely proportional to the temperatureand the supersaturation. At a constant temperature, an increasein the supersaturation will translate into a decrease in criticalnucleus size. As a consequence, in spite of the nonzero stepedge free energy, a critical supersaturation σR will exist forwhich the barrier for 2D nucleation essentially vanishes andthe size of the critical 2D nucleus is reduced to the order of
one growth unit. Due to a large step density and a very small2D critical nucleus at elevated supersaturations, the surfacebecomes rough and offers many favorable sites uniformlydistributed across the surface. Consequently, arriving moleculescan be incorporated quasi at any site. This transition from aslow, layer-by-layer growth regime to a fast continuous growthregime at high driving forces is called the kinetic rougheningtransition.17-22 Kinetic roughening for the case of crystallizationfrom solution has been observed for many small molecules, thatis, SiO2,23 Al2O3,24 ZnO, and ZnS,25,26 n-paraffins27,28 and manyothers. For the case of protein crystallization, continuous growthhas only been observed for lysozyme29-31 and apoferritin.6
In this paper we will discuss kinetic roughening for the caseof the protein glucose isomerase. The first section deals withthe difference in growth kinetics at low and high supersaturationlevels (i); in what follows we present quantitative data for boththe classical layer-by-layer growth mechanism at low super-saturation (ii) and the kinetic roughening regime at highsupersaturation (iii).
Materials and Methods
A. Crystallization of Glucose Isomerase. Glucose isomerase fromStreptomyces rubiginosus was purchased from Hampton Research(California, USA). The protein solution was dialyzed against 10 mMHepes buffer pH 7.0 and 1 mM MgCl2. Protein concentrations weredetermined by UV absorbance at 280 nm. For the interferometryexperiments, protein crystals were grown in situ inside the Mach-Zehnderinterferometer (MZI) in a Hellma fluorescence cuvette (Jena, Germany)kept at a constant 20 °C using the batch method. Mother liquor consistedof 40 mg/mL glucose isomerase, 100 mM Hepes pH 7.0, 200 mMMgCl2, 5% PEG 1000 and 0.1% LM agarose (Hampton) to inhibitconvective flows. For the atomic force microscopy (AFM) experiments,crystals were grown at 20 °C on nonsiliconized 10 mm diameter glassdiscs using the sitting drop vapor diffusion technique with the aid ofmicrobridges (Hampton Research). The protein solution used in thecrystallization set-ups contained 30 mg/mL protein in 100 mM HepespH 7.0 and 200 mM MgCl2. Drops were prepared by mixing 2 µL ofglucose isomerase solution with 2 µL reservoir solution of 100 mMHepes pH 7.0, 200 mM MgCl2 and 5% PEG 1000. For these conditions,
* To whom correspondence should be addressed. E-mail: [email protected]. Telephone: +32-2-6291923. Fax: +32-2-6291963.
CRYSTALGROWTH& DESIGN
2008VOL. 8, NO. 12
4409–4414
10.1021/cg701220t CCC: $40.75 2008 American Chemical SocietyPublished on Web 11/08/2008
the protein crystallizes in the orthorhombic form (I222, a ) 94.01 Å,b ) 99.37 Å, c ) 103.01 Å).32
B. Protein Depletion Zone Characterization. Protein concentra-tion gradients were measured using a computer controlled MZI-microscopy system (680 nm) using a quartz fluorescence cuvette asexperimental cell with inner dimensions 10 mm × 4 mm × 45 mm (D× W × L). The experimental cell was placed in the interferometer inthe object beam trajectory and kept at 20 ( 0.1 °C using Peltierelements in combination with coolant water flows at the sides of theexperimental cell. Phases were obtained using the phase-shift method.Phase-shifts were induced by a piezo connected to the object beammirror. Using the Hariharan algorithm33 phase interferograms couldbe reconstructed. Real phase values were obtained by subtracting thereference phase field (taken at the start of the experiment) from eachphase map. Phase difference maps were transformed into concentrationdifference maps by using refractive index versus concentration calibra-tion curves determined using an Abbe Refractometer model 60/ED.Such a conversion from refractive indices to protein concentrations doeshowever require that the phase difference between two successiveinterferograms is smaller than one corresponding wavelength. This wasensured by conducting the time-lapse imaging at a frame rate of 1 frame/15 min. The obtained raw data represents the integration of the proteinconcentration along the optical path, and as such are averaged values.Assuming a spherical depletion zone,34 the error introduced throughthis integration can be estimated by using the correction proposed byOtalora et al.35 For realistic values of the following parameters, facekinetic constant face ) 5 × 10⁻⁵ cm/s, bulk diffusivity Dbulk ) 4 ×10⁻⁷ cm2/s, protein concentration Cbulk ) 40 mg/mL, protein equilib-rium concentration Ceq ) 0.22 mg/mL, an optical path length of 2 mmand a varying crystal size from 10-1000 µm, Otalora’s model predictson average an error of 5% for the surface concentration. This errorremains reasonable and the data derived from the MZI will be usedwithout correction. For larger crystal sizes however, the error can beas large as 20%. Hence, data for crystal sizes larger than 1 mm werediscarded.
C. Face Growth Velocity Measurements Using Mach-ZehnderInterferometry. Face growth velocities were extracted from the intensitydata recorded with the MZI. From these interferometric images, werecorded observations of changes in linear dimensions of specific facetsof crystals as a function of time. The slope of the observed lineardimension versus time determined the normal crystal growth velocity.
D. Step Growth Velocity Measurements Using Atomic ForceMicroscopy (AFM). AFM imaging of the crystallization processes wasconducted in tapping mode using Nanoscope IIIa multimode AFM(Veeco, Santa Barabara, USA). Images were recorded in buffer solutionsof identical composition to the mother liquor, but at varying proteinconcentrations (0.5-40 mg/mL). Because the equilibrium glucoseisomerase concentration Ceq at 5% PEG 1000, obtained from themeasured solubility curve is sensitive to temperature changes, thesample temperature was measured in situ while scanning the surface.Standard silicon nitride and oxide sharpened SPM tips (Veeco, SantaBarabara, USA) were used. Cantilevers with nominal force constantsof 0.01 N/m were typically utilized. In order to minimize the forceapplied to the crystalline surface during scanning, the set point voltagewas continually adjusted to the lowest level for which tip-crystal contactwas maintained. Step growth velocities were determined by scanningperpendicular to the step and disabling the slow scan (vertical) axis.The slopes of the steps were taken as the tangential growth velocities.
E. Growth Mechanism Identification Using Laser ConfocalMicroscopy (LCM) Combined with Differential InterferenceContrast Microscopy (DIM). Growing (011) faces of orthorhombicglucose isomerase crystals were observed in situ by LCM-DIM.36 Forthis, a D-Eclipse C1 confocal system was attached to an inverted EclipseTE-2000 U optical microscope (Nikon, Japan). An air objective lensPlanFluor 20× with a numerical aperture of 0.45 and a working distanceof 7.6 mm was used (lateral resolution 660 nm). The diameter of theconfocal aperture used for the observation was 103 µm. A Nomarskiprism was inserted into the optical path to utilize differential interferencecontrast. The experimental cell was a 45 mm × 12.5 mm quartz cuvettewith two detachable windows (Hellma, Mullheim, Germany). Crystalswere illuminated with an argon-ion laser with a wavelength of 488nm. Photomicrographs of 512 × 512 pixels were acquired over a 4 sscan time with a pixel-dwell of 11 µs and the images were recorded asfast as possible given the high growth velocities for elevated super-
saturation levels. Crystals were grown in situ using the batch methodat 30 mg/mL glucose isomerase, 100 mM Hepes pH 7.0, 200 mMMgCl2 and 5% PEG1000. Protein crystals were obtained within minutesafter sample preparation and LCM-DIM data collection started im-mediately. Next, one (011) face was observed using LCM-DIM forseveral days.
Results and Discussion
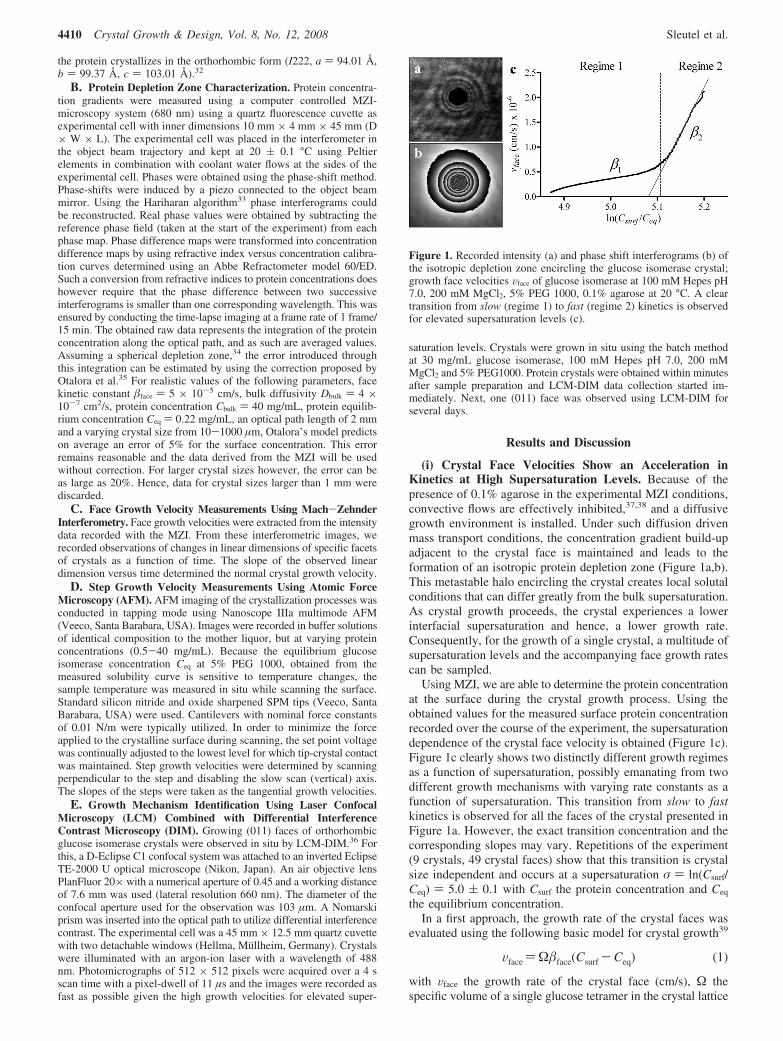
(i) Crystal Face Velocities Show an Acceleration inKinetics at High Supersaturation Levels. Because of thepresence of 0.1% agarose in the experimental MZI conditions,convective flows are effectively inhibited,37,38 and a diffusivegrowth environment is installed. Under such diffusion drivenmass transport conditions, the concentration gradient build-upadjacent to the crystal face is maintained and leads to theformation of an isotropic protein depletion zone (Figure 1a,b).This metastable halo encircling the crystal creates local solutalconditions that can differ greatly from the bulk supersaturation.As crystal growth proceeds, the crystal experiences a lowerinterfacial supersaturation and hence, a lower growth rate.Consequently, for the growth of a single crystal, a multitude ofsupersaturation levels and the accompanying face growth ratescan be sampled.
Using MZI, we are able to determine the protein concentrationat the surface during the crystal growth process. Using theobtained values for the measured surface protein concentrationrecorded over the course of the experiment, the supersaturationdependence of the crystal face velocity is obtained (Figure 1c).Figure 1c clearly shows two distinctly different growth regimesas a function of supersaturation, possibly emanating from twodifferent growth mechanisms with varying rate constants as afunction of supersaturation. This transition from slow to fastkinetics is observed for all the faces of the crystal presented inFigure 1a. However, the exact transition concentration and thecorresponding slopes may vary. Repetitions of the experiment(9 crystals, 49 crystal faces) show that this transition is crystalsize independent and occurs at a supersaturation σ ) ln(Csurf/Ceq) ) 5.0 ( 0.1 with Csurf the protein concentration and Ceq
the equilibrium concentration.In a first approach, the growth rate of the crystal faces was
evaluated using the following basic model for crystal growth39
Vface )Ωface(Csurf -Ceq) (1)
with Vface the growth rate of the crystal face (cm/s), Ω thespecific volume of a single glucose tetramer in the crystal lattice
Figure 1. Recorded intensity (a) and phase shift interferograms (b) ofthe isotropic depletion zone encircling the glucose isomerase crystal;growth face velocities Vface of glucose isomerase at 100 mM Hepes pH7.0, 200 mM MgCl2, 5% PEG 1000, 0.1% agarose at 20 °C. A cleartransition from slow (regime 1) to fast (regime 2) kinetics is observedfor elevated supersaturation levels (c).
4410 Crystal Growth & Design, Vol. 8, No. 12, 2008 Sleutel et al.
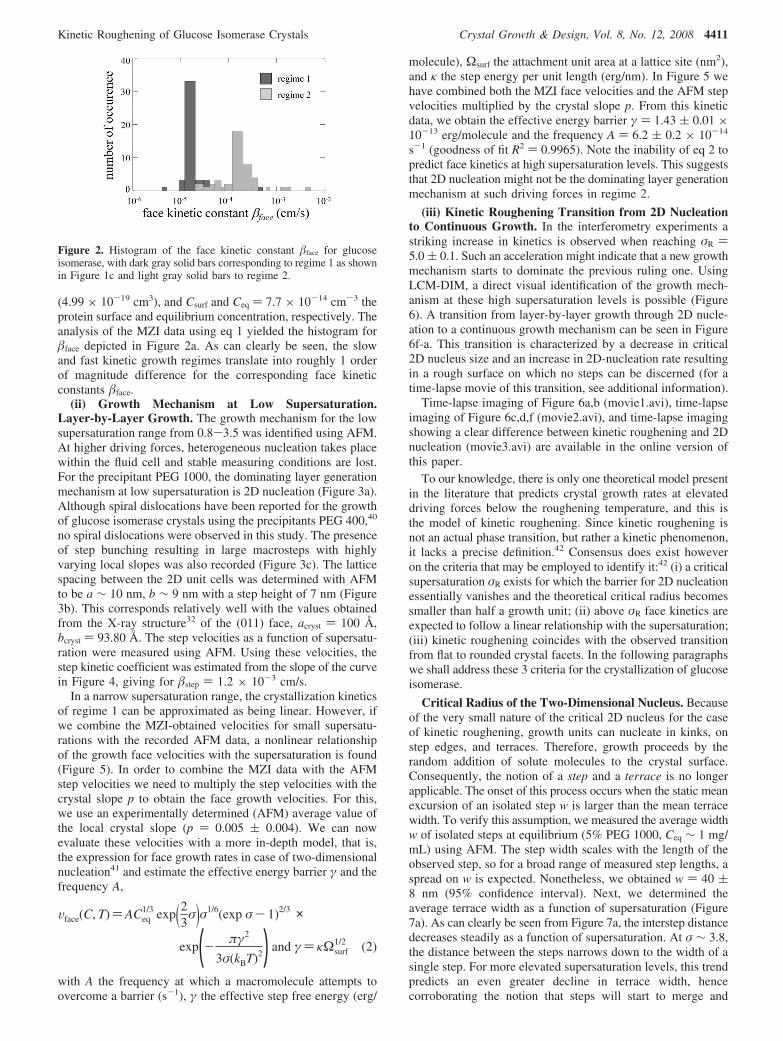
(4.99 × 10⁻¹⁹ cm3), and Csurf and Ceq ) 7.7 × 10⁻¹⁴ cm-3 theprotein surface and equilibrium concentration, respectively. Theanalysis of the MZI data using eq 1 yielded the histogram forface depicted in Figure 2a. As can clearly be seen, the slowand fast kinetic growth regimes translate into roughly 1 orderof magnitude difference for the corresponding face kineticconstants face.
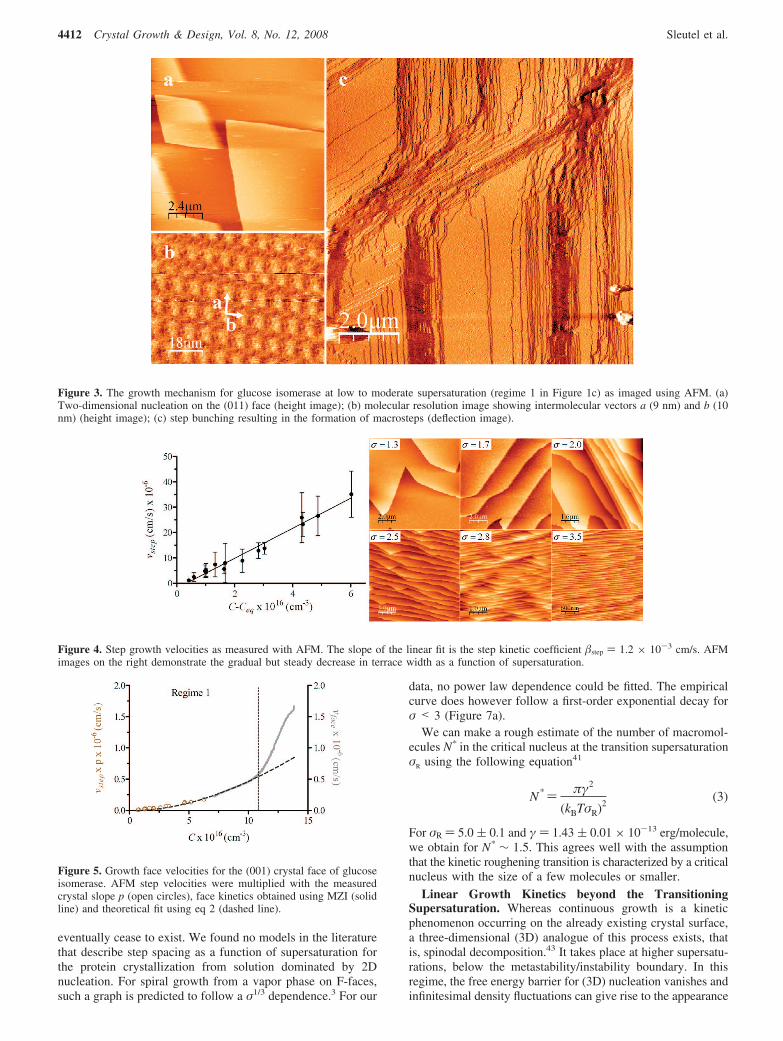
(ii) Growth Mechanism at Low Supersaturation.Layer-by-Layer Growth. The growth mechanism for the lowsupersaturation range from 0.8-3.5 was identified using AFM.At higher driving forces, heterogeneous nucleation takes placewithin the fluid cell and stable measuring conditions are lost.For the precipitant PEG 1000, the dominating layer generationmechanism at low supersaturation is 2D nucleation (Figure 3a).Although spiral dislocations have been reported for the growthof glucose isomerase crystals using the precipitants PEG 400,40
no spiral dislocations were observed in this study. The presenceof step bunching resulting in large macrosteps with highlyvarying local slopes was also recorded (Figure 3c). The latticespacing between the 2D unit cells was determined with AFMto be a ∼ 10 nm, b ∼ 9 nm with a step height of 7 nm (Figure3b). This corresponds relatively well with the values obtainedfrom the X-ray structure32 of the (011) face, acryst ) 100 Å,bcryst ) 93.80 Å. The step velocities as a function of supersatu-ration were measured using AFM. Using these velocities, thestep kinetic coefficient was estimated from the slope of the curvein Figure 4, giving for step ) 1.2 × 10⁻³ cm/s.
In a narrow supersaturation range, the crystallization kineticsof regime 1 can be approximated as being linear. However, ifwe combine the MZI-obtained velocities for small supersatu-rations with the recorded AFM data, a nonlinear relationshipof the growth face velocities with the supersaturation is found(Figure 5). In order to combine the MZI data with the AFMstep velocities we need to multiply the step velocities with thecrystal slope p to obtain the face growth velocities. For this,we use an experimentally determined (AFM) average value ofthe local crystal slope (p ) 0.005 ( 0.004). We can nowevaluate these velocities with a more in-depth model, that is,the expression for face growth rates in case of two-dimensionalnucleation41 and estimate the effective energy barrier γ and thefrequency A,
Vface(C, T))ACeq1/3 exp(2
3σ)σ1/6(exp σ- 1)2/3 ×
exp(- πγ2
3σ(kBT)2) and γ) κΩsurf1/2 (2)
with A the frequency at which a macromolecule attempts toovercome a barrier (s-1), γ the effective step free energy (erg/
molecule), Ωsurf the attachment unit area at a lattice site (nm2),and κ the step energy per unit length (erg/nm). In Figure 5 wehave combined both the MZI face velocities and the AFM stepvelocities multiplied by the crystal slope p. From this kineticdata, we obtain the effective energy barrier γ ) 1.43 ( 0.01 ×10⁻¹³ erg/molecule and the frequency A ) 6.2 ( 0.2 × 10⁻¹⁴
s-1 (goodness of fit R2 ) 0.9965). Note the inability of eq 2 topredict face kinetics at high supersaturation levels. This suggeststhat 2D nucleation might not be the dominating layer generationmechanism at such driving forces in regime 2.
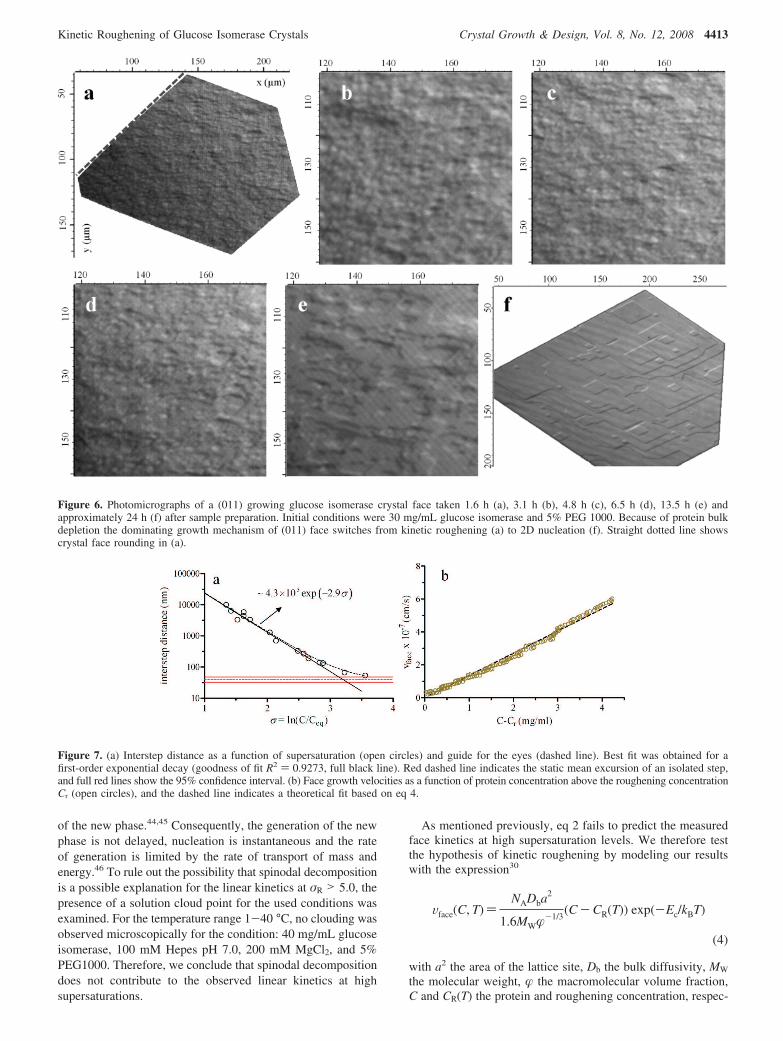
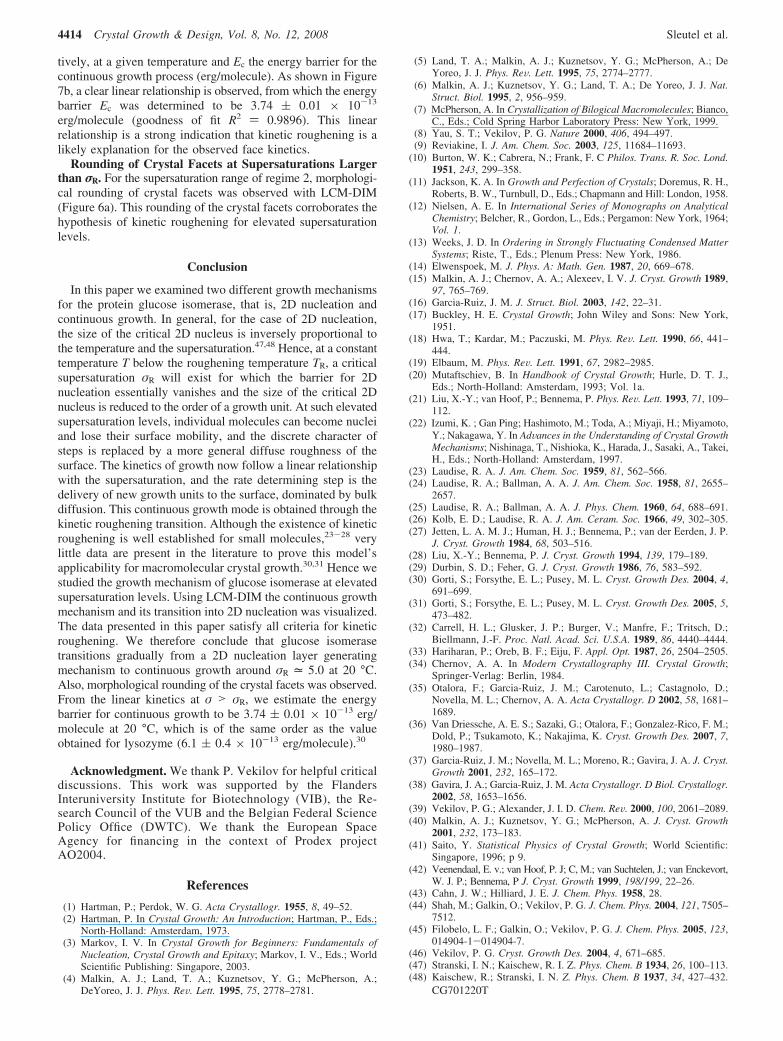
(iii) Kinetic Roughening Transition from 2D Nucleationto Continuous Growth. In the interferometry experiments astriking increase in kinetics is observed when reaching σR )5.0 ( 0.1. Such an acceleration might indicate that a new growthmechanism starts to dominate the previous ruling one. UsingLCM-DIM, a direct visual identification of the growth mech-anism at these high supersaturation levels is possible (Figure6). A transition from layer-by-layer growth through 2D nucle-ation to a continuous growth mechanism can be seen in Figure6f-a. This transition is characterized by a decrease in critical2D nucleus size and an increase in 2D-nucleation rate resultingin a rough surface on which no steps can be discerned (for atime-lapse movie of this transition, see additional information).
Time-lapse imaging of Figure 6a,b (movie1.avi), time-lapseimaging of Figure 6c,d,f (movie2.avi), and time-lapse imagingshowing a clear difference between kinetic roughening and 2Dnucleation (movie3.avi) are available in the online version ofthis paper.
To our knowledge, there is only one theoretical model presentin the literature that predicts crystal growth rates at elevateddriving forces below the roughening temperature, and this isthe model of kinetic roughening. Since kinetic roughening isnot an actual phase transition, but rather a kinetic phenomenon,it lacks a precise definition.42 Consensus does exist howeveron the criteria that may be employed to identify it:42 (i) a criticalsupersaturation σR exists for which the barrier for 2D nucleationessentially vanishes and the theoretical critical radius becomessmaller than half a growth unit; (ii) above σR face kinetics areexpected to follow a linear relationship with the supersaturation;(iii) kinetic roughening coincides with the observed transitionfrom flat to rounded crystal facets. In the following paragraphswe shall address these 3 criteria for the crystallization of glucoseisomerase.
Critical Radius of the Two-Dimensional Nucleus. Becauseof the very small nature of the critical 2D nucleus for the caseof kinetic roughening, growth units can nucleate in kinks, onstep edges, and terraces. Therefore, growth proceeds by therandom addition of solute molecules to the crystal surface.Consequently, the notion of a step and a terrace is no longerapplicable. The onset of this process occurs when the static meanexcursion of an isolated step w is larger than the mean terracewidth. To verify this assumption, we measured the average widthw of isolated steps at equilibrium (5% PEG 1000, Ceq ∼ 1 mg/mL) using AFM. The step width scales with the length of theobserved step, so for a broad range of measured step lengths, aspread on w is expected. Nonetheless, we obtained w ) 40 (8 nm (95% confidence interval). Next, we determined theaverage terrace width as a function of supersaturation (Figure7a). As can clearly be seen from Figure 7a, the interstep distancedecreases steadily as a function of supersaturation. At σ ∼ 3.8,the distance between the steps narrows down to the width of asingle step. For more elevated supersaturation levels, this trendpredicts an even greater decline in terrace width, hencecorroborating the notion that steps will start to merge and
Figure 2. Histogram of the face kinetic constant face for glucoseisomerase, with dark gray solid bars corresponding to regime 1 as shownin Figure 1c and light gray solid bars to regime 2.
Kinetic Roughening of Glucose Isomerase Crystals Crystal Growth & Design, Vol. 8, No. 12, 2008 4411
eventually cease to exist. We found no models in the literaturethat describe step spacing as a function of supersaturation forthe protein crystallization from solution dominated by 2Dnucleation. For spiral growth from a vapor phase on F-faces,such a graph is predicted to follow a σ1/3 dependence.3 For our
data, no power law dependence could be fitted. The empiricalcurve does however follow a first-order exponential decay forσ < 3 (Figure 7a).
We can make a rough estimate of the number of macromol-ecules N* in the critical nucleus at the transition supersaturationσR using the following equation41
N* ) πγ2
(kBTσR)2(3)
For σR ) 5.0 ( 0.1 and γ ) 1.43 ( 0.01 × 10⁻¹³ erg/molecule,we obtain for N* ∼ 1.5. This agrees well with the assumptionthat the kinetic roughening transition is characterized by a criticalnucleus with the size of a few molecules or smaller.
Linear Growth Kinetics beyond the TransitioningSupersaturation. Whereas continuous growth is a kineticphenomenon occurring on the already existing crystal surface,a three-dimensional (3D) analogue of this process exists, thatis, spinodal decomposition.43 It takes place at higher supersatu-rations, below the metastability/instability boundary. In thisregime, the free energy barrier for (3D) nucleation vanishes andinfinitesimal density fluctuations can give rise to the appearance
Figure 3. The growth mechanism for glucose isomerase at low to moderate supersaturation (regime 1 in Figure 1c) as imaged using AFM. (a)Two-dimensional nucleation on the (011) face (height image); (b) molecular resolution image showing intermolecular vectors a (9 nm) and b (10nm) (height image); (c) step bunching resulting in the formation of macrosteps (deflection image).
Figure 4. Step growth velocities as measured with AFM. The slope of the linear fit is the step kinetic coefficient step ) 1.2 × 10⁻³ cm/s. AFMimages on the right demonstrate the gradual but steady decrease in terrace width as a function of supersaturation.
Figure 5. Growth face velocities for the (001) crystal face of glucoseisomerase. AFM step velocities were multiplied with the measuredcrystal slope p (open circles), face kinetics obtained using MZI (solidline) and theoretical fit using eq 2 (dashed line).
4412 Crystal Growth & Design, Vol. 8, No. 12, 2008 Sleutel et al.
of the new phase.44,45 Consequently, the generation of the newphase is not delayed, nucleation is instantaneous and the rateof generation is limited by the rate of transport of mass andenergy.46 To rule out the possibility that spinodal decompositionis a possible explanation for the linear kinetics at σR > 5.0, thepresence of a solution cloud point for the used conditions wasexamined. For the temperature range 1-40 °C, no clouding wasobserved microscopically for the condition: 40 mg/mL glucoseisomerase, 100 mM Hepes pH 7.0, 200 mM MgCl2, and 5%PEG1000. Therefore, we conclude that spinodal decompositiondoes not contribute to the observed linear kinetics at highsupersaturations.
As mentioned previously, eq 2 fails to predict the measuredface kinetics at high supersaturation levels. We therefore testthe hypothesis of kinetic roughening by modeling our resultswith the expression30
Vface(C, T))NADba
2
1.6MW-1/3(C-CR(T)) exp(-Ec/kBT)
(4)
with a2 the area of the lattice site, Db the bulk diffusivity, MW
the molecular weight, the macromolecular volume fraction,C and CR(T) the protein and roughening concentration, respec-
Figure 6. Photomicrographs of a (011) growing glucose isomerase crystal face taken 1.6 h (a), 3.1 h (b), 4.8 h (c), 6.5 h (d), 13.5 h (e) andapproximately 24 h (f) after sample preparation. Initial conditions were 30 mg/mL glucose isomerase and 5% PEG 1000. Because of protein bulkdepletion the dominating growth mechanism of (011) face switches from kinetic roughening (a) to 2D nucleation (f). Straight dotted line showscrystal face rounding in (a).
Figure 7. (a) Interstep distance as a function of supersaturation (open circles) and guide for the eyes (dashed line). Best fit was obtained for afirst-order exponential decay (goodness of fit R2 ) 0.9273, full black line). Red dashed line indicates the static mean excursion of an isolated step,and full red lines show the 95% confidence interval. (b) Face growth velocities as a function of protein concentration above the roughening concentrationCr (open circles), and the dashed line indicates a theoretical fit based on eq 4.
Kinetic Roughening of Glucose Isomerase Crystals Crystal Growth & Design, Vol. 8, No. 12, 2008 4413
tively, at a given temperature and Ec the energy barrier for thecontinuous growth process (erg/molecule). As shown in Figure7b, a clear linear relationship is observed, from which the energybarrier Ec was determined to be 3.74 ( 0.01 × 10⁻¹³
erg/molecule (goodness of fit R2 ) 0.9896). This linearrelationship is a strong indication that kinetic roughening is alikely explanation for the observed face kinetics.
Rounding of Crystal Facets at Supersaturations Largerthan σR. For the supersaturation range of regime 2, morphologi-cal rounding of crystal facets was observed with LCM-DIM(Figure 6a). This rounding of the crystal facets corroborates thehypothesis of kinetic roughening for elevated supersaturationlevels.
Conclusion
In this paper we examined two different growth mechanismsfor the protein glucose isomerase, that is, 2D nucleation andcontinuous growth. In general, for the case of 2D nucleation,the size of the critical 2D nucleus is inversely proportional tothe temperature and the supersaturation.47,48 Hence, at a constanttemperature T below the roughening temperature TR, a criticalsupersaturation σR will exist for which the barrier for 2Dnucleation essentially vanishes and the size of the critical 2Dnucleus is reduced to the order of a growth unit. At such elevatedsupersaturation levels, individual molecules can become nucleiand lose their surface mobility, and the discrete character ofsteps is replaced by a more general diffuse roughness of thesurface. The kinetics of growth now follow a linear relationshipwith the supersaturation, and the rate determining step is thedelivery of new growth units to the surface, dominated by bulkdiffusion. This continuous growth mode is obtained through thekinetic roughening transition. Although the existence of kineticroughening is well established for small molecules,23-28 verylittle data are present in the literature to prove this model’sapplicability for macromolecular crystal growth.30,31 Hence westudied the growth mechanism of glucose isomerase at elevatedsupersaturation levels. Using LCM-DIM the continuous growthmechanism and its transition into 2D nucleation was visualized.The data presented in this paper satisfy all criteria for kineticroughening. We therefore conclude that glucose isomerasetransitions gradually from a 2D nucleation layer generatingmechanism to continuous growth around σR = 5.0 at 20 °C.Also, morphological rounding of the crystal facets was observed.From the linear kinetics at σ > σR, we estimate the energybarrier for continuous growth to be 3.74 ( 0.01 × 10⁻¹³ erg/molecule at 20 °C, which is of the same order as the valueobtained for lysozyme (6.1 ( 0.4 × 10⁻¹³ erg/molecule).30
Acknowledgment. We thank P. Vekilov for helpful criticaldiscussions. This work was supported by the FlandersInteruniversity Institute for Biotechnology (VIB), the Re-search Council of the VUB and the Belgian Federal SciencePolicy Office (DWTC). We thank the European SpaceAgency for financing in the context of Prodex projectAO2004.
References
(1) Hartman, P.; Perdok, W. G. Acta Crystallogr. 1955, 8, 49–52.(2) Hartman, P. In Crystal Growth: An Introduction; Hartman, P., Eds.;
North-Holland: Amsterdam, 1973.(3) Markov, I. V. In Crystal Growth for Beginners: Fundamentals of
Nucleation, Crystal Growth and Epitaxy; Markov, I. V., Eds.; WorldScientific Publishing: Singapore, 2003.
(4) Malkin, A. J.; Land, T. A.; Kuznetsov, Y. G.; McPherson, A.;DeYoreo, J. J. Phys. ReV. Lett. 1995, 75, 2778–2781.
(5) Land, T. A.; Malkin, A. J.; Kuznetsov, Y. G.; McPherson, A.; DeYoreo, J. J. Phys. ReV. Lett. 1995, 75, 2774–2777.
(6) Malkin, A. J.; Kuznetsov, Y. G.; Land, T. A.; De Yoreo, J. J. Nat.Struct. Biol. 1995, 2, 956–959.
(7) McPherson, A. In Crystallization of Bilogical Macromolecules; Bianco,C., Eds.; Cold Spring Harbor Laboratory Press: New York, 1999.
(8) Yau, S. T.; Vekilov, P. G. Nature 2000, 406, 494–497.(9) Reviakine, I. J. Am. Chem. Soc. 2003, 125, 11684–11693.
(10) Burton, W. K.; Cabrera, N.; Frank, F. C Philos. Trans. R. Soc. Lond.1951, 243, 299–358.
(11) Jackson, K. A. In Growth and Perfection of Crystals; Doremus, R. H.,Roberts, B. W., Turnbull, D., Eds.; Chapmann and Hill: London, 1958.
(12) Nielsen, A. E. In International Series of Monographs on AnalyticalChemistry; Belcher, R., Gordon, L., Eds.; Pergamon: New York, 1964;Vol. 1.
(13) Weeks, J. D. In Ordering in Strongly Fluctuating Condensed MatterSystems; Riste, T., Eds.; Plenum Press: New York, 1986.
(14) Elwenspoek, M. J. Phys. A: Math. Gen. 1987, 20, 669–678.(15) Malkin, A. J.; Chernov, A. A.; Alexeev, I. V. J. Cryst. Growth 1989,
97, 765–769.(16) Garcia-Ruiz, J. M. J. Struct. Biol. 2003, 142, 22–31.(17) Buckley, H. E. Crystal Growth; John Wiley and Sons: New York,
1951.(18) Hwa, T.; Kardar, M.; Paczuski, M. Phys. ReV. Lett. 1990, 66, 441–
444.(19) Elbaum, M. Phys. ReV. Lett. 1991, 67, 2982–2985.(20) Mutaftschiev, B. In Handbook of Crystal Growth; Hurle, D. T. J.,
Eds.; North-Holland: Amsterdam, 1993; Vol. 1a.(21) Liu, X.-Y.; van Hoof, P.; Bennema, P. Phys. ReV. Lett. 1993, 71, 109–
112.(22) Izumi, K. ; Gan Ping; Hashimoto, M.; Toda, A.; Miyaji, H.; Miyamoto,
Y.; Nakagawa, Y. In AdVances in the Understanding of Crystal GrowthMechanisms; Nishinaga, T., Nishioka, K., Harada, J., Sasaki, A., Takei,H., Eds.; North-Holland: Amsterdam, 1997.
(23) Laudise, R. A. J. Am. Chem. Soc. 1959, 81, 562–566.(24) Laudise, R. A.; Ballman, A. A. J. Am. Chem. Soc. 1958, 81, 2655–
2657.(25) Laudise, R. A.; Ballman, A. A. J. Phys. Chem. 1960, 64, 688–691.(26) Kolb, E. D.; Laudise, R. A. J. Am. Ceram. Soc. 1966, 49, 302–305.(27) Jetten, L. A. M. J.; Human, H. J.; Bennema, P.; van der Eerden, J. P.
J. Cryst. Growth 1984, 68, 503–516.(28) Liu, X.-Y.; Bennema, P. J. Cryst. Growth 1994, 139, 179–189.(29) Durbin, S. D.; Feher, G. J. Cryst. Growth 1986, 76, 583–592.(30) Gorti, S.; Forsythe, E. L.; Pusey, M. L. Cryst. Growth Des. 2004, 4,
691–699.(31) Gorti, S.; Forsythe, E. L.; Pusey, M. L. Cryst. Growth Des. 2005, 5,
473–482.(32) Carrell, H. L.; Glusker, J. P.; Burger, V.; Manfre, F.; Tritsch, D.;
Biellmann, J.-F. Proc. Natl. Acad. Sci. U.S.A. 1989, 86, 4440–4444.(33) Hariharan, P.; Oreb, B. F.; Eiju, F. Appl. Opt. 1987, 26, 2504–2505.(34) Chernov, A. A. In Modern Crystallography III. Crystal Growth;
Springer-Verlag: Berlin, 1984.(35) Otalora, F.; Garcia-Ruiz, J. M.; Carotenuto, L.; Castagnolo, D.;
Novella, M. L.; Chernov, A. A. Acta Crystallogr. D 2002, 58, 1681–1689.
(36) Van Driessche, A. E. S.; Sazaki, G.; Otalora, F.; Gonzalez-Rico, F. M.;Dold, P.; Tsukamoto, K.; Nakajima, K. Cryst. Growth Des. 2007, 7,1980–1987.
(37) Garcia-Ruiz, J. M.; Novella, M. L.; Moreno, R.; Gavira, J. A. J. Cryst.Growth 2001, 232, 165–172.
(38) Gavira, J. A.; Garcia-Ruiz, J. M. Acta Crystallogr. D Biol. Crystallogr.2002, 58, 1653–1656.
(39) Vekilov, P. G.; Alexander, J. I. D. Chem. ReV. 2000, 100, 2061–2089.(40) Malkin, A. J.; Kuznetsov, Y. G.; McPherson, A. J. Cryst. Growth
2001, 232, 173–183.(41) Saito, Y. Statistical Physics of Crystal Growth; World Scientific:
Singapore, 1996; p 9.(42) Veenendaal, E. v.; van Hoof, P. J; C, M.; van Suchtelen, J.; van Enckevort,
W. J. P.; Bennema, P J. Cryst. Growth 1999, 198/199, 22–26.(43) Cahn, J. W.; Hilliard, J. E. J. Chem. Phys. 1958, 28.(44) Shah, M.; Galkin, O.; Vekilov, P. G. J. Chem. Phys. 2004, 121, 7505–
7512.(45) Filobelo, L. F.; Galkin, O.; Vekilov, P. G. J. Chem. Phys. 2005, 123,
014904-1-014904-7.(46) Vekilov, P. G. Cryst. Growth Des. 2004, 4, 671–685.(47) Stranski, I. N.; Kaischew, R. I. Z. Phys. Chem. B 1934, 26, 100–113.(48) Kaischew, R.; Stranski, I. N. Z. Phys. Chem. B 1937, 34, 427–432.
CG701220T
4414 Crystal Growth & Design, Vol. 8, No. 12, 2008 Sleutel et al.