Paramagnetic spin correlations in CaFe2As2 single crystals
12
arXiv:1001.2804v2 [cond-mat.supr-con] 7 Jul 2010 Paramagnetic Spin Correlations in CaFe 2 As 2 Single Crystals S.O. Diallo, 1 D.K. Pratt, 1 R.M. Fernandes, 1 W. Tian, 1 J.L. Zarestky, 1 M. Lumsden, 2 T.G. Perring, 3 C.L. Broholm, 4 N. Ni, 1 S.L. Bud’ko, 1 P.C. Canfield, 1 H.-F. Li, 1 D. Vaknin, 1 A. Kreyssig, 1 A.I. Goldman, 1 and R.J. McQueeney 1 1 Ames Laboratory and Department of Physics and Astronomy, Iowa State University, Ames, IA 50011 USA 2 Oak Ridge National Laboratory, Oak Ridge, TN 37831 USA 3 ISIS Facility, Rutherford Appleton Laboratory, Chilton, Didcot, Oxon OX11 OQX, United Kingdom 4 Department of Physics and Astronomy, Johns Hopkins University, Baltimore, MD 21218 USA (Dated: July 8, 2010) Magnetic correlations in the paramagnetic phase of CaFe2As2 (TN = 172 K) have been examined by means of inelastic neutron scattering from 180 K (∼ 1.05TN ) up to 300 K (1.8TN ). Despite the first-order nature of the magnetic ordering, strong but short-ranged antiferromagnetic (AFM) cor- relations are clearly observed. These correlations, which consist of quasi-elastic scattering centered at the wavevector QAFM of the low-temperature AFM structure, are observed up to the highest measured temperature of 300 K and at high energy transfer (¯ hω > 60 meV). The L dependence of the scattering implies rather weak interlayer coupling in the tetragonal c-direction corresponding to nearly two-dimensional fluctuations in the (ab) plane. The spin correlation lengths within the Fe layer are found to be anisotropic, consistent with underlying fluctuations of the AFM stripe structure. Similar to the cobalt doped superconducting BaFe2As2 compounds, these experimen- tal features can be adequately reproduced by a scattering model that describes short-ranged and anisotropic spin correlations with overdamped dynamics. PACS numbers: 74.70.-b,75.30.Et,78.70.Nx I. INTRODUCTION The appearance of superconductivity (SC) in doped AFe 2 As 2 materials (A = Ca,Sr,Ba) is linked to the sup- pression of antiferromagnetic (AFM) ordering found in the parent compounds. 1–3 Other unconventional super- conductors share a similar phase diagram, suggesting that the AFM spin fluctuations may be responsible for pairing of electrons in the SC state. Certainly, the AFM fluctuation spectrum itself is directly influenced by superconductivity. 4–6 The appearance of a gap and resonance-like feature in the paramagnetic spectrum of these compounds below the superconducting tempera- ture T C also closely resembles 7 other unconventional su- perconductors and highlights the coupling of the iron spins with electronic charge carriers. Recent neutron scattering results elegantly show that the magnetic reso- nance can infer details about the symmetry of the super- conducting gap. 4 In order to understand the nature of the superconduct- ing pairing, details of the normal state spin fluctuations must be first understood. These spin fluctuations are expected to be unusual 8–11 since magnetic frustration in the tetragonal paramagnetic phase leads to an additional nematic 12 degree-of-freedom due to the weak net mag- netic coupling of nearest-neighbor Fe sublattices. The AFM ordering in parent AFe 2 As 2 compounds below T N is observed to occur either simultaneously with or after a structural transition from tetragonal to orthorhombic at T S . The magnetic excitations in AFe 2 As 2 in stripe AFM ordered parent compounds have been extensively studied 13–17 and indicate itinerant spin waves whose ex- citation spectrum can be adequately described by large nearest (J 1 ) and next-nearest-neighbor (J 2 ) in-plane ex- change constants, a substantial interlayer coupling (J c ), and strong Landau damping γ . The primary role of doping is to suppress both the AFM and structural transitions, resulting in strong AFM spin fluctuations. In the context of establishing the con- nection between spin fluctuations and superconductivity, it becomes imperative to examine the evolution of these spin excitations across the entire phase diagram of doped AFe 2 As 2 . There have been several theoretical and ex- perimental studies on the effects of charge doping on the spin excitations in the superconducting compounds. 18–23 In general, these studies show that the normal state spin fluctuations are quasi-two-dimensional (2D) and strongly damped while remaining peaked at Q AFM , the magnetic ordering wavevector of the stripe AFM state. It is un- clear if the quasi-2D nature and strong damping are fea- tures that appear only with sufficient doping, or whether these are common features of the spin fluctuations in the tetragonal phase. In order to address these questions, we examine the spin correlations that occur in the parent compound CaFe 2 As 2 above the AFM ordering temperature T N . Inelastic neutron scattering data on CaFe 2 As 2 single- crystals show that above the simultaneous first order transitions at T N = T S = 172 K, 24 the spin gap col- lapses and spin wave scattering centered at the stripe ordering wavevector Q AFM is replaced by short-ranged and quasi-elastic AFM correlations that extend up to at least 60 meV. Just above T N (at T = 180 K) the low en- ergy magnetic response is quasi-elastic with anisotropic in-plane correlations. We find the in-plane correlation length to be ξ T+ ≃ 8 ˚ A along the orthorhombic a-axis and ξ T- ≃6 ˚ A along b. Weak modulations of the scat-
Transcript of Paramagnetic spin correlations in CaFe2As2 single crystals

arX
iv:1
001.
2804
v2 [
cond
-mat
.sup
r-co
n] 7
Jul
201
0
Paramagnetic Spin Correlations in CaFe2As2 Single Crystals
S.O. Diallo,1 D.K. Pratt,1 R.M. Fernandes,1 W. Tian,1 J.L. Zarestky,1 M. Lumsden,2 T.G. Perring,3 C.L. Broholm,4
N. Ni,1 S.L. Bud’ko,1 P.C. Canfield,1 H.-F. Li,1 D. Vaknin,1 A. Kreyssig,1 A.I. Goldman,1 and R.J. McQueeney1
1Ames Laboratory and Department of Physics and Astronomy, Iowa State University, Ames, IA 50011 USA2Oak Ridge National Laboratory, Oak Ridge, TN 37831 USA
3ISIS Facility, Rutherford Appleton Laboratory, Chilton, Didcot, Oxon OX11 OQX, United Kingdom4Department of Physics and Astronomy, Johns Hopkins University, Baltimore, MD 21218 USA
(Dated: July 8, 2010)
Magnetic correlations in the paramagnetic phase of CaFe2As2 (TN = 172 K) have been examinedby means of inelastic neutron scattering from 180 K (∼ 1.05TN ) up to 300 K (1.8TN ). Despite thefirst-order nature of the magnetic ordering, strong but short-ranged antiferromagnetic (AFM) cor-relations are clearly observed. These correlations, which consist of quasi-elastic scattering centeredat the wavevector QAFM of the low-temperature AFM structure, are observed up to the highestmeasured temperature of 300 K and at high energy transfer (hω > 60 meV). The L dependenceof the scattering implies rather weak interlayer coupling in the tetragonal c-direction correspondingto nearly two-dimensional fluctuations in the (ab) plane. The spin correlation lengths within theFe layer are found to be anisotropic, consistent with underlying fluctuations of the AFM stripestructure. Similar to the cobalt doped superconducting BaFe2As2 compounds, these experimen-tal features can be adequately reproduced by a scattering model that describes short-ranged andanisotropic spin correlations with overdamped dynamics.
PACS numbers: 74.70.-b,75.30.Et,78.70.Nx
I. INTRODUCTION
The appearance of superconductivity (SC) in dopedAFe2As2 materials (A = Ca,Sr,Ba) is linked to the sup-pression of antiferromagnetic (AFM) ordering found inthe parent compounds.1–3 Other unconventional super-conductors share a similar phase diagram, suggestingthat the AFM spin fluctuations may be responsible forpairing of electrons in the SC state. Certainly, theAFM fluctuation spectrum itself is directly influencedby superconductivity.4–6 The appearance of a gap andresonance-like feature in the paramagnetic spectrum ofthese compounds below the superconducting tempera-ture TC also closely resembles7 other unconventional su-perconductors and highlights the coupling of the ironspins with electronic charge carriers. Recent neutronscattering results elegantly show that the magnetic reso-nance can infer details about the symmetry of the super-conducting gap.4
In order to understand the nature of the superconduct-ing pairing, details of the normal state spin fluctuationsmust be first understood. These spin fluctuations areexpected to be unusual8–11 since magnetic frustration inthe tetragonal paramagnetic phase leads to an additionalnematic12 degree-of-freedom due to the weak net mag-netic coupling of nearest-neighbor Fe sublattices. TheAFM ordering in parent AFe2As2 compounds below TN
is observed to occur either simultaneously with or aftera structural transition from tetragonal to orthorhombicat TS .
The magnetic excitations in AFe2As2 in stripeAFM ordered parent compounds have been extensivelystudied13–17 and indicate itinerant spin waves whose ex-citation spectrum can be adequately described by large
nearest (J1) and next-nearest-neighbor (J2) in-plane ex-change constants, a substantial interlayer coupling (Jc),and strong Landau damping γ.
The primary role of doping is to suppress both theAFM and structural transitions, resulting in strong AFMspin fluctuations. In the context of establishing the con-nection between spin fluctuations and superconductivity,it becomes imperative to examine the evolution of thesespin excitations across the entire phase diagram of dopedAFe2As2. There have been several theoretical and ex-perimental studies on the effects of charge doping on thespin excitations in the superconducting compounds.18–23
In general, these studies show that the normal state spinfluctuations are quasi-two-dimensional (2D) and stronglydamped while remaining peaked at QAFM, the magneticordering wavevector of the stripe AFM state. It is un-clear if the quasi-2D nature and strong damping are fea-tures that appear only with sufficient doping, or whetherthese are common features of the spin fluctuations in thetetragonal phase.
In order to address these questions, we examine thespin correlations that occur in the parent compoundCaFe2As2 above the AFM ordering temperature TN .Inelastic neutron scattering data on CaFe2As2 single-crystals show that above the simultaneous first ordertransitions at TN = TS = 172 K,24 the spin gap col-lapses and spin wave scattering centered at the stripeordering wavevector QAFM is replaced by short-rangedand quasi-elastic AFM correlations that extend up to atleast 60 meV. Just above TN (at T = 180 K) the low en-ergy magnetic response is quasi-elastic with anisotropicin-plane correlations. We find the in-plane correlationlength to be ξT+
≃ 8 A along the orthorhombic a-axis
and ξT−
≃6 A along b. Weak modulations of the scat-

2
FIG. 1: Summary of scans performed at T = 10 K, 140 K (emptysymbols) and 180 K (filled symbols) on HB3 (Ef = 41.2 meV) andHB-1A with spectrometer configurations described in the text. (a)shows (hhL) plane in reciprocal space where the scans at HB3 wereperformed. (b)-(f) shows the various cuts investigated, as indicatedin (a). (g) and (h) show the scans performed in the (h0L) planeusing HB1A. No diffuse magnetic scattering was observed in the(h0L) plane. The magnetic signal is only observed centered atwavevectors Q = QAFM.
tered intensity are also observed along the c-axis indi-cating a two-dimensional character to the paramagneticfluctuations. In general, spin correlations weaken andbroaden further in momentum and energy with increas-ing temperature, but are still observed up to the highestmeasured temperature of 300 K. These observations canbe explained in the context of spin dynamics overdampedby particle-hole excitations. In particular, we use a phe-nomenological theoretical model with in-plane and inter-plane magnetic anisotropy to consistently fit our data forall temperatures, obtaining the ratios J1/J2 ≃ 0.55 andJc/J2 ≃ 0.1. We find that the spin fluctuations in theparamagnetic phase of the parent compound bear a closeresemblance to the paramagnetic fluctuations in the su-perconducting compositions.
This article is laid out as follows. In section II below,the experimental conditions under which the experiment
FIG. 2: Temperature evolution of the neutron scattering signalmeasured on HB3 at hω = 10 meV. (a) Background estimatemeasured away from QAFM at (002) (solid symbols) and (003)(open symbols) showing no anomaly at TN . Solid lines are lin-ear fits to the temperature dependent intensity. (b) Intensity atQAFM = (1/2, 1/2, 1) and (1/2, 1/2, 0). The solid line is thenon-magnetic background estimate obtained from averaging thefits at (002) and (003), shown in panel (a).
were performed and the sample details are presented.The data analysis and results are presented in sectionIII. Finally, a discussion and a summary are given in sec-tion IV.
II. EXPERIMENTAL PROCEDURES
Inelastic neutron scattering measurements were per-formed on a single crystal mosaic (∼400 small single-crystal samples) of CaFe2As2 with a total mass of∼ 2 grams that are co-aligned to within 1.5 degreesfull-width-at-half-maximum (FWHM). The preparationmethods of the single-crystals have been describedelsewhere.24 Data were collected using the HB3 andHB1A triple-axis spectrometers at the High Flux Iso-tope Reactor at Oak Ridge National Laboratory andthe MAPS chopper spectrometer at the ISIS facility atRutherford Appleton Laboratory. HB3 was operated inrelaxed resolution for measurement of the diffuse scat-tering signals in the paramagnetic phase, with fixed finalenergy (Ef ) configurations, Ef = 14.7 meV and 41.2meV, and 48’-60’-80’-120’ collimation. The sample wasmounted in a closed-cycle refrigerator and oriented forscattering in the tetragonal (hhL) plane. HB1A was op-erated with fixed incident neutron energy of 14.7 meVand 48’-40’-40’-136’ collimation and the sample mountedin the (h0L) plane. The MAPS experiment was per-formed at T =180 K, with an incident energy of 100 meVusing the same sample aligned with the c-axis along theincident beam direction.To avoid confusion, the data is exclusively presented in
tetragonal units and we define Q = 2πa (hi + kj) + 2π
c Lkas the momentum transfer indexed according to theI4/mmm tetragonal cell with lattice parameters a = 3.88A and c = 11.74 A at 300 K. The vectors i, j and k are thefundamental translation unit vectors in real space. Forcomparison with the AFM low temperature orthorhom-

3
-4 -2 0 2 4
1500
2000
2500
3000
300 K
Cou
nts/
4 m
inut
es
(1/2,1/2,L) (rlu)
180 Kc
-0.5 0.0 0.5
(h,h,3) (rlu)
d
10 meV
1500
2000
2500
3000a
b
FIG. 3: (Color online). L and h-dependence of the scatter-ing at hω = 10 meV measured on the HB3 instrument withEf =41.2 meV. The scans are performed along the (1/2, 1/2, L)and (h, h, 3) directions for temperatures T =300 K [(a) and (b)]and T =180 K [(c) and (d)]. The solid lines in (a) and (c) corre-spond to fits to the dynamical susceptibility described in Eq. (5).The solid lines in (b) and (d) are guide to the eye, and based onLorentzian fits to the data. The dashed line is an estimate of back-ground scattering. Panels (c) and (d) show the sharper magneticscattering at 180 K.
bic (o) structure, we note the following relations betweenthe Miller indices of the two phases, h=(Ho + Ko)/2,k=(Ho −Ko)/2, and L=Lo. For convenience, we some-times use the reduced momentum transfer q=Q−QAFM
in reciprocal lattice units (rlu) where Q is the momen-tum transfer to the sample and QAFM=(h0, k0, l0) thereciprocal lattice vector which defines the AFM low tem-perature zone center. Typical AFM wave vectors studiedare (1/2, 1/2, L) with L = odd.
After suitable subtractions of the non-magnetic (back-ground) scattering, the observed magnetic inelastic neu-tron scattering data is cast in terms of the dynamicalstructure factor S(Q, ω), which is related to the imagi-nary part of the dynamic spin susceptibility χ′′(Q, ω) viathe fluctuation-dissipation theorem,
S(Q, ω) = 2(r0)2F
2(Q)
4πµ2B
χ′′(Q, ω)
1− e−hω/kT(1)
where (r0)2= 290.6 mbarns Sr−1 is a conversion fac-
tor to bring the intensity into absolute units of mbarnsmeV−1Sr−1 f.u.−1 (Sr=Steradian, f.u.=Formula Unit)and F (Q) is the magnetic form factor for the Fe2+ ion.
III. ANALYSIS AND RESULTS
A. Survey of reciprocal space
Fig. 1 shows the (hhL) plane in reciprocal space wherethe low energy measurements were performed. It alsoshows several Q-scans taken at temperatures below (10K and 140 K) and above TN (180 K) the concomitantstructural and Neel ordering temperature TN = TS = 172K. Below TN , magnetic Bragg peaks appear at QAFM =(1/2, 1/2, L) positions with L = odd that describe theordered AFM stripe structure. Figs. 1(b)-(f) show var-ious cuts, as indicated in Fig. 1(a), through the (hhL)scattering plane at a finite energy transfer of 10 meV andEf = 41.2 meV. Similar scans performed with Ef = 14.7meV show qualitatively the same results. Below TN ,sharp excitations are observed at QAFM that originatefrom very steep spin wave excitations in the orderedstate.13,15 The difference in sharpness of the spin wavepeaks in the [h, h, 0] and [0, 0, L] directions is due tothe anisotropy in the spin wave velocity, as discussedin Ref.[15]. When the sample is warmed up above TN ,strong intensity remains at QAFM position with muchbroader lineshapes indicating short-ranged AFM spincorrelations. The scans shown in Fig. 1 are stronglyinfluenced at higher angles by the presence of aluminumphonon scattering from the sample holder and low anglescattering from the direct beam. Both contributions leadto very high background levels and limit the range of theQ-scans.Since the stripe AFM ordering may be frustrated in the
tetragonal structure, we searched for evidence of spin cor-relations at other wavevectors in addition to the strongcomponents of the diffuse excitations near QAFM. Nomagnetic diffuse scattering was observed along varioussymmetry directions in the (h0L) plane. In particular, noevidence of magnetic scattering was seen at the wavevec-tor (1,0,L = even) corresponding to Neel (C-type) AFMfluctuations (see Figs. 1(g) and (h)). In the (hhL) plane,there are indications of weak peaks in the extended Q-scans at wavevectors other than QAFM which may arisefrom additional magnetic modulations in the paramag-netic phase. For example, very weak peaks can be ob-served at (002) and (003) (see Figs. 1(b), (d), and (e))which would correspond to the presence of ferromagneticcorrelations and A-type magnetic correlations (ferromag-netic within the layer, AFM between layers), respectively.In order to understand the development of correlations
at QAFM and address the potential existence of addi-tional magnetic modulations (002) and (003), the tem-perature dependence was measured at various points inthe (hhL) plane at an energy transfer of 10 meV. Fig.2(a) shows the temperature evolution of the scatteredintensities at (002) and (003). The intensities show noanomaly at TN , but rather the intensity increases linearlywith temperature as expected for a phonon background.This background is observed throughout the scatteringplane and partly arises from aluminum phonon scatter-

4
FIG. 4: (Color online) The dynamic magnetic susceptibility ofCaFe2As2 as a function of energy at QAFM = (1/2, 1/2, 3) forT = 140 K (blue solid squares), T = 180 K (grey solid circles) andT = 220 K (red solid diamonds). Above the magneto-structuraltransition TN = TS = 172 K, a broad magnetic spectrum is ob-served as quasi-elastic response nearQAFM. Data taken at T = 180K were fit to a Lorentzian form given in Eq. (2) convoluted withthe instrumental resolution (black solid line). The Lorentzian half-width ΓT at T = 180 K is 10 meV. At T = 220 K, we estimate theenergy linewidth to be ∼ 13 meV using the expression ΓT = γ( a
ξT)2
and the fitted value of γ (temperature independent Landau damp-ing defined in the text) and that of the correlation length ξT at 220K. The calculated Lorentzian scattering at T = 220 K is shown asa red solid line. In contrast, sharp spin waves having an energy gap∆ of ∼7 meV are observed in the ordered phase at T = 140 K.
ing from the sample holder, with little or no magneticcontribution. We can use the intensity at (002) and (003)as an estimate for this phonon background. In Fig. 2(b),the temperature dependence at QAFM = (1/2, 1/2, 1)and also (1/2, 1/2, 0) is shown. The intensity at QAFM
increases from low temperatures as expected for the in-creasing Bose population factor of the low lying spin wavemodes. At TN , there is a sharp drop in the intensity con-sistent with the first-order transition to the paramagneticstate. The paramagnetic intensity decreases above TN
and is nearly at background by 300 K. At (1/2, 1/2, 0)the intensity is nearly at background level below TN , in-creases sharply at the transition, and decreases slowly athigher temperatures.
The L−dependence of the paramagnetic scattering isconsistent with weak antiferromagnetic correlations be-tween layers atop a constant magnetic background, asillustrated in Fig. 2(b). Figs. 3(a) and (c) show the L-dependence of the scattering at hω = 10 meV and alongthe (1/2, 1/2, L) direction for T = 300 K and 180 K,respectively. The L-dependence displays sinusoidal vari-ation with maxima at odd values of L. The lines showncorrespond to fits to the dynamic susceptibility and willbe described in detail below. The intensity drops by afactor of 2 between 180 K and 300 K indicating the grad-ual evolution of the system to less correlated quasi-2Dspin fluctuations similar to the reduction in intensity for
FIG. 5: (Color online). Magnetic excitations in CaFe2As2 mea-sured on the MAPS spectrometer with an incident energy ofEi = 100 meV at T = 10 K (left panel) and 180 K (right panel).The data shows magnetic intensity as a function of the [h, h] di-rection and the energy transfer after averaging over the transverse[h,−h] direction in the range 0.4< h <0.6. Given the fixed crystalorientation with incident beam along L, the L component of thewave vector varies with the energy transfer as indicated. Excita-tions below TN are consistent with steep spin waves and diffusemagnetic excitations are observed above TN at T = 180 K.
cuts along the [h, h, 3] direction shown in Figs. 3 (b)and (d). The temperature dependence of Al phonons isprimarily responsible for the increase in background be-tween 180 K and 300 K. However, the constant magneticbackground itself is also weakly temperature dependentas inferred from Fig. 2 (a). We return to this in sectionIII C.In all, the surveys of magnetic scattering intensities
above TN in the (hhL) and (h0L) planes indicate thatthe AFM spin correlations are restricted to the vicinity ofQAFM, the wavevector of the stripe ordered phase. Oneessential difference in the paramagnetic phase is an in-crease in the c-axis anisotropy and tendency towards 2Dspin fluctuations, as indicated by the weakly modulatedrod of scattering along L. This is entirely analogous tothe behavior of AFM spin fluctuations in the optimallydoped superconductors, where interlayer correlations arevery weak5,23.
B. Energy dependence
Fig. 4 depicts the dynamical structure factorχ′′(QAFM, ω)/hω at QAFM = (1/2, 1/2, 3) and hω < 22meV for temperatures above and below TN . In order toobtain χ′′ from the raw data, a non-magnetic backgroundwas estimated by measurements at Q = (0.35, 0.35, 3)and subtracted. Below TN , the low energy magneticspectrum consists of spin waves with a sizeable spin gapof 7 meV (see Ref. 15). Just above TN , the gap collapsesand the spin wave scattering is replaced by gapless, dif-fusive excitations. At 180 K, the diffusive excitations canbe fit to a quasi-elastic Lorentzian form,
χ′′(QAFM, ω)
hω=
A
(hω)2 + Γ2T
(2)
with an energy linewidth of ΓT = 10 ± 1 meV. Theparameter A is an arbitrary intensity scale factor. As
5
FIG. 6: (Color online). Constant energy slices (∆E = ±5 meV)through the excitation spectrum of CaFe2As2 in the (h, k) planeat T = 10 K and 180 K, as observed on MAPS. Energy slicesare chosen to correspond to odd values of L. Intensity shown isin absolute units (mbarn Sr−1 meV−1 per formula unit). BelowTN , well defined spin waves are observed around QAFM (see alsoRef. [16]). Above TN , strong but short-range magnetic correlationsremain around QAFM and extend up to at least 60 meV. Solid linesin panel (c) show the directions along which the cuts in Fig. 7 aretaken, with (+) designating longitudinal cuts and (-) transversecuts.
the temperature is increased, the Lorentzian half-widthgrows rapidly. At T = 220 K, the spectrum weakensconsiderably with temperature and appears flat withinthe energy range measured, thus the Lorentzian widthsbecome large and poorly defined. This rapid increase inthe quasi-elastic linewidth with temperature is explainedbelow.
C. Spectrum of paramagnetic spin fluctuations
near QAFM
At temperatures just above TN (T = 180 K, T/TN =1.05) we used the MAPS spectrometer to perform a de-tailed survey of the spin fluctuations in the paramagneticphase in the vicinity ofQAFM. For detailed modeling, theMAPS measurements were normalized in absolute scat-tering units of mb Sr−1 meV−1 f.u.−1 by comparison toa vanadium standard. Data were collected at 180 K andalso in the AFM ordered phase at 10 K (with an inci-dent energy of 100 meV). As in previous work,16 we use
100
200
300
200
300
400
Inte
nsity
(A
.U.)
0.25 0.5 0.75h in [hhL]
100
200
300
-0.4 -0.2 0 0.2 0.4[1/2+ ε, 1/2- ε, L]
60 meV
12 meV
39 meV
T=180 K
L=1
L=3
L=5
(+) (-)
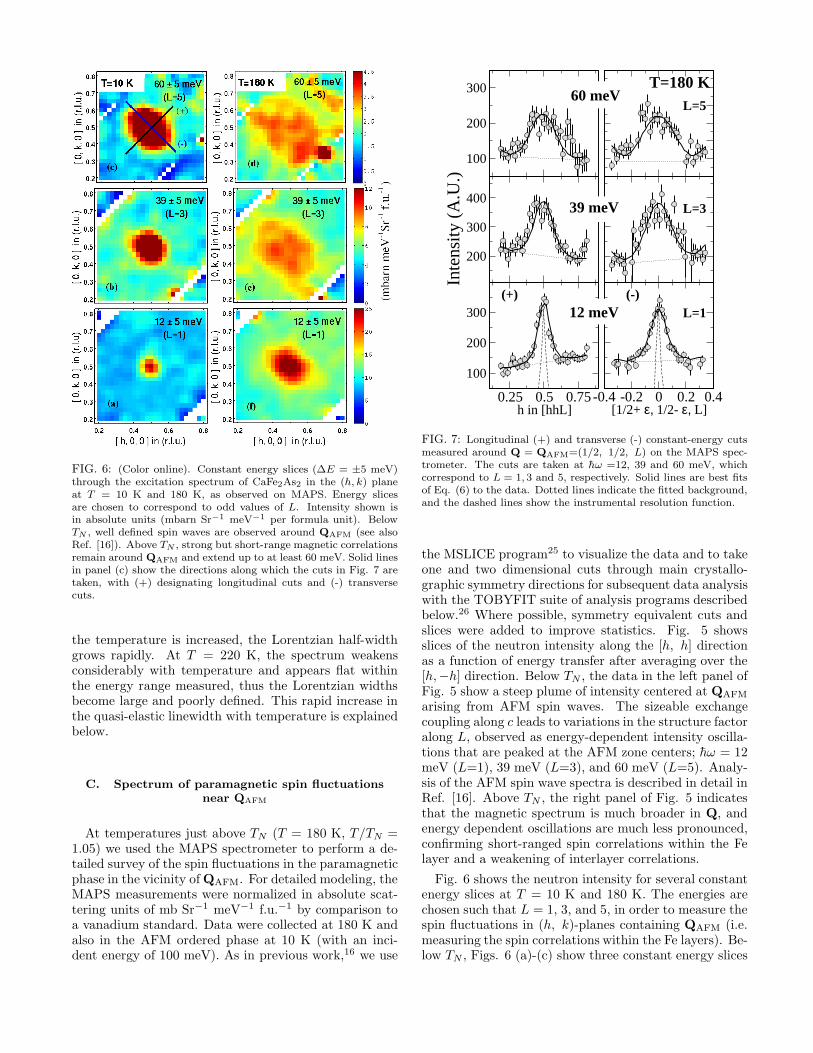
FIG. 7: Longitudinal (+) and transverse (-) constant-energy cutsmeasured around Q = QAFM=(1/2, 1/2, L) on the MAPS spec-trometer. The cuts are taken at hω =12, 39 and 60 meV, whichcorrespond to L = 1, 3 and 5, respectively. Solid lines are best fitsof Eq. (6) to the data. Dotted lines indicate the fitted background,and the dashed lines show the instrumental resolution function.
the MSLICE program25 to visualize the data and to takeone and two dimensional cuts through main crystallo-graphic symmetry directions for subsequent data analysiswith the TOBYFIT suite of analysis programs describedbelow.26 Where possible, symmetry equivalent cuts andslices were added to improve statistics. Fig. 5 showsslices of the neutron intensity along the [h, h] directionas a function of energy transfer after averaging over the[h,−h] direction. Below TN , the data in the left panel ofFig. 5 show a steep plume of intensity centered at QAFM
arising from AFM spin waves. The sizeable exchangecoupling along c leads to variations in the structure factoralong L, observed as energy-dependent intensity oscilla-tions that are peaked at the AFM zone centers; hω = 12meV (L=1), 39 meV (L=3), and 60 meV (L=5). Analy-sis of the AFM spin wave spectra is described in detail inRef. [16]. Above TN , the right panel of Fig. 5 indicatesthat the magnetic spectrum is much broader in Q, andenergy dependent oscillations are much less pronounced,confirming short-ranged spin correlations within the Felayer and a weakening of interlayer correlations.
Fig. 6 shows the neutron intensity for several constantenergy slices at T = 10 K and 180 K. The energies arechosen such that L = 1, 3, and 5, in order to measure thespin fluctuations in (h, k)-planes containing QAFM (i.e.measuring the spin correlations within the Fe layers). Be-low TN , Figs. 6 (a)-(c) show three constant energy slices

6
10 20 30 40 50 60 70
0
5
10
15
20
25
30L=3 L=5
S(Q
,) (
mba
rns
meV
-1 S
r-1 f.
u.-1)
h (meV)
MAPS Model
L=1
T=180 K
FIG. 8: Net magnetic neutron scattering intensity as a function ofenergy measured on MAPS around QAFM = (1/2, 1/2, L) aftersubtraction of a non-magnetic background at Q = (0.15, 0.5, L).The integration ranges used in MSLICE are such that ∆h = ±0.05.Lines are the best fits of Eq. (5) to the data.
through the AFM spin wave cone centered QAFM. AboveTN , Figs. 6 (d)-(f) again demonstrate that the sharp spinwaves are replaced by very broad scattering in the para-magnetic phase. The paramagnetic fluctuations persistup to at least 60 meV and are notably anisotropic withan elliptical shape. This anisotropic scattering is charac-terized by transverse [h,−h] cuts through QAFM beingbroader than the longitudinal [h, h] cuts, as illustratedin Fig. 7 where the solid lines are the resolution convo-luted fits of Eq. (5) to the experimental data, describedbelow. This anisotropy implies that the paramagneticfluctuations are described by two different spin correla-tion lengths within the Fe layer. An in-plane anisotropyof this type is allowed in the I4/mmm tetragonal cell, i.e.4-fold symmetry has not been broken. The origin of thisanisotropy is discussed below.Fig. 8 shows the energy dependence of the MAPS neu-
tron intensity at QAFM = (1/2, 1/2, L) at T = 180K after subtraction of background estimated at Q =(0.15, 0.5, L). In the geometry of our time-of-flightexperiment, L varies with energy transfer, however, L-dependent oscillations here and in Fig. 5 are only weaklypresent. After correcting for the dependence of the mag-netic form factor, the data was fit to the full susceptibilityfunction described in Eq. 5 after convolution with the in-strumental resolution function. The model describes theMAPS data quite well, including weak L-dependent os-cillations, and gives relaxational half-width ΓT = 10±1meV, which is consistent with the HB3 measurementsshown in Fig. 4.Fig. 9 shows HB3 scans along the [h, h] and L-
directions through QAFM = (1/2, 1/2, 3) and hω = 5meV at several temperatures. Similar to Fig. 1, the
0.25 0.5 0.75h in [hhL]
0
500
1000
1500
Inte
nsity
(A
.U.)
2.5 3 3.5L in [1/2 1/2 L]
140 K
180 K
220 K
250 K
300 KHB-3 5 meV
(a) (b)
FIG. 9: Fits of Eq. (5) to constant energy cuts at 5 meV along hand L, as a function of increasing temperature (180 ≤ T ≤ 300 K).Circles are experimental data measured on HB3 with Ef = 14.7meV. Solid lines are the best fit to the data. Both the h- and Lscans were fit to Eq. (5) (as shown in Fig. 3 over a wider range ofh- and L). The data at T = 140 K was fit to a spin wave model(as described in Ref. [15]), and is shown here for comparison.
cuts below TN show sharp spin wave scattering. Themeasurements at several temperatures above TN indicatea gradual weakening of the scattering at QAFM as thetemperature is raised, reminiscent of Figs. 3 and 4. Asnoted above, the magnetic scattering along the [h, h] di-rection through QAFM is much sharper, as shown in Fig.3 (d), indicating much longer ranged spin correlationswithin the Fe layer than between layers. We see now thatthe weakening originates from temperature-dependentbroadening of the scattering in reciprocal space, indicat-ing a gradual reduction in the spin correlation lengthwith temperature. Similar to Fig. 3, the L−dependenceof scans atQAFM =(1/2, 1/2, 3) and hω = 5 meV were fitto the susceptibility in Eq. (5) for several temperaturesup to 300 K and are shown as solid lines in Fig. 9(b).The description of this fitting and the interpretation ofthe results is now described.
D. Theoretical Model
In this section, we describe the theoretical model usedto fit the experimental data. At temperatures belowTN , the imaginary part of the generalized susceptibil-ity χ′′(Q, ω) for CaFe2As2 is well described by dampedspin wave models.15–17 Above TN , our neutron scatter-ing data reveal several features that have allowed us todevelop a fairly detailed model of the paramagnetic exci-tations. First, the excitations are diffusive in character,at least for the measured energy scales (< 60 meV). Sec-ond, the excitations are nearly two-dimensional, with a

7
weak modulation of the scattered intensities along L. Fi-nally, broad scattering is observed within the Fe layersthat is anisotropically distributed around QAFM. We arethus forced to define two in-plane spin correlation lengthsin order to fully describe the quasi-2D spin fluctuations.Considering these facts, we start by writing the to-
tal dynamical magnetic susceptibility per formula unitas that of a two-dimensional metallic AFM in the para-magnetic phase,23,27 which we have extended to includethe effects of an in-plane anisotropy of the magnetic in-teractions.
χ−12D(Q2D
AFM + q||, ω) = χ−10
[
(q2|| + ηqxqy)a2 + (ξT /a)
−2 − ihω/γ]
. (3)
The parameter ξT defines the magnetic correlation lengthat temperature T in units of A, χ0 is the staggered sus-ceptibility, and γ denotes the damping coefficient origi-nating from the spin decay into particle-hole excitations.The dimensionless parameter η is used to represent theanisotropy of the in-plane correlation lengths. The vectorq|| = (qx, qy) =
2πa (h, k) is a 2D vector defined relative to
Q2DAFM = 2π
a (1/2, 1/2) and a =√2a0 is the lattice con-
stant of the tetragonal cell with a0 the nearest neighborFe-Fe distance. We can define two correlation lengthsin directions longitudinal (qx = qy denoted (+) scan)
to Q2DAFM with a value ξT+
= ξT (1 + η2)1/2 and trans-
verse (qx = −qy denoted (-) scan) to Q2DAFM with value
ξT−
= ξT (1 − η2)1/2. Thus, we must have 0 ≤ η < 2
in order for these correlation lengths to be meaningful,which we found indeed to be the case.
The effect of weak interlayer AFM coupling Jc on totaldynamic susceptibility can be written as
χ−1(QAFM+q, ω) = χ−12D(Q2D
AFM+q||, ω)+2Jcsin2(qzc/4)
(4)
where the scattering vector is defined as Q = QAFM +q|| + qzk. This expression can be motivated using the1/N approach for the action of the collective magneticdegrees of freedom employed in Refs.35,37. Taking theimaginary part of Eq. (4), we obtain the expression
χ′′(Q, ω) =hωγχ0
(hω)2 + γ2
[
(q2 + ηqxqy)a2 + ( ξTa )−2 + ηc(1 + cos(πL))]2
, (5)
TABLE I: Best fit parameters of Eq. (5) obtained self consis-tently from both HB-3 and MAPS at temperature T =180 K. Theparameter χ0 was solely obtained from the MAPS data which werenormalized in absolute units.
γ ξT χ0 η ηc
(meV) (A) (µB2 meV−1 f.u.−1)
43± 5 7.9±0.10 0.2±0.05 0.55±0.36 0.20±0.02
which we used to fit our inelastic neutron scattering data.Here, the parameter ηc = Jcχ0 controls the strength ofthe interlayer spin correlations and we have substitutedqz = 2π(L − 1)/c. A physical motivation for this ex-pression and an interpretation of these parameters in thecontext of the iron arsenides is given later in section IV.
As we are only able to define η from a single MAPSdata set at 180 K, we make the assumption that the pa-rameters χ0, γ, Jc and η in Eq. (5) do not depend on tem-
perature, making ξT the only temperature dependent pa-rameter in the model. However, one can introduce effec-tive temperature dependent parameters XT = χ0(
ξTa )2
and ΓT = γ( aξT
)2. With these definitions, the dynam-
ical susceptibility along the longitudinal direction at,
q =(
q√2, q√
2, L = 1
)
, or in the 2D limit where Jc = 0
can be written as,
χ′′2D(Q2D
AFM + q, ω) =hωΓTXT
(hω)2 + Γ2T (1 + q2ξ2T+
)2(6)
At q = 0, this model reduces to the quasi-elasticLorentzian lineshape used to describe the susceptibilityin Eq. (2).In the context of the iron arsenides, Eq. (6) was first
used successfully by Inosov et al.23 to describe the Co-
doped BaFe2As2 superconducting compound. In theirwork, Inosov et al.
23 assumed a mean-field behavior for
the correlation length ξT ∝ (T − TN)1/2
. Here, given the

8
TABLE II: Temperature evolution of the correlation lengthξT (in A) for several incident energies, as measured on HB-3.For a given temperature, ξT appears largely independent ofenergy, as expected. The final column, containing the corre-lation length averaged over all energies, is the value used insubsequent model calculations.
5 meV 10 meV 15 meV < ξT > (A)
180 K 8.1±0.2 7.9±0.1 7.8±0.3 7.9±0.1
220 K 7.0±0.2 7.2±0.3 6.9±0.2 7.0±0.1
250 K 6.0±0.1 6.0±0.2 6.2±0.2 6.1±0.1
300 K 4.9±0.1 4.9±0.2 4.9±0.2 4.9±0.1
strong first-order character of the magnetic transition inthe parent compound CaFe2As2, we do not assume anyparticular form for temperature dependence of ξT .
For detailed comparison of model susceptibility in Eq.(5) to the data, we use standard inelastic neutron scat-tering computer programs that account for resolutioneffects. Specifically, the high energy data collected onMAPS was analyzed using TOBYFIT26 while the lowenergy response measured on HB3 (up to 15 meV) wasanalyzed using RESLIB.28
Our protocol was to establish the value of the temper-ature independent parameters using data sets from bothHB3 and MAPS at 180 K where scattering features aremore sharply defined. Data fits at subsequent tempera-tures would then only require the refinement of a singleparameter, ξT . Due to the interrelated nature of the fit-ting parameters, self-consistency checks were performedfor model fittings on the HB3 and MAPS data sets. Thein-plane anisotropy parameter η was obtained indepen-dently from the MAPS data by fitting the longitudinal(+) and transverse (-) cuts, as depicted in Fig. 8. The ob-served in-plane anisotropy is then determined from these
fitted widths according to η = 2ξ2T+
−ξ2T−
ξ2T+
+ξ2T−
. The temper-
ature independent damping parameter, γ, was obtainedfrom both the HB3 and MAPS energy scans at T = 180K where we have the best signal to noise ratio. The cor-responding fits are illustrated in Figs. 4 and 7. The fitswere performed by constraining the value of γ = ΓT (
ξTa )2
such that the Lorentzian width ΓT remains fixed at 10meV (fitting only for ξT ). Once γ was determined atT = 180 K, it was held fixed in all subsequent fits.
To determine ηc at 180 K, we have performed a chi-squared analysis of fits in which only ηc (0 ≤ ηc ≤ 0.5)was allowed to vary, and other parameters held fixed.The best fits were obtained for 0.9 < ηc < 0.11, as indi-cated in Fig. (3), which also corresponds to a minimumχ2 value. Outside this range, χ2 drastically increases andthe fits are altered. The parameter ηc in Eq. (5) whichdescribes the interlayer coupling was found to be ≃ 10%at T = 180 K.
The parameters χ0 and ξT were found to be stronglycorrelated. The prescription was used to fix ξT (effec-
tively fixing the width) and then vary the scale factor χ0
to get the best fit. This procedure was performed for con-stant energy cuts at several energy transfers on both HB3and MAPS data sets at T = 180 K. Upon convergenceto reasonable values of χ0 and ξT , the whole procedurewas repeated for consistency. Once the best fitted valueof χ0 was obtained at 180 K, we kept it fixed at thatsame value for all other temperatures and fit the data byvarying only ξT .The MAPS data was normalized to vanadium stan-
dard, allowing us to report χ0 in absolute units. In con-trast, the HB3 data was not in absolute units. Thus,the corresponding best fitted scale factor from HB3 givesa value that is proportional to the true χ0. Thereforethe χ0 value reported here are obtained solely from theMAPS data. In all, we arrived at the following finalset of parameters at T = 180 K; γ = 43 ± 5 meV,χ0 = 0.20 ± 0.05 µ2
B meV−1f.u.−1, ξT+= 8 ± 1 A and
ξT−
= 6± 1.5 A. Fits are shown as solid lines in Figs. 3,4, 7 and 8. From these values, we estimate the averagein-plane anisotropy parameter 〈η〉 ≃ 0.55±0.36, and thuskept η fixed at this value in subsequent model fits to thehigher temperature data. The corresponding value of thestatic correlation length ξT obtained from MAPS is 7±2A, in good agreement with the low energy HB3 value of7.9±0.1 A. A summary of all of the model parameters atT = 180 K are listed in Table I.Fig. 9(a) shows the temperature dependence of the
HB3 constant energy cuts along the [1, 1, 0] direction at5 meV for several temperatures up to 300 K. These datawere fit to determine the values of ξT at different tem-peratures. The correlation length decreases by a factor of∼2 from 180 K to 300 K. Similar fits were performed atconstant energy cuts of 10 meV and 15 meV (not shown),giving comparable results. The results are summarizedin Table II.We note that the set of parameters in Tables I and II
describe the full data set at all temperatures and energytransfers exceptionally well, as can be seen by reviewingall of the fitted curves in Figs. 3, 4, 7, 8 and 9. Forexample, the line through the data in Fig. 4 at T = 220K is not a fit, rather it is a model calculation based onthe fixed parameters in Tables I and II. This universalagreement with the data at all measured energies andtemperatures is a strong endorsement for the validity ofthe nearly AFM model.
IV. DISCUSSION AND CONCLUSIONS
A. Discussion
Despite the strong first order transition and the pos-sible influence of magnetic frustration in the tetragonalphase, we find that the spin fluctuations observed abovethe AFM ordering temperature in CaFe2As2 are peakedat QAFM, the wavevector of the stripe AFM structure.We found no evidence of substantial magnetic fluctua-
9
TABLE III: The derived staggered susceptibility XT , relax-ational linewidth ΓT , and bulk susceptibility χbulk, as a func-tion of temperature from 180 < T < 300 K.
Temp. 180 K 220 K 250 K 300 K
XT (µ2
BmeV−1 f.u.−1) 0.84 0.66 0.49 0.32
ΓT (meV) 10 13 17 26
χbulk (10−4 emu mol−1) 2.41 2.40 2.39 2.37
tions at any of the other wavevectors studied, indicat-ing that the relevant spin fluctuations throughout thephase diagram are short-ranged fluctuations of the low-temperature stripe AFM ordering. In addition, we findweaker interlayer coupling immediately above TN in theparent compound, suggesting that the quasi-2D spin fluc-tuations are a property of the tetragonal paramagneticphase in general, and does not necessarily occur only af-ter doping.The substantial spin fluctuations that persist above TN
should have an effect on the bulk transport and magneticproperties of CaFe2As2. For example, such spin fluctua-tions are a likely source of the high resistivity found forCaFe2As2 between TN and 300 K at ambient pressure.24
Large spin disorder scattering at ambient pressure is sup-ported by dramatic decrease of the resistivity29,30 anddisappearance of spin fluctuations31 upon transition tothe collapsed tetragonal phase under applied pressure.The bulk magnetic susceptibility of CaFe2As2 also dis-
plays a weak, non Curie-Weiss temperature dependenceabove TN .24 Even though Eq. (5) is strictly valid onlyas an expansion for momenta close the AFM orderingvector, we can use this expression for the dynamic spinsusceptibility to estimate theQ = 0 bulk susceptibility asχbulk = χ(Q = 0, ω = 0) = χ0/[2π
2(1 + η/2) + ( ξTa )−2 +2ηc].For large correlation lengths, the bulk susceptibility
takes on a temperature independent value of χbulk ≈χ0/[1 + 2π2(1 + η/2) + 2ηc] = 2.43x10⁻⁴ emu mol−1
f.u.−1. This estimate has the same order of magnitudeas the bulk susceptibility determined from magnetiza-tion measurements,24 further justifying the validity of themodel. The shorter correlation lengths found well aboveTN will decrease the bulk susceptibility as shown in Ta-ble III, although this effect is small for the temperaturesstudied.The extrapolation of Eq. (5) to other momentum val-
ues also allows us to estimate the size of the fluctuatingmoment per iron atom
〈m2〉 = 1
2
3h
π
∫
χ′′(Q, ω)(1− e−hω/kT )−1
dQdω∫
dQ. (7)
The Q-integration is performed in the orthorhombiczone (containing one ellipse of scattering) defined by theranges 0 ≤ Qx(Qy) ≤ 2π
a and 0 ≤ Qz ≤ 4πc . The factor
of 1/2 in eq. 7 converts the results from squared-moment
per formula unit to squared moment per iron. If wechoose a high energy cut-off of ∼200 meV correspondingto the upper limit of observed spin wave excitations,16,17
we obtain√
〈m2〉 ≃ 0.7 µB per iron which is very closeto the size of the observed ordered moment.32
The spin fluctutations observed above the AFM order-ing temperature in CaFe2As2 bear a close resemblance tothat of doped superconducting BaFe2As2. Based on themodel fitting, the similarity of the spin fluctuations in theparent and superconducting compositions can be com-pared more quantitatively. The paper by Inosov et al.
23
describes the parameters for short-range spin correlationsin the optimally doped superconducting composition us-ing an equation similar to (6). We can estimate the valuesof the model parameters at 180 K for this SC composi-tion using mean-field temperature scaling as described byInosov et al. Also, since the model parameters describedin their work assume isotropic in-plane spin correlations,we extended their model by including the anisotropy pa-rameter, η, obtained from our results (i.e. assuming ηto be both temperature and composition independent).With these assumptions, we estimated the values of themodel parameters for the superconducting sample withthe following results at 180 K; the static susceptibilityat the antiferromagnetic wavevector is XT = 0.18 µ2
BmeV−1 f.u.−1, the longitudinal correlation length is ξT+
= 11 A, and the Landau damping γ = 180 meV. Thiscan be compared to the values in CaFe2As2 at the sametemperature as found here; XT = 0.9 µ2
B meV−1 f.u.−1,ξT+
= 8 A, and γ = 43 meV. The results show that theLandau damping parameter is much larger in the super-conducting composition, whereas the correlation lengthsat 180K are similar. In comparing these numbers, it isimportant to also recall the differences between the twomaterials investigated. For instance, in the sample stud-ied by Inosov et al.,23 the alkaline earth metal is Ba andno magnetic phase transition is present. On the otherhand, in the sample analyzed here, the alkaline earthmetal is Ca and, at 180K, the system is very close to astrong first-order magnetic transition.
We now turn to a discussion of the physical interpre-tation of the data. The new feature observed in ourresults is the anisotropy of the in-plane spin fluctua-tions in the paramagnetic phase, represented by the pa-rameter η. As discussed above, Eq. (5) is based ona metallic AFM model and a proper starting point tounderstand this anisotropy is an electronic band modelfor the magnetic susceptibility. The unique band struc-ture of the iron arsenides, consisting of circular holepockets at Q=(0, 0) and elliptical electron pockets atQ2D
AFM=(1/2, 1/2), combined with electron-electron in-teractions will lead to an anisotropic spin response,even in the tetragonal phase.33,34 More physical insightcan be gained by considering a phenomenological modelfor the collective magnetic degrees of freedom of thepnictides.35–37 In these materials, the magnetic latticein each iron arsenide plane can be subdivided in two in-terpenetrating antiferromagnetic sublattices, each con-
10
taining one iron per unit cell. These two sublatticesare only loosely coupled, because the local magnetic fieldproduced by one sublattice on the other vanishes in thecompletely ordered state. To dominant order, the onlycouplings between the two sublattices that are allowedby symmetry are the biquadratic term −g(m1 ·m2)
2 andthe momentum-dependent quadratic term ηqxqym1 ·m2.Evaluation of the spin-spin correlation function using thistwo-sublattice model leads to Eq. (5). Within this de-scription, the anisotropy of the correlation length resultsfrom an inter-sublattice coupling.
This phenomenological model can be motivated byeither an itinerant38 or a localized moment picture9.Indeed, the short correlation lengths encountered inthe paramagnetic phase suggest a minimum descriptionwhere only the short-range interactions are kept. Onethen has the so-called frustrated J1-J2 model, with an-tiferromagnetic nearest-neighbor exchange interaction J1and next-nearest neighbor exchange J2. The anisotropyparameter η becomes simply the ratio between the twoexchange constants, η = J1/J2, and J2 is related to thebare susceptibility χ0 of Eq. (5) through χ0 = 2/J2. Thisalso allows us to equate the interlayer coupling parameterηc with the ratio 2Jc/J2.
The exchange ratios in the paramagnetic phase canbe compared directly to the values in the orthorhom-bic AFM ordered phase as obtained from measurementsof spin waves16,17 (see also Fig. 6) From the observedanisotropy of the in-plane correlation lengths, we can de-termine J1/J2 = 0.55± 0.36 in the tetragonal phase, im-plying that J1 is indeed antiferromagnetic. In the AFMordered orthorhombic phase, there are distinct nearest-neighbor exchange interactions, J1a and J1b and the ex-perimentally determined ratio16,17 (J1a + J1b)/2J2 ≈0.6 − 1 is similar in magnitude to the exchange ratioin the paramagnetic phase and within the error bars.Thus, the relative strength of the average exchange in-teractions in the Fe plane do not appear to be stronglyaffected by the structural transition. The value of this ra-tio J1/J2 < 2 places the paramagnetic phase of CaFe2As2in a regime of frustrated magnetism within the J1 − J2model and consistent with the presence of spin nematiccorrelations.35–37 Taking the fitted value of χ0 and con-sidering the Fe moment to be ∼ 1µB, one can use therelation χ0 ∼ 2/J2 to estimate the the effective next-nearest neighbor exchange J2 ≈ 10 meV, which can becompared with the value of 25-35 meV obtained from fitsto the spin wave dispersion in the ordered phase.
With regard to the 2D nature of the spin fluctuationsabove TN , we can estimate the relative strength of theinterlayer coupling in the paramagnetic phase throughthe parameter ηc. The resulting exchange ratio Jc/J2 =0.1 ± 0.01, is lower than the ratio Jc/J2 ≈ 0.15 − 0.25in the ordered AFM state17, implying that the fluctua-tions have a more two-dimensional character above TN .This result is consistent with angle-resolved photoemis-sion spectroscopy (ARPES),39 which showed that theband structure dispersion of CaFe2As2 is quasi-2D above
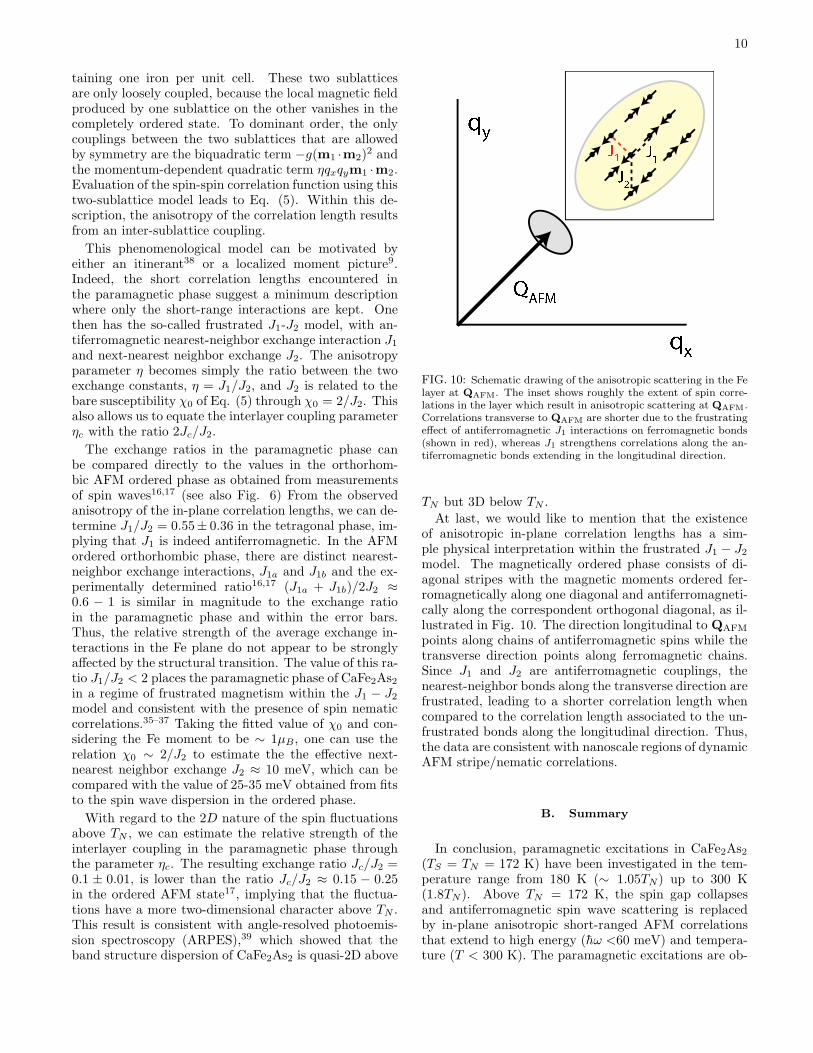
FIG. 10: Schematic drawing of the anisotropic scattering in the Felayer at QAFM. The inset shows roughly the extent of spin corre-lations in the layer which result in anisotropic scattering at QAFM.Correlations transverse to QAFM are shorter due to the frustratingeffect of antiferromagnetic J1 interactions on ferromagnetic bonds(shown in red), whereas J1 strengthens correlations along the an-tiferromagnetic bonds extending in the longitudinal direction.
TN but 3D below TN .
At last, we would like to mention that the existenceof anisotropic in-plane correlation lengths has a sim-ple physical interpretation within the frustrated J1 − J2model. The magnetically ordered phase consists of di-agonal stripes with the magnetic moments ordered fer-romagnetically along one diagonal and antiferromagneti-cally along the correspondent orthogonal diagonal, as il-lustrated in Fig. 10. The direction longitudinal to QAFM
points along chains of antiferromagnetic spins while thetransverse direction points along ferromagnetic chains.Since J1 and J2 are antiferromagnetic couplings, thenearest-neighbor bonds along the transverse direction arefrustrated, leading to a shorter correlation length whencompared to the correlation length associated to the un-frustrated bonds along the longitudinal direction. Thus,the data are consistent with nanoscale regions of dynamicAFM stripe/nematic correlations.
B. Summary
In conclusion, paramagnetic excitations in CaFe2As2(TS = TN = 172 K) have been investigated in the tem-perature range from 180 K (∼ 1.05TN) up to 300 K(1.8TN). Above TN = 172 K, the spin gap collapsesand antiferromagnetic spin wave scattering is replacedby in-plane anisotropic short-ranged AFM correlationsthat extend to high energy (hω <60 meV) and tempera-ture (T < 300 K). The paramagnetic excitations are ob-

11
served only around the low temperature magnetic zonecenter QAFM. The in-plane anisotropy of the spin corre-lation length has a natural explanation in terms of short-ranged magnetic interactions in the J1−J2 model. Thus,the paramagnetic fluctuations correspond to the emer-gent stripe AFM ordered structure and are suggestive ofnematic correlations. The magnetic correlations aboveTN have an anisotropic 2D character and bear a close re-semblance to the paramagnetic fluctuations observed inthe superconducting compositions.
V. ACKNOWLEDGMENTS
We thank V.P. Antropov, D. Johnston and J.Schmalian for stimulating discussions. Work at the AmesLaboratory was supported by the Department of Energy,Basic Energy Sciences under Contract No. DE-AC02-07CH11358. Technical assistance of the staff at ORNLand ISIS is gratefully acknowledged.
1 N. Ni, A. Thaler, A. Kracher, J.-Q. Yan, S. L. Bud’ko, andP. C. Canfield. Phys. Rev. B 80, 024511, (2009).
2 P. C. Canfield, S. L. Bud’ko, N. Ni, J.-Q. Yan, and A.Kracher. Phys. Rev. B 80, 060501(R), (2009).
3 J.-.H Chu, J. G. Analytis, C. Kucharczyk, and I. R. Fisher.Phys. Rev. B 79, 014506, (2009).
4 A. D. Christianson, E. A. Goremychkin, R. Osborn, S.Rosenkranz, M. D. Lumsden, C. D. Malliakas, I. S.Todorov, H. Claus, D. Y. Chung, M. G. Kanatzidi, R.I.Bewley, and T. Guidi. Nature 456, 930, (2008).
5 M. D. Lumsden, A. D. Christianson, D. Parshall, M. B.Stone, S. E. Nagler, G. J. MacDougall, H. A. Mook,K. Lokshin, T. Egami, D. L. Abernathy, E. A. Goremy-chkin, R. Osborn, M. A. McGuire, A. S. Sefat, R. Jin,B. C. Sales, and D. Mandrus. Phys. Rev. Lett. 102, 107005,(2009).
6 S. Chi, A. Schneidewind, J. Zhao, L. W. Harriger, L. Li,Y. Luo, G. Cao, Z. Xu, M. Loewenhaupt, J. Hu, and P.Dai. Phys. Rev. Lett. 102, 107006, (2009).
7 Y. J. Uemura. Nature Mater. 8, 253, (2009).8 T. Yildirim. Phys. Rev. Lett. 101, 057010, (2008).9 Q. Si and E. Abrahams. Phys. Rev. Lett. 101, 076401,(2008).
10 I. I. Mazin, D. J. Singh, M. D. Johannes, and M. H. Du.Phys. Rev. Lett. 101, 057003, (2008).
11 A. V. Chubukov, D. V. Efremov, and I. Eremin. Phys.
Rev. B 78, 134512, (2008).12 T.-M. Chuang, M. P. Allan, J. Lee, Y. Xie, N. Ni, S. L.
Bud’ko, G. S. Boebinger, P. C. Canfield, and J. C. Davis,Science 327, 5962, (2010).
13 J. Zhao, D.-X. Yao, S. Li, T. Hong, Y. Chen, S. Chang,W. Ratcliff II, J. W. Lynn, H. A. Mook, G. F. Chen, J. L.Luo, N. L. Wang, E. W. Carlson, J. Hu, and P. Dai. Phys.Rev. Lett. 101, 167203, (2008).
14 K. Matan, R. Morinaga, K. Iida, and T. J. Sato. Phys.
Rev. B 79, 054526, (2009).15 R. J. McQueeney, S. O. Diallo, V. P. Antropov, G. D.
Samolyuk, C. Broholm, N. Ni, S. Nandi, M. Yethiraj, J. L.Zarestky, J. J. Pulikkotil, A. Kreyssig, M. D. Lumsden,B. N. Harmon, P. C. Canfield, and A. I. Goldman. Phys.
Rev. Lett. 101, 227205, (2008).16 S. O. Diallo, V. P. Antropov, T. G. Perring, C. Bro-
holm, J. J. Pulikkotil, N. Ni, S. L. Bud’ko, P. C. Canfield,A. Kreyssig, A. I. Goldman, and R. J. McQueeney. Phys.
Rev. Lett. 102, 187206, (2009).17 J. Zhao, D.T. Adroja, D.-X. Yao, R. Bewley, L. Shiliang,
F.X. Wang, G. Wu, X.H. Chen, J. Hu, and P. Dai, Nature
Phys. 5, 555, (2009).18 M. M. Korshunov and I. Eremin. Eur. Phys. Lett. 83,
67003, (2008).19 A. N. Yaresko, G.-Q. Liu, V. N. Antonov, and O. K. An-
dersen. Phys. Rev. B 79, 144421, (2009).20 L. W. Harriger, A. Schneidewind, S. Li, J. Zhao, Z. Li, W.
Lu, X. Dong, F. Zhou, Z. Zhao, J. Hu, and P. Dai. Phys.
Rev. Lett. 103, 087005, (2009).21 D. K. Pratt, W. Tian, A. Kreyssig, J. L. Zarestky,
S. Nandi, N. Ni, S. L. Bud’ko, P. C. Canfield, A. I. Gold-man, and R. J. McQueeney. Phys. Rev. Lett. 103, 087001,(2009).
22 A. D. Christianson, M. D. Lumsden, S. E. Nagler, G. J.MacDougall, M. A. McGuire, A. S. Sefat, R. Jin, B. C.Sales, and D. Mandrus. Phys. Rev. Lett. 103, 087002,(2009).
23 D. S. Inosov, T. Shapoval, V. Neu, U. Wolff, J. S. White,S. Haindl, J. T. Park, D. L. Sun, C. T. Lin, E. M. For-gan, M. S. Viazovska, J. H. Kim, M. Laver, K. Nenkov,O. Khvostikova, S. Kuehnemann, and V. Hinkov. arXiv
(Cond-mat.) 0907.3632, (2009).24 N. Ni, S. Nandi, A. Kreyssig, A. I. Goldman, E. D. Mun,
S. L. Bud’ko, and P. C. Canfield. Phys. Rev. B 78, 014523,(2008).
25 R. Coldea. MSLICE: A Data Analysis Programme forTime-of-Flight Neutron Spectrometers. (2004).
26 T.G. Perring. Tobyfit - least-squares fitting to sin-gle crystal data on HET, MARI and MAPS. (2004).Source code and documentation available from the author
at [email protected] T. Moriya. Spin Fluctuations in Itinerant Electron Mag-
netism. Springer Series in Solid State Sciences (1985).28 A. Zheludev. (MATLAB)
http://neutron.ornl.gov/~zhelud/reslib/index.html.
.29 Milton S. Torikachvili, Sergey L. Bud’ko, N. Ni, and P. C.
Canfield. Phys. Rev. Lett. 101, 057006 (2008).30 W. Yu, A. A. Aczel, T. J. Williams, S. L. Bud’ko, N. Ni, P.
C. Canfield, and G. M. Luke. Phys. Rev. B 79, 020511(R),(2009).
31 D. K. Pratt, Y. Zhao, S. A. J. Kimber, A. Hiess, D. N.Argyriou, C. Broholm, A. Kreyssig, S. Nandi, S. L. Bud’ko,N. Ni, P. C. Canfield, R. J. McQueeney, and A. I. Goldman.Phys. Rev. B 79, 060510(R), (2009).
32 A. I. Goldman, D. N. Argyriou, B. Ouladdiaf, T. Chatterji,A. Kreyssig, S. Nandi, N. Ni, S. L. Bud’ko, P. C. Canfield,and R. J. McQueeney. Phys. Rev. B 78, 100506(R), (2008).
33 S. Graser, T. A. Maier, P. J. Hirschfeld and D J Scalapino.New J. Phys. 11, 025016, (2009).
34 J. Zhang. Private communication.35 C. Fang, H. Yao, W-F. Tsai, J.P. Hu, and S. A. Kivelson.
12
Phys. Rev. B 77, 224509, (2008).36 C. Xu, M. Muller, and S. Sachdev. Phys. Rev. B 78,
020501(R), (2008).37 R. M. Fernandes, L. H. VanBebber, S. Bhattacharya, P.
Chandra, V. Keppens, D. Mandrus, M. A. McGuire, B. C.Sales, A. S. Sefat, and J. Schmalian. arXiv (Cond-mat.)0911.3084 (2009).
38 I. Eremin and A. V. Chubukov. Phys. Rev. B 81, 024511,(2010).
39 C. Liu, T. Kondo, N. Ni, A. D. Palczewski, A. Bostwick,G. D. Samolyuk, R. Khasanov, M. Shi, E. Rotenberg, S.L. Bud’ko, P. C. Canfield, and A. Kaminski. Phys. Rev.
Lett. 102, 167004, (2009).