Theory, Instrumentation, and Applications of Electron Paramagnetic Resonance Oximetry
Upload
khangminh22Category
view
0download
0
EG0900025
Study of Radiation-induced Paramagnetic
Centers in Quartz and Its Possible use in
Radiation Dosimetry
A THESIS SUBMITTED TO FACULTY OF SCIENCE AL-AZHAR UNIVERSITY
In partial fulfillment of the requirements of
THE DEGREE OF DOCTOR PHILOSOPHY IN PHYSICS
BY ABDO MOHAMED EBRAHEEM MANSOUR
(M. Sc. Physics 2005) Under the Supervision of
Prof. Dr. Mohamed M. El-Okr Prof. Dr. Fouad M. Abdel-Rehim
Professor of Physics Professor of Radiation Chemistry
El-Azhar University NCRRT
Prof. Dr. Atef A. Abdel-Fattah Prof. Dr. Seif E. Ebraheem
Head of Radiation Protection Professor of Radiation Chemistry
and Dosimetry Department-NCRRT NCRRT
Dr. Mohamed Sherif El΄kotb
Lecturer of Material Science-Physics Department-Ain-Shams University
(Cairo, 2008)

ACKNOWLEDGMENT
The author wishes gratefully to thank Prof. Dr.
Mohamed El-Oker, Professor of Physics, Faculty of
Science, El-Azhar University, for his supervision,
continuous guidance and helpful discussions
throughout this work. The author wishes to express her highest appreciation
and profound gratitude to Prof. Dr. Fouad Abdel-Rehim,
Professor of Radiation Chemistry and Head of Reference
Dosimetry Laboratory, National Center for Radiation Research
and Technology (NCRRT), Egyptian Atomic Energy
Authority (EAEA), for suggesting the problem, his keen
supervision, continuous and variable helpful discussion,
theoretical and experimental advice, and encouragement
during all the stages of this work.
Deep thanks and gratitude to my Prof. Dr. Atef A.
Abdel-Fattah, Head of Radiation Protection and Dosimetry
Department, (NCRRT), for his continuous and helpful
discussions and for his effort in reviewing the final version
of the work.
I would like also to thank Prof. Dr. Seif E.
Ebraheem, Professor of Radiation Chemistry

(NCRRT), for their continuous encourages and
support.
The author is grateful to the Dr. Mohamed
Sherif El΄kotb, Lecturer of Material Science, Physics
Department, Faculty of Science, Ain-Shams
University, for his continuous encourages, support in
sample preparation and helpful discussions
throughout this work. My deep appreciation is extended to Prof. Dr. S.
Hegazy Chairman of the NCRRT for his encourage and
support.
Finally, deep appreciation is extended to all members of
Radiation Dosimetry Department, NCRRT, for their co-
operation.

CONTENTS
Acknowledgement
Figures List
Tables List
Aim of the Work
Abstract
Subject Page
no.
Chapter I: Introduction I.1- Gamma and electron beam radiation processing 1
I.2- Industrial application of radiation technology 3
I.3-Radiation dosimetry 7
I.3.1- Absorbed dose 8
I.3.2- The role of dosimetry in quality control 9
I.3.3- Characterization of dosimetry systems 10
I.3.3.1- Lot homogeneity 11
I.3.3.2- Influence quantities 12
I.3.3.3- Calibration 12
I.3.3.4- Traceability 13
I.3.3.5- Uncertainty in dose measurement 16
I.3.4- Dosimeter classes and application 17
I.3.4.1- Primary standard dosimeters 18
I.3.4.2- Reference standard dosimeters 18
I.3.4.3- Transfer dosimeters 19
I.3.4.4- Routine dosimeter 20
I.4- Principles of EPR spectroscopy 22
I.5- Properties of quartz 24
I.5.1- Structure of quartz 24
I.5.2- Defects in quartz 25
I.5.3- Effect of gamma radiation on quartz 25
Chapter II: Literature Reviews 29
II-1-Literature reviews on solid phase dosimeters for gamma
radiation and electron beam 29
II.1.1- Undyed plastics 29
II.1.2-Dyed plastics 33
II.1.3- Film dosimeters based on radiation-induced HCl generation 41
II.I.4- Radiation indicators 43
II.1.5- EPR Dosimetry 45
II-2. Literature reviews on quartz dosimetry 51
II.2.1- Quartz applications in low doses dosimetry 51
II.2.2- Quartz applications in high doses dosimetry 53
Chapter III: Experimental 55
III.1- Materials 55
III.2- Apparatus 56
III.2.1- Irradiation source (Gamma Irradiation) 56
III.2.2- EPR Spectroscopy 60
III.3- Preparation of quartz rods 62
III.4- Irradiation procedure (Gamma irradiation) 62
III.5- EPR spectra measurements 63
III.6- Dosimetry uncertainty for calibrations at egyptian
high-dose reference laboratory
65
III.6.1- Uncertainty calculation of alanine dosimeter 69

Chapter IV : Results and Discussion 71
IV.1- Study of EPR parameter for irradiated quartz rods 72
IV.1.1- Microwave power, (P) 72
IV.1.2- Modulation amplitude, (MA) 74
IV.1.3- Sweep width, (Sw) 76
IV.1.4- Conversion time, (Ct) 76
IV.1.5- Time constant, (Tc) 81
IV.2-EPR signal for irradiated and non-irradiated quartz rods 86
IV.3- Radiation Studies on quartz rods 91
IV.3.1- Binder effect on EPR spectra 91
IV.3.2- EPR spectra for irradiated different concentration samples 93
IV.3.3- Homogeneity of quartz rods 96
IV.3.4- Effect quartz rod length 96
IV.3.5- Stability of paramagnetic centers at low and high doses 98
IV.3.6- The relation between spin density and absorbed dose 99
IV.3.7- Minimum detectable dose 102
IV.4- Assessment of dosimetric characteristics for new
quartz rods
104
IV.4.1- EPR spectra 104
IV.4.2- Response curves for different concentrations 106
IV.4.3- Response curves for concentration of 30 % 115
IV.4.4- Uncertainty associated with calibration of 30 %
quartz rods
117
IV.4.4.1- Sources of type-B uncertainty 117
IV.4.4.2- Sources of type-A uncertainty 118
IV-4.4.3- Overall combined uncertainty associated with
calibration
131

IV.4.5- Pre- and Post-irradiation stability 134
IV.4.6- Temperature during irradiation 137
IV.4.7- Comparison between quartz and alanine dosimetry system 139
IV.4.8- Conclusion 141
SUMMARY 143
REFERENCES 149
ARABIC SUMMERY

LIST OF FIGURES
Page No.
Figure Title
Figure No.
15 A schematic representation of alternative
means of transfer of national absorbed dose
standards to field measurements in radiation
processing plants
Fig. (1)
25
Three-dimensional fully connected SiO2
network
Fig. (2)
26
Effect of gamma radiation on SiO2 network,
(a) represent SiO2 before irradiation
[crystalline or ordered phase], (b) represent
SiO2 after irradiation [amorphous or
disordered phase], (c) represent
paramagnetic centers in SiO2
Fig. (3)
55
The schematic of unit of the SiO2 network Fig.(4)
58 Irradiation gamma cell Fig. (5)
59 Irradiation gamma cell (central cavity) Fig. (6)
61 EPR spectroscopy Fig. (7)
73 Relative EPR signal intensity as a function
of P1/2 in the range 0.272- 1.591 mW
Fig. (8)
75 EPR spectra for quartz sample,(a) P=0.201
mW, (b)P=0.074 mW, (c) P=10.008 mW,
Fig. (9)

all the spectra are the same scale 77 Relative EPR signal intensity as a function
of the modulation amplitude values in the
range 0.37-12.07 Gauss
Fig. (10)
78 EPR spectra for quartz sample, (a)
MA=4.07 G, (b) MA=0.37 G, (c)
MA=12.07 G, all the spectra are the same
scale
Fig. (11)
79 Relative EPR signal intensity as a function
of the sweep width values in the range 10-
1000 Gauss
Fig. (12)
80 EPR spectra for quartz sample, (a) Sw=200
G, (b) Sw=10 G, (c) Sw=1000 G, all the
spectra are the same scale
Fig. (13)
82 Relative EPR signal intensity as a function
of the conversion time values in the range
0.32-163.48 ms
Fig. (14)
83 EPR spectra for quartz sample, (a)
Ct=20.48 ms, (b) Ct=1.28 ms, (c)
Ct=163.84 ms, all the spectra are the same
scale
Fig. (15)
84 Relative EPR signal intensity as a function
of the time constant values in the range 0.16
- 665.36 ms
Fig. (16)

85
EPR spectra for quartz sample, (a)
Tc=81.92 ms, (b) Tc = 0.16 ms, (c)
Tc=655.36 ms, all the spectra are the same
scale
Fig. (17)
87 EPR spectra recorded for quartz, (a) non-
irradiated, (b 5%, c 10%, d 20%, e 30 % and
f 50%) are different concentrations of
samples irradiated at the same dose
Fig. (18)
88 EPR signals intensity versus different
concentrations at different doses
Fig. (19)
90 EPR spectrum of irradiated quartz sample:
(a) E′ center, (b) peroxy radical, (c) non-
bridging oxygen hole center
Fig. (20)
92 EPR spectra (a) irradiated binder/ quartz
rod, (b) irradiated binder rod (dose= 300
kGy)
Fig. (21)
95 EPR spectra recorded for different
concentrations at 25 kGy, (a) 5 % , (b) 10 %
, (c) 20 % , (d) 30 % , (e) 50 %
Fig. (22)
100 Decay of EPR line of irradiated quartz rod
at 5 kGy
Fig. (23)
100 Decay of EPR line of irradiated quartz rod
at 50 kGy
Fig. (24)
103 Dose response of quartz rods as a function Fig. (25)

of absorbed doses in the range 0.1-1.5 kGy 105
The EPR spectra of quartz rods to different
absorbed doses
Fig. (26)
107 Dose response of irradiated quartz rods at
different doses for different concentrations
(dose range 0.1-290 kGy)
Fig.(27a)
107 Dose response of irradiated quartz rods at
different doses for different concentrations
(dose range 0.1- 80 kGy)
Fig.(27b)
108 Dose response of irradiated quartz rods at
different doses for different concentrations
(dose range 2.34- 26 kGy)
Fig.(27c)
108 Dose response of irradiated quartz rods at
different doses for different concentrations
(low dose range 0.1-2.34 kGy)
Fig.(27d)
116 Dose response of irradiated quartz rods at
dose range 0.1-80 kGy
Fig.(28a)
116 Dose response of irradiated quartz rods at
dose range 2.34-26 kGy
Fig.(28b)
116 Dose response of irradiated quartz rods at
dose range 0.1-2.34 kGy
Fig.(28c)
127 Fitting curve of irradiated quartz rods by
using linear equation, dose range 0.1–80
kGy
Fig. (29)

127
Variation of the residual from fitting of
response curve of irradiated quartz rods at
dose range 0.1– 80 kGy, linear equation
Fig. (30)
128 Fitting curve of irradiated quartz rods by
using second polynomial equation, dose
range 0.1– 80 kGy
Fig. (31)
128 Variation of the residual from fitting of
response curve of irradiated quartz rods at
dose range 0.1–80 kGy, second polynomial
equation
Fig. (32)
129 Fitting curve of irradiated quartz rods by
using third polynomial equation, dose range
0.1– 80 kGy
Fig. (33)
129 Variation of the residual from fitting of
response curve of irradiated quartz rods at
dose range 0.1 – 80 kGy, third polynomial
equation
Fig. (34)
130 Fitting curve of irradiated quartz rods by
using exponential equation, dose range 0.1 –
80 kGy
Fig. (35)
130 Variation of the residual from fitting of
response curve of irradiated quartz rods at
dose range 0.1 – 80 kGy, exponential
equation
Fig. (36)

135 Decay of EPR line of irradiated quartz rods
at different storage conditions (dose = 25
kGy)
Fig. (37)
138 Response of quartz rods as a function of
temperature during irradiation to three
concentrations (dose = 3 kGy)
Fig. (38)

LIST OF TABLES
Page
No. Table Title Table No.
9 Levels of radiation dose relevant for
various applications (Mehta, 2004)
Table (1)
17 Classes of dosimeters (ISO/ASTM
standards 51261, 2003; Mehta, 2004)
Table (2)
19 Examples of Reference Standard
Dosimeters (ISO/ASTM standards 51261,
2003)
Table (3)
21 Routine dosimetry systems (ISO/ASTM
standards 51261, 2003)
Table (4)
23 Typical setting of EPR parameters for
measurement of irradiated quartz
Table (5)
69 Uncertainty of response from EPR
analysis of alanine dosimeter pellets
Table (6)
70 Uncertainty of response function for
determining absorbed dose
Table (7)
94 Coefficient of variation for irradiated
quartz rods at different concentrations
Table (8)
97 Coefficient of variation for irradiated
quartz rods at different stirred times
Table (9)
98 Coefficient of variation for two irradiated Table (10)

quartz sets with different rod lengths 101 The relation between absorbed dose and
spin number
Table (11)
110 Values of constants a, b, c and d as well as
correlation coefficient, r2, and F-statistic
for different equations fitted to obtained
data for concentration 5 % at different
doses range
Table (12)
111 Values of constants a, b, c and d as well as
correlation coefficient, r2, and F-statistic
for different equations fitted to obtained
data for concentration 10 % at different
doses range
Table (13)
112 Values of constants a, b, c and d as well as
correlation coefficient, r2, and F-statistic
for different equations fitted to obtained
data for concentration 20 % at different
doses range
Table (14)
113 Values of constants a, b, c and d as well as
correlation coefficient, r2, and F-statistic
for different equations fitted to obtained
data for concentration 30% at different
doses range
Table (15)
114 Values of constants a, b, c and d as well as Table (16)
correlation coefficient, r2, and F-statistic
for different equations fitted to obtained
data for concentration 50 % at different
doses range 115 Coefficient of variation for quartz rods
irradiated at different dose ranges
Table (17)
119 Coefficient of variation of response from
EPR analysis for quartz sample
Table (18)
120 Coefficient of variation of EPR
reproducibility for quartz sample
Table (19)
122 Coefficient of variation of orientation
effects for quartz rod
Table (20)
123 Coefficient of variation of repositioning
effects for quartz sample
Table (21)
125 Coefficient of variation of signal
amplitude within 10 quartz rods irradiated
to 25 kGy
Table (22)
132 Mathematical equations fit test parameters
for measured response of quartz rods with
concentration of 30 % at different dose
ranges
Table (23)
133 Different uncertainty sources and its
values arise during dose measurement
Table (24)

using quartz rods with concentration of 30
% 139 Comparison between quartz and alanine
dosimetric system
Table (25)

Aim of the Work
Radiation dosimetry is fundamental to all radiation
processing applications as it offers the means by which a
process is first developed in the laboratory, then transferred to
an industrial applications and finally to routine control
properly. Dosimetry plays a very essential role in both the
process validation (product qualification and facility
characterization) and process control in radiation processing
and it assists in this process by establishing baseline data for
monitoring the effectiveness, predictability and reproducibility
of the facility operation under the range of conditions over
which it will operate.
The aim of this work is to study the radiation-induced
paramagnetic properties in quartz and to investigate the
possibility of binding quartz powder in rods shape for use as
radiation dosimetry system for gamma radiation processing.
Moreover, it is amid at finding suitable practical quartz
dosimeter for low and high dose ranges. The study is extended
to investigate in detail its dosimetric characteristics such as
dose response function, effect of environmental conditions
during irradiation, post-irradiation stability at different storage
conditions, as well as assessment of overall uncertainty of
absorbed dose measurement by using EPR spectrometer.

ABSTRACT
Thesis title: Study of radiation-induced paramagnetic
centers in quartz and its possible use in
radiation dosimetry.
Presented by: Abdo Mohamed Ebraheem Mansour
A new EPR dosimetry system has been developed based
on the radiation-formed stable paramagnetic centers in quartz.
The first part of the thesis includes the preparation of quartz
rods (diameter = 3 mm, length = 10 mm) where quartz powder
was mixed with molten mixture of paraffin wax and ethylene
vinyl acetate copolymer (EVA). The binding-mixture EVA /
paraffin do not present interference or noise in the EPR signal
before or after irradiation to high doses. The quartz rods were
prepared by different concentrations (5, 10, 20, 30 and 50 %).
The rods (30 %) show good mechanical properties for safe and
multi-use handling. The second part is concerned with
studying the dosimetric characteristics of gamma irradiation
sensitive rods where the radiation-formed stable free radicals
(E′-center, peroxy radical and non-bridging oxygen hole
center) which analyzed by using electron paramagnetic
resonance (EPR) spectrometer. Unirradiated rods have no EPR
signals. The useful dose range of these rods was found to

range from 0.1 to 80 kGy depending on concentration of
quartz powder, indicating their suitability for low and high
dose gamma radiation applications. Also it was found that
quartz rod exhibits a linear dose response in the dose regions
0.1–2.34 and 2.34-26 kGy at optimum EPR parameters. The
dosimeter response was assessed using the peak-to-peak
amplitude of the first-derivatives EPR spectrum. Its EPR
signal was found unchanged in shape with different doses and
different concentrations. A signal line spectrum attributed to
the E′-center was observed after irradiation, and this radical is
insensitive to temperature, light independence as well as it
have a very low decay (4.768 % per year). The overall
uncertainty for quartz rod dosimeters at 2σ (σ is standard
deviation) was found to be 3.8436 %. The dosimetric
parameters, e. g. dose response, effect of temperature during
irradiation on response as well as pre- and post-irradiation
stability at different storage conditions are discussed.

I-INTRODUCTION
I.1- Gamma and electron beam radiation processing
Radiation processing, which makes use of certain doses
of radiation to achieve specific biological, chemical, or
physical effects, is a relatively young industry dating from the
mid of 1950s (applied in Egypt since 1977 at the National
Center for Radiation Research and Technology, Atomic
Energy Authority). This technology is expanding; it has its ups
and downs. However, now, it looks like ready to expand
rapidly. Not only more facilities are being built but also more
different types of applications are being investigated.
Traditionally isotopic sources, Co-60 (1.25 MeV) and Cs-137
(0.661 MeV) were employed to produce gamma radiation) (1-3).
Cobalt-60 and Caesium-137 are the most suitable gamma
radiation sources for radiation processing because of relatively
high energy of the gamma rays and fairly long half-life time
(30.1 years for Caesium-137 and 5.27 years for Cobalt-60).
However, the use of Cs-137 has been limited to small self-
contained dry-storage irradiators, used primarily for the
irradiation of blood and for insect sterilization. Currently, all
industrial radiation processing facilities employ Co-60 as the
gamma radiation source, mainly because of its easy production

method and its non solubility in water (4). Also, low energy
(100 to 300 keV) and medium energy (< 5 MeV) electron
accelerators have been in use (5-7). Now lately higher energy
(10 to 12 MeV) electron accelerators are coming in the market.
Recent development of very high current electron beam
accelerators show a considerable promise for the industrial use
of X-rays as a future technology of choice. X-rays are
comparable in penetration to gamma rays. The use of high
energy X-rays for sterilization medical devices were proposed
during the 1960s, but not implemented until the late 1990s. X-
ray processing is now practical for sterilization applications
since high-energy, high-power electron accelerators and large-
area targets for converting electron beam to X-rays are
available (8). And with that, we also have machine produced
photons. International trade of irradiated products is also
slowly rising and now it is receiving an added push with
globalization.
The sterilization of medical products by radiation was
demonstrated early and accounts for a considerable proportion
of the industry, establishing itself soundly during the 1970s.
The radiation processing of polymers was also important from
the beginning, and it continues to expand introducing novel
applications year by year. A third application with early

promise, the large-scale treatment of food by radiation has
been thoroughly investigated.
I.2- Industrial application of radiation technology Radiation processing is a growing industry and an active
developmental technology. Radiation technology is now well
established and is contributing to the industrial development,
thus playing its legitimate role. Taking into account the total
value of the products treated with ionizing radiation, the
economic scale of this technology is enormous. Some well
established applications like sterilization and semiconductors
modification common use. This is especially true for health
care products in industrial countries like USA and Canada,
where it is estimated that more than half of these products are
currently sterilized using ionizing radiation. At the same time,
radiation technology is expanding. More facilities are being
built, and new applications are being added. These new
applications follow the general trends of technological
development and social needs, like nanotechnology, natural
polymers, composites and environment protection (9).
With international trade comes standardization and
emphasis on quality. Industry and government thus have been
working to set up guidelines and regulations. There are several
standards developed by the regional and international bodies,

such as ISO (International Organization for Standardization),
WHO (World Health Organization), ECS (European
Committee for Standardization), ASTM (American Society of
Testing and Materials) and AAMI (Association for the
Advancement of Medical Instrumentation), etc. These become
much more important when one is dealing with health
products, such as food and medical devices. These documents
provide recommendations for the radiation processes. The
principal elements for all these recommendations are process
validation and process control protocols that must be followed
rigorously for the process to satisfactorily produce a quality
product. For all these protocols, dosimetry is absolutely
essential.
Process validation that is recommended by the ISO and
CEN requires several stages to be followed. The first one is the
product qualification that establishes the dose required to
affect the desired change (for example, sterilization or
extension of shelf life of a food product), and the maximum
dose that the product can tolerate without impairing its
essential properties. These two requirements set the two dose
limits within which the product must be processed. Dosimetry
plays an essential role in product qualifications.
Another stage of process validation is facility
characterization that should be undertaken after a new facility

is commissioned and after any significant modifications are
made. Dosimetry assists in this process by establishing
baseline data for monitoring the effectiveness, predictability
and reproducibility of the facility operation under the range of
conditions over which it will operate.
Before a process is executed, that is before a product is
routinely processed, it is important that the process is
qualified. This involves determining all the process parameters
that will yield the required dose to every part of the product as
well as satisfy all other specifications with high degree of
confidence. Process parameters include source parameters,
product box characteristics and irradiation conditions.
To show with a high degree of confidence that the
process was under control, it is necessary to have in place
some methods for process control. For radiation processing,
this is accomplished by two independent methods: first is
routine dosimetry that involves placing dosimeters on product
boxes, and second method is to monitor all the process
parameters that can affect dose throughout the process. The
product is then released for use only after inspection of the
dosimetry results and the values of the process parameters
during the process.
Dosimetry plays a very essential part in both the
processes (process validation and process control), and

different requirements are placed on the dosimeters.
Depending on the needs, dosimeters must be selected to
accomplish the task at hand.
Radiation processing is a growing industry and an active
developmental technology, as is clearly witnessed by the series
of proceedings of the International Meetings on Radiation
Processing (10-19). The following list of processes is presented to
illustrate the scope of the radiation processing industry (20, 21):
- Radiation sterilization of a wide range of medical products.
- Radiation sterilization of pharmaceuticals.
- Radiation treatment of cosmetics.
- Pathogen elimination in food and spices.
- Shelf-life extension of perishable food.
- Delayed ripening of fruit and vegetables.
- Disinfestations of grain and citrus fruits.
- Inhibition of sprouting in onions and potatoes.
- Water purification and sludge treatment.
- Treatment of industrial wastes.
- Polymer degradation.
- Polymer cross-linking.
- Curing of plastic coatings.
- Curing of printing inks.
- Degradation of polychlorinated biphenyls.
- Modification of semiconductor materials.

- Monomer elimination in polymers.
- Production of improved and more compact electrical
insulation for wires and cables.
- Production of heat-shrinkable plastics.
- Production of pressure sensitive adhesives.
- Production of dry lubricants from certain waste plastics.
- Curing resins for magnetic media.
- Immobilization of enzymes in or on polymer materials, etc.
The kinds of applications that use gamma radiation have
also steadily increased; from crosslinking/polymerization and
sterilization of health care products to food irradiation and
environmental applications such as flue gases, wastewater and
sludge treatment. Emerging applications could be in the field
of nano-materials.
I.3- Radiation dosimetry Dosimetry is the science of radiation dose measurement.
There are several reasons why one would like to measure the
dose. Dose is a parameter or a physical quantity that can be
measured and compared against biological or chemical change
in a material. Also it is a useful quantity when one needs to
transfer the information or experience gained in a laboratory to
another laboratory or to a commercial radiation facility.
Dosimetry is needed for the following objectives
(ISO/ASTM Standards 51702, 2004; Mehta, 2004, IAEA,
2005):
a- Determination of the process dose limits (along with
microbiology and/or materials testing laboratories),
b- Operational qualification of the irradiation facility on
regular basis,
c- Performance qualification for each product/process,
d- Process control during routine production, and
e- Research facilities.
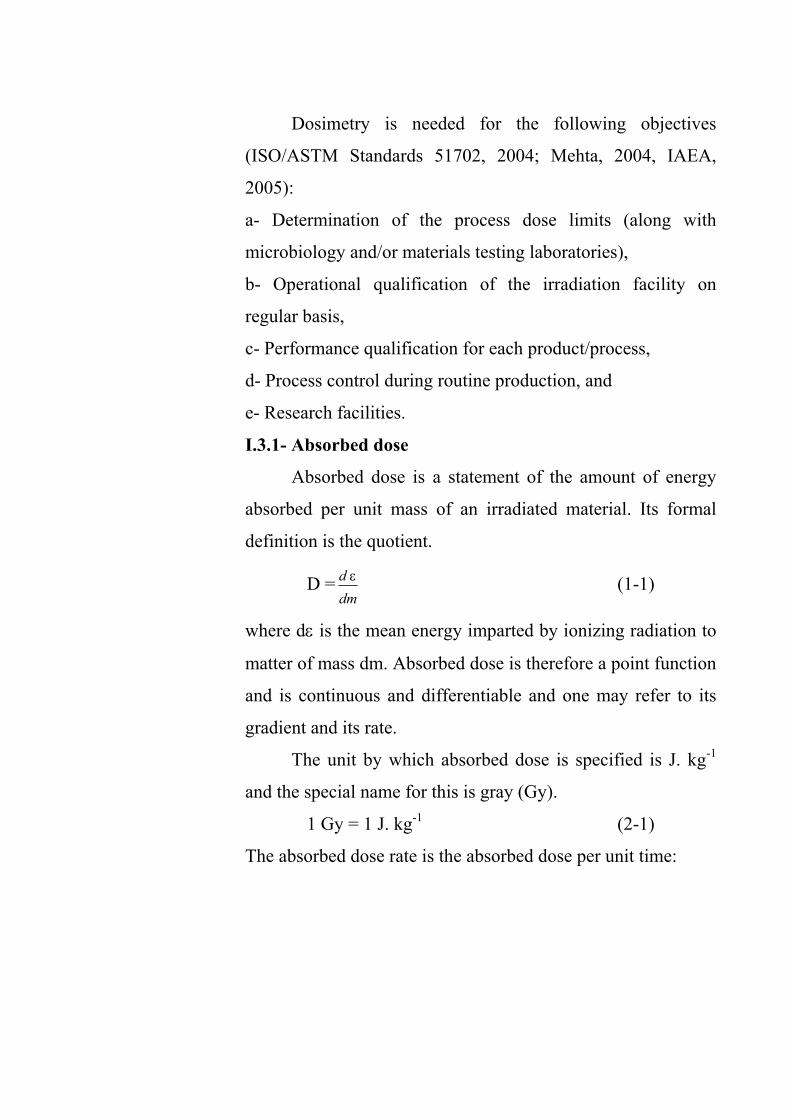
I.3.1- Absorbed dose
Absorbed dose is a statement of the amount of energy
absorbed per unit mass of an irradiated material. Its formal
definition is the quotient.
D = ddm
ε (1-1)
where dε is the mean energy imparted by ionizing radiation to
matter of mass dm. Absorbed dose is therefore a point function
and is continuous and differentiable and one may refer to its
gradient and its rate.
The unit by which absorbed dose is specified is J. kg-1
and the special name for this is gray (Gy).
1 Gy = 1 J. kg-1 (2-1)
The absorbed dose rate is the absorbed dose per unit time:

D = dDdt
Gy.s-1 (3-1)
Table (1) shows different levels of radiation dose that are
relevant for various applications. The commercial applications
(shown at the last three items of the table) are generally
referred to as "radiation processing" and the relevant dose
range may be referred to as "radiation-processing dose".
Sometimes this is also referred to "high dose".
Table (1). Levels of radiation dose relevant for various applications
(Mehta, 2004)
Application Dose range
Environmental 1 – 100 µGy
Diagnostic (medical) 1 – 100 mGy
Therapy (medical) 1 – 10 Gy
Food and agriculture 0.1 – 10 kGy
Sterilization 10 – 30 kGy
Material modification 50 – 100 or more kGy
I.3.2- The role of dosimetry in quality control
For those processes that are regulated namely health
related, dosimetry can be used to show that the process is
correctly applied. Sterilization of medical products and food
irradiation fall in this category. Regulation in a country
generally specifies the minimum dose and quite often the
maximum dose depending upon the application. Dosimetry is
used to provide this important starting point by measuring the
relation between absorbed dose and the key parameters and by
measuring the dose distribution in a reference product. Before
radiation sterilization of a specific product can begin, it must
be ensured that the legally required minimum dose is exceeded
in all parts of the product, and that the maximum dose
occurring will not impair the functionality of the product.
For some other processes, where human safety is not of
concern, for example, polymerization or cross-linking, the
facility operator in this case does not have to satisfy the
regulators, however, his customers demand a reliable and
consistent product and again radiation dose can be used as a
normalizing factor to which the process can be anchored to.
I.3.3- Characterization of dosimetry systems
Basically a dosimeter is any material whose at least one
property changes systematically when exposed to radiation,
such that this change is measurable and that it can be uniquely
corrected to the absorbed dose. Thus, a dosimetry system
consists of: dosimeters, equipment to measure the dosimeter
response [spectrophotometer, thermometer, electro-chemical
cell and electron paramagnetic resonance] and a documented
procedure for its use.

Before a routine dosimetry system can be used for dose
measurement, it should be carefully:
- Characterized of the dosimetry system (lot homogeneity and
influence quantities),
- Calibration of the dosimetry system,
- Made traceable to a national laboratory (establishing
traceabi-lity), and
- Determining uncertainty in the measured dose value.
I.3.3.1- Lot homogeneity
This involves understanding the behavior of the
dosimetry system under various conditions. This includes
intra-batch variability and influence of various parameters on
its response.
A few dosimeters are generally used from the entire lot
of dosimeters for establishing the calibration relationship for
the dosimetry system, and it assumed that the relationship is
valid for the entire lot. Also, when a dose is measured at a
point, generally only 1 or 2 dosimeters which have been
selected randomly from the lot are used. It is assumed that all
the dosimeters are the “same”- that is they all behave the same
way. Therefore, it is necessary to ascertain the extent to which
these dosimeters are the same or behave the same (Mehta,
2004) (22).

I.3.3.2- Influence quantities
There are many external factors that can influence the
signal (radiation-induced response) of the dosimeter. Most
common are temperature, humidity, oxygen content, light,
radiation type, dose rate, energy of radiation and geometrical
factors. These effects should be carefully studied and the
impact minimized or corrected. For example, if the dosimetry
system is used for dose measurement at a temperature different
than the one for which it was calibrated, some correction is
necessary (Mehta, 2004).
I.3.3.3- Calibration
Calibration is always of a dosimetry system not a
dosimeter. A dosimetry system consists of dosimeters and
analysis equipment. Thus, if the equipment has been repaired
or changed, the dosimetry system should be recalibrated or a
few points may be checked. Also, calibration established with
one equipment is not valid for equipment.
Calibration is the relationship between the absorbed
dose and the response of the dosimeters measured using the
analysis equipment. Such a calibration must be traceable to a
National Laboratory. This means that the measurements are
certified by a National Laboratory.
There are three different ways to calibrate a routine
dosimetry system (ISO/ASTM standards 51261, 2003) (23).

I- Irradiation of routine dosimeters at a Calibration Laboratory
to very accurate dose levels. The response of these
dosimeters is then measured at the processing plant
laboratory using their equipment. This calibration procedure
involves mailing the dosimeters back and forth.
II- Irradiation of the dosimeters in an in-house calibration
facility whose dose rate has been measured using a
reference or transfer standard dosimeter by the National
Laboratory or Calibration Laboratory. The advantage is that
the post- and pre-storage conditions of routine dosimeters
are controlled to similar to those during actual use.
III- Routine dosimeters are irradiated in the production facility
along with the transfer dosimeters provided by a Calibration
Laboratory. These transfer dosimeters are then returned to
the Calibration Laboratory for analysis. The advantage is
that the environmental conditions are similar to those in
production irradiation. However, special care should be
taken to assure that both dosimeters receive the same dose.
I.3.3.4- Traceability
It is essential that all measurements are traceable to a
National Laboratory or a Standard Laboratory. Traceability
may be defined as the ability to show that a measurement is
consistent with the appropriate national or international
standards through an unbroken chain of comparisons. For a

measurement to be traceable to a national standard, the
measurement value must through an unbroken chain of
calibrations be linked to that national standard. Every aspect of
the dosimetry system should be traceable. Every equipment
that is used, for example, should be calibrated and compared
against a standard supplied by a national laboratory or a
standard laboratory. This exercise should be done regularly.
Figure (1) shows how the traceability is achieved to a national
laboratory in various situations.

Figure (1). A schematic representation of alternative means of transfer
of national absorbed dose standards to field measurements
in radiation processing plants
Reference field
National Standard
Routine dosimeter Transfer dosimeter
2nd Lab. Ref. field
Transfer dosimeter
Irradiation facility
Routine dosimeter
Irradiation facility
Routine dosimeter

I.3.3.5- Uncertainty in dose measurement
The objective of a measurement is to determine the
value of the measurand, that is, the value of the specific
quantity to be measured. A measurement therefore begins with
an appropriate specification of the measurand, the method of
measurement, and the measurement procedure. Thus,
uncertainty of the result of a measurement indicates the lack of
exact knowledge of the value of the measurand, or in other
word it reflects the degree of accuracy in the measured value
(ISO/ASTM standards 51707, 2003)(24).
In practice there are many possible source of uncertainty
in a measurement, including:
- Incomplete definition of the measurand,
- Sampling, the sample measured may not represent the
defined measurand, - Inadequate knowledge of the effects of environmental
conditions, - Personal bias in reading analog instruments, - Instrument resolution or discrimination threshold, - Values assigned to measurement standard, - Approximations and assumptions incorporated in the
measurement method and procedure.

I.3.4- Dosimeter classes and applications Dosimeters may be divided into four basic classes
according to their relative quality and areas of application
(ISO/ASTM standards 51261, 2003); these four classes of
dosimeters are defined below and some examples of these
dosimeters and typical uncertainties in the dose values
measured by them are given in the table (2).
Table (2). Classes of dosimeters (ISO/ASTM standards 51261, 2003;
Mehta, 2004)
Class Calibration
necessary
Uncertain-
ty (k=1)
Examples
Primary No 1 % Calorimeter and
ionization chamber
Reference Yes 1-2 % Calorimeter, alanine,
dichromate, ceric-
cerous and Fricke
Transfer Yes 1-2 % Alanine, dichromate,
ceric-cerous, Fricke
Routine Yes 3-5 % Radiochromic and
CTA

I.3.4.1- Primary standard dosimeters
Primary standard dosimeters are generally of the highest
meteorological quality in the field of radiation dosimetry. They
are established and maintained by national standards
laboratories for calibration of radiation fields. The two most
commonly used primary standard dosimeters are ionization
chambers and calorimeters.
I.3.4.2- Reference standard dosimeters
Reference standard dosimeter is defined as a dosimeter
of high meteorological quality available at a given location,
that has been calibrated against a primary standard (e.g.
calorimeters or ionization chambers) and to be of use it must
satisfy well-established criteria. It must have a radiation signal
that is accurately measurable, and this signal must have a well-
defined functional relationship with absorbed dose. For
example, calorimeters, alanine, and the ferrous sulfate
dosimeter may serve as reference dosimeters if irradiated at
conditions where the response of these dosimeters is not
influenced by the dose rate. Examples of reference dosimeters
are listed in Table (3).

Table (3). Examples of Reference Standard Dosimeters (ISO/ASTM
standards 51261, 2003)
Dosimeter Readout system Absorbed
dose range, Gy
Refere-nces no.
Calorimeter Thermometer 102 to 105 (25)
Alanine EPR spectrometer 1 to 105 (26)
Ceric-cerous sulfate solution
UV spectrophotometer or electrochemical potentiometer
103 to 105 (27, 28)
Ethanol- Chlorobenzene
Colorimetric titration 102 to105 (29)
Ferrous-sulfate solution
UV spectrophotometer 10 to 4x10² (30)
Potassium/silver dichromate
UV spectrophotometer 103 to 105 (31)
I.3.4.3- Transfer dosimeters
Transfer dosimeters are specially selected dosimeters for
transferring dose information from an accredited or national
standards laboratory to a local irradiation facility in order to
establish traceability for the local calibration facility. These
dosimeters should be sufficiently precise and stable so that
they can be transported for irradiation at an irradiation facility
for dose evaluation, or for calibration of routine dosimeter
(Mehta, 2004). The alanine, dichromate solution, ceric-cerous

sulfate solution and ethanol chlorobenzene dosimeters are
examples of transfer dosimeters. Characteristics of transfer
standard dosimeters are summarized as follows:
- Long shelf life,
- Easily calibrated,
- Portable,
- Mailable and stable,
- Broad absorbed dose range,
- Produced in reproducible lots,
- Radiation absorption properties similar to those of irradiated
product,
- Relatively insensitive to extremes of environmental
conditions,
- Correctable systematic errors (e.g. temperature, humidity,
etc.), and
- Small dimensions compared to distances over which
absorbed-dose gradients become significant.
I.3.4.4- Routine dosimeter
Routine dosimeter is generally a working standard that
is used routinely in the processing facility, but it must itself be
frequently calibrated against reference or transfer dosimeters,
as it may not be stable enough to serve as a transfer dosimeter.
Several dosimetry systems (plastic plates, pellets, films,
chemical solutions, dye systems and glasses) are used for

routine dosimetry and many of these are available
commercially. Examples of routine dosimeters are listed in
table (4). Some of the reference-standard dosimeters are often
used as routine dosimeters, such as ceric-cerous and alanine.
Table (4). Routine dosimetry systems (ISO/ASTM standards 51261,
2003)
Dosimeter Measurement Instrument
Dose range,Gy
Alanine ESR Spectrometer
1 - 105
Dyed PMMA Visible spectrophotometer
102 – 105
Cellulose acetate films
UV spectrophotometer
104 – 4x10⁵
Radiochromic dye films
Visible spectrophotometer
1 - 105
Ceric-cerous sulfate solutions
UV spectrophotometer
103 – 105
I.4- Principles of EPR spectroscopy

EPR spectrometer is a physical technique designed to
detect molecules with unpaired electrons (free radicals), which
have a permanent magnetic-dipole moment (µ), and this
magnetic-dipole moment arises from spinning motion of the
electron about its axis and the motion of the electron in its
orbital in atom or molecule. In most cases the contribution to
the magnetic moment from orbital motion is negligible in
comparison to that from the spinning motion of the electron.
EPR is non-destructive analytical method. The instrumentation
employed in EPR spectrometer consists of:
1- Source of the microwave radiation.
2- Appropriate detection system for monitoring the amount of microwave absorbed by the sample.
3- Electromagnet to give an external magnetic field.
4- Microwave cavity.
5- Quartz tubes to hold solid or solution samples. Optimal values for the spectrum registration parameters
are summarized in table (5).
Table (5) Typical setting of EPR parameters for measurement of
irradiated quartz samples

Parameter Name Value
Center field 3480.16 Gauss
Microwave frequency 9.775 GHz
Modulation frequency 100 GHz
Sweep width 200 Gauss
Microwave power 0.201 mW
Modulation amplitude 4 Gauss
Sweep time 20.97 s
Time constant 81.92 ms
Resolution 1024 points
Receiver gain 5.02 e +003
Number of scan 1
Harmonic 1
Where the EPR spectrometer is based on the
measurements of long-lived free radicals produced in different
materials as a result of irradiation. EPR is established as a
qualitative test for the detection of irradiated foods and
pharmaceutical materials (32).
I.5- Properties of quartz

Quartz or silicon dioxide is resistant to chemical
weathering (it is only soluble in hydrofluoric acid and in hot
alkalis) and corrosion. It is hard, brittle, and has a very high
melting point (1710 0C) (33). Due to its wide band gap of about
9 eV, it is optically transparent and shows low electrical
conductivity (34).
I.5.1- Structure of quartz
Quartz is one of the most common compounds in the
Earth’s Crust. Quartz has an extremely rich phase diagram
with a wide variety of crystal structures (35). A common feature
of crystalline SiO2 at ordinary pressure are the [SiO4]
tetrahedron building units, where a central silicon atom is
surrounded by four oxygen atoms. Each tetrahedron is bridged
via (Si-O-Si) bonds to neighboring tetrahedrons to form a
three-dimensional fully connected network see figure (2) (36).
The Si-O-Si bond length is 1.61 Å and the Si-O-Si bond angle
varies between 108.80 and 110.50. The angle between two
corner-sharing tetrahedral [SiO4] units is 143.60 (37). Silicon
dioxide has a density of 2.65 g/cm3 (38).

Figure (2). Three-dimensional fully connected SiO2 network
I.5.2- Defects in quartz
Many parameters, such as manufacturing process,
irradiation, mechanical stress, and change of temperature cause
the formation of different defects. Generally, the lattice defects
can be grouped according to their structure and size as follows:
point defects (paramagnetic centers), dislocations (linear
defects), as well as plane defects. The point defects in silicon
dioxide have been studied by Electron Spin Resonance (ESR)
or Electron Paramagnetic Resonance (EPR) technique. Gamma
radiation and natural radioactivity leads to formation of
paramagnetic centers in quartz (39).
I.5.3- Effect of gamma radiation on quartz
The gamma radiation forms paramagnetic centers in
silicon dioxide either by trapping an electron or by forming a

hole. EPR spectrometer is a powerful and widely used
technique for the detection and identification of these
paramagnetic centers, where these centers have a net magnetic
moment. The following fundamental paramagnetic centers
were identified in silicon dioxide: the E′-center (≡Si.), the
peroxy radical (≡Si-O-O.) and the non-bridging oxygen hole
center NBOHC (≡Si-O.) as in figure (3). In each case, the
symbol ≡Si represents a silicon atom bonded to three oxygen
atoms in the SiO2 network, and the dot refers to an unpaired
electron (40).
E′ (●) and POR (•) centers
Figure (3). Effect of gamma radiation on SiO2 network, (a) represent
SiO2 before irradiation [crystalline or ordered phase], (b) represent
SiO2 after irradiation [amorphous or disordered phase], (c) represent
paramagnetic centers in SiO2

Several properties of silicon dioxide are dominated by a
single point defect known as the E′-center. E′-center is an
unpaired electron is at an oxygen vacancy, where this unpaired
electron exists in a dangling sp3 orbital of the silicon atom
which is pyramidal bonded to the three oxygen atoms in the
SiO2 network. These point defects have been strongly observed
in EPR spectrum of SiO2. The peroxy radical is an oxygen
associated hole center consisting of a trapped hole on a singly
coordinated O2-2 molecule ion (41). According to Gupta and
Cooper (42), the structural freedom, f, of each vertex refers to
the difference between the number of degrees of freedom d,
and the number of constraints h, which originate from the
surrounding structure giving by:
f = d - h = d - (C/V)[бV – б (б + 1)/2] …… (4-1)
where V is the number of vertices of the elemental polytopes,
C is the relative proportion of corners, edges, and faces of the
polytopes shared with one another and б is called the
dimensionality of the structuring polytopes. In the case of
quartz, each [SiO4] tetrahedron has four vertices and each of
them is linked to a neighboring tetrahedron, i. e. V=4 and C=2.
For SiO2, d = 3; б = 3; substitution in equation (4-1), then

f = 3 – (2 / 4) [3 x 4 – 3 ( 3 + 1) /2 ] = 3 – 1/2 (6)] = 3 – 3 = 0
This means that SiO2 forms a fully-connected network and
each [SiO4] tetrahedron is linked to the maximum number of
neighboring tetrahedra and there is no presence of non-
connected tetrahedral units in the structure, also a periodic
SiO2-network shows high resistance to re-crystallization, this
means the paramagnetic centers created by gamma radiation
are very stable (E′ centers).

II- LITERATURE REVIEWS II-1- Literature reviews on solid phase dosimeters
for gamma radiation and electron beam
Most solids used for low- and high-dose dosimetry
consist of amorphous or quasi-crystalline materials (e.g.
plastics, dyed plastics, glasses, ceramics or semi-conductors).
Some carefully controlled solid dosimeters have a particular
advantage over typical liquid dosimeters, namely the
possibility of small dimensions, for example, as thin films,
which offer improved spatial resolution in the measurement of
absorbed dose distributions. Other significant advantages are
ruggedness for industrial processing conditions and ease of
handling. These film dosimeters are mainly used for:
- Routine dosimetric for process control,
- Product dose mapping for performance qualification,
- Operational qualification of the facilities (gamma
and electron beam), and
- Validation studies for different sterilized products.
II.1.1- Undyed plastics
Polymethylmethacrylate (PMMA or Clear Perspex) has
been widely used for routine dosimetry, with nominal
uncertainty limits of about + 5 % in spite of its instability after
irradiation (43). The measurement of the increase in optical
density at a convenient wavelength near 310 nm provides a
reproducible estimate of dose in the range 103 to 5x10⁴ Gy.
Most commercially available clear PMMA sheets contain a
UV absorber which precludes their use in dosimetry; however,
specially manufactured dosimeters (e.g. HX Dosimetry
Perspex, Radix RN 15) are available. For HX Perspex, 315 nm
has been found to be the most stable wavelength for
measurement (44). The system can be used to a dose of about 60
kGy. The fading characteristics of clear PMMA are a complex
function of temperature, time, dose, and measurement
wavelength (45-47). In the temperature range 0 to 30 0C, the
response can be assumed to be independent of temperature
during irradiation, but at temperatures above 30 0C the
response decreases (48). The relative humidity changes in the
low relative humidity range have little effect on the response
characteristics of undyed PMMA, but a significant decrease in
response occurs above 80 % relative humidity (49, 50). At dose
rates > 106 Gy s-1, the response of PMMA dosimeter decreases (51). The irradiated dosimeters are slightly light sensitive and
should be stored in the dark (52).
Cellulose Triacetate (CTA) is one of the most widely
used undyed plastics. CTA films have been produced
especially for dosimetry in 8 mm wide rolls and having the

same thickness (0.125 mm). The CTA film is produced with
an additive (15% triphenylphosphate), which serves as
plasticizer and also stabilize the absorbance after irradiation.
The response of CTA is also affected by temperature and
relative humidity during irradiation (53-55). A difference in
response is observed between low and high absorbed dose
rates. The response to electron beams at absorbed dose rates >
103 Gy s-1 is about 20 to 40 % lower than to gamma radiation
at dose rates < 1Gy.s-1 (56). This difference in response is
ascribed to the diffusion of oxygen from the surface during
irradiation and disappears if the film is conditioned and
irradiated in an inert atmosphere. When the CTA film is stored
in air, about 20 % fading (at 280 nm) occurs during the first 15
minutes after a short-term irradiation with electrons (57). After
15 minutes storage, a slow increase in absorbance of about 10-
20% continues for several days. As with most the plastic
dosimeters, oxygen plays a role in the absorption band
formation in CTA and also affects its stability.
Abdel-Rehim et. al. (1996) (58), carried out a detailed study on
the effect of read-out wavelength (from 269 to 290 nm) on the
CTA dosimetry precision in the absorbed dose range from 10
to 150 kGy. The obtained results indicate that the precision of
the dosimeter response depends largely on the wavelength

selected for optical density measurements as well as the
spectrophotometeric quantity used for calculating the response.
Abdel-Fattah et. al. (1998) (59), carried out a detailed
study to develop the dosimetric characteristic of commercially
low-density poly ethylene film (LDPE), to be used as a film
dosimeter for large-dose γ-radiation dosimetry for useful dose
range extend up to 880 kGy. This study established the
correlation between the absorbed dose of γ-radiation and the
radiation-induced changes in LDPE measured using Fourier
transform infrared (FTIR) at 1716 cm-1 and ultraviolet (UV)
spectrophotometry at 220 and 270 nm. The field of this study
showed a significant dependence on the selected read out tool
of measurements as well as on the quantity used for
calculation. The radiation chemical yield of ketonic carbonyl
group produced in irradiated LDPE film was found to be 0.7
µmol/J.
McLaughlin et. al. (1999) (60), have study the formation
of transvinylene instauration ―CH=CH― in high-density
polyethylene film (HDPE) by irradiation, which is the basic
reaction in polyethylene and is useful for dosimetry at high
absorbed doses. The radiation-enhanced infrared absorption
having a maximum at ν = 965 cm-1 (λ = 10.36 µm) is stable by
air and can be measured by Fourier-transform infrared (FTIR)
spectrophotometry. The transvinylene response in air to

gamma radiation is linear with dose and has relatively low
yield compared with the response to electrons, whereas the
response in deaerted polyethylene samples is also linear, but is
more sensitive, and has negligible dose-rate dependence in its
response to gamma rays and electrons. The useful dose range
of 0.053 cm thick HDPE film (ρ =0.961 g cm-3, melt index =
0.8 dg min–1), for irradiation by 60Co gamma radiation and 2
MeV electron beam in deaerted atmosphere (N2 gas), is about
50-103 kGy for FTIR transvinylene spectrophotometric
analysis.
Muratoglu et. al. (2003)(61), have used of the
quantification of transvinylene instaurations in irradiated
ultrahigh molecular weight polyethylene (UHMWPE) in
determining the spatial distribution of electron beam
penetration. UHMWPE was irradiated with a 10 MeV linear
electron beam accelerator to 100 kGy at both room
temperature and 125 °C in air. Dose–depth profiles were
measured by quantifying the yields of transvinylene
instaurations as a function of depth away from the e-beam
incidence surfaces using infrared spectroscopy.
II.1.2-Dyed plastics
The spectrophotometric measurement of color change in
plastic films or plates containing dyes is one of the most
widely used routine methods of high-dose dosimetry (62-64).

Some films and papers, such as dyed cellulosic materials and
indicator dyes in halogenated substrates (e.g. PVC), are
bleached or change color upon irradiation to high doses (65, 66).
Several types of specially prepared dyed
polymethylmethacrylate (PMMA) are available for dosimetry
and supplied in sealed pouches e.g. red Perspex 4034, amber
Perspex 3042, GAMMACHROME YR, Gammex Type S, or
red Acrylic 400. Upon irradiation, dyed PMMA becomes
darker (67-71). The red, amber and GAMMACHROME YR
Perspex have nominal absorbed dose range of 5 to 50 kGy, 2
to 20 kGy and 0.1 to 3 kGy respectively (72). Depending on
several factors such as dose, dose rate, temperature, humidity
and whether or not the pouch is broken, will be the extent of
the increase of specific absorbance of all types of dyed
PMMA. After about the second or third day following
irradiation, there is generally a fading effect, the extent of
which also depends on the above conditions of irradiation and
storage as well as on the type of dyed PMMA dosimeter.
Miller et. al. (1975) (73), found that, there is a little temperature
dependence during irradiation at temperatures from 10 to 40 oC
but at about 80 oC the irradiation temperature coefficient is
about +1.5 % oC-1 for a dose of 20 kGy. Olejnik (1979) (74) ,
have reported significant influences of temperature and
relative humidity, both during irradiation and storage, but the

instability and humidity effects are diminished when
maintaining sealed pouches. The GAMMACHROME YR type
seems to be useful over a wide temperature range during
irradiation, with suitable corrections for temperature
dependence, and can be employed for dosimetry for foods
irradiated at low temperature (75). In Pakistan a locally
manufactured polymethylmethacrylate containing a blue dye
(blue PMMA) was evaluated spectrophotometrically for use as
a high-dose radiation dosimeter. The effects of post-irradiation
storage time, storage temperature, light and relative humidity
during post-irradiation storage on the response were
investigated (76).
FWT-60-00 radiochromic dosimeter films which are
nearly colorless thin plastic films (typically nylon) containing
certain leucocyanides or leucomethoxides of triphenylmethane
dyes become deeply colored upon irradiation to absorbed
doses in the range 102-106 Gy (77-84). The absorption bands
formed in the radiochromic dye films are due to radiolytic
scission of the -CN or -OCH3 groups from the colorless leuco
dye molecule, resulting in isomerization to the highly colored
polar carbonium cation of the dye (85). Up to ∼ 40 kGy, the
response of these films is independent of dose rate up to 103
Gys-1 (86, 87) and is not affected by dose fractionation. Routine
use of the nylon-base dosimeter at extreme relative humidities

<20 % or >80 % should be avoided (88). Radiochromic
dosimeter films are generally sensitive to ultraviolet light
(wavelengths less than 370 nm) and must be protected from
fluorescent light and sunlight. The absorbance increases for
several hours immediately after short-term irradiation. This
effect can, however, be eliminated by a post-irradiation
treatment at 60 oC for a few minutes (89). This film is most
commonly used for high dose applications such as radiation
processing, food irradiation and sterilization. It lacks the
sensitivity for any medical application (90, 91).
FWT-60 film dosimeter is using at NCRRT to maintain
a quality control for radiation processing industries. This
selection for that dosimeter based on several characteristics of
this system (92):
- Low cost,
- Suitable for both, electron and gamma radiation, and
-Wide useful dose range (1-200 kGy), covering diverse
application such as food irradiation, radiation sterilization and
polymer modification applications.
Abdel-Fattah and Miller (1996) (93), investigated the
effects of both relative humidity and temperature during
irradiation on the dose response of FWT-60-00 and Riso B3
radiochromic film dosimeters in the relative humidity range
11-94% and temperature range 20-60 oC for irradiation by 60Co

photons and 10-MeV electrons. The results show that humidity
and temperature cannot be treated as independent variables,
rather there appears to be interdependence between absorbed
dose, temperature, and humidity. Dose rate does not seem to
play a significant role.
Abdel-Fattah et. al. (2001) (94), have investigated Risø
B3 film dosimeters (23 m) prepared from poly(vinyl butyral)
(PVB) incorporating pararosaniline cyanide as the radiation-
sensitive element and PVB films (25 m) prepared from PVB
without any additives are investigated for γ- radiation
measurement using spectrofluorimetry based on their emission
properties. The unirradiated Risø B3 film when excited at
554 nm shows an emission band at 602 nm while PVB film
shows an emission band at 305 nm when excited at 235 nm
wavelength. The useful dose range of Risø B3 film extends up
to 120 kGy while that of PVB film extends up to 60 kGy. Risø
B3 and PVB films show good post-irradiation stability in dark
and indirect daylight where the deviation in the response
overall a 2-month storage period was found to be ± 5% for
Risø B3 and ± 2% for PVB.
The thin radiochromic films show no dose rate
dependence and therefore are particularly useful for electron
beam dosimetry. Most of the films are made of hydrogenous
ingredients, and with carefully selected medium atomic

number additives (e.g. halogen-containing polymers) they can
be given radiation absorption cross-sections similar to those of
biological tissues, e.g. fat, muscle and bone (95). The
polyhalostyrene and nylon radiochromic films have nearly the
same gamma ray and electron-beam responses in vacuum and
in nitrogen atmosphere as in air or oxygen, provided the
optical density readings are made in air at least several hours
after irradiation (96, 97).
An inexpensive new dyed-plastic film dosimeter has
been made commercially available in large quantities for use
in radiation processing applications in the dose range 8 to 60
kGy by Abdel-Rehim et. al. (1992) (98). This transparent,
green-colored, flexible thin film is rugged and can be used in
various sizes and shapes, for example, long strips, rolls, large
or small sheets. The change in color due to irradiation (green
to red) is visually apparent or it can be measured with a
spectrophotometer, either an absorption band peak (425 nm)
bleached by irradiation, or at another pair of absorption peaks
(525 or 556 nm) formed by irradiation. When made into
radiation monitoring labels, the films have limited shelf life
and must be protected from extreme environmental conditions (99).
A highly sensitive dosimeter consists of poly vinyl
alcohol film containing methyl viologen has been developed

using the phenomenon of ionizing radiation-induced one
electron reduction of methyl viologen (MV)2+ to produce the
intensely blue-colored cation radical (MV)+ in the polymer
film. This MV2+ -PVA film is useful in the lower dose range
below 0.1 kGy (100).
Abdel-Rehim et. al. (1993) (101), developed dyed grafted
films for large radiation dosimetry. The development of these
types of dosimeters based on a new approach by reacting ionic
dyes (cationic or anionic) with grafted polymeric films by
acidic or basic monomers. Recently Abdel-Fattah (2002) (102),
has prepared grafted film of poly (vinyl butyral) with acrylic
acid monomer (PVB-g-PAAc) and reacting with solution of
two ionic dyes, namely Rhodamine B (RB) or Methylene Blue
(MB). The radiation induced color bleaching has been
analyzed spectrophotometry. The investigation shows that
these dosimeter films may be useful for high-dose gamma
radiation applications. The useful absorbed dose range of the
dyed films extend up to 600 kGy for PVBRB and 300 kGy for
PVBMB, with a minimum useful dose of about 10 kGy.
A new thin transparent Cellophane film was developed
for high-dose dosimetry (by McLaughlin, 2003) (103). This
film containing disazo "Direct" dyes, e.g. blue Cellophanes,
have long been used as monitors of large absorbed doses of
ionizing radiation (10 – 300 kGy) and especially for mapping

electron-beam dose profiles. Such dyed Cellophanes are
typically lightfast but can readily be bleached irreversibly by
ionizing radiation, as a means of dosimetry using
spectrophotometry as the analytical tool. The radiation
response is markedly dependent on temperature and relative
humidity during irradiation.
Hansen et. al. (2005) (104) , have study the irradiation of
thin-film dosimeters (RisØ B3 and alanine film) at 10 MeV and
80-120 keV electron accelerators, and it has been shown that
the radiation response of the dosimeter materials (the radiation
chemical yields) are constant at these irradiation energies.
However, dose gradients within the dosimeters mean that
calibration functions at the lower electron energies will be
dependent on both irradiation energy and the required effective
point of measurement of the dosimeter.
Kattan et. al. (2007) (105), have study polyvinyl chloride
(PVC) film dyed with malachite green for high-dose radiation
dosimetry using visible spectrophotometry. A linear
relationship between the relative absorbance and the absorbed
dose at the wavelength 628 nm in the range of 0-125 kGy was
found. The effect of dose rate, irradiation temperature, film
thickness and dye intensity were found not to influence the
response.

II.1.3- Film dosimeters based on radiation-induced HCl
generation
Using the phenomenon of HCl generation from PVC
under irradiation, pH indicating dyes have been added to PVC (106-109). A chlorine-containing polymer is not necessary for this
reaction to occur. A similar color change can be produced if
chloroalkanes are present in the dye-containing matrix (110).
Ueno et. al. (1987) (111), developed a radiation dosimeter from
acidity indicators by coating a high molecular weight polymer
support (e.g. polyester film) with a composition containing a
halogen-containing polymer (e.g. PVC), a pigment which
changes color with the change of pH and a basic material (e.g.
KOH in EtOH).
Aliphatic compounds containing chlorine, bromine, or
iodine are among the substances most sensitive to attack by
hydrated electrons, which bring about release of the halogen as
the halide ion, hydrogen atoms may react in the same way, but
generally the reaction is slower and is in composition with
other hydrogen atom reactions. Chloroacetic acid was used by
several groups in early experimental to establish the nature and
properties of the reducing species in irradiated water (112).
A new plastic film dosimeter has prepared from poly
vinyl alcohol (PVA) incorporating an acid-sensitive dye
(bromophenol red, BPR) and water soluble chlorine containing

substance [CCl3COONa or chloral hydrate (CCl3CH(OH)2,
2,2,2-trichloroethan-1,1-diol)]. This film is easy to prepare in
laboratory and can be used as a dosimeter in the relatively low
dose range up to 5 kGy (113). Many other films containing a
radiation sensitive pH indicator dye with chloral hydrate have
been prepared to be used as gamma radiation monitoring
dosimeters and indicators (114).
Ebraheem et. al. (2002) (115), have prepared a new dyed
poly vinyl alcohol film dosimeter incorporating a mixture of
two dyes namely, 2,6 dichloro phenol indophenol sodium salt
(DCP) and cresol red (CR) indicator with different
concentrations of chloral hydrate. The color of this film
changes in two steps, i.e. from green to yellow and finally to
red color. Due to irradiation, first the bleaching reaction for
DCP take place in the absorbed dose range up to about 17
kGy, followed by the transformation of CR to its acidic form
due to the presence of chloral hydrate in the dose range up to
50 kGy.
Akhavan et. al. (2002) (116), have prepared a new thin
film dosimeter by using chlorine-containing polymer
matrix doped with malachite green methoxide as an
indicator. Gamma irradiation of the film induces blue
characteristic color. The produced film with an average

thickness of 0.05 mm has a linear response over the dose
range of 1– 60 kGy at the measured wavelength of 630 nm.
Hoang Hoa Mai et. al. (2004) (117), have prepared a
dyed PVC films containing malachite green oxalate or
6GX-setoglausine. These films show basically color
bleaching under irradiation with 60Co γ-rays in a dose
range of 5-50 kGy. The bleaching of the dyes in irradiated
PVC films is closely related to radiation-induced formation
of hydrogen chloride (HCl) since such a bleaching behavior
was not appreciable in dyed poly vinyl butyral film after
irradiation. The sensitivity of the dosimeters and the
linearity of dose-response curves are improved by adding
2.5 % of chloral hydrate and 0.15 % hydroquinone.
II.I.4- Radiation indicators
The radiation indicators may be labels, paper, inks or
packing materials which undergo a color change or become
colored when exposed to ionizing radiation. Color change
radiation-indicating labels are sometimes used on an individual
item to monitor whether or not a product has been exposed to
gamma irradiation (118).
A label dosimetry system capable of giving quantitative
information regarding the dose delivered to product during
routine processing (119-121). The dosimeter system has the

additional benefit of having bar coded labels remain attached
to containers throughout the distribution of the product.
Abdel-Rehim et. al. (1992) (122), have prepared a new
label dosimeter with a peal-off paper backing, allowing it to
stick by self-adhesion to a product box. This label turns its
color gradually from green to brown then to red upon gamma
irradiation. The irradiated label was correlated between
absorbed doses and color scale or the green/red axis, using a
micro color unit. This concept of measuring reflected light
from dose labels has been discussed earlier and emerged
recently due to the requirement of introducing semi-
quantitative label dose indicators for quarantine control.
Kovács et. al. (2000) (123), have prepared a radiochromic
films containing nitro blue tetrazolium dissolved in a
polymeric matrix, these films can undergo a color change by γ-
rays from colorless to blue color. These films are suitable for a
wide dose range both by absorbance and reflectance.
A new radiation indicator for gamma and electron-beam
radiation, which changes color at high radiation doses, has
been developed at NCRRT. The yellow unirradiated indicators
turn to red at about 3 kGy then to violet at about 7 kGy. The
indicators were prepared with a peal-off paper backing,
allowing them to stick by self-adhesion to a product box.
These indicators are currently available in large quantities

under the commercial name "NCRRT Indicators for Gamma
and E-beam Sterilization” (124).
II.1.5- EPR Dosimetry
The radiation dosimetry is important for all radiation
processes; it has as objective the determination of the absorbed
dose resulting from the interactions of the ionizing radiation
with the medium. The electron paramagnetic resonance (EPR)
is a technique commonly used for high doses dosimetry of the
gamma ray and electron beam radiations, accident dosimetry,
archaeological and geological dating, studies of defects,
characterization of materials, analysis of radicals, etc. The
EPR technique detects unpaired electrons trapped in the
crystalline lattice. The intensity of the EPR signal is
proportional to the absorbed dose. The non destructive nature
of the EPR detection also allows the study of species trapped
in biological samples such as bone, quartz, tissues, drug, teeth,
hair, fingernails and dry skin. The most used inorganic
materials are shells and minerals. Some advantages of EPR
are: the information is cumulative with the dose, the reading is
not destructive, high sensibility, handle easiness, good
reproducibility, small fading of the sign, large linearity
interval, and doesn't present energy dependence, once the
measurement is made at room temperature or at the liquid

nitrogen temperature. The use of the alanine as a dosimeter
happened after the discovery of EPR technique. The alanine
presents a very resolved spectrum and a great number of free
radicals formed by absorbed dose unit, it presents a stable and
simple signal, with low background, low cost, easy handling
and available universally. The dosimetric system using alanine
as detector element can be considered a reliable system for
absorbed dose measurements in processes of industrial
irradiation.
Olsson et. al. (1999) (125), have study the ammonium
tartrate as an EPR dosimetry material with a higher signal
intensity than the commonly used alanine, to be useful in the
clinical dose range (approximately 0.1-20 Gy). The
ammonium tartrate was found and investigated regarding
signal intensity, radical stability, dose response and dose
resolution. The EPR signal intensity of ammonium tartrate was
shown to be most than twice the intensity of the alanine signal.
Ammonium tartrate has a linear dose response in the
investigated range of 0.5-4000 Gy and a dose resolution of 0.1
Gy where, as a comparison, the corresponding value for
alanine is 0.3 Gy. Therefore ammonium tartrate is suitable for
clinical dosimetry.
Lund et. al. (2000) (126), have study new materials for
EPR dosimetry to find system more sensitive than alanine

accepted as a standard for high dose determinations. Among
the investigated systems ammonium tartrate, 2-methylalanine,
salts of formic acids and dithionates were be found to be more
sensitive than alanine by a factor 2-10. the lower limit applies
to tissue equivalent materials, while much higher sensitivities
were obtained with formats and dithionates containing heavier
atoms. The increased sensitivity was mainly attributed to
suitable EPR properties of the room temperature stable
radicals as regards spectral shape (narrow lines, little or no
hyperfine structure).
Marchionia et. al. (2002) (127), reported that many
previous papers described the use of low-concentration alanine
pellets, powder or films for industrial high-dose application,
but very few authors presented applications of such dosimeters
to the low-dose range used for wastewater, flowers or
radiotherapy treatment. The present paper describes the large-
scale manufacturing process of high concentration alanine
pellets used for radiotherapy dose control in some French
hospitals. The fading process due to sunlight exposure has
been evaluated by means of direct UV light irradiation. The
major disadvantage of alanine is its strong solubility in water
(the pellets are completely dissolved when immersed for 10
min in pure water). The use of barium sulphate, not soluble in
water, made it possible to carry out dosimetric measurements

even when the dosimeter is completely immersed in water or
stored after irradiation in high humidity levels. The paper
presents manufacturing process of barium sulphate pellets,
their dosimetric characteristics and one application of this
dosimeter for the control of the absorbed doses during
wastewater treatments.
Vestad et. al. (2003) (128), have study polycrystalline
samples of lithium formate monohydrate, magnesium formate
dihydrate and calcium formate by EPR spectrometer. Alanine
was included for comparison and reference. Samples were
irradiated with 60Co gamma-rays and 60-220 kV X-rays. The
dosimeter response was assessed using the peak-to-peak
amplitude of the first-derivative EPR spectrum. Dose-response
curves for the 60Co gamma-irradiated samples were
constructed, and the dependence of the response on the photon
energy, microwave power, and modulation amplitude were
studied. Stability of the irradiation products upon storage
(signal fading) was also investigated. Lithium formate
monohydrate is by far the best candidate of the tested
formates, suitable for measuring doses down to approximately
0.1 Gy. Lithium formate monohydrate is more sensitive than
alanine by a factor of 5.6-6.8 in tested photon energy range, it
exhibits no zero-dose signal and shows a linear dose response
in the dose range from 0.2 to 1000 Gy. Its EPR signal was

found unchanged in shape. Various less favorable properties
rendered the other formates generally unsuitable.
Engin and Unnisa (2004) (129), have investigate the
dosimetric properties of chicken egg shells by using ESR
spectroscopy. The ESR spectra of the irradiated egg shell were
found to have an asymmetric absorption characterized by a
major resonance at g=2.0019 and a minor resonance at g=
1.9980. The study was carried out on g=2.0019 signal because
of the accuracy of measurements and the possibility of using it
as ESR dosimeter. Dose response was found to be appropriate
for dosimetry in the range 3 Gy to 10 kGy. The lower limit of
observable doses for egg shell sample was about 3 Gy. The
other ESR dosimetric parameters of egg shell samples, fading
characteristic, light effect, dose-rate dependence and energy
dependence, have also been studied in detail. Apart from its
non-tissue equivalence, egg shell has very good dosimetric
properties with insignificant fading, light independence,
linearity in dose–response (3 Gy–10 kGy), dose-rate
independence and independence from energy above 500 keV.
It suggests that egg shell may be used as a retrospective
gamma radiation dosimetry after nuclear accidents or other
short accidental radiation events.
Lin et. al. (2005) (130), have developed the thin film
alanine-PE dosimeter to be used as transfer dosimetry system

particularly for electron beam dose measurement. Its basic
dosimetry characteristics were studied under Co-60 gamma-
ray and electron beam irradiation. The investigated dose range
was between 0.02 and 300 kGy. The background dose for the
unirradiated dosimeter was about 4 Gy. No significant dose
response dependent on energy or dose rate was found in both
gamma-ray and electron beams irradiation. The irradiation
temperature coefficient was about 0.26 %/ 0C between 15 and
50 0C in the dose range from 5 to 50 kGy. Another important
feature, post-irradiation stability, was also studied in detail for
dosimeters stored at room temperature and 40 0C with relative
humidity of 98%, 76%, 58%, 33% and 12%. The preliminary
inter-comparison results between alanine-PE/EPR dosimetry
system and the reference dosimetry systems from RISO,
JAERI and INCT were comparable within their combined
uncertainty, which showed the potential of alanine-PE/EPR
dosimetry system to be used as transfer dosimetry system.
Gancheva et. al. (2006) (131), have study polycrystalline
phenyl-alanine and perdeuterated L-ά-alanine (L-ά-alanine-d4) as
potential high-energy radiation-sensitive materials for solid
state/EPR dosimetry. It was found that phenyl-alanine exhibits
a linear dose response in the dose region 0.1–17 kGy.
However, phenyl-alanine is about 10 times less sensitive to
gamma irradiation than standard L-ά-alanine irradiated at the

same dose. Moreover, the EPR response from phenyl-alanine
is unstable and, independent of the absorbed dose, decreases
by about 50 % within 20 days after irradiation upon storage at
room temperature.
II-2. Literature reviews on quartz dosimetry II.2.1- Quartz applications in low doses dosimetry
Quartz is one of the most abundant minerals on the
earth surface. Quartz materials were used as a dosimeter
accumulated paramagnetic centers as a result of cosmic
rays, and has many applications of EPR spectroscopy, such
as,
Ranjbar et. al. (1996) (132), have studied the ESR dose
response (at low dose) for 60Co-gamma irradiated quartz
powder (75 mg of the powder with particle size of 212-250
µm). The results shown that, the minimum detectable dose
(MDD) is about 2 Gy at 2 standard deviation. This MDD,
when using the ESR method, is too high for radiological
protection applications, but adequate for applications such as
sterilization and some medical purposes.
Bensimon et. al. (2000) (133), studied nature and thermal
stability of paramagnetic defects in natural clay by ESR
technique. Two radiation-induced defects are revealed,
certainly localized in the quartz contained in clay. The first is
E`-center, where an electron was trapped in oxygen vacancy to

give (≡Si.). The second is the peroxy-center, associated with
oxygen vacancy, formed by the action of an O2- ion in a silicon
atom to produce ≡Si-O-O. radical. The thermal stability of
these defects is studied by isothermal annealing experiments.
These paramagnetic defects can be observed in old materials
which generated by natural radioactivity and cosmic rays,
where these defects are very stable at room temperature.
Sastry et. al. (2004) (134) , reported that about 30 years
ago a rock shelter with engravings by early settlers was found
at Montalvanian Carvings, northern end of state of Minas
Gerais, Brazil. Lower part of engravings was covered with thin
deposit of calcite mixed with quartz grains, due to occasional
flood. This mixture of two minerals dated by
thermoluminescence and electron paramagnetic resonance
using in both case, additive method. The accumulated dose
DAC, that is, natural radioactivity and cosmic rays radiation
dose that induces TL and EPR signal intensity has been found
to be around 50 Gy both by TL and EPR methods.
Moritani et. al. (2005) (135), have study the
paramagnetic defects created in quartz by ion beam and
neutron irradiation. In each case, the formation of the E`-
centers and peroxy radicals (PORs) was observed but that of
the non-bridging oxygen hole center (NBOHC) was hardly

observed. These are all of paramagnetic centers have been well
characterized by electron spin resonance spectrometer.
Stpeanenko et. al. (2007) (136), reported that three
methods of individual dose reconstruction, namely dose
calculations based on the available archive data and on the
individual questioning of inhabitants, EPR dosimetry in human
tooth enamel, and retrospective luminescence dosimetry
(RLD) with quartz inclusions in the bricks were applied for
assessment of accumulated external doses in Dolon village
(Kazakhstan). Dose values obtained by EPR and RLD methods
were compared with computed dose values.
II.2.2- Quartz applications in high doses dosimetry
Wieser et. al. (1989) (137) , showed that the E` center
in quartz could be used as a gamma radiation dosimeter useful
to doses as high as 107 Gy, which are similar to doses
experienced by natural quartz from beta and gamma rays over
hundreds of millions of years.
Toyoda and Hattori (2000) (138), reported that the E`-
center has been used for ESR dating of quartz with assuming
that the signal intensity increases with natural radiation dose.
Formation and decay of the E`-center are closely related with
its precursor (diamagnetic oxygen vacancies). Gamma ray of

large dose (> 100 kGy) creates oxygen vacancies, therefore,
might be useful for dating of granite and high dose dosimetry.
Dobosz et. al. (2007) (139), shown that the samples of
natural clay and quartz have been investigated by using EPR
method. Because of young age (100–5000 years old) of these
materials and the presence of iron compounds the big doses
(1–200 kGy) of irradiation have been used.
The above survey show that, no one studded the quartz
as dosimeter for radiation processing, therefore, the present
study discussed the possibility of preparing quartz rods as
dosimeter in radiation processing applications by using EPR
spectrometer.

III-EXPERIMENTAL III.1- Materials The commercially available quartz material (silicon
dioxide) is in crystal form. It's crushed to obtain quartz powder
(particle size 175-215 µm) to prepared quartz rods. Silicon
dioxide has a molecular weight of 60.08 and a density of 2.65
g/cm3 in crystal form, product of ALDRICH, USA. It has the
following scheme.
Figure (4). The schematic of unit of the SiO2 network
Also, the following materials were used in sample preparation:
1- Hot melt stick adhesive based on ethylene vinyl acetate copolymer
(Tec-Bond 232/12, Power Adhesives Limited, England).
2- Paraffin wax (Congealing point 65-71 0C, BDH).
III.2- Apparatus

III.2.1- Irradiation source (Gamma Irradiation)
The Gamma cell 220 Excel 60Co irradiation facilities
(manufactured by MDS Nordion, Canada) is a compact and
self-contained irradiation unit offering an irradiation volume of
approximately 6 L. The activity of this irradiation facility was
11994.8 Ci at the time of installation (18 Jan. 2002). The unit
consists of annular sources, permanently enclosed within a
lead shield, a cylindrical drawer which carries samples to and
from the irradiation position, and a device mechanism to move
the drawer up or down along the vertical source center-line.
The chamber, contained within the drawer, can accommodate
samples up to approximately six inches in diameter and eight
inches in height. An access tube in the upper portion of the
drawer can introduce liquid, gaseous, electrical or mechanical
connections into the sample chamber. An electrically powered
digital timer automatically signals the drawer to rise at the
termination of the sample irradiation.
The Gamma Cell 220 Excel is equipped with a
temperature control unit to maintain temperature constant of
the GC during irradiation in the range from 10 oC – 60 oC ± 0.1 oC. The temperature controller system installed in the gamma
cell 220 Excel was manufactured at National Physical
Laboratory (UK) and exactly similar to the system installed at
NPL for controlling temperature of their irradiation facility.

The system is shown in figure (5). The oven has across-linked
polystyrene shell and an aluminium lining. The 220 Excel has
a sample holder presented at the central spatial positions of
γ-irradiation field and it used for irradiating rod samples see
figure (6).
Heating and, to a lesser extent, cooling are provided by
means of a Peltier junction mounted in the base of the oven.
The oven control unit applies voltages of the appropriate
magnitude and polarity to the Peltier junction. The main means
of cooling the oven is by use of a CO2 system. Pulses are sent
to a CO2 flow control valve and liquid CO2 is delivered to the
base of the irradiation chamber. Platinum resistance
thermometers are used to measure the sample temperature and
the temperatures either side of the Peltier junction. The
absorbed dose rate of the GC 220 excel was measured by using
NPL alanine reference dosimeter.

Figure (5). Irradiation gamma cell.

Figure (6). Irradiation gamma cell (central cavity)

III.2.2- EPR Spectrometer Electron Paramagnetic resonance (EPR) has matured
into a powerful, versatile, non-destructive, and non-intrusive
analytical method. Unlike many other techniques, EPR yields
meaningful structural and dynamical information, even from
ongoing chemical or physical processes without influencing
the process itself. Therefore, it is an ideal complementary
technique for other methods in a wide range of studies and
applications area. EPR signals were recorded at room
temperature by using a Bruker EMX spectrometer (X-band)
product of Bruker, Germany. The operating conditions are,
microwave power=0.201 mW, modulation amplitude=4.00
Gauss, modulation frequency=100 kHz, sweep width=200
Gauss, microwave frequency=9.775 GHz, time constant=81.92
ms and sweep time=20.97 s. Figure (7) shows the EPR
spectrometer. The detection limits of EPR technique depends
on the type of sample, sample size, detector sensitivity,
frequency of the incident microwave radiation, and the
electronic circuits of the instrument.

Figure (7). EPR spectrometer

III.3- Preparation of quartz rods An equal weight mixture of paraffin wax and ethylene
vinyl acetate (EVA) hot-melt adhesive was melted in a round
bottle at 85-95 0C in a water bath. EVA shows a complete
compatibility with paraffin wax. 5, 10, 20, 30 and 50 % fine
powdered quartz material is added to the hot mixture solution
and mechanically stirred for about 20 minutes at the same
temperature to obtain a homogeneous mixture. The hot
solution is sucked into polypropylene tubes (inner diameter 3
mm) and was left to solidify by cooling. Quartz mixture rod
was obtained by removing the polypropylene tube, and then
cutting into rods (3 x 10 mm dimensions). The average mass
of the quartz was found to be 0.0742 ± 0.0102 g for
concentration of 5 %, 0.0788 ± 0.0117 g for concentration of
10 %, 0.0839 ± 0.0126 g for concentration of 30 % and 1.094
± 0.0138 g for concentration of 50 %.
III.4- Irradiation procedure (Gamma irradiation) The irradiation of quartz rods were carried out with
γ-rays in the 60Co gamma cell 220 Excel at the central
spatial position. In order to establish a good
reproducibility and accuracy of absorbed radiation dose at
the gamma cell, an especially designed holders in our
laboratory made from polystyrene was used to hold rod

samples at the central spatial position of the sample
chamber of the gamma cell. The design of this holder
ensures that all irradiated rods are exposed to the same
radiation field in the most homogenous region of the
irradiation chamber. These places are the most uniform
isodose in the chamber, and its accurately calibrated using
the standard NPL alanine reference dosimeter. The
temperature during γ-ray irradiation was adjusted at 35 oC. In response irradiation curve and quartz rod was
exposed to accumulated additional irradiation doses
followed by an EPR measurement immediately of each
dose. Five rods for each dose were grouped together and
conditioned in the glove box in air at room temperature.
Then each group is irradiated together in polystyrene
holder to the required dose.
III.5- EPR spectra measurements The EPR spectra of unirradiated and irradiated
quartz rods were recorded using EMX spectrometer (X-
band), the cavity used was the standard Bruker ER 4102
rectangular cavity. The operating conditions for the EPR
spectrometer were as follow: microwave power 2.012 mW,
modulation amplitude 4 G, time constant 81.92 ms and
conversion time 20.48 ms. Samples were inserted in EPR

tubes and measured at the above instrument parameters.
The bottom of the EPR tube was adjusted at a fixed
position to ensure reproducible and accurate positioning of
the rods in the sensing zone of the cavity. The peak height
of the radiation-induced EPR signals was measured for
each group samples. To obtain high reproducibility in
measurement each rod was marked and placed in fixed
direction during measurement of doses from 0.1 to 290
kGy. All EPR measurements were carried out at lab
temperature (25±2 0C). EPR spectra were recorded at two
orientations of each rod in the EPR cavity (0 and 90
degrees). The response curves were established in terms of
signal height for strong middle peak (average peak-to-peak
heights of the two orientations h0 and h90) divided by
sample weight as a function of irradiation dose in kGy.
Stability of the EPR spectrometer sensitivity was checked
before and after each series of measurements using
reference alanine dosimeters irradiated to known dose.
The influence of the decay of the radiation-induced
paramagnetic centers in quartz rods have been studied
over a storage period of 20 months at different conditions
such as dark, daylight and at temperature = 40 0C.

III.6- Dosimetry uncertainty for calibrations at egyptian
high-dose reference laboratory
An important and unavoidable fact of life in any
measurement of error and the ensuing uncertainties.
Uncertainty is a parameter, characterizes the dispersion of the
values that could reasonably be attributed to the measured. In
other words, the uncertainty of the results of a measurement
reflects the lack of exact knowledge of the value of the
measured. The result of a measurement after correction for
recognized systematic effects is still only an estimate of the
value of the measured because of the uncertainty arising from
random effects and from imperfect correction of the result for
systematic effects.
In practice there many possible sources of uncertainty in
a measurement including.
a) Incomplete definition of measured.
b) Imperfect realization of definition of the measured.
c) Sampling-the measured may not represent the defined
measured.
d) Inadequate knowledge of the effects of environmental
conditions on the measurement procedure.
e) Personal bias in reading analog instrument.
f) Instrument resolution or discrimination threshold.

g) Values assigned to measurement standard.
h) Values of constant and other parameters obtained from
external sources and used in the data reduction algorithm.
i) Approximations and assumptions incorporated in the
measurement method and procedure.
j) Variations in repeated observations of the measured under
apparently identical condition.
Uncertainty component are classified into two categories
based on their method of evaluation, "Type A" and "Type B".
Type A evaluation (of standard uncertainty) is a method of
evaluation of standard uncertainty by the statistical analysis of
a series of observations. Type B evaluation (of standard
uncertainty) is a method of evaluation of standard uncertainty
by means other than the statistical analysis of series
observations. Contributions to the combined uncertainty in the
experimental value for measurement of observed dose by a
dosimetry system include four sources; each source usually
consists of several components of both Type A and Type B.
These four sources of uncertainty and their components are;
a) Uncertainty in the absorbed dose received by the dosimeters
during system calibration. The component of this source
includes the following:
1) Response of primary of reference standard.
2) Irradiation time.

3) Decay corrections.
4) Non uniformities in standard radiation field.
b) Analysis of dosimeter response. The components of this
source are:
1) Intrinsic variation in dosimeter response.
2) Variation in thickness of individual dosimeters.
3) Variation in readout equipment.
c) Fit of dosimetry data to calibration curve. The components
of this source are:
1) Variation in response of dosimeters.
2) Analytical function used in fit.
d) Routine use of dosimetry in a production irradiation facility.
This source includes the following components:
1) Deviation in environment from calibration conditions.
2) Influence of adjacent product on dosimeter.
3) Orientation of dosimeters to source of radiation.
Clearly all components may not apply to a given class of
dosimeter or method of calibration.
A quoted value of a parameter without the associated
uncertainties has little meaning. Thus the ability to measure
the absorbed dose precisely and accurately should be

thoroughly evaluated. Every effort should be made to
minimize the uncertainty in the dose measurement. All the
components of uncertainty should be investigated, beginning
from calibration to its use, including inherent non-
homogeneity of the dosimeters and influence factors.
For example, to evaluate the uncertainty associated with
measurement of dosimeter response (where the absorbance
measurements should be made under conditions of
repeatability), calculate the average of a measured quantity
(Xi) and the standard deviation (σι−1) of each group of quartz
rods irradiated to the same dose (not less than five rods at each
dose). After that, calculate the overall uncertainty CV % at 1σ
by applying the following formula.
∑
∑−
−=
−
ii
iii
n
n
)1(
)X/)(1(CV%
2i1
σ × 100 ……… (1-3)
where CV % is the percentage of coefficient of variation; σι−1 is the sample standard deviation of a spectrophotometric
quantity for ith set of data; (ni -1) is the degrees of freedom for
ith set of data; iX is the average value of a spectrophotometric
quantity for ith set of data and ni is the number of replicate
measurements for ith set of data.

III.6.1-Uncertainty calculation of alanine dosimeter
a- Analysis of alanine-EPR dosimeters
The combined standard uncertainty for the absorbed
doses received during the irradiation calibration, as estimated
in table (6).
Table (6).Uncertainty of response from EPR analysis of alanine
dosimeter pellets
Source of uncertainty
Type of
uncert-ainty
Value (%)
Probability distribution
Divi-sor
Standard deviation
(%)
Vertical positioning of the sample cavity
A 0.2 rectangular √3 0.115
Angular positioning of the dosimeter pellet
A 0.2 rectangular √3 0.115
Sensitivity variation A 0.2 rectangular √3 0.115
Reproducibility of relative EPR measurements (pellet and standard)
A 0.2 rectangular √3 0.115
Mass of dosimeter pellets A 0.2 rectangular √3 0.115
Homogeneity of dosimeter pellets A 0.2 rectangular √3 0.115
Combined standard uncertainty
normal 0.282
Expanded uncertainty normal k=2 0.564

b- Response function for alanine dosimeter pellets
The uncertainties in the calibration irradiation dose
rates and uncertainties in the EPR analysis of the dosimeters
will result in uncertainties in both the response and absorbed
dose values used for determining the response function. These
uncertainties are given in table (7). Table (7). Uncertainty of response function for determining
absorbed dose
Source of uncertainty
Type of
uncert-ainty
Value (%)
Probability
distribution
Divisor
Standard deviation
(%)
Calibration irradiation dose rate
B 1.145
EPR analysis of dosimeters B 0.282
Uncertainty from fitting of response to absorbed dose as determined from the variation of the residuals.
B 0.5 rectangular √3 0.286
Irradiation temperature B 0.2 rectangul
ar √3 0.115
Combined standard uncertainty
normal 1.219
Expanded uncertainty normal
(k = 2) 2.438

The choice of the analytical function chosen to fit the
response as a function of absorbed dose will affect the
calibration uncertainty. Information on this effect can be
obtained from the absorbed dose residuals at the calibration
absorbed doses. Uncertainties in the response function may be
introduced by variations in the irradiation temperature.

IV-Results and Discussion
The present thesis deals with the investigation of the
possibility of the preparation of quartz rods for use as gamma
radiation dosimeters. The prepared rods (concentration =30 %,
length = 1 cm) cover a wide range of absorbed doses for many
applications such as sterilization of medical devices, food
irradiation and blood irradiation. An ideal binder should
improve the mechanical stability of quartz powder (quartz
rods) and has no EPR signal after irradiation. Accordingly, it
can be concluded that the contribution of binder is considered
to be negligible and the obtained EPR signal is due to quartz
powder only which exist in the quartz rods. For ease of
presentation the results and discussion will be presented
separately. Thus, chapter four will be divided into:-
IV.1- Study of EPR parameters for irradiated quartz rods
IV.2-EPR signals of irradiated and non-irradiated
quartz rods
IV.3- Radiation studies on quartz rods IV.4- Assessment of dosimetric characteristics for quartz
rods

IV.1- Study of EPR parameters for irradiated quartz rods
EPR parameters must be selected carefully to see all the
details in EPR spectra for irradiated samples (dose=25 kGy). If
the parameters are too low, the spectrum will be suffering from
the effect of digitization (weaker spectrum), whereas at high
values of EPR parameters the small peaks in spectrum will
disappear.
IV.1.1- Microwave power, (P)
Prior to this study, care was taken with the use of
microwave power to avoid power saturation. Power saturation
curve was obtained by measuring the peak-to-peak amplitude
of the first derivative EPR signal for quartz sample as a
function of the microwave power. Intensity of EPR signals
have been plotted against the square root of the microwave
power (range 0.272-1.591 mW) as shown in figure (8). The
power 0.201 mW (corresponding to P1/2 =0.448 mW) has been
selected for carrying out the measurements as it is almost at
the upper end of the linear range of the dependence. Practically
at power levels in excess of 0.1 mW, the signal output voltage
from the detector system of EPR spectrometer is proportional
to square root of microwave power, i.e. the intensity of EPR
signals increase with the square root of the microwave power
in the absence of saturation effects. A general rule for
quantitative EPR measurements is to keep the microwave

Power (mW) 1/2
0.3 0.4 0.5 0.6 0.7 0.8 0.9 1.0 1.1 1.2 1.3 1.4 1.5 1.6 1.7
EPR
Sig
nal I
nten
sity,
rel
ativ
e uni
ts
0.95
1.00
1.05
1.10
1.15
1.20
1.25
1.30
1.35
1.40
1.45
1.50
1.55
1.60
Figure (8). Relative EPR signal intensity as a function of
P1/2 in the range 0.272 - 1.591 mW

power in the unsaturated region. At saturation, the area under
the absorption curve is no longer valid to spin concentration
measurement in the sample and the signal becomes broaden.
Figure (9) shows the EPR spectra of quartz sample at
microwave powers 0.074, 0.201 and 10.008 mW. It can be
seen that the signal at low power (0.074 mW) is much weaker
than the power 0.201 mW, while that at excessive power
(10.008 mW) is broad.
IV.1.2- Modulation amplitude, (MA)
The effect of the modulation amplitude on the measured
spectra has been studied by measuring a quartz sample at
different modulation amplitude values in the range 0.37–12.07
Gauss. Figure (10) shows the relative EPR signal intensity as a
function of modulation amplitude values. It can be seen that
the intensity of the EPR signal increase linearly up to about 4
Gauss, then tend to saturate at higher values. The selected
value for carrying out the measurements is 4.07 Gauss as it is
almost at the upper end of the linear range of the dependence.
Figure (11) shows the EPR spectra at different MA values
namely 0.37, 4.07 and 12.07 Gauss. It can be seen that, the
spectrum obtained at 4.07 Gauss has the optimum line shape
and accurate line-width. On the other hand the spectrum
obtained with lower MA (0.37 G) is distorted while that it
obtained with excessive MA at 12.07 G give a broad signal

c
b
a
Figure (9). EPR spectra for quartz sample,(a) P=0.201 mW, (b)P=0.074
mW, (c) P=10.008 mW, all the spectra are the same scale

with lost small peaks or hyperfine.
IV.1.3- Sweep width (Sw)
The effect of the sweep width on the measured spectra
has been studied by measuring a quartz sample at different
sweep width values in the range 10–1000 Gauss. Figure (12)
shows the relative EPR signal intensity as a function of sweep
width values, the signal amplitude was found to decrease
linearly with the increase of sweep width. The selected value
for carrying out the measurements is 200 G as it gives
optimum EPR signal. If the sweep width is too low (10 G) the
signal becomes diminishes and broad, but at too large sweep
width (1000 G) the detected EPR line is very narrow and
becomes distorted with difficult interpretation of our results as
in figure (13).
IV.1.4- Conversion time (Ct)
Conversion time curve was obtained by measuring the
peak-to-peak amplitude of the first derivative EPR signal
as a function of the conversion time. Intensity of EPR signals
have been plotted against the conversion time in the range
0.32–163.84 ms to obtain a linear relationship as in figure (14).
Figure (15) shows the spectra of quartz sample measured at
1.28, 20.48 and 163.84 ms. It can be seen that the spectrum
obtained at 20.48 ms has a clear non-distorted signal, while if
the conversion time is too short (1.28 ms) the EPR signal

Modulation Amplitude Values, Gauss
1 2 3 4 5 6 7 8 9 10 11 12 13
EPR
Sig
nal I
nten
sity,
rela
tive u
nits
0.0
0.1
0.2
0.3
0.4
0.5
0.6
0.7
0.8
0.9
1.0
1.1
1.2
1.3
1.4
Figure (10). Relative EPR signal intensity as a function of the
modulation amplitude values in the range 0.37-12.07 Gauss

c
b
a
Figure (11). EPR spectra for quartz sample, (a) MA=4.07 G, (b)
MA=0.37 G, (c) MA=12.07 G, all the spectra are the same scale
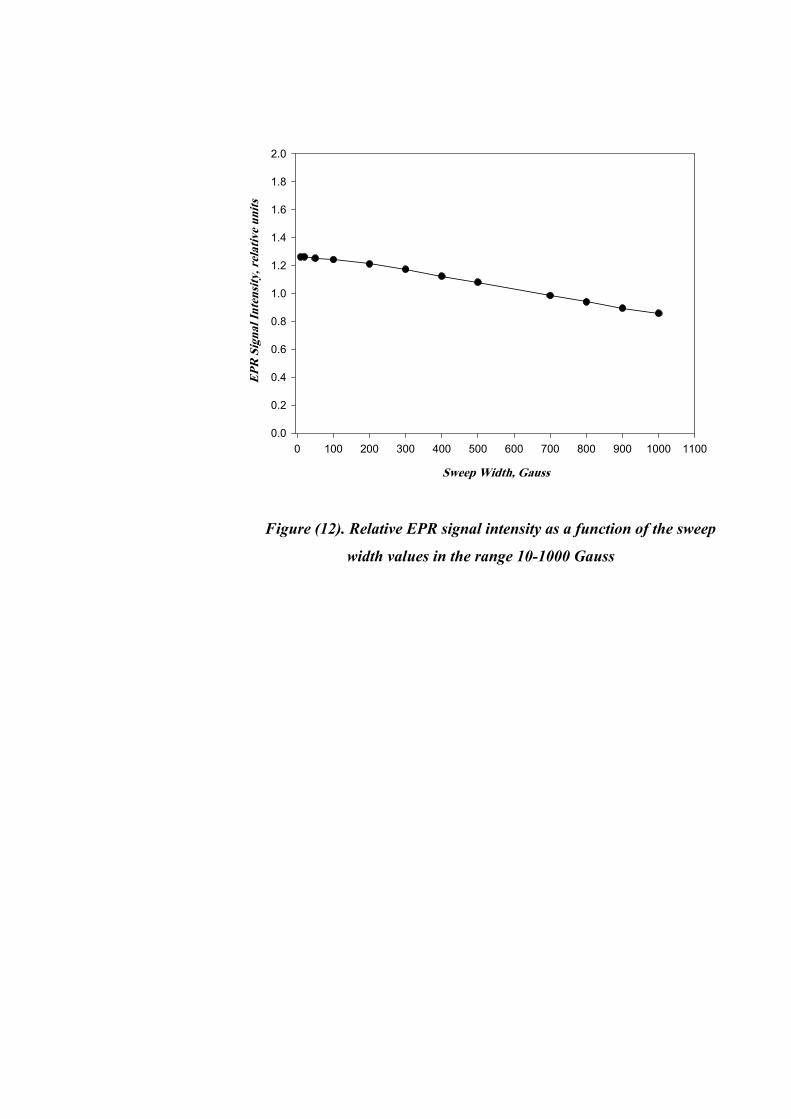
Sweep Width, Gauss
0 100 200 300 400 500 600 700 800 900 1000 1100
EPR
Sig
nal I
nten
sity,
rel
ativ
e un
its
0.0
0.2
0.4
0.6
0.8
1.0
1.2
1.4
1.6
1.8
2.0
Figure (12). Relative EPR signal intensity as a function of the sweep
width values in the range 10-1000 Gauss

c
b
a
Figure (13). EPR spectra for quartz sample, (a) Sw=200 G, (b) Sw=10
G, (c) Sw=1000 G, all the spectra are the same scale

becomes very low intensity and distorted. The signal obtained
at 163.84 ms is very strong and could be unreal. Accordingly,
the conversion time value 20.48 ms has been selected for
measuring quartz samples.
IV.1.5- Time constant (Tc)
The effect of the time constant on the measured EPR
spectra has been studied by measuring a quartz sample at
different time constant values in the range 0.16–655.36 ms.
Figure (16) shows the relative EPR signal intensity as a
function of time constant values. It can be seen that the
intensity of the EPR signal decrease linearly with the increase
of time constant. The selected value for carrying out the
measurements is 81.92 ms as it is almost best value for
measurement of quartz sample. Figure (17) shows the EPR
spectra at different Tc values namely 0.16, 81.92 and 655.36
ms. It can be seen that the time constant filter EPR signal from
the noise. The spectrum obtained at 81.92 ms has no noise, but
the spectrum obtained with lower Tc (0.16 ms) gives a lot of
noise with the signal. If the time constant is too large (655.36
ms) the signal will be distorted and becomes very weak.

Conversion Time, ms
0 10 20 30 40 50 60 70 80 90 100 110 120 130 140 150 160 170 180
EPR
Sig
nal I
nten
sity,
rela
tive
units
0
1
2
3
4
5
6
7
8
9
10
11
12
13
14
15
Figure (14). Relative EPR signal intensity as a function of the
conversion time values in the range 0.32-163.48 ms

c
b
a
Figure (15). EPR spectra for quartz sample, (a) Ct=20.48 ms, (b)
Ct=1.28 ms, (c) Ct=163.84 ms, all the spectra are the same scale

Time Costant Values, ms
0 50 100 150 200 250 300 350 400 450 500 550 600 650 700
EPR
Sig
nal I
nten
sity,
rel
ativ
e va
lue
0.10.20.30.40.50.60.70.80.91.01.11.21.31.41.51.61.71.8
Figure (16). Relative EPR signal intensity as a function of the time
constant values in the range 0.16 - 665.36 ms

c
b
a
Figure (17). EPR spectra for quartz sample, (a) Tc=81.92 ms, (b) Tc =
0.16 ms, (c) Tc=655.36 ms, all the spectra are the same scale

IV.2- EPR signal for irradiated and non-irradiated
quartz rods
EPR is a suitable technique for the study of irradiated
quartz rods. The signal recorded should be specific of the
radiation treatment of these rods. To measured EPR spectrum
for concentrations (5, 10, 20, 30 and 50 %) of quartz samples,
5 rods (each rod represent one concentration) were prepared
and grouped into one set and irradiated to dose 25 kGy. EPR
signals of rods begin to develop upon irradiation and its
intensity increases gradually with increasing concentration as
in figure (18). It can be seen that, all concentrations have EPR
signals, while no control signal was present. The concentration
of 30 % has high intensity with good mechanical properties
(quartz microcrystals are homogenous distribution inside the
rod), while the concentration of 50 % has high intensity with
bad mechanical properties (quartz microcrystals are non-
homogenous distribution inside the rod). Also the
concentrations 5, 10 and 20 % are giving low intensity of EPR
signals. Figure (19) shows the relation between these
concentrations and the intensity of EPR signals at different
absorbed doses. The obtained results show that the intensity of
EPR signals of the different concentrations increase with
increasing absorbed dose.

ab
c
d
e
f
Figure (18). EPR spectra recorded for quartz, (a) non-irradiated, (b
5%, c 10%, d 20%, e 30 % and f 50%) are different concentrations
irradiated at the same dose

Concentration %
0 5 10 15 20 25 30 35 40 45 50 55
EPR
Sig
nal I
nten
sity,
rel
ativ
e in
tens
ity
-1.0
-0.5
0.0
0.5
1.0
1.5
2.0
2.5
3.0
3.5
4.0
4.5
5.0
1 kGy5 kGy26 kGy120 kGy290 kGy
Figure (19). EPR signals intensity versus different concentrations
at different doses

In EPR spectrum for quartz rod, there are many peaks
and could suggest that more than one paramagnetic centers
present in the sample as in figure (20). This spectrum generally
possessed three readily discernible peaks, the first one is an
intense peak at g = 2.00606 (magnetic field = 3485.34 gauss)
due to E′ center. E′ center is very stable at room temperature
and is intrinsic in SiO2. Its can be formed by the breaking of
the Si-Si bond to lead a silicon atom with an unpaired electron.
The second is a weaker peak around g = 2.00958 (magnetic
field = 3478.11) due to peroxy radical which comes from the
formation of asymmetrical bond between the Oֿ2 ion and a
silicon atom. The third is a very weaker peak around g =
2.01386 (magnetic field = 3448.74) due to non-bridging
oxygen hole center which comes from the breaking of the Si-
O-Si bond. The formation of the E′ center by gamma radiation
was easily observed by EPR technique because it has high
production efficiency and more stability but that of the POR
and non-bridging oxygen hole centers were hardly observed
because they have low production efficiency and less stability.

c
a
b
Magnetic field, Gauss
Figure (20). EPR spectrum of irradiated quartz sample: (a) E′
center, (b) peroxy radical, (c) non-bridging oxygen hole center

IV.3- Radiation studies on quartz rods
The EPR method is based on the measurements of long-
lived paramagnetic centers produced in quartz rods as results
of gamma irradiation. EPR could be used for qualitative and
quantitative analysis of these centers.
IV.3.1- Binder effect on EPR spectra
The commercially available quartz is in crystal form, it's
crushed to obtain polycrystalline powder form and to prepare
solid state quartz rods a suitable binder is needed. An ideal
binder should improve the mechanical stability of quartz
powder and has no EPR signal after irradiation. To investigate
the effect of binder on the radiation-induced EPR signal in
quartz powder, ethylene vinyl acetate copolymer/Paraffin rods
with and without quartz powder have been prepared. Two sets
of rods with and without quartz powder (5 rods for each set)
were exposed to a dose of 300 kGy. The EPR spectra were
recorded using the same EPR operating parameters. Figure
(21) shows the EPR spectra for the two sets. It can be seen that
the radiation-induced free radicals in binder rods was zero, i.e.
there is no EPR signal while the rods containing quartz powder
have an EPR signal due to trapped free radicals (paramagnetic
centers) in quartz crystals. The shape of EPR spectra of quartz

a
b
Figure (21). EPR spectra (a) irradiated binder/ quartz rod, (b)
irradiated binder rod (dose= 300 kGy)

is not changed by the presence of binder. Accordingly, it can
be concluded that the contribution of binder is considered to be
negligible and the obtained EPR signal is due to quartz powder
only.
IV.3.2- EPR spectra for irradiated different concentration
samples
25 rods have concentrations 5, 10, 20, 30 and 50 % (5
rods for each concentration) were irradiated at 25 kGy. The
EPR spectra of these rods were recorded in two orientations
(peak-to-peak heights h0 and h90). The average intensity of two
orientations divided on the rod weight and the correction factor
(alanine value), and then calculating the peak height as relative
units. Coefficient of variation was determined by dividing the
standard deviation of a measurement by the average
(100/average) for a set of five rods. EPR results were tabulated
in table (8), and shown graphically in figure (22). It can be
seen that, the lowest coefficient of variation (0.4782 %) due to
the rods have concentration of 30 %.
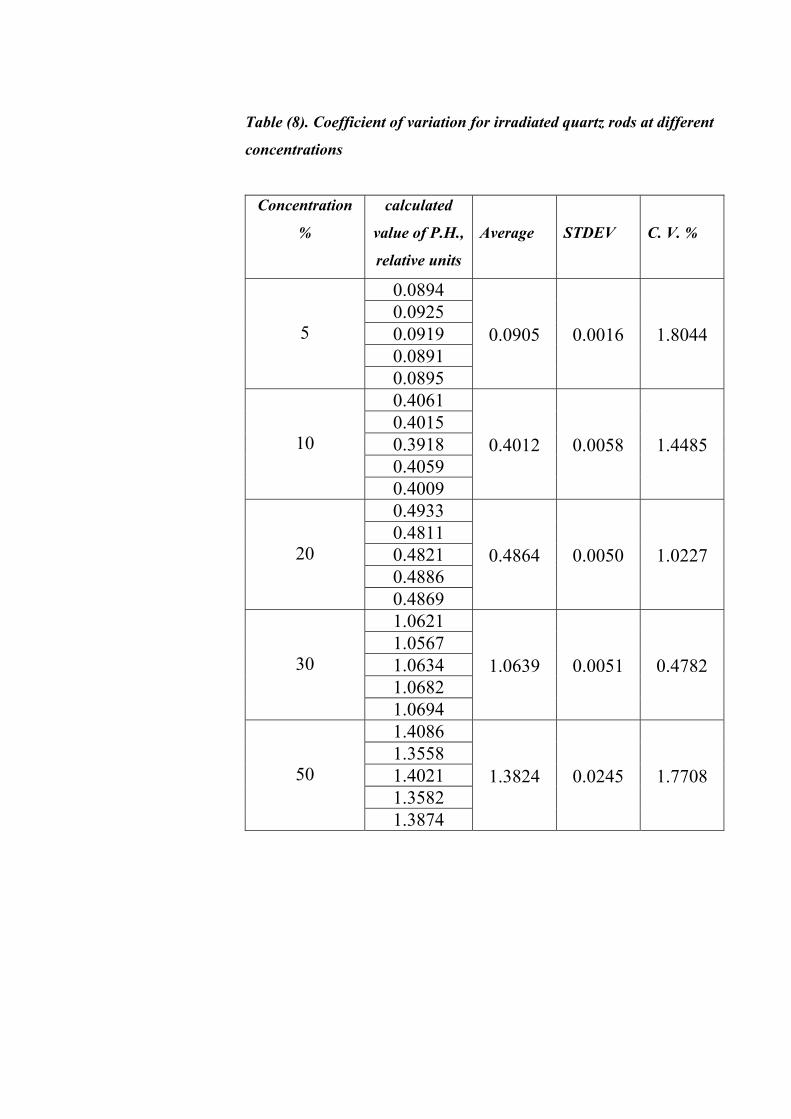
Table (8). Coefficient of variation for irradiated quartz rods at different
concentrations
Concentration
%
calculated
value of P.H.,
relative units
Average
STDEV
C. V. %
0.0894 0.0925 0.0919 0.0891
5
0.0895
0.0905
0.0016
1.8044
0.4061 0.4015 0.3918 0.4059
10
0.4009
0.4012
0.0058
1.4485
0.4933 0.4811 0.4821 0.4886
20
0.4869
0.4864
0.0050
1.0227
1.0621 1.0567 1.0634 1.0682
30
1.0694
1.0639
0.0051
0.4782
1.4086 1.3558 1.4021 1.3582
50
1.3874
1.3824
0.0245
1.7708

e
d
C
b
a .
Figure (22). EPR spectra for quartz rods with different concentrations
at 25 kGy, (a) 5 % , (b) 10 % , (c) 20 % , (d) 30 % ,(e) 50 %

IV.3.3- Homogeneity of quartz rods
Quartz rods containing 30 % (by mass) SiO2 powder
and 35 % for both ethylene vinyl acetate copolymer and
paraffin wax were prepared by mechanically stirred for
different interval times (5, 10, 20, and 30 minutes) at the same
temperature to obtain a homogeneous mixture. To choose the
best stirred time, quartz rods were irradiated (3 rods at each
interval time) at dose 25 kGy under equilibrium condition
within spatial holder fixed at the central position of the sample
chamber. The EPR spectra were recorded (at ambient
temperature 23±2 0C) at 0 degree rod orientation (h0) and by
rotating the tube containing rod around the vertical mid-axis
by 900 (h90) in the EPR cavity. The dose response of rods was
calculated from the averaged measured peak-to-peak heights
normalized to the rod mass as in table (9). It can be seen that
the lowest coefficient of variation is 0.8426 % which represent
stirred time 20 minute.
IV.3.4- Effect of quartz rod length
The length of the quartz rod affects the measured
absorbed dose. Two set of rods (1cm, 3cm) were prepared with
concentration of 30 % and exposed to a dose of 25 kGy (5 rods
for each length). The EPR spectra were recorded. Table (10)
shows the coefficient of variation of signal amplitude for two
irradiated sets with different lengths. It can be observed that,

Table (9). Coefficient of variation for irradiated quartz rods at different
stirred times
Stirred
time, min
Av. P. H.
/ weight,
relative unit Average
STDEV
C.V. %
1.24301091.3183846
5 1.33888561.300093
0.050487
3.8833
1.44374561.3635863
10 1.39213671.399822
0.040629
2.9024
1.20440811.2129138
20 1.22477601.214032
0.01023
0.8426
1.22756981.2204474
30 1.27802721.242014
0.03139
2.5274
the 1 cm rods give better result (lower coefficient of variation).
Increasing the length of the rod increases the EPR response
under the next condition, the rod length not longer than the
active zone for the EPR cavity. Also the fluctuations in the
EPR response due to fluctuation in the mass sample, therefore
the length of rod sample must be not long in order to decrease
EPR fluctuation.

Table (10). Coefficient of variation for two irradiated quartz sets with
different rod lengths
Length,
cm
Av. P. H.
/ weight,
relative unit Average
STDEV
C.V. %
1.2516 1.2508 1.2576 1.2546
1
1.2555
1.254
0.0028
0.2246
2.3978 2.4765 2.4592 2.4616
3
2.4941
2.4578
0.0363
1.4787
IV.3.5- Stability of paramagnetic centers at low and high
doses
Concerning the time stability of the radiation-induced
paramagnetic centers for irradiated quartz rod to a dose of 5
kGy (low dose). Where the irradiated rod was fixed in the EPR
cavity center and measured for 16 hours, every spectrum was
recorded in about 10 minutes. Figure (23) shows the obtained
fading behavior of EPR signal. It can be seen that, the intensity
of EPR signals changed rapidly within first few minutes, and
then the intensity decreased very slowly, also it is clear that,
within the first 50 minute from irradiation the EPR signal

intensity decreased by 1.760 % with respect to initial intensity
after that tends to be stable where within 960 minute the EPR
signal intensity decreased by 2.209 % with respect to initial
intensity. The same study has been carried out on a rod
irradiated to 50 kGy (high dose). The obtained results are
shown in figure (24). It can be seen that, almost identical
behavior has been found (decrease in signal intensity is 2.301
% within 960 minute), this result indicating that the short term-
decay of the paramagnetic centers is independent of the dose
level.
IV.3.6- The relation between spin density and absorbed
dose
The irradiated quartz rod gives three types of
paramagnetic centers (E′, POR, and NBOHC). There are
different intensities of these centers due to the production and
reaction mechanism. In quartz rod, the production of the E′
center is considerably very high compared with the production
of POR and NBOHC centers according to Hobbs and Pascucci
model (140). The E′ center appears at 3485.34 Gauss of
magnetic field with high intensity. The POR center appears at
3478.11 Gauss of magnetic field and its more intense than
NBOHC but less intense than E′ center. The NBOHC center
appears at 3448.74 Gauss of magnetic field with very poor
intensity. To investigate quantitatively the effect of increasing

S to ra g e T im e, m in
0 70 140 210 280 350 420 490 560 630 700 770 840 910 980 1050
EPR
sign
al In
tens
ity, r
elat
ive u
ints
0 .2616
0 .2620
0 .2624
0 .2628
0 .2632
0 .2636
0 .2640
0 .2644
0 .2648
0 .2652
0 .2656
0 .2660
0 .2664
0 .2668
0 .2672
Figure (23). Decay of EPR line of irradiated quartz rod at 5 kGy
S to ra ge T im e, m in
0 70 1 40 210 280 35 0 420 490 560 6 30 700 770 84 0 910 980 1050
EPR
Sig
nal I
nten
sity,
rel
ativ
e un
it
2 .280
2 .285
2 .290
2 .295
2 .300
2 .305
2 .310
2 .315
2 .320
2 .325
2 .330
2 .335
2 .340
Figure (24). Decay of EPR line of irradiated quartz rod at 50 kGy

the dose of gamma radiation on the quantity of paramagnetic
centers, the number of spins were calculated by using formula
(1-4). The obtained data are recorded and tabulated in table
(11).
Table (11). The relation between absorbed dose and spin number
Dose, kGy No. of spin (1015)
5
4.83
50
18.1
200
43.5
Ns = k . [H0 (∆H)2 A / 2] / [Hm Ge √P] (141) … (1-4)
Where, k is factor depending on experimental condition of the
EPR spectrometer and equal 1013, H0 is magnetic field at peak
in gauss, (∆H) is peak width, A is intensity per weight (EPR
signal intensity was divided on rod weight), Hm is modulation
amplitude value, √P is root of microwave power in mW, Ge is
receiver gain. These data indicates that the number of spins
created in quartz rods increase generally with the increase of
absorbed dose.

IV.3.7- Minimum detectable dose
Minimum detectable dose is one of the most important
characteristics of dosimetric materials. The minimum detection
limit of the EPR spectrometer for quartz rods (30 %) was
determined by irradiating 33 rods to decremented doses 0.01,
0.03, 0.05, 0.1, 0.2, 0.3, 0.5, 0.7, 1, 1.2 and 1.5 kGy (3 rods for
each dose) and recording their EPR spectra. EPR signals of
rods begin to appear at the dose of 0.1 kGy and its intensity
increases gradually with increasing absorbed dose as shown in
figure (25). It can be seen that the minimum detectable dose is
0.1 kGy (100 Gy).

Absorbed Dose, Gy
150 300 450 600 750 900 1050 1200 1350 1500 1650
EPR
Sig
nal I
nten
sity,
rel
ativ
e uni
ts
0.009
0.018
0.027
0.036
0.045
0.054
0.063
0.072
0.081
Figure (25). Dose response of quartz rods as a function of absorbed
doses in the range 0.1-1.5 kGy

IV.4- Assessment of dosimetric characteristics of
quartz rods
EPR-Dosimetric system provides a reliable means for
measuring the absorbed dose. It is based on the generation of
specific stable radicals (paramagnetic centers) in quartz
samples by ionizing radiation. The concentration of quartz-
derived radicals directly proportional to absorbed dose (linear
relation). EPR technique is non-destructive, so quartz rods can
be read out repeatedly. This part of work compresses studies
on dose response for different quartz concentrations, describes
the sources of uncertainty and the overall uncertainties
associated with the response curve, effect of temperature
during irradiation, as well as pre- and post-irradiation stability
at different conditions.
IV.4.1- EPR spectra
The EPR spectra of quartz rods were recorded after
irradiation to different doses (0.1-100 kGy) at microwave
power = 0.201 mW, modulation amplitude = 4.00 gauss, and
sweep width = 200 gauss as shown in figure (26). It can be
seen that the EPR signals begins to develop upon irradiation
and its amplitude increases gradually with increasing absorbed
dose of gamma ray photons without any change of its shape.

100 kGy
75 kGy
50 kGy
10 kGy
5 kGy1 kGy
0.1 kGy
Figure (26). The EPR spectra of quartz rods irradiated to
different absorbed doses

IV.4.2- Response curves for different concentrations
To carry out the response curves for different
concentrations (5, 10, 20, 30 and 50 %), 5 sets of rods (5 rods
for each set and each set represents only one concentration)
were grouped together and irradiated to different doses from
0.1 to 290 kGy. EPR measurements were taken to establish the
response curves (each dose point represented by the average
value of 5 rod measurements). Response curves were
established in terms of signal intensity corrected for sample
weight. Figure (27a) shows the response curves of irradiated
quartz rods (range 0.1-290 kGy) with different concentrations.
It can be seen that the radiation sensitivity of quartz rod
increases with increasing the concentration, and all response
curves have the same non-linear behavior. Also the curves
tend to saturate at high doses which may be due to radical-
radical reactions as the radical concentration increase (142).
Figure (27b) shows the dose working range 0.1-80 kGy of
response curves (at absorbed dose higher than 80 kGy the
signal intensity becomes saturate). Figure (27c) shows the
linear part (2.34- 26 kGy) of response curves which could be
useful for many different applications such as sterilization of
medical products. Figure (27d) shows the response curves at
low doses (0.1-2.34 kGy) which could be useful for
application in sprouting inhibition and insects disinfestations.

D ose, kG y
0 20 40 60 80 100 120 140 160 180 200 220 240 260 280 300 320
EPR
Sig
nal I
nten
sity,
rela
tive u
nits
0.00.51.01.52.02.53.03.54.04.55.05.56.06.57.07.58.0
C oncentration 5 %C oncentration 10 %C oncentration 20 %C oncentration 30 %C oncentration 50 %
Figure (27a). Dose response of irradiated quartz rods at different
doses for different concentrations (dose range 0.1-290 kGy)
D ose, kG y
0 5 10 15 20 25 30 35 40 45 50 55 60 65 70 75 80 85
EPR
Sig
nal I
nten
sity,
rel
ativ
e un
it
0.00.20.40.60.81.01.21.41.61.82.02.22.42.62.83.03.23.43.63.84.04.24.44.6
C oncentration 5 %C oncentration 10 %C oncentration 20 %C oncentration 30 %C oncentration 50 %
Figure (27b). Dose response of irradiated quartz rods at different
doses for different concentrations (dose range 0.1- 80 kGy)

D o se , k G y
0 2 4 6 8 10 12 1 4 1 6 1 8 20 22 24 2 6 2 8
EPR
Sig
nal I
nten
sity,
rela
tive u
nits
0 .0
0 .2
0 .4
0 .6
0 .8
1 .0
1 .2
1 .4
1 .6
1 .8
2 .0
2 .2
2 .4C o n cen tra tio n 5 %C o n cen tra tio n 1 0 %C o n cen tra tio n 2 0 %C o n cen tra tio n 3 0 %C o n cen tra tio n 5 0 %
Figure (27c). Dose response of irradiated quartz rods at different
doses for different concentrations (dose range 2.34- 26 kGy)
D o se , k G y
0 .0 0 .2 0 .4 0 .6 0 .8 1 .0 1 .2 1 .4 1 .6 1 .8 2 .0 2 .2 2 .4 2 .6
EPR
Sig
nal I
nten
sity,
rela
tive
units
0 .0 00 .0 20 .0 40 .0 60 .0 80 .1 00 .1 20 .1 40 .1 60 .1 80 .2 00 .2 20 .2 40 .2 60 .2 80 .3 00 .3 2
C o n cen tra tio n 5 %C o n cen tra tio n 1 0 %C o n cen tra tio n 2 0 %C o n cen tra tio n 3 0 %C o n cen tra tio n 5 0 %
Figure (27d). Dose response of irradiated quartz rods at different
doses for different concentrations (low dose range 0.1-2.34 kGy)

For all concentrations, different mathematical equations
were applied to fit the obtained data by using computer
software (Table curve, 2D, jandel Scientific Co.), based on the
correlation coefficients and F-statistics values. Tables (12-16)
show different mathematical equations and their constants a, b,
c and d as well as correlation coefficient, r2, and F-statistic for
different concentrations. Correlation coefficient, r2, and F-
statistic values were used as measure for the goodness of the
fitting process (143). From data in these tables, it can be seen
that the best fit to the data could be obtained by using the
exponential equation in the range 0.1-290 kGy where its
correlation coefficient and F-statistic values are larger than
those obtained for linear, second and third polynomial
equations, respectively. The third polynomial equation has the
best fit to the data in the range 0.1-80 kGy where its
correlation coefficient and F-statistic values are larger than
those obtained with linear, second polynomial and exponential
functions. Also the linear equation has the best fit to the data in
two ranges 0.1- 2.34 and 2.34- 26 kGy where its correlation
coefficient and F-statistic values are larger than those obtained
with second, third polynomial and exponential functions
According to the obtained results, an ideal concentration was
30 %. Then the concentration of 30 % will be used in the
remaining studies.

Table (12).Values of constants a, b, c and d as well as correlation
coefficient, r2, and F-statistic for different equations fitted to obtained
data for concentration of 5 % at different doses range
Equation constants Dose
range,
kGy
Equations
a b c d
r2 F-
stat.
Y = a + bx 0.0561 0.0020 - - 0.9037 723.001
Y = a + bx + cx2 0.0263 0.0040 -7.9e-6 - 0.9946 7122.52
Y = a +bx+cx2+dx3 0.0218 0.0048 -1.6e-5 2.01e-8 0.9971 8513.45
0.1-
290
Y=a{1-exp[-c+x)/b]} 0.5730 3.5739 107.31 - 0.9972 15416.5
Y = a + bx 0.0276 0.0035 - - 0.9701 2017.21
Y = a + bx + cx2 0.0163 0.0056 -2.6e-5 - 0.9946 5663.44
Y = a +bx+cx2+dx3 0.0134 0.0066 -2.1e-5 2.85e-7 0.9962 7345.08
0.1-80
Y=a{1-exp[-c+x)/b]} 0.4142 2.2871 64.113 - 0.9957 7220.39
Y = a + bx 0.0178 0.0062 - - 0.9989 7891.24
Y = a + bx + cx2 0.0151 0.0054 -2.2e-5 - 0.9989 8961.21
Y = a +bx+cx2+dx3 0.0121 0.0079 -0.001 6.25e-6 0.9968 1324.28
2.34-
26
Y=a{1-exp[-c+x)/b]} 0.6696 3.1433 114.52 - 0.9833 1524.86
Y = a + bx 0.0013 0.0202 - - 0.9992 8676.54
Y = a + bx + cx2 0.0028 0.0159 0.0017 - 0.9989 1961.81
Y = a +bx+cx2+dx3 0.0027 0.0164 0.0012 0.0001 0.9987 1322.62
0.1-
2.34
Y=a{1-exp[-c+x)/b]} -1.397 1.1630 4.0641 - 0.9837 160.151

Table (13).Values of constants a, b, c and d as well as correlation
coefficient, r2, and F-statistic for different equations fitted to obtained
data for concentration of 10 % at different doses range
Equation constants Dose
range,
kGy
Equations
a b c d
r2 F-
stat.
Y = a + bx 0.1182 0.0041 - - 0.9152 830.735
Y = a + bx + cx2 0.0630 0.0077 -1.477 - 0.9958 9134.01
Y = a +bx+cx2+dx3 0.0554 0.0088 -2.7e-5 3.09e-8 0.9973 9290.23
0.1-
290
Y=a{1-exp[-c+x)/b]} 1.1813 5.2014 117.84 - 0.9973 14950.9
Y = a + bx 0.0659 0.0068 - - 0.9768 2615.11
Y = a + bx + cx2 0.0500 0.0097 -3.6e-5 - 0.9901 3072.76
Y = a +bx+cx2+dx3 0.0406 0.0128 -0.002 9.05e-7 0.9946 3711.93
0.1-80
Y=a{1-exp[-c+x)/b]} 0.9340 4.3077 83.501 - 0.9914 3550.15
Y = a + bx 0.0512 0.086 - - 0.9991 9786.27
Y = a + bx + cx2 0.0462 0.0114 -2.3e-5 - 0.9969 9273.11
Y = a +bx+cx2+dx3 0.0401 0.0112 -0.001 2.19e-5 0.9841 4837.16
2.34-
26
Y=a{1-exp[-c+x)/b]} 1.7281 5.0147 180.34 - 0.9740 973.731
Y = a + bx 0.0042 0.0314 - - 0.9993 9427.55
Y = a + bx + cx2 0.0032 0.0167 0.0019 - 0.9986 3240.81
Y = a +bx+cx2+dx3 0.0041 0.0155 0.0021 0.0002 0.9988 2014.37
0.1-
2.34
Y=a{1-exp[-c+x)/b]} -1.532 1.1742 4.1247 - 0.9843 436.241
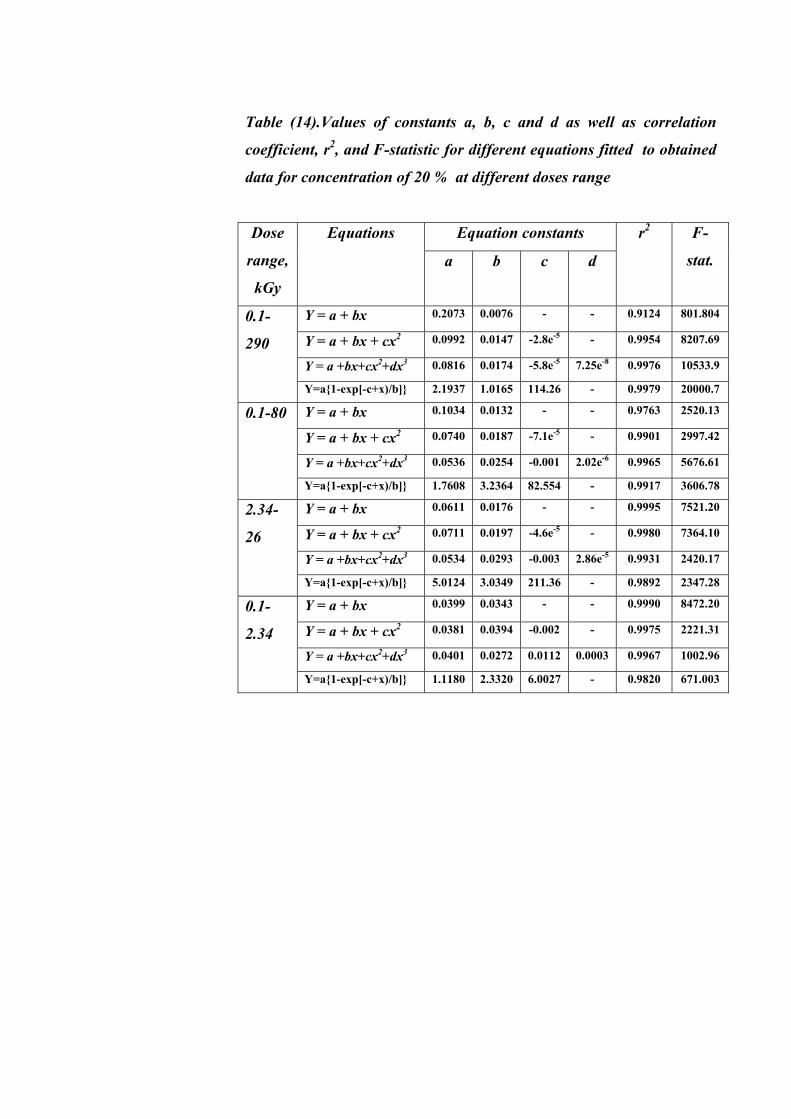
Table (14).Values of constants a, b, c and d as well as correlation
coefficient, r2, and F-statistic for different equations fitted to obtained
data for concentration of 20 % at different doses range
Equation constants Dose
range,
kGy
Equations
a b c d
r2 F-
stat.
Y = a + bx 0.2073 0.0076 - - 0.9124 801.804
Y = a + bx + cx2 0.0992 0.0147 -2.8e-5 - 0.9954 8207.69
Y = a +bx+cx2+dx3 0.0816 0.0174 -5.8e-5 7.25e-8 0.9976 10533.9
0.1-
290
Y=a{1-exp[-c+x)/b]} 2.1937 1.0165 114.26 - 0.9979 20000.7
Y = a + bx 0.1034 0.0132 - - 0.9763 2520.13
Y = a + bx + cx2 0.0740 0.0187 -7.1e-5 - 0.9901 2997.42
Y = a +bx+cx2+dx3 0.0536 0.0254 -0.001 2.02e-6 0.9965 5676.61
0.1-80
Y=a{1-exp[-c+x)/b]} 1.7608 3.2364 82.554 - 0.9917 3606.78
Y = a + bx 0.0611 0.0176 - - 0.9995 7521.20
Y = a + bx + cx2 0.0711 0.0197 -4.6e-5 - 0.9980 7364.10
Y = a +bx+cx2+dx3 0.0534 0.0293 -0.003 2.86e-5 0.9931 2420.17
2.34-
26
Y=a{1-exp[-c+x)/b]} 5.0124 3.0349 211.36 - 0.9892 2347.28
Y = a + bx 0.0399 0.0343 - - 0.9990 8472.20
Y = a + bx + cx2 0.0381 0.0394 -0.002 - 0.9975 2221.31
Y = a +bx+cx2+dx3 0.0401 0.0272 0.0112 0.0003 0.9967 1002.96
0.1-
2.34
Y=a{1-exp[-c+x)/b]} 1.1180 2.3320 6.0027 - 0.9820 671.003

Table (15).Values of constants a, b, c and d as well as correlation
coefficient, r2, and F-statistic for different equations fitted to obtained
data for concentration of 30% at different doses range
Equation constants Dose
range,
kGy
Equations
a b c d
r2 F-
stat.
Y = a + bx 0.2943 0.0104 - - 0.9482 679.094
Y = a + bx + cx2 0.1326 0.0212 -4.3e-5 - 0.9937 3590.4
Y = a +bx+cx2+dx3 0.1115 0.0242 -7.6e-5 8.14e-8 0.9933 13954.9
0.1-
290
Y=a{1-exp[-c+x)/b]} 2.9327 3.4843 104.38 - 0.9945 17971.7
Y = a + bx 0.2560 0.0347 - - 0.9623 1481.24
Y = a + bx + cx2 0.1213 0.0585 0.0003 - 0.9977 12662.1
Y = a +bx+cx2+dx3 0.0983 0.0659 -0.006 2.52e-6 0.9986 14074.1
0.1-80
Y=a{1-exp[-c+x)/b]} 3.4971 1.6752 53.301 - 0.9974 11119.8
Y = a + bx 0.0897 0.0215 - - 0.9995 11638.0
Y = a + bx + cx2 0.0769 0.0301 -4.8e-5 - 0.9985 10011.4
Y = a +bx+cx2+dx3 0.0638 0.0516 -0.001 4.13e-5 0.9940 2367.11
2.34-
26
Y=a{1-exp[-c+x)/b]} 7.0017 3.6248 239.00 - 0.9888 2237.98
Y = a + bx 0.0671 0.0514 - - 0.9997 9217.04
Y = a + bx + cx2 0.0662 0.0541 -0.001 - 0.9991 4752.22
Y = a +bx+cx2+dx3 0.0673 0.0469 0.0068 -0.002 0.9981 1681.12
0.1-
2.34
Y=a{1-exp[-c+x)/b]} 1.0381 3.2587 7.1110 - 0.9818 782.313

Table (16).Values of constants a, b, c and d as well as correlation
coefficient, r2, and F-statistic for different equations fitted to obtained
data for concentration of 50 % at different doses range
Equation constants Dose
range,
kGy
Equations
a b c d
r2 F-
stat.
Y = a + bx 0.4129 0.0149 - - 0.9231 923.655
Y = a + bx + cx2 0.2186 0.0277 -5.1e-5 - 0.9941 6452.99
Y = a +bx+cx2+dx3 0.1722 0.0343 -0.001 1.80e-7 0.9978 11377.2
0.1-
290
Y=a{1-exp[-c+x)/b]} 4.3947 4.9307 122.38 - 0.9979 17296.5
Y = a + bx 0.2207 0.0255 - - 0.9864 2566.45
Y = a + bx + cx2 0.1529 0.0380 -0.001 - 0.9937 4827.31
Y = a +bx+cx2+dx3 0.1265 0.0466 -0.002 2.55e-6 0.9962 5355.17
0.1-80
Y=a{1-exp[-c+x)/b]} 3.2626 3.3404 75.326 - 0.9948 5924.66
Y = a + bx 0.2003 0.0427 - - 0.9986 3587.13
Y = a + bx + cx2 0.1332 0.0348 -4.2e-5 - 0.9972 2013.23
Y = a +bx+cx2+dx3 0.1102 0.0613 -0.002 5.2e-5 0.9889 1856.12
2.34-
26
Y=a{1-exp[-c+x)/b]} -1.5e11 4.0164 -4.3e12 - 0.9887 1923.10
Y = a + bx 0.0111 0.0750 - - 0.9991 8012.33
Y = a + bx + cx2 0.0104 0.0944 -0.007 - 0.9990 5321.31
Y = a +bx+cx2+dx3 0.1033 0.1401 -0.015 0.0021 0.9986 3024.11
0.1-
2.34
Y=a{1-exp[-c+x)/b]} 1.1471 4.1002 9.2374 - 0.9832 641.005

IV.4.3- Response curves for concentration of 30 %
The response curve for concentration of 30 % was
established in terms of change in paramagnetic centers density
versus absorbed doses (0.1-80 kGy). Five rods was used at
each dose point. Then the average value of peak heights for
each dose point was taken to establish the response curves as
in figures (28a-c). It was clearly found from those figures that,
the response curve (0.1-80 kGy) starts the non-linear behavior
after the dose of 26 kGy and increase gradually with
increasing the absorbed dose as shown in Fig. (28a). The
response curves are linear in the other two dose ranges (2.34-
26 and 0.1-2.34 kGy) as shown in figures (28b, c). The
coefficient of variation (CV %) associated with the
measurement of quartz dose response at different dose ranges
are reported in table (17). It can be seen that the lowest
coefficient of variation (1.103 %) is obtained with the range
0.1-2.34 kGy. Table (17). Coefficient of variation for quartz rods irradiated at
different dose ranges
C. V. %
Dose range,
kGy
1.227 0.1- 80
1.198 2.34 - 26
1.103 0.1- 2.34

D o s e , k G y0 5 1 0 1 5 2 0 2 5 3 0 3 5 4 0 4 5 5 0 5 5 6 0 6 5 7 0 7 5 8 0 8 5
EPR
sign
al In
tens
ity, r
elat
ive
units
0 . 20 . 40 . 60 . 81 . 01 . 21 . 41 . 61 . 82 . 02 . 22 . 42 . 62 . 83 . 0
Figure (28a). Dose response of irradiated quartz rods at dose range 0.1-80 kGy
D o s e , k G y4 6 8 1 0 1 2 1 4 1 6 1 8 2 0 2 2 2 4 2 6 2 8
EPR
Sig
nal I
nten
sity,
rela
tive
units
0 . 30 . 40 . 50 . 60 . 70 . 80 . 91 . 01 . 11 . 21 . 31 . 41 . 5
Figure (28b). Dose response of irradiated quartz rods at dose range 2.34-26 kGy
D o s e , k G y0 . 2 0 . 4 0 . 6 0 . 8 1 . 0 1 . 2 1 . 4 1 . 6 1 . 8 2 . 0 2 . 2 2 . 4 2 . 6
EPR
Sig
nal I
nten
sity,
rel
ativ
e un
its
0 . 0 80 . 0 90 . 1 00 . 1 10 . 1 20 . 1 30 . 1 40 . 1 50 . 1 60 . 1 70 . 1 80 . 1 90 . 2 0
Figure (28c). Dose response of irradiated quartz rods at dose range 0.1-2.34 kGy

IV.4.4- Uncertainty associated with calibration of 30 %
quartz rods
Uncertainty (of measurement) may be defined as a
parameter, associated with the results of a measurement that
characterizes the dispersion of the values that could reasonably
be attributed to the measurand. Thus, uncertainty of the results
of a measurement indicates the lack of exact knowledge of the
measurand value, or in other words it reflects the degree of
accuracy in the measured value. Uncertainty is divided into
two types A and B [see experimental (III.6)]. There are
different sources could contribute for uncertainty associated
with calibration of quartz rods (30 %) which will be discussed
in details in this part:
IV-4.4.1- Sources of type-B uncertainty
a- Calibration of irradiation facility
The source of combined uncertainty of irradiation
facility calibration is quoted from calibration certificate (1.145
%).
b- Irradiation facility
The uncertainty in the dose calculation due to
uncertainty in the half-life time of cobalt-60 is quoted from
calibration certificate (0.44 %).

c- Irradiation temperature
The source of combined uncertainty of irradiation
temperature is quoted from calibration certificate (0.115 %).
IV-4.4.2- Sources of type-A uncertainty
a- Spectroscopic measurements (EPR measurements)
1) Stability of EPR Spectrometer
Stability of the EPR spectrometer sensitivity was
checked by using quartz rod irradiated to 25 kGy to determine
the coefficient of variation during measurement processes. The
sample was fixed in the cavity center and measured in
different intervals of time after switching on the EPR
spectrometer. The intensity of EPR signals changed with the
time shown in table (18), the calculated coefficient of variation
was 0.1152 %.
2) Reproducibility of EPR measurements of quartz rods
The reproducibility of the measured EPR signal
amplitude of quartz sample exposed to 25 kGy was determined
by carrying out 50 consecutive measurements of a quartz
sample without moving the sample tube during the
measurements. The bottom of EPR tube was adjusted at a
fixed position to ensure reproducible and accurate positioning
of the quartz sample in the sensing zone of the cavity. The
coefficient of variation of these 50 results was found to be
0.0691 % as in table (19).

Table (18). Coefficient of variation of response from EPR analysis
for quartz sample
Measuring Time, min
Peak Height
0 6674.5 5 6672.0 20 6671.0 35 6669.0 60 6664.5
120 6667.0 180 6665.5 240 6659.5 300 6665.5 360 6661.5 480 6653.0 660 6648.5
Mean 6664.29 STDEV 7.6795 C. V. % 0.1152

Table (19). Coefficient of variation of EPR reproducibility for
quartz sample
No. Of
Measurements
Peak Height
No. of
Measurements
Peak Height
1 5892.0 26 5890.0 2 5886.0 27 5888.0 3 5896.5 28 5888.5 4 5889.5 29 5887.5 5 5888.5 30 5880.0 6 5893.5 31 5884.5 7 5885.0 32 5889.5 8 5888.0 33 5886.0 9 5883.5 34 5884.0 10 5883.5 35 5885.5 11 5882.5 36 5882.0 12 5882.5 37 5890.5 13 5886.0 38 5883.0 14 5891.0 39 5877.0 15 5888.0 40 5882.5 16 5883.5 41 5879.5 17 5880.0 42 5879.0 18 5882.5 43 5878.5 19 5883.5 44 5884.5 20 5882.0 45 5883.5 21 5885.0 46 5885.0 22 5882.0 47 5882.5 23 5885.0 48 5879.0 24 5880.0 49 5882.5 25 5883.5 50 5885.0
Mean 5884.81 STDEV 4.0694 C. V. % 0.0691

3) Orientation effects of quartz sample
The quartz sample irradiated at 25 kGy has an
orientation effect due to alignment of quartz microcrystals
(spins of paramagnetic centers) inside the rod. Thus, to study
the orientation effect on the measurement, a sample was
measured repeatedly at 0 and 90 degrees orientations. The two
response values were calculated in terms of the two
orientations (peak-to-peak heights h0 and h90). The measured
values at the two orientations and the average value are
reported in table (20). From this table, it can be seen that the
∆h value is ranging from + 7 to - 20 reflecting the orientation
effect on the measurement. The coefficient of variation of the
average of h0 and h90 was found to be 0.0981 %.
4) Vertical positioning effects of quartz sample
In order to test the effect of vertical position (Up/Down)
on the EPR measurements of irradiated quartz samples, one of
the EPR tubes containing one quartz sample irradiated to 25
kGy was removed and reinserted in the EPR cavity in random
orientation between measurements for 26 times. The values of
repeated EPR measurements obtained via repositioning the
sample in the cavity are recorded in table (21), which shows a
coefficient of variation of 0.1262 %.

Table (20). Coefficient of variation of orientation effects for quartz rod
No. of Measurements
h0
h90
∆h
Average Value
1 5899 5898 + 1 5898.5 2 5898 5901 - 3 5899.5 3 5907 5900 + 7 5903.5 4 5903 5903 0 5903.0 5 5900 5919 - 19 5909.5 6 5897 5895 + 2 5896.0 7 5897 5894 + 3 5895.5 8 5889 5909 - 20 5899.0 9 5894 5899 - 5 5896.5 10 5892 5893 - 1 5892.5 11 5890 5897 - 7 5893.5 12 5892 5898 - 6 5895.0 13 5893 5890 + 3 5891.5 14 5885 5891 - 6 5888.0 15 5889 5888 + 1 5888.5
Mean 5895.00 5898.33 5896.66
STDEV 5.8918 7.8528 5.7869
C.V. % 0.0999 0.1331 0.0981

Table (21). Coefficient of variation of repositioning effects for quartz
sample
No. of Measurements
peak Height
No. of Measurements
Peak Height
1 5942.5 14 5932.5 2 5940.5 15 5921.5 3 5945.5 16 5926.0 4 5948.0 17 5933.0 5 5934.0 18 5932.5 6 5930.5 19 5940.0 7 5925.5 20 5938.5 8 5942.0 21 5941.0 9 5934.0 22 5926.0 10 5936.5 23 5931.5 11 5946.0 24 5925.0 12 5930.0 25 5926.5 13 5925.5 26 5928.0
Mean 5933.9
STDEV 7.4944
C.V. % 0.1262

b- Uniformity of dosimeters
The EPR intensity is proportional to weight of the rod.
Because of non-uniformity weight within a given batch of
rods, single rod reading can be susceptible to measurement
errors. In a search to eliminate this error and to improve the
precision of the rod, different treatment of the data were
undertaken, such as dividing the signal amplitude on the
weight and the correction factor for the individual response of
each measurement has to be considered. The batch uniformity
is very important for a dosimetric system. The uniformity of
dosimeters were measured by selecting 10 rods from the batch
(irradiated to the same dose in the same position and time)
measured by EPR spectrometer at the same parameters, and
then calculating the coefficient of variation. The obtained
results are given in table (22). The coefficient of variation of
rods irradiated to 25 kGy was found to be 0.1245%.

Table (22). Coefficient of variation of signal amplitude within 10
quartz rods irradiated to 25 kGy
Sample
No.
Signal amplitude
Weight, gm Signal amplitude
/ weight
1 5968.5 0.0866 68920.32 2 5937.5 0.0861 68960.51 3 5962.0 0.0866 68845.27 4 5957.5 0.0865 68872.83 5 5923.0 0.0861 68792.1 6 5940.0 0.0867 68712.11 7 5928.0 0.0863 68690.61 8 5907.0 0.0859 68766.01 9 5913.5 0.0859 68841.68 10 5981.5 0.0872 68800.18
Mean 68820.16 STDEV 85.74 C. V. % 0.1245
c- Uncertainty from calibration of dosimeters
The chosen analytical function to fit the response as a
function of absorbed dose will affect the calibration
uncertainty. Information on this effect can be obtained from
the response residuals at the calibration absorbed doses.
Uncertainty often increases markedly at low doses, where the
"signal-to-noise" ratio increases, and also at high doses if the
calibration function begins to saturate. This uncertainty can be
calculated by using the following formula (144).

ncnd
residuals
−=
∑ 2)(U …… (2-4)
Where nd is the number of dosimeters and nc is the number of
coefficients in the selected mathematical fitting function. The
percentage residuals can be calculated as follow:
Residuals % =[(Dcalculated – Ddelivered) / Ddelivered ]* 100 …… (3-4)
Where D is the dose.
Four mathematical equations (linear, 2nd, 3rd order
polynomial and exponential equation) were applied to
response curve of irradiated quartz rods by using computer
software (Table curve, 2D, jandel Scientific Co.). The fitting
of response, residual variation with dose and uncertainty of
fitting were calculated for each equation. Figures (29-36)
shows different mathematical equations, correlation
coefficient, r2, F-statistic and variation of the residual from
fitting of response curve as a function of absorbed dose for
quartz rods at dose range 0.1–80 kGy. Correlation coefficient,
F-statistic values and uncertainty were used as measure for the
goodness of the fitting process.
The criteria for the goodness of fitting are;
- The equation with correlation coefficient more close to
one indicates the good fit.

Figure (29). Fitting curve of irradiated quartz rods by using linear
equation, dose range 0.1 – 80 kGy .
Figure (30). Variation of the residual from fitting of response curve of irradiated quartz rods at dose range 0.1 – 80 kGy, linear equation

Figure (31). Fitting curve of irradiated quartz rods by using second polynomial equation, dose range 0.1 – 80 kGy
Figure (32). Variation of the residual from fitting of response curve of irradiated quartz rods at dose range 0.1 – 80 kGy, second polynomial equation

Figure (33). Fitting curve of irradiated quartz rods by using third polynomial equation, dose range 0.1 – 80 kGy
Figure (34). Variation of the residual from fitting of response curve of irradiated quartz rods at dose range 0.1 – 80 kGy, third polynomial equation

Figure (35). Fitting curve of irradiated quartz rods by using exponential equation, dose range 0.1 – 80 kGy
Figure (36). Variation of the residual from fitting of response curve of irradiated quartz rods at dose range 0.1 – 80 kGy, exponential equation

- Large F-value indicates better fit to the data.
- The lowest polynomial order is the lowest order that
dose not exhibits systematic trends of residuals.
- The best fitting of equation is fitting that has low
uncertainty of fitting.
According to these criteria of the goodness of fitting the
function with the highest r2 value, the highest F-value, the
lowest uncertainty and non-systematic trend of residuals is
recommended for use. Table (23) shows the correlation
coefficient r2, F-statistic value, uncertainty and residual trend
for three different dose ranges. It can be concluded that the
third polynomial equation is recommended for case with the
range 0.1-80 kGy. Linear equation is recommended for use
with the ranges 2.34-26 and 0.1-2.34 kGy.
IV-4.4.3- Overall combined uncertainty associated with
calibration
The overall uncertainty associated with the calibration of
30 % quartz rods has been estimated by considering the
previously studied sources of uncertainties. Sometimes a
normal distribution for data will adequately describe an error.
At other times, when information is lacking, it may be
appropriate to model it with as rectangular distribution (divisor
√3) assigning equal probabilities to values between extreme
limits. Therefore in cases of doubt the rectangular distribution

can be assumed, the importance of this is that it makes it
possible to assign at least a minimum level of confidence in
terms of probability to the total uncertainty associated with this
error (145). The obtained results are recorded in table (24).
Table (23). Mathematical equations fit test parameters for measured
response of quartz rods with concentration of 30 % at different dose ranges
Dose
Range, kGy
Equation
r 2
F-value
Uncertainty
Residual
trend
linear 0.9623 1481.241 1.983 systematic
2 nd 0.9977 12662.19 1.395 non-systematic
3 rd 0.9986 14074.12 1.277 non-systematic
0.1-
80
exponential 0.9974 11119.84 1.746 non-systematic
linear 0.9995 11638.0 1.198 non-systematic
2 nd 0.9985 10011.4 1.311 non-systematic
3 rd 0.9940 2367.11 2.012 non-systematic
2.34-
26
exponential 0.9888 2237.98 2.317 non-systematic
linear 0.9997 9217.04 1.103 non-systematic
2 nd 0.9991 4752.22 1.181 non-systematic
3 rd 0.9981 1681.12 1.612 non-systematic
0.1-
2.34
exponential 0.9818 782.313 2.533 non-systematic

Table (24). Different uncertainty sources and its values arise during
dose measurement using quartz rods with concentration of 30 %
Source of uncertainty Type of uncert-ainty
Divisor Uncerta-inty value
Calibration irradiation dose rate B 1.1450 irradiation facility B 0.4400 Irradiation temperature B 0.1150 Stability of EPR during measurements A √3 0.1152
Reproducibility of EPR A √3 0.0691 Angular positioning of the quartz rod (orientation) A √3 0.0981 Vertical positioning of the sample in the cavity A √3 0.1262
Sensitivity variation (uniformity) A √3 0.1245 Uncertainty from fitting of response to absorbed dose as determined from the variation of the residuals by using third polynomial equation
A 0.6970
Uncertainty associated with measurement of rods response curve (5 rods at each absorbed dose)
A √3 1.2770
Combined standard uncertainty (uc ) 1.9218 Expanded uncertainty 3.8436
- uc = (u1 2 + u2
2 + u3 2 + u4
2 + ………..) 1/2
- Expanded uncertainty = uc multiplied by a factor of 2, i.e. the
overall uncertainty for quartz response is 3.8436 %.

IV.4.5- Pre- and Post-irradiation stability
Quartz rod is quite insensitive to visible light, because
exposure of unirradiated quartz rods to normal laboratory
illumination (overhead white fluorescent light) plus daily
indirect daylight over 12 month's produced no detectable EPR
signal. To study post irradiation stability of the quartz rods, 15
rods were irradiated for a dose of 25 kGy. The EPR signal for
each rod was measured (zero time) and the rods were kept at
different environmental conditions including: room
temperature (dark storage), room temperature (normal
laboratory illumination) and storage in an oven at a regulated
temperature of 40 0C. These conditions correspond to leaving
the rods in a car or airplane exposed to different cycles of
light, shade and varying temperature. After that the rods were
measured daily over a period of one week and then from time
to time over a period of 20 months. The EPR results were
reported as function of time, and are given in figure (37). From
this figure, it can be seen that, at dark condition no detectable
different in EPR signal intensities could be noted after the first
day of irradiation (decay percent within first day equal 3.998
% from initial intensity) and in the first year the decay percent
was found 4.768 % from initial intensity. This means the
darkness does not produce a significant effect on the stability

Storage Time, Days
0 50 100 150 200 250 300 350 400 450 500 550 600 650
EPR
Sig
nal I
nten
sity,
rela
tive u
nits
1.19
1.20
1.21
1.22
1.23
1.24
1.25
1.26
1.27
1.28
1.29
1.30
1.31
1.32
Dark, room temperatureLight, room temperatureDark, 40 0C
Figure (37). Decay of EPR lines of irradiated quartz rods at
different storage conditions (dose = 25 kGy)

of the irradiated rods. The curve correspond normal laboratory
illumination condition show that a slight increase in decay was
noted and decay percent equal 4.151 % from initial intensity
within first day, and decay percent equal 6.414 % from initial
intensity per year. Also a similar behavior of decay was noted
for storage in an oven at a regulated temperature of 40 0C,
where the increase of decay in this case is higher and the decay
percent was found 4.732 % from initial intensity within first
day, and decay percent equal 7.718 % from initial intensity per
year. According to these results, it is recommended to store the
rods in dark at room temperature and measure the radiation-
induced EPR signal at least one day after irradiation.
In the network structure of quartz all Si ions are
coordinated by 4 oxygen ions and all O ions are coordinated
by 2 silicon ions. The E′ center is negatively charged while the
oxygen vacancy is positively charged because the oxygen
vacancy trapped a hole. This hole due to removal of an oxygen
atom. The removal of oxygen atom by gamma ray is
accompanied by a Si–Si bond formation, this means the
distance between the two Si ions becomes much shorter than
the original distance (origin bond length = 2.7 Å becomes
equal 2.3 Å) and, as Si ion move closer to each other i.e. they
pull the network ions with them, and this leads to the
relaxation time is very long ranged. Due to long relaxation

time at room temperature (dark condition), E′ centers in quartz
are stable (146). The unpaired electron in E′ center could get
deep trapped (high energy gab= 2.1 eV) and this leads to high
stability of EPR line (147).
IV.4.6- Temperature during irradiation
The effect of temperature during irradiation on the dose
response of quartz rods have been investigated at different
temperature (20, 25, 30, 35 and 40 0C) for irradiation by
gamma ray to a dose of 3 kGy followed by recording EPR
spectra. The obtained data are shown in figure (38). Three
concentrations (10, 20 and 30 %) show generally the same
trend, namely linear increase of response with increase of
temperature during irradiation. The temperature coefficient for
the 30 % concentration was found to equal to + 0.26 0C-1. This
temperature coefficient is typically expressed in percent
change per degree. The relationship between the radiation-
induced EPR signal and the dose not only depend on the
amount of the ionizing radiation absorbed by the sample but
also depend on the temperature during irradiation. The
irradiation temperature coefficient is derived from the slope of
this response-irradiation temperature relationship.

Temperature During Irradiation, 0C
20 25 30 40
EPR
Sig
nal I
nten
sity,
rela
tive u
nits
0.13
0.14
0.15
0.16
0.17
0.18
0.19
0.20
0.21
0.22
0.23
Concentration 10 %Concentration 20 %Concentration 30%
Figure (38). Response of quartz rods as a function of temperature
during irradiation to three concentrations (dose = 3 kGy)

IV.4.7- Comparison between quartz and alanine
dosimetric system
In order to check the reliability of quartz rod dosimetry
system, it was compared with the alanine dosimetry system
from Egyptian High-dose Reference Laboratory as in table
(25). The preliminary results in this table were demonstrated
that the quartz rods can be used as a dosimetry system.
Table (25). Comparison between quartz and alanine dosimetric system
S.
Items
Alanine
dosimetric
system
Quartz rod
dosimetric
system
1 Lowest detectable value 1 Gy 100 Gy
2 Fading per year 0.5 -1 % 3.998 - 4.768 %
3 Coefficient of variation for
batch variation
0.3 %
0.1371 %
4 Useful dose range 0.001-200 kGy 0.1-80 kGy
5 Linear response 3 - 10 kGy 1-26 kGy
6 Temperature coefficient 0.2 % per 0C 0.26 % per 0C
7 Overall uncertainty at 2σ 2 % 3.8436 %
Quartz rod advantages can be summarized as following;
1- Easily calibrated.
2- Long term stability.

3- Broad range of doses.
4- Simple and reproducibility read-out.
5-The prepared rods have good mechanical properties
adequate for easy and safe handling.
The previously results show that, the quartz rods with
concentration of 30 % can be used as routine dosimeter in the
range 0.1-80 kGy, i.e. they can be used in the food irradiation
applications and medical product sterilization.
Quartz disadvantage
Many proprieties of a sample, such as physical shape,
crystalline or amorphous form and particle size may affect the
quality of the data obtained from EPR. Treatment of material
by mechanical actions such as grinding may result in the
production of defects. Therefore high multisignal of EPR
background was found in the very fine powder of quartz
(particle size 20-38 µm) which due to free bonds. In the case
of the coarse powder (particle size 175-215 µm) the
background of EPR signal is very small.

IV.4.8- Conclusion
The radiation sensitive quartz rods were prepared by
different concentrations (5, 10, 20, 30 and 50 %) with suitable
binder (ethylene vinyl acetate copolymer and paraffin wax).
EPR is a suitable technique for the study of irradiated quartz
rods (paramagnetic centers). The EPR parameters were
selected carefully to obtain all the details in EPR spectra for
irradiated samples. EPR signals of rods begin to develop upon
irradiation ant its intensity increases gradually with increasing
concentration, also the intensity of EPR signals increases
gradually with increasing absorbed dose of gamma ray
photons without any change of its shape. In EPR spectrum for
irradiated quartz rod, three readily discernible peaks were
detected; the first one is E′ center (strong peak); the second is
peroxy radical (weak peak) and the third is non-bridging
oxygen hole center (very weak peak). All response curves for
different concentrations of irradiated quartz rods have the
same non-linear behaviour. Also the curves tend to saturate at
high doses which may be due to radical-radical reactions as the
radical concentration increase. The best fit to the data was
obtained by using the exponential equation in the range 0.1-
290 kGy, the third polynomial equation has the best fit to the
data in the range 0.1-80 kGy, as well as the linear equation has

the best fit to the data in two ranges 0.1- 2.34 and 2.34- 26
kGy. The overall uncertainty for quartz response was found to
be 3.8 % (at 2 б of confidence level 95 %). The paramagnetic
centers in irradiated quartz rods showed a high stability at dark
storage (decay percent was 4.8 % per year). The quartz rods
with concentration of 30 % can be used as routine dosimeter
for gamma irradiation in the range 0.1-80 kGy, i.e. these rods
can be used in the food irradiation applications and medical
product sterilization.

SUMMARY
The main objective of this work is to study the radiation-
induced paramagnetic centers in quartz by using EPR
spectrometer and to investigate the possibility of binding
quartz powder in rods shape (3x10 mm) for use as radiation
dosimetric system for gamma radiation processing.
This thesis divided into four chapters as follow,
Chapter I: - This chapter is an introduction and divided into
five parts;
First part: This part deals with the radiation treatment
processing for different materials such as food irradiation, the
sterilization of medical products and polymers modification by
using gamma radiation, electron beam and X-rays.
Second part: This part includes the international
organizations reasonable of standardization processes and
emphasis on quality. Industry and government thus have been
working to set up guidelines and regulations. Emerging
applications could be in the fields of semiconductors,
environmental and nano-materials.
Third part: This part includes the definition of
dosimetry science and the different types of dosimeters used in
radiation processing applications.

Fourth part: This part includes the fundamentals of
EPR technique which is designed to detect molecules with
unpaired electrons in the material (free radicals).
Fifth part: This part includes the physical properties of
the quartz used in this thesis. It also includes the effect of
gamma radiation on the quartz.
Chapter II:-
This chapter is a literature review on solid phase
dosimeters for gamma radiation and electron beam processing.
Chapter III:- This chapter includes the experimental work
carried out in this thesis. It also shows the chemical
structure of silicon dioxide, the method of preparation
of sample rods from silicon dioxide powder. The
irradiation procedure and EPR spectra measurements
as well as the method of studying the effect of
different storage conditions (namely dark at room
temperature, daylight at room temperature and at
temperature of 40 0C) on the stability of the radiation-
induced paramagnetic centers in quartz samples.
Chapter IV:-
This chapter is allotted to discuss the obtained results
and it is divided into four sections which could be summarized
as follow,
Section I: This section deals with EPR spectrometer to
determine the optimum EPR parameters for measurement of
radiation-induced paramagnetic centers in quartz rods. The
EPR parameters were selected carefully to obtain all the details
in EPR spectra for irradiated samples.
Section II: This section deals with the general study
carried out on unirradiated and irradiated quartz rods. It also
includes the types of radiation-induced paramagnetic centers in
quartz rods.
The results showed the following:
1- Irradiated quartz samples showed EPR signals. No EPR
signal was detected for unirradiated samples.
2- In EPR spectrum for irradiated quartz rod, three readily
discernible peaks were detected; the first one is E′ center
(strong peak); the second is peroxy radical (weaker peak) and
the third is non-bridging oxygen hole center (very weaker
peak).

3- The concentration of 30 % from binder/quartz powder has
high intensity with good mechanical properties.
Section III: This section deals with radiation effects on
the prepared quartz rods (30 %).
The results showed the following:
1- An ideal binder should improve the mechanical stability of
quartz powder and has no EPR signal after irradiation, i.e. the
EPR signal only due to the quartz powder in the binder/quartz
rod.
2- The 1 cm quartz rod gives high accuracy of the measured
EPR signal.
Section IV: This section includes the dosimetric
properties of gamma radiation sensitive new quartz rods.
The obtained results can be summarized as follows:
1- The EPR signals intensity of quartz rods begin to develop
upon irradiation and its amplitude increases gradually with
increasing absorbed dose of gamma ray photons without any
change of its shape.
2- All response curves for different concentrations of
irradiated quartz rods have the same non-linear behaviour.
Also the curves tend to saturate at high doses which may be
due to radical-radical reactions as the radical concentration
increase.

3- For all concentrations, different mathematical equations
were applied to fit the obtained data to determine the optimum
equation which express the response curve of quartz.
4- The best fit to the data was obtained by using the
exponential equation in the range 0.1-290 kGy, the third
polynomial equation has the best fit to the data in the range
0.1-80 kGy, as well as the linear equation has the best fit to the
data in two ranges 0.1- 2.34 and 2.34- 26 kGy.
5- The different sources could contribute of uncertainty are:
instability of the EPR spectrometer during the time of
measurement, the orientation and the vertical positioning of
the rod in the EPR cavity during EPR measurement.
6- The overall uncertainty for quartz response in the range 0.1-
80 kGy was found to be 3.8 % (at 2 б of confidence level 95
%).
7- The paramagnetic centers in irradiated quartz rods showed a
high stability at dark storage (decay percent was 4.8 % per
year), while at normal laboratory illumination storage the
decay percent equal 6.4 % per year, also the decay percent at
40 0C was found to be 7.7 % per year.
8- The performance of the rods was found to be affected by the
temperature during irradiation, where the temperature
coefficient was found to be + 0.26 % 0C-1 for the experimental
conditions.

9- The previously results show that, the quartz rods with
concentration of 30 % can be used as routine dosimeter for
gamma irradiation in the range 0.1-80 kGy, i.e. these rods can
be used in the food irradiation applications and medical
product sterilization.

REFERENCS
1) Brynjolfsson, A., In Sterilization by Ionizing Radiation, vol. I
edited by E.R.L. Gaughran and A. J.Z Goudie (Monterial:
Multiscience Pub. Ltd.) p. 145, (1974).
2) Eymery R., Sterilization by Ionizing Radiation, Volume 1,
edited by E.R.L. Gaughran and A.J. Goudie (Monterial:
Multiscience Pub. Ltd.), p. 48, (1974).
3) Harrod R. A., Radiat. Phys. Chem., p. 91, (1977).
4) Meta, K., and Chmielewski, A., G., Gamma irradiation for
radiation sterilization, in trends in Radiation Sterilization.
IAEA-TECDOC, International Atomic Energy Agency,
Vienna p. 5-23, November (2005).
5) Grunewald T., Food Irradiation. Proc. Symp. Kardsrune,
1966, IAEA, Vienna, p. 55, (1966).
6) Haimson J., Sterilization by Ionizing Radiation, vol. І, edited
by E.R.L. Gaughran and A.J. Goudie (Monterial:
Multiscience Pub. Ltd.), p. 71, (1974).
7) Nablo S. V., In Sterilization by Ionizing Radiation, Volume І,
edited by E.R.L. Gaughran and A.J. Goudie (Monterial:
Multiscience Pub. Ltd.), p. 51, (1974).
8) Stichelbaut, F., Bol, J.L., Cleland, M.R., Gregoire, O., Herer,
A. S., and Mullier, B., The palletron TM: a high-dose

uniformity pallet irradiator with X-rays. Radiat. Phys. Chem.,
vol. 71, p. 291 (2004).
9) IAEA, Gamma irradiators for radiation processing, A booklet
of International Atomic Energy Agency, printed by the
Institute of Nuclear Chemistry and Technology, Warszawa,
Polanda, (2005).
10) IMRAP Transactions of the 1st International Meeting on
Radiation Processing. Puerto Rico, 1976, Radiat. Phys.
Chem., 9, (1-6) (1977).
11) IMRAP, Transactions of the 2nd International Meeting on
Radiation Processing. Miami, 1978, Radiat. Phys. Chem., 14,
(1-6) (1979).
12) IMRAP, Transactions of the 3rd International Meeting on
Radiation Processing. Tokyo, 1980, Radiat. Phys. Chem., 18,
(1-6) (1981).
13) IMRAP, Transactions of the 4th International Meeting on
Radiation Processing. Dubrovnik, 1982, Radiat. Phys. Chem.,
22, (1-5) (1983).
14) IMRAP, Transactions of the 5th International Meeting on
Radiation Processing. San Diego, 1984, Radiat. Phys. Chem.,
25, (1-6) (1985).
15) IMRAP, Transactions of the 6th International Meeting on
Radiation Processing. Ottawa, 1987, Radiat. Phys. Chem., 31,
(1-6) (1988).

16) IMRAP, Transactions of the 7th International Meeting on
Radiation Processing. Norwijkerhout, Netherlands, 1989,
Radiat. Phys. Chem., 35, (1-3) (1990).
17) IMRAP, Transactions of the 8th International Meeting on
Radiation Processing. Beijing, 1991, Radiat. Phys. Chem.,
(1992).
18) IMRAP, Transactions of the 9th International Meeting on
Radiation Processing. Istanbul, 1994, Radiat. Phys. Chem.,
46, (4-6) (1995).
19) IMRAP, Transactions of the 10th International Meeting on
Radiation Processing. Amhein, California, 1997, Radiat.
Phys. Chem., 52, (1-6) (1997).
20) McLaughlin W.L., Boyd A. W.; Chadwick K.H.; McDonald
J.C. and Miller A., (London: Taylor & Francis), (1989).
21) Silverman J. and Van Dyken 1997; ISO/ASTM Standards
51702, (2004); IAEA, (2005).
22) 22-Mehta, K., Radiation Processing Dosimetry, A Practical
manual in radiation processing dosimetry, printed in Egyptian
Atomic Energy Authority (EAEA), National Center for
Radiation Research and Technology (NCRRT), Nasr City,
Cairo, EGYPT, (2004).
23) ISO/ASTM, Standard guide for selecting and calibration of
dosimetry systems for radiation processing, ISO/ASTM 51261,

In Annual Book of ASTM standards, Vol. 12.02, ASTM
International, USA, (2003).
24) ISO/ASTM, Standard guide for estimating uncertainties in
dosimetry for radiation processing, ISO/ASTM 51707, In
Annual Book of ASTM standards, Vol. 12.02, ASTM
International, USA, (2003).
25) Miller and Kovaces A., Applications of Accelerators in
Research and Industry, 1984, Part ІІ, Proc. 8th Conference,
Denton, Texas. Nucl. Instr. Methods, BIO/11, 944, (1985).
26) Regulla D. F. and Deffner U., High-Dose Dosimetry, Proc.
Sympos.,Vienna, 1984. IAEA STI/PUB/671 (Vienna:
International Atomic Energy Agency), p. 221, (1985).
27) Matthews, R.W., Int. J. Appl. Radiat. Isotopes, vol. 33, P.
1159, (1982).
28) Bjergbakke E., In Manual of Radiation Dosimetry, edited by
N.W. Holm and R.J. Berry, (New York: Marcel Dekker) p.
323, (1970).
29) Kováces A., Stenger V., Foldik G. and Legeza І., Proc.
Sympos. High-Dose Dosimetry, Proc. Sympos. Vienna, 1984,
IAEA Puplication. STI/PUB/671, (Vienna: International
Atomic Energy Agency), p. 135, (1985).
30) Ellis S.C., Ionizing Radiation Metrology, edited by E. Casnati,
(Bologna: Editric Compositiori), p. 163, (1977).

31) Sharp P.H.G., Barrett J.H. and Berkley A.M., Int. J. Appl.
Radiat. Isotopes, vol. 36, p. 647, (1985).
32) Dodd, N. J. F., Lea, J. S., Swallow, A. J., ESR Detection of
irradiated food. Nature 334, 387, (1998).
33) CRC Handbook of Chemistry and Physics, ed by David R.
Lide (CRC Press, Boca Raton, New York, 1997-1998).
34) Fan, X. D., Peng, J. L., and Bursill, L. A., Modern Phys. Lett.
vol. 12, p. 541-546, (1998).
35) Marians, C. S. and Hobbs, L. W., J. Non-Cryst. Solids, vol.
124, p. 242-247, (1990).
36) Walrafen, G. E. and Revesz, A. G., Structure and Bonding in
Noncrystalline Solids (Plenum Press, New York and London,
1986).
37) Douillard, L., Jollet, F., Duraud, J. P., Devine, R. A. B., and
Dooryhee, E., Radiation Effects and Defects in Solids, vol.
124, p. 351-358, (1992).
38) Goresy, A. E., Dubrovinsky, L., Sharp, T.G. and Saxena, S.
K., J. Non-Cryst. Solids, vol. 288, p. 1632 (2000).
39) Kofstad, P., High Temperature Corrosion (Elsevier, London
and New York, 1988).
40) Dannefaer, S., Bretagnon, T. and Craigen, D., J. Appl. Phys.
Vol. 86, p. 190-194, (1999).
41) Edwards, A. H., and Fowler, W. B., Phys. Rev. vol. 26, p.
6649, (1982).

42) Gupta, P. K. and Cooper, A. R., J. Non-Cryst. Solids, vol.
123, p. 14-19, (1990).
43) Chadwick K.H., Ionizing Radiation Metrology, edited by E.
Casnati (Bologna: Editrice compositori), p. 195, (1977).
44) Chadwick K. H., Dosimetry in Agriculture, Industry, Biology
and Medicine, Proc. Sympos., Vienna, 1972. IAEA
Publication STI/PUB/311 (Vienna: International Atomic
Energy Agency), p. 653, (1973).
45) Barrett J. H., Int. J. .Appl. Radiat. Isotopes, 33, 1177, (1982).
46) Chadwick K. H., Rinntjema D. and ten Broeke W.R.R., Food
Preservation by Irradiation, Volume ІІ, IAEA Publication
STI/PUB/470 (Vienna: International Atomic Energy Agency),
p. 327, (1978).
47) Ten Broeke W.R.R., Rintjema D. and Chadwick K.H., Int. J.
.Appl. Radiat. Isotopes, vol. 28, p. 429, (1977).
48) Miller A. and McLaughlin W.L., High-Dose Measurements in
Industrial Radiation Processing, Technical Report Series No.
205, IAEA Publication STI/DOC/10/205 (Vienna:
International Atomic Energy Agency), p. 119, (1981).
49) Barrett J.H., Sharpe P.H.G. and Stuart І.P., NPL Report RS 52
(Teddington, UK: National Physical Laboratory), (1981).
50) Chadwick K.H., Research in Radiation Processing Dosimetry,
IAEA Tech. Doc. 321, Report of Coordinated Research

Chadwick K.H., Research in Radiation Processing Dosimetry,
IAEA Tech. Doc. 321, Report of Coordinated Research
Chadwick K.H., Research in Radiation Processing Dosimetry,
IAEA Tech. Doc. 321, Report of Coordinated Research
Meeting, Munich, 1983. (Vienna: International Atomic
Energy Agency), (1985).
51) Miller A., Bjergbakke E. and McLaughlin W.L., Int. J. Appl.
Radiat. Isotopes, vol. 26, p. 611, (1975).
52) Whittaker B. and Lowe C.A., Int. J. Appl. Radiation Isotopes,
vol. 18, p. 89, (1967).
53) Tamura N., Tanaka R., Mitomo S., Malsuda K. and Nagai S.,
Radiat. Phys. Chem., vol. 18, p. 947, (1981).
54) Levine H. McLaughlin W.L. and Miller A., Radiat. Phys.
Chem., vol. 14, p. 551, (1979).
55) Tanaka R., Mitomo S. and Tamura N., Int. J. Appl. Radiat.
Isotopes, vol. 35, p. 875, (1984).
56) McLaughlin W.L..; Humphreys J.C.; Radak B.B.; Miller A.
and Oleijnik T.A., Radiat. Phys. Chem., vol. 14, p.535 (1979).
57) Gehringer P.; Proksch E. and Eschweiler H., High Dose
Dosimetry, Proc. Sympos., Vienna, 1984. IAEA Publication
STI/PUB/671 (Vienna: International Atomic Energy Agency),
p. 333, (1985).
58) Abdel-Rehim F; Abdel-Fattah A. A. Ebraheem S. and Ali Z.,
Appl. Radiat. Isotopes, vol. 47, p. 247, (1996).

59) Abdel-Fattah A. A; Ebraheem S.; Ali Z.I. and Abdel-Rehim
F., Journal of Applied Polymer Science. Vol. 67, 1851 (1998).
60) McLaughlin W.L., Silverman J., Al-Sheikhly M., Chppas
W.J., Liu Zhan-Jun, Miller A., and Bastsberg-Pedersen W.,
Radiat. Phys. Chem., vol. 56, p. 503, (1999).
61) Muratoglu, O. K., John Delaney, Daniel O. O'Connor and
William H. Harris, Biomaterials, vol. 24, p. 2021, (2003).
62) McLaughlin W.L., Preisinger T., Miller A. and Abdel-Rehim
F., Radiat. Phys. Chem., vol. 25, p. 729, (1985).
63) McLaughlin W.L., Humphreys J.C., Hocken D. and Chappas
W.J., Radiat. Phys. Chem., vol. 31, p. 505, (1988).
64) Saylor M.C., Tamargo T.T., McLaughlin W.L., Khan H.M.,
Lewis D.F. and Schenfele R.D., Radiat. Phys. Chem. Vol.
31, p. 529, (1988).
65) Abdel-Rehim F., Miller A. and McLaughlin W.L., Radiat.
Phys. Chem., vol. 25, p. 767, (1985).
66) McLaughlin W.L.; Wei-Zhen Ba and Chappas W.J., Radiat.
Phys. Chem., vol. 31, p. 481, (1988b).
67) ISO/ASTM, Standard practice for the use of
Polymethylmethacrylate Dosimetry System, ISO/ASTM
Standard 51276, Annual Book of ASTM Standards. Vol.
12.02, ASTM International, USA, (2004).
68) Barrett J.H., Int. J. Appl. Radiat. Isotopes, 33, 1177, (1982).

69) Whittaker B., Manual on Radiation Dosimetry, edited by
N.W. Holm and R.J Berry (New York: Marcel Dekker), p.
363, (1970a).
70) Whittaker B., Recent Development in poly(methyl
methacrylate) dye systems for mega-rad dosimetry. In
Radiation Dose and Dose rate Measurements in the mega-rad
range (Teddington, UK: UK Panel on Gamma and Electron
Irradiation, National Physical Laboratory), P.11, (1970b).
71) Whittaker B., Dosimetry and Control of Radiation
Processing, NPL Report RS (RXT) 97, Symposium of UK
Panel on Gamma and Electron Irradiation, (Teddington, UK:
National Physical Laboratory), P.18, (1988).
72) Whittaker B., Watts M., Mellor S. and Heneghan M. (1985).
High-Dose Dosimetry, Proc. of Symp., Vienna, 1984, IAEA
Publication STI/PUB/671 (Vienna: International Atomic
Energy Agency), p.293, (1985).
73) Miller A., Bjergbakke E. and McLaughlin W.L., Int. J. Appl.
Radiat. Isotopes, vol. 26, p. 611 (1975).
74) Olejnik T.A., Radiat. Phys. Chem., vol. 14, p. 431, (1979).
75) Whittaker B., Radiat. Phys. Chem., vol. 35, p. 699, (1990).
76) Khan H. M. and Ahmed G., Radiat. Phys. Chem., vol. 35, p.
732, (1990).
77) ISO/ASTM, Standard practice for the use of a radiochromic
film dosimetry system, ISO/ASTM Standard 51275, Annual

Book of ASTM Standards. Vol. 12.02, ASTM International,
USA, (2003).
78) McLaughlin W.L., Manual on Radiation Dosimetry, edited by
N.W. Holm and R.J. Berry (New York: Marcel Dekker)
p.377, (1970).
79) McLaughlin W.L., High-Dose Dosimetry, Proc. Symp.,
Vienna, 1984, IAEA Publication STI/PUB/671 (Vienna:
International Atomic Energy Agency), p.357, (1985).
80) McLaughlin W.L. and Chalkely L., Photo. Sci. Engr., vol. 9,
p. 195, (1965).
81) McLaughlin W.L., Hjortenberg P.E. and Radak B. B.,
Dosimetry in Agriculture, Industry, Biology and Medicine.
Proc. Symp., Vienna, 1972, IAEA Publication STI/PUB/311,
(Vienna: International Atomic Energy Agency), p.577,
(1973).
82) McLaughlin W.L., Rosenstein M. and Levine H., Biomedical
Dosimeters, IAEA Publication STI/PVB/401, (Vienna:
International Atomic Energy Agency), p.267, (1975).
83) McLaughlin W.L., Miller A., Fidan S., Pejtersen K. and
Batsberg Pedersen W., Radiat. Phys. Chem., 10, 119 (1977).
84) McLaughlin W.L., Humphreys J. C., Farahani M. and Miller
A., High-Dose Dosimetry, Proc. Symp., Vienna, 1984, IAEA
Publication STI/PUB/671 (Vienna: International Atomic
Energy Agency), p.109, (1985).

85) McLaughlin W.L., Int. J. Appl. Radiat. Isotopes, vol. 17, p.
85, (1966).
86) McLaughlin W.L., Manual on Radiation Dosimetry, edited by
N.W. Holm and R.J. Berry (New York: Marcel Dekker)
Chapter 6, (1970).
87) McLaughlin W.L., Technical Report Series No. 205, IAEA
Publication STI/PUB/10/205 (Vienna: International Atomic
Energy Agency), p.17, (1981).
88) Shaffer H. L. and Garcia R. D., Radiat. Phys. Chem., vol. 31,
p. 497, (1988).
89) Chappas W. X., Radiat. Phys. Chem., vol. 18, p. 1017, (1976).
90) Butson M. J., Peter, K. N., Yu, Tsang Cheung and Peter, M.
Radiochromic film for medical radiation dosimetry. Material
Science and Engineering, R 41, 61, (2003).
91) Christopher, G. Soares, Radiochromic film dosimetry.
Radiation Measurements, In press accepted manuscript,
(2007).
92) Mehta, K., and Abdel-Fattah, A. A., dosimetry and radiation
sterilization process, In Trends in Radiation Sterilization.
IAEA-TECDOC, International Atomic Energy Agency.
Vienna p. 5-23, November (2005).
93) Abdel-Fattah A.A. and Miller A.; Radiat. Phys. Chem., vol.
47, p. 611, (1996).

94) Abdel-Fattah A.A., W.B. Beshir, El-Sayed A. Hegazy, and
Ezz El-Din H., Radiat. Phys. Chem., vol. 62, p. 423, (2001).
95) McLaughlin W.L, Miller A., Kronenberg S., Uribe R.M.
and Siebentritt C.R., High-Dose Dosimetry, Proc. of Symp.,
Vienna 1984, IAEA Publication STI/PUB/671, (Vienna:
International Atomic Energy Agency) p. 397, (1985c).
96) Chen Wenxiu., Jia H. and McLaughlin W.L.; High-Dose
Dosimetry. Proc. Of Symp., Vienna 1984, IAEA Publication
STI/PUB/671, (Vienna: International Atomic Energy Agency)
p. 345, (1985).
97) McLaughlin W.L., Chen Wenxiu, Jia H. and Humphreys J.C.;
Radiat. Phys. Chem., vol. 25, p. 793, (1985d).
98) Abdel-Rehim F., Ebraheem S., Wei-Zhen Ba and McLaughlin
W.L., Appl. Radiat. Isotopes. vol. 43, p. 1503, (1992b).
99) Abdel-Rehim F., Miller, A. and Mclaughlin, W. L., response
of radiation monitoring labels to gamma rays and electrons.
Radiat. Phys. Chem., vol. 25, p. 767, (1985).
100) Ogawa T., Nishilkawa H., Nishimoto s. and Kagiya T.,
Radiat. Phys. Chem., vol. 29, p. 353, (1987).
101) Abdel-Rehim F., El-Sawy N.M and Abdel-Fattah A.A., Appl.
Radiat. Isotopes, vol. 44, p.1055, (1993).
102) Abdel-Fattah A.A., Appl. Radiat. Isotopes, 65, 575 (2002).
103) Mclaughlin, W. L., Radiat. Phys. Chem.,vol.67,p. 561 (2003).

104) Hansen, J. H., Miller, A. and Sharpe, P., Radiation Phys. and
chem. vol. 74, p. 341-353, (2005).
105) Kattan, M., Daher, Y. and Alkassiri, H., Radiation Phys. and
chem., vol. 76, p. 1195-1199, (2007).
106) Hori Y., Yoshikawa N. and Ohmori S., US Patent 3,899, 677,
(1975).
107) Matsumoto S., Tsukada T., Umetsu K. and Fukaya H., US
Patent 3, 743, 846, (1973).
108) Ohinishi T., Hiraoka E. and Furuta J., Annual Report of the
Radiation center of Osaka Prefecture, vol. 18, p.67, (1977).
109) Ueno K., Radiat. Phys. Chem., vol. 31, p. 467, (1988).
110) Whittaker B., Radiation-sensitive material UK Patent
Application GB 2182941 A. (1987).
111) Ueno K., Katanosaka M. and Matoba N., Jpn. Kokai Tokyo
Koho 62, 9, 285, (1987).
112) Spinks J.W.T and Wood R.J., An Introduction to Radiation
Chemistry, 3th Ed, Jhon Wiley and Sons, New York, (1994).
113) Abdel-Fattah A.A., El-Kelany M. and Abdel-Rehim F.,
Radiat. Phys. Chem., vol. 48, p. 497, (1996).
114) Abdel-Fattah A.A., Hegazy, E. S. A., and Ezz El-Din, H.,
Radiation chemical formation of HCl in Poly (vinyl butyral)
films containing chloral hydrate for use in radiation
dosimetry. Int. J. Polymeric Materials, vol. 51, p. 413, (2002).

115) Ebraheem S., Eid S. and Kovacs A., Radiat. Phys. Chem.,
vol. 63, p. 807, (2002).
116) Akhavan A., Sohrabpour and Sharifzadeh M., Radiat. Phys.
Chem., vol. 63, p. 773, (2002).
117) Hoang Hoa Mai, Nguyen Dinh Duong and Takuji Kojima,
Radiat. Phys. Chem., vol. 69, p. 439, (2004).
118) ISO/ASTM, Standard guide for use of radiation-sensitive
indicators, ISO/ASTM Standard 51539, In Annual Book of
ASTM Standards. Vol. 12.02, ASTM International, USA,
(2003).
119) Prussik T., Montesalno M. and Wallace T. Radiat. Phys.
Chem., vol. 31, p. 444, (1988).
120) Ehlermann D.A.E., Appl. Radiat. Isotopes, 8, 1197 (1997).
121) Watts M.F. and R. Bett, Radiat. Phys. Chem., 63, 799 (2002).
122) Abdel-Rehim F., Ebraheem S. and Souka N., Radiat. Phys.
Chem., vol. 39, p. 191, (1992).
123) Kovács A., Baranyai M., Wojnárovits L., Slezsák I.,
McLaughlin W.L., Miller A. and Moussa A., Radiat. Phys.
And Chem. Vol. 57, p. 711, (2000).
124) Abdel-Rehim, F., Abdel-Fattah A.A., and Ezz El-Din, H.,
Development of a new indicator for gamma and E-beam
radiation. Pending patent in Egyptian Academy of Science,
(2002).

125) Olsson, S., Bagherian, Sh., Lund, E. and Alm, G., Applied
Radiation and Isotopes, vol. 50, p. 955-965, (1999).
126) Lund, A., Olsson, S., Bonora, M., Lund, E. and Gustafsson,
H., Spectrochimica Acta Part A 58, p. 1301-1311, (2002).
127) Marchioni, E., Pabst, J. and Kuntz, F., Radiation Phys. and
Chem., vol. 65, p. 187-191, (2002).
128) Vestad, T., Malinen, E., Lund, A., and Sagstuen, E., Applied
Radiation and Isotopes, vol. 59, p. 181-188, (2003).
129) Engin, B., and Unnisa, H., Radiation Physics and Chemistry
vol. 71, p. 1113–1123, (2004).
130) Lin, M., Li, H., Chen, Y., Cui, Y., and Xiao, Z., Radiation
Phys., and Chem., vol. 73, p. 280-286, (2005).
131) Gancheva, V., Sagstuen, E. and Yordanov, N. D., Radiation
Phys. and chem., vol. 75, p. 329-335, (2006).
132) Ranjbar, A. H., Charles, M. W., Radiation Protection
Dosimetry, vol. 65, p. 351-354, (1996).
133) Bensimon, Y., Deroide, B., Dijoux, F. and Martineau, M.,
Journal of Physics and Chemistry of solids, vol. 61, p. 1623-
1632, (2000).
134) Sastry, M. D., Prous, A. P. and Silva, M. C., Nuclear
Instruments and Methods in Physics Research, Vol. 213, p.
751-755, (2004).

135) Moritani, K., Teraoka, Y., Takagi, I. and Moriyama, H.,
Nuclear Instruments and Methods in Physics Research, vol.
232, p. 317-321, (2005).
136) Stpeanenko V. F., Hoshi, M. and Bailiff, I. K., Comparison of
individual dose estimates by modeling with EPR retrospective
dosimetry and luminescence retrospective dosimetry data.
Radia. Measurements, vol. 42, Issues 6-7, p. 1041-
1048, (2007).
137) Wieser, A., Regulla, D.F., Applied Radiation and Isotopes,
vol. 40, p. 911-913, (1989).
138) Toyoda, S. and Hattori, W., Applied Radiation and Isotopes,
vol. 52, p. 1351-1356, (2000). Benny, P. G. and Bhatt, B. G.,
Applied Radiation and Isotopes, vol. 56, p. 891-894, (2002).
139) Dobosz, B. and Krzyminiewski, R., Radiation
Measurements, vol. 42, p. 213-219, (2007).
140) Hobbs, I., and Pascucci, M., Solid State Commun. vol. 14, p.
225, (1974).
141) Gohn, A., ESR and Elementary Particle Applications, John,
wiely, New Yourk, (1986).
142) L. Douillard, F. Jollet, J. P. Duraud, R. A. B. Devine, and E.
Dooryhee, Radiation Effects and Defects in Solids, vol. 124,
p. 351-358, (1992).
143) ASTM standard E 1707 (Philadelphia: American Society for
Testing and Materials), vol. 12.02, 905, (1995).
144) Sharp, P. and Miller, A., Guidelines for the calibration of
dosimeters for use in radiation processing. NPL report CIRM
vol. 29, p. 1-15, (1999).
145) The expression of uncertainty and confidence in
measurement, edition1-M 3003, p. 8-13, (1997).
146) Toyoda, S. and Asai, T., Radiation Measurements, vol. 29, p.
604-609, (2004).
147) Shin, T. and Wataru, H., Appl. Radia. and Isotopes, vol. 50,
p. 1257-1262 (1999).
Copyright © 2022 FDOKUMEN