Theory, Instrumentation, and Applications of Electron Paramagnetic Resonance Oximetry
65
Theory, Instrumentation, and Applications of EPR Oximetry Rizwan Ahmad † and Periannan Kuppusamy † † Center for Biomedical EPR Spectroscopy and Imaging, Davis Heart and Lung Research Institute, Department of Internal Medicine, The Ohio State University, Columbus, Ohio 43210, USA 1 Introduction Oxygen is the third most abundant element in the universe by mass after hydrogen and helium. It has an atomic number 8 and is represented by the symbol O. At standard temperature and pressure, two atoms of the element bind to form molecular oxygen (O 2 ) which is a colorless, odorless, and tasteless diatomic gas, occupying 20.9% of air volume. Since its discovery 1 in the 1770s, its properties, chemistry, and relevance to life have intrigued generations of scholars and scientists. A multitude of scientific evidence 2–4 builds a compelling case for the vital role of oxygen in the evolution of life on earth. Aerobic organisms consume molecular oxygen to generate chemical energy, required for biologic processes, in the form of adenine triphosphate. Also, O 2 serves as a regulatory molecule for important physiologic processes. In mammals, including humans, inhaled oxygen from the lungs is carried to the target tissue by the oxygen-carrying protein, hemoglobin. At the target tissue, where the cells actively engage themselves in respiration (oxidative phosphorylation), oxygen is released from the oxygen-bound hemoglobin (oxyhemoglobin), and the released oxygen is available to the metabolically active tissues. Any imbalance in tissue oxygen levels, which may occur due to altered supply or utilization of oxygen, may affect metabolic homeostasis and lead to pathophysiological conditions 5 . In addition, the level of oxygen at specific sites may affect cell signaling 6,7 . Hence, a precise knowledge of the levels of oxygen in the tissue of interest will be of paramount importance in our ability to understand the mechanism of pathogenesis and to develop strategies to correct the imbalance. This would require methods capable of quantifying the levels of tissue oxygenation with good spatial and temporal resolution. The information gained will enable better understanding of various metabolic and disease states and will assist in making effective clinical decisions regarding treatment and therapy options. The chemical and physical properties of oxygen enable a wide variety of methods for measuring and mapping oxygen content in vivo. There are numerous reviews on various oxygen measurement techniques and their applications to specific organs and diseases 8–10 . For any particular application, the choice of an oximetry method is determined by its accuracy, measurement procedure, acquisition time, invasiveness, and relevance of the measured form of oxygen, which includes oxygen concentration, partial pressure of oxygen (pO 2 ), or oxygen saturation. Electron paramagnetic resonance (EPR), also called electron spin resonance, is a magnetic resonance based technique capable of measuring oxygen levels in biological sampling, both in vitro and in vivo 11 . Over the past couple of decades, EPR oximetry technique has been continually refined to collect repetitive, minimally invasive, and accurate measurements of pO 2 over an extended duration 12,13 . At the same time, the biological applications for EPR oximetry have been rapidly growing and now include monitoring tumor oxygenation for determining cancer-treatment efficacy 14,15 and measuring tissue oxygen for estimating the extent of myocardial injury during both ischemia and subsequent reperfusion 16 . NIH Public Access Author Manuscript Chem Rev. Author manuscript; available in PMC 2011 May 12. Published in final edited form as: Chem Rev. 2010 May 12; 110(5): 3212–3236. doi:10.1021/cr900396q. NIH-PA Author Manuscript NIH-PA Author Manuscript NIH-PA Author Manuscript
Transcript of Theory, Instrumentation, and Applications of Electron Paramagnetic Resonance Oximetry

Theory, Instrumentation, and Applications of EPR Oximetry
Rizwan Ahmad† and Periannan Kuppusamy†† Center for Biomedical EPR Spectroscopy and Imaging, Davis Heart and Lung Research Institute,Department of Internal Medicine, The Ohio State University, Columbus, Ohio 43210, USA
1 IntroductionOxygen is the third most abundant element in the universe by mass after hydrogen and helium.It has an atomic number 8 and is represented by the symbol O. At standard temperature andpressure, two atoms of the element bind to form molecular oxygen (O2) which is a colorless,odorless, and tasteless diatomic gas, occupying 20.9% of air volume. Since its discovery1 inthe 1770s, its properties, chemistry, and relevance to life have intrigued generations of scholarsand scientists. A multitude of scientific evidence2–4 builds a compelling case for the vital roleof oxygen in the evolution of life on earth. Aerobic organisms consume molecular oxygen togenerate chemical energy, required for biologic processes, in the form of adenine triphosphate.Also, O2 serves as a regulatory molecule for important physiologic processes.
In mammals, including humans, inhaled oxygen from the lungs is carried to the target tissueby the oxygen-carrying protein, hemoglobin. At the target tissue, where the cells activelyengage themselves in respiration (oxidative phosphorylation), oxygen is released from theoxygen-bound hemoglobin (oxyhemoglobin), and the released oxygen is available to themetabolically active tissues. Any imbalance in tissue oxygen levels, which may occur due toaltered supply or utilization of oxygen, may affect metabolic homeostasis and lead topathophysiological conditions5. In addition, the level of oxygen at specific sites may affect cellsignaling6,7. Hence, a precise knowledge of the levels of oxygen in the tissue of interest willbe of paramount importance in our ability to understand the mechanism of pathogenesis andto develop strategies to correct the imbalance. This would require methods capable ofquantifying the levels of tissue oxygenation with good spatial and temporal resolution. Theinformation gained will enable better understanding of various metabolic and disease statesand will assist in making effective clinical decisions regarding treatment and therapy options.The chemical and physical properties of oxygen enable a wide variety of methods for measuringand mapping oxygen content in vivo.
There are numerous reviews on various oxygen measurement techniques and their applicationsto specific organs and diseases8–10. For any particular application, the choice of an oximetrymethod is determined by its accuracy, measurement procedure, acquisition time, invasiveness,and relevance of the measured form of oxygen, which includes oxygen concentration, partialpressure of oxygen (pO2), or oxygen saturation.
Electron paramagnetic resonance (EPR), also called electron spin resonance, is a magneticresonance based technique capable of measuring oxygen levels in biological sampling, bothin vitro and in vivo11. Over the past couple of decades, EPR oximetry technique has beencontinually refined to collect repetitive, minimally invasive, and accurate measurements ofpO2 over an extended duration12,13. At the same time, the biological applications for EPRoximetry have been rapidly growing and now include monitoring tumor oxygenation fordetermining cancer-treatment efficacy14,15 and measuring tissue oxygen for estimating theextent of myocardial injury during both ischemia and subsequent reperfusion16.
NIH Public AccessAuthor ManuscriptChem Rev. Author manuscript; available in PMC 2011 May 12.
Published in final edited form as:Chem Rev. 2010 May 12; 110(5): 3212–3236. doi:10.1021/cr900396q.
NIH
-PA Author Manuscript
NIH
-PA Author Manuscript
NIH
-PA Author Manuscript

This article provides a brief survey of basic principle and novelty, instrumentation,measurement procedures, and a few promising applications of EPR oximetry for biologicalsystems. Section 2 describes some commonly used experimental and clinical methods for tissueoxygen measurements. Section 3 discusses the basic principle of EPR oximetry and providesmotivation by outlining its unique advantages. Section 4 provides the basic layout of a typicalEPR spectrometer. Section 5 covers basics of data collection and processing procedures forEPR oximetry, and highlights some of the developments proposed to speed up the acquisitionprocess. Section 6 describes spin probe development for EPR oximetry and encapsulationmethods for particulate spin probes. Section 7 lists a few important, mainly in vivo, applicationsof EPR oximetry.
2 History of Tissue Oxygen MeasurementEven though the discovery of oxygen was made in the late 18th century, measurements ofoxygen levels in biological samples have been studied only in the 20th century. In the 1930s,the German scientist Karl Matthes first used variable transmission of red and infrared lightthrough the human ear to assess oxygenation17. An ear oximeter, developed in 1942 by theAmerican scientist Glen Milliken, was used for many years in pulmonary and physiologylaboratories. Several other attempts were made in the 1960s18,19 but it was in the late 1980sthat the computerized polarographic needle electrode system was used to assess tumoroxygenation in the clinic20. The use of this electrode technique helped establish the role ofhypoxia in determining the effectiveness of radio- or chemotherapy21,22. Now there existseveral oximetry methods that are based on other principles, including fluorescence andphosphorescence quenching, optical detection, immunohistochemical detection, and magneticresonance techniques.
2.1 Chemical Methods2.1.1 Polarographic Electrode—Blood and tissue oximetry using a polarographicelectrode was proposed by Leland Clark23. The method is based on measuring the electriccurrent resulting from the electrochemical reduction of oxygen at the cathode. In addition tothe consumption of oxygen, the relatively large size of earlier designs lead to serious practicalissues, such as artifacts due to blood flow, acute tissue injury, and signal averaging over a largevolume. To avoid such issues, efforts have been made to design miniaturized polarographicelectrodes24, also called ‘microelectrodes’. Modern recessed tip microelectrodes are availablein the range of 5–10 μm25 in diameter.
The commercially available recessed tip microelectrode by Eppendorf has been widely usedto measure in vivo oxygenation of tissues. Owing the widespread use of this technique, it hasbeen considered the ‘gold standard’ for measuring tissue oxygenation26. The method has beenextensively used for measuring oxygen in tumor27–29 and brain30. However, there are severaldisadvantages associated with polarographic electrodes including, consumption of oxygen bythe electrode, poor signal-to-noise ratio (SNR) at low oxygen concentration, inability to makerepeated measurements, and the highly invasive nature of the measurement procedure.
2.1.2 Transcutaneous Oxygen Sensor—A different setup using polarographic oxygenelectrodes has been used for transcutaneous oxygen monitoring31 (TCOM). In a typical setup,the electrode is pressed against skin to effectively measure the diffusion of oxygen throughskin noninvasively. The method is quantitative, and it is thus far the only device that measuresoxygen delivery to an end organ (the skin). It has been used to monitor oxygenation levels (inmmHg) in the skin, especially for premature infants32, but also for adults in the intensive caresetting33. Physicians also use TCOM to determine whether or not there is adequate blood flowto support healing of a lower extremity wound34, such as a venous stasis ulcer or diabetic foot
Ahmad and Kuppusamy Page 2
Chem Rev. Author manuscript; available in PMC 2011 May 12.
NIH
-PA Author Manuscript
NIH
-PA Author Manuscript
NIH
-PA Author Manuscript

ulcer. The necessity for exogenous skin heating along with the sensitivity of this method toskin properties, temperature fluctuations, and mechanical pressure pose a serious limit to itaccuracy.
2.1.3 Immunochemical Methods—This technique requires the administration of ahypoxia marker such as 2-nitroimidazoles35. These bioreductive markers belong to the classof compounds that have maximum binding to severely hypoxic cells (with less than 0.38 mmHgof oxygen, for example) and increased inhibition to increasing oxygenation as dictated byMichaelis-Menton kinetics36. This approach is also used in combination withimmunohistochemical techniques where hypoxia can be visualized and compared withnecrosis, proliferation or oxygen-regulated protein expression37. However, the dependence ofhypoxia marker binding on factors other than pO2, such as level of tissue perfusion or theamount of reductases in the tissue, may make quantification of the result more complex. Also,binding of the hypoxia marker may not differentiate between long-term steady-state hypoxiaand short-term transient hypoxia.
2.2 Optical Methods2.2.1 Fluorescence Oximetry—Fluorescence oximetry is based on oxygen dependantchanges in the lifetime of fluorescence. This principle has been used in the construction ofOxyLite38, a widely used commercially available oxygen-measuring sensor. It uses rutheniumchloride, a fluorescent dye, connected to the tip of a fiber-optic cable. Photodiodes excite thefluorophores of the dye, and the resulting fluorescence lifetime relates inversely to the oxygentension at the tip. Typical probe diameter is ~ 220 μm.
This method does not consume oxygen and is capable of monitoring rapid temporal oxygenchanges at a given tissue location. This technique has been widely used for measurement ofoxygen in tumor39, liver and brain40, and has been compared to other oximetry techniques41,42. Some drawbacks of the technique include: sensitivity to movement and temperature,pressure induced artifacts due to insertion of the probe, invasiveness, and the inability toperform repeated measurements at the same location overtime.
2.2.2 Phosphorescence Oximetry—Measurement of oxygen using phosphorescenceoximetry involves injection of a phosphor material into the vasculature and measuring theoxygen-induced changes in the lifetime of the induced phosphorescence43. A bifurcated lightguide is used to focus the excitation light from the source to the surface of the tissue where itis detected by a phosphorometer. Oximetry by phosphorescence-quenching has now been inuse for over two decades44. This technique is gaining importance for in vivo applications45,46 as further technical improvements, including probe development47, are continuously beingmade. In a typical setup, the phosphorometer (detector) utilizes photomultipliers or avalanchephotodiodes to measure the phosphorescence signal to get information about the distributionof the lifetimes and amplitudes of the phosphor probe. Data analysis involving calibration anddeconvolution subsequently gives histogram representations of pO2 over the sampled region.When the measurements are done in a grid pattern, it is possible to construct contour mapswhich then can be used to compute the volume fraction of tissue sampled for any selected rangeof pO2 values. Besides the minimally invasive nature, a significant advantage of this methodis its ability to provide real-time, repeated measurements. Phosphorescence oximetry has beenwidely used for mapping the oxygen distribution in the retina48 and other organs such as theheart and brain49. It has also been used to study oxygen distribution in murine vasculature50
and oxygenation of tumors51. A major disadvantage of this technique is the need to inject thephosphor material into the vasculature. Also, the technique provides only the vascular oxygenconcentration.
Ahmad and Kuppusamy Page 3
Chem Rev. Author manuscript; available in PMC 2011 May 12.
NIH
-PA Author Manuscript
NIH
-PA Author Manuscript
NIH
-PA Author Manuscript

2.2.3 Pulse Oximetry—Pulse oximetry enables indirect measurement of oxygen saturationof blood which indicates the balance between oxygen delivery and consumption. It is anoninvasive method based on the differential absorption of red and infrared light byoxyhemoglobin and deoxyhemoglobin52. The ratio of the absorption of the red and infraredlight is converted to the ratio of oxyhemoglobin and deoxyhemoglobin. The pulse oximeterconsists of a pair of small light emitting diodes, one red and one infrared, facing a photodetector.Sites of measurement include fingers, toes, and earlobes, which have adequate blood flow. Dueto the noninvasive nature and ease of use, this technique is more commonly used for clinicalapplications53. The major shortcomings of this method include: requirement of adequatearterial perfusion, motion artifacts, inability to measure tissue oxygenation, measurement ofoxygen saturation rather than the actual oxygen content, inability to distinguish betweencarboxyhemoglobin and oxyhemoglobin, and stray light interference.
2.2.4 Near-Infrared Spectroscopy (NIRS)—The NIRS technique works on a physicalprinciple similar to that of pulse oximetry, i.e., the light transmitted through a tissue is absorbeddifferently by oxygenated and deoxygenated hemoglobin in the circulation. The NIRStechnique is noninvasive, with excellent temporal resolution, low-cost, and portability54. Dueto the longer penetration depth of NIRS, real-time repeated measurements from relatively deeplocations are possible. NIRS has been used for clinical studies of oxygen utilization in tissuesand muscle oxygenation55, especially in the area of exercise physiology. In other clinicalstudies, NIRS has been used for monitoring peripheral vascular disease56, ischemic andhemorrhagic stroke57, cerebral oxygenation58, and blood flow measurements59. One drawbackof the NIRS method is that it does not measure tissue pO2 directly but rather provides theinformation about vascular oxygen saturation. Also, the absorption spectra of most commonchromophores, such as oxyhemoglobin, deoxyhemoglobin, and cytochrome c oxidase, overlapwhich may result in ambiguous quantification60.
2.2.5 Hyperspectral Imaging (HSI)—Oximetry using hyperspectral imaging relies onanalyzing reflectance measurements that are backscattered and spectrally altered by the tissueto assess blood oxygen saturation61. The working principle of HSI is similar to NIRS, butunlike NIRS, it collects and processes information from many different visible wavelengths.The main advantage of using this technique is that it is noninvasive and allows a directobservation of blood-oxygen supply. This method has been applied to measure oxygensaturation in the optical nerve head and retina62. It has also been used to evaluate hemoglobinsaturation in murine tumors63 and tissue perfusion in humans64. In addition, HSI based methodshave been used to investigate wound healing65 and to diagnose hemorrhagic shock66. Majordrawbacks associated with HSI include: lack of accuracy, complexity of data analysis, andinability to directly measure tissue oxygenation.
2.3 Nuclear and Magnetic Methods2.3.1 PET Imaging—PET-based oximetry uses short-lived positron-emitting radionuclidesfor in vivo imaging of a variety of hypoxia biomarkers67. Besides radio-labeling of thebiomarkers, the basic principle of this modality is similar to that of immunochemical methods.The common hypoxia markers used in PET are 18F-containing imidazoles68 (e.g., 18Ffluoromisonidazole, FMISO) and 18F-containing pentafluorinated derivative ofetanidazole69 (EF5). Researchers at Washington University and Searle Radiographersdeveloped instrumentation that could be used for in vivo imaging of the positron-emittingradionuclides70. PET oximetry is a noninvasive method that has been extensively used in tumormodels for hypoxia mapping in mice and rat. Clinical studies include head and neckcancer71 and lung cancer72. The PET/MRI and PET/CT combined modalities are also gainingimportance as they have the added advantage of obtaining anatomical information along with
Ahmad and Kuppusamy Page 4
Chem Rev. Author manuscript; available in PMC 2011 May 12.
NIH
-PA Author Manuscript
NIH
-PA Author Manuscript
NIH
-PA Author Manuscript

PET data. The use of PET oximetry is limited by the availability and cost of cyclotrons neededto produce short-lived radionuclides.
2.3.2 19F MRI—In 1988, Busse et al.73 showed that 19F nuclear magnetic resonance (NMR)spin-lattice relaxation rate (R1) of perfluorocarbon probes could be used for imaging tumorpO2 in vivo. The technique is based on NMR, but unlike conventional MRI (proton imaging),a probe based on perfluorocarbons (PFCs) is used. The PFCs are infused intravenously in theform of emulsions74. The 19F spin lattice relaxation rate (R1) of PFCs varies linearly withdissolved oxygen concentration. Thus, the 19F-based oximetry reports absolute values ofoxygen concentration. Hexafluorobenzene75 (HFB) and perfluoro-15-crown-5-ether76 (15C5)have been the most widely used PFCs for this application. Using this technique, it is possibleto image pO2 as well as follow dynamic changes in tumor oxygenation. It is also possible tocombine the 19F images and 1H anatomical images to provide spatial registration. This methodhas been used in rodent models for different types of tumors including breast77 andprostate78. Studies have also been conducted in rat brain79, lung80, and human eye81. Yu et al.82 have reviewed 19F MRI for physiological and pharmacological applications. The mainconcern with 19F MRI is the toxicity of PFCs which needs to be fully characterized before thismethod can be used for clinical applications.
2.3.3 BOLD Imaging—In 1982, Thulborn et al.83 described the oxygenation dependence ofthe transverse relaxation time of water protons. Later, Ogawa et al. described blood oxygenlevel-dependent (BOLD) MRI of tissues for imaging the blood oxygen level in rat brain84.BOLD images reflect the changes in the amount of oxygen bound to hemoglobin in blood. Thepresence of deoxyhemoglobin, which is paramagnetic in nature, can cause differences insusceptibility (i.e. changes in the local magnetic field) around the blood vessels, which affectsthe relaxation properties of the surrounding protons. Thus, a change in T2-weighted image canbe used to quantify changes in blood oxygenation. BOLD MRI oximetry is noninvasive andcan be performed using available clinical scanners and has the advantage of the availability offast imaging sequences. It can also provide information regarding temporal changes85 inoxygenation. The repeatability and voxel-by-voxel information about changes in bloodoxygenation co-registered with anatomical information are also advantages over other imagingtechniques. A major disadvantage of the BOLD oximetry is that it does not provide quantitativeinformation86 of blood oxygenation. It measures the changes in blood oxygenation, but notabsolute oxygen concentration in tissue.
3 EPR OximetryEPR oximetry is a minimally invasive magnetic resonance method capable of measuring directand absolute values of pO2 or O2 concentration. In 1977, Backer et al.87 reported the reversibleand repeatable effect of oxygen concentration on the superhyperfine structure of EPR spectraof a soluble spin probe, also called spin label. Soon after, more oxygen-sensitive spin probeswere developed and used for biological applications88,89. In the 1980s, James Hyde exploredthe quantifiable affect of oxygen concentration on the relaxation rates90,91 of various spinprobes, which remains the basis of present day EPR oximetry. He also greatly contributed tothe development of instrumentation92 and methodology for making EPR measurements. In1986, Subczynski et al. reported the first in vivo EPR oximetry measurement93 which wasconducted on mice using an L-band EPR spectrometer. Over the last two decades, EPRoximetry has emerged as a promising technique for biological applications with uniqueadvantages over other existing oximetry methods11,94. It possesses a high sensitivity to pO2,and can provide three dimensional (3D) mapping of oxygen distribution, if required. Thismethod shows a high specificity because of minimal interference from other sources. Inaddition, the spin probes are nontoxic, and are generally stable in a tissue environment. In fact,particulate (solid-state, crystalline, and water-insoluble) spin probes can stay in a biological
Ahmad and Kuppusamy Page 5
Chem Rev. Author manuscript; available in PMC 2011 May 12.
NIH
-PA Author Manuscript
NIH
-PA Author Manuscript
NIH
-PA Author Manuscript

sample for months without losing their oxygen sensitivity95,96. Therefore, the particulate-basedEPR oximetry is usually described as ‘minimally invasive’ as only one-time implantation ofthe particulate spin probe is needed, and the subsequent measurements are carried out withoutany invasive procedure.
Despite all these advantages, there exist numerous technical challenges that have limited thewidespread use of in vivo EPR oximetry. Some of the technical problems encountered in EPRoximetry include: nonresonant absorption at higher frequencies resulting in unwanted heatingof aqueous samples, poor SNR, small penetration depth especially at higher frequencies,requirement of an exogenous probe, rapid bioreduction or excretion of soluble spin probes,long acquisition times, and motion artifacts.
3.1 Principle of EPR SpectroscopyEPR was first discovered by Zavoisky in 1944. It is a branch of spectroscopy in which electronswith unpaired spins, when placed under a magnetic field, absorb electromagnetic radiation totransition from low energy level to high energy level. In principle, EPR is similar to nuclearmagnetic resonance (NMR) spectroscopy where the transition of protons between two energylevels is observed.
In EPR, the energy differences studied are primarily due to the interaction between electronicmagnetic moments and the external magnetic field, Bext, also called main magnetic field. Dueto its magnetic moment, an unpaired election acts like a tiny bar magnet in the presence of anexternal magnetic field. It possesses the lowest energy if the magnetic moment is aligned withBext and the highest energy if it is aligned opposite to Bext as shown in Figure 1. This is generallycalled the Zeeman Effect.
Since an electron is a spin 1/2 particle, the low energy and high energy states can be designatedas Ms = −1/2 and Ms = +1/2, respectively. The energy E of an unpaired electron in an externalmagnetic field Bext can be defined as
(1)
where ΔE is the energy difference between the two states, dimensionless g is the g-factor org-value, β is the Bohr magneton which is the unit of magnetic moment, γ = gβ/Ħ is thegyromagnetic ratio, and Ħ is the reduced Plank’s constant. If B0 is the external magnetic fieldwhere ΔE in Eq. (1) matches the radiated energy hυ0, we can write
(2)
where υ0 is the frequency, in Hertz, of electromagnetic excitation usually in the radiofrequency(RF) range.
The splitting between energy states, depicted in Figure 2, varies linearly with Bext and isdegenerate when Bext = 0, which means that the two states have the same energy in the absenceof external magnetic field. In the presence of the external magnetic field, absorption of theelectromagnetic radiation happens whenever Eq. 2 is satisfied. The condition can be satisfiedeither by fixing the radiation frequency and adjusting Bext, or by fixing Bext and adjusting theradiation frequency. The limitation of RF hardware, however, makes the latter choice
Ahmad and Kuppusamy Page 6
Chem Rev. Author manuscript; available in PMC 2011 May 12.
NIH
-PA Author Manuscript
NIH
-PA Author Manuscript
NIH
-PA Author Manuscript

unattractive. At resonance, the unpaired electrons at the lower energy level absorb the RFradiation and jump to the higher energy state. These excited electrons move back to the lowerenergy state by releasing the excess energy. It is this transition between low and high energystates that is recorded in EPR.
Since the unpaired electron is exposed to its surrounding, nuclei with magnetic moment in thevicinity of an unpaired electron may affect the local magnetic field experienced by the unpairedelectron, which may result in further splitting of the spectrum, called hyperfine splitting97. Thepresence of hyperfine structures in an EPR spectrum can provide a wealth of informationregarding the free radical species and their environments.
3.2 Principle of EPR OximetryMolecular oxygen is a naturally occurring triplet radical and cannot be directly detected byEPR when in dissolved state due to extremely short relaxation time98. Hence, measurement ofoxygen concentration by EPR (EPR oximetry) involves the use of an external spin probeconsisting of paramagnetic material in either particulate (solid) or soluble form. The changesin the EPR linewidth of the exogenous spin probe are caused by the interaction of twoparamagnetic species, molecular oxygen and the spin probe. The interaction includes dipole-dipole interaction and Heisenberg spin exchange99, with the latter being the dominantinteraction for the majority of commonly used soluble spin probes with low viscosities. Thebroadening of EPR spectrum, depicted in Figure 3, permits quantification of pO2 or O2concentration.
The spin-spin relaxation rate, R2, which is directly related to linewidth (W) and inversely relatedto relaxation time (T2), increases with oxygen concentration. For soluble spin probes, the line-broadening is caused by direct bimolecular collisions between two paramagnetic species, withthe rate of collision, ω, given by the Smoluchowski equation,
(3)
where r is the interaction distance between oxygen and the spin probe, DP and DO are thediffusion coefficients of the soluble spin probe and oxygen respectively, and CO is the oxygenconcentration. Usually DO is much greater than DP. Therefore, Eq. (3) can be approximatedas,
(4)
Since the linewidth of the EPR absorption spectrum varies linearly with the collision frequencyω, the relationship between linewidth and oxygen concentration is expected to be linear.Therefore, the measured linewidth can be used to quantify oxygen concentration.
For particulate spin probes, line-broadening is based predominantly on Heisenberg spinexchange90. In the absence of oxygen, the radicals of the particulate spin probe undergo intenseHeisenberg electron-electron exchange, also called exchange narrowing, which results in avery narrow lineshape. This phenomenon of exchange narrowing for paramagnetic resonancewas first suggested by Gorter et al.100 in 1947 and was later mathematically modeled byAnderson et al.101 in 1953. In the presence of exchange narrowing, any line broadening, forinstance, due to magnetic dipole interaction, is narrowed by a fast dynamics resulting from theexchange coupling. With the introduction of oxygen, the spin exchange between two
Ahmad and Kuppusamy Page 7
Chem Rev. Author manuscript; available in PMC 2011 May 12.
NIH
-PA Author Manuscript
NIH
-PA Author Manuscript
NIH
-PA Author Manuscript

paramagnetic species – oxygen and the spin probe – results in reversible line-broadening ofthe EPR spectrum.
The line broadening (ΔW) due to spin exchange between the spin probe and O2 can be writtenas102,
(5)
where
(6)
and
(7)
where d is the distance of closest approach of O2 to a spin of the particulate probe, γI is thegyromagnetic ratio of the paramagnetic specie, CO is the concentration of O2 adsorbed intothe probe, pA is the probability of spin exchange per collision, given by
(8)
Here, J is the exchange interaction between the spins of a colliding O2 and the spins ofparticulate probe, τc is the mean interaction time, and T1 is the oxygen relaxation time. Forstrong spin exchange (pA ≈ 1), Eq. (5) becomes
(9)
For many carbon-based particular spin probes, however, the dipole-dipole interaction,depending on the pore size of the material and the temperature, may become the leadingcontributor to the line broadening102.
On a pulsed EPR spectrometer103, the decay of magnetization, called free induction decay(FID), is recorded after applying an excitation pulse in the presence of a fixed magnetic field.On a continuous wave (CW) EPR spectrometer, the absorption spectrum is instead collectedby subjecting the sample to a fixed monochromatic electromagnetic excitation and sweepingBext. The EPR spectrum, also referred to as the EPR lineshape, is simply the Fourier transformof FID104. The most common lineshapes are Lorentzian and Gaussian but other nonparametriclineshapes are not uncommon.
Ahmad and Kuppusamy Page 8
Chem Rev. Author manuscript; available in PMC 2011 May 12.
NIH
-PA Author Manuscript
NIH
-PA Author Manuscript
NIH
-PA Author Manuscript
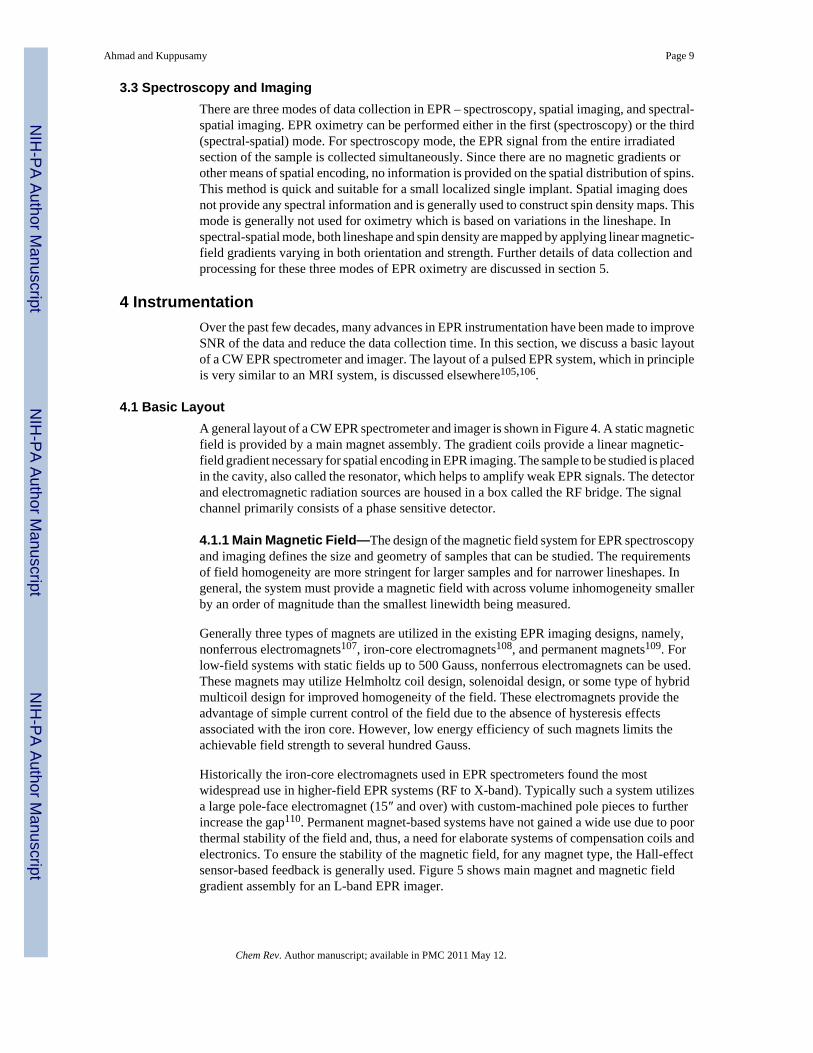
3.3 Spectroscopy and ImagingThere are three modes of data collection in EPR – spectroscopy, spatial imaging, and spectral-spatial imaging. EPR oximetry can be performed either in the first (spectroscopy) or the third(spectral-spatial) mode. For spectroscopy mode, the EPR signal from the entire irradiatedsection of the sample is collected simultaneously. Since there are no magnetic gradients orother means of spatial encoding, no information is provided on the spatial distribution of spins.This method is quick and suitable for a small localized single implant. Spatial imaging doesnot provide any spectral information and is generally used to construct spin density maps. Thismode is generally not used for oximetry which is based on variations in the lineshape. Inspectral-spatial mode, both lineshape and spin density are mapped by applying linear magnetic-field gradients varying in both orientation and strength. Further details of data collection andprocessing for these three modes of EPR oximetry are discussed in section 5.
4 InstrumentationOver the past few decades, many advances in EPR instrumentation have been made to improveSNR of the data and reduce the data collection time. In this section, we discuss a basic layoutof a CW EPR spectrometer and imager. The layout of a pulsed EPR system, which in principleis very similar to an MRI system, is discussed elsewhere105,106.
4.1 Basic LayoutA general layout of a CW EPR spectrometer and imager is shown in Figure 4. A static magneticfield is provided by a main magnet assembly. The gradient coils provide a linear magnetic-field gradient necessary for spatial encoding in EPR imaging. The sample to be studied is placedin the cavity, also called the resonator, which helps to amplify weak EPR signals. The detectorand electromagnetic radiation sources are housed in a box called the RF bridge. The signalchannel primarily consists of a phase sensitive detector.
4.1.1 Main Magnetic Field—The design of the magnetic field system for EPR spectroscopyand imaging defines the size and geometry of samples that can be studied. The requirementsof field homogeneity are more stringent for larger samples and for narrower lineshapes. Ingeneral, the system must provide a magnetic field with across volume inhomogeneity smallerby an order of magnitude than the smallest linewidth being measured.
Generally three types of magnets are utilized in the existing EPR imaging designs, namely,nonferrous electromagnets107, iron-core electromagnets108, and permanent magnets109. Forlow-field systems with static fields up to 500 Gauss, nonferrous electromagnets can be used.These magnets may utilize Helmholtz coil design, solenoidal design, or some type of hybridmulticoil design for improved homogeneity of the field. These electromagnets provide theadvantage of simple current control of the field due to the absence of hysteresis effectsassociated with the iron core. However, low energy efficiency of such magnets limits theachievable field strength to several hundred Gauss.
Historically the iron-core electromagnets used in EPR spectrometers found the mostwidespread use in higher-field EPR systems (RF to X-band). Typically such a system utilizesa large pole-face electromagnet (15″ and over) with custom-machined pole pieces to furtherincrease the gap110. Permanent magnet-based systems have not gained a wide use due to poorthermal stability of the field and, thus, a need for elaborate systems of compensation coils andelectronics. To ensure the stability of the magnetic field, for any magnet type, the Hall-effectsensor-based feedback is generally used. Figure 5 shows main magnet and magnetic fieldgradient assembly for an L-band EPR imager.
Ahmad and Kuppusamy Page 9
Chem Rev. Author manuscript; available in PMC 2011 May 12.
NIH
-PA Author Manuscript
NIH
-PA Author Manuscript
NIH
-PA Author Manuscript

4.1.2 Gradient Coils—EPR imaging imposes extremely stringent requirements for magneticfield gradient design when compared to MRI. This is due to the fact that strong linear gradients(more than an order of magnitude stronger than for clinical MRI systems which are typicallyin the range of 1–4 G/cm) are required to obtain high spatial and spectral resolution due to themuch broader lineshapes of EPR spectra. Also in CW-EPR imaging, the gradients must be ableto dissipate peak power during long periods of time. Transient response, however, is lessimportant than that for MRI so that active shielding is usually not necessary. As the samplesize increases, problems imposed by the need for powerful field gradients escalate since thepower required to generate a given gradient increases with the cube of the gap distance betweenthe coils of the main magnet. Dissipation of the power in the coils also becomes more difficultas the surface/volume ratio of the coil decreases.
Two distinct gradient coil designs are selected for the two major geometries of main magneticfield coil designs, i.e., Helmholtz pair coils and a solenoidal coil111. The Z-gradient coils, foreither of the main magnetic field coil designs, are Maxwell pair coil configuration. However,for X- and Y-gradient coils, the use of flat square pairs (four coils per axis as shown in Figure6) is preferred for the Helmholtz main field geometry, while curved Golay gradient coildesign112 is required for the solenoid electromagnet to conform with the cylindrical geometry.A system of multiple computer-controlled power supplies must be utilized to drive the gradientcoils as required by the projection acquisition sequence. Ideally these power supplies are abank of switching mode operational power amplifiers capable of four-quadrant operation withan IEEE-488 or other computer interface.
4.1.3 RF Bridge—The RF bridge handles the generation of RF signal and the detection ofthe EPR signal coming out of the resonator. Key components of a typical RF EPR bridge,labeled in Figure 7, are briefly described below.
• i - Oscillator: It is used to generate RF energy. The frequency of RF energy is generallyvaried with mechanical and electrical means. While mechanical adjustments are usedfor coarse tuning, electronic adjustments are applied for fine tuning. The oscillatormust have a stable output frequency and amplitude, as even slight changes canintroduce distortion in the data.
• ii - Attenuator: It precisely controls the amount of RF energy delivered to theresonator. It must be very stable over time and a broad temperature range.
• iii - Circulator: Circulator allows reflected energy from the resonator at port 2 to reachthe detector diode at port 3 while blocking high level excitation energy from port 1to reach port 3.
• iv - Resonator: Resonator is used to amplify small changes induced in the RF radiationdue to the magnetic resonance of the sample. The change in RF energy absorbed bythe sample, upon magnetic resonance, changes the impedance of the resonator. Thischange in impedance changes the reflection coefficient of the resonator, resulting inreflected RF power fluctuation. In CW EPR, it is this fluctuation of the reflected RFpower that is converted into an EPR signal.
• v - Detector: It converts RF energy reflected from the resonator into baseband signal.It is generally comprised of a diode detector and a passive low pass filter. The electricaloutput signal from a typical detector diode is 1500 mV output per mW of RF input.Since excessive RF power can permanently damage the diode, additional protectioncircuitry is included to monitor and limit the diode current
• vi - Reference Arm: It is used to apply small RF power to bias the detector diode intothe more sensitive operating region. An RF phase (α) shifter synchronizes reference
Ahmad and Kuppusamy Page 10
Chem Rev. Author manuscript; available in PMC 2011 May 12.
NIH
-PA Author Manuscript
NIH
-PA Author Manuscript
NIH
-PA Author Manuscript

arm power with the reflected power from the resonator. Many homebuilt units do nothave a reference arm and require off resonance coupling of the resonator for the bias.
• vii - Preamplifier: It amplifies the small signal (typically less than 10 mV) from thedetector for further filtering and amplification by lock-in amplifier (signal channel).
• viii - AFC: Automatic frequency controller modulates frequency of the RF sourcewith 70 kHz signal. It further processes the 70 kHz component of the signal comingfrom the preamplifier to provide a feedback to electronically match RF oscillatorfrequency to that of the resonator.
• ix - SAW Oscillator: It generates saw tooth waveform (in the range of 400 Hz) toprovide frequency sweep for tuning mode.
• x - Tuning Display: It displays oscillator frequency sweep (x-axis) verses reflectedpower from resonator (y-axis) during the tuning mode. It allows visual feedback fortuning the oscillator frequency to the resonator frequency.
4.1.4 Resonator—EPR resonator design is important to maximize sensitivity, and must betailored to accommodate the sample with the highest possible filling factor × quality factorproduct. The quality factor, Q, is the ratio of energy stored to energy lost by the resonator,while the filling factor is the fraction of total RF magnetic field power entering the resonatorthat is incident upon the sample. Higher Q allows larger detectable changes during absorptionand hence improves signal intensity.
The resonator must be a mechanically stable structure and should make most efficient use ofthe space within the magnet. Space constraints present a major consideration in the choice ofthe resonator design for EPR imaging. Innovations in resonator design, which enable automaticcoupling adjustment and frequency tuning113,114, can be used to suppress motion-induceddistortion that occurs in biological samples.
In recent years much effort has been focused on the development of lumped-parameter RFsample cavities for L- and S-bands. Two major types of such resonators, namely loop-gap andreentrant, have been introduced and extensively discussed in literature 115,116.
Loop-gap resonators (LGR) provide straightforward design and high filling factors comparedto standard distributed parameters RF cavities. However, due to the open structure of theinductive loop element, LGRs have significant radiation losses unless a shield is provided. Theneed for the shield leads to problems in achieving an optimum magnitude of modulation fieldand at least a 20% increase of overall resonator dimensions. A sketch of a loop-gap surfaceresonator design, originally developed by Bacic et al.117 is shown in Figure 8a. The reentrantresonator (RER design) was introduced and described in great detail by Sotgiu116. Since theresonant structure of the RER forms a closed volume, it does not require any additional shield,thus providing substantial space savings as compared to LGRs. A number of RERs constructedof ceramic silver plated material are also reported118 offering improved rigidity and stability.Figure 8b shows an RER resonator design for L-band EPR.
4.1.5 Modulation Coil and Signal Channel—To improve the system sensitivity, it is acommon practice in CW-EPR to modulate Bext by adding an oscillating the magnetic fieldusing a pair of modulation coils and to detect the signal using a phase-locked loop detectorwhich is also called a phase-sensitive or a lock-in detector. The lock-in detector compares theEPR signal from the crystal with the reference signal which comes from the same oscillatorthat generates the magnetic field. The lock-in detector only accepts the EPR signal that is phasecoherent to the reference signal119. The advantages of lock-in detection include less 1/f noisefrom the detection diode and elimination of the baseline instabilities due to drift in DC
Ahmad and Kuppusamy Page 11
Chem Rev. Author manuscript; available in PMC 2011 May 12.
NIH
-PA Author Manuscript
NIH
-PA Author Manuscript
NIH
-PA Author Manuscript

electronics. It is important to note that for certain data collection method, rapid scan120 forinstance, no field modulation is applied and the absorption signal is recorded directly.
4.2 Tuning ParametersThere is array of instrument parameters which, when adjusted properly, can improve theperformance of the spectrometer or imager for a given oximetry application. Selection of theseparameters depends on the experimental setup, such as sample size, and the nature and extentof information sought.
Here we briefly mention some of the important instrument setup parameters which affect theSNR and hence the acquisition time and the accuracy of final results. (i) Radiation Frequency:An increase in the radiation frequency improves the SNR, but at the same time results inunwanted nonresonant absorption and reduction in penetration depth. (ii) Magnetic Gradient:An increase in magnetic gradient strength thermally burdens the gradient coils and degradesSNR, but improves spatial resolution. (iii) RF Power: An increase in RF power improves SNRbut may also result in heating of the sample and power saturation induced line broadening. (iv)Quality Factor: High Q of a resonator, along with critical coupling, improves SNR but alsoleads to extra sensitivity to sample motion. (v) Modulation Amplitude: An increase inmodulation amplitude improves SNR but exerts extra burden on the modulation coils and alsoresults in lineshape distortion, which is generally corrected by post-processing121. (vi) SweepTime: Increasing the magnetic field sweep time for each spectral scan improves SNR butprolongs the acquisition time, which can be very critical for in vivo applications. (vii) Numberof Projections: For imaging, collecting data along a large number of orientations generallyimproves reconstruction quality but only at the cost of increased acquisition time.
5 Data Collection and Processing5.1 Spectroscopy
In spectroscopy, the measurements take place in the absence of a magnetic field gradient.Hence, no information is captured regarding the spatial distribution of the spin probe. Thecollected information is solely limited to the shape of the composite spectrum. If there are morethan one paramagnetic species present in the sample, the observed signal is the superpositionof individual spectra.
5.1.1 Data Collection—Although in principle it is possible to sweep the RF frequency fora fixed Bext, the related hardware challenges make it an unattractive option. Therefore, in EPRthe spectrum is generally observed, in the presence of a fixed frequency excitation, by sweepingBext,
(10)
where Bδ represents field sweep, B0, defined by Eq. 2, is the magnetic field strength at whichmagnetic resonance occurs. For a majority spin probes, the lineshape l belongs to family ofparametric functions such as Lorentzian, Gaussian, or Voigt122. A Lorentzian lineshape withfull-width at half-maximum (FWHM) linewidth W and amplitude, κ, which is the area underthe absorption curve, is defined in Eq. 11,
(11)
Ahmad and Kuppusamy Page 12
Chem Rev. Author manuscript; available in PMC 2011 May 12.
NIH
-PA Author Manuscript
NIH
-PA Author Manuscript
NIH
-PA Author Manuscript

As mentioned earlier, SNR can be improved by modulating the magnetic field and observingthe first harmonic, which, for small modulation amplitude Bm, represents the firstderivative123 of l as shown in Figure 9.
5.1.2 Data Processing—For oximetry, linewidth for an oxygen sensitive spin probeincreases monotonically with the pO2 to which the spin probe is exposed. Hence, measuringW can provide a direct reading of pO2. For spectroscopy, the data processing involvesestimating linewidth from noisy measurements. For high SNR, a direct peak-to-peakmeasurement can be used to estimate linewidth. For low SNR, however, curve fitting, shownin Figure 10 can be applied to improve robustness. For curve fitting, the measured noisyspectrum is fitted to a known parametric lineshape of the spin probe.
5.2 Spatial ImagingSpatial EPR imaging is capable of providing the distribution of paramagnetic spins in the 1D,2D, or 3D spatial domain124,125 u ∈ □ d. Application of a magnetic field gradient gu is usedto resolve the spatial distribution of spin probes. In spatial imaging, it is assumed that thelineshape of the spin probe is spatially invariant. In cases where lineshape changes with thelocation (possibly due to changes in the environment such as variations in pO2) or where thereare multiple spin probes with different lineshapes, it may not be possible to provide an accuratedistribution of the spin probes using purely spatial EPR imaging. Although spatial imaging isnot used for oximetry, a basic understanding would help the reader comprehend the conceptof spectral-spatial imaging which is discussed later.
5.2.1 Data Collection—The net external magnetic field in the presence of a gradient gubecomes,
(12)
where ⟨.,.⟩ represents the inner product. The resonance condition is only met where Bδ +⟨gu,u⟩ = 0. Each term in Eq. 12 has units of magnetic field, but can be converted to spatial unitsby dividing both sides by −|gu|.
For EPR imaging, data is collected in the form of projections. A projection p is computed bythe Radon transform (RT) of a 2D or 3D object f,
(13)
where ρ = −Bδ/|gu| and ĝu = gu/|gu| Here, ⟨ĝu, u⟩ is the plane to be integrated, and ρ is thedistance of this plane from the center of image space as shown in Figure 11. For a spin probewith lineshape lρ(Wρ, κ), each measured projection is a convolution of a true projection obtainedby Radon transform and the lineshape lρ (Wρ, κ).
(14)
where ⊗ stands for convolution in the first variable. Note, lρ (Wρ, κ) is the lineshape in spatialdomain, and l (W, κ) is the lineshape in terms of magnetic field and is related to the former by
Ahmad and Kuppusamy Page 13
Chem Rev. Author manuscript; available in PMC 2011 May 12.
NIH
-PA Author Manuscript
NIH
-PA Author Manuscript
NIH
-PA Author Manuscript

(15)
where W = |gu|Wρ.
5.2.2 Data Processing—For EPR spatial imaging, data processing involves reconstructing2D or 3D images from a set of collected projections. It is a linear inverse problem and has beendiscussed extensively126. Generally, filtered backprojection (FBP) or direct Fourier method isused to reconstruct the image. For a small number of projections, the reconstruction using FBPmay result in undesired streak artifacts. To overcome this problem, iterative reconstructionmethods127,128 can be used to improve the reconstruction quality at the cost of reconstructiontime. The effect of spatial blurring, represented in Eq. 14, can be suppressed by applying highergradient |gu| For situations where the application of a large enough gradient is not possible dueto SNR degradation or hardware limitations, deconvolution129 is applied either before or duringthe reconstruction. A common practice is to perform deconvolution on individual projectionsbefore the reconstruction. The most common method of performing deconvolution is by apoint-by-point division, in the discrete Fourier domain, of each measured 1D projection by themeasured or calculated lineshape. To avoid, divide-by-zero problem, each projection islowpass filtered before the deconvolution.
5.3 Spectral-Spatial ImagingFor samples having variable linewidths, which is the case for EPR oximetry, it is not possibleto obtain an accurate map of the spin distribution using data-collection and image-reconstruction procedures used for purely spatial EPR. Furthermore, the information obtainedby purely spatial EPR imaging is limited to the spin density and cannot resolve the nature ofthe spins at each spatial volume element (voxel). To overcome this limitation, an additionalspectral dimension is considered to capture the lineshape at each voxel. The imaging techniquethat includes a spectral dimension along with one or more spatial dimensions is termed spectral-spatial imaging130.
5.3.1 Data Collection—For spectral-spatial imaging, the spatial information is captured bycollecting projections along different spatial orientations of the gradient vector, while thespectral information is captured by varying the gradient strength in addition to the orientation.Spectral-spatial imaging can be performed in 1, 2 or 3 spatial dimensions giving rise to 2D,3D, or 4D spectral-spatial images, respectively. Conceptually, the data acquisition in n spatialand one spectral dimension is similar to the data acquisition in n +1 spatial dimensions. Toaugment the spectral dimension, an addition angle, θ, also called spectral angle, is introduced.The spectral angle is defined as
(16)
where ΔL and ΔB define the size of the field-of-view along spatial and spectral dimensionsrespectively. Figure 12 shows the data collection scheme for a 2D spectral-spatial object.
5.3.1 Data Processing—Conceptually, image reconstruction for spectral-spatial imagingis identical to spatial imaging with the exception of an added dimension. Generally, afterrescaling of the collected projections to accommodate for the signal loss at higher gradientstrengths, FBP is applied to obtain a spectral-spatial image. For high gradient projections, time
Ahmad and Kuppusamy Page 14
Chem Rev. Author manuscript; available in PMC 2011 May 12.
NIH
-PA Author Manuscript
NIH
-PA Author Manuscript
NIH
-PA Author Manuscript

averaging is applied to partially compensate for the SNR loss. Also, due to limited gradientstrength, it is not possible to collect projections with the spectral angle values in the vicinityof ±π/2, which leads to the problem of image recovery from an incomplete dataset. This isusually referred to as limited-angle tomography and has been studied extensively131. Spectral-spatial imaging is generally time consuming, especially in 4D where hundreds or eventhousands of projections are collected with each requiring a sweep time of a couple of secondsor more.
5.4 Recent DevelopmentsEPR oximetry, especially when performed over 3 spatial dimensions, is time consuming, whichhas adversely affected the wide use of EPR for clinical applications. Several innovations,ranging from improved hardware designs to optimized data collection and processing schemes,have been implemented to reduce the data collection time to the levels suitable for in vivostudies. However, there is still room for further acceleration of data acquisition before EPRcan be declared a serious contender for clinical oximetry. In this section, we look at some ofthe data collection and processing methodologies adopted by the EPR community to speed updata acquisition.
5.4.1 Pulsed System—In CW EPR, the data are collected by exposing the sampling to afixed frequency excitation and sweeping the magnetic field gradually. It may take a couple ofseconds or more to acquire one projection. Therefore, acquiring data for higher dimensions,where hundreds and even thousands of projections may be required, becomes impractical formany applications where conditions may change rapidly. Pulsed EPR, on the other hand, hasthe potential to reduce the acquisition time substantially106. However, there are numeroustechnical challenges still to be addressed before pulsed EPR overtakes CW EPR for broad EPRapplications. In pulsed EPR, the excitation is provided by a train of short RF pulses, and theemitted signal from the spins, called free induction decay (FID), is digitized and recorded. TheEPR spectrum can be obtained by simply applying the Fourier transform to the FID. Althoughthe basic principle of the pulsed EPR spectrometer is similar to that of NMR, extremely shortrelaxation times for EPR make the instrumentation much more challenging. At low frequencies,the dead time of an EPR resonator, defined as the time required by the resonator to dissipatethe RF energy, can approach the relaxation times of many commonly used spin probes, makingit extremely difficult to collect the data. Therefore, spin probes with longer relaxation timesare highly preferred to exploit the advantages of the pulsed system. Lately, there has been arenewed interest in the development of a low frequency pulsed EPR system132.
5.4.2 Overmodulation—Modulation amplitude is another important parameter that affectsthe data quality. In the presence of a modulating field Bmcosωmt and without the applicationof the gradient, Eq. 12 can be written as
(17)
where Bm is the modulation amplitude. Eq. 11 then becomes
(18)
where κ0 = 2κ/πW is the amplitude of l at Bδ = 0. In terms of a Fourier series
Ahmad and Kuppusamy Page 15
Chem Rev. Author manuscript; available in PMC 2011 May 12.
NIH
-PA Author Manuscript
NIH
-PA Author Manuscript
NIH
-PA Author Manuscript

(19)
where
(20)
The closed form expression for an can be calculated by contour integration. In order to observethe first harmonic, a1, the signal at the output of the lock-in detector is multiplied withcosωmt and lowpass filtered. For Bm much smaller than W, the first harmonic is approximatelyequivalent to the first derivative of the absorption signal. When Bm increases so does the signalintensity, but the signal gets distorted and no longer remains Lorentzian as shown in Figure13. Fortunately, this modulation induced distortion is well characterized121. In order to improvethe SNR, the use of Bm that is much larger than W has been reported133,134.
5.4.3 Rapid Scan—In traditional CW EPR, a slow linear scan is made to collect a spectrumor a projection. The magnetic field modulation and the lock-in detection are applied to increaseSNR. In rapid scan, the magnetic field is swept back-and-forth at a high rate, usually in kHzrange, and the absorption signal is recorded directly without any field modulation or lock-indetection. For scan rates comparable to the relaxation times, a distortion is introduced in thespectrum. Fortunately, this distortion is well characterized using Bloch equations and can beeasily accounted for by post-processing135. When the RF power is optimized for a given scanrate, the signal intensity is enhanced by up to a factor of three relative to the conventional slowscan lock-in detection120. Also, the SNR for rapid scan is inversely proportional to the magneticfield sweep width as compared to the lock-in detection where the SNR is inversely proportionalto the square of the magnetic field sweep width. The relative performance of rapid scan hasbeen evaluated for EPR recently136. High scan rates, usually in the kHz range, make rapid scanthe method of choice for EPR imaging of a moving object such as beating heart.
5.4.4 Iterative Reconstruction—Iterative methods, also known as series expansionreconstruction methods or algebraic reconstruction methods, have been used for tomographicreconstruction for the last few decades127. These methods are based on the discretization ofthe image domain prior to any mathematical analysis, which is in contrast to the transformmethods, such as the FBP, where the continuous problem is only discretized as the last step ofthe reconstruction process137.
Iterative methods are computationally intensive, but the reconstruction is usually superior tothe FBP. Algebraic reconstruction technique138 (ART) is a common iterative method used toreconstruct data from projections. The most attractive feature of ART, and other similariterative techniques, is its ability to merge a variety of constraints into the iterative process.For example, a nonnegativity constraint can be readily implemented by setting the negativeportions of the estimate to zero in each iteration. Further, the iterative methods do not requireprojections to be uniformly distributed and hence the missing angle problem is handledseamlessly. A comparison of ART reconstruction and FBP reconstruction from 20 noiselessprojections for a 2D digital Shepp-Logan phantom is represented in Figure 14. A strong streakartifact is visible for the FBP reconstruction.
Ahmad and Kuppusamy Page 16
Chem Rev. Author manuscript; available in PMC 2011 May 12.
NIH
-PA Author Manuscript
NIH
-PA Author Manuscript
NIH
-PA Author Manuscript

For spatial imaging, another major advantage of iterative methods is their ability to incorporatethe deconvolution step into the interactive scheme, eliminating the need for a separatedeconvolution which generally yields poor results. Computationally efficient algorithms havebeen reported to carry out the iterative reconstructions from projection data139. Recently, anumber of iterative methods have been suggested for EPR image reconstruction, each differingin the cost function to be minimized140,141.
5.4.5 Single-Point Imaging—Single-point imaging (SPI) or constant-time imaging142 is aspecial way of collecting data using pulsed EPR. In SPI, for every pulsed RF excitation, asingle data point of the FID after a fixed delay in the presence of static magnetic field gradientsis acquired. It is analogous to performing pure phase encodings in all dimensions to fill thenD Fourier domain point-by-point. Since the phase-encoding time (the fixed delay afterexcitation) remains constant for a given image data set, the spectral information (lineshape) isautomatically deconvolved, providing well-resolved pure spatial images. Therefore, SPI hasthe potential to provide high resolution artifact free images which can be useful for manybiological applications. For spectral-spatial imaging, the spectral information can also beextracted from a series of SPI images each corresponding to a different delay from the excitationpulse. Since only one data point is recorded per excitation, acquisition times for SPI can belonger than that for CW EPR imaging.
5.4.6 Spinning Gradient—Conventionally, the main magnetic field is slowly swept for agiven gradient orientation, and the process is repeated for a set of different gradient orientations.For such an acquisition, the adjacent data points in each projection are highly correlated,resulting in data redundancy. For spinning gradient, on the other hand, the main magnetic fieldis kept fixed while the gradient orientation is rotated rapidly, and the process is repeated fordifferent values of the main magnetic field. The resulting data have lesser redundancy andgenerate better quality images. The performance of spinning gradient-based data acquisitionhas been explored for EPR by Deng et al.143. Usually, special low-inductance gradient coilsare used to spin the gradients rapidly. If the spinning frequency is low (< 100 Hz), the existingsystems with phase-sensitive detection can be used without any major hardware modifications.
5.4.7 Multisite Oximetry—Swartz et al.144 have pioneered an approach coined “multisiteoximetry”. A single favorable gradient direction is assumed for which each of several isolatedimplants is resolved. The EPR lineshape for the spin probe material is assumed to be Lorentzian,with unknown linewidths. A spectrum is recorded for two gradient magnitudes. The linewidthsare then estimated by nonlinear least-squares curve fit; the curve fit is computed on intervalsfor which spectral components are nonoverlapping. In this manner, the linewidth of each spinprobe site is estimated without reconstruction of the entire spectral-spatial object. The keyassumption is that lineshapes are resolved with a single, one dimensional magnetic fieldgradient. The approach has been applied for in vivo oximetry of transient focal cerebralischemia in the rat134. Recently, Som et al.145 proposed a model based approach to solve themultisite problem with much more favorable constraints on the experimental setup. For fourisolated implants of a particulate spin probe, acquisition time reduction of 40:1 was reportedin this study.
5.4.1 Digital Detection—Digital detection146, for both pulsed and CW EPR, has beengaining interest lately. There are several classes of digital detectors proposed for EPR147,including homodyne detection followed by A/D conversion, superheterodyne detectionfollowed by A/D conversion, time-locked subsampling (TLSS) of intermediate frequencycarrier, and TLSS of RF carrier. In TLSS of intermediate frequency carrier, RF signal is firstbandpass filtered and downconverted to intermediate frequency and then subsampled in a time-locked manner. For CW with field modulation, main advantage of digital detection is the ability
Ahmad and Kuppusamy Page 17
Chem Rev. Author manuscript; available in PMC 2011 May 12.
NIH
-PA Author Manuscript
NIH
-PA Author Manuscript
NIH
-PA Author Manuscript

to simultaneously collect data across multiple harmonics of both absorption and dispersionsignals. With the quality of digital hardware improving rapidly, digital detection will gainfurther popularity in the years to come.
5.4.1 Overhauser Enhanced MRI—Overhauser enhanced MRI (OMRI) combines theadvantages of MRI with the sensitivity of EPR. It is a double resonance technique148 that isbased on the Overhauser effect149. In the presence of an exogenous, soluble spin probe, MRImeasurements are recorded both with and without RF irradiation. The map of the differencebetween the intensities of two MRI reconstructions is related to the linewidth map of the spinprobe. OMRI has been applied to study oxygenation of murine tumors150. Despite all theadvantages, high RF power and long RF irradiation times are required to obtain good signalenhancement in OMRI151.
6 EPR Oximetry Spin ProbesIn living systems, free radicals and other paramagnetic species are either present at a very lowconcentration or have very short relaxation times, prohibiting their direct measurement. Forinstance, the relaxation time (T1) for molecular oxygen dissolved in several solvents was foundto be approximately 7.5 ps98, making the direct measurement using current EPR spectrometersimpossible. Therefore, in all EPR oximetry applications, an exogenous material, called a spinprobe or spin label, is delivered into the biological system, and the interaction of endogenousparamagnetic specie, molecular oxygen in the case of oximetry, with the spin probe is used toquantify the endogenous specie.
6.1 DevelopmentFor the past two decades, several spin probes for EPR oximetry have been developed andextensively analyzed for biological applications. There are two classes of spin probes, namely,soluble and particulate spin probes. An appropriate choice of spin probe depends upon theexperimental setup and the nature of desired information. Some of the pertinent properties ofa spin probe include: (i) Spin Density: A higher spin density leads to higher SNR and ensuresadministration of smaller quantities of spin probe and shorter acquisition times. (ii) Sharplineshape: A single sharp lineshape improves SNR and reduces data acquisition times. (iii)Power Saturation: RF power saturation broadens lineshape and degrades SNR. A highthreshold for power saturation allows for stronger RF irradiation without the saturation inducedbroadening. (iv) Oxygen Sensitivity: It is defined as the change in linewidth for unit change inpO2. Generally, higher oxygen sensitivity is desirable for accurate pO2 measurements, butexcessive broadening of lineshape due to high oxygen sensitivity may lower the SNR. (v)Biostability: Biostability of a spin probe ensures that it does not degrade or lose it propertiesin a biological environment. (vi) Chemical Toxicity: It measures the extent of damaging effect,besides the injury caused by the implantation, which a spin probe may have on biologicalsystem. (vii) Distribution: It refers to spatial distribution of the spin probe in the sample. Solublespin probes tend to distribute more evenly while particulate spin probes tend to stay localized.Table 1 summarizes anoxic linewidths and oxygen sensitivities for commonly used oximetryspin probes.
6.1.1 Soluble Spin Probes—For oximetry, the main advantages of soluble spin probesinclude even distribution in the sample, access to deep organs, and automatic removal (bybioreduction or excretion) from the in vivo system. Nitroxides were among the first spin probesused for EPR oximetry152. Use of both five-and six-membered nitroxides has been extensivelyreported for a wide array of EPR oximetry applications153–155. Some of the commonly usednitroxides are shown in Figure 15a and 15b.
Ahmad and Kuppusamy Page 18
Chem Rev. Author manuscript; available in PMC 2011 May 12.
NIH
-PA Author Manuscript
NIH
-PA Author Manuscript
NIH
-PA Author Manuscript

Nitroxide synthesized with 14N has an EPR spectrum with three lines while the nitroxidesynthesized with 15N exhibits an EPR spectrum with two lines. As compared to particulatespin probes, the EPR signals from nitroxides exhibit low SNR and poor sensitivity to oxygen.A number of improvements, including use of perdeuterated nitroxides167 and encapsulation ofnitroxides in lipophilic environments168, have been suggested to improve oxygen sensitivity.The synthesis of nitroxides can be manipulated to affect their bindings and hence distributionin a biological sample. For instance, a charged nitroxide cannot permeate the cellular membranewhile a neutral nitroxide can, giving a spin probe distribution in both intracellular andextracellular compartments169. Howard Halpern, over the last twenty five years, hascontributed immensely to the development of nitroxides for EPR measurements170,171.
Nycomed Innovations Inc. developed172 a family of trityl radicals (Figure 15c) bearing twelvesulfur atoms. These are analogs of triphenyl methyl radicals and have been synthesized on alarge-scale and used for a variety of EPR oximetry applications173–175. Trityl radicals, alsoreferred as TAM, offer a single sharp lineshape and an order-of-magnitude improvement inSNR over other commonly used soluble spin probes. Recently, synthesis of other derivativesof TAM have also been reported176–178. Perchlorotriarylmethyl (PTM) radicals (Figure 15d)constitute another important trityl-type radical used for EPR oximetry.Perchlorotriphenylmethyl triester radical (PTM-TE) was synthesized, as outlined in Scheme1, by a facile 3-step synthesis179 using Friedal-Crafts reaction of tetrachlorobenzene withchloroform followed by ethoxycarbonylation and subsequent oxidation. Bratasz et al.180
reported on the development of an injectable spin probe formulation, consisting PTM-TEradical dissolved in hexafluorobenzene (HFB), for in vivo oximetry and imaging of oxygenconcentration in tissues. PTM-TE was evaluated for its oxygen sensitivity, biostability, anddistribution in a radiation-induced fibrosarcoma (RIF-1) tumor transplanted into C3H mice.Some of the favorable features of the spin probe are: a single narrow EPR peak (anoxiclinewidth, 410 mG), high solubility in HFB (> 12 mM), large linewidth sensitivity to molecularoxygen (~ 17 mG/mmHg), good stability in tumor tissue (half-life: 3.3 h), absence of spin-spinbroadening (up to 12 mM), and lack of power saturation effects (up to 200 mW).
6.1.2 Particulate Spin Probes—The main advantages of particulate spin probes includehigh spin density, which leads to high SNR; higher sensitivity to oxygen; and long term invivo stability. Particulate spin probe-based oximetry is ideal for making repeated measurementsover an extended duration in live animals. A wide array of naturally occurring, semi-synthetic,and synthetic particulate spin probes have been developed for EPR oximetry.
Carbon-based materials including coals (such as funinite161,181 and gloxy163), chars182,183
(either prepared from coals or synthesized from carbohydrates, wood, or other materials) andcarbon black184 (India Ink) have been extensively used for in vivo EPR oximetry. Thus far,India Ink remains the only spin probe approved for in vivo clinical use, both in the USA andEurope. In fact, EPR oximetry using India Ink has already been reported on humansubjects95. Despite a strong EPR signal and easy availability, poor oxygen sensitivity(charcoals), broad lineshape (India Ink), nonlinear relationship between linewidth and pO2(almost all carbon-based particulate spin probes), lack of quality control (coals), poor stability(chars), and presence of nonparamagnetic components in the spectrum (almost all carbon-basedparticulate spin probes) may render carbon-based particulate spin probes an unattractive optionfor in vivo applications.
Lithium phthalocyanine (LiPc) (Figure 16a) was the first synthetic particulate molecule to beextensively investigated for biological applications156. LiPc is synthesized by electrochemicaloxidation of Li2Pc185–187. The EPR spectrum of LiPc is characterized by a single lineshapewith anoxic linewidth of ~20 mG. LiPc has been studied for long-term in vivo oximetrymeasurements188. The shortcomings of LiPc are: saturation at lower power, lack of quality
Ahmad and Kuppusamy Page 19
Chem Rev. Author manuscript; available in PMC 2011 May 12.
NIH
-PA Author Manuscript
NIH
-PA Author Manuscript
NIH
-PA Author Manuscript

control, a nonlinear relationship between linewidth and pO2, and lack of long-term stability intissues156. Recently, derivatives of LiPc, such as phenoxy-substituted LiPc (lithium 1,8,15,22-tetraphenoxyphthalocyanine, LiPc-α-OPh), shown in Figure 16a, have been developed158
using electrochemical methods. As compared to LiPc, the derivative LiPc-α-OPh showsimproved linearity of linewidth vs. pO2 curve, higher oxygen sensitivity, and improved stabilityfor in vivo applications. The schematic for LiPc-α-OPh synthesis is given in Scheme 2.
Another synthetic crystalline spin probe, lithium naphthalocyanine159 (LiNc), shown in Figure16b, has been widely studied for EPR oximetry applications. The LiNc shows higher spindensity, a broader range of linear response to oxygen partial pressure, and more favorablepower saturation properties when compared to LiPc189. However, the chemical properties ofLiNc limit its attractiveness for biological oximetry applications. First of all, it is difficult tosynthesize this material in a pure form, and secondly, it has shown limited stability andresponsiveness in tissues189. Recently, Pandian et al.190 have reported an improved chemicalprocedure to synthesize LiNc crystals in pure form with sustained oxygen sensitivity in tissues.The schematic for LiNc synthesis is shown in Scheme 3.
In efforts to develop better spin probes for EPR oximetry, Pandian et al.160 reported thepreparation of a new derivatized radical, lithium 5,9,14,18,23,27,32,36-octa-n-butoxy-2,3-naphthalocyanine (LiNc-BuO). Synthesis for LiNc-BuO is shown in Scheme 4. The spin probewas synthesized191 from lithium metal and Nc-BuO in n-pentanol. The metal-free octa-n-butoxy-substituted naphthalocyanine (Nc-BuO) macrocyclic ligand readily reacted withlithium pentoxide to give dilithium octa-n-butoxy-naphthalocyanine (Li2Nc-BuO), followedby oxidation to give LiNc-BuO radical which formed as needle-shaped, dark-greenmicrocrystals, 5–10 μm in diameter and 50–150 μm in length. Preliminary studies of thismaterial showed that the spin probe was stable in tissues and responsive to O2 for more than6 months160.
The crystal structure of LiNc-BuO contains strongly coupled dimers of LiNc-BuO molecules,which favors a high degree of spin exchange, and results in a single sharp EPR line. Themolecular packing leads to a structure with open channels large enough (10×6 Å2) for thepenetration of small diatomic paramagnetic molecules such as oxygen (O2) and nitric oxide(NO), as well as the larger triatomic molecules such as nitrogen dioxide (NO2). The EPRlinewidth of LiNc-BuO is extremely sensitive to the concentration of paramagnetic gases inthe pressure range of 0–760 mmHg. The effect of oxygen on LiNc-BuO is reversible withoutany signs of permanent adsorption or chemical oxidation. The time response of the effect ofoxygen is extremely rapid (0.24 s). The paramagnetic gas-sensing properties of LiNc-BuO areattributed to the open molecular framework of the crystal structure. The oxygen sensitivitycurves of LiNc and LiNc-BuO are shown in Figure 17. Photograph of LiNc-BuO microcrystaland stacking of LiNc-BuO molecules within the microcrystal are shown in Figure 18.
6.2 Particulate Spin Probe EncapsulationThe particulate spin probes can be used in their crystalline form to sense molecularoxygen94, but may have limitations associated with particle migration within the tissue and,potentially, with biocompatibility and chemical toxicity of particles directly exposed to tissue.Exposure of some spin probes to the in vivo environment degrades their oximetry propertiesover time156,189. Successful transformation of EPR oximetry into a powerful clinical toolrequires long-term stabilization of the spin probes in tissue sites, protection of the spin probesfrom degradative conditions, and insulation between the spin probe and tissue to avoid potentialchemical toxicity.
Several studies have approached this set of challenges by encapsulating crystalline spin probesin biocompatible, biostable, gas-permeable polymer matrices192–195. Some critical parameters
Ahmad and Kuppusamy Page 20
Chem Rev. Author manuscript; available in PMC 2011 May 12.
NIH
-PA Author Manuscript
NIH
-PA Author Manuscript
NIH
-PA Author Manuscript

that need to be considered in the development of encapsulated oximetry spin probes includethe cost of the encapsulating polymer, in vivo stability (mechanical and chemical) of thepolymer material, and film oxygen permeability.
In the past, coating of carbon-based particulate spin probes using a number of biopolymers13
has been reported. Encapsulation of LiPc using Teflon AF 2400 (TAF), cellulose acetate (CA)and polyvinyl acetate (PVAc) has also been reported. The coating of LiPc using TAF wasperformed by solvent evaporation approaches, which produced very thin TAF films193. Whilethe oximetry properties of TAF-encapsulated LiPc were encouraging, the handling propertiesof the films were inconvenient. Thin TAF films were brittle and maintaining them intact duringimplantation and explantation was challenging. Thick, multilayer TAF encapsulation ofoximetry particles was not feasible, owing to the low solubility of TAF in the available solvents.
To overcome these operational difficulties, Meenakshisumdaram et al.196 recently proposed asimple and easy-to-use cast-molding and polymerization method, using PDMS, which allowedfor the fabrication of mechanically-robust spin probe encapsulations. PDMS is abiocompatible, highly flexible, and highly oxygen permeable silicone polymer that has beenused in a wide range of medical device and health care applications. Also, PDMS has beenapproved for use in human subjects and is one of the reference materials provided by theNational Heart Lung and Blood Institute for standardized biocompatibility testing197. Themethod also provided the capability of covering the embedded oximetry crystals with multiplelayers of PDMS for fully sequestering them from the in vivo environment, and improving theirbiotolerability. Figure 19 shows chips fabricated by the encapsulation of LiNc-BuOparticulates in PDMS.
7 Applications of EPR OximetryEPR oximetry has been used extensively for cellular studies to measure intracellular andextracellular oxygen concentrations, oxygen consumption rate, and membrane permeabilityand structure11. It has also been developed as a powerful tool for localized measurements ofoxygen in organs and tissues which is extremely helpful in investigating various physiologicaland pathophysiological conditions. Several studies have been conducted using EPR oximetryto measure oxygen in the brain, heart, gastrointestinal tract, skeletal muscle, liver, kidneys,skin, and other organs94. Due to limited penetration depth, the existing EPR techniques arerestricted to studies involving small animals or topical regions of large animals. In this section,a few important applications of EPR are briefly discussed.
7.1 In Vitro ApplicationsOne of early applications of EPR oximetry was to measure oxygen consumption rate in tumorcell suspensions198,199. Two models, closed-chamber and open-chamber, were developed. Inthe closed-chamber model, the sample was isolated from the surrounding using oxygenimpermeable medium. The oxygen consumption rate was quantified by measuring the overalloxygen concentration as a function of time in the sample. In the open-chamber model, theoxygen consumption rate was quantified by measuring the amount of oxygen diffusing throughan oxygen permeable membrane, such as Teflon or methyl pentene polymer152, separating thesample from the surroundings. Recently, EPR oximetry has also been shown to successfullymonitor the intracellular and extracellular oxygen simultaneously by using two different spinprobes174,200. One spin probe was internalized in the cells and reported the intracellular pO2,while other particulate spin probe stayed outsides and reported the extracellular pO2 values.
EPR oximetry has also been applied to study oxygen transportation both across and within alipid bilayer model membrane90. This method was used to obtain profiles of oxygen transportparameter which, in turn, was used to evaluate the oxygen permeability coefficient of the
Ahmad and Kuppusamy Page 21
Chem Rev. Author manuscript; available in PMC 2011 May 12.
NIH
-PA Author Manuscript
NIH
-PA Author Manuscript
NIH
-PA Author Manuscript

membrane91. In addition, oxygen transport parameter profiles have also been used to studymembrane structure. The DOT method201 (method of discrimination by oxygen transport), forinstance, was effectively used to indicate the existence of lipid domains which exhibit slowoxygen transport rate. EPR oximetry has also been utilized to study the effects of membranemodifiers such as cholesterol202, carotenoids203, and transmembrane α-helical peptides204 onoxygen transportation across the membrane. A book chapter by Subczynski and Swartz11 treatsthe topic of in vitro EPR oximetry applications in detail.
7.2 In Vivo ApplicationsIn vivo EPR oximetry applications generally include the study of oxygenation of several tissuesand organs under various pathophysiological conditions. Exciting in vivo applications of EPRoximetry have emerged in the last two decades, but continuous development of oxygen-sensitive spin probes coupled with technical advancements in the instrumentation promisesthat more applications will follow. Here, we visit some of the widely studied in vivo applicationsof EPR oximetry.
7.2.1 Cancer/Tumor Applications—Tumor hypoxia is strongly linked to poor treatmentoutcome from chemo- or radiotherapy in several human malignancies205. Hypoxic tumors arebiologically more aggressive, and it has been reported that hypoxic sarcoma or cervicalcancers27,206 tend to metastasize faster. More recently, it has also been reported207 that ovariancancer cells grown in a hypoxic environment tend to be more resistant to commonchemotherapies than the cancer cells grown under normoxia. The fact that poorly oxygenatedtumors are more aggressive and less susceptible to treatment suggests that tumor oxygenationstatus is an important parameter for cancer treatment208. The observation of substantial inter-and intra-tumor heterogeneities among tumors of similar histology and sites further emphasizesthe importance of the measurement of hypoxia in individual tumors patients. The ability tomonitor changes in the pO2 before and after treatment could have profound implications forthe planning of effective therapeutic strategies209. In particular, radiotherapy could benefitfrom modulated treatment based on regional variations in pO2.
While these tumor oximetry studies demonstrate the clinical potential of in vivo oximetry, theyalso point to the limitations of commonly employed oximetry methods. For instance,measurements involving electrodes are highly invasive and cannot be used for repeatedmeasurements from the same site, and measurements using PET involve exposure to ionizingradiation. EPR oximetry avoids some of the important limitations associated with othermethods. It is a minimally invasive method that allows for repeated measurements andpossesses high sensitivity to in vivo oxygen levels. Elas et al.173 conducted a comparative studyquantitatively correlating EPR oximetry using a trityl spin probe with OxyLite based oximetry.
Halpern et al.210 conducted spectral-spatial imaging, in one spatial dimension, to provide aquantitative map of pO2 distribution across the tumor using a soluble spin probe. In anotherstudy211, the same group examined the affect of breathing in perfluorocarbon/carbogen on theoxygenation of fibrosarcomas. Gallez et al.153 used nitroxides for assessing perfusion,oxygenation, and viability of tissues in murine tumor models. Krishna et al.150 reportedcoregistration of tumor anatomy with pO2 distribution using OMRI. Bratasz et al.180 reportedthe development of an injectable spin probe formulation, consisting of PTM-TE radicaldissolved in hexafluorobenzene, for in vivo oximetry under two different breathingenvironments. These results are summarized in Figure 20.
EPR oximetry employing particulate spin probes has also been used extensively to measuremurine tumor oxygenation. Particulate spin probes are more suitable for long-termmeasurements and require onetime implantation at one or more locations in the region ofinterest. Measurements over several days or weeks enable the tracking of tumor oxygenation.
Ahmad and Kuppusamy Page 22
Chem Rev. Author manuscript; available in PMC 2011 May 12.
NIH
-PA Author Manuscript
NIH
-PA Author Manuscript
NIH
-PA Author Manuscript
Goda et al. studied changes in oxygen tension in experimental tumors, RIF-1 tumor and mousemammary tumor (MTG-B), after a single dose of X-ray irradiation. Ilangovan et al.212 reportedpO2 mapping of tumors by co-implanting LiPc particulates with RIF-1 cells subcutaneouslyin the murine leg. Spectral-spatial imaging can be performed to map the spatial distribution ofoxygen concentration in a tumor. Using a similar model, Bratasz et al.213 conducted studiesusing LiNc-BuO to report pO2 maps before and after a single dose of 30 Gy X-ray irradiation.The results are summarized in Figure 21. Hou et al.214 has investigated the temporal effectsof single or fractionated radiotherapy on subcutaneous RIF-1 tumor using multisiteoximetry144. The purpose of the study was to determine the therapeutic outcomes when thetiming of fractionations is guided by tumor pO2. In another interesting study, the role ofGranulocyte-macrophage colony-stimulating factor (GM-CSF) in the inhibition of breastcancer growth has been studied using EPR oximetry215. Figure 22 shows the effect on GM-CSF on tumor size. Murine tumor oximetry using encapsulated particulate spin probes hasbeen reported216,217. A review article by Gallez et al.218 provides a well-rounded account ofEPR tumor oximetry.
7.2.2 Cardiac Applications—Fluctuations in free radical generation, oxygenation, andnitric oxide concentration carry importance in a variety of cardiovascular diseases. Cardiacoximetry imposes a great technical challenge due to cardiac motion. EPR oximetry in isolatedperfused rat hearts has been demonstrated110,219. Studies have also been conducted for isolatedbeating heart16,220 and heart in situ models221, with both soluble and particulate spin probes.
Grinberg et al.222 reported measurements of myocardial pO2 by EPR oximetry in an isolatedperfused rat heart during treatment with different cardioactive drugs: dobutamine, metoprolol,verapamil, vasopressin, and N omega-Nitro-L-Arginine Methyl Ester. The relationship ofoxidative damage associated with ischemia/reperfusion (I/R) injury and the amount of oxygenin the heart has been focus in several studies. Ilangovan et al.16 studied myocardial oxygenconsumption rate as an index of postischemic recovery. Angelos et al.223 studied the effect ofhypoxic reperfusion and subsequent reactive oxygen specie (ROS) generation on cardiacfunction using EPR oximetry.
EPR oximetry has also been used to investigate the efficacy of various treatment options,including ischemic preconditioning and ROS-scavenging (antioxidant) drugs. For instance,studies by Zhu et al.224 reported that ischemic preconditioning attenuated in vivo postischemicmyocardial hyperoxygenation by improving myocardial oxygen consumption and decreasingROS or reactive nitrogen specie generation after regional I/R. Another recent study225 showedthat sulfaphenazole (SPZ) protected the hearts from I/R injury. The overall aim of this studywas to investigate the cardioprotective effect of SPZ and to delineate the involvement of NO,superoxide, and oxygenation and also to establish the signaling mechanism involved incardioprotection in an in vivo rat model of acute myocardial infarction (MI). The beneficialeffect, measured by hemodynamic functionality, correlated with a significant elevation oftissue oxygenation and bioavailability of NO.
Several recent studies utilized EPR oximetry to investigate the efficacy of stem-cell therapyfor treating MI. Khan et al.226 reported noninvasive long-term monitoring of in situ pO2 duringengraftment of stem cells in the infarct heart. Figure 23 displays the in situ oximetry datacollected for over three months from a mouse heart transplanted with skeletal myoblasts (SM)using LiNc-BuO as a spin probe. In a separate but related study227, the same author comparedthe oxygenation of infracted myocardial tissue with and without transplantation of SM. Themyocardial pO2 at the site of SM cell therapy was significantly higher when compared to theuntreated group throughout the 4-week period as shown in Figure 24. The increased myocardialpO2 positively correlated with neoangiogenesis and cardiac function.
Ahmad and Kuppusamy Page 23
Chem Rev. Author manuscript; available in PMC 2011 May 12.
NIH
-PA Author Manuscript
NIH
-PA Author Manuscript
NIH
-PA Author Manuscript

In another study by Chacko et al.228, bone marrow-derived mesenchymal stem cells (MSC)were transplanted in the infarct heart of rats, and showed significant reduction of infarct sizefollowed by substantial recovery of tissue oxygenation, neovascularization, and cardiacfunction. In a recent report, Khan et al.229 investigated the effect of hyperbaric oxygenation(HBO) on the engraftment of bone-marrow- derived rat MSCs transplanted in infarct rat hearts.HBO (100% oxygen at 2 ATA for 90 min) was administered daily for 2 weeks. The resultsshowed (Figure 25) an increase in oxygenation levels reaching significance at 60 min followedby a return to baseline in about 2.5 h after the conclusion of HBO application in the noninfarctedhearts. Elevated oxygen levels were, however, sustained for more than two hours after the HBOadministration in the infarcted heart. The results suggested that HBO treatment restoredmyocardial oxygenation to near normal levels in the infarct heart transplanted with MSCs.
7.2.3 Wound Healing Applications—Oxygen measurement in skin and other immediatelyunderlying tissues is critical for evaluating the condition and treatment options for topicalwounds, burns, and peripheral vascular disease. For these applications, where penetration depthis generally not a deciding factor, EPR oximetry holds a lot of promise for large animal modelsand potential clinical applications involving humans.
At the wound site, vasculature disruption leads to localized hypoxia230. Interestingly bothhypoxia and hyperoxia, when present in moderation, have been known to induceangiogenesis231 which plays a critical role in wound healing. However, hypoxia and hyperoxia,when present in the extreme, can derail tissue repair. Extreme hypoxia is unable to promote orsustain the growth of functional blood vessels. Extreme hyperoxia, on the other hand, can causeoxygen toxicity which can adversely affect the healing process. Oxygen therapy is commonlyused in the wound clinics to treat wound hypoxia232. Schugart et al.233 developed amathematical model for addressing the role of tissue oxygenation on cutaneous wound healing.In a recent study, Lu et al.234 studied decreases in oxygen levels due to Tibial fracture.
Oxygen measurements also provide a useful insight into the status, progression, and treatmentof peripheral vascular diseases such as diabetic foot. Studies using this technique have beencarried out in volunteers using India Ink and whole body clinical EPR instruments, andencouraging results have been reported95.
7.2.4 Application of EPR Oximetry to Other Organs—EPR oximetry has also beenstudied for in vivo measurements in other organs and tissues such as liver, brain, kidney andskeletal muscle. Numerous studies, using EPR oximetry, have reported oxygen levels in themedulla and cortex of isolated perfused163 and in vivo235 kidney models. A number ofpathophysiological conditions can affect liver pO2. EPR oximetry also been used to studylocalized pO2 in liver164,236. The value of pO2 is known to affect the energetics of musclefunction. EPR oximetry has been applied to study oxygenation of skeletal muscle237. The brainis quite vulnerable to pO2 fluctuations. Several studies238,239 show that EPR has beensuccessfully used in small animal models to monitor brain oxygen over an extended durationof time. In addition, EPR oximetry has been used to evaluate the relationship between elevatedlevels of tissue pO2 and healing of radiation damaged tissues.
8 ConclusionsMeasurement of oxygen in biological samples, especially in vivo, has been of paramountinterest. Several techniques have been developed for in vivo oxygen measurement, but no singletechnique has fully established itself for broad applications. EPR oximetry, due to its minimallyinvasive nature, capability to measure absolute pO2, high sensitivity to oxygen, and ability tomake repeated measurements, has emerged as a method of choice for wide array of biologicalapplications. In the recent years, the number of laboratories and research groups contributing
Ahmad and Kuppusamy Page 24
Chem Rev. Author manuscript; available in PMC 2011 May 12.
NIH
-PA Author Manuscript
NIH
-PA Author Manuscript
NIH
-PA Author Manuscript

to the development of EPR oximetry has increased. Significant strides have been made in spinprobe synthesis and encapsulation, instrumentation development, and algorithm developmentfor data collection and processing. Despite all the progress, translation of EPR oximetry tobroad clinical applications have been hindered by lack of SNR at low frequencies, longacquisition times, and lack of FDA-approved spin probes suitable for implantation.Considering the progress made in the last decade, however, realization of clinical applicationsof EPR oximetry, especially for oncology, peripheral vascular disease, and wound healing,seems only few strides away.
AcknowledgmentsWe acknowledge the support of National Institute of Health for providing funding for several EPR related researchprojects, many of which have been discussed in this review. We also thank Brian Rivera for proofreading.
References1. Lane, N. Oxygen: The Molecule that Made the World. Oxford University Press; Oxford: 2002.2. Falkowski PG. Science 2006;311:1724. [PubMed: 16556831]3. Jiang YY, Kong DX, Qin T, Zhang HY. Biochem Biophys Res Commun. 20094. Raymond J, Segre D. Science 2006;311:1764. [PubMed: 16556842]5. Kulkarni AC, Kuppusamy P, Parinandi N. Antioxid Redox Signal 2007;9:1717. [PubMed: 17822371]6. Prabhakar NR, Kumar GK, Nanduri J, Semenza GL. Antioxid Redox Signal 2007;9:1397. [PubMed:
17627465]7. Sieck GC. J Appl Physiol 2004;96:375. [PubMed: 14660499]8. Dewhirst MW, Klitzman B, Braun RD, Brizel DM, Haroon ZA, Secomb TW. Int J Cancer 2000;90:237.
[PubMed: 11091348]9. Swartz HM, Dunn JF. Adv Exp Med Biol 2003;530:1. [PubMed: 14562699]10. Hunt TK, Rabkin J, Jensen JA, Jonsson K, Smitten KV, Goodson WH. World J Surg 1987;11:126.
[PubMed: 3590819]11. Subczynski, WK.; Swartz, HM. Biomedical EPR, Part A: Free Radicals, Metals, Medicine, and
Physiology. Eaton, SR.; Eaton, GR.; Berliner, JL., editors. Kluwer Academic/Plenum Publisher; NewYork: 2005.
12. Dunn JF, Swartz HM. Methods 2003;30:159. [PubMed: 12725782]13. Gallez B, Jordan BF, Baudelet C. Magn Reson Med 1999;42:193. [PubMed: 10398966]14. Gallez B, Jordan BF, Baudelet C, Misson PD. Magn Reson Med 1999;42:627. [PubMed: 10502749]15. O’Hara JA, Goda F, Demidenko E, Swartz HM. Radiat Res 1998;150:549. [PubMed: 9806597]16. Ilangovan G, Liebgott T, Kutala VK, Petryakov S, Zweier JL, Kuppusamy P. Magn Reson Med
2004;51:835. [PubMed: 15065258]17. Severinghaus, JW. The History of Anesthesia: Proceedings of the Fifth International Symposium on
the History of Anesthesia; Santiago, Spain. 2001. p. 11518. Cater DB, Silver IA. Acta Radiol 1960;53:233. [PubMed: 13808406]19. Kolstad P. Scand J Clin Lab Invest Suppl 1968;106:145. [PubMed: 5731701]20. Hockel M, Schlenger K, Knoop C, Vaupel P. Cancer Res 1991;51:6098. [PubMed: 1933873]21. Brizel DM, Scully SP, Harrelson JM, Layfield LJ, Dodge RK, Charles HC, Samulski TV, Prosnitz
LR, Dewhirst MW. Cancer Res 1996;56:5347. [PubMed: 8968082]22. Dewhirst MW, Ong ET, Madwed D, Klitzman B, Secomb T, Brizel D, Bonaventura J, Rosner G,
Kavanagh B, Edwards J, Gross J. Radiat Res 1992;132:61. [PubMed: 1410275]23. Clark LC. Trans Am Soc Artif Internal Organs 1956;2:41.24. Whalen WJ, Riley J, Nair P. J Appl Physiol 1967;23:798. [PubMed: 6061398]25. Tsai AG, Friesenecker B, Mazzoni MC, Kerger H, Buerk DG, Johnson PC, Intaglietta M. Proc Natl
Acad Sci USA 1998;95:6590. [PubMed: 9618456]26. Baudelet C, Gallez B. Magn Reson Imaging 2004;22:905. [PubMed: 15288130]
Ahmad and Kuppusamy Page 25
Chem Rev. Author manuscript; available in PMC 2011 May 12.
NIH
-PA Author Manuscript
NIH
-PA Author Manuscript
NIH
-PA Author Manuscript

27. Brizel DM, Scully SP, Harrelson JM, Layfield LJ, Bean JM, Prosnitz LR, Dewhirst MW. Cancer Res1996;56:941. [PubMed: 8640781]
28. Okunieff P, Ding I, Vaupel P, Hockel M. Adv Exp Med Biol 2003;510:69. [PubMed: 12580407]29. Vaupel P, Schlenger K, Knoop C, Hockel M. Cancer Res 1991;51:3316. [PubMed: 2040005]30. O’Hara JA, Khan N, Hou H, Wilmo CM, Demidenko E, Dunn JF, Swartz HM. Physiol Meas
2004;25:1413. [PubMed: 15712720]31. Huch A, Huch R, Arner B, Rooth G. Scand J Clin Lab Invest Suppl 1973;31:269.32. Rooth G. Pediatrics 1975;55:232. [PubMed: 1090895]33. Yu M, Morita SY, Daniel SR, Chapital A, Waxman K, Severino R. Shock 2006;26:450. [PubMed:
17047514]34. Amann B, Luedemann C, Ratei R, Schmidt-Lucke JA. Cell Transplant 2009;18:371. [PubMed:
19500466]35. Hodgkiss RJ. Anticancer Drug Des 1998;13:687. [PubMed: 9755725]36. Koch CJ, Evans SM. Adv Exp Med Biol 2003;510:285. [PubMed: 12580442]37. Kennedy AS, Raleigh JA, Perez GM, Calkins DP, Thrall DE, Novotny DB, Varia MA. Int J Radiat
Oncol Biol Phys 1997;37:897. [PubMed: 9128967]38. Griffiths JR, Robinson SP. Br J Radiol 1999;72:627. [PubMed: 10624317]39. Wen B, Urano M, O’Donoghue JA, Ling CC. Radiat Res 2006;166:512. [PubMed: 16953670]40. Nwaigwe CI, Roche MA, Grinberg O, Dunn JF. Adv Exp Med Biol 2003;530:101. [PubMed:
14562708]41. O’Hara JA, Hou H, Demidenko E, Springett RJ, Khan N, Swartz HM. Physiol Meas 2005;26:203.
[PubMed: 15798296]42. Jordan BF, Cron GO, Gallez B. Magn Reson Med 2009;61:634. [PubMed: 19097235]43. Pawlowski M, Wilson DF. Adv Exp Med Biol 1992;316:179. [PubMed: 1288078]44. Rumsey WL, Vanderkooi JM, Wilson DF. Science 1988;241:1649. [PubMed: 3420417]45. Shibata M, Ichioka S, Ando J, Kamiya A. J Appl Physiol 2001;91:321. [PubMed: 11408447]46. Vinogradov SA, Lo LW, Jenkins WT, Evans SM, Koch C, Wilson DF. Biophys J 1996;70:1609.
[PubMed: 8785320]47. Tsukada K, Sakai S, Hase K, Minamitani H. Biosens Bioelectron 2003;18:1439. [PubMed: 12941558]48. Wilson DF, Vinogradov SA, Grosul P, Vaccarezza MN, Kuroki A, Bennett J. Appl Opt 2005;44:5239.
[PubMed: 16149347]49. DeCampli WM, Schears G, Myung R, Schultz S, Creed J, Pastuszko A, Wilson DF. J Thorac
Cardiovasc Surg 2003;125:472. [PubMed: 12658188]50. Lo LW, Jenkins WT, Vinogradov SA, Evans SM, Wilson DF. Adv Exp Med Biol 1997;411:577.
[PubMed: 9269475]51. Wilson DF, Cerniglia GJ. Adv Exp Med Biol 1994;345:539. [PubMed: 8079756]52. Severinghaus JW. J Clin Monit 1986;2:270. [PubMed: 3537215]53. Walters TP. Br J Nurs 2007;16:1332. [PubMed: 18073672]54. Cohn SM. J Am Coll Surg 2007;205:322. [PubMed: 17660081]55. Quaresima V, Ferrari M. J Appl Physiol 2009;107:371. [PubMed: 19567814]56. Thomson, SJ.; Cowan, ML.; Forton, DM.; Clark, SJ.; Musa, S.; Grounds, M.; Rahman, TM. Liver
Int. 2009.57. Carandang R, Krieger DW. Neurocrit Care 2007;6:161. [PubMed: 17572858]58. De Blasi RA, Fantini S, Franceschini MA, Ferrari M, Gratton E. Med Biol Eng Comput 1995;33:228.
[PubMed: 7643667]59. Gora F, Shinde S, Elwell CE, Goldstone JC, Cope M, Delpy DT, Smith M. J Neurosurg Anesthesiol
2002;14:218. [PubMed: 12172295]60. Tamura M, Hazeki O, Nioka S, Chance B. Annu Rev Physiol 1989;51:813. [PubMed: 2653207]61. Vo-Dinh T, Stokes DL, Wabuyele MB, Martin ME, Song JM, Jagannathan R, Michaud E, Lee RJ,
Pan X. IEEE Eng Med Biol Mag 2004;23:40. [PubMed: 15565798]62. Khoobehi B, Beach JM, Kawano H. Invest Ophthalmol Vis Sci 2004;45:1464. [PubMed: 15111603]
Ahmad and Kuppusamy Page 26
Chem Rev. Author manuscript; available in PMC 2011 May 12.
NIH
-PA Author Manuscript
NIH
-PA Author Manuscript
NIH
-PA Author Manuscript

63. Sorg BS, Moeller BJ, Donovan O, Cao Y, Dewhirst MW. J Biomed Opt 2005;10:44004. [PubMed:16178638]
64. Zuzak KJ, Schaeberle MD, Gladwin MT, Cannon RO 3rd, Levin IW. Circulation 2001;104:2905.[PubMed: 11739304]
65. Shah SA, Bachrach N, Spear SJ, Letbetter DS, Stone RA, Dhir R, Prichard JW, Brown HG,LaFramboise WA. Biotechniques 2003;34:408. [PubMed: 12613264]
66. Cancio LC, Batchinsky AI, Mansfield JR, Panasyuk S, Hetz K, Martini D, Jordan BS, Tracey B,Freeman JE. J Trauma 2006;60:1087. [PubMed: 16688075]
67. Aboagye EO, Kelson AB, Tracy M, Workman P. Anticancer Drug Des 1998;13:703. [PubMed:9755726]
68. Read SJ, Hirano T, Abbott DF, Sachinidis JI, Tochon-Danguy HJ, Chan JG, Egan GF, Scott AM,Bladin CF, McKay WJ, Donnan GA. Neurology 1998;51:1617. [PubMed: 9855512]
69. Dolbier WR Jr, Li AR, Koch CJ, Shiue CY, Kachur AV. Appl Radiat Isot 2001;54:73. [PubMed:11144255]
70. Chapman JD, Engelhardt EL, Stobbe CC, Schneider RF, Hanks GE. Radiother Oncol 1998;46:229.[PubMed: 9572615]
71. Lehtio K, Oikonen V, Gronroos T, Eskola O, Kalliokoski K, Bergman J, Solin O, Grenman R, NuutilaP, Minn H. J Nucl Med 2001;42:1643. [PubMed: 11696633]
72. Koh WJ, Bergman KS, Rasey JS, Peterson LM, Evans ML, Graham MM, Grierson JR, Lindsley KL,Lewellen TK, Krohn KA, Griffin TW. Int J Radiat Oncol Biol Phys 1995;33:391. [PubMed: 7673026]
73. Busse LJ, Thomas SR, Pratt RG, Clark LC Jr, Ackerman JL, Samaratunga RC, Hoffmann RE. MedPhys 1986;13:518. [PubMed: 3736510]
74. Clark LC Jr, Ackerman JL, Thomas SR, Millard RW, Hoffman RE, Pratt RG, Ragle-Cole H, KinseyRA, Janakiraman R. Adv Exp Med Biol 1984;180:835. [PubMed: 6534151]
75. Mason RP, Rodbumrung W, Antich PP. NMR Biomed 1996;9:125. [PubMed: 8892399]76. Sotak CH, Hees PS, Huang HN, Hung MH, Krespan CG, Raynolds S. Magn Reson Med 1993;29:188.
[PubMed: 8429782]77. Bartusik D, Tomanek B, Siluk D, Kaliszan R, Fallone G. Anal Biochem 2009;387:315. [PubMed:
19454246]78. McNab JA, Yung AC, Kozlowski P. Magma 2004;17:288. [PubMed: 15605277]79. Duong TQ, Kim SG. Magn Reson Med 2000;43:393. [PubMed: 10725882]80. Jacob RE, Chang YV, Choong CK, Bierhals A, Zheng Hu D, Zheng J, Yablonskiy DA, Woods JC,
Gierada DS, Conradi MS. Magn Reson Med 2005;54:577. [PubMed: 16086368]81. Ito Y, Berkowitz BA. Vision Res 2001;41:1307. [PubMed: 11322975]82. Yu JX, Kodibagkar VD, Cui W, Mason RP. Curr Med Chem 2005;12:819. [PubMed: 15853714]83. Thulborn KR, Waterton JC, Matthews PM, Radda GK. Biochim Biophys Acta 1982;714:265.
[PubMed: 6275909]84. Ogawa S, Lee TM, Kay AR, Tank DW. Proc Natl Acad Sci USA 1990;87:9868. [PubMed: 2124706]85. Di Salle F, Formisano E, Linden DE, Goebel R, Bonavita S, Pepino A, Smaltino F, Tedeschi G. Eur
J Radiol 1999;30:84. [PubMed: 10401589]86. Baudelet C, Gallez B. Magn Reson Med 2002;48:980. [PubMed: 12465107]87. Backer JM, Budker VG, Eremenko SI, Molin YN. Biochim Biophys Acta 1977;460:152. [PubMed:
192284]88. Gurbiel R, Cieszka K, Pajak S, Subczynski W, Lukiewicz S. Folia Histochem Cytochem (Krakow)
1980;18:87. [PubMed: 6256266]89. Morse PD 2nd, Swartz HM. Magn Reson Med 1985;2:114. [PubMed: 3007919]90. Kusumi A, Subczynski WK, Hyde JS. Proc Natl Acad Sci USA 1982;79:1854. [PubMed: 6952236]91. Subczynski WK, Hyde JS. Biochim Biophys Acta 1981;643:283. [PubMed: 6261814]92. Thomas DD, Wendt CH, Francisz W, Hyde JS. Biophys J 1983;43:131. [PubMed: 6309262]93. Subczynski WK, Lukiewicz S, Hyde JS. Magn Reson Med 1986;3:747. [PubMed: 3023786]94. Swartz HM, Clarkson RB. Phys Med Biol 1998;43:1957. [PubMed: 9703059]
Ahmad and Kuppusamy Page 27
Chem Rev. Author manuscript; available in PMC 2011 May 12.
NIH
-PA Author Manuscript
NIH
-PA Author Manuscript
NIH
-PA Author Manuscript

95. Khan N, Hou H, Hein P, Comi RJ, Buckey JC, Grinberg O, Salikhov I, Lu SY, Wallach H, SwartzHM. Adv Exp Med Biol 2005;566:119. [PubMed: 16594143]
96. He J, Beghein N, Clarkson RB, Swartz HM, Gallez B. Phys Med Biol 2001;46:3323. [PubMed:11768508]
97. Kessel AR, Salimov VG. Russian Phys J 317–322;14:317.98. Teng CL, Hong H, Kiihne S, Bryant RG. J Magn Reson 2001;148:31. [PubMed: 11133273]99. Eastman MP, Kooser RG, Das MR, Freed JH. J Chem Phys 1969;51:2690.100. Gorter CJ, Van Vleck JH. Phys Rev 1947;72:1128.101. Anderson PW, Weiss PR. Rev Mod Phys 1953;25:269.102. Grinberg OY, Williams BB, Ruuge AE, Grinberg SA, Wilcox DE, Swartz HM, Freed JH. J Phys
Chem B 2007;111:13316. [PubMed: 17973414]103. Murugesan R, Cook JA, Devasahayam N, Afeworki M, Subramanian S, Tschudin R, Larsen JA,
Mitchell JB, Russo A, Krishna MC. Magn Reson Med 1997;38:409. [PubMed: 9339442]104. Ernst RR, Anderson WA. Rev Sci Instrum 1966;37:93.105. Quine RW, ARG, Eaton SS, Eaton GR. Concepts Magn Reson 2002;15:59.106. Subramanian S, Matsumoto K, Mitchell JB, Krishna MC. NMR Biomed 2004;17:263. [PubMed:
15366027]107. Oikawa K, Ogata T, Togashi H, Lin Y, Sato T. Anal Sci 1995;11:885.108. He G, Shankar RA, Chzhan M, Samouilov A, Kuppusamy P, Zweier JL. Proc Natl Acad Sci USA
1999;96:4586. [PubMed: 10200306]109. Rupp LW, Wittig KR, Wash MW. Am J Phys 1976;44:655.110. Kuppusamy P, Chzhan M, Vij K, Shteynbuk M, Lefer DJ, Giannella E, Zweier JL. Proc Natl Acad
Sci USA 1994;91:3388. [PubMed: 8159757]111. Thomas, SR.; Busse, LJ.; Scheuck, VF. AAPM 1985 Summer School in Medical Physics; Seattle,
WA. 1985.112. Golay MJ. Rev Sci Instrum 1958;29:313.113. Chzhan M, Kuppusamy P, Zweier JL. J Magn Reson, Ser B 1995;108:67. [PubMed: 7627435]114. He G, Petryakov S, Samouilov A, Chzhan M, Kuppusamy P, Zweier JL. J Magn Reson
2001;149:218. [PubMed: 11318620]115. Froncisz W, Hyde JS. J Magn Reson 1982;47:515.116. Sotgiu A. J Magn Reson 1985;65:206.117. Bacic G, Nilges MJ, Magin RL, Walczak T, Swartz HM. Magn Reson Med 1989;10:266. [PubMed:
2761384]118. Chzhan M, Shtenbuk M, Kuppusamy P, Zweier JL. J Magn Reson, Ser A 1993:105.119. Poole, CPJ. Electron Spin Resonance: A Comprehensive Treatise on Experimental Techniques. 2.
Dover Publications; Mineola: 1997.120. Stoner JW, Szymanski D, Eaton SS, Quine RW, Rinard GA, Eaton GR. J Magn Reson 2004;170:127.
[PubMed: 15324766]121. Robinson BH, Mailer C, Reese AW. J Magn Reson 1999;138:199. [PubMed: 10341123]122. Bales BL, Peric M, Lamy-Freund MT. J Magn Reson 1998;132:279. [PubMed: 9632554]123. Williams BB, Pan X, Halpern HJ. J Magn Reson 2005;174:88. [PubMed: 15809176]124. Alecci M, Colacicchi S, Indovina PL, Momo F, Pavone P, Sotgiu A. J Magn Reson Imaging
1990;8:59.125. Kuppusamy P, Wang P, Zweier JL. Magn Reson Med 1995;34:99. [PubMed: 7674904]126. Deans, SR. The Radon Transform and Some of its Applications. John Wiley & Sons; New York:
1983.127. Herman GT, Lent A. Comput Biol Med 1976;6:273. [PubMed: 1000955]128. Wang CX, Snydera WE, Bilbro G, Santago P. Comput Biol Med 1998;28:13. [PubMed: 9644571]129. Press, WH.; Flannery, BP.; Teukolsky, SA.; Vetterling, WT. Numerical Recipes in FORTRAN: The
Art of Scientific Computing. Cambridge University Press; Cambridge: 1992.130. Maltempo MM. J Magn Reson 1986;69:156.
Ahmad and Kuppusamy Page 28
Chem Rev. Author manuscript; available in PMC 2011 May 12.
NIH
-PA Author Manuscript
NIH
-PA Author Manuscript
NIH
-PA Author Manuscript
131. Hanson KM. J Op Soc Am 1983;73:1501.132. Epel B, Sundramoorthy SV, Mailer C, Halpern HJ. Concepts Magn Reson 2008;33B:163.133. Mailer C, Robinson BH, Williams BB, Halpern HJ. Magn Reson Med 2003;49:1175. [PubMed:
12768596]134. Williams BB, Hou H, Grinberg OY, Demidenko E, Swartz HM. Antioxid Redox Signal 2007;9:1691.
[PubMed: 17678442]135. Dadok J, Sprecher RF. J Magn Reson 1974;13:243.136. Joshi JP, Ballard JR, Rinard GA, Quine RW, Eaton SS, Eaton GR. J Magn Reson 2005;175:44.
[PubMed: 15949747]137. Lewitt RM. IEEE Proc 1983;71:390.138. Kak, AC.; Slaney, M. IEEE Press. New York: 1988.139. Delaney AH, Bresler Y. IEEE Trans Image Process 1996;5:740. [PubMed: 18285163]140. Ahmad R, Clymer B, Vikram DS, Deng Y, Hirata H, Zweier JL, Kuppusamy P. J Magn Reson
2007;184:246. [PubMed: 17113800]141. Tseitlin M, Dhami A, Eaton SS, Eaton GR. J Magn Reson 2007;184:157. [PubMed: 17070083]142. Subramanian S, Devasahayam N, Murugesan R, Yamada K, Cook J, Taube A, Mitchell JB, Lohman
JA, Krishna MC. Magn Reson Med 2002;48:370. [PubMed: 12210946]143. Deng Y, Petryakov S, He G, Kesselring E, Kuppusamy P, Zweier JL. J Magn Reson 2007;185:283.
[PubMed: 17267252]144. Grinberg OY, Smirnov AI, Swartz HM. J Magn Reson 2001;152:247. [PubMed: 11567578]145. Som S, Potter LC, Ahmad R, Vikram DS, Kuppusamy P. J Magn Reson 2008;193:210. [PubMed:
18538600]146. Hyde JS, Mchaourab HS, Camenisch T, Ratke JJ, Cox RW, Froncisz W. Rev Sci Instrum
1998;69:2622.147. Hyde, JS.; Camenisch, TG.; Ratke, JJ.; Strangeway, RA.; Froncisz, W. Biomedical EPR, Part B:
Methodology, Instrumentation, and Dynamics. Eaton, SR.; Eaton, GR.; Berliner, LJ., editors.Kluwer Academic/Plenum Publishers; New York: 2005.
148. Lurie DJ, Bussell DM, Bell LH, Mallard JR. J Magn Reson 1988;76:366.149. Overhauser AW. Phys Rev 1953;92:411.150. Krishna MC, English S, Yamada K, Yoo J, Murugesan R, Devasahayam N, Cook JA, Golman K,
Ardenkjaer-Larsen JH, Subramanian S, Mitchell JB. Proc Natl Acad Sci USA 2002;99:2216.[PubMed: 11854518]
151. Matsumoto S, Yamada K, Hirata H, Yasukawa K, Hyodo F, Ichikawa K, Utsumi H. Magn ResonMed 2007;57:806. [PubMed: 17390363]
152. Popp CA, Hyde JS. J Magn Reson 1981;43:249.153. Gallez B, Bacic G, Goda F, Jiang J, O’Hara JA, Dunn JF, Swartz HM. Magn Reson Med 1996;35:97.
[PubMed: 8771027]154. Liu S, Timmins GS, Shi H, Gasparovic CM, Liu KJ. NMR Biomed 2004;17:327. [PubMed:
15366032]155. Smirnov AI, Clarkson RB, Belford RL. J Magn Reson, Ser B 1996;111:149. [PubMed: 8661272]156. Liu KJ, Gast P, Moussavi M, Norby SW, Vahidi N, Walczak T, Wu M, Swartz HM. Proc Natl Acad
Sci USA 1993;90:5438. [PubMed: 8390665]157. Ilangovan G, Zweier JL, Kuppusamy P. J Phys Chem B 2000;104:9404.158. Pandian RP, Dolgos M, Dang V, Sostaric JZ, Woodward PM, Kuppusamy P. Chem Mater
2007;19:3545.159. Manivannan A, Yanagi H, Ilangovan G, Kuppusamy P. J Magn Magn Mater 2001;233:L131.160. Pandian RP, Parinandi NL, Ilangovan G, Zweier JL, Kuppusamy P. Free Radical Biol Med
2003;35:1138. [PubMed: 14572616]161. Vahidi N, Clarkson RB, Liu KJ, Norby SW, Wu M, Swartz HM. Magn Reson Med 1994;31:139.
[PubMed: 8133749]162. Smirnova TI, Smirnov AI, Clarkson RB, Belford RL. J Phys Chem 1994;98:2464.
Ahmad and Kuppusamy Page 29
Chem Rev. Author manuscript; available in PMC 2011 May 12.
NIH
-PA Author Manuscript
NIH
-PA Author Manuscript
NIH
-PA Author Manuscript

163. James PE, Grinberg OY, Goda F, Panz T, O’Hara JA, Swartz HM. Magn Reson Med 1997;38:48.[PubMed: 9211379]
164. Goda F, Liu KJ, Walczak T, O’Hara JA, Jiang J, Swartz HM. Magn Reson Med 1995;33:237.[PubMed: 7707915]
165. Shen J, Bottle S, Khan N, Grinberg O, Reid D, Micallef A, Swartz H. Appl Magn Reson 2002;22:357.166. Dhimitruka I, Velayutham M, Bobko AA, Khramtsov VV, Villamena FA, Hadad CM, Zweier JL.
Bioorg Med Chem Lett 2007;17:6801. [PubMed: 17964156]167. Philipp R, McIntyre JO, Robinson BH, Huth H, Trommer W, Fleischer S. Biochim Biophys Acta
1984;790:251. [PubMed: 6091764]168. Liu KJ, Grinstaff MW, Jiang J, Suslick KS, Swartz HM, Wang W. Biophys J 1994;67:896. [PubMed:
7948703]169. Glockner JF, Norby SW, Swartz HM. Magn Reson Med 1993;29:12. [PubMed: 8380480]170. Halpern HJ, Peric M, Nguyen TD, Spencer DP, Teicher BA, Lin YJ, Bowman MK. J Magn Reson
1990;90:40.171. Alecci M, Ferrari M, Quaresima V, Sotgiu A, Ursini CL. Biophys J 1994;67:1274. [PubMed:
7811942]172. Ardenkjaer-Larsen JH, Laursen I, Leunbach I, Ehnholm G, Wistrand LG, Petersson JS, Golman K.
J Magn Reson 1998;133:1. [PubMed: 9654463]173. Elas M, Ahn KH, Parasca A, Barth ED, Lee D, Haney C, Halpern HJ. Clin Cancer Res 2006;12:4209.
[PubMed: 16857793]174. Kutala VK, Parinandi NL, Pandian RP, Kuppusamy P. Antioxid Redox Signal 2004;6:597.
[PubMed: 15130286]175. Subramanian S, Yamada K, Irie A, Murugesan R, Cook JA, Devasahayam N, Van Dam GM, Mitchell
JB, Krishna MC. Magn Reson Med 2002;47:1001. [PubMed: 11979580]176. Driesschaert B, Charlier N, Gallez B, Marchand-Brynaert J. Bioorg Med Chem Lett 2008;18:4291.
[PubMed: 18640034]177. Bobko AA, Dhimitruka I, Eubank TD, Marsh CB, Zweier JL, Khramtsov VV. Free Radical Biol
Med 2009;47:654. [PubMed: 19523513]178. Liu Y, Villamena FA, Sun J, Xu Y, Dhimitruka I, Zweier JL. J Org Chem 2008;73:1490. [PubMed:
18201099]179. Dang V, Wang J, Feng S, Buron C, Villamena FA, Wang PG, Kuppusamy P. Bioorg Med Chem
Lett 2007;17:4062. [PubMed: 17499990]180. Bratasz A, Kulkarni AC, Kuppusamy P. Biophys J 2007;92:2918. [PubMed: 17259268]181. Swartz HM, Boyer S, Gast P, Glockner JF, Hu H, Liu KJ, Moussavi M, Norby SW, Vahidi N,
Walczak T, Wu M, Clarkson RB. Magn Reson Med 1991;20:333. [PubMed: 1663568]182. Zweier JL, Chzhan M, Ewert U, Schneider G, Kuppusamy P. J Magn Reson, Ser B 1994;105:52.
[PubMed: 7921671]183. Smirnov AI, Norby SW, Clarkson RB, Walczak T, Swartz HM. Magn Reson Med 1993;30:213.
[PubMed: 8396190]184. Swartz HM, Liu KJ, Goda F, Walczak T. Magn Reson Med 1994;31:229. [PubMed: 8133760]185. Afeworki M, Miller NR, Devasahayam N, Cook J, Mitchell JB, Subramanian S, Krishna MC. Free
Radical Biol Med 1998;25:72. [PubMed: 9655524]186. Ilangovan G, Zweier JL, Kuppusamy P. J Phys Chem B 2000;104:4047.187. Turek P, Andre JJ, Giraudeau A, Simon J. Chem Phys Lett 1986:134.188. Ilangovan G, Li H, Zweier JL, Kuppusamy P. J Phys Chem B 2001;105:5323.189. Ilangovan G, Manivannan A, Li H, Yanagi H, Zweier JL, Kuppusamy P. Free Radical Biol Med
2002;32:139. [PubMed: 11796202]190. Pandian RP, Dolgos M, Marginean C, Woodward PM, Hammel PC, Manoharan PT, Kuppusamy
P. J Mater Chem 2009;19:4138. [PubMed: 19809598]191. Pandian RP, Kim YI, Woodward PM, Zweier JL, Manoharan PT, Kuppusamy P. J Mater Chem
2006;16:3609.192. Dinguizli M, Beghein N, Gallez B. Physiol Meas 2008;29:1247. [PubMed: 18843166]
Ahmad and Kuppusamy Page 30
Chem Rev. Author manuscript; available in PMC 2011 May 12.
NIH
-PA Author Manuscript
NIH
-PA Author Manuscript
NIH
-PA Author Manuscript

193. Eteshola E, Pandian RP, Lee SC, Kuppusamy P. Biomed Microdevices 2009;11:379. [PubMed:19083100]
194. Gallez B, Debuyst R, Liu KJ, Demeure R, Dejehet F, Swartz HM. Magma 1996;4:71. [PubMed:8774004]
195. He J, Beghein N, Ceroke P, Clarkson RB, Swartz HM, Gallez B. Magn Reson Med 2001;46:610.[PubMed: 11550256]
196. Meenakshisundaram G, Eteshola E, Pandian RP, Bratasz A, Lee SC, Kuppusamy P. BiomedMicrodevices 2009;11:773. [PubMed: 19291409]
197. Belanger MC, Marois Y. J Biomed Mater Res 2001;58:467. [PubMed: 11505420]198. Pajak, S.; Cieszka, K.; Gurbiel, R.; Subczynski, WK.; Lukiewicz, SJ. Third meeting of the Polish
Biophysical Society; Wroclaw-Olesnicka. 1978. p. 70199. Sarna T, Duleba A, Korytowski W, Swartz HM. Arch Biochem Biophys 1980;200:140. [PubMed:
6244787]200. Shen J, Khan N, Lewis LD, Armand R, Grinberg O, Demidenko E, Swartz H. Biophys J
2003;84:1291. [PubMed: 12547809]201. Ashikawa I, Yin JJ, Subczynski WK, Kouyama T, Hyde JS, Kusumi A. Biochemistry 1994;33:4947.
[PubMed: 8161556]202. Subczynski WK, Wisniewska A, Yin JJ, Hyde JS, Kusumi A. Biochemistry 1994;33:7670. [PubMed:
8011634]203. Subczynski WK, Markowska E, Sielewiesiuk J. Biochim Biophys Acta 1991;1068:68. [PubMed:
1654104]204. Subczynski WK, Lewis RN, McElhaney RN, Hodges RS, Hyde JS, Kusumi A. Biochemistry
1998;37:3156. [PubMed: 9485469]205. Hockel M, Schlenger K, Mitze M, Schaffer U, Vaupel P. Semin Radiat Oncol 1996;6:3. [PubMed:
10717157]206. Rofstad EK. Int J Radiat Biol 2000;76:589. [PubMed: 10866281]207. Selvendiran K, Bratasz A, Kuppusamy ML, Tazi MF, Rivera BK, Kuppusamy P. Int J Cancer
2009;125:2198. [PubMed: 19623660]208. Menon C, Fraker DL. Cancer Lett 2005;221:225. [PubMed: 15808408]209. Evans SM, Du KL, Chalian AA, Mick R, Zhang PJ, Hahn SM, Quon H, Lustig R, Weinstein GS,
Koch CJ. Int J Radiat Oncol Biol Phys 2007;69:1024. [PubMed: 17967299]210. Halpern HJ, Yu C, Peric M, Barth E, Grdina DJ, Teicher BA. Proc Natl Acad Sci USA
1994;91:13047. [PubMed: 7809170]211. Halpern HJ, Yu C, Peric M, Barth ED, Karczmar GS, River JN, Grdina DJ, Teicher BA. Radiat Res
1996;145:610. [PubMed: 8619027]212. Ilangovan G, Bratasz A, Li H, Schmalbrock P, Zweier JL, Kuppusamy P. Magn Reson Med
2004;52:650. [PubMed: 15334586]213. Bratasz A, Pandian RP, Deng Y, Petryakov S, Grecula JC, Gupta N, Kuppusamy P. Magn Reson
Med 2007;57:950. [PubMed: 17457861]214. Hou H, Lariviere JP, Demidenko E, Gladstone D, Swartz H, Khan N. Radiother Oncol 2009;91:126.
[PubMed: 19013657]215. Eubank TD, Roberts RD, Khan M, Curry JM, Nuovo GJ, Kuppusamy P, Marsh CB. Cancer Res
2009;69:2133. [PubMed: 19223554]216. Gallez B, Debuyst R, Dejehet F, Liu KJ, Walczak T, Goda F, Demeure R, Taper H, Swartz HM.
Magn Reson Med 1998;40:152. [PubMed: 9660565]217. Meenakshisundaram G, Eteshola E, Pandian RP, Bratasz A, Selvendiran K, Lee SC, Krishna MC,
Swartz HM, Kuppusamy P. Biomed Microdevices 2009;11:817. [PubMed: 19319683]218. Gallez B, Baudelet C, Jordan BF. NMR Biomed 2004;17:240. [PubMed: 15366026]219. Friedman BJ, Grinberg OY, Isaacs KA, Walczak TM, Swartz HM. J Mol Cell Cardiol 1995;27:2551.
[PubMed: 8825876]220. Zweier JL, Kuppusamy P. Proc Natl Acad Sci USA 1988;85:5703. [PubMed: 2840672]
Ahmad and Kuppusamy Page 31
Chem Rev. Author manuscript; available in PMC 2011 May 12.
NIH
-PA Author Manuscript
NIH
-PA Author Manuscript
NIH
-PA Author Manuscript
221. Zweier JL, Thompson-Gorman S, Kuppusamy P. J Bioenerg Biomembr 1991;23:855. [PubMed:1663949]
222. Grinberg OY, Grinberg SA, Friedman BJ, Swartz HM. Adv Exp Med Biol 1997;411:171. [PubMed:9269425]
223. Angelos MG, Kutala VK, Torres CA, He G, Stoner JD, Mohammad M, Kuppusamy P. Am J PhysiolHeart Circ Physiol 2006;290:H341. [PubMed: 16126819]
224. Zhu X, Zuo L, Cardounel AJ, Zweier JL, He G. Antioxid Redox Signal 2007;9:447. [PubMed:17280486]
225. Khan M, Mohan IK, Kutala VK, Kotha SR, Parinandi NL, Hamlin RL, Kuppusamy P. AntioxidRedox Signal 2009;11:725. [PubMed: 18855521]
226. Khan M, Kutala VK, Wisel S, Chacko SM, Kuppusamy ML, Kwiatkowski P, Kuppusamy P. AdvExp Med Biol 2008;614:45. [PubMed: 18290313]
227. Khan M, Kutala VK, Vikram DS, Wisel S, Chacko SM, Kuppusamy ML, Mohan IK, Zweier JL,Kwiatkowski P, Kuppusamy P. Am J Physiol Heart Circ Physiol 2007;293:H2129. [PubMed:17660391]
228. Chacko SM, Khan M, Kuppusamy ML, Pandian RP, Varadharaj S, Selvendiran K, Bratasz A, RiveraBK, Kuppusamy P. Am J Physiol Heart Circ Physiol 2009;296:H1263. [PubMed: 19286938]
229. Khan M, Meduru S, Mohan IK, Kuppusamy ML, Wisel S, Kulkarni A, Rivera BK, Hamlin RL,Kuppusamy P. J Mol Cell Cardiol 2009;47:275. [PubMed: 19376124]
230. Gordillo GM, Schlanger R, Wallace WA, Bergdall V, Bartlett R, Sen CK. Methods Enzymol2004;381:575. [PubMed: 15063699]
231. Hopf HW, Gibson JJ, Angeles AP, Constant JS, Feng JJ, Rollins MD, Zamirul Hussain M, HuntTK. Wound Repair Regen 2005;13:558. [PubMed: 16283871]
232. Mills C, Bryson P. Eur J Cardiothorac Surg 2006;30:153. [PubMed: 16769519]233. Schugart RC, Friedman A, Zhao R, Sen CK. Proc Natl Acad Sci USA 2008;105:2628. [PubMed:
18272493]234. Lu C, Rollins M, Hou H, Swartz HM, Hopf H, Miclau T, Marcucio RS. Iowa Orthop J 2008;28:14.
[PubMed: 19223943]235. James PE, Bacic G, Grinberg OY, Goda F, Dunn JF, Jackson SK, Swartz HM. Free Radical Biol
Med 1996;21:25. [PubMed: 8791090]236. Jiang J, Nakashima T, Liu KJ, Goda F, Shima T, Swartz HM. J Appl Physiol 1996;80:552. [PubMed:
8929598]237. Glockner JF, Chan HC, Swartz HM. Magn Reson Med 1991;20:123. [PubMed: 1658535]238. Hou H, Grinberg O, Williams B, Grinberg S, Yu H, Alvarenga DL, Wallach H, Buckey J, Swartz
HM. Physiol Meas 2007;28:963. [PubMed: 17664686]239. Liu KJ, Bacic G, Hoopes PJ, Jiang J, Du H, Ou LC, Dunn JF, Swartz HM. Brain Res 1995;685:91.
[PubMed: 7583257]
BiographiesRizwan Ahmad received the B.S. degree with honors in electrical engineering from TheUniversity of Engineering and Technology, Lahore, Pakistan in 2000, and the M.S. and Ph.D.degrees in electrical and computer engineering from The Ohio State University in 2004 and2007, respectively. In his M.S., he worked as a research assistant on Electrical CapacitanceTomography with the Department Chemical Engineering. In his Ph.D., he worked as a researchassistant on fast data collection and reconstruction methods for EPR imaging with the DavisHeart & Lung Research Institute (DHLRI). Since 2007, he has been with the DHLRI, OhioState University Medical Center, Columbus, Ohio, where he is currently appointed as aResearch Scientist. His research interests include biomedical signal processing, tomographicreconstruction, in vivo oximetry, and electron paramagnetic resonance spectroscopy andimaging.
Ahmad and Kuppusamy Page 32
Chem Rev. Author manuscript; available in PMC 2011 May 12.
NIH
-PA Author Manuscript
NIH
-PA Author Manuscript
NIH
-PA Author Manuscript
Periannan Kuppusamy received his Ph.D. degree in 1986 with specialization in EPR (electronparamagnetic resonance) spectroscopy from the Indian Institute of Technology, Chennai, India.Following a brief Fogarty Fellowship program at the National Institutes of Health (NIH), Dr.Kuppusamy joined the Johns Hopkins University School of Medicine in 1987 as a ResearchFellow and became a faculty in the cardiology division in 1991. In 2002, Dr. Kuppusamymoved to The Ohio State University, where he is currently a Professor in the Department ofInternal Medicine. Dr. Kuppusamy functions as the Director of the Center for BiomedicalSpectroscopy & Imaging; and Director of the Small Animal Imaging Center in the OSU Collegeof Medicine. Dr. Kuppusamy has developed a variety of in vivo EPR spectroscopic and imaging
Ahmad and Kuppusamy Page 33
Chem Rev. Author manuscript; available in PMC 2011 May 12.
NIH
-PA Author Manuscript
NIH
-PA Author Manuscript
NIH
-PA Author Manuscript

techniques for noninvasive measurements of free radicals and oxygen in biological systems.His major research focus is stem-cell therapy for myocardial infarction, novel bi-functionaltherapeutics for cardiovascular and cancer applications, and technology development for EPR-based oximetry for clinical applications. Dr. Kuppusamy has published over 280 peer-reviewedmanuscripts of his research in leading scientific journals. He has several grants from theNational Institutes of Health for the development of clinical oximetry and cardiovascularresearch. Dr. Kuppusamy has received research awards, including a Silver Medal in 2006 fromthe International EPR Society for significant contributions to the development of EPR imagingfor biomedical applications; and a Doctorate of Medicine (honoris causa) in 2008 from theUniversity of Pecs (Pecs, Hungary) for his cardiovascular research.
Ahmad and Kuppusamy Page 34
Chem Rev. Author manuscript; available in PMC 2011 May 12.
NIH
-PA Author Manuscript
NIH
-PA Author Manuscript
NIH
-PA Author Manuscript

Figure 1.Lowest (left) and highest (right) energy orientations of the magnetic moment of an unpairedelectron in the presence of an external magnetic field Bext.
Ahmad and Kuppusamy Page 35
Chem Rev. Author manuscript; available in PMC 2011 May 12.
NIH
-PA Author Manuscript
NIH
-PA Author Manuscript
NIH
-PA Author Manuscript
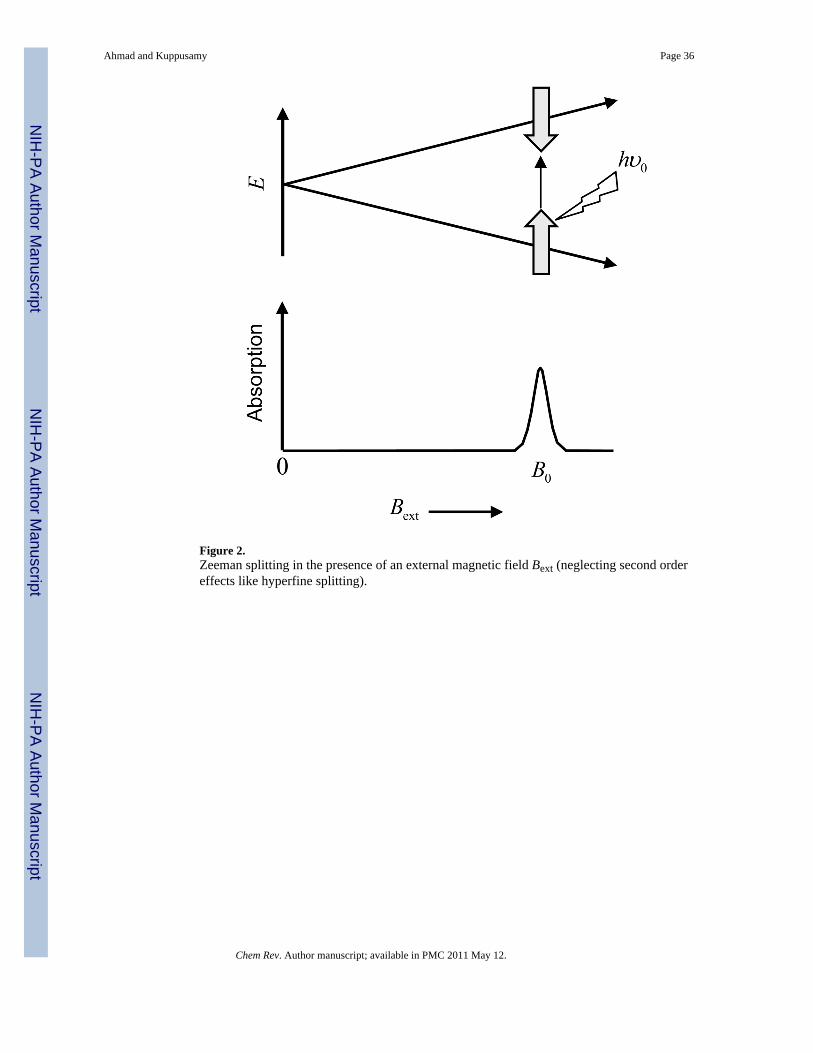
Figure 2.Zeeman splitting in the presence of an external magnetic field Bext (neglecting second ordereffects like hyperfine splitting).
Ahmad and Kuppusamy Page 36
Chem Rev. Author manuscript; available in PMC 2011 May 12.
NIH
-PA Author Manuscript
NIH
-PA Author Manuscript
NIH
-PA Author Manuscript

Figure 3.Effect of oxygen on exchange narrowed lineshape. Black dots represents spin probe molecules.Introduction of O2 induces line broadening measured by peak-to-peak linewidth Wpp.
Ahmad and Kuppusamy Page 37
Chem Rev. Author manuscript; available in PMC 2011 May 12.
NIH
-PA Author Manuscript
NIH
-PA Author Manuscript
NIH
-PA Author Manuscript

Figure 4.A basic layout of a CW EPR spectrometer and imager. i, main magnet; ii, gradient coilassembly; iii, field modulation coil; iv, resonator; v, field modulation source.
Ahmad and Kuppusamy Page 38
Chem Rev. Author manuscript; available in PMC 2011 May 12.
NIH
-PA Author Manuscript
NIH
-PA Author Manuscript
NIH
-PA Author Manuscript

Figure 5.Bruker (Bruker BioSpin, Billerica, MA, USA) L-band EPR imager. Main magnet (i) andmagnetic field gradient assembly (ii).
Ahmad and Kuppusamy Page 39
Chem Rev. Author manuscript; available in PMC 2011 May 12.
NIH
-PA Author Manuscript
NIH
-PA Author Manuscript
NIH
-PA Author Manuscript
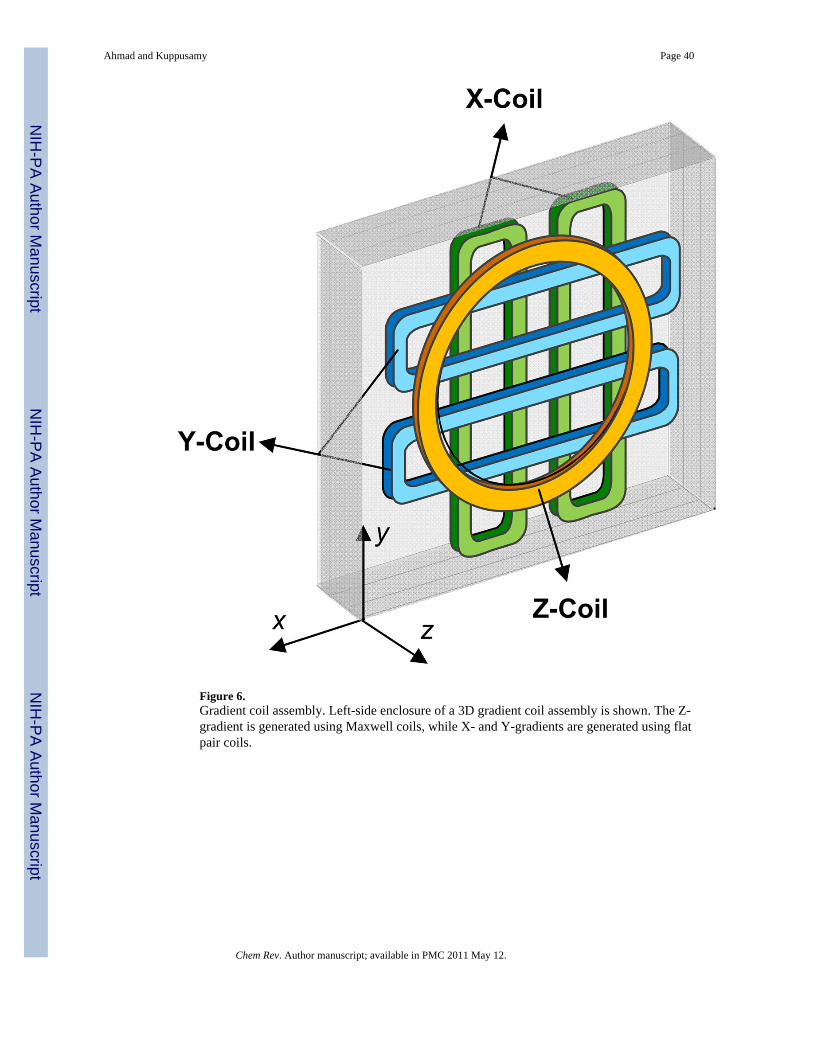
Figure 6.Gradient coil assembly. Left-side enclosure of a 3D gradient coil assembly is shown. The Z-gradient is generated using Maxwell coils, while X- and Y-gradients are generated using flatpair coils.
Ahmad and Kuppusamy Page 40
Chem Rev. Author manuscript; available in PMC 2011 May 12.
NIH
-PA Author Manuscript
NIH
-PA Author Manuscript
NIH
-PA Author Manuscript

Figure 7.Layout of a typical CW EPR bridge. Adapted with permission from Mr. Eric Kesselring.
Ahmad and Kuppusamy Page 41
Chem Rev. Author manuscript; available in PMC 2011 May 12.
NIH
-PA Author Manuscript
NIH
-PA Author Manuscript
NIH
-PA Author Manuscript
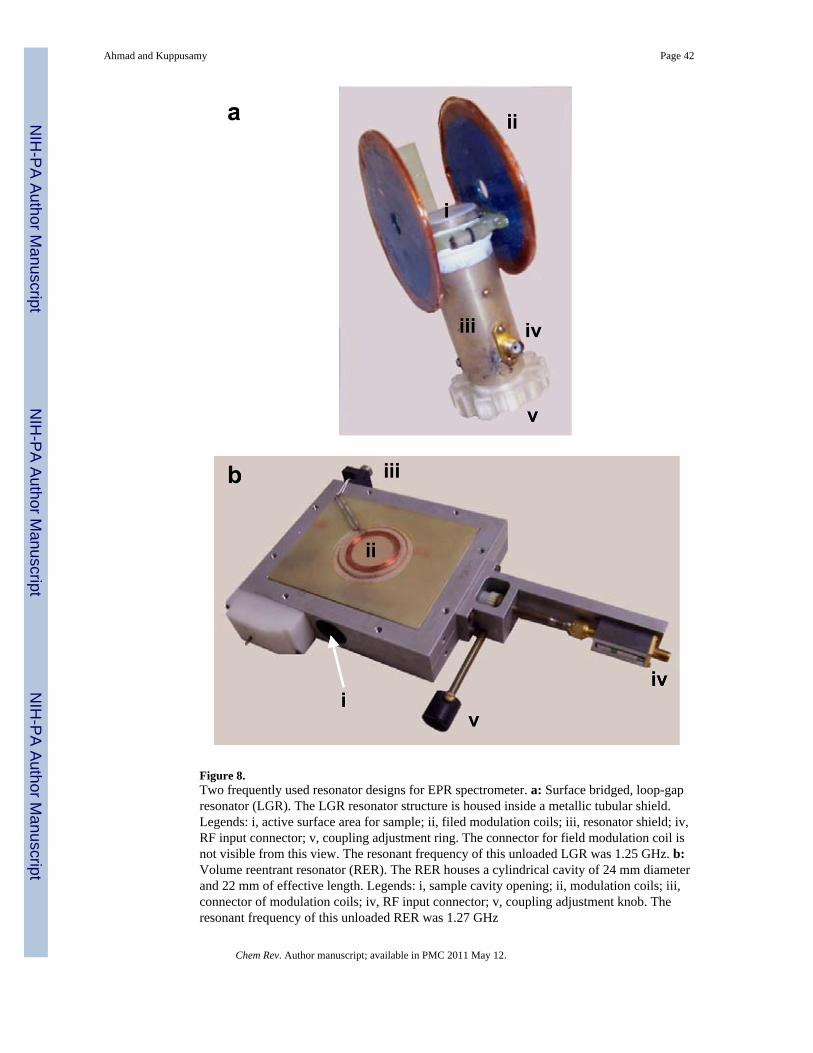
Figure 8.Two frequently used resonator designs for EPR spectrometer. a: Surface bridged, loop-gapresonator (LGR). The LGR resonator structure is housed inside a metallic tubular shield.Legends: i, active surface area for sample; ii, filed modulation coils; iii, resonator shield; iv,RF input connector; v, coupling adjustment ring. The connector for field modulation coil isnot visible from this view. The resonant frequency of this unloaded LGR was 1.25 GHz. b:Volume reentrant resonator (RER). The RER houses a cylindrical cavity of 24 mm diameterand 22 mm of effective length. Legends: i, sample cavity opening; ii, modulation coils; iii,connector of modulation coils; iv, RF input connector; v, coupling adjustment knob. Theresonant frequency of this unloaded RER was 1.27 GHz
Ahmad and Kuppusamy Page 42
Chem Rev. Author manuscript; available in PMC 2011 May 12.
NIH
-PA Author Manuscript
NIH
-PA Author Manuscript
NIH
-PA Author Manuscript

Figure 9.Lorentzian lineshape (dotted line) with FWHM linewidth W = 1 G. First derivative Lorentzianlineshape (solid line) with peak-to-peak linewidth Wpp =0.58 G. For a Lorentzian lineshape,
.
Ahmad and Kuppusamy Page 43
Chem Rev. Author manuscript; available in PMC 2011 May 12.
NIH
-PA Author Manuscript
NIH
-PA Author Manuscript
NIH
-PA Author Manuscript
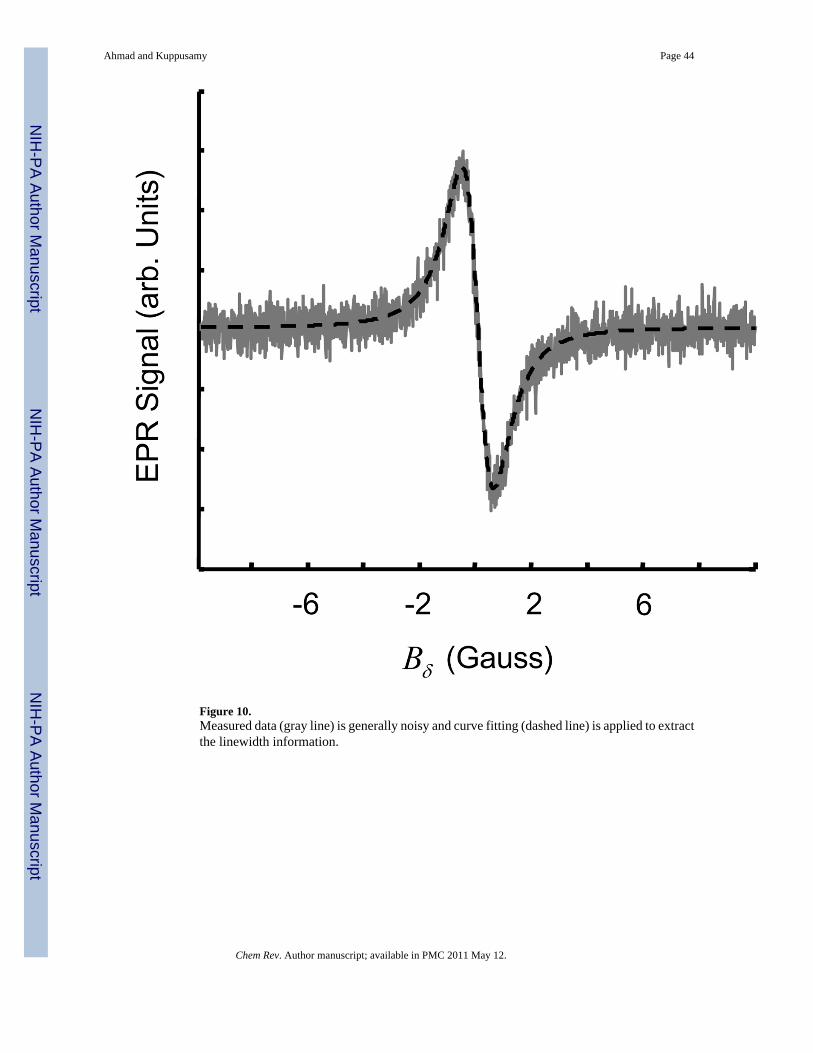
Figure 10.Measured data (gray line) is generally noisy and curve fitting (dashed line) is applied to extractthe linewidth information.
Ahmad and Kuppusamy Page 44
Chem Rev. Author manuscript; available in PMC 2011 May 12.
NIH
-PA Author Manuscript
NIH
-PA Author Manuscript
NIH
-PA Author Manuscript

Figure 11.Projection acquisition for a 2D spatial digital object. Angle η defines orientation of the appliedgradient gu, ρ defines the distance of resonant plane ⟨ĝu,u⟩ from the origin.
Ahmad and Kuppusamy Page 45
Chem Rev. Author manuscript; available in PMC 2011 May 12.
NIH
-PA Author Manuscript
NIH
-PA Author Manuscript
NIH
-PA Author Manuscript

Figure 12.Data collection for a 2D spectral-spatial digital object. The vertical-axis represents the spatialdimension while the horizontal-axis represents the spectral dimension. The figure shows tworegions; the one on the top has a large linewidth while on the bottom exhibits a smallerlinewidth. Here, k = ΔB/ΔL and ĝ = (ĝu sinθ,cosθ)is a generalized gradient vector whichincorporates gradient strength with gradient orientation.
Ahmad and Kuppusamy Page 46
Chem Rev. Author manuscript; available in PMC 2011 May 12.
NIH
-PA Author Manuscript
NIH
-PA Author Manuscript
NIH
-PA Author Manuscript
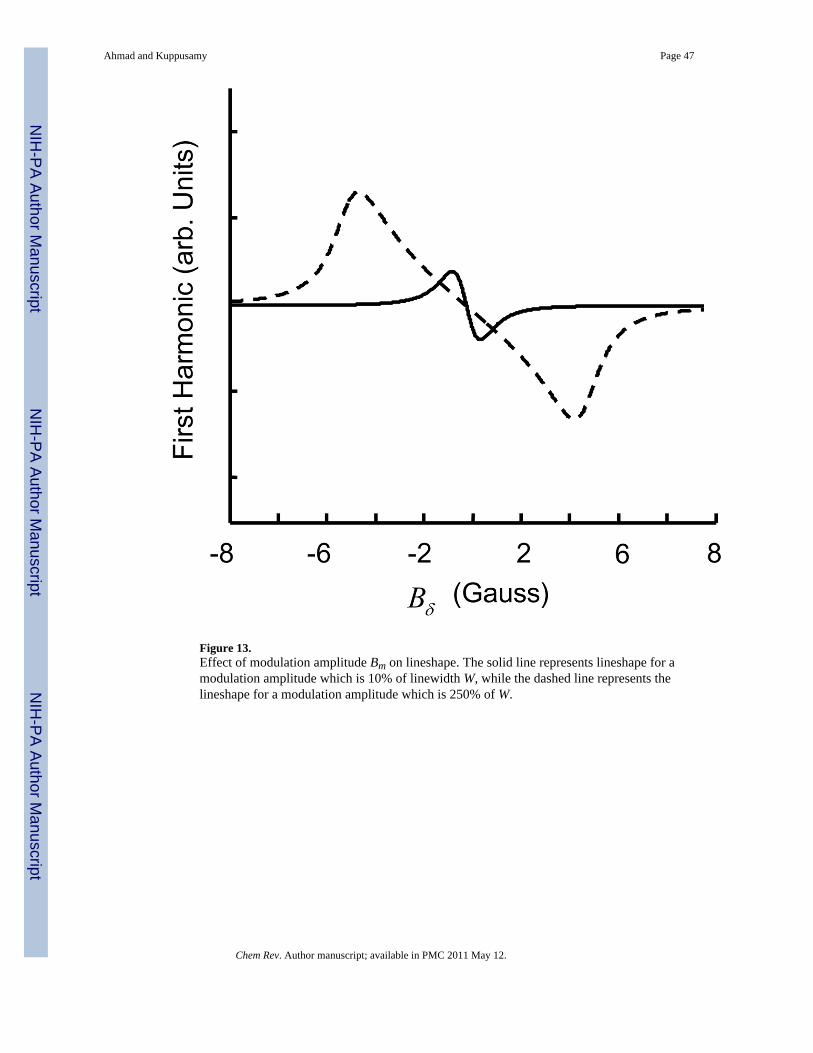
Figure 13.Effect of modulation amplitude Bm on lineshape. The solid line represents lineshape for amodulation amplitude which is 10% of linewidth W, while the dashed line represents thelineshape for a modulation amplitude which is 250% of W.
Ahmad and Kuppusamy Page 47
Chem Rev. Author manuscript; available in PMC 2011 May 12.
NIH
-PA Author Manuscript
NIH
-PA Author Manuscript
NIH
-PA Author Manuscript

Figure 14.Comparison of an iterative reconstruction method with the commonly used filteredbackprojection method. a: A 128×128 2D digital Shepp-Logan phantom; b: Reconstructionfrom filtered backprojection using 20 noiseless projections, after the reconstruction all pixelswith negatives values were set to zero; c: Reconstruction based on algebraic reconstructiontechnique (ART) with nonnegativity constraint using 20 noiseless projections.
Ahmad and Kuppusamy Page 48
Chem Rev. Author manuscript; available in PMC 2011 May 12.
NIH
-PA Author Manuscript
NIH
-PA Author Manuscript
NIH
-PA Author Manuscript

Figure 15.Chemical structure of soluble spin probes commonly used for EPR oximetry. a: Tempone (1-oxyl-2,2,6,6-tetramethyl-4-piperidione); b: CTPO (2,2,5,5-tetramethyl-3-pyrroline-1-oxyl-2-carboxamide); c: TAM (triarylmethyl) OX063; d: PTM (perchlorotriphenylmethyl) for X=Cl,PTM-TE for X= COOR, and PTM-TC for X=COOH;
Ahmad and Kuppusamy Page 49
Chem Rev. Author manuscript; available in PMC 2011 May 12.
NIH
-PA Author Manuscript
NIH
-PA Author Manuscript
NIH
-PA Author Manuscript
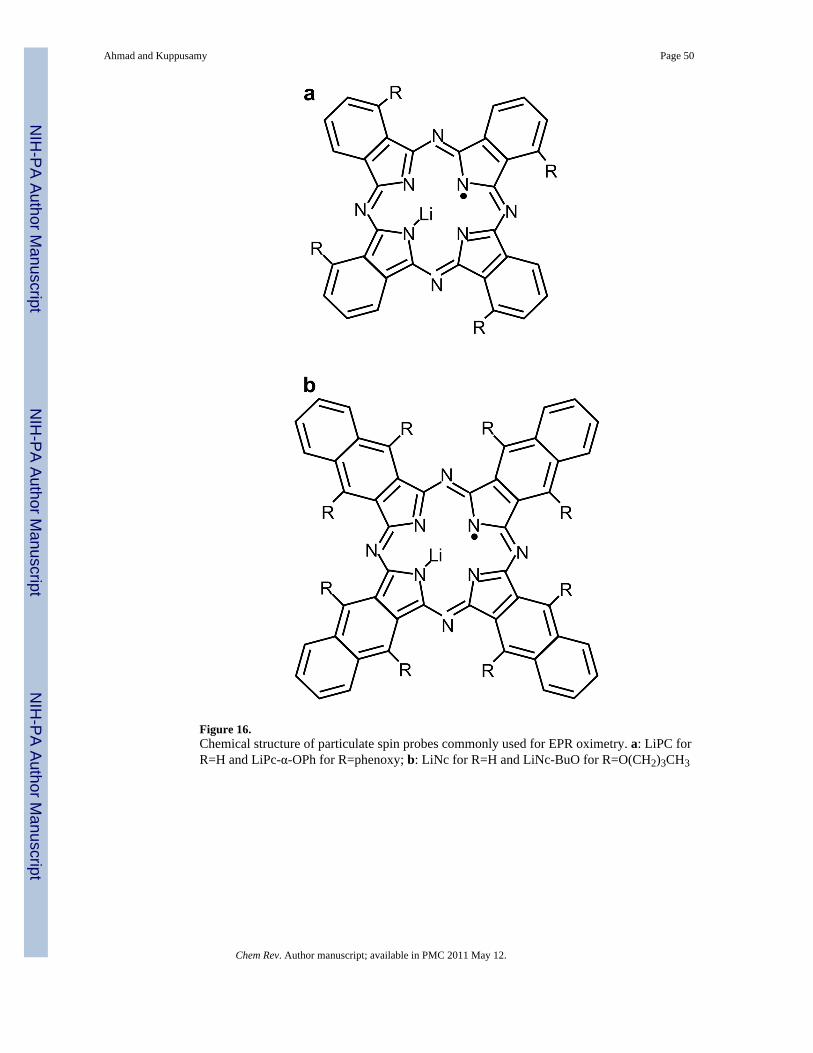
Figure 16.Chemical structure of particulate spin probes commonly used for EPR oximetry. a: LiPC forR=H and LiPc-α-OPh for R=phenoxy; b: LiNc for R=H and LiNc-BuO for R=O(CH2)3CH3
Ahmad and Kuppusamy Page 50
Chem Rev. Author manuscript; available in PMC 2011 May 12.
NIH
-PA Author Manuscript
NIH
-PA Author Manuscript
NIH
-PA Author Manuscript
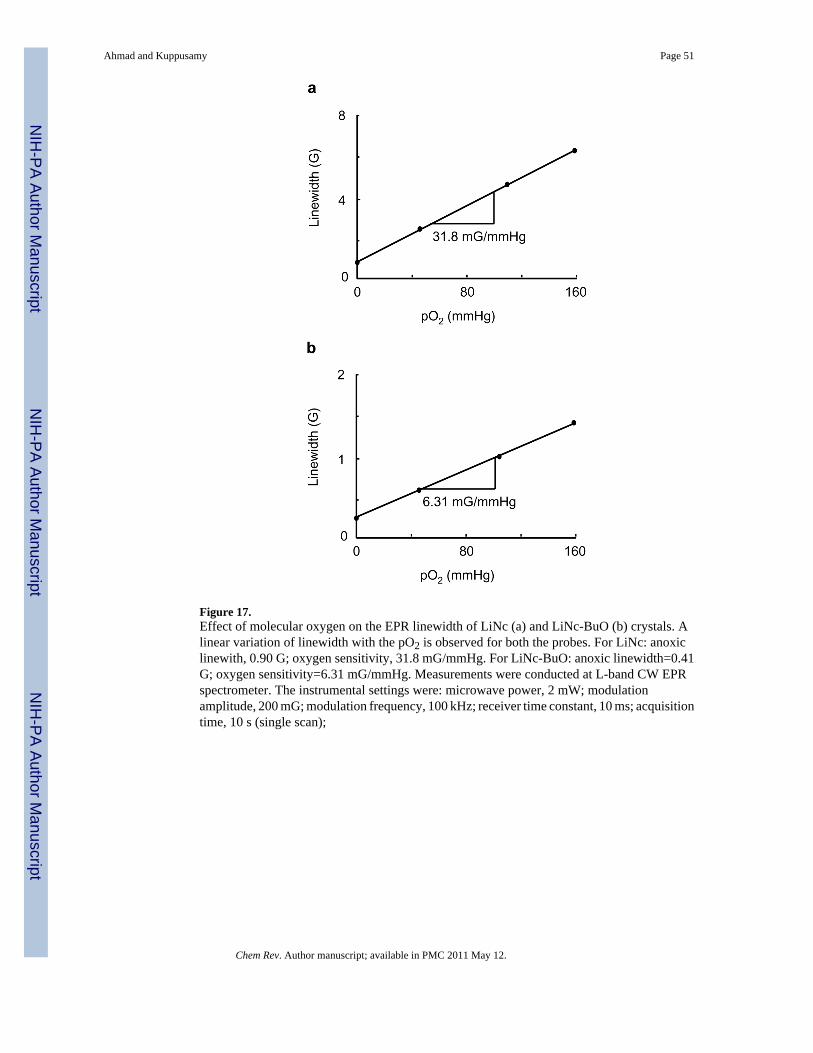
Figure 17.Effect of molecular oxygen on the EPR linewidth of LiNc (a) and LiNc-BuO (b) crystals. Alinear variation of linewidth with the pO2 is observed for both the probes. For LiNc: anoxiclinewith, 0.90 G; oxygen sensitivity, 31.8 mG/mmHg. For LiNc-BuO: anoxic linewidth=0.41G; oxygen sensitivity=6.31 mG/mmHg. Measurements were conducted at L-band CW EPRspectrometer. The instrumental settings were: microwave power, 2 mW; modulationamplitude, 200 mG; modulation frequency, 100 kHz; receiver time constant, 10 ms; acquisitiontime, 10 s (single scan);
Ahmad and Kuppusamy Page 51
Chem Rev. Author manuscript; available in PMC 2011 May 12.
NIH
-PA Author Manuscript
NIH
-PA Author Manuscript
NIH
-PA Author Manuscript
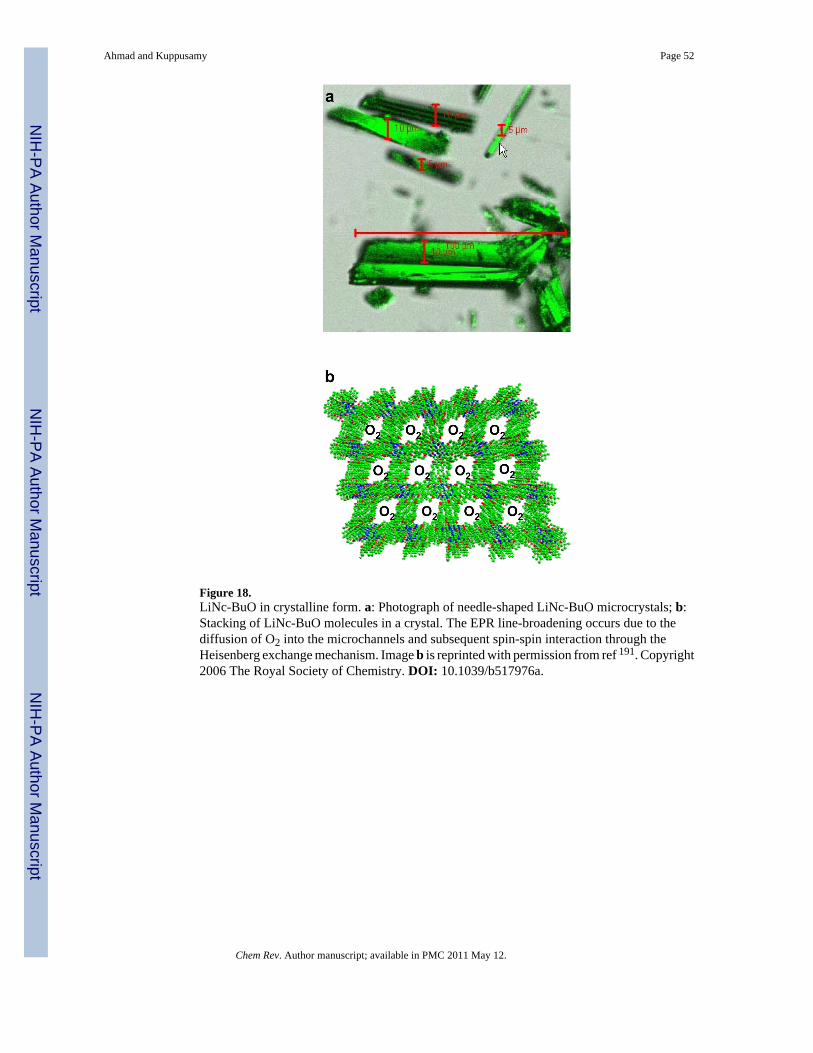
Figure 18.LiNc-BuO in crystalline form. a: Photograph of needle-shaped LiNc-BuO microcrystals; b:Stacking of LiNc-BuO molecules in a crystal. The EPR line-broadening occurs due to thediffusion of O2 into the microchannels and subsequent spin-spin interaction through theHeisenberg exchange mechanism. Image b is reprinted with permission from ref 191. Copyright2006 The Royal Society of Chemistry. DOI: 10.1039/b517976a.
Ahmad and Kuppusamy Page 52
Chem Rev. Author manuscript; available in PMC 2011 May 12.
NIH
-PA Author Manuscript
NIH
-PA Author Manuscript
NIH
-PA Author Manuscript

Figure 19.Chips fabricated by the encapsulation of LiNc-BuO particulates in PDMS. a: Pieces ofpolymerized LiNc-BuO with varying sizes, shapes and ratios of particulate to polymer. Darkshade indicates higher concentration of LiNc-BuO crystals. b: X-band EPR images ofpolymerized LiNc-BuO chip to evaluate spin distribution. Samples were imaged under anoxicconditions, in a sealed tube. Reprinted with permission from ref 196. Copyright 2009 Springer.
Ahmad and Kuppusamy Page 53
Chem Rev. Author manuscript; available in PMC 2011 May 12.
NIH
-PA Author Manuscript
NIH
-PA Author Manuscript
NIH
-PA Author Manuscript
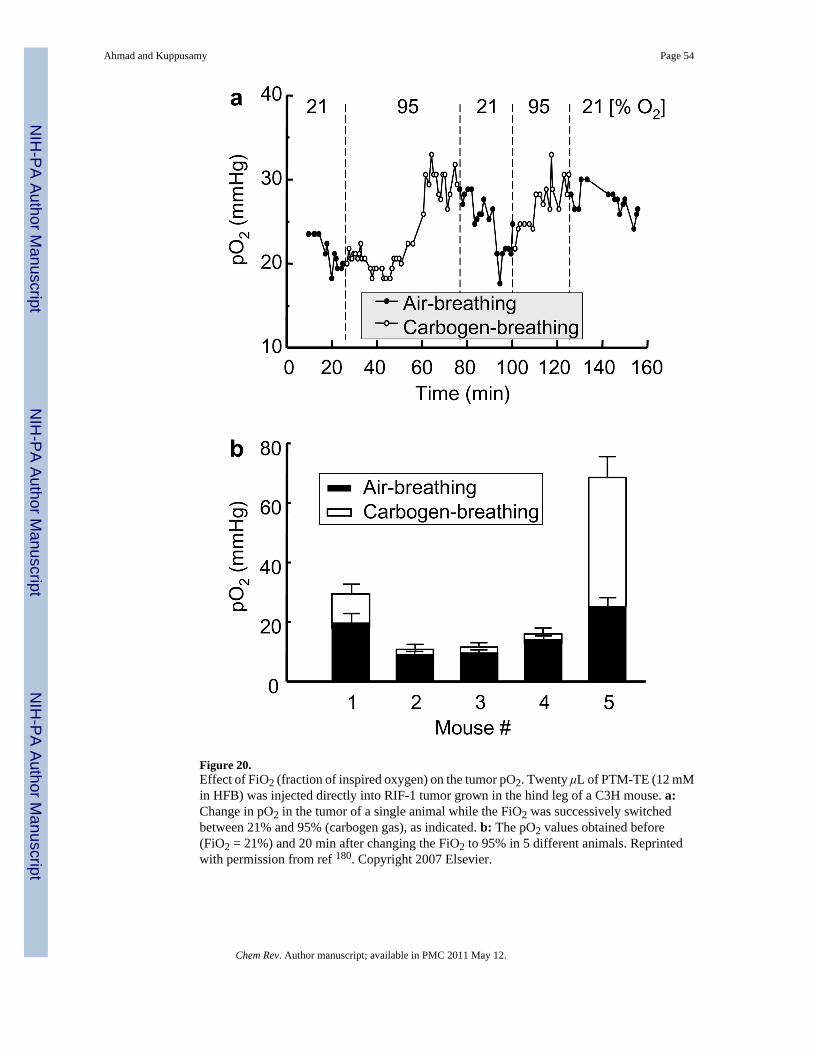
Figure 20.Effect of FiO2 (fraction of inspired oxygen) on the tumor pO2. Twenty μL of PTM-TE (12 mMin HFB) was injected directly into RIF-1 tumor grown in the hind leg of a C3H mouse. a:Change in pO2 in the tumor of a single animal while the FiO2 was successively switchedbetween 21% and 95% (carbogen gas), as indicated. b: The pO2 values obtained before(FiO2 = 21%) and 20 min after changing the FiO2 to 95% in 5 different animals. Reprintedwith permission from ref 180. Copyright 2007 Elsevier.
Ahmad and Kuppusamy Page 54
Chem Rev. Author manuscript; available in PMC 2011 May 12.
NIH
-PA Author Manuscript
NIH
-PA Author Manuscript
NIH
-PA Author Manuscript

Figure 21.In vivo mapping of tumor pO2 during growth and after treatment with X-ray irradiation. Changeand redistribution of tumor pO2 are shown for a small (volume 113 mm3) RIF-1 tumor before(pre-) and 1 h after (post-) X-ray irradiation. The tumor was implanted with RIF-1 cellsinternalized with nanoparticulates of LiNc-BuO. A dose of 30 Gy was delivered with 6-MeVelectrons at a dose rate of 3 Gy/min. Redistribution is seen with a modest increase in thepO2. Reprinted with permission from ref 213. Copyright 2007 John Wiley and Sons.
Ahmad and Kuppusamy Page 55
Chem Rev. Author manuscript; available in PMC 2011 May 12.
NIH
-PA Author Manuscript
NIH
-PA Author Manuscript
NIH
-PA Author Manuscript
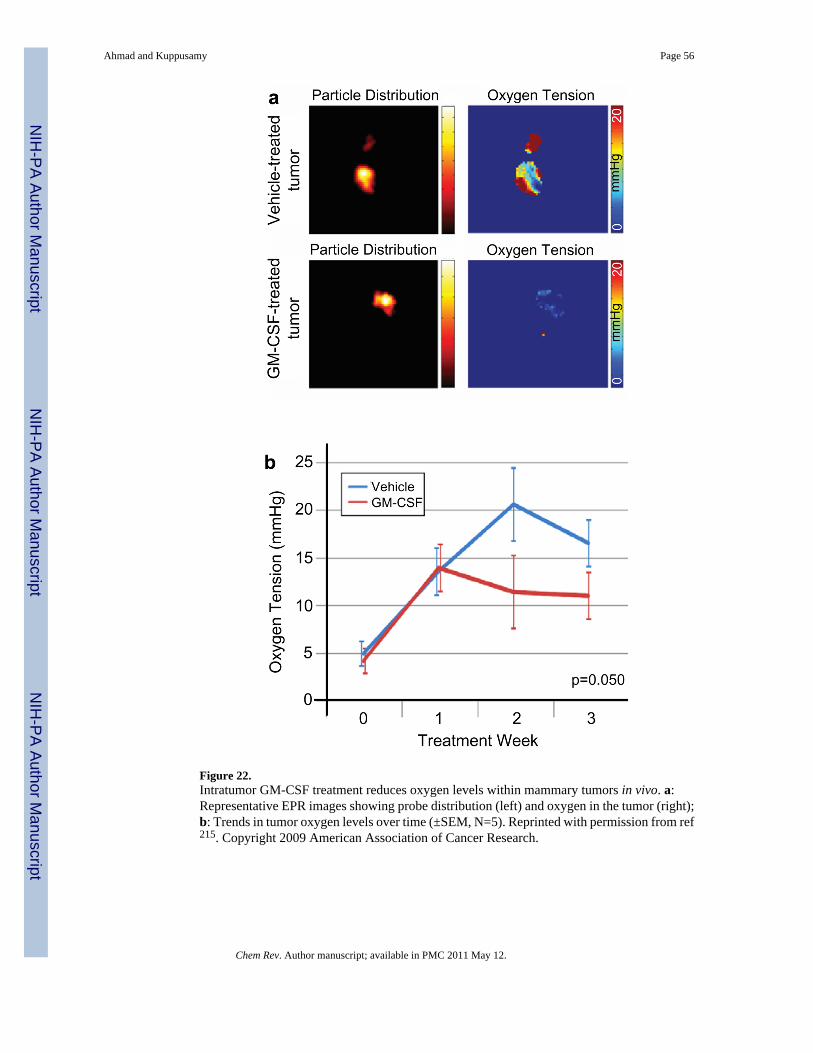
Figure 22.Intratumor GM-CSF treatment reduces oxygen levels within mammary tumors in vivo. a:Representative EPR images showing probe distribution (left) and oxygen in the tumor (right);b: Trends in tumor oxygen levels over time (±SEM, N=5). Reprinted with permission from ref215. Copyright 2009 American Association of Cancer Research.
Ahmad and Kuppusamy Page 56
Chem Rev. Author manuscript; available in PMC 2011 May 12.
NIH
-PA Author Manuscript
NIH
-PA Author Manuscript
NIH
-PA Author Manuscript
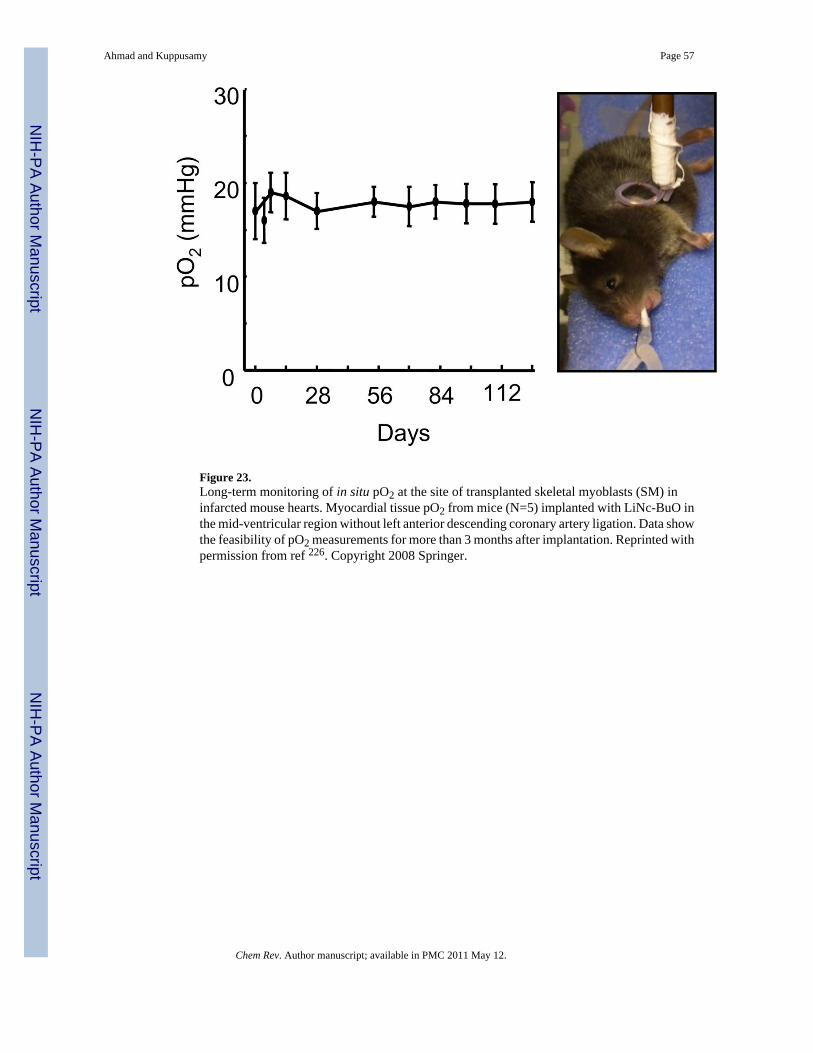
Figure 23.Long-term monitoring of in situ pO2 at the site of transplanted skeletal myoblasts (SM) ininfarcted mouse hearts. Myocardial tissue pO2 from mice (N=5) implanted with LiNc-BuO inthe mid-ventricular region without left anterior descending coronary artery ligation. Data showthe feasibility of pO2 measurements for more than 3 months after implantation. Reprinted withpermission from ref 226. Copyright 2008 Springer.
Ahmad and Kuppusamy Page 57
Chem Rev. Author manuscript; available in PMC 2011 May 12.
NIH
-PA Author Manuscript
NIH
-PA Author Manuscript
NIH
-PA Author Manuscript

Figure 24.Myocardial pO2 in the infarcted heart at site of cell transplantation. Myocardial pO2 valueswere measured repeatedly for 4 weeks using in vivo EPR oximetry in mice hearts transplantedwith LiNc-BuO-labeled skeletal myoblasts (SM) cells. a: Tissue pO2 at 4 weeks after treatmentwith SM cells (MI+SM) was significantly higher as compared to untreated (MI) hearts. b: Thetime-course values of myocardial pO2 measured from infarcted hearts (MI), and infarctedhearts treated with SM cells (MI+SM) are shown. Values are expressed as mean±SD (n=7 pergroup). *p<0.05 vs MI group. Reprinted with permission from ref 227. Copyright 2007American Physiological Society.
Ahmad and Kuppusamy Page 58
Chem Rev. Author manuscript; available in PMC 2011 May 12.
NIH
-PA Author Manuscript
NIH
-PA Author Manuscript
NIH
-PA Author Manuscript

Figure 25.Hyperbaric oxygenation and myocardial pO2, in vivo. a: Myocardial pO2 in (noninfarcted andinfarct) rat hearts measured before (normoxia) and after HBO. Data represent mean±SDobtained from 4 rats. The results show an increase in oxygenation levels reaching significanceat 60 min followed by returning to baseline in about 2.5 hours in the noninfarcted hearts. Inthe infarcted hearts the oxygenation levels are significantly higher up to 2 hours post-treatment.It is interesting to note that a 5.8-fold increase in oxygenation is achieved in the infarct heartsafter 90 min of HBO. b: Myocardial pO2 in rat hearts transplanted with stem cells at 2 weeks.The results (mean±SD; N=4 rats) show an increase in myocardial oxygenation in hearts treated
Ahmad and Kuppusamy Page 59
Chem Rev. Author manuscript; available in PMC 2011 May 12.
NIH
-PA Author Manuscript
NIH
-PA Author Manuscript
NIH
-PA Author Manuscript

with MSC and further enhancement in pO2 was observed in hearts treated with HBO. Reprintedwith permission from ref 229. Copyright 2009 Elsevier.
Ahmad and Kuppusamy Page 60
Chem Rev. Author manuscript; available in PMC 2011 May 12.
NIH
-PA Author Manuscript
NIH
-PA Author Manuscript
NIH
-PA Author Manuscript

Scheme 1.Synthesis of PTM-TE radical. Reagents and conditions: (a) CHCl3, AlCl3; (b) n-BuLi,TMEDA, ethyl chloroformate, 77%; (c) (1) NaOH, DMSO/Et2O, (2) I2, Et2O, 93%.
Ahmad and Kuppusamy Page 61
Chem Rev. Author manuscript; available in PMC 2011 May 12.
NIH
-PA Author Manuscript
NIH
-PA Author Manuscript
NIH
-PA Author Manuscript

Scheme 2.LiPc-α-OPh was synthesized by cyclotetramerization of 3-phenoxyphthalonitrile (i) in thepresence of lithium pentoxide to obtain Li2Pc-α-OPh (ii) followed by electrochemicaloxidation to form microcrystals of LiPc-α-OPh (iii).
Ahmad and Kuppusamy Page 62
Chem Rev. Author manuscript; available in PMC 2011 May 12.
NIH
-PA Author Manuscript
NIH
-PA Author Manuscript
NIH
-PA Author Manuscript

Scheme 3.LiNc was synthesized by cyclotetramerization of 2,3-dicyano naphthalene (i), in the presenceof lithium/pentanol to give Li2Nc (ii), followed by oxidation to form microcrystals of LiNc(iii).
Ahmad and Kuppusamy Page 63
Chem Rev. Author manuscript; available in PMC 2011 May 12.
NIH
-PA Author Manuscript
NIH
-PA Author Manuscript
NIH
-PA Author Manuscript

Scheme 4.LiNc-BuO was synthesized from lithium metal and octa-n-butoxy-substitutednaphthalocyanine (Nc-BuO) (i) in n-pentanol. Nc-BuO macrocyclic ligand reacted with lithiumpentoxide (lithium metal in pentanol) to give dilithium octa-n-butoxy-naphthalocyanine(Li2Nc-BuO) (ii), followed by oxidation to give LiNc-BuO radical (iii) which formed as needle-shaped dark-green microcrystals.
Ahmad and Kuppusamy Page 64
Chem Rev. Author manuscript; available in PMC 2011 May 12.
NIH
-PA Author Manuscript
NIH
-PA Author Manuscript
NIH
-PA Author Manuscript

NIH
-PA Author Manuscript
NIH
-PA Author Manuscript
NIH
-PA Author Manuscript
Ahmad and Kuppusamy Page 65
Table 1
Anoxic linewidth and oxygen sensitivity values for some commonly used EPR oximetry spin probes. Values forLiPc from Liu et al.156 and Ilangovan et al.157; values for LiPc-α-OPh from Pandian et al.158; values for LiNcfrom Manivannan et al.159; values for LiNc-BuO from Pandian et al.160; values for Fusinite from Vahidi et al.161 and Smirnova et al.162; values for Gloxy from James et al.163; values for India Ink from Goda et al.164; valuesfor Tempone from Shen et al.165; values for TAM from Dhimitruka et al.166.
Spin Probe Spin Density (spins/g) ×1019 Anoxic Peak-to-Peak Linewidth (mG) Oxygen Sensitivity (mG/mm Hg)
LiPc 10 10–14 6.1–9.5
LiPc-α-OPh -- 530 13.7
LiNc 68 510 30
LiNc-BuO 72 210 8.5
Fusinite 1–2 800 25
Gloxy 4.6 550 27
India Ink 2.5 650 420
Tempone -- 330 0.64
TAM -- 90 0.84
Chem Rev. Author manuscript; available in PMC 2011 May 12.