HPLC Basics / Instrumentation - MIT-CARS
58
Proprietary & Confidential HPLC Basics / Instrumentation Justin Nadar Application Specialist, HPLC/UHPLC
-
Upload
khangminh22 -
Category
Documents
-
view
0 -
download
0
Transcript of HPLC Basics / Instrumentation - MIT-CARS

Proprietary & Confidential
HPLC Basics / Instrumentation
Justin Nadar
Application Specialist, HPLC/UHPLC
Proprietary & Confidential
Understanding the Principles of HPLC

3
Overview
• Fundamentals of Chromatography – HPLC
• Instrumentation – HPLC
• Applications

4
INTRODUCTION

5
Mikhail Tswett, Russian Botanist, 1872-1919
In 1906 Tswett used chromatography
to separate plant pigments.
He called the new technique chromatography
Chromatography means color writing
Chroma means “color” and graphein means to “write”
He used liquid –adsorption column chromatography with calcium carbonate as adsorbent and petrol ether / ethanol mixtures as eluent to separate chlorophylls & carotenoids
History
6
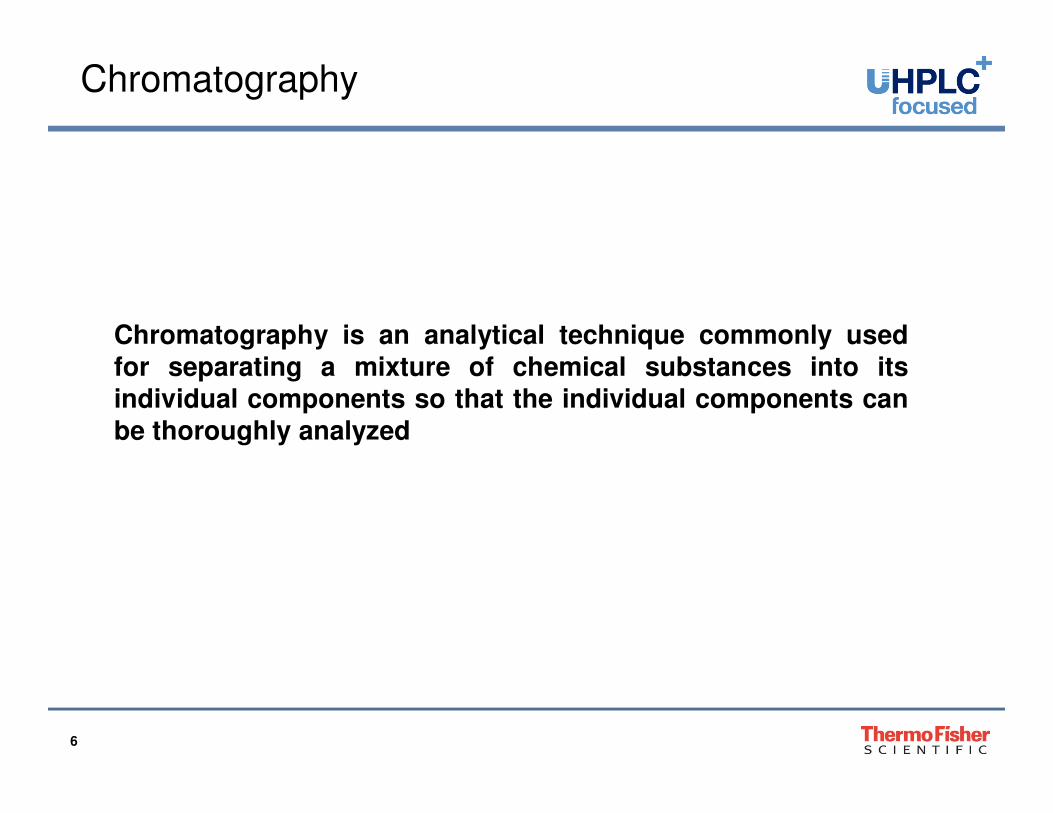
Chromatography is an analytical technique commonly usedfor separating a mixture of chemical substances into itsindividual components so that the individual components canbe thoroughly analyzed
Chromatography
7
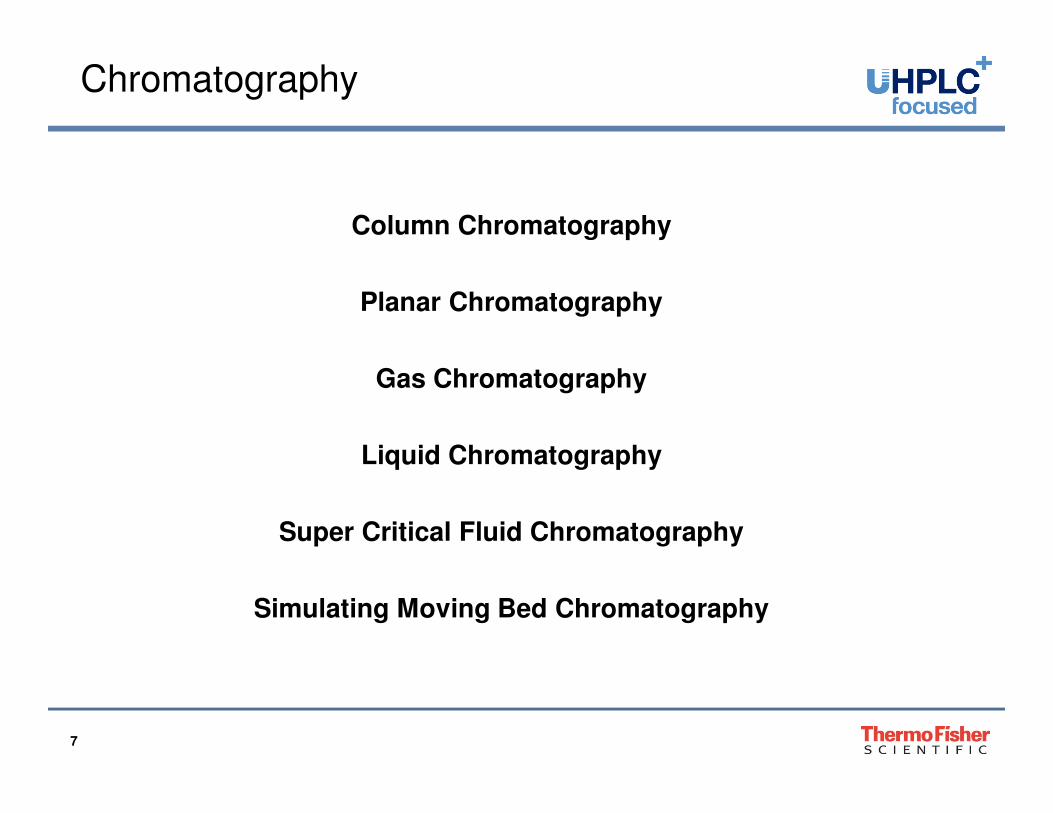
Chromatography
Column Chromatography
Planar Chromatography
Gas Chromatography
Liquid Chromatography
Super Critical Fluid Chromatography
Simulating Moving Bed Chromatography
8
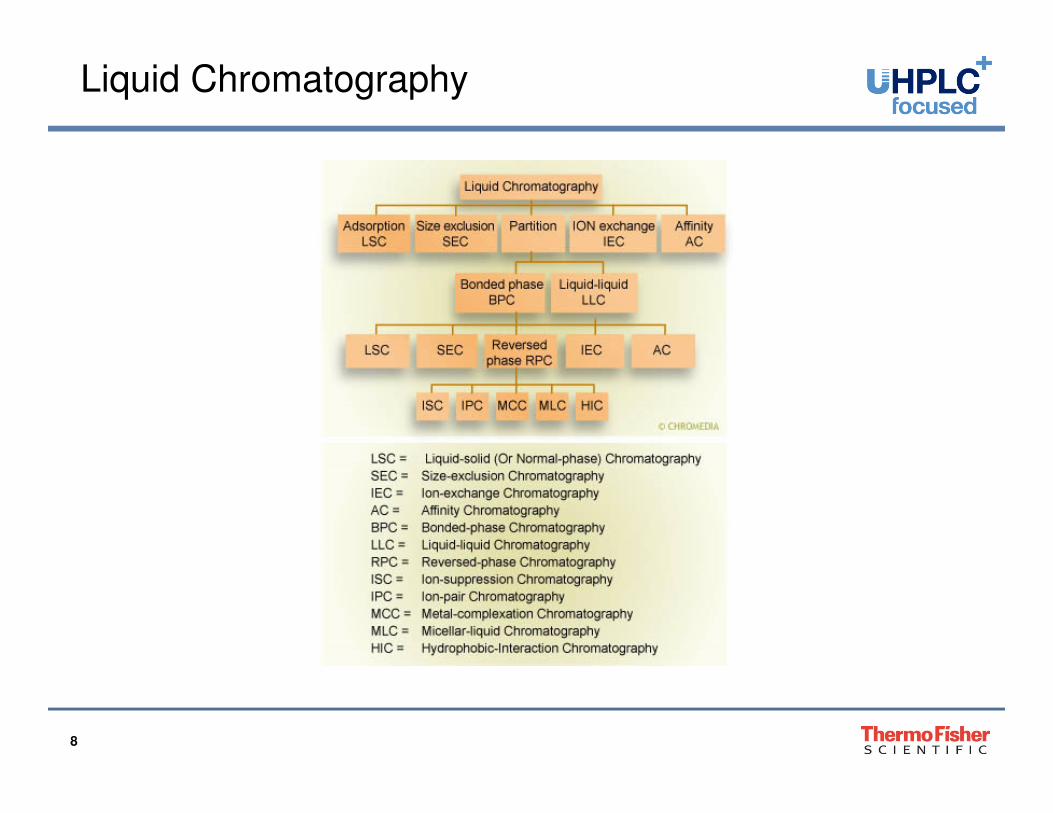
Liquid Chromatography

9
Introduction – The Chromatographic Process
• The separation is based on differential partitioning between the mobile
and stationary phases
• Subtle differences in a compound's partition coefficient result in
differential retention on the stationary phase and thus affect the
separation
Continous stream of mobile phase
Column Stationary Phase Mobile Phase

10
Introduction – HPLC-System: General Design
• Pump with Degasser
• Autosampler
• Column (installed in a Column Compartment)
• Detector
• Computer with control software
AutosamplerColumn

11
Detectors
Detector Response –
Solute
Selectivity Sensitivity Linear Range Destructive Flow
Sensitive
RI/RID Universal –
Bulk
No microgram 104
No Yes
UV-PDA Selective -
Solute
Chromophore nanogram 105
No No
FL/FD Selective -
Solute
Fluorophore picogram 103
No No
ELS/ELD/
ELSD
Selective -
Bulk
Volatization picogram Non-Linear Yes Yes
MS Selective-
Solute
Ionization femtogram 104 - IS* Yes Yes
MS/MS Selective -
Solute
Ionization femtogram
attogram
105 - IS* Yes Yes
ECD Selective -
Solute
Redox picogram 106
Yes Yes
CAD Selective -
Bulk
Aerosols nanogram 104
yes Yes

12
Chromatography
Characteristics that are to be fulfilled by a detector to be used in HPLC
determination are:
� High sensitivity, facilitating trace analysis
� Negligible baseline noise to facilitate lower detection
� Low drift and noise level
� Wide linear dynamic range (this simplifies quantitation)
� Low dead volume (minimal peak broadening)
� Cell design that eliminates remixing of the separated bands
� Insensitivity to changes in type of solvent, flow rate and temperature
� Operational simplicity and reliability
� Tunability so that detection can be optimized for different compounds

13
Chromatography
Assay
Related substances
Dissolution
Content Uniformity
Genotoxic impurities
Determination of Molecular weight
Reverse engineering
Characterisation
Carry-over studies
Bioequivalence studies (ADME/PDPK)
Reaction monitoring
Chemical kinetics
Toxicological studies
Clinical and pharmacological studies

14
Introduction – Characteristics of a Chromatogram
0,0 1,0 2,0 3,0 4,0 5,0 6,0 7,0 8,0 9,0 10,0 11,0 12,0 13,0 14,0 15,0-50
100
200
300
400
500
600
90,0
100,0
110,0
120,0
130,0
140,0
1 - Parabene_Summit_071002 #5 Parabene isocratic 70B Summit 5 UV_VIS_12 - Parabene_Summit_071002 #5 Parabene isocratic 70B Summit 5 Pump_PressuremAU bar
min
1
1 -
5,3
63
2 -
6,5
73
3 -
8,8
63
4 -
12
,93
0
2
Flow: 0,50 ml/min
Methanol: 70,0 %
%C: 0,0 %
%D: 0,0 %
Baseline
Pressure signal and
ripple
Retention time
Peak area
Detector signal
Peak Height

15
THEORY OF CHROMATOGRAPHY
Plate Theory and Column Efficiency
Band Broadening (van Deemter plot)
Resolution
Influence of Smaller Particle Diameter

16
Theory of Chromatography – Plate Theory
• Plate model assumes that the chromatographic column contains a large number of separate layers, called theoretical plates.
• These plates do not really exist; they are a figment of the imagination to help us describe the processes in the column.
• Within the plates, the mobile and stationary phases, are described as being in equilibrium.
• The partition coefficient K is based on this equilibrium and is defined as:K = cstat / cmob
• As K increases it takes longer for solute to elute and the retention time increases.
Stationary Phase
Mobile Phase

17
Theory of Chromatography– Plate Number and Column Efficiency
• The plate theory serves as a way of measuring column quality
• Either by stating the number of theoretical plates (N) in a column (the more plates the better)
or
• by stating the plate height (HETP, H); the Height Equivalent to a Theoretical Plate (the smaller the better)
• Columns with high plate numbers are more efficient than columns with
lower plate numbers.
• A column with a high number of plates will have a narrower peak at a
given retention time than a column with a lower number of plates.

18
wh2
2ln8
⋅=
R
h
t
wLH
H
L
w
tN
h
R=
⋅=
2
54.5
Small H or high N meanssharp peaks!
co
ncen
trati
on
time (length)
H - plate height; N - plate numberL - column lengthtR - retention timewh - peak width at half height
N is related to band broadening in the chromatographic system.
wh
Formulas are only valid for isocratic methods!
Theory of Chromatography – Influence of Efficiency on the Separation Quality

19
Van Deemter Theory explains natural processes.
Theory of Chromatography – Causes of Band Broadening
• Extra column effects
• Tubing and connections
• Detector flow cell
• Eluent pre-conditioner
• In-line filter
• In-column effects
• Unwanted processes
• Damaged packing, void volumes
• Immobilized impurities on stationary phase or column inlet frit
• Thermal mismatch
• Natural processes
• Eddy dispersion
• Longitudinal diffusion
• Resistance to mass transfer
20
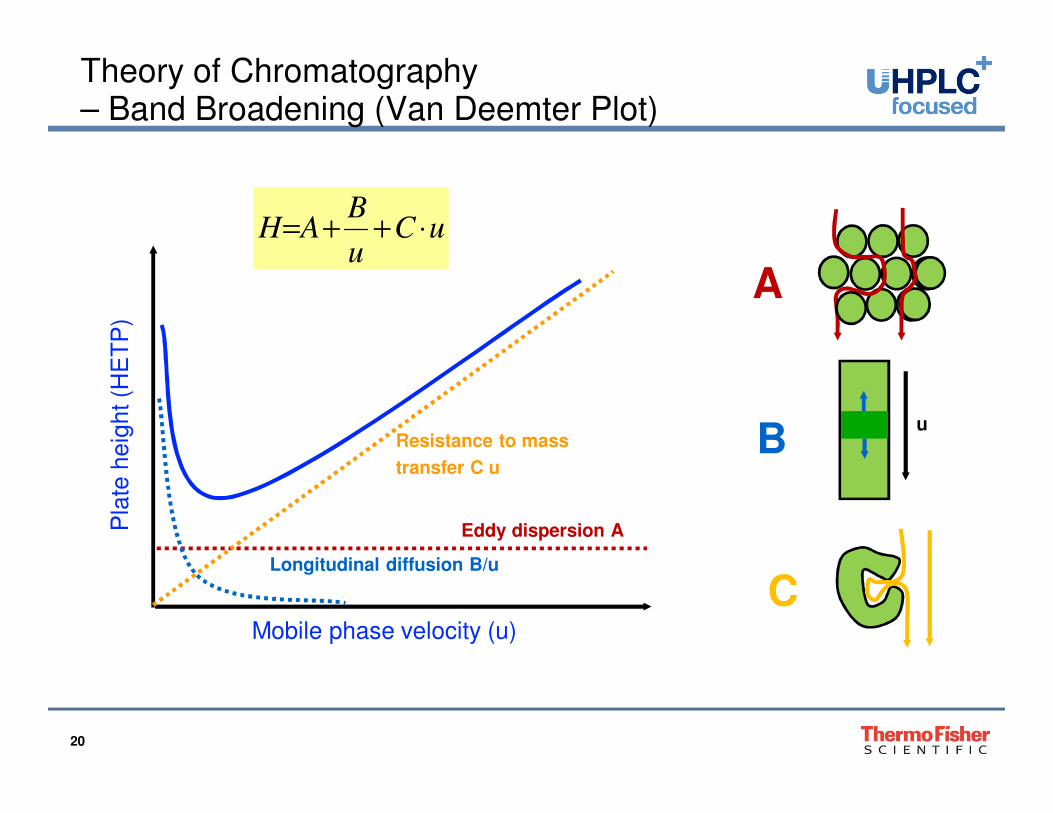
Theory of Chromatography – Band Broadening (Van Deemter Plot)
uCu
BAH ⋅++=
Eddy dispersion A
Longitudinal diffusion B/u
Resistance to mass
transfer C u
Pla
te h
eig
ht (H
ET
P)
Mobile phase velocity (u)
A
u
B
C

21
• Particle diameter
• Column packing quality
• Linear velocity of mobile phase
• Sample characteristic
• Eluent viscosity
• Retention factor
Van Deemter describes only efficiency optimization but we are actually looking into resolution optimization
Theory of Chromatography – Parameters which Influence Band Broadening
dp = 10 µmdp = 5 µmdp = 3 µmdp = 1.7 µm
H[ µ
m]
u [mm/s]
0
20
40
60
80
0 2 4 6 8 10

22
Theory of Chromatography
• Distance between the peak centers of two peaks divided by the average base width of the peaks.
• From theory R > 1.50 indicates baseline separation.
• In real life R ≥ 2 is usually the goal (requested in regulated environment).
• Much more resolution than 2 does not improve separation quality but increases analysis time.
Time, s
tR2
tR1
Sig
nal
Peak 1
Peak 2
w1 w2
Resolution R of two peaks: Goal of every chromatographic method!
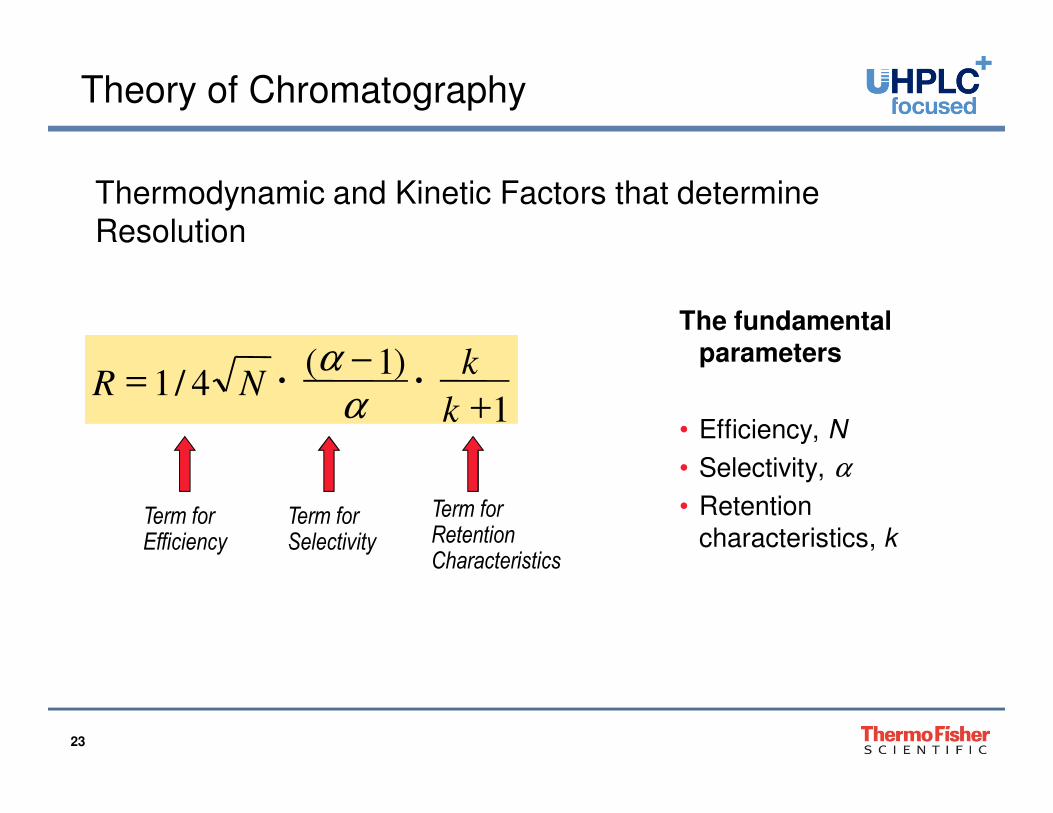
23
Theory of Chromatography
The fundamental parameters
• Efficiency, N
• Selectivity, α
• Retention
characteristics, kTerm for Efficiency
Term for Selectivity
1
)1(4/1
+
•
−•=
k
kNR
α
α
Term for Retention Characteristics
Thermodynamic and Kinetic Factors that determine Resolution
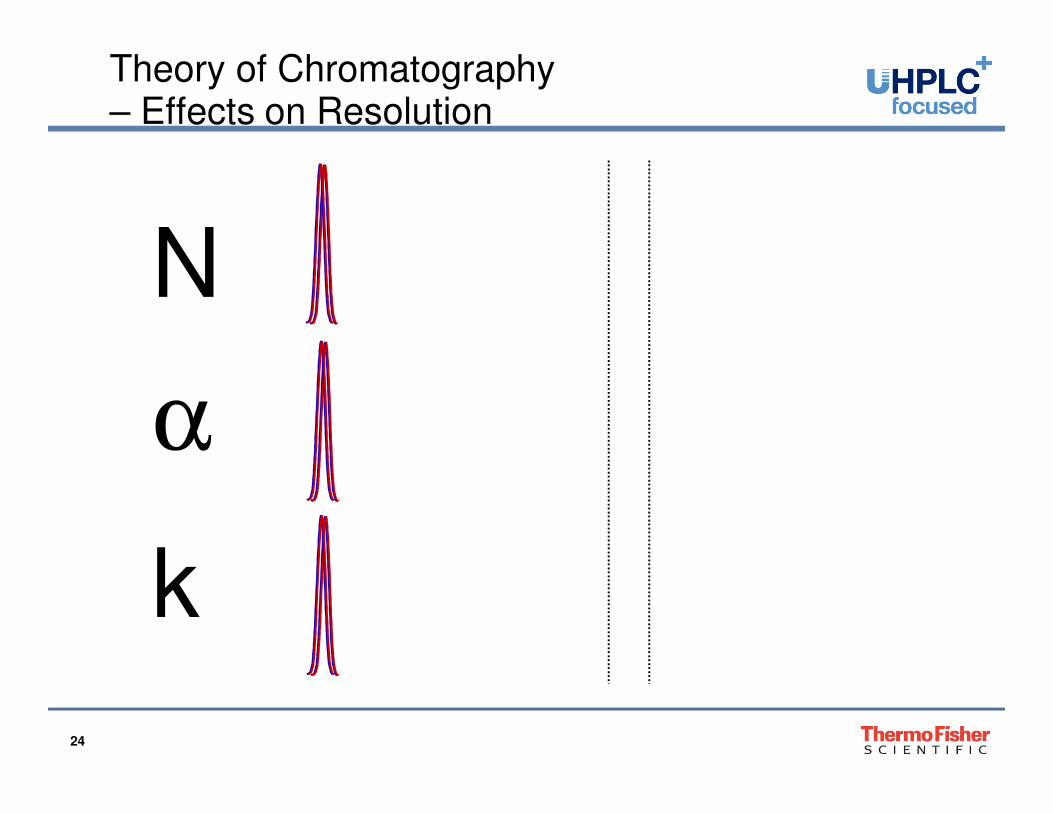
24
N
α
k
Theory of Chromatography – Effects on Resolution
25
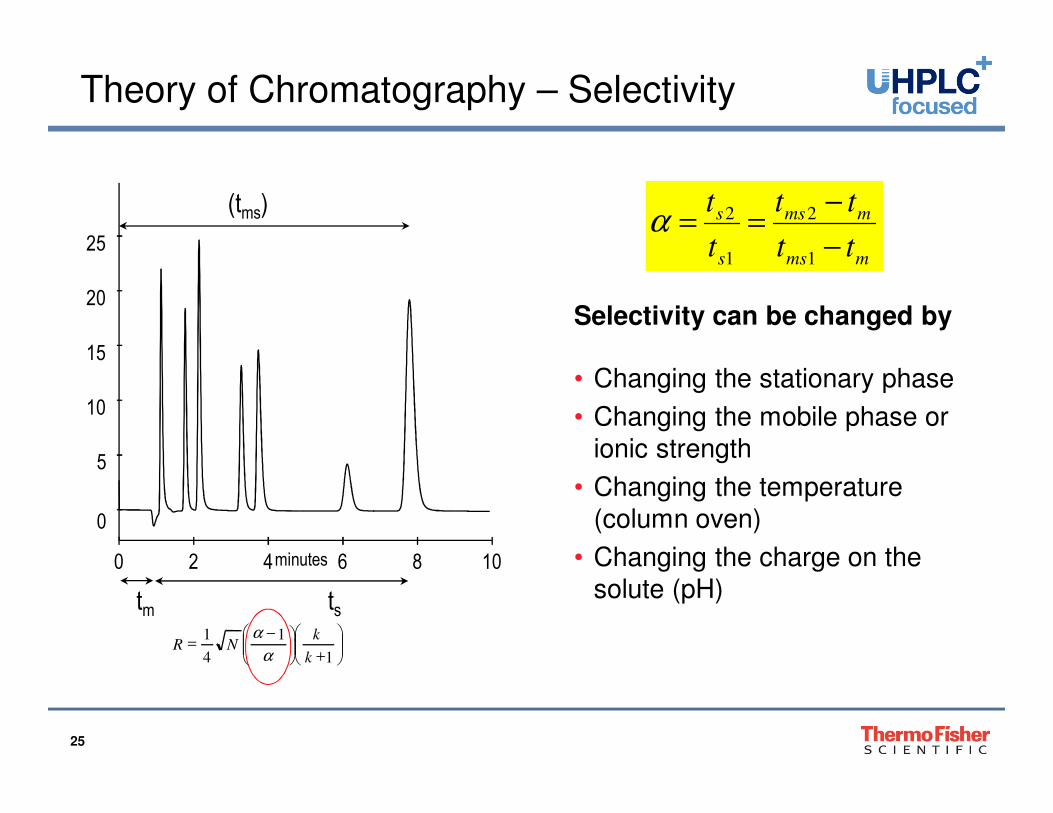
Theory of Chromatography – Selectivity
mms
mms
s
s
tt
tt
t
t
−
−==
1
2
1
2α
Selectivity can be changed by
• Changing the stationary phase
• Changing the mobile phase or
ionic strength
• Changing the temperature
(column oven)
• Changing the charge on the
solute (pH)0 2 4 6 8 10minutes
0
5
10
15
20
25
(tms)
tm ts
+
−=
1
1
4
1
k
kNR
α
α
26
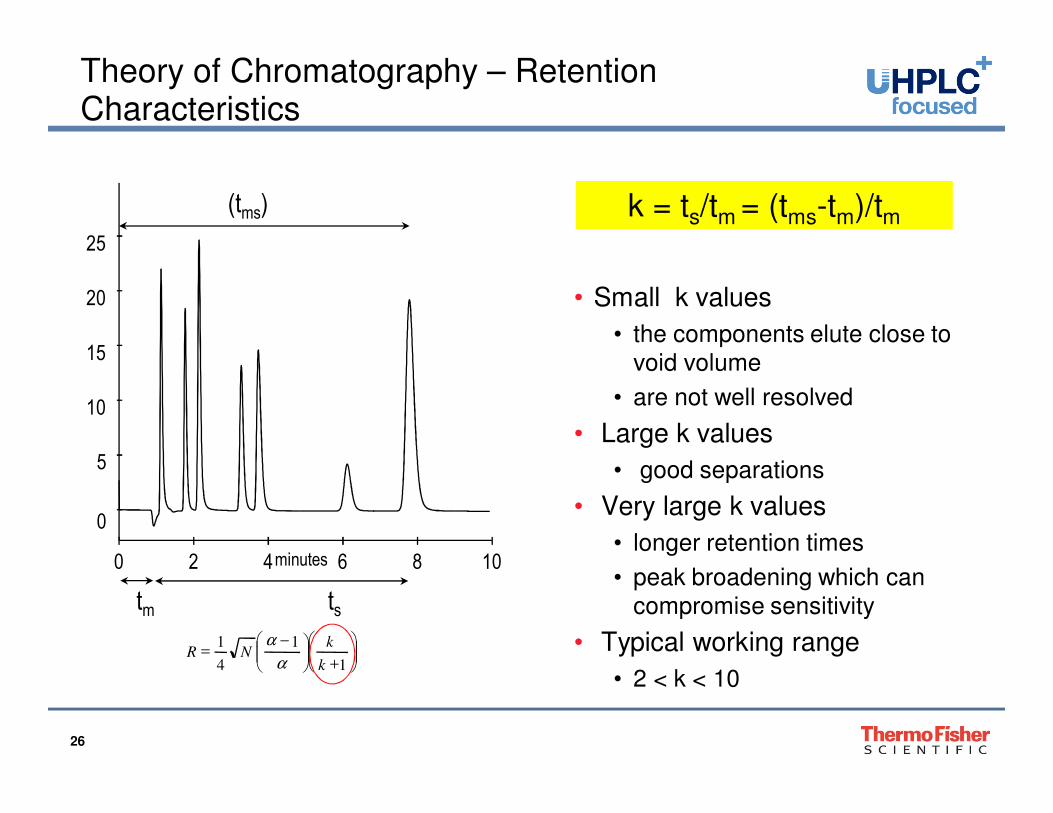
Theory of Chromatography – Retention Characteristics
• Small k values
• the components elute close to void volume
• are not well resolved
• Large k values
• good separations
• Very large k values
• longer retention times
• peak broadening which can compromise sensitivity
• Typical working range
• 2 < k < 10
0 2 4 6 8 10minutes
0
5
10
15
20
25
(tms)
tm ts
+
−=
1
1
4
1
k
kNR
α
α
k = ts/tm = (tms-tm)/tm

27
Theory of Chromatography – The Influence of the Particle Diameter on Speed
250 x 4.6 mm; 5 µm
L/dp = 50
1.5 mL/min
150 x 4.6 mm; 3 µm
L/dp = 50
2.5 mL/min
100 x 4.6 mm; 2 µm
L/dp = 50
3.75 mL/min
0.0 1.0 2.0 3.0 4.0 5.0 6.0 7.0 8.0 9.0 10.0 11.0 12.0
min
Speed 2.8x
No loss in resolution
Speed 6.2x
No loss in resolution
10 µm particles5 µm particles3 µm particles2 µm particles
0 105
Linear Velocity u [mm/s]
0
100
H [
µm
]
uopt, 5 µm
Hmin, 5 µm
Hmin, 2 µm
uopt, 2 µm
uopt, 3 µm
Hmin, 3 µm

28
For separation speed – We Need High Pressure and Fast Flows
Theory of Chromatography – Influence of the Particle Diameter on Pressure
Co
lum
n p
res
su
re [
ba
r]0
200
400
600
800
1000
1200
0 2 4 6 8 10
Linear Velocity u [mm/s]
2 µm particles3 µm particles5 µm particles10 µm particles
0
100
H [
µm
]
Linear Velocity u [mm/s]
2 µm particles3 µm particles5 µm particles10 µm particles
0 2 4 6 8 10
Efficiency Pressure

29
• The smaller the particles, the better the separation performance
• But: Smaller particles generate higher back pressure
• UHPLC: Ultra High Performance Liquid Chromatography
TypicalParticle Size
TypicalBack Pressure
Typical Column Diameter
Preparative HPLC 100 – 10 µm 10 - 100 bar 21 mm
Conventional HPLC 5 – 3 µm 100 – 300 bar 4.6 mm
UHPLC ≤ 3 µm ≥ 600 bar 2.1 mm
• HPLC: High Performance Liquid Chromatography
Introduction – Size of Silica Particles

30
Theory of Chromatography – Summary
• Plate theory and column Efficiency
• The higher the plate number N the better the efficiency of the column
• Band broadening (van Deemter plot)
• Natural processes result in band broadening
• Resolution is a function of column efficiency, selectivity and retention
characteristics.
• Influence of smaller particle diameter:
• Higher resolution
• More speed possible
• Higher back pressure generated

31
COLUMN CHEMISTRY
Normal Phase Chromatography
Reversed Phase Chromatography
Isocratic elution
Gradient Elution
Mobile Phase Additives

32
Column Chemistry – The Column
• Solid Support - Backbone for bonded phases
- Usually porous silica or polymeric particles
• Bonded Phases
- Functional groups chemically bound to the solid support.
• Frits or Sieves as Stationary Phase Retainers
- Protects the packing from sample matrix particles
- Mesh size shrinks with particle size ≤ 3 µm require thorough eluent
filtration!
33
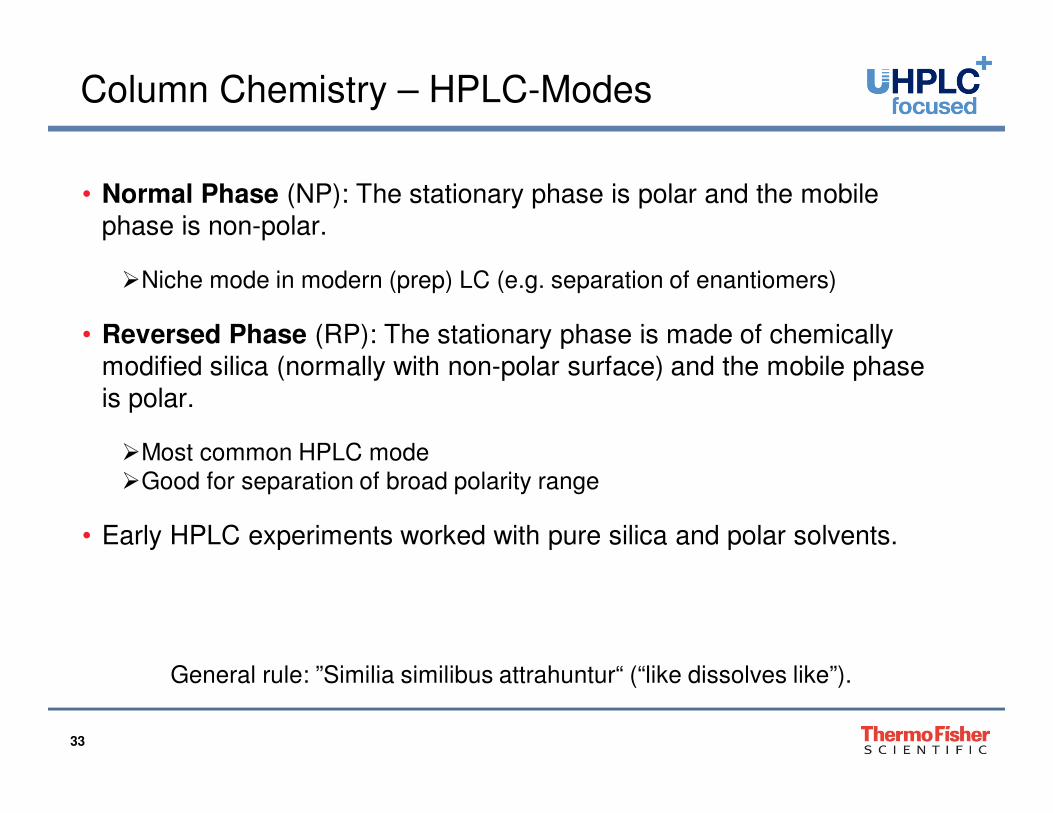
Column Chemistry – HPLC-Modes
• Normal Phase (NP): The stationary phase is polar and the mobile
phase is non-polar.
Niche mode in modern (prep) LC (e.g. separation of enantiomers)
• Reversed Phase (RP): The stationary phase is made of chemically
modified silica (normally with non-polar surface) and the mobile phase
is polar.
Most common HPLC modeGood for separation of broad polarity range
• Early HPLC experiments worked with pure silica and polar solvents.
General rule: ”Similia similibus attrahuntur“ (“like dissolves like”).

34
Column Chemistry– Reversed Phase Chromatography
• Common RP stationary phases:
Normal silica treated with RMe2SiCl
R=(CH2)17CH3: C18
R=(CH2)7CH3: C8
• Common RP mobile phases:
Water < Methanol < Acetonitrile
(elutropic series for RP: decreasing retention)
O
O
Si
O
Si
Si
Si
Silica- C8
Example: C8

35
Column Chemistry – Mobile Phase Additives in Reversed Phase
• Inorganic salts:
• Altered surface tension affects retention characteristics by altering the analyte/surface interaction
• Example: Ammonium sulfate for peptide separation
• Ion pairing reagents
• Neutralize charged analytes for better retention
• Example: Trifluoroacetic acid (TFA), Triethylamine (TEA)
• Buffering agents
• Neutralize charged analytes for better retention and increase reproducibility of retention time
• Example: Sodium acetate buffer, sodium phosphate buffer

36
0.0 1.0 2.0 3.0 4.0 5.0 6.0 7.0 8.0 9.0 10.0
-10
0
13
25
38
50
63
75
90mAU
min
1 - Uracil
2 Aniline
3-
Phenol
4 - p-Ethylaniline
5 Toluene
6 - Ethylbenzene
WVL:254 nm
Basic compound:Aniline pKb=2.7
Acidic compound:Phenol pKa=9.9
Neutral compound:Toluene
C18, 2x100 mm, 1.8 µm
H2O/MeOH (50/50), 450 µL/min
Unpolar compounds have longer retention times
Column Chemistry – Separation of Acidic, Basic and Neutral Compounds

37
Acids Base
The stronger an analyte is charged, the less its retention on a RP-Phase
Practical HPLC Method DevelopmentSnyder, Glajch, Kirkland 1988
Column Chemistry – Acids and Bases – pH Effects

38
SYSTEM CONTRIBUTION
Eluent
Capillaries
Column
Pump
Autosampler
Oven
Detector

39
Pump Retention time
Pressure ripple
Detector baseline noise
Autosampler Peak area
Detector Baseline noise
Sensitivity
Oven Retention time
Sensitivity
System Contribution –How do the Modules Contribute to the Chromatogram?

40
System Contribution – Summary
• Eluents have to be prepared and handled with reasonable care to
avoid particle contamination.
• Dead-volume free connections and minimized extra-column volume by
use of appropriate tubing and fitting systems.
• The pump has to mix the eluents precisely and accurately and provide
a constant flow rate and back pressure.
• The autosampler has to work accurately for successful method
transfer and preciscely for good result reproducibility.
• The temperature effect compound retention and peak shape and has to
be controlled reliably by the column oven.
• Reasonable detector settings are essential for good peak mapping.

41 Proprietary & Confidential
Dionex’ UHPLC-Compatible Detectors
The most complete UHPLC detector range
Note: 200 Hz only available with Chromeleon 7
100Hz VWD-3100
200Hz VWD-3400RS
100Hz MWD-3000SD
200Hz MWD-3000RS
100Hz DAD-3000SD
200Hz DAD-3000RS
MWD DADVWD
100Hz FLD-3100
200Hz FLD-3400RS200Hz Corona Ultra RS (CAD)200Hz ECD-3000RS
ECDFLD Corona Ultra (CAD)
42
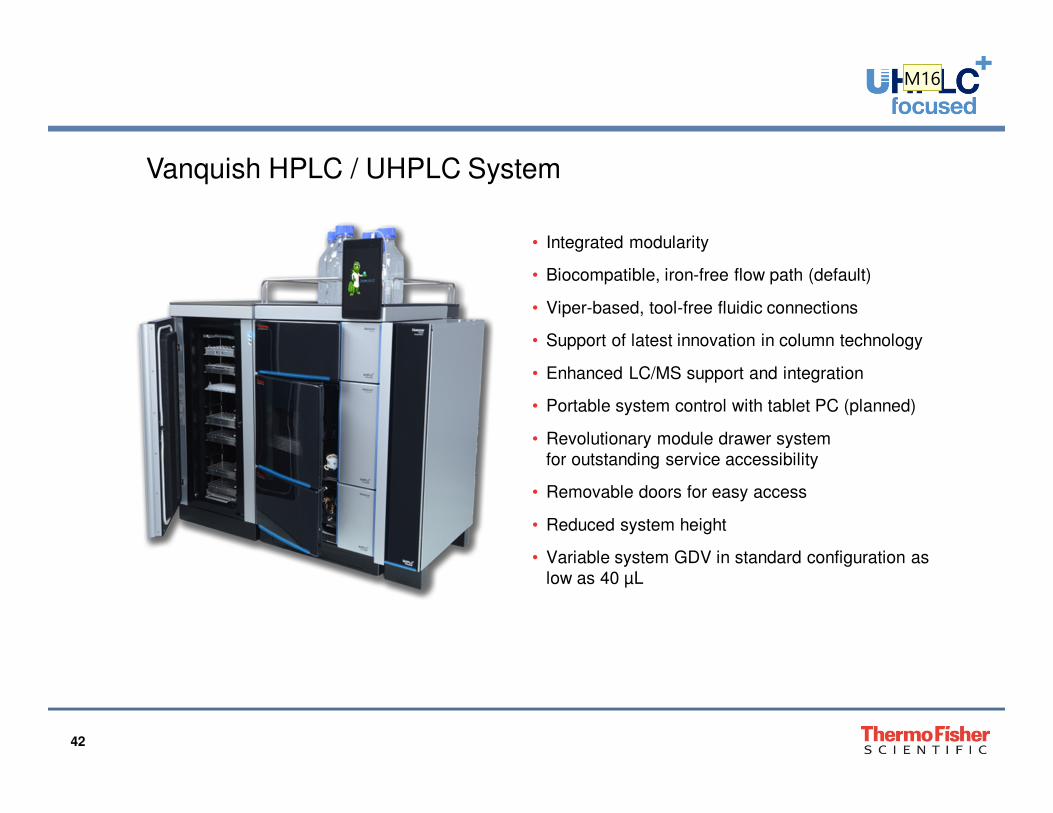
• Integrated modularity
• Biocompatible, iron-free flow path (default)
• Viper-based, tool-free fluidic connections
• Support of latest innovation in column technology
• Enhanced LC/MS support and integration
• Portable system control with tablet PC (planned)
• Revolutionary module drawer system
for outstanding service accessibility
• Removable doors for easy access
• Reduced system height
• Variable system GDV in standard configuration as
low as 40 µL
Vanquish HPLC / UHPLC System
M16
Slide 42
M16 Slide 7 bis 12 kommen auch in der Customer-Präsentation vor - da sind sie auch verfeinert worden
MNeubaue, 6/30/2014

43
Universal UHPLC Detection with Corona Ultra
Separation of 9 pharmaceutical compounds in less than 5 minutes
UV 5 Peaks
Corona 9 Peaks

44
Time / Min.
0.0 0.5 1.0 1.5 2.0 2.5 3.0
Cu
rre
nt
/ n
A
225
250
275
300
325
1
2
3
1 – Internal Std2 – D3
3 – D2
Vitamin D - Coulochem III and ultra Analytical cell
500 ng on columnRun Time = 3 min

45
AN109: Rapid HPLC Separation of Multiclass Antibioticsin Food and Water
Column: Dionex Acclaim RSLC PA2, 2.2 µm, 150 x 2.1 mm
F&B
46
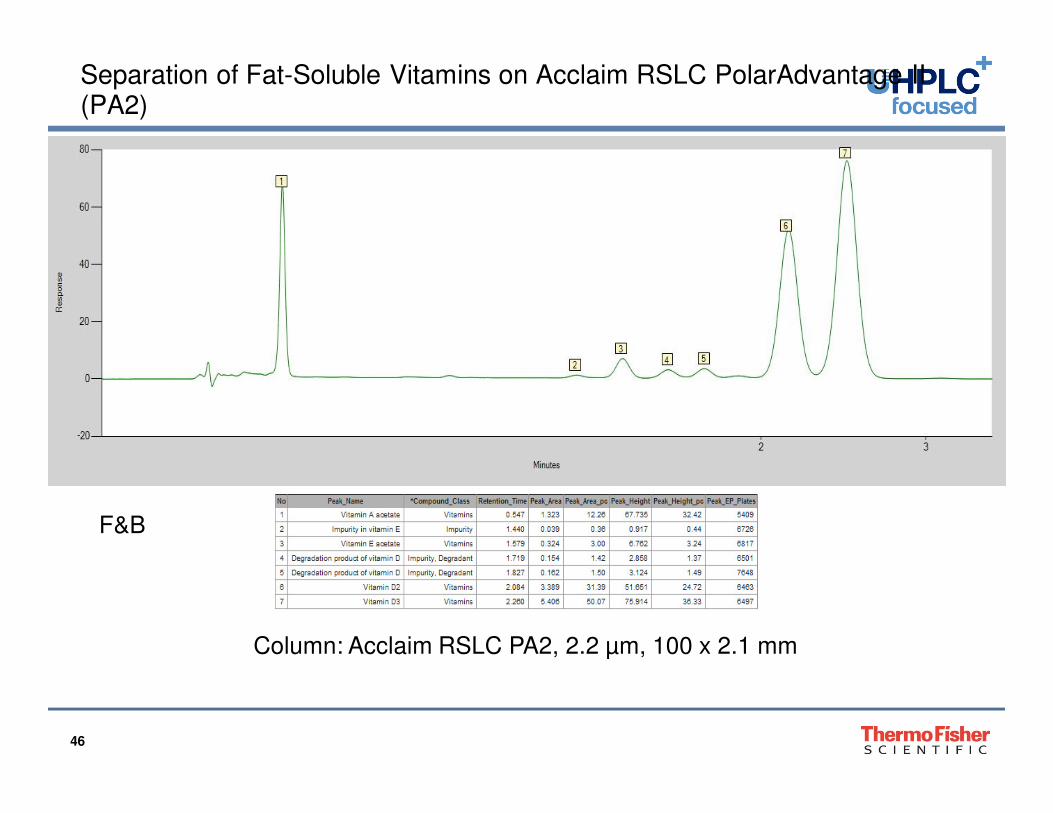
Separation of Fat-Soluble Vitamins on Acclaim RSLC PolarAdvantage II (PA2)
Column: Acclaim RSLC PA2, 2.2 µm, 100 x 2.1 mm
F&B
47
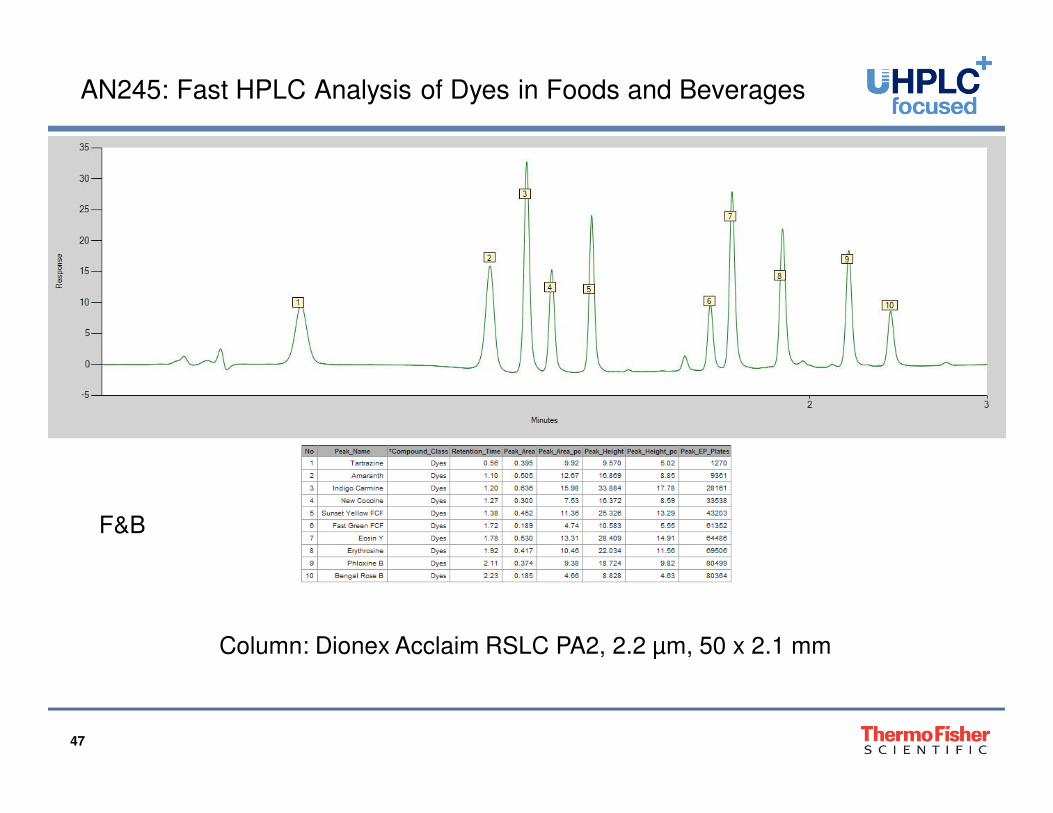
AN245: Fast HPLC Analysis of Dyes in Foods and Beverages
Column: Dionex Acclaim RSLC PA2, 2.2 µm, 50 x 2.1 mm
F&B

48
Anthocyanidins analysis with Standard System
-5,0
70,0
Billberry extract
mAU
1 -
De
lph
inid
n 2 -
Cya
nid
in
4 -
Pe
larg
on
idin
0,00 0,50 1,00 1,50 2,00
-5,0
80,0
Pomegranate Juice
mAU
min
1 -
De
lph
inid
n
2 -
Cya
nid
in3
-P
etu
nid
in
5 -
Pe
on
idin
6 -
Ma
lvid
in
Analysis Time: 2 min Max Pressure: 600 bar
Column: AcQuity BEH, C18,1.7 µm
Dimensions: 50 x 2.1 mm ID
Eluent: A: 0.3% H3PO4
B: ACN
Temperature: 40 oC
Flow rate: 1.0 mL/min
Injection Vol: 1 µL sample in 80% EtOH
Detection: UV 520 nm
Peaks: 1. Delphinidin 2. Cyanidin
3. Petunidin 4. Pelargonidin
5. Peonidin 6. Malvidin
Gradient Table: 0.00 min 10.0% B
2.00 min 20.0% B

49
Ultrafast Analysis of Water Soluble Vitaminsby Parallel UHPLC
Column: Dionex Acclaim RSLC PA2, 2.2 µm, 100 x 2.1 mm
F&B

50
AN193: Determination of Additives in Carbonated Beverages using Mixed-mode WAX-1 columns
Column: Acclaim Mixed-Mode WAX-1, 5 µm, 150 x 4.6 mm
F&B

51
High-Resolution Triglyceride Profile of Cooking Oils
Column: Acclaim RSLC 120 C18, 2.2 µm, 100 x 2.1 mm
F&B

52
EPA-PAHs in Tea Samples with Standard System
Column: MN Nucleodur C18 PAH,
3 µm (100 x 3.0 mm)
Eluents: A:Water
B:Acetonitrile
Gradient: 0 – 0.5 min: 45% B
45 – 90% B in 3.262 min
90 – 95% B in 0.513 min
95% B for 1.013 min
Flow Rate: 2.0 mL/min @ 537 bar
Temperature: 30 °C
Inj. Vol.: 12.5 µL
Detection: FLU
Sample: see fig.0 1.0 2.0 3.0 4.0 5.0 6.0
0
5.0
10.0
Phenanth
rene
Anth
racene
Flu
ora
nth
ene Pyre
ne
Chry
sene
Benzo(b
)flu
ora
nth
ene
Benzo(k
)-fluora
nth
ene
Benzo(a
)pyre
ne
Benzo(g
,h,i)p
ery
lene
Indeno(1
,2,3
-cd)p
yre
ne
A
B
C
D
E
A: EPA-PAH Standard, 10 ng.mL-1
B: Black Tea, St. Petersburg
C: Black Tea, London
D: Korean Green Tea
E: Brazilian Mate Tea
Minutes
10
7cts
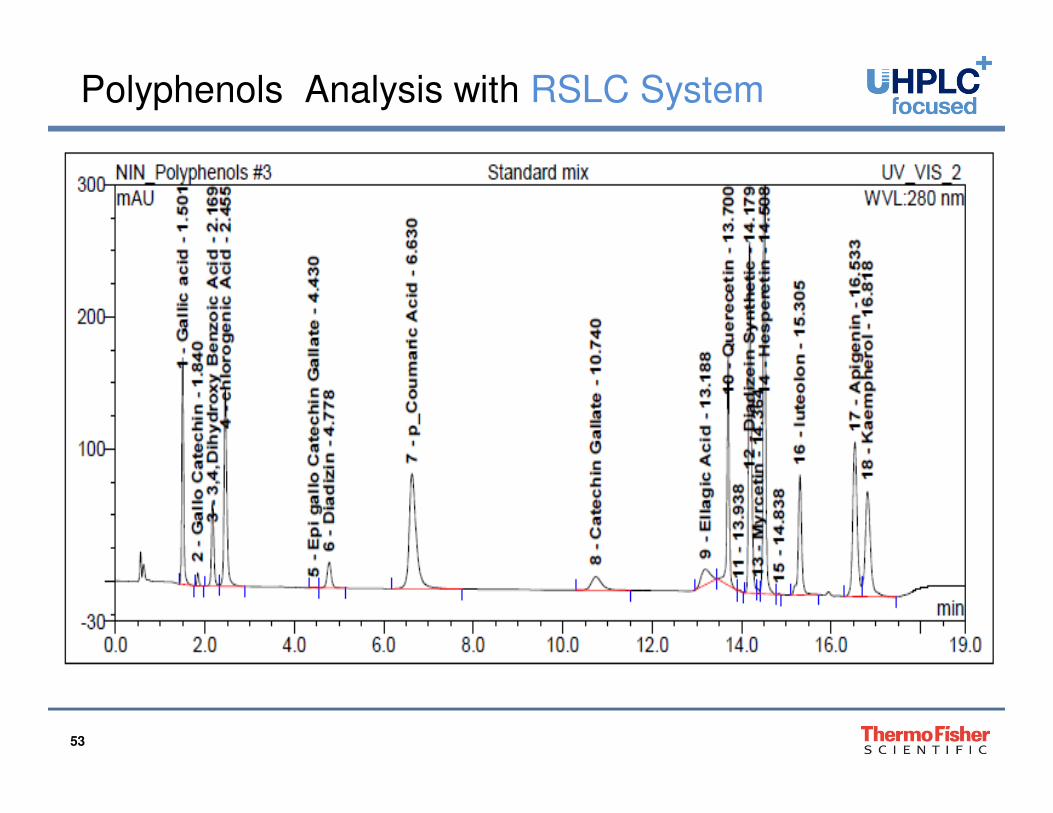
53
Polyphenols Analysis with RSLC System

54
Carotenoides Analysis with RSLC System
55
AppsLibrary Conclusion
• Web Based Application Search Engine
• Offers easy search option for Dionex IC/LC applications
• Provides unique structured searching tools for
• Analyte name or class
• Market and instrument type
• Column information such as particle size and packing material
• Modern application view screen
• See all details in a single glance
• Unique download of all application settings for immediate use

Proprietary & Confidential © 2012 Thermo Fisher Scientific
Thank You!
57
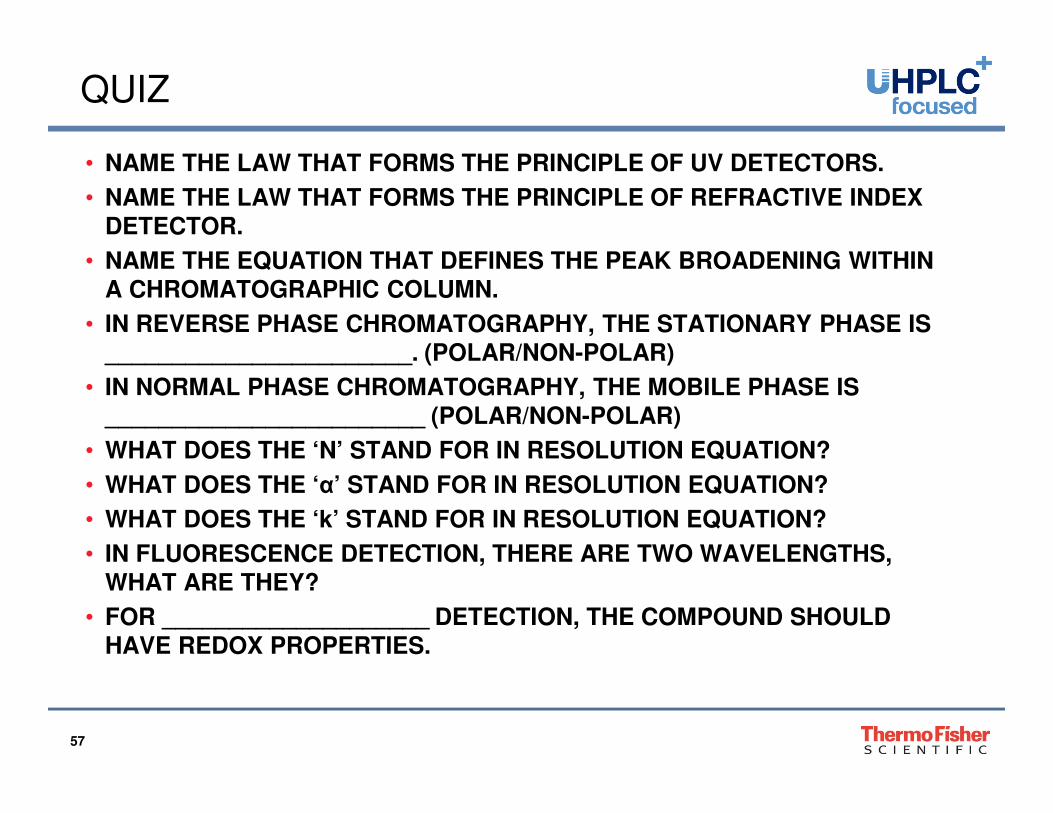
QUIZ
• NAME THE LAW THAT FORMS THE PRINCIPLE OF UV DETECTORS.
• NAME THE LAW THAT FORMS THE PRINCIPLE OF REFRACTIVE INDEX DETECTOR.
• NAME THE EQUATION THAT DEFINES THE PEAK BROADENING WITHIN A CHROMATOGRAPHIC COLUMN.
• IN REVERSE PHASE CHROMATOGRAPHY, THE STATIONARY PHASE IS _______________________. (POLAR/NON-POLAR)
• IN NORMAL PHASE CHROMATOGRAPHY, THE MOBILE PHASE IS ________________________ (POLAR/NON-POLAR)
• WHAT DOES THE ‘N’ STAND FOR IN RESOLUTION EQUATION?
• WHAT DOES THE ‘α’ STAND FOR IN RESOLUTION EQUATION?
• WHAT DOES THE ‘k’ STAND FOR IN RESOLUTION EQUATION?
• IN FLUORESCENCE DETECTION, THERE ARE TWO WAVELENGTHS, WHAT ARE THEY?
• FOR ____________________ DETECTION, THE COMPOUND SHOULD HAVE REDOX PROPERTIES.